Health monitoring of pavement systems using smart sensing ...
198
Graduate eses and Dissertations Graduate College 2014 Health monitoring of pavement systems using smart sensing technologies Shuo Yang Iowa State University Follow this and additional works at: hp://lib.dr.iastate.edu/etd Part of the Civil Engineering Commons is esis is brought to you for free and open access by the Graduate College at Digital Repository @ Iowa State University. It has been accepted for inclusion in Graduate eses and Dissertations by an authorized administrator of Digital Repository @ Iowa State University. For more information, please contact [email protected]. Recommended Citation Yang, Shuo, "Health monitoring of pavement systems using smart sensing technologies" (2014). Graduate eses and Dissertations. Paper 14247.
-
Upload
khangminh22 -
Category
Documents
-
view
3 -
download
0
Transcript of Health monitoring of pavement systems using smart sensing ...

Graduate Theses and Dissertations Graduate College
2014
Health monitoring of pavement systems usingsmart sensing technologiesShuo YangIowa State University
Follow this and additional works at: http://lib.dr.iastate.edu/etd
Part of the Civil Engineering Commons
This Thesis is brought to you for free and open access by the Graduate College at Digital Repository @ Iowa State University. It has been accepted forinclusion in Graduate Theses and Dissertations by an authorized administrator of Digital Repository @ Iowa State University. For more information,please contact [email protected].
Recommended CitationYang, Shuo, "Health monitoring of pavement systems using smart sensing technologies" (2014). Graduate Theses and Dissertations.Paper 14247.

Health monitoring of pavement systems using smart sensing technologies
by
Shuo Yang
A thesis submitted to the graduate faculty
in partial fulfillment of the requirements for the degree of
MASTER OF SCIENCE
Major: Civil Engineering (Civil Engineering Materials)
Program of Study Committee:
Halil Ceylan, Major Professor
Kasthurirangan Gopalakrishnan
Sunghwan Kim
Peter C. Taylor
Liang Dong
Paul G. Spry
Iowa State University
Ames, Iowa
2014
Copyright © Shuo Yang, 2014. All rights reserved.

ii
TABLE OF CONTENTS
Page
LIST OF FIGURES .................................................................................................................. v
LIST OF TABLES .................................................................................................................... x
ACKNOWLEDGEMENTS ..................................................................................................... xi
ABSTRACT ............................................................................................................................ xii
CHAPTER 1. INTRODUCTION ............................................................................................. 1
Background ........................................................................................................................... 1
Research Objectives .............................................................................................................. 2
Thesis Organization .............................................................................................................. 3
CHAPTER 2. LITERATURE REVIEW .................................................................................. 5
Structural Health Monitoring ................................................................................................ 5
History of SHM in Civil Infrastructure ............................................................................. 5
Smart Structural Health Monitoring ................................................................................. 7
Traditional SHM Approach to Pavement Infrastructure System .......................................... 8
Highway Pavement ........................................................................................................... 8
Airfield Pavement ........................................................................................................... 13
Limitations of Current SHM Practices for Pavement System ........................................ 16
Micro-Electromechanical Systems ..................................................................................... 17
Overview ......................................................................................................................... 17
MEMS Sensors for Civil Infrastructure SHM ................................................................ 18
Wireless Sensor Network (WSN) ....................................................................................... 21
Wireless Network Topologies......................................................................................... 21
Wireless Network Protocols ........................................................................................... 23
Passive and Active Sensors: Case of Radio Frequency Identification (RFID) System .. 23
Wireless Sensor System Application in SHM of Pavement ........................................... 24
CHAPTER 3. FIELD INSTRUMENTATION AND EVALUATION OF COMMERCIAL
OFF-THE-SHELF MICRO-ELECTROMECHANICAL SYSTEMS (MEMS) SENSORS
AND WIRELESS SENSORS ................................................................................................. 29
Description of Site .............................................................................................................. 29
Description of Sensors ........................................................................................................ 31

iii
Radio-Frequency Identification (RFID) Temperature Tag ............................................. 32
MEMS Digital Humidity Sensor .................................................................................... 34
Thermochron iButton ...................................................................................................... 36
Strain Gage...................................................................................................................... 37
Installation of Sensors ......................................................................................................... 39
Location of Sensors......................................................................................................... 39
Processes of Installation .................................................................................................. 42
Data Acquisition System (DAS) ..................................................................................... 45
Concrete Paving .............................................................................................................. 47
Sensor Performance Evaluation .......................................................................................... 52
Temperature and Moisture .............................................................................................. 52
Monitoring Period Overview .......................................................................................... 53
Before Traffic Opening (May 2013 to June 2013) ......................................................... 59
Two Months after Traffic Opening (June 2013 to July 2013) ........................................ 68
Six Months after Traffic Opening (December 2013) ...................................................... 71
Concrete Maturity ........................................................................................................... 74
Discussion ....................................................................................................................... 80
CHAPTER 4. IMPLEMENTATION OF WIRELESS COMMUNICATION SYSTEM
TO MEMS SENSOR .............................................................................................................. 84
Implemented Wireless System Overview ........................................................................... 84
Wireless Protocols .......................................................................................................... 84
Microcontrollers .............................................................................................................. 85
XBee-PRO Modules ....................................................................................................... 86
Wireless Transmitter ....................................................................................................... 87
Wireless Receiver ........................................................................................................... 88
Packaging ............................................................................................................................ 88
Evaluation of Implemented Wireless Communication System .......................................... 90
Working Principle of Implemented Wireless System ..................................................... 90
Comparison between Wired MEMS System and Implemented Wireless MEMS
System ............................................................................................................................. 91
Evaluation of Wireless Communication Capability ....................................................... 91
Future Improvement........................................................................................................ 93
iv
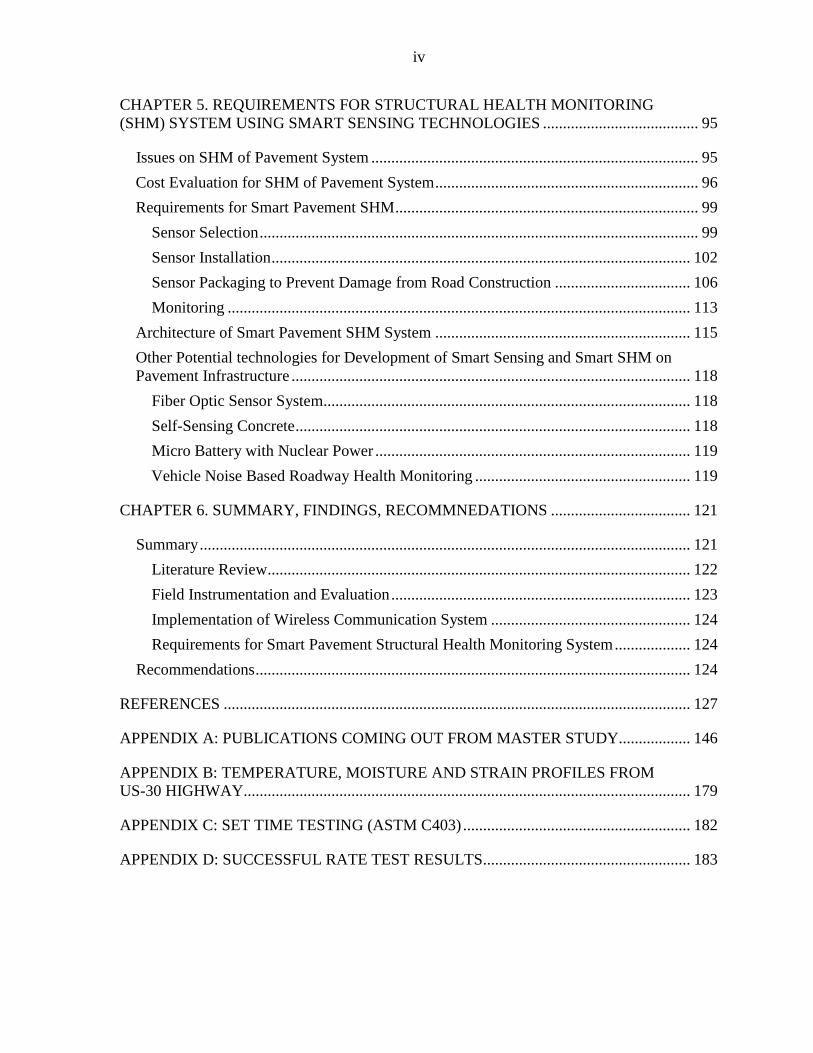
CHAPTER 5. REQUIREMENTS FOR STRUCTURAL HEALTH MONITORING
(SHM) SYSTEM USING SMART SENSING TECHNOLOGIES ....................................... 95
Issues on SHM of Pavement System .................................................................................. 95
Cost Evaluation for SHM of Pavement System .................................................................. 96
Requirements for Smart Pavement SHM ............................................................................ 99
Sensor Selection .............................................................................................................. 99
Sensor Installation ......................................................................................................... 102
Sensor Packaging to Prevent Damage from Road Construction .................................. 106
Monitoring .................................................................................................................... 113
Architecture of Smart Pavement SHM System ................................................................ 115
Other Potential technologies for Development of Smart Sensing and Smart SHM on
Pavement Infrastructure .................................................................................................... 118
Fiber Optic Sensor System............................................................................................ 118
Self-Sensing Concrete ................................................................................................... 118
Micro Battery with Nuclear Power ............................................................................... 119
Vehicle Noise Based Roadway Health Monitoring ...................................................... 119
CHAPTER 6. SUMMARY, FINDINGS, RECOMMNEDATIONS ................................... 121
Summary ........................................................................................................................... 121
Literature Review.......................................................................................................... 122
Field Instrumentation and Evaluation ........................................................................... 123
Implementation of Wireless Communication System .................................................. 124
Requirements for Smart Pavement Structural Health Monitoring System ................... 124
Recommendations ............................................................................................................. 124
REFERENCES ..................................................................................................................... 127
APPENDIX A: PUBLICATIONS COMING OUT FROM MASTER STUDY.................. 146
APPENDIX B: TEMPERATURE, MOISTURE AND STRAIN PROFILES FROM
US-30 HIGHWAY................................................................................................................ 179
APPENDIX C: SET TIME TESTING (ASTM C403) ......................................................... 182
APPENDIX D: SUCCESSFUL RATE TEST RESULTS.................................................... 183

v
LIST OF FIGURES
Page
Figure 1-1. Thesis organization flow chart. .............................................................................. 4
Figure 2-1. Sensors used in traditional pavement health monitoring (Hugo and Epps, 2004). 9
Figure 2-2. MnROAD (photo courtesy of Minnesota DOT). ................................................. 11
Figure 2-3. Virginia Smart Road (photo courtesy of Dr. Edgar de Leon Izeppi, Virginia
aaaaaaaaaa Transportation Institute). ...................................................................................... 12
Figure 2-4. NCAT test track (photo courtesy of National Center for Asphalt Technology). . 13
Figure 2-5. Pavement blowup and damaged aircraft in Ankeny Regional Airport runway
aaaaaaaaaa (photo courtesy of Snyder & Associates, Inc./Polk County Aviation Authority).14
Figure 2-6. National Airport Pavement Test Facility (photo courtesy of Federal Aviation
AAAAAA Administration). .................................................................................................... 16
Figure 2-7. Manufactured MEMS sensor chip from Norris et al. (2008). .............................. 19
Figure 2-8. Wireless network topologies: (a) star; (b) peer-to-peer; (c) multi-tier network
aaaaaaaaaa topologies (Lynch and Loh, 2006). ...................................................................... 22
Figure 3-1. US-30 highway project location. (Source from Map data @2013 Google)......... 30
Figure 3-2. US-30 highway construction plan. ....................................................................... 30
Figure 3-3. i-Q32T wireless RFID transponder (photo courtesy of WAKE, Inc.). ................ 33
Figure 3-4. HardTrack portable handheld transceiver Pro (photo courtesy of WAKE, Inc.). 33
Figure 3-5. RFID tag and portable Pro. .................................................................................. 34
Figure 3-6. Sensirion sensor system: (a) Sensirion SHT71 sensor; (b) evaluation kit. .......... 35
Figure 3-7. Thermochron iButtons and USB cable. ............................................................... 37
Figure 3-8. Geokon model 4200 strain gage (Geokon, Inc., 2014). ....................................... 38
Figure 3-9. Model 4200 Vibrating Wire Strain Gage (Geoko, Inc., 2014)............................. 38
Figure 3-10. Datalogger and Model 4200 strain gage. ........................................................... 39

vi
Figure 3-11. Sensor instrumentation plan: (a) top view; (b) cross-section view. ................... 41
Figure 3-12. Installation of strain gage at joint. ...................................................................... 42
Figure 3-13. Installation of sensors: (a) near slab corner; (b) near mid-span edge. ............... 43
Figure 3-14. Wires in PVC pipe. ............................................................................................ 44
Figure 3-15. PVC pipe in ditch with wires. ............................................................................ 45
Figure 3-16. Data Acquisition System (DAS). ....................................................................... 46
Figure 3-17. Ambient sensors. ................................................................................................ 47
Figure 3-18. Concrete paving. ................................................................................................ 48
Figure 3-19. Sensor protection during road construction: (a) obtain fresh concrete from
aaaaaaaaaaa paver; (b) pour concrete on the sensors. ............................................................. 49
Figure 3-20. Embedment of MEMS digital humidity sensors. ............................................... 50
Figure 3-21. RFID extended probe in wooden box. ............................................................... 50
Figure 3-22. Shoulder construction: (a) backfilling; (b) HMA shoulder paving. ................... 51
Figure 3-23. Traffic opening. .................................................................................................. 52
Figure 3-24. RFID extended probe measurement: (a) in the corner; (b) in the center. .......... 54
Figure 3-25. RFID embedded probe measurement in the mid-span. ...................................... 55
Figure 3-26. Temperature measurement of MEMS digital humidity sensors. ....................... 56
Figure 3-27. RH measurement of MEMS digital humidity sensor. ........................................ 57
Figure 3-28. Temperature measurement from iButtons. ......................................................... 58
Figure 3-29. Strain measurement. ........................................................................................... 59
Figure 3-30. Measurement of RFID extended probes before traffic opening: (a) in the
aaaaaaaaaaa corner; (b) in the center. ..................................................................................... 60
Figure 3-31. Measurement of RFID embedded probes before traffic opening. ...................... 61
Figure 3-32. Measurement of iButtons before traffic opening. .............................................. 61

vii
Figure 3-33. MEMS digital humidity sensor measurement before traffic opening: (a)
aaaaaaaaaaa temperature measurement; (b) RH measurement. .............................................. 62
Figure 3-34. Strain profile before traffic opening. .................................................................. 63
Figure 3-35. Stresses exerted due to curling and warping: (a) tensile stresses exerted at
a top in PCC slab with upward curvature; (b) tensile stresses exerted at bottom
a in PCC slab with downward curvature (Nassiri, 2011). ..................................... 66
Figure 3-36. Strain measurement: curling and warping.......................................................... 67
Figure 3-37. Measurement of RFID extended probes in the corner at two months after
aaaa traffic opening. ................................................................................................... 68
Figure 3-38. Measurement of RFID extended probes in the center at two months after
aaaaaaaaa traffic opening. ................................................................................................... 69
Figure 3-39. Measurement of RFID embedded probes at two months after traffic opening .. 69
Figure 3-40. Measurement of iButtons at two months after traffic opening. ......................... 70
Figure 3-41. Temperature measurement of MEMS digital humidity sensor at two months
aaaaaaaaaaa after traffic opening. ........................................................................................... 70
Figure 3-42. RH measurement of MEMS digital humidity sensor at two months after
aaaaaaaaaa traffic opening. ................................................................................................... 71
Figure 3-43. Measurement of RFID extended probes at six months after traffic opening:
a (a) in the corner; (b) in the center....................................................................... 72
Figure 3-44. Measurement of iButtons at six months after traffic opening. ........................... 73
Figure 3-45. Temperature measurement of MEMS digital humidity sensor at six months
aaaaaaaaaa after traffic opening ............................................................................................ 73
Figure 3-46. RH measurement of MEMS digital humidity sensor at six months after
aaaaaaaaa traffic opening. ................................................................................................... 74
Figure 3-47. Compressive strength test results ....................................................................... 75
Figure 3-48. Split tensile strength test results. ........................................................................ 75
Figure 3-49. Modulus of elasticity test results. ....................................................................... 76
Figure 3-50. Coefficient of thermal expansion test results. .................................................... 76
Figure 3-51. Concrete maturity curve. .................................................................................... 79

viii
Figure 3-52. Relationship between in-place strength and maturity index. ............................. 80
Figure 3-53. Data acquisition of RFID extended probes in winter. ........................................ 83
Figure 4-1. Microcontrollers: (a) Arduino Uno for wireless transmitter; (b) Arduino Mega
aaaaaaaaaa 2560 for wireless receiver. ................................................................................... 86
Figure 4-2. XBee device: (a) XBee-PRO modules; (b) XBee Explorer Regulated. ............... 87
Figure 4-3. Wireless transmitter. ............................................................................................ 87
Figure 4-4. Wireless receiver. ................................................................................................. 88
Figure 4-5. MEMS sensor with packaging. ............................................................................ 89
Figure 4-6. Packaging for wireless transmitter. ...................................................................... 90
Figure 4-7. Comparison between previous wired MEMS system and implemented
aaaaaaaa wireless system. ................................................................................................... 91
Figure 4-8. Wireless MEMS system inside concrete. ............................................................. 92
Figure 4-9. Success rate test: (a) wireless MEMS system inside concrete buried
aaaaaaa underground; (b) vertical distance measurement for data transmission. ............. 92
Figure 4-10. Arduino Fio (left) and Arduino Mega 2560 (right). ........................................... 94
Figure 5-1. Typical PCC pavement response sensors installation layout. ............................ 103
Figure 5-2. Typical PCC pavement environmental-condition-monitoring sensors
aaaaaaaaaa installation layout. .............................................................................................. 104
Figure 5-3. Sheet metal boxes (Sargand and Khoury, 1999). ............................................... 105
Figure 5-4. MEMS sensor packaging system (Hsu, 2008). .................................................. 107
Figure 5-5. Hygrochron packaged in the field (Ye et al., 2006; Choi and Won, 2008). ...... 108
Figure 5-6. Moisture sensor packaging (Wells, 2005). ......................................................... 109
Figure 5-7. Moisture sensor packaging (Quinn and Kelly, 2010; Wang, 2013). .................. 110
Figure 5-8. Wireless strain/stress/temperature sensor platform (Lian et al., 2010). ............. 110
Figure 5-9. Sensor packaging made by Barroca et al. (2013): (a) sensor fabrication; (b)
aaaaaaaaaa Porous mortar shell; (c) concrete casting. .......................................................... 111

ix
Figure 5-10. Stainless steel jacket packaging: (a) Sensor die by polymeric coating (Saafi
aaaa and Romine, 2005); (b) stainless jacket packaging (Norris et al., 2008). ........ 112
Figure 5-11. Moisture sensor with detecting probe: (a) MK33 humidity sensor (Every
aaaaa and Deyhim, 2009); (b) Hydro-Probe II moisture sensor (Hydronix, 2014). .. 113
Figure 5-12. RF reader mounted on a moving vehicle (Lajnef et al., 2013). ....................... 114
Figure 5-13. i-TOWER with turbine & solar panel (Wake, Inc., 2014). .............................. 115
Figure 5-14. Smart pavement monitoring systems for: (a) highway pavement; (b) airfield
aaaaaaaaaaa pavement. ........................................................................................................ 117
Figure 5-15. Typical fiber optic sensors (Kottiswaran et al., 2014). .................................... 118
Figure 5-16. Self-sensing concrete for strain measurement (Han et al., 2014). ................... 119
Figure 5-17. Vehicle noise based roadway health monitoring: (a) VOTER test van; (b)
aaaaaaaaaaa Millimeter-wave radar (Yousuf and Morton, 2014). ....................................... 120

x
LIST OF TABLES
Page
Table 2-1. Test tracks instrumentation.................................................................................... 10
Table 2-2. MnROAD cost benefits (MnROAD Brochure, 2014). .......................................... 11
Table 2-3. Airfield pavement instrumentation. ....................................................................... 14
Table 2-4. Research related to MEMS temperature, moisture and strain sensors. ................. 20
Table 2-5. Summary table of development of wireless sensor platforms from 1998 to
aaaaaaa 2009 (Lynch and Loh, 2006; Cho et al. 2008; Aygun and Gungor, 2011). .......... 26
Table 3-1. US-30 highway construction timeline. .................................................................. 31
Table 3-2. Concrete testing plan summary. ............................................................................ 74
Table 3-3. Sensor survivability evaluation. ............................................................................ 82
Table 4-1. Comparison of wireless technologies (Al-Khatib et al., 2006). ............................ 85
Table 5-1. Issues on SHM of pavement system. ..................................................................... 96
Table 5-2. Sensor unit cost comparison as of 2014. ............................................................... 98
Table 5-3. DAS cost comparison as of 2014. ......................................................................... 98
Table 5-4. MEMS sensor packaging methods and materials. ............................................... 107

xi
ACKNOWLEDGEMENTS
I would like to thank my major professor and committee chair, Dr. Halil Ceylan for
his support in this study. His valuable guidance is the key for me to complete my master
degree. His knowledge and work ethics inspire me for my future career plans. His patient,
inspiration, and encouragement are precious for me and it has been a great pleasure and good
fortune for me to work with him.
Furthermore, I would like to thank my committee members, Dr. Kasthurirangan
Gopalakrishnan, Dr. Sunghwan Kim, Dr. Liang Dong, Dr. Peter C Taylor, and Dr. Paul G
Spry, for their guidance and constructive comment for this research. It’s great pleasure for
me that they can review my thesis and serve on my exam committee. Special thanks are
extended to Dr. Kasthurirangan Gopalakrishnan and Dr. Sunghwan Kim for their extra
invaluable assistance to my research.
In addition, I would also like to thank my friends, colleagues, the department faculty
and staff for giving me a wonderful experience at Iowa State University. I want to also offer
‘’’my appreciation to my friends and co-workers Keyan Shen, the graduate student in
Electrical and Computer Engineering, Dr. Daji Qiao, the associate professor in Electrical and
Computer Engineering, and Mr. Robert Frank Steffes, the lab manager in the Portland
Cement Concrete Research Laboratory. This study could not have been completed without
their help.
Finally, I would like to thank to my wonderful family, including my parents and
brother. Their love, encouragement, understanding, support and patience always inspire me
throughout my whole life.

xii
ABSTRACT
Pavement undergoes a process of deterioration resulting from repeated traffic and/or
environmental loading. By detecting pavement distress and damage early enough, it is
possible for transportation agencies to develop more effective pavement maintenance and
rehabilitation programs and thereby produce significant cost and time saving. Structural
Health Monitoring (SHM) has been conceived as a systematic method for assessing the
structural state of pavement infrastructure systems and documenting their condition. Over the
past several years, this process has traditionally been accomplished through the use of wired
sensors embedded in bridge and highway pavement. However, the use of wired sensors has
limitations for long-term SHM and presents other associated cost and safety concerns.
Recently, Micro-Electromechanical Systems (MEMS) and Nano-Electromechanical Systems
(NEMS) have emerged as advanced/smart-sensing technologies with potential for cost-
effective and long-term SHM.
To this effect, a study has thus been initiated to evaluate the off-the-shelf MEMS
sensors and wireless sensors, identify their limitations, and demonstrate how the acquired
sensor data can be utilized to monitor and assess concrete pavement behavior. The feasibility
of implementing a wireless communication system into a MEMS sensor was also
investigated.
Off-the-shelf MEMS sensors and wireless sensors were deployed in a newly
constructed concrete highway pavement. During the monitoring period, the temperature,
moisture, and strain profiles were obtained and analyzed. The monitored data captured the
effects of daily and seasonal weather changes on concrete pavement, especially, early-age
curling and warping behavior of concrete pavement. These sensors, however, presented

xiii
issues for long-term operation, so to improve performance, a ZigBee protocol-based wireless
communication system was implemented for the MEMS sensors.
By synthesizing knowledge and experience gained from literature review, field
demonstrations, and implementation of wireless systems, issues associated with sensor
selection, sensor installation, sensor packaging to prevent damage from road construction,
and monitoring for concrete pavement SHM are summarized. The requirements for achieving
Smart Pavement SHM are then explored to develop a conceptual design of smart health
monitoring of both highway and airport pavement systems for next-generation pavement
SHM. A cost evaluation was also performed for traditional as well as MEMS sensors and
other potential smart technologies for SHM.

1
CHAPTER 1
INTRODUCTION
Background
Pavement is a fundamental transportation infrastructure system to sustain both
moving vehicles and people. Common pavement system construction materials include soil,
aggregates, concrete, and asphalt. Pavement material types for pavement surface layer can be
divided into Portland Cement Concrete (PCC) and Hot Mix Asphalt (HMA), also known as
rigid (PCC) pavement and flexible (HMA) pavement, respectively.
Portland Cement Concrete (PCC) is a mixture of cement, aggregates, and water that
gains strength in its initial stage through a reaction called hydration. The first use of PCC for
pavement in the United States was a local street construction project in Ohio in 1893; from
the 1970s to now PCC is widely used in highway pavement construction (Pasko, 1998).
Currently, there are more than 64,000 miles of paved concrete roads in the United States
(FHWA, 2012a). Asphalt concrete is a mixture of mineral aggregates and asphalt which will
be compacted in the field for pavement construction. Similar to PCC pavement, HMA
pavement is also widely used in pavement construction in the United States.
Like any other man-made structural system, pavement can fail due to environmental
load, traffic load, or a combination of both. Environmental load such as temperature (curling
stress) and moisture (warping stress) can cause volumetric distortion at an early stage of PCC
pavement. Such environmental and mechanical loads combined with PCC aging will greatly
influence long-term pavement performance and pavement distress (Ruiz et al., 2005).

2
According to the ASCE 2013 Report Card, the current national pavement system is
assessed a “D” grade, reflecting poor pavement condition. The Federal Highway
Administration estimates that it needs approximately $170 billion to effectively improve
pavement condition and performance. Structural Health Monitoring (SHM) is considered to
be a systematic approach that could be employed to monitor and preserve rapidly-
deteriorating pavement assets. Traditional SHM approaches utilizing wired sensors have
been used to track pavement response under environmental and traffic loads, including
temperature, moisture, strain, stress, deflection, etc. However, over the past twenty years,
fewer pavement instrumentation projects have been initiated and almost all of them were
associated with negative issues such as high array density, wire damage, high installation
cost and time, low survivability of wired sensors for long term operation, etc. Recent
achievements in Micro-Electromechanical Systems (MEMS) or Nano-Electromechanical
Systems (NEMS) technology make it possible to manufacture sensors using microfabrication
techniques. This kind of advanced/smart-sensing technology, including wireless sensors,
shows vast potential for improving the traditional SHM approach. However, MEMS-based
and wireless-based smart-sensing technologies have up to now been little used for monitoring
pavement response in the field, and the requirements for using those kinds of smart sensing
technologies have not yet been thoroughly discussed.
Research Objectives
The overall objective of this study was to review both existing and emerging sensing
technologies for pavement health monitoring through a detailed literature review
supplemented by a full-scale pavement instrumentation project on a real highway. However,

3
due to limited pavement construction in the field, this thesis will more focus on the smart
sensing technologies used for PCC pavement. The MEMS-technology-based sensing method
represents an innovative solution to pavement infrastructure health monitoring, and wireless
sensors generally exhibit lower installation cost and time compared with traditional wired
sensors. However, the system requirements of Smart Pavement SHM under actual traffic load
and weather conditions have not yet been investigated and discussed, so the specific
objectives of this study include:
To evaluate the field performance of commercial off-the-shelf MEMS sensors and
wireless sensors
To identify the system requirements of MEMS sensors and wireless communication
systems for Smart Pavement SHM
To investigate packaging methods for wireless communication system implemented
to MEMS sensors
Thesis Organization
This thesis consists of six chapters. Chapter 1 will introduce the background and
objectives of this study. Chapter 2 is a comprehensive literature review of Structural Health
Monitoring (SHM), including recent successes in applying Micro-Electromechanical
Systems (MEMS) and wireless-system technology to SHM. In Chapter 3, the performance of
off-the-shelf MEMS sensors for monitoring US Highway 30 pavement is discussed, and a
concrete maturity curve based on laboratory test and field temperature data is developed.
Chapter 4 describes field experience using a wireless system for a MEMS multifunction
sensor in a US Highway30 highway project. Chapter 5 summarizes issues of SHM and the

4
requirements of Smart Pavement SHM and provides cost evaluation and architecture of
Smart Pavement SHM systems for both highway and airfield pavement. Chapter 6
summarizes the conclusions and recommendations from this study. Figure 1-1 is a flow chart
representing the thesis structure.
Figure 1-1. Thesis organization flow chart.
Chapter 1: Introduction
Chapter 3: Field
Instrumentation and Evaluation of MEMS Sensors
and Wireless Sensors
Chapter 2: Literature
Review
Chapter 4: Implementation
of Wireless Communication System to MEMS sensor
Chapter 5: Requirements
for SHM System Using Smart Sensing Technologies
Chapter 6: Summary, Finds and Recommendations

5
CHAPTER 2
LITERATURE REVIEW
Structural Health Monitoring
History of SHM in Civil Infrastructure
Structural Health Monitoring (SHM) is the process of implementing structural
damage detection strategy and evaluating structural state to learn load and response
mechanisms (Farrar and Worden, 2007; Brownjohn, 2007). In recent years it has become a
rapidly-growing priority for transportation infrastructures to identify and monitor structural
deterioration. An ideal SHM application can monitor the integrity of in-service structures on
a continuous real-time basis, and data processing and analysis can be subsequently used to
assess the symptoms of operational anomalies that may cause service or safety issues (Wong,
2004).
Early development of health-monitoring techniques focusing on vibration-based
damage identification methods can be traced to the 1970s in the oil industry and the
aerospace community in conjunction with offshore platforms and space shuttles.
Investigating modal properties and related quantities of civil infrastructures like bridges and
buildings using vibration- based damage-identification methods has been done since the
1980s. However, difficulties in using vibration-based damage-identification methods for
large-scale structures during that time sometimes occurred, often due to variable
environmental and operation conditions; this frequently resulted in an expensive and time-
consuming process of damage assessment (Phares et al., 2005; Qi et al., 2005; Farrar and
Worden, 2007).

6
SHM can be widely used as an approach to in-service structural integrity assessment
in bridges, buildings, towers, dams, offshore installations, pavements, etc. Traditional SHMs
for such civil infrastructures have utilized wired sensors strategically deployed in the
structures to monitor and record external conditions and associated structural response.
Among these structures, bridges and buildings have represented the most common SHM
applications in civil infrastructures. SHM implemented in bridges is used to characterize
their dynamic behavior under unpredictable mechanical and environmental loads that may
result in unanticipated behavior (Modares and Waksmanski, 2012). The most common
techniques include eddy current, ultrasonic, acoustic-based sensing, strain monitoring,
corrosion monitoring, etc. SHM in building structures has been deployed to monitor
structural performance under natural disaster conditions such as earthquakes, storms and
harsh winds (Brownjohn, 2007). Furthermore, as a common practice, SHM implemented in
concrete structure can also monitor concrete temperature and moisture. The producing data
can be used to determine frame removal time during construction through monitoring of
concrete maturity and curing processing.
Unlike bridges and buildings structures, the application of SHM in pavement systems
has been used to document structural responses from a combination of vehicle and
environment loads. Monitoring sensors embedded in pavement structure has been
investigated since the 1960s to improve pavement design methods (Potter et al., 1969;
Rollings and Pittman, 1992). However, survivability of embedded sensors in pavement
structure is not always high because they can be easily damaged by asphalt/concrete medium
and harsh climate conditions.

7
Global and Local Health Monitoring
According to Plankis and Heyliger (2013), there are four levels of damage
identification. From the first level to the fourth level they are, in sequence: determination of
damage presence, identification of damage location, evaluation of damage, and prediction of
remaining structure service life. To address the first three levels, health-monitoring methods
can be divided into global and local health monitoring. Global health monitoring is the
concept of using technology to detect changes in properties such as stiffness and mass change
and other dynamic global properties caused by significant structural damage. For global
health monitoring, there is no need to know the location or potential location of damage. The
important modal properties for global health monitoring are resonant frequencies, mode-
shape vectors, mode-shape curvatures, a dynamic flexibility matrix, updating of modal
parameters, and acoustic properties (Plankis and Heyliger, 2013). Local health monitoring
refers to tracking damage progress and evaluation of damage level at known or predicted
damage locations. In summary, global techniques are used for damage detection that may
affect the integrity of a whole structure, while local techniques focus on small defects (Haque
et al., 2012). Technically, traditional wired-sensors-based SHM represent a type of local
health-monitoring technology.
Smart Structural Health Monitoring
Lynch (2002) defined the term “smart structure” as “sensing and/or actuation
technologies embedded within the system to provide insight to the structure’s response and
an opportunity to limit responses”. Then Spencer et al. (2004) stated that a sensor must have
features like an on-board Central-Processing-Unit (CPU), small size, wireless capability, and
promise of low cost to be considered a smart sensor. Similarly, Nagayama and Spencer

8
(2007) stated that a sensor can be considered “smart” if it includes an on-board
microprocessor, a wireless communication system, and sensing capability. It also should be
battery powered and has low cost. However, Phares et al. (2005) gave a more detailed
definition of the term “smart”. The term “smart” technology they defined is a “system
systematically reports on the condition of the structure by automatically making engineering-
based judgments, recording a history of past patterns and intensities, and providing early
warning for excessive conditions or for impending failure without requiring human
intervention. These features make the system capable of providing and facilitating self-
diagnostic, real-time continuous sensing, advanced remote sensing, self-organizing, self-
identification, or self-adaptation (decision making and alarm triggering) function”. In short,
smart SHM should enable structures to be capable of real-time continuous sensing of both
external and internal condition changes and responding to these changes to improve
performance without human intervention. To apply this concept to pavement, a Smart
Pavement SHM should be long-term and cost-effective as well. However, a truly “smart”
system or structure meeting all these requirements has never existed if this definition is
rigorously followed. It is clear, however that a practical smart SHM could be achieved by
employing a “smart sensor” system having features of small size, wireless function, low cost,
and an on-board Central-Processing- Unit (CPU).
Traditional SHM Approach to Pavement Infrastructure System
Highway Pavement
In the US, traditional SHM approaches for highway pavement infrastructure system
have utilized full-scale test tracks instrumented by large number of sensors such as strain

9
gages, pressure cells, displacement gauges, subgrade moisture sensors, etc. The motivation
underlying constructing and operating a full-scale pavement test track is to understand
pavement response and behavior under realistic but controlled conditions (Hugo and Epps,
2004). Figure 2-1 from Hugo and Epps (2004) summarizes the common sensors used in
various test tracks. Detailed descriptions of full-scale test tracks, including MnROAD, the
Virginia Smart Road, and the National Center for Asphalt Technology (NCAT) Test Track
are summarized in Table 2-1.
RIOH–ALF WesTrack
HVS–A
TxMLS
PRF–La RIOH–ALF MnROAD HVS–A RIOH–ALF LINTRACK TxMLS WesTrack
LCPC–Fr RIOH–ALF RRT–Rom HVS–A
K–ATL HVS–A MnROAD TxMLS
ISETH TxMLS LCPC–Fr RRT–Rom
In–APLF PRF–La K–ATL NCAT
HVS–SA MnROAD In–APLF MnROAD
HVS–Nordic LCPC–Fr HVS–SA LCPC–Fr
FHWA–PTF K–ATL HVS–Nordic K–ATL
NAPTF HVS–Nordic NAPTF HVS–SA MnROAD
DRTM NAPTF HVS–CRREL NAPTF LINTRACK
HVS–CRREL DRTM RIOH–ALF CEDEX DRTM FHWA–PTF
CEDEX HVS–CRREL HVS–A CAPTIF–NZ HVS–CRREL DRTM
CAL/APT CEDEX TxMLS CAL/APT CEDEX CAPTIF–NZ
ARRB–ALF CAPTIF–NZ PRF–La ARRB–ALF CAL/APT CAL/APT
Oh–APLF ARRB–ALF MnROAD Oh–APLF ARRB–ALF Oh–APLF
Strain gages Pressure cells Load cells Displacement gauges Subgrade moisture
sensors Other*
*Other instruments cited by respondents:
Temperature sensors—Oh–APLF; CAL/APT Temperature
gauge—DRTM Emu & Bison strain coils—CAPTIF–NZ
LVDT—FHWA–PTF
Several attempts for measurement of asphalt sublayers: LINTRACK–NL
MnROAD—see website (http://mnroad.dot.state.mn.us/researc/Mnresearc.asp) and beyond the surface handout.
Figure 2-1. Sensors used in traditional pavement health monitoring (Hugo and Epps,
2004).

10
Table 2-1. Test tracks instrumentation.
Projects Monitoring System Year
MnROAD
Over 9,500 sensors included LVDT, strain gages,
dynamic soil pressure cells, moisture gauges,
thermocouples, resistivity probes et al. were installed
1991
Virginia Smart Road Over 400 sensors included moisture, temperature, strain,
vibration, weigh-in-motion sensors were installed 1997
NCAT Test Track in
Auburn University
Copper-based strain gages, temperature sensors, soil
pressures, soil moisture sensors were installed 2000
MnROAD
In 1991, the MnROAD test track (See Figure 2-2) was constructed to enable civil
engineers to conduct research on making roads longer, safer, and cheaper. The project
funding, approximately $25,000,000, was used to build a 2.5-mile low-volume road and a
3.5-mile main line in the I-94 roadway. Since the 1990s, more than 9,500 sensors have been
installed in the test track to document effects produced by test vehicles. These sensors were
linked by fiber optic or copper wires to a Data Acquisition System (DAS) connected to the
MnROAD main building. The data collected from MnROAD were used to improve
pavement performance and life with cost benefits related to maintenance, repairs, user
delays, and congestion (MnROAD Brochure, 2014). Table 2-2 lists a summary of estimated
overall cost saving from Phase 1 research (1994-2006). It is claimed that a total of $33
million was saved for Minnesota and a potential cost of $749 million was saved for the
nation overall.

11
Figure 2-2. MnROAD (photo courtesy of Minnesota DOT).
Table 2-2. MnROAD cost benefits (MnROAD Brochure, 2014).
Phase I (MN) Implemented Research Annual Savings
Spring Load Restriction Policy $14 Million
Winter Load Increase Policy $7 Million
Low Temperature Cracking Reduction $5.7 Million
ME Flexible Design Method $4 Million
ME Rigid Design Method $1.2 Million
Sealing Pavement/ Shoulder Joints $1.2 Million
Total $ 33.1 Million
In MnROAD, the DAS were distributed as data acquisition nodes near the test cells.
Each data acquisition node consisted of a series of cabinets containing sensors, data
collection devices, and AC power sources as well as communication systems. The insulated
cabinets were heated during winter and cooled during summer by installed fans. In order to
cost-effectively install so many sensors, the construction manager of MnROAD paid
considerable attention to sensor life span and sensor installation plan. However, there still
were many sensor failures reported, requiring their replacement after road construction. In
doing so, it was found that the in-situ sensor positions differed a great deal from the
instrumentation plan, so they had to install sensors into new holes using full-depth coring.

12
After installation, they assumed the data from the new sensors was accurate (Tompkins and
Khazanovich, 2007).
Virginia Smart Road
The Virginia Smart Road was a 5.7 mile-long limited-access highway constructed at
the end of the 1990s. This road, as shown in Figure 2-3, links highway I-81 and Blacksburg,
Virginia. It has all-weather test towers, variable-lighting sections, and experimental sections,
as well as a control room for data analysis. The Virginia Smart Road contains more than 400
installed sensors, including thermocouples, strain gages, pressure cells, time-domain
reflectometry (TDR) probes, resistivity probes, etc. However, approximately 70% of the
sensors failed after two years (Al-Qadi et al., 2004).
Figure 2-3. Virginia Smart Road (photo courtesy of Dr. Edgar de Leon Izeppi, Virginia
Transportation Institute).
Auburn University National Center for Asphalt Technology (NCAT) Test Track
The NCAT test track, shown in Figure 2-4, was designed and built to evaluate and
improve current pavement design in 2000. This 1.7-mile long test track contains more than
46 experimental sections. The test period of NCAT test track can be divided into a first and a

13
second round of tests. The first round of tests was initiated in 2000 and finished in 2002.
After the first round, the second round started in 2003 after several sections were replaced.
While many sensors, including strain gages, temperature sensors, soil pressure sensors, and
soil moisture sensors, were embedded in subgrade and asphalt pavement, almost 35% of
them failed before 2003 (Timm et al., 2004).
Figure 2-4. NCAT test track (photo courtesy of National Center for Asphalt
Technology).
Airfield Pavement
Pavement deterioration caused by aircraft loading, temperature, and moisture
variation can be a major concern in airport safety. Compared to highway pavement, airfield
pavement typically deals with higher load magnitudes and higher tire pressures but fewer
load repetitions from airplanes. Additionally, although both airfield and highway pavements
are prone to deterioration from traffic and environment loads, airfield pavement usually
predominately exhibits environmental-load-related rather than traffic-load-related stresses
(FAA Advisory Circular, 2011).
14
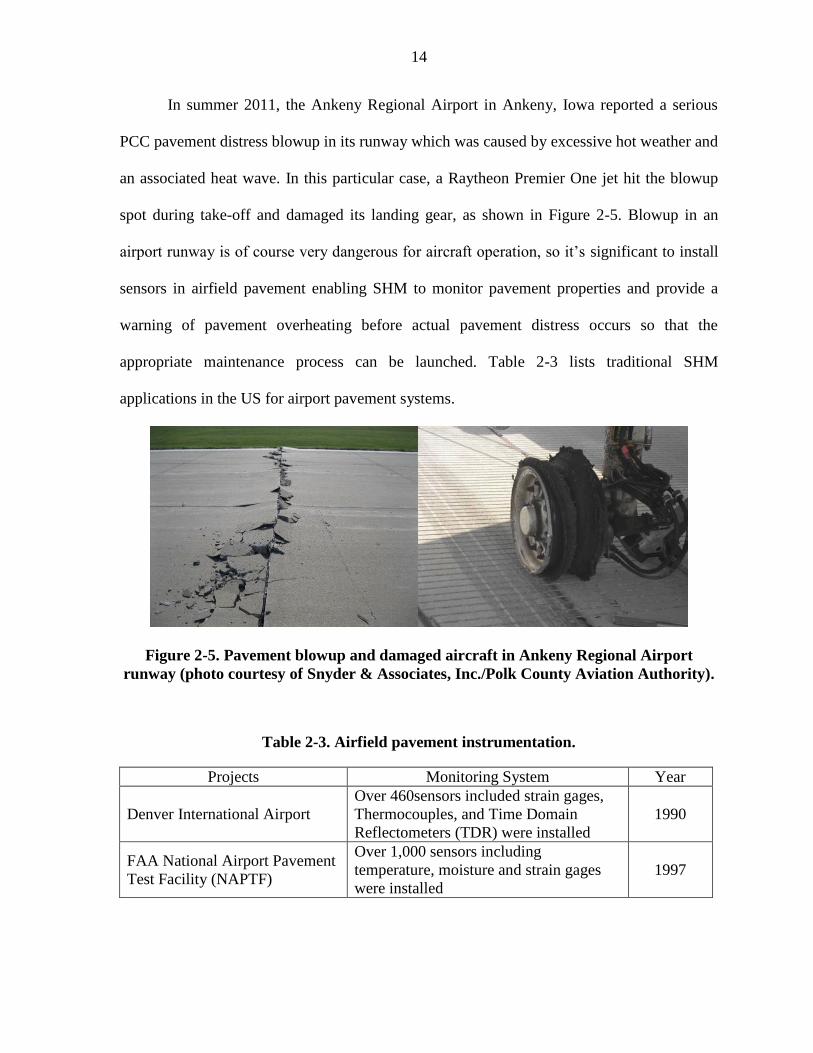
In summer 2011, the Ankeny Regional Airport in Ankeny, Iowa reported a serious
PCC pavement distress blowup in its runway which was caused by excessive hot weather and
an associated heat wave. In this particular case, a Raytheon Premier One jet hit the blowup
spot during take-off and damaged its landing gear, as shown in Figure 2-5. Blowup in an
airport runway is of course very dangerous for aircraft operation, so it’s significant to install
sensors in airfield pavement enabling SHM to monitor pavement properties and provide a
warning of pavement overheating before actual pavement distress occurs so that the
appropriate maintenance process can be launched. Table 2-3 lists traditional SHM
applications in the US for airport pavement systems.
Figure 2-5. Pavement blowup and damaged aircraft in Ankeny Regional Airport
runway (photo courtesy of Snyder & Associates, Inc./Polk County Aviation Authority).
Table 2-3. Airfield pavement instrumentation.
Projects Monitoring System Year
Denver International Airport
Over 460sensors included strain gages,
Thermocouples, and Time Domain
Reflectometers (TDR) were installed
1990
FAA National Airport Pavement
Test Facility (NAPTF)
Over 1,000 sensors including
temperature, moisture and strain gages
were installed
1997
15
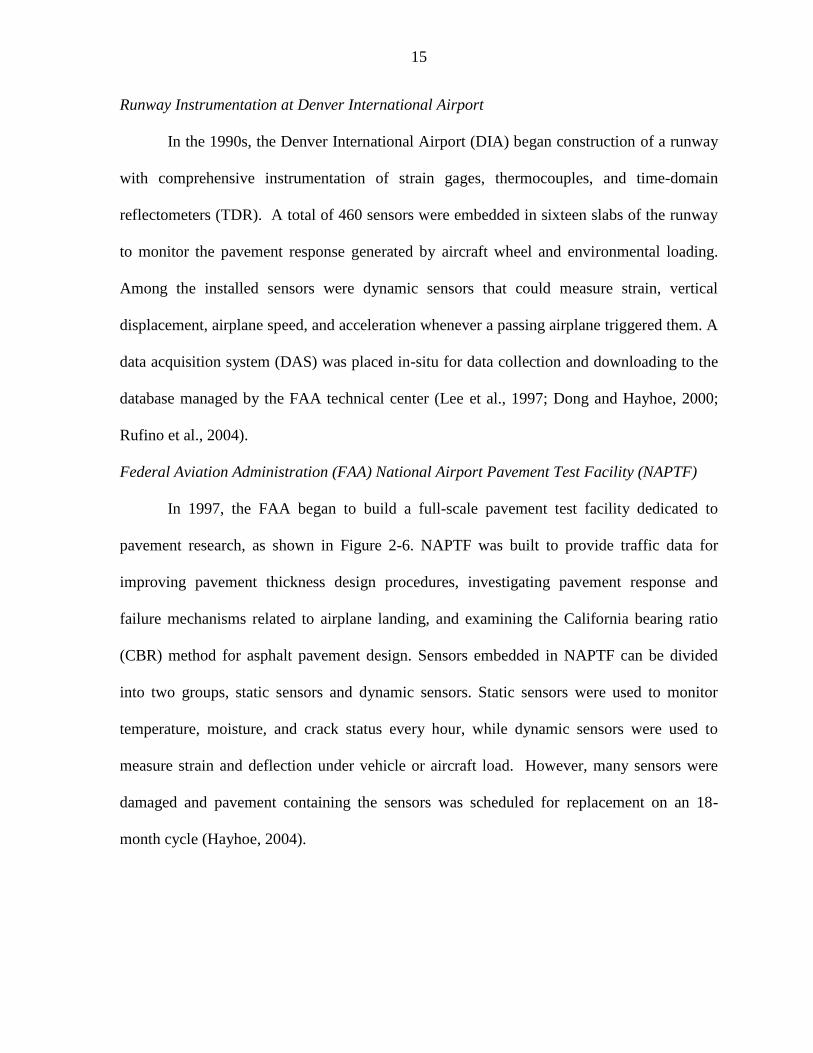
Runway Instrumentation at Denver International Airport
In the 1990s, the Denver International Airport (DIA) began construction of a runway
with comprehensive instrumentation of strain gages, thermocouples, and time-domain
reflectometers (TDR). A total of 460 sensors were embedded in sixteen slabs of the runway
to monitor the pavement response generated by aircraft wheel and environmental loading.
Among the installed sensors were dynamic sensors that could measure strain, vertical
displacement, airplane speed, and acceleration whenever a passing airplane triggered them. A
data acquisition system (DAS) was placed in-situ for data collection and downloading to the
database managed by the FAA technical center (Lee et al., 1997; Dong and Hayhoe, 2000;
Rufino et al., 2004).
Federal Aviation Administration (FAA) National Airport Pavement Test Facility (NAPTF)
In 1997, the FAA began to build a full-scale pavement test facility dedicated to
pavement research, as shown in Figure 2-6. NAPTF was built to provide traffic data for
improving pavement thickness design procedures, investigating pavement response and
failure mechanisms related to airplane landing, and examining the California bearing ratio
(CBR) method for asphalt pavement design. Sensors embedded in NAPTF can be divided
into two groups, static sensors and dynamic sensors. Static sensors were used to monitor
temperature, moisture, and crack status every hour, while dynamic sensors were used to
measure strain and deflection under vehicle or aircraft load. However, many sensors were
damaged and pavement containing the sensors was scheduled for replacement on an 18-
month cycle (Hayhoe, 2004).

16
Figure 2-6. National Airport Pavement Test Facility (photo courtesy of Federal
Aviation Administration).
Limitations of Current SHM Practices for Pavement System
Current SHM practice utilized in pavement systems has mainly used wired sensing
technologies, resulting in low survivability of sensors with respect to both pavement
construction and long-term operation. It is difficult to provide either continuously long-term
monitoring for pavement structural behavior changes or real-time warning for in-service
pavement failure. Furthermore, wired sensors always require high installation cost and time.
If many sensors are used the cost of the DAS may also increase due to a limit in the number
of data-logger connection ports. Current SHM practice also may not directly integrate actual
Pavement Management Information System (PMIS) to establish Maintenance and
Rehabilitation (M&R) strategies for in-service pavement systems. Other limitations such as
lack of easy installation of the SHM system and optimization of the field’s data collection

17
and storage mechanisms may also hamper the implementation of pavement SHM (FHWA,
2012b).
Hence, implementation of smart sensors should be investigated as a means for
overcoming current limitations. Micro-Electromechanical Systems (MEMS) and wireless
sensor systems are reviewed in the following subsection to evaluate their potential for
employment in “smart sensor" development.
Micro-Electromechanical Systems
Overview
The emergence of Micro-Electromechanical Systems (MEMS) and their recent
achievements represent an alternative solution to achieving long-term, continuous, real-time,
and cost-effective SHM for pavement systems. Micro-Electromechanical Systems (MEMS)
is a term referring to miniaturized systems consisting of microsensors and actuators
fabricated by using microfabrication techniques; their critical physical dimensions could
range from just one micron up to one millimeter (MEMSnet, 2014). This allows use of
integrated circuits and on-board central processing units to make the system intelligent. As a
result, microsensors and actuators with active perception and microcircuit control can
effectively sense their environments and be able to react to changes in those environments
(Varadan and Varadan, 2000; AllAboutMEMS, 2002; Phares et al., 2005).
The early motivation of “small size” sensing devices can be traced back to the first
point-contact transistor developed in the 1940s by Shockley et al. at Bell Laboratories; it was
about one-half inch high (SCME, 2013). Since the 1970s, the manufacturing processes of
electronic devices have undergone remarkable progress associated with the use of silicon as

18
the dominant material. MEMS devices were first developed and widely commercialized in
the 1990s. Nowadays, MEMS technologies are used in many applications (AllAboutMEMS
2002; Lee, 2004; SCME, 2013).
MEMS-based sensors are generally comprised of miniaturized mechanical-sensing
elements fabricated on silicon chips. Contemporary microfabrication techniques enable a
variety of complex electromechanical systems to be integrated into such miniaturized sensing
elements (MEMSnet, 2014). The most distinguishing features of a typical MEMS sensor are
incredibly small size and an on-board microprocessor, or CPU. Such a sensor has a much
lower price due to material used and integrated interconnection. The microprocessor supports
digital processing, analog-digital conversion, and basic computation. Compared to MEMS
sensors, traditional sensors have both relatively larger size and higher price and they must
always be equipped with data management system, so the instrumentation of traditional
sensors may require a large array density in the structure if many sensors are used, which
itself may result in pavement distress (e.g. cracking). MEMS sensors, on the other hand,
could potentially be used to improve current SHM of pavement system performance with
relatively little concern for inherent compromising properties.
MEMS Sensors for Civil Infrastructure SHM
Current researches related to SHM primarily focus on development of MEMS sensors
and wireless-sensor systems. Norris et al., (2008) developed a MEMS sensor capable of
measuring temperature and moisture inside concrete using the microcantilever principle, as
shown in Figure 2-7. The cantilever beam used in this sensor can generate stresses related to
concrete moisture. Beam curvature will be produced and the deflection can be measured as
resistance by an embedded nano-strain gage (resistor) so that the stress can be calculated.

19
Then, based on the established relationship between stress and water concentration, the
moisture content can be determined. Temperature was measured using an on-chip
temperature sensor. The fabrication of the MEMS sensor was conducted in accordance using
a combination of standard and customized semiconductor processing steps. Standard
complementary metal-oxide-semiconductor (CMOS) procedures, i.e., photolithography and
chemical wet etching, were used to form the silicon platform. After patterning and activating
the moisture-sensing element, the cantilever beam was released through plasma etch. The
sensor die was then surrounded by a polymeric coating and the entire chip embedded in a
stainless steel jacket to protect it from the enclosing concrete.
Figure 2-7. Manufactured MEMS sensor chip from Norris et al. (2008).
Other previous studies on MEMS sensors for concrete monitoring include “Smart
Aggregate” by Sackin, et al. (2000), “Smart Pebbles” by Watters (2003), “Smart Dust” by
Pei et al. (2007, 2009), and “Self-sustaining damage detection sensor” (Kuang, 2014). Table
2-4 lists MEMS sensors developed through previous research efforts but not all of them can
be used for concrete pavement.

20
Table 2-4. Research related to MEMS temperature, moisture and strain sensors.
Sensor Type Applications Reference
Temperature
Early age concrete property monitoring Saafi & Romine (2005)
Monitoring pavement condition using “Smart Dust” Pei et al. (2007)
Cascaded “Triple-Bent-Beam” MEMS sensor for
contactless temperature measurements in non-
accessible environments
Andò et al. (2011)
Wireless temperature microsensors integrated on
bearings Scott et al. (2011)
Highly reliable MEMS temperature sensors for 275
˚c applications Scott et al. (2012)
Multisensor MEMS for temperature, relative
humidity, and high-g shock monitoring Smith (2012)
MEMS-based Pt film temperature sensor Han et al. (2014)
Rapid temperature measurement of meteorological
detection system based on MEMS Lu et al. (2014)
Moisture
Early age concrete property monitoring Saafi & Romine (2005)
Monitoring pavement condition using “Smart Dust” Pei et al. (2007)
A wireless, passive embedded sensor for real-time
monitoring of water content in civil engineering
materials
Ong et al. (2008)
Multisensor MEMS for temperature, relative
humidity, and high-g shock monitoring Smith (2012)
A highly sensitive humidity sensor with a novel
hole array structure using a polyimide sensing layer Choi et al. (2014)
A CMOS humidity sensor for passive RFID
sensing applications Deng et al. (2014)
Digital hygrometer for trace moisture measurement Islam et al. (2014)
MEMS-based humidity sensor based on
thiol-coated gold nanoparticles Lin et al. (2014)
Strain
Early age concrete property monitoring Saafi & Romine (2005)
A carbon nanotube strain sensor for SHM Kang et al. (2006)
Microwave Weigh-In-Motion (WIM) sensor Liu et al. (2007)
Smart pavement monitoring system Lajnef et al. (2011)
High-performance piezoresistive MEMS strain
sensor with low thermal sensitivity
Mohammed et al.
(2011)
Novel MEMS strain sensor Saboonchi & Ozevin
(2012)
Surface-Bonded MEMS strain sensors Moradi &Sivoththaman
(2013)
Although there has been considerable research focusing on MEMS sensors, the
majority of studies are still at the proof-of concept level. For MEMS sensors used in

21
pavement SHM, one must consider short-term effects such as high temperature, moisture,
and alkali environment in fresh concrete, as well as the effect of fine particles from concrete
compounds. Long-term effects such as freezing-thawing cycles in actual pavement must also
be considered.
Wireless Sensor Network (WSN)
Traditional wired sensors generally require high installation costs and time as well as
avoidance of wire-damage problems. For example, Cho et al. (2008) reported that a
contractor spent over $5,000 on each wired sensing channel in a high-rise building practicing
SHM. Furthermore, Hong Kong government spent more than $8 million to install a total of
350 wired sensing channels in the Tsing Ma Suspension Bridge (Farrar, 2001). In view of
such examples, economic motivation facilitates the adoption of wireless sensors to replace
traditional wired sensors. In general, wireless sensor network can utilize Radio Frequency
(RF), acoustics, infrared transmission, and lasers as transmission media. In terms of SHM,
RF has mainly been used, and it follows specific topologies and protocols associated with
signal transmission.
Wireless Network Topologies
A WSN can be represented as a cluster in an SHM system, so the whole system can
be structured using three common topologies for civil infrastructures: start, peer-to-peer, and
multi-tier, as shown in Figure 2-8 (Lynch and Loh, 2006). Star topology is designed to allow
each node (wireless sensor) to communicate only with a designated center server. The
connection between node and the center server is usually coaxial or fiber optical cable; the
center server should be capable of data storage and high rate transmission. Peer-to-peer

22
topology is designed so that each node can communicate with any other with no center server
in the system. This topology leaves sensors free to join or disconnect from the network. In
other words, it can provide resiliency if a sensor fails or is added. Multi-tier network is a
topology in which there is more than one central server in the wireless system. In this
topology, central servers can communicate with one another and each of them can
communicate with several designated wireless sensors as well (Lynch, 2002; Lewis, 2004;
Lynch and Loh, 2006; Aygun and Gungor, 2011).
Figure2-8. Wireless network topologies: (a) star; (b) peer-to-peer; (c) multi-tier
network topologies (Lynch and Loh, 2006).

23
Wireless Network Protocols
Wireless network protocols are defined to standardize rules, conventions, and data
structure for networked communication using various wireless devices (Lloret, 2009). Such
protocols govern how data is packaged, sent, and received in the entire wireless system. In
general, wireless protocols are mainly based on two Institute of Electrical and Electronics
Engineers (IEEE) communication standards, IEEE 802.11 and IEEE 802.15.4. These two
standards for wireless systems generally have been associated with low power consumption,
high throughput, and reasonable communication range. However, compared to an IEEE
802.11 device, an IEEE 802.15.4-based wireless system typically has longer battery life and
greater range. ZigBee is a typical IEEE 802.15.4-based protocol; it will be further discussed
in Chapter 4 (Al-Khatib et al., 2009; Aygun and Gungor, 2011).
Passive and Active Sensors: Case of Radio Frequency Identification (RFID) System
Radio Frequency Identification (RFID) is a wireless identification technology using
radio waves to identify an object (tag), acquire data, and write data to the tag (Ruan, et al.,
2011). Typically, an RFID system is composed of an RFID tag and an RFID reader. In
general, RFID can be divided into passive and active sensor systems. Passive RFID needs no
battery. Instead, its power comes from a wireless signal received and converted by an
antenna. Conversely, active RFID requires a battery to provide its energy for functioning;
active RFID is usually more expensive (Bouhouche et al., 2014). Inclusion of the battery will
lead to larger size and limited lifetime. Active RFID also uses a larger-capacity memory
module than passive RFID. Additionally, active RIFD usually employs read/write devices
while passive RIFD uses read tags only. Passive RFID generally has a shorter read range (< 5
m) and a higher-power reader is therefore required (Roberts, 2006). Moreover, RFID

24
performance could be adversely affected by electromagnetically ‘‘noisy’’ environments
(Lynch and Loh, 2006; Roberts, 2006). However, even though the term “passive” or “active”
is mainly used for RFID tags, sensor systems may generally be defined as passive or active
depending on whether or not they are self-powered.
Wireless Sensor System Application in SHM of Pavement
As promising sensing paradigms providing Smart Pavement SHM, wireless sensors
and sensor networks have been extensively investigated during the 21st century in both
academic and commercial fields; they represent improvements in installation processes, data
aggregation, signal analysis, sensor clustering, event localization, time synchronization,
measurement progress, discrete monitoring, and event-based monitoring as well as in cost
saving (Krüger et al., 2005). They also reduce the threat of wire damage in concrete.
Wireless sensor technologies were initially developed and deployed only for military
and heavy industrial purposes (SILICON LABS, 2014a). Early applications of wireless-
sensor-based SHM in civil infrastructure began with bridges and buildings. Maser et al.
(1996) built a two-level wireless telemetry system to measure strain and dynamic load-
changing in a highway bridge. The first level of this system contained small transducers
powered by self-contained batteries that were used to detect rotation, acceleration, and strain
of the bridge structure. The measured data were first transmitted through a wireless
transceiver to an on-site data repository and then transmitted via cellular link to a second-
level wireless system at the agency office (Maser et al., 1996). For pavement applications,
Bennett et al. (1999) in the UK carried out a study assessing performance of wireless sensors
developed for monitoring strain and temperature in asphalt pavements; this might be the
earliest wireless-sensor-based pavement-monitoring system. In their study, two strain gages

25
and two thermometers were placed in an instrumented cylindrical core embedded in
pavement. Data collected from sensors was transmitted to a roadside laptop via a radio
frequency (RF) wireless link located approximately 4 m from the core. A success rate test
conducted before opening to traffic proved that the wireless system had good reliability.
However, after traffic opening, a decrease in transmission reliability was observed.
In the latter part of 1990, many researchers began working on wireless-sensor
platforms for civil infrastructures in which mobile computing and wireless transmission
components converged with the sensing transducers (Lynch and Loh, 2006). Table 2-5
provides a summary table of development of wireless sensor platforms and their
corresponding technical parameters for both commercial and academic fields from 1998 to
2009, based on the work by Lynch and Loh (2006), Cho et al. (2008), and Aygun and
Gungor (2011). Among the studies shown in the table, the focus was mainly on developing
new wireless sensing units, and detailed descriptions of the underlying processes were
summarized by Lynch and Loh (2006). Through standardization and establishment of the
IEEE 802.15.4 standard in 2007, researchers began adapting IEEE 802.15.4 standards-based
devices to traditional sensors to make them “wireless” (Salman et al., 2010). Because of
these standards, it was unnecessary to develop scratch from all layers of the Open Systems
Interconnection (OSI) reference model for new systems, and these standards-based
independently-developed wireless systems could easily communicate with one another as
well (Nagayama and Spencer, 2007).

26
Table 2-5. Summary table of development of wireless sensor platforms from 1998 to
2009 (Lynch and Loh, 2006; Cho et al. 2008; Aygun and Gungor, 2011).
As a common wireless technology, RFID was used a great deal in wireless sensor
systems as well. Lajnef et al. (2013) conducted a study to develop a passive RFID strain-
sensing system for asphalt pavement health monitoring and fatigue damage detection. The
wireless-sensor system developed in this study was a passive radio-frequency system
containing a low-power-consumption wireless integrated circuit sensor interfaced with a
piezoelectric transducer. This piezoelectric ceramic transducer was designed with an array of
Developer and Year Processor Radio Frequency Availability
Straser and Kiremidjian (1998) Motorola 68HC11 Proxim/ProxLink 900 MHz Research
Bennett and Hayes-Gill (1999) Hitachi H8/329 Radiometrix 418 MHz Research
Lynch et al. (2002) Atmel AVR8515 Proxim RangeLan2 2.4 GHz Research
Mitchell et al. (2002) Cygnal 8051 Ericsson Bluetooth 2.4 GHz Research
Kottapalli et al. (2003) Microchip PIC16F73 BlueChip RBF915 900 MHz Research
Lynch et al. (2003) AV90S8515 Proxim RangeLan2 2.4 GHz Research
Aoki et al. (2003) Renesas H8/4069F RealtekRTL-8019AS – Research
Basheer et al. (2003) ARM7TDMI Philips Blueberry 2.4 GHz Research
Casciati et al. (2004) – Aurel XTR-915 914.5 MHz Research
Wang et al. (2004) Analog ADuC832 Linx Technologies 916 MHZ Research
Mastroleon et al. (2004) Microchip PIC-micro BlueChip RFB915B 900 MHz Research
Ou et al. (2004) Atmega 8L Chipcon CC1000 433 MHz Research
Sazonov et al. (2004) MSP 430F1611 Chipcon CC2420 2.4 GHz Research
Farrar et al. (2005) Intel Pentium MotorolaneuRFon 2.4 GHz Research
Pei et al. (2005) Motorola 68HC11 Max-stream Xstream 2.4 GHz Research
Musiani et al. (2007) ATMega128L ChipconCC1100 1 MHz Research
Wang et al. (2007) ATMega128 9XCite 900 MHz Research
Bocca et al. (2009) MSP430 ChipconCC2420 2.4 GHz Research
Zhou et al. (2009) MSP430 ChipconCC2500 2.4 GHz Research
Zhu et al. (2009) Atmega128 XStream 2.4 GHz Research
Rockwell, Agre et al. (1999) Intel Stron Conexant RDSS9M 916 MHz Commerce
US Berkeley- Crossbow (2003) Atmega128L Chipcon CC1000 916 MHz Commerce
Intel-iMote2 (2003) ARM7TDMI Wireless BT Zeevo 2.4 GHz Commerce
Microstrain, Galbreath et al. (2003) PIC16F877 RF Monolithics 916 MHz Commerce

27
ultra-low power floating gate (FG) computational circuits and could generate enough power
to supply an FG analog processor for the sensor under stress. Each sensor node distributed in
the pavement could store the data and then periodically transmit it to a vehicle-mounted
Radio frequency (RF) reader.
A wireless-sensor network can also be built by connecting traditional sensors to a
commercial wireless-transmission node. Xue et al. (2014) designed a sensing network with
various commercial sensors for pavement-health monitoring. In that 2011 study on Virginia
State Route 114, the sensors included horizontal and vertical strain gages, load cells,
thermocouples, and moisture sensors embedded at the bottom of a reconstruction pavement
section. All embedded sensors were connected to V-Link wireless voltage nodes near the
pavement through wires of different diameters connected to a wireless data logger to collect
sensor data and transmit it to a base station via RF. In this system, V-Link nodes had to be
first interfaced with the sensors using wires. Once data was collected, numerical simulation
was conducted using the monitored strain-response data through finite-element analysis
(FEA) based software to compare it with the measured field data. Back-calculation of
pavement dynamic modulus was also demonstrated in this study using data collected from a
test vehicle. A Mechanistic-Empirical Pavement Design Guide (MEPDG) based on a fatigue-
cracking and rutting-prediction model was used to estimate the accumulated damage from
distress; this was intended for use in initiating an early warning of pavement deterioration.
However, according to their paper, all vertical strain gages failed after five months, probably
due to harsh environment and excessive load (Xue et al., 2014).
Wireless sensor networks offer huge benefits for SHM application. There are several
different ways to build such networks, but using wireless systems for SHM in pavement is

28
still in the study phase and there are still several challenges to be resolved. These challenges
include noisy wireless environment, limited bandwidth, low signal strength, hardware
architecture, embedded software, energy consumption, battery life, weather effects on data
collection, data aggregation, communication hops for large scale structure, etc.

29
CHAPTER 3
FIELD INSTRUMENTATION AND EVALUATION OF COMMERCIAL OFF-THE-
SHELF MICRO-ELECTROMECHANICAL SYSTEMS (MEMS) SENSORS AND
WIRELESS SENSORS
This chapter describes a field demonstration of off-the-shelf MEMS sensors and
wireless sensor system applications in actual in-service concrete applications. The specific
objectives of the field demonstration are to
Evaluate the performance of commercially available off-the-shelf MEMS sensors and
wireless sensors
Identify current limitations of these MEMS sensors for SHM of pavement
infrastructure
Demonstrate how sensing data can be utilized to monitor concrete pavement behavior
Description of Site
In summer 2013, new jointed plain concrete pavement (JPCP) construction projects
were carried out in US Highway 30 under the supervision of the Iowa Department of
Transportation (Iowa DOT). The project site was located near the southeast area of Ames,
IA, as shown in Figure 3-1. To evaluate the performance of the off-the shelf MEMS sensors
used for concrete pavement health monitoring, one section from this newly constructed
highway pavement was selected for instrumentation to identify requirements for a smart
sensing system to advance SHM application for concrete pavement systems.

30
Figure 3-1. US-30 highway project location. (Source from Map data @2013 Google).
Figure 3-2 illustrates the concrete pavement construction plan of this project. The
newly-constructed pavement section was approximately 10 inches in thickness and
constructed above a granular subbase with thickness ranging from 6 to 10.3 in. The PCC
pavement was crowned with a 2.0% transverse slope and had widths of 12 ft. and 14 ft. for
passing lane and travel lane, respectively. The transverse-joint spacing was set at 20 ft.,
reflecting general practice in Iowa. Dowel bars with baskets were placed on the subbase
before concrete paving.
Figure 3-2. US-30 highway construction plan.

31
Installation of sensors was conducted on May 23, 2013, one day before concrete
paving in US Highway 30 at 8:00 am on May 24, 2013. A slipform paver moved from west
to east to pour fresh concrete on the subbase. A viborator followed the paver to consolidate
the fresh concrete using viboration tubes. Surface smoothing was performed manually. A
slipform paver dragging a piece of burlap was used to create texture for the pavement surface
and a chemical curing compound sprayed on the paving surface. Shoulder backfilling was
conducted approximately 14 days after concrete paving; a 6-in thick Hot-Mix Asphalt (HMA)
shoulder was then placed on June 10, 3 days after shoulder backfilling. One day later,
granular shoulder was added to the pavement. The constructed pavement was opened to
traffic on June 14, 2013. Table 3-1 lists details of the construction timeline.
Table 3-1. US-30 highway construction timeline.
Timeline
Date Activities
May 23, 2013 Sensor installation
May 24, 2013 Concrete paving
June 7, 2013 Backfilling for shoulder
June 10, 2013 HMA shoulder paving
June 11, 2013 Granular shoulder paving
June 14, 2013 Opened to traffic
Description of Sensors
Temperature and moisture are vital factors contributing to concrete properties such as
strength and durability. Low temperature and rapid loss of moisture can result in insufficient
development of strength, and different temperature and moisture gradients in concrete can

32
contribute to curling and warping behaviors that may result in cracks if the induced stress
exceeds the concrete strength. A total of 30 sensors, including off-the-shelf MEMS based
temperature and moisture sensors and strain gages, were evaluated in this study. The sensors
used were Radio-Frequency Identification (RFID) temperature tags, Sensirion digital
humidity sensors SHT71, Thermochron iButtons, and Geokon model 4200 strain gages. A
detailed description of each type of sensor is presented in the following sections.
Radio-Frequency Identification (RFID) Temperature Tag
The wireless RFID tags from the HardTrack Concrete Monitoring System, WAKE,
Inc. were selected for temperature monitoring due to their low cost, extensive communication
range, durability in concrete and low power consumption. This active wireless RFID tag is a
MEMS-based temperature sensor with advanced UHF RF technology that can provide real-
time data collection and storage. This RFID system consists of a RFID transponder called “i-
Q32T” and a portable handheld transceiver called “Pro”, which are shown in Figures 3-3 and
3-4 (IDENTEC SOLUTIONS, 2008; WAKE, Inc., 2010). Figure 3-3 shows that the tag
contains an internal temperature logger to capture the temperature of concrete at definable
intervals, and a battery for power (IDENTEC SOLUTIONS, 2008). The antenna inside this
tag enables the Pro to identify the tag to read/extract data or to change the time interval. In
this study, temperature readings were taken every 30 minutes. By communicating with the
portable Pro, the collected temperature data could be imported into this handheld transceiver
for data-saving and concrete-maturity calculation using a PCC maturity concept.
Consequently, this RFID tag was applicable to concrete-temperature monitoring, and its
excellent accuracy exceeded that of the ASTM C1074-93 requirement. This tag had a
claimed capability of transmitting and receiving data within distances of up to 100 feet (30

33
meters) from the handheld device or up to 300 feet (100 meters) from a fixed interrogator; its
operational life could be greater than 6 years due to its low power consumption (IDENTEC
SOLUTIONS, 2008).
Figure 3-3. i-Q32T wireless RFID transponder (photo courtesy of WAKE, Inc.).
Figure 3-4. HardTrack portable handheld transceiver Pro (photo courtesy of WAKE,
Inc.).
Figure 3-5 illustrates the whole RFID system, including the portable handheld
transceiver Pro. In this system, the i-Q32T RFID tag can be divided into an “embedded

34
probe” and an “extended probe”. The embedded probe was the tag the temperature logger
installed inside of the i-Q32T tag, but when making deep pours the RFID tag could be
equipped with a stainless steel temperature probe, referred to as an “extended probe” in this
thesis, to enable it to penetrate deeper into large concrete structures. RFID extended probes
are typically used in large-scale structures like dams to measure the temperature of concrete
several feet below the concrete surface, but the i-Q32T tag with an antenna can still be placed
at the surface to transmit data. The biggest advantage of the “extended probe” was that it
could be removed from the tag so the tag could be recycled if there was no need to use the
extended probe. Both embedded probe and extended probe are shown in Figure 3-5.
Figure 3-5. RFID tag and portable Pro.
MEMS Digital Humidity Sensor
The Sensirion digital humidity sensor SHT71 evaluated in this study was classified as
a commercial multifunctional off-the-shelf MEMS sensor that could simultaneously measure
Relative Humidity (RH) and temperature. Figure 3-6 (a) and (b) show pictures of the MEMS

35
digital humidity sensor and the evaluation kit, respectively. The commercial MEMS digital
humidity sensor, developed by Sensirion, Inc., is a kind of metal pin-based sensor integrating
both the sensing elements and signal processing circuitry on a silicon chip to provide a fully-
calibrated digital output. In this sensor, a unique capacitive sensing element consisting of
paired conductors was used to capture RH while another band-gap sensor measured
temperature. The paired conductors were separated by a dielectric, a kind of polymer to
absorb or release water proportionally with the relative environmental humidity. The
capacitance change was measured by an electronic circuit to calculate RH (Sensirion, Inc.,
2014). To simultaneously protect the sensor from interference, a "micro-machined" finger
electrode system with different polymer-covered layers was used to produce the capacitance
for this MEMS sensor.
The MEMS digital humidity sensors must be connected with evaluation kit EK-H4
(Figure 3-6 (b)) at all times to continuously monitor temperature and RH. Moreover, it is
should also be pointed out that this evaluation kit does not have memory, so a laptop with
related software must be connected at all times to store the measurements. Time intervals
could be set through the laptop; in this study measurements were performed at one-minute
intervals.
(a) (b)
Figure 3-6. Sensirion sensor system: (a) Sensirion SHT71 sensor; (b) evaluation kit.

36
Thermochron iButton
The Thermochron iButton from Maxim Integrated Products, Inc. is designed for
temperature measurement and storage. This low-cost and reliable temperature sensor is
equipped with a wide-temperature-range thermometer (14 to 185˚F) and has a protected
memory section. It is able to record time and temperature at user-defined intervals of up to
255 minutes, and total of 2048 temperature readings can be stored (Maxim Integrated, 2014).
Therefore, the monitoring period could be extended to 340 days based on the maximum
measurement interval if the internal battery could guarantee a minimum of 2 years’ working
time at room temperature. Furthermore, this iButton sensor is protected by a durable stainless
steel shield with plastic cover to ensure that it is working properly in the concrete
environment.
The main advantages of the iButton temperature sensor are large memory, long
battery life, rugged packaging, and low cost. iButtons have been used in field projects for
temperature monitoring of fresh concrete during construction. For example, the Texas
Department of Transportation conducted a demonstration project in 1999 using a large
number of iButtons; Des Moines International Airport utilized iButtons to monitor the
temperature history of fresh concrete (Tully, 2007). Figure 3-7 is a picture of an iButton. It
can be seen that the iButton requires a USB cable for data downloading. Unlike the MEMS
digital humidity sensor, the iButton doesn’t require constant connection with the laptop
because it has its own memory system. In this study, iButtons were used as reference sensors
to measure internal temperature of concrete at 30-minute measuring intervals.
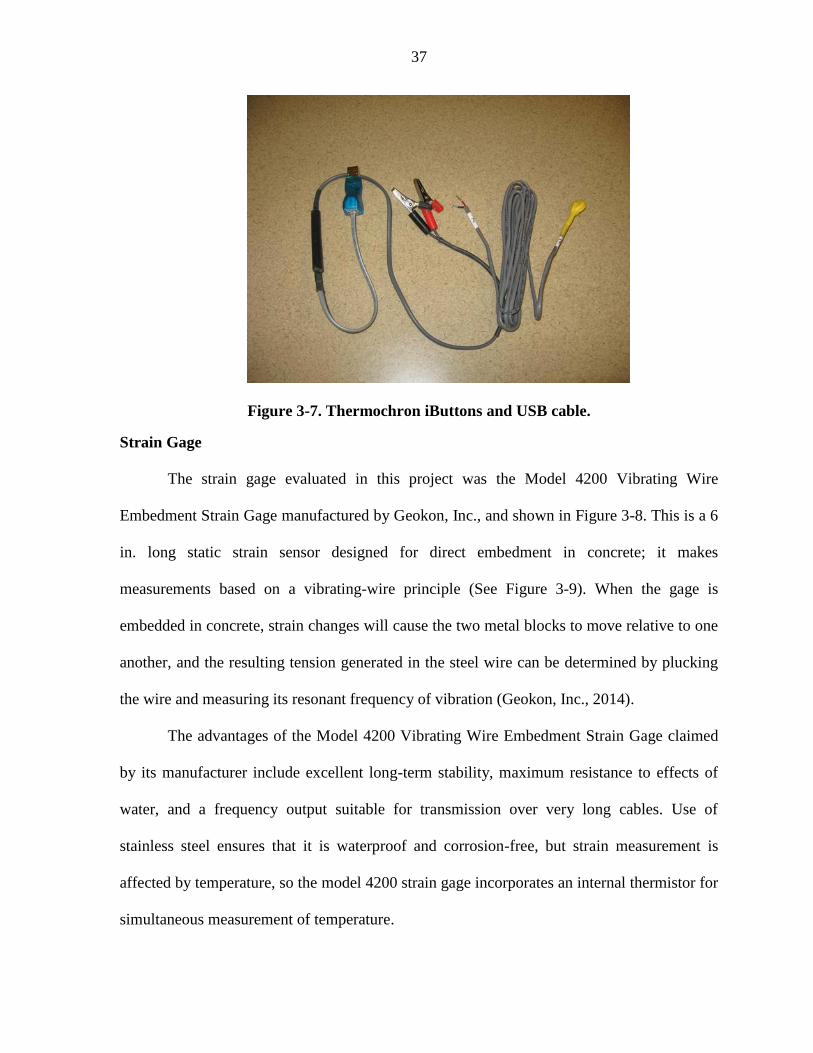
37
Figure 3-7. Thermochron iButtons and USB cable.
Strain Gage
The strain gage evaluated in this project was the Model 4200 Vibrating Wire
Embedment Strain Gage manufactured by Geokon, Inc., and shown in Figure 3-8. This is a 6
in. long static strain sensor designed for direct embedment in concrete; it makes
measurements based on a vibrating-wire principle (See Figure 3-9). When the gage is
embedded in concrete, strain changes will cause the two metal blocks to move relative to one
another, and the resulting tension generated in the steel wire can be determined by plucking
the wire and measuring its resonant frequency of vibration (Geokon, Inc., 2014).
The advantages of the Model 4200 Vibrating Wire Embedment Strain Gage claimed
by its manufacturer include excellent long-term stability, maximum resistance to effects of
water, and a frequency output suitable for transmission over very long cables. Use of
stainless steel ensures that it is waterproof and corrosion-free, but strain measurement is
affected by temperature, so the model 4200 strain gage incorporates an internal thermistor for
simultaneous measurement of temperature.

38
Figure 3-8. Geokon model 4200 strain gage (Geokon, Inc., 2014).
Figure 3-9. Model 4200 Vibrating Wire Strain Gage (Geoko, Inc., 2014).
Figure 3-10 shows a picture of the entire strain measurement system including the
Geokon model 8002 data-logger used for data collection. This data-logger can be
conveniently powered either by widely available alkaline D cells, or by an external 12 V
source. It has an operating time ranging from 8 days to 2 years, depending on the scan
interval. However, in this study the strain reading was recorded every minute so the
estimated operational time was about two and one-half days.

39
Figure 3-10. Datalogger and Model 4200 strain gage.
Installation of Sensors
The instrumented pavement section was located in the driving lane of US Highway
30. A total of 30 sensors, including 14 RFID temperature tags (9 extended probes and 5
embedded probes), 4 MEMS digital humidity sensors, 5 iButtons, and 7 longitudinal strain
gages were installed at different locations throughout at various concrete pavement depths
and placed near to DAS for ambient temperature monitoring.
Location of Sensors
In general, concrete pavement edges and corners will suffer more from load than
other positions (Darestani, 2007), so the locations selected in this project were the corners
and mid-panels of the slab. Figure 3-11 (a) and (b) show the detailed instrumented plan of
this slab. Referring to these two figures, there were five cross-sections (section A-A through
E-E) totally instrumented with these sensors. The distances from each section to the shoulder
were all different. Among these cross sections, section A-A, 44 in. away from the HMA

40
shoulder, was instrumented at mid-span using 4 RFID embedded probes, 4 iButtons, and 2
strain gages. The RFID tags were installed at distances of 3, 5, 6, and 7.5 inch below the
pavement surface, and iButtons were installed at distances of 4, 5, 8.5, and 10 inches below
the surface, respectively. Strain gages were embedded only at the top and bottom positions, 2
and 8.5 in. away from the pavement surface. Section B-B, located at the joint between two
adjacent slabs, was 40 in. away from the HMA shoulder. It was instrumented using only one
strain gage under a dowel bar, as shown in Figure 3-12. Section C-C was 28 in. away from
the shoulder. It was instrumented using 8 RFID extended probes and 3 MEMS digital
humidity sensors. Among these embedded RFID tags, 5 RFID extended probes were
embedded in the corner at distances of 2, 4, 6, 8, and 10 inches below the surface and 3 RFID
extended probes were embedded in the mid-span at distances of 2, 5.5, and 8.5 inches below
the pavement surface. With regard to the 3 MEMS digital humidity sensors, they were
embedded at the same locations where the 3 RFID extended probes were installed. Section
D-D, located 20 in. away from the HMA shoulder, was instrumented by strain gages only. In
this section, 2 strain gages were embedded at the top and bottom in the corner at 2 and 9
inches below the surface. Another pair of strain gages was embedded at the top and bottom in
the center, 2 and 9 inches, respectively, below the surface. The last section, E-E, was 8 in.
away from the shoulder and was instrumented using only one MEMS digital humidity sensor,
located just 0.1 in. below the surface at the mid-span.

41
(a)
(b)
Figure 3-11. Sensor instrumentation plan: (a) top view; (b) cross-section view.
40 in.44 in.
20ftTraffic Direction
12ft
Passing Lane
RFID temp (Ex. Probe)
RFID temp (Em. Probe)
MEMS RH/Temp.
iButton (Temp)
Longitudinal strain gage
10ft
14ft
Driving Lane
See Section A-A
Lane Marking
HMA Shoulder
10ft
8 in.
12 in.
2ft
See Section B-B
See Section C-C
10 in PCC Thickness
12ft
Not to scale
OWL
11ft
1 ft12 in.4 in.
28 in.
8 in. 8 in.
See Section D-DSee Section E-E
Cross Section A-A: 44 in. away from
shoulder
1.5 in.
8 in7 in
5 in4 in
2.5in
6 in
10 in
No.2
No. 3
No. 10
No. 11No. 12
No. 13
No. 1
No. 2
No. 3
No. 4
5 in
10 in No. 1
10 in8 in
6 in4 in
2 in
8 in
4.5 in
1.5 in
No. 1
No. 2
No. 3No. 1
No. 2
No. 3
No. 4
No. 5
No. 6
No. 7
No. 8
10 in8 in
1 in
No. 4
No. 5
No. 6
No. 7
10 in0.1in.
No. 4 Dummy sensor nearby data logger to measure ambient conditions & check sensor functionality
No. 9 No. 13 No. 5
Cross Section B-B: 40 in. away from
shoulder
Cross Section C-C: 28 in. away from
shoulder
Cross Section D-D: 20 in. away from
shoulder
Cross Section E-E: 8 in. away from
shoulder
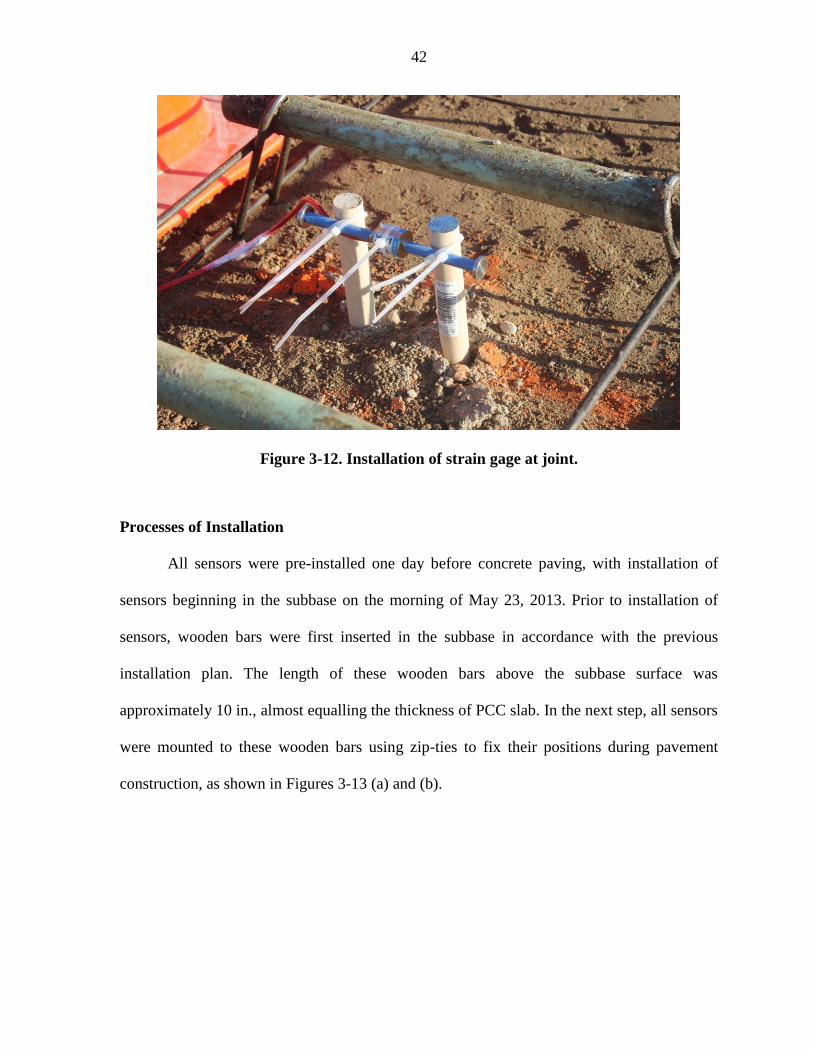
42
Figure 3-12. Installation of strain gage at joint.
Processes of Installation
All sensors were pre-installed one day before concrete paving, with installation of
sensors beginning in the subbase on the morning of May 23, 2013. Prior to installation of
sensors, wooden bars were first inserted in the subbase in accordance with the previous
installation plan. The length of these wooden bars above the subbase surface was
approximately 10 in., almost equalling the thickness of PCC slab. In the next step, all sensors
were mounted to these wooden bars using zip-ties to fix their positions during pavement
construction, as shown in Figures 3-13 (a) and (b).

43
(a)
(b)
Figure 3-13. Installation of sensors: (a) near slab corner; (b) near mid-span edge.
As shown in the above two figures, two wooden bars were used to fix the location of
strain gages and RFID tags. While a wooden bar would not cause any issues related to

44
thermal conductivity that might may affect strain and temperature measurement, it should be
pointed out that the strain gages and the RFID tags were placed in alignment with traffic
direction, the same as the direction of concrete paving. Additionally, iButtons and MEMS
digital humidity sensors were mounted on the back of the wooden bars to reduce the direct
force of concrete paving. All these strategies were applied to help sensors survive during
paving construction.
It should be noted that, during installation of sensors, wires from sensors needed extra
attention because there was no way to repair them once inside the concrete if they are broken
or have loose connection issues. In this project, all the sensors deployed in US Highway 30
were wired sensors except for RFID tags; even the RFID extended probe had a long cable
between the temperature probe and the “i-Q32T” tag. To protect these wires, all were spliced
and soldered to create connections and then placed in a polyvinyl chloride (PVC) pipe, as
shown in Figure 3-14. The PVC pipes were then placed in a ditch dug in advance and then
wires were connected to the Data Acquisition System, as shown in Figure 3-15.
Figure 3-14. Wires in PVC pipe.

45
Figure 3-15. PVC pipe in ditch with wires.
Data Acquisition System (DAS)
Figure 3-16 shows the on-site DAS of the sensors used in US-30 highway. It can be
seen that both the DAS and the batteries were stored in a plastic shield box. The laptop was
used to collect data from MEMS digital humidity sensors, and the rechargable batteries were
used to supply power to the laptop only. The box located approximately 14 ft. away from the
HMA shoulder was covered by an orange protective blanket. All devices were placed on a
wooden board supported by two concrete caps and a plastic bag was used to protect them
from rain. These protective strategies were used to protect the DAS from animals, rain, wind,
etc., because it was important to keep the DAS away from external disturbances.
Additionally, ambient RFID tags (both extended probes and embeded probes) and iButtons
were placed beside the shield box to capture ambient temperature conditions, as shown in
Figure 3-17.

46
Among the sensors deployed in the US Highway30 project, only RFID tags and
iButtons were quipped with internal batteries. MEMS digital humidity sensors and strain
gages, as well as the DAS, required batteries to make them function during the monitoring
period. However, the batteries could provide only 3 days’ power for the laptop, so data
acquisition and battery replacement were scheduled every two days to achieve continuous
data collection during the initial stages up until June 28, 2013. However, these procedures
were time and labor-consuming, so different times were scheduled for summer and winter
data-acquistion times late due to traffic and environmental conditions.
Figure 3-16. Data Acquisition System (DAS).

47
Figure 3-17. Ambient sensors.
Concrete Paving
Concrete paving for the instrumented pavement section started at 7:45 am on May 24,
2013. Before concrete paving, dowel bars with baskets were placed above the subbase. The
average water/cement ratio for the concrete ranged from 0.4 to 0.43. The time of initial and
final set were determined at 4.84 and 7.17 hours, respectively, in acordance with ASTM C
403, attached as Appendix C. During road construction, both a paver and a vibrator were
used. A huge amount of fresh concrete first poured on the subbase was spread out by the
passing paver, as shown in Figure 3-18. A vibrator with vibration tubes followed the paver to
produce consolidated concrete. The vibrator leveled off the concrete as it passed through and
the workers behind the vibrator then smoothed the surface. Finally, the surface was textured
by dragging a piece of burlap in the longitudinal direction. Water was sprayed onto the

48
pavement surface after texturing, followed by spraying of chemical components for curing
purposes.
Figure 3-18. Concrete paving.
However, both paver and vibrator were sources of potential threat of sensor damage
due to their auger and vibration forces that might break either the sensors or the wires during
pavement construction. Moveover, dropping a heavy mass of concrete could crush the
sensors and tear up the wires. Therefore, to protect the sensors as much as possible, fresh
concrete was carefully pre-poured on the top of sensors to mitigate the force from the paver,
vibrator, and dropped concrete, as shown in Figures 3-19 (a) and (b). Then, after concrete
paving, a MEMS digital humidity sensor was embedded 0.1 in. below the pavement surface
at cross section E-E, as shown in Figure 3-20.

49
(a)
(b)
Figure 3-19. Sensor protection during road construction: (a) obtain fresh concrete from
paver; (b) pour concrete on the sensors.

50
Figure 3-20. Embedment of MEMS digital humidity sensors.
The temperature probes of RFID tags (extended probes) were mounted on wooden
bars, and the i-Q32T tags (transponder) were placed in a protective wooden box beside the
concrete slab, as shown in Figure 3-21. This box was used to protect the tags during shoulder
construction as shown in Figures 3-22 (a) and (b). As a result, data measured inside the
concrete could be successfully transmitted from the transponders in the box. Figure 3-23
shows the traffic opening on June 14, 2013, and the protective wooden box for RFID tags can
be seen at the bottom of the picture.
Figure 3-21. RFID extended probe in wooden box.

51
(a)
(b)
Figure 3-22. Shoulder construction: (a) backfilling; (b) HMA shoulder paving.
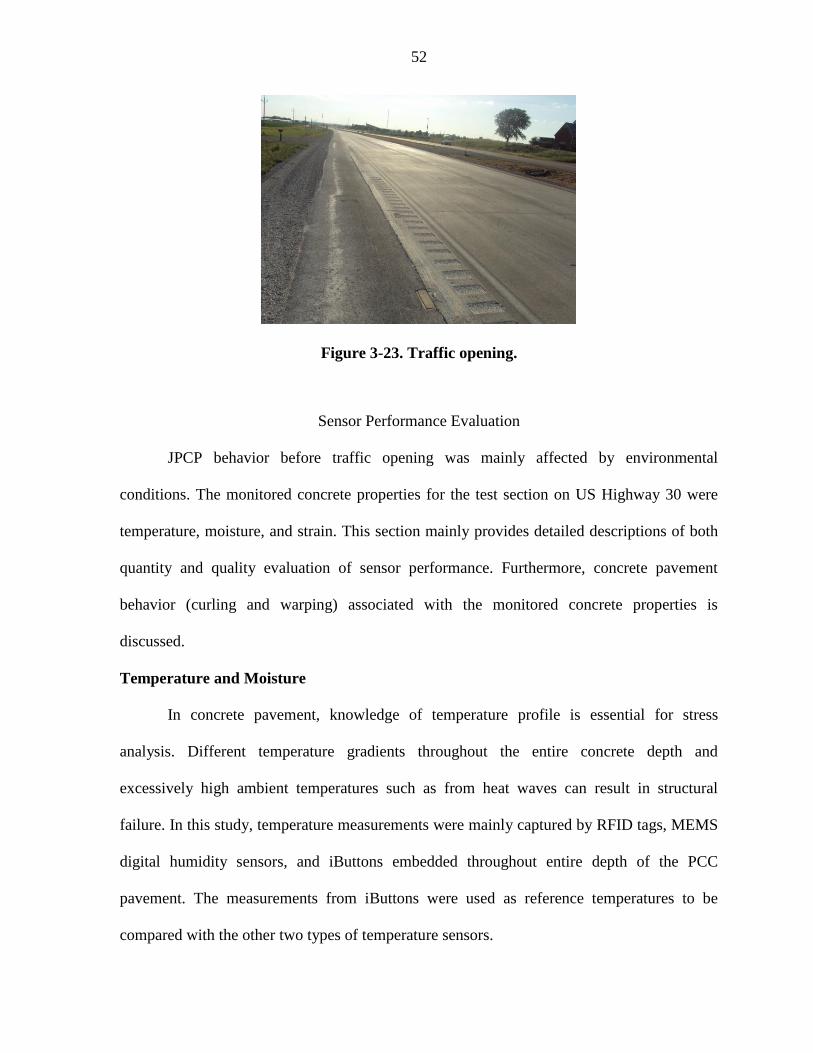
52
Figure 3-23. Traffic opening.
Sensor Performance Evaluation
JPCP behavior before traffic opening was mainly affected by environmental
conditions. The monitored concrete properties for the test section on US Highway 30 were
temperature, moisture, and strain. This section mainly provides detailed descriptions of both
quantity and quality evaluation of sensor performance. Furthermore, concrete pavement
behavior (curling and warping) associated with the monitored concrete properties is
discussed.
Temperature and Moisture
In concrete pavement, knowledge of temperature profile is essential for stress
analysis. Different temperature gradients throughout the entire concrete depth and
excessively high ambient temperatures such as from heat waves can result in structural
failure. In this study, temperature measurements were mainly captured by RFID tags, MEMS
digital humidity sensors, and iButtons embedded throughout entire depth of the PCC
pavement. The measurements from iButtons were used as reference temperatures to be
compared with the other two types of temperature sensors.

53
Moisture content plays a significant role in cement hydration because it may not
proceed properly under low-moisture conditions. Moisture-gradient changes inside concrete,
just like temperature gradients, can lead to concrete deformation. Moisture-content
distribution is also crucial in evaluating the severity of shrinkage during setting and
hardening processes. However, moisture content measured in concrete is usually represented
by humidity level. Moisture typically means amount of water present in a material, but
humidity is the amount of water vapor present in air or gas and can be represented as either
absolute humidity or relative humidity (Das, 2009; Ye et al., 2006). Absolute humidity is the
ratio of the mass of water vapor to the volume of air or gas, while relative humidity (RH)
refers to the percent of the water content in air compared to the saturated moisture level at the
same temperature and pressure (Ye et al., 2006).
Monitoring Period Overview
The entire monitoring period extended from May 24, 2013 to April 1, 2014,
approximately 10 months after traffic opening. However, to obtain continuous data, data
acquisition had to be scheduled every two days, which was an unrealistic requirement over
the entire 10 months due to the remote location of the DAS, the harsh climate, and the
limited labor force. As a result, the longest continuously-monitored period actually used is
described and discussed in this section.
RFID Tag (Extended Probe)
Figures 3-24 (a) and (b) illustrate the temperature profiles captured by RFID extended
probes at slab corner and center, 28 in. away from HMA shoulder. Probes No. 1 through 5
were 2, 4, 6, 8, and 10 in., respectively, below the pavement surface, and probe No.9 was an
ambient temperature sensor. Probes No. 6 through 8 were located 2, 5.5, and 8.5 in.,

54
respectively, below the surface. As seen in Figure 3-24, a maximum temperature of 111 ˚F
and a minimum temperature of 0 ˚F were observed during May through April in 2014. The
average temperature rose to about 80 ˚F in summer and rapidly went down to about 20 ˚F in
winter. Furthermore, fewer and fewer sensors remained functional as time passed; the
sensors embedded in the center were not functional after December, 2013.
(a)
(b)
Figure 3-24. RFID extended probe measurement: (a) in the corner; (b) in the center.
0
20
40
60
80
100
120
5/24
/13
7:00
6/17
/13
7:00
7/11
/13
7:00
8/04
/13
7:00
8/28
/13
7:00
9/21
/13
7:00
10/1
5/13
7:0
0
11/0
8/13
7:0
0
12/0
2/13
7:0
0
12/2
6/13
7:0
0
1/19
/14
7:00
2/12
/14
7:00
3/08
/14
7:00
4/01
/14
7:00
Tem
pera
ture
(˚F)
Date and Time
2 in./Ex. Probe 14 in./Ex. Probe 26 in./Ex. Probe 38 in./Ex. Probe 410 in./Ex. Probe 5Ambient/Ex. Probe 9
0
20
40
60
80
100
120
5/24
/13
7:00
6/17
/13
7:00
7/11
/13
7:00
8/04
/13
7:00
8/28
/13
7:00
9/21
/13
7:00
10/1
5/13
7:0
0
11/0
8/13
7:0
0
12/0
2/13
7:0
0
Tem
pera
ture
(˚F)
Date and Time
2.0 in./Ex. Probe 6
5.5 in./Ex. Probe 7
8.5 in./Ex. Probe 8
Ambient/Ex. Probe 9

55
RFID Tag (Embedded Probe)
Figure 3-25 illustrates the temperature profile captured by RFID embedded probes in
mid-span 44 in. away from the shoulder. RIFD extended probes No.10 through 13 were
embedded 3, 5, 6 and 7.5 in. below pavement surface and probe No.14 was an ambient
temperature sensor. From Figure 3-25, the temperature ranged from 20 to 108 ˚F before
December 6, 2013, similar to the temperature captured by RFID extended probes embedded
in the center. However, fewer and fewer RFID-embedded probes remained functional as time
passed and no embedded probes were functional after December 7. Note that the ambient
temperature probe No. 14 was removed on July 19, 2013. Furthermore, based on observation,
it was found that the temperature difference between top concrete and bottom concrete was in
the range from 4 ˚F to 12 ˚F.
Figure 3-25. RFID embedded probe measurement in the mid-span.
0
20
40
60
80
100
120
5/24
/13
7:00
6/07
/13
7:00
6/21
/13
7:00
7/05
/13
7:00
7/19
/13
7:00
8/02
/13
7:00
8/16
/13
7:00
8/30
/13
7:00
9/13
/13
7:00
9/27
/13
7:00
10/1
1/13
7:0
0
10/2
5/13
7:0
0
11/0
8/13
7:0
0
11/2
2/13
7:0
0
12/0
6/13
7:0
0
Tem
pera
ture
(˚F)
Date and Time
3.0 in./Em. Probe 105.0 in./Em. Probe 116.0 in./Em. Probe 127.5 in./Em. Probe 13Ambient/Em. Probe 14

56
MEMS Digital Humidity Sensor
Four MEMS digital humidity sensors were embedded in US Highway 30. MEMS
digital humidity sensors No. 1 through 3 were embedded 8.5, 5.5, and 2 in. below the
pavement surface and No. 4 was just 0.1 in. below the pavement surface. However, sensors
No. 1 and 2 were unable to collect data within just a few hours after concrete paving. This
could probably be attributed to wire damage or loose connections incurred by the concrete
paver, the vibrator, or the high-alkali environment prevailing during concrete hydration. Note
also that data could not be acquired in the period May 26 through 28, 2013 because the
battery (power supply) for the DAS was not recharged. Figures 3-26 and 3-27 give the
temperature and RH profiles captured by the MEMS digital humidity sensors.
Figure 3-26. Temperature measurement of MEMS digital humidity sensors.
0
20
40
60
80
100
120
5/24
/13
7:00
5/28
/13
7:00
6/01
/13
7:00
6/05
/13
7:00
6/09
/13
7:00
6/13
/13
7:00
6/17
/13
7:00
6/21
/13
7:00
6/25
/13
7:00
6/29
/13
7:00
Tem
pera
ture
(˚F)
Date and Time
0.1 in./8 in. away/MEMS RH_Temp.4
2.0 in./28 in. away/MEMS RH_Temp.3
Power chargingsupply

57
Figure 3-27. RH measurement of MEMS digital humidity sensor.
According to Figure 3-26, the temperature before June 29 ranged from 60 to 120 ˚F.
It can also be seen that sensor No. 4 in its initial stage reflected higher temperature in
daytime and lower temperature at night. This is because sensor No. 4 was closer to the
pavement surface so it would be more easily affected by ambient environment such as solar
radiation. Meanwhile, temperature at the pavement top would drop more rapidly than that at
the bottom. However, in later stages, sensor No. 4 also exhibited a higher temperature at
night; this was probably due to a heat wave reported in June 2013. According to Figure 3-27,
the RH was about 67% in the beginning followed by a sharp increase in RH from 63% to
78% observed on June 3, 2013, and due to a serious thunderstorm occurring on June 3 and 4,
2013. Following that, the RH value fluctuated between 70% and 80% most of the time.
iButton
Figure 3-28 illustrates temperature measurements taken from the iButton between
May 24 and August 22, 2013. iButtons No. 1 to 4 were embedded 4, 5, 8.4, and 10 in. below
50
55
60
65
70
75
80
85
90
95
100
5/24
/13
7:00
5/28
/13
7:00
6/01
/13
7:00
6/05
/13
7:00
6/09
/13
7:00
6/13
/13
7:00
6/17
/13
7:00
6/21
/13
7:00
6/25
/13
7:00
6/29
/13
7:00
Rela
tive
Hum
idit
y (%
)
Date and Time
0.1 in./8 in. away/MEMS RH_Temp.4
Power chargingsupply

58
pavement surface, and iButton No. 5 was an ambient temperature sensor. Among these
sensors, only one iButton (No. 4) stopped functioning (on July 18, 2013). It can be seen that
the temperature range measured by iButtons ranged from 47 to 105 ˚F, lower than the values
captured by the RFID tags. This was because the highest temperature was captured by
iButtons No. 1 and 2 installed at the midpoint of the pavement depth, so their readings were
lower than the values captured by the RFID tags and the MEMS digital humidity sensors
located near the top of pavement. However, comparing ambient temperature measurements,
the ambient RFID extended probe and the embedded probe had the same reading,
approximately 2 ˚F higher than the ambient iButton’s measurement.
Figure 3-28. Temperature measurement from iButtons.
Strain Gage
Strain is a significant indicator of concrete structural quality. Figure 3-29 illustrates
the strain change captured in the period between May 24 and June 29, 2013. Strain gages No.
3 and 5 were embedded 8.5 and 9 in. below the pavement surface at the slab corner, while
0
20
40
60
80
100
120
5/24
/13
7:00
6/03
/13
7:00
6/13
/13
7:00
6/23
/13
7:00
7/03
/13
7:00
7/13
/13
7:00
7/23
/13
7:00
8/02
/13
7:00
8/12
/13
7:00
8/22
/13
7:00
Tem
pera
ture
(˚F)
Date and Time
4.0 in./iButton 15.0 in./iButton 28.5 in./iButton 310 in./iButton 4Ambient/iButton 5

59
strain gages No. 6 and 7 were embedded 2 and 9 in. below the pavement surface at the mid-
span edge. The other strain gages, No. 1, 2, and 4, stopped functioning immediately,
probably due to wire issues. In Figure 3-29, positive and negative microstrain represented
tension and compression, respectively. However, after opening to traffic, the strain readings
were greatly affected by the traffic load. The strain behavior after traffic activity began was
not in the research scope and therefore not discussed in this section. A detailed description of
strain behavior before traffic opening is provided in the next section.
Figure 3-29. Strain measurement.
Before Traffic Opening (May 2013 to June 2013)
The overall monitoring period was divided into three periods: before traffic opening,
two months after traffic opening (summer), and six months after traffic opening (winter).
Traffic opening occurred on June 14, 2013, and there was therefore no vehicular effect on
pavement properties before that date. The strain behavior of pavement associated with
-500
-400
-300
-200
-100
0
100
200
300
400
500
5/24
/13
7:00
5/28
/13
7:00
6/01
/13
7:00
6/05
/13
7:00
6/09
/13
7:00
6/13
/13
7:00
6/17
/13
7:00
6/21
/13
7:00
6/25
/13
7:00
6/29
/13
7:00
Mic
rost
rain
Date and Time
2.0 in./Slab corner/20 in. away/Sensor 69.0 in./Slab corner/20 in. away/Sensor 78.5 in./Mid-span edge/44 in. away/Sensor 39.0 in./Mid-span edge/20 in. away/Sensor 5
Traffic opening

60
environmental effects from temperature and moisture could be analyzed for this period.
Figures 3-30 through 3-34 illustrate temperature, RH, and strain captured by the sensors.
(a)
(b)
Figure 3-30. Measurement of RFID extended probes before traffic opening: (a) in the
corner; (b) in the center.
40
50
60
70
80
90
100
110
120
5/24
/13
7:00
5/27
/13
7:00
5/30
/13
7:00
6/02
/13
7:00
6/05
/13
7:00
6/08
/13
7:00
6/11
/13
7:00
6/14
/13
7:00
Tem
pera
ture
(˚F)
Date and Time
2 in./Ex. Probe 14 in./Ex. Probe 26 in./Ex. Probe 38 in./Ex. Probe 410 in./Ex. Probe 5Ambient/Ex. Probe 9
40
50
60
70
80
90
100
110
120
5/24
/13
7:00
5/27
/13
7:00
5/30
/13
7:00
6/02
/13
7:00
6/05
/13
7:00
6/08
/13
7:00
6/11
/13
7:00
6/14
/13
7:00
Tem
pera
ture
(˚F)
Date and Time
2.0 in./Ex. Probe 6
5.5 in./Ex. Probe 7
8.5 in./Ex. Probe 8
Ambient/Ex. Probe 9

61
Figure 3-31. Measurement of RFID embedded probes before traffic opening.
Figure 3-32. Measurement of iButtons before traffic opening.
40
50
60
70
80
90
100
110
120
5/24
/13
7:00
5/27
/13
7:00
5/30
/13
7:00
6/02
/13
7:00
6/05
/13
7:00
6/08
/13
7:00
6/11
/13
7:00
6/14
/13
7:00
Tem
pera
ture
(˚F)
Date and Time
3.0 in./Em. Probe 105.0 in./Em. Probe 116.0 in./Em. Probe 127.5 in./Em. Probe 13Ambient/Em. Probe 14
40
50
60
70
80
90
100
110
120
5/24
/13
7:00
5/27
/13
7:00
5/30
/13
7:00
6/02
/13
7:00
6/05
/13
7:00
6/08
/13
7:00
6/11
/13
7:00
6/14
/13
7:00
Tem
pera
ture
(˚F)
Date and Time
4.0 in./iButton 15.0 in./iButton 28.5 in./iButton 310 in./iButton 4Ambient/iButton 5

62
(a)
(b)
Figure 3-33. MEMS digital humidity sensor measurement before traffic opening: (a)
temperature measurement; (b) RH measurement.
40
50
60
70
80
90
100
110
120
5/24
/13
7:00
5/27
/13
7:00
5/30
/13
7:00
6/02
/13
7:00
6/05
/13
7:00
6/08
/13
7:00
6/11
/13
7:00
6/14
/13
7:00
Tem
pera
ture
(˚F)
Date and Time
0.1 in./8 in. away/MEMS RH_Temp.4
2.0 in./28 in. away/MEMS RH_Temp.3
Power chargingsupply
50
55
60
65
70
75
80
85
90
95
100
5/24
/13
7:00
5/27
/13
7:00
5/30
/13
7:00
6/02
/13
7:00
6/05
/13
7:00
6/08
/13
7:00
6/11
/13
7:00
6/14
/13
7:00
Rela
tive
Hum
idit
y (%
)
Date and Time
0.1 in./8 in. away/MEMS RH_Temp.4
Power charging supply

63
(g)
Figure 3-34. Strain profile before traffic opening.
Figures 3-30 to 3-33 illustrate temperature measurements from RFID tags (extended
and embedded probes) and iButtons, as well as MEMS digital humidity sensors, show similar
temperature trends. All sensors captured the sharp increase in temperature due to the cement
hydration reaction at the beginning of concrete paving. Furthermore, these figures also show
that the temperature at the concrete top was usually higher than the temperature at the bottom
in daytime but would become lower in night. This was due to the fact that the top PCC
pavement was mainly influenced by daily ambient temperature while the bottom part was
mainly influenced by seasonal weather (Wells et al., 2006). During daytime, temperature at
the pavement top was high because of ambient temperature and solar radiation, and it
dropped quickly at night. However, bottom concrete is not as sensitive to ambient
temperature, so its change was much smaller than the concrete top throughout the day. It was
also observed that that peak temperature occurred later when the concrete was deeper
-500
-400
-300
-200
-100
0
100
200
300
400
500
5/24
/13
7:00
5/27
/13
7:00
5/30
/13
7:00
6/02
/13
7:00
6/05
/13
7:00
6/08
/13
7:00
6/11
/13
7:00
6/14
/13
7:00
Mic
rost
rain
Date and Time
2.0 in./Slab corner/20 in. away/Sensor 69.0 in./Slab corner/20 in. away/Sensor 78.5 in./Mid-span edge/44 in. away/Sensor 39.0 in./Mid-span edge/20 in. away/Sensor 5

64
because it took more time for deeper concrete to reach its peak temperature caused by
ambient temperature change.
RH measurement exhibited a trend similar to temperature, i.e., RH went up while
temperature increased according to Figures 3-33. At the beginning of concrete paving, RH
built up rapidly and then the value was maintained at between 65 to 70% until a thunderstorm
on June 3, 2013 caused a sharp increase in RH. After that, RH reached 78% and then
fluctuated between 75 and 80%. However, only one moisture sensor remained operational so
the RH profile at various depths could not be developed. However, RH generally increased
when pavement depth increased (Asbahan, 2009).
Figure 3-34 illustrates strain captured by strain gages before traffic opening. It was
found that the strain value was mainly in the range of -200 to +200 microstrain except for
strain gage No. 5 that may have suffered from disturbance problems. The value captured was
similar to that in the research study by Wells (2005), Asbahan (2009), Qin (2011), and
Nassiri (2011) who found typical strain values in response to environmental loads in a range
from -150 to +150 microstrain. However, according to Figure 3-34, the curve patterns of
strain gages No. 3, 5, and 7 agreed but were totally opposite to those of strain gage No. 8
because the deformation behavior of pavement was different under environmental load
between the bottom and the top sections. In the instrumented section, strain gages No. 3, 5,
and 7 were at the bottom and strain gage No. 6 was at the top. When tension was induced at
the top (strain gage No. 6), compression was induced at the bottom. This phenomenon is
referred to as curling and warping behavior of concrete and is explained in the following
paragraphs. However, strain gage No. 5 exhibited a noisy signal but could still provide clear
curve pattern.

65
Curling and Warping
Curling and warping are common concrete behaviors that have been extensively
investigated. In general, conventional concrete pavement deteriorates under the influence of
repeated traffic and environmental load. In terms of environmental load, two well-known
factors, temperature and moisture, produce significant effects called curling and warping.
Curling and warping stresses are developed as a result of temperature and moisture gradients.
When non-uniform temperature or moisture gradient is induced in a PCC slab, the
differential strain response throughout the slab depth will lead to curvature. Generally, when
the top of the PCC slab has higher temperature or moisture content, a positive gradient will
be induced and the top part of the PCC slab will expand more than the bottom, resulting in
downward slab curling or warping. Conversely, if the bottom of the PCC slab has higher
temperature or moisture content than the top, a negative gradient will occur and the bottom
part of the slab will expand more than top, resulting in upward curling or warping of the slab.
The curling and warping behavior of a PCC slab may influence the degree of support
offered by the subgrade and the stiffness along the joint. When curling and warping occurs in
the PCC slab, the self-weight of the slab tends to exert tensile stresses resisting the
deformation caused by the curvature, as shown in Figure 3-35. Additionally, internal tensile
stresses in a PCC slab can be developed by restraints to deformation such as dowel bars and
friction between the PCC slab and the base course (Wells, 2005). The induced tensile stresses
will be further magnified under repetitive vehicle loading and can easily lead to transverse
cracking. In addition to temperature and moisture gradients in a PCC slab, curling and
warping behavior of early-age concrete is also affected by early-age curing and temperature
conditions during pavement construction and by other factors like solar radiation, base-layer
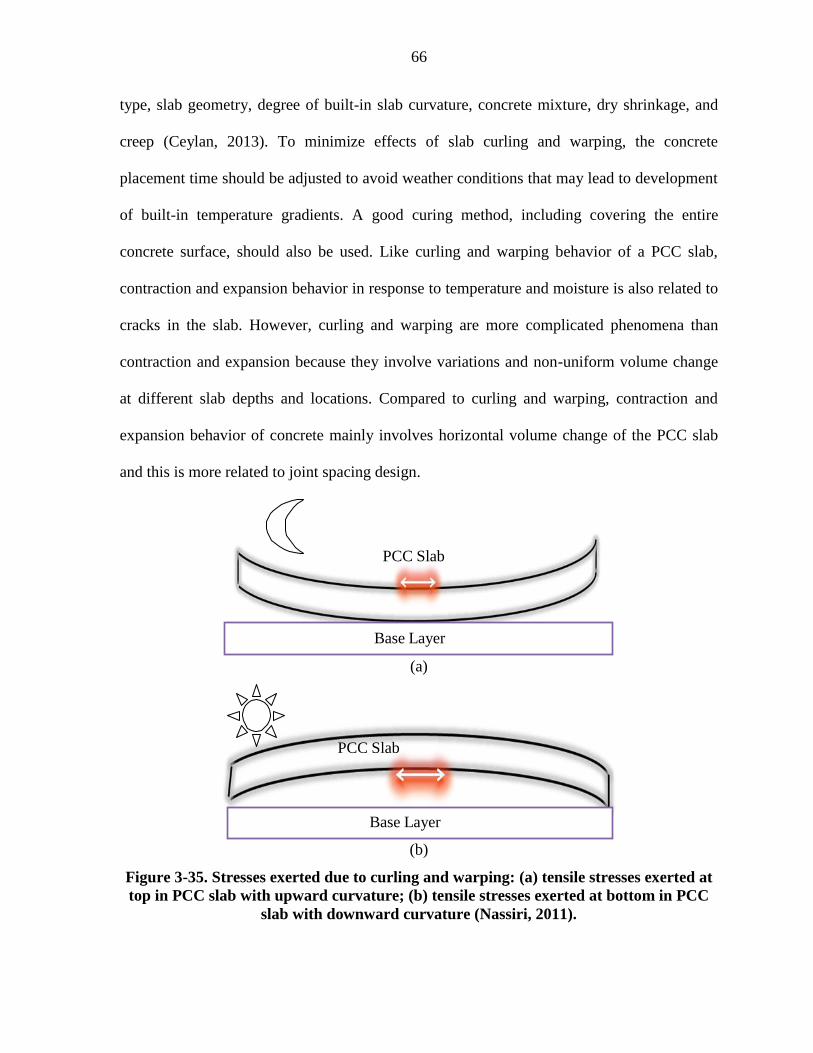
66
type, slab geometry, degree of built-in slab curvature, concrete mixture, dry shrinkage, and
creep (Ceylan, 2013). To minimize effects of slab curling and warping, the concrete
placement time should be adjusted to avoid weather conditions that may lead to development
of built-in temperature gradients. A good curing method, including covering the entire
concrete surface, should also be used. Like curling and warping behavior of a PCC slab,
contraction and expansion behavior in response to temperature and moisture is also related to
cracks in the slab. However, curling and warping are more complicated phenomena than
contraction and expansion because they involve variations and non-uniform volume change
at different slab depths and locations. Compared to curling and warping, contraction and
expansion behavior of concrete mainly involves horizontal volume change of the PCC slab
and this is more related to joint spacing design.
(a)
(b)
Figure 3-35. Stresses exerted due to curling and warping: (a) tensile stresses exerted at
top in PCC slab with upward curvature; (b) tensile stresses exerted at bottom in PCC
slab with downward curvature (Nassiri, 2011).
Base Layer
PCC Slab
Base Layer
PCC Slab

67
In summary, curling and warping are developed as a result of induced non-uniform
temperature or moisture gradients that generate differential strain responses throughout the
slab depth, leading to slab curvature. In this study, curling and warping are illustrated in
Figure 3-36, shown below. According to Figure 3-36, when concrete curled up, the top
concrete (strain gage No. 6) had a maximum of 200 tensile microstrain at 2:00 am on June 8,
2013. Meanwhile, the bottom concrete (strain gage No. 3) had a maximum of 200
compressive microstrain. Comparing with temperature measurements previously shown in
Figure 3-30 through 3-33, it can be observed that top concrete had an approximate
temperature of 60 ˚F while that of bottom concrete was 65 ˚F. As a result, top concrete was
cooler than bottom so that slab curled up, in agreement with the strain readings of Figure 3-
36.
Figure 3-36. Strain measurement: curling and warping.

68
Two Months after Traffic Opening (June 2013 to July 2013)
Figures 3-37 through 4-42 illustrate the temperature and RH behavior approximately
two months after traffic opening, i.e., from July 25 through 27, 2013. According to these
figures, it was discovered that an additional 26% of sensors were not functional at the end of
July 27, 2013. These sensors were RFID extended probes No. 1, 4, and 6, embedded probes
No. 10 and 12, iButton No. 4, MEMS digital humidity sensor No. 3, and strain gage No. 5.
Furthermore, these sensors were distributed in everywhere throughout the slab so there was
no “concentrated location” where the sensors stopped functioning.
Figure 3-37. Measurement of RFID extended probes in the corner at two months after
traffic opening.
40
50
60
70
80
90
100
110
120
7/25
/13
7:00
7/25
/13
19:0
0
7/26
/13
7:00
7/26
/13
19:0
0
7/27
/13
7:00
Tem
pera
ture
(˚F)
Date and Time
4 in./Ex. Probe 2
6 in./Ex. Probe 3
10 in./Ex. Probe 5
Ambient/Ex. Probe 9

69
Figure 3-38. Measurement of RFID extended probes in the center at two months after
traffic opening.
Figure 3-39. Measurement of RFID embedded probes at two months after traffic
opening.
40
50
60
70
80
90
100
110
120
7/25
/13
7:00
7/25
/13
19:0
0
7/26
/13
7:00
7/26
/13
19:0
0
7/27
/13
7:00
Tem
pera
ture
(˚F)
Date and Time
5.5 in./Ex. Probe 7
8.5 in./Ex. Probe 8
Ambient/Ex. Probe 9
40
50
60
70
80
90
100
110
120
7/25
/13
7:00
7/25
/13
19:0
0
7/26
/13
7:00
7/26
/13
19:0
0
7/27
/13
7:00
Tem
pera
ture
(˚F)
Date and Time
5.0 in./Em. Probe 11
7.5 in./Em. Probe 13

70
Figure 3-40. Measurement of iButtons at two months after traffic opening.
Figure 3-41. Temperature measurement of MEMS digital humidity sensor at two
months after traffic opening.
40
50
60
70
80
90
100
110
120
7/25
/13
7:00
7/25
/13
19:0
0
7/26
/13
7:00
7/26
/13
19:0
0
7/27
/13
7:00
Tem
pera
ture
(˚F)
Date and Time
4.0 in./iButton 1
5.0 in./iButton 2
8.5 in./iButton 3
Ambient/iButton 5
40
50
60
70
80
90
100
110
120
7/25
/13
7:00
7/25
/13
19:0
0
7/26
/13
7:00
7/26
/13
19:0
0
7/27
/13
7:00
Tem
pera
ture
(˚F)
Date and Time
0.1 in./8 in. away/MEMS RH_Temp.4

71
Figure 3-42. RH measurement of MEMS digital humidity sensor at two months after
traffic opening.
Figure 3-37 through 3-40 show that the average temperature mainly was in a range
from 74 to 94 ˚F. According to Figure 3-41, the MEMS digital humidity sensor exhibited a
higher temperature than other sensors, ranging from 80 to 110 ˚F, probably due to strong
solar radiation at noon because the MEMS digital humidity sensor was just 0.1 in. below
pavement surface. Furthermore, it’s obvious that the ambient temperature was lower than that
of concrete, and it reached its peak earlier as well, as previously discussed.
Six Months after Traffic Opening (December 2013)
Figures 3-43 through 3-46 illustrate temperature and RH measurements in winter. By
the end of December 6, 2013, RFID extended probes No. 5, 7, 8, and 9 and RFID embedded
probes No. 13 had stopped functioning. According to these figures, the MEMS digital
humidity sensor also reported a temperature more than 50 ˚F higher than the RFID tags and
the iButton that reported maximum temperatures of approximately 40 ˚F. The RH value in
50
55
60
65
70
75
80
85
90
95
100
7/25
/13
7:00
7/25
/13
19:0
0
7/26
/13
7:00
7/26
/13
19:0
0
7/27
/13
7:00
Rela
tive
Hum
idit
y (%
)
Date and Time
0.1 in./8 in. away/MEMS RH_Temp.4

72
winter was maintained between 80 and 90% and that sensor followed a similar temperature
pattern.
(a)
(b)
Figure 3-43. Measurement of RFID extended probes at six months after traffic opening:
(a) in the corner; (b) in the center.
0
10
20
30
40
50
60
70
80
12/0
3/13
7:0
0
12/0
4/13
7:0
0
12/0
5/13
7:0
0
12/0
6/13
7:0
0
Tem
pera
ture
(˚F)
Date and Time
4 in./Slab corner/Ex. Probe 2
6 in./Slab corner/Ex. Probe 3
0
10
20
30
40
50
60
70
80
12/0
3/13
7:0
0
12/0
4/13
7:0
0
12/0
5/13
7:0
0
12/0
6/13
7:0
0
Tem
pera
ture
(˚F)
Date and Time
5.0 in./Em. Probe 11

73
Figure 3-44. Measurement of iButtons at six months after traffic opening.
Figure 3-45. Temperature measurement of MEMS digital humidity sensor at six
months after traffic opening
0
10
20
30
40
50
60
70
80
12/0
3/13
7:0
0
12/0
4/13
7:0
0
12/0
5/13
7:0
0
12/0
6/13
7:0
0
Tem
pera
ture
(˚F)
Date and Time
4.0 in./iButton 1
5.0 in./iButton 2
8.5 in./iButton 3
Ambient/iButton 5
0
10
20
30
40
50
60
70
80
12/0
3/13
7:0
0
12/0
4/13
7:0
0
12/0
5/13
7:0
0
12/0
6/13
7:0
0
Tem
pera
ture
(˚F)
Date and Time
0.1 in./8 in. away/MEMS RH_Temp.4
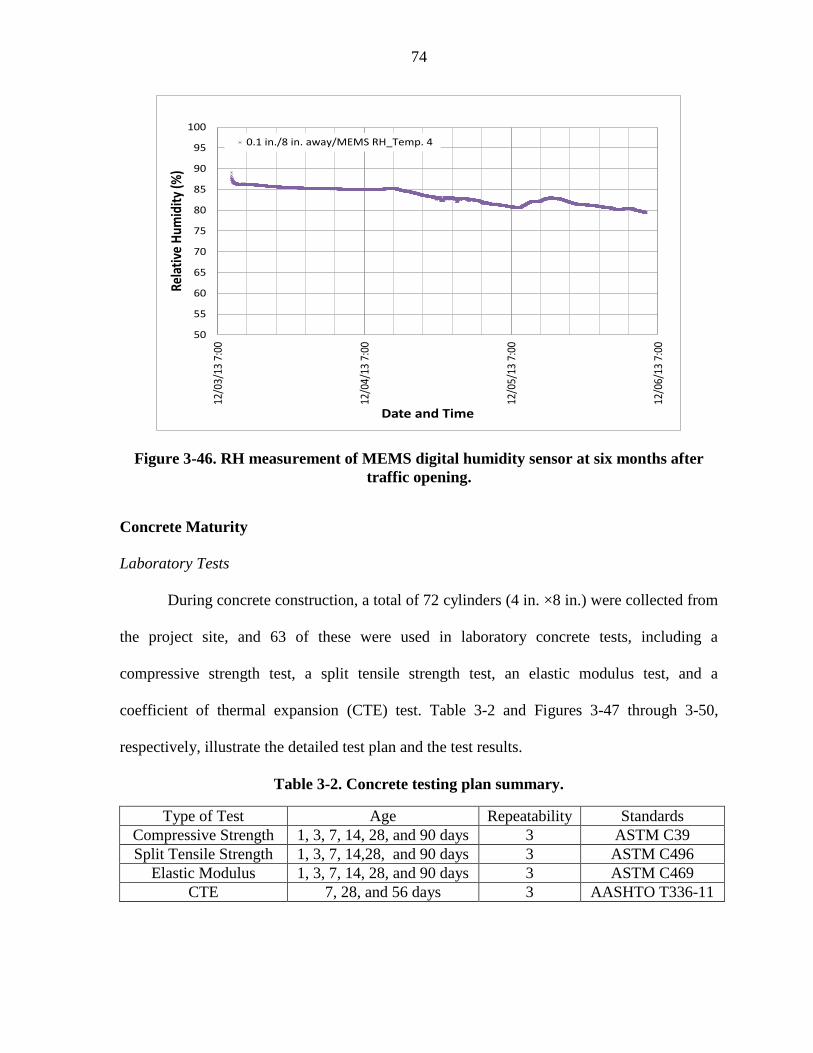
74
Figure 3-46. RH measurement of MEMS digital humidity sensor at six months after
traffic opening.
Concrete Maturity
Laboratory Tests
During concrete construction, a total of 72 cylinders (4 in. ×8 in.) were collected from
the project site, and 63 of these were used in laboratory concrete tests, including a
compressive strength test, a split tensile strength test, an elastic modulus test, and a
coefficient of thermal expansion (CTE) test. Table 3-2 and Figures 3-47 through 3-50,
respectively, illustrate the detailed test plan and the test results.
Table 3-2. Concrete testing plan summary.
Type of Test Age Repeatability Standards
Compressive Strength 1, 3, 7, 14, 28, and 90 days 3 ASTM C39
Split Tensile Strength 1, 3, 7, 14,28, and 90 days 3 ASTM C496
Elastic Modulus 1, 3, 7, 14, 28, and 90 days 3 ASTM C469
CTE 7, 28, and 56 days 3 AASHTO T336-11
50
55
60
65
70
75
80
85
90
95
100
12/0
3/13
7:0
0
12/0
4/13
7:0
0
12/0
5/13
7:0
0
12/0
6/13
7:0
0
Rela
tive
Hum
idit
y (%
)
Date and Time
0.1 in./8 in. away/MEMS RH_Temp. 4

75
Figure 3-47. Compressive strength test results
Figure 3-48. Split tensile strength test results.
0
1,000
2,000
3,000
4,000
5,000
6,000
7,000
0 500 1,000 1,500 2,000 2,500
Com
pres
sive
Str
engt
h (p
si)
Time (hours)
0
100
200
300
400
500
600
700
0 500 1,000 1,500 2,000 2,500
Split
Ten
sile
Str
engt
h (p
si)
Time (hours)

76
Figure 3-49. Modulus of elasticity test results.
Figure 3-50. Coefficient of thermal expansion test results.
0
1,000
2,000
3,000
4,000
5,000
6,000
0 500 1,000 1,500 2,000 2,500
Mod
ulus
of E
last
icit
y (k
si)
Time (hours)
0.0
1.0
2.0
3.0
4.0
5.0
6.0
7.0
7 28 56
CTE,
mic
ro-s
trai
n/de
gree
F
Time, days

77
Figure 3-47 through 3-50 illustrate the results of common laboratory concrete tests
conducted in accordance with corresponding related standards. It can be seen that the
strength increased rapidly during an initial period of 7 days after which the speed of strength
increase became slower. However, a slight decrease in split tensile strength and modulus of
elasticity were recorded by the 14-day test, and the results of the 28-day coefficient of
thermal expansion test exhibited a slight decrease as well. These differences were probably
due to variation in different concrete specimens and machine calibration errors. Nevertheless,
all the test data were in a reasonable range and met minimum construction requirements.
Estimated initial set time and final set time were also obtained in accordance with ASTM C
403. The detailed test results are shown in Appendix C.
Maturity Calculation
The concrete maturity method is a simple and reliable quality control approach for
estimating in-place concrete strength. This method accounts for both time and temperature
effects on strength development. According to ASTM C1074 (1998), the maturity method is
defined as “a technique for estimating concrete strength that is based on the assumption that
samples of a given concrete mixture attain equal strengths if they attain equal values of the
maturity index.” The method can help engineers determine appropriate times for form
removal, traffic opening, and joint sawing so that the money can be saved through more
efficient construction.
ASTM C1074 provides two alternative equations for maturity index calculation: the
temperature-time-factor-based Nurse-Saul function and the equivalent age-based Arrhenius
function. The Nurse-Saul function assumes a linear relationship between the rate of strength
development and temperature, while the Arrhenius function assumes an exponential

78
relationship between the rate of strength development and temperature. This study adopted
the Nurse-Saul function that can be expressed as
𝑀 = ∑ (𝑇 − 𝑇0𝑡0 )∆𝑇 (1)
where
𝑀 = maturity index, ˚C-hours (or ˚C-days),
𝑇 = average concrete temperature, ˚F, during the time interval ∆𝑇,
𝑇0 = datum temperature,
∆𝑇 = time interval (hours or days).
The equation above can be used to calculate the maturity index by utilizing monitored
temperature history. The maturity index is an indicator of concrete maturity that can be used
to estimate the corresponding in-place strength. The datum temperature is 10 ˚C based on the
recommendation given in ASTM C1074. The in-place strength estimation can be calculated
from:
𝑆 = 𝑆𝑢𝐾(𝑡−𝑡0)
1+𝐾(𝑡−𝑡0) (2)
where
𝑆 = in-place compressive strength at age t,
𝑡 = test age,
𝑆𝑢 = limiting strength,
𝑡0 = age when strength development is assumed to begin,
𝐾 = the rate constant.
According to equation (2), in-place strength can be calculated by using the estimated
limiting strength, the rate constant, the test age, and the assumed age at which cement
hydration began. The limiting strength and the rate constant can be found by developing the

79
plots described in ASTM C1074. Equation (3) below shows how to calculate the A-value for
y-axis in the plot to determine the K-value, and Figures 3-51 and 3-52, respectively, show the
concrete maturity curve and the relationship between the estimated in-place strength and the
maturity index.
𝐴 =s
(𝑆𝑢−s) (3)
where
s = compressive strength from laboratory test.
Figure 3-51. Concrete maturity curve.
0
1,000
2,000
3,000
4,000
5,000
6,000
7,000
0 7 14 21 28
Stre
ngth
(psi
)
Age (days)
MEMS digital humidity sensor
iButton
Wireless RFID tag
Laboratory

80
Figure 3-52. Relationship between in-place strength and maturity index.
The concrete maturity curves shown in Figure 3-51 were determined from the sensor
data and compressive strength data described earlier. Figure 3-52 shows the relationship
between in-place strength and maturity index derived from different sensors. However, the
RFID tags and the iButtons had similar average temperature readings, so their curves overlap
one another. MEMS digital humidity sensors indicate higher average temperatures due to
different sensor position and temperature measurement methods, so they lead to a relatively
lower curve. The gap shown in the curve for the MEMS digital humidity sensor is due to
power recharging.
Discussion
As stated earlier, this project was conducted to evaluate the performance of MEMS
sensors and wireless sensors that had shown promise in helping to achieve Smart Pavement
SHM and overcome limitations of traditional wired sensor-based SHM. The MEMS sensors
0
1,000
2,000
3,000
4,000
5,000
6,000
0 5000 10000 15000 20000 25000
Stre
ngth
(psi
)
Maturity (C-Hrs)
MEMS digital humidity sensor
iButton
Wireless RFID tag

81
nicely captured temperature variation for different pavement depth, weather, and seasons,
and produced results consistent with early-age curling and warping behaviors of concrete
pavement. However, as in earlier projects, some embedded sensors stopped functioning both
during road construction and during the pavement-monitoring period. Table 3-3 depicts the
number of embedded sensors surviving at various times throughout the entire monitoring
period. According to this table, it can be seen that 19% of the sensors had stopped
functioning after concrete paving and approximately 63% of the sensors gradually stopped
functioning during the 10 months following traffic opening. Possible reasons for these
malfunctions can be attributed to
Damage of sensors due to high alkali environment in concrete
Damage of sensors and wires incurred by paving and vibration operations of concrete
paver
Corrosion of wires in concrete
Battery issues
Harsh climate and slab movement
High temperature, moisture, and adverse pH values all represent challenges to
embedded-sensor survivability in plastic concrete. The high alkali environment in concrete is
critical to sensors, especially moisture sensors, because their operation requires exposure of
their sensing elements to the water vapor in concrete. In US Highway 30 road construction,
two out of four MEMS digital humidity sensors directly failed and another MEMS digital
humidity sensor could measure temperature only after concrete paving, probably due to alkali
environment and extreme moisture content (liquid water) in the concrete. In addition to high
alkali environment, other road construction activities can be considered as primary sources of

82
sensor malfunction as well, as happened in MnROAD construction. The paving and vibration
operations of concrete pavers will generate huge lateral forces that can damage a sensor,
loosen wire connections, and change the sensor position; the spreading plow or auger at the
front of a paver used to spread concrete might also cut the sensor or its wiring, as shown in
Figure 3-18. Wire also has potential for corrosion due to the chemical environment inside of
concrete. Figure 3-53 shows the winter data acquisition process for RFID tags. During this
process, the portable handheld transceiver “Pro” was generally able to identify tags but could
not download data from some tags. Even though the distance between the “Pro” and RFID
extended probes was only 2 ft., it’s still difficult to download data even though a range of
300 ft. was claimed by the manufacturer. This difficulty could be related to battery issues
such as reduction of battery capacity and battery life under severe temperature changes and
harsh climate conditions such as repeated freezing-thawing cycles that might lead to sensor
malfunction or low signal strength. Even the ambient RFID tags stopped functioning during
winter time. Slab movement could also be a source of sensor damage.
Table 3-3. Sensor survivability evaluation.
Sensor
Number of Sensor Survived
May 23
2013
May 24
2013
Jun. 14
2013
Aug. 22
2013
Dec. 6
2013
Apr. 1
2014
RFID temp (Ex. Probe) 8 8 7 3 2 1
RFID temp (Em. Probe) 4 4 4 2 1 0
EMS RH/Temp. 4 2 2 1 1 1
ibutton (Temp) 4 4 4 3 3 3
Longitudinal strain gage 7 4 4 3 3 0
Total 27 22 21 12 10 5

83
Figure 3-53. Data acquisition of RFID extended probes in winter.
Although several sensors malfunctioned after road construction, the 81% sensor
survival rate at the beginning of opening to traffic could still be regarded as successful
instrumentation in comparison to previous pavement instrumentations (Sebaaly et al., 1991).
Furthermore, the result of the concrete maturity calculation shows the benefit of using the
SHM of pavement. By using MEMS sensors, maturity could be directly calculated on-site
and immediately generated as one of the sensor-system outputs. However, the performance
of the off-the-shelf MEMS sensors deployed on US Highway 30 illuminated the current
limitations, i.e., packaging, wires, signal strength, etc., when using them in pavement health-
monitoring systems. A wireless communication system with robust packaging for the MEMS
digital humidity sensor was thus implemented to demonstrate a preliminary design for a
wireless sensor system.
RFID extended probes

84
CHAPTER 4
IMPLEMENTATION OF WIRELESS COMMUNICATION SYSTEM TO MEMS
SENSOR
Implemented Wireless System Overview
The wireless system discussed in this study was a preliminary design mainly focusing
on the wireless transmission function motivated by field instrumentation in US Highway 30.
In this study, an Institute of Electrical and Electronics Engineers (IEEE) standard-based
wireless system was utilized because of both its low price and low power consumption. A
MEMS digital humidity sensor was used as sensing unit; this pin-based sensor had no
packaging for its sensing element so an additional robust packaging was also required.
This wireless system could be subdivided into two parts: wireless transmitter and
wireless receiver. The wireless transmitter was interfaced with a MEMS digital humidity
sensor to transfer the data captured, while the wireless receiver received transmitted data and
downloaded it to a computer through a USB port. Microcontrollers and XBee-PRO modules
were used for both the transmitter and the receiver.
Wireless Protocols
As described earlier, wireless network protocols are used to define or standardize the
rules and conventions for communication between devices (Lee et al., 2007). The wireless
protocol implemented in this design was ZigBee, used to construct a decentralized self-
healing wireless mesh network. In this mesh network, nodes can find a new route when an
original route fails (Texas Instruments, 2013). ZigBee is the standard IEEE 802.15.4-based
protocol; in addition to ZigBee, there are also other possibilities, including Bluetooth, Wi-Fi,
cellular, etc. Table 4-1 gives a comparison between different wireless technologies by

85
evaluating their total scores derived from weighted scores considering various aspects such
as data rate, range, energy consumption, etc. In this table, the weighted score of each aspect
is calculated by multiplying its weight by the score of each specific wireless technology; a
higher total score represents a better wireless technology for this application. Based on this
table, it can be seen that ZigBee is more energy-efficient, cost-effective, and easier to work
with than the other technologies.
Table 4-1. Comparison of wireless technologies (Al-Khatib et al., 2006).
Aspects Score (0 to 10)
Factors Weight Bluetooth ZigBee Wifi Cellular
Multi‐node network support 100 5 10 10 10
Throughput 60 7 6 8 3
Data rate 60 7 6 10 10
Range 50 6 5 7 10
Ease of implementation 50 6 8 6 4
Power consumption ‐80 6 2 8 6
Cost ‐100 5 3 7 8
Total Score 460 910 390 200
Microcontrollers
Arduino board is a single-board microcontroller consisting of an Atmel AVR® 8-bit
or 32-bit microcontroller which can be wirelessly programmed by a device utilizing the
ZigBee protocol (Atmel, 2014). In this study, Arduino Uno and Arduino Mega 2560,
respectively, shown in Figure 4-1, were used for the wireless transmitter and receiver.
The Arduino Uno is a microcontroller using an ATmega328 processor with 32 KB of
flash memory, 2 KB of static random-access memory (SRAM), and 1 KB of electrically-
erasable programmable read-only memory (EEPROM). The board has 14 digital input/output
pins, 6 analog inputs, a 5-volt linear regulator, a 16 MHz ceramic resonator, a USB
connection, a power jack, an In-Circuit Serial Programming (ICSP) header, and a reset

86
button. The Arduino Mega 2560 is similar to the Arduino Uno but it has an ATmega2560
processor with 54 digital input/output pins, 16 analog inputs, 4 hardware serial ports
(UARTs), and a 16 MHz crystal oscillator. The Arduino Mega 2560 is compatible with most
shields designed for the Arduino Duemilanove or Diecimila and it has 256 KB of flash
memory, 8 KB of SRAM, and 4 KB of EEPROM for storing code and data. These two
microcontrollers were selected because of their high reliability and low cost. Furthermore,
Arduino 1.0.4 (open-source software) can be used for program coding such as setting up a
time interval, changing the format of exported data, etc., to control both the Arduino Uno and
the Arduino Mega 2560.
(a) (b)
Figure 0-1. Microcontrollers: (a) Arduino Uno for wireless transmitter; (b) Arduino
Mega 2560 for wireless receiver.
XBee-PRO Modules
XBee-PRO RF module (series 1) as shown in Figure 4-2 is a wireless device, which
can offer low cost wireless connectivity in ZigBee mesh networks. It is reliable in point-to-
point, multipoint wireless transmission and is designed to conform to the IEEE 802.15.4
standard. Furthermore, the XBee-PRO module has an easy set-up process; its software is
called X-CTU, and it can adjust frequency, signal strength, energy consumption, etc. An
XBee Explorer Regulated board can also be used to help regulate the voltage input.

87
(a) (b)
Figure 4-2. XBee device: (a) XBee-PRO modules; (b) XBee Explorer Regulated.
Wireless Transmitter
The wireless transmitter shown in Figure 4-3 consists of a MEMS digital humidity
sensor, an XBee-PRO module, an XBee Explorer Regulated, an Arduino Uno
microcontroller, and twelve 1.5V AA batteries. Among these devices, the XBee Explorer
Regulated is a board that can be pinned onto the XBee-PRO to help it regulate the voltage
input. At the wireless transmitter, both a SHT71 sensor and an XBee-PRO with XBee
Explorer Regulated were pinned to the digital port and power port on the Arduino Uno board.
Meanwhile, twelve 1.5V AA batteries were placed in a plastic holder and connected to the
microcontroller to power the entire wireless transmitter through the board’s voltage output
pin. Furthermore, because the entire wireless transmitter will be buried in concrete, a robust
packaging framework is needed, as will be discussed later.
Figure 4-3. Wireless transmitter.

88
Wireless Receiver
Figure 4-4 is a photograph of the wireless receiver; it consists of an XBee-PRO
module, an XBee Explorer Regulated, and an Arduino Mega 2560 microcontroller. The
XBee Explorer Regulated used here plays the same role as in wireless transmitter. However,
there was no battery used on the Arduino Mega 2560 because it is computer-powered
through a USB cable. The XBee-PRO on the Arduino Mega 2560 was paired with the other
XBee-PRO on the Arduino Uno in the wireless transmitter to receive the transmitted data.
The data was then stored on the Arduino Mega 2560 in a data-storage module with 4096
bytes of non-volatile memory.
Figure 4-4. Wireless receiver.
Packaging
Robust packaging is required to protect both the sensor and wireless transmission
devices like the XBee-PRO module and the microcontroller to ensure that they can work
properly inside the concrete. The packaging functions include protecting the wireless
transmitter during sensor installation and pavement construction processes, protecting the
sensor from alkali-cement hydration reaction, and protecting the wireless transmitter under
harsh climate and traffic condition.

89
Two types of in-house packaging were designed to protect the sensor, the
microcontroller, and the XBee-PRO module. For the MEMS sensor, a piece of adhesive tape,
a protection filter cap, and steel wool comprised a protective package to prevent direct
contact between the raw sensor and fresh concrete, as shown in Figure 4-5. In this packaging,
a filter cap was attached to the top of the MEMS sensor using adhesive tape, and steel wool
was used to attach the sensor. For the microcontroller and the XBee-PRO module, a small
box with an open bottom was prepared; it was comprised of a 0.5 in. thick wooden board and
a wooden board nailed to a 7.1 in. long sharp-edged wood stick, A hole was drilled on the
board nailed to the stick to permit a sensor cable to pass through and be connected to the
Arduino Uno microcontroller. The size of the box was 6.3 in. × 4.1 in. ×3.5 in., sufficient to
contain the entire wireless transmission system, as shown in Figure 4-6. Silicon glue and
adhesive tape were additionally used to seal the small gap in the box. However, it should be
noted that the basic design concept for the packaging for the moisture sensor was to use the
material like a filter to allow only water vapor to pass through. Furthermore, an extra eight
sensors packaged in the same way were first tested in mortar specimens, and seven out of the
eight were able to continuously capture data, indicating that this packaging was successful.
Figure 4-5. MEMS sensor with packaging.
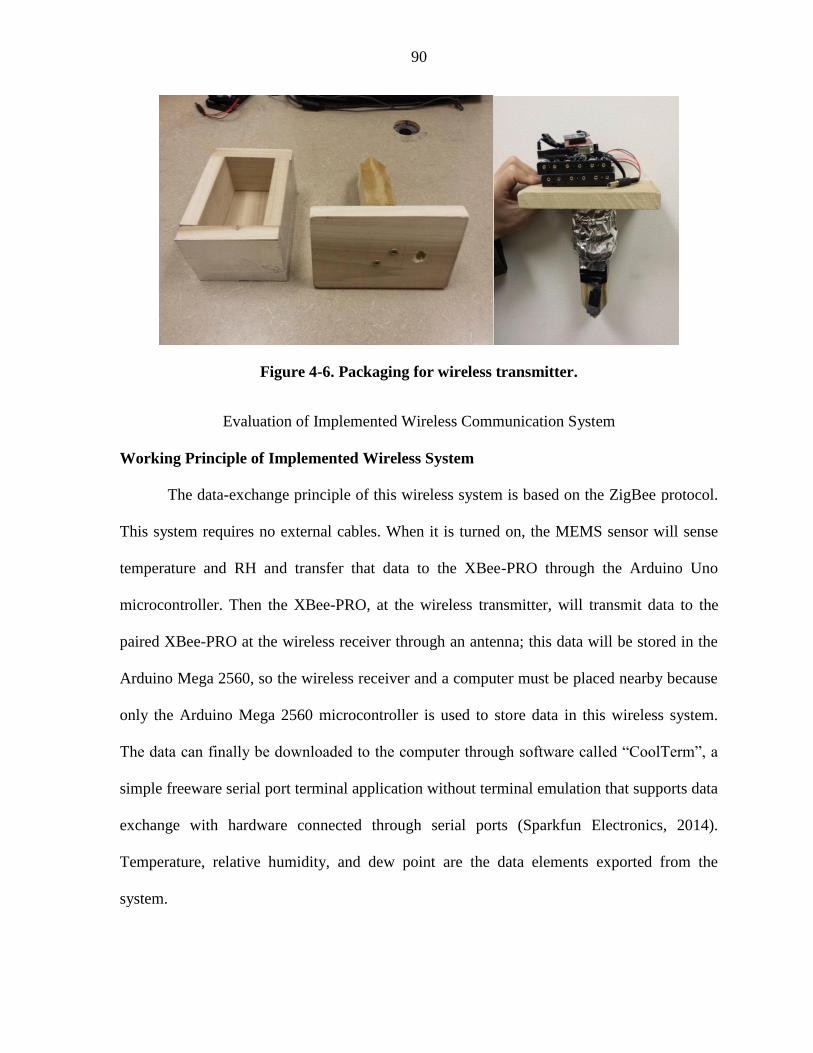
90
Figure 4-6. Packaging for wireless transmitter.
Evaluation of Implemented Wireless Communication System
Working Principle of Implemented Wireless System
The data-exchange principle of this wireless system is based on the ZigBee protocol.
This system requires no external cables. When it is turned on, the MEMS sensor will sense
temperature and RH and transfer that data to the XBee-PRO through the Arduino Uno
microcontroller. Then the XBee-PRO, at the wireless transmitter, will transmit data to the
paired XBee-PRO at the wireless receiver through an antenna; this data will be stored in the
Arduino Mega 2560, so the wireless receiver and a computer must be placed nearby because
only the Arduino Mega 2560 microcontroller is used to store data in this wireless system.
The data can finally be downloaded to the computer through software called “CoolTerm”, a
simple freeware serial port terminal application without terminal emulation that supports data
exchange with hardware connected through serial ports (Sparkfun Electronics, 2014).
Temperature, relative humidity, and dew point are the data elements exported from the
system.

91
Comparison between Wired MEMS System and Implemented Wireless MEMS System
Figure 4-7 provides an overall system-level comparison between a wired MEMS
system and the wireless MEMS system developed for this study. In the wired MEMS system,
the sensor must be connected to the data reader and the computer through cables to
continuously monitor concrete properties and the data. As a consequence, both the data
reader and the computer require an electrical power supply. However, the implemented
wireless system requires no external cables and can thereby save installation time and reduce
the risk of sensor malfunction.
Figure 4-7. Comparison between previous wired MEMS system and implemented
wireless system.
Evaluation of Wireless Communication Capability
To test the reliability and survivability of the wireless communication system inside
the concrete, both wireless transmitter and receiver were embedded in concrete as shown in
Figure 4-8 to conduct a success rate test. Success rate refers to the rate of data transmitted
from the transmitter in successfully reaching the receiver. The higher this rate, the more
reliable the system will be.
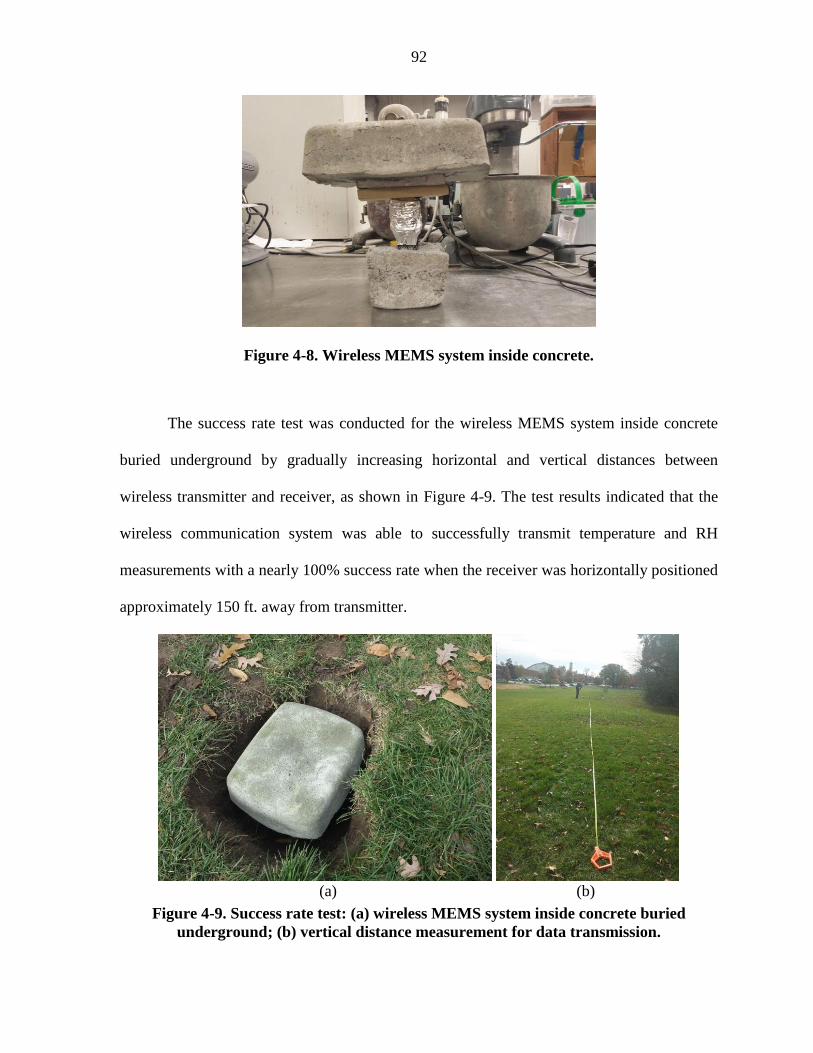
92
Figure 4-8. Wireless MEMS system inside concrete.
The success rate test was conducted for the wireless MEMS system inside concrete
buried underground by gradually increasing horizontal and vertical distances between
wireless transmitter and receiver, as shown in Figure 4-9. The test results indicated that the
wireless communication system was able to successfully transmit temperature and RH
measurements with a nearly 100% success rate when the receiver was horizontally positioned
approximately 150 ft. away from transmitter.
(a) (b)
Figure 4-9. Success rate test: (a) wireless MEMS system inside concrete buried
underground; (b) vertical distance measurement for data transmission.

93
Future Improvement
The objective of this study was to investigate the feasibility of implementing wireless
based MEMS for concrete pavement structural health monitoring. The system requirements
for the wireless MEMS system were derived from field experiences from the wired MEMS
system used in US Highway 30. In this design, a wireless communication system was
integrated with off-the-shelf MEMS sensors originally designed to be wired. The wireless
MEMS system developed was capable of providing reliable temperature and RH
measurement data over a distance of more than 150 ft. from the receiver when embedded in
concrete. However, the entire system was still energy consuming for the current-limited
energy source. It could work for just a few days at a reasonable data-sampling rate using
twelve 1.5AA batteries. The lifetime of these batteries could easily be diminished by harsh
environmental factors like high temperatures occurring during concrete hydration; extremes
of both temperature and humidity can reduce the lifetime and capacity of such batteries.
Furthermore, future research should focus on increasing memory capacity and making the
whole system smaller. Some recommendations for resolving the aforementioned issues are:
A power management circuit called Texas Instruments Debuts TPL5000 power timer
can be used to control power output of battery; this can possibly extend the current
working time to as much as several years under ideal conditions.
A micro-SD card or QuadRam Shield can be added to the microcontroller to
tremendously increase its memory capacity.
A smaller microcontroller called an Arduino Fio with an XBee plug, shown in Figure
4-10, can be used to replace the original microcontroller to reduce overall system size.

94
Figure 4-10. Arduino Fio (left) and Arduino Mega 2560 (right).

95
CHAPTER 5
REQUIREMENTS FOR STRUCTURAL HEALTH MONITORING (SHM) SYSTEM
USING SMART SENSING TECHNOLOGIES
This chapter summarizes the issues of using MEMS and wireless sensors in pavement
health monitoring system based on previous literature review, field instrumentation, and
implementation of a wireless communication system. The requirements of advanced SHM of
pavement system are addressed to generate some ideas regarding the strategies that can be
effectively used in resolving related issues. A cost evaluation for pavement SHM system and
the architecture of advanced pavement SHM system are presented.
Issues on SHM of Pavement System
Over the decades of pavement instrumentation, the general issues related to pavement
SHM systems can be mainly divided into four categories: sensor selection, sensor
installation, sensor packaging to prevent damage from road construction, and monitoring.
These issues exist in the beginning of planning a SHM system for pavement infrastructures
until the end of monitoring period. Each of these categories can be crucial to SHM of
pavement, so relative strategies must be identified to develop Micro-Electromechanical
Systems (MEMS)-based smart wireless sensing technologies for structural health monitoring
of concrete pavement. Table 5-1 summarizes the issues related to each category. The
corresponding requirements of the advanced SHM of pavement system are discussed in the
latter part of this chapter.

96
Table 5-1. Issues on SHM of pavement system.
Aspect Issues
Sensor selection
Effect of asphalt/concrete medium, temperature and moisture effects,
battery life (measurement frequency), placement, sensor specifications
and operating characteristics, cost, hardware architecture, packaging,
delivery time
Sensor
installation
Optimal number, optimal locations to capture critical responses,
orientation/direction, read/write range (placement depth), repeatability
and reproducibility, the way of installation (embedded or surface-
mounted), training sensor instrumentation personnel off site
Road
construction
Design and cost of durable sensor packaging, packaging for moisture
sensor
Monitoring
Monitoring period, data measuring interval, frequency of data
collection, data signal interference, wireless communications (“hop”
network architecture), off-site power, data transfer and storage,
protection of equipment, data acquisition systems, embedded software
Cost Evaluation for SHM of Pavement System
The cost to implement SHM systems in similar projects can vary a great deal because it is
associated with design, materials, labor and many other factors that depend on the scale and
type of structure, number and type of sensors, site location, monitoring period, etc. There is
therefore no standard cost for a typical pavement SHM system at this time. However, the
typical factors contributing to total SHM cost are:
Type and number of sensors (traditional sensor /MEMS based, wired/wireless,
static/dynamic, active/passive, etc.)
DAS (automatic or manual)
Sensor and DAS installation cost
Travel cost (site investigation, sensor installation, data collection, etc.)
Software
Protective equipment (cabinet for DAS, safety vests, helmets, etc.)

97
Table 5-2 gives a unit sensor cost comparison between traditional sensors and MEMS
sensors. In general, unit sensor cost depends on the number of sensors procured; a larger
number of sensors typically will be associated with lower per-unit cost. According to Table
5-2, MEMS sensors generally have a lower unit cost, varying perhaps from $3 to a few tens
of dollars per sensor. Traditional sensor prices are usually range from $50 to $500. However,
the cost of a DAS is much higher than that of a sensor. Table 5-3 illustrates the cost of DAS
(The PC is not included) for some of the sensors from Table 5-2. It can be seen that the DAS
is much more expensive and may cost $500 to $3,000 per unit. Furthermore, DAS using
wired sensors usually have a limited number of connection ports so that a more
comprehensive DAS must be purchased if large number of sensors are needed. When using
MEMS sensors the cost of a DAS would be relatively lower because many MEMS sensors
can use an evaluation kit/board equipped with a USB cable to read and transmit data to a PC,
usually resulting in a relatively lower cost compared to a traditional data-logger. However,
sensors can be interfaced with different data acquisition devices and their prices vary quite a
lot over different models and accessories, so there is not a well-defined standard value for
DAS cost.
In addition to sensor and DAS cost, SHM expense also includes labor cost. According
to a report from Titi et al. (2012), the typical labor cost of an instrumentation plan/design
with construction drawings ranges from $5,000 to $10,000. Furthermore, the maintenance
cost per trip due to electrical storms or vandalism could be as much as $2,500 to $5,000, and
the data processing cost depends on frequency.

98
Table 5-2. Sensor unit cost comparison as of 2014.
Categories Traditional Sensors MEMS Sensors
Manufacture (Model) Price ($) Manufacture (Model) Price ($)
Strain or
Soil
Pressure
Geokon (4000 series) 120~600
Melexis (90809) 7~8
Geokon (3900 series) 605
Vishay (EGP) 44
Tokyo Sokki (PML) 143
Encardio Rite (EDS) 65~90
Endevco Corp. 5~10
Marton Geotechnical Services 150~500
Micron Optic (os3600) 649
RST Instruments 70~90
Smartec 65~90
Omega (KFH) 110~290
LTD 150~500
Applied Geomechanics 150~500
CTL (ASG) 500
Temperature
Omega (Thermocouple) 65~260 Analog Device (ADT7320) 3
Geokon
(Vibrating Wire Temperature
Sensor)
200 iButton (DS1921) 15~23
Applied Geomechanics 200 MEMS VISION
(MVH3000D) N/A
Slope Indicator 200 RFID tag Q350 series* 30~50
Omega (RTD) 50~110 Sensirion (SHT71) 25
Omega (Infrared temperature
sensors) 65~260
STMicroelectronics
( HTS221) 4~3
Omega (TT-K-24-100) 78 MEMS VISION
(MVH3000D) N/A
Moisture
Vaisala Inc. (SHM40) 635 Hygrochron iButton 4~3
Decagon Devices (GS3) 260 Sensirion (SHT71) 25
Irrometer Watermark (200SS) 90 STMicroelectronics
( HTS221) 4~3 Campbell Scientific
(CS616-L25) 140
Stevens (Hydraprobe II) 360
MEMS VISION
(MVH3000D) N/A Hydronix (Hydro-Probe II) 5,000
Innovative Sensor
Technology (MK33) 32~50
Note: * means wireless sensors, and the other sensors shown in the table are wired sensors.

99
Table 5-3. DAS cost comparison as of 2014.
Traditional Sensors MEMS Sensors
Sensor Type DAS Cost ($) Sensor Type DAS Cost ($)
Strain or
Soil
Pressure
Geokon strain gage 1,760
Melexis (90809) N/A Micron Optic (os3600) 24,000
Tokyo Sokki (PML) 3,000
Vishay (EGP) 708
Temperature
Omega (Thermocouple) 549
Analog Device
(ADT7320) 45~60
iButton 40
MEMS VISION
(MVH3000D) N/A
Omega
(TT-K-24-100) 450
RFID tag Q350 series 2,000
Sensirion (SHT 71) 640
STMicroelectronics
(HTS221) 31.5
Moisture
Campbell Scientific
(CS616-L25) 1,465
Hygrochron 40
MEMS VISION
(MVH3000D) N/A
Stevens (Hydra probe
II) 3,270
Sensirion (SHT 71) 640
STMicroelectronics
(HTS221) 31.5
Requirements for Smart Pavement SHM
Sensor Selection
Selection of sensors can be crucial for pavement health monitoring. When assessing
potential sensors, the following factors must be considered:
Capability of measuring pavement response
Reliability (i.e., accuracy, life time, survivability in pavement)
Availability (i.e., shipping time)
Cost
Practicality for field instrumentation

100
Previous pavement instrumentation projects have disclosed the limitations of
traditional wired sensors, including high cost, low reliability, complexity of field
instrumentation, etc. Furthermore, traditional sensors usually have relatively large size and
many external wires, so locating large numbers of sensors of different types to obtain
continuous data may very likely cause logistical problems and potential damage to the
structure. In addition, data acquisition systems must be placed in close proximity to the
pavement, causing more problems in such elements as power supply and data storage and
transmission. However, an on-site data acquisition system for a test track may not have such
problems because on-site office structures are usually built alongside the test track in projects
like MnROAD and Virginia Smart Road; this is not realistic for an actual highway. All these
drawbacks combine to limit the use of SHM for pavement systems. Therefore, it is important
that sensors used in pavement health monitoring should have small size, be wireless, have
low cost, and include an on-board CPU. However, it should be noted that a sufficiently long
strain gage length is required to precisely capture the strain values in a concrete matrix.
Based on Copley (1994), a gage length three to five times the maximum aggregate size
should be sufficient.
It’s already universally accepted that MEMS-sensor technology can provide
improved system performance, reliability, longevity, and safety compared to existing
traditional wired-sensor systems. Their on-board CPUs support a more efficient type of data
interrogation. Compared to a traditional sensor, a MEMS sensor has a lower unit cost and
smaller size, making it possible to increase in-pavement array density to obtain more data.
Furthermore, through the micro-fabrication of MEMS technologies, a highly-integrated
multifunction sensor capable of simultaneously measuring several parameters such as

101
temperature, RH, and strain can be developed. This multifunctional MEMS sensor can also
reduce the number of sensors needed, further reducing installation cost.
A wireless sensor system has many benefits such as low installation cost and time,
elimination of wire damage, good flexibility, etc. The common wireless technologies used in
civil infrastructure include the earlier-described RFID and ZigBee. However, the main
challenge for a wireless sensor system is related to the battery issue. In general, pavement has
a designed life from 20 to 50 years and maintenance and rehabilitation can be scheduled
every 5 to 15 years (Luhr et al., 2010). Therefore, the monitoring period should extend over
decades ideally. However, current commercial battery life can only be extended as much as
about 10 years under ideal conditions and common sensors equipped with internal batteries
have only a 2 to 6 year continuous working time (Roberts, 2006). For example, the iButton
and the active RFID tag used in the US-30 Highway project have maximum battery lifetimes
of 2 and 6 years, respectively. The harsh climate in a real highway can greatly reduce battery
life, and there is no feasible way to replace embedded-sensor batteries in concrete.
Accordingly, a passive wireless system should be more suitable for long-term pavement
health monitoring.
The aforementioned passive RFID tag usually uses an antenna to convert the wireless
signal from the RFID reader into operating power; the idea is to convert electromagnetic
wave or RF radiation into DC electrical power. Other potential energy scavenging sources
that might be used by self-energy-harvesting systems include wind, solar, thermoelectricity,
and physical vibration (Yildiz, 2009). Among these options, physical vibration could be an
ideal energy source for pavement health monitoring because it uses strain changes caused by
passing vehicles. Therefore, piezoelectric material can be used to make the accelerometer or

102
transducer for harvesting energy from the physic vibration. In addition to using passive
systems, the computational capabilities provided by logical blocks on a board-mounted CPU
can be incorporated into the sensor by MEMS technologies to manage power. In this
situation, energy might be conserved by putting the device into a sleep mode, as described
earlier.
To summarize, the Smart Pavement SHM needs to have MEMS-based sensors,
wireless capability, multifunctionality, and be self-powered. Therefore, a wireless MEMS
multifunctional sensor containing a self-energy harvesting system represents a promising
solution for a Smart Pavement SHM. Durable packaging is also required in this system to
protect the sensor from concrete. This kind of wireless multifunctional MEMS sensor is,
however, not yet commercially available, because fully integrating all the sensing elements
may result in relatively excessive device dimensions and high unit cost due to complex
fabrication, assembly and implementation. More importantly, energy consumption may be
large because of the need to simultaneously measure a number of parameters.
Sensor Installation
In planning a SHM system, questions always emerge like how many sensors are
needed and where the sensors should be installed. Installing sensors throughout the entire
structure can produce a superior database but may not be realistic because of cost, logistics,
and potential cracking issues. For that reason the number and locations of sensors should be
optimized at the planning stage.
Temperature, moisture, and strain sensors are the most common types installed in
pavement infrastructure. Vertical displacement gauges such as linear variable differential
transformers (LVDTs) placed at the pavement bottom are often used to measure vertical
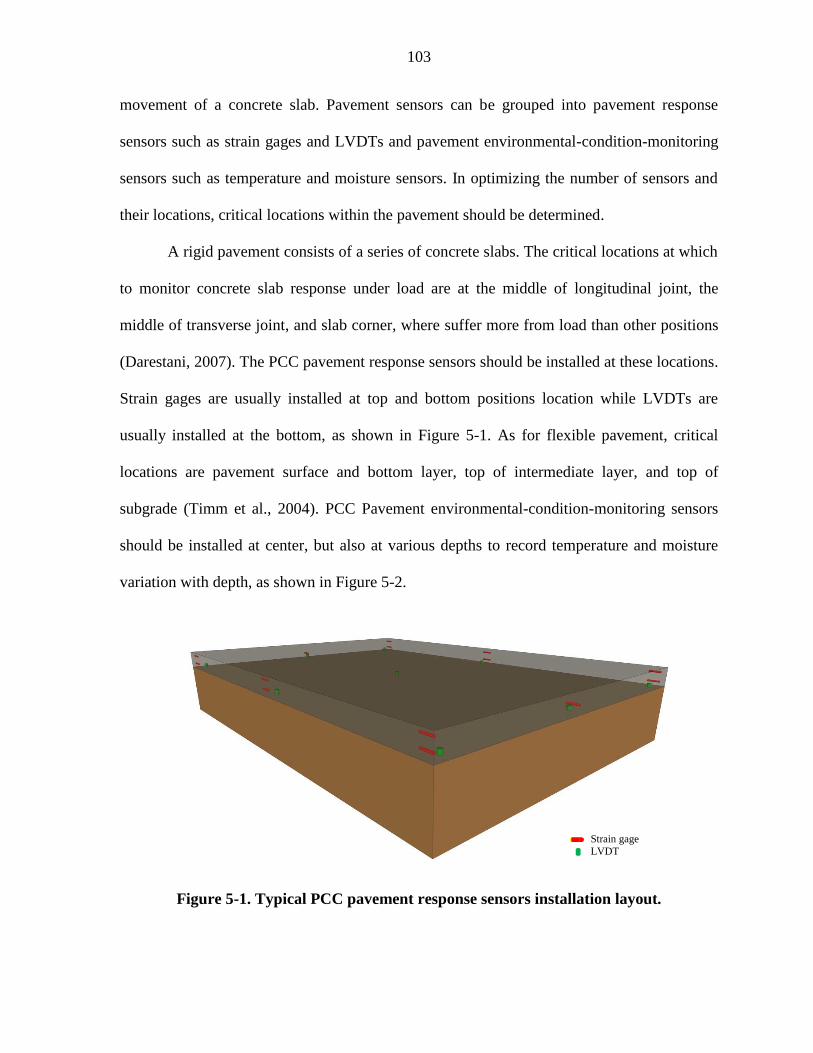
103
movement of a concrete slab. Pavement sensors can be grouped into pavement response
sensors such as strain gages and LVDTs and pavement environmental-condition-monitoring
sensors such as temperature and moisture sensors. In optimizing the number of sensors and
their locations, critical locations within the pavement should be determined.
A rigid pavement consists of a series of concrete slabs. The critical locations at which
to monitor concrete slab response under load are at the middle of longitudinal joint, the
middle of transverse joint, and slab corner, where suffer more from load than other positions
(Darestani, 2007). The PCC pavement response sensors should be installed at these locations.
Strain gages are usually installed at top and bottom positions location while LVDTs are
usually installed at the bottom, as shown in Figure 5-1. As for flexible pavement, critical
locations are pavement surface and bottom layer, top of intermediate layer, and top of
subgrade (Timm et al., 2004). PCC Pavement environmental-condition-monitoring sensors
should be installed at center, but also at various depths to record temperature and moisture
variation with depth, as shown in Figure 5-2.
Figure 5-1. Typical PCC pavement response sensors installation layout.
Strain gage
LVDT

104
Figure 5-2. Typical PCC pavement environmental-condition-monitoring sensors
installation layout.
It should be noted that the installation plan may require modification based on
specific conditions such as project purpose, sensor types, sensor size, budget, etc. However,
it is recommended that temperature and moisture sensors always be installed every 2 in.
along the depth from top to bottom. The highest sensor embedded in the concrete pavement
should be only 1 to 2 in. away from the surface. If a sensor needs to be installed at lesser
depths, it is probably better to install it after concrete paving.
Pavement sensors are delicate so they must be very well-protected to increase their
survivability. Previous projects using sensors anchored on wooden bars did not work well
and led to a time-consuming process. Instead, a pre-manufactured cage may be useful in
making the installation process both easier and faster. The sensor packaging and the wooden
bar used to fix the location of sensors can be equipped with multiple screw holes to permit
flexible mounting and increased reliability. An oblong rather than a cylindrical bar shape
might be more stable during concrete spreading. A sensor might be installed in an
instrumented core or even inside a hollow wooden bar so that the core or wooden bar could
Temperature or moisture sensor

105
act as a shell and protect the sensor. A sensor might also be installed in a specially-designed
gyroscopic frame so that its angle of orientation resulting from concrete paving could be
measured. It is notable that the sheet metal boxes (See Figure 5-3) used in the pavement
instrumentation conducted by the Ohio University had a 90% strain gage survival rate, so
that approach might also be useful (Sargand and Khoury, 1999).
Figure 5-3. Sheet metal boxes (Sargand and Khoury, 1999).
The quality of sensor installation directly affects sensor survivability in pavement, so
training installers in advance will increase the survivability rate and save time. Furthermore,
maintaining the vertical distance from the top sensor to the paver and vibrator to be greater
than at least 1 in. will reduce vibration effects due to the construction equipment; pouring
some fresh concrete on the top of sensor prior to paver operation can also mitigate the force
from concrete spreading. The instrumented location should be remote from power lines to
avoid electro-magnetic noise, and protection of the sensors and wires from shoulder paving
and drainage system layout operation should also be considered. It is essential to
communicate with the construction crew in developing an optimal installation plan.

106
Sensor Packaging to Prevent Damage from Road Construction
As previously mentioned, packaging is crucial in establishing a reliable sensor
system, particularly one with moisture sensors, to be used in pavement health monitoring.
The cost of packaging can represent 75% to 95% of the overall product cost (Attoh-Okine,
2003). Sensor packaging involves more than just choosing standard chip packages; it
includes packaging for the whole sensor system. One therefore must take into account
different system and assembly requirements, especially when using multifunctional sensors
(Wang, 2010; Frank, 2013).
In general, packaging a system of MEMS sensors can be divided into three levels: die
packaging, device packaging, and system packaging. The sensor die refers to the actual
silicon chip containing the integrated circuit (IC) whose packaging system includes wafer
packaging, sometimes considered to be another level of packaging (SILICON LABS, 2014b).
Device packaging provides protection for micromechanical components immediately after
their manufacture, and the system package protects the entire system, including battery,
antenna, etc. (Chiao and Lin, 2006).
In the packaging process, the structure of a MEMS sensor is first encapsulated by
bonding the device wafer to a second wafer to protect it from moisture contamination and
particle impingement before assembling it into a standard packaging module. During
assembly of die packaging, to reduce potential packaging-material-induced stress on the
sensor die, cavity packaging, specially-designed die coating, and transfer-molding processes
are used to minimize such effects. Then die bonding and wire bonding complete device-level
packaging, and insertion into a metal or plastic case accomplishes system-level packaging.

107
Figure 5-4 and Table 5-4 provide detailed descriptions for each level of packaging (IMEGO,
2014, Amkor, 2014).
Figure 5-4. MEMS sensor packaging system (Hsu, 2008).
Table 5-4. MEMS sensor packaging methods and materials.
Levels Packages
Die Cavity packaging (CSP-cavity LGA package), CERDIP, Ceramic LCC, SOIC,
and MLF® derivatives
Device Die bonding, wire bonding, interconnect, etc.
System
Ceramic packages (basic dual in-line packages, chip carriers, flat packs, and
multilayers packages), plastic packages (leadframe materials include copper
alloy, nickel-iron, composite strip, etc.), metal packages (Kovar, cold rolled stell,
copper, molybdenum, silicon carbide reinforced aluminum, etc.)
New packaging materials and methods emerge virtually every day, but MEMS
sensors are application-specific so it is hard to develop “one size fits all” packaging and
sensor systems. Among the various sensors, the moisture sensor is most vulnerable to
environment because to measure water vapor it must have access to its outside environment
via an open pore, representing a severe challenge for MEMS sensor encapsulation (Wang,
2010). The most common packaging for moisture sensors is a pre-molded open-cavity
package. In concrete, both the high pH environment and excessive water exposure can
damage moisture sensors through their open pores. Therefore, a hand-made simple packaging
Sensing
Element
Actuating
Element
Signal Mapping
&Transduction
Signal Conditioning
& Processing
Input
Action
Output
Motion
Output
Signals
Power
Supply
Die Packaging
Device Packaging
System Packaging

108
approach is usually used for the moisture sensor to improve its performance, as described by
Ye et al. (2006), Choi and Won (2008), and Wells (2005). However, there are no 100%
reliable moisture sensors with robust packaging yet available, and most moisture sensors do
stop functioning in concrete pavement a few weeks after road construction. As a result,
engineers continue to pursue a reliable moisture-sensor packaging method to be used in
pavement applications. There are also companies specializing in sensor-packaging design
and manufacture. The following paragraphs give a summary of past packaging methods for
moisture sensors used in pavement.
Simple Packaging Used in the Field
Ye et al. (2006) conducted a literature review about curing in PPC pavement and a
moisture sensor called Hygrochron was evaluated in that study. Choi and Won (2008)
performed a similar study to identify compliance-testing methods for curing, and a plastic
pipe with Gore-Tex was used to protect the Hygrochron sensor in concrete pavement, as
shown in Figure 5-5. However, the pore size or the configuration of this fabric may have
influenced the RH measurements and the readings in concrete therefore may not have been
consistent (Choi and Won, 2008). Near the end of their study, an RH value over 100% was
observed.
Figure 5-5. Hygrochron packaged in the field (Ye et al., 2006; Choi and Won, 2008).

109
Figure 5-6 illustrates a packaging method from Wells (2005) used in a field pavement
construction project, similar to Choi and Won (2008). The University of Pittsburgh
conducted a study in 2002 to investigate early-age concrete pavement behavior. In this study,
a Sensirion SHT75 humidity sensor was used to monitor RH value; this was the same sensor
used in the US Highway 30 study. During road construction, the moisture sensor was inserted
into a plastic cylindrical tube and the enclosure was sealed with a circular GoreTM
membrane
vent using ordinary superglue. The idea behind this kind of packaging was to protect sensors
from direct contact with the concrete mixture, but the majority of the sensors later stopped
functioning and unrealistic RH measurement values above 100% were also observed. The
reason for these failures was probably due to condensation along the sensor tips.
Figure 5-6. Moisture sensor packaging (Wells, 2005).
Wang (2013) performed a study of sensor network applications in building
construction. He used polyoxymethylene plastic to make a package for prevention of direct
contact with liquid in fresh concrete, as shown in Figure 5-7. A Gore screw-in vents was used
to provide a protective seal over the sensor to allow diffusion of moisture vapor only.

110
Furthermore, the final dimensions of this packaging were 65 mm in diameter and 45 mm in
height.
Figure 5-7. Moisture sensor packaging (Quinn and Kelly, 2010; Wang, 2013).
Spherical Steel Platform
Lian et al. (2010) have developed the embedded wireless strain/stress/temperature
sensor platform for highway applications shown in Figure 5-8. This steel platform was
spherical in shape with a 3-inch diameter. The top half of this platform contained an RF data
acquisition/control/communication board along with pressure, strain, moisture, temperature,
and three-axial acceleration sensors, and the bottom half contained a rechargeable battery and
Faraday energy-harvesting devices. The platform has large power consumption and is still in
the testing stage.
.
Figure 5-8. Wireless strain/stress/temperature sensor platform (Lian et al., 2010).

111
Porous Cement Paste
Bennett et al. (1999) installed temperature sensors in an instrumented core to measure
temperature of pavement as described in the literature review of Chapter 2. Barroca et al.
(2013) used a similar approach to embed the moisture sensor in a porous mortar cube, as
shown in Figure 5-9. In this study, the moisture sensor was fabricated by first welding a filter
cap and a filter membrane and it was then buried in a porous 2 in. mortar cube made with
coarse sand using a low water/cement ratio of 1:3. In this packaging system, the mortar
worked as a shell to protect sensor wire connections during concrete casting, and the high
porosity of this cube allowed the sensor to measure the RH level of concrete through the
pores.
(a) (b) (c)
Figure 5-9. Sensor packaging made by Barroca et al. (2013): (a) sensor fabrication; (b)
Porous mortar shell; (c) concrete casting.
Stainless Steel Jacket
Sarrfi and Romine (2005) conducted a study to develop a sensor capable of
measuring both temperature and moisture. The sensor die was protected by a polymeric
coating and the whole chip was encapsulated in a stainless steel jacket equipped with a
ceramic filter for RH measurement, as shown in Figure 5-10 (Saafi and Romine, 2005;
Jackson et al., 2008; Norris et al., 2008). The dimensions of the completed sensor are 3 mm
in height and 5 mm in diameter.

112
(a) (b)
Figure 5-10. Stainless steel jacket packaging: (a) Sensor die by polymeric coating (Saafi
and Romine, 2005); (b) stainless jacket packaging (Norris et al., 2008).
Moisture Sensor with Detecting Probe
There have been several probe-based moisture sensors, including the MK33 and the
Hydro-Probe II Moisture Sensor, claimed to be applicable to internal concrete RH
measurement. The MK 33 is a capacitive sensor that could be directly embedded in concrete
mixture because of its high solvent and hot water resistance, as shown in Figure 5-11 (a)
(Every and Deyhim, 2009). The Hydro-Probe II moisture sensor is a sensor using digital
microwave to measure RH in concrete, as shown in Figure 5-11 (b). Similarly to MK 33, the
Hydro-Probe II moisture sensor can be directly placed in plastic concrete to provide reliable
RH measurement. However, this sensor is very expensive with a unit cost of more than
$5,000 (Sebesta, 2013). In addition to the MK33 and the Hydro-Probe II Moisture Sensor,
other probe-based moisture sensors such as Time Domain Reflectometer (TDR) and the
Stevens Hydra Probe are often used in soil-moisture detection. These probe-based moisture
sensors are, however, unable to provide an RH profile versus pavement depth.

113
(a) (b)
Figure 5-11. Moisture sensor with detecting probe: (a) MK33 humidity sensor (Every
and Deyhim, 2009); (b) Hydro-Probe II moisture sensor (Hydronix, 2014).
Monitoring
The monitoring period can be divided into either short-term or long-term intervals
depending on project objectives, sensor survivability, and battery life. A short-term period
might be just few months while a long-term period could be several years; a longer
monitoring period is usually desirable even it’s hard to achieve. Data-measuring intervals can
vary from one minute up to one hour. Typically, one-half hour should be sufficient for
temperature and moisture measurements while strain can be measured each minute. Short
intervals can, however, provide more detailed data while consuming more power, so a
balance point between size of the data-measuring interval and battery life should be
established. One strategy is to adjust the interval depending on changes in situation. It’s well
known that early-age behavior of concrete pavement may impact long-term performance, so
at early age a short measuring interval might be applied (Ruiz et al., 2005). Then longer
intervals can be used for the time remaining to consume less energy; they might be shortened
when a critical situation is detected. Early age is defined as the first 72 hours after pavement
construction by the Federal Highway Administration guidelines, although sometimes the
term may refer to the time before traffic opening (Ruiz et al., 2005).

114
Daily data collection and backup is preferred to guard against accidental data loss, but
this may depend on specific situations affected by weather, distance, cost, etc. Onsite DAS
and power sources should be protected from harsh climate and local animals. However, if
wireless sensors are used, a moving truck mounting a DAS could be used for data collection.
To achieve this goal, reliable wireless transmission technology is required to provide a strong
signal and eliminate electronic interference, as shown in Figure 5-12 (Lajnef et al., 2013). In
addition to a vehicle mounted with DAS, a two-level wireless communication system for
remote data collection might be employed. The first level would use a wireless
communication device at the data collection site. This device would act as a transfer station
to transmit data via the internet to the second level. Figure 5-13 shows an example of this
kind of wireless device, an “i-TOWER” used in the HardTrack concrete-monitoring system.
It can transmit data via cellular internet with a built-in 3G/4G Hot-Spot. Furthermore, it can
be powered with either turbine or solar power (Wake, Inc., 2014).
Figure 5-12. RF reader mounted on a moving vehicle (Lajnef et al., 2013).
RF signals

115
Figure 5-13. i-TOWER with turbine & solar panel (Wake, Inc., 2014).
Architecture of Smart Pavement SHM System
Smart Pavement SHM is defined as long-term, continuous, sustainable pavement
system providing information about in-situ pavement conditions to prevent multi-faceted
safety concerns, including pavement deterioration. The previous literature review in Chapter
2 has described the need of Smart Pavement SHM for both highway and airfield pavement.
The basic concepts of the Smart Pavement SHM systems are similar for both highway
pavement and airfield pavement. For airfield pavement, a SHM system can be combined with
a Foreign Object Debris (FOD) detection system to provide in-time warning for appearance
of FOD, which is the foreign substance or debris that could cause aircraft damage (Ang,
2013).
Figures 5-14 (a) and (b) illustrate conceptual designs of highway and airport health
monitoring systems, respectively. In both Figures 5-14 (a) and (b), the embedded smart
MEMS sensor subsystem is a wireless multifunction MEMS sensor able to simultaneously

116
measure strain, temperature, and moisture. A robust packaging subsystem should also be
implemented to protect the embedded smart MEMS sensors from pavement construction,
high alkali environment of concrete, and harsh climactic and traffic conditions. A reliable
DAS, mounted either on a moving vehicle for highway pavement or a control tower for
airfield pavement, can be used for data collection, storage, and transfer from embedded
MEMS sensors. An intelligent data-mapping model subsystem employing sensing data
fusion and geo-spatial analysis approach can be utilized in data mapping of collected data
from sensors installed at specific locations. Realistic characterization of pavement-layer
properties and responses through an intelligent data-mapping model subsystem can be used
to provide early warning about critical distress initiation, accurate airport pavement-life
predictions, and planning pavement management activities, as well as calibration and
validation of mechanistic-based pavement-response prediction models. Unlike highway
pavement SHMs, smart MEMS sensor subsystem for airfield pavement SHM can be
integrated with Electro-optical (EO) based distress and FOD detectors to monitor actual
pavement surface condition.

117
(a)
(b)
Figure 5-14. Smart pavement monitoring systems for: (a) highway pavement; (b)
airfield pavement.
Embedded smart MEMS
sensor subsystem
Pavement distress warning system
Reliable mobile data acquisition
subsystem
Intelligent data mapping
model subsystem
Embedded smart MEMS
sensor subsystem
Pavement distress warning system
Reliable data acquisition
subsystem with EO based
distress and FOD Detectors
acquisition subsystem
Intelligent data mapping
model subsystem
Robust packaging subsystem
(Photo courtesy of
CEAT)
(Photo courtesy of
Stephanie)
FOD
Robust packaging subsystem

118
Other Potential technologies for Development of Smart Sensing and Smart SHM on
Pavement Infrastructure
Fiber Optic Sensor System
A fiber optic sensor is a type of sensor that can either monitor environmental
conditions or transmit data using fiber optic communication that modulates a light beam
within the fiber. In general, fiber optic sensors have small size and weight and can be used in
explosive and corrosive environments. They can also be used to provide distributed sensing
along the optical fiber. Theoretically, hundreds of locations along a fiber just 1-m long can be
measured. Furthermore, fiber optic sensors can be used to measure strain, temperature,
humidity, pH, etc. (Balageas et al., 2006; Glisic and Inaudi, 2007; Rice, 2014). Figure 5-15
illustrates a typical fiber optic sensor.
Figure 5-15. Typical fiber optic sensors (Kottiswaran et al., 2014).
Self-Sensing Concrete
Self-sensing concrete is a new alternative for Smart Pavement SHM relying on
making measurements based on electrical resistivity, impedance, capacitance and so on (Han
et al., 2014). It utilizes conductive materials such as nanotubes to configure an internal
electric network inside the concrete, so properties such as stress and strain can be measured

119
based on piezoresistivity effects; the data can be acquired using either wired or wireless
methods (Li and Ou, 2009; Sun et al., 2010; Han et al., 2014; Ubertini et al., 2014). Self-
sensing concrete can also be used to monitor traffic or melt snow in transportation
infrastructures. Figure 5-16 illustrates a self-sensing concrete system for strain measurement.
Figure 5-16. Self-sensing concrete for strain measurement (Han et al., 2014).
Micro Battery with Nuclear Power
Battery life is a key factor for active wireless sensors used in health monitoring, and
traditional battery technology may extend the work life by as much as 10 years (Roberts,
2006). Micro batteries using nuclear energy may provide a solution that can increase battery
life to several decades with sizes at the micro or even nano scale. This technology, still in the
research stage, has its main concept that uses radioisotopes rather than fossil or chemical
fuels (Guo et al., 2008).
Vehicle Noise Based Roadway Health Monitoring
Vehicle noise based roadway health monitoring systems use a noise-based data
collection system to evaluate infrastructure for proactive maintenance, operation, and safety.
In such a system, a vehicle is used as mobile sensor to measure noise, vibration, and
harshness. Sensing devices such as accelerometers can be mounted on the vehicle for such
load

120
data measurement and they generate less congestion than other methods (Yousuf and
Morton, 2014). Figure 5-17 illustrates a versatile onboard traffic-embedded roaming-sensor
(VOTERS) test van equipped with sensors, camera, and millimeter-wave radar to measure
pavement surface conditions.
(a)
(b)
Figure 5-17. Vehicle noise based roadway health monitoring: (a) VOTER test van; (b)
Millimeter-wave radar (Yousuf and Morton, 2014).

121
CHAPTER 6
SUMMARY, FINDINGS, RECOMMNEDATIONS
Summary
Early damage detection in transportation infrastructure systems could provide better
pavement maintenance and rehabilitation strategies to give such system longer operational
life. To perform such early damage detection inn transportation infrastructure, the Structural
Health Monitoring (SHM) was conceived, has been implemented or is currently being
implemented. Recent advancements in sensing technology make SHM more evolving and
driving to develop the next generation of SHM, so called as Smart SHM. As considering
current shift changes in SHM through applications of new sensing technologies, this study
discusses the use of Micro-Electromechanical Systems (MEMS) based smart wireless
sensing technologies on health monitoring of concrete pavement. The literature review
results pertain to SHM of pavement infrastructure system was discussed to evaluate the
current pavement SHM practices and to identify how terms of “Smart Sensor” and “Smart
SHM” applied to transportation infrastructure systems have been defined in the literature.
MEMS and wireless sensing technologies and their applications to pavement SHM
reported in the literature were reviewed and documented as these have been considered as
promising technologies to meet requirements of “Smart Sensor”. A field demonstration of
off-the-shelf MEMS and wireless sensor system applications under actual in-service concrete
pavement site was conducted to evaluate their performance, identify their limitations, and
demonstrate how their sensed data can be utilized to monitor concrete pavement behaviors.
The feasibility of implementation of a wireless communication system into the MEMS sensor

122
has been investigated. As following up literature review, field demonstration, and
implementation of wireless communication system, issues regarding concrete pavement
SHM using current available MEMS and wireless sensor system were synthesized and
enumerated and the requirements for achieving Smart Pavement SHM were explored to
develop the conceptual design of smart health monitoring of both of highway and airport
pavement systems as the next generation of Pavement SHM. The findings and
recommendations drawn from this study can be summarized as follows:
Literature Review
SHM can be useful for civil infrastructure to save both money and time by turning
schedule-based maintenance into condition-based maintenance. However, the
traditional sensor based SHM approach has limitations such as high installation cost
and time, high array density, wire damage, and low survivability of sensors for long-
term application. Therefore, the traditional approach may provide neither
continuously long-term monitoring for pavement structural behavior changes nor
real-time warning indications of in-service pavement failure.
MEMS based sensor system is a type of promising smart-sensing technology that
could be used to achieve Smart Pavement SHM. Most MEMS-based sensors for SHM
purpose are still in the research stage and have not yet been commercialized.
Wireless sensors can save both installation time and cost and they do not present
wire-damage concerns. Even though they represent a potentially huge benefit for
SHM, they have not yet been widely applied to pavement health monitoring, and
most research studies are still in the proof-of-concept stage.

123
Field Instrumentation and Evaluation
Sensor survivability is critical for long-term SHM of pavement systems. In the field
instrumentation studied, about 78% of the embedded sensors remained functional
one month after traffic opening, but only 20% were still functional ten months after
traffic opening.
Temperature, moisture, and strain profiles were developed from the monitored data,
and they accurately reflected weather and seasonal change, including effects of
thunderstorms, heat waves, summer, and winter. Furthermore, curling and warping
behaviors of concrete resulting from different temperatures at different concrete
depths was observed and analyzed. According to the strain curve, the top concrete
and bottom concrete showed opposite patterns of curvature.
The main reasons for cessation of sensor functioning included concrete paver
operation, alkali-cement hydration reaction in concrete, corrosion of sensor wires,
battery issues, harsh climate, and slab movement. The moisture sensor was more
sensitive to chemical environment. Furthermore, the RFID tags had a low wireless
communication range, probably due to battery issues, cold weather, and steel
reinforcement in concrete.
Normal concrete tests were conducted in the laboratory and a concrete maturity
curve was developed to estimate in-place concrete strength gain. However, MEMS
digital humidity sensors showed a higher maturity index for same-design in-place
strength because they indicated higher average temperatures.

124
Implementation of Wireless Communication System
The ZigBee based wireless network implemented for the MEMS sensors
demonstrated reliable communication and achieved a high success rate over a 150 ft.
span.
The Power consumption of the system was still high, mainly due to the
microcontrollers, so a power-saving mechanism such as power management circuit
could be added to extend its working time.
Requirements for Smart Pavement Structural Health Monitoring System
Procedures and strategies for pavement instrumentation must be considered well in
advance. Communication with the construction manager is important in increasing
sensor survivability in pavement.
Use of MEMS sensors usually produces lower unit sensor cost and DAS purchase fee.
Robust packaging, especially for moisture sensors, is a key element for sensor
survivability. However, no 100% reliable moisture sensor is yet available.
Recommendations
Based on the findings of this research, the followings recommendations are proposed
for future development of “Smart Sensor” and “Smart SHM” for pavement infrastructure
systems.
A wireless multifunctional MEMS sensor with an energy-harvesting system and
durable packaging is recommended for Smart Pavement SHM. A power-management
circuit could also be used to reduce device power consumption.

125
An active RFID system has a long communication range but limited lifetime and
relative large size, while a passive RFID system has unlimited lifetime but a short
communication range. Therefore, a semi-passive RFID system with internal batteries
that can be also self-powered may be a solution combining the advantages of both
active and passive RFID systems.
Several types of wireless communication systems given in Chapter 5 are
recommended for data collection. The first system would use a vehicle-mounted DAS
system to collect data using a passive wireless-sensor system. Wireless
communication range and on-board data storage capacity would be critical factors in
this whole system. The second system would use a two-level wireless system with a
local data-transfer station powered by solar or wind. The data-transfer station could
both collect data from embedded sensors and transmit data to a remote office. For
example, a small scale-structure and near an office site could use an RFID system for
first-level communication and a ZigBee network as a second level. Such a combined
RFID and ZigBee-based monitoring system could improve monitoring efficiency and
promise low cost.
For a large structure where data must be transmitted to a remote office, the data can
be transmitted via the Internet (second level) so a technician could download data at
either home or office.
RF communication usually has a limited range. The data can be lost if the
transmission distance is too long, so a “Hop network” can be used to resolve this
problem and save power (Zhao and Guibas, 2004).

126
Sensor installation should use smart strategies to eliminate effects of road
construction activities, as described in Chapter 5. Communicating with the
construction manager as soon as possible to optimize the installation method is
critically important. An easy sensor-installation method should also be investigated in
the future. Specially-designed tools or packaging of sensors may be needed.
Other sensing technologies such as fiber optic sensor systems, self-sensing concrete,
micro battery using nuclear power, and vehicle noise for roadway health monitoring
are recommended for future investigation.

127
REFERENCES
Adams, D. (2007). Health Monitoring of Structural Materials and Components: Methods
with Applications. John Wiley & Sons, Ltd., Chichester, UK.
Ahlborn, T. M., Shuchman, R., Sutter, L. L., Brooks, C. N., Harris, D. K., Burns, J. W., and
Oats, R. C. (2010). The State-of-the-Practice of Modern Structural Health Monitoring
for Bridges: A Comprehensive Review, Michigan Tech, MI.
Al-Khatib, Z., Yu, J., Al-Khakani, H. G., and Kombarji, S. (2009). A Wireless Multivariable
Control Scheme for A Quadrotor Hovering Robotic Platform Using IEEE® 802.15.4.
Concordia University, Canada.
AllAboutMEMS. (2002). What is MEMS?
http://www.allaboutmems.com/whatismems.html (accessed July 15, 2014).
Al-Qadi, I. L., Loulizi, A., Elseifi, M., and Lahouar, S. (2004). The Virginia SMART
ROAD: The Impact of Pavement Instrumentation on Understanding Pavement
Performance. Journal of the Association of Asphalt Paving Technologists, Vol. 73.
Amkor Technology. (2014). MEMS & Sensors Packaging Technology Solutions.
http://www.amkor.com/go/mems (Accessed Oct 11, 2014)
Andò, B., Baglio, S., Savalli, N., and Trigona, C. (2011). Cascaded “Triple-Bent-Beam”
MEMS Sensor for Contactless Temperature Measurements in Nonaccessible
Environments. IEEE Transactions on Instrumentation and Measurement. 60(4), pp.
1348-1357.
Ang, L. (2013). Research and Design of an Airfield Runway FOD Detection System Based
on WSN. International Journal of Distributed Sensor Networks, Hindawi Publishing
Corporation.
ARDUINO. (2014). Products
http://arduino.cc/en/Main/Products#.UxTTlfm9l8E (Accessed in March 29, 2014).
Atmel. (2014). Atmel AVR 8-bit and 32-bit Microcontrollers
http://www.atmel.com/products/microcontrollers/avr/ (Accessed in March 29, 2014).

128
Attoh-Okine, N., and Mensah, S. (2003). MEMS Application in Pavement Condition
Monitoring-Challenges. NIST SPECIAL PUBLICATION SP, pp. 387-392.
Asbahan, R. E. (2009). Effects of the Built-In Construction Gradient and Environmental
Conditions on Jointed Plain Concrete Pavements. Dissertation, University of
Pittsburgh, PA.
ASCE. (2013). 2013 Report Card for America’s Infrastructure.
http://www.infrastructurereportcard.org/a/documents/2013-Report-Card.pdf
(Accessed Oct 28, 2014)
ASTM. (2007). Standard Practice for Estimating Concrete Strength by the Maturity Method.
Annual Book of ASTM Standards (Vol. ASTM C1074). West Conshohocken, PA.
Aygun, B., and Gungor, V. C. (2011). Wireless Sensor Networks for Structure Health
Monitoring: Recent Advances and Future Research Directions. Sensor Review, 31(3),
pp. 261-276.
Baker, H. B., Buth, M. R., and Van Deusen, D. A. (1994). Minnesota Road Research Project
Load Response Instrumentation Installation and Test Procedures. Technical Report
No. MN/PR-94/01, Minnesota Department of Transportation, MN.
Balageas, D., Fritzen, C. P., and Güemes, A. (2006). Structural Health Monitoring. ISTE
Ltd., Newport Beach, CA.
Barroca, N., Borges, L. M., Velez, F. J., Monteriro, F., Gorski, M., and Castro-Gomes, J.
(2013). Wireless Sensor Networks for Temperature and Humidity Monitoring within
Concrete Structures. Construction and Building Materials, Vol.40, pp. 1156–1166.
Bennett, R., Hayes-Gill, B., Crowe, J. A., Armitage, R., Rodgers, D., and Hendroff, A.
(1999). Wireless Monitoring of Highways. Smart Systems for Bridges, Structures,
and Highways, Proceedings of the SPIE, Newport Beach, CA, March 1–2, Vol.3671,
pp. 173–182.

129
Bouhouche, T., El Khaddar, M. A., Boulmalf, M., Bouya, M., and Elkoutbi, M. (2014). A
New Middleware Architecture for the Integration of RFID Technology into
Information Systems. In Multimedia Computing and Systems (ICMCS), International
Conference, IEEE, pp. 1025-1030.
Bremer, K., Wollweber, M., Guenther, S., Werner, G., Sun, T., Grattan, K. T. V., and Roth,
B. (2014). Fiber Optic Humidity Sensor Designed for Highly Alkaline Environments.
Processing of SPIE, Vol. 9157, pp. 9571A4-1.
Brownjohn, J. M. (2007). Structural Health Monitoring of Civil Infrastructure. Phil. Trans. R.
Soc. A, 365(1851), pp. 589-622.
Buenfeld, N., Davis, R., Karmini, A., and Gilbertson, A. (2008). Intelligent Monitoring of
Concrete Structures. CIRIA, UK, pp. 150.
Cepero, E. D. (2013). Structural Health Monitoring Inside Concrete and Grout Using the
Wireless Identification and Sensing Platform (WISP). Dissertation, Florida
International University, FL.
Ceylan, H., Gopalakrishnan, K., Taylor, P., Shrotriya, P., Kim, S., Prokudin, M., Wang, S.,
Buss, A. F., and Zhang, K. (2011). A Feasibility Study on Embedded Micro-
Electromechanical Sensors and Systems (MEMS) for Monitoring Highway Structures.
Iowa Highway Research Board Publication No. IHRB Project TR-575, Iowa State
University, Ames, IA.
Ceylan, H., Gopalakrishnan, K., Kim, S., Taylor, P. C., Prokudin, M., and Buss, A. F. (2013).
Highway Infrastructure Health Monitoring Using Micro-Electromechanical Sensors
and Systems (MEMS). Journal of Civil Engineering and Management, Vol.19 (sup1),
pp. 188-201.
Chiao, M., and Lin, L. (2006). Device-level Hermetic Packaging of Microresonators by RTP
Aluminum-to-Nitride Bonding. Microelectromechanical Systems, Journal of 15(3),
pp. 515-522.
Cho, S., Yun, C. B., Lynch, J. P., Zimmerman, A. T., Spencer Jr, B. F., and Nagayama, T.
(2008). Smart Wireless Sensor Technology for Structural Health Monitoring of Civil
Structures. International Journal of Steel Structures, 8(4), pp. 267-275.

130
Choi, K. S., Kim, D. S., Yang, H. J., Ryu, M. S., and Chang, S. P. (2014). A Highly Sensitive
Humidity Sensor with a Novel Hole Array Structure Using a Polyimide Sensing
Layer. RSC Advances, Vol.4, pp. 32075-32080.
Choi, S. and Won, M. (2008). Identification of Compliance Testing Method for Curing
Effectiveness. FHWA Publication No. FHWA/TX-09/0-5106-2, pp. 21-30, Center for
Transportation Research, the University of Texas, Austin, TX.
Chou, C. P., Cheng, H. J., and Lin, S. T. (2004). Analysis of Concrete Joint Movements and
Seasonal Thermal Stresses at the Chiang Kai-Shek International Airport. FAA
Worldwide Airport Technology Transfer Conference, Atlantic City, NJ.
Copley, J. R. (1994). Rout 2 Rigid Pavement Instrumentation Project: Installation and
Testing of Selected Instruments and Data Analysis for Slabs 3, 4, 6, 7, & 9. Thesis,
Ohio University, OH.
Cortez, N. E., Vieira Filho, J., and Baptista, F. G. (2014). Design and Implementation of
Wireless Sensor Networks for Impedance-Based Structural Health Monitoring Using
ZigBee and Global System for Mobile Communications. Journal of Intelligent
Material Systems and Structures, pp. 1-12.
Darestani, M. Y. (2007). Response of Concrete Pavements under Moving Vehicular Loads
and Environmental Effects. Dissertation. Queensland University of Technology,
Australia.
Das, B. M. (2010). Principles of Geotechnical Engineering. 25th
Edition, CENGAGE
Learning, Stamford, CT.
Deng, F., He, Y., Zhang, C., and Feng, W. (2014). A CMOS Humidity Sensor for Passive
RFID Sensing Applications. Sensors, 14(5), pp. 8728-8739.
DIgI. (2014). ZigBee Wireless Standards
https://www.digi.com/technology/rf-articles/wireless-zigbee (Accessed in March 25,
2014).

131
Doebling, S. W., Charles R. F., and Prime, M. B. (1998). A Summary Review of Vibration-
Based Damage Identification Methods. Shock and Vibration Digest, 30(2), pp. 91-
105.
Dong, M., and Hayhoe, G. F. (2000). Denver International Airport Sensor Processing and
Database. Technical Report DOT/FAA/AR-00/17, U.S. Department of
Transportation, Federal Aviation Administration, Office of Aviation Research,
Washington, DC.
Dong, Z. J., Li, S. L., Wen, J. Y., & Chen, H. C. (2012). Asphalt Pavement Structural Health
Monitoring Utilizing FBG Sensors. Advanced Engineering Forum, Vol. 5, pp. 339-
344.
Enckell, M. (2011). Lessons Learned in Structural Health Monitoring of Bridges Using
Advanced Sensor Technology. TRITA-BKN. Bulletin 108, KTH Architecture and the
Build Environment.
Every, E. V., Faridazar, F., and Deyhim, A. (2009). Embedded Sensors for Life-time
Monitoring of Concrete. 4th International Conference on Structural Health
Monitoring on Intelligent Infrastructure (SHMII-4), July 22-24, 2009, Zurich,
Switzerland.
Farrar, C. R. (2001). Historical Overview of Structural Health Monitoring. Lecture Notes on
Structural Health Monitoring Using Statistical Pattern Recognition, Los Alamos
Dynamics, Los Alamos, NM.
Farrar, C. R., Hemez, F. M., Shunk, D. D., Stinemates, D. W., Nadler, B. R., and Czarnecki,
J. J. (2004). A Review of Structural Health Monitoring Literature: 1996-2001. Los
Alamos National Laboratory, NM.
Farrar, C. R., & Worden, K. (2007). An Introduction to Structural Health Monitoring. Phil.
Trans. R. Soc. A, 365(1851), pp. 303-315.
Federal Aviation Administration. (2011). Development of Standards for Nonprimary
Airports. Advisory Circular AC 150/5100-13B, U.S. Department of Transportation.

132
Federal Aviation Administration. (2007). Guidelines and Procedures for Maintenance of
Airport Pavements. Advisory Circular AC 150/5380-6B, U.S. Department of
Transportation.
Federal Aviation Administration. (2009). Airport Foreign Object Debris (FOD) Detection
Equipment. Advisory Circular AC 150/5220-24, U.S. Department of Transportation.
Federal Highway Administration. (2012a). Highway statistics, 2012, Section 4—Highway
Infrastructure, Table HM-12.
http://www.fhwa.dot.gov/policyinformation/statistics/2012/ (Accessed Oct 11, 2014).
Federal Highway Administration. (2012b). Pavement Assessment. Federal Highway
Administration Broad Agency Announcement No. DTFH61-12-R-00055.
Frank, R. (2013), Smart Sensors: Packaging, Testing, and Reliability.
http://www.memsjournal.com/2013/09/smart-sensors-packaging-testing-and
reliability.html (Accessed Oct 11, 2014)
Garg, N., Guo, E., and McQueen, R. (2004). Operational Life of Airport Pavements.
Technical Report DOT/FAA/AR-04/46, U.S. Department of Transportation, Federal
Aviation Administration, Office of Aviation Research, Washington, DC.
Geokon, Inc. (2014). Concrete Embedment.
http://www.geokon.com/4200-Series. (Accessed August 6, 2013).
Glisic, B., and Inaudi, D. (2007). Fibre Optic Methods for Structural Health Monitoring.
John Wiley & Sons Ltd., Chichester, UK.
Granja, J. L., Azenha, M., de Sousa, C., Faria, R., and Barros, J. (2014). Hygrometric
Assessment of Internal Relative Humidity in Concrete: Practical Application Issues.
Journal of Advanced Concrete Technology, 12(8), pp. 250-265.
Graves, S. W. (2012). Electro-optical Sensor Evaluation of Airfield Pavement. Thesis,
University of Illinois at Urbana-Champaign, Urbana, Illinois, IL.

133
Guo, H., Li, H., Lal, A., and Blanchard, J. (2008). Nuclear Microbatteries for Micro and
Nano Devices. In Solid-State and Integrated-Circuit Technology (ICSICT), 9th
International Conference, IEEE, pp. 2365-2370.
Han, J., Cheng, P., Wang, H., Zhang, C., Zhang, J., Wang, Y., Duan, L., and Ding, G. (2014).
MEMS-based Pt Film Temperature Sensor on an Alumina Substrate. Materials
Letters, Vol.125, pp. 224-226.
Hansen, W., Arbor, A., and Surlaker, S. (2006). Embedded Wireless Temperature Monitoring
Systems for Concrete Quality Control. Ann Arbor, MI.
Haque, M. E., Zain, M. F. M., Hannan, M. A., Jamil, M., and Johari, H. (2012). Recent
Application of Structural Civil Health Monitoring Using WSN and FBG. World
Applied Sciences Journal, 20(4), pp. 585-590.
Hayhoe, G. F. (2004). Traffic testing results from the FAA’s national airport pavement test
facility. Proceedings of the 2nd International Conference on Accelerated Pavement
Testing. Minneapolis, MN.
Herricks, E. E., Lazar, P., Woodworth, E., and Patterson, J. (2012). Performance Assessment
of an Electro-optical-based Foreign Object Debris Detection System. Technical
Report DOT/FAA/AR-11/13, U.S. Department of Transportation, Federal Aviation
Administration, William J. Hughes Technical Center, Aviation Research Division,
Atlantic City International Airport, NJ.
Hsu, T. R. (2008). MEMS & Microsystems: Design, Manufacture, and Nanoscale
Engineering. John Wiley & Sons, Inc., NJ.
Hugo, F., and Epps, A. L. (2004). NCHRP Synthesis 325: Significant Findings from Full-
scale Accelerated Pavement Testing. National Cooperative Highway Research
Program.
Hydronix. (2014). Hydro-Probe II Moisture Sensor for Bins, Chutes and Conveyor Belts.
http://www.hydronix.com/products/hydroprobe.php. (Assess June 6, 2014).

134
IDENTEC SOLUTIONS. (2008). Technology Rises with New York Skyline.
http://www.wakeinc.com/PDF/FreedomTowerRelease.pdf (Accessed in March 27,
2014).
IMEGO. (2005). Sensor-System Packaging.
http://www.imego.com/Expertise/electronic-packaging/sensor-system-packaging.aspx
(Accessed Oct 11, 2014)
Islam, T., Khan, A., Akhtar, J., and Rahman, M. (2014). A Digital Hygrometer for Trace
Moisture Measurement. IEEE Transactions on Industrial Electronics, 61(10), pp.
5599-5605.
Jackson, T., Mansfield, K., Saafi, M., Colman, T., and Romine, P. (2008). Measuring Soil
Temperature and Moisture Using Wireless MEMS Sensors. Measurement, 41(4), pp.
381-390.
Jang, J. H., Jeong, J. H., Kwon, S. M., and Park, H. G. (2005). Long-term Monitoring
Operation of the Test-Road in Korea Highway Corporation (KHC). In Sensing Issues
in Civil Structural Health Monitoring, Springer Netherlands, pp. 505-514.
Kang, I., Schulz, M. J., Kim, J. H., Shanov, V., and Shi, D. (2006). A Carbon Nanotube
Strain Sensor for Structural Health Monitoring. Smart materials and structures, 15(3),
pp. 737-748.
Kaur, N., and Bhalla, S. (2014). Combined Energy Harvesting and Structural Health
Monitoring Potential of Embedded Piezo-Concrete Vibration Sensors. Journal of
Energy Engineering, ASCE.
Kim, S. K., Pakzad, S., Culler, D., Demmel, J., Fenves, G., Glaser, S., and Turon, M. (2007).
Health Monitoring of Civil Infrastructures Using Wireless Sensor Networks. IPSN'07,
pp. 254-263.
Kottiswaran, N., Jayabalaji, K. A., Deepak, S., and Priyadarshini, S. (2007). Health
Monitoring of Civil Infrastructures Using Wireless Sensor Networks. IJIRSET, 3(2)
pp. 226-231.

135
Krüger, M., Große, C. U., and Marrón, P. J. (2005). Wireless Structural Health Monitoring
using MEMS. Key Engineering Materials, Vol. 293, pp. 625-634.
Kuang, K. S. C. (2014). Development of a Wireless, Self-Sustaining Damage Detection
Sensor System Based on Chemiluminescence for Structural Health Monitoring.
Processing of SPIE, Smart Sensor Phenomena, Technology, Networks, and Systems
Integration, Vol. 9062.
Lajnef, N., Chatti, K., Chakrabartty, S., Rhimi, M., and Sarkar, P. (2013). Smart Pavement
Monitoring System. FHWA Publication No. FHWA-HRT-12-072, Michigan State
University, MI.
Lajnef, N., Rhimi, M., Chatti, K., Mhamdi, L., and Faridazar, F. (2011). Toward an
Integrated Smart Sensing System and Data Interpretation Techniques for Pavement
Fatigue Monitoring. Computer-Aided Civil and Infrastructure Engineering, 26(7), pp.
513-523.
Lary, J. (2009). Airport Pavement Maintenance and Management. Airfield Safety, Sign
Systems and Maintenance Management Workshop, Pavement Consultants Inc.
Lazar, P., and Herricks, E. E. (2010). Procedures for FOD Detection System Performance
Assessments: Electro-optical FOD Detection System. FAA Worldwide Airport
Technology Transfer Conference, Atlantic City, NJ.
Lee, H. S., Cho, M. W., Yang, H. M., Lee, S. B., and Park, W. J. (2014). Curing
Management of Early-age Concrete at Construction Site Using Integrated Wireless
Sensors. Journal of Advanced Concrete Technology, 12(3), pp. 91-100.
Lee, J. (2004). Use of MEMS Sensors in Structural Engineering. Final Project of CEE 619
Advanced Structural Dynamics and Smart Structures, University of Michigan, MI.
Lee, J. S., Su, Y. W., and Shen, C. C. (2007). A Comparative Study of Wireless Protocols:
Bluetooth, UWB, Zigbee, and Wi-Fi. Industrial Electronics Society (IECON), 33rd
Annual Conference of the IEEE, Nov. 5-8, Taipei, Taiwan.

136
Lee, J., Kim, J., Kim, D., and Lee, K. (2003). Improvement of Field Installation Method for
Asphalt Concrete Pavement Strain gage. Journal of the Korean Society of Road
Engineers, (5)3. pp. 31-42.
Lee, X. G., Hovan, M., King, R., Dong, M. Y., and Hayhoe, G. F. (1997). Runway
Instrumentation at Denver International Airport Development of Database.
Aircraft/pavement technology: in the midst of change, pp. 348.
Lewis, F. L. (2004). Wireless Sensor Networks. Smart Environments: Technologies,
Protocols, and Applications, pp. 11-46.
Li, H., and Ou, J. P. (2009). Smart Concrete, Sensors and Self-Sensing Concrete Structures.
Key Engineering Materials, Vol. 400, pp. 69-80.
Lian, K. (2010). Developing Embedded Wireless Strain/Stress/Temperature Sensor Platform
for Highway Applications. Report No. NCHRP IDEA Project 129, Highway IDEA
Program, Louisiana State University, LA.
Lin, C. H., Fu, L. M., and Lee, C. Y. (2014). MEMS-based Humidity Sensor Based on Thiol-
coated Gold Nanoparticles. Proceedings of the 9th IEEE International Conference on
Nano/Micro Engineered and Molecular Systems, HI.
Liu, C. R., Guo, L., Li, J., and Chen, X. (2007). Weigh-in-motion (WIM) Sensor Based on
EM Resonant Measurements. Antennas and Propagation Society International
Symposium, IEEE, pp. 561-564.
Lloret, J. (2009). Introduction to Network Protocols and Algorithms. Network Protocols and
Algorithms, Macrothink InstituteTM
, (1)1, pp. 1-6.
Loh, K. J., Zimmerman, A. T., and Lynch, J. P., (2007). Wireless Monitoring Techniques for
Structural Health Monitoring. In proceeding of the International Symposium of
Applied Electromagnetics & Mechanics, Lansing, MI.
Lu, Y. F., Lou, W. Z., and Guo, M. R. (2014). Rapid Temperature Measurement of
Meteorological Detection System Based on MEMS. Key Engineering Materials,
Vol.609, pp. 1185-1188.

137
Luhr, D., Kinne, C., Uhlmeyer, J. S., and Mahoney, J. P. (2010). What We Don’t Know
about Pavement Preservation. In First International Conference on Pavement
Preservation, Chapter 8, Newport Beach, CA.
Lynch, J. P. (2002). Decentralization of Wireless Monitoring and Control Technologies for
Smart Civil Structures. Technical Report No.140, John A. Blume Earthquake
Engineering Center. Stanford, CA.
Lynch, J. P., (2007). An Overview of Wireless Structural Health Monitoring for Civil
Structures. Phil. Trans. R. Soc. A, 365(1851), pp. 345-372.
Lynch, J. P., and Loh, K. J. (2006). A Summary Review of Wireless Sensors and Sensor
Networks for Structural Health Monitoring. The Shock and Vibration Digest, Vol.38,
No.2, pp. 91–128.
Lynch, J. P., Sundararajan, A., Law, K. H., Kiremidjian, A. S., and Carryer, E. (2003).
Power-efficient Wireless Structural Monitoring with Local Data Processing. In
proceedings of the International Conference on Structural Health Monitoring and
Intelligent Infrastructure, Tokyo, Japan, Vol.1, pp. 331–338.
Maser, K., Egri, R., Lichtenstein, A., and Chase, S. (1996). Field Evaluation of a Wireless
Global Bridge Evaluation and Monitoring System. In proceedings of the 11th
Conference on Engineering Mechanics, Fort Lauderdale, FL, May 19–22, Vol.2, pp.
955–958.
Maxim Integrated. (2014). Overview of Ibutton Sensors and Temperature/Humidity Data
Loggers.
http://www.maximintegrated.com/en/products/ibutton/ibuttons/thermochron.cfm
(Accessed April 2, 2014)
Mccarter, W. and Vennesland, O. (2004). Sensor Systems for Use in Reinforced Concrete
Structures. Construction and Building Materials, 18(6), pp. 351–358.
MEMSnet. (2014). What is MEMS Technology?
https://www.memsnet.org/about/what-is.html (Accessed March 26, 2014).

138
Modares, M. and Waksmanski, N. (2012). Overview of Structural Health Monitoring for
Steel Bridges. Practice Periodical on Structural Design and Construction,18(3), pp.
187-191.
Mohammed, A. A., Moussa, W. A., and Lou, E. (2011). High-performance Piezoresistive
MEMS Strain Sensor with Low Thermal Sensitivity. Sensors, 11(2), pp. 1819-1846.
Moradi, M., and Sivoththaman, S. (2013). Strain Transfer Analysis of Surface-Bonded
MEMS Strain Sensors. Sensors Journal, IEEE, 13(2), pp. 637-643.
MnROAD Brochure. (2014). MnROAD: Safer, Smarter, Sustainable Pavement through
Innovative Research
http://www.dot.state.mn.us/mnroad/pdfs/2014MnROADBrochure.pdf (Accessed June
30, 2014)
MNX. (2014). What is MEMS Technology.
https://www.mems-exchange.org/MEMS/what-is.html. (Accessed in February 20,
2014).
Mullen, M. (2011). Special Inspections of Paved Areas during Excessive Heat Periods.
Central Region Airport Certification Bulletin, Federal Aviation Administration,
Central Region, Airports Division, Kansas City, MO.
Nagayama, T., and Spencer Jr, B. F. (2007). Structural Health Monitoring Using Smart
Sensors. Technical Report No. NSEL-001, Newmark Structural Engineering
Laboratory. University of Illinois at Urbana-Champaign, IL.
Nassiri, S. (2011). Establishing Permanent Curl/Warp Temperature Gradient in Jointed Plain
Concrete Pavements. Dissertation, University of Pittsburgh, PA.
National Instruments. (2012). Five Factors to Consider When Implementing a Wireless
Sensor Network (WSN).
http://www.ni.com/white-paper/10789/en/ (Accessd in September 5, 2014).
Norris, A., Saafi, M., and Romine, P. (2008). Temperature and Moisture Monitoring in
Concrete Structures Using Embedded Nanotechnology/Microelectromechanical
Systems (MEMS) Sensors. Construction and Building Materials. 22(2), pp. 111-120.

139
Ong, J. B., You, Z., Mills-Beale, J., Tan, E. L., Pereles, B. D., and Ong, K. G. (2008). A
Wireless, Passive Embedded Sensor for Real-Time Monitoring of Water Content In
Civil Engineering Materials. Sensors Journal, IEEE, 8(12), pp. 2053-2058.
Oppenheim, I. J., Garrett, J. H., and Gabriel, K. J. (2000). Potential MEMS Applications in
Civil Engineering. Space 2000, ASCE, pp. 495-501.
Park, S., Ahmad, S., Yun, C. B., and Roh, Y. (2006). Multiple Crack Detection of Concrete
Structures Using Impedance-based Structural Health Monitoring Techniques.
Experimental Mechanics. Vol. 46, pp. 609–618.
Pasko, T. J. (1998). Concrete Pavements-Past, Present, and Future. Public Roads, 62(1), pp.
7-15.
Phares, B. M., Wipf, T. J., Greimann, L. F., and Lee, Y. S. (2005). Health Monitoring of
Bridge Structures and Components Using Smart-Structure Technology, Volume I.
Technical Report No. 0092-04-14, Bridge Engineering Center, Center for
Transportation Research and Education, Iowa State University, IA.
Pei, J. S., Ivey, R. A., Lin, H., Landrum, A. R., Sandburg, C. J., King, T., Zaman, M. M.,
Refal, H. H., Mal, E. C., Oshlake, O., Heriba, A., and Hurt, E. (2007). Monitoring
Pavement Condition Using “Smart Dust” under Surge Time Synchronization. Sensors
and Smart Structures Technologies for Civil, Mechanical, and Aerospace Systems
2007, Proceedings of the SPIE, Vol.6529, pp. 173–182.
Pei, J. S., Ivey, R. A., Lin, H., Landrum, A. R., Sandburg, C. J., Ferzli, N., and Mai, E. C.
(2009). An Experimental Investigation of Applying Mica2 Motes in Pavement
Condition Monitoring. Journal of Intelligent Material Systems and Structures.
Vol.20, pp. 63-85.
Plankis, A., and Heyliger, P. (2013). Off-Grid MEMS Sensors Configurations for
Transportation Applications. Technical Report No. MPC-13-257.
Potter, J. F., Mayhew, H. C., and Mayo, A. P. (1969). Instrumentation of the full scale
experiment on A1 trunk road at Conington, Huntingdonshire. Rrl Report, Transport
Research Laboratory (Road Research Laboratory), Wokingham, Berkshire, U.K.

140
Qi, G. Z., Xun, G., Qi, X. Z., Dong, W., and Chang, P. (2005). Local Measurement for
Structural Health Monitoring. Earthquake Engineering and Engineering Vibration,
4(1), pp. 165-172.
Qin, Y. (2011). Numerical Study on the Curling and Warping of Hardened Rigid Pavement
Slabs. Dissertation, Michigan technological University, MI.
Quinn, B., and Kelly, G. (2010). Feasibility of Embedded Wireless Sensors for Monitoring of
Concrete Curing and Structural Health. Processing of SPIE, Sensors and Smart
Structures Technologies for Civil, Mechanical, and Aerospace Systems, Vol.7647.
Read more: CoolTerm - Free Download and Software Reviews - CNET Download.com
http://download.cnet.com/CoolTerm/3000-2383_4-10915882.html#ixzz2ueTEGqCd
(Accessed March 3, 2014).
Rice, J. A., and Lloyd, J. (2014). Optimization of A Pavement Instrumentation Plan for A
Full-Scale Test Road: Evaluation. Florida Department of Transportation, FL.
Roberts, C. M. (2006). Radio frequency identification (RFID). Computers & Security, 25(1),
pp. 18-26.
Rollings, R. S., and Pittman, D. W. (1992). Field Instrumentation and Performance
Monitoring of Rigid Pavements. J. Transp. Eng., ASCE, 118(3), pp. 361-370.
Ruan, Q., Xu, W., and Wang, G. (2011). RFID and ZigBee Based Manufacturing Monitoring
System. Electric Information and Control Engineering (ICEICE), 2011 International
Conference on. IEEE. pp. 1672-1675.
Rufino, D., Roesler, J., and Barenberg, E. (2004). Mechanistic Analysis of Pavement
Responses from Denver International Airport. FAA Center of Excellence (COE) for
Airport Technology Report No.26, Department of Civil and Environmental
Engineering, University of Illinois at Urbana-Champaign, IL.
Ruiz, J. M., Rasmussen, R. O., Chang, G. K., Dick, J. C., and Nelson, P. K. (2005).
Computer-Based Guidelines for Concrete Pavements, Volume II--Design and
Construction Guidelines and HIPERPAV II User's Manual. Technical Report No.
FHWA-HRT-04-122, The Transtec Group, Inc., Austin, TX.

141
Saafi, M., and Romine, P. (2005). Preliminary Evaluation of MEMS Devices for Early Age
Concrete Property Monitoring. Cement and Concrete Research, 35(11), pp. 2158-
2164.
Saboonchi, H. and Ozevin, D. (2012). Numerical Simulation of Novel MEMS Strain Sensor
for Structural Health Monitoring. 20th Analysis and Computation Specialty
Conference, ASCE, pp. 139-150.
Sackin, D., Garret, J., Gabriel, K., and Patton, M. (2000). MEMS for Civil Infrastructure:
Smart Aggregate for Concrete. Advanced Technology in Structural Engineering,
ASCE, pp. 1-8.
Salman, N., Rasool, I., and Kemp, A. H. (2010). Overview of the IEEE 802.15. 4 Standards
Family for Low Rate Wireless Personal Area Networks. Wireless Communication
Systems (ISWCS), 7th International Symposium, IEEE, pp. 701-705.
Sargand, S. M., and Khoury, I. S. (1999). Sensor Installation in Rigid Pavement.
Experimental Techniques, 23(3), pp. 25-27.
Scott, S., Kovacs, A., Gupta, L., Katz, J., Sadeghi, F., and Peroulis, D. (2011). Wireless
Temperature Microsensors Integrated on Bearings for Health Monitoring
Applications. Micro Electro Mechanical Systems (MEMS), 2011 IEEE 24th
International Conference. pp. 660-663.
Scott, S., Sadeghi, F., and Peroulis, D. (2012). Highly Reliable MEMS Temperature Sensors
for 275 ˚C Applications-Part 1: Design and Technology. Journal of
Microelectromechanical Systems, 22(1), pp. 225-235.
Sebaaly, P. E., Tabatabaee, N., Kulakowski, B., and Scullion, T. (1991). Instrumentation for
Flexible Pavements-Field Performance of Selected Sensors. Technical Report No.
FHWA-RD-91-094, Federal Highway Administration, Washington, DC.
Sebesta, S., Oh, J., Lee, S. I., Sanchez, M., and Taylor, R. (2013). Initial Review of Rapid
Moisture Measurement for Roadway Base and Subgrade. Technical Report No.
FHWA/TX-13/0-6676-1, Texas A&M Transportation Institute, TX.

142
Sensirion, Inc. (2014). Datasheet SHT7X Humidity and Temperature Sensor.
http://www.sensirion.com/en/technology/humidity/ (Accessed in March 24, 2014).
Shen, K. Y. (2013). Wireless System for Sensors on US-30, Creative Component, Iowa State
University, Ames, IA.
Sheridan, V., Tsegaye, B., and Echols, M. (2005). ZigBee-Enabled RFID Reader Network.
Dissertation, Worcester Polytechnic Institute, MA.
SILICON LABS. Silicon Laboratories, Inc. The Evolution of Wireless Sensor Networks.
http://www.silabs.com/Support%20Documents/TechnicalDocs/evolution-of-wireless-
sensor-networks.pdf (Accessed in March 25, 2014a).
SILICON LABS. Silicon Laboratories, Inc. Integrating Raw Die Can Enable Innovative
Packaging Solutions for Embedded Systems.
http://www.silabs.com/support%20documents/technicaldocs/mcu-die-sales-enables-
innovation.pdf (Accessed in September 23, 2014b).
Smith, D. (2012). Multisensor MEMS for Temperature, Relative humidity, and High-g Shock
Monitoring. Thesis, Rochester Institute of Technology, NY.
Southwest Center for Microsystems Education (SCME). (2013). History of MEMS.
http://scmenm.org/index.php?option=com_docman&task=cat_view&gid=63&Itemid
=162. (Accessed Aug 22, 2014)
Sparkfun Electronics. CoolTerm (Windows, Mac, Linux)
https://learn.sparkfun.com/tutorials/terminal-basics/coolterm-windows-mac-linux
(Accessed in March 20, 2014).
Spencer, B. F., Ruiz-Sandoval, M. E., and Kurata, N. (2004). Smart Sensing Technology:
Opportunities and Challenges. Structural Control and Health Monitoring, 11(4), pp.
349-368.
Sun, M., Staszewski, W. J., and Swamy, R. N. (2010). Smart Sensing Technologies for
Structural Health Monitoring of Civil Engineering Structures. Advances in Civil
Engineering, Vol.2010, pp. 13.

143
Texas Instruments. (2013). ZigBee Wireless Networking Overview.
http://www.ti.com/lit/sg/slyb134d/slyb134d.pdf (Accessed in December 5, 2013).
Texas Instruments. (2014). TPL5000 Datasheet
http://pdf1.alldatasheet.com/datasheet-pdf/view/530828/TI/TPL5000.html (Accessed
in March 22, 2014).
Timm, D. H., Priest, A. L., and McEwen, T. V. (2004). Design and Instrumentation of the
Structural pavement Experiment at the NCAT Test Track. NCAT Report 04-01,
National Center for Asphalt Technology, Auburn University, AL.
Titi, H., Tabatabai, H., Sobolev, K., Crovetti, J., and Foley, C. (2012). Feasibility Study for a
Freeway Corridor Infrastructure Health Monitoring Instrumentation Testbed.
Technical Report No. CFIRE 04-08, National Center for Freight and Infrastructure
Research and Education (CFIRE), University of Wisconsin-Madison, WI.
Tompkins, D., and Khazanovich, L. (2007). MnROAD Lessons Learned. Technical Report
No. MN/RC-2007-06, Minnesota Department of Transportation, University of
Minnesota, MN.
Tully, R. (2007). The use of low cost “iButton” Temperature Logger Arrays to Generate
High Spatial Resolution Tidal Inundation Regime Data. Marine Resource
Management, Oregon State University, OR.
Yousuf, M and Morton, T. (2014). Use of Vehicle Noise for Roadways, Bridge, and
Infrastructure Health Monitoring. Technical Report No. FHWA-HRT-14-059,
Workshop Summary Report, Woodward Communication, Inc.
Ubertini, F., Materazzi, A. L., D’Alessandro, A., and Laflamme, S. (2014). Natural
Frequencies Identification of A Reinforced Concrete Beam Using Carbon Nanotube
Cement-Based Sensors. Engineering Structures, Vol. 60, pp. 265-275.
Varadan, V. K., and Varadan, V. V. (2000). Microsensors, Microelectromechanical Systems
(MEMS), and Eectronics for Smart Structures and Systems. Smart Materials and
Structures, 9(6), pp. 953-972.

144
WAKE, Inc. (2010). The HARD TRACK System.
http://www.wakeinc.com/hardtrack.html. (Accessed Oct 19, 2014)
Wang, C. Y., Wang, H. L., and Chen, M. H. (2006). Structural Health Monitoring Activities
of Applying Optical Fiber Sensors in Taiwan. International Workshop on Structural
Health Monitoring and Damage Assessment, National Chung Hsing University,
Taichung, Taiwan, ROC.
Wang, L., Bos, A., Van Weelden, T., and Boschman, F. (2010). The Next Generation
Advanced MEMS & Sensor Packaging. In Electronic Packaging Technology & High
Density Packaging (ICEPT-HDP), 2010 11th International Conference, IEEE, pp.
55-60.
Wang, X. T. (2013). Study of Sensor Network Applications in Building Construction. Thesis,
Kungliga Tekniska Högskolan Royal Institute of Technology, Sweden.
Watters, D. G., Jayaweera, P., Bahr, A. J., Huestis, D. L., Priyantha, N., Meline, R., and
Parks, D. (2003). Smart Pebble: Wireless Sensors for Structural Health Monitoring of
Bridge Decks. Processing of SPIE, Smart Structures and Materials, Mechanical
2003: Smart Systems and Nondestructive Evaluation for Civil Infrastructures,
Vol.5057.
Weinmann, T. L., Lewis, A. E., and Tayabji, S. D. (2004). Pavement Sensors Used at
Accelerated Pavement Test Facilities. In Proceedings of the Second International
Conference on Accelerated Pavement Testing.
Wells, S. A. (2005). Early Age Response of Jointed Plain Concrete Pavements to
Environmental Loads. Thesis, University of Pittsburgh, PA.
Wong, K. (2004). Instrumentation and Health Monitoring of Cable-supported Bridges.
Struct. Control Health Monit, 11(2), pp. 91-124.
Wu, N. C., Nystrom, M. A., Lin, T. R., and Yu, H. C. (2006). Challenges to Global RFID
Adoption. Technovation, 26(12), pp. 1317-1323.

145
Varaiya, P. P. (2008). A Low Cost Wireless MEMS System for Measuring Dynamic Pavement
Loads. California PATH Program, Institute of Transportation Studies, University of
California at Berkeley, CA.
Xue, W., Wang, L., Wang, D., and Druta, C. (2013). Pavement Health Monitoring System
Based on an Embedded Sensing Network. Journal of Materials in Civil Engineering,
ASCE, 26(10).
Ye, D., Mukhopadhyay, A. K., and Zollinger, D. G. (2009). Laboratory and Field Evaluation
of Concrete Paving Curing Effectiveness. Technical Report No. FHWA/TX-10/0-
5106-3, Texas Transportation Institute, Texas A&M University System, TX.
Ye, D., Zollinger, D., Choi, S., and Won, M. (2006). Literature Review of Curing in Portland
Cement Concrete Pavement. FHWA Publication No. FHWA/TX06/0-5106-1, pp. 8-
13, Center for Transportation Research, the University of Texas at Austin, TX.
Yildiz, F. (2009). Potential Ambient Energy-Harvesting Sources and Techniques. The
Journal of Technology Studies, 35(1).
http://scholar.lib.vt.edu/ejournals/JOTS/v35/v35n1/yildiz.html (Assessed Oct 5,
2014).
Zhao, F., and Guibas, L. J. (2004). Wireless Sensor Networks: An Information Processing
Approach. Morgan Kaufmann Publishers Inc., San Francisco, CA.
Zhu, X., Mukhopadhyay, S. K., and Kurata, H. (2012). A Review of RFID Technology and
Its Managerial Applications in Different Industries. Journal of Engineering and
Technology Management, 29(1), pp. 152-167.
Zinck, C. (2013). MEMS & Sensors Packaging Evolution (Power Point Slide).
http://www.semi.org/eu/sites/semi.org/files/docs/ASE%20MEMS%20packaging%20-
%20SEMI%202013%20C%20Zinck%20final%20new2.pdf (Access Oct 6, 2013).

146
APPENDIX A: PUBLICATIONS COMING OUT FROM MASTER STUDY
This appendix displays the two conference papers published from master study.

147
Development of a Wireless Communication System for Concrete Pavement Health Monitoring
by
Shuo Yang, Graduate Research Assistant
Phone: +1-(515) 708-0562, Fax: +1-(515) 294-8216, E-mail: [email protected] Department of Civil, Construction & Environmental Engineering
24 Town Engineering Building
Keyan Shen, Graduate Research Assistant Phone: +1-(515) 708-8832, Fax: +1-(515) 294-8432, E-mail: [email protected]
Department of Electrical and Computer Engineering
Dr. Halil Ceylan – Associate Professor (Corresponding Author)
Phone: +1-(515) 294-8051, Fax: +1-(515) 294-8216, E-mail: [email protected] Department of Civil, Construction & Environmental Engineering
406 Town Engineering Building
Dr. Sunghwan Kim – Research Assistant Professor Phone: +1-(515) 292-3475, Fax: +1-(515) 294-8216, E-mail: [email protected]
Department of Civil, Construction & Environmental Engineering 24 Town Engineering Building
Dr. Daji Qiao, Associate Professor
Phone: +1-(515) 294-2390, Fax: +1-(515) 294-8432, E-mail: [email protected] Department of Electrical and Computer Engineering
3214 Coover Hall
and
Dr. Kasthurirangan Gopalakrishnan – Senior Research Scientist Phone: +1-(515) 294-3044, Fax: +1-(515) 294-8216, E-mail: [email protected]
Department of Civil, Construction & Environmental Engineering 354 Town Engineering Building
Iowa State University of Science and Technology Ames, Iowa 50011-3232
USA
Submitted for the 8th International DUT-Workshop on Research and Innovations for Design of Sustainable and Durable Concrete Pavements, to be held on September 20-21, 2014, in
Prague, Czech Republic
June 201

148
Development of a Wireless Communication System for Concrete Pavement Health Monitoring
Shuo Yang1, Keyan Shen2, Daji Qiao3, Halil Ceylan4, Sunghwan Kim5 and Kasthurirangan Gopalakrishnan6 Iowa State University, Ames, Iowa, USA
ABSTRACT: In recent years, structural health monitoring and management (SHM) has become a popular approach and is considered essential for achieving well-performing, long-lasting, sustainable transportation infrastructure systems. Key requirements in ideal SHM of road infrastructure include long-term, continuous, and real-time monitoring of pavement behaviors under various pavement geometry-materials-loading configurations and environmental conditions. With advancements in wireless technologies, integration of wireless communications into sensing device is considered an alternate and superior solution to existing time- and labor-intensive wired sensor systems to meet these requirements. This study explored the development and deployment of a wireless communications sub-system into a commercial off-the-shelf concrete pavement monitoring sensor system. The overall goal was to investigate the feasibility of developing wireless based Micro-Electromechanical Sensors and Systems (MEMS) by integrating a wireless network system with off-the-shelf MEMS sensors. A success rate test was performed after the wireless transmission system was buried in the concrete, and the test results indicated that the system was able to provide reliable communications at a distance of more than 46 m (150 ft.). This will be a useful feature for highway engineers performing routine pavement scans from the shoulder without the need for traffic control or road closure. KEY WORDS: Pavement, wireless, temperature, humidity, concrete, MEMS
1. INTRODUCTION Like many advanced technologies, wireless sensor technologies were initially developed and deployed for military and industrial purposes. In recent years, these kinds of technologies are extensively applied in civil engineering infrastructure to measure the material and geometric properties changes for serviceability assessment, which is referred to as structural health monitoring (SHM). Over past decades, SHM has been widely used in civil engineering infrastructure to monitor structural integrity failures such as cracks, concrete deterioration, and steel corrosion. An early warning could avoid unnecessary costs to the maintenance programs. Moreover, continuously measured data can contribute to improved modeling and analytics resulting in prolonged system service life and reduced life cycle costs (Buenfeld et al., 2008; Mccarter et al., 2004). Wired sensor systems are widely used in traditional SHM to detect structural damage. However, the use of wired sensors can be very time-consuming and costly if a large number of sensors have to be installed to improve quality of measured

149
data in SHM. Furthermore, in cases where wires are buried in concrete, wires may be corroded or damaged. Due to these drawbacks, the use of wireless technologies is considered a promising substitute to provide better functionality at a lower price especially when a higher spatial density of sensors is desired (Kim et al., 2007). In addition, Micro-Electromechanical Sensors and Systems (MEMS) technology has been investigated for SHM since MEMS make it possible for systems of all kinds to be smaller, faster, more energy-efficient and less expensive (Ceylan et al., 2011). Numerous studies have been conducted to apply wireless sensor technologies in bridge system SHM (Maser et al., 1996; Lynch and Loh, 2006). However, only few recent studies have investigated these technologies in pavement system SHM applications. For instance, Lajnef et al. (2013) focused on development of a wireless strain sensing system for asphalt pavement SHM to detect fatigue damage. The sensor system developed in this study contained a low-power consumption wireless integrated circuit sensor interfaced with a piezoelectric transducer. This piezoelectric ceramic transducer was designed with an array of ultra-low power floating gate (FG) computational circuits and it could generate power to supply FG analog processor in the sensor under stress. Each sensor node could store the data and then periodically transmit them to Radio frequency (RF) reader mounted on a moving vehicle. The objective of this study was to investigate the feasibility of developing a wireless based MEMS for concrete pavement SHM. A wireless network system was integrated with an off-the-shelf MEMS sensor which was originally designed for wired data acquisition. The field performance of commercial wired MEMS sensors was evaluated in a newly constructed concrete pavement under actual traffic load and weather conditions to identify the system requirements for development of the wireless MEMS sensor system. A preliminary design of prototype wireless system with robust packaging was developed to improve the survivability of MEMS sensors. The wireless system utilized XBee-PRO modulus interfaced with Arduino boards to build the transmission system based on ZigBee protocol. The detailed procedure and findings pertaining to the development of wireless based MEMS are discussed.
2. EVALUATION OF COMMERCIAL OFF-THE-SHELF WIRED MEMS SENSORS
2.1. Description of evaluated sensor Temperature and moisture content are significant factors in the hydration process between cementitious materials and water, which in turn influence early-age concrete properties. Anomalies in the hydration process may result in insufficient strength and durability since the development of early concrete strength mainly depends on the moisture diffusion and hydration temperature (Ye, et al., 2006). Furthermore, concrete pavement can be subjected to deformation due to different temperature and moisture gradients throughout the concrete, commonly referred to as curling (temperature) and warping (moisture/humidity) behaviors. This, when combined with heavy traffic loading, could lead to cracking of slabs. Considering the significant impact of temperature and moisture gradients within the concrete slab on the overall slab behavior and performance, these two properties were selected for sensor-based measurement and health monitoring investigations.

150
The Sensirion SHT71 digital humidity sensor, classified as a commercial off-the-shelf MEMS device that can simultaneously measure Relative Humidity (RH) as well as temperature, was evaluated in this study. Note that moisture content measured inside concrete is typically expressed as RH which refers to the ratio of moisture content of air compared to saturated moisture level at the same temperature and pressure (Ye et al., 2006).
The commercial MEMS digital humidity sensor integrates sensor elements coupled with signal processing circuitry on a silicon chip by MEMS technology to provide a fully calibrated digital output. A unique capacitive sensor element consisting of paired conductors is built out of the capacitor of MEMS sensor to capture humidity while another band-gap sensor measures temperature. These conductors are separated by a polymer dielectric that can absorb or release water proportional to the relative environmental humidity, and thus can change the capacitance of the capacitor (Sensirion, Inc., 2014). An electronic circuit calculates RH by measuring the capacitance difference. Additionally, the capacitance for the chip of this MEMS sensor is formed by a "micro-machined" finger electrode system with different protective and polymer cover layers, which can simultaneously protect the sensor from interference as well. However, in order to continuously monitor and store measurement data, MEMS sensors have to be connected with a data reader of evaluation kit EK-H4 (see Figure 1) and a computer which require power (battery) supply all the time.
Figure 1: Sensirion SHT71 sensor (left) and evaluation kit EK-H4 (right)
2.2. Field instrumentation and results A set of four wired commercial MEMS RH/Temperature (RH/T) sensors were instrumented in a newly constructed jointed plain concrete pavement (JPCP) in a US-30 highway section near Ames, Iowa, USA. The instrumented JPCP, constructed at 8:00 am on May 24, 2013, consists of 254 mm (10 in.) thick concrete slab with approximately 6 m (20 ft.) transverse joints spacing. The passing lane and travel lane widths for this JPCP are 3.7 m (12 ft.) and 4.3 m (14 ft.), respectively. A 152-mm (6 in.) thick Hot-Mix Asphalt (HMA) shoulder was constructed approximately 28 days after concrete paving. A set of wireless temperature sensors and longitudinal strain gages were installed in the same section along with the commercial MEMS RH/T sensors for another series of investigations, which is not the focus of this study. Before the paving of concrete took place, the RH/T sensors were tied on to short wood sticks installed on top of the base course. As seen in Figure 2, all the cables/wires from the sensors were tied together and then placed in a polyvinyl chloride (PVC) pipe buried underground to protect them from damage during concrete paving operations. The cables in

151
the PVC pipe were connected to a Data Acquisition System (DAS) equipment (laptop, data logger, evaluation kit, and batteries) in a plastic shield box placed near the drainage ditch away from the HMA shoulder (See Figure 3). The installation of these wired sensors required great care, was time consuming and labor-intensive.
Figure 2: Sensor instrumentation on US-30 highway section
Figure 3: Data acquisition system
Figure 4 illustrates measured temperature and RH profiles captured by wired MEMS RH/T sensors one month after concrete paving. This figure shows measurements from MEMS RH/T sensor No. 3 (installed at 51 mm (2 in.) below pavement surface and 711 mm (28 in.) away from shoulder) and MEMS RH/T sensor No. 4 (installed at 2.5 mm (0.1 in.) below pavement surface and 203 mm (8 in.) away from shoulder). Among the four sensors installed before paving, two sensors (No. 3 and No. 4) remained functional in measuring temperature inside concrete while one sensor (No. 4) measured only RH of concrete. The other two sensors, No. 1 and No. 2 (installed at 216 mm (8.5 in.) and 140 mm (5.5 in.) below pavement surface and 711 mm (28 in.) away from shoulder) malfunctioned several hours after concrete paving operations. This could probably be attributed to damages incurred to the wires/cables from concrete paver and vibrator operations. The sensor itself could also have been damaged because of the high alkali environment prevailing during concrete hydration. Data could not be acquired from May 26 to 28, 2013 since the battery (power supply) for the DAS was not recharged. These practical constraints and limitations of

152
wired sensor systems with respect to continuous monitoring and storage of measured data highlight the need for a self-powered, wireless sensor system.
(a)
(b)
Figure 4: Commercial off-the-shelf wired MEMS RH/Temperature sensor measurements: (a) Temperature profile, (b) RH profile
2.3. Lessons learned from field evaluation The on-site experiences from US-30 highway sensor installation and monitoring and the identified limitations of wired sensor systems proved to be resources in identifying the system requirements in the development of wireless MEMS sensor systems. These

153
limitations include time consuming and labor intensive installation process, poor sensor survivability caused by cable damage, and complicated sensor packaging required to protect sensor from high alkali environment during concrete hydration. Critical factors to be considered in wireless MEMS sensor systems include hardware architecture, packaging, embedded software, wireless signal strength, and low-power consumption under on-site conditions. Considering these critical factors, a preliminary wireless system with a robust packaging for MEMS sensors was developed. This is discussed in the following sections.
3. DEVELOPMENT OF WIRELESS COMMUNICATIONS SYSTEM
3.1. Overview of wireless system The wireless system presented in this study was a preliminary design mainly focusing on the wireless transmission function. The wireless system could be divided into two parts: wireless transmission end and wireless receiving end. The wireless transmission end is used to transfer data from MEMS sensors into wireless transmission devices. The wireless receiving end connected with computer is used to download data without the need for a wire. Microcontrollers and XBee-PRO modules are required for the transmission and receiving ends to communicate with each other.
3.2. Wireless network protocol ZigBee is selected as the wireless networking protocol. It can be used to construct a decentralized self-healing wireless mesh network. In this mesh network, nodes can find a new route when the original route fails (Texas Instruments, 2013). Besides ZigBee, there are also other wireless technologies such as Bluetooth, Wi-Fi, and cellular. However, ZigBee is more energy-efficient, cost-effective, and easy to work with than these other technologies as shown in Table 1. Table 1 compares different wireless technologies by evaluating their total scores, which are sums of weighted scores from all the factors. The weighted score of each factor is to multiply its weight by the score of specific wireless technology. A higher total score represents better wireless technology for this application.
Table 1. Comparison of wireless technologies (Al-Khatib et al., 2006)
Aspects Score (0 to 10)
Factors Weight Bluetooth® ZigBee® Wifi® Cellular
Multi‐node network support 100 5 10 10 10
Throughput 60 7 6 8 3
Data rate 60 7 6 10 10
Range 50 6 5 7 10
Ease of implementation 50 6 8 6 4
Power consumption ‐80 6 2 8 6
Cost ‐100 5 3 7 8
Total Score 460 910 390 200

154
3.3. Microcontrollers Arduino board is a single-board microcontroller consisting of an Atmel AVR® 8-bit or 32-bit microcontroller which can be wirelessly programmed by the device utilizing ZigBee protocol (Atmel, 2014). In this study, Arduino Uno and Arduino Mega 2560, as shown in Figure 5, were used for the wireless transmission end and receiving end, respectively. Arduino Uno is the microcontroller using processor ATmega328 which has 32 KB of flash memory, 2 KB of static random access memory (SRAM), and 1 KB of electrically erasable programmable read-only memory (EEPROM). It contains 14 digital input/output pins, 6 analog inputs, a 5 volt liner regulator, a 16 MHz ceramic resonator, a USB connection, a power jack, an In Circuit Serial Programming (ICSP) header, and a reset button on its board. As for Arduino Mega 2560, it is similar to Arduino Uno but it has an ATmega2560 processor with 54 digital input/output pins, 16 analog inputs, 4 hardware serial ports (UARTs), and a 16 MHz crystal oscillator. Moreover, the Arduino Mega 2560 is compatible with most shields designed for the Arduino Duemilanove or Diecimila and it has 256 KB of flash memory, 8 KB of SRAM and 4 KB of EEPROM for storing code and data. These two microcontrollers were selected due to their high reliability and low cost. Arduino 1.0.4 (open-source software) can be used for program coding to control both Arduino Uno and Arduino Mega 2560 such as setting up time interval, changing the format of exported data, and etc.
Figure 5: Arduino Uno for wireless transmission end (left) and Arduino Mega 2560 for wireless receiving end (right)
3.4. XBee-PRO modulus XBee-PRO RF modulus (series 1) as shown in Figure 6 is a wireless device, which can offer low cost wireless connectivity in ZigBee mesh networks. It’s reliable in point-to-point, multipoint wireless transmission and it is designed to meet the IEEE 802.15.4 standard. Furthermore, XBee-PRO modulus also has an easy set up process and the software used to program is called X-CTU, which adjusts its frequency, signal strength, energy consumption, and so on. Additionally, an XBee Explorer Regulated board can be used to help it regulate the voltage input.

155
Figure 6: XBee-PRO (left) and XBee Explorer Regulated (right)
3.5. Wireless transmission
The wireless transmission end as shown in Figure 7 consists of a MEMS sensor (SHT71 digital humidity and temperature sensor), an XBee-PRO modulus, an XBee Explorer Regulated, an Arduino Uno microcontroller, and 12×1.5V AA batteries. Among these devices, XBee Explorer Regulated is a board that can be pinned on XBee-PRO to help it regulate the voltage input. In the wireless transmission end, both the SHT71 sensor and XBee-PRO with XBee Explorer Regulated were pinned on the digital port and power port on Arduino Uno board. Meanwhile, twelve 1.5V AA batteries were placed in a plastic holder connected with the microcontroller to power the entire wireless transmission end through the voltage output pin on the board. Furthermore, because the entire wireless transmission end will be buried in concrete, a robust packaging framework is needed for the wireless transmission system which will be discussed later.
Figure 7: Wireless transmission end without batteries
3.6. Wireless reception The wireless receiving end, as shown in Figure 8, consists of an XBee-PRO modulus, an XBee Explorer Regulated, and an Arduino Mega 2560 microcontroller. The XBee Explorer Regulated here plays the same role as it was used in the wireless transmission end. However, there were no batteries on the Arduino Mega 2560 because it was powered by computer through a USB cable. The XBee-PRO on the Arduino Mega 2560 was paired with the other XBee-PRO on the Arduino Uno in the wireless transmission end to receive the

156
transmitted data. After that, the data will be stored in a data-storage module with 4096 bytes non-volatile memory on the Arduino Mega 2560.
Figure 8: Wireless receiving end
3.7. Packaging
Robust packaging is required to protect both the sensor and wireless transmission devices such as XBee-PRO modulus and microcontroller to make sure they can work properly inside the concrete. The functions of the packaging include protecting the wireless transmission end during the sensor installation and pavement construction process, protecting the sensor from alkali-cement hydration reaction, and protecting the wireless transmission end under harsh climate and traffic conditions. Two kinds of in-house packaging were designed to protect the sensor, microcontroller and XBee-PRO modulus, respectively. For the MEMS sensor, a piece of adhesive tape, a protection filter cap, and steel wool were used to make the protective package to prevent direct contact between the raw sensor and fresh concrete. In this packaging, a filter cap was placed on the top of the MEMS sensor using adhesive tape. Steel wool was used to attach the sensor. As for the microcontroller and XBee-PRO modulus, a small box with the bottom open, consisting of 12 mm thick wood board and a wood board nailed with a 180 mm long sharp-edged wood stick, was prepared. A hole was drilled on the board nailed with the stick to allow the cable from the sensor to go through to connect the Arduino Uno microcontroller. The size of the box was 160 mm × 105 mm × 88 mm (6.3”×4.1”×3.5”) which was sufficient to place the entire wireless transmission system, as shown in Figure 10. Silicon glue and adhesive tape were used as well to seal the small gap in the box.

157
Figure 9: MEMS sensor with packaging
Figure 10: Packaging for wireless transmission end
4. EVALUATION OF DEVELOPED WIRELESS COMMUNICATION SYSTEM
4.1. Working principle of developed wireless system The data exchange principle of this wireless system is based on ZigBee protocol. This system does not require any external cables. When the system is turned on, the MEMS sensor will sense temperature and RH and then transfer data to XBee-PRO through Arduino Uno microcontroller. Then XBee-PRO in wireless transmission end will transmit data to the paired XBee-PRO in wireless receiving end through antenna. The data captured in wireless receiving end will be stored in Arduino Mega 2560. Thereby, the wireless receiving end with a computer must be placed nearby to receive the data packets because only the Arduino Mega 2560 microcontroller is used to store data in this wireless system. At last, the data can be downloaded to the computer through a software, referred to as “CoolTerm”. CoolTerm is a simple freeware serial port terminal application without terminal emulation which allows data exchange with hardware connected to serial ports (Sparkfun Electronics, 2014). The output data exported from the system are temperature, relative humidity, and dew point.

158
4.2. Comparison between wired MEMS system and wireless MEMS system developed
Figure 11 provides an overall system-level comparison between wired MEMS system and wireless MEMS system developed. In the wired MEMS system, the sensor should be connected to the data reader and the computer through cables to continuously monitor the concrete properties and download the data. As a consequence, both the data reader and the computer require electrical supply for operations. However, the developed wireless system does not require any external cables which can save installation time and reduce the risk of malfunction of sensors.
Figure 11: Comparison between pervious MEMS system and implemented wireless system
4.3. Evaluation of wireless communication capacity
To test the reliability and survivability of the wireless communication system inside the concrete, both wireless ends were embedded in the concrete as shown in Figure 12 to conduct a success rate test. Success rate means the success rate of data transmitted from transmission end that can be received by the receiving end. The higher the rate is, the more reliable the system will be.
Figure 12: Wireless MEMS system inside concrete

159
The success rate test was conducted for wireless MEMS system inside concrete buried underground by increasing horizontal and vertical distances between wireless transmission and receiving ends (See Fig 13).
(a) (b)
(c)
Figure 13: Success rate test: (a) wireless MEMS system inside concrete buried underground, (b) measuring horizontal distance, (c) four positions to measure vertical
distance
The temperature and RH measurements acquired by the wireless sensor system during the success rate test are presented in Figures 14 and 15. The implemented wireless communication system was able to transmit temperature and RH measurement when the receiver was positioned approximately 46m away from transmission end with an almost
100 success rate. Furthermore, it was also found that the success rate increased as the vertical distance decreased.

160
Figure 14: Temperature measurement
Figure 15: Relative humidity measurement
5. SUMMARY
The objective of this study is to investigate the feasibility of developing wireless based MEMS for concrete pavement structural health monitoring. The system requirements in the development of wireless MEMS system were identified from field experiences from US-30 highway wired MEMS system installation and monitoring. In the development, a wireless communication system was integrated with off-the-shelf MEMS sensors that were originally designed to be wired. The wireless MEMS system developed was capable of providing reliable temperature and RH measurement data over more than approximately 46m (150 ft.) from the receiver when it was embedded inside concrete. However, the entire system was still energy consuming under current limited energy source. At a reasonable data sampling rate, it can just work for few days with twelve 1.5AA batteries. Also, the lifetime of batteries could easily be impaired by the harsh environmental factors like high temperature during concrete hydration. Both extremes of temperature and humidity magnitudes can reduce the

161
lifetime and capacitance of the batteries. Furthermore, future research should focus on improving the memory capacity and making the whole system smaller. Some recommendations to resolve the aforementioned issues are:
A power management circuit called Texas Instruments Debuts TPL5000 power timer can be used to control power output of battery, which can extend the current working time to approximately several years in ideal conditions.
A micro-SD card or QuadRam Shield can be added on the microcontroller to tremendously increase the memory size.
A smaller microcontroller called Arduino Fio with XBee plug as shown in Figure 16 can be used to replace the original microcontroller to reduce the overall system size.
Figure 16: Comparison between Arduino Fio (left) and Arduino Uno (right)

162
6. REFERENCE
Al-Khatib, Z., Yu, J. M., Al-Khakani, H. G., and Kombarji, S. 2009. A Wireless Multivariable Control Scheme for A Quadrotor Hovering Robotic Platform Using IEEE® 802.15.4. Concordia University, Canada ARDUINO. 2014. Products http://arduino.cc/en/Main/Products#.UxTTlfm9l8E (Accessed in March 29, 2014) Atmel. 2014. Atmel AVR 8-bit and 32-bit Microcontrollers http://www.atmel.com/products/microcontrollers/avr/ (Accessed in March 29, 2014) Barroca, N., Borges, L. M., Velez, F. J., Monteriro, F., Gorski, M., and Castro-Gomes, J. 2013. Wireless Sensor Networks for Temperature and Humidity Monitoring within Concrete Structures. Construction and Building Materials Vol.40, pp. 1156–1166. Bennett, R., Hayes-Gill, B., Crowe, J. A., Armitage, R., Rodgers, D., and Hendroff, A. 1999. Wireless Monitoring of Highways. Smart Systems for Bridges, Structures, and Highways, Newport Beach, CA, March 1–2, Proceedings of the SPIE, Vol.3671, pp. 173–182. Buenfeld, N., Davis, R., Karmini, A., and Gilbertson, A. 2008. Intelligent Monitoring of Concrete Structures. CIRIA, pp. 150, UK. Cepero, E. D. 2013. Structural Health Monitoring Inside Concrete and Grout Using the Wireless Identification and Sensing Platform (WISP). Dissertation, Florida International University, FL. Ceylan, H., Gopalakrishnan, K., Taylor, P., Shrotriya, P., Kim, S., Prokudin, M., Wang, S. Y., Buss, A. F., and Zhang J. K. 2011. A Feasibility Study on Embedded Micro-Electromechanical Sensors and Systems (MEMS) for Monitoring Highway Structures. Iowa Highway Research Board Publication No. IHRB Project TR-575, Iowa State University, Ames, IA. Cho, S., Yun, C. B., Lynch, J. P., Zimmerman, A. T., Spencer Jr, B. F., and Nagayama, T. 2008. Smart Wireless Sensor Technology for Structural Health Monitoring of Civil Structures. International Journal of Steel Structures, 8(4), pp. 267-275. Choi, S. and Won, M. 2008. Literature Review of Curing in Portland Cement Concrete Pavement. FHWA Publication No. FHWA/TX-09/0-5106-2, pp. 21-30, Center for Transportation Research, the University of Texas at Austin. DIgI. 2014. ZigBee Wireless Standards https://www.digi.com/technology/rf-articles/wireless-zigbee (Accessed in March 25, 2014) Every, E. V., Faridazar, F., and Deyhim, A. 2009. Embedded sensors for life-time monitoring of concrete. 4th International Conference on Structural Health Monitoring on Intelligent Infrastructure (SHMII-4), 22-24 July 2009, Zurich, Switzerland.

163
IDENTEC SOLUTIONS. 2008. Technology rises with New York skyline. Press Release. March 2008. http://www.wakeinc.com/PDF/FreedomTowerRelease.pdf (Accessed in March 27, 2014) Jackson, T., Mansfield, K., Saafi, M., Colman, T., and Romine, P. 2008. Measuring Soil Temperature and Moisture Using Wireless MEMS Sensors. Cement and Concrete Research 35, pp. 2158-2164. Kim, S. K., Pakzad, S., Culler, D., Demmel, J., Fenves, G., Glaser, S., and Turon, M. 2007. Health Monitoring of Civil Infrastructures Using Wireless Sensor Networks. IPSN'07, pp254-263, Cambridge, Massachusetts, USA. Lajnef, N., Chatti, K., Chakrabartty, S., Rhimi, M., and Sarkar, P. 2013. Smart Pavement Monitoring System. FHWA Publication No. FHWA-HRT-12-072, Michigan State University, MI. Lajnef, N., Rhimi, M., Chatti, K., Mhamdi, L., and Faridazar, F. 2011. Toward an Integrated Smart Sensing System and Data Interpretation Techniques for Pavement Fatigue Monitoring. Computer-Aided Civil and Infrastructure Engineering, 26(7), pp. 513-523. Lee, J. S., Su, Y. W., and Shen, C. C. 2007. A comparative study of wireless protocols: Bluetooth, UWB, ZigBee, and Wi-Fi. Industrial Electronics Society (IECON), 33rd Annual Conference of the IEEE, Nov. 5-8, Taipei, Taiwan. Lewis, F. L. 2004. Wireless Sensor Networks. Smart Environments: Technologies, Protocols, and Applications, pp11-46. Loh, K. J., Zimmerman, A. T., and Lynch, J. P., 2007. Wireless Monitoring Techniques for Structural Health Monitoring. In proceeding of the International Symposium of Applied Electromagnetics & Mechanics, Lansing, MI, September 9-12. Lynch, J. P. 2002. Decentralization of Wireless Monitoring and Control Technologies for Smart Civil Structures. Technical Report No.140, John A. Blume Earthquake Engineering Center. Stanford, CA: Stanford University. Lynch, J. P., 2007. An Overview of Wireless Structural Health Monitoring for Civil Structures. Phil. Trans. R. Soc. A 365, pp. 345-372. Lynch, J. P., and Loh, K. J. 2006. A Summary Review of Wireless Sensors and Sensor Networks for Structural Health Monitoring. The Shock and Vibration Digest, Vol.38, No.2, pp. 91–128. Lynch, J. P., Sundararajan, A., Law, K. H., Kiremidjian, A. S., and Carryer, E. 2003. Power-efficient Wireless Structural Monitoring with Local Data Processing. In proceedings of the International Conference on Structural Health Monitoring and Intelligent Infrastructure, Tokyo, Japan, November 13–15, Vol.1, pp. 331–338.

164
Maser, K., Egri, R., Lichtenstein, A., and Chase, S. 1996. Field Evaluation of a Wireless Global Bridge Evaluation and Monitoring System. In proceedings of the 11th Conference on Engineering Mechanics, Fort Lauderdale, FL, May 19–22, Vol.2, pp. 955–958. Mccarter, W. and Vennesland, O. 2004. Sensor Systems for Use in Reinforced Concrete Structures. Construction and Building Materials, 18(6), pp. 351–358. Norris, A., Saafi, M., and Romine, P. 2006. Temperature and Moisture Monitoring in Concrete Structures Using Embedded Nanotechnology/microelectromechanical Systems (MEMS) Sensors. Construction and Building Materials. 22(2), pp. 111-120. Park, S., Ahmad, S., Yun, C. B., and Roh, Y. 2006. Multiple Crack Detection of Concrete Structures Using Impedance-based Structural Health Monitoring Techniques. Experimental Mechanics. 46, pp. 609–618. Saafi, M., and Romine, P. 2005. Preliminary Evaluation of MEMS Devices for Early Age Concrete Property Monitoring. Cement and Concrete Research 35, pp. 2158-2164. Sensirion, Inc. 2014. Datasheet SHT7X Humidity and Temperature Sensor. http://www.sensirion.com/en/technology/humidity/ (Accessed in March 24, 2014) Shen, K. Y. 2013. Wireless System for Sensors on US-30, Creative Component, Iowa State University, Ames, IA. SILICON LABS. Silicon Laboratories, Inc. The Evolution of Wireless Sensor Networks http://www.silabs.com/Support%20Documents/TechnicalDocs/evolution-of-wireless-sensor-networks.pdf (Accessed in March 25, 2014) Sparkfun Electronics. CoolTerm (Windows, Mac, Linux) https://learn.sparkfun.com/tutorials/terminal-basics/coolterm-windows-mac-linux (Accessed in March 20, 2014) Read more: CoolTerm - Free download and software reviews - CNET Download.com http://download.cnet.com/CoolTerm/3000-2383_4-10915882.html#ixzz2ueTEGqCd Texas Instruments. 2013. ZigBee Wireless Networking Overview. http://www.ti.com/lit/sg/slyb134d/slyb134d.pdf (Accessed in December 5, 2013) Texas Instruments. 2014. TPL5000 Datasheet http://pdf1.alldatasheet.com/datasheet-pdf/view/530828/TI/TPL5000.html (Accessed in March 22, 2014) Wang, X. T. 2013. Study of Sensor Network Applications in Building Construction. Thesis, Kungliga Tekniska Högskolan Royal Institute of Technology, Sweden. Wong, K. 2004. Instrumentation and Health Monitoring of Cable-supported Bridges. Struct. Control Health Monit. 11, pp. 91-124.

165
Ye, D., Zollinger, D., Choi, S., and Won, M. 2006. Literature Review of Curing in Portland Cement Concrete Pavement. FHWA Publication No. FHWA/TX06/0-5106-1, pp. 8-13, Center for Transportation Research, the University of Texas at Austin.

166
SMART AIRPORT PAVEMENT INSTRUMENTATION AND HEALTH MONITORING
By: Shuo Yang, Graduate Student 24 Town Engineering Building
Department of Civil, Construction and Environmental Engineering Iowa State University, Ames, IA 50011-3232
Phone: +1-515-294-4698, E-mail:
Halil Ceylan, Ph.D., Associate Professor Director, Program for Sustainable Pavement Engineering and Research
(PROSPER) 406 Town Engineering Building
Department of Civil, Construction and Environmental Engineering Iowa State University, Ames, IA 50011-3232
Phone: +1-515-294-8051, E-mail: [email protected]
Kasthurirangan Gopalakrishnan, Ph.D., Senior Research Scientist 354 Town Engineering Building
Department of Civil, Construction and Environmental Engineering Iowa State University, Ames, IA 50011-3232
Phone: +1-515-294-3044, E-mail: [email protected]
Sunghwan Kim, Ph.D., P.E., Research Assistant Professor 24 Town Engineering Building
Department of Civil, Construction and Environmental Engineering Iowa State University, Ames, IA 50011-3232
Phone: +1-515-294-4698, E-mail: [email protected]
PRESENTED FOR THE 2014 FAA WORLDWIDE AIRPORT TECHNOLOGY TRANSFER CONFERENCE
Galloway, New Jersey, USA
August 2014

167
ABSTRACT
Realistic characterization of pavement layer properties and responses under in-situ field
conditions is critical for accurate airport pavement life predictions, planning pavement
management activities as well as for calibration and validation of mechanistic-based
pavement response prediction models. The recent advancements in Micro-Electro-
Mechanical Sensor (MEMS)/Nano-Electro-Mechanical Sensor (NEMS) technologies and
wireless sensor networks combined with efficient energy scavenging paradigms provide
opportunities for long-term, continuous, real-time response measurement and health
monitoring of transportation infrastructure systems.
This paper presents a summary review of some recent studies that have focused on the
development of advanced smart sensing and monitoring systems for highway pavement
system with potential applications for long-term airport pavement health monitoring. Some
examples of these potential applications include: the use of wireless Radio-Frequency
Identification (RFID) tags for determining thermal gradients in pavement layers; self-
powered MEMS/NEMS multifunction sensor system capable of real-time, remote monitoring
of localized strain, temperature and moisture content in airport pavement that will eventually
prevent catastrophic failures such as blow-ups on runways during heat waves.
INTRODUCTION
Airfield pavements are designed and constructed to provide adequate support for the
various loads imposed by both aircrafts and environmental (climate) conditions such as
temperature or moisture variations. In general, airfield pavements are fundamentally different
from highway pavement in terms of the applied load properties. Typically, airfield pavement
deals with higher load magnitude and tire pressure from airplanes, but fewer load repetitions
compared to highway pavement. Although both airfield and highway pavements are prone to
have deterioration from traffic and environment loads, airfield pavement usually
predominately shows the environmental load related distresses rather than traffic load related
ones [1].
For airport concrete pavement, one of the most common environmental related distresses
is blowup [2], which is the disintegration of pavement due to axial compression force
generated by slab expansion due to pavement temperature and moisture changes. It usually
occurs at transverse joints or cracks in hot weather if their widths are not wide enough for
concrete expansion. If pressure from concrete expansion in insufficient width cannot be
relieved in time, it results in a localized upward movement of slab edges or shattering in the
vicinity of the joint [3, 4, 5, and 6].
Blowup in the airport runway is very dangerous for aircraft operations and it needs
immediate attention. Figure 1 presents a case of airport runway pavement blowup failure at
Ankeny Regional Airport in Iowa in summer, 2011, which was reported in Central Region
Airport Certification Bulletin [7]. Excessive hot weather and the associated heat wave
reportedly caused the pavement blowup and buckling. As shown in Figure 2, a Raytheon
Premier One jet hit the blowup spot during taking off and damaged its landing gear.

168
Figure 1. Blowup in Ankeny Regional Airport Runway (Photo courtesy of
Snyder & Associates, Inc./Polk County Aviation Authority)
Figure 2. Damaged Aircraft in Ankeny Regional Airport Runway [7]
The other airport concrete pavement distress types caused by environmental (climate)
loads in association with traffic loads include corner break, longitudinal, transverse, and
diagonal cracks. These distresses can be aggravated by curling stresses induced by different
thermal gradients between top and bottom parts of concrete slab.
Airport pavement distresses, when deemed detrimental to aircraft operations, can also
lead to runway closure. For instance, a number of international flights in Tribhuvan
International Airport in Kathmandu, Nepal were delayed, diverted and cancelled due to
airport flexible pavement distress during August 2013 [8]. Figure 3 presents rutting and
potholes occurring in the asphalt overlay of the runway. During the summer season of 2013,
the asphalt overlay surface temperature went over 60 ˚C leading to rutting under repeated
heavy aircraft loads. In the coming monsoon rain after summer season, water was
accumulated on the rutting surface and then infiltrated inside the pavement through cracks.
Potholes were developed from water in the underlying structure and aircraft wheel loads. As
a consequence, this runway had to be closed. The impact of this event not only delivered a
negative message to other countries but also caused a huge loss on their tourism business.

169
Figure 3. Airport Pavement Rutting (Left) and Potholes (Right) [8]
In addition to pavement distresses, the Foreign Object Debris (FOD) referred as a foreign
substance or debris is considered to cause aircraft damage during its operation on airport
runway [9]. Common FOD include aircraft parts, ground vehicle parts, stone, wild animals,
garbage, and so on. Pavement deterioration including raveling and weathering, blowup,
various cracks, corner break, popouts, and patching have significant potential to produce
FOD as well [10, 11].
Pavement distresses and FOD are dangerous for aircraft operations. Once they occur on
airport runways without any attention, the aircraft can be damaged during takeoff or landing
and consequently the passengers inside the aircraft may be injured or lose their lives. The
runway needs to be closed for repairing distresses removal of FOD. A closed runway
signifies economic losses resulting from flight delays, cancellations, etc.
Pavement deterioration, as a major airport safety concern, can be controlled through in-situ
pavement response and performance monitoring. In addition, realistic pavement responses
from in-situ field conditions are critical for accurate airport pavement life predictions,
management, calibration and validation of mechanistic-based pavement response prediction
models. Real-time and continuous health monitoring and management of airport pavement
systems have the potential to enable sustainable, smoother, and also safer airport
infrastructure systems. This paper aims to review the state-of-the-art in smart airport
pavement instrumentation and proposes a conceptual model of a smart airport pavement
health monitoring system which includes MEMS-based sensors, a FOD detector, an
intelligent data mapping model, as well as pavement distress and FOD warning systems.
HEALTH MONITORING OF AIRPORT PAVEMENT SYSTEMs
Needs of Airport Pavement Health Monitoring
Pavement deteriorations caused by aircraft loading, temperature, and moisture variations can
be one of the major concerns in the safety of airport operations. Other pavement related
safety concerns include the skid resistance (friction), FOD on pavement surface and the
infiltration of water into the pavement sub-structure. Pavement health monitoring could be an
effective solution to prevent the aircraft accidents and damages caused by poor pavement

170
performance and FOD. Pavement health monitoring is an extension of the structural health
monitoring (SHM) concept which employs advanced technology to allow the assessment of
the structural reliability and detection of structural changes in civil infrastructure, mainly of
buildings and bridges.
In recent years, with advancement in sensor and wireless technologies, SHM demonstrates
that it can be applied for pavement functional and structural assessments by monitoring
pavement responses and environmental conditions (temperature, moisture, etc.) in real-time.
An early warning of incipient problems enabling the in-time scheduling and planning of
maintenance can be provided before the appearance of remarkable structural changes to
minimize unnecessary costs.
In the end, the continuously measured data can be utilized to improve distress prediction
models, which can help engineers prolong the structure service life to minimize life cycle
costs and the current existing defects can be corrected as well. Hence, SHM employing smart
sensor system is an effective way to improve the pavement safety and to reduce maintenance
cost for airfield pavement.
How to Conduct Health Monitoring of Airport Pavement Systems?
Health monitoring of airport pavement system requires smart sensing technology which can
provide long term, continuous and real time monitoring of pavement conditions. In order to
achieve these goals, embedded sensor interfaced with advanced wireless sensor networks is a
cost-effective solution.
MEMS Sensors
The recent advancement in Micro-Electromechanical Systems (MEMS)/ Nano-
Electromechanical Systems (NEMS) technologies represent an emerging solution in health
monitoring for transportation infrastructure system. MEMS/NMES sensor is generally
comprised of miniaturized mechanical sensing element fabricated with silicon chip. The
techniques of microfabrication enable different complex electromechanical systems to be
integrated in the miniaturized mechanical sensing element. Therefore, the typical dimension
of MEMS devices can vary from one micron to several millimeters [12]. In addition to small
size, MEMS/NEMS sensor also has high performance with relatively low energy
consumption. As a result, MEMS sensors have much potential in providing cost-effective
health monitoring solutions to help engineers identify pavement deterioration before the
distress is noticeable to the aircrafts.
Radio-Frequency Identification (RFID) tag is a MEMS-based sensor using the radio-
frequency spectrum for digital data transmission. It can be an active or passive sensing
device capable of both data receiving and storing. Various RFID tag types are available for
different applications.
For pavement temperature monitoring purpose, some of the commercial RFID tags available
include GT-301 by GENTAG, Inc, RFID chips by RF SAW, Inc, PaveTag RFID by Minds,
Inc, i-Q32T tag by WAKE, Inc., etc. Among these, the i-Q32T RFID tag has the capability to
detect the inside temperature of concrete and to communicate the information to the portable
Pro [13]. The i-Q32T, as shown in Figure 4, contains an internal MEMS sensor for
temperature monitoring that measures and logs the temperature in definable intervals. The
collected data could be imported into the portable Pro, shown in Figure 5, wirelessly for
maturity calculation and saving data for posterity. The use of two-way RF communication
between the buried tag and a portable Pro enables the portable Pro to read and write data.

171
Figure 4. i-Q32T Wireless RFID Transponder (Photo courtesy of WAKE, Inc.)
Figure 5. HardTrack Portable Pro (Photo courtesy of WAKE, Inc.)
A MEMS based multifunction sensor system is currently being developed at Iowa State
University (ISU) to design an integrated sensor system capable of measuring different
properties such as temperature, moisture, and strain simultaneously. MEMS based
multifunction sensor system can reduce installation cost and installation time which will
otherwise be incurred by installation of large number of traditional single-function sensors to
measure each of the properties. Moreover, if it could be integrated with a wireless
transmission system, the MEMS based multifunction sensor system will not just save time
and money but also improve the convenience and workability of health monitoring.
However, a truly integrated miniature multifunction sensor to detect these factors at same
time is not commercially available because the device dimension and unit cost may be
relatively large due to fabrication and assembling. Furthermore, it may also be more complex
to implement a wireless transmission system for this kind of multifunction sensor compared
to single-function sensor. Additionally, the energy consumption may be large because of
measuring several parameters at the same time. One possible solution is to design an energy
harvesting system by using piezoelectric materials, which can generate electric power subject
to traffic loads, thunder vibrations, etc.
Wireless Networks
Traditional wired sensors generally cost more money than wireless sensors for health
monitoring in civil infrastructures due to longer installation time. Furthermore, the damage
and corrosion of wires in civil infrastructures is difficult to repair or replace as well. Wireless

172
sensor technologies based health monitoring has been investigated in civil infrastructures
mainly focusing on building and bridges structures.
Typical, wireless technologies available for sensor systems include Bluetooth, cellular
telephony, Wi-Fi, Zigbee, and radio frequency. These technologies have different data rate,
range, power consumption, ease of implementation, cost, and so on. The use of different
wireless technologies also leads to the use of different wireless network topologies including
star, peer-to-peer, and two-tier network [14]. Hence, the choice of the appropriate wireless
technologies and networks depends on the specific environment. A robust hardware
architecture and packaging for wireless sensor is also required to make wireless sensor
system functional under the high alkali environment from concrete hydration and repeated
vehicle loads. In addition, the limited power sources of on-site conditions can affect the
working life of the wireless sensors in concrete structure. Moreover, the effective distance
range of sensors in concrete should be considered as well. Typically, the longer the distance,
the more power consumption there will be. It is critical to select a balance point between
these factors.
Electro-optical (EO) Sensing
A FOD detection system can help airport management to detect FOD which can pose a
serious threat to the safety of airport operations. An Electro-optical (EO) sensing system has
been proposed as a potential solution that can detect FOD by converting light ray into
electronic signal. In 2009, Stratech Systems, Ltd., developed an electro-optical sensing
system called as iFerret to evaluate runway condition of Chicago O’Hare International
Airport (ORD). The performance of this electro-optical sensors system was assessed and
reported by various studies [11, 15, and 16]. This iFerret is an optical video based sensors
system consisting of high-quality image capture system. The high resolution video sensors
with zoom capabilities in the passive sensing system were mounted in several towers to
ensure it to sweep a large scan area continuously. Furthermore, the video sensor can scan the
pavement surface almost up to 1,100-ft by using ambient lighting conditions [15]. All the
sensors in the system interfaced with image-processing software are networked to the central
console located in the air traffic control tower. The iFerret system detects the FOD by
interpreting the data collected by the electro-optical sensors and then sends an alert to the
operator if an FOD is detected. The location and video image of the FOD will be also sent to
the operator to confirm. As a consequence, hazard assessment and clear-up work can be
processed.
Figure 6. iFerret Electro-optical Sensor at Chicago O’Hare International Airport
(Source : iFerret™, http://www.stratechsystems.com/iv_iferret.asp)
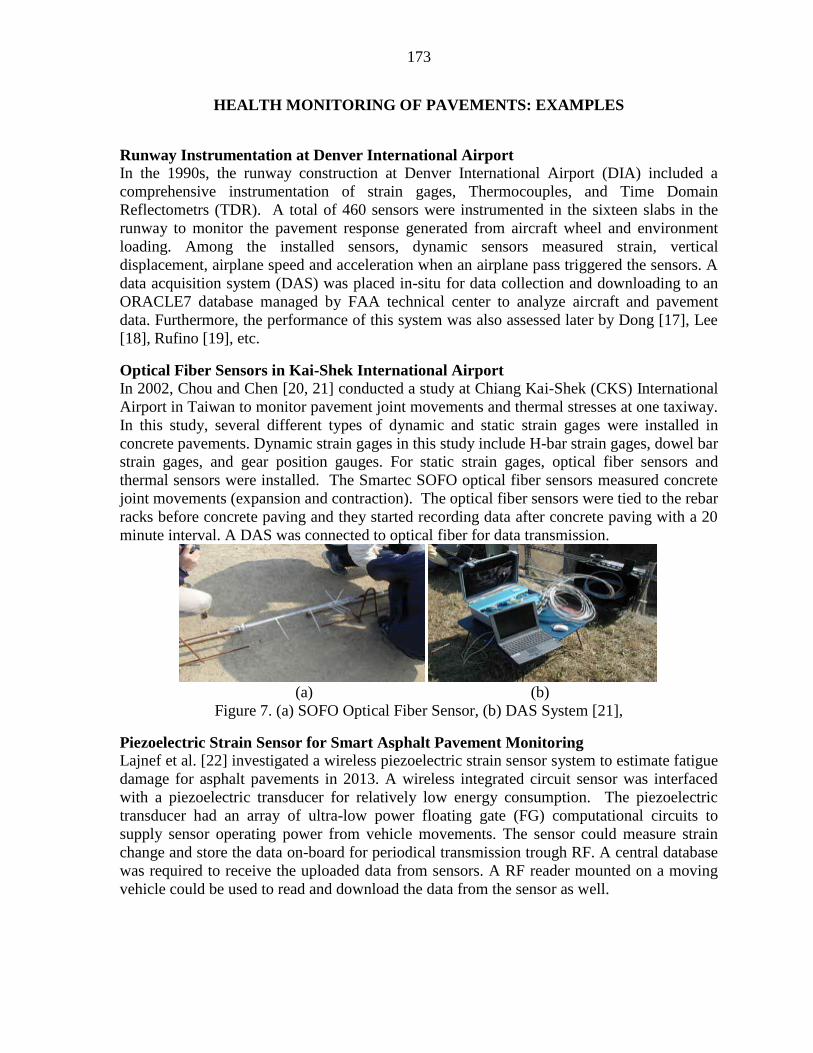
173
HEALTH MONITORING OF PAVEMENTS: EXAMPLES
Runway Instrumentation at Denver International Airport
In the 1990s, the runway construction at Denver International Airport (DIA) included a
comprehensive instrumentation of strain gages, Thermocouples, and Time Domain
Reflectometrs (TDR). A total of 460 sensors were instrumented in the sixteen slabs in the
runway to monitor the pavement response generated from aircraft wheel and environment
loading. Among the installed sensors, dynamic sensors measured strain, vertical
displacement, airplane speed and acceleration when an airplane pass triggered the sensors. A
data acquisition system (DAS) was placed in-situ for data collection and downloading to an
ORACLE7 database managed by FAA technical center to analyze aircraft and pavement
data. Furthermore, the performance of this system was also assessed later by Dong [17], Lee
[18], Rufino [19], etc.
Optical Fiber Sensors in Kai-Shek International Airport
In 2002, Chou and Chen [20, 21] conducted a study at Chiang Kai-Shek (CKS) International
Airport in Taiwan to monitor pavement joint movements and thermal stresses at one taxiway.
In this study, several different types of dynamic and static strain gages were installed in
concrete pavements. Dynamic strain gages in this study include H-bar strain gages, dowel bar
strain gages, and gear position gauges. For static strain gages, optical fiber sensors and
thermal sensors were installed. The Smartec SOFO optical fiber sensors measured concrete
joint movements (expansion and contraction). The optical fiber sensors were tied to the rebar
racks before concrete paving and they started recording data after concrete paving with a 20
minute interval. A DAS was connected to optical fiber for data transmission.
(a) (b)
Figure 7. (a) SOFO Optical Fiber Sensor, (b) DAS System [21],
Piezoelectric Strain Sensor for Smart Asphalt Pavement Monitoring
Lajnef et al. [22] investigated a wireless piezoelectric strain sensor system to estimate fatigue
damage for asphalt pavements in 2013. A wireless integrated circuit sensor was interfaced
with a piezoelectric transducer for relatively low energy consumption. The piezoelectric
transducer had an array of ultra-low power floating gate (FG) computational circuits to
supply sensor operating power from vehicle movements. The sensor could measure strain
change and store the data on-board for periodical transmission trough RF. A central database
was required to receive the uploaded data from sensors. A RF reader mounted on a moving
vehicle could be used to read and download the data from the sensor as well.

174
Figure 8. Prototype Installation of Self-powered Strain Sensor [22]
Wireless MEMS System for Concrete Moisture Monitoring
Figure 9 compares the wired MEMS scheme for in-situ concrete moisture monitoring with a
wireless MEMS scheme in a recently completed study conducted by the authors and
collaborators from the electrical engineering department at ISU. In the working scheme of
wired MEMS scheme, the sensor should be connected to the data reader and the computer
through cables to continuously monitor the concrete properties and download the data. As a
consequence, both the data reader and the computer require electrical supply for operations.
However, the wireless system does not require any external cables which can save
installation time and reduce the risk of malfunction of sensors.
Figure 9. Comparison between Wired MEMS based Moisture Sensor System and Wireless
MEMS based Moisture Sensor System
A CONCEPTUALSMART AIRPORT PAVEMENT HEALTH MONITORING

175
A health monitoring and management system for airport pavements could provide in-situ
pavement conditions and responses to prevent multi-faceted safety concerns including
pavement deteriorations and FODs from aircraft operations.
Figure 9 illustrates a conceptual design of airport health monitoring system. In this figure, the
embedded smart MEMS sensor subsystem is a wireless multifunction MEMS which can
measure strain, temperature, and moisture simultaneously. The robust packaging subsystem
should be implemented to protect the embedded smart MEMS sensors during installation and
operation under harsh climatic and traffic conditions. The smart MEMS sensor subsystem
can be integrated with EO based distress and FOD detectors to monitor actual pavement
surface condition. A reliable data acquisition subsystem mounted on a moving vehicle or
control tower can be used to collect, store, and transfer data from MEMS sensors and EO
based detectors. The intelligent data mapping model subsystem employing sensing data
fusion and geo-spatial analysis approach can be utilized in data mapping of entire section
from collected data from sensor installed in specific locations. Realistic characterization of
pavement layer properties and responses through intelligent data mapping model subsystem
can be utilized for early warning of critical distress initiation, accurate airport pavement life
predictions, planning pavement management activities as well as for calibration and
validation of mechanistic-based pavement response prediction models.
Figure10. Conceptual Smart Health Monitoring of Airport Pavement Systems

176
SUMMARY
The recent advancements in Micro-Electro-Mechanical Sensor (MEMS)/Nano-Electro-
Mechanical Sensor (NEMS) technologies and wireless sensor networks combined with
efficient energy scavenging paradigms provide opportunities for long-term, continuous, real-
time response measurement and health monitoring of airport pavement systems.
MEMS/NEMS represent an innovative solution in airport pavement condition monitoring
that can be used to wirelessly detect and monitor structural health (damage initiation and
growth) as well as functional health in airport pavement structures. Static or dynamic
sensors, such as strain gages or pressure cells, have also been used in new or existing airport
pavements, but are mostly restricted to experimental studies on a short-term basis. The
required properties for health monitoring of airport pavement systems include multifunction
sensing capacity, wireless communications, lower energy consumption for operation, robust
packaging, reliable data acquisition, intelligent data mapping, and early warning of critical
distress initiation. Such health monitoring of airport pavement systems is crucial for:
Maintaining the structural and functional performance for safe aircraft operations
Providing optimal timing of maintenance/rehabilitation activities and efficient allocation
of scanty resources
Understanding complex pavement system behavior to achieve sustainable airport
pavement systems
ACKNOWLEDGEMENTS
This paper was prepared from a study conducted at Iowa State University (ISU) with
partial support from Iowa Department of Transportation (Iowa DOT). The contents of this
paper reflect the views of the authors who are responsible for the facts and accuracy of the
data presented within. The contents do not necessarily reflect the official views and policies
of the FAA or Iowa DOT. This paper does not constitute a standard, specification, or
regulation. The presentation of this information is in the interest of invoking comments by
the technical community on the results and conclusions of the research.

177
REFERENCES
1. Federal Aviation Administration, U.S. Department of Transportation, “Development of
Standards for Nonprimary Airports,” Advisory Circular AC 150/5100-13B, 2011.
2. Lary, Jo., “Airport Pavement Maintenance and Management,” Airfield Safety, Sign
Systems and Maintenance Management Workshop, Pavement Consultants Inc., April
2009.
3. Applied Pavement Technology, Inc., “Creston Municipal Airport Pavement Management
Report,” Iowa Department of Transportation, Office of Aviation, December 2011.
4. Applied Pavement Technology, Inc., “Washington Airport Pavement Management
System- Pavement Management Manual,” Washington State Department of
Transportation Aviation, Arlington, WA.
5. Federal Aviation Administration, U.S. Department of Transportation, “Guidelines and
Procedures for Maintenance of Airport Pavements,” Advisory Circular AC 150/5380-6B,
2007.
6. Garg, Navneet., Guo, Edward., and McQueen, Roy., “Operational Life of Airport
Pavements,” Technical Report DOT/FAA/AR-04/46, U.S. Department of Transportation,
Federal Aviation Administration, Office of Aviation Research, Washington, DC,
December 2004.
7. Mullen, Mike., “Special Inspections of Paved Areas During Excessive Heat Periods,”
Central Region Airport Certification Bulletin, Federal Aviation Administration, Central
Region, Airports Division, Kansas City, MO, July 2011.
8. Nepal, Shailesh., “ TIA Runway Overlay Project Failure: A Case Study from Nepal,” PM
World Journal, Vol. 3, Issue. 5, 2014.
9. Ang, Li., “Research and Design of an Airfield Runway FOD Detection System Based on
WSN,” International Journal of Distributed Sensor Networks, Hindawi Publishing
Corporation, 2013.
10. Federal Aviation Administration, U.S. Department of Transportation, “Airport Foreign
Object Debris (FOD) Detection Equipment,” Advisory Circular AC 150/5220-24, 2009.
11. Graves, Stephanie W., “Electro-optical Sensor Evaluation of Airfield Pavement,” Thesis,
University of Illinois at Urbana-Champaign, Urbana, Illinois, 2012
12. MNX, What is MEMS Technology. https://www.mems-exchange.org/MEMS/what-
is.html. 2014.
13. Ceylan, Halil., Gopalakrishnan, Kasthurirangan., Taylor, Peter., Shrotriya, Pranav., Kim,
Sunghwan., Prokudin, Max., Wang, Shiyun., Buss, Ashley F., and Zhang Jiake., “A
Feasibility Study on Embedded Micro-Electromechanical Sensors and Systems (MEMS)
for Monitoring Highway Structures,” Technical Report IHRB Project TR-575, National
Concrete Pavement Technology Center, Ames, IA, June 2011.
14. Lynch, Jerome P., and Loh, Kenneth J., “A Summary Review of Wireless Sensors and
Sensor Networks for Structural Health Monitoring,” The Shock and Vibration Digest,
Vol. 38, No. 2, pp. 91–128, 2006.
15. Herricks, Edwin E., Lazar, Peter., Woodworth, Elizabeth., and Patterson, James.,
“Performance Assessment of An Electro-optical-based Foreign Object Debris Detection
System,” Technical Report DOT/FAA/AR-11/13, U.S. Department of Transportation,
Federal Aviation Administration, William J. Hughes Technical Center, Aviation
Research Division, Atlantic City International Airport, New Jersey, March 2012.

178
16. Lazar, Peter., and Herricks, Edwin E., “Procedures for FOD Detection System
Performance Assessments: Electro-optical FOD Detection System,” FAA Worldwide
Airport Technology Transfer Conference, Atlantic City, New Jersey, USA, April 2010.
17. Dong, Mingyao., and Hayhoe, Gordon F., “Denver International Airport Sensor
Processing and Database,” Technical Report DOT/FAA/AR-00/17, U.S. Department of
Transportation, Federal Aviation Administration, Office of Aviation Research,
Washington, DC, March 2000.
18. Lee, Xiaogong., Hovan, Michel., King, Ryan., Dong, Mingyao., and Hayhoe, Gordon F.,
“Runway Instrumentation at Denver International Airport Development of Database,”
Aircraft/pavement technology: in the midst of change, pp. 348, 1997.
19. Rufino, Dulce., Roesler, Jeffery., and Barenberg, Ernest., “Mechanistic Analysis of
Pavement Responses from Denver International Airport,” FAA Center of Excellence
(COE) for Airport Technology Report No.26, Department of Civil and Environmental
Engineering, University of Illinois at Urbana-Champaign, January 2004.
20. Chou, Chia-pei., Cheng, Hsiang-Jen., and Lin, Shyh-tai., “Analysis of Concrete Joint
Movements and Seasonal Thermal Stresses at the Chiang Kai-Shek International
Airport,” FAA Worldwide Airport Technology Transfer Conference, Atlantic City, New
Jersey, USA, April 2004.
21. Wang, Chung-Yue., Wang, Hao-Lin., and Chen, Ming-Hung., “Structural Health
Monitoring Activities of Applying Optical Fiber Sensors in Taiwan,” International
Workshop on Structural Health Monitoring and Damage Assessment, National Chung
Hsing University, Taichung, Taiwan, ROC, December 14-15, 2006.
22. Lajnef, Nizar., Chatti, Karim., Chakrabartty, Shantanu., Rhimi, Mohamed., and Sarkar,
Pikul., “Smart Pavement Monitoring System,” Technical Report FHWA-HRT-12-072,
U.S. Department of Transportation, Federal Highway Administration, Research,
Development, and Technology Turner-Fairbank Highway Research Center, McLean, VA,
May, 2013.

179
APPENDIX B: TEMPERATURE, MOISTURE AND STRAIN PROFILES FROM US-30
HIGHWAY
Figure B-1. RFID extended probe measurement in spring 2014.
Figure B-2. iButton measurement in spring 2014.
0
10
20
30
40
50
60
70
80
2/18
/14
7:00
2/24
/14
7:00
3/02
/14
7:00
3/08
/14
7:00
3/14
/14
7:00
3/20
/14
7:00
3/26
/14
7:00
4/01
/14
7:00
Tem
pera
ture
(˚F)
Date and Time
4 in./Slab corner/Ex. Probe 2
0
10
20
30
40
50
60
70
80
2/18
/14
7:00
2/24
/14
7:00
3/02
/14
7:00
3/08
/14
7:00
3/14
/14
7:00
3/20
/14
7:00
3/26
/14
7:00
4/01
/14
7:00
Tem
pera
ture
(˚F)
Date and Time
4.0 in./iButton 1
5.0 in./iButton 2
8.5 in./iButton 3
Ambient/iButton 5

180
Figure B-3. MEMS digital humidity sensor temperature measurement in spring 2014.
Figure B-4. MEMS digital humidity sensor RH measurement in spring 2014.
0
10
20
30
40
50
60
70
80
3/28
/14
7:00
3/29
/14
7:00
3/30
/14
7:00
3/31
/14
7:00
Tem
pera
ture
(˚F)
Date and Time
0.1 in./8 in. away/MEMS RH_Temp.4
50
55
60
65
70
75
80
85
90
95
100
3/28
/14
7:00
3/29
/14
7:00
3/30
/14
7:00
3/31
/14
7:00
Rela
tive
Hum
idit
y (%
)
Date and Time
0.1 in./8 in. away/MEMS RH_Temp. 4

181
Figure B-5. Strain measurement in summer 2013.
Figure B-5. Strain measurement in winter 2013.
-500
-400
-300
-200
-100
0
100
200
300
400
500
7/25
/13
7:00
7/25
/13
19:0
0
7/26
/13
7:00
7/26
/13
19:0
0
7/27
/13
7:00
Mic
rost
rain
Date and Time
2.0 in./Slab corner/20 in. away/Sensor 6
9.0 in./Slab corner/20 in. away/Sensor 7
8.5 in./Mid-span edge/44 in. away/Sensor 3
-500
-400
-300
-200
-100
0
100
200
300
400
500
12/2
1/13
7:0
0
12/2
2/13
7:0
0
12/2
3/13
7:0
0
12/2
4/13
7:0
0
Mic
rost
rain
Date and Time
8.5 in./Mid-span edge/44 in. away/Sensor 32.0 in./Slab corner/20 in. away/Sensor 69.0 in./Slab corner/20 in. away/Sensor 7

182
APPENDIX C: SET TIME TESTING (ASTM C403)
This appendix displays the set time test in accordance with ASTM C403.
Figure C-1. Set time test (ASTM C403)
240
240
300
300
360
360
420
420
480
480
540
540
600
600
100
1,000
10,000
100 1,000
Pen
etra
tio
n R
esis
tan
ce (
psi
)
Elapsed Time (min)
Set Time Testing (ASTM C 403)
MEMS
FS
IS Initial Set
Final Set
Initial Set : 4.84 hr

183
APPENDIX D: SUCCESSFUL RATE TEST RESULTS
This appendix displays the results from successful rate test and temperature and moisture
data obtained from the test.
Figure D-1. Success rate test results.

184
Figure D-2. RH measurement from success rate test.
Figure D-3. Temperature measurement from success rate test.
50
55
60
65
70
75
80
85
90
95
100
0 50 100 150 200 250 300
Re
lati
ve
Hu
mid
ity (
%)
Time (minutes)
20
21
22
23
24
25
26
0 50 100 150 200 250 300
Te
mp
era
ture
(C
˚)
Time (minutes)