PAVEMENT DESIGN MANUAL
298
REPUBLIC OF SOMALILAND ROADS DEVELOMENT AGENCY (RDA) PAVEMENT DESIGN MANUAL 2014
-
Upload
khangminh22 -
Category
Documents
-
view
1 -
download
0
Transcript of PAVEMENT DESIGN MANUAL

REPUBLIC OF SOMALILAND
ROADS DEVELOMENT AGENCY (RDA)
PAVEMENT DESIGN MANUAL
2014

ROADS DEVELOMENT AGENCY
PAVEMENT DESIGN MANUAL
2014

Pavement Design Manual - 2014 Preface
Roads Development Agency Page i
PREFACE
This is the first comprehensive Pavement Design Manual prepared for the use and
technical guidance of design personnel of the Roads Development Agency and
consultants doing Pavement Design work for the Agency. However, it may also be used
as a guide by other agencies undertaking relevant work in the road sector.
The Roads Development Agency has prepared this Manual under a credit from the
International Labour Organization (ILO) for design of roads in order to standardize
design practices in all RDA design works.
The road network comprises a huge national asset that requires adherence to appropriate
standards for design, construction and maintenance in order to provide a high level of
service. As the length of the engineered road network is increasing, appropriate choice of
methods to preserve this investment becomes increasingly important.
The design standards set out in this Manual shall be adhered to unless otherwise directed
by the concerned bodies with in RDA. However, I will like to emphasize that careful
consideration to sound engineering practice shall be observed in the use of the Manual,
and under no circumstances shall the Manual waive professional judgment in applied
engineering. For simplification in reference this Manual may be cited as “Pavement
Design Manual –2014.”
It is my sincere hope that this Manual will provide all users with both a standard
reference and a ready source of good practice for the Pavement design, and will assist in
a cost effective operation, and environmentally sustainable development of our road
network.
I look forward to the practices contained in this Manual being quickly adopted into our
operations, thereby making a sustainable contribution to the improved infrastructure of
our country.
As this Manual due to technological development and change, requires periodic updating,
comments and suggestions on all aspects from any concerned body, group or individual
as feedback during its implementation is expected and will be highly appreciated.
ROADS DEVELOPMENT AGENCY

Pavement Design Manual – 2014 Table of Contents
Roads Development Agency Page
Pavement Design Manual - 2014
Table of Contents
Preface ............................................................................................................................. i
Table of contents ............................................................................................................. ii
1 Introduction......................................................................................................... 1-1
1.1 General ....................................................................................................... 1-1
1.2 Underlying Principles ................................................................................. 1-1
1.3 Overview of Pavement Structures ............................................................... 1-2
1.4 Design Process ............................................................................................ 1-7
1.5 Variability and Reliability ........................................................................... 1-7
1.6 Economic Considerations .......................................................................... 1-11
1.7 Basis for the Design Catalog ..................................................................... 1-12
2 Traffic ................................................................................................................. 2-1
2.1 General ....................................................................................................... 2-1
2.2 Design Period ............................................................................................. 2-1
2.3 Traffic Volumes .......................................................................................... 2-3
2.4 Axle Loads ................................................................................................. 2-7
2.5 Traffic Classes for Flexible Pavement Design ........................................... 2-10
2.6 Accuracy- Traffic Classes ......................................................................... 2-11
2.7 Design Example ........................................................................................ 2-11
2.8 Estimating Axle Loads for Gravel Roads .................................................. 2-13
3 Subgrade ............................................................................................................. 3-1
3.1 General ....................................................................................................... 3-1
3.2 General Density- Moisture Content- Strength Relationships of the Subgrade3-1
3.3 Design Subgrade Strength ........................................................................... 3-2
4 Earthworks .......................................................................................................... 4-1
4.1 Introduction ................................................................................................ 4-1
4.2 Embankments ............................................................................................. 4-1
4.3 Cuttings ...................................................................................................... 4-6
5 Drainage and Shoulders....................................................................................... 5-1
5.1 Drainage System ......................................................................................... 5-1
5.2 External Drainage ....................................................................................... 5-1
5.3 Internal Drainage ........................................................................................ 5-2
5.4 Shoulders .................................................................................................... 5-3
5.5 Typical Pavement Cross Sections ................................................................ 5-3
6 Unbound Pavement Materials.............................................................................. 6-1
6.1 Base Course Materials ................................................................................ 6-1
6.2 Sub-Bases (GS)........................................................................................... 6-5
6.3 Selected Subgrade Materials and Capping Layers (GC) .............................. 6-8
7 Cement and Lime-Stabilized Materials ................................................................ 7-1
7.1 Introduction ............................................................................................... 7-1
7.2 The Stabilization Process ........................................................................... 7-2

Table of Contents Pavement Design Manual – 2014
Roads Development Agency
Page iii
7.3 Selection of Type of Treatment ................................................................. 7-2
7.4 Cement Stabilization ................................................................................. 7-4
7.5 Lime Stabilization ..................................................................................... 7-4
8 Bitumen-Bound Materials ................................................................................... 8-1
8.1 Introduction .............................................................................................. 8-1
8.2 Components of a Mix................................................................................ 8-1
8.3 Bitumen Surfacing .................................................................................... 8-1
8.4 Common Types of Premix ........................................................................ 8-4
8.5 Bituminous Base Courses ......................................................................... 8-7
8.6 Manufacture and Construction .................................................................. 8-9
9 Surface Treatments ............................................................................................. 9-1
9.1 Introduction .............................................................................................. 9-1
9.2 Types of Surface Treatments ..................................................................... 9-1
9.3 Chippings for Surface Treatments ............................................................. 9-3
9.4 Bitumen .................................................................................................... 9-7
9.5 Design .....................................................................................................9-13
9.6 Example of Surface Treatment Design .....................................................9-24
9.7 Other Surface Treatments ........................................................................9-25
10 Flexible Pavement Design Catalog ....................................................................10-1
10.1 Description of Catalog ............................................................................10-1
10.2 Use of the Catalog ..................................................................................10-1
10.3 Design Example .....................................................................................10-2
11 Problematic Soils ...............................................................................................11-1
11.1 Low Strength Soils .................................................................................11-1
11.2 Expansive Soils ......................................................................................11-1
11.3 Saline Soils ............................................................................................11-5
11.4 Organic Soils ..........................................................................................11-6
12 Design of Gravel and Low Standard Roads ........................................................12-1
12.1 General...................................................................................................12-1
12.2 Design Principles ...................................................................................12-1
12.3 Design Method .......................................................................................12-2
12.4 Pavement and Materials..........................................................................12-3
12.5 Cross fall and Drainage ..........................................................................12-3
12.6 Material Requirements ...........................................................................12-3
12.7 Gravel Wearing Course ..........................................................................12-6
12.8 Determination of CBRDESIGN ..................................................................12-9
12.9 Improved Subgrade and Pavement Design ............................................ 12-10
12.10 Climatic Zones ..................................................................................... 12-11
13 Concrete Roads .................................................................................................13-1
13.1 Introduction ............................................................................................13-1
13.2 Rigid Pavements……………………………………………………..….13-1
13.3 Pavement structure, function of pavement layers and components…......13-2
13.4 Joints……………………………………………………………………..13-4
13.5 Selection of pavement type………………………………………………13-6
13.6. Stress development and design criteria…………………………………..13-7

Pavement Design Manual – 2014 Table of Contents
Roads Development Agency Page
13.7. Design of rigid pavements………………………………………………13-11
14 Pavement Rehabilitation and Asphalt Overlay Design ....................................... 14-1
14.1 Introduction ........................................................................................... 14-1
14.2 Data Collection …………………………………………….…….…..….14-7
14.3 Analysis – Need for Rehabilitation …....................................................14-12
14.4 Design and Asphalt Overlays ……………………………………….….14-16
14.5 Design of Alternative Rehabilitation Methods ……………….………14-31
14.6. Selection of Preferred Alternative …………………….…….…………14-41
14.7. Design of rigid pavements………………………………………………14-45
APPENDICES
A Applicable Standards .................................................................................... A1-A2
B. Estimating Subgrade Moisture Content for Category 1 Conditions ...................... A3
C. TRL Dynamic Cone Penetrometer ................................................................. A4-A7
D. Refusal Density Design ............................................................................... A8-A10
E. The Immersion Tray Test for Determining the Concentration of Adhesion Agent
Required ................................................................................................... A11-A12
F. The Probe Penetration Test for Measuring Road Surface Hardness .............A13-A14
G Rigid Pavement Design Example…………………………………………A15-A16
H Vizir Method for Quality Evaluation of Paved Roads ..................................... A17-A45
I. Fieldwork ....................................................................................................... A46-A58
J. Typical Rigid Pavement Distress / Type – Severity Description ..................... A59-A70
K. Method for predicting Mean Pavement / Temperature (adapted from Ref. 1) .. A71-A73
L. Derivation of SNnew, Structural Number of a new Pavement ................................... A74
M Derivation of a Sneff, effective Structural Number of an existing Pavement
(adapted from Ref. 3)...................................................................................... A75-A76
N Definitions and Abbreviations ........................................................................ A76-A84
REFERENCES .............................................................................................. REF1-REF3

Pavement Design Manual - 2014 Chapter 1
Flexible Pavements and Gravel Roads Introduction
Roads Development Agency Page 1-1
1 INTRODUCTION
1.1 GENERAL
This manual gives recommendations for the structural design of flexible pavement and
gravel roads in Somaliland. The manual is intended for engineers responsible for the
design of new road pavements and is appropriate for roads which are required to carry up
to 30 million cumulative equivalent standard axles in one direction. This upper limit is
suitable at present for the most trafficked roads in Somaliland.
1.2 UNDERLYING PRINCIPLES
FLEXIBLE PAVEMENTS
Road flexible pavements are intended to limit the stress created at the subgrade level by
the traffic traveling on the pavement surface, so that the subgrade is not subject to
significant deformations. In effect, the concentrated loads of the vehicle wheels are
spread over a sufficiently larger area at subgrade level. At the same time, the pavement
materials themselves should not deteriorate to such an extent as to affect the riding
quality and functionality of the pavement. These goals must be achieved throughout a
specific design period.
Pavements do deteriorate, however, due to time, climate and traffic. Therefore, the goal
of the pavement design is to limit, during the period considered, deteriorations which
affect the riding quality, such as, in the case of flexible pavements, cracking, rutting,
potholes and other such surface distresses to acceptable levels.
At the end of the design period, a strengthening overlay would normally be required, but
other remedial treatments, such as major rehabilitation or reconstruction, may be
required. The design method aims at producing a pavement which will reach a relatively
low level of deterioration at the end of the design period, assuming that routine and
periodic maintenance are performed during that period.
It is understandable that what constitutes an “acceptable riding quality” depends on what
the users expect. For roads with higher traffic, higher geometric standards, and higher
vehicle speeds as a consequence, less distress will be expected and considered
acceptable. Hence, for instance, trunk and link roads may be expected to offer some
higher rideability than access, collector roads, etc. in a similar design period. Similarly,
gravel roads may be expected to offer a lower riding quality. These differences are
implicitly considered in the design, although in broad terms rather than in precise
measurable economic terms.
GRAVEL ROADS
Unpaved roads consist of gravel wearing courses. Gravel pavements are also designed to
a minimum thickness required to avoid excessive strain at the subgrade level. This in turn
ensures that the subgrade is not subject to significant deformations. At the same time, the
gravel materials themselves should not deteriorate to such an extent as to affect the riding
quality and functionality of the pavement. These goals must be achieved throughout a
Chapter 1 Pavement Design Manual - 2014
Introduction Flexible Pavements and Gravel Roads
Page 1-2 Roads Development Agency
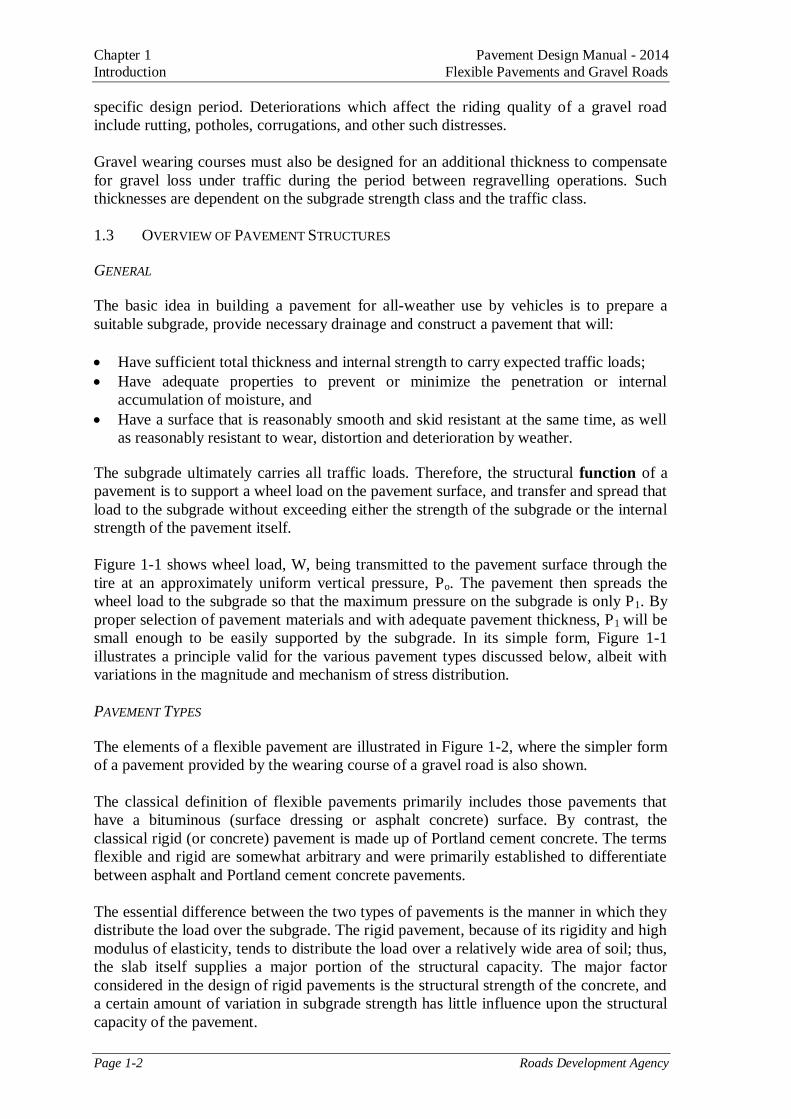
specific design period. Deteriorations which affect the riding quality of a gravel road
include rutting, potholes, corrugations, and other such distresses.
Gravel wearing courses must also be designed for an additional thickness to compensate
for gravel loss under traffic during the period between regravelling operations. Such
thicknesses are dependent on the subgrade strength class and the traffic class.
1.3 OVERVIEW OF PAVEMENT STRUCTURES
GENERAL
The basic idea in building a pavement for all-weather use by vehicles is to prepare a
suitable subgrade, provide necessary drainage and construct a pavement that will:
Have sufficient total thickness and internal strength to carry expected traffic loads;
Have adequate properties to prevent or minimize the penetration or internal
accumulation of moisture, and
Have a surface that is reasonably smooth and skid resistant at the same time, as well
as reasonably resistant to wear, distortion and deterioration by weather.
The subgrade ultimately carries all traffic loads. Therefore, the structural function of a
pavement is to support a wheel load on the pavement surface, and transfer and spread that
load to the subgrade without exceeding either the strength of the subgrade or the internal
strength of the pavement itself.
Figure 1-1 shows wheel load, W, being transmitted to the pavement surface through the
tire at an approximately uniform vertical pressure, Po. The pavement then spreads the
wheel load to the subgrade so that the maximum pressure on the subgrade is only P1. By
proper selection of pavement materials and with adequate pavement thickness, P1 will be
small enough to be easily supported by the subgrade. In its simple form, Figure 1-1
illustrates a principle valid for the various pavement types discussed below, albeit with
variations in the magnitude and mechanism of stress distribution.
PAVEMENT TYPES
The elements of a flexible pavement are illustrated in Figure 1-2, where the simpler form
of a pavement provided by the wearing course of a gravel road is also shown.
The classical definition of flexible pavements primarily includes those pavements that
have a bituminous (surface dressing or asphalt concrete) surface. By contrast, the
classical rigid (or concrete) pavement is made up of Portland cement concrete. The terms
flexible and rigid are somewhat arbitrary and were primarily established to differentiate
between asphalt and Portland cement concrete pavements.
The essential difference between the two types of pavements is the manner in which they
distribute the load over the subgrade. The rigid pavement, because of its rigidity and high
modulus of elasticity, tends to distribute the load over a relatively wide area of soil; thus,
the slab itself supplies a major portion of the structural capacity. The major factor
considered in the design of rigid pavements is the structural strength of the concrete, and
a certain amount of variation in subgrade strength has little influence upon the structural
capacity of the pavement.

Pavement Design Manual - 2014 Chapter 1
Flexible Pavements and Gravel Roads Introduction
Roads Development Agency Page 1-3
Figure 1-1: Spread of Wheel-Load through Pavement Structure
Figure 1-2: Elements of a Flexible Pavement

Chapter 1 Pavement Design Manual - 2014
Introduction Flexible Pavements and Gravel Roads
Page 1-4 Roads Development Agency
FLEXIBLE PAVEMENTS
To give satisfactory service, a flexible pavement must satisfy a number of structural
criteria or considerations; some of these are illustrated in Figure 1-3. Some of the
important considerations are:
(1) the subgrade should be able to sustain traffic loading without excessive
deformation; this is controlled by the vertical compressive stress or strain at this
level,
(2) bituminous materials and cement-bound materials used in roadbase design should
not crack under the influence of traffic; this is controlled by the horizontal tensile
stress or strain at the bottom of the roadbase,
(3) the roadbase is often considered the main structural layer of the pavement,
required to distribute the applied traffic loading so that the underlying materials
are not overstressed. It must be able to sustain the stress and strain generated
within itself without excessive or rapid deterioration of any kind.
(4) in pavements containing a considerable thickness of bituminous materials, the
internal deformation of these materials must be limited; their deformation is a
function of their creep characteristics,
(5) the load spreading ability of granular subbase and capping layers must be
adequate to provide a satisfactory construction platform.
Figure 1-3: Critical Stresses and Strains in a Flexible Pavement

Pavement Design Manual - 2014 Chapter 1
Flexible Pavements and Gravel Roads Introduction
Roads Development Agency Page 1-5
In practice, other factors have to be considered such as the effects of drainage.
When some of the above criteria are not satisfied, distress or failure will occur. For
instance, rutting may be the result of excessive internal deformation within bituminous
materials, or excessive deformation at the subgrade level (or within granular layers
above).
GRAVEL ROADS
Gravel roads represent the other type of design considered in this volume of the manual.
The elements of a flexible pavement are illustrated in Figure 1-4, where the simpler form
of a pavement provided by the wearing course of a gravel road is also shown.
Figure 1-4: Elements of a Gravel Pavement
The mechanisms of deterioration of gravel roads differ from those of flexible pavement.
While the functions of the wearing course still include the protection of the subgrade, and
the wearing course needs to be designed for that aspect, the potential defects of a gravel
road require other considerations in the design.
Typical defects which may affect gravel roads are dustiness, potholes, stoniness,
corrugations, ruts, cracks, ravelling (formation of loose material), erosion, slipperiness,
impassibility and loss of wearing course material. Many of these have a direct effect on
the road roughness and safety.
Since corrugations are one of the most disturbing defects of gravel roads (and one which
still causes much debate), an illustration of the likely mechanism of their formation is

Chapter 1 Pavement Design Manual - 2014
Introduction Flexible Pavements and Gravel Roads
Page 1-6 Roads Development Agency
worthwhile, and is given in Figure 1-5. In illustration a), localized areas of the gravel
wearing course have slightly lesser cohesion than adjacent areas, and a result is that the
wheel displaces this material towards the back, at the same time compressing the
remaining material at the contact point. Continuing actions as in a) result eventually in
the wheel loosing contact with the road, as in b). When the wheel regains road contact, as
in c), the result is a magnification of the effects as in a).
Figure 1-5: The Forced Oscillation Theory for the Formation of Corrugation
A number of the typical defects can be mitigated by an adequate selection of the
materials for gravel wearing courses, which should satisfy the following requirements
that are often somewhat conflicting:

Pavement Design Manual - 2014 Chapter 1
Flexible Pavements and Gravel Roads Introduction
Roads Development Agency Page 1-7
(a) They should have sufficient cohesion to prevent ravelling and corrugating
(especially in dry conditions)
(b) The amount of fines (particularly plastic fines) should be limited to avoid
a slippery surface under wet conditions
These aspects are dealt with in the Specifications and are naturally influenced by the
availability of materials. In design, the thickness requirements for the gravel wearing
course will essentially derive from the combined need to protect the subgrade and to
periodically replace the lost materials.
1.4 DESIGN PROCESS
The organization of this Manual is as presented in Figure 1-7 at the end of this chapter.
The main steps involved in designing a new road pavement are as presented below and
given in Figure 1-6):
Surveying possible route (usually part of the feasibility study, see Route Corridor
Selection Chapter in Geometric Design Manual-2014);
estimating the traffic in terms of the cumulative number of equivalent standard axles
that will use the road over the selected design life (cf. Chapter 2);
characterizing the strength of the subgrade soil over which the road is to be built (cf.
Chapter 3);
selecting an adequate pavement structure, i.e. pavement materials and layer
thicknesses providing satisfactory service over the design life, utilizing the catalog of
pavement structures presented in Chapter 10 for flexible pavement, and the design
process presented in Chapter 11 for gravel pavements. The structures given in this
manual are based primarily on results of full-scale experiments and studies of the
performance of as-built existing road networks.
Intermediate chapters of the manual re: Chapters 4 and 5, which give guidance and
background information related to the soils, shoulder design, drainage, and cross section
assumptions underlying the design of the structures presented; Chapters 6 to 9, similarly,
provide guidance regarding the materials of the various pavement layers.
1.5 VARIABILITY AND RELIABILITY
TRAFFIC
Pavement design relies heavily on the expected level of traffic. Axle load studies (to
determine equivalent axle loads) and traffic counts (to determine initial traffic volumes)
are essential for a reliable design, together with estimates of traffic growth. Yet traffic
forecasting remains a difficult and often uncertain task. The parameters are rarely well
known, particularly the axle loads and the projected growth. Although every effort must
be made to reduce the uncertainty inherent to these estimates, caution is still
recommended and certain conservatism is justified. Moreover, sensitivity analyses of the
resulting pavement structures to these parameters are recommended.
CLIMATE
Climate also has a strong influence on the pavement performance, and may be accounted
for in the design to some extent. This is particularly true for Somaliland where a wide
range of climatic zones are encountered, from maritime semidesert plain parallels the

Chapter 1 Pavement Design Manual - 2014
Introduction Flexible Pavements and Gravel Roads
Page 1-8 Roads Development Agency
Gulf of Aden coast, to temperate and mountainous (subalpine) over a significant part of
the country, with annual rainfalls up to 600 mm.
The climate influences the subgrade moisture content and strength (cf. Chapter 3) and
requires precautions to ensure adequate drainage (Chapter 5). The rainfall also influences
the selection of adequate pavement materials, such as the allowable limits of materials
properties (cf. Chapter 6), and is a potential incentive to use stabilized materials (cf.
Chapter 7). The temperature influences the selection and design of bituminous surfacings
(Chapters 8 and 9).
Figure 1-6: Pavement Design Process

Pavement Design Manual - 2014 Chapter 1
Flexible Pavements and Gravel Roads Introduction
Roads Development Agency Page 1-9
Climate also affects the nature of the soils and rocks encountered at subgrade level. Soil-
forming processes are very active and the surface rocks are often deeply weathered. The
soils themselves occasionally display unusual properties which can pose considerable
problems for road designers.
MATERIALS
The properties of the materials are variable, and construction control is enforced with
varying success. As mentioned elsewhere, expectations from the users play a role in
defining acceptable levels of riding quality. By the same token, even if only a small
percentage of the surface of a road shows distress, the road may be considered
unacceptable. As a result, the weakest parts of the road are very important in design and
identifying these parts and the variability of the pavement components similarly
important. This argues strongly against minimizing the extent of preliminary
investigations to determine this variability.
Changes in the subgrade strength are usually considered first, and other factors are
assumed to be controlled by enforcing specifications (i.e. minimum acceptable values for
key characteristics of the pavement materials). Even so, a considerable variation in
performance between a priori identical pavements is often observed, which cannot be
fully explained. An optimum design therefore remains partly dependent on knowledge of
the performance of in-service roads and quantification of the variability of the observed
performance itself (elements of pavement management systems). As a result, designs
integrating local experience usually perform better.
The pavement structures given in this manual should be regarded essentially with the
layers thicknesses and materials strength requirements as being minimum values. From a
practical viewpoint, however, they may be interpreted as lower ten percentile values, i.e.
with 90% of all test results exceeding the values quoted. Random variations in thickness
and strength should be such that minor deficiencies in thickness or strength do not occur
concomitantly, or very rarely so. Good construction practices to ensure this randomness
and also to minimize variations themselves cannot be over emphasized.
The design process of flexible pavements must include an evaluation of the available
materials in order to allow a selection among the viable alternatives. Similarly, for gravel
roads, the availability of materials suitable as gravel wearing course needs to be verified.
The design of flexible pavements in this manual offers alternatives given in a catalog of
pavement structures presented in Chapter 10 and discussed in Chapters 8 and 9. Gravel
wearing courses are covered under Chapters 6 and 11.
MAIN CHARACTERISTICS OF MAJOR MATERIAL TYPES: GRANULAR MATERIALS
Granular materials include selected fill layer; gravel subbase, roadbase or wearing
course; and crushed stone subbase or roadbase. These materials exhibit stress dependent
behavior, and under repeated stresses, deformation can occur through shear and/or
densification.

Chapter 1 Pavement Design Manual - 2014
Introduction Flexible Pavements and Gravel Roads
Page 1-10 Roads Development Agency
The selected fill, compacted at 95% MDD (AASHTO T180) exhibits a minimum soaked
CBR of 10%. Its minimum characteristics are specified by a minimum grading modulus
(0.75) and maximum plasticity index (20%) (see Appendix A).
The gravel subbase and roadbase materials have minimum soaked CBRs of 30% and
80% respectively, when compacted to 95% and 98% MDD respectively. They are subject
to requirements regarding grading modulus and plasticity index. In addition, the roadbase
materials must satisfy requirements regarding particle shape, Ten Percent Fines value,
Los Angeles Abrasion value and grading (see Appendix A).
The gravel wearing course materials should have sufficient cohesion and, simultaneously,
a limited amount of plastic fines. The materials must satisfy requirements regarding
minimum soaked CBR (20% at 95% MDD), Los Angeles abrasion value, particle shape,
and grading.
Crushed stone materials are produced entirely by the crushing of rock or boulders and
subject to strict grading requirements. The CBR need not be explicitly specified and only
the compaction is controlled (95% and 98% MDD for subbase and roadbase,
respectively). Other requirements include: Los Angeles Abrasion Value; flakiness index,
percentage of crushed particles, plasticity index, and for roadbase materials, aggregate
crushing value and sodium sulfate soundness value (see Appendix A).
MAIN CHARACTERISTICS OF MAJOR MATERIAL TYPES: BITUMINOUS MATERIALS
Bituminous materials include bituminous concrete pavement layers; bituminous
stabilization for roadbase; and dense bitumen macadam for roadbase. Bituminous
materials are viscoelastic and under repeated stresses may either weaken or deform or
both.
Bituminous concrete, i.e. asphalt concrete, for wearing and binder courses of surfacings,
is a dense, continuously graded mix relying on the aggregate interlock and the bitumen
properties for its strength. The mix is designed for durability and fatigue behavior.
Bituminous stabilization can be used for roadbase materials based largely on local
experience and subject to construction of trial sections.
Dense bitumen macadams for use as roadbase are continuously graded mixes with an
aggregate structure less dense than asphalt concrete.
MAIN CHARACTERISTICS OF MAJOR MATERIAL TYPES: CEMENT OR LIME STABILIZED
MATERIALS
Cement or lime stabilized materials include cement or lime stabilized subbase or
roadbase
Materials stabilized with cement or lime, for use as subbase or roadbase, are elastic and
possess tensile strength. They usually crack under repeated flexure, and also because of
shrinkage and drying. Advantages of stabilized materials include the fact that they retain
a substantial proportion of their strength when saturated, that the surface deflections of
the pavement are reduced, and that the underlying materials cannot contaminate the
stabilized layer. On the other hand, the tendency of these materials to crack may induce
reflection cracks in the surfacing.

Pavement Design Manual-2014 Chapter 1
Flexible Pavements and Gravel Roads Introduction
Roads Development Agency Page 1-11
The selection of an appropriate stabilizer is made on the basis of the plasticity and
grading of the materials to be treated. The stabilized materials exhibit increased strength
and the required percentage of stabilizer is determined in the laboratory, with a view to
achieve CBRs on the order of 40 and 80 - 100 for subbase and roadbase, respectively.
MAIN CHARACTERISTICS OF MAJOR MATERIAL TYPES: SURFACE TREATMENTS AND SEALS
Double seal bituminous surface treatments are most commonly used in connection with
the catalog of pavement thickness. They consist of the application of two successive
seals, each including the application of a bituminous binder followed by the application
of chippings entirely produced by crushing stone, boulder or gravels. The application of
chippings corresponds to selected combinations, of chipping sizes with specified grading
requirements. Also specified are the flakiness index and the soundness of the chippings.
Single seals for new pavements may also be used over bituminous stabilized roadbases,
for structures expected to carry medium levels of traffic. The single seals may be used in
combination with a slurry (Cape Seal).
1.6 ECONOMIC CONSIDERATIONS
The pavement design engineer, on the basis of the site investigations, should ascertain
that materials required for all components of the pavement structure are available. This
task should be performed concurrently with the design discussed in the following
chapters since, for a given traffic and subgrade conditions, several structures are offered.
Hence, the availability of materials will often influence or dictate the choice between the
alternate pavement structures.
Next, the prevailing unit costs of the materials should be compiled either based on recent
works of similar type and magnitude in the vicinity of the proposed project, or by an
analysis of the mobilization, production and haulage costs.
While researching the recent unit costs of particular materials, a knowledge of past
experience with these materials should necessarily develop, and their performance can be
evaluated. This experience can in turn be incorporated into the process of selection of the
materials.
Vehicle operating costs depend on the road surface condition. The road surface
deterioration, hence its condition, depends on the nature of the traffic, the properties of
the pavement layers materials, the environment, and the maintenance strategy adopted.
Knowledge of the interaction between these factors is the object of RDA’s Pavement
Management System (PMS) and is expected to evolve and be refined as the PMS
procedures are implemented in Somaliland. Ideally, it will be possible in the future to
design a road in such a way that, provided maintenance and strengthening can be carried
out at the proper time, the total cost of the road, i.e. the sum of construction costs,
maintenance costs and road user costs, can be minimized. As road condition surveys and
PMS procedures are conducted on a regular basis, additional information will be
collected to allow road performance models to be refined. Pavement structural design and
pavement rehabilitation design may then become an integral part of the management
system in which design could be modified according to the expected maintenance inputs
in such a way that the most economic strategies could be adopted. These refinements lie

Chapter 1 Pavement Design Manual - 2014
Introduction Flexible Pavements and Gravel Roads
Page 1-12 Roads Development Agency
in the future, but research in this domain has been used, in part, in preparing the
recommendations presented in this manual.
For the pavement structures recommended in this manual, the level of deterioration that
is reached by the end of the design period should be limited to levels which yield
acceptable economic designs under most anticipated conditions. Routine and periodic
maintenance activities are assumed to be performed at a reasonable and not excessive
level.
Illustrative examples of slab thickness design are given in this manual for concrete
pavements. The implementation of such designs, if contemplated, should be further
justified by comparative life-cycle cost analyses.
1.7 BASIS FOR THE DESIGN CATALOG
The pavement designs presented in this manual are based primarily on results of full-
scale experiments and studies of the performance of as-built existing road networks.
In view of the statistical nature of pavement design caused by the large uncertainties in
traffic forecasting and the variability in material properties, climate and road behavior,
the design charts (see Chapter 10) are presented as a catalog of structures. Each structure
is applicable over a small range of traffic and subgrade strength. Such a procedure makes
the charts easy to use, but it is important that the designer is conversant with the notes
applicable to each chart.

Pavement Design Manual - 2014 Chapter 2
Flexible Pavements and Gravel Roads Traffic
Roads Development Agency Page 2-1
2 TRAFFIC
2.1 GENERAL
The deterioration of paved roads caused by traffic results from both the magnitude of
the individual wheel loads and the number of times these loads are applied. It is
necessary to consider not only the total number of vehicles that will use the road but also
the wheel loads (or, for convenience, the axle loads) of these vehicles. Equivalency
factors are used to convert traffic volumes into cumulative standard axle loads and are
discussed in this section. Traffic classes are defined for paved roads, for pavement design
purposes, by ranges of cumulative number of equivalent standard axles (ESAs).
The mechanism of deterioration of gravel roads differs from that of paved roads and is
directly related to the number of vehicles using the road rather than the number of
equivalent standard axles. The traffic volume is therefore used in the design of unpaved
roads, as opposed to the paved roads which require the conversion of traffic volumes into
the appropriate cumulative number of equivalent standard axles.
The process by which traffic is evaluated, in both cases, is illustrated in Figure 2-1. A
complete design example of traffic calculations for flexible pavement design is presented
in subchapter 2.7.
2.2 DESIGN PERIOD
Determining an appropriate design period is the first step towards pavement design.
Many factors may influence this decision, including budget constraints. However, the
designer should follow certain guidelines in choosing an appropriate design period,
taking into account the conditions governing the project. Some of the points to consider
include:
· Functional importance of the road
· Traffic volume
· Location and terrain of the project
· Financial constraints
· Difficulty in forecasting traffic
It generally appears economical to construct roads with longer design periods, especially
for important roads and for roads with high traffic volume. Where rehabilitation would
cause major inconvenience to road users, a longer period may be recommended. For
roads in difficult locations and terrain where regular maintenance proves to be costly and
time consuming because of poor access and non-availability of nearby construction
material sources, a longer design period is also appropriate.
Problems in traffic forecasting may also influence the design. When accurate traffic
estimates cannot be made, it may be advisable to reduce the design period to avoid costly
overdesign.

Chapter 2 Pavement Design Manual - 2014
Traffic Flexible Pavements and Gravel Roads
Page 2-2 Roads Development Agency
Select Design Period
FIGURE 2-1 TRAFFIC EVALUATION
Estimate Initial Traffic
Volume (Initial AADT) per
Class of Vehicle
Estimate Traffic Growth
Determine Cumulative
Traffic Volumes over the Design Period
For Flexible Pavements
Estimate Mean Equivalent Axle Load (ESA) per
Class of Vehicle
Estimate Cumulative ESAs
Over the Design Period
(in one direction)
Select Appropriate Traffic Class (based on ESAs) for
Flexible Pavement Design
Select Appropriate AADT for Design of Gravel
Wearing Course
For Gravel Roads

Pavement Design Manual - 2014 Chapter 2
Flexible Pavements and Gravel Roads Traffic
Roads Development Agency Page 2-3
Bearing in mind the above considerations, it is important that the designer consults RDA
at the outset of the project to ascertain the design period. Table 2-1 shows the general
guidelines:
Table 2-1: Design Period
Road Classification Design Period (years)
Trunk Road
Link Road
Main Access Road
Other Roads
20
20
15
10
2.3 TRAFFIC VOLUMES
VEHICLE CLASSIFICATION
Vehicle classification is an essential aspect of traffic volume evaluation (as well as
evaluation of equivalent axle loads). The types of vehicles are defined according to the
breakdown adopted by RDA for traffic counts: cars; pick-ups and 4-wheel drive vehicles
such as Land Rovers and Land Cruisers; small buses; medium and large size buses; small
trucks; medium trucks; heavy trucks; and trucks and trailers. This breakdown is further
simplified, for reporting purposes, and expressed in the five classes of vehicles (with
vehicle codes 1 to 5) listed in Table 2-2.
Table 2-2: Vehicle Classification
Vehicle
Code
Type of Vehicle Description
1
2
3
4
5
Small car
Bus
Medium Truck
Heavy Truck
Articulated
Truck
Passenger cars, minibuses (up to 24-passenger seats),
taxis, pick-ups, and Land Cruisers, Land Rovers, etc.
Medium and large size buses above 24 passenger seats
Small and medium sized trucks including tankers up to 7
tons load
Trucks above 7 tons load
Trucks with trailer or semi-trailer and Tanker Trailers
It is most often in terms of volumes (e.g. AADT) in each of these 5 classes that the traffic
data will initially be available to the designer. As mentioned before, small cars do not
contribute significantly to the structural damage, particularly for paved roads. Even
though the small cars count is included in any regular traffic count survey, their number
does not influence the pavement design of paved roads. It is also worth noting that the
“heavy” vehicles used in the development of the pavement structures essentially
correspond, for all practical design purposes, to vehicle codes 2 through 5.

Chapter 2 Pavement Design Manual - 2014
Traffic Flexible Pavements and Gravel Roads
Page 2-4 Roads Development Agency
INITIAL TRAFFIC VOLUMES
In order to determine the total traffic over the design life of the road, the first step is to
estimate initial traffic volumes. The estimate should be the (Annual) Average Daily
Traffic (AADT) currently using the route (or, more specifically, the AADT expected to
use the route during the first year the road is placed in service), classified into the five
classes of vehicles described above. Adjustments will usually be required between the
AADT based on the latest traffic counts and the AADT during the first year of service.
These adjustments can be made using the growth factors discussed further below.
Based on the review of various traffic studies conducted in Somaliland, over the past 15
years, it can be concluded that the reported traffic volumes are very erratic. The traffic
volumes do not indicate any specific trend. This makes it all the more difficult to predict
volumes. Some practical constraints in enforcing accurate traffic surveys were also
reported.
Because of the above constraints, a very thorough and conservative traffic count survey
shall be taken up, in particular for all major and heavy traffic roads.
The AADT is defined as the total annual traffic summed for both directions and divided
by 365. It is usually obtained by recording actual traffic volumes over a shorter period
from which the AADT is then estimated. It should be noted that for structural design
purposes the traffic loading in one direction is required and for this reason care is always
required when interpreting AADT figures. For long projects, large differences in traffic
along the road may make it necessary to estimate the flow at several locations.
Traffic counts carried out over a short period as a basis for estimating the AADT can
produce estimates which are subject to large errors because traffic volumes can have
large daily, weekly, monthly and seasonal variations. The daily variability in traffic
volume depends on the volume of traffic, with particularly high variability on roads
carrying less than 1000 vehicles per day. Traffic volumes vary more from day-to-day
than from week-to-week over the year. Thus there are large errors associated with
estimating annual AADTs from traffic counts of only a few days duration, or excluding
the weekend. For the same reason there is a rapid decrease in the likely error as the
duration of the counting period increases up to one week. For counts of longer duration,
improvements in accuracy are less pronounced. Traffic volumes also vary from month-
to-month (seasonal variation), so that a weekly traffic count repeated at intervals during
the year provides a better base for estimating the annual volume of traffic than a
continuous traffic count of the same total duration. Traffic also varies considerably
through a 24-hour period and this needs to be taken into account explicitly as outlined
below.
Based on the above, and in order to reduce error, it is recommended that traffic counts to
establish AADT at a specific site conform to the following practice:
i. The counts are for seven consecutive days.
ii. The counts on some of the days are for a full 24 hours, with preferably at least
one 24-hour count on a weekday and one during a weekend. On the other days
16-hour counts should be sufficient. These should be extrapolated to 24-hour
values in the same proportion as the 16-hour/24-hour split on those days when
full 24-hour counts have been undertaken.

Pavement Design Manual - 2014 Chapter 2
Flexible Pavements and Gravel Roads Traffic
Roads Development Agency Page 2-5
iii. Counts are avoided at times when travel activity is abnormal for short periods
due to the payment of wages and salaries, public holidays, etc. If abnormal
traffic flows persist for extended periods, for example during harvest times,
additional counts need to be made to ensure this traffic is properly included.
iv. If possible, the seven-day counts should be repeated several times throughout
the year. Countrywide traffic data should preferably be collected on a
systematic basis to enable seasonal trends in traffic volumes to be quantified.
Presently, classified traffic counts are normally obtained by counting
manually.
TRAFFIC FORECAST
Even with stable economic conditions, traffic forecasting is an uncertain process.
Although the pavement design engineer may often receive help from specialized
professionals at this stage of the traffic evaluation, some general remarks are in order.
In order to forecast traffic growth it is necessary to separate traffic into the following
three categories:
(a) Normal traffic. Traffic which would pass along the existing road or track even if
no new pavement were provided.
(b) Diverted traffic. Traffic that changes from another route (or mode of transport) to
the project road because of the improved pavement, but still travels between the
same origin and destination.
(c) Generated traffic. Additional traffic which occurs in response to the provision or
improvement of the road.
Normal traffic. The most common method of forecasting normal traffic is to extrapolate
data on traffic levels and assume that growth will either remain constant in absolute
terms i.e. a fixed number of vehicles per year, or constant in relative terms i.e. a fixed
percentage increase. As a general rule it is only safe to extrapolate forward for as many
years as reliable traffic data exist from the past, and for as many years as the same
general economic conditions are expected to continue.
As an alternative to time, growth can be related linearly to anticipated Gross Domestic
Product (GDP). This is normally preferable since it explicitly takes into account changes
in overall economic activity.
If it is thought that a particular component of the traffic (e.g. a category of trucks, due to
the development of an industry) will grow at a different rate to the rest, it should be
specifically identified and dealt with separately, i.e. a uniform growth rate among the
various traffic classes should not necessarily be assumed a priori.
Whatever the forecasting procedure used, it is essential to consider the realism of forecast
future levels.
Diverted traffic. Where parallel routes exist, traffic will usually travel on the quickest or
cheapest route although this may not necessarily be the shortest. Thus, surfacing an
existing road may divert traffic from a parallel and shorter route because higher speeds

Chapter 2 Pavement Design Manual - 2014
Traffic Flexible Pavements and Gravel Roads
Page 2-6 Roads Development Agency
are possible on the surfaced road. Origin and destination surveys should preferably be
carried out to provide data on the traffic diversions likely to arise.
Analysis of origin / destination survey data can be done using computer based programs
to determine the diverted traffic volumes.
Diversion from other transport modes, such as rail or water, is not easy to forecast.
Transport of bulk commodities will normally be by the cheapest mode, though this may
not be the quickest.
Diverted traffic is normally forecast to grow at the same rate as traffic on the road from
which it diverted.
Generated traffic. Generated traffic arises either because a journey becomes more
attractive by virtue of a cost or time reduction or because of the increased development
that is brought about by the road investment. Generated traffic is also difficult to forecast
accurately and can be easily overestimated.
The recommended approach to forecasting generated traffic is to use demand
relationships.
Some studies carried out in similar countries give an average for the price elasticity of
demand for transport of about -1.0. This means that a one per cent decrease in transport
costs leads to a one per cent increase in traffic.
Note: At this stage, the designer has the required elements to determine the initial and
forecast AADT. For paved roads, it is still necessary to consider the axle loads in order to
determine the cumulative equivalent standard axle loads (ESA) over the design period
(see Section 2.4 below) in order to select an appropriate traffic class (Section 2.4). For
unpaved roads, as indicated earlier, only AADTs are required: the design AADT can be
determined in a similar fashion as for paved roads using only Steps 1 to 3 of 5 of Section
2.4 and select the corresponding traffic class in Section 2.5.
DETERMINATION OF CUMULATIVE TRAFFIC VOLUMES
In order to determine the cumulative number of vehicles over the design period of the
road, the following procedure should be followed:
1. Determine the initial traffic volume (AADT0) using the results of the traffic survey
and any other recent traffic count information that is available. For paved roads,
detail the AADT in terms of car, bus, truck, and truck-trailer.
2. Estimate the annual growth rate “i” expressed as a decimal fraction, and the
anticipated number of years “x” between the traffic survey and the opening of the
road.
3. Determine AADT1 the traffic volume in both directions on the year of the road
opening by:
AADT1 = AADT0 (1+i)x

Pavement Design Manual - 2014 Chapter 2
Flexible Pavements and Gravel Roads Traffic
Roads Development Agency Page 2-7
For paved roads, also determine the corresponding daily one-directional traffic
volume for each type of vehicle.
4. The cumulative number of vehicles, T over the chosen design period N ( in years) is
obtained by:
T = 365 AADT1 [ (1+i)N – 1] / ( i )
For paved roads, conduct a similar calculation to determine the cumulative volume in
each direction for each type of vehicle.
2.4 AXLE LOADS
AXLE EQUIVALENCY
The damage that vehicles do to a paved road is highly dependent on the axle loads of the
vehicles. For pavement design purposes the damaging power of axles is related to a
“standard” axle of 8.16 metric tons using empirical equivalency factors. In order to
determine the cumulative axle load damage that a pavement will sustain during its design
life, it is necessary to express the total number of heavy vehicles that will use the road
over this period in terms of the cumulative number of equivalent standard axles (ESAs).
Axle loads can be converted and compared using standard factors to determine the
damaging power of different vehicle types. A vehicle’s damaging power, or Equivalency
Factor (EF), can be expressed as the number of equivalent standard axles (ESAs), in units
of 80 kN. The design lives of pavements are expressed in terms of the ESAs they are
designed to carry.
AXLE LOAD SURVEYS
Axle load surveys must be carried out to determine the axle load distribution of a sample
of the heavy vehicles (vehicles with codes of 2 to 5) using the road. Data collected from
these surveys are used to calculate the mean number of ESA for a typical vehicle in each
class. These values are then used in conjunction with traffic forecasts to determine the
predicted cumulative equivalent standard axles that the road will carry over its design
life.
Most of the countries have regulations on the size and weight of vehicles to ensure road
safety and to contain the weight of vehicles within the carrying capacity of the road
pavements and bridges. However, in developing countries like Somaliland, enforcement
has usually proved to be quite impracticable. Vehicles are grossly overloaded. Examples
were reported where axle loads are as much as 60 per cent higher than those permitted in
the regulations. In such cases, a pavement design which assumes that the vehicles would
be conforming to the country’s regulations on vehicle weight and axle loading is bound
to fail.
Hence, it is emphasized here that the designer should consider the factors:
1. Overloaded vehicles using the road
2. Ability to undertake effective road maintenance in his pavement design
analysis on case by case basis.

Chapter 2 Pavement Design Manual - 2014
Traffic Flexible Pavements and Gravel Roads
Page 2-8 Roads Development Agency
The types of construction must be robust, capable of carrying the heavy loads, as far as
possible, be capable withstanding some neglect of routine and periodic maintenance.
No regular axle load surveys are conducted in Somaliland at present. Each individual
project depends on its own axle load survey data. As mentioned earlier, since these
surveys are for a limited time period, they may not give a representative data. Hence it is
recommended that, a very thorough and conservative axle load survey over extended
periods be carried out to determine the axle loads as accurately as possible. The accuracy
of these surveys will have influence on the determination of traffic class.
Ideally, several surveys at periods that will reflect seasonal changes in the magnitude of
axle loads are recommended. Portable vehicle-wheel weighing devices are available
which enable a small team to weigh up to 90 vehicles per hour.
The duration of the survey should be based on the same considerations as for traffic
counting outlined in Section 2.3.
On certain roads it may be necessary to consider whether the axle load distribution of the
traffic travelling in one direction is the same as that of the traffic travelling in the
opposite direction. Significant differences between the two streams can occur on roads
serving ports, quarries, cement works, etc., where the vehicles travelling one way are
heavily loaded but are empty on the return journey. In such cases the results from the
more heavily trafficked lane should be used when converting volumes to ESA for
pavement design. Similarly, special allowance must be made for unusual axle loads on
roads which mainly serve one specific economic activity, since this can result in a
particular vehicle type being predominant in the traffic spectrum. This is often the case,
for example, in such areas as timber extraction areas or mining areas.
Once the axle load data has been gathered, it remains to be used to determine the mean
equivalency factor for each class of vehicle. Computer programs may be used to assist
with the analysis of the results from axle load surveys. Such programs provide a detailed
tabulation of the survey results and determine the mean equivalency factors for each
vehicle type if required. Alternatively, standard spreadsheet programs can be used.
The following method of analysis is recommended:
a. Determine the equivalency factors for each of the wheel loads measured during
the axle load survey, using Table 2-3 or the accompanying equation, in order to
obtain the equivalency factors for vehicle axles. The factors for the axles are
totaled to give the equivalency factor for each of the vehicles. For vehicles with
multiple axles i.e. tandems, triples etc., each axle in the multiple group is
considered separately.
b. Determine the mean equivalency factor for each class of heavy vehicle (i.e. bus,
truck and truck-trailer) travelling in each direction. It is customary to assume that
the axle load distribution of the heavy vehicles will remain unchanged for the
design period of the pavement.

Pavement Design Manual - 2014 Chapter 2
Flexible Pavements and Gravel Roads Traffic
Roads Development Agency Page 2-9
Note: This method of determining the mean equivalency factors must always be used;
calculating the equivalency factor for the average axle load is incorrect and leads to large
errors.
CUMULATIVE EQUIVALENT STANDARD AXLES OVER THE DESIGN PERIOD
Finally, the cumulative ESAs over the design period (N) are calculated as the products of
the cumulative one-directional traffic volume (T) for each class of vehicle by the mean
equivalency factor for that class and added together for each direction. The higher of the
two directional values should be used for design.
The relationship between a vehicle’s EF and its axle loading is normally considered in
terms of the axle mass measured in kilograms. The relationship takes the form:
Equivalency factor = Axlei n
8160
where
axlei = mass of axle i
n = a power factor that varies depending on the pavement construction type and
subgrade but which can be assumed to have a value of 4.5
and the standard axle load is taken as 8 160kg with the summation taken over the
number of axles on the vehicle in question
A list of axle load equivalency factors in given in Table 2-3:
Table 2-3: Equivalency Factors for Different Axle Loads (Flexible Pavements)
Wheel load Axle load Equivalency
(single & dual) (103kg) Factor
(103 kg) (EF)
1.5 3.0 0.01
2.0 4.0 0.04
2.5 5.0 0.11
3.0 6.0 0.25
3.5 7.0 0.50
4.0 8.0 0.91
4.5 9.0 1.55
5.0 10.0 2.50
5.5 11.0 3.93
6.0 12.0 5.67
6.5 13.0 8.13
7.0 14.0 11.3
7.5 15.0 15.5
8.0 16.0 20.7
8.5 17.0 27.2
9.0 18.0 35.2
9.5 19.0 44.9
10.0 20.0 56.5 Notes: (1) The equivalency factors given in Table 2-3 are to be used solely in the context of this
volume for flexible pavement design. Refer to Chapter 13 2 for specific factors for rigid
pavements.

Chapter 2 Pavement Design Manual - 2014
Traffic Flexible Pavements and Gravel Roads
Page 2-10 Roads Development Agency
(2) The equation used has been widely used for years, but was not developed under a range of loads and climatic and soils conditions representative of those prevailing in
Somaliland. Caution must therefore be exercised in assessing the results of its use and
sensitivity analyses are recommended in final design.
When the pavement design is for carriageways with more than one traffic lane in each
direction, a reduction may be considered in the cumulative ESA to take into account for
the design. The ranges given in Table 2-4 are suggested for the percentage of design
ESAs to consider in the design lane:
Table 2-4: Percentage ESAs per Lane for Multiple Lanes
Number of lanes
in each direction
Percent of ESAs
in design lane 1
2
3
100
80 – 100
60 – 80
The pavement design thicknesses required for the design lane are usually applied to the
whole carriageway width.
2.5 TRAFFIC CLASSES FOR FLEXIBLE PAVEMENT DESIGN
Accurate estimates of cumulative traffic are very difficult to achieve due to errors in the
surveys and uncertainties with regard to traffic growth, axle loads and axle equivalencies.
To a reasonable extent, however, pavement thickness design is not very sensitive to
cumulative axle loads and the method recommended in this manual provides fixed
structures of paved roads for ranges of traffic as shown in Table 2-5. As long as the
estimate of cumulative equivalent standard axles is close to the center of one of the
ranges, any errors are unlikely to affect the choice of pavement design.
However, if estimates of cumulative traffic are close to the boundaries of the traffic
ranges, then the basic traffic data and forecasts should be re-evaluated and sensitivity
analyses carried out to ensure that the choice of traffic class is appropriate. As mentioned
earlier, depending on the degree of accuracy achieved, a higher traffic class may be
appropriate for some cases.
Table 2-5: Traffic Classes for Flexible Pavement Design
Traffic classes Range (106
ESAs)
T1 < 0.3
T2 0.3 - 0.7
T3 0.7 - 1.5
T4 1.5 - 3.0
T5 3.0 - 6.0
T6 6.0 - 10
T7 10 - 17
T8 17 – 30

Pavement Design Manual - 2014 Chapter 2
Flexible Pavements and Gravel Roads Traffic
Roads Development Agency Page 2-11
2.6 ACCURACY- TRAFFIC CLASSES
All survey data are subject to errors. Traffic data, in particular, can be very inaccurate
and predictions about traffic growth are also prone to large errors. Accurate calculations
of cumulative traffic are therefore very difficult to make. To minimize these errors there
is no substitute for carrying out specific traffic surveys for each project for the durations
suggested in Section 2.3. Additional errors are introduced in the calculation of
cumulative standard axles because any small errors in measuring axle loads are amplified
by the fourth power law relationship between the two.
Fortunately, pavement thickness design is not very sensitive to cumulative axle loads and
the method recommended in this manual provides fixed structures of paved roads for
ranges of traffic as shown in Table 2-5. As long as the estimate of cumulative equivalent
standard axles is close to the center of one of the ranges, any errors are unlikely to affect
the choice of pavement design. However, if estimates of cumulative traffic are close to
the boundaries of the traffic ranges, then the basic traffic data and forecasts should be re-
evaluated and sensitivity analyses carried out to ensure that the choice of traffic class is
appropriate. As mentioned in section 2.3 and 2.4, depending on the degree of accuracy
achieved, higher traffic class may be appropriate for some cases.
It is recommended that for the highest traffic class for unpaved roads (T4), a verification
of the cumulative number of equivalent axle loads be carried out as for paved roads, in
order to determine in which traffic class of paved road a particular road project would
fall. Consideration should be given to paving if the evaluation indicates a traffic class of
paved road higher than T1. No strict higher limit of traffic is given for the traffic class T4
for unpaved roads, but the recommendations given herein are generally considered to be
for traffic levels below an AADT of 500 vehicles per day in both directions.
2.7 DESIGN EXAMPLE
Initial traffic volumes in terms of AADTs have been established for 2014 for a section of
a trunk road under study, as follows:
Vehicle classification 2014 AADT
Car 250
Bus 40
Truck 130
Truck-trailer 180
The anticipated traffic growth is a constant 5%, and the opening of the road is scheduled
for 2005. In addition, an axle load survey has been conducted, giving representative axle
loads for the various classes of heavy vehicles, such as given below for truck-trailers (it
is assumed that the loads are equally representative for each direction of traffic):

Chapter 2 Pavement Design Manual - 2014
Traffic Flexible Pavements and Gravel Roads
Page 2-12 Roads Development Agency
Axle loads (Kg)
Vehicle No Axle 1 Axle 2 Axle 3 Axle 4
1 6780 14150 8290 8370
2 6260 12920 8090 9940
3 6350 13000 8490 9340
4 5480 12480 7940 9470
5 6450 8880 6290 10160
6 5550 12240 8550 10150
7 5500 11820 7640 9420
8 4570 13930 2720 2410
9 4190 15300 3110 2450
10 4940 15060 2880 2800
The projected AADTs in 2005 can be calculated as (AADTs in 2001) x (1.05)3, and the
corresponding one-directional volumes for each class of vehicle in 2005 are:
Vehicle classification One-directional traffic volume in 2014
Car 145
Bus 23
Truck 75
Truck-trailer 104
Selecting, for this trunk road, a design period of 20 years, the cumulative number of
vehicles in one direction over the design period is calculated as:
Vehicle classification Cumulative no. of vehicles in one direction over 20 years
Car 365x145[(1.05)20
-1]/0.05=1750016
Bus 365x23[(1.05)20
-1]/0.05=277589
Truck 365x75[(1.05)20
-1]/0.05=905180
Truck-trailer 365x104[(1.05)20
-1]/0.05=1255184
Equivalency factors for the sample of truck-trailers, and a mean equivalency factor for
that class of heavy vehicles, can be calculated as outlined below:
Vehicle No Axle 1 Axle 2 Axle 3 Axle 4 Total
Load Factor Load Factor Load Factor Load Factor Factor
1 6780 0.43 14150 11.91 8290 1.07 8370 1.12 14.54
2 6260 0.30 12920 7.91 8090 0.96 9940 2.43 11.60
3 6350 0.32 13000 8.13 8490 1.20 9340 1.84 11.49
4 5480 0.17 12480 6.77 7940 0.88 9470 1.95 9.77
5 6450 0.35 8880 1.46 6290 0.31 10160 2.68 4.80
6 5550 0.18 12240 6.20 8550 1.23 10150 2.67 10.28
7 5500 0.17 11820 5.30 7640 0.74 9420 1.91 8.12
8 4570 0.07 13930 11.10 2720 0.01 2410 0.00 11.18
9 4190 0.05 15300 16.92 3110 0.01 2450 0.00 16.99
10 4940 0.10 15060 15.76 2880 0.01 2800 0.01 15.88
Mean equivalency factor for truck-trailers = 11.47

Pavement Design Manual - 2014 Chapter 2
Flexible Pavements and Gravel Roads Traffic
Roads Development Agency Page 2-13
For the sake of this example, it will be assumed that similar calculations have been
performed, giving mean equivalency factors for buses and trucks of 0.14 and 6.67
respectively.
Finally, the cumulative numbers of ESAs over the design period are calculated as
follows, using the cumulative numbers of vehicles previously calculated and the
equivalency factors:
Vehicle classification Cum. no. of vehicles Equivalency factor 106 ESAs
Car 1750016 0.00 0.0
Bus 277589 0.14 0.0
Truck 905180 6.67 6.0
Truck-trailer 1255184 11.47 14.4
Total ESAs = 20.4
Based on the above analysis, the trunk road under study would belong to the traffic class
T8 for flexible pavement design.
2.8 ESTIMATING AXLE LOADS FOR GRAVEL ROADS
It is unlikely to be cost effective to carry out axle load surveys on gravel and low
standard in Somaliland. In such circumstances, the default values given in Table 2.6
should be used:
Table 2-6: Default Values for Axle Load Factors for Gravel and Low Standard
Roads
Axles per Heavy Vehicle 2.3
ESAs per Heavy Axle 0.20
ESAs per Heavy Vehicle 0.46
The implications of applying the default values for different design periods are shown in
Table 2.7.
Default ESA values should be modified for specific local circumstances. For example,
where a factory or mine exists near the project road, use values higher than the defaults,
or an axle load survey can be done to provide a better estimate of ESAs per vehicle. A
simpler option is to analyze the types of vehicles expected to use the road. General
Guidance on likely equivalency factors for different vehicle types is given in Table 2.8.
Use the following procedure to determine the cumulative ESAs over the design life:
1. Determine the daily traffic flow of heavy vehicles using results from the traffic
counts or other recent traffic survey data.
2. Determine the average daily one-directional traffic flow for heavy vehicles.
3. Using considerations of flows and growth rates for normal, diverted and generated
traffic, forecast the one-directional traffic flow of heavy vehicles which will travel
over the road during the design life.

Chapter 2 Pavement Design Manual - 2014
Traffic Flexible Pavements and Gravel Roads
Page 2-14 Roads Development Agency
4. Determine the mean EF for heavy vehicles in each direction of travel, and take the
higher of these values.
5. The products of the cumulative one-directional traffic flows for heavy vehicles over
the design life of the road and the mean EF, should then be calculated. This gives the
cumulative ESAs for the heavier laden direction.
Note the following points in the calculation:
The traffic used is that 1) for heavy vehicles only, and 2) traveling on one direction
only (the most heavily laden direction)
If axle load data are available from surveys, it is important that the EF for each
vehicle is determined, and the mean found by averaging these values. Determining
the EF of the mean axle load will seriously underestimate the true value.
Table 2-7: Cumulative Default ESAs for Different Design Periods
First Year Traffic Cumulative Values
after 10 Years
Cumulative Values
after 15 Years
Cumulative Values
after 20 Years
AADT
Heavy
vehicles
per lane
Heavy
vehicles
per lane
ESAs
Heavy
vehicles
per lane
ESAs
Heavy
vehicles
per lane
ESAs
18
20
30
40
50
60
80
100
120
150
180
200
300
350
400
500
3
4
5
7
9
11
14
18
21
26
32
35
55
61
70
88
13 803
15 337
22 786
30 674
39 438
46 011
61 348
76 685
92 022
113 932
138 033
155 379
230 055
268 398
306 740
383 425
6 350
7 055
10 482
14 110
18 141
21 165
28 220
35 275
42 330
52 409
63 495
70 050
105 825
123 463
141 100
176 376
23 023
25 582
38 007
51 163
65 781
76 745
102 326
127 908
153 489
190 034
230 234
258 515
383 723
447 676
511 630
639 538
10 591
11 767
17 483
23 535
30 259
35 302
47 070
58 837
70 605
87 416
105 907
117 675
176 512
205 931
235 350
294 187
34 237
38 042
56 519
76 083
97 821
114 125
152 166
190 208
228 249
282 594
342 374
380 415
570 623
665 726
760 830
951 038
15 749
17 499
25 999
34 998
44 998
52 497
69 996
87 495
104 995
129 993
157 492
174 991
262 486
306 234
349 982
437 477 Notes:
1. Heavy vehicles per lane is assumed to be 35% of the one lane flow (ie (AADT x 0.35)/2) 2. Traffic assumed to grow at 4 per cent
Table 2-8: Equivalency Factors for Different Heavy Vehicle Configurations
Vehicle Type Average ESAs
per Vehicle
Typical Range of Average
ESAs per Vehicle
2-axle truck
2-axle bus
3-axle truck
4-axle truck
5-axle truck
0.70
0.73
1.70
1.80
2.20
0.30 – 1.10
0.41 – 1.52
0.80 – 2.60
0.80 – 3.00
1.00 – 3.00

Pavement Design Manual - 2014 Chapter 2
Flexible Pavements and Gravel Roads Traffic
Roads Development Agency Page 2-15
Estimates of baseline traffic flows, traffic growth rates and axle loading are subject to
errors of 20% or more. Additional errors are introduced into the calculation of
Cumulative ESAs because small errors in axle loads are amplified by the 4.5-power
relationship between the two. To minimize these errors, carry out specific traffic and
axle load surveys. The design methods in this manual tend to be conservative, so the
lower standard design should always be adopted at the margin.

Pavement Design Manual - 2014 Chapter 3
Flexible Pavements and Gravel Roads Subgrade
Roads Development Agency Page 3-1
3 SUBGRADE
3.1 GENERAL
The type of subgrade soil is largely determined by the location of the road. However,
where the soils within the possible corridor for the road vary significantly in strength
from place to place, it is clearly desirable to locate the pavement on the stronger soils if
this does not conflict with other constraints. For this reason, the pavement engineer
should be involved in the route corridor selection process when choices made in this
regard influence the pavement structure and the construction costs.
The strength of the road subgrade for flexible pavements is commonly assessed in terms
of the California Bearing Ratio (CBR) and this is dependent on the type of soil, its
density, and its moisture content. Direct assessment of the likely strength or CBR of the
subgrade soil under the completed road pavement is often difficult to make. Its value,
however, can be inferred from an estimate of the density and equilibrium (or ultimate)
moisture content of the subgrade together with knowledge of the relationship between
strength, density and moisture content for the soil in question. This relationship must be
determined in the laboratory. The density of the subgrade soil can be controlled within
limits by compaction at suitable moisture content at the time of construction. The
moisture content of the subgrade soil is governed by the local climate and the depth of
the water table below the road surface.
In the following sections, it has been considered useful to first recall some basic
relationships involved in the modifications imposed on the subgrade soil during and after
the road construction, and how they affect the final subgrade strength (Section 3.2). Next,
in Section 3.3, the various steps leading to the selection of a design CBR are detailed.
3.2 GENERAL DENSITY-MOISTURE CONTENT-STRENGTH RELATIONSHIPS OF THE
SUBGRADE
As indicated above, the strength of the subgrade is assessed in terms of CBR. The CBR
depends on the nature of the soil, its density and its moisture content.
The nature of the soil is dictated by the route location and the selected longitudinal
profile for the road, and does not change except for the influence of the borrow materials
and the movement of materials between cut and fill during earthworks operations.
By contrast, the (dry) density of the subgrade soil will be modified from its original state
at the time of the road construction, by compaction at subgrade level in cuts and by
compaction of the excavated materials used in embankments. Similarly, the moisture
content of the natural subgrade soil will be altered during construction, in order to
approach the optimum (indicated by laboratory tests) which is conducive to a greater
increase in density and in corresponding CBR strength. Upon completion of the
construction operations, the natural soils will have been brought to a second state of
moisture, density and strength. This second state is not the final state of the subgrade,
however, and except in few particular cases (see Category 1 below), should not be used
in design.

Chapter 3 Pavement Design Manual - 2014
Subgrade Flexible Pavements and Gravel Roads
Page 3-2 Roads Development Agency
Following the construction, the compacted subgrade soil will approximately keep the
same dry density, except for compaction under traffic and possible volume variations of
certain sensitive soils. However, even if the pavement was constructed immediately after
finishing the subgrade and if the pavement could be considered perfectly waterproof, the
moisture content of the subgrade would nevertheless evolve due to local soil,
groundwater or seasonal conditions. It is this third ultimate state of the subgrade that
generally needs to be considered in design.
To illustrate the above discussion, Figures 3-1 and 3-2 (adapted from Ref. 7) give
examples of relationships between density, moisture content and CBR. Two figures are
given to emphasize that the relationships are specific to the nature of the subgrade soil.
The figures indicate a “likely level of compaction achieved during construction”, i.e. the
second stage mentioned above. It is easy to imagine an initial state of the natural soil,
with lower density and CBR. It is also easy to imagine an increase (for instance) in
moisture content following the construction, with a corresponding decrease in strength.
3.3 DESIGN SUBGRADE STRENGTH
To determine the subgrade strength to use for the design of the road pavement, it is
apparent from the above that it is necessary to ascertain the density-moisture content-
strength relationship(s) specific to the subgrade soil(s) encountered along the road under
study. It is also necessary to select the density which will be representative of the
subgrade once compacted. Estimating the subgrade moisture content that will ultimately
govern the design, i.e. the moisture content following the construction, is also required. It
is recommended to determine the moisture content as a first step in the process, as this
could influence the subsequent ones.
Figure 3-1: Dry Density, Moisture Content, Soil Strength Relationship for a
Silty Clay

Pavement Design Manual - 2014 Chapter 3
Flexible Pavements and Gravel Roads Subgrade
Roads Development Agency Page 3-3
Figure 3-2: Dry Density, Moisture Content, Soil Strength Relationship for a Well-
Graded Sand
ESTIMATED DESIGN MOISTURE CONTENT OF THE SUBGRADE
After the pavement is constructed, the moisture content of the subgrade will generally
change.
In the dry southeast and northeast parts of Somaliland, a decrease in the moisture content
may be expected.
The moisture content, on the other hand, can increase elsewhere due to perched water
tables during wet seasons. Also, in low-lying areas, the normal water table may be close
to the finished subgrade level and influence the ultimate moisture content (whereas, with
deep water tables and proper design and construction, it is less likely that the subgrade
will get wetter after construction).
To approach the selection of the design moisture content, it is worth considering the
classification into three conditions (cf. Ref. 1 and 7):
Category 1: The water table is within 7 meters of the proposed road surface
In that case, the depth to the water table may govern the subgrade moisture.
Note: The depth at which the water table becomes the dominant factor depends on the
type of soil. For example, in non-plastic soils the water table will dominate the subgrade moisture
content when it rises to within 1 m of the road surface, in sandy clays (PI<20 %) the water table will dominate when it rises to within 3m of the road surface, and in heavy clays (PI>40 %) the
water table will dominate when it rises to within 7m of the road surface.

Chapter 3 Pavement Design Manual - 2014
Subgrade Flexible Pavements and Gravel Roads
Page 3-4 Roads Development Agency
It is best, for this category of conditions, to observe the water table in boreholes and
determine its seasonal high. The moisture content may be measured below existing
pavements in the vicinity, if such pavements exist, care being taken to make the
measurements when the water table is at its highest level. These pavements should be
greater than 3m wide and more than two years old and samples should preferably be
taken from under the carriageway about 0.5m from the edge. Allowance can be made for
different soil types by virtue of the fact that the ratio of subgrade moisture content to
plastic limit is the same for different subgrade soils when the water table and climatic
conditions are similar.
As an alternate, if there is no suitable paved road in the vicinity, measurement of soil
suction may be considered to determine the influence of the water table on the subgrade
moisture content (as described in Appendix B). This method however requires that the
apparatus and skilled personnel are available.
Another design approach alternative, if the water table level can be determined, is given
further below (see Table 3-2). This approach may on occasions omit the determination of
the moisture content and correlate directly the depth of water table and nature of the soil
to an estimated subgrade strength class. This method is not as precise as a direct
measurement, but can help in any event to verify that the results obtained are reliable.
Finally, in some cases such as in particularly low lying areas, or where it is determined or
strongly suspected that the water table is close to the subgrade finished level, it is
appropriate to consider that the moisture content will reach or approach saturation. The
design strength may then be based on this assumption (design CBR based on testing
soaked specimens).
Category 2: The water table is deep, but the rainfall can influence the subgrade
moisture content under the road
These conditions occur when rainfall exceeds evapotranspiration for at least two months
of the year. The rainfall in such areas, which represent the greater part of Somaliland, is
greater than 250 mm per year and is seasonal. The moisture condition under an
impermeable pavement will depend on the balance between the water entering the
subgrade (e.g. through the shoulders and at the edges of the pavement) during wet
weather and the moisture leaving the ground by evapotranspiration during dry periods.
The moisture condition for design purposes can be taken as the optimum moisture
content given by ASTM Test Method D 698.
Exceptions to this situation are when perched water tables are suspected, or where there
may be doubts as to the possibility to keep the pavement surface sufficiently waterproof
or to ensure adequate internal drainage (cf. Chapter 5). In these latter cases it will be
prudent to consider saturated conditions.
Category 3: Deep water table and arid climate
These conditions may occur where the climate is dry throughout most of the year, with
annual rainfall of 250 mm or less.

Pavement Design Manual - 2014 Chapter 3
Flexible Pavements and Gravel Roads Subgrade
Roads Development Agency Page 3-5
In such conditions, the moisture content is likely to be relatively low. It is recommended
to adopt for design purposes a value on the order of 80% of the optimum moisture
content obtained by ASTM Test Method D 698, reflecting the probability that the
subgrade will lose some moisture and gain strength after construction.
Note: The methods of estimating the subgrade moisture content for design outlined above are
based on the assumption that the road pavement is virtually impermeable. Dense bitumen-
bound materials, stabilized soils with only very fine cracks, and crushed stone or gravel with more than 15 per cent of material finer than the 75 micron sieve are themselves impermeable
(permeability less than 10-7
meters per second) and therefore subgrades under road pavements
incorporating these materials are unlikely to be influenced by water infiltrating directly from above.
However, if water, shed from the road surface or from elsewhere, is able to penetrate to the subgrade for any reason, the subgrade may become much wetter. In such cases the strength of
subgrades with moisture conditions in Categories 1 and 2 should be assessed on the basis of
saturated CBR samples, as previously indicated. Subgrades with moisture conditions in
Category 3 are unlikely to wet up significantly and the subgrade moisture content for design in such situations can be taken as the optimum moisture content given by ASTM Test Method D
698.
REPRESENTATIVE DENSITY
After estimating the subgrade moisture content for design, it is then necessary to
determine a representative density at which a design CBR value will be selected.
To specify densities during construction, it is recommended that the top 25 cm of all
subgrades should be compacted to a relative density of at least 100% of the maximum
dry density achieved by ASTM Test Method D 698 (light or standard compaction).
Alternatively, at least 93% of the maximum dry density achieved by ASTM Test Method
D 1557 may be specified. With modern compaction equipment, a relative density of 95%
of the density obtained in the heavier compaction test should be achieved without
difficulty, but tighter control of the moisture content will be necessary.
As a result, it is generally appropriate to base the determination of the design CBR on a
density of 100% of the maximum dry density achieved by ASTM Test Method D 698
(light or standard compaction) or, alternately, on 93% of the maximum dry density
achieved by ASTM Test Method D 1557 (heavy or modified compaction).
Variations from these usual assumptions are possible on a case by case basis, in light of
local experience and laboratory testing. It remains nevertheless important to verify that
the density assumed in design is consistent with the minimum density specified for a
particular road project.
SPECIFIC DENSITY-MOISTURE CONTENT- STRENGTH RELATIONSHIPS
It is generally recommends as a first step to conduct standard compaction tests (ASTM D
698) and to measure the CBR on samples molded at 100% MDD and OMC (standard
compaction), to guide in the selection of homogeneous sections of a road project.
Following this selection, each typical soil is subjected to a more detailed testing
involving three levels of compaction, and, at each level, two conditions of moisture.

Chapter 3 Pavement Design Manual - 2014
Subgrade Flexible Pavements and Gravel Roads
Page 3-6 Roads Development Agency
The design CBR is then obtained by interpolation as illustrated below. This method
enables an estimate to be made of the subgrade CBR at different densities and allows the
effects of different levels of compaction control on the structural design to be evaluated.
DESIGN CBR AND DESIGN SUBGRADE STRENGTH CLASS
Figure 3-3 shows a detailed dry density/moisture content/CBR relationship (adapted from
Ref. 1) for a sandy-clay soil that was obtained by compacting samples at several moisture
contents to three levels of compaction. By interpolation, a design subgrade CBR of about
15 per cent is obtained if a relative density of 100 per cent of the maximum dry density
obtained in the ASTM Test Method D 698 Test is specified and the subgrade moisture
content was estimated to be 20 percent.
Figure 3-3: Dry Density, Moisture Content-CBR Relationships for Sandy-Clay
Soil
The procedure outlined above is not as elaborate as to give complete interpolation curves
as shown in Figure 3-3, but is nevertheless sufficient to conduct the necessary
interpolations. This laboratory determination is the first (and generally preferred) option
available to obtain a design CBR.
As an additional option (but not recommended to be used alone), in areas where existing
roads have been built on the same subgrade, direct measurements of the subgrade
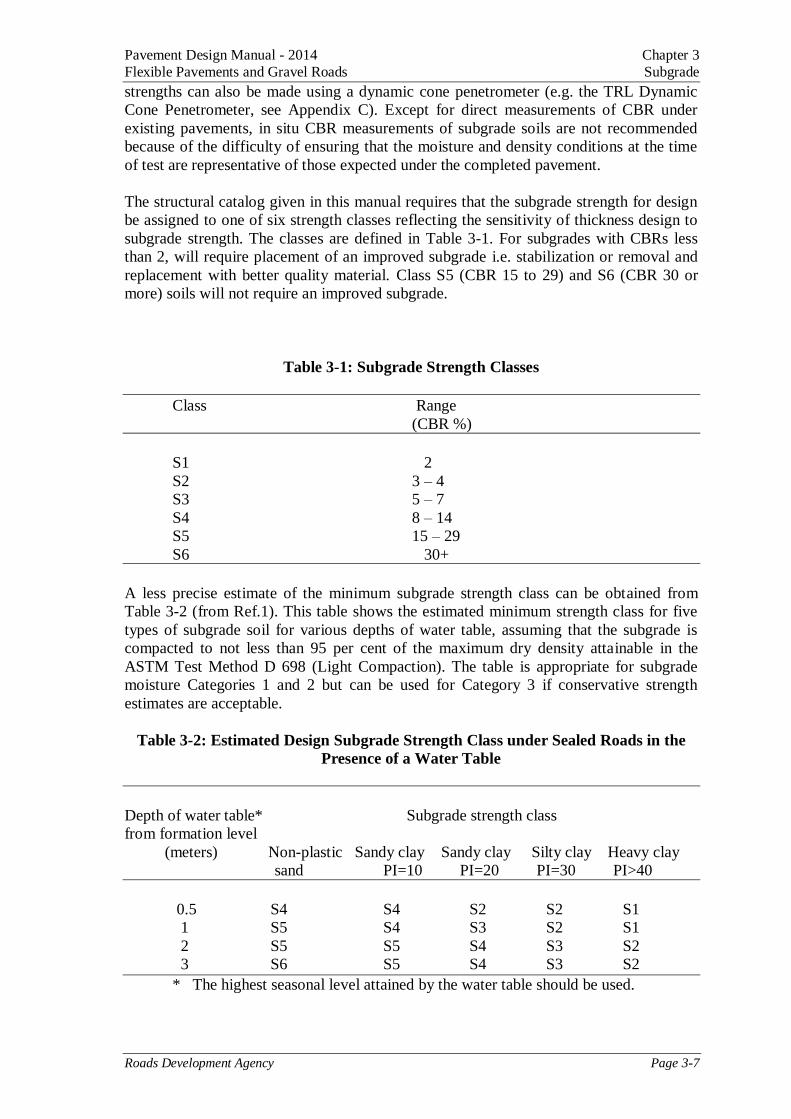
Pavement Design Manual - 2014 Chapter 3
Flexible Pavements and Gravel Roads Subgrade
Roads Development Agency Page 3-7
strengths can also be made using a dynamic cone penetrometer (e.g. the TRL Dynamic
Cone Penetrometer, see Appendix C). Except for direct measurements of CBR under
existing pavements, in situ CBR measurements of subgrade soils are not recommended
because of the difficulty of ensuring that the moisture and density conditions at the time
of test are representative of those expected under the completed pavement.
The structural catalog given in this manual requires that the subgrade strength for design
be assigned to one of six strength classes reflecting the sensitivity of thickness design to
subgrade strength. The classes are defined in Table 3-1. For subgrades with CBRs less
than 2, will require placement of an improved subgrade i.e. stabilization or removal and
replacement with better quality material. Class S5 (CBR 15 to 29) and S6 (CBR 30 or
more) soils will not require an improved subgrade.
Table 3-1: Subgrade Strength Classes
Class Range
(CBR %)
S1 2
S2 3 – 4
S3 5 – 7
S4 8 – 14
S5 15 – 29
S6 30+
A less precise estimate of the minimum subgrade strength class can be obtained from
Table 3-2 (from Ref.1). This table shows the estimated minimum strength class for five
types of subgrade soil for various depths of water table, assuming that the subgrade is
compacted to not less than 95 per cent of the maximum dry density attainable in the
ASTM Test Method D 698 (Light Compaction). The table is appropriate for subgrade
moisture Categories 1 and 2 but can be used for Category 3 if conservative strength
estimates are acceptable.
Table 3-2: Estimated Design Subgrade Strength Class under Sealed Roads in the
Presence of a Water Table
Depth of water table* Subgrade strength class
from formation level
(meters) Non-plastic Sandy clay Sandy clay Silty clay Heavy clay
sand PI=10 PI=20 PI=30 PI>40
0.5 S4 S4 S2 S2 S1
1 S5 S4 S3 S2 S1
2 S5 S5 S4 S3 S2
3 S6 S5 S4 S3 S2
* The highest seasonal level attained by the water table should be used.

Chapter 3 Pavement Design Manual - 2014
Subgrade Flexible Pavements and Gravel Roads
Page 3-8 Roads Development Agency
The design subgrade strength class together with the traffic class obtained in Chapter 2 is
then used with the catalog of structures to determine the pavement layer thicknesses
(Chapter 10).
Note: Since the strength classes given in Table 3-2 are based on estimated minimum CBR values,
wherever possible the CBR should be measured by laboratory testing at the appropriate moisture content.
1. Table 3-2 is not applicable for silt, micaceous, organic or tropically weathered clays.
Laboratory CBR tests should be undertaken for these soils.
2. A more detailed table relating soil type, minimum design CBR and depth of water table may
be found in Ref. 7.
DELINEATION OF SUBGRADE AREAS
A road section for which a pavement design is undertaken should be subdivided into
subgrade areas where the subgrade CBR can be reasonably expected to be uniform, i.e.
without significant variations. Significant variations in this respect mean variations that
would yield different subgrade classes as defined herein further below. However, it is not
practical to create delineation between subgrade areas that would be too precise, and
indeed this could be the source of confusion during construction. The soils investigations
should delineate subgrade design units on the basis of geology, pedology, drainage
conditions and topography, and consider soil categories which have fairly consistent
geotechnical characteristics (e.g. grading, plasticity, CBR). Usually, the number of soil
categories and the number of uniform subgrade areas will not exceed 4 or 5 for a given
road project. Generally, it is advisable to avoid short design sections along the alignment.
Where the subgrade CBR values are very variable, the design should consider the
respective benefits and costs of short sections and of a conservative approach based on
the worst conditions over longer sections.
It is important to differentiate between localized poor (or good) soils and general
subgrade areas. Normally, localized poor soils will be removed and replaced with
suitable materials.
Lateritic gravels can generally be assigned a subgrade classification S5. It must be
emphasized that too many variables influence the subgrade strength for the above to be
anything more than a general indication and detailed investigations are required for final
design.
Other useful correlations for assessing qualitatively the subgrade strength include: a
correlation between the nature of the soils (as given in the Unified Soil Classification
System, USCS, described in ASTM Method D2487) and typical design CBR values; and
the use of the AASHTO classification. By nature, these classifications cover all soils
encountered in Somaliland. The correlation between the nature of the soil and typical
design CBR values is given in Table 3-3.

Pavement Design Manual - 2014 Chapter 3
Flexible Pavements and Gravel Roads Subgrade
Roads Development Agency Page 3-9
The AASHTO classification is given in AASHTO M145. It includes seven basic groups
(A-1 to A-7) and twelve subgroups. Of particular interest is the Group Index, which is
used as a general guide to the load bearing ability of a soil. The group index is a function
of the liquid limit, the plasticity index and the amount of material passing the 0.075mm
sieve. Under average conditions of good drainage and thorough compaction, the
supporting value of a material may be assumed as an inverse ratio to its group index, i.e.
a group index of 0 indicates a “good” subgrade material and a group index of 20 or more
indicates a poor subgrade material.
Table 3-3: Typical Design CBR Values (adapted from Ref. 10)
Major Divisions
Symbol
Name
Value as
Subgrade
Typical Design
CBR Values
COARSE
GRAINED
SOIL
GRAVEL
AND
GRAVELLY
SOILS
GW Well-graded gravels or gravel- sand mixtures, little or no fines
Excellent 40-80
GP Poorly graded gravels or gravel-sand mixtures, little or no fines
Good to excellent 30-60
GM
d
Silty gravels, gravel-sand-silt mixtures
Good to excellent 40-60
u
Good 20-30
GC Clayey gravels, gravel-sand-clay mixtures Good 20-40
SAND
AND
SANDY
SOILS
SW Well-graded sands or gravelly sands, little or no fines
Good 20-40
SP Poorly graded sands or gravelly sands, little or no fines
Fair to good 10-40
SM
d
Silty sands, sand-silt mixtures
Fair to good 15-40
u
Fair 10-20
SC Clayey sands, sand-clay mixtures Poor to fair 5-20
FINE
GRAINED SOILS
SILTS AND
CLAYS LL IS LESS
THAN 50
ML Inorganic silts and very fine sands, rock Flour, silty or clayey fine sands or clayey Silts with slight plasticity
Poor to fair 15 or less
CL Inorganic clays of low to medium plasticity, Gravelly clays, sandy clays, silty clays, Lean clays
Poor to fair 15 or less
OL Organic silts and organic silt-clays of low Plasticity
Poor 5 or less
SILTS AND
CLAYS LL IS
GREATER THAN 50
MH Inorganic silts, micaceous or diatomaceous fine sandy or silty soils, elastic silts
Poor 10 or less
CH Inorganic clays of high plasticity, fat clays Poor to fair 15 or less
OH Organic clays of medium to high plasticity, Organic silts
Poor to very poor 5 or less
HIGHLY ORGANIC SOILS
Pt Peat and other highly organic soils Not suitable

Chapter 3 Pavement Design Manual - 2014
Subgrade Flexible Pavements and Gravel Roads
Page 3-10 Roads Development Agency
NOTE: The division of GM and SM groups into subdivisions of d and u is on basis of Atterberg limits;
suffix d (e.g., GMd) will be used when the liquid limit is 25 or less and the plasticity index is 5 or less; the suffix u will be used otherwise.

Pavement Design Manual - 2014 Chapter 4
Flexible Pavements and Gravel Roads Earthworks
Roads Development Agency Page 4-1
4 EARTHWORKS
4.1 INTRODUCTION
In this chapter, guidelines are given which pertain both to geotechnical design of the
roadway and more specifically to pavement design. The geotechnical considerations are
mentioned only to the extent that they participate in a comprehensive design; however,
the guidelines given herein are not intended to replace a comprehensive geotechnical
design. Geotechnical design per se is beyond the scope of this manual, which deals with
pavements.
Considerations relative to materials and compaction, for instance, are more directly
related to pavement design and performance than slope stability.
It is also to note that some considerations relative to earthworks belong to a manual
dealing with soils rather than one dealing with pavements.
4.2 EMBANKMENTS
GENERAL
For the design of embankments, the following areas of concern should be addressed:
Foundations conditions, with their associated potential problems of settlements
and stability
Embankment materials and related topics regarding specified methods of placing
and compaction. Protection of the completed embankment slopes is equally
important.
Potential problems in these areas should be identified during the reconnaissance.
EMBANKMENT FOUNDATIONS
The design of embankments over soft and compressible soils requires the determination
of both the magnitude of settlement which will occur under the future embankments and
the anticipated rate of settlement. It also requires verification of the allowable height of
embankment, or side slopes, or construction rate to prevent shear failure and ensure
embankment stability.
Considerations regarding settlements and stability are covered separately hereunder for
convenience, although it should be realized that the problems are usually concomitant.
Also, some of the typical solutions (e.g. accelerated consolidation, removal of soft soils)
often deal with both aspects of the problem.

Pavement Design Manual - 2014 Chapter 4 Flexible Pavements and Gravel Roads Earthworks
Page 4-2 Roads Development Agency
EMBANKMENT SETTLEMENTS
Settlements during construction are often unavoidable. Post-construction settlements (i.e.
after paving and opening to traffic) are those which must be minimized. Differential
settlements are the most detrimental to riding quality. In order to reduce these differential
settlements, it is often convenient to set a limit to the total post-construction settlements,
e.g. on the order of 3 to 5 cm.
It is rather important to distinguish between two types of soft and compressible soils:
Under-consolidated silt-clay mixtures
Organic soils
The difference lies in their consolidation characteristics.
It is also convenient to group the possible solutions to settlement concerns as follows:
Methods involving excavation or displacement. Excavation may be partial or
complete. Displacement may be by rockfill or controlled failure.
Several consolidation methods or combination of methods, including preloading,
surcharging and accelerated vertical drainage (e.g. by prefabricated drains).
With under consolidated silts and clays, the settlements occur mostly during the primary
consolidation and the primary consolidation parameters govern, together with the
thickness of the compressible soils. The consolidation parameters are determined from
laboratory testing of undisturbed samples. It is important to obtain and preserve good
quality samples to carry out reasonable predictions of settlement magnitude and rate. It is
also important to verify whether stratified or varied deposits are present, as this can make
horizontal drainage far more important than vertical drainage in the consolidation
process. Vertical as well as horizontal drainage must be accounted for in the design of
prefabricated (wick) drains. The use of sand drains, although efficient, is less common
than in the past due to the difficulties and cost of installation.
Traditional methods of predicting settlements are given in the geotechnical literature. The
choice between the methods of alleviating the problems will depend on the time available
for construction and consolidation, and by stability concerns.
Strict specifications and monitoring of settlements (e.g. settlement platforms,
piezometers) are often essential to the success of the design and the embankment
performance.
Organic soils are a common cause for excessive post-construction settlements (i.e.
affecting the rideability and potentially the structural integrity of the pavement),
especially due to secondary settlements after the primary consolidation has taken place.
In addition, their bearing capacity remains poor even when consolidated. It is therefore
best to avoid such materials altogether during the selection of the route alignment. If this

Pavement Design Manual - 2014 Chapter 4
Flexible Pavements and Gravel Roads Earthworks
Roads Development Agency Page 4-3
is not possible, however, the methods consisting of removing and replacing the organic
soils are preferable. These methods may still not be feasible, either because the organic
deposits are very thick, or because underground water flows should not be restricted. In
such cases, traditional methods similar to those outlined above for underconsolidated
silts-clays may be used. Very gentle side slopes or wide embankments with berms are
often used under those conditions primarily for stability reasons, but low, wide
embankments are occasionally used to limit the rate of settlement to acceptable levels. In
addition, the use of geosynthetics (geogrids, geotextiles) is expanding to help in the
construction, improve stability and reduce differential settlements. Geosynthetics are also
used as reinforcement of the embankment itself.
EMBANKMENT STABILITY
The design of embankments regarding their stability should be initiated by the
verification that the weight of the embankment will not overcome the shear strength of
the foundation soil (punching failure), with consideration given to the side slopes.
Further analyses include verification of the safety factor (e.g. 1.2 or 1.3) against
rotational failures (slip circles) or random shaped failures, using a variety of methods
now made easier by computerized means. It is important when using such methods to
consider failure modes that may be dictated by the local conditions (wedge shaped
failures, sloping firm ground under the soft soils, etc.).
It is also useful to note that there exist a variety of simplified methods and design charts
which will give a fair approximation of the safety factor under common conditions (e.g.
Ref. 8).
During construction of embankments over soft soils, pore water pressures can be
monitored using piezometers. Further precautions can be taken by installing
inclinometers to detect any movement of soil that might indicate that unstable conditions
exist.
When no specific foundation problem is encountered, the suitability of the side slopes is
largely determined by the internal stability of the embankment material (provided erosion
is controlled). In those cases, general recommendations can be made as follows for
embankments up to 10 meters high:
Cohesionless sands: 1: 3 if h <= 1 m
1: 2 if h > 1 m
Other materials: 1: 3 if h <= 1 m
1: 2 if 1 m < h < 3 m
1: 1.5 if 3 m < h < 10 m
where h is the height of the embankment.
In particularly wet areas of Somaliland, it may be desirable however to use flatter slopes
when the embankments are silty or clayey.
Steeper slopes in combination with reinforcement of the embankment material may
become of value in certain urban sites.

Pavement Design Manual - 2014 Chapter 4 Flexible Pavements and Gravel Roads Earthworks
Page 4-4 Roads Development Agency
TYPES OF EMBANKMENT MATERIALS
Embankments fill material will normally come from adjacent cut sections. If the
quantities are insufficient, borrow areas will be required, preferably adjacent to the road.
If the quality is not suitable, additional haulage will be required.
Most soils are suitable for embankment construction and the use of the majority of
available materials should be encouraged.
Some soils are however generally unsuitable:
Materials with more than 5% by weight of organic materials
Materials with a swell of more than 3% (e.g. black cotton soils)
Clays with a plasticity index over 45 or a liquid limit over 90
Exceptions may be made to the above, on a case by case basis. For instance, when
alternatives are prohibitively expensive, black cotton soils may be used, provided
methods to alleviate their associated problems are effected.
Rockfill may be used to form the base of the embankments in uniform layers not
exceeding 1 meter in thickness (oversize materials to be reduced in size). Voids in the top
layer (30 cm) of rock should be filled. Rock in embankments should not reach above an
elevation 60 cm below the finished subgrade.
Soils with lower plasticity should be preferred for the lower layers, and dried as
necessary to allow proper compaction. The best materials should be reserved for the
upper layers of the subgrade.
PLACING AND COMPACTION OF EMBANKMENT MATERIALS
When the embankment is to be placed and compacted on hillsides, or when new
embankment is to be compacted against existing embankments, or when the embankment
is to be built a portion at a time, the slope against which the embankment is to be placed
should be benched continuously as the embankment is brought up in layers. This applies
whenever the slopes against which the embankment is to be constructed are steeper than
1 (V) to 3 (H). Benching should be a minimum of 2 meters in width in order to integrate
the new embankment with the existing slope. Material cut out should be recompacted
along with the new embankment.
A uniform compaction is important in order to prevent uneven settlements. Some
settlement can be tolerated, but it should be minimized, particularly at the approaches to
bridges and culverts where adequate compaction is essential.
It is usual, unless otherwise indicated in special provisions, to specify that a minimum
density must be achieved. It is therefore essential that laboratory tests be carried out to
determine the dry density/moisture content relationships for the soils to be used and to

Pavement Design Manual - 2014 Chapter 4
Flexible Pavements and Gravel Roads Earthworks
Roads Development Agency Page 4-5
define the achievable densities. Prevailing high temperatures in certain areas promote the
drying of soils. This can be beneficial with soils of high plasticity but, generally, greater
care is necessary to keep the moisture content of the soil as close as possible to the
optimum for compaction with the particular compaction equipment in use.
Moisture contents well below the OMC (standard compaction) may be accepted,
provided the compaction equipment and methods are adapted. In the arid areas of
Somaliland, this may reduce costs significantly. For silts and clays, the moisture content
at the time of compaction should not exceed 105% of the OMC (standard compaction).
As indicated in Section 3.3, it is recommended that the upper 25 cm of soil immediately
beneath the subbase or capping layer, i.e. the top of the embankment fill or the natural
subgrade, be compacted to a minimum of 100 % of the maximum dry density obtained
by ASTM D 698 (standard compaction). Alternatively, 93 % of the maximum dry density
achieved by ASTM Test Method D 1557 (heavy compaction) may be specified. The
same density should also be specified for fill behind abutments to bridges and for the
backfill behind culverts. For the lower layers of an embankment, a compaction level of
90-93 per cent of the maximum dry density obtained by the heavy compaction is suitable,
or a level of 95-100 per cent of the maximum density obtained by the light compaction.
During construction, compaction trials are to be carried out to determine the best way to
achieve the specified density with the equipment available. Also during construction, it is
not always easy to obtain an accurate measure of field density on site. The standard
traditional methods of measurement are tedious, not particularly reproducible, and it is
difficult to carry out sufficient tests to define a reliable density distribution. This problem
can be alleviated to a great extent by making use of nuclear density and moisture gauges,
since such devices are quicker and the results are more reproducible than traditional
methods. However, the instruments will usually need calibration for use with the
materials in question if accurate absolute densities are required. It may also be advisable
to measure the moisture contents using traditional methods.
SLOPE PROTECTION
Protection is required for the side slopes of the embankments, against erosion from
runoff water from rainfall and also from wind. This is normally done by providing
vegetation. The specific method (planting, seeding) of establishing the vegetation cover
may be left unspecified, provided the Contractor is held to a maintenance period
(normally one year). Hydroseeding has advantages that should be utilized. Details of
retaining the topsoil should be suggested in the contract documents, but incentives should
be given to the Contractor to propose alternate methods. This favors the use of methods
sanctioned by local experience.
4.3 CUTTINGS
Cuttings through sound rock can often stand at or near vertical, but in weathered rock or
soil the conditions are more unstable. Instability is usually caused by an accumulation of
water in the soil, and slips occur when this accumulation of water reduces the natural
cohesion of the soil and increases its mass. Thus the design and construction of the road
should always promote the rapid and safe movement of water from the area above the

Pavement Design Manual - 2014 Chapter 4 Flexible Pavements and Gravel Roads Earthworks
Page 4-6 Roads Development Agency
road to the area below, and under no circumstances should the road impede the flow of
water or form a barrier to its movement.
SLOPE STABILITY
Methods of analyzing slope stability are usually based on measurements of the density,
moisture content and strength of the soil together with calculations of the stresses in the
soil using classic slip-circle analyses. This type of analysis assumes that the soil mass is
uniform. Sometimes failures do indeed follow the classic slip-circle pattern, but uniform
conditions are rare, particularly in residual soils, and it is more common for slips to occur
along planes of weakness in the vertical profile. Nevertheless, slope stability analysis
remains an important tool in investigating the likely causes of slope failures and in
determining remedial works, and such an analysis may be a necessary component of
surveys to help design cuttings in soils.
SURVEYS
The construction of cuttings invariably disturbs the natural stability of the ground by the
removal of lateral support and a change in the natural ground water conditions. The
degree of instability will depend on the dip and stratification of the soils relative to the
road alignment, the angle of the slopes, the ground water regime, the type of material, the
dimensions of the cut, and numerous other variables. A full investigation is therefore an
expensive exercise but, fortunately, most cuttings are small and straightforward.
Investigations for the most difficult situations are best left to specialists. Local experience
is an invaluable tool and every opportunity should be taken to maintain a local database.
An important part of a survey is to examine the performance of both natural and man-
made slopes in the soils encountered along the length of the road, to identify the existing
forms of failures, and to make the best possible use of the empirical evidence available in
the area.
Where well defined strata appear in the parent rock, it is best to locate the road over
ground where the layers dip towards the hill and to avoid locating the road across
hillsides where the strata are inclined in the same direction as the ground surface.
During the survey, all watercourses crossing the road line must be identified and the need
for culverts and erosion control established.
DESIGN AND CONSTRUCTION
The angle of cutting faces will normally be defined at the survey stage. Benching of the
cut faces can be a useful construction expedient enabling the cutting to be excavated in
well defined stages and simplifying access for subsequent maintenance. The slope of the
inclined face cannot usually be increased when benching is used and therefore the
volume of earthworks is increased substantially. The bench itself can be inclined either
outwards to shed water down the face of the cutting or towards the inside. In the former,

Pavement Design Manual - 2014 Chapter 4
Flexible Pavements and Gravel Roads Earthworks
Roads Development Agency Page 4-7
surface erosion may pose a problem. In the latter, a paved drain will be necessary to
prevent the concentration of surface water causing instability in the cutting.
A similar problem applies to the use of cut-off drains at the top of the cutting which are
designed to prevent runoff water from the area above the cutting from adding to the run-
off problems on the cut slope itself. Unless such drains are lined and properly maintained
to prevent water from entering the slope, they can be a source of weakness.
Control of ground water in the cut slopes is sometimes necessary. Various methods are
available but most are expensive and complex, and need to be designed with care. It is
advisable to carry out a proper ground water survey to investigate the quantity and
location of sources of water.
As with embankments, it is essential that provision is made to disperse surface water
from the formation at all stages of construction. Subsoil drains at the toe of the side
slopes may be necessary.
The subsequent performance, stability and maintenance of cuttings will depend on the
measures introduced to alleviate the problems created by rainfall and ground water. It is
much more cost effective to install all the necessary elements at construction rather than
to rely on remedial treatment later.
5

Pavement Design Manual - 2014 Chapter 5
Flexible Pavements and Gravel Roads Drainage and Shoulders
Roads Development Agency Page 5-1
5 DRAINAGE AND SHOULDERS
5.1 DRAINAGE SYSTEM
Provision must be made for protecting the road from surface water or ground water. If
water is allowed to enter the structure of the road, the pavement will be weakened and it
will be much more susceptible to damage by traffic. Water can enter the road as a result
of rain penetrating the surface or as a result of the infiltration of ground water. The road
surface must be constructed with a camber so that is sheds rainwater quickly and the top
of the subgrade or improved subgrade must be raised above the level of the local water
table to prevent it being soaked by ground water.
A good road (external) drainage system, properly maintained, is essential to the
successful performance of a road and the pavement designs described in this manual are
based on the assumption that the side drains (see Section 5.2) and culverts associated
with the road are properly designed and function correctly.
Drainage within the pavement layers themselves (internal drainage) is a critical element
of the pavement design because the strength of the subgrade used for design purposes
depends on the moisture content during the most likely adverse conditions (see Chapter
3). It is impossible to guarantee that road surfaces will remain waterproof throughout
their lives, hence it is important to ensure that water is able to drain away quickly from
within the pavement layers (see Section 5.3).
5.2 EXTERNAL DRAINAGE
Provision must be made for protecting the road from surface water or ground water. If
water is allowed to enter the structure of the road, the pavement will be weakened and it
will be much more susceptible to damage by traffic. Water can enter the road as a result
of rain penetrating the surface or as a result of the infiltration of ground water. The road
surface must be constructed with a camber so that it sheds rainwater quickly and the top
of the subgrade or improved subgrade must be raised above the level of the local water
table to prevent it being soaked by ground water.
A good road (external) drainage system, properly maintained, is essential to the
successful performance of a road and the pavement designs described in this manual are
based on the assumption that the side ditches and culverts associated with the road are
properly designed and function correctly.
In order to exclude water from the road, the top of the shoulders should preferably be
impermeable and a surface dressing or other seal may be applied to serve this purpose
(see Chapter 9). Sealed shoulders also prevent the ingress of water at the edge of the
pavement, which is an area particularly vulnerable to structural damage, particularly if
the base course material lacks cohesion. A surfacing also helps protecting the shoulder
against erosion.
The preferred solution consists of using a (usually single) surface dressing (see Chapter
9). This solution is particularly beneficial for road segments with high traffic. It is also
one of two alternatives (together with the solution below using a prime coat) which is
required for crushed stone shoulders.

Chapter 5 Pavement Design Manual - 2014
Drainage and Shoulders Flexible Pavements and Gravel Roads
Page 5-2 Roads Development Agency
Alternatively, a prime coat may provide some protection to the shoulders. A sanding may
follow the priming of the surface of the shoulder. Variations to this solution (e.g. seals)
are given in Chapter 9. Such a solution, or a surface dressing, is required for crushed
stone shoulders and may be used for gravel shoulders. Paved or sealed shoulders should be differentiated from the carriageway e.g. by the use
of edge markings.
Finally, if economics or local conditions warrant it, unsurfaced shoulders may be used,
but will generally require maintenance and are not generally recommended. Unsurfaced
shoulders must not be used if the materials are pervious (e.g. extended pervious base
course). Unsurfaced shoulders may be provided with topsoiling and seeding. If gravel
shoulders are left unsurfaced, the extra width given to the base course (over the road
surface width) should nevertheless be primed and sealed (see Section 5.4). This edge seal
should also extend over the shoulder.
Crossfall is needed on all roads in order to assist the shedding of water into the side
ditches. A suitable value for paved roads is about 3% for the carriageway, with a slope of
about 4% for the shoulders.
Note: A uniform cross slope of 4% is considered adequate for both wearing course and
shoulders of unpaved (gravel) roads, where in any case materials are usually
undistinguished.
5.3 INTERNAL DRAINAGE
Drainage within the pavement layers themselves (internal drainage) is a critical element
of the pavement design. The strength of the subgrade used for design purposes depends
on the moisture content during the most likely adverse conditions (cf. Chapter 3). Since it
is unlikely that road surfaces will remain waterproof throughout the design life of the
pavement, it is important to ensure that water is able to drain away quickly from within
the pavement.
Provided that the crossfalls indicated above are adhered to and the bituminous surfacing
and the shoulders are properly maintained, rainwater falling on the road will run off
adequately over the shoulders.
When permeable base course materials are used and in particular crushed stone bases
(see Section 3.1 for permeability of base course material), particular attention must be
given to the drainage of this layer. Under no circumstances should the “trench” type of
cross-section be used in which the pavement layers are confined between continuous
impervious shoulders.
When permeable bases are used, a distinction may be made depending on the nature of
the subbase:
If the subbase is relatively impervious, the preferred solution is to extend the
base and subbase across the shoulders. An alternative solution consists of
providing a drainage layer under the shoulder material (which may be gravel)
at the level of the bottom of the base course. Although cheaper, this later
solution is highly dependent on proper execution, and may not provide as
Pavement Design Manual - 2014 Chapter 5
Flexible Pavements and Gravel Roads Drainage and Shoulders
Roads Development Agency Page 5-3
much bearing capacity for the shoulder. Generally, the drainage layer should
be omitted on the upper side of superelevated sections.
When both the base and subbase are pervious, the preferred solution is again
to extend both layers across the shoulders. An alternative consists of
extending only the subbase course across the shoulder. This alternative may
be effective if the subbase can be confidently considered pervious. Gravel
may be used for the shoulders above the subbase.
When the base course can confidently be considered impervious, then the internal
drainage is of lesser consequence. Impervious materials should still be used for the
shoulder, and it is still preferable to provide them with surfacing. As mentioned
previously, an effective seal should be provided between base and shoulder materials.
5.4 SHOULDERS
The width of the carriageway and the overall geometric design of the road are dealt with
in RDA’s Geometric Design Manual-2014. For trunk and link roads, carriageway widths
of 7 meters or greater are be used throughout and additional lanes will be needed when
the capacity of a two-lane road is exceeded.
Shoulders participate in the structural function of a road pavement, providing lateral
support for the pavement layers. They should help in removing surface water from the
road surface and facilitate the internal drainage of the pavement. They are especially
important when unbound materials are used in the pavement. From a functional point of
view a minimum width of 1m is recommended and it is also recommended that shoulders
on paved roads having a width less then 1m should be paved. Shoulders give additional
width for emergency and temporary parking.
The main requirements for shoulders are their ability to support traffic on occasions, to
be practically impervious and not prone to rapid erosion.
The main materials to be considered for constructing the shoulders are:
The same materials as those used for the base and subbase of the pavement (preferred
alternative); or
Gravel materials
Cement or lime-treated materials may also be considered if they are used elsewhere in the
pavement.
If gravel materials (unbound) are used for the construction of the shoulders, they should
be of a quality similar to those described for subbase (see Section 6.2) or for gravel
wearing courses (see Section 6.4).
For gravel roads, it is recommended that the shoulders be constructed with the same
materials as the wearing course.
5.5 TYPICAL PAVEMENT CROSS-SECTIONS
Based on the above considerations, four alternative cross-sections are presented in Figure
5-1. It is to be noted that, unless the base course material is extended fully across the
shoulders, some extra width is nevertheless provided for the base. This provides support

Chapter 5 Pavement Design Manual - 2014
Drainage and Shoulders Flexible Pavements and Gravel Roads
Page 5-4 Roads Development Agency
to the edge of the pavement, where compaction is difficult to achieve. The extra width of
the base course should be on the order of 20 to 30 cm. The edge seal covering the extra
width of the base and the joint should extend a total of 40 to 60 cm.
A fifth cross-section is also shown, using curbs, as is occasionally required in urban
areas. It is to be noted that, since the drainage of the base course is impeded, it is
essential that internal drainage be provided by a pervious subbase or a drainage layer.
Side drains should be avoided in areas with expansive soils. If side drains cannot be
avoided due to site conditions, they shall be kept at a minimum distance of 4 - 6 m. from
the toe of the embankment, dependent on the road functional classification. Side slopes
shall also be flattened to 1:6 or flatter. A more thorough discussion of expansive soils is
given in Chapter 4.
Figure 5-1: Typical Pavement Cross Sections

Pavement Design Manual - 2014 Chapter 5
Flexible Pavements and Gravel Roads Drainage and Shoulders
Roads Development Agency Page 5-5
5.6 EROSION CONTROL
Erosion problems may occur on the side slopes of embankments or cuttings, gravel
shoulders or at any other point where surface run-off concentrated or a spring occurs. The
obvious remedies are therefore well-designed surface and sub-surface drainage features
and appropriate slope angles for the soils and rocks present. This last measure is
problematic as there is no standard test to assess “erodibility”. The best guidance would
be obtained from observations of actual road sections, assuming these exist.
Various surface protection systems can be used in conjunction with the above.
5.6.1 PROTECTION OF SLOPES
5.6.1.1 TOP SOILING AND GRASSING
Sprigs of indigenous “runner” type, grass may be planted on slopes by one or two
methods:
The slope shall be covered with a layer of fine topsoi1 free of stones greater than 50mm.
The minimum thickness should be 75mm. The layer shall then be planted with grass
Sprigs of grass shall be planted at approximately 200 mm centres in pockets of topsoil,
75 mm deep.
Planting should be carried out at the beginning of a rainy season.
5.6.1.2 SURFACE TREATMENTS WITH SEEDS AND FERTILIZERS
When difficulties are anticipated in establishing a healthy growth of grass on a sterile
soil, a mixture of grass seeds and fertilizer may be applied. This can be done either as a
wet or dry process. In the former process grass seed, fertilizer, mulch material and water
are mixed to form slurry which is then sprayed onto the ground. In the dry process grass
seed and fertilizer are mixed and applied to the ground, followed by watering and
possible application of mulching material.
5.6.1.3 GRAVEL OR STONE BLANKETING
Erodible materials may be protected by placing coverings of gravel or stone blankets.
The blanketing material should have a maximum size of 40 mm and he placed in an even
layer of at least 75 mm.
5.6.1.4 FASCINES
Placing fascines or branches over the most vulnerable areas, generally combined with
some form of grass planting, will help stabilize the slope until it is covered by grass or
other vegetation.
5.6.1.4.1 SERRATED SLOPES
Serrated slopes aid in the establishment of vegetation. Serrations may be constructed in
any material that is rippable or that will hold a vertical or subvertical face for a few
weeks, until vegetation becomes established.

Chapter 5 Pavement Design Manual - 2014
Drainage and Shoulders Flexible Pavements and Gravel Roads
Page 5-6 Roads Development Agency
5.6.1.4.2 OTHER PROTECTIVE WORKS
More costly types of protection, such as stone pitching (possibly grouted), gabions,
masonry or placing of concrete may also be used, but, in general, they are economically
justified only where the overall slope stability has to be improved.
5.6.2 PROTECTION OF DITCHES AND CHANNELS
5.6.2.1 CRITICAL LENGTH OF UNLINED DITCHES
The critical length of unlined ditches must be determined, with regard to erosion control.
The critical length is defined as the maximum length of unlined ditch, in which water
velocities do not give rise to erosion.
The maximum velocity of water can be calculated from the slope, shape and dimensions
of the ditch, volume of water and from the roughness coefficient of the material.
Knowing the maximum permissible velocity for each type of material, the maximum
length of ditch in this material can then be determined. The recommended maximum
permissible velocities for different types of material are as follows:
Table 5.1: Maximum velocity of water flow
*Where the materials are grassed, the maximum permissible velocity is of the order of
1.5 m/s if a good cover is provided and 1.1m/s if a sparse cover is provided.
5.6.2.2 METHODS OF PROTECTION
Sections of ditch beyond the critical length must be protected from erosion by lining. The
following methods may be used:
Grassing
Turfing
Stone pitching (possibly grouted)
Placing of masonry
Concreting
Reducing the gradient and constructing steps (the steps must be paved)
Placing velocity breakers
Material
Max. permissible
velocity (m/s)
Fine sand
Silt – Coarse sand
Silty Clay – fine gravel
Stiff clay
Coarse Gravel
Soft rock – Conglomerate
Hard rock – Masonry - Concrete
0.3*
0.4 – 0.6*
0.5 -0.8*
0.9 – 1.3
1.2 – 1.7
1.8 – 2.5
3.0+

Pavement Design Manual - 2014 Chapter 5
Flexible Pavements and Gravel Roads Drainage and Shoulders
Roads Development Agency Page 5-7
5.6.2.3 SEDIMENTATION CONTROL
If water velocities are too low sedimentation may occur. Ditches and drains should
therefore be given sufficient gradient everywhere, in so far as topography and erosion
control will permit. Sedimentation velocities for a few types of material are
approximately the following:
Silt 0.08 m/s
Fine sand 0.15 m/s
Coarse sand 0.20 m/s
Fine gravel 0.30 m/s
Gravel 0.65 m/s

Pavement Design Manual - 2014 Chapter 6
Flexible Pavements and Gravel Roads Unbound Pavement Material
Roads Development Agency Page 6-1
6 UNBOUND PAVEMENT MATERIALS
This chapter gives guidance on the selection of unbound materials for use as base course,
sub-base, capping and selected subgrade layers. The main categories with a brief
summary of their characteristics are shown in Table 6-1.
Table 6-1: Properties of Unbound Materials
Code Description Summary of Specification
GB1 Fresh, crushed rock Dense graded, unweathered crushed
stone, non-plastic parent fines
GB2 Crushed weathered rock, gravel or
boulders
Dense grading, PI < 6, soil or parent
fines
GB3 Natural coarsely graded granular
material, including processed and
modified gravels
Dense grading, PI < 6
CBR after soaking > 80
GS Natural gravel CBR after soaking > 30
GC Gravel or gravel-soil Dense graded; CBR after soaking > 15
Notes: 1.These specifications are sometimes modified according to site conditions, material type and principal use (see text).
2. GB = Granular base course, GS = Granular sub-base, GC = Granular capping layer.
6.1 BASE COURSE MATERIALS
A wide range of materials can be used as unbound base course including crushed
quarried rock, crushed and screened, mechanically stabilized, modified or naturally
occurring “as dug” or “pit run” gravels. Their suitability for use depends primarily on the
design traffic level of the pavement and climate. However, all base course materials must
have a particle size distribution and particle shape which provide high mechanical
stability and should contain sufficient fines (amount of material passing the 0.425 mm
sieve) to produce a dense material when compacted. In circumstances where several
suitable types of base course materials are available, the final choice should take into
account the expected level of future maintenance and the total costs over the expected life
of the pavement. The use of locally available materials is encouraged, particularly at low
traffic volumes (i.e. categories T1 and T2, see Table 2-6). Their use should be based on
the results of performance studies and should incorporate any special design features
which ensure their satisfactory performance.
Note: When considering the use of natural gravels a statistical approach should be applied in
interpreting test results to ensure that their inherent variability is taken into account in the
selection process.
For lightly trafficked roads the requirements set out below may be too stringent and in
such cases reference should be made to specific case studies, preferably for roads under
similar conditions.
CRUSHED STONE
Graded crushed stone (GB1) This material is produced by crushing fresh, quarried rock
(GB1) and may be an all-in product, usually termed a 'crusher-run', or alternatively the
material may be separated by screening and recombined to produce a desired particle size

Chapter 6 Pavement Design Manual - 2014
Unbound Pavement Material Flexible Pavements and Gravel Roads
Page 6-2 Roads Development Agency
distribution, as per the specifications. Alternate gradation limits, depending on the local
conditions for a particular project, are shown in Table 6-2. After crushing, the material
should be angular in shape with a Flakiness Index (British Standard 812, Part 105) of less
than 35%, and preferably of less than 30%. If the amount of fine aggregate produced
during the crushing operation is insufficient, non-plastic angular sand may be used to
make up the deficiency. In constructing a crushed stone base course, the aim should be to
achieve maximum impermeability compatible with good compaction and high stability
under traffic.
Table 6-2: Grading Limits for Graded Crushed Stone Base Course Materials (GB1)
Test sieve (mm) Percentage by mass of total aggregate passing test sieve
Nominal maximum particle size
37.5 mm 28 mm 20 mm
50 100 - -
37.5 95 – 100 100 -
28 - - 100
20 60 – 80 70 - 85 90 – 100
10 40 – 60 50 - 65 60 – 75
5 25 - 40 35 - 55 40 – 60
2.36 15 – 30 25 - 40 30 – 45
0.425 7 – 19 12 - 24 13 – 27
0.075 (1) 5 – 12 5 - 12 5 – 12 Note 1. For paver-laid materials a lower fines content may be accepted.
To ensure that the materials are sufficiently durable, they should satisfy the criteria given
in Table 6-3. These are a minimum Ten Per Cent Fines Value (TFV) (British Standard
812, Part 111) and limits on the maximum loss in strength following a period of 24 hours
of soaking in water. The likely moisture conditions in the pavement are taken into
account in broad terms based on annual rainfall. Alternatively, requirements expressed in
terms of the results of the Aggregate Crushing Value (ACV) (British Standard 812, Part
110) may be used: the ACV should preferably be less than 25 and in any case less than
29. Other simpler tests e.g. the Aggregate Impact Test (British Standard 812, Part 112,
1990) may be used in quality control testing provided a relationship between the results
of the chosen test and the TFV has been determined. Unique relationships do not exist
between the results of the various tests but good correlations can be established for
individual material types and these need to be determined locally.
Table 6-3: Mechanical Strength Requirements for the Aggregate Fraction of
Crushed Stone Base Course Materials (GB1) as Defined by the Ten Per Cent Fines
Test
Typical Annual Rainfall
(mm)
Minimum 10%
Fines Values (kN)
Minimum Ratio
Wet/Dry Test (%)
>500 110 75
<500 110 60

Pavement Design Manual - 2014 Chapter 6
Flexible Pavements and Gravel Roads Unbound Pavement Material
Roads Development Agency Page 6-3
When dealing with materials originating from the weathering of basic igneous rocks, the
recommendations in Section 6.1 Naturally Occurring Granular Materials, Boulders,
Weathered Rocks, below, should be used.
The fine fraction of a GB1 material should be nonplastic.
These materials may be dumped and spread by grader but it is preferable to use a paver to
ensure that the completed surface is smooth with a tight finish. The material is usually
kept wet during transport and laying to reduce the likelihood of particle segregation.
The in situ dry density of the placed material should be a minimum of 98% of the
maximum dry density obtained in the ASTM Test Method D 1557 (Heavy Compaction).
The compacted thickness of each layer should not exceed 200 mm.
Crushed stone base courses constructed with proper care with the materials described
above should have CBR values well in excess of 100 per cent. There is usually no need
to carry out CBR tests during construction.
NATURALLY OCCURRING GRANULAR MATERIALS, BOULDERS, WEATHERED ROCKS
Normal requirements for natural gravels and weathered rocks (GB2, GB3). A wide
range of materials including lateritic, calcareous and quartzitic gravels, river gravels,
boulders and other transported gravels, or granular materials resulting from the
weathering of rocks can be used successfully as base course materials. Table 6-4 contains
three recommended particle size distributions for suitable materials corresponding to
maximum nominal sizes of 37.5 mm, 20 mm and 10 mm. Only the two larger sizes
should be considered for traffic in excess of 1.5 million equivalent standard axles. To
ensure that the material has maximum mechanical stability, the particle size distribution
should be approximately parallel with the grading envelope.
To meet the requirements consistently, screening and crushing of the larger sizes may be
required. The fraction coarser than 10 mm should consist of more than 40 per cent of
particles with angular, irregular or crushed faces. The mixing of materials from different
sources may be warranted in order to achieve the required grading and surface finish.
This may involve adding fine or coarse materials or combinations of the two.
Table 6-4: Recommended Particle Size Distributions for Mechanically Stable
Natural Gravels and Weathered Rocks for Use as Base Course Material (GB2, GB3)
Test sieve (mm) Percentage by mass of total aggregate passing test sieve
Nominal maximum particle size
37.5 mm 20 mm 10 mm
50 100 - -
37.5 80 – 100 100 -
20 60 – 80 80 – 100 100
10 45 – 65 55 – 80 80 – 100
5 30 – 50 40 – 60 50 – 70
2.36 20 – 40 30 – 50 35 – 50
0.425 10 – 25 12 – 27 12 – 30
0.075 5 – 15 5 – 15 5 – 15

Chapter 6 Pavement Design Manual - 2014
Unbound Pavement Material Flexible Pavements and Gravel Roads
Page 6-4 Roads Development Agency
All grading analyses should be done on materials that have been compacted. This is
especially important if the aggregate fraction is susceptible to breakdown under
compaction and in service. For materials whose stability decreases with breakdown, an
aggregate hardness based on a minimum soaked Ten Per Cent Fines Value of 50 kN may
be specified.
The fines of these materials should preferably be nonplastic but should normally never
exceed a PI of 6.
If the PI approaches the upper limit of 6, it is desirable that the fines content be restricted
to the lower end of the range. To ensure this, a maximum PP of 60 is recommended or
alternatively a maximum Plasticity Modulus (PM) of 90 where:
PM = PI x (percentage passing the 0.425 mm sieve)
If difficulties are encountered in meeting the plasticity criteria, consideration should be
given to modifying the material by the addition of a low percentage of hydrated lime or
cement.
When used as a base course, the material should be compacted to a density equal to or
greater than 98 per cent of the maximum dry density achieved in the ASTM Test Method
D 1557 (Heavy Compaction). When compacted to this density in the laboratory, the
material should have a minimum CBR of 80% after four days immersion in water
(ASTM D 1883).
Arid and semi-arid areas. In Somaliland, the low altitude areas of the northern coastal
areas (Guban) are dry throughout most of the year. In these low rainfall areas, typically
with a mean annual rainfall of less than 200 mm, and where evaporation is high, moisture
conditions beneath a well sealed surface are unlikely to rise above the optimum moisture
content determined in the ASTM Test Method D 1557 (Heavy Compaction). In such
conditions, high strengths (CBR>80 %) are likely to develop even when natural gravels
containing a substantial amount of plastic fines are used. In these situations, for the
lowest traffic categories (Tl, T2) the maximum allowable PI can be increased to 12 and
the minimum soaked CBR criterion reduced to 60% at the expected field density.
Materials of basic igneous origin. Materials in this group are sometimes weathered and
may release additional plastic fines during construction or in service. Problems are likely
to worsen if water enters the pavement and this can lead to rapid and premature failure.
The state of decomposition also affects their long-term durability when stabilized with
lime or cement. The group includes common rocks such as basalts and dolerites but also
covers a wider variety of rocks and granular materials derived from their weathering,
transportation or other alteration. Normal aggregate tests are often unable to identify
unsuitable materials in this group. Even large, apparently sound particles may contain
minerals that are decomposed and potentially expansive. The release of these minerals
may lead to a consequent loss in bearing capacity. There are several methods of
identifying unsound aggregates. These include petrographic analysis to detect secondary
(clay) minerals and the use of various chemical soundness tests, e.g. sodium or
magnesium sulphate (ASTM C 88). Indicative limits based on these tests include (a) a

Pavement Design Manual - 2014 Chapter 6
Flexible Pavements and Gravel Roads Unbound Pavement Material
Roads Development Agency Page 6-5
maximum secondary mineral content of 20%, (b) a maximum loss of 12 or 20% after 5
cycles in the sodium or magnesium sulphate tests respectively. In most cases it is
advisable to seek expert advice when considering their use, especially when new deposits
are being evaluated. It is also important to subject the material to a range of tests since no
specific method can consistently identify problem materials.
Results to date indicate that these materials stabilized with 3 per cent of lime and surface
dressed should provide an acceptable alternative to crushed stone base construction for
main roads in Somaliland. A particular advantage of this material is that it avoids the
problem of clay working up into the base, which is a frequent source of failure when
using crushed stone over active clay.
Materials of marginal quality. Naturally occurring gravels which do not normally meet
the normal specifications for base course materials have occasionally been used
successfully. They include lateritic, calcareous and volcanic gravels. In general their use
should be confined to the lower traffic categories (i.e. T1 and T2) unless local studies
have shown that they have performed successfully at higher levels.
Laterite gravels with plasticity index in the range of 6-12 and plasticity modulus in the
range of 150-250 is recommended (Ref. 9) for use as base course material for T3 level of
traffic volume. The values towards higher range are valid for semi-arid and arid areas of
Somaliland, i.e. with annual rainfall less than 500 mm.
The calcareous gravels, which include calcretes and marly limestones, deserve special
mention. Typically, the plasticity requirements for these materials, all other things being
equal, can be increased by up to 50% above the normal requirements in the same climatic
area without any detrimental effect on the performance of otherwise mechanically stable
bases. Strict control of grading is also less important and deviation from a continuous
grading is tolerable.
Cinder gravels can also be used as a base course materials in lightly trafficked (T1 and
T2) surface dressed roads (Ref. 4).
6.2 SUB-BASES (GS)
The sub-base is an important load spreading layer in the completed pavement. It enables
traffic stresses to be reduced to acceptable levels in the subgrade, it acts as a working
platform for the construction of the upper pavement layers and it acts as a separation
layer between subgrade and base course. Under special circumstances, it may also act as
a filter or as a drainage layer. In wet climatic conditions, the most stringent requirements
are dictated by the need to support construction traffic and paving equipment. In these
circumstances, the sub-base material needs to be more tightly specified. In dry climatic
conditions, in areas of good drainage, and where the road surface remains well sealed,
unsaturated moisture conditions prevail and sub-base specifications may be relaxed. The
selection of sub-base materials will therefore depend on the design function of the layer
and the anticipated moisture regime, both in service and at construction.

Chapter 6 Pavement Design Manual - 2014
Unbound Pavement Material Flexible Pavements and Gravel Roads
Page 6-6 Roads Development Agency
BEARING CAPACITY
A minimum CBR of 30 per cent is required at the highest anticipated moisture content
when compacted to the specified field density, usually a minimum of 95 per cent of the
maximum dry density achieved in the ASTM Test Method D 1557 (Heavy Compaction).
Under conditions of good drainage and when the water table is not near the ground
surface (see Chapter 3) the field moisture content under a sealed pavement will be equal
to or less than the optimum moisture content in the ASTM Test Method D 698 (Light
Compaction). In such conditions, the sub-base material should be tested in the laboratory
in an unsaturated state. Except in arid areas (Category (3) in Chapter 3), if the base
course allows water to drain into the lower layers, as may occur with unsealed shoulders
and under conditions of poor surface maintenance where the base course is pervious (see
Section 3.1), saturation of the sub-base is likely. In these circumstances, the bearing
capacity should be determined on samples soaked in water for a period of four days. The
test should be conducted on samples prepared at the density and moisture content likely
to be achieved in the field. In order to achieve the required bearing capacity, and for
uniform support to be provided to the upper pavement, limits on soil plasticity and
particle size distribution may be required. Materials which meet the recommendations of
Tables 6-5 and 6-6 will usually be found to have adequate bearing capacity.
USE AS A CONSTRUCTION PLATFORM
In many circumstances the requirements of a sub-base are governed by its ability to
support construction traffic without excessive deformation or ravelling. A high quality
sub-base is therefore required where loading or climatic conditions during construction
are severe. Suitable material should possess properties similar to those of a good
surfacing material for unpaved roads. The material should be well graded and have a
plasticity index at the lower end of the appropriate range for an ideal unpaved road
wearing course under the prevailing climatic conditions. These considerations form the
basis of the criteria given in Tables 6-5 and 6-6. Material meeting the requirements for
severe conditions will usually be of higher quality than the standard sub-base (GS). If
materials to these requirements are unavailable, trafficking trials should be conducted to
determine the performance of alternative materials under typical site conditions.
In the construction of low-volume roads, where cost savings at construction are
particularly important, local experience is often invaluable and a wider range of materials
may often be found to be acceptable.
In Somaliland, laterite is one of the widely available material and can be used as a sub-
base material. Laterite meeting the gradation requirements of Table 6-6 can be used for
traffic levels up to 3x10⁶ ESA provided the following criteria is satisfied (Ref. 9):
Plasticity Index (%) < 25
Plasticity Modulus (PM) < 500
CBR (%) > 30

Pavement Design Manual - 2014 Chapter 6
Flexible Pavements and Gravel Roads Unbound Pavement Material
Roads Development Agency Page 6-7
Table 6-5: Recommended Plasticity Characteristics for Granular Sub-Bases (GS)
Climate Typical Annual
Rainfall
Liquid
Limit
Plasticity
Index
Linear
Shrinkage
Moist tropical and
wet tropical
>500mm <35 <6 <3
Seasonally wet trop >500mm <45 <12 <6
Arid and semi-arid <500mm <55 <20 <10
Table 6-6: Typical Particle Size Distribution for Sub-Bases (GS)
Which Will Meet Strength Requirements
Test Sieve (mm) Percentage by mass of total aggregate
passing test sieve (%)
50 100
37.5 80 – 100
20 60 – 100
5 30 – 100
1.18 17 – 75
0.3 9 – 50
0.075 5 – 25
SUB-BASE AS A FILTER OR SEPARATING LAYER
This may be required to protect a drainage layer from blockage by a finer material or to
prevent migration of fines and the mixing of two layers. The two functions are similar
except that for use as a filter the material needs to be capable of allowing drainage to take
place and therefore the amount of material passing the 0.075 mm sieve must be restricted.
The following criteria should be used to evaluate a subbase as a separating or filter layer:
a) The ratio D15(coarse layer) should be less than 5
D85(fine layer)
where D15 is the sieve size through which 15% by weight of the material passes
and D85 is the sieve size through which 85% passes.
b) The ratio D50(coarse layer) should be less than 25
D50(fine layer)
For a filter to possess the required drainage characteristics a further requirement is:
c) The ratio D15(coarse layer) should lie between 5 and 40
D15(fine layer)
These criteria may be applied to the materials at both the base course/sub-base and the
sub-base/subgrade interfaces.

Chapter 6 Pavement Design Manual - 2014
Unbound Pavement Material Flexible Pavements and Gravel Roads
Page 6-8 Roads Development Agency
6.3 SELECTED SUBGRADE MATERIALS AND CAPPING LAYERS (GC)
These materials are often required to provide sufficient cover on weak subgrades. They
are used in the lower pavement layers as a substitute for a thick sub-base to reduce costs,
and a cost comparison should be conducted to assess their cost effectiveness.
As an illustrative example, approximately 30 cm of “GC” material (as described below)
placed on an S1 or S2 subgrade will allow to select a pavement structure as for an S3
subgrade. An additional 5 cm of “GC” material may allow to consider an S4 subgrade
class.
The requirements are less strict than for sub-bases. A minimum CBR of 15 per cent is
specified at the highest anticipated moisture content measured on samples compacted in
the laboratory at the specified field density. This density is usually specified as a
minimum of 95 per cent of the maximum dry density in the ASTM Test Method D 1557
(Heavy Compaction). In estimating the likely soil moisture conditions, the designer
should take into account the functions of the overlying sub-base layer and its expected
moisture condition and the moisture conditions in the subgrade. If either of these layers is
likely to be saturated during the life of the road, then the selected layer should also be
assessed in this state. Recommended gradings or plasticity criteria are not given for these
materials. However, it is desirable to select reasonably homogeneous materials since
overall pavement behavior is often enhanced by this. The selection of materials which
show the least change in bearing capacity from dry to wet is also beneficial.

Pavement Design Manual - 2014 Chapter 7
Flexible Pavements and Gravel Roads Cement and Lime Stabilized Materials
Roads Development Agency Page 7-1
7 CEMENT AND LIME STABLIZED MATERIALS
7.1 INTRODUCTION
This chapter gives guidance on the manufacture and use of cement and lime-stabilized
materials in base course, subbase, capping and selected fill layers of pavements. The
stabilizing process involves the addition of a stabilizing agent to the soil, mixing with
sufficient water to achieve the optimum moisture content, compaction of the mixture, and
final curing to ensure that the strength potential is realized.
Many natural materials can be stabilized to make them suitable for road pavements but
this process is only economical when the cost of overcoming a deficiency in one material
is less than the cost of importing another material which is satisfactory without
stabilization.
The primary use for cement and lime stabilization in tropical countries like Somaliland
has so far been with gravelly soils to produce roadbases. The processes can also be used
with more clayey soils to make the upper layer of sub-bases.
Stabilization can enhance the properties of road materials and pavement layers in the
following ways:
A substantial proportion of their strength is retained when they become
saturated with water.
Surface deflections are reduced.
Materials in the supporting layer cannot contaminate the stabilized layer.
Lime-stabilized material is suitable for use as a capping layer or working
platform when the in situ material is excessively wet or weak and removal is
not economical.
Associated with these desirable qualities are several possible problems:
Traffic, thermal and shrinkage stresses can cause stabilized layers to crack.
Cracks can reflect through the surfacing and allow water to enter the
pavement structure.
If carbon dioxide has access to the material, the stabilization reactions are
reversible and the strength of the layers can decrease.
The construction operations require more skill and control than for the
equivalent unstabilized material.
Methods of dealing with these problems are outlined in Section 7.6.
The minimum acceptable strength of a stabilized material depends on its position in the
pavement structure and the level of traffic. It must be sufficiently strong to resist traffic
stresses but upper limits of strength are usually set to minimize the risk of reflection
cracking. Three types of stabilized layer have been used in the structural design catalog
(Chapter 10) and the strengths required for each are defined in Table 7-1.

Chapter 7 Pavement Design Manual - 2014
Cement and Lime Stabilized Materials Flexible Pavements and Gravel Roads
Page 7-2 Roads Development Agency
Table 7-1: Properties of Cement and Lime-Stabilized Materials
Code Description Unconfined compressive
strength* (Mpa)
(Cement Stabilized)
Minimum CBR
value* (%)
(Lime stabilized)
CB1 Stabilized base course 3.0 - 6.0 100
CB2 Stabilized base course 1.5 - 3.0 80
CS Stabilized sub-base 0.75 - 1.5 40
* Strength tests on 150 mm cubes (see Section 7.4)
7.2 THE STABILIZATION PROCESS
When lime is added to a cohesive soil, calcium ions replace sodium ions in the clay
fraction until the soil becomes saturated with calcium and the pH rises to a value in
excess of 12 (i.e. highly alkaline). The quantity of lime required to satisfy these reactions
is determined by the initial consumption of lime test (ICL), (British Standard 1924).
The solubility of silica and alumina in the soil increase dramatically when the pH is
greater than 12 and their reaction with lime can then proceed producing cementitious
calcium silicates and aluminates. Amorphous silica reacts particularly well with lime.
The cementitious compounds form a skeleton that holds the soil particles and aggregates
together.
The primary hydration of cement forms calcium silicate and aluminate hydrates,
releasing lime, which reacts with soil components, as described above, to produce
additional cementitious material.
The gain in strength associated with the formation of calcium silicates and aluminates
occurs slowly. It is accelerated by heat, an advantage when using lime stabilization in hot
climates.
7.3 SELECTION OF TYPE OF TREATMENT
The selection of the stabilizer is based on the plasticity and particle size distribution of
the material to be treated. The appropriate stabilizer can be selected according to the
criteria shown in Table 7-2:
Table 7-2: Guide to the Type of Stabilization Likely to be Effective
PP60
Type of
stabilization
Soil properties
More than 25% passing the
0.075 mm sieve
Less than 25% passing the
0.075 mm sieve
PIl0 10<PI20 PI>20 PI6 PI10 PI > 10
Cement Yes Yes * Yes Yes Yes
Lime * Yes Yes No * Yes
Lime-Pozzolan Yes * No Yes Yes * Notes. 1. * Indicates that the agent will have marginal effectiveness
2. PP = Plasticity Product (see Chapter 6).

Pavement Design Manual - 2014 Chapter 7
Flexible Pavements and Gravel Roads Cement and Lime Stabilized Materials
Roads Development Agency Page 7-3
Except for materials containing amorphous silica, e.g. some sandstones and chert,
material with low plasticity is usually best treated with cement. However, reactive silica
in the form of pozzolans can be added to soils with low plasticity to make them suitable
for stabilization with lime. If the plasticity of the soil is high there are usually sufficient
reactive clay minerals which can be readily stabilized with lime. Cement is more difficult
to mix intimately with plastic materials but this problem can be alleviated by pre-treating
the soil with approximately 2 per cent of lime to make it more workable. When lime is
added to a plastic material, it flocculates the clay and substantially reduces the plasticity
index.
If possible, the quality of the material to be stabilized should meet the minimum
standards set out in Table 7-3. Stabilized layers constructed from these materials are
more likely to perform satisfactorily even if they are affected by carbonation during their
lifetime. Materials not complying with Table 7-3 can sometimes be stabilized but more
additive will be required and the cost and the risk from cracking and carbonation will
increase.
Table 7-3: Desirable Properties of Material before Stabilization
Test sieve
(mm)
Percentage by mass of total aggregate passing sieve (mm)
CB1 CB2 CS
53 100 100 -
37.5 85 – 100 80 – 100 -
20 60 – 90 55 – 90 -
5 30 – 65 25 – 65 -
2 20 – 50 15 – 50 -
0.425 10 – 30 10 – 30 -
0.075 5 - 15 5 - 15 -
Maximum allowable value
LL 25 30 -
PI 6 10 20
LS 3 5 - Note: It is recommended that materials should have a coefficient of uniformity of 5 or more.
Some aspects of construction must also be considered in selecting the stabilizer. It is not
always possible to divert traffic during construction and the work must then be carried
out in half-widths. The rate of gain of strength in the pavement layer may sometimes
need to be rapid so that traffic can be routed over the completed pavement as soon as
possible. Under these circumstances, cement stabilization, with a faster curing period, is
likely to be more suitable than lime stabilization.
Certain types of organic compounds in soils can affect the hydration of cement and
inhibit the gain in strength. It is recommended that the effects of organic matter are
assessed by strength tests as outlined below.
Recent experience has shown that soils in which sulphates are present should be avoided.
Examples have been reported of lime stabilized clays swelling to a marked degree in the
months following construction. The cause of this swelling has been traced to a reaction
between sulphates in the soil and the calcium silica-alumina hydrates formed as the lime
reacts with soil. This reaction can occur in the presence of as little as 0.3 per cent of

Chapter 7 Pavement Design Manual - 2014
Cement and Lime Stabilized Materials Flexible Pavements and Gravel Roads
Page 7-4 Roads Development Agency
sulphate in the soil and is reported to be activated in situations where the soil is in or near
a saturated condition.
7.4 CEMENT STABILIZATION
SELECTION OF CEMENT CONTENT
The cement content determines whether the characteristics of the mixture are dominated
by the properties of the original soil or by the hydration products. As the proportion of
cement in the mixture increases, so the strength increases. Strength also increases with
time. During the first one or two days after construction this increase is rapid. Thereafter,
the rate slows down although strength gain continues provided the layer is well cured.
The choice of cement content depends on the strength required, the durability of the
mixture, and the soundness of the aggregate.
The minimum cement content, expressed as a percentage of the dry weight of soil, should
exceed the quantity consumed in the initial ion exchange reactions. It is recommended
that the percentage of cement added should be equal to or greater than the ICL.
PREPARATION OF SPECIMENS
The optimum moisture content and the maximum dry density for mixtures of soil plus
stabilizer are determined according to British Standard 1924 for additions of 2, 4, 6 and 8
per cent of cement.
Samples for the strength tests should also be mixed and left for two hours (to account for
delays in practice) before being compacted into 150 mm cubes at 97 per cent of the
maximum dry density obtained, after a similar two hour delay, in the ASTM Test Method
D 1557 (Heavy Compaction). These samples are then moist cured for 7 days and soaked
for 7 days in accordance with BS 1924.
When the soaking phase is completed, the samples are crushed, their strengths measured,
and an estimate made of the cement content needed to achieve the target strength.
As an alternative, the strength of stabilized sub-base material may be measured by the
CBR test after 7 days of moist curing and 7 days of soaking. A minimum CBR of 70 is
recommended.
7.5 LIME STABILIZATION
PROPERTIES OF LIME-STABILIZED MATERIALS
By lime-stabilization, both the ion exchange reaction and the production of cementitious
materials increase the stability and reduce the volume change within the clay fraction. It
is not unusual for the swell to be reduced from 7 or 8 per cent to 0.1 per cent by the
addition of lime. The ion exchange reaction occurs quickly and can increase the CBR of
clayey materials by a factor of two or three.
The production of cementitious materials can continue for ten years or more but the
strength developed will be influenced by the materials and the environment. The elastic

Pavement Design Manual - 2014 Chapter 7
Flexible Pavements and Gravel Roads Cement and Lime Stabilized Materials
Roads Development Agency Page 7-5
modulus behaves similarly to the strength and continues to increase for a number of
years. Between the ages of one month and two to three years there can be a four-fold
increase in the elastic modulus.
TYPES OF LIME
The most common form of commercial lime used in lime stabilization is hydrated high
calcium lime, Ca(OH)2, but monohydrated dolomitic lime, Ca(OH)2, MgO, calcitic quick
lime, CaO, and dolomitic quicklime, CaOMgO are also used.
For hydrated high calcium lime the majority of the free lime, which is defined as the
calcium oxide and calcium hydroxide that is not combined with other constituents,
should be present as calcium hydroxide. British Standard 890 requires a minimum free
lime and magnesia content (CaO + MgO), of 65 per cent.
Quicklime has a much higher bulk density than hydrated lime and it can be produced in
various aggregate sizes. It is less dusty than hydrated lime but the dust is much more
dangerous and strict safety precautions are necessary when it is used. For quicklime,
British Standard 890 requires a minimum free lime and magnesia content, (CaO + MgO),
of 85 per cent. ASTM C977 requires 90 per cent for both quicklime and hydrated lime.
Quicklime is an excellent stabilizer if the material is very wet. When it comes into
contact with the wet soil the quicklime absorbs a large amount of water as it hydrates.
This process is exothermic and the heat produced acts as a further drying agent for the
soil. The removal of water and the increase in plastic limit cause a substantial and rapid
increase in the strength and trafficability of the wet material.
In many parts of the world, lime has been produced on a small scale for many hundreds
of years to make mortars and lime washes for buildings. Different types of kilns have
been used and most appear to be relatively effective. Trials have been carried out by
TRRL in Ghana (Ref. 11) to determine the output possible from small kilns and to assess
the suitability of lime produced without commercial process control for soil stabilization.
Small batch kilns have subsequently been used to produce lime for stabilized layers on
major road projects.
SELECTION OF LIME CONTENT
The procedure for selecting the lime content follows the steps used for selecting cement
content and should, therefore, be carried out in accordance with British Standard 1924.
The curing period for lime-stabilized materials is 21 days of moist cure followed by 7
days of soaking. If the amount of lime exceeds the ICL, the stabilized material will
generally be non-plastic or only slightly plastic.
The temperature of the samples should be maintained near the ambient temperature.
Accelerated curing at higher temperatures is not recommended because the correlation
with normal curing at temperatures near to the ambient temperature can differ from soil
to soil. At high temperatures the reaction products formed by lime and the reactive silica
in the soil can be completely different from those formed at ambient temperatures.

Pavement Design Manual - 2014 Chapter 8
Flexible Pavements and Gravel Roads Bitumen-Bound Materials
Roads Development Agency Page 8-1
8 BITUMEN-BOUND MATERIALS
8.1 INTRODUCTION
This chapter describes types of bituminous materials, commonly referred to as premixes,
which are manufactured in asphalt mixing plants and laid hot (hence the other used
designation, “hot-mix”). In-situ mixing can also be used for making base courses for
lower standard roads but these methods are not generally recommended and are not
discussed in detail here.
Note: This chapter is not intended to replace standard specifications, to which the designer should refer. Rather, it is intended to outline the basic qualities assumed in the development of
the catalog of pavement structures (Chapter 10) and aid the designer in making choices in the
formulation of supplementary specifications tailored to the specific conditions and availability of
materials of a specific project.
8.2 COMPONENTS OF A MIX
The coarse aggregates for premixes should be produced by crushing sound, unweathered
rock or natural gravel. The specifications for the aggregates are similar to those for
granular base courses. The aggregate must be clean and free of clay and organic material,
the particles should be angular and not flaky. Gravel should be crushed to produce at
least two fractured faces on each particle. Aggregates for wearing course must also be
resistant to abrasion and polishing. Highly absorptive aggregates should be avoided
where possible, but otherwise the absorption of bitumen must be taken into account in the
mix design procedure. Hydrophilic aggregates which have a poor affinity for bitumen in
the presence of water should also be avoided. They may be acceptable only where
protection from water can be guaranteed.
The fine aggregate can be crushed rock or natural sand and should also be clean and free
from organic impurities. The filler (material passing the 0.075 mm sieve) can be crushed
rock fines, Portland cement or hydrated lime. Portland cement or hydrated lime is often
added to natural filler (1-2 % by mass of total mix) to assist the adhesion of the bitumen
to the aggregate. Fresh hydrated lime can help reduce the rate of hardening of bitumen in
surface dressings and may have a similar effect in premixes.
Suitable specifications for the coarse and fine mineral components are given in Tables 8-
1 and 8-2.
8.3 BITUMINOUS SURFACINGS
The highest quality material is necessary for the bituminous surfacing. Where thick
bituminous surfacing is required, they are normally constructed with a wearing course
laid on a binder course (see Figure 1-2) which can be made to slightly less stringent
specifications.

Chapter 8 Pavement Design Manual - 2014
Bitumen-Bound Materials Flexible Pavements and Gravel Roads
Page 8-2 Roads Development Agency
Table 8-1: Coarse Aggregate for Bituminous Mixes
Property Test Specification
Cleanliness Sedimentation or < 5 per cent passing
Decantation1 0.075mm sieve
Particle shape Flakiness index2 < 45 per cent
Strength Aggregate Crushing < 25. For weaker
Value (ACV)3 aggregates the Ten
per Cent Fines Value
Test (TFV) is used
Aggregate Impact < 25
Value (AIV)3
Los Angeles Abrasion < 30 (wearing course)
Value (LAA)4 < 35 (other)
Abrasion Aggregate Abrasion < 15
Value (AAV)3 < 12 (very heavy traffic)
Polishing Polished Stone Not less than 50-75
(wearing course only) Value3 depending on location
Durability Soundness:5 < 12 per cent
Sodium Test < 18 per cent
Magnesium Test
Magnesium Test < 18 per cent
Water Absorption Water Absorption6 < 2 per cent
Bitumen Affinity Coating and Stripping7 Non-stripped area of
aggregate > 95 per cent
Immersion Tray Test (7)
Effect of water on Index of retained
cohesion of compacted stability > 75 per
cent
mixes
Notes: 1. BS 812, Part 103 5. ASTM C 88
2. BS 812, Part 105 6. ASTM C 127
3. BS 812, Part 110 7. AASHTO T-182
3.4. ASTM C 131 and C535
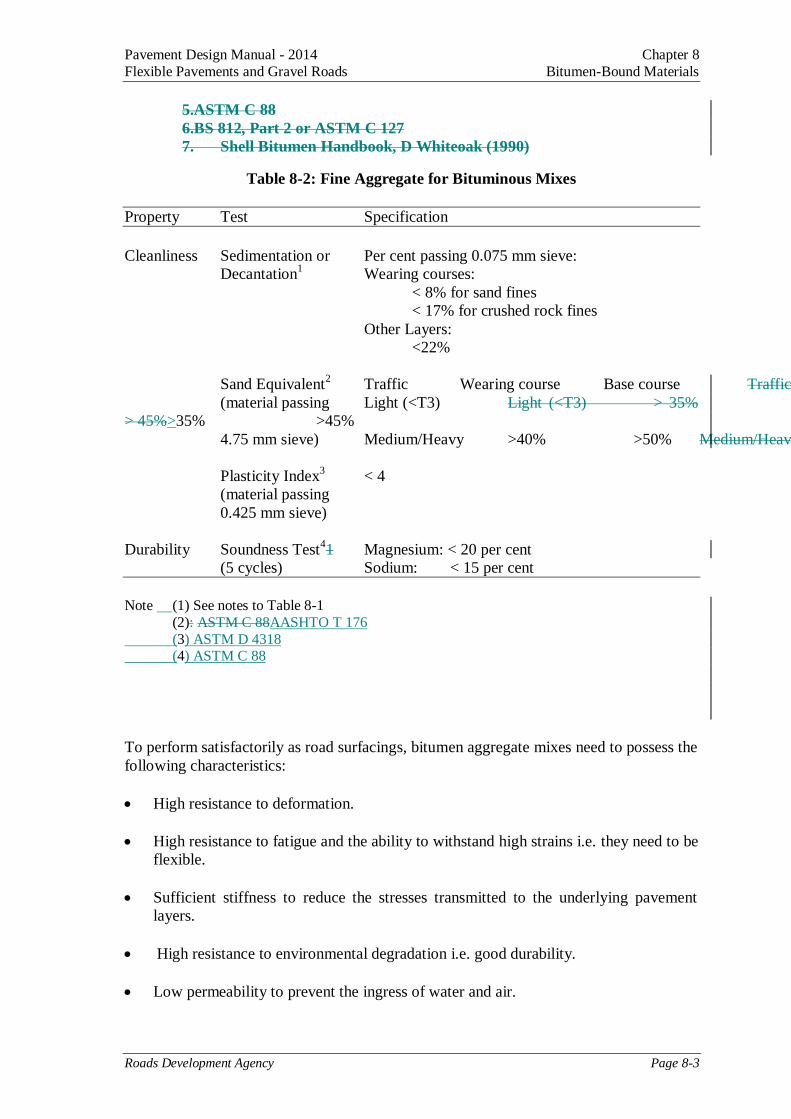
Pavement Design Manual - 2014 Chapter 8
Flexible Pavements and Gravel Roads Bitumen-Bound Materials
Roads Development Agency Page 8-3
5.ASTM C 88
6.BS 812, Part 2 or ASTM C 127
7. Shell Bitumen Handbook, D Whiteoak (1990)
Table 8-2: Fine Aggregate for Bituminous Mixes
Property Test Specification
Cleanliness Sedimentation or Per cent passing 0.075 mm sieve:
Decantation1
Wearing courses:
< 8% for sand fines
< 17% for crushed rock fines
Other Layers:
<22%
Sand Equivalent2
Traffic Wearing course Base course Traffic Wearing Course Binder Course
(material passing Light (<T3) Light (<T3) > 35%
> 45%>35% >45%
4.75 mm sieve) Medium/Heavy >40% >50% Medium/Heavy > 40% > 50%
Plasticity Index3 < 4
(material passing
0.425 mm sieve)
Durability Soundness Test41 Magnesium: < 20 per cent
(5 cycles) Sodium: < 15 per cent
Note (1) See notes to Table 8-1
(2): ASTM C 88AASHTO T 176
(3) ASTM D 4318 (4) ASTM C 88
To perform satisfactorily as road surfacings, bitumen aggregate mixes need to possess the
following characteristics:
High resistance to deformation.
High resistance to fatigue and the ability to withstand high strains i.e. they need to be
flexible.
Sufficient stiffness to reduce the stresses transmitted to the underlying pavement
layers.
High resistance to environmental degradation i.e. good durability.
Low permeability to prevent the ingress of water and air.

Chapter 8 Pavement Design Manual - 2014
Bitumen-Bound Materials Flexible Pavements and Gravel Roads
Page 8-4 Roads Development Agency
Good workability to allow adequate compaction to be obtained during construction
The requirements of a mix which will ensure each of these characteristics are often
conflicting. For example, mixes suitable for areas carrying heavy, slow-moving traffic,
such as on climbing lanes, or areas where traffic is highly channeled, will be unsuitable
for flat, open terrain where traffic moves more rapidly. A mix suitable for the latter is
likely to deform on a climbing lane and a mix suitable for a climbing lane is likely to
possess poor durability in flat terrain. In severe locations the use of bitumen modifiers is
often advantageous.
It has been shown that 40/50, 60/70 and 80/100 penetration grade bitumens in the surface
of wearing courses all tend to harden to a similar viscosity within a short time. It is
therefore recommended that 60/70 penetration bitumen is used to provide a suitable
compromise between workability, deformation resistance and potential hardening in
service. If possible, a bitumen should be selected which has a low temperature sensitivity
and good resistance to hardening as indicated by the standard and extended forms of the
Rolling Thin Film Oven Test (ASTM D 2872).
8.4 COMMON TYPES OF PREMIX
The main types of premix are asphaltic concrete, bitumen macadam and hot rolled
asphalt. Each type can be used in surfacings or base courses. Their general properties and
suitable specifications described below.
ASPHALTIC CONCRETE
Asphaltic concrete (AC) is a dense, continuously graded mix which relies for its strength
on both the interlock between aggregate particles and, to a lesser extent, on the properties
of the bitumen and filler. The mix is designed to have low air voids and low permeability
to provide good durability and good fatigue behavior but this makes the material
particularly sensitive to errors in proportioning, and mix tolerances are therefore very
narrow.
The particle size distributions for wearing course material given in Table 8-3 have
produced workable mixes that have not generally suffered from deformation failures.
Table 8-3: AsphalticConcrete Surfacings
Mix designation WC1 WC2 BC1
Wearing course Binder Course
Test sieve (mm) Percentage by mass of total aggregate passing test sieve
28 - - 100
20 100 - 80 – 100
10 60 – 80 100 60 – 80
5 54 – 72 62 – 80 36 – 56
2.36 42 – 58 44 – 60 28 – 44
1.18 34 – 48 36 – 50 20 – 37
0.6 26 – 38 28 – 40 15 – 27
0.3 18 – 28 20 – 30 10 – 20
0.15 12 – 20 12 – 20 5 – 13
0.075 6 – 12 6 – 12 2 – 6
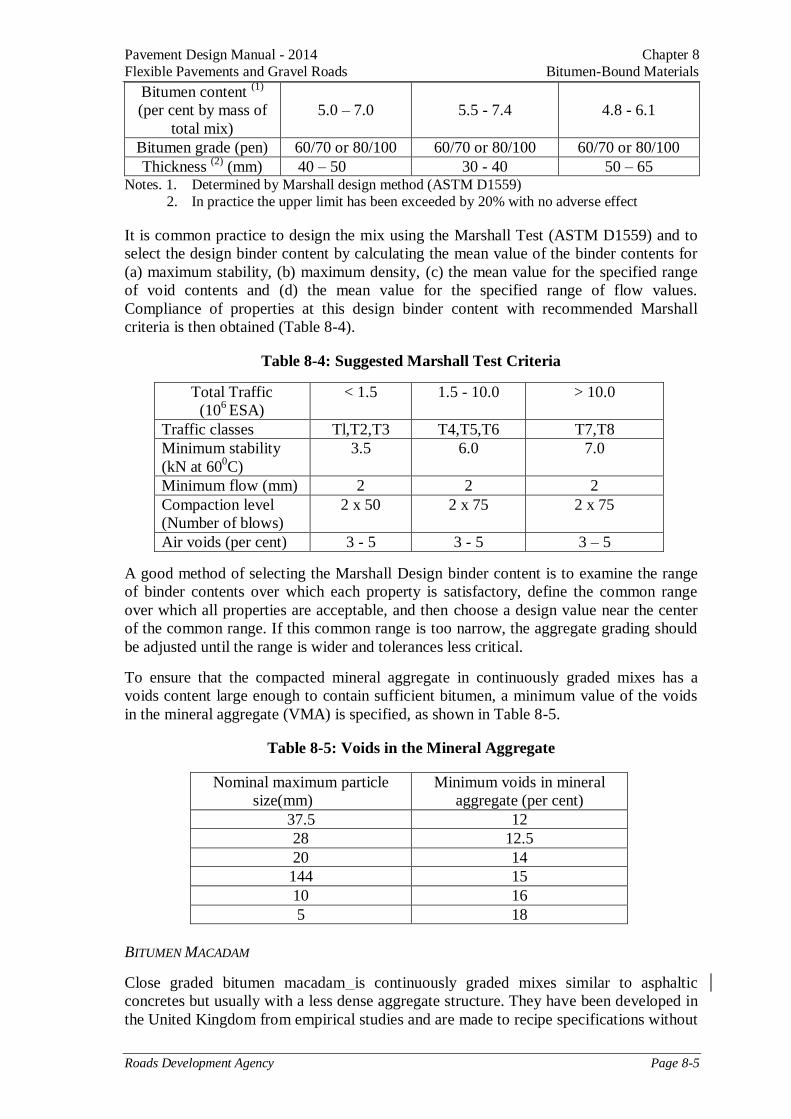
Pavement Design Manual - 2014 Chapter 8
Flexible Pavements and Gravel Roads Bitumen-Bound Materials
Roads Development Agency Page 8-5
Bitumen content (1)
(per cent by mass of
total mix)
5.0 – 7.0
5.5 - 7.4
4.8 - 6.1
Bitumen grade (pen) 60/70 or 80/100 60/70 or 80/100 60/70 or 80/100
Thickness (2)
(mm) 40 – 50 30 - 40 50 – 65 Notes. 1. Determined by Marshall design method (ASTM D1559)
2. In practice the upper limit has been exceeded by 20% with no adverse effect
It is common practice to design the mix using the Marshall Test (ASTM D1559) and to
select the design binder content by calculating the mean value of the binder contents for
(a) maximum stability, (b) maximum density, (c) the mean value for the specified range
of void contents and (d) the mean value for the specified range of flow values.
Compliance of properties at this design binder content with recommended Marshall
criteria is then obtained (Table 8-4).
Table 8-4: Suggested Marshall Test Criteria
Total Traffic
(106 ESA)
< 1.5 1.5 - 10.0 > 10.0
Traffic classes Tl,T2,T3 T4,T5,T6 T7,T8
Minimum stability
(kN at 600C)
3.5 6.0 7.0
Minimum flow (mm) 2 2 2
Compaction level
(Number of blows)
2 x 50 2 x 75 2 x 75
Air voids (per cent) 3 - 5 3 - 5 3 – 5
A good method of selecting the Marshall Design binder content is to examine the range
of binder contents over which each property is satisfactory, define the common range
over which all properties are acceptable, and then choose a design value near the center
of the common range. If this common range is too narrow, the aggregate grading should
be adjusted until the range is wider and tolerances less critical.
To ensure that the compacted mineral aggregate in continuously graded mixes has a
voids content large enough to contain sufficient bitumen, a minimum value of the voids
in the mineral aggregate (VMA) is specified, as shown in Table 8-5.
Table 8-5: Voids in the Mineral Aggregate
Nominal maximum particle
size(mm)
Minimum voids in mineral
aggregate (per cent)
37.5 12
28 12.5
20 14
144 15
10 16
5 18
BITUMEN MACADAM
Close graded bitumen macadam is continuously graded mixes similar to asphaltic
concretes but usually with a less dense aggregate structure. They have been developed in
the United Kingdom from empirical studies and are made to recipe specifications without

Chapter 8 Pavement Design Manual - 2014
Bitumen-Bound Materials Flexible Pavements and Gravel Roads
Page 8-6 Roads Development Agency
reference to a formal design procedure. Their suitability for different conditions and with
different materials may be questioned but, in practice, numerous materials including
crushed gravels have been used successfully. The advantage of this method is that quality
control testing is simplified and this should allow more intensive compliance testing to be
performed. Aggregates which behave satisfactorily in asphaltic concrete will also be
satisfactory in dense bitumen macadam. Suitable specifications for a both wearing course
and base course mixes are aregiven in Table 8-6. Sealing the wearing course with a
surface dressing soon after laying is recommended for a long maintenance-free life.
Slurry seals can also be used but they are best used in combination with a surface
dressing to form a Cape seal.
Table 8-6: Bitumen Macadam surfacings
Mix designation BC2
Binder Course
Test sieve (mm) Percentage by mass of total aggregate
passing test sieve
28 100
20 95 – 100
14 65 – 85
10 52 – 72
6.3 39– 55
3.35 32 – 46
1.18 -
0.3 7 – 21
0.075 (1)
2 – 8
Bitumen content (2)
(per
cent by mass of total mix)
5.0 0.6
Bitumen grade (3)
(pen) 60/70 or 80/100
Thickness (4)
(mm) 50 – 80
Notes: 1. When gravel other than limestone is used, the anti-stripping properties will be
improved by including 2% Portland cement or hydrated lime in the material passing
the 0.075 mm sieve. 2. For aggregate with fine microtexture e.g. limestone, the bitumen content should be
reduced by 0.1 to 0.3%.
3. 60/70 grade bitumen is preferred, see text. 4. In practice the upper limit has been exceeded by 20% with no adverse effect.
5. Limestone and gravel are not recommended for wearing courses where high skidding
resistance is required.
Close graded bitumen macadam mixes offer a good basis for the design of deformation
resistant materials for severe sites, and in these cases they should be designed on the
basis of their refusal density (see paragraph below). Recipe mixes are not recommended
in these circumstances are the Marshall Design criteria in Table 8-7 should be used. At
the time of construction the air voids content is virtually certain to be in excess of five
per cent and therefore a surface dressing should be placed soon after construction.
Table 8-7: Suggested Marshall Criteria for Close Graded Bitumen Macadams
Design Traffic < 1.5 1.5 - 10.0 > 10.0 Severe Sites

Pavement Design Manual - 2014 Chapter 8
Flexible Pavements and Gravel Roads Bitumen-Bound Materials
Roads Development Agency Page 8-7
(106 ESA)
Traffic classes Tl,T2,T3 T4,T5,T6 T7,T8 -
Minimum stability
(kN at 600C)
3.5 6.0 7.0 9.0
Minimum flow
(mm)
2-4 2-4 2-4 2-4
Compaction level
(Number of blows)
2 x 50 2 x 75 To refusal To refusal
8.3.3 ROLLED ASPHALT
Rolled asphalt is a gap-graded mix which relies for its properties primarily on the
mortar of bitumen, filler (<0.075 mm) and fine aggregate (0.075 - 2.36 mm). The
coarse aggregate (>2.36 mm) acts as an extender but its influence on stability and
density increases as the proportion of coarse aggregate in the mix increases above
approximately 55 per cent. If the coarse aggregate content is less than about 40
per cent, pre-coated chippings should be rolled into the surface to provide texture
for good skid resistance where necessary.
It is generally recognized that these mixtures are more durable and flexible than
the continuously graded asphaltic concretes. However, they can be more sensitive
to deformation under heavy traffic in hot weather and careful design of the
mixture is necessary to avoid this risk.
Also, rolled asphalt mixtures can be used in surfacing roads over the weak sub-
grades of Ethiopia (such as black cotton soils) to take advantage of their
flexibility characteristics.
Rolled asphalt has been developed elsewhere to recipe specifications but can also
be designed using the Marshall Test so that the physical characteristics of the fine
aggregate can be taken into account (British Standard 594). Wearing courses
made to the particle size distributions in the British Standard and with filler-to-
binder ratios in the range 0.8 - 1.0 have performed well in the tropics. The
compositions of suitable mixes are summarized in Table 8.7. The mixes made
with natural sand are more tolerant of proportioning errors than asphaltic concrete
and are easier to compact. Although the air voids tend to be slightly higher than
asphaltic concrete, they are discontinuous and the mixes are impermeable.
TABLE 8.7
Rolled asphalt surfacings
Mix designation WC5 WC6 BC3
BC4
Wearing Course (1,2) Binder
Course
Test sieve (mm) Percentage by mass of total aggregate passing test sieve
28 - - -
100

Chapter 8 Pavement Design Manual - 2014
Bitumen-Bound Materials Flexible Pavements and Gravel Roads
Page 8-8 Roads Development Agency
20 100 100 100 90-
100
1.4 90 - 100 90 - 100 90 - 100 65-
100
1.0 50 - 85 50 - 85 65 - 100 35 -
75
2.36 50 - 62 50 - 62 35 - 55- 35 -
55
0.6 35 - 62 20 - 40 15 - 35 15 -
55
0.212 10 - 40 10 - 25 5 - 30 5 -
30
0.075 6 - 10 6 - 10 2 - 9 2 -
9
Type of fines Natural sand Crushed rock Sand or
crushed rock
Bitumen grade (pen) 40/50 or 60/70 60/70 40/50 or
60/70
Thickness (mm) 50 50 40-65
50-80
Bitumen content (per cent Minimum target value 6.5 + 0.6
(crushed rock)
by mass of total mix) 6.3 0.5 (3) 6.3 0.6
(gravel)
Notes. 1. The preferred target for coarse aggregate is 50 per cent.
2. For WC5 a maximum of 12 per cent should be retained between the 0.6 mm
and 2.36 mm sieves.
3. With 50 % coarse aggregate (see BS594).
FLEXIBLE BBITUMINOUS SURFACING
It is essential that the thin bituminous surfacings (50mm) recommended for structures
described in Charts 3,4 and 7 of the structural catalog are flexible. This is particularly
important for surfacings laid on granular base courses. Mixes which are designed to have
good durability rather than high stability are flexible and are likely to have “sand” and
bitumen contents at the higher end of the permitted ranges. In areas where the production
of sand-sized material is expensive and where there is no choice but to use higher
stability mixes, additional stiffening through the aging and embrittlement of the bitumen
must be prevented by applying a surface dressing.
DESIGN TO REFUSAL DENSITY

Pavement Design Manual - 2014 Chapter 8
Flexible Pavements and Gravel Roads Bitumen-Bound Materials
Roads Development Agency Page 8-9
Under severe loading conditions asphalt mixes must be expected to experience
significant secondary compaction in the wheel paths. Severe conditions cannot be
precisely defined but will consist of a combination of two or more of the following:
High maximum temperatures
Very heavy axle loads
Very channeled traffic
Stopping or slow moving heavy vehicles
Failure by plastic deformation in continuously graded mixes occurs very rapidly once the
VIM are below 3 per cent. Therefore the aim of refusal density design is to ensure that at
refusal there is still at least 3 per cent voids in the mix.
For sites which do not fall into the severe category, the method can be used to ensure that
the maximum binder content for good durability is obtained. This may be higher than the
Marshall optimum but the requirements for resistance to deformation will be maintained.
Where lower axle loads and higher vehicle speeds are involved, the minimum VIM at
refusal can be reduced to 2 per cent.
Refusal density can be determined by two methods:
(a) Extended Marshall Compaction
(b) Compaction by vibrating hammer
Details of the tests and their limitations are given in Appendix D.
8.5 BITUMINOUS BASE COURSES
Satisfactory bituminous base courses can be made using a variety of specifications. They
should possess properties similar to bituminous mix surfacings but whenever they are
used in conjunction with such a surfacing the loading conditions are less severe, hence
the mix requirements are less critical. Nevertheless, the temperatures of base courses may
be high and the mixes are therefore prone to deformation in early life, and aging and
embrittlement later.
PRINCIPAL MIX TYPES
Particle size distributions and general specifications for continuously graded mixes are
given in Table 8-8. No formal design method is generally available for determining the
optimum composition for these materials because the maximum particle size and
proportions of aggregate greater than 25 mm precludes the use of the Marshall Test.
Table 8-8: Bitumen Macadam Base Course
Mix designation RB1
Test sieve (mm) Percentage by mass of total aggregate
passing test sieve
50 100

Chapter 8 Pavement Design Manual - 2014
Bitumen-Bound Materials Flexible Pavements and Gravel Roads
Page 8-10 Roads Development Agency
37.5 95 – 100
28 70 – 94
14 56 – 76
10 44 – 60
5 32 – 46
0.3 7 – 21
0.075 2 – 8 (1)
Bitumen content (per cent
by mass of total mix)
4.0 (2)
0.5
Thickness (mm) 65 – 125
Voids (per cent) 4 – 8
Bitumen grade (pen) 60/70 or 80/100
Notes. 1.Where gravel other than limestone is used, the anti-stripping properties will be improved
by including 2% Portland cement or hydrated lime in the material passing the 0.075 mm sieve.
2. Up to 1% additional bitumen may be required for gravel aggregate.
These specifications are recipes which have been developed from experience and rely on
performance data for their optimum adaptation to local conditions. The following
principles should be adopted for all bituminous layers but are particularly important for
recipe type specifications:
(i) Trials for mix production, laying and compaction should be carried out to
determine suitable mix proportions and procedures.
(ii) Durable mixes require a high degree of compaction and this is best achieved
by specifying density in terms of maximum theoretical density of the mix.
(iii) Mixing times and temperatures should be set at the minimum required to
achieve good coating of the aggregates and satisfactory compaction.
(iv) The highest bitumen content commensurate with adequate stability should
be used.
SAND-BITUMEN MIXES
For light and medium trafficked roads (defined as roads carrying less than 300
commercial vehicles per day and with mean equivalent standard axles per vehicle of 0.5
or less) and in areas lacking coarse aggregates, bitumen stabilized sands are an
alternative. Best results are achieved with well-graded angular sands in which the
proportion of material passing the 0.075mm sieve does not exceed 10% and is non-
plastic. The bitumen can range from a viscous cutback that will require heating to a more
fluid cutback or emulsion that can be used at ambient temperatures. The most viscous
cutbacks that can be properly mixed at ambient temperatures are RC or MC 800 or
equivalents. In general, the more viscous the bitumen the higher will be the stability of
the mix.
The amount of bitumen required will generally lie between 3 and 6 per cent by weight of
the dry sand, the higher proportions being required with the finer-grained materials.

Pavement Design Manual - 2014 Chapter 8
Flexible Pavements and Gravel Roads Bitumen-Bound Materials
Roads Development Agency Page 8-11
The Marshall Test (ASTM D1559) can be used for determining the amount of bitumen
required (ref. 12). Design criteria are given in Table 8-9 for sand bitumen mixes used as
base course materials for tropical roads carrying medium to light traffic.
Table 8-9: Criteria for Sand-Bitumen Base Course Materials
Traffic Classes
Tl T2
Marshall stability at 60oC (min) 1 kN 1.5 kN
Marshall flow value at 60oC (max) 2.5 mm 2 mm
8.6 MANUFACTURE AND CONSTRUCTION
General guidance on the design, manufacture and testing of bitumen macadams can be
found in the British Standards, BS 4987. Similar guidance for asphalt concrete is given
in the publications of the Asphalt Institute (Refs. 12-14).
It is normal practice to carry out preliminary design testing to determine the suitability of
available aggregates and their most economical combination to produce a job mix
formula.
The importance of detailed compaction trials at the beginning of asphalt construction
work cannot be over emphasized. During these trials, compaction procedures and
compliance of the production-run asphalt with the job-mix formula should be established.
Adjustments to the job-mix formula and, if necessary, redesign of the mix are carried out
at this stage to ensure that the final job mix satisfies the mix design requirements and can
be consistently produced by the plant.
Tolerances are specified for bitumen content and for the aggregate grading to allow for
normal variation in plant production and sampling. Typical tolerances for single tests are
given in Table 8-10. Good quality control is essential to obtain durable asphalt and the
mean values for a series of tests should be very close to the job-mix formula which, in
turn, should have a grading entirely within the specified envelope.
Mixing must be accomplished at the lowest temperatures and in the shortest time that
will produce a mix with complete coating of the aggregate and at a suitable temperature
to ensure proper compaction. The ranges of acceptable mixing and rolling temperatures
are shown in Table 8-11. Very little additional compaction is achieved at the minimum
rolling temperatures shown in the table and only pneumatic tired rollers should be used at
these temperatures.
Table 8-10: Job-Mix Tolerances for a Single Test
Combined aggregate passing test sieve
(mm)
Bitumen content
Test sieve Per cent Mix type Per cent
12.5+ ± 5 Wearing Courses ± 0.3
10.0 ± 5
2.36 ± 5 Binder Courses ± 0.4

Chapter 8 Pavement Design Manual - 2014
Bitumen-Bound Materials Flexible Pavements and Gravel Roads
Page 8-12 Roads Development Agency
0.60 ± 4
0.30 ± 3 Base Courses ± 0.4
0.15 +2
0.075 +2
Table 8-11: Manufacturing and Rolling Temperatures (oC)
Grade of bitumen (pen) Bitumen Mixing Aggregate Mixing Mix Rolling (minimum)
80 – 100 130 - 160 130 – 155 80
60 – 70 150 – 175 150 - 170 90
40 – 50 160 - 175 160 - 170 100
Rolled asphalts are relatively easy to compact but bitumen macadams and asphaltic
concretes are relatively harsh and more compactive effort is required. Heavy pneumatic
tired rollers are usually employed, the kneading action of the tires being important in
orientating the particles. Vibratory compaction has been used successfully but care is
needed in selecting the appropriate frequency and amplitude of vibration, and control of
mix temperature is more critical than with pneumatic tired rollers. Steel-wheeled dead-
weight rollers are relatively inefficient and give rise to a smooth surface with poor texture
but are required to obtain satisfactory joints. Rolling usually begins near the shoulder and
progresses towards the center. It is important that directional changes of the roller are
made only on cool compacted mix and that each pass of the roller should be of slightly
different length to avoid the formation of ridges. The number of joints to cold, completed
edges should be minimized by using two pavers in echelon of a full-width paver to avoid
cold joints between adjacent layers. If this is not possible, repositioning of the paver from
lane to lane at frequent intervals is another option.
If a layer is allowed to cool before the adjacent layer is placed, then the edge of the first
layer must be “roller over” and thoroughly compacted. Before laying the second lane, the
cold joint should be broomed if necessary and tack coated.
The paver screed should be set to overlap the first mat by a sufficient amount to allow the
edge of the rolled over layer to be brought up to the correct level. Coarse aggregates in
the material overlapping the cold joint should be carefully removed. The remaining fine
materials will allow a satisfactory joint to be constructed.

Pavement Design Manual - 2014 Chapter 9
Flexible Pavements and Gravel Roads Surface Treatments
Roads Development Agency Page 9-1
9 SURFACE TREATMENTS
9.1 INTRODUCTION
This chapter presents a general guide to the design of surface treatments and draws
attention to some of the more common mistakes that are made. It provides a framework
on which the engineer can base specific decisions to suit particular local conditions,
thereby producing cost effective results. It also contains brief descriptions of certain other
types of surface treatments.
A surface treatment is a simple, highly effective and inexpensive road surfacing if
adequate care is taken in the planning and execution of the work. The process is used for
surfacing both medium and lightly trafficked roads, an also as a maintenance treatment
for roads of all kinds.
A surface treatment comprises a thin film of binder, generally bitumen or tar, which is
sprayed onto the road surface and then covered with a layer of stone chippings. The thin
film of binder acts as a waterproofing seal preventing the entry of surface water into the
road structure. The stone chippings protect this film of binder from damage by vehicle
tires, and form a durable, skid-resistant and dust-free wearing surface. In some
circumstances the process may be repeated to provide double or triple layers of
chippings.
A surface treatment can provide an effective and economical running surface for newly
constructed road pavements. For sealing new roadbases, traffic flows of up to 500
vehicles/lane/day are appropriate, although this can be higher if the roadbase is very
stable or if a triple seal is used. Roads carrying in excess of 1000 vehicles/lane/day, have
been successfully surfaced with multiple surface treatments.
A correctly designed and constructed surface treatment should last at least 5 years before
resealing with another surface treatment becomes necessary. If traffic growth over a
period of several years necessitates a more substantial surfacing or increased pavement
thickness, a bituminous overlay can be laid over the original surface treatment when the
need arises.
A surface treatment is also a very effective maintenance technique, which is capable of
greatly extending the life of a structurally sound road pavement if the process is
undertaken at the optimum time. Under certain circumstances a surface treatment may
also retard the rate of failure of a structurally inadequate road pavement by preventing the
ingress of water and preserving the inherent strength of the pavement layers and the sub-
grade.
9.2 TYPES OF SURFACE TREATMENT
Surface treatments can be constructed in a number of ways to suit site conditions. The
common types of surface treatments are illustrated in Figure 9-1.
SINGLE SURFACE TREATMENT
A single surface treatment would not normally be used on a new roadbase because of the
risk that the film of bitumen will not give complete coverage. It is also particularly

Chapter 9 Pavement Design Manual - 2014
Surface Treatments Flexible Pavements and Gravel Roads
Page 9-2 Roads Development Agency
important to minimize the need for future maintenance and a double dressing should be
considerably more durable than a single dressing. However, a ‘racked-in’ dressing (see
below) may be suitable for use on a new roadbase which has a tightly knit surface
because of the heavier applications of binder which is used with this type of single
dressing.
When applied as a maintenance operation to an existing bituminous road surface a single
surface treatment can fulfill the functions required of a maintenance re-seal, namely
waterproofing the road surface, arresting deterioration, and restoring skid resistance.
Figure 9-1: Types of Surface Treatments
DOUBLE SURFACE TREATMENT
Double surface treatments should be used when:
A new roadbase is surface treated.
Extra ‘cover’ is required on an existing bituminous road surface because of its
condition (e.g. when the surface is slightly cracked or patched).

Pavement Design Manual - 2014 Chapter 9
Flexible Pavements and Gravel Roads Surface Treatments
Roads Development Agency Page 9-3
There is a requirement to maximize durability and minimize the frequency of
maintenance and resealing operations.
The quality of a double surface treatment will be greatly enhanced of traffic is allowed to
run on the first treatment for a minimum period of 2-3 weeks (and preferable longer)
before the second treatment is applied. This allows the chippings of the first treatment to
adopt a stable interlocking mosaic, which provides a firm foundation for the second
treatment. However, traffic and animals may cause contamination of the surface with
mud or soil during this period and this must be thoroughly swept off before the second
treatment is applied. Such cleaning is sometimes difficult to achieve and the early
application of the second seal to prevent such contamination may give a better result.
Sand may sometimes be used as an alternative to chippings for the second treatment.
Although it cannot contribute to the overall all thickness of the surfacing, the
combination of binder and sand provides a useful grouting medium for the chipping of
the first seal and helps to hold them in place more firmly when they are poorly shaped. A
slurry seal may also be used for the same purpose (see below).
TRIPLE SURFACE TREATMENT
A triple surface treatment may be used to advantage where a new road is expected to
carry high traffic volumes from the outset. The application of a small chipping in the
third seal will reduce noise generated by traffic and the additional binder will ensure a
longer maintenance-free service life.
RACKED-IN SURFACE TREATMENT
This treatment is recommended for use where traffic is particularly heavy or fast. A
heavy single application of binder is made and a layer of large chippings is spread to give
approximately 90 per cent coverage. This is followed immediately by the application of
smaller chippings which should ‘lock-in’ the larger aggregate and form a stable mosaic.
The amount of bitumen used is more than would be used with a single seal but less than
for a double seal. The main advantages of the racked-in surface treatment are:
Less risk of dislodged large chippings.
Early stability through good mechanical interlock.
Good surface texture.
OTHER TYPES OF SURFACE TREATMENT
‘Pad coats’ are used where the hardness of the existing road surface allows very little
embedment of the first layer of chippings, such as on a newly constructed cement
stabilized roadbase or a dense crushed rock base. A first layer of nominal 6mm chippings
will adhere well to the hard surface and will provide a ‘key’ for larger 10mm or 14mm
chippings in the second layer of the treatment.
‘Sandwich’ surface treatments are principally used on existing binder rich surfaces and
sometimes on gradients to reduce the tendency for the binder to flow down the slope.
9.3 CHIPPINGS FOR SURFACE TREATMENTS
The selection of chipping sizes is based on the volume of commercial vehicles having
unladen weight of more than 1.5 tonnes and the hardness of the existing pavement.

Chapter 9 Pavement Design Manual - 2014
Surface Treatments Flexible Pavements and Gravel Roads
Page 9-4 Roads Development Agency
Ideally, chippings used for surface treatment should be single sized, cubical in shape,
clean and free from dust, strong, durable, and not susceptible to polishing under the
action of traffic. In practice the chippings available usually fall short of this ideal.
It is recommended that chippings used of surface treatment should comply with the
requirements of Table 9-1 for higher levels of traffic, and to the requirements of Table 9-
2 for lightly trafficked roads of up to 250 vehicles per day:
Table 9-1: Grading Limits, Specified Size and Maximum Flakiness Index for
Surface Treatment Aggregates
Grading Limits
Test Sieve
Nominal Size of Aggregates (mm)
20 14 10 6.3
28
20
14
10
6.3
5.0
3.35
2.36
0.600
0.075
100
85-100
0-35
0-7
-
-
-
0-2
-
0-1
-
100
85-100
0-35
0-7
-
-
0-2
-
0-1
-
-
100
85-100
0-35
0-10
-
0-2
-
0-1
-
-
-
100
85-100
-
0-35
0-10
0-2
0-1
Specified Size
Minimum Percentage by Mass Retained
on Test Sieve
65 65 65 65
Maximum Flakiness Index 25 25 25 -
Table 9-2: Grading Limits, Specified Size and Maximum Flakiness Index for
Surface Treatment Aggregates for Lightly Trafficked Roads
Grading Limits
Test Sieve
Nominal Size of Aggregates (mm)
20 14 10 6.3
28
20
14
10
6.3
5.0
3.35
2.36
0.600
0.075
100
85-100
0-40
0-7
-
-
-
0-3
0-2
-
-
100
85-100
0-40
0-7
-
-
0-3
0-2
-
-
-
100
85-100
0-35
0-10
-
0-3
0-2
-
-
-
-
100
85-100
-
0-35
0-10
0-2
-
Specified Size
Minimum Percentage by Mass Retained
On Test Sieve
60 60 65 65
Maximum Flakiness Index 35 35 35 -

Pavement Design Manual - 2014 Chapter 9
Flexible Pavements and Gravel Roads Surface Treatments
Roads Development Agency Page 9-5
Samples of the chippings should be tested for grading, flakiness index, aggregate
crushing value and, when appropriate, the polished stone value and aggregate abrasion
value. Sampling and testing should be in accordance with the methods described in
Appendix A.
Specifications for maximum aggregate crushing value (ACV) for surface treatment
chippings typically lie in the range 20 to 35. For lightly trafficked roads the higher value
is likely to be adequate but on more heavily trafficked roads a maximum ACV of 20 is
recommended.
The polished stone value (PSV) of the chippings is important if the primary purpose of
the surface treatment is to restore or enhance the skid resistance of the road surface. The
PSV required in a particular situation is related to the nature of the road site and the
speed and intensity of the traffic (Ref. 15). The resistance to skidding is also dependent
upon the macro texture of the surface which, in turn, is affected by the durability of the
exposed aggregate. Table 9-3 gives recommended values of PSV for various road and
traffic conditions and provides and indication of the required aggregate properties.
Table 9-3: Recommended Polished Stone Values of Chippings
Traffic (cv/l/d) at Design Life
Site Definition 0
to
100
101
to
250
251
to
500
501
to
750
751
to
1000
1001
to
1250
1251
to
1500
1501
to
1750
1751
to
2000
2001
to
2250
2251
to
2500
2501
to
2750
2751
to
3250
Over
3250
1 Dual carriageway
non-event sections
and minor junctions 55 57 60 65 68
2 Single carriageway
non-event sections
and minor junctions 45 50 53 55 57 60 63 65 68
3 Approaches to and
across major junctions(all limbs)
Gradient 5%-10%,
Longer than 50m
Bend, radius 100-
250m.
Roundabout
50 55 57 60 63 65 68 Over 70
4 Gradient > 10%,
longer than 50m
Bend,radius < 100m.
55 60 63 65 68 Over 70
5 Approach to
roundabout, traffic
signals, pedestrian
crossing, railway
level crossing, etc.
63 65 68 Over 70
The nominal sizes of chippings normally used for surface treatment are 6, 10, 14 and 20
mm. Flaky chippings are those with a thickness (smallest dimension) less than 0.6 of
their nominal size. The proportion of flaky chippings clearly affects the average thickness
of a single layer of the chippings, and it is for this reason that the concept of the ‘average
least dimension’ (ALD) of chippings was introduced.

Chapter 9 Pavement Design Manual - 2014
Surface Treatments Flexible Pavements and Gravel Roads
Page 9-6 Roads Development Agency
In effect, the ALD is the average thickness of a single layer of chippings when they have
bedded down into their final interlocked positions. The amount of binder required to
retain a layer of chippings is thus related to the ALD of the chippings rather than to their
nominal size. This is discussed further in subchapter 9.5 where guidance is given on the
selection of the appropriate nominal size of chipping and the effect of flakiness on
surface treatment design.
The most critical period for a surface treatment occurs immediately after the chippings
have been spread on the binder film. At this stage the chippings have yet to become an
interlocking mosaic and are held in place solely by the adhesion of the binder film. Dusty
chippings can seriously impede adhesion and can cause immediate failure of the dressing.
The effect of dust can sometimes be mitigated by dampening them prior to spreading
them on the road. The chippings dry out quickly in contact with the binder and when a
cutback bitumen or emulsion is used, good adhesion develops more rapidly than when
the coating of dust is dry.
Most aggregates have a preferential attraction for water rather than for bitumen. Hence if
heavy rain occurs within the first few hours when adhesion has not fully developed, loss
of chippings under the action of traffic is possible. Where wet weather damage is
considered to be a severe risk, or the immersion tray test, described in Appendix E,
shows that the chippings have poor affinity with bitumen, an adhesion agent should be
used. An adhesion agent can be added to the binder or, used in a dilute solution to pre-
coat the chippings. However, the additional cost of the adhesion agent will be wasted of
proper care an attention is not given to all other aspects of the surface treatment process.
Improved adhesion of chippings to the binder film can also be obtained by pre-treating
the chippings before spreading. This is likely to be most beneficial if the available
chippings are very dusty or poorly shaped, or if traffic conditions are severe. There are
basically two ways of pre-treating chippings:
Spraying the chippings with a light application of creosote, diesel oil, or kerosene
at ambient temperature (Ref. 16). This can be conveniently done as the chippings
are transferred from stockpile to gritting lorries by a belt conveyor or,
alternatively, they can be mixed in a simple concrete mixer.
Pre-coating the chippings with a thin coating of hard bitumen such that the
chippings do not stick together and can flow freely.
Chippings which are pre-coated with bitumen enable the use of a harder grade of binder
for construction which can provide early strong adhesion and thus help to obtain high
quality dressings. The binder used for pre-coating need not necessarily be the same kind
as that used for the surface treatment; for example, tar-coated chippings adhere well to a
sprayed bitumen film. Pre-coating is usually undertaken in a hot-mix plant and the
hardness of the coating, and thus the tendency for the chippings to adhere to each other,
can be controlled by the mixing temperature and/or the duration of mixing; typical
coating temperatures are about 140oC for bitumen binders and 120
oC for tar binders.
Table 9-4 indicates the amount of binder recommended for lightly coating chippings.

Pavement Design Manual - 2014 Chapter 9
Flexible Pavements and Gravel Roads Surface Treatments
Roads Development Agency Page 9-7
Table 9-4: Binder Contents for Lightly-Coated Chippings
Nominal Size of Chippings (mm)
Target Binder Content (per cent by mass)
Bitumen
Tar
6
10 14
20
1.0
0.8 0.6
0.5
1.2
1.0 0.8
0.7
Pre-coated chippings should not be used with emulsions because the breaking of the
emulsion will be adversely affected.
Adhesion agents or pre-treatment chippings are often used in an attempt to counteract the
adverse effect of some fundamental fault in the surface treatment operation. If loss of
chippings has occurred, it is advisable to check whether the viscosity of the binder was
appropriate for the ambient road temperature at the time to spraying. The effectiveness of
the chipping and traffic control operations should also be reviewed before the use of an
adhesion agent or pre-treated chippings is considered.
9.4 BITUMENS
It is essential that good bonding is achieved between the surface treatment and the
existing road surface. This means that non-bituminous materials must be primed before
surface treatment is carried out.
PRIME COATS
Where a surface treatment is to be applied to a previously untreated road surface it is
essential that the surface should be dry, clean and as dust-free as possible. On granular,
cement or lime-stabilized surfaces a prime coat of bitumen ensures that these conditions
are met. The functions of a prime coat can be summarized as follows:
It assists in promoting and maintaining adhesion between the roadbase and a
surface treatment by pre-coating the roadbase and penetrating surface voids.
It helps to seal the surface pores in the roadbase thus reducing the absorption of the
first spray of binder of the surface treatment.
It helps to strengthen the roadbase near its surface by binding the finer particles of
aggregate together.
If the application of the surface treatment is delayed for some reason it provides the
roadbase with a temporary protection against rainfall and light traffic until the
surfacing can be laid.
The depth of penetration of the prime should be between 3-10mm and the quantity
sprayed should be such that the surface is dry within a few hours. The correct viscosity
and application rate are dependent primarily on the texture and density of the surface
being primed. The application rate is, however, likely to lie within the range 0.3-1.1
kg/m2. Low viscosity cutbacks are necessary for dense cement or lime-stabilized

Chapter 9 Pavement Design Manual - 2014
Surface Treatments Flexible Pavements and Gravel Roads
Page 9-8 Roads Development Agency
surfaces, and higher viscosity cutbacks for untreated coarse-textured surfaces. It is
usually beneficial to spray the surface lightly with water before applying the prime coat
as this helps to suppress dust and allows the primer to spread more easily over the surface
and to penetrate. Bitumen emulsions are not suitable for priming as they tend to form a
skin on the surface.
Low viscosity, medium curing cutback bitumens such as MC-30, MC-70, or in rare
circumstances MC-250, can be used for prime coats (Ref. 17). The relationship between
grade and viscosity (see Appendix A) for cutback primes is shown in Table 9-5.
Table 9-5: Kinematic Viscosities of Current Cutback Binders
Grade of Cutback Binder
Permitted Viscosity Range
(Centistokes at 60oC)
MC 250
MC 70
MC 30
250-500
70-140
30-60
BITUMENS FOR SURFACE TREATMENTS
The correct choice of bitumen for surface treatment work is critical. The bitumen must
fulfill a number of important requirements. It must:
be capable of being sprayed;
‘wet’ the surface of the road in a continuous film;
not run off a cambered road or form pools of binder in local depressions;
‘wet’ and adhere to the chipping at road temperature;
be strong enough to resist traffic forces and hold the chippings at the highest
prevailing ambient temperatures;
remain flexible at the lowest ambient temperature, neither cracking nor becoming
brittle enough to allow traffic to ‘pick-off’ the chippings; and
resist premature weathering and hardening.
Some of these requirements conflict, hence the optimum choice of binder involves a
careful compromise. For example, the binder must be sufficiently fluid at road
temperature to ‘wet’ the chippings whilst being sufficiently viscous to retain the
chippings against the dislodging effect of vehicle tires when traffic is first allowed to run
on the new dressing.
Figure 9-2 shows the permissible range of binder viscosity for successful surface
treatment at various road surface temperatures. In Somaliland, daytime road temperatures
typically lie between about 25oC and 50
oC, normally being in the upper half of this range
unless heavy rain is falling. For these temperatures the viscosity of the binder should lie
between approximately 104 and 7x10
5 centistokes. At the lower road temperatures
cutback grades of bitumen are most appropriate, whilst at higher road temperatures
penetration grade bitumens can be used.
The temperature/viscosity relationships shown in Figure 9-2 do not apply to bitumen
emulsions. These have a relatively low viscosity and ‘wet’ the chippings readily, after
which the emulsion ‘breaks,’ the water evaporates and particles of high viscosity bitumen
adhere to the chippings and the road surface.

Pavement Design Manual - 2014 Chapter 9
Flexible Pavements and Gravel Roads Surface Treatments
Roads Development Agency Page 9-9
Depending upon availability and local conditions at the time of construction, the
following types of bitumen are commonly used:
Penetration grade
Emulsion
Cutback
Modified bitumens
Figure 9-2: Surface Temperature/Choice of Binder for Surface Treatments

Chapter 9 Pavement Design Manual - 2014
Surface Treatments Flexible Pavements and Gravel Roads
Page 9-10 Roads Development Agency
PENETRATION GRADE BITUMENS
Penetration grade bitumens vary between 80/100 to approximately 700 penetration. The
softer penetration grade binders are usually produced at he refinery but can be made in
the field by blending appropriate amounts of kerosene, diesel, or a blend of kerosene and
diesel. With higher solvent contents the binder has too low a viscosity to be classed as
being of penetration grade and is then referred to as a cutback bitumen which, for surface
treatment work, is usually an MC or RC 3000 grade. In very rare circumstances a less
viscous grade such as MC or RC 800 may be used if the pavement temperature is below
15oC for long periods of the year.
BITUMEN EMULSION
Cationic bitumen emulsion with a bitumen content of 70 to 75 per cent is recommended
for most surface treatment work. This type of binder can be applied through whirling
spray jets at a temperature between 70 and 85oC and, once applied, it will break rapidly
on contact with chippings of most mineral types. The cationic emulsifier is normally an
anti-stripping agent and this ensures good initial bonding between chippings and the
bitumen.
When high rates of spray are required, the road is on a gradient, or has considerable
camber, the emulsion is likely to drain from the road or from high parts of the road
surface before ‘break’ occurs. In these cases it may be possible to obtain a satisfactory
result if the bitumen application is ‘split’, with a reduced initial rate of spray and a
heavier application after the chippings have been applied. If the intention was to
construct a single seal then the second application of binder will have to be covered with
sand or quarry fines to prevent the binder adhering to roller and vehicle wheels. If a
double dressing is being constructed then it should be possible to apply sufficient binder
in the second spray to give the required total rate of spray for the finished dressing.
If split application of the binder is used care must be taken with the following:
The rate of application of chippings must be correct so that there is a minimum of
excess chippings.
The second application of binder must be applied before traffic is allowed onto the
dressing.
For a single seal it will be necessary to apply grit or sand after the second application
of binder.
CUTBACK BITUMENS
Except for very cold conditions, MC or RC 3000 grade cutback is normally the most
fluid binder used for surface treatments. This grade of cutback is basically an 80/100
penetration grade bitumen blended with approximately 12 to 17 percent of cutter.
In Somaliland, the range of binders available to the engineer may be restricted. In this
situation it may then be necessary to blend two grades together or to ‘cut-back’ a
supplied grade with diesel oil or kerosene in order to obtain a binder with the required
viscosity characteristics. Diesel oil, which is less volatile than kerosene and is generally
more easily available, is preferable to kerosene for blending purposes. Only relatively
small amounts of diesel oil or kerosene are required to modify a penetration grade

Pavement Design Manual - 2014 Chapter 9
Flexible Pavements and Gravel Roads Surface Treatments
Roads Development Agency Page 9-11
bitumen such that its viscosity is suitable for surface treatment at road temperatures in
Somaliland. For example, Figure 9-3 shows that between 2 and 10 per cent of diesel oil
was required to modify 80/100 pen bitumen to produce binders with viscosities within
the range of road temperatures of between 40°– 60°, which prevail in Somaliland (Figure
9-2). Figure 9-4 shows the temperature/viscosity relationships for five of the blends
made for trials in Kenya.
Figure 9-3: Blending Characteristics of 80/100 Pen Bitumen with Diesel Fuel
Figure 9-4: Viscosity/Temperature Relationahips for Blends of 80/100 Pen Bitumen
with Diesel Fuel
Chapter 9 Pavement Design Manual - 2014
Surface Treatments Flexible Pavements and Gravel Roads
Page 9-12 Roads Development Agency
POLYMER MODIFIED BITUMENS
Polymers can be used in surface treatment to modify penetration grade, cutback bitumens
and emulsions. Usually these modified binders are used at locations where the road
geometry, traffic characteristics or the environment dictate that the road surface
experiences high stresses. Generally the purpose of the polymers is to reduce binder
temperature susceptibility so that variation in viscosity over the ambient temperature
range is as small as possible. Polymers can also improve the cohesive strength of the
binder so that it is more able to retain chippings when under stress from the action of
traffic. They also improve the early adhesive qualities of the binder allowing the road to
be reopened to traffic earlier than may be the case with conventional unmodified binders.
Other advantages claimed for modified binders are improved elasticity in bridging
hairline cracks and overall improved durability.
Examples of polymers that may be used to modify bitumens are proprietary
thermoplastic rubbers such as Styrene-Butadiene-Styrene (SBS), crumb rubber derived
from waste car tires and also glove rubber from domestic gloves. Latex rubber may also
be used to modify emulsions. Binders of this type are best applied by distributors fitted
with slotted jets of a suitable size.
Rubber modified bitumen may consist, typically, of a blend of 80/100 penetration grade
bitumen and three per cent powdered rubber. Blending and digestion of the rubber with
the penetration grade bitumen should be carried out prior to loading into a distributor.
This must be done in static tanks which incorporate integral motor driven paddles. The
blending temperature is approximately 200°C.
Cationic emulsion can be modified in specialized plant by the addition of three per cent
latex rubber. One of the advantages of using emulsions is that they can be sprayed at
much lower temperatures than penetration grade bitumens, which reduces the risk of
partial degradation of the rubber which can occur at high spraying temperatures.
Bitumen modified with SBS exhibits thermoplastic qualities at high temperatures while
having a rubbery nature at lower ambient temperatures. With three per cent of SBS,
noticeable changes in binder viscosity and temperature susceptibility occur and good
early adhesion of the chippings is achieved. SBS can be obtained in a carrier bitumen in
blocks of approximately 20kg mass. The blocks can be blended, at a concentration
recommended by the manufacturer, with 80/100 penetration binder in a distributor. In
this procedure it is best to place half of the required polymer into the empty distributor,
add hot bitumen from a main storage tank and then circulate the binder in the distributor
tank. The remaining blocks are added after about 30 minutes and then about 2 hours is
likely to be required to complete blending and heating of the modified binder. Every
effort should be made to use the modified bitumen on the day it is blended.
ADHESION AGENTS
Fresh hydrated lime can be used to enhance adhesion. It can be mixed with the binder in
the distributor before spraying (slotted jets are probably best suited for this) or the
chippings can be pre-coated with the lime just before use, by spraying with lime slurry.
The amount of lime to be blended with the bitumen should be determined in laboratory
trials but approximately 12 per cent by mass of the bitumen will improve bitumen-
Pavement Design Manual - 2014 Chapter 9
Flexible Pavements and Gravel Roads Surface Treatments
Roads Development Agency Page 9-13
aggregate adhesion and it should also improve the resistance of the bitumen to oxidative
hardening (Ref. 18).
Proprietary additives, known as adhesion agents, are also available for adding to binders
to help to minimize the damage to surface treatments that may occur in wet weather with
some types of stone. When correctly used in the right proportions, these agents can
enhance adhesion between the binder film and the chippings even though they may be
wet. The effectiveness and the amount of an additive needed to provide satisfactory
adhesion of the binder to the chippings in the presence of free water must be determined
by tests such as the Immersion Tray Test which is described in Appendix E.
Cationic emulsions inherently contain an adhesion agent and lime should not be used
with this type of binder.
9.5 DESIGN
The key stages in the surface treatment design procedure are illustrated in Figure 9-5.
EXISTING SITE CONDITIONS
Selection of a suitable surface treatment system for a road and the nominal size of
chippings to be used is based on the daily volume of commercial vehicles using each lane
of the road and the hardness of the existing pavement surface.
With time, the action of traffic on a surface treatment gradually forces the chippings into
the underlying surface, thus diminishing the surface texture. When the loss of surface
texture reaches an unacceptable level, a reseal will be required to restore skid resistance.
The embedment process occurs more rapidly when the underling road surface is softer, or
when the volume of traffic, particularly of commercial vehicles, is high. Accordingly,
larger chippings are required on soft surfaces or where traffic is heavy whilst small
chippings are best for hard surfaces. For example, on a very soft surface carrying 1000
commercial vehicles per lane per day, 20mm chipping are appropriate, whilst on a very
hard surface such as concrete, 6mm chipping should be the best choice.
Guidance on the selection of chipping size for single surface treatments, relating the
nominal size of chipping to the hardness of the underlying road surface and the weight of
traffic expressed in terms of the number of commercial vehicles carried per lane per day,
is shown in Table 9-6.
Road surface hardness may be assessed by a simple penetration probe test (Ref. 19).
This test utilizes a modified soil assessment cone penetrometer and is described briefly in
Appendix F. Alternatively the hardness of the existing road surface may be made on the
basis of judgement with the help of the definitions given in Table 9-7 (see also Appendix
A).
If larger sized chippings are used than those recommended in Table 9-6 then the
necessary bitumen spray rate, required to hold the chippings in place, is likely to be
underestimated by the design procedure described in this subchapter. This is likely to
result in the ‘whip-off’ of chippings by traffic early in the life of the dressing and also to
have a significant effect on the long term durability of low volume roads.

Chapter 9 Pavement Design Manual - 2014
Surface Treatments Flexible Pavements and Gravel Roads
Page 9-14 Roads Development Agency
Figure 9-5: Outline Procedure for Design of Surface Treatments

Pavement Design Manual - 2014 Chapter 9
Flexible Pavements and Gravel Roads Surface Treatments
Roads Development Agency Page 9-15
Table 9-6: Recommended Nominal Size of Chippings (mm)
Approximate Number of Commercial Vehicles with an Unladen Weight
Greater Than 1.5 Tonnes Currently Carried per Day in the Design Lane
Type of Surface 2000-4000 1000-2000 200-1000 20-200 Less Than 20
Very Hard Hard
Normal
Soft
Very Soft
10 14
201
*
*
10 14
14
201
*
6 10
10
14
201
6 6
10
14
14
6 6
6
10
10 The size of chipping specified is related to the mid-point of each lane traffic category. Lighter traffic
conditions may make the next smaller size of stone more appropriate. 1 Very particular care should be taken when using 20mm chippings to ensure that no loose chippings
remain on the surface when the road is opened to unrestricted traffic as there is a high risk of
windscreen breakage.
* Unsuitable for surface treatment.
Table 9-7: Categories of Road Surface Hardness
Category
of Surface
Penetration at 30
oC
1
Definition
Very Hard
Hard
Normal
Soft
Very Soft
0-2
2-5
5-8
8-12
>12
Concrete or very lean bituminous structures with dry stony
surfaces. There would be negligible penetration of chippings under
the heaviest traffic. Likely to be an asphalt surfacing which has aged for several years
and is showing some cracking. Chippings will penetrate only
slightly under heavy traffic. Typically, an existing surface treatment which has aged but retains
a dark and slightly bitumen-rich appearance. Chippings will
penetrate moderately under medium and heavy traffic.
New asphalt surfacing or surface treatments which look bitumen-rich and have only slight surface texture. Surfaces into which
chippings will penetrate considerable under medium and heavy
traffic. Surfaces, usually a surface treatment which is very rich in binder
and has virtually no surface texture. Even large chippings will be
submerged under heavy traffic. 1 See Appendices A and F
In selecting the nominal size of chippings for double surface treatments the size of
chipping for the first layer should be selected on the basis of the hardness of the existing
surface and the traffic category as indicated in Table 9-6. The nominal size of chipping
selected for the second layer should preferably have an ALD of not more than half that of
the chippings used in the first layer. This will promote good interlock between the
layers.
In the case of a hard existing surface, where very little embedment of the first layer of
chippings is possible, such as newly constructed cement stabilized road base or a dense
crushed rock base, a ‘pad coat’ of 6mm chippings should be applied first followed by
10mm or14mm chippings in the second layer. The first layer of small chippings will
adhere well to the hard surface and will provide a ‘key’ for the larger stone of the second
dressing.

Chapter 9 Pavement Design Manual - 2014
Surface Treatments Flexible Pavements and Gravel Roads
Page 9-16 Roads Development Agency
SELECTING THE BINDER
The selection of the appropriate binder for a surface treatment is usually constrained by
the range of binders available from suppliers, although it is possible for the user to
modify the viscosity of penetration grade and cutback binders to suit local conditions as
described in subchapter 9.4.
The factors to be taken into account in selecting an appropriate binder are:
The road surface temperature at the time the surface treatment is undertaken.
For penetration grade and cutback binders the viscosity of the binder should
be between 104 and 7x10
5 centistokes at the road surface temperature (see
subchapter 9.4).
The nature of the chippings. If dusty chippings are anticipated and no pre-
treatment is planned, the viscosity of the binder used should be towards the
lower end of the permissible range. If the binder selected is an emulsion it
should be borne in mind that anionic emulsions may not adhere well to certain
acidic aggregates such as granite and quartzite.
The characteristics of the road site. Fluid binders such as emulsions are not
suited to steep crossfalls or gradients since they may drain off the road before
‘breaking’. However, it may be possible to use a ‘split application’ of binder.
The type of binder handling and spraying equipment available. The
equipment must be capable of maintaining an adequate quantity of the
selected binder at its appropriate spraying temperature and spraying it evenly
at the required rate of spread.
The available binders. There may be limited choice of binders but a balanced
choice should be made where possible. Factors which may influence the final
selection of a binder include cost, ease of use, flexibility with regard to
adjusting binder viscosity on site and any influence on the quality of the
finished dressing.
Consideration of these factors will usually narrow the choice of binder to one or two
options. The final selection will be determined by other factors such as the past
experience of the surface treatment team.
CHOICE OF BINDER AND TIMING OF CONSTRUCTION WORK
The choice of cutback grade or penetration grade bitumen for surface treatment work is
largely controlled by road temperatures at and shortly after the time of construction.
However, there are relative advantages and disadvantages associated with the use of
penetration grade binders or cutback bitumen.
MC 3000 cutback binder typically contains 12 to 17 per cent of cutter. Under warm road
conditions this makes the binder very tolerant of short delays in the application of
chippings and of the use of moderately dusty chippings. It is therefore a good material to
use. However, a substantial percentage of the cutter, especially if it is diesel, can remain
in the seal for many months. If road temperatures increase soon after construction, it is
likely that MC 3000 will be found to be ‘tender’ and that the seal can be easily damaged.

Pavement Design Manual - 2014 Chapter 9
Flexible Pavements and Gravel Roads Surface Treatments
Roads Development Agency Page 9-17
This should not be a problem for lightly trafficked roads and for new roads that are not
opened to general traffic for several days after the surface treatment is constructed. If a
road must be opened to fast high volume traffic within a few hours of construction then
there will be considerable advantage in using as high a viscosity binder as conditions will
permit. For instance, if the road temperature is 40oC ten for heavy traffic the chart in
Figure 9-2 would suggest that MC 3000 would be only just viscous enough. 400/500
penetration grade bitumen would be on the limit of being too viscous, however, it would
be preferable to cut-back the bitumen to a 500/600 penetration grade rather than use a
MC 3000 grade. If pre-coated chippings could be used then the use of a 400 penetration
grade bitumen would be acceptable.
Penetration grade bitumens as hard as 80/100 are often used for surface treatment work
when road temperatures are high. With such a high viscosity bitumen it is very important
that the chippings are applied immediately after spraying and, to achieve this, the
chipping spreader must follow closely behind the distributor. This type of binder will not
be tolerant of delays in the application of the chippings nor of the use of dusty chippings.
In either situation, early trafficking is very likely to dislodge chippings and seriously
damage the seal.
The use of penetration grade binders in the range 80/100 to 400 is preferred to MC 3000
wherever circumstances allow this. For high volume fast traffic, where very early
adhesion of the chippings is essential, consideration should be given to the use of pre-
coated chippings. This will allow the use of a more viscous binder for a given road
temperature and will ensure that a strong early bonding of the hipping is obtained. A
polymer modified or rubberized binder can also provide immediate strong adhesion.
Alternatively, emulsions will provide good ‘wetting’ and early adhesion provided rainfall
does not interfere with curing.
The most difficult situations occur when it is required to start work early in the day and
temperatures are considerably lower than they will be in the afternoon. It may appear to
be appropriate to user a cutback binder, such as MC 3000, for the low road temperature
but, by the afternoon, the seal is likely to be too ‘soft.’ In these situations it is better to
use a more viscous binder and keep the traffic off of the new seal until it has been rolled
in the afternoon.
DESIGNING THE SURFACE TREATMENT
Having selected the nominal size of chipping and the type of binder to be used, the next
step in the design of a surface treatment is to determine the rate of spread of the binder.
Differences in climate, uniformity of road surfaces, the quality of aggregates, traffic
characteristics and construction practice, necessitate a general approach to the
determination of the rate of spread of the binder for application in Somaliland.
The method of design relates the voids in a layer of chippings to the amount of binder
necessary to hold the chippings in place. In a loose single layer of chippings such as is
spread for a surface treatment, the voids are initially about 50 per cent, decreasing to
about 30 per cent after rolling and subsequently to 20 per cent by the action of traffic.
For best results, between 50 and 70 per cent of the voids in the compacted aggregate
should be filled with binder. Hence it is possible to calculate the amount of binder
required to retain a layer of regular, cubical chipping of any size. However, in practice
chippings are rarely the ideal cubical shape (especially when unsuitable crushing plant
has been used) and this is why the ALD concept was originally introduced.

Chapter 9 Pavement Design Manual - 2014
Surface Treatments Flexible Pavements and Gravel Roads
Page 9-18 Roads Development Agency
DETERMINING THE AVERAGE LEAST DIMENSION (ALD) OF CHIPPINGS
The ALD of chippings is a function of both the average size of the chippings, as
determined by normal square mesh sieves, and the degree of flakiness. The ALD may be
determined in two ways:
Method A: A grading analysis is performed on a representative sample of the
chippings in accordance with ASTM C136. The sieve size through which 50 per cent of
the chippings pass is determined (i.e. the ‘median size’). The flakiness index is then also
then derived from the nomograph shown in Figure 9-6.
Method B: A representative sample of the chipping is carefully subdivided (in
accordance with British Standard 812: 1985) to give approximately 200 chippings. The
least dimension of each chipping is measured manually and the mean value, or ALD, is
calculated.
Figure 9-6: Determination of Average Least Dimension

Pavement Design Manual - 2014 Chapter 9
Flexible Pavements and Gravel Roads Surface Treatments
Roads Development Agency Page 9-19
DETERMINING THE OVERALL WEIGHTING FACTOR
The ALD of the chippings is used with an overall weighting factor to determine the basic
rate of spray of bitumen. The overall weighting factor ‘F’ is determined by adding
together four factors that represent; the level of traffic, the condition of the existing road
surface, the climate and the type of chippings that will be used. Factors appropriate to
the site to be surface dressed are selected from Table 9-8.
For example, if flaky chippings (factor –2) are to be used at a road site carrying medium
to heavy traffic (factor –1) and which has a primed base surface (factor +6) in a wet
tropical climate (factor +1) the overall weighting factor ‘F’ is:
-2 –1 +6 +1 = +4
Table 9-8: Weighting Factors for Surface Treatment Design
Description Factor
Total traffic (all classes) Vehicles/lane/day
Very light 0 – 50 +3
Light 50 – 250 +1
Medium 250 – 500 0
Medium-Heavy 500 – 1500 -1
Heavy 1500 – 3000 -3
Very Heavy 3000+ -5
Existing Surface
Untreated or primed base +6
Very lean bituminous +4
Lean bituminous 0
Average bituminous -1
Very rich bituminous -3
Climatic Conditions
Wet and cold +2
Tropical (wet and hot) +1
Temperate 0
Semi-arid (hot and dry) -1
Arid (very dry and very hot) -2
Type of Chippings
Round/dusty +2
Cubical 0
Flaky (see Tables 9-1 and 9-2) -2
Pre-coated -2

Chapter 9 Pavement Design Manual - 2014
Surface Treatments Flexible Pavements and Gravel Roads
Page 9-20 Roads Development Agency
The rating for the existing surface allows for the amount of binder that is required to fill
the surface voids and which is therefore not available to contribute to the binder film that
retains the chippings. If the existing surface of the road is rough, it should be rated as
‘very lean bituminous’ even if its overall color is dark with bitumen. Similarly, when
determining the rate of spread of binder for the second layer of a double surface
treatment, the first layer should also be rated ‘very lean bituminous’.
This method of determining the rate of spread of binder requires the estimation of traffic
in terms of numbers of vehicles only. However if the proportion of commercial vehicles
in the traffic stream is high (say more than 20 per cent) the traffic factor selected should
be for the next higher category of traffic than is indicated by the simple volume count.
DETERMINING THE BASIC BITUMEN SPRAY RATE
Using the ALD and ‘F’ values in equation 1 will give the required basic rate of spread of
binder.
R = 0.6250 + 0 (F*0.023) + [0.0375 + (F*0.0011)] ALD (1)
Where F = Overall weighting factor
ALD = The average least dimension of the chippings (mm)
R = Basic rate of spread of bitumen (kg/m2)
Alternatively, the values for F and ALD can be used in the design chart given in Figure
9-7. The intercept between the appropriate factor line and the ALD line is located and
the rate of spread of the binder is then read off directly at the bottom of the chart. The
basic rate of spread of bitumen (R) is the mass of MC 3000 binder per unit area on the
road surface immediately after spraying. The relative density of MC 3000 can be
assumed to be 1.0 and the spread rate can therefore also be expressed in 1iters/m2;
however, calibration of a distributor is easier to do by measuring spray rates in terms of
mass.
SPRAY RATE ADJUSTMENT FACTORS
Best results will be obtained if the basic rate of spread of binder is adjusted to take
account of traffic speed and road gradient as follows:
For slow traffic or climbing grades with gradients steeper than 3 per cent, the basic
rate of spread of binder should be reduced by approximately 10 per cent.
For fast traffic or down grades steeper than 3 per cent the basic rate of spread of
binder should be increased by approximately 10 per cent.
The definition of traffic speed is not precise but is meant to differentiate between roads
with a high proportion of heavy vehicles and those carrying mainly cars traveling at
80km/h or more.

Pavement Design Manual - 2014 Chapter 9
Flexible Pavements and Gravel Roads Surface Treatments
Roads Development Agency Page 9-21
Figure 9-7 Surface Treatment Design Chart
The basic rate of spread of binder must also be modified to allow for the type of binder
used. The following modifications are appropriate:
Penetration grade binders: decrease the rate of spread by 10 per cent.
Cutback binders: for MC/RC 3000 no modification is required (in the rare
cases when cutbacks with lower viscosity are used the rate of spread should
be increased to allow for the additional percentage of cutter used).

Chapter 9 Pavement Design Manual - 2014
Surface Treatments Flexible Pavements and Gravel Roads
Page 9-22 Roads Development Agency
Suggested adjustment factors for different binders and different site conditions are given
in Table 9-9. The adjustment factors reflect the amount of cutter used in the base 80/100
penetration grade bitumen but must be regarded as approximate values.
Table 9-9: Typical Bitumen Spray Rate Adjustment Factors
Binder
Grade
Basic Spray
Rate from
Figure 9-7 or
Equation 1
Flat Terrain,
Moderate
Traffic Speed
High Speed
Traffic,
Down-Hill
Grades>3%
Low Speed
Traffic,
Up-Hill
Grades>3%
MC 3000
300 pen
80/100 pen
Emulsion1
R
R
R
R
R
R*0.95
R*0.9
R*(90/% binder)
R*1.1
R*1.05
R*0.99
R*(99/% binder)
R*0.9
R*0.86
R*0.81
R*(81/% binder) 1 ‘% binder’ is the percentage of bitumen in the emulsion.
The amount of cutter required for ‘on-site’ blending should be determined in the
laboratory by making viscosity tests on a range of blends of bitumen and cutter. MC
3000 can be made in the field by blending 90 penetration bitumen with 12 to 14 per cent
by volume of a 3:1 mixture of kerosene and diesel. It is suggested that if there is
significantly more than 14 per cent of cutter by volume then the spray rate should be
adjusted to compensate for this. For binders that have been cutback at the refinery, the
cutter content should be obtained from the manufacturer.
If a different grade of binder is required then the adjustment factor should reflect the
different amount of cutter used. For instance, a 200 penetration binder may have 3 per
cent cutter in it and therefore the spray rate is 103 per cent of the rate for a 80/100
penetration bitumen. Subchapter 9.6 gives an example of the use of the design chart and
adjustment factors.
ADJUSTING RATES OF SPRAY FOR MAXIMUM DURABILITY
The spray rate which will be arrived at after applying the adjustment factors in Table 9-9
will provide very good surface texture and use an ‘economic’ quantity of binder.
However, because of the difficulties experienced in carrying out effective maintenance,
there is considerable merit in sacrificing some surface texture for increased durability of
the seal. For roads on flat terrain and carrying moderate to high-speed traffic it is possible
to increase the spray rates obtained from Table 9-9 by approximately 8 per cent. The
heavier spray rate may result in the surface having a ‘bitumen-rich’ appearance in the
wheel paths of roads carrying appreciable volumes of traffic. However, the additional
binder should not result in bleeding and it can still be expected that more surface texture
will be retained than is usual in an asphalt concrete wearing course.
SURFACE TREATMENT DESIGN FOR LOW VOLUME ROADS
If a low volume road, carrying less than about 100 vehicles per day, is surface dressed it
is very important that the seal is designed to be as durable as possible to minimize the
need for subsequent maintenance.
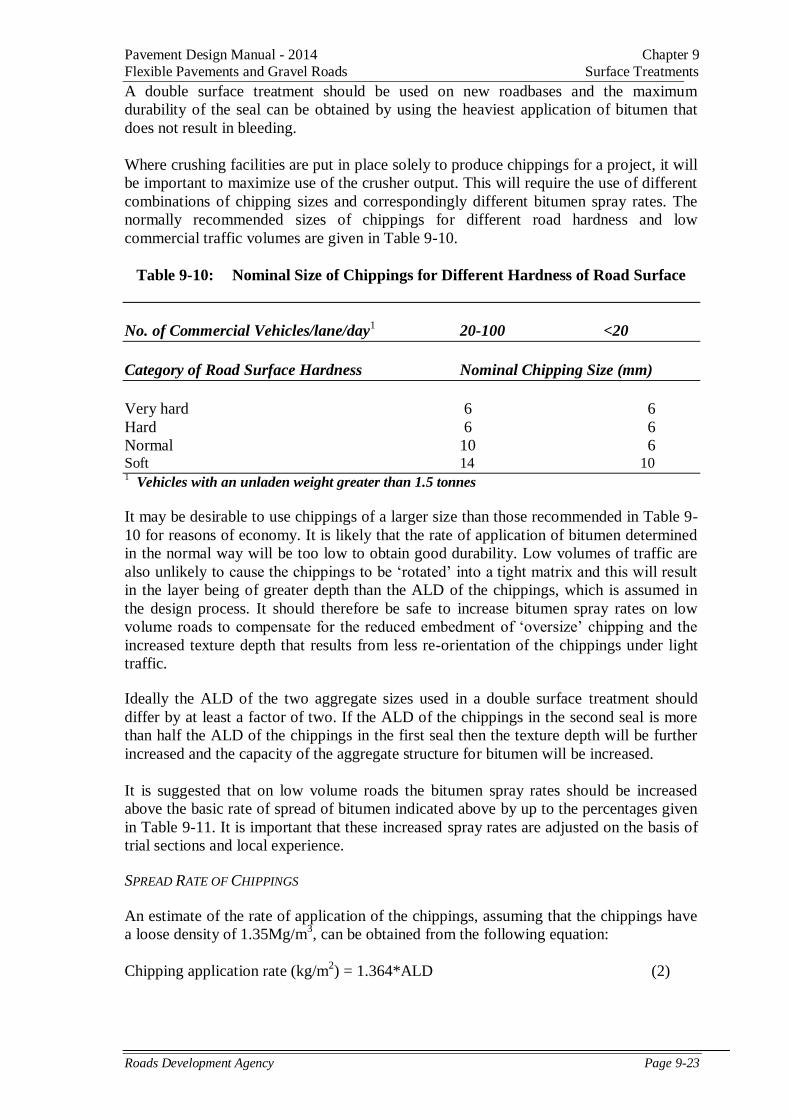
Pavement Design Manual - 2014 Chapter 9
Flexible Pavements and Gravel Roads Surface Treatments
Roads Development Agency Page 9-23
A double surface treatment should be used on new roadbases and the maximum
durability of the seal can be obtained by using the heaviest application of bitumen that
does not result in bleeding.
Where crushing facilities are put in place solely to produce chippings for a project, it will
be important to maximize use of the crusher output. This will require the use of different
combinations of chipping sizes and correspondingly different bitumen spray rates. The
normally recommended sizes of chippings for different road hardness and low
commercial traffic volumes are given in Table 9-10.
Table 9-10: Nominal Size of Chippings for Different Hardness of Road Surface
No. of Commercial Vehicles/lane/day1 20-100 <20
Category of Road Surface Hardness Nominal Chipping Size (mm)
Very hard 6 6
Hard 6 6
Normal 10 6 Soft 14 10 1 Vehicles with an unladen weight greater than 1.5 tonnes
It may be desirable to use chippings of a larger size than those recommended in Table 9-
10 for reasons of economy. It is likely that the rate of application of bitumen determined
in the normal way will be too low to obtain good durability. Low volumes of traffic are
also unlikely to cause the chippings to be ‘rotated’ into a tight matrix and this will result
in the layer being of greater depth than the ALD of the chippings, which is assumed in
the design process. It should therefore be safe to increase bitumen spray rates on low
volume roads to compensate for the reduced embedment of ‘oversize’ chipping and the
increased texture depth that results from less re-orientation of the chippings under light
traffic.
Ideally the ALD of the two aggregate sizes used in a double surface treatment should
differ by at least a factor of two. If the ALD of the chippings in the second seal is more
than half the ALD of the chippings in the first seal then the texture depth will be further
increased and the capacity of the aggregate structure for bitumen will be increased.
It is suggested that on low volume roads the bitumen spray rates should be increased
above the basic rate of spread of bitumen indicated above by up to the percentages given
in Table 9-11. It is important that these increased spray rates are adjusted on the basis of
trial sections and local experience.
SPREAD RATE OF CHIPPINGS
An estimate of the rate of application of the chippings, assuming that the chippings have
a loose density of 1.35Mg/m3, can be obtained from the following equation:
Chipping application rate (kg/m2) = 1.364*ALD (2)

Chapter 9 Pavement Design Manual - 2014
Surface Treatments Flexible Pavements and Gravel Roads
Page 9-24 Roads Development Agency
Table 9-11: Suggested Maximum Increases in Bitumen Spray Rate for Low Volume
Roads
ALD of chippings (mm) 3 6 >6
All traffic (vehicles/lane/day) <20 20-100 <20 20-100 <20 20-100
Increase in bitumen spray rate
(per cent) 15 10 20 15 30 20
The chipping application rate should be regarded as a rough guide only. It is useful in
estimating the quantity of chippings that is required for a surface treatment project before
crushing and stockpiling of the chippings is carried out. A better method of estimating the
approximate application rate of the chippings is to spread a single layer of chippings
taken from the stockpile on a tray of known area. The chippings are then weighed, the
process repeated ten times with fresh chippings, and the mean value calculated. An
additional ten per cent is allowed for whip off. Storage and handling losses must also be
allowed for when stockpiling chippings.
The precise chipping application rate must be determined by observing on site whether
any exposed binder remains after spreading the chippings, indicating too low a rate of
application of chippings, or whether chippings are resting on top of each other, indicating
too high an application rate. Best results are obtained when the chippings are tightly
packed together, one layer thick. To achieve this, a slight excess of chippings must be
applied. Some will be moved by the traffic and will tend to fill small areas where there
are insufficient chippings. Too great an excess of chippings will increase the risk of
whip-off and windscreen damage.
9.6 EXAMPLE OF A SURFACE TREATMENT DESIGN
Site Description
A two-lane trunk road at an altitude of approximately 1500m.
Vehicle count averaged 3370 per day/lane (i.e. ‘Heavy’ rating).
Bitumen to be used is 400 penetration grade (made by cutting back 80/100 pen bitumen
with 6.7 per cent by mass or approximately 7.5 per cent by volume) of a 3:1 mixture of
kerosene and diesel.
Design Factor
Traffic (Heavy) -3
Existing Surface (Average Bituminous) -1
Chippings (Cubical) 0
Climate (Hot/Dry) -1
Overall Weighing Factor (F) -5
Aggregate (Nominal 19 mm)
Medium Size (i.e. 50 per cent passing) 16mm
Flakiness Index 16
Average Least Dimension (from Nomograph, Figure 9-6) 12
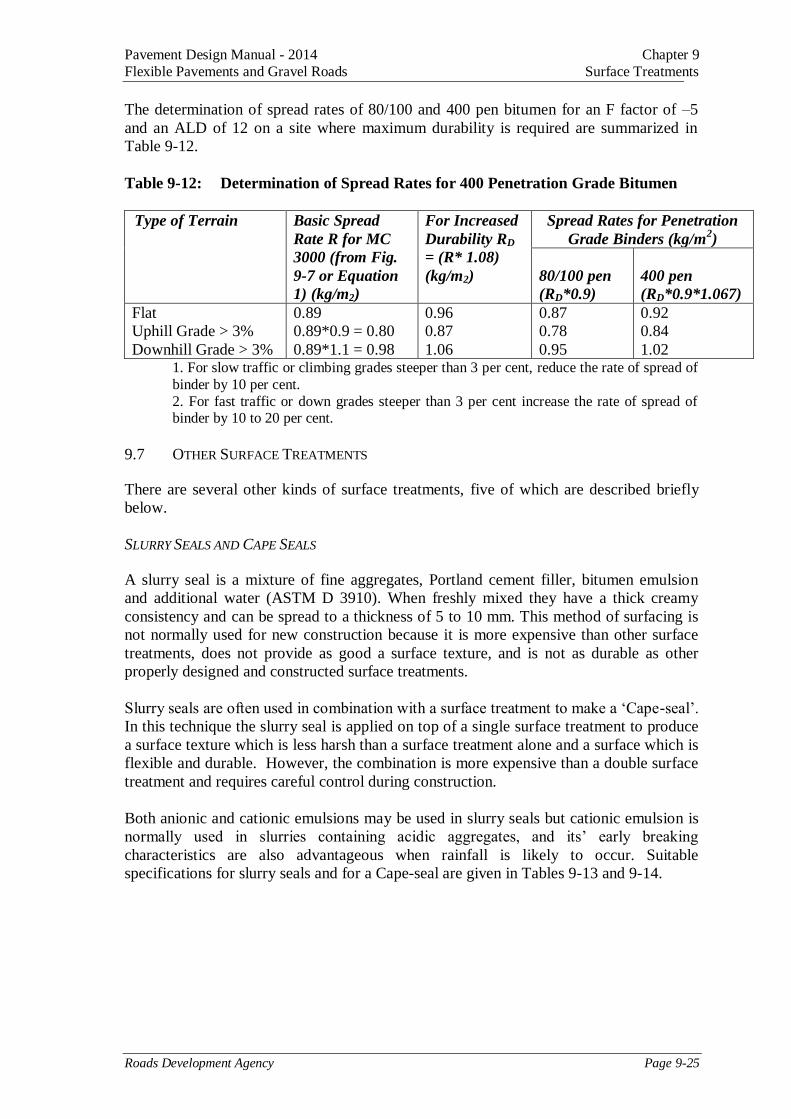
Pavement Design Manual - 2014 Chapter 9
Flexible Pavements and Gravel Roads Surface Treatments
Roads Development Agency Page 9-25
The determination of spread rates of 80/100 and 400 pen bitumen for an F factor of –5
and an ALD of 12 on a site where maximum durability is required are summarized in
Table 9-12.
Table 9-12: Determination of Spread Rates for 400 Penetration Grade Bitumen
Type of Terrain Basic Spread
Rate R for MC
3000 (from Fig.
9-7 or Equation
1) (kg/m2)
For Increased
Durability RD
= (R* 1.08)
(kg/m2)
Spread Rates for Penetration
Grade Binders (kg/m2)
80/100 pen
(RD*0.9)
400 pen
(RD*0.9*1.067)
Flat
Uphill Grade > 3%
Downhill Grade > 3%
0.89
0.89*0.9 = 0.80
0.89*1.1 = 0.98
0.96
0.87
1.06
0.87
0.78
0.95
0.92
0.84
1.02 1. For slow traffic or climbing grades steeper than 3 per cent, reduce the rate of spread of
binder by 10 per cent.
2. For fast traffic or down grades steeper than 3 per cent increase the rate of spread of binder by 10 to 20 per cent.
9.7 OTHER SURFACE TREATMENTS
There are several other kinds of surface treatments, five of which are described briefly
below.
SLURRY SEALS AND CAPE SEALS
A slurry seal is a mixture of fine aggregates, Portland cement filler, bitumen emulsion
and additional water (ASTM D 3910). When freshly mixed they have a thick creamy
consistency and can be spread to a thickness of 5 to 10 mm. This method of surfacing is
not normally used for new construction because it is more expensive than other surface
treatments, does not provide as good a surface texture, and is not as durable as other
properly designed and constructed surface treatments.
Slurry seals are often used in combination with a surface treatment to make a ‘Cape-seal’.
In this technique the slurry seal is applied on top of a single surface treatment to produce
a surface texture which is less harsh than a surface treatment alone and a surface which is
flexible and durable. However, the combination is more expensive than a double surface
treatment and requires careful control during construction.
Both anionic and cationic emulsions may be used in slurry seals but cationic emulsion is
normally used in slurries containing acidic aggregates, and its’ early breaking
characteristics are also advantageous when rainfall is likely to occur. Suitable
specifications for slurry seals and for a Cape-seal are given in Tables 9-13 and 9-14.

Chapter 9 Pavement Design Manual - 2014
Surface Treatments Flexible Pavements and Gravel Roads
Page 9-26 Roads Development Agency
Table 9-13: Aggregate Particle Size Distribution for Slurry Seals
Percentage by Mass of Total Aggregate Passing Test Sieve
BS Test Sieve (mm) Fine General Coarse
10
5.0
2.36
1.18
0.6
0.3
0.15
0.075
-
100
90-100
65-90
40-60
25-42
15-30
10-20
100
90-100
65-90
45-70
30-50
18-30
10-21
5-15
100
70-90
45-70
28-50
19-34
12-25
7-18
5-15
Bitumen content (per cent by
mass of dry aggregate)
10-16
7.5-13.5
6.5-12.0
The optimum mix design for the aggregate, filler, water and emulsion mixture should
be determined using ASTM D 3910-84 (1996).
Table 9-14: Typical Coverage for a New ‘Cape Seal’
Size of Chipping in Surface treatment (mm) Coverage (m2/m
3)
20 130-170
14 170-240
10 180-250
OTTA SEAL
An Otta seal is different to surface treatment in that a graded gravel or crushed aggregate
containing all sizes, including filler, is used instead of single sized-chippings. There is no
formal design procedure but recommendations based on case studies have been published
(Ref. 20). An Otta seal may be applied in a single or double layer. Evidence on the
performance of these types of seal has shown them to carrying up to 300 vehicles per day
(Ref. 21).
The grading of the material is based on the level of traffic expected. Recommended
grading envelopes are given in Table 9-15. Generally for roads carrying light traffic
(<100 vehicles per day), a ‘coarse’ grading should be chosen while a ‘dense’ grading
should be applied to one carrying greater than 100 vehicles per day.
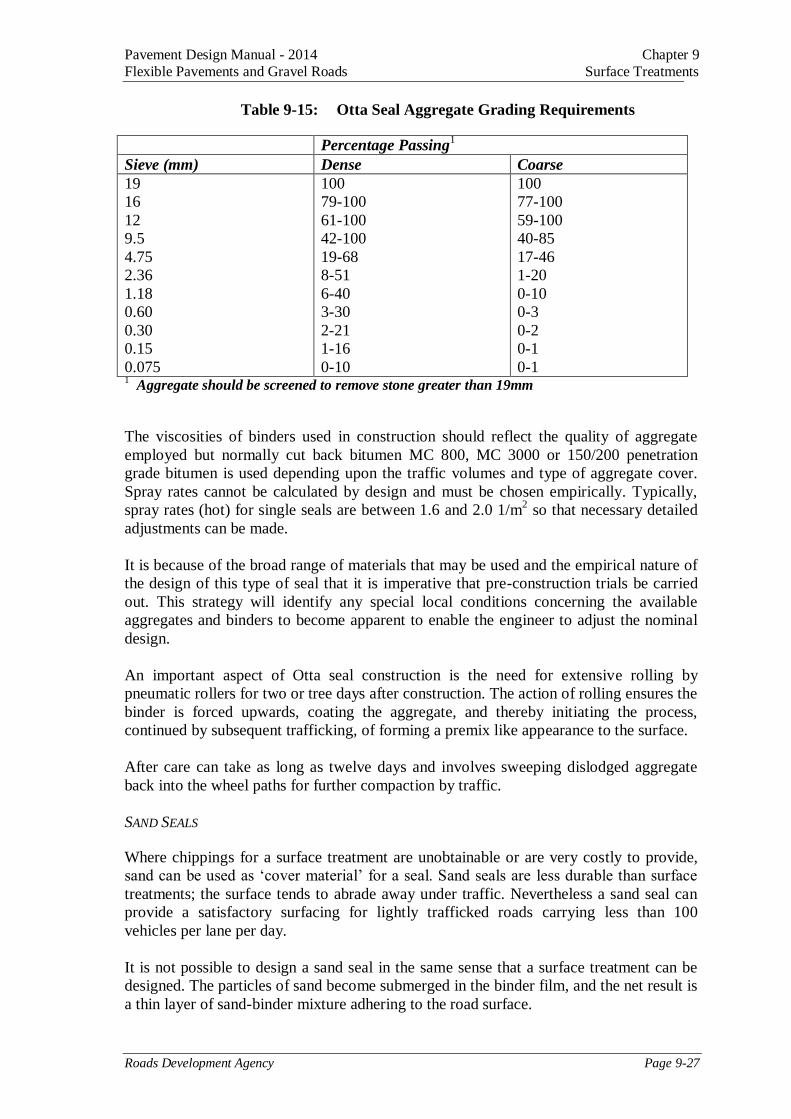
Pavement Design Manual - 2014 Chapter 9
Flexible Pavements and Gravel Roads Surface Treatments
Roads Development Agency Page 9-27
Table 9-15: Otta Seal Aggregate Grading Requirements
Percentage Passing1
Sieve (mm) Dense Coarse
19
16
12
9.5
4.75
2.36
1.18
0.60
0.30
0.15
0.075
100
79-100
61-100
42-100
19-68
8-51
6-40
3-30
2-21
1-16
0-10
100
77-100
59-100
40-85
17-46
1-20
0-10
0-3
0-2
0-1
0-1 1 Aggregate should be screened to remove stone greater than 19mm
The viscosities of binders used in construction should reflect the quality of aggregate
employed but normally cut back bitumen MC 800, MC 3000 or 150/200 penetration
grade bitumen is used depending upon the traffic volumes and type of aggregate cover.
Spray rates cannot be calculated by design and must be chosen empirically. Typically,
spray rates (hot) for single seals are between 1.6 and 2.0 1/m2 so that necessary detailed
adjustments can be made.
It is because of the broad range of materials that may be used and the empirical nature of
the design of this type of seal that it is imperative that pre-construction trials be carried
out. This strategy will identify any special local conditions concerning the available
aggregates and binders to become apparent to enable the engineer to adjust the nominal
design.
An important aspect of Otta seal construction is the need for extensive rolling by
pneumatic rollers for two or tree days after construction. The action of rolling ensures the
binder is forced upwards, coating the aggregate, and thereby initiating the process,
continued by subsequent trafficking, of forming a premix like appearance to the surface.
After care can take as long as twelve days and involves sweeping dislodged aggregate
back into the wheel paths for further compaction by traffic.
SAND SEALS
Where chippings for a surface treatment are unobtainable or are very costly to provide,
sand can be used as ‘cover material’ for a seal. Sand seals are less durable than surface
treatments; the surface tends to abrade away under traffic. Nevertheless a sand seal can
provide a satisfactory surfacing for lightly trafficked roads carrying less than 100
vehicles per lane per day.
It is not possible to design a sand seal in the same sense that a surface treatment can be
designed. The particles of sand become submerged in the binder film, and the net result is
a thin layer of sand-binder mixture adhering to the road surface.

Chapter 9 Pavement Design Manual - 2014
Surface Treatments Flexible Pavements and Gravel Roads
Page 9-28 Roads Development Agency
The sand should be a clean coarse sand, with a maximum size of 6mm, containing no
more than 15 per cent of material finer than 0.3mm and a maximum of 2 per cent of
material finer than 0.15mm. The sand should be applied at a rate of 6 to 7x10⁻³
m3/m
2
(Ref. 22). The binder, which may be a cutback or an emulsion, should be spread at a rate
of approximately 1.0 to 1.2 kg/m2 depending on the type of surface being sealed.
SYNTHETIC AGGREGATE AND RESIN TREATMENTS
These treatments are costly and are used only on relatively small areas usually in urban
situations, where high skidding resistance is required. The aggregate is normally a small
single-sized, calcined bauxite which has a high resistance to polishing under traffic. The
aggregate is held by a film of epoxy-resin binder (Ref. 23). The process requires special
mixing and laying equipment and is normally undertaken by specialist contractors.
APPLICATIONS OF LIGHT BITUMEN SPRAYS
There are two main uses for light sprays of bitumen:
A light film of binder which can be applied as the final spray on a new surface
treatment. The advantage of this procedure is that the risk of whip-off of
chippings under fast traffic is reduced. This is particularly useful where
management of traffic speed is difficult.
A light spray of binder can be used to extend the life of a bituminous surfacing.
This is particularly useful where a surfacing is showing signs of bitumen aging by
fretting or cracking.
These applications may be referred to as Fog Sprays of Enrichment Sprays.
Fog Sprays. A light spray of bitumen emulsion is ideal for improving early retention of
chippings in a new dressing (Ref. 22). The road surface is usually dampened before
spraying or, if a low bitumen content emulsion (45 per cent) is available, this dampening
can be omitted. Complete breaking of the emulsion must occur before traffic is allowed
onto the dressing and it may be necessary to dust the surface with sand or crusher fines to
prevent pick-up by traffic. If emulsion is diluted with water, to obtain a 45 per cent
bitumen content to ensure the bitumen will flow around the chippings, then the suitability
of the water must be established by mixing small trial batches.
The spray rate for the diluted emulsion will depend upon the surface texture of the new
dressing but the best results will be achieved if the residual bitumen in the fog spray is
treated as part of the design spray rate for the surface treatment. The spray rate is likely to
be between 0.4 and 0.8 liters/m2. It is important to avoid over application of bitumen
which could result in poor skid resistance.
Enrichment Sprays. Surfaces which are showing obvious signs of disintegration through
bitumen aging can be enriched by applying stable grade anionic bitumen emulsion which
has been diluted at a rate of 1:1 with water (Ref. 22). The rate of application will depend
upon the texture of the surfacing and this must be determined by trial sprays, however, it
is likely to be between 0.2 and 0.5 liters/m2 of residual bitumen. Great care must be taken
to avoid leaving a slippery surface and a light application of sand sized fines may be
required in some cases.

Pavement Design Manual - 2014 Chapter 10
Flexible Pavements and Gravel Roads Flexible Pavement Design Catalog
Roads Development Authority Page 10-1
10 FLEXIBLE PAVEMENT DESIGN CATALOG
10.1 DESCRIPTION OF THE CATALOG
The design of flexible pavements, as given in this manual, is based on the catalog of
pavement structures of TRL Road Note 31 (Ref. 1).
Before the catalog is used, the elements described in Chapters 2 and 3 regarding traffic
and subgrade should be considered. Simultaneously, the information regarding
availability, costs and past experience with materials should be gathered.
The catalog offers, in eight different charts, alternative pavement structures for
combinations of traffic and subgrade classes. The various charts correspond to distinct
combinations of surfacing and roadbase materials, as shown in Table 10-1:
Table 10-1: Summary of Material Requirements for the Design Charts
CHART
NO
SURFACING BASE COURSE REFER TO
CHAPTERS
1 Double surface dressing T1 -T4 use GB1,GB2 or GB3
T5 use GB1 or GB2
T6 must be GB1
6 and 9
2 Double surface dressing T1 -T4 use GB1,GB2 or GB3
T5 use GB1 or GB2
T6 – T8 must be GB1
6, 7 and 8
3 ―Flexible‖ asphalt T1 –T5 use GB1 or GB2
T6 use GB1
6 and 8
4 ―Flexible‖ asphalt T1 –T5 use GB1 or GB2
T6 – T8 use GB1
6, 7 and 8
5 Wearing course and
Base course
GB1 6 and 8
6 Wearing course and
Base course
GB1 or GB2 6, 7 and 8
7 High quality single seal or
double seal for T4
―Flexible‖ asphalt for T5-
T8
RB1, RB2 or RB3 8 and 9
8 Double surface dressing CB1, CB2 7 and 9
All the charts provide alternate pavement structures for all subgrade classes (S1 through
S6). They are not however suitable for all classes of traffic, as some structures would be
neither technically appropriate nor economically justified.
10.2 USE OF THE CATALOG
Although the thicknesses of layers should follow the design charts whenever possible,
some limited substitution of materials between subbase and selected fill is allowable
based on the structural number principles outlined in the AASHTO Guide for Design of
Pavement Structures (Ref. 6). Where substitution is allowed, a note is included with the
design chart.

Chapter 10 Pavement Design Manual - 2014
Flexible Pavement Design Catalog Flexible Pavements and Gravel Roads
Page 10-2 Roads Development Authority
In Charts 3, 4 and 7 where a thin surfacing of asphalt concrete is defined, it is important
that the surfacing material should be able to withstand some deformation and that the
granular roadbase (bitumen stabilized in the case of Chart 7) be of the highest quality
crushed stone. This latter point is particularly important for the higher classes of traffic
(classes T5 through T8). For the asphalt concrete, the mix design should favor durability
over seeking a high stability.
The above requirement for high quality roadbase also applies to classes of traffic T5 and
higher in Charts 1 and 2 using surface treatment as surfacing, but a gravel roadbase may
be considered for the lower classes (T1-T4). The same requirement always applies to the
granular roadbase of Chart 5 and to the granular roadbase component of the composite
roadbase of Chart 6.
For lime or cement-stabilized materials (Charts 2, 4, 6 and 8), the charts define the layers
with different symbols and thereby indicate the underlying assumptions regarding the
strength of material.
The choice of chart will depend on a variety of factors but should be based on
minimizing total transport costs. Factors that will need to be taken into account in a full
evaluation include:
· the likely level and timing of maintenance
· the probable behavior of the structure
· the experience and skill of the contractors and the availability of suitable equipment
· the cost of the different materials that might be used
· other risk factors
It is not possible to give detailed guidance on these issues. The charts have been
developed on the basis of reasonable assumptions concerning the first three of these and
therefore the initial choice should be based on the local costs of the feasible options. If
any information is available concerning the likely behavior of the structures under the
local conditions, then a simple risk analysis can also be carried out to select the most
appropriate structure. For many roads, especially those that are more lightly trafficked,
local experience will dictate the most appropriate structures and sophisticated analysis
will not be warranted.
10.3 DESIGN EXAMPLE
An example of traffic calculations was given in Chapter 2 for a particular section of a
trunk road. In the example, a traffic class T8 has been derived (with a total of ESAs on
the order of 20 millions over the design period).
From Table 10-1 given above, for that class of traffic, it is readily apparent that the use of
the design charts in the catalog of structures is narrowed down to Charts 4 through 7.
From the same table, without further information regarding the subgrade and the
materials, it would also appear that any type of surfacing is possible, as well as several
types of roadbase.
The subgrade strength has reasonably been ascertained (cf. Section 3.2) to be represented
by CBRs in the range of 5 to 7, considering that some portions of the alignment which
might exhibit higher strength are so limited in number and extent that it makes it
impractical to consider several designs. The subgrade strength class to be assigned to this
project is therefore S3 (cf. Table 3-1 and Figure 10-1).

Pavement Design Manual - 2014 Chapter 10
Flexible Pavements and Gravel Roads Flexible Pavement Design Catalog
Roads Development Authority Page 10-3
The following preliminary information has been derived from the investigations and
simple cost comparison:
The materials which may be considered for cement- or lime-stabilization have
relatively low percentages of fines and low plasticity, thus making cement-
stabilization more promising.
Granular subbase materials are available in sufficient quantities and cement
stabilization of the subbase is uneconomical when compared to bank-run materials.
Stabilization of subbase materials will not be further considered.
All other materials entering the composition of the possible pavement structures are
available, albeit in various quantities and associated transport/construction costs.
Based on the above, and with the T8/S3 combination of traffic and subgrade strength
classes, the design charts 4 through 7 indicate the possible alternate pavement structures
given in Table 10-2.
Table 10-2: Design Example: Possible Pavement Structures
Design Chart No. 4 5 6 7 Pavement
Components and
Selected Fill
Possible Alternate
Pavement
Structures Pavement Structures
Alternate
Structure
No. 1
Alternate
Structure
No. 2
Alternate
Structure
No. 3
Alternate
Structure
No. 4 Surfacing (asphalt concrete) (1) 5 cm AC 15cm AC 15cm AC 5 cm AC
Roadbase:
· Crushed Stone
· Cement stabilized (e.g. 4 Mpa)
· Cement stabilized (e.g. 2.5 Mpa)
· Bituminous stabilized
15 cm
15 cm 12.5 cm
—
25 cm
—
—
—
15 cm
—
22.5 cm
—
—
—
—
20 cm
Granular subbase — 27.5 cm — 27.5 cm (2) Selected fill 15 cm — — — (2)
Notes: (1) Asphalt concrete (AC) only alternative for T8
(2) In the alternate structure No. 4, 27.5 cm of granular subbase can be used (Alt.
4a). Alternatively, up to 7.5 cm of granular subbase may be substituted with 10 cm of selected fill (Alt. 4b).
Further analyses of recent contracts, production costs hauling distances and associated
costs have established relative costs for the various alternate pavement layers (all costs
per m2 and expressed as a ratio to the highest cost element) as shown in Table 10-3.
With these elements, the relative costs of the possible alternate pavement structures are
evaluated as follows in Table 10-4.
Based on the above, the alternate structures including cement stabilized layers (Nos. 1
and 3) appear prohibitive, and the alternate (No. 2) including only crushed stone roadbase
and subbase also appear at a disadvantage. The preferred solutions (Nos. 4a and 4b) are
only marginally different. It may be advisable to present both alternatives for bidding
purposes.

Chapter 10 Pavement Design Manual - 2014
Flexible Pavement Design Catalog Flexible Pavements and Gravel Roads
Page 10-4 Roads Development Authority
Table 10-3: Design Example: Relative Unit Costs of Materials
MATERIAL RELATIVE UNIT COST
Asphalt Concrete
Bituminous stabilized roadbase
Crushed stone roadbase
Cement stabilized roadbase, 4 MPa
Cement stabilized roadbase, 2.5 MPa
Granular subbase
Select fill
5 cm thick
15 cm thick*
20 cm thick
15 cm thick
25 cm thick
15 cm thick
12.5 cm thick
22.5 cm thick
20 cm thick
15 cm thick
10 cm thick
15 cm thick
0.33
0.87
1.00
0.56
0.90
0.81
0.73
0.91
0.29
0.39
0.13
0.19
*wearing course and binder course
Table 10-4: Relative Costs of the Possible Alternate Pavement Structures
Alternate
Pavement
Structure No.
Description Relative
Unit Cost
1 5 cm AC
+15 cm crushed stone roadbase
+15 cm cement stabilized roadbase (4 MPa)
+12.5 cm cement stabilized roadbase (2.5 MPa)
+15 cm selected fill
2.62
2 15 cm AC
+25 cm crushed stone roadbase
+27.5 cm granular subbase
2.16
3 15 cm AC
+25 cm crushed stone roadbase
+22.5 cm cement stabilized roadbase (2.5 Mpa)
2.33
4a 5 cm AC
+20 cm bituminous stabilized roadbase
+27.5 cm granular subbase
1.73
4b 5 cm AC
+20 cm bituminous stabilized roadbase
+20 cm granular subbase
+10 cm selected fill
1.75

Pavement Design Manual - 2014 Chapter 10
Flexible Pavements and Gravel Roads Flexible Pavement Design Catalog
Roads Development Authority Page 10-5
Figure 10-1: Key to Structural Catalog

Chapter 10 Pavement Design Manual - 2014
Flexible Pavement Design Catalog Flexible Pavements and Gravel Roads
Page 10-6 Roads Development Authority

Pavement Design Manual - 2014 Chapter 10
Flexible Pavements and Gravel Roads Flexible Pavement Design Catalog
Roads Development Authority Page 10-7

Chapter 10 Pavement Design Manual - 2014
Flexible Pavement Design Catalog Flexible Pavements and Gravel Roads
Page 10-8 Roads Development Authority

Pavement Design Manual - 2014 Chapter 10
Flexible Pavements and Gravel Roads Flexible Pavement Design Catalog
Roads Development Authority Page 10-9

Chapter 10 Pavement Design Manual - 2014
Flexible Pavement Design Catalog Flexible Pavements and Gravel Roads
Page 10-10 Roads Development Authority

Pavement Design Manual - 2014 Chapter 10
Flexible Pavements and Gravel Roads Flexible Pavement Design Catalog
Roads Development Authority Page 10-11

Chapter 10 Pavement Design Manual - 2014
Flexible Pavement Design Catalog Flexible Pavements and Gravel Roads
Page 10-12 Roads Development Authority

Pavement Design Manual - 2014 Chapter 10
Flexible Pavements and Gravel Roads Flexible Pavement Design Catalog
Roads Development Authority Page 10-13

Pavement Design Manual - 2014 Chapter 11
Flexible Pavements and Gravel Roads Problematic Soils
Roads Development Agency Page 11-1
11 PROBLEMATIC SOILS
This chapter describes particular subgrade soils which can be a problem to the highway
engineer in road construction. They are described as ‘Low strength soils’, ‘Expansive
soils’, ‘Saline soils’ and ‘Organic’ soils.
11.1 LOW STRENGTH SOILS
Soils with CBR < 3%, or < 2% in arid areas, occurring within the design depth, are
defined as ‘Low Strength Soils’. Before they can be included in the foundation structure
they require treatment which can include one or several of the following measures:
Removal and replacement
Chemical stabilisation with either lime and/or cement
Mechanical stabilisation, or
Raising of the vertical alignment to increase cover, thereby re-defining the design
depth
Details regarding the treatment of such soils will vary according to soil properties, site
conditions, available equipment, alternative materials and parallel experience and will be
determined at the time of the project.
11.2 EXPANSIVE SOILS
11.2.1 Definition
Otherwise known as ‘black cotton soil’ because of its characteristic appearance, the main
property of expansive soil is the significant volume changes it undergoes when wetted
and dried. When a road is sealed a strip of land is created under the road which is
protected from seasonal variation of rainfall. The centre of the strip will be subject to
different moisture (and therefore volume) changes. This can result in longitudinal
cracking along the road edges if it is founded on black cotton soil, which become more
accentuated with time and progressively extend towards the center of the road.
Figure 11.1: Moisture Variation in Expansive Soils

Chapter 11 Pavement Design Manual - 2014
Problematic Soils Flexible Pavements and Gravel Roads
Page 11-2 Roads Development Agency
11.2.2 Distribution
It is believed that the primary source of residual expansive clay soils is the in situ
weathering of basic igneous, metamorphic and pyroclastic rocks, which occur in
Somaliland. Thus, expansive soil is quite common and local knowledge is very useful to
identify areas where it can be a problem. Typically it forms in flat, poorly drained
environments which favour the formation of the expansive soil minerals.
11.2.3 Identification
Apart from their appearance other indicators of expansive soils are described in Table
11.1:
Table 11.1: Indicators of Expansive Soils
Soil Description Typical Features of Expansive Soils
Soil Type The more clayey, the more likely to be
expansive
Consistency, when slightly moist to dry Stiff or very stiff
Consistency, when wet Soft and sticky
Structure Cracked surface and slickensided fissures
Colour Usually dark but this is not always so
The shrinking and swelling property is caused by the preponderance of the clay mineral
montmorillonite. There is no quantitative test to determine the amount of
montmorillonite present but normal classification tests enable the severity of the
expansiveness to be established, as explained below.
It has been found that the ratio of Plasticity Index to clay fraction is more or less constant
for any one soil, but this constant varies depending on clay type. The correlation between
PI and clay type is termed ‘Activity’, where:
Activity = PI/clay fraction
To be consistent, the clay fraction is expressed as that portion of the soil sample passing
the 0.425mm sieve, rather than the percentage passing 2µm. On this basis clays can be
classified into four groups as shown in Table 11.2.
Table 11.2: Activity of clays
Description Activity
Inactive clays <0.75
Normal clays 0.75 to 1.25
Active clays 1.25 to 2
Highly active clays >2
If the presence of active or highly active clays is established, further testing involving the
determination of the Shrinkage Limit (KS 999 Part 2: 2001) is advisable. The
Expansiveness, ex, is calculated from the following empirical formula:
ex = 2.4*Wp – 3.9*Ws + 32.5

Pavement Design Manual - 2014 Chapter 11
Flexible Pavements and Gravel Roads Problematic Soils
Roads Development Agency Page 11-3
where Wp = Plastic Limit * fraction passing the 425m sieve/100
and Ws = Shrinkage Limit * fraction passing the 425m sieve/100
Expansiveness is then classified according to Table 11.2:
Table 11.3: Degree of Expansiveness of Expansive Soils
Expansiveness,
ex
Classification
<20 Low
20 to 50 Medium
>50 High
11.2.4 Remediation
Four possible treatments are possible to overcome the problem of expansive soils:
avoid by re-alignment
excavate and replace with non-expansive materials
stabilise with lime, or
minimise moisture changes by engineering measures
11.2.4.1 Re-alignment
This is only possible if the expansive soil is limited in extent.
11.2.4.2 Replacement
This is the simplest and most effective treatment but the cost and effect on the
environment by sidecasting large quantities of material must be assessed. In practice it is
sufficient to remove the expansive soil to a depth of 1m. Even if some expansive clay
remains it should be adequately confined and protected from moisture changes. The
backfill should be at least of S2 quality and impermeable enough not to act as a drain.
Embankments should be constructed with suitable fill material as discussed later.
11.2.4.3 Stabilisation
If proper mixing can be achieved, treatment of expansive soil with 4% to 6% of hydrated
lime is usually effective and provides the following improvements:
reduces the Plasticity Index to less than 20
increases considerably the Shrinkage Limit
reduces Swell to negligible values, and
increases the CBR to minimum of 10 (after 7 days cure) and 15 (after 28 days cure)
alters the grading by agglomeration of the clay particles similar to that of a silt

Chapter 11 Pavement Design Manual - 2014
Problematic Soils Flexible Pavements and Gravel Roads
Page 11-4 Roads Development Agency
All these improvements render the treated soil easily workable and it can be assumed that
it will become of S4 quality. However, it is costly because a substantial thickness must be
treated (minimum 300mm) and therefore is advantageous where no suitable backfill or
improved subgrade material exists, or there are strong environmental objections to side
casting large amounts of expansive soil.
The mixing procedure is to add the lime in two or three increments, followed by intense
mixing by pulvimixer. The mixed soil should be left fallow for two to three days between
each mixing operation to enable the lime to take effect. Wet weather makes initiating this
operation impossible owing to the physical nature of the soil.
11.2.4.4 Engineering Measures for Construction on Expansive Soils
If none of the above measures can be avoided, special precautions are required to avoid
damage to the road structure caused by detrimental volume changes when building on or
with expansive soils.
Widening of shoulders is beneficial whenever economically feasible. The zone of
seasonal moisture (and volume) change is thus moved further away from the
carriageway.
Side drains, if required, should be placed at a minimum distance of 4 to 6 m, depending
on road category .Side fill consisting of expansive soil requires protection from erosion
by grasses but no trees should be planted or allowed to root on the embankment slope.
Table 11.4 proposes alternative methods of construction over expansive soil:
Table 2.4: Construction on Expansive Soils
Expansiveness Alternative proposed construction over expansive soil
Paved Trunk Roads Other Paved Roads
Low
ex<20
Sealed shoulders
Side slopes 1:6* As normal design
Medium
ex20-50
See Fig 11.2
Sealed shoulders
Side slopes 1:6 minimum
Earthworks cover min 1m Earthworks cover min 0.6m
High
ex>50
See Fig
Excavate and replace 0.6m clay as Fig
Earthworks cover min 1m
Sealed shoulders
Side slopes 1:6 min
Shoulder width min 2m
Alternative:
None
Alternative:
Sealed shoulders
Shoulder width min 2m
Earthworks cover min 1m
Side slopes min 1:6
* Where the earthworks cover is > 2m the side slopes can be made maximum 1:4

Pavement Design Manual - 2014 Chapter 11
Flexible Pavements and Gravel Roads Problematic Soils
Roads Development Agency Page 11-5
Processing and compaction of expansive soils does not reduce their swell properties and
their strength is not significantly increased. Attempts to adjust the moisture content, eg to
achieve an optimum are time-consuming, impractical and unnecessary. Nominal rolling
of the roadbed is desirable to obtain a working surface for construction of pavement
layers. Fill materials used for replacement of expansive soil should meet the
specifications for fill. Plastic soils with minimum PI of 15 should be used when available
at economic haulage distances.
Figure11.2: Alternative methods of construction on Expansive Soil
11.3 SALINE SOILS
The presence of soluble salts, ie NaCl, Na2CO3, NaHCO3, (but not gypsum, Na2SO4,
which is only slightly soluble) in pavement or earthwork materials, or more critically in
the subgrade and/or groundwater can cause damage to prime coats and thin surfacings.
This is a significant risk in arid climates because of the migration of these salts to the
surface as a result of evaporation. Coastal areas are most at risk from this mode of
damage.

Chapter 11 Pavement Design Manual - 2014
Problematic Soils Flexible Pavements and Gravel Roads
Page 11-6 Roads Development Agency
The content of soluble salt can be rapidly but indirectly determined by laboratory or field
determination of electrical conductivity. It is prudent to determine the precise
configuration of soluble salts by chemical analysis on a few samples and relate this to the
conductivity. If the tests are carried out on potential pavement materials, rather than
subgrade, construction water should be added at 1.5 times the required amount to obtain
the OMC, to allow for evaporation, before the sample is tested.
Prime coats are very vulnerable to the formation of blisters in the bituminous surfacing
and by fretting of the edges of the surfacing. If the soluble salt content, measured as %
Total Soluble Salt (TSS), exceeds approximately 0.3% in the upper 50mm of the road
base, they are susceptible to damage. Cutback prime is more vulnerable than emulsion
prime. Blistering damage is accelerated if the road is low-trafficked.
Surface dressing is more resistant to attack. Single and double surface dressings are not
susceptible to damage unless the %TSS exceeds 1.0%; however, if surface dressings are
constructed on saline subgrades, it is recommended that an impermeable fabric be placed
beneath the road base to prevent the upward rise of salt and protect the surface dressing
from eventual salt damage. If the road is well trafficked, the susceptibility to damage is
reduced.
11.4 ORGANIC SOILS
These commonly occur in swamp areas and require special investigations to evaluate
ground stability and potential for excessive settlement. Typically, remediation consists of
surcharging the pavement structure for a specified time before removing the surcharge
and constructing the pavement. Other remediation measures comprise removal and
replacement of the organic soil or, in extreme cases, construction of the road ‘floating‘on
the swamp material.
A high content of organic matter (>2%) is undesirable in pavement materials, particularly
in stabilized layers because it causes increased demand for stabilizer to achieve the
required strength.

Pavement Design Manual - 2014 Chapter 12
Flexible Pavements and Gravel Roads Gravel and Low Standard Roads
Roads Development Agency Page 12-1
12 DESIGN OF GRAVEL AND LOW STANDARD ROADS
12.1 GENERAL
Much of the information presented in this Section of the Pavement Design Manual is
based on the "Pavement and Materials Design Manual" prepared by the United Republic
of Tanzania Ministry of Works 1999, and on relevant TRL publications. Available
information has been modified to provide a simple procedure to design gravel wearing
courses and low standard roads, which is appropriate to Somaliland conditions.
Gravel road pavements are generally utilized for roads where design traffic flow Annual
Average Daily Traffic (AADT) is less than 200. This Section sets out the standards for
pavement design, and specifies the materials which may be used for gravel roads.
12.2 DESIGN PRINCIPLES
STEPS TO BE CONSIDERED IN THE DESIGN PROCESS
1. Traffic (Baseline flow and forecast)
2. Material and geotechnical information (Field survey and material properties)
3. Subgrade (Classification, foundation for expansive soils and material strength)
4. Thickness design (Gravel wearing coarse thickness)
5. Materials design
ALL-WEATHER ACCESS
An essential consideration in the design of gravel roads is to ensure all-weather access.
This requirement places particular emphasis on the need for sufficient bearing capacity of
the pavement structure and provision of drainage and sufficient earthworks in flood or
problem soil areas (e.g. black cotton).
SURFACE PERFORMANCE
The performance of the gravel surface mainly depends on material quality, the location of
the road, and the volume of traffic using the road. Gravel roads passing through
populated areas in particular require materials that do not generate excessive dust in dry
weather. Steep gradients place particular demands on gravel wearing course materials,
which must not become slippery in wet weather or erode easily. Consideration should
therefore be given to the type of gravel wearing course material to be used in particular
locations such as towns or steep sections. Gravel loss rates of about 25-30mm thickness
a year per 100 vehicles per day is expected, depending on rainfall and materials
properties (particularly plasticity).
Performance characteristics that will assist in identifying suitable material are shown in
Figure 12-1.
MAINTENANCE
The material requirements for the gravel wearing course include provision of a gravel
surface that is effectively maintainable. Adherence to the limits on oversize particles in
the material is of particular importance in this regard and will normally necessitate the
use of crushing or screening equipment during material production activities.

Chapter 12 Pavement Design Manual - 2014
Gravel and Low Standard Roads Flexible Pavements and Gravel Roads
Page 12-2 Roads Development Agency
12.3 DESIGN METHOD
The required gravel thickness shall be determined as follows:
1. Determine the minimum thickness necessary to avoid excessive compressive strain in
the subgrade (D1).
2. Determine the extra thickness needed to compensate for the gravel loss under traffic
during the period between regravelling operations (D2).
3. Determine the total gravel thickness required by adding the above two thicknesses
(D1+ D2).
MINIMUM THICKNESS REQUIRED
It is necessary to limit the compressive strain in the subgrade to prevent excessive
permanent deformation at the surface of the road .Figure 3 gives the minimum gravel
thickness required for each traffic category with the required thickness of improved
subgrade materials for upper and lower subgrade layers.
GRAVEL LOSS
According to TRL Laboratory Report 673, an estimate of the annual gravel loss is given
by the following equation:
GL = f T2
/ ( T
2 + 50)
( 4.2 + 0.092 T + 3.50 R
2 + 1.88V)
Where
GL = the annual gravel loss measured in mm
T = the total traffic volume in the first year in both directions, measured in
thousands of vehicles
R = the average annual rainfall measured in m
V = the total (rise + fall) as a percentage of the length of the road
f = 0.94 to 1.29 for lateritic gravels
= 1.1 to 1.51 for quartizitic gravels
= 0.7 to 0.96 for volcanic gravels (weathered lava or tuff)
= 1.5 for coral gravels
= 1.38 for sandstone gravels

Pavement Design Manual - 2014 Chapter 12
Flexible Pavements and Gravel Roads Gravel and Low Standard Roads
Roads Development Agency Page 12-3
TOTAL THICKNESS REQUIRED
The wearing course of a new gravel road shall have a thickness D calculated from:
D = D1 + N. GL
Where D1 is the minimum thickness from Figure 12.3
N is the period between regravelling operations in years
GL is the annual gravel loss
Regravelling operations should be programmed to ensure that the actual gravel thickness
never falls below the minimum thickness D1.
12.4 PAVEMENT AND MATERIALS
Depending on the CBRdesign of the subgrade, improved subgrade layers shall be
constructed as required, on which the gravel wearing course is placed.
12.5 CROSSFALL AND DRAINAGE
The crossfall of carriageway and shoulders for gravel roads shall be “4%” as indicated in
RDA’s Geometric Design Manual - 2014. This is to ensure that potholes do not develop
by rapidly removing surface water and to ensure that excessive crossfall does not cause
erosion of the surface. Provision of drainage is extremely important for the performance
of gravel roads.
12.6 MATERIAL REQUIREMENTS
EXPERIENCE WITH LOCAL MATERIALS
Knowledge of past performance of locally occurring materials for gravel roads is
essential. Material standards may be altered to take advantage of available gravel sources
provided they have proved to give satisfactory performance under similar conditions.
MARGINAL MATERIALS
Figure 12-1 illustrates the performance characteristics to be expected of materials that do
not meet the requirements for gravel wearing course. Refinements and amendments of
the standard material specification may be necessary to overcome problem areas such as
towns (dust nuisance) or steep hills (slipperiness).

Chapter 12 Pavement Design Manual - 2014
Gravel and Low Standard Roads Flexible Pavements and Gravel Roads
Page 12-4 Roads Development Agency
IMPROVED SUBGRADE LAYER
In General the use of improved subgrade layers has the following advantages:
Provision of extra protection under heavy axle loads;
Protection of underlying earthworks;
Provides running surface for construction traffic;
Assists compaction of upper pavement layers;
Provides homogenous subgrade strength;
Acts as a drainage filter layer;
More economical use of available materials.
SUBGRADE CBR
All subgrade materials shall be brought to strength of at least a minimum CBR of 7% for
minor gravel roads and at least a minimum CBR 25 % for major gravel roads. The
different types of gravel roads are explained in Section 12.7.
TREATMENT OF EXPANSIVE FORMATIONS
The following treatment operations should be applied on Expansive Formations for
higher class roads of AADTdesign greater than 50:
i) Removal of Expansive Soil
a) Where the finished road level is designed to be less than 2 metres above ground
level, remove the expansive soil to a minimum depth of 600 mm over the full
width of the road, or
b) Where the finished road level is designed to be greater than 2 metres above
ground level, remove the expansive soil to a depth of 600 mm below the ground
level under the unsurfaced area of the road structure, or
100
000
000
200
000
000
300
000
000
400
000
000
500
000
000
Sh
rin
ka
ge P
ro
du
ct,
SP
10 20 30 40
Grading Coefficient, CG
Good but may be
dusty
Good
Ravels Erodible materials
Ravels and corrugates
Slippery
Figure 12-1. Expected Performance of Gravel Wearing Course Materials
Note: SP = (Linear Shrinkage) x (% passing 0.425 mm)
GC = ((% passing 28 mm) - (% passing 2 mm)x (% passing 5 mm)/100

Pavement Design Manual - 2014 Chapter 12
Flexible Pavements and Gravel Roads Gravel and Low Standard Roads
Roads Development Agency Page 12-5
c) Where the expansive soil does not exceed 1 meter in depth, remove it to its full
depth.
ii) Stockpile the excavated material on either side of the excavation for subsequent
spreading on the fill slopes so as to produce as flat a slope as possible.
iii) The excavation formed as directed in paragraph (i) should be backfilled with a
plastic non-expansive soil of CBR value 3 - 4 or better, and compacted to a density
of 95% modified AASHTO.
iv) After the excavated material has been replaced with non-expansive material in
150mm lifts to 95% modified AASHTO density, bring the road to finished level in
approved materials, with a side slope of 1:2, and ensure that pavement criteria are
complied with; the previously stockpiled expansive soil excavated as directed under
(i) should then be spread over the slope.
v) Do not construct side drains unless they are absolutely essential to stop ponding;
where side drains are necessary, they should be as shallow as possible and located
as far from the toe of the fill as possible.
vi) Ideally, construction over expansive soil should be done when the in-situ moisture
content is at its highest, i.e. at the end of rainy season.
The following treatment operations may be applied on Expansive Formations for light
traffic class roads of AADTdesign less than 50:
i) Remove 150mm of expansive topsoil and stockpile conveniently for subsequent
use on shoulder slopes
ii) Shape road bed and compact to 90% modified AASHTO
iii) The excavation formed as directed in paragraph (i) should be backfilled with a
plastic non-expansive soil of CBR value 3 - 4 or better, and compacted to a
density of 95% modified AASHTO in each 150mm layer; the subgrade material
may be plastic but non-expansive.
MATERIAL CHARACTERISTICS
Soils used for improved subgrade layers shall be non-expansive, non-dispersive and free
from any deleterious matter. They shall comply with the requirements shown in Table
12-1.

Chapter 12 Pavement Design Manual - 2014
Gravel and Low Standard Roads Flexible Pavements and Gravel Roads
Page 12-6 Roads Development Agency
Table 12-1
Material
Properties
G20
(Upper Layer)
G7
(Lower Layer)
CBR Dry Climatic Zones
(See Note)
Minimum 20 after 4 days
soaking
Minimum 7 after 4 days soaking
CBR Wet Climatic Zones
(See Note)
Minimum 20 at OMC
Minimum 7 after 4 days soaking
Minimum 7 at OMC
Minimum 3 after 4 days soaking
PI [%] Maximum 25 Maximum 30
Compacted Density 95% of AASHTO T180 95% of AASHTO T180
Maximum particle size 2/3 of layer thickness 2/3 of layer thickness
Compacted layer thickness Maximum 200 mm Maximum 250 mm
Note: Climatic Zones for Somaliland are described in Section 12.10.
12.7 GRAVEL WEARING COURSE
PERFORMANCE CHARACTERISTICS OF GRAVEL WEARING COURSE
The materials for gravel wearing course should satisfy the following requirements that
are often somewhat conflicting:
a) They should have sufficient cohesion to prevent ravelling and corrugating (especially
in dry conditions)
b) The amount of fines (particularly plastic fines) should be limited to avoid a slippery
surface under wet conditions.
Figure 12-1 shows the effect of the Shrinkage Product (SP) and Grading Coefficient
(GC) on the expected performance of gravel wearing course materials. Excessive
oversize material in the gravel wearing course affects the riding quality in service and
makes effective shaping of the surface difficult at the time of maintenance. For this
reason the following two types of gravel wearing course material are recommended.
Type 1 gravel wearing course which is one of the best material alternatives which shall
be used on all roads which have AADTdesign greater than 50. Type 1 material shall also be
used for all routine and periodic maintenance activities for both major and minor gravel
roads. Type 1 or Type 4 gravel wearing course material may be used on new construction
of roads having AADTdesign less than 50. Other alternatives are also specified in this
chapter.

Pavement Design Manual - 2014 Chapter 12
Flexible Pavements and Gravel Roads Gravel and Low Standard Roads
Roads Development Agency Page 12-7
GRAVEL WEARING COURSE MATERIAL SPECIFICATION
Selected material shall consist of hard durable angular particles of fragments of stone or
gravel. The material shall be free from vegetable matter and lumps or balls of clay.
Type 1
The grading of the gravel after placing and compaction shall be a smooth curve within
and approximately parallel to the envelopes detailed in Table 12-2.
The material shall have a percentage of wear of not more than 50 at 500 revolutions, as
determined by AASHTO T96.
The material shall be compacted to a minimum in-situ density of 95% of the maximum
dry density determined in accordance with the requirements of AASHTO T 180.
The plasticity index should be not greater than 15 and not less than 8 for wet climatic
zones and should be not greater than 20 and not less than 10 for dry climatic zones.
The linear Shrinkage should be in a range of 3-10%.
Note that the above gradation and plasticity requirements are only to be used with
angular particles and that crushing and screening are likely to be required in many
instances for this purpose.
Type 2 & 3
These materials may be more rounded particles fulfilling the following:
a) The Plasticity Index lies in a range of 5-12% in wet areas, and in any case less than
16% in other areas
b) The materials have the sanction of local experience
Use of more rounded particles may allow the use of river gravel. Trials should
nevertheless be conducted to verify whether crushing occurs under traffic or whether
crushing should be considered prior to use. Subject to trials, a minimum percentage by
weight of particles with at least one fractured face of 40% may be considered. This
requirement may also be expressed in terms of crushing ratio.
Except for very low traffic (less than 15 vehicles per day), the CBR should be in excess
of 20 after 4 days of soaking at 95% of maximum dry density under Heavy Compaction.
For very low traffic, the requirement may be relaxed to a CBR of 15.
Type 4
This material gradation allows for larger size material and corresponds to the gradation of
a base course material. The use of this gradation of materials is subject to the local
experience and shall be used with PIs in a range of 10-20.

Chapter 12 Pavement Design Manual - 2014
Gravel and Low Standard Roads Flexible Pavements and Gravel Roads
Page 12-8 Roads Development Agency
Type 5 & 6
These materials gradations are recommended for smaller size particles. They may be
used if sanctioned by experience with plasticity characteristics as for material Type 1.
Table 12-2
Test Sieve
Size(mm)
Percent(%) by mass of total aggregate passing test sieve
Type 1
Type 2
Type 3 Type 4
Type 5
Type 6
50
- - - 100 - -
37.5
100 - 100 80-100 - -
28
- 100 95 - 100 - - -
20
80 - 100 95 - 100 85-100 60-80 100 -
14
- 80-100 65 - 100 - - -
10
55 - 100 65 - 100 55 - 100 45-65 80 - 100 100
5
40 - 60 45 - 85 35-90 30-50 60 -85 80-100
2.36
30 - 50 - - 20-40 45-70 50-80
2
- 30 - 65 22-75 - - -
1
- 25-55 18-60 - - -
0.425
15 - 30 18 - 45 15-50 10-25 25-45 25-45
0.075
5 - 15 12-32 10-40 5-15 10-25 10-25
MAJOR GRAVEL ROADS (AADTDESIGN = 20 TO 200)
Major gravel roads are roads which have a design AADT greater than 20 and less than
200. These will generally fall within the design category of DS5 to DS8 (See RDA
Geometric Design Manual -2014, Chapter 2. It is recommended to use a gravel wearing
course material of grading Type 1 in the new construction of roads having an AADT
greater than 50 and for all routine and periodic maintenance activities. Type 4 material
may be used in the new construction of roads having an AADT less than 50.
MINOR GRAVEL ROADS (AADTDESIGN < 20)
Minor gravel roads are roads which have a design AADT (AADTdesign) less than 20. They
are normally community roads, which are constructed by labor-based methods. These
roads generally fall within the design category of DS9 to DS10 (Refer to RDA Geometric
Design Manual-2014). Usually these roads are unsurfaced (earth roads). However, for
subgrade CBR values less than 5% and longitudinal gradients of greater than 6%, a
gravel wearing course is recommended. Materials for gravel wearing course shall comply
with the requirements for Type 4 material for new construction and Type 1 for
maintenance activities.

Pavement Design Manual - 2014 Chapter 12
Flexible Pavements and Gravel Roads Gravel and Low Standard Roads
Roads Development Agency Page 12-9
The CBR requirements may be reduced to 20% if other suitable material is not locally
available.
12.8 DETERMINATION OF CBRDESIGN
GENERAL
The CBRdesign is the CBR value of a homogenous section, for which the subgrade
strength is classified into S5, S4 or S2 for the purpose of pavement design. The procedure
to determine CBRdesign is shown in the flow chart in Figure 12-2.
Figure 12-2: Flow Chart for Design
HOMOGENOUS SECTIONS
Identification of sections deemed to have homogenous subgrade conditions is carried out
by desk studies of appropriate documents such as geological maps, followed by site
reconnaissance that includes excavation of inspection pits and initial indicator testing for
confirmation of the site observations. Due regard for localized areas that require
individual treatment is an essential part of the site reconnaissance. Demarcation of
homogenous sections shall be reviewed and changed as required when the CBR test
results of the centerline soil survey are available.
Site
Reconnaissance
Compilation
of input data
Demarcation of
homogenous
sections
Minimum 3
CBR tests
per section
Cutting?
Yes
Use lowest CBR
value
CBRdesign:
Classify S3,
S7, S15
Design improved
subgrade as
required
Minimum 5
CBR tests
per section
No
Special
assessment of the
section
Plot values in
ascending order
Yes
No
Yes
Determine 90%-ile at
the 0.1 X (n-1) point on
the curve

Chapter 12 Pavement Design Manual - 2014
Gravel and Low Standard Roads Flexible Pavements and Gravel Roads
Page 12-10 Roads Development Agency
STATISTICAL ANALYSIS
The flow chart in Figure 2 shows the procedure to determine CBRdesign.
The CBRdesign for cuttings is the lowest CBR value encountered for the homogenous
section.
The CBRdesign for sections that do not require special assessment or are not within
cuttings are determined by the 90%-ile value of the CBR test results. The 90%-ile value
for a section of this type is the CBR value which 10% of the test results fall below. The
following example shows how this is calculated.
1. CBR values are plotted in ascending order (number of tests on the "x axis" and the
CBR test result values on the "y axis");
2. Calculate d = 0.1 x (n-1), where n = number of tests;
3. d is measured along the "x axis" and the CBRdesign is determined from the "y axis".
LABORATORY TESTING
Each CBR value shall be determined by laboratory measurement carried out for a
minimum of three density values to give a CBR - Density relationship for the material.
The CBR value is determined at the normal field density specified for the respective
operation (i.e. a minimum in-situ density of 95% of the maximum dry density determined
in accordance with the requirements of AASHTO T 180).
12.9 IMPROVED SUBGRADE AND PAVEMENT DESIGN
MAJOR GRAVEL ROADS
Pavement and improved subgrade for major gravel roads shall be constructed in
accordance with Figure 12-3. This includes all design categories DS5, DS6, DS7 and
DS8 as defined in RDA Geometric Design Manual -2014.
MINOR GRAVEL ROADS
Pavement and improved subgrade for minor gravel roads shall also be constructed in
accordance with Figure 12-3. This includes design categories DS9 and DS10 as defined
in RDA Geometric Design Manual -2014. The desired properties of the gravel wearing
course material, GW, are given in Section 12.7. However, the CBR may be reduced to
20%, and the LA abrasion value may be increased to 55% for minor roads, if better
quality material is not locally available.

Pavement Design Manual - 2014 Chapter 12
Flexible Pavements and Gravel Roads Gravel and Low Standard Roads
Roads Development Agency Page 12-11
12.10 CLIMATIC ZONES
ZONES
For the purposes of gravel wearing course design, Somaliland is divided into two
climatic zones. All places with elevations over 1,000 meters (average rainfall
40mm/month) are considered to be wet zones and all places with elevations 1,000 meters
or less (average rainfall 15mm/month) are considered to be dry zones. However,
engineering judgement should be made for individual projects as to which category the
design falls.
ARID AREAS
It is acknowledged that, in many arid areas, rates of rainfall may be extremely high over
short durations. Pavement design techniques, unlike drainage design techniques, do not
take this into account as they are based on annual rates of rainfall.
Figure 12-3: Pavement and Improved Subgrade for Gravel Roads for ADDTs < 200
AADTdesign
<20 20 - 50 50 - 200
S15 150mm
GW
175mm
GW
200mm
GW
S7
200mm
GW
150mm
100mm
GW
G20
175mm
100mm
GW
G20
S3 Dry Zones
mm
150
150
150 G7
G20
GW
Wet Zones
mm
150
200
200 G7
G20
GW
Dry Zones
mm
200
150
200 G7
G20
GW
Wet Zones
mm
200
200
250 G7
G20
GW
Dry Zones
mm
150
150 G7
GW
Wet Zones
mm
150
300 G7
GW

Pavement Design Manual - 2014 Chapter 13
Concrete Roads
Roads Development Agency Page13-1
13 CONCRETE ROADS
13.1 INTRODUCTION
The purpose of this chapter is to give specific guidance and recommendations to the
engineers responsible for the design of rigid pavements in Somaliland.
This chapter contains:
- A description of rigid pavements: their characteristics, their components and their
function, the different types of slabs and joints, including drawing details.
- A description of the factors influencing the pavement type selection and the design
process.
- A design procedure for the different types of pavement, slab reinforcement, joint
details and joint layout.
The design method is a directly utilizable one, based mainly on empirical results and full
scale experiments. Although an analytical, comprehensive approach to the design is
possible, based on the stresses and strains induced in the pavement by an applied wheel
loading, it is very complicated, rarely used, leads to minor changes and as such is not
covered in these pages.
13.2 RIGID PAVEMENTS
13.2.1 GENERAL CHARACTERISTICS
Rigid pavements (concrete pavements), as the name implies, are rigid and considerably
stronger in compression than in tension. One of the main characteristics of rigid
pavements is that a relatively thin pavement slab distributes the load over a wider area
due to its high rigidity. Localized low strength roadbed material can be overcome due to
this wider distribution area. In concrete pavements, the strength of the pavement is
contributed mainly by the concrete slab, unlike flexible pavements where successive
layers of the pavement contribute cumulatively.
Concrete pavements are subject to thermal stresses due to variation in daily and annual
temperatures. In Somaliland, though the annual range of temperature is small, the daily
range of temperature is high, varying from 20°C to 40° C (Ref. 1), and hence thermal
stresses deserve attention for the design of concrete pavements.
Skidding resistance of concrete pavement surfaces is also an important functional
characteristic. The rugose surface required for an adequate resistance to skidding in wet
conditions can be provided by dragging stiff brooms transversely across the newly-laid
concrete or by cutting shallow randomly spaced grooves in the surface of the hardened
concrete slab.
In the absence of deleterious materials (either in the aggregate or entering the concrete in
solution from an external source), unlike with flexible pavements, concrete does not
Chapter 13 Pavement Design Manual - 2014
Concrete Roads
Page 13-2 Roads Development Agency
suffer deterioration from weathering. Neither its strength nor its stiffness is materially
affected by temperature changes.
At present, concrete pavements have not been extensively used in most tropical countries
and in Somaliland in particular, mainly due to a lack of tradition and experience in design
and construction. One characteristic of concrete pavements is that either they prove to be
extremely durable, lasting for many years with little attention, or they give trouble from
the start, sometimes because of faults in design, but more often because of mistakes in
construction.
13.2.2 TYPES OF RIGID PAVEMENTS
Depending on the level of reinforcement, the rigid pavements can be categorized into
three basic types:
Jointed unreinforced concrete pavements (JUCP)
Jointed reinforced concrete pavements (JRCP)
Continuously reinforced concrete pavements (CRCP)
In jointed unreinforced concrete pavements (JUCP), the pavement consists in a
succession of cast in place unreinforced concrete slabs separated by joints to prevent
expansion from developing stresses and to control cracks. The slabs are linked together
by tie bars or dowels to transmit the vertical stresses.
In Jointed reinforced concrete pavements (JRCP) the pavement consists in a succession
of cast in place reinforced concrete slabs separated by joints to prevent expansion from
developing stresses and to control cracks. The slabs are linked together by tie bars or
dowels to transmit the vertical stresses. JRCP are used where a probability exists for
transverse cracking during pavement life due to such factors as soil movement and/or
temperature/moisture change stresses. The longitudinal reinforcement is the main
reinforcement. A transverse reinforcement though not absolutely necessary in most cases
is usually added to facilitate the placing of longitudinal bars.
Continuously reinforced concrete pavements (CRCP) are used for rather trafficked roads
where a good level of comfort is expected. The principal reinforcement, in the form of
prefabricated mesh or reinforcing bars installed at mid-depth of the slab, is again the
longitudinal steel which is essentially continuous throughout the length of the pavement.
This longitudinal reinforcement is used to control cracks which form in the pavement due
to volume change in the concrete.
13.3 PAVEMENT STRUCTURE, FUNCTION OF PAVEMENT LAYERS
AND COMPONENTS
Rigid pavements generally consist of, as shown in Figure 1, a subbase, and a concrete
slab constructed above the subgrade constituted of the roadbed or embankment and a
capping layer (if required).
The capping layer consists of selected fill and is provided in cases of low strength
roadbed material. It protects the underlying subgrade from construction traffic loading
and provides a stronger platform for the subbase layer, which is placed on top of the
capping layer

Pavement Design Manual - 2014 Chapter 13
Concrete Roads
Roads Development Agency Page13-3
The subbase of a rigid pavement structure consists of one or more compacted layers of
material placed between the subgrade and the rigid concrete slab. In some cases the
material can be cement stabilized to increase its quality. If the roadbed soils are of an
acceptable quality and if the design traffic is low (less than one million equivalent
standard axles (ESAs)), a subbase layer may not be necessary between the prepared road
bed and the concrete slab.
A subbase is provided under a concrete pavement for the following reasons:
to provide a stable “working platform” for the construction equipment;
to provide a uniform concrete slab support;
to help in the control of excessive volume changes in roadbed soils susceptible to
such phenomena; and
to prevent “pumping” at joints and slab edges.
The concrete slab consists of Portland cement concrete, reinforcing steel (When
required), load transfer devices and joint sealing materials.
Transverse reinforcement is provided to ensure that the longitudinal bars remain in the
correct position during the construction of the slab. It also helps to control any
longitudinal cracking that may develop.
Figure 1 Rigid Pavement

Chapter 13 Pavement Design Manual - 2014
Concrete Roads
Page 13-4 Roads Development Agency
The details regarding the design of the pavement slab thickness and the amount of
reinforcement required are discussed in Chapter 7.
13.4 JOINTS
Joints are placed in concrete pavements, whether reinforced or not to permit expansion
and contraction of the pavement, thereby relieving stresses due to environmental changes
(Temperature and moisture), friction, and to facilitate construction. There are four
general types of joints: contraction, expansion, warping and construction.
In most cases joints combine several of these functions:
Contraction joints are provided to relieve the tensile stresses due to temperature, moisture
and friction, therefore controlling cracking. If contraction joints were not installed,
random cracking would occur on the surface of the pavement.
The primary function of an expansion joint is to provide space for the expansion of the
pavement, thereby preventing the development of compressive stresses, which cause the
pavement to buckle. Expansion joints are also contraction joints.
Warping joints allow a slight relative rotation of the slab portions delimited by joints and
reduce the strains due to warping. Warping joints are also contraction joints.
Longitudinal joints are always warping joints but they can be found also as transverse
joints in some cases (See further)
Construction joints are required to facilitate construction, especially when concreting is
stopped. For JUCP and JRCP, they shall be coupled with other joints and additional
reinforcement shall be placed when dealing with transverse construction joints for CRCP.
Load transfer between slabs is provided by dowels. All materials required for joints and
sealing shall be as per the Standard Specifications.
Joints can be broadly classified into two categories according to their direction: (1)
Transverse Joints and (2) Longitudinal Joints.
Typical details of the joints are presented in Appendix B (adapted from Ref. 8).
Transverse Joints
Based on their function, the transverse joints can be divided into three types: (i)
contraction joints, (ii) expansion joints and (iii) warping joints.
Contraction Joints
Contraction joints are the main type of transverse joint. They provide weakened sections
between slabs to induce tension cracking at preferred locations in the concrete after it has
been placed. They also contribute to limiting the strain due to warping as a result of
temperature and moisture changes. Contraction joints shall consist of:
- a sawn joint groove

Pavement Design Manual - 2014 Chapter 13
Concrete Roads
Roads Development Agency Page13-5
- dowel bars
- a sealing groove
The groove and sealant shall be as specified. The dowel bars shall be 20 mm in diameter
at 300 mm spacing, 400 mm long for slabs up to 239 mm thick, and 25 mm in diameter
for slabs 240 mm thick or more.
Expansion Joints
Transverse expansion joints are required in JUCP and JRCP at regular intervals. The
distance required between joints depends on the expected expansion and on the friction
between the different layers of the pavement.
In expansion joints, complete separation between the two adjacent concrete slabs is
required, and a compressible joint is used to fill the void.
Expansion joints shall consist of:
- a joint filler board
- dowel bars
- a sealing groove
The joint filler board and sealing groove shall be as per the Specifications. The dowel
bars shall be 25 mm in diameter at 300 mm spacing, 600 mm long for slabs up to 239
mm thick, and 32 mm in diameter for slabs 240 mm thick or more.
Warping Joints
Transverse warping joints are used for special cases, such as extra joints at manhole
positions, or when unreinforced slabs are alongside reinforced slabs, or in long and
narrow or tapered (odd-shaped) JUCP slabs between normal joint positions, to reduce the
length/width ratio of the slabs to 2 or less, and in other similar situations.
Warping joints shall consist of:
- a sawn groove
- tie bars
- a sealing groove
The sealant shall be as per the Specifications. The tie bars shall be 12 mm in diameter at
300 mm spacing, and 1000 mm long.
Longitudinal Joints
Longitudinal joints are warping joints, required at such a spacing as will reduce the
combination of thermal warping stresses and loading stresses to a minimum, and reduce
the risk of longitudinal random cracking, and often serve at the same time as construction
joints. These joints allow a slight rotation, but differential lateral displacements between
adjacent slabs are prevented by tie bars provided at mid-depth of the slab.

Chapter 13 Pavement Design Manual - 2014
Concrete Roads
Page 13-6 Roads Development Agency
Longitudinal joints shall consist of:
- bottom crack inducer
- a sawn groove
- tie bars
- a sealing groove
The sealant shall be as per the Specifications. The tie bars for all longitudinal joints,
except where transverse reinforcement is permitted in lieu, shall be 12 mm in diameter at
600 mm spacing, and 1000 mm long.
13.5 SELECTION OF PAVEMENT TYPE
The highway engineer or administrator does not have at his disposal an absolute or
indisputable method for determining the type of pavement which should be selected for a
given set of conditions.
First a judgement must be made on many varying factors such as traffic, soil, weather,
materials, construction, maintenance and environment. In some cases overriding factors
can dictate pavement type. For instance, for heavily traveled facilities in congested
locations, the need to minimize the disruptions and hazard to traffic may dictate the
selection of CRCP.
When there is no overriding factor, which may often be the case, it is standard practice to
design typical sections of the road using each of the available options and then to
compare them on an economical point of view.
Unavoidably, there will be instances where financial circumstances are such to make first
cost the dominate factor in selection, even though higher maintenance or repair costs may
be involved at a later date.
Where circumstances permit, a more realistic economical evaluation has to take into
account all expected costs including the initial cost of construction, the cost of
subsequent stages or corrective works, anticipated life, maintenance cost and salvage
value. Costs to road users during periods of reconstruction or maintenance operations are
also appropriate for consideration.
Although pavement structures are based on an initial design period, few are abandoned at
the end of this period and continue to serve as part of the future pavement structure. For
this reason, the analysis period should be of sufficient duration to include a representative
reconstruction of all pavement types.
If the analysis of the above given factors does not show a far higher interest of one option
rather than another, a second set of factors can be considered such as the performance of
similar pavements in the area or the skills of contractors.
Basically, the use of the different types of rigid pavement is as follows:
- JUCP is suitable for all levels of traffic, whenever the risk of subgrade movement
is low and an uncontrolled cracking not very prejudicial.
- JRCP is suitable for all levels of traffic and is used when the risk of settlements of
the subgrade can not be neglected.
- CRCP shall basically be considered only for rather high design traffic (>30 msa).

Pavement Design Manual - 2014 Chapter 13
Concrete Roads
Roads Development Agency Page13-7
They can also be included for less heavily trafficked schemes where the advantage of
lower maintenance throughout the design life may be worthwhile.
13.6 STRESS DEVELOPMENT AND DESIGN CRITERIA
13.6.1 STRESS DEVELOPMENT
The concrete slabs in concrete pavement are subjected to two main types of stresses, the
stresses developed because of changes of the environment (moisture and temperature)
and closely depending on the intrinsic properties of the concrete and the stresses coming
from the traffic loads.
These kinds of stresses can not be prevented from developing, but the design of concrete
pavement shall take them into account in order to keep them in acceptable ranges of
values. Analytical methods have been developed aiming at computing accurately the
stresses developed in concrete pavements for a theoretical design. But they are rather
complicated and necessitate strong hypothesis on the quality and the evolution of the
different layers composing the road bed. That’s why the approach of this manual is
limited to a qualitative description of the phenomena which justify the pragmatic design
procedure exposed in section 7.
Horizontal Tensile stresses
While setting and later depending on external humidity, the moisture rate of the concrete
changes, thus inducing tensile stresses in the material.
If the temperature drops after setting, thermal tensile stresses are also induced, depending
on the thermal coefficient of the concrete.
Pavement type selection process

Chapter 13 Pavement Design Manual - 2014
Concrete Roads
Page 13-8 Roads Development Agency
The acceleration or slowing down of vehicles also induces horizontal tensile stresses in
the pavement, because of the mechanical reaction.
Since the movements of the lower face of the pavement are limited by the friction with
the subbase, cracks appear as soon as the sum of these tensile stresses exceed the
concrete tensile strength. When uncontrolled cracks become too wide, they enable water
infiltration or slabs and subgrade vertical movements thus accelerating the degradation of
the pavement.
Depending on the type of slab this issue is treated differently:
In JUCP and JRCP:
The development of cracks is controlled by placing joints at regular intervals and a
separation membrane between the slab and the subbase. The limited lengths of slabs and
the increased possibility of horizontal movements limit the tensile stresses and thus
prevent the slabs from cracking between joints.
In CRCP:
The continuous reinforcement causes the cracking to occur at regular and little spaced
locations thus limiting the width of cracks to acceptable values.
Horizontal compressive stresses
If the temperature rises after setting, thermal compressive stresses are also induced,
depending on the thermal coefficient of the concrete.
The acceleration or slowing down of vehicles also induces horizontal compressive
stresses in the pavement, because of the mechanical reaction.
If the sum of these compressive strengths become to high, this may cause the pavement
to buckle.
According to the type of slab, this issue is treated as follows:
In JUCP and JRCP:
The placing of expansion joints and the increased possibility of movement through the
use of the separation membrane permit the expansion of the concrete and the dissipation
of compressive stresses.
In CRCP:
The continuous reinforcement increases the resistance of slabs, eliminates week sections
and prevents any buckling.
Vertical stresses
With a minimum concrete thickness of 150 mm, vertical stresses developed by the traffic
loads are prejudicial for rigid pavement only because of their repetitive character causing
the progressive degradation of the underlying layers. Indeed, the punctual loss of support
and the movements of the subgrade are the main reasons for rigid pavement not to bear
vertical stresses.

Pavement Design Manual - 2014 Chapter 13
Concrete Roads
Roads Development Agency Page13-9
13.6.2 DESIGN CRITERIA
As above explained, the factors which shall intervene in the design of rigid pavements
are as follows:
- the roadbed quality
- the quality of the steel and concrete composing the slabs
- the traffic
- the environment. (Moisture and temperature)
Another criterion which usually intervenes in the design of road pavement, the design
period is not considered here because rigid pavements are deemed suitable for long
design periods, which means 20 years.
For the simplified experience-based design procedure exposed in this manual, the
assumption is made that the materials used for construction meets the standard
requirements as defined in section 3. Which means mainly a yield strength of 500 MPa
for the steel reinforcement bars and a 28 day characteristic compressive strength of 40
MPa for the concrete.
As stated in the previous section, the accurate computation of the stresses in the concrete
is not in the scope of this manual and thus, the proposed thickness design procedure and
joint layout for rigid pavement is suitable for the usual natural ranges of temperature and
moisture rates.
Consequently, the two parameters to be accounted for in the design procedure are the
traffic data and the bearing capacity of the roadbed.

Chapter 13 Pavement Design Manual - 2014
Concrete Roads
Page 13-10 Roads Development Agency
Equivalency Factors – Cumulative Equivalent Standard Axles (ESAs)
Refer to Chapter 3, for details for computing equivalency factors and the cumulative
ESAs.
The equivalency factors for rigid pavements for different axle loads are given in Table 1.
These factors are marginally higher, when compared with the corresponding values from
Table 2.3 , for loads up to an axle load of 9 x 10³ kg. However, for heavier loads, the
equivalency factors for rigid pavements are lower and the difference increases sharply
with higher loads. For rigid pavements, by adopting the equivalency factors from Table
2.1, the resultant cumulative ESAs may be much higher, particularly for traffic with a
high percentage of heavy trucks. Hence, the design engineer should evaluate the
sensitivity of the results prior to deciding which factors should be used in calculating
cumulative ESAs.
Subgrade Assessment
Table 1
Equivalency Factors for Different Axle Loads (Rigid Pavements)
Wheel load
(single and dual)
(103 kg)
Axle load
(103 kg)
Equivalency
factor
1.5 3.0 0.02
2.0 4.0 0.05
2.5 5.0 0.13 3.0 6.0 0.28
3.5 7.0 0.53
4.0 8.0 0.93
4.5 9.0 1.53 5.0 10.0 2.40
5.5 11.0 3.63
6.0 12.0 5.25 6.5 13.0 7.33
7.0 14.0 9.92
7.5 15.0 13.1 8.0 16.0 17.0
8.5 17.0 21.6
9.0 18.0 27.1
9.5 19.0 33.7 10.0 20.0 41.4

Pavement Design Manual - 2014 Chapter 13
Concrete Roads
Roads Development Agency Page13-11
The strength of the subgrade is assessed in terms of the California Bearing Ratio (CBR).
Refer to Chapter 3.2 for subgrade assessment.
13.7 DESIGN OF RIGID PAVEMENTS
A general methodology of rigid pavement design is presented in Figure 2.
13.7.1 DESIGN TRAFFIC LOADING
Refer to Chapter 3 and to subsection 6-2 for the computation of the design Equivalency
Axle Load of the road.
13.7.2 THICKNESS DESIGN
Capping and Subbase
The capping layer is required only if CBR of the subgrade is 15% or less. The required
thickness of a capping layer for a CBR value less than 15% can be obtained from
Figure 3.
The subbase layer is required when the subgrade material doesn’t comply with the
requirement for a subbase (CBR is less than 30%) or to facilitate the obtaining of the
surface levels with the tolerances required. Generally, the thickness of the subbase
provided will be a constant 15 cm and can be cement stabilized.
For subgrade CBR values less than 2%, the roadbed material needs to be treated either by
replacement or in-situ stabilization. These methods of soil improvement are described in
section 7 of the flexible pavement design manual.
A separation membrane (such as a polythene sheet) is required between subbase and
concrete slab, mainly in order to reduce the friction between the slab and the subbase in
JUCP and JRCP pavements, and thus inhibits the formation of mid-bay cracks. It also
reduces the loss of water from the fresh concrete. For CRCP pavements, a bituminous
spray should be used on the subbase, instead of polythene, because a degree of restraint
is required.
Concrete Slab Thickness and Reinforcement
Based on the design traffic volume determined as per Chapter 2 and project-specific
characteristics, the thickness of pavement is determined.
The following represents procedures for determining the thickness and reinforcement for
each of the pavement types.
Jointed Unreinforced Concrete Pavement (JUCP)
For a given traffic volume in terms of ESAs, the thickness of JUCP concrete slab can be
determined using Figure 4.

Chapter 13 Pavement Design Manual - 2014
Concrete Roads
Page 13-12 Roads Development Agency
Figure 4 assumes the presence of an effective lateral support to the edge of the most
heavily-trafficked lane (i.e., the right lane), such as a shoulder with a pavement structure
able to carry occasional loads. In the absence of such a shoulder adjacent to the most
heavily trafficked lane, an additional slab thickness is required, and this additional
thickness can be determined using Figure 6.
JUCP pavements have no reinforcements. However, the longitudinal and transverse
joints are provided with reinforcements. The joint details are discussed in Section 5
Jointed Reinforced Concrete Pavement (JRCP)
For a given traffic volume in terms of ESAs, the thickness of a JRCP concrete slab can
be determined using Figure 4. The figure can also be used to determine the longitudinal
reinforcement in terms of mm2/m for a design thickness of concrete slab. Thus, several
alternate combinations of thickness of concrete slab and amount of reinforcement can be
compared.
In the absence of an effective lateral support provided by the shoulder adjacent to the
most heavily trafficked lane, an additional slab thickness is required and can be
determined using Figure 6.
In addition to the longitudinal reinforcement, JRCP pavements shall be provided with
transverse reinforcement, if required, depending on site conditions. In that case,
reinforcement shall be provided at 600 mm spacing and consist of 12 mm diameter steel
bars.
Continuously Reinforced Concrete Pavement (CRCP)
CRCP pavement can withstand severe stresses induced by differential movements. For a
given traffic volume, in terms of ESAs, the thickness of CRCP concrete slab can be
obtained from Figure 5.
Longitudinal reinforcement in CRCP pavements shall be 0.6% of the concrete slab cross-
sectional area, consisting of 16 mm diameter deformed steel bars. If required, transverse
reinforcement shall be provided at 600 mm spacings, consisting of 12 mm diameter
deformed steel bars, to control the width of any longitudinal cracks which may form.
Transverse reinforcement is normally required only for ease of construction. It may be
omitted except where there is a risk of differential settlements.
Similarly to JUCP and JRCP pavements, in the absence of effective shoulder support
adjacent to the most heavily trafficked lane, the additional slab thickness required can be
determined using Figure 6.
As is evident from Figure 4 and 5, the minimum thickness of concrete pavement for
JUCP and JRCP pavement is 150 mm and that for CRCP pavement is 200 mm. Hence,
the designer should carefully assess the necessity and requirements for such pavements,
depending on the design traffic volume, and shall include flexible pavement as an
alternate.
A design example of rigid pavement design is presented in Appendix C.
13.7.3 DESIGN FOR MOVEMENT

Pavement Design Manual - 2014 Chapter 13
Concrete Roads
Roads Development Agency Page13-13
Joints shall be designed according to the general considerations of sub section 2.2 and
using Drawings B2 to B8.
The general layout of joints shall account for construction consideration and the
following limitations concerning joint spacing and slabs dimensions:
Transverse Joint Spacing
Maximum transverse joint spacing for JUCP pavements is 4 m for slab thickness up to
230 mm and is 5 m for slab thickness over 230 mm.
Expansion joints should replace every third contraction joint, ie. at a spacing of 12m or
15m.
For JRCP, contraction joints are generally at a standard distance of 25m, unless there is
500mm2/m of reinforcement. Then refer to Figure 4. For expansion joints, replace every
third contraction joint with an expansion joint. For example, a pavement with contraction
joint spacing of 25m has an expansion joint spacing of 75m.
Longitudinal joint spacing
The longitudinal joint spacing shall not be greater than 4.2 m for pavement slabs without
transverse reinforcement and 6.0 m for pavement slabs with transverse reinforcement.
When required, longitudinal joints shall be placed at the edge of traffic lanes.
Slabs dimensions
Warping joints shall be added to the general layout in special cases, as described in
section 2.2. In general, the length/width ratio of the slabs shall be of 2 or less.
Layout at junctions
For intersection of joints at junctions and crossings, refer to the drawing below:

Chapter 13 Pavement Design Manual - 2014
Concrete Roads
Page 13-14 Roads Development Agency
Intersection of
transverse joints
Longitudinal joints Transverse joints
Joints layout at junctions and crossings

Pavement Design Manual - 2014 Chapter 13
Concrete Roads
Roads Development Agency Page13-15
Check forRequirement ofCapping Layer
No
Determine CappingLayer Thicknessfrom Figure 3.2
Determine Concrete SlabThickness and
Reinforcement from Figure3.3.
Check forRequirementof Subbase Layer
Determineslab thicknessfrom Figure 3.3.
Check for Site Constraints,if any.
Determine pavement type.
Determine Concrete SlabThickness from Figure
3.4.
CRCP
Check for requirement oftransverse reinforcement (cf. §
3.2).
Determine joint type,joint spacing and joint
reinforcement.
Determine additional slabthickness from Figure 3.5.
Check for requirement oftransverse reinforcement (cf.
§ 3.2).
Yes
JRCP
JUCPDetermine longitudinalreinforcement (cf. § 3.2)
Determine
Design CBR
Design ESAs
Figure 2 Design Methodology – Flow Diagram

Chapter 13 Pavement Design Manual - 2014
Concrete Roads
Page 13-16 Roads Development Agency
Figure 3 Capping Layer and Subbase Thickness design
(Adapted from Ref.5)
mm

Pavement Design Manual - 2014 Chapter 13
Concrete Roads
Roads Development Agency Page13-17
Figure 4 Design Thickness and joint spacing for JUCP and JRCP
(Adapted from Ref. 5)
18
19
20
21
22
23
24
25
26
1 10 100 1000
Design Traffic (millions of ESAs)
3
4
5
6
7
8
9
10
11600
700
800
500
0 JUCP
Longitudinal
Reinforcement
(mm2/m)
JRCP
4
5
400
Spacing of Joints (m)
100
150
200
250
300
350
400
1 10 100 1000
Design Traffic (millions of ESAs)
0 JUCP
500
600
700
800
JRCP
Longitudinal
Reinforcement
(mm2/m)
Design tickness
of Concrete (mm)

Chapter 13 Pavement Design Manual - 2014
Concrete Roads
Page 13-18 Roads Development Agency
0
50
100
150
200
250
300
1 10 100 1000
Design Traff ic (Millions of ESAs)
Desig
n T
hic
kness o
f concre
te (
mm
)
Figure 5 Design Thickness for CRCP Pavements
(Adapted from Ref. 5)
6


Chapter 13 Pavement Design Manual - 2014
Concrete Roads
Page 13-18 Roads Development Agency

Chapter 14 Pavement Design Manual - 2014
Pavement Rehabilitation and Asphalt Overlay Design
Roads Development Agency Page14-1
14 PAVEMENT REHABILITATION AND ASPHALT OVERLAY
DESIGN
14.1 INTRODUCTION
14.1.1 PURPOSE AND SCOPE OF THE CHAPTER
PURPOSE
The Roads Development Agency (RDA) has initiated a comprehensive program to
rehabilitate and upgrade the highway network in Somaliland.
As the network of paved roads in Somaliland evolves, it is likely that a gradual shift in
emphasis will occur, from new design and construction to maintenance and rehabilitation
of the existing paved network.
The purpose of this chapter is to provide, as a complement, a guide for the design of the
most common rehabilitation solutions applicable to paved roads, and for the selection of
an appropriate rehabilitation alternative for a particular project.
SCOPE
This chapter provides design procedures for the rehabilitation of both flexible and rigid
pavements. The procedures utilize data which are collected during desk studies as well
as by means of field work.
The data and their analysis are primarily directed towards a rehabilitation design on an
individual project basis, but are also meant to be used, on a more general basis, as inputs
to RDA’s Pavement Management System (PMS).
Several rehabilitation alternatives, including asphalt overlays, are usually available to the
design engineer from a technical viewpoint; the manual provides guidance regarding the
choices, practical and economical, between the various alternatives.
14.1.2 THE PAVEMENT MANAGEMENT CONTEXT
RDA’S PAVEMENT MANAGEMENT SYSTEM
Pavement management, in its broadest sense, encompasses all the activities involved in
the planning, design, construction, maintenance, evaluation and rehabilitation of the
pavement portion of a public works program. A pavement management system (PMS) is
a set of tools or methods that assist decision makers in finding optimum strategies for
providing, evaluating, and maintaining pavements in a serviceable condition over a given
period of time. The function of a PMS is to improve the efficiency of decision-making,
expand its scope, provide feedback on the consequences of decisions, facilitate the
coordination of activities within the agency, and ensure the consistency of decisions
made at different management levels within the agency.
In this sense, pavement ―design‖, as covered by RDA’s above-mentioned manual as
covered in this manual, are essential parts of the overall pavement management process,
a conceptual illustration of which is given in Figure 1.2 (after Ref. 3 and 4).

Chapter 14 Pavement Design Manual - 2014
Pavement Rehabilitation and Asphalt Overlay Design
Page14-2 Roads Development Agency
As can be seen on Figure 1.2, it is convenient and customary to describe a PMS in terms
of two generalized levels: (1) the network management level, and (2) the project level.
Figure 1.2 Activities of a Pavement Management System (after Ref. 3 and 4)
At the network level, the pavement management system gives information relevant to the
development of programs involving the road infrastructure considered as a group of
itineraries, identified by their functional class and their main technical characteristics and
level of traffic. Basically, the pavement management system deals primarily with
network level where key administrative decisions that affect programs for road networks
are made. It allows one to evaluate and compare series of maintenance activities and
maintenance and rehabilitation alternatives, and to test them with regard to budget
constraints.
The project level is the appropriate level for evaluating the detailed pavement conditions
of a section of an itinerary, and for designing technical solutions for routine, periodic

Chapter 14 Pavement Design Manual - 2014
Pavement Rehabilitation and Asphalt Overlay Design
Roads Development Agency Page14-3
maintenance, or rehabilitation, according to road management priorities, selected cost-
efficient policy alternatives, and budget constraints. Here again, by comparing the
benefits and costs associated with several alternative activities, an optimum strategy is
identified that will provide the desired benefits at the least cost over a selected analysis
period.
MAINTENANCE AND REHABILITATION
A list of terms and abbreviations used in this manual is presented in Appendix A.
However, two terms, ―maintenance‖ and ―rehabilitation‖, deserve particular attention in
order to fully understand, and better benefit from, this manual. As already indicated, the
PMS aims at allocating resources between maintenance and rehabilitation, and an outline
of the method used by RDA’s PMS for this purpose is given in Chapter 4. It is therefore
appropriate to define what is covered by these two groups of activities.
MAINTENANCE
The following excerpt from the introduction to the Asphalt Institute Manual Series No.
16, Asphalt in Pavement Maintenance (Ref. 6) is considered appropriate to define
maintenance, as well as to provide some insight into two general categories of
maintenance:
―Pavement maintenance is not easy to define. Maintenance departments generally agree
what it is, but there are some minor differences. Some call pavement improvement
―maintenance‖. Others include only the work that keeps the pavement in its as-
constructed condition.
Taking all these into consideration, the definition that seems to fit best is:
Pavement maintenance is work performed from time to time to keep a pavement,
under normal conditions of traffic and forces of nature, as nearly as possible in its
as-constructed condition.
Distinctions are usually made between forms of maintenance, based on their required
frequency. The International Road Maintenance Handbook (Ref. 7) uses the grouping of
―routine‖ and ―periodic‖ maintenance, while other sources (e.g. TRRL, Ref. 8) use
―routine‖, ―recurrent‖, ―periodic‖ and ―urgent‖. The following excerpt from Reference 8
illustrates these categories:
―… There are four categories:
routine maintenance, required continually on every road, whatever its engineering
characteristics or traffic volume
recurrent maintenance, required at intervals during the year with a frequency that
depends on the volume of traffic using the road
periodic maintenance, required only at intervals of several years
urgent maintenance, needed to deal with emergencies and problems calling for
immediate action when a road is blocked.
Examples of activities within these categories are as follows:
routine:

Chapter 14 Pavement Design Manual - 2014
Pavement Rehabilitation and Asphalt Overlay Design
Page14-4 Roads Development Agency
grass cutting; drain clearing; recutting ditches; culvert maintenance; road signs
maintenance
recurrent on paved roads:
repairing pot-holes; patching; repairing edges; sealing cracks
periodic on paved roads:
resealing (surface dressing, slurry sealing, fog spray, etc.); regravelling shoulders; road
surface marking
urgent:
removal of debris and other obstacles; placement of warning signs and diversion works.‖
REHABILITATION
The following excerpt from the AASHTO Guide (Ref. 3) illustrates the essential
difference between maintenance and rehabilitation:
―Major rehabilitation activities differ markedly from periodic maintenance
activities (sometimes called normal, routine and/or preventive maintenance) in
that the primary function of the latter activity is to preserve the existing pavement
so that it may achieve its applied loading, while rehabilitation is undertaken to
significantly increase the functional life.‖
In this manual, the following definition of rehabilitation, which also introduces the major
rehabilitation categories, will be retained:
―Work undertaken to significantly extend the service life of an existing pavement.
This may include overlays and preoverlay repairs, and may include complete
removal and reconstruction of the existing pavement, or recycling of part of the
existing materials.‖
Rehabilitation is the subject of this manual, and is given further scrutiny hereunder.
REHABILITATION ALTERNATIVES
In the context of pavement management at a project level, and as noted earlier, several
rehabilitation alternatives are usually available after technical evaluation, and will need to
be compared. It is therefore appropriate, before a more detailed description of these
alternatives is given, to outline their main characteristics and the classification used in
this manual.
For simplicity, rehabilitation is subdivided into two major categories:
(1) Rehabilitation Methods with Overlays
(2) Rehabilitation Methods other than Overlays
It is realized that various agencies define overlays in different ways, e.g. some sources
would consider the addition of unbound courses as overlay. For clarity, and consistent

Chapter 14 Pavement Design Manual - 2014
Pavement Rehabilitation and Asphalt Overlay Design
Roads Development Agency Page14-5
with the scope of this manual, the following definition of an overlay will be adopted for
use in this manual:
―One or more courses of asphalt construction on existing pavement. The overlay
often includes a leveling course, to correct the contour of the old pavement,
followed by a uniform course or courses to provide needed thickness.‖
Bearing in mind the distinction between maintenance and rehabilitation, thin overlays
will not be emphasized in the manual, nor will resurfacing with surface dressing or
overlays of short (spot) length. It is noteworthy that asphalt concrete overlays of 5 cm
are considered periodic maintenance in the context of the Pavement Management System
(Ref. 5) on which RDA’s PMS is based.
It is also realized, and it should be recognized, that some of the methods which fall under
―rehabilitation methods other than overlays‖ may be used/required as pre-overlay
treatments in major rehabilitation work.
Rehabilitation methods other than overlays include, as broad primary categories:
Reconstruction: in this category, little or no contribution is expected from the existing
pavement materials and the materials needed for rehabilitation will be mostly new
materials.
Recycling: the rehabilitation takes advantage of the existing pavement materials,
which are re-used in part or as a whole, in the construction of the rehabilitated
pavement.
The above categories are general in nature, and some combinations of methods are
possible and indeed used. For instance, the materials of an existing surface treatment and
roadbase may be recycled as the roadbase or subbase of a reconstructed pavement, with
new materials brought on site to construct the upper layers, e.g. roadbase and AC surface.
In addition to the above primary categories of non-overlay rehabilitation methods, other
rehabilitation techniques (some of them, as noted, being also applicable prior to an
overlay) can be applied to pavements to significantly extend their lives without the
placement of an overlay, or may delay recycling or reconstruction for several years.
These techniques, however, in order to truly qualify as rehabilitation techniques, must
satisfy several criteria:
1) They must be applied only to pavements which are structurally adequate to support
future traffic loadings over the design period without structural improvement from an
overlay. Only structurally adequate pavements, or pavements restored to a
structurally adequate state, are candidates for rehabilitation without overlay.
2) They must address the cause(s) of the pavement distress and be effective in both
repairing existing deterioration and preventing its recurrence. For this, a combination
of techniques may be required (one repair method and one preventive technique).
If each of the repair and preventive methods meet the pavement’s needs and satisfy the
imposed constraints (such as available funding and minimum life extension), then they
qualify as feasible rehabilitation alternatives.
If the alternative considered fails to satisfy the above criteria, it will be better classified
under the term of maintenance.

Chapter 14 Pavement Design Manual - 2014
Pavement Rehabilitation and Asphalt Overlay Design
Page14-6 Roads Development Agency
Examples of major rehabilitation methods that may be employed as non-overlay
techniques include:
(1) Full-Depth Repair
(2) Partial Depth Patching
(3) Joint-Crack Sealing
(4) Subsealing-Undersealing
(5) Grinding and Milling
(6) Subdrainage
(7) Pressure Relief Joints
(8) Load Transfer Restoration
(9) Surface Treatments
These methods are defined and described further in Chapter 5 of the manual.
Finally, non-overlay rehabilitation methods also include, as required when these elements
have become deficient, geometric improvements and/or drainage improvements or
restoration.

Chapter 14 Pavement Design Manual - 2014
Pavement Rehabilitation and Asphalt Overlay Design
Roads Development Agency Page14-7
14.2 DATA COLLECTION
In this chapter, general guidance is given relative to the gathering of data other than the
data which needs to be collected in the field.
It is recommended that this collection and review of data be conducted prior to the field
activities, as it can influence the latter with regard to their scope and organization.
The collection includes a search through the PMS Branch records, as detailed below.
Conversely, the results of this collection, to the extent that they can update and/or
complete the PMS Branch records, should be made available to the PMS Branch.
14.2.1 PMS BRANCH RECORDS
These records are among the first sources of data to be sought and collected. Normally,
the data required for the PMS are regularly updated. They fall into three categories, as
follows:
1) Data specifically collected for the PMS. This data deals with road inventory and road
conditions. It includes the results of visual inspection, roughness and deflection
surveys, and geotechnical investigations.
The visual inspection includes information about road geometry, road inventory
features (length; width; profile; alignment; type of structures encountered; etc.), and
about road damage (deformation; cracks; potholes; rutting; gullies; etc.). This
information is extremely valuable in assessing the road condition; it is usually
gathered along the entire length of the road.
Roughness is normally measured using a Bump Integrator and expressed through the
International Roughness Index (IRI). Typical values of the IRI, depending upon the
type of road and its condition, are as follows:
Table 2.1 Condition of the Road vs. IRI (from Ref. 5 and 9)
IRI Ranges Road Condition
Lower than 6 very good
6 to 11 good
11 to 15 fair
15 to 19 poor
Larger than 19 very poor
While the road roughness is not directly involved in the structural design of the
rehabilitation procedures presented in this manual, it may influence the choice and
the method of effecting one alternative, e.g. by indicating a probable need for a
leveling course prior to applying a structural overlay course.
Deflection surveys for the PMS are usually carried out using a Benkelman beam.
Except for a variation in the magnitude of the load application, the procedure is
similar to that described in this manual in Appendix B, and the user of this manual

Chapter 14 Pavement Design Manual - 2014
Pavement Rehabilitation and Asphalt Overlay Design
Page14-8 Roads Development Agency
should refer to these sections for details. A review of the PMS deflection data and a
comparison with the results of the deflection survey undertaken for the specific
project should give insight into the evolution of the load carrying capacity of the
pavement and/or increased confidence in the results of the specific survey.
Data specifically collected for the PMS also include detailed information about the
subgrade, pavement materials, and pavement structure. This information would have
been collected on sample sections by means of test pits with retrieval of samples for
laboratory analysis. The data from the test pits would normally include:
a) Layers of the pavement structure: type, thickness, and maximum size of
aggregates of each layer.
b) Subgrade: in-situ dry density; in situ moisture content; gradation; Atterberg
limits; classification according to AASHTO and/or USCS systems; and in situ
CBR obtained from correlation with DCP testing.
Here again, this data can be compared, and be a useful complement, to the project
specific geotechnical data collected in the field as detailed in Appendix B.
2) Data required for the PMS, but that has usually been collected separately in the field
and then forwarded to or obtained by the PMS Branch. This essentially includes
traffic and axle load data.
The data should normally include AADTs, classification of the traffic among the
various vehicle categories, and axle load data within each category. The data
available from the PMS Branch may already have been processed and be readily
available only in terms of traffic classes and cumulative equivalent axles loaded at 10
tonnes. It will then be necessary to collect the raw data in order to reprocess them
according to the procedure detailed further in this chapter (Section 2.3).
The usefulness of the traffic data thus collected will depend greatly on whether they
are sufficiently up-to-date. Nevertheless, they should be a valuable complement to
the evaluation of the traffic made for the specific project under consideration. In some
cases, they may be sufficiently recent, reliable, and complete to be used, at least in
part, for the project.
3) The third category of data normally available from the PMS Branch includes archive
data such as theoretical pavement structures; ages of the pavement structures; unit
prices of road works; vehicle operating costs and geo-climatic data.
General information about pavement structure and history should normally have been
made available to the PMS through RDA’s office and includes:
- number and thickness of the pavement layers (surfacing, roadbase and
subbase), together with a description of the material of each layer (asphalt,
concrete, surface treatment, crushed basalt aggregates, etc.)
- the date of construction or rehabilitation of the pavement structure
- the type and date of major periodic maintenance activities
This data is very important to properly assess the road condition.

Chapter 14 Pavement Design Manual - 2014
Pavement Rehabilitation and Asphalt Overlay Design
Roads Development Agency Page14-9
Unit rates of road works should also be available among the data in the PMS records.
These costs will be useful in the economic comparison of the feasible rehabilitation
alternatives, as detailed in Chapter 6 of this manual.
Vehicle operating costs (VOC) should not normally have an impact on the design of a
specific project already selected for rehabilitation.
14.2.2 OTHER DATA
A review of existing documents, in addition to those available from the PMS Branch,
should be conducted prior to field activities.
Such a review includes essentially a desk study similar to that undertaken for the
feasibility study of any road project.
The geological environment of the project should be researched, together with the
geotechnical characteristics corresponding to the geological formations along the
alignment.
Sources of information regarding past investigations, published or not, are to be gathered
and reviewed. They may include activities only loosely related to road construction
concerns (e.g. agricultural, hydrology, mining).
Existing reports, maps, mineral resource surveys, boring logs, and any relevant data need
to be collected and compiled. This is particularly valuable in identifying road
construction materials.
Of particular importance, when available, are as-built plans of the road section under
consideration or of adjacent projects, together with any memoirs or design reports
(including pavement design reports and/or pavement evaluation reports) and maintenance
records.
14.2.3 TRAFFIC DATA
The rehabilitation procedures presented in this manual require a characterization of the
traffic expected to be carried by the road after rehabilitation. Such a characterization is
done in terms of a cumulative number of equivalent standard axles (ESAs). This method
of characterization is necessary because the deterioration of paved roads due to traffic
results from both the magnitude of the individual wheel loads and the number of times
these loads are applied. Equivalency factors are used to convert traffic volumes into
cumulative equivalent standard axles loaded at 8.2 metric tonnes.
The process by which the cumulative number of ESAs is determined is illustrated in
Figure 2.1, and is essentially as described in the previous chapters. The details of the
determination are given in Chapter 3 and Chapter 2 , respectively. The user of this
rehabilitation manual should refer to these chapters for such details which will not be
repeated herein.

Chapter 14 Pavement Design Manual - 2014
Pavement Rehabilitation and Asphalt Overlay Design
Page14-10 Roads Development Agency
Figure 2.1 Traffic Evaluation
Some notes are, nevertheless, worth mentioning, as follows:
The design period of a rehabilitation project may be subject to constraints of a different
nature than those relative to a new construction project. In some cases, for instance, a
rehabilitation project may be necessary during a relatively short period, during which an
alternate alignment is being designed and/or constructed. The design period should be
carefully ascertained with RDA at the outset of the rehabilitation design.
Vehicle classification, initial traffic volume determination and cumulative traffic
volumes over the design period shall be as detailed in the previous chapters of this
manual.
The conversion of traffic volumes into cumulative ESAs over the design period, as
detailed in the previous chapters of this manual, is effected through the use of axle load
equivalency factors. These equivalency factors could be calculated using standard
formulae; they are given in tabular form in the previous chapters of this manual and are
Select Design Period
Determine Initial Traffic Volume
(Initial AADT) per Class of
Vehicle
Determine Traffic Growth
Determine Cumulative Traffic
Volumes over the Design Period
Estimate Mean Equivalent Axle
Load (ESA) per Class of Vehicle
Estimate Cumulative ESAs over
the Design Period (in one
direction)

Chapter 14 Pavement Design Manual - 2014
Pavement Rehabilitation and Asphalt Overlay Design
Roads Development Agency Page14-11
relative to single axle loads. For vehicles with multiple axles, i.e. tandems, triples, etc.,
each axle in the multiple group is considered separately, and weighted separately in axle
load surveys.
It is noted that the rehabilitation methods presented in this manual are derived from
methods proposed by the Asphalt Institute (e.g. Ref. 11), which uses equivalency
factors for tandem axles. The use of equivalency factors considering each axle
separately, as detailed in the previous chapters of this manual, is comparatively
conservative and is recommended.

Chapter 14 Pavement Design Manual - 2014
Pavement Rehabilitation and Asphalt Overlay Design
Page14-12 Roads Development Agency
14.3 ANALYSIS – NEED FOR REHABILITATION
14.3.1 INTRODUCTION
Upon completion of the data collection and fieldwork, the engineer normally has all the
elements necessary to perform the rehabilitation design. It is worth, however, evaluating
at this point, at the project level, the need for rehabilitation by applying the method of
determination used by the PMS mostly at the network level.
If the need for rehabilitation is not confirmed, this may indicate that the most recent data
collected for the project has refined the earlier, tentative determination that rehabilitation
was needed for a particular project, and that rehabilitation should be reconsidered. It may
also indicate, on the other hand, that the project under consideration is of such a nature
and/or presents such overriding characteristics that have not yet been entirely
incorporated into the overall PMS system, which does not operate on a strictly technical
basis.
The purpose of this chapter is to outline the method used in the PMS to differentiate
between the needs for rehabilitation or maintenance for flexible pavements. The method
is given in detail for reference in Appendix C (copied from Ref. 12).
14.3.2 DAMAGE QUANTIFIERS
During the pavement condition survey (cf. Appendix B.1), two types of damage (A and
B) have been noted, together with their extent and severity level. Type B damage
generally influences the type of work to be done only if there is no Type A damage. In
the method, a global visual index Is is used, which is based solely on Type A damage
(indicative of structural condition).
The global visual index Is is calculated from three damage groups:
- cracking and crazing
- deformation and rutting
- repairs
The index Is (from 1 to 7) is calculated following the flow chart given in Figure 3.1.
Ratings of 1 and 2 reflect good surface conditions requiring no work or for which work
can safely be postponed. Ratings 3 and 4 represent an intermediate surface condition,
serious enough to trigger maintenance work in the absence of any other consideration.
Ratings 5, 6 and 7 represent very poor surface conditions requiring major maintenance or
rehabilitation work.
14.3.3 PAVEMENT QUALITY RATING
A pavement quality rating Qi is estimated by combining the value of the index Is as
defined above, characterizing the ―visual condition‖, with the results of deflection
measurements qualifying the combined ―bearing capacity‖ of the pavement structure and
its subgrade support.

Chapter 14 Pavement Design Manual - 2014
Pavement Rehabilitation and Asphalt Overlay Design
Roads Development Agency Page14-13
The deflection of an homogeneous section of road is characterized by its value ―d‖ (in 1/100 mm). In the PMS method, ―d‖ is defined as ―m + 1.3 ‖, ―m‖ being the mean value
of the deflection measurements and ―‖ their standard deviation.
No cracking or deformation 0
Vis
ual
Ex
amin
atio
n
(1)
Extent
0 to
10%
10 to
50%
>50%
Deformation
Extent
0 to
10%
10 to
50%
> 50%
Severity
Severity
Cracking 1 1 3 3 Index 1 1 3 3
Index 2 2 3 4 2 2 3 4
If 3 3 4 5 Id 3 3 4 5
(1) Separate
calculation for
longitudinal
cracking and
crazing.
The larger of the
two indices is used.
Fir
st d
amag
e in
dex
If 0 1-2 3 4-5
Id
0 1 2 3 4
1-2 3 3 4 5
3 4 5 5 6
4-5 5 6 7 7
Extent
0 to 10% 10 to 50% > 50%
Severity
1 0 0 0
2 0 0 +1
3 0 +1 +1
Correction for repairs
Surface
Damage
Index
Is
Scale from (best) to 7 (worst)
Final rating
Figure 3.1 (from Ref. 12) Determination of Damage Index Is
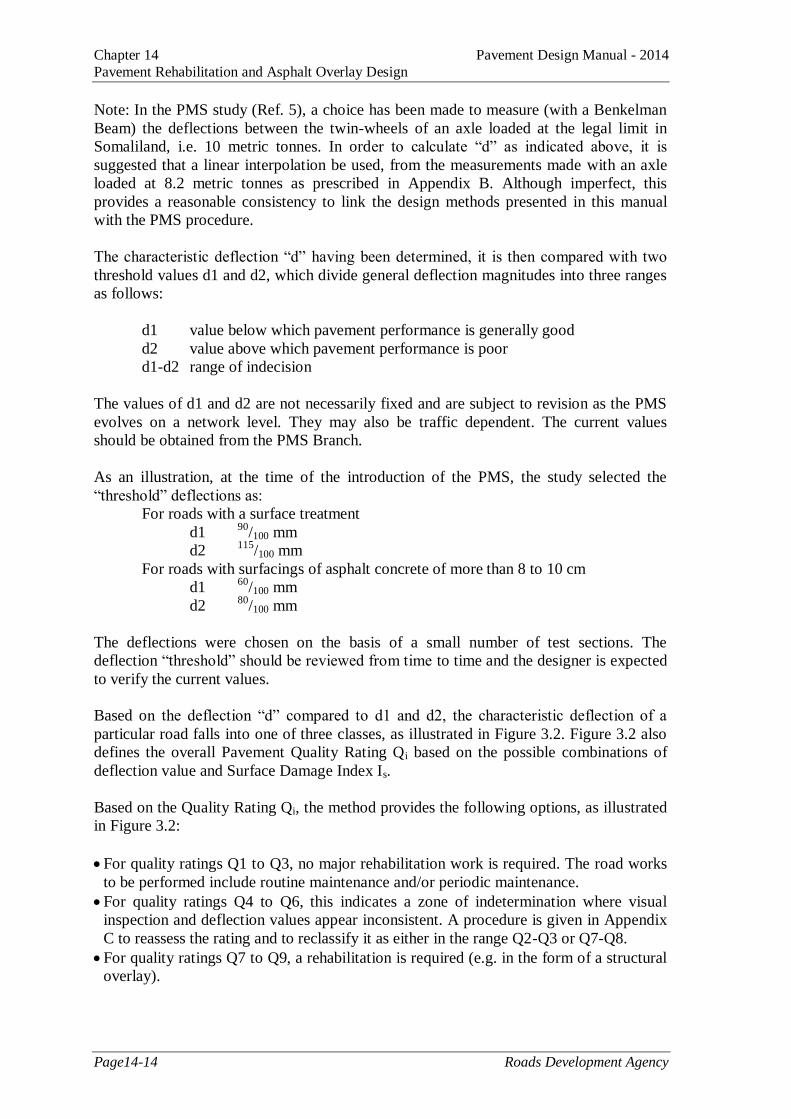
Chapter 14 Pavement Design Manual - 2014
Pavement Rehabilitation and Asphalt Overlay Design
Page14-14 Roads Development Agency
Note: In the PMS study (Ref. 5), a choice has been made to measure (with a Benkelman
Beam) the deflections between the twin-wheels of an axle loaded at the legal limit in
Somaliland, i.e. 10 metric tonnes. In order to calculate ―d‖ as indicated above, it is
suggested that a linear interpolation be used, from the measurements made with an axle
loaded at 8.2 metric tonnes as prescribed in Appendix B. Although imperfect, this
provides a reasonable consistency to link the design methods presented in this manual
with the PMS procedure.
The characteristic deflection ―d‖ having been determined, it is then compared with two
threshold values d1 and d2, which divide general deflection magnitudes into three ranges
as follows:
d1 value below which pavement performance is generally good
d2 value above which pavement performance is poor
d1-d2 range of indecision
The values of d1 and d2 are not necessarily fixed and are subject to revision as the PMS
evolves on a network level. They may also be traffic dependent. The current values
should be obtained from the PMS Branch.
As an illustration, at the time of the introduction of the PMS, the study selected the
―threshold‖ deflections as:
For roads with a surface treatment
d1 90
/100 mm
d2 115
/100 mm
For roads with surfacings of asphalt concrete of more than 8 to 10 cm
d1 60
/100 mm
d2 80
/100 mm
The deflections were chosen on the basis of a small number of test sections. The
deflection ―threshold‖ should be reviewed from time to time and the designer is expected
to verify the current values.
Based on the deflection ―d‖ compared to d1 and d2, the characteristic deflection of a
particular road falls into one of three classes, as illustrated in Figure 3.2. Figure 3.2 also
defines the overall Pavement Quality Rating Qi based on the possible combinations of
deflection value and Surface Damage Index Is.
Based on the Quality Rating Qi, the method provides the following options, as illustrated
in Figure 3.2:
For quality ratings Q1 to Q3, no major rehabilitation work is required. The road works
to be performed include routine maintenance and/or periodic maintenance.
For quality ratings Q4 to Q6, this indicates a zone of indetermination where visual
inspection and deflection values appear inconsistent. A procedure is given in Appendix
C to reassess the rating and to reclassify it as either in the range Q2-Q3 or Q7-Q8.
For quality ratings Q7 to Q9, a rehabilitation is required (e.g. in the form of a structural
overlay).
Chapter 14 Pavement Design Manual - 2014
Pavement Rehabilitation and Asphalt Overlay Design
Roads Development Agency Page14-15
* or other rehabilitation method
Figure 3.2 Pavement Quality Rating (Qi) and Required Road Works
(adapted from Ref. 5)
Deflection d1 d2
Surface damage index Is
Q1
(maintenance)
Q3
(maintenance)
Q6
(to be
reclassified)
Q2
(maintenance)
Q5
(to be
reclassified)
Q8
(overlay)*
Q4
(to be
reclassified)
Q7
(overlay)*
Q9
(overlay)*
1 - 2
Little or no cracking or no deformation
3 - 4
Cracks with little or no deformation,
deformation without cracks
5 – 6 - 7
Cracks and deformation
Class 1 Class 2 Class 3

Chapter 14 Pavement Design Manual - 2014
Pavement Rehabilitation and Asphalt Overlay Design
Page14-16 Roads Development Agency
14.4 DESIGN OF ASPHALT OVERLAYS
14.4.1 ASPHALT OVERLAYS OF FLEXIBLE PAVEMENTS
GENERAL
Asphalt overlays may be used to correct both surface deficiencies (raveling, roughness,
slipperiness) and structural deficiencies. Surface deficiencies in asphalt pavements
usually are corrected by thin resurfacings (functional overlays), but structural
deficiencies require overlays designed on factors such as pavement properties and traffic
loadings (structural overlays).
There are many instances when a surface treatment will not accomplish what is needed.
Examples are depressions or severe raveling. In such cases, a thin overlay should be used
over any required leveling course. Thin overlays usually range from 2.5 cm to 5 cm thick
using a fine-grained top size dense mix. These are considered maintenance.
The overlay design procedures in the remainder of this section provide an overlay
thickness to correct a structural deficiency. If no structural deficiency exists, a thin
overlay may still be required to correct a functional deficiency.
This section covers the design of structural overlays by means of one or several lifts of
asphalt concrete.
It is assumed that this option is feasible, i.e. that the condition of the existing pavement is
not such that it dictates substantial removal and replacement of the existing pavement.
Such conditions would include:
A large amount of very severe alligator cracking
Excessive rutting which can be attributed to unstable existing materials
Seriously deteriorated stabilized roadbase requiring an excessive amount of
repairs prior to overlay operations
Contaminated granular roadbase
Excessive stripping of the existing AC surface
Two methods of overlay design are recommended, namely a deflection procedure
(adapted from the Asphalt Institute, Ref. 11) and an effective thickness (or component
analysis) procedure (adapted from AASHTO, Ref. 3). It is recommended that both
methods always be used for comparison purposes. It is unlikely that the methods will
agree exactly, and sound engineering judgment is required to estimate the possible
reasons for the discrepancies and make a choice or a compromise between the results
obtained by both methods.
Preference may be given to the effective thickness procedure when the history of
pavement construction is well known and the destructive testing results are such that the
quality of the materials is also well-known. When the results and the records indicate the
possibility of significant variation and uncertainty in the structure of the existing
pavement, or extensive localized repairs, it is probably preferable to rely on statistical
deflection results indicative of the overall load carrying capacity of the system
comprising the pavement and its supporting subgrade.

Chapter 14 Pavement Design Manual - 2014
Pavement Rehabilitation and Asphalt Overlay Design
Roads Development Agency Page14-17
DEFLECTION PROCEDURE
The deflection procedure recommended herein uses the results of a deflection survey
conducted with a Benkelman Beam as described in Section B.3.1
The steps involved in the procedure are as follows:
Step 1: Determine a representative rebound deflection (RRD)
Step 2: Determine the design future traffic in terms of cumulated equivalent
standard axles (ESAs).
Step 3: Determine the required overlay thickness.
Step 1
The individual deflection measurements recorded during the deflection survey must be
adjusted by a temperature adjustment factor which can be read from Figure 4.1. The
determination of the mean pavement temperature can be made in accordance with the
procedure given in Appendix E.
Figure 4.1 (from Ref. 15): Temperature Adjustment Factor for
Benkelman Beam Deflections
The mean and standard deviation of the adjusted individual deflection readings are then
calculated. The representative rebound deflection RRD is taken as:
RRD = ( x + 2s) c
Where:
x is the arithmetic mean of the individual deflection measurements adjusted for
temperature
s is the standard deviation of the adjusted individual measurements
c is a critical period adjustment factor
1 The results of deflection surveys conducted with a FWD are well-suited for use, after back-calculation of
pavement parameters, as an input to the effective thickness procedure.

Chapter 14 Pavement Design Manual - 2014
Pavement Rehabilitation and Asphalt Overlay Design
Page14-18 Roads Development Agency
The critical period is the interval during which the pavement is most likely to be
damaged by heavy loads. The Asphalt Institute (Ref. 11) recommends the following
methods for determining the critical period adjustment factor:
a) Obtain a continuous record of measured rebound values for a similar
pavement in a similar environment and on a similar subgrade, and determine
the most critical period. Then either:
1) Make the rebound measurements during the critical period, in which case
the adjustment factor, c, equals 1.0. Or:
2) Make the rebound measurements at any time and adjust to the critical
deflection by letting the adjustment factor, c, equal the ratio of the critical
period deflection to the deflection for the date of the test.
b) If no record of comparable deflection data is available, make the rebound
measurements at any time and make any needed adjustments using
engineering judgment.
Example
Rebound deflections were measured for a section of asphalt pavement under uniform
temperature conditions. The measurements were made under an 8.2 tonne axle load and
the pavement temperature was estimated to be 17° C. The aggregate roadbase of the
pavement was 350 mm thick. Using Figure 4.1, the temperature adjustment factor is
F = 1.04. The measurements were made at the end of the rainy season and may
reasonably be considered to be representative of the critical period, hence c = 1.0.
Individual and adjusted measurements, and calculated representative deflection, are given
below:
Measured deflections
(under 8.2 tonne axle), mm
Deflections adjusted for
temperature (factor 1.04), mm
0.60 0.62
0.56 0.58
0.46 0.48
0.70 0.72
0.80 0.83
0.68 0.71
0.57 0.60
0.71 0.74
0.53 0.55
0.86 0.90
Mean adjusted value (mm) 0.673
Standard deviation (mm) 0.130
Representative deflection (mm) 0.932
Step 2

Chapter 14 Pavement Design Manual - 2014
Pavement Rehabilitation and Asphalt Overlay Design
Roads Development Agency Page14-19
The traffic analysis outlined in Section 2.3 of this manual is to be used to determine the
design number of equivalent standard axles (ESAs) expected to be carried by the road
after overlay. As a reminder, this design number of ESAs is expressed in equivalent 8.2
tonne axles.
Step 3
To find the thickness of asphalt concrete overlay required, enter the overlay thickness
design chart, Figure 4.2, with the RRD obtained in Step 1, move vertically to the curve
representing the design ESA (from Step 2), and move horizontally to the Overlay
Thickness scale.
Figure 4.2 (from Ref. 15): Overlay Thickness Design Chart
Example
The pavement considered in the example in Step 1 is being considered for a future traffic
of 5 x 10⁶ ESAs. With a RRD of 0.93 mm, the required overlay thickness is found from
the chart to be 75 mm.
EFFECTIVE ANALYSIS PROCEDURE
The required thickness of AC overlay is computed as:
T(SN SN )
a0
new eff
0
where
T0 = required overlay thickness in centimeters
SNnew = structural number of a new pavement (centimeters)
SNeff = effective structural number of the existing pavement (centimeters)
a0 = structural coefficient of the AC overlay
It may be noted that the structural numbers have the same dimension as a thickness.

Chapter 14 Pavement Design Manual - 2014
Pavement Rehabilitation and Asphalt Overlay Design
Page14-20 Roads Development Agency
SNnew is computed as indicated in Appendix F. It requires the determination of the
required structure of a new pavement for the specific subgrade strength and traffic
applicable to the project, in accordance with the procedure detailed in RDA’s Pavement
Design Manual-2014. The procedure given in Appendix F lists structural layer
coefficients for the conversion of the required structure into SNnew. The same coefficient
as given for new AC surface course materials may be used for the structural coefficient a0
of the AC overlay.
SNeff requires knowing the existing pavement structure and using the equation:
SNeff = a1T1 + a2T2m2 + a3T3m3
where
T1, T2, T3 = thicknesses (in centimeters) of existing pavement surface, roadbase,
and subbase layers
a1, a2, a3 = corresponding structural layer coefficients
m2, m3 = drainage coefficients for granular roadbase and subbase
The thicknesses Ti are determined from the previously collected data and field work, as
indicated in Chapter 2 and Appendix B.
The coefficients ai may be determined from Table 4.1, which lists suggested layer
coefficients for commonly used materials. Other suggested coefficients, for stabilized
roadbase materials, are given in Table 4.2.
Table 4.1 (from Ref. 3)
Suggested Layer Coefficients for Existing AC Pavement Layer Materials
MATERIAL SURFACE CONDITION COEFFICIENT
AC Surface Little or no alligator cracking and/or only low-severity
transverse cracking
0.35 to 0.40
<10 percent low-severity alligator cracking and/or
<5 percent medium- and high-severity transverse
cracking
0.25 to 0.35
>10 percent low-severity alligator cracking and/or
<10 percent medium-severity alligator cracking and/or
>5-10 percent medium- and high-severity transverse
cracking
0.20 to 0.30
>10 percent medium-severity alligator cracking and/or
<10 percent medium-severity alligator cracking and/or
>10 percent medium- and high-severity transverse
cracking
0.14 to 0.20
>10 percent high-severity alligator cracking and/or
>10 percent high-severity transverse cracking
0.08 to 0.15
Granular
Roadbase or
Subbase
No evidence of pumping, degradation, or contamination
by fines.
Some evidence of pumping, degradation, or
contamination by fines.
0.10 to 0.14
0.00 to 0.10
Table 4.2 (from Ref. 3)

Chapter 14 Pavement Design Manual - 2014
Pavement Rehabilitation and Asphalt Overlay Design
Roads Development Agency Page14-21
Additional Suggested Layer Coefficients for
Stabilized Roadbase Materials
MATERIAL SURFACE CONDITION COEFFICIENT
Stabilized
Roadbase
Little or no alligator cracking and/or only low-severity
transverse cracking
0.20 to 0.35
<10 percent low-severity alligator cracking and/or
<5 percent medium- and high-severity transverse
cracking
0.15 to 0.25
>10 percent low-severity alligator cracking and/or
<10 percent medium-severity alligator cracking and/or
>5-10 percent medium- and high-severity transverse
cracking
0.15 to 0.20
>10 percent medium-severity alligator cracking and/or
<10 percent high-severity alligator cracking and/or
>10 percent medium- and high-severity transverse
cracking
0.10 to 0.20
>10 percent high-severity alligator cracking and/or
>10 percent high-severity transverse cracking
0.08 to 0.15
It must be realized that relatively limited guidance is available for the selection of layer
coefficients for in-service pavement materials. Engineers are encouraged to use judgment
and to build experience in the selection of the coefficients, particularly with regard to
local materials and pavement behavior.
The drainage coefficients m2 and m3 may be determined on the basis of Table 4.3 and 4.4
further below.
Table 4.3: Quality of Drainage (from Ref. 3)
Quality of Drainage Water Removed Within
Excellent 2 hours
Good 1 day
Fair 1 week
Poor 1 month
Very Poor (water will not drain)
Table 4.4 (from Ref. 3)
Recommended mi Values for Modifying Structural Layer Coefficients of Untreated
Roadbase and Subbase Materials
Percent of Time Pavement Structure is Exposed to Moisture Levels
Approaching Saturation
Quality of Drainage Less Than 1% 1-5% 5-25% Greater Than
25%
Excellent 1.40-1.35 1.35-1.30 1.30-1.20 1.20
Good 1.35-1.25 1.25-1.15 1.15-1.00 1.00
Fair 1.25-1.15 1.15-1.05 1.00-0.80 0.80
Poor 1.15-1.05 1.05-0.80 0.80-0.60 0.60
Very Poor 1.05-0.95 0.95-0.75 0.75-0.40 0.40
Example

Chapter 14 Pavement Design Manual - 2014
Pavement Rehabilitation and Asphalt Overlay Design
Page14-22 Roads Development Agency
An existing pavement is made up of the following layers:
5 cm AC surfacing (T1)
15 cm granular roadbase (T2)
15 cm subbase (T3)
The AC surface shows less than 10 percent of low-severity cracking, very little medium-
and high-severity transverse cracking, and can be assigned (cf. Table 4.1) a structural
layer coefficient a1 of 0.30. Roadbase and subbase courses show no evidence of
degradation or contamination. The coefficients a2 and a3 may both be taken as 0.12. The
quality of drainage is considered fair and the pavement structure is exposed to levels near
saturation on the order of 5%. Both coefficients m2 and m3 can be taken as 1.00.
SNeff is calculated as:
SNeff = 0.30x5 + 0.12x1.00x(15 + 15) = 5.1
It is contemplated to overlay the pavement for an expected traffic class T6. The subgrade
strength class is S4. The structural number of an adequate pavement structure for these
conditions is SNnew = 9.13 (see Appendix F).
The required overlay thickness is: T0 = (9.13 – 5.1)/0.44 = 9.15 cm (which may be
rounded up to 10 cm).
Note: The above method is based on the determination of SNeff essentially from an
assessment of the quality of the pavement layers from visual, field (e.g., DCP) and/or
laboratory testing. Alternatively, SNeff may be estimated from the results of deflection
(FWD) testing as outlined in Appendix G.
SURFACE PREPARATION FOR OVERLAY
In the design of overlays and the adoption of the overlay as a rehabilitation solution, the
construction feasibility should be verified first (besides the economic constraints) with
reference to factors such as:
Traffic control, traffic disruption
Materials and equipment availability
Construction problems such as utilities, bridge clearances, side slope extension
Having determined the feasibility, careful and correct preparation of the existing
pavement, prior to construction of overlays, is essential to good construction and to
maximum overlay performance. The overlay thickness is designed to correct a below-
average pavement condition, but not to provide the extra structural strength needed for
localized weak areas. If the overlay thickness is based on the weakest condition in the
section, it would be over-designed for the rest of the section and thus be needlessly
costly. Therefore, the weaker areas must be corrected to provide a uniform foundation for
the overlay.
Some of the factors which need consideration in preparation of the existing pavement are
as follows:
Pre-Overlay Pavement Repairs

Chapter 14 Pavement Design Manual - 2014
Pavement Rehabilitation and Asphalt Overlay Design
Roads Development Agency Page14-23
If distress in the existing pavement is likely to affect the performance of the overlay, it
should be repaired prior to the placement of the overlay. Much of the deterioration that
occurs in overlays results from deterioration that was not repaired in the existing
pavements. The cost tradeoffs of pre-overlay repair and overlay type should also be
considered.
Severe alligator cracking and linear cracks, rutting and surface irregularities should be
repaired prior to overlay of AC pavements.
The pre-overlay repairs generally fall in the maintenance categories. One particular pre-
overlay operation to consider is an effective reflection crack control.
Reflection Crack Control
Reflection cracks are a frequent cause of overlay deterioration. The thickness design
procedures described in the preceding sections do not consider reflection cracking. Pre-
overlay repairs (patching and crack filling) may help delay the occurrence and
deterioration of reflection cracks. Additional reflection crack control measures include:
Pavement fabrics
Crack relief layers. These are composed of open-graded coarse aggregate and a
small percentage of asphalt cement.
Increased overlay thickness
Subdrainage
As indicated in Appendix B, the existing subdrainage condition of the pavement should
be evaluated since it has a great influence on how well the overlay performs. Removal of
excess water from the pavement cross-section will increase the strength of the pavement
layers and subgrade, and reduce deflections.
Milling-Recycling
Milling, with or without the intent of recycling the milled materials, can improve the
performance of the overlay, by removing some of the cracked and hardened materials and
by minimizing existing rutting or other significant distortions.
Surface Recycling
This process may be considered as analogous to pre-overlay surface preparation or an in-
place variant of cold milling and recycling. The asphalt pavement surface is heated in
place, scarified, remixed, relaid, and rolled. Asphalts, recycling agents, new asphalt hot-
mix, aggregates, or a combination of these may be added to obtain a desirable mixture.
When new asphalt hot-mix is added, the finished product may be used as the final
surface; otherwise, an asphalt surface course should be used.
Shoulders
Overlaying traffic lanes generally requires that the shoulders be overlaid to match the
grade line of the traffic lanes. In selecting an overlay material and thickness for the
shoulder, the designer should consider the extent to which the existing shoulder is
deteriorated and the amount of traffic that will use the shoulder. For example, if trucks

Chapter 14 Pavement Design Manual - 2014
Pavement Rehabilitation and Asphalt Overlay Design
Page14-24 Roads Development Agency
tend to park on the shoulder at certain locations, this should be considered in the shoulder
overlay design.
If an existing shoulder is in good condition, any deteriorated areas should be patched. An
overlay may then be placed to match the shoulder grade to that of the traffic lanes. If an
existing shoulder is in such poor condition that it cannot be patched economically, it
should be removed and replaced.
14.4.2 ASPHALT OVERLAYS OF RIGID PAVEMENTS
DEFLECTION PROCEDURE
Deflection tests measure the response of a pavement to a specified load. Depending on
the type of pavement, the measured deflection indicates the necessity for overlay. The
thickness of the overlay can be reduced by limiting the deflections by way of
undersealing.
In Jointed Plain Concrete Pavements (JPCP), the differential deflection should be 0.05
mm, and mean edge deflection should be 0.36 mm. In Continuously Reinforced
Concrete Pavement (CRCP), the deflection should be less than 0.015 mm. If the above
criterion is exceeded, overlaying with or without undersealing is required. The
deflections are assumed to be reduced by 0.2 percent per millimeter of overlay thickness.
The thickness of overlay can be obtained from the chart shown in Figure 4.3, based on
the temperature differential and the length of the slab. Alternatives 2 and 3, mentioned in
the figure, can be used to reduce the overlay thickness in sections B and C of the chart.
Example
Slab = 13.5 m Jointed Plain Concrete Pavement (JPCP)
High Temperature = 28° C
Low Temperature = -16° C
t = 44° C
Measured Benkelman Beam deflections:
d1 = 0.85 mm
d2 = 0.63 mm
Diff. Deflection = d1 – d2 = 0.85 – 0.63 = 0.22 mm
Mean Deflection = (d1 + d2)/2 = (0.85 + 0.63)/2 = 0.74 mm

Chapter 14 Pavement Design Manual - 2014
Pavement Rehabilitation and Asphalt Overlay Design
Roads Development Agency Page14-25
NOTES:
(1) Temperature differential (t) is the difference between the highest normal daily maximum temperature and the lowest normal daily maximum temperature for
the hottest and coldest months, based on a 30-year average.
(2) Alternative 2: Crack and seat the slab into smaller sections with thinner overlay. (3) Alternative 3: Utilize a crack-relief layer with drainage system with thinner
overlay.
Figure 4.3 (from Ref. 11) Chart for Selecting Asphalt Concrete
Structural Overlay Thickness for PCC Pavement
Alternative 1: Thick Overlay
Step 1—Enter the design chart, Figure 4.3, with t = 44°C and slab length = 13.5 m

Chapter 14 Pavement Design Manual - 2014
Pavement Rehabilitation and Asphalt Overlay Design
Page14-26 Roads Development Agency
The required overlay is more than 230 mm. Therefore, use Alternative 2 or 3.
Alternative 2: Reduce Slab Length
Step 1—Break the slab into 6.8 m sections.
Step 2—Enter the design chart, Figure 4.3, with t = 44° C and slab length = 6.8 m
Required overlay = 160 mm (by interpolation)
Use 165 mm
Step 3—Check vertical mean deflection:
At the rate of 0.2 percent per millimeter of overlay thickness, the reduction in
deflection is: 165 x 0.74 x 0.002 = 0.24 mm
Remaining deflection is: 0.74 – 0.24 = 0.50 mm > 0.36 mm allowable.
Therefore, undersealing is required.
EFFECTIVE THICKNESS PROCEDURE
If the overlay is being placed for some functional purpose such as roughness or friction, a
minimum thickness overlay that solves the functional problem should be placed. If the
overlay is being placed for the purpose of structural improvement, the required thickness
of the overlay is a function of the structural capacity required to meet future traffic
demands and the structural capacity of the existing pavement. The required overlay
thickness to increase structural capacity to carry future traffic is determined by the
following equation:
Dol = A(Df – Deff)
where
Dol = Required thickness of AC overlay, cm
A = Factor to convert PCC thickness deficiency to AC overlay thickness
Df = Slab thickness to carry future traffic, cm
Deff = Effective thickness of existing slab, cm
The A factor, which is a function of the PCC thickness deficiency, is given by the
following equation:
A = 2.2233 + 0.0015(Df – Deff)2 – 0.0604(Df – Deff)
AC overlays of conventional JPCP, JRCP, and CRCP have been constructed as thin as 5
cm and as thick as 25 cm. The most typical thicknesses that have been constructed for
highways are 7.5 to 15 cm.
Deff is computed from the following equation:
Deff = Fjc x Fdur x Ffat x D
where

Chapter 14 Pavement Design Manual - 2014
Pavement Rehabilitation and Asphalt Overlay Design
Roads Development Agency Page14-27
D = Existing PCC slab thickness, cm
Fjc = Joints and cracks adjustment factor
Fdur = durability adjustment factor
Ffat = fatigue damage adjustment factor
The factors Fjc, Fdur, Ffat, are dependent on the existing condition of the pavement and can
be evaluated based on the condition survey detailed in Appendix B.
Fjc depends on the total number of unrepaired deteriorated joints, cracks, punchouts and
other discontinuities per kilometer in the design lane and is determined using Figure 4.4.
Fdur depends on the existing durability problems, such as aggregate distress. Using the
condition survey, Fdur is determined as follows:
1.00: No sign of PCC durability problems
0.96-0.99: Durability cracking exists, but no spalling
0.88-0.95: Substantial cracking and some spalling exists
0.80-0.88: Extensive cracking and severe spalling exists
The Ffat factor adjusts for past fatigue damage that may exist in the slab. It is determined
by observing the extent of transverse cracking (JPCP, JRCP) or punchouts (CRCP) that
may be caused primarily by repeated loading.
The following guidelines can be used to estimate the Ffat factor in the design lane:
0.97-1.00: Few transverse cracks/punchouts exist (none caused by
―D‖ cracking or reactive aggregate distress)
JPCP: <5 percent slabs are cracked
JRCP: <25 working cracks per mile (about 16 per km)
CRCP: <4 punchouts per mile (2 or 3 per km)
0.94-0.96: A significant number of transverse cracks/punchouts
exist (none caused by ―D‖ cracking or reactive aggregate
distress)
JPCP: 5-15 percent slabs are cracked
JRCP: 25-75 working cracks per mile (16-47 per km)
CRCP: 4-12 punchouts per mile (3 to 8 per km)
0.90-0.93: A large number of transverse cracks/punchouts exist
(none caused by ―D‖ cracking or reactive aggregate
distress)
JPCP: >15 percent slabs are cracked
JRCP: >75 working cracks per mile (>47 per km)
CRCP: >12 punchouts per mile (>8 per km)

Chapter 14 Pavement Design Manual - 2014
Pavement Rehabilitation and Asphalt Overlay Design
Page14-28 Roads Development Agency
Figure 4.4 Fjc Adjustment Factor
SURFACE PREPARATION FOR OVERLAYS
The following types of distress in JPCP, JRCP and CRCP should be repaired prior to
placement of an AC overlay.
Distress Type Repair Type
Working cracks Full-depth repair or slab replacement
Punchouts Full-depth PCC repair
Spalled joints Full-depth or partial-depth repair
Deteriorated repairs Full-depth repair
Pumping/faulting Edge drains
Settlements/heaves AC level-up, slab jacking, or
localized reconstruction
Full depth repairs and slab replacements in JPCP and JRCP should be PCC, dowelled or
tied to provide load transfer across repair joints. Full depth repairs in CRCP should be
PCC and should be continuously reinforced with steel which is tied or welded to
reinforcing steel in the existing slab to provide load transfer across joints and slab
continuity.
Installation of edge drains, maintenance of existing edge drains, or other subdrainage
improvement should be done prior to placement of the overlay if a sub-drainage
evaluation indicates a need for such an improvement.
Deteriorated Transverse Joints and Cracks / Kilometer

Chapter 14 Pavement Design Manual - 2014
Pavement Rehabilitation and Asphalt Overlay Design
Roads Development Agency Page14-29
Pressure relief joints should be placed only at fixed structures, and not at regular intervals
along the pavement. The only exception to this is where reactive aggregate has caused
expansion of the slab.
Reflection Crack Control
The basic mechanism of reflection cracking is strain concentration in the overlay due to
movement in the vicinity of joints and cracks in the existing pavement.
A variety of reflection crack control measures have been used in attempts to control the
rates of reflection crack occurrence and deterioration. Any one of the following
treatments may be employed in an effort to control reflection cracking in an AC overlay
of JPCP or JRCP:
(1) Sawing and sealing joints in the AC overlay at locations coinciding with joints in
the underlying JPCP or JRCP.
(2) Increasing AC overlay thickness. Reflection cracks will take more time to
propagate through a thicker overlay and deteriorate more slowly.
(3) Placing a bituminous-stabilized granular interlayer (large-sized crushed stone
crack relief layer), prior to or in combination with placement of the AC overlay
has been effective. See Figure 4.5.
(4) Cracking and seating JPCP or breaking and seating JRCP prior to placement of
the AC overlay. This technique reduces the size of PCC pieces and seats them in
the underlying base, which reduces horizontal (and possibly vertical) movements
at cracks.
Reflection cracking can have a considerable (often controlling) influence on the life of an
AC overlay of JPCP or JRCP. Deteriorated reflection cracks detract from a pavement’s
serviceability and also require frequent maintenance, such as sealing, milling, and
patching.
Figure 4.5 (from Ref.11) Crack-Relief Layer in an Overlay System, Cross-
Section
When the pavement has been rendered as uniformly stable as possible, it must be cleaned
thoroughly and tack-coated with asphalt before the overlay is placed.
When overlaying a PCC pavement that has been grooved, special treatment is necessary
to prevent moisture intrusion. Here, a heavy asphalt tack coat, an asphalt slurry seal, or a
sand (fine-graded) asphalt leveling course is used to fill the grooves.
Old PCC surfaces that range from polished to coarse-textured can vary significantly in
bonding ability. Polished surfaces can be re-textured to improve their bonding with

Chapter 14 Pavement Design Manual - 2014
Pavement Rehabilitation and Asphalt Overlay Design
Page14-30 Roads Development Agency
overlays. However, in most cases, the proper use of a tack coat, selection of the proper
mix type and overlay thickness, coupled with correct construction procedures, will prove
more economical in ensuring a good bond.

Chapter 14 Pavement Design Manual - 2014
Pavement Rehabilitation and Asphalt Overlay Design
Roads Development Agency Page14-31
14.5 DESIGN OF ALTERNATIVE REHABILITATION METHODS
Alternative rehabilitation methods other than overlays include, as primary broad
categories:
Reconstruction: In this category, little or no contribution is expected from the
existing pavement materials and the materials needed for rehabilitation will be
new materials.
Recycling: The rehabilitation takes advantage of the existing pavement
materials, which are reused in part or as a whole in the construction of the
rehabilitated pavement.
Other methods which are effective in both repairing existing deterioration and, to some
extent, preventing or delaying its recurrence include repairs by patching, crack sealing,
milling and surface treatments or seals. These methods, however, are better classified
under the term of maintenance (cf. Chapter 1). It is recognized that they are often
required for the preparation of the existing pavement prior to overlay (cf. Chapter 4).
The above categories are general in nature, and some combinations of methods are
possible and indeed used. For instance, the materials of an existing surface treatment and
base course may be recycled as the base or subbase of a reconstructed pavement, with
new materials brought on site to construct the upper layers, e.g. roadbase and AC surface.
15.5.1 RECONSTRUCTION
ASPHALT PAVEMENT
Since the pavement is to be reconstructed with new materials, generally only the
subgrade of the existing pavement will remain. It is assumed in this case that the existing
pavement materials are trucked away. If the materials are removed from the roadway and
carried to a central plant for processing and later reuse, this central plant recycling is
considered a cold recycling technique.
For reconstruction design, therefore, the subgrade strength (CBR) must be evaluated.
This evaluation yields the design CBR to use in pavement design.
The rest of the design process for reconstruction follows that of a new pavement design.
This design is to be carried out in accordance with the RDA Pavement Design Manual –
2014 (Ref. 1).
In case a variant reconstruction procedure is used, whereby, for instance, the existing
subbase is left in place, prior to the addition of a new roadbase and surface course, the
principles of component analysis, as detailed for the overlay design in Chapter 4, may be
applied.
Example
An existing pavement is made up of the following layers:

Chapter 14 Pavement Design Manual - 2014
Pavement Rehabilitation and Asphalt Overlay Design
Page14-32 Roads Development Agency
Surface dressing
20 cm of granular roadbase
15 cm of subbase
The condition survey has indicated the need for rehabilitation. The subgrade has been
evaluated and is considered properly compacted and homogeneous. Investigations have
revealed that the subgrade can be characterized by a CBR within the range of subgrade
strength class S4 (CBR between 8 and 14). Traffic studies concluded that the future
traffic would be in excess of 6 x 10⁶ ESA but well within the range of traffic class T6 (6
to 10 x 106 ESA).
An adequate new pavement structure (cf. RDA Pavement Design Manual - 2014) consists
of:
10 cm AC surfacing
20 cm granular roadbase
17.5 cm subbase
The existing subbase course is of good quality, with a CBR consistently in excess of 30.
The existing roadbase is of marginal or poor quality and new sources of adequate quality
of crushed stone have been located. It was elected to reconstruct the pavement from the
existing subbase (to be preserved) up. The scarified surface dressing and existing base
course will be disposed of.
The existing subbase may remain and contribute to the new pavement structure as 15 cm
of subbase (at a 1-to-1 ratio with new materials). It is simpler, in view of the abundance
of materials, to substitute crushed stone base materials to the missing 2.5 cm of subbase.
The reconstruction operations will consequently lay down 22.5 cm of new roadbase and
10 cm of new AC surfacing.
PCC PAVEMENT
At some point near the end of the life of a PCC pavement, the slab is so badly
deteriorated that total reconstruction becomes more cost-effective than resurfacing or
restoration. PCC pavement conditions that favor reconstruction include:
1. Little or no remaining structural life, as evidenced by extensive slab cracking.
2. Extensive slab settlement, heave, or cracking due to foundation movement
(caused by swelling soil or frost heave).
3. Extensive joint deterioration (particularly for short-jointed pavements, since full-
depth repair would require replacement of a large percentage of the concrete
surface).
4. Extensive concrete deterioration due to poor durability (D-cracking or reactive
aggregate distress).
Reconstruction may also be warranted for highways that do not meet required geometric
design standards (e.g. lane width, bridge clearance, curve superelevation). On resurfacing

Chapter 14 Pavement Design Manual - 2014
Pavement Rehabilitation and Asphalt Overlay Design
Roads Development Agency Page14-33
projects, it may sometimes be necessary to reconstruct short sections of pavement near
bridges to maintain required bridge clearances.
As is the case with asphalt pavement, in reconstruction projects, generally only the
subgrade of the existing pavement will remain. For reconstruction design, therefore, the
subgrade strength (CBR) must be evaluated and the rest of the design is to be carried out
in accordance with the RDA Pavement Design Manual – 2014 (Ref. 2).
14.5.2 RECYCLING
As long as virgin (new) materials are in abundant supply and within reasonable distance,
reconstruction can remain an attractive option. However, when new materials are less
plentiful and the costs of haulage become uneconomical, the need to conserve energy and
materials favors pavement recycling.
The processes for pavement recycling are conveniently grouped into two categories:
(a) Asphalt Pavement Recycling
This category is further divided into three groups:
Surface recycling. This type of recycling is described earlier in Section 4.1.
Cold-mix recycling
Hot-mix recycling
(b) Portland Cement Concrete Pavement Recycling
These categories are illustrated by Figure 5.1.
Figure 5.1 Categorization of Recycling Approaches (from Ref. 16)
RECYCLING OF ASPHALT PAVEMENT
Cold-Mix Recycling
Pavement
Recycling
Asphalt Pavement
Recycling
Portland Cement
Concrete Recycling
Surface Recycling
Cold-Mix
Recycling
Hot-Mix Recycling
In-Place
With or Without Heat
In-Place
Central Plant
Central Plant

Chapter 14 Pavement Design Manual - 2014
Pavement Rehabilitation and Asphalt Overlay Design
Page14-34 Roads Development Agency
In this process, reclaimed asphalt pavement materials, reclaimed aggregate materials, or
both, are combined with new asphalt, and/or recycling agents in place, or at a central
plant, to produce cold-mix roadbase mixtures. An asphalt surface course is required. This
is a common method for recycling old pavements, including both the surface and
untreated roadbase materials.
From the viewpoint of thickness design, the design procedure is similar to that of a
reconstruction. The required structure of a new pavement must be determined in
accordance with the RDA Pavement Design Manual– 2014. A component analysis helps
to determine the contribution of the recycled materials.
Example
The same example is used as given above for reconstruction, with the following
modification: in this case, the subbase is still left in place, but the existing roadbase and
surface treatment are being recycled as a bituminous roadbase. The materials are recycled
in-place and may be attributed a structural coefficient of 0.25 (see Appendix F).
Keeping the same 1:1 ratio between the existing 15 cm of subbase to be left in place and
15 cm of the required subbase, the deficiency to be made up to complete the required
structure is:
10 cm of AC surfacing
20 cm of granular roadbase
2.5 cm of subbase
Using structural layer coefficients of 0.44, 0.14 and 0.11, respectively, this corresponds
to a deficit of structural number of 7.5.
One solution consists therefore of laying down 12.5 cm of recycled roadbase
(contributing 12.5x0.25 i.e. 3.1 to the SN) and the originally required 10 cm of AC
surfacing (contributing 10x0.44 i.e. 4.4 to the SN).
However, alternate solutions providing the same SN may be considered (e.g. 17 cm of
recycled roadbase and 7.5 cm of AC surfacing). This illustrates a commonly advocated
advantage of recycling.
Cold-mix recycling involves ripping, scarifying, pulverizing, or crushing the old
pavement. It is either hauled to a central site and upgraded with asphalt cement,
emulsified asphalt or other stabilizing agents (lime, cement, fly ash in combination with
lime or cement, or calcium chloride), or it is treated in place. Treatment in place may be
achieved by blading, rotary mixers or a travel plant. Before beginning the project,
representative samples should be obtained. The asphalt content and consistency and the
gradation of the aggregates should be determined. Then the materials should be blended
and a mix design developed. The real economical advantage of cold-mix recycling often
lies in the ability to upgrade an old pavement structure with a relatively thin wearing
course with limited need for new aggregates. After the recycled mix is placed, it should
be capped with an AC wearing course or a surface treatment.
Hot-Mix Recycling

Chapter 14 Pavement Design Manual - 2014
Pavement Rehabilitation and Asphalt Overlay Design
Roads Development Agency Page14-35
In this process, reclaimed asphalt pavement materials, reclaimed aggregate materials, or
both, are combined with new asphalt and/or recycling agents and/or new aggregate, as
necessary, in a central plant to produce hot-mix paving mixtures.
Two methods are used to process the old pavement: (1) Scarifying and removing the
material to a crushing plant where it is sized, or (2) sizing the material in-place with
rotating drummilling equipment or hammermills and hauling the sized materials to a
central location for later processing. The reclaimed asphalt pavement contains both
asphalt and aggregate. Testing is conducted to determine the characteristics of the
reclaimed asphalt pavement (e.g. asphalt extraction, gradation of the aggregate and
consistency of the extracted asphalt).
Equipment to centrally hot-process the recycled material can be, for convenience,
separated into three general categories: direct flame heating, indirect flame heating, and
superheated aggregate. The techniques and related operations are illustrated in Figure 5.2.
From the viewpoint of thickness design, the design procedure is identical to that given for
cold-mix recycling. It should only be noted that hot-mix recycling lends itself to higher
quality control, hence a higher layer structural coefficient may be assigned to the
recycled materials.
RECYCLING OF PORTLAND CEMENT CONCRETE
In most cases where reconstruction is justified, the existing concrete can be recycled to
reduce the cost of reconstruction.
Concrete pavement recycling involves breaking up the old pavement on grade, loading
and hauling the material to a crushing plant, and processing it at the plant to produce
recycled concrete aggregate (RCA). The product of this process is an aggregate that can
be used in place of virgin aggregate in any component of the pavement structure where
aggregate is used, including:
1. Untreated, dense-graded aggregate roadbase
2. Cement- and asphalt-stabilized roadbases
3. Lean concrete roadbase
4. Portland cement concrete surfacing
5. Asphalt concrete surfacing
6. Fill
7. Filter material
8. Drainage layer or edge drains

Chapter 14 Pavement Design Manual -2014
Pavement Rehabilitation & Asphalt Overlay
Page 14-36 Roads Development Agency
Figure 5.2 (from Ref. 16) Central Plant Hot-Mix Recycling Techniques

Chapter 14 Pavement Design Manual-2014
Pavement Rehabilitation & Asphalt Overlay
Roads Development Agency Page 14-37
Recycling of PCC pavements is not limited to those pavements that contain sound
aggregate. Pavements containing reactive aggregate can be recycled into new concrete
using fly ash to control expansion of the reactive aggregate. Badly D-cracked pavements
have also been successfully recycled into new pavements. The common practice in
recycling D-cracked pavement is to limit the maximum size of the recycled concrete
aggregate, so that any aggregate particles that contain sizable voids are fractured before
being used in the new concrete mix.
One limitation of small aggregate size is poor aggregate interlock at joints and cracks,
especially on JRCP and CRCP. Additional large virgin aggregate may need to be added
so that sufficient aggregate interlock will develop.
A PCC pavement that has an AC overlay can be recycled, but the two layers must be
recycled separately. Asphalt concrete should not be recycled for aggregate in a PCC mix,
because the asphalt cement will inhibit entrainment of air in the concrete mix.
Whether or not a particular project should be recycled depends on numerous factors,
including suitability of the pavement for recycling, availability and cost of virgin
aggregate, cost of disposing of old pavement material if it is not recycled, approximate
cost of recycling, policy toward recycling, and the extent of local contractors’ experience
with recycling. PCC pavement recycling has proven to be both economical and
environmentally advantageous. Laboratory and field studies have shown that a high
quality concrete, with improved durability, can be produced using recycled concrete
aggregate. Significant savings in material transportation and disposal costs are possible
through recycling, particularly in urban areas.
PCC pavement recycling can be divided into two groups:
surface recycling
central plant recycling
Both surface and central plant recycling techniques have been utilized on roadways
containing Portland cement concrete. However, surface recycling techniques applied to
concrete pavements is most often considered a pavement removal operation. The
removed pavement can be recycled. Figure 5.3 describes some of the Portland cement
concrete recycling options.
Surface Recycling
Surface recycling techniques involve the use of cold milling or cold planing techniques
that are capable of economically removing up to approximately two inches of concrete in
a single pass. Traffic can operate for extended periods of time on the milled surface, or an
asphalt concrete overlay can be placed.
The sequence of operation involving surface recycling is as follows:
1. Establishing desirable grade line.
2. Milling, grinding, or planing the pavement to the desired depth.
3. Clean-up involving rotary broom and vacuum equipment.
4. Disposal or recycling of the millings.

Chapter 14 Pavement Design Manual-2014
Pavement Rehabilitation & Asphalt Overlay
Page 14-38 Roads Development Agency
Surface recycling operations, involving overlays, use the sequence of operations as
described above, with the addition of a tack coat and asphalt concrete overlay.
Pavement milling operations are suitable for the removal of localized severe surface
undulations caused by swelling clays, etc.; for removal of pavement prior to overlay
along gutters, at bridge approaches, and other areas where a feathered edge of asphalt
concrete or Portland cement concrete is likely to abrade; and for improved drainage,
surface texture, and skid resistance.
An added advantage of surface recycling is the increase in bond strength between a
milled Portland cement concrete and an overlay as compared to a normal overlay
operation. This anticipated increase in bond strength may allow the use of thin overlays
on Portland cement concrete pavements.
Central Plant Recycling
The pavement removal and crushing operations are performed with conventional
construction and demolition equipment or specially designed equipment. The old
concrete pavement is normally broken such that the size of the resulting slab is normally
small enough to be received by the primary crusher. Additional reduction in slab size can
be performed at the crushing location. Central plant sizing can be performed with
conventional, fixed and portable crushing equipment; however, reinforcing steel may be
a problem and may have to be removed at one or more of six processing locations:
1. On the grade during the loading operation,
2. During the locating operation for crushing if stockpiling occurs prior to crushing,
3. At the entry to the primary crushing,
4. On the belt after primary crushing,
5. On the belt after final crushing, or
6. In the stockpile prior to remixing.
Equipment recently developed pulverizes the concrete to smaller sizes on grade and thus
more complete steel removal is possible on grade.
Blending and mixing operations in the central plant are standard operations, as are the
techniques utilized for the placing and curing of recycled materials. Gradation
adjustments (particularly the addition of natural sands) are often made to improve
workability.
Structural Design
The structural design of PCC pavement using recycled materials can be done, in
principle, using the guidelines given in the RDA Pavement Design Manual, - 2014 (Ref.
2).
In essence, recycled material is viewed no differently from new or virgin material in
either new or rehabilitated pavement systems. Because of this, the most important
structural rehabilitation parameter for recycled material is the characterization of the load
carrying ability (lab and/or field) of the material.

Chapter 14 Pavement Design Manual-2014
Pavement Rehabilitation & Asphalt Overlay
Roads Development Agency Page 14-39
Break
Pavement
Load and
Haul to Plant Crush, screen
and stockpile
Blend crushed PCC with
new aggregate as required.
Blend crushed PCC with
new aggregate as required and
add Portland cement or
asphalt.
Blend crushed PCC with
new aggregate as required and
add Portland cement and
water to make lean concrete -
econocrete
Blend crushed PCC with
new aggregate as required and
add Portland cement and
water to make Portland
cement concrete.
Blend crushed PCC with
new aggregate as required and
add asphalt cement to make
asphalt concrete.
Haul, place
and cure
Figure 5.3 (from Ref. 16) Portland Cement Concrete Pavement Recycling
Chapter 14 Pavement Design Manual - 2014
Pavement Rehabilitation and Asphalt Overlay Design
Page 14-42 Roads Development Agency
Literature review indicates that the structural coefficients of recycled materials do reflect
the extreme variation of reused materials and recycling processes utilized. However, it is
equally apparent that recycled materials have the capacity to be equivalent, or greater, in
load spreading capabilities than the original material. With good control on the recycling
process, and based on laboratory test data, an appropriate structural coefficient can be
evaluated to be used in the design.
Similarly, the properties of concrete made with recycled aggregate show some variations
compared to the concrete made with virgin aggregate, as given below.
Concrete Properties
The following is a comparison of the properties of PCC made with recycled concrete
aggregate and concrete made with virgin aggregate:
1. The compressive strength of recycled concrete is between 60 and 100 percent of
the compressive strength of conventional concrete at the same water-cement ratio.
Water-reducing admixtures can be used to obtain higher strength concrete at the
same cement content without compromising workability.
2. The static modulus of elasticity of recycled concrete is between 60 and 100
percent of the modulus of conventional concrete at the same water-cement ratio.
3. The flexural strength of recycled concrete is between 80 and 100 percent of the
flexural strength of conventional concrete at the same water-cement ratio.
4. Recycled concrete has a higher ratio of flexural strength to compressive strength
than conventional concrete.
5. Low-strength recycled concrete can be recycled into higher-strength concrete
through proper mix design.
6. The durability of concrete made with aggregate susceptible to D-cracking can be
substantially increased by limiting the top size of the aggregate.
7. The volume response to moisture and temperature changes of recycled concrete is
not significantly different from that of normal concrete.
The fact that concrete containing recycled concrete aggregate has a higher ratio of
flexural strength to compressive strength than conventional concrete should be
considered if compressive strength is to be used as the criterion for acceptance or for
timing the early opening of reconstruction projects.
All of the above comments about recycled concrete aggregate’s performance in concrete
surfaces applies to its use in lean concrete roadbase courses, as well. Recycled concrete
aggregate was used in lean concrete roadbases long before it was used in concrete
surfaces because not enough was known about its performance in surface courses. In
general, the use of recycled concrete aggregate is restricted to roadbase courses (granular,
cement- or asphalt-stabilized, and lean concrete).
Chapter 14 Pavement Design Manual - 2014
Pavement Rehabilitation and Asphalt Overlay Design
Roads Development Agency Page 14-41
14.6 SELECTION OF PREFERRED ALTERNATIVE
The following excerpt from Part III of the AASHTO Guide (Ref. 3) appears relevant to
this section:
"While analytical solutions to portions of the rehabilitation methodology are presented,
the engineer must recognize that it may be impossible to accurately determine the
optimal rehabilitation solution from a rigorous analytical model. However, the user
should not be discouraged from employing this approach but rather feel encouraged to
use every available tool at his/her disposal to determine the problem cause, identify
potentially sound and economic solution alternatives, and then select the most preferred
rehabilitation strategy from sound engineering experience‖.
14.6.1 REHABILITATION FACTORS
Rehabilitation choices should be viewed with reference to several factors, including:
the decision to use new materials, recycled materials, or a combination of both
(noting that recycled materials need not be those obtained from the specific pavement
project being rehabilitated)
the decision to employ full reconstruction, partial reconstruction, a direct overlay, or
some combination of reconstruction and overlay.
Due to state of the art limitations regarding the entire rehabilitation process, there is a
definite need for feedback on the performance of various rehabilitation methods. The
―optimum‖ solution (from the viewpoint of cost to benefit ratio) may not be attainable for
a particular project due to constraints imposed (e.g. funding). There should however be a
―preferred‖ solution which is cost-effective, has other desirable characteristics, and meets
the existing constraints.
Some factors which may influence the rehabilitation choices have been listed as data
which must be collected prior to the condition survey (cf. Chapter 2). Road inventory is
one of them, and the geometric design (i.e. the adequacy of the existing geometry) should
be viewed as one major factor to decide between overlay and non-overlay methods. Other
potential constraints to be contended with include:
traffic control problems
possible funding limitations
desirable service life of the rehabilitation
right-of-way
availability of materials and equipment
probable contractor’s capacities
On the basis of the above factors and constraints, the design engineer should be able to
suggest candidate solutions among those described in Chapters 4 and 5, and among the
multiple combinations thereof. After the feasible candidate solutions have been selected,
by weighing candidate solutions against project constraints, preliminary design should be
prepared. Preliminary designs require only approximate cost estimates.
Chapter 14 Pavement Design Manual - 2014
Pavement Rehabilitation and Asphalt Overlay Design
Page 14-42 Roads Development Agency
14.6.2 SELECTION OF PREFERRED SOLUTION
There is no infallible method for selecting the most ―preferred‖ rehabilitation alternative
for a given project. The selection process requires engineering judgment, creativity and
flexibility. Guidance can nevertheless be offered to select a preferred solution. Both
monetary and non-monetary considerations apply.
COST ANALYSIS
The cost is generally considered the most important criterion in the selection process.
Normally, a life-cycle cost analysis is required, and an outline of its main components is
given below. However, one must bear in mind a few points regarding life cycle cost
analysis as it is applied to the selection of a rehabilitation method.
Life-cycle cost analysis requires inputs of both cost and time. Unfortunately, both of
these elements are subject to a large degree of uncertainty. For instance, the effective
life of a rehabilitation technique is subject to the following influences:
the skill and care with which the work is performed
the quality of the materials used
environmental conditions prevalent in the region where the pavement exists
the traffic which uses the pavement
other rehabilitation and maintenance work being performed concurrently
Even the engineer familiar with the performance of various rehabilitation methods in
his or her local area can appreciate the difficulty of selecting appropriate inputs for
use in the life-cycle cost analysis. To eliminate as much uncertainty as possible, it is
essential to collect rehabilitation performance data whenever available (e.g. PMS
Branch).
Another important consideration regarding life-cycle cost analysis is that the same
rehabilitation techniques, when applied to different pavements, may have variant
effects. Furthermore, some methods keep a pavement at a consistently high-condition
level, while others may allow the condition of the same pavement to fluctuate. Thus,
discrepancy is often not revealed by the cost analysis if user costs are not included in
the calculations. It is therefore important to include user costs in a cost analysis.
The major costs to consider in the economic analysis include:
(1) Government costs
(a) Initial rehabilitation costs. These should include, in particular, the costs of
pavement preparation (repairs, etc.) required prior to overlay, if this is the
alternative considered in the analysis.
(b) Future rehabilitation costs (after the selected design period for the
rehabilitation design).
(c) Maintenance costs, recurring throughout the design period.
(d) Salvage return or residual value at the end of the design period.
(e) Engineering and administrative costs.
Chapter 14 Pavement Design Manual - 2014
Pavement Rehabilitation and Asphalt Overlay Design
Roads Development Agency Page 14-41
(f) Traffic control costs, if applicable.
(2) User costs
(a) Travel time
(b) Vehicle operation
(c) Accidents
(d) Discomfort
(e) Time delay and extra vehicle operating costs during resurfacing or major
maintenance
There are a number of methods of economic analysis that are applicable to the evaluation
of alternative strategies.
(1) Equivalent uniform annual cost method, often simply termed the ―annual cost
method‖
(2) Present worth method for:
(a) costs
(b) benefits, or
(c) benefits minus costs, usually termed the ―net present worth‖ or ―net
present value method‖
(3) Rate-of-return method
(4) Benefit-cost ratio method
(5) Cost-effectiveness method
Either the net present worth value or the equivalent uniform annual cost may be used to
determine life cycle costs for comparisons of alternate pavement rehabilitation strategies.
In either case, it is essential that comparisons only be made for analysis periods of equal
length. Details of the equations used in the methods are beyond the scope of this manual.
They may be found in the HDM models developed by the World Bank.
NON-MONETARY CONSIDERATIONS
As with the review of the constraints in the selection of candidate rehabilitation methods,
several factors need to be considered in selecting the preferred solution. They include, in
particular, service life, duration of construction, reliability of the solution, constructibility
and maintainability.
Also, as with monetary considerations, the service life (selected and ascertained during
the data collection) of a rehabilitation method is an important factor. This is particularly
significant for high-volume roads, for which lane closures and traffic delays pose
considerable difficulties. The important time parameter is years of pavement life
extension achieved by the rehabilitation methods and should be a factor in almost any
decision criterion.
PREFERRED REHABILITATION ALTERNATIVE
The preferred rehabilitation alternative will be selected using first cost considerations,
then monetary factors. When the cost does not indicate a clear advantage, weighing
factors may be assigned to the non-monetary considerations. Each factor is evaluated and

Chapter 14 Pavement Design Manual - 2014
Pavement Rehabilitation and Asphalt Overlay Design
Page 14-42 Roads Development Agency
multiplied by its weight, and a final ―score‖ is calculated. This procedure is in relatively
common use to select the preferred rehabilitation alternative.
Such a method for measuring several rehabilitation alternatives against criteria that
cannot be expressed in monetary units is illustrated in Figure 6.1.
Detailed design, plans and cost estimates are normally prepared after the selection of the
preferred alternative. If major differences occur at this stage, either in cost or in design,
it may be necessary to reinvestigate the cost-effectiveness of the solution.
First, the relative importance of each criterion is assigned by the design team in
consultation with RDA. Next, the alternatives are rated according to their anticipated
performance in the criterion areas. Then, an alternative’s rating in an area is multiplied by
the assigned weight of that factor to achieve a ―score‖. Finally, all of the scores for an
alternative are summed, and the alternative with the highest score is the preferred
solution.
Figure 6.1: Illustrative Method of Selecting Rehabilitation Alternatives (from Ref 3)

Chapter 14 Pavement Design Manual - 2014
Pavement Rehabilitation and Asphalt Overlay Design
Roads Development Agency Page 14-41
14.7 DESIGN OF RIGID PAVEMENTS
A general methodology of rigid pavement design is presented in Figure 2.
14.7.1 DESIGN TRAFFIC LOADING
Refer to Chapter 3 and to subsection 6-2 of this volume for the computation of the design
Equivalency Axle Load of the road.
14.7.2 THICKNESS DESIGN
- Capping and Subbase
The capping layer is required only if CBR of the subgrade is 15% or less. The required
thickness of a capping layer for a CBR value less than 15% can be obtained from
Figure 3.
The subbase layer is required when the subgrade material doesn’t comply with the
requirement for a subbase (CBR is less than 30%) or to facilitate the obtaining of the
surface levels with the tolerances required. Generally, the thickness of the subbase
provided will be a constant 15 cm and can be cement stabilized.
For subgrade CBR values less than 2%, the roadbed material needs to be treated either by
replacement or in-situ stabilization. These methods of soil improvement are described in
section 7 of the flexible pavement design manual.
A separation membrane (such as a polythene sheet) is required between subbase and
concrete slab, mainly in order to reduce the friction between the slab and the subbase in
JUCP and JRCP pavements, and thus inhibits the formation of mid-bay cracks. It also
reduces the loss of water from the fresh concrete. For CRCP pavements, a bituminous
spray should be used on the subbase, instead of polythene, because a degree of restraint is
required.
- Concrete Slab Thickness and Reinforcement
Based on the design traffic volume determined as per Chapter 2 and project-specific
characteristics, the thickness of pavement is determined.
The following represents procedures for determining the thickness and reinforcement for
each of the pavement types.
Jointed Unreinforced Concrete Pavement (JUCP)
For a given traffic volume in terms of ESAs, the thickness of JUCP concrete slab can be
determined using Figure 4.
Figure 4 assumes the presence of an effective lateral support to the edge of the most
heavily-trafficked lane (i.e., the right lane), such as a shoulder with a pavement structure
able to carry occasional loads. In the absence of such a shoulder adjacent to the most

Chapter 14 Pavement Design Manual - 2014
Pavement Rehabilitation and Asphalt Overlay Design
Page 14-42 Roads Development Agency
heavily trafficked lane, an additional slab thickness is required, and this additional
thickness can be determined using Figure 6.
JUCP pavements have no reinforcements. However, the longitudinal and transverse joints
are provided with reinforcements. The joint details are discussed in Section 5
Jointed Reinforced Concrete Pavement (JRCP)
For a given traffic volume in terms of ESAs, the thickness of a JRCP concrete slab can be
determined using Figure 4. The figure can also be used to determine the longitudinal
reinforcement in terms of mm2/m for a design thickness of concrete slab. Thus, several
alternate combinations of thickness of concrete slab and amount of reinforcement can be
compared.
In the absence of an effective lateral support provided by the shoulder adjacent to the
most heavily trafficked lane, an additional slab thickness is required and can be
determined using Figure 6.
In addition to the longitudinal reinforcement, JRCP pavements shall be provided with
transverse reinforcement, if required, depending on site conditions. In that case,
reinforcement shall be provided at 600 mm spacing and consist of 12 mm diameter steel
bars.
Continuously Reinforced Concrete Pavement (CRCP)
CRCP pavement can withstand severe stresses induced by differential movements. For a
given traffic volume, in terms of ESAs, the thickness of CRCP concrete slab can be
obtained from Figure 5.
Longitudinal reinforcement in CRCP pavements shall be 0.6% of the concrete slab cross-
sectional area, consisting of 16 mm diameter deformed steel bars. If required, transverse
reinforcement shall be provided at 600 mm spacings, consisting of 12 mm diameter
deformed steel bars, to control the width of any longitudinal cracks which may form.
Transverse reinforcement is normally required only for ease of construction. It may be
omitted except where there is a risk of differential settlements.
Similarly to JUCP and JRCP pavements, in the absence of effective shoulder support
adjacent to the most heavily trafficked lane, the additional slab thickness required can be
determined using Figure 6.
As is evident from Figure 4 and 5, the minimum thickness of concrete pavement for
JUCP and JRCP pavement is 150 mm and that for CRCP pavement is 200 mm. Hence,
the designer should carefully assess the necessity and requirements for such pavements,
depending on the design traffic volume, and shall include flexible pavement as an
alternate.
A design example of rigid pavement design is presented in Appendix C.
14.7.3 DESIGN FOR MOVEMENT
Joints shall be designed according to the general considerations of sub section 2.2 and
using Drawings B2 to B8.

Chapter 14 Pavement Design Manual - 2014
Pavement Rehabilitation and Asphalt Overlay Design
Roads Development Agency Page 14-41
The general layout of joints shall account for construction consideration and the
following limitations concerning joint spacing and slabs dimensions:
- Transverse Joint Spacing
Maximum transverse joint spacing for JUCP pavements is 4 m for slab thickness up to
230 mm and is 5 m for slab thickness over 230 mm.
Expansion joints should replace every third contraction joint, ie. at a spacing of 12m or
15m.
For JRCP, contraction joints are generally at a standard distance of 25m, unless there is
500mm2/m of reinforcement. Then refer to Figure 4. For expansion joints, replace every
third contraction joint with an expansion joint. For example, a pavement with contraction
joint spacing of 25m has an expansion joint spacing of 75m.
- Longitudinal joint spacing
The longitudinal joint spacing shall not be greater than 4.2 m for pavement slabs without
transverse reinforcement and 6.0 m for pavement slabs with transverse reinforcement.
When required, longitudinal joints shall be placed at the edge of traffic lanes.
- Slabs dimensions
Warping joints shall be added to the general layout in special cases, as described in
section 2.2. In general, the length/width ratio of the slabs shall be of 2 or less.
- Layout at junctions
For intersection of joints at junctions and crossings, refer to the drawing below:
Intersection of
transverse joints
Longitudinal joints Transverse joints
Joints layout at junctions and crossings

Chapter 14 Pavement Design Manual - 2014
Pavement Rehabilitation and Asphalt Overlay Design
Page 14-42 Roads Development Agency
Check forRequirement ofCapping Layer
No
Determine CappingLayer Thicknessfrom Figure 3.2
Determine Concrete SlabThickness and
Reinforcement from Figure3.3.
Check forRequirementof Subbase Layer
Determineslab thicknessfrom Figure 3.3.
Check for Site Constraints,if any.
Determine pavement type.
Determine Concrete SlabThickness from Figure
3.4.
CRCP
Check for requirement oftransverse reinforcement (cf. §
3.2).
Determine joint type,joint spacing and joint
reinforcement.
Determine additional slabthickness from Figure 3.5.
Check for requirement oftransverse reinforcement (cf.
§ 3.2).
Yes
JRCP
JUCPDetermine longitudinalreinforcement (cf. § 3.2)
Determine
Design CBR
Design ESAs
Figure 2 Design Methodology – Flow Diagram
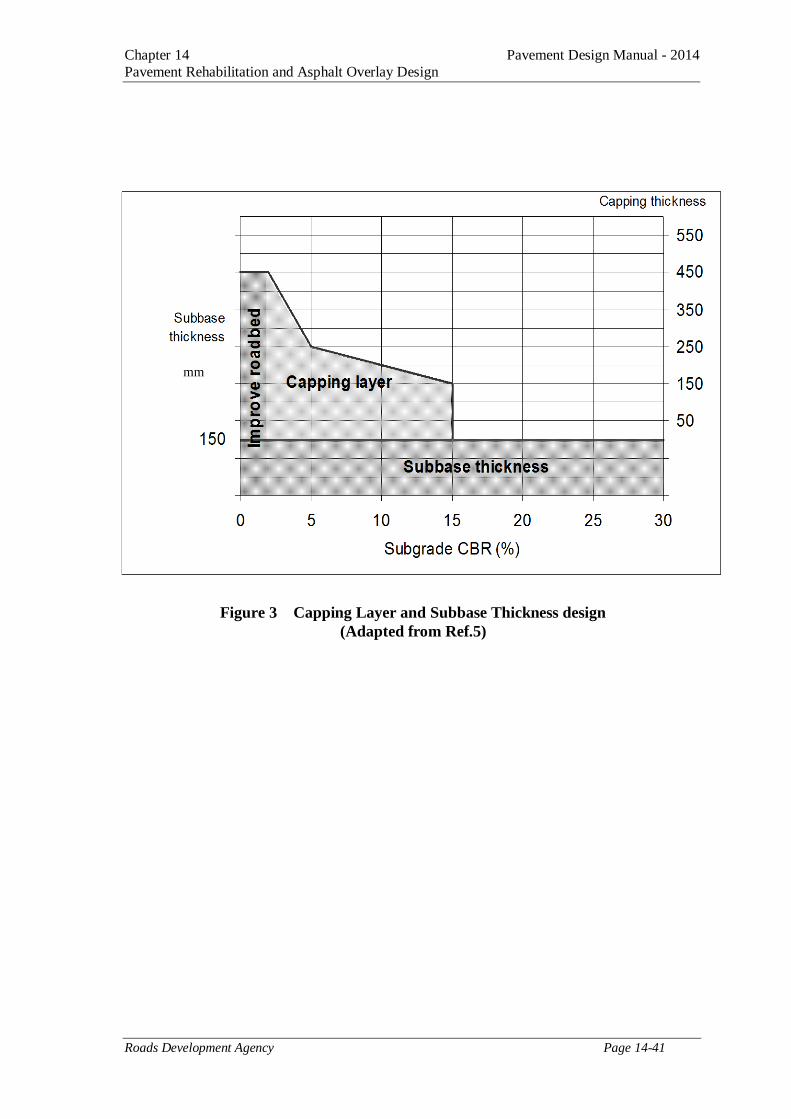
Chapter 14 Pavement Design Manual - 2014
Pavement Rehabilitation and Asphalt Overlay Design
Roads Development Agency Page 14-41
Figure 3 Capping Layer and Subbase Thickness design
(Adapted from Ref.5)
mm

Chapter 14 Pavement Design Manual - 2014
Pavement Rehabilitation and Asphalt Overlay Design
Page 14-42 Roads Development Agency
18
19
20
21
22
23
24
25
26
1 10 100 1000
Design Traffic (millions of ESAs)
3
4
5
6
7
8
9
10
11600
700
800
500
0 JUCP
Longitudinal
Reinforcement
(mm2/m)
JRCP
4
5
400
100
150
200
250
300
350
400
1 10 100 1000
Design Traffic (millions of ESAs)
0 JUCP
500
600
700
800
JRCP
Longitudinal
Reinforcement
(mm2/m)
Figure 4 Design Thickness and joint spacing for JUCP and JRCP
(Adapted from Ref. 5)

Chapter 14 Pavement Design Manual - 2014
Pavement Rehabilitation and Asphalt Overlay Design
Roads Development Agency Page 14-41
0
50
100
150
200
250
300
1 10 100 1000
Design Traff ic (Millions of ESAs)
Desig
n T
hic
kness o
f concre
te (
mm
)
Figure 5 Design Thickness for CRCP Pavements
(Adapted from Ref. 5)

Appendix Pavement Design Manual - 2014
Roads Development Agency Page A-1
APPENDIX A APPLICABLE STANDARDS
Designation Name of Test
Tests on Soils
ASTM D698 Moisture-Density Relations of Soils/Soil-Aggregate Mix (Light)
ASTM D1557 Moisture-Density Relations Using Modified Effort (Heavy)
AASHTO T180 Compaction Test
ASTM D1883 or
AASHTO T193
CBR Test for Laboratory-Compacted Soils
ASTM C136 or
AASHTO T27
Particle Size Distribution
ASTM D424 or
AASHTO T90
Plastic Limit and Plasticity Index
ASTM D2487 or
AASHTO M145
Classification of Soils for Engineering Purposes
Tests on Gravels
ASTM D698 Moisture-Density Relations of Soils/Soil-Aggregate Mix (Light)
ASTM D1557 Moisture-Density Relations Using Modified Effort
AASHTO T180 Compaction Test
ASTM D1883 or
AASHTO T193
CBR Test for Laboratory-Compacted Soils
ASTM C136 or
AASHTO T27
Particle Size Distribution
ASTM D4318 Liquid Limit
ASTM D424 or
AASHTO T90
Plastic Limit and Plasticity Index
BS 812, Part 105 Flakiness Index (see also ASTM Practice C 670)
BS 812, Part 111 Ten Per Cent Fines Value (TFV)
ASTM C535-89 Los Angeles Abrasion Test (LAA)
BS 812, Part 110 Aggregate Crushing Value (ACV)
BS 812, Part 112 Aggregate Impact Test
ASTM C88 Sodium Soundness Test (SST)
BS 1924, Part 2 Initial Consumption of Lime (ICL)
ASTM C977 Lime for Soil Stabilization
Tests on Asphalts and Bitumens
BS 812, Part 103 Cleanliness (Sedimentation or Decantation)
BS 812, Part 105 Flakiness Index (see also ASTM Practice C 670)
BS 812, Part 110 Aggregate Crushing Value (ACV)
ASTM C131 and
ASTM C535-89
Los Angeles Abrasion Test (LAA)

Appendix Pavement Design Manual - 2014
Page A-2 Roads Development Agency
BS 812, Part 110 Polished Stone Value
ASTM C88 Sodium Soundness Test (SST)
ASTM C88 Magnesium Soundness Test (SST)
ASTM C127 Water Absorption for Fines
ASTM C128 Water Absorption for Coarse Materials
AASHTO T-182 Bitumen Affinity (Coating and Stripping)
AASHTO T-176 Sand Equivalent
ASTM D4318 Plastic Limit and Plasticity Index
ASTM D2872 Rolling Thin Film Oven Test (TFOT)
ASTM D1559 or
AASHTO T245
Marshall Mix Design and Test
ASTM D4402 Viscosity Determination
ASTM D5 Penetration of Bituminous Materials
ASTM D3910 Slurry Seal Design and Testing
TRL ORN 31 Refusal Density Mix Design
TRL ORN 3 DCP Test
TRL ORN 3 Immersion Tray Test
TRL ORN 3 Probe Penetration Test
ASTM D3497 Dynamic Modulus of Bituminous Material

Appendix Pavement Design Manual - 2014
Roads Development Agency Page A-3
APPENDIX B ESTIMATING SUBGRADE MOISTURE CONTENT
FOR CATEGORY 1 CONDITIONS
The subgrade moisture content under an impermeable road pavement can increase after
construction where a water table exists close to the ground surface. This ultimate
moisture content can be predicted from the measured relationship between soil suction
and moisture content for the particular soil and knowledge of the depth of water table.
Measuring the complete relationship between suction and moisture content is time
consuming and a simpler, single measurement procedure can be used. A small sample of
soil, compacted to field density and moisture content, is placed within suitable laboratory
equipment that can apply a pressure equivalent to the effective depth of the water table
(e.g. a pressure plate extractor). The effective depth of the water table for design
purposes comprises the actual depth from the subgrade to the water table plus an apparent
depression of the water table due to the pressure of the overlying pavement. This
apparent depression varies with soil type and an approximate correction factor is given in
Table B-1.
Table B-1: Correction Factors for Soil Type P1 Used in Calculating the Effective
Depth of the Water Table
P1 Correction factor
SF
0
10
15
20
25
30
35
>35
0
0.3
0.55
0.80
1.1
1.4
1.6
2.0
To calculate the effective depth D which is used to determine the applied suction in the
pressure plate extractor, the following equation is used:
D = WT + (SF x t)
Where WT = depth of water table below subgrade (at its highest expected seasonal
level).
SF = correction factor from Table B-1.
t = pavement thickness, with consistent units for WT, t, and D.
When equilibrium is attained in the pressure plate extractor, the sample is removed and
its moisture content measured. This moisture content is the value at which the CBR for
design should be estimated following standard soil tests as outlined in Section 3.2.

Appendix Pavement Design Manual - 2014
Page A-4 Roads Development Agency
APPENDIX C TRL DYNAMIC CONE PENETROMETER
The TRL Dynamic Cone Penetrometer (DCP), shown in Figure C-l, is an instrument
designed for the rapid in situ measurement of the structural properties of existing road
pavements with unbound granular materials. Continuous measurements can be made to a
depth of 800 mm or to 1200 mm when an extension rod is fitted.
The underlying principle of the DCP is that the rate of penetration of the cone, when
driven by a standard force, is inversely related to the strength of the material as measured
by, for example, the California Bearing Ratio (CBR) test (see Figure C-2). Where the
pavement layers have different strengths, the boundaries between the layers can be
identified and the thickness of the layers determined. A typical result is shown in Figure
C-3.
The DCP needs three operators; one to hold the instrument, one to raise and drop the
weight and a technician to record the results. The instrument is held vertical and the
weight carefully raised to the handle. Care should be taken to ensure that the weight is
touching the handle, but not lifting the instrument, before it is allowed to drop and that
the operator lets it fall freely and does not lower it with his hands. If during the test the
DCP tilts from the vertical, no attempt should be made to correct this as contact between
the shaft and the sides of the hole will give rise to erroneous results. If the angle of the
instrument becomes worse, causing the weight to slide on the hammer shaft and not fall
freely, the test should be abandoned.
It is recommended that a reading should be taken at increments of penetration of about 10
mm. However it is usually easier to take readings after a set number of blows. It is
therefore necessary to change the number of blows between readings according to the
strength of the layer being penetrated. For good quality granular base courses readings
every 5 or 10 blows are normally satisfactory but for weaker sub-base layers and
subgrade readings every 1 or 2 blows may be appropriate.
Little difficulty is normally experienced with the penetration of most types of granular or
weakly stabilized materials. It is more difficult to penetrate strongly stabilized layers,
granular materials with large particles and very dense, high quality crushed stone. The
TRL instrument has been designed for strong materials and therefore the operator should
persevere with the test. Penetration rates as low as 0.5 mm/blow are acceptable but if
there is no measurable penetration after 20 consecutive blows it can be assumed that the
DCP will not penetrate the material. Under these circumstances a hole can be drilled
through the layer using either an electric or pneumatic drill or by coring. The lower layers
of the pavement can then be tested in the normal way.
DCP results are conveniently processed by computer and a program has been developed
that is designed to assist with the interpretation and presentation of DCP data.

Appendix Pavement Design Manual - 2014
Roads Development Agency Page A-5

Appendix Pavement Design Manual - 2014
Page A-6 Roads Development Agency
Figure C-1: TRL Dynamic Cone Penetrometer
Figure C-2: DCP-CBR Relationships

Appendix Pavement Design Manual - 2014
Roads Development Agency Page A-7
Figure C-3: DCP Test Result

Appendix Pavement Design Manual - 2014
Page A-8 Roads Development Agency
APPENDIX D REFUSAL DENSITY DESIGN
D1. INTRODUCTION
The extended Marshall compaction procedure can be used to design asphalts which will
retain a required minimum voids in the mix (VIM) after secondary compaction by traffic.
An alternative method based on an extended form of the compaction procedure used in
the Percentage Refusal Density (PRD) Test (BS 598 Part 104 (1989)) uses a vibrating
hammer for compaction. These methods are appropriate for sites which are subject to
severe loading where research shows that it is desirable to retain a minimum VIM of
three per cent to minimise the risk of failure by plastic deformation. Neither method
exactly reproduces the mode of compaction which occurs under heavy traffic but the
latter procedure is both quicker and more representative. There are no national or
international standards for these procedures and therefore they are both likely to be
subject to further development.
D2. EXTENDED MARSHALL COMPACTION
For severe sites, the basecourse specifications, BC1 and BC2, given in Table 8-4 and
Table 8-7, are likely to be the most appropriate. The normal Marshall design procedure
using 75 blows on each face should be completed first to provide an indication that the
Marshall design parameters will be met.
The binder content corresponding to 6 per cent VIM obtained in the Marshall test should
be noted and additional test samples prepared at each of three binder contents, namely the
binder content corresponding to 6 per cent VIM and also binder content which are 0.5 per
cent above and 0.5 per cent below this value. These samples must be compacted to
refusal.
The number of blows required to produce a refusal condition will vary from one mix to
another. It is preferable to conduct a trial using the lowest binder content and to compact
using an increasing number of blows, say 200, 300, 400, etc. until no further increase in
density occurs. Usually 500 blows on each face is found to be sufficient.
By plotting a graph of VIM at the refusal density against binder content the design binder
content which corresponds to a VIM of 3 per cent can be determined. This value should
be obtained by interpolation, not by extrapolation. If necessary, the binder content range
should be extended upwards or downwards, as appropriate, to permit this.
D3. EXTENDED VIBRATING HAMMER COMPACTION
Laboratory Design Procedure
In the vibrating hammer method, the samples are compacted in 152-153 mm diameter
moulds to a thickness approximately the same as will be laid on the road. The BS 598
compaction procedure for the PRD test is repeated if necessary to achieve an absolute
refusal density. The electric vibrating hammer should have a power consumption of 750
watts or more and operate at a frequency of 20 to 50 Hz. Two tamping feet are used, one
with a diameter of 102 mm and the other of 146 mm. Samples should be mixed so that

Appendix Pavement Design Manual - 2014
Roads Development Agency Page A-9
they can be compacted immediately afterwards at an initial temperature of 140 ± 5oC for
80/100 penetration grade bitumen or 145 ± 5oC for 60/70 penetration grade bitumen.
The moulds and tamping feet must be pre-heated in an oven before starting the test.
Cooling of the sample by as much as 15 to 20oC during compaction should not prevent
achievement of the correct refusal density. The small tamping foot is used for most of the
compaction sequence. The hammer must be held firmly in a vertical position and moved
from position to position in the prescribed order, i.e. using the points of a compass. To
identify the position, the order should be N, S, W, NW, SE, SW, NE or equivalent. At
each point, compaction should continue for between 2 and 10 seconds, the limiting factor
being that material should not be allowed to push up around the compaction foot. The
compaction sequence is continued until a total of 2 minutes ± 5 seconds of compaction
time has been reached. The large tamping foot is then used to smooth the surface of the
sample.
A spare base-plate, previously heated in the oven, is placed on top of the mould which is
then turned over. The sample is driven to the new base plate with the hammer and large
tamping foot. The compaction sequence is then repeated. The free base plate should be
returned to the oven between compaction cycles.
This is the standard PRD compaction procedure but to ensure that the refusal density is
reached, it may be necessary to repeat this procedure a second time. It is suggested that
trial mixes with a bitumen content which corresponds to approximately 6 per cent VIM
in the Marshall test, are used to
(i) Determine the mass of material required to give a compacted thickness of
approximately the same thickness as for the layer on the road.
(ii) Determine the number of compaction cycles which will ensure that absolute
refusal density is achieved.
After these tests have been completed, samples are made with bitumen contents starting
at the Marshall optimum and decreasing in 0.5 per cent steps until the bitumen content at
which 3 per cent voids is retained at absolute refusal density can be determined.
Transfer of Laboratory Design to Compaction Trials
After the standard PRD compaction cycle, test samples of basecourse or roadbase which
have been compacted from the loose state can be expected to have densities between 1.5
and 3 per cent lower than for the same material compacted in the road but cored out and
subjected to the PRD test. This is an indication of the effect of the different compaction
regimes and is caused by a different resultant orientation of particles. The differences
between the densities for laboratory and field samples after refusal compaction should be
measured to confirm whether this difference occurs.
A minimum of three trial lengths should be constructed with bitumen contents at the
laboratory optimum for refusal density (93 per cent VIM) and at 0.5 per cent above and
0.5 per cent below the optimum. These trials should be used to:

Appendix Pavement Design Manual - 2014
Page A-10 Roads Development Agency
(i) Determine the rolling pattern required to obtain a satisfactory density
(ii) Establish that the mix has satisfactory workability to allow a minimum of 93 per
cent of PRD (standard compaction (BS598: 1989)) to be achieved after rolling
(iii) Obtain cores so that the maximum binder content which allows at least 3 per cent
VIM to be retained at refusal density can be confirmed.
For a given aggregate and grading, cores cut from the compacted layer can be expected to
give a constant value of voids in the mineral aggregate (VMA) at the refusal density,
irrespective of bitumen content. This will allow a suitable binder content to be chosen to
give a minimum of 3 per cent VIM at refusal density.
A minimum of 93 per cent and a mean value of 95 per cent of the standard PRD density
is recommended as the specification for density on completion of compaction of the
layer. From these trials and the results of laboratory tests, it is then possible to establish a
job mix formula. This initial procedure is time consuming, but is justified by the long
term savings in extended pavement service life that can be obtained. After this initial
work, subsequent compliance testing based on analysis of mix composition and refusal
density should be quick, especially if field compaction can be monitored with a nuclear
density gauge.
It is essential to provide a surface dressing for the type of basecourse mixes which are
best suited to these severe conditions. This protects the mix from severe age hardening
during the period when secondary compaction occurs in the wheelpaths, and also protects
those areas which will not be trafficked and are likely to retain air voids above 5 per cent.
D4. POSSIBLE PROBLEMS WITH THE TEST PROCEDURES
Multi-blow Marshall compaction and vibratory compaction may cause breakdown of
aggregate particles. If this occurs to a significant extent then the test is unlikely to be
valid.
Because of the time taken to complete the Marshall procedure, considerable care must be
taken to prevent excessive cooling of the sample during compaction.
It is important to note that the different particle orientation produced by these compaction
methods, in comparison with that produced by roller compaction, limits the use of
samples prepared in these tests to that of determining VIM at refusal. It would be unwise
to use samples prepared in this way for fatigue or creep tests.

Appendix Pavement Design Manual - 2014
Roads Development Agency Page A-11
APPENDIX E THE IMMERSION TRAY TEST FOR DETERMINING THE
CONCENTRATION OF ADHESION AGENT REQUIRED
The following test procedure has been included in editions of Road Note 39, Design
Guide for Road Surface Dressing (Ref. 19) since at least 1964. The method is reproduced
below and then suggestions are made which may help to make it more appropriate for
Ethiopia.
In this test a tin lid approximately 135mm diameter is covered with 15 to 20g of binder
giving a film some 1.5mm thick. When this has cooled to the test temperature* it is
immersed in water also at test temperature to a depth of about 25mm. Nominal 14mm
chippings are then applied by hand and lightly pressed in. At least six pieces of the
aggregate are used. The chippings are left for 10 minutes and are then carefully removed
from the binder film: the percentage of binder retained on the chippings is assessed
visually.
When testing an adhesion agent, a known quantity of agent is added to the binder and
thoroughly stirred to ensure good dispersion. The procedure is then as outlined above.
The test is repeated with varying concentrations of agent in the binder until the minimum
concentration required to give satisfactory results has been found. The concentration
normally falls in the range 0.5 to 2.5 per cent by mass of agent.
The agent may be considered satisfactory for use on the road if, in the test, when the
chippings are lifted from the binder film the faces which have been in contact with the
film are all 90-100 per cent coated with binder.
*The temperature of water and tray of binder in the above test should be the expected
temperature of the road surface during the treatment. Where it is desired to compare the
behavior of different agents with a given stone and binder it is suggested that 20oC should
be used as the test temperature.
SUGGESTED NEW PROCEDURE
For Somaliland conditions the test bitumen should be of the grade to be used on site and
it should be tested at appropriate site temperatures. Testing different adhesion agents at
20°C is not practical if, for instance, hot conditions warrant the use of an 80/100
penetration grade bitumen. It is considered appropriate to test the adhesion agents at a
temperature which relates to the design road temperature on which binder selection was
based.
A tin lid approximately 135mm diameter, or other suitable tray, is covered with binder to
give a film some 1.5mm thick. Place at least 10 chippings which are damp, but not with
shiny wet surfaces, in the film of binder at the ―design road temperature‖ and leave for 10
minutes. Then withdraw some of the chips to confirm coating. Add water to about half
the depth of the remaining chippings at the chosen test temperature and leave for 10
minutes before withdrawing them and noting the degree of coating. If the coating is less
than 90 per cent on any chipping then an adhesion agent should be tried. In this case

Appendix Pavement Design Manual - 2014
Page A-12 Roads Development Agency
different percentages of the adhesion agent are added to samples of the binder until 90-
100 per cent coverage is obtained, after soaking, on all chippings.
If limestone chippings are available they will provide a good comparison of adhesion
properties with the chippings to be used on site because limestone has good affinity with
bitumen.

Appendix Pavement Design Manual - 2014
Roads Development Agency Page A-13
APPENDIX F THE PROBE PENETRATION TEST FOR MEASURING
ROAD SURFACE HARDNESS
F1. GENERAL DESCRIPTION
This test utilizes a modified soil assessment cone penetrometer, originally designed by
the UK Military Engineering Experimental Establishment for the assessment of in-situ
soil strength. The standard cone normally used with this penetrometer is replaced by a
4mm diameter probe rod with a hemispherical tip made of hardened steel. The probe is
forced into the road surface under a load of 35kgf (343N) applied for 10 seconds and the
depth of penetration is measured by a spring loaded collar that slides up the probe rod.
The distance the collar has moved is measured with a modified dial gauge. The
temperature of the road surface is recorded and a graphical method is used to correct the
probe measurements to an equivalent value at a standard temperature of 30°C.
F2. METHOD OF OPERATION
All measurements are made in the nearside wheel track of each traffic lane where
maximum embedment of chippings can be expected. A minimum of ten measurements is
required at each location. These should be evenly spaced along the road at intervals of
0.5m, any recently repaired or patched areas being ignored. For convenience the
measurement points can be marked with a chalk cross. The probe tip should not be
centered on any large stones present in the road surface.
Before each measurement the collar is slid down the probe rod until it is flush with the
end of the probe. The probe is then centered on the measurement mark and a pressure of
35kgf is applied for 10 seconds, care being taken to keep the probe vertical. The probe is
then lifted clear and the distance the collar has slid up the probe is recorded in
millimeters.
It sometimes occurs that the point selected for test is below the general level of the
surrounding road surface. It is then necessary to deduct the measurement of the initial
projection of the probe tip from the final figure.
The road surface temperature should be measured at the same time that the probe is used
and the tests should not be made when the surface temperature exceeds 35°C. This will
limit probe testing to the early morning in many locations. The probe readings are
corrected to a standard temperature of 30°C using Figure F-1, and the mean of ten probe
measurements is calculated and reported as the mean penetration at 30°C. Categories of
road surface hardness and the corresponding ranges of surface penetration values are
shown in Table 9-7.

Appendix Pavement Design Manual - 2014
Page A-14 Roads Development Agency
Figure F-1: Graphical Method for Correcting Measurements of Road Surface
Hardness to the Standard Test Temperature of 30oC

Appendix Pavement Design Manual - 2014
Roads Development Agency Page A-15
APPENDIX G RIGID PAVEMENT DESIGN - DESIGN EXAMPLE
Design of Rigid Pavement for the following data:
Design period: 20 years
Cumulative number of ESAs over the design period (given): 40 x 106
CBR of roadbed material: 8%
Width of paved carriageway: 7.3 m
Step 1 Check for Capping Layer
Since the CBR value is less than 15%, a capping layer is required.
Referring to Figure 3, the required thickness of the capping layer for a subgrade CBR of 8% is
200 mm
Step 2 Subbase
The thickness of the required subbase layer (Cf. § 3.1) is 150 mm.
Step 3 Pavement Slab
From Figure 4, for a design traffic volume of 40 x 106 ESAs and a longitudinal reinforcement of
500 mm2/m, the thickness of pavement slab required is 200 mm.
Step 4 Joints
From Figure 4, the maximum transverse joint spacing is 25 m. Since the thickness of concrete
slab is 200 mm (<239 mm), the dowel bars shall be 20 mm in diameter at 300 mm spacing, 400
mm long. Depending on site conditions, expansion joints may be provided, if required.
The conditions are assumed to be such that no transverse reinforcement is deemed necessary. As
a result, the maximum longitudinal joint spacing is 4.2 m and we place one longitudinal joint in
the middle of the carriageway, between the two lanes (3.65m each). The tie bars for this slab (<239 mm in thickness) shall be 12 mm in diameter at 600 mm spacing, 1000 mm long.
Step 5 Final Design
The pavement cross-section is shown on the next page.
Longitudinal reinforcement: 500 mm2/m
Transverse joint spacing: 25 m
Longitudinal joint spacing: 3.65 m
Dowels for transverse joints: 20 mm diameter @ 3000 mm c/c, 400 mm long
Tie rods for longitudinal joints: 12 mm diameter @ 600 mm c/c, 1000 mm long

Appendix Pavement Design Manual - 2014
Page A-16 Roads Development Agency
200 mm
150 mm
200 mm
Roadbed
(CBR 8%)
Rigid Pavement Cross-Section
Concrete Slab
Subbase
(cement stabilized)
Capping layer

Appendix Pavement Design Manual - 2014
Roads Development Agency Page A-17
APPENDIX H
VIZIR METHOD
FOR QUALITY EVALUATION OF PAVED ROADS
CLASSIFICATION AND QUANTIFICATION OF DAMAGES
GENERAL
The first part of VIZIR is a method of classification and quantification of damage that
forms part of general road maintenance management studies or special route maintenance
studies. It is intended to provide a picture of the surface condition of a road at a given
time and to identify zones of equal quality (in terms of three damage levels).
These zones of equal quality and these three damage levels are used to determine the
nature and type of work required; in some cases, the very identification of the damage
determines the solution, while in others it is only one factor in a more complex diagnosis
involving other criteria.
The damage classified in the VIZIR method is relevant primarily to flexible pavements
with bituminous surfacings. This damage is divided into two categories:
TYPE A DAMAGE
This characterizes the structural condition of a pavement, affecting either all of its
courses and the ground or the surfacing only. This damage is caused by a structural
deficiency of the pavement, and its identification is used in the search for a solution in
conjunction with other criteria, in particular the bearing capacity as characterized by the
static deflection.
Type A damage includes four types:
deformation
rutting
(fatigue) cracking
crazing
TYPE B DAMAGE
This damage leads to repairs that are generally unrelated to the pavement’s structural
capacity. It may be caused by defective placement, by deficient product quality, or by
some special local condition, possibly aggravated by traffic.
Type B damage includes:
cracking other than fatigue cracking, i.e. longitudinal joint cracks, transverse thermal
shrinkage cracks, and longitudinal and transverse clay shrinkage (desiccation) cracks,
potholes,
raveling and, more generally, all surfacing defects such as fretting, bleeding, etc.

Appendix Pavement Design Manual - 2014
Page A-18 Roads Development Agency
SURVEY AND GRADING OF DAMAGE
The damage is surveyed by an operator who travels the length of the route and records,
for any damage:
its type,
its severity,
its extent, i.e., the length of road affected or, as appropriate, the area.
VIZIR provides a damage topology and, for each type of damage, three levels of severity.
The survey can be done manually, while travelling the road on foot or
by car. The operator in this case enters his observations (identification
of damage and estimate of its severity) on a route diagram, a document
representing the route as a straight line, the scale and precision of
which are appropriate to the type of study.
The survey may also be done using the LCPC’s DESYROUTE equipment. Carried in a
car, it makes it easy to record the type, severity, and location of any damage (position on
curved x-axis based on information from the distance indicator). Its data entry and
retrieval software allows all sorts of calculations, such as a mean severity index and an
extent as a percentage of a given length, or an overall quality index based on a
combination of several types of damage. It can also read out all of these data, either in
the form of a route diagram identical to the one produced by hand or in the form of files
that can be incorporated in a road data bank (for instance the VISAGE road data bank).
To help the operator in his work, VIZIR proposes a catalogue of damage and a method of
graphic representation that are summed up in Table 1 (Type A damage) and Table 2
(Type B damage).
In the route diagram, damage is represented by a rectangle of which the background
(white, grayish, or black) indicates the level of severity, while the two sides represent the
co-ordinates of the beginning and end of the damaged zone, or in other words, its extent.
The severity values given in Tables 1 and 2 are average values suitable for many road
networks. However, they can be altered to fit the assigned maintenance objectives and
the expected level of severity.

Appendix Pavement Design Manual - 2014
Roads Development Agency Page A-19
Each type of damage and each associated level of severity, as indicated in Tables 1 and 2,
is described in detail in the next sub-section and shown in a photograph attached to the
present appendix.

Appendix Pavement Design Manual - 2014
Page A-20 Roads Development Agency
DESCRIPTION OF TYPE A DAMAGES
This concerns the following types of damage:
1. Deformation, rutting
2. Fatigue cracking and crazing
3. Patching and repairs
DEFORMATION AND RUTTING
The deformations specific to flexible pavements almost always lead to rutting or
subsidence. Their degree of severity is determined by the depth h measured on a
straightedge 1.5 m long placed crosswise on the pavement (see following figure).
Figure H.1 Measurements of Deformation
Rutting appears in the wheel tracks, on the back of the pavement about 50 to 80 cm from
the edge. It is caused by settlement of the materials under heavy, channelized traffic,
possibly but not necessarily aggravated by a deficiency of bearing capacity of the soil.
There may also be rutting through creep of the bituminous courses only, but this is found
most often in semi-rigid pavement or in pavements with a bituminous roadbase.
The following values are given for guidance:
Severity 1 h < 2 cm Photo 1
Severity 2 2 cm < h < 4 cm Photo 2
Severity 3 h > 4 cm Photo 3
Subsidence affects the entire edge of the pavement. It is a result of deficiencies of
bearing capacity or of stability, possibly caused by materials of poor quality or
excessively high water contents. Subsidence often occurs in bends and in zones of very
high stress:
Localized subsidence of severity 1 Photo 4
Ridge of severity 3 Photo 5
Subsidence of severity 3 Photo 6
Longitudinal deformations generally show up in the evenness measurement (sag of a few
cm, wavelength from 1 to 20 cm) and must not be counted twice. However, longitudinal

Appendix Pavement Design Manual - 2014
Roads Development Agency Page A-21
deformation in the form of an isolated ridge may properly be recorded with transverse
deformations.
FATIGUE CRACKING
This category does not include cracks resulting from faulty construction, such as the
longitudinal joint between two mix spreading bands, or cracks caused by some particular
behavior of the material, such as longitudinal or transverse thermal shrinkage cracks or
clay shrinkage cracks.
Longitudinal fatigue cracks, on the other hand, are recorded. Most often initially single
and isolated, they evolve toward continuous cracking, sometimes branching, before
multiplying in the wheel tracks to the point of becoming very closely spaced.
Severity 1 Single or clearly separated longitudinal cracks Photos 7 and
10
Severity 2 Continuous cracks, branched or clearly open Photos 8 and
11
Severity 3 Extensively branched cracks foreshadowing crazing Photos 9 and
12 or wide open cracks
PATCHING AND REPAIRS
In some damage survey methods, repairs may not be counted. This is true of the OECD
Manual– Road monitoring for question of maintenance – DC1 – 1990. The LCPC has
always held that repairs, like damage, are an integral part of the visual examination. The
1977 guide to the examination of flexible pavements, in fact, says, ―a recent repair
conceals a problem; frequent repairs call attention to it‖. Repairs are intended to palliate
the deficiencies of a pavement, temporarily or permanently; their number, extent, and
frequency in time are elements of the diagnosis. In the VIZIR method, repairs must be
rated in the course of the visual examination, because some of them are used in
determining the index of pavement appearance. Two cases are distinguished:
The repair has definitively eliminated the defect, in which case it will appear on the
survey document (route diagram) but not be counted when calculating the surface
quality index;
The repair has more or less adequately eliminated the defect, but not its cause, and
will doubtless reappear here or there or nearby; the repair is therefore reflected as an
aggravating factor in calculating the visual index.
The first category includes repairs of Type B defects or partial or complete rebuilding of
the pavement, in good condition. VIZIR rates them as being of severity 1. Rebuilding
may be of the surfacing only or of the whole pavement:
Rebuilding of wearing course at longitudinal joint Photo 19
(Type B damage)
Rebuilding of pavement (Type A damage) Photos 20 and 21

Appendix Pavement Design Manual - 2014
Page A-22 Roads Development Agency
Patching of the wearing course (Type B damage) Photo 22
Structural defects of pavement after repair (Type A) Photos 23 and 24
The second category includes localised pavement repairs of Type A defects, classed as
severity 2 if in good condition and severity 3 otherwise. Only severities 2 and 3 may,
according to their extent, increase the visual index. Photos 21 and 24 illustrate such
cases.
Table H.3 Extent of Patching and Repair vs. Severity
Extent
Severity
0 to 10% 10 to 50% > 50%
1 0 0 0
2 0 0 +1
3 0 +1 +1
Table for calculating the correction of surface damage Is according to the severity and extent of repairs.
DESCRIPTION OF TYPE B DAMAGES
The common Type B damage in flexible pavements includes:
Cracking of longitudinal joint;
Potholes
Raveling and, more generally, any surface defect such as fretting, bleeding, etc.
There are others that depend on extreme climatic conditions or particular materials, such
as:
Thermal shrinkage of bituminous materials;
Clay shrinkage of pavement courses.
These latter damages do not occur on the Ethiopian network. VIZIR is intended for
flexible pavements, and so does not cover the thermal shrinkage cracking of hydraulic
materials. If they had to be included, they would be in category B.
CRACKING OF LONGITUDINAL JOINT
This is a failure of bonding between two adjacent bands of coated
materials. This type of crack is initially single and straight, and can be
repaired by treatment specific to such cracking (severity 1). Traffic
causes the crack to branch or double and lose material at the edges
(severity 2, 3). Repairs are more costly: complete rebuilding of the
damaged zone or placement of a new wearing course.
Severity 1 Single hair line crack Photo 16
Severity 2 Branching crack Photo 17

Appendix Pavement Design Manual - 2014
Roads Development Agency Page A-23
Severity 3 Wide, branching crack with loss of materials Photo 18
POTHOLES
Potholes most often result from wear or destruction of the wearing course, sometimes
from the presence of foreign bodies in the surfacing.
They are small when they first appear. In the absence of maintenance, they grow and
reproduce in rows, often with a pitch equal to the circumference of a truck type.
Depending on the degree of severity of these potholes, it may be necessary to rebuild part
of the wearing course or, if they have become too deep, of the wearing course and
roadbase. In some cases, it may even be necessary to rebuild the whole pavement. If there
are too many potholes, it may be necessary to rebuild a considerable length of pavement.
The three levels of severity depend on the nature of the work:
Severity 1 Small number of potholes that can be plugged Photo 22
by ordinary patching
Severity 2 Large number of small potholes in surface Photo 23
Severity 3 Potholes or crazing formation – pavement Photo 30
must be rebuilt or overlaid
MOVEMENT OF MATERIAL: RAVELLING, FRETTING, BLEEDING, ETC.
Movements of materials include ravelling and bleeding: some ravelling is caused by
excessive wear of the wearing course and may lead to the formation of potholes. It is
normally counted as cracking or crazing.
Ravelling of severity 1 on crazing of severity 2, counted as Type A damage Photo
25
Other ravelling is caused by defective construction. The following damages are
distinguished:
Ravelling: more or less large losses of gravel from surface dressings (deficiency of
bonding, hence of the quality and/or quantity of bitumen);
Scabbing: loss of all or part of a thin (<3 cm) wearing course of coated materials and
separation from its substrate; this is often preceded by major cracking of the wearing
course;
Fretting: deficient implementation due to bad equipment operation: poor distribution
of bitumen by the sprayer, hence surface unequally covered by the bitumen or bad
gravel distribution on the pavement.
Bleeding: upward movement of excess bitumen in hot weather
Severity 1 Discontinuous ravelling of plucking type Photo 26
Severity 2 Continuous ravelling Photo 27

Appendix Pavement Design Manual - 2014
Page A-24 Roads Development Agency
Severity 1 Localised ravelling (scabbing) Photo 28
Severity 3 Very marked generalised fretting Photo 29
Severity 3 Generalised bleeding Photo 30
SHOULDER AND DITCH EROSION
There are other forms of damage that are specific to a climate, a country, or a given
traffic pattern and that may require rebuilding of the shoulders as part of maintenance:
Lacy edge: this damage occurs in pavements in which the roadbase and shoulders
are of the same type, and is caused by the frequent stopping of vehicles on the
shoulders. The extent of the damage is more important than its severity.
Severity 1 Onset of lacy edges Photo 31
Severity 2 Lace cutting more than 0.50 m into the pavement Photo 32
Severity 3 Extreme erosion approaching destruction of the pavement Photo 33
Low shoulders: this damage is caused by maintenance of the shoulders, which
gradually become lower than the pavement surface.
Severity 1 From 1 to 5 cm lower
Severity 2 From 5 to 10 cm lower Photo 34
Severity 3 More than 10 cm lower
Ditch and shoulder erosion: the erosion may take a number of forms (rainwash of
ditch; rainwash and destruction of ditch; destruction gravely endangering a part of the
pavement). The severity code follows this progression:
Severity 1 Erosion of ditch – repairs limited to ditch Photo 35
Severity 2 Erosion and rainwash of shoulder
Severity 3 Threat to or destruction of a part of the pavement Photo 36

Appendix
Pavement Design Manual – 2014
Roads Development Agency Page A-25
RUTTING DEFORMATION
Severity 1 Severity 1
Photo 1 Photo 4 The sag under a 1.5 m Localized subsidence straightedge is less than 2 cm. revealed by puddle
Severity 2 Severity 3
The sag is less than 4 cm.
Severity 3 Severity 3
Photo 6 Subsidence over a long stretch Photo 3 of pavement, The sag is greater than 5 cm. with depths exceeding 8 cm.
CRACKING
CRACKING
Photo 5 Ridge in centre of pavement; more
Than 10 cm thick but localized

Appendix Pavement Design Manual - 2014
Page A-26 Roads Development Agency
Severity 1 Severity 1
Photo 7 Photo 10 Single hairline longitudinal crack Longitudinal cracks
Severity 2 Severity 2
Photo 8 Photo 11 Branching longitudinal Clearly open longitudinal crack crack Severity 3 Severity 3
Photo 9 Photo 12 Highly branching longitudinal crack Branching and very open foreshadowing crazing longitudinal crack

Appendix
Pavement Design Manual – 2014
Roads Development Agency Page A-27
Severity 1 Severity 1
Photo 13 Photo 16 Fine crazing with large map Single fine centreline crack,
cracking straight
Severity 2 Severity 2
Photo 14 Photo 17 Crazing with medium map cracking, Branching centreline crack, cracks clearly open. no stripping.
Severity 3 Severity 3
Photo 15 Photo 18
Generalized crazing with fish net Wide branching centreline crack cracking; losses of materials with stripping
CRACKING AND CRAZING CRACKING OF LONGITUDINAL JOINT

Appendix Pavement Design Manual - 2014
Page A-28 Roads Development Agency
PATCHING POTHOLES Severity 1 Severity 1 Photo 19 Repair of wearing course: patching Photo 22
(Type B defect) A few small potholes
Severity 3 Severity 2 Photos 20-21 Photo 23 Structural defects of pavement Potholes small and shallow,
after repairs. but numerous.
Severity 3 Severity 3
Photo 24 Potholes forming in crazing; pavement must be
rebuilt or overlaid.

Appendix
Pavement Design Manual – 2014
Roads Development Agency Page A-29
RAVELLING, FRETTING, BLEEDING
RAVELLING, FRETTING, BLEEDING Severity 1 Severity 1
Photo 25 Photo 28 Isolated stripping on crazing Isolated stripping of scabbing type.
Severity 1 Severity 2
Photo 26
Discontinuous stripping Photo 29 of plucking type Very marked generalized fretting
Severity 2 Severity 2
Photo 27 Photo 30 Continuous stripping Very marked continuous bleeding without appearance of roadbase in wheel tracks.

Appendix Pavement Design Manual - 2014
Page A-30 Roads Development Agency

Appendix
Pavement Design Manual – 2014
Roads Development Agency Page A-31
LACY EDGE LOW SHOULDER
Severity 1 Severity 2
Photo 31 Photo 34 Lacy edge forming; damage Shoulder substantially lower than not clearly marked pavement (up to 10 cm).
Severity 2 Severity 1
Photo 32 Photo 35 Continuous marked Erosion of ditch. lacy edge
Severity 3 Severity 3
Photo 36 Photo 33 Destruction by undermining Disappearance of pavement. of shoulder.

Appendix Pavement Design Manual - 2014
Page A-32 Roads Development Agency
SURFACE DAMAGE SURFACE DAMAGE Rating 2 Rating 3
Hairline cracking in wheel tracks Pavement not cracked; If = 0
(severity 1), not very extensive. Highly localized rutting of
If = 1. pavement, rut depth < 4 cm
Pavement not deformed; Id = 0. (Severity 2); Id = 2.
Rating 2 Rating 4
Hair line cracking in wheel tracks
Continuous branching cracking and in vehicle centreline (Severity 1) rather extensive; If = 2 (severity 2); If = 4
Pavement not deformed; Id = 0. Pavement not deformed; Id = 0.
Rating 3 Rating 4
Pavement crazed with highly localized deformation.
Closely-spaced crazing
(severity 2); If = 2 Pavement not cracked; If = 0.
Deformation < 4 cm Pavement slightly deformed
(severity 2); Id = 2 (severity 1), continuously; Id = 3

Appendix
Pavement Design Manual – 2014
Roads Development Agency Page A-33
Rating 5 Rating 6
Closely-spaced crazing with losses
of materials (severity 3), Pavement not cracked,
continuous, If = 5. continuously deformed
Very slight localized deformation longitudinally (severity = 3);
of pavement; Id = 1. If = 0.
Pavement continuously
repaired.
Rating 5 Rating 7
Pavement badly cracked and
locally deformed, hair line cracking; If = 3 Pavement continuously rather large bsidences; Id = 2.
Rather closely spaced crazing and formed Intermediate rating 4. some losses of materials
Systematic repair of with Deep rutting (severity); Id=5.
edges of pavement.
(severity 2); If = 4. Final rating 5.
Rating 6 Rating 7
Pavement continuously crazed
and deformed. Pavement badly crazed (severity 3)
Rather closely spaced crazing with and deeply rutted (severity 3)
some losses of materials (severity 2), continuously; If = 5 If = 4. Id = 5
Slight rutting (severity 1); Id = 3

Appendix Pavement Design Manual - 2014
Page A-34 Roads Development Agency
Deformation due to loss Deformation due to
of material subsidence
Severity 1
Severity 2
Severity 3

Appendix
Pavement Design Manual – 2014
Roads Development Agency Page A-35
Deformation due to Potholes
rutting
Severity 1
Severity 2
Severity 3

Appendix Pavement Design Manual - 2014
Page A-36 Roads Development Agency
Corrugation Gullies
Severity 1
Severity 2
Severity 3

Appendix
Pavement Design Manual – 2014
Roads Development Agency Page A-37
Mud Water Cut

Appendix Pavement Design Manual - 2014
Page A-38 Roads Development Agency
Use of Damage Quantifiers to Determine Maintenance Needs
GENERAL
In the previous chapter, two types of damage have been distinguished (A and B). For
each type of damage, a scale of classification according to three levels of severity has
been provided. Each type of damage is accordingly quantified by two estimators:
its extent (length of road affected);
its severity.
VIZIR quantifies damage to estimate the quality of a pavement, investigated either in
connection with a road maintenance management study (network) or with a view to
particular work (route). In both cases, even if the levels of precision are different,
rehabilitation approaches must be identified.
In the case of type B damage, the maintenance approach follows from the identification
of the damage by itself, and no other parameters are needed for the diagnosis. For
example, centerline cracking requires bridging of the cracks, lacy edges require
rebuilding of the edges and shoulders, and so on.
This is not true of type A damage; the approach will depend on other factors, and the
diagnosis will be based on damage, bearing capacity, traffic, etc. It is therefore necessary
to establish an overall rating of visual condition, similar to the ratings or classes used for
the other parameters. Type A damage leads to major work such as rebuilding or
overlaying of the surfacing. This work remedies type B damage in passing: bridging a
centerline crack to prevent the infiltration of water is pointless if a wearing course is
going to be applied over the pavement. Generally, type B damage influences the type of
work done only if there is no type A damage (whence the choice of the order A and B)
and, conversely, the global visual index used to qualify the pavement counts only type A
damage.
DAMAGE INDEX IS
The global visual index Is is calculated for a specified length of road from three damage
groups:
cracking and crazing;
deformation and rutting;
repairs.
A cracking index If, depending on the severity and extent of cracking or crazing of the
length of road in question, is calculated first. When both cracking and crazing are
present, the larger of both values is used.
A deformation index Id, depending on the severity and extent of deformation and rutting
is then calculated in a similar manner.

Pavement Design Manual - 2014 Appendix
Roads Development Agency Page A-39
If and Id are combined in a first pavement quality index. It may, as appropriate, be
corrected to reflect the severity and extent of certain repairs. It has already been pointed
out that some repairs conceal pavement deficiencies, and so are treated as aggravating
factors when estimating surface quality.
This correction yields a global damage index Is that qualifies the pavement over the
length chosen for the calculation. Is ranges from 1 to 7. Ratings 1 and 2 reflect good
surface conditions that need no work (or at least on which work may safely be
postponed). Ratings 3 and 4 represent a rather intermediate surface condition, bad
enough to trigger maintenance work in the absence of any other consideration. Ratings 5,
6 and 7 represent very poor surface conditions requiring major maintenance or overlay
work.
The baseline length on which Is is calculated may depend on the type of study, the
database, other parameters included in the diagnosis, and the operator.
For studies of road maintenance management systems, which are global studies, the route
diagram is plotted to a scale of about 2 cm per km; the database itself is established with
a step on the order of 500 m. Is may therefore be calculated for 500 m lengths.
For route maintenance planning, the survey is plotted to a scale of about 5 cm per km,
and a 200 m step may be used for the calculation.
Finally, in the case of a test section, the route diagram is plotted to a scale of about 20 cm
per km; a high degree of precision is attained and Is may be calculated for 50 m lengths.
When the damage survey is done using DESYROUTE, the software of which includes
VIZIR, simply indicate, during data processing, the measurement length on which the
calculation should be based and the scale on which the route diagram should be printed
out.

Appendix Pavement Design Manual - 2014
Page A-40 Roads Development Agency
Figure 2 Principles of Determination of Surface Condition Rating
Extent and severity
of cracking:
cracking index
Extent and severity
of deformation:
deformation index
Surface condition rating
Possible correction
for repairs
Damage index
Is

Pavement Design Manual - 2014 Appendix
Roads Development Agency Page A-41
No cracking or deformation 0
V
isu
al E
xam
inat
ion
(1)
Extent
0 to
10%
10 to
50%
>50%
Deformation
Extent
0 to
10%
10 to
50%
> 50%
Severity
Severity
Cracking 1 1 3 3 Index 1 1 3 3
Index 2 2 3 4 2 2 3 4
If 3 3 4 5 Id 3 3 4 5
(1) Separate
calculation for
longitudinal
cracking and
crazing.
The larger of the
two indices is used.
Fir
st d
amag
e in
dex
If 0 1-2 3 4-5
Id
0 1 2 3 4
1-2 3 3 4 5
3 4 5 5 6
4-5 5 6 7 7
Extent
0 to 10% 10 to 50% > 50%
Severity
1 0 0 0
2 0 0 +1
3 0 +1 +1
Correction for repairs
Surface
Damage
Index
Is
Scale from (best) to 7 (worst)
Final rating
Figure 3.1 (from Ref. 12) Determination of Damage Index Is

Appendix Pavement Design Manual - 2014
Page A-42 Roads Development Agency
DEVELOPMENT OF SOLUTIONS
GENERAL
The development of maintenance or overlay solutions from a diagnosis combining a
visual examination with other parameters such as bearing capacity and traffic is not
independent of the context of the study. This section deals with the search for solutions in
the context of road maintenance management systems.
The methodology of the studies performed by the LCPC may be represented
schematically as follows:
a. Construction of a database, field survey of data, determination of network quality
at time t0
b. Analysis of data, determination of ―technical solution‖, i.e. what should be done
to the road network on the basis of its quality image at time t0 to restore a certain
level of service, in the absence of any budgetary constraints.
c. Search for an ―optimised solution‖ reflecting both technical requirements and
budgetary constraints, including staging of the work over several years, and time
projection of the image of the network at time t0 and of the technical solution.
For this, laws describing change against time must be available. The World
Bank’s HDM III model proposes such laws for developing countries.
The technical solution is determined in two stages.
First, ―visual condition‖ and ―bearing capacity‖ are combined; the bearing capacity is
indicated by the deflection value and the visual condition is represented by index Is as
determined in the previous section. The combination generates a pavement quality
rating on a scale from 1 to 9 and a conclusion as to what needs to be done: nothing,
maintenance or an overlay.
Then, in a second stage, the pavement quality rating and the level of traffic are
combined and the work to be done is decided for each pair of values.
PAVEMENT QUALITY RATING QI
The pavement quality rating Qi is estimated by combining the value of the Index Is
qualifying the pavement surface and the deflection value qualifying the combined
bearing capacity of the pavement and foundation soil.
Damage Index Is
The damage index is divided into three ranges:
Rating 1 or 2 Little or no cracking or deformation; good surface condition
requiring no (or only just requiring) immediate maintenance.

Pavement Design Manual - 2014 Appendix
Roads Development Agency Page A-43
Rating 3 or 4 Cracks with little or no deformation, or deformation without
cracking; intermediate surface condition, bad enough to trigger
maintenance work in the absence of any other consideration.
Rating 5, 6 or 7 Extensive cracking and deformation; poor surface condition
requiring major maintenance or overlay work.
Deflection
Deflection is also divided into three ranges, by thresholds d1 and d2:
d1 value above which pavement performance is generally good
d2 value above which pavement performance is poor
d1-d2 range of indecision.
The choice of thresholds d1 and d2 depends on many factors, such as climate, type and
thickness of pavement, soils, axle loads, and so on. These values are generally based on a
particular country’s experience. They may, where possible, be based on the examination
of control sections during the general study of the network. If values based on experience
are not available in a country, this calibration may be done during the study. As far as
Ethiopia is concerned, the issue of the determination of d1 and d2 is discussed in Part III
of the present manual.
Table 4 gives the pavement quality rating Qi as a function of the Index Is and the
deflection value. Three main ranges have to be considered:
Q1, Q2, and Q3 : these ratings mean that there is nothing that needs to be done, or
at most maintenance work depending on the traffic carried by the
road. When sealing is required, the cracking index is used to
determine the data and type of work.
Q7, Q8, and Q9 : these ratings mean that the pavement requires an overlay, the
thickness of which is determined by the traffic.
Q4, Q5, and Q6 : this is a zone of indetermination for which the index Is and the
deflection value seem inconsistent. These cases should be further
examined and eventually reclassified. The procedure is as follows:
Q4 : pavement with marked damage in spite of a good bearing
capacity. The validity of the deflection measurement should be
checked together with the nature of the damages (in particular
rutting layers of coated materials, unrelated to the deflection
measurement). Depending upon the answer, Q4 will be
reclassified as Q2 (priority to deflection) or Q7 (priority to
damage).
Q5 : same analysis as above; allowance will be made for the position
of the deflection with respect to the limits and to the traffic;
depending upon the answer, may be reclassified as Q3, Q7, or Q8.

Appendix Pavement Design Manual - 2014
Page A-44 Roads Development Agency
Q6 : pavement having a large deflection value without apparent
damage; to validate or unvalidate the surface condition, check the
age of the pavement or the date of the most recent work, together
with the traffic level. Depending upon the answer, may be
reclassified as Q3 or Q8.
* or other rehabilitation method
Figure 3.2Pavement Quality Rating (Qi) and Required Road Works
(adapted from Ref. 5)
Deflection d1 d2
Surface damage index Is
Q1
(maintenance)
Q3
(maintenance)
Q6
(to be
reclassified)
Q2
(maintenance)
Q5
(to be
reclassified)
Q8
(overlay)*
Q4
(to be
reclassified)
Q7
(overlay)*
Q9
(overlay)*
1 - 2
Little or no cracking or no deformation
3 - 4
Cracks with little or no deformation,
deformation without cracks
5 - 6 - 7
Cracks and deformation
Class 1 Class 2 Class 3

Pavement Design Manual - 2014 Appendix
Roads Development Agency Page A-45
APPENDIX I
FIELDWORK PAVEMENT CONDITION SURVEYS
Condition surveys are essentially required to assess a pavement’s
physical distress and form the basis of a diagnosis regarding the
maintenance or rehabilitation needs. Together with drainage,
destructive and non-destructive testing, they are mandatory before
rehabilitation design. Flexible Pavements
One of the stated objectives of the PMS within RDA is to provide a pavement condition
evaluation system. A condition survey conducted for a specific project, in order to be
compatible with the PMS of the network, must follow the same method. Also, by using
the same method, the results of the specific condition survey can be forwarded to the
PMS Branch and incorporated into the PMS Road Data Bank.
Following is a summarized description of the method of classification and quantification
of visible damage, adapted from the ―VIZIR method‖, as presented in the Manual of
Procedures for PMS (Ref 12) and copied in extension for reference in Appendix A.
General
The method of classification and quantification of damage is intended to provide a
picture of the road surface condition at the time of inspection and to identify zones of
equal quality (in terms of three damage levels). The damage is divided into two
categories:
Type A damage, which characterizes the structural condition of the pavement
and includes four types as follows:
- deformation
- rutting
- (fatigue) cracking
- crazing
Type B damage, generally unrelated to the pavement structural capacity. This
type of damage may be caused either by defective placement, or by deficient
materials quality, or by some special local condition, aggravated by traffic.
Type B damage includes:
- cracking other than fatigue cracking, i.e. longitudinal joints and transverse
thermal shrinkage cracks,
- potholes,
- ravelling and, more generally, all surfacing defects such as fretting,
bleeding, etc.
Survey and Grading of Damage
The survey is intended to record, for any damage:
its type
its severity
its extent, i.e. the length of road affected, or, as appropriate, the area

Appendix Pavement Design Manual - 2014
Page A-46 Roads Development Agency
It is to be noted that the method was designed for use with automatic data recording
equipment, which facilitates the recording of the distresses and the calculation of quality
ratings. Nevertheless, the survey can also be done manually. Two options are therefore
offered to the team in charge of the pavement condition survey:
Hiring the services of RDA’s PMS Branch personnel and use of its equipment;
or
Performing with its own forces the survey manually, while travelling the road
on foot or by car.
The severity of each type of damage is described in detail, in tabulated form as well as by
illustrations (photographs) in Appendix A. Following are some examples.
Description of Type A Damage
Rutting appears in wheel tracks about 50 to 80 cm from the pavement edge. It may be
due to settlement of the materials under heavily channelized traffic, or occasionally due
to creep within the bituminous layers only.
As an example, rutting is characterized by the following levels of severity:
Severity 1 h < 2 cm
Severity 2 2 cm < h < 4 cm (see Figure B.1)
Severity 3 4 cm < h
Where h is the depth of rutting measured by a straight edge. As indicated earlier,
complete illustrations and guidance regarding severity levels are given in Appendix C for
rutting, as well as for other types of Type A damage, and the user should refer to that
Appendix for complete details.
Figure I.1 Rutting – Severity Level 2

Pavement Design Manual - 2014 Appendix
Roads Development Agency Page A-47
Description of Type B Damage
Similarly, damage of Type B is characterized by a severity level, as detailed in Appendix
A. One example is that of cracking of longitudinal joints. This type of crack is initially
single and straight (Severity 1, e.g. Figure B.2). Under traffic, the crack evolves,
branches or doubles, and eventually loses material at the edges (Severity 2,3).
Figure I.2 Cracking – Severity Level 1
Rigid Pavements
As for flexible pavements, a visual condition (distress) survey is essential for planning
rehabilitation efforts. In order to make knowledgeable decisions, the engineer should
have the following information:
Distress type
Distress severity
Distress amount
The distress type will assist in defining probable cause(s) of the distress and ultimately
help in selecting a rehabilitation strategy suitable to repair and prevent the recurrence of
the problem. The distress is not necessarily related to traffic loads. Tables B.1 and B.2
(from Ref. 3) classify the distress types of jointed concrete and continuously reinforced
concrete pavements respectively.
The condition survey will also document the severity of the distress and provide a record
of the pavement condition at the time of the survey, including the location of the distress.
Thus, differences between sections of the pavement (or lanes) will become apparent and
guide in the rehabilitation design process.
Definitions of the major distress types and of severity levels suggested for use during the
condition survey are presented in Appendix D, together with recommended methods of
measurement (to record the distress amount).

Appendix Pavement Design Manual - 2014
Page A-48 Roads Development Agency
DRAINAGE SURVEY
In the design of pavement rehabilitation, the possible contribution of drainage
improvement should be investigated. The existing drainage of the pavement and
subgrade may be inadequate and the pavement distress may result from this condition or
be accelerated by it.
The pavement condition survey will often indicate moisture-related distress. Distress
types in flexible pavements which may either be caused or be accelerated by moisture
include stripping, rutting, depression, fatigue cracking and potholes. In rigid pavement,
they include pumping, ―D‖ cracking, joint deterioration, faulting and corner breaks.
Subsequent to the pavement condition survey and depending on whether or not drainage-
related distress is apparent, a determination needs to be made regarding the need for a
specific drainage survey.
Table I.1 General Categorization of Jointed Concrete Pavement Distress
(from Ref. 3)
Distress Type Primarily
Traffic Load Caused
Primarily
Climate/Materials
Caused
1. Blow-up X
2. Corner break X
3. Depression X
4. Durability ―D‖ cracking X
5. Faulting of transverse joints and cracks X
6. Joint load transfer associated distress X X
7. Joint seal damage of transverse joints X
8. Lane/shoulder dropoff or heave X
9. Lane/shoulder joint separation X
10. Longitudinal cracks X
11. Longitudinal joint faulting X X
12. Patch deterioration X (M, H) X (L)
13. Patch adjacent slab deterioration X X
14. Popouts X
15. Pumping and water bleeding X (M, H) X (L)
16. Reactive aggregate durability distress X
17. Scaling, map cracking and crazing X
18. Spalling (transverse and longitudinal
joints)
X (M, H) X (L, M. H)
19. Spalling (corner) X
20. Swell X
21. Transverse and diagonal cracks X (L, M, H) X (L)

Pavement Design Manual - 2014 Appendix
Roads Development Agency Page A-49
Table I.2 General Categorization of Continuously Reinforced Concrete
Pavement Distress (from Ref. 3)
Distress Type Primarily
Traffic Load Caused
Primarily
Climate/Materials
Caused
1. Asphalt patch deterioration X
2. Blow-up X
3. Concrete patch deterioration X (M, H) X (L)
4. Construction joint distress X
5. Depression X
6. Durability ―D‖ cracking X
7. Edge punchout X
8. Lane/shoulder dropoff or heave X
9. Lane/shoulder joint separation X
10. Localized distress X
11. Longitudinal cracking X
12. Longitudinal joint faulting X X
13. Patch adjacent slab deterioration X X
14. Popouts X
15. Pumping and water bleeding X (M, H) X (L)
16. Reactive aggregate distress X
17. Scaling, map cracking and crazing X
18. Spalling X X
19. Swell X
20. Transverse cracking X (M, H) X (L, M)
Note: L, M, H refer to low, medium and high severity levels.
It should be recognized that even when moisture-related distress is absent, drainage
deficiencies may exist which need to be corrected. Maintenance personnel regularly
involved with a particular section of road under evaluation should be consulted in this
regard, as they are a good source of relevant information.
The first step in drainage evaluation will include a review of the as-built documents
collected as part of the data collection discussed in Chapter 2. That will encompass the
determination of the initial drainage provisions, and examination of pavement cross-
sections and profiles. If moisture-related distress is apparent, then the original drainage
system is inadequate (due to design or present condition). The next step of the evaluation
will include an examination of topographical features. This may lead to discovering
streams or wet areas above the pavement elevation.
The drainage evaluation also requires a site investigation (preferably during a wet
season), with the aim of answering such questions as the following:
Where and how does water move across the pavement surface?
Where does water collect on and near the pavement?
How high is the water level in the ditches?
Do the joints and cracks contain any water?

Appendix Pavement Design Manual - 2014
Page A-50 Roads Development Agency
Does water pond on the shoulder?
Does water-loving vegetation flourish along the roadside?
Are deposits of fines or other evidence of pumping (blowholes) visible at the
pavement’s edge?
Do the inlets contain debris or sediment buildup?
Are the joints and cracks sealed well?
If the original drainage design appears adequate, the site investigation should also verify
that it has actually been entirely built as planned, and determine whether changes have
taken place since it was built.
Drainage problems often encountered include shallow side ditches, broken or clogged
pipes and outlets, permeable shoulders and slow draining aggregate roadbase with no
outlets or outlets of insufficient capacity.
Subgrade problems related to drainage include pockets of poor soils (e.g. saturated silts
and/or clays, or organic materials) and localized springs, groundwater seepage or non-
functioning subsurface drainage systems.
NDT DEFLECTION MEASUREMENTS
The use of non-destructive testing (NDT) for the measurement of pavement deflection
under applied loading has been part of the process of structural evaluation and
rehabilitation design for decades, using various types of equipment (e.g. Ref. 13). The
total deflection under load has been used as an indicator of the load-carrying capacity of
the pavement, especially for flexible pavements, by correlating allowable repetitions of
ESAs to the maximum deflection. This has later been refined by taking into consideration
only the ―rebound‖ or ―elastic‖ portion of the deflection as the key indicator of
performance, rather than the total deflection under load. Various methods utilizing
measurements of the slope (e.g. radius of curvature) of the deflection basin (or deflection
bowl) under load have also been developed to further characterize the pavement behavior
and structural capacity.
In this manual, emphasis is placed on measurements of the rebound deflection made by
means of a Benkelman Beam. This presents the advantages of a certain consistency with
the procedures of the PMS, a relatively simple field procedure, and a consistency with
the selected overlay design methods presented further in the manual. An alternate
deflection survey procedure is also outlined, using a Falling Weight Deflectometer
(FWD). This method, which is well-suited and actually intended to make use of
deflection bowl measurements, requires more logistical support and is more expensive.
It may be used with the explicit approval of RDA.
Benkelman Beam Rebound Deflection Testing Procedure
The following (adapted from Ref. 11) gives a procedure for determining the static
Benkelman Beam rebound deflection at a point on an asphalt pavement structure under
specified axle load, tire size, tire spacing and tire pressure. The absolute minimum
spacing of sample locations should be 100 m, on either side (in either direction) of the
road. Shorter intervals should be adopted if practical, and in areas of special concern
(particular distress).

Pavement Design Manual - 2014 Appendix
Roads Development Agency Page A-51
Equipment
Major equipment includes:
1. A Benkelman Beam as per AASHTO T256.
Painting the beam white or aluminum will reduce temperature effects.
2. A 4.5 metric tonne truck as the reaction load. The vehicle shall have an 8.2 tonne
load equally distributed on the two dual wheels of the rear axle. The clear
distance between two tires of each dual shall be a minimum of 50 mm. The tires
shall be 10.00 x 20, 12 ply, inflated to a pressure of 552 kPa. The use of tires with
tubes and rib treads is recommended.
3. Tire pressure-measuring gauge.
4. Standard Iron-Constantan thermocouple wire and a temperature potentiometer
(any other surface temperature measuring equipment that gives results
comparable to the thermocouple potentiometer equipment may be used).
Procedure
1. The preselected point to be tested is located (usually only the outside lane is
tested) and marked on the pavement. Points should be located 0.6 m from the
pavement edge if the lane width is less than 3.35 m; 0.9 m from the pavement
edge if the lane width is 3.35 m or more.
2. Center one set of dual wheels of the truck over the marked point. A location
within 75 mm of the point is acceptable.
3. Insert the probe of the Benkelman Beam between the dual wheels and place on
the selected sample point.
4. Remove the locking pin from the beam and adjust the front legs to permit
approximately 13 mm travel of the dial gauge stem.
5. Start the buzzer on the beam and record the initial dial reading.
6. Immediately after recording the reading, drive the truck slowly forward 9 m or
more.
7. Record the final dial reading. When the dial movement stops, stop the buzzer.
The dial movement may resume after a short pause, but no more readings are
necessary.
8. Measure the pavement surface temperature in the following manner:
One pavement surface temperature measurement an hour usually will be sufficient. Make the
measurement at the location currently being tested for deflection.

Appendix Pavement Design Manual - 2014
Page A-52 Roads Development Agency
a. At a point not less than 254 mm from the pavement’s edge, drive a small hole
into the pavement 3 mm in diameter and 3 mm in depth.
b. Fill the hole with water or asphalt. Insert a thermocouple with the wire bent
at right angles 5 mm from the end, 3 mm into the water or asphalt.
c. Read the temperature with a temperature potentiometer. At this time, also
record the air temperature.
9. Check the truck tire pressure once a day and correct to the 552 kPa standard
equipment, if necessary.
10. Determine the total thickness, to the nearest 25 mm of asphalt-bound components
in the pavement structure. This may be done from construction records (cf.
Chapter 2), by core drilling, or by a small excavation at the pavement’s edge.
Determine also the types and general condition of materials in the remainder of
the pavement structure, i.e., ―granular roadbase, wet‖ or ―granular subbase,
saturated and contaminated with silt from subgrade‖.
Calculations
Subtract the final dial reading from the initial dial reading and record. The total pavement
rebound deflection is twice the dial movement during the test (two-to-one is the usual
ratio for the Benkelman Beam; some models may be built with a different ratio).
Report
The report shall include the following:
Sample location
Total pavement rebound deflection
Pavement surface temperature
Air temperature
Asphalt pavement thickness
For rigid pavements, the deflection measurements using the Benkelman Beam are made
along the edge of the concrete slab, according to the following guidelines essentially
taken from those of the Asphalt Institute (Ref. 11):
For two-lane highways, the deflection measurements are made on the outside edge on
both sides of the centerline. For divided highways, deflections should be measured on the
outermost edge only. Additional deflection measurements should be made at corners,
joints, cracks, and deteriorated pavement areas, to determine load-transfer capability.
The total vertical movement in these areas is important, but the differential movement
from one slab to another is more important, because it may indicate the need for
undersealing. The differential movement is considered a measurement of the load-
transfer capability of the slab. Load-transfer is defined as the ratio of the deflection on
one side of the joint or crack to the deflection on the opposite side. This is illustrated in
Figure B.3.

Pavement Design Manual - 2014 Appendix
Roads Development Agency Page A-53
Figure I.3 Differential Deflection and Load Transfer (from Ref. 11)
The deflection testing procedure for rigid pavements is as follows:
The Benkelman Beam should be positioned on the shoulder as shown in Figure B.4.
Figure I.4 (after Ref. 11) Position of vehicle and Benkelman Beam for making
static rebound deflection measurements on rigid pavements.
Measurements should be made on either side of the joint or crack to determine the
parameters described in Figure B.3. They should be taken, to the extent practical, during
the most severe environmental circumstances, e.g. at the end of a wet season. A
suggested minimum spacing is 100 m, with more closely spaced sample locations where
cut and fill sections alternate rapidly.

Appendix Pavement Design Manual - 2014
Page A-54 Roads Development Agency
Falling Weight Deflectometer (FWD)
The Falling Weight Deflectometer (FWD) is classed as an impulse deflection device
providing a non-destructive means of determining a pavement response to dynamic
loading.
Various models and manufacturers (e.g. Dynatest, Foundation Mechanics, KUAB, etc.)
exist, which follow the same principle and provide similar information. A typical
arrangement is given schematically in Figure B.5.
Figure I.5 Falling Weight Deflectometer
Weights are raised to a predetermined height and allowed to fall on a specially-designed
plate, transmitting an impulse force to the pavement. The shape of the load pulse
obtained is somewhat similar to that obtained from a moving wheel load. Figure B.6
schematically illustrates a typical pavement structure under a FWD dynamic load. By
varying the weights dropped and the height from which they are dropped, the force
developed upon impulse can be varied, as can the range of wheel load effects simulated.
For instance, a typical dynamic force of 40 kN (a generally recommended magnitude)
applied to a 30 cm diameter disk by a dropping weight on the order of 60 kg is common.

Pavement Design Manual - 2014 Appendix
Roads Development Agency Page A-55
Usually, six or seven geophones (sensors, or velocity transducers) record the deflections
at offset distances from the center of load application. A typical configuration for flexible
pavements is given in Figure B.7.
Figure I.6 Schematic of Stress Zone within Pavement Structure under the FWD
Load (from Ref. 3)
Figure I.7 Deflection Sensors Configuration for Flexible Pavement Testing
The tests should be made in the outer wheelpath at intervals sufficient to adequately
assess conditions. Intervals of 25 m to 250 m are typical. Areas that are seriously

Appendix Pavement Design Manual - 2014
Page A-56 Roads Development Agency
deteriorated and obviously will require repairs should not be tested, or tested separately
so as not to influence statistical analyses of the results.
For rigid pavements, special test configurations can be used to evaluate joint load transfer
and for slab void detection. Some typical configurations are illustrated in Figure B.8.
Figure I.8 Deflection Sensors Configuration (Rigid Pavements)
The results of deflection are best analyzed by computer software to perform statistical
analyses and to back-calculate relevant pavement and subgrade support parameters.
Since the particular equipment used and the software vary, they should be submitted for
approval to RDA. For use with Dynatest and KUAB FWDs, a companion software
package to the AASHTO Guide (Ref. 3) is available (Ref. 14). The Guide also gives
equations which can be used, but only on a point-by-point basis, and are not practical for
use unless computerized (e.g., by spreadsheet programs).
EXISTING PAVEMENT STRUCTURE AND SUBGRADE ASSESSMENT
The data obtained from PMS records and the subsequent review of those records should
serve as the basis for the fieldwork. The PMS data can be reconfirmed by carrying out a
specific field study and reviewing the field data.
In general, field testing is categorized into two broad areas: nondestructive testing (NDT)
and destructive testing. Destructive tests (such as test pits, DCP tests) require the physical
removal of pavement layer material in order to obtain a sample (either disturbed or
undisturbed) or to conduct an in-situ test. Such testing has many disadvantages and

Pavement Design Manual - 2014 Appendix
Roads Development Agency Page A-57
limitations, particularly when conducted on moderate to heavily trafficked roadways.
Practical restraints in terms of time and money severely limit the number and variety of
destructive tests conducted on routine rehabilitation studies.
Nondestructive testing, on the other hand, does not necessitate physical disturbance of
the pavement. The most widely used form of NDT is associated with the field deflection
tests noted in Section B.3.
In spite of their disadvantages, destructive tests are the only definitive means of
determining pavement layer thicknesses and layer material type.
Test Pits
Test pits represent one of the common methods of investigation to determine the
thickness and type of the various pavement layers and to assess the subgrade. Samples
from each pavement layer and subgrade can be collected for visual inspection and
subsequent laboratory testing. The test results can be used in the rehabilitation design
analysis and to check conformance of the material with standard specifications. Test pits
shall be dug through the pavement layers and into the subgrade soil for a minimum total
depth of 0.80 m (alternatively, the pit should extend at least 0.20 m below subgrade
level).
The spacing of the test pits should depend on sound engineering judgement and be
guided by a prior review of all possible documents, as well as a visual pavement
condition survey.
However, as a general guideline, one test pit every 500 meters, alternating on either side
of the roadway, is recommended. The position of each test pit shall be accurately
determined and reported.
DCP Testing
DCP testing frequency can be the same as that of the test pits, i.e. every 500 m. In fact,
the DCP test location can be adjacent to the test pit location. However, as mentioned
before, depending on the pavement location, the frequency can be altered to better assess
the pavement and to optimize the testing program.
The DCP instrument is designed for the rapid in-situ measurement of the structural
properties of existing road pavements (with the exception of hard layers like concrete)
and subgrade. In cases of material that the DCP cannot penetrate, a hole can be drilled
through that layer using a suitable drill. Lower layers of the pavement can then be tested
in the normal way.
The DCP test results can be compared with the laboratory test results, and the data
collected from review of the possible documents, including PMS records. Additional
testing may be necessary in case of discrepancies to better evaluate pavement conditions.

Appendix Pavement Design Manual - 2014
Page A-58 Roads Development Agency
APPENDIX J
TYPICAL RIGID PAVEMENT DISTRESS
TYPE-SEVERITY DESCRIPTIONS
Name of Distress: Blow-up
Description:
Most blow-ups occur during the spring and hot summer at a transverse joint or wide
crack. Infiltration of incompressible materials into the joint or crack during cold periods
results in high compressive stresses in hot periods. When this compressive pressure
becomes too great, a localized upward movement of the slab or shattering occurs at the
joint or crack. Blow-ups are accelerated due to a spalling away of the slab at the bottom,
creating reduced joint contact area. The presence of ―D‖ cracking or freeze-thaw damage
also weakens the concrete near the joint, resulting in increased spalling and blow-up
potential.
Severity Levels:
L—Blow-up has occurred, but only causes some bounce of the vehicle which creates no
discomfort.
M—Blow-up causes a significant bounce of the vehicle which creates some discomfort.
Temporary patching may have been placed because of the blow-up.
H—Blow-up causes excessive bounce of the vehicle, which creates substantial discomfort
and/or a safety hazard and/or vehicle damage, requiring a reduction
HOW TO MEASURE:
BLOW-UPS ARE MEASURED BY COUNTING THE NUMBER EXISTING IN EACH UNIFORM
SECTION. SEVERITY LEVEL IS DETERMINED BY RIDING IN A MID- TO FULL-SIZED SEDAN
WEIGHING APPROXIMATELY 13.3-16.9 KN OVER THE UNIFORM SECTION AT THE POSTED
SPEED LIMIT. THE NUMBER IS NOT AS IMPORTANT AS THE FACT THAT INITIAL BLOW-UPS
SIGNAL A PROBLEM WITH ―LENGTHENING‖ OR GRADUAL DOWNHILL MOVEMENT—AND
OTHERS SHOULD BE EXPECTED TO OCCUR UNTIL THE MAXIMUM DISTANCE IS DOWN TO 300
METERS BETWEEN BLOW-UPS, THE DISTANCE REQUIRED TO DEVELOP FULL RESTRAINT OF
AN INTERIOR SECTION.
NAME OF DISTRESS: CORNER BREAK
DESCRIPTION:
A CORNER BREAK IS A CRACK THAT INTERSECTS THE JOINTS AT A DISTANCE LESS THAN 1.8
M ON EACH SIDE, MEASURED FROM THE CORNER OF THE SLAB. A CORNER BREAK EXTENDS
VERTICALLY THROUGH THE ENTIRE SLAB THICKNESS. IT SHOULD NOT BE CONFUSED WITH A
CORNER SPALL, WHICH INTERSECTS THE JOINT AT AN ANGLE THROUGH THE SLAB AND IS

Pavement Design Manual - 2014 Appendix
Roads Development Agency Page A-59
TYPICALLY WITHIN 0.3 M FROM THE SLAB CORNER. HEAVY REPEATED LOADS, COMBINED
WITH PUMPING, POOR LOAD TRANSFER ACROSS THE JOINT, AND THERMAL CURLING AND
MOISTURE WARPING STRESSES, RESULT IN CORNER BREAKS.
SEVERITY LEVELS:
L—CRACK IS TIGHT (HAIRLINE). WELL-SEALED CRACKS ARE CONSIDERED TIGHT. NO
FAULTING OR BREAK-UP OF BROKEN CORNER EXISTS. CRACK IS NOT SPALLED.
M—CRACK IS WORKING AND SPALLED AT MEDIUM SEVERITY, BUT BREAK-UP OF
BROKEN CORNER HAS NOT OCCURRED. FAULTING OF CRACK OR JOINT IS LESS THAN
13 MM. TEMPORARY PATCHING MAY HAVE BEEN PLACED BECAUSE OF CORNER
BREAK.
H—CRACK IS SPALLED AT HIGH SEVERITY, THE CORNER PIECE HAS BROKEN INTO TWO
OR MORE PIECES, OR FAULTING OF CRACK OR JOINT IS MORE THAN 13 MM.
HOW TO MEASURE:
CORNER BREAKS ARE MEASURED BY COUNTING THE NUMBER THAT EXISTS IN THE UNIFORM
SECTION. DIFFERENT LEVELS OF SEVERITY SHOULD BE COUNTED AND RECORDED
SEPARATELY. CORNER BREAKS ADJACENT TO A PATCH WILL BE COUNTED AS “PATCH ADJACENT
SLAB DETERIORATION”.
Name of Distress: Depression
Description:
Depressions in concrete pavements are localized settled areas. There is generally
significant slab cracking in these areas, due to uneven settlement. The depressions can be
located by stains caused by oil droppings from vehicles and by riding over the pavement.
Depressions can be caused by settlement or consolidation of the foundation soil, or can
be ―built-in‖ during construction. They are frequently found near culverts. This is usually
caused by poor compaction of soil around the culvert during construction. Depressions
cause slab cracking, roughness, and hydroplaning when filled with water of sufficient
depth.
Severity Levels:
L—Depression causes a distinct bounce of vehicle which creates no discomfort.
M—Depression causes significant bounce of the vehicle, which creates some
discomfort.
H—Depression causes excessive bounce of the vehicle, which creates substantial
discomfort, and/or a safety hazard, and/or vehicle damage, requiring a reduction
in speed for safety.
How to Measure:
Depressions are measured by counting the number that exists in each uniform section.
Each depression is rated according to its level of severity. Severity level is determined by
riding in a mid- to full-sized sedan weighing approximately 13.3-16.9 kN over the
uniform section at the posted speed limit.

Appendix Pavement Design Manual - 2014
Page A-60 Roads Development Agency
Name of Distress: Durability (“D”) Cracking
Description:
―D‖ cracking is a series of closely-spaced, crescent-shaped hairline cracks that appear at
a PCC pavement slab surface adjacent and roughly parallel to transverse and longitudinal
joints, transverse and longitudinal cracks, and the free edges of pavement slab. The fine
surface cracks often curve around the intersection of longitudinal joints/cracks and
transverse joints/cracks. These surface cracks often contain calcium hydroxide residue,
which causes a dark coloring of the crack and immediate surrounding area. This may
eventually lead to disintegration of the concrete within 0.3 to 0.6 m or more of the joint
or crack, particularly in the wheelpaths. ―D‖ cracking is caused by freeze-thaw expansive
pressures of certain types of coarse aggregates and typically begins at the bottom of the
slab, which disintegrates first. Concrete durability problems caused by reactive
aggregates are rated under ―Reactive Aggregate Distress‖.
Severity Levels:
L—The characteristic pattern of closely-spaced fine cracks has developed near joints,
cracks, and/or free edges; however, the width of the affected area is generally <30
cm wide at the center of the lane in transverse cracks and joints. The crack pattern
may fan out at the intersection of transverse cracks/joints with longitudinal
cracks/joints. No joint/crack spalling has occurred, and no patches have been
placed for ―D‖ cracking.
M—The characteristic pattern of closely-spaced cracks has developed near the crack,
joint, or free edge and: (1) is generally wider than 30 cm at the center of the lane
in transverse cracks and/or joints; or (2) low- or medium-severity joint/crack or
corner spalling has developed in the affected area; or (3) temporary patches have
been placed due to ―D‖ cracking-induced spalling.
H—The pattern of fine cracks has developed near joints or cracks and (1) a high
severity level of spalling at joints/cracks exists and considerable material is loose
in the affected area; or (2) the crack pattern has developed generally over the
entire slab area between cracks and/or joints.
How to Measure:
―D‖ cracking is measured by counting the number of joints or cracks (including
longitudinal) affected. Different severity levels are counted and recorded separately. ―D‖
cracking adjacent to a patch is rated as patch-adjacent slab deterioration. ―D‖ cracking
should not be counted if the fine crack pattern has not developed near cracks, joints, and
free edges. Popouts and discoloration of joints, cracks, and free edges may occur without
―D‖ cracking.

Pavement Design Manual - 2014 Appendix
Roads Development Agency Page A-61
Name of Distress: Faulting of Transverse Joints and Cracks
Description:
Faulting is the difference of elevation across a joint or crack. Faulting is caused in part by
a buildup of loose materials under the approach slab near the joint or crack, as well as
depression of the leave slab. The buildup of eroded or infiltrated materials is caused by
pumping from under the leave slab and shoulder (free moisture under pressure) due to
heavy loadings. The warp and/or curl upward of the slab near the joint or crack due to
moisture and/or temperature gradient contributes to the pumping condition. Lack of load
transfer contributes greatly to faulting.
Severity Levels:
Severity is determined by the average faulting over the joints within the sample unit.
How to Measure:
Faulting is determined by measuring the difference in elevation of slabs at transverse
joints for the slabs in the sample unit. Faulting of cracks is measured as a guide to
determine the distress level of the crack. Faulting is measured 30 cm in from the outside
(right) slab edge on all lanes except the innermost passing lane. Faulting is measured 30
cm in from the inside (left) slab edge on the inner passing lane. If temporary patching
prevents measurement, proceed on to the next joint. Sign convention: + when approach
slab is higher than departure slab, – when the opposite occurs. Faulting never occurs in
the opposite direction.
Name of Distress: Joint Load Transfer System Associated Deterioration (Second
Stage Cracking)
Description:
This distress develops as a transverse crack a short distance (e.g., 23 cm) from a
transverse joint at the end of joint dowels. This usually occurs when the dowel system
fails to function properly due to extensive corrosion or misalignment. It may also be
caused by a combination of smaller diameter dowels and heavy traffic loadings.
Severity Levels:
L—Hairline (tight) crack with no spalling or faulting or well-sealed crack with no
visible faulting or spalling.
M—Any of the following conditions exist: the crack has opened to a width less than
25 mm; the crack has faulted less than 13 mm; the crack may have spalled to a
low- or medium-severity level; the area between the crack and joint has started to
break up, but pieces have not been dislodged to the point that a tire damage or
safety hazard is present; or temporary patches have been placed due to this joint
deterioration.
Appendix Pavement Design Manual - 2014
Page A-62 Roads Development Agency
H—Any of the following conditions exist: a crack with width of opening greater than
25 mm; a crack with a high-severity level of spalling; a crack faulted 13 mm or
more; or the area between the crack and joint has broken up and pieces have been
dislodged to the point that a tire damage or safety hazard is present.
How to Measure:
The number of joints with each severity level are counted in the uniform section.
Name of Distress: Joint Seal Damage of Transverse Joints
Description:
Joint seal damage exists when incompressible materials and/or water can infiltrate into
the joints. This infiltration can result in pumping, spalling, and blow-ups. A joint sealant
bonded to the edges of the slabs protects the joints from accumulation of incompressible
materials and also reduces the amount of water seeping into the pavement structure.
Typical types of joint seal damage are: (1) stripping of joint sealant, (2) extrusion of joint
sealant, (3) weed growth, (4) hardening of the filler (oxidation), (5) loss of bond to the
slab edges, and (6) lack or absence of sealant in the joint.
Severity Levels:
L—Joint sealant is in good condition throughout the section with only a minor
amount of any of the above types of damage present. Little water and no
incompressibles can infiltrate through the joint.
M—Joint sealant is in fair condition over the entire surveyed section, with one or
more of the above types of damage occurring to a moderate degree. Water can
infiltrate the joint fairly easily; some incompressibles can infiltrate the joint.
Sealant needs replacement within 1 to 3 years.
H—Joint sealant is in poor condition over most of the sample unit, with one or more
of the above types of damage occurring to a severe degree. Water and
incompressibles can freely infiltrate the joint. Sealant needs immediate
replacement.
How to Measure:
Joint sealant damage of transverse joints is rated based on the overall condition of the
sealant over the entire sample unit.
Name of Distress: Lane/Shoulder Drop-Off or Heave
Description:
Lane/shoulder drop-off or heave occurs when there is a difference in elevation between
the traffic lane and shoulder. Typically, the outside shoulder settles due to consolidation
or a settlement of the underlying granular or subgrade material or pumping of the
underlying material. Heave of the shoulder may occur due to frost action or swelling

Pavement Design Manual - 2014 Appendix
Roads Development Agency Page A-63
soils. Drop-off of granular or soil shoulder is generally caused from blowing away of
shoulder material from passing trucks.
Severity Levels:
Severity level is determined by computing the mean difference in elevation between the
traffic lane and shoulder.
How to Measure:
Lane/shoulder drop-off or heave is measured in the sample unit at all joints when joint
spacing is > 15 m, at every third joint when spacing is < 15 m. It is also measured at mid-
slab in each slab measured at the joint. The mean difference in elevation is computed
from the data and used to determine severity level. Measurements at joints are made 0.3
m from the transverse joint on the departure slab only on the outer lane/shoulder.
Name of Distress: Lane/Shoulder Joint Separation
Description:
Lane/shoulder joint separation is the widening of the joint between the traffic lane and
the shoulder, generally due to movement in the shoulder. If the joint is tightly closed or
well-sealed so that water cannot easily infiltrate, then lane/shoulder joint separation is not
considered a distress.
Severity Levels:
No severity level is recorded if the joint is tightly sealed.
L—Some opening, but less than or equal to 3 mm.
M—More than 3 mm, but equal or less than 10 mm opening.
H—More than 10 mm opening. Gravel or sod shoulders are rated as high.
How to Measure:
Lane/shoulder joint separation is measured and recorded in mm near transverse joints and
at mid-slab. The mean separation is used to determine the severity level.
Name of Distress: Longitudinal Cracks
Description:
Longitudinal cracks occur generally parallel to the centerline of the pavement. They are
often caused by improper construction of longitudinal joints or by a combination of
heavy load repetition, loss of foundation support, and thermal and moisture gradient
stresses.

Appendix Pavement Design Manual - 2014
Page A-64 Roads Development Agency
Severity Levels:
L—Hairline (tight) crack with no spalling or faulting, or a well-sealed crack with no
visible faulting or spalling.
M—Working crack with a moderate or less severity spalling and/or faulting less than
12 mm.
H—A crack with width greater than 25 mm; a crack with a high-severity level of
spalling; or a crack faulted 13 mm or more.
How to Measure:
Cracks are measured in meters for each level of distress. The length and average severity
of each crack should be identified and recorded.
Name of Distress: Longitudinal Joint Faulting
Description:
Longitudinal joint faulting is a difference in elevation of two traffic lanes measured at the
longitudinal joint. It is caused primarily by heavy truck traffic and settlement of the
foundation.
Severity Levels:
Severity level is determined by measuring the maximum fault.
How to Measure:
Where the longitudinal joint has faulted, the length of the affected area and the maximum
joint faulting is recorded.
Name of Distress: Patch Deterioration (including replaced slabs)
Description:
A patch is an area where a portion or all of the original slab has been removed and
replaced with a permanent type of material (e.g., concrete or hot-mixed asphalt). Only
permanent patches should be considered.
Severity Levels:
L—Patch has little or no deterioration. Some low severity spalling of the patch edges
may exist. Faulting across the slab-patch joints must be less than 6 mm. Patch is
rated low severity even if it is in excellent condition.
M—Patch has cracked (low severity level) and/or some spalling of medium-severity
level exists around the edges. Minor rutting may be present. Faulting of 6-19 mm

Pavement Design Manual - 2014 Appendix
Roads Development Agency Page A-65
exists. Temporary patches may have been placed because of permanent patch
deterioration.
H—Patch has deteriorated by spalling, rutting, or cracking within the patch to a
condition which requires replacement.
How to Measure:
The number of patches within each uniform section is recorded. Patches at different
severity levels are counted and recorded separately. Additionally, the approximate area
(in square meters) of each patch and type (i.e., PCC or asphalt) is recorded. All patches
are rated either L, M, or H.
Name of Distress: Patch Adjacent Slab Deterioration
Description:
Deterioration of the original concrete slab adjacent to a permanent patch is given the
above name. This may be in the form of spalling of the slab at the slab/patch joint, ―D‖
cracking of the slab adjacent to the patch, a corner break in the adjacent slab, or a second
permanent patch placed adjacent to the original patch.
Severity Levels:
Severity levels are the same as that described for the particular distress found. A second
permanent patch, placed adjacent to a previously-placed permanent patch, will be rated
here as medium severity. Temporary patches placed because of this deterioration will
also be rated here as medium severity.
How to Measure:
The number of permanent patches with distress in the original slab adjacent to the patch
at each severity level will be counted and recorded separately. Additionally, the type of
patch (AC or PCC) and distress will be recorded separately.
Name of Distress: Popouts
Description:
A popout is a small piece of concrete that breaks loose from the surface due to freeze-
thaw action, expansive aggregates, and/or nondurable materials. Popouts may be
indicative of unsound aggregates and ―D‖ cracking. Popouts typically range from
approximately 25 mm to 10 cm in diameter and from 13 to 51 mm deep.
Severity Levels:
No degrees of severity are defined for popouts. The average popout density must exceed
approximately one popout per square meter over the entire slab area before they are
counted as a distress.

Appendix Pavement Design Manual - 2014
Page A-66 Roads Development Agency
How to Measure:
The density of popouts can be determined by counting the number of popouts per square
meter of surface in areas having typical amounts.
Name of Distress: Pumping and Water Bleeding:
Description:
Pumping is the movement of material by water pressure beneath the slab when it is
deflected under a heavy moving wheel load. Sometimes the pumped material moves
around beneath the slab, but often it is ejected through joints and/or cracks (particularly
along the longitudinal lane/shoulder joint with an asphalt shoulder). Beneath the slab
there is typically particle movement counter to the direction of traffic across a joint or
crack that results in a buildup of loose materials under the approach slab near the joint or
crack. Many times, some fine materials are pumped out, leaving a thin layer of relatively
loose clean sand and gravel beneath the slab, along with voids causing loss of support.
Pumping occurs even in pavement sections containing stabilized subbases.
Water bleeding occurs when water seeps out of joints and/or cracks. Many times it drains
out over the shoulder in low areas.
Severity Levels:
L—Water is forced out of a joint or crack when trucks pass over the joints or cracks;
water is forced out of the lane/shoulder longitudinal joint when trucks pass along
the joint; or water bleeding exists. No fines can be seen on the surface of the
traffic lanes or shoulder.
M—A small amount of pumped material can be observed near some of the joints or
cracks on the surface on the traffic lane or shoulder. Blow holes may exist.
H—A significant amount of pumped materials exist on the pavement surface of the
traffic lane or shoulder along the joints or cracks.
How to Measure:
If pumping or water bleeding exists anywhere in the sample unit, it is counted as
occurring at highest severity level, as defined above.
Name of Distress: Reactive Aggregate Distresses
Description:
Reactive aggregates either expand in alkaline environments or develop prominent
siliceous reaction rims in concrete. It may be an alkali-silica reaction or an alkali-
carbonate reaction. As expansion occurs, the cement matrix is disrupted and cracks. It
appears as a map-cracked area; however, the cracks may go deeper into the concrete than

Pavement Design Manual - 2014 Appendix
Roads Development Agency Page A-67
in normal map cracking. It may affect most of the slab or it may first appear at joints and
cracks.
Severity Levels:
Only one level of severity is defined. If alkali-aggregate cracking occurs anywhere in the
slab, it is counted. If the reaction has caused spalling or map cracking, these are also
counted.
How to Measure:
Reactive-aggregate distress is measured in square feet or square meters.
Name of Distress: Scaling and Map Cracking or Crazing
Description:
Scaling is the deterioration of the upper 3 to 13 cm of the concrete slab surface. Map
cracking or crazing is a series of fine cracks that extend only into the upper surface of the
slab surface. Map cracking or crazing is usually caused by overfinishing of the slab and
may lead to scaling of the surface. Scaling can also be caused by reinforcing steel being
too close to the surface.
Severity Levels:
L—Crazing or map cracking exists; the surface is in good condition with no scaling.
M/H—Scaling exists.
How to Measure:
Scaling and map cracking or crazing are measured by area of slab in square meters.
Name of Distress: Spalling (Transverse and Longitudinal Joint/Crack):
Description:
Spalling of cracks and joints is the cracking, breaking or chipping (or fraying) of the slab
edges within 0.6 m of the joint/crack. A spall usually does not extend vertically through
the whole slab thickness but extends to intersect the joint at an angle. Spalling usually
results from (1) excessive stresses at the joint or crack caused by infiltration of
incompressible materials and subsequent expansion, (2) disintegration of the concrete
from freeze-thaw action of ―D‖ cracking, (3) weak concrete at the joint (caused by
honeycombing), (4) poorly designed or constructed load transfer device (misalignment,
corrosion), and/or (5) heavy repeated traffic loads.
Severity Levels:
L—The spall or fray does not extend more than 8 cm on either side of the joint or
crack. No temporary patching has been placed to repair the spall.

Appendix Pavement Design Manual - 2014
Page A-68 Roads Development Agency
M—The spall or fray extends more than 8 cm on either side of the joint or crack.
Some pieces may be loose and/or missing, but the spalled area does not present a
tire damage or safety hazard. Temporary patching may have been placed because
of spalling.
H—The joint is severely spalled or frayed to the extent that a tire damage or safety
hazard exists.
How to Measure:
Spalling is measured by counting and recording separately the number of joints with each
severity level. If more than one level of severity exists along a joint, it will be recorded as
containing the highest severity level present. Although the definition and severity levels
are the same, spalling of cracks should not be recorded. The spalling of cracks is included
in rating severity levels of cracks. Spalling of transverse and longitudinal joints will be
recorded separately. Spalling of the slab edge adjacent to a permanent patch will be
recorded as patch adjacent slab deterioration. If spalling is caused by ―D‖ cracking, it is
counted as both spalling and ―D‖ cracking at appropriate severity levels.
Name of Distress: Spalling (Corner):
Description:
Corner spalling is the raveling or breakdown of the slab within approximately 0.3 m of
the corner. However, corner spalls with both edges less than 8 cm long will not be
recorded. A corner spall differs from a corner break in that the spall usually angles
downward at about 45° to intersect the joint, while a break extends vertically through the
slab. Corner spalling can be caused by freeze-thaw deterioration, ―D‖ cracking, and
other factors.
Severity Levels:
L—Spall is not broken into pieces and not loose.
M—One of the following conditions exists: Spall is broken into pieces; cracks are
spalled; some or all pieces are loose or absent but do not present tire damage or
safety hazard; or spall is patched.
H—Pieces of the spall are missing to the extent that the hole presents a tire damage
or safety hazard.
How to Measure:
Corner spalling is measured by counting and recording separately the number of corners
spalled at each severity level within the sample unit.

Pavement Design Manual - 2014 Appendix
Roads Development Agency Page A-69
Name of Distress: Swell
Description:
A swell is an upward movement or heave of the slab surface, resulting in a sometimes
sharp wave. The swell is usually accompanied by slab cracking. It is usually caused by
frost heave in the subgrade or by an expansive soil. Swells can often be identified by oil
droppings on the surface as well as riding over the pavement in a vehicle.
Severity Levels:
L—Swell causes distinct bounce of the vehicle which causes no discomfort.
M—Swell causes significant bounce of the vehicle which creates some discomfort.
H—Swell causes excessive bounce of the vehicle which creates substantial
discomfort, and/or a safety hazard, and/or vehicle damage, requiring a reduction
in speed for safety.
How to Measure:
The number of swells within the uniform section are counted and recorded by severity
level. Severity levels are determined by riding in a mid- to full-sized sedan weighing
approximately 13.3-16.9 kN over the uniform section at the posted speed limit.
Name of Distress: Transverse and Diagonal Cracks
Description:
Linear cracks are caused by one or a combination of the following: heavy load repetition,
thermal and moisture gradient stresses, and drying shrinkage stresses. Medium- or high-
severity cracks are working cracks and are considered major structural distresses. They
may sometimes be due to deep-seated differential settlement problems. (NOTE: Hairline
cracks that are less than 1.8 m long are not rated.)
Severity Levels:
L—Hairline (tight) crack with no spalling or faulting, a well-sealed crack with no
visible faulting or spalling.
M—Working crack with low- to medium-severity level of spalling, and/or faulting
less than 13 mm. Temporary patching may be present.
H—A crack with width of greater than 25 mm; a crack with a high-severity level of
spalling; or a crack faulted 13 mm or more.
How to Measure:
The number and severity level of each crack should be identified and recorded. If the
crack does not have the same severity level along the entire length, the crack is rated at
the highest severity level present. Cracks in patches are recorded under patch
deterioration.

Appendix Pavement Design Manual - 2014
Page A-70 Roads Development Agency
APPENDIX K
METHOD FOR PREDICTING MEAN PAVEMENT
TEMPERATURE (adapted from Ref. 1)
Definition and Purpose:
Mean pavement temperature is an average of the temperatures at the surface, mid-depth,
and bottom of the asphalt-bound portion of the pavement, even though it may have been
placed in several layers and at different times.
The mean pavement temperature is used to find a Temperature Adjustment Factor,
required for adjusting pavement deflection values to a standard temperature of 21°C, as
indicated in Step 1 of Appendix B.2 of the manual.
Information Required:
The temperature prediction method requires five items of information:
1. Location of test site—for identification of test data to guide in selection of the
weather station from which air temperature data must be obtained.
2. Date of test—required to indicate the dates on which air temperature will be needed
for pavement temperature adjustment.
3. Maximum and minimum air temperature—needed for each of the five days
immediately prior to the date of deflection testing to provide an air-temperature
history at the test site.
4. Pavement surface temperature—measured at the time the deflection test is performed.
5. Thickness of asphalt-bound portion of the pavement—required for selection of the
proper curves on the pavement temperature chart.
All information listed above, except Item 3, is recorded during performance of the
Benkelman beam deflection survey.
Item 3, the five days of air temperature history, prior to the date of the deflection
measurements, can be obtained in one of three ways.
1. Hourly air temperatures may be read and recorded for a period of five days preceding
each test location in the general vicinity where deflection measurements are made.
From these data the maximum and minimum daily temperatures are determined.
2. Obtain from the nearest weather station the maximum and minimum air temperatures
for each of the five days preceding each day of testing. This station should be in a
location that records essentially the same temperature readings as at the test site.
3. Obtain the maximum and minimum air temperatures for each of the five days
preceding each day of testing from published weather bureau (or similar agency)
data. This is the most practical approach if the evaluation of test results is needed
immediately.

Pavement Design Manual - 2014 Appendix
Roads Development Agency Page A-71
When the five-day air temperature history has been obtained, the average of the ten
values is determined. This average is used, together with pavement surface temperature
to estimate the pavement temperature at any depth. Surface temperature is measured and
recorded when the deflection test is performed. The date and time of these are also
recorded.
Surface temperature may be measured by inserting a thermometer or thermocouple into a
small, 6mm± deep hole or indentation in the surface of the pavement. The hole should be
filled with water or asphalt, which should be allowed to come to equilibrium before the
temperature is read.
Prediction of Mean Pavement Temperature:
Relationships between pavement surface temperature, air-temperature history, and
pavement temperature at any depth have been derived and are shown in condensed form
in Figure D-1. It should be used for overlay design only. Pavement temperatures at
various depths can be estimated by applying the required information to this chart.
The first step is to add the five-day air temperature history (average of maximum and
minimum air temperatures for five days preceding the test) and the pavement surface
temperature to determine the value with which to enter the chart. Then, the Mean
Pavement Temperature is estimated:
(a) Determine pavement thickness and mid-depth.
(b) Enter Figure D-1 on the horizontal scale with the pavement surface temperature.
Extend a line vertically to intersect the depth lines. Extend lines horizontally from the
depth representing the bottom of the layer to intersect the vertical scale. Interpolate
between the depth lines as necessary.
(c) The sum of the surface temperature, mid-depth temperature, and bottom temperature
is averaged to provide the Mean Pavement Temperature.
(d) The Mean Pavement Temperature is used to enter Figure 4.1 in the Manual to obtain
a temperature adjustment factor for Benkelman beam deflection readings.

Appendix Pavement Design Manual - 2014
Page A-72 Roads Development Agency
Figure K.1 Predicted Pavement Temperature
Example
Given: Asphalt concrete pavement 10cm thick. Surface temperature is 31°C. Average air
temperature for 5 days preceding the test is 22°C. The adjusted surface temperature is 31
+ 22 = 53°C (surface temperature plus 5-day average air temperature). Find predicted
pavement mean temperature.
1. Surface temperature = 31°C
2. Temperature at 5cm depth = 30°C (From Figure D-1)
3. Temperature at 10cm depth = 27°C (From Figure D-1)
4. Pavement mean temperature =
31° + 30° + 27° = 29°
3
(Use this temperature in Figure 4.1 of the manual to find temperature adjustment factor, F.)

Pavement Design Manual - 2014 Appendix
Roads Development Agency Page A-73
APPENDIX L DERIVATION OF SNnew, STRUCTURAL NUMBER
OF A NEW PAVEMENT
SNnew is required in the component analysis procedure (Section 4.1 of the manual) to
determine a required asphalt overlay thickness. SNnew is computed in three steps as
follows:
Step 1: Select an appropriate required structure of a new pavement for the specific
subgrade strength and traffic applicable to the project, in accordance with the
procedure detailed in RDA’s Pavement Design Manual-2014. The structure selected
is characterized by the thicknesses Ti of its component layers, i.e. T1, T2, T3=
thicknesses of required pavement surfacing, roadbase and subbase layers
respectively.
Step 2: To each of the layers determined in Step 1, assign an appropriate structural
layer coefficient ai.
The following structural layer coefficients are recommended:
- Bituminous surface: a1 = 0.44
- Bituminous roadbase: a1 = 0.30 (note: use 0.25 for in-place recycled materials)
- Cement or lime stabilized roadbase: a2 = 0.15 to 0.20
- Granular roadbase: a2 = 0.14
- Cement or lime stabilized subbase: a3 = 0.12
- Granular subbase: a3 = 0.11
- Granular capping layer: a3 = 0.09
Step 3: compute SNnew as:
SNnew = a1T1 + a2T2 + a3T3
Example
The example of Section 4.1 is considered: subgrade strength class S4, anticipated future
traffic class T6.
Step 1:
An adequate new pavement structure consists of:
10 cm AC surfacing
20 cm granular roadbase
17.5 cm subbase
Step 2:
Structural layer coefficients are assigned as follows: a1 = 0.44; a2 = 0.14; a3 = 0.11
Step 3:
SNnew = a1T1 + a2T2 + a3T3 = 0.44x10 + 0.14x20 +0.11x17.5 = 9.13

Appendix Pavement Design Manual - 2014
Page A-74 Roads Development Agency
APPENDIX M
DERIVATION OF SNeff, EFFECTIVE STRUCTURAL
NUMBER OF AN EXISTING PAVEMENT
(adapted from Ref. 3)
The NDT method of SNeff determination follows an assumption that the structural
capacity of the pavement is a function of its total thickness and overall stiffness. The
relationship between SNeff and stiffness is:
SNT
Eeff
t
p6
1 0003
, (Equation 1)
where Tt = total thickness (in centimeters) of all pavement layers above the subgrade
Ep = effective modulus of pavement layers above the subgrade (kPa)
Ep may be back-calculated from deflection data as follows.
The data required for the calculations is:
do = deflection measured at the center of the load plate (and adjusted to a standard
temperature of 20° C), cm
P = applied load, kg
D = total thickness of pavement layers above the subgrade, cm
dr = deflection at a distance r from the center of the load, cm
r = distance from center of load, cm
a = NDT load plate radius, cm
With the above data, using Figure F-1, the ratio of Ep/MR can be calculated.
Where MR = subgrade resilient modulus, kPa
Based on the ratio of Ep/MR and known value of MR, Ep can be computed in kPa. SNeff is
then calculated using Equation 1.
rd
P
r
54.23

Pavement Design Manual - 2014 Appendix
Roads Development Agency Page A-75
0 12.5 25 37.5 50 62.5 75 87.5 100 112.5 125 137.5 150Total pavement thickness D, cm
a = 15 cm
25.89 MR do / P (MR kPa, do cm, P kg)
Figure M.1 Determination of Ep/MR (Ref. 3)

Appendix Pavement Design Manual - 2014
Page A-76 Roads Development Agency
APPENDIX N
DEFINITIONS
Aggregate Hard mineral elements of construction material mixtures, for example: sand, gravel
(crushed or uncrushed) or crushed rock.
Asphalt Concrete A mixture to predetermined proportions of aggregate, filler and bituminous
binder material plant mix and usually placed by means of a paving machine.
Asphalt Surfacing The layer or layers of asphalt concrete constructed on top of the roadbase, and, in
some cases, the shoulders.
Average Annual
Daily Traffic
(AADT)
The total yearly traffic volume in both directions divided by the number of days in the
year.
Average Daily
Traffic (ADT)
The total traffic volume during a given time period in whole days greater than one day
and less than one year divided by the number of days in that time period.
Base Course This is the main component of the pavement contributing to the spreading of the
traffic loads. In many cases, it will consist of crushed stone or gravel, or of good quality gravelly soils or decomposed rock. Bituminous base courses may also be
used (for higher classes of traffic). Materials stabilized with cement or lime may also
be contemplated.
Binder Course The lower course of an asphalt surfacing laid in more than one course.
Borrow Area An area within designated boundaries, approved for the purpose of obtaining borrow material. A borrow pit is the excavated pit in a borrow area.
Borrow Material Any gravel, sand, soil, rock or ash obtained from borrow areas, dumps or sources other
than cut within the road prism and which is used in the construction of the specified
work for a project. It does not include crushed stone or sand obtained from commercial
sources.
Boulder
Bound Pavement
Materials
A rock fragment, usually rounded by weathering or abrasion, with an average
dimension of 0.30 m or more.
Pavement materials held together by an adhesive bound between the materials and
another binding material such as bitumen.
Camber The convexity given to the curved cross-section of a roadway.
Capping Layer (selected or improved subgrade).. The top of embankment or bottom of excavation
prior to construction of the pavement structure. Where very weak soils and/or
expansive soils (such as black cotton soils) are encountered, a capping layer is
sometimes necessary. This consists of better quality subgrade material imported
from elsewhere or subgrade material improved by stabilization (usually mechanical),
and may also be considered as a lower quality subbase.
Carriageway That portion of the roadway including the various traffic lanes and auxiliary lanes but excluding shoulders.
Cross-Section A vertical section showing the elevation of the existing ground, ground data and
recommended works, usually at right angles to the centerline.

Pavement Design Manual - 2014 Appendix
Roads Development Agency Page A-77
Crossfall The difference in level measured transversely across the surface of the roadway.
Culvert A structure, other than a bridge, which provides an opening under the carriageway or
median for drainage or other purposes.
Cutting Cutting shall mean all excavations from the road prism including side drains, and excavations for intersecting roads including, where classified as cut, excavations for
open drains.
Chippings Stones used for surface dressing (treatment).
Design Period The period of time that an initially constructed or rehabilitated pavement structure will perform before reaching a level of deterioration requiring more than routine or
periodic maintenance.
Diverted Traffic Traffic that changes from another route (or mode of transport) to the project road
because of the improved pavement, but still travels between the same origin and
destination.
Equivalency Factors
Used to convert traffic volumes into cumulative standard axle loads.
Equivalent Single
Axle Load (ESA)
Summation of equivalent 8.16 ton single axle loads used to combine mixed traffic to
design traffic for the design period.
Fill Material of which a man-made raised structure or deposit such as an embankment is composed, including soil, soil-aggregate or rock. Material imported to replace
unsuitable roadbed material is also classified as fill.
Flexible Pavements Includes primarily those pavements that have a bituminous (surface dressing or
asphalt concrete) surface. The terms "flexible and rigid" are somewhat arbitrary and
were primarily established to differentiate between asphalt and Portland cement concrete pavements.
Formation Level Level at top of subgrade.
Generated Traffic Additional traffic which occurs in response to the provision of improvement of the
road.
Grading Modulus
(GM)
The cumulative percentages by mass of material in a representative sample of
aggregate, gravel or soil retained on the 2.00 mm, 0.425 mm and 0.075 mm sieves,
divided by 100.
Heavy Vehicles Those having an unloaded weight of 3000 kg or more.
Maintenance Routine work performed to keep a pavement, under normal conditions of traffic and
forces of nature, as nearly as possible in its as-constructed condition.
Mountainous
(Terrain)
Terrain that is rugged and very hilly with substantial restrictions in both (terrain)
horizontal and vertical alignment.
Normal Traffic Traffic which would pass along the existing road or track even if no new pavement
were provided.
Overlay One or more courses of asphalt construction on an existing pavement. The overlay
often includes a leveling course, to correct the contour of the old pavement, followed by a uniform course or courses to provide needed thickness.
Pavement Layers The layers of different materials which comprise the pavement structure.
Project Specifications
The specifications relating to a specific project, which form part of the contract documents for such project, and which contain supplementary and/or amending
specifications to the standard specifications

Appendix Pavement Design Manual - 2014
Page A-78 Roads Development Agency
Quarry An area within designated boundaries, approved for the purpose of obtaining rock by sawing or blasting.
Reconstruction The process by which a new pavement is constructed, utilizing mostly new materials,
to replace an existing pavement.
Rehabilitation Work undertaken to significantly extend the service life of an existing pavement. This may include overlays and preoverlay repairs, and may include complete removal and
reconstruction of the existing pavement, or recycling of part of the existing materials.
Roadbase A layer of material of defined thickness and width constructed on top of the subbase,
or in the absence thereof, the subgrade. A roadbase may extend to outside the
carriageway.
Road Bed The natural in situ material on which the fill, or in the absence of fill, any pavement
layers, are to be constructed.
Road Bed Material The material below the subgrade extending to such depth as affects the support of
the pavement structure.
Road Prism That portion of the road construction included between the original ground level and
the outer lines of the slopes of cuts, fills, side fills and side drains. It does not include
subbase, roadbase, surfacing, shoulders, or existing original ground.
Roadway The area normally traveled by vehicles and consisting of one or a number of contiguous traffic lanes, including auxiliary lanes and shoulders.
Rolling (Terrain) Terrain with low hills introducing moderate levels of rise and fall with some
restrictions on vertical alignment.
Side Fill That portion of the imported material within the road prism which lies outside the fills, shoulders, roadbase and subbase and is contained within such surface slopes as shown
on the Drawings or as directed by the Engineer. A distinction between fills and side fill
is only to be made if specified.
Side Drain Open longitudinal drain situated adjacent to and at the bottom of cut or fill slopes.
Stabilization The treatment of the materials used in the construction of the road bed material, fill or pavement layers by the addition of a cementitious binder such as lime or Portland
Cement or the mechanical modification of the material through the addition of a soil
binder or a bituminous binder. Concrete and asphalt shall not be considered as materi-
als that have been stabilized.
Subbase The layer of material of specified dimensions on top of the subgrade and below the
roadbase. It is the secondary load-spreading layer underlying the base course. It will
usually consist of a material of lower quality than that used in the base course and particularly of lower bearing strength. Materials may be unprocessed natural gravel,
gravel-sand, or gravel-sand-clay, with controlled gradation and plasticity
characteristics. The subbase also serves as a separating layer preventing
contamination of the base course by the subgrade material and may play a role in the
internal drainage of the pavement.
Subgrade The surface upon which the pavement structure and shoulders are constructed. It is
the top portion of the natural soil, either undisturbed (but recompacted) local material in cut sections, or soil excavated in cut or borrow areas and placed as
compacted embankment.
Subsurface Drain Covered drain constructed to intercept and remove subsoil water, including any pipes
and permeable material in the drains.
Surface Treatment The sealing or resealing of the carriageway or shoulders by means of one or more successive applications of bituminous binder and crushed stone chippings.

Pavement Design Manual - 2014 Appendix
Roads Development Agency Page A-79
Surfacing This comprises the top layers(s) of the flexible pavement and consists of a bituminous surface dressing or one or two layers of premixed bituminous material (generally
asphalt concrete). Where premixed materials are laid in two layers, these are known as
the wearing course and the binder course as shown in Figure 1-2.
Traffic Lane Part of a traveled way intended for a single stream of traffic in one direction, which
has normally been demarcated as such by road markings.
Traffic Volume Volume of traffic usually expressed in terms of average annual daily traffic
(AADT).
Typical Cross-
Section
A cross-section of a road showing standard dimensional details and features of
construction.
Unbound Pavement
Materials
Wearing Course
Naturally occurring or processed granular material which is not held together by the
addition of a binder such as cement, lime or bitumen.
The top course of an asphalt surfacing or, for gravel roads, the uppermost layer of
construction of the roadway made of specified materials.
Aggregate Hard mineral elements of construction material mixtures, for
example: sand, gravel (crushed or uncrushed) or crushed rock.
Average Annual Daily Traffic (AADT)
The total yearly traffic volume in both directions divided by the
number of days in the year.
Average Daily Traffic (ADT)
The total traffic volume during a given time period in whole days
greater than one day and less than one year divided by the number
of days in that time period.
Capping Layer
The top of embankment or bottom of excavation prior to
construction of the pavement structure.
Carriageway
That portion of the roadway including the various traffic lanes and
auxiliary lanes but excluding shoulders.
Construction Joint
A joint made necessary by a prolonged interruption in the placing
of concrete.
Contraction Joint
A joint normally placed at recurrent intervals in a rigid slab to
control transverse cracking.

Appendix Pavement Design Manual - 2014
Page A-80 Roads Development Agency
Deformed Bar
A reinforcing bar for rigid slabs conforming to ―Requirements for
Deformations‖ in AASHTO Designations M 31M.
Design Period
The period of time that an initially constructed or rehabilitated
pavement structure will perform before reaching a level of
deterioration requiring more than routine or periodic maintenance.
Dowel
A load transfer device in a rigid slab, usually consisting of a plain
round steel bar.
Equivalent Standard Axles (ESAS)
Summation of equivalent 8.2 metric ton single axle loads used to
combine mixed traffic to design traffic for the design period .
Expansion Joint
A joint located to provide for expansion of a rigid slab, without
damage to itself, adjacent slabs, or structures.
Fill
Material of which a man-made raised structure or deposit such as
an embankment is composed, including soil, soil-aggregate or
rock. Material imported to replace unsuitable roadbed material is
also classified as fill.
Longitudinal Joint
A joint normally placed between traffic lanes in rigid pavements to
control longitudinal cracking.
Maintenance
Routine work performed to keep a pavement, under normal
conditions of traffic and forces of nature, as nearly as possible in
its as-constructed condition.
Pavement Layers
The layers of different materials which comprise the pavement
structure.
Project Specifications
The specifications relating to a specific project, which form part of
the contract documents for such project, and which contain
supplementary and/or amending specifications to the standard
specifications.
Pumping
The ejection of foundation material, either wet or dry, through
joints or cracks, or along edges of rigid slabs resulting from
vertical movements of the slab under traffic.

Pavement Design Manual - 2014 Appendix
Roads Development Agency Page A-81
Reinforcement
Steel embedded in a rigid slab to resist tensile stresses and
detrimental opening of cracks.
Rigid Pavement
A pavement structure which distributes loads to the subgrade,
having as one course a Portland cement concrete slab of relatively
high-bending resistance.
Road Bed
The natural in situ material on which the fill, or in the absence of
fill, any pavement layers, are to be constructed.
Road Bed Material
The material below the subgrade extending to such depth as affects
the support of the pavement structure.
Roadway
The area normally traveled by vehicles and consisting of one or a
number of contiguous traffic lanes, including auxiliary lanes and
shoulders.
Stabilization
The treatment of the materials used in the construction of the road
bed material, fill or pavement layers by the addition of a cemen-
titious binder such as lime or Portland Cement or the mechanical
modification of the material through the addition of a soil binder or
a bituminous binder. Concrete and asphalt shall not be considered
as materials that have been stabilized.
Subbase
The layer of material of specified dimensions on top of the
subgrade and, in the case of rigid pavements, below the concrete
slab.
Subgrade
The surface upon which the pavement structure and shoulders are
constructed.
Tie Bar
A deformed steel bar or connector embedded across a joint in a
rigid slab to prevent separation of abutting slabs.
Traffic Lane
Part of a traveled way intended for a single stream of traffic in one
direction, which has normally been demarcated as such by road
markings.
Welded Wire Fabric
Welded Steel Wire Fabric for Concrete Reinforcement.

Appendix Pavement Design Manual - 2014
Page A-82 Roads Development Agency
ABBREVIATIONS
AADT Average Annual Daily Traffic
ADT Average Daily Traffic
AC Asphalt concrete
AASHO American Association of State Highway Officials (previous designation)
AASHTO American Association of State Highway and Transportation Officials
BCEOM Bureau Central d’Etudes d’Outre Mer (France)
BS British Standard
CBR California Bearing Ratio (as described in AASHTO T 193)
CEBTP Centre d’Etudes du Batiment et des Travaux Publics (France)
CRCP Continuously Reinforced Concrete Pavement
CSRA Committee of State Road Authorities (South Africa)
DCP Dynamic Cone Penetrometer
Drainage Coefficients (m2, m3)
Factors used to modify layer coefficients in flexible pavements as a function of
how well the pavement structure can handle the adverse effect of water
infiltration
ERA Ethiopian Roads Agency
ESA Equivalent Single Axle
Equivalent Standard Axles (ESA)
Summation of equivalent 8.2 t single axle loads used to combine mixed traffic to design traffic class
FWD Falling Weight Deflectometer
IRI International Roughness Index
ICL Initial Consumption of Lime Test
Is Global damage index (used in the VIZIR method)
JPCP Jointed Plain Concrete Pavement
JRCP Jointed Reinforced Concrete Pavement
Layer Coefficients (a1, a2, a3)
The empirical relationship between structural number (SN) and layer thickness
which expresses the relative ability of a material to function as a structural
component of the pavement
LCPC Laboratoire Central des Ponts et Chaussees (France)

Pavement Design Manual - 2014 Appendix
Roads Development Agency Page A-83
Maintenance Routine work performed to keep a pavement, under normal conditions of traffic
and forces of nature, as nearly as possible in its as-constructed condition.
MDD Maximum Dry Density
NDT Non-Destructive Testing
Overlay One or more courses of asphalt construction on an existing pavement. The
overlay often includes a leveling course, to correct the contour of the old
pavement, followed by a uniform course or courses to provide needed thickness.
PCC Portland Cement Concrete
PMS Pavement Management System
QI Pavement Quality Rating (used in the VIZIR method)
Reconstruction
The process by which a new pavement is constructed, utilizing mostly new
materials, to replace an existing pavement.
Recycling The reuse, usually after some processing, of a material that has already served
its first-intended purpose.
Rehabilitation Work undertaken to significantly extend the service life of an existing pavement. This
may include overlays and preoverlay repairs, and may include complete removal
and reconstruction of the existing pavement, or recycling of part of the existing
materials.
Roadbase A layer of material of defined thickness and width constructed on top of the
subbase, or in the absence thereof, the subgrade.
RRD Representative Rebound Deflection
S1 to S6 Subgrade strength classes used to characterize the subgrade in pavement design
Structural Number (SN)
An index number into which thickness of flexible pavement layers may be converted
through the use of suitable layer coefficients related to the type of material being used in
each layer of the pavement structure
SNeff Effective structural number of an existing pavement.
SNnew Structural number of a new pavement.
Subbase The layer of material of specified dimensions on top of the subgrade and below the
roadbase.
Subgrade The surface upon which the pavement structure and shoulders are constructed.
Surfacing The asphalt surfacing of a flexible pavement or the concrete slab of a rigid pavement.
T1 to T8 Traffic classes used to characterize the anticipated traffic in terms of ESA for flexible
pavement design purposes
T1, T2, T3 Thicknesses (in centimeters) of pavement surface, base and subbase layers (existing or
required)
TRL Transport Research Laboratory (UK)

Appendix Pavement Design Manual - 2014
Page A-84 Roads Development Agency
VIZIR A method for quality evaluation of paved roads developed by the LCPC and used in PMS
implementation
VOC Vehicle Operating Cost
VMA Voids in mineral aggregate

Pavement Design Manual – 2014 References
Roads Development Agency REF-1
REFERENCES
1. Transport and Road Research Laboratory (1993). A guide to the structural design of
bitumen-surfaced roads in tropical and sub-tropical countries. Overseas Road Note 31
(fourth edition). Overseas Centre, TRL, Crowthorne.
2. Transport and Road Research Laboratory (1982). A guide to surface dressing in
tropical and subtropical countries. Overseas Road Note No 3. TRRL, Crowthorne.
3. The performance of experimental weathered basalt gravel roads in Ethiopia, Research
Report 147, TRRL (1998).
4. Experimental use of cinder gravels on roads in Ethiopia, TRRL, Crowthorne
Berkshire, United Kingdom, 1987.
5. Newill, D. & Kassaye Aklilu, 1980. The location and engineering properties of
volcanic cinder gravels in Ethiopia.
6. American Association of State Highway and Transportation Officials (1993).
AASHTO Guide for Design of Pavement Structures. Washington, D.C.
7. Transport and Road Research Laboratory (1993). Road Building in the Tropics.
State-of-the-Art Review No. 9
8. Navy Manual DM 7.01 - 1989. Soil Mechanics, Foundation and Earth Structures.
9. Laterite in road pavements, Special Publication 47, TRRL (1995).
10. Ministry of Transport and Communications- Roads Department– Republic of Kenya -
Road Design Manual –Part III– Materials and Pavement Design for New Roads
(August 1987)
11. Ellis, C.I., 1974. Village-Scale Production of Lime in Ghana, TRRL Supplementary
Report SR 42, Transport and Road Research Laboratory, Crowthorne.
12. Asphalt Institute. Mix design methods for asphalt concrete and other hot-mix types.
Manual Series No. 2 (MS-2 Sixth Edition). The Asphalt Institute, Lexington, KY.
13. Asphalt Institute (1984). Model construction specifications for asphalt concrete and
other plant-mix types. Specification Series No 1 (SS- 1). The Asphalt Institute,
Lexington, Kentucky.
14. Asphalt Institute (1998). Construction of hot-mix asphalt pavements. Manual Series
No. 22 (MS-22, Second Edition). The Asphalt Institute, Lexington, Kentucky.
15. Salt G F and Szatkowski W S (1973). A guide to levels of skidding resistance for
roads. Laboratory Report LR 510. TRL Limited. Crowthorne.
16. National Association of Australian State Road Authorities (1986). Principles and
practice of bituminous surfacing Vol. 1: Sprayed work. (National Association of
Australian State Road Authorities, Sydney).

Pavement Design Manual – 2014 References
REF-2 Roads Development Agency
17. Asphalt Institute (1983). Specifications for paving and industrial asphalts.
Specification Series No. 2 (SS-2). College Park, Maryland (The Asphalt Institute).
18. Dickinson E J (1984). Bituminous roads in Australia. Australian Road Research
Board, Vermont South, Victoria.
19. Transport Research Laboratory (1996). Design guide for road surface dressings.
Road Note 39 4th edition. TRL Limited, Crowthorne.
20. Norwegian Public Roads Administration (1999). A guide to the use of Otta Seals.
Publication No. 93. Directorate of Public Roads, Road Technology Department,
International Division. Oslo.
21. Overby C (1998). Otta seal – A durable and cost effective global solution for low
volume sealed roads, 9th
REAAA Conference, ‗An International Focus of Roads:
Strategies for the Future‘. Wellington.
22. Committee for State Road Authorities (1986). TRH 7. Surfacing seals for rural and
urban roads and compendium of design methods for surfacing seals used in the
Republic of South Africa. Technical Recommendations for Highways. Department of
Transport, Pretoria.
23. Denning J H (1978). Epoxy-resin/calcined bauxite surface dressing on A1, Sandy,
Bedfordshire: skid resistance measurements 1968 to 1977. Laboratory Report LR
867. TRL Limited, Crowthorne.
24. Committee for State Road Authorities (1990). Draft TRH 20. Structural Design,
construction, and maintenance of gravel roads. Department of Transport, Pretoria.
25. Ethiopian Roads Authority (July 1998). Design Standards for Rural Roads (Draft).
26. Transport and Road Research Laboratory (1984). The Kenya road maintenance study
on unpaved roads: research on deterioration. TRRL Report LR 1111, Crowthorne.
27. Transport and Road Research Laboratory (1988). A view of road maintenance,
economics, policy and management in developing countries. TRRL Research
Report 145. TRRL, Crowthorne.
28. Roberts, F.L., McCullough, B.F., Williamson, H.J., and Wallin, W.R., ―A Pavement
Design and Management System for Forest Service Roads: A Working Model—
Phase II,‖ Research Report 43, Council for Advanced Transportation Studies,
University of Texas at Austin, February 1977.
29. McCullough, B.F., and Luhr, D.R., ―A Pavement Design and Management System
for Forest Service Roads: Implementation—Phase III,‖ Research Report 60, Council
for Advanced Transportation Studies, University of Texas at Austin, January 1979.
30. BCEOM (1998). Pavement Management System. Draft Final Report.

Pavement Design Manual – 2014 References
Roads Development Agency REF-3
31. Pavement and Materials Design Manual- 1999. The United Republic of Tanzania,
Ministry of Works.
32. Design Manual for Roads and Bridges (DMRB), Volume 7 (Pavement Design); IAN
73/06 (Foundation Design); HD29 (Surveys & Investigations); HD30 (Maintenance Assessment Procedure); HD32 (Maintenance of Concrete Roads)
33. Cement & Concrete Association. Australia, Concrete Roads Manual 1997 34. AASHTO Pavement Design Guide 1993 35. Whitetopping-State of the Practice: American Concrete Association, 1998 36. Road Building in the Tropics: HMSO State of the Art Review 9, Millard, 1993 37. ROAD DESIGN MANUAL: Vol. 3: Pavement Design, Part II: Rigid Pavements. The
Republic of Uganda, Ministry of Works, Housing and Communications
38. HUDSON, W.R., R. HAAS, AND R.D. PEDIGO (1979). Pavement Management
System Development, NCHRP Report 215.
39. BCEOM (1998). Pavement Management System. Draft Final Report.
40. ASPHALT INSTITUTE Manual Series No 16 (MS-16): Asphalt in Pavement
Maintenance.
41. PIARC International Road Maintenance Handbook, Volume III. Maintenance of
Paved Roads.
42. TRANSPORT AND ROAD RESEARCH LABORATORY. Overseas Road Note 1
(2nd Edition, Reprinted 1995). Maintenance Management for District Engineers.
43. WORLD BANK. Technical Paper 46, Guidelines for Conducting and Calibrating
Road Roughness Measurements.
44. ETHIOPIAN ROADS AGENCY. Site Investigations Manual-2001.
45. ASPHALT INSTITUTE (June 1983). Manual Series No. 17 (MS-17). Asphalt
Overlays for Highway and Street Rehabilitation. The Asphalt Institute, Lexington,
Kentucky.
46. BCEOM (1998). Pavement Management System. Draft Final Report. Appendix
II/2/1 to Part II. Road Dictionary and Data Acquisition. VIZIR Method for Quality
Evaluation of Paved Roads.
47. LOUIS BERGER AND ASSOCIATES, INC. (1994). Non-Destructive Testing of
Roadway Pavements – Equipment Used to Derive Inputs for Pavement Management
Systems. From Proceedings of the 8th Annual Road and Bridge Conference and
Exposition, Rosemont, Illinois, December 1994.
48. AASHTOWare® DARWin® 3.1 (1997). Pavement Design and Analysis System.