
Pavement Design Report - City of Ottawa
39
Pavement Design Report 190 David Manchester Road Prepared for: Nortrax Canada Inc. 1655 Briatannia Road East Mississauga, ON L45 I55 Prepared by: McIntosh Perry Consulting Engineers Ltd. 192 Hickson Avenue Kingston, ON K7K 2N9 28 January 2014
-
Upload
khangminh22 -
Category
Documents
-
view
5 -
download
0
Transcript of Pavement Design Report - City of Ottawa

Pavement Design Report190 David Manchester Road
Prepared for:
Nortrax Canada Inc.1655 Briatannia Road EastMississauga, ONL45 I55
Prepared by:
McIntosh Perry Consulting Engineers Ltd.192 Hickson AvenueKingston, ONK7K 2N9
28 January 2014

1
Project No. OCP-130410-00 28 January 2014
PREPARED FOR:
Nortrax Canada Inc.1655 Britannia Road East
Mississauga, OntarioL4W 1S5
CONCERNING:DRAFT PAVEMENT DESIGN REPORT
David Manchester Road
Prepared by:McIntosh Perry Consulting Engineers Ltd.
192 Hickson AvenueKingston, ON
K7K 2N9
Phone (613) 542-3788Fax (613) 542-7583

2
REVISION NOTES
Revision Date Description OriginatorA 16 Jan. 2014 Draft C. O’NeillB 17 Jan. 2014 Issued for Internal Review C. O’NeillC 24 Jan. 2014 Issued for Review (Ted) T. Phillips0 28 Jan. 2014 Final C. O’Neill


1
1.0 EXECUTIVE SUMMARY ................................................................................................. 3
2.0 INTRODUCTION ............................................................................................................. 42.1 Scope of Work ..................................................................................................... 42.2 Project Description ............................................................................................... 5
2.2.1 General .................................................................................................... 5
3.0 EXISTING CONDITIONS ................................................................................................ 63.1.1 Traffic Volume Information........................................................................ 63.1.2 Adjacent Flexible Pavement ..................................................................... 63.1.3 Granular Base / Subbase ......................................................................... 63.1.4 Native soils ............................................................................................... 73.1.5 Refusal ..................................................................................................... 73.1.6 Groundwater Level ................................................................................... 73.1.7 Physiography ........................................................................................... 8
4.0 FIELD INVESTIGATION .................................................................................................. 94.1 Borehole Investigation and Testing ...................................................................... 94.2 Site Visit Observations ......................................................................................... 9
5.0 PAVEMENT DESIGN SELECTION ............................................................................... 105.1 Related Design Considerations .......................................................................... 105.2 Design Analysis ................................................................................................. 10
5.2.1 Design Methods ..................................................................................... 105.2.2 Design Parameters ................................................................................. 12
5.3 Recommended Design....................................................................................... 125.3.1 Recommendation ................................................................................... 125.3.2 Longitudinal Transition Details ................................................................ 135.3.3 Cross-Sectional Details .......................................................................... 14
6.0 CLOSURE - ................................................................................................................... 15
7.0 BIBLIOGRAPHY ............................................................................................................ 16
8.0 APPENDICES ............................................................................................................... 17A. Borehole Logs, Laboratory Results .................................................................... 17B. AASHTO 93 Design Results .............................................................................. 17C. Site Plan ............................................................................................................ 17

2
Tables
Table 1. Refusal DepthsTable 2. Groundwater level.Table 3. Design traffic dataTable 4. AASHTO InputTable 5. Parameters for ESAL CalculationTable 6. Design Parameters
Figures
Figure 1. Key MapFigure 2. PhysiographyFigure 3. Longitudinal Transition DetailsFigure 4. Cross-Sectional Details

3
1.0 EXECUTIVE SUMMARY
The purpose of the investigation was to identify the geotechnical conditions and providedesign and reconstruction recommendations for a portion of David Manchester Road,north of Hazeldean Road in the City of Ottawa. The road is being upgraded as a part ofa development agreement with Nortrax Canada Inc.
In this report we discuss the findings of the geotechnical investigation of DavidManchester Road on the granular surface from the south asphalt pavement limit,approximately 1.0 km north of Hazeldean Road, northerly for approximately 150 meters.The pavement design recommendations utilize the results of the field investigation andlaboratory testing; this report presents detailed pavement design analyses andrecommendations for the rehabilitation of David Manchester Road.
MPCE representatives were onsite logging the boreholes and collecting samples forlaboratory testing. MPCE did a complete geotechnical field investigation including thedrilling of boreholes with a rubber tire drill rig and a powered two man hand auger forchecking for the presence of bedrock. Associated laboratory work was completed byAME.
The proposed road reconstruction will consist of full depth new construction to supportan asphalt surface. The project includes minor widening of the existing platform andconstruction of ditches as necessary.
4
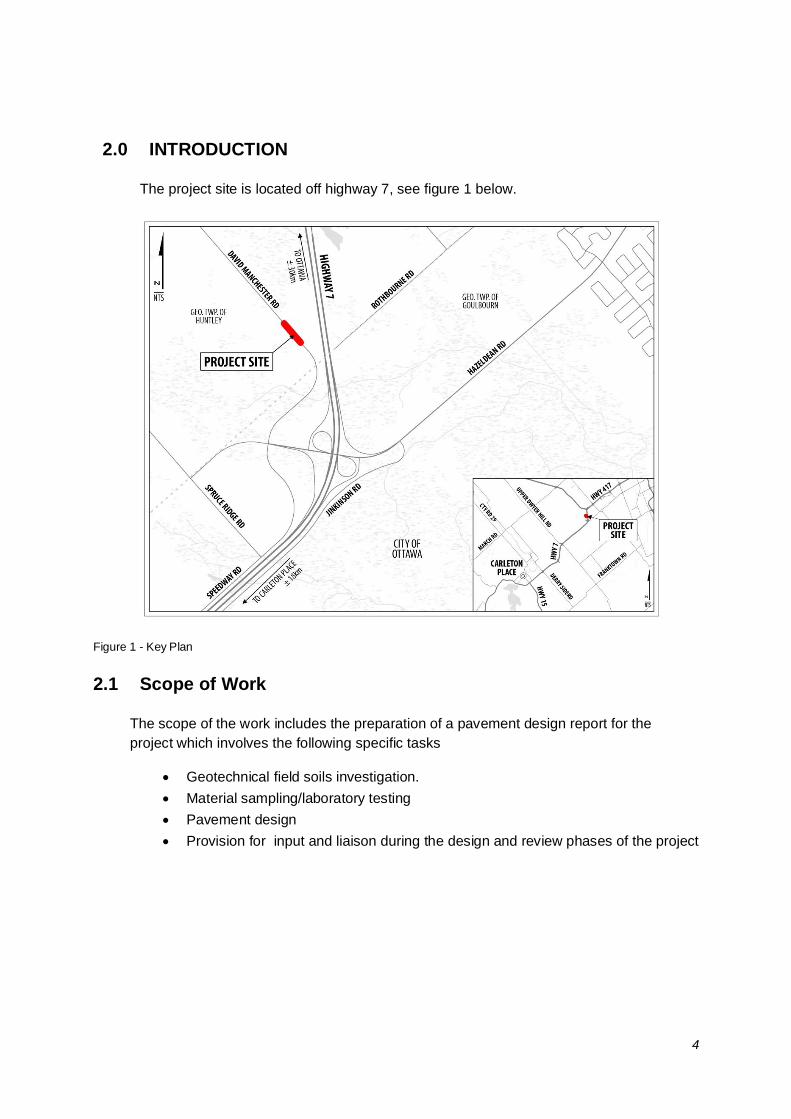
2.0 INTRODUCTION
The project site is located off highway 7, see figure 1 below.
Figure 1 - Key Plan
2.1 Scope of Work
The scope of the work includes the preparation of a pavement design report for theproject which involves the following specific tasks
Geotechnical field soils investigation. Material sampling/laboratory testing Pavement design Provision for input and liaison during the design and review phases of the project

5
2.2 Project Description
2.2.1 General
As part of the site plan approval, the Owner is to upgrade David Manchester from theexisting asphalt limit to the second access point, approximately 150 meters. The typicalroad cross-section will be 3.5 meters of paved lanes with 1.5 meter shoulders. Thetypical pavement structure will be two lifts of asphalt and 150mm Granular A built overthe existing road. The site plan is shown in appendix D.
The section of David Manchester Road under consideration is a two-lane rural facility.The road is maintained by the City of Ottawa. The existing pavement structure is agravel road.
The project components include new pavement design for extending the currentpavement structure for the limits of the new development.

6
3.0 EXISTING CONDITIONS
3.1.1 Traffic Volume Information
Traffic data was interpreted from a transportation impact statement prepared by MPCEin July 2013, and also a field survey. AADT is anticipated as below 2000 AADT. Thiswas taking new development and existing developments into consideration, along withthe transportation impact statement. The percentage of truck vehicles was not provided;therefore we conservatively assumed 10% would be sufficient knowing the surroundingarea. It is understood that both the asphalt and gravel access roadway and parkingareas will be exposed to heavy truck traffic.
With respect to the Superpave mix design method, we conservatively expect DavidManchester Road will experience 990,610 ESALs over a 15-year design life (with up to2% growth) which corresponds to Design Category B (0.3 to < 3 million ESALs).
3.1.2 Adjacent Flexible Pavement
Information provided by the Ministry of Transportation indicates the adjacent section offlexible pavement, to Hazeldean Road, was reconstructed as part of the upgrading ofHighway 7 to a four lane facility. The pavement structure is 50 mm of HL3, over 150 mmof Granular A, and a minimum of 350 mm Granular B – Type 2 over fill material.
3.1.3 Granular Base / Subbase
Currently the existing surface is a granular material, primarily comprised of gravelly sandwith some silt. Sieve analysis based on one test indicates it is composed of a GranularM type base material, although slightly out of existing specification with regards coarseaggregate content. This is not considered unusual; one explanation could becontamination with winter sand. The thickness of the base material was between 100mmand 150mm.
Borehole information also found a granular subbase (non-quarried) material. Sieveanalysis found it to meet the Granular B type 1 specification, confirmed by fieldobservations. The depth of this material was found to be a minimum 1000m of material.This was confirmed in BH numbers 1- 4. Thus subexcavation is indicated during originalconstruction as this material is not found in the adjacent hand auger holes.

7
3.1.4 Native soils
Typically underlying the granular subbase is primarily a wet to very wet sand with gravel,some silt, and trace clay. In some instances the material was saturated. In someboreholes bedrock was found under the granular B material.
3.1.5 Refusal
Refusal, due to probable bedrock, was observed below the granular B at locations anddepths indicated in Table 1. Borehole logs are in appendix B.
Table 1
3.1.6 Groundwater Level
Groundwater inflow was encountered in the boreholes listed in table 2 below. Thefollowing table provides approximate groundwater levels and corresponding elevationmeasured in boreholes. Borehole logs are in appendix B.
Table 2
Borehole Number Depth Below Surface Datum
BH #1 600mm 0mm
BH #1A 150mm -700mm
Borehole Number Depth to Refusal Datum
BH #1 1500mm 0mm
BH #2 1300mm 0mm
BH #3 1500mm 0mm
BH #4A (East Ditch) 900mm -600mm
BH #5A (West Ditch) 560mm -600mm
BH #7A (East Ditch) 1100mm -400mm
8
BH #2A 500mm -300mm
BH# 4A 200mm -600mm
It should be noted that the groundwater levels may not represent stabilized conditions.Notably it was raining during the investigation. Also, the groundwater levels may behigher during wet periods of the year such as the early spring or fall, or following periodsof precipitation.
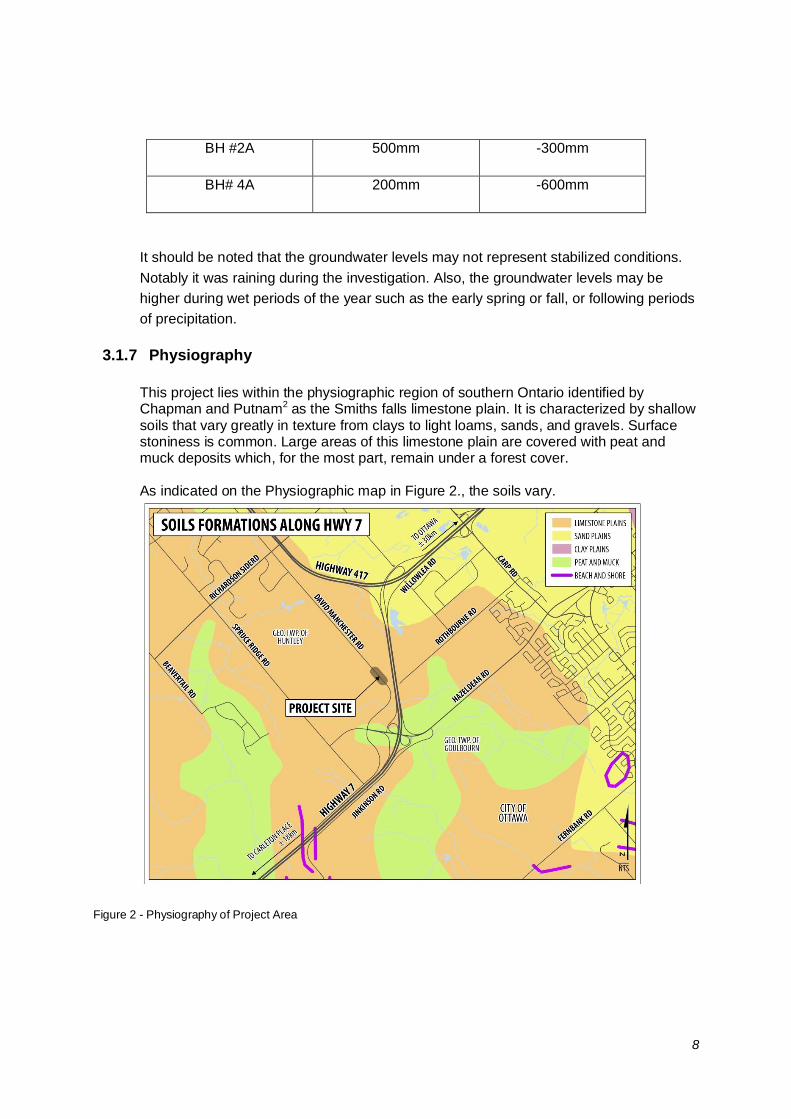
3.1.7 Physiography
This project lies within the physiographic region of southern Ontario identified byChapman and Putnam2 as the Smiths falls limestone plain. It is characterized by shallowsoils that vary greatly in texture from clays to light loams, sands, and gravels. Surfacestoniness is common. Large areas of this limestone plain are covered with peat andmuck deposits which, for the most part, remain under a forest cover.
As indicated on the Physiographic map in Figure 2., the soils vary.
Figure 2 - Physiography of Project Area

9
4.0 FIELD INVESTIGATION
4.1 Borehole Investigation and Testing
Upon receiving confirmation of award of project, utility clearances where undertaken byusing Ontario One Call. A laboratory and a drilling contractor were retained by MPCE.
A drilling program was established to ensure we had adequate information. The MPCEinvestigation consisted of drilling a total of 4 auger holes in the existing road bed, usinga truck mounted rig equipped with a 150mm solid stem auger, at generally equallyspaced intervals along the roadway. The boreholes were drilled to an approximatedepth of 1.5 meters. Auger holes were also carried out in the toe of slope of the roadbed on, every 50 meters each side, using a two man powered hand auger.
Samples were collected on each soil type encountered and appropriate associatedlaboratory tests were run on selected samples. Atterberg Limits, hydrometer, moisturecontent, and grain size tests were completed and analyzed for selected materials fromrepresentative samples, at AME’s Ottawa laboratory. The test results are appended atthe end of the report in appendix B.
The sieve analysis completed on the base showed that it did not entirely meet thegranular M specification envelope. As discussed previously however, we intend ontreating the granular M material as borderline for analysis purposes.
The sub base sieve analysis was completed and the gradations indicate that thegranular base material is acceptable for Granular B1.
Water was present in a few boreholes. While drilling MPCE found water in BH #1, BH#1A, BH #2A, and BH #4A which are identified in table 2. After pulling the auger out ofthe hole the water level appeared to rise.
4.2 Site Visit Observations
The section of David Manchester Road that we are investigating is in a wooded area thathas a few low spots that collect surface runoff water that potentially could be fixed with across culvert. It was also noticed that the existing ditching does not support positivedrainage, ditches should be reviewed to determine where ditching and ditch cleanout isrequired. The surface seems to be draining well off into the partial ditches and low areas.Limestone rock was also noted in an adjacent area, that has been cut out for a ditch,therefore we suspected limestone close to surface, confirmed during the investigation.Table 1 shows approximate depths.

10
5.0 PAVEMENT DESIGN SELECTION
5.1 Related Design Considerations
David Manchester Road is undergoing commercial development and our understandingis it will continue to in the future, therefore taking the approximate forecasted traffic loadinto consideration we have included this into our design selection process.
The existing platform of the gravel road is narrow compared to the newly paved sectionof David Manchester Road, therefore it is our design team’s recommendation to maintainconsistent geometric design and widen the platform to include 3.5m paved lanes, with1.5m shoulders. Also roadside ditches shall be improved to provide positive drainage.
Generally a 12 to 15 year initial service life for surface and initial service life for strengthis expected from the design options. Analysis using AASHTO 93 confirmed that theinitial service life of 15 years can be easily met with the present loads on the design lanefor the option selected. The inputs for these design programs are normally conservative,so the margin for error is low.
5.2 Design Analysis
5.2.1 Design Methods
The main design tool used to determine if design options meet requirements wasAASHTO Darwin 93. Guidelines for the selection of suitable input parameters forAASHTO Darwin 93 were obtained from an MTO Report1.
5.2.1.1 AASHTO 93
AASHTO 93 (American Association of State Highway and Transportation Officials) is apavement design tool based on empirical based models developed from the AASHTOroad tests. It incorporates the following input parameters in the structural analysis: 1)Equivalent Single Axle loads (ESALs), 2) granular base equivalencies assessed in termsof structural layer coefficients and 3) the subgrade material strength measured in termsof Mr (Modulus of Resilience). Its output is a measure of pavement strength, representedby a structural number (SN), and required to carry the traffic load over the design life. SNdepends on the thickness and characteristics of the pavement layers. The material inputparameters have been selected to reflect pavement performance under Ontario trafficconditions (MTO Report1 ).
11
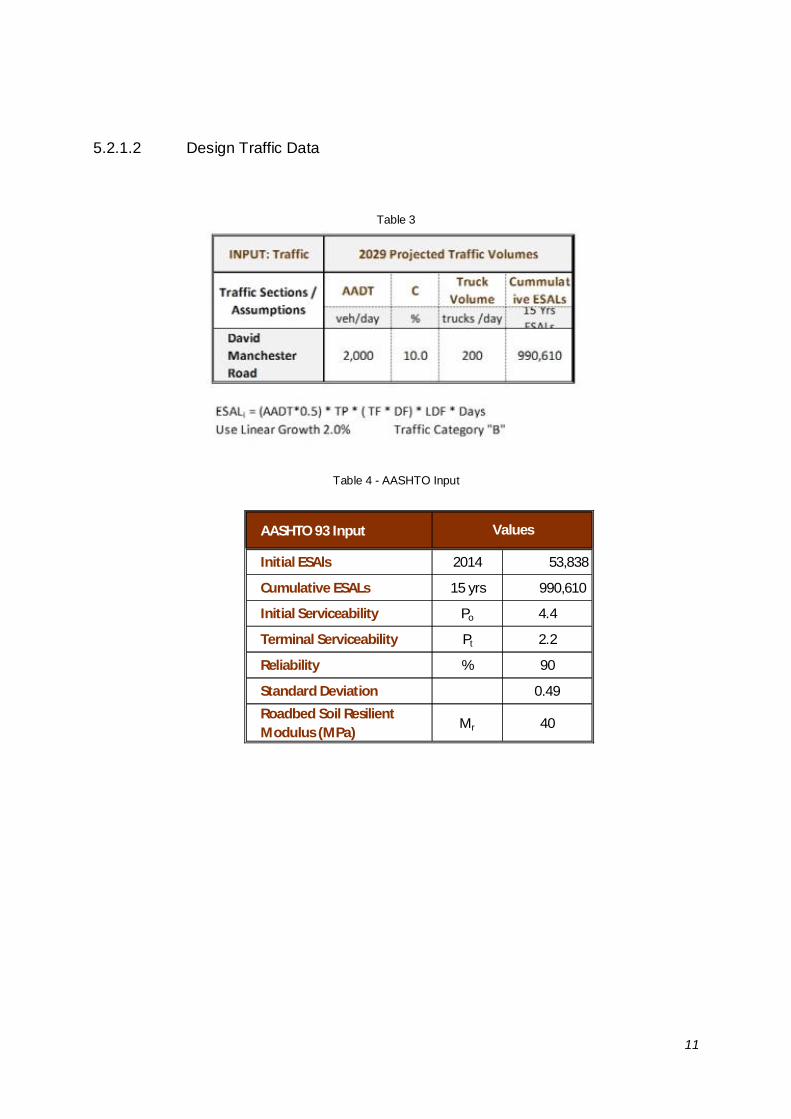
5.2.1.2 Design Traffic Data
Table 3
Table 4 - AASHTO Input
AASHTO 93 Input
Initial ESAls 2014 53,838
Cumulative ESALs 15 yrs 990,610
Initial Serviceability Po 4.4
Terminal Serviceability Pt 2.2
Reliability % 90
Standard Deviation 0.49
Roadbed Soil ResilientModulus (MPa)
Mr 40
Values
12
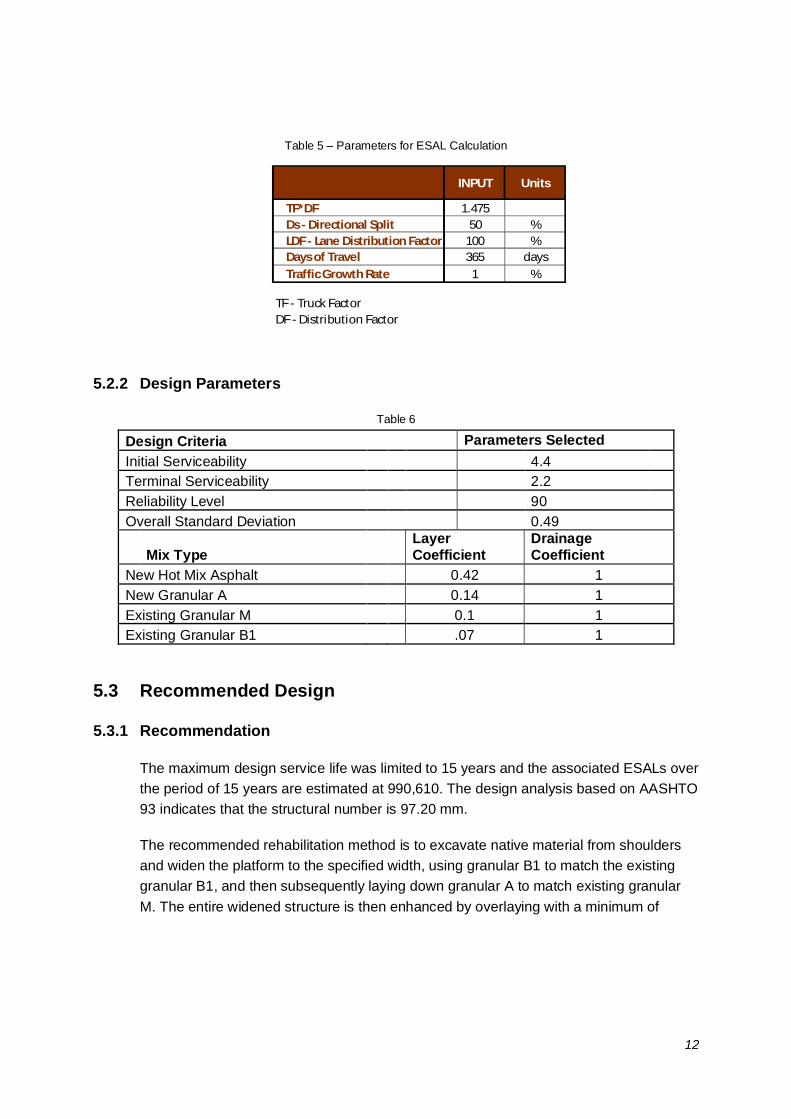
Table 5 – Parameters for ESAL Calculation
TF*DF 1.475Ds - Directional Split 50 %LDF - Lane Distribution Factor 100 %Days of Travel 365 daysTraffic Growth Rate 1 %
TF - Truck FactorDF - Distribution Factor
INPUT Units
5.2.2 Design Parameters
Table 6
Design Criteria Parameters SelectedInitial Serviceability 4.4Terminal Serviceability 2.2Reliability Level 90Overall Standard Deviation 0.49
Mix TypeLayerCoefficient
DrainageCoefficient
New Hot Mix Asphalt 0.42 1New Granular A 0.14 1Existing Granular M 0.1 1Existing Granular B1 .07 1
5.3 Recommended Design
5.3.1 Recommendation
The maximum design service life was limited to 15 years and the associated ESALs overthe period of 15 years are estimated at 990,610. The design analysis based on AASHTO93 indicates that the structural number is 97.20 mm.
The recommended rehabilitation method is to excavate native material from shouldersand widen the platform to the specified width, using granular B1 to match the existinggranular B1, and then subsequently laying down granular A to match existing granularM. The entire widened structure is then enhanced by overlaying with a minimum of
13
150mm of granular A throughout the road platform. As specified by the City of Ottawa,two lifts of pavement are to be applied to the reconstructed platform. Thus therecommended asphalt structure is 40 mm of SP 12.5 over 50 mm of SP 19.0.
The design output calculation is shown in appendix C and indicates the above pavementstructure actually attains an SN of 93.65mm, which more than adequately will supportthe anticipated traffic.
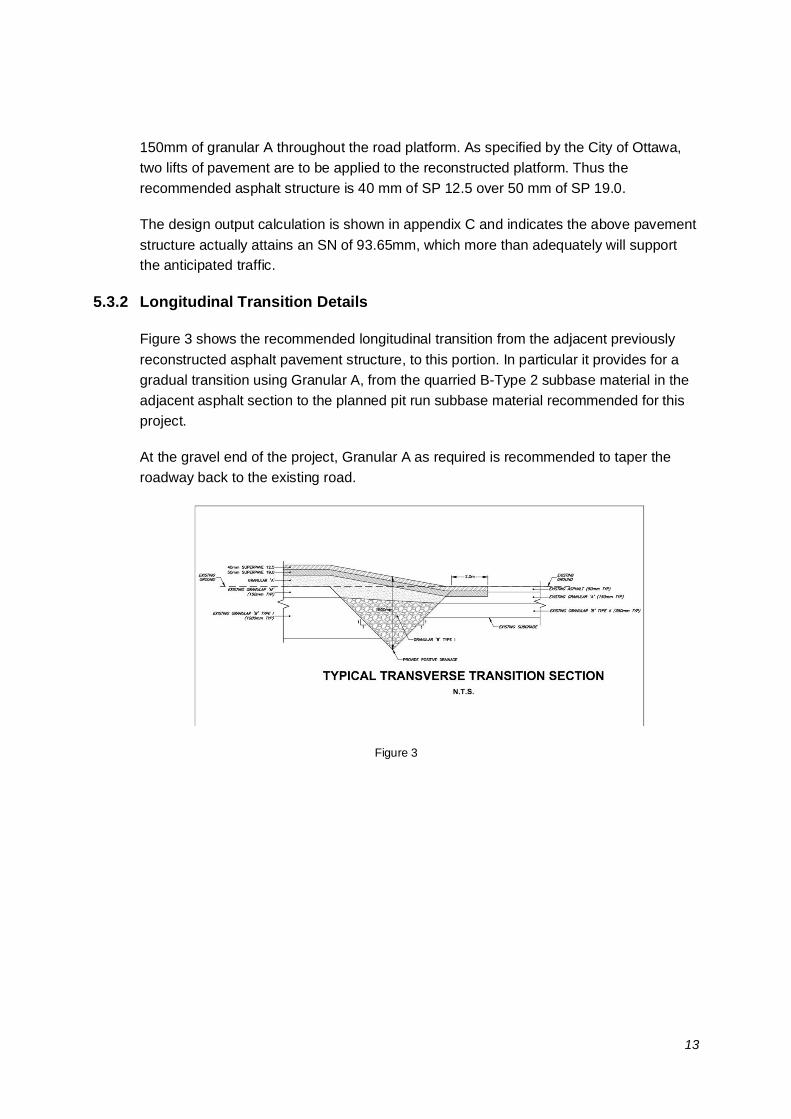
5.3.2 Longitudinal Transition Details
Figure 3 shows the recommended longitudinal transition from the adjacent previouslyreconstructed asphalt pavement structure, to this portion. In particular it provides for agradual transition using Granular A, from the quarried B-Type 2 subbase material in theadjacent asphalt section to the planned pit run subbase material recommended for thisproject.
At the gravel end of the project, Granular A as required is recommended to taper theroadway back to the existing road.
Figure 3
14
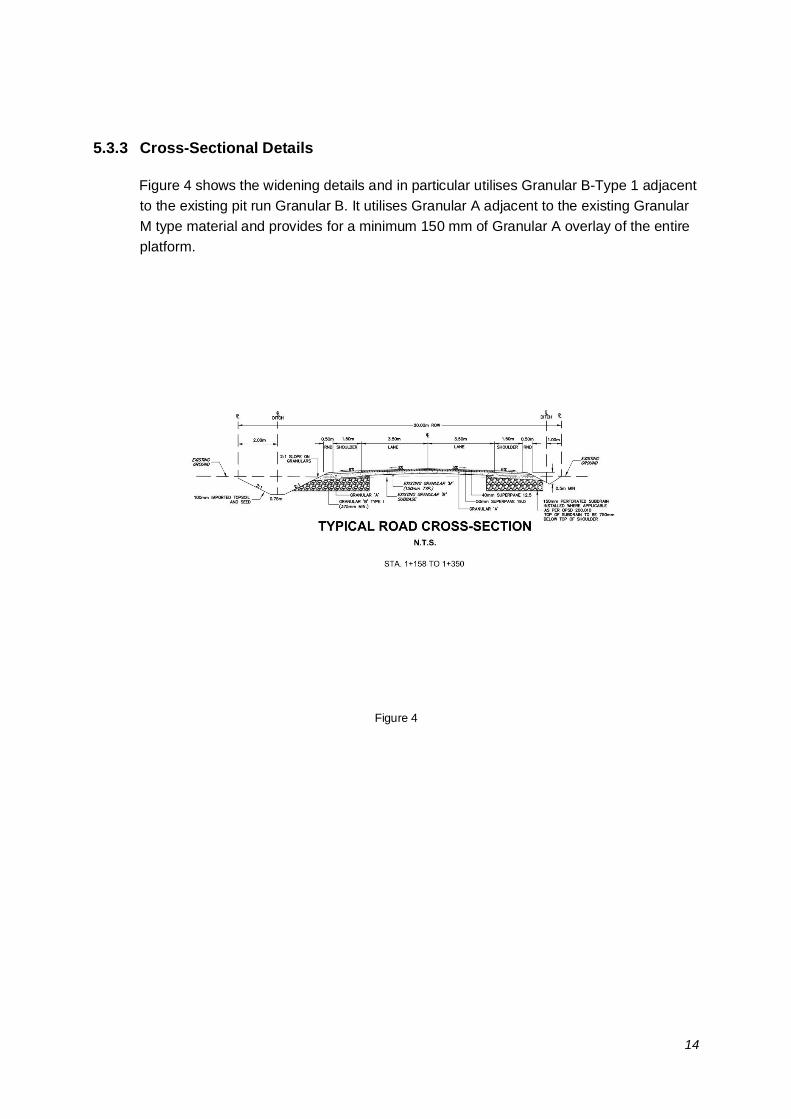
5.3.3 Cross-Sectional Details
Figure 4 shows the widening details and in particular utilises Granular B-Type 1 adjacentto the existing pit run Granular B. It utilises Granular A adjacent to the existing GranularM type material and provides for a minimum 150 mm of Granular A overlay of the entireplatform.
Figure 4

15
6.0 CLOSURE -
This report presents the results of the David Manchester Road investigation completed byMcIntosh Perry Consulting Engineers Ltd. (MPCE) on November 18 and 28, 2013 for NortraxCanada Inc. The geotechnical investigation included a limited sampling of the roadway, and theinformation presented herein is representative of the findings at the specific borehole locations.The design and reconstruction recommendations given are based upon the results of the limitedinvestigation. Conditions other than those noted in this report may exist within the site. Ifdiffering site conditions are encountered, or if any additional information becomes available at afuture date, we recommend that the conclusions presented in this report be re-evaluated byMPCE.
MPCE prepared this report for the exclusive use of Nortrax Canada and its representatives.Any use a third party makes of this report, or any reliance on or decision to be made based onit, are the responsibility of such third parties. MPCE accepts no responsibility for damages, ifany, suffered by any third party as a result of decisions made or actions taken based on thisreport.
We trust that this report adequately meets your present requirements. Should you have anyquestions or require additional information, please do not hesitate to contact us.

16
7.0 BIBLIOGRAPHY
1) Hajek, Jerry, MTO November 1995. Procedures for Estimating Traffic Loads forPavement Design.
2) Chapman, L.J. and Putnam, D.F. 2007. Physiography of Southern Ontario; OntarioGeological Survey, Miscellaneous Release--Data 228 ISBN 978-1-4249-5158-1.

17
8.0 APPENDICES
A. Borehole Logs, Laboratory Results
B. AASHTO 93 Design Results
C. Site Plan

APPENDIX A
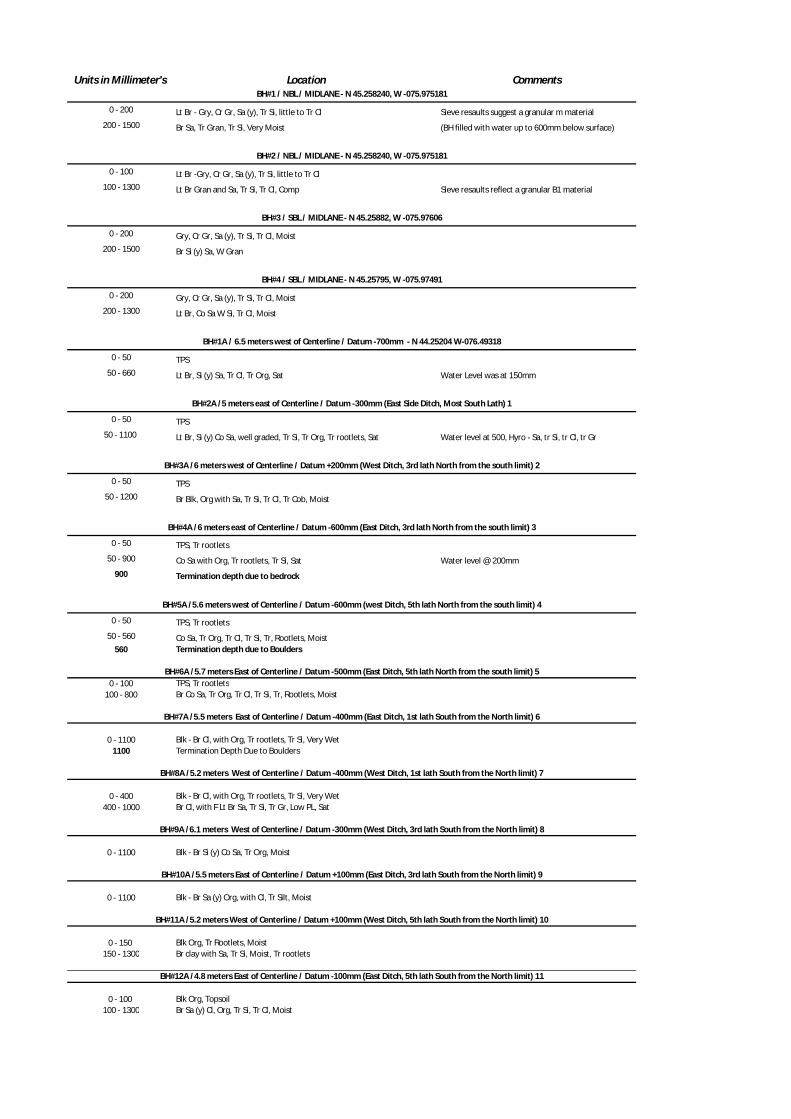
Units in Millimeter's Location Comments
0 - 200 Lt Br - Gry, Cr Gr, Sa (y), Tr Si, little to Tr Cl Sieve resaults suggest a granular m material200 - 1500 Br Sa, Tr Gran, Tr Si, Very Moist (BH filled with water up to 600mm below surface)
0 - 100 Lt Br -Gry, Cr Gr, Sa (y), Tr Si, little to Tr Cl100 - 1300 Lt Br Gran and Sa, Tr Si, Tr Cl, Comp Sieve resaults reflect a granular B1 material
0 - 200 Gry, Cr Gr, Sa (y), Tr Si, Tr Cl, Moist200 - 1500 Br Si (y) Sa, W Gran
0 - 200 Gry, Cr Gr, Sa (y), Tr Si, Tr Cl, Moist200 - 1300 Lt Br, Co Sa W Si, Tr Cl, Moist
0 - 50 TPS50 - 660 Lt Br, Si (y) Sa, Tr Cl, Tr Org, Sat Water Level was at 150mm
0 - 50 TPS50 - 1100 Lt Br, Si (y) Co Sa, well graded, Tr Si, Tr Org, Tr rootlets, Sat Water level at 500, Hyro - Sa, tr Si, tr Cl, tr Gr
0 - 50 TPS50 - 1200 Br Blk, Org with Sa, Tr Si, Tr Cl, Tr Cob, Moist
0 - 50 TPS, Tr rootlets50 - 900 Co Sa with Org, Tr rootlets, Tr Si, Sat Water level @ 200mm
900 Termination depth due to bedrock
0 - 50 TPS, Tr rootlets50 - 560 Co Sa, Tr Org, Tr Cl, Tr Si, Tr, Rootlets, Moist
560 Termination depth due to Boulders
0 - 100 TPS, Tr rootlets100 - 800 Br Co Sa, Tr Org, Tr Cl, Tr Si, Tr, Rootlets, Moist
0 - 1100 Blk - Br Cl, with Org, Tr rootlets, Tr Si, Very Wet1100 Termination Depth Due to Boulders
0 - 400 Blk - Br Cl, with Org, Tr rootlets, Tr Si, Very Wet400 - 1000 Br Cl, with F Lt Br Sa, Tr Si, Tr Gr, Low PL, Sat
0 - 1100 Blk - Br Si (y) Co Sa, Tr Org, Moist
0 - 1100 Blk - Br Sa (y) Org, with Cl, Tr Silt, Moist
0 - 150 Blk Org, Tr Rootlets, Moist150 - 1300 Br clay with Sa, Tr Si, Moist, Tr rootlets
0 - 100 Blk Org, Topsoil100 - 1300 Br Sa (y) Cl, Org, Tr Si, Tr Cl, Moist
BH#9A /6.1 meters West of Centerline / Datum -300mm (West Ditch, 3rd lath South from the North limit) 8
BH#10A /5.5 meters East of Centerline / Datum +100mm (East Ditch, 3rd lath South from the North limit) 9
BH#11A /5.2 meters West of Centerline / Datum +100mm (West Ditch, 5th lath South from the North limit) 10
BH#12A /4.8 meters East of Centerline / Datum -100mm (East Ditch, 5th lath South from the North limit) 11
BH#3A /6 meters west of Centerline / Datum +200mm (West Ditch, 3rd lath North from the south limit) 2
BH#4A /6 meters east of Centerline / Datum -600mm (East Ditch, 3rd lath North from the south limit) 3
BH#5A /5.6 meters west of Centerline / Datum -600mm (west Ditch, 5th lath North from the south limit) 4
BH#6A /5.7 meters East of Centerline / Datum -500mm (East Ditch, 5th lath North from the south limit) 5
BH#7A /5.5 meters East of Centerline / Datum -400mm (East Ditch, 1st lath South from the North limit) 6
BH#8A /5.2 meters West of Centerline / Datum -400mm (West Ditch, 1st lath South from the North limit) 7
BH#2A /5 meters east of Centerline / Datum -300mm (East Side Ditch, Most South Lath) 1
BH#1 / NBL / MIDLANE - N 45.258240, W -075.975181
BH#2 / NBL / MIDLANE - N 45.258240, W -075.975181
BH#3 / SBL / MIDLANE - N 45.25882, W -075.97606
BH#4 / SBL / MIDLANE - N 45.25795, W -075.97491
BH#1A / 6.5 meters west of Centerline / Datum -700mm - N 44.25204 W-076.49318
AME Materials Engineering
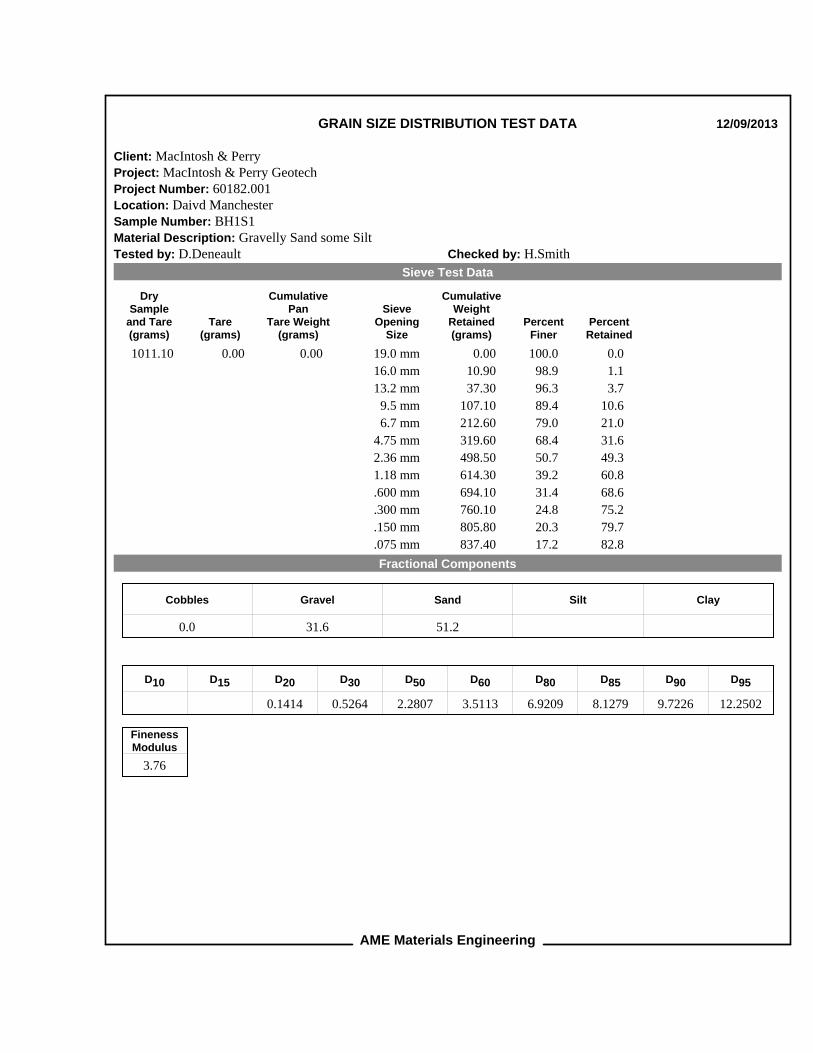
GRAIN SIZE DISTRIBUTION TEST DATA 12/09/2013
Client: MacIntosh & PerryProject: MacIntosh & Perry GeotechProject Number: 60182.001Location: Daivd ManchesterSample Number: BH1S1Material Description: Gravelly Sand some SiltTested by: D.Deneault Checked by: H.Smith
Sieve Test Data
DrySample
and Tare(grams)
Tare(grams)
CumulativePan
Tare Weight(grams)
SieveOpening
Size
CumulativeWeight
Retained(grams)
PercentFiner
PercentRetained
1011.10 0.00 0.00 19.0 mm 0.00 100.0 0.0
16.0 mm 10.90 98.9 1.1
13.2 mm 37.30 96.3 3.7
9.5 mm 107.10 89.4 10.6
6.7 mm 212.60 79.0 21.0
4.75 mm 319.60 68.4 31.6
2.36 mm 498.50 50.7 49.3
1.18 mm 614.30 39.2 60.8
.600 mm 694.10 31.4 68.6
.300 mm 760.10 24.8 75.2
.150 mm 805.80 20.3 79.7
.075 mm 837.40 17.2 82.8
Fractional Components
Cobbles
0.0
Gravel
31.6
Sand
51.2
Silt Clay
D10 D15 D20
0.1414
D30
0.5264
D50
2.2807
D60
3.5113
D80
6.9209
D85
8.1279
D90
9.7226
D95
12.2502
FinenessModulus
3.76
AME Materials Engineering
GRAIN SIZE DISTRIBUTION TEST DATA 12/09/2013
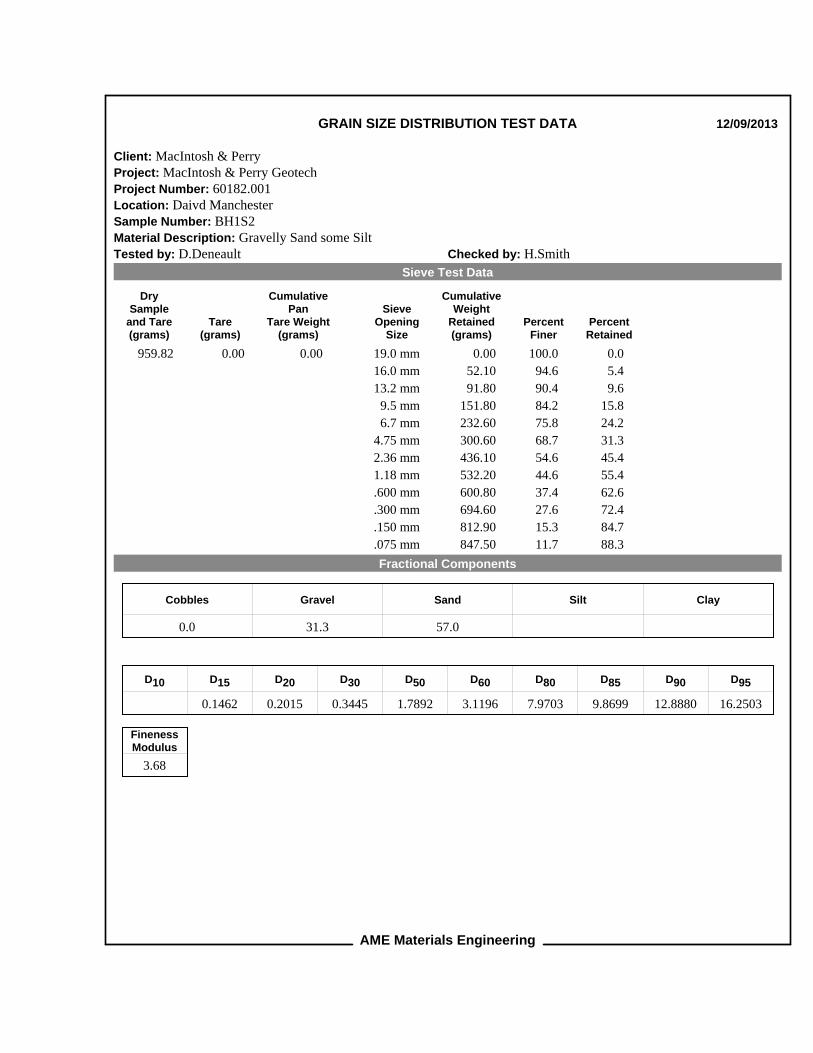
Client: MacIntosh & PerryProject: MacIntosh & Perry GeotechProject Number: 60182.001Location: Daivd ManchesterSample Number: BH1S2Material Description: Gravelly Sand some SiltTested by: D.Deneault Checked by: H.Smith
Sieve Test Data
DrySample
and Tare(grams)
Tare(grams)
CumulativePan
Tare Weight(grams)
SieveOpening
Size
CumulativeWeight
Retained(grams)
PercentFiner
PercentRetained
959.82 0.00 0.00 19.0 mm 0.00 100.0 0.0
16.0 mm 52.10 94.6 5.4
13.2 mm 91.80 90.4 9.6
9.5 mm 151.80 84.2 15.8
6.7 mm 232.60 75.8 24.2
4.75 mm 300.60 68.7 31.3
2.36 mm 436.10 54.6 45.4
1.18 mm 532.20 44.6 55.4
.600 mm 600.80 37.4 62.6
.300 mm 694.60 27.6 72.4
.150 mm 812.90 15.3 84.7
.075 mm 847.50 11.7 88.3
Fractional Components
Cobbles
0.0
Gravel
31.3
Sand
57.0
Silt Clay
D10 D15
0.1462
D20
0.2015
D30
0.3445
D50
1.7892
D60
3.1196
D80
7.9703
D85
9.8699
D90
12.8880
D95
16.2503
FinenessModulus
3.68
Tested By: D.Deneault Checked By: H.Smith
Client:
Project:
Project No.: Figure
MacIntosh & Perry
MacIntosh & Perry Geotech
60182.001 GW
SYMBOL SOURCESAMPLE DEPTH
Material Description USCSNO. (m.)
SOIL DATA
PE
RC
EN
T F
INE
R
0
10
20
30
40
50
60
70
80
90
100
PE
RC
EN
T C
OA
RS
ER
100
90
80
70
60
50
40
30
20
10
0
GRAIN SIZE - mm.
0.0010.010.1110100
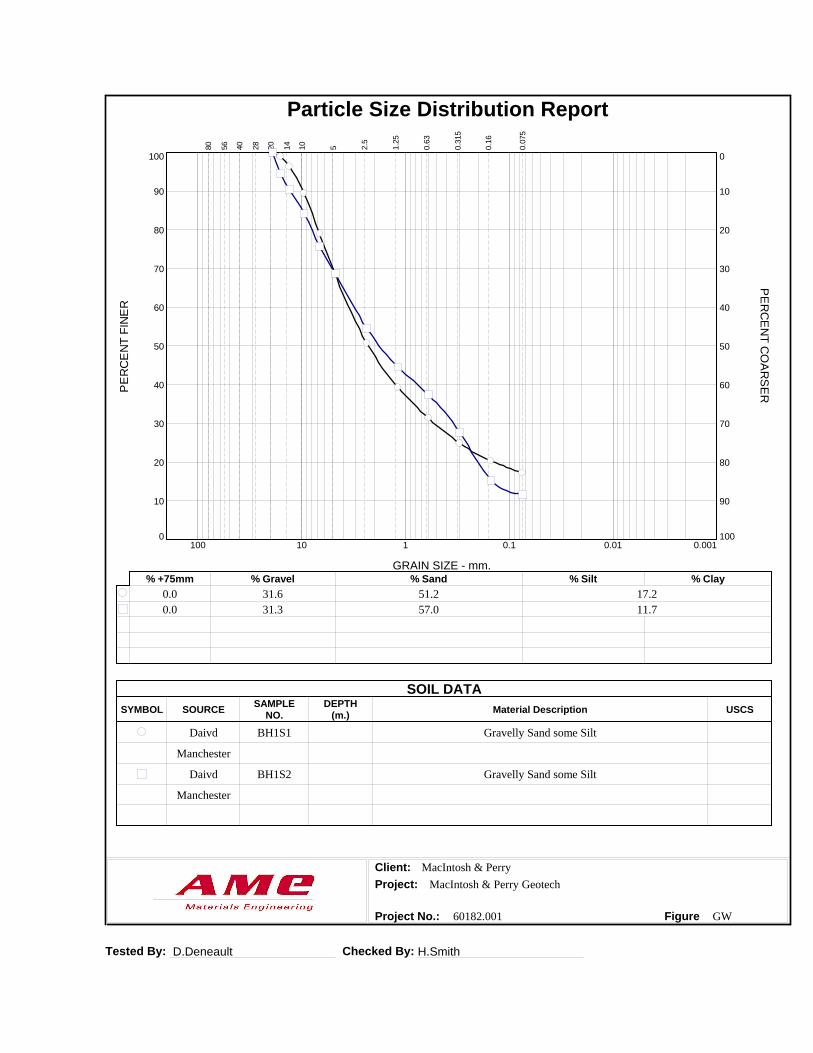
% +75mm % Gravel % Sand % Silt % Clay
0.0 31.6 51.2 17.2
0.0 31.3 57.0 11.7
80
56
40
28
20
14
10
5 2.5
1.2
5
0.6
3
0.3
15
0.1
6
0.0
75
Particle Size Distribution Report
Daivd
Manchester
BH1S1 Gravelly Sand some Silt
Daivd
Manchester
BH1S2 Gravelly Sand some Silt
AME Materials Engineering
GRAIN SIZE DISTRIBUTION TEST DATA 12/09/2013
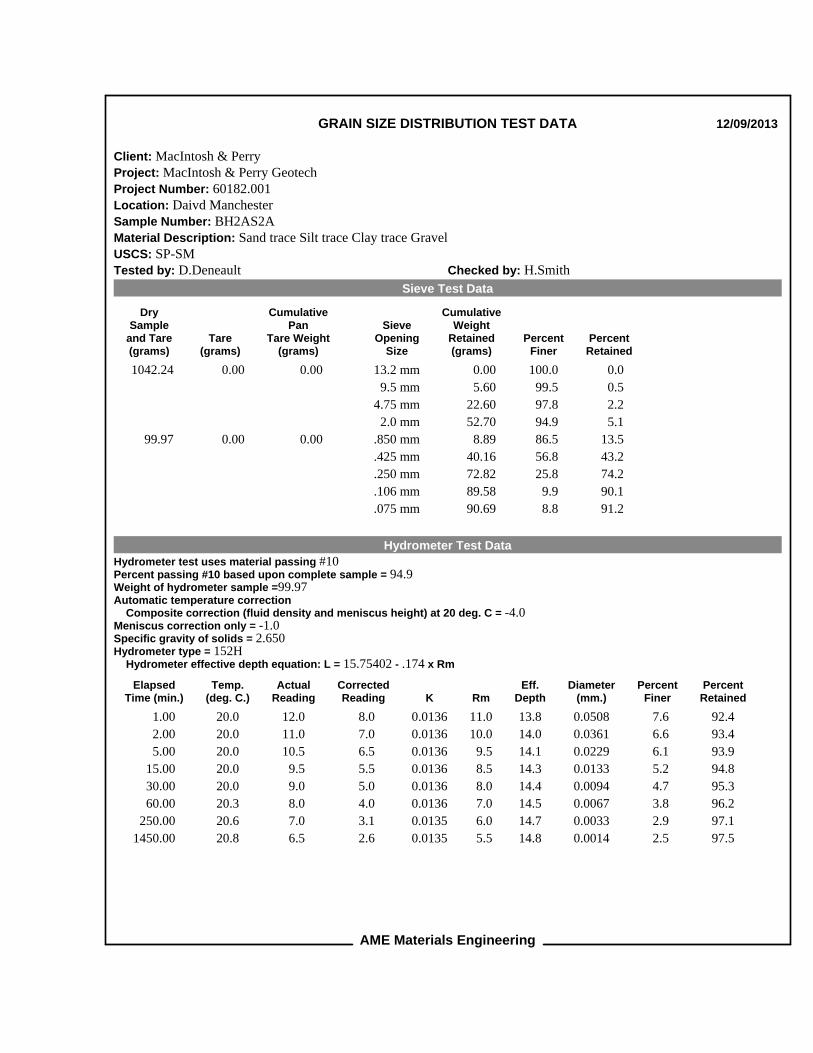
Client: MacIntosh & PerryProject: MacIntosh & Perry GeotechProject Number: 60182.001Location: Daivd ManchesterSample Number: BH2AS2AMaterial Description: Sand trace Silt trace Clay trace GravelUSCS: SP-SMTested by: D.Deneault Checked by: H.Smith
Sieve Test Data
DrySample
and Tare(grams)
Tare(grams)
CumulativePan
Tare Weight(grams)
SieveOpening
Size
CumulativeWeight
Retained(grams)
PercentFiner
PercentRetained
1042.24 0.00 0.00 13.2 mm 0.00 100.0 0.0
9.5 mm 5.60 99.5 0.5
4.75 mm 22.60 97.8 2.2
2.0 mm 52.70 94.9 5.1
99.97 0.00 0.00 .850 mm 8.89 86.5 13.5
.425 mm 40.16 56.8 43.2
.250 mm 72.82 25.8 74.2
.106 mm 89.58 9.9 90.1
.075 mm 90.69 8.8 91.2
Hydrometer Test Data
Hydrometer test uses material passing #10Percent passing #10 based upon complete sample = 94.9Weight of hydrometer sample =99.97Automatic temperature correction Composite correction (fluid density and meniscus height) at 20 deg. C = -4.0Meniscus correction only = -1.0Specific gravity of solids = 2.650Hydrometer type = 152H Hydrometer effective depth equation: L = 15.75402 - .174 x Rm
ElapsedTime (min.)
Temp.(deg. C.)
ActualReading
CorrectedReading K Rm
Eff.Depth
Diameter(mm.)
PercentFiner
PercentRetained
1.00 20.0 12.0 8.0 0.0136 11.0 13.8 0.0508 7.6 92.4
2.00 20.0 11.0 7.0 0.0136 10.0 14.0 0.0361 6.6 93.4
5.00 20.0 10.5 6.5 0.0136 9.5 14.1 0.0229 6.1 93.9
15.00 20.0 9.5 5.5 0.0136 8.5 14.3 0.0133 5.2 94.8
30.00 20.0 9.0 5.0 0.0136 8.0 14.4 0.0094 4.7 95.3
60.00 20.3 8.0 4.0 0.0136 7.0 14.5 0.0067 3.8 96.2
250.00 20.6 7.0 3.1 0.0135 6.0 14.7 0.0033 2.9 97.1
1450.00 20.8 6.5 2.6 0.0135 5.5 14.8 0.0014 2.5 97.5

AME Materials Engineering
Fractional Components
Cobbles
0.0
Gravel
2.2
Sand
89.0
Silt
5.5
Clay
3.3
D10
0.1098
D15
0.1790
D20
0.2159
D30
0.2722
D50
0.3801
D60
0.4491
D80
0.6885
D85
0.8036
D90
1.0052
D95
2.0397
FinenessModulus
1.93
Cu
4.09
Cc
1.50

AME Materials Engineering
GRAIN SIZE DISTRIBUTION TEST DATA 12/09/2013
Client: MacIntosh & PerryProject: MacIntosh & Perry GeotechProject Number: 60182.001Location: Daivd ManchesterSample Number: BH7AS4AMaterial Description: Sand with Gravel some Silt trace ClayUSCS: SMTested by: D.Deneault Checked by: H.Smith
Sieve Test Data
DrySample
and Tare(grams)
Tare(grams)
CumulativePan
Tare Weight(grams)
SieveOpening
Size
CumulativeWeight
Retained(grams)
PercentFiner
PercentRetained
436.65 0.00 0.00 26.5 mm 0.00 100.0 0.0
19.0 mm 70.90 83.8 16.2
16.0 mm 70.90 83.8 16.2
13.2 mm 86.00 80.3 19.7
9.5 mm 107.60 75.4 24.6
4.75 mm 129.10 70.4 29.6
2.0 mm 150.50 65.5 34.5
50.36 0.00 0.00 .850 mm 5.12 58.9 41.1
.425 mm 13.15 48.4 51.6
.250 mm 21.29 37.8 62.2
.106 mm 29.66 26.9 73.1
.075 mm 30.68 25.6 74.4
Hydrometer Test Data
Hydrometer test uses material passing #10Percent passing #10 based upon complete sample = 65.5Weight of hydrometer sample =50.36Automatic temperature correction Composite correction (fluid density and meniscus height) at 20 deg. C = -4.0Meniscus correction only = -1.0Specific gravity of solids = 2.690Hydrometer type = 152H Hydrometer effective depth equation: L = 15.75402 - .174 x Rm
ElapsedTime (min.)
Temp.(deg. C.)
ActualReading
CorrectedReading K Rm
Eff.Depth
Diameter(mm.)
PercentFiner
PercentRetained
1.00 20.0 20.0 16.0 0.0135 19.0 12.4 0.0476 20.6 79.4
2.00 20.0 19.0 15.0 0.0135 18.0 12.6 0.0339 19.3 80.7
5.00 20.0 18.5 14.5 0.0135 17.5 12.7 0.0215 18.6 81.4
15.00 20.0 17.0 13.0 0.0135 16.0 13.0 0.0125 16.7 83.3
30.00 20.0 12.0 8.0 0.0135 11.0 13.8 0.0092 10.3 89.7
60.00 20.2 11.5 7.5 0.0134 10.5 13.9 0.0065 9.7 90.3
250.00 20.5 9.5 5.6 0.0134 8.5 14.3 0.0032 7.2 92.8
1461.00 20.8 8.5 4.6 0.0133 7.5 14.4 0.0013 6.0 94.0

AME Materials Engineering
Fractional Components
Cobbles
0.0
Gravel
29.6
Sand
44.8
Silt
17.0
Clay
8.6
D10
0.0076
D15
0.0115
D20
0.0435
D30
0.1531
D50
0.4630
D60
0.9458
D80
13.0157
D85
20.1432
D90
22.6099
D95
24.5730
FinenessModulus
3.16
Cu
124.35
Cc
3.26

Tested By: D.Deneault Checked By: H.Smith
Client:
Project:
Project No.: Figure
MacIntosh & Perry
MacIntosh & Perry Geotech
60182.001 Hydrometer
SYMBOL SOURCESAMPLE DEPTH
Material Description USCSNO. (m.)
SOIL DATA
PE
RC
EN
T F
INE
R
0
10
20
30
40
50
60
70
80
90
100
PE
RC
EN
T C
OA
RS
ER
100
90
80
70
60
50
40
30
20
10
0
GRAIN SIZE - mm.
0.0010.010.1110100
% +75mm % Gravel % Sand % Silt % Clay
0.0 2.2 89.0 5.5 3.3
0.0 29.6 44.8 17.0 8.6
80
56
40
28
20
14
10
5 2.5
1.2
5
0.6
3
0.3
15
0.1
6
0.0
75
Particle Size Distribution Report
Daivd
Manchester
BH2AS2A Sand trace Silt trace Clay trace Gravel SP-SM
Daivd
Manchester
BH7AS4A Sand with Gravel some Silt trace Clay SM
AME Materials Engineering
LIQUID AND PLASTIC LIMIT TEST DATA 12/09/2013
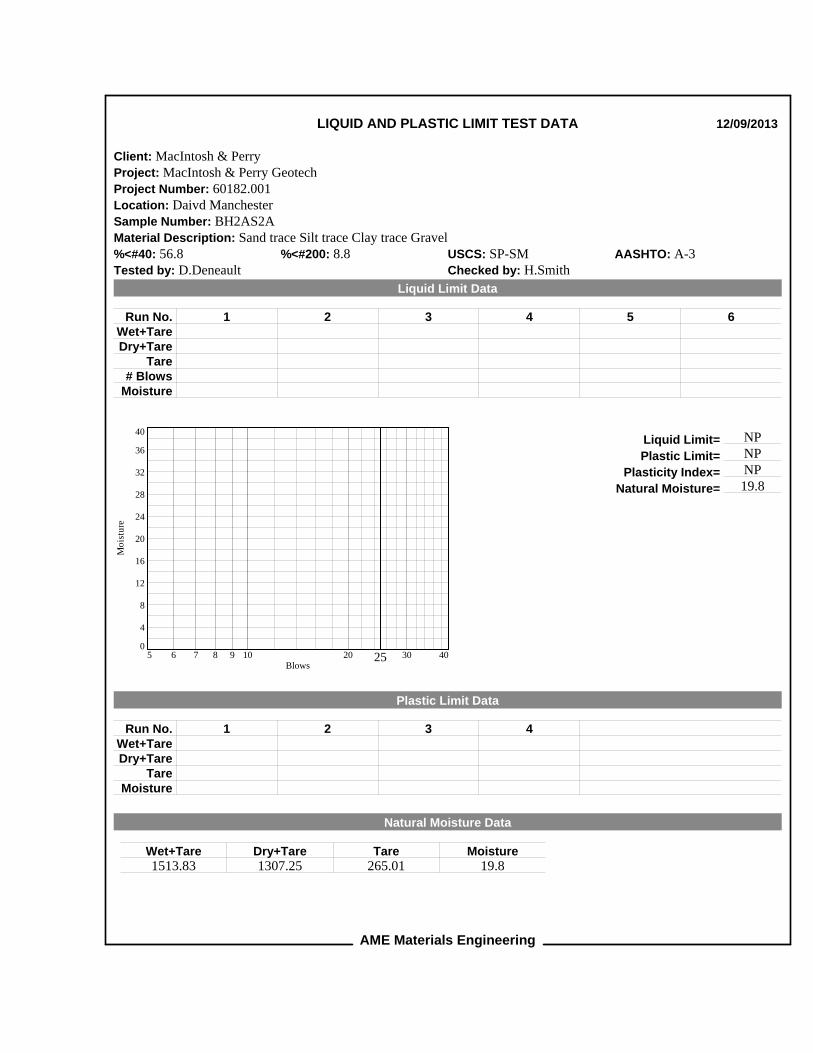
Client: MacIntosh & PerryProject: MacIntosh & Perry GeotechProject Number: 60182.001Location: Daivd ManchesterSample Number: BH2AS2AMaterial Description: Sand trace Silt trace Clay trace Gravel%<#40: 56.8 %<#200: 8.8 USCS: SP-SM AASHTO: A-3Tested by: D.Deneault Checked by: H.Smith
Liquid Limit Data
1 2 3 4 5 6Run No.Wet+TareDry+Tare
Tare# Blows
Moisture
Mo
istu
re
0
4
8
12
16
20
24
28
32
36
40
Blows5 6 7 8 9 10 20 25 30 40
Liquid Limit= NP
Plastic Limit= NP
Plasticity Index= NP
Natural Moisture= 19.8
Plastic Limit Data
1 2 3 4Run No.Wet+TareDry+Tare
TareMoisture
Natural Moisture Data
Wet+Tare1513.83
Dry+Tare1307.25
Tare265.01
Moisture19.8

AME Materials Engineering
LIQUID AND PLASTIC LIMIT TEST DATA 12/09/2013
Client: MacIntosh & PerryProject: MacIntosh & Perry GeotechProject Number: 60182.001Location: Daivd ManchesterSample Number: BH7AS4AMaterial Description: Sand with Gravel some Silt trace Clay%<#40: 48.4 %<#200: 25.6 USCS: SM AASHTO: A-2-4(0)Tested by: D.Deneault Checked by: H.Smith
Liquid Limit Data
1 2 3 4 5 6Run No.Wet+TareDry+Tare
Tare# Blows
Moisture
Mo
istu
re
0
4
8
12
16
20
24
28
32
36
40
Blows5 6 7 8 9 10 20 25 30 40
Liquid Limit= NP
Plastic Limit= NP
Plasticity Index= NP
Natural Moisture= 71.9
Plastic Limit Data
1 2 3 4Run No.Wet+TareDry+Tare
TareMoisture
Natural Moisture Data
Wet+Tare1015.80
Dry+Tare701.87
Tare265.22
Moisture71.9

Tested By: D.Deneault Checked By: H.Smith
Sand trace Silt trace Clay trace Gravel NP NP NP 56.8 8.8 SP-SM
Sand with Gravel some Silt trace Clay NP NP NP 48.4 25.6 SM
60182.001 MacIntosh & Perry
MATERIAL DESCRIPTION LL PL PI %<#40 %<#200 USCS
Project No. Client: Remarks:
Project:
Figure
Source of Sample: Daivd Manchester Sample Number: BH2AS2A
Source of Sample: Daivd Manchester Sample Number: BH7AS4A
PL
AS
TIC
ITY
IN
DE
X
0
10
20
30
40
50
60
LIQUID LIMIT0 10 20 30 40 50 60 70 80 90 100 110
CL-ML
CL or O
L
CH or O
H
ML or OL MH or OH
Dashed line indicates the approximateupper limit boundary for natural soils
4
7
LIQUID AND PLASTIC LIMITS TEST REPORT
MacIntosh & Perry Geotech

Job No.: Date Sampled:
Job Name: Date Tested:
Source: Tested By:
BH1A BH6A
S1A S3A
1 2
Weight of Tare (t ) 45.89 45.54
Weight of tare & wet sample (A ) 307.64 261.76
Weight of tare & dry sample (B ) 275.07 238.27
Weight of Water = (A-B ) 32.57 23.49
Weight of dry sample (C )=(B-t ) 229.18 192.73
Moisture Content = (A-B)/C*100 14.2 12.2
X - Conforming
- Non Conforming(Attach Report)
- Meets Spec
- Out of Spec
Comments:
Moisture Content of Soils and Aggregates (ASTM D-2216)
Dec 03,2013
D. Deneault
60182.001
MacIntosh & Perry Geotech
David Manchester Dr.
Tare Number
Depth (m)
Sample Number
Page 1 of 1

APPENDIX B

Project Name: David Manchester Road
Date/Time: December. 2013Prepared By: Corey O'Neill
Input Design Parameters Calculations SN (initial)= 93.65082026 mmCumulative ESAL's 990,610 A -0.62818000Initial Serviceability(Po) 4.4 B 5.99590271Terminal Serviceability(Pt) 2.2 C 8.73141518 1. Go to Tools menu;Reliability (%) 90 D -0.08894108 2. Go to Goal Seek;
Overall Standard Deviation 0.49 E 0.76062281Roadbed Soil Resilient Modulus (MPa) 40.0 F 6.27961160Zr -1.282 Goal 0.00001216ΔPSI 2.2 Target 0
The Required SN = 93.65 mm
4.Click on OK.
Layer Material DescriptionStructural Coef. Ai
Drainage Coef. Mi
Thickness Di (mm)
Calculated SN (mm)
1 HMA 0.42 1 90 37.802 Granular A 0.14 1 150 21.003 EX Granular M 0.1 1 150 15.00
EX Granular B 0.07 1 1000 70.00
1390143.80
Required Structural Number (SN) Calculations
Note: This simplified spreadsheet pavement design tool based on 93' AASHTO Pavement Design Guide for flexible pavement design is developed for the exclusive use by the Geotechnical Section staff. Comments are welcome!
Project Information
DESIGN OUTPUT- 1993 AASHTO PAVEMENT DESIGN METHOD
Calculated SN = Design is Okay! Congratulations!
How to Calculate the Design SN?
Total Pavement Thickness =
Design Structural Number (SN) Calculations
3. Set cell of Goal to 0.0 by changing SN (initial) as follows.
You created this PDF from an application that is not licensed to print to novaPDF printer (http://www.novapdf.com)

APPENDIX C