Probabilistic Segment-linked Pavement Management Optimization Model
Upload
khangminh22Category
view
4download
0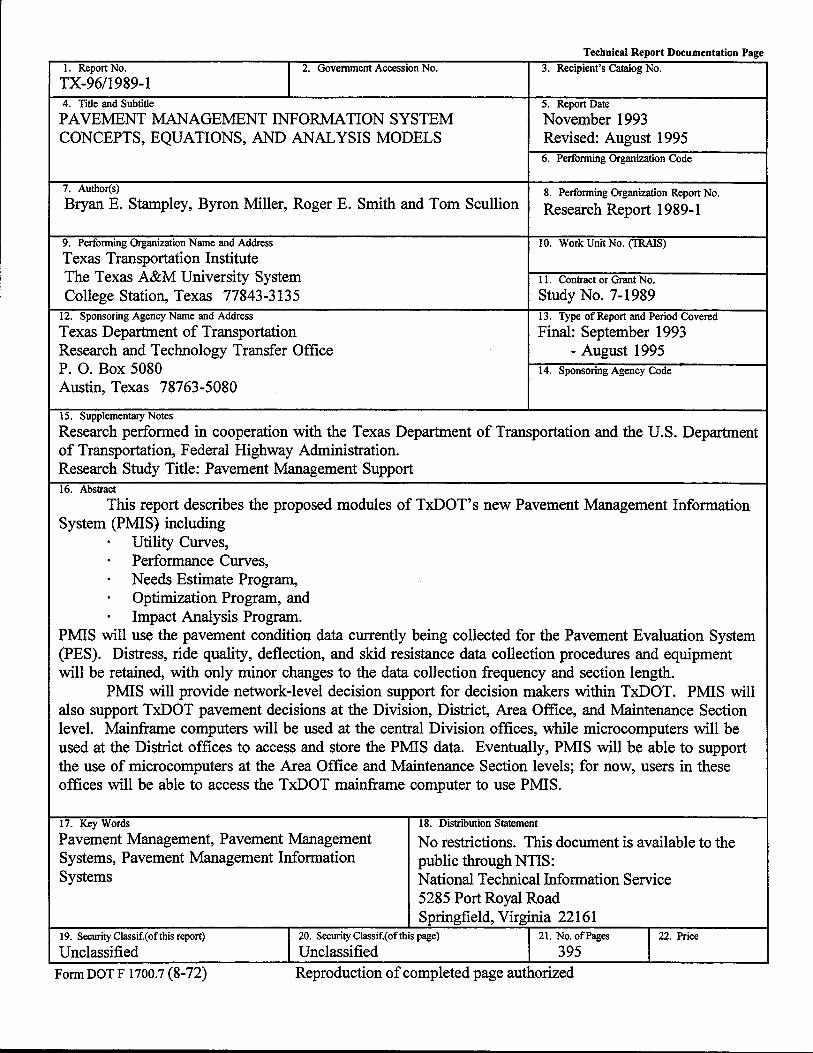
Technical Report Documentation Page
l. Report No.
TX-96/1989-1 I 2. Government Accession No. 3. Recipient's Catalog No.
4. Title and Subtitle
PAVEMENT MANAGEMENT INFORMATION SYSTEM CONCEPTS, EQUATIONS, AND ANALYSIS MODELS
7. Author( s)
Bryan E. Stampley, Byron Miller, Roger E. Smith and Tom Scullion
9. Performing Organization Name and Address
Texas Transportation Institute The Texas A&M University System College Station, Texas 77843-3135
12. Sponsoring Agency Name and Address
Texas Department of Transportation Research and Technology Transfer Office P. 0. Box 5080 Austin, Texas 78763-5080
15. Supplementary Notes
5. Report Date
November 1993 Revised: August 1995 6. Performing Organization Code
8. Performing Organization Report No.
Research Report 1989-1
10. Work Unit No. (TRAIS)
11. Contract or Grant No.
Study No. 7-1989 13. Type of Report and Period Covered
Final: September 1993 - August 1995
14. Sponsoring Agency Code
Research performed in cooperation with the Texas Department of Transportation and the U.S. Department of Transportation, Federal Highway Administration. Research Study Title: Pavement Management Support 16. Abstract
This report describes the proposed modules of TxDOT' s new Pavement Management Information System (PMIS) including
· Utility Curves, · Performance Curves, · Needs Estimate Program, · Optimization Program, and · Impact Analysis Program.
PMIS will use the pavement condition data currently being collected for the Pavement Evaluation System (PES). Distress, ride quality, deflection, and skid resistance data collection procedures and equipment will be retained, with only minor changes to the data collection frequency and section length.
PMIS will provide network-level decision support for decision makers within TxDOT. PMIS will also support TxDOT pavement decisions at the Division, District, Area Office, and Maintenance Section level. Mainframe computers will be used at the central Division offices, while microcomputers will be used at the District offices to access and store the PMIS data. Eventually, PMIS will be able to support the use of microcomputers at the Area Office and Maintenance Section levels; for now, users in these offices will be able to access the TxDOT mainframe computer to use PMIS.
17. Key Words
Pavement Management, Pavement Management Systems, Pavement Management Information Systems
18. Distribution Statement
No restrictions. This document is available to the public through NTIS: National Technical Information Service 5285 Port Royal Road Springfield, Virginia 22161
19. Security Classif.(ofthis report)
Unclassified I 20. Security Classif.(ofthis page) 21. No. of Pages
Unclassified 395 I 22. Price
Form DOT F 1700.7 (8-72) Reproduction of completed page authorized


PAVEMENT MANAGEMENT INFORMATION SYSTEM CONCEPTS, EQUATIONS, AND ANALYSIS MODELS
by
Bryan E. Stampley, P.E. Senior Pavement Engineer
Texas Department of Transportation
and
Byron Miller Systems Analyst
Texas Department of Transportation
and
Roger E. Smith, P .E. Associate Research Engineer Texas Transportation Institute
and
Tom Scullion, P.E. Associate Research Engineer Texas Transportation Institute
Research Report 1989-1 Research Study Number 7-1989
Study Title: Pavement Management Support
Sponsored by Texas Department of Transportation
November 1993 Revised: August 1995
TEXAS TRANSPORTATION INSTITUTE The Texas A&M University System College Station, Texas 77843-3135


IMPLEMENTATION STATEMENT
This report describes concepts to be included in TxDOT' s Pavement Management
Information System (PMIS). It includes a discussion of the basic utility theory concepts
and values used to compare pavement distress types, formulae used to calculate pavement
condition and other scores, and the models used to predict future pavement conditions.
This report also includes a detailed description of the analysis procedures used to
estimate total pavement preventive maintenance and reliability needs, to prioritize
pavement sections which can be treated within limited funding, and to assess the impacts
of pavement funding and other factors on future pavement condition.
TxDOT and TTI staff worked closely during the development of PMIS. Although
TxDOT has made a few minor changes while coding the PMIS computer programs, the
basic concepts outlined in this report have been incorporated into PMIS.
TxDOT should use PMIS as a "first-cut" method for identifying candidate
pavement sections for rehabilitation, reconstruction, and preventive maintenance.
TxDOT should also use PMIS to determine the impact of different decisions on
pavement performance and future pavement needs.
The pavement performance prediction models described in this report should be
considered as preliminary because they are based on limited data. TxDOT should
continuously review and improve these models and sponsor additional research as
needed, to provide better estimates of future pavement condition.
TxDOT should also ensure that the PMIS computer programs are written to allow
access by District and Area Office personnel. Training should also be provided on a
periodic basis to ensure that potential users can readily enter, access, and use the PMIS
data to support pavement decision-making.
v


DISCLAIMER
The contents of this report reflect the views of the authors who are responsible for
the facts and the accuracy of the data presented herein.
This report does not constitute a standard, specification or regulation and does not
necessarily represent the views or policy of the Texas Department of Transportation.
Additionally, this report is not intended for construction, bidding, or permit purposes.
Vll

ACKNOWLEDGMENT
The work described was supported by the Pavements Section of the Design
Division. The researchers also conducted the work under the guidance of the TxDOT
Pavement Management Steering Committee.
The Pavement Management Information Systems (PMIS) concepts described in this
report were developed during extensive meetings of research study and TxDOT
personnel.
Mr. Bryan E. Stampley, P.E., was Project Director for thi~ study. Ms. Karen
VanHooser, C.D.P., directed the analysis, design, and programming of the PMIS for
TxDOT. Mr. David E. Fink, P.E., of TxDOT developed the detailed utility and
performance curve tables.
The authors would also like to thank:
Those TxDOT employees who had the vision and foresight to test pavement
management concepts in the field many years before PMIS was developed;
The Federal Highway Administration, for having the courage to make
pavement management a matter of national concern;
The TxDOT District offices, which collect the data and operate the equipment
which keeps the PMIS "running;" and
All TxDOT employees who are now putting the PMIS concepts to the test,
and making the vision of longer-lasting pavements a reality.
Vlll

TABLE OF CONTENTS
Page
LIST OF FIGURES . . . . . . . . . . . . . . . . . . . . . . . . . . . . . . . . . . . . . . . . . . . . XIV
LIST OF TABLES . . . . . . . . . . . . . . . . . . . . . . . . . . . . . . . . . . . . . . . . . . . . . xv
CHAPTER I - INTRODUCTION . . . . . . . . . . . . . . . . . . . . . . . . . . . . . . . . . . . 1
DESCRIPTION . . . . . . . . . . . . . . . . . . . . . . . . . . . . . . . . . . . . . . . . . . . 1
PAVEMENT TYPES . . . . . . . . . . . . . . . . . . . . . . . . . . . . . . . . . . . . . . . 2
DATA COLLECTION SAMPLE SIZE AND TYPE .................. 3
PMIS SECTIONS .......................................... 4
CONDITION DATA . . . . . . . . . . . . . . . . . . . . . . . . . . . . . . . . . . . . . . . . 5
Distress . . . . . . . . . . . . . . . . . . . . . . . . . . . . . . . . . . . . . . . . . . . . . 5
Ride Quality . . . . . . . . . . . . . . . . . . . . . . . . . . . . . . . . . . . . . . . . . 7
Deflection . . . . . . . . . . . . . . . . . . . . . . . . . . . . . . . . . . . . . . . . . . . 8
Skid Resistance . . . . . . . . . . . . . . . . . . . . . . . . . . . . . . . . . . . . . . . 8
PMIS SCORES . . .. . . . . . . . . . . . . . . . . . . . . . . . . . . . . . . . . . . . . . . . . 9
ANALYSIS PROCEDURES . . . . . . . . . . . . . . . . . . . . . . . . . . . . . . . . . 11
CHAPTER II-PAVEMENT UTILITY CURVES ...................... 13
DESCRIPTION . . . . . . . . . . . . . . . . . . . . . . . . . . . . . . . . . . . . . . . . . . 13
DEFINING UTILITY FOR PAVEMENT DISTRESS ................ 15
DEFINING UTILITY FOR RIDE QUALITY . . . . . . . . . . . . . . . . . . . . . . 16
BASIC PAVEMENT UTILITY CURVE EQUATION ................ 17
Alpha Factor . . . . . . . . . . . . . . . . . . . . . . . . . . . . . . . . . . . . . . . . 18
Beta Factor . . . . . . . . . . . . . . . . . . . . . . . . . . . . . . . . . . . . . . . . . 20
Rho Factor . . . . . . . . . . . . . . . . . . . . . . . . . . . . . . . . . . . . . . . . . . 20
Computing the L Value . . . . . . . . . . . . . . . . . . . . . . . . . . . . . . . . . 20
For Distress Types . . . . . . . . . . . . . . . . . . . . . . . . . . . . . . . . 23
For Ride Quality. . . . . . . . . . . . . . . . . . . . . . . . . . . . . . . . . . 27
UTILITY CURVE COEFFICIENTS ............................ 28
IX
Page
UTILITY VALUES FOR DISTRESS TYPES AND RIDE SCORE . . . . . . . 28
CALCULATING THE DISTRESS SCORE ....................... 113
Equation for CRCP (Pavement Type = 1) . . . . . . . . . . . . . . . . . . . . . 113
Equation for JCP (Pavement Type= 2-3) ..................... 114
Equation for ACP (Pavement Type= 4-10) ................... 114
CALCULATING THE CONDITION SCORE ...................... 115
SUMMARY ............................................. 115
CHAPTER III - PAVEMENT PERFORMANCE CURVES ................ 117
DESCRIPTION .......................................... 117
EFFECT OF TREATMENTS ON PAVEMENT PERFORMANCE ....... 119
DEFINING PERFORMANCE CURVES ......................... 121
Distress Types ....................................... 121
Patching on ACP Sections ............................... 121
Ride Quality ........................................ 123
BASIC PERFORMANCE CURVE EQUATION .................... 124
Traffic Factor (Chi) .................................... 125
Climate Factor (Epsilon) ................................ 156
Subgrade Support Factor (Sigma) .......................... 156
PERFORMANCE CURVE COEFFICIENTS ...................... 169
TABLES FOR DISTRESS AND RIDE SCORE OVER TIME .......... 180
ESTIMATING "THEORETICAL AGE" ......................... 180
SUMMARY ............................................. 255
CHAPTER IV - NEEDS ESTIMATE ............................... 257
DESCRIPTION .......................................... 257
SECTIONS TO BE ANALYZED .............................. 258
Data Collection Sections ................................ 258
Management Sections .................................. 258
x

Page
Calculating Ratings, Scores, and Treatments for
Management Sections ........................... 259
TREATMENT TYPES AND COSTS ........................... 259
SELECTING THE TREATMENT TYPE ......................... 265
NEEDS ESTIMATE PROCESS ............................... 267
Step 1: User selects run/report parameters ................... 268
Step 2: Program selects records which can be analyzed .......... 268
Step 3: Program ages all records to the first Fiscal Year
selected by the user . . . . . . . . . . . . . . . . . . . . . . . . . . . . 269
Step 4: Program selects treatments (using the decision tree
statements) and costs ............................ 271
Step 5: Program lists results for each report
which the user has requested in Step 1 ............... 271
Step 6: Program returns to Step 3 if a multi-year
Needs Estimate was requested ..................... 272
NEEDS ESTIMATE REPORTS ............................... 272
Detail List of Sections Which Need to be Treated ............... 273
Statewide Pavement Needs, by District ...................... 274
Statewide Pavement Needs, by Highway System ................ 274
Statewide Pavement Needs, Executive Summary ................ 274
District Pavement Needs, by Highway System ................. 274
District Pavement Needs, Executive Summary .................. 274
PROPOSED PMIS NEEDS ESTIMATE DECISION TREE
STATEMENTS ...................................... 282
SUMMARY ............................................. 283
CHAPTER V - OPTIMIZATION .................................. 299
DESCRIPTION .......................................... 299
SECTIONS TO BE ANALYZED .............................. 300
Xl

Page
TREATMENT TYPES AND COSTS ........................... 300
SELECTING THE TREATMENT TYPE ......................... 301
OPTIMIZATION PROCESS ................................. 301
Step 1:
Step 2:
Step 3:
Step 4:
Step 5:
Step 6:
Step 7:
Step 8:
Step 9:
User selects run/report parameters ................... 302
Program selects records which can be analyzed .......... 303
Program ages all records to the first Fiscal
Year selected by the user ......................... 303
Program selects treatments (using
the decision tree statements) and costs ................ 303
Program computes "after treatment" distress
ratings and ride quality ("gain in rating") .............. 304
Program computes "Benefit" and "Effective Life" of
of the Needs Estimate treatment for each section ......... 305
Program computes "Cost Effectiveness Ratio"
for each section ............................... 315
Program determines sections to be funded . . . . . . . . . . . . . 318
Program lists results for each report
which the user has requested in Step 1 . . . . . . . . . . . . . . . 319
Step 10: Program returns to Step 3 if a multi-year
Optimization was requested . . . . . . . . . . . . . . . . . . . . . . . 319
"FORCED" TREATMENTS ................................. 328
OPTIMIZATION REPORTS ................................. 329
Detail List of Sections Which Can be Treated .................. 330
Statewide Optimization, by District ......................... 330
Statewide Optimization, by Highway System .................. 332
District Optimization, by Highway System .................... 332
SUMMARY ............................................. 332
CHAPTER VI - IMP ACT ANALYSIS .............................. 335
Xll

Page
DESCRIPTION .......................................... 335
PURPOSE OF THE IMP ACT ANALYSIS ........................ 335
Funding, Section Limits, and Section Treatments ................ 336
Truck Traffic (18-k ESAL) and Preventive Maintenance
(seal coat) Policy ........ -......................... 336
Impact Analysis at Different Points in Time ................... 336
CONDITION MEASURES FOR IMP ACT ANALYSIS .................... 338
Pavement Maintenance Levels of Service ..................... 338
Average PMIS Scores .................................. 342
OTHER CONDITION MEASURES ............................ 342
Stopgap Mileage ...................................... 342
Stopgap Cost ........................................ 342
Funding Backlog ..................................... 343
IMP ACT ANALYSIS REPORTS .............................. 343
District Impact, by Highway System ........................ 344
Statewide Impact, by District . . . . . . . . . . . . . . . . . . . . . . . . . . . . . 344
Statewide Impact, by Highway System ....................... 355
SUMMARY ............................................. 355
CHAPTER VII - SUMMARY .................................... 361
Xlll

Figure
1
2
3
4
5
6
7
8
9
10
LIST OF FIGURES
Page
Utility Curve for Alligator Cracking . . . . . . . . . . . . . . . . . . . . . . . . 14
Effect of Alpha Factor on Utility Curve . . . . . . . . . . . . . . . . . . . . . . 19
Effect of Beta Factor on Utility Curve . . . . . . . . . . . . . . . . . . . . . . . 21
Effect of Rho Factor on Utility Curve . . . . . . . . . . . . . . . . . . . . . . . 22
Performance Curve for Shallow Rutting . . . . . . . . . . . . . . . . . . . . . . 118
Proposed Definition of "Benefit" for PMIS Optimization Program .... 306
Boundary Condition for Curves (Distress and Ride) Intersecting ..... 309
Boundary Condition for 20-year Treatment Life ................ 310
Boundary Condition for No Gain in Year 1 for Distress or Ride ..... 311
Boundary Condition for Failure Criterion (Distress or Ride) Reached .. 313
XIV

LIST OF TABLES
Table Page
1 Proposed PMIS Pavement Types . . . . . . . . . . . . . . . . . . . . . . . . . . . . 2
2 Original PES Data Collection Sample Size and Type . . . . . . . . . . . . . . 3
3 Proposed PMIS CRCP Distress Types and Rating Methods .......... 6
4 Proposed PMIS JCP Distress Types and Rating Methods ........... 6
5 Proposed PMIS ACP Distress Types and Rating Methods ........... 7
6 Proposed Use of PES Scores in PMIS. . . . . . . . . . . . . . . . . . . . . . . . 10
7 Proposed PMIS Traffic Classes (based on product of ADT
and Speed Limit) . . . . . . . . . . . . . . . . . . . . . . . . . . . . . . . . . . . . . 17
8 Computing the L Value for CRCP Distress Types . . . . . . . . . . . . . . . 23
9 Computing the L Value for JCP Distress Types . . . . . . . . . . . . . . . . . 24
10 Computing the L Value for ACP Distress Types . . . . . . . . . . . . . . . . 26
11 Distress Utility Factors . . . . . . . . . . . . . . . . . . . . . . . . . . . . . . . . . 29
12 Ride Score Utility Factors for Detailed Pavement Type 01 . . . . . . . . . 32
13 Ride Score Utility Factors for Detailed Pavement Type 02 . . . . . . . . . 33
14 Ride Score Utility Factors for Detailed Pavement Type 03 . . . 34
15 Ride Score Utility Factors for Detailed Pavement Type 04 . . . 35
16 Ride Score Utility Factors for Detailed Pavement Type 05 . . . . 36
17 Ride Score Utility Factors for Detailed Pavement Type 06 . . . 37
18 Ride Score Utility Factors for Detailed Pavement Type 07 . . . . . 38
19 Ride Score Utility Factors for Detailed Pavement Type 08 . . . . . 39
20 Ride Score Utility Factors for Detailed Pavement Type 09 . . . . . 40
21 Ride Score Utility Factors for Detailed Pavement Type 10 . . 41
22 Distress Utility Factors for Spalled Cracks for Detailed
Pavement Type: 01 .................................... 42
23 Distress Utility Factors for Punchouts for Detailed
Pavement Type: 01 . . . . . . . . . . . . . . . . . . . . . . . . . . . . . . . . . . . . 43
xv

Table Page
24 Distress Utility Factors for Asphalt Patches for Detailed
Pavement Type: 01 . . . . . . . . . . . . . . . . . . . . . . . . . . . . . . . . . . . . 44
25 Distress Utility Factors for Concrete Patches for Detailed
Pavement Type: 01 .................................... 45
26 Distress Utility Factors for Failed Joints and Cracks for
Detailed Pavement Type: 02 . . . . . . . . . . . . . . . . . . . . . . . . . . . . . . 46
27 Distress Utility Factors for JCP Failures for Detailed
Pavement Type: 02 . . . . . . . . . . . . . . . . . . . . . . . . . . . . . . . . . . . . 4 7
28 Distress Utility Factors for Slabs with Longitudinal Cracks
for Detailed Pavement Type: 02 . . . . . . . . . . . . . . . . . . . . . . . . . . . 48
29 Distress Utility Factors for Shattered Slabs for Detailed
Pavement Type: 02 . . . . . . . . . . . . . . . . . . . . . . . . . . . . . . . . . . . . 49
30 Distress Utility Factors for Concrete Patching for Detailed
Pavement Type: 02 . . . . . . . . . . . . . . . . . . . . . . . . . . . . . . . . . . . . 50
31 Distress Utility Factors for Failed Joints and Cracks for
Detailed Pavement Type: 03 . . . . . . . . . . . . . . . . . . . . . . . . . . . . . . 51
32 Distress Utility Factors for JCP Failures for Detailed
Pavement Type: 03 . . . . . . . . . . . . . . . . . . . . . . . . . . . . . . . . . . . . 52
33 Distress Utility Factors for Shattered Slabs for Detailed
Pavement Type: 03 . . . . . . . . . . . . . . . . . . . . . . . . . . . . . . . . . . . . 53
34 Distress Utility Factors for Slabs with Longitudinal Cracks
for Detailed Pavement Type: 03 . . . . . . . . . . . . . . . . . . . . . . . . . . . 54
35 Distress Utility Factors for Concrete Patching for Detailed
Pavement Type: 03 . . . . . . . . . . . . . . . . . . . . . . . . . . . . . . . . . . . . 55
36 Distress Utility Factors for Shallow Rutting for Detailed
Pavement Type: 04 . . . . . . . . . . . . . . . . . . . . . . . . . . . . . . . . . . . . 56
37 Distress Utility Factors for Deep Rutting for Detailed
Pavement Type: 04 . . . . . . . . . . . . . . . . . . . . . . . . . . . . . . . . . . . . 57
XVl
Table Page
38 Distress Utility Factors for Patching for Detailed
Pavement Type: 04 . . . . . . . . . . . . . . . . . . . . . . . . . . . . . . . . . . . . 58
39 Distress Utility Factors for Failures for Detailed
Pavement Type: 04 . . . . . . . . . . . . . . . . . . . . . . . . . . . . . . . . . . . . 59
40 Distress Utility Factors for Block Cracking for Detailed
Pavement Type: 04 . . . . . . . . . . . . . . . . . . . . . . . . . . . . . . . . . . . . . 60
41 Distress Utility Factors for Alligator Cracking for
Detailed Pavement Type: 04 . . . . . . . . . . . . . . . . . . . . . . . . . . . . . . 61
42 Distress Utility Factors for Longitudinal Cracking for
Detailed Pavement Type: 04 . . . . . . . . . . . . . . . . . . . . . . . . . . . . . . 62
43 Distress Utility Factors for Transverse Cracking for
Detailed Pavement Type: 04 . . . . . . . . . . . . . . . . . . . . . . . . . . . . . . 63
44 Distress Utility Factors for Shallow Rutting for Detailed
Pavement Type: 05 . . . . . . . . . . . . . . . . . . . . . . . . . . . . . . . . . . . . 64
45 Distress Utility Factors for Deep Rutting for Detailed
Pavement Type: 05 . . . . . . . . . . . . . . . . . . . . . . . . . . . . . . . . . . . . 65
46 Distress Utility Factors for Patching for Detailed Pavement
Type: 05 ........................................... 66
47 Distress Utility Factors for Failures for Detailed Pavement
Type: 05 ........................................... 67
48 Distress Utility Factors for Block Cracking for Detailed
Pavement Type: 05 . . . . . . . . . . . . . . . . . . . . . . . . . . . . . . . . . . . . 68
49 Distress Utility Factors for Alligator Cracking for Detailed
Pavement Type: 05 . . . . . . . . . . . . . . . . . . . . . . . . . . . . . . . . . . . . 69
50 Distress Utility Factors for Longitudinal Cracking for
Detailed Pavement Type: 05 . . . . . . . . . . . . . . . . . . . . . . . . . . . . . . 70
51 Distress Utility Factors for Transverse Cracking for Detailed
Pavement Type: 05 . . . . . . . . . . . . . . . . . . . . . . . . . . . . . . . . . . . . 71
XVll

Table Page
52 Distress Utility Factors for Shallow Rutting for Detailed
Pavement Type: 06 . . . . . . . . . . . . . . . . . . . . . . . . . . . . . . . . . . . . 72
53 Distress Utility Factors for Deep Rutting for Detailed
Pavement Type: 06 . . . . . . . . . . . . . . . . . . . . . . . . . . . . . . . . . . . . 73
54 Distress Utility Factors for Patching for Detailed Pavement
Type: 06 . . . . . . . . . . . . . . . . . . . . . . . . . . . . . . . . . . . . . . . . . . . 74
55 Distress Utility Factors for Failures for Detailed Pavement
Type: 06 ........................................... 75
56 Distress Utility Factors for Block Cracking for Detailed
Pavement Type: 06 .................................... 76
57 Distress Utility Factors for Alligator Cracking for Detailed
Pavement Type: 06 . . . . . . . . . . . . . . . . . . . . . . . . . . . . . . . . . . . . 77
58 Distress Utility Factors for Transverse Cracking for Detailed
Pavement Type: 06 . . . . . . . . . . . . . . . . . . . . . . . . . . . . . . . . . . . . 78
59 Distress Utility Factors for Longitudinal Cracking for Detailed
Pavement Type: 06 . . . . . . . . . . . . . . . . . . . . . . . . . . . . . . . . . . . . 79
60 Distress Utility Factors for Shallow Rutting for Detailed
Pavement Type: 07 . . . . . . . . . . . . . . . . . . . . . . . . . . . . . . . . . . . . 80
61 Distress Utility Factors for Deep Rutting for Detailed
Pavement Type: 07 . . . . . . . . . . . . . . . . . . . . . . . . . . . . . . . . . . . . 81
62 Distress Utility Factors for Patching for Detailed
Pavement Type: 07 . . . . . . . . . . . . . . . . . . . . . . . . . . . . . . . . . . . . 82
63 Distress Utility Factors for Failures for Detailed Pavement Type: 07 83
64 Distress Utility Factors for Block Cracking for Detailed
Pavement Type: 07 . . . . . . . . . . . . . . . . . . . . . . . . . . . . . . . . . . . . 84
65 Distress Utility Factors for Alligator Cracking for
Detailed Pavement Type: 07 . . . . . . . . . . . . . . . . . . . . . . . . . . . . . . 85
xviii

Table Page
66 Distress Utility Factors for Longitudinal Cracking for
Detailed Pavement Type: 07 . . . . . . . . . . . . . . . . . . . . . . . . . . . . . . 86
67 Distress Utility Factors for Transverse Cracking for
Detailed Pavement Type: 07 . . . . . . . . . . . . . . . . . . . . . . . . . . . . . . 87
68 Distress Utility Factors for Shallow Rutting for Detailed
Pavement Type: 08 . . . . . . . . . . . . . . . . . . . . . . . . . . . . . . . . . . . . 88
69 Distress Utility Factors for Deep Rutting for Detailed
Pavement Type: 08 . . . . . . . . . . . . . . . . . . . . . . . . . . . . . . . . . . . . 89
70 Distress Utility Factors for Patching for Detailed Pavement
Type: 08 ........................................... 90
71 Distress Utility Factors for Failures for Detailed Pavement
Type: 08 . . . . . . . . . . . . . . . . . . . . . . . . . . . . . . . . . . . . . . . . . . . 91
72 Distress Utility Factors for Block Cracking for Detailed
Pavement Type: 08 . . . . . . . . . . . . . . . . . . . . . . . . . . . . . . . . . . . . 92
73 Distress Utility Factors for Alligator Cracking for Detailed
Pavement Type: 08 . . . . . . . . . . . . . . . . . . . . . . . . . . . . . . . . . . . . 93
74 Distress Utility Factors for Longitudinal Cracking for
Detailed Pavement Type: 08 . . . . . . . . . . . . . . . . . . . . . . . . . . . . . . 94
75 Distress Utility Factors for Transverse Cracking for
Detailed Pavement Type: 08 . . . . . . . . . . . . . . . . . . . . . . . . . . . . . . 95
76 Distress Utility Factors for Shallow Rutting for Detailed
Pavement Type: 09 . . . . . . . . . . . . . . . . . . . . . . . . . . . . . . . . . . . . 96
77 Distress Utility Factors for Deep Rutting for Detailed
Pavement Type: 09 . . . . . . . . . . . . . . . . . . . . . . . . . . . . . . . . . . . . 97
78 Distress Utility Factors for Patching for Detailed Pavement
Type: 09 ........................................... 98
79 Distress Utility Factors for Failures for Detailed Pavement
Type: 09 ........................................... 99
XIX

Table Page
80 Distress Utility Factors for Block Cracking for Detailed
Pavement Type: 09 . . . . . . . . . . . . . . . . . . . . . . . . . . . . . . . . . . . . 100
81 Distress Utility Factors for Alligator Cracking for Detailed
Pavement Type: 09 . . . . . . . . . . . . . . . . . . . . . . . . . . . . . . . . . . . . 101
82 Distress Utility Factors for Longitudinal Cracking for
Detailed Pavement Type: 09 . . . . . . . . . . . . . . . . . . . . . . . . . . . . . . 102
83 Distress Utility Factors for Transverse Cracking for Detailed
Pavement Type: 09 . . . . . . . . . . . . . . . . . . . . . . . . . . . . . . . . . . . . 103
84 Distress Utility Factors for Shallow Rutting for Detailed
Pavement Type: 10 . . . . . . . . . . . . . . . . . . . . . . . . . . . . . . . . . . . . 104
85 Distress Utility Factors for Deep Rutting for Detailed
Pavement Type: 10 . . . . . . . . . . . . . . . . . . . . . . . . . . . . . . . . . . . . 105
86 Distress Utility Factors for Patching for Detailed Pavement
Type: 10 ........................................... 106
87 Distress Utility Factors for Failures for Detailed Pavement
Type: 10 ........................................... 107
88 Distress Utility Factors for Block Cracking for Detailed
Pavement Type: 10 . . . . . . . . . . . . . . . . . . . . . . . . . . . . . . . . . . . . 108
89 Distress Utility Factors for Alligator Cracking for Detailed
Pavement Type: 10 . . . . . . . . . . . . . . . . . . . . . . . . . . . . . . . . . . . . 109
90 Distress Utility Factors for Transverse Cracking for Detailed
Pavement Type: 10 . . . . . . . . . . . . . . . . . . . . . . . . . . . . . . . . . . . . 110
91 Distress Utility Factors for Longitudinal Cracking for Detailed
Pavement Type: 10 . . . . . . . . . . . . . . . . . . . . . . . . . . . . . . . . . . . . 111
92 Proposed PMIS Treatment Types .......................... 120
93 Example of Aging Patching and Failures for ACP ............... 123
94 Proposed Xmax• x~, and Xp Coefficients for Computing
Chi Factor for Pavement Distress (PMIS Pavement Types 4-8) ...... 126
xx

Table Page
95 Proposed Xmax• Xp• and Xp Coefficients for Computing Chi Factor
for Pavement Distress (PMIS Pavement Types 9-10) ............. 127
96 Proposed Xmax• Xp, and Xp Coefficients for Computing
Chi Factor for Ride Quality (PMIS Pavement Types 4-10) ......... 127
97 Traffic Factors (CHI) for Shallow Rutting for Detailed
Pavement Type 04 .................................... 128
98 Traffic Factors (CHI) for Deep Rutting for Detailed Pavement
Type 04 ........................................... 129
99 Traffic Factors (CHI) for Alligator Cracking for Detailed
Pavement Type 04 . . . . . . . . . . . . . . . . . . . . . . . . . . . . . . . . . . . . 130
100 Traffic Factors (CHI) for Ride Score for Detailed
Pavement Type 04 . . . . . . . . . . . . . . . . . . . . . . . . . . . . . . . . . . . . 131
101 Traffic Factors (CHI) for Shallow Rutting for Detailed
Pavement Type 05 . . . . . . . . . . . . . . . . . . . . . . . . . . . . . . . . . . . . 132
102 Traffic Factors (CHI) for Deep Rutting for Detailed
Pavement Type 05 . . . . . . . . . . . . . . . . . . . . . . . . . . . . . . . . . . . . 133
103 Traffic Factors (CHI) for Alligator Cracking for Detailed
Pavement Type 05 . . . . . . . . . . . . . . . . . . . . . . . . . . . . . . . . . . . . 134
104 Traffic Factors (CHI) for Ride Score for Detailed
Pavement Type 05 .................................... 135
105 Traffic Factors (CHI) for Shallow Rutting for Detailed
Pavement Type 06 . . . . . . . . . . . . . . . . . . . . . . . . . . . . . . . . . . . . 136
106 Traffic Factors (CHI) for Deep Rutting for Detailed
Pavement Type 06 .................................... 137
107 Traffic Factors (CHI) for Alligator Cracking for Detailed
Pavement Type 06 . . . . . . . . . . . . . . . . . . . . . . . . . . . . . . . . . . . . 13 8
108 Traffic Factors (CHI) for Ride Score for Detailed
Pavement Type 06 .................................... 139
XXl

Table Page
109 Traffic Factors (CHI) for Shallow Rutting for Detailed
Pavement Type 07 . . . . . . . . . . . . . . . . . . . . . . . . . . . . . . . . . . . . 140
110 Traffic Factors (CHI) for Alligator Cracking for Detailed
Pavement Type 07 . . . . . . . . . . . . . . . . . . . . . . . . . . . . . . . . . . . . 141
111 Traffic Factors (CHI) for Deep Rutting for Detailed
Pavement Type 07 . . . . . . . . . . . . . . . . . . . . . . . . . . . . . . . . . . . . 142
112 Traffic Factors (CHI) for Shallow Rutting for Detailed
Pavement Type 08 ............... : .................... 143
113 Traffic Factors (CHI) for Ride Score for Detailed Pavement
Type 07 ........................................... 144
114 Traffic Factors (CHI) for Alligator Cracking for Detailed
Pavement Type 08 .................................... 145
115 Traffic Factors (CHI) for Deep Rutting for Detailed
Pavement Type 08 .................................... 146
116 Traffic Factors (CHI) for Shallow Rutting for Detailed
Pavement Type 09 .................................... 14 7
117 Traffic Factors (CHI) for Ride Score for Detailed Pavement
Type 08 ........................................... 148
118 Traffic Factors (CHI) for Alligator Cracking for Detailed
Pavement Type 09 . . . . . . . . . . . . . . . . . . . . . . . . . . . . . . . . . . . . 149
119 Traffic Factors (CHI) for Deep Rutting for Detailed Pavement
Type 09 ........................................... 150
120 Traffic Factors (CHI) for Shallow Rutting for Detailed
Pavement Type 10 . . . . . . . . . . . . . . . . . . . . . . . . . . . . . . . . . . . . 151
121 Traffic Factors (CHI) for Shallow Rutting for Detailed
Pavement Type 09 · .................................... 152
122 Traffic Factors (CHI) for Alligator Cracking for Detailed
Pavement Type 10 .................................... 153
XXll

Table Page
123 Traffic Factors (CHI) for Deep Rutting for Detailed
Pavement Type 10 . . . . . . . . . . . . . . . . . . . . . . . . . . . . . . . . . . . . 154
124 Traffic Factors (CHI) for Ride Score for Detailed
Pavement Type 10 .................................... 155
125 Sigma Values, by County, for Each TxDOT District ............. 157
126 Performance Coefficients for Detailed Pavement Type 01 .......... 170
127 Performance Coefficients for Detailed Pavement Type 02 .......... 171
128 Performance Coefficients for Detailed Pavement Type 03 .......... 172
129 Performance Coefficients for Detailed Pavement Type 04 .......... 173
130 Performance Coefficients for Detailed Pavement Type 05 .......... 174
131 Performance Coefficients for Detailed Pavement Type 06 . . . . . . . . . . 175
132 Performance Coefficients for Detailed Pavement Type 07 .......... 176
133 Performance Coefficients for Detailed Pavement Type 08 . . . . . . . . . . 177
134 Performance Coefficients for Detailed Pavement Type 09 . . . . . . . . . . 178
135 Performance Coefficients for Detailed Pavement Type 10 .......... 179
136 Projected Condition for Spalled Cracks on Detailed
Pavement Type: 01 . . . . . . . . . . . . . . . . . . . . . . . . . . . . . . . . . . . . 181
137 Projected Condition for Punchouts on Detailed
Pavement Type: 01 . . . . . . . . . . . . . . . . . . . . . . . . . . . . . . . . . . . . 182
138 Projected Condition for Asphalt Patches on Detailed
Pavement Type: 01 .................................... 183
139 Projected Condition for Concrete Patches on Detailed
Pavement Type: 01 . . . . . . . . . . . . . . . . . . . . . . . . . . . . . . . . . . . . 184
140 Projected Condition for Average Crack Spacing on
Detailed Pavement Type: 01 . . . . . . . . . . . . . . . . . . . . . . . . . . . . . . 185
141 Projected Condition for Ride Score on Detailed Pavement
Type: 01 ........................................... 186
xxiii

Table Page
142 Projected Condition for Failed Joints and Cracks on
Detailed Pavement Type: 02 . . . . . . . . . . . . . . . . . . . . . . . . . . . . . . 187
143 Projected Condition for JCP Failures on Detailed
Pavement Type: 02 . . . . . . . . . . . . . . . . . . . . . . . . . . . . . . . . . . . . 188
144 Projected Condition for Shattered Slabs on Detailed
Pavement Type: 02 . . . . . . . . . . . . . . . . . . . . . . . . . . . . . . . . . . . . 189
145 Projected Condition for Slabs with Longitudinal Cracks
on Detailed Pavement Type: 02 ........................... 190
146 Projected Condition for Concrete Patching on Detailed
Pavement Type: 02 .................................... 191
147 Projected Condition for Ride Score on Detailed Pavement Type: 02 ... 192
148 Projected Condition for Failed Joints and Cracks on Detailed
Pavement Type: 03 . . . . . . . . . . . . . . . . . . . . . . . . . . . . . . . . . . . . 193
149 Projected Condition for JCP Failures on Detailed Pavement
Type: 03 . . . . . . . . . . . . . . . . . . . . . . . . . . . . . . . . . . . . . . . . . . . 194
150 Projected Condition for Shattered Slabs on Detailed
Pavement Type: 03 .................................... 195
151 Projected Condition for Slabs with Longitudinal Cracks
on Detailed Pavement Type: 03 . . . . . . . . . . . . . . . . . . . . . . . . . . . 196
152 Projected Condition for Concrete Patching on Detailed
Pavement Type: 03 . . . . . . . . . . . . . . . . . . . . . . . . . . . . . . . . . . . . 197
153 Projected Condition for Ride Score on Detailed Pavement
Type: 03 . . . . . . . . . . . . . . . . . . . . . . . . . . . . . . . . . . . . . . . . . . . 198
154 Projected Condition for Shallow Rutting on Detailed
Pavement Type: 04 . . . . . . . . . . . . . . . . . . . . . . . . . . . . . . . . . . . . 199
155 Projected Condition for Deep Rutting on Detailed
Pavement Type: 04 .................................... 200
XXlV

Table Page
156 Projected Condition for Failures on Detailed Pavement
Type: 04 ........................................... 201
157 Projected Condition for Block Cracking on Detailed
Pavement Type: 04 .................................... 202
158 Projected Condition for Alligator Cracking on Detailed
Pavement Type: 04 .................................... 203
159 Projected Condition for Longitudinal Cracking on
Detailed Pavement Type: 04 .............................. 204
160 Projected Condition for Transverse Cracks on Detailed
Pavement Type: 04 .................................... 205
161 Projected Condition for Ride Score on Detailed
Pavement Type: 04 .................................... 206
162 Projected Condition for Shallow Rutting on Detailed
Pavement Type: 05 .................................... 207
163 Projected Condition for Deep Rutting on Detailed
Pavement Type: 05 .................................... 208
164 Projected Condition for Failures on Detailed Pavement Type: 05 ..... 209
165 Projected Condition for Block Cracking on Detailed
Pavement Type: 05 .................................... 210
166 Projected Condition for Alligator Cracking on Detailed
Pavement Type: 05 .................................... 211
167 Projected Condition for Longitudinal Cracking on Detailed
Pavement Type: 05 .................................... 212
168 Projected Condition for Transverse Cracking on Detailed
Pavement Type: 05 .................................... 213
169 Projected Condition for Ride Score on Detailed Pavement Type: 05 ... 214
170 Projected Condition for Shallow Rutting on Detailed
Pavement Type: 06 .................................... 215
xxv

Table Page
171 Projected Condition for Deep Rutting on Detailed
Pavement Type: 06 . . . . . ............................... 216
172 Projected Condition for Failures on Detailed Pavement Type: 06 ..... 217
173 Projected Condition for Block Cracking on Detailed
Pavement Type: 06 . . . . . ............................... 218
174 Projected Condition for Alligator Cracking on Detailed
Pavement Type: 06 .................................... 219
175 Projected Condition for Longitudinal Cracking on Detailed
Pavement Type: 06 .................................... 220
176 Projected Condition for Transverse Cracking on Detailed
Pavement Type: 06 .................................... 221
177 Projected Condition for Ride Score on Detailed Pavement Type: 06 ... 222
178 Projected Condition for Shallow Rutting on Detailed
Pavement Type: 07 .................................... 223
179 Projected Condition for Deep Rutting on Detailed Pavement
Type: 07 ........................................... 224
180 Projected Condition for Failures on Detailed Pavement Type: 07 ..... 225
181 Projected Condition for Block Cracking on Detailed
Pavement Type: 07 .................................... 226
182 Projected Condition for Alligator Cracking on Detailed
Pavement Type: 07 .................................... 227
183 Projected Condition for Longitudinal Cracking on Detailed
Pavement Type: 07 .................................... 228
184 Projected Condition for Transverse Cracking on Detailed
Pavement Type: 07 .................................... 229
185 Projected Condition for Ride Score on Detailed Pavement Type: 07 ... 230
186 Projected Condition for Shallow Rutting on Detailed
Pavement Type: 08 .................................... 231
XXVl

Table Page
187 Projected Condition for Deep Rutting on Detailed Pavement
Type: 08 ........................................... 232
188 Projected Condition for Failures on Detailed Pavement Type: 08 ..... 233
189 Projected Condition for Block Cracking on Detailed
Pavement Type: 08 .................................... 234
190 Projected Condition for Alligator Cracking on Detailed
Pavement Type: 08 .................................... 235
191 Projected Condition for Longitudinal Cracking on Detailed
Pavement Type: 08 .................................... 236
192 Projected Condition for Transverse Cracking on Detailed
Pavement Type: 08 .................................... 237
193 Projected Condition for Ride Score on Detailed Pavement
Type: 08 ........................................... 238
194 Projected Condition for Shallow Rutting on Detailed
Pavement Type: 09 .................................... 239
195 Projected Condition for Deep Rutting on Detailed Pavement
Type: 09 . . . . . . . . . . ................................. 240
196 Projected Condition for Failures on Detailed Pavement Type: 09 ..... 241
197 Projected Condition for Block Cracking on Detailed Pavement
Type: 09 . . . . . . . . . . ................................. 242
198 Projected Condition for Alligator Cracking on Detailed
Pavement Type: 09 .................................... 243
199 Projected Condition for Longitudinal Cracking on Detailed
Pavement Type: 09 .................................... 244
200 Projected Condition for Transverse Cracking on Detailed
Pavement Type: 09 .................................... 245
201 Projected Condition for Ride Score on Detailed Pavement
Type: 09 ........................................... 246
XXVll

Table Page
202 Projected Condition for Shallow Rutting on Detailed
Pavement Type: 10 .................................... 24 7
203 Projected Condition for Deep Rutting on Detailed Pavement
Type: 10 ........................................... 248
204 Projected Condition for Failures on Detailed Pavement Type: 10 ..... 249
205 Projected Condition for Block Cracking on Detailed
Pavement Type: 10 .................................... 250
206 Projected Condition for Alligator Cracking on Detailed
Pavement Type: 10 .................................... 251
207 Projected Condition for Longitudinal Cracking on Detailed
Pavement Type: 10 .................................... 252
208 Projected Condition for Transverse Cracking on Detailed
Pavement Type: 10 .................................... 253
209 Projected Condition for Ride Score on Detailed Pavement
Type: 10 . . . . . . . . . . . . . . . . . . . . . . . . . . . . . . . . . . . . . . . . . . . 254
210 Examples of Proposed PMIS Treatment Types and Costs .......... 261
211 Grouping of ACP Reason Code Numbers ..................... 266
212 Proposed Data Items Required for Analysis ................... 269
213 Example Needs Estimate (Distress Ratings) ................... 270
214 Example Needs Estimate (Theoretical Ages) ................... 270
215 Example Needs Estimate (Distress Ratings and Utility Factors) ...... 271
216 Example Needs Estimate (Theoretical Ages, After Treatment) ....... 272
217 Proposed Statewide Pavement Needs (Lane Miles),
by District, Report .................................... 275
218 Proposed Statewide Pavement Needs (Dollars),
by District, Report .................................... 275
219 Proposed Statewide Pavement Needs (Lane Miles),
by Highway System, Report .............................. 276
xx viii

Table Page
220 Proposed Statewide Pavement Needs (Dollars),
by Highway System, Report .............................. 276
221 Proposed Statewide Pavement Needs (Lane Miles),
Executive Summary, Report .............................. 277
222 Proposed Statewide Pavement Needs (Dollars),
Executive Summary, Report .............................. 278
223 Proposed District Pavement Needs (Lane Miles),
by Highway System, Report .......... ~ ................... 279
224 Proposed District Pavement Needs (Dollars),
by Highway System, Report .............................. 279
225 Proposed District Pavement Needs (Lane Miles),
Executive Summary, Report .............................. 280
226 Proposed District Pavement Needs (Dollars),
Executive Summary, Report .............................. 281
227 "Low" and "High" ADT per Lane Values .................... 282
228 Needs Estimate Reason Codes for CRCP (Pavement Type = 1) ...... 284
229 Reason Codes for JCP (Pavement Type = 2-3) ................. 287
230 Reason Codes for ACP (Pavement Type= 4-10) ................ 291
231 Proposed Gain of Rating Values for PMIS Optimization Program .... 305
232 CRCP and JCP L Values Which Fall Below the Proposed
Failure Criterion (0.6000) ............................... 314
233 ACP L Values Which Fall Below the Proposed
Failure Criterion (0.6000) ............................... 314
234 Ride Scores Which Fall Below the Proposed
Failure Criterion (0.3000) ............................... 315
235 Example Optimization (Ranked List of Sections) ................ 318
236 Distress L Values Which Exceed Proposed Maximum
Theoretical Age (40 years) Pavement Type= 1 ................. 321
XXlX

Table Page
237 Distress L Values Which Exceed Proposed Maximum
Theoretical Age (40 years) Pavement Type= 2 ................. 321
238 Distress L Values Which Exceed Proposed Maximum
Theoretical Age (40 years) Pavement Type= 3 ................. 322
239 Distress L Values Which Exceed Proposed Maximum
Theoretical Age (40 years) Pavement Type= 4 ................. 322
240 Distress L Values Which Exceed Proposed Maximum
Theoretical Age (40 years) Pavement Type= 5 ................. 323
241 Distress L Values Which Exceed Proposed Maximum
Theoretical Age (40 years) Pavement Type= 6 ................. 324
242 Distress L Values Which Exceed Proposed Maximum
Theoretical Age (40 years) Pavement Type= 7 ................. 325
243 Distress L Values Which Exceed Proposed Maximum
Theoretical Age (40 years) Pavement Type= 8 ................. 326
244 Distress L Values Which Exceed Proposed Maximum
Theoretical Age (40 years) Pavement Type= 9 ................. 327
245 Distress L Values Which Exceed Proposed Maximum
Theoretical Age (40 years) Pavement Type= 10 ................ 328
246 Proposed Statewide Optimization Report
(Lane Miles), by District ................................ 331
24 7 Proposed Statewide Optimization Report (Dollars),
by District .......................................... 331
248 Proposed Statewide Optimization Report (Lane Miles),
by Highway System ................................... 333
249 Proposed Statewide Optimization Report (Dollars),
by Highway System ................................... 333
250 Proposed District Optimization Report (Lane Miles),
by Highway System ................................... 334
xxx

Table Page
251 Proposed District Optimization Report (Dollars),
by Highway System ................................... 334
252 Example Impact Analysis (Effect of Rehab Budget
on Average Condition Score) ............................. 337
253 Pavement Maintenance Level of Service Definitions for Rutting ..... 339
254 Pavement Maintenance Level of Service Definitions for
Alligator Cracking . . . . . . . . . . . . . . . . . . . . . . . . . . . . . . . . . . . . 340
255 Pavement Maintenance Level of Service Definitions for Ride Quality .. 341
256 Proposed District Impact Analysis Report, by Highway System ...... 345
257 Proposed Statewide Impact Analysis Report, by District ........... 350
258 Proposed Statewide Impact Analysis Report, by Highway System .... 356
XXXl

xxxii

SUMMARY
This report describes the proposed modules of TxDOT' s new Pavement
Management Information System (PMIS). These modules include:
Utility Curves (Chapter 2),
Performance Curves (Chapter 3),
Needs Estimate Program (Chapter 4),
Optimization Program (Chapter 5), and
Impact Analysis Program (Chapter 6).
PMIS will use the pavement condition data currently being collected for the
Pavement Evaluation System (PES). Distress, ride quality, deflection, and skid
resistance data collection procedures and equipment will be retained, with only minor
changes to the data collection frequency and section length.
PMIS will provide network-level decision support for decision makers within
TxDOT. PMIS will also support TxDOT pavement decisions at the Division, District,
Area Office, and Maintenance Section level. Mainframe computers will be used at the
central Division offices, while microcomputers will be used at the District offices to
access and store the PMIS data. Eventually, PMIS will be able to support the use of
microcomputers at the Area Office and Maintenance Section levels; for now, users in
these offices will be able to access the TxDOT mainframe computer to use PMIS.
PMIS decision support for pavement managers is based on analyses conducted from
the annual pavement condition data collection survey. The first analysis, described in
Chapter 2, uses utility curves to convert each pavement distress type, along with the ride
quality, into a utility value. By computing utility values, PMIS lets the pavement
manager compare distress types and ride quality, even on different types of pavement.
The second analysis, described in Chapter 3, takes the current pavement condition
data and predicts the future condition of each pavement section. These results form a
xxxm

critical part of the Needs Estimate, Optimization, and Impact Analysis programs.
The third analysis, described in Chapter 4, estimates total pavement needs based on
pavement distress, ride quality, functional classification, traffic per lane, and average
county rainfall. This Needs Estimate program can produce results for the current fiscal
year, as well as for future fiscal years. PMIS uses the Needs Estimate results to identify
what each pavement section needs, regardless of funding or other constraints. The Needs
Estimate results are used as input into the PMIS Optimization and Impact Analysis
programs.
The fourth analysis, described in Chapter 5, is the PMIS Optimization program.
This program estimates the expected benefit obtained from each pavement sections'
Needs Estimate treatment (if any) and compares that benefit with the available funding.
The Optimization program then simulates treatment on the most cost-effective sections,
within available funding. PMIS can perform Optimization for the current fiscal year, as
well as for future fiscal years.
The fifth analysis, described in Chapter 6, is the PMIS Impact Analysis program.
This program produces a series of reports which summarize pavement conditions before
and after "optimization" to help describe the expected impacts of pavement funding,
truck traffic, preventive maintenance seal coat practice, project selections, and treatment
choices on current and future pavement condition. These reports are meant to help
District personnel keep an overall view of the consequences of various pavement-related
matters.
These five analysis procedures, along with the rest of the PMIS programs and data,
provide a sound foundation for network-level pavement management, and can be used to
support and guide more intensive, project-level, pavement testing and design. Over time,
this project-level work should identify improvements to PMIS, in turn strengthening the
support that PMIS will be able to provide to network- and project-level pavement
managers.
XXXIV

I - INTRODUCTION
This report describes the modules of TxDOT' s new Pavement Management
Information System (PMIS). PMIS is the family of computer programs, which is being
designed by TxDOT to support its network-level pavement management and decision
making activities. PMIS will become the major automated part of TxDOT' s statewide
pavement management system (PMS).
DESCRIPTION
The basic concept is for PMIS to provide network-level decision support for
decision makers within TxDOT. A major goal is that PMIS will not change the lines of
authority for pavement decisions within TxDOT, but that it will support and strengthen
TxDOT's overall pavement management process. To do this, PMIS must support
pavement management decisions at all levels within the organization: at the central
Division offices, at the District offices, and at the Area and maintenance section offices.
Mainframe computers will be used at the central Division offices, while microcomputers
will be used at the District offices to access and store the PMIS data. Eventually, PMIS
will be able to support the use of microcomputers at the Area Office and maintenance
section levels; for now, users in these offices will be able to access the TxDOT
mainframe computer to use PMIS.
Research study personnel made several assumptions and decisions while proposing
the PMIS modules. One of the major assumptions made was that PMIS will use the
pavement condition data currently being collected for the Pavement Evaluation System
(PES). Distress, ride quality, deflection, and skid resistance data collection procedures
and equipment will be retained. However, the "typical" pavement section length will be
changed from 3.2 km (two miles) to 0.8 km (0.5 miles). The data summarization rate
for ride quality will also be changed from 0.3 km (0.2 miles) to 0.1 km (0.1 miles).
Researchers and TxDOT personnel also agreed to a major change in the distress
rating procedure for flexible pavements. Instead of the PES rating codes (i.e., "000,"
1

"100," "010," "001," "200," "020," and "002"), PMIS will use actual measures of area,
length, or number.
Once all of these changes have been made, TxDOT plans to convert all of the
existing PES data (some dating back to Fiscal Year 1984) to PMIS. PMIS will then
completely replace PES as TxDOT's network-level pavement management decision
support system.
Other assumptions and decisions made during this research study will be explained
while describing specific PMIS modules.
PAVEMENT TYPES
~xDOT' s PES covered the major types of pavement found on TxDOT highways.
We propose that PMIS keep these major pavement types, along with the existing PES
Pavement Type codes and definitions, as shown in Table 1.
Table 1: Proposed PMIS Pavement Types.
· ·· ·· nescriptio1l
CRCP 1 Continuously-Reinforced Concrete Pavement
2 Jointed Concrete Pavement - reinforced JCP
3 Jointed Concrete Pavement - unreinforced ("plain")
4 Thick Asphalt Concrete Pavement (greater than 14.0 cm thick; [5.5"])
5 Intermediate Asphalt Concrete Pavement (6.4-14.0 cm thick; [2.5-5.5"])
6 Thin Asphalt Concrete Pavement (less than 6.4 cm thick; [2.5"])
ACP 7 Composite Pavement (asphalt surfaced concrete pavement)
8 Overlaid or Widened Old Concrete Pavement
9 Overlaid or Widened Old Flexible Pavement
10 Thin-surfaced Flexible Base Pavement (surface treatment or seal coat)
2

We also propose that TxDOT use both categories of Pavement Type, as shown in
Table 1. The Broad Pavement Type will be used to select "general" pavement
performance curves, and the Detail Pavement Type will be used in the pavement distress
rating, utility value, and score calculations.
DATA COLLECTION SAMPLE SIZE AND TYPE
Table 2 shows the original PES data collection sample size and types.
Table 2. Original PES Data Collection Sample Size and Type.
. ·.·, .;: ··.;; .. ·:' ... -·.·.:· .-:··; ·:. : _.
PES'Data c~ii~i~n.~11µtple:, ;•··.·.··· ... ·• ~'././•· ....• , ...•• : ••.• ''. •·· •·· ....•.•••••. 1-................ ----~----....---.-----------...... mgh"W~y·syst.em,• •· ., ....
IH 100 Non-random
us 50 Random
SH 50 Random
FM 20 Random,
Many TxDOT personnel, especially those in the Districts, had long been concerned
about this sample size and type. Although Districts were concerned about the large
number of people needed to collect the annual pavement condition data, they also
realized that the PES sample was too small to consistently cover all of the highways that
they wanted to include in their rehabilitation and preventive maintenance work programs.
Many Districts also had problems with gaps, caused by the "randomness" of the
PES sample. For example, a District would want to review the PES data before
resurfacing the middle 16.1 km (ten miles) of a 48.3 km (30-mile) highway. Because of
the random PES sample, the District would likely find PES data for many of the sections
on either end of the proposed work, but would find very little (if any) PES data for the
sections within the proposed work. These experiences discouraged some Districts from
using PES and made it more difficult for them to justify allocation of the large number
3
of people and time spent in collecting the data.
We therefore propose that PMIS keep the existing PES sample sizes on IH (100
percent), US (50 percent), and SH (50 percent) highways, and increase the FM sample
size to 50 percent.
We also propose that PMIS use a non-random "alternating" sample type which
would rate all of a highway within a county in one year, and then skip the ratings in the
next year. Thus, District pavement managers would be able to pick any highway within
any county and be assured that there would be no gaps in the PMIS data (assuming, of
course, that all of the required PMIS pavement condition data were collected and stored).
Finally, we propose that PMIS use this "50 percent, alternating" sample only for the
collection of distress and ride quality data. This proposal will be further explained later
in this Chapter.
PMIS SECTIONS
Pavement managers rarely "manage" the entire length of pavement at any one time,
especially when locating "problem spots" or when selecting treatments. Thus, it is
helpful to split long stretches of pavement into "sections." This process is called
"segmentation."
It would be beyond the scope of this report to discuss all of the aspects of
segmentation, even as it pertains to pavement management systems. Thus, we will
discuss only the proposed types, lengths, and locations of sections for PMIS.
The existing PES "typically" divided pavements into 3.2 km (2-mile) sections, by
centerline. These 3.2 km (2-mile) sections were used for data collection and analysis
We propose that PMIS divide pavements into 0.8 km (0.5-mile) "Data Collection
Sections" for use in collecting the pavement condition data. We also propose that PMIS
define a new type of section - a "Management Section" - to be used for analysis. We
propose that these Management Sections be variable length and that they be user
definable, to correspond to candidate projects.
PES located its sections in terms of "mileposts." A "milepost" was simply a
number placed below the highway route sign at approximately 3.2 km (2-mile) intervals.
4

Although most other TxDOT computer systems were locating sections in terms of
Control-Section or Control-Section and Milepoint, it was important for PES to use a
"physical" marker which actually existed out in the field. ·
In Fiscal Year 1991 (September, 1990), TxDOT converted all of its mileposts to
"Reference Markers" as the first part of its Texas Reference Marker (TRM) System
project. We propose that PMIS use these new Reference Markers to locate pavement
sections.
CONDITION DATA
TxDOT' s PES included the following types of pavement condition data:
Distress (or "visual distress"),
Ride Quality (or "roughness"),
Deflection, and
Skid Resistance.
We propose that PMIS keep these types of pavement condition data. We also
propose that PMIS condition data be collected in the "worst" lane of each roadbed, as
was done in PES. Specific changes for each data type are described in the following
sections.
Distress
We propose that PMIS use the pavement distress types and rating methods shown
in Table 3 for Continuously Reinforced Concrete Pavements (CRCP). These CRCP
distress types and rating methods are the same as those used in PES.
5

Table 3. Proposed PMIS CRCP Distress Types and Rating Methods .
... · ,'· . ... · .. .. . .... •
: CRCP Distress Type ' '.
Rating Method··· ·'· .
Spalled Cracks total number (0 to 999)
Punch outs total number (0 to 999)
Asphalt Patches total number (0 to 999)
Concrete Patches total number (0 to 999)
Average Crack Spacing spacing (1 to 75), to the nearest 0.1 m (foot)
We propose that PMIS use the pavement distress types and rating methods shown
in Table 4 for Jointed Concrete Pavements (JCP). These JCP distress types and rating
methods are the same as those used in PES.
Table 4. Proposed PMIS JCP Distress Types and Rating Methods.
Failed Joints and Transverse Cracks Total number (0 to 999)
Comer Breaks Total number (0 to 999)
Failures Total number (0 to 999)
Shattered (Failed) Slabs Total number (0 to 999)
Slabs With Longitudinal Cracks Total number (0 to 999)
Concrete Patches Total number (0 to 999)
Apparent Joint Spacing Spacing (15 to 75), to the nearest 0.1 m (foot)
We propose that PMIS use the pavement distress types and rating methods shown
in Table 5 for Asphalt Concrete Pavement (ACP).
6

Table 5. Proposed PMIS ACP Distress Types and Rating Methods.
: : ( •· : ... ·· · .... ·· ACP Distre8s Type .. i. ........ :···::··::·.· .. :.:.·.:.·· ...
Ratin1fM~thO<i ...... ···· ·•··•·. . ·.. . ... '····· ··•.· •.
Shallow (13 to 25 mm [(Yz" to l "] depth) Rutting percent of wheelpath length (0 to 100)
Deep (25 to 76 mm [l" to 3"] depth) Rutting percent of wheelpath length (0 to 100)
Patching percent of lane area (0 to 100)
Failures total number (0 to 99)
Block Cracking percent of lane area (0 to 100)
Alligator Cracking percent of wheelpath length (0 to 100)
Longitudinal Cracking length per 100' station (0 to 999)
Transverse Cracking number per 100' station (0 to 99)
Raveling (optional) none, low, medium, or high
Flushing (optional) none, low, medium, or high
The ACP distress types in Table 5 are the same as those used in PES except for the
rutting (now rated in "shallow" and "deep" categories), raveling, and flushing. The
rating methods, as mentioned earlier, are much different from the old PES rating codes.
As shown in Table 2, PES used a 40 percent, "random" sample for collecting
distress data. We propose that PMIS use the "50 percent, alternating" sample instead.
Each District would basically have one group of pavements to be rated in even-numbered
Fiscal Years and another group of pavements to be rated in odd-numbered Fiscal Years.
Ride Quality
In PES, TxDOT collected ride quality data continuously along the entire 3 .2 km (2-
mile) section and summarized that data at every 0.3 km (0.2-mile ). Thus, PES had ten
ride quality data points for each 3.2 km (2-mile) section. We propose that PMIS
summarize its ride quality data at every 0.1 km (0.1-mile) to provide finer detail. Thus,
PMIS would have five ride quality data points for each 0.8 km (0.5-mile) Data
Collection Section.
7
As shown in Table 2, PES used a 40 percent, "random" sample for collecting ride
quality data. We propose that PMIS use the "50 percent, alternating" sample instead.
Each District would basically have one group of pavements to be rated in even-numbered
Fiscal Years and another group of pavements to be rated in odd-numbered Fiscal Years.
Deflection
TxDOT began collecting pavement deflection data for PES in Fiscal Year 1987
(September, 1986). The data were collected on a random, 15 percent, sample at five
equidistant points within each PES section. Thus, the typical 3.2 km (2-mile) PES
section would have deflection data at each 0.7 km (0.4-mile). We propose that PMIS
collect deflection data at the beginning of each Data Collection Section. This would
provide deflection data at approximately each 0.8 km (0.5-mile). With regards to the
sample size and type, we propose that PMIS use a 33 percent, alternating sample of each
year's distress and ride quality sections. On a statewide basis, this would be one-third of
the one-half sample size, and would thus provide almost the same amount of data as the
original 15 percent PES sample.
Skid Resistance
Even before it developed PES, TxDOT had a system for collecting, storing, and
reporting skid resistance data. This system was called "Skid-R," and it was started back
in 1973. Skid-R divided pavements into "Construction Sections," as opposed to
mileposts.
When PES began, TxDOT proposed a milepost-based method for collecting skid
data, but most Districts stayed with Skid-R because it contained detailed material type
and work history information. The Skid-R Construction Sections were also more closely
related to Control-Sections, which, of course, were used when programming pavement
work. TxDOT has since proposed development of an automated enhancement to its
existing Road Life logs, which would contain much of the pavement cross-section,
surface type, and work history information that was contained in the Skid-R files.
8

Skid-R data were usually collected at every 0.8 km (0.5-mile) within a Construction
Section. Skid-R would then list the raw 0.8 km (0.5-mile) skid resistance data and
summarize it for each Construction Section. Given the predominant use of Reference
Markers in TxDOT operations, we propose that PMIS use Reference Markers when
collecting, storing, and reporting skid resistance data. We also propose that PMIS
replace Skid-R when the proposed enhancements to the Road Life logs have been
finished.
As with Skid-R, collection of skid resistance data for PES was optional. Although
all Districts monitored skid resistance on their pavements, they found that skid resistance
data (Skid-R or PES) rarely had any relationship to accident history. Because of this
lack of any clear relationship between skid resistance data and accident history, we
propose that collection of the skid resistance data remain optional.
PMIS SCORES
Along with its pavement condition data, PES had eight scores that it would
calculate to describe a section's condition. These scores made it easy for pavement
managers to describe specific and overall pavement condition. Of these scores, only the
Pavement Score was used with any consistency - and its meaning was often
misunderstood. Pavement Score was designed to measure a PES section's relative need
for rehabilitation, but it was often used to describe pavement condition. Very few of the
other scores were ever used. The PES scores also had confusing names and acronyms,
which became a problem as TxDOT tried to distribute the information to less
experienced or casual users. We propose that PMIS eliminate three of the PES scores
(A VU, WVU, and PS) and rename the other five scores, as shown in Table 6.
9

Table 6. Proposed Use of PES Scores in PMIS.
1,:,• H, ; ; ' . ·.· .. ·., .... ·.: .... :·: .·:··:·:·:.:·,.·.··:· . PES
... PMis ·(Piol>oseif> > ··. ·
. ' : .... · .· · .. ' ....
' ' .· . ' ' .. ·'· ' .
Score ' · nescription :
Score (and description) ..
' . :'. . . •.....
Unadjusted Visual Utility (UVU): Distress same as PES measures relative amount of pavement distress, from 1 (worst) Score to 100 (best)
Adjusted Visual Utility (A VU): not used UVU, adjusted for climate (county rainfall and freeze-thaw cycles), from 1 (worst) to 100 (best)
Weighted Visual Utility (WVU): not used A VU, adjusted for traffic (ADT and 18-k ESAL), from 1 (worst) to 100 (best)
Unadjusted Pavement Score (UPS): Condition same as PES UVU, adjusted for SI utility, from 1 (worst) to 100 (best) Score
Pavement Score (PS): not used WVU, adjusted for ride and functional class, from 1 (highest rehab priority) to 100 (lowest rehab priority)
Serviceability Index (SI): Ride Score same as PES average of raw ride quality values for PES section, from 0.1 (roughest) to 5.0 (smoothest)
Structural Strength Index (SSI): SSI Score same as PES measure of overall pavement structural strength, from 1 (weakest) to 100 (strongest)
Skid Number (SN): Skid Score same as PES average of raw skid resistance values for PES section, from 1 (least skid resistance) to about 70 (most skid resistance)
As described in Table 6, the Ride Score is the average of the raw 0.2 km (0.1-mile)
ride quality values. The SSI Score is calculated using procedures described in TTI
Research Report 409-3F. Although PMIS will store more than one set of deflection test
values in a Data Collection Section, it will only compute SSI Score for the first
deflection test (i.e., at the beginning of the Data Collection Section). The Skid Score is
also calculated only from the first test in a Data Collection Section, even though PMIS
will store more than one set of skid numbers per section.
The other two PMIS scores - Distress Score and Condition Score - are calculated
10

using pavement utility curves. Chapter 2 describes these pavement utility curves in more
detail.
ANALYSIS PROCEDURES
TxDOT developed PES to report statewide pavement condition and to estimate
statewide pavement rehabilitation needs. Reporting statewide pavement condition
worked well because PES was good at displaying data that had already been entered into
the system. However, estimating statewide pavement rehabilitation needs was not easy.
The State Cost Estimating (SCE) procedure used in PES was conceptually sophisticated,
but it only worked for ACP ("flexible pavement") ~ections, it only considered
rehabilitation treatments, and it could not analyze sections that had not been rated in the
current fiscal year.
As TxDOT' s needs for pavement management information increased, Design
Division and District personnel had to write many ad hoc computer programs to analyze
PES data. Duplication of effort and currency of analysis became serious problems that
threatened the credibility of TxDOT' s entire pavement management system operation.
To eliminate these problems, we propose that PMIS incorporate expanded analysis
procedures including, but not limited to, the following three programs:
1. Needs Estimate: to estimate pavement rehabilitation and preventive
maintenance needs for the current and the next Fiscal Year;
2. Optimization: to identify pavement sections in each of the next ten Fiscal
Years that can be treated within given funding, and to list those sections in
order of decreasing cost-effectiveness ratio; and
3. Impact Analysis: to determine the impact of pavement funding, truck traffic
changes, and preventive maintenance seal coat practices on pavement condition
for each of the next ten Fiscal Years.
We also propose that these PMIS analysis procedures be made available to TxDOT
employees at all levels of the organization.
11


II - PAVEMENT UTILITY CURVES
PMIS will contain a large amount of distress and ride quality data for each Data
Collection Section. As proposed in Chapter 1, PMIS will have several scores that will
make comparison of specific sections easier. However, how is it possible to combine
different distress and ride quality data on different sections and get a consistent, reliable
measure of each section's condition?
How can the pavement manager compare an ACP section with 25 percent Shallow
Rutting to a CRCP section with 5 Punchouts and 3 Concrete Patches? Is a JCP section
with 38 Failed Joints and Cracks in worse condition than an ACP section with 10
percent Alligator Cracking? And if so, then by how much?
We propose that PMIS use utility theory and pavement utility curves to answer
these questions, as was done in PES.
DESCRIPTION
PES uses a system of utility values to determine the subjective value of the
pavement at different levels of condition. "Utility" may be thought of as the value of
the service provided by the pavement in use with a particular damage level. Utility
values will vary between 1.0 (highest) and 0.0 (lowest). This value of service may be
measured in two ways: structural and functional.
"Structural utility" considers the pavement section as a structure designed to carry
traffic loads effectively. "Functional utility" considers the pavement section as a small
link in a network which is designed to move traffic smoothly and efficiently.
For example, consider a flexible pavement with alligator cracking. A utility curve
for this pavement would look something like the curve in Figure 1. As defined in PMIS,
the pavement's alligator cracking could range from 0 to 100 percent of the total
wheelpath length. With 0 percent alligator cracking, the pavement's utility value is 1.0
(the highest possible). Structural utility is excellent because the pavement structure is
strong - there are no cracks. Functional utility is excellent because the pavement has
13

1.0 \
Q) 0.8 .:! ~ 0.6
\ ' \..
" '--
~ ..... - ~ 0.4 ~ :::>
0.2
0 0 20 40 60 80 100
PMIS Rating, % Whee/path Length
Figure 1. Utility Curve for Alligator Cracking.

no cracks to make the surface rough.
As the amount of alligator cracking increases, structural utility begins to drop.
Functional utility also drops, though probably not as quickly - there are a few cracks,
but not enough to make the road rough. As the alligator cracking approaches 100
percent,- the pavement engineer would say that the structural utility is near zero. But the
functional utility is not zero - maybe the road is somewhat rough from all the cracks,
but it is still passable. Thus, the pavement's overall utility would fall to some value
between 0.0 and 1.0.
Looking at the pavement's ride quality would give a different view of the utility
curve. As mentioned before, PMIS ride quality values range from 0.1 (roughest) to 5.0
(smoothest). At 5.0, the pavement's functional utility is certainly 1.0. But the structural
utility might not necessarily be that high - a newly-resurfaced pavement tends to be
very smooth, no matter how strong the underlying pavement. As the ride quality drops,
structural and functional drop as well, until eventually the road gets so rough that people
complain (this will occur before the ride quality value drops to 0.1). At that point, the
functional utility might be considered to be zero, but the pavement structure could still
be somewhat sound. Once again, the pavement's overall utility would fall to some value
between 0.0 and 1.0.
There is no exact rule that guarantees which of the two utility types will limit the
pavement's overall utility. Thus, we propose that PMIS use utility values which
combine structural and functional utility. Such an approach will make the utility values
more appropriate to a wider range of users within TxDOT. Obviously, it will not be
possible to exactly match each user's opinion of pavement utility, but this combined
approach will help address the concerns of pavement engineers, designers, planners, and
administrators. It will also help address the concerns of a much larger number of users:
Texas' highway drivers and passengers.
DEFINING UTILITY FOR PAVEMENT DISTRESS
For pavement distress, utility can usually be defined in terms of the distress rating
itself. Ratings that have been "normalized" to a percentage or other similar value (e.g.,
15

Shallow Rutting or Longitudinal Cracking) may be used directly in the utility curve
equations. However, other distress types use ratings that give the total number of
occurrences (e.g., Failures, Punchouts, or Slabs With Longitudinal Cracks). These
distress ratings must be "normalized" before they can be used in the utility curve
equations. For example, does a 0.8 km (0.5-mile) flexible pavement section with five
Failures have the same subjective value as a 1.6 km (I-mile) flexible pavement section
with five Failures? No. From a subjective standpoint, the shorter section has "twice" as
many Failures, and thus has less value (i.e., a lower utility) than the longer section. The
utility value concept intuitively "normalizes" the distress ratings.
We therefore propose that PMIS normalize any of its distress ratings that are based
on total number of occurrences before use in the distress utility curve equations. This
Chapter will describe how to normalize the distress ratings. We also propose that PMIS
not defme utility values for its optional distress types (currently, Raveling and Flushing)
or for those distress types that are used to normalize other distress ratings (currently,
Average Crack Spacing and Apparent Joint Spacing).
DEFINING UTILITY FOR RIDE QUALITY
For ride quality, utility cannot be defined just in terms of the ride quality "rating"
(or Ride Score, in PMIS). Traffic volume and speed must also be considered. Traffic
volume is important because of TxDOT' s continuing goal to provide the best possible
roads to as many "users" as possible. This is not a written policy or a legal requirement,
but it is a very important "public service" goal. Ideally, TxDOT would provide
"perfect" roads everywhere, but that is not practical considering funding and other
constraints outside of the agency's control. Thus, TxDOT tries to put its "best" roads
where the most "users" are, to provide the highest overall public service.
However, lower-volume roads cannot simply be "ignored" - traffic speed is also
important. Many Texas highways are in rural areas where there are long distances
between towns. These highways do not necessarily carry high volumes of traffic, but
traffic that travels at high speeds. At the same time, many urban highways carry very
high volumes of traffic, but at lower speeds.
16

Utility values for ride quality must balance the needs of traffic volume and traffic
speed. We therefore propose that PMIS define three classes of sections, based on traffic
volume (Average Daily Traffic) and speed (Speed Limit), when calculating utility values
for ride quality. We propose that these three classes be based on the product of ADT
and Speed Limit, as was done in PES. We also propose that PMIS define "minimum"
Ride Score values, which will not cause a loss of utility. In other words, a Ride Score
less than 5.0 should not necessarily cause a reduction in the utility value. Table 7 shows
the proposed PMIS traffic classes and "minimum" Ride Score values.
Table 7. Proposed PMIS Traffic Classes (based on product of ADT and Speed Limit).
· >::PMIS·.····· < >.: ·.:: ProducthfADT·· .. ·.. · ADT"Ra.11ge{for:s.1>~ · :·:::: 'ii~MinimuJii" Rtde Sch~e•;~ 'l'raffit':c1~ss:: ··· · ·· ~~·c1·~peed Limit ···• Limit= 9Q'i1kph:Jss Dlpl:tff , ! .(wit1l'::n<>·:It>s8:orutiUty) ·
Low 1to27,500 1 to 500 2.5
Medium 27,501 to 165,000 501 to 3,000 3.0
High 165,001 to 999,999 3,001 to 999,999 3.5
BASIC PAVEMENT UTILITY CURVE EQUATION
The basic shape of a pavement's utility curve is sigmoidal (S-shaped). Most of the
PMIS distress types have a utility curve, with the exception of (Raveling, Flushing,
Average Crack Spacing, and Apparent Joint Spacing). This curve may be represented by
the following equation:
where:
u = 1 = e =
U. = 1 - cxe - (f j l
utility value;
a PMIS distress type (e.g., deep rutting or punchouts);
base of the natural logarithms (e::::: 2.71828 ... );
17

ex =
p =
p =
L =
alpha, a horizontal asymptote factor that controls the maximum
amount of utility that can be lost;
beta, a slope factor that controls how steeply utility is lost in the
middle of the curve;
rho, a prolongation factor that controls "how long" the utility curve
will "last" above a certain value; and
level of distress (for distress types) or ride quality lost (for ride
quality).
For information about the ex, p, and p factors, please refer to the next three
sections. For information about computing the L value, please refer to the sections
entitled "Computing the L Value for Distress Types" and "Computing the L Value for
Ride Quality."
Alpha Factor
Alpha (ex) is a horizontal asymptote factor, which controls the maximum amount of
utility that can be lost. Subtracting Alpha from 1.0000 will give the curve's minimum
utility value. Figure 2 shows the effect of Alpha on the utility curve.
When the alpha value equals 1.0, the utility value can have a value between 1.0
(highest value) and 0.0 (no value). When the alpha value is less than 1.0, say 0.5, the
utility value can have a value between 1.0 and 1.0 minus the alpha value, in this case
0.5. Thus, when the damage being considered is at its maximum value, the pavement
surface still has some value to the user, in this case one-half the value with no damage.
18

I
N ~ (~ . 0 .
CD -II 11 I m t:g
~ ..c: - J-
<( J ~ :~) < ....
I ) I
) I I '
j / I v ~ a
a CD o ~ "' a ..: c:S c:S c:S c:S
811J8A Alilllfl
19
~ u 0 ·-~ §

Beta Factor
Beta ( p) is a slope factor, which controls how steeply utility is lost in the middle of
the curve. Specifically, it is the slope of the utility curve at its inflection point. Figure
3 shows the effect of Beta on the utility curve. If the beta value is very small, the utility
curve will have a sharp initial slope followed by a gradual approach to the minimum
utility value. If beta value is large, there will be a slow initial rate of deterioration
followed by a steep rate of deterioration. The final slope will asymptotically approach
the alpha value.
Rho Factor
Rho (p) is a prolongation factor, which controls "how long" the utility curve will
"last" above a certain value. Specifically, Rho is defined as the level of distress at which
the utility value will have the value of (1-.36cx). In the case where ex = 1.0, Rho is the
level of distress to achieve a utility value of 0.64. Figure 4 shows the effect of Rho on
the utility curve.
As the Rho value increases, the point along the X-axis at which the inflection point
occurs increases. The Rho is the main factor in relating level of distress to utility value.
As observed in Figure 4 to obtain a utility value of 0.7 requires only 10% distress for a
Rho value of 15, but 30% distress for a Rho value of 45.
Computing the L Value
Some distress types must be "normalized" before they can be used in the utility
equation. This is done through use of "L" value and is discussed in the following
sections.
20

N -
1. 0 -·~..,;:::--...,-----,------r--r----r---r---r---i------i
CD 0.8 ~ ca :s 0.6 I I I l~I I I ,..1 I 1 I
~ ..... ...... '!"Ill! 04 5 .
I I I I I I~ I~! 1
02 I I I I I • I f.JFJ7',.. I ~ I 1
0 0
Figure 3. Effect of Beta Factor on Utility Curve.
20 40 60 80 100 L, Percent

N N
1.0
CD 0.8 .:! ~ 0.6 ~ ..... :;::: 0 4 5 .
0.2
0 0 20
Figure 4. Effect of Rho Factor on Utility Curve.
40 60 80 100 L, Percent

For Distress Types
We propose that PMIS use the methods shown in Table 8 for computing L values
for CRCP distress types.
Table 8. Computing the L Value for CRCP Distress Types .
... . • ..... /CRCP .Distress .. ·
. . ..... . ..
1'ype .. PMIS Rating · •• ••Computing LValue .: .... . .. . . .... :· ... ••.: ..
Spalled Cracks total number L = percent of cracks that are spalled (0 to 999) (see equation below this table)
Punch outs total number L = number _per mile (0 to 999) (see equation below this table)
Asphalt Patches total number L = number per mile (0 to 999) (see equation below this table)
Concrete Patches total number L = number per mile (0 to 999) (see equation below this table)
Average Crack spacing (1 to 75), to the none Spacing nearest foot (0.1 m)
For Spalled Cracks, use the following equation to compute L:
L = 100 x [ Spall
( s2s~~s Len)
where:
Spall = Spalled Cracks (use the PMIS rating);
5280 = number of feet per mile;
Len = Section Length, in miles; and
ACS = Average Crack Spacing.
For Punchouts, Concrete Patches, and Asphalt Patches, use the following equation
to compute L:
23

where:
Rat L--Len
Rat = Punchouts, Asphalt Patches, or Concrete Patches (use the PMIS
rating); and
Len = Section Length, in miles.
When calculating utility values from this table, when L = 0, the utility value is pre
defined to be equal to 1.0000 (this prevents "division by zero" errors).
We propose that PMIS use the methods shown below in Table 9 for computing L
values for JCP distress types.
Table 9. Computing the L Value for JCP Distress Types.
•... .. ......... • .... ·•· .. ·. ·:· .. 1 •. ·• . . . . ..
·••·.·• .JqpJ)i$tfesS:'l'Yrie :1:: .<• . •'J>Mlsi:Rating:····
Failed Joints and Cracks
Failures
Shattered (Failed) Slabs
Slabs With Longitudinal Cracks
Concrete Patches
Apparent Joint Spacing
total number (0 to 999)
total number (0 to 999)
total number (0 to 999)
total number (0 to 999)
total number (0 to 999)
spacing (15 to 75), to the nearest foot (0.1 m)
L = percent of joints and cracks that are failed (see equation below this table)
L = number per mile (see equation below this table)
L = percent of slabs that are failed (see equation below this table)
L = percent of slabs that have longitudinal cracks (see equation below this table)
L = number per mile (see equation below this table)
none
For Failed Joints and Cracks, Shattered (Failed) Slabs, and Slabs With Longitudinal
Cracks, use the following equation to compute L:
24

where:
Rat =
5280 = Len =
AJS =
L = 100 x Rat l ( 528~Len)
Failed Joints and Cracks, Shattered (Failed) Slabs, and
Slabs With Longitudinal Cracks (use the PMIS rating);
number of feet per mile;
Section Length, in miles; and
Apparent Joint Spacing.
For Failures and Concrete Patches, use the following equation to compute L:
where:
Rat L--
Len
Rat = Failures or Concrete Patches (use the PMIS rating); and
Len = Section Length, in miles.
When calculating utility values from this table, when L = 0, the utility value is pre
defined to be equal to 1.0000 (this prevents "division by zero" errors).
We propose that PMIS use the methods shown below in Table 10 for computing L
values for ACP distress types.
25
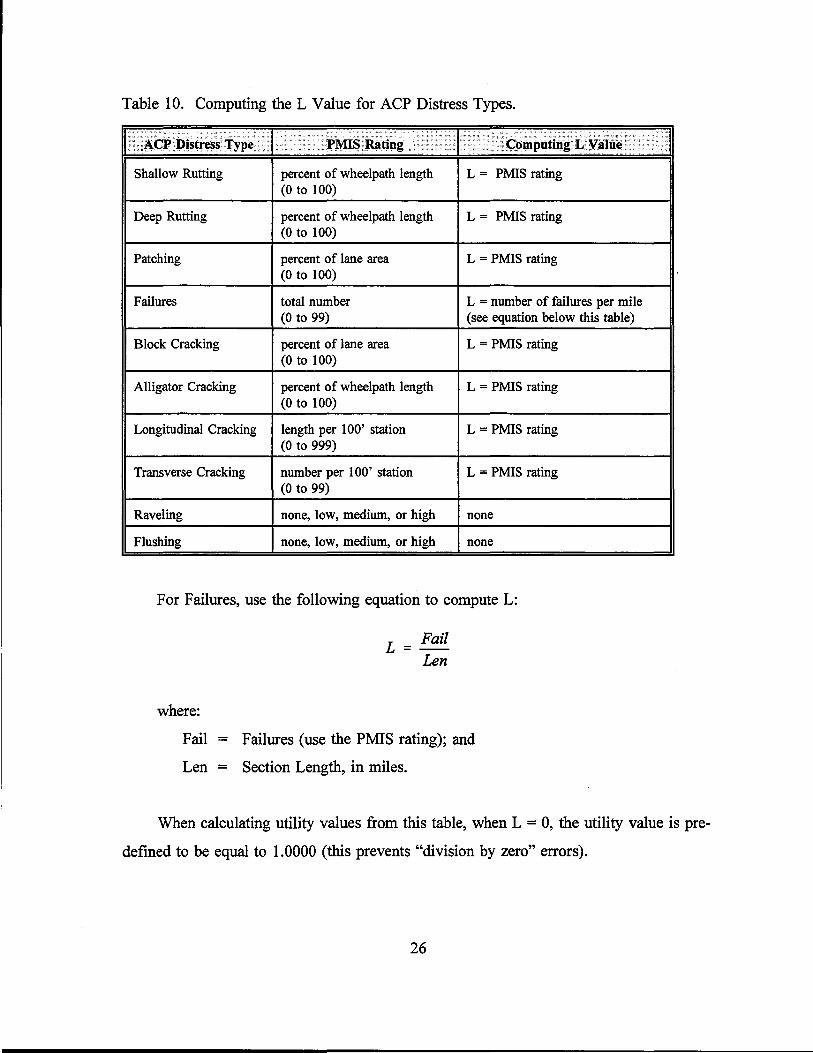
Table 10. Computing the L Value for ACP Distress Types.
>· . ..
,. ,AcP Distress Type PMIS Rating .. <computing''L•Value ... '
Shallow Rutting percent of wheelpath length L= PMIS rating (0 to 100)
Deep Rutting percent of wheelpath length L= PMIS rating (0 to 100)
Patching percent of lane area L = PMIS rating (0 to 100)
Failures total number L = number of failures per mile (0 to 99) (see equation below this table)
Block Cracking percent of lane area L = PMIS rating (0 to 100)
Alligator Cracking percent of wheelpath length L = PMIS rating (0 to 100)
Longitudinal Cracking length per 100' station L = PMIS rating (0 to 999)
Transverse Cracking number per 100' station L = PMIS rating (0 to 99)
Raveling none, low, medium, or high none
Flushing none, low, medium, or high none
For Failures, use the following equation to compute L:
where:
Fail L--
Len
Fail = Failures (use the PMIS rating); and
Len = Section Length, in miles.
:
When calculating utility values from this table, when L = 0, the utility value is pre
defined to be equal to 1.0000 (this prevents "division by zero" errors).
26

For Ride Quality
As mentioned earlier, PMIS should not use just the Ride Score to compute utility
values
For "Low" Traffic Class pavements, use the following equation to compute L:
where:
L = 100 x ( 2·5-RS)
2.5
L = level of ride quality lost,
2.5 = "minimum" Ride Score, and
RS = Ride Score.
For "Medium" Traffic Class pavements, use the following equation to compute L:
where:
L = 100 x ( 3.0-RS) 3.0
L = level of ride quality lost,
3.0 = "minimum" Ride Score, and
RS = Ride Score.
For "High" Traffic Class pavements, use the following equation to compute L:
where:
L = 100 x ( 3.s-RS)
3.5
L = level of ride quality lost,
3.5 = "minimum" Ride Score, and
RS = Ride Score.
27

UTILITY CURVE COEFFICIENTS
We propose that PMIS use the utility curve coefficients shown in Table 11 for
pavement distress. The coefficients were generated using regression analysis on a series
of curves developed by experienced TxDOT engineers. These initial curves ranked the
relative importance of each distress type.
The coefficients for JCP Failures will produce negative utility values when a PMIS
Data Collection Section has more than 60 per mile. We propose that PMIS have an
"underflow limit," which sets the minimum calculated utility value equal to 0.0001 to
prevent errors resulting from negative values.
We also propose that PMIS use the utility curve coefficients shown in Tables 12
through 21 for ride quality. These coefficients will not be used to calculate the Ride
Score; they are only meant to calculate a utility value for ride quality (i.e., a utility value
for the Ride Score). This utility value will be used to compute the PMIS Condition
Score, as described later in this Chapter.
The coefficients for ride quality will produce negative utility values when Ride
Score is below 0.5 for "Medium" traffic and below 0.9 for "High" traffic. Again earlier,
PMIS should have an "underflow limit" which sets the minimum calculated utility value
equal to 0.0001 to prevent errors resulting from negative values.
UTILITY VALUES FOR DISTRESS TYPES AND RIDE SCORE
For reference purposes we have included Tables 22-91, which list utility values for
distress ratings, based on the above-described utility curve coefficients.
Use of these Tables will answer the two questions posed at the beginning of this
Chapter.
Question #1: How can the pavement manager compare an ACP section
with 25 percent Shallow Rutting to a CRCP section with 5
Punchouts and 3 Concrete Patches?
28

Table 11. Distress Utility Factors.
uetauea 1-'avement 1 ype: 01 u1stress Type ALPHA tst:. fA RHO
.Spalled Cracks 0.9369 1 62.7 Punch outs 0.9849 1 5.14 Asphalt Patches 0.9849 1 5.14 Concrete t-'atcnes 0.8649 1 8.2
Detailed Pavement Type: uz Distress Type ALl-'HA 1:3c I A RHO
t-auea Jomts ana cracKs 0.:>298 1 21.4 JCP Failures 1.4555 1 22.15 s1aos w1tn Longituaina1 cracKs 1.00:>~ 1 47.8 Shattered SlaDs 1.171 1 16.31 Concrete Patching 1.067 1 24.24
uetauea t-'avement 1 ype: U;:j
u1stress 1 ype ALl-'HA tsclA RHO t-auea Joints ana cracKs 0.5298 1 21.4 JCP Failures 1.4555 1 22.15 s1aos w1m Longituaina1 cracKs 1.0058 1 47.8 Shattered Slabs 1.171 1 16.31 Concrete Patching 1.067 1 24.24
uetauea 1-'avement 1 ype: 04 u1stress I ype ALPHA BEIA RHO
~nanow Rutting ·0.31 1 19./2 Deep Rutting 0.69 1 16.27 Patcning 0.45 1 10.15 Failures 1 1 4.7 Block Cracking 0.49 1 9.78
i Alligator cracking 0.53 1 8.Ul Longitudinal Cracking 0.87 1 184 Transverse Cracking 0.69 1 10.39
Detailed Pavement Type: 05 u1stress 1 ype ALl-'HA tsc IA ~t1U
Shallow Rutting 0.31 1 19./2 Deep Rutting 0.69 1 16.27 Patching 0.45 1 10.15 Failures 1 1 4.7 Block Cracking 0.49 1 9.78 Alligator CracKing U.53 1 8.Ul
Longitudinal Cracking 0.87 1 184 Transverse Cracking 0.69 1 10.39
29

Table 11 (Continued). Distress Utility Factors.
Detailed Pavement 1 ype: uo Distress 1 ype ALI-'HA CC:IA Kt1U
~nanow Rutting 0.31 1 19./"L. Deep Rutting 0.69 1 16.27 Patching 0.45 1 1U.15 Failures 1 1 4.7 BIOCK craCKmg 0.49 1 l:J.16
Alligator Cracking 0.53 1 8.01 Longitudinal craCKing 0.87 1 184 Transverse cracking 0.69 1 1U.39
Detauea t-'avemem 1 ype: u1
u1stress 1 ype ALPHA BEIA Kt1U Shallow Rutting 0.23 1 17.55 Deep Rutting 0.32 1 9.04 Patching 0.32 1 17.28 Failures 1 1 4.f
Block Cracking 0.31 1 13.79 Alligator CraCKing 0.42 1 18.77 Longitudinal cracking o.~1 1 1~o.9
Transverse Cracking 0.43 1 9.56
Detailed Pavement Type: 08 u1stress 1 ype ALI-'HA BErA Kt1U
;:;nanow Rutting 0.23 1 11.55 Deep Rutting 0.32 1 9.U4
Patcmng U.~L 1 17:LO Failures 1 1 4.7 BIOCK cracKing 0.31 1 13./~
Alligator Cracking 0.42 1 18.77 Longitudinal craCKing 0.~I 1 1~o.9
Transverse Cracking 0.43 1 9.56
Detalled Pavement Type: u~ u1stress Type ALPHA BErA KHU
~nallow Rutting 0.31 1 19. /"L.
Deep Rutting 0.69 1 16.27 Patcning 0.45 1 10.15 Failures 1 1 4.7 Block Cracking 0.49 1 9.78 Alltgator Cracking 0.53 1 8.01 Longitudinal Cracking 0.87 1 184 Transverse Cracking 0.69 1 10.39
30

Table 11 (Continued). Distress Utility Factors.
31

Table 12. Ride Score Utility Factors for Detailed Pavement Type 01.
How Rated: Percent of Ride Quality Lost (0-1)
Low Medium High Traffic Traffic Traffic
Alpha: 1.8180 1.7600 1.7300
Beta: 1.0000 1.0000 1.0000
Rho: 58.5000 48.1000 41.0000
32

Table 13. Ride Score Utility Factors for Detailed Pavement Type 02.
How Rated: Percent of Ride Quality Lost (0-1)
Low Medium High Traffic Traffic Traffic
Alpha: 1.8180 1.7600 1.7300
Beta: 1.0000 1.0000 1.0000
Rho: 58.5000 48.1000 41.0000
33

Table 14. Ride Score Utility Factors for Detailed Pavement Type 03.
How Rated: Percent of Ride Quality Lost (0-1)
Low Medium High Traffic Traffic Traffic
Alpha: 1.8180 1.7600 1.7300
Beta: 1.0000 1.0000 1.0000
Rho: 58.5000 48.1000 41.0000
34
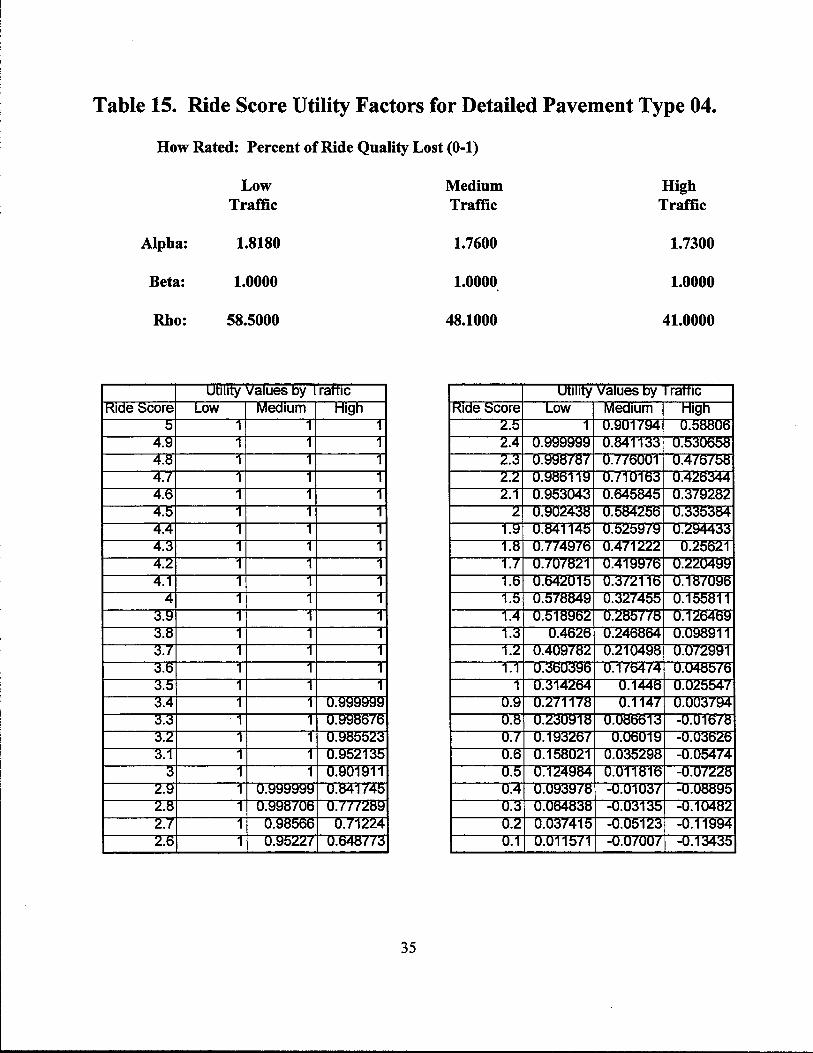
Table 15. Ride Score Utility Factors for Detailed Pavement Type 04.
How Rated: Percent of Ride Quality Lost (0-1)
Low Medium High Traffic Traffic Traffic
Alpha: 1.8180 1.7600 1.7300
Beta: 1.0000 1.0000 1.0000
Rho: 58.5000 48.1000 41.0000
35
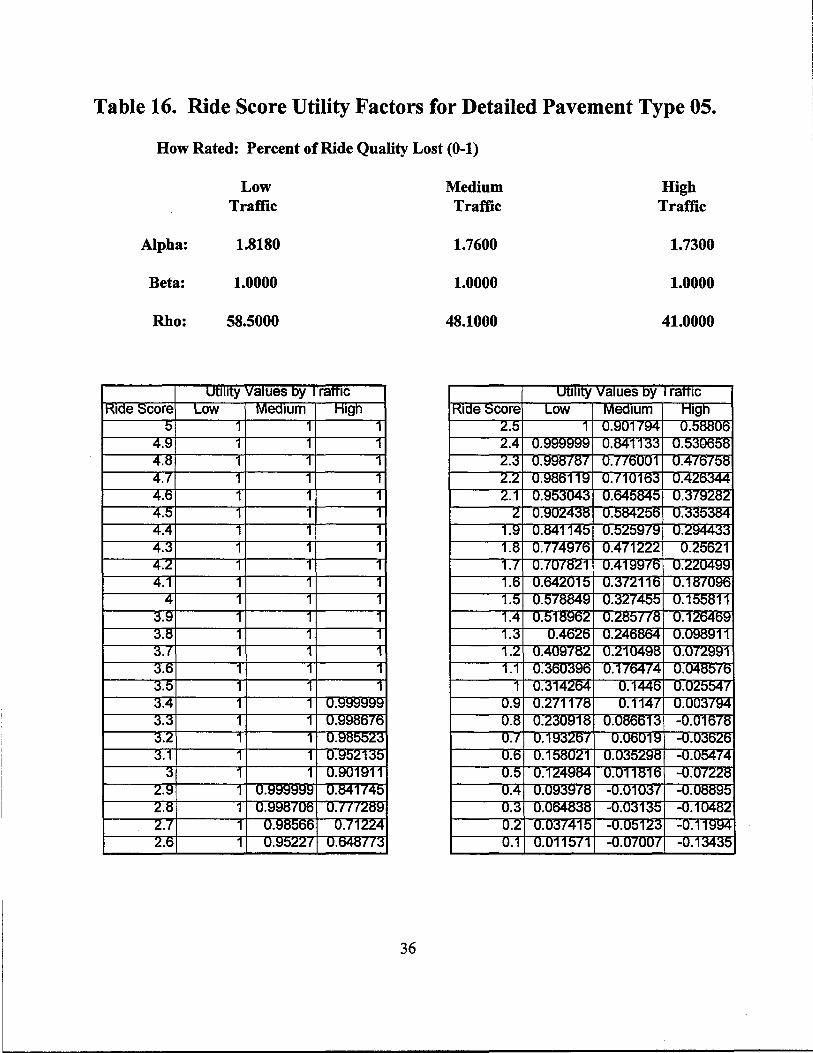
Table 16. Ride Score Utility Factors for Detailed Pavement Type 05.
How Rated: Percent of Ride Quality Lost (0-1)
Low Medium High Traffic Traffic Traffic
Alpha: 1.8180 1.7600 1.7300
Beta: 1.0000 1.0000 1.0000
Rho: 58.5000 48.1000 41.0000
36

Table 17. Ride Score Utility Factors for Detailed Pavement Type 06.
How Rated: Percent of Ride Quality Lost (0-1)
Low Medium High Traffic Traffic Traffic
Alpha: 1.8180 1.7600 1.7300
Beta: 1.0000 1.0000 1.0000
Rho: 58.5000 48.1000 41.0000
37

Table 18. Ride Score Utility Factors for Detailed Pavement Type 07.
How Rated: Percent of Ride Quality Lost (0-1)
Low Medium High Traffic Traffic Traffic
Alpha: 1.8180 1.7600 1.7300
Beta: 1.0000 1.0000 1.0000
Rho: 58.5000 48.1000 41.0000
38

Table 19. Ride Score Utility Factors for Detailed Pavement Type 08.
How Rated: Percent of Ride Quality Lost (0-1)
Low Medium High Traffic Traffic Traffic
Alpha: 1.8180 1.7600 1.7300
Beta: 1.0000 1.0000 1.0000
Rho: 58.5000 48.1000 41.0000
39

Table 20. Ride Score Utility Factors for Detailed Pavement Type 09.
How Rated: Percent of Ride Quality Lost (0-1)
Low Medium High Traffic Traffic Traffic
Alpha: 1.8180 1.7600 1.7300
Beta: 1.0000 1.0000 1.0000
Rho: 58.5000 48.1000 41.0000
40

Table 21. Ride Score Utility Factors for Detailed Pavement Type 10.
How Rated: Percent of Ride Quality Lost (0-1)
Low Medium High Traffic Traffic Traffic
Alpha: 1.8180 1.7600 1.7300
Beta: 1.0000 1.0000 1.0000
Rho: 58.5000 48.1000 41.0000
41

Table 22. Distress Utility Factors for Spalled Cracks for Detailed Pavement Type: 01.
Alpha: 0.9369 How Rated: Total Number
Beta: 1.0000
Rho: 62. 7000
42

Table 23. Distress Utility Factors for Punchouts for Detailed Pavement Type: 01.
Alpha: 0.9849 How Rated: Total Number
Beta:- 1.0000
Rho: 5.1400
Number UTILITY Number UTILITY Number UTILITY Number Per VALUE Per VALUE Per VALUE Per Mile Mile Mile Mile
1 0.9942 26 0.1918 51 0.1095 76 2 0.9246 27 0.1858 52 0.1078 77 3 0.8225 28 0.1803 53 0.1"061 78 4 0.7275 29 0.1751 54 0.1045 79 5 0.6477 30 0.1702 55 0.1030 80 6 0.5818 31 0.1656 56 0.1015 81 7 0.5274 32 0.1612 57 0.1000 82 8 0.4820 33 0.1572 58 0.0986 83 9 0.4436 34 0.1533 59 0.0973 84 10 0.4109 35 0.1496 60 0.0960 85 11 0.3828 36 0.1461 61 0.0947 86 12 0.3582 37 0.1428 62 0.0935 87 13 0.3367 38 0.1397 63 0.0923 88 14 0.3177 39 0.1367 64 0.0911 89 15 0.3008 40 0.1339 65 0.0900 90 16 0.2857 41 0.1311 66 0.0889 91 17 0.2721 42 0.1285 67 0.0878 92 18 0.2598 43 0.1261 68 0.0868 93 19 0.2485 44 0.1237 69 0.0858 94 20 0.2383 45 0.1214 70 0.0848 95 21 0.2289 46 0.1192 71 0.0839 96 22 0.2203 47 0.1171 72 0.0830 97 23 0.2123 48 0.1151 73 0.0821 98 24 0.2050 49 0.1132 74 0.0812 99 25 0.1981 50 0.1113 75 0.0803 100
43
UTILITY VALUE
0.0795 0.0787 0.0779 0.0771 0.0764 0.0757 0.0749 0.0742 0.0736 0.0729 0.0722 0.0716 0.0710 0.0704 0.0698 0.0692 0.0686 0.0681 0.0675 0.0670 0.0664 0.0659 0.0654 0.0649 0.0644

Table 24. Distress Utility Factors for Asphalt Patches for Detailed Pavement Type: 01.
Alpha: 0.9849 How Rated: Total Number
Beta: 1.0000
Rho: 5.1400
Number UTILITY Number UTILITY Number UTILITY Number UTILITY Per VALUE Per VALUE Per VALUE Per VALUE Mile Mile Mile Mile
1 0.9942 26 0.1918 51 0.1095 76 0.0795 2 0.9246 27 0.1858 52 0.1078 77 0.0787 3 0.8225 28 0.1803 53 0.1061 78 0.0779 4 0.7275 29 0.1751 54 0.1045 79 0.0771 5 0.6477 30 0.1702 55 0.1030 80 0.0764 6 0.5818 31 0.1656 56 0.1015 81 0.0757 7 0.5274 32 0.1612 57 0.1000 82 0.0749 8 0.4820 33 0.1572 58 0.0986 83 0.0742 9 0.4436 34 0.1533 59 0.0973 84 0.0736 10 0.4109 35 0.1496 60 0.0960 85 0.0729 11 0.3828 36 0.1461 61 0.0947 86 0.0722 12 0.3582 37 0.1428 62 0.0935 87 0.0716 13 0.3367 38 0.1397 63 0.0923 88 0.0710 14 0.3177 39 0.1367 64 0.0911 89 0.0704 15 0.3008 40 0.1339 65 0.0900 90 0.0698 16 0~2857 41 0.1311 66 0.0889 91 0.0692 17 0.2721 42 0.1285 67 0.0878 92 0.0686 18 0.2598 43 0.1261 68 0.0868 93 0.0681 19 0.2485 44 0.1237 69 0.0858 94 0.0675 20 0.2383 45 0.1214 70 0.0848 95 0.0670 21 0.2289 46 0.1192. 71 0.0839 96 0.0664 22 0.2203 47 0.1171 72 0.0830 97 0.0659 23 0.2123 48 0.1151 73 0.0821 98 0.0654 24 0.2050 49 0.1132 74 0.0812 99 0.0649 25 0.1981 50 0.1113 75 0.0803 100 0.0644
44

Table 25. Distress Utility Factors for Concrete Patches for Detailed Pavement Type: 01.
Alpha: 0.8649 How Rated: Total Number
Beta: 1.0000
Rho: 8.2000
Number UTILITY Number UTILITY Number UTILITY Number UTILITY Per VALUE Per VALUE Per VALUE Per VALUE Mile Mile Mile Mile
1 0.9998 26 0.3690 51 0.2636 76 0.2236 2 0.9857 27 0.3616 52 0.2613 77 0.2225 3 0.9438 28 0.3547 53 0.2591 78 0.2214 4 0.8887 29 0.3481 54 0.2570 79 0.2204 5 0.8322 30 0.3420 55 0.2549 80 0.2194 6 0.7795 31 0.3361 56 0.2529 81 0.2184 7 0.7319 32 0.3306 57 0.2510 82 0.2174 8 0.6897 33 0.3254 58 0.2491 83 0.2165 9 0.6522 34 0.3204 59 0.2473 84 0.2155 10 0.6191 35 0.3157 60 0.2456 85 0.2146 11 0.5896 36 0.3113 61 0.2439 86 0.2138. 12 0.5633 37 0.3070 62 0.2422 87 0.2129 13 0.5397 38 0.3030 63 0.2407 88 0.2121 14 0.5185 39 0.2991 64 0.2391 89 0.2112 15 0.4993 40 0.2954 65 0.2376 90 0.2104 16 0.4819 41 0.2919 66 0.2361 91 0.2096 17 0.4661 42 0.2885 67 0.2347 92 0.2089 18 0.4516 43 0.2853 68 0.2334 93 0.2081 19 0.4383 44 0.2822 69 0.2320 94 0.2074 20 0.4260 45 0.2792 70 0.2307 95 0.2066 21 0.4147 46 0.2763 71 0.2294 96 0.2059 22 0.4042 47 0.2736 72 0.2282 97 0.2052 23 0.3945 48 0.2709 73 0.2270 98 0.2045 24 0.3854 49 0.2684 74 0.2258 99 0.2039 25 0.3770 50 0.2659 75 0.2247 100 0.2032
45

Table 26. Distress Utility Factors for Failed Joints and Cracks for Detailed Pavement Type: 02 ..
Alpha: 0.5298 How Rated: Total Number
Beta: 1.0000
Rho: 21.4000
Percent UTILITY Percent UTILITY Percent UTILITY Percent UTILITY Joints & VALUE Joints & VALUE Joints & VALUE Joints & VALUE
Cracks Failed Cracks Failed Cracks Failed Cracks Failed 1 1.0000 26 0.7674 51 0.6518 76 0.6002 2 1.0000 27 0.7602 52 0.6489 77 0.5988 3 0.9996 28 0.7533 53 0.6462 78 0.5973 4 0.9975 29 0.7467 54 0.6435 79 0.5959 5 0.9927 30 0.7404 55 0.6410 80 0.5945 6 0.9850 31 0.7344 56 0.6385 81 0.5932 7 0.9751 32 0.7286 57 0.6360 82 0.5919 8 0.9635 33 0.7230 58 0.6337 83 0.5906 9 0.9509 34 0.7177 59 0.6314 84 0.5894 10 0.9377 35 0.7125 60 0.6291 85 0.5881 11 0.9243 36 0.7076 61 0.6270 86 0.5869 12 0.9110 37 0.7029 62 0.6248 87 0.5857 13 0.8979 38 0.6983 63 0.6228 88 0.5846 14 0.8851 39 0.6939 64 0.6208 89 0.5834 15 0.8728 40 0.6897 65 0.6188 90 0.5823 16 0.8609 41 0.6856 66 0.6169 91 0.5812 17 0.8495 42 0.6817 67 0.6151 92 0.5802 18 0.8386 43 0.6779 68 0.6132 93 0.5791 19 0.8282 44 0.6742 69 0.6115 94 0.5781 20 0.8183 45 0.6707 70 0.6098 95 0.5771 21 0.8088 46 0.6673 71 0.6081 96 0.5761 22 0.7997 47 0.6640 72 0.6064 97 0.5751 23 0.7911 48 0.6608 73 0.6048 98 0.5741 24 0.7828 49 0.6577 74 0.6032 99 0.5732 25 0.7749 50 0.6547 75 0.6017 100 0.5723
46

Table 27. Distress Utility Factors for JCP Failures for Detailed Pavement Type: 02.
Alpha: 1.4555 How Rated: Total Number
Beta: 1.0000
Rho: 22.1500
Number UTILITY Number UTILITY Number UTILITY Number Per VALUE Per VALUE Per VALUE Per Mile Mile Mile Mile
1 1.0000 26 0.3791 51 0.0573 76 2 1.0000 27 0.3592 52 0.0494 77 3 0.9991 28 0.3401 53 0.0417 78 4 0.9943 29 0.3219 54 0.0342 79 5 0.9827 30 0.3044 55 0.0270 80 6 0.9637 31 0.2876 56 0.0200 81 7 0.9385 32 0.2716 57 0.0132 82 8 0.9087 33 0.2561 58 0.0065 83 9 0.8758 34 0.2413 59 0.0001 84 10 0.8411 35 0.2270 60 -0.0062 85 11 0.8057 36 0.2133 61 -0.0123 86 12 0.7702 37 0.2001 62 -0.0183 87 13 0.7351 38 0.1874 63 -0.0240 88 14 0.7008 39 0.1752 64 -0.0297 89 15 0.6676 40 0.1634 65 -0.0352 90 16 0.6354 41 0.1520 66 -0.0405 91 17 0.6045 42 0.1410 67 -0.0458 92 18 0.5748 43 0.1304 68 -0.0509 93 19 0.5464 44 0.1202 69 -0.0558 94 20 0.5191 45 0.1103 70 -0.0607 95 21 0.4931 46 0.1007 71 -0.0654 96 22 0.4682 47 0.0915 72 -0.0701 97 23 0.4444 48 0.0825 73 -0.0746 98 24 0.4216 49 0.0738 74 -0.0790 99 25 0.3999 50 0.0654 75 -0.0833 100
47
UTILITY VALUE
-0.0875 -0.0916 -0.0957 -0.0996 -0.1035 -0.1073 -0.1110 -0.1146 -0.1181 -0.1216 -0.1250 -0.1283 -0.1316 -0.1348 -0.1380 -0.1410 -0.1441 -0.1470 -0.1499 -0.1528 -0.1556 -0.1584 -0.1611 -0.1637 -0.1663

Figure 28. Distress Utility Factors for Slabs with Longitudinal Cracks for Detailed Pavement Type: 02.
Alpha: 1.0058 How Rated: Total Number
Beta: 1.0000
Rho: 47.8000
Percent of UTILITY Percent of UTILITY Percent of UTILITY Percent of Slabs with VALUE Slabs with VALUE Slabs with VALUE Slabs with
Long. Cracks Long. Cracks Long. Cracks Long. Cracks 1 1.0000 26 0.8400 51 0.6060 76 2 1.0000 27 0.8287 52 0.5989 77 3 1.0000 28 0.8176 53 0.5918 78 4 1.0000 29 0.8065 54 0.5850 79 5 0.9999 30 0.7956 55 0.5782 80 6 0.9997 31 0.7848 56 0.5716 81 7 0.9989 32 0.7742 57 0.5652 82 8 0.9974 33 0.7637 58 0.5588 83 9 0.9950 34 0.7534 59 0.5526 84 10 0.9916 35 0.7433 60 0.5466 85 11 0.9870 36 0.7334 61 0.5406 86 12 0.9813 37 0.7237 62 0.5348 87 13 0.9746 38 0.7141 63 0.5290 88 14 0.9669 39 0.7047 64 0.5234 89 15 0.9585 40 0.6955 65 0.5179 90 16 0.9493 41 0.6865 66 0.5125 91 17 0.9396 42 0.6777 67 0.5072 92 18 0.9293 43 0.6691 68 0.5020 93 19 0.9187 44 0.6606 69 0.4969 94 20 0.9078 45 0.6523 70 0.4919 95 21 0.8967 46 0.6442 71 0.4870 96 22 0.8855 47 0.6362 72 0.4822 97 23 0.8741 48 0.6284 73 0.4774 98 24 0.8627 49 0.6208 74 0.4728 99 25 0.8514 50 0.6133 75 0.4682 100
48
UTILITY VALUE
0.4638 0.4594 0.4550 0.4508 0.4466 0.4425 0.4385 0.4345 0.4307 0.4268 0.4231 0.4194 0.4157 0.4122 0.4086 0.4052 0.4018 0.3984 0.3951 0.3919 0.3887 0.3855 0.3824 0.3794 0.3764

Table 29. Distress Utility Factors for Shattered Slabs for Detailed Pavement Type: 02.
Alpha: 1.1710 How Rated: Total Number
Beta: 1.0000
Rho: 16.3100
Percent UTILITY Percent UTILITY Percent UTILITY Percent UTILITY of Slabs VALUE of Slabs VALUE of Slabs VALUE of Slabs VALUE Failed Failed Failed Failed
1 1.0000 26 0.3747 51 0.1495 76 0.0552 2 0.9997 27 0.3600 52 0.1443 77 0.0525 3 0.9949 28 0.3460 53 0.1392 78 0.0500 4 0.9802 29 0.3327 54 0.1343 79 0.0474 5 0.9551 30 0.3201 55 0.1295 80 0.0450 6 0.9227 31 0.3081 56 0.1249 81 0.0426 7 0.8861 32 0.2966 57 0.1204 82 0.0402 8 0.8475 33 0.2857 58 0.1160 83 0.0379 9 0.8088 34 0.2752 59 0.1118 84 0.0357 10 0.7708 35 0.2652 60 0.1077 85 0.0335 11 0.7342 36 0.2556 61 0.1037 86 0.0313 12 0.6992 37 0.2464 62 0.0999 87 0.0292 13 0.6660 38 0.2377 63 0.0961 88 0.0271 14 0.6347 39 0.2292 64 0.0924 89 0.0251 15 0.6052 40 0.2211 65 0.0889 90 0.0231 16 0.5775 41 0.2133 66 0.0854 91 0.0211 17 0.5514 42 0.2058 67 0.0820 92 0.0192 18 0.5268 43 0.1986 68 0.0787 93 0.0174 19 0.5037 44 0.1917 69 0.0755 94 0.0155 20 0.4819 45 0.1850 70 0.0724 95 O.Q137 21 0.4614 46 0.1786 71 0.0693 96 0.0120 22 0.4421 47 0.1723 72 0.0664 97 0.0102 23 0.4238 48 0.1663 73 0.0635 98 0.0085 24 0.4065 49 0.1605 74 0.0606 99 0.0069 25 0.3901 50 0.1549 75 0.0579 100 0.0052
49

Table 30. Distress Utility Factors for Concrete Patching for Detailed Pavement Type: 02.
Alpha: 1.0670 How Rated: Total Number
Beta: 1.0000
Rho: 24.2400
Number UTILITY Number UTILITY Number UTILITY Number Per VALUE Per VALUE Per VALUE Per Mile Mile Mile Mile
1 1.0000 26 0.5800 51 0.3366 76 2 1.0000 27 0.5652 52 0.3306 77 3 0.9997 28 0.5511 53 0.3246 78 4 0.9975 29 0.5375 54 0.3189 79 5 0.9916 30 0.5244 55 0.3133 80 6 0.9812 31 0.5118 56 0.3079 81 7 0.9666 32 0.4998 57 0.3026 82 8 0.9484 33 0.4881 58 0.2975 83 9 0.9278 34 0.4770 59 0.2925 84 10 0.9055 35 0.4662 60 0.2876 85 11 0.8822 36 0.4558 61 0.2829 86 12 0.8585 37 0.4458 62 0.2783 87 13 0.8347 38 0.4362 63 0.2738 88 14 0.8111 39 0.4269 64 0.2694 89 15 0.7880 40 0.4179 65 0.2651 90 16 0.7655 41 0.4093 66 0.2610 91 17 0.7436 42 0.4009 67 0.2569 92 18 0.7225 43 0.3928 68 0.2529 93 19 0.7021 44 0.3850 69 0.2491 94 20 0.6825 45 0.3774 70 0.2453 95 21 0.6636 46 0.3700 71 0.2416 96 22 0.6455 47 0.3629 72 0.2380 97 23 0.6281 48 0.3561 73 0.2345 98 24 0.6114 49 0.3494 74 0.2310 99 25 0.5954 50 0.3429 75 0.2277 100
50
UTILITY VALUE
0.2244 0.2212 0.2180 0.2149 0.2119 0.2090 0.2061 0.2032 0.2005 0.1977 0.1951 0.1925 0.1899 0.1874 0.1849 0.1825 0.1801 0.1778 0.1755 0.1733 0.1711 0.1689 0.1668 0.1647 0.1627

Table 31. Distress Utility Factors for Failed Joints and Cracks for Detailed Pavement Type: 03.
Alpha: 0.5298 How Rated: Total Number
Beta: 1.0000
Rho: 21.4000
Percent of UTILITY Percent of UTILITY Percent of UTILITY Percent of UTILITY Joints& VALUE Joints & VALUE Joints & VALUE Joints& VALUE
Cracks Failed Cracks Failed Cracks Failed Cracks Failed 1 1.0000 26 0.7674 51 0.6518 76 0.6002 2 1.0000 27 0.7602 52 0.6489 77 0.5988 3 0.9996 28 0.7533 53 0.6462 78 0.5973 4 0.9975 29 0.7467 54 0.6435 79 0.5959 5 0.9927 30 0.7404 55 0.6410 80 0.5945 6 0.9850 31 0.7344 56 0.6385 81 0.5932 7 0.9751 32 0.7286 57 0.6360 82 0.5919 8 0.9635 33 0.7230 58 0.6337 83 0.5906 9 0.9509 34 0.7177 59 0.6314 84 0.5894 10 0.9377 35 0.7125 60 0.6291 85 0.5881 11 0.9243 36 0.7076 61 0.6270 86 0.5869 12 0.9110 37 0.7029 62 0.6248 87 0.5857 13 0.8979 38 0.6983 63 0.6228 88 0.5846 14 0.8851 39 0.6939 64 0.6208 89 0.5834 15 0.8728 40 0.6897 65 0.6188 90 0.5823 16 0.8609 41 0.6856 66 0.6169 91 0.5812 17 0.8495 42 0.6817 67 0.6151 92 0.5802 18 0.8386 43 0.6779 68 0.6132 93 0.5791 19 0.8282 44 0.6742 69 0.6115 94 0.5781 20 0.8183 45 0.6707 70 0.6098 95 0.5771 21 0.8088 46 0.6673 71 0.6081 96 0.5761 22 0.7997 47 0.6640 72 0.6064 97 0.5751 23 0.7911 48 0.6608 73 0.6048 98 0.5741 24 0.7828 49 0.6577 74 0.6032 99 0.5732 25 0.7749 50 0.6547 75 0.6017 100 0.5723
51

Table 32. Distress Utility Factors for JCP Failures for Detailed Pavement Type: 03.
Alpha: 1.4555 How Rated: Total Number
Beta: 1.0000
Rho: 22.1500
Number UTILITY Number UTILITY Number UTILITY Number Per VALUE Per VALUE Per VALUE Per Mile Mile Mile Mile
1 1.0000 26 0.3791 51 0.0573 76 2 1.0000 27 0.3592 52 0.0494 77 3 0.9991 28 0.3401 53 0.0417 78 4 0.9943 29 0.3219 54 0.0342 79 5 0.9827 30 0.3044 55 0.0270 80 6 0.9637 31 0.2876 56 0.0200 81 7 0.9385 32 0.2716 57 0.0132 82 8 0.9087 33 0.2561 58 0.0065 83 9 0.8758 34 0.2413 59 0.0001 84 10 0.8411 35 0.2270 60 -0.0062 85 11 0.8057 36 0.2133 61 -0.0123 86 12 0.7702 37 0.2001 62 -0.0183 87 13 0.7351 38 0.1874 63 -0.0240 88 14 0.7008 39 0.1752 64 -0.0297 89 15 0.6676 40 0.1634 65 -0.0352 90 16 0.6354 41 0.1520 66 -0.0405 91 17 0.6045 42 0.1410 67 -0.0458 92 18 0.5748 43 0.1304 68 -0.0509 93 19 0.5464 44 0.1202 69 -0.0558 94 20 0.5191 45 0.1103 70 -0.0607 95 21 0.4931 46 0.1007 71 -0.0654 96 22 0.4682 47 0.0915 72 -0.0701 97 23 0.4444 48 0.0825 73 -0.0746 98 24 0.4216 49 0.0738 74 -0.0790 99 25 0.3999 50 0.0654 75 -0.0833 100
52
UTILITY VALUE
-0.0875 -0.0916 -0.0957 -0.0996 -0.1035 -0.1073 -0.1110 -0.1146 -0.1181 -0.1216 -0.1250 -0.1283 -0.1316 -0.1348 -0.1380 -0.1410 -0.1441 -0.1470 -0.1499 -0.1528 -0.1556 -0.1584 -0.1611 -0.1637 -0.1663

Table 33. Distress Utility Factors for Shattered Slabs for Detailed Pavement Type: 03.
Alpha: 1.1710 How Rated: Total Number
Beta: 1.0000
Rho: 16.3100
Percent UTILITY Percent UTILITY Percent UTILITY Percent UTILITY of Slabs VALUE of Slabs VALUE of Slabs VALUE of Slabs VALUE Failed Failed Failed Failed
1 1.0000 26 0.3747 51 0.1495 76 0.0552 2 0.9997 27 0.3600 52 0.1443 77 0.0525 3 0.9949 28 0.3460 53 0.1392 78 0.0500 4 0.9802 29 0.3327 54 0.1343 79 0.0474 5 0.9551 30 0.3201 55 0.1295 80 0.0450 6 0.9227 31 0.3081 56 0.1249 81 0.0426 7 0.8861 32 0.2966 57 0.1204 82 0.0402 8 0.8475 33 0.2857 58 0.1160 83 0.0379 9 0.8088 34 0.2752 59 0.1118 84 0.0357 10 0.7708 35 0.2652 60 0.1077 85 0.0335 11 0.7342 36 0.2556 61 0.1037 86 0.0313 12 0.6992 37 0.2464 62 0.0999 87 0.0292 13 0.6660 38 0.2377 63 0.0961 88 0.0271 14 0.6347 39 0.2292 64 0.0924 89 0.0251 15 0.6052 40 0.2211 65 0.0889 90 0.0231 16 0.5775 41 0.2133 66 0.0854 91 0.0211 17 0.5514 42 0.2058 67 0.0820 92 0.0192 18 0.5268 43 0.1986 68 0.0787 93 0.0174 19 0.5037 44 0.1917 69 0.0755 94 0.0155 20 0.4819 45 0.1850 70 0.0724 95 0.0137 21 0.4614 46 0.1786 71 0.0693 96 0.0120 22 0.4421 47 0.1723 72 0.0664 97 0.0102 23 0.4238 48 0.1663 73 0.0635 98 0.0085 24 0.4065 49 0.1605 74 0.0606 99 0.0069 25 0.3901 50 0.1549 75 0.0579 100 0.0052
53
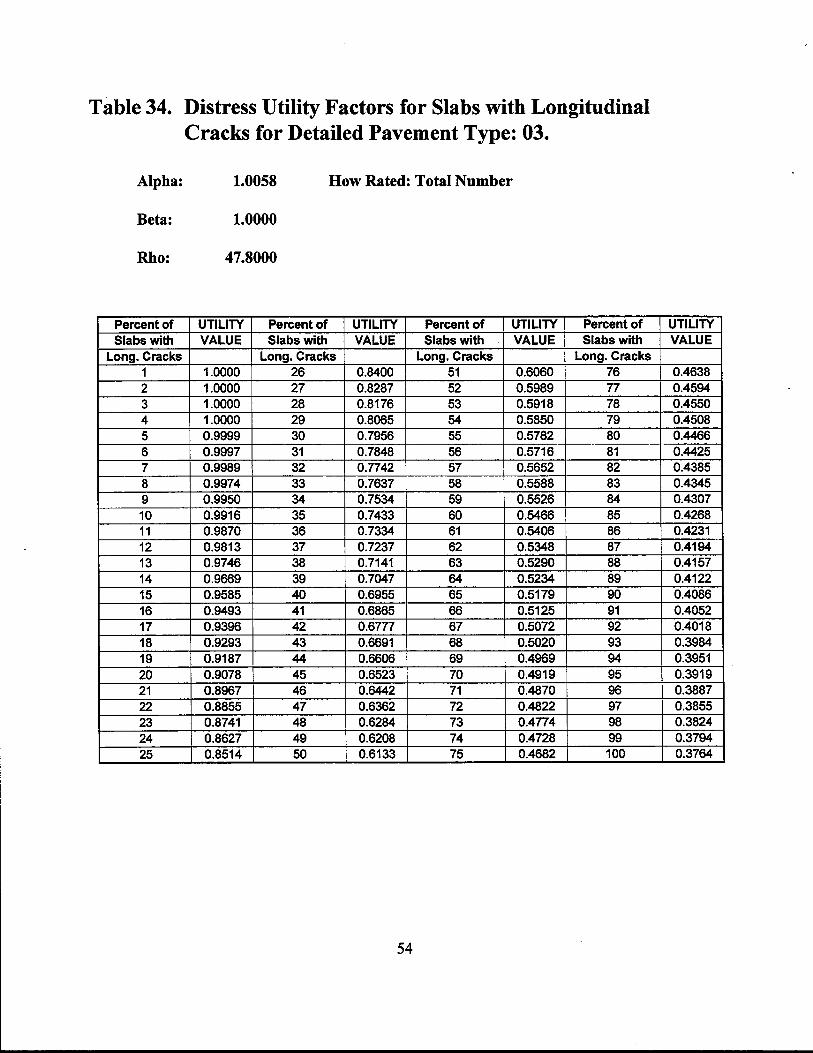
Table 34. Distress Utility Factors for Slabs with Longitudinal Cracks for Detailed Pavement Type: 03.
Alpha: 1.0058 How Rated: Total Number
Beta: 1.0000
Rho: 47.8000
Percent of UTILITY Percent of UTILITY Percent of UTILITY Percent of Slabs with VALUE Slabs with VALUE Slabs with VALUE Slabs with
Long. Cracks Long. Cracks Long. Cracks Long. Cracks 1 1.0000 26 0.8400 51 0.6060 76 2 1.0000 27 0.8287 52 0.5989 77 3 1.0000 28 0.8176 53 0.5918 78 4 1.0000 29 0.8065 54 0.5850 79 5 0.9999 30 0.7956 55 0.5782 80 6 0.9997 31 0.7848 56 0.5716 81 7 0.9989 32 0.7742 57 0.5652 82 8 0.9974 33 0.7637 58 0.5588 83 9 0.9950 34 0.7534 59 0.5526 84 10 0.9916 35 0.7433 60 0.5466 85 11 0.9870 36 0.7334 61 0.5406 86 12 0.9813 37 0.7237 62 0.5348 87 13 0.9746 38 0.7141 63 0.5290 88 14 0.9669 39 0.7047 64 0.5234 89 15 0.9585 40 0.6955 65 0.5179 90 16 0.9493 41 0.6865 66 0.5125 91 17 0.9396 42 0.6777 67 0.5072 92 18 0.9293 43 0.6691 68 0.5020 93 19 0.9187 44 0.6606 69 0.4969 94 20 0.9078 45 0.6523 70 0.4919 95 21 0.8967 46 0.6442 71 0.4870 96 22 0.8855 47 0.6362 72 0.4822 97 23 0.8741 48 0.6284 73 0.4774 98 24 0.8627 49 0.6208 74 0.4728 99 25 0.8514 50 0.6133 75 0.4682 100
54
UTILITY VALUE
0.4638 0.4594 0.4550 0.4508 0.4466 0.4425 0.4385 0.4345 0.4307 0.4268 0.4231 0.4194 0.4157 0.4122 0.4086 0.4052 0.4018 0.3984 0.3951 0.3919 0.3887 0.3855 0.3824 0.3794 0.3764
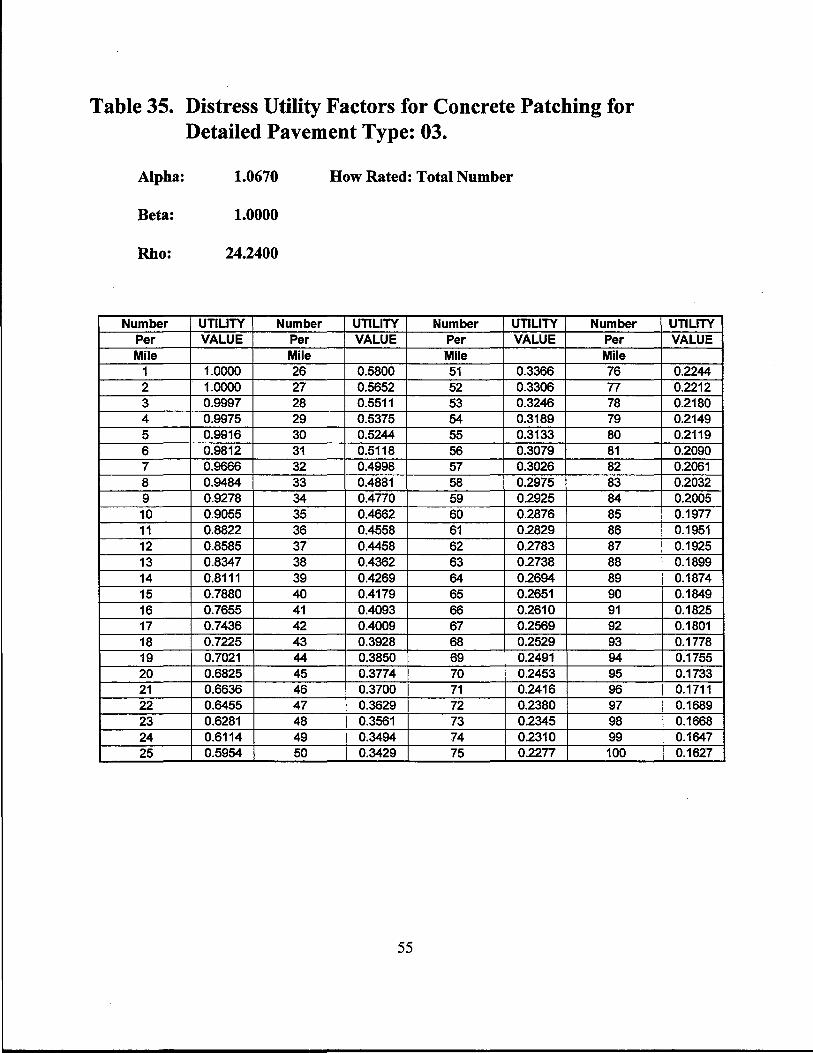
Table 35. Distress Utility Factors for Concrete Patching for Detailed Pavement Type: 03.
Alpha: 1.0670 How Rated: Total Number
Beta: 1.0000
Rho: 24.2400
Number UTILITY Number UTILITY Number UTILITY Number Per VALUE Per VALUE Per VALUE Per Mile Mile Mile Mile
1 1.0000 26 0.5800 51 0.3366 76 2 1.0000 27 0.5652 52 0.3306 77 3 0.9997 28 0.5511 53 0.3246 78 4 0.9975 29 0.5375 54 0.3189 79 5 0.9916 30 0.5244 55 0.3133 80 6 0.9812 31 0.5118 56 0.3079 81 7 0.9666 32 0.4998 57 0.3026 82 8 0.9484 33 0.4881 58 0.2975 83 9 0.9278 34 0.4770 59 0.2925 84 10 0.9055 35 0.4662 60 0.2876 85 11 0.8822 36 0.4558 61 0.2829 86 12 0.8585 37 0.4458 62 0.2783 87 13 0.8347 38 0.4362 63 0.2738 88 14 0.8111 39 0.4269 64 0.2694 89 15 0.7880 40 0.4179 65 0.2651 90 16 0.7655 41 0.4093 66 0.2610 91 17 0.7436 42 0.4009 67 0.2569 92 18 0.7225 43 0.3928 68 0.2529 93 19 0.7021 44 0.3850 69 0.2491 94 20 0.6825 45 0.3774 70 0.2453 95 21 0.6636 46 0.3700 71 0.2416 96 22 0.6455 47 0.3629 72 0.2380 97 23 0.6281 48 0.3561 73 0.2345 98 24 0.6114 49 0.3494 74 0.2310 99 25 0.5954 50 0.3429 75 0.2277 100
55
UTILITY VALUE
0.2244 0.2212 0.2180 0.2149 0.2119 0.2090 0.2061 0.2032 0.2005 0.1977 0.1951 0.1925 0.1899 0.1874 0.1849 0.1825 0.1801 0.1778 0.1755 0.1733 0.1711 0.1689 0.1668 0.1647 0.1627

Table 36. Distress Utility Factors for Shallow Rutting for Detailed Pavement Type: 04.
Alpha: 0.3100 How Rated: Percent ofwheelpath length
Beta: 1.0000
Rho: 19. 7200
Percent of UTILITY Percent of UTILITY Percent of UTILITY Percent of UTILITY Wheel path VALUE Wheel path VALUE Wheel path VALUE Wheel path VALUE
Length Length Length Length 1 1.0000 26 0.8548 51 0.7894 76 0.7608 2 1.0000 27 0.8507 52 0.7878 77 0.7600 3 0.9996 28 0.8467 53 0.7863 78 0.7593 4 0.9978 29 0.8429 54 0.7848 79 0.7585 5 0.9940 30 0.8393 55 0.7834 80 0.7577 6 0.9884 31 0.8359 56 0.7820 81 0.7570 7 0.9815 32 0.8326 57 0.7807 82 0.7563 8 0.9736 33 0.8295 58 0.7794 83 0.7556 9 0.9653 34 0.8264 59 0.7781 84 0.7549 10 0.9569 35 0.8235 60 0.7768 85 0.7542 11 0.9484 36 0.8207 61 0.7756 86 0.7535 12 0.9401 37 0.8181 62 0.7745 87 0.7529 13 0.9320 38 0.8155 63 0.7733 88 0.7522 14 0.9242 39 0.8130 64 0.7722 89 0.7516 15 0.9167 40 0.8107 65 0.7711 90 0.7510 16 0.9096 41 0.8084 66 0.7701 91 0.7504 17 0.9028 42 0.8062 67 0.7690 92 0.7498 18 0.8964 43 0.8040 68 0.7680 93 0.7492 19 0.8902 44 0.8020 69 0.7671 94 0.7487 20 0.8843 45 0.8000 70 0.7661 95 0.7481 21 0.8788 46 0.7981 71 0.7652 96 0.7476 22 0.8735 47 0.7962 72 0.7643 97 0.7470 23 0.8685 48 0.7944 73 0.7634 98 0.7465 24 0.8637 49 0.7927 74 0.7625 99 0.7460 25 0.8591 50 0.7910 75 0.7617 100 0.7455
56

Table 37. Distress Utility Factors for Deep Rutting for Detailed Pavement Type: 04.
Alpha: 0.6900 How Rated: Percent of wheelpath length
Betai 1.0000
Rho: 16.2700
Percent of UTILITY Percent of UTILITY Percent of UTILITY Percent of Wheel path VALUE Wheel path VALUE Wheel path VALUE Wheel path
Length Length Length Length 1 1.0000 26 0.6310 51 0.4985 76 2 0.9998 27 0.6223 52 0.4954 77 3 0.9970 28 0.6141 53 0.4924 78 4 0.9882 29 0.6063 54 0.4895 79 5 0.9734 30 0.5988 55 0.4867 80 6 0.9542 31 0.5918 56 0.4840 81 7 0.9325 32 0.5850 57 0.4813 82 8 0.9097 33 0.5786 58 0.4788 83 9 0.8868 34 0.5724 59 0.4763 84 10 0.8644 35 0.5665 60 0.4739 85 11 0.8428 36 0.5609 61 0.4715 86 12 0.8222 37 0.5555 62 0.4693 87 13 0.8026 38 0.5503 63 0.4670 88 14 0.7842 39 0.5454 64 0.4649 89 15 0.7668 40 0.5406 65 0.4628 90 16 0.7504 41 0.5360 66 0.4608 91 17 0.7350 42 0.5316 67 0.4588 92 18 0.7206 43 0.5274 68 0.4568 93 19 0.7069 44 0.5233 69 0.4549 94 20 0.6941 45 0.5194 70 0.4531 95 21 0.6820 46 0.5156 71 0.4513 96 22 0.6706 47 0.5119 72 0.4496 97 23 0.6599 48 0.5084 73 0.4479 98 24 0.6497 49 0.5050 74 0.4462 99 25 0.6401 50 0.5017 75 0.4446 100
57
UTILITY VALUE
0.4430 0.4414 0.4399 0.4384 0.4370 0.4356 0.4342 0.4328 0.4315 0.4302 0.4289 0.4277 0.4265 0.4253 0.4241 0.4230 0.4218 0.4207 0.4197 0.4186 0.4176 0.4165 0.4156 0.4146 0.4136

Table 38. Distress Utility Factors for Patching for Detailed Pavement Type: 04.
Alpha: 0.4500 How Rated: Percent of lane area
Beta: 1.0000
Rho: 10.1500
Percent of UTILITY Percent of UTILITY Percent of UTILITY Percent of Lane VALUE Lane VALUE Lane VALUE Lane
·Area Area Area Area 1 1.0000 26 0.6954 51 0.6312 76 2 0.9972 27 0.6910 52 0.6298 77 3 0.9847 28 0.6868 53 0.6284 78 4 0.9644 29 0.6829 54 0.6271 79 5 0.9409 30 0.6792 55 0.6258 80 6 0.9171 31 0.6756 56 0.6246 81 7 0.8944 32 0.6723 57 0.6234 82 8 0.8735 33 0.6691 58 0.6222 83 9 0.8543 34 0.6661 59 0.6211 84 10 0.8369 35 0.6633 60 0.6200 85 11 0.8212 36 0.6606 61 0.6190 86 12 0.8069 37 0.6580 62 0.6180 87 13 0.7939 38 0.6555 63 0.6170 88 14 0.7821 39 0.6531 64 0.6160 89 15 0.7713 40 0.6509 65 0.6151 90 16 0.7614 41 0.6487 66 0.6141 91 17 0.7523 42 0.6466 67 0.6133 92 18 0.7440 43 0.6446 68 0.6124 93 19 0.7362 44 0.6427 69 0.6116 94 20 0.7291 45 0.6409 70 0.6107 95 21 0.7225 46 0.6391 71 0.6099 96 22 0.7163 47 0.6374 72 0.6092 97 23 0.7106 48 0.6358 73 0.6084 98 24 0.7052 49 0.6342 74 0.6077 99 25 0.7002 50 0.6327 75 0.6070 100
58
UTILITY VALUE
0.6063 0.6056 0.6049 0.6043 0.6036 0.6030 0.6024 0.6018 0.6012 0.6007 0.6001 0.5996 0.5990 0.5985 0.5980 0.5975 0.5970 0.5965 0.5961 0.5956 0.5951 0.5947 0.5943 0.5939 0.5934
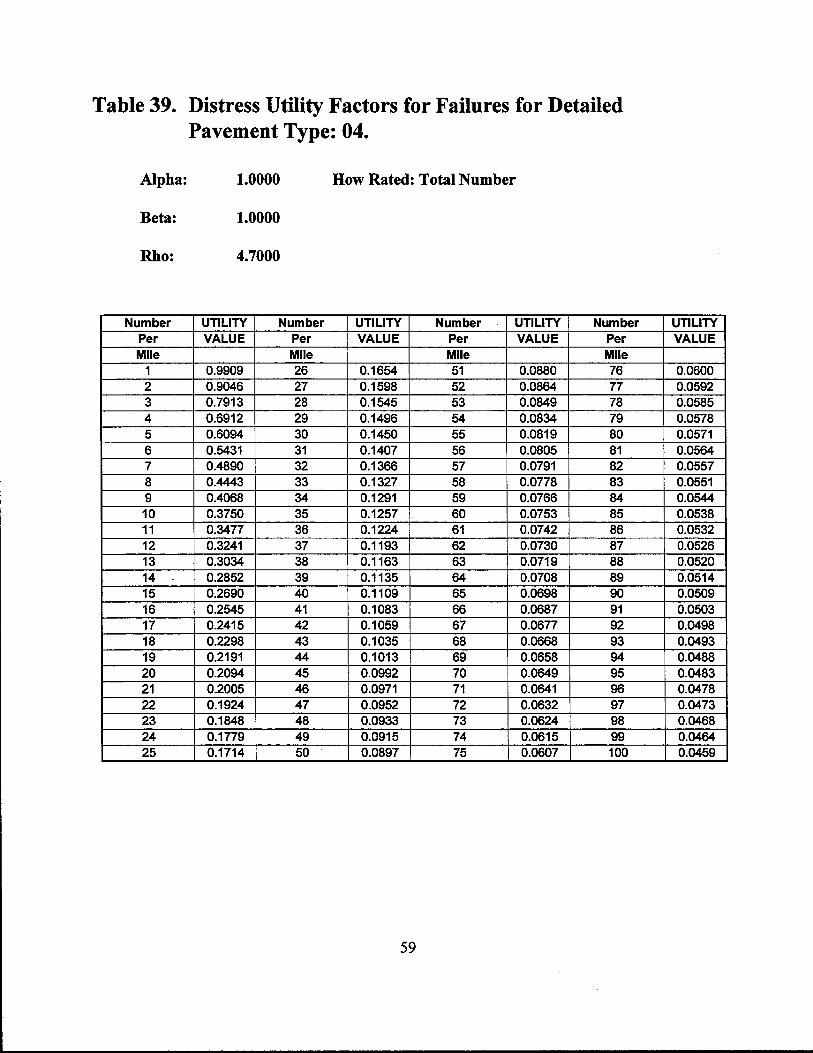
Table 39. Distress Utility Factors for Failures for Detailed Pavement Type: 04.
Alpha: 1.0000 How Rated: Total Number
Beta: 1.0000
Rho: 4.7000
Number UTILITY Number UTILITY Number UTILITY Number Per VALUE Per VALUE Per VALUE Per Mile Mile Mile Mile
1 0.9909 26 0.1654 51 0.0880 76 2 0.9046 27 0.1598 52 0.0864 77 3 0.7913 28 0.1545 53 0.0849 78 4 0.6912 29 0.1496 54 0.0834 79 5 0.6094 30 0.1450 55 0.0819 80 6 0.5431 31 0.1407 56 0.0805 81 7 0.4890 32 0.1366 57 0.0791 82 8 0.4443 33 0.1327 58 0.0778 83 9 0.4068 34 0.1291 59 0.0766 84 10 0.3750 35 0.1257 60 0.0753 85 11 0.3477 36 0.1224 61 0.0742 86 12 0.3241 37 0.1193 62 0.0730 87 13 0.3034 38 0.1163 63 0.0719 88 14 0.2852 39 0.1135 64 0.0708 89 15 0.2690 40 0.1109 65 0.0698 90 16 0.2545 41 0.1083 66 0.0687 91 17 0.2415 42 0.1059 67 0.0677 92 18 0.2298 43 0.1035 68 0.0668 93 19 0.2191 44 0.1013 69 0.0658 94 20 0.2094 45 0.0992 70 0.0649 95 21 0.2005 46 0.0971 71 0.0641 96 22 0.1924 47 0.0952 72 0.0632 97 23 0.1848 48 0.0933 73 0.0624 98 24 0.1779 49 0.0915 74 0.0615 99 25 0.1714 50 0.0897 75 0.0607 100
59
UTILITY VALUE
0.0600 0.0592 0.0585 0.0578 0.0571 0.0564 0.0557 0.0551 0.0544 0.0538 0.0532 0.0526 0.0520 0.0514 0.0509 0.0503 0.0498 0.0493 0.0488 0.0483 0.0478 0.0473 0.0468 0.0464 0.0459

Table 40. Distress Utility Factors for Block Cracking for Detailed Pavement Type: 04.
Alpha: 0.4900 How Rated: Percent of lane area
Beta: 1.0000
Rho: 9.7800
Percent of UTILITY Percent of UTILITY Percent of UTILITY Percent of UTILITY Lane VALUE Lane VALUE Lane VALUE Lane VALUE Area Area Area Area
1 1.0000 26 0.6636 51 0.5955 76 0.5692 2 0.9963 27 0.6589 52 0.5940 77 0.5684 3 0.9812 28 0.6545 53 0.5926 78 0.5677 4 0.9575 29 0.6503 54 0.5912 79 0.5671 5 0.9307 30 0.6463 55 0.5898 80 0.5664 6 0.9040 31 0.6426 56 0.5885 81 0.5657 7 0.8788 32 0.6390 57 0.5873 82 0.5651 8 0.8557 33 0.6357 58 0.5860 83 0.5645 9 0.8347 34 0.6325 59 0.5848 84 0.5639 10 0.8157 35 0.6295 60 0.5837 85 0.5633 11 0.7986 36 0.6266 61 0.5826 86 0.5627 12 0.7831 37 0.6238 62 0.5815 87 0.5621 13 0.7691 38 0.6212 63 0.5805 88 0.5615 14 0.7563 39 0.6187 64 0.5794 89 0.5610 15 0.7447 40 0.6163 65 0.5784 90 0.5605 16 0.7341 41 0.6140 66 0.5775 91 0.5599 17 0.7244 42 0.6118 67 0.5766 92 0.5594 18 0.7154 43 0.6097 68 0.5756 93 0.5589 19 0.7071 44 0.6077 69 0.5748 94 0.5584 20 0.6995 45 0.6057 70 0.5739 95 0.5579 21 0.6924 46 0.6038 71 0.5731 96 0.5575 22 0.6859 47 0.6021 72 0.5722 97 0.5570 23 0.6797 48 0.6003 73 0.5714 98 0.5565 24 0.6740 49 0.5987 74 0.5707 99 0.5561 25 0.6686 50 0.5971 75 0.5699 100 0.5557
60

Table 41. Distress Utility Factors for Alligator Cracking for Detailed Pavement Type: 04.
Alpha: 0.5300 How Rated: Percent'bf wheelpath length
Beta: 1.0000
Rho: 8.0100
Percent of UTILITY Percent of UTILITY Percent of UTILITY Percent of Wheel path VALUE Wheel path VALUE Wheel path VALUE Wheel path
Length Length Length Length 1 0.9998 26 0.6105 51 0.5470 76 2 0.9903 27 0.6061 52 0.5457 77 3 0.9633 28 0.6019 53 0.5443 78 4 0.9285 29 0.5979 54 0.5431 79 5 0.8932 30 0.5942 55 0.5418 80 6 0.8605 31 0.5907 56 0.5406 81 7 0.8312 32 0.5874 57 0.5395 82 8 0.8053 33 0.5842 58 0.5384 83 9 0.7824 34 0.5812 59 0.5373 84 10 0.7621 35 0.5784 60 0.5362 85 11 0.7441 36 0.5757 61 0.5352 86 12 0.7281 37 0.5732 62 0.5342 87 13 0.7138 38 0.5707 63 0.5333 88 14 0.7009 39 0.5684 64 0.5323 89 15 0.6893 40 0.5662 65 0.5314 90 16 0.6787 41 0.5641 66 0.5306 91 17 0.6691 42 0.5620 67 0.5297 92 18 0.6604 43 0.5601 68 0.5289 93 19 0.6523 44 0.5582 69 0.5281 94 20 0.6449 45 0.5564 70 0.5273 95 21 0.6381 46 0.5547 71 0.5265 96 22 0.6317 47 0.5530 72 0.5258 97 23 0.6259 48 0.5515 73 0.5251 98 24 0.6204 49 0.5499 74 0.5244 99 25 0.6153 50 0.5485 75 0.5237 100
61
UTILITY VALUE
0.5230 0.5224 0.5217 0.5211 0.5205 0.5199 0.5193 0.5188 0.5182 0.5177 0.5171 0.5166 0.5161 0.5156 0.5151 0.5147 0.5142 0.5137 0.5133 0.5129 0.5124 0.5120 0.5116 0.5112 0.5108

Table 42. Distress Utility Factors for Longitudinal Cracking for Detailed Pavement Type: 04.
Alpha: 0.8700 How Rated: Length per 100' station
Beta: 1.0000
Rho: 184.0000
Length UTILITY Length UTILITY Length UTILITY Length UTILITY Per VALUE Per VALUE Per VALUE Per VALUE
Station Station Station Station 5 1.0000 130 0.7887 255 0.5772 380 0.4639 10 1.0000 135 0.7774 260 0.5713 385 0.4605 15 1.0000 140 0.7663 265 0.5655 390 0.4572 20 0.9999 145 0.7554 270 0.5599 395 0.4540 25 0.9994 150 0.7449 275 0.5544 400 0.4508 30 0.9981 155 0.7346 280 0.5491 405 0.4477 35 0.9955 160 0.7245 285 0.5438 410 0.4446 40 0.9913 165 0.7148 290 0.5387 415 0.4416 45 0.9854 170 0.7052 295 0.5337 420 0.4386 50 0.9781 175 0.6960 300 0.5289 425 0.4357 55 0.9693 180 0.6870 305 0.5241 430 0.4329 60 0.9595 185 0.6782 310 0.5194 435 0.4301 65 0.9487 190 0.6697 315 0.5149 440 0.4273 70 0.9372 195 0.6614 320 0.5104 445 0.4246 75 0.9252 200 0.6533 325 0.5061 450 0.4220 80 0.9128 205 0.6454 330 0.5018 455 0.4194 85 0.9001 210 0.6378 335 0.4977 460 0.4168 90 0.8874 215 0.6303 340 0.4936 465 0.4143 95 0.8746 220 0.6230 345 0.4896 470 0.4118 100 0.8618 225 0.6160 350 0.4857 475 0.4094 105 0.8492 230 0.6091 355 0.4819 480 0.4070 110 0.8367 235 0.6024 360 0.4781 485 0.4047 115 0.8244 240 0.5958 365 0.4745 490 0.4024 120 0.8122 245 0.5895 370 0.4709 495 0.4001 125 0.8004 250 0.5832 375 0.4674 500 0.3979
62

Table 43. Distress Utility Factors for Transverse Cracking for Detailed Pavement Type: 04.
Alpha: 0.6900 How Rated: Number per 100' station
Beta: 1.0000
Rho: 10.3900
Number UTILITY Number UTILITY Number UTILITY Number Per VALUE Per VALUE Per VALUE Per
Station Station Station Station 1 1.0000 26 0.5373 51 0.4372 76 2 0.9962 27 0.5304 52 0.4350 77 3 0.9784 28 0.5239 53 0.4328 78 4 0.9486 29 0.5178 54 0.4308 79 5 0.9136 30 0.5120 55 0.4288 80 6 0.8779 31 0.5065 56 0.4268 81 7 0.8436 32 0.5013 57 0.4250 82 8 0.8117 33 0.4964 58 0.4232 83 9 0.7825 34 0.4917 59 0.4214 84 10 0.7559 35 0.4872 60 0.4197 85 11 0.7317 36 0.4830 61 0.4181 86 12 0.7097 37 0.4789 62 0.4165 87 13 0.6897 38 0.4751 63 0.4149 88 14 0.6715 39 0.4714 64 0.4134 89 15 0.6548 40 0.4678 65 0.4119 90 16 0.6396 41 0.4645 66 0.4105 91 17 0.6255 42 0.4612 67 0.4091 92 18 0.6126 43 0.4581 68 0.4078 93 19 0.6006 44 0.4551 69 0.4065 94 20 0.5896 45 0.4523 70 0.4052 95 21 0.5793 46 0.4495 71 0.4039 96 22 0.5697 47 0.4469 72 0.4027 97 23 0.5608 48 0.4443 73 0.4015 98 24 0.5525 49 0.4418 74 0.4004 99 25 0.5446 50 0.4395 75 0.3993 100
63
UTILITY VALUE
0.0000 0.3971 0.3961 0.3950 0.3940 0.3931 0.3921 0.3912 0.3903 0.3894 0.3885 0.3877 0.3868 0.3860 0.3852 0.3845 0.3837 0.3829 0.3822 0.3815 0.3808 0.3801 0.3794 0.3787 0.3781

Table 44. Distress Utility Factors for Shallow Rutting for Detailed Pavement Type: 05.
Alpha: 0.3100 How Rated: Percent ofwheelpath length
Beta: 1.0000
Rho: 19.7200
Percent of UTILITY Percent of UTILITY Percent of UTILITY Percent of UTILITY Wheel path VALUE Wheel path VALUE Wheel path VALUE Wheel path VALUE
Length Length Length Length 1 1.0000 26 0.8548 51 0.7894 76 0.0000 2 1.0000 27 0.8507 52 0.7878 77 0.7600 3 0.9996 28 0.8467 53 0.7863 78 0.7593 4 0.9978 29 0.8429 54 0.7848 79 0.7585 5 0.9940 . 30 0.8393 55 0.7834 80 0.7577 6 0.9884 31 0.8359 56 0.7820 81 0.7570 7 0.9815 32 0.8326 57 0.7807 82 0.7563 8 0.9736 33 0.8295 58 0.7794 83 0.7556 9 0.9653 34 0.8264 59 0.7781 84 0.7549 10 0.9569 35 0.8235 60 0.7768 85 0.7542 11 0.9484 36 0.8207 61 0.7756 86 0.7535 12 0.9401 37 0.8181 62 0.7745 87 0.7529 13 0.9320 38 0.8155 63 0.7733 88 0.7522 14 0.9242 39 0.8130 64 0.7722 89 0.7516 15 0.9167 40 0.8107 65 0.7711 90 0.7510 16 0.9096 41 0.8084 66 0.7701 91 0.7504 17 0.9028 42 0.8062 67 0.7690 92 0.7498 18 0.8964 43 0.8040 68 0.7680 93 0.7492 19 0.8902 44 0.8020 69 0.7671 94 0.7487 20 0.8843 45 0.8000 70 0.7661 95 0.7481 21 0.8788 46 0.7981 71 0.7652 96 0.7476 22 0.8735 47 0.7962 72 0.7643 97 0.7470 23 0.8685 48 0.7944 73 0.7634 98 0.7465 24 0.8637 49 0.7927 74 0.7625 99 0.7460 25 0.8591 50 0.7910 75 0.7617 100 0.7455
64
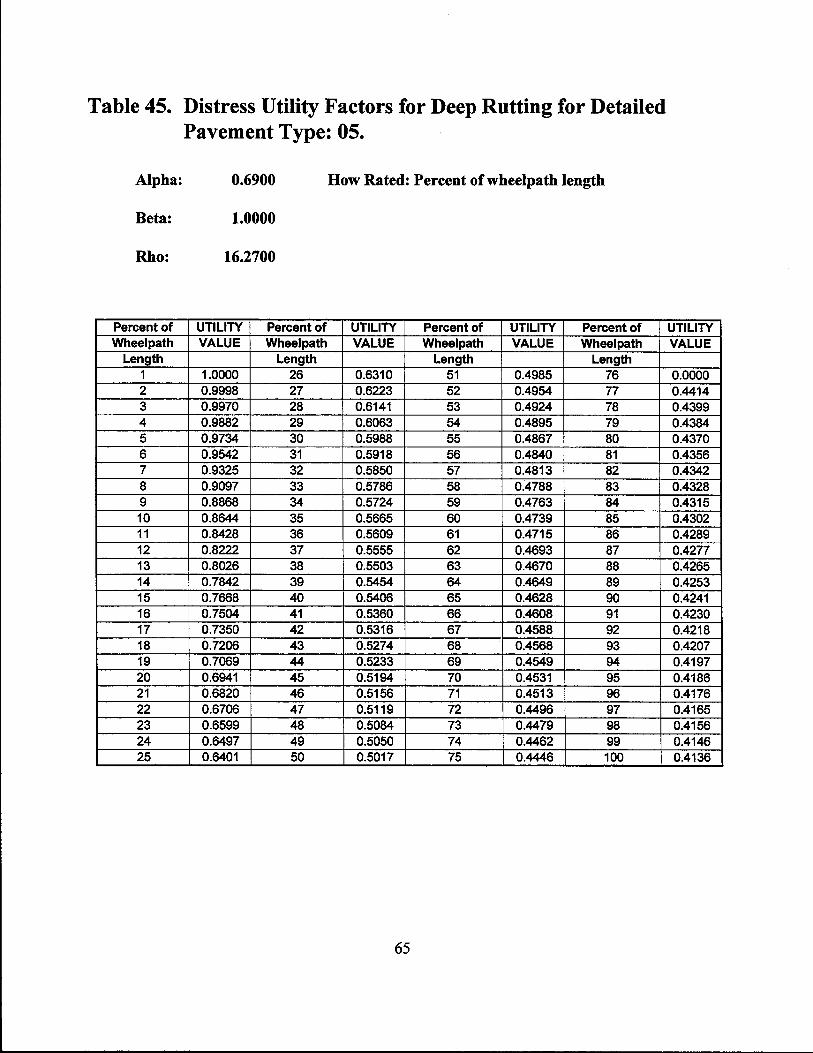
Table 45. Distress Utility Factors for Deep Rutting for Detailed Pavement Type: 05.
Alpha: 0.6900 How Rated: Percent of wheelpath length
Beta: 1.0000
Rho: 16.2700
Percent of UTILITY Percent of UTILITY Percent of UTILITY Percent of Wheel path VALUE Wheel path VALUE Wheelpath . VALUE Wheel path
Length Length Length Length 1 1.0000 26 0.6310 51 0.4985 76 2 0.9998 27 0.6223 52 0.4954 77 3 0.9970 28 0.6141 53 0.4924 78 4 0.9882 29 0.6063 54 0.4895 79 5 0.9734 30 0.5988 55 0.4867 80 6 0.9542 31 0.5918 56 0.4840 81 7 0.9325 32 0.5850 57 0.4813 82 8 0.9097 33 0.5786 58 0.4788 83 9 0.8868 34 0.5724 59 0.4763 84 10 0.8644 35 0.5665 60 0.4739 85 11 0.8428 36 0.5609 61 0.4715 86 12 0.8222 37 0.5555 62 0.4693 87 13 0.8026 38 0.5503 63 0.4670 88 14 0.7842 39 0.5454 64 0.4649 89 15 0.7668 40 0.5406 65 0.4628 90 16 0.7504 41 0.5360 66 0.4608 91 17 0.7350 42 0.5316 67 0.4588 92 18 0.7206 43 0.5274 68 0.4568 93 19 0.7069 44 0.5233 69 0.4549 94 20 0.6941 45 0.5194 70 0.4531 95 21 0.6820 46 0.5156 71 0.4513 96 22 0.6706 47 0.5119 72 0.4496 97 23 0.6599 48 0.5084 73 0.4479 98 24 0.6497 49 0.5050 74 0.4462 99 25 0.6401 50 0.5017 75 0.4446 100
65
UTILITY VALUE
0.0000 0.4414 0.4399 0.4384 0.4370 0.4356 0.4342 0.4328 0.4315 0.4302 0.4289 0.4277 0.4265 0.4253 0.4241 0.4230 0.4218 0.4207 0.4197 0.4186 0.4176 0.4165 0.4156 0.4146 0.4136

Table 46. Distress Utility Factors for Patching for Detailed Pavement Type: 05.
Alpha: 0.4500 How Rated: Percent of lane area
Beta: 1.0000
Rho: 10.1500
Percent of UTILITY Percent of UTILITY Percent of UTILITY Percent of Lane VALUE Lane VALUE Lane VALUE Lane Area Area Area Area
1 1.0000 26 0.6954 51 0.6312 76 2 0.9972 27 0.6910 52 0.6298 77 3 0.9847 28 0.6868 53 0.6284 78 4 0.9644 29 0.6829 54 0.6271 79 5 0.9409 30 0.6792 55 0.6258 80 6 0.9171 31 0.6756 56 0.6246 81 7 0.8944 32 0.6723 57 0.6234 82 8 0.8735 33 0.6691 58 0.6222 83 9 0.8543 34 0.6661 59 0.6211 84 10 0.8369 35 0.6633 60 0.6200 85 11 0.8212 36 0.6606 61 0.6190 86 12 0.8069 37 0.6580 62 0.6180 87 13 0.7939 38 0.6555 63 0.6170 88 14 0.7821 39 0.6531 64 0.6160 89 15 0.7713 40 0.6509 65 0.6151 90 . 16 0.7614 41 0.6487 66 0.6141 91 17 0.7523 42 0.6466 67 0.6133 92 18 0.7440 43 0.6446 68 0.6124 93 19 0.7362 44 0.6427 69 0.6116 94 20 0.7291 45 0.6409 70 0.6107 95 21 0.7225 46 0.6391 71 0.6099 96 22 0.7163 47 0.6374 72 0.6092 97 23 0.7106 48 0.6358 73 0.6084 98 24 0.7052 49 0.6342 74 0.6077 99 25 0.7002 50 0.6327 75 0.6070 100
66
UTILITY VALUE
0.0000 0.6056 0.6049 0.6043 0.6036 0.6030 0.6024 0.6018 0.6012 0.6007 0.6001 0.5996 0.5990 0.5985 0.5980 0.5975 0.5970 0.5965 0.5961 0.5956 0.5951 0.5947 0.5943 0.5939 0.5934

Table 47. Distress Utility Factors for Failures for Detailed Pavement Type: 05.
Alpha: 1.0000 How Rated: Total Number
Beta: 1.0000
Rho: 4.7000
Number UTILITY Number UTILITY Number UTILITY Number Per VALUE Per VALUE Per VALUE Per Mile Mile Mile Mile
1 0.9909 26 0.1654 51 0.0880 76 2 0.9046 27 0.1598 52 0.0864 77 3 0.7913 28 0.1545 53 0.0849 78 4 0.6912 29 0.1496 54 0.0834 79 5 0.6094 30 0.1450 55 0.0819 80 6 0.5431 31 0.1407 56 0.0805 81 7 0.4890 32 0.1366 57 0.0791 82 8 0.4443 33 0.1327 58 0.0778 83 9 0.4068 34 0.1291 59 0.0766 84 10 0.3750 35 0.1257 60 0.0753 85 11 0.3477 36 0.1224 61 0.0742 86 12 0.3241 37 0.1193 62 0.0730 87 13 0.3034 38 0.1163 63 0.0719 88 14 0.2852 39 0.1135 64 0.0708 89 15 0.2690 40 0.1109 65 0.0698 90 16 0.2545 41 0.1083 66 0.0687 91 17 0.2415 42 0.1059 67 0.0677 92 18 0.2298 43 0.1035 68 0.0668 93 19 0.2191 44 0.1013 69 0.0658 94 20 0.2094 45 0.0992 70 0.0649 95 21 0.2005 46 0.0971 71 0.0641 96 22 0.1924 47 0.0952 72 0.0632 97 23 0.1848 48 0.0933 73 0.0624 98 24 0.1779 49 0.0915 74 0.0615 99 25 0.1714 50 0.0897 75 0.0607 100
67
UTILITY VALUE
0.0000 0.0592 0.0585 0.0578 0.0571 0.0564 0.0557 0.0551 0.0544 0.0538 0.0532 0.0526 0.0520 0.0514 0.0509 0.0503 0.0498 0.0493 0.0488 0.0483 0.0478 0.0473 0.0468 0.0464 0.0459

Table 48. Distress Utility Factors for Block Cracking for Detailed Pavement Type: 05.
Alpha: 0.4900 How Rated: Percent of lane area
Beta: 1.0000
Rho: 9.7800
Percent of UTILITY Percent of UTILITY Percent of UTILITY Percent of UTILITY Lane VALUE Lane VALUE Lane VALUE Lane VALUE Area Area Area Area
1 1.0000 26 0.6636 51 0.5955 76 0.0000 2 0.9963 27 0.6589 52 0.5940 77 0.5684 3 0.9812 28 0.6545 53 0.5926 78 0.5677 4 0.9575 29 0.6503 54 0.5912 79 0.5671 5 0.9307 30 0.6463 55 0.5898 80 0.5664 6 0.9040 31 0.6426 56 0.5885 81 0.5657 7 0.8788 32 0.6390 57 0.5873 82 0.5651 8 0.8557 33 0.6357 58 0.5860 83 0.5645 9 0.8347 34 0.6325 59 0.5848 84 0.5639 10 0.8157 35 0.6295 60 0.5837 85 0.5633 11 0.7986 36 0.6266 61 0.5826 86 0.5627 12 0.7831 37 0.6238 62 0.5815 87 0.5621 13 0.7691 38 0.6212 63 0.5805 88 0.5615 14 0.7563 39 0.6187 64 0.5794 89 0.5610 15 0.7447 40 0.6163 65 0.5784 90 0.5605 16 0.7341 41 0.6140 66 0.5775 91 0.5599 17 0.7244 42 0.6118 67 0.5766 92 0.5594 18 0.7154 43 0.6097 68 0.5756 93 0.5589 19 0.7071 44 0.6077 69 0.5748 94 0.5584 20 0.6995 45 0.6057 70 0.5739 95 0.5579 21 0.6924 46 0.6038 71 0.5731 96 0.5575 22 0.6859 47 0.6021 72 0.5722 97 0.5570 23 0.6797 48 0.6003 73 0.5714 98 0.5565 24 0.6740 49 0.5987 74 0.5707 99 0.5561 25 0.6686 50 0.5971 75 0.5699 100 0.5557
68

Table 49. Distress Utility Factors for Alligator Cracking for Detailed Pavement Type: 05.
Alpha: 0.5300 How Rated: Percent ofwheelpath length
Beta: 1.0000
Rho: 8.0100
Percent of UTILITY Percent of UTILITY Percent of UTILITY Percent of Wheel path VALUE Wheel path VALUE Wheel path VALUE Wheel path
Length Length Length Length 1 0.9998 26 0.6105 51 0.5470 76 2 0.9903 27 0.6061 52 0.5457 77 3 0.9633 28 0.6019 53 0.5443 78 4 0.9285 29 0.5979 54 0.5431 79 5 0.8932 30 0.5942 55 0.5418 80 6 0.8605 31 0.5907 56 0.5406 81 7 0.8312 32 0.5874 57 0.5395 82 8 0.8053 33 0.5842 58 0.5384 83 9 0.7824 34 0.5812 59 0.5373 84 10 0.7621 35 0.5784 60 0.5362 85 11 0.7441 36 0.5757 61 0.5352 86 ' 12 0.7281 37 0.5732 62 0.5342 87 13 0.7138 38 0.5707 63 0.5333 88 14 0.7009 39 0.5684 64 0.5323 89 15 0.6893 40 0.5662 65 0.5314 90 16 0.6787 41 0.5641 66 0.5306 91 17 0.6691 42 0.5620 67 0.5297 92 18 0.6604 43 0.5601 68 0.5289 93 19 0.6523 44 0.5582 69 0.5281 94 20 0.6449 45 0.5564 70 0.5273 95 21 0.6381 46 0.5547 71 0.5265 96 22 0.6317 47 0.5530 72 0.5258 97 23 0.6259 48 0.5515 73 0.5251 98 24 0.6204 49 0.5499 74 0.5244 99 25 0.6153 50 0.5485 75 0.5237 100
69
UTILITY VALUE
0.0000 0.5224 0.5217 0.5211 0.5205 0.5199 0.5193 0.5188 0.5182 0.5177 0.5171 0.5166 0.5161 0.5156 0.5151 0.5147 0.5142 0.5137 0.5133 0.5129 0.5124 0.5120 0.5116 0.5112 0.5108

Table 50. Distress Utility Factors for Longitudinal Cracking for Detailed Pavement Type: 05.
Alpha: 0.8700 How Rated: Length per 100' station
Beta: 1.0000
Rho: 184.0000
Length UTILITY Length UTILITY Length UTILITY Length UTILITY Per VALUE Per VALUE Per VALUE Per VALUE
Station Station Station Station 5 1.0000 130 0.7887 255 0.5772 380 0.0000 10 1.0000 135 0.7774 260 0.5713 385 0.4605 15 1.0000 140 0.7663 265 0.5655 390 0.4572 20 0.9999 145 0.7554 270 0.5599 395 0.4540 25 0.9994 150 0.7449 275 0.5544 400 0.4508 30 0.9981 155 0.7346 280 0.5491 405 0.4477 35 0.9955 160 0.7245 285 0.5438 410 0.4446 40 0.9913 165 0.7148 290 0.5387 415 0.4416 45 0.9854 170 0.7052 295 0.5337 420 0.4386 50 0.9781 175 0.6960 300 0.5289 425 0.4357 55 0.9693 180 0.6870 305 0.5241 430 0.4329 60 0.9595 185 0.6782 310 0.5194 435 0.4301 65 0.9487 190 0.6697 315 0.5149 440 0.4273 70 0.9372 195 0.6614 320 0.5104 445 0.4246 75 0.9252 200 0.6533 325 0.5061 450 0.4220 80 0.9128 205 0.6454 330 0.5018 455 0.4194 85 0.9001 210 0.6378 335 0.4977 460 0.4168 90 0.8874 215 0.6303 340 0.4936 465 0.4143 95 0.8746 220 0.6230 345 0.4896 470 0.4118 100 0.8618 225 0.6160 350 0.4857 475 0.4094 105 0.8492 230 0.6091 355 0.4819 480 0.4070 110 0.8367 235 0.6024 360 0.4781 485 0.4047 115 0.8244 240 0.5958 365 0.4745 490 0.4024 120 0.8122 245 0.5895 370 0.4709 495 0.4001 125 0.8004 250 0.5832 375 0.4674 500 0.3979
70

Table 51. Distress Utility Factors for Transverse Cracking for Detailed Pavement Type: 05.
Alpha: 0.6900 How Rated: Number per 100' station
Beta·: 1.0000
Rho: 10.3900
Number UTILITY Number UTILITY Number UTILITY Number Per VALUE Per VALUE Per VALUE Per
Station Station Station Station 1 1.0000 26 0.5373 51 0.4372 76 2 0.9962 27 0.5304 52 0.4350 77 3 0.9784 28 0.5239 53 0.4328 78 4 0.9486 29 0.5178 54 0.4308 79 5 0.9136 30 0.5120 55 0.4288 80 6 0.8779 31 0.5065 56 0.4268 81 7 0.8436 32 0.5013 57 0.4250 82 8 0.8117 33 0.4964 58 0.4232 83 9 0.7825 34 0.4917 59 0.4214 84 10 0.7559 35 0.4872 60 0.4197 85 11 0.7317 36 0.4830 61 0.4181 86 12 0.7097 37 0.4789 62 0.4165 87 13 0.6897 38 0.4751 63 0.4149 88 14 0.6715 39 0.4714 64 0.4134 89 15 0.6548 40 0.4678 65 0.4119 90 16 0.6396 41 0.4645 66 0.4105 91 17 0.6255 42 0.4612 67 0.4091 92 18 0.6126 43 0.4581 68 0.4078 93 19 0.6006 44 0.4551 69 0.4065 94 20 0.5896 45 0.4523 70 0.4052 95 21 0.5793 46 0.4495 71 0.4039 96 22 0.5697 47 0.4469 72 0.4027 97 23 0.5608 48 0.4443 73 0.4015 98 24 0.5525 49 0.4418 74 0.4004 99 25 0.5446 50 0.4395 75 0.3993 100
71
UTILITY VALUE
0.0000 0.3971 0.3961 0.3950 0.3940 0.3931 0.3921 0.3912 0.3903 0.3894 0.3885 0.3877 0.3868 0.3860 0.3852 0.3845 0.3837 0.3829 0.3822 0.3815 0.3808 0.3801 0.3794 0.3787 0.3781
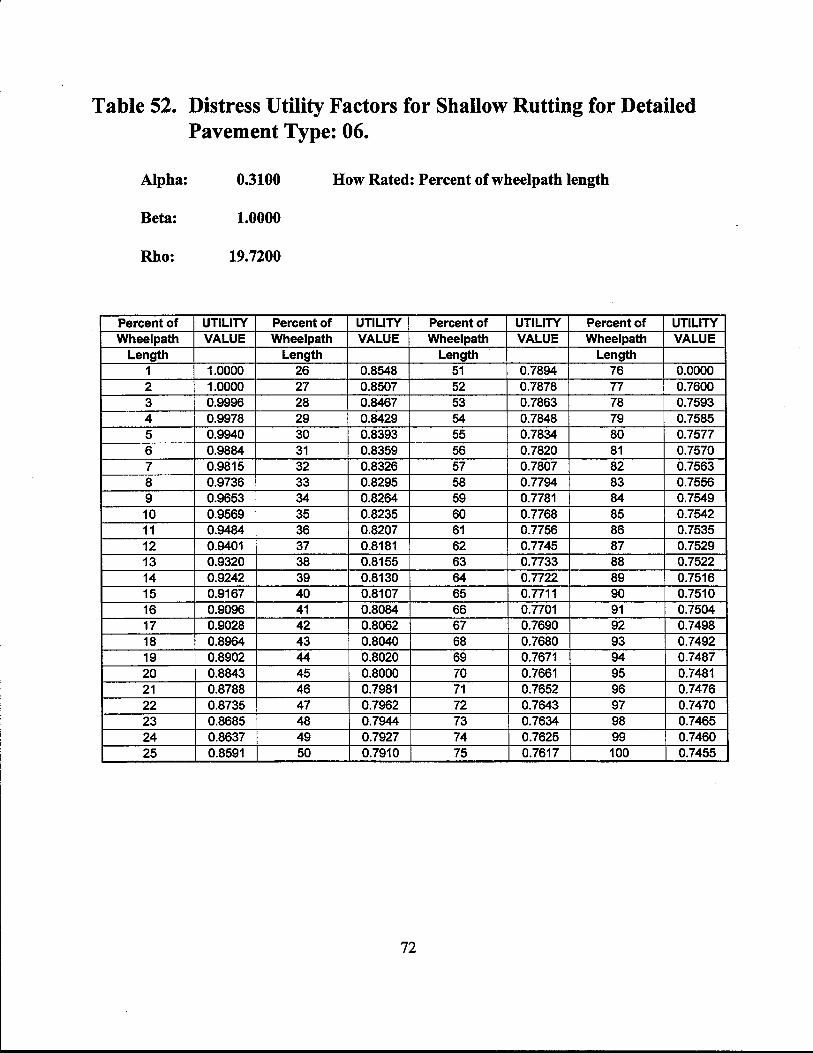
Table 52. Distress Utility Factors for Shallow Rutting for Detailed Pavement Type: 06.
Alpha: 0.3100 How Rated: Percent ofwheelpath length
Beta: 1.0000
Rho: 19. 7200
Percent of UTILITY Percent of UTILITY Percent of UTILITY Percent of UTILITY Wheel path VALUE Wheelpath VALUE Wheel path VALUE Wheel path VALUE
Length Length Length Length 1 1.0000 26 0.8548 51 0.7894 76 0.0000 2 1.0000 27 0.8507 52 0.7878 77 0.7600 3 0.9996 28 0.8467 53 0.7863 78 0.7593 4 0.9978 29 0.8429 54 0.7848 79 0.7585 5 0.9940 30 0.8393 55 0.7834 80 0.7577 6 0.9884 31 0.8359 56 0.7820 81 0.7570 7 0.9815 32 0.8326 57 0.7807 82 0.7563 8 0.9736 33 0.8295 58 0.7794 83 0.7556 9 0.9653 34 0.8264 59 0.7781 84 0.7549 10 0.9569 35 0.8235 60 0.7768 85 0.7542 11 0.9484 36 0.8207 61 0.7756 86 0.7535 12 0.9401 37 0.8181 62 0.7745 87 0.7529 13 0.9320 38 0.8155 63 0.7733 88 0.7522 14 0.9242 39 0.8130 64 0.7722 89 0.7516 15 0.9167 40 0.8107 65 0.7711 90 0.7510 16 0.9096 41 0.8084 66 0.7701 91 0.7504 17 0.9028 42 0.8062 67 0.7690 92 0.7498 18 0.8964 43 0.8040 68 0.7680 93 0.7492 19 0.8902 44 0.8020 69 0.7671 94 0.7487 20 0.8843 45 0.8000 70 0.7661 95 0.7481 21 0.8788 46 0.7981 71 0.7652 96 0.7476 22 0.8735 47 0.7962 72 0.7643 97 0.7470 23 0.8685 48 0.7944 73 0.7634 98 0.7465 24 0.8637 49 0.7927 74 0.7625 99 0.7460 25 0.8591 50 0.7910 75 0.7617 100 0.7455
72

Table 53. Distress Utility Factors for Deep Rutting for Detailed Pavement Type: 06.
Alpha: 0.6900 How Rated: Percent ofwheelpath length
Beta: 1.0000
Rho: 62. 7000
Percent of UTILITY Percent of UTILITY Percent of UTILITY Percent of Wheel path VALUE Wheel path VALUE Wheel path VALUE Wheel path
Length Length Length Length 1 1.0000 26 0.6310 51 0.4985 76 2 0.9998 27 0.6223 52 0.4954 77 3 0.9970 28 0.6141 53 0.4924 78 4 0.9882 29 0.6063 54 0.4895 79 5 0.9734 30 0.5988 55 0.4867 80 6 0.9542 31 0.5918 56 0.4840 81 7 0.9325 32 0.5850 57 0.4813 82 8 0.9097 33 0.5786 58 0.4788 83 9 0.8868 34 0.5724 59 0.4763 84 10 0.8644 35 0.5665 60 0.4739 85 11 0.8428 36 0.5609 61 0.4715 86 12 0.8222 37 0.5555 62 0.4693 87 13 0.8026 38 0.5503 63 0.4670 88 14 0.7842 39 0.5454 64 0.4649 89 15 0.7668 40 0.5406 65 0.4628 90 16 0.7504 41 0.5360 66 0.4608 91 17 0.7350 42 0.5316 67 0.4588 92 18 0.7206 43 0.5274 68 0.4568 93 19 0.7069 44 0.5233 69 0.4549 94 20 0.6941 45 0.5194 70 0.4531 95 21 0.6820 46 0.5156 71 0.4513 96 22 0.6706 47 0.5119 72 0.4496 97 23 0.6599 48 0.5084 73 0.4479 98 24 0.6497 49 0.5050 74 0.4462 99 25 0.6401 50 0.5017 75 0.4446 100
73
UTILITY VALUE
0.0000 0.4414 0.4399 0.4384 0.4370 0.4356 0.4342 0.4328 0.4315 0.4302 0.4289 0.4277 0.4265 0.4253 0.4241 0.4230 0.4218 0.4207 0.4197 0.4186 0.4176 0.4165 0.4156 0.4146 0.4136

Table 54. Distress Utility Factors for Patching for Detailed Pavement Type: 06.
Alpha: 0.4500 How Rated: Percent of lane area
Beta: 1.0000
Rho: 10.1500
Percent of UTILITY Percent of UTILITY Percent of UTILITY Percent of Lane VALUE Lane VALUE Lane VALUE Lane Area Area Area Area
1 1.0000 26 0.6954 51 0.6312 76 2 0.9972 27 0.6910 52 0.6298 77 3 0.9847 28 0.6868 53 0.6284 78 4 0.9644 29 0.6829 54 0.6271 79 5 0.9409 30 0.6792 55 0.6258 80 6 0.9171 31 0.6756 56 0.6246 81 7 0.8944 32 0.6723 57 0.6234 82 8 0.8735 33 0.6691 58 0.6222 83 9 0.8543 34 0.6661 59 0.6211 84 10 0.8369 35 0.6633 60 0.6200 85 11 0.8212 36 0.6606 61 0.6190 86 12 0.8069 37 0.6580 62 0.6180 87 13 0.7939 38 0.6555 63 0.6170 88 14 0.7821 39 0.6531 64 0.6160 89 15 0.7713 40 0.6509 65 0.6151 90 16 0.7614 41 0.6487 66 0.6141 91 17 0.7523 42 0.6466 67 0.6133 92 18 0.7440 43 0.6446 68 0.6124 93 19 0.7362 44 0.6427 69 0.6116 94 20 0.7291 45 0.6409 70 0.6107 95 21 0.7225 46 0.6391 71 0.6099 96 22 0.7163 47 0.6374 72 0.6092 97 23 0.7106 48 0.6358 73 0.6084 98 24 0.7052 49 0.6342 74 0.6077 99 25 0.7002 50 0.6327 75 0.6070 100
74
UTILITY VALUE
0.0000 0.6056 0.6049 0.6043 0.6036 0.6030 0.6024 0.6018 0.6012 0.6007 0.6001 0.5996 0.5990 0.5985 0.5980 0.5975 0.5970 0.5965 0.5961 0.5956 0.5951 0.5947 0.5943 0.5939 0.5934
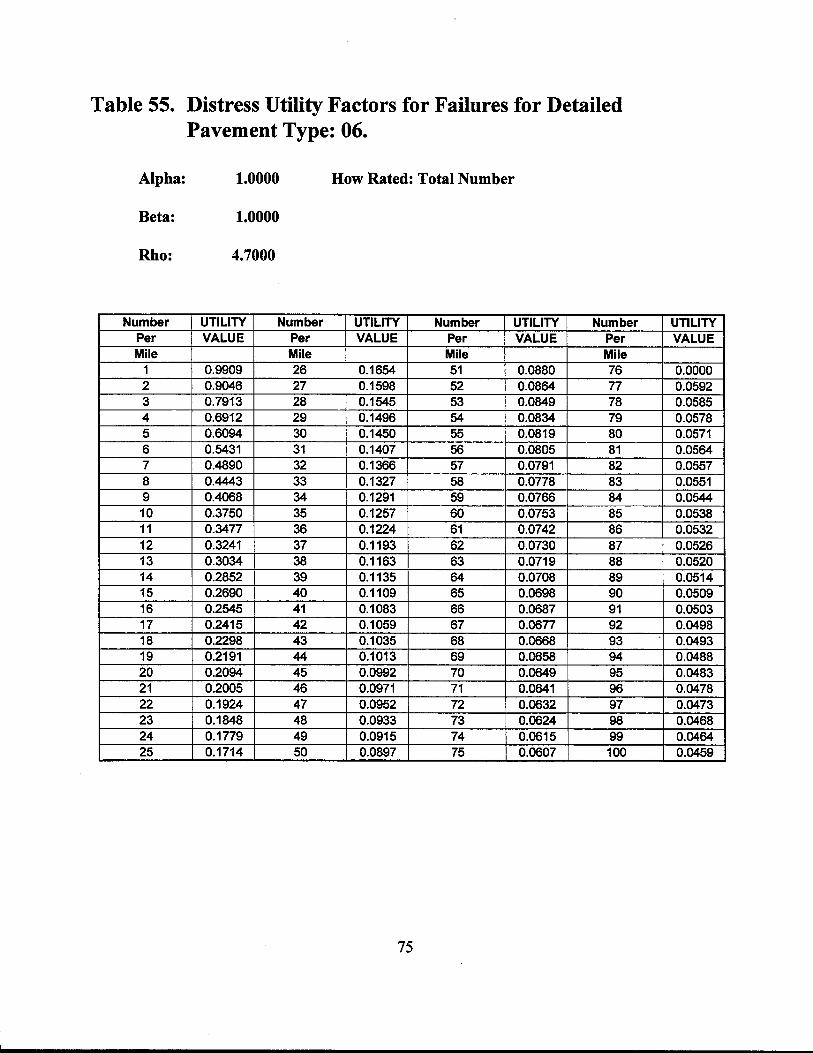
Table 55. Distress Utility Factors for Failures for Detailed Pavement Type: 06.
Alpha: 1.0000 How Rated: Total Number
Beta: 1.0000
Rho: 4.7000
Number UTILITY Number UTILITY Number UTILITY Number Per VALUE Per VALUE Per VALUE Per Mile Mile Mile Mile
1 0.9909 26 0.1654 51 0.0880 76 2 0.9046 27 0.1598 52 0.0864 77 3 0.7913 28 0.1545 53 0.0849 78 4 0.6912 29 0.1496 54 0.0834 79 5 0.6094 30 0.1450 55 0.0819 80 6 0.5431 31 0.1407 56 0.0805 81 7 0.4890 32 0.1366 57 0.0791 82 8 0.4443 33 0.1327 58 0.0778 83 9 0.4068 34 0.1291 59 0.0766 84 10 0.3750 35 0.1257 60 0.0753 85 11 0.3477 36 0.1224 61 0.0742 86 12 0.3241 37 0.1193 62 0.0730 87 13 0.3034 38 0.1163 63 0.0719 88 14 0.2852 39 0.1135 64 0.0708 89 15 0.2690 40 0.1109 65 0.0698 90 16 0.2545 41 0.1083 66 0.0687 91 17 0.2415 42 0.1059 67 0.0677 92 18 0.2298 43 0.1035 68 0.0668 93 19 0.2191 44 0.1013 69 0.0658 94 20 0.2094 45 0.0992 70 0.0649 95 21 0.2005 46 0.0971 71 0.0641 96 22 0.1924 47 0.0952 72 0.0632 97 23 0.1848 48 0.0933 73 0.0624 98 24 0.1779 49 0.0915 74 0.0615 99 25 0.1714 50 0.0897 75 0.0607 100
75
UTILITY VALUE
0.0000 0.0592 0.0585 0.0578 0.0571 0.0564 0.0557 0.0551 0.0544 0.0538 0.0532 0.0526 0.0520 0.0514 0.0509 0.0503 0.0498 0.0493 0.0488 0.0483 0.0478 0.0473 0.0468 0.0464 0.0459

Table 56. Distress Utility Factors for Block Cracking for Detailed Pavement Type: 06.
Alpha: 0.4900 How Rated: Percent of lane area
Beta: 1.0000
Rho: 9.7800
Percent of UTILITY Percent of UTILITY Percent of UTILITY Percent of UTILITY Lane VALUE Lane VALUE Lane VALUE Lane VALUE Area Area Area Area
1 1.0000 26 0.6636 51 0.5955 76 0.0000 2 0.9963 27 0.6589 52 0.5940 77 0.5684 3 0.9812 28 0.6545 53 0.5926 78 0.5677 4 0.9575 29 0.6503 54 0.5912 79 0.5671 5 0.9307 30 0.6463 55 0.5898 80 0.5664 6 0.9040 31 0.6426 56 0.5885 81 0.5657 7 0.8788 32 0.6390 57 0.5873 82 0.5651 8 0.8557 33 0.6357 58 0.5860 83 0.5645 9 0.8347 34 0.6325 59 0.5848 84 0.5639 10 0.8157 35 0.6295 60 0.5837 85 0.5633 11 0.7986 36 0.6266 61 0.5826 86 0.5627 12 0.7831 37 0.6238 62 0.5815 87 0.5621 13 0.7691 38 0.6212 63 0.5805 88 0.5615 14 0.7563 39 0.6187 64 0.5794 89 0.5610 15 0.7447 40 0.6163 65 0.5784 90 0.5605 16 0.7341 41 0.6140 66 0.5775 91 0.5599 17 0.7244 42 0.6118 67 0.5766 92 0.5594 18 0.7154 43 0.6097 68 0.5756 93 0.5589 19. 0.7071 44 0.6077 69 0.5748 94 0.5584 20 0.6995 45 0.6057 70 0.5739 95 0.5579 21 0.6924 46 0.6038 71 0.5731 96 0.5575 22 0.6859 47 0.6021 72 0.5722 97 0.5570 23 0.6797 48 0.6003 73 0.5714 98 0.5565 24 0.6740 49 0.5987 74 0.5707 99 0.5561 25 0.6686 50 0.5971 75 0.5699 100 0.5557
76

Table 57. Distress Utility Factors for Alligator Cracking for Detailed Pavement Type: 06.
Alpha: 0.5300 How Rated: Percent ofwheelpath length
Beta: 1.0000
Rho: 8.0100
Percent of UTILITY Percent of UTILITY Percent of UTILITY Percent of Wheel path VALUE Wheel path VALUE Wheel path VALUE Wheel path
Length Length Length Length 1 0.9998 26 0.6105 51 0.5470 76 2 0.9903 27 0.6061 52 0.5457 77 3 0.9633 28 0.6019 53 0.5443 78 4 0.9285 29 0.5979 54 0.5431 79 5 0.8932 30 0.5942 55 0.5418 80 6 0.8605 31 0.5907 56 0.5406 81 7 0.8312 32 0.5874 57 0.5395 82 8 0.8053 33 0.5842 58 0.5384 83 9 0.7824 34 0.5812 59 0.5373 84 10 0.7621 35 0.5784 60 0.5362 85 11 0.7441 36 0.5757 61 0.5352 86 12 0.7281 37 0.5732 62 0.5342 87 13 0.7138 38 0.5707 63 0.5333 88 14 0.7009 39 0.5684 64 0.5323 89 15 0.6893 40 0.5662 65 0.5314 90 16 0.6787 41 0.5641 66 0.5306 91 17 0.6691 42 0.5620 67 0.5297 92 18 0.6604 43 0.5601 68 0.5289 93 19 0.6523 44 0.5582 69 0.5281 94 20 0.6449 45 0.5564 70 0.5273 95 21 0.6381 46 0.5547 71 0.5265 96 22 0.6317 47 0.5530 72 0.5258 97 23 0.6259 48 0.5515 73 0.5251 98 24 0.6204 49 0.5499 74 0.5244 99 25 0.6153 50 0.5485 75 0.5237 100
77
UTILITY VALUE
0.0000 0.5224 0.5217 0.5211 0.5205 0.5199 0.5193 0.5188 0.5182 0.5177 0.5171 0.5166 0.5161 0.5156 0.5151 0.5147 0.5142 0.5137 0.5133 0.5129 0.5124 0.5120 0.5116 0.5112 0.5108

Table 58. Distress Utility Factors for Transverse Cracking for Detailed Pavement Type: 06.
Alpha: 0.6900 How Rated: Number per 100' station
Beta: 1.0000
Rho: 10.3900
Number UTILITY Number UTILITY Number UTILITY Number Per VALUE Per VALUE Per VALUE Per
Station Station Station Station 1 1.0000 26 0.5373 51 0.4372 76 2 0.9962 27 0.5304 52 0.4350 77 3 0.9784 28 0.5239 53 0.4328 78 4 0.9486 29 0.5178 54 0.4308 79 5 0.9136 30 0.5120 55 0.4288 80 6 0.8779 31 0.5065 56 0.4268 81 7 0.8436 32 0.5013 57 0.4250 82 8 0.8117 33 0.4964 58 0.4232 83 9 0.7825 34 0.4917 59 0.4214 84 10 0.7559 35 0.4872 60 0.4197 85 11 0.7317 36 0.4830 61 0.4181 86 12 0.7097 37 0.4789 62 0.4165 87 13 0.6897 38 0.4751 63 0.4149 88 14 0.6715 39 0.4714 64 0.4134 89 15 0.6548 40 0.4678 65 0.4119 90 16 0.6396 41 0.4645 66 0.4105 91 17 0.6255 42 0.4612 67 0.4091 92 18 0.6126 43 0.4581 68 0.4078 93 19 0.6006 44 0.4551 69 0.4065 94 20 0.5896 45 0.4523 70 0.4052 95 21 0.5793 46 0.4495 71 0.4039 96 22 0.5697 47 0.4469 72 0.4027 97 23 0.5608 48 0.4443 73 0.4015 98 24 0.5525 49 0.4418 74 0.4004 99 25 0.5446 50 0.4395 75 0.3993 100
78
UTILITY VALUE
0.0000 0.3971 0.3961 0.3950 0.3940 0.3931 0.3921 0.3912 0.3903 0.3894 0.3885 0.3877 0.3868 0.3860 0.3852 0.3845 0.3837 0.3829 0.3822 0.3815 0.3808 0.3801 0.3794 0.3787 0.3781

Table 59. Distress Utility Factors for Longitudinal Cracking for Detailed Pavement Type: 06.
Alpha: 0.8700 How Rated: Length per 100' station
Beta: 1.0000
Rho: 184.0000
Length UTILITY Length UTILITY Length. UTILITY Length UTILITY Per VALUE Per VALUE Per VALUE Per VALUE
Station Station Station Station 5 1.0000 130 0.7887 255 0.5772 380 0.0000 10 1.0000 135 0.7774 260 0.5713 385 0.4605 15 1.0000 140 0.7663 265 0.5655 390 0.4572 20 0.9999 145 0.7554 270 0.5599 395 0.4540 25 0.9994 150 0.7449 275 0.5544 400 0.4508 30 0.9981 155 0.7346 280 0.5491 405 0.4477 35 0.9955 160 0.7245 285 0.5438 410 0.4446 40 0.9913 165 0.7148 290 0.5387 415 0.4416 45 0.9854 170 0.7052 295 0.5337 420 0.4386 50 0.9781 175 0.6960 300 0.5289 425 0.4357 55 0.9693 180 0.6870 305 0.5241 430 0.4329 60 0.9595 185 0.6782 310 0.5194 435 0.4301 65 0.9487 190 0.6697 315 0.5149 440 0.4273 70 0.9372 195 0.6614 320 0.5104 445 0.4246 75 0.9252 200 0.6533 325 0.5061 450 0.4220 80 0.9128 205 0.6454 330 0.5018 455 0.4194 85 0.9001 210 0.6378 335 0.4977 460 0.4168 90 0.8874 215 0.6303 340 0.4936 465 0.4143 95 0.8746 220 0.6230 345 0.4896 470 0.4118 100 0.8618 225 0.6160 350 0.4857 475 0.4094 105 0.8492 230 0.6091 355 0.4819 480 0.4070 110 0.8367 235 0.6024 360 0.4781 485 0.4047 115 0.8244 240 0.5958 365 0.4745 490 0.4024 120 0.8122 245 0.5895 370 0.4709 495 0.4001 125 0.8004 250 0.5832 375 0.4674 500 0.3979
79

Table 60. Distress Utility Factors for Shallow Rutting for Detailed Pavement Type: 07.
Alpha: 0.2300 How Rated: Percent ofwheelpath length
Beta: 1.0000
Rho: 17.5500
Percent of UTILITY Percent of UTILITY Percent of UTILITY Percent of UTILITY Wheel path VALUE Wheel path VALUE Wheel path VALUE Wheel path VALUE
Length Length Length Length 1 1.0000 26 0.8829 51 0.8370 76 0.0000 2 1.0000 27 0.8799 52 0.8359 77 0.8169 3 0.9993 28 0.8771 53 0.8348 78 0.8163 4 0.9971 29 0.8744 54 0.8338 79 0.8158 5 0.9931 30 0.8719 55 0.8328 80 0.8153 6 0.9877 31 0.8694 56 0.8319 81 0.8148 7 0.9813 32 0.8671 57 0.8310 82 0.8143 8 0.9744 33 0.8649 58 0.8301 83 0.8138 9 0.9673 34 0.8627 59 0.8292 84 0.8134 10 0.9602 35 0.8607 60 0.8283 85 0.8129 11 0.9534 36 0.8587 61 0.8275 86 0.8125 12 0.9467 37 0.8569 62 0.8267 87 0.8120 13 0.9404 38 0.8551 63 0.8259 88 0.8116 14 0.9343 39 0.8533 64 0.8252 89 0.8112 15 0.9286 40 0.8517 65 0.8244 90 0.8107 16 0.9232 41 0.8501 66 0.8237 91 0.8103 17 0.9181 42 0.8486 67 0.8230 92 0.8099 18 0.9132 43 0.8471 68 0.8223 93 0.8096 19 0.9087 44 0.8457 69 0.8217 94 0.8092 20 0.9044 45 0.8443 70 0.8210 95 0.8088 21 0.9003 46 0.8430 71 0.8204 96 0.8084 22 0.8964 47 0.8417 72 0.8198 97 0.8081 23 0.8928 48 0.8404 73 0.8191 98 0.8077 24 0.8893 49 0.8392 74 0.8186 99 0.8074 25 0.8860 50 0.8381 75 0.8180 100 0.8070
80

Table 61. Distress Utility Factors for Deep Rutting for Detailed Pavement Type: 07.
Alpha: 0.3200 How Rated: Percent ofwheelpath length
Beta: 1.0000
Rho: 9.0400
Percent of UTILITY Percent of UTILITY Percent of UTILITY Percent of Wheel path VALUE Wheel path VALUE Wheel path VALUE Wheel path
Length Length Length Length 1 1.0000 26 0.7740 51 0.7320 76 2 0.9965 27 0.7710 52 0.7311 77 3 0.9843 28 0.7683 53 0.7302 78 4 0.9666 29 0.7657 54 0.7293 79 5 0.9475 30 0.7633 55 0.7285 80 6 0.9291 31 0.7609 56 0.7277 81 7 0.9120 32 0.7588 57 0.7269 82 8 0.8966 33 0.7567 58 0.7262 83 9 0.8828 34 0.7547 59 0.7255 84 10 0.8704 35 0.7528 60 0.7248 85 11 0.8593 36 0.7511 61 0.7241 86 12 0.8493 37 0.7494 62 0.7234 87 13 0.8404 38 0.7477 63 0.7228 88 14 0.8322 39 0.7462 64 0.7222 89 15 0.8248 40 0.7447 65 0.7215 90 16 0.8181 41 0.7433 66 0.7210 91 17 0.8120 42 0.7420 67 0.7204 92 18 0.8063 43 0.7407 68 0.7198 93 19 0.8012 44 0.7394 69 0.7193 94 20 0.7964 45 0.7382 70 0.7188 95 21 0.7919 46 0.7371 71 0.7183 96 22 0.7878 47 0.7360 72 0.7178 97 23 0.7840 48 0.7349 73 0.7173 98 24 0.7804 49 0.7339 74 0.7168 99 25 0.7771 50 0.7329 75 0.7163 100
81
UTILITY VALUE
0.0000 0.7154 0.7150 0.7146 0.7142 0.7138 0.7134 0.7130 0.7126 0.7123 0.7119 0.7116 0.7112 0.7109 0.7106 0.7103 0.7099 0.7096 0.7093 0.7090 0.7088 0.7085 0.7082 0.7079 0.7077

Table 62. Distress Utility Factors for Patching for Detailed Pavement Type: 07.
Alpha: 0.3200 How Rated: Percent of lane area
Beta: 1.0000
Rho: 17.2800
Percent of UTILITY Percent of UTILITY Percent of UTILITY Percent of Lane VALUE Lane VALUE Lane VALUE Lane Area Area Area Area
1 1.0000 26 0.8354 51 0.7720 76 2 0.9999 27 0.8313 52 0.7705 77 3 0.9990 28 0.8274 53 0.7690 78 4 0.9957 29 0.8237 54 0.7676 79 5 0.9899 30 0.8201 55 0.7663 80 6 0.9820 31 0.8167 56 0.7650 81 7 0.9729 32 0.8135 57 0.7637 82 8 0.9631 33 0.8104 58 0.7624 83 9 0.9531 34 0.8075 59 0.7612 84 10 0.9432 35 0.8047 60 0.7601 85 11 0.9335 36 0.8020 61 0.7589 86 12 0.9242 37 0.7994 62 0.7578 87 13 0.9153 38 0.7969 63 0.7568 88 14 0.9069 39 0.7945 64 0.7557 89 15 0.8989 40 0.7923 65 0.7547 90 16 0.8913 41 0.7901 66 0.7537 91 17 0.8842 42 0.7879 67 0.7527 92 18 0.8775 43 0.7859 68 0.7518 93 19 0.8711 44 0.7839 69 0.7509 94 20 0.8651 45 0.7820 70 0.7500 95 21 0.8595 46 0.7802 71 0.7491 96 22 0.8541 47 0.7784 72 0.7483 97 23 0.8490 48 0.7767 73 0.7475 98 24 0.8442 49 0.7751 74 0.7466 99 25 0.8397 50 0.7735 75 0.7459 100
82
UTILITY VALUE
0.0000 0.7443 0.7436 0.7429 0.7422 0.7415 0.7408 0.7401 0.7395 0.7389 0.7382 0.7376 0.7371 0.7365 0.7359 0.7353 0.7348 0.7343 0.7337 0.7332 0.7327 0.7322 0.7317 0.7313 0.7308

Table 63. Distress Utility Factors for Failures for Detailed Pavement Type: 07.
Alpha: 1.0000 How Rated: Total Number
Beta: 1.0000
Rho: 4.7000
Number UTILITY Number UTILITY Number UTILITY Number Per VALUE Per VALUE Per VALUE Per Mile Mile Mile Mile
1 0.9909 26 0.1654 51 0.0880 76 2 0.9046 27 0.1598 52 0.0864 77 3 0.7913 28 0.1545 53 0.0849 78 4 0.6912 29 0.1496 54 0.0834 79 5 0.6094 30 0.1450 55 0.0819 80 6 0.5431 31 0.1407 56 0.0805 81 7 0.4890 32 0.1366 57 0.0791 82 8 0.4443 33 0.1327 58 0.0778 83 9 0.4068 34 0.1291 59 0.0766 84 10 0.3750 35 0.1257 60 0.0753 85 11 0.3477 36 0.1224 61 0.0742 86 12 0.3241 37 0.1193 62 0.0730 87 13 0.3034 38 0.1163 63 0.0719 88 14 0.2852 39 0.1135 64 0.0708 89 15 0.2690 40 0.1109 65 0.0698 90 16 0.2545 41 0.1083 66 0.0687 91 17 0.2415 42 0.1059 67 0.0677 92 18 0.2298 43 0.1035 68 0.0668 93 19 0.2191 44 0.1013 69 0.0658 94 20 0.2094 45 0.0992 70 0.0649 95 21 0.2005 46 0.0971 71 0.0641 96 22 0.1924 47 0.0952 72 0.0632 97 23 0.1848 48 0.0933 73 0.0624 98 24 0.1779 49 0.0915 74 0.0615 99 25 0.1714 50 0.0897 75 0.0607 100
83
UTILITY VALUE
0.0000 0.0592 0.0585 0.0578 0.0571 0.0564 0.0557 0.0551 0.0544 0.0538 0.0532 0.0526 0.0520 0.0514 0.0509 0.0503 0.0498 0.0493 0.0488 0.0483 0.0478 0.0473 0.0468 0.0464 0.0459

Table 64. Distress Utility Factors for Block Cracking for Detailed Pavement Type: 07.
Alpha: 0.3100 How Rated: Percent of lane area
Beta: 1.0000
Rho: 13. 7900
Percent of UTILITY Percent of UTILITY Percent of UTILITY Percent of UTILITY Lane VALUE Lane VALUE Lane VALUE Lane VALUE Area Area Area Area
1 1.0000 26 0.8176 51 0.7634 76 0.0000 2 0.9997 27 0.8140 52 0.7622 77 0.7408 3 0.9969 28 0.8106 53 0.7610 78 0.7402 4 0.9901 29 0.8073 54 0.7599 79 0.7397 5 0.9803 30 0.8042 55 0.7587 80 0.7391 6 0.9689 31 0.8013 56 0.7577 81 0.7385 7 0.9568 32 0.7985 57 0.7566 82 0.7380 8 0.9447 33 0.7959 58 0.7556 83 0.7375 9 0.9330 34 0.7934 59 0.7546 84 0.7369 10 0.9219 35 0.7910 60 0.7537 85 0.7364 11 0.9115 36 0.7886 61 0.7527 86 0.7359 12 0.9018 37 0.7865 62 0.7518 87 0.7354 13 0.8927 38 0.7843 63 0.7509 88 0.7350 14 0.8842 39 0.7823 64 0.7501 89 0.7345 15 0.8764 40 0.7804 65 0.7493 90 0.7340 16 0.8691 41 0.7785 66 0.7485 91 0.7336 17 0.8623 42 0.7768 67 0.7477 92 0.7332 18 0.8559 43 0.7751 68 0.7469 93 0.7327 19 0.8500 44 0.7734 69 0.7462 94 0.7323 20 0.8444 45 0.7718 70 0.7454 95 0.7319 21 0.8392 46 0.7703 71 0.7447 96 0.7315 22 0.8344 47 0.7688 72 0.7440 97 0.7311 23 0.8298 48 0.7674 73 0.7434 98 0.7307 24 0.8255 49 0.7660 74 0.7427 99 0.7303 25 0.8214 50 0.7647 75 0.7421 100 0.7299
84
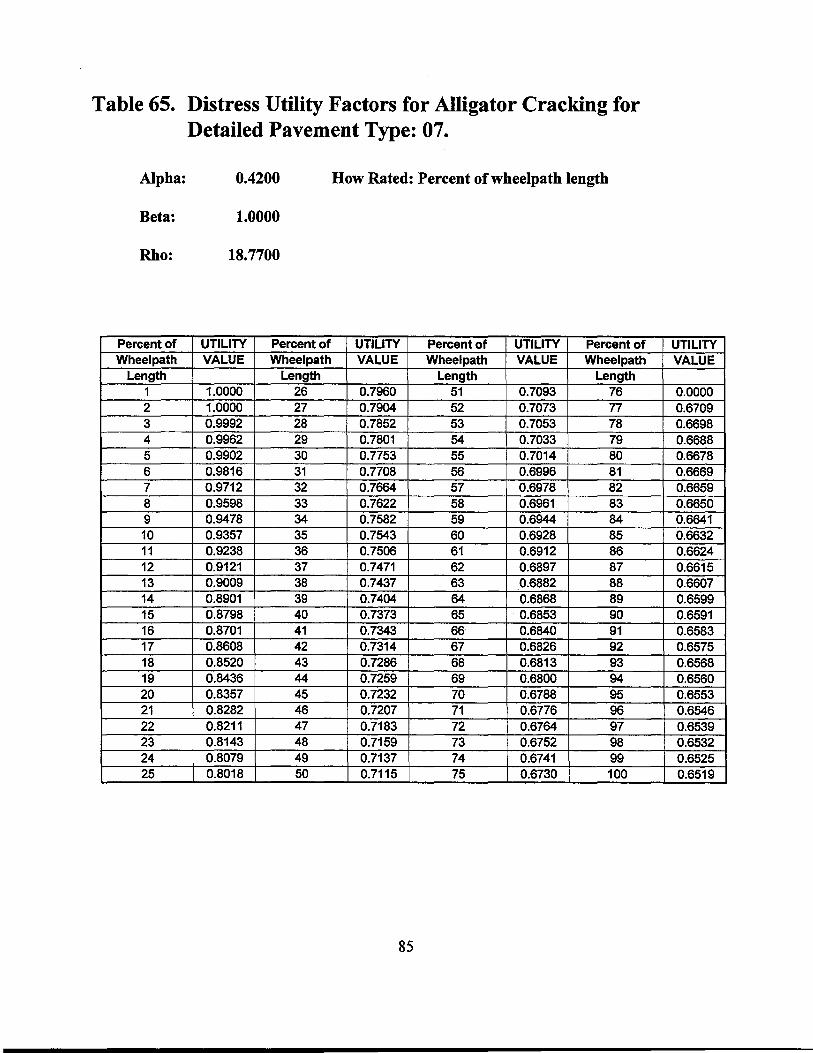
Table 65. Distress Utility Factors for Alligator Cracking for Detailed Pavement Type: 07.
Alpha: 0.4200 How Rated: Percent of wheelpath length
Beta: 1.0000
Rho: 18. 7700
Percent of UTILITY Percent of UTILITY Percent of UTILITY Percent of Wheel path VALUE Wheel path VALUE Wheel path VALUE Wheel path
Length Length Length Length 1 1.0000 26 0.7960 51 0.7093 76 2 1.0000 27 0.7904 52 0.7073 77 3 0.9992 28 0.7852 53 0.7053 78 4 0.9962 29 0.7801 54 0.7033 79 5 0.9902 30 0.7753 55 0.7014 80 6 0.9816 31 0.7708 56 0.6996 81 7 0.9712 32 0.7664 57 0.6978 82 8 0.9598 33 0.7622 58 0.6961 83 9 0.9478 34 0.7582 59 0.6944 84 10 0.9357 35 0.7543 60 0.6928 85 11 0.9238 36 0.7506 61 0.6912 86 12 0.9121 37 0.7471 62 0.6897 87 13 0.9009 38 0.7437 63 0.6882 88 14 0.8901 39 0.7404 64 0.6868 89 15 0.8798 40 0.7373 65 0.6853 90 16 0.8701 41 0.7343 66 0.6840 91 17 0.8608 42 0.7314 67 0.6826 92 18 0.8520 43 0.7286 68 0.6813 93 19 0.8436 44 0.7259 69 0.6800 94 20 0.8357 45 0.7232 70 0.6788 95 21 0.8282 46 0.7207 71 0.6776 96 22 0.8211 47 0.7183 72 0.6764 97 23 0.8143 48 0.7159 73 0.6752 98 24 0.8079 49 0.7137 74 0.6741 99 25 0.8018 50 0.7115 75 0.6730 100
85
UTILITY VALUE
0.0000 0.6709 0.6698 0.6688 0.6678 0.6669 0.6659 0.6650 0.6641 0.6632 0.6624 0.6615 0.6607 0.6599 0.6591 0.6583 0.6575 0.6568 0.6560 0.6553 0.6546 0.6539 0.6532 0.6525 0.6519

Table 66. Distress Utility Factors for Longitudinal Cracking for Detailed Pavement Type: 07.
Alpha: 0.3700 How Rated: Length per 100' station
Beta: 1.0000
Rho: 136.9000
Length UTILITY Length UTILITY Length UTILITY Length UTILITY Per VALUE Per VALUE Per VALUE Per VALUE
Station Station Station Station 5 1.0000 130 0.8709 255 0.7837 380 0.0000 10 1.0000 135 0.8658 260 0.7815 385 0.7407 15 1.0000 140 0.8608 265 0.7793 390 0.7395 20 0.9996 145 0.8561 270 0.7772 395 0.7384 25 0.9985 150 0.8515 275 0.7751 400 0.7372 30 0.9961 155 0.8470 280 0.7731 405 0.7361 35 0.9926 160 0.8427 285 0.7711 410 0.7350 40 0.9879 165 0.8386 290 0.7692 415 0.7340 45 0.9823 170 0.8346 295 0.7674 420 0.7329 50 0.9761 175 0.8308 300 0.7656 425 0.7319 55 0.9693 180 0.8271 305 0.7638 430 0.7309 60 0.9622 185 0.8235 310 0.7621 435 0.7299 65 0.9550 190 0.8200 315 0.7604 440 0.7289 70 0.9477 195 0.8166 320 0.7588 445 0.7280 75 0.9404 200 0.8134 325 0.7572 450 0.7271 80 0.9332 205 0.8103 330 0.7556 455 0.7261 85 0.9261 210 0.8072 335 0.7541 460 0.7252 90 0.9192 215 0.8043 340 0.7526 465 0.7244 95 0.9124 220 0.8014 345 0.7512 470 0.7235 100 0.9059 225 0.7986 350 0.7498 475 0.7226 105 0.8995 230 0.7960 355 0.7484 480 0.7218 110 0.8934 235 0.7934 360 0.7470 485 0.7210 115 0.8875 240 0.7908 365 0.7457 490 0.7202 120 0.8818 245 0.7884 370 0.7444 495 0.7194 125 0.8762 250 0.7860 375 0.7432 500 0.7186
86

Table 67. Distress Utility Factors for Transverse Cracking for Detailed Pavement Type: 07.
Alpha: 0.4300 How Rated: Number_per 100' station
Beta: 1.0000
Rho: 9.5600
Number UTILITY Number UTILITY Number UTILITY Number Per VALUE Per VALUE Per VALUE Per
Station Station Station Station 1 1.0000 26 0.7023 51 0.6435 76 2 0.9964 27 0.6982 52 0.6422 77 3 0.9822 28 0.6944 53 0.6410 78 4 0.9606 29 0.6908 54 0.6398 79 5 0.9365 30 0.6873 55 0.6386 80 6 0.9126 31 ' 0.6841 56 0.6375 81 7 0.8903 32 0.6810 57 0.6364 82 8 0.8698 33 0.6781 58 0.6353 83 9 0.8514 34 0.6754 59 0.6343 84 10 0.8347 35 0.6728 60 0.6333 85 11 0.8197 36 0.6703 61 0.6324 86 12 0.8061 37 0.6679 62 0.6314 87 13 0.7939 38 0.6656 63 0.6305 88 14 0.7828 39 0.6635 64 0.6297 89 15 0.7727 40 0.6614 65 0.6288 90 16 0.7634 41 0.6594 66 0.6280 91 17 0.7550 42 0.6575 67 0.6272 92 18 0.7472 43 0.6557 68 0.6264 93 19 0.7400 44 0.6540 69 0.6256 94 20 0.7334 45 0.6523 70 0.6249 95 21 0.7273 46 0.6507 71 0.6242 96 22 0.7215 47 0.6491 72 0.6235 97 23 0.7162 48 0.6477 73 0.6228 98 24 0.7113 49 0.6462 74 0.6221 99 25 0.7066 50 0.6448 75 0.6215 100
87
UTILITY VALUE
0.0000 0.6202 0.6196 0.6190 0.6184 0.6179 0.6173 0.6168 0.6163 0.6157 0.6152 0.6147 0.6143 0.6138 0.6133 0.6129 0.6124 0.6120 0.6116 0.6112 0.6108 0.6104 0.6100 0.6096 0.6092

Table 68. Distress Utility Factors for Shallow Rutting for Detailed Pavement Type: 08.
Alpha: 0.2300 How Rated: Percent ofwheelpath length
Beta: 1.0000
Rho: 17.5500
Percent of UTILITY Percent of UTILITY Percent of UTILITY Percent of UTILITY Wheel path VALUE Wheel path VALUE Wheel path VALUE Wheel path VALUE
Length Length Length Length 1 1.0000 26 0.8829 51 0.8370 76 0.0000 2 1.0000 27 0.8799 52 0.8359 77 0.8169 3 0.9993 28 0.8771 53 0.8348 78 0.8163 4 0.9971 29 0.8744 54 0.8338 79 0.8158 5 0.9931 30 0.8719 55 0.8328 80 0.8153 6 0.9877 31 0.8694 56 0.8319 81 0.8148 7 0.9813 32 0.8671 57 0.8310 82 0.8143 8 0.9744 33 0.8649 58 0.8301 83 0.8138 9 0.9673 34 0.8627 59 0.8292 84 0.8134 10 0.9602 35 0.8607 60 0.8283 85 0.8129 11 0.9534 36 0.8587 61 0.8275 86 0.8125 12 0.9467 37 0.8569 62 0.8267 87 0.8120 13 0.9404 38 0.8551 63 0.8259 88 0.8116 14 0.9343 39 0.8533 64 0.8252 89 0.8112 15 0.9286 40 0.8517 65 0.8244 90 0.8107 16 0.9232 41 0.8501 66 0.8237 91 0.8103 17 0.9181 42 0.8486 67 0.8230 92 0.8099 18 0.9132 43 0.8471 68 0.8223 93 0.8096 19 0.9087 44 0.8457 69 0.8217 94 0.8092 20 0.9044 45 0.8443 70 0.8210 95 0.8088 21 0.9003 46 0.8430 71 0.8204 96 0.8084 22 0.8964 47 0.8417 72 0.8198 97 0.8081 23 0.8928 48 0.8404 73 0.8191 98 0.8077 24 0.8893 49 0.8392 74 0.8186 99 0.8074 25 0.8860 50 0.8381 75 0.8180 100 0.8070
88

Table 69. Distress Utility Factors for Deep Rutting for Detailed Pavement Type: 08.
Alpha: 0.3200 How Rated: Percentage ofwheelpath length
Beta: 1.0000
Rho: 9.0400
Percent of UTILITY Percent of UTILITY Percent of UTILITY Percent of Wheel path VALUE Wheel path VALUE Wheel path VALUE Wheel path
Length Length Length Length 1 1.0000 26 0.7740 51 0.7320 76 2 0.9965 27 0.7710 52 0.7311 77 3 0.9843 28 0.7683 53 0.7302 78 4 0.9666 29 0.7657 54 0.7293 79 5 0.9475 30 0.7633 55 0.7285 80 6 0.9291 31 0.7609 56 0.7277 81 7 0.9120 32 0.7588 57 0.7269 82 8 0.8966 33 0.7567 58 0.7262 83 9 0.8828 34 0.7547 59 0.7255 84 10 0.8704 35 0.7528 60 0.7248 85 11 0.8593 36 0.7511 61 0.7241 86 12 0.8493 37 0.7494 62 0.7234 87 13 0.8404 38 0.7477 63 0.7228 88 14 0.8322 39 0.7462 64 0.7222 89 15 0.8248 40 0.7447 65 0.7215 90 16 0.8181 41 0.7433 66 0.7210 91 17 0.8120 42 0.7420 67 0.7204 92 18 0.8063 43 0.7407 68 0.7198 93 19 0.8012 44 0.7394 69 0.7193 94 20 0.7964 45 0.7382 70 0.7188 95 21 0.7919 46 0.7371 71 0.7183 96 22 0.7878 47 0.7360 72 0.7178 97 23 0.7840 48 0.7349 73 0.7173 98 24 0.7804 49 0.7339 74 0.7168 99 25 0.7771 50 0.7329 75 0.7163 100
89
UTILITY VALUE
0.0000 0.7154 0.7150 0.7146 0.7142 0.7138 0.7134 0.7130 0.7126 0.7123 0.7119 0.7116 0.7112 0.7109 0.7106 0.7103 0.7099 0.7096 0.7093 0.7090 0.7088 0.7085 0.7082 0.7079 0.7077

Table 70. Distress Utility Factors for Patching for Detailed Pavement Type: 08.
Alpha: 0.3200 How Rated: Percent of lane area
Beta: 1.0000
Rho: 17.2800
Percent of UTILITY Percent of UTILITY Percent of UTILITY Percent of Lane VALUE Lane VALUE Lane VALUE Lane Area Area Area Area
1 1.0000 26 0.8354 51 0.7720 76 2 0.9999 27 0.8313 52 0.7705 77 3 0.9990 28 0.8274 53 0.7690 78 4 0.9957 29 0.8237 54 0.7676 79 5 0.9899 30 0.8201 55 0.7663 80 6 0.9820 31 0.8167 56 0.7650 81 7 0.9729 32 0.8135 57 0.7637 82 8 0.9631 33 0.8104 58 0.7624 83 9 0.9531 34 0.8075 59 0.7612 84 10 0.9432 35 0.8047 60 0.7601 85 11 0.9335 36 0.8020 61 0.7589 86 12 0.9242 37 0.7994 62 0.7578 87 13 0.9153 38 0.7969 63 0.7568 88 14 0.9069 39 0.7945 64 0.7557 89 15 0.8989 40 0.7923 65 0.7547 90 16 0.8913 41 0.7901 66 0.7537 91 17 0.8842 42 0.7879 67 0.7527 92 18 0.8775 43 0.7859 68 0.7518 93 19 0.8711 44 0.7839 69 0.7509 94 20 0.8651 45 0.7820 70 0.7500 95 21 0.8595 46 0.7802 71 0.7491 96 22 0.8541 47 0.7784 72 0.7483 97 23 0.8490 48 0.7767 73 0.7475 98 24 0.8442 49 0.7751 74 0.7466 99 25 0.8397 50 0.7735 75 0.7459 100
90
UTILITY VALUE
0.0000 0.7443 0.7436 0.7429 0.7422 0.7415 0.7408 0.7401 0.7395 0.7389 0.7382 0.7376 0.7371 0.7365 0.7359 0.7353 0.7348 0.7343 0.7337 0.7332 0.7327 0.7322 0.7317 0.7313 0.7308

Table 71. Distress Utility Factors for Failures for Detailed Pavement Type: 08.
Alpha: 1.0000 How Rated: Total Number
Beta: 1.0000
Rho: 4.7000
Number UTILITY Number UTILITY Number UTILITY Number Per VALUE Per VALUE Per VALUE Per Mile Mile Mile Mile
1 0.9909 26 0.1654 51 0.0880 76 2 0.9046 27 0.1598 52 0.0864 77 3 0.7913 28 0.1545 53 0.0849 78 4 0.6912 29 0.1496 54 0.0834 79 5 0.6094 30 0.1450 55 0.0819 80 6 0.5431 31 0.1407 56 0.0805 81 7 0.4890 32 0.1366 57 0.0791 82 8 0.4443 33 0.1327 58 0.0778 83 9 0.4068 34 0.1291 59 0.0766 84 10 0.3750 35 0.1257 60 0.0753 85 11 0.3477 36 0.1224 61 0.0742 86 12 0.3241 37 0.1193 62 0.0730 87 13 0.3034 38 0.1163 63 0.0719 88 14 0.2852 39 0.1135 64 0.0708 89 15 . 0.2690 40 0.1109 65 0.0698 90 16 0.2545 41 0.1083 66 0.0687 91 17 0.2415 42 0.1059 67 0.0677 92 18 0.2298 43 0.1035 68 0.0668 93 19 0.2191 44 0.1013 69 0.0658 94 20 0.2094 45 0.0992 70 0.0649 95 21 0.2005 46 0.0971 71 0.0641 96 22 0.1924 47 0.0952 72 0.0632 97 23 0.1848 48 0.0933 73 0.0624 98 24 0.1779 49 0.0915 74 0.0615 99 25 0.1714 50 0.0897 75 0.0607 100
91
UTILITY VALUE
0.0000 0.0592 0.0585 0.0578 0.0571 0.0564 0.0557 0.0551 0.0544 0.0538 0.0532 0.0526 0.0520 0.0514 0.0509 0.0503 0.0498 0.0493 0.0488 0.0483 0.0478 0.0473 0.0468 0.0464 0.0459

Table 72. Distress Utility Factors for Block Cracking for Detailed Pavement Type: 08.
Alpha: 0.3100 How Rated: Percent of lane area
Beta: 1.0000
Rho: 13.7900
Percent of UTILITY Percent of UTILITY Percent of UTILITY Percent of UTILITY Lane VALUE Lane VALUE Lane VALUE Lane VALUE Area Area Area Area
1 1.0000 26 0.8176 51 0.7634 76 0.0000 2 0.9997 27 0.8140 52 0.7622 77 0.7408 3 0.9969 28 0.8106 53 0.7610 78 0.7402 4 0.9901 29 0.8073 54 0.7599 79 0.7397 5 0.9803 30 0.8042 55 0.7587 80 0.7391 6 0.9689 31 0.8013 56 0.7577 81 0.7385 7 0.9568 32 0.7985 57 0.7566 82 0.7380 8 0.9447 33 0.7959 58 0.7556 83 0.7375 9 0.9330 34 0.7934 59 0.7546 84 0.7369 10 0.9219 35 0.7910 60 0.7537 85 0.7364 11 0.9115 36 0.7886 61 0.7527 86 0.7359 12 0.9018 37 0.7865 62 0.7518 87 0.7354 13 0.8927 38 0.7843 63 0.7509 88 0.7350 14 0.8842 39 0.7823 64 0.7501 89 0.7345 15 0.8764 40 0.7804 65 0.7493 90 0.7340 16 0.8691 41 0.7785 66 0.7485 91 0.7336 17 0.8623 42 0.7768 67 0.7477 92 0.7332 18 0.8559 43 0.7751 68 0.7469 93 0.7327 19 0.8500 44 0.7734 69 0.7462 94 0.7323 20 0.8444 45 0.7718 70 0.7454 95 0.7319 21 0.8392 46 0.7703 71 0.7447 96 0.7315 22 0.8344 47 0.7688 72 0.7440 97 0.7311 23 0.8298 48 0.7674 73 0.7434 98 0.7307 24 0.8255 49 0.7660 74 0.7427 99 0.7303 25 0.8214 50 0.7647 75 0.7421 100 0.7299
92
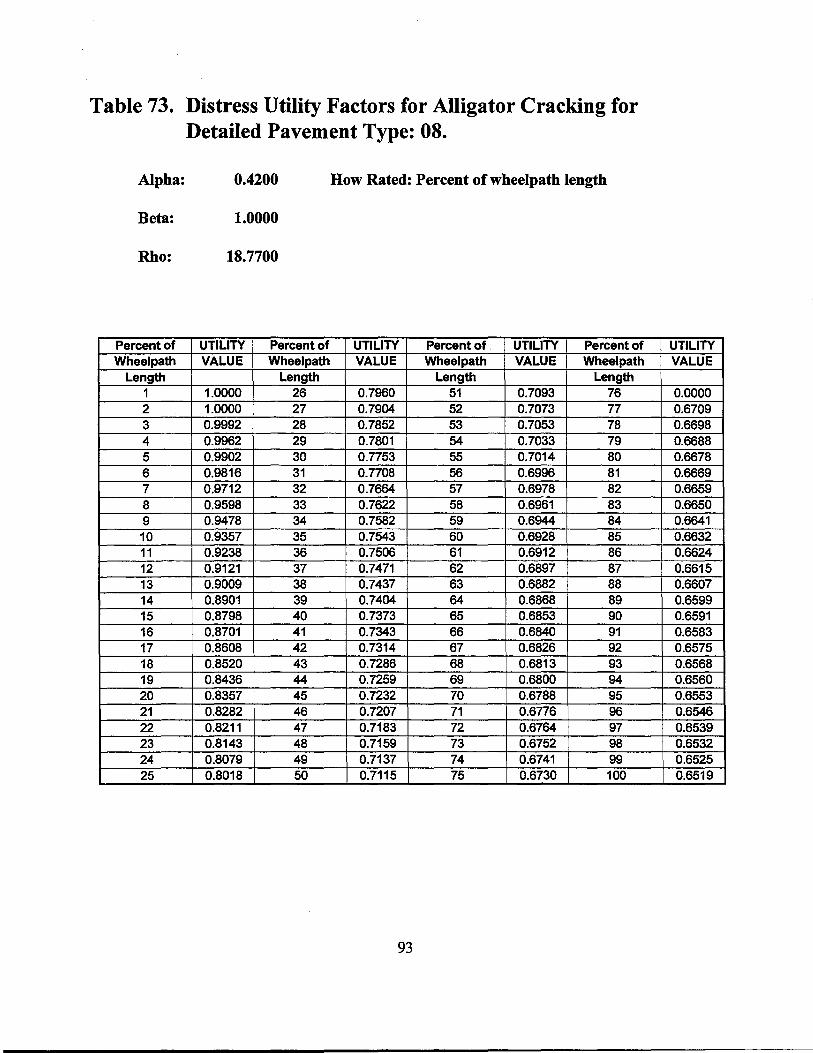
Table 73. Distress Utility Factors for Alligator Cracking for Detailed Pavement Type: 08.
Alpha: 0.4200 How Rated: Percent of wheelpath length
Beta: 1.0000
Rho: 18. 7700
Percent of UTILITY Percent of UTILITY Percent of. UTILITY Percent of Wheel path VALUE Wheel path VALUE Wheel path VALUE Wheel path
Length Length Length Length 1 1.0000 26 0.7960 51 0.7093 76 2 1.0000 27 0.7904 52 0.7073 77 3 0.9992 28 0.7852 53 0.7053 78 4 0.9962 29 0.7801 54 0.7033 79 5 0.9902 30 0.7753 55 0.7014 80 6 0.9816 31 0.7708 56 0.6996 81 7 0.9712 32 0.7664 57 0.6978 82 8 0.9598 33 0.7622 58 0.6961 83 9 0.9478 34 0.7582 59 0.6944 84 10 0.9357 35 0.7543 60 0.6928 85 11 0.9238 36 0.7506 61 0.6912 86 12 0.9121 37 0.7471 62 0.6897 87 13 0.9009 38 0.7437 63 0.6882 88 14 0.8901 39 0.7404 64 0.6868 89 15 0.8798 40 0.7373 65 0.6853 90 16 0.8701 41 0.7343 66 0.6840 91 17 0.8608 42 0.7314 67 0.6826 92 18 0.8520 43 0.7286 68 0.6813 93 19 0.8436 44 0.7259 69 0.6800 94 20 0.8357 45 0.7232 70 0.6788 95 21 0.8282 46 0.7207 71 0.6776 96 22 0.8211 47 0.7183 72 0.6764 97 23 0.8143 48 0.7159 73 0.6752 98 24 0.8079 49 0.7137 74 0.6741 99 25 0.8018 50 0.7115 75 0.6730 100
93
UTILITY VALUE
0.0000 0.6709 0.6698 0.6688 0.6678 0.6669 0.6659 0.6650 0.6641 0.6632 0.6624 0.6615 0.6607 0.6599 0.6591 0.6583 0.6575 0.6568 0.6560 0.6553 0.6546 0.6539 0.6532 0.6525 0.6519

Table 74. Distress Utility Factors for Longitudinal Cracking for Detailed Pavement Type: 08.
Alpha: 0.3700 How Rated: Length per 100' station
Beta: 1.0000
Rho: 136.9000
Length UTILITY Length UTILITY Length UTILITY Length UTILITY Per VALUE Per VALUE Per VALUE Per VALUE
Station Station Station Station 5 1.0000 130 0.8709 255 0.7837 380 0.0000 10 1.0000 135 0.8658 260 0.7815 385 0.7407 15 1.0000 140 0.8608 265 0.7793 390 0.7395 20 0.9996 145 0.8561 270 0.7772 395 0.7384 25 0.9985 150 0.8515 275 0.7751 400 0.7372 30 0.9961 155 0.8470 280 0.7731 405 0.7361 35 0.9926 160 0.8427 285 0.7711 410 0.7350 40 '0.9879 165 0.8386 290 0.7692 415 0.7340 45 0.9823 170 0.8346 295 0.7674 420 0.7329 50 0.9761 175 0.8308 300 0.7656 425 0.7319 55 0.9693 180 0.8271 305 0.7638 430 0.7309 60 0.9622 185 0.8235 310 0.7621 435 0.7299 65 0.9550 190 0.8200 315 0.7604 440 0.7289 70 0.9477 195 0.8166 320 0.7588 445 0.7280 75 0.9404 200 0.8134 325 0.7572 450 0.7271 80 0.9332 205 0.8103 330 0.7556 455 0.7261 85 0.9261 210 0.8072 335 0.7541 460 0.7252 90 0.9192 215 0.8043 340 0.7526 465 0.7244 95 0.9124 220 0.8014 345 0.7512 470 0.7235 100 0.9059 225 0.7986 350 0.7498 475 0.7226 105 0.8995 230 0.7960 355 0.7484 480 0.7218 110 0.8934 235 0.7934 360 0.7470 485 0.7210 115 0.8875 240 0.7908 365 0.7457 490 0.7202 120 0.8818 245 0.7884 370 0.7444 495 0.7194 125 0.8762 250 0.7860 375 0.7432 500 0.7186
94

Table 75. Distress Utility Factors for Transverse Cracking for Detailed Pavement Type: 08.
Alpha: 0.4300 How Rated: Number per 100' station
Beta: 1.0000
Rho: 9.5600
Number UTILITY Number UTILITY Number UTILITY Number Per VALUE Per VALUE Per VALUE Per
Station Station Station Station 1 1.0000 26 0.7023 51 0.6435 76 2 0.9964 27 0.6982 52 0.6422 77 3 0.9822 28 0.6944 53 0.6410 78 4 0.9606 29 0.6908 54 0.6398 79 5 0.9365 30 0.6873 55 0.6386 80 6 0.9126 31 0.6841 56 0.6375 81 7 0.8903 32 0.6810 57 0.6364 82 8 0.8698 33 0.6781 58 0.6353 83 9 0.8514 34 0.6754 59 0.6343 84 10 0.8347 35 0.6728 60 0.6333 85 11 0.8197 36 0.6703 61 0.6324 86 12 0.8061 37 0.6679 62 0.6314 87 13 0.7939 38 0.6656 63 0.6305 88 14 0.7828 39 0.6635 64 0.6297 89 15 0.7727 40 0.6614 65 0.6288 90 16 0.7634 41 0.6594 66 0.6280 91 17 0.7550 42 0.6575 67 0.6272 92 18 0.7472 43 0.6557 68 0.6264 93 19 0.7400 44 0.6540 69 0.6256 94 20 0.7334 45 0.6523 70 0.6249 95 21 0.7273 46 0.6507 71 0.6242 96 22 0.7215 47 0.6491 72 0.6235 97 23 0.7162 48 0.6477 73 0.6228 98 24 0.7113 49 0.6462 74 0.6221 99 25 0.7066 50 0.6448 75 0.6215 100
95
UTILITY VALUE
0.0000 0.6202 0.6196 0.6190 0.6184 0.6179 0.6173 0.6168 0.6163 0.6157 0.6152 0.6147 0.6143 0.6138 0.6133 0.6129 0.6124 0.6120 0.6116 0.6112 0.6108 0.6104 0.6100 0.6096 0.6092

Table 76. Distress Utility Factors for Shallow Rutting for Detailed Pavement Type: 09.
Alpha: 0.3100 How Rated: Percentage ofwheelpath length
Beta: 1.0000
Rho: 19.7200
Percent of UTILITY Percent of UTILITY Percent of UTILITY Percent of UTILITY Wheel path VALUE Wheel path VALUE Wheel path VALUE Wheel path VALUE
Length Length Length Length 1 1.0000 26 0.8548 51 0.7894 76 0.0000 2 1.0000 27 0.8507 52 0.7878 77 0.7600 3 0.9996 28 0.8467 53 0.7863 78 0.7593 4 0.9978 29 0.8429 54 0.7848 79 0.7585 5 0.9940 30 0.8393 55 0.7834 80 0.7577 6 0.9884 31 0.8359 56 0.7820 81 0.7570 7 0.9815 32 0.8326 57 0.7807 82 0.7563 8 0.9736 33 0.8295 58 0.7794 83 0.7556 9 0.9653 34 0.8264 59 0.7781 84 0.7549 10 0.9569 35 0.8235 60 0.7768 85 0.7542 11 0.9484 36 0.8207 61 0.7756 86 0.7535 12 0.9401 37 0.8181 62 0.7745 87 0.7529 13 0.9320 38 0.8155 63 0.7733 88 0.7522 14 0.9242 39 0.8130 64 0.7722 89 0.7516 15 0.9167 40 0.8107 65 0.7711 90 0.7510 16 0.9096 41 0.8084 66 0.7701 91 0.7504 17 0.9028 42 0.8062 67 0.7690 92 0.7498 18 0.8964 43 0.8040 68 0.7680 93 0.7492 19 0.8902 44 0.8020 69 0.7671 94 0.7487 20 0.8843 45 0.8000 70 0.7661 95 0.7481 21 0.8788 46 0.7981 71 0.7652 96 0.7476 22 0.8735 47 0.7962 72 0.7643 97 0.7470 23 0.8685 48 0.7944 73 0.7634 98 0.7465 24 0.8637 49 0.7927 74 0.7625 99 0.7460 25 0.8591 50 0.7910 75 0.7617 100 0.7455
96

Table 77. Distress Utility Factors for Deep Rutting for Detailed Pavement Type: 09.
Alpha: 0.6900 How Rated: Percent ofwheelpath length
Beta: 1.0000
Rho: 16.2700
Percent of UTILITY Percent of UTILITY Percent of UTILITY Percent of Wheel path VALUE Wheel path VALUE Wheel path VALUE Wheel path
Length Length Length Length 1 1.0000 26 0.6310 51 0.4985 76 2 0.9998 27 0.6223 52 0.4954 77 3 0.9970 28 0.6141 53 0.4924 78 4 0.9882 29 0.6063 54 0.4895 79 5 0.9734 30 0.5988 55 0.4867 80 6 0.9542 31 0.5918 56 0.4840 81 7 0.9325 32 0.5850 57 0.4813 82 8 0.9097 33 0.5786 58 0.4788 83 9 0.8868 34 0.5724 59 0.4763 84 10 0.8644 35 0.5665 60 0.4739 85 11 0.8428 36 0.5609 61 0.4715 86 12 0.8222 37 0.5555 62 0.4693 87 13 0.8026 38 0.5503 63 0.4670 88 14 0.7842 39 0.5454 64 0.4649 89 15 0.7668 40 0.5406 65 0.4628 90 16 0.7504 41 0.5360 66 0.4608 91 17 0.7350 42 0.5316 67 0.4588 92 18 0.7206 43 0.5274 68 0.4568 93 19 0.7069 44 0.5233 69 0.4549 94 20 0.6941 45 0.5194 70 0.4531 95 21 0.6820 46 0.5156 71 0.4513 96 22 0.6706 47 0.5119 72 0.4496 97 23 0.6599 48 0.5084 73 0.4479 98 24 0.6497 49 0.5050 74 0.4462 99 25 0.6401 50 0.5017 75 0.4446 100
97
UTILITY VALUE
0.0000 0.4414 0.4399 0.4384 0.4370 0.4356 0.4342 0.4328 0.4315 0.4302 0.4289 0.4277 0.4265 0.4253 0.4241 0.4230 0.4218 0.4207 0.4197 0.4186 0.4176 0.4165 0.4156 0.4146 0.4136

Table 78. Distress Utility Factors for Patching for Detailed Pavement Type: 09.
Alpha: 0.4500 How Rated: Percent of lane area
Beta: 1.0000
Rho: 10.1500
Percent of UTILITY Percent of UTILITY Percent of UTILITY Percent of Lane VALUE Lane VALUE Lane VALUE Lane Area Area Area Area
1 1.0000 26 0.6954 51 0.6312 76 2 0.9972 27 0.6910 52 0.6298 77 3 0.9847 28 0.6868 53 0.6284 78 4 0.9644 29 0.6829 54 0.6271 79 5 0.9409 30 0.6792 55 0.6258 80 6 0.9171 31 0.6756 56 0.6246 81 7 0.8944 32 0.6723 57 0.6234 82 8 0.8735 33 0.6691 58 0.6222 83 9 0.8543 34 0.6661 59 0.6211 84 10 0.8369 35 0.6633 60 0.6200 85 11 0.8212 36 0.6606 61 0.6190 86 12 0.8069 37 0.6580 62 0.6180 87 13 0.7939 38 0.6555 63 0.6170 88 14 0.7821 39 0.6531 64 0.6160 89 15 0.7713 40 0.6509 65 0.6151 90 16 0.7614 41 0.6487 66 0.6141 91 17 0.7523 42 0.6466 67 0.6133 92 18 0.7440 43 0.6446 68 0.6124 93 19 0.7362 44 0.6427 69 0.6116 94 20 0.7291 45 0.6409 70 0.6107 95 21 0.7225 46 0.6391 71 0.6099 96 22 0.7163 47 0.6374 72 0.6092 97 23 0.7106 48 0.6358 73 0.6084 98 24 0.7052 49 0.6342 74 0.6077 99 25 0.7002 50 0.6327 75 0.6070 100
98
UTILITY VALUE
0.0000 0.6056 0.6049 0.6043 0.6036 0.6030 0.6024 0.6018 0.6012 0.6007 0.6001 0.5996 0.5990 0.5985 0.5980 0.5975 0.5970 0.5965 0.5961 0.5956 0.5951 0.5947 0.5943 0.5939 0.5934

Table 79. Distress Utility Factors for Failures for Detailed Pavement Type: 09.
Alpha: 1.0000 How Rated: Total Number
Beta! 1.0000
Rho: 4.7000
Number UTILITY Number UTILITY Number UTILITY Number Per VALUE Per VALUE Per VALUE Per Mile Mile Mile Mile
1 0.9909 26 0.1654 51 0.0880 76 2 0.9046 27 0.1598 52 0.0864 77 3 0.7913 28 0.1545 53 0.0849 78 4 0.6912 29 0.1496 54 0.0834 79 5 o,6094 30 0.1450 55 0.0819 80 6 0.5431 31 0.1407 56 0.0805 81 7 0.4890 32 0.1366 57 0.0791 82 8 0.4443 33 0.1327 58 0.0778 83 9 0.4068 34 0.1291 59 0.0766 84 10 0.3750 35 0.1257 60 0.0753 85 11 0.3477 36 0.1224 61 0.0742 86 12 0.3241 37 0.1193 62 0.0730 87 13 0.3034 38 0.1163 63 0.0719 88 14 0.2852 39 0.1135 64 0.0708 89 15 0.2690 40 0.1109 65 0.0698 90 16 0.2545 41 0.1083 66 0.0687 91 17 0.2415 42 0.1059 67 0.0677 92 18 0.2298 43 0.1035 68 0.0668 93 19 0.2191 44 0.1013 69 0.0658 94 20 0.2094 45 0.0992 70 0.0649 95 21 0.2005 46 0.0971 71 0.0641 96 22 0.1924 47 0.0952 72 0.0632 97 23 0.1848 48 0.0933 73 0.0624 98 24 0.1779 49 0.0915 74 0.0615 99 25 0.1714 50 0.0897 75 0.0607 100
99
UTILITY VALUE
0.0000 0.0592 0.0585 0.0578 0.0571 0.0564 0.0557 0.0551 0.0544 0.0538 0.0532 0.0526 0.0520 0.0514 0.0509 0.0503 0.0498 0.0493 0.0488 0.0483 0.0478 0.0473 0.0468 0.0464 0.0459
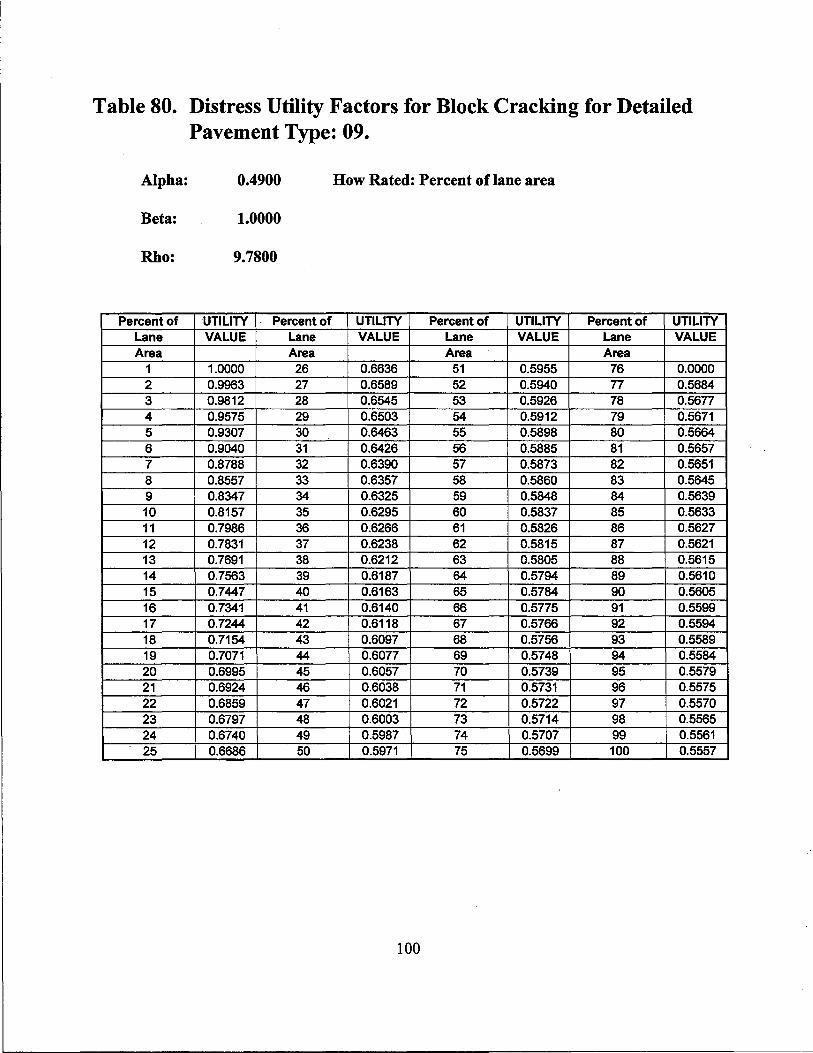
Table 80. Distress Utility Factors for Block Cracking for Detailed Pavement Type: 09.
Alpha: 0.4900 How Rated: Percent of lane area
Beta: 1.0000
Rho: 9.7800
Percent of UTILITY Percent of UTILITY Percent of UTILITY Percent of UTILITY Lane VALUE Lane VALUE Lane VALUE Lane VALUE Area Area Area Area
1 1.0000 26 0.6636 51 0.5955 76 0.0000 2 0.9963 27 0.6589 52 0.5940 77 0.5684 3 0.9812 28 0.6545 53 0.5926 78 0.5677 4 0.9575 29 0.6503 54 0.5912 79 0.5671 5 0.9307 30 0.6463 55 0.5898 80 0.5664 6 0.9040 31 0.6426 56 0.5885 81 0.5657 7 0.8788 32 0.6390 57 0.5873 82 0.5651 8 0.8557 33 0.6357 58 0.5860 83 0.5645 9 0.8347 34 0.6325 59 0.5848 84 0.5639 10 0.8157 35 0.6295 60 0.5837 85 0.5633 11 0.7986 36 0.6266 61 0.5826 86 0.5627 12 0.7831 37 0.6238 62 0.5815 87 0.5621 13 0.7691 38 0.6212 63 0.5805 88 0.5615 14 0.7563 39 0.6187 64 0.5794 89 0.5610 15 0.7447 40 0.6163 65 0.5784 90 0.5605 16 0.7341 41 0.6140 66 0.5775 91 0.5599 17 0.7244 42 0.6118 67 0.5766 92 0.5594 18 0.7154 43 0.6097 68 0.5756 93 0.5589 19 0.7071 44 0.6077 69 0.5748 94 0.5584 20 0.6995 45 0.6057 70 0.5739 95 0.5579 21 0.6924 46 0.6038 71 0.5731 96 0.5575 22 0.6859 47 0.6021 72 0.5722 97 0.5570 23 0.6797 48 0.6003 73 0.5714 98 0.5565 24 0.6740 49 0.5987 74 0.5707 99 0.5561 25 0.6686 50 0.5971 75 0.5699 100 0.5557
100

Table 81. Distress Utility Factors for Alligator Cracking for Detailed Pavement Type: 09.
Alpha: 0.5300 How Rated: Percentage of wheelpath length
Beta: 1.0000
Rho: 8.0100
Percent of UTILITY Percent of UTILITY Percent of UTILITY Percent of Wheel path VALUE Wheelpath VALUE Wheel path VALUE Wheel path
Length Length Length Length 1 0.9998 26 0.6105 51 0.5470 76 2 0.9903 27 0.6061 52 0.5457 77 3 0.9633 28 0.6019 53 0.5443 78 4 0.9285 29 0.5979 54 0.5431 79 5 0.8932 30 0.5942 55 0.5418 80 6 0.8605 31 0.5907 56 0.5406 81 7 0.8312 32 0.5874 57 0.5395 82 8 0.8053 33 0.5842 58 0.5384 83 9 0.7824 34 0.5812 59 0.5373 84 10 0.7621 35 0.5784 60 0.5362 85 11 0.7441 36 0.5757 61 0.5352 86 12 0.7281 37 0.5732 62 0.5342 87 13 0.7138 38 0.5707 63 0.5333 88 14 0.7009 39 0.5684 64 0.5323 89 15 0.6893 40 0.5662 65 0.5314 90 16 0.6787 41 0.5641 66 0.5306 91 17 0.6691 42 0.5620 67 0.5297 92 18 0.6604 43 0.5601 68 0.5289 93 19 0.6523 44 0.5582 69 0.5281 94 20 0.6449 45 0.5564 70 0.5273 95 21 0.6381 46 0.5547 71 0.5265 96 22 0.6317 47 0.5530 72 0.5258 97 23 0.6259 48 0.5515 73 0.5251 98 24 0.6204 49 0.5499 74 0.5244 99 25 0.6153 50 0.5485 75 0.5237 100
101
UTILITY VALUE
0.0000 0.5224 0.5217 0.5211 0.5205 0.5199 0.5193 0.5188 0.5182 0.5177 0.5171 0.5166 0.5161 0.5156 0.5151 0.5147 0.5142 0.5137 0.5133 0.5129 0.5124 0.5120 0.5116 0.5112 0.5108

. Table 82. Distress Utility Factors for Longitudinal Cracking for
Detailed Pavement Type: 09.
Alpha: 0.8700 How Rated: Length per 100' station
Beta: 1.0000
Rho: 184.0000
Length UTILITY Length UTILITY Length UTILITY Length UTILITY Per VALUE Per VALUE Per VALUE Per VALUE
Station Station Station Station 5 1.0000 130 0.7887 255 0.5772 380 0.0000 10 1.0000 135 0.7774 260 0.5713 385 0.4605 15 1.0000 140 0.7663 265 0.5655 390 0.4572 20 0.9999 145 0.7554 270 0.5599 395 0.4540 25 0.9994 150 0.7449 275 0.5544 400 0.4508 30 0.9981 155 0.7346 280 0.5491 405 0.4477 35 0.9955 160 0.7245 285 0.5438 410 0.4446 40 0.9913 165 0.7148 290 0.5387 415 0.4416 45 0.9854 170 0.7052 295 0.5337 420 0.4386 50 0.9781 175 0.6960 300 0.5289 425 0.4357 55 0.9693 180 0.6870 305 0.5241 430 0.4329 60 0.9595 185 0.6782 310 0.5194 435 0.4301 65 0.9487 190 0.6697 315 0.5149 440 0.4273 70 0.9372 195 0.6614 320 0.5104 445 0.4246 75 0.9252 200 0.6533 325 0.5061 450 0.4220 80 0.9128 205 0.6454 330 0.5018 455 0.4194 85 0.9001 210 0.6378 335 0.4977 460 0.4168 90 0.8874 215 0.6303 340 0.4936 465 0.4143 95 0.8746 220 0.6230 345 0.4896 470 0.4118 100 0.8618 225 0.6160 350 0.4857 475 0.4094 105 0.8492 230 0.6091 355 0.4819 480 0.4070 110 0.8367 235 0.6024 360 0.4781 485 0.4047 115 0.8244 240 0.5958 365 0.4745 490 0.4024 120 0.8122 245 0.5895 370 0.4709 495 0.4001 125 0.8004 250 0.5832 375 0.4674 500 0.3979
102

Table 83. Distress Utility Factors for Transverse Cracking for Detailed Pavement Type: 09.
Alpha: 0.6900 How Rated: Number per 100' station
Beta: 1.0000
Rho: 10.3900
Number UTILITY Number UTILITY Number UTILITY Number Per VALUE Per VALUE Per VALUE Per
Station Station Station Station 1 1.0000 26 0.5373 51 0.4372 76 2 0.9962 27 0.5304 52 0.4350 77 3 0.9784 28 0.5239 53 0.4328 78 4 0.9486 29 0.5178 54 0.4308 79 5 0.9136 30 0.5120 55 0.4288 80 6 0.8779 31 0.5065 56 0.4268 81 7 0.8436 32 0.5013 57 0.4250 82 8 0.8117 33 0.4964 58 0.4232 83 9 0.7825 34 0.4917 59 0.4214 84 10 0.7559 35 0.4872 60 0.4197 85 11 0.7317 36 0.4830 61 0.4181 86 12 0.7097 37 0.4789 62 0.4165 87 13 0.6897 38 0.4751 63 0.4149 88 14 0.6715 39 0.4714 64 0.4134 89 15 0.6548 40 0.4678 65 0.4119 90 16 0.6396 41 0.4645 66 0.4105 91 17 0.6255 42 0.4612 67 0.4091 92 18 0.6126 43 0.4581 68 0.4078 93 19 0.6006 44 0.4551 69 0.4065 94 20 0.5896 45 0.4523 70 0.4052 95 21 0.5793 46 0.4495 71 0.4039 96 22 0.5697 47 0.4469 72 0.4027 97 23 0.5608 48 0.4443 73 0.4015 98 24 0.5525 49 0.4418 74 0.4004 99 25 0.5446 50 0.4395 75 0.3993 100
103
UTILITY VALUE
0.0000 0.3971 0.3961 0.3950 0.3940 0.3931 0.3921 0.3912 0.3903 0.3894 0.3885 0.3877 0.3868 0.3860 0.3852 0.3845 0.3837 0.3829 0.3822 0.3815 0.3808 0.3801 0.3794 0.3787 0.3781

Table 84. Distress Utility Factors for Shallow Rutting for Detailed Pavement Type: 10.
Alpha: 0.3100 How Rated: Percent ofwheelpath length
Beta: 1.0000
Rho: 19. 7200
Percent of UTILITY Percent of UTILITY Percent of UTILITY Percent of UTILITY Wheel path VALUE Wheel path VALUE Wheel path VALUE Wheel path VALUE
Length Length Length Length 1 1.0000 26 0.8548 51 0.7894 76 0.0000 2 1.0000 27 0.8507 52 0.7878 77 0.7600 3 0.9996 28 0.8467 53 0.7863 78 0.7593 4 0.9978 29 0.8429 54 0.7848 79 0.7585 5 0.9940 30 0.8393 55 0.7834 80 0.7577 6 0.9884 31 0.8359 56 0.7820 81 0.7570 7 0.9815 32 0.8326 57 0.7807 82 0.7563 8 0.9736 33 0.8295 58 0.7794 83 0.7556 9 0.9653 34 0.8264 59 0.7781 84 0.7549 10 0.9569 35 0.8235 60 0.7768 85 0.7542 11 0.9484 36 0.8207 61 0.7756 86 0.7535 12 0.9401 37 0.8181 62 0.7745 87 0.7529 13 0.9320 38 0.8155 63 0.7733 88 0.7522 14 0.9242 39 0.8130 64 0.7722 89 0.7516 15 0.9167 40 0.8107 65 0.7711 90 0.7510 16 0.9096 41 0.8084 66 0.7701 91 0.7504 17 0.9028 42 0.8062 67 0.7690 92 0.7498 18 0.8964 43 0.8040 68 0.7680 93 0.7492 19 0.8902 44 0.8020 69 0.7671 94 0.7487 20 0.8843 45 0.8000 70 0.7661 95 0.7481 21 0.8788 46 0.7981 71 0.7652 96 0.7476 22 0.8735 47 0.7962 72 0.7643 97 0.7470 23 0.8685 48 0.7944 73 0.7634 98 0.7465 24 0.8637 49 0.7927 74 0.7625 99 0.7460 25 0.8591 50 0.7910 75 0.7617 100 0.7455
104

Table 85. Distress Utility Factors for Deep Rutting for Detailed Pavement Type: 10.
Alpha: 0.6900 How Rated: Percentage of wheelpath length
Beta: 1.0000
Rho: 16.2700
Percent of UTILITY Percent of UTILITY Percent of UTILITY Percent of Wheel path VALUE Wheel path VALUE Wheel path VALUE Wheel path
Length Length Length Length 1 1.0000 26 0.6310 51 0.4985 76 2 0.9998 27 0.6223 52 0.4954 77 3 0.9970 28 0.6141 53 0.4924 78 4 0.9882 29 0.6063 54 0.4895 79 5 0.9734 30 0.5988 55 0.4867 80 6 0.9542 31 0.5918 56 0.4840 81 7 0.9325 32 0.5850 57 0.4813 82 8 0.9097 33 0.5786 58 0.4788 83 9 0.88'68 34 0.5724 59 0.4763 84 10 0.8644 35 0.5665 60 0.4739 85 11 0.8428 36 0.5609 61 0.4715 86 12 0.8222 37 0.5555 62 0.4693 87 13 0.8026 38 0.5503 63 0.4670 88 14 0.7842 39 0.5454 64 0.4649 89 15 0.7668 40 0.5406 65 0.4628 90 16 0.7504 41 0.5360 66 0.4608 91 17 0.7350 42 0.5316 67 0.4588 92 18 0.7206 43 0.5274 68 0.4568 93 19 0.7069 44 0.5233 69 0.4549 94 20 0.6941 45 0.5194 70 0.4531 95 21 0.6820 46 0.5156 71 0.4513 96 22 0.6706 47 0.5119 72 0.4496 97 23 0.6599 48 0.5084 73 0.4479 98 24 0.6497 49 0.5050 74 0.4462 99 25 0.6401 50 0.5017 75 0.4446 100
105
UTILITY VALUE
0.0000 0.4414 0.4399 0.4384 0.4370 0.4356 0.4342 0.4328 0.4315 0.4302 0.4289 0.4277 0.4265 0.4253 0.4241 0.4230 0.4218 0.4207 0.4197 0.4186 0.4176 0.4165 0.4156 0.4146 0.4136
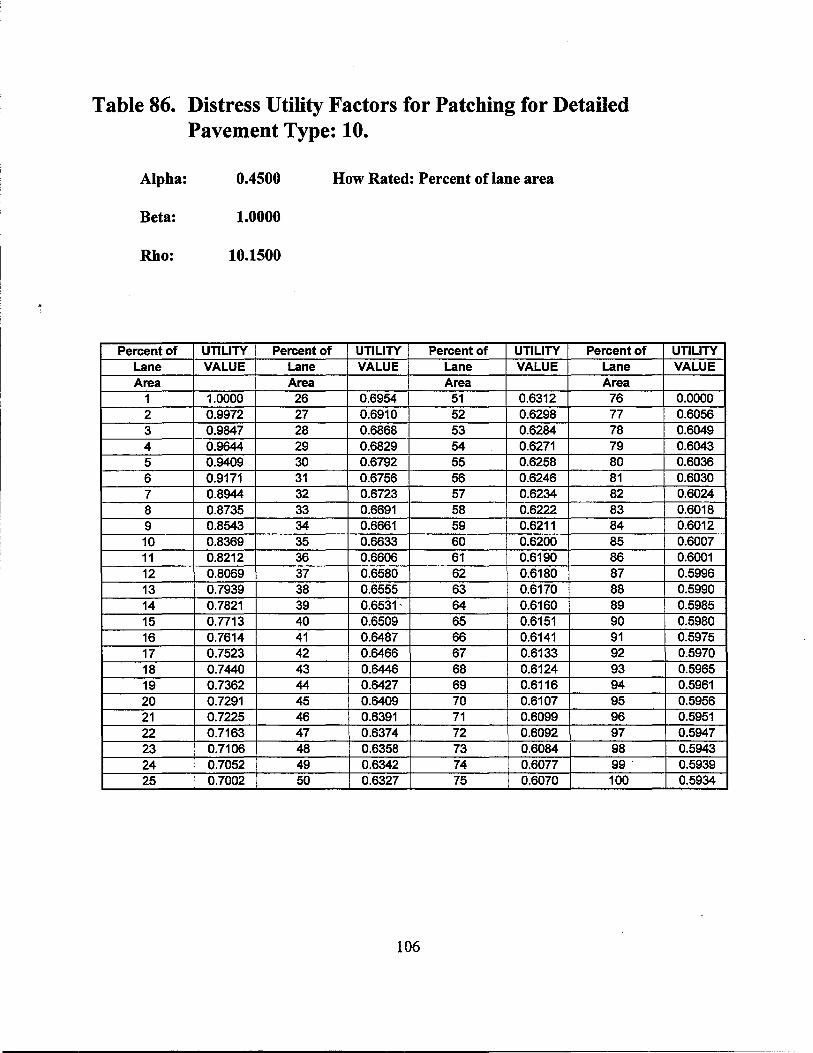
Table 86. Distress Utility Factors for Patching for Detailed Pavement Type: 10.
Alpha: 0.4500 How Rated: Percent of lane area
Beta: 1.0000
Rho: 10.1500
Percent of UTILITY Percent of UTILITY Percent of UTILITY Percent of Lane VALUE Lane VALUE Lane VALUE Lane Area Area Area Area
1 1.0000 26 0.6954 51 0.6312 76 2 0.9972 27 0.6910 52 0.6298 77 3 0.9847 28 0.6868 53 0.6284 78 4 0.9644 29 0.6829 54 0.6271 79 5 0.9409 30 0.6792 55 0.6258 80 6 0.9171 31 0.6756 56 0.6246 81 7 0.8944 32 0.6723 57 0.6234 82 8 0.8735 33 0.6691 58 0.6222 83 9 0.8543 34 0.6661 59 0.6211 84 10 0.8369 35 0.6633 60 0.6200 85 11 0.8212 36 0.6606 61 0.6190 86 12 0.8069 37 0.6580 62 0.6180 87 13 0.7939 38 0.6555 63 0.6170 88 14 0.7821 39 0.6531- 64 0.6160 89 15 0.7713 40 0.6509 65 0.6151 90 16 0.7614 41 0.6487 66 0.6141 91 17 0.7523 42 0.6466 67 0.6133 92 18 0.7440 43 0.6446 68 0.6124 93 19 0.7362 44 0.6427 69 0.6116 94 20 0.7291 45 0.6409 70 0.6107 95 21 0.7225 46 0.6391 71 0.6099 96 22 0.7163 47 0.6374 72 0.6092 97 23 0.7106 48 0.6358 73 0.6084 98 24 0.7052 49 0.6342 74 0.6077 99 25 0.7002 50 0.6327 75 0.6070 100
106
UTILITY VALUE
0.0000 0.6056 0.6049 0.6043 0.6036 0.6030 0.6024 0.6018 0.6012 0.6007 0.6001 0.5996 0.5990 0.5985 0.5980 0.5975 0.5970 0.5965 0.5961 0.5956 0.5951 0.5947 0.5943 0.5939 0.5934

Table 87. Distress Utility Factors for Failures for Detailed Pavement Type: 10.
Alpha: 1.0000 How Rated: Total Number
Beta: 1.0000
Rho: 4.7000
Number UTILITY Number UTILITY Number UTILITY Number Per VALUE Per VALUE Per VALUE Per Mile Mile Mile Mile
1 0.9909 26 0.1654 51 0.0880 76 2 0.9046 27 0.1598 52 0.0864 77 3 0.7913 28 0.1545 53 0.0849 78 4 0.6912 29 0.1496 54 0.0834 79 5 0.6094 30 0.1450 55 0.0819 80 6 0.5431 31 0.1407 56 0.0805 81 7 0.4890 32 0.1366 57 0.0791 82 8 0.4443 33 0.1327 58 0.0778 83 9 0.4068 34 0.1291 59 0.0766 84
10 0.3750 35 0.1257 60 0.0753 85 11 0.3477 36 0.1224 61 0.0742 86 12 0.3241 37 0.1193 62 0.0730 87 13 0.3034 38 0.1163 63 0.0719 88 14 0.2852 39 0.1135 64 0.0708 89 15 0.2690 40 0.1109 65 0.0698 90 16 0.2545 41 0.1083 66 0.0687 91 17 0.2415 42 0.1059 67 0.0677 92 18 0.2298 43 0.1035 68 0.0668 93 19 0.2191 44 0.1013 69 0.0658 94 20 0.2094 45 0.0992 70 0.0649 95 21 0.2005 46 0.0971 71 0.0641 96 22 0.1924 47 0.0952 72 0.0632 97 23 0.1848 48 0.0933 73 0.0624 98 24 0.1779 49 0.0915 74 0.0615 99 25 0.1714 50 0.0897 75 0.0607 100
107
UTILITY VALUE
0.0000 0.0592 0.0585 0.0578 0.0571 0.0564 0.0557 0.0551 0.0544 0.0538 0.0532 0.0526 0.0520 0.0514 0.0509 0.0503 0.0498 0.0493 0.0488 0.0483 0.0478 0.0473 0.0468 0.0464 0.0459

Table 88. Distress Utility Factors for Block Cracking for Detailed Pavement Type: 10.
Alpha: 0.4900 How Rated: Percent of lane area
Beta: 1.0000
Rho: 9.7800
Percent of UTILITY Percent of UTILITY Percent of UTILITY Percent of UTILITY Lane VALUE Lane VALUE Lane VALUE Lane VALUE Area Area Area Area
1 1.0000 26 0.6636 51 0.5955 76 0.0000 2 0.9963 27 0.6589 52 0.5940 77 0.5684 3 0.9812 28 0.6545 53 0.5926 78 0.5677 4 0.9575 29 0.6503 54 0.5912 79 0.5671 5 0.9307 30 0.6463 55 0.5898 80 0.5664 6 0.9040 31 0.6426 56 0.5885 81 0.5657 7 0.8788 32 0.6390 57 0.5873 82 0.5651 8 0.8557 33 0.6357 58 0.5860 83 0.5645 9 0.8347 34 0.6325 59 0.5848 84 0.5639 10 0.8157 35 0.6295 60 0.5837 85 0.5633 11 0.7986 36 0.6266 61 0.5826 86 0.5627 12 0:7831 37 0.6238 62 0.5815 87 0.5621 13 0.7691 38 0.6212 63 0.5805 88 0.5615 14 0.7563 39 0.6187 64 0.5794 89 0.5610 15 0.7447 40 0.6163 65 0.5784 90 0.5605 16 0.7341 41 0.6140 66 0.5775 91 0.5599 17 0.7244 42 0.6118 67 0.5766 92 0.5594 18 0.7154 43 0.6097 68 0.5756 93 0.5589 19 0.7071 44 0.6077 69 0.5748 94 0.5584 20 0.6995 45 0.6057 70 0.5739 95 0.5579 21 0.6924 46 0.6038 71 0.5731 96 0.5575 22 0.6859 47 0.6021 72 0.5722 97 . 0.5570 23 0.6797 48 0.6003 73 0.5714 98 0.5565 24 0.6740 49 0.5987 74 0.5707 99 0.5561 25 0.6686 50 0.5971 75 0.5699 100 0.5557
108

Table 89. Distress Utility Factors for Alligator Cracking for Detailed Pavement Type: 10.
Alpha: 0.5300 How Rated: Percent of wheelpath length
Beta: 1.0000
Rho: 8.0100
Percent of UTILITY Percent of UTILITY Percent of UTILITY Percent of Wheel path VALUE Wheel path VALUE Wheel path VALUE Wheel path
Length Length Length Length 1 0.9998 26 0.6105 51 0.5470 76 2 0.9903 27 0.6061 52 0.5457 77 3 0.9633 28 0.6019 53 0.5443 78 4 0.9285 29 0.5979 54 0.5431 79 5 0.8932 30 0.5942 55 0.5418 80 6 0.8605 31 0.5907 56 0.5406 81 7 0.8312 32 0.5874 57 0.5395 82 8 0.8053 33 0.5842 58 0.5384 83 9 0.7824 34 0.5812 59 0.5373 84 10 0.7621 35 0.5784 60 0.5362 85 11 0.7441 36 0.5757 61 0.5352 86 12 0.7281 37 0.5732 62 0.5342 87 13 0.7138 38 0.5707 63 0.5333 88 14 0.7009 39 0.5684 64 0.5323 89 15 0.6893 40 0.5662 65 0.5314 90 16 0.6787 41 0.5641 66 0.5306 91 17 0.6691 42 0.5620 67 0.5297 92 18 0.6604 43 0.5601 68 0.5289 93 19 0.6523 44 0.5582 69 0.5281 94 20 0.6449 45 0.5564 70 0.5273 95 21 0.6381 46 0.5547 71 0.5265 96 22 0.6317 47 0.5530 72 0.5258 97 23 0.6259 48 0.5515 73 0.5251 98 24 0.6204 49 0.5499 74 0.5244 99 25 0.6153 50 0.5485 75 0.5237 100
109
UTILITY VALUE
0.0000 0.5224 0.5217 0.5211 0.5205 0.5199 0.5193 0.5188 0.5182 0.5177 0.5171 0.5166 0.5161 0.5156 0.5151 0.5147 0.5142 0.5137 0.5133 0.5129 0.5124 0.5120 0.5116 0.5112 0.5108
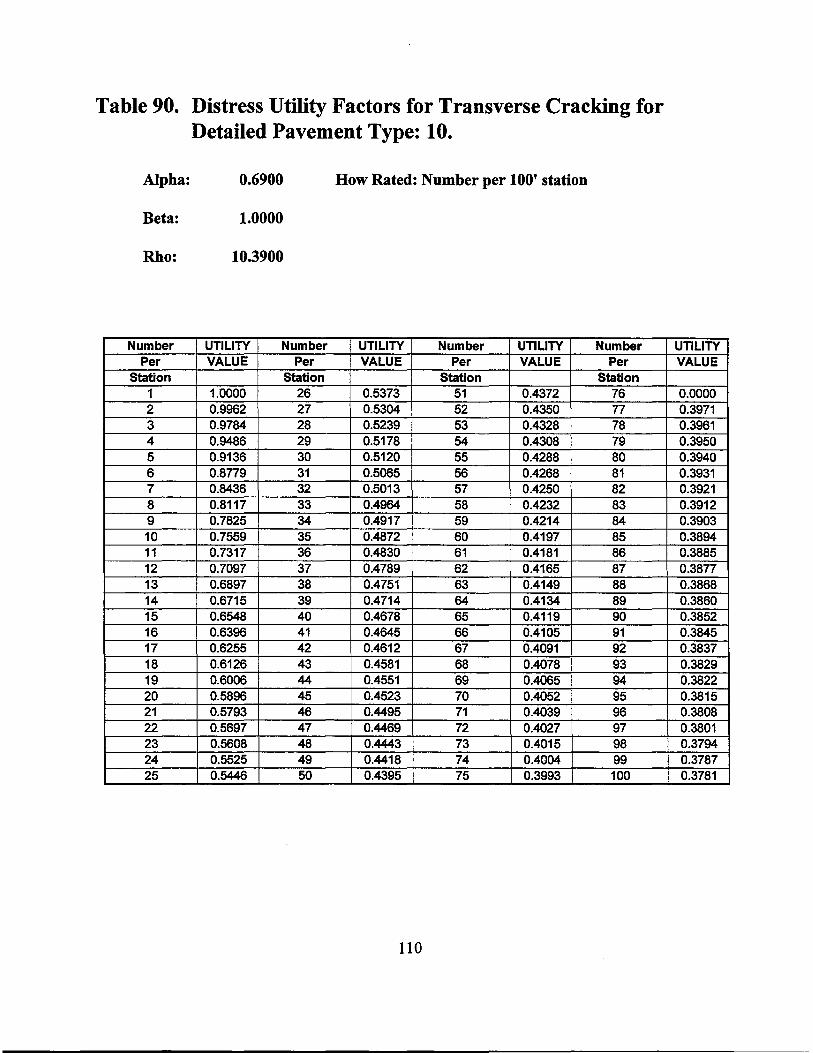
Table 90. Distress Utility Factors for Transverse Cracking for Detailed Pavement Type: 10.
Alpha: 0.6900 How Rated: Number per 100' station
Beta: 1.0000
Rho: 10.3900
Number UTILITY Number UTILITY Number UTILITY Number Per VALUE Per VALUE Per VALUE Per
Station Station Station Station 1 1.0000 26 0.5373 51 0.4372 76 2 0.9962 27 0.5304 52 0.4350 77 3 0.9784 28 0.5239 53 0.4328 78 4 0.9486 29 0.5178 54 0.4308 79 5 0.9136 30 0.5120 55 0.4288 80 6 0.8779 31 0.5065 56 0.4268 81 7 0.8436 32 0.5013 57 0.4250 82 8 0.8117 33 0.4964 58 0.4232 83 9 0.7825 34 0.4917 59 0.4214 84 10 0.7559 35 0.4872 60 0.4197 85 11 0.7317 36 0.4830 61 0.4181 86 12 0.7097 37 0.4789 62 0.4165 87 13 0.6897 38 0.4751 63 0.4149 88 14 0.6715 39 0.4714 64 0.4134 89 15 0.6548 40 0.4678 65 0.4119 90 16 0.6396 41 0.4645 66 0.4105 91 17 0.6255 42 0.4612 67 0.4091 92 18 0.6126 43 0.4581 68 0.4078 93 19 0.6006 44 0.4551 69 0.4065 94 20 0.5896 45 0.4523 70 0.4052 95 21 0.5793 46 0.4495 71 0.4039 96 22 0.5697 47 0.4469 72 0.4027 97 23 0.5608 48 0.4443 73 0.4015 98 24 0.5525 49 0.4418 74 0.4004 99 25 0.5446 50 0.4395 75 0.3993 100
110
UTILITY VALUE
0.0000 0.3971 0.3961 0.3950 0.3940 0.3931 0.3921 0.3912 0.3903 0.3894 0.3885 0.3877 0.3868 0.3860 0.3852 0.3845 0.3837 0.3829 0.3822 0.3815 0.3808 0.3801 0.3794 0.3787 0.3781

Table 91. Distress Utility Factors for Longitudinal Cracking for Detailed Pavement Type: 10.
Alpha: 0.8700 How Rated: Length per 100' station
Beta: 1.0000
Rho: 184.0000
Length UTILITY Length UTILITY Length UTILITY Length UTILITY Per VALUE Per VALUE Per VALUE Per VALUE
Station Station Station Station 5 1.0000 130 0.7887 255 0.5772 380 0.0000 10 1.0000 135 0.7774 260 0.5713 385 0.4605 15 1.0000 140 0.7663 265 0.5655 390 0.4572 20 0.9999 145 0.7554 270 0.5599 395 0.4540 25 0.9994 150 0.7449 275 0.5544 400 0.4508 30 0.9981 155 0.7346 280 0.5491 405 0.4477 35 0.9955 160 0.7245 285 0.5438 410 0.4446 40 0.9913 165 0.7148 290 0.5387 415 0.4416 45 0.9854 170 0.7052 295 0.5337 420 0.4386 50 0.9781 175 0.6960 300 0.5289 425 0.4357 55 0.9693 180 0.6870 305 0.5241 430 0.4329 60 0.9595 185 0.6782 310 0.5194 435 0.4301 65 0.9487 190 0.6697 315 0.5149 440 0.4273 70 0.9372 195 0.6614 320 0.5104 445 0.4246 75 0.9252 200 0.6533 325 0.5061 450 0.4220 80 0.9128 205 0.6454 330 0.5018 455 0.4194 85 0.9001 210 0.6378 335 0.4977 460 0.4168 90 0.8874 215 0.6303 340 0.4936 465 0.4143 95 0.8746 220 0.6230 345 0.4896 470 0.4118 100 0.8618 225 0.6160 350 0.4857 475 0.4094 105 0.8492 230 0.6091 355 0.4819 480 0.4070 110 0.8367 235 0.6024 360 0.4781 485 0.4047 115 0.8244 240 0.5958 365 0.4745 490 0.4024 120 0.8122 245 0.5895 370 0.4709 495 0.4001 125 0.8004 250 0.5832 375 0.4674 500 0.3979
111

For the ACP section, assume that Pavement Type= 4. The rating for Shallow
Rutting (25 percent) is the L value. Thus, use Table 36 to find a utility value
of 0.8591.
Assuming that there are no other distress types (i.e., all other utility values =
1.0000), the Distress Score for the ACP section is 86 (rounded up from 85.91).
For the CRCP section, assume that the length of the section is 0.5 miles.
Pavement Type is 1. The ratings for Punchouts and Concrete Patches must be
converted to L values, using the equations shown below:
LPunch 5
0.5 3 L =-
PCPat 0.5
The L values are thus 10 per mile for Punchouts and 6 per mile for Concrete
Patches. Then use Tables 23 and 25 to find a utility value of 0.4109 for
Punchouts and 0. 7795 for Concrete Patches.
Assuming that there are no other distress types (i.e., all other utility values=
1.0000), the Distress Score for the CRCP section is 32 (rounded down from
32.03), as shown in the equation below:
Answer #1:
Question #2:
The CRCP section is worse, by 54 points.
Is a JCP section with 38 Failed Joints and Cracks in worse
condition than an ACP section with 10 percent Alligator
Cracking? And if so, then by how much?
For the JCP section, assume that Pavement Type= 2, and that Section Length=
0.5 miles. The rating for Failed Joints and Cracks must be converted to an L
value, using the equation shown below:
112

L = 100 x 38
· The L value is thus 86.36 percent. Use 86 percent in Table 31 to find a utility
value of 0.5869.
Assuming that there are no other distress types (i.e., all other utility values=
1.0000), the Distress Score for the JCP section is 59 (rounded up from 58.69).
For the ACP section, assume that Pavement Type= 6, and that Section Length
is also 0.5 miles. The rating for Alligator Cracking (10 percent) is the L value.
Thus, use Table 57 to find a utility value of 0.7621.
Assuming that there are no other distress types (i.e., all other utility values =
1.0000), the Distress Score for the ACP section is 76 (rounded down from
76.21).
Answer #2: The JCP section is in worse condition, by 17 points.
CALCULATING THE DISTRESS SCORE
As mentioned in Chapter 1, the PMIS Distress Score is calculated from the
pavement utility curves. We propose that PMIS use the equations listed below, one for
each Broad Pavement Type (CRCP, JCP, and ACP), to calculate the Distress Score.
These equations are similar to the Unadjusted Visual Utility (UVU) equations, which
were used in PES.
Equation for CRCP (Pavement Type = 1)
For CRCP sections, use the following equation:
113

where:
DS = Distress Score,
u = Utility value,
Spall = Spalled Cracks,
Punch = Punchouts,
ACPat = Asphalt Patches, and
PC Pat = Concrete Patches.
Equation for JCP (Pavement Type = 2-3)
For JCP sections, use the following equation:
DS = 100 x [UFij*UFaiI*Uss*ULng *UPCPat]
where:
DS = Distress Score,
u = Utility value,
Flj = Failed Joints and Cracks,
Fail = Failures,
SS = Shattered (Failed) Slabs,
Lng = Slabs With Longitudinal Cracking, and
PCP at = Concrete Patches.
Equation for ACP (Pavement Type= 4-10)
For ACP sections, use the following equation:
114

where:
DS = Distress Score,
u = Utility value,
SRut = Shallow Rutting,
DRut = Deep Rutting,
Pat = Patching,
Fail Failures,
Blk = Block Cracking,
Alg = Alligator Cracking,
Lng = Longitudinal Cracking, and
Tm = Transverse Cracking.
CALCULATING THE CONDITION SCORE
As mentioned in Chapter 1, the PMIS Condition Score is also calculated from the
pavement utility curves. We propose that PMIS use the equation shown below to
calculate the Condition Score:
cs = 100 x DS x u RS
where:
cs = Condition Score,
DS = Distress Score,
u = Utility value, and
RS = Ride Score.
This equation is similar to the Unadjusted Pavement Score (UPS) equation, which
was used in PES.
SUMMARY
The PMIS utility values will give pavement managers a consistent way to compare
different pavement sections in different conditions in different places. By serving as
115

inputs to the PMIS Distress and Condition Score equations, they will also provide a way
for TxDOT to describe the overall condition of its pavements.
For all of their applications, the utility values by themselves are not enough to
describe the future condition of any pavement section. However, they can support this
process, as will be described in Chapter 3.
116

III - PAVEMENT PERFORMANCE CURVES
Although comparing the current condition of different pavement sections is important,
one of the most important benefits of a pavement management system comes from its
ability to predict future pavement condition. This ability allows the pavement manager to
"plan ahead," and fix a "problem" section before it becomes a problem. By "heading off'
these problem sections, the pavement manager can use less-expensive treatments, and thus
treat more pavements with the same amount of money. As more pavements are improved,
the overall network condition should rise.
To provide this ability for TxDOT pavement managers, we propose that PMIS use a
set of pavement performance curves to predict the future condition of Texas highways.
DESCRIPTION
As mentioned in Chapter 2, it is possible to relate increasing pavement distress to
decreasing pavement utility (as was shown in Figure 1 ). Of course, increasing pavement
distress is also related to increasing pavement age. Thus, pavement age, pavement distress,
and pavement utility are all related to each other. As the pavement gets older, the amount
of pavement distress increases (as described by the performance curve), and the pavement's
utility drops.
Actually, it would be better to replace "pavement age" with a measure of accumulated
traffic load (e.g., accumulated 18-k ESAL ), but the performance curve concepts are the
same. In the absence of consistent accumulated traffic load data on Texas highways, we
propose that PMIS use "pavement age" in its pavement performance curves.
The pavement performance curve gives a way to estimate a pavement section's
theoretical "age," based upon the amount of distress observed, as shown in Figure 5. When
compared to the expected "design life," this age can be used to determine the section's
remaining life, using the equation shown below:
117

100 ~ -
ca 80 Q)
'-q: ,.... 60 c: Q) (.)
- ; 40 -00 a..
~ ,,,_.
~
/ ~
/ J
I f
J
20 I
I I
0 /
0 5 10 15 20 25 30 Age in Years
Figure 5. Performance Curve for Shallow Rutting.
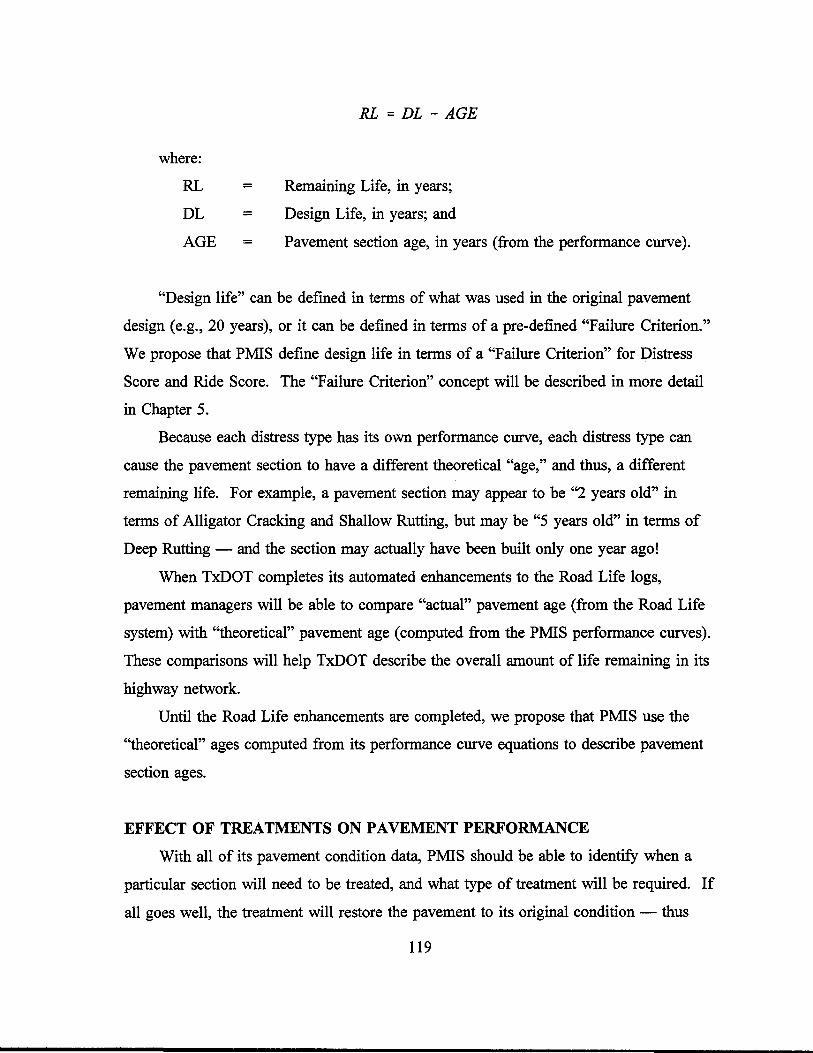
where:
RL = DL =
AGE =
RL = DL -AGE
Remaining Life, in years;
Design Life, in years; and
Pavement section age, in years (from the performance curve).
"Design life" can be defined in terms of what was used in the original pavement
design (e.g., 20 years), or it can be defined in terms of a pre-defined "Failure Criterion."
We propose that PMIS define design life in terms of a "Failure Criterion" for Distress
Score and Ride Score. The "Failure Criterion" concept will be described in more detail
in Chapter 5.
Because each distress type has its own performance curve, each distress type can
cause the pavement section to have a different theoretical "age," and thus, a different
remaining life. For example, a pavement section may appear to be "2 years old" in
terms of Alligator Cracking and Shallow Rutting, but may be "5 years old" in terms of
Deep Rutting - and the section may actually have been built only one year ago!
When TxDOT completes its automated enhancements to the Road Life logs,
pavement managers will be able to compare "actual" pavement age (from the Road Life
system) with "theoretical" pavement age (computed from the PMIS performance curves).
These comparisons will help TxDOT describe the overall amount of life remaining in its
highway network.
Until the Road Life enhancements are completed, we propose that PMIS use the
"theoretical" ages computed from its performance curve equations to describe pavement
section ages.
EFFECT OF TREATMENTS ON PAVEMENT PERFORMANCE
With all of its pavement condition data, PMIS should be able to identify when a
particular section will need to be treated, and what type of treatment will be required. If
all goes well, the treatment will restore the pavement to its original condition - thus
119
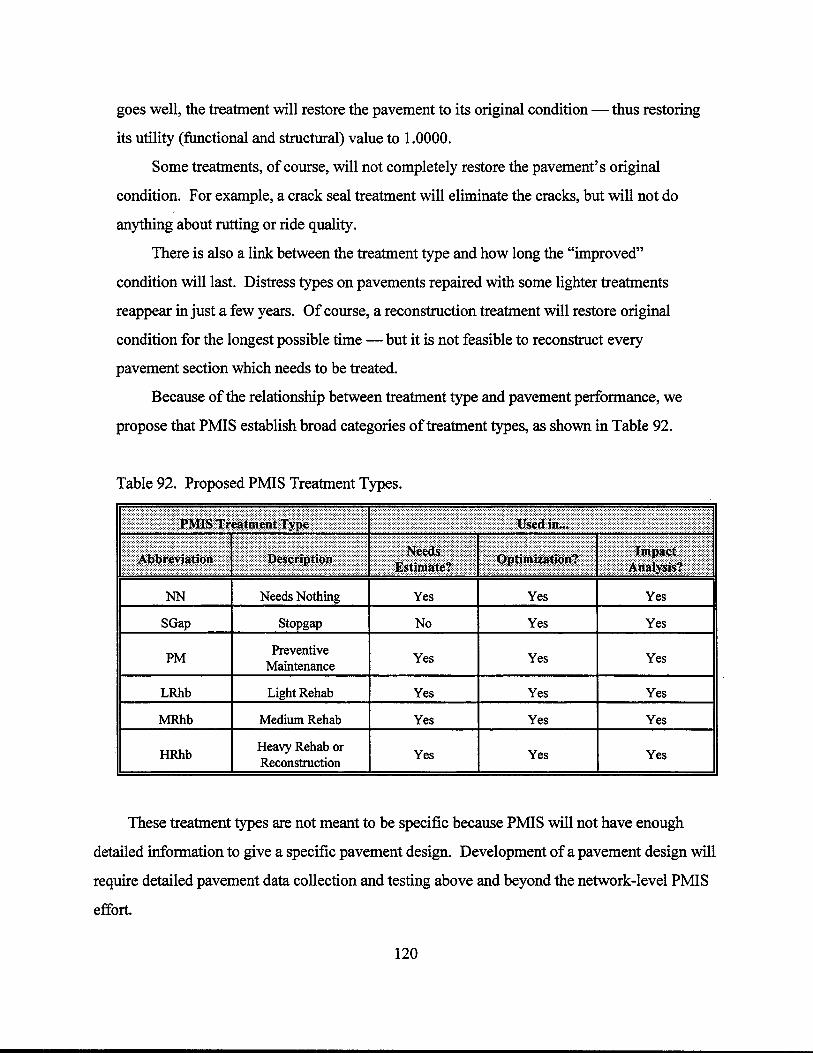
goes well, the treatment will restore the pavement to its original condition - thus restoring
its utility (functional and structural) value to 1.0000.
Some treatments, of course, will not completely restore the pavement's original
condition. For example, a crack seal treatment will eliminate the cracks, but will not do
anything about rutting or ride quality.
There is also a link between the treatment type and how long the "improved"
condition will last. Distress types on pavements repaired with some lighter treatments
reappear in just a few years. Of course, a reconstruction treatment will restore original
condition for the longest possible time - but it is not feasible to reconstruct every
pavement section which needs to be treated.
Because of the relationship between treatment type and pavement performance, we
propose that PMIS establish broad categories of treatment types, as shown in Table 92.
Table 92. Proposed PMIS Treatment Types.
·.·.·-·.·-·.·.·.·.·.-... ;.;.;.;.;:;·:· .. ··········- ·.:.:::::::::: :::::::. ·.·.·.·.·.·.· ........ .
:::r : rf:[:::~lfi~:rnr~i.!mim1'$P~::::mr···=
NN Needs Nothing Yes Yes Yes
SGap Stopgap No Yes Yes
PM Preventive
Yes Yes Yes Maintenance
LRhb Light Rehab Yes Yes Yes
MRhb Medium Rehab Yes Yes Yes
HRhb Heavy Rehab or
Yes Yes Yes Reconstruction
These treatment types are not meant to be specific because PMIS will not have enough
detailed information to give a specific pavement design. Development of a pavement design will
require detailed pavement data collection and testing above and beyond the network-level PMIS
effort.
120

For more information about these treatment types, please refer to Chapter 4.
DEFINING PERFORMANCE CURVES
The performance curves are a foundation of the PMIS analysis procedures (Needs Estimate,
Optimization, and Impact Analysis). As will be described in later Chapters, the performance
curves project distress ratings and Ride Scores into the future for use in predicting future
pavement condition, treatments, and costs. Because of their importance to the overall PMIS
effort, we propose that TxDOT continually evaluate and improve the PMIS performance curves,
to give the most reliable results possible.
Distress Types
The performance curves should determine how much distress will be observed at any time
during the pavement's life. Thus, the performance curve will be able to give a PMIS rating for
each distress type.
As with the utility curve equations described in Chapter 2, some of the distress ratings will
have to be "normalized" to a percentage or other similar value. Thus, we propose that the PMIS
performance curves for pavement distress compute the L value (level of distress) as a function of
pavement age. The "predicted" PMIS distress rating can then be back-calculated from the L
value. One advantage of this feature is that the pavement manager will be able to "calibrate" the
performance curve equations by comparing a section's current PMIS distress ratings with those
predicted from previous years' data.
As in Chapter 2, we propose that PMIS not define performance curves for its optional
distress types (currently, Raveling and Flushing) or for those distress types that are used to
normalize other distress ratings (currently, Average Crack Spacing and Apparent Joint Spacing).
We also propose that PMIS not define a performance curve for Patching on ACP sections, as
described below.
Patching on ACP Sections
Research study personnel had often observed a relationship between Patching on ACP
121

sections and the number of Failures. The immediate problem, of course, was to develop a
performance curve that TxDOT could use to predict Failures before they occurred.
It was originally expected that data from the Flexible Pavement Database and PES would
define a performance curve for Failures on ACP sections. However, the data indicated that very
few pavement sections ever developed more than two Failures per mile (i.e., had a PES rating of
"010" or "001 "). Discussion with TxDOT Districts revealed that they were patching the Failures
as quickly as possible.
Research study personnel reviewed the data again and defined a relationship between
Failures and Patching: every time the number of Failures rose above two per mile, the amount of
Patching increased (and the number of Failures went back down below two per mile again). It
was difficult to determine an exact percentage increase in Patching when Failures were repaired,
because the broad PES rating categories (i.e., "000," "100," "010," and "001") did not identify
the actual percent of Patching. Research study personnel tried many different combinations; the
one that worked the best was to use a 5 percent increase in Patching for every 2 Failures per mile
repaired.
Because of this relationship, we propose that PMIS define performance curves for Failures,
but not for Patching, on ACP. To "age" the amount of Patching over time, we propose that
PMIS increase the rating for Patching by 5 percent (up to a maximum of 100, of course) for
every 2 Failures per mile- stopping only when the Failures rating drops below 2 (per mile).
The Failures should then be "aged" according to the appropriate treatment-based performance
curve each year and more Patching added only when the Failures rating exceeds 2 (per mile). An
example of this process is shown below in Table 93.
122

Table 93. Example of Aging Patching and Failures for ACP.
·.·•· ····················.·.·-:.······
:=::.::.:1:1:::1ii¢~it.g·:.:=·=: .t' 1995 (current) 3 11
1996 28
1997 28 1.7587
1998 28 2.3934
1999 33 0.3934
current ratings (no aging)
failures were above 2 per mile: reduce failures to 9, 7, 5, 3, and then to 1; increase patching by 5 percent each time to 8, 13, 18, 23, and fmally to 28, respectively
failures were below 2 per mile: age failures according to performance curve to get 1.7587; no change in patching
failures were below 2 per mile: age failures according to performance curve to get 2.3934; no change in patching
failures were above 2 per mile; reduce failures to 0.3934; increase patching by 5 percent
This proposal has not been used in the current version of PMIS. PMIS ages Failures
and lets those values trigger Preventive Maintenance treatments, as needed.
Ride Quality
The performance curves should also be able to track the expected decrease in ride quality as
a pavement ages. However, this approach would contradict the "shape" of the performance curve
used for distress: the ride curve would have a negative slope (i.e., ride quality goes down as the
pavement ages), while the distress curve would have a positive slope (i.e., the level of distress
increases as the pavement ages). The performance curves would be more difficult to understand
if one group of curves went up with time and the other group of curves went down with time.
To ensure that the ride quality performance curves have the same positive slope as the
distress performance curves, we propose that PMIS compute the L value (percent of ride quality
lost) as a function of pavement age. The "predicted" PMIS Ride Score can then be back
calculated from the L value. One advantage of this feature is that the pavement manager will be
123

able to "calibrate" the performance curve equations by comparing a section's current PMIS Ride
Score with that predicted from previous year's data.
BASIC PERFORMANCE CURVE EQUATION
As with the utility curves, the basic shape of a pavement's performance curve is sigmoidal
(S-shaped). Most of the PMIS distress types have a performance curve (Patching, Raveling,
Flushing, Average Crack Spacing, and Apparent Joint Spacing do not). This curve may be
represented by the following equation:
where:
L =
1 =
(X =
e =
x =
E =
a =
p =
AGE =
~ =
level of distress (for distress types) or ride quality lost (for ride quality);
a PMIS distress type (e.g., Deep Rutting or Punchouts) or Ride Score;
alpha, a horizontal asymptote factor that controls the maximum range of
percentage distress growth or ride loss;
base of the natural logarithms (e z 2.71828 ... );
chi, a traffic weighting factor that controls the effect of 18-k ESAL on
performance;
epsilon, a climate weighting factor that controls the effect of rainfall
and freeze-thaw cycles on performance;
sigma, a subgrade weighting support factor that controls the effect of
subgrade strength on performance;
rho, a prolongation factor, in years, that controls "how long" the
pavement will "last" before significant increases in distress occur;
pavement section age, in years; and
beta, a slope factor that controls how steeply condition is lost in the
middle of the curve.
The x, e, and a factors are curve modifiers used only in the performance curve equations.
124

These factors are described in the next three sections. The a, p, and p factors are described
in Chapter 2. Please refer to Chapter 2 for information about the L value.
Traffic Factor (Chi)
Chi (X) controls the effect of traffic on pavement performance. We propose that PMIS
define Chi in terms of a section's 20-year projected 18-k ESAL, as shown in the equation
below:
where:
x i
Xmax
e
X13
ESAL
=
=
=
=
=
=
=
traffic weighting factor;
a PMIS distress type (e.g., Deep Rutting or Punchouts);
the maximum value of Chi;
base of the natural logarithms (e:::: 2.71828 ... );
ChiBeta, a slope factor that controls how steeply utility is lost in the
middle of the curve;
ChiRho, a prolongation factor, in 18 kips (millions), that controls the
shape of the traffic factor curve; and
the pavement section's 20-year projected 18-k ESAL (Equivalent
Single Axle Load) value, in millions.
We propose that PMIS define the coefficients of the Chi equation, as shown in Tables
94-96. The tables contain minimum values for Chi (XmuJ· These values ensure that PMIS
will not "fail" a pavement section immediately under very high traffic loads (which would
happen as x approaches zero).
Because Chi is related to traffic load, we propose that Chi be computed only for the load
associated ACP distress types (i.e., Shallow Rutting, Deep Rutting, Alligator Cracking), and
for ACP ride quality. For all other ACP distress types, we propose that Chi should be defined equal
to 1.0000. We also propose that a Chi value of 1.0000 be used for rigid pavements (CRCP and
125

JCP), as suggested by Research Study 1908 ("Texas Pavement Management System"), conducted
by the Center for Transportation Research-University of Texas at A~stin.
Table 94. Proposed Xmax, x~, and Xp Coefficients for Computing Chi Factor for Pavement Distress (PMIS Pavement Types 4-8).
4 Shallow Rutting 1.1800 1.4800 33.2800 0.8300
Deep Rutting 1.1800 1.4800 33.2800 0.8300
Alligator Cracking 1.3000 3.1600 37.3500 0.7000
5 Shallow Rutting 1.1800 1.1400 13.5600 0.8300
Deep Rutting 1.1800 1.1400 13.5600 0.8300
Alligator Cracking 1.3000 2.3400 15.3700 0.7000
6 Shallow Rutting 1.1800 1.1300 5.1300 0.8300
Deep Rutting 1.1800 1.1300 5.1300 0.8300
Alligator Cracking 1.3000 2.3100 5.8100 0.7000
7 Shallow Rutting 1.1800 1.3400 33.9700 0.8300
Deep Rutting 1.1800 1.3400 33.9700 0.8300
Alligator Cracking 1.3000 2.8400 38.5300 0.7000
8 Shallow Rutting 1.1800 1.1800 24.1800 0.8300
Deep Rutting 1.1800 1.1800 24.1800 0.8300
Alligator Cracking 1.3000 2.4300 27.4100 0.7000
126

Table 95. Proposed Xmax• Xp, and Xp Coefficients for Computing Chi Factor for Pavement Distress (PMIS Pavement Types 9-10).
9 Shallow Rutting 1.1800 1.0900 10.1300 0.8300
Deep Rutting 1.1800 1.0900 10.1300 0.8300
Alligator Cracking 1.3000 2.2400 11.4800 0.7000
10 Shallow Rutting 1.1800 0.9600 1.6500 0.8300
Deep Rutting 1.1800 0.9600 1.6500 0.8300
Alligator Cracking 1.3000 1.9200 1.8700 0.7000
Table 96. Proposed Xmax• Xp, and Xp Coefficients for Computing Chi Factor for Ride Quality (PMIS Pavement Types 4-10).
4 1.1200 0.6300 27.5800 0.9400
5 1.1200 0.5000 11.2000 0.9400
6 1.1200 0.5000 4.2400 0.9400
7 1.1200 0.5800 28.1400 0.9400
8 1.1200 0.5200 19.9900 0.9400
9 1.1200 0.4900 8.3600 0.9400
10 1.1200 0.4400 1.3600 0.9400
For reference purposes, we have enclosed Tables 97-124, which list the proposed Chi
factors for "typical" 18-k ESAL values from 1 million to 100 million repetitions in 20 years.
Tables 97-124 only cover the proposed Chi factors for load-associated distress types and ride
quality on ACP (Pavement Types = 4-10).
127

Table 97. Traffic Factors (CHI) for Shallow Rutting for Detailed Pavement Type 04.
Chi Maximum: 1.1800 Chi Minimum: 0.8300
Chi Beta: 1.4800 Chi Rho: 33.2800
128

Table 98. Traffic Factors (CHI) for Deep Rutting for Detailed Pavement Type 04.
Chi Maximum: 1.1800 Chi Minimum: 0.8300
Chi Beta: 1.4800 Chi Rho: 33.2800
129

Table 99. Traffic Factors (CHI) for Alligator Cracking for Detailed Pavement Type 04.
Chi Maximum: 1.3000 Chi Minimum: 0.7000
Chi Beta: 3.1600 Chi Rho: 37.3500
130

Table 100. Traffic Factors (CHI) for Ride Score for Detailed Pavement Type 04.
Chi Maximum: 1.1200 Chi Minimum: 0.9400
Chi Beta: 0.6300 Chi Rho: 27.5800
131

Table 101. Traffic Factors (CHI) for Shallow Rutting for Detailed Pavement Type 05.
Chi Maximum: 1.1800 Chi Minimum: 0.8300
Chi Beta: 1.1400 Chi Rho: 13.5600
132

Table 102. Traffic Factors (CHI) for Deep Rutting for Detailed Pavement Type 05.
Chi Maximum: 1.1800 Chi Minimum: 0.8300
Chi Beta: 1.1400 Chi Rho: 13.5600
133

Table 103. Traffic Factors (CHI) for Alligator Cracking for Detailed Pavement Type 05.
Chi Maximum: 1.3000 Chi Minimum: 0.7000
Chi Beta: 2.3400 Chi Rho: 15.3700
134

Table 104. Traffic Factors (CHI) for Ride Score for Detailed Pavement Type 05.
Chi Maximum: 1.1200 Chi Minimum: 0.9400
Chi Beta: 0.5000 Chi Rho: 11.2000
135

Table 105. Traffic Factors (CHI) for Shallow Rutting for Detailed Pavement Type 06.
Chi Maximum: 1.1800 Chi Minimum: 0.8300
Chi Beta: 1.1300 Chi Rho: 5.1300
136

Table 106. Traffic Factors (CHI) for Deep Rutting for Detailed Pavement Type 06.
Chi Maximum: 1.1800 Chi Minimum: 0.8300
Chi Beta: 1.1300 Chi Rho: 5.1300
137

Table 107. Traffic Factors (CHI) for Alligator Cracking for Detailed Pavement Type 06.
Chi Maximum: 1.3000 Chi Minimum: 0.7000
Chi Beta: 2.3100 Chi Rho: 5.8100
138

Table 108. Traffic Factors (CHI) for Ride Score for Detailed Pavement Type 06.
Chi Maximum: 1.1200 Chi Minimum: 0.9400
Chi Beta: 0.5000 Chi Rho: 4.2400
139

Table 109. Traffic Factors (CHI) for Shallow Rutting for Detailed Pavement Type 07.
Chi Maximum:. 1.1800 Chi Minimum: 0.8300
Chi Beta: 1.3400 Chi Rho: 33.9700
140

Table 110. Traffic Factors (CHI) for Alligator Cracking for Detailed Pavement Type 07.
Chi Maximum: 1.3000 Chi Minimum: 0.7000
Chi Beta: 2.8400 Chi Rho: 38.5300
141

Table 111. Traffic Factors (CHI) for Deep Rutting for Detailed Pavement Type 07.
Chi Maximum: 1.1800 Chi Minimum: 0.8300
Chi Beta: 1.3400 Chi Rho: 33.9700
142

Table 112. Traffic Factors (CHI) for Shallow Rutting for Detailed Pavement Type 08.
Chi Maximum: 1.1800 Chi Minimum: 0.8300
Chi Beta: 1.1800 Chi Rho: 24.1800
143
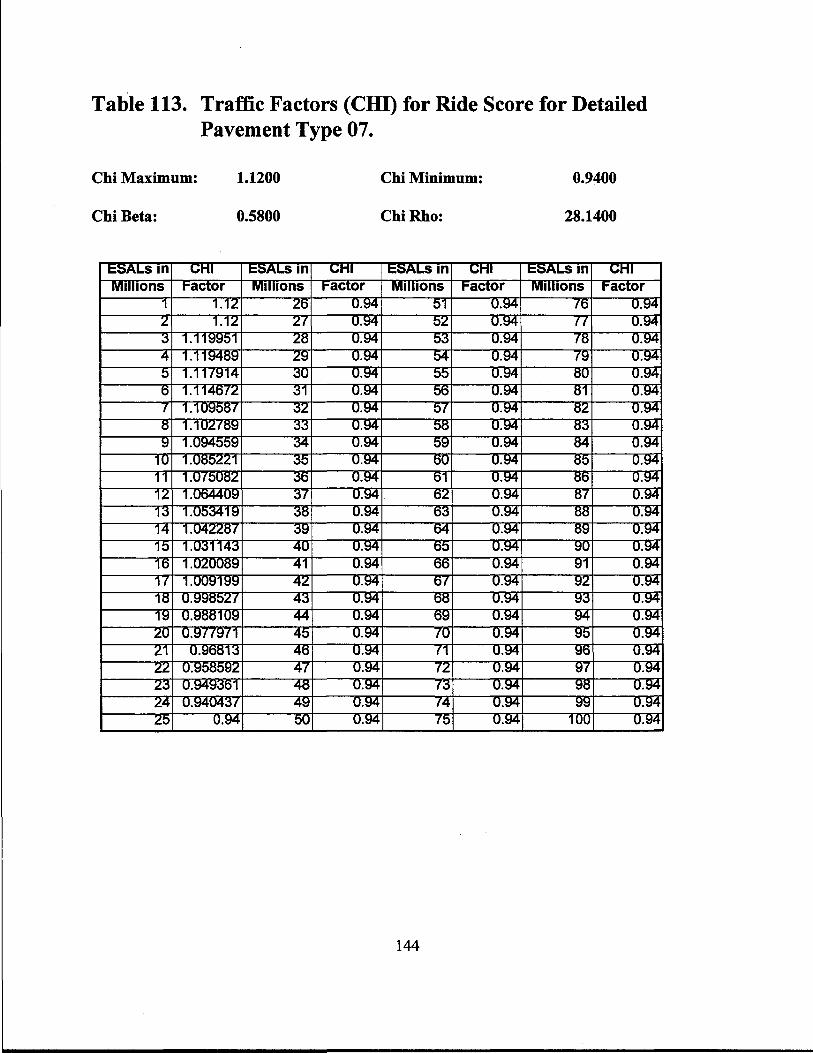
Table 113. Traffic Factors (CHI) for Ride Score for Detailed Pavement Type 07.
Chi Maximum: 1.1200 Chi Minimum: 0.9400
Chi Beta: 0.5800 Chi Rho: 28.1400
144

Table 114. Traffic Factors (CHI) for Alligator Cracking for Detailed Pavement Type 08.
Chi Maximum: 1.3000 Chi Minimum: 0.7000
Chi Beta: 2.4300 Chi Rho: 27.4100
145

Table 115. Traffic Factors (CHI) for Deep Rutting for Detailed Pavement Type 08.
Chi Maximum: 1.1800 Chi Minimum: 0.8300
Chi Beta: 1.1800 Chi Rho: 24.1800
146

Table 116. Traffic Factors (CHI) for Shallow Rutting for Detailed Pavement Type 09.
Chi Maximum: 1.1800 Chi Minimum: 0.8300
Chi Beta: 1.0900 Chi Rho: 10.1300
147

Table 117. Traffic Factors (CHI) for Ride Score for Detailed Pavement Type 08.
Chi Maximum: 1.1200 Chi Minimum: 0.9400
Chi Beta: - 0.5200 Chi Rho: 19.9900
148

Table 118. Traffic Factors (CHI) for Alligator Cracking for Detailed Pavement Type 09.
Chi Maximum: 1.3000 Chi Minimum: 0.7000
Chi Beta: 2.2400 Chi Rho: 11.4800
149

Table 119. Traffic Factors (CHI) for Deep Rutting for Detailed Pavement Type 09.
Chi Maximum: 1.1800 Chi Minimum: 0.8300
Chi Beta: 1.0900 Chi Rho: 10.1300
150

Table 120. Traffic Factors (CHI) for Shallow Rutting for Detailed Pavement Type 10.
Chi Maximum: 1.1800 Chi Minimum: 0.8300
Chi Beta: 0.9600 Chi Rho: 1.6500
151

Table 121. Traffic Factors (CHI) for Shallow Rutting for Detailed Pavement Type 09.
Chi Maximum: 1.1200 Chi Minimum: 0.9400
Chi Beta: 0.4900 Chi Rho: 8.3600
152

Table 122. Traffic Factors (CHI) for Alligator Cracking for Detailed Pavement Type 10.
Chi Maximum: 1.3000 Chi Minimum: 0.7000
Chi Beta: 1.9200 Chi Rho: 1.8700
153

Table 123. Traffic Factors (CHI) for Deep Rutting for Detailed Pavement Type 10.
Chi Maximum: 1.1800 Chi Minimum: 0.8300
Chi Beta: 0.9600 Chi Rho: 1.6500
154

Table 124. Traffic Factors (CHI) for Ride Score for Detailed Pavement Type 10.
Chi Maximum: 1.1200 Chi Minimum: 0.9400
Chi Beta: 0.4400 Chi Rho: 1.3600
155

Climate Factor (Epsilon)
Epsilon ( e) controls the effect of climate on pavement performance. PES used average
county rainfall and average county freeze-thaw cycles to account for climatic effects when
computing its Adjusted Visual Utility (A VU) score, but this did nothing to "age" pavement
sections solely under the effects of climate.
Although climate is an important factor to consider when predicting future pavement
condition, most TxDOT-sponsored research studies have focused on the effects of traffic on
performance. Several important climatic factors have been identified in the research, but many
questions still remain to be answered in this area.
We propose that PMIS use an Epsilon value of 1.0000 for all ACP distress types and ride
quality until more is learned about the effects of climate on pavement performance. For rigid
pavements (CRCP and JCP) we propose that PMIS use an Epsilon value of 1.0000, as suggested
by Research Study 1908 ("Texas Pavement Management System"), conducted by the Center for
Transportation Research- University of Texas at Austin.
Subgrade Support Factor (Sigma)
Sigma (a) controls the effect of subgrade support on pavement performance. Although the
man-made upper pavement layers may be carefully designed and constructed, the final pavement
performance will still be affected by the quality of the underlying subgrade material. Obviously,
there are many factors which will effect subgrade quality - not all of which are within the
pavement manager's control. Because of the complex interaction of the factors that affect
subgrade quality, TxDOT has taken an empirical approach to subgrade support by describing it
in terms of the W7 geophone readings taken from Falling Weight Deflectometer (FWD) tests.
The W7 sensor measures surface deflection at a distance of 1.82 m (72 ins) from the center of the
FWD's loadplate. TxDOT has computed average W7 values for each County.
We propose that PMIS use these average County W7 values to compute the Sigma factor,
by County, for each TxDOT District, as shown in Table 125. Obviously this is not an exact
approach to estimating the support offered by subgrade at any one location, however it does give
acceptable results for network-level studies. For rigid pavements (CRCP and JCP) we propose
that PMIS use a Sigma value of 1.0000, as suggested by Research Study 1908 ("Texas Pavement
156

Management System"), conducted by the Center for Transportation Research - University of
Texas at Austin.
Table 125. Sigma Values, by County, for Each TxDOT District.
District 1 (Paris)
:::::::~: :;:::::::::::::::::::;::;::--.·.·.·.···· :::::::::::::::::::::::::::::{::: ;:;:;:;:;:;:;::::;:::::::::::::::: ·::::::::::::::::: :::=:=:;:
::•::::::n_•·.•.·.••.• .. '_h_.•_·.·_: .. ~.-· .• ·.:.•_:_n_.· .. • .. • .. ·.t_.·_.·.•_y_·_·.· .• •.:_::_N_.·.·_:_;_.· .. ·.:_.u_.· .. · .•. :· .. ·.:'_in_.·_.· .. •_.:.·_.'.ti_:· .. ·_ ...•• _.' . .'_e_ .• _:_ •• _ ••. r_.'. [j ' stiligf~ai tr .=.•.•.•· .... ·.··.·.=.• .. · ... · .• ·.· .... · .. ·•· .. ·.··,·a·····.·n·····d·. ••· .• ·.·N.· ........ ·.·.···m········e···.•· .• · .•.• ••·•· .•.• · •.• · ..• ·•. .·•.·•.·•.·.·.· • .• ·• ..• ' ..• • ..• • ..• • ..• • ..• ·• ..• • ...• • ..• •_ ..• • ..• ' ...• • ..• ' .. ···s'.·.:.·.·.··_·u:.·:_'_•.·_:·_::.p•_··.·.·_·p··.•.•.·.··.·o· .• ·•.·.•.:~.··.·.·.·.·.·.·.·.·.·.:•_ ..• • ..• •_ ..• • ..• ·• ...• •_ .• • ..• •_.:::::::= =··· •••s· tJ•1·~2w•·•=::::::::::: •:::=:•·•::::::::=::::;:::•:•:•:•:•:•:•:•:::::::? i:tfiu""'G:a··•·••t·=·;;;.:;;=• • ::::•••u:·······1\;;:•;~>:•:•:•:•:•:::=:· :)trit:t·e•·•?t• ••·••••rt• ···<>· ........•... :i ........... ::::··:::::. ..... :.~ ..... Iii :ii. ::1ijlll1 •. :111111~1•1ll~l!l !:•111ij1~i! .! illi!i!i!~~i[ll•lli!ll: •-llli1G!i!I
60 Delta 5 Very Poor 1.00 1.00 1.00 1.00 1.00
75 Fannin 3 Fair 1.42 1.42 1.42 1.42 1.08
81 Franklin 4 Poor 1.21 1.21 1.21 1.21 1.04
92 Grayson 1 Very Good 1.80 1.80 1.80 1.80 1.19
113 Hopkins 4 Poor 1.21 1.21 1.21 1.21 1.04
117 Hunt 1 Very Good 1.80 1.80 1.80 1.80 1.19
139 Lamar 4 Poor 1.21 1.21 1.21 1.21 1.04
190 Rains 4 Poor 1.21 1.21 1.21 1.21 1.04
194 Red River 4 Poor 1.21 1.21 1.21 1.21 1.04
District 2 (Fort Worth)
•••::: · ·····= · ····· ·· ••••• ••••• •• :: •••••••• •>·•·• •:•:••:J• ... :::::ttI tE::: .. ::::::: •.:.:§i~~Iv~ii~~·!~iW~Iit:: ::It JI•• •••••••••>··••tc::::·:.
• __ .. i __ .:•.:_ .. •_ .. i __ .. 1 __ ... i __ .. 1 __ ... i __ .. 1 __ ... i __ .. • ... ·.· .. ··eo_ .. ·.·_:_ .. ::• •.. :_ .. ·_:·.:_! __ .•_ .• ·.:_ .• : __ .·.·_ .• : __ .•.. :_ .. : __ .·.·_ .• a'111_.:.:.:.:_•_:_~::··.:_.:.:_ ... 9.!.~::: ...•.. :•.• .... •_ ... :_ ... ·.:.~.• .. N'_:.•.·~::.••.•-~::_r_: ___ ::_ri_:._::_ .. ~_:_ .. :_r_:_ .•... :_.:_ .. :_ •. e ..•. • .. : .. ·._ .. •.: .... :_.~.: .... :.i ....•. 1 .... 1.i .... i __ .:.:_ .. i __ .l .... • ... • ... ·.• ... • ... ·.• .. _:_·· ..• ··:_ ... ··• ... •_.•_ ..... ·• ... ··•· ... ··•.· ... ···•.·····•.·····• .. ···: __ .. ··•· .. ·::.s_ ..... :_.::_,·_ .. :;s:•_.:::
0_ .• • .• • ..• ~:··b··.:_·.·.:.·.~-·.:P:·!"_;.:.A.~.: ... :.; __ a_:_:_.:_:_:.~_:.· ...•.... :_ .. :_ .. l_ .. l_.l_ .. i•:•_!.::··::•_.:.; ....•.••• ,.Sh.················n·=·=·=·•·•···•·•·•·•·•·•·•·•·• ·:·:·:·:·:·:·:·:·•n·······:·•·•·•·:=•·•·.·.·.·.·.·.·.·.·.·. ·•·•·····••j:=:=1···,··~··········t·············•·•·•·•·• •·•·•·····•·•·•·u··=·=··~=r·~>·•·•·•·•·•·•·: ·••••••••••••·R·=·=···~d·•·=·•=•=•···•·•·•·•·•· ~™ ~"'......... Ml"• .. ~... ·.• .• • .• • ......... :_· .•••. ·• •• i.• .• 'n.:_:_._· .. ·.·.·.·u·.·.a .•. • .. t·.·.·.··.t·.·.·.;1·.~ •• n·.·.·.·.w;.•g· ···.•.•_::_: .• _ ••••• : ......... •.• ..................... • .• :.:.::_._ .... ~.·.•.•.•.•.·.·:_:·u·.·.·.· .•.••. t~ ... '.t'_:_ •. •.=.;.P_ ..... ·.·.·.·.•g••••:_.·.··.• ... •.•.•• .. • .. • .. ·.·•··. •te .. ~! ernn ·········••t :Jm:~.~1f?i )ff .L!Y••····· ...... · ·.·.• ..... •:•:::::•/\. .......... . ..... ••••t• .. ~ "" "'' • rJtij~tfmg:@: ::::•••§§~ijg}J ::·•P##HJYl
73 Erath 2 Good 1.61 1.61 1.61 1.61 1.14
112 Hood 1 Very Good 1.80 1.80 1.80 1.80 1.19
120 Jack 1 Very Good 1.80 1.80 1.80 1.80 1.19
127 Johnson 3 Fair 1.42 1.42 1.42 1.42 1.08
182 Palo Pinto 1 Very Good 1.80 1.80 1.80 1.80 1.19
184 Parker 1 Very Good 1.80 1.80 1.80 1.80 1.19
213 Somervell 1 Very Good 1.80 1.80 1.80 1.80 1.19
220 Tarrant 1 Very Good 1.80 1.80 1.80 1.80 1.19
249 Wise 2Good 1.42 1.42 1.42 1.42 1.08
157

Table 125 (Continued). Sigma Values, by County, for Each TxDOT District.
District 3 (Wichita Falls)
.. ···············.·-:·'.-'· ··········-:-:-:;:·:· .·.· ;:::;:::.:;:::::::;:;:;:::::::;::::::::;:;:;::::;:;:-:.:-:··· .·.·.·-·.·.·.·.·-·-·.·.·.·-·.·.·. ·.·.·.·.·.·.·.·.·.·.·-·.·.·.·.·.·.·.·.·.·.·.·.·.·.·.·.·.·.·.·.·.·.·.·.·.·.·.·.·.·.·.·.·.·.·.·.·-·.·.·.·.·.·.·.·.·.·.·.·.·.·.·.-.·.·.·.·.·.·.·.·.·.·.·.·.·.· ·.·.· .. ·.·.·.·.·.·.· .·. ·.·.·.·.·.·.···.···.··.·.·.· .·. ··.··-··-·· ,,,,,,, ,,,,,,,,,,, ,, ·'' ··· ······························ ttttt• ::: ttI:IIIt:t:§Jgfuii:!ilij~K!O.t@?it' :: • •:t::;,:.J,:r:::• • ... '.• ... ''·· .. ,• ... ',• ... ·'·· .. ·',· ... '.• .. ,':, •. ' •... ' .... '.• ... 'JP.•,,···,·•,,• .. :,:.o,,·.•,.:,, .. •,.•,, .. :,ua:,•.:,:.•.'11," ..• ,.:, .•. :.,~··.······'·,·:.,.·.:~,···.··.•a• .. u.:.:.,'m:.r.:.: .. •.e:.b. :.,e,•.,·.,•·,'.,.·:r.·., •. , •. ,.·,:':.',•.,•.,.•.•.,'·,·.,•,•., ··,·:,:·: • .. ·':·: .. ,· .. ,:·· .. ·':.• .. ,·s···'·' .. ·'·' ... '•.:s,',,':,~,,·,.·,'.·u.·,.ti.•',·',·',·.·p:'.·.g,:.'.,.'p:.·.:t, ... :.',:·h·,~.·.·.'.·,·· .•• ~,·.·.',,',:,·· ... '',·.·,~ .. '·' ... '.• ... '.' ... ':• ... '· ... ·':• ... 'i ... '• .. ,•.: ... 'i ... ': ... ': ... ':.' .. ':··'·.· ... ':,• ... ,•.•,••.·'s·'.·':b'.''''a''•'• .. ll.,.,.,o.:::::.v..•'•.'•'.•.•.,•.•.•:.•: .. ••.•• ,.,:,:,:,:,:n··-.:e':'•'e'':{f:,:,.,:,:,.,., .... ,.,.,.,.,.,.,.,.,.,.,.,.,.,.,.,.,.,.,.,.,.,.,.,.,.,. ,.,.,.,.,.,.,.,.,.,.,.,.,.,.,.,.,.,.,.,.,.,.,.,...... ,.,. 04U ~~.· vu :: 'M ·:::: r.::·:·:·:·::. jfrH~m!~9tit •m:.tm:.Pwt!M:l] .::::iRm~f{j•
.·.·.,· .. ·,.·.· .. ·,·.·,·.·,·.·,·.·,·.·,·.·.·.·,·.·,·.·,· ... '.·,· ... '.·.'.·.'.·.'.·,.·.'··.'.·.'··.' J .. ,:.,•.·,•.,•R'.'.'.' .. ','.•,•,.•.•.•.•.•,t' .•. ' .• ,t'.'.'.··'•'.'.·.•n•.' .•. '.•.g'::::. '.,•,•.·.,•.:•.,•.,•.,•.,• ,• .. ,•.,•.,•.,•.,•.,•.,•,•.,•,•.:.,•:ri.••.•:,···.· .. •.·u,·.'.' .. '·,:.'t',•.'·,:t .. :,.··.·,•1",'n'.''.'··· .. •g•:t:'.:,·,• .. •,·.,i.,•·.,:·'•.•:.':.•,•.•:• · ·:n· · .. k ............ ····,,,.;·······,;;::·········· ... ""' .............. . ,.,.,,,, • , , , ., • < A t•••¥ti!¢ mgtm n:•~t?~~µgr r•*!m .. Mn~ 5 Archer 4 Poor 1.21 1.21 1.21 1.21 1.04
12 Baylor 4 Poor 1.21 1.21 1.21 1.21 1.04
39 Clay 3 Fair 1.42 1.42 1.42 1.42 1.08
49 Cooke 1 VeryGood 1.80 1.80 1.80 1.80 1.19
169 Montague 1 VeryGood 1.80 1.80 1.80 1.80 1.19
224 Throckmorton 4 Poor 1.21 1.21 1.21 1.21 1.04
243 Wichita 4 Poor 1.21 1.21 1.21 1.21 1.04
244 Wilbarger 4 Poor 1.21 1.21 1.21 1.21 1.04
252 Young 3 Fair 1.42 1.42 1.42 1.42 1.08
District 4 (Amarillo)
6 Annstrong 4 Poor
33 Carson 4 Poor 1.21 1.21 1.21 1.21 1.04
56 Dallam 4 Poor 1.21 1.21 1.21 1.21 1.04
59 Deaf Smith 4Poor 1.21 1.21 1.21 1.21 1.04
91 Gray 4 Poor 1.21 1.21 1.21 1.21 1.04
99 Hansford 4 Poor 1.21 1.21 1.21 1.21 1.04
104 Hartley 4 Poor 1.21 1.21 1.21 1.21 1.04
107 Hemphill 4Poor 1.21 1.21 1.21 1.21 1.04
118 Hutchinson 4 Poor 1.21 1.21 1.21 1.21 1.04
148 Lipscomb 4 Poor 1.21 1.21 1.21 1.21 1.04
171 Moore 4 Poor 1.21 1.21 1.21 1.21 1.04
179 Ochiltree 4 Poor 1.21 1.21 1.21 1.21 1.04
180 Oldham 4Poor 1.21 1.21 1.21 1.21 1.04
188 Potter 4 Poor 1.21 1.21 1.21 1.21 1.04
191 Randall 4 Poor 1.21 1.21 1.21 1.21 1.04
197 Roberts 5 Very Poor 1.00 1.00 1.00 1.00 1.00
211 Sherman 4Poor 1.21 1.21 1.21 1.21 1.04
158

Table 125 (Continued). Sigma Values, by County, for Each TxDOT District.
District 5 (Lubbock)
9 Bailey 4 Poor
35 Castro 4 Poor 1.21 1.21 1.21 1.21 1.04
40 Cochran 3 Fair 1.42 1.42 1.42 1.42 1.08
54 Crosby 4 Poor 1.21 1.21 1.21 1.21 1.04
58 Dawson 4 Poor 1.21 1.21 1.21 1.21 1.04
78 Floyd 4 Poor 1.21 1.21 1.21 1.21 1.04
84 Gaines 3 Fair 1.42 1.42 1.42 1.42 1.08
86 Garza 4 Poor 1.21 1.21 1.21 1.21 1.04
96 Hale 4 Poor 1.21 1.21 1.21 1.21 1.04
Ill Hockley 4Poor 1.21 1.21 1.21 1.21 1.04
140 Lamb 4Poor 1.21 1.21 1.21 1.21 1.04
152 Lubbock 4 Poor 1.21 1.21 1.21 1.21 1.04
153 Lynn 4 Poor 1.21 1.21 1.21 1.21 1.04
185 Panner 4 Poor 1.21 1.21 1.21 1.21 1.04
219 Swisher 4 Poor 1.21 1.21 1.21 1.21 1.04
223 Terry 3 Fair 1.42 1.42 1.42 1.42 1.08
251 Yoakum 3 Fair 1.42 1.42 1.42 1.42 1.08
District 6 (Odessa)
•t::mtr •: • '• ••?\,:::;,,; · ·· ,.,,,,,,,,, ., ,,,, ,,,,,,,,,,,, · ::::::::····, ,, ,, •: •• f tJ.i.••••••••:•• •.,••.•.•. :.,:.:•.:.:•.::=.::.• •.,:'.,•'.••'.:.:.J.•••'.J$.~1t1n.:.:' .. ' .. a .. :·.''. :.:v .• :,: .• :a.:.Ju.'.''.J¥:•ti.:9ri. •.t.•.•.•• :.•••.••.•.•.•::.·:.•:,.':.••.:::::::::. ••.·=:-.:.::::·.••·.•:: .. :'.:: .. ,.,:•.J.••.•'.·•·.•:.•:•.••.:• . .:.\Jt •t••N:!iU'.~!ml~r::•:•.•·· .. :··:-§!!ir~I!:,.-:•.:., · ··········· ·.. ········ ······· ·s······ ·····=··· : sliilii~t:j ,•.·.· . .-.:,:.:,:.•,•.•,:.:,:.:,:: .. ,•.n,·.:,·.·.··.•,:.~,' .. ,' .• ,~ .. ' ... P.•.'' ... =.·.:.' .•. :.•.i.•.•.•.i.•.•.•.i• .. •.:,:.: .•.·.•,•.•.• .. :,•.•,•.'A,•·.·.'.,' ... =.·.·.:.:·.1.·' ... l ..... m.' .. •·.:.=• .. ·a ..... '.'.'..t ...•. P ...•. : .. '.r.:.·.;.•.•:.:.•• ... ••.•.i.:.: .'.• . .:.',:.:,:.:,•.'.:.: .• ,:.:,•.•.:.••.•.8.' .. , ... :.•'.·.·.1 ... · ... P,:.•.·.·'.•.·.Ck.'.:.:=,.'.:· .. = ... ''.•.:.•.::.:.•:.:.::.•• ... •.:.•.•.•.• .. •• .•. ••.:.:.:.•,•.•.=.:.:',•'.::,:=.'•,•.J«a.· ... :.·.··,··.:,•.·,·' .. ,:.:,··.:,·.~,:.:,'• .. •,•.•,•.•,•.•,•.•.•.·.:,:= .• •,• ••tt: r::•anqrn,fa:me:r:: :•:t::: fi:.:.•i.•:.•:,.:.•:.=:.~.•:.•:.P.)?:?.:f::~ttf ······· · .. ·.·.·.· .... ,,,.·. r:••i••••t•:::::;:::::: :: t::::: ::.:.,.,., ... ,.,. , ... ,, ,::s: ••••:J~~###g t ft••HJ~1!!ng•tr •••••••Jltij~J9:@g\'m ••••••••Pf:j~filijiti •tQqijUfif'm
2 Andrews 2Good 1.61 1.61 1.61 1.61 1.14
52 Crane 1 Very Good 1.80 1.80 1.80 1.80 1.19
69 Ector 1 Very Good 1.80 1.80 1.80 1.80 1.19
151 Loving 1 Very Good 1.80 1.80 1.80 1.80 1.19
156 Martin 3 Fair 1.42 1.42 1.42 1.42 1.08
165 Midland 2Good 1.61 1.61 1.61 1.61 1.14
186 Pecos 1 Very Good 1.80 1.80 1.80 1.80 1.19
192 Reeves 1 Very Good 1.80 1.80 1.80 1.80 1.19
222 Terrell 1 Very Good 1.80 1.80 1.80 1.80 1.19
231 Upton 3 Fair 1.42 1.42 1.42 1.42 1.08
238 Ward 1 Very Good 1.80 1.80 1.80 1.80 1.19
248 Winkler 2Good 1.61 1.61 1.61 1.61 1.14
159

Table 125 (Continued). Sigma Values, by County, for Each TxDOT District.
District 7 (San Angelo)
IWi~flll-41 Coke 2 Good 1.61 1.61 1.61 1.61 1.14
48 Concho 3 Fair 1.42 1.42 1.42 1.42 1.08
53 Crockett 1 Very Good 1.80 1.80 1.80 1.80 1.19
70 Edwards 1 Very Good 1.80 1.80 1.80 1.80 1.19
88 Glasscock 4 Poor 1.21 1.21 1.21 1.21 1.04
119 Irion 2Good 1.61 1.61 1.61 1.61 1.14
134 Kimble 1 Very Good 1.80 1.80 1.80 1.80 1.19
164 Menard 1 Very Good 1.80 1.80 1.80 1.80 1.19
192 Reagan 4 Poor 1.21 1.21 1.21 1.21 1.04
193 Real 1 Very Good 1.80 1.80 1.80 1.80 1.19
200 Runnels 3 Fair 1.42 1.42 1.42 1.42 1.08
207 Schleicher 1 Very Good 1.80 1.80 1.80 1.80 1.19
216 Sterling 2 Good 1.61 1.61 1.61 1.61 1.14
218 Sutton 1 Very Good 1.80 1.80 1.80 1.80 1.19
226 Tom Green 3 Fair 1.42 1.42 1.42 1.42 1.08
District 8 (Abilene) :•:::::::::=::--·= ........... ·.:::•:::::. :,:··::;::•:)(/''''' :;:·:;:;;::. :)()() :::;::::::::::•=•=: :····:: :: \ff:lt•ttt .... •::=:=•=•==:::::: ;.;.· :·:·:·:·:·:·:·:·:·:·:·:·:·:·~··=·:·:·:·:·:·:·:·:·•·•t:r·=·=···.;.;.;.;.;.;-:-:·,.;·:·:·:·:·•·•=•·:·:·:·:·:·:·:·:·:·:·:·:·: :::::::::::::;:: :::::::;::;:; :;;:;:;:;: ;:;:;:; •••. :.,;,,
=.=:=.:= .• ·_:•_.·_ ••. :'_:'_••.:'.:c_.=.== .. _·= .. =,,= .• •,:=_::,h_.·,· .. ,·~.=·,:_•,·_.=_._ •. n,·.•·,·.•,·_k,'',•=_•=,.: .• _!N,'._·_=_:',.'.,'.u,•=,•=,:ni,•=,:_ .. :=,:ti,.·_.·.=._:_•_~_•=_=:_.•.-~_-=_.·_=_;_,=_•_:_,•_.= .• ·· ·.·.·. ···········=·=·=·=·=·=··=·=·=··=·=·==·=·· ••· .. ·.-....... ·.·.· ... · .. · .. ·· .. ·.· ... · •••· ·· =:•trtr~~g~m:~tr=~ ~~~·•~9r;w::::::::rt . .. ....... ........ ==••
"!..J..= ,,.,,,,,,: __ ,:_· __ ,• ___ ,• ___ ,•_: __ :• __ :• .. _.=•. __ .=•_,•_.·_ .. ·';_·_ .. =·_ ... =' .. =·,_.:•.·_ .. ·': __ .·'s_ ... =•_ ... =•.= __ s·_, __ ,·_ .. :• __ .=
0
__ ,·_,•.= __ .=:0 __ ,:_._.=
6
__ ,·_.•_.=:P;_::_g_:•._.•.:n_:_••.•r_,,·_i,•01,··_.-,.,'.·,~,.,: __ ,•,•,·,e.:,•.,•_.=•_,= __ ,•_,r __ ,•,•_:,·_ .•. ·.•, .. ,•_, •. :,•_,:=·-=· _: __ ... =: ___ .=i __ ... =·_ ... =·_ .... =:·_ ... =·:_ .... =•_ ... = .. __ ... =•_ .. =·.·_ .. =·,:_:_.·Rs_,·.·_,·_.::·_,•_ti_,•._,:u':•·.·.·:_,a_'..,•._.tt'._,•_ .. ·_i_.=•.•_,··_,·1 __ ,:_.=·.-.• _o_,·_n=·; .. =·_,'. __ ,1_, •. _g·'··=·"=_,:, .. =, •. _,;·_ .... =·_ .. ·'i __ .. ·': __ .. =i:_ ... ·': __ .. =· __ ,:_,_ ... =i __ .. =·.·_ ... =•_:: =•••=••'•'=••'•••n'=•=••==•••:::••••••••••••••::::• =•=•=•=:::;;1e•=•=•=•=•r===•=•=•=•=•=•=== •=•=•=•===•=•=•=•nwtit'••====••=••• •==•=•=•=•=•=n:ra•=•=:::===•=•=•=•= •••••••-·=.:,,•,•:·:·;·:~:·:~:!~,.,!!•••·:::•••·• =~,.,,,;:~,. ·=·==·=· l••l•l•iilij~lliill:•1••11 •11:•:•iirl~l.l·l•ll••• •1•1•1-lliii~li•ii!: ••11:1ijiitli!:111 17 Borden 4 Poor 1.21 1.21 1.21 1.21 1.04
30 Callahan 1 Very Good 1.80 1.80 1.80 1.80 1.19
77 Fisher 4 Poor 1.21 1.21 1.21 1.21 1.04
105 Haskell 4 Poor 1.21 1.21 1.21 1.21 1.04
115 Howard 3 Fair 1.42 1.42 1.42 1.42 1.08
128 Jones 4 Poor 1.21 1.21 1.21 1.21 1.04
132 Kent 4 Poor 1.21 1.21 1.21 1.21 1.04
168 Mitchell 1 Very Good 1.80 1.80 1.80 1.80 1.19
177 Nolan 3 Fair 1.42 1.42 1.42 1.42 1.08
208 Scurry 3 Fair 1.42 1.42 1.42 1.42 1.08
209 Shackelford 2Good 1.61 1.61 1.61 1.61 1.14
217 Stonewall 2Good 1.61 1.61 1.61 1.61 1.14
221 Taylor 2Good 1.61 1.61 1.61 1.61 1.14
160

Table 125 (Continued). Sigma Values, by County, for Each TxDOT District.
District 9 (Waco)
14 Bell 1 Very Good 1.80 1.80 1.80 1.80 1.19
18 Bosque 1 Very Good 1.80 1.80 1.80 1.80 1.19
50 Coryell 1 Very Good 1.80 1.80 1.80 1.80 1.19
74 Falls 4 Poor 1.21 1.21 1.21 1.21 1.04
98 Hamilton 1 Very Good 1.80 1.80 1.80 1.80 1.19
llOHill 1 Very Good 1.80 1.80 1.80 1.80 1.19
14 7 Limestone 4 Poor 1.21 1.21 1.21 1.21 1.04
161 McLennan 2Good 1.61 1.61 1.61 1.61 1.14
District 10 (Tyler)
ilM•lfllliiif&Biilrlliii 1 Anderson 3 Fair 1.42 1.42 1.42 1.42 1.08
37 Cherokee 3 Fair 1.42 1.42 1.42 1.42 1.08
93 Gregg 3 Fair 1.42 1.42 1.42 1.42 1.08
108 Henderson 4 Poor 1.21 1.21 1.21 1.21 1.04
210 Rusk 3 Fair 1.42 1.42 1.42 1.42 1.08
212 Smith 3 Fair 1.42 1.42 1.42 1.42 1.08
234 Van Zandt 4 Poor 1.21 1.21 1.21 1.21 1.04
250 Wood 3 Fair 1.42 1.42 1.42 1.42 1.08
161
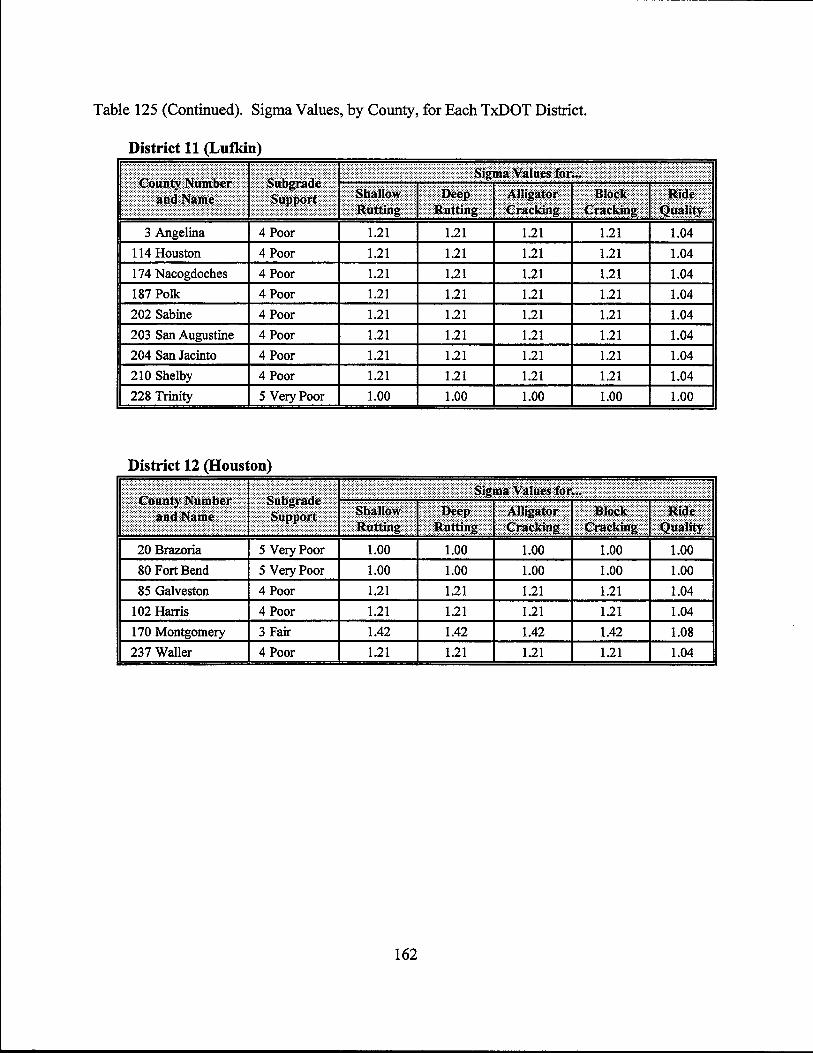
Table 125 (Continued). Sigma Values, by County, for Each TxDOT District.
District 11 (Lufkin) ·.·.··.·.·.·.·.·.·.·-:-·---:-:-·-:-:-:-:-:-:-:-:-:-:-:-:-:-:-:-:-:-:-:·:::·:·:::;;::·:::::· -:-:-:-:-:-:-:-:-:-:-:-:-:-:.:-:-:-:-: -:-:-: :;:;:;:;:;:;:::::::::::::::::·:·:-:-·-:-·-·.·.··· ::::::::::::::::::::::;::::; -:-:-:·:-:-:-:-:-:-:-:-:-:-:-:-:-:-:-:-;.:-:-:.:-.-:-:.;-:-:-;.:-:-:-:-:-:-:-:-:-:-:-:-:-:-:-:-:-:-:-:.:-:-: -:-:-:-:-:-:-:- -:-:-:- :-:·:-:-:-:-:-:-:-:-:-:.:-:-:-:-:-·-·-·.···· :::::;:::::::::::::::::;::::::::::::::::::::::::::::::::::::::::::::::::::::::::::::::::::: "''' ::::::::=:::::::::::::??:::::= ,:,::::::.;.:.::: =?::::?r?r:?::::::::::=?• :::::::::::::::::::::::::<••t\§jgm~:mv.~Jij~~·:r.9:rm:tc::::::::::::::.;.;.:.:.:.;,.;.;;.;.:.:::::::::.:.:.: ... ·.;.·.·.;.;.·.· .. · .. ·.·.·. •:HJJQ.ijij~yJ;ifijfil~~rH : :: ··.:·.•.:•·.:·.•.:s·.:·'·:··.:S::·:··:.~.:.:: .• : .. :u:.,:b··::•.·:;p:grn···:···P··.:.· .... :"·:·:···:::·'.:~.d .• :··'·.:':::··e:J .. :;:::::.:•• .. :• .. :! ... :: .. :•::·:' .. :::.::.•' .·.·.·.·.··:···:·:·:·:·:·:·: ···:···:·:·:·::;.:.:·:·:·:·:·:·:·:·:·:·:·:·:-::::;.;:::::::;.;:::;.;.;:::::::::::::::::·
: :Jan&l~;affieI/F · • f .. u •••:·§Ii~!?!: .. : :.:·:0-::•0-::R~ijE •.::.::•.:=-.•... :;•:•.:: ..•. •.:••.:··.:: •. :.•.::•.:··.::~:A····,··:·•.: .. :··.·.·.~.·.····:1:·~.·.··f···g.~,···· .. •::,· .. ·.:;·.~t .•... •~.::n•.·.•.•,•.r.g••::· .. •.::•.:•.::•.:.•.:•:·.·.J:·.:· •::.·.•: .• ::.•::.•::.:::.•.::::~.:•::::•.••: .• ::·:·:·:~········:·~·.·.·····:~·······: •.. ~,• .• ·.=.:
1:,.m;·:·.:····.··::!g•i:•::•.:·:.::·.:· •:•· •.: .. ::.·.:·:.:;:····::·i.:n;•.:,• .. •.•~.:u;.:····:····j:a•.·,a·::·.·1•.•.¢ .•.. · .. t ...• :"··.•.: .. •:·.::.::··:.•.::.:'::.'.:· nm ,, •ti ::::=:::::::••••::<••• :):;:: :;::: , .. :.::: t••J~ijftjijg r• •·•~#!JMg ~ .. :"'"""""' ~": "'"°' Sl .,,.:
3 Angelina 4 Poor 1.21 1.21 1.21 1.21 1.04
114 Houston 4 Poor 1.21 1.21 1.21 1.21 1.04
174 Nacogdoches 4 Poor 1.21 1.21 1.21 1.21 1.04
187 Polk 4 Poor 1.21 1.21 1.21 1.21 1.04
202 Sabine 4 Poor 1.21 1.21 1.21 1.21 1.04
203 San Augustine 4 Poor 1.21 1.21 1.21 1.21 1.04
204 San Jacinto 4 Poor 1.21 1.21 1.21 1.21 1.04
210 Shelby 4 Poor 1.21 1.21 1.21 1.21 1.04
228 Trinity 5 Very Poor 1.00 1.00 1.00 1.00 1.00
District 12 (Houston)
20 Brazoria 5 Very Poor 1.00 1.00 1.00 1.00 1.00
80 Fort Bend 5 Very Poor 1.00 1.00 1.00 1.00 1.00
85 Galveston 4 Poor 1.21 1.21 1.21 1.21 1.04
102 Harris 4 Poor 1.21 1.21 1.21 1.21 1.04
170 Montgomery 3 Fair 1.42 1.42 1.42 1.42 1.08
237 Waller 4 Poor 1.21 1.21 1.21 1.21 1.04
162

Table 125 (Continued). Sigma Values, by County, for Each TxDOT District.
District 13 (Yoakum)
8 Austin 4 Poor 1.21 1.21 1.21 1.21 1.04
29 Calhoun 5 Very Poor 1.00 1.00 1.00 1.00 1.00
45 Colorado 3 Fair 1.42 1.42 1.42 1.42 1.08
62 DeWitt 3 Fair 1.42 1.42 1.42 1.42 1.08
76 Fayette 3 Fair 1.42 1.42 1.42 1.42 1.08
90 Gonzales 4 Poor 1.21 1.21 1.21 1.21 1.04
121 Jackson 5 Very Poor 1.00 1.00 1.00 1.00 1.00
143 Lavaca 4 Poor 1.21 1.21 1.21 1.21 1.04
158 Matagorda 5 Very Poor 1.00 1.00 1.00 1.00 1.00
235 Victoria 4 Poor 1.21 1.21 1.21 1.21 1.04
241 Wharton 5 Very Poor 1.00 1.00 1.00 1.00 1.00
District 14 (Austin)
11 Bastrop 4 Poor
16 Blanco 1 Very Good 1.80 1.80 1.80 1.80 1.19
27 Burnet 1 VeryGood 1.80 1.80 1.80 1.80 1.19
28 Caldwell 4 Poor 1.21 1.21 1.21 1.21 1.04
87 Gillespie 1 Very Good 1.80 1.80 1.80 1.80 1.19
106 Hays 1 Very Good 1.80 1.80 1.80 1.80 1.19
144 Lee 4 Poor 1.21 1.21 1.21 1.21 1.04
150 Llano 1 Very Good 1.80 1.80 1.80 1.80 1.19
157 Mason 1 Very Good 1.80 1.80 1.80 1.80 1.19
227 Travis 1 Very Good 1.80 1.80 1.80 1.80 1.19
246 Williamson 1 Very Good 1.80 1.80 1.80 1.80 1.19
163

Table 125 (Continued). Sigma Values, by County, for Each TxDOT District.
District 15 (San Antonio) _,,, .. ,,.,,.,,,,,, ,,,,,,,,,,,,,,,:::::::: ,,, ''''''''<' ,,,,,,,,,,,,,,,,,, '''''"''::: \• :::::::::::=<::::::::: ?::::::::=:::-? :i:t::ii•$igm~•:!~J~~~••it9tMI '::::=::::: :::::::::\::::===== '"'''"'' '''"
•,.•,.•,.•,.•,.•,.•,.•,.•,.•,.=,i•,.•_.0,.•_.:::_.0_:,.=_,,:_11,.:~_,n_n::_:.•~_-'_._._ .• ,t,•_-_ ... _.rm!_jil_ •. :,:._.:,;_e,·;_:,.•_r:,.• .. •,i_:,:_.!,.•_.!,.•_:,1_.•_i_,! __ ' '_-,i,:,.i,i,.i,.•,:,.i,J,J,i,8,:,;,-~_•.•.~_'_:_.u'_b_;_: __ p:~_:p._::p._:_·_,._-.• _:_:,!_:_._-,•_-.:, .• _·_e_.•,._•,•,.,••,i,•,•,••,:,•_:_,'_, iiiii•;;;;;;;;·:;;·;,;;;:·'·_;.,, .. ,. =·n~~~=•=•=•=•'•= •••••••:A!l;~fir••·•• ;·:••••·••••:•:l!iiiii••J:J:;;;;,·;:::1:1;:1@i!iii;iiiiii: .. ~ t,.._ "' " ... ,,~ .............. ·. · ··· _,• __ ,•_,:,•,·.:,;: __ ,:.:,._,•_,•:•:·•,:_,·_·.0 __ •._•,•_, __ ,•u••_=_•_._•_•,J'':'tt' __ ••::._'_','-n'_'.'_'.'g/.,_:,_,·_,:_,:_,:_,· : •:::: • •:??L::: :: .. •'\::•},.,::::)) :: ·: ~JU~#mf ~ ····••gr~~l~i•l ••JP.~?§~iijg@@••Q#M~!Yl
7 Atascosa 4 Poor 1.21 1.21 1.21 1.21 1.04
10 Bandera 1 Very Good 1.80 1.80 1.80 1.80 1.19
15 Bexar 1 Very Good 1.80 1.80 1.80 1.80 1.19
46 Comal 1 VeryGood 1.80 1.80 1.80 1.80 1.19
83 Frio 4 Poor 1.21 1.21 1.21 1.21 1.04
95 Guadalupe 3 Fair 1.42 1.42 1.42 1.42 1.08
131 Kendall 1 Very Good 1.80 1.80 1.80 1.80 1.19
133 Kerr 1 Very Good 1.80 1.80 1.80 1.80 1.19
162 McMullen 5 Very Poor 1.00 1.00 1.00 1.00 1.00
163 Medina 2 Good 1.61 1.61 1.61 1.61 1.14
232 Uvalde 2 Good 1.61 1.61 1.61 1.61 1.14
247 Wilson 4 Poor 1.21 1.21 1.21 1.21 1.04
District 16 (Corpus Christi)
13 Bee 4 Poor 1.21 1.21 1.21 1.21 1.04
89 Goliad 3 Fair 1.42 1.42 1.42 1.42 1.08
126 Jim Wells 5 Very Poor 1.00 1.00 1.00 1.00 1.00
129 Karnes 5 Very Poor 1.00 1.00 1.00 1.00 1.00
137 Kleberg 5 Very Poor 1.00 1.00 1.00 1.00 1.00
149 Live Oak 4 Poor 1.21 1.21 1.21 1.21 1.04
178 Nueces 5 Very Poor 1.00 1.00 1.00 1.00 1.00
196 Refugio 5 Very Poor 1.00 1.00 1.00 1.00 1.00
205 San Patricio 5 Very Poor 1.00 1.00 1.00 1.00 1.00
164

Table 125 (Continued). Sigma Values, by County, for Each TxDOT District.
District 17 (Bryan)
21 Brazos 1 Very Good 1.80 1.80 1.80 1.80 1.19
26 Burleson 4 Poor 1.21 1.21 1.21 1.21 1.04
82 Freestone 4 Poor 1.21 1.21 1.21 1.21 1.04
94 Grimes 4 Poor 1.21 1.21 1.21 1.21 1.04
145 Leon 4 Poor 1.21 1.21 1.21 1.21 1.04
154 Madison 4 Poor 1.21 1.21 1.21 1.21 1.04
166 Milam 4 Poor 1.21 1.21 1.21 1.21 1.04
198 Robertson 4 Poor 1.21 1.21 1.21 1.21 1.04
236 Walker 3 Fair 1.42 1.42 1.42 1.42 1.08
239 Washington 3 Fair 1.42 1.42 1.42 1.42 1.08
District 18 (Dallas)
57 Dallas 2 Good 1.61 1.61 1.61 1.61 1.14
61 Denton 1 Very Good 1.80 1.80 1.80 1.80 1.19
71 Ellis 2 Good 1.61 1.61 1.61 1.61 1.14
130 Kaufinan 5 Very Poor 1.00 1.00 1.00 1.00 1.00
175 Navarro 4 Poor 1.21 1.21 1.21 1.21 1.04
199 Rockwall 4 Poor 1.21 1.21 1.21 1.21 1.04
165

Table 125 (Continued). Sigma Values, by County, for Each TxDOT District.
District 19 (Atlanta) ,.,,,, ''''''"'=''''""''' '''''''''''''''''' ::::::'::::::::::::?'''''''' ?_,: :::::: \ :;:::::;:;::;::: ···· ::::::::: ::::::::::::::::::'::::: :.·::·:·::·:·::::::::::::·::::::::::::::::::: ··,•,•,•,i,•,i,•,i,•,•=,·',:,•:,:_,_:,,:_~_-.. _,·.·.·_,1'·.'_.g''''':m'.'.'_'_'.'.'.'.'a .. '_'·.·,.·_•,i,•,"',.,'.·,_=r.,·,:_:a''.·.:' __ '1· .. ' .. u'.·_,_'.'.'.'e'.'.'.'s'.'.'.',•,•.i.-;.'_'.·,~.·.:: .. '.'r''.·.',·.:_,_•,•.•.•.=.·.=.·.:,:.,•·,=·.· ::::::=::::: .... ::::=:::=:::: ,,.,,,,,,,,,,,,,,,,,,,,,,,,,,,,,,,,::::: .,,,,,,,,,,,,,,,, ...... .·.·.·.·.·.·.·.·.·.·.·.·.·.·.·.·.·.·.·.·.·.·.·:::::::.:.:.:.: .... ·.·.·.·.·.·.· ::::::::::::::::::;:;:::::::::;::::::::::::::::::::::::::: ·:-:-:-:-:-:-:-:-:-:-:-:-:-:-:-:-·-:-·-:-:-:-:-:-:-:-:-:;::::::::::::::;:::::;:;:::: :J, ::Y.:: :Ib· ~:}}~:f~{:f=:~ -:-:-:-:-;-:-:-:-:-:-:-:-:·:·:·:·:-:-:-:-:-:-:::::::·:-:-:-: HJG:9.Ji:t~9WNtl.m!:!tt ,, .,.,.· :§9~~m~~:mr• ·.·.·.·.·. ·········•· ···.
19 Bowie 3 Fair 1.42 1.42 1.42 1.42 1.08
32 Camp 3 Fair 1.42 1.42 1.42 1.42 1.08
34 Cass 3 Fair 1.42 1.42 1.42 1.42 1.08
103 Harrison 3 Fair 1.42 1.42 1.42 1.42 1.08
155 Marion 3 Fair 1.42 1.42 1.42 1.42 1.08
172 Morris 3 Fair 1.42 1.42 1.42 1.42 1.08
183 Panola 4 Poor 1.21 1.21 1.21 1.21 1.04
225 Titus 4 Poor 1.21 1.21 1.21 1.21 1.04
230 Upshur 3 Fair 1.42 1.42 1.42 1.42 1.08
District 20 (Beaumont) ,, ,.,.,, .. ,,,.. :::::t,,:,· ·· ,,,,, ,.,,, ' ..•• ,,, ......... :·. ' .··.·.· .......... ·· l !'::::::::::::::i=§i!MiZV.iiPif:::f~tM ::::,::: :: :::I::f:::.IIf: ,,, r:
::::-·=:'ii!~~::IMmiiit:···::n:,iiiiii:.iiiiiiiiiii·i··.::_• .. : .. =_;:_i._i.i_;_;·_;,_;=_;,_:_i!.s_: .••. : .•. :h_._:.•·.!.'_a_•:_:.•_:,_._1_ •• _.,_1_:.~.:.•:.: .• :.w_.,_:.•:_.: .• ,_: .•. i_;_;:_:_ •.. :_:_:~ .• ~.:::=,:::;::::::::::Di~lf''''''''''''::: ''''\iiilitMF'::: :::=::':::;::;:iiiM.df''::::::::: :::::::::::::kidi''''''''''''' r:r: fii.ijd:.:Ni:ril~ t r II]I§~ijpgrM@ •,:_,:,:,._:,:_,.:,:_,•_,_.:_,!_:_:_,·.~_=.:.•_•_ .. '.,•_.,0=_•_=.=,•.=_,·t'.'.-.•·tt','.','.; .. _'·0·:'.','.'.•_'grn:_:_•.,:,.•_,:,.:_,:,.•_,:,:_,·•,•_,· ·_,•.·,.'_=.'::.•.·,:_::_,•_,',~•,•_,,:_••_,.'_,',.:_i.,'.'.,:.=~.'_','.',·c·_','.'.'_~,'.'.•'.'_'~.;_•'.""'.'.=.=,•.:gt.•_,:,:_,.:,•.·:·•,:_,·', :_,:_:.•_.::,••_,•,:_,·•,-~_,:,•,•_•:•.•,._L,:_=_:_.=,:_=_.•.=.=_;.,_:=.= .. •,~_,,·_,',:_~:~.',·_~•_:_•_•_•,•grn•:•,.•,-.•,:_,·•,:_,:,•_,· :,:_,.:,.:_,.:,.:_,.:,.~,:_•_::.•:.'.·u','.'.'.',:_.~,=.=,=.=.·1·_','.~•'.•_fu_,_•.•.:_••.•_,:,:_,:,•_,.:,:_,.•, ::::;:: I=:'::,:;::/;;:::;:: : Lt.: ·::::,::::::;: :::::;:::;:;:;:;:; •••• [{Jl#ijiijg{I "' ""H• - ~'""""'!\."'" ~ "' ~.;1.:
36 Chambers 5 Very Poor 1.00 1.00 1.00 1.00 1.00
101 Hardin 5 Very Poor 1.00 1.00 1.00 1.00 1.00
122 Jasper 3 Fair 1.42 1.42 1.42 1.42 1.08
124 Jefferson 5 Very Poor 1.00 1.00 1.00 1.00 1.00
146 Liberty 4 Poor 1.21 1.21 1.21 1.21 1.04
176 Newton 3 Fair 1.42 1.42 1.42 1.42 1.08
181 Orange 5 Very Poor 1.00 1.00 1.00 1.00 1.00
229 Tyler 2 Good 1.61 1.61 1.61 1.61 1.14
166

Table 125 (Continued). Sigma Values, by County, for Each TxDOT District.
District 21 (Pharr)
i!ii.iiiiiili~ij·Nijffi:§~ij:i•• • j•§illll~••O::• ·:····.• .. :• .. :• .. ::·:···:·:·:···:·:·:···:·.:·:···:·::··.'.·:·:·:···:·:·.•.:;:.·:··.·::··.··:·•~:;·:·::n·;::;·:::.•a.;::···· ... ',·.•.:·,·.io;,.:···:.···:-r·.;·:·;:.a:;::;··.:.'.m:,;::·;:::;;::;;::;..;:.;:::···:·.·:···:· .. :::,• .. :•, .. ; .. ;•.·;•.:::::;·:···:•;·:•: •.:· ;·:·;·:·:··· .•. : .•. •.;•.•:•.$:::·;:·:··::.::.u·.··;·.··:·:··P··.:.':::.n_:_:·.:_._::~:···:·:•.,•;.+:··;·.··.:·:·;:.·;·.:·_: •. :._;._:::•.:::•.:·;•:• .... :· ... :• •.... :· ... :·:·:···'· _,•.: __ ,._; __ .. ::: __ .. ::_ .... :• .... ::·_ ... :• ..... :• ..... :•_: __ .:··:_ ... :::····:· .. :·:s._._ .•.•... :····;li.·: __ .:•u_::_::··':a:•.,•_.tt::···:·.:1 ___ :•.•.:i·····-~.-.n: •. ; .. :._·: .. w.:•.:g·::_.:: .. :;·:··:··::·····:· ... ··:· .... :· ... ··:· .... :· ..... :• .... :• ..... :• .... :• .... ::_ ... :. ttl)t;~jh ••• • Xii;iMWJ : .... .= .... •: .... .= ... _=' ... _.= ... _.=.:_.= ....... •B_ .. ; ... ·; ....... io .. :.·.··.:.·:····.c.•'.: ..•. k_:_·.··.:···.:·:···.·····:···•.•.•.•:.:_:_ ••• r /f{ia~ ::::: '"' t,,, "" :r.:"'•·:-" ·.•_,.•_.:··'_:.•_:··'_:.•:,··'_,.•::··'_:·.•_:··'.:.•.:•·:·,•.•:•.•_:_•,_,•u•_•.:_• ... •:'·":·:.•:;...::·'.:._':_ .. ·.n: .. :_•.•_• .. •gt_:.•_.:··'.:.•.:··'.:·:.'.:•.;.::::·:.:.•_.:··'.:.•.: ·.'.:.•_.:···:•_::·.'.:.•;:·.•.:.•;:•e·,•::·: .. ;:····;::_:·r:_•_• .. •_:'_,a•,:_•,• .. :, ..... :,;.:,;:•,;.:., .. ;;:!:·:_:':~,:.'·',n'.·'.:.•.•_.•g••.•••:···_.:···_:.•_.:···.:.•_.:•.•_, ::::::: ..... :: .... ·.·.-. ...:::::::::::::
"""' ... - ::::_.=:::_.=:::_.=.:_:.e;: .. ·; .. _".·:··.r,·_:,-.·~,·.·_·.·.·.e;·.·.·.:,k.,.·_·.:_,_in_,_·_·.·,··::·g··:_:_.=:::_:.·_::_:::: •_:':-'.=':::_,:_.:_;n;·.,0-u,:_:_:_·,:_a,:.·;:.',l.·;·.1,·.:_ffi_·_· .. :.:·:··:·: ... :·•.·:: ... ='::•_, :·:·:·:·:·:::·:·:::·:·:::::::::::::::::·:-:-:·:-: :-:···:-:-:·:·:---:-:-:-:-:-:-:-:·:·::>:::: ::::::::::: -:-:-:-:;:::·:::::·:::·:::::::::::-:-:-:-·-· Sl: ~J.=:
24 Brooks 4 Poor 1.21 1.21 1.21 1.21 1.04
31 Cameron 5 Very Poor 1.00 1.00 1.00 1.00 1.00
109 Hidalgo 5 Very Poor 1.00 1.00 1.00 1.00 1.00
125 Jim Hogg 3 Fair 1.42 1.42 1.42 1.42 1.08
66 Kenedy 4 Poor 1.21 1.21 1.21 1.21 1.04
214 Starr 4 Poor 1.21 1.21 1.21 1.21 1.04
245 Willacy 5 Very Poor 1.00 1.00 1.00 1.00 1.00
253 Zapata 4 Poor 1.21 1.21 1.21 1.21 1.04
District 22 (Laredo)
;n11~1i~,ifi11•••*;a•1•~•~ 64 Dimmitt 4 Poor 1.21 1.21 1.21 1.21 1.04
67 Duval 4 Poor 1.21 1.21 1.21 1.21 1.04
136 Kinney 2 Good 1.61 1.61 1.61 1.61 1.14
142 LaSalle 4 Poor 1.21 1.21 1.21 1.21 1.04
159 Maverick 3 Fair 1.42 1.42 1.42 1.42 1.08
233 Val Verde 1 Very Good 1.80 1.80 1.80 1.80 1.19
240 Webb 4 Poor 1.21 1.21 1.21 1.21 1.04
254 Zavala 4 Poor 1.21 1.21 1.21 1.21 1.04
167

Table 125 (Continued). Sigma Values, by County, for Each TxDOT District.
District 23 (Brownwood) =:::: ;::::::::~:{~:~:~:::::::···-:·:·:·:·:·:::....... :::::::::::;:::::::::::: ::::::::::::;:::::::=::::{::::::=:::::::::::::::;:·:·:·:-·-·
··•]•••-~e~i~~j~-~~rtI i,!_,i,i_,i_,i_,i_,i_,
8
_,;_,;_:·,s'_•,•_h ___ -_·,=u·_•,:_6_•_;_-,·P-•~_:_.pra_:_:_•0:_•_:_•,•-_•-~-d-·:=.=,•,-_e_•_J --- •sMdMW r ,•_•,•-•,•_•,,_•,••-·,•-•,••_,,•_•,•_n,=_·,=_•,=_:,=_~-·--=,=_:,~_•,=_•,:~_== ___ =_-_•,•-•-•-•.,•.•,•-•,•-•,•-••_: • •••r:=xnmit~t·•••••••• ••••••••••=-=·=·=Bmek"'·=·=·=·=·=·=·= =·=·=·=·=·=·Rid~r=·=·=·=-=· . n···········•••?;@~•·N~m~ :::::=•===•• H lI •• .... ..... . ..... w.. r. •_,· ·=·=·_•,-•_,--, .• _,-•,•_, .• ,n,;_,,•_=:_'_=',-~_:•_=_',',-~_·,~_~=_;.._=,=_=,:_i_'_;;::•_·_·.-~.•.n•_·_·_·,•_•g .... ,._,•,•_,•, .. _,.,_.,.,· •_,:,:•,•,•_=,•,:_,:•_ •. -~,--•_._.,·_·_-.:_•_._._:~:-'.'_=_.'.:'.'_:_,_=_:..,=_=_=_·,k·_·,=_·_·=_•:t-.·_=_.=,=_ ... _:_;_:g::::_.·::_;:;_,·•,._:·:· =·=·-·=·=·_--,•_,•.•_'A_._-_ •• ,._.•·_=.·u=_·_=.·_··_=~_··_._._·_:=_•_1','_··1·.·.·~:=:_-~_:_: __ , .. ,:_,••,:_,•,;_,:,• tt :., =···· :- =····= > l •:: : >:· : :·----··· ••!t#f:#ijg.] •=·J~'iJ.t.tj~gf• "' .... ,..~ ~ .... .., "" :~ .. ";1.:
25 Brown 2 Good 1.61 1.61 1.61 1.61 1.14
42 Coleman 2 Good 1.61 1.61 1.61 1.61 1.14
47 Comanche 2 Good 1.61 1.61 1.61 1.61 1.14
68 Eastland 1 Very Good 1.80 1.80 1.80 1.80 1.19
141 Lampasas 1 Very Good 1.80 1.80 1.80 1.80 1.19
160 McCulloch 1 Very Good 1.80 1.80 1.80 1.80 1.19
167 Mills 1 Very Good 1.80 1.80 1.80 1.80 1.19
206 San Saba 1 VeryGood 1.80 1.80 1.80 1.80 1.19
215 Stephens 2 Good 1.61 1.61 1.61 1.61 1.14
District 24 (El Paso)
22 Brewster 2 Good
55 Culberson 1 Very Good 1.80 1.80 1.80 1.80 1.19
72 El Paso 4 Poor 1.21 1.21 1.21 1.21 1.04
116 Hudspeth 3 Fair 1.42 1.42 1.42 1.42 1.08
123 JeffDavis 3 Fair 1.42 1.42 1.42 1.42 1.08
189 Presidio 4 Poor 1.21 1.21 1.21 1.21 1.04
168
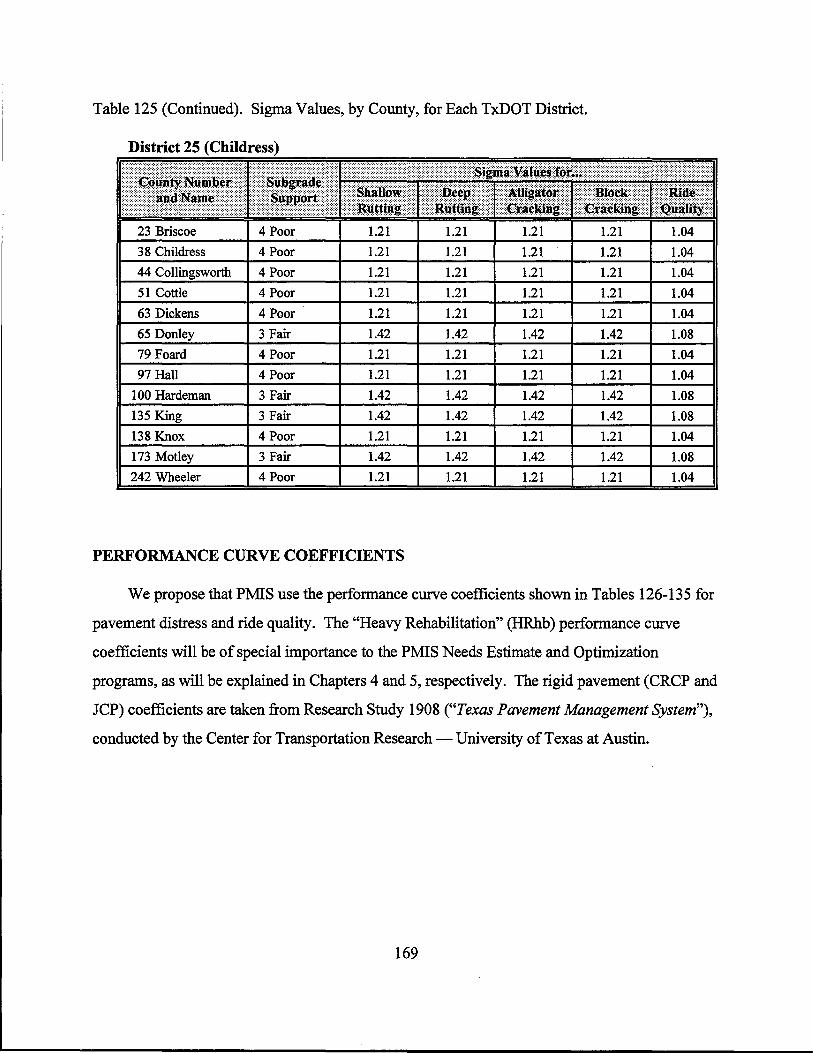
Table 125 (Continued). Sigma Values, by County, for Each TxDOT District.
District 25 (Childress)
23 Briscoe 4 Poor 1.21 1.21 1.21 1.21 1.04
38 Childress 4 Poor 1.21 1.21 1.21 1.21 1.04
44 Collingsworth 4 Poor 1.21 1.21 1.21 1.21 1.04
51 Cottle 4 Poor 1.21 1.21 1.21 1.21 1.04
63 Dickens 4 Poor 1.21 1.21 1.21 1.21 1.04
65 Donley 3 Fair 1.42 1.42 1.42 1.42 1.08
79 Foard 4 Poor 1.21 1.21 1.21 1.21 1.04
97 Hall 4 Poor 1.21 1.21 1.21 1.21 1.04
100 Hardeman 3 Fair 1.42 1.42 1.42 1.42 1.08
135 King 3 Fair 1.42 1.42 1.42 1.42 1.08
138 Knox 4 Poor 1.21 1.21 1.21 1.21 1.04
173 Motley 3 Fair 1.42 1.42 1.42 1.42 1.08
242 Wheeler 4 Poor 1.21 1.21 1.21 1.21 1.04
PERFORMANCE CURVE COEFFICIENTS
We propose that PMIS use the performance curve coefficients shown in Tables 126-135 for
pavement distress and ride quality. The "Heavy Rehabilitation" (HRhb) performance curve
coefficients will be of special importance to the PMIS Needs Estimate and Optimization
programs, as will be explained in Chapters 4 and 5, respectively. The rigid pavement (CRCP and
JCP) coefficients are taken from Research Study 1908 ("Texas Pavement Management System"),
conducted by the Center for Transportation Research- University of Texas at Austin.
169

Table 126. Performance Coefficients for Detailed Pavement Type 01.
170

Table 127. Performance Coefficients for Detailed Pavement Type 02.
171

Table 128. Performance Coefficients for Detailed Pavement Type 03.
172

Table 129. Performance Coefficients for Detailed Pavement Type 04.
173

Table 130. Performance Coefficients for Detailed Pavement Type 05.
174

Table 131. Performance Coefficients for Detailed Pavement Type 06.
175

Table 132. Performance Coefficients for Detailed Pavement Type 07.
176

Table 133. Performance Coefficients for Detailed Pavement Type 08.
177

Table 134. Performance Coefficients for Detailed Pavement Type 09.
178

Table 135. Performance Coefficients for Detailed Pavement Type 10.
179
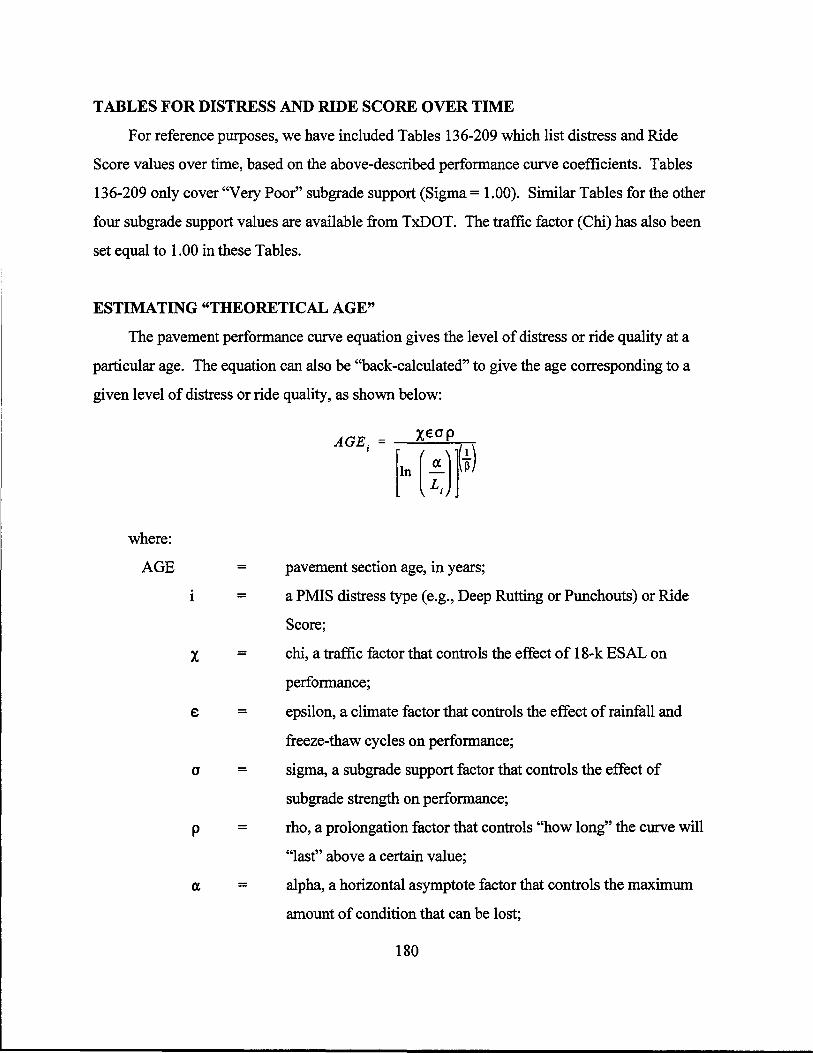
TABLES FOR DISTRESS AND RIDE SCORE OVER TIME
For reference purposes, we have included Tables 136-209 which list distress and Ride
Score values over time, based on the above-described performance curve coefficients. Tables
136-209 only cover "Very Poor" subgrade support (Sigma= 1.00). Similar Tables for the other
four subgrade support values are available from TxDOT. The traffic factor (Chi) has also been
set equal to 1.00 in these Tables.
ESTIMATING "THEORETICAL AGE"
The pavement performance curve equation gives the level of distress or ride quality at a
particular age. The equation can also be "back-calculated" to give the age corresponding to a
given level of distress or ride quality, as shown below:
where:
AGE
1
a
p
= pavement section age, in years;
= a PMIS distress type (e.g., Deep Rutting or Punchouts) or Ride
Score;
= chi, a traffic factor that controls the effect of 18-k ESAL on
performance;
= epsilon, a climate factor that controls the effect of rainfall and
freeze-thaw cycles on performance;
=
=
sigma, a subgrade support factor that controls the effect of
subgrade strength on performance;
rho, a prolongation factor that controls "how long" the curve will
"last" above a certain value;
= alpha, a horizontal asymptote factor that controls the maximum
amount of condition that can be lost;
180

Table 136. Projected Condition for Spalled Cracks on Detailed Pavement Type: 01.
How Projected: Percent of transverse cracks spalled
Subgrade Factor: 1.00 _Very Poor
181

·Table 137. Projected Condition for Punchouts on Detailed Pavement Type: 01.
How Projected: Number per mile
Subgrade Factor: 1.00 _Very Poor
182

Table 138. Projected Condition for Asphalt Patches on Detailed Pavement Type: 01.
How Projected: Number per mile
Subgrade Factor: 1.00 _Very Poor
1me, m years
183
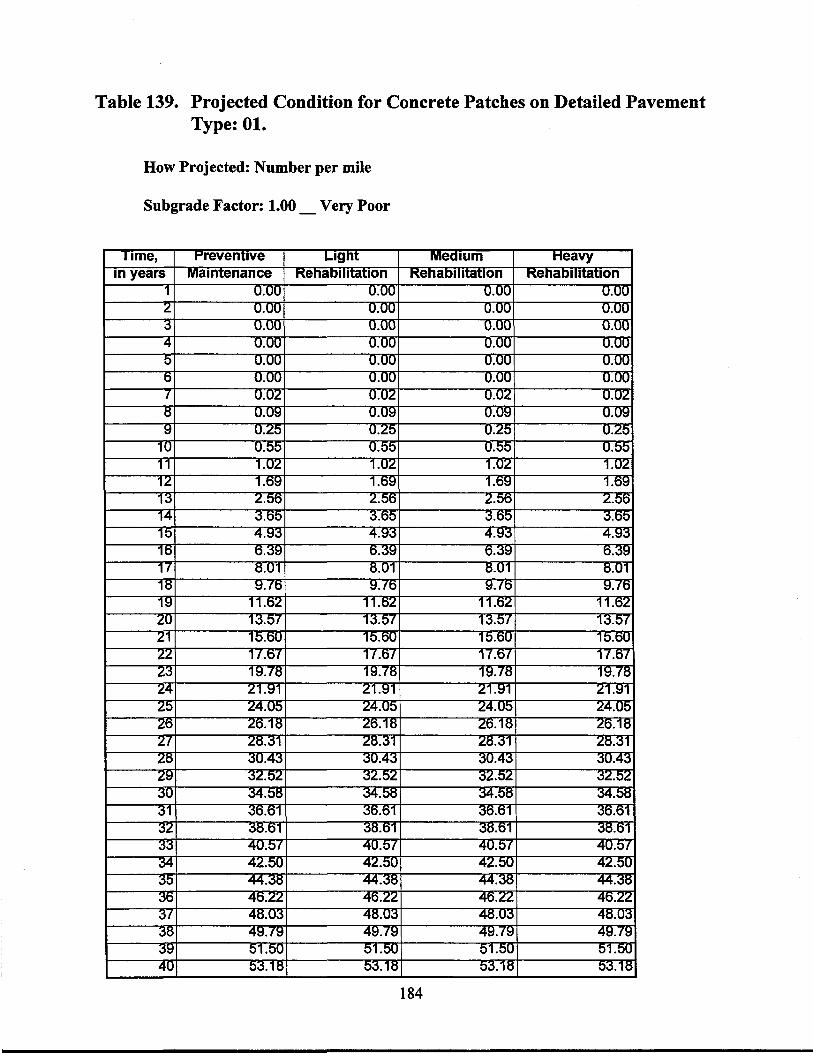
Table 139. Projected Condition for Concrete Patches on Detailed Pavement Type: 01.
How Projected: Number per mile
Subgrade Factor: 1.00 _ Very Poor
1me, in years
184

Table 140. Projected Condition for Average Crack Spacing on Detailed Pavement Type: 01.
How Projected: Number per 100' station
Subgrade Factor: 1.00 _Very Poor
1me, m years
185

Table 141. Projected Condition for Ride Score on Detailed Pavement Type: 01.
How Projected: Percent of Ride Quality Lost (0-1)
Subgrade Factor: 1.00 _ Very Poor
1me, m years
186

Table 142. Projected Condition for Failed Joints and Cracks on Detailed Pavement Type: 02.
How Projected: Percent of transverse joints and cracks fajled
Subgrade Factor: 1.00 _Very Poor
187

Table 143. Projected Condition for JCP Failures on Detailed Pavement Type: 02.
How Projected: Number per mile
Subgrade Factor: 1.00 _ Very Poor
188
:;.·

Table 144. Projected Condition for Shattered Slabs on Detailed Pavement Type: 02.
How Projected: Percent of slabs shattered
Subgrade Factor: 1.00 _Very Poor
189

Table 145. Projected Condition for Slabs with Longitudinal Cracks on Detailed Pavement Type: 02.
How Projected: Percent of slab with longitudinal cracks
Subgrade Factor: 1.00 Very Poor
190

Table 146. Projected Condition for Concrete Patching on Detailed Pavement Type: 02.
How Projected: Number per mile
Subgrade Factor: 1.00 _Very Poor
191

Table 147. Projected Condition for Ride Score on Detailed Pavement Type: 02.
How Projected: Percent of Ride Quality Lost (0-1)
Subgrade Factor: 1.00 _ Very Poor
192

Table 148. Projected Condition for Failed Joints and Cracks on Detailed Pavement Type: 03.
How Projected: Percent of transverse joints and cracks failed
Subgrade Factor: 1.00 _Very Poor
193

Table 149. Projected Condition for JCP Failures on Detailed Pavement Type: 03.
How Projected: Number per mile
Subgrade Factor: 1.00 _Very Poor
194

Table 150. Projected Condition for Shattered Slabs on Detailed Pavement Type: 03.
How Projected: Percent of slabs shattered
Subgrade Factor: 1.00 _Very Poor
195

Table 151. Projected Condition for Slabs with Longitudinal Cracks on Detailed Pavement Type: 03.
How Projected: Percent of slabs with longitudinal cracks
Subgrade Factor: 1.00 _ Very Poor
196

Table 152. Projected Condition for Concrete Patching on Detailed Pavement Type: 03.
How Projected: Number per mile
Subgrade Factor: 1.00 _ Very Poor
197
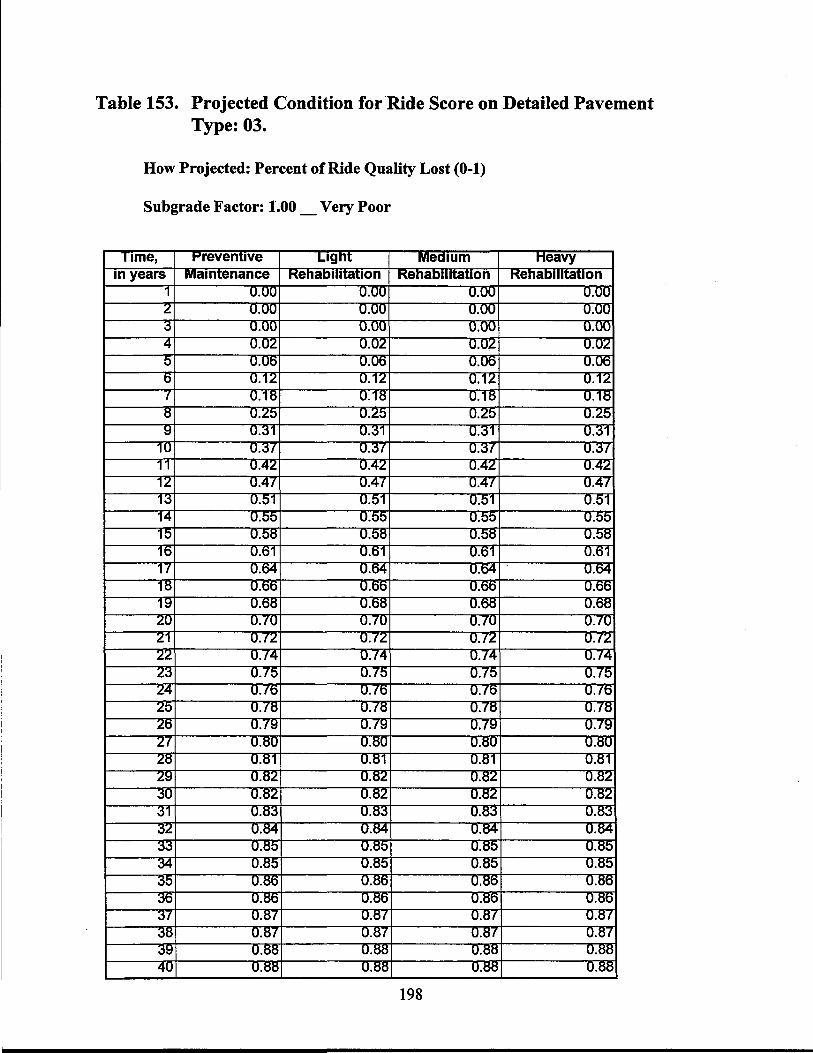
Table 153. Projected Condition for.Ride Score on Detailed Pavement Type: 03.
How Projected: Percent of Ride Quality Lost (0-1)
Subgrade Factor: 1.00 _Very Poor
198

Table 154. Projected Condition for Shallow Rutting on Detailed Pavement Type: 04.
How Projected: Percent of wheelpath length
Subgrade Factor: 1.00 _ Very Poor
199
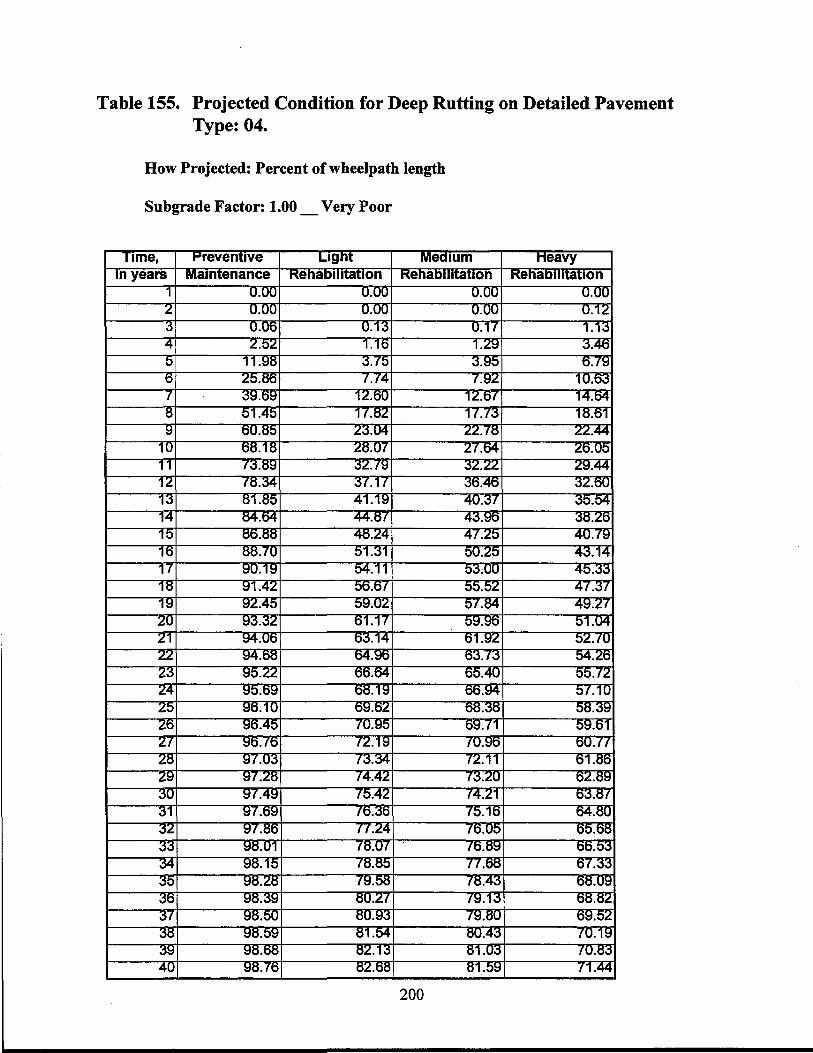
Table 155. Projected Condition for Deep Rutting on Detailed Pavement Type: 04.
How Projected: Percent of wheelpath length
Subgrade Factor: 1.00 _Very Poor
200

Table 156. Projected Condition for Failures on Detailed Pavement Type: 04.
How Projected: Number per mile
Subgrade Factor: 1.00 _Very Poor
201

Table 157. Projected Condition for Block Cracking on Detailed Pavement Type: 04.
How Projected: Percent of lane area
Subgrade Factor: 1.00 _Very Poor
202

Table 158. Projected Condition for Alligator Cracking on Detailed Pavement Type: 04.
How Projected: Percent ofwheelpath length
Subgrade Factor: 1.00 _Very Poor
203
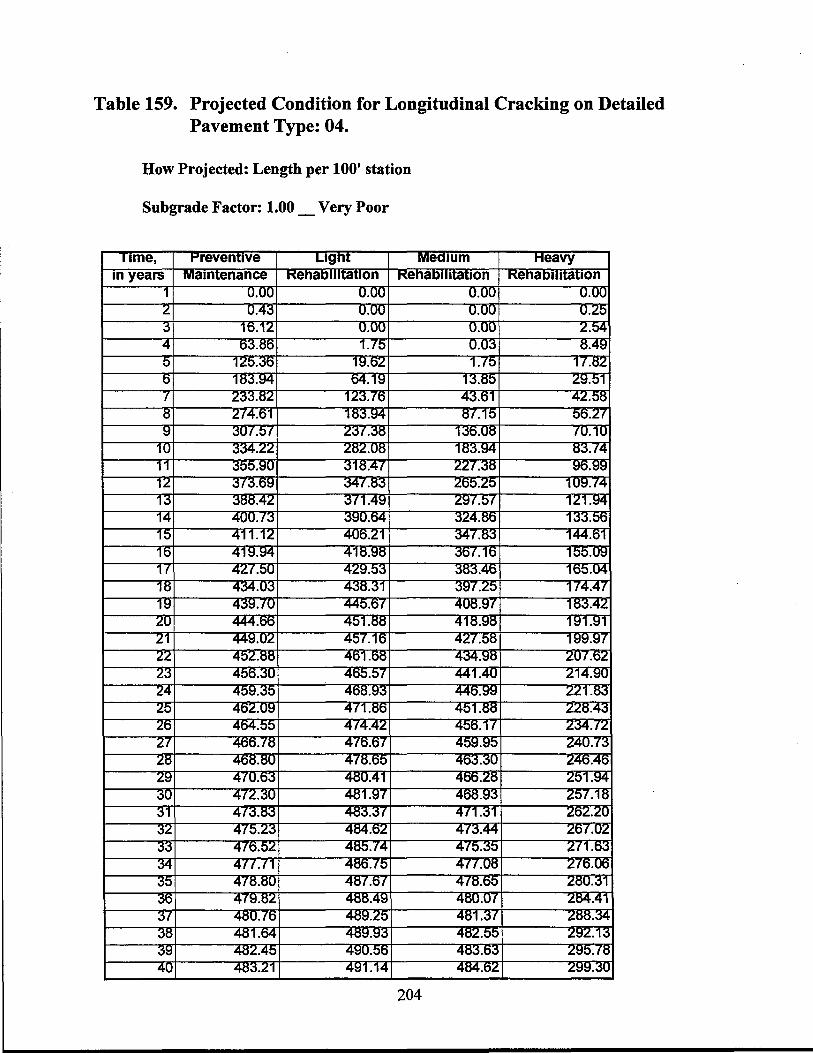
Table 159. Projected Condition for Longitudinal Cracking on Detailed Pavement Type: 04.
How Projected: Length per 100' station
Subgrade Factor: 1.00 _ Very Poor
204

Table 160. Projected Condition for Transverse Cracks on Detailed Pavement Type: 04.
How Projected: Number per 100' station
Subgrade Factor: 1.00 _ Very Poor
205

Table 161. Projected Condition for Ride Score on Detailed Pavement Type: 04.
How Projected: Percent of Ride Quality Lost (0-1)
Subgrade Factor: 1.00 _ Very Poor
206

Table 162. Projected Condition for Shallow Rutting on Detailed Pavement Type: 05.
How Projected: Percent ofwheelpath length
Subgrade Factor: 1.00 _Very Poor
Time, Preventive Light Mea1um Heavy m years Maintenance Rehaomtat1on Rehabilitation Rehabilitation
1 0.00 0.00 0.00 0.00 2 0.00 0.00 0.00 0.00 3 0.00 0.00 0.00 0.06 4 6.52 0.34 0.45 2.77 5 36.79 4.58 5.11 13.14 6 64.39 15.45 16.08 27.94 7 80.25 29.46 29.79 42.29 8 88.64 42.89 42.84 54.21 9 93.15 54.21 53.85 63.54
10 95.68 63.23 62.68 70.71 11 97.16 70.28 69.61 76.20 12 98.07 75.76 75.04 80.43 13 98.65 80.03 79.30 83.73 14 99.03 83.39 82.67 86.33 15 99.29 86.05 85.36 88.40 16 99.47 88.17 87.53 90.07 17 99.59 89.90 89.29 91.43 18 99.69 91.30 90.73 92.55 19 99.75 92.45 91.93 93.48 20 99.80 93.41 92.92 94.25 21 99.84 94.22 93.76 94.91 22 99.87 94.89 94.47 95.46 23 99.90 95.47 95.07 95.94 24 99.91 95.96 95.59 96.35 25 99.93 96.38 96.03 96.71 26 99.94 96.74 96.42 97.01 27 99.95 97.06 96.76 97.28 28 99.96 97.34 97.05 97.52 29 99.96 97.58 97.31 97.73 30 99.97 97.79 97.54 97.92 31 99.97 97.98 97.75 98.08 32 99.98 98.15 97.93 98.23 33 99.98 98.30 98.09 98.36 34 99.98 98.43 98.24 98.48 35 99.98 98.55 98.37 98.59 36 99.99 98.66 98.48 98.69 37 99.99 98.75 98.59 98.77 38 99.99 98.84 98.69 98.85 39 99.99 98.92 98.77 98.93 40 99.99 98.99 98.85 98.99
207

Table 163. Projected Condition for Deep Rutting on Detailed Pavement Type: 05.
How Projected: Percent of wheelpath length
Subgrade Factor: 1.00 _Very Poor
lime, Preventive L1gnt Medium Heavy m years Maintenance Rehao11itat1on Rehabilitation Rehaomtat1on
1 0.00 0.00 0.00 0.00 2 0.00 0.00 0.00 0.12 3 0.06 0.13 0.17 1.13 4 2.52 1.16 1.29 3.46 5 11.98 3.75 3.95 6.79 6 25.86 7.74 7.92 10.63 7 39.69 12.60 12.67 14.64 8 51.45 17.82 17.73 18.61 9 60.85 23.04 22.78 22.44
10 68.18 28.07 27.64 26.05 11 73.89 32.79 32.22 29.44 12 78.34 37.17 36.46 32.60 13 81.85 41.19 40.37 35.54 14 84.64 44.87 43.96 38.26 15 86.88 48.24 47.25 40.79 16 88.70 51.31 50.25 43.14 17 90.19 54.11 53.00 45.33 18 91.42 56.67 55.52 47.37 19 92.45 59.02 57.84 49.27 20 93.32 61.17 59.96 51.04 21 94.06 63.14 61.92 52.70 22 94.68 64.96 63.73 54.26 23 95.22 66.64 65.40 55.72 24 95.69 68.19 66.94 57.10 25 96.10 69.62 68.38 58.39 26 96.45 70.95 69.71 59.61 27 96.76 72.19 70.96 60.77 28 97.03 73.34 72.11 61.86 29 97.28 74.42 73.20 62.89 30 97.49 75.42 74.21 63.87 31 97.69 76.36 75.16 64.80 32 97.86 77.24 76.05 65.68 33 98.01 78.07 76.89 66.53 34 98.15 78.85 77.68 67.33 35 98.28 79.58 78.43 68.09 36 98.39 80.27 79.13 68.82 37 98.50 80.93 79.80 69.52 38 98.59 81.54 80.43 70.19 39 98.68 82.13 81.03 70.83 40 98.76 82.68 81.59 71.44
208

Table 164. Projected Condition for Failures on Detailed Pavement Type: 05.
How Projected: Number per mile
Subgrade Fa~tor: 1.00 _Very Poor
11me, nevent1ve ugnt Mea1um Heavy in years Maintenance Rehabil1tat1on Rehabil1tat1on Rehabil1tat1on
1 0.00 0.00 0.00 0.00 2 0.00 0.00 0.02 0.01 3 0.48 0.20 0.35 0.24 4 2.72 1.84 1.27 1.00 5 5.85 4.77 2.59 2.19 6 8.74 7.78 4.04 3.55 7 11.06 10.31 5.44 4.93 8 12.84 12.27 6.74 6.22 9 14.19 13.77 7.90 7.39
10 15.22 14.92 8.93 8.44 11 16.01 15.80 9.83 9.37 12 16.64 16.49 10.63 10.20 13 17.13 17.03 11.34 10.94 14 17.53 17.46 11.96 11.59 15 17.86 17.81 12.52 12.17 16 18.12 18.10 13.01 12.69 17 18.34 18.34 13.46 13.15 18 18.53 18.53 13.86 13.57 19 18.69 18.70 14.22 13.95 20 18.82 18.84 14.54 14.29 21 18.94 18.96 14.84 14.60 22 19.04 19.06 15.11 14.89 23 19.12 19.15 15.36 15.15 24 19.20 19.23 15.58 15.39 25 19.27 19.29 15.79 15.61 26 19.32 19.35 15.98 15.81 27 19.38 19.41 16.16 16.00 28 19.42 19.45 16.32 16.17 29 19.47 19.49 16.48 16.33 30 19.50 19.53 16.62 16.48 31 19.54 19.57 16.75 16.62 32 19.57 19.60 16.88 16.75 33 19.59 19.62 16.99 16.87 34 19.62 19.65 17.10 16.99 35 19.64 19.67 17.20 17.09 36 19.66 19.69 17.30 17.20 37 19.68 19.71 17.39 17.29 38 19.70 19.73 17.48 17.38 39 19.72 19.74 17.56 17.47 40 19.73 19.76 17.63 17.55
209

Table 165. Projected Conditions for Block Cracking on Detailed Pavement Type: 05.
How Projected: Percent of lane area
Subgrade Factor: 1.00 _Very Poor
11me, Preventive Light Mea1um Heavy rn years Maintenance Rehao111tat1on Rehaomtat1on Rehaomtat1on
1 0.00 0.00 0.00 0.00 2 0.00 0.00 0.00 0.00 3 0.02 0.07 0.19 0.11 4 1.51 1.03 1.60 1.12 5 9.12 4.19 5.01 3.83 6 21.98 9.51 10.05 8.10 7 35.74 16.08 15.92 13.32 8 47.91 23.04 22.00 18.91 9 57.84 29.82 27.90 24.48
10 65.68 36.13 33.43 29.80 11 71.83 41.86 38.51 34.77 12 76.65 47.00 43.12 39.35 13 80.45 51.58 47.29 43.52 14 83.47 55.64 51.04 47.32 15 85.91 59.24 54.41 50.77 16 87.88 62.44 57.45 53.89 17 89.50 65.28 60.19 56.73 18 90.83 67.82 62.67 59.31 19 91.95 70.09 64.92 61.66 20 92.89 72.13 66.96 63.81 21 93.68 73.97 68.82 65.77 22 94.36 75.62 70.52 67.57 23 94.94 77.12 72.08 69.22 24 95.44 78.49 73.50 70.74 25 95.87 79.73 74.81 72.14 26 96.25 80.86 76.02 73.44 27 96.59 81.90 77.14 74.64 28 96.88 82.85 78.18 75.75 29 97.14 83.73 79.14 76.79 30 97.37 84.54 80.03 77.76 31 97.57 85.28 80.86 78.66 32 97.76 85.97 81.64 79.50 33 97.92 86.62 82.37 80.29 34 98.07 87.21 83.05 81.03 35 98.21 87.77 83.68 81.72 36 98.33 88.29 84.28 82.38 37 98.44 88.77 84.84 82.99 38 98.54 89.22 85.38 83.57 39 98.63 89.65 85.88 84.12 40 98.71 90.05 86.35 84.64
210

Table 166. Projected Condition for Alligator Cracking on Detailed Pavement Type: 05.
How Projected: Percent ofwheelpath length
Subgrade Factor: 1.00 _Very Poor
11me, Preventive Light Medium Heavy in years Maintenance Rehabil1tat1on Rehabilitation Rehabilitation
1 0.00 0.00 0.00 0.00 2 0.00 0.00 0.00 0.00 3 0.00 0.01 0.04 0.34 4 0.44 0.57 0.92 3.01 5 7.76 3.52 4.19 9.04 6 25.16 9.58 9.97 17.10 7 44.06 17.61 17.20 25.64 8 59.34 26.22 24.82 33.76 9 70.43 34.51 32.18 41.07
10 78.23 42.05 38.95 47.48 11 83.70 48.71 45.02 53.05 12 87.58 54.50 50.39 57.85 13 90.38 59.49 55.11 62.00 14 92.43 63.80 59.25 65.59 15 93.95 67.51 62.89 68.70 16 95.11 70.72 66.08 71.42 17 96.00 73.51 68.90 73.80 18 96.69 75.93 71.38 75.90 19 97.23 78.05 73.59 n.75 20 97.67 79.92 75.55 79.39 21 98.02 81.56 77.31 80.85 22 98.31 83.01 78.88 82.16 23 98.54 84.31 80.29 83.34 24 98.73 85.46 81.57 84.40 25 98.90 86.49 82.72 85.36 26 99.03 87.42 83.n 86.23 27 99.15 88.26 84.72 87.02 28 99.25 89.02 85.59 87.75 29 99.33 89.71 86.39 88.41 30 99.40 90.33 87.12 89.02 31 99.47 90.90 87.79 89.58 32 99.52 91.42 88.41 90.09 33 99.57 91.90 88.98 90.57 34 99.61 92.34 89.51 91.01 35 99.64 92.75 90.01 91.42 36 99.68 93.12 90.46 91.81 37 99.71 93.47 90.89 92.16 38 99.73 93.79 91.29 92.49 39 99.75 94.09 91.66 92.81 40 99.77 94.36 92.00 93.10
211

Table 167. Projected Condition for Longitudinal Cracking on Detailed Pavement Type: 05.
How Projected: Length per 100' station
Subgrade Factor: 1.00 _Very Poor
11me, Preventive Light Medium Heavy in years Maintenance Rehao111tat1on Renao111tat1on Rehabilitation
1 0.00 0.00 0.00 0.00 2 0.43 0.00 0.00 0.25 3 16.12 0.00 0.00 2.54 4 63.86 1.75 0.03 8.49 5 125.36 19.62 1.75 17.82 6 183.94 64.19 13.85 29.51 7 233.82 123.76 43.61 42.58 8 274.61 183.94 87.15 56.27 9 307.57 237.38 136.08 70~10
10 334.22 282.08 183.94 83.74 11 355.90 318.47 227.38 96.99 12 373.69 347.83 265.25 109.74 13 388.42 371.49 297.57 121.94 14 400.73 390.64 324.86 133.56 15 411.12 406.21 347.83 144.61 16 419.94 418.98 367.16 155.09 17 427.50 429.53 383.46 165.04 18 434.03 438.31 397.25 174.47 19 439.70 445.67 408.97 183.42 20 444.66 451.88 418.98 191.91 21 449.02 457.16 427.58 199.97 22 452.88 461.68 434.98 207.62 23 456.30 465.57 441.40 214.90 24 459.35 468.93 446.99 221.83 25 462.09 471.86 451.88 228.43 26 464.55 474.42 456.17 234.72 27 466.78 476.67 459.95 240.73 28 468.80 478.65 463.30 246.46 29 470.63 480.41 466.28 251.94 30 472.30 481.97 468.93 257.18 31 473.83 483.37 471.31 262.20 32 475.23 484.62 473.44 267.02 33 476.52 485.74 475.35 271.63 34 477.71 486.75 477.08 276.06 35 478.80 487.67 478.65 280.31 36 479.82 488.49 480.07 284.41 37 480.76 489.25 481.37 288.34 38 481.64 489.93 482.55 292.13 39 482.45 490.56 483.63 295.78 40 483.21 491.14 484.62 299.30
212

Table 168. Projected Condition for Transverse Cracking on Detailed Pavement Type: 05.
How Projected: Number per 100' station
Subgrade Factor: 1.00 _Very Poor
213

Table 169. Projected Condition for Ride Score on Detailed Pavement Type: 05.
How Projected: Percent of Ride Quality Lost (0-1)
Subgrade Factor: 1.00 _Very Poor
214

Table 170. Projected Condition for Shallow Rutting on Detailed Pavement Type: 06.
How Projected: Percent ofwheelpath length
Subgrade Factor: 1.00 _Very Poor
215

Table 171. Projected Condition for Deep Rutting on Detailed Pavement Type: 06.
How Projected: Percent ofwheelpath length
Subgrade Factor: 1.00 _Very Poor
216

Table 172. Projected Condition for Failures on Detailed Pavement Type: 06.
How Projected: Number per mile
Subgrade Factor: 1.00 _Very Poor
217

Table 173. Projected Condition for Block Cracking on Detailed Pavement Type: 06.
How Projected: Percent of lane area
Subgrade Factor: 1.00 _Very Poor
218

Table 174. Projected Condition for Alligator Cracking on Detailed Pavement Type: 06.
How Projected: Percent ofwheelpath length
Subgrade Factor: 1.00 _ Very Poor
219

Table 175. Projected Condition for Longitudinal Cracking on Detailed Pavement Type: 06.
How Projected: Length per 100' station
Subgrade Factor: 1.00 _ Very Poor
220

Table 176. Projected Condition for Transverse Cracking on Detailed Pavement Type: 06.
How Projected: Number per 100' station
Subgrade Factor: 1.00 _Very Poor
221

Table 177. Projected Condition for Ride Score on Detailed Pavement Type: 06.
How Projected: Percent of Ride Quality Lost
Subgrade Factor: 1.00 _ Very Poor
222

Table 178. Projected Condition for Shallow Rutting on Detailed Pavement Type: 07.
How Projected: Percent of wheelpath length
Subgrade Factor: 1.00 _Very Poor
223

Table 179. Projected Condition for Deep Rutting on Detailed Pavement Type: 07.
How Projected: Percent ofwheelpath length
Subgrade Factor: 1.00 _Very Poor
1me, m years
224

Table 180. Projected Condition for Failures on Detailed Pavement Type: 07.
How Projected: Number per mile
Subgrade Factor: 1.00 _Very Poor
1me, m years
225

Table 181. Projected Condition for Block Cracking on Detailed Pavement Type: 07.
How Projected: Percent of lane area
Subgrade Factor: 1.00 _Very Poor
226

Table 182. Projected Condition for Alligator Cracking on Detailed Pavement Type: 07.
How Projected: Percent ofwheelpath length
Subgrade Factor: 1.00 _Very Poor
227

Table 183. Projected Condition for Longitudinal Cracking on Detailed Pavement Type: 07.
How Projected: Length per 100' station
Subgrade Factor: 1.00 _Very Poor
228

Table 184. Projected Condition for Transverse Cracking on Detailed Pavement Type: 07.
How Projected: Number per 100' station
Subgrade Factor: 1.00 _Very Poor
229

Table 185. Projected Condition for Ride Score on Detailed Pavement Type: 07.
How Projected: Percent of Ride Quality Lost (0-1)
Subgrade Factor: 1.00 _ Very Poor
1me, m years
230
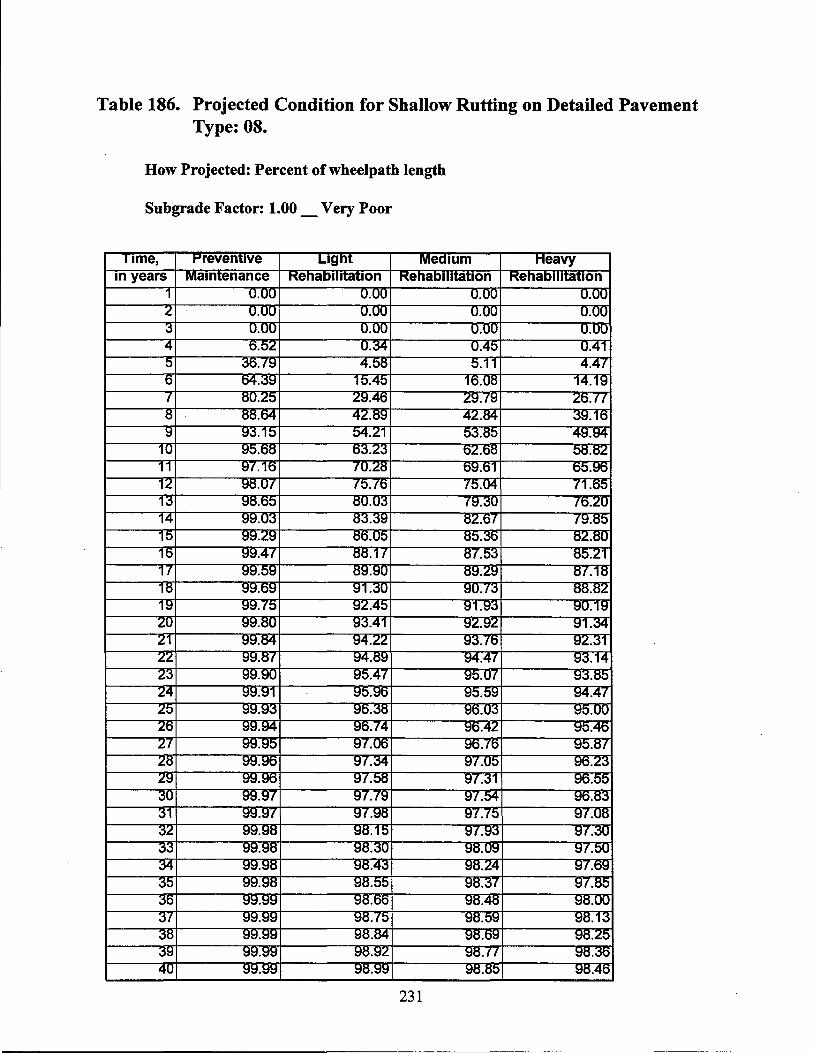
Table 186. Projected Condition for Shallow Rutting on Detailed Pavement Type: 08.
How Projected: Percent ofwheelpath length
Subgrade Factor: 1.00 _Very Poor
231

Table 187. Projected Condition for Deep Rutting on Detailed Pavement Type: 08.
How Projected: Percent ofwheelpath length
Subgrade Factor: 1.00 _Very Poor
232

Table 188. Projected Condition for Failures on Detailed Pavement Type: 08.
How Projected: Number per mile
Subgrade Factor: 1.00 _ Very Poor
233

Table 189. Projected Condition for Block Cracking on Detailed Pavement Type: 08.
How Projected: Percent of lane area
Subgrade Factor: 1.00 _Very Poor
234

Table 190. Projected Condition for Alligator Cracking on Detailed Pavement Type: 08.
How Projected: Percent ofwheelpath length
Subgrade Factor: 1.00 _Very Poor
235

Table 191. Projected Condition for Longitudinal Cracking on Detailed Pavement Type: 08.
How Projected: Length per 100' station
Subgrade Factor: 1.00 _Very Poor
236
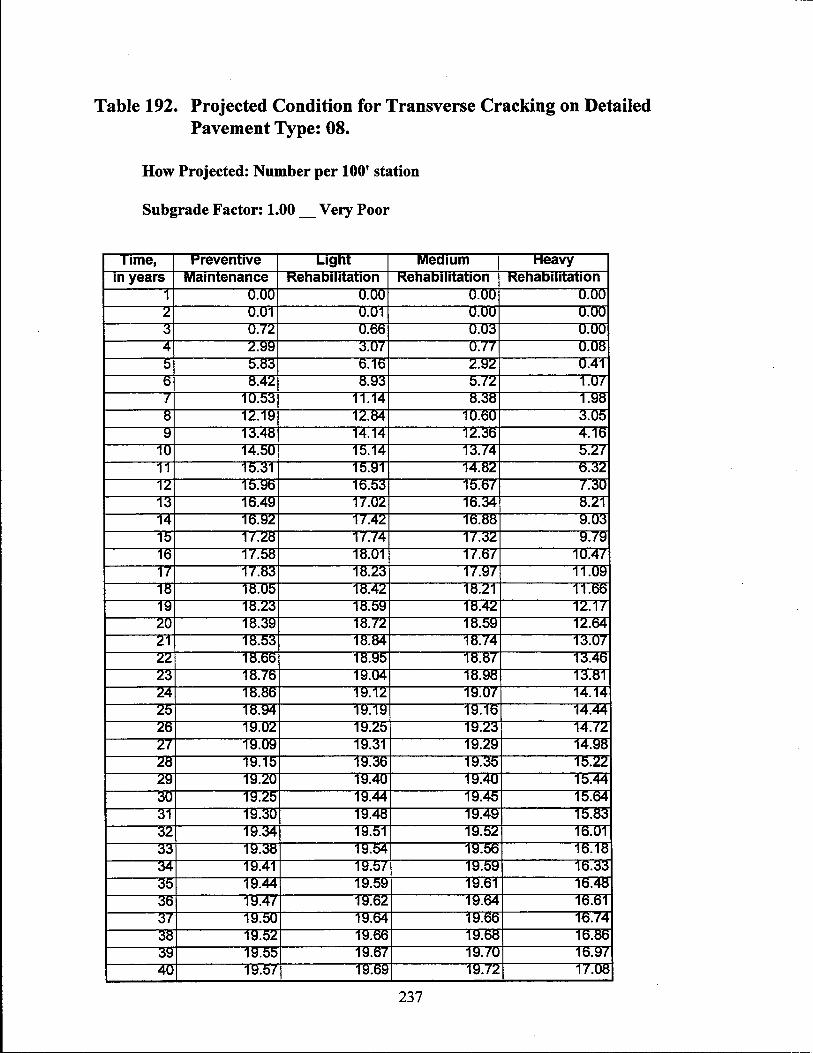
Table 192. Projected Condition for Transverse Cracking on Detailed Pavement Type: 08.
How Projected: Number per 100' station
Subgrade Factor: 1.00 _Very Poor
237

Table 193. Projected Condition for Ride Score on Detailed Pavement Type: 08.
How Projected: Percent of Ride Quality Lost (0-1)
Subgrade Factor: 1.00 _Very Poor
238

Table 194. Projected Condition for Shallow Rutting on Detailed Pavement Type: 09.
How Projected: Percent ofwheelpath length
Subgrade Factor: 1.00 _ Very Poor
239

Table 195. Projected Condition for Deep Rutting on Detailed Pavement Type: 09.
How Projected: Percent ofwheelpath length
Subgrade Factor: 1.00 _Very Poor
240

Table 196. Projected Condition for Failures on Detailed Pavement Type: 09.
How Projected: Number per mile
Subgrade Factor: 1.00 _Very Poor
241

Table 197. Projected Condition for Block Cracking on Detailed Pavement Type: 09.
How Projected: Percent oflane area
Subgrade Factor: 1.00 _ Very Poor
242

Table 198. Projected Condition for Alligator Cracking on Detailed Pavement Type: 09.
How Projected: Percent ofwheelpath length
Subgrade Factor: 1.00 _ Very Poor
243
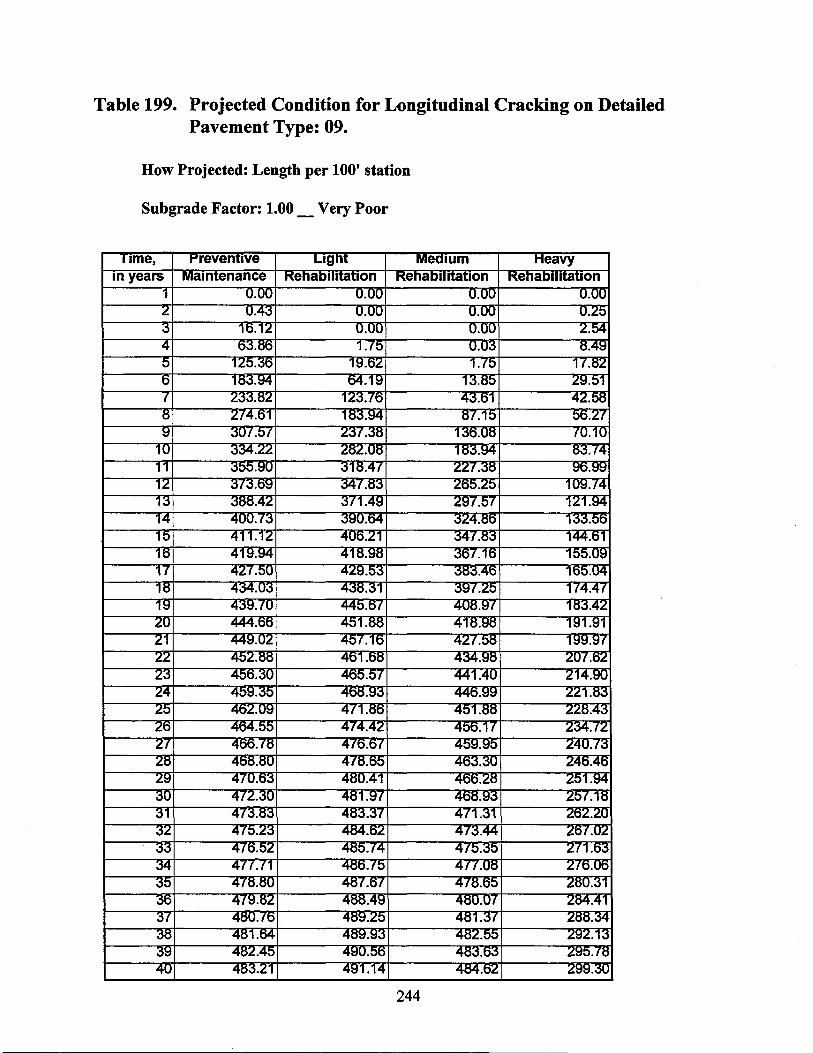
Table 199. Projected Condition for Longitudinal Cracking on Detailed Pavement Type: 09.
How Projected: Length per 100' station
Subgrade Factor: 1.00 _ Very Poor
244

Table 200. Projected Condition for Transverse Cracking on Detailed Pavement Type: 09.
How Projected: Number per 100' station
Subgrade Factor: 1.00 _Very Poor
245

Table 201. Projected Condition for Ride Score on Detailed Pavement Type: 09.
How Projected: Percent of Ride Quality Lost (0-1)
Subgrade Factor: 1.00 _Very Poor
246

Table 202. Projected Condition for Shallow Rutting on Detailed Pavement Type: 10.
How Projected: Percent ofwheelpath length
Subgrade Factor: 1.00 _Very Poor
247

Table 203. Projected Condition for Deep Rutting on Detailed Pavement Type: 10.
How Projected: Percent of wheelpath length
Subgrade Factor: 1.00 _ Very Poor
248

Table 204. Projected Condition for Failures on Detailed Pavement Type: 10.
How Projected: Number per mile
Subgrade Factor: 1.00 _Very Poor
249

Table 205. Projected Condition for Block Cracking on Detailed Pavement Type: 10.
How Projected: Percent of lane area
Subgrade Factor: 1.00 _ Very Poor
250
'--------------------------------------------------

Table 206. Projected Condition for Alligator Cracking on Detailed Pavement Type: 10.
How Projected: Percent ofwheelpath length
Subgrade Factor: 1.00 _Very Poor
251

Table 207. Projected Condition for Longitudinal Cracking on Detailed Pavement Type: 10.
How Projected: Length per 100' station
Subgrade Factor: 1.00 _Very Poor
252

Table 208. Projected Condition for Transverse Cracking on Detailed Pavement Type: 10.
How Projected: Number per 100' station
Subgrade Factor: 1.00 _Very Poor
253

Table 209. Projected Condition for Ride Score on Detailed Pavement Type: 10.
How Projected: Percent of Ride Quality Lost (0-1)
Subgrade Factor: 1.00 _Very Poor
254

L = level of distress (for distress types) or ride quality lost (for ride
quality); and
= beta, a slope factor that controls how steeply condition is lost in the
middle of the curve.
We propose that PMIS use this theoretical age equation when projecting future distress
ratings and ride quality. As mentioned earlier, "actual" pavement age can be measured in terms
of the number of months since the last resurfacing or reconstruction. Because pavement behavior
and traffic levels can change unexpectedly, it is better to define pavement age in terms of the
actually-observed distress and ride quality.
SUMMARY
The PMIS performance curve equations will help pavement managers "plan ahead," by
giving them a consistent way to predict future pavement condition. Describing future pavement
condition, though, is still not enough to truly practice effective pavement management. A
pavement management system inust be able to identify pavement sections which need to be
treated and then suggest an effective treatment for each section. This "needs estimate" function
will be described in Chapter 4.
255


IV - NEEDS ESTIMATE
Describing the current condition of pavement sections is helpful for tracking
condition trends and for monitoring progress towards meeting pavement condition goals.
Predicting future pavement condition is also helpful for planning ahead. But neither of
these abilities gives any idea about what to actually do to specific pavements or how
much repairing those sections will cost.
DESCRIPTION
TxDOT pavement managers continually evaluate pavements and recommend
treatments. These treatments are usually meant to correct surface distress and ride
quality problems (e.g., sealing cracks, patching potholes, or levelling up rough spots).
Traffic volume and highway function also influence proposed pavement treatments.
High-traffic or major sections (such as Interstate or U.S. highways) tend to be
maintained at a higher level, to provide the best possible service to the most number of
users. Low-traffic or minor sections (such as State highways or Farm-to-Market roads)
tend to be maintained at a lower level, especially when pavement funds are restricted.
It is almost impossible to separate total pavement needs from the reality of limited
funding - pavement managers instinctively tend to think in terms of what can be done.
But separating "what can be done" from "what needs to be done" is essential to
providing the best possible pavement treatments, because what a pavement gets is not
always what it needs.
Estimating total pavement needs can also help pavement managers assess the
adequacy of current funding. This is more difficult than it seems! For example,
consider the case of a District which receives $20 million in rehab each year. When
asked if the District gets enough pavement funds each year, a District pavement manager
will (almost) always reply "No." But if this $20 million is not enough, then how much
is enough? $30 million? $40 million? $50 million?
Comparing actual pavement funds with total needs can be an effective way to
257

document prolonged under-funding. Funding restrictions may "force" the District to use
lighter treatments just to get by until the next year - even the best seal coat will not last
long on a pavement that needed a full reconstruction.
Some Districts also have trouble balancing preventive maintenance and
rehabilitation needs. One year, the District may get an increase in preventive
maintenance funds when they really need rehab money. Next year the reverse happens,
and the District gets "too much" rehab money and "not enough" preventive maintenance.
Pavement managers know that there is a place for both types of funding, but it is often
difficult to get them both going in the "right" direction at the same time.
SECTIONS TO BE ANALYZED
We propose that the Needs Estimate program analyze Data Collection Sections and
"Management Sections." These terms are defined later in this Chapter. When running
the Needs Estimate program, we suggest that users begin with the Data Collection
Sections to get the clearest view of exactly where the pavement needs are. The detailed
list of Data Collection Section needs can then be used to cluster sections with similar
needs. These "clusters" can be used to define Management Sections for use in additional
Needs Estimate (or Optimization) runs.
Data Collection Sections
A "Data Collection Section" is an arbitrarily-defined section of highway, usually 0.8
km (0.5-mile) in length. PMIS stores inventory data, distress ratings, and Scores, by
Data Collection Section. Data Collection Sections typically range from 0.16 km (0.1-
mile) to 1.61 km (LO-mile) in length.
Management Sections
A "Management Section" is a section of pavement, of similar structure, that the
Engineer intends to maintain in a uniform manner. Management Sections are similar to
candidate projects - the user enters PMIS, picks a county and highway, and then
defines the section limits (beginning and ending Reference Marker and Displacement).
258

Because Management Sections are meant to simulate candidate projects, we propose
that PMIS create the first Management Sections from each District's list of Control
Sections. We also propose that PMIS allow users to alter Management Sections, as
needed, in the following ways:
1. Divide (specify a point in the middle of an existing Management Section and
create two Management Sections from one);
2. Combine (identify two adjacent Management Sections and create one
Management Section from two); and
3. Straddle (identify two adjacent Management Sections, specify a point in the
middle of each, and create three Management Sections from two).
This capability is needed to allow users to reflect changes in candidate projects.
Calculating Ratings, Scores, and Treatments for Management Sections
Management Sections can be much longer than the standard 0.8 km (0.5-mile)
PMIS Data Collection Section. A Management Section can cover two, ten, or even more
Data Collection Sections, and each Data Collection Section can have a different set of
PMIS ratings and scores. The pavement manager must somehow consolidate the ratings
and scores for each Data Collection Section into a single set of values for the entire
Management Section.
When running a Needs Estimate program for Management Sections, we propose
that PMIS compute an average rating for each distress type and Ride Score, weighted by
the length of the Data Collection Section. Having computed these "composite" ratings
and scores, the Needs Estimate program can then analyze the Management Section using
the same Needs Estimate process (described later in this Chapter) as that used for Data
Collection Sections.
TREATMENT TYPES AND COSTS
To provide the greatest possible use to TxDOT pavement managers, we propose
259

that the PMIS Needs Estimate program identify the type of treatment (if any) that each
pavement section needs. However, as mentioned in Chapter 3, these treatment types
should be broad because PMIS will not have all of the information necessary to propose
a specific pavement or mix design.
The Needs Estimate treatment types should bear some resemblance to actual field
treatments, as suggested in Table 210. These treatment types, of course, will change as
new technologies and materials become available and as TxDOT "weeds out" less
effective treatments.
To reflect this process of continual improvement in treatment types, we propose that
TxDOT annually review its Needs Estimate treatment types and update them, as needed,
to reflect new or improved treatments. Table 210 also shows recommended unit costs, in
dollars per lane mile (1.61 kilometer), for each treatment type. We recommend that
PMIS use these unit costs for the statewide Needs Estimate program. We also
recommend that future versions of PMIS use unit costs for each District, to reflect
differences in local treatment costs.
260

N 0\ -
Table 210. Examples of Proposed PMIS Treatment Types and Costs.
Pavement Type = 1-3
Preventive Maintenance (PM)
Light Rehabilitation (LRhb)
Medium Rehabilitation (MRhb)
Heavy Rehabilitation or Reconstruction (HRhb)
Crack (or Joint) Seal
$6,000 per lane mile $3,660 per lane kilometer
CPR (Concrete Pavement Restoration)
$60,000 per lane mile $36,600 per lane kilometer
Patch and Asphalt Overlay
$125,000 per lane mile $76,250 per lane kilometer
Concrete Overlay
$400,000 per lane mile $244,000 per lane kilometer
Joint Seal
$6,000 per lane mile $3,660 per lane kilometer
CPR (Concrete Pavement Restoration)
$60,000 per lane mile $36,600 per lane kilometer
Patch and Asphalt Overlay
$125,000 per lane mile $76,250 per lane kilometer
Concrete Overlay
$400,000 per lane mile $244,000 per lane kilometer
Note: Treatment costs for rigid pavements proposed by Design Division, Pavements Section.
.· .·.· :' .. \ :•·i<JcJ>, .. u11teirtrot~~) ·:.·· ;•:•:.···
Joint Seal
$6,000 per lane mile $3, 660 per lane kilometer
CPR (Concrete Pavement Restoration)
$60,000 per lane mile $36,600 per lane kilometer
Patch and Asphalt Overlay
$125,000 per lane mile $76,250 per lane kilometer
Concrete Overlay
$400,000 per lane mile $244,000 per lane kilometer
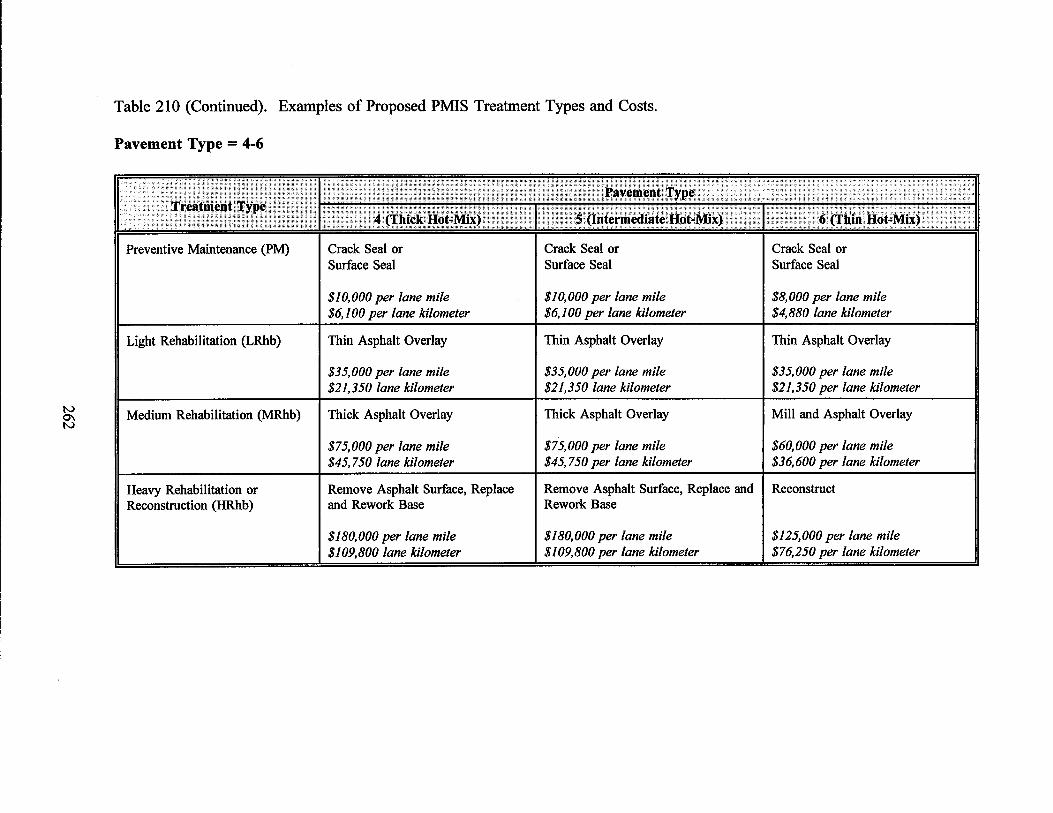
N O'\ N
Table 210 (Continued). Examples of Proposed PMIS Treatment Types and Costs.
Pavement Type = 4-6
Preventive Maintenance (PM)
Light Rehabilitation (LRhb)
Medium Rehabilitation (MRhb)
Heavy Rehabilitation or Reconstruction (HRhb)
Crack Seal or Surface Seal
$10,000 per lane mile $6, 100 per lane kilometer
Thin Asphalt Overlay
$35,000 per lane mile $21,350 lane kilometer
Thick Asphalt Overlay
$75,000 per lane mile $45, 750 lane kilometer
Remove Asphalt Surface, Replace and Rework Base
$180,000 per lane mile $109,800 lane kilometer
. jilt~~ril~i~i~: i{~t~I\1ixf .... Crack Seal or Surface Seal
$10,000 per lane mile $6, 100 per lane kilometer
Thin Asphalt Overlay
$35,000 per lane mile $21,350 lane kilometer
Thick Asphalt Overlay
$75,000 per lane mile $45, 750 per lane kilometer
Crack Seal or Surface Seal
$8,000 per lane mile $4,880 lane kilometer
Thin Asphalt Overlay
$35,000 per lane mile $21,350 per lane kilometer
Mill and Asphalt Overlay
$60,000 per lane mile $36,600 per lane kilometer
Remove Asphalt Surface, Replace and I Reconstruct Rework Base
$180, 000 per lane mile $109,800 per lane kilometer
$125,000 per lane mile $76,250 per lane kilometer

Table 210 (Continued). Examples of Proposed PMIS Treatment Types and Costs.
Pavement Type= 7-8
Preventive Maintenance (PM) I Crack Seal or Crack Seal or Surface Seal Surface Seal
$11,000 per lane mile $11,000 per lane mile $6, 710 per lane kilometer $6, 710 per lane kilometer
Light Rehabilitation (LRhb) I Thin Asphalt Overlay Thin Asphalt Overlay
N
I $40,000 per lane mile $40,000 per lane mile
0\ $24,400 per lane kilometer $24,400 per lane kilometer w
Medium Rehabilitation (MRhb) Mill and Asphalt Overlay Mill and Asphalt Overlay
$62,000 per lane mile $62,000 per lane mile $37,820 per lane kilometer $37,820 per lane kilometer
Heavy Rehabilitation or Remove Asphalt Surface, Replace Remove Asphalt Surface, Replace Reconstruction (HRhb) and Repair Concrete Base and Repair Concrete Base
$175,000 per lane mile $175,000 per lane mile $106,750 per lane kilometer $106, 750 per lane kilometer

Table 210 (Continued). Examples of Proposed PMIS Treatment Types and Costs.
Pavement Type= 9-10
Preventive Maintenance (PM) I Crack Seal or I Surface Seal, No Patching Surface Seal
$11,000 per lane mile $6,000 per lane mile $6, 710 per lane kilometer $3,660 per lane kilometer
Light Rehabilitation (LRhb) Thin Asphalt Overlay Surface Seal, Light/Medium Patching
N
II I $40,000 per lane mile O'\ $11,000 per lane mile +:-$24,400 per lane kilometer $6, 7 JO per lane kilometer
Medium Rehabilitation (MRhb) Thick Asphalt Overlay Surface Seal, Heavy Patching
$62,000 per lane mile $20,000 per lane mile $37,820 per lane kilometer $12,200 per lane kilometer
Heavy Rehabilitation or Remove Asphalt Surface, Replace Rework Base and Surface Seal Reconstruction (HRhb) and Rework Base
$175,000 per lane mile $62,000 per lane mile $106,750 per lane kilometer $37,820 per lane kilometer

SELECTING THE TREATMENT TYPE
As mentioned earlier, pavement treatments are usually meant to correct surface
distress and ride quality problems. Traffic volume and highway function also play a part
in determining the treatment that a particular pavement section needs.
We propose that PMIS use the following seven factors to propose treatments:
1. Pavement type,
2. Distress ratings,
3. Ride Score,
4. Average Daily Traffic (ADT) per lane,
5. Functional class,
6. Average County rainfall (in inches per year), and
7. Time since last surface (in years).
We propose that PMIS use a series of "decision tree" statements to "pick" the
treatment type for each pavement section. For example, a decision tree statement might
be:
ACPOOS RECONST
TYPE OF TREATMENT: Heavy Rehabilitation or Reconstruction (HRhb).
CAUSE: ADT per lane greater than 5,000 and Ride Score less than 2.5.
We propose that PMIS use a "Reason Code" (ACPOOS RECONST in the example)
for each decision tree statement. The "Reason Code" will help the pavement manager
identify why PMIS picked the treatment that it did. This is important because there are
many combinations of factors which can require the same treatment - PMIS should be
able to tell the pavement manager what the specific problem is, instead of just picking a
treatment "out of the blue."
265

As shown above, each Reason Code includes a number that identifies the type and
cause of the recommended Needs Estimate treatment. Although the numbers are not
specifically significant, the numbers for the ACP Reason Codes have been grouped into
similar categories, as shown in Table 211.
Table 211. Grouping of ACP Reason Code Numbers.
11----------------------------· .... · . . . . .· .. . . . 000
100
200
300
400
500
600
700
900
Note:
· ·': ]:'reat01e~t'fyp~~· ': ·
099 HRhb Regardless of Traffic
199 MRhb Regardless of Traffic
299 Regardless of Traffic
399 LRhb "HIGH'' Traffic
499 "LOW'' Traffic
599 "HIGH'' Traffic
699 "LOW'' Traffic PM
799 Regardless of Traffic
999 Time-based Treatments
Similar groupings for CRCP and JCP Reason Codes have not been defined.
The actual proposed decision tree statements and Reason Codes are listed at the end of
this Chapter.
Although decision tree statements give a simple way to select treatment types, there
are three potential problems which can limit how well they work.
1. Decision tree statements of the "If-Then" variety tend to be "hard-coded" into
the needs estimate computer program. If the pavement manager disagrees with
the reasoning behind a specific treatment, there is no easy way to change the
treatment to make it more "reasonable."
266

We propose that TxDOT should go ahead and use "hard-coded" decision tree
statements, but we also propose that TxDOT should design the PMIS Needs
Estimate program with enough flexibility to support "soft-coded" user-defined
statements.
2. It is very difficult for a single decision tree statement to cover everything
wrong with a particular pavement section. For example, a section could
"need" reconstruction because of poor ride quality, but it could also "need"
preventive maintenance because of Shallow Rutting - which treatment should
be applied?
We propose that PMIS use a "hierarchical" scheme, with the decision tree
statements arranged in the following order: HRhb, MRhb, LRhb, and PM.
The Needs Estimate program should begin with the first of the HRhb
statements and check each statement until a treatment is selected. If the Needs
Estimate program is unable to pick a treatment (i.e., if it runs through all of
the decision tree statements), then the section should receive a "Needs
Nothing" treatment.
3. It is difficult to write decision tree statements to cover every possible
combination of factors on any pavement section. This lack of "closure" can
mean that some pavement sections which need to be treated will "fall through
the cracks" and not be treated.
Although we have reviewed the decision tree statements for closure, we
propose that TxDOT verify the closure of these statements.
NEEDS ESTIMATE PROCESS
To provide the greatest use to TxDOT pavement managers, the PMIS Needs
Estimate program must be able to serve two major functions:
1. It must be able to estimate current and future pavement needs; and
2. It must be able to estimate needs for every pavement section, even though
TxDOT only rates 50 percent of the sections in any Fiscal Year.
267
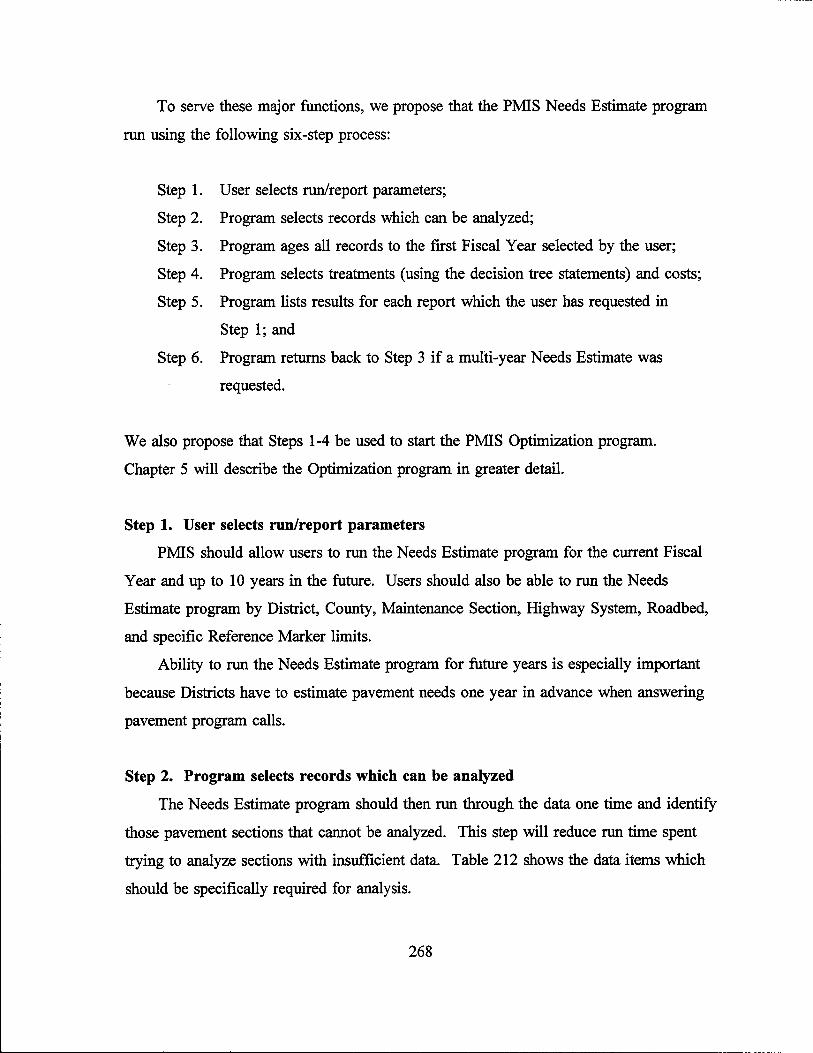
To serve these major functions, we propose that the PMIS Needs Estimate program
run using the following six-step process:
Step 1. User selects run/report parameters;
Step 2. Program selects records which can be analyzed;
Step 3. Program ages all records to the first Fiscal Year selected by the user;
Step 4. Program selects treatments (using the decision tree statements) and costs;
Step 5. Program lists results for each report which the user has requested in
Step 1; and
Step 6. Program returns back to Step 3 if a multi-year Needs Estimate was
requested.
We also propose that Steps 1-4 be used to start the PMIS Optimization program.
Chapter 5 will describe the Optimization program in greater detail.
Step 1. User selects run/report parameters
PMIS should allow users to run the Needs Estimate program for the current Fiscal
Year and up to 10 years in the future. Users should also be able to run the Needs
Estimate program by District, County, Maintenance Section, Highway System, Roadbed,
and specific Reference Marker limits.
Ability to run the Needs Estimate program for future years is especially important
because Districts have to estimate pavement needs one year in advance when answering
pavement program calls.
Step 2. Program selects records which can be analyzed
The Needs Estimate program should then run through the data one time and identify
those pavement sections that cannot be analyzed. This step will reduce run time spent
trying to analyze sections with insufficient data. Table 212 shows the data items which
should be specifically required for analysis.
268

-- -------- - -------------------------
Table 212. Proposed Data Items Required for Analysis .
Pavement Type
Distress Ratings
Ride Score
ADT
Number of Lanes
Functional Class
County
Date of Last Surface
18-k ESAL
Section Length
. --:;: ·.: .·.,,·.,.:·, .·
Reason Needed
for decision tree statements
for decision tree statements
for decision tree statements
for decision tree statements
for decision tree statements (ADT per lane), and to compute treatment cost in terms of lane miles
for decision tree statements, and for Executive Summary report
for decision tree statements, and for computing future needs (supplies average county subgrade support factor to performance curves)
for decision tree statements, and for scheduling preventive maintenance seal coats (in Optimization program)
for computing future needs (supplies traffic factor to performance curves)
for computing treatment cost in terms of lane miles
We propose that PMIS include a page on the Needs Estimate printout that
summarizes the amount of "un-analyzable" data found.
Step 3. Program ages all records to the first Fiscal Year selected by the user
The Needs Estimate program should then use the PMIS performance equations to
age all "analyzable" records to the first Fiscal Year selected by the user. This approach
would allow PMIS to estimate needs for every pavement section, even though TxDOT
only rates 50 percent of the sections in any year. Ideally, PMIS should have to go back
no further than one year to find data (because of the proposed alternating 50 percent
sample) for every section.
To use the performance equations, PMIS must input the age of the pavement
section (as described in Chapter 3). Given the absence of reliable pavement history
information, we propose that PMIS back-calculate the pavement's age using the
269

Theoretical Age equation shown at the end of Chapter 3. We also propose that PMIS
use the HRhb performance curve coefficients. For example, consider a 0.8 km (0.5-
mile) Data Collection Section (Pavement Type= 6) with the FY 1993 distress ratings
shown below in Table 213.
Table 213. Example Needs Estimate (Distress Ratings).
.... ... .. .
Rating·
Shallow Rutting 15 percent Block Cracking 12 percent
Deep Rutting 6 percent Alligator Cracking 7 percent
Patching 13 percent Longitudinal Cracking 35 feet/station
Failures 2 failures Transverse Cracking 2 per station
To age the section for a report beginning in FY 1995, the Needs Estimate program
must calculate the FY 1993 theoretical age for each distress type (and ride quality), and
then add two to get the FY 1995 value. This process is shown below in Table 214.
Table 214. Example Needs Estimate (Theoretical Ages).
Shallow Rutting 15 15 percent 4.51 6.51
Deep Rutting 6 6 percent 4.78 6.78
Failures 2 1 per mile 4.00 6.00
Block Cracking 12 12 percent 6.76 7.86
Alligator Cracking 7 7 percent 4.54 6.54
Longitudinal Cracking 35 35 ft./sta. 6.43 8.43
Transverse Cracking 2 2 per sta. 7.02 9.02
Patching is not projected because no performance curves are defined. The theoretical
age for Ride Score is not shown, but it is calculated in a similar fashion.
270

The calculated FY 1995 theoretical ages can then be used to determine the distress
ratings and utility factors, as shown below in Table 215.
Table 215. Example Needs Estimate (Distress Ratings and Utility Factors) .
. ..... : · .. :··- __ - .. ..
·· •. •Distres~:J-jpe• · · :; · bi years ·
Shallow Rutting 6.51 47.48 percent 47 0.7954
Deep Rutting 6.78 13.75 percent 14 0.7887
Failures 6.00 3.55 per mile 2 0.7339
Block Cracking 8.76 23.16 percent 23 0.6788
Alligator Cracking 6.54 23.80 percent 24 0.6215
Longitudinal Cracking 8.43 62.23 ft./sta. 62 0.9548
Transverse Cracking 9.02 4.19 per sta. 4 0.9422
"Rating" is integer value shown on reports. Internal decimal values are used for
utility calculation and treatment selection.
With the newly-calculated "current" distress ratings, the program can go to the next
step.
Step 4. Program selects treatments (using the decision tree statements) and costs
The PMIS Needs Estimate program should then select treatments and costs using the
decision tree statements.
Step 5. Program lists results for each report which the user has requested in Step 1
Having selected treatments and costs for all of the "analyzable" sections, the program
should list out the results for those reports that the user requested. The printouts will
only be for the "current" Fiscal Year.
271

Step 6. Program returns to Step 3 if a multi-year Needs Estimate was requested
If the user has only asked for a single-year Needs Estimate, the program ends at Step
5. If the user has asked for a multi-year Needs Estimate, the program must age the
sections by one year and return to Step 3. For the example section described above, the
calculation of theoretical ages is shown below in Table 216.
Table 216. Example Needs Estimate (Theoretical Ages, After Treatment).
> FY1996 :' , '<fril'~tea> ); : ::(if :~<>1 't~ted)
Shallow Rutting 6.51 1.001 7.51
Deep Rutting 6.78 1.001 7.78
Failures 6.00 1.001 7.00
Block Cracking 8.76 1.001 9.76
Alligator Cracking 6.54 1.001 7.54
Longitudinal Cracking 8.43 1.001 9.43
Transverse Cracking 9.02 1.001 10.02
Theoretical age is set equal to 0.001 if a section is treated (0.001 eliminates "divide by
zero" errors). The "treated" section is then aged to the next Fiscal Year.
NEEDS ESTIMATE REPORTS
A P:MIS Needs Estimate list of each Data Collection Section for an entire District
would produce about 150 pages of printout. Although such a list would be useful for
locating specific pavements and treatments, it would hardly be useful for managing
pavements across the entire District. A Needs Estimate report for Management Sections
would reduce the size of the printout, but it still would not help with the problem of
managing pavements across the entire District. Upper-level pavement managers need
summary reports which give an overall view of the District's total pavement needs.
272

Therefore, we propose that PMIS include the following types of Needs Estimate
reports:
1. Detail List of Sections Which Need to be Treated;
2. Statewide Pavement Needs, by District;
3. Statewide Pavement Needs, by Highway System;
4. Statewide Pavement Needs, Executive Summary;
5. District Pavement Needs, by Highway System; and
6. District Pavement Needs, Executive Summary.
Detail List of Sections Which Need to be Treated
We propose that the Needs Estimate program have a report which lists each section
and its "needed" treatment (if any). The report should include basic location information
(District, County, Highway, Reference Marker limits, and Roadbed), PMIS Scores, and
the Needs Estimate treatment and cost.
The report should also include a "treatment code," derived from the decision tree
statements, which describes why the treatment was selected. Such a code will make it
easier for District users to understand how the Needs Estimate program works. It will
also help TxDOT calibrate the Needs Estimate program by allowing users to identify
disagreements with specific sections, treatment types, and costs. This "detail report" will
also help District users to create Management Sections by locating clusters of Data
Collection Sections with similar treatments.
273

Statewide Pavement Needs, by District
We propose that the Needs Estimate program have a report that summarizes the total
Statewide lane miles and dollars needed, by District. Tables 217 and 218 illustrate the
proposed report format for lane miles and dollars, respectively.
Statewide Pavement Needs, by Highway System
We propose that the Needs Estimate program also have a report that summarizes the
total Statewide lane miles and dollars needed, by Highway System. Tables 219 and 220
illustrate the proposed report format for lane miles and dollars, respectively.
Statewide Pavement Needs, Executive Summary
We also propose that PMIS provide a Statewide summary Needs Estimate report for use
in TxDOT' s Executive Information System. This report should summarize total statewide
lane miles and dollars needed, as shown in Tables 221and222. This report should also
print one page for each District. The Statewide Executive Summary report should only be
accessible to Austin Division users. A District version of this report is described later in
this Chapter.
District Pavement Needs, by Highway System
We propose that the Needs Estimate program also have a report that summarizes the
total District lane miles and dollars needed, by Highway System. Tables 223 and 224
illustrate the proposed report format for lane miles and dollars, respectively.
District Pavement Needs, Executive Summary
As with the Statewide analysis, we propose that PMIS provide a District summary
Needs Estimate report for use in TxDOT's Executive Information System. This report
should summarize total lane miles and dollars needed, for each District, as shown in Tables
225 and 226. These District reports should be accessible to any District user.
274

N ......:i Vi
Table 217. Proposed Statewide Pavement Needs (Lane Miles), by District, Report.
Notes: Miles are in Lane Miles Fiscal Year: 1995 Dollar Values are in Thousands Funding = Unlimited ============================================================================================
Needs Nothing Prev. Maint. Light Rehab
District Miles Pct. Miles Pct. Miles Pct.
Medium Rehab
Miles Pct.
Heavy Rehab/ Reconstruction
Miles Pct.
TOTAL
Miles Pct. ============================================================================================
01 02
24 25
============================================================================================ STATEWIDE
============================================================================================
Table 218. Proposed Statewide Pavement Needs (Dollars), by District, Report.
Fiscal Year: 1995 Notes: Miles are in Lane Miles
Dollar Values are in Thousands Funding = Unlimited ===============================================================================================
Needs Nothing Prev. Maint. Light Rehab
District Dollars Pct. Dollars Pct. Dollars Pct.
Medium Rehab
Dollars Pct.
Heavy Rehab/ Reconstruction
Dollars Pct.
TOTAL
Dollars Pct. ===============================================================================================
01 02
24 25
=============================================================================================== STATEWIDE ===============================·====================·==========================================

N -...J O'I
Table 219. Proposed Statewide Pavement Needs (Lane Miles), by Highway System, Report.
Notes: Fiscal Year: 1995
Miles are in Lane Miles Dollar Values are in Thousands Funding = Unlimited
============================================================================================ Heavy Rehab/
PMIS Needs Nothing Prev. Maint. Light Rehab Medium Rehab Reconstruction TOTAL Highway ------------- ------------ ----------- ------------ -------------- ----------System Miles Pct. Miles Pct. Miles Pct. Miles Pct. Miles Pct. Miles Pct. ============================================================================================ IH us SH FM PR BR ============================================================================================ STATEWIDE ============================================================================================
Table 220. Proposed Statewide Pavement Needs (Dollars), by Highway System, Report.
Notes: Miles are in Lane Miles Fiscal Year: 1995 Dollar Values are in Thousands Funding = Unlimited ===============================================================================================
Heavy Rehab/ PMIS Needs Nothing Prev. Maint. Light Rehab Medium Rehab Reconstruction TOTAL Highway ------------- ------------ ------------ ------------ -------------- ------------System Dollars Pct. Dollars Pct. Dollars Pct. Dollars Pct. Dollars Pct. Dollars Pct. =============================================================================================== IH us SH FM PR BR =============================================================================================== STATEWIDE ===============================================================================================

N .....;i .....;i
Table 221. Proposed Statewide Pavement Needs (Lane Miles), Executive Summary, Report.
Fiscal Year: 1995 Statewide ====================================================================================
Prev. Maint./ Medium Rehab/ PMIS Needs Nothing Light Rehab Heavy Rehab TOTAL Functional ------------- ------------- ------------- ------------Class Miles Pct. Miles Pct. Miles Pct. Miles Pct. ==================================================================================== IH & Other Fwy/Expwy US Non-Fwy/Expwy Secondary ==================================================================================== STATEWIDE ==================================================================================== Fiscal Year: 1995 District: 17 Bryan ====================================================================================
Prev. Maint./ Medium Rehab/ PMIS Needs Nothing Light Rehab Heavy Rehab TOTAL Functional ------------- ------------- ------------- ------------Class Miles Pct. Miles Pct. Miles Pct. Miles Pct. ==================================================================================== IH & Other Fwy/Expwy US Non-Fwy/Expwy Secondary =================·=====================··========·================================== DISTRICT 17 ====================================================================================

N '1 00
Table 222. Proposed Statewide Pavement Needs (Dollars), Executive Summary, Report.
Fiscal Year: 1995 Statewide ==================================================================================== PMJ:S Functional Class
Prev. Maint./ Light Rehab
Dollars Pct.
Medium Rehab/ Heavy Rehab
Dollars Pct.
TOTAL
Dollars Pct. ==================================================================================== IH & Other Fwy/Expwy US Non-Fwy/Expwy Secondary ==================================================================================== STATEWJ:DE ==================================================================================== Fiscal Year: 1995 District: 17 Bryan ========================================·=========================================== PMJ:S Functional Class
Prev. Maint./ Light Rehab
Dollars Pct.
Medium Rehab/ Heavy Rehab
Dollars Pct.
TOTAL
Dollars Pct. ==================================================================================== IH & Other Fwy/Expwy US Non-Fwy/Expwy Secondary ===================================·================================================ DJ:STRJ:CT 17 ====================================================================================

N
Table 223. Proposed District Pavement Needs (Lane Miles), by Highway System, Report.
Fiscal Year: 1995 Notes: Miles are in Lane Miles District: 08 Abilene Dollar Values are in Thousands Funding = Unlimited ============================================================================================
Heavy Rehab/ PMIS Needs Nothing Prev. Maint. Light Rehab Medium Rehab Reconstruction TOTAL Highway ------------- ------------ ----------- ------------ -------------- ----------System Miles Pct. Miles Pct. Miles Pct. Miles Pct. Miles Pct. Miles Pct. ============================================================================================ IH us SH FM PR BR ============================================================================================ DISTRICT 08 ============================================================================================
~ Table 224. Proposed District Pavement Needs (Dollars), by Highway System, Report.
Fiscal Year: 1995 District: 08 Abilene
Notes: Miles are in Lane Miles Dollar Values are in Thousands Funding = Unlimited
=============================================================================================== Heavy Rehab/
PMIS Needs Nothing Prev. Maint. Light Rehab Medium Rehab Reconstruction TOTAL Highway ------------- ------------ ------------ ------------ -------------- ------------System Dollars Pct. Dollars Pct. Dollars Pct. Dollars Pct. Dollars Pct. Dollars Pct. =============================================================================================== IH us SH FM PR BR =============================================================================================== DISTRICT 08 ===============================================================================================

N 00 0
Table 225. Proposed District Pavement Needs (Lane Miles), Executive Summary, Report.
Fiscal Year: 1995 District: 17 Bryan ====================================================================================
Prev. Maint./ Medium Rehab/ PMIS Needs Nothing Light Rehab Heavy Rehab TOTAL Functional ------------- ------------- ------------- ------------Class Miles Pct. Miles Pct. Miles Pct. Miles Pct. ==================================================================================== IH & Other Fwy/Expwy US Non-Fwy/Expwy Secondary ==================================================================================== DISTRICT 01 ==================================================================================== Fiscal Year: 1995 District: 17 Bryan County: 026 Burleson ====================================================================================
Prev. Maint./ Medium Rehab/ PMIS Needs Nothing Light Rehab Heavy Rehab TOTAL Functional ------------- ------------- ------------- ------------Class Miles Pct. Miles Pct. Miles Pct. Miles Pct. ==================================================================================== IH & Other Fwy/Expwy US Non-Fwy/Expwy Secondary ==================================================================================== COUNTY 026 ===========================================a======================================== Fiscal Year: 1995 District: 17 Bryan Maintenance Section: 04 Caldwell ==================================================================================== PMIS Functional Class
Needs Nothing
Miles Pct.
Prev. Maint./ Light Rehab
Miles Pct.
Medium Rehab/ Heavy Rehab
Miles Pct.
TOTAL
Miles Pct. ==================================================================================== IH & Other Fwy/Expwy us Non-Fwy/Expwy Secondary ==================================================================================== MAINTENANCE SECTION 04 ====================================================================================

N 00 ,_.
Table 226. Proposed District Pavement Needs (Dollars), Executive Summary, Report.
Fiscal Year: 1995 District: 17 Bryan ==================================================================================== PMIS Functional Class
Prev. Maint./ Light Rehab
Dollars Pct.
Medium Rehab/ Heavy Rehab
Dollars Pct.
TOTAL
Dollars Pct. ==================================================================================== IH & Other Fwy/Expwy US Non-Fwy/Expwy Secondary ==================================================================================== DISTRICT 17 ==================================================================================== Fiscal Year: 1995 District: 17 Bryan County: 026 Burleson ==================================================================================== PMIS Functional Class
Prev. Maint./ Light Rehab
Dollars Pct.
Medium Rehab/ Heavy Rehab
Dollars Pct.
TOTAL
Dollars Pct. ==================================================================================== IH & Other Fwy/Expwy US Non-Fwy/Expwy Secondary ==================================================================================== COUNTY 026 ==================================================================================== Fiscal Year: 1995 District: 17 Bryan Maintenance Section: 04 Caldwell ==================================================================================== PMIS Functional Class
Prev. Maint./ Light Rehab
Dollars Pct.
Medium Rehab/ Heavy Rehab
Dollars Pct.
TOTAL
Dollars Pct. ==================================================================================== IH & Other Fwy/Expwy us Non-Fwy/Expwy Secondary ==================================================================================== MAINTENANCE SECTION 04 ====================================================================================

This report is a duplicate of the District-by-District pages printed in the Statewide
Executive Summary report. This duplication will give District pavement managers the
same information that the TxDOT Administration has, and thus allow the Districts to
proactively anticipate and correct pavement problems before they become serious enough
to warrant "Administrative" attention.
We also propose that the District Executive Summary report print one page for each
County and one page for each Maintenance Section, to help the District allocate enough
of its available pavement funds to each Area Office and Maintenance Section.
PROPOSED PMIS NEEDS ESTIMATE DECISION TREE STATEMENTS
Selecting a Needs Estimate treatment begins with a classification of the pavement
section's traffic level, as shown in Table 227.
Table 227. "Low" and "High" ADT per Lane Values.
1 Rural Interstate
2 Rural Principal Arterial (Other)
6 Rural Minor Arterial
7 Rural Major Collector
8 Rural Minor Collector
9 Rural Local
11 Urban Principal Arterial (Interstate)
12 Urban Principal Arterial (Other Freeway)
14 Urban Principal Arterial (Other)
16 Urban Minor Arterial
17 Urban Collector
19 Urban Local
.. . . . .. . ...
thC,n'LOw~,·Ant:rier:tane
1 to 7,499
1 to 7,499
1 to 2,999
1 to 1,999
1 to 1,999
1 to 1,999
1 to 7,499
1 to 7,499
1 to 7,499
1to2,999
1 to 1,999
1 to 1,999
7,500 to 999,999
7,500 to 999,999
3,000 to 999,999
2,000 to 999,999
2,000 to 999,999
2,000 to 999,999
7,500 to 999,999
7,500 to 999,999
7,500 to 999,999
3,000 to 999,999
2,000 to 999,999
2,000 to 999,999
Note: PMIS does not use Functional Class values of 3, 4, 5, 10, 13, 15, or 18. ADT per lane values are in vehicles per day, by roadbed.
282

These values are the same for all pavement types. However, we propose that
TxDOT review the values for each Pavement Type and change them, if necessary. After
classifying the section's traffic level, PMIS can select the Needs Estimate treatment by
using the decision tree statements. We propose that PMIS assign Reason Codes to each
decision tree statement, as shown in Table 228 (for CRCP), Table 229 (for JCP), and
Table 230 (for ACP).
SUMMARY
The PMIS Needs Estimate program will give pavement managers a consistent way to
identify "problem" pavement sections. It will also give a way to estimate the total
amount of work (in terms of lane miles and dollars) necessary to fix all of the problem
sections. Tracking these total needs over time will help the pavement manager monitor
progress made in improving overall pavement condition.
However, the Needs Estimate program assumes that resources (especially funding)
are unlimited - and this is obviously not the case. The pavement manager also needs a
way to deal with the reality of limited resources, and some way to get the best possible
use out of those resources. The PMIS approach to these problems is through its
Optimization program, which will be described in Chapter 5.
283

Table 228. Needs Estimate Reason Codes for CRCP (Pavement Type = 1 ).
CRCOlO RECONST
TYPE OF TREATMENT: Heavy Rehabilitation or Reconstruction (HRhb).
CAUSE: Average Crack Spacing less than 4 feet and Average County Rainfall greater than 40 inches per year.
CRC015 RECONST
TYPE OF TREATMENT: Heavy Rehabilitation or Reconstruction (HRhb ).
CAUSE: ADT per lane equal to 'HIGH' and The sum of (Punchouts +Asphalt Patches+ Concrete Patches) greater than 8 per mile.
CRC016 RECONST
TYPE OF TREATMENT: Heavy Rehabilitation or Reconstruction (HRhb).
CAUSE: ADT per lane equal to 'HIGH' and Average Crack Spacing less than or equal to 2 feet and The sum of (Punchouts + Asphalt Patches + Concrete Patches) greater than 6 per mile.
CRC020 RECONST
TYPE OF TREATMENT: Heavy Rehabilitation or Reconstruction (HRhb).
CAUSE: ADT per lane equal to 'HIGH' and Average Crack Spacing less than 6 feet and Ride Score less than 2.5
CRC021 MED REHAB
TYPE OF TREATMENT: Medium Rehabilitation (MRhb ).
CAUSE: ADT per lane equal to 'HIGH' and Average Crack Spacing less than or equal to 2 feet and The sum of (Punchouts +Asphalt Patches+ Concrete Patches) greater than 3 per mile.
284

Table 228 (Continued). Needs Estimate Reason Codes for CRCP (Pavement Type= 1).
CRC025 MED REHAB
TYPE OF TREATMENT: Medium Rehabilitation (MRhb).
CAUSE: ADT per lane equal to 'HIGH' and Spalled Cracks greater than 20 percent.
CRC030 MED REHAB
TYPE OF TREATMENT: Medium Rehabilitation (MRhb).
CAUSE: ADT per lane equal to 'HIGH' and Ride Score less than 3.0
CRC035 LIGHT REHAB
TYPE OF TREATMENT: Light Rehabilitation (LRhb).
CAUSE: ADT per lane equal to 'HIGH' and Punchouts greater than 0 per mile.
CRC040 RECONST
TYPE OF TREATMENT: Heavy Rehabilitation or Reconstruction (HRhb).
CAUSE: ADT per lane equal to 'LOW' and The sum of (Punchouts + Asphalt Patches + Concrete Patches) greater than 10 per mile.
CRC041 RECONST
TYPE OF TREATMENT: Heavy Rehabilitation or Reconstruction (HRhb).
CAUSE: ADT per lane equal to 'LOW' and Average Crack Spacing less than or equal to 2 feet and The sum of (Punchouts + Asphalt Patches + Concrete Patches) greater than 8 per mile.
285

------------ ----------------------------------
Table 228 (Continued). Needs Estimate Reason Codes for CRCP (Pavement Type= I).
CRC045 MED REHAB
TYPE OF TREATMENT: Medium Rehabilitation (MRhb).
CAUSE: ADT per lane equal to 'LOW' and Spalled Cracks greater than 33 percent.
CRC046 MED REHAB
TYPE OF TREATMENT: Medium Rehabilitation (MRhb).
CAUSE: ADT per lane equal to 'LOW' and Average Crack Spacing less than or equal to 2 feet and The sum of (Punchouts +Asphalt Patches+ Concrete Patches) greater than 4 per mile.
CRC050 MED REHAB
TYPE OF TREATMENT: Medium Rehabilitation (MRhb).
CAUSE: ADT per lane equal to 'LOW' and Ride Score less than 2.5
CRC055 LIGHT REHAB
TYPE OF TREATMENT: Light Rehabilitation (LRhb).
CAUSE: ADT per lane equal to 'LOW' and Punchouts greater than 0 per mile.
286

Table 229. Reason Codes for JCP (Pavement Type= 2-3).
JCP005 RECONST
TYPE OF TREATMENT: Heavy Rehabilitation or Reconstruction (HRhb).
CAUSE: ADT per lane equal to 'HIGH' and Failed Joints and Cracks greaterh than 33 percent.
JCPOlO RECONST
TYPE OF TREATMENT: Heavy Rehabilitation or Reconstruction (HRhb ).
CAUSE: ADT per lane equal to 'HIGH' and Shattered Slabs greater than 10 per mile.
JCP015 RECONST
TYPE OF TREATMENT: Heavy Rehabilitation or Reconstruction (HRhb).
CAUSE: ADT per lane equal to 'HIGH' and Failures greater than 50 per mile.
JCP020 RECONST
TYPE OF TREATMENT: Heavy Rehabilitation or Reconstruction (HRhb ).
CAUSE: ADT per lane equal to 'HIGH' and Slabs With Longitudinal Cracks greater than 20 percent.
JCP025 RECONST
TYPE OF TREATMENT: Heavy Rehabilitation or Reconstruction (HRhb ).
CAUSE: ADT per lane equal to 'HIGH' and Concrete Patches greater than 10 per mile.
287

Table 229 (Continued). Reason Codes for JCP (Pavement Type= 2-3).
JCP030 RECONST
TYPE OF TREATMENT: Heavy Rehabilitation or Reconstruction (HRhb).
CAUSE: ADT per lane equal to 'HIGH' and Shattered Slabs greater than 5 per mile and Ride Score less than 3.5
JCP035 RECONST
TYPE OF TREATMENT: Heavy Rehabilitation or Reconstruction (HRhb).
CAUSE: ADT per lane equal to 'HIGH' and Failed Joints and Cracks greater than 15 percent and Ride Score less than 3.5
JCP040 RECONST
TYPE OF TREATMENT: Heavy Rehabilitation or Reconstruction (HRhb).
CAUSE: ADT per lane equal to 'HIGH' and Failures greater than 25 per mile and Ride Score less than 3.5
JCP045 MED REHAB
TYPE OF TREATMENT: Medium Rehabilitation (MRhb).
CAUSE: ADT per lane equal to 'HIGH' and Ride Score less than 3.0
JCP050 LIGHT REHAB
TYPE OF TREATMENT: Light Rehabilitation (LRhb ).
CAUSE: ADT per lane equal to 'HIGH' and Failed Joints and Cracks greater than 0 percent.
288

Table 229 (Continued). Reason Codes for JCP (Pavement Type= 2-3).
JCP055 LIGHT REHAB
TYPE OF TREATMENT: Light Rehabilitation (LRhb ).
CAUSE: ADT per lane equal to 'HIGH' and Shattered Slabs greater than 0 per mile.
JCP060 PREV MAINT
TYPE OF TREATMENT: Preventive Maintenance (PM).
CAUSE: ADT per lane equal to 'HIGH' and Slabs With Longitudinal Cracks greater than 0 percent.
JCP065 MED REHAB
TYPE OF TREATMENT: Medium Rehabilitation (MRhb ).
CAUSE: ADT per lane equal to 'LOW' and Ride Score less than 2.5
JCP070 MED REHAB
TYPE OF TREATMENT: Medium Rehabilitation (MRhb).
CAUSE: ADT per lane equal to 'LOW' and Shattered Slab greater than 10 per mile.
JCP075 MED REHAB
TYPE OF TREATMENT: Medium Rehabilitation (MRhb).
CAUSE: ADT per lane equal to 'LOW' and Failures greater than 50 per mile.
289

Table 229 (Continued). Reason Codes for JCP (Pavement Type= 2-3).
JCP080 MED REHAB
TYPE OF TREATMENT: Medium Rehabilitation (MRhb ).
CAUSE: ADT per lane equal to 'LOW' and Failed Joints and Cracks greater than 50 percent.
JCP085 LIGHT REHAB
TYPE OF TREATMENT: Light Rehabilitation (LRhb ).
CAUSE: ADT per lane equal to 'LOW' and Failed Joints and Cracks greater than 0 percent.
JCP090 LIGHT REHAB
TYPE OF TREATMENT: Light Rehabilitation (LRhb ).
CAUSE: ADT per lane equal to 'LOW' and Shattered Slabs greater than 0 per mile.
JCP095 PREV MAINT
TYPE OF TREATMENT: Preventive Maintenance (PM).
CAUSE: ADT per lane equal to 'LOW' and Slabs With Longitudinal Cracks greater than 0 percent.
290

Table 230. Reason Codes for ACP (Pavement Type = 4-10).
ACP005 RECONST
TYPE OF TREATMENT: Heavy Rehabilitation or Reconstruction (HRhb).
CAUSE: ADT per lane greater than 5,000 and Ride Score less than 2.5
ACPOlO RECONST
TYPE OF TREATMENT: Heavy Rehabilitation or Reconstruction (HRhb).
CAUSE: ADT per lane greater than 750 and Ride Score less than 2.0
ACP015 RECONST
TYPE OF TREATMENT: Heavy Rehabilitation or Reconstruction (HRhb ).
CAUSE: Ride Score less than 1.5
ACP020 RECONST
TYPE OF TREATMENT: Heavy Rehabilitation or Reconstruction (HRhb).
CAUSE: Deep Rutting greater than 50 percent.
ACP025 RECONST
TYPE OF TREATMENT: Heavy Rehabilitation or Reconstruction (HRhb).
CAUSE: ADT per lane greater than 750 and Alligator Cracking greater than 50 percent and Ride Score less than 3.0
291

Table 230 (Continued). Reason Codes for ACP (Pavement Type= 4-10).
ACP030 RECONST
TYPE OF TREATMENT: Heavy Rehabilitation or Reconstruction (HRhb ).
CAUSE: Alligator Cracking greater than 50 percent and Ride Score less than 2.5
ACPlOO MED REHAB
TYPE OF TREATMENT: Medium Rehabilitation (MRhb ).
CAUSE: ADT per lane greater than 5,000 and Ride Score less than 3. 0
ACP105 MED REHAB
TYPE OF TREATMENT: Medium Rehabilitation (MRhb).
CAUSE: ADT per lane greater than 750 and Ride Score less than 2.5
ACPllO MED REHAB
TYPE OF TREATMENT: Medium Rehabilitation (MRhb).
CAUSE: Ride Score less than 2.0
ACP115 MED REHAB
TYPE OF TREATMENT: Medium Rehabilitation (MRhb).
CAUSE: ADT per lane greater than 750 and Deep Rutting greater than 25 percent.
292
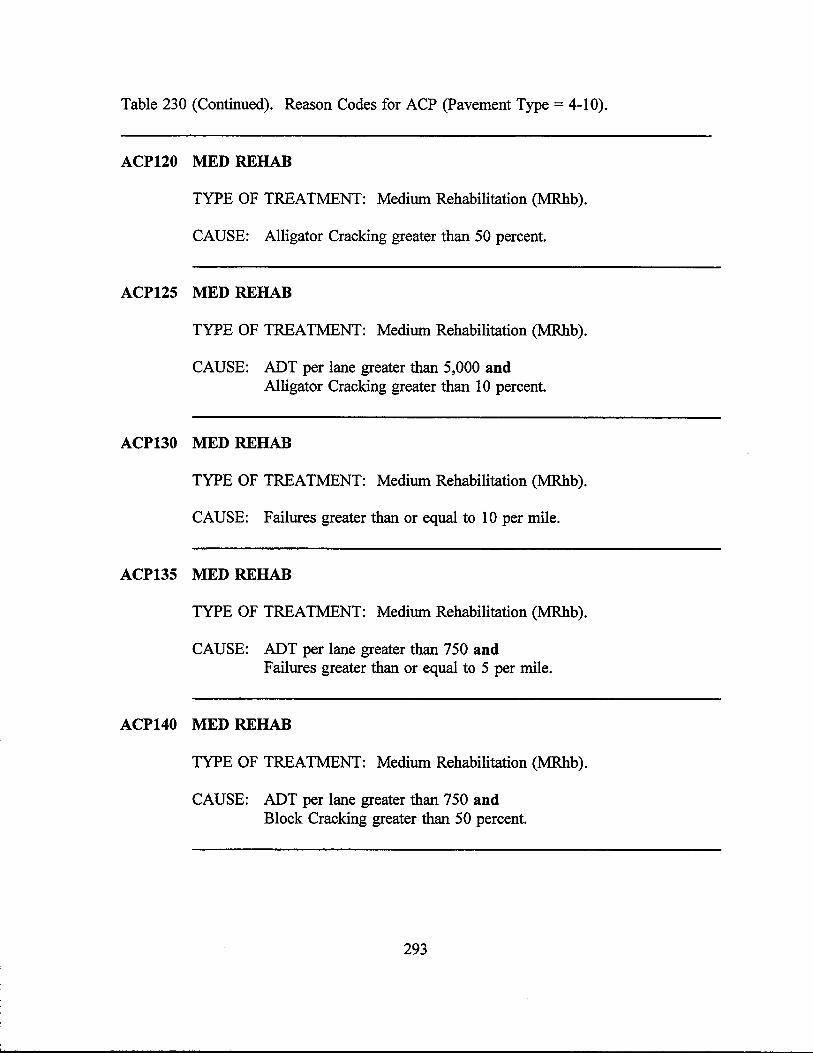
Table 230 (Continued). Reason Codes for ACP (Pavement Type = 4-10).
ACP120 MED REHAB
TYPE OF TREATMENT: Medium Rehabilitation (MRhb ).
CAUSE: Alligator Cracking greater than 50 percent.
ACP125 MED REHAB
TYPE OF TREATMENT: Medium Rehabilitation (MRhb).
CAUSE: ADT per lane greater than 5,000 and Alligator Cracking greater than 10 percent.
ACP130 MED REHAB
TYPE OF TREATMENT: Medium Rehabilitation (MRhb ).
CAUSE: Failures greater than or equal to 10 per mile.
ACP135 MED REHAB
TYPE OF TREATMENT: Medium Rehabilitation (MRhb ).
CAUSE: ADT per lane greater than 750 and Failures greater than or equal to 5 per mile.
ACP140 MED REHAB
TYPE OF TREATMENT: Medium Rehabilitation (MRhb ).
CAUSE: ADT per lane greater than 750 and Block Cracking greater than 50 percent.
293

Table 230 (Continued). Reason Codes for ACP (Pavement Type = 4-10).
ACP200 LIGHT REHAB
TYPE OF TREATMENT: Medium Rehabilitation (MRhb).
CAUSE: Ride Score less than 2.5
ACP300 LIGHT REHAB
TYPE OF TREATMENT: Light Rehabilitation (LRhb).
CAUSE: ADT per lane equal to 'HIGH' and Shallow Rutting greater than 25 percent.
ACP305 LIGHT REHAB
TYPE OF TREATMENT: Light Rehabilitation (LRhb).
CAUSE: ADT per lane equal to 'HIGH' and Deep Rutting greater than 10 percent.
ACP310 LIGHT REHAB
TYPE OF TREATMENT: Light Rehabilitation (LRhb).
CAUSE: ADT per lane equal to 'HIGH' and Ride Score less than 3.0
ACP400 PREV MAINT
TYPE OF TREATMENT: Preventive Maintenance (PM).
CAUSE: ADT per lane equal to 'LOW' and Shallow Rutting greater than 50 percent.
294

Table 230 (Continued). Reason Codes for ACP (Pavement Type= 4-10).
ACP405 PREV MAINT
TYPE OF TREATMENT: Preventive Maintenance (PM).
CAUSE: ADT per lane equal to 'LOW' and Deep Rutting greater than 10 percent.
ACP500 PREV MAINT
TYPE OF TREATMENT: Preventive Maintenance (PM).
CAUSE: ADT per lane equal to 'HIGH' and Block Cracking greater than 5 percent.
ACP505 PREV MAINT
TYPE OF TREATMENT: Preventive Maintenance (PM).
CAUSE: ADT per lane equal to 'HIGH' and Failures greater than 1 per mile.
ACP510 PREV MAINT
TYPE OF TREATMENT: Preventive Maintenance (PM).
CAUSE: ADT per lane equal to 'HIGH' and Alligator Cracking greater than 5 percent.
ACP515 PREV MAINT
TYPE OF TREATMENT: Preventive Maintenance (PM).
CAUSE: ADT per lane equal to 'HIGH' and Longitudinal Cracking greater than 50 feet per station.
295

Table 230 (Continued). Reason Codes for ACP (Pavement Type= 4-10).
ACP520 PREV MAINT
TYPE OF TREATMENT: Preventive Maintenance (PM).
CAUSE: ADT per lane equal to 'HIGH' and Transverse Cracking greater than 2 per station.
ACP600 PREV MAINT
TYPE OF TREATMENT: Preventive Maintenance (PM).
CAUSE: ADT per lane equal to 'LOW' and Alligator Cracking greater than 5 percent.
ACP605 PREV MAINT
TYPE OF TREATMENT: Preventive Maintenance (PM).
CAUSE: ADT per lane equal to 'LOW' and Block Cracking greater than 5 percent.
ACP610 PREV MAINT
TYPE OF TREATMENT: Preventive Maintenance (PM).
CAUSE: ADT per lane equal to 'LOW' and Failures greater than 1 per mile.
296

Table 230 (Continued). Reason Codes for ACP (Pavement Type= 4-10).
ACP615 PREV MAINT
TYPE OF TREATMENT: Preventive Maintenance (PM).
CAUSE: ADT per lane equal to 'LOW' and Longitudinal Cracking greater than 50 feet per station.
ACP620 PREV MAINT
TYPE OF TREATMENT: Preventive Maintenance (PM).
CAUSE: ADT per lane equal to 'LOW' and Transverse Cracking greater than 2 per station.
ACP700 PREV MAINT
TYPE OF TREATMENT: Preventive Maintenance (PM).
CAUSE: Shallow Rutting greater than 25 percent.
ACP705 PREV MAINT
TYPE OF TREATMENT: Preventive Maintenance (PM).
CAUSE: Deep Rutting greater than 0 percent.
ACP900 PREV MAINT
TYPE OF TREATMENT: Preventive Maintenance (PM).
CAUSE: Time since last surface greater than 7 years.
Author's Note: This treatment has not been used in the current version of PMIS, pending availability of current pavement layer and work history information.
297


V - OPTIMIZATION
Identifying total pavement needs is helpful for locating problem sections and
balancing preventive maintenance and rehabilitation funding requirements, but it assumes
that funding is unlimited. The reality is that pavement funding is limited. Pavement
managers must pick the right section, the right treatment, and the right time to get the
most effectiveness out of their limited funds.
DESCRIPTION
Limited funding forces the pavement manager to choose between giving a section
the treatment that it needs and giving a section some lesser treatment. Sometimes, the
pavement manager must forego treating the section altogether, and rely upon routine
maintenance to keep the section together until it can be treated. It is also possible that a
section might be treated earlier, to take advantage of other work being done at the same
time (e.g., pavement rehab done during a widening project).
Limited funding sometimes forces pavement managers to adopt a "worst first"
strategy towards treating pavements. Although this strategy fixes the worst roads, it is
not able to fix very many - "worst first" involves many reconstruction treatments,
which are expensive. As a result, the pavement manager spends most of the time (and
money) fixing a few roads, while the majority of the roads (which are in "good" to
"fair" condition) get worse. After a few years, the amount of mileage needing
reconstruction increases. The net effect to the pavement manager is the sense of getting
"further and further behind."
In an attempt to treat the most mileage possible, pavement managers sometimes
adopt a "least cost" strategy instead of "worst first." Although this strategy gives the
appearance of aggressive maintenance, it can encourage the pavement manager to select
superficial or "band-aid" treatments which, while inexpensive, do not last very long.
Heavier rehab-type treatments tend to be overlooked because of their high initial cost,
even though they last much longer. Ultimately, "least cost" can be dangerously
misleading, especially in areas where pavement structural problems are common - the
299
roads "look" good, but they are capable of failing rapidly with little warning. Neither of
these strategies - "worst first" nor "least cost" - ensures that the pavement manager is
getting the most effectiveness out of the pavement treatments.
Some Districts respond to limited funding by establishing an annual seal coat
program to resurface lower-volume roads on a pre-specified interval (e.g., every 7 years).
Even then, there is often not enough preventive maintenance funding to support such a
program, and the untreated sections are left for routine maintenance. Complicating the
issue is the fact that traffic, especially truck traffic, is increasing. The establishment of
the North American Free Trade Agreement (NAFTA) will significantly increase future
truck volumes on Texas highways. Pavements will have to carry the extra traffic
loading, regardless of how much funding is available.
SECTIONS TO BE ANALYZED
As with the Needs Estimate program, we propose that the Optimization program let
the user analyze either Data Collection Sections or Management Sections. This approach
provides greater consistency of analysis between the two programs.
TREATMENT TYPES AND COSTS
We also propose that the Optimization program use the broad treatment types
defined in the Needs Estimate program, with one exception. We propose that the
Optimization program include a "Stopgap" treatment type for those sections which do
not have enough money to fund their "needed" treatment.
The Stopgap treatment simulates ongoing repair maintenance that a section must
receive to preserve its condition over the next fiscal year. Funding for such treatments
should be taken from the existing maintenance budget - it should not be taken from the
user-specified Optimization budget. In extreme cases, it is possible for Stopgap
treatment costs to exceed the existing maintenance budget.
We propose that the Optimization program use the same treatment costs defined in
the Needs Estimate program, with the Stopgap treatment cost set equal to the Preventive
Maintenance treatment cost.
300

SELECTING THE TREATMENT TYPE
We propose that the Optimization program also use the Needs Estimate decision
tree statements, in their proposed "hierarchical" scheme (as described in Chapter 4), to
select treatment type.
This proposal is extremely important. Although PMIS must work within the reality
of limited funding, it must also focus on providing treatments which "need to be done"
as opposed to only those treatments which "can be done." The Needs Estimate and
Optimization programs should not analyze the same pavement section and get two
different treatments, unless the difference is caused by limited funding.
OPTIMIZATION PROCESS
As with the Needs Estimate, the PMIS Optimization program must be able to:
1. Prioritize current and future pavement sections; and
2. Prioritize all pavement sections, even though TxDOT only rates 50 percent of
the sections in any Fiscal Year.
To meet these requirements, we propose that the PMIS Optimization program run
using the following ten-step process:
Step 1.
Step 2.
Step 3.
Step 4.
Step 5.
Step 6.
Step 7.
Step 8.
User selects run/report parameters;
Program selects records which can be analyzed;
Program ages all records to the first Fiscal Year selected by the user;
Program selects treatments (using the decision tree statements) and costs;
Program computes "after treatment" distress ratings and ride quality
("gain in rating");
Program computes "Benefit" and "Effective Life" of the Needs Estimate
treatment for each section;
Program computes "Cost Effectiveness Ratio" for each section;
Program determines sections to be funded;
301

Step 9. Program lists results for each report which the user has requested in Step 1;
Step 10. Program returns to Step 3 if a multi-year Optimization was requested.
The first four steps are the same as those used in the Needs Estimate program.
Although the proposed Optimization program is not inherently complicated, it does
contain many parts. The easiest way to explain the Optimization program is to go
through it step by step.
Step 1. User selects run/report parameters
PMIS should allow users to run the Optimization program for the current Fiscal
Year and up to 10 years in the future. Users should also be able to run the Optimization
program by District, County, Maintenance Section, Highway System, and Roadbed.
Ability to run the Optimization program for future years is especially important
because Districts have to identify and prioritize candidate projects one year in advance
when answering pavement program calls. This ability will also help the pavement
manager proactively solve problems before they become serious enough to warrant
review by upper management.
We propose that the Optimization program allow the user to enter a base funding
level for the first analysis year, along with a specified percentage increase or decrease,
which the program can use to compute funding for future analysis years. This feature
would allow PMIS to simulate legislative appropriations proposals, which usually involve
current funding plus or minus a constant percent per year (e.g., "current funding minus
one percent per year, for the next five years").
We also propose that the Optimization program allow the user to enter a percent
increase or decrease in the 20-year projected 18-k ESAL. This feature will be especially
useful for NAFTA-related studies of specific highway corridors. It would have the effect
of changing the rate of pavement deterioration by changing the Chi factor in the
section's performance equations (described in Chapter 3).
We finally propose that the Optimization program allow the user to enter a value
for the number of years between regularly-scheduled preventive maintenance seal coats.
302

This feature, when used with the Date of Last Surface, would simulate the scheduling of
a preventive maintenance seal coats on any section which is otherwise in good condition
(i.e., has a Needs Estimate treatment of "Needs Nothing") but has not been resurfaced in
several years. This proposal has not been implemented in the current version of PMIS,
and is pending availability of current pavement layer and work history information.
Step 2. Program selects records which can be analyzed
The Optimization program should then run through the data one time and identify
those pavement sections which cannot be analyzed. This step will reduce run time spent
trying to analyze and prioritize sections with insufficient data. The criteria used to
identify sections as "analyzable" should be the same as those used for the Needs
Estimate (described in Chapter 4). We propose that PMIS include a page on the
Optimization printout which summarizes the amount of "un-analyzable" data found.
Step 3. Program ages all records to the first Fiscal Year selected by the user
We propose that the Optimization program then use the PMIS performance
equations to age all "analyzable" records to the first Fiscal Year selected by the user.
This approach would allow PMIS to prioritize every section, even though TxDOT only
rates 50 percent of the sections in any year. Ideally, PMIS should have to go back no
further than one year to find data (because of the proposed alternating 50 percent
sample) for every section.
This step is also the same as that performed by the Needs Estimate program. We
propose that the PMIS Optimization program use the theoretical age equation (shown in
Chapter 3) to project "old" rating data to the first Fiscal Year selected by the user.
These theoretical ages provide the basis for computing distress ratings and ride quality to
be used in the next step.
Step 4. Program selects treatments (using the decision tree statements) and costs
We propose that the PMIS Optimization program then select treatments and costs
using the same decision tree statements as those used in the Needs Estimate program.
303

This step is important because it ensures that both of the PMIS analysis programs will
get the same answer ("needed treatment") when analyzing the same section.
This step is also important because we propose that the Optimization program limit
its analysis to calculating the Cost Effectiveness ratio of the Needs Estimate treatment, as
opposed to comparing the effectiveness of lighter or heavier treatments.
For example, consider a section with a Needs Estimate treatment of "Medium
Rehabilitation." It would be possible to consider the effectiveness of a heavier "HRhb"
treatment, or of a lighter "LRhb" or "PM" treatment. Considering these additional
treatments would greatly increase the run time of the program. Thus, we recommend
that the Optimization program only consider the effectiveness of the "needed" MRhb
treatment - if the treatment is effective enough (given the user-specified funding) then
it should be funded, otherwise, the section should receive a "Stopgap" treatment.
Step 5. Program computes "after treatment" distress ratings and ride quality
("gain in rating")
Here is where the Optimization program first distinguishes itself from the Needs
Estimate.
The purpose of the Optimization program is to get as much effectiveness as
possible from each pavement treatment. "Effectiveness" is defined in terms of:
1. How much the treatment improves the section's distress and ride quality (Step
5); and
2. How long that improvement lasts (Step 6).
Not every treatment (especially the lighter PMs and LRhbs) is effective at removing
all distress types. For example, a preventive maintenance seal coat will not remove
Deep Rutting by itself; nor will it necessarily improve the section's ride quality. For this
reason, we propose that TxDOT define a "gain of rating" value for each distress type
and ride quality. These values should describe the treatment's ability to improve distress
and ride quality utility, as shown in Table 231.
304

---------------------------------------
Table 231. Proposed Gain of Rating Values for PMIS Optimization Program.
Sgap
PM
LRhb
MRhb
HRhb
No change in distress ratings (None)
Reset distress ratings to zero (1.0 max)
Reset distress ratings to zero (1.0 max)
Reset distress ratings to zero (1.0 max)
Reset distress ratings to zero (1.0 max)
No change in Ride Score (None)
Increase Ride Score by 0.5 (1.0 max)
Increase Ride Score by 1.5 (1.0 max)
Reset Ride Score to 4.8 (1.0 max)
Reset Ride Score to 4.8 (1.0 max)
It should be noted that the Stopgap treatment results in no improvement because the
section receives no actual Optimization-funded treatment.
Having selected a treatment (Step 4) and improved the section's distress and ride
quality (Step 5), the Optimization program can then address the issue of how long the
improvement will last.
Step 6. Program computes "Benefit" and "Effective Life" of the Needs Estimate
treatment for each section
By applying a treatment, the pavement manager hopes to improve the section's
overall condition (distress and ride quality), not just for the current Fiscal Year, but for
many years to come. Each year that the newly-treated section's condition is better than
its original "untreated" condition represents "Benefit" to the agency and its customers.
This concept of "Benefit" can be represented as the area between two performance
curves, as shown in Figure 6. The bottom curve is the section's original "untreated"
condition over time. We propose that this curve be based on the HRhb performance
curve coefficients. The upper curve is the section's ''treated" condition over time. We
propose that this curve be based on the performance curve coefficients for the Needs
305

VJ 0 O"I
1.00
~ ·-·-~ :::> ~ ·-en +:i en s.... :::> Q) 0 s.... Q) en u (5 ~
0
"Untreated"
0 Age
Figure 6. Proposed Definition of "Benefit" for PMIS Optimization Program.
"Benefit"
"Treated"
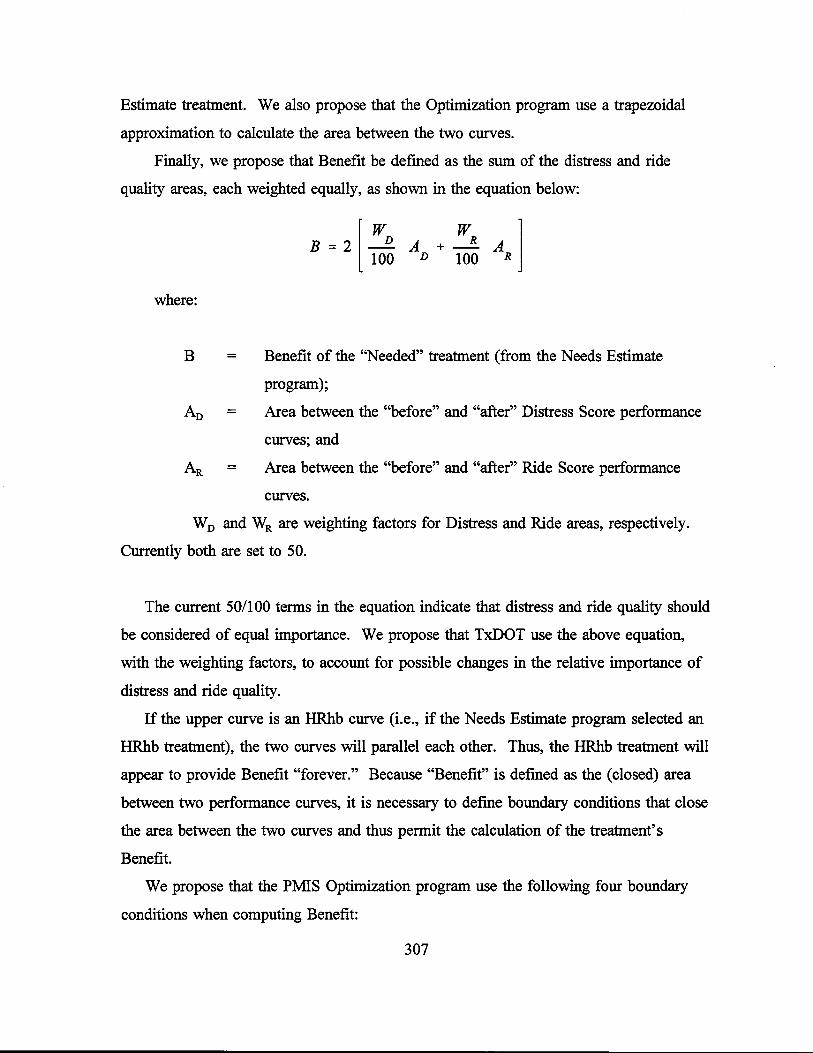
Estimate treatment. We also propose that the Optimization program use a trapezoidal
approximation to calculate the area between the two curves.
Finally, we propose that Benefit be defined as the sum of the distress and ride
quality areas, each weighted equally, as shown in the equation below:
where:
B =
B = 2 [ WD A + WR A l 100 D 100 R
Benefit of the "Needed" treatment (from the Needs Estimate
program);
Area between the "before" and "after" Distress Score performance
curves; and
Area between the "before" and "after" Ride Score performance
curves.
W0 and WR are weighting factors for Distress and Ride areas, respectively.
Currently both are set to 50.
The current 50/100 terms in the equation indicate that distress and ride quality should
be considered of equal importance. We propose that TxDOT use the above equation,
with the weighting factors, to account for possible changes in the relative importance of
distress and ride quality.
If the upper curve is an HRhb curve (i.e., if the Needs Estimate program selected an
HRhb treatment), the two curves will parallel each other. Thus, the HRhb treatment will
appear to provide Benefit "forever." Because "Benefit" is defined as the (closed) area
between two performance curves, it is necessary to define boundary conditions that close
the area between the two curves and thus permit the calculation of the treatment's
Benefit.
We propose that the PMIS Optimization program use the following four boundary
conditions when computing Benefit:
307
---,

1. Curves (Distress and Ride) intersecting
There comes a point in the life of every treatment when the pavement's
condition is just as bad as it would have been without a treatment. In this case,
the section's distress utility "before" and "after" treatment is the same and the
section's ride quality utility "before" and "after" treatment is also the same.
Figure 7 illustrates this boundary condition. This boundary condition is mainly
expected on PM, LRhb, and MRhb treatments because they deteriorate more
rapidly than the baseline "untreated" HRhb treatment.
2. 20-year treatment life
Ideally, the pavement's condition "after" treatment will always be better than
its condition "before" treatment. To reduce computer time spent in calculating
Benefit "forever," we propose that PMIS stop calculating Benefit after 20 years.
Figure 8 illustrates this boundary condition. This boundary condition is expected
on HRhb treatments because its performance curve is used as the baseline
"untreated" curve (i.e., the two curves parallel each other and, theoretically, never
intersect).
3. No gain in year 1 for distress and ride
In some cases, the PMIS Needs Estimate will select a treatment to correct
distress problems on a section with "good" ride quality. As described in Chapter
2, low-traffic or low-speed sections can have a Ride Score below 3.0 without
reducing the ride utility value. In such a case, the treatment will increase the
Ride Score, but the ride utility will not change (i.e., it will remain equal to
1.0000). The ride quality Benefit for such a section will thus be zero. In other
cases, the PMIS Needs Estimate will select a treatment to correct a ride quality
problem (e.g., an ACP005 HRhb treatment) on a section with little or no distress.
In such a case, the distress utility will not change and the distress Benefit will be
zero. Figure 9 illustrates this boundary condition.
4. Failure Criterion (Distress or Ride) reached
In most cases, it is not appropriate to wait for the performance curves to
intersect, because by then the pavement condition will have become "too bad."
308

w 0 \0
1.00
0.60 -1--------.r-------Failure Criterion
0--+---------------------------. 0
Age
Figure 7. Boundary Condition for Curves (Distress and Ride) Intersecting.
1.00
0.30 I ........._ Failure Criterion
0 Age
0

1.00
0.60 Failure Criterion
~ +:l :::> fl) fl) e
w 1i) - a 0
0 0 Age
Figure 8. Boundary Condition for 20-year Treatment Life.
1.00
0.30
~ 5 CD 'C
~
Failure Criterion
0 • Age 0

VJ ...... ......
1.00
o.: ]Failure Criterion~ :ad -Vs :s a :ll
0 0
• 1.00
0.60
t/) t/) >. Q)~ L-= ............ • c.o :::> Cl
0 0
AD I
• •
Figure 9. Boundary Condition for No Gain in Year 1 for Distress or Ride.
1.00
~ ;s ::> C1>
"O a:: 0.30
I 0
0
1.00
~ :;:: :::> Q)
"C
Failure Criterion
ii: ' 0.30 I Failure ~r~erion
0 0

To address this concern, we propose that the PMIS Optimization program define a
"Failure Criterion" below which the pavement section is assumed to provide no benefit.
We also propose that the Failure Criterion be set at 0.6000 for distress utility and at
0.3000 for ride utility. Figure 10 illustrates this boundary condition. To give an idea of
the pavement conditions represented by the Failure Criterion, Tables 232-234 list distress
ratings and Ride Scores which fall below the proposed Failure Criterion.
Use of the Failure Criterion as a boundary condition provides the possibility that a
Needs Estimate treatment will provide "no Benefit." For example, a PM treatment on a
high-volume or high-speed section will increase the Ride Score by 0.5, as proposed
earlier in this chapter. However, if the original Ride Score is 1.4 or below, the PM
treatment will not improve the ride quality enough to meet the Failure Criterion (ride
utility= 0.3000). Thus the treatment will "fail" Boundary Condition #3 ("No gain in
year 1 for distress and ride"). Of course, such a section should receive an HRhb
(ACP015) treatment, for Ride Score less than 1.5, as shown in Chapter 4.
312

Figure 10. Boundary Condition for Failure Criterion (Distress or Ride) Reached.

Table 232. CRCP and JCP L Values Which Fall Below the Proposed Failure Criterion (0.6000).
<: ... :;. . : . : : ··.· : .. :·:•·: . .
(;RCP•l)istr~s:]'ype ·.· .: L .
. .·• JCP::'l>istress/I'yp'e :· : - -: ··.
Spalled Cracks 74 percent Failed Joints and Cracks
Punch outs 6 per mile Failures
Asphalt Patches 6 per mile Shattered (Failed) Slabs
Concrete Patches 11 per mile Slabs With Longitudinal Cracks .. ··· ..... > ::, Concrete Patches
·. ·. : .· . .. ..
Note: Please refer to Chapter 2 for a description of the L values. Any one of these distress L values will cause "Failure."
Table 233. ACP L Values Which Fall Below the Proposed Failure Criterion (0.6000) .
. : : -::· :._ : .. _: ::~. ·;· :- . :::;,:: .: ··:.:::>:::· ·:--'=-:~>):.=::.:~:=.· :: .... :_:, ~.,:,. ::f::. ::., ... , .... ,; ,~·· . ,;: .. i- : . - ::;:.;;:,:_;·=::;/::::- ~ ·: .::::.'.,::.:.: .;:.
· ·, .,. , · · , • ···• , ·· .. , < t/v&111es~':~y:•J>a\'~Dient·t"Y1>e:: ,'
Shallow Rutting none none
Deep Rutting 30 percent none
Patching 87 percent none
Failures 6 per mile 6 per mile
Block Cracking 49 percent none
Alligator Cracking 29 percent none
Longitudinal Cracking 240 feet per station none
Transverse Cracking 20 per station none
Raveling none
Flushing none
Note: Please refer to Chapter 2 for a description of the L values. Any one of these distress L values will cause "Failure."
314
·. . .· :;. ····/L.· . :· ..
77 percent
18 per mile
16 percent
52 percent
25 per mile

Table 234. Ride Scores Which Fall Below the Proposed Failure Criterion (0.3000).
' .. >J>MIS Traffic Class ''···' .• ,'.:.:o,.
Low
Medium
High
Product :orADT ,~rid Spe¢irtiil1it
1 to 27,500
27,501 to 165,000
165,001 to 999,999
,, ·. :RideSeore·• ,i:<
) ,,
0.9
1.4
1.9
Note: Please refer to Chapter 2 for a description of the L values.
As mentioned earlier, the Needs Estimate treatment will be providing distress Benefit,
ride Benefit, or both, as it ages. Eventually, one of the two Benefit areas (rarely both at
the same time!) will trigger a boundary condition.
We propose that the PMIS Optimization program stop computing Benefit for both
areas when either area triggers a boundary condition. We propose that PMIS define this
point as the "Effective Life" of the treatment, in years, and use this value to compute the
"Cost-Effectiveness Ratio" (defined in Step 7).
As suggested in Step 5, a treatment can correct distress problems or ride quality
problems. However, its "Effective Life" must be considered in terms of the section's
overall condition; that is, in terms of its newly-treated distress and ride quality.
Use of the "Effective Life" value will help the pavement manager identify which
treatments "work best" for distress and which treatments "work best" for ride quality. It
also gives a basic concept to use when describing how long specific treatments last.
Finally, when used with the Theoretical Age, it provides a way to estimate the remaining
life of an existing pavement.
Step 7. Program computes "Cost Effectiveness Ratio" for each section
The purpose of computing the Benefit and Effective Life for each section is to
develop a measure which can be used to rank the sections in order of increasing
"Effectiveness." As suggested in Chapter 4, the Needs Estimate program does not have
315

such a measure because it assumes that funding is unlimited. The Optimization program,
however, deals with the "reality" of limited funding; and when funding is limited, the
pavement manager needs a way to determine which sections will provide the greatest
overall effectiveness.
To address this requirement, we propose that the PMIS Optimization program define
a "Cost-Effectiveness Ratio" for each section, as shown in the following equation:
. [ LM*B l CERatio = 10000 * * log10 VMT EfjLife * UACost
where:
CERatio = Cost-Effectiveness Ratio
LM = Lane Miles
B = Benefit (distress and ride quality)
EffLife = Effective Life of the Needs Estimate treatment, in years
VA Cost = Uniform Annual Cost of the Needs Estimate treatment, in dollars
VMT = Vehicle Miles Traveled.
The "10000" term in the equation converts the Cost-Effectiveness Ratio values into one
to four-digit integers (instead of small decimal values) which can be easily printed in a
report.
As shown above, we propose that the Cost-Effectiveness Ratio include a weighting
factor for Vehicle Miles Traveled. In cases where identically Effective sections are
competing to be the last funded project, this factor gives preference to the section with
the higher traffic.
We also propose that the Cost-Effectiveness Ratio annualize cost over the Effective
Life of the Needs Estimate treatment, as shown in the equation below:
UACost = TCost * [DRate (1 +DRate)EffLifel (1+DRate)EflLife_1
316

where:
UACost = Uniform Annual Cost of the Needs Estimate treatment, in dollars;
TCost = Treatment Cost (current or future) of the Needs Estimate treatment,
in dollars;
DRate = Discount Rate, in percent per year; and
EffLife = Effective Life of the Needs Estimate treatment, in years.
The equation uses a Discount Rate, which is the expected return on investment if
TxDOT chooses not to fund the Needs Estimate treatment. We propose that the PMIS
Optimization program use a DRate of 0.065 (6.5 percent per year).
Multi-year Optimization analyses pose a special problem for the Cost-Effectiveness
Ratio because not all treatments are funded in Year One of the analysis, and the unit cost
of the "typical" Needs Estimate treatment often increases over time. Thus we propose
that PMIS include yet another equation, shown below, to adjust the unit costs to the year
of the actual treatment:
TCost = UCost * (1 + lnjRate )n
where:
TCost = Treatment Cost of the Needs Estimate treatment, in dollars;
UCost = Unit Cost of the Needs Estimate treatment (from Chapter 4), in
dollars;
lnfRate = Inflation Rate, in percent per year; and
n = Number of years that the Unit Cost has been projected.
This equation uses an Inflation Rate, which is the expected increase (or decrease) in
price over time. We propose that the PMIS Optimization program use an IntRate
of 0.065 (6.5 percent per year). We also propose that PMIS allow users to change the
lnfRate, when necessary.
317

Step 8. Program determines sections to be funded
Having computed the Cost-Effectiveness Ratio for each section, the PMIS
Optimization can then rank the sections in order of decreasing "effectiveness" and
determine which sections will be funded.
This is not simply a matter of picking the "top ten" or "top twenty-five" from the
list. For example, consider the sections shown in Table 235 which have been given a
$50,000 budget.
Table 235. Example Optimization (Ranked List of Sections).
A 1,500 $20,000 Yes $30,000
c 1,225 $40,000 No $30,000
F 900 $50,000 No $30,000
B 750 $4,500 Yes $25,500
E 700 $15,000 Yes $10,500
D 675 $12,000 No $10,500
etc. etc. etc. etc. etc.
There are several things to note about this example:
1. The Optimization program sorts the sections in order of decreasing Cost
Effectiveness Ratio, so they are not listed in their original alphabetical order.
2. Section A is the top-ranked project. Its treatment cost ($20,000) is less than the
current budget, so it receives its needed treatment. The remaining budget drops
to $30,000.
3. Section C is the second-ranked project. It also has a high Cost-Effectiveness
Ratio, but there is not enough money left to fund its $40,000 treatment cost.
Thus, it is not funded. Section C is listed as receiving a Stopgap treatment.
318

4. Section F is the third-ranked project. Its treatment cost ($50,000) is also greater
than the remaining budget, so it receives a Stopgap treatment.
5. Section B is the fourth-ranked project. There is enough money to fund its
$4,500 treatment cost. Thus, Section B receives its needed treatment and the
remaining budget drops to $25,500.
6. Section Eis the fifth-ranked project. There is enough money to fund its
$15,000 treatment cost. Thus, Section E receives its needed treatment and the
remaining budget drops to $10,500.
7. Section D is the sixth-ranked project. There is not enough money to fund its
$12,000 treatment cost. Thus, it receives a Stopgap treatment.
The Optimization program continues in this fashion until it either runs out of
sections or runs out of money. It is possible for a small amount of money to be "left on
the table," unspent by the program, depending on the treatment costs of the sections
analyzed.
One "unusual" result of this approach is that the Optimization program will tend to
"stock up" on the less-expensive PM treatments. This is a good approach in one sense
because it realizes the benefit of an aggressive preventive maintenance program in
preserving pavements in the best possible condition. However, we propose that TxDOT
review the approach to see if it really is the most effective approach to limited funding.
Step 9. Program lists results for each report which the user has requested in Step 1
Having analyzed all of the "analyzable" pavement sections, the program should list
out the results for those reports that the user requested. The printouts will only be for
the "current" Fiscal Year.
Step 10. Program returns to Step 3 if a multi-year Optimization was requested
If the user has only asked for a single-year Optimization, the program ends at Step
9. If the user has asked for a multi-year Optimization, the program must age the
sections by one year and return to Step 3. This aging process involves use of the
319

Theoretical Age equation described in Chapter 3.
For sections funded by the Optimization program, we propose that P:MJS recalculate
the Theoretical Age for the "after treatment" distress ratings and ride quality, based on
the "gain of rating" values shown in Table 231. To eliminate "divide by zero" errors,
we propose that the Optimization program use a minimum Theoretical Age of 0.001
years. Otherwise, the program should use the Theoretical Age calculated by the
equation.
For sections not funded by the Optimization program (i.e., for "Stopgap" and
"Needs Nothing" treatment types), we propose that P:MJS add 1.0 years to the
Theoretical Age of each distress type and ride quality before looping back to Step 3.
One drawback to using Theoretical Age with the P:MJS distress ratings is that there
is an inherent conflict between the "maximum allowable" distress rating in P:MJS and the
"maximum expected" distress rating in the performance equations. For example, the
"maximum allowable" distress rating for Deep Rutting is 100 percent, but the "maximum
expected" rating in the LRhb performance equation is around 80 percent. When a
pavement rater stores a rating of 80 percent or greater for Deep Rutting, the performance
equation calculates an "infinite" Theoretical Age!
To get around this problem, we propose that P:MJS define a Maximum Theoretical
Age of 40 years. We also propose that TxDOT carefully review the performance curve
equations and coefficients to determine if there truly needs to be a difference between
"maximum allowable" distress ratings and "maximum expected" distress occurrence.
To give an idea of the pavement conditions represented by the Maximum
Theoretical Age, Tables 236 - 245 list distress ratings which exceed the proposed
Maximum Theoretical Age of 40 years. There is no corresponding Table for Ride Score
because the proposed performance equations exhaust all possible ride quality (i.e., L =
100 percent ride quality lost) before the proposed 40 year maximum.
320

Table 236. Distress L Values Which Exceed Proposed Maximum Theoretical Age (40 years). Pavement Type= 1
: .. - .--- - - -·
,, :M:Rb.I> - ..........
Spalled Cracks, percent 1.69 1.69 1.69
Punchouts, per mile 4.47 4.47 4.47
Asphalt Patches, per mile 4.30 4.30 4.30
Concrete Patches, per mile 53.18 53.18 53.18
Average Crack Spacing, 35.24 35.24 35.24 number per 100' station
1.69
4.47
4.30
53.18
35.24
Note: Please refer to Chapter 2 for a description of the L values. Any one of these distress L values will exceed the proposed maximum Theoretical Age. The table assumes that Chi (traffic), Epsilon (climate), and Sigma (subgrade support) factors are equal to 1.0000.
Table 237. Distress L Values Which Exceed Proposed Maximum Theoretical Age (40 years). Pavement Type= 2
Failed Joints and Cracks, percent 37.01 37.01 37.01 37.01
Failures, per mile 16.40 16.40 16.40 16.40
Shattered (Failed) Slabs, percent 37.79 37.79 37.79 37.79
Slabs With Longitudinal Cracks, 2.71 2.71 2.71 2.71 percent
Concrete Patches, per mile 37.20 37.20 37.20 37.20
Note: Please refer to Chapter 2 for a description of the L values. Any one of these distress L values will exceed the proposed maximum Theoretical Age. Table assumes that Chi (traffic), Epsilon (climate), and Sigma (subgrade support) factors are equal to 1.0000.
321

•·
Table 238. Distress L Values Which Exceed Proposed Maximum Theoretical Age (40 years). Pavement Type= 3 ... . : .. : •· : •.:· .. · ·····:·•.... . :.,. : ·. < .. ::: : .. ·.. .: ) .. . ..
.•... Distress .Type .... : .. ··: .:.
Failed Joints and Cracks, percent
Failures, per mile
Shattered (Failed) Slabs, percent
Slabs With Longitudinal Cracks, percent
Concrete Patches, per mile
LValues folj•\rMIS Treatm"nf'J'ype..-
' PM.: . LRhb' MRhb . .······ :llRhb
37.01 37.01 37.01 37.01
16.40 16.40 16.40 16.40
37.79 37.79 37.79 37.79
2.71 2.71 2.71 2.71
37.20 37.20 37.20 37.20
Note: Please refer to Chapter 2 for a description of the L values. Any one of these distress L values will exceed the proposed maximum Theoretical Age. Table assumes that Chi (traffic), Epsilon (climate), and Sigma (subgrade support) factors are equal to 1.0000.
Table 239. Distress L Values Which Exceed Proposed Maximum Theoretical Age (40 years). Pavement Type= 4
Shallow Rutting, percent 99.99 98.99 98.85 99.28
Deep Rutting, percent 98.76 82.68 81.59 71.44
Patching, percent Performance curve not defined
Failures, per mile 19.73 19.76 17.63 17.55
Block Cracking, percent 98.71 90.05 86.35 84.64
Alligator Cracking, percent 99.77 94.36 92.00 93.49
Longitudinal Cracking, 483.21 491.14 484.62 299.30 feet per 100' station
Transverse Cracking, 19.58 19.39 19.42 17.08 number per 100' station
Note: Please refer to Chapter 2 for a description of the L values. Any one of these distress L values will exceed the proposed maximum Theoretical Age. Table assumes that Chi (traffic), Epsilon (climate), and Sigma (subgrade support) factors are equal to 1.0000.
322
;
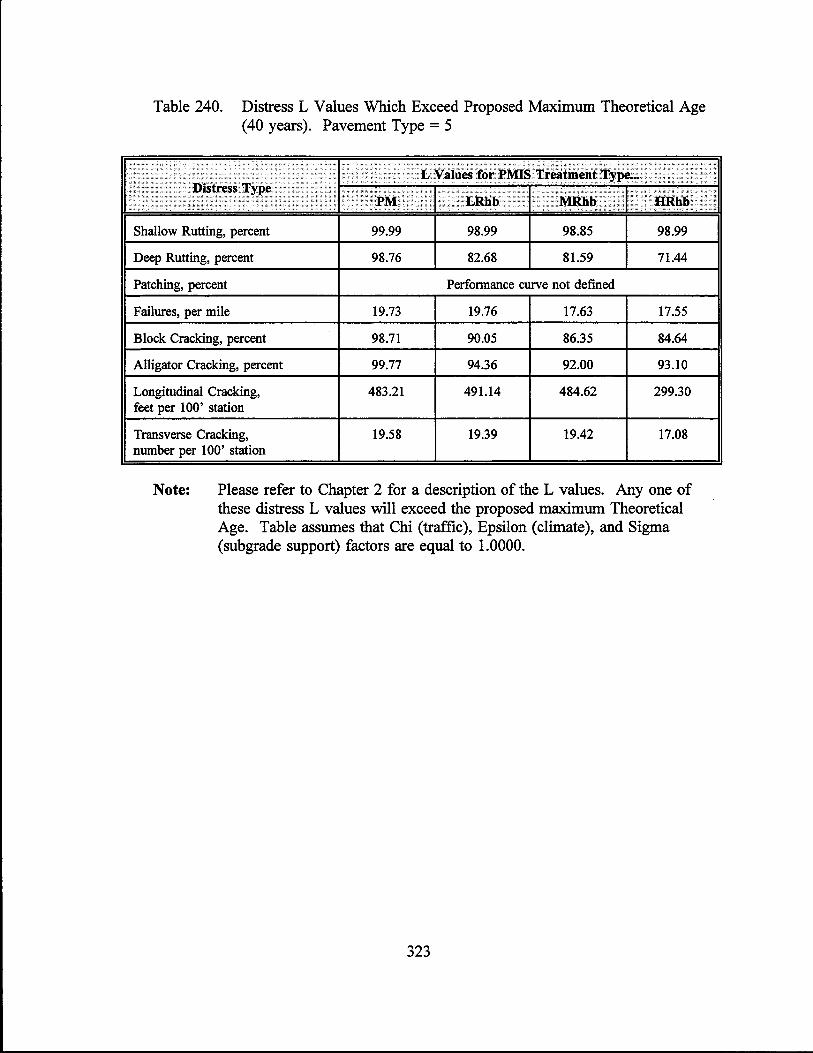
Table 240. Distress L Values Which Exceed Proposed Maximum Theoretical Age (40 years). Pavement Type= 5
·.· ·. ;: : .'·. . . . .: ·. :··· : . : : : : . : . .. . ... . .•: . . . ... · . . . . . . ..
., 1 <> /i; .. . LValues:forPMISTr~tlnent Type..~::....... . ....... ·. ::: I>istress Type · •• :< ............... · . >•. . . ..... ·:· <><: ... •· . . ....... .::·.····•··•··· ·· .. ··.> .......• ······ ··· >>E:pl\f ·: ::::.> .;.::: ·::LRbb .·.· .. l\fl,{hb. : .. : ::.•:(•111{111)•[ .:
Shallow Rutting, percent 99.99 98.99 98.85 98.99
Deep Rutting, percent 98.76 82.68 81.59 71.44
Patching, percent Perfonnance curve not defined
Failures, per mile 19.73 19.76 17.63 17.55
Block Cracking, percent 98.71 90.05 86.35 84.64
Alligator Cracking, percent 99.77 94.36 92.00 93.10
Longitudinal Cracking, 483.21 491.14 484.62 299.30 feet per 100' station
Transverse Cracking, 19.58 19.39 19.42 17.08 number per 100' station
Note: Please refer to Chapter 2 for a description of the L values. Any one of these distress L values will exceed the proposed maximum Theoretical Age. Table assumes that Chi (traffic), Epsilon (climate), and Sigma (subgrade support) factors are equal to 1.0000.
323

i::
Table 241. Distress L Values Which Exceed Proposed Maximum Theoretical Age (40 years). Pavement Type= 6
. .:·.: ;: . . --·· .... · ,- -.. -.. :.·:·.· .. ··.::.··. . ..
Ii J)istress''fype , ''°,1--.,...', ,_,,_,,,.,...,.,....,..._:_>L.,...' .... -V.,...al.,...11..,.es.,...lti_o.,...r,.,...P_MI..,., ..,.s_,T_r.,...~_t_llt_en_t.,...rT_y_:1>..,..•~.,...}~.,...'··: ___ .. _.. .... ·
11
:PM <i: LRhfr> / 1\IR.hb( ' : HRhb: : ' ' ' ' ,,' ,, ',,,:: ::')
Shallow Rutting, percent
Deep Rutting, percent
Patching, percent
Failures, per mile
Block Cracking, percent
Alligator Cracking, percent
Longitudinal Cracking, feet per 100' station
Transverse Cracking, number per 100' station
99.99
98.76
19.73
98.71
99.77
483.21
19.58
.. ·. ::· '· .... , :: .. 1· ,,., ..... ,., .....
98.99 98.85 97.86
82.68 81.59 71.44
Perfonnance curve not defined
19.76 17.63 17.55
90.05 86.35 84.64
94.36 92.00 87.58
491.14 484.62 299.30
19.39 19.42 17.08
Note: Please refer to Chapter 2 for a description of the L values. Any one of these distress L values will exceed the proposed maximum Theoretical Age. Table assumes that Chi (traffic), Epsilon (climate), and Sigma (subgrade support) factors are equal to 1.0000.
324

1 .•• :
Table 242. Distress L Values Which Exceed Proposed Maximum Theoretical Age (40 years). Pavement Type= 7
·: :· ..... : :·. :, . :::<. :· ... :· ... >··:: .··. ,··:·::··:: .:· :··.: >!< : ··,, I, Vafoes for PMIS Treatment, Type. •• •·'. .... :
.;
: :.: Ii Distress Type .:·. : ·.·.... · ..... : .... ·:.: : ,.'· :· .: : :.: .. ::·.: ·:·.
1: •'>! I• :: •• . PM··:. •. ,::LRhb ·. ::··: . . MRhb }'· IIR.hb,• ·:·. .. .
Shallow Rutting, percent 99.99 98.99 98.85 98.93
Deep Rutting, percent 98.76 82.68 81.59 71.44
Patching, percent Performance curve not defined
Failures, per mile 19.73 19.76 17.63 17.55
Block Cracking, percent 98.71 90.05 86.35 84.64
Alligator Cracking, percent 99.77 94.36 92.00 87.91
Longitudinal Cracking, 483.21 491.14 484.62 299.30 feet per 100' station
Transverse Cracking, 19.58 19.39 19.42 17.08 number per 100' station
Note: Please refer to Chapter 2 for a description of the L values. Any one of these distress L values will exceed the proposed maximum Theoretical Age. Table assumes that Chi (traffic), Epsilon (climate), and Sigma (subgrade support) factors are equal to 1.0000.
325

Table 243. Distress L Values Which Exceed Proposed Maximum Theoretical Age (40 years). Pavement Type= 8
· •· L v81ue1riroi-J:>Mis ;'l'rea~ltleJI~ Type. .•.. • •••· ··. . ·• .·. .· ·····•· .. ·.·•• .·J>istressType .. ·. ::: ...•.. ·.• ... •'.(>l\f··············· ' ··• · ..• LRhl{ .. · · · · • Mfllifi :.:;. ; ···••·· !~lib .•. ··::
Shallow Rutting, percent
Deep Rutting, percent
Patching, percent
Failures, per mile
Block Cracking, percent
Alligator Cracking, percent
Longitudinal Cracking, feet per 100' station
Transverse Cracking, number per 100' station
99.99
98.76
19.73
98.71
99.77
500.00
19.57
98.99 98.85 98.46
82.68 81.59 71.44
Performance curve not defmed
19.76 17.63 17.55
90.05 86.35 84.64
94.36 92.00 87.91
442.12 479.54 299.30
19.69 19.72 17.08
Note: Please refer to Chapter 2 for a description of the L values. Any one of these distress L values will exceed the proposed maximum Theoretical Age. Table assumes that Chi (traffic), Epsilon (climate), and Sigma (subgrade support) factors are equal to 1.0000.
326

.
Table 244. Distress L Values Which Exceed Proposed Maximum Theoretical Age (40 years). Pavement Type= 9
.. ·.·· ......... ·. ·.
· : bistre5s 'fype
Shallow Rutting, percent
Deep Rutting, percent
Patching, percent
Failures, per mile
Block Cracking, percent
Alligator Cracking, percent
Longitudinal Cracking, feet per 100' station
Transverse Cracking, number per 100' station
..· ._
. .,, ·• : .•. .. . .. •:·. •.. ,:.: .. · ;•,·:. ·,; '·: :··,·· .. .. LV'alu~:forPMISTr~tmenf'fype." ... .. ... :,/ .•
99.99 98.99 98.85 98.46
98.76 82.68 81.59 71.44
Performance curve not defined
19.73 19.76 17.63 17.55
98.71 90.05 86.35 84.64
99.77 94.36 92.00 87.91
483.21 491.14 484.62 299.30
19.58 19.39 19.42 17.08
Note: Please refer to Chapter 2 for a description of the L values. Any one of these distress L values will exceed the proposed maximum Theoretical Age. Table assumes that Chi (traffic), Epsilon (climate), and Sigma (subgrade support) factors are equal to 1.0000.
327

Table 245. Distress L Values Which Exceed Proposed Maximum Theoretical Age ( 40 years). Pavement Type = 10
. ··.c·· • ... . .... ,. ··>• .... . .. ·• •• ···: ·.•
. .. ':' ··:r;rva1u~··fof:PMISTreatllleiit J:ype..~ .. · .. · , • :
Shallow Rutting, percent
Deep Rutting, percent
Patching, percent
Failures, per mile
Block Cracking, percent
Alligator Cracking, percent
Longitudinal Cracking, feet per 100' station
Transverse Cracking, number per 100' station
>: •··· :Pl\f. . ...
99.99
98.76
19.73
98.71
99.77
483.21
19.58
. ··ri~iiiib ..... I·. ''MRhb .. :::: .IIRhb .•..••••. ,1 .. ,,
98.99 98.85 98.79
82.68 81.59 71.44
Perfonnance curve not defmed
19.76 17.63 17.55
90.05 86.35 84.64
94.36 92.00 88.86
491.14 484.62 299.30
19.39 19.42 17.08
Note: Please refer to Chapter 2 for a description of the L values. Any one of these distress L values will exceed the proposed maximum Theoretical Age. Table assumes that Chi (traffic), Epsilon (climate), and Sigma (subgrade support) factors are equal to 1.0000.
"FORCED"TREATMENTS
..: ...
If it were possible to develop the "perfect" Optimization program, the pavement
manager would be able to take the list of ranked projects, design the selected treatments,
and perform the work. But there is no such thing as the "perfect" program (of any
kind). The pavement manager must deal with local conditions, "political decisions," and
many other such factors which are far beyond the scope of any computer program.
To address these needs, we propose that the PMIS Optimization program include a
feature which lets the user "force" treatments on specific sections. We also propose that
such "forced" treatments be allowed only on Management Sections, to most closely
support local use on candidate projects.
328

The "forced" treatment part of the PMIS Optimization program would let users
"force"
1. sections to be treated,
2. sections not to be treated,
3. type of treatment (lighter or heavier than the Needs Estimate treatment), and
4. time of treatment (earlier or later than suggested by the Needs Estimate).
Because these are user-selected sections and treatments, we propose that the
Optimization program cluster all "forced" treatments together in Step 8 ("Program
determines sections to be fu.ndecf') and fund them in order of decreasing Cost
Effectiveness Ratio, before funding any other sections.
Of course, it is possible for a pavement manager to "force" treatments on more
sections than can be funded. fo such a case, the Optimization program would fund only
the "forced" sections with the highest Cost-Effectiveness Ratios. The other "forced"
sections - and all of the other sections - would be unfunded. It is also possible for a
pavement manager to use "forced" treatments to "circumvent" the entire PMIS
Optimization process. In some cases, such an approach would be the only proper way to
address local needs, but we propose that TxDOT continually review the Optimization
results to ensure that such drastic approaches are needed as rarely as possible.
OPTIMIZATION REPORTS
A PMIS Optimization list of each Data Collection Section for an entire District
would produce about 150 pages of printout. Although such a list would be useful for
locating specific pavements and treatments, it would hardly be useful for managing
pavements across the entire District. An Optimization report for Management Sections
would reduce the size of the printout, but it still would not help with the problem of
managing pavements across the entire District. Upper-level pavement managers need
summary reports which give an overall view of the District's total pavement needs.
329

Therefore, we propose that PMIS include the following types of Optimization
reports:
1. Detail List of Sections Which Can be Treated;
2. ·Statewide Optimization, by District;
3. Statewide Optimization, by Highway System; and
4. District Optimization, by Highway System.
We also propose that the PMIS Optimization program allow users to select various
Impact Analysis reports, without having to run a separate program. Chapter 6 will
describe these reports in greater detail.
Detail List of Sections Which Can be Treated
We propose that the Optimization program have a detailed report which lists each
section. The report should include basic location information (District, County,
Highway, Reference Marker limits, and Roadbed), PMIS Scores, the Needs Estimate
treatment and cost, Cost-Effectiveness Ratio, and funding status (Funded or Stopgap).
We also propose that this report allow users to sort the sections by decreasing Cost
Effectiveness Ratio, to help identify those sections which provide the most "effective"
treatments. This proposal has not been used in the current version of PMIS, although we
expect it to be added later. Use of this detail report will help pavement managers
identify Management Sections. It will also help users select sections for possible "forced
treatments," as described earlier.
Statewide Optimization, by District
We propose that the Optimization program have a report which summarizes the total
Statewide lane miles and dollars which were treated with the available funding, by
District. Tables 246 and 247, illustrate the proposed report format for lane miles and
dollars, respectively.
330
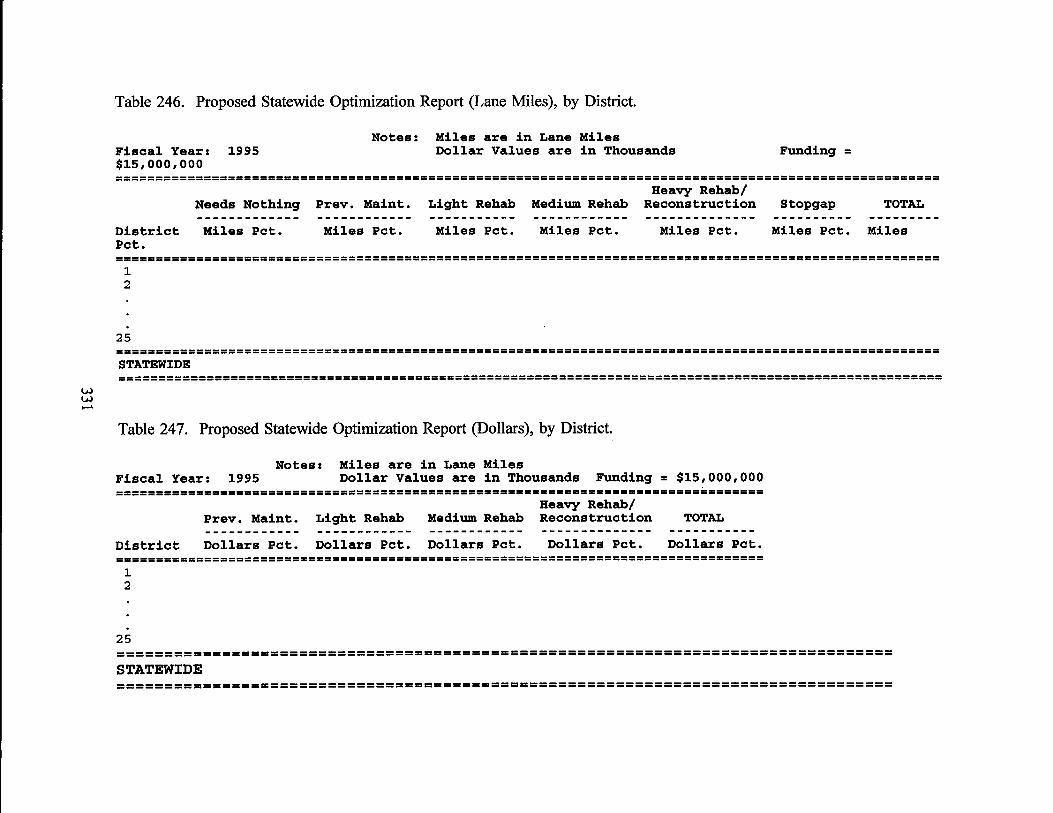
VJ VJ -
Table 246. Proposed Statewide Optimization Report (Lane Miles), by District.
Fiscal Year: $15,000,000
1995 Notes: Miles are in Lane Miles
Dollar Values are in Thousands Funding =
=======================================================================================================
District Pct.
Needs Nothing Prev. Maint.
Miles Pct. Miles Pct.
Heavy Rehab/ Light Rehab Medium Rehab Reconstruction
Miles Pct. Miles Pct. Miles Pct.
Stopgap TOTAL
Miles Pct. Miles
======================================================================================================= 1 2
25 ======================================================================================================= STATEWIDE =======================================================================================================
Table 247. Proposed Statewide Optimization Report (Dollars), by District.
Notes: Miles are in Lane Miles Fiscal Year: 1995 Dollar Values are in Thousands Funding = $15,000,000 ==================================================·==============================
Prev. Main t.
District Dollars Pct.
Heavy Rehab/ Light Rehab Medium Rehab Reconstruction
Dollars Pct. Dollars Pct. Dollars Pct.
TOTAL
Dollars Pct. =================================================================================
1 2
25 ================================================================================= STATEWIDE =================================================================================

Statewide Optimization, by Highway System
We propose that the Optimization program have a report which summarizes the total
Statewide lane miles and dollars which were treated with the available funding, by
Highway System. Tables 248 and 249, illustrate the proposed report format for lane
miles and dollars, respectively.
District Optimization, by Highway System
We propose that the Optimization program have a report which summarizes the total
District lane miles and dollars which were treated with the available funding, by
Highway System. Tables 250 and 251, illustrate the proposed report format for lane
miles and dollars, respectively.
SUMMARY
The PMIS Optimization program will give pavement managers one way to deal with
the reality of limited funding. The program is meant to be run iteratively, to give an
idea of the relationship between total benefit and total funding. In this way, the
Optimization program can help the pavement manager determine the adequacy of
existing funding. Of course, the pavement manager could simply compare existing
funding to the Needs Estimate funding, but the Optimization program allows comparison
to all "reasonable" funding levels.
The Optimization program also gives a way to identify which projects will be "cut"
if funding is reduced. Such considerations are important in the final stages of project
selection.
With all of its capabilities, the PMIS Optimization program does not describe the
results of its recommendations on overall pavement condition. Thus, the pavement
manager has no clear idea if pavement condition is improving or not, especially in multi
year studies.
The PMIS approach to these problems is through its Impact Analysis program,
which will be described in Chapter 6.
332

w w w
Table 248. Proposed Statewide Optimization Report (Lane Miles), by Highway System.
Fiscal Year: $15,000,000
1995 Notes: Miles are in Lane Miles
Dollar Values are in Thousands Funding =
======================================================================================================= PMJ:S Highway System Pct.
Needs Nothing Prev. Maint.
Miles Pct. Miles Pct.
Heavy Rehab/ Light Rehab Medium Rehab Reconstruction Stopgap TOTAL
Miles Pct. Miles Pct. Miles Pct. Miles Pct. Miles
======================================================================================================= IH us SH FM PR BR ======================================================================================================= STATEWIDE =======================================================================================================
Table 249. Proposed Statewide Optimization Report (Dollars), by Highway System.
Notes: Miles are in Lane Miles Fiscal Year: 1995 Dollar Values are in Thousands Funding = $15,000,000 =====================================================================================
Heavy Rehab/ PMJ:S Prev. Maint. Light Rehab Medium Rehab Reconstruction TOTAL Highway ------------ ------------ ------------ -------------- ------------System Dollars Pct. Dollars Pct. Dollars Pct. Dollars Pct. Dollars Pct. ===================================================================================== IH us SH FM PR BR =========================================================================== STATEWIDE ===========================================================================

w w .i::..
Table 250. Proposed District Optimization Report (Lane Miles), by Highway System.
Fiscal Year: District: $15,000,000
1995 08 Abilene
Notes: Miles are in Lane Miles Dollar Values are in Thousands Funding =
============================================================================·========================== PMIS Highway System Pct.
Needs Nothing Prev. Maint.
Miles Pct. Miles Pct.
Heavy Rehab/ Light Rehab Medium Rehab Reconstruction Stopgap TOTAL
Miles Pct. Miles Pct. Miles Pct. Miles Pct. Miles
======================================================================================================= IH us SH FM PR BR ======================================================================================================= District 08 =======================================================================================================
Table 251. Proposed District Optimization Report (Dollars), by Highway System.
Fiscal Year: 1995 Notes: Miles are in Lane Miles District: 08 Abilene Dollar Values are in Thousands Funding = $15,000,000 =======================================================================================
Heavy Rehab/ PMIS Prev. Maint. Light Rehab Medium Rehab Reconstruction TOTAL Highway ------------ ------------ ------------ -------------- -----------System Dollars Pct. Dollars Pct. Dollars Pct. Dollars Pct. Dollars Pct. ======================================================================================= IH us SH FM PR BR ============================================================================= District 08 =============================================================================

VI - IMPACT ANALYSIS
The most important part of any pavement management system is its ability to identify a
pavement problem while it is still minor. In this way, the pavement manager can use
preventive maintenance or light rehabilitation treatments, without having to resort to more
expensive heavy rehabilitation or reconstruction. By treating pavements while they are still in
good condition, the pavement manager can treat more miles with existing funding, reduce
traffic delays caused by road work, and preserve overall pavement condition at a higher level.
DESCRIPTION
Despite increasing traffic demands being placed on Texas pavements, total pavement
funding is being dispersed to meet additional, multi-modal transportation needs. TxDOT
pavement managers are having to come up with innovative ways to preserve pavement
condition in an environment of decreasing or, at best, stable funding.
There are many approaches to this problem. One approach is to emphasize surface
condition and resurface as many miles each year as possible. Another approach is to
emphasize structural rehabilitation; the idea being that the additional pavement life will offset
the smaller number of miles treated. Yet another approach is to emphasize a particular class
(or classes) of highway; for example, Interstate highways, metropolitan areas, etc.
Any of these approaches may work. The problem for the pavement manager is to
determine which approach is the most appropriate, given agency and customer expectations.
To do this, the pavement manager must have clearly-stated goals and objectives, and - most
importantly - one or more condition measures which describe how closely the pavements are
meeting these goals and objectives.
It is obviously not the purpose of PMIS to establish agency goals and objectives.
However, PMIS does provide many condition measures which are suitable for monitoring how
well the pavement manager is meeting the goals and objectives.
PURPOSE OF THE IMPACT ANALYSIS
The purpose of the PMIS Impact Analysis is to estimate the effects of pavement
335

decisions, policies, and other external factors on overall pavement condition. To do this, we
propose that the Impact Analysis show the effects of
1. Funding,
2. Section limits,
3. Section treatments (especially "forced" treatments),
4. Truck traffic (18-k ESAL), and
5. Preventive maintenance (seal coat) policy.
at the following three points in time:
1~ Current,
2. After Needs Estimate treatments, and
3. After Optimization treatments.
Funding, Section Limits, and Section Treatments
The first three items - funding, section limits, and section treatments - are the natural
complements to the Optimization program. By including these items in its reports, the Impact
Analysis helps the pavement manager determine the effects of "what can be done," as
compared to "what needs to be done."
Truck Traffic (18-k ESAL) and Preventive Maintenance (seal coat) Policy
As mentioned in Chapter 5, we propose that the PMIS Optimization program include
procedures for changing the levels of truck traffic and for changing the number of years
between regularly-scheduled preventive maintenance seal coats. Impact Analysis reports run
under such conditions will describe the effects of these changes, especially over time.
Impact Analysis at Different Points in Time
Impact Analysis usually deals with only two points in time: "before" and "after" some
expected action. The "before" case summarizes the current value of the condition measure
336

(maintenance levels of service or average PMIS Scores), while the "after" case summarizes
the value of the condition measure after. the expected action. As mentioned earlier, we have
suggested that the expected actions be limited to funding, section limits, section treatments,
truck traffic, and preventive maintenance (seal coat) policy.
One would expect to use the Optimization program results in the "after" case of the
Impact Analysis, because it deals with the "reality" of limited funding. But PMIS also allows
consideration of a "best case" scenario, through use of its Needs Estimate program. Even
though the Needs Estimate program "unrealistically" assumes that funding is unlimited, it does
give yet another way to gauge the adequacy of pavement funding.
Thus, we have proposed that the PMIS Impact Analysis program summarize its
condition measures at three points in time: currently, after the Needs Estimate treatments, and
after the Optimization treatments. The pavement manager will then be able to consider
"current case," "best case," and "expected case" scenarios, respectively.
For example, suppose the Needs Estimate program indicates that $50 million is needed
for pavement rehabilitation, but the pavement manager only expects to receive $30 million. If
the current Condition Score is 87.5, the PMIS Impact Analysis program could be run for
various budget levels, to give the results shown in Table 252.
Table 252. Example Impact Analysis (Effect of Rehab Budget on Average Condition Score).
·. • ....... ,. • .. ' .· ' ........ •.'.•>".'• •••.••••. •·••· ......... ••••·• •.. ..,:,.· •..
::: ... ·. ~xp~ted+Rehal>BUdget < ; ... ::> ·····• · '.A.V-e~g~'Condlti61l·sco~ · $20 million 80.2
$30 million 83.7 "Expected Case"
$40 million 86.l
$50 million 90.3 "Best Case"
$60 million 90.3 (no change - all sections treated)
In this example, the pavement manager can suggest that at least $40 million is needed to
maintain pavement condition at approximately its current level (87.5).
337

CONDITION MEASURES FOR IMPACT ANALYSIS
As mentioned earlier, just about every item in PMIS could be used as a condition
measure for the Impact Analysis: distress ratings, utility values, scores, treatment types and
costs, and many others. To reduce potential confusion and to provide easily-interpreted
executive-level information, we propose that PMIS use only the following two condition
measures:
1. Pavement maintenance levels of service, and
2. Average PMIS Scores.
Pavement Maintenance Levels of Service
To meet increasing customer expectations, TxDOT has developed guidelines which
describe the overall level of service provided by its maintenance operations. TxDOT reports
these levels of service to the Legislature for use in preparing the biennial agency budget.
Although many of these levels of service pertain to roadside maintenance (e.g., rest
areas, mowing, litter pickup, etc.), there are three which pertain to pavements:
1. Rutting,
2. Alligator Cracking, and
3. Ride quality.
TxDOT Administrative Circular 5-92 (dated 2/13/92) defined the pavement levels of
service in terms of the original PES data. We propose that TxDOT redefine these levels of
service using the new PMIS distress ratings and Ride Score, as shown in Tables 253 - 255,
and incorporate them into the PMIS Impact Analysis program.
338

Table 253. Pavement Maintenance Level of Service Definitions for Rutting.
' .. . '· . ·: . Shallow Rutting .
.. · . ...... . . ··.
.
: Dee)> Ro!ting. Level ofServiee :.: ::Traffic (Al>T) >..;. :,: .. ··:. . ... ,., .. · , ............ :. ··.• .·.· · (percent) . • .··. .. .·. JI>ercent) . ·
"Desirable" 1-500 0 and 0
501-10,000 0 and 0
Over 10,000 0 and 0
"Acceptable" 1-500 1-50 and 0
501-10,000 1-50 and 0
Over 10,000 1-25 and 0
"Tolerable" 1-500 51-100 and 0
0-50 and 1-25
501-10,000 51-100 and 0
0-50 and 1-25
Over 10,000 26-50 and 0
"Intolerable" 1-500 51-100 and 1-25
0-100 and 26-100
501-10,000 51-100 and 1-25
0-100 and 26-100
Over 10,000 51-100 " and 0
0-100 and 1-100
Note: Pavement Maintenance Level of Service defined for ACP (Pavement Types 4-10) only.
339
.":
.. · ·'< ·::::
or
or
or
or
or

Table 254. Pavement Maintenance Level of Service Definitions for Alligator Cracking.
LeveLof Service· .•·· ..
"Desirable" 1-500 0
501-10,000 0
Over 10,000 0
"Acceptable" 1-500 1-10
501-10,000 1-10
Over 10,000 1-10
"Tolerable" 1-500 11-50
501-10,000 11-50
Over 10,000 11-50
"Intolerable" 1-500 51-100
501-10,000 51-100
Over 10,000 51-100
Note: Pavement Maintenance Level of Service defined for ACP (Pavement Types 4-10) only.
340

Table 255. Pavement Maintenance Level of Service Definitions for Ride Quality.
.. :: ::·::::··::,,:·,: .. : .. ·:··:.· i;' > .: . ' <. .·
> Leyel ofSeniiCe <I• . :1'.r#fic (AD]') : ·.. ; .. : R1deScore
"Desirable" 1-500 2.6-5.0
501-10,000 3.1-5.0
Over 10,000 3.6-5.0
"Acceptable" 1-500 2.1-2.5
501-10,000 2.6-3.0
Over 10,000 3.1-3.5
"Tolerable" 1-500 1.6-2.0
501-10,000 2.1-2.5
Over 10,000 2.6-3.0
"Intolerable" 1-500 0.1-1.5
501-10,000 0.1-2.0
Over 10,000 0.1-2.5
Note: Pavement Maintenance Level of Service defined for ACP (Pavement Types 4-10) only.
341

Average PMIS Scores
We also propose that PMIS include average PMIS Scores (Distress, Ride, and
Condition) as another condition measure for the Impact Analysis program. These Scores will
be especially suited for making multi-year bar charts of pavement condition over time.
OTHER CONDffiON MEASURES
Although the maintenance levels of service and average PMIS Scores give a quick way
to estimate the impact of pavement funding, decisions, and policy on overall condition, the
PMIS Optimization program provides additional measures which can be used for impact
analyses. We propose that TxDOT also use the following three items as condition measures
for impact analyses:
1. Stopgap mileage,
2. Stopgap cost, and
3. Funding backlog.
Stopgap Mileage
As mentioned in Chapter 5, the Optimization program applies a "Stopgap" treatment to
any section which does not receive its Needs Estimate treatment. The Optimization program
includes a report which summarizes the total lane miles receiving "Stopgap" treatment. This
"Stopgap Mileage" can be compared to the total mileage and used as an impact analysis
condition measure.
Stopgap Mileage is an especially accurate measure of prolonged under-funding, even
in areas where the maintenance levels of service and average PMIS Scores are stable.
Increases in Stopgap Mileage require greater maintenance activity which, while creating quick
improvements in surface conditions (i.e., distress and ride quality), tend to "destabilize" long
term pavement condition.
Stopgap Cost
Closely related to Stopgap Mileage is "Stopgap Cost," which is the total cost of
342

Stopgap treatments. As proposed in Chapter 5, the Stopgap treatment cost is equal to the unit
cost for Preventive Maintenance. Stopgap Cost is accumulated separately from the
Optimization budget as a measure of "increased" maintenance burden. It is possible in
extreme cases for the Stopgap Cost to exceed a District's total maintenance budget (pavement
and roadside). Pavement managers may find it useful to compute the ratio of Stopgap Cost to
Preventive Maintenance budget as yet another Impact Analysis condition measure.
Funding Backlog
A common task for any pavement management system is to assess the adequacy of
existing funding. An easy way to do this is to define a condition measure called "Backlog,"
which is the difference between total funds needed and total funds available:
where:
Backlog
FNeeds
F0ptim
=
= =
Backlog = F - F Needs Optim
Funding backlog,
Funding needed (from Needs Estimate), and
Funding available (from Optimization).
Backlog is a measure of unmet pavement needs, expressed in dollar terms.
In some cases it is possible for overall pavement condition to get worse, despite increases
in funding. For example, if a District's funding increases by $10 million but total needs
increase by $20 million, it is likely that the overall pavement condition will get worse instead
of better.
IMPACT ANALYSIS REPORTS
Unlike the Needs Estimate and Optimization programs, the Impact Analysis program is
meant to generate only summary tables. These summary tables can be converted to pie
charts, bar charts, and other such graphics which upper-level managers can use to make
strategic pavement decisions.
343
To meet these upper-level requirements, we propose that P:MIS include the following three
types of Impact Analysis reports:
1. District Impact, by Highway System;
2. Statewide Impact, by District; and
3. Statewide Impact, by Highway System.
As mentioned in Chapter 5, we propose that users be able to select these Impact Analysis
reports when running the Optimization program. We do not expect that Impact Analysis
reports will be run during the Needs Estimate.
District Impact, by Highway System
We propose that P:MIS include an Impact Analysis report which summarizes the three
maintenance levels of service and the three average P:MIS Scores for a single District, by
Highway System, as shown in Table 256. As mentioned earlier, the report should print tables
for the "current," "after Needs Estimate," and "after Optimization" cases. We also propose
that all TxDOT P:MIS users be able to run this report.
Statewide Impact, by District
We propose that P:MIS include an Impact Analysis report which summarizes the three
maintenance levels of service and the three average P:MIS Scores statewide, by District, as
shown in Table 257. As mentioned earlier, the report should print tables for the "current,"
"after Needs Estimate," and "after Optimization" cases. We also propose that all TxDOT
P:MIS users be able to run this report.
344

w ~ VI
Table 256. Proposed District Impact Analysis Report, by Highway System.
Fiscal Year: 1995 District 14 - Current Condition Funding = $15,000,000 ============================================================================================================
PMIS Highway System
"Desirable"
Lane Miles Percent
Rutting Level of Service
"Acceptable" "Tolerable"
Lane Miles Percent Lane Miles
"Intolerable" TOTAL
Percent Lane Miles Percent Lane Miles ============================================================================================================ IH us SH FM PR BR ============================================================================================================ District 14 ============================================================================================================
Fiscal Year: 1995 District 14 - Current Condition Funding = $15,000,000 =====================·=======================·==·======·====================================================
PMIS Highway System
Alligator Cracking Level of Service
-------------------------------------------------------------------------------------"Desirable" "Acceptable" "Tolerable" "Intolerable"
Lane Miles Percent Lane Miles Percent Lane Miles Percent Lane Miles Percent TOTAL Lane Miles
============================================================================================================ IH us SH FM PR BR ============================================================================================================ District 14 ============================================================================================================

VJ ~ 0\
Table 256 (Continued). Proposed District Impact Analysis Report, by Highway System.
Fiscal Year: 1995 District 14 - Current Condition Funding = $15,000,000 ============================================================================================================
PMIS Highway System
"Desirable"
Lane Miles Percent
Ride Quality Level of Service
"Acceptable" "Tolerable"
Lane Miles Percent Lane Miles
"Intolerable" TOTAL
Percent Lane Miles Percent Lane Miles ============================================================================================================ IH us SH FM PR BR ============================================================================================================ District 14 ======================================••====================================================================
Fiscal Year: 1995 District 14 - After Needs Estimate Funding = $15,000,000 ============================================================================================================
PMIS Highway System
"Desirable"
Lane Miles Percent
Rutting Level of Service
"Acceptable" "Tolerable"
Lane Miles Percent Lane Miles
"Intolerable" TOTAL
Percent Lane Miles Percent Lane Miles ============================================================================================================ IH us SH FM PR BR ====================================··=================·==================================================== District 14 =========================···================================================================================

VJ ..J::>. ......:i
Table 256 (Continued). Proposed District Impact Analysis Report, by Highway System.
Fiscal Year: 1995 District 14 - After Needs Estimate Funding = $15,000,000 ========================·===================================================================================
PMIS Highway System
"Desirable"
Lane Miles Percent
Alligator Cracking Level of Service
"Acceptable" "Tolerable"
Lane Miles Percent Lane Miles Percent
"Intolerable"
Lane Miles Percent TOTAL Lane Miles
============================================================================================================ IH us SH FM PR BR ============================================================================================================ District 14 ============================================================================================================
Fiscal Year: 1995 District 14 - After Needs Estimate Funding = $15,000,000 ================================================================·===========================================
PMIS Highway System
"Desirable"
Lane Miles Percent
Ride Quality Level of Service
"Acceptable" "Tolerable"
Lane Miles Percent Lane Miles
"Intolerable" TOTAL
Percent Lane Miles Percent Lane Miles ============================================================================================================ IH us SH FM PR BR ============================================================================================================ District 14 ==================================================·=========================================================

w ~ 00
Table 256 (Continued). Proposed District Impact Analysis Report, by Highway System.
Fiscal Year: 1995 District 14 - After Optimization Funding = $15,000,000 ============================================================================================================
PMJ:S Highway System
"Desirable"
Lane Miles Percent
Rutting Level of Service
"Acceptable" "Tolerable"
Lane Miles Percent Lane Miles
":Intolerable" TOTAL
Percent Lane Miles Percent Lane Miles ============================================================================================================ IH us SH FM PR BR ============================================================================================================ District 14 ============================================================================================================
Fiscal Year: 1995 District 14 - After Optimization Funding = $15,000,000 ==================================================·========·================================================
PMJ:S Highway System
"Desirable"
Lane Miles Percent
Alligator Cracking Level of Service
"Acceptable" "Tolerable"
Lane Miles Percent Lane Miles Percent
":Intolerable" TOTAL
Lane Miles Percent Lane Miles ==================·======··================================================================================= IH us SH FM PR BR ============================================================================================================ District 14 ===============================================·============================================================
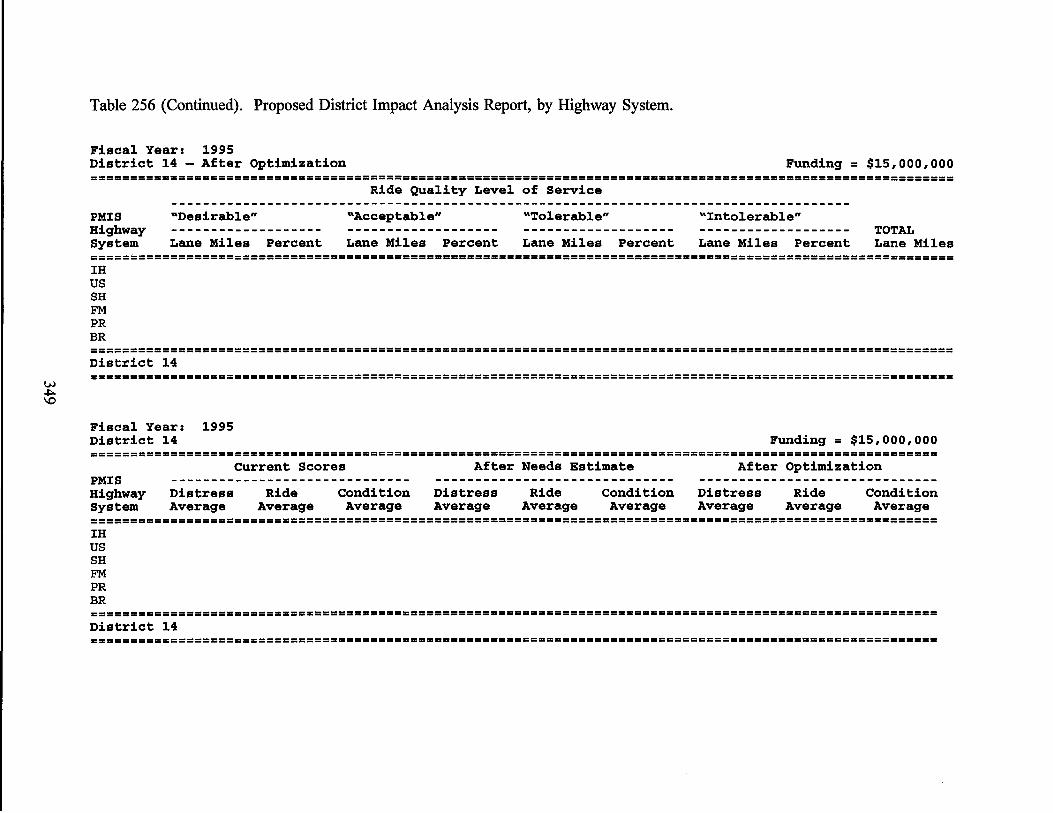
w .j:::.. \0
Table 256 (Continued). Proposed District Impact Analysis Report, by Highway System.
Fiscal Year: 1995 District 14 - After Optimization Funding = $15,000,000 ============================================================================================================
PMIS Highway System
"Desirable"
Lane Miles Percent
Ride Quality Level of Service
"Acceptable" "Tolerable"
Lane Miles Percent Lane Miles
"Intolerable" TOTAL
Percent Lane Miles Percent Lane Miles ============================================================================================================ IH us SH FM PR BR ============================================================================================================ District 14 ============================================================================================================
Fiscal Year: 1995 District 14 Funding = $15,000,000 ========================================================================================================== PMIS Highway System
Distress Average
Current Scores
Ride Average
Condition Average
After Needs Estimate
Distress Average
Ride Average
Condition Average
After Optimization
Distress Average
Ride Average
Condition Average
========================================================================================================== IH us SH FM PR BR ===================================·====================================================================== District 14 ==========================================================================================================

VJ Vl 0
Table 257. Proposed Statewide Impact Analysis Report, by District.
Fiscal Year: 1995 Statewide - Current Condition Funding = $15,000,000 ============================================================================================================
Rutting Level of Service
"Desirable" "Acceptable" "Tolerable" "Intolerable" TOTAL
District Lane Miles Percent Lane Miles Percent Lane Miles Percent Lane Miles Percent Lane Miles ============================================================================================================
1 2
25 ============================================================================================================ STATEWIDE ============================================================================================================
Fiscal Year: 1995 Statewide - Current Condition Funding = $15,000,000 ============================================================================================================
Alligator Cracking Level of Service
"Desirable" "Acceptable" "Tolerable" "Intolerable" TOTAL
District Lane Miles Percent Lane Miles Percent Lane Miles Percent Lane Miles Percent Lane Miles ============================================================================================================
1 2
25 ============================================================================================================ STATEWIDE ============================================================================================================

VJ Vl -
Table 257 (Continued). Proposed Statewide Impact Analysis Report, by District.
Fiscal Year: 1995 Statewide - Current Condition Funding = $15,000,000 ============================================================================================================
Ride Quality Level of Service
"Desirable" "Acceptable" "Tolerable"
District Lane Miles Percent Lane Miles Percent Lane Miles
"Intolerable"
Percent Lane Miles Percent TOTAL Lane Miles
============================================================================================================ 1 2
25 ============================================================================================================ STATEWIDE ============================================================================================================
Fiscal Year: 1995 Statewide - After Needs Estimate Funding = $15,000,000 ============================================================================================================
Rutting Level of Service
"Desirable" "Acceptable" "Tolerable"
District Lane Miles Percent Lane Miles Percent Lane Miles
"Intolerable"
Percent Lane Miles Percent TOTAL Lane Miles
============================================================================================================ 1 2
25 ============================================================================================================ STATEWIDE ============================================================================================================ Fiscal Year: 1995

Table 257 (Continued). Proposed Statewide Impact Analysis Report, by District.
Statewide - After Needs Estimate Funding = $15,000,000 ============================================================================================================
Alligator Cracking Level of Service
"Desirable" "Acceptable" "Tolerable" "Intolerable" TOTAL
District Lane Miles Percent Lane Miles Percent Lane Miles Percent Lane Miles Percent Lane Miles ============================================================================================================
1 2
25 =========================================================================================================== =
VJ STATEWIDE Vl N ===========================================================================================================
=
Fiscal Year: 1995 Statewide - After Needs Estimate Funding = $15,000,000 ================================·===========================================================================
Ride Quality Level of Service
"Desirable" "Acceptable" "Tolerable" "Intolerable" TOTAL
District Lane Miles Percent Lane Miles Percent Lane Miles Percent Lane Miles Percent Lane Miles ============================================================================================================
1 2
25 =========================================·================================================================== STATEW:IDE ============================================================================================================

I.;.)
Table 257 (Continued). Proposed Statewide Impact Analysis Report, by District.
Fiscal Year: 1995 Statewide - After Optimization Funding = $15,000,000 ============================================================================================================
Rutting Level of Service
"Desirable" "Acceptable" "Tolerable"
District Lane Miles Percent Lane Miles Percent Lane Miles
"Intolerable"
Percent Lane Miles Percent TOTAL Lane Miles
==========================·================================================================================= 1 2
25 ============================================================================================================ STATEWIDE
Ve ============================================================================================================ I.;.)
Fiscal Year: 1995 Statewide - After Optimization Funding = $15,000,000 ============================================================================================================
Alligator Cracking Level of Service
"Desirable" "Acceptable" "Tolerable" "Intolerable" TOTAL
District Lane Miles Percent Lane Miles Percent Lane Miles Percent Lane Miles Percent Lane Miles ============================================================================================================
1 2
25 =========================·================================================================================== STATEWIDE ============================================================================================================

v.> Vl ..j:>..
Table 257 (Continued). Proposed Statewide Impact Analysis Report, by District.
Fiscal Year; 1995 Statewide - After Optimization Funding = $15,000,000 ============================================================================================================
Ride Quality Level of Service
"Desirable" "Acceptable" "Tolerable" "Intolerable" TOTAL
District Lane Miles Percent Lane Miles Percent Lane Miles Percent Lane Miles Percent Lane Miles ============================================================================================================
1 2
25 ============================================================================================================ STATEWIDE ============================================================================================================
Fiscal Year; Statewide
1995 Funding = $15,000,000
===========================================================================================================
District Distress Average
Current Scores
Ride Average
Condition Average
After Needs Estimate
Distress Average
Ride Average
Condition Average
After Optimization
Distress Average
Ride Average
Condition Average
============·==============··============================================================================== l 2
25 =========================================================================================================== STATEWIDE ===========================================================================================================

Statewide Impact, by Highway System
We propose that PMIS include an Impact Analysis report which summarizes the three
maintenance levels of service and the three average PMIS Scores statewide, by Highway
System, as shown in Table 258. As mentioned earlier, the report should print tables for the
"current," "after Needs Estimate," and "after Optimization" cases. We also propose that all
TxDOT PMIS users be able to run this report.
SUMMARY
The PMIS Impact Analysis reports give the pavement manager the ability to anticipate
future pavement problems. TxDOT will thus be able to simulate the effects of funding,
policy, and truck traffic on future pavement condition. District users will also be able to fine
tune specific section- and treatment-related decisions to give the best possible overall
pavement condition.
355
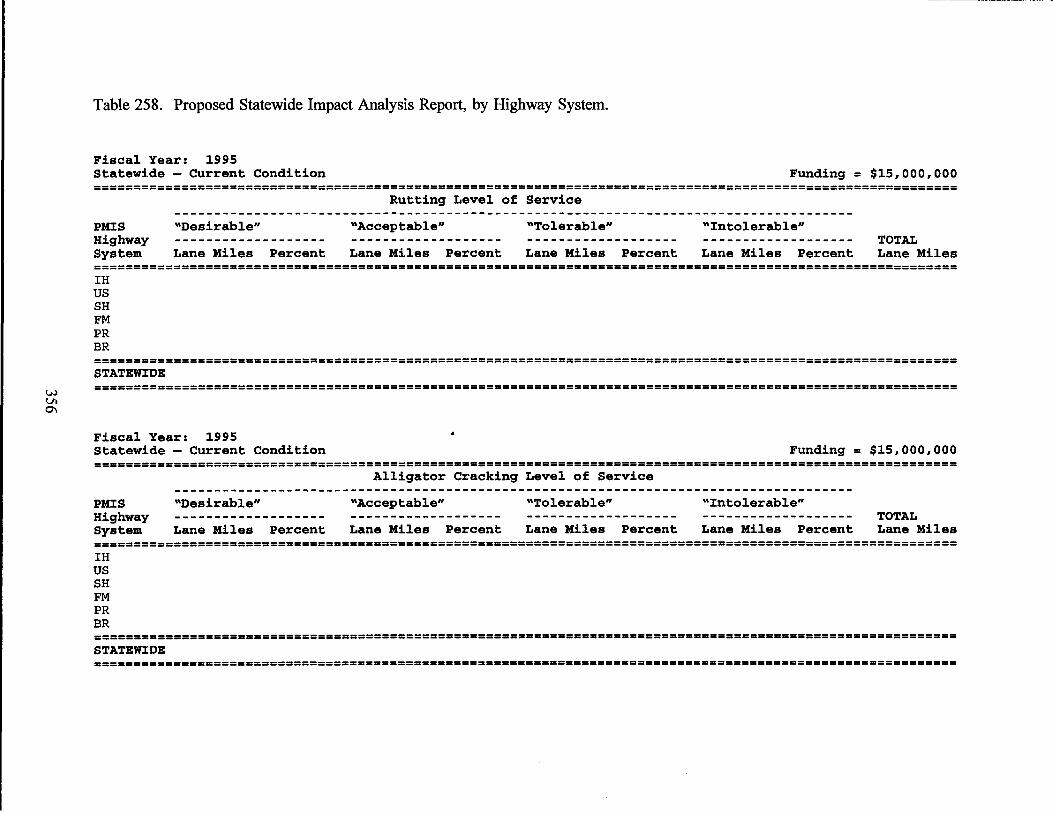
VJ VI
°'
Table 258. Proposed Statewide Impact Analysis Report, by Highway System.
Fiscal Year: 1995 Statewide - Current Condition Funding = $15,000,000 ============================================================================================================
PMIS Highway System
"Desirable"
Lane Miles Percent
Rutting Level of Service
"Acceptable" "Tolerable"
Lane Miles Percent Lane Miles
"Intolerable" TOTAL
Percent Lane Miles Percent Lane Miles ============================================================================================================ IH us SH FM PR BR ============================================================================================================ STATEWIDE ============================================================================================================
Fiscal Year: 1995 Statewide - Current Condition Funding = $15,000,000 ============================================================================================================
PMIS Highway System
"Desirable"
Lane Miles Percent
Alligator Cracking Level of Service
"Acceptable" "Tolerable"
Lane Miles Percent Lane Miles Percent
"Intolerable" TOTAL
Lane Miles Percent Lane Miles ============================================================================================================ IH us SH FM PR BR ============================================================================================================ STATEWIDE ===========·================================================================================================
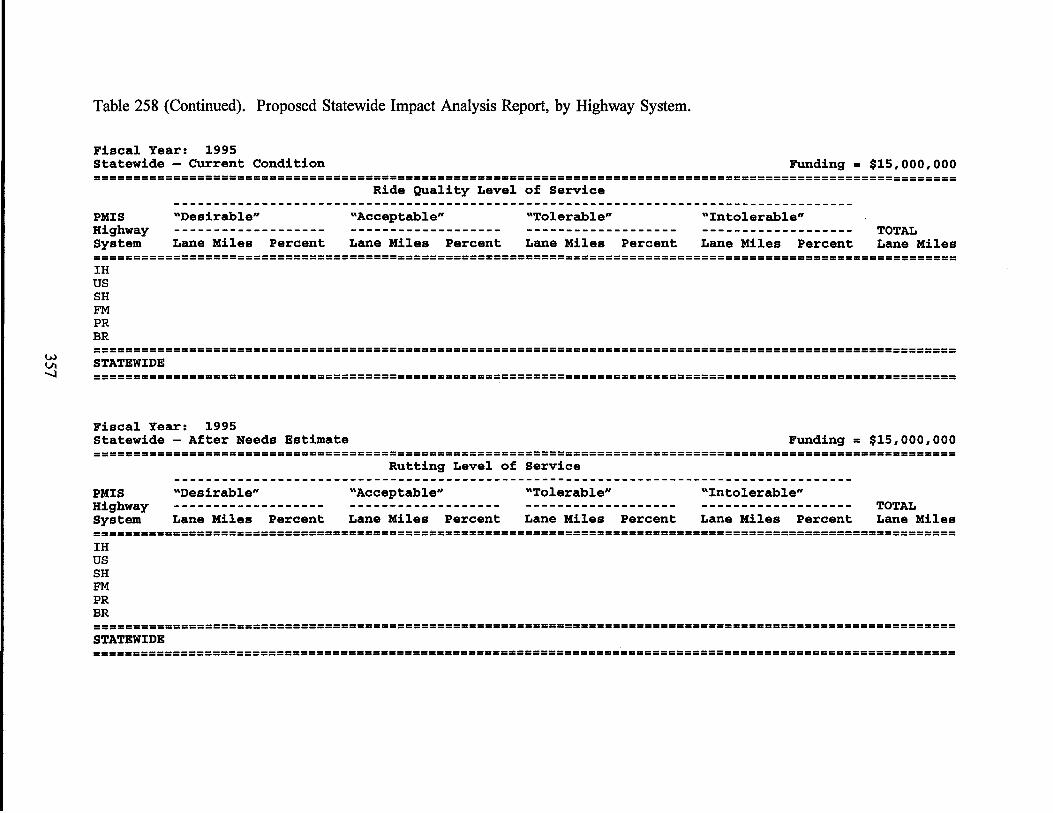
w Vl -....I
Table 258 (Continued). Proposed Statewide Impact Analysis Report, by Highway System.
Fiscal Year: 1995 Statewide - Current Condition Funding = $15,000,000 ============================================================================================================
PMIS Highway System
"Desirable"
Lane Miles Percent
Ride Quality Level of Service
"Acceptable" "Tolerable"
Lane Miles Percent Lane Miles
"Intolerable" TOTAL
Percent Lane Miles Percent Lane Miles ============================================================================================================ IH us SH FM PR BR ============================================================================================================ STATEWIDE ============================================================================================================
Fiscal Year: 1995 Statewide - After Needs Estimate Funding = $15,000,000 ============================================================================================================
PMIS Highway System
"Desirable"
Lane Miles Percent
Rutting Level of Service
"Acceptable" "Tolerable"
Lane Miles Percent Lane Miles
"Intolerable" TOTAL
Percent Lane Miles Percent Lane Miles ============================================================================================================ IH us SH FM PR BR ============================================================================================================ STATEWIDE ============================================================================================================

Table 258 (Continued). Proposed Statewide Impact Analysis Report, by Highway System.
Fiscal Year: 1995 Statewide - After Needs Estimate Funding = $15,000,000 ============================================================================================================
PMIS Highway System
"Desirable"
Lane Miles Percent
Alligator Cracking Level of Service
"Acceptable" "Tolerable"
Lane Miles Percent Lane Miles Percent
"Intolerable"
Lane Miles Percent TOTAL Lane Miles
====================·=====·================================================================================= IH us SH FM PR BR
w ========================== ------~ STATEWIDE ==------=========================--------------========================================== ============================================================================================================
Fiscal Year: 1995 Statewide - After Needs Estimate Funding = $15,000,000 ============================·===============================================================================
PMIS Highway System
"Desirable"
Lane Miles Percent
Ride Quality Level of Service
"Acceptable" "Tolerable"
Lane Miles Percent Lane Miles
"Intolerable" TOTAL
Percent Lane Miles Percent Lane Miles ============================================================================================================ IH us SH FM PR BR ============================================================================================================ STATEWIDE ============================================================================================================

VJ V'I \0
Table 258 (Continued). Proposed Statewide Impact Analysis Report, by Highway System.
Fiscal Year: 1995 Statewide - After Optimization Funding = $15,000,000 ============================================================================================================
PMIS Highway System
"Desirable"
Lane Miles Percent
Rutting Level of Service
"Acceptable" "Tolerable"
Lane Miles Percent Lane Miles
"Intolerable" TOTAL
Percent Lane Miles Percent Lane Miles ===================•======================================================================================== IH us SH FM PR BR ============================================================================================================ STATEWIDE ============================================================================================================
Fiscal Year: 1995 Statewide - After Optimization Funding = $15,000,000 ============================================================================================================
PMIS Highway System
Alligator Cracking Level of Service -------------------------------------------------------------------------------------"Desirable" "Acceptable" "Tolerable" ":Intolerable"
Lane Miles Percent Lane Miles Percent Lane Miles Percent Lane Miles Percent TOTAL Lane Miles
============================================================================================================ IH us SH FM PR BR =======================•======================================·============================================= STATEWJ:DE ============================================================================================================

Table 258 (Continued). Proposed Statewide Impact Analysis Report, by Highway System.
Fiscal Year: 1995 Statewide - After Optimization Funding = $15,000,000 ============================================================================================================
PMIS Highway System
"Desirable"
Lane Miles Percent
Ride Quality Level of Service
"Acceptable" "Tolerable"
Lane Miles Percent Lane Miles
"Intolerable" TOTAL
Percent Lane Miles Percent Lane Miles ============================================================================================================ IH us SH FM PR BR ============================================================================================================ STATEWIDE
w =============================================================================·============================== O'I ~
Fiscal Year: 1995 Funding = $15,000,000 ========================·================================================================================= PMIS Highway System
Distress Average
Current Scores
Ride Average
Condition Average
After Needs Estimate
Distress Average
Ride Average
Condition Average
After Optimization
Distress Average
Ride Average
Condition Average
======================================================================·=================================== IH us SH FM PR BR ========================================================================================================== STATEWIDE ==·======================·================================================================================

VII - SUMMARY
This report has described TxDOT' s new Pavement Management Information
System (PMIS). It is current as of the time of publication, however TxDOT is installing
the last few programs onto its mainframe computer and some minor changes may still be
made before the expected completion date (December, 1995).
This report has included specific proposals for each of the major PMIS
components: pavement utility curves, pavement performance curves, the Needs Estimate
program, the Optimization program, and the Impact Analysis program.
We expect that TxDOT will continually evaluate PMIS and make changes, as
necessary, to improve the reliability of the results. This process is essential if PMIS is to
remain an integral part of TxDOT' s overall pavement management system.
361
Copyright © 2022 FDOKUMEN