An analysis of pavement heat flux to optimize the water efficiency of a pavement-watering method
12
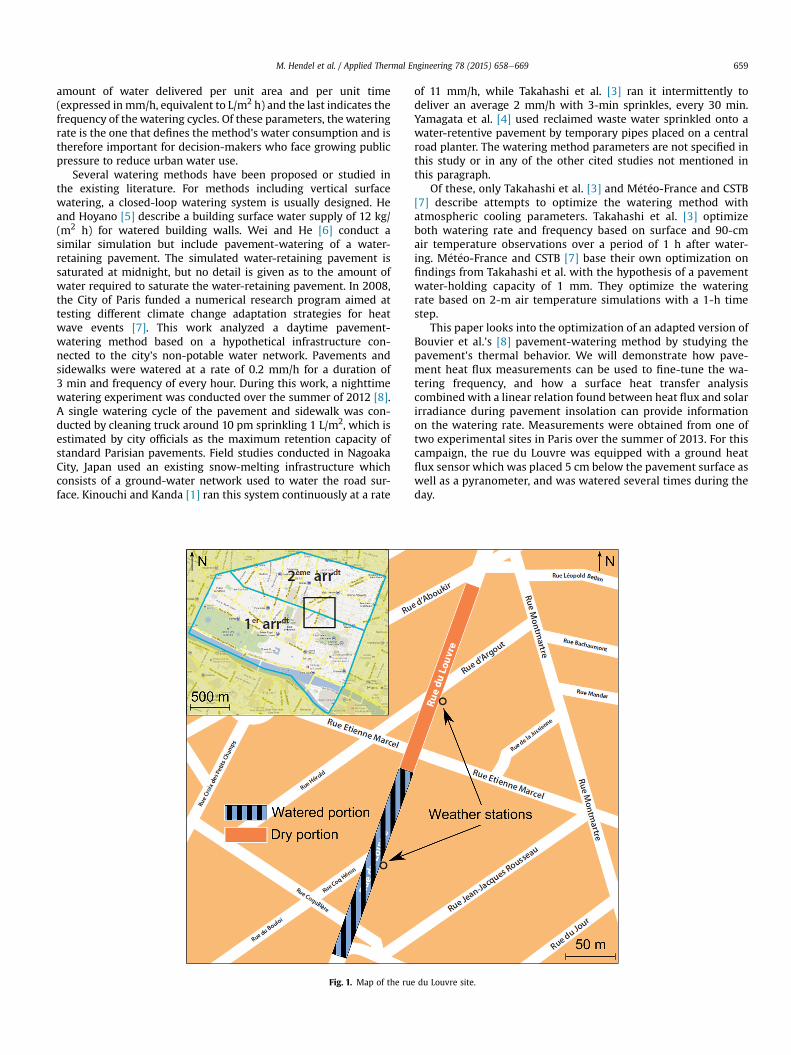
Research paper An analysis of pavement heat flux to optimize the water efficiency of a pavement-watering method Martin Hendel a, b, c, * , Morgane Colombert b , Youssef Diab b , Laurent Royon c a Paris City Hall, Water and Sanitation Department, F-75014 Paris, France b Universit e Paris-Est, Lab'Urba, EA 3482, EIVP, F-75019 Paris, France c Univ Paris Diderot University, Sorbonne Paris Cit e, MSC, UMR 7057, CNRS, F-75013 Paris, France highlights The thermal effects of pavement-watering were investigated in Paris, France. Pavement-watering was found to significantly affect pavement heat flux 5 cm deep. When insolated, a linear relation was found between heat flux and solar radiation. Pavement-watering did not alter its slope, but introduced a negative intercept. Subsequent improvements of the watering period, frequency and rate are proposed. article info Article history: Received 6 May 2014 Accepted 28 November 2014 Available online 5 December 2014 Keywords: Evaporative cooling Pavement heat flux Pavement-watering Urban heat island Climate change adaptation Heat wave abstract Pavement-watering as a technique of cooling dense urban areas and reducing the urban heat island effect has been studied since the 1990's. The method is currently considered as a potential tool for and climate change adaptation against increasing heat wave intensity and frequency. However, although water consumption necessary to implement this technique is an important aspect for decision makers, opti- mization of possible watering methods has only rarely been conducted. An analysis of pavement heat flux at a depth of 5 cm and solar irradiance measurements is proposed to attempt to optimize the watering period, cycle frequency and water consumption rate of a pavement-watering method applied in Paris over the summer of 2013. While fine-tuning of the frequency can be conducted on the basis of pavement heat flux observations, the watering rate requires a heat transfer analysis based on a relation established between pavement heat flux and solar irradiance during pavement insolation. From this, it was found that watering conducted during pavement insolation could be optimized to 30-min cycles and water consumption could be reduced by more than 80% while reducing the cooling effect by less than 13%. © 2014 Elsevier Ltd. All rights reserved. 1. Introduction Watering horizontal or vertical urban surfaces as a method for cooling urban spaces has been studied in Asia since the 1990s [1e6] and is only a recent topic in French cities such as Paris and Lyons [7e9]. With reported air temperature reductions ranging from 0.4 C at 2 m [8] to 4 C at 0.9 m [3], this technique is viewed as an efficient means of reducing urban heat island (UHI) intensity. In France and especially Paris, the predicted increases in heat wave intensity and frequency due to climate change [10], combined with the high sensitivity of dense cities to such episodes [11,12], have focused efforts on the development of appropriate adaptation tools. In parallel to techniques such as green space development, pavement-watering is seen as one of these potential tools for heat- wave adaptation in mineral areas. Pavement-watering implies the choice of a watering method and a corresponding urban infrastructure. For any given target- area, every watering method can be characterized by three pa- rameters: the watering period, the watering rate and the watering frequency. The former indicates the period of each day during which pavement-watering is active, the second is the average * Corresponding author. Paris City Hall, Water and Sanitation Department, F- 75014 Paris, France. E-mail address: [email protected] (M. Hendel). Contents lists available at ScienceDirect Applied Thermal Engineering journal homepage: www.elsevier.com/locate/apthermeng http://dx.doi.org/10.1016/j.applthermaleng.2014.11.060 1359-4311/© 2014 Elsevier Ltd. All rights reserved. Applied Thermal Engineering 78 (2015) 658e669
-
Upload
univ-paris-diderot -
Category
Documents
-
view
0 -
download
0
Transcript of An analysis of pavement heat flux to optimize the water efficiency of a pavement-watering method
lable at ScienceDirect
Applied Thermal Engineering 78 (2015) 658e669
Contents lists avai
Applied Thermal Engineering
journal homepage: www.elsevier .com/locate/apthermeng
Research paper
An analysis of pavement heat flux to optimize the water efficiency of apavement-watering method
Martin Hendel a, b, c, *, Morgane Colombert b, Youssef Diab b, Laurent Royon c
a Paris City Hall, Water and Sanitation Department, F-75014 Paris, Franceb Universit�e Paris-Est, Lab'Urba, EA 3482, EIVP, F-75019 Paris, Francec Univ Paris Diderot University, Sorbonne Paris Cit�e, MSC, UMR 7057, CNRS, F-75013 Paris, France
h i g h l i g h t s
� The thermal effects of pavement-watering were investigated in Paris, France.� Pavement-watering was found to significantly affect pavement heat flux 5 cm deep.� When insolated, a linear relation was found between heat flux and solar radiation.� Pavement-watering did not alter its slope, but introduced a negative intercept.� Subsequent improvements of the watering period, frequency and rate are proposed.
a r t i c l e i n f o
Article history:Received 6 May 2014Accepted 28 November 2014Available online 5 December 2014
Keywords:Evaporative coolingPavement heat fluxPavement-wateringUrban heat islandClimate change adaptationHeat wave
* Corresponding author. Paris City Hall, Water an75014 Paris, France.
E-mail address: [email protected] (M. Hende
http://dx.doi.org/10.1016/j.applthermaleng.2014.11.0601359-4311/© 2014 Elsevier Ltd. All rights reserved.
a b s t r a c t
Pavement-watering as a technique of cooling dense urban areas and reducing the urban heat island effecthas been studied since the 1990's. The method is currently considered as a potential tool for and climatechange adaptation against increasing heat wave intensity and frequency. However, although waterconsumption necessary to implement this technique is an important aspect for decision makers, opti-mization of possible watering methods has only rarely been conducted. An analysis of pavement heatflux at a depth of 5 cm and solar irradiance measurements is proposed to attempt to optimize thewatering period, cycle frequency and water consumption rate of a pavement-watering method applied inParis over the summer of 2013. While fine-tuning of the frequency can be conducted on the basis ofpavement heat flux observations, the watering rate requires a heat transfer analysis based on a relationestablished between pavement heat flux and solar irradiance during pavement insolation. From this, itwas found that watering conducted during pavement insolation could be optimized to 30-min cycles andwater consumption could be reduced by more than 80% while reducing the cooling effect by less than13%.
© 2014 Elsevier Ltd. All rights reserved.
1. Introduction
Watering horizontal or vertical urban surfaces as a method forcooling urban spaces has been studied in Asia since the 1990s [1e6]and is only a recent topic in French cities such as Paris and Lyons[7e9]. With reported air temperature reductions ranging from0.4 �C at 2 m [8] to 4 �C at 0.9 m [3], this technique is viewed as anefficient means of reducing urban heat island (UHI) intensity. In
d Sanitation Department, F-
l).
France and especially Paris, the predicted increases in heat waveintensity and frequency due to climate change [10], combined withthe high sensitivity of dense cities to such episodes [11,12], havefocused efforts on the development of appropriate adaptation tools.In parallel to techniques such as green space development,pavement-watering is seen as one of these potential tools for heat-wave adaptation in mineral areas.
Pavement-watering implies the choice of a watering methodand a corresponding urban infrastructure. For any given target-area, every watering method can be characterized by three pa-rameters: the watering period, the watering rate and the wateringfrequency. The former indicates the period of each day duringwhich pavement-watering is active, the second is the average
M. Hendel et al. / Applied Thermal Engineering 78 (2015) 658e669 659
amount of water delivered per unit area and per unit time(expressed inmm/h, equivalent to L/m2 h) and the last indicates thefrequency of the watering cycles. Of these parameters, the wateringrate is the one that defines the method's water consumption and istherefore important for decision-makers who face growing publicpressure to reduce urban water use.
Several watering methods have been proposed or studied inthe existing literature. For methods including vertical surfacewatering, a closed-loop watering system is usually designed. Heand Hoyano [5] describe a building surface water supply of 12 kg/(m2 h) for watered building walls. Wei and He [6] conduct asimilar simulation but include pavement-watering of a water-retaining pavement. The simulated water-retaining pavement issaturated at midnight, but no detail is given as to the amount ofwater required to saturate the water-retaining pavement. In 2008,the City of Paris funded a numerical research program aimed attesting different climate change adaptation strategies for heatwave events [7]. This work analyzed a daytime pavement-watering method based on a hypothetical infrastructure con-nected to the city's non-potable water network. Pavements andsidewalks were watered at a rate of 0.2 mm/h for a duration of3 min and frequency of every hour. During this work, a nighttimewatering experiment was conducted over the summer of 2012 [8].A single watering cycle of the pavement and sidewalk was con-ducted by cleaning truck around 10 pm sprinkling 1 L/m2, which isestimated by city officials as the maximum retention capacity ofstandard Parisian pavements. Field studies conducted in NagoakaCity, Japan used an existing snow-melting infrastructure whichconsists of a ground-water network used to water the road sur-face. Kinouchi and Kanda [1] ran this system continuously at a rate
Fig. 1. Map of the rue
of 11 mm/h, while Takahashi et al. [3] ran it intermittently todeliver an average 2 mm/h with 3-min sprinkles, every 30 min.Yamagata et al. [4] used reclaimed waste water sprinkled onto awater-retentive pavement by temporary pipes placed on a centralroad planter. The watering method parameters are not specified inthis study or in any of the other cited studies not mentioned inthis paragraph.
Of these, only Takahashi et al. [3] and M�et�eo-France and CSTB[7] describe attempts to optimize the watering method withatmospheric cooling parameters. Takahashi et al. [3] optimizeboth watering rate and frequency based on surface and 90-cmair temperature observations over a period of 1 h after water-ing. M�et�eo-France and CSTB [7] base their own optimization onfindings from Takahashi et al. with the hypothesis of a pavementwater-holding capacity of 1 mm. They optimize the wateringrate based on 2-m air temperature simulations with a 1-h timestep.
This paper looks into the optimization of an adapted version ofBouvier et al.'s [8] pavement-watering method by studying thepavement's thermal behavior. We will demonstrate how pave-ment heat flux measurements can be used to fine-tune the wa-tering frequency, and how a surface heat transfer analysiscombined with a linear relation found between heat flux and solarirradiance during pavement insolation can provide informationon the watering rate. Measurements were obtained from one oftwo experimental sites in Paris over the summer of 2013. For thiscampaign, the rue du Louvre was equipped with a ground heatflux sensor which was placed 5 cm below the pavement surface aswell as a pyranometer, and was watered several times during theday.
du Louvre site.
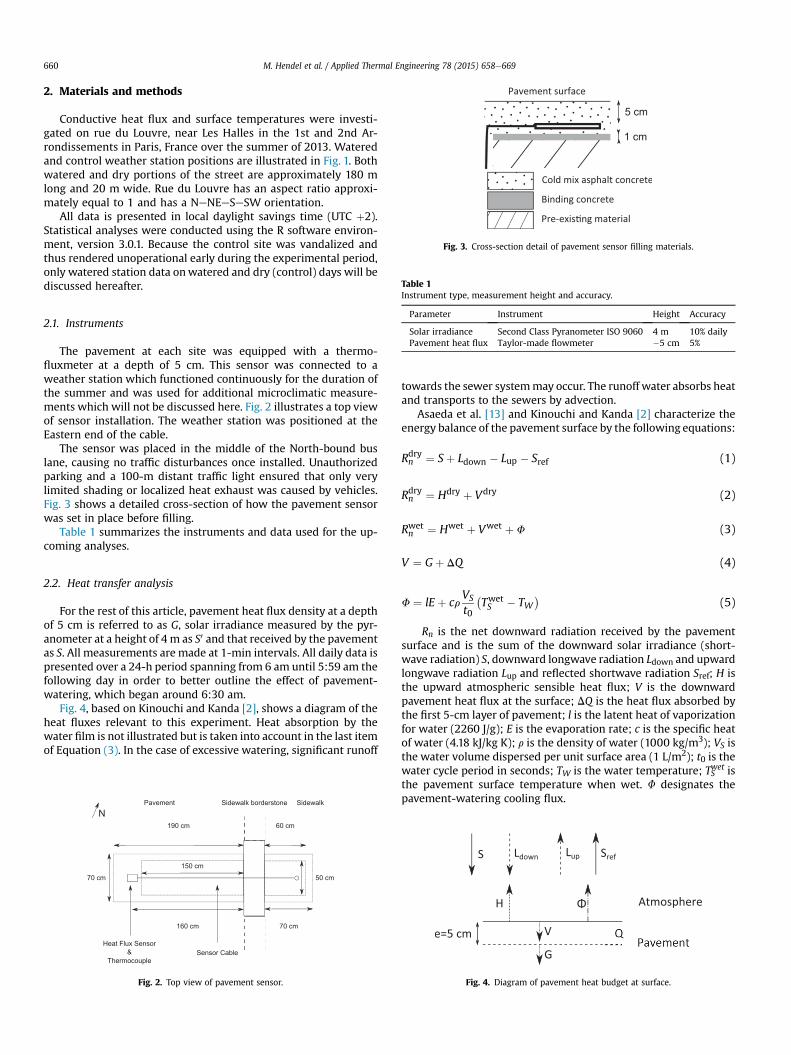
Fig. 3. Cross-section detail of pavement sensor filling materials.
Table 1
M. Hendel et al. / Applied Thermal Engineering 78 (2015) 658e669660
2. Materials and methods
Conductive heat flux and surface temperatures were investi-gated on rue du Louvre, near Les Halles in the 1st and 2nd Ar-rondissements in Paris, France over the summer of 2013. Wateredand control weather station positions are illustrated in Fig. 1. Bothwatered and dry portions of the street are approximately 180 mlong and 20 m wide. Rue du Louvre has an aspect ratio approxi-mately equal to 1 and has a NeNEeSeSW orientation.
All data is presented in local daylight savings time (UTC þ2).Statistical analyses were conducted using the R software environ-ment, version 3.0.1. Because the control site was vandalized andthus rendered unoperational early during the experimental period,only watered station data onwatered and dry (control) days will bediscussed hereafter.
Instrument type, measurement height and accuracy.
Parameter Instrument Height Accuracy
Solar irradiance Second Class Pyranometer ISO 9060 4 m 10% dailyPavement heat flux Taylor-made flowmeter �5 cm 5%
2.1. Instruments
The pavement at each site was equipped with a thermo-fluxmeter at a depth of 5 cm. This sensor was connected to aweather station which functioned continuously for the duration ofthe summer and was used for additional microclimatic measure-ments which will not be discussed here. Fig. 2 illustrates a top viewof sensor installation. The weather station was positioned at theEastern end of the cable.
The sensor was placed in the middle of the North-bound buslane, causing no traffic disturbances once installed. Unauthorizedparking and a 100-m distant traffic light ensured that only verylimited shading or localized heat exhaust was caused by vehicles.Fig. 3 shows a detailed cross-section of how the pavement sensorwas set in place before filling.
Table 1 summarizes the instruments and data used for the up-coming analyses.
2.2. Heat transfer analysis
For the rest of this article, pavement heat flux density at a depthof 5 cm is referred to as G, solar irradiance measured by the pyr-anometer at a height of 4 m as S0 and that received by the pavementas S. All measurements are made at 1-min intervals. All daily data ispresented over a 24-h period spanning from 6 am until 5:59 am thefollowing day in order to better outline the effect of pavement-watering, which began around 6:30 am.
Fig. 4, based on Kinouchi and Kanda [2], shows a diagram of theheat fluxes relevant to this experiment. Heat absorption by thewater film is not illustrated but is taken into account in the last itemof Equation (3). In the case of excessive watering, significant runoff
190 cm
160 cm 70 cm
60 cm
70 cm 50 cm
150 cm
NSidewalk borderstonePavement Sidewalk
Heat Flux Sensor &
Thermocouple Sensor Cable
Fig. 2. Top view of pavement sensor.
towards the sewer systemmay occur. The runoff water absorbs heatand transports to the sewers by advection.
Asaeda et al. [13] and Kinouchi and Kanda [2] characterize theenergy balance of the pavement surface by the following equations:
Rdryn ¼ Sþ Ldown � Lup � Sref (1)
Rdryn ¼ Hdry þ Vdry (2)
Rwetn ¼ Hwet þ Vwet þ F (3)
V ¼ Gþ DQ (4)
F ¼ lE þ crVS
t0
�TwetS � TW
�(5)
Rn is the net downward radiation received by the pavementsurface and is the sum of the downward solar irradiance (short-wave radiation) S, downward longwave radiation Ldown and upwardlongwave radiation Lup and reflected shortwave radiation Sref; H isthe upward atmospheric sensible heat flux; V is the downwardpavement heat flux at the surface; DQ is the heat flux absorbed bythe first 5-cm layer of pavement; l is the latent heat of vaporizationfor water (2260 J/g); E is the evaporation rate; c is the specific heatof water (4.18 kJ/kg K); r is the density of water (1000 kg/m3); VS isthe water volume dispersed per unit surface area (1 L/m2); t0 is thewater cycle period in seconds; TW is the water temperature; TSwet isthe pavement surface temperature when wet. F designates thepavement-watering cooling flux.
Fig. 4. Diagram of pavement heat budget at surface.

Table 2Weather conditions required for pavement-watering and heat wave warnings.
Parameter Pavement-watering Heat-wavewarning level
Mean 3-day minimumair temperature (BMIMin)
>16 �C >21 �C
Mean 3-day maximumair temperature (BMIMax)
>25 �C >31 �C
Wind speed <10 km/h e
Sky conditions Sunny (less than 2oktas cloud cover)
e
M. Hendel et al. / Applied Thermal Engineering 78 (2015) 658e669 661
By subtracting Equations (2) and (3):
F ¼ Hdry � Hwet þ Vdry � Vwet þ Ldryup � Lwetup þ Sdryref � Swet
ref (6)
According to Jürges' formula [14], convective heat flux can bewritten as:
H ¼ hðTS � TairÞ (7)
TS is the surface temperature of the pavement and Tair is that of theair above it. h is the convective heat transfer coefficient.
Furthermore, following the StefaneBoltzmann law and infraredreflection, Lup can be expressed as:
Lup ¼ εsT4S þ ð1� εÞLdown (8)
ε is the emissivity of the emitting surface, while s is Boltzmann'sconstant.
By definition, Sref can be expressed as:
Sref ¼ aS (9)
where a is the surface albedo, i.e. its shortwave reflectance.Hence:
Ldryup � Lwetup ¼ s
�εdT
dry4
S � εwTwet4S
�þ ðεw � εdÞLdown (10)
Sdryref � Swetref ¼ ðad � awÞS (11)
From these equations, the following can be derived:
F ¼ h�TdryS � Twet
S þ Twetair � Tdryair
�þ Vdry � Vwet
þ s�εdT
dry4
S � εwTwet4S
�þ ðεw � εdÞLdown þ ðad � awÞS
(12)
The resulting heat budget is analogous to that used by He andHoyano [5] and Wei and He [6] for a vertical surface with a waterfilm.
Therefore, knowledge of G, DQ, Ldown, S, h, air, water and pave-ment surface temperatures and pavement emissivity and albedounder dry and wet conditions allows an estimation of the latentheat flux and thus the evaporation rate.
Unfortunately, Ldown was not measured. In dry conditions, theasphalt surface's emissivity (εd) was measured to be 0.97, while inwet conditions the surface's emissivity (εw) is that of water, equal to0.98. Because the difference in emissivity between the wet and drypavements is minor, it is neglected in the second term of Equation(10). Thus:
Ldryup � Lwetup ¼ s
�εdT
dry4
S � εwTwet4S
�(13)
Furthermore, pavement albedo was not measured either. Ac-cording to Santamouris, the typical albedo range for asphalt is0.05e0.20, the former value referring to new asphalt pavements,the latter to older ones [15]. Because of the road work necessary tolay the pavement sensor, the pavement above it was practicallynew. We therefore assume an albedo of 0.05 in dry conditions.According to Lekner and Dorf [16], since ad << 1, both dry and wetasphalt have approximately equal albedos: aw z ad. Therefore:Sdryref � Swet
ref z0. This holds true for the rest of the pavement surfaceas well if an albedo of 0.10 is assumed.
Finally, several empirical formulas exist to calculate h based onwind speed, v (in m/s). These include h ¼ 6.15 þ 4.18v used byKusaka et al. [17] and h ¼ 5.7 þ 3.8v in Duffie and Beckman [18].
Under the field conditions described (hourly wind speed approxi-mately equal to 1 m/s), h is approximately equal to 10 W/m K.
With these approximations, the following equation is obtained:
F ¼ h�TdryS � Twet
S þ Twetair � Tdryair
�þ s�εdT
dry4
S � εwTwet4S
�þ Vdry � Vwet
(14)
Thus, knowledge of G, DQ, air, water and pavement surfacetemperatures under dry and wet conditions is sufficient to estimatethe latent heat flux.
As defined, F has two components, a latent flux component andan advective flux component. Both components are positive and aredependent on the watering rate VS/t0.
The analysis of the mass convection transport problem can alsobe used to estimate the evaporation rate, although it is inadequateat optimizing the watering frequency. This method assumes thatevaporation is uninterrupted, i.e. that the watered surface does notdry out. Pagliarini and Rainieri use such a method to determine theevaporation rate on a continuously-watered glass roof [19].Adapted to our problem by assuming that the water film and theroad surface have the same temperature, their equation becomes:
lE ¼ 0:622lh
cpp0TwetS
ps
TwetS
� pvTwetair
!(15)
p0, ps and pv represent total air pressure, saturation vapor pressureat the water film temperature Twet
s and partial air vapor pressure atTwetair in Pa, respectively. cp is air specific heat (1.005 J/g K).The meteorological data required to solve this equation was not
measured at the rue du Louvre site. The best available data isprovided by M�et�eo-France's Montsouris weather station and con-sists of hourly measurements.
This approach will be used to confront the results obtained fromthe heat transfer analysis.
2.3. Watering method and optimization goals
Watering was started if certain weather conditions were metbased on M�et�eo-France's three-day forecast. These as well as thosefor heat-wave warnings are presented in Table 2.
Cleaning trucks were used to sprinkle approximately 1 mm (VS)every hour from 6:30 am to 11:30 am and every 30 min from 2 pmuntil 6:30 pm on the sidewalk and pavement.1 mm is considered tobe the maximum water-holding capacity of the pavement. Water-ing times were reported by truck operators and cross-checkedagainst visible images taken by a rooftop thermal camera. Result-ing watering time precision is estimated to be no better than 5 min.
Water used for this experiment was supplied by the city's1600 km non-potable water network, principally sourced from the

M. Hendel et al. / Applied Thermal Engineering 78 (2015) 658e669662
Ourcq Canal. Although water temperature was not measured, itssummertime range is reported by city services to be 20e25 �C.
In this situation, the goals chosen for optimization were, byorder of importance:
� Minimize the watering frequency, i.e. maximize t0� Maximize obtained pavement cooling, F� Minimize the watering rate, VS/t0
The last two goals can be recombined as “Minimize the pave-ment cooling to watering rate ratio, F/(VS/t0)”.
Direct pavement heat flux analysis is sufficient for the frequencyoptimization, while a heat transfer analysis is necessary to estimatethe effect of pavement-watering and to optimize water consump-tion. The heat transfer analysis requires a preliminary analysis ofpavement heat flux measurements.
2.4. Derivation of pavement solar irradiance from measured solarirradiance
S0 was measured continuously starting on July 2nd, 2013.Because of the difference in positioning of the pyranometer and thepavement sensor, S0 is not equal to S and can therefore not be usedin its place for the heat transfer analysis. S must therefore bederived from S0.
Apart from possible insolation interruptions due to road trafficnot visible in S0, the only difference is the insolation period. Thevisible images taken by an infrared rooftop camera reveal a 20-min-long time lag between the beginning of pavement sensor andpyranometer insolation during the month of July. The time lag isimmediately identifiable when comparing the graphs of G and S0 forJuly 11th in Fig. 5. The beginning and end of pavement and pyr-anometer insolation are illustrated by the two dashed and long-dashed vertical lines, respectively. These coincide with the sud-den increases and declines seen in each signal. The insolationperiod of the pavement is approximately 1:35 pm to 6:30 pm, whilethat of the pyranometer is 1:55 pm to 6:50 pm. No signal distortionother than the time lag is expected or taken into account.
With these hypotheses, a modification of S0 during the two 20-min exclusive disjunctions of pyranometer and pavement insola-tion is undertaken to obtain S. The rest of the signal is unchanged,apart for distortions due to vehicles. Finally, to ensure signal con-tinuity, the 5 min following and/or preceding these 20-min periodsare also modified.
Fig. 5. G (left) and S0 (right)
3. Watering period and frequency
Pavement heat flux density data from the watered station willnow be compared between watered days and days without wa-tering (control days). These observations will help infer conclusionson the watering frequency. All selected days are of Pasquill StabilityClass A (i.e. strong daytime insolation and surface wind speedsbelow 2 m/s) [20].
3.1. Results
3.1.1. Control daysThe evolution of G and S on July 11th, 14th, and 20th are pre-
sented in Fig. 6. S ranges from 0W/m2 to 200W/m2 during shadingand from 200W/m2 to 900W/m2 during direct insolation. G rangesfrom �75 W/m2 to 215 W/m2.
In terms of heat flux, each day can be divided into three periods:two of net heat release (G < 0) in the morning and evening and oneof net heat storage (G > 0) during the day. The net release of heat bythe pavement lasts about 18 h, while heat is during the remaining6 h, approximately between 1:30 pm and 7 pm.
When the sun starts to hit the pavement, G enters a transientperiod during which the top 5 cm layer of pavement begins to storeheat, i.e. during which DQ s 0. The transient period is outlined bythe first dotted vertical line in Fig. 7 and the peak in heat flux. Thelast dashed vertical line indicates the instant when the pavement isshaded, at 6:30 pm. After the transient period, G and S follow asimilar trend.
It should be noted that an illegally-parked vehicle covered thepavement sensor for 30 min on July 20th. S was been corrected inorder to take this into account.
3.1.2. Watered daysWatered days will now be considered in the following order:
July 8th, 22nd and 10th. Fig. 8 illustrates G and S on those dates.Long-dashed vertical lines represent watering cycles. S is in thesame range as found on control days, while G ranges from �75 W/m2 to 130 W/m2.
The watering methods applied in the afternoon onwatered daysand the daily maximum value of G is summarized in Table 3. Wa-tering cycles occurred at the specified frequencies except for a 50-min interruption on July 22nd at approximately 3 pm.
The maximum value of G is about half that reached on controldays, ranging from 70 W/m2 to 130 W/m2, approximately half that
measured on July 11th.

Fig. 6. Pavement heat flux G (left) and shortwave radiation S (right) on control days.
M. Hendel et al. / Applied Thermal Engineering 78 (2015) 658e669 663
observed on control days. The daily peak in G is found to coincidewith the beginning of afternoonwatering, except on July 10thwhenafternoon watering began simultaneously to insolation. Further-more, the observed reduction is inversely proportional to the delaybetween the start of afternoon watering and the start of pavementinsolation. In other words, the later afternoon pavement-wateringbegins, the higher the daily peak in G. Between 3 pm and 6:30pm, the average reduction in pavement heat flux compared todifferent reference control days is found to be between 100 and150 W/m2. Table 4 summarizes these reductions. In the morning, Gis reduced by approximately 15 W/m2.
3.2. Discussion
The comparison of G onwatered days with control days revealedstrong effects due to pavement-watering. On the one hand, heatflux density reductions were found to be highest in the afternoonduring pavement insolation with G being more than halved. Theaverage reduction is between 100 and 150W/m2 during this period.Morning heat flux density, when the pavement is shaded, was alsoreduced by pavement-watering in the order of 15 W/m2. On theother hand, the daily peak in G was found to coincide with the firstafternoon watering cycle and to be proportional to the delay be-tween this cycle and pavement insolation. Furthermore, spikes in Gwere observed if watering cycles were more than 45 min apart.
This provides insight on two aspects of the watering method: itswatering period and its frequency. First, the value of the dailymaximum of G depends on the start of afternoon watering rela-tively to pavement insolation. Second, if the pavement-wateringfrequency is too low, the pavement surface has enough time to dryand G rises towards its normal control value until the next wateringcycle.
In order to maximize pavement cooling in the afternoon, wa-tering should begin just a few minutes prior to pavement insola-tion. Furthermore, the watering frequency must be adjusted toprevent the pavement surface from drying. These observationssuggest that a period of 45 min is too long, while 30 min is nearlyoptimal during insolation. In themorning, in shaded conditions, thedata suggests that watering every hour is sufficient, perhapsoptimal.
Overall, these observations are consistent with previous work.On control days, the trend in heat flux is comparable to measure-ments made without pavement-watering by Kinouchi and Kanda[2], also 5 cm deep, although inside a porous pavement. The heatflux values are about twice as large as what Asaeda et al. [13]
observed 20 cm below the asphalt pavement surface. Given thedifference in depth, this discrepancy is not considered surprising.On watered days, observations are similar to those of Kinouchi andKanda [1,2] as well: the first watering cycle on all watered dayscoincides with a small “nose-dive” in G in the order of 15 W/m2.Lastly, the net storage period observed in this experiment is shorterthan in reports from Kinouchi and Kanda [2] or Asaeda et al. [13],but they were working in nearly unmasked conditions.
4. Watering rate
Kinouchi and Kanda [2] put into perspective a correlation be-tween Rn and G. They proceeded by plotting G as a function of Rn.Camuffo and Bernardi [21] explore the hysteresis cycles found be-tween surface heat fluxes and net radiation for soil. Other authorssuch as Asaeda et al. [13], studying the effect of pavement heatstorage on the lower atmosphere, also look into this hysteresis cyclefor asphalt and concrete pavements. Because net radiation was notmeasured, we shall proceed in an analogous fashionwith S instead.This will permit the estimation of the surface cooling effect ofpavement-watering based on a relation between S and G duringpavement insolation. From this an estimate of the evaporation rateis obtained and therefrom watering rate adjustment recommen-dations can be made.
4.1. Results
Fig. 8 shows G as a function of S on a) July 11th, b) July 14th, c)July 20th, d) July 8th, e) July 22nd and f) July 10th. The chronologicalorder of the data points is anti-clockwise. The least square regres-sion line of G according to S between 3 pm and 6:30 pm, when thepavement has been both insolated and watered for at least 30 min,is plotted for each date.
The parameters from the linear regression can be formalized as:
G ¼ aS þ G0 (16)
a is the conversion coefficient of solar irradiance to pavement heatflux 5 cm below the pavement surface, while G0 is the interceptheat flux under these conditions.
The regressions were conducted for control and watered days.On control days, an intercept of 0 W/m2 was used. Table 5 sum-marizes the regression parameters for control days.

Fig. 7. Pavement heat flux G and shortwave radiation S on watered days. a) and d) July 8th; b) and e) July 16th; c) and f) July 10th.
M. Hendel et al. / Applied Thermal Engineering 78 (2015) 658e669664
Each fit is statistically significant, with coefficients of determi-nation in excess of 0.98. Overall, the conversion coefficients derivedon control days range from 22% to 27%.
On watered days, different intercepts, corresponding to theaverage reduction of G found in Table 4, were tested. Using theseintercepts, similar slopes to those found on control days were ob-tained. Table 6 summarizes the regression parameters using thedifferent intercepts for watered days.
Regardless of the intercept value used, the conversion co-efficients deviate only slightly from those derived on control days,
remaining in the same 22e27% range. Considering the statisticalsignificance of these regression parameters, it is concluded thatpavement-watering does not significantly affect the conversioncoefficient, but adds a constant heat flux, G0.
Solar energy is therefore transmitted in the same manner 5 cmbelow the pavement surface when wet or dry up to a constant. Itcan therefore be assumed that DQ is unchanged by watering duringinsolation, i.e. DQwet ¼ DQdry. In other words, V is also unchangedup to the same constant as G when dry or watered in insolatedconditions. This hypothesis is in agreement with experimental data
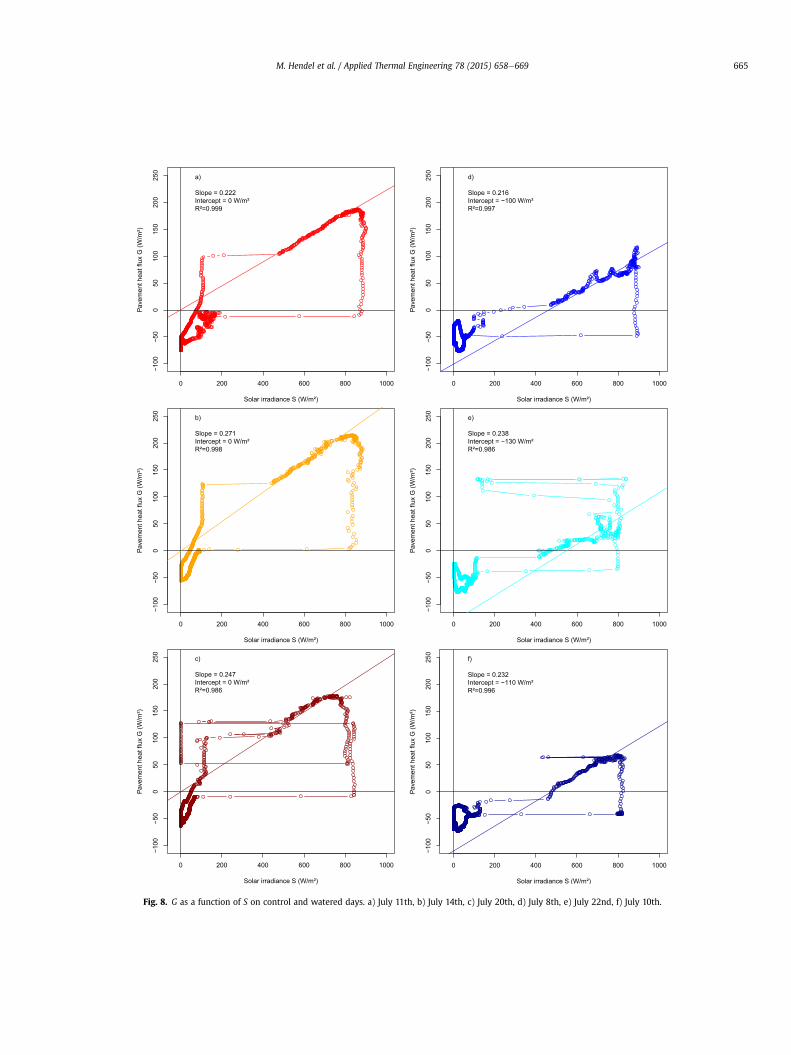
Fig. 8. G as a function of S on control and watered days. a) July 11th, b) July 14th, c) July 20th, d) July 8th, e) July 22nd, f) July 10th.
M. Hendel et al. / Applied Thermal Engineering 78 (2015) 658e669 665
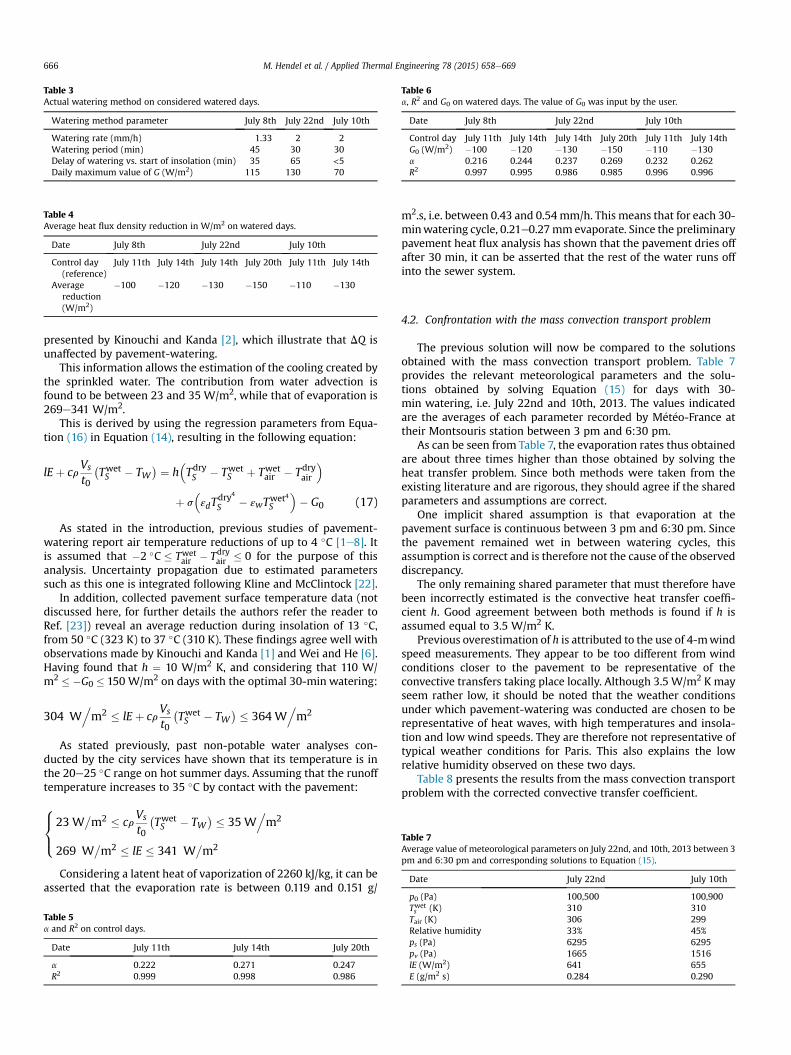
Table 3Actual watering method on considered watered days.
Watering method parameter July 8th July 22nd July 10th
Watering rate (mm/h) 1.33 2 2Watering period (min) 45 30 30Delay of watering vs. start of insolation (min) 35 65 <5Daily maximum value of G (W/m2) 115 130 70
Table 4Average heat flux density reduction in W/m2 on watered days.
Date July 8th July 22nd July 10th
Control day(reference)
July 11th July 14th July 14th July 20th July 11th July 14th
Averagereduction(W/m2)
�100 �120 �130 �150 �110 �130
Table 6a, R2 and G0 on watered days. The value of G0 was input by the user.
Date July 8th July 22nd July 10th
Control day July 11th July 14th July 14th July 20th July 11th July 14thG0 (W/m2) �100 �120 �130 �150 �110 �130a 0.216 0.244 0.237 0.269 0.232 0.262R2 0.997 0.995 0.986 0.985 0.996 0.996
Table 7Average value of meteorological parameters on July 22nd, and 10th, 2013 between 3pm and 6:30 pm and corresponding solutions to Equation (15).
Date July 22nd July 10th
M. Hendel et al. / Applied Thermal Engineering 78 (2015) 658e669666
presented by Kinouchi and Kanda [2], which illustrate that DQ isunaffected by pavement-watering.
This information allows the estimation of the cooling created bythe sprinkled water. The contribution from water advection isfound to be between 23 and 35 W/m2, while that of evaporation is269e341 W/m2.
This is derived by using the regression parameters from Equa-tion (16) in Equation (14), resulting in the following equation:
lE þ crVs
t0
�TwetS � TW
� ¼ h�TdryS � Twet
S þ Twetair � Tdryair
�
þ s�εdT
dry4
S � εwTwet4S
�� G0 (17)
As stated in the introduction, previous studies of pavement-watering report air temperature reductions of up to 4 �C [1e8]. Itis assumed that �2 �C � Twet
air � Tdryair � 0 for the purpose of this
analysis. Uncertainty propagation due to estimated parameterssuch as this one is integrated following Kline and McClintock [22].
In addition, collected pavement surface temperature data (notdiscussed here, for further details the authors refer the reader toRef. [23]) reveal an average reduction during insolation of 13 �C,from 50 �C (323 K) to 37 �C (310 K). These findings agree well withobservations made by Kinouchi and Kanda [1] and Wei and He [6].Having found that h ¼ 10 W/m2 K, and considering that 110 W/m2 � �G0 � 150 W/m2 on days with the optimal 30-min watering:
304 W.m2 � lE þ cr
Vs
t0
�TwetS � TW
� � 364 W.m2
As stated previously, past non-potable water analyses con-ducted by the city services have shown that its temperature is inthe 20e25 �C range on hot summer days. Assuming that the runofftemperature increases to 35 �C by contact with the pavement:
8><>:
23 W�m2 � cr
Vs
t0
�TwetS � TW
� � 35 W.m2
269 W�m2 � lE � 341 W
�m2
Considering a latent heat of vaporization of 2260 kJ/kg, it can beasserted that the evaporation rate is between 0.119 and 0.151 g/
Table 5a and R2 on control days.
Date July 11th July 14th July 20th
a 0.222 0.271 0.247R2 0.999 0.998 0.986
m2.s, i.e. between 0.43 and 0.54mm/h. This means that for each 30-minwatering cycle, 0.21e0.27mmevaporate. Since the preliminarypavement heat flux analysis has shown that the pavement dries offafter 30 min, it can be asserted that the rest of the water runs offinto the sewer system.
4.2. Confrontation with the mass convection transport problem
The previous solution will now be compared to the solutionsobtained with the mass convection transport problem. Table 7provides the relevant meteorological parameters and the solu-tions obtained by solving Equation (15) for days with 30-min watering, i.e. July 22nd and 10th, 2013. The values indicatedare the averages of each parameter recorded by M�et�eo-France attheir Montsouris station between 3 pm and 6:30 pm.
As can be seen from Table 7, the evaporation rates thus obtainedare about three times higher than those obtained by solving theheat transfer problem. Since both methods were taken from theexisting literature and are rigorous, they should agree if the sharedparameters and assumptions are correct.
One implicit shared assumption is that evaporation at thepavement surface is continuous between 3 pm and 6:30 pm. Sincethe pavement remained wet in between watering cycles, thisassumption is correct and is therefore not the cause of the observeddiscrepancy.
The only remaining shared parameter that must therefore havebeen incorrectly estimated is the convective heat transfer coeffi-cient h. Good agreement between both methods is found if h isassumed equal to 3.5 W/m2 K.
Previous overestimation of h is attributed to the use of 4-mwindspeed measurements. They appear to be too different from windconditions closer to the pavement to be representative of theconvective transfers taking place locally. Although 3.5 W/m2 K mayseem rather low, it should be noted that the weather conditionsunder which pavement-watering was conducted are chosen to berepresentative of heat waves, with high temperatures and insola-tion and low wind speeds. They are therefore not representative oftypical weather conditions for Paris. This also explains the lowrelative humidity observed on these two days.
Table 8 presents the results from the mass convection transportproblem with the corrected convective transfer coefficient.
p0 (Pa) 100,500 100,900Twets (K) 310 310
Tair (K) 306 299Relative humidity 33% 45%ps (Pa) 6295 6295pv (Pa) 1665 1516lE (W/m2) 641 655E (g/m2 s) 0.284 0.290

Table 8Solutions to Equation (15) obtained with h ¼ 3.5 W/m2 K.
Date July 22nd July 10th
lE (W/m2) 224 229E (g/m2s) 0.099 0.101
M. Hendel et al. / Applied Thermal Engineering 78 (2015) 658e669 667
With h ¼ 3.5 W/m2 K, total pavement cooling found usingEquation (17) amounts to between 232 and 279 W/m2, dividedbetween water advection and evaporation as follows:
8><>:
23 W�m2 � cr
Vs
t0
�TwetS � TW
� � 35 W.m2
198 W�m2 � lE � 256 W
�m2
This corresponds to an evaporation rate of between 0.087 and0.113 g/m2 s, i.e. between 0.31 and 0.41 mm/h. This means that foreach 30-min watering cycle 0.16e0.20 mm of water evaporate.
4.3. Discussion
The analysis of G as a function of S during insolation after theinitial transient period has allowed the demonstration thatpavement-watering accounts for 232e279 W/m2 of pavementsurface cooling. At least 85% of total cooling attributable topavement-watering is produced by evaporation, 15% at most isproduced by water advection.
The relative contributions of advection and evaporation contraststrongly with the amount of water used by each of these phe-nomena which is respectively 2 mm/h and 0.31e0.41 mm/h.Pavement cooling by water advection is therefore much less waterefficient than that from evaporation: 12e18 W/m2 of cooling per1 mm/h of sprinkled water, compared to 628 W/m2 per 1 mm/h ofevaporated water. However, evaporation cannot increase past acertain value, dependent on the local meteorological conditions.
Fig. 9 illustrates pavement cooling F (left) and the cooling towatering rate ratio (right) according to the watering rate, assuminga constant water and pavement surface temperature differentialand a maximum evaporation rate of 0.41 mm/h. The 0.41 mm/hmark is emphasized by the long-dashed vertical lines in Fig. 9. It isclear that once evaporation has beenmaximized, pavement coolingis onlymarginally increased by additional watering as the advectivecontribution increases.
Fig. 9. Pavement cooling F (left) and pavement cooling to watering
In regards to the optimization goals, the cooling towatering rateratio is minimized for a watering rate anywhere below themaximum evaporation rate. Therefore, any of the values below thatrate are optimal. However, in order to maximize pavement-watering's cooling effect, the best watering rate is that of themaximum evaporation rate.
The authors therefore recommend adjusting the watering rateto match the maximum evaporation rate exactly. In the describedexperimental conditions, this would lower advective cooling tobetween 4 and 7 W/m2, bringing total pavement cooling down tobetween 201 and 263 W/m2, i.e. a 6e13% reduction for a 80e84%water saving.
Our estimations of latent heat flux are consistent with thosereported by M�et�eo-France and CSTB [7] who find that latent heatflux can reach 300 W/m2. They also agree well with findings by Heand Hoyano [5] who report an advective heat flux of 23e47 W/m2
and a latent heat flux of 250e320 W/m2 for a westward-facingbuilding wall.
M�et�eo-France and CSTB found an optimal watering rate of0.2 mm/h for all of Paris' road surfaces was found [7]. This valuewas obtained by testing different watering rates with a frequencyof every hour and a water-holding capacity of 1 mm. However, it isa daily and city average for watering every hour between 5 am and7 pm and is not more accurately defined for individual streetconfigurations. Furthermore, the authors were limited in thechoice of the watering frequency since the model's time step was1 h and was found sufficient considering a water-holding capacityof 1 mm. The findings reported here are therefore consistent withtheirs.
Another consequence of these results is information on thewater-holding capacity of the pavement. Since the pavement dries30min after watering during insolation, thewater-holding capacityof the pavement is therefore equal to the amount of water evapo-rated in between 30-min watering cycles, i.e. between 0.16 and0.20 mm. This is significantly less than that assumed by M�et�eo-France and CSTB [7], but is only valid for the portion of pavementsurveyed by the heat flux sensor. This portion has a specific geo-metric configuration and surface composition (cold-versus hot-mixasphalt concrete). However, it can still be asserted that the opti-mizedwateringmethod applies the exact water-holding capacity ofthe target-area at the frequency that it takes for that amount ofwater to completely evaporate. Thus, if it is assumed that the wa-tering frequency used in the morning is optimal, morning evapo-ration can be estimated to between 0.16 and 0.20 mm/h.
rate ratio F/VS (right) according to the applied watering rate.

M. Hendel et al. / Applied Thermal Engineering 78 (2015) 658e669668
Sources of uncertainty in these estimations lie in the use of Srather than Rn, assumptions regarding water temperature changesand those regarding DQ. Concerning the latter, observations overseveral days by Kinouchi and Kanda [2] substantiate our assump-tion as does the presented analysis of Gwhich is unchanged up to aconstant in dry and wet conditions over the considered time span.
5. Conclusion
The field study conducted on rue du Louvre in Paris over thesummer of 2013 has allowed us to expose the thermal effects ofpavement-watering on a pavement area located 1.6 m away fromthe eastern sidewalk in a street with an aspect ratio of H/W ¼ 1 andof approximate NeS orientation. Pavement heat flux density at5 cm depth was found to be more than halved by pavement-watering during insolation. Furthermore, a heat transfer analysisbased on a linear relation found between solar irradiance and heatflux density allowed the estimation of evaporative cooling to be-tween 232 and 279 W/m2, i.e. an evaporation rate of between 0.31and 0.41 mm/h. This was confirmed by an independent estimationobtained by solving the mass convection problem. In the studyconditions, evaporation was found to represent at least 85% of totalpavement-watering cooling. Assuming that the 1-h morning wa-tering cycles were optimal, the evaporation rate during morningshaded conditions is 0.16e0.20 mm/h. Finally, it was found that thewater-holding capacity of the surveyed pavement zone is0.16e0.20 mm.
Based on these analyses, it is recommended to sprinkle the exactwater-holding capacity of the pavement at the lowest possiblefrequency that prevents the pavement from drying. In the casedescribed in this paper, this translates to 30-min watering cycleswith a watering rate of 0.31e0.41 mm/h during pavement insola-tion. In the morning, 60-min watering cycles and a watering rate of0.16e0.20mm/h are recommended. In the experimental conditionsdescribed here, this would use at least 80% less water while stillproviding at least 87% of observed pavement cooling. Finally, thewatering period should be extended to include a few minutesbefore pavement insolation begins to maximize the cooling effect.
In order to reduce the watering frequency further and thuscause less disturbance associated with watering cycles, the pave-ment water-holding capacity would need to be increased. As Pari-sian streets are currently designed to evacuate surface water as fastas possible, a change in street design is necessary to meet thisobjective. One alternative that can be considered is to use water-retaining pavement materials. The new street material wouldhave to store water at or near its surface in order not to preventevaporation. Such a material would permit the delivery of largeramounts of water per watering cycle with lower runoff and thusreduce the watering frequency. In addition, the new road structuremay be able to store rainfall from summer storms or water alreadybeing used today for street cleaning long enough for evaporation onhot days. This would lead to additional water savings all whilehaving positive impacts on rainwater runoff management.
Water temperature, net radiation and sensible heat flux mea-surements as well as the determination of the thermal character-istics of the pavement material would help address the sources ofuncertainty in this analysis. In addition, thesemeasurements wouldhelp verify the conjecture on optimal watering during pavementshading via a similar approach to that used for the afternoon.
Acknowledgements
The authors would like to thank APUR for lending their FlirTiR32 infrared camera and Orange for allowing the use of theirrooftop terrace located at 46, rue du Louvre for instruments used
during this experiment. They also acknowledge the support ofM�et�eo-France and APUR as well as the Green Spaces and Environ-ment, Roads and Traffic and the Waste and Water Divisions of theCity of Paris during the preparation phase of this experiment.
Funding for this experiment was provided for by the Water andSanitation Department of the City of Paris.
References
[1] T. Kinouchi, M. Kanda, An observation on the climatic effect of watering onpaved roads, J. Hydrosci. Hydraul. Eng. 15 (1) (1997) 55e64.
[2] T. Kinouchi, M. Kanda, Cooling effect of watering on paved road and retentionin porous pavement, in: Second Symposium on Urban Environment, 1998, pp.255e258.
[3] R. Takahashi, A. Asakura, K. Koike, S. Himeno, S. Fujita, Using snow meltingpipes to verify the water Sprinkling's effect over a wide area, in: NOVATECH2010, 2010, p. 10.
[4] H. Yamagata, M. Nasu, M. Yoshizawa, A. Miyamoto, M. Minamiyama, Heatisland mitigation using water retentive pavement sprinkled with reclaimedwastewater, Water Sci. Technol. 57 (5) (Jan. 2008) 763e771.
[5] J. He, A. Hoyano, A numerical simulation method for analyzing the thermalimprovement effect of super-hydrophilic photocatalyst-coated building sur-faces with water film on the urban/built environment, Energy Build. 40 (6)(Jan. 2008) 968e978.
[6] J. Wei, J. He, Numerical simulation for analyzing the thermal improving effectof evaporative cooling urban surfaces on the urban built environment, Appl.Therm. Eng. 51 (1e2) (Mar. 2013) 144e154.
[7] M�et�eo-France and CSTB, EPICEA Project e Final Report, 2012. Paris, France (inFrench).
[8] M. Bouvier, A. Brunner, F. Aim�e, Nighttime watering streets and induced ef-fects on the surrounding refreshment in case of hot weather. The city of Parisexperimentations, Tech. Sci. M�ethodes 12 (2013) 43e55 (in French).
[9] P. Maillard, F. David, M. Dechesne, J.-B. Bailly, E. Lesueur, Characterization ofthe Urban Heat Island and evaluation of a road humidification mitigationsolution in the district of La Part-Dieu, Lyon (France), Tech. Sci. M�ethodes 6(2014) 23e35 (in French).
[10] A. Lemonsu, R. Kounkou-Arnaud, J. Desplat, J.-L. Salagnac, V. Masson, Evolu-tion of the Parisian urban climate under a global changing climate, Clim.Change 116 (3e4) (Jul. 2012) 679e692.
[11] J.-M. Robine, S.L.K. Cheung, S. Le Roy, H. Van Oyen, C. Griffiths, J.-P. Michel,F.R. Herrmann, Death toll exceeded 70,000 in Europe during the summer of2003, C. R. Biol. 331 (2) (Feb. 2008) 171e178.
[12] D. Li, E. Bou-Zeid, Synergistic interactions between urban heat islands andheat waves: the impact in cities is larger than the sum of its parts, J. Appl.Meteorol. Climatol. 52 (9) (Sep. 2013) 2051e2064.
[13] T. Asaeda, V.T. Ca, A. Wake, Heat storage of pavement and its effect on thelower atmosphere, Atmos. Environ. 30 (3) (Feb. 1996) 413e427.
[14] W. Jürges, Heat transfer on a flat wall, Beih. zum Gesundheits-Ingenieur 19 (1)(1924) 1227e1249 (in German).
[15] M. Santamouris, Appropriate materials for the urban environment, in:M. Santamouris (Ed.), Energy and Climate in the Urban Built Environment,2001.
[16] J. Lekner, M.C. Dorf, Why some things are darker when wet, Appl. Opt. 27 (7)(Apr. 1988) 1278e1280.
[17] H. Kusaka, H. Kondo, Y. Kikegawa, A simple single-layer urban canopy modelfor atmospheric models: comparison with multi-layer and slab models,Boundary-Layer Meteorol. 101 (3) (2001) 329e358.
[18] J.A. Duffie, W.A. Beckman, Solar Engineering of Thermal Processes, second ed.,1991, p. 944. New York.
[19] G. Pagliarini, S. Rainieri, Dynamic thermal simulation of a glass-covered semi-outdoor space with roof evaporative cooling, Energy Build. 43 (2e3) (Feb.2011) 592e598.
[20] F. Pasquill, The estimation of the dispersion of windborne material, Meteorol.Mag. 90 (1063) (1961) 33e49.
[21] D. Camuffo, A. Bernardi, An observational study of heat fluxes and their re-lationships with net radiation, Boundary-Layer Meteorol. 23 (3) (Jul. 1982)359e368.
[22] S.J. Kline, F.A. McClintock, Describing uncertainties in single-sample experi-ments, Mech. Eng. 75 (1953) 3e8.
[23] M. Hendel, M. Colombert, Y. Diab, L. Royon, Improving a pavement-wateringmethod on the basis of pavement surface temperature measurements, UrbanClim (2014), http://dx.doi.org/10.1016/j.uclim.2014.11.002.
Nomenclature
a: a conversion coefficient of solar irradiance to pavement heat flux density at 5 cmdepth, e
a: ad/w pavement albedo (dry/wet), eAPUR: Parisian urban planning agencyBMIMin:minimum biometeorological index, 3-daymean of daily low temperature, �C

M. Hendel et al. / Applied Thermal Engineering 78 (2015) 658e669 669
BMIMax: maximum biometeorological index, 3-day mean of daily high temperature,�C
c: water specific heat, 4.18 J/g Kcp: air specific heat, 1.005 J/g KDQ: downwards pavement heat flux density absorbed by top 5-cm layer of pave-
ment, W/m2
e: pavement thickness above the heat flux sensor, 5 cmE: evaporation rate, g/sεd: dry pavement emissivity, 0.97εw: wet pavement emissivity, 0.98G: downward conductive heat flux density, 5 cm below the pavement surface, W/m2
H: upward sensible heat flux density at pavement surface, W/m2
h: convective heat transfer coefficient, W/m2 Kl: latent evaporation heat of water, 2260 kJ/kgLdown: downward longwave radiation density, W/m2
Lup: upward longwave radiation density, W/m2
MRT: mean radiant temperature, �C
p0: total air pressure, Paps: saturation water vapor pressure at Twet
S , Papv: partial air water vapor pressure at Twet
air , PaF: total pavement cooling, W/m2
Rn: net radiation density, W/m2
r: water density, 1000 kg/m3
S: pavement solar irradiance, W/m2
S0: pyranometer solar irradiance, W/m2
Sref: reflected shortwave radiation density, W/m2
Tair: atmospheric air temperature, �CTS: pavement surface temperature, �CTw: water temperature, �Ct0: watering cycle period, hV: pavement conductive heat flux density, at surface, W/m2
VS: volume of sprinkled water per watering cycle, mmUHI: urban heat island