Early Evaluation of Long-Term Pavement Performance Specific Pavement Studies-2, Colorado
Upload
khangminh22Category
view
0download
0


Francisco João Anastácio Duarte
PAVEMENT ENERGY HARVESTING SYSTEM TO CONVERT
VEHICLES KINETIC ENERGY INTO ELECTRICITY
PhD Thesis in Doctoral Program in Transport Systems supervised by Professor Adelino Ferreira, presented to the
Department of Civil Engineering of the Faculty of Sciences and Technology of the University of Coimbra
August 2017

[Page Intentionally Left Blank]

To Sílvia and my parents

[Page Intentionally Left Blank]

vii
Financial support
This research work was financed by “Fundação para a Ciência e a Tecnologia” (FCT,
Portugal) through the Ph.D. grant with reference SFRH / BD / 95018 / 2013, and was
co-financed by the European Social Fund (ESF) within the “Programa Operacional
Potencial Humano” (POPH). The POPH research program is integrated in the “National
Strategic Reference Framework 2007-2013 - Tipologia 4.1 – Formação Avançada”
(QREN 2007-2013).
Several developments of the present research work has been carried out in the framework of
project PAVENERGY – Pavement Energy Harvest Solutions (PTDC/ECM-
TRA/3423/2014), co-financed by the European Regional Development Fund (POCI-01-
0145-FEDER-016676) through the Operational Programme for Competitiveness Factors
(COMPETE) and by national funds through “Fundação para a Ciência e a Tecnologia”
(FCT, Portugal).

[Page Intentionally Left Blank]

ix
Acknowledgements
The work developed for this thesis could not been developed and concluded without the
support of several people and organizations, to which I would like to express my
gratitude.
In first place I would like to express my gratitude to Professor Adelino Ferreira. Firstly,
I thank for the invitation and incentive to apply for the Doctoral Program in
Transportation Systems, which has led me to start this adventure. Initially this was an
area somehow out of my scope and I was not able to perceive all the value of
developing the research project within the scope of transportation systems. However, in
the course of the PhD work I was able to understand that this project is totally related to
transportation system and the PhD, both the doctoral program and the thesis work, has
bring an immense value to the project, with a completely new approach that was only
possible through this process. I would also want to thank for the continuous mentoring,
support and knowledge transmitted through all the research activities, essential to
develop this research project successfully.
I would also like to express my gratitude to Professor Paulo Fael, who was my mentor
in the final project in electromechanical engineering degree, then in my MSc thesis, and
now, once again, he has supported me through the PhD work. His support has been very
important during all these stages, but in particular during the PhD work, where his
contribution was very important and essential to develop this project. His vision and
knowledge in the mechanical engineering area was decisive in many stages of the
project. Many thanks for everything!
To Professor António Pais Antunes, I would like to thank for the way he received me in
the PhD and in the Civil Engineering Department of the FCTUC, which has facilitated
my integration and adaptation to a new environment.

Acknowledgements
x
To all the professors from the Transportation Systems Doctoral Program of the MIT-
Portugal Program I would like to thank for all the knowledge and learning transmitted
which, in a way or another, I’ve used during the developments of my thesis and allowed
me to see the project with different perspectives. In particular to Professor Luís Picado
Santos, I would like to thank for the perspectives he gave regarding this project, which
has challenged me to think differently regarding its practical implementation and
allowed me to make some developments that I haven’t considered initially.
To Professors Carlos Cabrita and Davide Fonseca, from University of Beira Interior, I
would like to thank for the support during the development of the electrical components
of the project, which has allowed me to develop these with more confidence and
knowledge.
I would like to thank to the companies and their responsible that were involved in the
prototype development and experimental validation, as their knowledge and know-how
was very important to the results achieved with the developed solution. In particular, I
would like to thank to Eng. Santiago Monteiro and Eng. Jorge Silva for the support in
the hydraulic project development, and to Eng. Fernando Dias for the support in the
mechanical parts development. Their industrial know-how was determinant to adjust the
initial version of the prototype to an industrial model. Also, to Eng. Alfredo Amaral for
the support in the prototype implementation and for let me test it in his company
facilities, which was important to have a test in a relevant environment.
I would also like to express my gratitude to all the Waydip team members who have
worked with me in the Waynergy project. They all have played an important role not
only in the project development, but also in my professional development and, for that, I
thank them all. In particular to João Paulo Champalimaud, for always believe in the
project and for the continuous incentive to pursuit its development, my sincere thank
you.
To "Fundação para a Ciência e Tecnologia" (FCT), I express my gratitude for the
financial support, which allowed me to continue my studies and project development.

Acknowledgements
xi
I would like to thank to Automóvel Cub de Portugal, BP Portugal, Agência Nacional de
Inovação and to the CRUP (Conselho de Reitores das Universidades Portuguesas) for
the distinction with the Road Safety Innovation Award 2016 (Prémio Inovação
Segurança Rodoviária 2016), due to the potential of this project in the contribution to
the reduction of road accidents.
Also to Vodafone Portugal, Ericsson and Universidade Nova de Lisboa, for the
distinction with the BIG Smart Cities 2017 innovation award, due to the potential
contribution of this project in turning cities safer, smarter and sustainable, many thanks!
In the same manner, many thanks to Climate-KIC, the most important European
program and competition tackling climate change, for the distinction with the Climate
LaunchPad innovation award and selection to represent Portugal in the European final
of the competition, for the potential of this project in tackling climate change.
To my family, for always be there in the good and not so good moments and for the
continuous motivation to develop this project, I also express my gratitude. In particular
to my father, mother and my cousin Henrique, for supporting me during the prototype
development and experimental validation, thank you!
Finally, I would like to express my profound and sincere gratitude to my wife, Sílvia,
for all the support during the development of this work. It has been quite a journey and
she has been always there for me. There are no words to express my gratitude for all the
support she gave me during the last years. Thank you so much!

[Page Intentionally Left Blank

xiii
Contents
FINANCIAL SUPPORT ................................................................................................................. VII
ACKNOWLEDGEMENTS ............................................................................................................... IX
CONTENTS ................................................................................................................................ XIII
LIST OF FIGURES ...................................................................................................................... XXI
LIST OF TABLES .................................................................................................................... XXVII
LIST OF ABBREVIATIONS .................................................................................................... XXXIII
LIST OF NOTATIONS ............................................................................................................. XXXV
ABSTRACT ................................................................................................................................. XLI
RESUMO ................................................................................................................................. XLVII
CHAPTER 1 ................................................................................................................................... 1
INTRODUCTION ............................................................................................................................ 1
1.1 GLOBAL PROBLEM ............................................................................................................. 1
1.2 RESEARCH PROBLEM AND OPPORTUNITY FOR INVESTIGATION ....................................... 4
1.3 MOTIVATION ..................................................................................................................... 6
1.4 RESEARCH OBJECTIVES ..................................................................................................... 7
1.5 RESEARCH METHODOLOGY ............................................................................................ 10
1.6 RESEARCH DESIGN .......................................................................................................... 13
1.7 STRUCTURE OF THE THESIS ............................................................................................. 17
1.8 PUBLICATIONS ................................................................................................................. 20

xiv
1.9 REFERENCES .................................................................................................................... 25
CHAPTER 2 ................................................................................................................................. 29
ENERGY HARVESTING IN TRANSPORTATION INFRASTRUCTURES: STATE-OF-THE-ART ..... 29
2.1 INTRODUCTION ................................................................................................................ 29
2.2 ENERGY HARVESTING ON ROAD PAVEMENTS ................................................................ 30
2.2.1 Introduction ..................................................................................................................................... 30
2.2.2 Solar energy harvesting on road pavements ..................................................................................... 31
2.2.2.1 Photovoltaic technology................................................................................................................... 31
2.2.2.2 Thermoelectric technology .............................................................................................................. 32
2.2.2.3 Asphalt solar collector technology ................................................................................................... 33
2.2.3 Vehicle mechanical energy harvesting on road pavements .............................................................. 34
2.2.3.1 Piezoelectric technology .................................................................................................................. 35
2.2.3.2 Electromagnetic technology ............................................................................................................. 36
2.2.4 Technical analysis ............................................................................................................................ 41
2.3 ENERGY HARVESTING ON RAILWAYS ............................................................................. 44
2.3.1 Introduction ..................................................................................................................................... 44
2.3.2 Piezoelectric technologies ................................................................................................................ 45
2.3.3 Electromagnetic technologies .......................................................................................................... 46
2.3.3.1 Electromechanical actuation ............................................................................................................ 47
2.3.3.2 Hydraulic actuation .......................................................................................................................... 49
2.3.3.3 Other actuation types ....................................................................................................................... 50
2.3.4 Technical analysis ............................................................................................................................ 50
2.4 SUMMARY AND CONCLUSIONS ........................................................................................ 52
2.4.1 Road pavement technologies ........................................................................................................... 52
2.4.2 Railway technologies ....................................................................................................................... 54
2.5 REFERENCES .................................................................................................................... 56
CHAPTER 3 ................................................................................................................................. 67

xv
DEVELOPMENT OF A SOFTWARE TOOL TO EVALUATE THE VEHICLE-ROAD INTERACTION
..................................................................................................................................................... 67
3.1 INTRODUCTION ...................................................................................................................... 67
3.2 VEHICLE DYNAMICS .............................................................................................................. 70
3.2.1 Introduction ..................................................................................................................................... 70
3.2.2 Vehicle forces distribution ............................................................................................................... 72
3.2.3 Vehicle dynamics models ................................................................................................................ 73
3.2.4 Vehicle-road interaction models ...................................................................................................... 76
3.2.5 Energetic analysis ............................................................................................................................ 79
3.3 ROAD PAVEMENT DEVICES ................................................................................................... 80
3.3.1 Introduction ..................................................................................................................................... 80
3.3.2 Speed reducers ................................................................................................................................. 80
3.3.3 Energy harvesting devices ............................................................................................................... 81
3.3.4 Energy captured ............................................................................................................................... 84
3.4 SIMULATION SOFTWARE TOOL ............................................................................................. 85
3.4.1 Introduction ..................................................................................................................................... 85
3.4.2 Inputs and outputs ............................................................................................................................ 86
3.4.3 Models ............................................................................................................................................. 89
3.4.4 Flowchart ......................................................................................................................................... 90
3.5 TECHNICAL ANALYSIS .......................................................................................................... 90
3.5.1 Introduction ..................................................................................................................................... 90
3.5.2 Simulations and results analysis ...................................................................................................... 92
3.5.2.1 Scenario 1 - Different vehicle models .............................................................................................. 94
3.5.2.2 Scenario 2 - Different interaction models ........................................................................................ 95
3.5.2.3 Scenario 3 - Different surface profile and displacement .................................................................. 97
3.6 SUMMARY AND CONCLUSIONS ............................................................................................. 99
3.7 REFERENCES ........................................................................................................................ 101
CHAPTER 4 ............................................................................................................................... 105

xvi
ROAD PAVEMENT ENERGY HARVESTING: OPTIMIZING THE ENERGY EXTRACTION FROM
VEHICLES TO PROMOTE ROAD SAFETY................................................................................. 105
4.1 INTRODUCTION .................................................................................................................... 105
4.2 SPEED REDUCTION EQUIPMENT .......................................................................................... 108
4.2.1 Introduction ................................................................................................................................... 108
4.2.2 Existing equipment analysis .......................................................................................................... 109
4.2.3 Energetic analysis .......................................................................................................................... 111
4.3 ROAD PAVEMENT ENERGY HARVESTING DEVICE FOR SPEED REDUCTION PURPOSES ...... 112
4.3.1 Introduction ................................................................................................................................... 112
4.3.2 Surface profile ............................................................................................................................... 112
4.3.3 VRI models with movable surface ................................................................................................. 114
4.3.4 Mechanical system modelling ........................................................................................................ 114
4.3.5 Energetic analysis .......................................................................................................................... 118
4.4 TECHNICAL ANALYSIS ........................................................................................................ 118
4.4.1 Introduction ................................................................................................................................... 118
4.4.2 Comparison between typical SRE and the proposed solution ........................................................ 119
4.4.2.1 Scenario 1 - Standard SRE ............................................................................................................. 120
4.4.2.2 Scenario 2 - New device with movable surface ............................................................................. 122
4.4.3 Potential contribution to road safety .............................................................................................. 125
4.5 EXPERIMENTAL VALIDATION .............................................................................................. 127
4.5.1 Introduction ................................................................................................................................... 127
4.5.2 Prototype ........................................................................................................................................ 128
4.5.3 Test scenarios................................................................................................................................. 130
4.5.4 Computational simulations ............................................................................................................ 132
4.5.5 Experimental results ...................................................................................................................... 136
4.5.6 Discussion ...................................................................................................................................... 140
4.6 SUMMARY AND CONCLUSIONS ........................................................................................... 143
4.7 REFERENCES ........................................................................................................................ 145

xvii
CHAPTER 5 ............................................................................................................................... 149
ROAD PAVEMENT ENERGY HARVESTING: A NEW ELECTROMECHANICAL DEVICE TO
CONVERT VEHICLES MECHANICAL ENERGY INTO ELECTRICAL ENERGY......................... 149
5.1 INTRODUCTION .................................................................................................................... 149
5.2 RPEH ELECTROMECHANICAL SYSTEM DEVELOPMENT ..................................................... 151
5.2.1 Introduction ................................................................................................................................... 151
5.2.2 Existing systems ............................................................................................................................ 151
5.2.3 New mechanical system ................................................................................................................. 156
5.2.4 Energetic analysis .......................................................................................................................... 159
5.3 ELECTRICAL SYSTEM .......................................................................................................... 160
5.3.1 Introduction ................................................................................................................................... 160
5.3.2 Electrical generator ........................................................................................................................ 161
5.3.3 Electric load ................................................................................................................................... 162
5.3.4 Energetic analysis .......................................................................................................................... 163
5.4 TECHNICAL ANALYSIS ........................................................................................................ 164
5.4.1 Introduction ................................................................................................................................... 164
5.4.2 Simulation software tool ................................................................................................................ 166
5.4.2.1 Software inputs .............................................................................................................................. 166
5.4.2.2 Software outputs ............................................................................................................................ 168
5.4.2.3 Models ........................................................................................................................................... 169
5.4.3 Computational simulations ............................................................................................................ 171
5.4.3.1 System 1 - RAP ............................................................................................................................. 171
5.4.3.2 System 2 - Lever ............................................................................................................................ 171
5.4.3.3 System 3 - CTS .............................................................................................................................. 174
5.4.4 Results analysis .............................................................................................................................. 176
5.5 EXPERIMENTAL VALIDATION .............................................................................................. 178
5.5.1 Introduction ................................................................................................................................... 178
5.5.2 Prototype ........................................................................................................................................ 179
5.5.3 Test scenarios................................................................................................................................. 182

xviii
5.5.4 Computational simulations ............................................................................................................ 183
5.5.5 Experimental results ...................................................................................................................... 187
5.5.6 Discussion ...................................................................................................................................... 191
5.6 SUMMARY AND CONCLUSIONS ........................................................................................... 195
5.7 REFERENCES ........................................................................................................................ 196
CHAPTER 6 ............................................................................................................................... 199
ROAD PAVEMENT ENERGY HARVESTING: A NEW HYDRAULIC DEVICE TO CONVERT
VEHICLES MECHANICAL ENERGY INTO ELECTRICAL ENERGY .......................................... 199
6.1 INTRODUCTION .................................................................................................................... 199
6.2 RPEH HYDRAULIC SYSTEM DEVELOPMENT....................................................................... 201
6.2.1 Introduction ................................................................................................................................... 201
6.2.2 Existing systems ............................................................................................................................ 201
6.2.3 New hydraulic system with mechanical actuation ......................................................................... 206
6.2.4 Electrical system ............................................................................................................................ 209
6.2.5 Energetic analysis .......................................................................................................................... 210
6.3 TECHNICAL ANALYSIS ........................................................................................................ 211
6.3.1 Introduction ................................................................................................................................... 211
6.3.2 Typical hydraulic system ............................................................................................................... 213
6.3.3 Hydraulic system with mechanical actuation ................................................................................. 215
6.3.4 Results analysis .............................................................................................................................. 216
6.4 SUMMARY AND CONCLUSIONS ........................................................................................... 218
6.5 REFERENCES ........................................................................................................................ 220
CHAPTER 7 ............................................................................................................................... 223
INTEGRATION OF A MECHANICAL ENERGY STORAGE SYSTEM IN A ROAD PAVEMENT
ENERGY HARVESTING HYDRAULIC DEVICE ......................................................................... 223
7.1 INTRODUCTION .................................................................................................................... 223

xix
7.2 MECHANICAL ENERGY STORAGE SYSTEM FOR HYDRAULIC DEVICES ............................... 225
7.2.1 Introduction ................................................................................................................................... 225
7.2.2 Hydraulic pressure storage ............................................................................................................. 225
7.2.3 Standard RPEH device with hydraulic system with integrated mechanical energy storage ........... 228
7.2.4 New RPEH device with hydraulic system with integrated mechanical energy storage ................. 233
7.2.5 Energetic analysis .......................................................................................................................... 235
7.3 TECHNICAL ANALYSIS ........................................................................................................ 238
7.3.1 Introduction ................................................................................................................................... 238
7.3.2 Standard hydraulic system ............................................................................................................. 239
7.3.3 Hydraulic system with mechanical actuation ................................................................................. 247
7.3.4 Results analysis .............................................................................................................................. 253
7.3.4.1 Standard hydraulic system ............................................................................................................. 253
7.3.4.2 Hydraulic system with mechanical actuation ................................................................................. 255
7.4 SUMMARY AND CONCLUSIONS ........................................................................................... 257
7.5 REFERENCES ........................................................................................................................ 259
CHAPTER 8 ............................................................................................................................... 261
A METHODOLOGY FOR TECHNICAL AND ECONOMIC EVALUATION OF ROAD PAVEMENT
ENERGY HARVESTING DEVICES ............................................................................................. 261
8.1 INTRODUCTION .................................................................................................................... 261
8.2 EVALUATION MODEL DESCRIPTION .................................................................................... 266
8.2.1 Introduction ................................................................................................................................... 266
8.2.2 Technical and economic analysis ................................................................................................... 267
8.2.3 Cost benefit analysis ...................................................................................................................... 271
8.3 SOFTWARE TOOL FOR TECHNICAL AND ECONOMICAL EVALUATION OF RPEH
APPLICATIONS ........................................................................................................................... 274
8.3.1 Introduction ................................................................................................................................... 274
8.3.2 Inputs and calculations ................................................................................................................... 275
8.3.3 Outputs and results presentation .................................................................................................... 278

xx
8.3.4 Sensitivity analysis ........................................................................................................................ 281
8.4 CASE STUDIES AND RESULTS .............................................................................................. 284
8.4.1 Introduction ................................................................................................................................... 284
8.4.2 Technical and economic analysis ................................................................................................... 286
8.4.3 Cost benefit analysis ...................................................................................................................... 292
8.5 SUMMARY AND CONCLUSIONS ........................................................................................... 298
8.6 REFERENCES ........................................................................................................................ 300
CHAPTER 9 ............................................................................................................................... 305
SUMMARY, CONCLUSIONS AND FUTURE WORK .................................................................... 305
9.1 SUMMARY AND CONCLUSIONS ........................................................................................... 305
9.2 FUTURE WORK ..................................................................................................................... 316
9.3 REFERENCES ........................................................................................................................ 319
[Page Intentionally Left Blank

xxi
List of Figures
Figure 1.1- Diagram showing the components of the proposed solution. ................................... 12
Figure 1.2- Schematic diagram of the research design framework. ............................................ 16
Figure 1.3- Schematic diagram of the thesis outline. .................................................................. 18
Figure 2.1- Road pavement energy harvesting technologies. ..................................................... 31
Figure 2.2- Railway EH and EG technologies. ........................................................................... 45
Figure 3.1- (a) Quarter car model and (b) bicycle car model (adapted from Jazar, 2008). ......... 74
Figure 3.2- (a) Quarter car model with a harvester surface on the pavement; and (b) bicycle car
model with a harvester surface on the pavement. ....................................................................... 75
Figure 3.3- (a) Perpendicular force distribution; and (b) longitudinal force distribution. .......... 76
Figure 3.4- Contact patch pressure and resultant distribution of forces. ..................................... 78
Figure 3.5- Speed reducer or EHD surface profiles. ................................................................... 82
Figure 3.6- GUI to select the inputs for the computational model. ............................................. 86
Figure 3.7- GUI to present the outputs for the computational model. ........................................ 88
Figure 3.8- Simulation software flowchart. ................................................................................ 91
Figure 3.9- Graphical user interface with the standard inputs. ................................................... 92
Figure 4.1- Typical SRE surface profiles. ................................................................................. 110
Figure 4.2- New SRE surface profiles for a one degree of freedom movable surface. ............. 113
Figure 4.3- SRE mechanical system. ........................................................................................ 115

xxii
Figure 4.4- Force diagrams for the downward motion of the surface. ...................................... 116
Figure 4.5- Force diagrams for the upward motion of the surface. ........................................... 117
Figure 4.6- SRE with two CTS mechanical systems connected to the surface. ........................ 117
Figure 4.7- Prototype design without sensors and instrumentation components. ..................... 129
Figure 4.8- (a) Prototype system fully assembled with sensors, trimetric view; (b) data logger
with instrumentation. ................................................................................................................ 130
Figure 4.9- Prototype installed in a road pavement. ................................................................. 131
Figure 4.10- Simulation results of the total energy harvested for VE1. ..................................... 135
Figure 4.11- Simulation results of the total energy harvested for VE2. ..................................... 135
Figure 4.12- Experimental results of the total energy harvested for VE1. ................................. 139
Figure 4.13- Experimental results of the total energy harvested for VE2. ................................. 139
Figure 5.1- Typical RAP system connected to an IW. .............................................................. 152
Figure 5.2- Forces distribution for the RAP system, (a) for the vehicle wheel - device surface
interaction; and (b) for the upward motion of the device surface without vehicle wheel
interaction.................................................................................................................................. 153
Figure 5.3- Lever system connected to an IW. ......................................................................... 154
Figure 5.4- Forces distribution for the lever system, (a) for the vehicle wheel - device surface
interaction; and (b) for the upward motion of the device surface without vehicle wheel
interaction.................................................................................................................................. 154
Figure 5.5- Crank to slider system connected to a RAP system and an IW. ............................. 157
xxiii
Figure 5.6- Forces distribution for the CTS system, (a) for the vehicle wheel - device surface
interaction; and (b) for the upward motion of the device surface without vehicle wheel
interaction.................................................................................................................................. 158
Figure 5.7- Purely DC electric circuit with a DC electric generator and a resistive load. ........ 161
Figure 5.8- GUI to select the inputs of the upgraded software tool. ......................................... 166
Figure 5.9- GUI to select the outputs of the upgraded software tool. ....................................... 169
Figure 5.10- Mechanical system using two CTS systems and one RAP system. ..................... 180
Figure 5.11- Prototype design without sensors and instrumentation components. ................... 181
Figure 5.12- Fully assembled prototype system with sensors. .................................................. 182
Figure 5.13- Simulation results for VE1. ................................................................................... 187
Figure 5.14- Simulation results for VE2. ................................................................................... 187
Figure 5.15- Experimental results for VE1. ............................................................................... 190
Figure 5.16- Experimental results for VE2. ............................................................................... 190
Figure 6.1- Hydraulic system with a DAC connected to a RAP mechanical system. ............... 202
Figure 6.2- Hydraulic system with a mechanical actuation, connected to a double cylinder and a
rack and pinion mechanical system. .......................................................................................... 207
Figure 7.1- Representation of a spring-loaded hydraulic accumulator. .................................... 226
Figure 7.2- Representation of a gas-loaded hydraulic accumulator. ......................................... 227
Figure 7.3- Representation of a RPEH device with a hydraulic transmission system, using a
MES unit based on a hydraulic accumulator, spring-loaded type. ............................................ 229
Figure 7.4- Representation of a RPEH device with a hydraulic transmission system, using a
MES unit based on a hydraulic accumulator, gas-loaded type. ................................................ 229

xxiv
Figure 7.5- Representation of a RPEH device with a mechanically actuated hydraulic
transmission system, using a MES unit based on a hydraulic accumulator, spring-loaded type.
................................................................................................................................................... 233
Figure 7.6- Representation of a RPEH device with a mechanically actuated hydraulic
transmission system, using a MES unit based on a hydraulic accumulator, gas-loaded type. .. 233
Figure 8.1- Schematic representation of RETEES. ................................................................... 275
Figure 8.2- RETEES GUI to select the inputs for the computational model. ........................... 276
Figure 8.3- RETEES flowcharts from Inputs GUI actions and buttons: (a) fill input data action;
(b) press "Default values" button; (c) press "Clear all" button; (d) press "Technical & Economic
Analysis" button; (e) press "Cost Benefit Analysis" button. ..................................................... 277
Figure 8.4- RETEES GUI to present the outputs for the TEA. ................................................. 279
Figure 8.5- RETEES graphical user interface to present the outputs for the cost benefit analysis.
................................................................................................................................................... 280
Figure 8.6- RETEES flowcharts from output GUI buttons: (a) press "Sensitivity Analysis"
button; (b) press "Print Sens Analysis Results" button; (c) press "Close" button; (d) press "Print
Graphics" button. ...................................................................................................................... 281
Figure 8.7- RETEES output GUI filled with TEA numerical and graphical results and with the
SA graphical results. ................................................................................................................. 282
Figure 8.8- RETEES output GUI filled with CBA numerical and graphical results and with the
SA graphical results. ................................................................................................................. 283
Figure 8.9- Sensitivity analysis results for the variation of the (a) AADT; (b) η; (c) PPM; (d)
YMP. .......................................................................................................................................... 289

xxv
Figure 8.10- SA results for the simultaneous variation of the AADT and η to determine the: (a)
LCOE and the (b) CF. ............................................................................................................... 291
Figure 8.11- SA results of a CBA for a GI application, for the variation of the (a) AADT; (b) η;
(c) PPM; (d) YMP; (e) GIEP. .................................................................................................... 294
Figure 8.12- Results of a multi-variable SA for a CBA to a RPEH system with a GI application,
for the (a) ROC; (b) NPV; (c) IRR. ............................................................................................ 296

xxvi

xxvii
List of Tables
Table 2.1- Patents related to electromechanical systems. ........................................................... 39
Table 2.2- Parameters for performing a technical analysis. ........................................................ 42
Table 2.3- Technical analysis of different road pavement energy harvesting technologies. ...... 43
Table 2.4- Technical analysis of different railway energy harvesting technologies. .................. 51
Table 3.1- Vehicle perpendicular force distribution on level and inclined pavements. .............. 72
Table 3.2- Vehicle longitudinal force distribution on level and inclined pavements. ................. 73
Table 3.3- Perpendicular and longitudinal wheel forces on an inclined surface. ........................ 77
Table 3.4- Speed reducer or EHD surface profile’s equations. ................................................... 83
Table 3.5- Fixed and initial values for the simulation variables. ................................................ 93
Table 3.6- Scenario 1 results. ...................................................................................................... 94
Table 3.7- Scenario 2 results. ...................................................................................................... 96
Table 3.8- Scenario 3 results. ...................................................................................................... 98
Table 4.1- Levels of acceptability of ride quality (ISO, 1997). ................................................ 119
Table 4.2- Fixed and initial values for the simulation variables. .............................................. 120
Table 4.3- Standard SRE simulation results. ............................................................................ 121
Table 4.4- New SRE with movable surface simulation results. ................................................ 124
Table 4.5- Speed reduction case study. ..................................................................................... 126
Table 4.6- Test scenarios for the system prototype. .................................................................. 131

xxviii
Table 4.7- Fixed and initial values for the simulation variables. .............................................. 132
Table 4.8- Simulation results of the new SRE with movable surface for VE1. ......................... 133
Table 4.9- Simulation results of the new SRE with movable surface for VE2. ......................... 134
Table 4.10- Prototype test results for VE1. ................................................................................ 137
Table 4.11- Prototype test results for VE2. ................................................................................ 138
Table 4.12- Difference between the simulations and experimental results for tested scenarios
using VE1. .................................................................................................................................. 141
Table 4.13- Difference between the simulations and experimental results for tested scenarios
using VE2. .................................................................................................................................. 142
Table 5.1- RAP system modelling. ........................................................................................... 155
Table 5.2- Lever system modelling. .......................................................................................... 156
Table 5.3- CTS system modelling using a RAP and an IW. ..................................................... 159
Table 5.4- Input data for the computational simulations of the three systems. ......................... 165
Table 5.5- Simulation results for the energy outputs of the RPEH device components using the
RAP mechanical system. ........................................................................................................... 172
Table 5.6- Simulation results for the efficiencies of the RPEH device components using the
RAP mechanical system. ........................................................................................................... 172
Table 5.7- Simulation results for the energy outputs of the RPEH device components using the
lever mechanical system. .......................................................................................................... 173
Table 5.8- Simulation results for the efficiencies of the RPEH device components using the
lever mechanical system. .......................................................................................................... 174

xxix
Table 5.9- Simulation results for the energy outputs of the RPEH device components using the
CTS mechanical system. ........................................................................................................... 175
Table 5.10- Simulation results for the efficiencies of the RPEH device components using the
CTS mechanical system. ........................................................................................................... 176
Table 5.11- Test scenarios for the system prototype. ................................................................ 183
Table 5.12- Fixed and initial values for the simulation variables. ............................................ 184
Table 5.13- Simulation results of the new RPEH system for VE1. ........................................... 185
Table 5.14- Simulation results of the new RPEH system for VE2. ........................................... 186
Table 5.15- Prototype test results for VE1. ................................................................................ 188
Table 5.16- Prototype test results for VE2. ................................................................................ 189
Table 5.17- Difference between the simulations and experimental results for tested scenarios
using VE1. .................................................................................................................................. 193
Table 5.18- Difference between the simulations and experimental results for tested scenarios
using VE2. .................................................................................................................................. 194
Table 6.1- Force diagrams for the RPEH DS, hydraulic circuit and DAC piston. .................... 203
Table 6.2- RPEH DS physical modelling. ................................................................................ 204
Table 6.3- RPEH hydraulic circuit with a DAC connected to a RAP system physical modelling.
................................................................................................................................................... 204
Table 6.4- Force diagrams for the RPEH DS, mechanical system, hydraulic circuit and DAC
piston. ........................................................................................................................................ 207
Table 6.5- RPEH DS and mechanical system physical modelling............................................ 208

xxx
Table 6.6- RPEH mechanically actuated hydraulic circuit with a DAC connected to a RAP
system physical modelling. ....................................................................................................... 209
Table 6.7- Input data for the computational simulations of the hydraulic systems. .................. 212
Table 6.8- Simulation results for the energy outputs of the RPEH device components using a
standard hydraulic system. ........................................................................................................ 213
Table 6.9- Simulation results for the efficiencies of the RPEH device components using a
standard hydraulic system. ........................................................................................................ 214
Table 6.10- Simulation results for the energy outputs of the RPEH device components using a
hydraulic system with mechanical actuation. ............................................................................ 215
Table 6.11- Simulation results for the efficiencies of the RPEH device components using a
hydraulic system with mechanical actuation. ............................................................................ 216
Table 7.1- Force diagrams for the RPEH DS, MES system and DAC piston........................... 230
Table 7.2- System modelling for the RPEH DS charging the MES device (spring loaded). .... 231
Table 7.3- System modelling for the MES device (spring loaded) releasing stored energy to the
hydraulic and mechanical system. ............................................................................................. 232
Table 7.4- Force diagrams for the RPEH DS, mechanical system, MES system and DAC piston.
................................................................................................................................................... 235
Table 7.5- System modelling for the RPEH hydraulic circuit with a mechanical actuation
charging the MES device (spring-loaded). ................................................................................ 236
Table 7.6- System modelling for the MES device (spring-loaded) releasing the stored energy for
the hydraulic and mechanical system. ....................................................................................... 237
Table 7.7- Input data for the computational simulations of the three systems. ......................... 240

xxxi
Table 7.8- Simulation results for the energy outputs of the RPEH device components using a
standard hydraulic system, without MES. ................................................................................. 241
Table 7.9- Simulation results for the efficiencies of the RPEH device components using a
standard hydraulic system, without MES. ................................................................................. 242
Table 7.10- Simulation results for the energy outputs of the RPEH device components using a
spring-loaded hydraulic accumulator connected to a standard hydraulic system. .................... 243
Table 7.11- Simulation results for the efficiencies of the RPEH device components using a
spring-loaded hydraulic accumulator connected to a standard hydraulic system. .................... 244
Table 7.12- Simulation results for the energy outputs of the RPEH device components using a
gas-loaded hydraulic accumulator connected to a standard hydraulic system. ......................... 245
Table 7.13- Simulation results for the efficiencies of the RPEH device components using a gas-
loaded hydraulic accumulator connected to a standard hydraulic system. ................................ 246
Table 7.14- Simulation results for the energy output of the RPEH device using a mechanically
actuated hydraulic system without MES. .................................................................................. 248
Table 7.15- Simulation results for the efficiencies of the RPEH device using a mechanically
actuated hydraulic system without MES. .................................................................................. 248
Table 7.16- Simulation results for the energy output s of the RPEH device components using a
spring-loaded hydraulic accumulator connected to a mechanically actuated hydraulic system.
................................................................................................................................................... 249
Table 7.17- Simulation results for the efficiencies of the RPEH device components using a
spring-loaded hydraulic accumulator connected to a mechanically actuated hydraulic system.
................................................................................................................................................... 250

xxxii
Table 7.18- Simulation results for the energy outputs of the RPEH device components using a
gas-loaded hydraulic accumulator connected to a mechanically actuated hydraulic system. ... 251
Table 7.19- Simulation results for the efficiencies of the RPEH device components using a gas-
loaded hydraulic accumulator connected to a mechanically actuated hydraulic system. .......... 252
Table 8.1- Average energy released by vehicle category in relation to the vehicle speed (EHW =
0.25 m). ..................................................................................................................................... 285
Table 8.2- Initial values for the simulation variables. ............................................................... 287
Table 8.3- Results for a TEA to a RPEH application. ............................................................... 288
Table 8.4- Results of a multi-variable SA for a TEA to a RPEH application. .......................... 290
Table 8.5- Simulation results for a CBA on a GI application. .................................................. 293
Table 8.6- Results of a multi-variable SA for a CBA to a RPEH system with a GI application.
................................................................................................................................................... 295
Table 8.7- Simulation results for a CBA on a SC application. ................................................. 298

xxxiii
List of Abbreviations
AC Alternating Current
ACV Accumulator Control Valve
ASC Asphalt Solar Collector
CBA Cost Benefit Analysis
CF Capacity Factor
CG Centre of Gravity
CO2 Carbon Dioxide
CPA Contact Patch Analysis
CTS Crank to Slider
CV Control Valve
DAC Double Acting Cylinder
DC Direct Current
EA Energy Application
EG Energy Generation
EH Energy Harvesting
EHD Energy Harvesting Device
EL Electric Load
EU European Union
FW Front Wheel
GI Grid Injection
GUI Graphical User Interface
ICT Information and Communications Technologies
IM Installation Method
INPI Instituto Português de Propriedade Industrial
IPEG Innowattech Piezo Electric Generator
IRR Internal Rate of Return
IT Information Technologies
IW Inertia Wheel
LCOE Levelized Cost of Electricity
MEMS Micro Electromechanical Systems
MES Mechanical Energy Storage
NPV Net Present Value
OECD Organization for Economic Co-operation and Development
PPW Price Per installed Watt

xxxiv
PRV Pressure Relief Valve
PV Photovoltaic
QW Quantum Well structured
RAP Rack and Pinion
RES Hydraulic Reservoir
RETEES Road Energy Technical and Economic Evaluation Software
RoadVISS Road Vehicle Interaction Simulation Software
ROC Return of Capital
RPEH Road Pavement Energy Harvesting
RPEH DS Road Pavement Energy Harvesting Device Surface
RW Rear Wheel
SA Sensitivity Analysis
SAC Single Acting Cylinder
SERSO Solar Energy Recuperation from the Road Pavement
SFA Single Force Analysis
SP Surface Profile
SRE Speed Reducer Equipment
SC Self Consumption
TEA Technical and Economic Analysis
TEG Thermoelectric Generator
TNO Toegepast Natuurwetenschappelijk Onderzoek
TRL Technology Readiness Level
TUB Hydraulic Tube
UK United Kingdom
USA United States of America
VRI Vehicle-Road Interaction
WHO World Health Organization

xxxv
List of Notations
a Vehicle acceleration (m/s2)
a1 Vehicle geometry - A1 (CG-FW) (m)
a2 Vehicle geometry - A2 (CG-RW) (m)
A Area (m2)
Acp Area of the DAC piston (m2)
Ah Area of the contact point between the RPEH DS and the TUB (m2)
Aha Pavement or harvester surface area (m2)
Arod Area of the DAC rod (m2)
Asp Area of the SAC piston (m2)
Asto Area of the MES hydraulic accumulator (m2)
Atub Area of the hydraulic circuit tube (m2)
AADT Annual average daily traffic (vehicles/day)
AEG Annual energy generated (kWh)
ATE Annual traffic evolution (%)
b Friction coefficient
bcb Mechanical system clutch bearing friction coefficient
bgen Electrical generator friction coefficient
cp_a Contact patch half length (m)
Cd Hydraulic valves discharge coefficient
Cs Vehicle suspension damping (Ns/m)
Cu Vehicle unsprung mass damping (Ns/m)
CAPEX Initial capital invested (€)
CCF CO2 conversion factor (kWh to g CO2)
CF Capacity factor (%)
CFLO Cash-flow (€)
CFLOU Updated Cash-flow (€)
COY CO2 avoided per year (ton)
COP Total CO2 avoided - period (ton)
CPA Contact patch area (m2)
CVT CO2 value per ton (€/ton)
dtub Hydraulic tube inner diameter (m)
d1 Distance from the lever axes to the force actuation point (m)
d2 Distance from the lever axes to the rack / lever total length (m)
DTcat Daily traffic by vehicle category (vehicles/day)

xxxvi
DTEG Daily energy generated (kWh)
E Energy (J)
Ea Electric generator armature induced voltage (V)
EDe Energy delivered by the mechanical system (J)
EGe Energy generated by the electric system (J)
EHa Energy harvested (J)
ELo Energy consumed by the electric load (J)
Esto Energy stored by the mechanical system (J)
ESu Energy absorbed by the road pavement/EHD surface material (J)
ETr Energy transmitted by the mechanical system (J)
Ev Energy released from the vehicle (J)
E' Elasticity modulus (Pa)
EEP Extra equipment cost (€)
EGcat Total energy generated by each vehicle category (kWh)
EGVcat Average energy generated by vehicle category (cat), per module (J)
EHW RPEH device’ surface width (m)
ERVcat Average energy released by vehicle category (J)
ET Electric torque (N.m)
F Force (N)
Fa Acceleration force (N)
Fd Drag force (N)
Fhl Force related to the hydraulic circuit losses (N)
Fk Mechanical system spring force (N)
Fl Lift force (N)
Flos Force losses due to friction (N)
Fsto MES piston force (N)
FSMj Force transmitted by the mechanical system element j (N)
FSMjs Opposition force from the mechanical system element j (N)
FSHj Force transmitted by the hydraulic system element j (N)
FSHjs Opposition force from the hydraulic system element j (N)
Fx Vehicle wheel longitudinal force (N)
Fx.f Vehicle front wheel longitudinal force (N)
Fx.r Vehicle rear wheel longitudinal force (N)
Fz Vehicle wheel perpendicular force (N)
Fz.f Vehicle front wheel perpendicular force (N)
Fz.r Vehicle rear wheel perpendicular force (N)
g Gravitational acceleration (m/s2)
GIAEP GI - Annual energy price (€/kWh)
GIAI GI - Annual income (€)
GIEP GI - Energy price - initial (€/kWh)

xxxvii
GIPI GI - Total income - period (€)
GIYE GI - Annual price evolution (%)
h Height (m)
hCG Height of the vehicle’ centre of gravity (m)
hcr Mechanical system crank height between axes (m)
hcr-in Initial crank height between axes (m)
hmax Surface maximum height (m)
ht Device surface height, related to its base (m)
i Iteration
Ia Electric generator armature current (A)
ILo Electric circuit load current (A)
Iy Vehicle inertia moment (kg.m2)
ICPM Installation cost per RPEH unit (€)
INF Annual price inflation (%)
IPM Installed power per module (W)
Jgen Moment of inertia of the electric generator (kg.m2)
Jiw Moment of inertia of the inertia wheel (kg.m2)
Jl Moment of inertia of the mechanical system lever (kg.m2)
Jp Moment of inertia of the mechanical system pinion (kg.m2)
Jra Moment of inertia of the mechanical system rack (kg.m2)
Jsh Moment of inertia of the mechanical system shaft (kg.m2)
ka Electric generator constant
Kh EH device (spring) stiffness (N/m)
Ks Vehicle suspension stiffness (N/m)
Ksto Spring-loaded hydraulic accumulator stiffness (N/m)
Kt Vehicle tire stiffness (N/m)
Ku Vehicle unsprung mass stiffness (N/m)
KH Loss coefficient for hydraulic elements
l Length (m)
lcr Crank length (m)
ltub Hydraulic circuit tube length (m)
lv Vehicle length (m)
l0 Pavement or harvest surface thickness (m)
La Electric generator armature inductance (H)
Lmax EH device surface’ maximum length (m)
LAT Lane annual traffic - average (vehicles)
LCOE Levelized cost of electricity (€/kWh)
LDT Lane daily traffic - average (vehicles)
LMT Lane monthly traffic - average (vehicles)
mcp DAC piston mass (kg)

xxxviii
mh RPEH DS mass (kg)
miw Mechanical system inertia wheel mass (kg)
ms Vehicle sprung mass (kg)
mSP Mechanical system piston mass (kg)
msto MES piston mass (kg)
mu Vehicle unsprung mass (kg)
mv Vehicle mass (kg)
NL Number of road lanes
NMI Number of installed RPEH units
NMP Number of RPEH devices installed meters
NPV Net present value (€)
OCI Other costs involved (€)
OPEX Annual operational costs (€)
patm Atmospheric pressure (Pa)
Pgas MES gas pressure (Pa)
psto MES hydraulic fluid pressure (Pa)
PGe Power produced by the electric generator (W)
PLo Power consumed by the electric load (W)
PPM Price per RPEH module (€)
PPW Price per installed Watt (€/W)
q(x) Pressure distribution on the contact patch (N/m2)
q0 Tire maximum normal pressure (N/m2)
rp Mechanical system pinion radius (m)
r1 Mechanical system gear 1 radius (m)
r2 Mechanical system gear 2 radius (m)
Ra Electric generator armature resistance (Ω)
RLo Electric circuit load resistance (Ω)
Rx Tire rolling resistance (N)
Rx.f FW tire rolling resistance (N)
Rx.r RW tire rolling resistance (N)
ROC Return of capital | payback (years)
SCAH SC - Daily average consumption hours (h/day)
SCAS SC - Annual savings (€)
SCECP SC - Total energy costs - period (€)
SCEI SC - Energy price annual inflation (%)
SCEP SC - Energy price - initial (€/kWh)
SCEPY SC - Annual energy price (€/kWh)
SCIP SC - Installed power (W)
SCPC SC - Generated energy contribution (%)
SCPCE SC - Total consumed energy - period (kWh)

xxxix
SCYCE SC - Annual consumed energy (kWh)
t Time (s)
TSM Mechanical system torque (N.m)
TAS Traffic average speed (km/h)
TDcat Traffic distribution by vehicle category (%)
TEGe Total energy generated - period (kWh)
TIP Total installed power (W)
TINV Total investment - period (€)
Ua Electric voltage generated (V)
ULo Electric circuit load voltage (V)
v Vehicle speed (m/s)
vini Vehicle initial speed (km/h)
vred Vehicle speed reduction (km/h)
Vgas MES gas volume (m3)
Vsto MES hydraulic fluid volume (m3)
VCP Total avoided CO2 valuation - period (€)
VCY Avoided CO2 valuation per year (€)
x Vehicle body vertical displacement (m) / motion coordinate
xCP Contact patch position (m)
xcp DAC piston displacement (m) / motion coordinate
xcr Mechanical system crank axes horizontal distance (m)
xh EH device’ surface vertical displacement (m) / motion coordinate
xh-max Maximum displacement of the RPEH DS (m)
xhf Hydraulic fluid displacement (m) / motion coordinate
xK Mechanical system spring displacement (m) / motion coordinate
xl1 Mechanical system lever displacement (m) / motion coordinate (in d1)
xl2 Mechanical system lever displacement (m) / motion coordinate (in d2)
xra Mechanical system rack displacement (m) / motion coordinate
xs Vehicle sprung mass vertical displacement (m) / motion coordinate
xsp Mechanical system / SAC piston displacement (m) / motion coordinate
xsp-in Initial position of the mechanical system piston / SAC piston (m)
xsto MES piston displacement (m) / motion coordinate
xu Vehicle unsprung mass vertical displacement (m) / motion coordinate
x1 Front wheel vertical displacement (m) / motion coordinate
x2 Rear wheel vertical displacement (m) / motion coordinate
y1 Road excitation at the front wheel (m)
y2 Road excitation at the rear wheel (m)
YMP Yearly maintenance cost per unit (€)
YRS Number of years (years)
ΔCPA Variation of the contact patch area (m2)

xl
Δl Material deflection (m)
Δp Hydraulic pressure variation / drop (Pa)
Δt Time variation for each iteration (s)
ΔT Thermal gradient of the road pavement (ºC)
ΔVsto Variation of the MES hydraulic fluid volume (m3)
Δxi Position variation for the variable i (m)
θ Vehicle body pitch angle (rad) / motion coordinate
θcr Mechanical system crank angle (rad) / angular motion coordinate
θcr-in Initial angle of the mechanical system crank (rad)
θiw Mechanical system IW angle (rad) / angular motion coordinate
θl Mechanical system lever angle (rad) / angular motion coordinate
θp Mechanical system pinion angle (rad) / angular motion coordinate
θra Mechanical system lever’ rack angle (rad) / angular motion coordinate
φ Road pavement / EH device surface angle (longitudinal direction) (rad)
η Energy conversion efficiency (%)
ηCo Energy conversion efficiency from the EGe to the ELo (%)
ηDe Energy conversion efficiency from the ETr to the EDe (%)
ηEle Energy conversion efficiency from the EDe to the ELo (%)
ηGe Energy conversion efficiency from the EDe to the EGe (%)
ηHa Energy conversion efficiency from the Ev to the EHa (%)
ηMec Energy conversion efficiency from the EHa to the EDe (%)
ηRPEH Energy conversion efficiency from the EHa to the ELo (%)
ηsto Energy conversion efficiency from the ETr to the Esto (%)
ηTot Energy conversion efficiency from the Ev to the ELo (%)
ηTr Energy conversion efficiency from the EHa to the ETr (%)
μ Kinematic viscosity (St)
ρ Hydraulic fluid density (kg/m3)

xli
Abstract
The increasing movement of human beings from rural areas to the city, known as
urbanization, the lifestyle changes and the increase in use of new technologies have led
to an exponential increase in the consumption of the planet’s resources in recent years.
Demand for energy and in particular electric energy has increased immensely. Change
is urgently required to the current paradigm, in which energy is produced in large power
plants outside cities, consuming non-renewable resources and inducing energy loss from
production to final consumption. Energy production must use renewable resources, be
decentralized, be done near to where the energy is consumed and, preferably, when
needed.
Within renewable energies, the concept of energy harvesting on a micro scale has
recently been adopted, where, from small energy variations, it is possible to generate
electrical energy. The road surface is continuously exposed to vehicle loads from which
it is possible to extract energy, which, using specific technologies, may be transformed
into electrical energy.
This thesis starts by evaluating the existing solutions in the road pavement energy
harvesting (RPEH) field, allowing us to draw conclusions regarding the efficiency of
each system, its working principle, its stage of development and method of installation.
Then, a new methodology is defined to develop a new RPEH system, in which an
energetic analysis is conducted, quantifying the energy delivered from a vehicle's
wheels to the surface of the device, the energy transmitted by the mechanical system
and delivered to an electromechanical converter, the electrical energy generated and
consumed. This methodology will allow us to understand and quantify the efficiency of
each component and optimize it, allowing us to achieve a maximum energy conversion
efficiency for the proposed and evaluated systems.

Abstract
xlii
Based on this methodology, a software tool is developed, to simulate and study vehicle–
road interaction (VRI) to quantify the forces induced and energy released from vehicles
to the road pavement, in different vehicle motion scenarios, and the energy absorbed by
the road surface, speed reducers or a specific RPEH device. The software tool also
enables users to quantify the energy efficiency of the process. The developed software
tool was called RoadVISS and it allows us to study VRI with greater precision than
existing tools, especially when energetic analyses are performed and when speed
reduction or RPEH devices are applied on the pavement.
Based on this tool, a study on speed reducer equipment optimization was performed,
and a new solution to promote more effective speed reduction without any driver action
was proposed. Through computational simulations it was concluded that the proposed
solution is able to extract 81.0% more energy than standard speed reducers, with 87.0%
less impact on the vehicle body for similar scenarios. A prototype was developed and
tested, which allowed us to validate most of the computational simulation results. This
solution has a great potential to contribute to road safety, as it is more effective than
existing solutions.
After this, new solutions to convert the vehicle's mechanical energy into electrical
energy were developed, one based on an electromechanical system, another based on a
hydraulic system with mechanical actuation without mechanical energy storage, and
another, similar to the previous one, using mechanical energy storage. All systems were
developed using the defined methodology. The physical models of each system were
defined and incorporated in the RoadVISS software tool, allowing us to develop a new
software tool directed at the development of RPEH devices. Through computational
simulations it was proved that all systems are more efficient than all existing solutions
studied in the state-of-the-art. The electromechanical device was also subjected to an
experimental validation and, for specific scenarios, it proved to have a conversion
efficiency of 60.5%, a higher value than current state-of-the-art, making it the most
efficient system validated through experimental tests. This system should be optimized
so that full validations are achieved for other test scenarios. The hydraulic systems

Abstract
xliii
should also be subjected to experimental validations to compare experimental data with
the computational simulation results.
Finally, evaluation models were developed to perform the technical and economical
analysis of RPEH systems, as well as performing a cost benefit analysis for the
application of this type of energy generation solution as an energy source for different
applications. The models also allow a sensitivity analysis to be performed, meaning
each parameter value is optimized to determine the best conditions for achieving
economic viability. Some case studies are presented and conclusions are drawn about
the required conditions for these systems to be economically viable.


xlv
Keywords
Road Pavement
Energy Harvesting
Road Safety
Vehicle-Road Interaction
System Modelling
Experimental Validation
Cost-Benefit Analysis


xlvii
Resumo
A crescente mobilização do ser humano para as cidades, as mudanças no estilo de vida e
a crescente adoção de novas tecnologias, levaram a um aumento exponencial do
consumo de recursos do planeta nos últimos anos, sendo a energia um dos recursos em
que o consumo aumentou muito significativamente, com ênfase especial na energia
elétrica. Nesta área, urge mudar o paradigma atual em que a produção é feita em
grandes centrais, fora das cidades, consumindo recursos não renováveis e induzindo
perdas de energia desde a produção até ao local de consumo final. A produção de
energia elétrica deverá ser feita a partir de recursos renováveis, de forma
descentralizada, próximo dos locais onde esta energia é consumida e, preferencialmente,
no momento em que é necessário consumir essa energia.
Na área das energias renováveis foi adotado recentemente o conceito de energy
harvesting, vulgarmente traduzido para "colheita de energia", sendo novidade quando
aplicado a uma escala "micro" em que, a partir de pequenas variações de energia é
possível gerar energia elétrica. A superfície do pavimento rodoviário está
continuamente exposta às cargas de veículos que se deslocam sobre a mesma, a partir
das quais é possível captar energia que, através da utilização de tecnologias específicas,
pode ser transformada em energia elétrica.
Esta tese começa pela avaliação das soluções existentes na área da "colheita de energia"
em pavimentos rodoviários (RPEH), permitindo tirar conclusões acerca da eficiência de
cada sistema, do seu princípio de funcionamento, estado de desenvolvimento e do
método de instalação no pavimento rodoviário.
É de seguida definida uma metodologia para desenvolver um novo sistema de RPEH, na
qual é realizada uma análise energética, quantificando a energia entregue pelas rodas do
veículo para a superfície do equipamento de RPEH, a energia transmitida pelo sistema
mecânico e entregue a um conversor eletromecânico, a energia elétrica gerada e também

Resumo
xlviii
consumida. Esta metodologia irá permitir compreender e quantificar a eficiência de cada
componente e otimizá-lo, permitindo assim alcançar a máxima eficiência de conversão
de energia possível para cada sistema proposto e avaliado.
Com base nesta metodologia foi desenvolvido um software para simular e estudar a
interação veículo-pavimento (VRI), de modo a quantificar as forças induzidas e a
energia libertada de um veículo para o pavimento rodoviário para diferentes cenários de
movimento do veículo, e ainda a energia absorvida pela superfície do pavimento, ou por
equipamentos redutores de velocidade ou equipamentos de RPEH. Esta ferramenta
permite também aos seus utilizadores quantificar a eficiência energética deste processo.
Este software, denominado RoadVISS, permite estudar a VRI com uma precisão
superior às ferramentas existentes, especialmente quando são realizadas análises
energéticas e quando o estudo é relativo a equipamentos de redução de velocidade ou de
RPEH.
Utilizando este software, foi realizado um estudo para otimização de equipamentos
redutores de velocidade, sendo proposta uma nova solução para promover uma redução
de velocidade mais eficaz, sem qualquer ação dos condutores de veículos. Através das
simulações computacionais realizadas concluiu-se que a solução proposta é capaz de
extrair 81,0% mais energia dos veículos em relação aos sistemas redutores de
velocidade normalmente utilizados, com um impacto 87,0% menor no chassi do
veículo, em cenários semelhantes. Foi desenvolvido e testado um protótipo da solução
proposta, que nos permitiu validar a maioria dos resultados obtidos a partir das
simulações computacionais. Esta solução apresenta um grande potencial para contribuir
para a promoção da segurança rodoviária, sendo mais eficaz do que as soluções
existentes.
De seguida foram desenvolvidas novas soluções para converter a energia mecânica de
veículos em energia elétrica, a primeira baseada num sistema eletromecânico, a segunda
baseada num sistema hidráulico com atuação mecânica, sem armazenamento de energia
mecânica, e a terceira semelhante à segunda, mas utilizando um acumulador de energia
mecânica. Os modelos físicos de cada sistema foram definidos e incorporados no
software RoadVISS, o que nos permitiu desenvolver uma nova ferramenta direcionada

Resumo
xlix
para o desenvolvimento de equipamentos de RPEH. Através das simulações
computacionais realizadas foi possível verificar que todos os sistemas propostos são
mais eficientes que as várias soluções existentes, previamente estudadas no estado-da-
arte. O equipamento eletromecânico foi submetido a uma validação experimental e, em
cenários específicos, provou ter uma eficiência de conversão de 60,5%, um valor
superior ao atual estado-da-arte, passando assim a ser o sistema mais eficiente validado
através de testes experimentais na literatura. Este sistema deve ainda ser otimizado, de
modo que se alcance uma validação completa para todos os cenários de teste. Os
sistemas hidráulicos propostos e estudados devem também ser submetidos a validações
experimentais de forma a comparar os dados experimentais com os resultados obtidos a
partir das simulações computacionais.
Finalmente, foram desenvolvidos modelos de avaliação para realizar a análise técnica e
económica dos equipamentos de RPEH, bem como para realizar análises de custo-
benefício para a aplicação deste tipo de solução de geração de energia como fonte
energética para diferentes aplicações. Os modelos propostos permitem também a
realização de análises de sensibilidade, permitindo assim otimizar o valor de cada
parâmetro de modo a definir as condições ótimas para que um sistema de RPEH tenha
viabilidade económica. Alguns estudos de caso são apresentados, permitindo tirar
conclusões acerca das condições necessárias para que estes sistemas sejam
economicamente viáveis.


li
Palavras-chave
Pavimento Rodoviário
Energy Harvesting
Segurança Rodoviária
Interação Veículo-Pavimento
Modelação de Sistemas
Validação Experimental
Análise Custo-Benefício


"Action without vision is only passing time,
vision without action is merely day dreaming,
but vision with action can change the world"
Nelson Mandela


PAVEMENT ENERGY HARVESTING
SYSTEM TO CONVERT VEHICLES
KINETIC ENERGY INTO
ELECTRICITY

[Page Intentionally Left Blank]

1
Chapter 1
Introduction
1.1 Global problem
The increasing movement of human beings from rural areas to the city has led to an
exponential increase in the consumption of the planet’s resources in recent years.
Energy, and in particular electrical energy, is one of the resources for which there has
been great increase in demand (IEA, 2016a). Currently, and for the first time in history,
approximately 54% of the world’s population lives in cities (Buhaug and Urdal, 2013;
WHO, 2016; UN, 2016) and, by 2050, this number will increase by more than 3 billion
people, reaching almost 70% (WHO, 2016; UN, 2016) and leading to global
urbanization, which will lead to further increases in energy consumption, especially in
cities.
Making cities “smart” is emerging as a strategy to mitigate the problems generated by
the urban population growth and fast urbanization. There are various different
definitions of the smart city concept in the literature, which can be summarised as
follows:
A city performing well in a forward-looking way in terms of its economy,
people, governance, mobility, environment and living, built on the smart

Chapter 1 Introduction
2
combination of endowments and activities of decisive, independent and aware
citizens (Giffinger et al., 2007);
A city that monitors and integrates conditions of all of its critical infrastructures,
including roads, bridges, tunnels, railways, subways, airports, seaports,
communications, water, power, even major buildings, can better optimize its
resources, plan its preventive maintenance activities, and monitor security while
maximizing services to its citizens (Hall, 2000);
A city “connecting the physical infrastructure, the IT infrastructure, the social
infrastructure, and the business infrastructure to leverage the collective
intelligence of the city” (Harrison et al., 2010);
A city “combining ICT and Web 2.0 technology with other organizational,
design and planning efforts to dematerialize and speed up bureaucratic processes
and help to identify new, innovative solutions for complex city management, in
order to improve sustainability and liveability.” (Toppeta, 2010);
“The use of Smart Computing technologies to make the critical infrastructure
components and services of a city – which include city administration,
education, healthcare, public safety, real estate, transportation, and utilities –
more intelligent, interconnected and efficient” (Whashburn et al., 2010).
For all the "smart cities" concepts presented an increase in the use of electrical
equipment is implicit, which, if any optimization is performed, will lead to an increase
in the consumption of electrical energy, justifying the need for new and more efficient
renewable energy sources that are able to generate electrical energy near the place of
consumption, i.e., inside cities.
Also, mobility increasingly uses electrical energy, and it is expected that this could be
the main source of energy by 2050 (Arthur D. Little, 2014). In 2015 the market share of
electric vehicles was only 0.1% on a global level, when compared with the total number
of passenger cars on the road worldwide, but this is expected to reach 1.7% by 2020,

Chapter 1 Introduction
3
showing the fast adoption of these vehicles (IEA, 2016b). This transition implies an
increase in the demand of electrical energy, especially in the urban environments where
mobility is greater, leading to the need to increase the levels of electrical energy
production. If production continues to be from fossil fuels, electric mobility will not be
sustainable. To change the paradigm and have a really sustainable concept of mobility
with the use of electric vehicles, electrical energy production must be done using
renewable energy sources (Garcia-Valle and Lopes, 2012).
With the present energetic paradigm, most electrical energy production uses fossil fuel
combustion, which makes economies dependent on fuel costs. This is also leading to
irreversible environmental damage, with growing levels of CO2 emissions. According to
International Energy Agency (IEA, 2016a), in 2014, globally, more than 80% of energy
production came from fossil fuels. Urgent action is required to change the paradigm of
electrical energy generation as, presently, energy is mostly produced outside cities,
consuming non-renewable resources and inducing energy losses between the point of
production and the point of consumption. Energy production must be based on
renewable resources, decentralized, happen near to the point of consumption and,
preferably, when it is needed.
However, renewable energy sources are not fully effective, as they do not allow
electrical energy to be produced when it is needed, but only when the resources are
available. These energy sources do not allow electrical energy to be produced where
this is needed either, but only where the resources are available and the installation of
the technologies is feasible and viable. New ways of generating electric energy are
needed, especially to generate energy when and where consumption is required.
In the area of renewable energies, besides the major energy sources (hydro, solar, wind,
waves), energy harvesting has recently been adopted in a micro-scale concept, where it
is possible to generate electrical energy from small energy variations, such as thermal
gradients, pressure, vibrations, radiofrequency or electromagnetic radiation, among
others (Khaligh and Onar, 2010). Road surfaces are continuously exposed to two
phenomena: solar radiation and vehicle loads. From both of these it is possible to extract

Chapter 1 Introduction
4
energy, which, using specific technologies, can be transformed into electrical energy
(Andriopoulou, 2012).
Within cities, there are roads that carry vehicles, the main option for mobility. Vehicles
consume energy to work their engines and release energy in different ways, by way of
different components. Part of the energy released by vehicles goes into the road
pavement. 15% to 21% of the energy is transferred to the vehicle’s wheels (IEA, 2012;
Hendrowati et al., 2012). As vehicles abound in all cities in developed countries, this
means that a considerable amount of energy is transferred to road pavements without
ever being used. Roads are also exposed to solar radiation, which induces thermal
gradients between its layers. This solar radiation and the resulting thermal gradients can
also be transformed into useful energy. So, road pavements represent a considerable
source of energy ready to be harvested and converted into useful forms of energy, such
as electrical energy, at the same time reducing the need to "import" energy from distant
places.
Considering this, infrastructure managers such as municipalities and motorway
operators have on their own road pavements a possible source of energy for harvesting
and conversion into useful energy such as electrical energy, allowing the need to
"import" energy from distant places to be reduced. Also, by harvesting typically wasted
energy and converting it into electrical energy, it allows energy to be produced without
polluting the environment, reducing the CO2 emissions associated to the energy
produced by fossil fuel combustion. In order to turn this into a viable process, the
infrastructure managers need a technology (or set of technologies) that allows this
conversion process to work in an efficient and cost effective way.
1.2 Research Problem and Opportunity for Investigation
With the growing energy demand in cities and knowing that road pavements are
permanently exposed to great amounts of energy, there is an opportunity to investigate

Chapter 1 Introduction
5
and develop a technology that allows a significant part of that wasted energy to be
converted into electrical energy.
Energy is transferred to the road pavement mainly in two different ways. The first is by
the pressure induced by the vehicles loads and the second is by the solar radiation that
reaches the road pavement surface. In recent years, some research has been done in this
area in order to develop technologies that can harvest this energy and transform it into a
useful energy, such as electrical energy. However, none of the developed systems have
presented a level of conversion efficiency or a technical-economic ratio to make the
solution cost-effective.
The research problem consists of the need for a technology to convert a typically wasted
energy delivered to the road pavements into electrical energy, with high conversion and
storage efficiencies, and in a cost-effective way, contributing to the supply of the
electrical network, mainly inside cities, as well as supplying specific electric
applications without the need to be connected to the electric grid system.
However, the traditional practice of developing energy harvesting devices based only on
the system itself without considering the road and traffic conditions has led to
unsuccessful projects. It is therefore clear that the development of a road pavement
energy harvesting (RPEH) device should be started by studying the vehicle-road
interaction (VRI) with a detailed analysis of forces, kinematics, dynamics and, finally,
an energetic analysis, so that the RPEH device can be modelled with complete
understanding of the loads and the energy delivered by each vehicle type and the motion
conditions. This study should include the complete VRI models and also the
development of a software tool, where the user can define the vehicle and the RPEH
device parameters and, based on it, perform computational simulations to understand
the impact of each variable in the end result. Then, different elements and systems can
be modelled as part of the RPEH device and added to the software tool, so that their
performance can be evaluated and the most efficient solution can be identified. After
this, an experimental validation should be performed, so that experimental results can
be compared with the computational simulations and conclusions can be drawn. Finally,

Chapter 1 Introduction
6
a complete Technical and Economic Analysis (TEA) should be performed, with the
definition of the complete models for such analysis and their integration in a software
tool which would allow detailed studies to be performed on each variable influence in
the viability of RPEH devices.
Therefore, to enable such a holistic approach, different techniques need to be used and
properly combined to enable the appropriate development of an efficient and cost-
effective RPEH device.
1.3 Motivation
Considering all the aforementioned facts, there is an awareness that to meet the
sustainability challenges of the near future, new efficient and cost-effective energy
generation technologies are needed and the development of a technology that makes use
of energy released by vehicle into road pavements, converting this typically wasted
energy into electrical energy, could play a very important role in the sustainability of
our cities, by reducing the need to import energy from the outside.
Previous to this doctoral research, a technology to convert the kinetic energy from the
movement of people into electrical energy was developed by a Portuguese start-up,
where the author was one of the promoters. This technology was called Waynergy®
People and its working principle was based on an electromechanical system that was
patented (Duarte and Casimiro, 2011) and experimentally validated (Duarte et al., 2013)
using a pre-industrial prototype. The system has achieved a conversion efficiency of
almost 60%, a higher value than all the existing pavement energy harvesting devices,
creating an expectation for a high potential technology.
It was identified that the energy generation depends greatly on the load applied over the
system surface and, since vehicles deliver a much higher load to the pavement than
people, the system was adapted to convert the kinetic energy released from vehicles to
the pavement into electrical energy (Duarte and Casimiro, 2013) and the system was

Chapter 1 Introduction
7
experimentally validated using a prototype (Duarte et al., 2014). This system was
named Waynergy®
Vehicles. Although the results were satisfactory, the need for further
research was identified, as the system did not support the vehicle loads properly, it was
extremely complex to install in the pavement infrastructure and the production cost was
too high.
Considering the technology previously developed for Waynergy®
People with a
conversion efficiency of almost 60% and the knowledge acquired in the development
and experimental validation of Waynergy®
Vehicles, I am led to believe that using the
scientific method in the development of a new RPEH system, using similar energy
conversion principles but with a redesigned system, integrated with the road pavement
engineering and traffic engineering rules, it is possible to achieve the goal of finding an
efficient and cost-effective solution to produce electrical energy in the road pavement,
which can make an impact on the sustainability challenges facing cities.
1.4 Research Objectives
Recently, some investigation has been done on road pavement energy harvesting,
mostly focused on the pavement’s thermal gradients and the vehicle load induced on the
pavement surface. This research has been performed both by academia and industry.
Despite the various attempts to develop a new set of products in this field, none of the
research projects has originated a successful product. The main reasons for the failure
are related to the low energy conversion efficiency of the technologies and also to the
difficulty integrating the systems in the road pavement infrastructure. The product’s
cost of production is also a challenge, but this should only be considered after the first
two challenges are solved.
Therefore, the main objective of this research work is the development of a new system
to convert the energy released by vehicles to the road pavement into electrical energy
with a higher conversion efficiency than the current state-of-the-art. As well as the
Chapter 1 Introduction
8
conversion efficiency, the system should be designed so that a simple method of
installing it in the road pavement infrastructure could be developed.
As the goal is to develop a new technology to implement in a place where there are not
any products or enough experiments conducted worldwide, there is a need to perform
several studies, developments and experiments during the development of this research
project. So, the fulfilment of the main objective of this research requires the following
research tasks to be conducted, which correspond to individual objectives:
1. To evaluate the state-of-the-art relating to infrastructure energy harvesting, both
related to the road pavement and railway tracks, so that each technology can be
identified in terms of conversion efficiency, energy generation potential, current
development stage and installation method. With this analysis, the best practices
can be defined and detailed guidelines for the development of the research can be
defined as well;
2. To develop a software tool to quantify the forces delivered from each vehicle tyre
to the pavement or to a RPEH device’s surface, as well as the energy released
from the vehicle to the road pavement or to the device, considering different
vehicle weights and speeds, as well as different vehicle parameters, and
depending on the pavement shape, slope and material properties and other
technical features of the RPEH device. Such a tool is fundamental for the
development of the project and to perform computational simulations during the
development of the RPEH device, as this will allow us to quantify the forces and
energy inputs of the system;
3. To evaluate the impact of the RPEH device in the vehicle body in terms of ride
comfort, so that this is not affected or, at least, it is minimized, which would allow
RPEH devices to be applied in a wide range of places. Combining this evaluation
with the energy harvested from vehicles and the vehicle speed reduction, the
impact of RPEH devices on road safety can also be studied, as they work as a
speed reducer. For this, an energy harvesting system can be modelled and

Chapter 1 Introduction
9
integrated in the software tool so that computational simulations can be performed
and evaluated;
4. To model existing RPEH device systems and incorporate the models in the
software tool, so that computational simulations can be performed and the
behaviour of existing systems can be evaluated;
5. To develop and model new systems for RPEH and incorporate them in the
software tool, so that computational simulations can be performed and the
performance of the new systems can be evaluated and compared to the
performance of existing systems;
6. To evaluate the inclusion of a mechanical energy storage unit in the developed
RPEH systems, model the proposed solutions and determine their impact on the
efficiency of the systems;
7. To perform an experimental validation of the developed solutions using a
prototype developed for this purpose, so that data can be collected and compared
with the computational simulation results, allowing us to make conclusions about
the precision of the models. At this stage, the installation method of the prototype
in the pavement should be addressed, so that the process can be simple;
8. To develop a complete model and a software tool to perform a TEA of RPEH
devices, as well as Cost-Benefit Analysis (CBA), considering different variables as
inputs and presenting the outputs numerically and graphically. This tool should
also allow a Sensitivity Analysis (SA) to be performed to evaluate the impact of
one or multiple variables in the technical and economic performance of the
system, so that the most critical variables can be identified.
To sum up, this thesis provides a scientifically-based development of a RPEH system
that, without affecting ride comfort, is able to efficiently convert the energy released
from vehicles to the device’s surface into electrical energy, with the option of also being
able to store the harvested energy. Guidelines to develop a viable product should be

Chapter 1 Introduction
10
defined through a CBA. Beside the system and models development, at the end of the
research project it is expected that two software tools will be finished that can support
other research projects to evaluate and develop RPEH devices, both technically and
economically.
1.5 Research Methodology
The research will start with an extensive literature review and state-of-the-art analysis
related to energy harvesting technologies, with special emphasis on one which can be
applied in transportation infrastructures such as road pavements and railways and that
are able to convert the vehicle released energy into electrical energy. This will allow us
to identify the positive aspects of each solution and also the main failures and
disadvantages of the existing technologies.
Prior to the development of the energy harvesting unit, a study of the VRI will be
performed, including the main vehicle dynamics models and the road pavement
parameters, so that this interaction can be properly evaluated depending on the vehicle
characteristics and actions (acceleration, braking, free rolling) and considering the road
pavement characteristics (materials, slope, shape, among others), in order to quantify
the energy released from vehicles to the road pavement precisely, the energy absorbed
by the road pavement material and the energy delivered to the conversion system. None
of the existing research projects within the field of RPEH have presented a complete
model for the energy released from vehicles with vehicle and road pavement
characteristics as inputs of the RPEH system. This research aims to develop and
validate such a model.
Looking at a typical energy harvesting system, it usually has three different units:
harvesting, conversion and storage. The harvesting component is always the first, as this
is responsible for capturing energy from the external sources. In most cases, the
conversion unit is the second and the storage is the third. However, in some specific

Chapter 1 Introduction
11
cases, storage is included between the harvesting and the conversion units, working as a
buffer of the harvested energy and allowing the global efficiency of the system to be
maximized. In the energy harvesting from vehicles mechanical energy, this approach
has never been reported and one of the goals of this research is to evaluate the best
combination of these different components of the global system, by studying the
efficiency of different combinations.
Following the development of the computational model, the energy conversion unit will
be developed, including four major components: energy harvesting, energy conversion,
energy storage, and the energy storage controller units. Each unit represents a different
component of the system, but the model combines them so that all can work as a single
unit. Each component will be physically and computationally modelled, using different
systems in the conversion and storage units. The performance of each component will
be evaluated considering the energy received and delivered or converted, allowing the
efficiency of each component and of the complete system to be determined. Using this
approach, it will be possible to identify the inefficiencies of each component of the
system and, consequently, the parts that need to be optimized to increase the global
efficiency of the complete system.
After these models are validated, the energy delivery model will be developed, while
studying different possible uses of the electrical energy that will be generated, such as
delivery to the electric grid or to an end application, both in DC or AC.
The different components of the research project are presented in Figure 1.1.
After concluding the physical and computational models and performing the
computational simulations and identifying the most efficient solutions, prototypes will
be developed to validate the models and the computational simulations using
experimental data. This step will be useful to calibrate the models and optimize the
achieved results.

Chapter 1 Introduction
12
Figure 1.1- Diagram showing the components of the proposed solution.
RPEH is a recent research area and the economic viability of the proposed solution will
be evaluated, as well as the technical validation. To do this, a model and a software tool
will be developed, which consider different inputs such as traffic distribution, vehicle
characteristics (including average weight, speed, among others), technical and economic
aspects of the RPEH installation and the application and price of electric energy. This
tool will calculate the electrical energy output of the application as well as the economic

Chapter 1 Introduction
13
outputs, such as the cost per installed watt, cost of the generated energy, net present
value of the investment and return on the investment, among other relevant technical
and economic parameters. This software tool will also allow a SA to be performed to
identify the parameters that can be optimized to maximise output.
1.6 Research Design
For the initial data collection of existing technologies, a literature review will be
performed for the different areas related to the research, including road pavement,
railway infrastructure, energy harvesting methods and technologies (general), focusing
then on the particular cases of road pavement energy harvesting and railway
infrastructure energy harvesting technologies. This will allow us to fully characterize
the state-of-the-art, by analysing papers and patents about existing technologies, their
efficiencies, technical characteristics, experiments performed and achieved results,
current development stage and installation method. A performance analysis will be used
as a quantitative method to evaluate each system and technology identified, both
technically and economically.
After this phase, experimental research will be carried out, focusing on the development
and testing of a new RPEH system. This will be performed using the scientific method,
with the following steps:
1- Formulation of hypothesis;
2- Project, modelling, simulation and testing of the hypothesis;
3- Application of inductive and deductive logic on the analysis of the obtained
results;
4- Prototyping and experimental tests;
5- Results analysis and comparison between theoretical and experimental data and
results;
6- Conclusions (and optimization).

Chapter 1 Introduction
14
During the different system modelling stages the System Dynamics technique will be
used, in order to optimize the performance of each component and obtain the maximum
theoretical efficiency of the system. Iterative Analysis will also be used, as multiple
simulations will be performed to optimize the different RPEH device characteristics in
order to obtain the most efficient combination and parameters. The methodologies
previously mentioned allow iterative steps to be taken, as with the results of the
computational simulations and experimental tests it is possible to perform changes to
the system and perform new tests, allowing new data and new conclusions to be
obtained.
An Experimental Development will be performed with the development of prototypes,
in order to evaluate different solutions in the laboratory environment and in an
operational environment, with experimental tests. This will allow us to collect data and
to make conclusions about the system’s efficiency and achieved results.
Scenarios will be performed, both during the technology development and modelling, to
compare and analyze different computational simulations results, as well as in the
evaluation of the prototype results. Also, Scenarios will be used during the technical
and economic evaluation of the system.
Finally, a Cost-Benefit Analysis will be performed, where the impact of the project and
its performance in terms of economic outputs will be evaluated. Different economic
variables such as the net present value and the internal rate of return will be evaluated
for different Scenarios and Case Studies, and a sensitivity analysis will be performed.
During this stage, the environmental impact of the application of the system in different
places will also be considered, as well as the costs associated with it.
Figure 1.2 presents the research design framework in a schematic diagram. As
explained, initially evidence will be collected through a literature review and state-of-
the-art techniques, in order to make a performance analysis, and define the research
problems and questions. The second step is the development of physical and
computational models for all the main components of the RPEH system, starting with
the evaluation of the energy released from vehicles to the road pavement surface or to

Chapter 1 Introduction
15
the RPEH device surface, followed by the models of the energy harvesting system,
including all its components, and finishing with the electrical energy management and
application models. These models will be developed using the System Dynamics
technique and simulations will be performed to evaluate each component both
individually and together. Different components will be considered for each model in
order to evaluate the most efficient combination.
The third step consists of the Experimental Development, with experimental tests being
performed on the system prototype, both in laboratory and tests in a relevant
environment. These will allow us to acquire experimental data and compare it to the
simulation results, which will allow us to calibrate and optimize the computational
models with an iterative analysis. During the prototype development stage the
installation of the system in the road pavement and the production costs of the system
will be evaluated, so that all the costs involved in real implementation can be defined
for the CBA.
The fourth step consists of a CBA with the development of a model and a software tool
where all the input variables can be defined using both the traffic and road parameters
as inputs, as well as the technical and economic characteristics of the RPEH system and
the electrical energy application. This will allow us to define multiple scenarios and
evaluate the technical and economic performance of each application, providing
important data for an end user to evaluate the benefits of the implementation of a RPEH
solution for a real case scenario. Also, this model will allow us to perform a SA in order
to identify the impact of each variable in the system performance. The results of the SA
will provide important information that can be used to enhance the models outputs by
focusing on adjusting and improving the system components that are identified as
having the greatest impact on the model outputs. Moreover, the SA provides insights to
the users of the system regarding the different types of data that need to be collected for
precise evaluation of the system performance.

Chapter 1 Introduction
16
Figure 1.2- Schematic diagram of the research design framework.

Chapter 1 Introduction
17
1.7 Structure of the Thesis
This thesis is organized into nine chapters. Excluding Chapters 1 and 9, the remaining
chapters of the thesis are based on the scientific papers produced during the
development of the present research work. The contents of each chapter do not
correspond to the exact text and structure of each scientific paper to avoid repetition and
to facilitate the reading of the thesis.
Although each chapter can be considered as an independent subject and related to a
specific scientific article, this thesis does not intend to represent a chain of scientific
articles, but a planned evolution of the research work developed during the research
activities. The relationship between the thesis chapters is presented in Figure 1.3,
through a schematic diagram of the outline of the thesis.
Chapter 1 provides an introduction to the thesis. It presents the global problem
statement, the research problem and opportunity for investigation, the motivation, the
research objectives, research methodology, research design and the organization of the
thesis.
Chapter 2 presents the state-of-the-art regarding infrastructure energy harvesting
systems, relating both to the road pavement and to the railway, as both infrastructure
types have similarities, but different energy harvesting technologies are being developed
for each. Each existing technology will be evaluated in terms of its energy generation
potential and energy conversion efficiency, current stage of development and the
installation mode in the infrastructure, allowing us to make conclusions about its
viability. Finally, conclusions will be drawn about the most promising technologies and
guidelines for the research to perform.
Chapter 3 describes the VRI in terms of a forces analysis, kinematic analysis and
dynamic analysis, allowing an energetic analysis of the interaction to be performed. A
detailed study regarding vehicle dynamics is presented, including the tyre contact patch
in the vehicle models, allowing a more detailed and complete model to be developed to
evaluate the interaction. Also, a movable surface in the pavement is considered and

Chapter 1 Introduction
18
modelled. A software tool is developed based on the presented models and the
simulation results are presented and discussed, allowing conclusions to be made about
more precise models.
Figure 1.3- Schematic diagram of the thesis outline.

Chapter 1 Introduction
19
Chapter 4 presents a study of the potential for energy harvesting from vehicles using a
RPEH device with a movable surface and the impact of such device in the ride comfort
and its contribution to promote road safety. The software tool developed in the previous
Chapter is used and simulations are performed evaluating not only the energy harvested
but also the ride quality and the vehicle’s speed reduction. Following this analysis, an
experimental evaluation is performed using a prototype of the proposed system and the
experimental results are compared to the computational simulation results, allowing
conclusions to be drawn about the precision of the model.
Chapter 5 presents the development of a RPEH device using an electromechanical
system. The two most common electromechanical devices are presented and modelled
and a new proposed device is then presented. The developed models are integrated into
the software tool developed in Chapter 3 and, using the upgraded tool, new
computational simulations are performed to evaluate the different electromechanical
systems and draw some conclusions. Following this analysis, an experimental
evaluation is performed using a prototype of the new electromechanical system and the
experimental results are compared to the computational simulation results, allowing us
to make conclusions about the model’s precision and system’s performance, as well as
making comparisons with the present state-of-the-art.
Chapter 6 presents the development of a RPEH device using a new hydraulic system
with a mechanical actuation, which is presented and modelled. First, the most common
hydraulic device is presented and modelled and both models are included in the
software tool previously developed. Based on the upgraded tool, computational
simulations are performed and some conclusions regarding each system’s efficiency and
behaviour are presented. Also, a comparison with electromechanical devices is
performed, as well as with the current state-of-the-art.
Chapter 7 describes the adoption of a mechanical energy storage unit in RPEH devices,
with emphasis on hydraulic devices. Different solutions are presented and modelled and
these are included in the software tool developed previously. The computational

Chapter 1 Introduction
20
simulations results are presented for different scenarios and conclusions regarding the
efficiency and effectiveness of these systems are presented.
Chapter 8 presents a technical and economical evaluation of RPEH devices, defining the
main equations to evaluate such devices. A computational model is developed based on
the presented equations and an analysis is performed for different scenarios, including a
SA for specific key variables. Based on this, several conclusions are made in order to
evaluate these devices and the conditions necessary for positive viability are defined.
Chapter 9 summarizes the research work described in this thesis, highlights its
contributions and main achievements, and establishes a set of research guidelines and
improvements for future work.
1.8 Publications
As mentioned in the previous section, this thesis is based on the scientific articles
written about the research work developed during the doctoral studies. Most of the
scientific articles have been submitted to international peer-reviewed journals and are
either published or under review, and others are about to be submitted. Below is the list
of references for the thesis chapters, in the sequence in which they are presented.
1) Scientific articles already published
Chapter 2:
Duarte, F. and Ferreira, A. (2016). Energy harvesting on road pavements: state of the
art. Proceedings of the Institution of Civil Engineers – Energy, 169(2): 79-90.
DOI: 10.1680/jener.15.00005.
Duarte, F. and Ferreira, A. (2017). Energy harvesting on railway tracks: state of the
art. Transport, Institution of Civil Engineers, 170(3): 123-130. DOI:
10.1680/jtran.16.00016.

Chapter 1 Introduction
21
Chapter 3:
Duarte, F., Ferreira, A. and Fael, P. (2016). Software for simulation of vehicle-road
interaction. New Advances in Information Systems and Technologies, Vol. 444 of
the Series Advances in Intelligent Systems and Computing, Springer International
Publishing, Switzerland, pp. 681-690. DOI: 10.1007/978-3-319-31232-3_64.
Duarte, F., Ferreira, A. and Fael, P. (2017). Software tool for simulation of vehicle-
road interaction. Engineering Computations Journal, 34(5): 1501-1526. DOI:
10.1108/EC-07-2016-0273.
Chapter 5:
Duarte, F., Ferreira, A. and Fael, P. (2017). Software to Support the Development of
Road Pavement Energy Harvesting Devices. Recent Advances in Information
Systems and Technologies, Vol. 569 of the Series Advances in Intelligent Systems
and Computing, Springer International Publishing, Switzerland, pp. 807-817.
DOI: 10.1007/978-3-319-56535-4_79.
Chapter 6:
Duarte, F., Ferreira, A. and Fael, P. (2017). Road pavement energy harvesting: an
evaluation methodology for new and existing vehicle-derived mechanical energy
collectors. Journal of Renewable and Sustainable Energy, 9(3): 1-22. DOI:
10.1063/1.4982795.
2) Scientific articles submitted and under review/accepted for publication
Chapter 4:
Duarte, F., Ferreira, A. and Fael, P. Contribution of a novel speed reduction
equipment to promote road safety. International Journal of Pavement
Engineering.
Duarte, F., Ferreira, A. and Fael, P. Experimental validation of a new speed
reduction equipment to promote road safety. Accident Analysis and Prevention.

Chapter 1 Introduction
22
Chapter 5:
Duarte, F., Ferreira, A. and Fael, P. Road pavement energy harvesting: a new
electromechanical device to convert vehicles mechanical energy into electrical
energy. Journal of Energy Engineering, American Society of Civil Engineers.
Accepted for publication.
Chapter 7:
Duarte, F., Ferreira, A. and Fael, P. Integration of a mechanical energy storage
system on a road pavement energy harvesting device. Proceedings of the
Institution of Civil Engineers – Energy.
Duarte, F., Ferreira, A. and Fael, P. Integration of a mechanical energy storage
system on a road pavement energy harvesting hydraulic device with mechanical
actuation. Journal of Renewable and Sustainable Energy, American Institute of
Physics. Accepted for publication.
Chapter 8:
Duarte, F., Ferreira, A. and Fael, P. Software tool for technical and economical
evaluation of road pavement energy harvesting devices. Advances in Engineering
Software.
Duarte, F., Ferreira, A. and Fael, P. A technical and economic evaluation of road
pavement energy harvesting devices applied in urban environment. Journal of
Renewable and Sustainable Energy.
3) Scientific article to be submitted soon
Chapter 5:
Duarte, F., Ferreira, A. and Fael, P. Experimental validation of a new
electromechanical road pavement energy harvesting device. The submission to
Journal of Energy Engineering is currently being considered.

Chapter 1 Introduction
23
Besides the scientific articles, two patent requests were submitted to the Portuguese
Institute for Intellectual Property (INPI - Instituto Português de Propriedade Industrial),
regarding the systems presented in Chapters 4, 5, 6 and 7, with the following
description:
4) Patent requests submitted
Chapters 4 and 5:
Duarte, F., Ferreira, A. and Fael, P. Equipamento de Aplicação em Pavimentos que
Integra um Sistema para Captação de Energia Mecânica de Veículos e Conversão
em Energia Elétrica. Instituto Nacional da Propriedade Industrial (INPI),
Portuguese Patent Request 109935 P (in Portuguese).
Chapters 6 and 7:
Duarte, F., Ferreira, A. and Fael, P. Equipamento de Aplicação em Pavimentos que
Integra um Sistema Hidráulico com Atuação Mecânica para Geração de Energia
Elétrica a partir do Movimento de Veículos. Instituto Nacional da Propriedade
Industrial (INPI), Portuguese Patent Request 109936 R (in Portuguese).
Complementarily, some scientific articles have been presented and discussed in
different international conferences, with the complete list of conferences presented
below.
5) Conference articles
Chapter 2:
Duarte, F. and Ferreira, A. (2015). Energy harvesting on road pavements.
Proceedings of the Third International Conference on Advances in Civil,
Structural and Environmental Engineering - ACSEE 2015, CD Ed., paper
ACSEE-15-535, pp. 126-130, Zurich, Switzerland.

Chapter 1 Introduction
24
Duarte, F., Ferreira, A., Paiva, C. (2016). Energy harvesting on transport
infrastructures: the particular case of railways. Proceedings of the 4th
International Conference on Road and Rail Infrastructure, CD Ed., pp. 811-816,
Sibenik, Croatia.
Chapter 3:
Duarte, F., Ferreira, A. and Fael, P. (2017). A new decision-aid tool for simulation of
tire-pavement interaction and for quantification of energy harvesting on
pavements. Proceedings of The World Conference on Pavements and Assets
Management, CD Ed., 02d05.pdf, pp. 1-10, Milan, Italy.
Chapter 4:
Duarte, F., Ferreira, A. and Fael, P. (2016). Optimization of the shape of road speed
reducers. Proceedings of the International Conference on Traffic and Transport
Engineering - ICTTE 2016, pp. 608-615, Belgrade, Serbia.
The work developed and presented in the present thesis was developed following
previous research project in which the author had been involved. Both the previous
project and the achieved results have made an important contribution to the work
developed during this thesis and the achieved results were recently published, both in
scientific articles and in conference papers:
6) Scientific articles published
Duarte, F., Champalimaud, J. and Ferreira, A. (2016). Waynergy Vehicles: an
innovative pavement energy harvest system. Municipal Engineer, Institution of
Civil Engineers, 169(1): 13-18.
DOI: 10.1680/muen.14.00021.
Duarte, F., Ferreira, A. and Champalimaud, J. (2016). Waynergy People - application
in an operational environment. Proceedings of the Institution of Civil Engineers –
Energy, pp. 1-8. DOI: 10.1680/jener.16.00010.

Chapter 1 Introduction
25
Duarte, F., Champalimaud, J. and Ferreira, A. (2017). Waynergy vehicles: system
prototype demonstration in an operational environment. Municipal Engineering -
Institution of Civil Engineers, pp. 1-8. DOI: 10.1680/jmuen.16.00071.
7) Conference articles
Duarte, F., Champalimaud, J. and Ferreira, A (2014). Waynergy Vehicles: an
innovative pavement energy harvest system. Proceedings of the 2nd International
Congress on Energy Efficiency and Energy Related Materials, CD Ed., pp. 343-
348, Oludeniz, Turkey.
Duarte, F., Ferreira, A. and Champalimaud, J. (2015). Waynergy Vehicles: a road
pavement energy harvest system application. Proceedings of the conference
Energy for Sustainability 2015 - Sustainable Cities: Designing for People and the
Planet, CD Ed., ID25, pp. 1-5, Coimbra, Portugal.
Duarte, F., Ferreira, A. and Champalimaud, J. (2016). Waynergy Vehicles: system
prototype demonstration in an operational environment. Proceedings of the
Transport Research Arena, CD Ed., Contribution10157.pdf, pp. 1-10, Warsaw,
Poland.
1.9 References
Andriopoulou, S. (2012). A review on energy harvesting from roads. KTH, Stockholm,
Sweden.
Arthur D. Little (2014). The Future of Urban Mobility 2.0, Imperatives to shape
extended mobility ecosystems of tomorrow. Available from
http://www.adlittle.com/future-of-urban-mobility.html. Accessed in October, 2015.
Buhaug, H., and Urdal, H. (2013). An urbanization bomb? Population growth and social
disorder in cities. Global Environmental Change, 23(1): 1-10.

Chapter 1 Introduction
26
Duarte, F. and Casimiro, F. (2011). Pavement Module for Generating Electric Energy
from the Movement of People and Vehicles. International Patent Application
PCT/IB2011/052164, Patent WO2011145057 A2, Nov.
Duarte, F. and Casimiro, F. (2013). Electromechanical System for Electric Energy
Generation and Storage Using a Surface Motion. International Patent Application
PCT/IB2013/050616, Patent WO2013114253 A1, Aug.
Duarte, F., Casimiro, F., Correia, D., Mendes, R. and Ferreira, A. (2013). Waynergy
people: a new pavement energy harvest system. Proceedings of the Institution of
Civil Engineers – Municipal Engineer, 166(4): 250–256.
http://dx.doi.org/10.1680/muen.12.00049.
Duarte, F., Champalimaud, J. and Ferreira, A. (2014). Waynergy vehicles: an innovative
pavement energy harvest system. Proceedings of the 2nd International Congress on
Energy Efficiency and Energy Related Materials, Oludeniz, Turkey. Springer,
London, UK.
Garcia-Valle, R., and Lopes, J. A. P. (Eds.) (2012). Electric vehicle integration into
modern power networks. Springer Science & Business Media, Berlin, Germany.
Giffinger, R., Fertner, C., Kramar, H., Kalasek, R., Pichler-Milanović, N., and Meijers,
E. (2007). Smart Cities: Ranking of European Medium-Sized Cities. Vienna, Austria:
Centre of Regional Science (SRF), Vienna University of Technology. Available
from: http://www.smartcities.eu/download/smart_cities_final_report.pdf. Accessed in
October, 2015.
Hall, R. E. (2000). The vision of a smart city. In Proceedings of the 2nd International
Life Extension Technology Workshop, Paris, France. Available from:
http://www.osti.gov/bridge/servlets/purl/773961-oyxp82/webviewable/773961.pdf.
Accessed in October, 2015.
Harrison, C., Eckman, B., Hamilton, R., Hartswick, P., Kalagnanam, J., Paraszczak, J.,
and Williams, P. (2010). Foundations for Smarter Cities. IBM Journal of Research
and Development, 54(4).

Chapter 1 Introduction
27
Hendrowati, W., Guntur, H. and Sutantra, I. (2012). Design, modelling and analysis of
implementing a multilayer piezoelectric vibration energy harvesting mechanism in
the vehicle suspension. Engineering, 4(11): 728–738.
IEA (2012). Technology Roadmap: Fuel Economy of Road Vehicles, International
Energy Agency, Paris, France. Available from:
http://www.iea.org/publications/freepublications/publication/Fuel_Economy_2012_
WEB.pdf. Accessed in September, 2015.
IEA (2016a). Key world energy statistics 2016, International Energy Agency, Paris,
France. Available from:
https://www.iea.org/publications/freepublications/publication/KeyWorld2016.pdf.
Accessed in June, 2017.
IEA (2016b). Global EV Outlook 2016, International Energy Agency, Paris, France.
Available from:
https://www.iea.org/publications/freepublications/publication/Global_EV_Outlook_2
016.pdf. Accessed in June, 2017.
Khaligh, A. and Onar, O.C. (2010). Energy Harvesting: Solar, Wind, and Ocean Energy
Conversion Systems. CRC Press Inc, Boca Raton, FL, USA.
Toppeta, D. (2010). The Smart City Vision: How Innovation and ICT Can Build Smart,
“Livable”, Sustainable Cities. The Innovation Knowledge Foundation. Available
from:
http://www.thinkinnovation.org/file/research/23/en/Toppeta_Report_005_2010.pdf.
Accessed in October, 2015.
UN (2016). The World's Cities in 2016. United Nations - Department of Economic and
Social Affairs, New York, NY, USA. Available from:
http://www.un.org/en/development/desa/population/publications/pdf/urbanization/the
_worlds_cities_in_2016_data_booklet.pdf. Accessed in July, 2017.

Chapter 1 Introduction
28
Washburn, D., Sindhu, U., Balaouras, S., Dines, R. A., Hayes, N. M., and Nelson, L. E.
(2010). Helping CIOs Understand "Smart City" Initiatives: Defining the Smart City,
Its Drivers, and the Role of the CIO. Cambridge, MA: Forrester Research, Inc.
Available from:
http://public.dhe.ibm.com/partnerworld/pub/smb/smarterplanet/forr_help_cios_und_s
mart_city_initiatives.pdf. Accessed in September, 2015.
WHO (2016). Global report on urban health: equitable, healthier cities for sustainable
development. World Health Organization, Geneva, Switzerland. Available from:
http://www.who.int/kobe_centre/publications/urban-global-report/en/. Accessed in
June, 2017.

29
Chapter 2
Energy Harvesting in Transportation
Infrastructures: State-of-the-art
2.1 Introduction
Energy Harvesting is described as a concept by which energy is captured, converted,
stored, and utilised using various sources, by employing interfaces, storage devices, and
other units (Khaligh and Onar, 2010; Priya and Inman, 2009). Simplified, energy
harvesting is the conversion of ambient energy present in the environment into other
useful means of energy, as for example, in electrical energy (Kazmierski and Beeby,
2009).
Energy harvesting is divided into two main groups: macro-energy harvesting sources,
associated with solar, wind, hydro and ocean energy; and micro-energy harvesting,
associated with electromagnetic, electrostatic, heat, thermal variations, mechanical
vibrations, acoustic and human body motion as energy sources (Harb, 2011; Khaligh
and Onar, 2010; Yildiz, 2009). Macro-energy harvesting is related to large-scale energy
harvesting, usually in the order of kilojoules or more. Micro-energy harvesting is related
to small-scale energy harvesting, usually in the order of a joule or less.

Chapter 2 Energy Harvesting in Transportation Infrastructures: State-of-the-art
30
Different transportation infrastructures are continuously exposed to different energy
sources. From these it is possible to extract energy, which, using specific technologies,
can be transformed into electrical energy. This Chapter aims to review the energy
harvesting technologies with possible implementation on the major transportation
infrastructures in which some research has been developed in recent years, namely in
road pavements and railways.
2.2 Energy Harvesting on Road Pavements
2.2.1 Introduction
From the energy harvesting technologies identified by Harb (2011), two groups of
technologies have a great potential for implementation on pavements: one uses solar
radiation as an energy source and the other uses the mechanical energy from vehicle
loads. Considering these energy sources, different technologies and systems have been
developed and tested in recent years. The main energy harvesting technologies
applicable on road pavement can be divided into two main groups, as presented in
Figure 2.1. The first group is related to technologies that make use of the solar exposure
on the road pavement. Solar radiation can be directly harvested by photovoltaic (PV)
cells and transformed into electrical energy; it can induce thermal gradients between the
road pavement layers, which can be used to power thermoelectric generators (TEGs),
which produce electrical energy, or be harvested by asphalt solar collectors (ASC),
which extract the temperature accumulated on the road pavement. Induction heating is a
concept in which introducing conductive particles in the asphalt mixture provides self-
healing capacities autonomously at high temperatures by harvesting solar radiation. The
second group is related to technologies that make use of the mechanical energy
transferred from vehicles to the road surface. This can be harvested directly by
piezoelectric harvesters, which generate electrical energy; or it can be harvested by
hydraulic, pneumatic, electromechanical or micro-electromechanical systems (MEMS)
that transfer the harvested energy to electromagnetic generators, which produce

Chapter 2 Energy Harvesting in Transportation Infrastructures: State-of-the-art
31
electrical energy. In the case of MEMS, they can also transfer the harvested energy to
piezoelectric generators.
Figure 2.1- Road pavement energy harvesting technologies.
2.2.2 Solar energy harvesting on road pavements
2.2.2.1 Photovoltaic technology
Researchers from the Korea Institute (Kang-Won and Correia, 2010) have investigated
the possibility of harvesting solar energy from road pavements, using solar cells
embedded into the pavement infrastructure. They have concluded that the current thin-
film solar cells are difficult to use on surfaces that receive mechanical loads and
environmental conditions can cause premature corrosion and wear. For these reasons,
the researchers are developing new thin-film solar cells that meet the requirements for
use on road surfaces.
Julie and Scott Brusaw proposed a solar collector system to replace the upper layer of
the road pavement, called Solar Roadway (SR, 2015). The Solar Roadway is a series of
structurally engineered solar panels that are able to support traffic loads and are applied
on the road surface transforming solar radiation into electrical energy. Each panel has

Chapter 2 Energy Harvesting in Transportation Infrastructures: State-of-the-art
32
an installed power of 36W and measures 0.37 m2. They have patented the upper layer of
the product with a design patent (Brusaw and Brusaw, 2014). The Brusaws indicate a
conversion efficiency of the system of 11.2% (SR, 2015), a value that cannot be
confirmed in any scientific publication or product certification. One of the major
challenges of this project is to offer safety and the appropriate conditions for the
mobility of the vehicles passing over the panels. At the same time, the upper layer needs
to guarantee the transmission of the solar radiation to the PV cells beneath it in order to
present good conversion efficiency.
In the Netherlands, Toegepast Natuurwetenschappelijk Onderzoek (TNO), along with
other technological partners, have developed a pilot project consisting of a modular
cycle path system, named SolaRoad (SolaRoad, 2014; TNO, 2014). The cycle path is
constructed of concrete elements which are covered by a 1.0 cm thick glass top layer.
Underneath this glass layer, crystal silicon solar cells are laid, although the values of the
installed power and energy conversion efficiency are not presented. The modules are
embedded in concrete slabs and applied on the base layer of the pavement. The authors
of the project indicate that the next step will be to adapt the system for application on
roads (SolaRoad, 2014).
2.2.2.2 Thermoelectric technology
TEGs produce electrical energy due to the Seebeck effect, described by Schreier et al.
(2013) as a voltage difference on a material, resulting from a temperature gradient
imposed between its surfaces. The greater the temperature gradient, the more energy is
generated.
Hasebe et al. (2006) developed a pavement-cooling system using a TEG incorporated
into the pavement. Solar heat is collected by a water piping system embedded in the
road pavement, and this water is cooled by river water. The water first passes on the hot
side of the TEG, and then on the cold side of the TEG, installed under the road. The
maximum power output of the prototype tested was 5 W, using 19 Bi-Te cells (1.23 cm3
each), for a ΔT of 40.5 ºC. For a ΔT of 25.9 ºC, the maximum output power was 2.9 W,

Chapter 2 Energy Harvesting in Transportation Infrastructures: State-of-the-art
33
and for a ΔT of 11.5 ºC, the maximum output power was 0.9 W. The conversion
efficiency of the system was not presented.
Wu and Yu (2012) studied the implementation of TEGs on the surface of pavements.
They propose the connection of the lower part of the module with the sub-grade soil via
highly thermal conductive materials in order to facilitate heat conduction and thus
increase electrical energy production. They have concluded that its maximum efficiency
reached 4% using Quantum Well structured (QW) materials, instead of Bi-Te cells, but
the problem was the storage of that energy. Tests were performed with a pavement ΔT
of 50 ºC, which generated 300 mV with one TEG cell. They have concluded that the
efficiency of the electronic system was 41.3%, which results in a global efficiency of
the TEG system of 1.6%. The prototype, which used a 7.7 cm3 TEG unit, was able to
produce a maximum output power of 0.02 W, for a thermal gradient of 6.44 K on the
TEG (Wu and Yu, 2013).
Due to their low conversion efficiency, none of these studies have led to a product
available on the market. Kelk (2015), a Japanese company, have different products
based on TEGs, and sell the TEG cells individually, but none of their available products
have been developed to implement on road pavements so far.
2.2.2.3 Asphalt solar collector technology
An alternative way of using the thermal gradients between the road pavement layers is
to transform the pavement into a solar collector, using pipes and pumps, arranged
specifically in order to capture solar energy and convert it into thermal energy. This is a
method that has been studied in recent years by different authors, called ASC (Bobes-
Jesus et al., 2013).
Sullivan et al. (2007) proposed an ASC system for heating and cooling road pavements
and other infrastructures, using the heat-absorbing property of asphalt concrete applied
on the construction of flexible pavements. The ASC system consists of an asphalt
pavement layer with water pipes in it. The ASC system is linked to two underground

Chapter 2 Energy Harvesting in Transportation Infrastructures: State-of-the-art
34
water storage reservoirs, one for cold water and another for warm water (RES, 2007),
involving seasonal storage. Solar radiation induces an increase in the temperature of the
road surface, which is absorbed by the road pavement materials and transferred to a
water piping system applied under the road surface and is then stored in the soil or other
storage tanks (Sullivan et al., 2007).
The real-world performance of ASCs has been demonstrated by systems installed in
different places around the world, working in different climatic conditions. In
Switzerland, the Solar Energy Recuperation from the Road Pavement (SERSO) system,
presented by Lund (2000), was successfully installed with the main purpose of melting
ice on roads. In the Netherlands, Road Energy Systems®, developed by Ooms (Sullivan
et al., 2007) and TNO (Loomans et al., 2003), has been commercialized in recent years,
with the main advantages presented by the company being a focus on increased road
safety (RES, 2007).
In the UK, ICAXTM
(ICAX, 2014) develops and implements ASC solutions. In Japan,
the Gaia system has been developed during the last decade, with different studies being
performed focused more on the snow melting heat storage capacity (Morita and Tago,
2000; Gao et al., 2010). The authors say that the heat collecting capacity is between 150
and 250 W/m2 under normal summer weather conditions (Gao et al., 2010). Other
applications have been developed in China (Tu et al., 2010) and the USA (Mallick et
al., 2009).
2.2.3 Vehicle mechanical energy harvesting on road
pavements
The mechanical energy transmitted by vehicle wheels to the road surface can induce
two types of action on the road pavement: vibrations or surface displacement. This
energy can be harvested using different methods and different technologies.

Chapter 2 Energy Harvesting in Transportation Infrastructures: State-of-the-art
35
2.2.3.1 Piezoelectric technology
Pierre and Jacques Curie, in 1880, were the first individuals to develop an energy
harvesting method from pressure. They successfully predicted and proved
experimentally that certain crystals would exhibit a surface charge when subjected to
mechanical stress. This phenomenon was given the name piezoelectricity (Harb, 2011),
after the Greek word piezo, meaning "to press".
Piezoelectric materials fall within a class of multiple solid-state materials that can
generate electrical energy with the application of pressure or vibrations (Beeby et al.,
2006). Both vehicle pressure and vibrations induced on the road pavement can be used
to actuate piezoelectric transducers, in order to convert mechanical energy into electrical
energy (Xiang et al., 2013).
Zhao et al. (2010) proposed and studied the application of cymbal piezoelectric
transducers on road pavements. The amount of generated energy was of 1.2 mW at 20
Hz for one vehicle passage. This was equivalent to 0.06 J per vehicle passage and a
conversion efficiency of lower than 15%.
Zhao et al. (2013) studied different piezoelectric materials in order to determine how to
adapt them for use on road pavements. They have identified that none of the typical
piezoelectric transducers made of lead zirconate titanate were suitable for the asphalt
pavement environment. They suggest a specific design and optimisation process to
adapt the piezoelectric materials for road pavement application.
Xiong et al. (2012) have defined two coupling modes of piezoelectric components: 31-
mode and 33-mode. With 31-mode, the piezoelectric material generates electrical
energy from transverse displacement. On the 33-mode, the power output of the system
increases linearly with the deflection of the pavement or the stress along the poling
direction of the material. They have stated that the usual power generation capacity of
piezoelectric transducers is about 300 μW/cm3.
Wischke et al. (2011) studied the application of piezoelectric modules in road
pavements in tunnels. They concluded that the vibrations caused by vehicles were small
due to vehicle suspension.

Chapter 2 Energy Harvesting in Transportation Infrastructures: State-of-the-art
36
The patent applications US20050127677 (Luttrull, 2005) and US20100045111 A1
(Abramovich et al., 2010a) relate to systems that make use of piezoelectric transducers
on road pavements that produce electrical energy while being deformed due to the
passage of vehicles.. The system presented by Abramovich et al. (2010a) was tested in a
real environment by Innowattech on a product called Innowattech Piezo Electric
Generator (IPEG) (Innowattech, 2014). There are no published results for the generated
energy, or for the conversion efficiency of this product.
Abramovich et al. (2010b, 2012) have developed a system with new methodologies to
increase energy generation and simplified the installation process, as well as using a
new methodology to multiply the forces of the vehicles delivered to the piezoelectric
transducers (Klein et al., 2012). Nevertheless, there were no scientific results presented
for any of these systems.
Bowen and Near (2000) have patented a piezoelectric actuator for road pavements,
which was developed recently (Near, 2013), presenting an energy harvesting product
based on piezoelectric components for use on road pavements. With this product, Near
(2013) created the Genziko company in the USA (Genziko, 2014).
Hill et al. (2014) have compared the products developed by Innowattech and Genziko
using data provided by both companies. From Innowattech, they present an energy
generation per module, per vehicle, of 5.76 J, while Genziko have presented an energy
generation per module, per vehicle, of 40 J, almost seven times more than that of
Innowattech. However, the authors of the study have concluded that none of these
companies have enough real-environment validations to support the presented energy
generation values.
2.2.3.2 Electromagnetic technology
Electromagnetic generators operate based on electromagnetic induction, known as
Faraday’s law, where, if an electric conductor is moved in relation to a magnetic field,
electric current will be induced in the conductor (Beeby et al., 2006). These generators

Chapter 2 Energy Harvesting in Transportation Infrastructures: State-of-the-art
37
are mostly used in big power plants, based on both non-renewable and renewable
sources. In energy harvesting, smaller electromagnetic generators have been developed
over the last decade in order to convert environmental energy sources (mechanical
vibrations, mostly) into electrical energy (Beeby et al., 2007; Saha, 2011; Arroyo and
Badel, 2011; Munaz et al., 2013; Peralta et al., 2014; Elliot and Zilletti, 2014).
Electromagnetic generators are different from piezoelectric systems in that they are not
actuated directly by the mechanical energy of vehicles. Interfaces are applied where the
harvester units are based on hydraulic or pneumatic systems, electromechanical systems
or MEMS, which will be presented following.
2.2.3.2.1 Hydraulic and pneumatic harvesting systems
A hydraulic system consists of a drive or transmission system that uses a
pressurized hydraulic fluid to transmit forces and actuate mechanical components,
which are usually actuated by electric machines. In the case of pneumatic systems, the
difference is in the working fluid; air is used instead of liquid (Parr, 2011). In road
pavements, hydraulic systems can be used in the opposite way, transmitting the
mechanical energy of the vehicles to actuate electric machines.
Some companies and individual inventors have registered patents where they use
hydraulic or pneumatic mechanisms to harvest energy released from vehicles and
convert it into electrical energy. These systems are designed to be implemented on
roads, as are related patent applications US5634774 (Angel and Gomez, 1997),
GB2290115A (Nakatsu, 1994), US6376925B1 (Galich, 2002), US20040130158A1
(Kenney, 2004), US20070246940A1 (Valon, 2007), WO2007045087 (Horianopoulos
and Horianopoulos, 2007), US20100192561A1 (Hendrickson,
2010a),WO2010081113A1 (Hendrickson, 2010b), US20110215593A1 (Chang and Lee,
2011) and GB2476826A (Houghton, 2011) for hydraulic systems, and US4173431
(Smith, 1979) and GB2408074A (Morley et al., 2005) for pneumatic systems.
Horianopoulos and Horianopoulos (2007) developed a hydraulic device that harvests
energy on road pavements, claiming an energy generation capacity of 51 kWh with

Chapter 2 Energy Harvesting in Transportation Infrastructures: State-of-the-art
38
10,000 vehicles passages along 50 meters (Kinergy Power, 2014). This is proportional
to 367 (J/m)/vehicle, an average of 91.8 J/wheel, which is a very high value. However,
this value is not supported by any scientific evidence, and the average vehicle weight
used in the study is not presented. In their patent (Horianopoulos and Horianopoulos,
2007), the working principles of the technology are described without reference to the
conversion efficiency. On the basis of this system, they have created the product
KinerBump, and the company KinergyPower International Corporation (Kinergy
Power, 2014) in the USA.
Moreover, Hendrickson (2010a, 2010b) has created the company New Energy
Technologies with a product line called MotionPowerTM
(NewEnergyTechnologies,
2015), based on his patents. Real-environment tests were performed with this
technology but the company has not published the results.
2.2.3.2.2 Electromechanical harvesting systems
In electromechanical systems, electrical devices are operated by mechanical
components or vice versa. In the case of electromechanical energy harvesting systems,
mechanical energy is used to actuate an electrical machine, which produces electrical
energy.
In the case of road pavement energy harvesting, the electromechanical systems can be
divided into four classes:
1) Conversion of rotational motion of a surface into a rotational motion of an
electric generator (Rot-Rot);
2) Conversion of linear motion of a surface into a rotational motion of an electric
generator (Lin-Rot);
3) Conversion of linear motion of a surface into a linear motion of an electric
generator (Lin-Lin);
4) Conversion of rotational motion of a surface into a linear motion of an electric
generator (Rot-Lin).

Chapter 2 Energy Harvesting in Transportation Infrastructures: State-of-the-art
39
Table 2.1 summarises the electromechanical systems that are being developed according
to the motion conversion principle. From this table, it can be seen that most of the
systems have a rotational output motion.
Table 2.1- Patents related to electromechanical systems.
Input motion
Rotational Linear
Output
motion
Rotational
US4238687 (Martinez, 1980),
US6767161B1 (Calvo and Calvo,
2004), US7102244B2 (Hunter,
2006), US20090315334A1 (Chen,
2009), US7714456B1 (Daya, 2010),
US20110187125A1 (Jang, 2011) and
WO2012099706A2 (Mansfield et al.,
2012)
US4434374 (Lundgren, 1984),
US20070181372A1 (Davis, 2007),
WO2009101448A1 (Hughes et al.,
2009), WO2011145057A2 (Duarte
and Casimiro, 2011) and
WO2013114253A1 (Duarte and
Casimiro, 2013)
Linear US20120248788A1 (Pirisi, 2012) WO2004067850A1 (Hughes et al.,
2004)
On the basis of the systems presented in the patents WO2004067850A1 (Hughes et al.,
2004) and WO2009101448A1 (Hughes et al., 2009), the company Highway Energy
Services was created (HES, 2015), in the UK. Besides the information presented in their
patents, no technical data is available on these systems.
Pirisi (2012), following his patent, has developed a prototype of the technology which,
together with researchers from Politecnico di Milano, he has tested and presented the
results (Pirisi et al., 2012a, 2012b, 2013). The generator is described as a tubular
permanent magnet linear generator, an electromechanical device able to convert linear
motion into electrical energy; using a 1:10 scale prototype in the laboratory, they claim
a conversion efficiency of 85% (Pirisi et al., 2013) between the mechanical energy
applied to the slider of the generator and the electrical output efficiency. This value does
not include power electronics, but presents only the conversion efficiency of the
generator. In laboratory tests, the system was applied on the top of the road surface. The

Chapter 2 Energy Harvesting in Transportation Infrastructures: State-of-the-art
40
authors of this system have created the company Underground Power, which is
developing a product called "LYBRA" (Underground Power, 2014).
In the USA, the authors of the patent WO2012099706A2 (Mansfield et al., 2012), a
class-1 system, have created the company Energy Intelligence. So far, there have been
no scientific results presented for the project. The authors maintain that the system will
be embedded in the road surface, replacing the upper layers of the road pavement
(EnergyIntelligence, 2014).
Following the development of a suitable system to convert people-released energy into
electrical energy (Duarte and Casimiro, 2011), with a 60% conversion efficiency
(Duarte et al., 2013a, 2013b), Duarte and co-authors have developed the system
presented in the patent WO2013114253A1 (Duarte and Casimiro, 2013), with a class-2
system, suited for application on roads. The authors, together with the company
Waydip, have tested a real-scale prototype, naming the project Waynergy® Vehicles
(Waydip, 2015). Laboratory tests with the prototype obtained experimental energy
generation data, achieving a conversion efficiency of about 50% for the mechanical
energy delivered to the system and the electrical energy output delivered to an electric
load (Duarte et al., 2014, 2016). The system was applied on the upper layer of the road
pavement.
2.2.3.2.3 MEMS harvesting systems
MEMS is a technology that is usually defined as miniaturised mechanical and
electromechanical elements, made using the techniques of micro-fabrication, which can
vary from relatively simple structures having no moving parts to extremely complex
electromechanical systems with multiple moving parts, usually under the control of
integrated microelectronics. There has been much recent interest in using MEMS to
harvest energy from ambient vibration and transform it into electrical energy (Stephen,
2006).
To find optimal architectures for maximal power generation under the different
operating constraints, analysis and verification by simulation of three classes of MEMS-

Chapter 2 Energy Harvesting in Transportation Infrastructures: State-of-the-art
41
based vibration-driven microgenerator architectures were presented by Mitcheson et al.
(2004).
Harb (2011) studied and tested different MEMS systems in laboratory, actuating
electromagnetic microgenerators. These generators presented a maximum energy
conversion efficiency of 18%, with ten cells and a buck converter.
Zorlu and Külah (2013) developed a MEMS-based energy harvesting device to generate
electrical energy from vibrations, with implementation on road pavements being one of
the possible applications. In laboratory tests with a prototype, a maximum output of 3.2
mW/cm3 was achieved, which is a high power density for this type of application.
However, when a prototype was developed to be tested in a real environment, the
energy generation was 6.0 μW/cm3, 500 times lower than in laboratory tests. So, the
technology presents some potential but, when applied in a real environment, its
efficiency decreased considerably.
The patent US20130193930A1 (Baugher, 2013) presents a system consisting of a
microstructure for implementation under the road surface, which uses vibrations to
actuate piezoelectric materials to generate electrical energy. No commercial application
of this system has been developed so far, nor have technical results of experiments been
published, as the system is under development.
2.2.4 Technical analysis
To perform a technical analysis and evaluate an energy generation technology, the most
commonly used parameters are the installed power (per area or volume), conversion
efficiency, power density and the energy generation of the technology in normal
operating conditions (Table 2.2). In the specific case of road pavement energy
harvesting, it is also important to classify the technologies according to the installation
method (IM), as this is an important issue regarding the final cost of the solution, the
driving and safety conditions and the maintenance operations of the equipment. Finally,

Chapter 2 Energy Harvesting in Transportation Infrastructures: State-of-the-art
42
as these are mostly new technologies, it is important to classify them regarding their
development status – in this case, using technology readiness levels (TRLs).
Table 2.2- Parameters for performing a technical analysis.
Parameter Description
Installed
power
The installed power of an electrical energy generation device is its energy generation
capacity in nominal conditions – that is, the maximum theoretical power it can
generate. It is related to the output power and is expressed in watts (W). In many cases,
it is expressed by comparing the installed power with the occupied area of the device
(W/m2), or with the occupied volume of the device (W/m
3). In micro-energy harvesting
devices, the analysis is usually done in regard to volume
Conversion
efficiency
Energy conversion efficiency (η) is the ratio between the useful output of an energy
conversion device and the energy input. In the case of electrical machines, the output is
electrical energy measured in joules (J), or electrical power measured in watts (W).
The energy conversion efficiency is a dimensionless parameter, usually expressed as a
percentage
Energy
generation
Energy generation is used to quantify the amount of electrical energy generated under
the operating conditions. It gives the energy input of the system, its efficiency and the
installed power. Usually, it is expressed in joules, but in some micro-energy harvesting
devices it can also be related to the volume (J/m3). In the analysis of energy harvesting
devices, sometimes power generation is also presented, related to the volume of the
device (W/m3)
IM
The different energy harvesting devices can be installed in the road pavement using
different techniques and in different layers of the road pavement. Four main
installation methods were identified
TRL
TRLs are measures used to evaluate the maturity of a technology during its
developmental stages. These levels were initially defined by NASA (Mankins, 1995),
but are now commonly used in project evaluations
Following the analysis of the different technologies presented in this study, the main
characteristics of each one are presented in Table 2.3. For this analysis, the technologies
that convert both solar and vehicle mechanical energy into useful electrical energy and
which have been tested on road pavements were considered. So, ASC, induction healing
and MEMS technologies were excluded from the analysis.

Chapter 2 Energy Harvesting in Transportation Infrastructures: State-of-the-art
43
Table 2.3- Technical analysis of different road pavement energy harvesting technologies.
Technology Company/ R&D
institute
Installed
power
(W/m2)
Conversion
efficiency (%)
Energy
generation IM
a TRL
b
PV Solar Roadways 97.3 11.2% Not reported 1 4
TNO Not reported Not reported Not reported 2 7c
TEG Hasabe et al. Not reported Not reported 38.0 mW/cm
3 3 3
Wu and Yu Not reported 1.6% 2.6 mW/cm3 3 3
Piezoelectric Innowattech Not reported Not reported 5.8 J/veh m 3 4
Genziko 1942.0 Not reported 40.0 J/veh m 3 4
Hydraulic
Kinergy Not reported Not reported 188.0 J/veh m 1/2 4
New Energy
Technologies Not reported Not reported Not reported 1/2 4
Electro-
mechanical
Waydip 833.0 50.0% 680.0 μW/cm
3
180.0 J/veh m 2 4
Underground
Power Not reported 85.0%
d Not reported 1/2 4
HES Not reported Not reported Not reported 2 3
Energy
Intelligence Not reported Not reported Not reported 2 3
a – IM 1 - on the road pavement surface, fixed to the upper layer (the device surface becomes the new road surface);
IM 2 - embedded in the road pavement, upper layer, surface exposed (the device surface becomes the new road
surface); IM 3 - embedded in the road pavement, upper layer, surface covered by road pavement material; IM 4 -
embedded in the road pavement, lower layer, surface covered by road pavement material
b - TRL 1 - basic principles observed and reported; TRL 2 - technology concept and/or application formulated; TRL
3 - analytical and experimental critical function and/or characteristic proof-of-concept; TRL 4 - component
validation in laboratory environment; TRL 5 - component validation in relevant environment; TRL 6 -
system/subsystem model or prototype demonstration in a relevant environment; TRL 7 - system prototype
demonstration in an operational environment; TRL 8 - actual system completed and qualified through tests and
demonstration; TRL 9 - actual system proven in operational environment
c - For cycle lanes. For road pavements it has only been conceptualized, not prototyped (TRL 1/2)
d - Efficiency on a 1:10 scale and not considering the losses of control, storage and deliver energy to an electrical
load
From Table 2.3, it may be seen that most of the studies do not meet all the parameters
required to perform a complete technical analysis, hindering a more detailed and direct
comparison of all the technologies. Most researchers or companies present only the
energy generation capacity and IM of the developed devices and only a few studies
present the installed power and the conversion efficiency of the technologies. From this
analysis, one can conclude that the systems that make use of vehicle mechanical energy
have a higher conversion efficiency and energy generation capacity than the systems

Chapter 2 Energy Harvesting in Transportation Infrastructures: State-of-the-art
44
that make use of solar radiation. In terms of energy generation, hydraulic and
electromechanical systems present higher capacities.
In terms of IMs, PV systems are mainly applied using IM 1, while TEG systems are
applied under the road surface, using IMs 3 and 4. Piezoelectric systems are also
applied using IM 3, while hydraulic and electromechanical systems can both be
installed using methods 1 or 2, with their surface in direct contact with vehicle wheels,
to maximise the energy input to the system.
In terms of development status, one can conclude that none of these devices are fully
validated and available on the market; they are generally at TRL 3 or 4. The TNO
system is on TRL 7, but this is for cycle path application and does not present any
evidence of application on roads.
To determine fully whether any technology is viable, an economic analysis should also
be performed. In such an analysis, the most important factor is the levelized cost of
electricity (LCOE), which determines the cost per watt produced, relating the total
economic investment in a technology to the energy generated (EIA, 2014). However, no
technology is fully developed and available on the market. So, no economic data of any
product are yet available and such an analysis cannot be performed at this stage.
2.3 Energy Harvesting on Railways
2.3.1 Introduction
The concept of energy harvesting in the railways industry has started with the goal of
directly supplying trackside electrical infrastructure used for safety and monitoring
purposes (e.g. electric and electronic equipment such as sensors, cameras, electric
panels, etc.). These devices typically have a power consumption of 10–100 W (Lin et
al., 2014), so this was set as the energy generation goal in several research projects (Lin
et al., 2014; Phillips, 2011; Pourghodrat, 2011).

Chapter 2 Energy Harvesting in Transportation Infrastructures: State-of-the-art
45
Different systems were developed for this purpose, both for harvesting the mechanical
vibrations induced by trains into the railway track, as well as converting these into
electricity. Energy conversion (or energy generation) technologies are mostly
electromagnetic and piezoelectric but, in the case of electromagnetic technology, the
systems to actuate the energy generation components can be electromechanical,
hydraulic, pneumatic or other specific systems. Electromagnetic generators can be
linear or rotational. Figure 2.2 illustrates the segmentation of the developed systems,
with EH representing energy harvesting and EG representing energy generation.
Figure 2.2- Railway EH and EG technologies.
2.3.2 Piezoelectric technologies
In the case of railways, Nelson et al. (2007) initially developed a system based on
piezoelectric technology to harvest the mechanical energy provided by moving trains to
the rail, in the form of mechanical vibrations and pressure, and to convert it into
electricity. They concluded that the maximum power generation with this technology
was about 0.05 mW per each train passage, a very small value that is insufficient to
supply electric equipment by itself.
The Israeli company Innowattech has also developed a system based on piezoelectric
technology to harvest the mechanical energy of moving trains and convert it into

Chapter 2 Energy Harvesting in Transportation Infrastructures: State-of-the-art
46
electricity (Innowattech, 2014). The company has registered three different patents.
Under the patent WO2009098673 A1 (Abramovich et al., 2009), a piezoelectric
generator (IPEG) is applied under the railroad fixation to the sleeper, producing
electrical energy when compressed by a moving train. Also based on piezoelectric
technology, alternative energy harvesting devices are presented in patents
US20100045111 A1 (Abramovich et al., 2010a) and US20110291526 A1 (Abramovich
et al., 2011); these consist of piezoelectric cells in a stack using the same installation
methodology as patent WO2009098673 A1 (Abramovich et al., 2009). However, no
prototype tests or results have been published about the systems presented in these
patents.
Wischke et al. (2011) tested the IPEG system developed by Innowattech in a laboratory
and in a real environment. They concluded that with one piezoelectric cell, the
maximum energy generation with a passing train was 0.26 mJ, a very small value to
fully supply electric or electronic equipment near the railway track. A huge number of
cells would be required to acquire acceptable values of energy generation with this
technology.
2.3.3 Electromagnetic technologies
Some researchers are investigating energy harvesting techniques on railway tracks using
electromagnetic generators as the energy generation component of the system.
Electromagnetic generators are different from piezoelectric systems, as they are not
actuated directly by the mechanical energy of moving trains. Interfaces are applied
between the energy source and the energy generator in order to maximise the harvested
energy, supply the electromagnetic generators with the appropriate characteristics of
mechanical energy, exploit their maximum efficiency, guarantee best performance and
protect them from high loads that could incur damage. The harvesting units are based on
electromechanical systems, hydraulic or pneumatic systems, or MEMS. The
technologies that have been developed for this purpose are now presented.

Chapter 2 Energy Harvesting in Transportation Infrastructures: State-of-the-art
47
2.3.3.1 Electromechanical actuation
Nelson et al. (2009) were the first to present an electromechanical system for
implementation on railway tracks to convert the mechanical vibrations induced by trains
into electrical energy. Their initial approach consisted of a mechanical system making
use of railway track vibrations to actuate a shaft, via a rack–pinion system, converting
the linear motion of the railway track into rotational motion of the shaft. The shaft, in
turn, was connected to an electromagnetic generator, through a gearbox and a flywheel.
The developed prototype was tested in a laboratory and achieved an energy generation
of 10.05 W for a load identical to a train in motion. This result was considered very
positive, being much higher than all other published results at the time (Nelson et al.,
2009).
Following Nelson’s research, Penamalli (2011) tried to optimise the electromechanical
system with a mechanical approach that increases the number of rotations in the shaft of
the electromagnetic generator, leading to higher generation. This was achieved with a
mechanical system called a "mechanical motion rectifier". The system was also based
on the rack and pinion methodology of Nelson et al. (2009), but it increased the number
of rotations on the shaft, with constant values, turning the irregular upward and
downward track vibrations into a unidirectional motion and used a flywheel to stabilise
the generator speed by storing energy during the high-speed vibration pulse and then
releasing the stored energy to rotate the generator during low-speed vibration. The
prototype was tested in a laboratory with loads emulating a moving train, and achieved
a global energy conversion of 22.0%. The results in terms of energy generation were not
higher than 3.00 W, but the author offered several recommendations for improvements
to the system to increase its efficiency and energy generation (Penamalli, 2011).
Also following the research of Nelson et al. (2009), Pourghodrat (2011) optimised the
electromechanical system, keeping the rack and pinion system, but with a different
approach: the system was actuated in both the downward and upward motion of the
railway track, increasing the rotation of the generator. Computational simulations of the
system presented a potential average output power of 41.82 W, much higher than the
system developed by Nelson’s team. The difference was mainly due to the higher

Chapter 2 Energy Harvesting in Transportation Infrastructures: State-of-the-art
48
rotation of the generator shaft and the new electromagnetic generator integrated in the
system. In extreme conditions (a loaded train and 60 mph (≈97 km/h) travelling speed),
the Nelson’ project achieved 10.05 W. Pourhodrat intended to achieve, theoretically,
306.28 W of average output power. However, when the prototype was tested in the
laboratory, only 4.24 W of average output power was achieved (Pourghodrat, 2011).
After failing to improve on Nelson’s system output, Pourghodrat proposed a new
electromechanical system with a new actuation principle – actuated directly by the train
wheels instead of using only the mechanical vibrations of the railway track
(Pourghodrat, 2011). To develop the system, Pourghodrat used the principle of the
mechanical wayside lubrication system. In this system, each train wheel actuates a lever
that, through the cam-follower mechanical system, actuates the gearbox shaft, which in
turn actuates the electromagnetic generator. The development or testing of a prototype
has not been reported, but Pourghodrat estimates, theoretically, that the system could
produce four times more power than the system developed by Nelson et al. (2009).
Following the research of Nelson et al. (2009) and combining it with the work of
Pourghodrat (2011), Phillips (2011) has modelled and computationally simulated the
potential of both systems. Phillips concluded that Pourghodrat’s system presents the
greater potential for generating electrical energy, achieving a theoretical value of 276.87
W, which is enough to supply most of the electric devices used near railway tracks.
Phillips also tested the system proposed by Pourghodrat (2011) in a laboratory,
achieving an average power output of 5.29 W. It was concluded that the problem was in
the generator shaft speed, which did not reach the theoretical speeds, leading to much
lower power generation in practice.
Following on from the research of Nelson et al. (2009) and Penamalli (2011), Lin et al.
(2014) optimised the electromechanical system, based on the double rack and pinion
proposed by Penamalli (2011), with a new mechanical approach. Lin et al. aimed to
reduce friction, which was the main cause of the low experimental results achieved with
the prototype developed by Penamalli (2011), and so used a single shaft, doubly
actuated (downward and upward motion of the railway track), with one flywheel and a
gearbox, connecting the shaft to the generator. The prototype was tested in the

Chapter 2 Energy Harvesting in Transportation Infrastructures: State-of-the-art
49
laboratory and in a real environment, and managed an average power output of 49.80
W, almost five times higher than the Nelson et al. (2009) prototype under the same test
conditions. This system achieved an overall conversion efficiency of 45.60%, the
highest value achieved with a prototype when comparing all the devices.
2.3.3.2 Hydraulic actuation
In railways, mechanical energy is delivered from train loads to the railway track so
hydraulic systems can be used in the opposite way to their common use: transmitting
the mechanical energy of the train to actuate electric machines.
Oxtoby (2010) developed a hydraulic system that makes use of the weight of a train to
actuate a turbine. In this system, a passing train compresses a pad on the railway track,
which produces a flow of air that in turn actuates a turbine. However, no technical
results of this system were presented and no commercial application of the system was
found.
Besides the two electromechanical systems described earlier, Pourghodrat (2011) also
came up with a hydraulic energy harvesting system to actuate an electromagnetic
generator using a train’s mechanical energy. The goal with this system was to amplify
the vertical deflection of the rail using a hydraulic actuator. This system was expected to
achieve 40.00 W of power output for each loaded train passage, and a prototype was
tested in the laboratory. Under the same test conditions used for the two
electromechanical systems proposed by Pourghodrat (2011), the hydraulic system
achieved an average power output of 11.08 W in the best case scenario. This is a
promising result because several hydraulic energy harvesters can be connected to the
same electromagnetic generator, multiplying the power output for the same train
passage, without additional electromagnetic generators.

Chapter 2 Energy Harvesting in Transportation Infrastructures: State-of-the-art
50
2.3.3.3 Other actuation types
Nelson et al. (2007) originally started the concept of harvesting a train’s mechanical
energy on a railway track by using an electromagnetic device, a simple electromagnetic
linear generator, directly driven by the vertical displacement of the rail. The generator
was called the ‘inductive coil’ electromagnetic generator. This system, tested in the
laboratory, achieved an average power output of 0.15 mW. Mian (2013a, 2013b),
representing the US International Electronic Machines Corporation (IEM, 2015),
developed a similar concept but, instead of using an inductive coil, used a magnetic coil
actuated by the train wheel pressure. This system was patented (Mian, 2013a, 2013b),
but technical results of the prototype have not been published. On the IEM website, this
technology is presented as a module of a multi-energy harvesting technology that is part
of the solution called RailPower Suite, which comprises several technologies for
harvesting energy on or nearby railroads and converting it into electrical energy.
However, with no technical results reported, it is not possible to compare this
technology with the other systems discussed.
2.3.4 Technical analysis
To perform a technical analysis and evaluate an energy generation technology, the most
commonly used parameters were presented in Table 2.2. For the particular case of the
railway energy harvesting systems, the IM is different when compared with the road
pavement energy harvesting systems, as different energy harvesting devices can be
installed on railway track using different techniques and in different zones of the
railway track. Three main IMs were identified:
IM 1: fixed on the rail lateral area, harvesting the rail vibrations;
IM 2: fixed on the rail base, between the rail and the sleeper;
IM 3: fixed on the railway track, harvesting the train’s wheel mechanical
pressure.

Chapter 2 Energy Harvesting in Transportation Infrastructures: State-of-the-art
51
Following the analysis of the different technologies previously presented, the main
characteristics of each are presented in Table 2.4. For this analysis, only technologies
with results published in scientific papers were considered. Table 2.4 reveals that most
of the reported studies do not quantify the conversion efficiency of the technologies, but
almost all reveal the power/energy generation, the IM and identify the TRL. From this
analysis, one can conclude that most current research is based on electromechanical
systems and these are the ones that permit higher values in terms of electrical energy
production.
Table 2.4- Technical analysis of different railway energy harvesting technologies.
Technology Reference Conversion
efficiency (%)
Power/ energy
generation IM TRL
Piezoelectric
Nelson et al. (2007) Not reported 0.05 x 10⁻³
W 1 5
Abramovich et al. (2009,
2010a, 2011) Not reported Not reported 2 3
Wischke et al. (2011) Not reported 0.26x10⁻³
W.s (J) 2 5
Hydraulic Oxtoby (2010) Not reported Not reported 3 2
Pourghodrat (2011) Not reported 11.08 W 1 4
Electro-
mechanical
Nelson et al. (2009) Not reported 10.05 W 1 4
Penamalli (2011) 22.0% 2.50 W 1 4
Pourghodrat (2011) Not reported 4.24 W 1 4
Pourghodrat (2011) Not reported 50.00 Wa 3 2
Philips (2011) Not reported 5.29 W 1 4
Lin et al. (2014) 45.6% 49.8 W 1 5
Other Nelson et al. (2007) Not reported 0.15 W 1 3
Mian (2013a, 2013b) Not reported Not reported 3 -
a – Theoretical value
The system developed by Lin et al. (2014), resulting from an optimisation of two
previous studies (Nelson et al., 2009; Penamalli, 2011), presents the highest value in
terms of energy generation (proved experimentally) and is one of the most advanced in
terms of TRL. Piezoelectric technology, besides being on an advanced TRL, presents
very low energy production values, making it a technology with low technical and
economic viability for generating electrical energy. Hydraulic systems, especially the
system developed by Pourghodrat (2011), present an interesting potential: with one unit

Chapter 2 Energy Harvesting in Transportation Infrastructures: State-of-the-art
52
a good value was achieved in terms of energy production (the second highest
experimentally proven value) and this could be multiplied with the use of more
hydraulic units connected to the same electromagnetic generator.
In terms of IM, most of the technologies are fixed on the rail lateral area, harvesting the
mechanical vibrations of the railway. The exceptions are the piezoelectric systems
installed between the rail and the sleepers and some other systems that use the pressure
of the train’s wheels to harvest mechanical energy directly from the train’s weight.
In terms of TRL, the system developed by Mian (2013a, 2013b) is already
commercially available (IEM, 2015), but no values regarding energy production or
conversion efficiency have been published. Innowattech (2014) also presents some
piezoelectric solutions in its portfolio, but again with no reported values for energy
generation or energy conversion efficiency of the systems. Apart from these two
systems, which are related to the R&D of the companies, the electromechanical system
presented by Lin et al. (2014) is at the most advanced stage as it has been tested and
validated in a real environment. Most of the other solutions analysed have only been
tested in laboratory conditions.
2.4 Summary and conclusions
2.4.1 Road pavement technologies
The concept of road pavement energy harvesting has become increasingly popular over
the last few years. Unlike the case of wind energy, the present situation shows a wide
variety of energy harvesting systems, at several stages of development, competing
against each other to get an opportunity in the market. In the last 15 years or so, the
research and development activity in road pavement energy harvesting has been
developed more by companies than by universities, leading to a lack of scientific
evidence being available on the developed technologies. The tests performed were not
fully characterised in the literature, making very limited information available about the
experimental tests and results obtained. It is clear that none of the developed

Chapter 2 Energy Harvesting in Transportation Infrastructures: State-of-the-art
53
technologies have been fully developed and validated, as none of them have entered the
market with a finished and certified product (with the exception of ASC, which is an
energy harvesting system, but not to generate electrical energy). In the road pavement
energy harvesting field, most of the technologies are at a laboratorial and prototyping
validation stage.
Comparing the technologies that make use of solar energy as their energy source with
the technologies that make use of vehicle mechanical energy, the former is at a more
advanced developmental stage, as it makes use of more mature systems and
technologies. However, presently, most research and development is being performed
on the latter, mainly due to the higher potential that these systems present, in terms of
energy conversion efficiency, energy generation and adaptability to road pavement
conditions.
Comparing the technologies that make use of solar energy as an energy source, PV
systems are the most efficient and mature. However, the implementation on road
pavements is still a challenge, as glass has been used on the PV cells, causing
difficulties for vehicle adherence, which is essential to guarantee rolling capacity and
safety conditions. Systems that make use of TEGs are easier to install on the road
pavement; however, efficiency is considerably reduced.
Comparing the technologies that make use of vehicle mechanical energy as an energy
source, piezoelectric technology was the first to get the attention of researchers.
However, due to its lower energy conversion efficiency, the developments with this
technology have decreased in the last 4 or 5 years. On the other hand, there has been an
increase in research and development of electromechanical systems that harvest vehicle
mechanical energy and, using electromagnetic generators, generate electrical energy.
These, together with hydraulic systems, have registered the highest energy generation
values in experimental tests. Their installation is also simpler than the installation of
piezoelectric devices and they currently present a higher likelihood of success as an
effective solution to transform vehicle mechanical energy into electrical energy
effectively.

Chapter 2 Energy Harvesting in Transportation Infrastructures: State-of-the-art
54
MEMS also present potential in this field since they have been successful in other
applications. However, in the case of road pavement energy harvesting, they have been
applied to harvesting pavement vibrations instead of directly harvesting vehicle
mechanical energy. Pavement vibrations represent a small amount of the available
energy, leading to a low level of energy generation. In the future, these systems should
also be developed to harvest vehicle mechanical energy in order to maximise energy
generation.
2.4.2 Railway technologies
The concept of railway energy harvesting is a very recent area of research, which has
only taken off in the last five years. Unlike wind energy, the present situation shows a
wide variety of energy harvesting systems at several stages of development and
competing with each other to obtain an opportunity in the market. Different
technologies are being investigated in order to convert the mechanical energy induced
by trains on railway tracks into electrical energy. Piezoelectric and electromagnetic
technologies are dominant, with electromagnetic generators being actuated by different
harvesting systems.
In terms of systems/technologies validated in a real environment and with published
results, only one system is available. This system, developed by Lin et al. (2014),
achieved a power production of 49.80 W for each train passage. Higher values of
energy production can be achieved for each train passage by multiplying the number of
devices, but investment in the solution would clearly be multiplied by the number of
devices. In that sense, the hydraulic system proposed by Pourghodrat (2011) could be a
very interesting solution. With one hydraulic energy harvester and one electromagnetic
generator, a power production of 11.08 W for one train passage was achieved in the
laboratory; as this system allows multiplication of the number of hydraulic harvesters
for the same electromagnetic generator, the harvested energy (and consequently the
electrical energy produced) can be multiplied without the need to multiply the number
of generators. Energy production could thus be greatly increased with a lower

Chapter 2 Energy Harvesting in Transportation Infrastructures: State-of-the-art
55
investment increase than required for the electromechanical system proposed by Lin et
al. (2014).
In terms of energy application, most researchers have targeted the electric and electronic
devices used to monitor railway tracks and guarantee user safety; these devices have
power consumptions of 10.00–100.00 W (Zuo and Tang, 2013). To supply these electric
and electronic devices, the systems proposed by Lin et al. (2014) and Pourghodrat
(2011) offer potential. These devices are the most targeted solutions, mainly due to the
fact that there are many areas on railway lines with no electricity, making it a challenge
to supply electric devices in those areas. The use of generated electrical energy to
directly supply electrical equipment near the railway is, at the present time, the most
interesting application for energy harvesting equipment.
However, by multiplying the number of energy harvesters and generators, higher values
of energy production could be achieved and the concept of railway energy harvesting
could increase its potential by injecting the produced energy into the national grid.
Considering the available power from a railway track over long distances, the extraction
and generation of a great amount of energy is possible (Zuo and Tang, 2013). These two
major applications should be considered when the technical and economic viability of
the developed technologies is studied: the cost of each solution needs to be considered
to analyse the return on investment.
In terms of future directions, the developed systems should be optimised and tested in
real environments, using the generated electrical energy to supply electrical equipment
used near railways or, if high energy generation values were achieved, to inject energy
into the electrical grid. New devices should also be developed using different
technologies that allow the conversion of mechanical energy into electrical energy, such
as pneumatic devices and other hydraulic systems, different from the system developed
by Pourghodrat (2011). Energy storage also needs to be analysed: these systems capture
mechanical energy, which can be more easily and efficiently stored than electrical
energy and then converted into electrical energy only when needed. The simultaneous
use of harvesting, storage and converting systems could be a key factor for the success
of mechanical energy harvesting and should be one of the key research areas in the

Chapter 2 Energy Harvesting in Transportation Infrastructures: State-of-the-art
56
future. Finally, the effect of railway dynamics on the developed systems needs to be
analysed to guarantee that a sufficient period of in-service time is available to make this
new technology viable as an alternative power source in economic terms.
2.5 References
Abramovich, H., Harash, E., Milgrom, C. and Amit, U. (2009). Power Harvesting from
Railways; Apparatus System and Method. Patent WO2009098673 A1, Aug.
Abramovich, H., Milgrom, C., Harash, E., Azulay, L. and Amit, U. (2010a). Multi-layer
modular energy harvesting apparatus, system and method. US Patent
US20100045111 A1, Feb.
Abramovich, H., Harash, E., Milgrom, C., Azulay, L., Tsikhotsky, E. and Amit, U.
(2010b). Modular Piezoelectric Generators. International Patent Application
PCT/IL2009/000365, Patent WO2010116348 A1, Oct.
Abramovich, H., Milgrom, C., Harash, E., Azulay, L. and Amit, U. (2011).
Piezoelectric Stack Compression Generator. US Patent US20110291526 A1, Dec.
Abramovich, H., Milgrom, C., Harash, E., Azulay, L., Amit, U. and Klein, G. (2012).
Piezoelectric-based weight in motion system and method for moving vehicles.
International Patent Application PCT/IL2011/000741, Patent WO2012038955 A1,
Mar.
Angel, R. and Gomez, J. (1997). Road vehicle-actuated air compressor. US Patent
US5634774, Jun.
Arroyo, E. and Badel, A. (2011). Electromagnetic vibration energy harvesting device
optimization by synchronous energy extraction. Sensors and Actuators A:
Physical, 171(2): 266-273.
Baugher, J.P. (2013). Energy Harvesting with a Mico-Electro-Mechanical System
(MEMS). US Patent US20130193930 A1, Aug.

Chapter 2 Energy Harvesting in Transportation Infrastructures: State-of-the-art
57
Beeby, S. P., Tudor, M. J. and White, N. M., (2006). Energy harvesting vibration
sources for Microsystems applications. Journal of Measurement Science and
Technology, 17(12): R175.
Beeby, S. P., Torah, R. N., Tudor, M. J., Glynne-Jones, P., O'Donnell, T., Saha, C. R.
and Roy, S. (2007). A micro electromagnetic generator for vibration energy
harvesting. Journal of Micromechanics and microengineering, 17(7): 1257.
Bobes-Jesus, V., Pascual-Muñoz, P. and Castro-Fresno, D. (2013). Asphalt solar
collectors: A literature review. Applied Energy 102: 962-970.
Bowen, L. and Near, C (2000). Low voltage piezoelectric actuator. US Patent
6,111,818, Aug.
Brusaw, S. and Brusaw, J. (2014). Solar Roadway Panel. Design Patent US D712822S,
Set.
Calvo, R. and Calvo, J. (2004). Highway electric power generator. US Patent
US6767161 B1, Jul.
Chang, H. and Lee, C. (2011). On-road energy conversion and vibration absorber
apparatus. US Patent US20110215593 A1, Sep.
Chen, R. (2009). Vehicular Movement Electricity Converter Embedded Within A Road
Bumb. US Patent US20090315334 A1, Dec.
Davis, C.R. (2007). Roadway power generating system. US Patent US20070181372 A1,
Aug.
Daya, A. (2010). Road vehicle actuated energy device. US Patent US7714456 B1, May.
Duarte, F. and Casimiro, F. (2011). Pavement module for generating electric energy
from the movement of people and vehicles. International Patent Application
PCT/IB2011/052164, Patent WO2011145057 A2, Nov.
Duarte, F. and Casimiro, F. (2013). Electromechanical system for electric energy
generation and storage using a surface motion. International Patent Application
PCT/IB2013/050616, Patent WO2013114253 A1, Aug.

Chapter 2 Energy Harvesting in Transportation Infrastructures: State-of-the-art
58
Duarte, F., Casimiro, F., Correia, D., Mendes, R. and Ferreira, A. (2013a). Waynergy
People: a new pavement energy harvest system. Proceedings of the Institution of
Civil Engineers – Municipal Engineer, 166(4): 250-256,
http://dx.doi.org/10.1680/muen.12.00049.
Duarte, F., Casimiro, F., Correia, D., Mendes, R. and Ferreira, A. (2013b). A new
pavement energy harvest system. Proceedings of the International Renewable and
Sustainable Energy Conference, Ouarzazate, Morocco. IEEE – Institute of Electrical
and Electronics Engineers, New York, NY, USA (CD-ROM).
Duarte, F., Champalimaud, J. and Ferreira, A. (2014). Waynergy Vehicles: an
innovative pavement energy harvest system. Proceedings of the 2nd
International
Congress on Energy Efficiency and Energy Related Materials, Oludeniz, Turkey.
Springer, London, UK (CD-ROM).
Duarte, F., Champalimaud, J. and Ferreira, A. (2016). Waynergy Vehicles: an
innovative pavement energy harvest system. Proceedings of the Institution of Civil
Engineers – Municipal Engineer, 169(1): 13-18,
http://dx.doi.org/10.1680/muen.14.00021.
EIA (2014). Levelized Cost and Levelized Avoided Cost of New Generation Resources
in the Annual Energy Outlook 2014. U.S. Energy Information Administration,
Washington DC, USA. Available from:
http://www.eia.gov/forecasts/aeo/pdf/electricity_generation.pdf. Accessed in
September, 2015.
Elliott, S. J. and Zilletti, M. (2014). Scaling of electromagnetic transducers for shunt
damping and energy harvesting. Journal of Sound and Vibration, 333(8): 2185-2195.
EnergyIntelligence (2014). http://www.energyintel.us/. Accessed in December, 2014.
Galich, T. (2002). Force stand for electrical energy producing platform. US Patent
US6376925 B1, Apr.
Gao, Q., Huang, Y., Li, M., Liu, Y. and Yan, Y. Y. (2010). Experimental study of slab
solar collection on the hydronic system of road. Solar Energy, 84(12): 2096-2102.

Chapter 2 Energy Harvesting in Transportation Infrastructures: State-of-the-art
59
Genziko (2014). http://www.genziko.com/. Accessed in December, 2014.
Harb, A. (2011). Energy Harvesting: State-of-the-art. Renewable Energy, 36(10): 2641-
2654.
Hasebe, M., Kamikawa, Y. and Meiarashi, S. (2006). Thermoelectric Generators using
Solar Thermal Energy in Heated Road Pavement. In Proceedings ICT ’06 – 25th
International Conference on Thermoelectrics (ICT), Vienna, Austria. IEEE –
Institute of Electrical and Electronics Engineers, New York, NY, USA, pp. 697–700.
Hendrickson, B. (2010a). Adaptive, Low-impact vehicle energy harvester. US Patent
US20100192561 A1, Aug.
Hendrickson, B. (2010b). Vehicle energy harvesting roadway. International Patent
Application PCT/US2010/020676, Patent WO2010081113 A1, Jul.
HES (Highway Energy Services) (2015). http://www.hughesresearch.co.uk/. Accessed
in January, 2015.
Hill, D., Agarwal, A. and Tong, N. (2014). Assessment of piezoelectric materials for
roadway energy harvesting. DNV KEMA Energy and Sustainability, Sacramento,
FL, USA. Available from: http://www.energy.ca.gov/2013publications/CEC-500-
2013-007/CEC-500-2013-007.pdf. Accessed in September 2015.
Horianopoulos, D. and Horianopoulos, S. (2007). Traffic-actuated electrical generator
apparatus. International Patent Application PCT/CA2006/001710, Patent WO
2007045087 A1, Apr.
Houghton, L. (2011). Hydraulic powermat. UK Patent Application GB 2476826 A,
Intellectual Property Office, UK, Jul.
Hughes, P., Hughes, A.M., Hughes, R. and Hughes, A.P. (2004). Apparatus for
converting kinetic energy. International Patent Application PCT/GB2004/000364,
Patent WO2004067850 A1, Aug.
Hughes, P., Hughes, A.M., Hughes, R. and Hughes, A.P. (2009). Improvements in and
relating to apparatus for converting kinetic energy. International Patent Application
PCT/GB2009/050145, Patent WO2009101448 A1, Aug.

Chapter 2 Energy Harvesting in Transportation Infrastructures: State-of-the-art
60
Hunter, J. (2006). Vehicle actuated road imbedded magneto generator. US Patent
US7102244 B2, Sep.
ICAX (2014). http://www.icax.co.uk. Accessed in November, 2014.
IEM (International Electronic Machines Corporation) (2015). http://www.iem.net/.
Accessed in June, 2015.
Innowattech (2014). http://www.innowattech.co.il/. Accessed in July, 2014.
Jang, J. S. (2011). Electrical generator apparatus, particularly for use on a vehicle
roadway. US Patent US20110187125 A1, Aug.
Kang-Won, W. and Correia, A.J. (2010). A pilot study for investigation of novel
methods to harvest solar energy from asphalt pavements. Korea Institute of
Construction Technology (KICT), Goyang City, South Korea.
Kazmierski, T. and Beeby, S. (Eds.). (2009). Energy harvesting Systems - Principles,
Modeling and Applications. Springer, New York, NY, USA.
Kelk (2015). http://www.kelk.co.jp/english/index.html. Accessed in February, 2015.
Kenney, T. (2004). System and method for electrical power generation utilizing vehicle
traffic on roadways. US Patent US20040130158 A1, Jul.
Khaligh, A. and Onar, O. C. (2010). Energy harvesting: solar, wind, and ocean energy
conversion systems. CRC Press Inc., Boca Raton, FL, USA.
Kinergy Power (2014). http://www.kinergypower.com/index.shtml. Accessed in
December, 2014.
Klein, G., Tsikhotsky, E., Abramovich, H. and Milgrom, C. (2012). Modular
Piezoelectric generators with a mechanical force multiplier. International Patent
Application PCT/IL2012/050369, Patent WO2013038415 A1, Mar.
Lin, T., Wang, J. and Zuo, L. (2014). Energy Harvesting from Rail Track for
Transportation Safety and Monitoring. University Transportation Research Center,
New York, NY, USA, UTRC-II Project Final Report, pp. 1–11.

Chapter 2 Energy Harvesting in Transportation Infrastructures: State-of-the-art
61
Loomans, M., Oversloot, H., de Bondt, A., Jansen, R. and van Rij, H. (2003). Design
tool for the thermal energy potential of asphalt pavements. Proceedings of Building
Simulation ’03 – the 8th International Building Performance Simulation Association
International Conference, Eindhoven, the Netherlands, pp. 745–752.
Lund, J. W. (2000). Pavement snow melting. Geo-Heat Center Quarterly
Bulletin, 21(2): 12-19.
Lundgren, R. (1984). Device for generating electricity by pedestrian and vehicular
traffic. US Patent US4434374, Feb.
Luttrull, J. (2005). Roadway generating electrical power by incorporating piezoelectric
materials. Patent US20050127677 A1, Jun.
Mallick, R. B., Chen, B. L. and Bhowmick, S. (2009). Reduction of urban heat island
effect through harvest of heat energy from asphalt pavements. In Proceedings of the
2nd international conference on countermeasures to urban heat Islands effect,
September. Berkeley, CA, USA. (Melvin P (ed.)). Lawrence Berkeley National
Laboratory, Berkeley, CA, USA, pp. 1–20.
Mankins, J. C. (1995). Technology readiness levels. White Paper, April, 6. National
Aeronautics and Space Administration (NASA), Washington, DC, USA.
Mansfield, R., Shani, N. and Shani, D. (2012). Method and system for energy
harvesting, recapture and control. International Patent Application
PCT/US2012/000033, Patent WO2012099706 A2, Jul.
Martinez, S. (1980). Highway turbine. US Patent US4238687, Dec.
Mian, Z. (2013a). Wireless Railroad Monitoring. US Patent US8423240 B2, Apr.
Mian, Z. (2013b). Energy Harvesting. US Patent US20130221680 A1, Aug.
Mitcheson, P. D., Green, T. C., Yeatman, E. M. and Holmes, A. S. (2004).
Architectures for vibration-driven micropower generators. Journal of
Microelectromechanical Systems, 13(3): 429-440.

Chapter 2 Energy Harvesting in Transportation Infrastructures: State-of-the-art
62
Morita, K. and Tago, M. (2000). Operational characteristics of the Gaia snow-melting
system in Ninohe, Iwate, Japan. In Proceedings of World Geothermal Congress.
Oregon Institute of Technology, Klamath Falls, OR, USA, pp. 3511–3516.
Morley, B, Roberts, E., Dean, L., Debenham, M. and Hammond, J. (2005). Rollers set
in road to extract energy from vehicles. UK Patent Application GB2408074 A, May.
Munaz, A., Lee, B. C. and Chung, G. S. (2013). A study of an electromagnetic energy
harvester using multi-pole magnet. Sensors and Actuators A: Physical, 201(2013):
134-140.
Nakatsu, S. (1994). Road apparatus. UK Patent Application GB2290115 A, Dec.
Near, C. (2013). Power Generator. US Patent US20130207520 A1, Aug.
Nelson, C., Platt, S., Farritor, S., Albrecht, D. and Kamarajugadda, V. (2007).
Regenerative Power for Track-Health Monitoring. Federal Railroad Administration,
Washington, DC, USA, RR 07-22, pp. 1–4.
Nelson, C., Platt, S., Hansen, S. and Fateh, M. (2009). Power harvesting for railroad
track safety enhancement using vertical track displacement. In SPIE Smart Structures
and Materials + Nondestructive Evaluation and Health Monitoring (Ahmadian, M.
and Ghasemi-Nejhad, M. (eds)). International Society for Optics and Photonics,
Bellingham, WA, USA, vol. 7288.
NewEnergyTechnologies (2015). http://www.newenergytechnologiesinc.com/.
Accessed in February, 2015.
Oxtoby, D. (2010). Road or Rail Track Energy Generator. UK Patent GB2469294 A,
Oct.
Parr, A. (2011). Hydraulics and pneumatics: a technician's and engineer's guide.
Elsevier, Oxford, UK.
Penamalli, G. (2011). Structural Health Monitoring and Energy Harvesting for
Railroad. Stony Brook University, Stony Brook, NY, USA.
Peralta, M., Costa-Krämer, J. L., Medina, E. and Donoso, A. (2014). Analysis and
fabrication steps for a 3D-pyramidal high density coil electromagnetic micro-

Chapter 2 Energy Harvesting in Transportation Infrastructures: State-of-the-art
63
generator for energy harvesting applications. Sensors and Actuators A:
Physical, 205(2014): 103-110.
Phillips, K. (2011). Simulation and Control System of a Railroad Track Power
Harvesting Device. University of Nebraska, Lincoln, NE, USA.
Pirisi, A. (2012). System for converting potential or kinetic energy of a body weighting
upon or travelling over a support or transit plane into useful energy. US Patent
US20120248788A1, Oct.
Pirisi, A., Grimaccia, F., Mussetta, M. and Zich, R. E. (2012a). Novel speed bumps
design and optimization for vehicles’ energy recovery in smart
cities. Energies, 5(11): 4624-4642.
Pirisi, A., Grimaccia, F., Mussetta, M. and Zich, R. E. (2012b). An evolutionary
optimized device for energy harvesting from traffic. In 2012 IEEE Congress
on Evolutionary Computation (CEC). IEEE - Institute of Electrical and Electronics
Engineers, New York, NY, USA.
Pirisi, A., Mussetta, M., Grimaccia, F. and Zich, R. E. (2013). Novel speed-bump
design and optimization for energy harvesting from traffic. IEEE Transactions on
Intelligent Transportation Systems, 14(4): 1983-1991.
Pourghodrat, A. (2011). Energy Harvesting Systems Design for Railroad Safety.
University of Nebraska, Lincoln, NE, USA.
Priya, S., and Inman, D. J. (Eds.) (2009). Energy harvesting technologies. Springer,
New York, NY, USA, vol. 21.
RES (Road Energy Systems) (2007). Energy from asphalt - asphalt solar collectors for
heating and cooling buildings and roads. Road Energy Systems, Avenhom, the
Netherlands. Available from:
http://www.ooms.nl/en/7/301/road_energy_system.aspx. Accessed in September,
2015.
Saha, C. R. (2011). Modelling theory and applications of the electromagnetic
vibrational generator. In Sustainable Energy Harvesting Technologies - Past, Present

Chapter 2 Energy Harvesting in Transportation Infrastructures: State-of-the-art
64
and Future (Tan, Y.K. (ed.)). InTech, Rijeka, Croatia, pp. 55-108. Available from:
http://www.intechopen.com/books/sustainable-energy-harvestingtechnologies-past-
present-and-future/modelling-theory-and-applications-of-the-electromagnetic-
vibrationalgenerator. Accessed in July, 2015.
Schreier, M., Roschewsky, N., Dobler, E., Meyer, S., Huebl, H., Gross, R., and
Goennenwein, S. (2013). Current heating induced spin Seebeck effect. Applied
Physics Letters, 103(242404): 1-5.
Smith, R. (1979). Road vehicle-actuated air compressor and system therefore. US
Patent US4173431, Nov.
SolaRoad (2014). http://www.solaroad.nl/en/. Accessed in November, 2014.
SR (Solar Roadways) (2015). http://www.solarroadways.com/main.html. Accessed in
February, 2015.
Stephen, N. G. (2006). On energy harvesting from ambient vibration. Journal of Sound
and Vibration, 293(1): 409-425.
Sullivan, C., Bondt, A., Jansen, R., and Verweijmeren (2007). Innovation in the
production and commercial use of energy extracted from asphalt pavements. Ooms
International Holding bv, Chelford, Cheshire, UK. Available from:
http://www.materialedge.co.uk/docs/Energy%20from%20Asphalt%20paper%2020%
2011%2006.pdf. Accessed in September, 2015.
TNO (2014). https://www.tno.nl/index.cfm/. Accessed in May, 2014.
Tu, Y., Li, J., and Guan, C. (2010). Heat transfer analysis of asphalt concrete pavement
based on snow melting. In 2010 International Conference on Electrical and Control
Engineering (ICECE), Wuhan, China. IEEE – Institute of Electrical and Electronics
Engineers, New York, NY, USA, pp. 3795–3798.
Underground Power (2014). http://www.upgen.it/. Accessed in December, 2014.
Valon, F. (2007). Highway's electrogenerators. US Patent US 20070246940 A1, Oct.
Waydip (2015). http://www.waydip.com/. Accessed in February, 2015.

Chapter 2 Energy Harvesting in Transportation Infrastructures: State-of-the-art
65
Wischke, M., Masur, M., Kroer, M. and Woias, P. (2011). Vibration harvesting in
traffic tunnels to power wireless sensor nodes. Smart Materials and Structures,
20(8): 1-8.
Wu, G. and Yu, X. (2012). Thermal Energy Harvesting Across Pavement Structure,
Proceedings of the Transportation Research Board (TRB) 91st Annual Meeting.
Transportation Research Board, Washington, DC, USA.
Wu, G. and Yu, X. (2013). Computer-Aided Design of Thermal Energy Harvesting
System across Pavement Structure. International Journal of Pavement Research and
Technology, 6(2): 73-79.
Xiang, H. J., Wang, J. J., Shi, Z. F. and Zhang, Z. W. (2013). Theoretical analysis of
piezoelectric energy harvesting from traffic induced deformation of
pavements. Smart Materials and Structures, 22(9): 095024.
Xiong, H., Wang, L., Wang, D. and Druta, C. (2012). Piezoelectric Energy Harvesting
from Traffic Induced Deformation of Pavements. International Journal of Pavement
Research and Technology. 5(5): 333-337.
Yildiz, F. (2009). Potential ambient energy-harvesting sources and techniques. Journal
of Technology Studies, 35(35): 40-48.
Zhao, H., Yu, J. and Ling, J. (2010). Finite element analysis of cymbal piezoelectric
transducers for harvesting energy from asphalt pavement. Journal of the Ceramic
Society of Japan, 118(1382): 909-915.
Zhao, H., Qin, L., Tao, Y. and Ling, J. (2013). Study on structure of PZT piles based
transducer for harvesting energy from asphalt pavement. Proceedings of the
International Journal of Pavements Conference, São Paulo, Brazil. IJP, São Paulo,
Brazil (CD-ROM).
Zorlu, Ö. and Külah, H. (2013). A MEMS-based energy harvester for generating energy
from non-resonant environmental vibrations. Sensors and Actuators A: Physical,
202: 124-134.

Chapter 2 Energy Harvesting in Transportation Infrastructures: State-of-the-art
66
Zuo, L. and Tang, X. (2013). Large-scale vibration energy harvesting. Journal of
Intelligent Material Systems and Structures, 24(11): 1405–1430.

67
Chapter 3
Development of a Software Tool to
Evaluate the Vehicle-Road
Interaction
3.1 Introduction
Road vehicles consume energy to work their engines and release energy in different
ways, by way of different components. Part of the energy released by vehicles goes into
the road pavement; 15 to 21 per cent of the energy is transferred to the vehicle’s wheels,
in a free rolling situation (IEA, 2012; Hendrowati et al., 2012), with the maximum
energy being transferred to the road pavement when there is a braking action, or when
vehicle wheels hit an elevated obstacle. From the vehicle loads, it is possible to extract
energy onto the pavement, which, using specific technologies, can be transformed into
electrical energy (Duarte and Ferreira, 2016; Andriopoulou, 2012).
From an energetic perspective, road vehicles represent a potential energy source. The
road pavement or specific equipment applied on its surface, such as speed reducer
equipment (SRE) or energy harvesting devices (EHD), becomes the energy collector
that extracts energy from vehicles and delivers it to specific components, which are then

Chapter 3 Development of a Software Tool to Evaluate the Vehicle-Road Interaction
68
responsible for its conversion into other useful means of energy, such as electrical
energy.
Because of the increasing rates of road accidents with serious injuries and fatalities,
road safety measures are being implemented globally, with speed reduction being the
main point of action (WHO, 2010, 2013). SRE, such as speed bumps or speed humps,
are the most commonly implemented measures, as they are the solution with the best
performance and effectiveness in speed reduction (Elvik et al., 2009; Ewing and Brown,
2009).
These humps or bumps cause great discomfort to vehicle passengers if the vehicle goes
over the obstacle above the design speed. To avoid this, drivers reduce the vehicle speed
by braking, before hitting the obstacle, losing energy to the brakes and to the pavement
before the obstacle. This “lost” energy can be harvested on the pavement, and then
converted into other means of energy.
Road vehicles can have different motion situations, such as free rolling, braking,
accelerating or turning. In each of them, they will have different forces and moment
distributions, which will depend on their characteristics, such as mass, geometry,
suspension and tyre characteristics, among other things. In each of these situations, as
the mass distributions and, consequently, the force distributions are different at each
vehicle wheel, different amounts of energy are transferred to the road pavement. To
perform a precise energy transfer analysis, both the static forces that vehicles induce on
the road pavement and the dynamic forces resulting from the vehicle’s oscillations must
be quantified. The element which contributes most to these oscillations is the road
surface, which can have different profiles and be made of different materials. This is
more relevant in the case of SRE or EHD, which typically induces higher oscillations on
the vehicle. The geometric profile of these elements is essential to evaluate the vehicle’s
dynamic behaviour.
There are some commercially available software tools for simulating the motion of
vehicles, quantifying the forces induced on the pavement, as well as the forces
developed by each component of the vehicle, such as tyres, suspensions, etc. The two

Chapter 3 Development of a Software Tool to Evaluate the Vehicle-Road Interaction
69
main software tools available for this purpose are ADAMS® (MSC.Software, 2016) and
AUTOSIM® (Carsim, 2016).
Although both software tools work well, when the goal is to perform an energetic
analysis on the interaction between the vehicle and the road pavement elements, such as
SRE or EHD (or any other device that is applied on the road pavement, with specific
motion characteristics), these software tools have limitations, because they were not
developed for this purpose.
Other studies to evaluate the vehicle dynamic performance in response to the road
pavement profile were done using specific models mostly based on the quarter-car
model (Borowiec et al., 2010; Barbosa, 2011; Florin and Liliana, 2013; Hassaan, 2014,
2015). However, the quarter-car model does not include the vehicle pitch, which is
important when considerable oscillations are induced on the vehicle body, as in the case
of SRE. Farroni (2016) has also developed a software tool to evaluate the tyre–road
interaction, focusing on the evaluation of steering actions on vehicle, but this tool does
not perform energetic analysis or allows including specific surface profiles on the
pavement.
Following the aforementioned facts, a simulation software tool that allows to study the
vehicle-road interaction (VRI) from an energetic perspective, in order to quantify the
amount of energy released from the vehicle to the pavement or an equipment applied in
the pavement surface for different motion scenarios is considered to be extremely
important to quantify with a high precision the amount of energy received by the road
pavement or a specific equipment applied on its surface.
This Chapter presents the development of a simulation software tool that allows to
perform such analysis, allowing the user to introduce the vehicle parameters, including
its mechanical properties and geometry, motion parameters and driving conditions, as
well as the road parameters and the desired element (SRE or EHD) characteristics and
parameters. This software tool was named RoadVISS (Road Vehicle Interaction
Simulation Software) and allows the simulation of the VRI from an energetic
perspective, by calculating the energy (as well as acceleration and velocity) lost by the
vehicle during the interaction with the obstacle, and the energy received by the obstacle,

Chapter 3 Development of a Software Tool to Evaluate the Vehicle-Road Interaction
70
considering its mechanical characteristics and properties. It also allows users to select
the vehicle model (quarter-car or bicycle car model) and interaction model (Single
Force Analysis (SFA) or Contact Patch Analysis (CPA)), to compare both models and
conclude regarding its precision.
Based on the aforementioned, this tool intends to overcome an existing gap, by
quantifying precisely the energy delivered by a road vehicle in motion onto an SRE or
an EHD, both in terms of the vehicle’s characteristics and the characteristics of the
device, thus evaluating the energy exchange process efficiency. With this, it will be
possible to determine the importance of each parameter in the extraction of the vehicle’s
energy and optimize the efficiency of the device.
The present Chapter also aims to simulate the VRI, using the software tool RoadVISS,
to determine which is the best vehicle model and interaction model, as well as to study
the effects of road pavement elements (SRE and EHD), on the energy released by the
vehicle. The energy captured by the SRE or EHD is also quantified and the energy
conversion efficiency is evaluated, depending on the evaluated parameters.
In this work, the vertical and horizontal dynamics of vehicles will be considered, as
only forward (linear) motions will be considered, excluding turning motions, which
include lateral dynamics. This assumption is due to the fact that SRE and EHD are
typically installed in places where vehicles only move in a straight line. Other
assumptions in this study are: only two-axle light vehicles are considered; front-wheel
drive; passenger weight is included with the vehicle weight; and wind speed is
neglected.
3.2 Vehicle Dynamics
3.2.1 Introduction
The loads applied by a vehicle in motion on the pavement, by each wheel, depend on
several parameters, such as vehicle geometry, mass, acceleration, speed and pavement

Chapter 3 Development of a Software Tool to Evaluate the Vehicle-Road Interaction
71
profile, among others, and have both static and dynamic components (Gillespie, 1992;
Jazar, 2008).
The road pavement induces vibrations on the vehicle, which are absorbed by the tyres
and the suspension system, which can either increase or decrease the loads applied on
the road surface, contributing to a dynamic component of the wheel load. To study these
variations, different models can be used, and the selection of the most appropriate
model should be made based on the specificities of the study being performed.
The interaction between each vehicle wheel and the road surface (or an obstacle
surface) is performed by the tyre, which delivers a perpendicular force onto the
pavement which is distributed by its contact patch. Most authors consider only the
resultant force applied by the tyre over its contact patch (SFA), neglecting the pressure
distribution across its area. For most studies, this is not incorrect, as it can represent a
real situation of continuous motion over a surface.
However, to study in great detail the forces applied over a specific surface which can
have an inclination angle or a vertical displacement that is a function of the applied
force, or in some situations, both scenarios may exist, the analysis must be performed in
terms of the force applied by each part of the contact patch, to obtain a precise
quantification of the force delivered by the surface during its passage over the patch.
This is defined as CPA.
This section presents the static and dynamic forces of a vehicle, taking into
consideration the vehicle parameters; the vehicle models, to study the dynamic
components of the vehicle forces; the formulations to determine the vehicle forces; the
contact patch and pressure distribution over it, to determine the forces applied over the
contact patch; and the equations to determine the energy released by a vehicle when it
interacts with an obstacle on the pavement.

Chapter 3 Development of a Software Tool to Evaluate the Vehicle-Road Interaction
72
3.2.2 Vehicle forces distribution
The distribution of the vehicle masses and forces, for parked and moving vehicles, both
on horizontal and inclined road pavements is well defined in the literature (Gillespie,
1992; Wong, 2001; Blundell and Harty, 2004; Pacejka, 2005; Jazar, 2008; Popp et al.,
2010; Rajamani, 2011).
Tables 3.1 and 3.2 summarize the vehicle’s perpendicular force distribution on level and
inclined road pavements, and the vehicle’s longitudinal force distribution on level and
inclined pavements, respectively. These equations were extracted from the main vehicle
dynamics references (Jazar, 2008; Popp et al., 2010; Rajamani, 2011). Equations to
determine the lift force (Fl), drag force (Fd) and rolling resistance (Rx), are presented in
these references. In this work, the indices f and r will be used for the front and rear
wheels, respectively. Each symbol definition is presented in the list of notations.
Table 3.1- Vehicle perpendicular force distribution on level and inclined pavements.
Motion Type Front Wheel Rear Wheel
Lev
el p
av
emen
t Stopped
Free Rolling
Accelerating
Braking
Incl
ined
pa
vem
ent
Stopped
Free Rolling
Accelerating
Braking

Chapter 3 Development of a Software Tool to Evaluate the Vehicle-Road Interaction
73
Table 3.2- Vehicle longitudinal force distribution on level and inclined pavements.
Front Wheel Rear Wheel
Lev
el p
av
emen
t Stopped
Free Rolling
Accelerating
Braking
Incl
ined
pa
vem
ent Stopped
Free Rolling
Accelerating
Braking
As can be seen from these equations, there is a static component of the force, which
depends mainly of the vehicle’s mass and geometry, and a dynamic component, which
depends, apart from these two parameters, on the vehicle acceleration and speed. Also,
the pavement inclination has an influence on the vehicle forces.
3.2.3 Vehicle dynamics models
Modelling of four-wheeled vehicles has been studied for the past 50 years. The
dynamics and characteristics are well understood, and validated models have been
developed for many applications, including the study of vehicle vibrations (Wong,
2001; Blundell and Harty, 2004; Jazar, 2008; Popp et al., 2010; Rajamani, 2011).
The most simple model is the quarter-car model, which is the most commonly used and
most useful model of a vehicle’s suspension system (Blundell and Harty, 2004; Jazar,
2008; Popp et al., 2010; Rajamani, 2011). This model only represents the sprung mass
of the vehicle, the unsprung mass, the suspension system and the tyre, as presented in
Figure 3.1(a). For more complex and detailed studies, regarding only forward linear
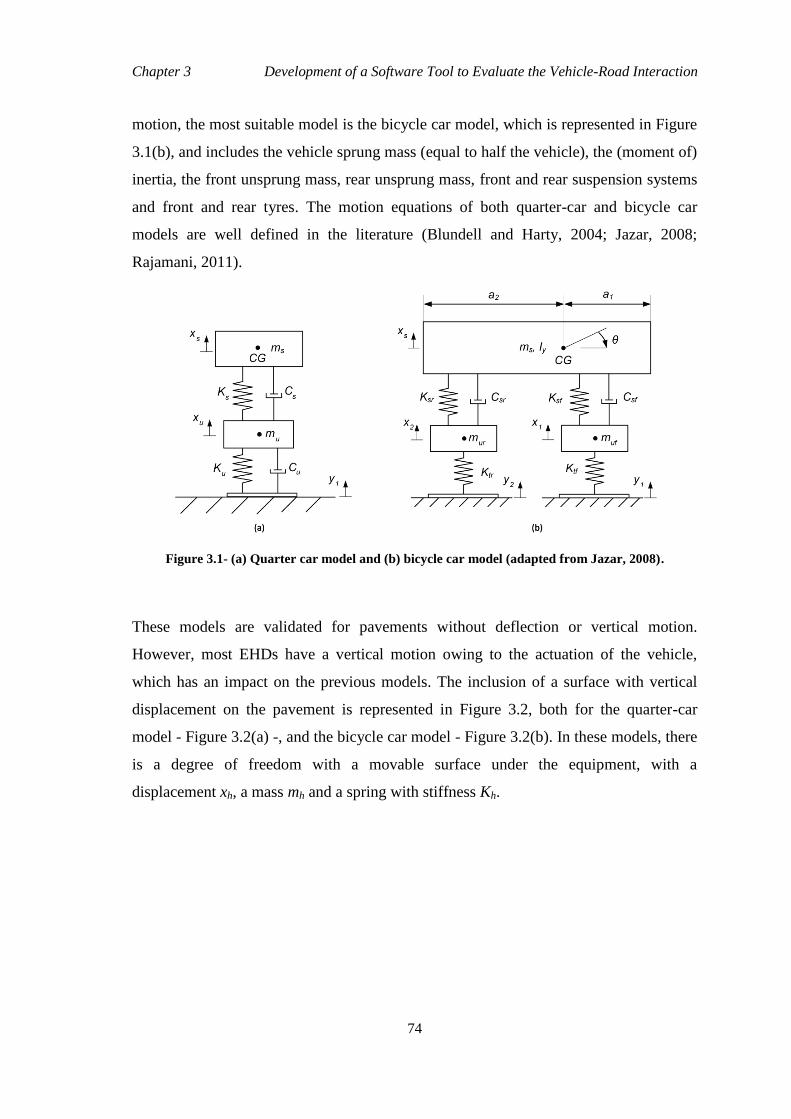
Chapter 3 Development of a Software Tool to Evaluate the Vehicle-Road Interaction
74
motion, the most suitable model is the bicycle car model, which is represented in Figure
3.1(b), and includes the vehicle sprung mass (equal to half the vehicle), the (moment of)
inertia, the front unsprung mass, rear unsprung mass, front and rear suspension systems
and front and rear tyres. The motion equations of both quarter-car and bicycle car
models are well defined in the literature (Blundell and Harty, 2004; Jazar, 2008;
Rajamani, 2011).
Figure 3.1- (a) Quarter car model and (b) bicycle car model (adapted from Jazar, 2008).
These models are validated for pavements without deflection or vertical motion.
However, most EHDs have a vertical motion owing to the actuation of the vehicle,
which has an impact on the previous models. The inclusion of a surface with vertical
displacement on the pavement is represented in Figure 3.2, both for the quarter-car
model - Figure 3.2(a) -, and the bicycle car model - Figure 3.2(b). In these models, there
is a degree of freedom with a movable surface under the equipment, with a
displacement xh, a mass mh and a spring with stiffness Kh.

Chapter 3 Development of a Software Tool to Evaluate the Vehicle-Road Interaction
75
Figure 3.2- (a) Quarter car model with a harvester surface on the pavement; and (b) bicycle car
model with a harvester surface on the pavement.
The governing differential equations of motion for the quarter-car model with a
movable harvester surface, shown in Figure 3.2(a), are represented by Equations (3.1-
3.3), whereas the governing differential equations of motion for the bicycle car model
with a movable harvester surface, shown in Figure 3.2(b), are represented by Equations
(3.4-3.8).
(3.1)
(3.2)
(3.3)
(3.4)
(3.5)
(3.6)
(3.7)
(3.8)

Chapter 3 Development of a Software Tool to Evaluate the Vehicle-Road Interaction
76
3.2.4 Vehicle-road interaction models
The VRI analysis can be performed considering a resultant force from the tyres over the
pavement, or considering the force distributed over the tyre’s contact patch, as a
pressure distribution.
An analysis considering only the resultant force applied over the contact patch, which
has both a perpendicular (with static and dynamic parts) and a longitudinal component,
is defined as SFA.
Figure 3.3 represents the perpendicular [Figure 3.3(a)] and longitudinal [Figure 3.3(b)]
force distributions for the front wheel of the vehicle when it passes on an inclined
surface with an inclination angle φ. Based on the literature (Blundell and Harty, 2004;
Jazar, 2008), the values for each force are presented in Table 3.3. The front wheel
perpendicular force is represented by Fzf, with Fzf_x representing the horizontal
component of this force, Fzf_z representing the vertical component and Fzf_x
representing the resultant component. The same approach is used to quantify the
different components of the longitudinal forces, both the acceleration force (Fa) and the
tyre rolling resistance force (Rx).
Figure 3.3- (a) Perpendicular force distribution; and (b) longitudinal force distribution.
An analysis considering the contact patch force and pressure distribution is defined as
CPA. To perform such analysis, first, the contact patch geometry must be defined, and
then the pressure distribution along the contact patch surface.

Chapter 3 Development of a Software Tool to Evaluate the Vehicle-Road Interaction
77
Equations for defining the contact patch geometry are well defined in the literature
(Pacejka, 2005; Jazar, 2008; Rajamani, 2011). Based on the tyre stiffness, or on tyre
pressure, and knowing the resultant force applied by the tyre, these equations allow us
to determine the tyre’s deflection and the geometry of the contact patch (the tyre’s area
in contact with the road surface).
Table 3.3- Perpendicular and longitudinal wheel forces on an inclined surface.
Component Front wheel Rear wheel
Per
pen
dic
ula
r
forc
es Vertical (z)
Resultant (r)
Horizontal (x)
Lo
ng
itu
din
al
forc
es Horizontal (x)
Resultant (r)
Vertical (z)
To determine the contact patch pressure distribution (q(x)), considering only the
variation on the longitudinal axis, Equation (3.9) can be used (Jazar, 2008), with the
maximum normal pressure (q0) defined by Equation (3.10). In these equations, xcp
represent the contact patch position, cp_a the contact patch half-length and CPA the
contact patch area.
(3.9)
(3.10)
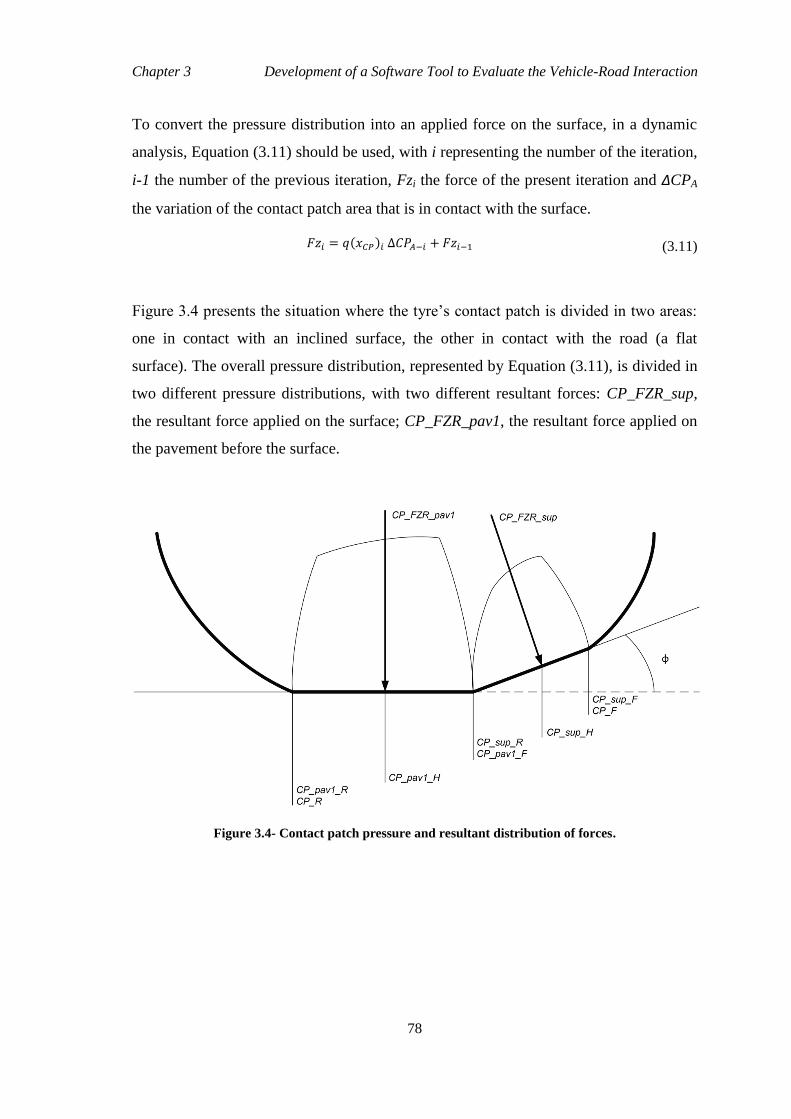
Chapter 3 Development of a Software Tool to Evaluate the Vehicle-Road Interaction
78
To convert the pressure distribution into an applied force on the surface, in a dynamic
analysis, Equation (3.11) should be used, with i representing the number of the iteration,
i-1 the number of the previous iteration, Fzi the force of the present iteration and ΔCPA
the variation of the contact patch area that is in contact with the surface.
(3.11)
Figure 3.4 presents the situation where the tyre’s contact patch is divided in two areas:
one in contact with an inclined surface, the other in contact with the road (a flat
surface). The overall pressure distribution, represented by Equation (3.11), is divided in
two different pressure distributions, with two different resultant forces: CP_FZR_sup,
the resultant force applied on the surface; CP_FZR_pav1, the resultant force applied on
the pavement before the surface.
Figure 3.4- Contact patch pressure and resultant distribution of forces.

Chapter 3 Development of a Software Tool to Evaluate the Vehicle-Road Interaction
79
Equation (3.11) is then divided in two, one for the area in contact with the surface of the
device and another for the area in contact with the road surface. The force on the area in
contact with the device has two components owing to the inclination of the surface,
which are represented by Equations (3.12) and (3.13), with CP_FZR_sup_Z being the
perpendicular component of the force applied on the surface and CP_FZR_sup_X its
longitudinal component.
(3.12)
(3.13)
3.2.5 Energetic analysis
Vehicle acceleration (a) is directly proportional to the longitudinal component of the
force (Equation 3.14). So, the variation of the vehicle’s acceleration is given by
Equation (3.15) and the vehicle’s speed (v) is calculated by Equation (3.16). Knowing
the longitudinal forces, it is possible to determine the vehicle’s acceleration, and later,
the vehicle’s speed at each iteration. The same happens for vehicle position, which is
given by Equation (3.17). The energy released from the vehicle (Ev) can be determined
using the vehicle speed reduction, which is associated with the loss of kinetic energy,
using Equation (3.18), with mv representing the vehicle total mass and v the vehicle
speed.
(3.14)
(3.15)
(3.16)
(3.17)
(3.18)
Chapter 3 Development of a Software Tool to Evaluate the Vehicle-Road Interaction
80
3.3 Road Pavement Devices
3.3.1 Introduction
Speed reducers consist of a specific type of traffic calming solution, involving vertical
alignment changes in the pavement, with the goal of reducing vehicle speed by causing
discomfort when vehicles go over them at high speeds (Elvik et al., 2009; Ewing and
Brown, 2009). EHDs are instruments actuated by vehicle tyre forces. They receive
mechanical energy from the vehicle and convert it into electrical energy.
To quantify the impact that SRE and EHD induce in vehicles, it is important to study
the geometric shape and dimensions of their surface.
In this section, the main characteristics of SRE and EHD will be presented, with special
emphasis on their surface geometry, material and displacements, when applicable. Also,
the quantification of the energy captured by the equipment will be presented and
compared with the energy lost from the vehicle, allowing us to evaluate the energy
extraction performance.
3.3.2 Speed reducers
To improve traffic safety, vehicle speed needs to be reduced in various places, both in-
and outside urban areas. Three types of measures can be adopted for this purpose:
horizontal alignment changes (chicanes, narrows, roundabouts, etc.); vertical alignment
changes (humps, platforms, raised crosswalks, etc.); or complementary measures, such
as illumination and urban features, among others (Elvik et al., 2009; Ewing and Brown,
2009). The most effective measures to control vehicle speeds are the vertical alignment
changes, as these usually affect the vehicle and their occupants if speed limits are not
respected. However, there are some design rules to guarantee softness and, therefore,
the design speed.

Chapter 3 Development of a Software Tool to Evaluate the Vehicle-Road Interaction
81
So, speed reducers should have an impact on vehicles, when they travel above the
design speed, which causes discomfort for the occupants and, at the same time, should
have a minimum impact on the vehicles if they travel under the design speed. This is
achieved through their geometry.
In this study, different geometries for the speed reducer surface (also applied to the
EHDs) were considered. There is no international uniformity for the geometric aspects
of speed reducers regarding their shape, height, length or width, or for materials or
applicable areas. Considering other research work (Johnson and Nedzesky, 2004;
Szurgott et al., 2009) and individual countries’ recommendations (DGV, 2004; Ewing
and Brown, 2009), nine surface profiles (SP) were considered for the speed reducers,
which are presented in Figure 3.5. A set of governing equations for each SP were
defined to characterize its height in function of its length. These equations are presented
in Table 3.4, with y representing the surface vertical position, x representing the surface
longitudinal position, φ representing the surface angle, Lmax representing the maximum
length of the surface and hmax representing the maximum height of the SP. The first
profile (S0) is not considered a speed reducer itself, as it represents a flat surface, which
is applicable when considered for a flat surface displacement.
In terms of materials, there are two main solutions: concrete or bituminous mixtures, if
speed reducers are implemented together with the pavement, and plastic or vulcanized
rubber mixtures, when commercial equipment is implemented.
3.3.3 Energy harvesting devices
Energy harvesting is described as a concept by which energy is captured, converted,
stored and utilized by means of various sources, using interfaces, storage devices and
other units (Priya and Inman, 2009; Khaligh and Onar, 2010). Put simply, energy
harvesting is the conversion of ambient energy present in the environment into other
useful means of energy; for example, electrical energy (Kazmierski and Beeby, 2009).

Chapter 3 Development of a Software Tool to Evaluate the Vehicle-Road Interaction
82
Figure 3.5- Speed reducer or EHD surface profiles.

Chapter 3 Development of a Software Tool to Evaluate the Vehicle-Road Interaction
83
Table 3.4- Speed reducer or EHD surface profile’s equations.
ID SP definition Equation(s)
S0 Plane
S1 Convex bump
S2 Sinusoidal bump
If 0 < x < (Lmax/4)
If (Lmax/4) < x < (3Lmax/4)
If x > (3Lmax/4)
S3 Hump
If 0 < x < (Lmax/2) and y(x) < hmax
If [0 < x < (Lmax/2) and y(x) > hmax ] OR [(Lmax/2) < x < Lmax and y(x) > hmax]
If (Lmax/2) < x < Lmax and y(x) < hmax
S4 Triangle
If 0 < x < (Lmax/2)
If x = (Lmax/2)
If x > (Lmax/2)
With
S5 Ramp
With
S6 S profile
If 0 < x < (Lmax/2)
If x > (Lmax/2)
S7 Scale up
S8 Crest

Chapter 3 Development of a Software Tool to Evaluate the Vehicle-Road Interaction
84
Road surfaces are continuously exposed to vehicle loads, making it possible to extract
energy from this which, using specific technologies, can be transformed into electrical
energy (Duarte and Ferreira, 2016; Andriopoulou, 2012).
Regarding the working principle of these devices, as presented with more detail in the
previous Chapter, the mechanical energy transmitted by vehicle wheels to the road
surface can induce two types of actions on the road pavement: vibrations or surface
displacement. Vibrations are mainly harvested by piezoelectric transducers, which have
a very low level of efficiency, so only small amounts of electrical energy are produced.
However, these are less “invasive” to the vehicle. Most road pavement EHDs have a
vertical displacement to actuate a mechanical system (electromechanical, hydraulic or
pneumatic) or directly actuate an electromagnetic generator. The harvested energy is
proportional to the maximum displacement of the surface, as well as its actuation speed
and acceleration. However, this displacement should be as small as possible, to avoid
interferences with the driving performance of the vehicle, creating pavement holes or
other such things.
Also, an EHD presents stiffness and, in some cases, a damping effect due to its
components (both mechanical and electrical), which should be considered in the VRI
study. In this study, only the mechanical stiffness was considered.
Its surface materials and profile can be similar to SREs, as usually these devices have
similar functions in terms of reducing vehicles speed.
3.3.4 Energy captured
The energy absorbed by the road surface material (ESu) can be determined using
Equation (3.19), where Fz is the force applied by the vehicle wheel, Δl being the
deflection of the material. This can be calculated in relation to the applied load (Fz),
elasticity modulus of the material (E') and the thickness (l0) and area (Aha) of the surface
under study, using Equation (3.20).

Chapter 3 Development of a Software Tool to Evaluate the Vehicle-Road Interaction
85
(3.19)
(3.20)
For a movable surface, applicable both for SRE and EHD, the energy associated with
the surface motion (EHa) is calculated using the total force applied on the surface (Fz)
and the surface displacement (xh), using Equation (3.21). Equation (3.22) allows us to
evaluate the efficiency of the process, between the energy lost by the vehicle and the
energy captured by the surface of the equipment.
(3.21)
(3.22)
3.4 Simulation Software Tool
3.4.1 Introduction
Based on the study presented in previous sections, a simulation software tool was
developed, using MATLAB® software, to study the VRI from an energetic perspective,
named RoadVISS – Road Vehicle Interaction Simulation Software.
The purpose of the simulation software tool is to study this interaction in great detail,
with the possibility of fully characterizing the vehicle under study, by defining its class,
weight, axles, wheels, geometry, speed, acceleration, suspensions and tyres; defining all
the mechanical parameters, such as damping and stiffness for each suspension and tyre;
and fully characterizing the pavement or SRE/EHD surface, by defining its material,
shape, geometry and, for a surface with displacement, its maximum displacement, mass,
stiffness and damping properties. It also allows the user to select the vehicle model

Chapter 3 Development of a Software Tool to Evaluate the Vehicle-Road Interaction
86
(quarter-car or bicycle car model) and whether the analysis is to consider the contact
patch or not.
RoadVISS calculates all the displacements, both for the vehicle and the pavement/
equipment surface, the applied and received forces and the power and energy
transferred, released from vehicle and received on the pavement/equipment surface, and
presents the results both graphically and numerically.
3.4.2 Inputs and outputs
To select the model inputs, a graphical user interface (GUI) platform was developed
(Figure 3.6).
Figure 3.6- GUI to select the inputs for the computational model.
Chapter 3 Development of a Software Tool to Evaluate the Vehicle-Road Interaction
87
This GUI has five distinct panels: three for parameter selection; one for the preview of
the selected features for the vehicle, the pavement and the harvester surface; and one for
the selection of analysis features.
The first panel allows the user to select the vehicle and motion properties. In terms of
the vehicle, it allows the vehicle class, weight, number of axles, wheels per axle,
percentage of sprung and unsprung mass, drag and lift coefficients, and inertia moment
of the vehicle to be selected. It also allows users to define the vehicle geometry in terms
of distances from each axle to the centre of gravity (CG), as well as the height of the
CG. In terms of vehicle motion, it allows to the selection of the action (free rolling,
accelerating, braking, or stopped), the motion direction, the vehicle speed and
acceleration (when the action is accelerating or braking).
The second panel allows the user to select the suspension and wheel properties. In terms
of suspension, it allows users to select the suspension type and to define the suspension
stiffness and damping values, for both the front and rear suspension. In terms of tyre, it
allows the user to select the tyre type and to define the tyre stiffness, damping and
pressure, for both the front and rear tyre. The tyre geometry in terms of external
diameter, tyre width and tread width can also be defined, for both front and rear tyres.
The third panel allows the road and harvester properties to be selected. In terms of road
pavement, the user can select the pavement type, the road condition, the longitudinal
and transversal inclination of the pavement. For the SRE/EHD surface, users can select
the shape (according to Figure 3.5), the motion type, the material of the surface, the
width and height and, when the user selects a surface motion, the maximum
displacement, the mass of the surface, its stiffness and damping can be defined.
The fourth panel presents a summary of the selection, showing an image of the selected
vehicle, an image of the selected pavement and an image of the harvester surface, by
shape. With this information, the user can confirm the selection visually.
The fifth panel allows the user to define the simulation time and each iteration interval,
the vehicle model to be simulated (quarter-car or bicycle car model), and contact patch
interaction model, selecting Yes for CPA, or No for a SFA. In this panel, the user can

Chapter 3 Development of a Software Tool to Evaluate the Vehicle-Road Interaction
88
clean all the fields to select new values, and can press the Simulate button to start the
simulation.
To present the software outputs graphically, a GUI platform was developed (Figure
3.7). This GUI has two distinct panels, one which presents the outputs and another for
selecting new values for the main variables of the system, as well as choosing an action
(new simulation, print plots or exit).
Figure 3.7- GUI to present the outputs for the computational model.
The first panel presents the outputs of the system graphically and numerically in eight
graphics and five values. Graphically, the main vehicle results are presented for the
vehicle (sprung mass, front unsprung mass and rear unsprung mass displacements; the
forces induced by the front and rear tyres on the pavement; the power and energy lost
by the vehicle in the interaction with the pavement equipment) and for the SRE or EHD
(the higher and lower positions of the equipment surface, which depends on the surface
profile and surface displacement; the forces received by the surface, from each wheel of

Chapter 3 Development of a Software Tool to Evaluate the Vehicle-Road Interaction
89
the vehicle; and the power and energy received by the surface). Numerically, the values
of the energy lost by each wheel of the vehicle and by the entire vehicle are presented;
the energy harvested by each wheel actuation and by the actuation of the entire vehicle;
and the efficiency of the energy transfer process.
The second panel allows users to define new values for the main variables of the
simulation to re-simulate the model with changes, without having to leave the results’
GUI and restart the process from the first GUI. The variables that can be changed are
the vehicle weight, vehicle speed, vehicle acceleration, front and rear suspension
stiffness and damping, front and rear tyre stiffness and pressure, the harvester
displacement, width, height and stiffness. The values are selected using a slider bar,
with the user simply having to press the New Simulation button to start a new
simulation. The graphics are updated after the new simulation is completed. This panel
also offers users the possibility to print the plots, allowing them to select the desired
plots to be printed and pressing the Print Plots button. Finally, it contains an Exit button
to close the results GUI and return to the initial GUI.
3.4.3 Models
Four computational models were developed, using the SIMULINK® tool, to perform the
dynamic analysis depending on the selected inputs:
1) quarter-car model and SFA;
2) bicycle car model and SFA;
3) quarter-car model and CPA;
4) bicycle car model and CPA.
Models 1 and 2 do not consider the contact patch, so they perform an SFA, while
Models 3 and 4 perform a CPA.
Each model uses the equations defined in the literature (Gillespie, 1992; Wong, 2001;
Blundell and Harty, 2004; Pacejka, 2005; Jazar, 2008; Popp et al., 2010; Rajamani,

Chapter 3 Development of a Software Tool to Evaluate the Vehicle-Road Interaction
90
2011) plus the equations previously defined for movable surfaces, with Equations (3.1-
3.3) being used in Models 1 and 3 and Equations (3.4-3.8) used in Models 2 and 4, with
Equations (3.9-3.13) being used in Models 3 and 4. Equations (3.14-3.21) were used in
all the models to quantify the energy lost by the vehicle and harvested by the surface, as
well as to determine the efficiency of the process.
3.4.4 Flowchart
The simulation software flowchart is presented in Figure 3.8.
After all the data are defined by the user on the Inputs window and the Simulation
button is pressed, all the data are collected and a validation is done to confirm if the data
are correctly defined. If not, an error message is presented. If it is, all the variables are
defined and the computational model ID is set in function of the selected Vehicle Model
(quarter-car or bicycle car) and contact patch interaction model (Yes or No).
The selected model is then opened and used to determine all the software outputs. After
the simulation is completed, the results are obtained and validated. If there are
simulation errors, a message is presented. If not, the outputs window is opened, and the
results are presented, both graphically and numerically, as explained previously.
3.5 Technical Analysis
3.5.1 Introduction
To study and quantify the energy delivered by a road vehicle in motion into an SRE or
an EHD depending on the equipment characteristics and evaluate the energy exchanging
process efficiency, the RoadVISS software tool is used.

Chapter 3 Development of a Software Tool to Evaluate the Vehicle-Road Interaction
91
Figure 3.8- Simulation software flowchart.
First, simulations will be performed for different vehicle models (quarter-car and
bicycle car models) and different VRI analysis modes (SFA and CPA), to determine the
precision of each model and select the most appropriate for the remaining simulations.
Then, simulations will be performed by changing the equipment surface profile and
geometry, as well as its maximum displacement, to evaluate the importance of these
variables in the energy extraction process.

Chapter 3 Development of a Software Tool to Evaluate the Vehicle-Road Interaction
92
3.5.2 Simulations and results analysis
Using RoadVISS, a set of simulations were performed, initially with fixed values
defined for the fixed variables, while the key variables vary in each simulation scenario
to evaluate the impact of each key variable in the results.
The selected key variables for this study are surface profile and surface displacement.
Also, the vehicle model (quarter-car/bicycle car model) and VRI interaction model
(SFA or CPA) are compared.
The values defined for the fixed variables are presented in Table 3.5, as well as the
initial values for the key variables (when the key variable is not changed in a scenario).
The GUI with all fields filled with these values is presented in Figure 3.9. The vehicle,
suspension and wheel data necessary to run the simulations are available in vehicle
manufacturer’s websites and vehicle datasheets.
Figure 3.9- Graphical user interface with the standard inputs.

Chapter 3 Development of a Software Tool to Evaluate the Vehicle-Road Interaction
93
Table 3.5- Fixed and initial values for the simulation variables.
Variable name Value Unit
Veh
icle
& M
oti
on
Vehicle class Light -
Vehicle weight 1,500 (kg)
Number of axles P1 2 -
Number of wheels per axle 2 -
Sprung-Unsprung % 90%-10% -
Drag coefficient 0.32 -
Inertia moment 1,100 (kg/m2)
Lift coefficients (Front | Rear) 0.19 | 0.13 -
Motion | Direction Free rolling | Forward -
Vehicle speed 30 (km/h)
Vehicle acceleration 0 (m/s2)
Su
spen
sio
n &
Wh
eel
Suspension type (Front | Rear) Independent | Independent -
Suspension stiffness (Front | Rear) 20,000 | 15,000 (N/m)
Suspension damping (Front | Rear) 1,500 | 1,700 (Ns/m)
Tyre type (Front | Rear) Radial | Radial -
Tyre stiffness (Front | Rear) 150,000 | 150,000 (N/m)
Tyre damping (Front | Rear) 800 | 800 (Ns/m)
Tyre pressure (Front | Rear) 200 | 200 (kPa)
Tyre external diameter (Front | Rear) 500 | 500 (mm)
Tyre width (Front | Rear) 200 | 200 (mm)
Tyre tread width (Front | Rear) 180 | 180 (mm)
Ro
ad
pa
vem
ent
& S
RE
/EH
D Pavement type Flexible -
Road condition Dry -
Inclination longitudinal | transversal 0 | 0 (º)
Harvester shape Ramp -
Motion Linear displacement -
Equipment material Rubber -
Equipment width | height 500 | 30 (mm)
Equipment maximum displacement 10 (mm)
Equipment mass 30 (kg)
Equipment stiffness 400,000 (N/m)
Equipment damping 1,000 (Ns/m)
An
aly
sis Simulation time 1 (s)
Iteration time 0.001 (s)
Vehicle model Bicycle car -
Contact Patch Analysis Yes -

Chapter 3 Development of a Software Tool to Evaluate the Vehicle-Road Interaction
94
3.5.2.1 Scenario 1 - Different vehicle models
In the first scenario, three different SPs (Ramp, S profile and Bump) were considered to
be simulated with the two vehicle models, quarter-car and bicycle car model. All the
remaining values for the simulations are presented in Table 3.5. The goal is to evaluate
the differences in the total energy released by the vehicle and harvested by a surface,
when different vehicle models are considered.
The simulation results are presented in Table 3.6. The value of the total energy released
by the vehicle using the quarter-car model is achieved by multiplying the calculated
vehicle released energy by the number of vehicle wheels. With the bicycle car model,
the value is achieved by multiplying the calculated vehicle released energy by two, in
other words by the number of vehicle sides.
Table 3.6- Scenario 1 results.
Vehicle
model SP Fz max (N) Ev (J) EHa (J) η (%)
Quarter car Ramp 4,622.86 428.00 116.00 27.10
Quarter car S profile 6,185.52 412.00 100.00 24.27
Quarter car Bump 4,003.90 1,064.00 144.00 13.53
Bicycle car Ramp 5,432.91 672.00 118.00 17.55
Bicycle car S profile 6,834.69 682.00 108.00 15.83
Bicycle car Bump 4,724.81 808.00 138.00 17.08
From the results presented in Table 3.6, it is possible to compare the differences
between the usage of the quarter-car model and the bicycle car model. Some
conclusions can be stated from the results analysis:
The maximum force is always higher when considered the bicycle car model,
due to the fact that it considers two different wheels, and for the considered
vehicle geometry, the rear wheel induces higher forces than the front wheel. For
the same conditions, the results’ difference can reach almost 20 per cent.

Chapter 3 Development of a Software Tool to Evaluate the Vehicle-Road Interaction
95
For surface profiles with smaller inclination angles, as the Ramp or S profile,
the vehicle released energy is higher for the bicycle car model, mainly because
of the fact that, when considered two different actuations, and as the rear wheel
has a higher impact, the total losses are higher than when a single wheel is
considered. For these surfaces, the received energy on the SRE/EHD does not
change too much between vehicle models. So, the energy extraction efficiency
is lower when considered the bicycle car model. For the same conditions, the
results difference can reach almost 65 per cent.
For surface profiles with high inclination angles, as the Bump profile, the
vehicle released energy is much higher for the quarter-car model. This
difference can be explained due to the inclusion of the pitch angle on the
bicycle car model, which allows to distribute the chassis oscillation between
front and rear wheel, leading to lower energy losses. Again, the value of the
harvested energy does not change significantly, leading to a higher energy
extraction efficiency for the bicycle car model. For the same conditions, the
efficiency results’ difference can reach almost 60 per cent.
When the bicycle car model is considered, the inclusion of the pitch angle and the
different mass distribution according with the vehicle geometry increases the precision
of the calculations and gives more realism to the results. So, the results for the bicycle
car model are more precise and closer to the reality than the quarter-car model results,
and the difference between them is considerable, reaching almost 60 per cent in the
process efficiency. Bicycle car model should be used in VRI analysis.
3.5.2.2 Scenario 2 - Different interaction models
In the second scenario, two different surface displacements (0 and 10 mm) for a Ramp
surface profile were considered to be simulated with the two vehicle models, quarter-car
and bicycle car model, both for SFA and CPA. All the remaining values for the
simulations are presented in Table 3.5. The goal is to evaluate the differences in the

Chapter 3 Development of a Software Tool to Evaluate the Vehicle-Road Interaction
96
total energy released by the vehicle and harvested by a surface, when different
interaction models are considered. The simulation results are presented in Table 3.7.
Table 3.7- Scenario 2 results.
Interaction
model
Vehicle
model
xh max
(mm) Fz max (N) Ev (J) EHa (J) η (%)
SFA
Quarter car 0 4,615.70 516.00 0.00 0.00
Quarter car 10 4,502.81 468.00 156.00 33.33
Bicycle car 0 5,608.96 544.00 0.00 0.00
Bicycle car 10 5,653.84 512.00 150.00 29.30
CPA
Quarter car 0 4,472.12 460.00 0.00 0.00
Quarter car 10 4,422.86 428.00 116.00 27.10
Bicycle car 0 5,398.68 734.00 0.00 0.00
Bicycle car 10 5,432.92 672.00 118.00 17.56
From the results presented in Table 3.7, it is possible to compare the differences
between the usage of the SFA and CPA models. Some conclusions can be drawn from
the analysis of the results:
The maximum force is always higher with the SFA model, due to the fact that it
measures the tyre’s resultant force as being constantly applied to the surface of
the device, while the CPA considers the force correspondent to the tyre area in
contact with the surface of the device, leading to a progressive force being
applied to it, and, consequently, a peak value lower than that for the SFA. For
the same conditions, the difference in results for the maximum force is 4 per
cent.
When the SFA is combined with the quarter-car model, the energy released by
the vehicle in the interaction is similar to the CPA combined with the quarter-car
model, but the energy harvested by the device is much higher, leading to a
higher conversion efficiency (in this case, 23 per cent higher). This is due to the
fact that a higher resultant force is considered during the whole interaction,

Chapter 3 Development of a Software Tool to Evaluate the Vehicle-Road Interaction
97
while on the CPA, a progressive force is applied, leading to a lower surface
speed and a smaller force during the surface downward motion, and
consequently, a smaller amount of energy is harvested.
When the SFA is combined with the bicycle car model, the energy released by
the vehicle in the interaction is lower than when the CPA is combined with the
quarter-car model, but the energy harvested by the device is much higher,
leading to a higher conversion efficiency (in this case, 67 per cent higher). The
explanation is similar to that previously given for the quarter-car model.
These are accepted and expected results, as for the CPA analysis, the force induced by
the vehicle wheel increases progressively over the surface, leading to a progressive
increase in the surface displacement and consequently in its velocity. As for SFA, the
resultant force is permanently applied on the surface from the moment the wheel makes
contact, so the values for the energy received are higher than for CPA. However, CPA
is more realistic and precise, as it is closer to reality than SFA. Considering the
conversion efficiency results, the difference between these two models can reach 67 per
cent.
Regarding the results comparing the surface displacement, it can be seen that in most
scenarios, the energy lost by a vehicle decreases when the surface has motion, which
may be an important conclusion, justifying that equipment with motion can be less
invasive for vehicles than equipment without surface motion, and at the same time, they
are more efficient, as they are able to convert a part of the vehicle’s mechanical energy
into other means of energy, while static equipment does not make use of vehicle
released energy.
3.5.2.3 Scenario 3 - Different surface profile and displacement
In the third scenario, three different surface displacements (5, 10 and 20 mm) for seven
different surface profiles (only surface S1 was not considered) were simulated using the

Chapter 3 Development of a Software Tool to Evaluate the Vehicle-Road Interaction
98
bicycle car model and CPA. All the remaining values for the simulations are presented
in Table 3.5. The goal is to evaluate the differences in the total energy released by the
vehicle and harvested by a surface, when different surface profiles and displacements
are considered. The simulation results are presented in Table 3.8.
Table 3.8- Scenario 3 results.
SP xh max (mm) Fz max (N) Ev (J) EHa (J) η (%)
Convex
bump
5 5,138.27 896.00 60.00 6.70
10 4,724.80 808.00 138.00 17.08
20 4,771.38 802.00 268.00 33.41
Ramp
5 5,472.96 690.00 46.00 6.67
10 5,432.92 672.00 118.00 17.56
20 5,779.61 668.00 182.00 27.24
Hump
5 5,026.87 1,508.00 72.00 4.77
10 4,549.53 1,980.00 168.00 8.48
20 4,981.83 2,080.00 356.00 17.12
Triangle
5 5,893.54 674.00 56.00 8.31
10 5,432.56 550.00 130.00 23.64
20 5,287.62 588.00 224.00 38.10
S profile
5 6,914.31 840.00 42.00 5.00
10 6,834.69 682.00 108.00 15.84
20 6,927.92 546.00 250.00 45.78
Scale up
5 5,100.01 266.00 40.00 15.04
10 5,204.35 344.00 124.00 36.05
20 5,458.93 356.00 168.00 47.19
Crest
5 5,015.76 856.00 56.00 6.54
10 4,616.98 806.00 130.00 16.13
20 5,403.82 760.00 252.00 33.16
From the results presented in Table 3.8, it is possible to compare the differences
between the usage of different surface profiles and different maximum displacement of
the surface. Some conclusions can be drawn from the results:
For the same surface displacement, the surface profile has a great influence on
the energy released by the vehicle and harvested from the surface. It can vary
from only 266.00 J of lost energy with a Scale up profile, with 5-mm maximum

Chapter 3 Development of a Software Tool to Evaluate the Vehicle-Road Interaction
99
displacement, to 1,508.00 J with a Hump surface profile, for the same
displacement, leading to completely different values of harvested energy and
conversion efficiency.
With an increase in the surface maximum displacement, for most surfaces, the
vehicles’ released energy decreases, and for all surfaces, the harvested energy
increases, increasing the efficiency of the process. It can therefore be concluded
that the surface maximum displacement is an essential feature for controlling
the extraction of energy from a vehicle, as well as the harvested energy from a
SRE or EHD. However, this displacement should be limited to take into account
the oscillation induced on the vehicle, which should respect specific limits of
ride comfort.
Analysing the results, it can be seen that there is no perfect combination, as this is
dependent on the goal of each application. If the goal is to minimize the impact on the
vehicle, minimizing its lost energy, the Scale-up profile presents better results. If the
goal is to maximize the harvested energy, Bump and Hump profiles present better
results. If process efficiency is the goal, Scale-up and S profile are the most appropriate
surface profiles.
3.6 Summary and Conclusions
In this Chapter it was presented the development of a simulation software tool -
RoadVISS - that allowed users to study the forces induced by a vehicle in motion into
the road pavement, a SRE or an EHD, as well as the energy lost by the vehicle,
associated to the contact with the referred surface, and the energy received by that
surface. Based on this tool it is possible to determine which is the best vehicle model
and VRI model, as well as to study the effects of road pavement elements, both SRE
and EHD, on vehicle energy extraction. It also enables to study the effect of the
characteristics of the equipment on the vehicle energy extraction process.

Chapter 3 Development of a Software Tool to Evaluate the Vehicle-Road Interaction
100
The software was developed in MATLAB® environment, including a GUI where the
user can select and define all the variables associated to the simulation, and another GUI
where the results are presented. The software has an extensive database of considered
variables, allowing a huge amount of different combinations of values to be simulated,
leading to the possibility of performing a great number of studies. The outputs of the
system are focused on the forces and energy released by the vehicle and received by the
pavement or by an energy harvest surface, but the computational model allows users to
define new outputs and study other variables.
From the simulations performed, several conclusions have been presented in the
analysis of the results. The first, and one of the most important conclusions, is related to
the precision of the vehicle models. The simulations performed showed that bicycle car
model results are more precise than the quarter-car model results, differing by up to 60
per cent. As most VRI studies use the quarter-car model (Borowiec et al., 2010;
Barbosa, 2011; Florin and Liliana, 2013; Hassaan, 2014, 2015), which is less precise
than the bicycle car model, this is an important conclusion, meaning that future VRI
research should adopt the bicycle car model to improve the precision of results.
Also, most studies consider that a resultant force is applied on the pavement,
corresponding to the SFA model, as well as the existing software (Carsim, 2016; MSC.
Software, 2016). In this study, the application of SFA was compared with that of CPA,
and it was found that, especially for the cases when the surface has motion, the
difference in results can reach 67 per cent, with the CPA model being more precise than
SFA. Again, future VRI studies must adopt the CPA model to maximize the precision
of results.
Regarding variations in the surface parameters (shape and displacement), it can be
concluded that these variables have a great influence on the energy released by the
vehicle, as well as on the energy harvested by the equipment surface. The surface shape
and its maximum displacement are variables that contribute the most to the interaction
results, both in terms of the vehicle’s released energy and the surface harvested energy.
Other variables can be changed during the simulations, such as the vehicle or harvester
geometry, which will impact the amount of energy released and harvested. The

Chapter 3 Development of a Software Tool to Evaluate the Vehicle-Road Interaction
101
selection of the surface parameters should be done according to the goals of each
application and the most appropriate solution for all scenarios was identified.
In conclusion, to design an SRE or EHD, a huge amount of simulations should be
performed, relating the different key variables and optimizing its design for the place of
application, design speeds, average traffic weights and available space for the
equipment, among other features. RoadVISS software allows us to perform these
simulations and it is an appropriate tool to support the design of an SRE or an EHD, in a
way that any of the existing software allows to do.
The developed software tool can have multiple applications, from the study of vehicle
suspensions and tyres, regarding their interaction with speed reducers, to the design of
SRE themselves, but one of the main applications can be the design of EHD to
implement on road pavements, which make use of vehicles’ released energy to convert
it into electrical energy. The developed models are validated for two-axle light vehicles.
Additional developments will be performed to include multiple-axle light vehicles and
heavy vehicles on the models.
3.7 References
Andriopoulou, S. (2012). A review on energy harvesting from roads. KTH, Stockholm,
Sweden.
Barbosa, R.S. (2011). Vehicle dynamic response due to pavement roughness. Journal of
the Brazilian Society of Mechanical Sciences and Engineering, 33(3): 302-307.
Borowiec, M., Sen, A.K., Litak, G., Hunicz, J., Koszalka, G. and Niewczas, A. (2010).
Vibrations of a vehicle excited by real road profiles, Forschung im Ingenieurwesen,
74(2): 99-109.
Blundell, M. and Harty, D. (2004). Multibody Systems Approach to Vehicle Dynamics.
Elsevier Butterworth-Heinemann, Oxford, UK.

Chapter 3 Development of a Software Tool to Evaluate the Vehicle-Road Interaction
102
Carsim (Mechanical Simulation Corporation) (2016). http://www.carsim.com. Accessed
in July, 2016.
DGV (2004). Technical Paper – Installation and Signalization of Speed reducer bumps
(In Portuguese), pp. 1-18.
Duarte, F. and Ferreira, A. (2016). Energy harvesting on road pavements: state of the
art, Proceedings of Institution of Civil Engineers: Energy, 169(2): 79-90.
Duarte, F., Ferreira, A. and Fael, P. (2016). Software for simulation of vehicle-road
interaction. New Advances in Information Systems and Technologies, Vol. 444 of the
Series Advances in Intelligent Systems and Computing, Springer International
Publishing, pp. 681-690.
Elvik, R., Vaa, T., Erke, A. and Sorensen, M. (2009). The Handbook of Road Safety
Measures. Emerald, Bingley, UK.
Ewing, R. and Brown, S. (2009). US Traffic Calming Manual. American Planning
Association. Chicago, IL, USA.
Farroni, F. (2016). TRICK-tire/road interaction characterization & knowledge-a tool for
the evaluation of tire and vehicle performances in outdoor test sessions. Mechanical
Systems and Signal Processing, 72(2016): 808-831.
Florin, A. and Liliana, P. (2013). Passive suspension modeling using MATLAB,
quarter-car model, input signal step type. New Technologies and Products in
Machine Manufacturing Technologies, pp. 258-263.
Gillespie, T. (1992). Fundamentals of Vehicle Dynamics. Society of Automotive
Engineers, Warrendale, PA, USA.
Hassaan, G.A. (2014). Car dynamics using quarter model and passive suspension, Part
I: effect of suspension damping and car speed. International Journal of Computer
Techniques, 1(2): 1-9.
Hassaan, G.A. (2015). Car dynamics using quarter model and passive suspension, Part
II: a novel simple harmonic hump. Journal of Mechanical and Civil Engineering,
12(1): 93-100.

Chapter 3 Development of a Software Tool to Evaluate the Vehicle-Road Interaction
103
Hendrowati, W., Guntur, H. L. and Sutantra, I. N. (2012). Design, modelling and
analysis of implementing a multilayer piezoelectric vibration energy harvesting
mechanism in the vehicle suspension. Engineering, 4(11): 728-738.
IEA. (2012). Technology Roadmap: Fuel Economy of Road Vehicles. International
Energy Agency, Paris, France. Available from
http://www.iea.org/publications/freepublications/publication/Fuel_Economy_2012_
WEB.pdf. Accessed in September, 2015.
Jazar, R. (2008). Vehicle Dynamics: Theory and Application. Springer, New York, NY,
USA.
Johnson, L. and Nedzesky, A. (2004). A Comparative Study of Speed Humps, Speed
Slots and Speed Cushions. Annual Meeting Compendium, Institute of Transportation
Engineers (ITE), Washington, DC, USA.
Kazmierski, T., and Beeby, S. (Eds.). (2009). Energy harvesting Systems - Principles,
Modeling and Applications. Springer, New York, NY, USA.
Khaligh, A. and Onar, O. C. (2010). Energy harvesting: solar, wind, and ocean energy
conversion systems. CRC Press Inc., Boca Raton, FL, USA.
MSC.Software (Adams) (2016). http://www.mscsoftware.com/product/adams. Accessed
in July, 2016.
Pacejka, H. (2005). Tire and Vehicle Dynamics. Elsevier, Butterworth-Heinemann,
Oxford, UK.
Popp, K., Schiehlen, W., Kroger, M. and Panning, L. (2010). Ground Vehicle
Dynamics. Springer, Berlin, Germany.
Priya, S. and Inman, D. J. (Eds.) (2009). Energy harvesting technologies . Springer,
New York, NY, USA, vol. 21.
Rajamani, R. (2011). Vehicle Dynamics and Control. Springer, New York, NY, USA.
Szurgott, P., Kwasniewski, L. and Wekezer, J. (2009). Dynamic interaction between
heavy vehicles and speed bumps. In ECMS: Proceedings 23rd European Conference
on Modelling and Simulation, pp. 585-591.

Chapter 3 Development of a Software Tool to Evaluate the Vehicle-Road Interaction
104
Wong, J. (2001). Theory of Ground Vehicles, 3rd Ed. Wiley, New York, NY, USA.
WHO (2010). European Status Report on Road Safety: Towards Safer Roads and
Healthier Transport Choices. World Health Organization, Geneva, Switzerland.
Available from:
http://www.euro.who.int/__data/assets/pdf_file/0015/43314/E92789.pdf?ua=1.
Accessed in May, 2016.
WHO (2013). Global Status Report on Road Safety 2013: Supporting A Decade of
Action. World Health Organization, Geneva, Switzerland. Available from:
http://www.who.int/violence_injury_prevention/road_safety_status/2013/en/.
Accessed in May, 2016.
105
Chapter 4
Road Pavement Energy Harvesting:
Optimizing the Energy Extraction
from Vehicles to Promote Road
Safety
4.1 Introduction
Road accidents are considered by the World Health Organization (WHO) to be one of
the main problems affecting public health in the WHO European Region, and are
responsible for causing the death of about 120,000 people per year. Road accidents are
the leading cause of death in children and young adults aged 5 to 29 years old (WHO,
2010). Additionally, the WHO estimates that each year about 2.4 million people are
seriously injured as a result of road accidents in the WHO European Region alone.
Worldwide, the WHO estimates that there are about 1.24 million deaths due to road
accidents (WHO, 2013).
All this has a massive social impact directly and indirectly because besides the decrease
in productivity caused by death or serious injury to people of a working age, a great

Chapter 4 Road Pavement Energy Harvesting: Optimizing the Energy
Extraction from Vehicles to Promote Road Safety
106
strain is caused on health system resources. In addition to the pain and suffering caused
to the families of victims, road accidents cause substantial economic loss for society,
estimated by the WHO to be as high as 3% of gross domestic product in many of the
countries studied (WHO, 2010, 2013).
Analyzing road accidents and their fatality rate, the WHO concludes that, globally, 22%
of deaths due to road accidents are pedestrians, 5% are cyclists, 23% are motorcyclists,
50% are so-called vulnerable road users (WHO, 2013). In the European region, this
figure is slightly lower, standing at 43%, with 27% of deaths involving pedestrians.
One of the main causes of accidents with vulnerable road users is excess of speed,
especially within urban areas. Most accidents with pedestrians (70%) occur on
pedestrian crossings or permitted crossing areas and in 80% of cases, with the
pedestrian in movement (Holzmann, 2008).
The WHO (2013) recommends six strategic points for action in order to reduce the
number of accidents effectively and rapidly, especially among vulnerable road users,
with the first and most relevant being speed reduction.
This issue is of great importance on several levels. Firstly, because the need to reduce
speed is properly studied and based on traffic engineering and road safety manuals
(Seco et al., 2008; Elvik et al., 2009) - the higher the speed, the greater the time and
distance for braking and stopping and, consequently, the greater the severity of
accidents. The state of the pavement (dry or wet) also has an influence on braking and
stopping distances, but the main factor is the vehicle speed at the moment that it begins
to brake (Seco et al., 2008). Similarly, studies show that the probability of an accident
involving a pedestrian being fatal is greatly reduced by the reduction of impact speed.
The probability of death is 80% if the speed is 65 km/h, 45% if the speed is 50 km/h and
lower than 10% if the speed is 30 km/h. These numbers highlight the importance of
controlling speed to keep it below 50 km/h in urban areas and below 30 km/h in
residential areas or pedestrian crossings.
Traffic calming measures have emerged as a way to minimize negative impacts of
traffic in places where vehicles move by moderating their speed, with the main

Chapter 4 Road Pavement Energy Harvesting: Optimizing the Energy
Extraction from Vehicles to Promote Road Safety
107
objective of reducing motorized vehicle speed to that of non-motorized vehicles and/or
pedestrians moving in the same space. One of the most effective measures is to change
vertical alignments, in particular with the implementation of speed reduction equipment
(SRE), such as speed bumps or speed humps. SREs are the most commonly used traffic
calming measure globally because they ensure a significant reduction in vehicle speed
(Seco et al., 2008; Elvik et al., 2009).
This equipment has the advantage of reducing the vehicle speed indirectly, rather than
directly by way of the impact on the vehicle, as it forces drivers to reduce vehicle speed
before hitting the equipment to avoid impact (Silva, 2010). SREs increase the respect
between vehicles and pedestrians on pedestrian crossings and are able to reduce the
number of road accidents by 41% (Silva, 2010), although many authorities indicate
substantially lower values, such as ITE, who suggest a reduction of 13% (Ewing and
Brown, 2009). According to Gifford (2004), accidents can be reduced in 20 mph zones
(32 km/h) by as much as 60%.
Due to the impact of these devices on vehicles and their occupants, overcoming the
admitted discomfort levels defined by ISO 2631-1 (ISO, 1997), such solutions are not
suitable for application in locations on roads where the design speed is usually between
40 and 50 km/h (Seco et al., 2008), which limits their range of application. Another
major drawback of SREs is the noise generated by the impact of the vehicle on the
equipment, which is considered a nuisance in residential areas, especially at night
(Silva, 2010; Freitas et al., 2013).
From the analysis performed, it can be concluded that traffic calming measures are
effective to some extent, yet there is plenty of margin for improvement and
development. In the particular case of SREs, they are seen as the most effective measure
in speed reduction, though possible locations for implementation are limited. If
solutions were optimized and less invasive in terms of the impact on vehicle occupants,
while remaining effective in terms of speed reduction, the potential application of these
devices would be greater and their contribution to an effective speed reduction would be
better, producing a significant decrease in the rate of road accidents.

Chapter 4 Road Pavement Energy Harvesting: Optimizing the Energy
Extraction from Vehicles to Promote Road Safety
108
Energy harvesting devices (EHD), when implemented in the road pavement, extracts
energy from vehicles which, in most cases, decrease the kinetic energy of vehicles,
meaning that it will decrease its speed. If this process is done without affecting the ride
comfort, it enables the vehicle speed to be reduced without any driver action. The speed
reduction is directly proportional to the extracted energy. In the same manner, a road
pavement EHD is able to produce more electrical energy according to the amount of
energy harvested from vehicles. So, in order to improve a road pavement EHD
performance, it should be studied the most appropriate techniques to maximize the
amount of energy harvested from the vehicle without affecting the ride comfort and, at
the same time, this study will lead to a solution to reduce the vehicle speed without any
driver action, promoting road safety with a new approach. If successful, it will be
possible to implement these devices in places where vehicles move at speeds higher
than 40 km/h and reduce their speed without causing discomfort to occupants.
In this Chapter the study of typical SRE is presented, to understand its common
characteristics. After that, a new approach to harvest mechanical energy from vehicles
minimizing the impact to the vehicle is presented. The proposed system is modelled,
computationally simulated and experimentally validated, so that conclusions of its
performance can be drawn.
4.2 Speed Reduction Equipment
4.2.1 Introduction
SRE consists of a specific type of traffic calming solution, involving vertical alignment
changes in the pavement, with the goal of reducing vehicle speed by causing discomfort
to their occupants when vehicles travel above the design speed (Elvik et al., 2009;
Ewing and Brown, 2010). To quantify the impact that a SRE induces on a moving
vehicle, it is important to study the geometric shape and dimensions of its surface, as
well as the vehicle-road interaction.

Chapter 4 Road Pavement Energy Harvesting: Optimizing the Energy
Extraction from Vehicles to Promote Road Safety
109
In this section, the main characteristics of existing SRE will be presented, with special
emphasis on their surface geometry and working principles. Based on this information,
the models defined in Chapter 3 for SRE can be tested later in this work.
4.2.2 Existing equipment analysis
SREs should have an impact on vehicles when they travel above the design speed, by
causing discomfort for the occupants and, at the same time, they should have minimum
impact on the vehicles if they travel under the design speed. This is achieved through
their geometry and surface profile.
Considering the existing products on the market, most of them are speed humps and
speed bumps, manufactured using a high-strength rubber (usually vulcanized) with
convex or sinusoidal surface profiles, the most widely used products being a maximum
of 3 or 5 cm high at the centre and 50 or 90 cm wide, respectively (3M, 2016). The 3 cm
speed bumps are used in places with a speed limit not exceeding 35 km/h, while the 5
cm height are used in places with a speed limit not exceeding 20 km/h. To fix these
devices to the pavement, screws are fastened in plastic expansion anchors applied in
holes made in the upper layers of the pavement.
Some manufacturers have different surface profiles, such as triangular or trapezoidal
shapes, using the high strength rubber as the predominant material, or using recycled
plastic as the main alternative (TSS, 2016; Hongqiao Traffic, 2016).
There is no international uniformity to the geometric aspects of SRE regarding their
shape, height, length or width. Considering other research (Johnson and Nedzesky,
2004; Szurgott et al., 2009), individual countries recommendations (DGV, 2004; Ewing
and Brown, 2010), and the previously mentioned products, it can be concluded that the
mostly commonly used surface profiles on SREs are, respectively, convex bump (S1),
sinusoidal bump (S2), trapezoidal (S3) and triangular (S4), as presented in Figure 4.1,
with Lmax being the maximum width and hmax the maximum height of the SRE surface.
The equations that characterize each surface profile were presented in Table 3.4.

Chapter 4 Road Pavement Energy Harvesting: Optimizing the Energy
Extraction from Vehicles to Promote Road Safety
110
Figure 4.1- Typical SRE surface profiles.
In terms of materials, there are two main solutions: concrete or bituminous mixtures, if
speed reducers are implemented together with the pavement; plastic or vulcanized
rubber mixtures, when commercial equipment is implemented. Speed bumps and speed
humps built directly in the pavement (in concrete or bituminous mixture) are not
considered in this work, as they are built by the infrastructure manager in accordance
with local standards.
Regarding the SRE patented devices, the majority are based on the same basic principle:
application of a device in the road surface that acts as a barrier to vehicle motion,
promoting the impact of the vehicle’s tyres with the equipment and thus creating an
oscillation in the vehicle, imposing discomfort to their occupants and reduce the linear
velocity of the vehicle.

Chapter 4 Road Pavement Energy Harvesting: Optimizing the Energy
Extraction from Vehicles to Promote Road Safety
111
One of the first patents related to a SRE goes back to 1982 was registered by Lecompte
(1982), in Canada, and consisted of a device which is very similar to the existing speed
bumps: convex surface, prefabricated high strength rubber, applied on the road surface
and fixed by screws.
In the USA, several patents were registered in the 90’s, where, in addition to the speed
bump registered by Lecompte (1982), mechanisms were added below the surface of the
equipment, allowing its displacement, as in the case of patents US4974991 (Mandavi,
1990), US5267808 (Welford, 1993) and US5509753 (Thompson, 1996). However, all
these devices had the same principle of typical speed bumps, with the disadvantage of
requiring a major adjustment in the pavement, in order to install the respective
mechanisms under the SRE. Sinclair (1997) registered a design patent, USD387181, for
a modular speed bump with reflective elements, similar to most SRE currently available
on the market.
In the 2000s, new patents were registered, in order to give greater dynamism to the
speed bumps and minimize the impact of the vehicle interacting with it. One example is
the system developed by Kamienchick (2000), where it is intended that the equipment
surface has a deflection effect when vehicle wheels pass over it. However, this keeps
the typical shape of a speed bump, installed above the pavement, containing air, oil or
another fluid inside it. In the case of equipment failure, the fluid will be spilled to the
pavement, which can have disastrous effects. A new product with this working principle
is being developed by Bandennova (2016), without any technical data available so far.
4.2.3 Energetic analysis
The interaction of a vehicle with a typical SRE can be characterized by typical VRI
equations, as defined in Chapter 3 by the equations in Tables 3.1 and 3.2, as well as the
models defined in the vehicle dynamics literature (Gillespie, 1992; Wong, 2001;
Blundell and Harty, 2004; Pacejka, 2005; Jazar, 2008; Popp et al., 2010; Rajamani,
2011).

Chapter 4 Road Pavement Energy Harvesting: Optimizing the Energy
Extraction from Vehicles to Promote Road Safety
112
The energetic analysis from this interaction can also be performed based in Chapter 3
models, with Equation (3.18) quantifying the energy lost by the vehicle in the
interaction and Equation (3.19) the energy harvested by the SRE surface.
4.3 Road Pavement Energy Harvesting Device for Speed
Reduction Purposes
4.3.1 Introduction
A new solution is proposed to promote a more effective speed reduction, based on the
RPEH device’s working principles. This approach consists of a device to be
implemented on the road pavement with a movable surface which has a degree of
freedom in the vertical axis and is actuated by the passage of a vehicle wheel over it.
The device is connected to a mechanical system below it, which receives and
temporarily stores the surface harvested mechanical energy delivered from the vehicle
during the interaction with the equipment surface. After the vehicle wheel leaves the
contact with the equipment surface, the accumulated energy is used to restore the
surface to its initial position.
The new SRE design has two main components: its surface profile and displacement,
and the mechanical system responsible for energy storage and surface position control.
Both components will be studied in this section.
4.3.2 Surface profile
The surface profiles presented in Figure 4.1, typical for standard SRE without surface
displacement, have a common feature: the initial and final height is the same at the road
pavement level so that the vehicle wheel starts and finishes the contact with the
equipment at pavement level.

Chapter 4 Road Pavement Energy Harvesting: Optimizing the Energy
Extraction from Vehicles to Promote Road Safety
113
When the SRE surface has vertical motion, moving downwards with the force exerted
by the moving vehicle wheel, its final height should not be the same as its initial height,
so that the vehicle tyre can reach the pavement level immediately after it leaves contact
with the SRE surface. So, at the surface maximum length, the surface profile height
should be the same as the surface maximum displacement. To accomplish this important
feature, four different surface profiles are presented in Figure 4.2. Each surface profile
(SP) has the following denomination: Ramp (S5); S profile (S6); Scale up (S7); and
Crest (S8). Each SP equation is presented in Table 3.4.
Figure 4.2- New SRE surface profiles for a one degree of freedom movable surface.

Chapter 4 Road Pavement Energy Harvesting: Optimizing the Energy
Extraction from Vehicles to Promote Road Safety
114
4.3.3 VRI models with movable surface
The main models for studying the VRI were presented in Chapter 3 with special
emphasis on the bicycle-car model, which is the most appropriate model to study the
interaction between a vehicle and a SRE in the pavement. Those models were validated
for pavements without a movable surface. However, when considering equipment
whose surface moves vertically due to the actuation of the vehicle, these models are
incomplete.
The inclusion of a surface with vertical displacement in the pavement for the bicycle car
model determines a significant change in the models. A new model to better define this
interaction was proposed in Chapter 3. Considering the bicycle car model, as in Figure
3.2b, Equations (3.4-3.8) defines the model to be considered in this work, with a one
degree of freedom movable system implemented under the equipment surface, which
has a displacement xh, a mass mh, and a spring with stiffness Kh.
4.3.4 Mechanical system modelling
The main element of the mechanical system responsible for the opposition force to the
surface motion, for the mechanical energy storage and for the surface position
replacement is a spring. This could be directly actuated by the equipment surface, but it
would limit the spring’s force to its displacement and stiffness. To increase the spring
displacement and, consequently, its reactive force, a mechanical system is coupled to
the surface, in order to transmit the received force to the spring and multiply the
displacement. This system, presented in Figure 4.3, is based on a crank of length lcr
connected to a surface at a fixed point, moving linearly with the linear motion of the
surface (xh), and transmitting the force from the surface to a piston, which is connected
to the spring, causing a horizontal linear motion (xsp). This is defined as a crank to slider
(CTS) mechanical system.

Chapter 4 Road Pavement Energy Harvesting: Optimizing the Energy
Extraction from Vehicles to Promote Road Safety
115
Figure 4.3- SRE mechanical system.
The kinematic relations of the system are defined by Equations (4.1-4.5), with xsp-in
representing the initial position of the piston and hcr-in representing the initial height of
the crank axis.
(4.1)
(4.2)
(4.3)
(4.4)
(4.5)
Figure 4.4 represents the force diagrams of the system for a downward motion of the
surface, with Equations (4.6-4.10) defining the force transmission. In these equations,
FSM1 represents the force entering the mechanical system, FSM2 the force transmitted by
the piston to the spring, and FSM3 the force exerted by the spring onto the piston, while
FSM2s and FSM1s represent the reaction force on the crank’s extremities connected to the
piston and the surface, respectively. The opposition forces are represented by an index
s, for example, the opposition force to FSM1 is represented by FSM1s. The force exerted
by the surface mass is not considered in the force analysis, due to its low expressivity.

Chapter 4 Road Pavement Energy Harvesting: Optimizing the Energy
Extraction from Vehicles to Promote Road Safety
116
Figure 4.4- Force diagrams for the downward motion of the surface.
(4.6)
(4.7)
(4.8)
(4.9)
(4.10)
Equations (4.11-4.12) represent the dynamic equations that define the motion of the
system, for the surface (4.11) and for the piston (4.12), Flos the losses being due to
mechanical friction.
(4.11)
(4.12)
When the surface is stopped at the lower limit after maximum displacement is reached,
the dynamic equations are equal to zero, and the force transmission equations are equal
to those defined by Equations (4.6-4.10).
For an upward motion of the surface, the force transmission through the mechanical
system is presented in Figure 4.5, and the forces are defined by Equations (4.13-4.15).
The opposition force from the surface, FSM1s, is defined by the surface mass (mh.g).
(4.13)
(4.14)
(4.15)

Chapter 4 Road Pavement Energy Harvesting: Optimizing the Energy
Extraction from Vehicles to Promote Road Safety
117
Figure 4.5- Force diagrams for the upward motion of the surface.
Equations (4.16-4.17) represent the dynamic equations that define the motion of the
system for the surface (4.16) and for the piston (4.17), respectively.
(4.16)
(4.17)
This system has the ability to multiply the force received by the surface by a higher
force delivered to the spring, while reducing the displacement from the surface to the
spring or the opposite, depending on the initial value of the crank angle (θcr) and the
crank length (lcr). Using two CTS mechanical systems connected to the surface, one on
each side of the device, as shown in Figure 4.6, allow us to have more precise control
over the surface displacement and distributing the loads, keeping the surface in line and
balanced. Also, a linear guiding system is used, connected to the surface and to the base,
so that the surface movement only occurs in the vertical axis. Considering this, FSM1 is
divided by two, and the total spring stiffness is also divided by the two springs.
Figure 4.6- SRE with two CTS mechanical systems connected to the surface.

Chapter 4 Road Pavement Energy Harvesting: Optimizing the Energy
Extraction from Vehicles to Promote Road Safety
118
4.3.5 Energetic analysis
Considering a one degree of freedom movable surface, the energy harvested by the
surface, associated with the surface motion is calculated using the vertical component of
the force applied in the surface (Fz) and the surface displacement (xh) using Equation
(4.18). Equation (4.19) allows us to evaluate the efficiency of the process, between the
energy lost by the vehicle (Ev) and the energy harvested by the surface of the equipment
(EHa). The energy lost by the vehicle is determined using Equation (3.18).
(4.18)
(4.19)
4.4 Technical Analysis
4.4.1 Introduction
Based on a software tool presented in Chapter 3, the equations of the SRE presented in
the previous sections were incorporated for the different surface profiles, the vehicle
dynamic models with a moving surface and the mechanical system responsible for the
actuation of the surface.
The purpose of the simulation software is to study this interaction in great detail, with
the possibility of fully characterizing the vehicle under study, by defining its class,
weight, axles, wheels, geometry, speed, acceleration, suspensions and tyres, defining all
the mechanical parameters, such as damping and stiffness for each suspension and tyre,
as well as fully characterizing the pavement or SRE surface, by defining its material,
shape, geometry and, for a surface with displacement, its maximum displacement, mass,
and stiffness. Considering the conclusions of Chapter 3, the selected vehicle model for
this analysis is the bicycle car model.
The software tool calculates all the displacements, both for the vehicle and the SRE
surface, the applied and received forces, and the power and energy transferred, released

Chapter 4 Road Pavement Energy Harvesting: Optimizing the Energy
Extraction from Vehicles to Promote Road Safety
119
from vehicle and received on the SRE surface, and presents the results both graphically
and numerically. From the vehicle’s chassis displacements and from the motion
equations, the software also quantifies the vertical and longitudinal accelerations, which
are important to determine the discomfort induced on the vehicle’s passengers.
In this section, the simulations performed with RoadVISS for two scenarios will be
presented: standard speed reducers, without surface motion; and the new SRE proposed,
for different surface profiles, maximum displacements and geometries, in order to
identify the most effective solution, both in terms of speed reduction and ride quality.
According to Uys et al. (2007) and considering ISO 2631-1 (ISO, 1997), the vertical
acceleration induced by the vehicle on the passengers is a key factor for measuring the
ride quality. The levels of acceptability of ride quality are presented in Table 4.1.
Considering these values, it is intended that the SRE do not induce vertical accelerations
above 0.80 m/s2.
Table 4.1- Levels of acceptability of ride quality (ISO, 1997).
Vehicle chassis vertical acceleration
(m/s2)
Acceptability
<0.315 Not uncomfortable
0.315-0.630 A little uncomfortable
0.500-1.000 Fairly uncomfortable
0.800-1.600 Uncomfortable
1.250-2.500 Very uncomfortable
>2.000 Extremely uncomfortable
4.4.2 Comparison between typical SRE and the proposed
solution
Using the RoadVISS software tool to perform the simulations both for standard SRE
and for the new proposed device, a vehicle with the characteristics presented in Table
4.2 was defined, using the bicycle car model and the contact patch analysis. The initial
speed considered was 50 km/h as this is the speed limit in urban areas.

Chapter 4 Road Pavement Energy Harvesting: Optimizing the Energy
Extraction from Vehicles to Promote Road Safety
120
Table 4.2- Fixed and initial values for the simulation variables.
Variable name Value Unit V
ehic
le &
mo
tio
n
Vehicle class Light -
Vehicle weight 1,500 (kg)
Number of axles P1 2 -
Number of wheels per axle 2 -
Sprung-Unsprung % 90%-10% -
Drag coefficient 0.32 -
Inertia moment 1,100 (kg.m2)
Lift coefficients (Front | Rear) 0.19 | 0.13 -
Motion | Direction Free rolling | Forward -
Vehicle speed 50 (km/h)
Vehicle acceleration 0 (m/s2)
Su
spen
sio
n &
wh
eel
Suspension type (Front | Rear) Independent | Independent -
Suspension stiffness (Front | Rear) 20,000 | 15,000 (N/m)
Suspension damping (Front | Rear) 1,500 | 1,700 (Ns/m)
Tyre type (Front | Rear) Radial | Radial -
Tyre stiffness (Front | Rear) 150,000 | 150,000 (N/m)
Tyre damping (Front | Rear) 800 | 800 (Ns/m)
Tyre pressure (Front | Rear) 200 | 200 (kPa)
Tyre external diameter (Front | Rear) 500 | 500 (mm)
Tyre width (Front | Rear) 200 | 200 (mm)
Tyre tread width (Front | Rear) 180 | 180 (mm)
4.4.2.1 Scenario 1 - Standard SRE
Considering the SRE available on the market, more specifically the commercial speed
bumps, which have a convex and sinusoidal profile with different widths (400, 500, 600
and 900 mm) and different maximum heights (20, 25 and 30 mm), and also some
products with triangular and trapezoidal surface profiles, as presented in Figure 4.1,
simulations for a vehicle with the characteristics presented in Table 4.2 were performed
in order to determine the impact of the different SRE on the vehicle, in terms of
maximum induced force form vehicle to the SRE (Fz), vehicle released energy (Ev),
chassis maximum vertical displacement (xs), maximum vertical acceleration (ẍs),
maximum longitudinal acceleration ( ), and vehicle speed reduction (vred). The
simulation results are presented in Table 4.3.

Chapter 4 Road Pavement Energy Harvesting: Optimizing the Energy
Extraction from Vehicles to Promote Road Safety
121
Table 4.3- Standard SRE simulation results.
SP Lmax
(mm)
hmax
(mm)
Fz max
(mm)
Ev
(J)
xs max
(mm)
ẍs max
(m/s2)
max
(m/s2)
vred
(km/h)
S1
400 20 5,691.16 760.00 1.61 2.25 -3.24 0.13
500 25 6,456.17 954.00 2.22 2.96 -3.40 0.16
600 30 6,685.55 1,200.00 3.37 3.58 -3.47 0.21
900 50 7,739.05 2,248.00 6.48 5.11 -3.82 0.39
S2
400 20 6,588.26 776.00 0.95 1.68 -2.12 0.13
500 25 7,121.65 836.00 1.23 2.33 -2.66 0.19
600 30 7,669.48 1,028.00 2.34 2.95 -2.95 0.21
900 50 9,738.73 2,680.00 3.89 4.83 -4.1 0.47
S3
500 30 7,045.11 3,368.00 3.25 3.13 -6.15 0.59
750 40 8,345.22 4,562.00 5.89 4.04 -6.99 0.79
1000 50 10,301.18 5,782.00 8.67 4.94 -7.11 1.01
S4
400 20 6,006.95 570.00 0.98 1.54 -0.75 0.10
600 30 7,025.51 864.00 1.79 2.47 -0.83 0.15
800 40 7,603.11 1,040.00 2.89 3.23 -0.84 0.18
From the results presented in Table 4.3, it is possible to compare the differences
between each SRE, depending on its particular characteristics. Some conclusions can be
drawn from the analysis of the results:
All the SRE analysed induce a vertical acceleration higher than 0.80 m/s2, which
indicates, according with ISO 2631-1 (ISO, 1997), that all SRE induce an
uncomfortable ride quality to the vehicle passengers, when passing over the SRE
at 50 km/h; in fact, most of the SRE studied present a vertical acceleration
higher than 2.50 m/s2, resulting in extremely uncomfortable ride quality for
passengers.
Comparing each of the SRE, one can conclude that the Triangular surface
profile (S4) presents the lowest vertical acceleration induced on vehicle
passengers, but is also the profile with the lowest energy extraction, meaning the
lowest vehicle speed reduction.
The convex Convex bump surface profile (S1), which is the mostly used profile
on municipal roads, especially 600 mm wide by 30 mm height version, gives to

Chapter 4 Road Pavement Energy Harvesting: Optimizing the Energy
Extraction from Vehicles to Promote Road Safety
122
the vehicle passengers an extremely uncomfortable ride quality and only
promotes a direct speed reduction of 0.21 km/h.
The Sinusoidal bump surface profile (S2), when compared with the Convex
bump surface profile (S1), induces lower vertical acceleration to the vehicle
chassis so less discomfort to passengers with similar results in terms of speed
reduction, meaning that this profile is more appropriate to improve ride quality.
The Trapezoidal surface profile (S3) presents the highest speed reduction
values; however, due to the very high vertical acceleration induced to the vehicle
passengers, its use should be very limited.
From all the simulations, it can be concluded that all SRE induce very uncomfortable or
extremely uncomfortable ride quality to the vehicle passengers, without resulting in
high values of vehicle speed reduction. It may be concluded, therefore, that the
effectiveness of these devices is due only to the discomfort caused to vehicle
passengers, leading to speed reduction before the equipment due to a braking action and
not by the equipment itself.
4.4.2.2 Scenario 2 - New device with movable surface
Considering the new solution proposed with a movable surface and considering the
same vehicle and motion conditions as in the previous simulations for standard SRE, a
set of simulations were performed for the different surface profiles presented in Figure
4.3, with different widths (200, 400 and 600 mm) and maximum heights (20, 25 and 30
mm), the maximum displacement being equivalent to the surface maximum height. The
considered spring stiffness value is 200,000 N/m, and the surface material is recycled
plastic with a rubber layer on top, with a total mass of 20 kg. The values for r1 and θ1-in
are, respectively, 0.10 m and 1.22 rad (or 70º). The simulation results are presented in
Table 4.4.

Chapter 4 Road Pavement Energy Harvesting: Optimizing the Energy
Extraction from Vehicles to Promote Road Safety
123
From the results presented in Table 4.4, it is possible to compare the differences
between each surface profile and SRE characteristics. Some conclusions may be drawn
from the analysis of the results:
Surface profiles Ramp (S5), S profile (S6) and Scale Up (S7) induce a vertical
acceleration lower than 0.80 m/s2, meaning that these three profiles provide a
comfortable or a little uncomfortable ride quality, while energy is being
harvested from the vehicle, leading to a speed reduction.
Surface profile Crest (S8) induces a vertical acceleration between 0.74 and 1.35
m/s2, values that are considered uncomfortable in terms of ride quality.
In terms of speed reduction, Crest is the surface profile that allows the most
energy to be harvested from the vehicle and, consequently, to maximize speed
reduction, followed by the surface profile Ramp, S Profile and Scale Up,
respectively.
The surface profile that presents the best relation speed reduction versus ride
quality is Ramp (S5), with special emphasis on the 200 mm wide by 25 mm
maximum displacement equipment, which allows a vehicle speed reduction of
0.13 km/h only in 0.20 metres, meaning that with five consecutive devices
applied on the pavement it would be possible to reduce the vehicle speed by 0.67
km/h and with a good level of ride quality (a little uncomfortable).
When comparing the achieved results using a movable surface and surface profiles S5-
S8 with the standard SRE with surface profiles S1-S4, it may be concluded that the
relationship between vehicle speed reduction and ride quality is much better with the
newly proposed device with movable surface, for all the studied surfaces, both in terms
of speed reduction and ride quality.

Chapter 4 Road Pavement Energy Harvesting: Optimizing the Energy
Extraction from Vehicles to Promote Road Safety
124
Table 4.4- New SRE with movable surface simulation results.
SP Lmax
(mm)
hmax
(mm)
Fz max
(mm)
Ev
(J)
xs max
(mm)
ẍs max
(m/s2)
max
(m/s2)
vred
(km/h)
S5
200 20 3,524.92 580.00 0.14 0.36 -0.62 0.10
200 25 3,968.15 724.00 0.31 0.49 -0.78 0.13
400 20 3,494.58 396.00 0.06 0.34 -0.29 0.07
400 25 3,501.22 500.00 0.06 0.29 -0.36 0.09
600 25 4,853.91 462.00 0.02 0.23 -0.33 0.08
600 30 4,507.48 534.00 0.16 0.81 -0.38 0.10
S6
200 20 4,119.11 286.00 0.18 0.38 -1.29 0.05
200 25 4,763.49 350.00 0.33 0.61 -1.23 0.06
400 20 4,120.48 134.00 0.04 0.39 -0.54 0.03
400 25 4,187.17 266.00 0.04 0.32 -0.95 0.05
600 25 5,160.44 272.00 0.13 0.92 -0.72 0.05
600 30 4,888.78 326.00 0.14 0.92 -0.65 0.06
S7
200 20 3,478.42 88.00 0.06 0.44 -1.02 0.02
200 25 3,497.61 110.00 0.03 0.37 -1.36 0.02
400 20 2,862.85 104.00 0.24 0.35 -0.65 0.02
400 25 2,939.65 142.00 0.21 0.36 -0.61 0.03
600 25 4,216.41 222.00 0.31 0.52 -0.89 0.04
600 30 3,619.58 224.00 0.4 0.62 -0.10 0.04
S8
200 20 3,767.39 820.00 0.64 1.02 -3.34 0.14
200 25 4,719.91 966.00 0.88 1.35 -3.45 0.17
400 20 3,996.51 780.00 0.57 0.74 -3.16 0.14
400 25 3,900.17 860.00 0.84 0.88 -3.18 0.15
600 25 4,541.08 898.00 1.13 0.87 -3.17 0.15
600 30 4,290.05 938.00 1.18 0.86 -3.19 0.16
As the movable surface concept induces both a small vertical acceleration and chassis
vertical displacement (lower than 1 mm for almost all scenarios), it allows multiple SRE
to be implemented consecutively in the pavement, without or with a very small distance
between each other, enabling vehicle speed reduction to be maximised in a very small
distance.

Chapter 4 Road Pavement Energy Harvesting: Optimizing the Energy
Extraction from Vehicles to Promote Road Safety
125
4.4.3 Potential contribution to road safety
A study by Donario and Santos (2012), sponsored by the Portuguese Authority for Road
Safety, assessed the economic and social cost of road accidents nationwide. From this
study several important conclusions were drawn, in particular the following numbers:
• Average annual economic and social cost of road accidents: about 2,500 million
Euros, representing 1.54% (on average) of Portuguese GDP in 2010;
• Average annual economic and social cost for each accident with victims: 60,000
Euros;
• Average annual economic and social cost for each accident with fatalities:
735,000 Euros;
• Average annual economic and social cost for each accident with serious injuries:
121,000 Euros;
• Average annual economic and social cost for each accident with minor injuries:
32,000 Euros;
• Average annual economic and social cost per victim: 44,000 Euros;
• Average annual economic and social cost per fatality: 664,000 Euros;
• Average annual economic and social cost per seriously injured victim: 96,000
Euros;
• Average annual economic and social cost per slightly injured victim: 23,000
Euros.
These numbers are in accordance with the numbers presented by the WHO (2010,
2013).
Considering the facts presented in the introduction to this work, it has been established
that the most affected groups in urban areas are vulnerable road users, accounting for
43% of road fatalities in the European region, with 27% being pedestrians (WHO,
2013), and given that the WHO itself points out that speed is the main cause for
accidents with vulnerable road users, reducing speed in urban areas is extremely
important to directly reduce the number of fatalities in road accidents, especially
involving vulnerable road users.
As studied by Seco et al. (2008), the probability of an accident involving a pedestrian
being fatal considerably decreases with the reduction of impact speed, the probability
being 80% if the speed is 65 km/h, 45% if the speed is 50 km/h and lower than 10% if
the speed is 30 km/h.

Chapter 4 Road Pavement Energy Harvesting: Optimizing the Energy
Extraction from Vehicles to Promote Road Safety
126
Since the vast majority of pedestrian accidents occur on pedestrian crossings
(Holzmann, 2008), it is of great importance to effectively reduce vehicle speed on the
approach to pedestrian crossings, without the problems presented by typical SRE, as
discussed in this research work.
The proposed device with movable surface, using the Ramp surface profile with the
dimensions of 200x25 mm (width x maximum height), with a maximum displacement
of 25 mm, which for the studied vehicle at a 50 km/h speed induces a vertical
acceleration in the vehicle chassis of 0.49 m/s2, considered to be a little uncomfortable,
results in a vehicle speed reduction of 0.67 km/h per metre.
Table 4.5 presents a case study for speed reduction based on the vehicle initial speed
and the total length of consecutive SRE installed in the pavement, with the exit speed
and the obtained speed reduction presented as outputs.
Table 4.5- Speed reduction case study.
Initial speed
(km/h)
SRE total length
(m)
Exit speed
(km/h)
vred
(km/h)
Speed reduction
percentage
60
20 47.0 13.0 21.7%
30 44.4 15.6 26.0%
40 38.7 21.3 35.5%
50 35.9 24.1 40.2%
50
20 45.0 5.0 10.0%
30 40.9 9.1 18.3%
40 38.2 11.8 23.7%
50 35.4 14.6 29.2%
40
20 34.5 5.5 13.7%
30 31.6 8.4 21.0%
40 28.2 11.8 29.4%
50 24.9 15.1 37.8%
From Table 4.5 it is possible to conclude that for an entry speed of 50 km/h, with 50
metres of the proposed SRE installed consecutively in the pavement, vehicle speed can
be reduced by approximately 14.6 km/h, or about 29.2% related to initial speed, slowing

Chapter 4 Road Pavement Energy Harvesting: Optimizing the Energy
Extraction from Vehicles to Promote Road Safety
127
down the vehicle from 50 km/h to 35.4 km/h. As studied by Holzmann (2008), a
reduction from 50 km/h to 30 km/h can reduce the probability of fatality in an accident
from 45% (medium-low) to 10% (very low), which is highly significant.
From this analysis, with 50 metres of the proposed SRE applied on the pavement, on
each side of the road, before a pedestrian crossing, it is possible to reduce vehicle speed
by almost 40% (depending on the initial speed), reducing very significantly the
probability of a fatal accident.
Based on the values presented by Donario and Santos (2012), for each fatality avoided,
664,000 Euros could be saved; for each seriously injured victim avoided 96,000 Euros
could be saved and for each slightly injured victim, 23,000 Euros could be saved.
Considering these values, and based on WHO (2010, 2013) estimates, it may be
concluded that the estimated total cost of pedestrian accidents is approximately 675
million Euros, just in Portugal. So, with a 100,000 Euro investment for each critical
pedestrian crossing, for every victim avoided there would an immediate return on the
investment.
4.5 Experimental Validation
4.5.1 Introduction
Following the computational simulations, a prototype of the system was designed,
simulated and constructed for experimentally evaluating the results. This prototype,
besides the mechanical system, also includes sensors and instrumentation components
to measure different variables, a data logger to collect these data and software to receive
data and generate plots. The prototype was then implemented in a controlled
environment and different scenarios were tested. A new set of computational
simulations was performed, for the same scenarios as those tested experimentally, so
that both results could be directly compared. The analysis of the results is also presented
in this section.

Chapter 4 Road Pavement Energy Harvesting: Optimizing the Energy
Extraction from Vehicles to Promote Road Safety
128
4.5.2 Prototype
The design of the experimental prototype was based on the CTS mechanical system
presented in Figure 4.3, but using two CTS systems, as presented in Figure 4.6.
Considering the usage of low weight and low cost materials, especially plastic, as the
core material for the components of the prototype, a multiple crank system was adopted.
The components were designed so that the prototype can support the passage of a heavy
vehicle with 10 tons per axle, with a safety factor of 1.5. Also, a linear guiding system
was used to guarantee a uniform displacement of the system surface, with a linear guide
and a linear bearing in each corner of the prototype. The values considered for the
prototype components, specially the crank length (lcr), its initial position (θcr-in), the
maximum displacement of the surface (xh-max) and the spring stiffness (Kh), were the
same as presented in previous sections.
The prototype design is presented in Figure 4.7, without sensors, instrumentation
components and the surface with a specific profile. Three SPs (Crest, Ramp and S
profile) were designed and built for the experimental tests. The external dimensions of
the prototype are 0.8 x 0.3 m, having a total area of 0.24 m2. Its total height is 0.11 m.
The external dimensions of the surface are 0.775 x 0.275 m, giving a total area of 0.213
m2.
Besides the mechanical system, sensors and instrumentation components were also
included in the prototype, namely two Tedea-Huntleigh load cells, model 1250 (Vishay,
2017), with a 1,000 kg maximum load each, to measure the force received by the
surface of the prototype and transferred to the mechanical system (FSM1), applied
between the surface with a specific profile and the mechanical system surface; and two
linear encoders Variohm - IPL Linear Position Sensor, model IPL-0025-103-3%-ST
(Farnell, 2017) to measure the linear displacement of the prototype surface (xh) and the
linear displacement of the mechanical system (xSM), applied in a fixed and a moving part
of the systems to measure the displacements.

Chapter 4 Road Pavement Energy Harvesting: Optimizing the Energy
Extraction from Vehicles to Promote Road Safety
129
Figure 4.7- Prototype design without sensors and instrumentation components.
These sensors were connected to a Data Logger from National Instruments, model NI
USB-6003 (National Instruments, 2017), with an intermediate instrumentation system to
adapt the sensors signals to the data logger requirements. The Data Logger was
connected to a laptop via USB, transferring the acquired data with a frequency of 100
Hz, and software was developed using LabVIEW® to read the received data and convert
it into plots, as well as store these data in readable files.
To convert the measured loads from the load cells into a received force, the values from
both load cells were added and multiplied for 9.81 m/s2, and to determine the load
delivered by the slider to the springs, Equation (4.7) was used. In this equation, to
define the angle θcr, Equations (4.1-4) were used considering the displacements xh and
xcr measured by the linear encoders. With these values, the energy harvested from the
surface (Eh) was measured using Equation (4.18).
In Figure 4.8a the prototype is presented with the sensors and with the Crest surface
profile, while Figure 4.8b shows the Data Logger and the instrumentation circuit.

Chapter 4 Road Pavement Energy Harvesting: Optimizing the Energy
Extraction from Vehicles to Promote Road Safety
130
Figure 4.8- (a) Prototype system fully assembled with sensors, trimetric view; (b) data logger with
instrumentation.
4.5.3 Test scenarios
The prototype was installed in a road pavement surface of a car parking space by
opening a hole with the external dimensions of the prototype (0.8 x 0.3 x 0.11 m3), with
the prototype surface at the external level of the road surface. Figure 4.9 shows the
prototype implemented in the road pavement surface. Considering the working principle
of the designed system, when the vehicle wheels start contact with the prototype
surface, it will be at the pavement level, and when the wheel leaves the contact with the
prototype surface it still continues at the road pavement level, avoiding the typical bump
effect of speed bumps.
To perform multiple tests with the prototype and evaluate its performance under
different conditions, different vehicles weighing 1,000 kg (VE1) and 2,000 kg (VE2),
different prototype surface profiles as presented in previous sections (Crest, Ramp and S
profile), different values for the spring stiffness of 200 kN/m (Kh1) and 400 kN/m (Kh2)
and different vehicle speeds, of 20, 30, 40 and 50 km/h were considered. Table 4.6
presents the different scenarios for the prototype experiments.

Chapter 4 Road Pavement Energy Harvesting: Optimizing the Energy
Extraction from Vehicles to Promote Road Safety
131
Figure 4.9- Prototype installed in a road pavement.
Table 4.6- Test scenarios for the system prototype.
Vehicle weight
(kg) SP
Total spring stiffness
(kN/m)
Vehicle speed
(km/h)
VE1=1,000
S8=Crest K1=200 10 | 20 | 30 | 40
K2=400 10 | 20 | 30 | 40
S5=Ramp K1=200 10 | 20 | 30 | 40
K2=400 10 | 20 | 30 | 40
S6=S profile K1=200 10 | 20 | 30 | 40
K2=400 10 | 20 | 30 | 40
VE2=2,000
S8=Crest K1=200 10 | 20 | 30 | 40
K2=400 10 | 20 | 30 | 40
S5=Ramp K1=200 10 | 20 | 30 | 40
K2=400 10 | 20 | 30 | 40
S6=S profile K1=200 10 | 20 | 30 | 40
K2=400 10 | 20 | 30 | 40

Chapter 4 Road Pavement Energy Harvesting: Optimizing the Energy
Extraction from Vehicles to Promote Road Safety
132
4.5.4 Computational simulations
Using the RoadVISS software tool to perform the simulations for the new SRE
proposed in this work and also to evaluate the impact of the vehicle characteristics in
the system performance, two vehicles with the characteristics presented in Table 4.7
were considered, using the bicycle car model and the CPA. Also, different initial
vehicle speeds (vini) were evaluated, from 20 km/h to 50 km/h, as this is the speed limit
in urban areas.
Table 4.7- Fixed and initial values for the simulation variables.
Variable name Value (VE1) Value (VE2) Unit
Veh
icle
& m
oti
on
Vehicle class Light -
Vehicle weight 1,000 2,000 (kg)
Number of axles P1 | wheels/axle 2 | 2 -
Distance a1 | a2 0.914 | 1.557 1.055 | 1.651 (m)
Sprung-Unsprung % 90%-10% -
Drag coefficient 0.3 0.34 -
Inertia moment 750 1,470 (kg.m2)
Lift coefficients (Front | Rear) 0.17 | 0.12 0.21 | 0.15 -
Motion | Direction Free rolling | Forward -
Vehicle speed 20 | 30 | 40 | 50 (km/h)
Vehicle acceleration 0 (m/s2)
Su
spen
sio
n &
wh
eel
Suspension type (Front | Rear) Independent | Independent -
Suspension stiffness (Front | Rear) 20,000 | 15,000 25,000 | 18,000 (N/m)
Suspension damping (Front | Rear) 1,500 | 1,700 1,700 | 1,900 (Ns/m)
Tyre type (Front | Rear) Radial | Radial -
Tyre stiffness (Front | Rear) 140,000 | 140,000 160,000 | 160,000 (N/m)
Tyre pressure (Front | Rear) 200 | 200 250 | 250 (kPa)
Tyre external diameter (Front | Rear) 400 | 400 500 | 500 (mm)
Tyre width (Front | Rear) 190 | 190 220 | 220 (mm)
Tyre tread width (Front | Rear) 175 | 175 200 | 200 (mm)
Considering the new solution proposed for a SRE with a movable surface, a set of
simulations were performed for the different SPs presented in Figure 4.2, with a surface
width (Lmax) of 275 mm and a maximum height (hmax) of 20 mm, the maximum

Chapter 4 Road Pavement Energy Harvesting: Optimizing the Energy
Extraction from Vehicles to Promote Road Safety
133
displacement (xh-max) being equivalent to the surface maximum height. The total spring
stiffness was changed between simulations, with Kh1 equal to 200,000 N/m and Kh2
equal to 400,000 N/m, and the surface material is recycled plastic with a rubber layer on
top, with a total mass of 18 kg. The values for lcr and θcr-in are, respectively, 0.04 m and
0.848 rad (or 48.6º). The simulation results for VE1 and VE2 are presented in Tables 4.8
and 4.9, respectively, for the maximum value of the force transmitted by the surface
(FSM1), the energy harvested by the surface during the vehicle front wheel actuation (EHa
FW), rear wheel actuation (EHa RW), and the total energy harvested by the surface (EHa).
Table 4.8- Simulation results of the new SRE with movable surface for VE1.
SP Kh
(kN/m)
vini
(km/h)
FSM1
(N)
EHa FW
(J)
EHa RW
(J)
EHa
(J)
S8
200
20 3,426.3 33.8 22.4 56.2
30 2,640.1 46.9 30.3 77.3
40 3,379.1 54.9 35.1 90.0
50 3,956.2 57.7 36.0 93.7
400
20 3,614.8 23.6 28.9 52.5
30 3,076.4 34.8 25.8 60.5
40 3,527.5 46.0 30.7 76.7
50 3,722.4 50.0 31.5 81.5
S5
200
20 3,326.6 31.8 17.3 49.1
30 2,269.9 43.1 25.8 68.9
40 2,890.1 47.8 29.6 77.4
50 3,137.4 52.1 30.6 82.7
400
20 3,834.0 21.2 20.9 42.1
30 2,134.9 27.8 17.3 45.1
40 3,027.5 36.7 21.2 57.9
50 3,327.4 40.3 23.5 63.8
S6
200
20 4,350.4 44.9 25.0 69.9
30 3,398.4 48.7 32.4 81.1
40 3,590.1 54.8 36.6 91.4
50 3,942.8 58.1 36.7 94.8
400
20 4,765.2 38.2 18.0 56.2
30 4,331.2 31.4 18.4 49.8
40 4,126.5 42.1 26.6 68.7
50 4,311.7 45.9 29.5 75.4

Chapter 4 Road Pavement Energy Harvesting: Optimizing the Energy
Extraction from Vehicles to Promote Road Safety
134
Table 4.9- Simulation results of the new SRE with movable surface for VE2.
SP Kh
(kN/m)
vini
(km/h)
FSM1
(N)
EHa FW
(J)
EHa RW
(J)
EHa
(J)
S8
200
20 5,024.2 53.1 40.1 93.2
30 4,540.2 56.9 51.5 108.4
40 3,878.5 69.1 62.0 131.1
50 4,492.6 81.5 66.5 148.0
400
20 5,422.1 60.0 34.0 94.0
30 5,049.8 42.4 37.9 80.3
40 5,164.5 69.8 67.5 137.3
50 5,036.1 82.8 68.4 151.2
S5
200
20 4,833.2 44.1 34.8 78.9
30 4,133.0 53.8 46.1 99.9
40 4,145.5 65.4 55.0 120.4
50 4,550.5 75.4 58.7 134.1
400
20 5,510.2 57.2 33.4 90.6
30 4,978.1 39.7 30.1 69.8
40 4,333.2 57.7 53.6 111.3
50 5,153.8 71.1 61.8 132.9
S6
200
20 5,195.1 44.9 42.3 87.2
30 4,483.7 51.7 49.2 100.9
40 4,049.4 63.7 57.5 121.2
50 4,504.2 68.8 63.3 132.1
400
20 5,321.1 54.9 47.2 102.1
30 4,930.2 37.0 31.2 68.2
40 4,527.5 51.7 50.1 101.8
50 4,607.8 63.2 59.5 122.7
Considering EHa as the most important variable to evaluate the performance of the
system, Figure 4.10 presents the energy harvested for VE1, for the different surfaces and
for different spring stiffness, while Figure 4.11 presents the results for the same
scenarios but for VE2.

Chapter 4 Road Pavement Energy Harvesting: Optimizing the Energy
Extraction from Vehicles to Promote Road Safety
135
Figure 4.10- Simulation results of the total energy harvested for VE1.
Figure 4.11- Simulation results of the total energy harvested for VE2.

Chapter 4 Road Pavement Energy Harvesting: Optimizing the Energy
Extraction from Vehicles to Promote Road Safety
136
From the results presented in Tables 4.8 and 4.9, as well as Figures 4.10 and 4.11, it is
possible to compare the differences between each surface profile and SRE
characteristics. Some conclusions may be drawn from the analysis of the results:
Surface profile S8 has the best performance of energy extracted from both types
of vehicles in almost all scenarios, with a few exceptions where surface profile
S6 has a better performance. For all scenarios, S5 has the lowest values of
energy harvested from vehicles. As the extracted energy is proportional to the
vehicle speed reduction, surface profile S8 reduced the vehicle speed the most
efficiently;
In most scenarios, the energy harvested from the device’s surface is higher the
lower value of the spring stiffness;
The lower value of the spring stiffness, the increase in the harvested energy is
proportional to the increase in the vehicle speed for all the tested scenarios.
However, for the highest spring stiffness value, the harvested energy is not
proportional to the vehicle speed increase.
4.5.5 Experimental results
Both the VE1 and VE2 used in the experimental tests have the same characteristics as the
vehicles considered in the computational simulations, as presented in Table 4.7, so that
the experimental test results can be compared with the appropriate level of confidence.
Tables 4.10 and 4.11 show the results of the experimental tests with the prototype, for
VE1 and VE2, respectively. In these tables, the different variables presented in Table 4.6
are identified, and the values regarding the force received by the surface and transmitted
to the mechanical system (FSM1), the energy harvested by each vehicle wheel (EHa FW
and EHa RW), as well as the total energy harvested from both wheels from one side of
the vehicle (EHa) are presented.

Chapter 4 Road Pavement Energy Harvesting: Optimizing the Energy
Extraction from Vehicles to Promote Road Safety
137
Considering the total EHa as the most important variable to evaluate the performance of
the system, Figure 4.12 presents the energy harvested for VE1, for the different surfaces
and the different spring stiffness, while Figure 4.13 presents the results for the same
scenarios but for VE2.
Table 4.10- Prototype test results for VE1.
SP Kh
(kN/m)
vini
(km/h)
FSM1
(N)
EHa FW
(J)
EHa RW
(J)
EHa
(J)
S8
200
20 3,694.2 50.0 31.5 81.5
30 3,339.1 60.1 40.8 100.9
40 3,673.1 65.8 37.2 103.0
50 3,791.5 69.6 38.8 108.4
400
20 3,640.1 45.4 38.4 83.8
30 4,012.1 53.8 30.6 84.4
40 4,641.7 83.8 31.3 115.1
50 4,230.2 65.4 28.5 93.9
S5
200
20 3,195.4 40.3 33.7 74.0
30 3,350.0 48.1 32.5 80.6
40 2,612.6 41.3 22.6 63.9
50 2,562.9 43.7 21.7 65.4
400
20 2,963.0 30.1 24.3 54.4
30 3,033.1 29.1 20.9 49.9
40 3,235.7 45.8 22.2 68.0
50 2,938.4 45.2 32.2 77.4
S6
200
20 3,573.7 45.5 30.8 76.3
30 2,901.5 46.3 27.0 73.3
40 3,639.6 60.5 38.9 99.4
50 2,699.2 36.2 17.2 53.3
400
20 2,759.0 42.9 17.6 60.5
30 3,137.4 38.5 24.3 62.8
40 3,667.8 54.5 24.2 78.7
50 3,730.5 65.2 31.9 97.2

Chapter 4 Road Pavement Energy Harvesting: Optimizing the Energy
Extraction from Vehicles to Promote Road Safety
138
Table 4.11- Prototype test results for VE2.
SP Kh
(kN/m)
vini
(km/h)
FSM1
(N)
EHa FW
(J)
EHa RW
(J)
EHa
(J)
S8
200
20 3,969.1 57.0 50.6 107.6
30 3,661.5 44.9 48.3 93.1
40 3,831.1 56.0 51.4 107.4
50 3,791.2 58.0 43.7 101.7
400
20 6,480.1 69.6 72.8 142.5
30 4,539.7 77.0 84.0 161.0
40 3,491.2 85.2 82.3 167.5
50 5,526.0 102.5 96.9 199.4
S5
200
20 3,969.0 57.0 47.3 104.3
30 3,909.0 52.0 47.3 99.3
40 3,771.3 56.7 56.0 112.7
50 3,972.9 63.5 51.8 115.3
400
20 3,573.9 44.1 41.3 85.4
30 3,934.1 67.2 63.8 131.0
40 3,854.0 68.7 62.7 131.4
50 3,470.2 50.3 50.3 100.7
S6
200
20 4,617.9 47.0 49.0 96.0
30 3,353.3 46.3 54.0 100.3
40 3,767.6 51.4 54.9 106.3
50 4,410.7 71.2 61.3 132.4
400
20 3,700.3 52.0 48.9 100.9
30 3,559.9 59.8 56.0 115.9
40 3,736.3 67.2 61.3 128.4
50 3,838.8 66.5 55.5 122.0

Chapter 4 Road Pavement Energy Harvesting: Optimizing the Energy
Extraction from Vehicles to Promote Road Safety
139
Figure 4.12- Experimental results of the total energy harvested for VE1.
Figure 4.13- Experimental results of the total energy harvested for VE2.

Chapter 4 Road Pavement Energy Harvesting: Optimizing the Energy
Extraction from Vehicles to Promote Road Safety
140
Analyzing the results, the following conclusions can be drawn.
For VE1 and for the same surface profile, EHa is generally higher for a lower
value of the spring stiffness, but for VE2 the opposite happens. This allows us to
conclude that for higher vehicle weights, higher values of spring stiffness must
be used to optimize the energy harvested from vehicles.
The surface profile S8 is the one which presents a higher value of EHa for most
scenarios, which was also verified with the computational simulations, allowing
us to conclude that this is the optimal surface profile regarding energy extraction
and, consequently, speed reduction.
An increase in the vehicle speed for VE1 is proportional to an increase in the EHa
only in half of the tested scenarios, while for VE2 this proportionality was
registered only for one scenario. This allows us to conclude that in the
experimental tests the proportionality between the vehicle speed and the energy
harvested was not fully validated.
For similar surface profiles and spring stiffness, the energy harvested from the
equipment increases with the vehicle weight, almost in direct proportion.
4.5.6 Discussion
Tables 4.12 and 4.13 present the difference between the simulations and the
experimental results for similar tested scenarios using VE1 and VE2, respectively.

Chapter 4 Road Pavement Energy Harvesting: Optimizing the Energy
Extraction from Vehicles to Promote Road Safety
141
Table 4.12- Difference between the simulations and experimental results for tested scenarios using
VE1.
SP Kh
(kN/m)
vini
(km/h)
FSM1
(N)
EHa FW
(J)
EHa RW
(J)
EHa
(J)
S8
200
20 7.8% 47.9% 40.9% 45.1%
30 26.5% 28.1% 34.5% 30.6%
40 8.7% 19.9% 6.0% 14.5%
50 -4.2% 20.6% 7.8% 15.7%
400
20 0.7% 92.4% 32.7% 59.6%
30 30.4% 54.7% 18.6% 39.3%
40 31.6% 82.1% 2.0% 50.0%
50 13.6% 30.8% -9.4% 15.3%
S5
200
20 -3.9% 26.6% 94.9% 50.7%
30 47.6% 11.6% 26.1% 17.0%
40 -9.6% -13.7% -23.7% -17.5%
50 -18.3% -16.2% -29.0% -20.9%
400
20 -22.7% 42.0% 16.4% 29.3%
30 42.1% 4.5% 20.7% 10.7%
40 6.9% 24.7% 4.7% 17.4%
50 -11.7% 12.1% 36.8% 21.2%
S6
200
20 -17.9% 1.2% 23.2% 9.1%
30 -14.6% -4.9% -16.8% -9.6%
40 1.4% 10.4% 6.4% 8.8%
50 -31.5% -37.8% -53.2% -43.7%
400
20 -42.1% 12.2% -2.2% 7.6%
30 -27.6% 22.6% 32.0% 26.1%
40 -11.1% 29.5% -9.1% 14.6%
50 -13.5% 42.1% 8.2% 28.9%
Average -1.1% 22.0% 12.8% 17.7%

Chapter 4 Road Pavement Energy Harvesting: Optimizing the Energy
Extraction from Vehicles to Promote Road Safety
142
Table 4.13- Difference between the simulations and experimental results for tested scenarios using
VE2.
SP Kh
(kN/m)
vini
(km/h)
FSM1
(N)
EHa FW
(J)
EHa RW
(J)
EHa
(J)
S8
200
20 -21.0% 7.3% 26.2% 15.4%
30 -19.4% -21.1% -6.3% -14.1%
40 -1.2% -18.9% -17.1% -18.1%
50 -15.6% -28.9% -34.3% -31.3%
400
20 19.5% 16.1% 114.2% 51.6%
30 -10.1% 81.7% 121.7% 100.5%
40 -13.0% 22.1% 21.9% 22.0%
50 9.7% 23.8% 41.6% 31.9%
S5
200
20 -17.9% 29.2% 36.0% 32.2%
30 -5.4% -3.3% 2.5% -0.6%
40 -9.0% -13.3% 1.7% -6.4%
50 -12.7% -15.7% -11.8% -14.0%
400
20 -35.1% -22.8% 23.6% -5.7%
30 -21.0% 69.2% 111.9% 87.6%
40 -11.1% 19.0% 16.9% 18.0%
50 -32.7% -29.2% -18.5% -24.3%
S6
200
20 -11.1% 4.7% 15.8% 10.1%
30 -25.2% -10.5% 9.8% -0.6%
40 -7.0% -19.3% -4.5% -12.3%
50 -2.1% 3.4% -3.2% 0.3%
400
20 -30.5% -5.3% 3.6% -1.2%
30 -27.8% 61.6% 79.6% 69.9%
40 -17.5% 29.9% 22.3% 26.2%
50 -16.7% 5.2% -6.8% -0.6%
Average -13.9% 7.7% 22.8% 14.0%

Chapter 4 Road Pavement Energy Harvesting: Optimizing the Energy
Extraction from Vehicles to Promote Road Safety
143
From these Tables, some conclusions can be drawn.
For VE1, the average difference of FSM1 is 1.1%, a very small value that allows
us to conclude that, on average, the simulations are accurate. Analyzing
individual values, the maximum difference was 42%, a considerable value,
registered for lower vehicle speeds. For VE2, the average difference of FSM1 is
13.9%, a higher value than for VE1, but it is still a reasonable value that allows
us to consider the simulations results with very positive precision.
Regarding EHa and for VE1, the average difference is 17.7%, with higher values
achieved experimentally when compared to the simulation results. A possible
justification for this difference could be a higher vehicle tyre pressure or a
higher spring stiffness from its suspension system when compared to the values
considered in the simulations.
Regarding EHa and for VE2, the average difference is 14.0%, which is a very
positive result, allowing us to accept the simulation results. Analyzing individual
simulations, there are some exceptions with a great difference between both
results, but generally the precision was very good, with multiple results having a
difference lower than 2%. As considered for VE1, a small difference in the
pressure of the vehicle’s tyres or a higher spring stiffness from its suspension
system can justify the registered differences.
4.6 Summary and Conclusions
The social and economic costs resulting from high rates of fatalities and serious injuries
due to road accidents increase every year and are currently a topic of very high
relevance. It is of the utmost importance that the number of accidents on roads be
reduced, so the WHO (2010, 2013), has identified six key areas for action. The first area
and the one that can have the greatest impact is the effective reduction of traffic speed,
especially in urban areas, where accident rates are very high, particularly affecting

Chapter 4 Road Pavement Energy Harvesting: Optimizing the Energy
Extraction from Vehicles to Promote Road Safety
144
vulnerable road users, especially pedestrians. There are already solutions on the market
and traffic engineering techniques that contribute to this goal, but as accident rates
continue to increase, more effective measures or solutions are needed.
By extracting kinetic energy from the vehicles motion it is possible to reduce its speed,
with a system which is applied directly on the road pavement, making it impossible for
the vehicles to avoid interacting with it. This solution is different from the existing SRE,
as it has a one degree of freedom movable surface, with a specific profile and geometry
that allows the impact on the vehicle to be minimised, keeping ride quality acceptable
and without affecting vehicle passengers.
Different surface profiles and dimensions were evaluated through computational
simulations, and the solution that presents the best relation between the energy
harvested from the vehicle and the vertical acceleration induced on the vehicle chassis is
the Ramp surface profile, which is 200 mm wide and a maximum of 25 mm height and
has a maximum displacement of 25 mm. When compared to standard speed bumps, this
solution can extract 81% more energy for the same width, with 87% lower impact on
the vehicle, for the same device height.
Different surface profiles and spring stiffness were evaluated through experimental
tests, and the solution that presents the best results for the energy harvested from the
vehicle is the Crest surface profile, using a 200 kN/m spring stiffness for a 1,000 kg
vehicle and a 400 kN/m spring stiffness for a 2,000 kg vehicle. The energy harvested
from the equipment’s surface is proportional to the energy lost by the vehicle, which is
proportional to its speed reduction. So, the more energy the equipment is able to extract,
the greater the reduction of vehicle speed.
From the analysis of results and the comparison between computational simulations and
experimental results, it was possible to conclude that there is a small difference between
the experimental results and the simulation results. On average, this is lower than 20%
and can be explained due to differences in the pressure of the vehicles’ tyres or in the
stiffness of their suspension systems, when compared to the considered values in the
simulations. So, one can conclude that the difference between the computational

Chapter 4 Road Pavement Energy Harvesting: Optimizing the Energy
Extraction from Vehicles to Promote Road Safety
145
simulations and the achieved results is acceptable, allowing to validate the software tool
presented in Chapter 3.
The values presented are from half a vehicle, meaning that the total amount of energy
extracted from a vehicle, if two prototypes are used side-by-side, would be twice the
value presented here. Also, the prototype surface has a total width of 0.275 m, meaning
that multiple devices can be implemented consecutively in the pavement, maximizing
the energy extraction in a small amount of space.
For the conditions simulated, where a 50-metre section of pavement has the proposed
SRE applied on its surface, it would be possible to reduce vehicle speed from 50 km/h
to 35.4 km/h, from 60 km/h to 35.9 km/h, or from 40 km/h to 24.9 km/h, without any
breaking action from the vehicle driver, and induce a very low vertical acceleration on
vehicle chassis, keeping the ride quality at an acceptable level (a little uncomfortable).
When compared to a typical speed bump, which induced an extremely uncomfortable
ride quality on the vehicle passengers and has a smaller impact on direct speed
reduction, it can be concluded that the proposed solution presents a better performance
and effectiveness.
The main difference of the proposed solution when compared to existing equipment is
that speed reduction is performed by harvesting energy from the vehicle without any
action by its driver, instead of inducing a great discomfort on the vehicle occupants,
forcing the vehicle driver to break.
4.7 References
Badennova (2016). http://www.badennova.com/. Accessed in July, 2016.
Blundell, M. and Harty, D. (2004). Multibody Systems Approach to Vehicle Dynamics.
Elsevier Butterworth-Heinemann, Oxford, UK.
DGV (2004). Technical Paper – Installation and Signalization of Speed reducer bumps
(In Portuguese), pp. 1-18.

Chapter 4 Road Pavement Energy Harvesting: Optimizing the Energy
Extraction from Vehicles to Promote Road Safety
146
Donario, A. and Santos, R. (2012). Custo Económico e Social dos Acidentes de Viação
em Portugal (In Portuguese). Ediual. Lisboa, Portugal.
Elvik, R., Vaa, T., Erke, A. and Sorensen, M. (2009). The Handbook of Road Safety
Measures. Emerald, Bingley, UK.
Ewing, R. and Brown, S. (2009). US Traffic Calming Manual. American Planning
Association, Chicago, IL, USA.
Farnell (2017). IPL Linear Position Sensor data sheet.
http://www.farnell.com/datasheets/1833199.pdf. Accessed in January, 2017.
Freitas, E., Machado, P., Santos, J. and Pereira, P. (2013). Planos de ação de redução do
ruído: consideração do custo benefício de superfícies de baixo ruído e do impacto de
medidas de gestão da velocidade (In Portuguese). In: XVII Congreso Ibero-
Latinoamericano del Asfalto-CILA.
Gifford, R. (2004). Road Humps should be dug up: The Case Against. Parliamentary
Advisory Council for Transport Safety. London, UK.
Gillespie, T. (1992). Fundamentals of Vehicle Dynamics. Society of Automotive
Engineers, Warrendale, PA, USA.
Holzmann, F. (2008). Adaptive cooperation between driver and assistant system (pp.
11-19). Springer Berlin Heidelberg, Berlin, Germany.
Hongqiao Traffic (2016). http://www.hongqiao.cc/english/index.asp. Accessed in July,
2016.
ISO (1997). Mechanical vibration and shock - Evaluation of human response to whole-
body vibration. Part I: General requirements. ISO 2631-1, Geneva, Switzerland.
Jazar, R. (2008). Vehicle Dynamics: Theory and Application. Springer, New York, NY,
USA.
Johnson, L. and Nedzesky, A. (2004). A comparative study of speed humps, speed slots
and speed cushions. In ITE Annual Meeting Compendium, Institute of Transportation
Engineers (ITE), Washington, DC, USA.

Chapter 4 Road Pavement Energy Harvesting: Optimizing the Energy
Extraction from Vehicles to Promote Road Safety
147
Kamienchick, Y. (2000). Device for speed restriction of vehicles. US Patent US6024510
A, Fev.
Lecompte, D. (1982). Removable Speed Reducer Bump. Canada Patent CA1185475,
Apr.
Mandavi, S. (1990). Vehicle speed bump device. US Patent US4974991 A, Dec.
National Instruments (2017). Data logger NI USB-6003 data sheet.
http://www.ni.com/pdf/manuals/374372a.pdf. Accessed in January, 2017.
Popp, K., Schiehlen, W., Kroger, M. and Panning, L. (2010). Ground Vehicle
Dynamics. Springer, Berlin, Germany.
Rajamani, R. (2011). Vehicle Dynamics and Control. Springer, New York, NY, USA.
Seco, A., Gonçalves, J. and Costa, A. (2008). Manual do planeamento de
acessibilidades e transportes (In Portuguese). CCDRN, Porto, Portugal.
Silva, J. (2010). Modelação e Avaliação do Potencial de Desempenho das Lombas
Redutoras de Velocidade (In Portuguese). University of Coimbra, Coimbra,
Portugal.
Sinclair, D. (1997). Speed Bump. US Design Patent USD387181, Dec.
Szurgott, P., Kwasniewski, L. and Wekezer, J. (2009). Dynamic interaction between
heavy vehicles and speed bumps. In ECMS: Proceedings 23rd European Conference
on Modelling and Simulation, pp. 585-591.
Thompson, C. (1996). Retractable Speed Bump. US Patent US5509753 A, Apr.
TSS (Traffic Safety Store) (2016). https://www.trafficsafetystore.com/. Accessed in
July, 2016.
Uys, P., Els, P. and Thoresson, M. (2007). Suspension settings for optimal ride comfort
of off-road vehicles travelling on roads with different roughness and speeds. Journal
of Terramechanics, 44(2), 163-175.
Vishay (2017). Load cell data sheet. http://www.vishay.com/docs/12017/1250.pdf.
Accessed in January, 2017.

Chapter 4 Road Pavement Energy Harvesting: Optimizing the Energy
Extraction from Vehicles to Promote Road Safety
148
Welford, J. (1993). Electronically controlled speed bump device. US Patent US5267808
A, Dec.
Wong, J. (2001). Theory of Ground Vehicles, 3rd Ed. Wiley, New York, NY, USA.
WHO (2010). European Status Report on Road Safety: Towards Safer Roads and
Healthier Transport Choices. World Health Organization, Geneva, Switzerland.
Available from:
http://www.euro.who.int/__data/assets/pdf_file/0015/43314/E92789.pdf?ua=1.
Accessed in May, 2016.
WHO (2013). Global Status Report on Road Safety 2013: Supporting A Decade of
Action. World Health Organization, Geneva, Switzerland. Available from:
http://www.who.int/violence_injury_prevention/road_safety_status/2013/en/.
Accessed in May, 2016.
3M (2016). http://www.3m.com/3M/en_US/company-us/. Accessed in July, 2016.

149
Chapter 5
Road Pavement Energy Harvesting: a
New Electromechanical Device to
Convert Vehicles Mechanical Energy
into Electrical Energy
5.1 Introduction
In Chapter 2 a state-of-the-art with the main technologies used to convert vehicle
mechanical energy into electrical energy, to be implemented on road pavements, and
which can be both micro and macro energy harvesting was presented. In these
technologies, typical systems have the following components: a surface that receives
energy from vehicle tyres and delivers energy to a transmission system; a system that
transmits energy from the surface to an electrical generation unit; and an electrical unit
that converts the mechanical energy into electrical energy, delivering it to an electrical
application.
Piezoelectric systems are the simplest, as usually they receive the mechanical energy
directly from the surface and convert it into electricity. However, these work on a micro
energy harvesting scale and have a very small energy conversion efficiency and output.

Chapter 5 Road Pavement Energy Harvesting: a New Electromechanical Device
to Convert Vehicles Mechanical Energy into Electrical Energy
150
Electromechanical systems transmit the energy received from the surface to
electromagnetic generators, adapting the surface motion, which can be linear or
rotational, into a similar or different motion, depending on the generator characteristics.
These systems can work both on a micro or macro scale, having higher conversion
efficiencies and energy outputs than piezoelectric systems, and are the most developed
group of technologies in this field.
Hydraulic and pneumatic systems use the same principle as electromechanical systems,
transmitting the energy received from the surface to electromagnetic generators.
Typically, these systems work on a macro scale, allowing larger amounts of energy to
be transferred. However, only a very small number of systems have been developed
with this principle and none of them have presented viability, mainly due to the high
costs of development and implementation.
In the last few years a considerable number of systems have been developed and tested
on road pavements to convert vehicle mechanical energy into electrical energy, most of
which have been validated in the laboratory environment, but none of them have
obtained validation in a relevant environment, such as a public road with regular traffic
actuating the system for a considerable amount of time. Also, for most of the existing
technologies, no system modelling or computational simulations have been published
that would allow energy harvesting, transmission and conversion efficiency to be
analyzed, which would make it possible to determine their global efficiency and draw
conclusions about their viability.
In this Chapter, different road pavement energy harvesting devices using
electromechanical systems will be studied, modelled and simulated, to study and come
to conclusions about the efficiency of its different components, meaning the most
efficient solutions can be known. Also, a new electromechanical system will be
proposed, to transmit the energy received by the RPEH device surface into an
electromagnetic generator, which will also be modelled and simulated, to come to a
conclusion about its efficiency.

Chapter 5 Road Pavement Energy Harvesting: a New Electromechanical Device
to Convert Vehicles Mechanical Energy into Electrical Energy
151
The software tool presented in Chapter 3 will be used as the basis for the computational
simulations, and an upgrade will be performed, to include the models of the different
RPEH devices. Based on this, computational simulations will be performed, allowing to
conclude about each system’s efficiency. A prototype of the new proposed system will
be presented and tested and the experimental results will allow to conclude about its
performance as well as the software tool accuracy.
5.2 RPEH Electromechanical System Development
5.2.1 Introduction
To transfer the energy received on the RPEH surface to an electric generator, different
systems can be used. From Chapter 2 it can be concluded that most existing RPEH
devices are electromechanical and have a mechanical system to transfer the surface
motion into an electromagnetic generator. Typical solutions use a rotational
electromagnetic generator for both linear and rotational surface motions.
In this section, the existing solutions will initially be analyzed and modelled. Then, a
new mechanical system for converting the linear motion of a RPEH surface into a
rotational motion of an inertia wheel (IW) is presented and modelled. It is connected to
an electromagnetic rotational generator. Finally, the equations that quantify the
transmitted and delivered energy will be defined, as well as the efficiency of each
process.
5.2.2 Existing systems
In Chapter 2, Table 2.1 summarizes the most relevant electromechanical systems
according to the motion conversion principle, taking patents into account. The most
common RPEH devices convert the linear or rotational motion of a surface into the
rotational motion of an electromagnetic generator. Besides the patents presented in

Chapter 5 Road Pavement Energy Harvesting: a New Electromechanical Device
to Convert Vehicles Mechanical Energy into Electrical Energy
152
Table 2.1, other studies have been performed both by companies and academia (e.g.,
Pirisi et al., 2013; Todaria et al., 2015; Duarte et al., 2016), to harvest vehicle energy on
road pavements and convert it into electrical energy.
To achieve a rotational motion output, two systems are mostly used: the rack and pinion
(RAP) system; and the lever system.
The most basic mechanical system for converting the linear motion of a surface into a
rotational motion of a shaft is the RAP system. To apply this system in a RPEH device,
the rack usually is directly connected to the surface and the pinion is in contact with the
rack and connected to a shaft which, in turn, actuates the electric generator. Commonly,
the generator shaft is connected to an IW, and the pinion is connected to the shaft
through an unidirectional bearing, also defined as a clutch bearing. This system includes
a spring, which returns the surface to its initial position. The spring stiffness should be
kept to a minimum to maximize the amount of force transmitted to the mechanical
system, but strong enough to replace the surface quickly, so that when the rear wheel of
the vehicle passes over the surface it is already on its initial position. The RAP system
typically uses an IW connected to an electric generator, as presented in Figure 5.1. The
forces distribution in the device surface are presented in Figure 5.2a, when the vehicle
wheel interacts with the surface. In Figure 5.2b are presented the forces distribution for
the upward motion of the device surface, after the vehicle wheel leaves the contact with
the surface.
Figure 5.1- Typical RAP system connected to an IW.

Chapter 5 Road Pavement Energy Harvesting: a New Electromechanical Device
to Convert Vehicles Mechanical Energy into Electrical Energy
153
Figure 5.2- Forces distribution for the RAP system, (a) for the vehicle wheel - device surface
interaction; and (b) for the upward motion of the device surface without vehicle wheel interaction.
Another mechanical system that is commonly used to convert the linear motion of a
surface into a rotational motion of a shaft is the lever system. This system has the
advantage of amplifying the motion of the surface, but the gain in motion represents a
loss in force. So, the lever geometry must be carefully designed.
To apply this system in an energy harvesting device, a bar, directly connected to the
surface, actuates a lever at a specific point, at a distance d1 from its rotational centre.
The lever has a rack connected to its extremity, at a distance d2 from its rotational
centre. The rack is in contact with a pinion, which is connected to a shaft. Commonly,
the generator shaft is connected to an IW and the pinion it is connected to the shaft
through a clutch bearing. This system includes a spring, which returns the surface to its
initial position, similarly to the spring used in the RAP system. The lever system
typically uses an IW connected to an electric generator, as presented in Figure 5.3. The
forces distribution over this mechanism are presented in Figure 5.4, for the downward
motion of the surface, when the vehicle wheel is interacting with the surface.

Chapter 5 Road Pavement Energy Harvesting: a New Electromechanical Device
to Convert Vehicles Mechanical Energy into Electrical Energy
154
Figure 5.3- Lever system connected to an IW.
Figure 5.4- Forces distribution for the lever system, (a) for the vehicle wheel - device surface
interaction; and (b) for the upward motion of the device surface without vehicle wheel interaction.
Tables 5.1 and 5.2 summarize all the equations that define both RAP systems and lever
systems, respectively, in terms of kinematic, dynamic and forces analysis and for all
motion scenarios: downward motion of the surface; surface stopped; and upward motion
of the surface. The variable FSM1 is the force transmitted by the surface to the

Chapter 5 Road Pavement Energy Harvesting: a New Electromechanical Device
to Convert Vehicles Mechanical Energy into Electrical Energy
155
mechanical system, while FSM1s is the oppositional force of the mechanical system on
the surface. The variable FSM2 is the force transmitted by the lever to the pinion, while
FSM2s is the oppositional force of the pinion on the lever.
As a clutch bearing is used, the motion equations are different for the different motion
scenarios, as the IW keeps rotating after the pinion stops acting.
In some systems, gears are used to amplify the rotation of a second shaft. However,
what is gained in rotation is lost in torque. To include these elements in the equations
presented in Tables 5.1 and 5.2, the motion of the secondary shaft must be multiplied by
the ration r1/r2, with r1 representing the radius of gear 1 and r2 representing the radius of
gear 2, but in the motion equations of the pinion and IW, both Jiw and Jgen must be
multiplied by (r1/r2)2.
Table 5.1- RAP system modelling.
Analysis Motion
Downward Stopped Upward
Kinematic
Dynamic
Forces

Chapter 5 Road Pavement Energy Harvesting: a New Electromechanical Device
to Convert Vehicles Mechanical Energy into Electrical Energy
156
Table 5.2- Lever system modelling.
Analysis Motion
Downward Stopped Upward
Kinematic
Dynamic
Forces
5.2.3 New mechanical system
To maximize the rotation of the generator shaft the maximum amount of force should
be transmitted from the surface to the shaft, with the maximum possible displacement.
In the RAP system, the force transmitted is equal to the force received on the surface,
with only the force absorbed by the spring being discounted. The shaft’s angular
displacement is similar to the surface linear displacement, divided only by the pinion

Chapter 5 Road Pavement Energy Harvesting: a New Electromechanical Device
to Convert Vehicles Mechanical Energy into Electrical Energy
157
radius. In the lever system, the surface motion is multiplied, but the force is reduced by
the same proportion, considerably reducing the torque applied on the generator shaft.
A more efficient solution would combine a maximization of both the transmitted force
and shaft rotation, with priority on increasing the transmitted force. To achieve this
goal, a system using a crank connected from the surface to a slider is proposed, as
presented in Figure 5.5. This is called a crank to slider (CTS) mechanical system.
Figure 5.5- Crank to slider system connected to a RAP system and an IW.
This system has the following working principle: the surface has a linear displacement,
actuating the crank with a rotational motion, which depends on its length and initial
angle; the crank, in turn, will actuate the slider with a translational motion, which is
directly connected to a rack; this will actuate a pinion with a rotational motion which, in
turn, is connected to an IW and the electric generator shaft. The pinion is connected to
the shaft through a clutch bearing. This system includes a spring, which returns the
surface to its initial position and has a similar function to the spring used in the lever or
RAP systems.
Table 5.3 summarizes all the equations that define this system in terms of kinematic,
dynamic and forces analysis and for all motion scenarios: downward motion of the
surface; surface stopped; and upward motion of the surface. FSM1 is the force
transmitted by the surface on the mechanical system, while FSM1s is the oppositional
force of the mechanical system on the surface. FSM2 is the force transmitted by the crank
to the slider piston, while FSM2s is the oppositional force of the slider piston on the
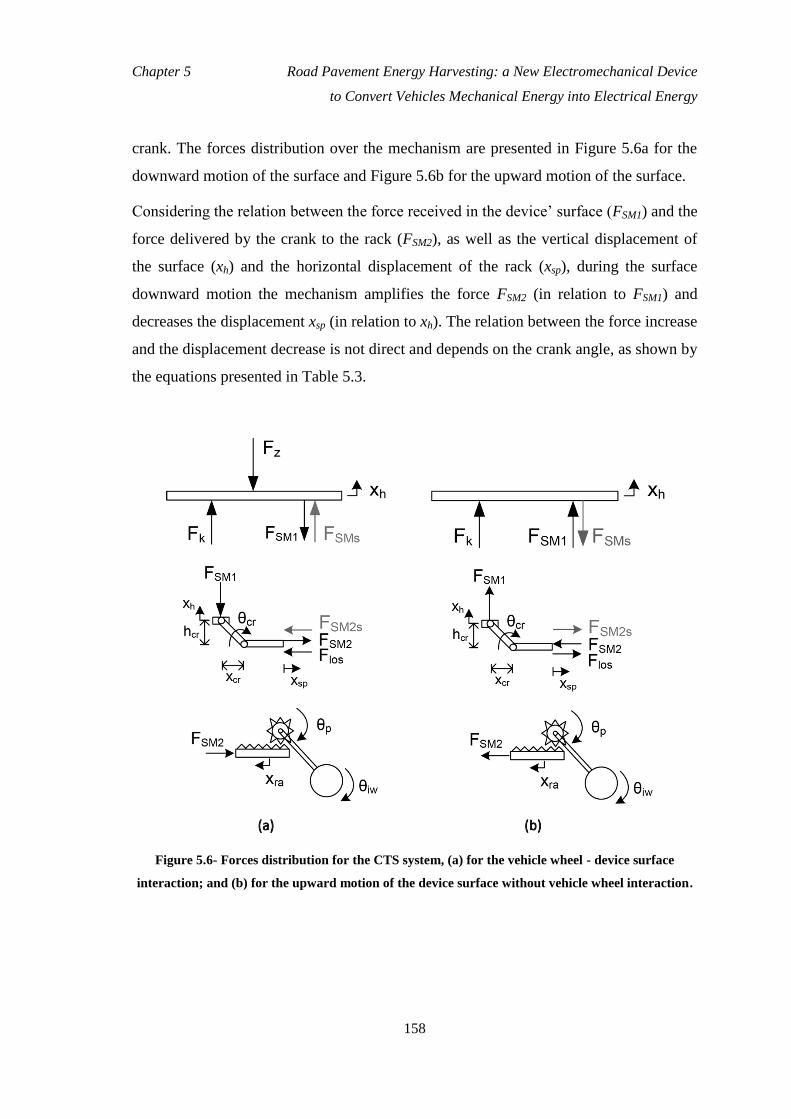
Chapter 5 Road Pavement Energy Harvesting: a New Electromechanical Device
to Convert Vehicles Mechanical Energy into Electrical Energy
158
crank. The forces distribution over the mechanism are presented in Figure 5.6a for the
downward motion of the surface and Figure 5.6b for the upward motion of the surface.
Considering the relation between the force received in the device’ surface (FSM1) and the
force delivered by the crank to the rack (FSM2), as well as the vertical displacement of
the surface (xh) and the horizontal displacement of the rack (xsp), during the surface
downward motion the mechanism amplifies the force FSM2 (in relation to FSM1) and
decreases the displacement xsp (in relation to xh). The relation between the force increase
and the displacement decrease is not direct and depends on the crank angle, as shown by
the equations presented in Table 5.3.
Figure 5.6- Forces distribution for the CTS system, (a) for the vehicle wheel - device surface
interaction; and (b) for the upward motion of the device surface without vehicle wheel interaction.

Chapter 5 Road Pavement Energy Harvesting: a New Electromechanical Device
to Convert Vehicles Mechanical Energy into Electrical Energy
159
Table 5.3- CTS system modelling using a RAP and an IW.
Analysis Motion
Downward Stopped Upward
Kinematic
Dynamic
Forces
5.2.4 Energetic analysis
When the output motion of the mechanical system is linear, as in the CTS system, the
energy transmitted by the piston is defined by Equation (5.1). When the output motion
is rotational, as in the RAP or the lever system, the energy transmitted by the pinion is

Chapter 5 Road Pavement Energy Harvesting: a New Electromechanical Device
to Convert Vehicles Mechanical Energy into Electrical Energy
160
defined by Equation (5.2). The energy delivered by the IW to the electric generator is
defined by Equation (5.3).
(5.1)
(5.2)
(5.3)
The efficiency of the energy transmission system is defined by Equation (5.4), relating
the transmitted energy with the energy harvested by the RPEH surface. The efficiency
of the energy delivering system is defined by Equation (5.5), relating the energy
delivered by the IW with the energy transmitted by the mechanical system.
(5.4)
(5.5)
5.3 Electrical System
5.3.1 Introduction
To convert the mechanical energy delivered by a mechanical system into electrical
energy, RPEH devices can use both permanent-magnet direct-current (DC) electric
generators or permanent-magnet alternating-current (AC) synchronous generators.
Power electronics are then used to adapt the generated current to the electric load,
depending on whether it consumes DC or AC power.
In order to simplify the physical modelling of the system, the computational simulations
and the experimental tests for an RPEH device under development, a DC generator
connected to a DC load is used.
In this section a permanent magnet DC generator will be presented and modelled, as
well as a DC load. Simple power electronics are used only to adapt the generated

Chapter 5 Road Pavement Energy Harvesting: a New Electromechanical Device
to Convert Vehicles Mechanical Energy into Electrical Energy
161
current to the electric load. An energetic analysis is performed to quantify both the
generated and consumed energy, as well as the energy conversion and consumption
efficiencies.
5.3.2 Electrical generator
The most basic electrical circuit to implement in RPEH devices is a purely DC circuit,
with a DC electric generator, a DC purely resistive electric load and a diode between
both, or a diode bridge in some circuits. Such a circuit is presented in Figure 5.7.
Figure 5.7- Purely DC electric circuit with a DC electric generator and a resistive load.
Both permanent-magnet DC generator and resistive load models were developed
according to the main electric machine references, i.e. Chapman (2004), Murthy (2008)
and Lyshevski (2008).
The mechanical system torque (TSM) actuates the generator shaft, with a rotational
speed, already defined by the IW speed ( ), resulting in the development of an
electromagnetic force (Ea), which represents the generator armature induced voltage.
Equation (5.6) allows Ea to be determined in relation to the generator shaft rotational
speed, multiplying it by the generator constant (ka). Equation (5.7) defines the generated
voltage (Ua) in relation to the armature voltage (Ea), armature resistance (Ra) and the
armature current (Ia). To determine the current produced in the armature windings,

Chapter 5 Road Pavement Energy Harvesting: a New Electromechanical Device
to Convert Vehicles Mechanical Energy into Electrical Energy
162
Equation (5.8) must be used, where the armature current (Ia) is calculated in relation to
the armature inductance (La), the armature resistance (Ra), the circuit resistive load
(RLo), the generator constant (ka), and the rotor angular speed ( . The electric torque
(ET) produced by the generator, which opposes to the mechanical system motion, is
determined by Equation (5.9).
(5.6)
(5.7)
(5.8)
(5.9)
5.3.3 Electric load
The diode implemented between the electric generator and the electric load establishes
an electrical separation between both, protecting both elements, guaranteeing a
regulated voltage to the load while avoiding reversible currents to the generator
armature.
The electric load consists of a purely resistive load, using an electric resistance
connected to the diode and to the electric ground. The current delivered to the resistive
load (ILo) is the same as the current produced by the generator (Ia), while the voltage
delivered to the resistive load is determined by Equation (5.10), limited by the voltage
produced by the electric generator.
(5.10)

Chapter 5 Road Pavement Energy Harvesting: a New Electromechanical Device
to Convert Vehicles Mechanical Energy into Electrical Energy
163
5.3.4 Energetic analysis
The power and energy generated by the DC electric generator are determined by
Equations (5.11) and (5.12), respectively. The power and energy consumed in a DC
purely resistive load are determined by Equations (5.13) and (5.14), respectively.
(5.11)
(5.12)
(5.13)
(5.14)
The efficiency of the energy conversion system (electric generator) is defined by
Equation (5.15), relating the generated electric energy to the mechanical energy
delivered by the IW. The efficiency of the electric circuit is defined by Equation (5.16),
relating the energy consumed by the electric load to the energy generated by the electric
generator.
(5.15)
(5.16)
The total efficiency of the system, from the vehicle lost energy to the electrical energy
consumed by the electric load is defined by Equation (5.17). To determine the total
efficiency of the mechanical system, Equation (5.18) should be applied, relating the
energy received by the mechanical system to the energy delivered to the electrical
circuit. To determine the total efficiency of the electrical system, Equation (5.19) should
be applied, relating the energy received by the electric circuit to the energy consumed
by the electric load. To determine the total efficiency of the RPEH internal device,
Equation (5.20) should be applied, relating the energy received by the mechanical
system to the energy consumed by the electric load.

Chapter 5 Road Pavement Energy Harvesting: a New Electromechanical Device
to Convert Vehicles Mechanical Energy into Electrical Energy
164
(5.17)
(5.18)
(5.19)
(5.20)
5.4 Technical Analysis
5.4.1 Introduction
Based on the software tool presented in Chapter 3 to simulate the VRI from an energetic
perspective, the equations of the RPEH devices presented in previous sections were
incorporated for the different mechanical systems and the electrical circuit.
The purpose of the simulation software is to study this interaction in great detail, with
the possibility of fully characterizing the vehicle under study, as well as fully
characterizing the pavement or the RPEH device, including its surface technical
parameters. Additionally, the RPEH device mechanical and electrical properties were
added to the model, depending on the mechanical system selected. The upgraded
software tool will be briefly presented in this section. The upgraded tool calculates all
the forces and displacements for both the vehicle elements and the RPEH surface, as
well as for the mechanical and electrical system components. After that, it calculates the
different energies transferred from each part of the system to the others and the
efficiency of each energy transfer process.
The simulations performed with RoadVISS for the three mechanical systems previously
presented will be presented in this section, using the same RPEH equipment surface
profile, geometry and displacement, the same vehicle and the same electric generator
and load. The goal is to evaluate the different mechanical systems and draw conclusions
about each system’s efficiency in transmitting and delivering mechanical energy.

Chapter 5 Road Pavement Energy Harvesting: a New Electromechanical Device
to Convert Vehicles Mechanical Energy into Electrical Energy
165
One RPEH device connected to one mechanical system is considered, which, in turn, is
connected to one electrical system, as the surface is actuated by one side of the vehicle.
So, the value presented for the energy lost by the vehicle is related to half the vehicle, as
only one front and one rear wheel actuates the RPEH device surface. The parameters
defined for the vehicle, the RPEH device surface, the mechanical and electrical systems,
common in the simulations of the three mechanical systems are presented in Table 5.4.
Table 5.4- Input data for the computational simulations of the three systems.
Variable name Value Unit
Veh
icle
& m
oti
on
Vehicle class Light -
Vehicle weight 1,500 (kg)
Number of axles P1 | wheels per axle 2 | 2 -
Sprung-Unsprung % 90%-10% -
Drag coefficient 0.32 -
Inertia moment 1,100 (kg.m2)
Lift coefficients (Front | Rear) 0.19 | 0.13 -
Motion | Direction Free rolling | Forward -
Vehicle speed | acceleration 40 | 0 (km/h) | (m/s2)
Su
spen
sio
n &
wh
eel
Suspension type (Front | Rear) Independent | Independent -
Suspension stiffness (Front | Rear) 20,000 | 15,000 (N/m)
Suspension damping (Front | Rear) 1,500 | 1,700 (Ns/m)
Tyre type (Front | Rear) Radial | Radial -
Tyre stiffness (Front | Rear) 150,000 | 150,000 (N/m)
Tyre pressure (Front | Rear) 200 | 200 (kPa)
Tyre external diameter (Front | Rear) 500 | 500 (mm)
Tyre width (Front | Rear) 200 | 200 (mm)
Tyre tread width (Front | Rear) 180 | 180 (mm)
RP
EH
dev
ice
Surface width 250 (mm)
Surface mass 20 (kg)
Surface max. height | max. displacement 20 | 20 (mm)
Spring stiffness 40,000 (N/m)
Pinion mass | friction coefficient 1 | 0.002 (kg) | -
Inertia wheel radius 30 (mm)
Electric generator constant Ka 0.25 -
Electric generator Ra | La 1.1 | 0.0048 (Ω) | (H)
Electric generator friction coef. | Inertia 0.0008 | 0.05 - | (kg.m2)
Electric load Power 50 (W)

Chapter 5 Road Pavement Energy Harvesting: a New Electromechanical Device
to Convert Vehicles Mechanical Energy into Electrical Energy
166
5.4.2 Simulation software tool
Based on the software tool RoadVISS, an upgrade was performed to include the models
of different RPEH devices. Applying the vehicle dynamics, VRI, as well as the
mechanical and electrical system modelling equations, the software calculates all the
displacements, both for the vehicle and the RPEH device components, the applied and
received forces, and the energy transferred by each system component, presenting the
results both graphically and numerically.
Beside the electromechanical systems previously presented, the new software tool was
developed already considering future developments and models, as for hydraulic
systems, mechanical energy storage systems and electrical energy storage units.
5.4.2.1 Software inputs
To select the inputs, a new GUI platform was developed, as presented in Figure 5.8.
Figure 5.8- GUI to select the inputs of the upgraded software tool.

Chapter 5 Road Pavement Energy Harvesting: a New Electromechanical Device
to Convert Vehicles Mechanical Energy into Electrical Energy
167
This GUI has 10 distinct panels, with eight for parameter selection, one for the preview
of the selected features, regarding the vehicle, the pavement, the RPEH device
(mechanical and electrical parts) and the electric load, and other for the selection of
simulation features.
The first panel allows the user to select the vehicle and motion properties. In terms of
the vehicle, it allows the vehicle class, weight, number of axles, wheels per axle,
percentage of sprung and unsprung mass, drag and lift coefficients, and inertia moment
of the vehicle to be selected. It also allows users to define the vehicle geometry in terms
of distances from each axle to the centre of gravity, as well as the height of the centre of
gravity. In terms of vehicle motion, it allows to the selection of the action, the motion
direction, the vehicle speed and acceleration.
The second panel allows the user to select the suspension and wheel properties. In terms
of suspension, it allows users to select the suspension type and to define the suspension
stiffness and damping values, for both the front and rear suspension. In terms of tyre, it
allows the user to select the tyre type and to define the tyre stiffness, damping and
pressure, for both the front and rear tyre. The tyre geometry in terms of external
diameter, tyre width and tread width can also be defined, for both front and rear tyres.
The third panel allows the road and RPEH device properties to be selected. In terms of
road pavement, the user can select the pavement type, the road condition, the
longitudinal and transversal inclination of the pavement. For the harvester surface, users
can select the shape, the motion type, the material, the width and height, its maximum
displacement, its mass, and also its stiffness and damping can be defined.
Panels four to eight allow to fully characterize the RPEH device: in panel four, its
mechanical (or hydraulic, with future developments) characteristics, including the
system selection and its parameters; in panel five, its mechanical storage characteristics,
with future developments in this field; in panel six, its electrical generator
characteristics; in panel seven, the electric load; and in panel eight, the electrical storage
characteristics, with future developments in this field.

Chapter 5 Road Pavement Energy Harvesting: a New Electromechanical Device
to Convert Vehicles Mechanical Energy into Electrical Energy
168
The ninth panel presents a summary of the selection, showing an image of the selected
vehicle, pavement type, surface shape, RPEH device type (mechanical and electrical
parts) and the electrical energy application. With this information, the user can confirm
selection visually.
The tenth panel allows the user to define the simulation time and each iteration interval,
as well as the vehicle model to be simulated and interaction model, in terms of the
inclusion of the tyre contact patch. In this panel, the user can clean all the fields to
select new values, and can press the Simulate button to start the simulation.
5.4.2.2 Software outputs
To present the software outputs graphically, a new GUI platform was developed, as
presented in Figure 5.9.
This GUI has nine distinct panels, with seven for outputs graphical presentation, one for
outputs numerical presentation and other for the selection of the plots to print.
The seven panels that presents the results graphically are related to each system
component output: vehicle results in the first panel, both for front wheel and rear wheel
forces and energy released; RPEH device surface in the second panel, both for received
force and energy transferred; RPEH mechanical or hydraulic system results in the third
panel, both for transmitted force and energy; RPEH mechanical storage system results
in the fourth panel, both for transmitted force and stored energy; RPEH electrical
generator results in the fifth panel, both for voltage, current, power and energy
generated; RPEH electrical storage system results in the sixth panel, both for voltage,
current, power and energy stored; and RPEH electrical load results in the seventh panel,
both for voltage, current, power and energy consumed. These results are related to each
vehicle side, representing half vehicle.

Chapter 5 Road Pavement Energy Harvesting: a New Electromechanical Device
to Convert Vehicles Mechanical Energy into Electrical Energy
169
Figure 5.9- GUI to select the outputs of the upgraded software tool.
Panel eight presents the results numerically, for each component of the system, for each
vehicle wheel actuation and for the entire vehicle, presenting also the efficiency of the
respective component, as well as the global efficiency of the system, from the
mechanical energy released by the vehicle and the electrical energy consumed by the
electrical load.
Finally, panel nine offers users the possibility to print the plots, allowing them to select
the desired plots to be printed and pressing the Print Plots button. Finally, it contains an
Exit button to close the results GUI and return to the initial GUI.
5.4.2.3 Models
When the simulation starts, the software defines all the "static" variables, i.e., those that
do not depend on the vehicle or RPEH system dynamics, such as the front and rear
unsprung masses, the sprung mass, drag and lift forces, forces per axle, both vertical

Chapter 5 Road Pavement Energy Harvesting: a New Electromechanical Device
to Convert Vehicles Mechanical Energy into Electrical Energy
170
and longitudinal, the contact patch geometry for each wheel, or the initial kinetic energy
of the vehicle.
As considered for the RoadVISS software tool, four vehicle and interaction models
were developed using the SIMULINK® tool:
1) quarter-car model and SFA;
2) bicycle-car model and SFA;
3) quarter-car model and CPA;
4) bicycle-car model and CPA.
The selected vehicle and interaction model is then connected to the correspondent
energy harvesting mechanical (or hydraulic, with future developments) system model.
Three initial models were developed using SIMULINK® and Simscape
® tools:
1) RAP mechanical system;
2) Level mechanical system;
3) CTS mechanical system.
The selected model of the mechanical system is then connected to the electrical system
model, composed by a DC electrical generator and a DC load. In the future, other
models can be added to the software tool, including electrical energy storage and an AC
electrical generator. This model (and future models) was developed using the
SIMULINK®
and Simscape® tools.
Depending on the user’ selection, the software connects the vehicle and interaction
selected models with the mechanical system model and with the electrical system
model, defines each system parameters with the data defined in the Input GUI, and runs
the simulation, in order to perform the dynamic analysis. The results are then presented
in the Output GUI, both graphically and numerically.

Chapter 5 Road Pavement Energy Harvesting: a New Electromechanical Device
to Convert Vehicles Mechanical Energy into Electrical Energy
171
5.4.3 Computational simulations
Considering the input data presented in Table 5.4, simulations the different mechanical
systems previously presented were performed, considering two different surfaces (Ramp
and Crest), presented in the Chapter 3. The electric generator and electric load
characteristics were not changed, as the main goal is to study the impact of the
mechanical system and its characteristics in the performance of the RPEH device.
For the RAP system, different pinion radius and IW mass values were considered to
evaluate the impact of these on the global results. For the lever system, besides these
two variables, two different lever geometries were also considered.
To evaluate the system performance, the vehicle released energy (Ev), RPEH surface
harvested energy (EHa), mechanical system transmitted energy (ETr), mechanical system
delivered energy (EDe), electrical system generated energy (EGe), and electrical system
consumed energy (ELo) were calculated. Also, the efficiencies of the energy transferred
between each part of the system were evaluated.
5.4.3.1 System 1 - RAP
Table 5.5 presents the simulation results for the energy output of each component of the
RPEH device using the RAP mechanical system, considering the input data presented in
Table 5.4. Table 5.6 presents the simulation results for the efficiency of each component
of the system, as well as the total efficiency of the device.
5.4.3.2 System 2 - Lever
Table 5.7 presents the simulation results for the energy output of each component of the
RPEH device using the lever mechanical system, considering the input data presented in
Table 5.4. Table 5.8 presents the simulation results for the efficiency of each component
of the system, as well as the total efficiency of the device.

Chapter 5 Road Pavement Energy Harvesting: a New Electromechanical Device
to Convert Vehicles Mechanical Energy into Electrical Energy
172
Table 5.5- Simulation results for the energy outputs of the RPEH device components using the RAP
mechanical system.
SP rp (mm) miw (kg) Ev
(J)
EHa
(J)
ETr
(J)
EDe
(J)
EGe
(J)
ELo
(J)
S5
15 5 263.0 83.0 19.0 19.0 17.0 13.8
10 263.0 83.0 19.0 19.0 16.0 12.9
20 5 265.0 82.0 37.0 37.0 33.0 27.0
10 265.0 82.0 37.0 36.0 31.0 25.1
25 5 266.0 81.0 59.0 59.0 53.0 43.5
10 266.0 81.0 59.0 58.0 51.0 41.6
S8
15 5 184.0 87.0 22.0 22.0 19.9 16.1
10 184.0 88.0 22.0 22.0 19.0 15.4
20 5 182.0 84.0 41.0 41.0 37.0 29.9
10 183.0 85.0 41.0 41.0 35.0 28.2
25 5 182.0 82.0 65.0 64.0 59.0 47.9
10 182.0 83.0 65.0 64.0 57.0 46.2
Table 5.6- Simulation results for the efficiencies of the RPEH device components using the RAP
mechanical system.
SP rp
(mm)
miw
(kg)
ηHa
(%)
ηTr
(%)
ηDe
(%)
ηGe
(%)
ηCo
(%)
ηMec
(%)
ηEle
(%)
ηRPEH
(%)
ηTOT
(%)
S5
15 5 31.6 22.9 99.7 89.7 80.9 22.8 72.6 16.6 5.2
10 31.6 22.9 99.7 84.4 80.3 22.8 67.8 15.5 4.9
20 5 30.9 45.1 99.9 89.3 81.8 45.1 73.1 32.9 10.2
10 30.9 45.1 97.3 86.1 81.0 43.9 69.7 30.6 9.5
25 5 30.5 72.8 99.9 89.9 82.1 72.8 73.8 53.7 16.4
10 30.5 72.8 98.3 87.9 81.6 71.6 71.7 51.4 15.6
S8
15 5 47.3 25.3 99.8 90.7 80.9 25.2 73.3 18.5 8.8
10 47.8 25.0 99.8 86.6 81.1 24.9 70.2 17.5 8.4
20 5 46.2 48.8 99.9 90.4 80.8 48.8 73.0 35.6 16.4
10 46.4 48.2 99.9 85.5 80.4 48.2 68.7 33.1 15.4
25 5 45.1 79.3 98.5 92.2 81.2 78.0 74.8 58.4 26.3
10 45.6 78.3 98.5 89.1 81.0 77.1 72.1 55.6 25.4

Chapter 5 Road Pavement Energy Harvesting: a New Electromechanical Device
to Convert Vehicles Mechanical Energy into Electrical Energy
173
Table 5.7- Simulation results for the energy outputs of the RPEH device components using the lever
mechanical system.
SP d1-d2
(mm)
rp
(mm)
miw
(kg)
Ev
(J)
EHa
(J)
ETr
(J)
EDe
(J)
EGe
(J)
ELo
(J)
S5
40-60
20 5 262.0 84.0 15.0 15.0 12.9 10.2
10 262.0 84.0 15.0 15.0 12.7 10.0
30 5 264.0 83.0 36.0 36.0 32.0 26.1
10 264.0 83.0 36.0 35.9 30.9 24.9
40 5 266.0 82.0 66.0 65.0 59.3 48.1
10 266.0 82.0 66.0 65.0 58.6 47.3
40-80
20 5 262.0 84.0 8.0 8.0 6.5 5.1
10 262.0 84.0 8.0 8.0 6.4 4.9
30 5 263.0 84.0 19.0 19.0 16.3 12.9
10 263.0 84.0 19.0 18.9 16.1 12.7
40 5 264.0 83.0 36.0 35.0 31.2 25.2
10 264.0 83.0 36.0 35.0 31.0 24.9
S8
40-60
20 5 185.0 89.0 17.0 17.0 14.6 11.6
10 185.0 89.0 17.0 17.0 14.4 11.4
30 5 184.0 85.0 40.0 40.0 35.6 29.0
10 184.0 85.0 40.0 39.9 34.3 27.7
40 5 182.0 82.0 73.0 72.0 65.7 53.5
10 182.0 82.0 73.0 72.0 64.9 52.5
40-80
20 5 188.0 91.0 9.0 9.0 7.4 5.8
10 188.0 91.0 9.0 9.0 7.3 5.8
30 5 186.0 88.0 22.0 22.0 18.9 15.0
10 186.0 88.0 22.0 22.0 18.7 14.8
40 5 184.0 85.0 40.0 40.0 35.6 29.0
10 184.0 85.0 40.0 39.9 34.3 27.7

Chapter 5 Road Pavement Energy Harvesting: a New Electromechanical Device
to Convert Vehicles Mechanical Energy into Electrical Energy
174
Table 5.8- Simulation results for the efficiencies of the RPEH device components using the lever
mechanical system.
SP d1-d2
(mm)
rp
(mm)
miw
(kg)
ηHa
(%)
ηTr
(%)
ηDe
(%)
ηGe
(%)
ηCo
(%)
ηMec
(%)
ηEle
(%)
ηRPEH
(%)
ηTOT
(%)
S5
40-60
20 5 32.1 17.9 99.7 86.3 79.1 17.8 68.3 12.1 3.9
10 32.1 17.9 99.7 84.9 78.8 17.8 66.9 11.9 3.8
30 5 31.4 43.4 99.9 89.0 81.6 43.3 72.6 31.5 9.9
10 31.4 43.4 99.7 86.0 80.6 43.3 69.3 30.0 9.4
40 5 30.8 80.5 98.5 91.2 81.1 79.3 74.0 58.6 18.1
10 30.8 80.5 98.5 90.1 80.8 79.3 72.8 57.7 17.8
40-80
20 5 32.1 9.5 99.4 81.2 78.8 9.5 64.0 6.1 1.9
10 32.1 9.5 99.4 80.1 77.7 9.5 62.2 5.9 1.9
30 5 31.9 22.6 99.7 86.1 79.2 22.6 68.2 15.4 4.9
10 31.9 22.6 99.5 85.1 79.0 22.5 67.2 15.1 4.8
40 5 31.4 43.4 97.2 89.1 80.9 42.2 72.1 30.4 9.6
10 31.4 43.4 97.1 88.8 80.2 42.1 71.2 30.0 9.4
S8
40-60
20 5 48.1 19.1 99.7 86.1 79.2 19.0 68.2 13.0 6.2
10 48.1 19.1 99.7 85.1 79.0 19.0 67.2 12.8 6.2
30 5 46.2 47.1 99.9 89.0 81.6 47.0 72.6 34.1 15.8
10 46.2 47.1 99.8 86.0 80.6 46.9 69.3 32.5 15.0
40 5 45.1 89.0 98.6 91.3 81.4 87.8 74.3 65.3 29.4
10 45.1 89.0 98.6 90.2 80.9 87.8 73.0 64.1 28.9
40-80
20 5 48.4 9.9 99.4 82.3 78.8 9.8 64.9 6.4 3.1
10 48.4 9.9 99.4 82.0 78.5 9.8 64.4 6.3 3.1
30 5 47.3 25.0 99.8 86.1 79.2 24.9 68.2 17.0 8.0
10 47.3 25.0 99.8 85.1 79.0 24.9 67.2 16.8 7.9
40 5 46.2 47.1 99.9 89.0 81.6 47.0 72.6 34.1 15.8
10 46.2 47.1 99.8 86.0 80.6 46.9 69.3 32.5 15.0
5.4.3.3 System 3 - CTS
Considering the same conditions as for the RAP system and the lever system,
simulations for the CTS mechanical system were also performed and the main results
are presented in Tables 5.9 and 5.10 for the energy output and the efficiency of each
component of the system, respectively. Besides the RPEH surface profile, pinion radius

Chapter 5 Road Pavement Energy Harvesting: a New Electromechanical Device
to Convert Vehicles Mechanical Energy into Electrical Energy
175
(rp) and IW mass (miw), the crank length (lcr) was changed between simulations to
evaluate the impact of this in the system’s performance. The initial vertical distance
between the crank axes (hcr-in) was considered to be equal to 30 mm.
Table 5.9- Simulation results for the energy outputs of the RPEH device components using the CTS
mechanical system.
SP lcr
(mm)
rp
(mm)
miw
(kg)
Ev
(J)
EHa
(J)
ETr
(J)
EDe
(J)
EGe
(J)
ELo
(J)
S5
35
15 5 261.0 85.0 21.0 20.9 18.3 14.7
10 261.0 85.0 21.0 20.9 18.1 14.4
20 5 262.0 85.0 39.0 38.9 34.7 28.3
10 262.0 85.0 39.0 38.9 33.6 27.1
25 5 263.0 85.0 64.0 63.9 57.7 47.2
10 263.0 85.0 64.0 63.9 53.1 43.0
40
15 5 263.0 84.0 36.0 35.9 32.0 26.0
10 263.0 84.0 36.0 35.9 31.0 24.8
20 5 264.0 84.0 67.0 66.9 59.7 48.7
10 264.0 84.0 67.0 66.9 55.0 44.6
25 5 265.0 83.0 82.0 81.9 75.3 61.7
10 265.0 83.0 82.0 81.9 73.8 60.2
S8
35
15 5 224.0 91.0 23.0 22.9 20.0 16.0
10 224.0 91.0 23.0 22.9 19.9 15.9
20 5 222.0 89.0 42.0 41.9 38.0 31.0
10 222.0 89.0 42.0 41.9 36.8 29.6
25 5 221.0 87.0 65.0 64.9 58.6 48.0
10 221.0 87.0 65.0 64.9 54.0 43.8
40
15 5 222.0 88.0 38.0 37.9 33.9 27.6
10 222.0 88.0 38.0 37.9 32.8 26.4
20 5 219.0 85.0 67.0 66.9 60.5 49.4
10 219.0 85.0 67.0 66.9 55.8 45.3
25 5 218.0 83.0 82.0 81.9 75.3 61.7
10 218.0 83.0 82.0 81.9 73.8 60.2

Chapter 5 Road Pavement Energy Harvesting: a New Electromechanical Device
to Convert Vehicles Mechanical Energy into Electrical Energy
176
Table 5.10- Simulation results for the efficiencies of the RPEH device components using the CTS
mechanical system.
SP lcr
(mm)
rp
(mm)
miw
(kg)
ηHa
(%)
ηTr
(%)
ηDe
(%)
ηGe
(%)
ηCo
(%)
ηMec
(%)
ηEle
(%)
ηRPEH
(%)
ηTOT
(%)
S5
35
15 5 32.6 24.7 99.5 87.3 80.3 24.6 70.1 17.3 5.6
10 32.6 24.7 99.5 86.5 79.7 24.6 68.9 17.0 5.5
20 5 32.4 45.9 99.5 89.1 81.5 45.8 72.6 33.3 10.8
10 32.4 45.9 99.5 86.2 80.7 45.8 69.6 31.9 10.3
25 5 32.3 75.3 99.5 90.2 81.9 75.2 73.9 55.6 18.0
10 32.3 75.3 99.5 83.0 81.1 75.2 67.3 50.6 16.4
40
15 5 31.9 42.9 99.5 89.0 81.2 42.8 72.3 30.9 9.9
10 31.9 42.9 99.5 86.2 80.1 42.8 69.0 29.6 9.4
20 5 31.8 79.8 98.5 90.4 81.6 78.6 73.8 58.0 18.4
10 31.8 79.8 98.5 83.3 81.1 78.6 67.6 53.1 16.9
25 5 31.3 98.8 99.5 91.9 81.9 98.7 75.3 74.3 23.3
10 31.3 98.8 99.5 90.1 81.5 98.7 73.4 72.5 22.7
S8
35
15 5 40.6 25.3 99.5 87.2 80.2 25.2 69.9 17.6 7.2
10 40.6 25.3 99.5 86.6 79.8 25.2 69.1 17.4 7.1
20 5 40.1 47.2 99.5 90.5 81.7 47.1 73.9 34.9 14.0
10 40.1 47.2 99.5 87.7 80.5 47.1 70.6 33.3 13.3
25 5 39.4 74.7 99.5 90.3 81.8 74.7 73.9 55.1 21.7
10 39.4 74.7 99.5 83.1 81.2 74.7 67.5 50.4 19.8
40
15 5 39.6 43.2 99.5 89.2 81.4 43.1 72.6 31.3 12.4
10 39.6 43.2 99.5 86.3 80.5 43.1 69.5 30.0 11.9
20 5 38.8 78.8 99.5 90.4 81.7 78.8 73.9 58.2 22.6
10 38.8 78.8 99.5 83.3 81.2 78.8 67.6 53.3 20.7
25 5 38.1 98.8 99.5 91.9 81.9 98.7 75.3 74.3 28.3
10 38.1 98.8 99.5 90.1 81.5 98.7 73.4 72.5 27.6
5.4.4 Results analysis
Analyzing the results obtained with the computational simulations of the RPEH device,
using the three different mechanical systems presented to transmit the energy received
by the equipment surface and deliver it to an electrical generator, some conclusions may
be drawn.

Chapter 5 Road Pavement Energy Harvesting: a New Electromechanical Device
to Convert Vehicles Mechanical Energy into Electrical Energy
177
Globally, the RPEH surface harvested energy efficiency depends on the surface profile,
varying significantly for each studied profile. Using the Crest profile (S8), the surface
energy harvesting efficiency can be 30% higher than with the Ramp surface profile
(S5), for the same conditions.
The mechanical energy delivery efficiency is close to 100% for all the studied systems
and scenarios, meaning that the IW delivers almost all the energy that the pinion
transmits to it. The only energy loss is due to the clutch bearing, which happens
between each vehicle wheel actuation.
The DC electrical generator efficiency varies in relation to the delivered energy, as it is
associated with its rotational speed. For lower rotational speeds, its efficiency is lower
than 85%, while for higher rotational speeds, it can be higher than 90%. The electric
energy consumption efficiency is usually around 80%, for the considered electrical load
and using a diode between the electrical generator and the load.
Comparing the different mechanical systems for the same conditions, it may be
concluded that:
The lever system presents the lowest transmission efficiency, for the same
pinion applied on the system; however, increasing the pinion radius and for a
small relation between d1 and d2, the transmission efficiency can be increased
and reach very high levels of around 80%;
The RAP system have similar transmission efficiencies when compared to the
lever system, but for lower pinion radius, meaning that in the same conditions, it
is more efficient;
The CTS system is the most efficient system regarding the mechanical energy
transmission, as, for the same pinion radius, it can duplicate the efficiency of the
RAP system and, with its optimal characteristics, it can have a transmission
efficiency of around 99%. Although this system has more mechanical parts than
the other two, due to the force increase and motion decrease principle, the
mechanical losses were reduced.
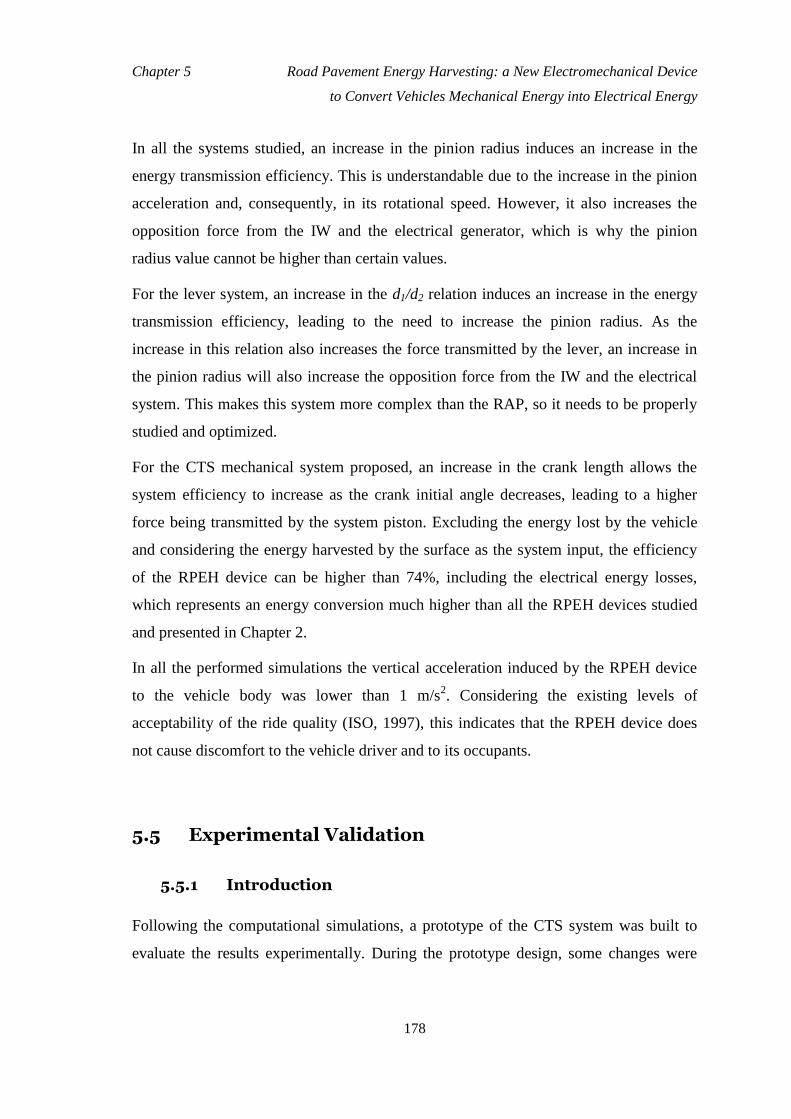
Chapter 5 Road Pavement Energy Harvesting: a New Electromechanical Device
to Convert Vehicles Mechanical Energy into Electrical Energy
178
In all the systems studied, an increase in the pinion radius induces an increase in the
energy transmission efficiency. This is understandable due to the increase in the pinion
acceleration and, consequently, in its rotational speed. However, it also increases the
opposition force from the IW and the electrical generator, which is why the pinion
radius value cannot be higher than certain values.
For the lever system, an increase in the d1/d2 relation induces an increase in the energy
transmission efficiency, leading to the need to increase the pinion radius. As the
increase in this relation also increases the force transmitted by the lever, an increase in
the pinion radius will also increase the opposition force from the IW and the electrical
system. This makes this system more complex than the RAP, so it needs to be properly
studied and optimized.
For the CTS mechanical system proposed, an increase in the crank length allows the
system efficiency to increase as the crank initial angle decreases, leading to a higher
force being transmitted by the system piston. Excluding the energy lost by the vehicle
and considering the energy harvested by the surface as the system input, the efficiency
of the RPEH device can be higher than 74%, including the electrical energy losses,
which represents an energy conversion much higher than all the RPEH devices studied
and presented in Chapter 2.
In all the performed simulations the vertical acceleration induced by the RPEH device
to the vehicle body was lower than 1 m/s2. Considering the existing levels of
acceptability of the ride quality (ISO, 1997), this indicates that the RPEH device does
not cause discomfort to the vehicle driver and to its occupants.
5.5 Experimental Validation
5.5.1 Introduction
Following the computational simulations, a prototype of the CTS system was built to
evaluate the results experimentally. During the prototype design, some changes were

Chapter 5 Road Pavement Energy Harvesting: a New Electromechanical Device
to Convert Vehicles Mechanical Energy into Electrical Energy
179
added to the system so that it could resist to loads applied by the vehicles and keep the
vertical displacement of the entire surface. These developments are presented in this
section. Besides the electromechanical system, the prototype also includes sensors and
instruments to measure different variables, a Data Logger to collect these data and
software to receive data and generate plots.
The prototype was then implemented in a controlled environment and different
scenarios were tested. A new set of computational simulations was performed, for the
same scenarios as those tested experimentally, so that both results could be directly
compared. The analysis of the results is also presented in this section.
5.5.2 Prototype
The design of the experimental prototype was based on the CTS mechanical system
presented in Figure 5.5, but using two CTS systems, as presented in Figure 5.10, so that
the force transmitted from the surface to the RAP system can be divided between both
systems and to balance the surface so that it has purely downward motion when
actuated. A linear guiding system is also used to help with this action.
Given the use of light weight and low cost materials, especially plastic, as the core
material for the components of the prototype, a multiple crank system was adopted. The
components were designed so that the prototype can support the passage of a heavy
vehicle with 10 tons per axle, with a safety factor of 1.5. Also, a linear guiding system
was used to guarantee a uniform displacement of the system’s surface, with a linear
guide and a linear bearing in each corner of the prototype. The values considered for the
prototype components, especially the crank length (lcr), its initial position (θcr-in), the
maximum displacement of the surface and the spring stiffness were the same as
presented in previous sections.

Chapter 5 Road Pavement Energy Harvesting: a New Electromechanical Device
to Convert Vehicles Mechanical Energy into Electrical Energy
180
Figure 5.10- Mechanical system using two CTS systems and one RAP system.
The two sliders were mechanically connected by a vertical axis RAP system, used to
cinematically unite the systems and also to transmit the forces between each other. With
this approach, only one slider was connected to the RAP system that transmits the
energy to the electrical generator. However, due to the lack of space for the generator in
the prototype, a connection was made to an external shaft using a belt and pulley
connection between the pinion shaft and the generator shaft. In the generator shaft, an
IW was used to store a small amount of the mechanical energy delivered to the
generator shaft, to keep it rotating between each wheel passage over the prototype. All
these changes increase inertia and friction in the system but are essential to guarantee
the correct operation of the system.
A DC generator was used, with the characteristics presented in Table 5.4. The electric
generator was directly connected to an electric load (EL), which can be changed to test
different loads - whether resistive or resistive-capacitive, as defined previously.
The prototype design is presented in Figure 5.11, without sensors, instrumentation
components and the surface with a specific profile. Three surface profiles (Crest, Ramp
and S profile) were designed and built for the experimental tests. The external
dimensions of the prototype are 1.1 x 0.3 m, with a total area of 0.33 m2 and a total
height of 0.11 m.
Besides the mechanical system, sensors and instrumentation equipment were also
included in the prototype, namely two Tedea-Huntleigh load cells, model 1250 (Vishay,
2017), with a 1,000 kg maximum load each, to measure the force received by the
surface of the prototype and transferred to the mechanical system (FSM1), applied
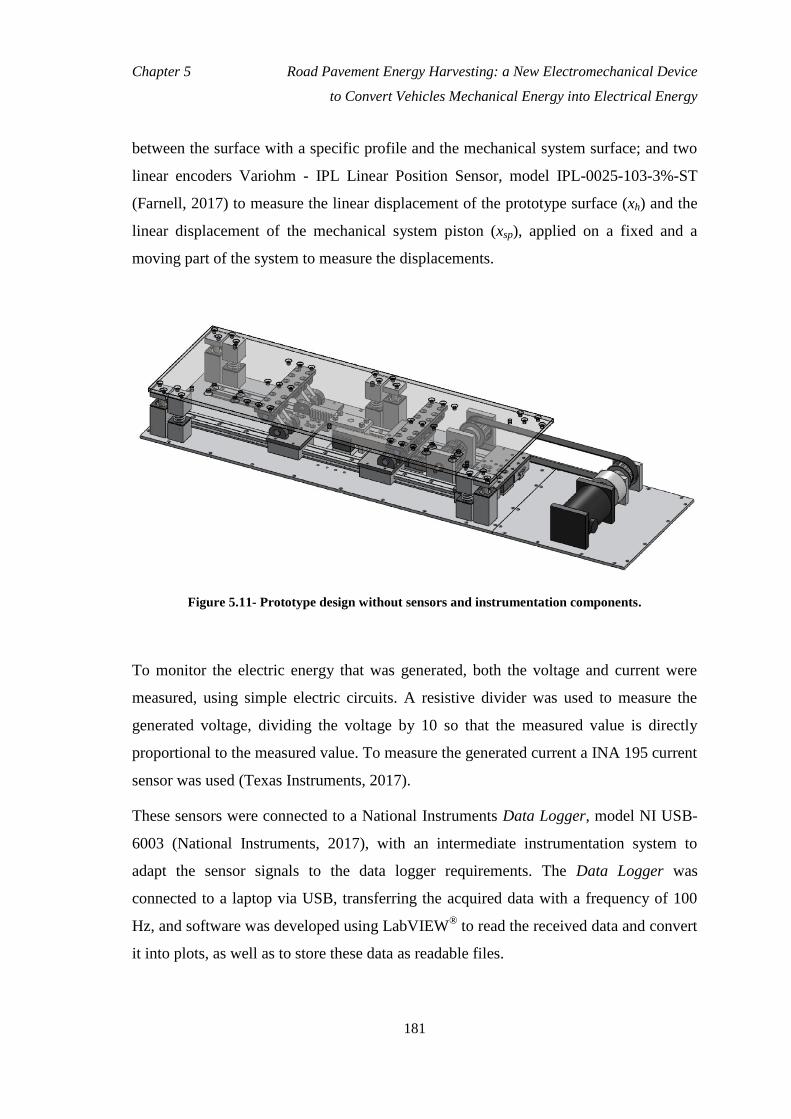
Chapter 5 Road Pavement Energy Harvesting: a New Electromechanical Device
to Convert Vehicles Mechanical Energy into Electrical Energy
181
between the surface with a specific profile and the mechanical system surface; and two
linear encoders Variohm - IPL Linear Position Sensor, model IPL-0025-103-3%-ST
(Farnell, 2017) to measure the linear displacement of the prototype surface (xh) and the
linear displacement of the mechanical system piston (xsp), applied on a fixed and a
moving part of the system to measure the displacements.
Figure 5.11- Prototype design without sensors and instrumentation components.
To monitor the electric energy that was generated, both the voltage and current were
measured, using simple electric circuits. A resistive divider was used to measure the
generated voltage, dividing the voltage by 10 so that the measured value is directly
proportional to the measured value. To measure the generated current a INA 195 current
sensor was used (Texas Instruments, 2017).
These sensors were connected to a National Instruments Data Logger, model NI USB-
6003 (National Instruments, 2017), with an intermediate instrumentation system to
adapt the sensor signals to the data logger requirements. The Data Logger was
connected to a laptop via USB, transferring the acquired data with a frequency of 100
Hz, and software was developed using LabVIEW® to read the received data and convert
it into plots, as well as to store these data as readable files.
Chapter 5 Road Pavement Energy Harvesting: a New Electromechanical Device
to Convert Vehicles Mechanical Energy into Electrical Energy
182
To convert the measured loads from the load cells into a received force, the values from
both load cells were added and multiplied by 9.81 m/s2, and to determine the load
delivered by the slider to the crank, the equation of FSM2 presented in Table 5.3 was
used. In this equation, to define angle θcr, the equations from the kinematic analysis
presented in the same Table were used, considering the displacements xh and xcr
measured by the linear encoders. With these values, the energy harvested from the
surface (EHa) was measured, using Equation (4.18).
Multiplying the generated voltage by the generated current, the generated power (PGe) is
measured, and integrating this value between acquisitions the electric energy generated
(EGe) is calculated. As the electrical energy generated is similar to electrical energy
consumed, to determine the energy conversion efficiency of the device (ηRPEH),
Equation (5.20) was used.
In Figure 5.12 the prototype assembled with the sensors and with the S Profile surface is
presented.
Figure 5.12- Fully assembled prototype system with sensors.
5.5.3 Test scenarios
The prototype was installed in a road pavement surface of a car parking space by
opening a hole with the external dimensions of the prototype (1.1 x 0.3 x 0.11 m3), in

Chapter 5 Road Pavement Energy Harvesting: a New Electromechanical Device
to Convert Vehicles Mechanical Energy into Electrical Energy
183
such a way that only the prototype surface was above the level of the road surface.
Considering the working principle of the designed system, when the vehicle wheels
starts the contact with the prototype surface, it will be at the pavement level, and when
the wheel leaves the contact with the prototype surface it still continues at the road
pavement level, avoiding the typical bump effect of speed bumps.
To perform multiple tests with the prototype and evaluate its performance under
different conditions, different vehicles weighing 1,000 kg (VE1) and 2,000 kg (VE2),
different prototype surface profiles (Crest, Ramp and S profile), different values for the
EL of 10 Ohm/0 F (EL1) and 10 Ohm/ 40 μF (EL2) and different vehicle speeds, of 20,
30, 40 and 50 km/h were considered. Table 5.11 presents the different scenarios for the
prototype experiments.
Table 5.11- Test scenarios for the system prototype.
Vehicle type and
weight (kg) Surface profile (SP)
Electric load - Resistance /
Capacitance (Ohm / μF) Vehicle speed (km/h)
VE1=1,000
S8=Crest EL1=10/0 10 | 20 | 30 | 40
EL2=10/40 10 | 20 | 30 | 40
S5=Ramp EL1=10/0 10 | 20 | 30 | 40
EL2=10/40 10 | 20 | 30 | 40
S6=S profile EL1=10/0 10 | 20 | 30 | 40
EL2=10/40 10 | 20 | 30 | 40
VE2=2,000
S8=Crest EL1=10/0 10 | 20 | 30 | 40
EL2=10/40 10 | 20 | 30 | 40
S5=Ramp EL1=10/0 10 | 20 | 30 | 40
EL2=10/40 10 | 20 | 30 | 40
S6=S profile EL1=10/0 10 | 20 | 30 | 40
EL2=10/40 10 | 20 | 30 | 40
5.5.4 Computational simulations
Using the upgraded version of the RoadVISS software tool to perform the simulations
for the new RPEH system proposed in this work, two vehicles with the characteristics

Chapter 5 Road Pavement Energy Harvesting: a New Electromechanical Device
to Convert Vehicles Mechanical Energy into Electrical Energy
184
presented in Table 5.12 were considered, with VE1 representing a 1,000 kg vehicle and
VE2 representing a 2,000 kg vehicle. The bicycle-car model and the CPA were used in
this study. Also, different speeds were evaluated, from 20 km/h to 50 km/h, as this is the
speed limit in urban areas.
Table 5.12- Fixed and initial values for the simulation variables.
Variable name Value (VE1) Value (VE2) Unit
Veh
icle
& m
oti
on
Vehicle class Light -
Vehicle weight 1,000 2,000 (kg)
Number of axles P1 | wheels/axle 2 | 2 -
Distance a1 | a2 0.914 | 1.557 1.055 | 1.651 (m)
Sprung-Unsprung % 90%-10% -
Drag coefficient 0.3 0.34 -
Inertia moment 750 1,470 (kg.m2)
Lift coefficients (Front | Rear) 0.17 | 0.12 0.21 | 0.15 -
Motion | Direction Free rolling | Forward -
Vehicle speed 20 | 30 | 40 | 50 (km/h)
Vehicle acceleration 0 (m/s2)
Su
spen
sio
n &
wh
eel
Suspension type (Front | Rear) Independent | Independent -
Suspension stiffness (Front | Rear) 20,000 | 15,000 25,000 | 18,000 (N/m)
Suspension damping (Front | Rear) 1,500 | 1,700 1,700 | 1,900 (Ns/m)
Tyre type (Front | Rear) Radial | Radial -
Tyre stiffness (Front | Rear) 140,000 | 140,000 160,000 | 160,000 (N/m)
Tyre pressure (Front | Rear) 200 | 200 250 | 250 (kPa)
Tyre external diameter (Front | Rear) 400 | 400 500 | 500 (mm)
Tyre width (Front | Rear) 190 | 190 220 | 220 (mm)
Tyre tread width (Front | Rear) 175 | 175 200 | 200 (mm)
RP
EH
dev
ice
Surface width | max height | max displac. 275 | 20 | 20 (mm)
Surface mass 20 (kg)
Spring stiffness 40,000 (N/m)
Pinion mass | Pinion radius | friction coef. 1 | 0.02 | 0.002 (kg) | (m) | -
Inertia wheel radius 30 (mm)
Electric generator constant Ka 0.25 -
Electric generator Ra | La 1.1 | 0.0048 (Ω) | (H)
Electric generator friction coef. | Inertia 0.0008 | 0.05 - | (kg.m2)
Considering the proposed electromechanical RPEH system, a set of simulations were
performed for the different surface profiles previously defined, with a surface width of

Chapter 5 Road Pavement Energy Harvesting: a New Electromechanical Device
to Convert Vehicles Mechanical Energy into Electrical Energy
185
0.275 m and a maximum height of 20 mm, the maximum displacement (xh-max) being
equivalent to the surface maximum height. The total spring stiffness (Kh) was 40 kN/m,
and the considered surface material is recycled plastic with a rubber layer on top, with a
total mass of 18 kg. The values for lcr and θcr-in are, respectively, 0.04 m and 0.848 rad
(or 48.6º). The simulation results for VE1 and VE2 are presented in Tables 5.13 and 5.14,
respectively, considering different vehicle speeds (20, 30, 40 and 50 km/h), and
different ELs, EL1 for a resistive load with 10 Ohm (10 W), and EL2 for a resistive-
capacitive load with 10 Ohm (10 W) and 40 μF.
Table 5.13- Simulation results of the new RPEH system for VE1.
SP EL vini (km/h) FSM1 (N) EHa (J) EGe (J) ηRPEH (%)
S8
EL1
20 2.512,8 70,1 21,2 30,2%
30 3.289,5 77,1 28,7 37,2%
40 3.551,5 75,4 31,5 41,8%
50 3.929,9 70,9 33,1 46,7%
EL2
20 2.478,5 69,5 20,3 29,2%
30 3.390,0 76,4 27,9 36,5%
40 3.652,2 72,3 30,6 42,3%
50 4.034,8 67,2 32,3 48,0%
S5
EL1
20 2.754,2 71,1 25,3 35,6%
30 2.847,7 75,0 35,5 47,3%
40 3.109,0 74,4 37,7 50,7%
50 3.341,0 70,2 38,9 55,4%
EL2
20 2.746,6 70,7 22,0 31,1%
30 2.828,9 79,9 31,1 38,9%
40 3.124,3 77,2 33,4 43,3%
50 3.321,5 71,6 34,8 48,6%
S6
EL1
20 3.691,1 77,2 28,9 37,4%
30 3.902,8 79,5 35,6 44,8%
40 4.033,6 75,8 39,1 51,6%
50 4.342,3 69,4 41,0 59,1%
EL2
20 3.549,8 75,9 27,9 36,8%
30 4.057,1 78,5 32,1 40,9%
40 4.157,9 75,9 37,5 49,4%
50 4.372,3 69,9 40,3 57,7%

Chapter 5 Road Pavement Energy Harvesting: a New Electromechanical Device
to Convert Vehicles Mechanical Energy into Electrical Energy
186
Table 5.14- Simulation results of the new RPEH system for VE2.
SP EL vini (km/h) FSM1 (N) EHa (J) EGe (J) ηRPEH (%)
S8
EL1
20 4.109,8 101,2 50,9 50,3%
30 4.671,2 129,8 65,9 50,8%
40 5.012,8 144,2 71,5 49,6%
50 5.548,9 135,8 70,3 51,8%
EL2
20 4.012,3 100,1 43,1 43,1%
30 4.521,8 122,9 56,2 45,7%
40 4.982,3 142,2 64,1 45,1%
50 5.421,1 134,4 61,1 45,5%
S5
EL1
20 4.578,5 97,2 53,1 54,6%
30 4.178,5 109,9 62,1 56,5%
40 4.891,7 125,9 70,5 56,0%
50 5.047,5 118,5 64,8 54,7%
EL2
20 4.544,1 88,1 41,1 46,7%
30 4.071,2 107,9 53,9 50,0%
40 4.158,9 122,9 59,9 48,7%
50 4.912,1 116,1 56,4 48,6%
S6
EL1
20 4.787,5 110,8 55,9 50,5%
30 4.688,2 129,9 65,4 50,3%
40 4.917,8 137,1 68,8 50,2%
50 5.272,3 120,2 65,2 54,2%
EL2
20 4.653,8 98,1 42,2 43,0%
30 3.999,4 124,0 60,1 48,5%
40 4.421,2 136,7 66,0 48,3%
50 5.148,2 120,4 60,4 50,2%
Considering EHa and EGe as the most important variables to evaluate the performance of
the system, Figure 5.13 presents the EHa and EGe for VE1, for the different surfaces and
for different electric loads, while Figure 5.14 presents the results for the same scenarios
but for VE2.

Chapter 5 Road Pavement Energy Harvesting: a New Electromechanical Device
to Convert Vehicles Mechanical Energy into Electrical Energy
187
Figure 5.13- Simulation results for VE1.
Figure 5.14- Simulation results for VE2.
5.5.5 Experimental results
Both the VE1 and VE2 used in the experimental tests have the same characteristics as the
vehicles considered in the computational simulations, as presented in Table 5.12, so that
the experimental test results can be compared with the appropriate level of confidence.

Chapter 5 Road Pavement Energy Harvesting: a New Electromechanical Device
to Convert Vehicles Mechanical Energy into Electrical Energy
188
Tables 5.15 and 5.16 present the results of the experimental tests with the prototype, for
VE1 and VE2, respectively. In these tables, the different variables presented in Table
5.11 are identified, and the values regarding the force received by the surface and
transmitted to the mechanical system, FSM1, the energy harvested by both wheels of one
side of the vehicle, EHa, the total electric energy generated, EGe, and the efficiency of the
energy conversion process, ηRPEH, are presented.
Table 5.15- Prototype test results for VE1.
SP EL vini (km/h) FSM1 (N) EHa (J) EGe (J) ηRPEH (%)
S8
EL1
20 2.310,2 53,1 9,2 17,4%
30 2.912,3 72,7 21,0 28,9%
40 2.824,9 69,6 25,5 36,7%
50 3.139,6 66,0 31,0 47,0%
EL2
20 2.304,1 66,3 15,3 23,0%
30 2.686,2 63,9 21,0 32,9%
40 2.895,8 63,6 20,6 32,3%
50 2.888,5 65,8 30,8 46,8%
S5
EL1
20 2.621,3 73,3 15,5 21,1%
30 2.668,1 64,7 24,2 37,4%
40 2.704,7 67,7 30,2 44,6%
50 2.851,7 65,9 36,4 55,2%
EL2
20 1.859,2 58,3 10,7 18,4%
30 2.471,7 68,9 14,3 20,8%
40 3.073,8 78,7 15,3 19,4%
50 2.767,1 70,9 28,4 40,1%
S6
EL1
20 2.666,6 58,8 9,9 16,9%
30 2.526,6 61,4 16,6 27,0%
40 2.548,8 71,8 31,9 44,4%
50 3.157,7 64,7 32,9 50,9%
EL2
20 2.863,7 65,3 10,6 16,2%
30 2.993,5 72,9 12,2 16,8%
40 3.401,9 76,8 20,6 26,9%
50 3.169,3 75,3 36,6 48,6%

Chapter 5 Road Pavement Energy Harvesting: a New Electromechanical Device
to Convert Vehicles Mechanical Energy into Electrical Energy
189
Considering that the EHa and the EGe as the most important variables for evaluating the
performance of the system, Figure 5.15 presents the energy harvested for VE1, for the
different surfaces and the different electric loads, while Figure 5.16 presents the results
for the same scenarios but for VE2.
Table 5.16- Prototype test results for VE2.
SP EL vini (km/h) FSM1 (N) EHa (J) EGe (J) ηRPEH (%)
S8
EL1
20 3.282,8 86,6 30,5 35,2%
30 4.470,2 124,7 32,0 25,7%
40 3.487,6 98,8 26,4 26,7%
50 3.965,0 104,8 57,0 54,4%
EL2
20 3.774,3 106,4 24,6 23,1%
30 3.979,0 114,6 24,5 21,4%
40 3.650,0 107,9 33,8 31,3%
50 3.949,4 114,0 50,2 44,1%
S5
EL1
20 4.478,2 104,8 25,5 24,3%
30 3.822,3 106,2 29,3 27,6%
40 4.130,1 126,0 45,1 35,8%
50 4.131,4 122,7 58,2 47,4%
EL2
20 3.934,1 71,7 15,1 21,1%
30 3.773,4 100,3 24,3 24,2%
40 3.873,2 127,7 27,0 21,1%
50 3.939,2 118,3 47,5 40,1%
S6
EL1
20 3.582,1 88,5 20,5 23,2%
30 4.021,2 117,9 30,6 25,9%
40 3.923,2 106,4 33,0 31,1%
50 4.178,1 119,7 72,4 60,5%
EL2
20 4.312,7 107,1 14,8 13,8%
30 3.976,0 115,9 20,6 17,7%
40 3.540,3 119,7 20,4 17,0%
50 3.982,5 137,3 40,9 29,8%

Chapter 5 Road Pavement Energy Harvesting: a New Electromechanical Device
to Convert Vehicles Mechanical Energy into Electrical Energy
190
Figure 5.15- Experimental results for VE1.
Figure 5.16- Experimental results for VE2.
Analyzing the experimental results, the following conclusions may be drawn.
For all the tested scenarios, the energy generation has increased with the
increase in vehicle speed, while the energy harvested does not change
considerably with the vehicle speed. This means that the conversion efficiency
increases considerably with the increase in vehicle speed. This increase was not

Chapter 5 Road Pavement Energy Harvesting: a New Electromechanical Device
to Convert Vehicles Mechanical Energy into Electrical Energy
191
so evident in the computational simulations, mainly because the efficiency at
low speeds achieved in the experimental tests was much lower than the
computational simulations results.
With the heavier vehicle, the total amount of energy harvested and generated
increased, but the average energy conversion efficiency of the system was lower,
with an average value of 30.1%, compared to 32.1% for VE1, contrary to the
simulated results. A possible justification for this is the lower efficiencies
achieved for lower vehicle speeds, which was more evident for VE2.
The highest values of energy harvested and generated were achieved using
surface profile S6, which was also verified with the computational simulations,
allowing us to conclude that this is the optimal surface profile for these
variables.
Comparing the results for different electric loads, it is possible to conclude that a
purely resistive load is more efficient and allows more energy to be generated
than a resistive-capacitive load, as seen in the computational simulations.
5.5.6 Discussion
Tables 5.17 and 5.18 present the difference between the simulations and the
experimental results for similar tested scenarios using VE1 and VE2, respectively. From
these, some conclusions can be drawn.
The average difference in FSM1 is 19.1% and 15.7% for VE1 and VE2,
respectively, both lower in the experimental results. Both values are lower than
20%, which allows us to accept the computational simulation results as
relatively accurate.
Regarding EHa, the average difference between the computational simulations
and experimental results if 8.6% for VE1 and 7.2% for VE2, both lower for the
Chapter 5 Road Pavement Energy Harvesting: a New Electromechanical Device
to Convert Vehicles Mechanical Energy into Electrical Energy
192
experimental results, but under 10%, which allows us to consider the
computational simulation results as very accurate.
For EGe, the differences between the computational simulations and the
experimental results were much higher, 33.6% for VE1 and 44.5% for VE2,
representing very high differences that mean the computational simulations
cannot be considered to be accurate. These differences can be justified by the
changes made to the mechanical system to transform it into a prototype, by
adding an additional CTS system, a RAP connection between both CTS systems,
the inclusion of a generator shaft apart from the pinion shaft and a pulley-belt
mechanical connection between these two shafts. All these connections added
inertia and friction to the mechanical system, which justifies the lower values of
electrical energy generation, which is dependent on the generator shaft rotation.
These differences are higher for lower speeds, as the delivered forces are lower,
leading to lower rotating speeds in the generator shaft and lower energy
generation values.
Consequently, the conversion efficiency was also lower in the experimental
results when compared to the computational simulations, with average
differences of 27.8% and 39.8% for VE1 and VE2, respectively.
However, when considering the total amount of EGe for the best case scenarios, which
were achieved experimentally for the 50 km/h vehicle speed and for a purely resistive
electric load, it is possible to conclude that the system presented an average conversion
efficiency of 52.6% for these scenarios, with a maximum of 60.5% for VE2 and S3. This
means that the system has presented a higher energy conversion efficiency than all the
systems described in the literature and presented in Chapter 2 - Table 2.3, as the
maximum efficiency experimentally validated was of 50.0%, a system developed by
Waydip, denominated Waynergy Vehicles (Duarte et al., 2016). This system has an
energy generation of 92.0 J for a 2,000 kg vehicle at 50 km/h, using a surface 0.8 m
wide.

Chapter 5 Road Pavement Energy Harvesting: a New Electromechanical Device
to Convert Vehicles Mechanical Energy into Electrical Energy
193
Table 5.17- Difference between the simulations and experimental results for tested scenarios using
VE1.
SP EL vini
(km/h) FSM1 EHa EGe ηRPEH
S8
EL1
20 -8,1% -24,3% -56,4% -42,4%
30 -11,5% -5,8% -26,8% -22,3%
40 -20,5% -7,7% -19,0% -12,1%
50 -20,1% -6,9% -6,3% 0,7%
EL2
20 -7,0% -4,6% -24,9% -21,2%
30 -20,8% -16,4% -24,7% -10,0%
40 -20,7% -12,0% -32,8% -23,6%
50 -28,4% -2,2% -4,8% -2,7%
S5
EL1
20 -4,8% 3,1% -38,8% -40,6%
30 -6,3% -13,8% -31,8% -20,9%
40 -13,0% -9,1% -20,0% -12,0%
50 -14,6% -6,1% -6,4% -0,4%
EL2
20 -32,3% -17,5% -51,2% -40,8%
30 -12,6% -13,8% -54,0% -46,6%
40 -1,6% 2,0% -54,2% -55,1%
50 -16,7% -1,0% -18,4% -17,5%
S6
EL1
20 -27,8% -23,8% -65,6% -54,8%
30 -35,3% -22,8% -53,4% -39,6%
40 -36,8% -5,3% -18,4% -13,9%
50 -27,3% -6,8% -19,7% -13,9%
EL2
20 -19,3% -14,0% -62,0% -55,8%
30 -26,2% -7,1% -61,9% -59,0%
40 -18,2% 1,2% -45,0% -45,6%
50 -27,5% 7,7% -9,3% -15,8%
Average -19,1% -8,6% -33,6% -27,8%

Chapter 5 Road Pavement Energy Harvesting: a New Electromechanical Device
to Convert Vehicles Mechanical Energy into Electrical Energy
194
Table 5.18- Difference between the simulations and experimental results for tested scenarios using
VE2.
SP EL vini
(km/h) FSM1 EHa EGe ηRPEH
S8
EL1
20 -20,1% -14,5% -40,2% -30,1%
30 -4,3% -3,9% -51,4% -49,4%
40 -30,4% -31,5% -63,1% -46,1%
50 -28,5% -22,8% -18,9% 5,2%
EL2
20 -5,9% 6,3% -43,0% -46,4%
30 -12,0% -6,8% -56,4% -53,3%
40 -26,7% -24,1% -47,3% -30,5%
50 -27,1% -15,2% -17,8% -3,1%
S5
EL1
20 -2,2% 7,8% -52,0% -55,4%
30 -8,5% -3,4% -52,9% -51,2%
40 -15,6% 0,1% -36,0% -36,0%
50 -18,1% 3,5% -10,2% -13,3%
EL2
20 -13,4% -18,6% -63,2% -54,8%
30 -7,3% -7,0% -55,0% -51,5%
40 -6,9% 3,9% -54,9% -56,6%
50 -19,8% 1,9% -15,8% -17,4%
S6
EL1
20 -25,2% -20,1% -63,3% -54,1%
30 -14,2% -9,2% -53,3% -48,5%
40 -20,2% -22,4% -52,0% -38,1%
50 -20,8% -0,4% 11,1% 11,6%
EL2
20 -7,3% 9,1% -64,9% -67,8%
30 -0,6% -6,6% -65,8% -63,4%
40 -19,9% -12,5% -69,2% -64,8%
50 -22,6% 14,0% -32,3% -40,7%
Average -15,7% -7,2% -44,5% -39,8%
Since the surface of the proposed system is only 0.275 m wide, it means that for the
same area of Waynergy Vehicles system, three systems could be used, generating 217.2
J, a value more than twice as high. So, relating the energy generation to the area, under
the same conditions, the proposed system is more efficient and generates more electrical
energy.
Chapter 5 Road Pavement Energy Harvesting: a New Electromechanical Device
to Convert Vehicles Mechanical Energy into Electrical Energy
195
5.6 Summary and Conclusions
Some technologies have been developed in recent years to convert vehicles’ mechanical
energy into electrical energy, mostly using mechanical systems to transmit the
mechanical energy received by the equipment’s surface to an electrical generator, which
convert the mechanical energy into electrical energy. The electromechanical systems
developed so far use mainly the RAP system and the lever system to perform the energy
transmission, with an IW connected to the electrical generator shaft to deliver and store
the mechanical energy. However, few studies present these systems modelling and
calculating their efficiencies.
A new mechanical system to transmit and deliver the mechanical energy received by the
RPEH surface to an electrical generator was developed in this research work. The
physical models of the system were defined, as well as the physical models of the two
mostly commonly used mechanical systems, as previously defined. The developed
system, defined as a CTS system, aims to increase the force applied by the vehicle in
the RPEH device surface, maximizing the energy delivered by the mechanical system to
the electrical generator.
Based on the software tool presented in Chapter 3, an upgraded version was developed,
in which the physical models of the three electromechanical systems presented in this
Chapter were added. With this upgraded tool, some computational simulations were
performed, to obtain the values of the energy harvested, transmitted, delivered,
converted and consumed by the RPEH device.
From the analysis of the computational simulations results it can be concluded that the
new mechanical system proposed, under the same conditions as the other two systems,
presents a two times greater efficiency than the RAP and four times greater efficiency
than the lever system for the same simulation scenario. Its main advantage is an increase
in the transmitted force, leading to a higher mechanical energy transmission, meaning
there is a greater acceleration of the pinion and, consequently, of the IW and the

Chapter 5 Road Pavement Energy Harvesting: a New Electromechanical Device
to Convert Vehicles Mechanical Energy into Electrical Energy
196
generator shaft, leading to a higher rotation speed and a higher amount of energy
transmission, delivery and conversion.
The experimental results obtained with a prototype based on the proposed system
allowed most of the computational simulations results to be validated, with the
exception of the electrical energy generated. The differences were understood and
justified due to several parts added to the mechanical system so that it could become
operational in a prototype. These changes added inertia and friction to the system,
leading to lower energy generation values and lower energy conversion efficiencies,
especially for lower vehicle speeds, where the forces were lower.
When comparing the experimental results with other RPEH devices, the achieved
results can be considered positive, since these are better than all the existing systems,
both in terms of conversion efficiency and electrical energy generated per area, with an
average conversion efficiency of 52.6% for a vehicle speed of 50 km/h and a resistive
electric load, and a maximum efficiency of 60.5% for VE2 and a S profile surface, and a
maximum energy generation of 72.4 J for the same scenario, using an area of 0.33 m2.
The presented values are all for half a vehicle, meaning that the total amount of energy
extracted from a vehicle, if two prototypes are used side-by-side, is twice the presented
values. Also, the prototype surface has a total width of 0.275 m, meaning than multiple
devices can be implemented consecutively in the pavement, maximizing the energy
extraction in a small amount of space, which is another important goal of the project.
5.7 References
Chapman, S. (2004). Electric Machines Fundamentals, Fourth Edition. McGraw-Hill,
New York, NY, USA.
Duarte, F., Champalimaud, J. and Ferreira, A. (2016). Waynergy Vehicles: an
innovative pavement energy harvest system. Proceedings of the Institution of Civil
Engineers – Municipal Engineer, 169(1): 13-18.

Chapter 5 Road Pavement Energy Harvesting: a New Electromechanical Device
to Convert Vehicles Mechanical Energy into Electrical Energy
197
Farnell (2017). IPL Linear Position Sensor data sheet.
http://www.farnell.com/datasheets/1833199.pdf. Accessed in January, 2017.
ISO (1997). Mechanical vibration and shock - Evaluation of human response to whole-
body vibration. Part I: General requirements. ISO 2631-1, Geneva, Switzerland.
Lyshevski, S. (2008). Electromechanical Systems and devices. CRC Press Inc, Boca
Raton, FL, USA.
Murthy, K. (2008). Computer-aided design of electrical machines. BS Publications,
Hyderabad, India.
National Instruments (2017). Data logger NI USB-6003 data sheet.
http://www.ni.com/pdf/manuals/374372a.pdf. Accessed in January, 2017.
Pirisi, A., Mussetta, M., Grimaccia, F. and Zich, R. E. (2013). Novel speed-bump
design and optimization for energy harvesting from traffic. IEEE Transactions on
Intelligent Transportation Systems, 14(4): 1983-1991.
Texas Instruments (2017). INA 195 Data sheet. http://www.ti.com/product/INA195.
Accessed in February, 2017.
Todaria, P., Wang, L., Pandey, A., O'Connor, J., McAvoy, D., Harrigan, T. and Zuo, L.
(2015). Design, modeling and test of a novel speed bump energy harvester. In SPIE
Smart Structures and Materials+ Nondestructive Evaluation and Health
Monitoring (pp. 943506-943514). International Society for Optics and Photonics.
Vishay (2017). Load cell data sheet. http://www.vishay.com/docs/12017/1250.pdf.
Accessed in January, 2017.


199
Chapter 6
Road Pavement Energy Harvesting: a
New Hydraulic Device to Convert
Vehicles Mechanical Energy into
Electrical Energy
6.1 Introduction
A state-of-the-art study with the technologies used to convert vehicle mechanical energy
into electrical energy was presented in Chapter 2. In these technologies, typical systems
have the following components: a surface that receives energy from vehicle tyres and
delivers energy to a transmission system; a system that transmits energy from the
surface to an electrical generation unit; and an electrical unit that converts the
mechanical energy into electrical energy, delivering it to an electrical application.
Piezoelectric systems are the simplest, as usually they receive the mechanical energy
directly from the surface and convert it into electricity. However, these work on a micro
energy harvesting scale and have a very small energy conversion efficiency and output.
Chapter 6 Road Pavement Energy Harvesting: a New Hydraulic Device to
Convert Vehicles Mechanical Energy into Electrical Energy
200
Electromechanical systems transmit the energy received from the surface to
electromagnetic generators, adapting the surface motion, which can be linear or
rotational, into a similar or different motion, depending on the generator characteristics.
These systems can work both on a micro or macro scale, having higher conversion
efficiencies and energy outputs than piezoelectric systems, and are the most developed
group of technologies in this field.
Hydraulic and pneumatic systems use the same principle as electromechanical systems,
transmitting the energy received from the surface to electromagnetic generators.
Typically, these systems work on a macro scale, allowing larger amounts of energy to
be transferred. However, only a very small number of systems have been developed
with this principle and none of them have presented viability, mainly due to the high
costs of development and implementation.
In Chapter 5 a new electromechanical system was proposed, which revealed higher
efficiency than all existing systems described in the literature. However,
electromechanical systems have one limitation - for each EH unit, an energy conversion
system is typically used. Beside other issues, to connect multiple EH units to a single
energy conversion unit more mechanical elements and connections are needed, leading
to a decrease in the system efficiency. To reduce the number of energy conversion units
for multiple EH modules, an hydraulic RPEH device may present higher performance.
Considering this situation, different road pavement energy harvesting devices using
hydraulic systems will be studied in this Chapter, and the most common system will be
modelled and simulated, in order to study and come to conclusions about its theoretical
efficiency. Also, a new hydraulic system with a mechanical actuation will be proposed,
to transmit the energy received by the RPEH device surface (RPEH DS) into an
electromagnetic generator, which will also be modelled and simulated, in order to come
to a conclusion about its efficiency. The evaluation of each system is based on the
developed systematic model and on the computations performed using the software tool
presented in Chapters 3 and 5, upgraded with the hydraulic system’s models.

Chapter 6 Road Pavement Energy Harvesting: a New Hydraulic Device to
Convert Vehicles Mechanical Energy into Electrical Energy
201
6.2 RPEH Hydraulic System Development
6.2.1 Introduction
To transfer the energy received on the RPEH surface to an electric generator, different
systems can be used. From the study presented in Chapter 2, it can be concluded that
some of the existing RPEH devices have a hydraulic system to transmit the energy
received on the equipment’s surface into an electromagnetic rotational generator.
In this section, the hydraulic system most commonly used in RPEH devices will
initially be analyzed and modelled. Then, a new hydraulic system with a mechanical
actuation is presented and modelled as well. The electrical system used in this work is
the same as the system presented in Chapter 5 and the same models are used. Finally,
the equations that quantify the transmitted and delivered energy, as well as the
efficiency of each process, will be defined.
6.2.2 Existing systems
Some companies and individual inventors have registered patents in which they use
hydraulic mechanisms to harvest energy released from vehicles to the road pavement
and convert it into electrical energy. These systems are designed to be implemented on
roads, with the main systems presented in Chapter 2 (Angel and Gomez, 1997; Nakatsu,
1994; Galich, 2002; Kenney, 2004; Valon, 2007; Horianopoulos and Horianopoulos,
2007; Hendrickson, 2010a; Hendrickson, 2010b; Chang and Lee, 2011; Houghton,
2011).
Apart from the published patents, no technical studies are being published with
experimental tests and results using these RPEH devices. From the analysis of the
patents, the common working principle of these devices can be understood: the RPEH
device surface, actuated by the vehicle wheels, actuates a hydraulic circuit underneath it
by directly pressing a tube or a valve, which is connected to a hydraulic cylinder. This
cylinder, typically a double acting cylinder (DAC), actuates a rack and pinion (RAP)

Chapter 6 Road Pavement Energy Harvesting: a New Hydraulic Device to
Convert Vehicles Mechanical Energy into Electrical Energy
202
mechanical system in order to induce a rotational motion on a shaft, which is connected
to an electrical generator.
Figure 6.1 presents a typical hydraulic system with a DAC connected to a RAP system.
The surface of the RPEH device (RPEH DS) compresses a hydraulic fluid inside a
hydraulic tube (TUB), through a contact area between both, and the fluid moves inside
the DAC. If the fluid pressure is higher than the acceptable pressure, a pressure relief
valve (PRV) directs the fluid back to the hydraulic reservoir (RES); if not, the fluid goes
into the DAC, controlled by a hydraulic control valve (CV). The fluid exerts force onto
the DAC piston, creating an oppositional force from the fluid between the DAC piston
opposite side and the RES. The DAC piston is connected, by a rod, to an external RAP
mechanical system which converts its linear motion into a rotational motion. The RAP
system is connected to an inertia wheel (IW) which, in turn, is directly connected to an
electrical generator. A spring is used under the RPEH DS to return it to its original
position after the vehicle wheel leaves the contact.
Figure 6.1- Hydraulic system with a DAC connected to a RAP mechanical system.
Table 6.1 presents the force diagrams for the different motion scenarios, both for the
RPEH DS and the hydraulic installation directly connected to it and for the DAC piston
of the hydraulic circuit, which is directly connected to the RAP system. The surface can
have two motion scenarios, by moving downwards or upwards, while the DAC piston
can have two different motion scenarios, by moving forwards or backwards. The
indexes SH are related to the hydraulic circuit forces, while indexes SHs are related to

Chapter 6 Road Pavement Energy Harvesting: a New Hydraulic Device to
Convert Vehicles Mechanical Energy into Electrical Energy
203
the hydraulic circuit reaction forces. The same happens for the forces in the mechanical
system, using SM and SMs.
Table 6.1- Force diagrams for the RPEH DS, hydraulic circuit and DAC piston.
Downward motion Upward motion
RPEH DS
Hydraulic circuit
Forward motion Backward motion
DAC piston
The working principles of hydraulic circuits and their components, as well as the main
equations to model these systems are well understood and described in the literature
(Rabie, 2009; Parr, 2011; and Durfee et al., 2015).
Tables 6.2 and 6.3 summarize all the equations that define the RPEH hydraulic device.
Table 6.2 defines the equations for the surface motion when it moves downwards,
upwards, or when it is stopped, with a dynamic and forces analysis. Table 6.3 defines
the equations for the DAC piston, the RAP system, and the IW, which is connected to
an electrical generator, with a kinematic, dynamic, and forces analysis.

Chapter 6 Road Pavement Energy Harvesting: a New Hydraulic Device to
Convert Vehicles Mechanical Energy into Electrical Energy
204
Table 6.2- RPEH DS physical modelling.
Analysis Surface motion
Downward Stopped Upward
Dynamic
0
Forces
Table 6.3- RPEH hydraulic circuit with a DAC connected to a RAP system physical modelling.
Analysis DAC piston motion
Forward Stopped Backward
Kinematic
Dynamic
0
Forces
0

Chapter 6 Road Pavement Energy Harvesting: a New Hydraulic Device to
Convert Vehicles Mechanical Energy into Electrical Energy
205
In terms of the RPEH DS working principles, when the vehicle wheel force is higher
than the spring force and the reacting force of the hydraulic circuit, the surface moves
downwards, but when the vehicle wheel force is lower, it starts to decelerate, until
motion is stopped. The motion of the surface is also stopped when the maximum
allowable displacement is reached, with a mechanical limitation used to define the limit
of the motion. When no vehicle load is applied on the surface and this is below its initial
position, it will move upwards, through the spring force.
In terms of the hydraulic circuit, when it receives a force from the RPEH DS, it will
increase or decrease such force depending on the relationship between the surface
contact area (Ah) and the DAC piston contact area (Acp), as presented in Table 6.3. The
force delivered to the DAC piston is reduced by the hydraulic losses (Fhl), determined in
relation to the pressure losses in the hydraulic circuit, which are determined through
Equation (6.1), including both localized and head losses, considering laminar flow
(Douglas et al., 2005; Husain et al., 2008).
(6.1)
Then, this force induces a displacement in the DAC piston in relation to the force
balance between the force induced by the hydraulic circuit (FSH2) and the opposition
forces from the RAP mechanical system (FSMs) and from a secondary hydraulic circuit
between the DAC piston and the RES. A hydraulic CV controls the direction of the
cylinder piston motion, allowing its direction to be inverted when it reaches its
maximum displacement, by switching the fluid entrance and exit ports.
When the DAC piston moves forwards, it induces a motion with the same displacement
on the rack, actuating a pinion and, by way of a shaft, actuating an IW directly
connected to an electric generator. When the cylinder piston motion is stopped, the RAP
motion is also stopped, but as a clutch bearing is used, the IW and the generator
continue their motion while decelerating. When the DAC piston is moving backwards,
for a standard RAP system with a clutch bearing, the rack will actuate the pinion in the

Chapter 6 Road Pavement Energy Harvesting: a New Hydraulic Device to
Convert Vehicles Mechanical Energy into Electrical Energy
206
opposite direction, and this will not actuate the IW or, consequently, the electric
generator.
6.2.3 New hydraulic system with mechanical actuation
In the hydraulic system previously presented, the force is directly transferred from the
RPEH DS to the hydraulic fluid through a contact area, with the displacement of this
interface being equal to the surface displacement. Analyzing the physical modulation of
the system, it can be seen that the DAC piston motion is mostly determined by the
hydraulic force exerted on it and the RAP motion is directly proportional to the DAC
piston motion.
To maximize the force delivered to the hydraulic circuit, a new approach is proposed:
the introduction of a mechanical system between the RPEH DS and the hydraulic circuit
that multiplies the force received from the RPEH DS. The mechanical system is based
in the crank to slider system presented in Chapter 5, and consists of a crank connected
from the surface to a slider, converting the vertical motion of the surface into a
longitudinal motion of the slider, decreasing the displacement and increasing the force
from the surface to the slider. The slider is then connected to a single acting cylinder
(SAC), through a piston with a specific area (Acp). This compresses a fluid, which in
turn is connected through a hydraulic circuit to a DAC. Then, a double acting RAP
system is applied, which has two racks and two pinions moving in opposite directions,
connected to the same shaft through clutch bearings, allowing the shaft rotation to keep
going in the same direction and, consequently, delivering torque to the IW
independently of the direction of the DAC piston motion. The complete system is
presented in Figure 6.2.
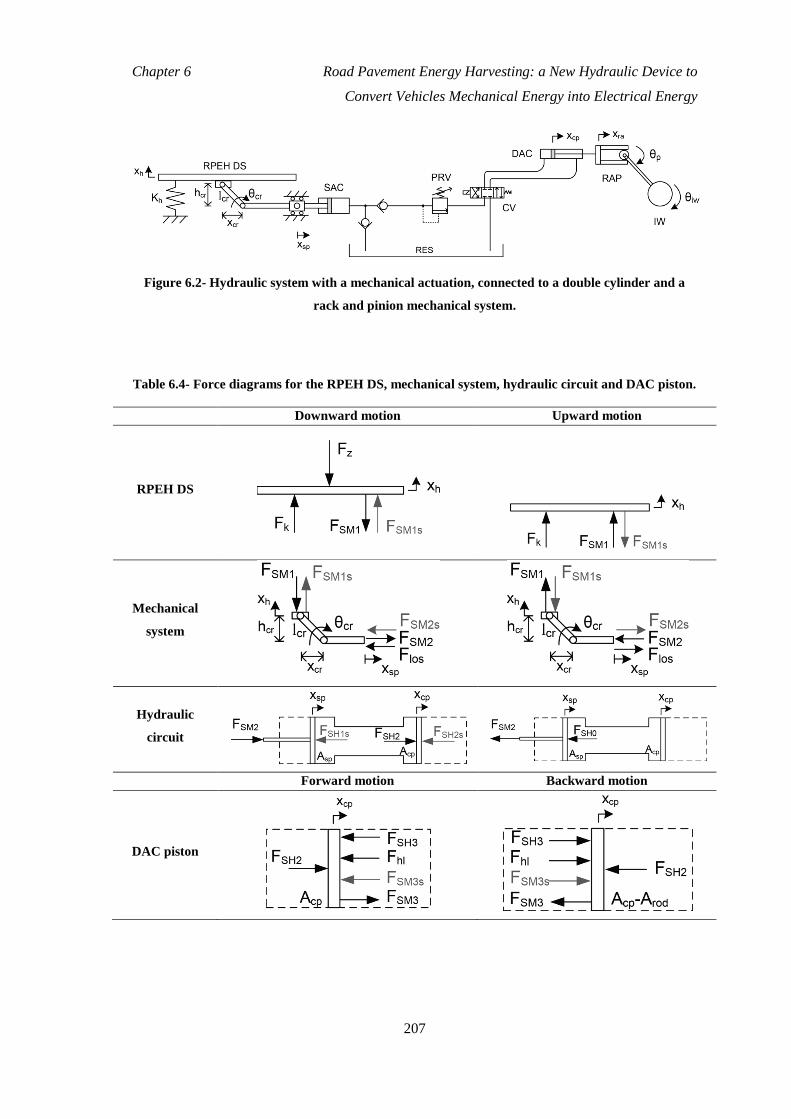
Chapter 6 Road Pavement Energy Harvesting: a New Hydraulic Device to
Convert Vehicles Mechanical Energy into Electrical Energy
207
Figure 6.2- Hydraulic system with a mechanical actuation, connected to a double cylinder and a
rack and pinion mechanical system.
Table 6.4- Force diagrams for the RPEH DS, mechanical system, hydraulic circuit and DAC piston.
Downward motion Upward motion
RPEH DS
Mechanical
system
Hydraulic
circuit
Forward motion Backward motion
DAC piston

Chapter 6 Road Pavement Energy Harvesting: a New Hydraulic Device to
Convert Vehicles Mechanical Energy into Electrical Energy
208
Table 6.4 presents the force diagrams for the different motion scenarios, both for the
RPEH DS, the mechanical system, and the hydraulic installation connected to it and for
the DAC piston of the hydraulic circuit, which is directly connected to the double acting
RAP system. The surface can have two motion scenarios, by moving downwards or
upwards, while the DAC piston can have two different motion scenarios, by moving
forwards or backwards.
Tables 6.5 and 6.6 summarize all the equations that define the RPEH hydraulic device
with a mechanical actuation in terms of kinematic, dynamic, and forces analysis. Table
6.5 defines the equations for the RPEH DS motion when it moves downwards, upwards,
or when it is stopped, as well as for the mechanical system directly connected to it.
Table 6.6 defines the equations for the DAC piston, the RAP system, and the IW, which
is connected to an electrical generator.
Table 6.5- RPEH DS and mechanical system physical modelling.
Analysis Surface motion
Downward Stopped Upward
Kinematic
-
Dynamic
0
Forces
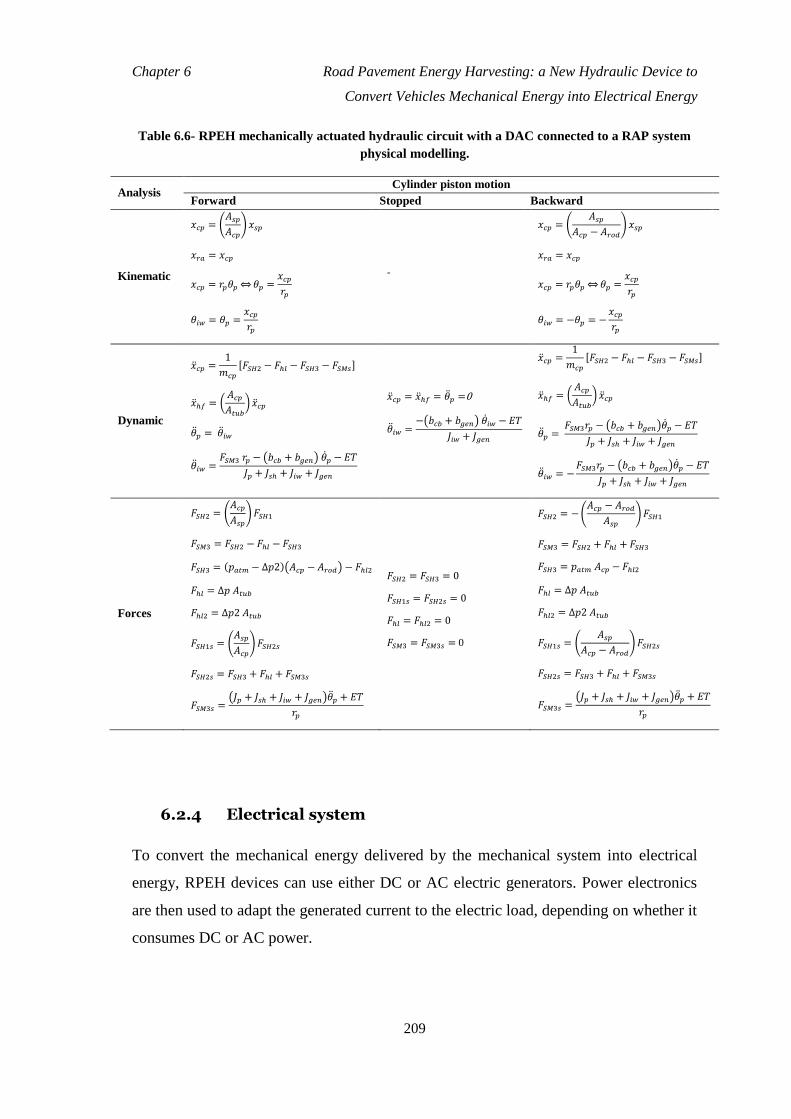
Chapter 6 Road Pavement Energy Harvesting: a New Hydraulic Device to
Convert Vehicles Mechanical Energy into Electrical Energy
209
Table 6.6- RPEH mechanically actuated hydraulic circuit with a DAC connected to a RAP system
physical modelling.
Analysis Cylinder piston motion
Forward Stopped Backward
Kinematic
-
Dynamic
0
Forces
0
6.2.4 Electrical system
To convert the mechanical energy delivered by the mechanical system into electrical
energy, RPEH devices can use either DC or AC electric generators. Power electronics
are then used to adapt the generated current to the electric load, depending on whether it
consumes DC or AC power.

Chapter 6 Road Pavement Energy Harvesting: a New Hydraulic Device to
Convert Vehicles Mechanical Energy into Electrical Energy
210
To simplify the physical modelling of the system and the computational simulations for
the RPEH device under development, a DC generator connected to a DC load is used, as
previously defined in Chapter 5. The considered circuit was presented in Figure 5.7, and
the equations that fully characterize the electrical system are defined by Equations (5.6-
5.10).
6.2.5 Energetic analysis
The energy lost by the vehicle during the interaction with the RPEH DS was already
defined by Equation (3.18), while the energy harvested by the RPEH DS was also
defined by Equation (3.21).
The energy transmitted to the cylinder piston is determined using Equation (6.2),
relating the force applied in the piston to its displacement.
(6.2)
The energy delivered by the IW to the electric generator was already defined by
Equation (5.3). The equations used to perform the energetic analysis of the electrical
system were presented in Chapter 5, through Equations (5.11-5.14).
To evaluate the efficiency of the different components of the system, Equations (4.19),
(5.4-5.5) and (5.15-5.16) can be used. The total efficiency of the system, from the
vehicle lost energy to the electrical energy consumed by the electric load is defined by
Equation (5.17). To determine the total efficiency of the mechanical and hydraulic
systems, Equation (5.18) should be applied, relating the energy received by the
mechanical-hydraulic system to the energy delivered to the electrical circuit. To
determine the total efficiency of the electrical system, Equation (5.19) should be
applied, and to determine the total efficiency of the RPEH internal device, Equation
(5.20) should be applied, relating the energy received by the mechanical-hydraulic
system to the energy consumed by the electric load.

Chapter 6 Road Pavement Energy Harvesting: a New Hydraulic Device to
Convert Vehicles Mechanical Energy into Electrical Energy
211
6.3 Technical Analysis
6.3.1 Introduction
Based on the software tools presented in Chapters 3 and 5, the equations of the RPEH
devices presented in the previous section were incorporated for the different hydraulic
and mechanical-hydraulic systems.
The purpose of the simulation software is to study the complete interaction of all
elements in great detail, with the possibility of fully characterizing the vehicle under
study, the RPEH device surface, as well as the hydraulic, mechanical and electrical
properties of the RPEH device, depending on the system selected.
The software tool calculates all the forces and displacements for both the vehicle
components and the RPEH device surface, as well as for the hydraulic, mechanical, and
electrical system components. After that, it calculates the different energies transferred
from each part of the system to the others and the efficiency of each energy transfer
process.
The simulations performed with the software tool for the two hydraulic systems
presented in the previous section will be presented in this section, using the same RPEH
equipment surface profile, geometry and displacement, the same vehicle, and the same
electric generator and load. The goal is to evaluate the different hydraulic systems and
to draw conclusions about each system’s efficiency in transmitting and delivering
mechanical energy.
One RPEH device connected to one hydraulic or mechanical system is considered,
which, in turn, is connected to one electrical system, as the surface is actuated by one
side of the vehicle. So, the value presented for the energy lost by the vehicle is in
relation to half the vehicle, as only one front and one rear wheel actuates the RPEH
device surface.
The parameters defined for the vehicle, the RPEH device surface, and the hydraulic,
mechanical, and electrical systems, common in the simulations of both systems, are
presented in Table 6.7.

Chapter 6 Road Pavement Energy Harvesting: a New Hydraulic Device to
Convert Vehicles Mechanical Energy into Electrical Energy
212
Table 6.7- Input data for the computational simulations of the hydraulic systems.
Variable name Value Unit V
ehic
le &
mo
tio
n
Vehicle class Light -
Vehicle weight 1,500 (kg)
Number of axles P1 | wheels per axle 2 | 2 -
Sprung-Unsprung % 90%-10% -
Drag coefficient 0.32 -
Inertia moment 1,100 (kg.m2)
Lift coefficients (Front | Rear) 0.19 | 0.13 -
Motion | Direction Free rolling | Forward -
Vehicle speed | acceleration 40 | 0 (km/h) | (m/s2)
Su
spen
sio
n &
wh
eel
Suspension type (Front | Rear) Independent | Independent -
Suspension stiffness (Front | Rear) 20,000 | 15,000 (N/m)
Suspension damping (Front | Rear) 1,500 | 1,700 (Ns/m)
Tyre type (Front | Rear) Radial | Radial -
Tyre stiffness (Front | Rear) 150,000 | 150,000 (N/m)
Tyre pressure (Front | Rear) 200 | 200 (kPa)
Tyre external diameter (Front | Rear) 500 | 500 (mm)
Tyre width (Front | Rear) 200 | 200 (mm)
Tyre tread width (Front | Rear) 180 | 180 (mm)
RP
EH
dev
ice
Surface width 250 (mm)
Surface mass 20 (kg)
Surface max. height | max. displacement 20 | 20 (mm)
Spring stiffness 30,000 (N/m)
Hydraulic fluid Oil SAE 30 -
Hydraulic fluid density | kinematic
viscosity 865 | 105 (kg.m
3) | (cSt)
Hydraulic circuit CV discharge coef. | KH 2.48 | 10.50 - | -
Hydraulic tube length 3 (m)
Hydraulic reservoir pressure 101,325 (Pa)
Hydraulic cylinder stroke 250 (mm)
Pinion mass | radius | friction coefficient 1 | 20 | 0.002 (kg) | (mm) | -
Inertia wheel mass | radius 10 | 30 (kg) | (mm)
Electric generator constant Ka 0.25 -
Electric generator Ra | La 1.1 | 0.0048 (Ω) | (H)
Electric generator friction coefficient |
Inertia 0.0008 | 0.05 - | (kg.m
2)
Electric load Power 50 (W)

Chapter 6 Road Pavement Energy Harvesting: a New Hydraulic Device to
Convert Vehicles Mechanical Energy into Electrical Energy
213
6.3.2 Typical hydraulic system
Considering the input data presented in Table 6.7, simulations for the standard hydraulic
system were performed on two different surface profiles (Ramp and Crest), presented in
Chapter 3. The RAP mechanical system, electric generator, and electric load
characteristics were not changed; one of the goals is to study the impact of the hydraulic
system and its characteristics in the performance of the RPEH device. For the hydraulic
system, different values for the contact area between the surface and the hydraulic
circuit (Ah), which defines the interaction area between the received force and the
hydraulic fluid, were considered. Also, different values for the hydraulic tube area (Atub)
and the hydraulic cylinder area (Acp) were considered. The goal is to evaluate the impact
of these variables in the energy transmitted.
Table 6.8- Simulation results for the energy outputs of the RPEH device components using a
standard hydraulic system.
SP Ah
(mm2)
Atub
(mm2)
Acp
(mm2)
Ev
(J)
EHa
(J)
ETr
(J)
EDe
(J)
EGe
(J)
ELo
(J)
S5
20
2,5
12 257.0 92.0 73.0 9.0 7.2 5.8
25 260.0 92.0 70.0 39.0 33.8 27.3
50 265.0 92.0 65.0 49.5 44.6 36.2
5
12 257.0 92.0 67.0 5.0 4.0 3.2
25 257.0 96.0 71.0 27.0 22.9 18.4
50 262.0 92.0 65.0 46.5 41.8 33.8
40
2.5
12 256.0 97.0 59.0 5.5 4.4 3.4
25 254.0 97.0 67.0 16.0 13.4 10.8
50 256.0 96.0 64.0 28.0 23.7 19.0
5
12 245.0 100.0 60.0 6.0 4.8 3.8
25 254.0 96.0 60.0 8.0 6.6 5.3
50 255.0 97.0 63.0 16.0 13.4 10.8
S8 20
2.5
12 183.0 102.0 77.0 9.0 7.2 5.8
25 178.0 97.0 71.0 41.0 35.4 28.6
50 176.0 93.0 67.0 49.0 44.1 35.8
5
12 186.0 105.0 77.0 4.0 3.2 2.5
25 180.0 100.0 72.0 26.0 22.0 17.7
50 175.0 105.0 90.0 32.0 27.2 21.8

Chapter 6 Road Pavement Energy Harvesting: a New Hydraulic Device to
Convert Vehicles Mechanical Energy into Electrical Energy
214
To evaluate the system’s performance, the vehicle released energy (Ev), RPEH surface
harvested energy (EHa), mechanical system transmitted energy (ETr), mechanical system
delivered energy (EDe), electrical system generated energy (EGe), and electrical system
consumed energy (ELo) were calculated. Also, the efficiencies of the energy transferred
between each part of the system were evaluated.
Table 6.8 presents the simulation results for the energy output of each component of the
RPEH device using the standard hydraulic system, considering the input data presented
in Table 6.7. Table 6.9 presents the simulation results for the efficiency of each
component of the system, as well as the total efficiency of the device.
Table 6.9- Simulation results for the efficiencies of the RPEH device components using a standard
hydraulic system.
SP Ah
(mm2)
Atub
(mm2)
Acp
(mm2)
ηHa
(%)
ηTr
(%)
ηDe
(%)
ηGe
(%)
ηCo
(%)
ηMec
(%)
ηEle
(%)
ηRPEH
(%)
ηTOT
(%)
S5
20
2,5
12 35.8 79.3 12.3 80.1 79.9 9.8 64.0 6.3 2.2
25 35.4 76.1 55.7 86.6 80.8 42.4 70.0 29.7 10.5
50 34.7 70.7 76.2 90.1 81.1 53.8 73.1 39.3 13.6
5
12 35.8 72.8 7.5 79.8 79.7 5.4 63.6 3.5 1.2
25 37.4 74.0 38.0 84.7 80.3 28.1 68.0 19.1 7.1
50 35.1 70.7 71.5 89.9 80.8 50.5 72.6 36.7 12.9
40
2.5
12 37.9 60.8 9.3 79.5 78.9 5.7 62.7 3.6 1.3
25 38.2 69.1 23.9 83.9 80.5 16.5 67.5 11.1 4.3
50 37.5 66.7 43.8 84.7 80.3 29.2 68.0 19.8 7.4
5
12 40.8 60.0 10.0 79.5 78.9 6.0 62.7 3.8 1.5
25 37.8 62.5 13.3 82.9 79.9 8.3 66.2 5.5 2.1
50 38.0 64.9 25.4 83.9 80.5 16.5 67.5 11.1 4.2
S8 20
2.5
12 55.7 75.5 11.7 80.1 79.9 8.8 64.0 5.6 3.1
25 54.5 73.2 57.7 86.4 80.7 42.3 69.7 29.5 16.1
50 52.8 72.0 73.1 90.1 81.1 52.7 73.1 38.5 20.3
5
12 56.5 73.3 5.2 79.6 79.5 3.8 63.3 2.4 1.4
25 55.6 72.0 36.1 84.7 80.3 26.0 68.0 17.7 9.8
50 60.0 85.7 35.6 84.9 80.4 30.5 68.3 20.8 12.5

Chapter 6 Road Pavement Energy Harvesting: a New Hydraulic Device to
Convert Vehicles Mechanical Energy into Electrical Energy
215
6.3.3 Hydraulic system with mechanical actuation
Considering the same conditions as for the standard hydraulic system, simulations for
the hydraulic system with mechanical actuation were also performed and the main
results are presented in Tables 6.10 and 6.11 for the energy output and the efficiency of
each component of the system, respectively. The same variables were changed between
simulations in order to make a direct comparison between both systems. The
mechanical system parameters defined for the simulations are as follows: crank length
(lcr) equal to 0.04m and crank initial height between the two axes (hcr-in) equal to 0.03
m.
Table 6.10- Simulation results for the energy outputs of the RPEH device components using a
hydraulic system with mechanical actuation.
SP Asp
(mm2)
Atub
(mm2)
Acp
(mm2)
Ev
(J)
EHa
(J)
ETr
(J)
EDe
(J)
EGe
(J)
ELo
(J)
S5
20
2,5
12 261.0 91.0 81.0 63.0 57.0 46.3
25 267.0 85.0 75.0 69.5 63.1 51.5
50 271.0 81.0 72.0 71.3 64.8 53.0
5
12 261.0 91.0 82.0 63.0 57.0 46.3
25 268.0 85.0 76.0 70.0 63.6 51.9
50 271.0 80.0 72.0 71.3 64.8 53.0
40
2.5
12 259.0 92.0 83.0 28.0 23.7 19.0
25 263.0 88.0 79.0 59.5 53.7 43.6
50 270.0 81.0 73.0 66.0 60.1 49.2
5
12 259.0 92.0 83.0 28.0 23.7 19.0
25 264.0 88.0 79.0 59.5 53.7 43.6
50 268.0 83.0 74.0 66.5 60.6 49.6
S8 20
2.5
12 200.0 94.0 83.0 72.0 65.6 53.7
25 192.0 95.0 84.5 78.0 71.2 58.3
50 184.0 101.0 94.5 93.5 85.6 70.2
5
12 192.0 86.0 77.0 75.0 68.4 56.0
25 188.0 87.0 80.0 78.0 71.4 58.5
50 181.0 89.0 88.0 87.5 79.9 65.4

Chapter 6 Road Pavement Energy Harvesting: a New Hydraulic Device to
Convert Vehicles Mechanical Energy into Electrical Energy
216
Table 6.11- Simulation results for the efficiencies of the RPEH device components using a hydraulic
system with mechanical actuation.
SP Asp
(mm2)
Atub
(mm2)
Acp
(mm2)
ηHa
(%)
ηTr
(%)
ηDe
(%)
ηGe
(%)
ηCo
(%)
ηMec
(%)
ηEle
(%)
ηRPEH
(%)
ηTOT
(%)
S5
20
2,5
12 34.9 89.0 77.8 90.4 81.3 69.2 73.5 50.9 17.7
25 31.8 88.2 92.7 90.8 81.6 81.8 74.1 60.6 19.3
50 29.9 88.9 99.0 91.0 81.7 88.0 74.3 65.4 19.5
5
12 34.9 90.1 76.8 90.4 81.3 69.2 73.5 50.9 17.7
25 31.7 89.4 92.1 90.9 81.6 82.4 74.2 61.1 19.4
50 29.5 90.0 99.0 91.0 81.7 89.1 74.3 66.2 19.5
40
2.5
12 35.5 90.2 33.7 84.7 80.3 30.4 68.0 20.7 7.4
25 33.5 89.8 75.3 90.3 81.2 67.6 73.3 49.6 16.6
50 30.0 90.1 90.4 91.1 81.8 81.5 74.5 60.7 18.2
5
12 35.5 90.2 33.7 84.7 80.3 30.4 68.0 20.7 7.4
25 33.3 89.8 75.3 90.3 81.2 67.6 73.3 49.6 16.5
50 31.0 89.2 89.9 91.1 81.8 80.1 74.5 59.7 18.5
S8 20
2.5
12 47.0 88.3 86.7 91.1 81.8 76.6 74.5 57.1 26.8
25 49.5 88.9 92.3 91.3 81.9 82.1 74.8 61.4 30.4
50 54.9 93.6 98.9 91.5 82.0 92.6 75.0 69.5 38.1
5
12 44.8 89.5 97.4 91.2 81.8 87.2 74.6 65.1 29.1
25 46.3 92.0 97.5 91.5 82.0 89.7 75.0 67.3 31.1
50 49.2 98.9 99.4 91.3 81.9 98.3 74.8 73.5 36.1
6.3.4 Results analysis
Analyzing the results obtained with the computational simulations of the RPEH device,
for both the standard hydraulic system with a double acting cylinder directly actuated by
the RPEH device surface and the same hydraulic system actuated by a mechanical
system connected to the equipment’s surface, some conclusions may be drawn.
Globally, the RPEH surface harvested energy efficiency depends on the surface profile,
varying significantly for each studied profile. Using the Crest surface profile, the
surface energy harvesting efficiency can be 60% higher than with the Ramp surface
profile, under the same conditions.

Chapter 6 Road Pavement Energy Harvesting: a New Hydraulic Device to
Convert Vehicles Mechanical Energy into Electrical Energy
217
For the standard hydraulic system, the average energy transmission efficiency is around
71%, which is a high value, but the average energy delivery efficiency is around 33%,
which is a low value. For the hydraulic system with mechanical actuation, the average
energy transmission efficiency is around 90% and the average energy delivery
efficiency is around 84%, both of which are very high values, especially when
compared to the standard hydraulic system.
These higher transmission and delivery efficiency values are achieved due to the
inclusion of the mechanical system acting as the hydraulic system, as the force
delivered to the hydraulic circuit increases, allowing the force applied in the cylinder
piston to be maximized and, consequently, to have a higher acceleration of this element
and a higher energy transmitted by it. With a higher force applied in the cylinder piston,
a higher force is transmitted to the rack and pinion system, leading to a higher
acceleration induced in the generator and inertia wheel shaft and to a higher rotational
speed, leading to more mechanical energy being delivered to the electrical generator.
The DC electrical generator efficiency varies in relation to the energy delivered, as it is
associated with its rotational speed. For lower rotational speeds, its efficiency is lower
than 85%, while for higher rotational speeds, it is higher than 90%. The electric energy
consumption efficiency is usually around 80% for the considered electrical load and
using a diode between the electrical generator and the load.
Considering the variables that were changed between simulations, it may be concluded
that:
Increasing the contact area between the RPEH device surface and the hydraulic
circuit, Ah, for standard hydraulic systems, or the SAC area, Acp, for the new
proposed system, leads to a decrease in the energy transmission efficiency (ETr)
due to a decrease in the force transmitted to the DAC piston. So, Ah and Acp
should be as small as possible to maximize the force delivered to the cylinder
piston and, consequently, the energy transmitted.
Increasing the area of the hydraulic circuit tubes (Atub) decreases the efficiency
of the system, as it decreases the fluid velocity and, consequently, the fluid flow

Chapter 6 Road Pavement Energy Harvesting: a New Hydraulic Device to
Convert Vehicles Mechanical Energy into Electrical Energy
218
rate transmitted to the cylinder piston. So, Atub should be as small as possible to
maximize the fluid velocity and, consequently, the energy transmitted to the
DAC piston. However, attention should be paid to the fact that with the increase
in the fluid velocity its losses will also increase.
Increasing the area of the DAC (Acp) leads to an increase in the efficiency of the
system, as the force transmitted by the hydraulic circuit is amplified and the
cylinder piston has a higher acceleration, leading to greater energy transmission
efficiency.
Excluding the energy lost by the vehicle and considering the energy harvested by the
surface as the input of the system, the global efficiency of the RPEH device using a
standard hydraulic system can reach 40% for the considered and simulated values and,
using a similar hydraulic system actuated by the proposed mechanical system, it can
reach 74%, already including the electrical energy losses. This value represents a much
higher energy conversion rate than that of all the RPEH devices presented in the
literature and presented in Chapter 2, and is similar to the maximum efficiency
registered in the computational simulations of the crank to slider electromechanical
system presented in Chapter 5.
In all the performed simulations the vertical acceleration induced by the RPEH device
to the vehicle body was lower than 1 m/s2. Considering the existing levels of
acceptability of the ride quality (ISO, 1997), this indicates that the proposed RPEH
device does not cause discomfort to the vehicle driver and to its occupants.
6.4 Summary and Conclusions
Different technologies have been developed in recent years to convert vehicles’
mechanical energy into electrical energy, in places where vehicles need to release
energy to the pavement to reduce their speed, some of them using hydraulic systems to
transmit the mechanical energy received by the equipment’s surface to an electrical

Chapter 6 Road Pavement Energy Harvesting: a New Hydraulic Device to
Convert Vehicles Mechanical Energy into Electrical Energy
219
generator, which convert the mechanical energy into electrical energy. Most RPEH
devices using hydraulic systems developed so far induce pressure from the equipment’s
surface to the fluid inside a hydraulic tube, transmitting it to a double acting cylinder.
This is controlled by a hydraulic control valve and transmits the mechanical energy to a
mechanical rack and pinion system, connected to an electric generator shaft with an
inertia wheel. The electric generator converts the mechanical energy into electrical
energy, delivering it to an electrical application. However, few studies model and
calculate the efficiency of these systems.
A means of assessing the efficiency of a new hydraulic system with a mechanical
actuation to transmit the mechanical energy received by the RPEH surface to the
hydraulic circuit was developed in this Chapter. The physical models of the system
were defined, as well as the physical models of a standard hydraulic system. The new
system aims to increase the force received by the RPEH device surface and delivered to
the hydraulic circuit, maximizing the energy transmitted by the hydraulic system and
delivered to the electrical generator.
With both hydraulic systems modelled, as well as the rest of the RPEH device, and
using a software previously developed and presented in Chapters 3 and 5, upgraded
with the models developed in this Chapter, some computational simulations were
performed in order to obtain the values of the energy harvested, transmitted, delivered,
converted, and consumed by the RPEH device, as well as the efficiency of each process.
From the analysis of the results, it can be concluded that the proposed new system,
under the same conditions as a standard hydraulic system, presents greater efficiency for
the same simulation scenarios. The new system reaches mechanical energy transmission
and delivery efficiency of more than 95% and global efficiency from the mechanical
energy harvested by the surface to the electrical energy consumed by the electric load of
74%, almost two times higher than the best scenario for a standard hydraulic system.
Its main advantage is in the greater force transmitted from the surface to the hydraulic
circuit, leading to a higher mechanical energy transmission. This particular
characteristic means that higher accelerations can be induced on the cylinder piston and,

Chapter 6 Road Pavement Energy Harvesting: a New Hydraulic Device to
Convert Vehicles Mechanical Energy into Electrical Energy
220
consequently, higher acceleration and rotational speed can be achieved in the inertia
wheel and the generator shaft, leading to higher delivery and conversion efficiency.
The systematic model developed in this Chapter and the computations performed with
this model have allowed to draw important conclusions regarding the most efficient
characteristics for the proposed solution.
The proposed system should be tested experimentally, to validate the results from
computational simulations and allow us to conclude about the technical viability of the
system.
6.5 References
Angel, R. and Gomez, J. (1997). Road vehicle-actuated air compressor. US Patent
US5634774, Jun.
Chang, H. and Lee, C. (2011). On-road energy conversion and vibration absorber
apparatus. US Patent US20110215593 A1, Sep.
Douglas, J., Gasiorek, J., Swaffield, J. and Jack, L. (2005). Fluid Mechanics, Fifth
Edition. Pearson Education Limited, Essex, UK.
Durfee, W., Sun, Z. and Van de Ven, J. (2015). Fluid Power System Dynamics.
University of Minnesota, Minneapolis, MN, USA.
Galich, T. (2002). Force stand for electrical energy producing platform. US Patent
US6376925 B1, Apr.
Hendrickson, B. (2010a). Adaptive, Low-impact vehicle energy harvester. US Patent
US20100192561 A1, Aug.
Hendrickson, B. (2010b). Vehicle energy harvesting roadway. International Patent
Application PCT/US2010/020676, Patent WO2010081113 A1, Jul.

Chapter 6 Road Pavement Energy Harvesting: a New Hydraulic Device to
Convert Vehicles Mechanical Energy into Electrical Energy
221
Horianopoulos, D. and Horianopoulos, S. (2007). Traffic-actuated electrical generator
apparatus. International Patent Application PCT/CA2006/001710, Patent WO
2007045087 A1, Apr.
Houghton, L. (2011). Hydraulic powermat. UK Patent Application GB 2476826 A,
Intellectual Property Office, UK, Jul.
Husain, Z., Abdullah, Z. and Alimuddin, Z. (2008). Basic fluid mechanics and
hydraulic machines. BS Publications, Hyderabad, India.
ISO (1997). Mechanical vibration and shock - Evaluation of human response to whole-
body vibration. Part I: General requirements. ISO 2631-1, Geneva, Switzerland.
Kenney, T. (2004). System and method for electrical power generation utilizing vehicle
traffic on roadways. US Patent US20040130158 A1, Jul.
Nakatsu, S. (1994). Road apparatus. UK Patent Application GB2290115 A, Dec.
Parr, A. (2011). Hydraulics and pneumatics: a technician's and engineer's guide.
Elsevier, Oxford, UK.
Rabie, M. (2009). Fluid power engineering. McGraw-Hill, New York, NY, USA.
Valon, F. (2007). Highway's electrogenerators. US Patent US 20070246940 A1, Oct.

223
Chapter 7
Integration of a Mechanical Energy
Storage System in a Road Pavement
Energy Harvesting Hydraulic Device
7.1 Introduction
In Chapter 2, a state-of-the-art study of the technologies used to convert vehicle
mechanical energy into electrical energy which can be implemented on road pavements
was presented. In these technologies, most part of the systems have the following
components: a surface that receives energy from vehicle tyres and delivers energy to a
transmission system; a system that transmits energy from the surface to an electrical
generation unit; and an electrical unit that converts the mechanical energy into electrical
energy, delivering it to an electrical application. Some systems include electrical energy
storage units, but almost no system includes mechanical energy storage (MES).
Analyzing some published results from RPEH device experimental tests performed in
laboratory environment (Pirisi et al., 2013; Todaria et al., 2015; Duarte et al., 2016a), it
may be concluded that electric generators are actuated only when there is a vehicle
passage, leading to a lower efficiency of these components when compared to their

Chapter 7 Integration of a Mechanical Energy Storage System in a Road
Pavement Energy Harvesting Hydraulic Device
224
optimal performance, as energy is spent to accelerate them, then they convert
mechanical energy into electrical energy with acceptable levels of efficiency but, then,
they slow down again if a vehicle actuates the RPEH device. Electrical generators of
typical RPEH devices work in pulsed mode, decreasing the global efficiency of the
device.
In other renewable energy source studies (Ibrahim et al., 2008; Chen et al., 2009;
Barnes and Levine, 2011; Steinke et al., 2013) the inclusion of MES devices was
evaluated, so that the mechanical energy received by the energy harvesting and energy
transmission elements could be stored and when mechanical energy is delivered to the
electrical generator, this occurs in a continuous mode, instead of the typical intermittent
mode, increasing the global efficiency of the energy conversion device. Storing water in
dams for a continuous discharge over electrical generators is a classic example of this
method (Huggins, 2010; Ter-Gazarian, 2011; Wood and Wollenberg, 2012). A similar
process can be implemented in RPEH devices by storing the mechanical energy
harvested from vehicle wheels and transmitted by a mechanical or a hydraulic system,
delivering it in a continuous mode to the electrical generator of the device, increasing its
efficiency.
Following the development of a RPEH device in Chapter 6, using mechanical and
hydraulic systems, and using the same methodology, the application of mechanical
energy storage devices will be studied, as will their integration both with typical RPEH
devices based on hydraulic systems and the new RPEH device based on a hydraulic
system with mechanical actuation presented in Chapter 6. Four complete systems will
be modelled and simulated, in order to come to a conclusion about the variation of the
device efficiencies.
Chapter 7 Integration of a Mechanical Energy Storage System in a Road
Pavement Energy Harvesting Hydraulic Device
225
7.2 Mechanical Energy Storage System for Hydraulic
Devices
7.2.1 Introduction
For an RPEH device, vehicles provide the source of energy, as they induce a
displacement on the device’s surface, which will be transmitted to an electric generator
through a mechanical or hydraulic system. Vehicle tyres interact between the vehicle
and the RPEH device, inducing a force on its surface. In Chapter 3, complete models of
the VRI were presented, including models that quantify the energy delivered from
vehicle’ tyres to a RPEH DS.
In Chapter 6, a typical RPEH device based on a hydraulic system was presented, as well
its physical models. Also, a new system that combines the most common hydraulic
system used in RPEH devices with a mechanical system to actuate it was presented,
including the electrical system of the device. The equations that quantify the transmitted
and delivered energy were defined, as well as the converted and consumed electrical
energy. The efficiency of each process was also defined.
The equations regarding the energy lost by the vehicle (Ev), the energy harvested by the
RPEH DS (EHa), the mechanical energy transmitted and delivered (ETr and EDe) and the
electrical energy generated and consumed (EGe and ELo) were defined in Chapters 3, 5
and 6. In this section, different MES systems will be studied and modelled, and then
incorporated into different RPEH device’s models. The equations that quantify both the
stored mechanical energy and the energy conversion efficiency will be defined.
7.2.2 Hydraulic pressure storage
A hydraulic accumulator is a device that stores the potential energy of an
incompressible fluid held under pressure by an external source against some dynamic
force, which can come from three different sources: gravity (using a weight);

Chapter 7 Integration of a Mechanical Energy Storage System in a Road
Pavement Energy Harvesting Hydraulic Device
226
mechanical spring; or a compressed gas. The potential energy stored in the accumulator
becomes a quick secondary source of fluid power, capable of realizing useful work
when required by the system (Mobley, 1999; Rabie, 2009; Parr, 2011; Durfee et al.,
2015). There are three basic types of hydraulic accumulators used in hydraulic systems:
weight-loaded type; spring-loaded type; and gas-loaded type.
In the weight-loaded type, the force of gravity acting on a weight above the cylinder
ram pressurizes the fluid inside the cylinder. As the force is constant and the area of the
cylinder piston is also constant, the pressure inside the cylinder is kept constant during
the process. This is the least commonly used type of accumulator and will not be
explored in this work.
The spring-loaded type is similar to the weight loaded system, except that piston is
preloaded with a spring, which is the source of energy that acts against the piston
forcing the fluid into the hydraulic system. The pressure generated by this type of
accumulator depends on the size and preloading of the spring. Also, the pressure exerted
on the fluid is not constant.
A representation of a spring-loaded hydraulic accumulator is presented in Figure 7.1. It
has a spring with stiffness Ksto, compressed by the accumulator piston, which moves
with a displacement xsto. The fluid input and output is controlled by a hydraulic
accumulator control valve (ACV).
Figure 7.1- Representation of a spring-loaded hydraulic accumulator.

Chapter 7 Integration of a Mechanical Energy Storage System in a Road
Pavement Energy Harvesting Hydraulic Device
227
When the fluid enters the hydraulic accumulator with a force FSH, the opposition force
of the MES system is given by Fsto, determined by Equation (7.1). When the fluid exits
the accumulator, it has a pressure defined by Equation (7.2), with Asto representing the
accumulator piston area. While the valve is closed, the fluid will keep the pressure psto
through the energy stored by the spring, which pressurizes the fluid under the
accumulator piston.
(7.1)
(7.2)
Gas-loaded accumulators operate according to Boyle’s law of gases which states that,
for a constant temperature process, the pressure of a gas varies inversely to its volume.
This means that, for example, the gas volume of the accumulator would be reduced to
half if the pressure were doubled. Gas-loaded accumulators can have three different
sub-types, according to the separation between the circuit fluid and the gas: piston type;
diaphragm-type; and bladder-type. In this work, a piston separated system was used.
Figure 7.2 shows a representation of a gas-loaded accumulator, piston type, which has a
chamber filled with gas above the piston, with a volume Vgas and a pressure pgas,
compressed by the accumulator piston, which moves with a displacement xsto. The fluid
input and output is controlled by a hydraulic ACV.
Figure 7.2- Representation of a gas-loaded hydraulic accumulator.

Chapter 7 Integration of a Mechanical Energy Storage System in a Road
Pavement Energy Harvesting Hydraulic Device
228
When the fluid enters to the hydraulic accumulator with a force FSH, it will induce a
displacement in the accumulator piston, compressing the gas above it and decreasing its
volume (Vgas). Equation (7.3) defines the pressure variation of the gas depending on the
variation of its volume, with the stored pressure to be equal to the gas pressure. The
force exerted by the accumulator piston in the fluid is defined by Equation (7.4), which
represents the force delivered to the hydraulic system when the fluid exits the
accumulator.
(7.3)
(7.4)
7.2.3 Standard RPEH device with hydraulic system with
integrated mechanical energy storage
Considering a RPEH device with a typical hydraulic system transmitting the mechanical
energy from the equipment’s surface to a mechanical system and to an electromagnetic
generator, based on standard hydraulic systems as presented in Chapter 6, two MES
systems based on hydraulic pressure storage devices are presented. Figure 7.3 presents
the RPEH device with a spring-loaded hydraulic accumulator working as a MES system
and Figure 7.4 presents the RPEH device with a gas-loaded hydraulic accumulator,
piston type, working as a MES system.
The working principle of both systems is the same, each having two storage stages:
receiving energy and releasing energy. In the receiving energy stage, when the RPEH
DS is moving downwards, it transmits a force onto the fluid inside the hydraulic circuit,
which is transmitted to the hydraulic accumulator through the fluid pressure. The ACV
lets the fluid in if the pressure is higher than the pressure inside the accumulator,
inducing a displacement of the accumulator piston. If the fluid pressure is lower than the
accumulator pressure, the valve remains closed.

Chapter 7 Integration of a Mechanical Energy Storage System in a Road
Pavement Energy Harvesting Hydraulic Device
229
Figure 7.3- Representation of a RPEH device with a hydraulic transmission system, using a MES
unit based on a hydraulic accumulator, spring-loaded type.
Figure 7.4- Representation of a RPEH device with a hydraulic transmission system, using a MES
unit based on a hydraulic accumulator, gas-loaded type.
In the releasing energy stage, the ACV opens the circuit between the accumulator and
the DAC, so that the accumulated and pressurized fluid can be released, actuating the
DAC piston and, consequently, the RAP mechanical system and the electromagnetic
generator.
Table 7.1 presents the force diagrams for the different motion scenarios, both for the
receiving energy stage, with the RPEH DS and the hydraulic installation directly
connected to the accumulator being presented, and for the releasing energy stage, with
the hydraulic circuit between the accumulator and the DAC as well as the DAC piston
being presented. The surface can have two motion scenarios, moving downwards or

Chapter 7 Integration of a Mechanical Energy Storage System in a Road
Pavement Energy Harvesting Hydraulic Device
230
upwards, as presented in Table 6.1, while the DAC piston can have two different motion
scenarios, moving forwards or backwards.
Table 7.1- Force diagrams for the RPEH DS, MES system and DAC piston.
Downward motion of the surface Upward motion of the surface
Hydraulic
circuit
with MES
Forward motion Backward motion
MES
discharge
and DAC
piston
Tables 7.2 and 7.3 summarize all the equations that define the RPEH hydraulic device
with the spring-loaded hydraulic accumulator, with a kinematic, dynamic and force
analysis. Table 7.2 defines the equations for the energy charging stage when the surface
moves downwards, upwards, or when it is stopped. Table 7.3 defines the equations for
the energy release stage, when the accumulator piston moves downwards inducing
motion on the DAC piston and, consequently, to the RAP system and the IW, which is
connected to an electrical generator.

Chapter 7 Integration of a Mechanical Energy Storage System in a Road
Pavement Energy Harvesting Hydraulic Device
231
Table 7.2- System modelling for the RPEH DS charging the MES device (spring loaded).
Analysis Surface motion
Downward Stopped Upward
Kinematic
- -
Dynamic
0
0
Force
To model the system using a gas-loaded accumulator, the equations defined in Tables
7.2 and 7.3 can be used, except the Fsto equation. For a gas-loaded accumulator, Fsto is
determined using Equation (7.4), with psto to be determined using Equations (7.5-7.10),
in relation to the surface displacement.
(7.5)
(7.6)
(7.7)
(7.8)
(7.9)
(7.10)

Chapter 7 Integration of a Mechanical Energy Storage System in a Road
Pavement Energy Harvesting Hydraulic Device
232
Table 7.3- System modelling for the MES device (spring loaded) releasing stored energy to the
hydraulic and mechanical system.
Analysis DAC piston motion
Forward Stopped Backward
Kinematic
Dynamic
0
Force
0

Chapter 7 Integration of a Mechanical Energy Storage System in a Road
Pavement Energy Harvesting Hydraulic Device
233
7.2.4 New RPEH device with hydraulic system with integrated
mechanical energy storage
Considering the RPEH device with a mechanically actuated hydraulic system
transmitting the mechanical energy from the equipment’s surface to a mechanical
system and to an electromagnetic generator, presented in Chapter 6, two MES systems
based on hydraulic pressure storage are presented. Figure 7.5 presents the RPEH device
with a spring-loaded hydraulic accumulator working as a MES system and Figure 7.6
presents the RPEH device with a gas-loaded hydraulic accumulator, piston type,
working as a MES system.
Figure 7.5- Representation of a RPEH device with a mechanically actuated hydraulic transmission
system, using a MES unit based on a hydraulic accumulator, spring-loaded type.
Figure 7.6- Representation of a RPEH device with a mechanically actuated hydraulic transmission
system, using a MES unit based on a hydraulic accumulator, gas-loaded type.

Chapter 7 Integration of a Mechanical Energy Storage System in a Road
Pavement Energy Harvesting Hydraulic Device
234
The working principle of both systems is the same, each having two storage stages:
receiving energy and releasing energy. In the receiving energy stage, when the RPEH
DS is moving downwards, it transmits a force onto the fluid inside the SAC through the
mechanical system, which is transmitted to the hydraulic accumulator through the fluid
pressure. The ACV lets the fluid in if the pressure is higher than the pressure inside the
accumulator, inducing a displacement of the accumulator piston. If the fluid pressure is
lower than the accumulator pressure, the valve remains closed.
In the releasing energy stage, the ACV opens the circuit between the accumulator and
the DAC, so that the accumulated and pressurized fluid can be released, actuating the
DAC piston and, consequently, the RAP mechanical system and the electromagnetic
generator.
Table 7.4 presents the force diagrams for the different motion scenarios, both for the
receiving energy stage, with the hydraulic installation directly connected to the
accumulator being presented, and for the releasing energy stage, with the hydraulic
circuit between the accumulator and the DAC as well as the DAC piston being
presented. The RPEH DS and mechanical system diagrams are not presented, once
these are similar to the diagrams presented in Table 6.4. Both the SAC and the DAC
pistons can have two different motion scenarios, moving forwards or backwards.
Tables 7.5 and 7.6 summarize all the equations that define the RPEH hydraulic device
with a mechanical actuation using a spring-loaded hydraulic accumulator, with a
kinematic, dynamic and force analysis. Table 7.5 defines the equations for the energy
charging stage when the surface moves downwards, upwards, or when it is stopped.
Table 7.6 defines the equations for the energy release stage, when the accumulator
piston moves downwards inducing motion on the DAC piston and, consequently, to the
RAP system and the IW, which is connected to an electrical generator.

Chapter 7 Integration of a Mechanical Energy Storage System in a Road
Pavement Energy Harvesting Hydraulic Device
235
Table 7.4- Force diagrams for the RPEH DS, mechanical system, MES system and DAC piston.
Forward motion Backward motion
Hydraulic
circuit with
the SAC and
the MES
Hydraulic
circuit with
the MES
discharge and
DAC piston
actuation
To model the system using a gas-loaded accumulator, the equations defined in Tables
7.5 and 7.6 can be used, except the Fsto equation. For a gas-loaded accumulator, Fsto is
determined using Equation (7.4), with psto to be determined using Equations (7.6-7.10),
in relation to the surface displacement. Equation (7.11) is used to determine Δxsto, in
substitution of Equation (7.5).
(7.11)
7.2.5 Energetic analysis
The equations regarding the energy lost by the vehicle (Ev), the energy harvested by the
RPEH DS (EHa), the mechanical energy transmitted and delivered (ETr and EDe) and the
electrical energy generated and consumed (EGe and ELo) were defined in Chapters 3, 5
and 6.

Chapter 7 Integration of a Mechanical Energy Storage System in a Road
Pavement Energy Harvesting Hydraulic Device
236
Table 7.5- System modelling for the RPEH hydraulic circuit with a mechanical actuation charging
the MES device (spring-loaded).
Analysis Surface motion
Downward Stopped Upward
Kinematic
-
Dynamic
0
0
0
Force
The energy and power stored by a spring loaded hydraulic accumulator are determined
by Equations (7.12) and (7.13), respectively. The energy stored by a gas loaded
hydraulic accumulator is determined by Equation (7.14), while the stored power is
determined by Equation (7.13).
(7.12)

Chapter 7 Integration of a Mechanical Energy Storage System in a Road
Pavement Energy Harvesting Hydraulic Device
237
(7.13)
(7.14)
Table 7.6- System modelling for the MES device (spring-loaded) releasing the stored energy for the
hydraulic and mechanical system.
Analysis DAC piston motion
Forward Stopped Backward
Kinematic
Dynamic
0
Force
0

Chapter 7 Integration of a Mechanical Energy Storage System in a Road
Pavement Energy Harvesting Hydraulic Device
238
The efficiency of the MES system is defined by Equation (7.15), relating the stored
mechanical energy to the mechanical energy transmitted by the hydraulic system. When
a MES system is applied in the hydraulic system, the equation that defines the energy
delivered is defined by Equation (7.16), relating the energy delivered by the mechanical
system to the electric generator with the energy stored in the MES system.
(7.15)
(7.16)
7.3 Technical Analysis
7.3.1 Introduction
In Chapter 3, a software tool that allows quantifying the energy transferred from
vehicles to an energy harvesting device was presented. In Chapter 5, an upgraded
version of the software tool was presented, to include different RPEH models, so that a
complete simulation from the energy released by the vehicle to the electrical energy
generated and consumed could be performed. In Chapter 6, the models for RPEH
devices based on typical hydraulic systems and a new proposed hydraulic system with a
mechanical actuation were presented, and both models were added to the software tool.
The models presented in this Chapter for the hydraulic systems with MES were also
incorporated in the software tool. This upgraded tool allows users to perform a complete
analysis, from the energy release from the vehicle to the device surface to the electrical
energy generated and delivered to an electrical load.
The software tool calculates all the forces and displacements for both the vehicle
components and the RPEH device surface, as well as for the hydraulic, mechanical and
electrical system components, including storage. After that, it calculates the different
energies transferred from each part of the system to the others and the efficiency of each
energy transfer process.

Chapter 7 Integration of a Mechanical Energy Storage System in a Road
Pavement Energy Harvesting Hydraulic Device
239
The simulations performed with the software tool for the RPEH hydraulic systems
without storage, both typical and mechanically actuated, and for the same systems with
two different MES systems, will be presented in this section. The same RPEH
equipment surface profile, geometry and displacement, as well as the same vehicle and
the same electric generator and load will be used. The goal is to evaluate the different
MES systems and reach conclusions about their mechanical energy storage efficiency,
and to compare the efficiency of the RPEH systems with and without mechanical
energy storage.
As the goal is to evaluate the system’s performance with and without MES and as the
effectiveness of the MES can only be evaluated with multiple vehicle actuations due to
the increase of the energy stored and, consequently, a higher amount of energy being
delivered to the electrical generator, the simulations will be performed for 10 vehicles
actuating the system. So, the results presented for all systems are related to 10 vehicle
actuations.
However, one RPEH device connected to one hydraulic system is used, which, in turn,
is connected to one MES system, one mechanical system and one electrical system, as
the surface is actuated by one side of the vehicle. So, the value presented for the energy
lost by the vehicles is for only half of each vehicle, as only one front and one rear wheel
of a vehicle will actuate the RPEH device surface.
The parameters defined for the vehicle, the RPEH device surface, the hydraulic,
mechanical and electrical systems, as well as the hydraulic accumulator, common to the
simulations of all systems, are presented in Table 7.7.
7.3.2 Standard hydraulic system
Considering the input data presented in Table 7.7, simulations for the standard hydraulic
system were performed using the Crest surface profile, without any MES device. The
RAP mechanical system, the electric generator and the electric load parameters were not
changed between simulations.

Chapter 7 Integration of a Mechanical Energy Storage System in a Road
Pavement Energy Harvesting Hydraulic Device
240
Table 7.7- Input data for the computational simulations of the three systems.
Variable name Value Unit V
ehic
le &
mo
tio
n
Vehicle class Light -
Vehicle weight 1,500 (kg)
Number of axles P1 | wheels per axle 2 | 2 -
Sprung-Unsprung % 90%-10% -
Drag coefficient 0.32 -
Inertia moment 1,100 (kg.m2)
Lift coefficients (Front | Rear) 0.19 | 0.13 -
Motion | Direction Free rolling | Forward -
Vehicle speed | acceleration 40 | 0 (km/h) | (m/s2)
Su
spen
sio
n &
wh
eel
Suspension type (Front | Rear) Independent | Independent -
Suspension stiffness (Front | Rear) 20,000 | 15,000 (N/m)
Suspension damping (Front | Rear) 1,500 | 1,700 (Ns/m)
Tyre type (Front | Rear) Radial | Radial -
Tyre stiffness (Front | Rear) 150,000 | 150,000 (N/m)
Tyre pressure (Front | Rear) 200 | 200 (kPa)
Tyre external diameter (Front | Rear) 500 | 500 (mm)
Tyre width (Front | Rear) 200 | 200 (mm)
Tyre tread width (Front | Rear) 180 | 180 (mm)
RP
EH
dev
ice
Surface width | mass 250 | 20 (mm) | (kg)
Surface max. height | max. displacement 20 | 20 (mm)
Mech. system crank length | initial height 40 | 30 (mm) | (mm)
Spring stiffness 30,000 (N/m)
Hydraulic fluid Oil SAE 30 -
Hydraulic fluid density | kinematic viscosity 865 | 105 (kg.m3) | (cSt)
Hydraulic circuit CV discharge coef. | KH 2.48 | 10.50 - | -
Hydraulic tube length 3 (m)
Hydraulic reservoir pressure 101,325 (Pa)
Hydraulic cylinder stroke 250 (mm)
Pinion mass | radius | friction coefficient 1 | 20 | 0.002 (kg) | (mm) | -
Inertia wheel mass | radius 10 | 30 (kg) | (mm)
Electric generator constant Ka 0.25 -
Electric generator Ra | La 1.1 | 0.0048 (Ω) | (H)
Electric generator friction coef. | Inertia 0.0008 | 0.05 - | (kg.m2)
Electric load Power 50 (W)
ME
S Accumulator height | external diameter 1 | 0.25 (m) | (m)
Accumulator piston mass 2 (kg)
Accumulator stroke 0.8 (m)

Chapter 7 Integration of a Mechanical Energy Storage System in a Road
Pavement Energy Harvesting Hydraulic Device
241
For the hydraulic system, different values of the contact area between the surface and
the hydraulic circuit (Ah), which defines the interaction area between the received force
and the hydraulic fluid, were simulated. Also, different values for the hydraulic cylinder
area (Acp) were used. The goal is to evaluate the impact of these variables on the energy
transmitted.
To evaluate the system’s performance, the vehicle released energy (Ev), RPEH surface
harvested energy (EHa), mechanical system transmitted energy (ETr), mechanical system
delivered energy (EDe), electrical system generated energy (EGe) and electrical system
consumed energy (ELo) were calculated. Also, the efficiencies of the energy transferred
between each part of the system were evaluated.
Table 7.8 presents the simulation results for the energy output of each component of the
RPEH device using the standard hydraulic system without energy storage, considering
the input data presented in Table 7.7. Table 7.9 presents the simulation results for the
efficiency of each component of the system, as well as the total efficiency of the device.
Table 7.8- Simulation results for the energy outputs of the RPEH device components using a
standard hydraulic system, without MES.
Ah
(mm2)
Acp
(mm2)
Ev
(J)
EHa
(J)
ETr
(J)
EDe
(J)
EGe
(J)
ELo
(J)
20
12 1,780.0 1,170.0 1,080.0 100.0 80.1 64.0
25 1,780.0 970.0 690.0 460.0 397.4 320.7
50 1,740.0 980.0 770.0 490.0 441.5 358.0
40
12 1,970.0 1,040.0 580.0 70.0 55.7 43.9
25 1,850.0 1,030.0 680.0 180.0 149.2 119.2
50 1,800.0 990.0 630.0 270.0 226.5 182.4

Chapter 7 Integration of a Mechanical Energy Storage System in a Road
Pavement Energy Harvesting Hydraulic Device
242
Table 7.9- Simulation results for the efficiencies of the RPEH device components using a standard
hydraulic system, without MES.
Ah
(mm2)
Acp
(mm2)
ηHa
(%)
ηTr
(%)
ηDe
(%)
ηGe
(%)
ηCo
(%)
ηMec
(%)
ηEle
(%)
ηRPEH
(%)
ηTot
(%)
20
12 65.7 92.3 9.3 80.1 79.9 8.5 64.00 5.5 3.6
25 54.5 71.1 66.7 86.4 80.7 47.4 69.72 33.1 18.0
50 56.3 78.6 63.6 90.1 81.1 50.0 73.07 36.5 20.6
40
12 52.8 55.8 12.1 79.5 78.9 6.7 62.73 4.2 2.2
25 55.7 66.0 26.5 82.9 79.9 17.5 66.24 11.6 6.4
50 55.0 63.6 42.9 83.9 80.5 27.3 67.54 18.4 10.1
Considering the same conditions as for the standard hydraulic system, simulations for
the hydraulic system with a MES system, based on a spring-loaded hydraulic
accumulator, were also performed. Beside Ah and Acp, the spring stiffness of the
hydraulic accumulator (Ksto) and the hydraulic cylinder piston area (Asto) were also
changed between simulations to evaluate the impact of these variables.
Table 7.10 presents the simulation results for the energy output of each component of
the system, while Table 7.11 presents the simulation results for the efficiency of each
component of the system, as well as the total efficiency of the device.
Using the same conditions as for the standard hydraulic system, simulations for the
hydraulic system with a MES system, based on a gas-loaded hydraulic accumulator,
were performed. Beside Ah and Acp, the initial pressure of the hydraulic accumulator gas
(pgas) and the hydraulic cylinder piston area (Asto) were also changed between
simulations to evaluate the impact of these variables.
Table 7.12 presents the simulation results for the energy output of each component of
the system, and Table 7.13 presents the simulation results for the efficiency of each
component of the system, as well as the total efficiency of the device.

Chapter 7 Integration of a Mechanical Energy Storage System in a Road
Pavement Energy Harvesting Hydraulic Device
243
Table 7.10- Simulation results for the energy outputs of the RPEH device components using a
spring-loaded hydraulic accumulator connected to a standard hydraulic system.
Ksto
(kN/m)
Ah
(mm2)
Asto
(mm2)
Acp
(mm2)
Ev
(J)
EHa
(J)
ETr
(J)
Esto
(J)
EDe
(J)
EGe
(J)
ELo
(J)
15
20
100 25 2,150.0 1,020.0 890.0 170.0 118.8 108.3 89.0
50 2,150.0 1,020.0 890.0 170.0 119.9 109.2 89.7
200 25 2,240.0 1,010.0 878.0 85.0 49.6 42.3 33.8
50 2,240.0 1,010.0 878.0 85.0 50.0 42.7 34.1
40
100 25 2,060.0 1,020.0 790.0 190.0 137.0 125.5 103.4
50 2,060.0 1,020.0 790.0 190.0 138.5 126.9 104.5
200 25 2,220.0 985.0 860.0 130.0 89.8 78.6 62.9
50 2,220.0 985.0 860.0 130.0 90.9 79.8 63.9
20
20
100 25 2,060.0 960.0 840.0 220.0 164.3 151.4 125.3
50 2,060.0 960.0 840.0 220.0 165.2 152.2 126.0
200 25 2,160.0 990.0 850.0 140.0 98.3 86.6 69.4
50 2,160.0 990.0 850.0 140.0 99.3 87.5 70.1
40
100 25 2,070.0 1,050.0 810.0 290.0 219.0 204.1 172.0
50 2,070.0 1,050.0 810.0 290.0 220.7 205.9 173.8
200 25 2,180.0 940.0 800.0 240.0 179.3 165.1 137.0
50 2,180.0 940.0 800.0 240.0 180.2 166.0 137.8

Chapter 7 Integration of a Mechanical Energy Storage System in a Road
Pavement Energy Harvesting Hydraulic Device
244
Table 7.11- Simulation results for the efficiencies of the RPEH device components using a spring-
loaded hydraulic accumulator connected to a standard hydraulic system.
Ksto
(kN/m)
Ah
(mm2)
Asto
(mm2)
Acp
(mm2)
ηHa
(%)
ηTr
(%)
ηsto
(%)
ηDe
(%)
ηGe
(%)
ηCo
(%)
ηMec
(%)
ηEle
(%)
ηRPEH
(%)
ηTot
(%)
15
20
100 25 47.4 87.3 19.1 69.9 91.1 82.2 11.7 74.9 8.7 4.1
50 47.4 87.3 19.1 70.5 91.1 82.2 11.8 74.9 8.8 4.2
200 25 45.1 86.9 9.7 58.3 85.4 79.8 4.9 68.1 3.3 1.5
50 45.1 86.9 9.7 58.8 85.5 79.8 4.9 68.2 3.4 1.5
40
100 25 49.5 77.5 24.1 72.1 91.6 82.4 13.4 75.5 10.1 5.0
50 49.5 77.5 24.1 72.9 91.6 82.4 13.6 75.5 10.2 5.1
200 25 44.4 87.3 15.1 69.1 87.5 80.0 9.1 70.0 6.4 2.8
50 44.4 87.3 15.1 69.9 87.8 80.1 9.2 70.3 6.5 2.9
20
20
100 25 46.6 87.5 26.2 74.7 92.1 82.8 17.1 76.3 13.1 6.1
50 46.6 87.5 26.2 75.1 92.1 82.8 17.2 76.3 13.1 6.1
200 25 45.8 85.9 16.5 70.2 88.1 80.1 9.9 70.6 7.0 3.2
50 45.8 85.9 16.5 70.9 88.2 80.1 10.0 70.6 7.1 3.2
40
100 25 50.7 77.1 35.8 75.5 93.2 84.3 20.9 78.6 16.4 8.3
50 50.7 77.1 35.8 76.1 93.3 84.4 21.0 78.7 16.6 8.4
200 25 43.1 85.1 30.0 74.7 92.1 83.0 19.1 76.4 14.6 6.3
50 43.1 85.1 30.0 75.1 92.1 83.0 19.2 76.4 14.7 6.3

Chapter 7 Integration of a Mechanical Energy Storage System in a Road
Pavement Energy Harvesting Hydraulic Device
245
Table 7.12- Simulation results for the energy outputs of the RPEH device components using a gas-
loaded hydraulic accumulator connected to a standard hydraulic system.
pgas
(bar)
Ah
(mm2)
Asto
(mm2)
Acp
(mm2)
Ev
(J)
EHa
(J)
ETr
(J)
Esto
(J)
EDe
(J)
EGe
(J)
ELo
(J)
2
20
100 25 2,160.0 1,020.0 870.0 505.0 439.9 415.7 355.4
50 2,160.0 1,020.0 870.0 505.0 445.4 420.9 359.9
200 25 2,220.0 1,020.0 870.0 505.0 439.9 415.7 355.4
50 2,220.0 1,020.0 870.0 505.0 445.4 420.9 359.9
10 100 25 2,390.0 940.0 770.0 245.0 176.6 162.3 132.1
50 2,390.0 940.0 770.0 245.0 179.3 165.0 134.5
30 200 25 2,150.0 1,020.0 850.0 570.0 502.7 475.1 407.2
50 2,150.0 1,020.0 850.0 570.0 503.9 476.2 408.1
4
20
100 25 2,180.0 1,030.0 860.0 545.0 470.3 444.5 380.5
50 2,180.0 1,030.0 860.0 560.0 483.8 457.2 391.4
200 25 2,170.0 1,040.0 880.0 560.0 483.8 457.2 391.4
50 2,170.0 1,040.0 880.0 560.0 485.0 458.3 392.3
10 100 25 2,200.0 990.0 820.0 285.0 208.6 193.6 159.1
50 2,200.0 990.0 820.0 285.0 209.5 194.4 159.8
30 200 25 2,070.0 1,060.0 900.0 620.0 557.4 528.4 453.4
50 2,070.0 1,060.0 900.0 620.0 560.5 531.3 455.9

Chapter 7 Integration of a Mechanical Energy Storage System in a Road
Pavement Energy Harvesting Hydraulic Device
246
Table 7.13- Simulation results for the efficiencies of the RPEH device components using a gas-
loaded hydraulic accumulator connected to a standard hydraulic system.
pgas
(bar)
Ah
(mm2)
Asto
(mm2)
Acp
(mm2)
ηHa
(%)
ηTr
(%)
ηsto
(%)
ηDe
(%)
ηGe
(%)
ηCo
(%)
ηMec
(%)
ηEle
(%)
ηRPEH
(%)
ηTot
(%)
2
20
100 25 47.2 85.3 58.0 87.1 94.5 85.5 43.1 80.8 34.8 16.5
50 47.2 85.3 58.0 88.2 94.5 85.5 43.7 80.8 35.3 16.7
200 25 45.9 85.3 58.0 87.1 94.5 85.5 43.1 80.8 34.8 16.0
50 45.9 85.3 58.0 88.2 94.5 85.5 43.7 80.8 35.3 16.2
10 100 25 39.3 81.9 31.8 72.1 91.9 81.4 18.8 74.8 14.1 5.5
50 39.3 81.9 31.8 73.2 92.0 81.5 19.1 75.0 14.3 5.6
30 200 25 47.4 83.3 67.1 88.2 94.5 85.7 49.3 81.0 39.9 18.9
50 47.4 83.3 67.1 88.4 94.5 85.7 49.4 81.0 40.0 19.0
4
20
100 25 47.2 83.5 63.4 86.3 94.5 85.6 45.7 80.9 36.9 17.5
50 47.2 83.5 65.1 86.4 94.5 85.6 47.0 80.9 38.0 18.0
200 25 47.9 84.6 63.6 86.4 94.5 85.6 46.5 80.9 37.6 18.0
50 47.9 84.6 63.6 86.6 94.5 85.6 46.6 80.9 37.7 18.1
10 100 25 45.0 82.8 34.8 73.2 92.8 82.2 21.1 76.3 16.1 7.2
50 45.0 82.8 34.8 73.5 92.8 82.2 21.2 76.3 16.1 7.3
30 200 25 51.2 84.9 68.9 89.9 94.8 85.8 52.6 81.3 42.8 21.9
50 51.2 84.9 68.9 90.4 94.8 85.8 52.9 81.3 43.0 22.0

Chapter 7 Integration of a Mechanical Energy Storage System in a Road
Pavement Energy Harvesting Hydraulic Device
247
7.3.3 Hydraulic system with mechanical actuation
Considering the input data presented in Table 7.7, simulations for the RPEH device with
a mechanically actuated hydraulic system were performed using the Crest surface
profile and without any MES device. The rack and pinion mechanical system, the
electric generator and the electric load parameters were not changed between
simulations.
For the mechanically actuated hydraulic system, different values of the contact area
between the slider and the hydraulic circuit (Asp), which defines the interaction area
between the received force and the hydraulic fluid, were simulated. Also, different
values for the hydraulic cylinder area (Acp) were used. The goal is to evaluate the impact
of these variables on the energy transmitted.
To evaluate the system’s performance, the vehicle released energy (Ev), RPEH surface
harvested energy (EHa), mechanical system transmitted energy (ETr), mechanical system
delivered energy (EDe), electrical system generated energy (EGe) and electrical system
consumed energy (ELo) were calculated. Also, the efficiencies of the energy transferred
between each part of the system were evaluated.
Table 7.14 presents the simulation results for the energy output of each component of
the RPEH device using the mechanically actuated hydraulic system without storage,
considering the input data presented in Table 7.7. Table 7.15 presents the simulation
results for the efficiency of each component of the system, as well as the total efficiency
of the device.
Considering the same conditions as for the RPEH mechanically actuated hydraulic
system, simulations for the same system with a MES system, based on a spring-loaded
hydraulic accumulator, were also performed. Beside Asp and Acp, the spring stiffness of
the hydraulic accumulator (Ksto) and the hydraulic cylinder piston area (Asto) were also
changed between simulations to evaluate the impact of these variables.
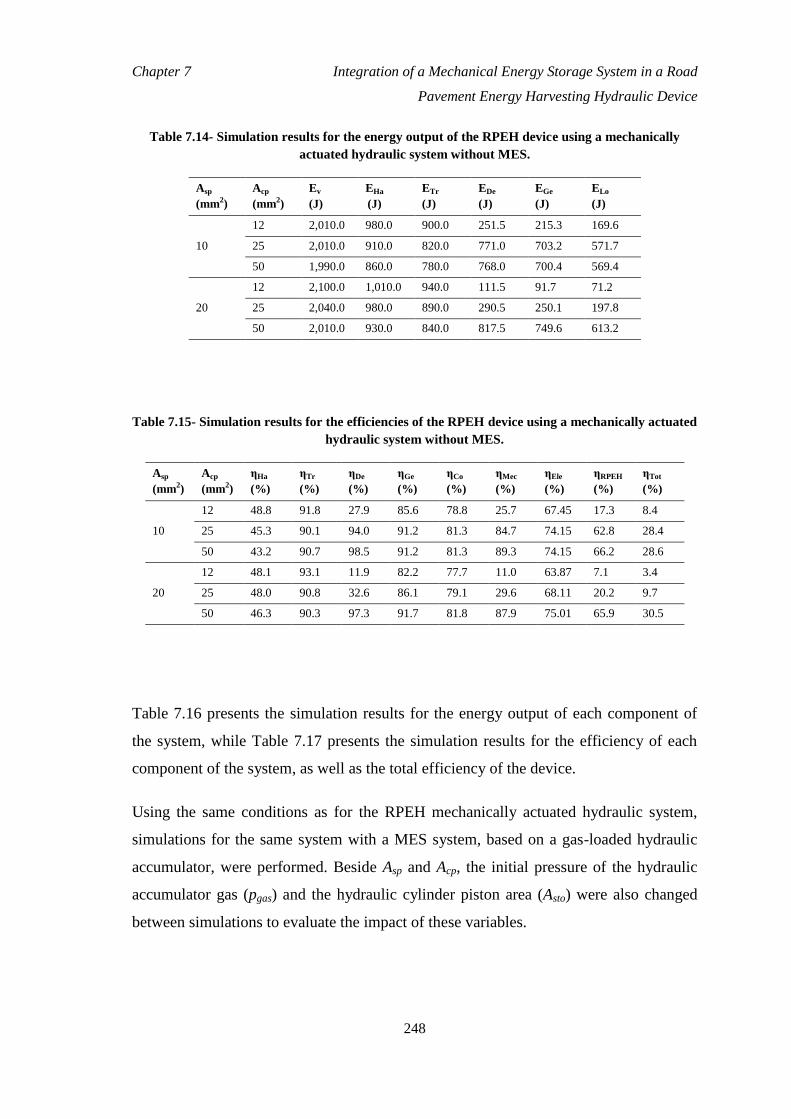
Chapter 7 Integration of a Mechanical Energy Storage System in a Road
Pavement Energy Harvesting Hydraulic Device
248
Table 7.14- Simulation results for the energy output of the RPEH device using a mechanically
actuated hydraulic system without MES.
Asp
(mm2)
Acp
(mm2)
Ev
(J)
EHa
(J)
ETr
(J)
EDe
(J)
EGe
(J)
ELo
(J)
10
12 2,010.0 980.0 900.0 251.5 215.3 169.6
25 2,010.0 910.0 820.0 771.0 703.2 571.7
50 1,990.0 860.0 780.0 768.0 700.4 569.4
20
12 2,100.0 1,010.0 940.0 111.5 91.7 71.2
25 2,040.0 980.0 890.0 290.5 250.1 197.8
50 2,010.0 930.0 840.0 817.5 749.6 613.2
Table 7.15- Simulation results for the efficiencies of the RPEH device using a mechanically actuated
hydraulic system without MES.
Asp
(mm2)
Acp
(mm2)
ηHa
(%)
ηTr
(%)
ηDe
(%)
ηGe
(%)
ηCo
(%)
ηMec
(%)
ηEle
(%)
ηRPEH
(%)
ηTot
(%)
10
12 48.8 91.8 27.9 85.6 78.8 25.7 67.45 17.3 8.4
25 45.3 90.1 94.0 91.2 81.3 84.7 74.15 62.8 28.4
50 43.2 90.7 98.5 91.2 81.3 89.3 74.15 66.2 28.6
20
12 48.1 93.1 11.9 82.2 77.7 11.0 63.87 7.1 3.4
25 48.0 90.8 32.6 86.1 79.1 29.6 68.11 20.2 9.7
50 46.3 90.3 97.3 91.7 81.8 87.9 75.01 65.9 30.5
Table 7.16 presents the simulation results for the energy output of each component of
the system, while Table 7.17 presents the simulation results for the efficiency of each
component of the system, as well as the total efficiency of the device.
Using the same conditions as for the RPEH mechanically actuated hydraulic system,
simulations for the same system with a MES system, based on a gas-loaded hydraulic
accumulator, were performed. Beside Asp and Acp, the initial pressure of the hydraulic
accumulator gas (pgas) and the hydraulic cylinder piston area (Asto) were also changed
between simulations to evaluate the impact of these variables.

Chapter 7 Integration of a Mechanical Energy Storage System in a Road
Pavement Energy Harvesting Hydraulic Device
249
Table 7.18 presents the simulation results for the energy output of each component of
the system, and Table 7.19 presents the simulation results for the efficiency of each
component of the system, as well as the total efficiency of the device.
Table 7.16- Simulation results for the energy output s of the RPEH device components using a
spring-loaded hydraulic accumulator connected to a mechanically actuated hydraulic system.
Ksto
(kN/m)
Asp
(mm2)
Asto
(mm2)
Acp
(mm2)
Ev
(J)
EHa
(J)
ETr
(J)
Esto
(J)
EDe
(J)
EGe
(J)
ELo
(J)
100
10
100 25 2,340.0 1,010.0 990.0 330.0 276.9 255.0 211.9
50 2,340.0 1,010.0 990.0 330.0 279.8 258.9 215.1
200 25 2,400.0 990.0 970.0 311.5 259.5 238.2 197.7
50 2,400.0 990.0 970.0 311.5 263.5 242.7 201.4
20
100 25 2,330.0 1,030.0 1,010.0 450.0 379.4 356.6 302.7
50 2,330.0 1,030.0 1,010.0 450.0 383.0 361.1 306.6
200 25 2,310.0 1,005.0 955.0 432.5 363.7 340.1 288.1
50 2,310.0 1,005.0 955.0 432.5 367.2 344.8 292.4
200
10
100 25 2,340.0 1,030.0 1,000.0 410.0 344.8 321.0 271.3
50 2,340.0 1,030.0 1,000.0 410.0 347.7 325.8 275.3
200 25 2,400.0 1,000.0 970.0 380.0 318.4 296.1 248.5
50 2,400.0 1,000.0 970.0 380.0 320.7 299.2 251.1
20
100 25 2,380.0 1,040.0 1,020.0 490.0 403.8 381.6 323.6
50 2,380.0 1,040.0 1,020.0 490.0 407.7 385.7 327.0
200 25 2,360.0 1,010.0 990.0 470.0 386.3 364.7 307.8
50 2,360.0 1,010.0 990.0 470.0 390.6 368.7 311.2
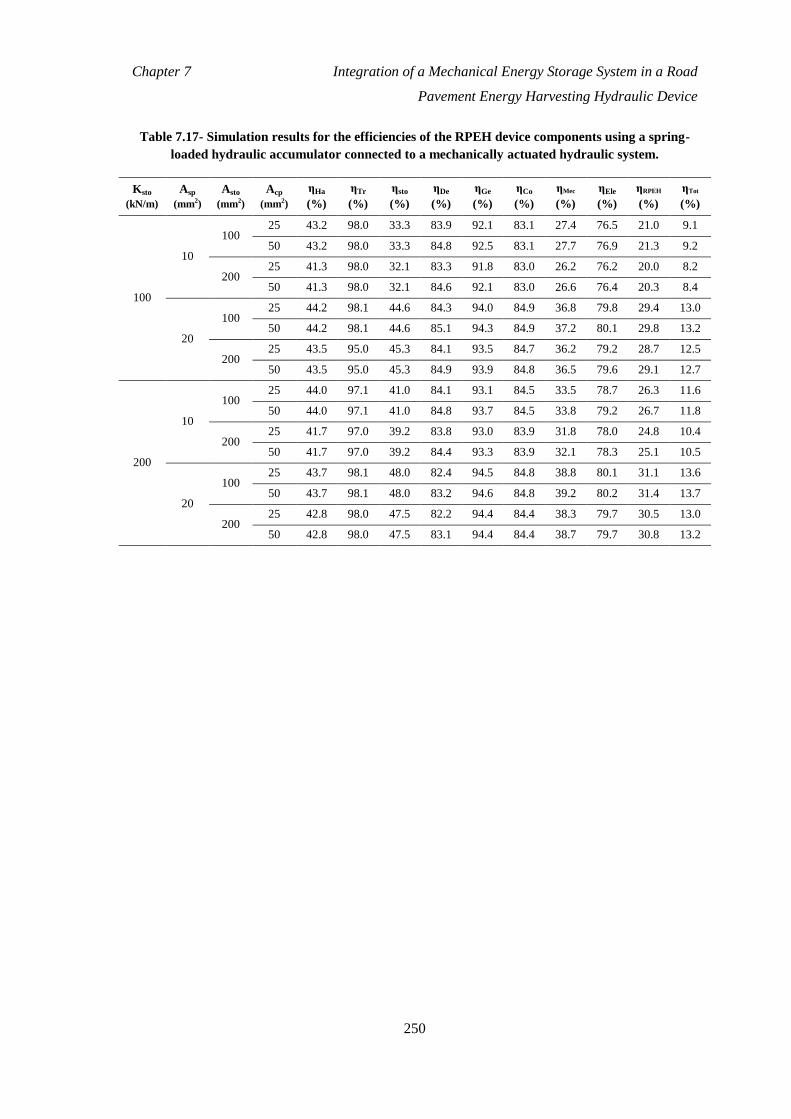
Chapter 7 Integration of a Mechanical Energy Storage System in a Road
Pavement Energy Harvesting Hydraulic Device
250
Table 7.17- Simulation results for the efficiencies of the RPEH device components using a spring-
loaded hydraulic accumulator connected to a mechanically actuated hydraulic system.
Ksto
(kN/m)
Asp
(mm2)
Asto
(mm2)
Acp
(mm2)
ηHa
(%)
ηTr
(%)
ηsto
(%)
ηDe
(%)
ηGe
(%)
ηCo
(%)
ηMec
(%)
ηEle
(%)
ηRPEH
(%)
ηTot
(%)
100
10
100 25 43.2 98.0 33.3 83.9 92.1 83.1 27.4 76.5 21.0 9.1
50 43.2 98.0 33.3 84.8 92.5 83.1 27.7 76.9 21.3 9.2
200 25 41.3 98.0 32.1 83.3 91.8 83.0 26.2 76.2 20.0 8.2
50 41.3 98.0 32.1 84.6 92.1 83.0 26.6 76.4 20.3 8.4
20
100 25 44.2 98.1 44.6 84.3 94.0 84.9 36.8 79.8 29.4 13.0
50 44.2 98.1 44.6 85.1 94.3 84.9 37.2 80.1 29.8 13.2
200 25 43.5 95.0 45.3 84.1 93.5 84.7 36.2 79.2 28.7 12.5
50 43.5 95.0 45.3 84.9 93.9 84.8 36.5 79.6 29.1 12.7
200
10
100 25 44.0 97.1 41.0 84.1 93.1 84.5 33.5 78.7 26.3 11.6
50 44.0 97.1 41.0 84.8 93.7 84.5 33.8 79.2 26.7 11.8
200 25 41.7 97.0 39.2 83.8 93.0 83.9 31.8 78.0 24.8 10.4
50 41.7 97.0 39.2 84.4 93.3 83.9 32.1 78.3 25.1 10.5
20
100 25 43.7 98.1 48.0 82.4 94.5 84.8 38.8 80.1 31.1 13.6
50 43.7 98.1 48.0 83.2 94.6 84.8 39.2 80.2 31.4 13.7
200 25 42.8 98.0 47.5 82.2 94.4 84.4 38.3 79.7 30.5 13.0
50 42.8 98.0 47.5 83.1 94.4 84.4 38.7 79.7 30.8 13.2

Chapter 7 Integration of a Mechanical Energy Storage System in a Road
Pavement Energy Harvesting Hydraulic Device
251
Table 7.18- Simulation results for the energy outputs of the RPEH device components using a gas-
loaded hydraulic accumulator connected to a mechanically actuated hydraulic system.
pgas
(bar)
Ah
(mm2)
Asto
(mm2)
Acp
(mm2)
Ev
(J)
EHa
(J)
ETr
(J)
Esto
(J)
EDe
(J)
EGe
(J)
ELo
(J)
2
20
100 25 2,440.0 1,040.0 1,000.0 340.0 299.5 276.8 230.8
50 2,440.0 1,040.0 1,000.0 340.0 301.9 279.0 232.7
200 25 2,260.0 1,080.0 1,040.0 340.0 299.5 276.8 230.8
50 2,260.0 1,080.0 1,040.0 340.0 301.9 279.0 232.7
40
100 25 2,380.0 1,040.0 920.0 460.0 414.5 390.0 331.9
50 2,380.0 1,040.0 920.0 460.0 419.5 394.8 335.9
200 25 2,420.0 1,040.0 920.0 460.0 415.8 392.1 334.5
50 2,420.0 1,040.0 920.0 460.0 419.5 395.6 337.5
4
20
100 25 2,380.0 1,080.0 1,040.0 440.0 392.0 362.2 302.1
50 2,380.0 1,080.0 1,040.0 440.0 395.6 365.5 304.8
200 25 2,380.0 1,080.0 1,040.0 440.0 392.0 362.2 302.1
50 2,380.0 1,080.0 1,040.0 440.0 395.6 365.5 304.8
40
100 25 2,360.0 940.0 920.0 520.0 474.8 446.7 380.2
50 2,360.0 940.0 920.0 520.0 480.5 452.1 384.8
200 25 2,460.0 920.0 860.0 540.0 490.3 462.4 394.4
50 2,460.0 920.0 860.0 540.0 490.3 462.4 394.4

Chapter 7 Integration of a Mechanical Energy Storage System in a Road
Pavement Energy Harvesting Hydraulic Device
252
Table 7.19- Simulation results for the efficiencies of the RPEH device components using a gas-
loaded hydraulic accumulator connected to a mechanically actuated hydraulic system.
pgas
(bar)
Ah
(mm2)
Asto
(mm2)
Acp
(mm2)
ηHa
(%)
ηTr
(%)
ηsto
(%)
ηDe
(%)
ηGe
(%)
ηCo
(%)
ηMec
(%)
ηEle
(%)
ηRPEH
(%)
ηTot
(%)
2
20
100 25 42.6 96.2 34.0 88.1 92.4 83.4 28.8 77.1 22.2 9.5
50 42.6 96.2 34.0 88.8 92.4 83.4 29.0 77.1 22.4 9.5
200 25 47.8 96.3 32.7 88.1 92.4 83.4 27.7 77.1 21.4 10.2
50 47.8 96.3 32.7 88.8 92.4 83.4 28.0 77.1 21.5 10.3
40
100 25 43.7 88.5 50.0 90.1 94.1 85.1 39.9 80.1 31.9 13.9
50 43.7 88.5 50.0 91.2 94.1 85.1 40.3 80.1 32.3 14.1
200 25 43.0 88.5 50.0 90.4 94.3 85.3 40.0 80.4 32.2 13.8
50 43.0 88.5 50.0 91.2 94.3 85.3 40.3 80.4 32.4 13.9
4
20
100 25 45.4 96.3 42.3 89.1 92.4 83.4 36.3 77.1 28.0 12.7
50 45.4 96.3 42.3 89.9 92.4 83.4 36.6 77.1 28.2 12.8
200 25 45.4 96.3 42.3 89.1 92.4 83.4 36.3 77.1 28.0 12.7
50 45.4 96.3 42.3 89.9 92.4 83.4 36.6 77.1 28.2 12.8
40
100 25 39.8 97.9 56.5 91.3 94.1 85.1 50.5 80.1 40.4 16.1
50 39.8 97.9 56.5 92.4 94.1 85.1 51.1 80.1 40.9 16.3
200 25 37.4 93.5 62.8 90.8 94.3 85.3 53.3 80.4 42.9 16.0
50 37.4 93.5 62.8 90.8 94.3 85.3 53.3 80.4 42.9 16.0

Chapter 7 Integration of a Mechanical Energy Storage System in a Road
Pavement Energy Harvesting Hydraulic Device
253
7.3.4 Results analysis
7.3.4.1 Standard hydraulic system
Analyzing the results obtained with the computational simulations of the RPEH device,
for both the standard hydraulic system without MES and with a MES system
incorporated, based on a spring-loaded or a gas-loaded hydraulic accumulator, some
conclusions may be drawn.
Taking the efficiency of the internal device of the RPEH to be the most important
parameter to evaluate and comparing the effectiveness of the MES system, one can
conclude that, for the same simulation parameters, compared to a hydraulic system the
spring-loaded hydraulic accumulator does not increase the efficiency of the RPEH
device, but rather decreases its efficiency, whereas the gas-loaded hydraulic
accumulator improves the RPEH device efficiency.
Both MES systems were implemented between the hydraulic circuit entrance and the
DAC, and are directly actuated by the fluid pressurized by the RPEH DS. The
difference in the results between both systems leads us to conclude that the gas-loaded
accumulator is three times more efficient than the spring-loaded accumulator, for the
same conditions, which has a direct impact on the efficiency of the RPEH internal
system.
As expected, the efficiency of the electrical system increases with both accumulators, as
the electrical generator is actuated in a continuous mode. However, as the storage
efficiency of the spring-loaded accumulator is too small, less than 36%, this does not
lead to an increase in the total efficiency of the system. For the gas-loaded accumulator,
as the storage efficiency is higher, reaching almost 70%, the accumulated energy means
the electrical generator is actuated with its nominal speed and, consequently, works with
a very high efficiency rate of almost 95%.
Analyzing individual variables, for the hydraulic system without a MES accumulator,
increasing the contact area between the RPEH DS and the hydraulic circuit (Ah) reduces
the harvested energy efficiency and the transmitted energy efficiency, leading to a lower

Chapter 7 Integration of a Mechanical Energy Storage System in a Road
Pavement Energy Harvesting Hydraulic Device
254
efficiency of the entire system. This is explained by the smaller displacement induced
on the DAC piston. On the other hand, increasing the DAC piston area (Acp) leads to an
increase in the delivered energy efficiency as well as the electrical generator efficiency,
as it means the force delivered on the mechanical system that actuates the electrical
generator is increased.
For the hydraulic system with a spring-loaded accumulator, the increase in the spring
stiffness allows the stored energy to be increased, as expected. However, the spring
stiffness value cannot be increased without limit, as it works as an opposition force to
the force transmitted by the hydraulic circuit and, above a certain value, the hydraulic
fluid will not be able to move the accumulator piston as the opposition force is higher
than the force transmitted by hydraulic fluid.
For this system, increasing the contact area between the RPEH DS and the hydraulic
circuit (Ah) has a small impact on the transmitted energy efficiency, but decreases the
storage energy efficiency, as the amplification of the force from the hydraulic circuit to
the hydraulic accumulator is lower, leading to a smaller displacement of the
accumulator piston and, consequently, a lower amount of energy is stored. Also,
increasing the accumulator piston area (Asto) decreases the stored energy efficiency, as
its displacement is lower and, consequently, the spring force and the stored energy are
lower.
For the hydraulic system with a gas-loaded accumulator, the increase in the gas pressure
allows the stored energy to increase, as the stored energy is directly related to the fluid
pressure, which depends on the gas pressure. However, the gas pressure value cannot be
increased without limit, as it works as an opposition force to the force transmitted by the
hydraulic circuit and, above a certain value, the hydraulic fluid will not be able to move
the accumulator piston as the opposition force is higher than the force transmitted by
hydraulic fluid, similar to the spring stiffness in the spring-loaded hydraulic
accumulator.
For this system, increasing the contact area between the RPEH DS and the hydraulic
circuit (Ah) has little impact on the transmitted energy efficiency, but increases the

Chapter 7 Integration of a Mechanical Energy Storage System in a Road
Pavement Energy Harvesting Hydraulic Device
255
storage energy efficiency, as the displacement induced in the hydraulic accumulator
piston increases, although the amplification of the force from the hydraulic circuit on
the hydraulic accumulator is decreased. By increasing the accumulator piston area (Asto),
there is little variation in both the transmitted energy and stored energy efficiencies.
In all the performed simulations the vertical acceleration induced by the RPEH device
to the vehicle body was lower than 1 m/s2. Considering the existing levels of
acceptability of the ride quality (ISO, 1997), this indicates that the RPEH device does
not cause discomfort to the vehicle driver and to its occupants.
7.3.4.2 Hydraulic system with mechanical actuation
Analyzing the results obtained with the computational simulations of the RPEH device,
both for the mechanically actuated hydraulic system with and without an incorporated
MES system, based on a spring-loaded or a gas-loaded hydraulic accumulator, some
conclusions may be drawn.
Taking the efficiency of the internal device of the RPEH to be the most important
parameter for evaluation, and comparing the effectiveness of the MES system, one can
conclude that, for the same simulation parameters, and compared to a hydraulic system
with mechanical actuation, both the spring-loaded and the gas-loaded hydraulic
accumulators do not increase the efficiency of the RPEH device. On the contrary, the
global efficiency decreases with these accumulators.
Both MES systems were implemented between the hydraulic circuit entrance and the
DAC, and are directly actuated by the fluid pressurized by the mechanical system.
However, due to each system’s working principles, their efficiencies are different. The
storage efficiency of the gas-loaded accumulator is higher than the spring-loaded
accumulator, with an average value of 46.2% for the simulated scenarios and a
maximum value of 62.8%, while the spring-loaded accumulator registered an average
storage efficiency value of 42.2% for the simulated scenarios and a maximum value of
48.0%. Also, the global efficiency of the entire system is higher for the gas-loaded

Chapter 7 Integration of a Mechanical Energy Storage System in a Road
Pavement Energy Harvesting Hydraulic Device
256
accumulator, compared to the spring-loaded accumulator. The best case scenario of the
gas-loaded accumulator is 42.9% efficiency of the energy received in the RPEH DS and
the electric energy consumed, compared to 31.4% efficiency for the spring-loaded
accumulator’s best case scenario.
When comparing the simulation results of the systems with and without MES, as
expected, the efficiency of the electrical system increases when using both MES
accumulators, as the electrical generator is actuated in a continuous mode. However, as
the storage efficiency of both accumulators is not very high it represents a mechanical
loss in the system, so the global efficiency of the system decreases slightly.
Analyzing individual variables for the RPEH device without a MES accumulator,
increasing the contact area of the SAC piston (Asp) has a small impact on the harvested
energy efficiency and the transmitted energy efficiency, and both increase slightly. By
increasing the DAC piston area (Acp), the delivered energy efficiency increases as does
the electrical generator efficiency, as there is an increase in the force delivered on the
mechanical system that actuates the electrical generator.
For the hydraulic system with a spring-loaded accumulator, the increase in the spring
stiffness allows the stored energy to increase, as expected. However, there is a limit to
the extent the spring stiffness value can be increased, as it works as an opposition force
to the force transmitted by the hydraulic circuit and, above a certain value, the hydraulic
fluid will not be able to move the accumulator piston as the opposition force will be
higher than the force transmitted by the hydraulic fluid.
For this system, increasing the SAC piston area (Asp) has a small impact on the
transmitted energy efficiency, slightly increasing the storage energy efficiency, as the
amplification of the displacement from the hydraulic circuit to the hydraulic
accumulator is greater, leading to a higher displacement of the accumulator piston and,
consequently, more energy being stored. On the other hand, increasing the accumulator
piston area (Asto) decreases the stored energy efficiency, as its displacement is lower
and, consequently, the spring force and the stored energy are lower.

Chapter 7 Integration of a Mechanical Energy Storage System in a Road
Pavement Energy Harvesting Hydraulic Device
257
For the RPEH device with a gas-loaded accumulator, the increase in the initial gas
pressure allows the stored energy to increase, as the stored energy is directly related to
the fluid pressure, which depends on the gas pressure. However, there is a limit to the
extent the gas pressure value can be increased, as it works as an opposition force to the
force transmitted by the hydraulic circuit and, above a certain value, the hydraulic fluid
will not be able to move the accumulator piston as the opposition force will be higher
than the force transmitted by the hydraulic fluid, similar to the spring stiffness in the
spring-loaded hydraulic accumulator.
For this system, increasing the SAC piston area (Asp) has very little impact either on the
transmitted energy efficiency or on the storage energy efficiency. Also, by increasing
the accumulator piston area (Asto) there is a very small variation in both the transmitted
energy and stored energy efficiency. By increasing the DAC piston area (Acp) there is an
increase in the delivered energy efficiency.
In all the performed simulations the vertical acceleration induced by the RPEH device
to the vehicle body was lower than 1 m/s2, a value that indicates that the RPEH device
does not cause discomfort to the vehicle driver and to its occupants, according to the
existing levels of acceptability of the ride quality (ISO, 1997).
7.4 Summary and Conclusions
Several technologies have been developed to convert vehicles’ mechanical energy into
electrical energy, some of them using hydraulic systems to transmit the mechanical
energy received by the surface of the equipment to an electrical generator, which
converts the mechanical energy into electrical energy. Most RPEH devices using
hydraulic systems developed so far induce pressure from the equipment’s surface to a
fluid inside a hydraulic tube, transmitting it to a double acting cylinder. This is
controlled by a hydraulic control valve and transmits the mechanical energy to a
mechanical RAP system, connected to an electric generator shaft with an inertia wheel.
The electric generator converts the mechanical energy into electrical energy, delivering

Chapter 7 Integration of a Mechanical Energy Storage System in a Road
Pavement Energy Harvesting Hydraulic Device
258
it to an electrical application. Most part of the systems described in the literature does
not include a MES unit, which can have a significant impact in the system performance,
considering that other renewable energy generation systems make use of such units with
successful results.
In this Chapter, different MES systems were studied and two accumulators were
incorporated in RPEH devices based on hydraulic systems, both a typical system and a
mechanically actuated hydraulic system, in order to study their impact on the total
efficiency of the device. The goal was to increase the energy delivered to the electric
generator in order to actuate this element in a continuous mode and, so, increase both
the individual efficiency and the global efficiency of the device.
With the hydraulic system modelled here, as well as the rest of the RPEH device, and
using a software which had been previously developed and presented in Chapters 3 and
5, computational simulations were performed in order to obtain the values of the energy
harvested, transmitted, stored, delivered, converted and consumed by the RPEH device.
From the analysis of the results it can be concluded that, for the same simulation
conditions of a standard hydraulic system, the spring-loaded accumulator does not
increase the total system efficiency, as it has a low storage efficiency, with average
values of around 18%, while the gas-loaded hydraulic accumulator has a high storage
efficiency, with average values of around 60%, allowing the total system efficiency to
increase by delivering a higher amount of energy to the electric generator in a
continuous mode and, so, increasing its efficiency to average values of around 94%.
When MES systems are applied to the RPEH device based on a hydraulic system with
mechanical actuation, presented in the previous Chapter, it can be concluded that, for
the same simulation conditions as the same system without a MES unit, neither the
spring-loaded nor the gas-loaded hydraulic accumulators increase the total efficiency of
the device, as the storage efficiency is not very high, reaching maximum values of
around 48.0% and 62.8%, respectively, and inducing losses in the mechanical system.
However, both hydraulic accumulators allow mechanical energy to be stored and

Chapter 7 Integration of a Mechanical Energy Storage System in a Road
Pavement Energy Harvesting Hydraulic Device
259
delivered in a continuous mode to the electrical generator, considerably increasing its
working efficiency and potential applications.
The inclusion of a MES system allows several energy harvesting and transmission
devices to be connected to the same MES system, which can be connected to a single
mechanical energy delivering system and to an electric system, reducing the total costs
of the system and allowing electrical energy to be generated only when necessary, and
not when the energy source (vehicles) is available. Harvesting and storing vehicle
mechanical energy during the day to be consumed at night for road illumination or grid
injection purposes, the solutions studied here become viable options, especially using
the gas-loaded accumulator.
7.5 References
Barnes, F. and Levine, J. (Eds.). (2011). Large energy storage systems handbook. CRC
Press, Boca Raton, FL, USA.
Chen, H., Cong, T.N., Yang, W., Tan, C., Li, Y. and Ding, Y. (2009). Progress in
electrical energy storage system: A critical review. Progress in Natural
Science, 19(3): 291-312.
Duarte, F., Champalimaud, J. and Ferreira, A. (2016). Waynergy Vehicles: an
innovative pavement energy harvest system. Proceedings of the Institution of Civil
Engineers – Municipal Engineer, 169(1): 13-18.
Durfee, W., Sun, Z. and Van de Ven, J. (2015). Fluid Power System Dynamics.
University of Minnesota, Minneapolis, MN, USA.
Huggins, R. (2010). Energy storage, vol. 406. Springer, New York, NY, USA.
Ibrahim, H., Ilinca, A. and Perron, J (2008). Energy storage systems—characteristics
and comparisons. Renewable and sustainable energy reviews, 12(5): 1221-1250.

Chapter 7 Integration of a Mechanical Energy Storage System in a Road
Pavement Energy Harvesting Hydraulic Device
260
ISO (1997). Mechanical vibration and shock - Evaluation of human response to whole-
body vibration. Part I: General requirements. ISO 2631-1, Geneva, Switzerland.
Mobley, R. (1999). Fluid power dynamics. Butterworth-Heinemann, Woburn, MA,
USA.
Parr, A. (2011). Hydraulics and pneumatics: a technician's and engineer's guide.
Elsevier, Oxford, UK.
Pirisi, A., Mussetta, M., Grimaccia, F. and Zich, R. E. (2013). Novel speed-bump
design and optimization for energy harvesting from traffic. IEEE Transactions on
Intelligent Transportation Systems, 14(4): 1983-1991.
Rabie, M. (2009). Fluid power engineering. McGraw-Hill, New York, NY, USA.
Steinke, F., Wolfrum, P. and Hoffmann, C. (2013). Grid vs. storage in a 100%
renewable Europe. Renewable Energy, 50: 826-832.
Ter-Gazarian, A. (2011). Energy storage for power systems, 2nd Edition. IET, London,
UK.
Todaria, P., Wang, L., Pandey, A., O'Connor, J., McAvoy, D., Harrigan, T. and Zuo, L.
(2015). Design, modeling and test of a novel speed bump energy harvester. In SPIE
Smart Structures and Materials+ Nondestructive Evaluation and Health
Monitoring (pp. 943506-943514). International Society for Optics and Photonics.
Wood, A. and Wollenberg, B. (2012). Power generation, operation, and control, Third
Edition. John Wiley & Sons, Hoboken, NJ, USA.

261
Chapter 8
A Methodology for Technical and
Economic Evaluation of Road
Pavement Energy Harvesting Devices
8.1 Introduction
In 2014, more than 80% of energy production came from fossil fuels (IEA, 2016),
proving that, in the present energetic paradigm, most electrical energy production still
makes use of fossil fuel combustion. This leads to irreversible environmental damage
and means economies have a great dependency on the fuels costs (IEA, 2015). Urgent
action is required to change the paradigm of electrical energy generation, which must be
based on renewable resources, decentralized, located near to the point of consumption
and, preferably, available when it is needed.
In the energy generation field, not only the technical aspects are critical for a new
technology to be accepted and used, but to be implemented in a considerable scale the
most important aspect is economic viability, and this represents the most significant
challenge with renewable energy sources, when compared with non-renewable sources.

Chapter 8 A Methodology for Technical and Economic Evaluation
of Road Pavement Energy Harvesting Devices
262
Several technologies have been developed and validated, but they are not yet
economically viable to promote an adoption en masse. In the last decade, renewable
energy sources such as solar and wind have been adopted increasingly, mainly through
governmental incentives in an initial phase, which has lead to an industrial development
that allowed providers reduce production costs, so making these technologies more
viable from an economic perspective, even with progressively reduced governmental
incentives (Lewis and Wiser, 2007; Carley, 2009; KPMG, 2015). This proved that with
the appropriate strategies and governmental incentives, other technologies can also
become economically attractive.
Besides solar and wind energy, other technologies such as wave energy or biomass
based systems have been studied intensively as renewable energy sources with a great
potential. In some literature (Priya and Inman, 2009; Khaligh and Onar, 2010), these are
called macro energy harvesting technologies. Energy Harvesting is typically described
as the conversion of ambient energy present in the environment into other useful means
of energy, such as electrical energy (Kazmierski and Beeby, 2009). Energy harvesting
technologies can be divided in two main groups, as presented in Chapter 2: macro
energy harvesting sources, which are associated mainly with solar, wind, hydro and
ocean energy; and micro energy harvesting, which is mostly associated with
electromagnetic, electrostatic, heat, thermal variations, mechanical vibrations, acoustic
and human body motion (Yidliz, 2009; Khaligh and Onar, 2010; Harb, 2010).
As studied in Chapter 2, road surfaces are continuously exposed to vehicle loads, from
which it is possible to extract energy which, using specific technologies, can be
transformed into electrical energy. These are called RPEH devices. As vehicles abound
in most cities of developed countries, it means that a considerable amount of energy is
transferred to road pavements without being used. In places where vehicles have to
reduce their speed, as for example on road type transitions, crosswalk or roundabout
entrances, road crossings, among others, the amount of energy released is maximized,
being these places the preferable spots to harvest energy. Road pavements can make use

Chapter 8 A Methodology for Technical and Economic Evaluation
of Road Pavement Energy Harvesting Devices
263
of that unused energy through RPEH devices that can harvest and convert vehicle
mechanical energy into electrical energy.
Although technical details of these technologies have been published, no economic
analysis has been presented so far to demonstrate the economic viability of these
systems. In this regard, the development of models not only for a technical but, most
importantly, for an economic evaluation of such technologies should be considered.
Such models would allow us to determine the most critical parameters of these
technologies, the importance and critical values of each parameter, so that researchers,
investors and decision makers can conclude on the feasibility of such applications. This
is a topic that requires attention since only economically viable technologies are usually
adopted in the energy production market.
Typically, an energy production unit is evaluated based on three key parameters,
namely: the capacity factor (CF), the levelized cost of electricity (LCOE) and the price
per installed watt (PPW). Renewable energy production units are no exception and these
are the key parameters to evaluate all technologies technically and economically, with
LCOE being the most important factor in classifying the economic potential of an
energy production unit (Mathew, 2006; Bradford, 2008; Sorensen, 2011; Adaramola,
2014; Narbel et al., 2014).
The CF of an electric energy power plant is the ratio of its actual output over a period of
time to its potential output if it were possible for it to operate at full capacity
continuously over the same period of time. The LCOE is an economic assessment of the
average total cost to build and operate an electric energy power plant over its lifetime
divided by the total energy output of the unit over the considered lifetime. The PPW
relates the amount of money one would have to spend to implement a power plant
capable of producing one watt of electricity, and is calculated by dividing the total cost
of the electric energy generation unit by the amount of peak power it can produce
(Sorensen, 2011; Adaramola, 2014; Narbel et al., 2014).
The typical CF values of other energy generation technologies are already quantified:
solar energy has CF values of around 20-30% (Adaramola, 2014; Joskow, 2011) and

Chapter 8 A Methodology for Technical and Economic Evaluation
of Road Pavement Energy Harvesting Devices
264
wind energy has CF values of around 30-40% (Mathew, 2006; Boccard, 2009). The
PPW of solar PV has values of around 2 to 5 €/W (Adaramola, 2014), depending on the
country and on the sector (residential, industrial, big scale), while wind energy has
values of around 2 €/W (Mathew, 2006; Boccard, 2009). The LCOE for solar PV is
between 107 (EU) and 125 (USA) €/MWh (Bradford, 2008; Adaramola, 2014), while
for wind energy it is around 73 (USA) and 142 (EU) €/MWh (Mathew, 2006; Boccard,
2009). These values are not as interesting as for non-renewable sources, as nuclear
power, coal or gas powered energy generation stations, among others, mainly due to the
intermittency of the energy sources. To give an example, nuclear power has a CF of
around 90% and a LCOE of around 50 to 60 €/MWh, making it the energy source with
the lowest costs (Narbel et al., 2014; Khatib, 2010).
For more detailed economic evaluations, a cost benefit analysis (CBA) is also
performed, in order to study the impact of the project and its importance in economic
terms, and to perform a monetary valuation of the solution. This type of analysis is
based on the evaluation of the return of capital (ROC), or payback time, for a specific
investment; the net present value (NPV) of such investment, and the internal rate return
(IRR) that the investment produces (Bradford, 2008; Sorensen, 2011; Diakoulaki and
Karangelis, 2007). NPV is an indicator of how much value an investment or project
adds to an investor. If the NPV is positive, the investment is considered to add
(financial) value to the investor, as it has the status of positive cash inflow in the
considered period. On the other hand, if the NPV has a negative value, the investment
would subtract value from the investor, and the project has the status of discounted cash
outflow in the considered period. The IRR on an investment is the rate of return that
makes the NPV of all cash flows, both positive and negative, from a particular
investment equal to zero. It is also defined as the discount rate at which the present
value of all future cash flow is equal to the initial investment or the rate at which an
investment breaks even. This is used to measure and compare the profitability of
investments. The higher a project’s IRR, the most desirable it is to invest (Bradford,
2008; Sorensen, 2011; Diakoulaki and Karangelis, 2007).

Chapter 8 A Methodology for Technical and Economic Evaluation
of Road Pavement Energy Harvesting Devices
265
The first novel point of this Chapter is the development of a complete model to evaluate
the performance of a road pavement energy harvesting system technically and
economically for different energy applications that will allow researchers, investors and
decision makers to decide on the feasibility of such applications.
Some software does exist for performing technical and economic evaluation of different
energy production technologies, for both renewable and non-renewable energy, which
calculates all the previously presented parameters in relation to the inputs defined by the
user (Sinha and Chandel, 2014). Solar energy is the technology with the software tools
developed in recent years for this purpose (INSEL, 2017; TRNSYS, 2017; PV*SOL,
2017; Solergo, 2017; Solterm, 2017; Polysun, 2017), while specific software for wind
energy is not so common (WindSim, 2017). There are several software solutions which
allow a user to simulating different energy generation technologies (HOMER, 2017;
HYBRID2, 2017; HOGA, 2017; RETScreen, 2017; GRHYSO, 2017), which means a
direct comparison can be made between different energy sources and technologies with
the same application.
For all of these software solutions, the inputs are related with: the energy source, which
in the case of solar energy is the solar availability for the considered place throughout
the year, while for wind energy, this is the wind availability; for both of these there is
easily accessible information in most countries and the software tools already include
this information for each available location; the technical characteristics of the
technology and the application; the economic aspects of both the technology and the
energy application. With this information, the tool is able to determine all the technical
and economic parameters and allow users to come to conclusions about the viability of
the application.
Despite the existence of several software tools to evaluate the performance of different
energy production technologies technically and economically, there is no tool to
perform this evaluation for a RPEH technology, leaving a gap that prevents investors
and decision makers from rigorously evaluating this type of solution, as well as

Chapter 8 A Methodology for Technical and Economic Evaluation
of Road Pavement Energy Harvesting Devices
266
meaning that each researcher use their own method to evaluate the technology under
development.
The second novel point of this Chapter is the development of a software tool to evaluate
the performance of a road pavement energy harvesting system technically and
economically for different energy applications that will allow researchers, investors and
decision makers to decide on the feasibility of such applications.
All the important variables, both technical and economic, are considered and the
evaluation is based on the potential energy generation of the system, the monetary
valuation of that energy depending on the considered energy application, which allows
different stakeholders to fully classify the system performance and make decisions
about the viability of an investment.
A sensitivity analysis is performed to understand about the impact of each key variable
in the technical and economic performance of the system and on the investment return
and profitability. These key variables are both technical (traffic data and energy
conversion efficiency of the device) and economic (system cost, energy price).
These developments allow to overcome an existing gap, by providing an entire model to
evaluate RPEH systems and information about the impact of each variable in the
performance of the system and its viability, allowing researchers to direct their attention
to optimizing critical variables, and investors and decision makers to seek the most
appropriate conditions to invest in this type of solution.
8.2 Evaluation Model Description
8.2.1 Introduction
To perform the technical and economic analysis of an electric energy generation unit, a
quantitative research with performance analysis is typically used, by quantifying the
electrical energy that the unit is able to produce, per year of operation and for the entire

Chapter 8 A Methodology for Technical and Economic Evaluation
of Road Pavement Energy Harvesting Devices
267
period of the study, relating it to the investment made both to implement the energy
generation unit and to maintain it over time. For this purpose, the CF, LCOE and PPW
are the three key parameters for quantification.
The usage of a multi-criteria decision analysis is also considered, with the usage of
scenarios and case studies to identify the optimal characteristics of the electric energy
generation unit. To implement these methodologies, the values of each key variable are
changed between simulations and the previously mentioned parameters are evaluated. A
non-monetary evaluation can also be performed considering the impact of the solution
in terms of the environmental benefits it provides.
Another important methodology used to evaluate an electrical energy generation unit is
the CBA, to study the impact of the project and its economic importance, and to
perform a monetary valuation of the solution. This type of analysis is based on the
evaluation of the ROC, or payback time, for a specific investment; the NPV of such
investment, and the IRR that the investment produces.
To evaluate these parameters, different technical and economical variables are
considered, taking in consideration the specificities of each technology. In this section,
the equations to perform a technical and economic analysis to a RPEH system
application are presented.
8.2.2 Technical and economic analysis
The energy source of a RPEH device is the mechanical energy from moving vehicles.
The first and most significant input for a technical analysis of a RPEH unit performance
is the traffic data. AADT quantifies the annual average daily traffic, measured for all the
road lanes. To determine the lane under study’s daily traffic (LDT) using a simple
method, Equation (8.1) can be used dividing AADT by the number of road lanes.
Proportionally, the lane annual traffic is determined through Equation (8.2).

Chapter 8 A Methodology for Technical and Economic Evaluation
of Road Pavement Energy Harvesting Devices
268
However, there are different types of vehicles, which release different amounts of
energy to the pavement, so it is important to quantify the energy each vehicle releases
according to its category. Four different categories were defined: TD1 for vehicles under
1 ton; TD2 for vehicles between 1 and 2 tons; TD3 for vehicles between 2 and 3.5 tons;
and TD4 for vehicles weighing more than 3.5 tons. The daily traffic (DT) can then be
quantified for each vehicle category, using Equation (8.3).
(8.1)
5 (8.2)
(8.3)
These equations are correct for the first year of the analysis only. Considering the
traffic’s annual evolution (ATE), the AADT changes every year and, consequently, the
LDT, LAT and DTcat also change. So, for a multiple year analysis, from the second year
forward, Equations (8.4-8.7) should be used to quantify the updated traffic.
(8.4)
(8.5)
(8.6)
(8.7)
For each vehicle category, a certain amount of energy is released to the RPEH device,
depending both on the vehicle and on the RPEH characteristics. These values can be
determined using the software tool presented in Chapter 3, which allows performing an
energetic analysis on the interaction between a vehicle and a RPEH device. For each
traffic average speed (TAS), the average amount of energy released by each vehicle
category (ERVcat) can be defined, as presented by Equation (8.8). Considering the
conversion efficiency of the RPEH device (η), the energy generated by each vehicle
category (EGVcat) can be determined by Equation (8.9).
(8.8)

Chapter 8 A Methodology for Technical and Economic Evaluation
of Road Pavement Energy Harvesting Devices
269
(8.9)
A RPEH unit can be defined by its installed power or by the number of meters of
equipment applied on the road pavement. This study considers as inputs the number of
meters of RPEH devices installed on the pavement (NMP), the installed power per
RPEH unit (IPM) and each device surface’ width (EHW). With these, the total number
of RPEH installed units (NMI) and the total installed power (TIP) are calculated, using
Equations (8.10) and (8.11), respectively.
Knowing the traffic distribution, the daily traffic for each category (DTcat), and the
energy generated by each category (EGVcat), and the number of modules installed (NMI)
in a RPEH application, the total energy generated per day can be determined using
Equation (8.12), for each year, while the total energy generated per year can be
determined using Equation (8.13). The total amount of energy generated during the
period studied (TEGe) is determined through Equation (8.14), where YRS represent the
number of years considered for the study.
(8.10)
(8.11)
(8.12)
(8.13)
(8.14)
Associated to renewable or alternative electric energy production, the amount of CO2
emissions avoided by not using fossil fuels in the energy production can be considered.
To do such an analysis, a conversion factor (CCF) from kWh to CO2 grams can be used,
allowing us to determine the CO2 emissions avoided per year (COY) and the total
emissions of CO2 avoided during the period under study (COP), using Equations (8.15)
and (8.16), respectively. Considering the CO2 economic value per ton (CVT), the

Chapter 8 A Methodology for Technical and Economic Evaluation
of Road Pavement Energy Harvesting Devices
270
economic value of the avoided emissions can be quantified, per year (VCY) and for the
entire period under study (VCP), using Equations (8.17) and (8.18), respectively.
(8.15)
(8.16)
(8.17)
(8.18)
To evaluate the CF of the RPEH application, the total amount of energy generated
during the studied period (TEGe) should be compared to the maximum possible energy
generated by the RPEH unit, which can be determined considering the total installed
power, producing energy during the entire period of the study. The CF is determined
using Equation (8.19), where the previous parameters are considered.
(8.19)
To perform an economical analysis, some important parameters should be defined. The
price per RPEH module (PPM) is the first and most important, as well as the installation
price per RPEH module (ICPM), the extra equipment price (EEP), other costs involved
(OCI) and yearly maintenance price per module (YMP). Annual inflation (INF) should
also be considered.
The price per module defines the price that the customer pays for each RPEH module
installed, excluding taxes. The ICPM is the total installation price divided by the
number of RPEH devices installed on the road pavement. The EEP is the sum of all the
equipment external to the road pavement, such as the energy converter, the electronic
and storage units, and the inverter. The item OCI represents all the additional costs
involved, such as the installation design, insurance and taxes. The YMP are the costs of
maintenance of the RPEH devices, per year, and these costs are updated each year,
considering the annual inflation (INF), as defined by Equation (8.20).

Chapter 8 A Methodology for Technical and Economic Evaluation
of Road Pavement Energy Harvesting Devices
271
(8.20)
With these parameters, it is possible to determine the initial investment on the RPEH
application (CAPEX), the annual maintenance costs (OPEX), and the total investment
for all the years considered for the project lifetime (TINV), using Equations (8.21-8.23).
Knowing the CAPEX, OPEX and TINV, it is possible to determine the PPW and the
LCOE, the two most important parameters in evaluating a renewable energy application.
These are determined using Equations (8.24) and (8.25), respectively.
(8.21)
(8.22)
(8.23)
(8.24)
(8.25)
8.2.3 Cost benefit analysis
To perform a CBA for a renewable energy production system, two different energy
applications (EA) are usually considered: the injection of the produced energy into the
grid (GI), receiving a defined amount of money for each kWh injected into the grid; or
the self-consumption (SC) of the generated energy, avoiding buying electricity from the
grid. Both EA were considered in the present study.
In the GI application, only two variables are needed to perform the CBA: the initial
price at which the electricity operator buys the produced electrical energy (GIEP) and
the energy price yearly evolution (GIYE). Then, the price at which the electricity
operator buys the produced electrical energy for each year (GIAEP) can be determined,

Chapter 8 A Methodology for Technical and Economic Evaluation
of Road Pavement Energy Harvesting Devices
272
as expressed by Equation (8.26). Knowing this value, to determine the annual income
(GIAI) and the total income for the studied period (GIPI), Equations (8.27) and (8.28)
can be used, respectively. The total profits can be determined by subtracting the TINV
from the GIPI.
(8.26)
(8.27)
(8.28)
To determine the ROC, or payback time, Equation (8.29) can be used, relating the TINV
to the average value of the GIAI. The annual cash flow (CFLO) is determined through
Equation (8.30), relating the CAPEX to the yearly GIAI and OPEX, and the updated
cash flow (CFLOU) is determined by Equation (8.31), considering the annual inflation
(INF). These two variables are important to determine the NPV and the IRR of the
investment, calculated through Equations (8.32) and (8.33), respectively.
(8.29)
(8.30)
(8.31)
(8.32)
(8.33)
In the SC application, more variables are needed besides the initial energy price (SCEP)
and the energy price annual inflation (SCEI). First, it is necessary to determine the
annual energy consumption (SCYCE) of the electrical application and, for that, the

Chapter 8 A Methodology for Technical and Economic Evaluation
of Road Pavement Energy Harvesting Devices
273
installed power (SCIP) and the average consumption hours per day (SCAH) are needed.
With these variables, SCYCE is determined through Equation (8.34). The total energy
consumed during the considered period (SCPCE) can be determined through Equation
(8.35), without considering any energy consumption variation during the period.
Knowing the total energy generated by the RPEH application (TEGe), it is possible to
determine the percentage of energy contribution (SCPC) to supply the electrical
application, through Equation (8.36). Ideally, this value should be close to 100%, as for
lower values the energy generated will not be enough to fully supply the electrical
application, and for higher values there is more energy being generated than required -
in this case, the exceeding energy could be injected into the grid.
(8.34)
(8.35)
(8.36)
As for the GI application, the energy price (SCEPY) should also be updated for each
year, through Equation (8.37). Then, the annual savings (SCAS) and the total savings for
the period considered (SCECP) can be determined by Equations (8.38) and (8.39),
respectively. The total savings can be quantified by subtracting the TINV from the
SCECP.
(8.37)
(8.38)
(8.39)
To determine the ROC for this EA, the GIAI should be substituted by the SCAS in
Equation (8.29). Similarly, to determine the CFLO, the GIAIy should be substituted by

Chapter 8 A Methodology for Technical and Economic Evaluation
of Road Pavement Energy Harvesting Devices
274
the SCASy in Equation (8.30). Then, the CFLOU, NPV and IRR are determined through
Equations (8.31-8.33).
8.3 Software Tool for Technical and Economical
Evaluation of RPEH Applications
8.3.1 Introduction
Based on the study presented in the previous section, a simulation software tool was
developed, using MATLAB® software, in order to study the technical and economic
performance of an RPEH system, as well as to perform the cost benefit analysis of these
systems for different energy applications. The software was named RETEES - Road
Energy Technical and Economic Evaluation Software.
The purpose of the simulation software is to perform this analysis in great detail, with
the possibility of fully characterizing the traffic of the road where the system is
implemented, the technical features of the RPEH devices, as well as their economical
features, and the energy applications where the electrical energy generated by the RPEH
unit is used. With all these data, the software determines all the technical and economic
data defined in the previous section, typically used for other renewable and non-
renewable energy sources, allowing the viability of the technology application for each
scenario to be determined. The results are presented both numerically and graphically.
Also, the software allows a sensitivity analysis to be performed, by defining a key
variable and indicating its values, recalculating the outputs for the different scenarios.
In this section, the simulation software is briefly presented in terms of the input and
output graphical user interfaces and the flowcharts that illustrate its working principles.
In Figure 8.1 a schematic representation of RETEES is presented.
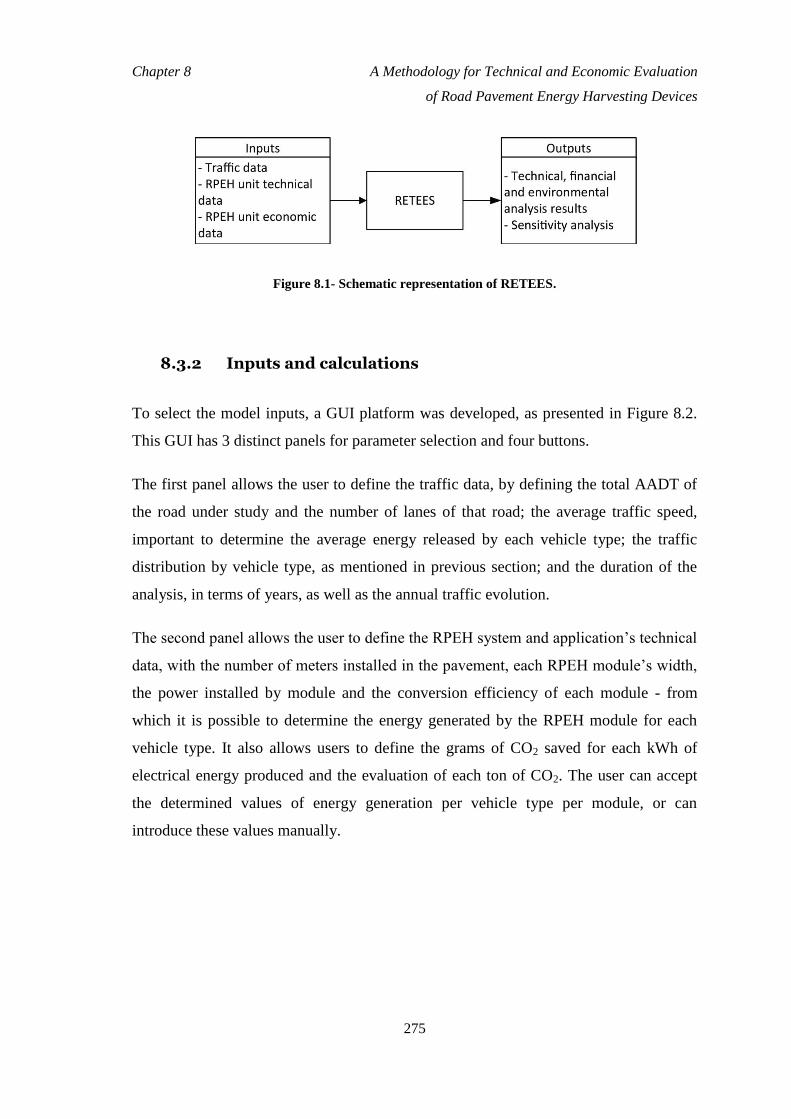
Chapter 8 A Methodology for Technical and Economic Evaluation
of Road Pavement Energy Harvesting Devices
275
Figure 8.1- Schematic representation of RETEES.
8.3.2 Inputs and calculations
To select the model inputs, a GUI platform was developed, as presented in Figure 8.2.
This GUI has 3 distinct panels for parameter selection and four buttons.
The first panel allows the user to define the traffic data, by defining the total AADT of
the road under study and the number of lanes of that road; the average traffic speed,
important to determine the average energy released by each vehicle type; the traffic
distribution by vehicle type, as mentioned in previous section; and the duration of the
analysis, in terms of years, as well as the annual traffic evolution.
The second panel allows the user to define the RPEH system and application’s technical
data, with the number of meters installed in the pavement, each RPEH module’s width,
the power installed by module and the conversion efficiency of each module - from
which it is possible to determine the energy generated by the RPEH module for each
vehicle type. It also allows users to define the grams of CO2 saved for each kWh of
electrical energy produced and the evaluation of each ton of CO2. The user can accept
the determined values of energy generation per vehicle type per module, or can
introduce these values manually.

Chapter 8 A Methodology for Technical and Economic Evaluation
of Road Pavement Energy Harvesting Devices
276
Figure 8.2- RETEES GUI to select the inputs for the computational model.
The third panel allows the user to define both the RPEH system economic data, by
introducing the price of each RPEH module, the installation price per RPEH module,
the extra equipment price (e.g., the inverter costs), other costs involved (e.g., the
application design costs), the yearly maintenance price per module (YMP) and the
annual costs inflation. This panel also allows users to define the energy application data,
for cost benefit analysis, by defining the energy application - grid injection or self
consumption - and the specific data of each application: the energy price per kWh and
the annual evolution of this price, for the grid injection energy application; and the
installed power, average consumption hours per day, energy cost per kWh and energy
price inflation, for the self consumption energy application.
Figure 8.3 presents the flowcharts for each action in the input GUI.
While the user inserts data in this GUI, the corresponding initial outputs of each section
are automatically calculated and presented in the GUI (Figure 8.3a). For example, with
AADT and NL defined, LDT, LMT and LAT are automatically determined and presented,

Chapter 8 A Methodology for Technical and Economic Evaluation
of Road Pavement Energy Harvesting Devices
277
and with TD1-TD4 defined, DT1-DT4 are also automatically determined and presented in
the GUI.
Figure 8.3- RETEES flowcharts from Inputs GUI actions and buttons: (a) fill input data action; (b)
press "Default values" button; (c) press "Clear all" button; (d) press "Technical & Economic
Analysis" button; (e) press "Cost Benefit Analysis" button.
When the user presses the button Default values, all the input boxes are automatically
presented with standard scenario values (Figure 8.3b), and if the user presses the button
Clear all, all the input boxes values are automatically cleared (Figure 8.3c).
After all the data is defined by the user in the Inputs GUI and the Technical &
Economic Analysis button is pressed, all the data is collected and a validation is done to
confirm if the data is correctly defined. If it is not, an error message is presented. If it is
correct, all the variables are defined and the computational model computes all the
technical and economic results for the selected period, based on the equations presented

Chapter 8 A Methodology for Technical and Economic Evaluation
of Road Pavement Energy Harvesting Devices
278
in the previous section for the TEA. After the simulation is completed, the results are
obtained and validated. A TEA Output GUI is opened and the results are presented,
both graphically and numerically (Figure 8.3d). If the Cost Benefit Analysis button is
pressed, the validation and computation processes are similar, but the CBA data is
determined instead of the TEA, based on the equations presented in the previous section
for the CBA, and a CBA Output GUI is opened where the results are presented, both
graphically and numerically (Figure 8.3e).
8.3.3 Outputs and results presentation
Two different Output GUI’s were developed, one for each type of analysis: one for the
TEA outputs (Figure 8.4) and another for the CBA outputs (Figure 8.5). The layout of
both GUI’s is identical, with four distinct panels - one to present the numerical results
and another to present the graphical results of the TEA/CBA; one to define the
sensitivity analysis data and another to present the sensitivity analysis graphical results -
and four buttons.
In the TEA Output GUI several numerical results are presented in the left panel, as
shown in Figure 8.4, with special emphasis on the Cost per installed Watt, Levelized
Cost of Electricity and the Capacity Factor, the most important parameters of the TEA.
Also, three graphical intermediate results are presented in the upper panel: the annual
variation of the LDT (in vehicles per day), the quantity of the annual energy generation
(in kWh) and the annual OPEX (in Euros).
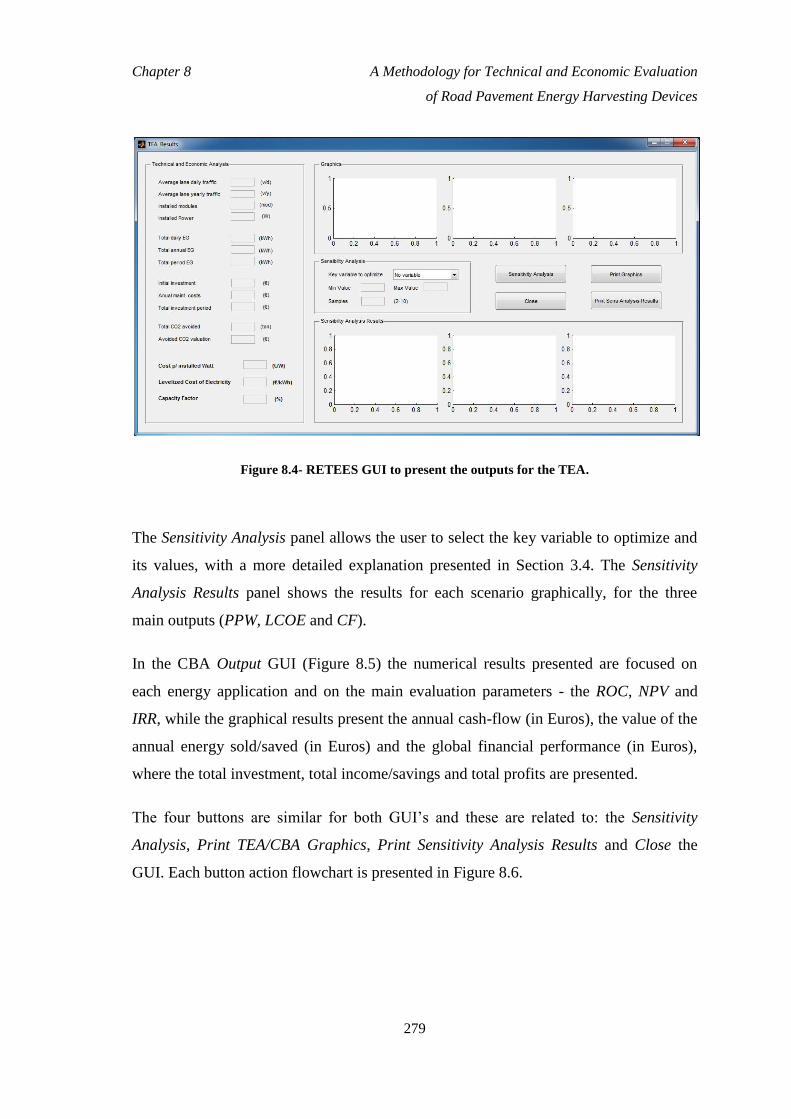
Chapter 8 A Methodology for Technical and Economic Evaluation
of Road Pavement Energy Harvesting Devices
279
Figure 8.4- RETEES GUI to present the outputs for the TEA.
The Sensitivity Analysis panel allows the user to select the key variable to optimize and
its values, with a more detailed explanation presented in Section 3.4. The Sensitivity
Analysis Results panel shows the results for each scenario graphically, for the three
main outputs (PPW, LCOE and CF).
In the CBA Output GUI (Figure 8.5) the numerical results presented are focused on
each energy application and on the main evaluation parameters - the ROC, NPV and
IRR, while the graphical results present the annual cash-flow (in Euros), the value of the
annual energy sold/saved (in Euros) and the global financial performance (in Euros),
where the total investment, total income/savings and total profits are presented.
The four buttons are similar for both GUI’s and these are related to: the Sensitivity
Analysis, Print TEA/CBA Graphics, Print Sensitivity Analysis Results and Close the
GUI. Each button action flowchart is presented in Figure 8.6.

Chapter 8 A Methodology for Technical and Economic Evaluation
of Road Pavement Energy Harvesting Devices
280
Figure 8.5- RETEES graphical user interface to present the outputs for the cost benefit analysis.
If the Sensitivity Analysis button is pressed, the model checks if any key variable is
selected in the SA panel - if not, an error message is displayed. If a variable is selected,
SA panel values are validated - if an error is detected, an error message is displayed, if
not, the model proceeds with the SA, computing the previously model with the
respective equations presented in the previous section, for the different key variable
values, registering the outputs of each scenario. In the end, the results are presented
graphically in the bottom panel of the GUI, with three graphics, each presenting an
output result for the different key variable scenarios (Figure 8.6a).
If the Print Sens Analysis Graphics button is pressed, the model checks if any key
variable is selected in the SA panel - if not, an error message is displayed. If a variable is
selected, the model checks if the SA Results graphics are filled in - if not, an error
message is displayed, if yes, the model proceeds by saving all the results in an Excel
file, and then printing the graphical results in jpeg files (Figure 8.6b).
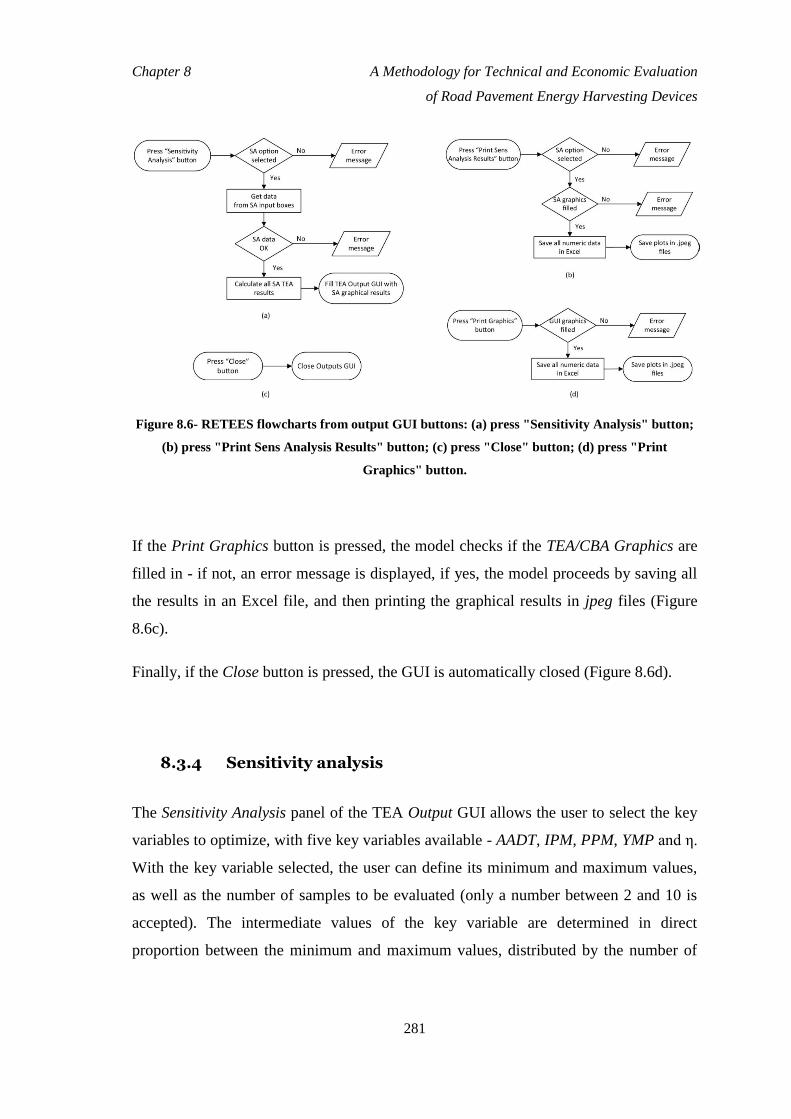
Chapter 8 A Methodology for Technical and Economic Evaluation
of Road Pavement Energy Harvesting Devices
281
Figure 8.6- RETEES flowcharts from output GUI buttons: (a) press "Sensitivity Analysis" button;
(b) press "Print Sens Analysis Results" button; (c) press "Close" button; (d) press "Print
Graphics" button.
If the Print Graphics button is pressed, the model checks if the TEA/CBA Graphics are
filled in - if not, an error message is displayed, if yes, the model proceeds by saving all
the results in an Excel file, and then printing the graphical results in jpeg files (Figure
8.6c).
Finally, if the Close button is pressed, the GUI is automatically closed (Figure 8.6d).
8.3.4 Sensitivity analysis
The Sensitivity Analysis panel of the TEA Output GUI allows the user to select the key
variables to optimize, with five key variables available - AADT, IPM, PPM, YMP and η.
With the key variable selected, the user can define its minimum and maximum values,
as well as the number of samples to be evaluated (only a number between 2 and 10 is
accepted). The intermediate values of the key variable are determined in direct
proportion between the minimum and maximum values, distributed by the number of

Chapter 8 A Methodology for Technical and Economic Evaluation
of Road Pavement Energy Harvesting Devices
282
samples. For example, if the selected key variable is AADT, the minimum value is
10,000, the maximum value is 50,000 and the number of samples is 5, the model will
evaluate five scenarios: 10 ,000; 20,000; 30,000; 40,000 and 50,000 vehicles/day
(Figure 8.7).
Figure 8.7- RETEES output GUI filled with TEA numerical and graphical results and with the SA
graphical results.
The software uses all the data inserted in the Input GUI to perform the SA, changing
only the key variable value in each scenario, registering the outputs. After computing all
the key variable values, the results are presented graphically, in the Sensibility Analysis
Results panel, with one graphic for each output: PPW, LCOE and CF (Figure 8.7).
For the previously mentioned case with five different AADT values, Figure 8.7 presents
the simulation results for the SA, with each graph having 5 bars, one for each scenario,
making it possible to conclude that the PPW does not change with AADT, the LCOE
decreases with the AADT increase, and the CF increases with the AADT increase.

Chapter 8 A Methodology for Technical and Economic Evaluation
of Road Pavement Energy Harvesting Devices
283
Similarly, the Sensitivity Analysis panel of the CBA Output GUI allows the user to
select the key variable to optimize, with six key variables available - AADT, IPM, PPM,
YMP, GIEP/SCEP (depending on the energy application) and η. With the key variable
selected, the user can define its minimum and maximum values, as well as the number
of samples to be evaluated (only a number between 2 and 10 is accepted). The
intermediate values of the key variable are determined in direct proportion between the
minimum and maximum values, distributed by the number of samples.
The evaluation process of the cost benefit SA is similar to the technical and economical
SA, with the results presented graphically in the Sensibility Analysis Results panel, with
one graph for each output: ROC, NPV and IRR (Figure 8.8).
Considering a case with 10 different AADT values, from 10,000 to 50,000 vehicles/day,
Figure 8.8 presents the simulation results for the SA, with each graph having 10 bars,
one for each scenario, making it possible to conclude that the ROC decreases with the
increase in AADT, while the NPV and the IRR increase with the increase in AADT.
Figure 8.8- RETEES output GUI filled with CBA numerical and graphical results and with the SA
graphical results.

Chapter 8 A Methodology for Technical and Economic Evaluation
of Road Pavement Energy Harvesting Devices
284
8.4 Case Studies and Results
8.4.1 Introduction
The models being developed are used to evaluate a RPEH system application both
technically and economically, as well as to perform a cost benefit analysis for an energy
application of the RPEH system, and the results obtained from the case studies are
discussed in this section.
First, the model inputs are presented and justified.
1. The road type considered for implementing the RPEH devices is a main distributor
in an urban environment, where the traffic speed is 50 km/h, traffic volume is high
enough to provide reasonable values of harvested energy and traffic speed
reduction is required at its entrance, exit and in specific spots. The number of
lanes of this road type can be two or four (AASHTO, 2001; Elvik et al., 2009). In
the present work, for simplification purposes, two lanes are considered, with the
total AADT distributed equally over the two lanes.
2. To define the traffic data, typical values for urban mobility are considered, based
on high density population cities (TRB, 2000). So, the initial value considered, for
a two lane road, is 20,000 vehicles per day, which is changed in the sensitivity
analysis.
3. The traffic distribution by vehicle category changes in relation to the country and
the type of road. Considering a typical scenario of a main distribution road in an
urban environment (TRB, 2000; AASHTO, 2001; Elvik et al., 2009), the selected
traffic profile is: TD1 equal to 25%; TD2 equal to 50%; TD3 equal to 23%; and
TD4 equal to 2%.
4. To determine the energy released by each vehicle type (ERV1-4) in relation to each
traffic average speed (TAS), the software RoadVISS, presented in Chapter 3, was
used. The results are presented in Table 8.1, for an EHW equal to 0.5 m.

Chapter 8 A Methodology for Technical and Economic Evaluation
of Road Pavement Energy Harvesting Devices
285
Table 8.1- Average energy released by vehicle category in relation to the vehicle speed (EHW = 0.25
m).
TAS (km/h) ERV1 (J) ERV2 (J) ERV3 (J) ERV4 (J)
30 100 150 200 300
40 150 200 300 500
50 200 266 400 666
60 180 230 350 600
70 150 200 300 500
5. To define the energy conversion efficiency of a RPEH device, as well as its typical
dimensions and installed power, the state-of-the-art study presented in Chapter 2
is used. From the different technologies under development, those which make
use of electromechanical systems are the most efficient, reaching a maximum
efficiency of 50% (currently). For this particular system (Duarte et al., 2016), the
module width is 0.7 m and the installed power per module is about 450 W.
Despite the fact the module width is slightly more than 0.5 m, considered to
determine the energy lost by the vehicle, the values of Table 8.1 are accepted for a
module width of 0.7 m.
6. The considered values of CO2 grams avoided for each kWh produced changes
from country to country, depending on their energy production profile. An
average value for OECD countries is 500 CO2g/kWh (EEA, 2017), and this value
is used in the present study. For USA, for example, this value is 480 CO2g/kWh,
while for Europe the average value is 290 CO2g/kWh.
7. Valuation of CO2, also known as carbon price, has been decreasing yearly.
Currently, and as defined by the World Bank (Luckow et al., 2015; The World
Bank, 2017), a price of 10 €/ton can be considered a reference value.
8. The price per module is not defined in the existing studies regarding RPEH
systems, as these are based on the technical performance of the systems under
development. So, in this study, values are set in relation to the costs of the
components used to produce the selected system (Duarte et al., 2016). The

Chapter 8 A Methodology for Technical and Economic Evaluation
of Road Pavement Energy Harvesting Devices
286
considered price of each module is 1,000 € and its installation cost is equal to 100
€. The extra equipment cost considered for a grid injection or self consumption
application is 1,000 €, for a power inverter solution. Extra costs with certification
and insurance are considered, giving a total cost of 500 €. The annual
maintenance costs used are 50 € per RPEH unit.
9. To define the grid injection energy price, a subsidized regime is considered.
Taking into consideration what has been done for other technologies in several
countries (Haas et al., 2004; Reiche and Bechberger, 2004; Alvarez et al., 2009;
Frondel et al., 2009; Boomsma et al., 2012; Schmalensee, 2012; Campoccia et al.,
2014), especially for solar PV, with several countries in Europe using feed-in
tariff’s higher than 0.50 €/kWh, a feed-in tariff of 0.65 €/kWh is considered in the
present study, similarly to what was done to set up the solar energy program in
Portugal, in 2007. This value is valid for a 10 year period (Portal Energia, 2017).
This value was set initially to support the market’s adoption of the technology and
was then progressively reduced in order to follow the falling price of the
technology.
The simulations input values are presented in Table 8.2.
8.4.2 Technical and economic analysis
Using the values presented in Table 8.2 to perform a TEA, the obtained results are
presented in Table 8.3. One can conclude that the PPW is close to that of other
renewable energy sources (Adaramola, 2014; Narbel et al., 2014), but the LCOE is
higher than current energy generation solutions, while the CF is too low. So, a
sensitivity analysis was performed for different key variables to understand the impact
of each variable in the technical and economic performance of the RPEH application.

Chapter 8 A Methodology for Technical and Economic Evaluation
of Road Pavement Energy Harvesting Devices
287
Table 8.2- Initial values for the simulation variables.
Variable name Value Unit
Tra
ffic
da
ta
AADT 20,000 (vehicles/day)
Number of road lanes 2 -
Average speed 50 (km/h)
Traffic distribution TD1-4 23 | 50 | 25 | 2 (%)
Analysis: number of years 10 (Years)
Annual traffic evolution 2 (%)
RP
EH
tec
hn
ica
l
da
ta
Number of installed meters 28 (m)
Module width 0.7 (m)
Power per RPEH module 450 (W)
Conversion efficiency 50 (%)
CO2 g/kWh 500 (g/kWh)
CO2 valuation 10 (€/ton)
Energy generation p/ vehicle type (EGM1-4) Determined (J)
RP
EH
eco
no
mic
da
ta
Price per module 1,000 (€)
Installation price per module 100 (€)
Extra equipment price 1,000 (€)
Other costs involved 500 (€)
Yearly maintenance price per module 50 (€)
Annual inflation 2 (%)
En
erg
y
ap
pli
cati
on
Energy Application GI -
GI: Energy price | price evolution 0.65 | 0 (€/kWh) | (%)
SC: Energy cost | Energy inflation 0 | 0 (€/kWh) | (%)
SC: Installed power | Av. Hours/day 0 | 0 (W) | (h)
The SA for different AADT values considers 5 values from 10,000 to 50,000 vehicles
per day on the two road lanes and its results are presented in Figure 8.9a for the three
key indicators. The SA for different values of η considers 5 values from 40 to 80% and
the results are presented in Figure 8.9b. The SA for different PPM values considers 5
values from 500 to 1,500 € and its results are presented in Figure 8.9c. The SA for
different YMP values considers 4 values from 20 to 100 € and its results are presented in
Figure 8.9d.
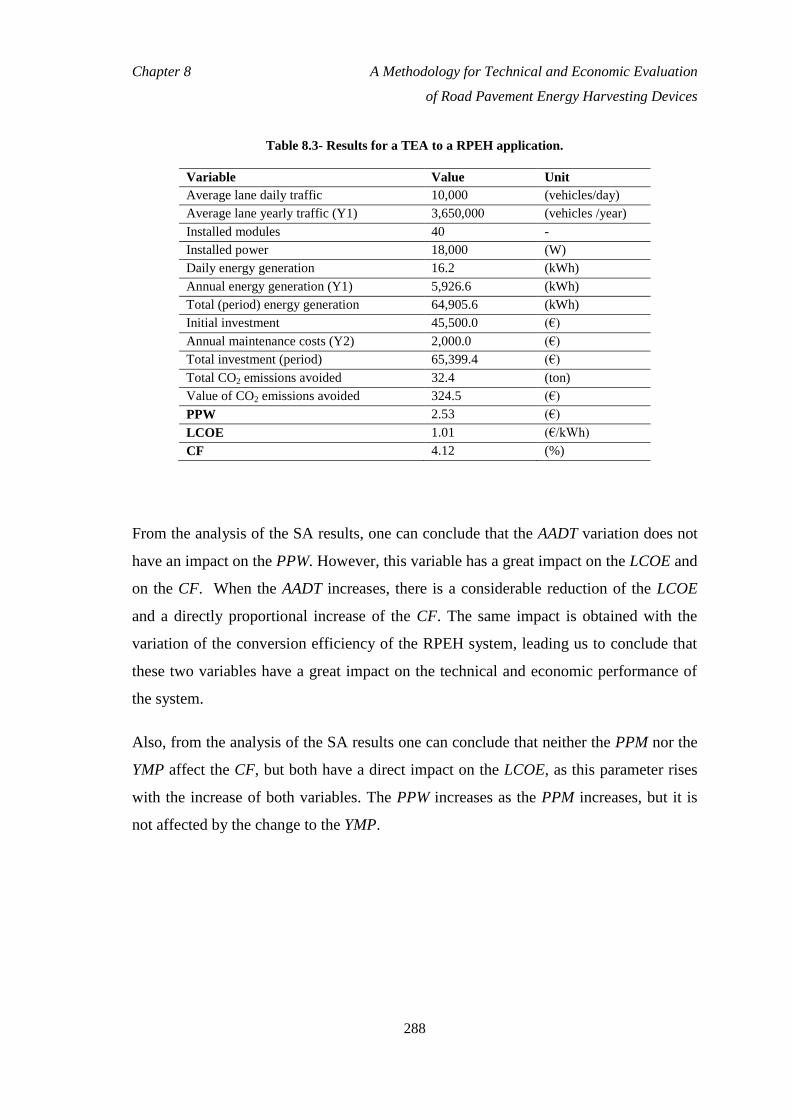
Chapter 8 A Methodology for Technical and Economic Evaluation
of Road Pavement Energy Harvesting Devices
288
Table 8.3- Results for a TEA to a RPEH application.
Variable Value Unit
Average lane daily traffic 10,000 (vehicles/day)
Average lane yearly traffic (Y1) 3,650,000 (vehicles /year)
Installed modules 40 -
Installed power 18,000 (W)
Daily energy generation 16.2 (kWh)
Annual energy generation (Y1) 5,926.6 (kWh)
Total (period) energy generation 64,905.6 (kWh)
Initial investment 45,500.0 (€)
Annual maintenance costs (Y2) 2,000.0 (€)
Total investment (period) 65,399.4 (€)
Total CO2 emissions avoided 32.4 (ton)
Value of CO2 emissions avoided 324.5 (€)
PPW 2.53 (€)
LCOE 1.01 (€/kWh)
CF 4.12 (%)
From the analysis of the SA results, one can conclude that the AADT variation does not
have an impact on the PPW. However, this variable has a great impact on the LCOE and
on the CF. When the AADT increases, there is a considerable reduction of the LCOE
and a directly proportional increase of the CF. The same impact is obtained with the
variation of the conversion efficiency of the RPEH system, leading us to conclude that
these two variables have a great impact on the technical and economic performance of
the system.
Also, from the analysis of the SA results one can conclude that neither the PPM nor the
YMP affect the CF, but both have a direct impact on the LCOE, as this parameter rises
with the increase of both variables. The PPW increases as the PPM increases, but it is
not affected by the change to the YMP.
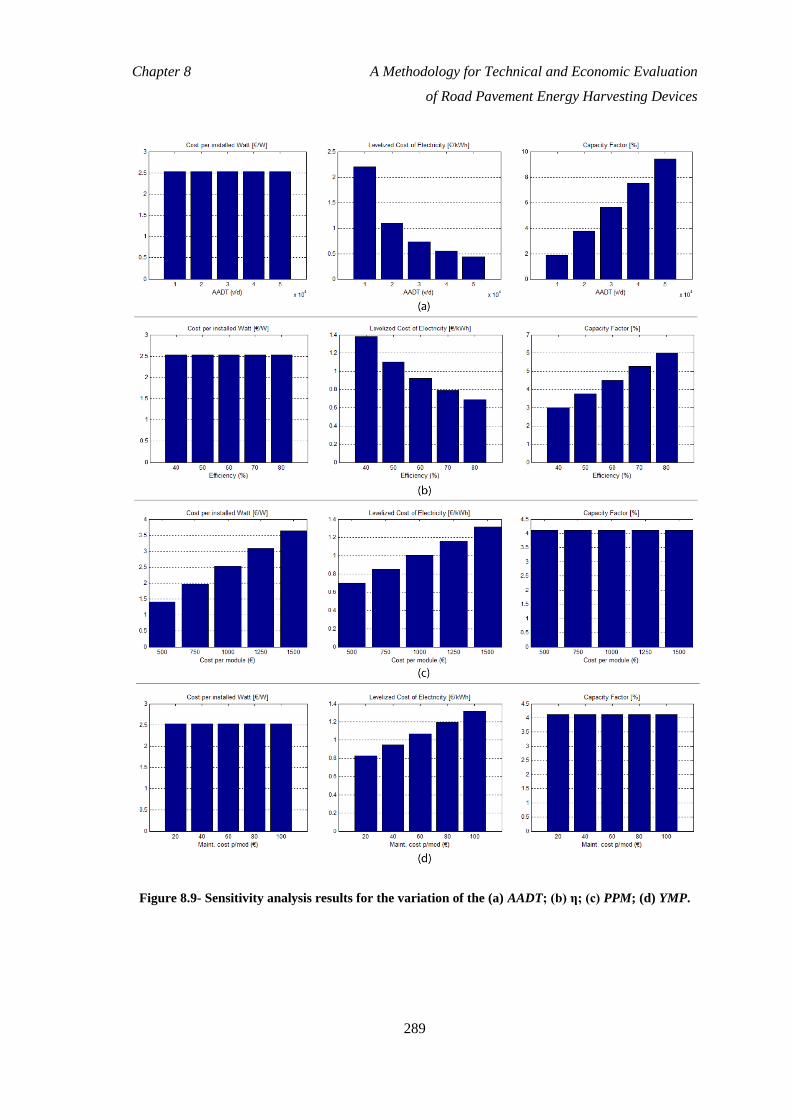
Chapter 8 A Methodology for Technical and Economic Evaluation
of Road Pavement Energy Harvesting Devices
289
Figure 8.9- Sensitivity analysis results for the variation of the (a) AADT; (b) η; (c) PPM; (d) YMP.

Chapter 8 A Methodology for Technical and Economic Evaluation
of Road Pavement Energy Harvesting Devices
290
So, to optimize the technical and economic evaluation of the RPEH system application,
the critical variables for consideration are the AADT and the η. With an SA performed
on both variables simultaneously, the achieved results are presented in Table 8.4 and
Figure 8.10 for the LCOE and the CF (PPW is not considered as this parameter does not
change with these variables).
Table 8.4- Results of a multi-variable SA for a TEA to a RPEH application.
AADT
(v/d)
η
(%)
LCOE
(€/kWh)
CF
(%)
10,000
40 2.78 1.51
50 2.22 1.92
60 1.85 2.25
70 1.61 2.66
80 1.42 3.05
20,000
40 1.38 3.00
50 1.10 3.76
60 0.92 4.51
70 0.79 5.26
80 0.69 6.01
30,000
40 0.92 4.61
50 0.74 5.64
60 0.61 6.77
70 0.52 7.90
80 0.46 7.92
40,000
40 0.69 6.01
50 0.55 7.52
60 0.46 9.02
70 0.39 10.53
80 0.35 12.03
50,000
40 0.55 7.52
50 0.44 9.40
60 0.37 11.28
70 0.31 13.16
80 0.28 15.04

Chapter 8 A Methodology for Technical and Economic Evaluation
of Road Pavement Energy Harvesting Devices
291
Figure 8.10- SA results for the simultaneous variation of the AADT and η to determine the: (a)
LCOE and the (b) CF.

Chapter 8 A Methodology for Technical and Economic Evaluation
of Road Pavement Energy Harvesting Devices
292
Analyzing the results, one can conclude that, as expected, the LCOE values decrease
with the simultaneous increase of AADT and η, reaching for the tested values a
minimum of 0.28 €/kWh, which might be considered enough for a technology launch,
but still needs to be optimized to compete with other renewable energy sources. This
can be achieved through the optimization of the PPM and YMP, through an industrial
optimization process and a considerable market penetration that would lead to a
decrease in production costs. Regarding the CF, it was also expected that this value
would increase with the simultaneous increase of AADT and η, reaching for the tested
values a maximum of 15%, which is considered competitive with other renewable
energy sources. To increase this parameter, the best scenario would be the increase of
the AADT, applying the RPEH system in places with higher AADT values.
8.4.3 Cost benefit analysis
The first energy application studied to perform a CBA on the RPEH system consists of
a grid injection application and the values presented in Table 8.2 are used, with three
changes resulting from the TEA: the AADT is increased to 30,000 vehicles per day, the
η is increased to 60% and the YMP is reduced to 50 € per module. The obtained results
are presented in Table 8.5 for two scenarios, with different periods: a 10-year study and
a 15-year study. From these results one can conclude that, for the considered input data
and for a 10-year study, the return of the investment is not positive, as although the
return of capital is achieved after eight years, the NPV and the IRR are negative at the
end of the period. However, when the study is extended to a 15 year period, the return
of the investment becomes positive, but with a reduced IRR. In this study, one of the
goals is to obtain positive viability for a 10 year period, so an SA is performed.

Chapter 8 A Methodology for Technical and Economic Evaluation
of Road Pavement Energy Harvesting Devices
293
Table 8.5- Simulation results for a CBA on a GI application.
Period 10 years 15 years Unit
Variable Value Value
Average annual income 7,593 7,995 (€)
Total income (period) 75,939 119,934 (€)
Total investment (period) 63,305 75,264 (€)
Total profits (period) 12,634 44,671 (€)
ROC 8.3 9.4 (Years)
NPV -125,592 3,750 (€)
IRR -27.9 1.8 (%)
For a 10-year study period, the SA for different AADT values considers 5 values from
10,000 to 50,000 vehicles per day on the two road lanes and its results are presented in
Figure 8.11a for the three key indicators. The SA for different values of η considers 5
values from 40 to 80% and the results are presented in Figure 8.11b.
The SA for different PPM values considers 5 values from 500 to 1,500 € and its results
are presented in Figure 8.11c. The SA for different YMP values considers 5 values from
20 to 100 € and its results are presented in Figure 8.11d. The SA for different GIEP
values considers 5 values from 0.50 to 0.90 €/kWh and its results are presented in
Figure 8.11e.
From the analysis of the SA results one can conclude that: the ROC decreases with the
increase of the AADT, the η and the GIEP or with the decrease of the PPM and the
YMP; the NPV and the IRR increase with the increase of the AADT, the η and the GIEP
or with the decrease of the PPM and the YMP.
The two variables that present the greatest impact on the results are the AADT and the
GIEP. So, an SA is performed for both variables simultaneously and the results
obtained for the ROC, the IRR and the NPV are presented numerically in Table 8.6 and
graphically in Figure 8.12.

Chapter 8 A Methodology for Technical and Economic Evaluation
of Road Pavement Energy Harvesting Devices
294
Figure 8.11- SA results of a CBA for a GI application, for the variation of the (a) AADT; (b) η; (c)
PPM; (d) YMP; (e) GIEP.

Chapter 8 A Methodology for Technical and Economic Evaluation
of Road Pavement Energy Harvesting Devices
295
Table 8.6- Results of a multi-variable SA for a CBA to a RPEH system with a GI application.
AADT
(v/d)
GIEP
(€/kWh)
ROC
(years)
NPV
(€)
IRR
(%)
10,000
0.5 32.5 -392,600 -200.1
0.6 16.3 -298,970 -193.9
0.7 10.8 -205,330 -172.5
0.8 8.1 -111,700 -22.6
0.9 6.5 -18,070 -1.5
20,000
0.5 27.1 -375,090 -199.2
0.6 13.5 -262,730 -189.8
0.7 9.0 -150,360 -39.6
0.8 6.8 -38,000 -5.0
0.9 5.4 74,360 12.6
30,000
0.5 23.2 -357,590 -198.2
0.6 11.6 -226,500 -182.8
0.7 7.7 -95,410 -17.9
0.8 5.8 35,680 7.1
0.9 4.6 166,790 24.7
40,000
0.5 20.3 -340,110 -197.1
0.6 10.2 -190,300 -109.6
0.7 6.8 -40,480 -5.5
0.8 5.1 109,340 17.3
0.9 4.0 259,150 36.1
50,000
0.5 18.0 -322,650 -195.9
0.6 9.0 -154,110 -42.2
0.7 6.0 14,430 3.9
0.8 4.5 182,980 26.7
0.9 3.6 351,520 47.6

Chapter 8 A Methodology for Technical and Economic Evaluation
of Road Pavement Energy Harvesting Devices
296
Figure 8.12- Results of a multi-variable SA for a CBA to a RPEH system with a GI application, for
the (a) ROC; (b) NPV; (c) IRR.

Chapter 8 A Methodology for Technical and Economic Evaluation
of Road Pavement Energy Harvesting Devices
297
Analyzing the results, one can conclude that, as expected, the ROC values decrease with
the simultaneous increase of AADT and GIEP, reaching a minimum of 3.6 years for the
tested values, which is considered very good for a technology launch and extremely
competitive with other renewable energy sources. Additional optimizations can be
performed, to the PPM, which will allow the ROC to be reduced. Regarding the NPV
and the IRR, it was also expected that these indicators would increase with the
simultaneous increase of AADT and GIEP, reaching a maximum of 351,520 € and
47.6%, respectively, for the tested values, which are very positive values for a 63,305 €
investment. There are several scenarios where these indicators are considered positive,
and others could become so by optimizing, for example, the PPM.
The second energy application studied to perform a CBA consists of a self-consumption
application and the values presented in Table 8.2 are used, with an exception for the
energy application values. Also, the AADT is increased to 30,000 vehicles per day and
the η to 60%. Regarding the energy application, a SCIP of 3,500 W with a SCAG of 10
hours per day is considered. The considered SCEP is equal to the average EU energy
price for the domestic sector, 0.22 €/kWh (Eurostat, 2017), with a SCEI of 2%.
The results for an SC energy application are presented in Table 8.7 for a 10-year period.
From these results one can conclude that no indicator is positive, mainly due to the low
value of the energy when compared with the investment made. Even after performing
an SA and keeping the SCEP constant, no positive scenarios are verified. So, at the
current energy prices, the application of RPEH systems for SC is not economically
viable if these CBA parameters are considered.

Chapter 8 A Methodology for Technical and Economic Evaluation
of Road Pavement Energy Harvesting Devices
298
Table 8.7- Simulation results for a CBA on a SC application.
Variable Value Unit
Annual energy consumption 12,775 (kWh)
Annual energy generation 11,682 (kWh)
RPEH system contribution 91.45 (%)
Average annual savings 2,814 (€)
Total period (period) 28,143 (€)
Total investment (period) 63,305 (€)
Total "profits" (period) -35,162 (€)
ROC 22.5 (Years)
NPV -355,430 (€)
IRR -198 (%)
8.5 Summary and Conclusions
In this Chapter, a complete model for evaluating an RPEH system technically and
economically was provided. Both the technical and economic analyses of renewable
energy generation systems as well as their cost benefit analysis models are established
and proven (Mathew, 2006; Bradford, 2008; Sorensen, 2011; Adaramola, 2014; Narbel
et al., 2014), with the values of the key parameters duly quantified and with the
thresholds for positive viability defined. However, for new technologies under
development, these models are not completely defined. Energy harvesting is a field
which has recently gained the attention of both academia and companies and a set of
new technologies are under development. RPEH is a field with some of these
technologies under development and a model that allows proper technical and economic
evaluation is needed.
The novelty of this Chapter lies in the definition of the complete model to evaluate an
RPEH technically and economically, with all the technical and economic variables
being presented, as well as the equations that allow all the key evaluation parameters to
be determined, not only to perform a TEA, but also to perform a CBA for different
energy applications. This model is applicable to different technologies that make use of
the energy harvested from vehicles moving through the RPEH devices, allowing the

Chapter 8 A Methodology for Technical and Economic Evaluation
of Road Pavement Energy Harvesting Devices
299
traffic and the RPEH system to be fully classified, considering piezoelectric,
electromechanical, hydraulic and pneumatic technologies to be used in the presented
model.
Then, a simulation software tool to evaluate RPEH applications both technically and
economically, as well as for performing cost benefit analysis of the application of
RPEH units on different energy applications was developed and presented.
The evaluation methodology proposed in this Chapter is based on existing
methodologies for other renewable energy sources, with special emphasis on solar
energy applications, being then adapted to RPEH systems. The simulation software tool
also follows the analysis provided by other software that evaluates other energy sources,
especially solar energy, allowing also sensitivity analyses to be performed to evaluate
different values for user defined key variables.
From the case studies presented in this work one can conclude that there are specific
conditions required for these technologies to achieve positive economic viability, and
there is also a great dependency on the traffic affluence of the application spot. The
AADT represents the most important variable to define the technical and economic
viability of the RPEH system, as this parameter is directly related to the energy input
into the system and from it results the total amount of generated energy and,
consequently, the resulting economic value provided by the system. Other important
variables with great influence on the viability of an RPEH system are the conversion
efficiency of the technology, the price of each unit of the system and its maintenance
costs. From the case studies one can also conclude that, for a grid injection scenario
with a feed-in tariff being considered, an RPEH system can achieve positive economic
viability with specific conditions, but for a self-consumption energy application, for the
current average energy price in the European Union, no economic viability was
achieved for the tested conditions.

Chapter 8 A Methodology for Technical and Economic Evaluation
of Road Pavement Energy Harvesting Devices
300
8.6 References
AASHTO (2001). A Policy on Geometric Design of Highways and Streets. American
Association of State Highway and Transportation Officials, Washington, DC, USA.
Adaramola, M. (2014). Solar Energy: Application, Economics, and Public Perception.
CRC Press, Boca Raton, FL, USA.
Alvarez, G., Jara, R., Julian, J. and Bielsa, J. (2009). Study of the effects on employment
of public aid to renewable energy sources. Universidad Rey Juan Carlos, Madrid,
Spain.
Boccard, N. (2009). Capacity factor of wind power realized values vs. estimates. Energy
Policy, 37(7): 2679-2688.
Boomsma, T., Meade, N. and Fleten, S. (2012). Renewable energy investments under different
support schemes: A real options approach. European Journal of Operational Research,
220(1): 225-237.
Bradford, T. (2008). Solar revolution: the economic transformation of the global energy
industry. MIT Press, Boston, MA, USA.
Campoccia, A., Dusonchet, L., Telaretti, E. and Zizzo, G. (2014). An analysis of feed’in
tariffs for solar PV in six representative countries of the European Union. Solar
Energy, 107: 530-542
Carley, S. (2009). State renewable energy electricity policies: An empirical evaluation
of effectiveness. Energy policy, 37(8): 3071-3081.
Diakoulaki, D. and Karangelis, F. (2007). Multi-criteria decision analysis and cost–
benefit analysis of alternative scenarios for the power generation sector in
Greece. Renewable and Sustainable Energy Reviews, 11(4): 716-727.
Duarte, F., Champalimaud, J. and Ferreira, A. (2016). Waynergy Vehicles: an
innovative pavement energy harvest system. Proceedings of the Institution of Civil
Engineers – Municipal Engineer, 169(1): 13-18,
http://dx.doi.org/10.1680/muen.14.00021.

Chapter 8 A Methodology for Technical and Economic Evaluation
of Road Pavement Energy Harvesting Devices
301
EEA (2017). Climate change, impacts and vulnerability in Europe 2016 - An indicator-
based report. European Environment Agency, Copenhagen, Denmark. Available
from: https://www.eea.europa.eu/publications/climate-change-impacts-and-
vulnerability-2016. Accessed in June, 2017.
Elvik, R., Vaa, T., Erke, A. and Sorensen, M. (2009). The handbook of road safety
measures. Emerald, Bingley, UK.
Eurostat (2017). http://ec.europa.eu/eurostat/statistics-
explained/index.php/Energy_price_statistics. Accessed in June, 2017.
Frondel, M., Ritter, N., Schmidt, C. and Vance, C. (2009). Economic Impacts from the
Promotion of Renewable Energy Technologies - The German Experience. RUB,
Bochum, Germany.
GRHYSO (2017). http://www.unizar.es/rdufo/grhyso.htm. Accessed in January, 2017.
Haas, R., Eichhammer, W., Huber, C., Langniss, O., Lorenzoni, A., ..., and Schleich, J. (2004).
How to promote renewable energy systems successfully and effectively. Energy Policy,
32(6): 833-839.
Harb, A. (2011). Energy Harvesting: State-of-the-art. Renewable Energy, 36(10): 2641-
2654.
HOGA (2017). http://hoga-renewable.es.tl/. Accessed in January, 2017.
HOMER (2017). http://www.homerenergy.com/. Accessed in January 2017.
HYBRID2 (2017). https://www.umass.edu/windenergy/research/topics/tools/software/hybrid2.
Accessed in January, 2017.
IEA (2015). World Energy Outlook Special Report on Energy and Climate Change,
International Energy Agency, Paris, France. Available from:
https://www.iea.org/publications/freepublications/publication/WEO2015SpecialRepo
rtonEnergyandClimateChangeExecutiveSummaryUKversionWEB.PDF. Accessed in
June, 2017.
IEA (2016). Key world energy statistics 2016, International Energy Agency, Paris,
France. Available from:

Chapter 8 A Methodology for Technical and Economic Evaluation
of Road Pavement Energy Harvesting Devices
302
https://www.iea.org/publications/freepublications/publication/KeyWorld2016.pdf.
Accessed in June, 2017.
INSEL (2017). http://www.insel.eu/index.php?id=301&L=1. Accessed in January, 2017.
Joskow, P. (2011). Comparing the costs of intermittent and dispatchable electricity
generating technologies. The American Economic Review, 101(3): 238-241.
Kazmierski, T. and Beeby, S. (Eds.). (2009). Energy harvesting Systems - Principles,
Modeling and Applications. Springer, New York, NY, USA.
Khaligh, A. and Onar, O. C. (2010). Energy harvesting: solar, wind, and ocean energy
conversion systems. CRC Press Inc., Boca Raton, FL, USA.
Khatib, H. (2010). Review of OECD study into “Projected costs of generating
electricity—2010 Edition”. Energy Policy, 38(10): 5403-5408.
KPMG (2015). Taxes and incentives for renewable energy. KPMG International Cooperative,
Amstelveen, Netherlands.
Lewis, J. and Wiser, R. (2007). Fostering a renewable energy technology industry: An
international comparison of wind industry policy support mechanisms. Energy policy, 35(3):
1844-1857.
Luckow, P., Stanton, E., Fields, S., Biewald, B., Jackson, S., Fisher, J. and Wilson, R. (2015).
Carbon Dioxide Price Forecast. Synapse Energy Economics, Cambridge, MA, USA.
Mathew, S. (2006). Wind energy: fundamentals, resource analysis and economics, vol. 1.
Springer, Heidelberg, Germany.
Narbel, P., Hansen, J. and Lien, J. (2014). Energy technologies and economics. Springer, Cham,
Switzerland.
Polysun (2017). http://www.polysunonline.com/PsoPublic/app/home/access. Accessed in
January, 2017.
Portal Energia (2017). http://www.portal-energia.com/microgeracao-em-portugal/. Accessed in
June, 2017.
Priya, S., and Inman, D. J. (Eds.) (2009). Energy harvesting technologies. Springer, New York,
NY, USA, vol. 21.
PV*SOL (2017). http://www.valentin-software.com/en/products/photovoltaics/57/pvsol-
premium. Accessed in January, 2017.

Chapter 8 A Methodology for Technical and Economic Evaluation
of Road Pavement Energy Harvesting Devices
303
Reiche, D. and Bechberger, M. (2004). Policy differences in the promotion of renewable
energies in the EU member states. Energy policy, 32(7): 843-849.
RETScreen. https://www.nrcan.gc.ca/energy/software-tools/7465. Accessed in January, 2017.
Schmalensee, R. (2012). Evaluating policies to increase electricity generation from renewable
energy. Review of Environmental Economics and Policy, 6(1): 45-64.
Sinha, S. and Chandel, S. (2014). Review of software tools for hybrid renewable energy
systems. Renewable and Sustainable Energy Reviews, 32: 192-205.
SOLergo (2017). http://hiperenergy.com.br/idc-portfolio/solergo/. Accessed in January, 2017.
Solterm (2017). http://www.lneg.pt/iedt/projectos/370/. Accessed in January, 2017.
Sorensen, B. (2011). Renewable Energy: Physics, Engineering, Environmental Impacts,
Economics & Planning. Elsevier, Burlington, MA, USA.
The World Bank (2017). Leaders Step Up To Double the Wave on Carbon Pricing. The World
Bank, Washington, DC, USA. Available from:
http://www.worldbank.org/en/news/feature/2017/01/17/leaders-step-up-to-double-the-wave-
on-carbon-pricing. Accessed in June, 2017.
TRB (2000). Highway Capacity Manual. Transportation Research Board, Washington, DC,
USA.
TRNSYS (2017). http://www.trnsys.com/. Accessed in January 2017.
Windsim (2017). https://windsim.com/. Accessed in January 2017.
Yildiz, F. (2009). Potential ambient energy-harvesting sources and techniques. Journal of
Technology Studies, 35(35): 40-48.

305
Chapter 9
Summary, Conclusions and Future
Work
9.1 Summary and Conclusions
Over the last two centuries, our planet has witnessed three industrial revolutions that
completely changed the way we live. The first industrial revolution used water and
steam power to mechanize production. The second used electric power to promote mass
production. The third used electronics and information technology to automate
production. Now, a fourth industrial revolution is building on the third, the digital
revolution, which has been going on since the middle of the last century. It is
characterized by a fusion of technologies that is combining the physical, digital, and
biological spheres (The World Bank, 2017).
This new industrial revolution will significantly alter the way we live, work, and relate
to each other. Due to its scale and complexity, this change will have a greater impact on
society than the previous industrial revolutions, and its effects are not known yet.
However, one thing that can be learnt from the previous industrial revolutions is that the
planet was not respected during any of them. With all industrial revolutions, a great
increase in the consumption of the planet’s resources was verified, reaching an

Chapter 9 Summary, Conclusions and Future Work
306
unsustainable point in which mankind is consuming more resources than those the
planet can provide year after year (WWF, 2017).
Energy, and in particular electrical energy, is one of the resources for which there has
been a great increase in demand, and whose production has one of the most negative
impacts on the environment, as almost 80% of the energy production comes from fossil
fuels (IEA, 2016).
The transition that is about to happen must be built on more sustainable and
environmentally friendly pillars so that it does not compromise the future of our planet
and, consequently, our existence.
One of the key areas for ensuring a more sustainable planet is to change the paradigm
for the production of electrical energy. Energy production must be based on renewable
resources, decentralized, happen near to the point of consumption and, preferably, when
it is needed. To achieve this goal, a combination of multiple energy sources will be
needed, and every potential energy source that can be converted effectively into
electrical energy should be used.
Renewable energy sources such as solar, wind and hydro have been developed in recent
decades and have already reached a stage of maturity. Biomass and ocean energy have
also been explored in the last few years and some technologies are being implemented
on a considerable scale.
However, there are a number of other sources of energy that have not been exploited
much and which, in specific places, would provide great potential for use and can
significantly contribute to the promotion of self-sustaining electrical equipment. To
accomplish this, energy harvesting has recently been adopted on a micro-scale, where it
is possible to generate electrical energy from small energy variations, such as thermal
gradients, pressure, vibrations, radiofrequency or electromagnetic radiation, among
others (Khaligh and Onar, 2010).
Road pavements are continuously exposed to vehicle loads and, from this, it is possible
to extract energy which, using specific technologies and equipment, can be converted

Chapter 9 Summary, Conclusions and Future Work
307
into electrical energy and supply the electrical devices near the road, such as public
illumination, traffic lights, sensors and cameras, among others. Such devices are called
RPEH devices.
In the last 15 years or so, several technologies have been developed in this field, but
none have been successful to the extent that they have entered the market. The main
goal of this research was the development of a new technology to convert mechanical
energy from vehicles into electrical energy, which would be implemented in the road
pavement to make use of a source of energy which is typically wasted.
Before the development of a new technology to be used in RPEH devices, a state-of-
the-art study was performed, presented in Chapter 2, so that the existing technologies
could be identified and evaluated, in order to draw some conclusions regarding their
positive and negative aspects, and understand what should be done differently to
succeed. In this study, not only were RPEH technologies analyzed, but also
technologies for harvesting railway energy, since both are related to infrastructure
applications and both make use of vehicles’ mechanical energy to produce electrical
energy.
From this study it was possible to conclude that several technologies have successfully
achieved TRL 5, with a prototype validation in a relevant environment, but when they
were implemented in a real environment most failed. One of the main reasons for this is
related to the vehicle loads delivered to the device’s surface, which were higher than
expected and led to component failure.
The problem that was identified in these studies is related to a lack of understanding
about how the vehicle’s wheels interact with the RPEH device’s surface, how loads are
applied and how the vehicle’s mechanical energy is delivered. With this in mind, it was
decided that prior to the development of the new technology, a detailed study had to be
performed to evaluate the VRI and to quantify the loads and energy delivered from
vehicles to the pavement or an equipment applied in the pavement’ surface precisely.

Chapter 9 Summary, Conclusions and Future Work
308
Also, from the state-of-the-art study, it was possible to analyze which are the most
promising technologies and those which have achieved better results for both energy
generation and energy conversion efficiency. In this field, electromechanical systems
present the highest values, while hydraulic systems, despite slightly lower results,
showed good potential for harvesting vehicle energy in multiple points and use only one
electrical generator to convert all the mechanical energy into electrical energy. So, both
types of systems should be considered and carefully evaluated when a new solution is
designed.
The state-of-the-art evaluation contributed to a deeper understanding of the existing
technologies both for RPEH and railway energy harvesting and their stage of
development, and has introduced new concepts for the classification of systems,
especially for different electromechanical devices, classifying them according to their
input and output motion type. Also, the identification of the installation method has
improved the existing knowledge of these types of technologies.
Based on the conclusions from Chapter 2, a detailed VRI study was performed in
Chapter 3, identifying the most common vehicle models used in the literature, namely
the quarter-car and bicycle-car models, and how loads are applied to the pavement
surface. However, these models were unable to fully define the interaction of a moving
vehicle and a RPEH device with a moving surface, as they are only related to the
vehicle and do not take into account the changes in the vehicle’s dynamics caused by
the movement of the surface of the RPEH device. Taking this into account, two new
models were developed to consider the interaction between a moving vehicle and a
RPEH device with a moving surface, as presented in Chapter 3.
Typically the VRI models do not consider the tyre contact patch, as they consider only a
resultant force applied on the pavement surface. For a typical VRI analysis, this
approach is not incorrect, as the tyre contact patch is permanently in contact with the
pavement surface, but when the interaction is related to a moving tyre and a specific
surface, separated from the pavement surface, this common approach is not correct, as
the tyre’s contact patch does not establish total contact with the surface immediately,

Chapter 9 Summary, Conclusions and Future Work
309
but rather it makes progressive contact while the wheel is moving forward. This means
that the tyre’s force is progressively applied to the surface, as the tyre’s contact patch
establishes contact with it, and this has a huge impact on the quantification of the load
applied to the surface of a RPEH device. As so, in Chapter 3 the equations are presented
that allow the contact patch to be integrated into the vehicle dynamics models with a
moving surface, allowing us to have more detailed and complete models to perform the
evaluation of the interaction of a vehicle and a RPEH device.
Based on the developed models, a new software tool was developed and presented in
Chapter 3, named RoadVISS, that allowed users to study the forces induced by a
vehicle in motion onto the road pavement, an SRE or an RPEH device, as well as the
energy lost by the vehicle, associated to the contact with the surface, and the energy
received by that surface. This software tool was developed in MATLAB® environment,
including a GUI where the user can select and define all the variables associated to the
simulation, and another GUI where the results are presented. The software has an
extensive database of considered variables, allowing a huge number of different
combinations of values to be simulated, which means a great number of studies can be
performed. The outputs of the system are focused on the forces and energy released by
the vehicle and received by the pavement or by RPEH device’ surface, but the
computational model allows users to define new outputs and study other variables.
The existing software tools, mainly ADAMS® (MSC.Software, 2017) and AUTOSIM
®
(Carsim, 2017), already allow users to select all the vehicle characteristics and motion
conditions, but the main differences of the developed software are evident: it allows us
to obtain energetic outputs, select the pavement/SRE/RPEH device characteristics,
dimensions and material, in a way that no other software tools do, and to compare the
output, for both the vehicle and the pavement parameters, together or separately. The
development of this software tool was a key milestone in the development of the
remaining project as it allows us to have a more detailed and precise quantification of
the loads and energy delivered from the vehicles’ wheels to the RPEH surface and to
have more realistic values during the project development stage of the RPEH device.

Chapter 9 Summary, Conclusions and Future Work
310
Using RoadVISS, a detailed study was performed of the interaction of different vehicles
with equipment with a movable surface applied in the road pavement. This study has
allowed us to come to conclusions not only about the energy lost by the vehicle and
harvested by the equipment, but also about the low vertical acceleration induced to the
vehicle body. Relating the achieved results with the international scale for the
discomfort induced to the vehicle occupants by SRE, defined by ISO 2631-1 (ISO,
1997), it was possible to identify an opportunity to reduce the vehicle’s speed by kinetic
energy harvesting using a device applied in the road pavement surface, without
affecting the ride comfort of the vehicle’s occupants.
This conclusion led to a specific research goal of developing a solution to effectively
contribute to the road safety promotion, by reducing the vehicle’s speed without the
need for driver action, such as breaking, and without affecting the ride comfort.
Therefore, in Chapter 4 a study was conducted to optimize the energy extraction from
vehicles with a minimum impact on ride comfort to promote road safety. In this
Chapter, typical SRE equipment was studied and evaluated, allowing us to conclude
that these devices induce extremely high levels of discomfort to the vehicle’s occupants
if the driver does not break before reaching the device, but do not extract significant
amounts of energy to the vehicles. Then, a new SRE was developed, with the physical
models of the proposed solution being presented and incorporated into the RoadVISS
software, allowing the user to perform computational simulations and evaluate their
performance. It was concluded that this new solution is able to extract 81% more energy
than a standard SRE, with 87% lower impact on the vehicle body for similar scenarios.
A prototype of the proposed solution was developed and tested, allowing us to get
experimental results of its performance. From the analysis of results and the comparison
between computational simulations and experimental results, it was possible to
conclude that there is a small difference between the two of under 20% on average,
which is a very satisfactory result, considering that the computational models include
several vehicle parameters that we were not able to quantify precisely.

Chapter 9 Summary, Conclusions and Future Work
311
Considering the results achieved for the system presented in Chapter 4, we consider that
the proposed solution may be effective in promoting road safety and is attractive both
for the users (drivers) and beneficiaries (mainly pedestrians, but vulnerable road users in
general), and there is great potential for application in the real world. With the
developments in this thesis, the solution has reached TRL5, as the technology was
validated in a relevant environment.
Following this study, and considering it as the first application of RoadVISS, the
development of a RPEH device came next. The first novelty presented in this
development was the approach that was defined and the methodology. The use of
forces, kinematic and dynamic analysis, combined with an energetic analysis applied to
all the device’s components allowed us to identify the performance of each element and
its impact on the end results of the entire system, so each component could be optimized
and the efficiency of the entire system maximized. None of the existing studies in the
literature, seen in Chapter 2, had implemented this methodology, which led to non-
optimized systems.
This methodology was first applied to the most common electromechanical systems,
namely the RAP system and the lever system, with these being modelled and then
included in the software previously developed, allowing a new and more advanced
software tool to be created for the development of RPEH devices. The results of the
simulations for these systems agreed with the values of the systems evaluated in
Chapter 2, allowing the models and the software to be considered accurate.
In Chapter 5, a new electromechanical system to implement in RPEH devices was
presented. The development of this system was performed taking into account the
limitations of the typical systems, in which the transmitted load and motion are
physically limited by each other. The goal was to devise a system in which this relation
was not direct, and in which the transmitted force could be maximized, while the
displacement of components was not affected in direct proportion. To achieve this goal,
a crank to slider system was proposed and its physical models were defined and
included in the software tool. Several computational simulations were performed and,

Chapter 9 Summary, Conclusions and Future Work
312
based on the achieved results, several conclusions were drawn. The main conclusions in
relation to typical electromechanical systems are that the new mechanical system
proposed is the most efficient system regarding the mechanical energy transmission as,
for the same pinion radius, it can double the efficiency of the RAP system which, in
turn, is more efficient than the lever system. The maximum theoretical efficiency of the
new proposed system is 74.3%, a much higher value than all systems studied and
evaluated in Chapter 2.
After this validation, a prototype was developed and tested in a relevant environment, so
that experimental results could be achieved and compared with the computational
simulations results. During the prototype design some changes to the initial version of
the system were made to avoid and prevent possible problems, but these led to an
increase in the number of components which led to more energy loss. Some of the
selected components have also proven to have higher friction coefficients than
originally defined, inducing higher energy losses.
The experimental results were not as satisfactory as expected for the lower vehicle
speed scenarios (20, 30 and 40 km/h), and there was a considerable difference in the
electrical energy generation results. However, for the higher value of vehicle speed (50
km/h), the experimental results were closer to the computational simulation results, with
the average difference being 11.9%, a very satisfactory result. For the 50 km/h tested
scenarios, the maximum energy conversion efficiency of the device, from the
mechanical energy harvested by the device’s surface to the electrical energy generated
and delivered to the electrical load was 60.5%, a value higher than all existing systems
studied in Chapter 2, which proves that the proposed system has the potential to be
more efficient than existing solutions. However, further developments should be made
to increase the efficiency of the system for the lower vehicle speeds and to improve the
global efficiency of the device, taking into account its theoretical energy conversion
efficiency of higher than 70%.
Thinking of a possible product development in the future, this solution also has other
technical advantages compared to the existing solutions studied in Chapter 2, as it is

Chapter 9 Summary, Conclusions and Future Work
313
smaller, which makes the installation process in the road pavement easier, and it is
made of mainly high density and resistant plastic, a material that can be produced much
more cheaply than iron and aluminium, the core materials typically used in the RPEH
devices studied in Chapter 2. Altogether, this solution has more chance of breaking into
the market than all the other solutions, as it is more efficient, simpler to install and costs
less.
Although the achieved results with the RPEH device based on an electromechanical
system were satisfactory, especially the computational simulations results, all
electromechanical systems have one limitation in common - to keep the maximum
efficiency of the system they all use one electromagnetic generator for each mechanical
system, which may increase the total cost of a solution with multiple devices. This is
where a hydraulic system may have an economic advantage as multiple hydraulic units
can be connected to a single electromechanical converter.
A technical evaluation of typical hydraulic systems used in RPEH devices was
conducted using the same methodology as used in the electromechanical systems, and
the most common hydraulic system was modelled physically, and the model was
incorporated in the software tool developed previously. The computational simulation
results were examined in order to compare them with the study performed in Chapter 2,
proving that a typical hydraulic system was not more efficient than an
electromechanical system, as it has a maximum energy conversion efficiency of only
39.3%.
A new hydraulic system with a mechanical actuation was presented in Chapter 6,
combining the electromechanical system presented in Chapter 5 with common hydraulic
systems, to evaluate the performance of the combined system. The physical models of
the solution were presented and integrated in the software tool, allowing us to perform
computational simulations for the same scenarios as the previous systems. From the
computational simulation results it was possible to conclude that this system can
achieve a maximum energy conversion efficiency of 73.5%, a value close to the 74.3%
of the electromechanical system, proving that a combined solution of a hydraulic system

Chapter 9 Summary, Conclusions and Future Work
314
with a mechanical actuation has the potential both technically and economically to be
the best solution in the RPEH field. Experimental validation is needed to confirm these
values, which is one of the next steps of the research.
Besides the connection of multiple devices to a single electromechanical converter, a
hydraulic system also offers the possibility of storing the mechanical energy harvested
from vehicles, transmitted through the mechanical and hydraulic system in the form of
pressure, and actuating the electromechanical unit only when needed, thus increasing
the number of potential applications of the electrical energy produced, especially at
night.
In Chapter 7, a MES in the RPEH device based on hydraulic systems was included, and
both a standard and the new proposed hydraulic system with mechanical actuation were
studied. Following the same methodology as with the previous developments, the
physical models of the MES systems were presented, as well as the complete models of
the hydraulic systems with the proposed MES. These models were then integrated in the
software tool and computational simulations were performed. The inclusion of a MES
in a typical hydraulic system allows the global efficiency of the device to be increased
to 43.0%, but it does not increase the efficiency of the hydraulic system with
mechanical actuation, which has a maximum efficiency of 66.2%, lower than the 73.5%
efficiency of the same system without storage. However, although the global efficiency
of the system is decreased, the global efficiency of the system with MES is still higher
than all existing solutions studied in Chapter 2, and the lower cost of this solution may
compensate the lower efficiency of the device. Experimental validation is needed to
confirm these values, which is one of the next steps of the research.
From Chapters 4 to 7, several technical developments were made leading to the
development of four new solutions, one to promote a more effective speed reduction of
vehicles without any driver action, one that consists of a RPEH device based on an
electromechanical system, one that consists of a RPEH device based on a hydraulic
system with a mechanical actuation without energy storage and another that is similar to
the previous one but which includes a MES system. The first two solutions were

Chapter 9 Summary, Conclusions and Future Work
315
validated through prototypes and experimental tests, while the last two solutions were
only evaluated based on computational simulations using the developed software. All
the proposed solutions have presented better results than the state-of-the-art in their
respective fields and have great potential for success in the future.
Besides the systems presented, the methodology used was also innovative and it can be
used in other areas of research, especially related to the development of energy
generation systems, as it allows researchers to identify the optimal characteristics of
each component of the system.
Finally, following all the technical developments, in Chapter 8 a complete model to
perform a technical and economic evaluation of RPEH applications was defined. Based
on this model, a new software tool was created, called RETEES, and based on this tool
several analyses were conducted to evaluate different applications. These analyses
include both a TEA of a RPEH system, a CBA and also a SA, by changing the values of
the most critical variables to define their impact on the achieved results.
The developed software tool has proved to be very useful in the technical and economic
evaluation of RPEH applications, allowing us to understand the impact of each variable
in the results. It is an important tool for defining the required traffic values for an
application to be viable or for defining the production costs of the system so that it can
be made viable, in relation to its energy generation potential. It can also be used by the
potential users of RPEH devices to evaluate the economic benefits that can be achieved
by investing in such solutions, or to define how many RPEH devices they need to
implement in an application so that it can become completely energetically self-
sufficient.

Chapter 9 Summary, Conclusions and Future Work
316
9.2 Future work
Three software tools were developed in Chapters 3, 5 and 8, one for the VRI analysis
and the evaluation of the energy transfer from vehicles to the road pavement surface of
specific devices applied on its surface (RoadVISS); one to evaluate the performance of
RPEH devices from an energetic perspective and another to evaluate RPEH applications
technically and economically (RETEES). All these solutions have been tested and some
validations were made, but all can be improved and further developments should be
performed.
First, the validation of vehicle parameters in the RoadVISS software tool can be
improved through experimental tests with sensors applied in the vehicle body to
compare the simulations results with experimental data. The developed models are
validated for two-axle light vehicles. Additional developments will be performed to
include multiple-axle light vehicles and heavy vehicles on the models, allowing the
software applications and studies to be expanded.
Secondly, the upgraded version of RoadVISS, for the development of RPEH devices,
has great potential to include more RPEH systems and components, not only
electromechanical or hydraulic ones, but any type of technology that makes use of a
vehicle’s mechanical energy as an energy source. More experimental tests are needed to
validate the performance of the hydraulic system, which should also include validating
the hydraulic system with mechanical actuation presented in Chapter 6, as well as the
same system with a MES unit presented in Chapter 7.
Thirdly, the RETEES software tool presented in Chapter 8 can also be used to perform
TEA and CBA with other RPEH technologies, and the models can also be integrated
with other existing software to evaluate different renewable energy sources technically
and economically, so that RPEH systems can be considered as an alternative for electric
energy production, especially in urban environments, where energy consumption
continues to increase and more energy will be needed in the years to come with the
growth of the electric mobility market. The RETEES software tool can also be upgraded

Chapter 9 Summary, Conclusions and Future Work
317
with new equations to determine the traffic distribution among several road lanes with
better precision, as well as to adjust the maintenance costs to the traffic.
Regarding the four systems presented in this thesis, all have the potential for further
developments, each with a different approach.
The system presented in Chapter 4, to be applied as a SRE, was successfully validated
through a prototype in a relevant environment, allowing us to assume that a TRL 5 stage
was achieved. However, more validations should be done. The next steps of this
research work will consist of implementing a monitoring system in the vehicle, so that
the vertical acceleration induced in the vehicle body can be measured, as well as
enabling us to quantify the energy lost by the vehicle, allowing us to draw conclusions
about the device’s efficiency and the ride quality of the vehicle’s occupants. Some
developments should also be performed to prepare the system to resist to breaking
actions from the vehicle and to water and snow conditions.
After this, a real scale pilot plant in an operational environment, such as an urban road,
should be implemented to evaluate the system performance with several meters in the
pavement and with real traffic.
Regarding the RPEH device based on an electromechanical system presented in Chapter
5, which presented a much higher energy conversion efficiency in relation to all existing
RPEH systems studied in Chapter 2, based on the computational simulations performed,
the developed prototype has only presented positive results for a vehicle speed of 50
km/h. So, further developments should be made to validate the simulation results for all
the tested speeds and to conclude the experimental validation. Beside these
improvements in the prototype, a monitoring system should also be implemented in the
vehicle so that the vertical acceleration induced in the vehicle body can be measured, as
well as making it possible to quantify the energy lost by the vehicle, allowing us to
reach conclusions on the device’s efficiency and the ride quality of the vehicle’s
occupants. As for the previous system, some developments should also be performed to
prepare the system to resist to vehicle’ breaking actions, as well as to resist to water and
snow conditions.

Chapter 9 Summary, Conclusions and Future Work
318
After these validations and achieving TRL 5, the implementation of a real scale pilot
plant in an operational environment, such as an urban road, will be performed to
evaluate the system’s performance with several meters implemented in the pavement
and with real traffic.
Also, with the prototype construction and achieved results, an economic evaluation will
be performed, allowing us to draw conclusions about the economic viability of the
system, using the RETEES software tool, presented in Chapter 8.
Both the RPEH device based on a hydraulic system with a mechanical actuation
presented in Chapter 6, and the same system with a MES unit presented in Chapter 7,
have revealed a much higher energy conversion efficiency value than typical hydraulic
systems, showing great potential for application in the real world. However, both
systems were only validated through computational simulations and further research
should be conducted to perform experimental validations. So, the next step of this
research work will consist of designing and constructing a prototype of each system in
order to test them in the laboratory and in a relevant environment and obtain
experimental results. These will be compared to the theoretical results achieved by the
computational simulations and will allow us to come to conclusions about the technical
viability of these systems.
Based on the technical and economic data of the developed prototype, a TEA and a
CBA can be performed, using the RETEES software tool presented in Chapter 8,
allowing us to reach conclusions about the economic viability of these solutions.
With these systems developed and validated, a specific installation process in the road
pavement should be designed. The four systems were designed to be as flat as possible,
so that installation can be simple and avoid digging a huge hole in the pavement for the
devices. However, a specific installation design should be developed, considering
multiple assumptions: it should be simple and fast, have a minimum impact on the
existing pavement and require a minimum amount of resources. It should take into
account pavement engineering rules and respect the existing pavement design, so that it
will not affect the pavement surrounding the RPEH device after its installation.

Chapter 9 Summary, Conclusions and Future Work
319
To sum up, the total or partial accomplishment of the research lines suggested above
will provide more detailed validations of the systems developed in this thesis, increase
the TRL of all systems and take them to a pre-market entrance stage. Ultimately, the
accomplishment of these activities combined with an industrial development process
will lead to the creation of innovative solutions in road safety, energy harvesting and
smart cities, which, if successful, could be applied worldwide, contributing to a more
sustainable planet, more cost-effective and self-sufficient electrical applications and to
decrease the number of fatal accidents on the road, promoting road safety more
effectively.
9.3 References
Carsim (Mechanical Simulation Corporation) (2017). http://www.carsim.com. Accessed
in July, 2017.
IEA (2016a). Key world energy statistics 2016, International Energy Agency, Paris,
France. Available from:
https://www.iea.org/publications/freepublications/publication/KeyWorld2016.pdf.
Accessed in June, 2017.
ISO (1997). Mechanical vibration and shock - Evaluation of human response to whole-
body vibration. Part I: General requirements. ISO 2631-1, Geneva, Switzerland.
Khaligh, A. and Onar, O.C. (2010). Energy Harvesting: Solar, Wind, and Ocean Energy
Conversion Systems. CRC Press Inc, Boca Raton, FL, USA.
MSC.Software (Adams) (2017). http://www.mscsoftware.com/product/adams. Accessed
in July, 2017.
The World Bank (2017). The Fourth Industrial Revolution: what it means, how to
respond. The World Bank, Washington, DC, USA. Available from:
https://www.weforum.org/agenda/2016/01/the-fourth-industrial-revolution-what-it-
means-and-how-to-respond/. Accessed in July, 2017.

Chapter 9 Summary, Conclusions and Future Work
320
WWF (2017). Planning to succeed - how to build strong 2050 climate and energy
development strategies. World Wide Fund For Nature (WWF), Gland, Switzerland.
Available from:
http://wwf.panda.org/about_our_earth/all_publications/?302651/Planning-to-
Succeed---how-to-build-strong-2050-climate-and-energy-development-strategies#.
Accessed in July, 2017.
Copyright © 2022 FDOKUMEN