DISCORDANT DISTRIBUTION OF POPULATIONS AND GENETIC VARIATION IN A SEA STAR WITH HIGH DISPERSAL...
14
ORIGINAL ARTICLE doi:10.1111/j.1558-5646.2009.00801.x DISCORDANT DISTRIBUTION OF POPULATIONS AND GENETIC VARIATION IN A SEA STAR WITH HIGH DISPERSAL POTENTIAL Carson C. Keever, 1,2 Jennifer Sunday, 1 Jonathan B. Puritz, 3 Jason A. Addison, 2,4 Robert J. Toonen, 3 Richard K. Grosberg, 2 and Michael W. Hart 1,5 1 Department of Biological Sciences, Simon Fraser University, Burnaby, British Columbia V5A 1S6, Canada 2 Center for Population Biology, College of Biological Sciences, University of California, Davis, California 95616 3 Hawaii Institute of Marine Biology, University of Hawaii, P.O. Box 1346, Kaneohe, Hawaii 96744 5 E-mail: [email protected] Received November 10, 2008 Accepted July 19, 2009 Patiria miniata, a broadcast-spawning sea star species with high dispersal potential, has a geographic range in the intertidal zone of the northeast Pacific Ocean from Alaska to California that is characterized by a large range gap in Washington and Oregon. We analyzed spatial genetic variation across the P. miniata range using multilocus sequence data (mtDNA, nuclear introns) and multilocus genotype data (microsatellites). We found a strong phylogeographic break at Queen Charlotte Sound in British Columbia that was not in the location predicted by the geographical distribution of the populations. However, this population genetic discontinuity does correspond to previously described phylogeographic breaks in other species. Northern populations from Alaska and Haida Gwaii were strongly differentiated from all southern populations from Vancouver Island and California. Populations from Vancouver Island and California were undifferentiated with evidence of high gene flow or very recent separation across the range disjunction between them. The surprising and discordant spatial distribution of populations and alleles suggests that historical vicariance (possibly caused by glaciations) and contemporary dispersal barriers (possibly caused by oceanographic conditions) both shape population genetic structure in this species. KEY WORDS: Asterinidae, ATPS, effective population size, GPI, life history, planktotrophy. Explaining the origin and persistence of large geographical dis- continuities in species distributions, such as the antitropical dis- tributions of many temperate-zone animals and plants, is one of the original goals of evolutionary ecology (Darwin 1859; Ekman 1953; Briggs 1987; Wiley 1988; Lindberg 1991). Such range disjunctions may be initiated and maintained by a com- plex combination of factors, encompassing extrinsic geological and climatic barriers to dispersal and colonization, and intrinsic biological properties of organisms including habitat preferences 4 Current address: Department of Biology, University of New Brunswick, Fredericton, NB E3B 5A3, Canada and dispersal capabilities (Schwaninger 2008). Dispersal barriers such as mountain ranges or climatic effects associated with Pleis- tocene glacial cycles (DeChaine and Martin 2006; Knowles and Carstens 2007) are well-known determinants of the geographical distribution both of populations and of genetic variation in ani- mals and plants of the Northern Hemisphere (Hewitt 1996; Riddle 1996; Byun et al. 1997; Knowles 2001; Lovette 2005). The intrinsic potential of some organisms to traverse physi- cal and geological features that are barriers to dispersal for other species (e.g., Lessios et al. 1998) is arguably greatest among sessile and sedentary marine animals that have prolonged de- velopment of feeding planktonic (planktotrophic) larvae. Direct 1 C 2009 The Author(s). Evolution
-
Upload
newbrunswick -
Category
Documents
-
view
0 -
download
0
Transcript of DISCORDANT DISTRIBUTION OF POPULATIONS AND GENETIC VARIATION IN A SEA STAR WITH HIGH DISPERSAL...
ORIGINAL ARTICLE
doi:10.1111/j.1558-5646.2009.00801.x
DISCORDANT DISTRIBUTION OF POPULATIONSAND GENETIC VARIATION IN A SEA STARWITH HIGH DISPERSAL POTENTIALCarson C. Keever,1,2 Jennifer Sunday,1 Jonathan B. Puritz,3 Jason A. Addison,2,4 Robert J. Toonen,3
Richard K. Grosberg,2 and Michael W. Hart1,5
1Department of Biological Sciences, Simon Fraser University, Burnaby, British Columbia V5A 1S6, Canada2Center for Population Biology, College of Biological Sciences, University of California, Davis, California 956163Hawaii Institute of Marine Biology, University of Hawaii, P.O. Box 1346, Kaneohe, Hawaii 96744
5E-mail: [email protected]
Received November 10, 2008
Accepted July 19, 2009
Patiria miniata, a broadcast-spawning sea star species with high dispersal potential, has a geographic range in the intertidal
zone of the northeast Pacific Ocean from Alaska to California that is characterized by a large range gap in Washington and
Oregon. We analyzed spatial genetic variation across the P. miniata range using multilocus sequence data (mtDNA, nuclear introns)
and multilocus genotype data (microsatellites). We found a strong phylogeographic break at Queen Charlotte Sound in British
Columbia that was not in the location predicted by the geographical distribution of the populations. However, this population
genetic discontinuity does correspond to previously described phylogeographic breaks in other species. Northern populations
from Alaska and Haida Gwaii were strongly differentiated from all southern populations from Vancouver Island and California.
Populations from Vancouver Island and California were undifferentiated with evidence of high gene flow or very recent separation
across the range disjunction between them. The surprising and discordant spatial distribution of populations and alleles suggests
that historical vicariance (possibly caused by glaciations) and contemporary dispersal barriers (possibly caused by oceanographic
conditions) both shape population genetic structure in this species.
KEY WORDS: Asterinidae, ATPS, effective population size, GPI, life history, planktotrophy.
Explaining the origin and persistence of large geographical dis-
continuities in species distributions, such as the antitropical dis-
tributions of many temperate-zone animals and plants, is one
of the original goals of evolutionary ecology (Darwin 1859;
Ekman 1953; Briggs 1987; Wiley 1988; Lindberg 1991). Such
range disjunctions may be initiated and maintained by a com-
plex combination of factors, encompassing extrinsic geological
and climatic barriers to dispersal and colonization, and intrinsic
biological properties of organisms including habitat preferences
4 Current address: Department of Biology, University of New
Brunswick, Fredericton, NB E3B 5A3, Canada
and dispersal capabilities (Schwaninger 2008). Dispersal barriers
such as mountain ranges or climatic effects associated with Pleis-
tocene glacial cycles (DeChaine and Martin 2006; Knowles and
Carstens 2007) are well-known determinants of the geographical
distribution both of populations and of genetic variation in ani-
mals and plants of the Northern Hemisphere (Hewitt 1996; Riddle
1996; Byun et al. 1997; Knowles 2001; Lovette 2005).
The intrinsic potential of some organisms to traverse physi-
cal and geological features that are barriers to dispersal for other
species (e.g., Lessios et al. 1998) is arguably greatest among
sessile and sedentary marine animals that have prolonged de-
velopment of feeding planktonic (planktotrophic) larvae. Direct
1C© 2009 The Author(s).Evolution
CARSON. C. KEEVER ET AL.
estimates of realized dispersal in species with planktotrophic
development are restricted for logistical reasons to cases in
which realized dispersal is limited to small spatial scales (e.g.,
Knowlton and Keller 1986), but inferences based on oceanogra-
phy and larval duration suggest that realized dispersal can exceed
103–104 km per generation (Scheltema 1986; Shanks et al. 2003).
Numerous lines of evidence suggest a correlation between the
evolutionary gain or loss of planktonic larval development and
the magnitude or geographical scale of neutral genetic differenti-
ation among marine animal populations (Arndt and Smith 1998;
Bohonak 1999; Kyle and Boulding 2000; Grosberg and Cun-
ningham 2001; Hellberg et al. 2002; Kelly and Eernisse 2007;
Teske et al. 2007). However, this trend conflicts with a con-
spicuous minority of other studies that reveal strong phylogeo-
graphic breaks in spite of prolonged planktonic larval develop-
ment, or large differences in population genetic structure between
sympatric species with similar larval dispersal potential (Benzie
1999; Swearer et al. 1999; Forward et al. 2003; Marko 2004;
Hickerson and Cunningham 2005; Crandall et al. 2008; Hamilton
et al. 2008).
The concordance between the geographical distributions of
populations (including patterns such as range disjunctions) and
of population genetic variation (phylogeographic breaks) can be
used to test biogeographic hypotheses (Avise 2000). Range dis-
junctions that coincide with phylogeographic breaks are consis-
tent with the effects of geological or physical processes (like
glaciations) that limit dispersal, and implicate dispersal barriers
in the origin of the disjunct range (e.g., Munoz-Salazar et al.
2005). Alternatively, range disjunctions that do not correspond to
phylogeographic breaks suggest gene flow across the disjunction,
and implicate ecological effects such as the distribution of suit-
able habitat, habitat selection by recruiting propagules, juvenile
mortality, or recent extirpation (rather than dispersal barriers) in
the origin of the disjunct range. Comparative analyses of sym-
patric species that share the same range disjunction have revealed
mixtures of results that match both of these patterns (Bernardi
et al. 2003; Ayre et al. 2009).
Here we use a large suite of mitochondrial and nuclear ge-
netic markers to test the strength of the concordance between
biogeographic and phylogeographic discontinuities in the bat
star Patiria miniata (formerly Asterina miniata; O’Loughlin and
Waters [2004]) from the northeast Pacific. Bat stars are abundant
omnivores in intertidal and shallow subtidal marine communities
in sheltered waters of southeast Alaska, British Columbia, central
and southern California, and Baja California (Fisher 1911; Lam-
bert 2000), but are strikingly rare in or absent from the outer
coasts of Washington, Oregon, and northern California between
Cape Flattery, WA (48◦38′N, 124◦71′W) and Cape Mendocino,
CA (40◦26′N, 124◦24′W) (Kozloff 1983) (Fig. 1). The north-
ern part of the P. miniata range includes the transition between
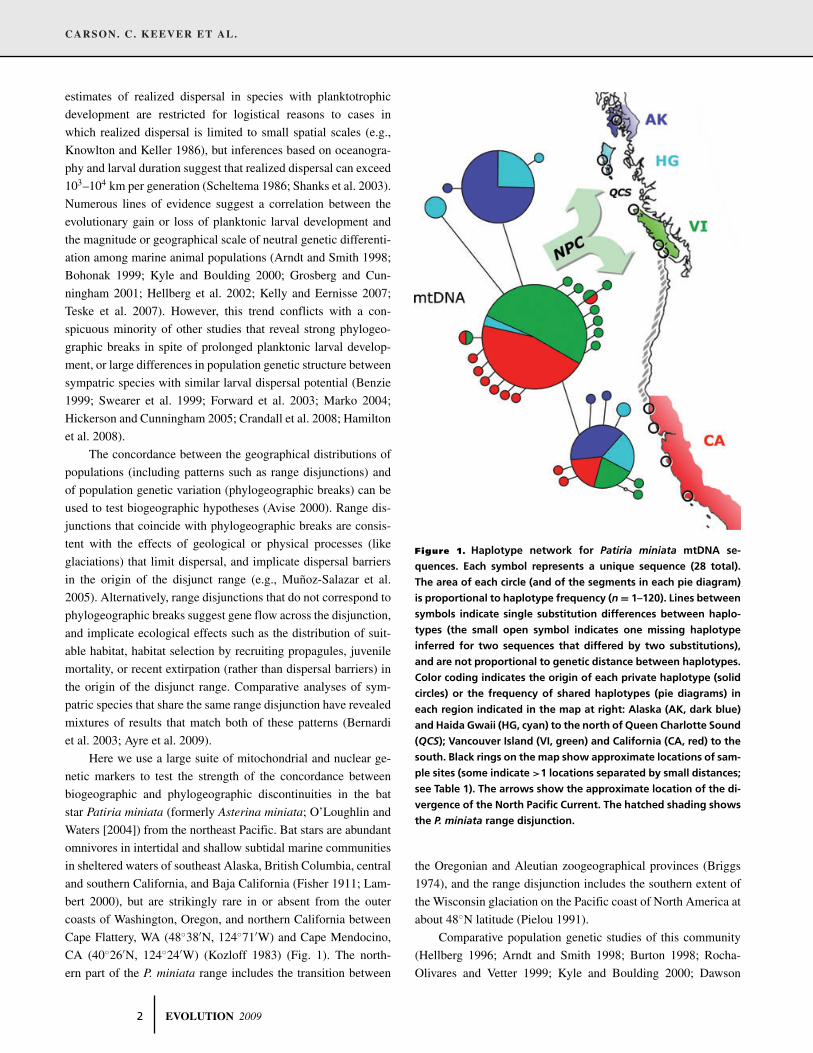
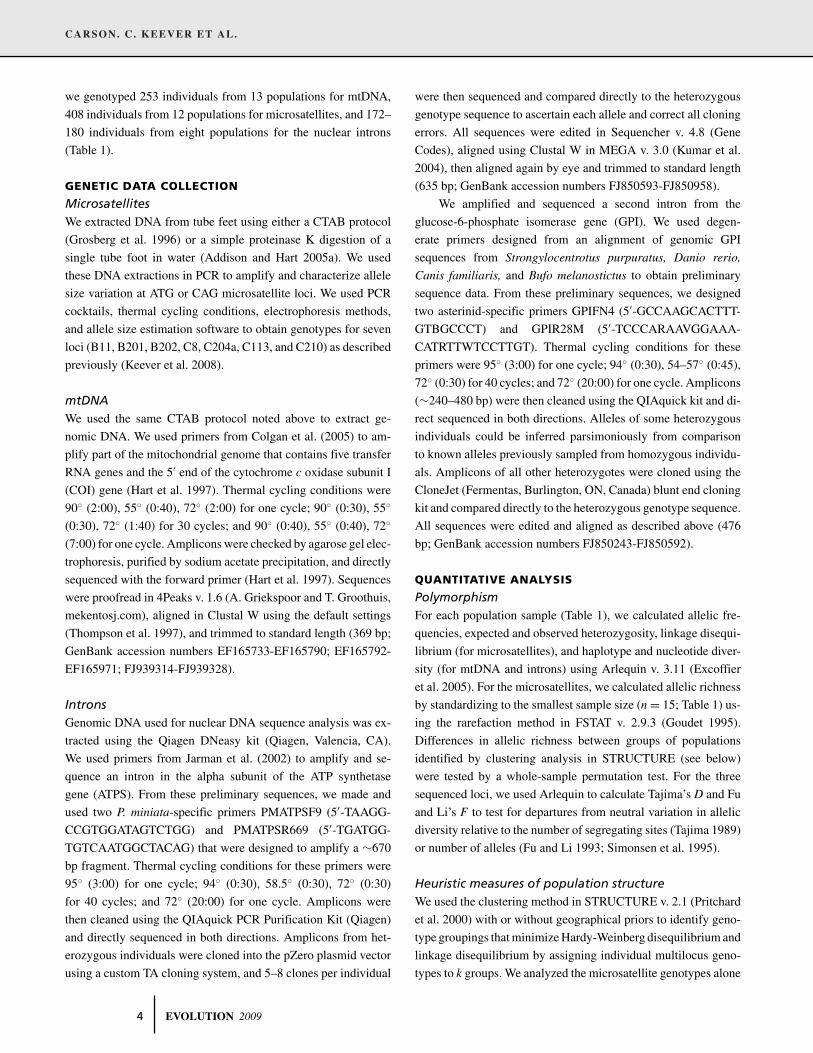
Figure 1. Haplotype network for Patiria miniata mtDNA se-
quences. Each symbol represents a unique sequence (28 total).
The area of each circle (and of the segments in each pie diagram)
is proportional to haplotype frequency (n = 1–120). Lines between
symbols indicate single substitution differences between haplo-
types (the small open symbol indicates one missing haplotype
inferred for two sequences that differed by two substitutions),
and are not proportional to genetic distance between haplotypes.
Color coding indicates the origin of each private haplotype (solid
circles) or the frequency of shared haplotypes (pie diagrams) in
each region indicated in the map at right: Alaska (AK, dark blue)
and Haida Gwaii (HG, cyan) to the north of Queen Charlotte Sound
(QCS); Vancouver Island (VI, green) and California (CA, red) to the
south. Black rings on the map show approximate locations of sam-
ple sites (some indicate >1 locations separated by small distances;
see Table 1). The arrows show the approximate location of the di-
vergence of the North Pacific Current. The hatched shading shows
the P. miniata range disjunction.
the Oregonian and Aleutian zoogeographical provinces (Briggs
1974), and the range disjunction includes the southern extent of
the Wisconsin glaciation on the Pacific coast of North America at
about 48◦N latitude (Pielou 1991).
Comparative population genetic studies of this community
(Hellberg 1996; Arndt and Smith 1998; Burton 1998; Rocha-
Olivares and Vetter 1999; Kyle and Boulding 2000; Dawson
2 EVOLUTION 2009
PATIRIA M INIATA POPULATION STRUCTURE
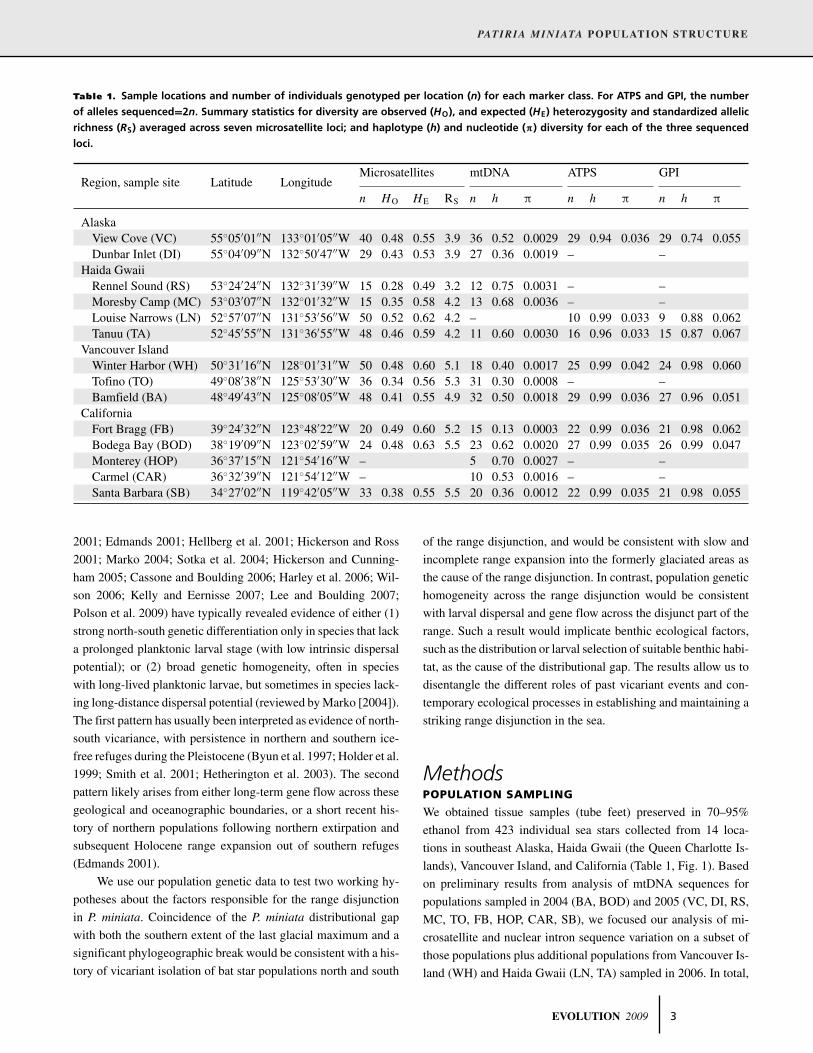
Table 1. Sample locations and number of individuals genotyped per location (n) for each marker class. For ATPS and GPI, the number
of alleles sequenced=2n. Summary statistics for diversity are observed (HO), and expected (HE) heterozygosity and standardized allelic
richness (RS) averaged across seven microsatellite loci; and haplotype (h) and nucleotide (π) diversity for each of the three sequenced
loci.
Microsatellites mtDNA ATPS GPIRegion, sample site Latitude Longitude
n HO HE RS n h π n h π n h π
AlaskaView Cove (VC) 55◦05′01′′N 133◦01′05′′W 40 0.48 0.55 3.9 36 0.52 0.0029 29 0.94 0.036 29 0.74 0.055Dunbar Inlet (DI) 55◦04′09′′N 132◦50′47′′W 29 0.43 0.53 3.9 27 0.36 0.0019 – –
Haida GwaiiRennel Sound (RS) 53◦24′24′′N 132◦31′39′′W 15 0.28 0.49 3.2 12 0.75 0.0031 – –Moresby Camp (MC) 53◦03′07′′N 132◦01′32′′W 15 0.35 0.58 4.2 13 0.68 0.0036 – –Louise Narrows (LN) 52◦57′07′′N 131◦53′56′′W 50 0.52 0.62 4.2 – 10 0.99 0.033 9 0.88 0.062Tanuu (TA) 52◦45′55′′N 131◦36′55′′W 48 0.46 0.59 4.2 11 0.60 0.0030 16 0.96 0.033 15 0.87 0.067
Vancouver IslandWinter Harbor (WH) 50◦31′16′′N 128◦01′31′′W 50 0.48 0.60 5.1 18 0.40 0.0017 25 0.99 0.042 24 0.98 0.060Tofino (TO) 49◦08′38′′N 125◦53′30′′W 36 0.34 0.56 5.3 31 0.30 0.0008 – –Bamfield (BA) 48◦49′43′′N 125◦08′05′′W 48 0.41 0.55 4.9 32 0.50 0.0018 29 0.99 0.036 27 0.96 0.051
CaliforniaFort Bragg (FB) 39◦24′32′′N 123◦48′22′′W 20 0.49 0.60 5.2 15 0.13 0.0003 22 0.99 0.036 21 0.98 0.062Bodega Bay (BOD) 38◦19′09′′N 123◦02′59′′W 24 0.48 0.63 5.5 23 0.62 0.0020 27 0.99 0.035 26 0.99 0.047Monterey (HOP) 36◦37′15′′N 121◦54′16′′W – 5 0.70 0.0027 – –Carmel (CAR) 36◦32′39′′N 121◦54′12′′W – 10 0.53 0.0016 – –Santa Barbara (SB) 34◦27′02′′N 119◦42′05′′W 33 0.38 0.55 5.5 20 0.36 0.0012 22 0.99 0.035 21 0.98 0.055
2001; Edmands 2001; Hellberg et al. 2001; Hickerson and Ross
2001; Marko 2004; Sotka et al. 2004; Hickerson and Cunning-
ham 2005; Cassone and Boulding 2006; Harley et al. 2006; Wil-
son 2006; Kelly and Eernisse 2007; Lee and Boulding 2007;
Polson et al. 2009) have typically revealed evidence of either (1)
strong north-south genetic differentiation only in species that lack
a prolonged planktonic larval stage (with low intrinsic dispersal
potential); or (2) broad genetic homogeneity, often in species
with long-lived planktonic larvae, but sometimes in species lack-
ing long-distance dispersal potential (reviewed by Marko [2004]).
The first pattern has usually been interpreted as evidence of north-
south vicariance, with persistence in northern and southern ice-
free refuges during the Pleistocene (Byun et al. 1997; Holder et al.
1999; Smith et al. 2001; Hetherington et al. 2003). The second
pattern likely arises from either long-term gene flow across these
geological and oceanographic boundaries, or a short recent his-
tory of northern populations following northern extirpation and
subsequent Holocene range expansion out of southern refuges
(Edmands 2001).
We use our population genetic data to test two working hy-
potheses about the factors responsible for the range disjunction
in P. miniata. Coincidence of the P. miniata distributional gap
with both the southern extent of the last glacial maximum and a
significant phylogeographic break would be consistent with a his-
tory of vicariant isolation of bat star populations north and south
of the range disjunction, and would be consistent with slow and
incomplete range expansion into the formerly glaciated areas as
the cause of the range disjunction. In contrast, population genetic
homogeneity across the range disjunction would be consistent
with larval dispersal and gene flow across the disjunct part of the
range. Such a result would implicate benthic ecological factors,
such as the distribution or larval selection of suitable benthic habi-
tat, as the cause of the distributional gap. The results allow us to
disentangle the different roles of past vicariant events and con-
temporary ecological processes in establishing and maintaining a
striking range disjunction in the sea.
MethodsPOPULATION SAMPLING
We obtained tissue samples (tube feet) preserved in 70–95%
ethanol from 423 individual sea stars collected from 14 loca-
tions in southeast Alaska, Haida Gwaii (the Queen Charlotte Is-
lands), Vancouver Island, and California (Table 1, Fig. 1). Based
on preliminary results from analysis of mtDNA sequences for
populations sampled in 2004 (BA, BOD) and 2005 (VC, DI, RS,
MC, TO, FB, HOP, CAR, SB), we focused our analysis of mi-
crosatellite and nuclear intron sequence variation on a subset of
those populations plus additional populations from Vancouver Is-
land (WH) and Haida Gwaii (LN, TA) sampled in 2006. In total,
EVOLUTION 2009 3
CARSON. C. KEEVER ET AL.
we genotyped 253 individuals from 13 populations for mtDNA,
408 individuals from 12 populations for microsatellites, and 172–
180 individuals from eight populations for the nuclear introns
(Table 1).
GENETIC DATA COLLECTION
MicrosatellitesWe extracted DNA from tube feet using either a CTAB protocol
(Grosberg et al. 1996) or a simple proteinase K digestion of a
single tube foot in water (Addison and Hart 2005a). We used
these DNA extractions in PCR to amplify and characterize allele
size variation at ATG or CAG microsatellite loci. We used PCR
cocktails, thermal cycling conditions, electrophoresis methods,
and allele size estimation software to obtain genotypes for seven
loci (B11, B201, B202, C8, C204a, C113, and C210) as described
previously (Keever et al. 2008).
mtDNAWe used the same CTAB protocol noted above to extract ge-
nomic DNA. We used primers from Colgan et al. (2005) to am-
plify part of the mitochondrial genome that contains five transfer
RNA genes and the 5′ end of the cytochrome c oxidase subunit I
(COI) gene (Hart et al. 1997). Thermal cycling conditions were
90◦ (2:00), 55◦ (0:40), 72◦ (2:00) for one cycle; 90◦ (0:30), 55◦
(0:30), 72◦ (1:40) for 30 cycles; and 90◦ (0:40), 55◦ (0:40), 72◦
(7:00) for one cycle. Amplicons were checked by agarose gel elec-
trophoresis, purified by sodium acetate precipitation, and directly
sequenced with the forward primer (Hart et al. 1997). Sequences
were proofread in 4Peaks v. 1.6 (A. Griekspoor and T. Groothuis,
mekentosj.com), aligned in Clustal W using the default settings
(Thompson et al. 1997), and trimmed to standard length (369 bp;
GenBank accession numbers EF165733-EF165790; EF165792-
EF165971; FJ939314-FJ939328).
IntronsGenomic DNA used for nuclear DNA sequence analysis was ex-
tracted using the Qiagen DNeasy kit (Qiagen, Valencia, CA).
We used primers from Jarman et al. (2002) to amplify and se-
quence an intron in the alpha subunit of the ATP synthetase
gene (ATPS). From these preliminary sequences, we made and
used two P. miniata-specific primers PMATPSF9 (5′-TAAGG-
CCGTGGATAGTCTGG) and PMATPSR669 (5′-TGATGG-
TGTCAATGGCTACAG) that were designed to amplify a ∼670
bp fragment. Thermal cycling conditions for these primers were
95◦ (3:00) for one cycle; 94◦ (0:30), 58.5◦ (0:30), 72◦ (0:30)
for 40 cycles; and 72◦ (20:00) for one cycle. Amplicons were
then cleaned using the QIAquick PCR Purification Kit (Qiagen)
and directly sequenced in both directions. Amplicons from het-
erozygous individuals were cloned into the pZero plasmid vector
using a custom TA cloning system, and 5–8 clones per individual
were then sequenced and compared directly to the heterozygous
genotype sequence to ascertain each allele and correct all cloning
errors. All sequences were edited in Sequencher v. 4.8 (Gene
Codes), aligned using Clustal W in MEGA v. 3.0 (Kumar et al.
2004), then aligned again by eye and trimmed to standard length
(635 bp; GenBank accession numbers FJ850593-FJ850958).
We amplified and sequenced a second intron from the
glucose-6-phosphate isomerase gene (GPI). We used degen-
erate primers designed from an alignment of genomic GPI
sequences from Strongylocentrotus purpuratus, Danio rerio,
Canis familiaris, and Bufo melanostictus to obtain preliminary
sequence data. From these preliminary sequences, we designed
two asterinid-specific primers GPIFN4 (5′-GCCAAGCACTTT-
GTBGCCCT) and GPIR28M (5′-TCCCARAAVGGAAA-
CATRTTWTCCTTGT). Thermal cycling conditions for these
primers were 95◦ (3:00) for one cycle; 94◦ (0:30), 54–57◦ (0:45),
72◦ (0:30) for 40 cycles; and 72◦ (20:00) for one cycle. Amplicons
(∼240–480 bp) were then cleaned using the QIAquick kit and di-
rect sequenced in both directions. Alleles of some heterozygous
individuals could be inferred parsimoniously from comparison
to known alleles previously sampled from homozygous individu-
als. Amplicons of all other heterozygotes were cloned using the
CloneJet (Fermentas, Burlington, ON, Canada) blunt end cloning
kit and compared directly to the heterozygous genotype sequence.
All sequences were edited and aligned as described above (476
bp; GenBank accession numbers FJ850243-FJ850592).
QUANTITATIVE ANALYSIS
PolymorphismFor each population sample (Table 1), we calculated allelic fre-
quencies, expected and observed heterozygosity, linkage disequi-
librium (for microsatellites), and haplotype and nucleotide diver-
sity (for mtDNA and introns) using Arlequin v. 3.11 (Excoffier
et al. 2005). For the microsatellites, we calculated allelic richness
by standardizing to the smallest sample size (n = 15; Table 1) us-
ing the rarefaction method in FSTAT v. 2.9.3 (Goudet 1995).
Differences in allelic richness between groups of populations
identified by clustering analysis in STRUCTURE (see below)
were tested by a whole-sample permutation test. For the three
sequenced loci, we used Arlequin to calculate Tajima’s D and Fu
and Li’s F to test for departures from neutral variation in allelic
diversity relative to the number of segregating sites (Tajima 1989)
or number of alleles (Fu and Li 1993; Simonsen et al. 1995).
Heuristic measures of population structureWe used the clustering method in STRUCTURE v. 2.1 (Pritchard
et al. 2000) with or without geographical priors to identify geno-
type groupings that minimize Hardy-Weinberg disequilibrium and
linkage disequilibrium by assigning individual multilocus geno-
types to k groups. We analyzed the microsatellite genotypes alone
4 EVOLUTION 2009
PATIRIA M INIATA POPULATION STRUCTURE
(n = 408) and the combined microsatellite and GPI genotype
data for individuals genotyped for both marker classes (n = 138;
we did not include ATPS in this combined analysis because of
the very high allelic diversity at this locus and the limited scope
for measuring linkage with alleles at other loci). For each data
set, we estimated the number of populations sampled (k) under
an admixture model without geographical priors, with allele fre-
quencies correlated between populations. Admixture proportions
were estimated from the dataset and fixed for all populations. We
ran Bayesian MCMC searches of 1,000,000 steps with a burn-in
of 250,000. For each analysis, we carried out seven independent
runs for each value of k up to k = 5 populations. We used the
method of Evanno et al. (2005) to find the best-fit value of k.
These analyses identified two significant genotype clusters (k =2) that were clearly segregated into a northern (Alaska, Haida
Gwaii) and a southern (Vancouver Island, California) group.
We also examined spatial associations within haplotype net-
works based on the ancestor–descendant relationships among
mtDNA and intron sequences. The very high haplotype diver-
sity in ATPS and GPI samples included many apparent recombi-
nants. Because recombination obscures ancestor–descendant re-
lationships among sequences, we used DnaSP v. 4.20 (Rozas
et al. 2003) to identify the largest contiguous block of nucleotide
sites for each intron alignment that satisfied the four-gamete test
and was therefore assumed to experience no recombination (e.g.,
Woerner et al. 2007). For ATPS, this largest nonrecombining
block consisted of nucleotide sites 202–314 (∼18% of the orig-
inal sequence alignment); for GPI, we analyzed nucleotide sites
85–427 (∼72% of the original sequence alignment). We used
median-joining networks constructed by the algorithm of Bandelt
et al. (1999) implemented in Network v. 4.5 using the default
parameter values (equal character weighting = 10; epsilon = 0;
distance criterion = connection cost) and simplified by using the
MP algorithm of Polzin and Daneshmand (2003). We resolved
one ambiguity (a closed circuit) in the resulting mtDNA network
in favor of ancestor–descendant relationships between common
haplotypes and singletons.
Population differentiationWe calculated fixation indices (F-statistics) among all popula-
tions, between pairs of populations (FST), and among individuals
within populations (F IS), using Arlequin. We used Mantel tests in
Arlequin to characterize isolation by distance as the correlation
between population differentiation (pairwise FST) and straight-
line geographical distance. All F-statistics were computed by the
method of Weir and Cockerham (1984), and F-values significantly
different from zero were identified by comparison to results from
10,000 permutations of the data (Raymond and Rousset 1995).
We tested the statistical significance of pairwise FST values by
genotypic permutation using a G-test implemented in FSTAT.
We adjusted the critical P-values for these tests using sequential
Bonferroni corrections.
We asked whether microsatellite allele size contributed sig-
nificant additional information to estimates of population struc-
ture (RST) compared to estimates based on allele frequencies alone
(FST). We calculated RST for each locus and compared the results
to an expected RST distribution generated by 10,000 allele-size
permutations in SPAGeDi v. 1.2.1 (Hardy and Vekemans 2002).
To test for regional subdivision of sequence and microsatel-
lite diversity, we used analysis of molecular variance (AMOVA)
in Arlequin. We used 10,000 permutations of the data to iden-
tify measures of differentiation (�) significantly different from
zero. We partitioned this variance into differences between north-
ern and southern population groups (�CT) and differences among
populations within each group (�SC). We carried out two of these
analyses: one based on population groups north (Alaska, Haida
Gwaii, Vancouver Island) and south (all California sites) of the
range disjunction; and a second based on the STRUCTURE re-
sults, which strongly suggested a phylogeographic break between
population groups north (Alaska, Haida Gwaii) and south (Van-
couver Island, California) of Queen Charlotte Sound (see Fig. 1).
Gene flow and effective population sizeWe carried out coalescent analyses of migration rate (m) and ef-
fective population size (Ne) for the mtDNA and intron sequences
using the Bayesian method in MIGRATE-N v. 2.4 (Beerli and
Felsenstein 2001; Beerli 2006). We tried to avoid the confound-
ing effects of recombination on each analysis of intron sequences
by using only the largest nonrecombining block of nucleotide
sites identified by DnaSP (see above). Because our STRUC-
TURE and haplotype network analyses identified an unexpected
and strong phylogeographic break at Queen Charlotte Sound in
northern British Columbia, we were specifically interested in con-
trasting gene flow across Queen Charlotte Sound relative to gene
flow across the range disjunction. We therefore organized our
MIGRATE analyses to match our AMOVA analyses. We pooled
all population samples from California, Vancouver Island, Haida
Gwaii, and Alaska, into four regional samples, and estimated
the 16 corresponding parameter values (four effective population
sizes, 12 pairwise migration rates). For this number of parame-
ters, it was not possible to run MIGRATE using our full popu-
lation samples because the gene genealogies were prohibitively
large. Consequently, we limited the analysis to the 102 individuals
from Alaska (n = 17), Haida Gwaii (n = 21), Vancouver Island
(n = 30), and California (n = 34), for which we had characterized
all loci. The MCMC search was based on a chain of 20,000,000
(ATPS, GPI) or 50,000,000 (mtDNA) steps sampled every 40 or
100 steps for a total of 500,000 samples (with a burn-in of 50,000
samples). We used exponential prior distributions for migration
rate (0, 1000) and effective population size (0, 0.01) because such
EVOLUTION 2009 5
CARSON. C. KEEVER ET AL.
priors often explore parameter space much more efficiently than
other prior distributions. We used adaptive heating of three addi-
tional chains to search more effectively the genealogy space for
the highly polymorphic ATPS and GPI data (but not for mtDNA).
We repeated this intron analysis using uniform (rather than ex-
ponential) priors to test for any bias caused by the exponential
priors, and because parameter estimates under uniform (but not
other) prior distributions can also be considered maximum like-
lihood estimates. We assessed convergence by comparing results
from multiple runs. We analyzed the two introns separately and
in parallel to obtain a single two-locus estimate of parameter val-
ues. We characterized effective population size as θ = 4Neμ, and
expressed the magnitude of gene flow estimated from these anal-
yses as the number of migrants per generation M = θm/μ. We
used the “estimate” option in MIGRATE to infer the mutation
rate parameter μ that scales both θ and M (Beerli 2006).
An alternative approach to accounting for the effects of re-
combination on such coalescent analyses is to estimate the re-
combination rate as part of the MCMC process using the whole
sequence alignment (rather than analyzing a smaller portion of
the alignment that is inferred to be nonrecombining). We used
LAMARC v. 2.1.3 (Kuhner 2006) to estimate simultaneously re-
combination rate (the ratio of recombination events per site per
generation to mutations per site per generation), migration, and
effective population size for both the mtDNA sequences (which
presumably were nonrecombining) and the full intron sequence
alignments. Estimating recombination rate greatly increased the
computational time for these MCMC analyses, so we further
trimmed the data set (and the allelic genealogies) to a randomly
selected group of 10 individuals (20 alleles) from each of the
four pooled population samples (80 alleles total). We used a short
chain of 1,250,000 steps sampled every 50 steps for a total of
25,000 samples (with a burn-in of 2500) and a long chain of
25,000,000 steps sampled every 100 steps for 250,000 samples
(with a burn-in of 25,000). We used logarithmic prior distributions
for recombination rate (0.001, 10), migration rate (0.01, 3000),
and effective population size (0.00001, 10). We assessed conver-
gence by monitoring the effective sample size for each parameter
and by confirming similar results from multiple runs.
ResultsPOLYMORPHISM
We found 3–12 microsatellite alleles per locus (summed across
all 12 populations), with standardized allelic richness of 3.9–5.5
(averaged across loci; Table 1). Observed and expected heterozy-
gosities were ∼0.3 to ∼0.6 across all populations. We found
homozygote excesses (high F IS) significantly greater than zero
in most populations (0.13 < F IS < 0.44) and at most loci
(0.09 < F IS < 0.70), a characteristic of many broadcast-spawning
marine invertebrates (Addison and Hart 2005b). Five of 2856 to-
tal single-locus genotypes were null homozygotes. We found one
case of a pair of loci (B11 and B202) in one population (Louise
Narrows) in linkage disequilibrium; no other loci were in linkage
disequilibrium within any other populations.
The mtDNA sequence alignment included 28 unique haplo-
types that differed by up to five substitutions. There were 2–11
haplotypes per population, with haplotype diversities of 0.13–
0.75 (Table 1). Nucleotide diversity was low (π < 0.004) for
these slow-evolving tRNA sequences but varied about four-fold
among populations.
We found 143 GPI alleles among 172 individuals, with 9–
36 alleles per population that differed by up to 14 substitutions.
Allele size ranged from 242 to 415 bp. The sequence alignment
(Table S1) included 318 gap sites and was consistent with 70
insertion–deletion events of 15.0 bp average length. Both hap-
lotype (0.74–0.99) and nucleotide (0.047–0.067) diversity were
correspondingly high.
The ATPS sequences exhibited the greatest overall diversity:
252 alleles among 180 individuals, and 19–50 alleles per popula-
tion, with up to 30 substitution differences. Allele size varied from
584 to 616 bp. The alignment (Table S2) included 158 gap sites,
consistent with 59 insertion–deletion events of 4.2 bp average
length. Most individuals in most populations were heterozygotes
(h >> 0.9) in part due to the many short insertion–deletion dif-
ferences. Nucleotide diversity was slightly lower (0.033–0.042)
than GPI diversity in the same samples.
Although there was no detectable association between lati-
tude and mitochondrial diversity, the nuclear markers were gen-
erally less diverse in northern compared to southern populations.
The sample site latitude (Table 1) was negatively correlated with
average allelic richness for microsatellites (r = −0.79, P = 0.002)
and with haplotype diversity for GPI (r = −0.71, P = 0.047). For
the very high ATPS haplotype diversities, the correlation was
slightly similar and nonsignificant (r = −0.58, P = 0.135), and
there was no association between latitude and mitochondrial di-
versity. A permutation test suggested that Haida Gwaii and Alaska
samples had significantly lower mean microsatellite allelic rich-
ness (4.0) than samples from California and Vancouver Island
(5.3; P = 0.003). These differences in diversity appeared to be
consistent with neutral variation (or at least not the product of
large and easily detected nonneutral effects). After correction for
58 simultaneous tests of neutrality (D or F) across three loci,
eight or 13 populations, and two methods, four values of F (from
−5.56 to −22.04) for ATPS from Bodega Bay and for mtDNA
from Louise Narrows, Tofino, and Bodega Bay, were significantly
different from zero (neutral expectation). No values of D were
significantly different from zero. The bias toward a few signifi-
cant F (rather than D) values could reflect the information from
invariant sites incorporated into the F statistic (329/635 bp for
6 EVOLUTION 2009
PATIRIA M INIATA POPULATION STRUCTURE
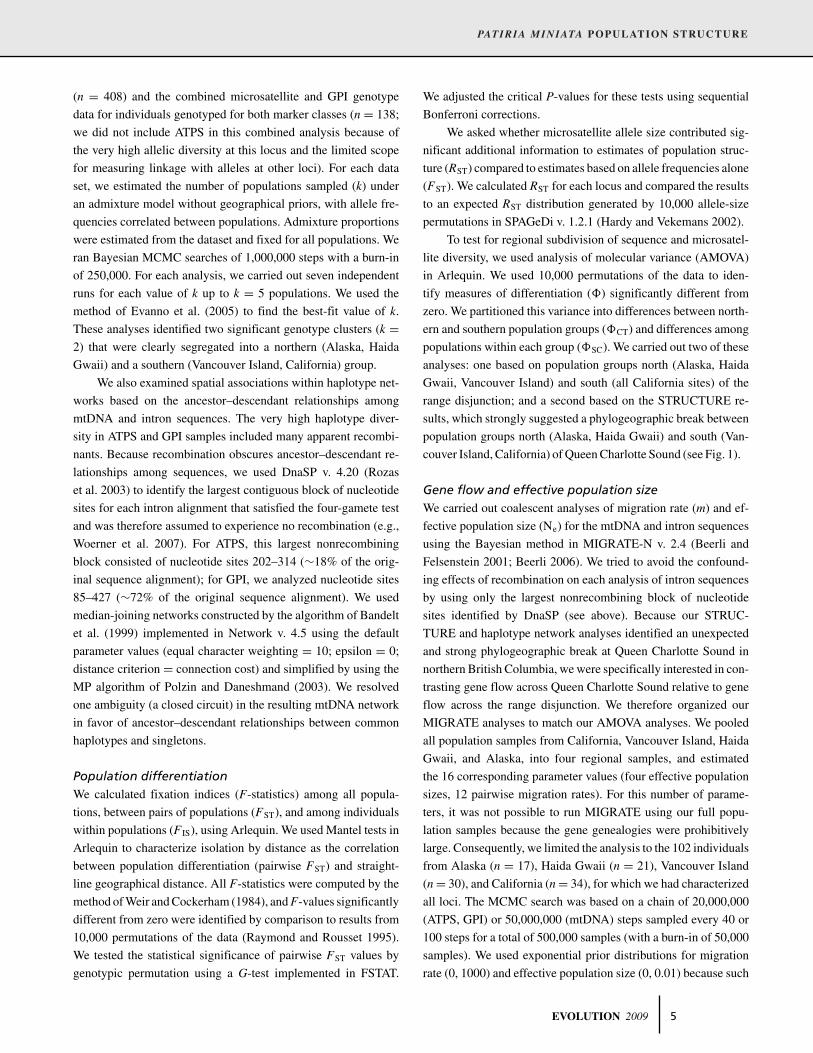
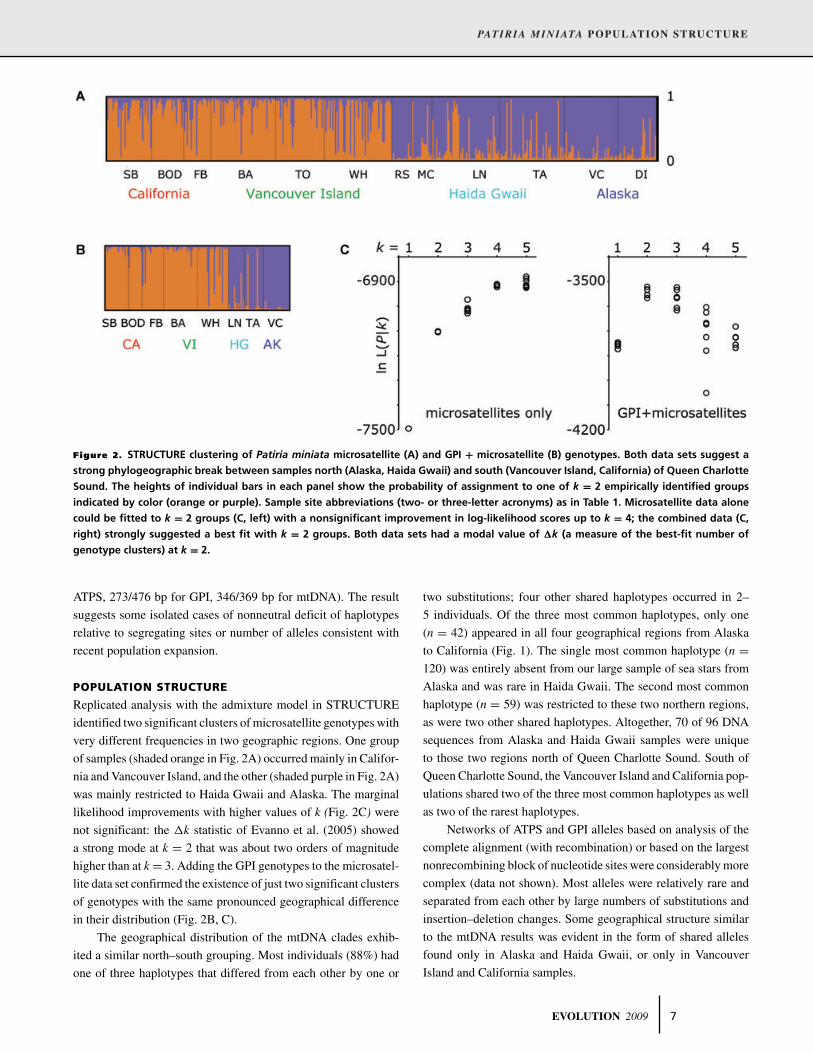
Figure 2. STRUCTURE clustering of Patiria miniata microsatellite (A) and GPI + microsatellite (B) genotypes. Both data sets suggest a
strong phylogeographic break between samples north (Alaska, Haida Gwaii) and south (Vancouver Island, California) of Queen Charlotte
Sound. The heights of individual bars in each panel show the probability of assignment to one of k = 2 empirically identified groups
indicated by color (orange or purple). Sample site abbreviations (two- or three-letter acronyms) as in Table 1. Microsatellite data alone
could be fitted to k = 2 groups (C, left) with a nonsignificant improvement in log-likelihood scores up to k = 4; the combined data (C,
right) strongly suggested a best fit with k = 2 groups. Both data sets had a modal value of �k (a measure of the best-fit number of
genotype clusters) at k = 2.
ATPS, 273/476 bp for GPI, 346/369 bp for mtDNA). The result
suggests some isolated cases of nonneutral deficit of haplotypes
relative to segregating sites or number of alleles consistent with
recent population expansion.
POPULATION STRUCTURE
Replicated analysis with the admixture model in STRUCTURE
identified two significant clusters of microsatellite genotypes with
very different frequencies in two geographic regions. One group
of samples (shaded orange in Fig. 2A) occurred mainly in Califor-
nia and Vancouver Island, and the other (shaded purple in Fig. 2A)
was mainly restricted to Haida Gwaii and Alaska. The marginal
likelihood improvements with higher values of k (Fig. 2C) were
not significant: the �k statistic of Evanno et al. (2005) showed
a strong mode at k = 2 that was about two orders of magnitude
higher than at k = 3. Adding the GPI genotypes to the microsatel-
lite data set confirmed the existence of just two significant clusters
of genotypes with the same pronounced geographical difference
in their distribution (Fig. 2B, C).
The geographical distribution of the mtDNA clades exhib-
ited a similar north–south grouping. Most individuals (88%) had
one of three haplotypes that differed from each other by one or
two substitutions; four other shared haplotypes occurred in 2–
5 individuals. Of the three most common haplotypes, only one
(n = 42) appeared in all four geographical regions from Alaska
to California (Fig. 1). The single most common haplotype (n =120) was entirely absent from our large sample of sea stars from
Alaska and was rare in Haida Gwaii. The second most common
haplotype (n = 59) was restricted to these two northern regions,
as were two other shared haplotypes. Altogether, 70 of 96 DNA
sequences from Alaska and Haida Gwaii samples were unique
to those two regions north of Queen Charlotte Sound. South of
Queen Charlotte Sound, the Vancouver Island and California pop-
ulations shared two of the three most common haplotypes as well
as two of the rarest haplotypes.
Networks of ATPS and GPI alleles based on analysis of the
complete alignment (with recombination) or based on the largest
nonrecombining block of nucleotide sites were considerably more
complex (data not shown). Most alleles were relatively rare and
separated from each other by large numbers of substitutions and
insertion–deletion changes. Some geographical structure similar
to the mtDNA results was evident in the form of shared alleles
found only in Alaska and Haida Gwaii, or only in Vancouver
Island and California samples.
EVOLUTION 2009 7
CARSON. C. KEEVER ET AL.
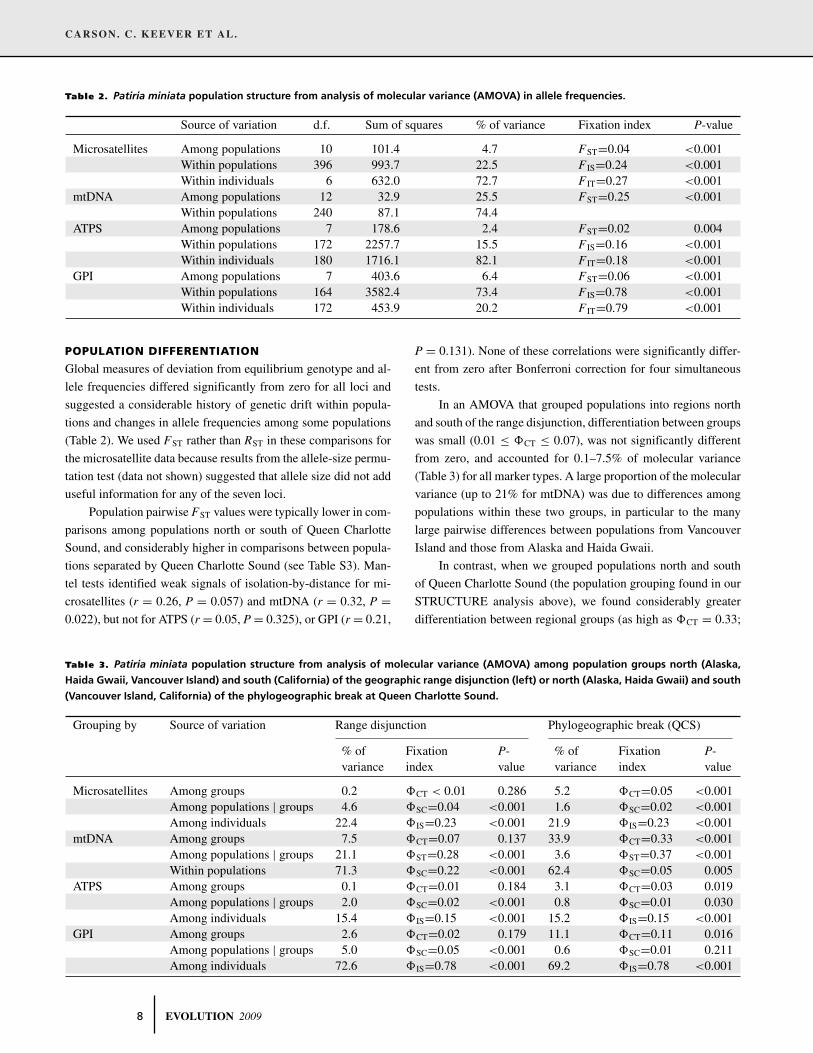
Table 2. Patiria miniata population structure from analysis of molecular variance (AMOVA) in allele frequencies.
Source of variation d.f. Sum of squares % of variance Fixation index P-value
Microsatellites Among populations 10 101.4 4.7 FST=0.04 <0.001Within populations 396 993.7 22.5 F IS=0.24 <0.001Within individuals 6 632.0 72.7 F IT=0.27 <0.001
mtDNA Among populations 12 32.9 25.5 FST=0.25 <0.001Within populations 240 87.1 74.4
ATPS Among populations 7 178.6 2.4 FST=0.02 0.004Within populations 172 2257.7 15.5 F IS=0.16 <0.001Within individuals 180 1716.1 82.1 F IT=0.18 <0.001
GPI Among populations 7 403.6 6.4 FST=0.06 <0.001Within populations 164 3582.4 73.4 F IS=0.78 <0.001Within individuals 172 453.9 20.2 F IT=0.79 <0.001
POPULATION DIFFERENTIATION
Global measures of deviation from equilibrium genotype and al-
lele frequencies differed significantly from zero for all loci and
suggested a considerable history of genetic drift within popula-
tions and changes in allele frequencies among some populations
(Table 2). We used FST rather than RST in these comparisons for
the microsatellite data because results from the allele-size permu-
tation test (data not shown) suggested that allele size did not add
useful information for any of the seven loci.
Population pairwise FST values were typically lower in com-
parisons among populations north or south of Queen Charlotte
Sound, and considerably higher in comparisons between popula-
tions separated by Queen Charlotte Sound (see Table S3). Man-
tel tests identified weak signals of isolation-by-distance for mi-
crosatellites (r = 0.26, P = 0.057) and mtDNA (r = 0.32, P =0.022), but not for ATPS (r = 0.05, P = 0.325), or GPI (r = 0.21,
Table 3. Patiria miniata population structure from analysis of molecular variance (AMOVA) among population groups north (Alaska,
Haida Gwaii, Vancouver Island) and south (California) of the geographic range disjunction (left) or north (Alaska, Haida Gwaii) and south
(Vancouver Island, California) of the phylogeographic break at Queen Charlotte Sound.
Grouping by Source of variation Range disjunction Phylogeographic break (QCS)
% of Fixation P- % of Fixation P-variance index value variance index value
Microsatellites Among groups 0.2 �CT < 0.01 0.286 5.2 �CT=0.05 <0.001Among populations | groups 4.6 �SC=0.04 <0.001 1.6 �SC=0.02 <0.001Among individuals 22.4 �IS=0.23 <0.001 21.9 �IS=0.23 <0.001
mtDNA Among groups 7.5 �CT=0.07 0.137 33.9 �CT=0.33 <0.001Among populations | groups 21.1 �ST=0.28 <0.001 3.6 �ST=0.37 <0.001Within populations 71.3 �SC=0.22 <0.001 62.4 �SC=0.05 0.005
ATPS Among groups 0.1 �CT=0.01 0.184 3.1 �CT=0.03 0.019Among populations | groups 2.0 �SC=0.02 <0.001 0.8 �SC=0.01 0.030Among individuals 15.4 �IS=0.15 <0.001 15.2 �IS=0.15 <0.001
GPI Among groups 2.6 �CT=0.02 0.179 11.1 �CT=0.11 0.016Among populations | groups 5.0 �SC=0.05 <0.001 0.6 �SC=0.01 0.211Among individuals 72.6 �IS=0.78 <0.001 69.2 �IS=0.78 <0.001
P = 0.131). None of these correlations were significantly differ-
ent from zero after Bonferroni correction for four simultaneous
tests.
In an AMOVA that grouped populations into regions north
and south of the range disjunction, differentiation between groups
was small (0.01 ≤ �CT ≤ 0.07), was not significantly different
from zero, and accounted for 0.1–7.5% of molecular variance
(Table 3) for all marker types. A large proportion of the molecular
variance (up to 21% for mtDNA) was due to differences among
populations within these two groups, in particular to the many
large pairwise differences between populations from Vancouver
Island and those from Alaska and Haida Gwaii.
In contrast, when we grouped populations north and south
of Queen Charlotte Sound (the population grouping found in our
STRUCTURE analysis above), we found considerably greater
differentiation between regional groups (as high as �CT = 0.33;
8 EVOLUTION 2009
PATIRIA M INIATA POPULATION STRUCTURE
Table 3). After correction for simultaneous comparisons for four
markers, only the estimate of between-group differentiation for
the very highly polymorphic ATPS (�CT = 0.03) was not signif-
icantly different from zero. For all four markers, this alternative
grouping improved the among-groups sum of squares by a factor
of ∼2 (for highly polymorphic introns) to ∼5 (for microsatellites
and mtDNA).
GENE FLOW AND EFFECTIVE POPULATION SIZE
The analyses above based on allele frequencies and genetic dis-
tances consistently revealed one major phylogeographic break
in P. miniata. We used the coalescent analyses to explore two
aspects of this population genetic structure: (1) demographic
differences among populations manifested as variation in ef-
fective population size; and (2) asymmetries in gene flow that
might underlie patterns of allele frequency similarities between
populations.
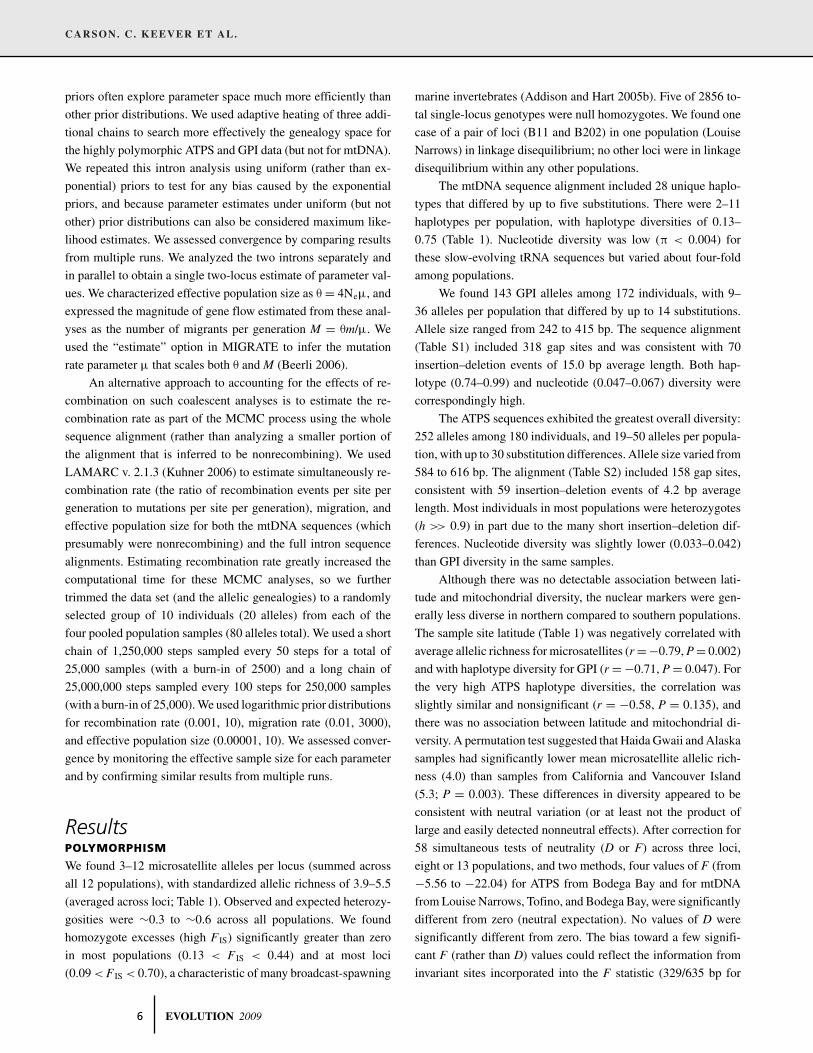
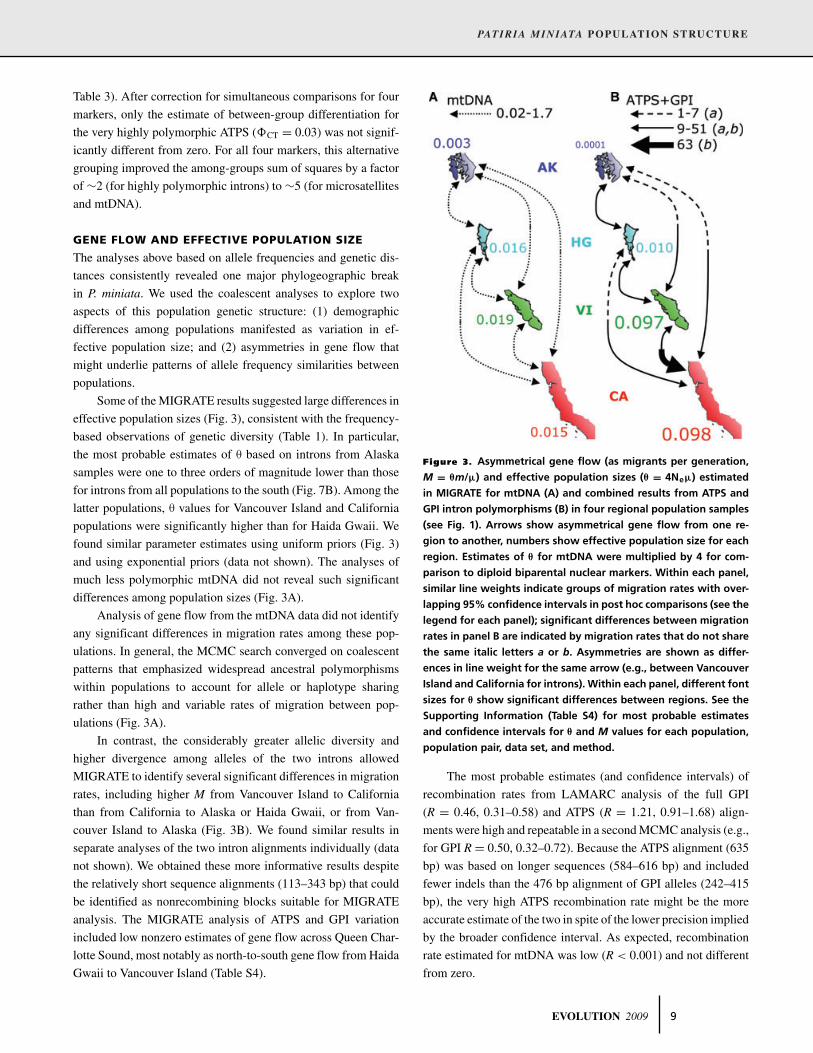
Some of the MIGRATE results suggested large differences in
effective population sizes (Fig. 3), consistent with the frequency-
based observations of genetic diversity (Table 1). In particular,
the most probable estimates of θ based on introns from Alaska
samples were one to three orders of magnitude lower than those
for introns from all populations to the south (Fig. 7B). Among the
latter populations, θ values for Vancouver Island and California
populations were significantly higher than for Haida Gwaii. We
found similar parameter estimates using uniform priors (Fig. 3)
and using exponential priors (data not shown). The analyses of
much less polymorphic mtDNA did not reveal such significant
differences among population sizes (Fig. 3A).
Analysis of gene flow from the mtDNA data did not identify
any significant differences in migration rates among these pop-
ulations. In general, the MCMC search converged on coalescent
patterns that emphasized widespread ancestral polymorphisms
within populations to account for allele or haplotype sharing
rather than high and variable rates of migration between pop-
ulations (Fig. 3A).
In contrast, the considerably greater allelic diversity and
higher divergence among alleles of the two introns allowed
MIGRATE to identify several significant differences in migration
rates, including higher M from Vancouver Island to California
than from California to Alaska or Haida Gwaii, or from Van-
couver Island to Alaska (Fig. 3B). We found similar results in
separate analyses of the two intron alignments individually (data
not shown). We obtained these more informative results despite
the relatively short sequence alignments (113–343 bp) that could
be identified as nonrecombining blocks suitable for MIGRATE
analysis. The MIGRATE analysis of ATPS and GPI variation
included low nonzero estimates of gene flow across Queen Char-
lotte Sound, most notably as north-to-south gene flow from Haida
Gwaii to Vancouver Island (Table S4).
Figure 3. Asymmetrical gene flow (as migrants per generation,
M = θm/μ) and effective population sizes (θ = 4Neμ) estimated
in MIGRATE for mtDNA (A) and combined results from ATPS and
GPI intron polymorphisms (B) in four regional population samples
(see Fig. 1). Arrows show asymmetrical gene flow from one re-
gion to another, numbers show effective population size for each
region. Estimates of θ for mtDNA were multiplied by 4 for com-
parison to diploid biparental nuclear markers. Within each panel,
similar line weights indicate groups of migration rates with over-
lapping 95% confidence intervals in post hoc comparisons (see the
legend for each panel); significant differences between migration
rates in panel B are indicated by migration rates that do not share
the same italic letters a or b. Asymmetries are shown as differ-
ences in line weight for the same arrow (e.g., between Vancouver
Island and California for introns). Within each panel, different font
sizes for θ show significant differences between regions. See the
Supporting Information (Table S4) for most probable estimates
and confidence intervals for θ and M values for each population,
population pair, data set, and method.
The most probable estimates (and confidence intervals) of
recombination rates from LAMARC analysis of the full GPI
(R = 0.46, 0.31–0.58) and ATPS (R = 1.21, 0.91–1.68) align-
ments were high and repeatable in a second MCMC analysis (e.g.,
for GPI R = 0.50, 0.32–0.72). Because the ATPS alignment (635
bp) was based on longer sequences (584–616 bp) and included
fewer indels than the 476 bp alignment of GPI alleles (242–415
bp), the very high ATPS recombination rate might be the more
accurate estimate of the two in spite of the lower precision implied
by the broader confidence interval. As expected, recombination
rate estimated for mtDNA was low (R < 0.001) and not different
from zero.
EVOLUTION 2009 9
CARSON. C. KEEVER ET AL.
Parameter value estimates from these coalescent analyses
were positively correlated across methods and genetic markers.
For example, MIGRATE (Fig. 3A) and LAMARC converged on
four similar pairs of θ estimates for the same mtDNA align-
ment (r = 0.52; see the Supporting Information). Similarly, the
LAMARC analysis converged on 12 similar pairs of M estimates
for ATPS and GPI alignments that differed in recombination rate,
total length, and overall levels of polymorphism (r = 0.90).
DiscussionPrevious reviews of empirical studies across oceans and taxa
(Bohonak 1999; Grosberg and Cunningham 2001; Hellberg et al.
2002) have clearly articulated the expected patterns of popula-
tion genetic variation for marine animals such as P. miniata with
sedentary benthic adults and long-lived planktonic larvae. These
patterns include (1) genetic homogeneity, perhaps with isolation-
by-distance across the extremes of the range (Hellberg 1996);
(2) genetic differentiation corresponding to present-day bio-
geographic features including physical oceanographic struc-
ture, range disjunctions, or boundaries between zoogeographic
provinces that represent past or continuing barriers to dispersal
(Burton 1998); or (3) population genetic signals of disjunction or
vicariance that do not correspond to obvious contemporary barri-
ers to gene flow (Benzie 1999). Identifying such patterns, docu-
menting their relative frequencies, and understanding their causes
is an important goal of evolutionary ecology and contributes to
a general understanding of the opportunities for local adaptation,
extirpation, and speciation in the seas (Foltz et al. 2008).
POPULATION GENETIC PATTERNS IN P. MINIATA
Two consistent and strong population genetic patterns emerged
from our multilocus analysis of genetic structure in the bat star.
First, most loci and methods of analysis showed strong and highly
significant genetic differentiation between P. miniata populations
north and south of Queen Charlotte Sound, including populations
from southern Haida Gwaii and northern Vancouver Island sepa-
rated by just a few hundred kilometers. Second, there was no evi-
dence from any locus or method for genetic differentiation across
the majority of the bat star geographic range from Vancouver Is-
land to southern California that includes the broad distributional
gap in Washington, Oregon, and northern California.
Our success in identifying these patterns from extremely
variable intron sequence data depended on the method of anal-
ysis. Under infinite allele models based on allele and genotype
frequencies (such as AMOVA) these data sometimes failed to
identify the major phylogeographic break that was clearly and
consistently evident in data from less polymorphic markers (such
as mtDNA; Table 3). However, the introns were considerably more
informative than other markers under coalescent models that em-
phasize allelic genealogies (such as MIGRATE; Fig. 3) because
such methods use the magnitude and history of allelic divergence
to estimate demographic parameters. Coalescent analysis of the
intron data suggested large and highly significant differences in
the effective population size that were consistent with severe pop-
ulation bottlenecks in Alaska and Haida Gwaii. We also found
10-fold higher rates of gene flow across the range disjunction in
comparison to some rates of gene flow across Queen Charlotte
Sound. Neither of these patterns was evident in similar analyses
of the mtDNA data, probably due to the very shallow coales-
cent depth of the mtDNA phylogeny (Fig. 1). Such differences
in information content across markers and models highlight the
specific utility of adding highly variable nuclear sequences to
phylogeographic studies (in coalescent analyses) and the impor-
tance of comparing such data against less variable markers (in
frequency-based analyses).
In the absence of genetic information, the coincidence of
the P. miniata geographic range disjunction and the southern ex-
tent of the last North American glaciation on the Pacific coast
might imply that bat star populations gradually expanded out of
northern and southern glacial refuges, leaving descendants that
established the extant populations north and south (respectively)
of the range disjunction. However, the discordance between the
location of the phylogeographic break and the geographic range
disjunction—and the genetic affinity between Vancouver Island
and California populations—allows us to reject this simple pre-
diction. Our data and analyses are consistent with either high
gene flow across the range disjunction or recent colonization of
Vancouver Island by California migrants. A third scenario (which
would be difficult to reject on the basis of genetic data alone)
is recent local extirpation of bat star populations in Washington,
Oregon, and northern California that fragmented a formerly more
continuous species range. However, under any of these scenar-
ios, the origin and maintenance of the range disjunction seems
to require an ecological rather than a geological or historical
explanation.
The origin and maintenance of the phylogeographic break
at Queen Charlotte Sound may be more easily associated with
geological and oceanographic dispersal barriers. A coalescent
estimate of population divergence time between bat stars from
Alaska and Vancouver Island using mtDNA and six anonymous
nuclear DNA sequence markers (T. McGovern, C. Keever, M.
Hart, C. Saski, and P. Marko, unpubl. data) is ∼80,000 years ago.
This divergence time is consistent with population isolation due
to changes in climate, sea level, and oceanographic circulation
associated with the last glacial episode (or with other ecological
or geological processes operating on the same time scale but not
associated with glacial cycles). The phylogeographic break that
we observed coincides with a west-to-east surface current (the
North Pacific Current) that diverges at about the same latitude
1 0 EVOLUTION 2009
PATIRIA M INIATA POPULATION STRUCTURE
to form the northward Alaska and southward California current
systems (Cummins and Freeland 2007). High-resolution models
of density- and wind-driven circulation in the northeast Pacific
(Foreman et al. 2008) suggest that exchange of P. miniata lar-
vae across Queen Charlotte Sound may be limited. This physical
current structure could contribute to the maintenance of a phy-
logeographic break established by Pleistocene climate change in
spite of the prolonged 6- to 10-week period of planktonic larval
growth and development in bat stars (Strathmann 1987; Rumrill
1989; Basch 1996).
COMPARISON TO CLOSE NEIGHBORS AND CLOSE
RELATIVES
Bat stars share a similar range disjunction with two other rocky
intertidal species, the kelp Eisenia arborea and the turban snail As-
traea gibberosa. Future phylogeographic studies of these species
across the shared range disjunction could test the hypothesis of a
shared ecological cause for this unusual distribution (if all three
species show the same population genetic pattern across the dis-
junction; Bermingham and Moritz 1998; Avise 2000).
Bat stars also share a similar phylogeographic break with a
taxonomically heterogeneous group of snails, fishes, and sea cu-
cumbers (see Marko 2004; Hickerson and Cunningham 2005) that
all lack a long-lived planktonic larval stage in the life cycle. Our
study is the first from this well-known zoogeographic transition
zone to show strong population genetic differentiation in a species
with long-lived feeding larvae and high intrinsic dispersal poten-
tial. Among members of the same community with planktotrophic
development, our results contrast with those for the abundant
keystone predator Pisaster ochraceus. Harley et al. (2006) found
no significant mtDNA differentiation in this sea star species at
Queen Charlotte Sound (or at any other well-known phylogeo-
graphic breaks such as Point Conception in California; Dawson
2001). Pisaster ochraceus and P. miniata have broadly overlapped
geographical distributions but occur in different habitats and on
different substrates (Lambert 2000). If the phylogeographic break
between bat star populations was initiated by late Pleistocene
glaciations and maintained by the North Pacific Current (as sug-
gested above), then these two species may also differ in their
response to Pleistocene climate change (and population history)
or in their response to present-day ocean currents and the tendency
to cross Queen Charlotte Sound during larval development. The
nature of such differences is unknown.
Bat stars are members of a clade of shallow-water sea stars
(Family Asterinidae) in which highly derived mating systems and
modes of dispersal have evolved in parallel in several genera
(Hart et al. 1997; Byrne 2006; Keever and Hart 2008). As ex-
pected, strong population genetic structure has been found in as-
terinid species with benthic development of brooded larvae (Hunt
1993; Matsuoka and Asano 2003; Waters et al. 2004; Baus et al.
2005; Colgan et al. 2005; Sherman et al. 2008). These results
suggest that evolutionary changes in mode of larval development
are important determinants of population genetic structure in as-
terinids. However, the discovery of unexpected and strong phylo-
geographic breaks in P. miniata and another asterinid (from New
Zealand; Waters and Roy 2004) with planktotrophic development
suggests that extrinsic physical or geological barriers and histor-
ical processes might also have significant effects on population
genetic variation in asterinids. Phylogenetic comparative analyses
(e.g., Kyle and Boulding 2000; Collin 2001; Kelly and Eernisse
2007; Teske et al. 2007; Sherman et al. 2008) can complement
community-level analyses of the contribution of biogeographic
history, mode of development, and ecological process to the evo-
lution of population genetic structure. Such phylogenetic com-
parative analyses using multiple asterinid lineages and genetic
markers could be used to estimate the phylogenetic correlations
between evolutionary changes in life history and population ge-
netic structure, and the residual contributions of other (geological
or ecological) processes in shaping the evolution of population
genetic structure.
ACKNOWLEDGMENTSThanks to Shane Anderson, John and Vicki Pearse, Ed Sunday, ScottWalker, and staff from Moresby Explorers and from the Bamfield Ma-rine Sciences Centre for collection assistance. Thanks to Mike Hellberg,Doug Eernisse, and three anonymous reviewers for constructive criticism.We received grant support from the National Science Foundation (OCE0623699) (RJT, RKG), the Mellon Foundation (RKG), the Natural Sci-ences and Engineering Research Council (2004–203052) (MWH), andSimon Fraser University.
LITERATURE CITEDAddison, J. A., and M. W. Hart. 2005a. Colonization, dispersal, and hybridiza-
tion influence phylogeography of North Atlantic sea urchins (Strongy-
locentrotus droebachiensis). Evolution 59:532–543.———. 2005b. Spawning, copulation and inbreeding coefficients in marine
invertebrates. Biol. Lett. 1:450–453.Arndt, A., and M. J. Smith. 1998. Genetic diversity and population structure
in two species of sea cucumber: differing patterns according to mode ofdevelopment. Mol. Ecol. 7:1053–1064.
Avise, J. C. 2000. Phylogeography: the history and formation of species.Harvard Univ. Press, Cambridge, MA.
Ayre, D. J., T. E. Minchinton, and C. Perrin. 2009. Does life history predictpast and current connectivity for rocky intertidal invertebrates across amarine biogeographic barrier? Mol. Ecol. 14:1887–1903.
Bandelt, H. J., P. Forster, and A. Rohl. 1999. Median-joining networks forinferring intraspecific phylogenies. Mol. Biol. Evol. 16:37–48.
Basch, L. V. 1996. Effects of algal and larval densities on development andsurvival of asteroid larvae. Mar. Biol. 126:693–701.
Baus, E., D. J. Darrock, and M. W. Bruford. 2005. Gene-flow patterns in At-lantic and Mediterranean populations of the Lusitanian sea star Asterina
gibbosa. Mol. Ecol. 14:3373–3382.Beerli, P. 2006. Comparison of Bayesian and maximum likelihood inference
of population genetic parameters. Bioinformatics 22:341–345.Beerli, P. and J. Felsenstein. 2001. Maximum likelihood estimation of a mi-
gration matrix and effective population sizes in n subpopulations by
EVOLUTION 2009 1 1
CARSON. C. KEEVER ET AL.
using a coalescent approach. Proc. Natl. Acad. Sci. USA 98:4563–4568.
Benzie, J. A. H. 1999. Genetic structure of coral reef organisms: ghosts ofdispersal past. Amer. Zool. 39:131–145.
Bermingham, E. and C. Moritz. 1998. Comparative phylogeography: conceptsand applications. Mol. Ecol. 7:367–369.
Bernardi, G., L. Findley, and A. Rocha-Olivares. 2003. Vicariance and disper-sal across Baja California in disjunct marine fish populations. Evolution57:1599–1609.
Bohonak, A. J. 1999. Dispersal, gene flow, and population structure. Quart.Rev. Biol. 74:21–45.
Briggs, J. C. 1987. Antitropical distribution and evolution in the Indo-WestPacific ocean. Syst. Zool. 36:237–247.
———. 1974. Marine zoogeography. McGraw-Hill, New York, NY.Burton, R. S. 1998. Intraspecific phylogeography across the Point Conception
biogeographic boundary. Evolution 52:734–745.Byrne, M. 2006. Life history diversity and evolution in the Asterinidae. Integr.
Comp. Biol. 46:243–254.Byun, S. A., B. F. Koop, and T. E. Reimchen. 1997. North American black bear
mtDNA phylogeography: implications for morphology and the HaidaGwaii glacial refugium controversy. Evolution. 51:1647–1653.
Cassone, B. J., and E. G. Boulding. 2006. Genetic structure and phylogeog-raphy of the lined shore crab, Pachygrapsus crassipes, along the north-eastern and western Pacific coasts. Mar. Biol. 149:213–226.
Chia, F.-S., and C. W. Walker. 1991. Echinodermata: Asteroidea. Pp. 301–353in A. C. Geise, J. S. Pearse and V. B. Pearse, eds. Vol. 6. Reproductionof marine invertebrates. Echinoderms and lophophorates. The BoxwoodPress, Pacific Grove, CA.
Colgan, D. J., M. Byrne, E. Rickard, and L. R. Castro. 2005. Limited nucleotidedivergence over large spatial scales in the asterinid sea star Patiriella
exigua. Mar. Biol. 146:263–270.Collin, R. 2001. The effects of mode of development on phylogeography and
population structure of North Atlantic Crepidula (Gastropoda: Calyp-traeidae). Mol. Ecol. 10:2249–2262.
Crandall, E. D., M. A. Frey, R. K. Grosberg, and P. H. Barber. 2008. Contrast-ing demographic history and phylogeographical patterns in two Indo-Pacific gastropods. Mol. Ecol. 17:611–626.
Cummins, P. F., and H. J. Freeland. 2007. Variability of the North Pacificcurrent and its bifurcation. Progr. Ocean. 75:253–265.
Darwin, C. 1859. On the origin of species by means of natural selection. JohnMurray, London.
Dawson, M. N. 2001. Phylogeography in coastal marine animals: a solutionfrom California? J. Biogeog. 28:723–736.
DeChaine, E. G., and A. P. Martin. 2006. Using coalescent simulations totest the impact of Quaternary climate cycles on divergence in an alpineplant-insect association. Evolution 60:1004–1013.
Edmands, S. 2001. Phylogeography of the intertidal copepod Tigriopus cali-fornicus reveals substantially reduced population differentiation at north-ern latitudes. Mol. Ecol. 10:1743–1750.
Ekman, S. 1953. Zoogeography of the sea. Sidgwick and Jackson, London.Evanno, G., S. Regnaut, and J. Goudet. 2005. Detecting the number of clusters
of individuals using the software STRUCTURE: a simulation study. Mol.Ecol. 14:2611–2620.
Excoffier L., G. Laval, and S. Schneider. 2005. Arlequin (Version 3.0): anintegrated software package for population genetics data analysis. Evol.Bioinform. Online 1:47–50.
Fisher, W. K. 1911. Asteroidea of the north Pacific and adjacent waters. Part 1.Phanerozonia and Spinulosa. Bull. US Natl. Mus. 76:1–419.
Foltz, D. W., A. T. Nguyen, J. R. Kiger, and C. L. Mah. 2008. Pleistocenespeciation of sister taxa in a North Pacific clade of brooding sea stars(Leptasterias). Mar. Biol. 154:593–602.
Foreman, M. G. G., W. R. Crawford, J. Y. Cherniawsky, and J. Galbraith. 2008.Dynamic ocean topography for the northeast Pacific and its continentalmargins. Geophys. Res. Lett. 35:L22606.
Forward, R. B., R. A. Tankersley, and J. M. Welch. 2003. Selective tidal-stream transport of the blue crab Callinectes sapidus: an overview. Bull.Mar. Sci. 72:347–365.
Fu, Y.-X., and W.-H. Li. 1993. Statistical tests of neutrality of mutations.Genetics 133:693–709.
Goudet, J. 1995. FSTAT version 1.2: a computer program to calculate F-statistics. J. Hered. 86:485–486.
Grosberg, R. K., and C. W. Cunningham. 2001. Genetic structure in the sea:From populations to communities. Pp. 61–84 in M. D. Bertness, S.D. Gaines and M. E. Hay, eds. Marine community ecology. SinauerAssociates, Sunderland, MA.
Grosberg, R. K., D. R. Levitan, and B. B. Cameron. 1996. Characterization ofgenetic structure and genealogies using RAPD-PCR markers: a randomprimer for the novice and nervous. Pp. 67–100 in J. D. Ferraris and S. R.Palumbi, eds. Molecular zoology: Advances, strategies, and protocols.Wiley-Liss, New York.
Hamilton, S. L., J. Regetz, and R. R. Warner. 2008. Postsettlement sur-vival linked to larval life in a marine fish. Proc. Natl. Acad. Sci. USA105:1561–1566.
Hardy, O. J., and X. Vekemans. 2002. SPAGEDi: a versatile computer programto analyse spatial genetic structure at the individual or population levels.Mol. Ecol. Notes 2:618–620.
Harley, C. D. G., M. S. Pankey, J. P. Wares, R. K. Grosberg, and M. J. Wonham.2006. Color polymorphisms and genetic structure in the sea star Pisaster
ochraceus. Biol. Bull. 211:248–262.Hart, M. W., M. Byrne, and M. J. Smith. 1997. Molecular phylogenetic anal-
ysis of life-history evolution in asterinid starfish. Evolution 51:1848–1861.
Hellberg, M. E. 1996. Dependence of gene flow on geographic distance intwo solitary corals with different larval dispersal capabilities. Evolution50:1167–1175.
Hellberg, M. E., D. P. Balch, and K. Roy. 2001. Climate-driven range ex-pansion and morphological evolution in a marine gastropod. Science292:1707–1710.
Hellberg, M. E., R. S. Burton, J. E. Neigel, and S. R. Palumbi. 2002. Geneticassessment of connectivity among marine populations. Bull. Mar. Sci.70(Suppl.):273–290.
Hetherington, R., J. V. Barrie, R. G. B. Reid, R. MacLeod, D. J. Smith, T. S.James, and R. Kung. 2003. Pleistocene coastal paleogeography of theQueen Charlotte Islands, British Columbia, Canada, and its implicationsfor terrestrial biogeography and early postglacial human occupation.Can. J. Earth Sci. 40:1755–1766.
Hewitt, G. M. 1996. Some genetic consequences of ice ages, and their role indivergence and speciation. Biol. J. Linn. Soc. 58:247–276.
Hickerson, M. J., and C. W. Cunningham. 2005. Contrasting quaternary his-tories in an ecologically divergent sister species pair of low-dispersingintertidal fish (Xiphister) revealed by multilocus DNA analysis. Evolu-tion 59:344–360.
Hickerson, M. J., and J. R. P. Ross. 2001. Post-glacial population historyand genetic structure of the northern clingfish (Gobbiesox maeandricus)revealed from mtDNA analysis. Mar. Biol. 38:407–419.
Holder, K., R. Montgomerie, and V. L. Friesen. 1999. A test of the glacialrefugium hypothesis using patterns of mitochondrial and nuclear DNAsequence variation in rock ptarmigan (Lagopus mutus). Evolution53:1936–1950.
Hunt, A. 1993. Effects of contrasting patterns of larval dispersal on the geneticconnectedness of local populations of two intertidal starfish, Patiriella
calcar and P. exigua. Mar. Ecol. Prog. Ser. 92:179–186.
1 2 EVOLUTION 2009
PATIRIA M INIATA POPULATION STRUCTURE
Jarman, S. N., R. D. Ward, and N. G. Elliott. 2002. Oligonucleotide primersfor PCR amplification of coelomate introns. Mar. Biotechnol. 4:347–355.
Keever, C. C., and M. W. Hart. 2008. Something for nothing? Reconstructionof ancestral character states in asterinid sea star development. Evol. Dev.10:62–73.
Keever, C. C., J. Sunday, C. Wood, M. Byrne, and M. W. Hart. 2008. Discoveryand cross-amplification of microsatellite polymorphisms in asterinid seastars. Biol. Bull. 215:164–172.
Kelly, R. P., and D. J. Eernisse. 2007. Southern hospitality: a latitudinalgradient in gene flow in the marine environment. Evolution 61:700–717.
Knowles, L. L. 2001. Did the Pleistocene glaciations promote divergence?Tests of explicit refugial models in montane grasshoppers. Mol. Ecol.10:691–701.
Knowles, L. L., and B. C. Carstens. 2007. Estimating a geographically explicitmodel of population divergence. Evolution 61:477–493.
Knowlton, N., and B. D. Keller. 1986. Larva which fall short of their potential:Highly localized recruitment in an alpheid shrimp with extended larvaldevelopment. Bull. Mar. Sci. 39:213–223.
Kozloff, E. N. 1983. Seashore life of the northern Pacific coast. Univ. Wash-ington Press, Seattle, WA.
Kuhner, M. K.. 2006. LAMARC 2.0: maximum likelihood and Bayesianestimation of population parameters. Bioinformatics 22:768–770.
Kumar, S., K. Tamura, and M. Nei. 2004. MEGA3: Integrated software formolecular evolutionary genetics analysis and sequence alignment. Brief.Bioinform. 5:150–163.
Kyle, C. J., and E. G. Boulding. 2000. Comparative population genetic struc-ture of marine gastropods (Littorina spp.) with and without pelagic larvaldispersal. Mar. Biol. 137:835–845.
Lambert, P. 2000. Sea stars of British Columbia, southeast Alaska, and PugetSound. Univ. British Columbia Press, Vancouver, BC.
Lee, H. J., and E. G. Boulding. 2007. Mitochondrial DNA variation ins paceand time in the northeastern Pacific gastropod, Littorina keenae. Mol.Ecol. 16:3084–3103.
Lessios, H. A., B. D. Kessing, and D. R. Robertson. 1998. Massive gene flowacross the world’s most potent marine biogeographic barrier. Proc. R.Soc. Lond. B 265:583–588.
Lindberg, D. R. 1991. Marine Biotic interchange between the northern andsouthern hemispheres. Paleobiology 17:308–234.
Lovette, I. J. 2005. Glacial cycles and the tempo of avian speciation. TrendsEcol. Evol. 20:57–59.
Marko, P. B. 2004. ‘What’s larvae got to do with it?’ Disparate patterns ofpost-glacial population structure in two benthic marine gastropods withidentical dispersal potential. Mol. Ecol. 13:597–611.
Matsuoka, N., and H. Asano. 2003. Genetic variation in northern Japanesepopulations of the starfish Asterina pectinifera. Zool. Sci. 20:985–988.
Munoz-Salazar, R., S. L. Talbot, G. K. Sage, D. H. Ward, and A. Cabello-Pasini. 2005. Population genetic structure of annual and perennial pop-ulations of Zostera marina L. along the Pacific coast of Baja Californiaand the Gulf of California. Mol. Ecol. 14:711–722.
O’Loughlin, P. M., and J. M. Waters. 2004. A molecular and morphologicalrevision of genera of Asterinidae (Echinodermata: Asteroidea). Mem.Mus. Victoria 61:1–40.
Pielou, E. C. 1991. After the ice age: The return of life to glaciated NorthAmerica. Univ. Chicago Press, Chicago.
Polson, M. P., W. E Hewson, D. J. Eernisse, P. K. Baker, and D. C. Zacherl.2009. You say conchaphila, I say lurida: Molecular evidence for re-stricting the Olympia oyster (Ostrea lurida Carpenter 1864) to temperatewestern North America. J. Shell. Res. 28:11–21.
Polzin, T., and S. V. Daneshmand. 2003. On Steiner trees and minimumspanning trees in hypergraphs. Oper. Res. Lett. 31:12–20.
Pritchard, J. K., M. Stephens, and P. Donnelly. 2000. Inference of pop-ulation structure using multilocus genotype data. Genetics 155:945–959.
Raymond, M., and F. Rousset. 1995. An exact test for population differentia-tion. Evolution 49:12808–1283.
Riddle, B. R. 1996. The molecular phylogeographic bridge between deep andshallow history in continental biotas. Trends Ecol. Evol. 11:207–211.
Rocha-Olivares, A., and R. D. Vetter. 1999. Effects of oceanographic circu-lation on the gene flow, genetic structure, and phylogeography of therosethorn rockfish (Sebastes helvomaculatus). Can. J. Fish. Aquat. Sci.56:803–813.
Rozas, J., J. C. Sanzhez-DelBarrio, X. Messeguer, and R. Rozas. 2003. DnaSP,DNA polymorphism analyses by the coalescent and other methods.Bioinformatics 19:2496–2497.
Rumrill, S. S. 1989. Population size-structure, juvenile growth, and breedingperiodicity of the sea star Asterina miniata in Barkley Sound, BritishColumbia. Mar. Ecol. Prog. Ser. 56:37.
Scheltema, R. S. 1986. Long-distance dispersal by planktonic larvae of shoal-water benthic invertebrates among central Pacific islands. Bull. Mar. Sci.39:241–256.
Schwaninger, H. R. 2008. Global mitochondrial DNA phylogeography andbiogeographic history of the antitropically and longitudinally disjunctmarine bryozoan Membranipora membranacea L. (Cheilostomata): an-other cryptic marine sibling species complex? Mol. Phylogen. Evol.49:893–908.
Shanks, A. L., B. A. Grantham, and M. H. Carr. 2003. Propagule disper-sal distance and the size and spacing of marine reserves. Ecol. Appl.13:S159–S169.
Sherman, C. D., A. Hunt, and D. J. Ayre. 2008. Is life history a bar-rier to dispersal? Contrasting patterns of genetic differentiation alongan oceanographically complex coast. Biol. J. Linn. Soc. 95:106–116.
Simonsen, K. L., G. A. Churchill, and C. F. Aquadro. 1995. Properties of statis-tical tests of neutrality for DNA polymorphism data. Genetics 141:413–429.
Smith, C. T., R. J. Nelson, C. C. Wood, and B. F. Koop. 2001. Glacial bio-geography of North American coho salmon (Oncorhynchus kisutch).Mol. Ecol. 10:2775–2785.
Sotka, E. E., J. P. Wares, J. A. Barth, R. K. Grosberg, and S. R. Palumbi.2004. Strong genetic clines and geographical variation in gene flow inthe rocky intertidal barnacle Balanus glandula. Mol. Ecol. 13:2143–2156.
Strathmann, M. F. 1987. Reproduction and development of marine inverte-brates of the northern Pacific coast. Univ. Washington Press, Seattle,WA.
Swearer, S. E., J. E. Caselle, D. W. Lea, and R. R. Warner. 1999. Larvalretention and recruitment in an island population of a coral-reef fish.Nature 402:799–802.
Tajima, F. 1989. Statistical method for testing the neutral mutation hypothesisby DNA polymorphism. Genetics 105:437–460.
Teske, P. R., I. Papadopoulos, G. I. Zardi, C. D. McQuaid, M. T. Edkins, C. L.Griffiths, and N. P. Barker. 2007. Implications of life history for geneticstructure and migration rates of southern African coastal invertebrates:planktonic, abbreviated and direct development. Mar. Biol. 152:697–711.
Thompson, J. D., T. J. Gibson, F. Plewniak, F. Jeanmougin, and D. G. Higgins.1997. The ClustalX windows interface: flexible strategies for multiplesequence alignment aided by quality analysis tools. Nucleic Acids Res.24:4876–4882.
EVOLUTION 2009 1 3
CARSON. C. KEEVER ET AL.
Waters, J. M., and M. S. Roy. 2004. Phylogeography of a high-dispersal NewZealand sea star: does upwelling block gene flow? Mol. Ecol. 13:2797–2806.
Waters, J. M., P. M. O’Loughlin, and M. S. Roy. 2004. Cladogenesis in astarfish species complex from southern Australia: evidence for vicariantspeciation? Mol. Phylogen. Evol. 32:236–245.
Weir, B. S., and C. C. Cockerham. 1984. Estimating F-statistics for the analysisof population structure. Evolution 38:1358–1370.
Wiley, E. O. 1988. Vicariance biogeography. Annu. Rev. Ecol. Syst. 19:513–542.
Wilson, A. B. 2006. Genetic signature of recent glaciation on populations of anear-shore marine fish species (Syngnathus leptorhynchus). Mol. Ecol.15:1857–1871.
Woerner, A. E., M. P. Cox and M. F. Hammer. 2007. Recombination-filtered genomic datasets by information maximization. Bioinformatics23:1851–1853.
Associate Editor: M. Hellberg
Supporting InformationThe following supporting information is available for this article:
Table S1. Sequence alignment for GPI alleles.
Table S2. Sequence alignment for ATPS alleles.
Table S3. Population pairwise FST values for seven microsatellites (plus the average across loci), mtDNA, ATPS, and GPI. Two-
or three-letter population identifier acronyms as in Table 1.
Table S4. Effective population size (θ) and number of migrants per generation (M) for mtDNA, ATPS, and GPI (estimated in
MIGRATE and in LAMARC).
Supporting Information may be found in the online version of this article.
(This link will take you to the article abstract).
Please note: Wiley-Blackwell are not responsible for the content or functionality of any supporting materials supplied by the authors.
Any queries (other than missing material) should be directed to the corresponding author for the article. Additional results and
discussion can be found in a document at http://www.repository.naturalis.nl/record/289893.
1 4 EVOLUTION 2009


![Star (with Answers)[1]](https://static.fdokumen.com/doc/165x107/631e9db04c5c8fb3a00e4680/star-with-answers1.jpg)