
Study of Ultrawide-Band Transmission in the Extremely High ...
Upload
independentCategory
view
1download
0
Extremely Preterm Infant Mortality Rates andCesarean Deliveries in the United StatesBeau Batton, MD, Christopher Burnett, Steven Verhulst, PhD, and Daniel Batton, MD
OBJECTIVES: To estimate trends in infant mortality ratesand cesarean delivery rates for extremely preterm infantsborn in the United States.
METHODS: This national population-based study usedpublic data from the Centers for Disease Control andPrevention to investigate extremely preterm infants bornalive between 22 0/7 and 27 6/7 weeks of gestational agefrom 1999 to 2005.
RESULTS: There were 177,552 extremely preterm infantbirths (fewer than 1% of all births) from 1999 to 2005. Thenumber of annual extremely preterm births increased by7% compared with a 4.5% increase for births at allgestations. During the study years, the extremely preterminfant mortality rate (percentage of infants who died inthe first year) remained steady (range 33–34%; P�.22),whereas the cesarean delivery rate increased from 43%to 54% (P<.001). The infant mortality rate after cesareandelivery increased from 24% to 26% (P�.012). At eachgestational age, the annual cesarean delivery rate in-creased over time (P<.001 for each), whereas gestationalage-specific infant mortality rates were unchanged ex-cept for a 2% decline from 2004 to 2005 for infants bornat 24 weeks of gestation (P�.01).
CONCLUSION: A significant rise in the cesarean deliveryrate in the United States from 1999 to 2005 for infantsborn at less than 28 weeks of gestation was not associ-ated with an improvement in the infant mortality rate.(Obstet Gynecol 2011;118:43–8)DOI: 10.1097/AOG.0b013e318221001c
LEVEL OF EVIDENCE: III
Infant mortality rates in the United States steadilydeclined in the latter half of the 20th century,
particularly for preterm infants.1–3 These remarkableimprovements in survival have commonly been at-tributed to the institution of regionalized perinatalcare, the evolution of neonatal intensive care units,the increased use of prenatal steroids, and the devel-opment of surfactant therapy.4–9 More recently, themortality rate for preterm infants seems to havereached a plateau because there has been little changein the last two decades.10–12 During this same timeperiod, the preterm birth rate has steadily in-creased.11–13 This is partially related to an increasedwillingness on the part of physicians to perform acesarean delivery for fetal indications at an increas-ingly lower gestational age.14–16 Although extremelypreterm infants born at less than 28 weeks of gesta-tional age are the least likely infants to survive,contemporary mortality rates and cesarean deliveryrates in the United States specific to this populationhave not been well documented. Therefore, the ob-jectives of this study were twofold: 1) to estimaterecent trends in the extremely preterm infant mortal-ity rate in the United States and; 2) to document thecurrent cesarean delivery rate for the same populationof infants.
MATERIALS AND METHODSData were analyzed from the Centers for DiseaseControl and Prevention National Center for HealthStatistics Linked Birth/Infant Death Records(www.wonder.cdc.gov/lbd) for all extremely preterminfants delivered between 22 0/7 and 27 6/7 weeks ofgestational age who were born alive between January1, 1999, and December 31, 2005 (the most recent yearfor which public data were available). During thistime, the National Center for Health Statistics pro-duced linked data in both birth cohort and periodformat. Period format data were used for this analysis.For example, the numerator for the 2005 periodlinked data represents all infant deaths occurring in
From the Departments of Pediatrics and Statistics and Research Consulting,Southern Illinois University School of Medicine, Springfield, Illinois.
Presented in part at the annual Pediatric Academic Society Meeting, May 1–4,2010, Vancouver, British Columbia, Canada.
Corresponding author: Beau Batton, MD, Southern Illinois University School ofMedicine, Department of Pediatrics, Division of Neonatology, PO Box 19676,Springfield, IL 62794; e-mail: [email protected].
Financial DisclosureThe authors did not report any potential conflicts of interest.
© 2011 by The American College of Obstetricians and Gynecologists. Publishedby Lippincott Williams & Wilkins.ISSN: 0029-7844/11
VOL. 118, NO. 1, JULY 2011 OBSTETRICS & GYNECOLOGY 43
2005 (regardless of whether the infant was born in2004 or 2005) and the denominator represents allinfant births in 2005. Mode of delivery, gestationalage, and record of death were compiled from birthcertificates for all infants born alive in the UnitedStates and death certificates for all infants who diedbefore their first birthday. These certificates arelinked by corresponding numbers. During the studyyears, births in the United States were recorded usingeither the 1989 revised birth certificate or the 2003revised birth certificate. Transition from the 1989 tothe 2003 birth certificate occurred during 2004 and2005. The 1989 revised birth certificate recorded the“clinical estimate of gestational age” and the 2003revised birth certificate recorded the “obstetrician’sestimate of gestation.” Standard practice in the UnitedStates during this time was to determine the gesta-tional age based on the mother’s last menstrual periodand to revise it based on the obstetrician’s examina-tion or early prenatal ultrasound examination if indi-cated. When early ultrasonography is not performedand either the last menstrual period is uncertain or thelast menstrual period-based gestational age is incon-sistent with the infant’s birth weight or physicalexamination, then gestational age is determinedbased on examination of the infant. No informationon early prenatal ultrasound examination is recordedon birth certificates, but in the National Center forHealth Statistics database, examination of the infantwas used to estimate gestational age for 4.6–5.9% ofall births annually from 1999 to 2005.17 The mortalityrate was defined as the percentage of extremelypreterm infants born alive who died in the first year.
Statistical analysis was performed using SAS 9.3software. The chi-square test for linear trend was used toassess changes in mortality and cesarean delivery ratesover time. The chi-square test was used to assess differ-
ences in mortality rates according to mode of delivery.This study was found to be exempt from institutionalreview board approval by the Springfield Committeefor Research Involving Human Subjects at the SouthernIllinois University School of Medicine.
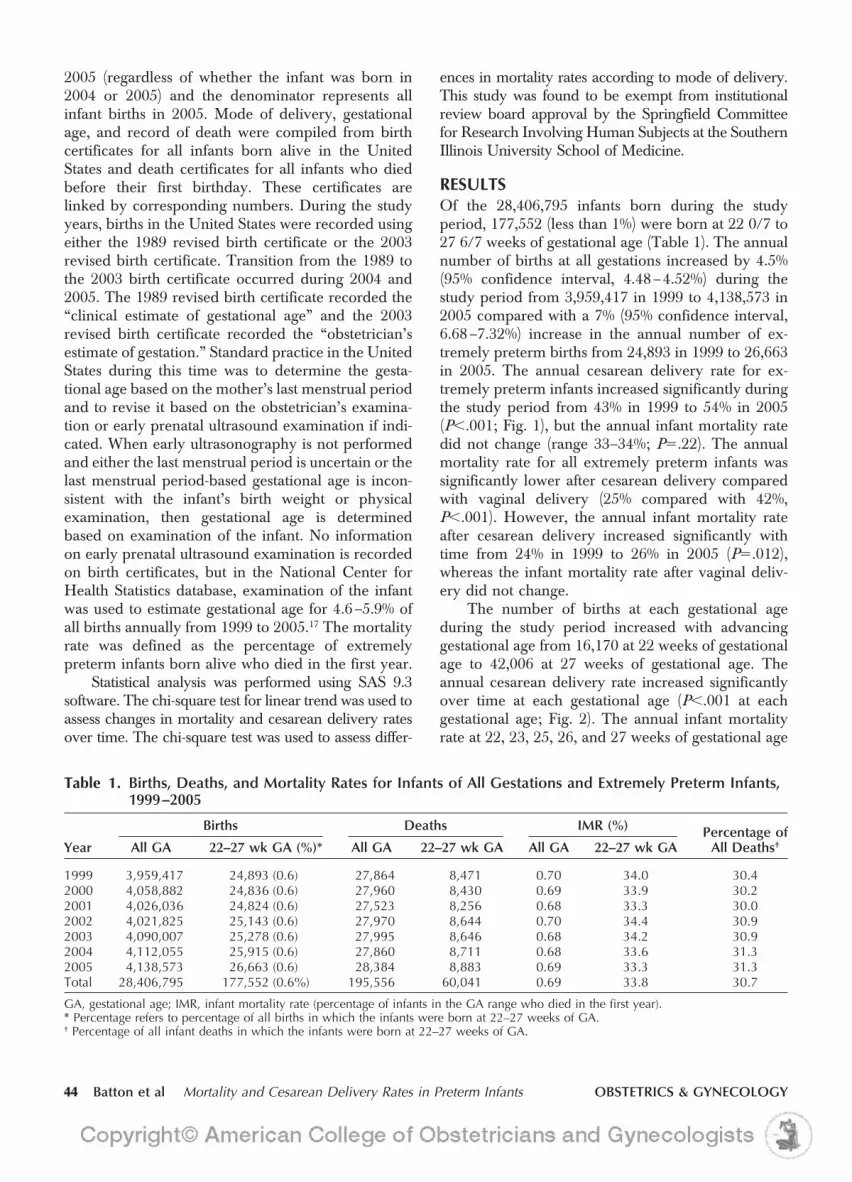
RESULTSOf the 28,406,795 infants born during the studyperiod, 177,552 (less than 1%) were born at 22 0/7 to27 6/7 weeks of gestational age (Table 1). The annualnumber of births at all gestations increased by 4.5%(95% confidence interval, 4.48–4.52%) during thestudy period from 3,959,417 in 1999 to 4,138,573 in2005 compared with a 7% (95% confidence interval,6.68–7.32%) increase in the annual number of ex-tremely preterm births from 24,893 in 1999 to 26,663in 2005. The annual cesarean delivery rate for ex-tremely preterm infants increased significantly duringthe study period from 43% in 1999 to 54% in 2005(P�.001; Fig. 1), but the annual infant mortality ratedid not change (range 33–34%; P�.22). The annualmortality rate for all extremely preterm infants wassignificantly lower after cesarean delivery comparedwith vaginal delivery (25% compared with 42%,P�.001). However, the annual infant mortality rateafter cesarean delivery increased significantly withtime from 24% in 1999 to 26% in 2005 (P�.012),whereas the infant mortality rate after vaginal deliv-ery did not change.
The number of births at each gestational ageduring the study period increased with advancinggestational age from 16,170 at 22 weeks of gestationalage to 42,006 at 27 weeks of gestational age. Theannual cesarean delivery rate increased significantlyover time at each gestational age (P�.001 at eachgestational age; Fig. 2). The annual infant mortalityrate at 22, 23, 25, 26, and 27 weeks of gestational age
Table 1. Births, Deaths, and Mortality Rates for Infants of All Gestations and Extremely Preterm Infants,1999–2005
Year
Births Deaths IMR (%) Percentage ofAll Deaths†All GA 22–27 wk GA (%)* All GA 22–27 wk GA All GA 22–27 wk GA
1999 3,959,417 24,893 (0.6) 27,864 8,471 0.70 34.0 30.42000 4,058,882 24,836 (0.6) 27,960 8,430 0.69 33.9 30.22001 4,026,036 24,824 (0.6) 27,523 8,256 0.68 33.3 30.02002 4,021,825 25,143 (0.6) 27,970 8,644 0.70 34.4 30.92003 4,090,007 25,278 (0.6) 27,995 8,646 0.68 34.2 30.92004 4,112,055 25,915 (0.6) 27,860 8,711 0.68 33.6 31.32005 4,138,573 26,663 (0.6) 28,384 8,883 0.69 33.3 31.3Total 28,406,795 177,552 (0.6%) 195,556 60,041 0.69 33.8 30.7
GA, gestational age; IMR, infant mortality rate (percentage of infants in the GA range who died in the first year).* Percentage refers to percentage of all births in which the infants were born at 22–27 weeks of GA.† Percentage of all infant deaths in which the infants were born at 22–27 weeks of GA.
44 Batton et al Mortality and Cesarean Delivery Rates in Preterm Infants OBSTETRICS & GYNECOLOGY

did not change during the study years (P�.1 at eachGA; Fig. 2). The infant mortality rate at 24 weeks ofgestational age decreased from 44% in 1999 to 41% in2005 (P�.01), primarily because of a decrease from43% to 41% between 2004 and 2005. From 1999 to2004, the infant mortality rate at 24 weeks of gesta-tional age did not change significantly (44% to 43%,P�.76). Gestational age-specific infant mortality ratesfrom 22 to 26 weeks differed by mode of delivery withsignificantly higher rates noted after vaginal birthcompared with cesarean delivery (Table 2). Theinfant mortality rate did not vary with mode ofdelivery at 27 weeks of gestational age.
DISCUSSIONStudies of larger preterm infants have not demonstrateda decline in the infant mortality rate in recent years.10,11,13
Fanaroff et al reported trends in morbidity and mortalityrates for very-low-birth-weight infants (less than 1,500 g)born at one of 12 National Institute for Child Health andHuman Development Neonatal Research Network cen-ters from 1991 through 2002.10 Although both morbid-ity and mortality improved from the 1990–1991 infantcohort to the 1995–1996 cohort, no significant changeswere noted between the 1995–1996 cohort and the1997–2002 cohort. A recent National Center for HealthStatistics report noted that the overall infant mortalityrate did not change significantly between 2000 and2005.11 This report also noted a lack of decline inmortality for very-low-birth-weight infants and for verypreterm infants (born less than 32 weeks of gestationalage) during the same time period. These studies did notpresent data that were gestational age-specific or data foronly extremely preterm infants. The results of this studyconfirm the observation that the infant mortality ratespecific for infants born less than 28 weeks of gestationalage in the United States has reached a plateau.
The rising cesarean delivery rate for extremelypreterm infants documented in this study is consistentwith studies of larger preterm infants.18–20 The deci-sion to perform a cesarean delivery at these gestationsis complex because maternal, fetal, and neonatalmorbidity and mortality risks must be considered.Because mode of delivery is influenced by fetal andmaternal conditions,16,20–22 differences in the infantmortality rate between vaginal birth compared withcesarean delivery are not surprising.14,21,22 However,data on whether all extremely preterm infants wouldbenefit from a cesarean delivery are unclear. Mortalityrates for breech-presenting preterm infants seem to belower after cesarean delivery compared with vaginaldelivery,16,21,22 but results vary by gestational age andbirth weight for vertex-presenting preterm infants.16,20–22
Cesarean delivery has been associated with a lowermortality rate for vertex preterm infants with a birth-weight of 500–749 g in some,16,21 but not all,20 studies.Conflicting data has also been reported for vertexvery-low-birth-weight preterm infants of larger birthweights20,21 and gestational age ranges,16,20,21 infantswith fetal growth restriction,20,22 or those who areeither small or appropriate size for gestational age.23
Recently, the World Association of Perinatal Medi-cine concluded “the available scientific evidence doesnot support a recommendation for Cesarean deliveryfor improving survival or decreasing morbidity forthe extremely premature fetus.”24
The increase in the number of infants bornextremely preterm demonstrated in this study is con-sistent with the rising preterm birth rate in generalreported by others.11–13,19 This trend may be partiallyrelated to the increase in the rate of induced oroperative deliveries, which has recently been re-ported for preterm infants.18,25,26 Currently only 51%of all preterm deliveries are attributable solely tospontaneous preterm labor.18 Unfortunately, thistrend toward an increased rate of obstetric interven-tion has not been associated with obvious benefit interms of an improved mortality rate for preterminfants.11,14,18,20 This study documented a similar in-crease in the cesarean delivery rate for extremelypreterm infants without demonstrating an associatedimprovement in the infant mortality rate. In addition,this study demonstrated a significant rise in the infantmortality rate after the cesarean delivery of extremelypreterm infants. These observations suggest that ob-stetric interventions may have resulted in a subtle shifttoward a lower gestational age for the extremelypreterm group in a manner similar to that of terminfants.26 This has important implications becausemortality rates increase dramatically as the gestational
P<.00150
60
P=.2230
40
Rat
e (%
)
0
10
20
Year1999 2000 2001 2002 2003 2004 2005
Cesarean delivery rateMortality rate
Fig. 1. Extremely preterm infant mortality and cesareandelivery rates in the United States, 1999–2005.Batton. Mortality and Cesarean Delivery Rates in Preterm Infants.Obstet Gynecol 2011.
VOL. 118, NO. 1, JULY 2011 Batton et al Mortality and Cesarean Delivery Rates in Preterm Infants 45

age at birth decreases and extending pregnancy evena few days may benefit the fetus.27
Gestational age-specific infant mortality rates re-mained steady, except at 24 weeks of gestational age.Because the decrease in mortality was primarily from2004 to 2005, this may be a statistical outlier that doesnot persist. Alternatively, it may represent a change inapproach to infants born at the “threshold of viabil-ity.” Recent approaches to resuscitation have been
suggested, which are not based solely on the gesta-tional age,28,29 and there is evidence physicians arebecoming more aggressive with care.14,15,25 If sus-tained, the lower mortality rate at 24 weeks of gesta-tional age may reflect a greater effort to maximize aninfant’s chances for survival at this gestational age.
Limitations to this study include the validity ofgestational age assignment for a small percentage ofinfants,17 the inability to link 2–3% of infant deaths to
22 weeks of gestation
P= .11
23 weeks of gestation
P<.001
P=.01
25 weeks of gestation
P=.20
26 weeks of gestation 27 weeks of gestation
P=.28
24 weeks of gestation
50
60
30
40
Rat
e (%
)
0
10
20
Year1999 2000 2001 2002 2003 2004 2005
P<.001
P<.001
P<.001
P=.63
P<.001
P<.001
P=.21
Cesarean delivery rateMortality rate
5060
30
40
Rat
e (%
)
0
1020
Year1999 2000 2001 2002 2003 2004 2005
70
5060
30
40
Rat
e (%
)
01020
Year1999 2000 2001 2002 2003 2004 2005
70
5060
30
40
Rat
e (%
)
0
1020
Year1999 2000 2001 2002 2003 2004 2005
70
5060
30
40
Rat
e (%
)
0
1020
Year1999 2000 2001 2002 2003 2004 2005
70
5060
3040
Rat
e (%
)
01020
Year1999 2000 2001 2002 2003 2004 2005
708090
A
C
E
B
D
F
Cesarean delivery rateMortality rate
Cesarean delivery rateMortality rate
Cesarean delivery rateMortality rate
Cesarean delivery rateMortality rate Cesarean delivery rate
Mortality rate
Fig. 2. Gestational age-specific mortality and cesarean delivery rates for extremely preterm infants in the United States,1999–2005. A. Twenty-two weeks of gestation; B. 23 weeks of gestation; C. 24 weeks of gestation; D. 25 weeks of gestation;E. 26 weeks of gestation; F. 27 weeks of gestation.Batton. Mortality and Cesarean Delivery Rates in Preterm Infants. Obstet Gynecol 2011.
46 Batton et al Mortality and Cesarean Delivery Rates in Preterm Infants OBSTETRICS & GYNECOLOGY

their corresponding birth certificates (although thedata are weighted up to the complete count of infantdeaths in the United States),11,17 and potential misclas-sification of some fetal deaths as early infant deaths.30
These limitations are related to the nature of the dataset but are unlikely to be significantly different be-tween study years or mode of delivery. Because dataregarding circumstances at the time of delivery werenot available, the primary reason cesarean deliverieswere performed is not known. Implications forclinical practice are limited because results arefrom nonrandomized population-based data. Studystrengths include the large number of births andinfant deaths, data specific to gestational age and theextremely preterm infant population, analysis of timetrends, and the comprehensive records for the UnitedStates population provided by the National Center forHealth Statistics.
In conclusion, the infant mortality rate for ex-tremely preterm infants born at less than 28 weeks ofgestational age in the United States from 1999 to 2005did not improve despite a dramatic increase in thecesarean delivery rate. The accelerated rise in thenumber of infants being born extremely preterm andthe increasing mortality rate after cesarean deliveryfor this population of infants are worrisome trendsthat warrant further investigation.
REFERENCES1. Wegman ME. Infant mortality in the 20th century: dramatic
but uneven progress. J Nutr 2001;131:401S–8S.
2. Achievements in public health, 1900–1999. Healthier mothersand babies. MMWR 1999;48:849–58.
3. Guyer B, Freedman MA, Strobino DM, Sondik EJ. Annualsummary of vital statistics: trends in the health of Americansduring the 20th century. Pediatrics 2000;106:1307–17.
4. Silverman WA, Fertig JW, Berger AP. The influence of thethermal environment upon the survival of newly born prema-ture infants. Pediatrics 1958;22:876–86.
5. McCormick MC, Shapiro S, Starfield BH. The regionalizationof perinatal services. Summary of the evaluation of a nationaldemonstration program. JAMA 1985;253:799–804.
6. Liggins GC, Howie RN. A controlled trial of antepartumglucocorticoid treatment for prevention of the respiratorydistress syndrome in premature infants. Pediatrics 1972;50:515–25.
7. Warner B, Musial MJ, Chenier T, Donovan E. The effect ofbirth hospital type on the outcome of very low birth weightinfants. Pediatrics 2004;113:35–41.
8. Doyle LW, Kitchen WH, Ford GW, Rickards AL, LissendenJV, Ryan MM. Effects of antenatal steroid therapy on mortalityand morbidity in very low birth weight infants. J Pediatr1986;108:287–92.
9. Horbar JD, Soll RF, Sutherland JM, Kotagal U, Philip AG,Kessler DL, et al. A multicenter randomized, placebo-con-trolled trial of surfactant therapy for respiratory distress syn-drome. N Engl J Med 1989;320:959–65.
10. Fanaroff AA, Stoll BJ, Wright LL, Carlo WA, Ehrenkranz RA,Stark AR, et al. Trends in neonatal morbidity and mortality forvery low birthweight infants. Am J Obstet Gynecol 2007;196:147.e1–8.
11. Mathews TJ, MacDorman MF. Infant mortality statistics fromthe 2005 period linked birth/infant death data set. Natl VitalStat Rep 2008;57:1–32.
12. MacDorman MF, Mathews TJ. The challenge of infant mor-tality: have we reached a plateau? Public Health Rep 2009;124:670–81.
13. Heron M, Sutton PD, Xu J, Ventura SJ, Strobino DM, GuyerB. Annual summary of vital statistics: 2007. Pediatrics 2010;125:4–15.
14. Redman ME, Gonik B. Cesarean delivery rates at the thresh-old of viability. Am J Obstet Gynecol 2002;187:873–6.
15. Bottoms SF, Paul RH, Iams JD, Mercer BM, Thom EA,Roberts JM, et al. Obstetric determinants of neonatal survival:influence of willingness to perform cesarean delivery on sur-vival of extremely low-birth-weight infants. National Instituteof Child Health and Human Development Network of Mater-nal-Fetal Medicine Units. Am J Obstet Gynecol 1997;1760:960–6.
16. Muhuri PK, MacDorman MF, Menacker F. Method of deliv-ery and neonatal mortality among very low birth weight infantsin the United States. Matern Child Health J 2006;10:47–53.
17. US Department of Health and Human Services, Centers forDisease Control and Prevention, National Center for HealthStatistics, Division of Vital Statistics System. Available at:www.cdc.gov/nchs/linked.htm. Retrieved July 15, 2010.
18. MacDorman MF, Declercq E, Zhang J. Obstetrical interven-tion and the singleton preterm birth rate in the United Statesfrom 1991–2006. Am J Public Health 2010;100:2241–7.
19. Martin JA, Kung HC, Mathews TJ, Hoyert DL, Strobino DM,Guyer B, et al. Annual summary of vital statistics: 2006.Pediatrics 2008;121:788–801.
20. Wylie BJ, Davidson LL, Batra M, Reed SD. Method of deliveryand neonatal outcome in very low-birthweight vertex-present-ing fetuses. Am J Obstet Gynecol 2008;198:640.e1–7; discus-sion e1–4.
21. Jonas HA, Khalid N, Schwartz SM. The relationship betweenCaesarean section and neonatal mortality in very-low-birth-weight infants born in Washington State, USA. Paediatr Peri-nat Epidemiol 1999;13:170–89.
22. Malloy MH. Impact of cesarean section on neonatal mortalityrates among very preterm infants in the United States,2000–2003. Pediatrics 2008;122:285–92.
Table 2. Percentage of Extremely Preterm InfantsWho Died in the First Year AfterCesarean Delivery Compared WithVaginal Birth, 1999–2005
GA (wk)
Infant Mortality Rate (%)
PCesarean Delivery Vaginal Birth
22 47 84 �.00123 49 72 �.00124 39 47 �.00125 26 29 �.00126 18 20 �.00127 13 13 .11
GA, gestational age.
VOL. 118, NO. 1, JULY 2011 Batton et al Mortality and Cesarean Delivery Rates in Preterm Infants 47

23. Lee HC, Gould JB. Survival rates and mode of delivery forvertex preterm neonates according to small- or appropriate-for-gestational-age status. Pediatrics 2006;118:e1836–44.
24. Skupski DW, Greenough A, Donn SM, Arabin B, Bancalari E,Vladareanu R; World Association of Perinatal Medicine.Delivery mode for the extremely premature fetus: a statementof the prematurity working group of the World Association ofPerinatal Medicine. J Perinat Med 2009;37:583–6.
25. Kollee LA, Cuttini M, Delmas D, Papiernik E, den Ouden AL,Agostino R, et al. Obstetric interventions for babies bornbefore 28 weeks of gestation in Europe: results of the MOSAICstudy. BJOG 2009;116:1481–91.
26. Zhang X, Joseph KS, Kramer MS. Decreased term and post-term birthweight in the United States: impact of labor induc-tion. Am J Obstet Gynecol 2010;203:124.e1–7.
27. Ancel PY, Livinec F, Larroque B, Marret S, Arnaud C, PierratV, et al. Cerebral palsy among very preterm children inrelation to gestational age and neonatal ultrasound abnormal-ities: the EPIPAGE cohort study. Pediatrics 2006;117:828–35.
28. Batton DG; Committee on Fetus and Newborn. Clinicalreport—Antenatal counseling regarding resuscitation at anextremely low gestational age. Pediatrics 2009;124:422–7.
29. Tyson JE, Parikh NA, Langer J, Green C, Higgins RD;National Institute of Child Health and Human DevelopmentNeonatal Research Network. Intensive care for extreme pre-maturity—moving beyond gestational age. N Engl J Med2008;358:1672–81.
30. Ehrenthal DB, Wingate MS, Kirby RS. Variation by state inoutcomes classification for deliveries less than 500 g in theUnited States. Matern Child Health J 2011;15:42–8.
48 Batton et al Mortality and Cesarean Delivery Rates in Preterm Infants OBSTETRICS & GYNECOLOGY
Copyright © 2022 FDOKUMEN