Factors contributing to rising cesarean section rates in South ...

ORIGINAL ARTICLE
Rising cesarean deliveries among apparently low-riskmothers at university teaching hospitals in Jordan:analysis of population survey data, 2002–2012Rami Al Rifaia
Cesarean deliveries nationally in Jordan have increased to 30%, including substantial increases amongbirths that are likely low risk for cesarean delivery for the most part. This level is double the threshold thatWHO considers reasonable.
ABSTRACTBackground: Cesarean delivery conducted without medical indication places mothers and infants at risk for adverseoutcomes. This study assessed changes in trends of, and factors associated with, cesarean deliveries in Jordan, from2002 to 2012.Methods: Data for ever-married women ages 15–49 years from the 2002, 2007, and 2012 Jordan Population andFamily Health Surveys were used. Analyses were restricted to mothers who responded to a question regarding thehospital-based mode of delivery for their last birth occurring within the 5 years preceding each survey (2002, N53,450;2007, N56,307; 2012, N56,365). Normal birth weight infants and singleton births were used as markers for birthsthat were potentially low risk for cesarean delivery, because low/high birth weight and multiple births are among themain obstetric variables that have been documented to increase risk of cesareans. Weighted descriptive and multivariateanalyses were conducted using 4 logistic regression models: (1) among all mothers; and among mothers stratified (2) byplace of delivery; (3) by birth weight of infants; and (4) by singleton vs. multiple births.Results: The cesarean delivery rate increased significantly over time, from 18.2% in 2002, to 20.1% in 2007, to 30.3% in2012. Place of delivery, birth weight, and birth multiplicity were significantly associated with cesarean delivery afteradjusting for confounding factors. Between 2002 and 2012, the rate increased by 99% in public hospitals vs. 70% in privatehospitals; by 93% among normal birth weight infants vs. 73% among low/high birth weight infants; and by 92% amongsingleton births vs. 29% among multiple births. The changes were significant across all categories except among multiplebirths. Further stratification revealed that the cesarean delivery rate was 2.29 times higher in university teaching hospitals(UTHs) than in private hospitals (P, .001), and 2.31 times higher than in government hospitals (P, .001). Moreover, inUTHs, the rate was higher among normal birth weight infants (adjusted OR52.15) and singleton births (adjusted OR52.39).Conclusion: The rising cesarean delivery rate among births that may have been at low risk for cesarean delivery,particularly in UTHs, indicates that many cesarean deliveries may increasingly be performed without any medicalindication. More vigilant monitoring of data from routine health information systems is needed to reduce unnecessarycesarean deliveries in apparently low-risk groups.
INTRODUCTION
W orldwide, cesarean delivery is one of the mostcommon surgeries performed in modern obstet-
rics.1 The surgery is intended to save the lives ofmothers and newborns, as in cases of dystocia, breechpresentation, multiple births, anticipated low/high
birth weight, and fetal distress.2,3 But cesareandeliveries conducted without any medical indicationplace mothers and infants at risk for unfavorableoutcomes. For example, compared with vaginal deliv-ery, cesarean delivery is associated with increased riskof blood transfusion, hysterectomy, maternal and childdeath,4–6 uterine rupture, placenta accreta, and placentaprevia in a subsequent pregnancy.7,8 In addition,cesarean deliveries cost more and require longerhospitalization than vaginal deliveries.9
a Graduate School of Tokyo Medical and Dental University, Division of PublicHealth, Department of International Health and Medicine, Tokyo, Japan.
Correspondence to Rami Al Rifai ([email protected]).
Global Health: Science and Practice 2014 | Volume 2 | Number 2 195

The World Health Organization (WHO) considersa population-based rate of cesarean deliveries over15% unreasonable.10 A recent study found that halfof 137 countries have exceeded this recommendedthreshold.11 A global survey conducted by WHO in24 countries over 25 years showed that about 26% ofall health facility-based deliveries were cesarean, andin 23 countries, rates of cesarean delivery withoutmedical indication ranged between 0.01% and 2%.5
In Jordan, the last study examining trends incesarean delivery rates using population-based datarevealed a consistent increase in the rate.12
Jordan has one of the most modern health careinfrastructures in the Middle East. The healthsystem consists of 3 major sectors—public, private,and donors—that cover primary, secondary, andtertiary health care services. The public sectorconsists of health facilities governed by theMinistry of Health (MOH), Royal Medical Services(RMS), and University Teaching Hospitals(UTHs).13 Only tertiary health care facilities (hos-pitals) have the capacity to perform major surgicalprocedures such as cesarean deliveries.
According to the Jordan Population and FamilyHealth Survey (JPFHS), almost all women (99%)in the country receive antenatal care (ANC) from askilled provider, most commonly from a doctor(96%). Nearly all women (91%) have an ANC visitbefore their fourth month of pregnancy, and78% of women make 7 or more ANC visits through-out their pregnancy.14 Virtually all births (99%)occur in a health facility; 3 births of every 4 aredelivered by a doctor, and 1 birth of every 4, by anurse or midwife.14 The maternal mortality ratioincreased from 53 maternal deaths per 100,000 livebirths in 2008 to 63/100,000 in 2010, while theneonatal mortality rate persisted at rate of 12deaths/1,000 live births between 2009 and 2013.15,16
The objectives of this study were to examinetrends in, and factors associated with, cesareandeliveries in Jordan, from 2002 to 2012, usingdata from nationally representative surveys ofever-married women ages 15–49 years.
METHODS
Data Source and SamplingThis study used nationally representative datafrom the 2002, 2007, and 2012 JPFHS, which ispart of the worldwide Demographic and HealthSurveys (DHS) program.14
In total, 28,234 ever-married womenages 15–49 years participated in the 3 JPFHSsurvey rounds (Figure). Women who did not
report giving birth over the prior 5 years or whoreported that they delivered their last birth athome or abroad were excluded, resulting in afinal sample of 16,774 women, or a weightedsample of 16,122 women (3,450 from the 2002survey; 6,307 from 2007; and 6,365 from 2012).
MeasurementsOutcome VariableThe outcome of interest was hospital-based modeof delivery for the last birth; cesarean deliverywas reported as a binary response (yes/no).
Sociodemographic VariablesThe analysis included information about differ-ent sociodemographic characteristics that may beassociated with cesarean delivery:
N Woman’s age reported in 5 groups (15–19,20–24, 25–29, and § 30 years)
N Place of residence (urban/rural)
N Geographic region (central, north, or south)
N Mother’s and partner’s education level (noeducation, primary, secondary, or highereducation)
N Employment status (mothers with anyincome-producing profession were reportedas employed)
N Place of delivery (public hospitals governed bythe MOH, RMS, or UTHs, or private hospitals)
N Wealth index constructed using data on house-hold assets and categorized into quintiles(poorest, poorer, middle, richer, and richest)14,17
Obstetric Variables
N Mother’s age at first birth was reported in4 groups: 12–18, 19–24, 25–30, or . 30 years.
N Parity was reported in 3 groups: 1, 2, or 3 ormore children.
N Since low or high birth weight and multiplebirths are among the main obstetric variablesdocumented in the literature to increase riskof cesarean delivery,12,18,19 these 2 variableswere used in this analysis as markers for birthsthat were potentially at low risk for cesareandelivery (while recognizing that this may notalways be the case). Women who deliveredeither singleton or normal birth weight infants(2,500 to 3,999 grams) were categorized as lowrisk for cesarean delivery while women whodelivered either multiple or low/high birth
WHO considers15% the thresholdfor a reasonablepopulation-basedcesarean deliveryrate.
Rising cesarean deliveries among apparently low-risk mothers in Jordan www.ghspjournal.org
Global Health: Science and Practice 2014 | Volume 2 | Number 2 196

weight infants (, 2,500 grams or § 4,000grams) were categorized as high risk.12
Statistical AnalysisFrequencies and percentages for each measuredcharacteristic by year of survey were recorded.Rates of cesarean delivery for the last birth bornwithin the 5 years prior to the survey werecompared between the 2002, 2007, and 2012 surveys,and the potential difference in the cesarean ratefor each measured variable was evaluated for eachsurvey, separately, by using chi-square tests.
To document trends in the cesarean rate over aperiod of 10 years, the first survey conducted in2002 was set as a reference in 4 binary logisticregression models, which estimated odds ratios(ORs) and adjusted odds ratios (aORs) as well as95% confidence intervals (CIs) for significancetesting. The first model was run among allmothers together and the other 3 models wererun for mothers stratified by: (1) place of delivery(public or private), (2) birth weights, and (3) birthmultiplicity (singleton vs. multiple births).
To assess whether place of delivery was asso-ciated with changes in trends of cesarean deliveries,all subjects were further stratified according to birthweights and birth multiplicity in public and privatehospitals, separately, as well as by type of publichospital (government hospitals vs. UTHs) for thosewho reported delivering in a public hospital. In orderto control for potential confounding effects, evenwhen there was no association with cesareandelivery, all covariates under analysis (sociodemo-graphic and obstetric) were entered simultaneouslyin the multivariate logistic regression models.
Logistic regression models were also used toassess the association between measured covari-ates with cesarean delivery and to investigate theindependent association of the year of the surveyon cesarean delivery after merging the 3 datasets.P value for the trend was assessed for each modelby entering the year of the survey as a continuousvariable.20 All analyses were conducted usingSPSS version 18.0. The level of statistical sig-nificance for all analysis was set at a5.05.
RESULTS
Descriptive Profile of the MothersOverall, 57.4% of mothers in the 3 datasetscombined were § 30 years old. The majority livedin urban areas and had secondary or highereducation. In 2002, 10.1% of the mothers wereemployed compared with 15.5% in 2012 (Table 1).
Approximately two-thirds (65.1%) of deliverieswere in public hospitals with no significant changesin that percentage over the study period. Thepercentage of women belonging to poor (‘‘poorest’’and ‘‘poorer’’) households declined by 8.5 percentagepoints between 2002 and 2012, with a corresponding5.2 percentage point increase in those belonging torich households (‘‘richer’’ and ‘‘richest’’).
First birth occurred at age 19–24 years among58.5% of mothers, and most had 1 or 2 children.From 2002 to 2012, there was no significantchange in the percentage of mothers reportinglow/high birth weight infants or multiple births.
Trends in the Cesarean Delivery RateThe cesarean delivery rate increased over time,from 18.2% in 2002 to 30.3% in 2012 (Table 2).Between 2007 and 2012, the rate increased by10.2 percentage points compared with an increaseof only 1.9 percentage points from 2002 to 2007.
Age, mother’s education, and place of deliv-ery persisted as significant factors in the cesareandelivery rate during each survey round (P, .05
FIGURE. Sample Selection (Unweighted Numbers)
Abbreviation: JPFHS, Jordan Population and Family Health Survey.
The cesareandelivery rate inJordan increasedfrom 18% in 2002to 30% in 2012.
Rising cesarean deliveries among apparently low-risk mothers in Jordan www.ghspjournal.org
Global Health: Science and Practice 2014 | Volume 2 | Number 2 197

TABLE 1. Background Characteristics of Survey Respondents by Year of Survey, Weighted Numbers (Percentages)
Characteristics 2002 (N53,450) 2007 (N56,307) 2012 (N56,365)
SOCIODEMOGRAPHIC
Age, y
15–19 55 (1.6) 123 (1.9) 135 (2.1)
20–24 515 (14.9) 974 (15.4) 854 (13.4)
25–29 884 (25.6) 1654 (26.2) 1669 (26.2)
§ 30 1997 (57.9) 3556 (56.4) 3707 (58.2)
Place of Residence
Urban 2705 (78.4) 5298 (84.0) 5198 (81.7)
Rural 746 (21.6) 1009 (16.0) 1167 (18.3)
Geographic Region
Central 2191 (63.5) 3908 (62.0) 3935 (61.8)
North 930 (27.0) 1844 (29.2) 1821 (28.6)
South 329 (9.5) 555 (8.8) 609 (9.6)
Mother’s Education
No education 128 (3.7) 147 (2.3) 114 (1.8)
Primary 277 (8.0) 337 (5.3) 373 (5.9)
Secondary 2087 (60.5) 3885 (61.6) 3825 (60.1)
Higher 959 (27.8) 1939 (30.7) 2053 (32.2)
Husband’s Education
No education 65 (1.9) 91 (1.5) 59 (0.9)
Primary 371 (10.8) 665 (10.6) 661 (10.4)
Secondary 1980 (57.4) 3793 (60.3) 4000 (62.8)
Higher 1034 (30.0) 1745 (27.7) 1645 (25.8)
Missing (Do not know) 12 (0.2) 1 (0.02)
Employment
Unemployed 3101 (89.9) 5526 (87.6) 5381 (84.5)
Employed 350 (10.1) 781 (12.4) 985 (15.5)
Place of Delivery
Public sector 2229 (64.6) 4036 (64.0) 4230 (66.5)
Private sector 1221 (35.4) 2271 (36.0) 2135 (33.5)
Rising cesarean deliveries among apparently low-risk mothers in Jordan www.ghspjournal.org
Global Health: Science and Practice 2014 | Volume 2 | Number 2 198

within each indicator for each year) (Table 2).The rate generally increased over time for allcategories within these indicators, thus display-ing similar trends (P . .05 for the trend overyears for these indicators). The largest increasesover time were observed among mothers aged25–29 years and § 30 years and among motherswith primary education.
Mother’s employment, parity, and age at firstbirth were also all significant factors in thecesarean delivery rate during each survey round,and the increases over time were also significant.In each category, the largest increases wereamong employed mothers (17.5 percentage pointincrease between 2002 and 2012), mothers with3 or more children (23 percentage point increase),
and mothers whose age at first birth was over30 years (23 percentage point increase).
Wealth was a significant factor in the cesareandelivery rate in the 2007 and 2012 survey years.Mothers in the poor wealth categories (‘‘poorest’’and ‘‘poorer’’) generally had lower cesareandelivery rates than those in the rich categories(‘‘richer’’ and ‘‘richest’’), but the largest increasein cesarean deliveries over time was amongmothers belonging to middle-income households(15.2 percentage point increase).
During the study period, the increase in thecesarean delivery rate among the normal birthweight group was the same as that of thelow/high birth weight group (about a 12 percen-tage point increase), but the rate increased more
TABLE 1 (continued).
Characteristics 2002 (N53,450) 2007 (N56,307) 2012 (N56,365)
Wealth Index
Poorest 786 (22.8) 1462 (23.2) 1313 (20.6)
Poorer 881 (25.5) 1475 (23.4) 1365 (21.4)
Middle 740 (21.4) 1368 (21.7) 1437 (22.6)
Richer 594 (17.2) 1131 (17.9) 1291 (20.3)
Richest 450 (13.0) 872 (13.8) 960 (15.1)
OBSTETRIC
Age at First Birth, y
12–18 687 (19.9) 1110 (17.6) 917 (14.4)
19–24 2010 (58.3) 3661 (58.1) 3747 (58.9)
25–30 645 (18.7) 1289 (20.4) 1369 (21.5)
. 30 107 (3.1) 246 (3.9) 332 (5.2)
Parity in Last 5 Years
1 1881 (54.5) 3531 (56.0) 3733 (58.6)
2 1263 (36.6) 2254 (35.7) 2182 (34.3)
§ 3 307 (8.9) 522 (8.3) 451 (7.1)
Birth Weight, g
Normal (2500–3999) 2618 (75.9) 4916 (77.9) 4907 (77.1)
Low or High (, 2500 or § 4000) 832 (24.1) 1391 (22.1) 1458 (22.9)
Birth Multiplicity
Singleton birth 3371 (97.7) 6185 (98.1) 6225 (97.8)
Multiple birth 80 (2.3) 123 (1.9) 140 (2.2)
All data are reported as No. (%).
Rising cesarean deliveries among apparently low-risk mothers in Jordan www.ghspjournal.org
Global Health: Science and Practice 2014 | Volume 2 | Number 2 199
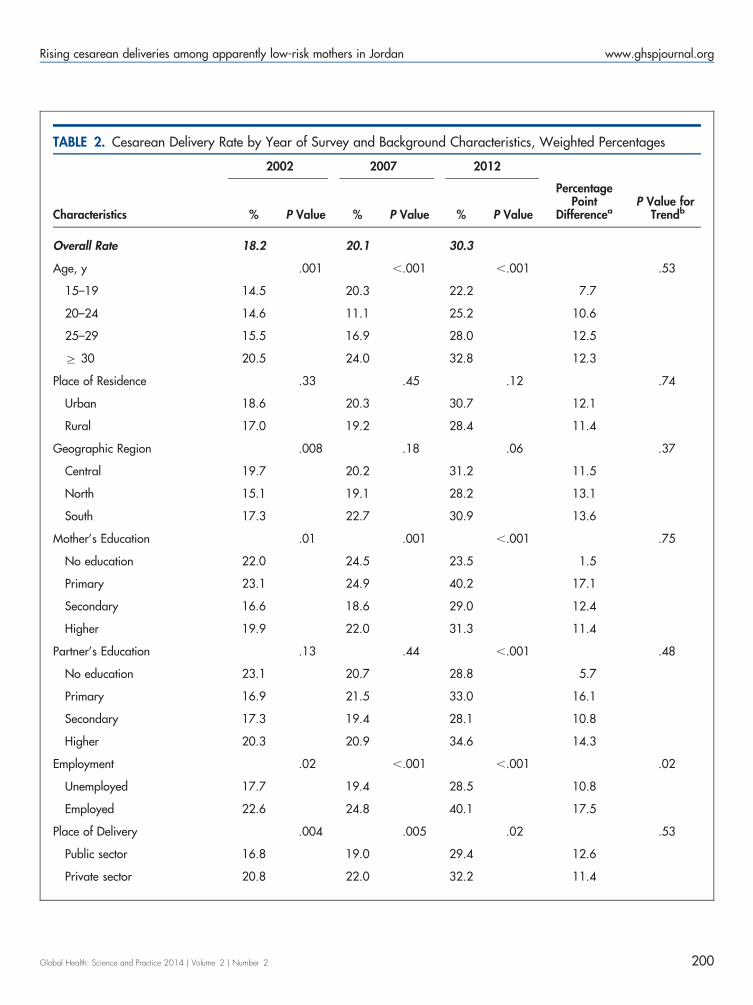
TABLE 2. Cesarean Delivery Rate by Year of Survey and Background Characteristics, Weighted Percentages
Characteristics
2002 2007 2012
% P Value % P Value % P Value
PercentagePoint
DifferenceaP Value for
Trendb
Overall Rate 18.2 20.1 30.3
Age, y .001 ,.001 ,.001 .53
15–19 14.5 20.3 22.2 7.7
20–24 14.6 11.1 25.2 10.6
25–29 15.5 16.9 28.0 12.5
§ 30 20.5 24.0 32.8 12.3
Place of Residence .33 .45 .12 .74
Urban 18.6 20.3 30.7 12.1
Rural 17.0 19.2 28.4 11.4
Geographic Region .008 .18 .06 .37
Central 19.7 20.2 31.2 11.5
North 15.1 19.1 28.2 13.1
South 17.3 22.7 30.9 13.6
Mother’s Education .01 .001 ,.001 .75
No education 22.0 24.5 23.5 1.5
Primary 23.1 24.9 40.2 17.1
Secondary 16.6 18.6 29.0 12.4
Higher 19.9 22.0 31.3 11.4
Partner’s Education .13 .44 ,.001 .48
No education 23.1 20.7 28.8 5.7
Primary 16.9 21.5 33.0 16.1
Secondary 17.3 19.4 28.1 10.8
Higher 20.3 20.9 34.6 14.3
Employment .02 ,.001 ,.001 .02
Unemployed 17.7 19.4 28.5 10.8
Employed 22.6 24.8 40.1 17.5
Place of Delivery .004 .005 .02 .53
Public sector 16.8 19.0 29.4 12.6
Private sector 20.8 22.0 32.2 11.4
Rising cesarean deliveries among apparently low-risk mothers in Jordan www.ghspjournal.org
Global Health: Science and Practice 2014 | Volume 2 | Number 2 200

among singleton than among multiple births(12.2 percentage points vs. 5.7 percentage points,respectively; P, .001) (Table 2).
Trends in the Cesarean Delivery RateStratified by Place of Delivery, BirthWeight, and Birth MultiplicityPlace of delivery, birth weight, and birth multi-plicity were significantly associated with cesar-ean delivery in the crude analysis and retainedtheir statistical significance after adjustment for
all covariates (Table 3). Multivariate modelsfrom the 3 combined datasets showed that thecesarean delivery rate increased significantlyover time, by 13% between 2002 and 2007, andby 90% between 2002 and 2012 (P, .001).
Between 2002 and 2012, stratification showedthat the cesarean delivery rate increased by 99% inpublic hospitals vs. 70% in private hospitals; therate increased by 93% among the normal birthweight group vs. 73% among the low/high birthweight group. During the same period, the cesarean
TABLE 2 (continued).
Characteristics
2002 2007 2012
% P Value % P Value % P Value
PercentagePoint
DifferenceaP Value for
Trendb
Wealth Index .18 ,.001 ,.001 .47
Poorest 17.4 17.0 28.8 11.4
Poorer 16.3 17.1 25.4 9.1
Middle 18.1 19.2 33.3 15.2
Richer 20.0 24.0 31.0 11.0
Richest 21.1 26.5 34.0 12.9
Parity in Last 5 Years ,.001 .02 .01 .01
1 20.1 21.3 30.0 9.9
2 14.8 18.5 29.5 14.7
§ 3 20.6 18.4 36.6 16.0
Age at First Birth, y ,.001 ,.001 ,.001 ,.001
12–18 16.9 16.8 24.3 7.4
19–24 16.7 17.0 27.0 10.3
25–30 20.3 28.2 34.5 14.2
. 30 43.9 38.5 66.9 23.0
Birth Weight, g ,.001 ,.001 ,.001 .85
Normal (2500–3999) 16.3 18.1 28.4 12.1
Low/High (, 2500 or § 4000) 24.2 27.1 36.6 12.4
Birth Multiplicity ,.001 ,.001 ,.001 ,.001
Singleton birth 17.3 19.3 29.5 12.2
Multiple birth 60.0 59.3 65.7 5.7a Percentage point difference between 2002 and 2012.b P value for the trend was obtained from logistic regression models by using outcome and explanatory variables as continuous variables and includinginteraction terms between survey year and each tested explanatory variable for the years 2002 and 2012.
Over the pastdecade, thecesarean deliveryrate in Jordanincreased by 93%among normalbirth weightinfants vs. 73%among low/highbirth weightinfants.
Rising cesarean deliveries among apparently low-risk mothers in Jordan www.ghspjournal.org
Global Health: Science and Practice 2014 | Volume 2 | Number 2 201

TABLE 3. Bivariate and Multivariate Logistic Regression Analysis on Trends in the Cesarean Delivery Rate, Among AllMothers and Stratified by Place of Delivery, Birth Weight, and Birth Multiplicity According to Year of Survey
No. (%) OR (95% CI) aOR (95% CI)
Among All Mothers
2002 629 (18.2) 1.00 1.00
2007 1267 (20.1) 1.13 (1.01–1.25)* 1.13 (1.01–1.26)*
2012 1929 (30.3) 1.95 (1.76–2.16)*** 1.90 (1.71–2.11)***
By Place of Delivery
Public Sector
2002 375 (16.8) 1.00 1.00
2007 768 (19.0) 1.16 (1.01–1.33)* 1.15 (1.00–1.33)*
2012 1242 (29.4) 2.05 (1.80–2.34)*** 1.99 (1.74–2.28)***
Private Sector
2002 254 (20.8) 1.00 1.00
2007 499 (22.0) 1.07 (0.90–1.27) 1.06 (0.88–1.26)
2012 687 (32.2) 1.80 (1.53–2.12)*** 1.70 (1.43–2.02)***
By Birth Weight
Normal
2002 428 (16.3) 1.00 1.00
2007 890 (18.1) 1.13 (0.99–1.28) 1.11 (0.98–1.26)
2012 1395 (28.4) 2.03 (1.80–2.29)*** 1.93 (1.71–2.19)***
Low/High
2002 201 (24.2) 1.00 1.00
2007 377 (27.1) 1.17 (0.96–1.42) 1.13 (0.93–1.39)
2012 534 (36.6) 1.81 (1.50–2.20)*** 1.73 (1.42–2.10)***
By Birth Multiplicity
Singleton Birth
2002 582 (17.3) 1.00 1.00
2007 1194 (19.3) 1.15 (1.03–1.28)* 1.14 (1.02–1.27)*
2012 1838 (29.5) 2.01 (1.81–2.23)*** 1.92 (1.72–2.13)***
Multiple Birth
2002 48 (60.0) 1.00 1.00
2007 73 (589.3) 0.99 (0.55–1.75) 0.98 (0.49–1.95)
2012 92 (65.7) 1.28 (0.72–2.26) 1.29 (0.64–2.58)
Abbreviations: aOR, adjusted odds ratio (for all covariates under analysis); CI, confidence interval; OR, odds ratio.P value for the trend was obtained by entering the survey year as a continuous variable.*P, .05; *** P, .001.
Rising cesarean deliveries among apparently low-risk mothers in Jordan www.ghspjournal.org
Global Health: Science and Practice 2014 | Volume 2 | Number 2 202

delivery rate increased significantly by 92% amongsingleton births (P, .001), whereas it increased byonly 29% among multiple births (P5.43).
Table 4 shows trends in cesarean deliveriesamong all subjects stratified by birth weight andbirth multiplicity according to place of delivery.The cesarean delivery rate for mothers of normalbirth weight babies in public hospitals was2.06 times higher in 2012 than in 2002, and inprivate hospitals, 1.71 times higher. Similarly,the cesarean delivery rate for singleton births inpublic hospitals was 2.0 times higher in 2012than in 2002, and in private hospitals, 1.76
times higher. Mothers who delivered multiplebirths in public hospitals were 3 times morelikely to undergo cesarean delivery in 2012 thanin 2002. In contrast, in private hospitals, therate declined by 92% over time (aOR50.08;P5.03).
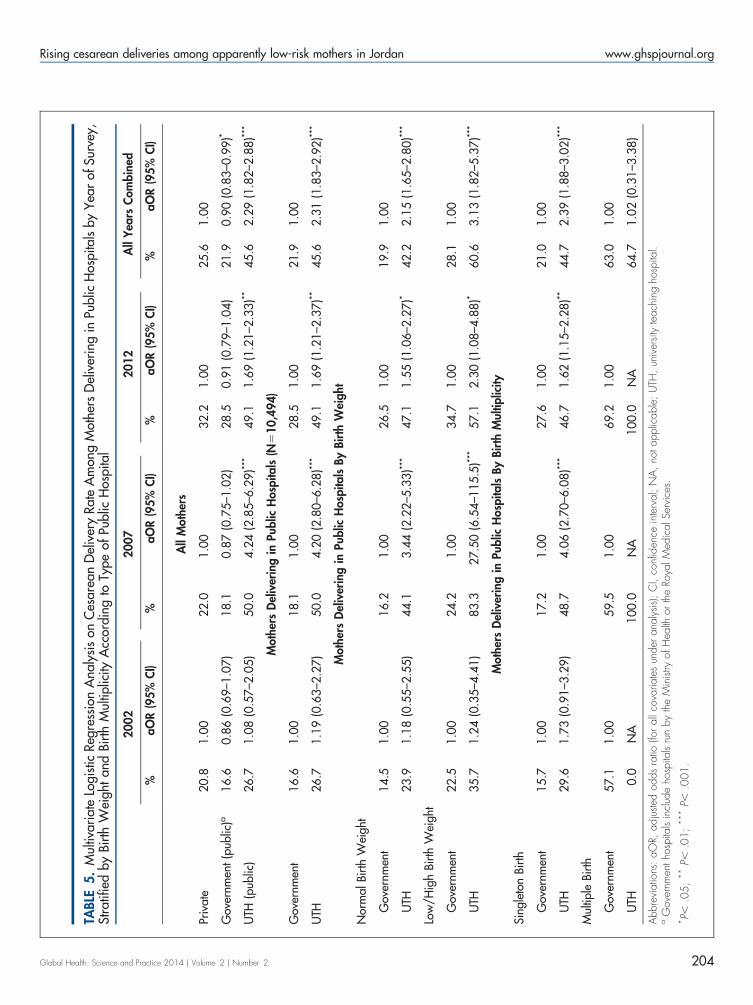
Between 2002 and 2012, the cesarean deliveryrate rose sharply in UTHs by 22.4 percentagepoints compared with increases of 11.4 and11.9 percentage points in private and governmenthospitals, respectively (Table 5). Overall, thecesarean delivery rate in UTHs was 2.29 timeshigher than in private hospitals (P, .001)
TABLE 4. Multivariate Logistic Regression Analysis on Trends in the Cesarean Delivery Rate by Place of Delivery,Stratified by Birth Weight and Birth Multiplicity According to Year of Survey
Public Hospitals
(N510,496)
Private Hospitals
(N55,627)
No. (%) aOR (95% CI) No. (%) aOR (95% CI)
By Birth Weight
Normal
2002 247 (14.8) 1.00 181 (19.1) 1.00
2007 525 (17.0) 1.17 (0.99–1.39) 365 (19.9) 1.00 (0.82–1.23)
2012 877 (27.4) 2.06 (1.76–2.42)*** 519 (30.4) 1.71 (1.41–2.09)***
Low/High
2002 128 (22.9) 1.00 73 (26.7) 1.00
2007 242 (25.3) 1.12 (0.87–1.45) 135 (31.0) 1.22 (0.85–1.75)
2012 366 (35.6) 1.87 (1.46–2.38)*** 168 (39.1) 1.66 (1.16–2.38)**
By Birth Multiplicity
Singleton Birth
2002 347 (16.0) 1.00 234 (19.6) 1.00
2007 718 (18.2) 1.15 (0.99–1.33) 476 (21.3) 1.08 (0.90–1.29)
2012 1171 (28.3) 2.00 (1.74–2.29)*** 667 (31.8) 1.76 (1.47–2.09)***
Multiple Birth
2002 28 (50.9) 1.00 20 (80.0) 1.00
2007 49 (60.5) 1.85 (0.78–4.35) 23 (56.1) 0.32 (0.05–2.09)
2012 72 (72.0) 3.05 (1.27–7.33)* 20 (50.0) 0.08 (0.01–0.78)*
Abbreviations: aOR, adjusted odds ratio (for all covariates under analysis); CI, confidence interval.P value for the trend was obtained by entering the survey year as a continuous variable.*P, .05; ** P, .01; *** P, .001.
The cesareandelivery rate inuniversityteaching hospitalswas more than2 times higherthan in private orgovernmenthospitals.
Rising cesarean deliveries among apparently low-risk mothers in Jordan www.ghspjournal.org
Global Health: Science and Practice 2014 | Volume 2 | Number 2 203
TABL
E5.
Mul
tivar
iate
Logi
stic
Regr
essi
onA
naly
sis
onC
esar
ean
Del
iver
yRa
teA
mon
gM
othe
rsD
eliv
erin
gin
Publ
icH
ospi
tals
byYea
rof
Surv
ey,
Stra
tifie
dby
Birt
hW
eigh
tan
dBi
rth
Mul
tiplic
ityA
ccor
ding
toTy
peof
Publ
icH
ospi
tal
2002
2007
2012
All
Yea
rsC
ombin
ed
%aO
R(9
5%
CI)
%aO
R(9
5%
CI)
%aO
R(9
5%
CI)
%aO
R(9
5%
CI)
All
Mot
hers
Priv
ate
20.8
1.0
022.0
1.0
032.2
1.0
025.6
1.0
0
Gov
ernm
ent(p
ublic
)a16.6
0.8
6(0
.69–1
.07)
18.1
0.8
7(0
.75–1
.02)
28.5
0.9
1(0
.79–1
.04)
21.9
0.9
0(0
.83–0
.99)*
UTH
(pub
lic)
26.7
1.0
8(0
.57–2
.05)
50.0
4.2
4(2
.85–6
.29)**
*49.1
1.6
9(1
.21–2
.33)**
45.6
2.2
9(1
.82–2
.88)**
*
Mot
hers
Del
iver
ing
inPu
blic
Hos
pita
ls(N
510,4
94)
Gov
ernm
ent
16.6
1.0
018.1
1.0
028.5
1.0
021.9
1.0
0
UTH
26.7
1.1
9(0
.63–2
.27)
50.0
4.2
0(2
.80–6
.28)**
*49.1
1.6
9(1
.21–2
.37)**
45.6
2.3
1(1
.83–2
.92)**
*
Mot
hers
Del
iver
ing
inPu
blic
Hos
pita
lsBy
Birt
hW
eight
Nor
mal
Birt
hW
eigh
t
Gov
ernm
ent
14.5
1.0
016.2
1.0
026.5
1.0
019.9
1.0
0
UTH
23.9
1.1
8(0
.55–2
.55)
44.1
3.4
4(2
.22–5
.33)**
*47.1
1.5
5(1
.06–2
.27)*
42.2
2.1
5(1
.65–2
.80)**
*
Low
/Hig
hBi
rth
Wei
ght
Gov
ernm
ent
22.5
1.0
024.2
1.0
034.7
1.0
028.1
1.0
0
UTH
35.7
1.2
4(0
.35–4
.41)
83.3
27.5
0(6
.54–1
15.5
)***
57.1
2.3
0(1
.08–4
.88)*
60.6
3.1
3(1
.82–5
.37)**
*
Mot
hers
Del
iver
ing
inPu
blic
Hos
pita
lsBy
Birt
hM
ultip
licity
Sing
leto
nBi
rth
Gov
ernm
ent
15.7
1.0
017.2
1.0
027.6
1.0
021.0
1.0
0
UTH
29.6
1.7
3(0
.91–3
.29)
48.7
4.0
6(2
.70–6
.08)**
*46.7
1.6
2(1
.15–2
.28)**
44.7
2.3
9(1
.88–3
.02)**
*
Mul
tiple
Birt
h
Gov
ernm
ent
57.1
1.0
059.5
1.0
069.2
1.0
063.0
1.0
0
UTH
0.0
NA
100.0
NA
100.0
NA
64.7
1.0
2(0
.31–3
.38)
Abb
revi
atio
ns:
aOR,
adju
sted
odds
ratio
(foral
lcov
aria
tes
unde
ran
alys
is);
CI,
conf
iden
cein
terv
al;
NA
,no
tapp
licab
le;
UTH
,un
iver
sity
teac
hing
hosp
ital.
aG
over
nmen
thos
pita
lsin
clud
eho
spita
lsru
nby
the
Min
istry
ofH
ealth
orth
eRo
yalM
edic
alSe
rvic
es.
*P,
.05
;**
P,.0
1;
***
P,.0
01
.
Rising cesarean deliveries among apparently low-risk mothers in Jordan www.ghspjournal.org
Global Health: Science and Practice 2014 | Volume 2 | Number 2 204

and 2.31 times higher than in government hospitals(P, .001). Moreover, the odds of performingcesarean deliveries for low-risk groups—mothersof normal birth weight babies (aOR52.15, 95%CI51.65–2.80) and singletons (aOR52.39, 95%CI51.88–3.02)—was higher in UTHs than ingovernmental hospitals, whereas there was nosignificant difference in the cesarean delivery ratefor multiple births between these hospital types.
Table 6 shows logistic regression analysis onthe cesarean delivery rate after combining the3 datasets. Employed mothers were significantlymore likely than unemployed mothers toundergo cesarean delivery (aOR51.34,95% CI51.19–1.51; P, .001). The odds ofundergoing cesarean delivery increased linearlyand significantly with increasing wealth andmother’s age at first birth. Mothers with only1 child had higher likelihood of cesarean deliverycompared with those with 2 or § 3 children.Low/high birth weight infants also were morelikely to have undergone cesareans. However, thestrongest predictor that was associated withcesarean delivery was multiple births(aOR55.60, 95% CI54.20–7.09; P, .001).
DISCUSSION
This study shows that in Jordan the cesareandelivery rate has increased steadily over the pastdecade by two-thirds, from 18% in 2002 to30% in 2012, and was double the maximumpopulation-based rate of 15% recommended byWHO.10 In Jordan, 99% of deliveries occur inhospitals14; thus, the cesarean delivery ratesreported in the JPHFS (on which this study isbased) reflect population-level rates since vir-tually all deliveries occur in facilities.
A similar study analyzing nationallyrepresentative population survey data fromJordan between 1990 and 2002 reported that thecesarean delivery rate was 8.5% in 1990 and 12.9%in 1997.12 In the current study, the 2012 cesareandelivery rate of 30.3% is 3.6 times higher than the1990 rate of 8.5%.12 This increase is in line withconsistent global increases in the cesarean deliv-ery rate.21 Some of the increase may be justified,for example, due to better access to maternalhealth services12 and delayed age at marriageresulting in advanced age at birth, which may beassociated with adverse pregnancy outcomes.22,23
However, the sizeable increases suggest that manycesarean deliveries might occur without any, or onquestionable, medical indications.
Globally there has been an increase in demandfor elective cesarean delivery. An estimated 4% to18% of all cesarean deliveries worldwide arerequested by mothers.24 In this study, from 2002to 2012, the cesarean delivery rate in births thatwere likely low risk increased significantly overtime after controlling for potentially confoundingfactors—among normal birth weight infants by93% and among singletons by 92%.
After combining all 3 datasets and adjustingfor all variables under analysis, the findingsrevealed that, on average, mothers who wereemployed had higher odds of cesarean deliverythan unemployed mothers, and the cesareandelivery rate increased linearly with increasingwealth—both indicators of better economicstatus. This is consistent with findings from astudy in Nepal.20 Mothers with higher economicstatus have a better chance of affording theexpense of such a surgical procedure.
Cesarean deliveries increased among bothpublic and private hospitals in Jordan but moresubstantially in public hospitals, and particularlyat UTHs. The high rate of cesareans in UTHs wasassociated with higher cesarean delivery ratesamong apparently low-risk groups (singletons,normal birth weight infants) than among high-risk groups (multiples, low/high birth weightinfants). Researchers have expected cesareandeliveries to increase particularly among theprivate sector in Jordan over time and havespeculated that the gap between public- andprivate-sector cesarean delivery rates may begrowing.12 However, in this study, the gapnarrowed from a 4.0 percentage point difference(P5.004) in 2002 to 2.8 percentage points(P5.02) in 2012 (Table 2). The overall trend incesarean deliveries between public and privatehospitals from 2002 to 2012 was not significant(P5.53). This new finding differs from what waspreviously reported in Jordan.12
In Jordan, there are 2 UTHs: the UTH of theUniversity of Jordan and the King AbdullahUniversity Hospital (KAUH) of the JordanUniversity of Science and Technology. A numberof factors could potentially explain the higher rateof cesarean deliveries in UTHs in Jordan. First, theKAUH, which is the largest UTH, opened to thepublic in November 2002 and dramaticallyincreased access to advanced medical procedures,including cesarean deliveries, for a large segmentof the Jordanian population, specifically for thoseliving in rural areas. In addition, the governmentinitiated a health reform agenda in 2005, which
The currentcesarean deliveryrate of 30% inJordan is doublethe threshold thatWHO considersreasonable.
Rising cesarean deliveries among apparently low-risk mothers in Jordan www.ghspjournal.org
Global Health: Science and Practice 2014 | Volume 2 | Number 2 205

TABLE 6. Logistic Regression Analysis on Cesarean Delivery Rate by Background Characteristics, Among All MothersFrom All Survey Datasets (2002–2012)
OR (95% CI) aOR (95% CI)
Age, y
15–19 1.00 1.00
20–24 0.85 (0.63–1.14) 0.82 (0.60–1.12)
25–29 1.01 (0.80–1.42) 0.97 (0.72–1.31)
§ 30 1.47 (1.11–1.94)** 1.05 (0.78–1.41)
Place of Residence
Urban 1.00 1.00
Rural 0.90 (0.82–0.99)* 0.96 (0.86–1.07)
Geographic Region
Central 1.00 1.00
North 0.87 (0.80–0.94)** 0.91 (0.83–0.99)*
South 1.02 (0. 90–1.16) 1.03 (0.99–1.18)
Mother’s Education
No education 1.00 1.00
Primary 1.41 (1.08–1.85)* 1.33 (1.00–1.78)*
Secondary 1.01 (0.80–1.29) 0.96 (0.73–1.25)
Higher 1.11 (0.87–1.42) 0.79 (0.60–1.06)
Husband’s Education
No education 1.00 1.00
Primary 1.14 (0.82–1.59) 1.21 (0.84–1.73)
Secondary 1.02 (0.74–1.39) 1.16 (0.81–1.65)
Higher 1.22 (0.89–1.68) 1.17 (0.81–1.68)
Employment
Unemployed 1.00 1.00
Employed 1.58 (1.43–1.75)*** 1.34 (1.19–1.51)***
Place of Delivery
Public sector 1.00 1.00
Private sector 1.17 (1.08–1.26)*** 1.04 (0.95–1.14)
Rising cesarean deliveries among apparently low-risk mothers in Jordan www.ghspjournal.org
Global Health: Science and Practice 2014 | Volume 2 | Number 2 206
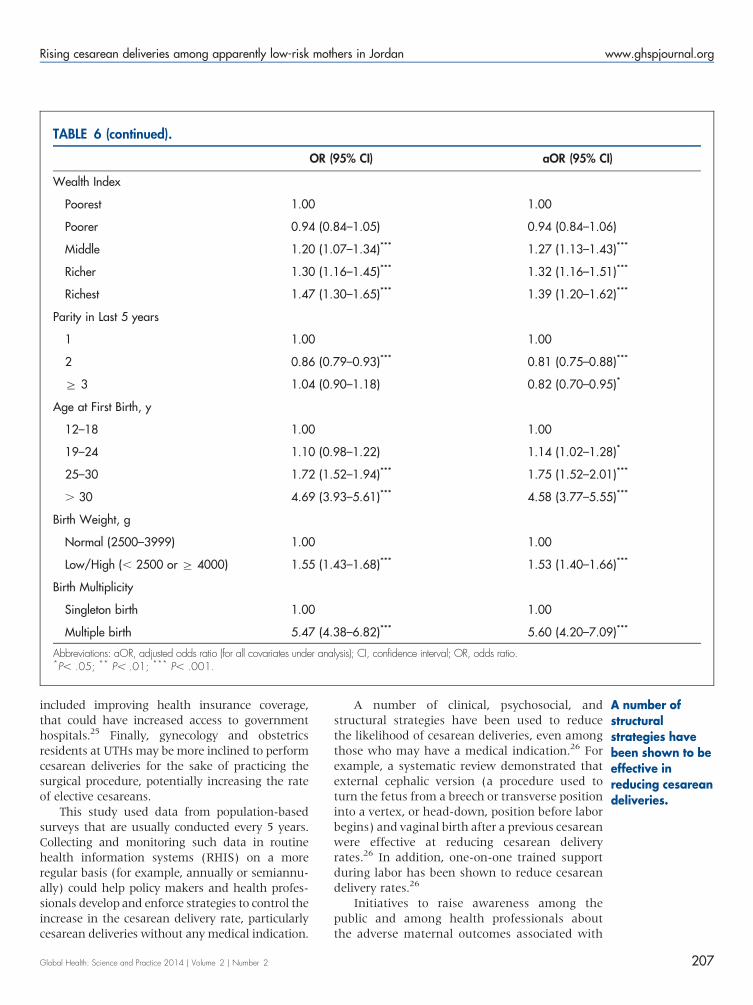
included improving health insurance coverage,that could have increased access to governmenthospitals.25 Finally, gynecology and obstetricsresidents at UTHs may be more inclined to performcesarean deliveries for the sake of practicing thesurgical procedure, potentially increasing the rateof elective cesareans.
This study used data from population-basedsurveys that are usually conducted every 5 years.Collecting and monitoring such data in routinehealth information systems (RHIS) on a moreregular basis (for example, annually or semiannu-ally) could help policy makers and health profes-sionals develop and enforce strategies to control theincrease in the cesarean delivery rate, particularlycesarean deliveries without any medical indication.
A number of clinical, psychosocial, andstructural strategies have been used to reducethe likelihood of cesarean deliveries, even amongthose who may have a medical indication.26 Forexample, a systematic review demonstrated thatexternal cephalic version (a procedure used toturn the fetus from a breech or transverse positioninto a vertex, or head-down, position before laborbegins) and vaginal birth after a previous cesareanwere effective at reducing cesarean deliveryrates.26 In addition, one-on-one trained supportduring labor has been shown to reduce cesareandelivery rates.26
Initiatives to raise awareness among thepublic and among health professionals aboutthe adverse maternal outcomes associated with
TABLE 6 (continued).
OR (95% CI) aOR (95% CI)
Wealth Index
Poorest 1.00 1.00
Poorer 0.94 (0.84–1.05) 0.94 (0.84–1.06)
Middle 1.20 (1.07–1.34)*** 1.27 (1.13–1.43)***
Richer 1.30 (1.16–1.45)*** 1.32 (1.16–1.51)***
Richest 1.47 (1.30–1.65)*** 1.39 (1.20–1.62)***
Parity in Last 5 years
1 1.00 1.00
2 0.86 (0.79–0.93)*** 0.81 (0.75–0.88)***
§ 3 1.04 (0.90–1.18) 0.82 (0.70–0.95)*
Age at First Birth, y
12–18 1.00 1.00
19–24 1.10 (0.98–1.22) 1.14 (1.02–1.28)*
25–30 1.72 (1.52–1.94)*** 1.75 (1.52–2.01)***
. 30 4.69 (3.93–5.61)*** 4.58 (3.77–5.55)***
Birth Weight, g
Normal (2500–3999) 1.00 1.00
Low/High (, 2500 or § 4000) 1.55 (1.43–1.68)*** 1.53 (1.40–1.66)***
Birth Multiplicity
Singleton birth 1.00 1.00
Multiple birth 5.47 (4.38–6.82)*** 5.60 (4.20–7.09)***
Abbreviations: aOR, adjusted odds ratio (for all covariates under analysis); CI, confidence interval; OR, odds ratio.*P, .05; ** P, .01; *** P, .001.
A number ofstructuralstrategies havebeen shown to beeffective inreducing cesareandeliveries.
Rising cesarean deliveries among apparently low-risk mothers in Jordan www.ghspjournal.org
Global Health: Science and Practice 2014 | Volume 2 | Number 2 207

cesarean deliveries and advantages of vaginaldelivery are also urgently needed to halt thesteady increase in the cesarean delivery rate.Health professionals should give mothers fullinformation about risks associated with cesareandelivery. Other interventions, such as midwiferytraining and education and establishment ofbirthing centers, could also help encouragemothers to deliver vaginally.
Strengths and LimitationsThis study has 3 major strengths. First, analysiswas based on data collected from nationallyrepresentative samples by accredited and reliableofficial entities using comparable sampling pro-cedure and inclusion criteria. Second, the prob-ability of recall bias is low since women who had acesarean delivery would not easily forget themode of delivery given its surgical nature,particularly for the last birth. A recent studyshowed that DHS data on cesarean deliveries aresufficiently reliable for national and global mon-itoring purposes.27 Third, stratification accordingto the type of hospital provided more insightsabout the substantial contribution of UTHs to therising cesarean delivery rate in Jordan.
Limitations include that samples were col-lected through a cross-sectional design thatlimits the causality pathway with regard to thedrivers of increased cesarean delivery rates andthat the data did not include information aboutwhether the cesarean deliveries were performedunder medical indications or based solely onmaternal demand. Instead, this study used onlysurrogate markers of what could potentially havebeen births at low or high risk of medicallynecessary cesarean delivery.
CONCLUSION
The cesarean delivery rate increased in Jordanfrom 2002 to 2012; the last survey in 2012 showedthat the rate was double the maximum thresholdrecommended by WHO. The cesarean rate washigher among apparently low-risk mothers, andwas particularly higher at UTHs than in private orgovernment hospitals, which suggests that manycesarean deliveries may have been performedwithout medical indications. Delayed maternalage at first birth, low/high birth weights, multiplebirths, employment of mothers, and greaterwealth were the main predictors of cesareandelivery in Jordan. More vigilant monitoring isneeded to reduce unnecessary cesarean deliveries
in what appear to be low-risk mothers, and inthose delivering at UTHs in particular.
Acknowledgments: The author extends his great appreciation to hisdirect supervisor, Prof. Keiko Nakamura, Head, Department ofInternational Health and Medicine, Tokyo Medical and DentalUniversity, Japan, for her guidance and thoughtful insights.
Competing Interests: None declared.
REFERENCES1. Subedi S. Rising rate of cesarean section – a year review.
J Nobel Med Coll. 2012;2:72–76. Available from: www.nepjol.info/index.php/JoNMC/article/download/7303/5919
2. Villar J, Valladares E, Wojdyla D, Zavaleta N, Carroli G,Velazco A, et al; WHO 2005 global survey on maternal andperinatal health research group. Cesarean delivery rates andpregnancy outcomes: the 2005 WHO global survey on maternaland perinatal health in Latin America. Lancet.2006;367(9525):1819–1829. CrossRef. Medline
3. Shah A, Fawole B, M’imunya JM, Amokrane F, Nafiou I,Wolomby JJ, et al. Cesarean delivery outcomes from the WHOglobal survey on maternal and perinatal health in Africa. Int JGynaecol Obstet. 2009;107(3):191–197. CrossRef. Medline
4. World Health Organization (WHO). Cesarean section withoutmedical indication increases risk of short-term adverse outcomesfor mothers. Geneva: WHO; 2010. Available from: http://whqlibdoc.who.int/hq/2010/WHO_RHR_HRP_10.20_eng.pdf.
5. Souza JP, Gulmezoglu A, Lumbiganon P, Laopaiboon M, CarroliG, Fawole B, et al. Cesarean section without medical indicationsis associated with an increased risk of adverse short-termmaternal outcomes: the 2004–2008 WHO Global Survey onMaternal and Perinatal Health. BMC Med. 2010;10:8:71.CrossRef. Medline
6. Villar J, Carroli G, Zavaleta N, Donner A, Wojdyla D, FuandesA, et al; World Health Organization 2005 Global Survey onMaternal and Perinatal Health Research Group. Maternal andneonatal individual risks and benefits associated with cesareandelivery: multicentre prospective study. BMJ.2007;335(7628):1025–1029. CrossRef. Medline
7. Kennare R, Tucker G, Heard A, Chan A. Risks of adverseoutcomes in the next birth after a first cesarean delivery. ObstetGynecol. 2007;109(2 Pt 1):270–276. CrossRef. Medline
8. Daltveit AK, Tollanes MC, Pihlstrøm H, Irgens LM. Cesareandelivery and subsequent pregnancies. Obstet Gynecol.2008;111(6):1327–1334. CrossRef. Medline
9. Allen VM, O’Connell CM, Farrell SA, Baskett TF. Economicimplications of method of delivery. Am J Obstet Gynecol.2005;193(1):192–197. CrossRef. Medline
10. Appropriate technology for birth. Lancet. 1985;2(8452):436-437. CrossRef. Medline
11. Gibbons L, Belizan JM, Lauer JA, Betran AP, Merialdi M, Althabe F.Inequities in the use of cesarean section deliveries in the world. Am JObstet Gynecol. 2012;206(4):331.e1, 331.e19. CrossRef. Medline
12. Khawaja M, Al-Nsour M. Trends in the prevalence anddeterminants of cesarean section delivery in Jordan: evidencefrom three demographic and health surveys, 1990–2002. WorldHealth Popul. 2007;9(4):17–28. CrossRef. Medline
13. World Health Organization (WHO), Regional Health SystemsObservatory. Health systems profile: Jordan. Cairo: WHO,Regional Office for the Eastern Mediterranean (EMRO); 2006.Available from: http://gis.emro.who.int/HealthSystemObservatory/PDF/Jordan/Full%20Profile.pdf
Rising cesarean deliveries among apparently low-risk mothers in Jordan www.ghspjournal.org
Global Health: Science and Practice 2014 | Volume 2 | Number 2 208

14. Department of Statistics [Jordan]; ICF International. Jordanpopulation and family health survey 2012. Calverton (MD): ICFInternational; 2013. Available from: http://dhsprogram.com/pubs/pdf/FR282/FR282.pdf
15. World Bank Open Data [Internet]. Washington (DC): World Bank.c2014. Maternal mortality ratio (modeled estimate, per 100,000live births); [cited 2014 Apr 11]; [about 10 screens]. Availablefrom: http://data.worldbank.org/indicator/SH.STA.MMRT
16. World Bank Open Data [Internet]. Washington (DC): WorldBank. c2014. Mortality rate, neonatal (per 1,000 live births);[cited 2014 Apr 11]; [about 10 screens]. Available from: http://data.worldbank.org/indicator/SH.DYN.NMRT
17. Filmer D, Pritchett LH. Estimating wealth effects without expendituredata—or tears: an application to educational enrollments in statesof India. Demography. 2001;38(1):115–132. Medline
18. Al Busaidi I, Al-Farsi Y, Ganguly S, Gowri V. Obstetric and non-obstetric risk factors for cesarean section in oman. Oman Med J.2012;27(6):478–481. CrossRef. Medline
19. Gomes UA, Silva AA, Bettiol H, Barbieri MA. Risk factors for theincreasing cesarean section rate in Southeast Brazil: acomparison of two birth cohorts, 1978–1979 and 1994. Int JEpidemiol. 1999;28(4):687–694. CrossRef. Medline
20. Prakash KC, Neupane S. Cesarean deliveries among Nepalesemothers: changes over time 2001–2011 and determinants. ArchGynecol Obstet. 2014;289(2):421–427. CrossRef. Medline
21. O’Leary CM, de Klerk N, Keogh J, et al. Trends in mode ofdelivery during 1984–2003: can they be explained bypregnancy and delivery complications? BJOG.2007;114(7):855–864. CrossRef. Medline
22. Cleary-Goldman J,, Vidaver J, Ball RH, Nyberg DA, ComstockCH, et al. Impact of maternal age on obstetric outcome. ObstetGynecol. 2005 May;105(5 Pt 1):983–90. Medline
23. Maharlouei N, Moalaee M, Ajdari S, Zarei M, Lankarani KB.Cesarean delivery in south-western Iran: trends and determinantsin a community-based survey. Med Princ Pract.2013;22(2):184–188. CrossRef. Medline
24. National Institutes of Health state-of-the-science conferencestatement: Cesarean delivery on maternal request March 27–29, 2006. Obstet Gynecol 2006;107(6):1386–1397.Medline
25. Library of Congress [US], Federal Research Division. Countryprofile: Jordan. Washington (DC): Library of Congress; 2006.Available from: http://lcweb2.loc.gov/frd/cs/profiles/Jordan.pdf.
26. Walker R, Turnbull D, Wilkinson C. Strategies to address globalcesarean section rates: a review of the evidence. Birth.2002;29(1):28–39. CrossRef. Medline
27. Stanton CK, Dubourg D, De Brouwere V, Pujades M, RonsmansC. Reliability of data on cesarean sections in developingcountries. Bull World Health Organ. 2005;83(6):449–455.Medline
______________________________________________________________________________________________________________________________________________Peer Reviewed
Received: 2014 Feb 10; Accepted: 2014 Apr 21
Cite this article as: Al Rifai R. Rising cesarean deliveries among apparently low-risk mothers at university teaching hospitals in Jordan: analysis ofpopulation survey data, 2002–2012. Glob Health Sci Pract. 2014;2(2):195-209. http://dx.doi.org/10.9745/GHSP-D-14-00027
� Al Rifai. This is an open-access article distributed under the terms of the Creative Commons Attribution License, which permits unrestricted use,distribution, and reproduction in any medium, provided the original author and source are properly cited. To view a copy of the license, visithttp://creativecommons.org/licenses/by/3.0/______________________________________________________________________________________________________________________________________________
Rising cesarean deliveries among apparently low-risk mothers in Jordan www.ghspjournal.org
Global Health: Science and Practice 2014 | Volume 2 | Number 2 209
Copyright © 2022 FDOKUMEN


![[Hepatic steatosis, visceral fat and metabolic alterations in apparently healthy overweight/obese individuals]](https://static.fdokumen.com/doc/165x107/6324f8237fd2bfd0cb03375f/hepatic-steatosis-visceral-fat-and-metabolic-alterations-in-apparently-healthy.jpg)