Proof firm downsizing and diagnosis-specific disability pensioning in Norway
9
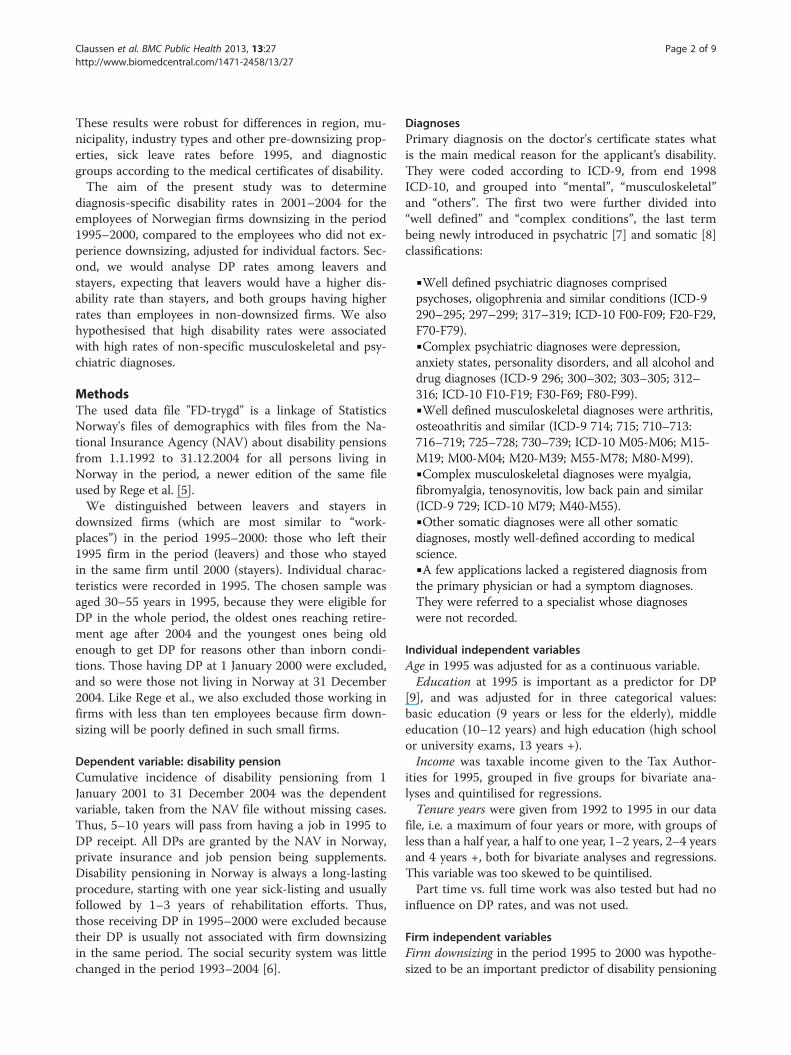
RESEARCH ARTICLE Open Access Proof firm downsizing and diagnosis-specific disability pensioning in Norway Bjørgulf Claussen 1* , Øyvind Næss 2 , Leif Jostein Reime 1 and Alastair H Leyland 3 Abstract Background: We wanted to investigate if firm downsizing is related to an increased rate of disability pensions among the former employed, especially for those with musculoskeletal and psychiatric diagnoses, and for those having to leave the firm. Methods: Statistics Norway provided a linked file with demographic information and all social security grants from the National Insurance Administration for 1992–2004 for all inhabitants in Norway. Our sample was aged 30–55 years in 1995, being alive, employed and not having a disability pension at the end of 2000. Downsizing was defined as percent change in number of employed per firm from 1995 to end 2000. Employment data were missing for 25.6% of the sample. Results: Disability pension rates in the next four years were 25% higher for those experiencing a 30-59% downsizing than for those not experiencing a reduction of the workforce. 1-29% and 60-100% downsizing did not have this effect. Stayers following down-sizing had higher disability pension rates than leavers. What we have called complex musculoskeletal and psychiatric diagnoses were relatively most common. Conclusion: Moderate downsizing is followed by a significant increase in disability pension rates in the following four years, often with complex musculoskeletal and psychiatric diagnoses. Keywords: Disability pension, Labour market, Firm downsizing Background Disability pension (DP) is relatively generous in Norway, giving a pension from 50% to a maximum of 66% of wages before disability, and about 60% for ordinary wages. About 11% of the population aged 18 to 66 years old have a DP [1]. In recent years, this tax-paid social se- curity system comprising all persons living in Norway has been vividly discussed. Being unable to work because of disease, injury or handicap determines eligibility to re- ceive a DP for stably working people, and demands a medical certificate with such a diagnosis. However, 40% of the disabling diagnoses are musculoskeletal, often considered medically unspecific diagnoses like muscle pain or low back pain, and another 30% are psychiatric diagnoses, mostly depression or anxiety with various levels of morbidity [1]. Structural causes of disability pensioning have not been widely studied. Vahtera et al. took advantage of a “natural experiment” in Finnish municipalities during a recession in 1993, and obtained data on more than 22,000 employees before and after downsizing. Those keeping their municipal jobs had increased sickness ab- sence after major downsizing (>18%) compared to minor downsizing (8-18%), had higher mortality rates in the next five years [2], and used more psychotropic drugs [3]. Disability pensioning in the same period among those aged 21–54 years was 7.7 per thousand for those not experiencing downsizing, 13.1 after minor downsiz- ing and 14.9 per thousand after major downsizing, the last figure being 1.81 times as high as for no downsizing, adjusted for a lot of factors [4]. In a register study of all employed persons in Norway, Rege et al. found that firm downsizing 60% or more in 1995–2000 increased the chance of having a DP in 2001 by 24% compared to employees in non-downsizing firms, with a 9% increase after 30-60% downsizing [5]. * Correspondence: [email protected] 1 Institute of Health and Society, University of Oslo, P.O.Box 1130, Blindern N0318, Norway Full list of author information is available at the end of the article © 2013 Claussen et al.; licensee BioMed Central Ltd. This is an Open Access article distributed under the terms of the Creative Commons Attribution License (http://creativecommons.org/licenses/by/2.0), which permits unrestricted use, distribution, and reproduction in any medium, provided the original work is properly cited. Claussen et al. BMC Public Health 2013, 13:27 http://www.biomedcentral.com/1471-2458/13/27
-
Upload
independent -
Category
Documents
-
view
0 -
download
0
Transcript of Proof firm downsizing and diagnosis-specific disability pensioning in Norway
Claussen et al. BMC Public Health 2013, 13:27http://www.biomedcentral.com/1471-2458/13/27
RESEARCH ARTICLE Open Access
Proof firm downsizing and diagnosis-specificdisability pensioning in NorwayBjørgulf Claussen1*, Øyvind Næss2, Leif Jostein Reime1 and Alastair H Leyland3
Abstract
Background: We wanted to investigate if firm downsizing is related to an increased rate of disability pensionsamong the former employed, especially for those with musculoskeletal and psychiatric diagnoses, and for thosehaving to leave the firm.
Methods: Statistics Norway provided a linked file with demographic information and all social security grantsfrom the National Insurance Administration for 1992–2004 for all inhabitants in Norway. Our sample was aged30–55 years in 1995, being alive, employed and not having a disability pension at the end of 2000. Downsizingwas defined as percent change in number of employed per firm from 1995 to end 2000. Employment data weremissing for 25.6% of the sample.
Results: Disability pension rates in the next four years were 25% higher for those experiencing a 30-59%downsizing than for those not experiencing a reduction of the workforce. 1-29% and 60-100% downsizing didnot have this effect. Stayers following down-sizing had higher disability pension rates than leavers. What wehave called complex musculoskeletal and psychiatric diagnoses were relatively most common.
Conclusion: Moderate downsizing is followed by a significant increase in disability pension rates in thefollowing four years, often with complex musculoskeletal and psychiatric diagnoses.
Keywords: Disability pension, Labour market, Firm downsizing
BackgroundDisability pension (DP) is relatively generous in Norway,giving a pension from 50% to a maximum of 66% ofwages before disability, and about 60% for ordinarywages. About 11% of the population aged 18 to 66 yearsold have a DP [1]. In recent years, this tax-paid social se-curity system comprising all persons living in Norwayhas been vividly discussed. Being unable to work becauseof disease, injury or handicap determines eligibility to re-ceive a DP for stably working people, and demands amedical certificate with such a diagnosis. However, 40%of the disabling diagnoses are musculoskeletal, oftenconsidered medically unspecific diagnoses like musclepain or low back pain, and another 30% are psychiatricdiagnoses, mostly depression or anxiety with variouslevels of morbidity [1].
* Correspondence: [email protected] of Health and Society, University of Oslo, P.O.Box 1130, BlindernN0318, NorwayFull list of author information is available at the end of the article
© 2013 Claussen et al.; licensee BioMed CentrCommons Attribution License (http://creativecreproduction in any medium, provided the or
Structural causes of disability pensioning have notbeen widely studied. Vahtera et al. took advantage of a“natural experiment” in Finnish municipalities during arecession in 1993, and obtained data on more than22,000 employees before and after downsizing. Thosekeeping their municipal jobs had increased sickness ab-sence after major downsizing (>18%) compared to minordownsizing (8-18%), had higher mortality rates in thenext five years [2], and used more psychotropic drugs[3]. Disability pensioning in the same period amongthose aged 21–54 years was 7.7 per thousand for thosenot experiencing downsizing, 13.1 after minor downsiz-ing and 14.9 per thousand after major downsizing, thelast figure being 1.81 times as high as for no downsizing,adjusted for a lot of factors [4].In a register study of all employed persons in Norway,
Rege et al. found that firm downsizing 60% or more in1995–2000 increased the chance of having a DP in 2001by 24% compared to employees in non-downsizingfirms, with a 9% increase after 30-60% downsizing [5].
al Ltd. This is an Open Access article distributed under the terms of the Creativeommons.org/licenses/by/2.0), which permits unrestricted use, distribution, andiginal work is properly cited.
Claussen et al. BMC Public Health 2013, 13:27 Page 2 of 9http://www.biomedcentral.com/1471-2458/13/27
These results were robust for differences in region, mu-nicipality, industry types and other pre-downsizing prop-erties, sick leave rates before 1995, and diagnosticgroups according to the medical certificates of disability.The aim of the present study was to determine
diagnosis-specific disability rates in 2001–2004 for theemployees of Norwegian firms downsizing in the period1995–2000, compared to the employees who did not ex-perience downsizing, adjusted for individual factors. Sec-ond, we would analyse DP rates among leavers andstayers, expecting that leavers would have a higher dis-ability rate than stayers, and both groups having higherrates than employees in non-downsized firms. We alsohypothesised that high disability rates were associatedwith high rates of non-specific musculoskeletal and psy-chiatric diagnoses.
MethodsThe used data file "FD-trygd" is a linkage of StatisticsNorway's files of demographics with files from the Na-tional Insurance Agency (NAV) about disability pensionsfrom 1.1.1992 to 31.12.2004 for all persons living inNorway in the period, a newer edition of the same fileused by Rege et al. [5].We distinguished between leavers and stayers in
downsized firms (which are most similar to “work-places”) in the period 1995–2000: those who left their1995 firm in the period (leavers) and those who stayedin the same firm until 2000 (stayers). Individual charac-teristics were recorded in 1995. The chosen sample wasaged 30–55 years in 1995, because they were eligible forDP in the whole period, the oldest ones reaching retire-ment age after 2004 and the youngest ones being oldenough to get DP for reasons other than inborn condi-tions. Those having DP at 1 January 2000 were excluded,and so were those not living in Norway at 31 December2004. Like Rege et al., we also excluded those working infirms with less than ten employees because firm down-sizing will be poorly defined in such small firms.
Dependent variable: disability pensionCumulative incidence of disability pensioning from 1January 2001 to 31 December 2004 was the dependentvariable, taken from the NAV file without missing cases.Thus, 5–10 years will pass from having a job in 1995 toDP receipt. All DPs are granted by the NAV in Norway,private insurance and job pension being supplements.Disability pensioning in Norway is always a long-lastingprocedure, starting with one year sick-listing and usuallyfollowed by 1–3 years of rehabilitation efforts. Thus,those receiving DP in 1995–2000 were excluded becausetheir DP is usually not associated with firm downsizingin the same period. The social security system was littlechanged in the period 1993–2004 [6].
DiagnosesPrimary diagnosis on the doctor's certificate states whatis the main medical reason for the applicant’s disability.They were coded according to ICD-9, from end 1998ICD-10, and grouped into “mental”, “musculoskeletal”and “others”. The first two were further divided into“well defined” and “complex conditions”, the last termbeing newly introduced in psychatric [7] and somatic [8]classifications:
▪Well defined psychiatric diagnoses comprisedpsychoses, oligophrenia and similar conditions (ICD-9290–295; 297–299; 317–319; ICD-10 F00-F09; F20-F29,F70-F79).▪Complex psychiatric diagnoses were depression,anxiety states, personality disorders, and all alcohol anddrug diagnoses (ICD-9 296; 300–302; 303–305; 312–316; ICD-10 F10-F19; F30-F69; F80-F99).▪Well defined musculoskeletal diagnoses were arthritis,osteoathritis and similar (ICD-9 714; 715; 710–713:716–719; 725–728; 730–739; ICD-10 M05-M06; M15-M19; M00-M04; M20-M39; M55-M78; M80-M99).▪Complex musculoskeletal diagnoses were myalgia,fibromyalgia, tenosynovitis, low back pain and similar(ICD-9 729; ICD-10 M79; M40-M55).▪Other somatic diagnoses were all other somaticdiagnoses, mostly well-defined according to medicalscience.▪A few applications lacked a registered diagnosis fromthe primary physician or had a symptom diagnoses.They were referred to a specialist whose diagnoseswere not recorded.
Individual independent variablesAge in 1995 was adjusted for as a continuous variable.Education at 1995 is important as a predictor for DP
[9], and was adjusted for in three categorical values:basic education (9 years or less for the elderly), middleeducation (10–12 years) and high education (high schoolor university exams, 13 years +).Income was taxable income given to the Tax Author-
ities for 1995, grouped in five groups for bivariate ana-lyses and quintilised for regressions.Tenure years were given from 1992 to 1995 in our data
file, i.e. a maximum of four years or more, with groups ofless than a half year, a half to one year, 1–2 years, 2–4 yearsand 4 years +, both for bivariate analyses and regressions.This variable was too skewed to be quintilised.Part time vs. full time work was also tested but had no
influence on DP rates, and was not used.
Firm independent variablesFirm downsizing in the period 1995 to 2000 was hypothe-sized to be an important predictor of disability pensioning
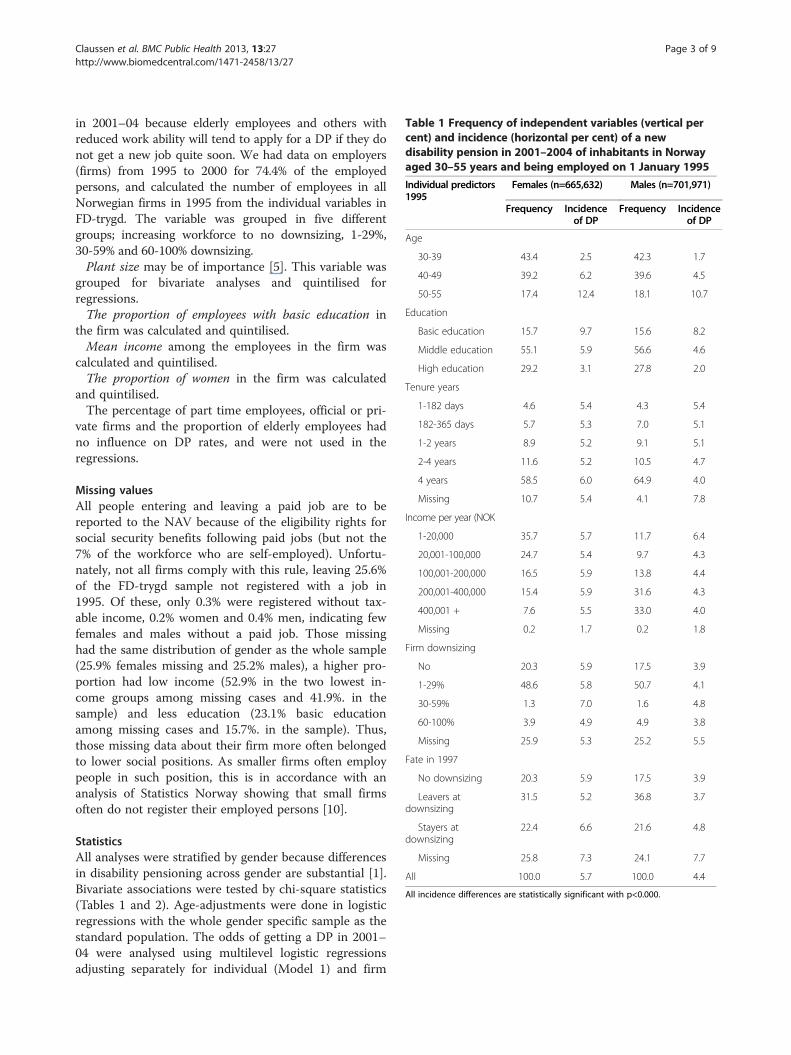
Table 1 Frequency of independent variables (vertical percent) and incidence (horizontal per cent) of a newdisability pension in 2001–2004 of inhabitants in Norwayaged 30–55 years and being employed on 1 January 1995
Individual predictors1995
Females (n=665,632) Males (n=701,971)
Frequency Incidenceof DP
Frequency Incidenceof DP
Age
30-39 43.4 2.5 42.3 1.7
40-49 39.2 6.2 39.6 4.5
50-55 17.4 12.4 18.1 10.7
Education
Basic education 15.7 9.7 15.6 8.2
Middle education 55.1 5.9 56.6 4.6
High education 29.2 3.1 27.8 2.0
Tenure years
1-182 days 4.6 5.4 4.3 5.4
182-365 days 5.7 5.3 7.0 5.1
1-2 years 8.9 5.2 9.1 5.1
2-4 years 11.6 5.2 10.5 4.7
4 years 58.5 6.0 64.9 4.0
Missing 10.7 5.4 4.1 7.8
Income per year (NOK
1-20,000 35.7 5.7 11.7 6.4
20,001-100,000 24.7 5.4 9.7 4.3
100,001-200,000 16.5 5.9 13.8 4.4
200,001-400,000 15.4 5.9 31.6 4.3
400,001 + 7.6 5.5 33.0 4.0
Missing 0.2 1.7 0.2 1.8
Firm downsizing
No 20.3 5.9 17.5 3.9
1-29% 48.6 5.8 50.7 4.1
30-59% 1.3 7.0 1.6 4.8
60-100% 3.9 4.9 4.9 3.8
Missing 25.9 5.3 25.2 5.5
Fate in 1997
No downsizing 20.3 5.9 17.5 3.9
Leavers atdownsizing
31.5 5.2 36.8 3.7
Stayers atdownsizing
22.4 6.6 21.6 4.8
Missing 25.8 7.3 24.1 7.7
All 100.0 5.7 100.0 4.4
All incidence differences are statistically significant with p<0.000.
Claussen et al. BMC Public Health 2013, 13:27 Page 3 of 9http://www.biomedcentral.com/1471-2458/13/27
in 2001–04 because elderly employees and others withreduced work ability will tend to apply for a DP if they donot get a new job quite soon. We had data on employers(firms) from 1995 to 2000 for 74.4% of the employedpersons, and calculated the number of employees in allNorwegian firms in 1995 from the individual variables inFD-trygd. The variable was grouped in five differentgroups; increasing workforce to no downsizing, 1-29%,30-59% and 60-100% downsizing.Plant size may be of importance [5]. This variable was
grouped for bivariate analyses and quintilised forregressions.The proportion of employees with basic education in
the firm was calculated and quintilised.Mean income among the employees in the firm was
calculated and quintilised.The proportion of women in the firm was calculated
and quintilised.The percentage of part time employees, official or pri-
vate firms and the proportion of elderly employees hadno influence on DP rates, and were not used in theregressions.
Missing valuesAll people entering and leaving a paid job are to bereported to the NAV because of the eligibility rights forsocial security benefits following paid jobs (but not the7% of the workforce who are self-employed). Unfortu-nately, not all firms comply with this rule, leaving 25.6%of the FD-trygd sample not registered with a job in1995. Of these, only 0.3% were registered without tax-able income, 0.2% women and 0.4% men, indicating fewfemales and males without a paid job. Those missinghad the same distribution of gender as the whole sample(25.9% females missing and 25.2% males), a higher pro-portion had low income (52.9% in the two lowest in-come groups among missing cases and 41.9%. in thesample) and less education (23.1% basic educationamong missing cases and 15.7%. in the sample). Thus,those missing data about their firm more often belongedto lower social positions. As smaller firms often employpeople in such position, this is in accordance with ananalysis of Statistics Norway showing that small firmsoften do not register their employed persons [10].
StatisticsAll analyses were stratified by gender because differencesin disability pensioning across gender are substantial [1].Bivariate associations were tested by chi-square statistics(Tables 1 and 2). Age-adjustments were done in logisticregressions with the whole gender specific sample as thestandard population. The odds of getting a DP in 2001–04 were analysed using multilevel logistic regressionsadjusting separately for individual (Model 1) and firm
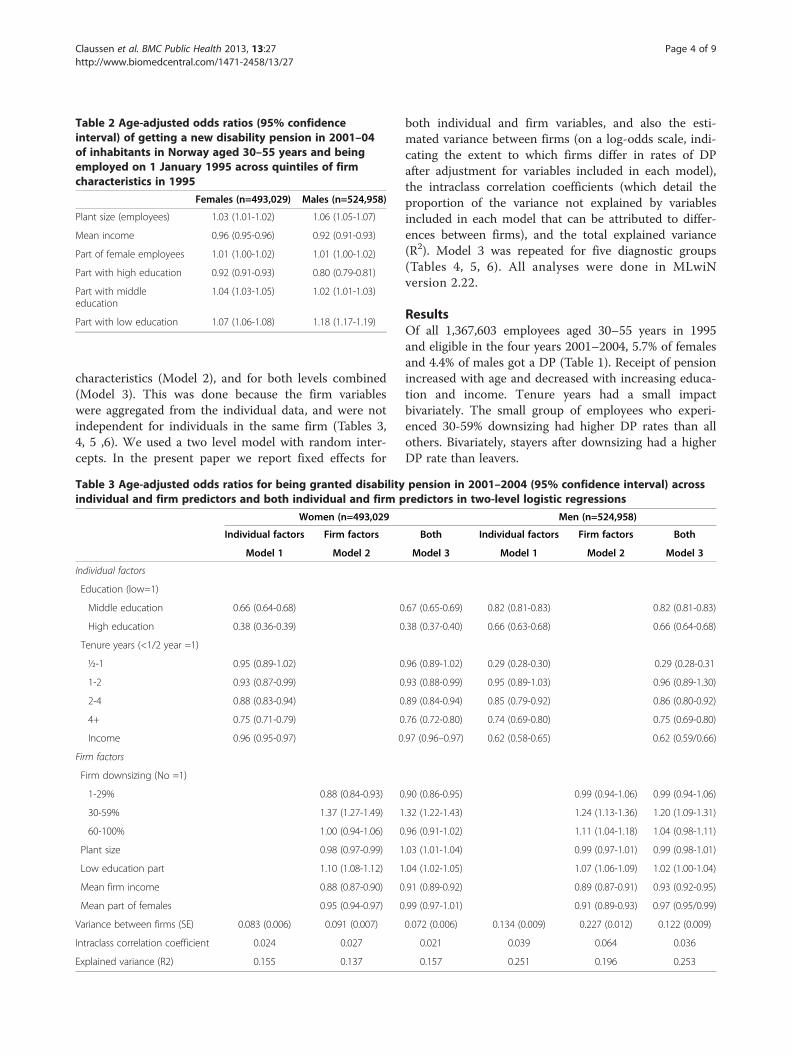
Table 2 Age-adjusted odds ratios (95% confidenceinterval) of getting a new disability pension in 2001–04of inhabitants in Norway aged 30–55 years and beingemployed on 1 January 1995 across quintiles of firmcharacteristics in 1995
Females (n=493,029) Males (n=524,958)
Plant size (employees) 1.03 (1.01-1.02) 1.06 (1.05-1.07)
Mean income 0.96 (0.95-0.96) 0.92 (0.91-0.93)
Part of female employees 1.01 (1.00-1.02) 1.01 (1.00-1.02)
Part with high education 0.92 (0.91-0.93) 0.80 (0.79-0.81)
Part with middleeducation
1.04 (1.03-1.05) 1.02 (1.01-1.03)
Part with low education 1.07 (1.06-1.08) 1.18 (1.17-1.19)
Claussen et al. BMC Public Health 2013, 13:27 Page 4 of 9http://www.biomedcentral.com/1471-2458/13/27
characteristics (Model 2), and for both levels combined(Model 3). This was done because the firm variableswere aggregated from the individual data, and were notindependent for individuals in the same firm (Tables 3,4, 5 ,6). We used a two level model with random inter-cepts. In the present paper we report fixed effects for
Table 3 Age-adjusted odds ratios for being granted disabilityindividual and firm predictors and both individual and firm p
Women (n=493,029
Individual factors Firm factors
Model 1 Model 2
Individual factors
Education (low=1)
Middle education 0.66 (0.64-0.68) 0
High education 0.38 (0.36-0.39) 0
Tenure years (<1/2 year =1)
½-1 0.95 (0.89-1.02) 0
1-2 0.93 (0.87-0.99) 0
2-4 0.88 (0.83-0.94) 0
4+ 0.75 (0.71-0.79) 0
Income 0.96 (0.95-0.97) 0
Firm factors
Firm downsizing (No =1)
1-29% 0.88 (0.84-0.93) 0
30-59% 1.37 (1.27-1.49) 1
60-100% 1.00 (0.94-1.06) 0
Plant size 0.98 (0.97-0.99) 1
Low education part 1.10 (1.08-1.12) 1
Mean firm income 0.88 (0.87-0.90) 0
Mean part of females 0.95 (0.94-0.97) 0
Variance between firms (SE) 0.083 (0.006) 0.091 (0.007)
Intraclass correlation coefficient 0.024 0.027
Explained variance (R2) 0.155 0.137
both individual and firm variables, and also the esti-mated variance between firms (on a log-odds scale, indi-cating the extent to which firms differ in rates of DPafter adjustment for variables included in each model),the intraclass correlation coefficients (which detail theproportion of the variance not explained by variablesincluded in each model that can be attributed to differ-ences between firms), and the total explained variance(R2). Model 3 was repeated for five diagnostic groups(Tables 4, 5, 6). All analyses were done in MLwiNversion 2.22.
ResultsOf all 1,367,603 employees aged 30–55 years in 1995and eligible in the four years 2001–2004, 5.7% of femalesand 4.4% of males got a DP (Table 1). Receipt of pensionincreased with age and decreased with increasing educa-tion and income. Tenure years had a small impactbivariately. The small group of employees who experi-enced 30-59% downsizing had higher DP rates than allothers. Bivariately, stayers after downsizing had a higherDP rate than leavers.
pension in 2001–2004 (95% confidence interval) acrossredictors in two-level logistic regressions
Men (n=524,958)
Both Individual factors Firm factors Both
Model 3 Model 1 Model 2 Model 3
.67 (0.65-0.69) 0.82 (0.81-0.83) 0.82 (0.81-0.83)
.38 (0.37-0.40) 0.66 (0.63-0.68) 0.66 (0.64-0.68)
.96 (0.89-1.02) 0.29 (0.28-0.30) 0.29 (0.28-0.31
.93 (0.88-0.99) 0.95 (0.89-1.03) 0.96 (0.89-1.30)
.89 (0.84-0.94) 0.85 (0.79-0.92) 0.86 (0.80-0.92)
.76 (0.72-0.80) 0.74 (0.69-0.80) 0.75 (0.69-0.80)
.97 (0.96–0.97) 0.62 (0.58-0.65) 0.62 (0.59/0.66)
.90 (0.86-0.95) 0.99 (0.94-1.06) 0.99 (0.94-1.06)
.32 (1.22-1.43) 1.24 (1.13-1.36) 1.20 (1.09-1.31)
.96 (0.91-1.02) 1.11 (1.04-1.18) 1.04 (0.98-1.11)
.03 (1.01-1.04) 0.99 (0.97-1.01) 0.99 (0.98-1.01)
.04 (1.02-1.05) 1.07 (1.06-1.09) 1.02 (1.00-1.04)
.91 (0.89-0.92) 0.89 (0.87-0.91) 0.93 (0.92-0.95)
.99 (0.97-1.01) 0.91 (0.89-0.93) 0.97 (0.95/0.99)
0.072 (0.006) 0.134 (0.009) 0.227 (0.012) 0.122 (0.009)
0.021 0.039 0.064 0.036
0.157 0.251 0.196 0.253
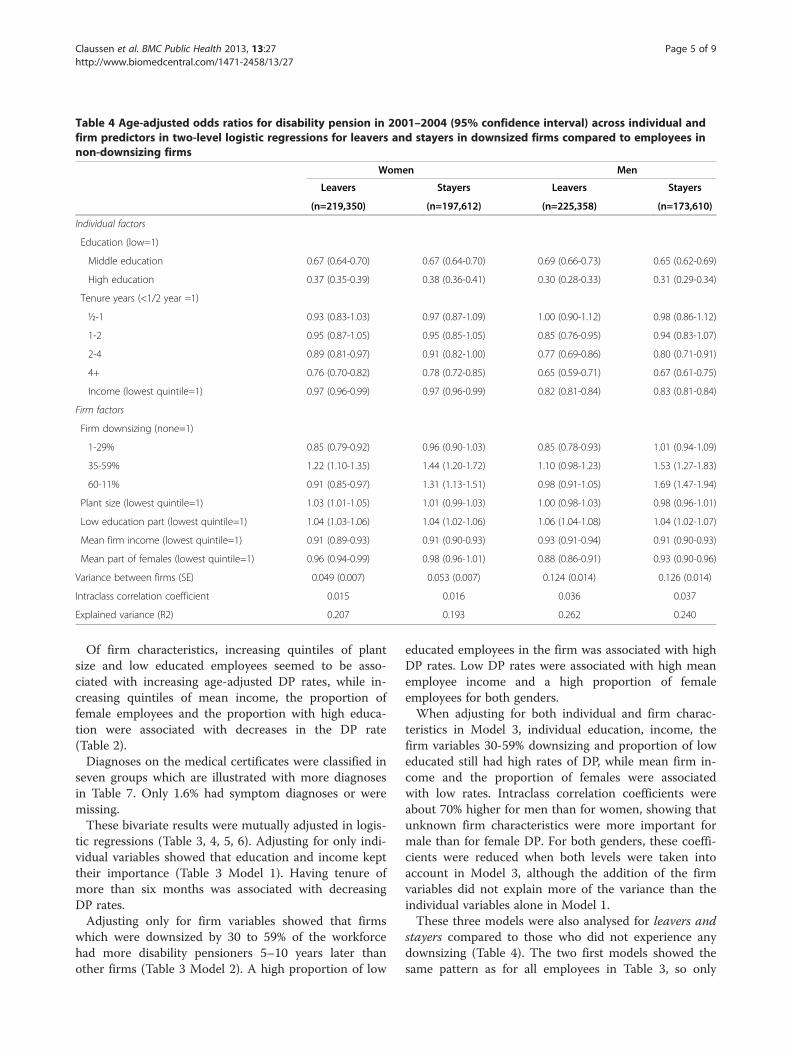
Table 4 Age-adjusted odds ratios for disability pension in 2001–2004 (95% confidence interval) across individual andfirm predictors in two-level logistic regressions for leavers and stayers in downsized firms compared to employees innon-downsizing firms
Women Men
Leavers Stayers Leavers Stayers
(n=219,350) (n=197,612) (n=225,358) (n=173,610)
Individual factors
Education (low=1)
Middle education 0.67 (0.64-0.70) 0.67 (0.64-0.70) 0.69 (0.66-0.73) 0.65 (0.62-0.69)
High education 0.37 (0.35-0.39) 0.38 (0.36-0.41) 0.30 (0.28-0.33) 0.31 (0.29-0.34)
Tenure years (<1/2 year =1)
½-1 0.93 (0.83-1.03) 0.97 (0.87-1.09) 1.00 (0.90-1.12) 0.98 (0.86-1.12)
1-2 0.95 (0.87-1.05) 0.95 (0.85-1.05) 0.85 (0.76-0.95) 0.94 (0.83-1.07)
2-4 0.89 (0.81-0.97) 0.91 (0.82-1.00) 0.77 (0.69-0.86) 0.80 (0.71-0.91)
4+ 0.76 (0.70-0.82) 0.78 (0.72-0.85) 0.65 (0.59-0.71) 0.67 (0.61-0.75)
Income (lowest quintile=1) 0.97 (0.96-0.99) 0.97 (0.96-0.99) 0.82 (0.81-0.84) 0.83 (0.81-0.84)
Firm factors
Firm downsizing (none=1)
1-29% 0.85 (0.79-0.92) 0.96 (0.90-1.03) 0.85 (0.78-0.93) 1.01 (0.94-1.09)
35-59% 1.22 (1.10-1.35) 1.44 (1.20-1.72) 1.10 (0.98-1.23) 1.53 (1.27-1.83)
60-11% 0.91 (0.85-0.97) 1.31 (1.13-1.51) 0.98 (0.91-1.05) 1.69 (1.47-1.94)
Plant size (lowest quintile=1) 1.03 (1.01-1.05) 1.01 (0.99-1.03) 1.00 (0.98-1.03) 0.98 (0.96-1.01)
Low education part (lowest quintile=1) 1.04 (1.03-1.06) 1.04 (1.02-1.06) 1.06 (1.04-1.08) 1.04 (1.02-1.07)
Mean firm income (lowest quintile=1) 0.91 (0.89-0.93) 0.91 (0.90-0.93) 0.93 (0.91-0.94) 0.91 (0.90-0.93)
Mean part of females (lowest quintile=1) 0.96 (0.94-0.99) 0.98 (0.96-1.01) 0.88 (0.86-0.91) 0.93 (0.90-0.96)
Variance between firms (SE) 0.049 (0.007) 0.053 (0.007) 0.124 (0.014) 0.126 (0.014)
Intraclass correlation coefficient 0.015 0.016 0.036 0.037
Explained variance (R2) 0.207 0.193 0.262 0.240
Claussen et al. BMC Public Health 2013, 13:27 Page 5 of 9http://www.biomedcentral.com/1471-2458/13/27
Of firm characteristics, increasing quintiles of plantsize and low educated employees seemed to be asso-ciated with increasing age-adjusted DP rates, while in-creasing quintiles of mean income, the proportion offemale employees and the proportion with high educa-tion were associated with decreases in the DP rate(Table 2).Diagnoses on the medical certificates were classified in
seven groups which are illustrated with more diagnosesin Table 7. Only 1.6% had symptom diagnoses or weremissing.These bivariate results were mutually adjusted in logis-
tic regressions (Table 3, 4, 5, 6). Adjusting for only indi-vidual variables showed that education and income kepttheir importance (Table 3 Model 1). Having tenure ofmore than six months was associated with decreasingDP rates.Adjusting only for firm variables showed that firms
which were downsized by 30 to 59% of the workforcehad more disability pensioners 5–10 years later thanother firms (Table 3 Model 2). A high proportion of low
educated employees in the firm was associated with highDP rates. Low DP rates were associated with high meanemployee income and a high proportion of femaleemployees for both genders.When adjusting for both individual and firm charac-
teristics in Model 3, individual education, income, thefirm variables 30-59% downsizing and proportion of loweducated still had high rates of DP, while mean firm in-come and the proportion of females were associatedwith low rates. Intraclass correlation coefficients wereabout 70% higher for men than for women, showing thatunknown firm characteristics were more important formale than for female DP. For both genders, these coeffi-cients were reduced when both levels were taken intoaccount in Model 3, although the addition of the firmvariables did not explain more of the variance than theindividual variables alone in Model 1.These three models were also analysed for leavers and
stayers compared to those who did not experience anydownsizing (Table 4). The two first models showed thesame pattern as for all employees in Table 3, so only
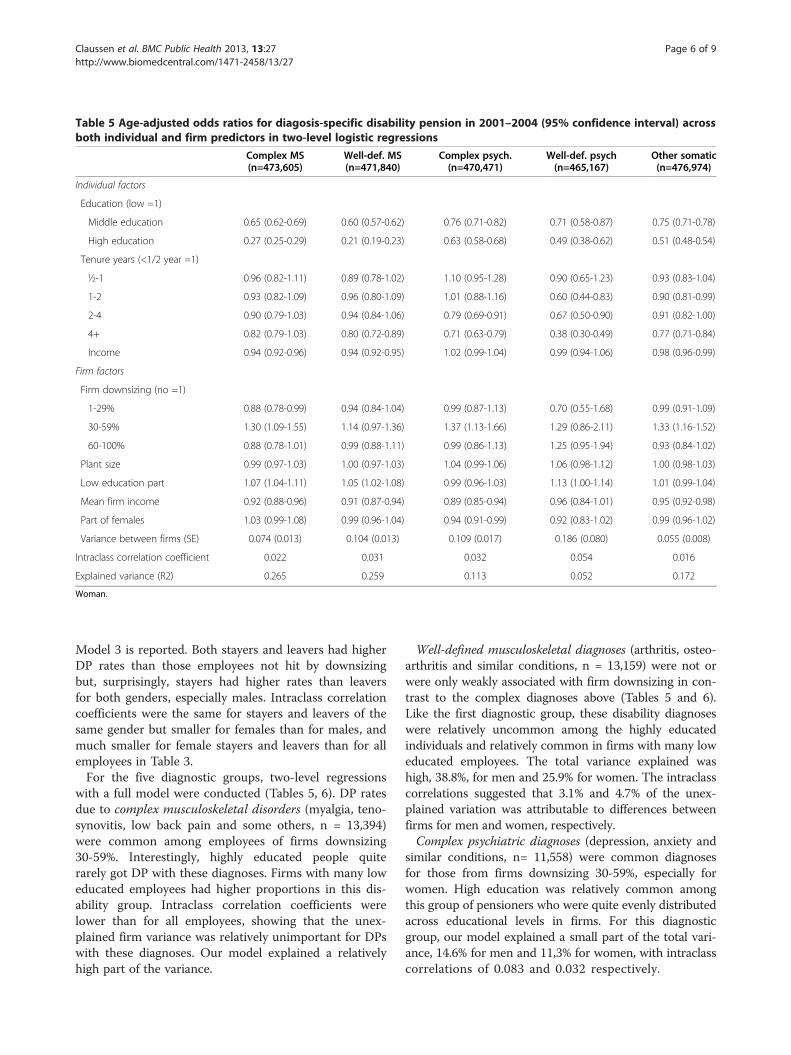
Table 5 Age-adjusted odds ratios for diagosis-specific disability pension in 2001–2004 (95% confidence interval) acrossboth individual and firm predictors in two-level logistic regressions
Complex MS Well-def. MS Complex psych. Well-def. psych Other somatic(n=473,605) (n=471,840) (n=470,471) (n=465,167) (n=476,974)
Individual factors
Education (low =1)
Middle education 0.65 (0.62-0.69) 0.60 (0.57-0.62) 0.76 (0.71-0.82) 0.71 (0.58-0.87) 0.75 (0.71-0.78)
High education 0.27 (0.25-0.29) 0.21 (0.19-0.23) 0.63 (0.58-0.68) 0.49 (0.38-0.62) 0.51 (0.48-0.54)
Tenure years (<1/2 year =1)
½-1 0.96 (0.82-1.11) 0.89 (0.78-1.02) 1.10 (0.95-1.28) 0.90 (0.65-1.23) 0.93 (0.83-1.04)
1-2 0.93 (0.82-1.09) 0.96 (0.80-1.09) 1.01 (0.88-1.16) 0.60 (0.44-0.83) 0.90 (0.81-0.99)
2-4 0.90 (0.79-1.03) 0.94 (0.84-1.06) 0.79 (0.69-0.91) 0.67 (0.50-0.90) 0.91 (0.82-1.00)
4+ 0.82 (0.79-1.03) 0.80 (0.72-0.89) 0.71 (0.63-0.79) 0.38 (0.30-0.49) 0.77 (0.71-0.84)
Income 0.94 (0.92-0.96) 0.94 (0.92-0.95) 1.02 (0.99-1.04) 0.99 (0.94-1.06) 0.98 (0.96-0.99)
Firm factors
Firm downsizing (no =1)
1-29% 0.88 (0.78-0.99) 0.94 (0.84-1.04) 0.99 (0.87-1.13) 0.70 (0.55-1.68) 0.99 (0.91-1.09)
30-59% 1.30 (1.09-1.55) 1.14 (0.97-1.36) 1.37 (1.13-1.66) 1.29 (0.86-2.11) 1.33 (1.16-1.52)
60-100% 0.88 (0.78-1.01) 0.99 (0.88-1.11) 0.99 (0.86-1.13) 1.25 (0.95-1.94) 0.93 (0.84-1.02)
Plant size 0.99 (0.97-1.03) 1.00 (0.97-1.03) 1.04 (0.99-1.06) 1.06 (0.98-1.12) 1.00 (0.98-1.03)
Low education part 1.07 (1.04-1.11) 1.05 (1.02-1.08) 0.99 (0.96-1.03) 1.13 (1.00-1.14) 1.01 (0.99-1.04)
Mean firm income 0.92 (0.88-0.96) 0.91 (0.87-0.94) 0.89 (0.85-0.94) 0.96 (0.84-1.01) 0.95 (0.92-0.98)
Part of females 1.03 (0.99-1.08) 0.99 (0.96-1.04) 0.94 (0.91-0.99) 0.92 (0.83-1.02) 0.99 (0.96-1.02)
Variance between firms (SE) 0.074 (0.013) 0.104 (0.013) 0.109 (0.017) 0.186 (0.080) 0.055 (0.008)
Intraclass correlation coefficient 0.022 0.031 0.032 0.054 0.016
Explained variance (R2) 0.265 0.259 0.113 0.052 0.172
Woman.
Claussen et al. BMC Public Health 2013, 13:27 Page 6 of 9http://www.biomedcentral.com/1471-2458/13/27
Model 3 is reported. Both stayers and leavers had higherDP rates than those employees not hit by downsizingbut, surprisingly, stayers had higher rates than leaversfor both genders, especially males. Intraclass correlationcoefficients were the same for stayers and leavers of thesame gender but smaller for females than for males, andmuch smaller for female stayers and leavers than for allemployees in Table 3.For the five diagnostic groups, two-level regressions
with a full model were conducted (Tables 5, 6). DP ratesdue to complex musculoskeletal disorders (myalgia, teno-synovitis, low back pain and some others, n = 13,394)were common among employees of firms downsizing30-59%. Interestingly, highly educated people quiterarely got DP with these diagnoses. Firms with many loweducated employees had higher proportions in this dis-ability group. Intraclass correlation coefficients werelower than for all employees, showing that the unex-plained firm variance was relatively unimportant for DPswith these diagnoses. Our model explained a relativelyhigh part of the variance.
Well-defined musculoskeletal diagnoses (arthritis, osteo-arthritis and similar conditions, n = 13,159) were not orwere only weakly associated with firm downsizing in con-trast to the complex diagnoses above (Tables 5 and 6).Like the first diagnostic group, these disability diagnoseswere relatively uncommon among the highly educatedindividuals and relatively common in firms with many loweducated employees. The total variance explained washigh, 38.8%, for men and 25.9% for women. The intraclasscorrelations suggested that 3.1% and 4.7% of the unex-plained variation was attributable to differences betweenfirms for men and women, respectively.Complex psychiatric diagnoses (depression, anxiety and
similar conditions, n= 11,558) were common diagnosesfor those from firms downsizing 30-59%, especially forwomen. High education was relatively common amongthis group of pensioners who were quite evenly distributedacross educational levels in firms. For this diagnosticgroup, our model explained a small part of the total vari-ance, 14.6% for men and 11,3% for women, with intraclasscorrelations of 0.083 and 0.032 respectively.
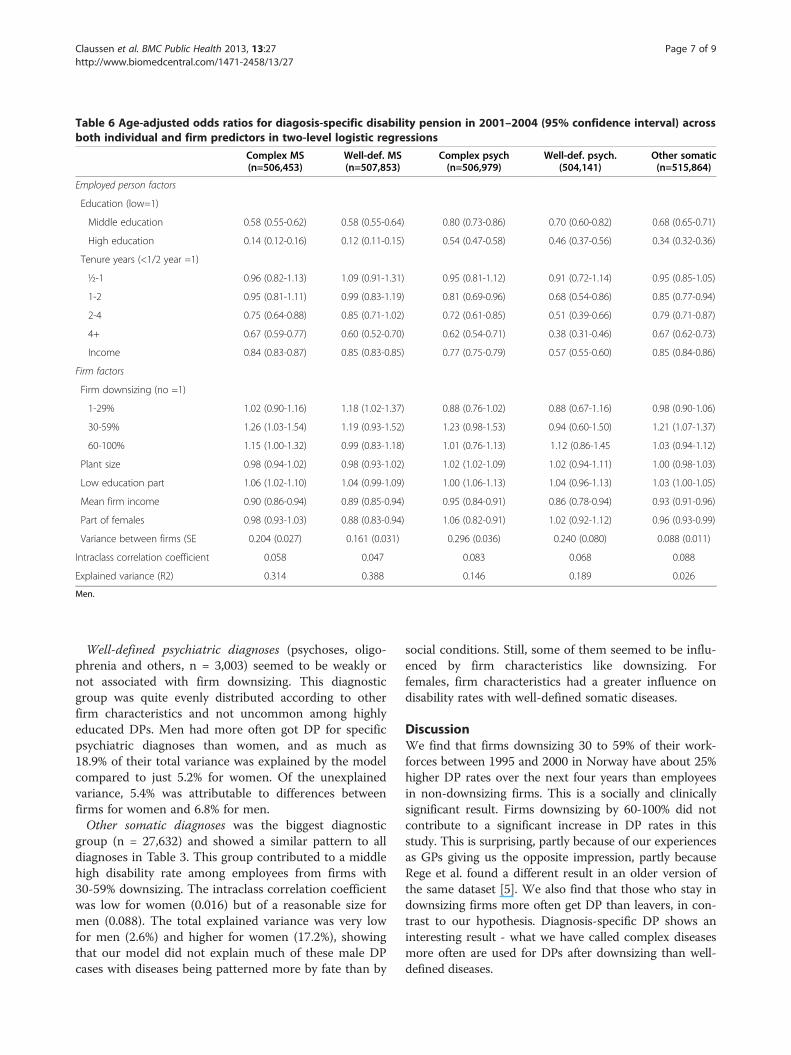
Table 6 Age-adjusted odds ratios for diagosis-specific disability pension in 2001–2004 (95% confidence interval) acrossboth individual and firm predictors in two-level logistic regressions
Complex MS(n=506,453)
Well-def. MS(n=507,853)
Complex psych(n=506,979)
Well-def. psych.(504,141)
Other somatic(n=515,864)
Employed person factors
Education (low=1)
Middle education 0.58 (0.55-0.62) 0.58 (0.55-0.64) 0.80 (0.73-0.86) 0.70 (0.60-0.82) 0.68 (0.65-0.71)
High education 0.14 (0.12-0.16) 0.12 (0.11-0.15) 0.54 (0.47-0.58) 0.46 (0.37-0.56) 0.34 (0.32-0.36)
Tenure years (<1/2 year =1)
½-1 0.96 (0.82-1.13) 1.09 (0.91-1.31) 0.95 (0.81-1.12) 0.91 (0.72-1.14) 0.95 (0.85-1.05)
1-2 0.95 (0.81-1.11) 0.99 (0.83-1.19) 0.81 (0.69-0.96) 0.68 (0.54-0.86) 0.85 (0.77-0.94)
2-4 0.75 (0.64-0.88) 0.85 (0.71-1.02) 0.72 (0.61-0.85) 0.51 (0.39-0.66) 0.79 (0.71-0.87)
4+ 0.67 (0.59-0.77) 0.60 (0.52-0.70) 0.62 (0.54-0.71) 0.38 (0.31-0.46) 0.67 (0.62-0.73)
Income 0.84 (0.83-0.87) 0.85 (0.83-0.85) 0.77 (0.75-0.79) 0.57 (0.55-0.60) 0.85 (0.84-0.86)
Firm factors
Firm downsizing (no =1)
1-29% 1.02 (0.90-1.16) 1.18 (1.02-1.37) 0.88 (0.76-1.02) 0.88 (0.67-1.16) 0.98 (0.90-1.06)
30-59% 1.26 (1.03-1.54) 1.19 (0.93-1.52) 1.23 (0.98-1.53) 0.94 (0.60-1.50) 1.21 (1.07-1.37)
60-100% 1.15 (1.00-1.32) 0.99 (0.83-1.18) 1.01 (0.76-1.13) 1.12 (0.86-1.45 1.03 (0.94-1.12)
Plant size 0.98 (0.94-1.02) 0.98 (0.93-1.02) 1.02 (1.02-1.09) 1.02 (0.94-1.11) 1.00 (0.98-1.03)
Low education part 1.06 (1.02-1.10) 1.04 (0.99-1.09) 1.00 (1.06-1.13) 1.04 (0.96-1.13) 1.03 (1.00-1.05)
Mean firm income 0.90 (0.86-0.94) 0.89 (0.85-0.94) 0.95 (0.84-0.91) 0.86 (0.78-0.94) 0.93 (0.91-0.96)
Part of females 0.98 (0.93-1.03) 0.88 (0.83-0.94) 1.06 (0.82-0.91) 1.02 (0.92-1.12) 0.96 (0.93-0.99)
Variance between firms (SE 0.204 (0.027) 0.161 (0.031) 0.296 (0.036) 0.240 (0.080) 0.088 (0.011)
Intraclass correlation coefficient 0.058 0.047 0.083 0.068 0.088
Explained variance (R2) 0.314 0.388 0.146 0.189 0.026
Men.
Claussen et al. BMC Public Health 2013, 13:27 Page 7 of 9http://www.biomedcentral.com/1471-2458/13/27
Well-defined psychiatric diagnoses (psychoses, oligo-phrenia and others, n = 3,003) seemed to be weakly ornot associated with firm downsizing. This diagnosticgroup was quite evenly distributed according to otherfirm characteristics and not uncommon among highlyeducated DPs. Men had more often got DP for specificpsychiatric diagnoses than women, and as much as18.9% of their total variance was explained by the modelcompared to just 5.2% for women. Of the unexplainedvariance, 5.4% was attributable to differences betweenfirms for women and 6.8% for men.Other somatic diagnoses was the biggest diagnostic
group (n = 27,632) and showed a similar pattern to alldiagnoses in Table 3. This group contributed to a middlehigh disability rate among employees from firms with30-59% downsizing. The intraclass correlation coefficientwas low for women (0.016) but of a reasonable size formen (0.088). The total explained variance was very lowfor men (2.6%) and higher for women (17.2%), showingthat our model did not explain much of these male DPcases with diseases being patterned more by fate than by
social conditions. Still, some of them seemed to be influ-enced by firm characteristics like downsizing. Forfemales, firm characteristics had a greater influence ondisability rates with well-defined somatic diseases.
DiscussionWe find that firms downsizing 30 to 59% of their work-forces between 1995 and 2000 in Norway have about 25%higher DP rates over the next four years than employeesin non-downsizing firms. This is a socially and clinicallysignificant result. Firms downsizing by 60-100% did notcontribute to a significant increase in DP rates in thisstudy. This is surprising, partly because of our experiencesas GPs giving us the opposite impression, partly becauseRege et al. found a different result in an older version ofthe same dataset [5]. We also find that those who stay indownsizing firms more often get DP than leavers, in con-trast to our hypothesis. Diagnosis-specific DP shows aninteresting result - what we have called complex diseasesmore often are used for DPs after downsizing than well-defined diseases.
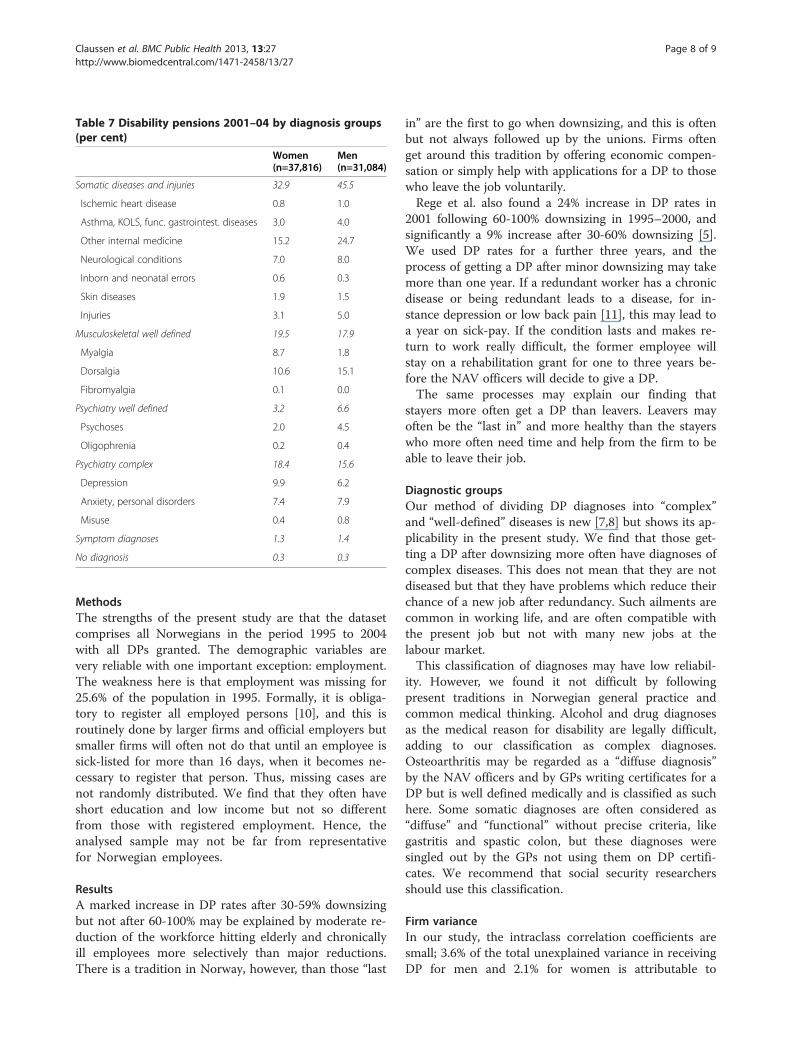
Table 7 Disability pensions 2001–04 by diagnosis groups(per cent)
Women(n=37,816)
Men(n=31,084)
Somatic diseases and injuries 32.9 45.5
Ischemic heart disease 0.8 1.0
Asthma, KOLS, func. gastrointest. diseases 3.0 4.0
Other internal medicine 15.2 24.7
Neurological conditions 7.0 8.0
Inborn and neonatal errors 0.6 0.3
Skin diseases 1.9 1.5
Injuries 3.1 5.0
Musculoskeletal well defined 19.5 17.9
Myalgia 8.7 1.8
Dorsalgia 10.6 15.1
Fibromyalgia 0.1 0.0
Psychiatry well defined 3.2 6.6
Psychoses 2.0 4.5
Oligophrenia 0.2 0.4
Psychiatry complex 18.4 15.6
Depression 9.9 6.2
Anxiety, personal disorders 7.4 7.9
Misuse 0.4 0.8
Symptom diagnoses 1.3 1.4
No diagnosis 0.3 0.3
Claussen et al. BMC Public Health 2013, 13:27 Page 8 of 9http://www.biomedcentral.com/1471-2458/13/27
MethodsThe strengths of the present study are that the datasetcomprises all Norwegians in the period 1995 to 2004with all DPs granted. The demographic variables arevery reliable with one important exception: employment.The weakness here is that employment was missing for25.6% of the population in 1995. Formally, it is obliga-tory to register all employed persons [10], and this isroutinely done by larger firms and official employers butsmaller firms will often not do that until an employee issick-listed for more than 16 days, when it becomes ne-cessary to register that person. Thus, missing cases arenot randomly distributed. We find that they often haveshort education and low income but not so differentfrom those with registered employment. Hence, theanalysed sample may not be far from representativefor Norwegian employees.
ResultsA marked increase in DP rates after 30-59% downsizingbut not after 60-100% may be explained by moderate re-duction of the workforce hitting elderly and chronicallyill employees more selectively than major reductions.There is a tradition in Norway, however, than those “last
in” are the first to go when downsizing, and this is oftenbut not always followed up by the unions. Firms oftenget around this tradition by offering economic compen-sation or simply help with applications for a DP to thosewho leave the job voluntarily.Rege et al. also found a 24% increase in DP rates in
2001 following 60-100% downsizing in 1995–2000, andsignificantly a 9% increase after 30-60% downsizing [5].We used DP rates for a further three years, and theprocess of getting a DP after minor downsizing may takemore than one year. If a redundant worker has a chronicdisease or being redundant leads to a disease, for in-stance depression or low back pain [11], this may lead toa year on sick-pay. If the condition lasts and makes re-turn to work really difficult, the former employee willstay on a rehabilitation grant for one to three years be-fore the NAV officers will decide to give a DP.The same processes may explain our finding that
stayers more often get a DP than leavers. Leavers mayoften be the “last in” and more healthy than the stayerswho more often need time and help from the firm to beable to leave their job.
Diagnostic groupsOur method of dividing DP diagnoses into “complex”and “well-defined” diseases is new [7,8] but shows its ap-plicability in the present study. We find that those get-ting a DP after downsizing more often have diagnoses ofcomplex diseases. This does not mean that they are notdiseased but that they have problems which reduce theirchance of a new job after redundancy. Such ailments arecommon in working life, and are often compatible withthe present job but not with many new jobs at thelabour market.This classification of diagnoses may have low reliabil-
ity. However, we found it not difficult by followingpresent traditions in Norwegian general practice andcommon medical thinking. Alcohol and drug diagnosesas the medical reason for disability are legally difficult,adding to our classification as complex diagnoses.Osteoarthritis may be regarded as a “diffuse diagnosis”by the NAV officers and by GPs writing certificates for aDP but is well defined medically and is classified as suchhere. Some somatic diagnoses are often considered as“diffuse” and “functional” without precise criteria, likegastritis and spastic colon, but these diagnoses weresingled out by the GPs not using them on DP certifi-cates. We recommend that social security researchersshould use this classification.
Firm varianceIn our study, the intraclass correlation coefficients aresmall; 3.6% of the total unexplained variance in receivingDP for men and 2.1% for women is attributable to

Claussen et al. BMC Public Health 2013, 13:27 Page 9 of 9http://www.biomedcentral.com/1471-2458/13/27
differences between firms. Individual characteristics ac-count for most of the variance, including the well knownfactors age, education and income [9,12]. This reflectsthe relatively small impact of firm downsizing but alsoother firm characteristics like mean income and meaneducational level are largely attenuated by the corre-sponding individual variables (Table 3 Model 3). Giventhat the intraclass correlation coefficients are higher formen than for women, this is probably a result of a verygender-specific labour market in Norway, women maymore often be working in firms with high but differentdemands of good health and good abilities for manualwork. Alternatively, in some firms they may give upworking more easily than men, for instance in healthand social work. Social security practitioners as well asresearchers should be more aware of these genderdivedes in the labour market.
ConclusionOur study shows that moderate downsizing is followedby a small but significant increase in disability pensionrates in the next four years. Those staying in the jobafterwards have a higher risk than those leaving. Down-sizing especially leads to increased rates of DPs withcomplex medical diagnoses.
AcknowledgementsWe thank Agata Wrzos-Kaminska and Anders Grøndahl for linking data inStatistics Norway. Also many thanks to Kjetil Telle for lots of advice. Thestudy is financed by our appointments.
Author details1Institute of Health and Society, University of Oslo, P.O.Box 1130, BlindernN0318, Norway. 2National Institute of Public Health, Oslo, Norway. 3MRC/CSOSocial and Public Health Sciences Unit, University of Glasgow, Glasgow, UK.
Received: 4 April 2012 Accepted: 3 January 2013Published: 11 January 2013
References1. National Insurance Agency: Yearbook of social insurance 2005. Oslo: National
Insurance Agency; 2005. in Norwegian.2. Vahtera J, Kivimäki M, Pentti J, Linna A, Virtanen M, Virtanen P, Ferrie JE:
Organisational downsizing, sickness absence, and mortality: 10-townprospective cohort study. BMJ 2004, 328:555–9.
3. Kivimäki M, Honkonen T, Wahlbeck K, Elovainio M, Pentti J, Klaukka T,Virtanen M, Vahtera J: Organisational downsizing and increased use ofpsychotropic drugs among employees who remain in employment.J Epidemiol Community Health 2007, 61:154–8.
4. Vahtera J, Kivimäki M, Forma P, Wikström J, Halmeenmäki T, Linna A,Pentti J: Organisational downsizing as a predictor of disabilitypension: the 10-town prospective cohort study. J Epidemiol CommunityHealth 2005, 59:238–42.
5. Rege M, Telle K, Votruba M: The Effect of Plant Downsizing on Disabilitypension utilization. Journal of the European Economic Assosication 2009,7:754–85.
6. Claussen B: Restricting the influx of disability beneficiaries by means oflaw: experiences in Norway. Scand J Soc Med 1998, 26:1–7.
7. Voigt K, Nagel A, Meyer B, Langs G, Braukhaus C, Löwe B: Towards positivediagnostic criteria: a systematic review of somatoform disorderdiagnoses and suggestions for future classification. J Psychosom Res 2010,68:403–14.
8. Petronis A: Epigenetics as a unifying principle in the aetiology ofcomplex traits and diseases. Nature 2010, 465:721–7.
9. Bruusgaard D, Smeby L, Claussen B: Education and disability pension: astronger association than previously found. Scand J Public Health 2010,38:686–90.
10. Akselsen A, Boe KI, Hansen OE, FD-trygd SO: Documentation report (inNorwegian). Oslo: Statistics Norway; 2008.
11. Claussen B: A clinical follow up of unemployed. I: Lifestyle, diagnosestreatment and re-employment. Scand J Prim Health Care 1993, 11:211–8.
12. Claussen B, Dalgard OS: Disability pensioning: The gender divide may beexplained by occupation, income, mental distress and health in the OsloHealth Study. Scand J Public Health 2009, 37:590–7.
doi:10.1186/1471-2458-13-27Cite this article as: Claussen et al.: Proof firm downsizing and diagnosis-specific disability pensioning in Norway. BMC Public Health 2013 13:27.
Submit your next manuscript to BioMed Centraland take full advantage of:
• Convenient online submission
• Thorough peer review
• No space constraints or color figure charges
• Immediate publication on acceptance
• Inclusion in PubMed, CAS, Scopus and Google Scholar
• Research which is freely available for redistribution
Submit your manuscript at www.biomedcentral.com/submit