Journal Pre-proof - WOVOdat
53
Journal Pre-proof Probabilistic analysis to correlate seismic data with lava extrusion phases at Merapi volcano (Indonesia) T. Espinosa-Ortega, A. Budi-Santoso, Sulistiyani, N.-T.-Z. Win, C. Widiwijayanti, F. Costa PII: S0377-0273(22)00068-3 DOI: https://doi.org/10.1016/j.jvolgeores.2022.107537 Reference: VOLGEO 107537 To appear in: Journal of Volcanology and Geothermal Research Received date: 5 August 2021 Revised date: 15 March 2022 Accepted date: 19 March 2022 Please cite this article as: T. Espinosa-Ortega, A. Budi-Santoso, Sulistiyani, et al., Probabilistic analysis to correlate seismic data with lava extrusion phases at Merapi volcano (Indonesia), Journal of Volcanology and Geothermal Research (2021), https://doi.org/10.1016/j.jvolgeores.2022.107537 This is a PDF file of an article that has undergone enhancements after acceptance, such as the addition of a cover page and metadata, and formatting for readability, but it is not yet the definitive version of record. This version will undergo additional copyediting, typesetting and review before it is published in its final form, but we are providing this version to give early visibility of the article. Please note that, during the production process, errors may be discovered which could affect the content, and all legal disclaimers that apply to the journal pertain. © 2022 Published by Elsevier B.V.
-
Upload
khangminh22 -
Category
Documents
-
view
1 -
download
0
Transcript of Journal Pre-proof - WOVOdat
Journal Pre-proof
Probabilistic analysis to correlate seismic data with lava extrusionphases at Merapi volcano (Indonesia)
T. Espinosa-Ortega, A. Budi-Santoso, Sulistiyani, N.-T.-Z. Win,C. Widiwijayanti, F. Costa
PII: S0377-0273(22)00068-3
DOI: https://doi.org/10.1016/j.jvolgeores.2022.107537
Reference: VOLGEO 107537
To appear in: Journal of Volcanology and Geothermal Research
Received date: 5 August 2021
Revised date: 15 March 2022
Accepted date: 19 March 2022
Please cite this article as: T. Espinosa-Ortega, A. Budi-Santoso, Sulistiyani, et al.,Probabilistic analysis to correlate seismic data with lava extrusion phases at Merapivolcano (Indonesia), Journal of Volcanology and Geothermal Research (2021),https://doi.org/10.1016/j.jvolgeores.2022.107537
This is a PDF file of an article that has undergone enhancements after acceptance, suchas the addition of a cover page and metadata, and formatting for readability, but it isnot yet the definitive version of record. This version will undergo additional copyediting,typesetting and review before it is published in its final form, but we are providing thisversion to give early visibility of the article. Please note that, during the productionprocess, errors may be discovered which could affect the content, and all legal disclaimersthat apply to the journal pertain.
© 2022 Published by Elsevier B.V.
Probabilistic analysis to correlate seismic data with lava extrusion phases at Merapi volcano
(Indonesia)
T. Espinosa-Ortegaa, A. Budi-Santoso
b, Sulistiyani
b, N-T-Z. Win
a, C. Widiwijayanti
a, F. Costa
a,c,d
aEarth Observatory of Singapore, Nanyang Technological University, Singapore.
bBalai Penyelidkan dan Pengembangan Teknologi Kebancanaan Geologi, Centre for Volcanology and
Geological Hazard Mitigation, Geological Agency, Indonesia.
cAsian School of the Environment, Nanyang Technological University, Singapore
dInstitut de Physique du Globe de Paris, Universite de Paris, France
Abstract
Volcanoes can produce a range of eruptive behavior even during a single eruption, changing quickly from
effusive to explosive style, and the other way around. The changes in eruption phases (e.g. phreatic
explosion, magmatic explosion, lava extrusion, etc.) can lead to different volcanic hazards and require
timely assessment for the implementation of mitigation measures. Here we explore how to correlate a
given eruption phase with changes in the monitoring data using statistical analysis and conditional
probabilities. We calculate the success of detection of an eruption phase using a threshold of monitoring
data, which includes the uncertainty on the eruption phase dates with a Monte Carlo simulation. We apply
the method to dome forming eruptions of Mt. Merapi (Indonesia) and evaluate their time occurrence using
an exceptionally long monitoring time series (from 1993 to 2012, over nineteen years) of Multiphase
(Hybrid) Seismic Energy. We identify the seismic energy threshold that is associated with the lava
extrusion phase with an accuracy of 90 +/- 2%, precision of 73 +/- 2%, specificity of 96 +/- 1 %, and
sensitivity of 56 +/- 1%. We further test our method with the recent 2018 eruption (not used in the
Jour
nal P
re-p
roof
Journal Pre-proof
thresholds calculations) and we identify the lava extrusion with a precision of 67%, specificity of 70%,
and sensitivity of 92%. We also seismically detected the 2018′𝑠 onset of the lava extrusion phase 14 days
earlier than the visual observation. Given the link between dome-collapse pyroclastic flows and growth
episodes of the lava dome at Merapi, our analysis also allows us to establish that 83% of the most
energetic pyroclastic flows occur within the first 3 months after the onset of lava extrusion phase. Our
method can be applicable to a range of time series of monitoring data (seismic, deformation, gas) and to
other volcanoes that have a significant number of past events.
1. Introduction
Understanding the dynamics of volcanic eruptions, their likely eruptive style, and how they
evolve through an episode of unrest are among the most important and still challenging problems
in volcanology. The physical nature of volcanic systems is highly complex and involves many
parameters, which makes it difficult to approach using deterministic models (Sparks, 2003).
Thus, assessment of the volcano status and forecasting models commonly rely on statistical
methods based on the past eruptive behaviour, including uncertainties and fluctuations inherent
to the volcanic system ( e.g., Newhall and Hoblitt, 2002; Marzocchi and Zaccarelli, 2006; Selva
et al., 2014; Tonini et al., 2016; Bebbington and Lai, 1996; Bebbington and Jenkins, 2019;
Pesicek et al., 2021).
The proper assessment of volcano-related hazards depends largely on our ability to identify the
monitoring data and patterns associated with a given eruption phase. The success of event
detection relies on data quality (e.g. accuracy, completeness, consistency) as well as on the
number of times the event has occurred in the past. To use statistical analysis, it is essential to
have significant eruptive and monitoring datasets formatted in a consistent manner. The
Jour
nal P
re-p
roof
Journal Pre-proof

WOVOdat database of volcanic unrest is one of such standardized resource that allows for the
comparison of unrest patterns between eruptions (Newhall et al., 2017; Costa et al., 2019).
The identification of the change of a volcano’s normal to an unrest state, and the further
progression towards eruption is largely based on the availability of time series monitoring data,
including geophysical, geodetical, geochemical, and hydrological signals (e.g. Newhall &
Dzurisin, 1988; Shroder & Papale, 2015; Loughlin et al., 2015; Gottsmann, 2019). Analysis of
the monitoring data can be used to identify threshold values as the volcano moves from one state
to the next (Potter et al., 2015), or to apply auto-regressive models to classify unrest intensity
(Carlà et al., 2016).
The recent advancement of satellite remote sensing techniques allows detection of volcanic
activities in the form of continuous time series data e.g. thermal, deformation, gas emission (e.g.
Coppola et al. (2016); Flower and Carn (2015); Reath et al. (2019)). Challenges to exploiting
satellite data include ensuring regular and more frequent acquisitions over active volcanoes and
developing tools for automated analysis of the massive volume of imagery for volcano-related
signals (Arnold et al. (2017); Poland et al. (2020)). Despite the advantages of satellite remote
sensing, these tools strongly depend on the weather conditions, therefore is essential to also
correlate other ground-based monitoring data.
The temporal evolution of unrest can be manifested by various types of eruption phases (e.g.
phreatic explosion, magmatic explosion, lava extrusion, etc.), which also define the eruption
chronology (Costa et al. (2019)). An eruption may consist of many phases (Global Volcanism
Program (2013)). Some examples at different volcanoes have been illustrated and described in a
chronological manner by Bebbington and Jenkins (2019). Long-duration volcanic eruptions
Jour
nal P
re-p
roof
Journal Pre-proof
provide an ideal target for studying temporal evolution of magmatic processes (Bebbington and
Jenkins (2019)), the transitions between eruptive style and the underlying processes (Cashman
and Sparks (2013); Segall (2013); Watts et al. (2002); Arnold et al. (2017)).
We have developed a method for eruption phase detection using a simple statistical procedure
that correlates the eruption phases with the values of monitoring parameters. We calculate the
probability to observe an on-going lava extrusion phase at Merapi (Java, Indonesia) using the
multiphase seismic energy as the indicator parameter. As there are no accurate dates for
the ’beginning’ and ’end’ of the lava extrusion phases (due to a lack of data or discrepancies
between reports) we used Monte Carlo simulations to randomly consider different lava extrusion
phase chronologies and calculate their respective conditional probabilities. We assess the
efficiency of the detection of lava extrusion phases using different seismic energy thresholds by
calculating the accuracy, precision, specificity, and sensitivity (defined in detail in Section 3.2.1).
Growing domes tend to collapse and generate pyroclastic density currents, and thus we also
explore this relationship and calculate the probably of occurrence with the view of better
evaluation of hazards related to dome eruptions.
1.1.Previous works regarding anticipating eruptions of Merapi
Merapi is among the most hazardous volcanoes in Indonesia, and is well-known for its lava
extrusion phases that produce dome growth, dome-collapse, and associated hazardous “Merapi-
Type” pyroclastic flows (Voight et al., 2000; Newhall et al., 2000; Ratdomopurbo & Poupinet,
2000). The accurate identification and eventual forecasting of lava extrusion phases is thus of
great importance to mitigate the impacts of the associated pyroclastic flows (PFs) generated by
dome collapse (Calder et al., 2002; Ogburn et al., 2015). Anticipating the evolution of dome
Jour
nal P
re-p
roof
Journal Pre-proof
growth is very difficult since lava extrusion dynamics are highly nonlinear (Melnik & Sparks,
1999) and are strongly controlled by the volcano’s summit morphology (Walter et al., 2013;
Zorn et al., 2019).
Previous analysis of monitoring data of Merapi eruptions include those of Ratdomopurbo and
Poupinet (2000), and Young (2007) who used the monitoring geophysical data to compare
different eruption phases and assess precursor signals (in hindsight) to gain a better
understanding of the driving mechanisms of dome collapse events at Merapi. Moreover, the
Center for Volcanology and Geological Hazards Mitigation (CVGHM) of Indonesia developed a
fuzzy inference system using a local instance of the WOVOdat system at Merapi observatory,
and analysed multi-parameter monitoring data (e.g. seismic counts, EDM-distance changes) of
five past unrest events (Budi-Santoso et al., 2018a). The indicators obtained were then used as
the input of a model which yielded two output variables: the alert level change and eruptive style
(effusive or explosive).
An important aspect to be considered for detecting Merapi’s dome eruptions is the accurate
identification of the onset and duration of the lava extrusion phases. This is not straightforward
due to a variety of reasons, including the limited access and visibility of the active lava dome, the
slow extrusion rate and endogenous regime of lava dome growth (Voight et al., 2000b, Young,
2007), the numerous and intermittent explosions (Pallister et al., 2013; Budi-Santoso et al., 2013),
and the occurrence of multiple vent extrusions sites (Voight et al. 2000a, Ratdomopurbo et al.,
2013). Proper identification of onset and evolution of lava extrusion phases is however
necessary to anticipate their potential hazards including the generation of PFs caused by dome
collapse due to gravitational instability or heavy rain (Carn et al., 2004; Hale, 2008; Walter et al.,
Jour
nal P
re-p
roof
Journal Pre-proof
2013), dome fractures that suddenly release the pressure in the lava conduit (Watts et al., 2002;
Walter et al., 2015), or/and hydrothermal alteration of the dome permeability (Heap et al., 2019).
In most cases the dome-forming eruptions are also associated to explosive phases (Newhall &
Melson, 1983; Ogburn et al., 2015; Calder et al., 2015).
Another important aspect for detecting lava extrusion phases is to be able to correlate them with
some type of monitoring data. Hybrid volcanic earthquakes, characterized by high-frequency
onsets and with low-frequency tail seismic signals (e.g. Power et al., 1994; McNutt, 2005), occur
during shallow brittle rock failure that may relate to dome building processes (Wassermann,
2012 Harrington & Brodsky, 2007; White & McCausland, 2016). In general, these earthquakes
are shallow and thus preserve most of their high-frequency energy (Neuberg et al., 1998). The
seismic energy has been used to characterize the size, generation and transport of PFs at Merapi
(Iguchi et. al., 2019) and other volcanoes ( e.g.Yamasato, 1997,; De Angelis et al., 2007).
Brodscholl et al., 2000 used seismic broadband data to characterize the 22 November 1994
sequential lava dome collapse PF at Merapi, where the seismic signal exhibits a linear relation
between source volume and recorded seismic-amplitude envelope area. PF and Rockfall (RF)
seismic amplitude-duration data were used as proxies to estimate collapsed lava dome volume of
Merapi (Young, 2007).
At the Merapi observatory, hybrid volcanic earthquakes are classified as multiphase (MP)
earthquakes Fig. 1 (Budi-Santoso et al., 2013). We use Merapi’s Seismic Energy time series of
MP and PF earthquakes covering a period of almost 20 years from 4 February 1993 to 31
December 2012; this period of time includes 7 lava extrusion phases (described in section 2.2).
The time series data, the eruption chronology, and the tools are also available and freely
accessible in WOVOdat (www.wovodat.org).
Jour
nal P
re-p
roof
Journal Pre-proof
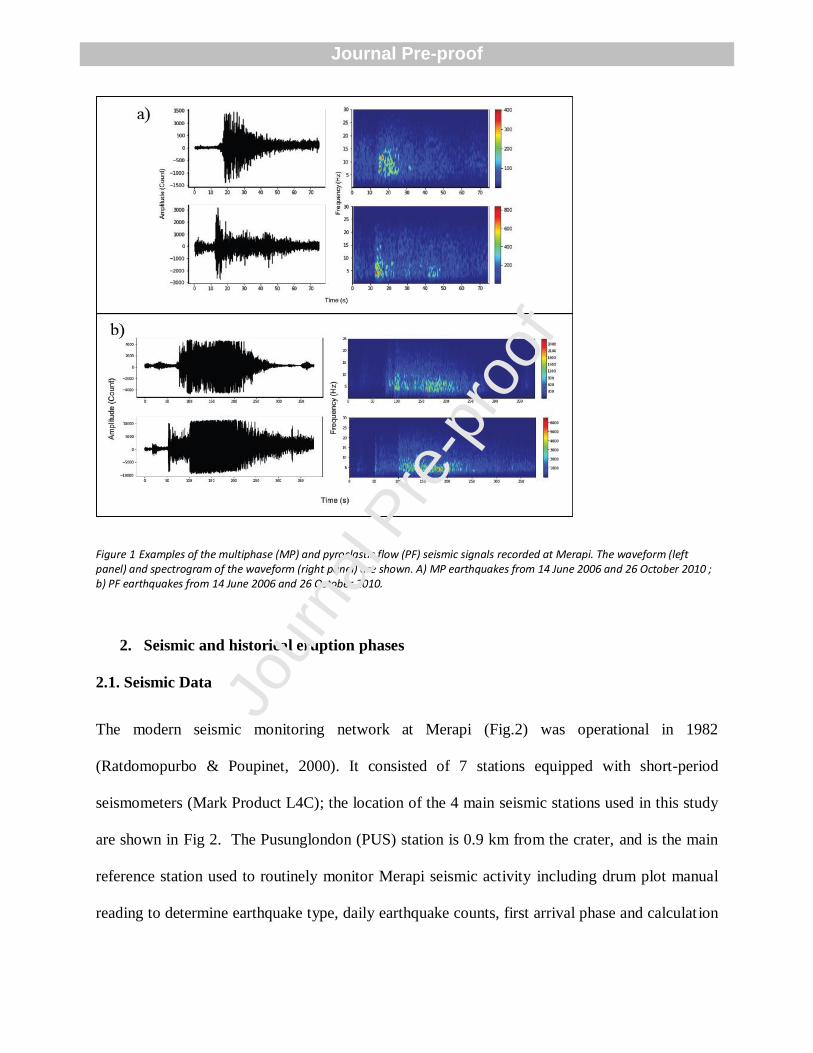
Figure 1 Examples of the multiphase (MP) and pyroclastic flow (PF) seismic signals recorded at Merapi. The waveform (left panel) and spectrogram of the waveform (right panel) are shown. A) MP earthquakes from 14 June 2006 and 26 October 2010 ; b) PF earthquakes from 14 June 2006 and 26 October 2010.
2. Seismic and historical eruption phases
2.1. Seismic Data
The modern seismic monitoring network at Merapi (Fig.2) was operational in 1982
(Ratdomopurbo & Poupinet, 2000). It consisted of 7 stations equipped with short-period
seismometers (Mark Product L4C); the location of the 4 main seismic stations used in this study
are shown in Fig 2. The Pusunglondon (PUS) station is 0.9 km from the crater, and is the main
reference station used to routinely monitor Merapi seismic activity including drum plot manual
reading to determine earthquake type, daily earthquake counts, first arrival phase and calculat ion
Jour
nal P
re-p
roof
Journal Pre-proof
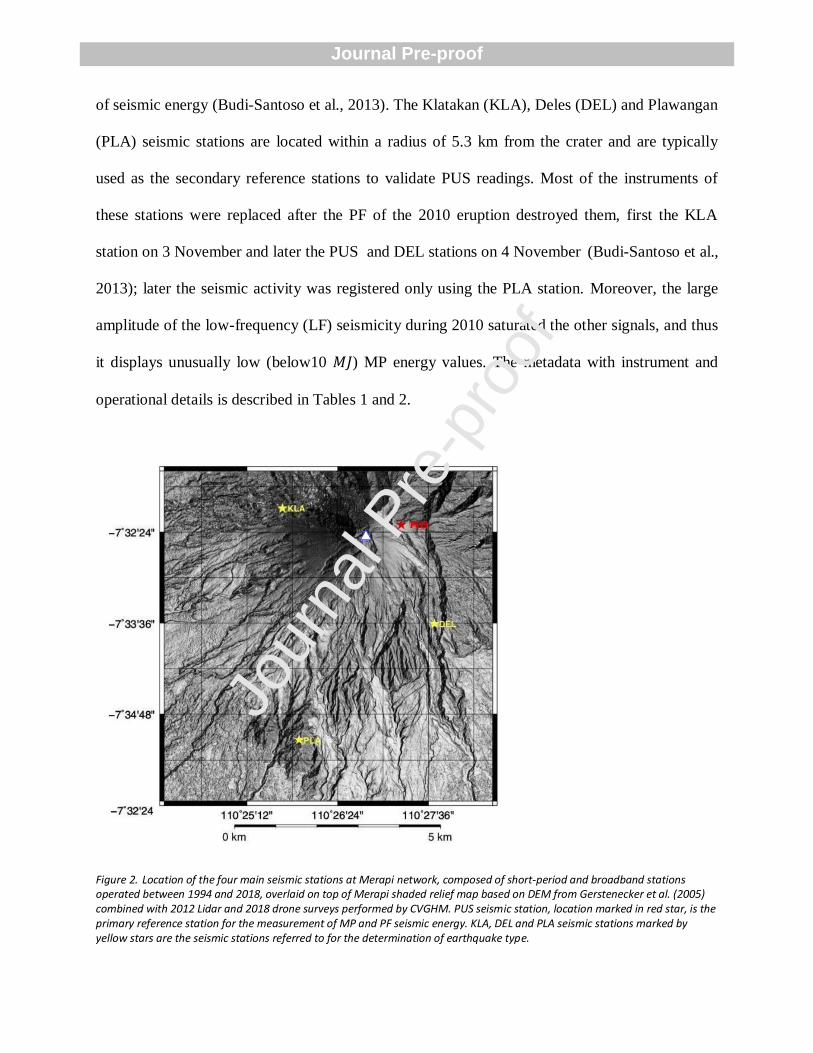
of seismic energy (Budi-Santoso et al., 2013). The Klatakan (KLA), Deles (DEL) and Plawangan
(PLA) seismic stations are located within a radius of 5.3 km from the crater and are typically
used as the secondary reference stations to validate PUS readings. Most of the instruments of
these stations were replaced after the PF of the 2010 eruption destroyed them, first the KLA
station on 3 November and later the PUS and DEL stations on 4 November (Budi-Santoso et al.,
2013); later the seismic activity was registered only using the PLA station. Moreover, the large
amplitude of the low-frequency (LF) seismicity during 2010 saturated the other signals, and thus
it displays unusually low (below10 𝑀𝐽) MP energy values. The metadata with instrument and
operational details is described in Tables 1 and 2.
Figure 2. Location of the four main seismic stations at Merapi network, composed of short-period and broadband stations operated between 1994 and 2018, overlaid on top of Merapi shaded relief map based on DEM from Gerstenecker et al. (2005) combined with 2012 Lidar and 2018 drone surveys performed by CVGHM. PUS seismic station, location marked in red star, is the primary reference station for the measurement of MP and PF seismic energy. KLA, DEL and PLA seismic stations marked by yellow stars are the seismic stations referred to for the determination of earthquake type.
Jour
nal P
re-p
roof
Journal Pre-proof
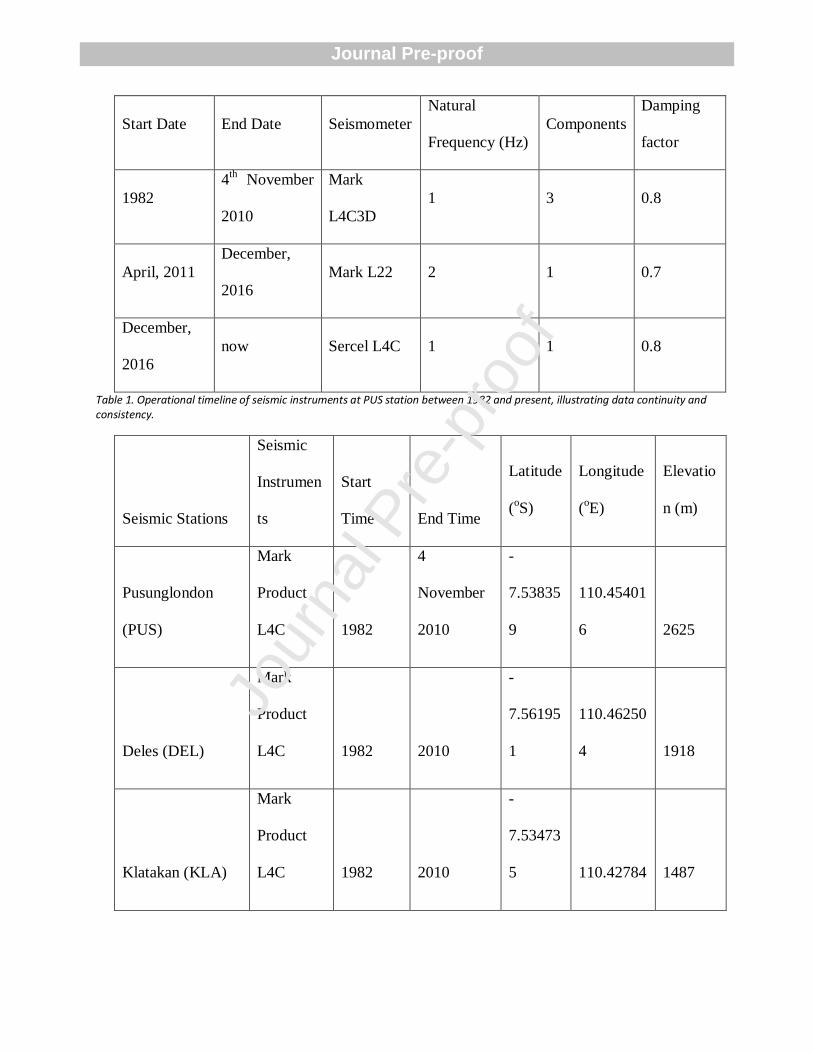
Start Date End Date Seismometer
Natural
Frequency (Hz)
Components
Damping
factor
1982
4th November
2010
Mark
L4C3D
1 3 0.8
April, 2011
December,
2016
Mark L22 2 1 0.7
December,
2016
now Sercel L4C 1 1 0.8
Table 1. Operational timeline of seismic instruments at PUS station between 1982 and present, illustrating data continuity and consistency.
Seismic Stations
Seismic
Instrumen
ts
Start
Time End Time
Latitude
(oS)
Longitude
(oE)
Elevatio
n (m)
Pusunglondon
(PUS)
Mark
Product
L4C 1982
4
November
2010
-
7.53835
9
110.45401
6 2625
Deles (DEL)
Mark
Product
L4C 1982 2010
-
7.56195
1
110.46250
4 1918
Klatakan (KLA)
Mark
Product
L4C 1982 2010
-
7.53473
5 110.42784 1487
Jour
nal P
re-p
roof
Journal Pre-proof
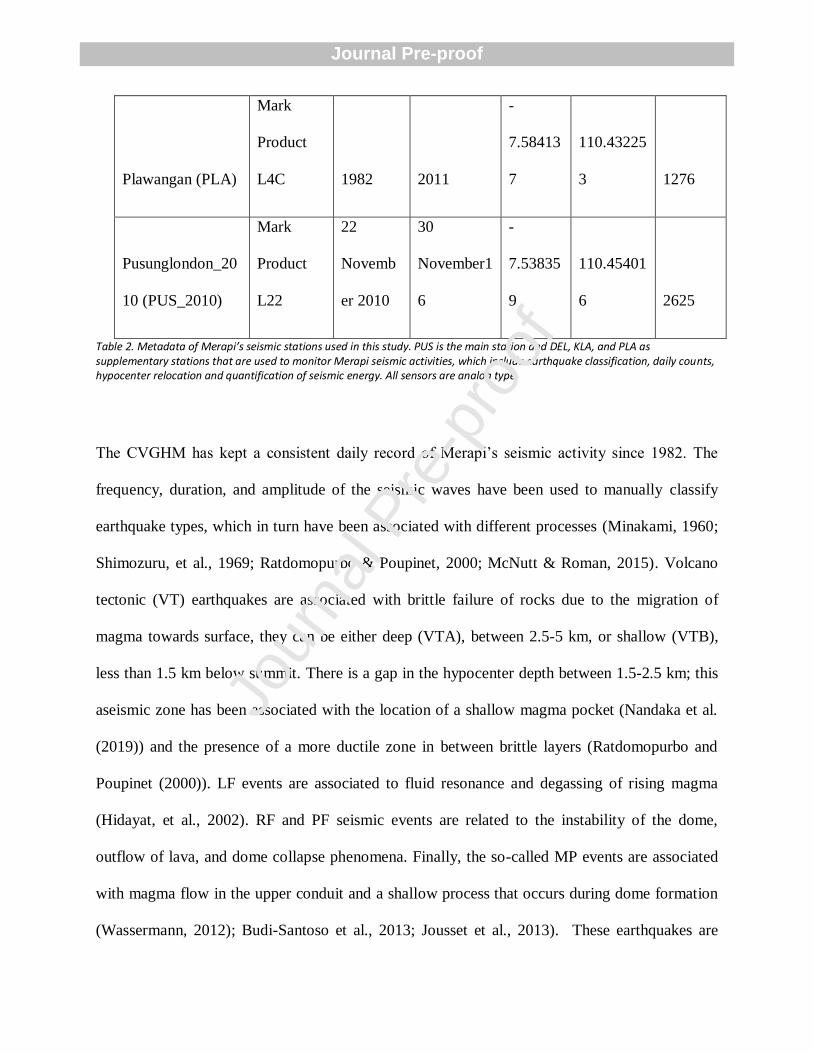
Plawangan (PLA)
Mark
Product
L4C 1982 2011
-
7.58413
7
110.43225
3 1276
Pusunglondon_20
10 (PUS_2010)
Mark
Product
L22
22
Novemb
er 2010
30
November1
6
-
7.53835
9
110.45401
6 2625
Table 2. Metadata of Merapi’s seismic stations used in this study. PUS is the main station and DEL, KLA, and PLA as supplementary stations that are used to monitor Merapi seismic activities, which include earthquake classification, daily counts, hypocenter relocation and quantification of seismic energy. All sensors are analog type.
The CVGHM has kept a consistent daily record of Merapi’s seismic activity since 1982. The
frequency, duration, and amplitude of the seismic waves have been used to manually classify
earthquake types, which in turn have been associated with different processes (Minakami, 1960;
Shimozuru, et al., 1969; Ratdomopurbo & Poupinet, 2000; McNutt & Roman, 2015). Volcano
tectonic (VT) earthquakes are associated with brittle failure of rocks due to the migration of
magma towards surface, they can be either deep (VTA), between 2.5-5 km, or shallow (VTB),
less than 1.5 km below summit. There is a gap in the hypocenter depth between 1.5-2.5 km; this
aseismic zone has been associated with the location of a shallow magma pocket (Nandaka et al.
(2019)) and the presence of a more ductile zone in between brittle layers (Ratdomopurbo and
Poupinet (2000)). LF events are associated to fluid resonance and degassing of rising magma
(Hidayat, et al., 2002). RF and PF seismic events are related to the instability of the dome,
outflow of lava, and dome collapse phenomena. Finally, the so-called MP events are associated
with magma flow in the upper conduit and a shallow process that occurs during dome formation
(Wassermann, 2012); Budi-Santoso et al., 2013; Jousset et al., 2013). These earthquakes are
Jour
nal P
re-p
roof
Journal Pre-proof
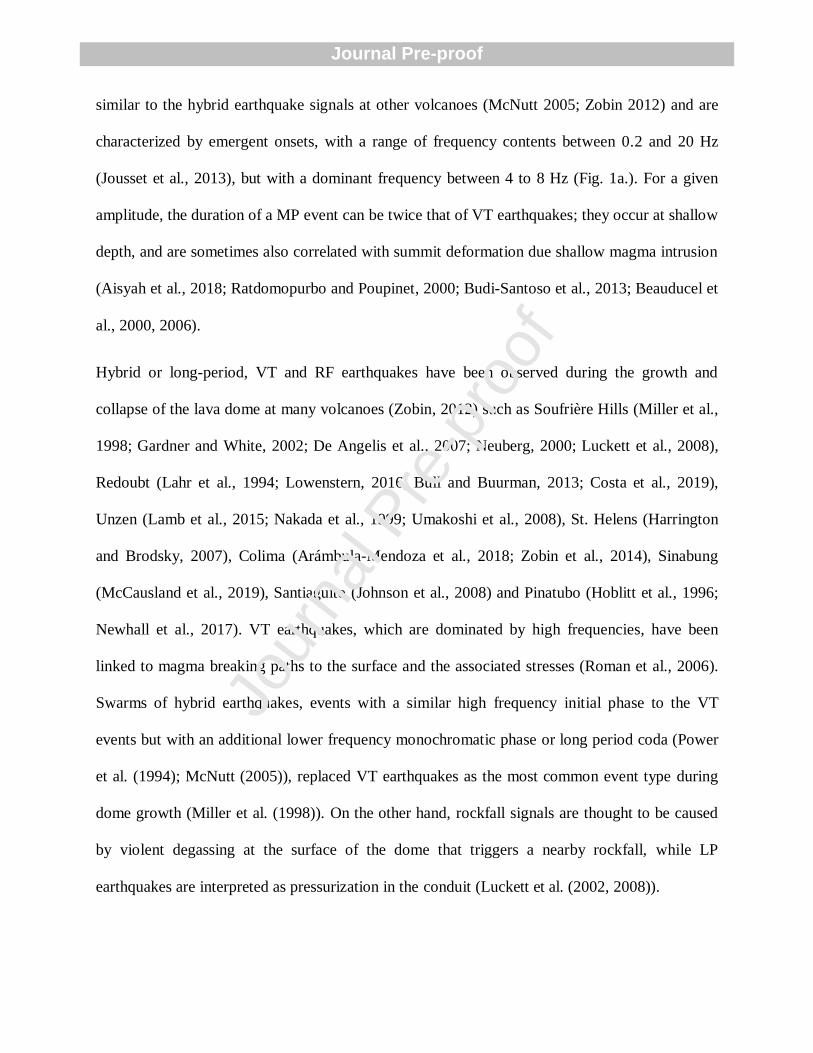
similar to the hybrid earthquake signals at other volcanoes (McNutt 2005; Zobin 2012) and are
characterized by emergent onsets, with a range of frequency contents between 0.2 and 20 Hz
(Jousset et al., 2013), but with a dominant frequency between 4 to 8 Hz (Fig. 1a.). For a given
amplitude, the duration of a MP event can be twice that of VT earthquakes; they occur at shallow
depth, and are sometimes also correlated with summit deformation due shallow magma intrusion
(Aisyah et al., 2018; Ratdomopurbo and Poupinet, 2000; Budi-Santoso et al., 2013; Beauducel et
al., 2000, 2006).
Hybrid or long-period, VT and RF earthquakes have been observed during the growth and
collapse of the lava dome at many volcanoes (Zobin, 2012) such as Soufrière Hills (Miller et al.,
1998; Gardner and White, 2002; De Angelis et al., 2007; Neuberg, 2000; Luckett et al., 2008),
Redoubt (Lahr et al., 1994; Lowenstern, 2016; Bull and Buurman, 2013; Costa et al., 2019),
Unzen (Lamb et al., 2015; Nakada et al., 1999; Umakoshi et al., 2008), St. Helens (Harrington
and Brodsky, 2007), Colima (Arámbula-Mendoza et al., 2018; Zobin et al., 2014), Sinabung
(McCausland et al., 2019), Santiaguito (Johnson et al., 2008) and Pinatubo (Hoblitt et al., 1996;
Newhall et al., 2017). VT earthquakes, which are dominated by high frequencies, have been
linked to magma breaking paths to the surface and the associated stresses (Roman et al., 2006).
Swarms of hybrid earthquakes, events with a similar high frequency initial phase to the VT
events but with an additional lower frequency monochromatic phase or long period coda (Power
et al. (1994); McNutt (2005)), replaced VT earthquakes as the most common event type during
dome growth (Miller et al. (1998)). On the other hand, rockfall signals are thought to be caused
by violent degassing at the surface of the dome that triggers a nearby rockfall, while LP
earthquakes are interpreted as pressurization in the conduit (Luckett et al. (2002, 2008)).
Jour
nal P
re-p
roof
Journal Pre-proof
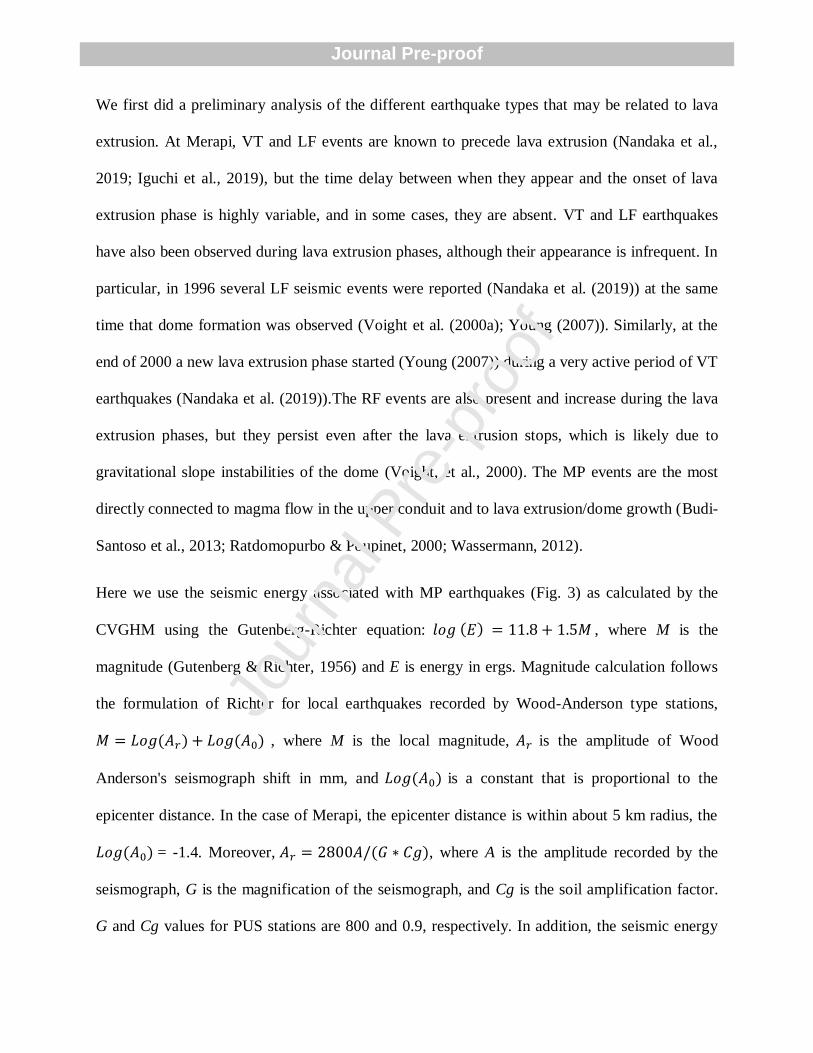
We first did a preliminary analysis of the different earthquake types that may be related to lava
extrusion. At Merapi, VT and LF events are known to precede lava extrusion (Nandaka et al.,
2019; Iguchi et al., 2019), but the time delay between when they appear and the onset of lava
extrusion phase is highly variable, and in some cases, they are absent. VT and LF earthquakes
have also been observed during lava extrusion phases, although their appearance is infrequent. In
particular, in 1996 several LF seismic events were reported (Nandaka et al. (2019)) at the same
time that dome formation was observed (Voight et al. (2000a); Young (2007)). Similarly, at the
end of 2000 a new lava extrusion phase started (Young (2007)) during a very active period of VT
earthquakes (Nandaka et al. (2019)).The RF events are also present and increase during the lava
extrusion phases, but they persist even after the lava extrusion stops, which is likely due to
gravitational slope instabilities of the dome (Voight, et al., 2000). The MP events are the most
directly connected to magma flow in the upper conduit and to lava extrusion/dome growth (Budi-
Santoso et al., 2013; Ratdomopurbo & Poupinet, 2000; Wassermann, 2012).
Here we use the seismic energy associated with MP earthquakes (Fig. 3) as calculated by the
CVGHM using the Gutenberg-Richter equation: 𝑙𝑜𝑔 (𝐸) = 11.8 + 1.5𝑀 , where M is the
magnitude (Gutenberg & Richter, 1956) and E is energy in ergs. Magnitude calculation follows
the formulation of Richter for local earthquakes recorded by Wood-Anderson type stations,
𝑀 = 𝐿𝑜𝑔 (𝐴𝑟) + 𝐿𝑜𝑔(𝐴0) , where M is the local magnitude, 𝐴𝑟 is the amplitude of Wood
Anderson's seismograph shift in mm, and 𝐿𝑜𝑔(𝐴0) is a constant that is proportional to the
epicenter distance. In the case of Merapi, the epicenter distance is within about 5 km radius, the
𝐿𝑜𝑔(𝐴0) = -1.4. Moreover, 𝐴𝑟 = 2800𝐴/(𝐺 ∗ 𝐶𝑔), where A is the amplitude recorded by the
seismograph, G is the magnification of the seismograph, and Cg is the soil amplification factor.
G and Cg values for PUS stations are 800 and 0.9, respectively. In addition, the seismic energy
Jour
nal P
re-p
roof
Journal Pre-proof

related to PFs is also computed. PFs generated by dome collapse produce RF-type signals but
with more impulsive onset of long duration (up to tens of minutes) and large enough amplitudes
to be recorded at the farthest stations in the network (Fig. 2). The PF energy was obtained by
multiplying the maximum amplitude and duration of the seismic wave by which we obtained an
arbitrary unit (a. u.) of its energy equivalent. Here we analyzed MP and PF seismic energy.
2.2 Lava extrusion phases
We studied the period between 4 February 1993 and 31 December 2012, during which time
Merapi had 4 eruptions (Table 3) and a range of different eruption styles including: lava
extrusion, magmatic explosions and phreatic explosions (Voight et al. (2000a); Ratdomopurbo
and Poupinet (2000); Ratdomopurbo et al. (2013)). Here we focus on the 7 lava extrusion phases
that occurred in this period (Table 4). Six of these consisted of long periods of slow lava-dome
growth, lasting weeks to months; whereas the 2010 lava extrusion phase involved intermittent
dome growth and explosions. The range of dates selected include the full duration of the 7 lava
extrusion phases and the pauses in between.
The eruptive phenomena of Merapi between 1994 and 2006 include near-continuous, mostly
endogenous basaltic-andesite lava-dome growth that filled the crater floor and piled on top of
previous lava domes that create structural discontinuity at the summit edifice (Voight et al., 2000;
Ratdomopurbo and Poupinet, 2000; Ratdomopurbo et al., 2013). Between the seven lava dome
extrusion phases (Table 4), there are periods of repose or with minimal extrusion, which we
categorized as periods of no lava extrusion. The periods of ‘unrest’ before the reported onsets of
lava extrusion varied greatly for different events, therefore we arbitrarily categorized as
precursor activity the 15 days preceding the onset (details discussed in section 3.1).
Jour
nal P
re-p
roof
Journal Pre-proof
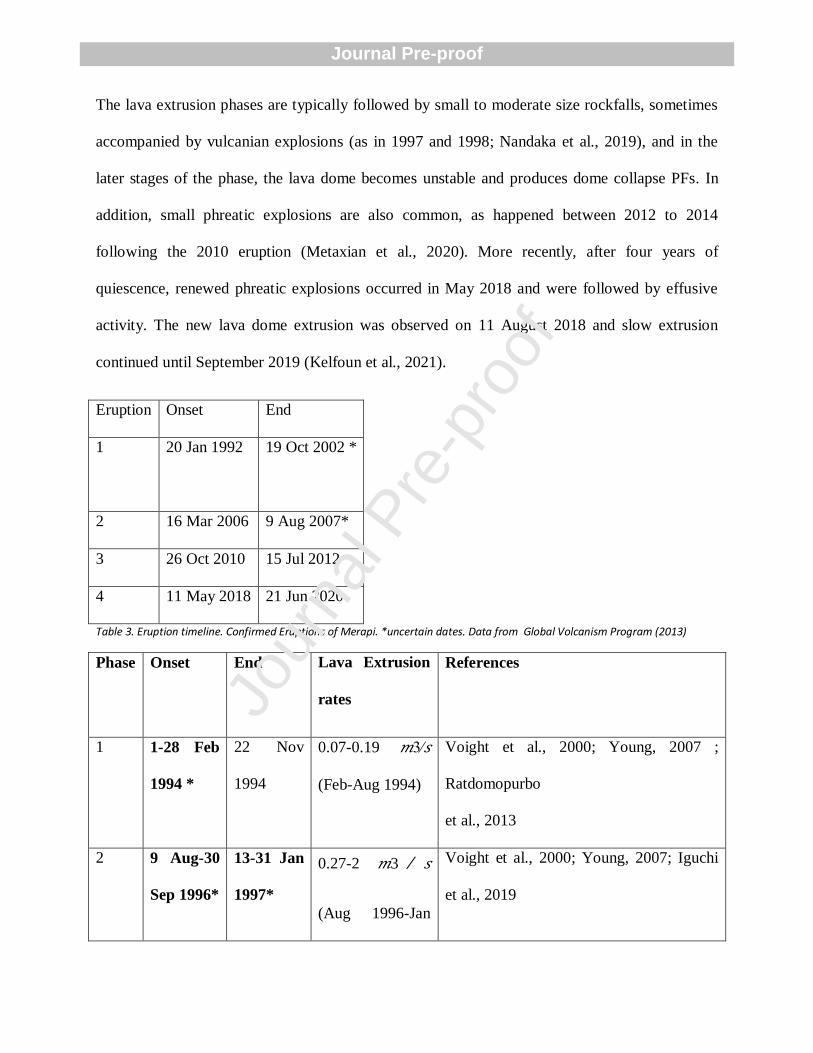
The lava extrusion phases are typically followed by small to moderate size rockfalls, sometimes
accompanied by vulcanian explosions (as in 1997 and 1998; Nandaka et al., 2019), and in the
later stages of the phase, the lava dome becomes unstable and produces dome collapse PFs. In
addition, small phreatic explosions are also common, as happened between 2012 to 2014
following the 2010 eruption (Metaxian et al., 2020). More recently, after four years of
quiescence, renewed phreatic explosions occurred in May 2018 and were followed by effusive
activity. The new lava dome extrusion was observed on 11 August 2018 and slow extrusion
continued until September 2019 (Kelfoun et al., 2021).
Eruption Onset End
1 20 Jan 1992
19 Oct 2002 *
2 16 Mar 2006 9 Aug 2007*
3 26 Oct 2010 15 Jul 2012
4 11 May 2018 21 Jun 2020
Table 3. Eruption timeline. Confirmed Eruptions of Merapi. *uncertain dates. Data from Global Volcanism Program (2013)
Phase Onset End Lava Extrusion
rates
References
1 1-28 Feb
1994 *
22 Nov
1994
0.07-0.19 𝑚3∕𝑠
(Feb-Aug 1994)
Voight et al., 2000; Young, 2007 ;
Ratdomopurbo
et al., 2013
2 9 Aug-30
Sep 1996*
13-31 Jan
1997*
0.27-2 𝑚3 ∕ 𝑠
(Aug 1996-Jan
Voight et al., 2000; Young, 2007; Iguchi
et al., 2019
Jour
nal P
re-p
roof
Journal Pre-proof
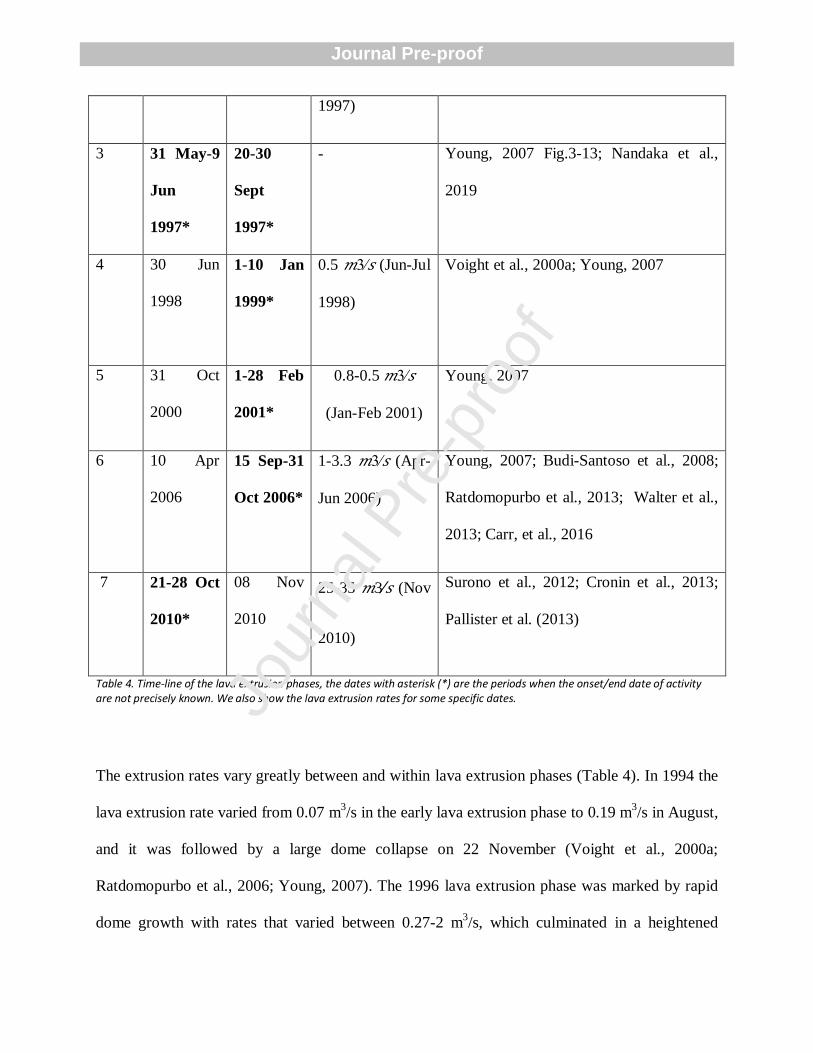
1997)
3 31 May-9
Jun
1997*
20-30
Sept
1997*
- Young, 2007 Fig.3-13; Nandaka et al.,
2019
4 30 Jun
1998
1-10 Jan
1999*
0.5 𝑚3∕𝑠 (Jun-Jul
1998)
Voight et al., 2000a; Young, 2007
5 31 Oct
2000
1-28 Feb
2001*
0.8-0.5 𝑚3∕𝑠
(Jan-Feb 2001)
Young, 2007
6 10 Apr
2006
15 Sep-31
Oct 2006*
1-3.3 𝑚3∕𝑠 (Apr-
Jun 2006)
Young, 2007; Budi-Santoso et al., 2008;
Ratdomopurbo et al., 2013; Walter et al.,
2013; Carr, et al., 2016
7 21-28 Oct
2010*
08 Nov
2010
25-35 𝑚3∕𝑠 (Nov
2010)
Surono et al., 2012; Cronin et al., 2013;
Pallister et al. (2013)
Table 4. Time-line of the lava extrusion phases, the dates with asterisk (*) are the periods when the onset/end date of activity are not precisely known. We also show the lava extrusion rates for some specific dates.
The extrusion rates vary greatly between and within lava extrusion phases (Table 4). In 1994 the
lava extrusion rate varied from 0.07 m3/s in the early lava extrusion phase to 0.19 m
3/s in August,
and it was followed by a large dome collapse on 22 November (Voight et al., 2000a;
Ratdomopurbo et al., 2006; Young, 2007). The 1996 lava extrusion phase was marked by rapid
dome growth with rates that varied between 0.27-2 m3/s, which culminated in a heightened
Jour
nal P
re-p
roof
Journal Pre-proof
extrusion rate of 2 m3/s on 14 January 1997, and was followed by a vulcanian explosion on 17
January 1997. Based on the dome volume between June and July 1998, the extrusion rate was
~0.5 m3/s (Voight et al., 2000b; Young, 2007). After 15 months of repose, in mid-January 2001
the extrusion rate reached ~0.8 m3/s then decreased by mid-February 2001, until the extrusion
waned (Ratdomopurbo et al, 2013). In 2006 the extrusion rate ranged from 1 m
3/s to 3.3
m
3/s
(Ratdomopurbo et. al. 2013), whereas in 2010 the lava extrusion was 25 m3/s on 1 November,
and culminated on 6 November with a rate of 35 m3/s (Surono et.al 2012; Pallister et al., 2013).
As there are no precise lava extrusion rates for the entire investigated period, we do not directly
use the extrusion rates in our analysis, but rather use them to complete the lava extrusion phase
chronology (Table 4). Thus, we considered dates when the lava extrusion was reported even if
there are no estimations of the extrusion rate.
Due to the complexity of the dome formation and surveillance, the dates of when the lava
extrusion occurred are not precisely known (Table 4). Where the onsets/end of lava extrusion do
not have exact dates and are referred as “early” or “late” by the data sources, we used the first 10
or the last 10 days of the month, respectively, as an estimate to define the uncertainty windows,
respectively. The uncertainty in these dates is taken into account in the probability distribution of
the monitoring time series. A detailed chronology of Merapi unrest between 1994 and 2019 is
reported in the Supplementary Material.
Jour
nal P
re-p
roof
Journal Pre-proof

Figure 3. Merapi daily multiphase (MP) energy (in black) between 4 February1993 to 31 December 2012. The light-red vertical bands mark the lava extrusion phases, the uncertain dates are shown by vertical the dashed red lines. The horizontal dashed lines are for reference and indicate energy intervals as used in Section 3.
3. Methodology and results
In this section we present an approach to calculate the conditional probabilities to detect an on-
going eruptive phase given the measured values of the monitoring data of the daily seismic
multiphase energy (MPE). First, we explain the use of Monte Carlo simulations to account for
the uncertainties in the lava extrusion start and end dates (Table 4). Later, we calculate the
probability to observe a lava extrusion phase given the range of MPE, and compute how these
Jour
nal P
re-p
roof
Journal Pre-proof

probabilities have evolved over the years at Merapi. Finally, we evaluate how the MPE
thresholds calculated using data from 1993-2012 could be used to detect the lava extrusion
phases of 2018.
3.1 Monte Carlo simulations to account for uncertainties in the lava extrusion phases time-
line
To classify the time series data during an eruption phase we need to know its exact ‘onset’ and
‘end’ dates, but these are not well known or have been inconsistently reported. From 4 February
1993 to 12 December 2012 Merapi experienced 7 lava extrusions phases (Fig.3), but their
onset/end are only known within a few days to months (Table 4). Considering these uncertainty
windows, the number of possible combinations of the onsets/end dates for all lava extrusion
phases is of the order of 1011
cases (see supplementary material for details). To account for this
large number of combinations, we used a Monte Carlo approach where we randomly selected the
onset/end dates within the uncertainty windows and calculated the probabilities to observe a lava
extrusion as a function of the daily MPE, then repeated the process for another random set of
dates 104 times. The uncertainty in these dates is reflected in the probabilities as the standard
deviation of the stochastic simulations.
3.2 Analysis of the time series
Using the randomly generated sets of onset/end dates of the 7 lava extrusion phases in Table 4,
we classified the seismic monitoring time series from 1993-2012 into three different periods:
I. Active period: These are the daily MPE values of the days during the lava extrusion
phase even if these days are not consecutive or occur simultaneously with other eruptive
phases.
Jour
nal P
re-p
roof
Journal Pre-proof

II. Precursory period: These are the daily MPE values of the days that precede the onsets of
the lava extrusion phase and therefore can capture the transition of activity in the
volcano. Here we arbitrarily choose 15 days prior to every onset.
III. Non-active period: These are the daily MPE values of the days that are neither the
periods of precursors nor of the active period. These are not necessarily days without
volcanic activity, as they may include other types of eruptive phases different from the
lava extrusion phase that we focus upon here.
We calculate both, the probability P(𝑘|𝑖) to have a daily MPE within the interval k, for each
period (i = I, II and III) and also the probability 𝑃(𝑖|𝑘) to observe each period (i=I, II, III) given
a daily value of the MPE:
(1) 𝑃(𝑘|𝑖) =𝑓𝑖(𝑘)
∑ 𝑓𝑖(𝑘)𝑘=
𝑓𝑖(𝑘)
𝑇𝑜𝑡𝑎𝑙 𝑑𝑎𝑦𝑠 𝑖𝑛 𝑝𝑒𝑟𝑖𝑜𝑑 𝑖,
(2) P(𝑖|𝑘) =𝑓𝑖(𝑘)
𝑓𝐼(𝑘)+𝑓𝐼𝐼(𝑘)+ 𝑓𝐼𝐼𝐼(𝑘)=
𝑓𝑖(𝑘)
𝑇𝑜𝑡𝑎𝑙 𝑑𝑎𝑦𝑠 𝑤𝑖𝑡ℎ 𝑀𝑃𝐸 є 𝑘,
where 𝑓𝑖(𝑘) is the number of days that a period i had a daily MPE value within a given interval k.
The k intervals were arbitrarily divided by the energies: 0, 1, 4, 10, 20, 50, 100, 200, 400, >400
in MJ, meaning the bin-width intervals k are [0,1) MJ, [1,4) MJ, and so on (Fig.4). The
conditional probabilities Eqs. (1, 2) are related to each other according to the Bayes theorem,
𝑃(𝑖|𝑘) = (𝑃(𝑘|𝑖)𝑃(𝑖))(𝑃(𝑘))−1 , where P(i)=(Total days in period i)/(Total days), is the
unconditional probability to have a period i, and P(k)= (Total days with MPE є 𝑘 )/(Total days),
is the unconditional probability to have a day with daily MPE values within the interval 𝑘.
The probabilities Eqs.(1, 2), give us complementary information. P(𝐼|𝑘) is the fraction of days
with MPE values within the interval k when the active period (lava extrusion phase) occurred,
Jour
nal P
re-p
roof
Journal Pre-proof

whereas P(𝑘|𝐼) is the fraction of days in the active period that had MPE within the interval k.
The probability distribution P(𝑘|𝑖) allows us to determine the dominant seismic energy for each
of the three periods. We found that the probability distribution for the days within the active
period (i = I) has a peak at the MPE interval [40,80) MJ (Fig 4). The maximum value of the MPE
interval is between 20 and 160 MJ, and does not vary significantly by including more lava
extrusion phases (Fig 4a), which suggests that the use of these energy intervals is a robust
indicator of the lava extrusion phase. Moreover, we found that the probability distributions of
each period have a maximum probability at different energy intervals (Fig. 4b).
Figure 4. a) Change of the probability 𝑃(𝑘|𝐼) (Eq.(1) with i=I)) for MPE during the active period. The colors of each line indicate the lava extrusion phase year(s) that were included in the calculation, and vary from the 1994 only (black line) to all lava extrusion phases from 1994 until 2010 (red line). b) Probability (Eq. (1)) to have a given MPE during each period (active, precursory, or non-active) from 1993-2012 . The solid lines are the mean of the iterations and the shaded areas the standard deviation of the stochastic simulations that are related to the uncertainty of the lava extrusion phase time-line (section 3.1). Please note that lines in the upper panel are associated with the year that the active period occurred, whereas the lower panel includes also the precursory and non-active periods.
Jour
nal P
re-p
roof
Journal Pre-proof

We also found that the probability P(𝐼|𝑘) to observe an active period (or in other words, the
probability to observe an on-going lava extrusion phase) is <0.1 for low values of MPE, but it
quickly increases to about 0.8 at the interval [40,80) and remains high for higher MPE values
(Fig.5). The probability to observe a non-active period P(𝐼𝐼𝐼|𝑘) is almost a mirror image of the
active period since it is approximately 1 − 𝑃(𝐼|𝑘). There is a cross-over of probabilities of the
two periods between the MPE intervals of [10,20) and [20,40). The value of 20 MJ is between
the two intervals, and can be used to define a so-called threshold of MPE. This threshold marks
where the probability to observe a lava extrusion phase is higher than no-lava extrusion, and
could be used as a critical indicator for decision making (see section below; e.g. Potter et. al.,
2015). The probability for the precursory period (i=II) is mainly < 0.1 for all energy intervals
because the total number of precursor days is much smaller than those of the two other periods
given that we have defined it to be 15 days. The choice of the number of days classified as
precursor doesn’t affect the probability to observe an active phase, since for each stochastic
simulation, the number of days in the active period (I) is fixed. Varying the length of the days
defined as precursors would only move some days from the precursory period (II) to the non-
active period (III) or vice versa. The probabilities shown in Figs. 4,5 were calculated using 7270
days (from 4 February 1993 to12 December 2012) and 104 random scenarios. Jo
urna
l Pre
-pro
of
Journal Pre-proof

Figure 5. Probability (Eq. (2)) to observe an active period (in red), a precursory period (in blue, or a non-active period (in black), as a function of the MPE, from 1993-2012. The light shaded area around the lines show the uncertainties due to the inaccuracy on the timeline of the lava extrusion phase, and are the standard deviation of the stochastic simulations.
We also calculated whether the probability to observe an on-going lava extrusion phase as a
function of the MPE intervals changed over time by accumulating the data progressively, starting
from 1993-1994 until 1993-2012 (Fig 6). We found that the probability to detect a lava extrusion
phase with ( P(𝐼|𝑘) =0.5) shifts to higher MPE through time, starting at MPE below 8 MJ for the
event in 1994, up to ~20 MJ when all the phases are included. For instance, from 1993 − 1995 a
daily MPE between 20 – 40 MJ indicated an on-going lava extrusion with a probability > 90%,
whereas from 1993−2003 the same energy values indicated an on-going lava extrusion with a
probability of 70%, and this value further drops to 60% from 1993−2012. The exact reasons for
the changes in probability in specific times are unclear but they could be associated with the state
of the volcanic conduit. For example, in an open conduit brittle fracture is not necessary for the
lava to extrude and consequently one can expect lower MPE values. In contrast, in plugged
conduits the lava extrusion requires brittle fracture and therefore one would expect higher MPE
values.
Jour
nal P
re-p
roof
Journal Pre-proof
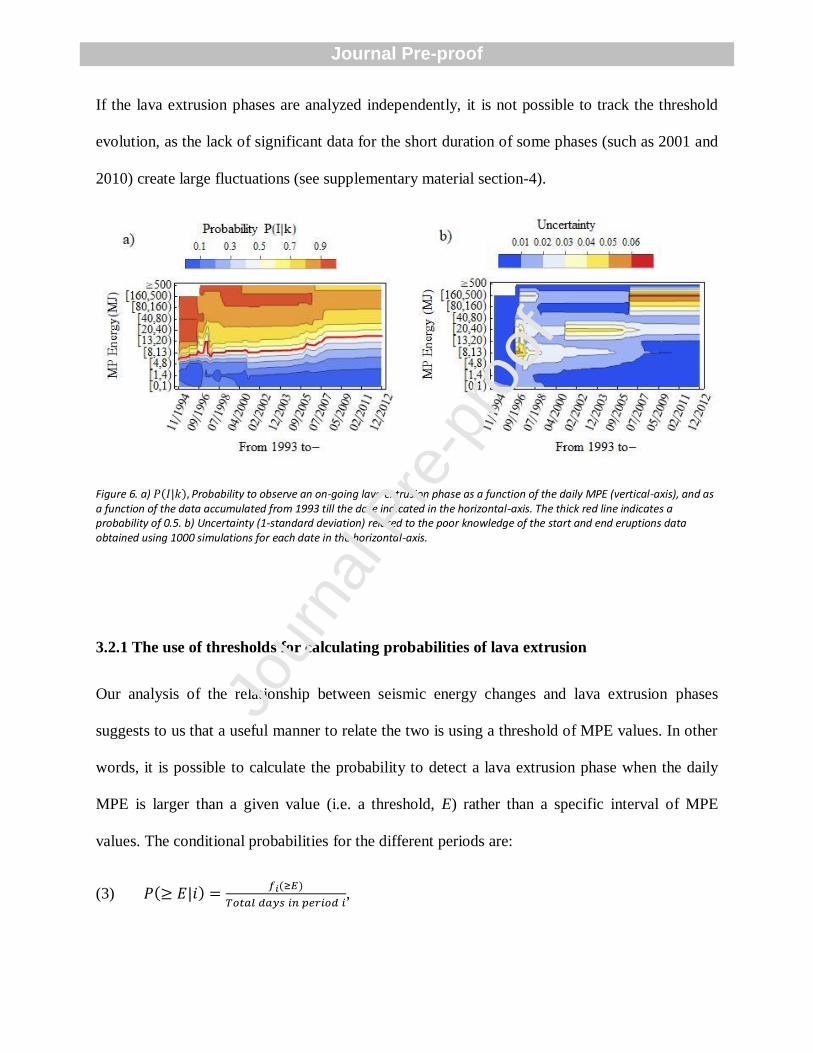
If the lava extrusion phases are analyzed independently, it is not possible to track the threshold
evolution, as the lack of significant data for the short duration of some phases (such as 2001 and
2010) create large fluctuations (see supplementary material section-4).
Figure 6. a) 𝑃(𝐼|𝑘), Probability to observe an on-going lava extrusion phase as a function of the daily MPE (vertical-axis), and as a function of the data accumulated from 1993 till the date indicated in the horizontal-axis. The thick red line indicates a probability of 0.5. b) Uncertainty (1-standard deviation) related to the poor knowledge of the start and end eruptions data obtained using 1000 simulations for each date in the horizontal-axis.
3.2.1 The use of thresholds for calculating probabilities of lava extrusion
Our analysis of the relationship between seismic energy changes and lava extrusion phases
suggests to us that a useful manner to relate the two is using a threshold of MPE values. In other
words, it is possible to calculate the probability to detect a lava extrusion phase when the daily
MPE is larger than a given value (i.e. a threshold, E) rather than a specific interval of MPE
values. The conditional probabilities for the different periods are:
(3) 𝑃(≥ 𝐸|𝑖) =𝑓𝑖(≥𝐸)
𝑇𝑜𝑡𝑎𝑙 𝑑𝑎𝑦𝑠 𝑖𝑛 𝑝𝑒𝑟𝑖𝑜𝑑 𝑖,
Jour
nal P
re-p
roof
Journal Pre-proof

(4) 𝑃(𝑖| ≥ 𝐸) =𝑓𝑖(≥𝐸)
𝑇𝑜𝑡𝑎𝑙 𝑑𝑎𝑦𝑠 𝑤𝑖𝑡ℎ 𝑀𝑃𝐸 ≥ 𝐸,
Where 𝑓𝑖(≥ 𝐸) is the number of days that the period i (i=I for active period, etc.), had a MPE
≥ 𝐸. Eqs. (3,4) are similar to Eqs.(1,2), but instead of using MPE within energy intervals, we
use MP energies above a threshold. Thus, 𝑓𝑖 (≥ 𝐸) is equal to the summation over of all the
intervals k with MPE ≥ 𝐸 , i.e., 𝑓𝑖 (≥ 𝐸) = ∑ 𝑓𝑖(𝑘)𝑘 ; therefore 𝑃(≥ 𝐸|𝑖) = ∑ 𝑃(𝑘|𝑖)𝑘 , but,
𝑃(𝑖| ≥ 𝐸) ≠ ∑ 𝑃(𝑖|𝑘)𝑘 , as the denominators in Eq. (2) and Eq.(4) are different.
In this section we focus solely on the probability to detect a lava extrusion phase, therefore we
reduce the 3 group classification of the previous section, to just two: ‘days with lava extrusion’
and ‘with no lava extrusion’ (we merged the precursory (II) and non-active (III) periods into a
no-lava extrusion period). The conditional probabilities to detect a lava extrusion phase when the
MPE is above an energy threshold can be expressed in terms of the accuracy, precision,
sensitivity, and specificity, (Fawcett, 2006) defined as (Table 5):
Reported Event
Lava Extrusion No Lava Extrusion
Test positive (weekly MPE ≥ E) TP =𝑓𝐼(≥ 𝐸) FP =𝑓𝐼𝐼(≥ 𝐸) + 𝑓𝐼𝐼𝐼(≥ 𝐸)
Test negative (weekly MPE < E) FN=𝑓𝐼(< 𝐸) TN=𝑓𝐼𝐼(< 𝐸) + 𝑓𝐼𝐼𝐼(< 𝐸) Figure 3. TP= True Positive = number of days with lava extrusion with weekly MPE≥E; FP= False Positive= number of days with no lava extrusion with weekly MPE≥E; FN= False Negative=number of days with lava extrusion with weekly MPE<E; TN=True Negative= number of days with no lava extrusion with weekly MPE<E. E is the threshold value of MPE.
(5) 𝑃𝑟𝑒𝑐𝑖𝑠𝑖𝑜𝑛 =𝑇𝑃
𝑇𝑃+𝐹𝑃=
𝑓𝐼(≥𝐸)
𝑇𝑜𝑡𝑎𝑙 𝑑𝑎𝑦𝑠 𝑤𝑖𝑡ℎ 𝑀𝑃𝐸≥𝐸= 𝑃(𝐼| ≥ 𝐸),
(6) 𝑆𝑒𝑛𝑠𝑖𝑡𝑖𝑣𝑖𝑡𝑦 =𝑇𝑃
𝑇𝑃+𝐹𝑁=
𝑓𝐼(≥𝐸)
𝑇𝑜𝑡𝑎𝑙 𝑑𝑎𝑦𝑠 𝑤𝑖𝑡ℎ 𝑙𝑎𝑣𝑎 𝑒𝑥𝑡𝑟𝑢𝑠𝑖𝑜𝑛= 𝑃(≥ 𝐸|𝐼).
(7) 𝑆𝑝𝑒𝑐𝑖𝑓𝑖𝑐𝑖𝑡𝑦 =𝑇𝑁
𝑇𝑁+𝐹𝑃=
𝑓𝐼𝐼(<𝐸)+𝑓𝐼𝐼𝐼(<𝐸)
𝑇𝑜𝑡𝑎𝑙 𝑑𝑎𝑦𝑠 𝑤𝑖𝑡ℎ 𝑛𝑜 𝑙𝑎𝑣𝑎 𝑒𝑥𝑡𝑟𝑢𝑠𝑖𝑜𝑛
Jour
nal P
re-p
roof
Journal Pre-proof

(8) 𝐴𝑐𝑐𝑢𝑟𝑎𝑐𝑦 =𝑇𝑃+𝑇𝑁
𝑇𝑃+𝑇𝑁+𝐹𝑁+𝐹𝑃=
𝑓𝐼(≥𝐸)+𝑓𝐼𝐼(<𝐸)+𝑓𝐼𝐼𝐼(<𝐸)
𝑇𝑜𝑡𝑎𝑙 𝑑𝑎𝑦𝑠 .
The precision is the fraction of days with MPE≥ 𝐸 when lava extrusion phase occurred (positive
predictive value); the sensitivity is the fraction days in the lava extrusion phase that had MPE
above the threshold (true positive rate); the specificity is the fraction of days that were correctly
classified as negatives (true negative rate); finally the accuracy describes the fraction of days that
our tests (Table 5) were correct.
Moving average. We evaluated the probabilities with Eqs (5-8), using the daily MPE and also
with the average of the MPE from previous days. We found that using a moving average (as
done in other studies of time series of monitoring data; e.g. moving window analysis rather than
daily; Jaquet et. al., 2006, Alvarez-Ramirez et. al., 2009), improves the precision and sensitivity,
as it minimizes the effect of large fluctuations of MPE that appear in consecutive days and it
preserves the overall trend in seismic activity.
We found that the optimal size of the time window is 7 days, as explained in the supplementary
material. In this manner, the frequencies 𝑓𝑖(≥ 𝐸) are equal to the number of days that the period i,
had a weekly moving average of MPE ≥ 𝐸 and the denominator of Eq.(5) is equal to the “Total
days with a weekly moving average of MPE≥ 𝐸”. Jour
nal P
re-p
roof
Journal Pre-proof

Figure 7. Conditional probabilities to detect a lava extrusion phase using a moving average of MPE of the past 7 days (e.g. weekly average) calculated with Eqs(5-8). Notice the x-axis scale is not linear. Probabilities calculated using 7270 days and 104 random scenarios, the solid lines represent the mean of the iterations and the shaded area around the solid lines represent the error (standard deviation) due to uncertainty of onset and end dates (see section 3.1).
Using a 7-day moving average of MPE values we found that the precision, sensitivity, specificity
and accuracy of a test to detect a lava extrusion phase vary depending on the threshold (Fig. 7):
the precision increases with higher thresholds, but the sensitivity decreases, which means that it’s
more likely to miss events. The optimal threshold value to detect lava extrusion is one that
maximizes the precision and accuracy, while keeping the sensitivity and specificity high. In
Section 3.2 we found that the 20 MJ MPE value marks a change in trends between the
probabilities (Fig.5). Using this same value as a threshold, the test to detect lava extrusion phases
has an accuracy = 0.90 +/-0.02, a precision= 0.73+/-0.02, a specificity = 0.96 +/- 0.01, and a
sensitivity = 0.56 +/- 0.01. In other words, the model is correct ~ 90% of days (accuracy);
approximately 73% of days with MPE>=20MJ had lava extrusion (precision), approximately 96%
of days were correctly classified as days with no lava (specificity), and about 56% of the days
when lava extrusion occurred had also MPE >= 20MJ (sensitivity).
Jour
nal P
re-p
roof
Journal Pre-proof
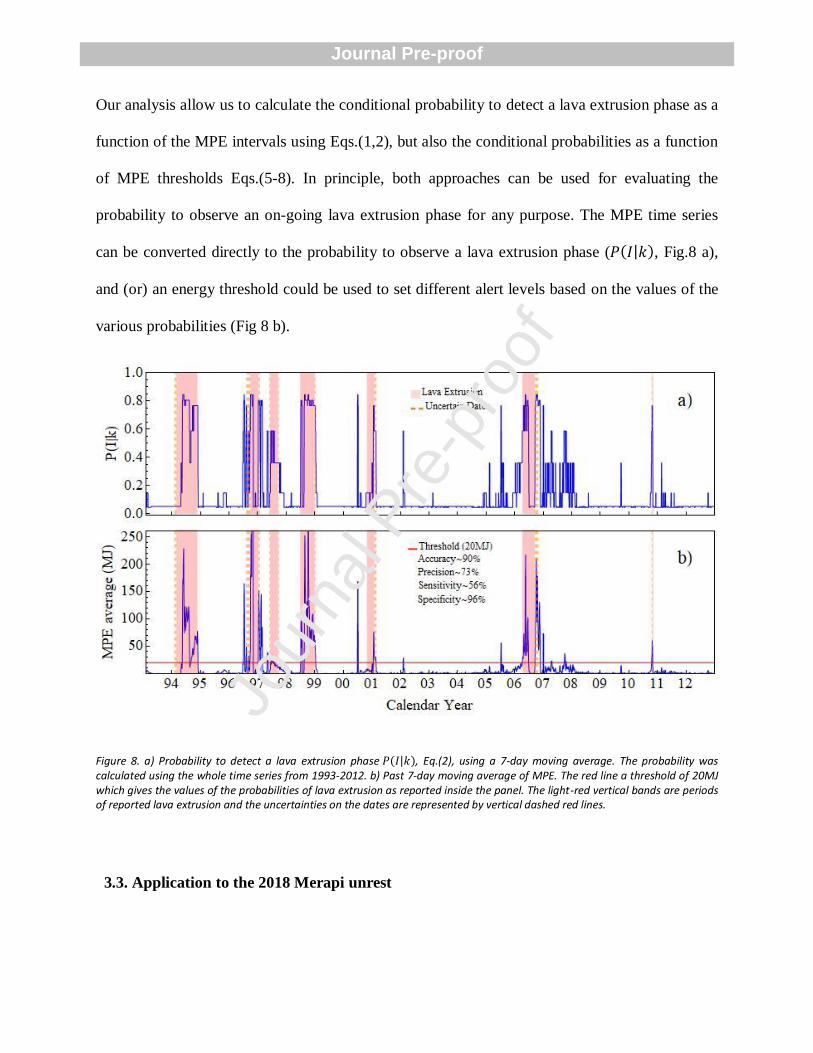
Our analysis allow us to calculate the conditional probability to detect a lava extrusion phase as a
function of the MPE intervals using Eqs.(1,2), but also the conditional probabilities as a function
of MPE thresholds Eqs.(5-8). In principle, both approaches can be used for evaluating the
probability to observe an on-going lava extrusion phase for any purpose. The MPE time series
can be converted directly to the probability to observe a lava extrusion phase (𝑃(𝐼|𝑘), Fig.8 a),
and (or) an energy threshold could be used to set different alert levels based on the values of the
various probabilities (Fig 8 b).
Figure 8. a) Probability to detect a lava extrusion phase 𝑃(𝐼|𝑘), Eq.(2), using a 7-day moving average. The probability was calculated using the whole time series from 1993-2012. b) Past 7-day moving average of MPE. The red line a threshold of 20MJ which gives the values of the probabilities of lava extrusion as reported inside the panel. The light-red vertical bands are periods of reported lava extrusion and the uncertainties on the dates are represented by vertical dashed red lines.
3.3. Application to the 2018 Merapi unrest
Jour
nal P
re-p
roof
Journal Pre-proof

We further tested our method on Merapi’s lava extrusion event of 2018 (Fig.9a) and illustrate
how the probability to detect a lava extrusion phase obtained from the previous calculations can
be used in real time (Fig.9c). We also compare the effectiveness of the value of 20MJ as a
threshold by calculating Eqs.(5-8) for 2018 (Fig.9b). The visual camera installed by CVGHM at
the crater captured the beginning of the lava dome formation on 11 August 2018.
We find that for the 2018 dataset the (past) 7-day moving average of MPE continuously
exceeded the 20 MJ threshold 14 days early than the observed onset of lava extrusion; overall for
this threshold the test has an accuracy=79%, precision =67%, sensitivity = 92%, and specificity =
70%, here we don’t have associated uncertainties as in Fig.7 because for 2018 there is an
accurate register of the dates when the lava extrusion phase took place.
Jour
nal P
re-p
roof
Journal Pre-proof
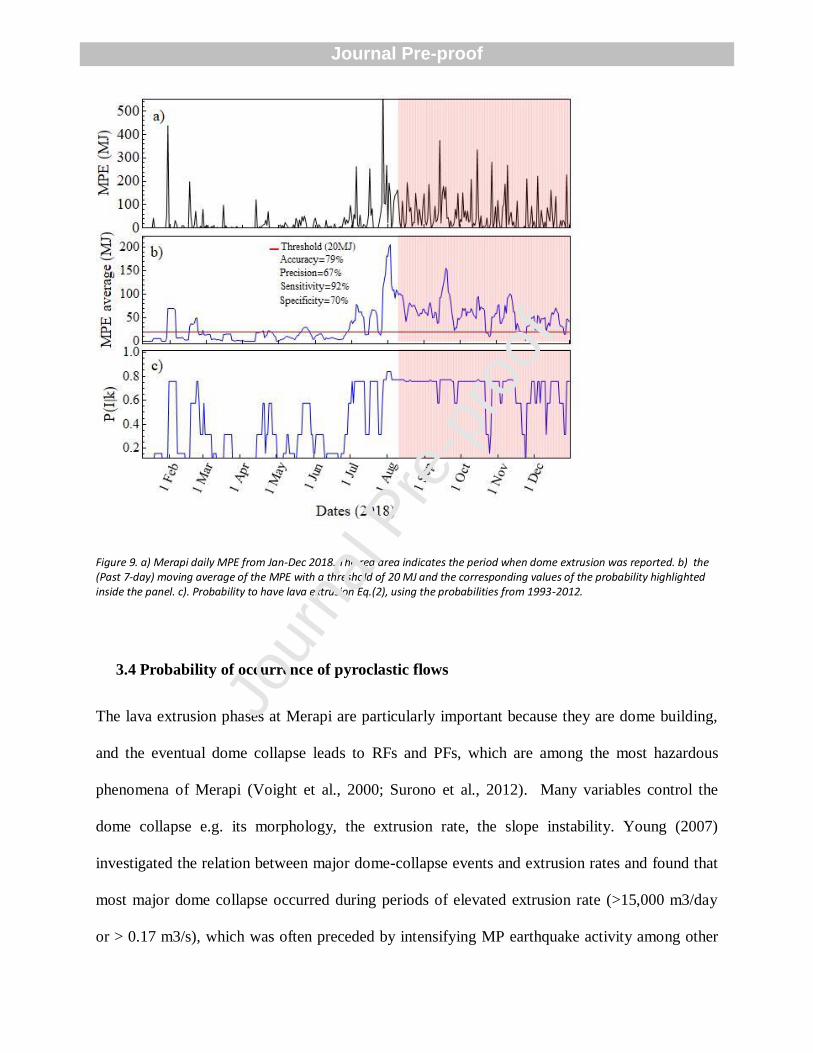
Figure 9. a) Merapi daily MPE from Jan-Dec 2018. The red area indicates the period when dome extrusion was reported. b) the (Past 7-day) moving average of the MPE with a threshold of 20 MJ and the corresponding values of the probability highlighted inside the panel. c). Probability to have lava extrusion Eq.(2), using the probabilities from 1993-2012.
3.4 Probability of occurrence of pyroclastic flows
The lava extrusion phases at Merapi are particularly important because they are dome building,
and the eventual dome collapse leads to RFs and PFs, which are among the most hazardous
phenomena of Merapi (Voight et al., 2000; Surono et al., 2012). Many variables control the
dome collapse e.g. its morphology, the extrusion rate, the slope instability. Young (2007)
investigated the relation between major dome-collapse events and extrusion rates and found that
most major dome collapse occurred during periods of elevated extrusion rate (>15,000 m3/day
or > 0.17 m3/s), which was often preceded by intensifying MP earthquake activity among other
Jour
nal P
re-p
roof
Journal Pre-proof

parameters. Iguchi et al. (2019) found a log-log linear correlation between the cumulative
seismic energy and the PF flow volume.
Fig.10. PF energy time series (in a.u.= arbitrary units) between 4 February 1993 to 31 December 2012 in blue bars. The light-red vertical bands mark the lava extrusion phases, the uncertainties in the dates are shown as vertical dashed red lines.
We also analyzed the PF seismic energy originated by the dome collapses from 1993 to 2012
(Fig. 10). As described in section 2.1, the PF seismic signals have a more impulsive onset of long
duration and large enough amplitudes to be registered at the farthest seismic stations (e.g. Fig.
1b). As expected, we found that there is an increase of PF activity during lava extrusion phases
(Fig.10). Moreover, we found that ~ 86% of the largest (>4 a.u) PFs up to the 2010 event
occurred when MPE > 20MJ, which is consistent with Young’s (2007) findings that PFs occur
more often during periods of dome growth. The PF events that occurred after the onset of the
lava-dome growth in 2010 are a different case, as they released > 100 x energy than all the PFs
of the previous 17 years, although the MPE incorrectly seems low because the seismic signal
from short period instruments (including PUS station) were saturated by LF events (Budi-
Santoso et al., 2013). As noted by Surono et al., (2012) and Pallister et al., (2013), the lava
Jour
nal P
re-p
roof
Journal Pre-proof

extrusion rate during the 2010 eruption was anomalously large ~25-35 m3/s, much larger than the
Merapi average extrusion rate ~0.1 m3/s (Young, 2007).
Fig.11 a) PF energy as a function of the time of occurrence with respect to the last lava extrusion onset. The PF that happened between the onset of 1994 and 1996 is labeled Lava 94, and analogously for the rest. b) Probability Distribution for PF energy for different ranges as a function of the time of occurrence respect to the lava extrusion phase onset.
We also evaluated whether there is a time correlation between the peak occurrences of PFs, and
the lava extrusion phases onset. We found that the most energetic and thus potentially dangerous
PFs occurred within the first months after the lava extrusion phase onset (Fig. 11). The only case
that differs from this pattern is the PF of 1994, when a large PF of ~6𝑥108 𝑎. 𝑢, happened 9
months after the lava extrusion phase onset (Ratdomopurbo & Poupinet, 2000). As noted above,
the 2010 event was different, with explosions starting within days of the lava extrusion phase
(Fig. 12), and thus the processes that lead to the explosion and PFs were very different from
previous ones (Surono et al., 2012; Budi-Santoso et al., 2013 and Cronin et al., 2013).
Jour
nal P
re-p
roof
Journal Pre-proof
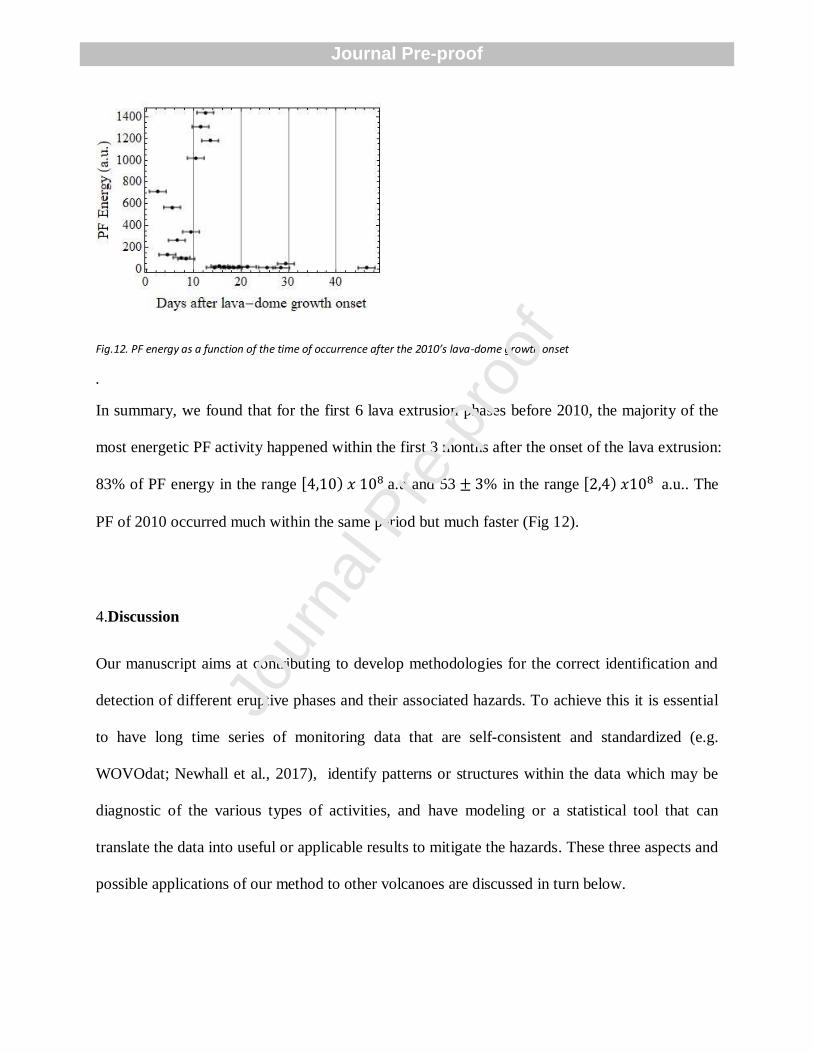
Fig.12. PF energy as a function of the time of occurrence after the 2010’s lava-dome growth onset
.
In summary, we found that for the first 6 lava extrusion phases before 2010, the majority of the
most energetic PF activity happened within the first 3 months after the onset of the lava extrusion:
83% of PF energy in the range [4,10) 𝑥 108 a.u and 53 ± 3% in the range [2,4) 𝑥108 a.u.. The
PF of 2010 occurred much within the same period but much faster (Fig 12).
4.Discussion
Our manuscript aims at contributing to develop methodologies for the correct identification and
detection of different eruptive phases and their associated hazards. To achieve this it is essential
to have long time series of monitoring data that are self-consistent and standardized (e.g.
WOVOdat; Newhall et al., 2017), identify patterns or structures within the data which may be
diagnostic of the various types of activities, and have modeling or a statistical tool that can
translate the data into useful or applicable results to mitigate the hazards. These three aspects and
possible applications of our method to other volcanoes are discussed in turn below.
Jour
nal P
re-p
roof
Journal Pre-proof
4.1 Data standardization and uncertainties
An important aspect to successfully detect an eruptive phase is to have enough data that are
curated and standardized in a manner that can be aggregated for statistical analysis. In our case,
we have 7 lava extrusion phases comprising 3 total accumulated years of extrusive activity over
an observation window of 19 years. During this time, the CVGHM closely monitored Merapi
volcano and developed a systematic method to manually classify the seismic events. However,
due to the active nature of the volcano and the changes in the technology over time, there are
some inconsistencies in the monitoring data and the records of volcanic activity. For example,
during the 2010 eruption, there was a disruption on the monitoring network; the intensified LF
seismic events produced amplitude saturation of the PUS short period instrument (Budi-Santoso
et al., 2013) overshadowing other earthquake types like the MP. Later on 4 November, the PUS
and DEL stations were destroyed and subsequently the seismic activity was registered only using
the PLA station.
Another source of uncertainty in our dataset is the lack of accurate dates when lava extrusion
phases occurred, as most observations were via direct visual inspection of the volcano’s summit
which (due the occurrence of PF currents and explosions) carried major risks. Only recently, the
monitoring network acquired thermal high-resolution visual images and movies in stereoscopic
configurations (Kelfoun et al., 2021). Also, unmanned aerial vehicles (UAV) and satellite remote
sensing analysis using Synthetic Aperture Radar (SAR) was used to detect morphological
changes as well as to quantify lava-dome extrusion rates during the 2006 and 2010 eruptions
(Pallister et al., 2013; Walter et al., 2013; Darmawan et al., 2018).
Jour
nal P
re-p
roof
Journal Pre-proof
We were able to take into account the uncertainty of the chronologies of lava extrusion phases by
using Monte Carlo simulations that randomly select different scenarios for the duration of the
lava extrusion phases and perform a statistical analysis for each case. In contrast to other
stochastic approaches that aim to forecast the sequence of eruptive events or the distribution of
eruptive phases by calculating the probability of transition between different states (Bebbington
& Lai, 1996; Marzocchi & Zaccarelli, 2006; Bebbington, 2008; Bebbington & Jenkins, 2019),
here we focus simply on the calculation of the probabilities to observe lava extrusion phase
(dome formation) as a function of the MPE levels. Notwithstanding the simplified approach we
have used, we still find clear trends linking lava extrusion with the MPE levels and their time
evolution. The identification of these trends (Figs.5,6,7) is possible thanks to the exceptionally
long time series analyzed that allowed us to have 7270 days (1993-2012) of representative
sampling data, highlighting the importance of long-term analysis.
4.2 Ambiguous interpretation of seismic activity
We found that the values of the calculated probabilities reflect a strong correlation between the
MPE levels and lava extrusion phases, however this relation is not reciprocally conditional at
Merapi. For example, there were several periods when dome formation was observed but the
MPE values were null or minimal. In 1994, the onset of the lava extrusion phase was reported in
February but the daily MPE was null until the end of April (Ratdomopurbo & Poupinet, 2000).
Again, at the end of October 2000, a new lava extrusion phase was observed (Table 4 &
supplementary material), but the MPE level was minimal until it increased in early January and
came along with a large PF event. Finally, in 2006 there was a gap between July and mid-
September, when the MPE values were very low although dome formation was reported
Jour
nal P
re-p
roof
Journal Pre-proof
(Ratdomopurbo et al., 2013). In contrast, there were periods between 2001-2006 and 2007-2008
where the MPE activity exceed the 20MJ (and therefore the probability to have lava
extrusion >0.5), but there was no dome formation reported. Moreover, the MP seismic events can
be related to several physical phenomena, such as fractures and faulting in the volcanic conduit
associated with magma ascent, pressurization (Harrington, R. M., & Brodsky, E. E. 2007) or
release of gas and ash between cracks (Neuberg et al., 2006).
Given these observations and those in other volcanic systems, the relation between the effusion
rates and the MP seismicity is likely nonlinear. Low values of MPE or a gap in seismicity during
lava extrusion phases can be attributed to slow extrusion rate (Carr et al. (2016)), or exogenous
dome growth through an open feeder conduit (which can take place during very high extrusion
rate periods), and therefore it can occur without the prevalent brittle failure mechanism (Lamb et
al. (2014)). Perhaps, if the lava extrusion rates can be determined with higher accuracy (Kelfoun
et al. (2021); Pallister et al. (2013); Walter et al. (2013); Darmawan et al. (2018)), it might be
possible to interpolate the relation between the MPE levels and the extrusion rate if these time
series are compared during a long enough period of time.
Notwithstanding these complexities, the high value of the probabilities calculated reflect a strong
correlation between the levels of MPE and lava extrusion phases. In the particular case of the
2018’s lava extrusion phase, the MPE levels indicated an on-going lava extrusion phase 14 days
before it was detected by the visual camera. Similar process can be expected at other volcanoes
but since the volcanic systems may differ, they would need further studies.
4.3 Simplifications and the use of thresholds
Jour
nal P
re-p
roof
Journal Pre-proof
The analysis of monitoring data to calculate probability we report is simpler than other studies,
as it does not use the time sequence of seismicity (Boué et al., 2015, Jaquet et. al., 2006, Bell &
Kilburn, 2013, Carlà et. al. 2016). We also performed a cursory analysis of the time sequence
length and size of MPE before the eruptive phases, but we did not find systematic patterns, and
thus we decided to simplify and use threshold of seismicity which can also be successfully
employed to make decisions at volcano observatories (e.g. Potter et al. 2015). Moreover, we
focus only on lava extrusion phases because they produce hazardous PFs and show an apparently
simple seismic signature, although other important types of eruptive activity also occur at Merapi
(vulcanian explosions, lateral blasts, or phreatic explosions; Young 2007; Surono et al., 2012;
Ratdomopurbo et. al., 2013; Budi-Santoso et al., 2018b; Metaxian et al., 2020).
Despite the simplicity of our analysis, we are able to identify the relevant seismic energy range
that characterizes lava extrusion. This allows to address questions such as what is the probability
that lava is extruding given an observed daily MPE? Moreover, continued analysis of future
eruption data should improve the performance of the method and allow the refinement of the
threshold values that could be used operationally to make decisions to mitigate volcano hazards
impacts (Potter et.al. 2015). We found that the relevant threshold has increased for recent years
(Fig.6), mostly due to the high MPE that marked the inter-eruption period between the end of
2006 and the onset of the 2010 lava dome extrusion that was associated with a higher explosivity
(Surono et al., 2012). The change in the energy threshold may relate to shifts in the volcanic
behavior associated with possible obstruction of the volcanic conduits due to old domes. In fact,
we observed a long period without lava extrusion phases between 2001 and 2006, as well as
between 2006 to 2010, that msy explain this shift in the energy threshold.
Jour
nal P
re-p
roof
Journal Pre-proof

Although the MPE can be used to identify on-going lava extrusion with high precision and
accuracy (Figs.8,9), it has a limited use as a forecasting tool. The MPE of the precursory period
(II) overlaps with both the active period (I) and the non-active period (III), making it difficult to
differentiate one from another using simple energy thresholds. Moreover, the absence of
significant MP seismicity preceding the lava extrusion phases for some years (1994 and 2000)
and the long unrest periods for others (2006), did not allow the identification of a precursory
period with similar duration for all the lava extrusion phases. Finally, the MP earthquakes are
mostly at shallow depths (Budi-Santoso et al., 2013; Ratdomopurbo & Poupinet, 2000), thus,
they appear more often when the lava extrusion is already on-going. Volcanic activity involves
many different types of earthquakes (e.g. Ratdomopurbo & Poupinet, 2000; White &
McCausland, 2016; Arambula-Mendoza et al., 2018), and other monitoring data (Potter et. al.,
2015) that we have not used, and hence our model could be improved by making a
multiparametric analysis that combines probabilities from different monitoring data indicators.
Finally, we also analyzed the relation between the lava extrusion and the PF events and found
that 83% of the dome collapse PFs occurred within the first 3 months of lava extrusion phases.
The MPE thresholds and the time after the start of the lava extrusion phase can be used by
volcano observatories as a guide for the likelihood that dome eruption is occurring at the summit
and thus characterize the possibility of pyroclastic flows to occur.
4.4 Possible applications to other volcanoes
A similar approach to the one we have presented here could be applied to other volcanoes and
quantitatively correlate monitoring data to eruptive phases. This would require the gathering of
Jour
nal P
re-p
roof
Journal Pre-proof
statistically significant data of daily sampling rate for eruptive phases of long duration (e.g. lava
flow, shallow magma intrusion/cryptodome, continuous ash emission) such as the one we have
studied, but events or eruptive phases of shorter duration ( e.g. explosion, ash venting), would
require higher sampling rate data.
Example of volcanoes with intermittent long-duration eruption phases, such as those that grow
viscous domes, are Redoubt (Miller, 1994), Soufrière Hills (Miller et al., 1998; Lamb et al.,
2014), Unzen (Nakada et al., 1999; Shi et al., 2018), St. Helens (Salzer et al., 2016), Santiaguito
(Anderson et al., 1995), Sinabung (Gunawan et al., 2019) and Volcán de Colima (Robin et al.,
1991; Lamb et al., 2014; Arámbula-Mendoza et al., 2018). This methodology could be applied to
other eruptive phase types besides lava extrusion, such as intermittent ash emission like at
Popocatepetl (Alvarez-Ramirez et al. (2009)), and stalled magmatic intrusion or failed eruption
(Moran and Roman, 2011) such as at Soufriere Guadeloupe (Feuillard et al., 1983), Akutan (Lu
et al., 2000), Iliamna (Roman et al., 2004; Roman and Power, 2011), Iwate (Nishimura and Ueki,
2011), Paricutin (Gardine and Cox, 2011) and Kilauea (Bell and Kilburn, 2013).
Our approach could be useful especially for volcanoes where direct observation and field
mapping are not possible due to the level of hazard or are difficult to observe (e.g. inner crater
lava flows), such as at Shinmoe-dake (Kato and Yamasato, 2013); Agung (Syahbana et al., 2019);
and Ruang (Kaneko et al., 2019). To detect short-duration eruptive phase or events (e.g.
explosion, ash venting Cole et al., 2014) would require a higher sampling rate data, e.g. acoustic
infrasound, realtime seismic amplitude measurement (RSAM) and displacement seismic
amplitude ratio (DSAR).This general method and the processed data we have used are available
in WOVOdat (https://dome.wovodat.org/probability/).
Jour
nal P
re-p
roof
Journal Pre-proof
5. Conclusions
We have developed a simple but general probabilistic approach to correlate monitoring time
series with a specific volcanic activity (eruption phase) accounting for uncertainties in the
historical records with Monte Carlo simulations. We used the daily values of MPE seismicity
from 4 February 1993 to 31 December 2012, to characterize lava extrusion phases that lead to
dome formation at Merapi. We calculated the conditional probability that lava extrusion was
occurring as a function of the daily MPE, and found an MPE threshold that indicates lava
extrusion with a 90% accuracy. We also characterized the PF activity and found that, the most
energetic PFs occurred during high lava extrusion and that 83% happened within the first 3
months of lava extrusion. The methodology that we have used could be implemented at volcano
observatories to compare a given episode of unrest with the historical data. Our method allows
for more quantitative assessment of hazards during volcanic crises and thus may help to mitigate
the impacts of volcanic activity.
Acknowledgements
This research was supported by the Earth Observatory of Singapore (grant number
04MNS001816A620OOE01 - WOVOdat) via its funding from the National Research
Foundation Singapore and the Singapore Ministry of Education under the Research Centres of
Excellence initiative. This work comprises EOS contribution number 427.
We would like to thank Center for Volcanology and Geological Hazard Mitigation
(CVGHM). This work is being part of our on-going NTU – Geological Agency of Indonesia
collaboration under MoU in “Cooperation in Geosciences” and the arrangement between EOS –
Jour
nal P
re-p
roof
Journal Pre-proof

CVGHM in “Assessment and Mitigation of Geological Hazards”. Kasbani, Hanik Humaida,
Hendra Gunawan, I.G.M. Nandaka from CVGHM are thanked for their support. We also would
like to thank Mr. Nguyen Tien Nhan and Mr. Nguyen To Vinh Huy for their help in the
development of the WOVOdat analytics tool interface. The authors wish to acknowledge of
many other colleagues at BPPTKG-CVGHM for their contribution in various ways. We would
also like to thank the reviewers for their insightful reviews.
Appendix A
The seismic data used for our calculations can be found online at:
https://wovodat.org/about/MerapiAnalyticPaper2022.php
References
Aisyah, N., Iguchi, M., Subandriyo, Budisantoso, A., Hotta, K., Sumarti, S., 2018. Combination of a
pressure source and block movement for ground deformation analysis at merapi volcano prior to the
eruptions in 2006 and 2010. Journal of Volcanology and Geothermal Research 357, 239–253.
doi:https://doi.org/10.1016/j.jvolgeores.2018.05.001
Alvarez-Ramirez, J., Sosa, E., & Rodriguez, E. (2009). Assessing temporal-dependent correlations in the
2000–2008 Popocatepetl exhalation sequence by using detrended fluctuation analysis. Journal of
Volcanology and Geothermal Research, 186(3–4), 426–431.
https://doi.org/10.1016/j.jvolgeores.2009.05.022
Anderson, S.W., Fink, J.H., Rose, W.I., 1995. Mount St. Helens and Santiaguito lava domes: The effect
of short-termeruption rate on surface texture and degassing processes. Journal of Volcanology and
Geothermal Research 69, 105 – 116. doi:https://doi.org/10.1016/0377-0273(95) 00022-4.
Arámbula-Mendoza, R., Reyes-Dávila, G., Vargas-Bracamontes Dulce, M., González-Amezcua, M.,
Navarro-Ochoa, C., Martínez-Fierros, A., Ramírez-Vázquez, A., 2018. Seismic monitoring of
effusive-explosive activity and large lava dome collapses during 2013–2015 at Volcán de Colima,
Mexico. Journal of Volcanology and Geothermal Research 351, 75 – 88.
doi:https://doi.org/10.1016/j.jvolgeores.2017.12.017.
Arnold, D.W.D., Biggs, J., Anderson, K., Vallejo Vargas, S., Wadge, G., Ebmeier, S.K., Naranjo, M.F.,
Mothes, P., 2017. Decaying Lava Extrusion Rate at El Reventador Volcano, Ecuador, Measured
Using High- Resolution Satellite Radar. Journal of Geophysical Research: Solid Earth 122, 9966–
9988. doi:https://doi.org/10.1002/2017JB014580.
Beauducel, F., Agung Nandaka, M., Cornet, F., Diament, M., 2006. Mechanical discontinuities
monitoring at Merapi volcano using kinematic GPS. Journal of Volcanology and Geothermal
Jour
nal P
re-p
roof
Journal Pre-proof
Research 150, 300–312. doi:https://doi.org/10.1016/j.jvolgeores.2005.07.005.
Beauducel, F., Cornet, F.-H., Suhanto, E., Duquesnoy, T., & Kasser, M. (2000). Constraints on magma
flux from displacements data at Merapi volcano, Java, Indonesia. Journal of Geophysical Research:
Solid Earth, 105(B4), 8193–8203. https://doi.org/10.1029/1999JB900368
Bebbington, M. (2008). Incorporating the eruptive history in a stochastic model for volcanic eruptions.
Journal of Volcanology and Geothermal Research, 175(3), 325–333.
https://doi.org/10.1016/j.jvolgeores.2008.03.013
Bebbington, M. S., & Lai, C. D. (1996). Statistical analysis of New Zealand volcanic occurrence data.
Journal of Volcanology and Geothermal Research. https://doi.org/10.1016/S0377-0273(96)00050-9
Bebbington, Mark S., & Jenkins, S. F. (2019). Intra-eruption forecasting. Bulletin of Volcanology, 81(6),
34. https://doi.org/10.1007/s00445-019-1294-9
Bell, A. F., & Kilburn, C. R. J. (2013). Trends in the aggregated rate of pre-eruptive volcano-tectonic
seismicity at Kilauea volcano, Hawaii. Bulletin of Volcanology, 75(1), 677.
https://doi.org/10.1007/s00445-012-0677-y
Boué, A., Lesage, P., Cortés, G., Valette, B., & Reyes-Dávila, G. (2015). Real-time eruption forecasting
using the material Failure Forecast Method with a Bayesian approach. Journal of Geophysical
Research: Solid Earth, 120(4), 2143–2161. https://doi.org/10.1002/2014JB011637
Brodscholl, A., Kirbani, S., Voight, B., 2000. Sequential dome-collapse nuées ardentes analyzed from
broadband seismic data, Merapi Volcano, Indonesia. Journal of Volcanology and Geothermal
Research 100, 363– 369. doi:https://doi.org/10.1016/S0377-0273(00)00145-1.
Budi-Santoso, Agus; Subandriyo; Humaida, Hanik; Sunarto; Suparwoko, H. . M. Y. B. S., & Amto.
(2008). Perkembangan dan Morfologi Kubah Lava Merapi (2006) Berdasarkan Data Analisis Visual.
Laporan BPPTKG, CVGHM, Geological Agency, 55–78.
Budi-Santoso, A., Lesage, P., Dwiyono, S., Sumarti, S., Subandriyo, Surono, Jousset, P., & Metaxian, J.-
P. (2013). Analysis of the seismic activity associated with the 2010 eruption of Merapi Volcano,
Java. Journal of Volcanology and Geothermal Research, 261, 153–170.
https://doi.org/https://doi.org/10.1016/j.jvolgeores.2013.03.024
Budi-Santoso, A., Rudianto, I., Widyolaksono, R., Sulistiyani, Fajiculay, E., Win, N., Widiwijayanti, C.,
Costa, F., 2018b. Fuzzy inference system for merapi alert level decision making, in: Abstract
volume of the international meeting Cities on Volcanoes (CoV) 10, Miscellanea INGV No. 43.
ISSN 2039-6651, p. 64.
Bull, K.F., Buurman, H., 2013. An overview of the 2009 eruption of Redoubt Volcano, Alaska. Journal of
Volcanology and Geothermal Research 259, 2–15. doi:https://doi.org/10.1016/j.jvolgeores.2012.
06.024. the 2009 Eruption of Redoubt Volcano, Alaska.
Calder, E. S., Luckett, R., Sparks, R. S. J., & Voight, B. (2002). Mechanisms of lava dome instability and
generation of rockfalls and pyroclastic flows at Soufrière Hills Volcano, Montserrat. Geological
Society, London, Memoirs, 21(1), 173–190. https://doi.org/10.1144/GSL.MEM.2002.021.01.08
Calder, Eliza S., Lavallée, Y., Kendrick, J. E., & Bernstein, M. (2015). Lava Dome Eruptions. In The
Encyclopedia of Volcanoes (pp. 343–362). Elsevier. https://doi.org/10.1016/B978-0-12-385938-
9.00018-3
Carlà, T., Intrieri, E., Di Traglia, F., & Casagli, N. (2016). A statistical-based approach for determining
the intensity of unrest phases at Stromboli volcano (Southern Italy) using one-step-ahead forecasts
of displacement time series. Natural Hazards, 84(1), 669–683. https://doi.org/10.1007/s11069-016-
2451-5
Jour
nal P
re-p
roof
Journal Pre-proof
Carn, S. ., Watts, R. ., Thompson, G., & Norton, G. . (2004). Anatomy of a lava dome collapse: the 20
March 2000 event at Soufrière Hills Volcano, Montserrat. Journal of Volcanology and Geothermal
Research, 131(3–4), 241–264. https://doi.org/10.1016/S0377-0273(03)00364-0
Carr, B. B., Clarke, A. B., & Vanderkluysen, L. (2016). The 2006 lava dome eruption of Merapi Volcano
(Indonesia): Detailed analysis using MODIS TIR. Journal of Volcanology and Geothermal
Research, 311, 60–71. https://doi.org/https://doi.org/10.1016/j.jvolgeores.2015.12.004
Cashman, K.V., Sparks, R.S.J., 2013. How volcanoes work: A 25 year perspective. GSA Bulletin 125,
664–690. doi:10.1130/B30720.1.
Cole, P.D., Smith, P.,Komorowski, J.C., Alfano, F., Bonadonna, C., Stinton, A., Christopher, T., Odbert,
H.M., Loughlin, S., 2014. Ash venting occurring both prior to and during lava extrusion at Soufrière
Hills Volcano, Montserrat, from 2005 to 2010, in: The Eruption of Soufrière Hills Volcano,
Montserrat from 2000 to 2010. Geological Society of London. doi:10.1144/M39.4.
Coppola, D., Laiolo, M., Cigolini, C., Donne, D.D., Ripepe, M., 2016. Enhanced volcanic hot-spot
detection using MODIS IR data: results from the MIROVA system, in: Detecting, Modelling and
Responding to Effusive Eruptions. Geological Society of London. doi:10.1144/SP426.5.
Costa, F., Widiwijayanti, C., Nang, T. Z. W., Fajiculay, E., Espinosa-Ortega, T., & Newhall, C. (2019).
WOVOdat – the global volcano unrest database aimed at improving eruption forecasts. Disaster
Prevention and Management: An International Journal, 28(6), 738–751.
https://doi.org/10.1108/DPM-09-2019-0301
Cronin, S. J., Lube, G., Dayudi, D. S., Sumarti, S., Subrandiyo, S., & Surono. (2013). Insights into the
October–November 2010 Gunung Merapi eruption (Central Java, Indonesia) from the stratigraphy,
volume and characteristics of its pyroclastic deposits. Journal of Volcanology and Geothermal
Research, 261, 244–259. https://doi.org/https://doi.org/10.1016/j.jvolgeores.2013.01.005
Darmawan, H.,Walter, T.R., Brotopuspito, K.S., Subandriyo, I Gusti Made Agung Nandaka, 2018.
Morphological and structural changes at the Merapi lava dome monitored in 2012–15 using
unmanned aerial vehicles (UAVs). Journal of Volcanology and Geothermal Research 349, 256– 267.
doi:https://doi.org/10.1016/j.jvolgeores.2017.11.006.
De Angelis, S., Bass, V., Hards, V., & Ryan, G. (2007). Seismic characterization of pyroclastic flow
activity at Soufrière Hills Volcano, Montserrat, 8 January 2007. Natural Hazards and Earth System
Sciences, 7(4), 467–472. https://doi.org/10.5194/nhess-7-467-2007
Fawcett, T., 2006. An Introduction to ROC Analysis. Pattern Recogn. Lett. 27, 861–874.
doi:10.1016/j.patrec.2005.10.010.
Feuillard, M., Allegre, C., Brandeis, G., Gaulon, R., Le Mouel, J., Mercier, J., Pozzi, J., Semet, M., 1983.
The 1975–1977 crisis of la Soufriere de Guadeloupe (F.W.I): A still-born magmatic eruption.
Journal of Volcanology and Geothermal Research 16, 317–334. doi:https://doi. org/10.1016/0377-
0273(83)90036-7.
Flower, V.J., Carn, S.A., 2015. Characterising volcanic cycles at Soufriere Hills Volcano, Montserrat:
Time series analysis of multi-parameter satellite data. Journal of Volcanology and Geothermal
Research 304, 82–93. doi:https://doi.org/10.1016/j.jvolgeores.2015.07.035.
Gardine, M., W.M., Cox, T., 2011. Dike emplacement near Parícutin volcano, Mexico in 2006. Bull
Volcanol 73, 123–132. doi:https: //doi.org/10.1007/s00445-010-0437-9.Gardner, C. A., & White, R.
A. (2002). Seismicity, gas emission and deformation from 18 July to 25 September 1995 during the
initial phreatic phase of the eruption of Soufrière Hills Volcano, Montserrat. Geological Society,
Jour
nal P
re-p
roof
Journal Pre-proof
London, Memoirs, 21(1), 567–581. https://doi.org/10.1144/GSL.MEM.2002.021.01.26
Gardner, C.A., White, R.A., 2002. Seismicity, gas emission and deformation from 18 July to 25
September 1995 during the initial phreatic phase of the eruption of Soufrière Hills Volcano,
Montserrat. Geological Society, London, Memoirs 21, 567–581. doi:10.1144/GSL.MEM.2002.021.
01.26.
Gerstenecker, C., Läufer, G., Steineck, D., Tiede, C., Wrobel, B., 2005. Validation of Digital Elevation
Models around Merapi Volcano, Java, Indonesia. Natural Hazards and Earth System Sciences 5,
863–876. doi:10.5194/nhess-5-863-2005.
Global Volcanism Program, 2013. Merapi (263250) in Volcanoes of the World, v. 4.10.3 (15 Oct 2021).
doi:https://doi.org/10.5479/si.GVP. VOTW4-2013.
Gottsmann, J., Neuberg, J., & Scheu, B. (2019). Volcanic Unrest. In J. Gottsmann, J. Neuberg, & B.
Scheu (Eds.), Advances in Volcanology. Springer International Publishing.
https://doi.org/10.1007/978-3-319-58412-6
Gunawan, H., Surono, Budianto, A., Kristianto, Prambada, O., McCausland, W., Pallister, J., Iguchi, M.,
2019. Overview of the eruptions of sinabung volcano, 2010 and 2013–present and details of the
2013 phreatomagmatic phase. Journal of Volcanology and Geothermal Research 382, 103–119.
doi:https://doi.org/10.1016/j.jvolgeores.2017. 08.005.
Gutenberg, B., & Richter, C. F. (1956). Earthquake magnitude, intensity, energy, and acceleration:
(Second paper). Bulletin of the Seismological Society of America.
Hale, A. J. (2008). Lava dome growth and evolution with an independently deformable talus. Geophysical
Journal International, 174(1), 391–417. https://doi.org/10.1111/j.1365-246X.2008.03806.x
Harrington, R. M., & Brodsky, E. E. (2007). Volcanic hybrid earthquakes that are brittle-failure events.
Geophysical Research Letters, 34(6), L06308. https://doi.org/10.1029/2006GL028714
Heap, M. J., Troll, V. R., Kushnir, A. R. L., Gilg, H. A., Collinson, A. S. D., Deegan, F. M., Darmawan,
H., Seraphine, N., Neuberg, J., & Walter, T. R. (2019). Hydrothermal alteration of andesitic lava
domes can lead to explosive volcanic behaviour. Nature Communications, 10(1), 5063.
https://doi.org/10.1038/s41467-019-13102-8
Hidayat, D., Chouet, B. A., Voight, B., Dawson, P. B., & Ratdomopurbo, A. (2002). Source mechanism
of very-long-period signals accompanying dome growth activity at Merapi Volcano, Indonesia.
Geophysical Research Letters, 29(23).
http://www.geoscienceworld.org/cgi/georef/georef;2004017756
Hoblitt, R.R., Wolfe, E.W., Scott, W.E., Couchman, M.R., Pallister, J.S., Javier, D., 1996. The
preclimactic eruptions of Mount Pinatubo, June 1991. Fire and mud: eruptions and lahars of Mount
Pinatubo, Philippines. doi:https://pubs.usgs.gov/pinatubo/.
Iguchi, M., Nakamichi, H., Miyamoto, K., Shimomura, M., Nandaka, I. G. M. A., Budi-Santoso, A.,
Sulistiyani, & Aisyah, N. (2019). Forecast of the Pyroclastic Volume by Precursory Seismicity of
Merapi Volcano. Journal of Disaster Research, 14(1), 51–60.
https://doi.org/10.20965/jdr.2019.p0051
Jaquet, O., Carniel, R., Sparks, S., Thompson, G., Namar, R., & Di, M. (2006). DEVIN : A forecasting
approach using stochastic methods applied to the Soufrie ` re Hills Volcano. 153, 97–111.
https://doi.org/10.1016/j.jvolgeores.2005.08.013
Johnson, J., Lees, J., Gerst, A., Sahagian, D., Varley, N., 2008. Longperiod earthquakes and co-eruptive
dome inflation seen with particle image velocimetry. Nature 456, 377–381.
doi:https://doi.org/10.1038/ nature07429.
Jour
nal P
re-p
roof
Journal Pre-proof
Jousset, P., Budi-Santoso, A., Jolly, A.D., Boichu, M., Surono, Dwiyono, S., Sumarti, S., Hidayati, S.,
Thierry, P., 2013. Signs of magma ascent in lp and vlp seismic events and link to degassing: An
example from the 2010 explosive eruption at merapi volcano, indonesia. Journal of Volcanology and
Geothermal Research 261, 171–192. doi:https: //doi.org/10.1016/j.jvolgeores.2013.03.014.
Kaneko, T., Maeno, F., Yasuda, A., 2019. Observation of the eruption sequence and formation process of
a temporary lava lake during the June–August 2015 Mt. Raung eruption, Indonesia, using high-
resolution and high-frequency satellite image datasets. Journal of Volcanology and Geothermal
Research 377, 17–32. doi:https://doi.org/10.1016/j. jvolgeores.2019.03.016.
Kato, K., Yamasato, H., 2013. The 2011 eruptive activity of Shinmoedake volcano, Kirishimayama,
Kyushu, Japan—Overview of activity and Volcanic Alert Level of the Japan Meteorological Agency.
Earth Planet 65, 2. doi:https://doi.org/10.5047/eps.2013.05.009.
Kelfoun, K., Santoso, A.B., Latchimy, T., Bontemps, M., Nurdien, I., Beauducel, F., Fahmi, A., Putra, R.,
Dahamna, N., Laurin, A., Rizal M.H., Sukmana, J.T., Gueugneau, V., 2021. Growth and collapse of
the 2018–2019 lava dome of Merapi volcano. Bulletin of Volcanology 83, 8.
doi:https://doi.org/10.1007/s00445-020-01428-x.Lahr, J. C., Chouet, B. A., Stephens, C. D., Power,
J. A., & Page, R. A. (1994). Earthquake classification, location, and error analysis in a volcanic
environment: implications for the magmatic system of the 1989–1990 eruptions at redoubt volcano,
Alaska. Journal of Volcanology and Geothermal Research, 62(1–4), 137–151.
https://doi.org/10.1016/0377-0273(94)90031-0
Lahr, J., Chouet, B., Stephens, C., Power, J., Page, R., 1994. Earthquake classification, location, and error
analysis in a volcanic environment: implications for the magmatic system of the 1989–1990
eruptions at redoubt volcano, Alaska. Journal of Volcanology and Geothermal Research 62, 137 –
151. doi:https://doi.org/10.1016/0377-0273(94) 90031-0. the 1989-1990 Eruptions of Redoubt
Volcano, Alaska.
Lamb, O.D., De Angelis, S., Umakoshi, K., Hornby, A.J., Kendrick, J.E., Lavallée, Y., 2015. Repetitive
fracturing during spine extrusion at Unzen volcano, Japan. Solid Earth 6, 1277–1293.
doi:10.5194/se-6-1277-2015.
Lamb, O.D., Varley, N.R., Mather, T.A., Pyle, D.M., Smith, P.J., Liu, E.J., 2014. Multiple timescales of
cyclical behaviour observed at two domeforming eruptions. Journal of Volcanology and Geothermal
Research 284, 106–121. doi:https://doi.org/10.1016/j.jvolgeores.2014.07.013.
Loughlin, S.C., Sparks, S., Brown, S.K., Jenkins, S.F., Vye-Brown, C., 2015. Global Volcanic Hazards
and Risk. Cambridge University Press. doi:10.1017/CBO9781316276273.
Lowenstern, 2016. Abstract volume for the 2016 biennial meeting of the Yellowstone Volcano
Observatory: U.S. Geological Survey Open-File Report 2016–1104.
doi:http://www.dx.doi.org/10.3133/ofr20161104.
Lu, Z., Wicks Jr., C., Power, J.A., Dzurisin, D., 2000. Ground deformation associated with the March
1996 earthquake swarm at Akutan volcano, Alaska, revealed by satellite radar interferometry.
Journal of Geophysical Research: Solid Earth 105, 21483–21495. doi:https://doi.org/10.
1029/2000JB900200.
Luckett, R., Baptie, B., Neuberg, J., 2002. The relationship between degassing and rockfall signals at
soufrière hills volcano, montserrat. Geological Society, London, Memoirs 21, 595–602.
doi:10.1144/GSL. MEM.2002.021.01.28.
Luckett, R., Loughlin, S., De Angelis, S., Ryan, G., 2008. Volcanic seismicity at montserrat, a
comparison between the 2005 dome growth episode and earlier dome growth. Journal of
Jour
nal P
re-p
roof
Journal Pre-proof

Volcanology and Geothermal Research 177, 894–902. doi:https://doi.org/10.1016/j.jvolgeores.
2008.07.006. volcanic Flows and Falls.
Marzocchi, W., & Zaccarelli, L. (2006). A quantitative model for the time-size distribution of eruptions.
Journal of Geophysical Research, 111(B4), B04204. https://doi.org/10.1029/2005JB003709
McCausland, W. A., Gunawan, H., White, R. A., Indrastuti, N., Patria, C., Suparman, Y., Putra, A.,
Triastuty, H., & Hendrasto, M. (2019). Using a process-based model of pre-eruptive seismic patterns
to forecast evolving eruptive styles at Sinabung Volcano, Indonesia. Journal of Volcanology and
Geothermal Research, 382, 253–266. https://doi.org/10.1016/j.jvolgeores.2017.04.004
McNutt, S. R. (2005). VOLCANIC SEISMOLOGY. Annual Review of Earth and Planetary Sciences,
33(1), 461–491. https://doi.org/10.1146/annurev.earth.33.092203.122459
McNutt, S.R., Roman, D.C., 2015. The Encyclopedia of Volcanoes (Second Edition). Second edition ed.,
Academic Press, Amsterdam. doi:https: //doi.org/10.1016/B978-0-12-385938-9.00059-6.
Melnik, O., & Sparks, R. S. J. (1999). Nonlinear dynamics of lava dome extrusion. 37–41.
Miller, A. D., Stewart, R. C., White, R. A., Luckett, R., Baptie, B. J., Aspinall, W. P., Latchman, J. L.,
Lynch, L. L., & Voight, B. (1998). Seismicity associated with dome growth and collapse at the
Soufriere Hills Volcano , Montserrat. 25(18), 3401–3404.
Miller, T.P., 1994. Dome growth and destruction during the 1989–1990 eruption of redoubt volcano.
Journal of Volcanology and Geothermal Research 62, 197 – 212. doi:https://doi.org/10.1016/0377-
0273(94) 90034-5.
Minakami, T. (1960). Fundamental research for predicting volcanic eruptions (Part I), Earthquakes and
crustal deformation originating from volcanic activity. Bulletin of the Earthquake Research Institute,
University of Tokyo, 38, 497–544.
Métaxian, J.P., Santoso, A.B., Caudron, C., Cholik, N., Labonne, C., Poiata, N., Beauducel, F., Monteiller,
V., Fahmi, A.A., Rizal, M.H., Nandaka, I.M.A., 2020. Migration of seismic activity associated with
phreatic eruption at Merapi volcano, Indonesia. Journal of Volcanology and Geothermal Research
396, 106795. doi:https://doi.org/10.1016/j. jvolgeores.2020.106795.Nakada, S., Shimizu, H., Ohta,
K., 1999. Overview of the 1990–1995 eruption at Unzen Volcano. Journal of Volcanology and
Geothermal Research 89, 1–22. doi:https://doi.org/10.1016/S0377-0273(98)00118-8.
Nandaka, I. G. M. A., Sulistiyani, Suharna, Y., & Putra, R. (2019). Overview of Merapi Volcanic
Activities from Monitoring Data 1992–2011 Periods. Journal of Disaster Research, 14(1), 18–26.
https://doi.org/10.20965/jdr.2019.p0018
Neuberg, J. (2000). Characteristics and causes of shallow seismicity in andesite volcanoes. Philosophical
Transactions of the Royal Society of London. Series A: Mathematical, Physical and Engineering
Sciences, 358(1770), 1533–1546. https://doi.org/10.1098/rsta.2000.0602
Neuberg, J., Baptie, B., Luckett, R., & Stewart, R. (1998). Results from the Broadband Seismic Network
on Montserrat. Geophysical Research Letters, 25(19), 3661–3664.
https://doi.org/10.1029/98GL01441
Neuberg, J., Tuffen, H., Collier, L., Green, D., Powell, T., Dingwell, D., 2006. The trigger mechanism of
low-frequency earthquakes on Montserrat. Journal of Volcanology and Geothermal Research 153,
37– 50. doi:https://doi.org/10.1016/j.jvolgeores.2005.08.008.
Newhall, C. G., Bronto, S., Alloway, B., Banks, N. G., Bahar, I., del Marmol, M. A., Hadisantono, R. D.,
Holcomb, R. T., McGeehin, J., Miksic, J. N., Rubin, M., Sayudi, S. D., Sukhyar, R., Andreastuti, S.,
Tilling, R. I., Torley, R., Trimble, D., & Wirakusumah, A. D. (2000). 10,000Years of explosive
eruptions of Merapi Volcano, Central Java: archaeological and modern implications. Journal of
Jour
nal P
re-p
roof
Journal Pre-proof
Volcanology and Geothermal Research, 100(1–4), 9–50. https://doi.org/10.1016/S0377-
0273(00)00132-3
Newhall, C., Bronto, S., Alloway, B., Banks, N., Bahar, I., del Marmol, M., Hadisantono, R., Holcomb,
R., McGeehin, J., Miksic, J., Rubin, M., Sayudi, S., Sukhyar, R., Andreastuti, S., Tilling, R., Torley,
R., Trimble, D., Wirakusumah, A., 2000. 10,000Years of explosive eruptions of Merapi Volcano,
Central Java: archaeological and modern implications. Journal ofVolcanology and Geothermal
Research 100, 9 – 50. doi:https: //doi.org/10.1016/S0377-0273(00)00132-3.
Newhall, C., Costa, F., Ratdomopurbo, A., Venezky, D., Widiwijayanti, C., Win, N.T.Z., Tan, K.,
Fajiculay, E., 2017. WOVOdat – An online, growing library of worldwide volcanic unrest. Journal
of Volcanology and Geothermal Research 345, 184 – 199. doi:https://doi.org/10.1016/
j.jvolgeores.2017.08.003.
Newhall, C. G., & Dzurisin, D. (1988). Historical unrest at large calderas of the world. In US Geological
Survey Bulletin. US Geological Survey. https://pubs.usgs.gov/bul/1855/
Newhall, C. G., & Melson, W. G. (1983). Explosive activity associated with the growth of volcanic
domes. Journal of Volcanology and Geothermal Research, 17(1), 111–131.
https://doi.org/https://doi.org/10.1016/0377-0273(83)90064-1
Newhall, C., & Hoblitt, R. (2002). Constructing event trees for volcanic crises. Bulletin of Volcanology,
64(1), 3–20. https://doi.org/10.1007/s004450100173
Nishimura, T., Ueki, S., 2011. Seismicity and magma supply rate of the 1998 failed eruption at Iwate
volcano, Japan. Bull Volcanol 73, 133– 142. doi:https://doi.org/10.1007/s00445-010-0438-8.Ogburn,
S. E., Loughlin, S. C., & Calder, E. S. (2015). The association of lava dome growth with major
explosive activity (VEI ≥ 4): DomeHaz, a global dataset. Bulletin of Volcanology, 77(5), 40.
https://doi.org/10.1007/s00445-015-0919-x
Ogburn, S.E., Loughlin, S.C., S., C.E., 2015. The association of lava dome growth with major explosive
activity (VEI ≥ 4): DomeHaz, a global dataset. Bulletin of Volcanology 77.
doi:https://doi.org/10.1007/ s00445-015-0919-x.
Pallister, J. S., Schneider, D. J., Griswold, J. P., Keeler, R. H., Burton, W. C., Noyles, C., Newhall, C. G.,
& Ratdomopurbo, A. (2013). Merapi 2010 eruption—Chronology and extrusion rates monitored
with satellite radar and used in eruption forecasting. Journal of Volcanology and Geothermal
Research, 261, 144–152. https://doi.org/https://doi.org/10.1016/j.jvolgeores.2012.07.012
Pesicek, J. D., Ogburn, S. E., & Prejean, S. G. (2021). Indicators of volcanic eruptions revealed by global
M4+ earthquakes. Journal of Geophysical Research: Solid Earth, 126, e2020JB021294.
https://doi.org/10.1029/2020JB021294
Potter, S. H., Scott, B. J., Jolly, G. E., Neall, V. E., & Johnston, D. M. (2015). Introducing the Volcanic
Unrest Index (VUI): a tool to quantify and communicate the intensity of volcanic unrest. Bulletin of
Volcanology, 77(9), 77. https://doi.org/10.1007/s00445-015-0957-4
Power, J. A., Lahr, J. C., Page, R. A., Chouet, B. A., Stephens, C. D., Harlow, D. H., Murray, T. L., &
Davies, J. N. (1994). Seismic evolution of the 1989–1990 eruption sequence of Redoubt Volcano,
Alaska. Journal of Volcanology and Geothermal Research, 62(1–4), 69–94.
https://doi.org/10.1016/0377-0273(94)90029-9
Ratdomopurbo, A, & Poupinet, G. (2000). An overview of the seismicity of Merapi Volcano (Java,
Indonesia); 1983-1994. Journal of Volcanology and Geothermal Research, 100(1–4), 193–214.
http://www.geoscienceworld.org/cgi/georef/georef;2000057503
Jour
nal P
re-p
roof
Journal Pre-proof
Ratdomopurbo, Antonius, Beauducel, F., Subandriyo, J., Nandaka, I. G. M. A., Newhall, C. G., Suharna,
Sayudi, D. S., Suparwaka, H., & Sunarta. (2013). Overview of the 2006 eruption of Mt. Merapi.
Journal of Volcanology and Geothermal Research, 261, 87–97.
https://doi.org/https://doi.org/10.1016/j.jvolgeores.2013.03.019
Reath, K., Pritchard, M., Poland, M., Delgado, F., Carn, S., Coppola, D., Andrews, B., Ebmeier, S.K.,
Rumpf, E., Henderson, S., Baker, S., Lundgren, P., Wright, R., Biggs, J., Lopez, T., Wauthier, C.,
Moruzzi, S., Alcott, A., Wessels, R., Griswold, J., Ogburn, S., Loughlin, S., Meyer, F., Vaughan, G.,
Bagnardi, M., 2019. Thermal, Deformation, and Degassing Remote Sensing Time Series (CE 2000–
2017) at the 47 most Active Volcanoes in Latin America: Implications for Volcanic Systems.
Journal of Geophysical Research: Solid Earth 124, 195–218.
doi:https://doi.org/10.1029/2018JB016199.
Robin, C., Camus, G., Gourgaud, A., 1991. Eruptive and magmatic cycles at Fuego de Colima volcano
(Mexico). Journal of Volcanology and Geothermal Research 45, 209 – 225.
Roman, D., Neuberg, J., Luckett, R., 2006. Assessing the likelihood of volcanic eruption through analysis
of volcanotectonic earthquake fault–plane solutions. Earth and Planetary Science Letters 248, 244–
252. doi:https://doi.org/10.1016/j.epsl.2006.05.029.
Roman, D., Power, J., 2011. Mechanism of the 1996–97 noneruptive volcano-tectonic earthquake swarm
at Iliamna Volcano, Alaska. Bull Volcanol 73, 143–153. doi:https://doi.org/10.1007/ s00445-010-
0439-7.
Roman, D.C., Power, J.A., Moran, S.C., Cashman, K.V., Doukas, M.P., Neal, C.A., Gerlach, T.M., 2004.
Evidence for dike emplacement beneath Iliamna Volcano, Alaska in 1996. Journal of Volcanology
and Geothermal Research 130, 265–284. doi:https://doi.org/10.1016/ S0377-0273(03)00302-0.
Salzer, J.T., Thelen,W.A., James, M.R.,Walter, T.R., Moran, S., Denlinger, R., 2016. Volcano dome
dynamics at Mount St. Helens: Deformation and intermittent subsidence monitored by seismicity
and camera imagery pixel offsets. Journal of Geophysical Research: Solid Earth 121, 7882–7902.
doi:https://doi.org/10.1002/2016JB013045.
Santoso, A.B., Subandriyo, Humaida, H., Sunarto, Suparwoko, H., Miswanto, Yulianto, Badrijas,
Suramto, 2008. Perkembangan dan Morfologi Kubah Lava Merapi. Berdasarkan Data Analisis
Visual , 55–78.
Segall, P., 2013. Volcano deformation and eruption forecasting, in: Remote Sensing of Volcanoes and
Volcanic Processes: Integrating Observation and Modelling. Geological Society of London.
doi:10.1144/SP380.4.
Selva, J., Costa, A., Sandri, L., Macedonio, G., & Marzocchi, W. (2014). Probabilistic short-term
volcanic hazard in phases of unrest: A case study for tephra fallout. Journal of Geophysical
Research: Solid Earth, 119(12), 8805–8826. https://doi.org/10.1002/2014JB011252
Seth C. Moran, C.N., Roman, D.C., 2011. Failed magmatic eruptions: late stage cessation of magma
ascent. Bulletin of Volcanology 73, 115–122. doi:https://doi.org/10.1007/s00445-010-0444-x.
Shi, X., Jiang, Y., Hirakawa, Y., 2018. Growth and potential collapse of the lava dome in Unzen volcano
and the estimation on block-and-ash flows. Geosciences Journal 22, 273–286.
doi:https://doi.org/10.1007/ s12303-017-0051-3.
Shimozuru, D., Miyazaki, T., Gyoda, N., & Matahelumual, J. (1969). Volcanological survey of
Indonesian volcanoes; part 2, Seismic observation at Merapi volcano. Bulletin of the Earthquake
Research Institute = Tokyo Daigaku Jishin Kenkyusho Iho, 47, Part 5, 969–990.
Jour
nal P
re-p
roof
Journal Pre-proof

http://www.geoscienceworld.org/cgi/georef/georef;1970018556
Shroder, J. F., & Papale, P. (2015). Volcanic Hazards, Risks and Disasters. In Volcanic Hazards, Risks,
and Disasters. Elsevier. https://doi.org/10.1016/C2011-0-07012-6
Sparks, R. S. J. (2003). Forecasting volcanic eruptions. Earth and Planetary Science Letters, 210(1–2), 1–
15. https://doi.org/10.1016/S0012-821X(03)00124-9
Surono, Jousset, P., Pallister, J., Boichu, M., Buongiorno, M. F., Budisantoso, A., Costa, F., Andreastuti,
S., Prata, F., Schneider, D., Clarisse, L., Humaida, H., Sumarti, S., Bignami, C., Griswold, J., Carn,
S., Oppenheimer, C., & Lavigne, F. (2012). The 2010 explosive eruption of Java’s Merapi
volcano—A ‘100-year’ event. Journal of Volcanology and Geothermal Research, 241–242, 121–
135. https://doi.org/10.1016/j.jvolgeores.2012.06.018
Syahbana, D., Kasbani, K., Suantika, G., Prambada, O., Andreas, A.S., Saing, U.B., Kunrat, S.L.,
Andreastuti, S., Martanto, M., Kriswati, E., Suparman, Y., Humaida, H., Ogburn, S., Kelly, P.J.,
Wellik, J., Wright, H.M.N., Pesicek, J.D.,Wessels, R., Kern, C., Lisowski, M., Diefenbach, A.,
Poland, M., Beauducel, F., Pallister, J., Vaughan, R.G., Lowenstern, J.B., 2019. The 2017–19
activity at Mount Agung in Bali (Indonesia): Intense unrest, monitoring, crisis response, evacuation,
and eruption. Sci Rep 9, 8848. doi:https://doi.org/10.1038/s41598-019-45295-9.
Tonini, R., Sandri, L., Rouwet, D., Caudron, C., Marzocchi, W., & Suparjan. (2016). A new Bayesian
Event Tree tool to track and quantify volcanic unrest and its application to Kawah Ijen volcano.
Geochemistry, Geophysics, Geosystems, 17(7), 2539–2555. https://doi.org/10.1002/2016GC006327
Umakoshi, K., Takamura, N., Shinzato, N., Uchida, K., Matsuwo, N., Shimizu, H., 2008. Seismicity
associated with the 1991-1995 dome growth at Unzen Volcano, Japan. Journal of Volcanology and
Geothermal Research 175, 91–99. doi:10.1016/j.jvolgeores.2008.03.030
Voight, B., Constantine, E., Siswowidjoyo, S., Torley, R., 2000a. Historical eruptions of Merapi Volcano,
Central Java, Indonesia, 1768–1998. Journal of Volcanology and Geothermal Research 100, 69 –
138. doi:https: //doi.org/10.1016/S0377-0273(00)00134-7.
Voight, B., Young, K. ., Hidayat, D., Subandrio, Purbawinata, M. ., Ratdomopurbo, A., Suharna, Panut,
Sayudi, D. ., LaHusen, R., Marso, J., Murray, T. ., Dejean, M., Iguchi, M., & Ishihara, K. (2000).
Deformation and seismic precursors to dome-collapse and fountain-collapse nuées ardentes at
Merapi Volcano, Java, Indonesia, 1994–1998. Journal of Volcanology and Geothermal Research,
100(1–4), 261–287. https://doi.org/10.1016/S0377-0273(00)00140-2
Walter, T R, Subandriyo, J., Kirbani, S., Bathke, H., Suryanto, W., Aisyah, N., Darmawan, H., Jousset, P.,
Luehr, B.-G., & Dahm, T. (2015). Volcano-tectonic control of Merapi’s lava dome splitting: The
November 2013 fracture observed from high resolution TerraSAR-X data. Tectonophysics, 639, 23–
33. https://doi.org/https://doi.org/10.1016/j.tecto.2014.11.007
Walter, Thomas R, Ratdomopurbo, A., Subandriyo, Aisyah, N., Brotopuspito, K. S., Salzer, J., & Lühr, B.
(2013). Dome growth and coulée spreading controlled by surface morphology, as determined by
pixel offsets in photographs of the 2006 Merapi eruption. Journal of Volcanology and Geothermal
Research, 261, 121–129. https://doi.org/https://doi.org/10.1016/j.jvolgeores.2013.02.004
Wassermann, J. (2012). Volcano Seismology. In P. Bormann (Ed.), New Manual of Seismological
Observatory Practice (NMSOP-2). Deutsches GeoForschungszentrum GFZ; IASPEI.
https://doi.org/https://doi.org/10.2312/GFZ.NMSOP-2
Watts, R. B., Herd, R. A., Sparks, R. S. J., & Young, S. R. (2002). Growth patterns and emplacement of
the andesitic lava dome at Soufrière Hills Volcano, Montserrat. Geological Society, London,
Memoirs, 21(1), 115–152. https://doi.org/10.1144/GSL.MEM.2002.021.01.06
Jour
nal P
re-p
roof
Journal Pre-proof
White, R., & McCausland, W. (2016). Volcano-tectonic earthquakes: A new tool for estimating intrusive
volumes and forecasting eruptions. Journal of Volcanology and Geothermal Research, 309, 139–
155. https://doi.org/10.1016/j.jvolgeores.2015.10.020
Yamasato, H. (1997). Quantitative Analysis of Pyroclastic Flows Using Infrasonic and Seismic Data at
Unzen Volcano, Japan. Journal of Physics of the Earth, 45(6), 397–416.
https://doi.org/10.4294/jpe1952.45.397
Young, K. D. (2007). Deformation, lava dome evolution, and eruption cyclicity at Merapi volcano,
Indonesia. In ProQuest Dissertations and Theses. Penn State University.
Zobin, V. (2012). Introduction to Volcanic Seismology. In Introduction to Volcanic Seismology. Elsevier.
https://doi.org/10.1016/C2011-0-06141-0
Zobin, V.M., Bretón, M., Navarro, C., 2014. Similarity in seismic source scaling relations for tectonic and
volcanic processes. Physics of the Earth and Planetary Interiors 231, 65–73.
doi:https://doi.org/10.1016/ j.pepi.2014.03.007.
Zorn, E. U., Le Corvec, N., Varley, N. R., Salzer, J. T., Walter, T. R., Navarro-Ochoa, C., Vargas-
Bracamontes, D. M., Thiele, S. T., & Arámbula Mendoza, R. (2019). Load Stress Controls on
Directional Lava Dome Growth at Volcán de Colima, Mexico. Frontiers in Earth Science, 7.
https://doi.org/10.3389/feart.2019.00084
Jour
nal P
re-p
roof
Journal Pre-proof

Author statement:
T. Espinosa-Ortega: Conceptualization, Formal Analysis, Writing-Original draft preparation. A.
Budi-Santoso: Investigation, Data Curation, Sulistiyani: Investigation, Data Curation N-T-
Z.Win: Data Curation, C.Widiwijayanti: Conceptualization, Writing- Review & Editing and F.
Costa: Conceptualization, Writing –Review & Editing, Supervision.
Jour
nal P
re-p
roof
Journal Pre-proof

Declaration of interests
☒ The authors declare that they have no known competing financial interests or personal relationships
that could have appeared to influence the work reported in this paper.
☐The authors declare the following financial interests/personal relationships which may be considered as potential competing interests:
Jour
nal P
re-p
roof
Journal Pre-proof

Probabilistic analysis to correlate time series with eruptive phases of long duration.
Real time detection of dome formation with Daily Hybrid Seismic Energy.
Mt. Merapi characterization of thresholds for lava extrusion and pyroclastic flow.
Use of Monte Carlo method to estimate uncertainties due inaccuracy in eruptive phase
classification.
Jour
nal P
re-p
roof
Journal Pre-proof


![On Mountains and Molehills [final pre-proof copy of paper published in Constellations, 2015]](https://static.fdokumen.com/doc/165x107/6316154b3ed465f0570be034/on-mountains-and-molehills-final-pre-proof-copy-of-paper-published-in-constellations.jpg)