UNCORRECTED PROOF
9
UNCORRECTED PROOF ARTICLE INFO Article history: Received 23 February 2016 Received in revised form 21 April 2016 Accepted 20 August 2016 Available online xxx Keywords: Extreme transit behavior Public transit Smart card data (SCD) Travel survey Big data ABSTRACT This paper seeks to understand extreme public transit riders in Beijing using both traditional household surveys and emerging new data sources such as Smart Card Data (SCD). We focus on four types of extreme transit behaviors: public transit riders who (1) travel significantly earlier than average riders (‘early birds’); (2) ride in unusual late hours (‘night owls’); (3) commute in excessively long distance (‘tireless itinerants’); and (4) make significantly more trips per day (‘recurring itinerants’). SCD are used to identify the spatiotemporal patterns of these four extreme transit behaviors. In addition, household surveys are employed to supplement the socioeconomic background and tentatively profile extreme travelers. While the research findings are useful to guide urban governance and planning in Beijing, our methodology and procedures can be extended to understand travel patterns elsewhere. © 2016 Published by Elsevier Ltd. Habitat International xxx (2016) xxx-xxx Contents lists available at ScienceDirect Habitat International journal homepage: www.elsevier.com Early birds, night owls, and tireless/recurring itinerants: An exploratory analysis of extreme transit behaviors in Beijing, China Ying Long a , Xingjian Liu b , Jiangping Zhou c, ∗ , Yanwei Chai d a Hang Lung Center for Real Estate, Tsinghua University, China; School of Architecture, Tsinghua University, China b The University of Hong Kong, China c University of Queensland, Australia d Peking University, China 1. Introduction Extreme conditions often capture our attention and point to impor- tant underlying mechanism; we have learned a great deal about our cities by examining the extremes, such as the emergence and dynam- ics of the most dominant city of a nation, the most depressed city of a region, as well as the most popular gateway city among immi- grants. In the past decade or so, against the backdrops of the global financial crisis, increased numbers of the unemployed, self-employed and part-time workers, the rise of telecommuters as well as the relo- cation of low-paying jobs, extreme commuters have received increas- ing academic and public attention in recent years. As extreme com- muting accounts for an increased portion of daily residential trips, re- cent analysis starts to look into travelers making unusually long, early, late, and/or frequent trips, which have discretely explored or described by Barr, Fraszczyk, and Mulley (2010); Gregor (2013); Jones (2012); Landsman (2013); Marion and Horner (2007); Moss and Qing (2012); Rapino and Fields (2013); U.S. Census (2005). As scholarly work on extreme travelers has been largely developed based on North American and European cities, we are interested in ex- tending the framework to understand extreme trips in China. We will examine extreme travel behaviors in public transit, as Chinese cities have historically relied on public transit, and the Chinese government has sought public transit as a major remedy for congestions, pollution, and other issues caused by the rising car ownership. ∗ Corresponding author. Email addresses: (Y. Long); [email protected] (X. Liu); [email protected] (J. Zhou); [email protected] (Y. Chai) To date, extreme traveler analyses have mostly used traditional data such as travel diaries and household surveys. More recently, emerging big data sources such as transit smart card data have been utilized to investigate the phenomenon. Transit smart card data record rich information about individual trips (e.g., origin, destination, and time length) and thus could be a useful supplementary data source for understanding travel behaviors. For example, since the 1990s, the use of smart cards has become prevalent in a large number of Chi- nese cities, partly owing to the development of the Internet and the advancement of mobile communication technologies (Blythe, 2004). Furthermore, Intelligent Transportation Systems (ITS) that incorpo- rate smartcard-automated fare systems had been in place in over 100 Chinese cities as of 2007 (Zhou & Long, 2014). The combination of these conventional and emerging data sources could offer new op- portunities to deepen our understandings of cities and related routine activities such as traveling and commuting (Batty, 2012; Liu et al., 2015). While most literature on extreme travelers focuses on excessively long trips, we extend the definition of extreme travelers into four types with the context of Chinese society. The other three types of extreme travelers are public transit riders (1) who make significantly more trips (‘recurring itinerants’), (2) travel significantly earlier than average rid- ers (the ‘early birds’) during weekdays, and (3) ride in unusual late hours (the ‘night owls’) during weekdays. More specifically, we seek to identify these extreme travelers in Beijing, characterize their spa- tiotemporal trajectories, profile their socioeconomic backgrounds, and propose necessary policy implications on the phenomenon. http://dx.doi.org/10.1016/j.habitatint.2016.08.004 0197-3975/© 2016 Published by Elsevier Ltd.
-
Upload
khangminh22 -
Category
Documents
-
view
0 -
download
0
Transcript of UNCORRECTED PROOF

UNCO
RREC
TED
PROO
F
A R T I C L E I N F O
Article history:Received 23 February 2016Received in revised form 21 April 2016Accepted 20 August 2016Available online xxx
Keywords:Extreme transit behaviorPublic transitSmart card data (SCD)Travel surveyBig data
A B S T R A C T
This paper seeks to understand extreme public transit riders in Beijing using both traditional household surveys andemerging new data sources such as Smart Card Data (SCD). We focus on four types of extreme transit behaviors: publictransit riders who (1) travel significantly earlier than average riders (‘early birds’); (2) ride in unusual late hours (‘nightowls’); (3) commute in excessively long distance (‘tireless itinerants’); and (4) make significantly more trips per day(‘recurring itinerants’). SCD are used to identify the spatiotemporal patterns of these four extreme transit behaviors. Inaddition, household surveys are employed to supplement the socioeconomic background and tentatively profile extremetravelers. While the research findings are useful to guide urban governance and planning in Beijing, our methodology andprocedures can be extended to understand travel patterns elsewhere.
© 2016 Published by Elsevier Ltd.
Habitat International xxx (2016) xxx-xxx
Contents lists available at ScienceDirect
Habitat Internationaljournal homepage: www.elsevier.com
Early birds, night owls, and tireless/recurring itinerants: An exploratory analysis ofextreme transit behaviors in Beijing, ChinaYing Long a, Xingjian Liu b, Jiangping Zhou c, ∗, Yanwei Chai d
a Hang Lung Center for Real Estate, Tsinghua University, China; School of Architecture, Tsinghua University, Chinab The University of Hong Kong, Chinac University of Queensland, Australiad Peking University, China
1. Introduction
Extreme conditions often capture our attention and point to impor-tant underlying mechanism; we have learned a great deal about ourcities by examining the extremes, such as the emergence and dynam-ics of the most dominant city of a nation, the most depressed cityof a region, as well as the most popular gateway city among immi-grants. In the past decade or so, against the backdrops of the globalfinancial crisis, increased numbers of the unemployed, self-employedand part-time workers, the rise of telecommuters as well as the relo-cation of low-paying jobs, extreme commuters have received increas-ing academic and public attention in recent years. As extreme com-muting accounts for an increased portion of daily residential trips, re-cent analysis starts to look into travelers making unusually long, early,late, and/or frequent trips, which have discretely explored or describedby Barr, Fraszczyk, and Mulley (2010); Gregor (2013); Jones (2012);Landsman (2013); Marion and Horner (2007); Moss and Qing (2012);Rapino and Fields (2013); U.S. Census (2005).
As scholarly work on extreme travelers has been largely developedbased on North American and European cities, we are interested in ex-tending the framework to understand extreme trips in China. We willexamine extreme travel behaviors in public transit, as Chinese citieshave historically relied on public transit, and the Chinese governmenthas sought public transit as a major remedy for congestions, pollution,and other issues caused by the rising car ownership.
∗∗ Corresponding author.Email addresses: (Y. Long); [email protected] (X. Liu); [email protected] (J. Zhou);[email protected] (Y. Chai)
To date, extreme traveler analyses have mostly used traditionaldata such as travel diaries and household surveys. More recently,emerging big data sources such as transit smart card data have beenutilized to investigate the phenomenon. Transit smart card data recordrich information about individual trips (e.g., origin, destination, andtime length) and thus could be a useful supplementary data sourcefor understanding travel behaviors. For example, since the 1990s, theuse of smart cards has become prevalent in a large number of Chi-nese cities, partly owing to the development of the Internet and theadvancement of mobile communication technologies (Blythe, 2004).Furthermore, Intelligent Transportation Systems (ITS) that incorpo-rate smartcard-automated fare systems had been in place in over 100Chinese cities as of 2007 (Zhou & Long, 2014). The combination ofthese conventional and emerging data sources could offer new op-portunities to deepen our understandings of cities and related routineactivities such as traveling and commuting (Batty, 2012; Liu et al.,2015).
While most literature on extreme travelers focuses on excessivelylong trips, we extend the definition of extreme travelers into four typeswith the context of Chinese society. The other three types of extremetravelers are public transit riders (1) who make significantly more trips(‘recurring itinerants’), (2) travel significantly earlier than average rid-ers (the ‘early birds’) during weekdays, and (3) ride in unusual latehours (the ‘night owls’) during weekdays. More specifically, we seekto identify these extreme travelers in Beijing, characterize their spa-tiotemporal trajectories, profile their socioeconomic backgrounds, andpropose necessary policy implications on the phenomenon.
http://dx.doi.org/10.1016/j.habitatint.2016.08.0040197-3975/© 2016 Published by Elsevier Ltd.
UNCO
RREC
TED
PROO
F
2 Habitat International xxx (2016) xxx-xxx
Extreme transit behavior is becoming more prevalent in China andmoving to the center of government agendas (Long & Thill, 2015).Without a solid understanding of extreme transit patterns, governmentprograms could easily result in misinformed interventions and policyfailures. Therefore, this study seeks to explore the spatiotemporal tra-jectories of extreme travelers based on refined definitions of ‘extremetransit behavior’, using Beijing as a case study. Our analysis wouldleverage the power of emerging public transit data and seek to answer:(1) Are there large number of extreme travelers? (2) Where do theseextreme travelers live and work? (3) What are their socioeconomiccharacters? In addition, our analysis will also tentatively address con-cerns about the causes of extreme transit behavior.
The remainder of this article is organized in five main sections.First, we relate our analysis to the ongoing debate on the causes andconsequences of extreme transit behavior. Second, we detail our datasources, which include both smart card data and conventional house-hold travel surveys. Third, we provide working definitions of extremetransit behavior and describe our empirical framework, which is amodification of the methodology detailed in Long and Thill (2015).Fourth, we summarize key findings based on our exploratory analyses.We conclude with a discussion of empirical contributions and avenuesfor future research.
2. Relevant literature
Passenger trips have long been of interest to transportation plan-ners and modelers. In existing literature, they have been primarilyclassified according to trip purpose, time of day, day of week, mode,person type, frequency, activity duration, and route choice (Meyer &Miller, 2001). Emerging big data such as smart card data have en-abled scholars to examine more types or aspects of passenger trips,over more time horizons and in large sample sizes, as compared to tra-ditional data (Bagchi and White, 2005). Multi-day data of transit rid-ers, for instance, were once difficult to collect if we rely on traditionalmethods such as surveys or interviews to collect data. But smart carddata make it possible. In addition, smart card data can greatly facili-tate our studies of activity space, locations and departure time of about80% of all transit riders (Chu & Chapleau, 2010).
Extra information provided by smart card data enables us to betterplan and manage our transit services (Frumin & Zhao, 2012). Utilizingthose data, for instance, we can now identify and visualize over 80%of the transit riders' route choices (Tao, Corcoran, Mateo-Babiano, &Rohde, 2014a, Tao, Rohde, & Corcoran, 2014b). Such data also cap-ture a great deal about revealed preference and could thus be useful forevidence-based planning and/or travel demand modeling (Janosikova,Slavik, & Kohani, 2014; Tao et al., 2014a).
Most smart card data, however, are not designed to capture all in-formation about passenger trips, especially socioeconomic informa-tion about trip makers and their trip purposes (Pelletier, Morency, &Trépanier, 2011). Extra work is needed to connect smart card data tomore information about trip makers. A small but an increased num-ber of scholars have done so. By combing smart card data and socioe-conomic information at a fine-grained spatial level, Mohamed, Côme,Baro, and Oukhellou (2014) show how we can detect which socialgroups (e.g. workers and students) travel, when/why they travel andwhere they travel to and from. Kusakabe and Asakura (2014) pro-pose and implement a data fusion approach to inferring trip purposesof transit riders. In the same vein, Lee and Hickman (2014) developheuristic rules and learning algorithms to infer trip purposes of smartcard users. Refereed articles similar to the above cited ones, however,as a whole are still small in quantity. They nevertheless have alreadyshown great potential of smart card data. Alone, they may only pro
vide limited information about transit riders. When they are combinedwith other small data such as household surveys, land use and census,the combined data can allow us to understand transit riders better intheory for every time horizon and to make more informed city-plan-ning and public-policy decisions based on the improved understand-ings (e.g., see Batty, 2013a).
Despite the progresses mentioned above, little has been done onextreme travelers based on smart card data. Most of the existing workon extreme travelers is by reporters, based on discrete evidences and/or personal stories. Landsman (2013), for instance, identifies several“extreme commuters” in New York, USA, who have a work trip tak-ing 90 min or more each way and cites other sources to show thatthose commuters are not just a few. Similarly, Gregor (2013) reportsseveral extreme commuters in London, UK and contends that the num-ber of such commuters is growing. Per some reporters, the rise ofextreme commuters are composite results of the tough labor market,dual-worker problem and/or personal choices, e.g., better educationfor children rather than proximity to workplace (e.g., Moss, 2012;Jones, 2012; Gregor, 2013).
Based on traditional data such as census data, nevertheless, ex-treme travel has been paid much attention by both governmental agen-cies and individual scholars. Moss and Qing (2012) argue that workhours, locations and styles have greatly changed due to the rise ofmodern Internet and Communication Technologies (ICT) and the in-creasingly globalized economy. These changes contribute to the emer-gence and growth of “super commuters”, who work in the centralcounty of a given metropolitan area, but live beyond the boundariesof that metropolitan area, commuting long distance by air, rail, car,bus, or a combination of modes once or twice per week. Among thetop 5 USA counties for super-commuting, each county has 7.3 to 13.2percent of the workforce that belongs to super commuters. But evenbefore the emergence or growth of super commuters, “extreme com-muters” have been profiled and quantified by USA Census (2005),which defines extreme commuters as those workers who travel 90 minor more to work, one-way and collects related data about them. Basedon the above, Rapino and Fields (2013) propose three definitions re-garding long commuting: (1) Extreme Commuting: Traveling 90 ormore minutes to work. (2) Long-distance Commuting: Traveling 50 ormore miles to work. (3) Mega Commuting: Traveling 90 or more min-utes and 50 or more miles to work. In this study, we assume that hu-man being's tolerance of long travel is similar across countries. There-fore, the above thresholds were used to categorize extreme commutingin Beijing as well.
Why long commuting or extreme travel have been given so muchattention and should be given more attention? Existing literature hasrarely directly dealt with this. But several streams of literature haveprovided some clues. The first stream argues that travel time is disu-tility and long travel time impairs people's access to opportunities thatincrease their utility (e.g., see Lyons & Urry, 2005 for a good re-view). Therefore, extreme travelers would have to face more disutilityand have worse access to opportunities. Scholars and decision-makersshould examine who they are, where they are and what we can andshould do to alleviate their suffering from the public-policy perspec-tive.
The second stream considers travel time as disutility and at thesame time contends that long travel (including extreme travel) can re-sult from a host of factors such as ‘motoring poor’, automobile mis-match, spatial mismatch, centralization of services or facilities, sub-urbanization of low-skilled jobs but not corresponding labor force,race discrimination and low household income (e.g., Froud, Johal,Leaver, & Williams, 2002; Gobillon, Selod, & Zenou, 2007; Kenyon

UNCO
RREC
TED
PROO
F
Habitat International xxx (2016) xxx-xxx 3
et al., 2002; Taylor & Ong, 1995). In light of this, one can concludethat long travel is not just a transportation problem and it can also bea symptom or indication of serious social, economic and racial prob-lems. Examining extreme travel thus can help us better qualify, diag-nose and even cure those problems.
The third stream relates commuting to issues such as car depen-dence, energy waste, air pollution, traffic congestion and urbansprawl. Long travel, long commutes in particular, can exacerbate thoseissues. Shortening commuting trips and/or jobs-housing balance thusare much needed (California Planning Round Table, 2008; Cervero,1991; Horner, 2004; Weitzel, 2003).
In addition to long commuting, the other three types of extremetravelers: early birds, night owls, and frequent travelers among tran-sit riders should also be given much more attention. But few existingstudies have looked at this. This may be simply because transit rid-ers in most cases only account for a small percentage of all the travel-ers in developed countries and the other three types of extreme travel-ers therefore account for an even smaller percentage. But in develop-ing countries like China, the numbers of transit riders and early birds,night owls, and frequent travelers among transit riders could still besignificant. In Beijing, for instance, 29% of all the travelers use tran-sit and therefore there are millions of them. For early birds and nightowls, they have to break their normal biological clock to make theirtrips. In the long run, this could not only be harmful to their health butalso to their social life (e.g., see Mintz, 2014). For frequent travelers,like the long commuters, they have to suffer from lots of disutilities.Therefore, all the four types of extreme travelers do matter to people'swelfare and thus have important policy implications.
To sum up, although extreme commuting patterns have importantpolicy implications, little has been done in the scholarly work on ex-treme travelers and ever less has been done in China. Existing explo-ration also rarely adopts emerging data sources. This study attempts tofill some existing gaps by examining extreme transit behaviors basedon smart card data. We will benchmark our results from smart carddata (SCD) with those derived from the more conventional travel sur-vey. This benchmarking exercise would also provide some clues to thesocioeconomic backgrounds of extreme travelers, as recorded in thetravel survey data.
3. Study area and data
3.1. Beijing and its transit system
Our study area – Beijing Metropolitan Area (BMA), China – cov-ers an area of 16,410 km2 and has a population of more than 20 millionin 2010. The BMA lies in northern China, to the east of the Shanxi al-tiplano and south of the Inner Mongolian altiplano. The southeasternpart of the BMA is a flatland, extending east for 150 km to the coastof the Bohai Sea. Mountains cover an area of 10,072 km2, 61% of thewhole study area. Gaining momentum from China's recent economicsuccess, Beijing, as the capital city, is becoming one of the world'smost populous and fastest growing metropolis. (See Yang, Cai, andOttens (2013) for more background information about Beijing).
Beijing's public transit system consists mainly of buses and sub-way lines. Thanks to the continuous expansion of subway lines aswell as subsidies for public transit, the share of subway and bus tripsamong all commutes in BMA has risen steadily, reaching 38.9% inthe end of 2010, making Beijing the largest public transit system interms of daily ridership in China (Beijing Transportation ResearchCenter, 2011). The car was still the most dominant mode of travelin Beijing, largely due to recent growth in car ownership and usage.
Contrary to many developed cities where the share of biking and walk-ing is reviving and increasing, the trend in Beijing was a decline since2010.
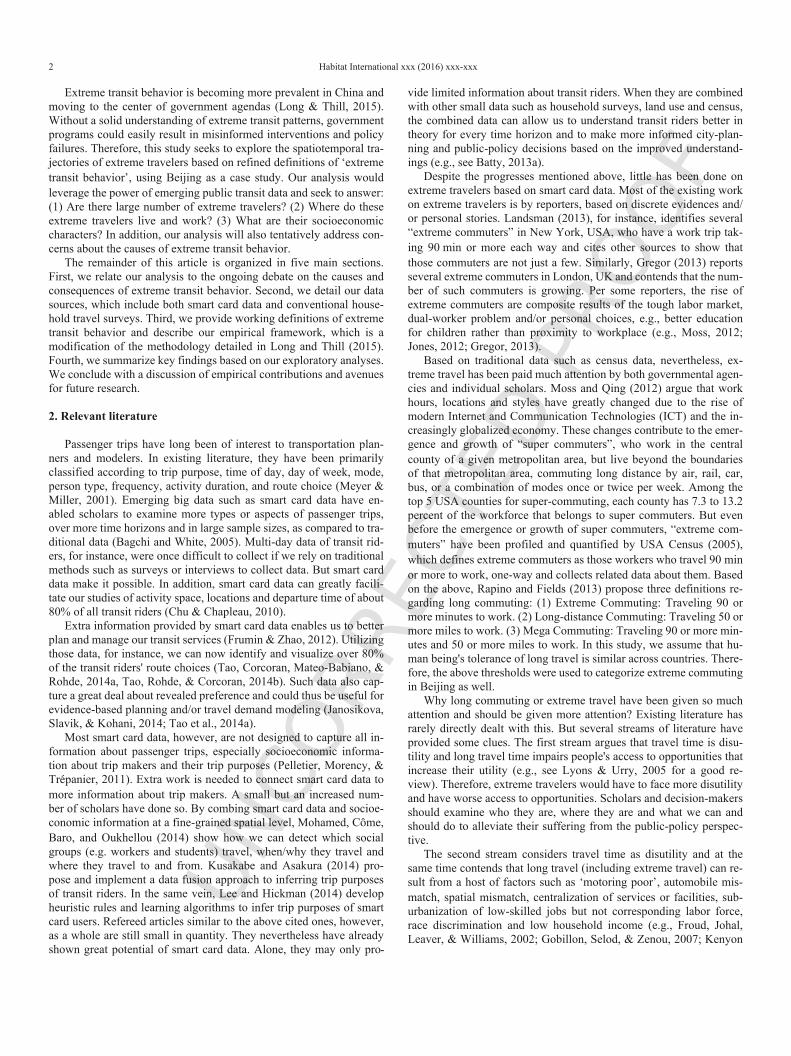
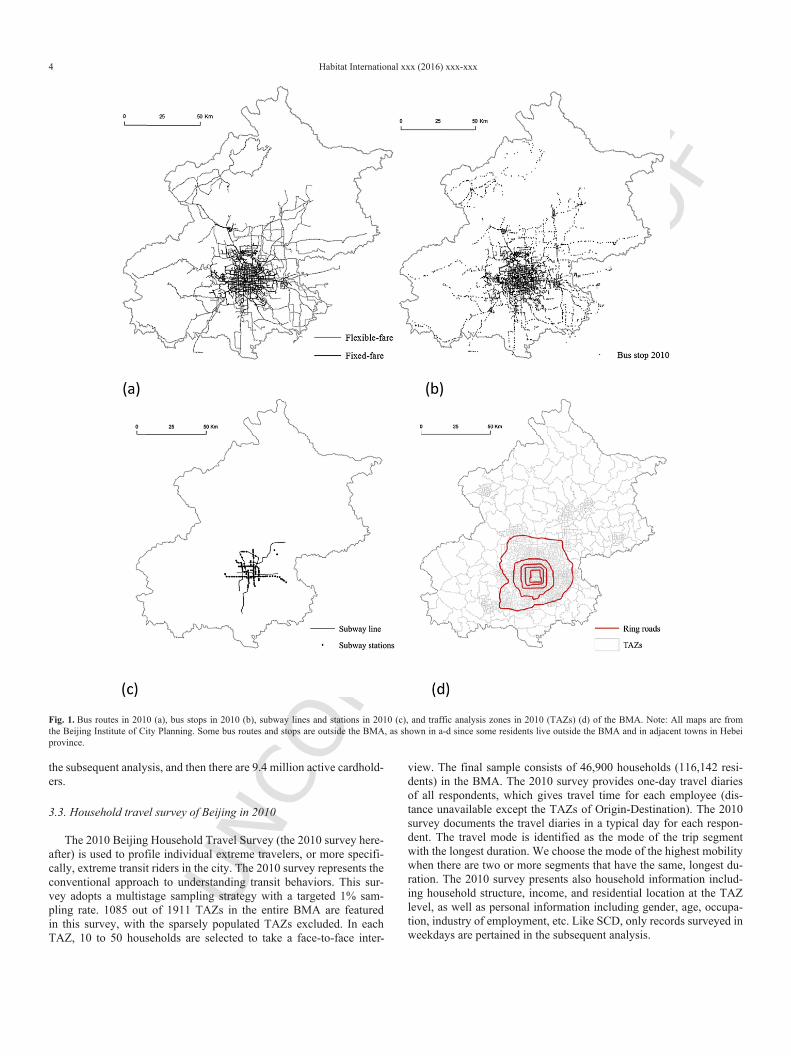
As already implied, GIS data about bus lines & stops, and subwayroutes & stations are essential for geocoding and mapping SCD. In2010, there were 1928 bus routes (Fig. 1a) and 21,372 bus stops (Fig.1b) in the BMA. Note that a bus route could have two directions, e.g.,the bus No. 113 has two routes, one from Dabeiyao to Qijiahuozi andthe other from Qijiahuozi to Dabeiyao. These routes are counted sep-arately in this paper. The average distance between consecutive busstops is around 231 m. As of April in 2010, there are 9 subway lines,including the airport express line, and 147 subway stations associatedwith (Fig. 1c).
We use Beijing TAZ data to aggregate the analytical results forbetter visualization. In total, 1911 TAZs are defined (Fig. 1d) accord-ing to the administrative boundaries, main roads, and the planning lay-out in the BMA.
3.2. Beijing bus/metro smart card data in 2010
Since 2005, over 90% of bus/metro riders in Beijing use anony-mous smart cards to pay their fare. This high rate of smart card usageamong bus/metro riders is largely due to governmental subsidies forpublic transit. For example, riders using smart card data enjoy 60%discounts on any routes in the local bus system, and the discount ratefor students is at 80%. Smart cards also enable cardholders to pay forother services such as taxi, electricity, and sewage that are offered bythe local government or government linked companies.
When cardholders use their smart cards to pay for bus/metro ser-vices, card readers installed on the bus and in the station automaticallyrecord information about trip origin and/or destination stops/stations,boarding and/or alighting time, smart card numbers, as well as the cardtype (e.g. student cards versus regular cards).
Information collected for bus trips needs some further elaboration.There exist types of bus fares in 2010 (all bus lines have been turnedinto distance based fare since January 2015). The first fixed fare isfor short routes most of which are within the fifth ring road, while thesecond distance based fare is associated with long routes. For the firsttype, 0.4 Chinese Yuan (CNY; approximately 0.06 USD) is chargedfor individual bus rides in 2010, and the corresponding SCD con-tains only the departure (tap-in) time and no departure stop ID, ar-rival (tap-off) time or arrival stop ID. Cardholders' spatiotemporal in-formation is incomplete for this kind of route. Our strategy for tack-ling this incomplete information issue of fixed-fare records have beenelaborated in Long and Thill (2015), and the strategy proposed by Ma,Wang, Chen, and Liu (2012) could be used in future for solving the in-complete information of Beijing bus SCD. For the distance-based faretype, the amount charged depends on the route ID and trip distance,and the SCD contains both tap-in and tap-off information. Both typesof bus SCD records are used in this paper for analyzing extreme bus/metro riders and profiling their mobility patterns. Still, one subwayride costs 2 CNY, regardless of the trip distance and time, and the sub-way records have complete spatiotemporal information.
We collected one-week bus/metro SCD in 2010 (5–11 April, Mon-day to Sunday) from Beijing Municipal Administration & Commu-nications Card Co. (BMAC). The dataset records 97.9 million trips(59.3 m fixed fare bus trips, 23.4 m distance based fare bus trips,and 15.2 m metro journeys) for 10.5 million cardholders. SCD havebeen geocoded using bus/metro routes and the locations of stops/sta-tions (Fig. 1). Only SCD records in weekdays (5–9 April) are used in
UNCO
RREC
TED
PROO
F
4 Habitat International xxx (2016) xxx-xxx
Fig. 1. Bus routes in 2010 (a), bus stops in 2010 (b), subway lines and stations in 2010 (c), and traffic analysis zones in 2010 (TAZs) (d) of the BMA. Note: All maps are fromthe Beijing Institute of City Planning. Some bus routes and stops are outside the BMA, as shown in a-d since some residents live outside the BMA and in adjacent towns in Hebeiprovince.
the subsequent analysis, and then there are 9.4 million active cardhold-ers.
3.3. Household travel survey of Beijing in 2010
The 2010 Beijing Household Travel Survey (the 2010 survey here-after) is used to profile individual extreme travelers, or more specifi-cally, extreme transit riders in the city. The 2010 survey represents theconventional approach to understanding transit behaviors. This sur-vey adopts a multistage sampling strategy with a targeted 1% sam-pling rate. 1085 out of 1911 TAZs in the entire BMA are featuredin this survey, with the sparsely populated TAZs excluded. In eachTAZ, 10 to 50 households are selected to take a face-to-face inter
view. The final sample consists of 46,900 households (116,142 resi-dents) in the BMA. The 2010 survey provides one-day travel diariesof all respondents, which gives travel time for each employee (dis-tance unavailable except the TAZs of Origin-Destination). The 2010survey documents the travel diaries in a typical day for each respon-dent. The travel mode is identified as the mode of the trip segmentwith the longest duration. We choose the mode of the highest mobilitywhen there are two or more segments that have the same, longest du-ration. The 2010 survey presents also household information includ-ing household structure, income, and residential location at the TAZlevel, as well as personal information including gender, age, occupa-tion, industry of employment, etc. Like SCD, only records surveyed inweekdays are pertained in the subsequent analysis.

UNCO
RREC
TED
PROO
F
Habitat International xxx (2016) xxx-xxx 5
4. Methods
Our analytical approach can be outlined as follows: Firstly, we setworking definitions for different types of extreme travel behaviors andconsequently identify extreme travelers from the SCD dataset. Sec-ondly, we characterize the spatiotemporal trajectories of extreme trav-elers. Lastly, we supplement the SCD data with the household surveyto profile the socioeconomic conditions of identified extreme travel-ers.
4.1. Defining and identifying extreme travelers from the SCD
We define four types of extreme travelers in Beijing according totheir transit behaviors in weekdays (Table 1). These working defin-itions draw upon the 2010 survey, existing literature, as well as re-searchers' own experiences of living in Beijing. For instance, the reg-ular working hour starts on 8:30 or 9:00 a.m. in Beijing, and thereforeboarding public transit before 6:00 a.m. would be considered as un-usually early.
4.2. Extracting jobs-housing locations and commuting trips ofextreme travelers from the SCD
To analyze the mobility pattern of identified extreme travelers, weconstruct commuting journeys based on commuters' job and home lo-cations, which are in turn inferred using the following procedure:
• The card type is not a student card;• Dj ≥ 6 h, where Dj is the duration that a cardholder stays at place j,
which is associated with all bus stops within 500 m of one another.Note that the benchmark of 6 h are set based on the analysis on full-time job in the 2010 survey;
• j <>1, which means that j is not the first place in a weekday that theserver records;
• The place where a cardholder visited most frequently in five week-days will be defined as the final workplace of the cardholder in thisstudy.Similarly, we deduced from the data queries that a place would be
a cardholder's housing place if the data meet these conditions:
• The card type is not a student card;• The place where a cardholder's first boarding bus stop/subway sta-
tion trip in a day most frequently in five weekdays will be definedas the final housing place of the cardholder in this study.
Table 1Working definitions of extreme travelers together with Abs (the SCD).
Type Definition
Early birds(EBs)
First trip < 6AM, more than two days in a week (60% of weekdays)
Night owls(NOs)
last trip (boarding time) > 10PM, more than two days in a week(60% weekdays)
Tirelessitinerants(TIs)
≥ one and a half hours for one-way commuting (from the homelocation to job location), more than two days in a week
Recurringitinerants(RIs)
≥ 30 trips in weekdays of a week (≥ 6 trips per day)
AverageBeijingers(ABs)
The “average” cardholders in the SCD
Second, commuting trips were then identified based on the identi-fied job and housing places of a cardholder.
More details about identifying housing and job locations and com-muting trips are available in Long and Thill (2015).
4.3. Defining and identifying extreme travelers from the survey
Big data do not inform us about individual extreme travelers andreasons behind their traveling behaviors. We probed into these issuesby using the 2010 survey samples mentioned above. The counterpartof each identified extreme travelers from the SCD was extracted fromthe survey with the same rules as we mined SCD for identifying ex-treme travelers. The temporal range of the SCD and the 2010 surveywas different, in that we slightly adapted the definition of extremetravelers for accommodating the 2010 survey (see Table 2). Using the2010 survey and the definitions, we analyze the first bus/metro tripof EBs, the last bus/metro trip of NOs, the bus/metro commuting tripof TIs, all bus/metro trips of RIs, and all trips of surveyed residents(Average Beijingers, ABs). Each type of extreme travelers can then beidentified and their socioeconomic information can be understood (seeTable 3).
We admit the gap between definitions of extreme travelers by us-ing the SCD and the 2010 survey. The two datasets we analyzed in thispaper were also concerned with two different samples. We believedthat the following two aspects would mitigate the potential bias in thecircumstance. First, the 2010 survey contains the most regular dailytravel diaries that were reported in Beijing. Second, we integrated thefindings from both datasets for each type of extreme travelers at thegroup level, not at the individual level. This, nevertheless, could be al-leviated by the availability of week-long travel surveys in the future.
5. Results
5.1. Extreme travelers from the SCD
Based on our working definitions of extreme travelers, 188.9 thou-sand or 2.0% of all active cardholders in weekdays are associatedwith one or more extreme travel behaviors (the percentage is con-sistent with the findings of Rapino and Fields (2013) in the U.S.).Totally 14.2 thousand extreme travelers use student smart cards. Wealso note that 4890 cardholders fit two types of extreme travel behav
Table 2Working definitions of extreme travelers together with ABs (the 2010 survey).
Type Definition
Early birds (EBs) First trip < 6AMNight owls (NOs) Last trip (boarding time) > 10PMTireless itinerants(TIs)
≥ one and a half hours for one-way commuting (from the homelocation to job location)
Recurringitinerants (RIs)
≥ 6 trips in the surveyed day
AverageBeijingers (ABs)
The “average” travelers in the 2010 survey
Table 3The inventory of four types of identified extreme travelers from the SCD.
Type # cardholders (×1000)
EBs 42.8NOs 70.6TIs 6.7RIs 73.7
UNCO
RREC
TED
PROO
F
6 Habitat International xxx (2016) xxx-xxx
iors, and 40 are three types. We find that there are more RIs and NOsthan the other two types of extreme travelers, and TIs are the fewest in2010.
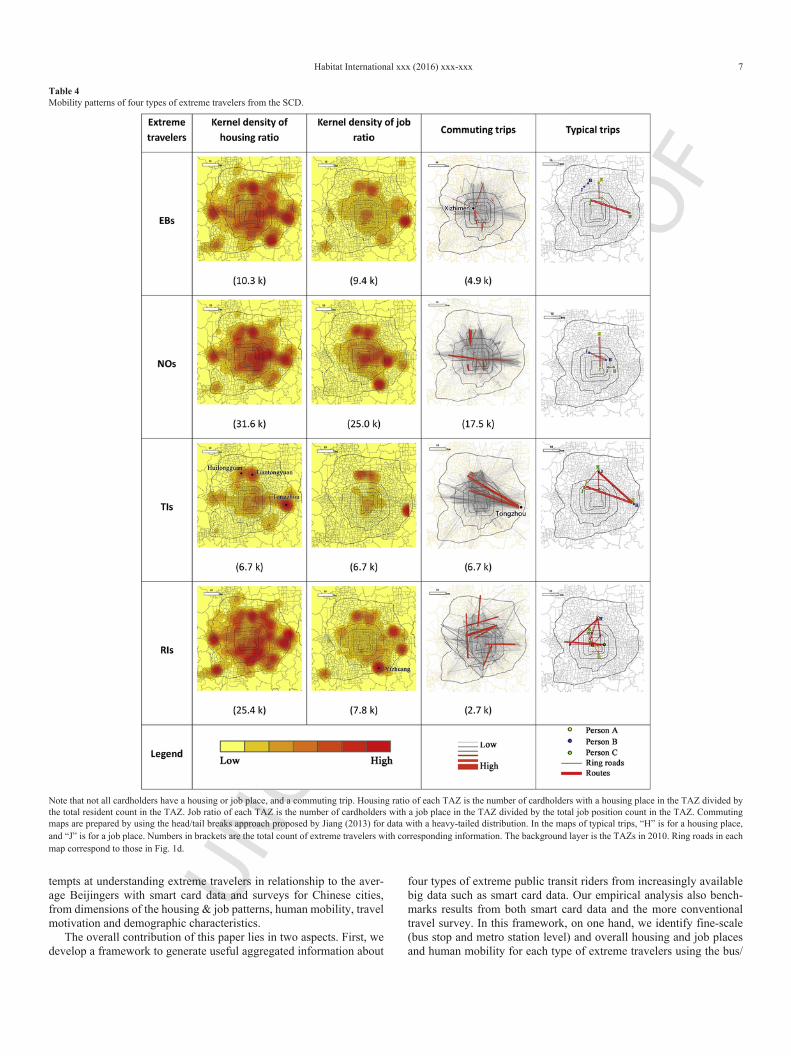
The mobility patterns of four types of extreme travelers are sum-marized in Table 4 (to reword according to the new maps in thefirst two columns of Table 4). For housing, residents in the threewell-known suburb residential areas (Tongzhou, Huilongguan andTiantongyuan) are associated with more percentage to be Tis. In ad-dition to the three areas, housing ratios of EBs, NOs and RIs exhibitsimilar polycentric pattern within the sixth ring road of Beijing. Forjobs, most of extreme travelers' job locations are within the fifth ringroad and are in the northern part of the city, which is more developedcompared with the southern part. Employees in the Yizhuang Indus-trial Park prone to be RIs. According to the survey, most of them re-side in the central city of Beijing. A notable number of TIs work at theShangdi Information Technology cluster and around Tiantongyuan.For commuting trips, the popular destinations of EBs' commuting arein Xizhimen area. Many TIs commute a long distance from Tongzhouto the northern part of the central city. Most TIs commute from out-side the central city to the central city. Many RIs commute a long dis-tance, although only 4.0% of all identified RIs have an identified com-muting trip. For typical trips of extreme travelers, there are only com-muting trips for EBs and NOs, and not all EBs and NOs commute along distance. In addition, RIs visit several places and travel a longdistance in a day. In addition, we analyze all identified extreme trav-elers' typical trips, EBs, NOs and TIs have very few non-commutingtrips (27.4%, 25.3% and 36.8% respectively), implying that they arebusy with working activities.
5.2. Extreme travelers from the 2010 survey
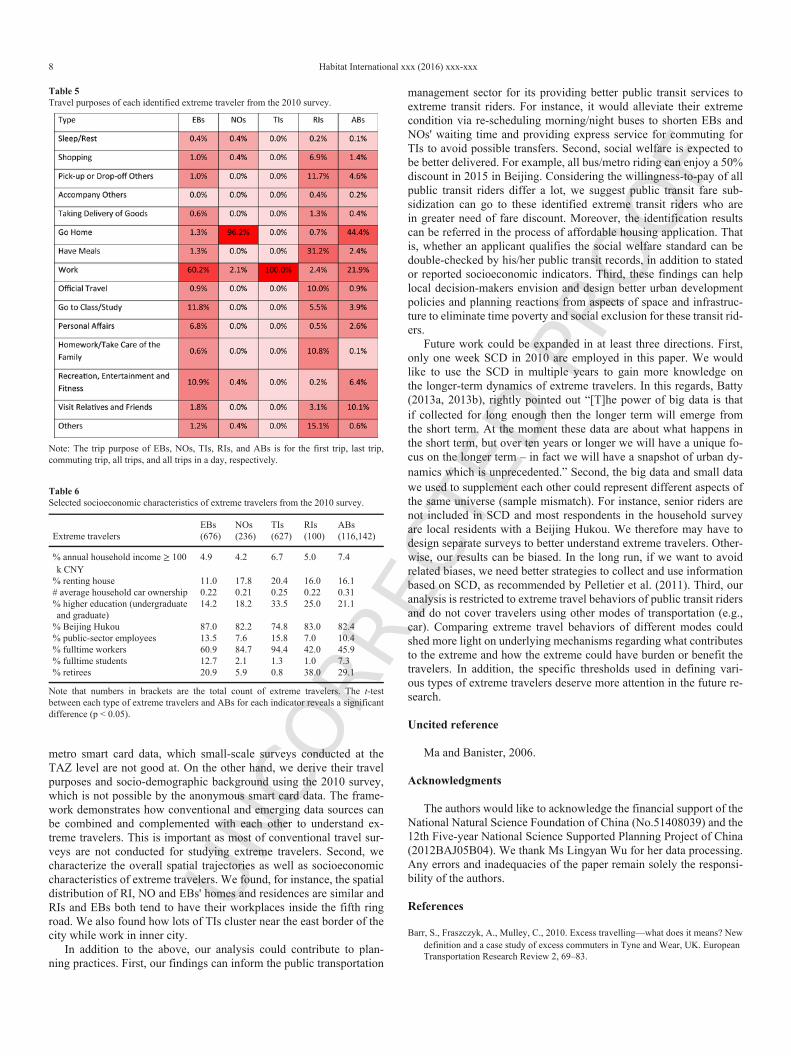
Overall 1569 or 7.2% extreme travelers are identified from all21,771 travelers with at least one bus/metro trip in weekdays as docu-mented in the 2010 survey. There are 676 EBs, 236 NOs, 627 TIs, and100 RIs (70 travelers fit two types of extreme travel behaviors). Asshown in Table 5, we found that 60.2%, 11.8% and 10.9% EBs' firsttrips are to workplace, school and recreation place, respectively. Theseare significantly different from those of ABs (21.9%, 3.9% and 6.4%).Most of NOs' last trips are to home (96.2%), and 2.1% are to work-place at night. Almost one third of RIs trips are for dining (31.2%),and a considerable amount of trips are for pick-up and drop-off as wellas business errands (all greatly than ABs).
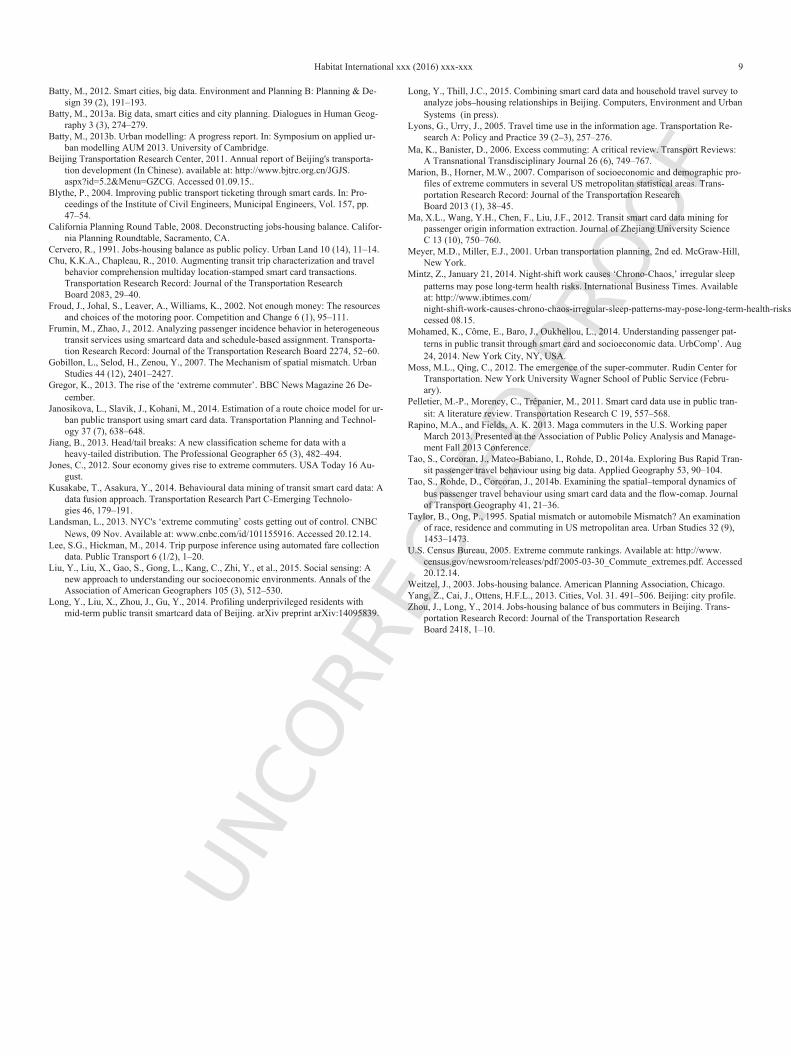
We further analyzed socioeconomic characteristics of different ex-treme travelers and their households. Table 6 summarizes our mainfindings.
(1) Classified households with 100 k CNY as high-income ones, wefound that all households consisting of extreme travelers have alower ratio as compared to AB households. This is consistent withour previous understandings of underprivileged residents in Bei-jing with SCD, in which we found the more one travel by bus,(s)he is with a greater probability to be economically underprivi-leged (Long, Liu, Zhou, & Gu, 2014).
(2) There are more residents who rent housing in Beijing in the groupsof NOs and TIs, comparing with ABs. Those renting housing inChinese cities tend to be new comers or those who cannot affordexpensive housing prices. This finding further proves that NOsand TIs are prone to be economically underprivileged.
(3) All four types of extreme travelers on average owned fewer carsthan ABs. In Beijing, most residents who could afford privatecars would commute by driving, instead of by taking oftentimes
over-crowed public transit.1 Economic-wise, car ownership isboth a goods reflecting social status as well as a life necessityin the increasingly car-dominant living in Beijing. This findingreveals that all types of extreme transit riders are not linked tohigh-income residents.
(4) TIs and RIs have more percentage of higher education in con-trast to ABs. This finding is not beyond our expectation accordingto our local knowledge for Beijing that economically underprivi-leged residents are directly associated with lower education levels.In some cases, it is the good education that provides TIs opportu-nities to reside and work in large cities in China.
(5) TIs had the lowest percentage of local Beijing residences (Hukou,a household registration system in China) among all extreme trav-elers. Hukou is a guarantee for some public services like educa-tion and welfare in China. It is a precondition for applying to adecent job in some cases. In the increasingly difficulty to obtain aBeijing Hukou, less Hukou percentage indicates social underpriv-ileged situations of TIs as well.2
(6) Fewer public-sector employees, who include civil servants andemployees of public institutions are NOs and RIs. In Beijing, pub-lic-sector employees tend to have more stable jobs and higher in-come. More third-sector workers are NOs and TIs, and more em-ployees in private companies are TIs. In addition, very few NOsare teachers and medical staffs. There are no soldiers and police-men in NOs, TIs and RIs.
(7) Regarding social status of all extreme travelers, 60.9% EBs arefull-time workers, 20.9% retirees, followed by 12.7% fulltime stu-dents. Most of NOs and TIs are fulltime workers. There are also asignificant number of retirees in NOs (5.9%). Surprisingly, of allRIs, 38.0% are retirees while 42.0% are fulltime workers. Thereare also 12.0% of all RIs are jobless.
We are able to draw pictures for all four types with the analysis us-ing the 2010 survey. For instance, most EBs are working full time inthe private tertiary sector, fulfilling jobs that are less well-paid and re-quire less educational attainment. Most of TIs are those who are alsobusy with working, with a higher percentage for renting house, welleducated, with a lower percentage for holding a Beijing Hukou, andworking for private sectors. In sum, the aforementioned analysis onvarious dimensions of socioeconomic characteristics of extreme tran-sit riders reveal that they (especially the first three types) tend to bethe economically underprivileged.
6. Conclusions and discussion
In this paper, we first extended the existing definition on extremecommuters and proposed four types of extreme transit riders, includ-ing Early Birds, Night Owls, Tireless Itinerants and Recurring Itin-erants. We then identified and profiled each type of extreme travel-ers using both big and traditional data. Smart card data are used tovisualize the overall spatiotemporal patterns of 188.9 thousand ex-treme travelers (2% of all active cardholders): where they reside andwork, and what their mobility patterns are. In addition, we located1568 extreme travelers in the traditional household survey data as thecounterparts identified from the smart card data, and probed the travelpurpose and socioeconomic attributes of extreme travelers and theirhouseholds. To the best of our knowledge, this is one of the first at
1 As of 2010, the policy on car plate restriction was not implemented in Beijing.2 It should be mentioned that there are around 40% residents in Beijing withoutHukou in 2014. The 2010 survey is with bias in terms of this attribute. While weadmit this bias, we still see the possibility on benchmarking four types of extremetransit riders using the survey.
UNCO
RREC
TED
PROO
F
Habitat International xxx (2016) xxx-xxx 7
Table 4Mobility patterns of four types of extreme travelers from the SCD.
Note that not all cardholders have a housing or job place, and a commuting trip. Housing ratio of each TAZ is the number of cardholders with a housing place in the TAZ divided bythe total resident count in the TAZ. Job ratio of each TAZ is the number of cardholders with a job place in the TAZ divided by the total job position count in the TAZ. Commutingmaps are prepared by using the head/tail breaks approach proposed by Jiang (2013) for data with a heavy-tailed distribution. In the maps of typical trips, “H” is for a housing place,and “J” is for a job place. Numbers in brackets are the total count of extreme travelers with corresponding information. The background layer is the TAZs in 2010. Ring roads in eachmap correspond to those in Fig. 1d.
tempts at understanding extreme travelers in relationship to the aver-age Beijingers with smart card data and surveys for Chinese cities,from dimensions of the housing & job patterns, human mobility, travelmotivation and demographic characteristics.
The overall contribution of this paper lies in two aspects. First, wedevelop a framework to generate useful aggregated information about
four types of extreme public transit riders from increasingly availablebig data such as smart card data. Our empirical analysis also bench-marks results from both smart card data and the more conventionaltravel survey. In this framework, on one hand, we identify fine-scale(bus stop and metro station level) and overall housing and job placesand human mobility for each type of extreme travelers using the bus/
UNCO
RREC
TED
PROO
F
8 Habitat International xxx (2016) xxx-xxx
Table 5Travel purposes of each identified extreme traveler from the 2010 survey.
Note: The trip purpose of EBs, NOs, TIs, RIs, and ABs is for the first trip, last trip,commuting trip, all trips, and all trips in a day, respectively.
Table 6Selected socioeconomic characteristics of extreme travelers from the 2010 survey.
Extreme travelersEBs(676)
NOs(236)
TIs(627)
RIs(100)
ABs(116,142)
% annual household income ≥ 100k CNY
4.9 4.2 6.7 5.0 7.4
% renting house 11.0 17.8 20.4 16.0 16.1# average household car ownership 0.22 0.21 0.25 0.22 0.31% higher education (undergraduateand graduate)
14.2 18.2 33.5 25.0 21.1
% Beijing Hukou 87.0 82.2 74.8 83.0 82.4% public-sector employees 13.5 7.6 15.8 7.0 10.4% fulltime workers 60.9 84.7 94.4 42.0 45.9% fulltime students 12.7 2.1 1.3 1.0 7.3% retirees 20.9 5.9 0.8 38.0 29.1
Note that numbers in brackets are the total count of extreme travelers. The t-testbetween each type of extreme travelers and ABs for each indicator reveals a significantdifference (p < 0.05).
metro smart card data, which small-scale surveys conducted at theTAZ level are not good at. On the other hand, we derive their travelpurposes and socio-demographic background using the 2010 survey,which is not possible by the anonymous smart card data. The frame-work demonstrates how conventional and emerging data sources canbe combined and complemented with each other to understand ex-treme travelers. This is important as most of conventional travel sur-veys are not conducted for studying extreme travelers. Second, wecharacterize the overall spatial trajectories as well as socioeconomiccharacteristics of extreme travelers. We found, for instance, the spatialdistribution of RI, NO and EBs' homes and residences are similar andRIs and EBs both tend to have their workplaces inside the fifth ringroad. We also found how lots of TIs cluster near the east border of thecity while work in inner city.
In addition to the above, our analysis could contribute to plan-ning practices. First, our findings can inform the public transportation
management sector for its providing better public transit services toextreme transit riders. For instance, it would alleviate their extremecondition via re-scheduling morning/night buses to shorten EBs andNOs' waiting time and providing express service for commuting forTIs to avoid possible transfers. Second, social welfare is expected tobe better delivered. For example, all bus/metro riding can enjoy a 50%discount in 2015 in Beijing. Considering the willingness-to-pay of allpublic transit riders differ a lot, we suggest public transit fare sub-sidization can go to these identified extreme transit riders who arein greater need of fare discount. Moreover, the identification resultscan be referred in the process of affordable housing application. Thatis, whether an applicant qualifies the social welfare standard can bedouble-checked by his/her public transit records, in addition to statedor reported socioeconomic indicators. Third, these findings can helplocal decision-makers envision and design better urban developmentpolicies and planning reactions from aspects of space and infrastruc-ture to eliminate time poverty and social exclusion for these transit rid-ers.
Future work could be expanded in at least three directions. First,only one week SCD in 2010 are employed in this paper. We wouldlike to use the SCD in multiple years to gain more knowledge onthe longer-term dynamics of extreme travelers. In this regards, Batty(2013a, 2013b), rightly pointed out “[T]he power of big data is thatif collected for long enough then the longer term will emerge fromthe short term. At the moment these data are about what happens inthe short term, but over ten years or longer we will have a unique fo-cus on the longer term – in fact we will have a snapshot of urban dy-namics which is unprecedented.” Second, the big data and small datawe used to supplement each other could represent different aspects ofthe same universe (sample mismatch). For instance, senior riders arenot included in SCD and most respondents in the household surveyare local residents with a Beijing Hukou. We therefore may have todesign separate surveys to better understand extreme travelers. Other-wise, our results can be biased. In the long run, if we want to avoidrelated biases, we need better strategies to collect and use informationbased on SCD, as recommended by Pelletier et al. (2011). Third, ouranalysis is restricted to extreme travel behaviors of public transit ridersand do not cover travelers using other modes of transportation (e.g.,car). Comparing extreme travel behaviors of different modes couldshed more light on underlying mechanisms regarding what contributesto the extreme and how the extreme could have burden or benefit thetravelers. In addition, the specific thresholds used in defining vari-ous types of extreme travelers deserve more attention in the future re-search.
Uncited reference
Ma and Banister, 2006.
Acknowledgments
The authors would like to acknowledge the financial support of theNational Natural Science Foundation of China (No.51408039) and the12th Five-year National Science Supported Planning Project of China(2012BAJ05B04). We thank Ms Lingyan Wu for her data processing.Any errors and inadequacies of the paper remain solely the responsi-bility of the authors.
References
Barr, S., Fraszczyk, A., Mulley, C., 2010. Excess travelling—what does it means? Newdefinition and a case study of excess commuters in Tyne and Wear, UK. EuropeanTransportation Research Review 2, 69–83.
UNCO
RREC
TED
PROO
F
Habitat International xxx (2016) xxx-xxx 9
Batty, M., 2012. Smart cities, big data. Environment and Planning B: Planning & De-sign 39 (2), 191–193.
Batty, M., 2013a. Big data, smart cities and city planning. Dialogues in Human Geog-raphy 3 (3), 274–279.
Batty, M., 2013b. Urban modelling: A progress report. In: Symposium on applied ur-ban modelling AUM 2013. University of Cambridge.
Beijing Transportation Research Center, 2011. Annual report of Beijing's transporta-tion development (In Chinese). available at: http://www.bjtrc.org.cn/JGJS.aspx?id=5.2&Menu=GZCG. Accessed 01.09.15..
Blythe, P., 2004. Improving public transport ticketing through smart cards. In: Pro-ceedings of the Institute of Civil Engineers, Municipal Engineers, Vol. 157, pp.47–54.
California Planning Round Table, 2008. Deconstructing jobs-housing balance. Califor-nia Planning Roundtable, Sacramento, CA.
Cervero, R., 1991. Jobs-housing balance as public policy. Urban Land 10 (14), 11–14.Chu, K.K.A., Chapleau, R., 2010. Augmenting transit trip characterization and travel
behavior comprehension multiday location-stamped smart card transactions.Transportation Research Record: Journal of the Transportation ResearchBoard 2083, 29–40.
Froud, J., Johal, S., Leaver, A., Williams, K., 2002. Not enough money: The resourcesand choices of the motoring poor. Competition and Change 6 (1), 95–111.
Frumin, M., Zhao, J., 2012. Analyzing passenger incidence behavior in heterogeneoustransit services using smartcard data and schedule-based assignment. Transporta-tion Research Record: Journal of the Transportation Research Board 2274, 52–60.
Gobillon, L., Selod, H., Zenou, Y., 2007. The Mechanism of spatial mismatch. UrbanStudies 44 (12), 2401–2427.
Gregor, K., 2013. The rise of the ‘extreme commuter’. BBC News Magazine 26 De-cember.
Janosikova, L., Slavik, J., Kohani, M., 2014. Estimation of a route choice model for ur-ban public transport using smart card data. Transportation Planning and Technol-ogy 37 (7), 638–648.
Jiang, B., 2013. Head/tail breaks: A new classification scheme for data with aheavy-tailed distribution. The Professional Geographer 65 (3), 482–494.
Jones, C., 2012. Sour economy gives rise to extreme commuters. USA Today 16 Au-gust.
Kusakabe, T., Asakura, Y., 2014. Behavioural data mining of transit smart card data: Adata fusion approach. Transportation Research Part C-Emerging Technolo-gies 46, 179–191.
Landsman, L., 2013. NYC's ‘extreme commuting’ costs getting out of control. CNBCNews, 09 Nov. Available at: www.cnbc.com/id/101155916. Accessed 20.12.14.
Lee, S.G., Hickman, M., 2014. Trip purpose inference using automated fare collectiondata. Public Transport 6 (1/2), 1–20.
Liu, Y., Liu, X., Gao, S., Gong, L., Kang, C., Zhi, Y., et al., 2015. Social sensing: Anew approach to understanding our socioeconomic environments. Annals of theAssociation of American Geographers 105 (3), 512–530.
Long, Y., Liu, X., Zhou, J., Gu, Y., 2014. Profiling underprivileged residents withmid-term public transit smartcard data of Beijing. arXiv preprint arXiv:14095839.
Long, Y., Thill, J.C., 2015. Combining smart card data and household travel survey toanalyze jobs–housing relationships in Beijing. Computers, Environment and UrbanSystems (in press).
Lyons, G., Urry, J., 2005. Travel time use in the information age. Transportation Re-search A: Policy and Practice 39 (2–3), 257–276.
Ma, K., Banister, D., 2006. Excess commuting: A critical review. Transport Reviews:A Transnational Transdisciplinary Journal 26 (6), 749–767.
Marion, B., Horner, M.W., 2007. Comparison of socioeconomic and demographic pro-files of extreme commuters in several US metropolitan statistical areas. Trans-portation Research Record: Journal of the Transportation ResearchBoard 2013 (1), 38–45.
Ma, X.L., Wang, Y.H., Chen, F., Liu, J.F., 2012. Transit smart card data mining forpassenger origin information extraction. Journal of Zhejiang University ScienceC 13 (10), 750–760.
Meyer, M.D., Miller, E.J., 2001. Urban transportation planning, 2nd ed. McGraw-Hill,New York.
Mintz, Z., January 21, 2014. Night-shift work causes ‘Chrono-Chaos,’ irregular sleeppatterns may pose long-term health risks. International Business Times. Availableat: http://www.ibtimes.com/night-shift-work-causes-chrono-chaos-irregular-sleep-patterns-may-pose-long-term-health-risks. Ac-cessed 08.15.
Mohamed, K., Côme, E., Baro, J., Oukhellou, L., 2014. Understanding passenger pat-terns in public transit through smart card and socioeconomic data. UrbComp’. Aug24, 2014. New York City, NY, USA.
Moss, M.L., Qing, C., 2012. The emergence of the super-commuter. Rudin Center forTransportation. New York University Wagner School of Public Service (Febru-ary).
Pelletier, M.-P., Morency, C., Trépanier, M., 2011. Smart card data use in public tran-sit: A literature review. Transportation Research C 19, 557–568.
Rapino, M.A., and Fields, A. K. 2013. Maga commuters in the U.S. Working paperMarch 2013. Presented at the Association of Public Policy Analysis and Manage-ment Fall 2013 Conference.
Tao, S., Corcoran, J., Mateo-Babiano, I., Rohde, D., 2014a. Exploring Bus Rapid Tran-sit passenger travel behaviour using big data. Applied Geography 53, 90–104.
Tao, S., Rohde, D., Corcoran, J., 2014b. Examining the spatial–temporal dynamics ofbus passenger travel behaviour using smart card data and the flow-comap. Journalof Transport Geography 41, 21–36.
Taylor, B., Ong, P., 1995. Spatial mismatch or automobile Mismatch? An examinationof race, residence and commuting in US metropolitan area. Urban Studies 32 (9),1453–1473.
U.S. Census Bureau, 2005. Extreme commute rankings. Available at: http://www.census.gov/newsroom/releases/pdf/2005-03-30_Commute_extremes.pdf. Accessed20.12.14.
Weitzel, J., 2003. Jobs-housing balance. American Planning Association, Chicago.Yang, Z., Cai, J., Ottens, H.F.L., 2013. Cities, Vol. 31. 491–506. Beijing: city profile.Zhou, J., Long, Y., 2014. Jobs-housing balance of bus commuters in Beijing. Trans-
portation Research Record: Journal of the Transportation ResearchBoard 2418, 1–10.

![48216 Baack Final Proof [FM]](https://static.fdokumen.com/doc/165x107/631bfe5b3e8acd997705b218/48216-baack-final-proof-fm.jpg)