Journal Pre-proof
51
Journal Pre-proof The SARS-CoV2 envelope differs from host cells, exposes pro-coagulant lipids, and is disrupted in vivo by oral rinses Zack Saud, Victoria J. Tyrrell, Andreas Zaragkoulias, Majd B. Protty, Evelina Statkute, Anzelika Rubina, Kirsten Bentley, Daniel A. White, Patricia Dos Santos Rodrigues, Robert C. Murphy, Harald Köfeler, William J. Griffiths, Jorge Alvarez-Jarreta, Richard William Brown, Robert G. Newcombe, James Heyman, Manon Pritchard, Robert WJ. Mcleod, Arvind Arya, Ceri-Ann Lynch, David Owens, P Vince Jenkins, Niklaas J. Buurma, Valerie B. O’Donnell, David W. Thomas, Richard J. Stanton PII: S0022-2275(22)00041-4 DOI: https://doi.org/10.1016/j.jlr.2022.100208 Reference: JLR 100208 To appear in: Journal of Lipid Research Received Date: 12 February 2022 Revised Date: 23 March 2022 Accepted Date: 4 April 2022 Please cite this article as: Saud Z, Tyrrell VJ, Zaragkoulias A, Protty MB, Statkute E, Rubina A, Bentley K, White DA, Rodrigues PDS, Murphy RC, Köfeler H, Griffiths WJ, Alvarez-Jarreta J, Brown RW, Newcombe RG, Heyman J, Pritchard M, Mcleod RW, Arya A, Lynch CA, Owens D, Jenkins PV, Buurma NJ, O’Donnell VB, Thomas DW, Stanton RJ, The SARS-CoV2 envelope differs from host cells, exposes pro-coagulant lipids, and is disrupted in vivo by oral rinses, Journal of Lipid Research (2022), doi: https:// doi.org/10.1016/j.jlr.2022.100208. This is a PDF file of an article that has undergone enhancements after acceptance, such as the addition of a cover page and metadata, and formatting for readability, but it is not yet the definitive version of record. This version will undergo additional copyediting, typesetting and review before it is published in its final form, but we are providing this version to give early visibility of the article. Please note that, during the production process, errors may be discovered which could affect the content, and all legal disclaimers that apply to the journal pertain.
-
Upload
khangminh22 -
Category
Documents
-
view
1 -
download
0
Transcript of Journal Pre-proof

Journal Pre-proof
The SARS-CoV2 envelope differs from host cells, exposes pro-coagulant lipids, andis disrupted in vivo by oral rinses
Zack Saud, Victoria J. Tyrrell, Andreas Zaragkoulias, Majd B. Protty, Evelina Statkute,Anzelika Rubina, Kirsten Bentley, Daniel A. White, Patricia Dos Santos Rodrigues,Robert C. Murphy, Harald Köfeler, William J. Griffiths, Jorge Alvarez-Jarreta, RichardWilliam Brown, Robert G. Newcombe, James Heyman, Manon Pritchard, RobertWJ. Mcleod, Arvind Arya, Ceri-Ann Lynch, David Owens, P Vince Jenkins, Niklaas J.Buurma, Valerie B. O’Donnell, David W. Thomas, Richard J. Stanton
PII: S0022-2275(22)00041-4
DOI: https://doi.org/10.1016/j.jlr.2022.100208
Reference: JLR 100208
To appear in: Journal of Lipid Research
Received Date: 12 February 2022
Revised Date: 23 March 2022
Accepted Date: 4 April 2022
Please cite this article as: Saud Z, Tyrrell VJ, Zaragkoulias A, Protty MB, Statkute E, Rubina A, BentleyK, White DA, Rodrigues PDS, Murphy RC, Köfeler H, Griffiths WJ, Alvarez-Jarreta J, Brown RW,Newcombe RG, Heyman J, Pritchard M, Mcleod RW, Arya A, Lynch CA, Owens D, Jenkins PV, BuurmaNJ, O’Donnell VB, Thomas DW, Stanton RJ, The SARS-CoV2 envelope differs from host cells, exposespro-coagulant lipids, and is disrupted in vivo by oral rinses, Journal of Lipid Research (2022), doi: https://doi.org/10.1016/j.jlr.2022.100208.
This is a PDF file of an article that has undergone enhancements after acceptance, such as the additionof a cover page and metadata, and formatting for readability, but it is not yet the definitive version ofrecord. This version will undergo additional copyediting, typesetting and review before it is publishedin its final form, but we are providing this version to give early visibility of the article. Please note that,during the production process, errors may be discovered which could affect the content, and all legaldisclaimers that apply to the journal pertain.

© 2022 THE AUTHORS. Published by Elsevier Inc on behalf of American Society for Biochemistry andMolecular Biology.
1
The SARS-CoV2 envelope differs from host cells, exposes pro-coagulant lipids, and is
disrupted in vivo by oral rinses
Zack Saud†1, Victoria J Tyrrell†1, Andreas Zaragkoulias1, Majd B Protty1, Evelina Statkute1, Anzelika
Rubina1, Kirsten Bentley1, Daniel A. White1, Patricia Dos Santos Rodrigues1, Robert C Murphy2, Harald
Köfeler3, William J Griffiths4, Jorge Alvarez-Jarreta1, Richard William Brown8, Robert G Newcombe5,
James Heyman6, Manon Pritchard7, Robert WJ Mcleod6, Arvind Arya8, Ceri-Ann Lynch9, David Owens6,
P Vince Jenkins10, Niklaas J. Buurma11, Valerie B O’Donnell1*, David W. Thomas7*, Richard J. Stanton1*
1Division of Infection & Immunity, School of Medicine, Cardiff University, Cardiff, CF14 4XN, UK
2Department of Pharmacology, University of Colorado Denver, Aurora, CO 80045, USA
3Core Facility Mass Spectrometry, Medical University of Graz, Stiftingtalstrasse 24, 8010 Graz, Austria
4Medical School, Swansea University, Singleton Park, Swansea SA2 8PP, UK
5Division of Population Medicine, School of Medicine, Cardiff University, Cardiff, CF14 4XN, UK
6Division of Surgery, Cardiff and Vale University Health Board, Heath Park, Cardiff, CF14 4XN, UK
7Advanced Therapies Group, School of Dentistry, Cardiff University, Heath Park, Cardiff CF14 4XY, UK
8ENT Department, Betsi Cadwaladr University Health Board, Wrexham Maelor Hospital, Wrexham, LL13 7TD
9Anaesthetics and Critical Care Directorate, Cwm Taf University Health Board, Royal Glamorgan Hospital, Llantrisant, CF72 8XR
10Haemostasis Diagnosis and Research, University Hospital Wales, Cardiff, CF14 4XN, UK
11Physical Organic Chemistry Centre, School of Chemistry, Cardiff University, Main Building, Park Place, Cardiff, CF10 3AT
* Address correspondence to: Richard Stanton ([email protected]), Valerie O’Donnell (o-
[email protected]), or David Thomas ([email protected]).
†Authors ZS and VT contributed equally to this manuscript. Running title: Targeting the SARS-CoV2 lipid envelope Keywords: phospholipids, Lipidomics, Inflammation, virology, clinical trials, aminophospholipids, coagulation, mouthwash, cetylpyridinium chloride, CPC
Journ
al Pre-
proof
2
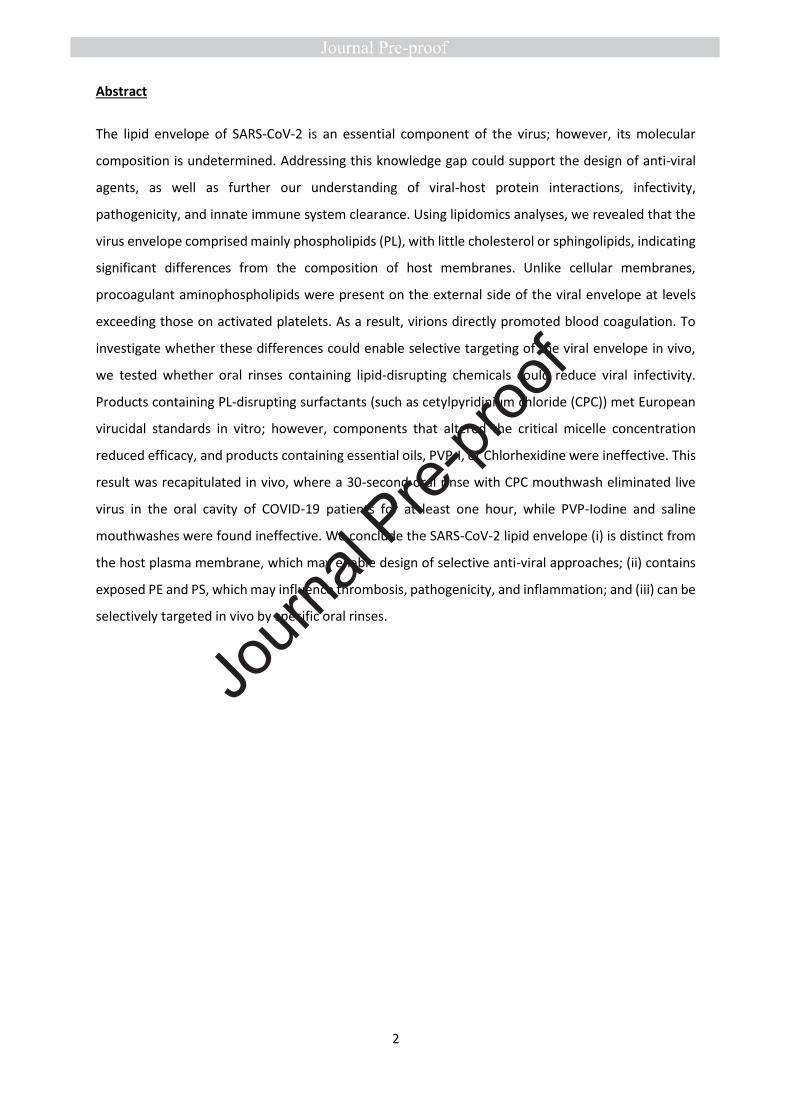
Abstract
The lipid envelope of SARS-CoV-2 is an essential component of the virus; however, its molecular
composition is undetermined. Addressing this knowledge gap could support the design of anti-viral
agents, as well as further our understanding of viral-host protein interactions, infectivity,
pathogenicity, and innate immune system clearance. Using lipidomics analyses, we revealed that the
virus envelope comprised mainly phospholipids (PL), with little cholesterol or sphingolipids, indicating
significant differences from the composition of host membranes. Unlike cellular membranes,
procoagulant aminophospholipids were present on the external side of the viral envelope at levels
exceeding those on activated platelets. As a result, virions directly promoted blood coagulation. To
investigate whether these differences could enable selective targeting of the viral envelope in vivo,
we tested whether oral rinses containing lipid-disrupting chemicals could reduce viral infectivity.
Products containing PL-disrupting surfactants (such as cetylpyridinium chloride (CPC)) met European
virucidal standards in vitro; however, components that altered the critical micelle concentration
reduced efficacy, and products containing essential oils, PVP-I, or Chlorhexidine were ineffective. This
result was recapitulated in vivo, where a 30-second oral rinse with CPC mouthwash eliminated live
virus in the oral cavity of COVID-19 patients for at least one hour, while PVP-Iodine and saline
mouthwashes were found ineffective. We conclude the SARS-CoV-2 lipid envelope (i) is distinct from
the host plasma membrane, which may enable design of selective anti-viral approaches; (ii) contains
exposed PE and PS, which may influence thrombosis, pathogenicity, and inflammation; and (iii) can be
selectively targeted in vivo by specific oral rinses.
Journ
al Pre-
proof
3
Introduction
The lipid envelope is critical to the structure and function of SARS-CoV2, as for all enveloped viruses,
such as influenza, HIV, herpes simplex virus, MERS and SARS-CoV (1,2). Yet despite this, the potential
of the envelope as an antiviral target has not been exploited, beyond being the target of handwashing
and gels, where soap or high concentrations of ethanol (>60%) dissolve the lipids and inactivate the
virus. This is in part because, unlike our extensive knowledge of the structure and function of the
proteins in the virion (1,2), there is no information on the lipid composition of the SARS-CoV2 envelope
– indeed, viral lipid envelopes overall are surprisingly unstudied, and their detailed lipid composition
unknown.
Coronaviruses bud from the endoplasmic reticulum/Golgi intermediate complex (ERGIC) and exit via
lysosomal secretion (3-8), thus the composition of the virion envelope may differ significantly from
plasma membrane, enabling selective therapeutic targeting that avoids damaging host membranes
(9). Furthermore, the envelope is not simply a structural component of the virion, with lipids
themselves being potent bioactive molecules. Mammalian cells maintain aminophospholipids (aPL),
such as phosphatidylethanolamine (PE) and phosphatidylserine (PS), in their inner plasma membrane
leaflet using energy-dependent enzymes, however these control mechanisms are not present in the
virus. This raises the possibility that the external face is enriched in PE and PS, which are highly pro-
thrombotic, and furthermore could directly promote virion uptake via apoptotic cell mimicry (10-16).
Indeed, a recent study showed that PS is present on the surface of the virions and that PS receptors
on host cells can support entry (17). However, that study relied on an ELISA method and neither the
amounts nor the molecular species of PS exposed were demonstrated, nor was the presence of PE
shown. Phospholipids (PL) such as lysophospholipids and sphingolipids/ceramides are pro-
inflammatory effectors (18,19), and can interact with complement to promote a pro-inflammatory
environment (3,11,20), while lysophospholipids signal through G-protein coupled receptors causing
immune cell migration and apoptosis (21-24). Understanding virion lipid composition therefore has
potential to inform our understanding of virus pathogenesis, dissemination, and how the virion
promotes transition from early infection to severe inflammatory thrombotic COVID19.
Following on from public health advice on handwashing, which disrupts the lipid envelope, we
considered whether similar approaches using formulations that are non-toxic in vivo could represent
potential anti-viral strategies directed at reducing SARS-CoV2 transmission, and published an evidence
review on this topic in 2020(25). The lipid membranes of enveloped viruses, including some
coronaviruses, had previously been shown to be sensitive to disruption by lipidomimetic agents and
surfactants(25). Thus, we hypothesised that the SARS-CoV2 virus might also be susceptible to
Journ
al Pre-
proof

4
inactivation by components in widely-available oral rinses, such as ethanol/essential oils,
cetylpyridinium chloride (CPC) and povidone-iodine (PVP-I)(25). If lipid-disrupting components in oral
rinses can dissolve the virion envelope, this approach could in theory reduce the risk to healthcare
workers or carers treating individuals asymptomatically (or symptomatically) carrying the virus. Early
in the pandemic, mouthwashes were employed empirically in outbreaks in China but without evidence
of efficacy (26). Since then, a series of studies have emerged indicating that some can inactivate SARS-
CoV2 in vitro, including a systematic review (27-32). Furthermore, a recent small study suggested that
oral rinsing could shorten hospital stay, while another suggested that oral and nasal rinsing could
reduce both disease and symptoms in healthcare professionals (33,34). Recently, WHO included a
recommendation that PVP-I could be used to reduce the risk of clinical transmission in dentistry
(https://www.who.int/publications/i/item/who-2019-nCoV-oral-health-2020.1). However, despite all
these encouraging studies, the relative efficacy and the persistence of mouthwashes in vivo is
currently unknown. Importantly, in order to most effectively target the virus in the oropharynx, a
detailed knowledge of the lipid composition is required, so that the most appropriate formulation is
selected.
To address these questions, we used lipidomics to provide the amount and molecular diversity of
envelope lipids and the levels of external facing aPL in virus cultured from two different cell lines. Our
data provides the first complete characterisation of a viral lipid envelope and shows a PL rich
membrane that also contains several lysoPL, but is relatively low in cholesterol, sphingomyelin (SM)
and other lipids. Sufficient aPL were present to enhance coagulation of plasma in vitro using live virus.
Following this, in vitro studies tested the interaction of varying lipid-membrane disrupting mouthwash
formulations and components. Importantly, only a subset of rinses demonstrated efficacy, specifically
those containing surfactant- and polar components. Furthermore, a randomised controlled clinical
study in COVID 19 patients showed the virucidal effect of a surfactant-containing rinse against SARS-
CoV2 in hospitalised patients. These studies demonstrate the accessibility and importance of lipids as
a potential target for anti-viral approaches, which is unlikely to be impacted by mutation of the virus.
They also suggest that targeting virus lipids in the oropharynx may be an important component of risk
management in healthcare during the COVID19 pandemic, and in the context of other enveloped
respiratory viruses including coronaviruses and seasonal influenza viruses in the future.
Journ
al Pre-
proof
5
Materials and Methods
Aqueous solutions CPC was dissolved in deionised water at 0.07% or 0.1% (w/v). For aqueous
solutions containing LAE, a 33 mM stock solution was prepared by dissolving 693.2 mg of N-ethyl
lauroyl arginate hydrochloride (Fluorochem, used as received) in deionised water (Elga Purelab Flex),
adjusting the pH to 7 using a NaOH solution (pH was determined using a Hanna Instruments pH210
microprocessor pH meter with a VWR simple junction universal combined pH/reference electrode)
and making up the solution to 50 mL. The required LAE solutions were then prepared by mixing 1 mL
of the stock solution and 9 mL of deionised water (3.3 mM), 3 mL of the stock solution and 7 mL of
deionised water (9.9 mM) and 1 mL of the stock solution, 6.7 mL of deionised water and 2.3 mL of
ethanol (3.3 mM LAE and 23 vol-% ethanol). For DBS, 807.4 mg 4-dodecylbenzenesulfonic acid,
mixture O (Merck Life Sciences UK, used as received) was dissolved in deionised water (Elga Purelab
Flex). The pH was adjusted to 6 using a NaOH solution (pH was determined using a Hanna Instruments
pH210 microprocessor pH meter with a VWR simple junction universal combined pH/reference
electrode) followed by making up the solution to 1 litre. The solutions of CPC in combination with
citrate and benzoate was prepared by dissolving ~0.11 g of CPC with 0.12 g of citric acid and/or 0.07
g of benzoic acid in deionised water, adjusting the pH as before, and making up to 100 mL. The solution
containing deionised water, ethanol and thymol was prepared by dissolving 0.1675 g of thymol in 50
mL of ethanol; 2.3 mL of this solution was combined with 7.7 ml deionised water. All commercial
mouthwash preparations are listed in Table 2.
Cells and viruses Virucidal assays utilised VeroE6 or A549 cells, a gift from the University of
Glasgow/MRC Centre for Virology, UK. To enhance infectivity and produce a more sensitive cell line
for detection of virus, both cell types were transduced with lentiviruses encoding ACE2 and TMPRSS2,
then drug selected as described (35). The England2 strain of SARS-CoV2 was provided by Public Health
England, and amplified in VeroE6 cells before being harvested from the supernatant. All cells were
grown in DMEM containing 2 % (v/v) FCS, and incubated at 37 °C in 5 % CO2.
Virucidal assays Virucidal activity of mouthwash was studied in media containing 100 μL mucin type
I-S, 25 μL BSA Fraction V, and 35 μL yeast extract to mimic oral secretions. 100 μL of this mixture was
added to 100 μL of virus suspension, and 800 μL of the test-product or medium as control. After 30
seconds, virucidal activity was neutralised by 10-fold serial dilution in ice-cold DMEM (containing 10%
FCS). Alternatively, virus was purified by size-exclusion chromatography (SEC) to prevent direct
cytotoxic effects of the products on the cell monolayer; 100 μL of the mixture was added to a
microspin S-400 HR column, and centrifuged for 2min at 700 x g. A 10-fold serial dilution was then
made of the flow-through in DMEM containing 10% FCS. Virus was titrated by plaque assay; serial
dilutions were used to infect VeroE6/ACE2/TMPRSS2 cells for 1 h. Following this, cells were overlaid
Journ
al Pre-
proof

6
with DMEM containing 2 % FCS, and 1.2 % Avicel®. After 72 h, the overlay was removed, and the
monolayer washed and fixed with 100% methanol. Monolayers were stained with a solution of 25%
(v/v) methanol and 0.5 % (w/v) Crystal Violet, then washed with water, and plaques were enumerated.
For measurement of toxicity, monolayers were similarly incubated, stained with crystal violet, and
scored by eye for live cells.
Harvest of virus particles and lipid extraction for lipidomics profiling Cells were infected with SARS-
CoV2 at MOI=0.01, when cells were 70% confluent, in either serum-free media (Vero cells) or at 2%
FCS (A549). At 96h post-infection, supernatants were harvested, cellular debris pelleted (2,000 xg,
5min), then virus pelleted through a 30 % sucrose cushion (25,000 rpm, 2.5 h, in a SW28 rotor (112,398
× g)). Pellets were resuspended in PBS, purified on a 20 – 60 % sucrose gradient (25,000 rpm, 16 h, in
a SW41 rotor (106,882 × g)), before being pelleted (35,000 rpm, 1 h, in a SW41 rotor (209,490 × g),
and resuspended as outlined below. All preparations were analysed for purity and abundance by
Nanoparticle tracking analysis using Nanocyte® (Malvern Panalytical), and by Western blot. For PS
externalisation, samples were used immediately. For lipidomic profiling they were used immediately
or stored for a few days at -80 ° as snap frozen pellets.
For untargeted and targeted lipidomics, virus particles were resuspended in 0.5 ml of PBS, which was
then spiked with 10 μl Splash mix (Avanti Polar Lipids), containing : d18:1-18:1(d9) SM (296ng), 15:0-
18:1(d7)PC (1.506μg), 15:0-18:1(d7)PE (53ng), 15:0-18:1(d7)PG (267ng), 15:0-18:1(d7)PI (85ng),
18:1(d7) Lyso PC (238ng), 18:1(d7) Lyso PE (49ng), cholesterol-d7 (984ng), CE 18:1-d7 (3.291μg) TG
15:0/18:1-d7/15:0 (528ng), 15:0-18:1(d7) PS (39ng) and 20ng of 17:1 Lyso PG. Samples were also
spiked with 5μl of ceramide/sphingoid internal standardmixII (Avanti Polar Lipids) containing 56.99ng
of d18:1/12:0 Ceramide. Samples were then extracted using a Bligh and Dyer method. Briefly, 1.9 ml
of solvent mixture 2:1 methanol:chloroform v:v was added to 0.5 ml sample. Samples were vortexed
for 30 sec, and then 0.625 ml of chloroform added. Samples were vortexed again (for 30 sec) and
0.625 ml of water then added. Samples were vortexed for 30 sec and centrifuged at 1500 rpm, at 4
°C, for 5 min. Lipids were recovered from the lower layer, and evaporated to dryness using a Labconco
RapidVap®. Extracted lipids were reconstituted in 200 μl methanol and stored at -80 °C until analysis.
Targeted LC/MS/MS analysis of lipid categories and classes. Targeted assays were performed on 3
separate culture preparations of gradient purified SARS-CoV2 virus, from either Vero or A549 cells (i)
Vero: For Preps 1 and 2, three technical replicates of the same extracted lipid samples were analysed
and averaged to give one set of mean values per Prep (n = 1 per prep). For Prep 3, three separate
extractions and analyses were performed (different virus particles in each extraction) and then values
averaged to give one value per lipid (n = 1). Combining Preps 1-3 gave n = 3 values for lipid molecular
Journ
al Pre-
proof

7
species. Standards for Ceramides (Cer) and DHCeramides (DHCer) were only included in Prep 3,
although these lipids were detected as present in all preparations. Data for Cer and DHCer are from
3 separate virus isolate extractions using Prep 3. (ii) A549. All samples had Cer and DHCer standards
included. Prep 1 was generated from an individual isolate, while Preps 2 and 3 arose from a larger
scaled up culture preparation, separated into Preps 2 and 3, prior to lipid extraction. Preps 1-3 were
analysed, giving n = 3 which was averaged to generate mean values. A full list of all lipids analysed is
shown in Supplementary Table 1, with data on extraction efficiency and instrument coefficient of
variation. Category specific figures show lipid molecular species comprising at least 2% of the signal
of the most abundant lipid in that class. We note that PEs annotated as plasmalogen (vinyl ether)
could also include isobaric ether lipids.
HILIC LC-MS/MS was used for PLs and sphingolipids (SL) on a Nexera liquid chromatography system
(Shimadzu) coupled to an API 6500 qTrap mass spectrometer (Sciex). Liquid chromatography was
performed at 35 °C using a Waters XBridge Amide column, 3.5μm, 4.6 x 150 mm, at a flow rate of 0.7
mL/min over 24 min. Mobile phase A was (water/acetonitrile 5/95; v/v and 1 mM ammonium acetate)
and mobile phase B was water/acetonitrile (50/50; v/v and 1 mM ammonium acetate). The following
linear gradient for B was applied: 0.1 % B – 6 % B over 6 min, 6 – 25 % B over 4 min, 25 – 98 % B over
1 min, 98 – 100 % B over 2 min. At 13.5 min, the flow rate changed to 1.5 ml/min and remained at
100 % B until 18.7 min where it returned to 0.1 % B. Flow rate then returned to 0.7 ml/min at 23.5
min. Source conditions for positive mode were IS 5.5 kV, CUR 35, TEM 550°C, GS1 50, GS2 60.
Negative mode source conditions were IS -4.5kV, CUR 35 psi, TEM 550°C, GS1 50 psi, GS2 60 psi. Dwell
time was calculated in Analyst automatically based on the number of MRMs. This is a scheduled
method with pos/neg switching throughout. PLs and ceramides were quantified using an external
calibration with the following standards, based on a single standard per class (Splash mix) since
structurally related lipids tend to closely elute on HILIC chromatography: d18:1-18:1(d9) SM, 15:0-
18:1(d7)PC, 15:0-18:1(d7)PE, 15:0-18:1(d7)PG, 15:0-18:1(d7)PI, 18:1(d7) Lyso PC, 18:1(d7) Lyso PE,
17:1 Lyso PG, 17:1 Lyso PI. PC’s, PE’s, PI’s, PG’s Lyso PG’s, Lyso PE’s and Lyso PC’s were quantified
from standard curves containing two primary standards each (with the exception of Lyso PE and Lyso
PG which had one primary standard each) (PC 16:0-18:1, PC 18;0-22:6, PE 16:0-18:1, PE 18:0-20:4, PG
16:0-18:1, PG 18:0-22:6, PI 16:0-18:1, PI 18:0-20:4, Lyso PC 16:0, Lyso PC 18:0, Lyso PE 16:0, Lyso PG
16:0). Ceramides were calculated from a standard curve generated by serially diluting the internal
standard. Sphingomyelins were calculated based on the following equation: (Area A/Area IS) * (ng IS
added). For confirming the absence of serum contamination of lipids in purified virus cultured from
A549 cells, blank isolates (medium+ 2% serum) were extracted and then analysed using direct
Journ
al Pre-
proof
8
injection precursor scanning MS/MS for the presence of PE (prec 196, -ve ion mode), PC (prec 184,
+ve ion mode) and CE (prec 369, +ve ion mode), comparing with virus lipid extracts.
Phosphatidylserine (PS) does not resolve well using the applied HILIC chromatography and was instead
analysed using a shotgun method to generate bulk species data. A neutral loss scan (NL 87) was
acquired in negative ion mode on the Sciex 6500 platform, to obtain a list of precursor PS species
present in the virus lipids. Samples were injected (10 l for Preps 1,3, 5μl for Prep 2) under flow
(mobile phase: methanol + 1 mM Ammonium acetate, 0.2 ml/min), with source and MS conditions as
follows: CUR 35, IS -4500, TEM 500, GS1 40, GS2 30, DP -50, CE -36, CXP -29. Once the main PS species
were identified, a multiple reaction monitoring (MRM) approach was used, monitoring precursor ions
(as determined by the NL precursor scan), to the NL fragment of m/z 87. These were quantified against
15:0-18:1(d7) PS, present in the splash mix. MRMs were as follows: m/z [M-H]- 758.6-671.5 (PS 34:2),
760.6-673.5 (PS 34:1), 774.6-687.5 (PS O-36:1), 786.6-699.5 (PS 36:2), 788.6-701.6 (PS 36:1), 810.7-
723.6 (PS 38:4), 812.7-725.6 (PS 38:3), 814.7-727.6 (PS 38:2), 816.7-729.6 (PS 38:1), 834.7-747.6 (PS
40:6), 836.7-749.6 (PS 40:5), 842.7-755.6 (PS 40:2).
LC-MS/MS for free cholesterol and cholesterol esters (CE) and LC-MS analysis of triacylglycerides (TG)
was performed on a Nexera liquid chromatography system (Shimadzu) coupled to an API 4000 qTrap
mass spectrometer (Sciex). Liquid chromatography was performed at 40 °C using a Hypersil Gold C18
(Thermo Fisher Scientific) reversed phase column (100 × 2.1 mm, 1.9 μm) at a flow rate of 0.4 mL/min
over 11 min. Mobile phase A was (water/solvent B 95/5; v/v and 4 mM ammonium acetate) and
mobile phase B was acetonitrile/isopropanol (60/40; v/v and 4 mM ammonium acetate). The following
linear gradient for B was applied: 90 % for 1 min, 90 – 100 % from 1 to 5 min and held at 100 % for 3
min followed by 3 min at initial condition for column re-equilibration. Samples were spiked with
cholesterol-d7 (984ng), CE 18:1-d7 (3.291μg) and TG 15:0/18:1-d7/15:0 (528ng) prior to extraction.
Triglycerides were analysed in selected ion monitoring (SIM) positive mode, covering a range from TG
32:0 up to TG 56:0 including also unsaturated TGs. MS conditions were: TEM 450°C, GS1 35 psi, GS2
50 psi, CUR 35 psi, IS 5 kV, declustering potential 60 V and entrance potential 10 V. Dwell time was 10
ms. TAGs were quantified using an external calibration with TG 15:0/18:1-d7/15:0. Free cholesterol
and CEs were analysed in MRM mode monitoring the precursor to product transitions of 12 CEs and
free cholesterol, as [M+NH4]+. MS conditions were as follows: TEM 150°C, GS1 25 psi, GS2 50 psi, CUR
35 psi, IS 5 kV, declustering potential 70 V, entrance potential 10 V, collision energy 20 V, and collision
cell exit potential 25 V. Dwell time was 100 ms for each transition. Cholesterol and CEs were quantified
using external calibration curves against the internal standards, with the following primary standards:
cholesterol, CE 14:0, CE 16:0, CE 18:0, CE 18:1, CE 20:4 and CE 22:6. For all targeted assays, inclusion
Journ
al Pre-
proof

9
criteria for peaks were those at least 5:1 signal-to-noise ratio, and with at least 7 points across the
peak.
All targeted lipidomics data were statistically analysed using Students T-test, followed by Benjamini
Hochberg correction where any lipid category had >20 variables. All statistical data is provided in
Source Data file.
Untargeted lipidomics Untargeted lipidomics was conducted using Vero culture Prep 3 (three
separate virus samples were extracted, and extracted blanks) on a Waters iClass liquid
chromatography system coupled to a Synapt XS QTOF (Waters), in resolution (21,500 FWHM pos,
19,000 FWHM neg) mode. HILIC liquid chromatography was performed at 35 °C using a Waters
XBridge Amide column, 3.5 μm, 4.6 x 150 mm, at a flow rate of 0.7 mL/min over 24 min. Mobile phase
A was (water/acetonitrile 5/95; v/v and 1 mM ammonium acetate) and mobile phase B was
water/acetonitrile (50/50; v/v and 1 mM ammonium acetate). The following linear gradient for B was
applied: 0.1 – 6 % B over 6 mins, 6 - 25 % B over 4 mins, 25 - 98 % B over 1 min, 98 – 100 % B over 2
mins. At 13.5 mins, the flow rate changes to 1.5 ml/min and remains at 100 % B until 18.7 min where
it returns to 0.1 % B. Flow rate then returns to 0.7 ml/min at 23.5 min. MS conditions were as follows
for analysis in negative ion mode: Capillary voltage 1.2kV, source temp 120° C, sampling cone 25,
desolvation temp 450 °C, cone gas flow 20, mass range 50 - 2000 amu, scan rate 0.5 sec. Lock mass
was Leucine Enkephalin m/z 554.2615. For analysis in positive ion mode: : Capillary voltage 1.5 kV,
source temp 100° C, sampling cone 30, desolvation temp 500°C, cone gas flow 30, resolution mode,
mass range 50 - 2000 amu, scan time 0.5 sec. Lock mass was Leucine Enkephalin m/z 556.2771. Prior
to feature analysis the data was processed using the Waters compression tool to reduce the noise,
changed to centroid using MassLynx and converted to .MZxml by the MSconvert module in
Proteowizard. Feature analysis was carried out using the HPLC/QTOF parameters in XCMS online(36).
The two resulting feature lists (positive and negative) were further processed using the Python
program LipidFinder 2.0 in its default configuration(37). This includes: solvent, ion fragments, salt
clusters, adducts, isotopes and contaminants as well as lipid stacks removal, and outlier and retention
time correction. The putative lipid profiling was done using LMSD on LIPID MAPS with 0.05 Da
tolerance, searching for "[M-H]-", "[M+H]+", "[M+Na]+", "[M+NH4]+", "[M+OAc]-" ions and
adducts. Next, all matches with deltaPPM >10 were manually removed. Matches to GL in negative
ion data, and matches to FA in positive ion data were removed and reassigned as unknowns, with
LMSD identifiers removed. In LipidFinder, to remove baseline noise from blanks, the mean of the blank
signals for each ion is subtracted from each lipid sample, where they match by RT and m/z value. Then,
every frame that is less than 3 times greater than the solvent mean for every sample is removed. After
processing, a manual step was also included where ions that were represented in blank samples at
Journ
al Pre-
proof

10
>15% the virus sample were judged to be background and removed. Retention time windows based
on standards were estimated as follows: lysoPE/PC 10-11 min, PE/PC 6-7 min, Lyso PI 10-12 min, PG
2-4 min, PI 8-10 min, LPG 4.5-5.5 min, MAG/TAG/DG 1-3 min, SM 9-11 min, Cer 1.5-3 min. Note that
many ions listed in unknowns are likely to be in source fragments, that will match LMSD entries, that
were moved to unknown since they are outside the expected RT window. Mass accuracy is broadly
considered down to 3 decimal places. Note that this is a largely unvalidated dataset and provided for
further information mining purposes. Data is in SupplementaryData2.xls
Identification and quantitation of external facing PE and PS on the surface of SARS-CoV2. Total and
external PE and PS were derivatised and analysed using LC/MS/MS as described previously(38). Briefly,
virus particles were suspended in 0.2 ml PBS and incubated with 20 μl of 20 mM NHS-biotin (total
PE/PS) or 86 μl of 11 mM EZ-Link Sulfo-NHS-biotin (external PE/PS) for 10 minutes at room
temperature before addition of 72 μl of 250 mM L-Lysine. Volumes were increased to 0.4 ml using
PBS. Vials containing 1.5 ml chloroform:methanol (1:2) solvent with 10 ng of internal standards
(biotinylated 1,2-dimyristoyl-PE and -PS) were used for lipid extraction. The solvent:sample ratio was
3.75:1 as a modified Bligh/Dyer technique (38). Following vortexing and centrifugation (400 g, 5 mins),
lipids were recovered in the lower chloroform layer, dried under vacuum and analyzed using LC-
MS/MS. Samples were separated on an Ascentis C-18 5 μm 150 mm × 2.1 mm column (Sigma Aldrich,
USA) with an isocratic solvent (methanol with 0.2 % w/v ammonium acetate) at a flow rate of 400
μl/min. Products were analysed in MRM mode on a Q-Trap 4000 instrument (Applied Biosystems, UK)
by monitoring transitions from the biotinylated precursor mass (Q1 m/z) to product ion mass (Q3 m/z)
in negative ion mode. The area under the curve for the analytes was integrated and normalized to
internal standards. The ratio of external to total PE/PS was calculated for each molecular species and
expressed as a fraction (%)externalised. MRM transitions monitored are provided in Table 5.
Comparative analysis of lipid species between categories. For the targeted assay, we first generated
quantitative data (ng/sample) for all lipids measured in all virus extracts. However, obtaining accurate
virus particle numbers, so that data can be converted to ng/particle number, proved difficult.
Standard measures of PFU are not useful since they do not correlate with particle numbers. We
attempted to use nanoparticle tracking analysis, however the accuracy of particle counts was
insufficient for our needs, potentially due to aggregation of virus particles following
ultracentrifugation. Our main question was whether lipid composition of individual virus preparations
varies when virus is propagated in different cells. For example, do they contain more PE or PC, or
other lipids, in terms of relative amounts. To answer this, we need to compare relative proportions
of lipid within the same virus preparations. To do this, we first converted ng values to molar amounts,
using a representative mass value for each lipid category (SM: 814, LPC: 523, PC: 757, LPE: 479, PE:
Journ
al Pre-
proof
11
775, PE-O: 775, PE-P: 775, LPG: 508, PG: 778, PI: 866, PS: 789, Chol: 386, CE: 652, TAG: 886). This then
allowed a direct comparison for all replicates and both preparations of virus both for total lipid
categories and within the categories themselves, without the need for accurate particle counts.
Assessment of coagulation activity by Activated Partial Thromboplastin Time (APTT). Due to logistics
of conducting assays with live SARS-CoV2 virus, we used a classical assay that doesn’t require specialist
equipment (39). Here, the activity of both intrinsic and extrinsic pathways of coagulation are
measured in re-calcified plasma activated on contact with a negatively-charged surface provided by a
glass test tube, and the ability of live virus to modulate coagulation was tested. Purified SARS-CoV2
virus was resuspended in PBS, then 50 µl added to 50 µl of normal pooled human plasma (Alpha
Laboratories, CCN-10), in a glass tube. As a negative control, 50 µl of PBS was added to plasma instead
of virus. Samples were incubated at 37 C for 1 minute, then 50 µl pre-warmed 20 mM CaCl2 added.
Samples were incubated at 37 C and the time until a visible clot formed was measured by visual
inspection using a stopwatch. Clot time is defined as any visual evidence for formation of a gel-like
structure, recognising that these can either be strong and stable, or looser. In control samples, the
fibrin clot was formed in around 2 min (120 sec).
Western blot Purity of gradient purified viruses was assessed by Western blot for spike protein (virus)
and actin (cells). Virions were resuspended in NuPAGE LDS sample buffer (Thermo) containing 10 %
dithiothreitol (DTT), then samples were loaded onto 14 % Tris-Glycine pre-cast gels (Biorad), and run
for 1 h at 20 V. Protein was transferred to nitrocellulose membranes by semi-dry transfer, blocked in
blocking buffer (5 % non-fat milk in PBST) for 1 h, then stained with primary antibody for 1 h at room
temperature. Membranes were washed, incubated with secondary antibody for 1 h at room
temperature, washed, developed with Supersignal West Pico (Thermo), and imaged using a G:Box
Chemi XX6 (Syngene). Antibodies were all diluted in blocking buffer, and were rabbit anti-actin (A2066,
Sigma-aldrich 1:2,000) and mouse anti-SARS-CoV2 Spike (Clone 1A9, Insight; 1:2,000), as well as anti-
mouse HRP or anti-rabbit HRP (GE Healthcare; 1:2,000).
Clinical study design. A four-arm, randomised controlled trial was conducted to study the
effectiveness of anti-microbial mouthwashes in vivo. Multicentre Research Ethics Committee
approval was obtained (IRAS285247; https://doi.org/10.1186/ISRCTN25647404) and all procedures
adhered to the Declaration of Helsinki. Original sample size was calculated based on reported
mouthwash activity against enveloped herpes virus; designed with a >80% power to detect a 2-fold
reduction in viral load(40). Plans for stopping data collection were established in advance; treatment
arms would be dropped at interim analysis for efficacy, if a >2-fold reduction in salivary viral load
(doi.org/10.1186/ISRCTN25647404) was observed Vs Normasol®. However, interim analysis was not
Journ
al Pre-
proof

12
possible as with 52 randomised patients recruited, only 15 samples contained live virus at baseline.
406 patients were screened for eligibility at 3 hospitals during a 6 month period. The majority were
deemed ineligible for inclusion (see CONSORT flow diagram). Following this, 78 individuals were
randomised to receive a mouthwash. On final analysis, 51/78 patients had no live SARS CoV2 in
baseline salivary samples and were excluded (see CONSORT flow diagram). No other patients were
excluded and no outlying data removed, leaving 27 patients. The primary and secondary endpoints
established prior to the study were: viral load of SARS CoV2 at 30 mins and viral load of SARS CoV2 at
1,15 and 60 mins (https://doi.org/10.1186/ISRCTN25647404). Sample collection was stopped after 6
months due to falling patient numbers and the data were independently analysed.
Briefly, following informed consent, in-patients with PCR-confirmed COVID-19 infection within the last
14 days, were recruited at the University Hospital of Wales, the Royal Glamorgan Hospital and Betsi
Cadwalader University Health Board in Wales UK. Participants were assigned to one of the four arms:
Dentyl Dual Action (CPC); Videne (povidone-iodine); SCD Ultra (CPC) or Normasol (sterile saline 0.9%
[w/v]) using a balanced randomisation scheme (provided by Dr Damian Farnell, Cardiff University).
Baseline saliva was collected into 30 mL Universal containers. The patient then rinsed their mouth for
30 seconds with 10 mL of the mouthwash. Saliva samples were then collected after 1, 15, 30 and 60
minutes into sterile 30 mL Universal containers. Anonymised samples were transported and stored
at -80oC and transferred to the approved BSL3 facility at Cardiff University where live virus was titrated
as above. Results were expressed as log2 fold change from baseline. Clinical and research staff
involved in sample collection and laboratory analysis were blinded as to which product was which.
Statistical analysis for clinical study: At termination of the study, blinded data was analysed by an
independent observer (RGN) who was not involved in the design of the clinical trial or randomisation.
All original data on viral load (PFU/mL of saliva), together with the Log2 fold change in from baseline
to 60 minutes post-treatment is presented. The viral load from baseline to 60 minutes post-treatment
was used to calculate a geometric mean ratio (mean change from baseline to post-treatment). Data
was then log transformed. Where virus was not detected, zero values were replaced with 4, just below
the lower limit of detection for the assay (5 PFU/ml). Lower and upper confidence limits from the
relevant mean and SD on the transformed scale and t and p-values were determined using unpaired t
test (Table 5).
Journ
al Pre-
proof

13
Results The SARS-CoV2 envelope from Vero or A549 cells is phospholipid (PL) rich and varies depending on
cellular origin.
SARS-CoV2 England 2 strain was grown in VeroE6 or A549 monolayers and purified using density
gradient centrifugation. A549 stably expressed ACE2 and TMPRSS2 to enhance infectivity (35). Purity
of virus was confirmed by Nanoparticle tracking analysis, with a single peak observed at approximately
100nm (Figure 1 A), and by western blot demonstrating absence of actin as a cellular marker from the
purified virus (Figure 1 B, Supplementary Figure 1 A,B). The absence of serum lipid contamination in
purified virus was confirmed using precursor scanning for PE, PC and CE (data not shown).
Viral lipid extracts were analysed using lipidomics, including targeted (virus from both cell types) and
untargeted (Vero cell virus only) to provide a comprehensive map of molecular composition and
abundance. First, targeted LC/MS/MS was used to analyse ~500 individual molecular species, in
triplicate for each cell type. Across the two separate preparations (Vero vs A549), ~260 lipids were
reproducibly detected. The full list of species analysed, and the dataset is provided in Supplementary
Data. These data are first shown with lipids grouped into their respective categories (Figure 1 C). Here,
data were converted to relative abundance in mol%. This was calculated using a generic mass value
for each category of a typical molecular species. Overall, the virus envelope was primarily comprised
of PL from several categories, with the most abundant for both preparations being
phosphatidylcholine (PC), phosphatidylethanol (PE) and phosphatidylinositol (PI), along with several
respective lyso, and ether/plasmalogen forms. Ether/plasmalogen PEs were relatively abundant
when compared with acylPEs. Smaller amounts of phosphatidylserine (PS) and phosphatidylglycerol
(PG) were seen. There was a low abundance of other lipids such as sphingolipids, including
sphingomyelin (SM), ceramide (Cer), dihydroceramides (DHCer), and also cholesteryl esters (CE),
triacylglycerides (TAG) and free cholesterol (Figure 1 C). This pattern overall was quite consistent
across both virus preparations. However, looking in more detail, some clear differences were also
apparent, depending on cell of origin. Comparing A549 with Vero-derived virus, a higher proportion
of PI versus PC was seen, along with a higher ratio of etherPE (PE-O), but lower PC and diacylPE (Figure
1C). Some significant differences in low abundance lipid categories such as Cer/DHCer, LPE, PS and
TAGs were also seen (Figure 1 C insets).
The SARS-CoV2 membrane contains low amounts of cholesterol, SM and PS, relative to other PL.
Next, mol% was calculated for PL and sphingolipids only, since this allows comparison with older
studies on composition of intracellular membranes of mammalian cells, which used thin layer
Journ
al Pre-
proof

14
chromatography coupled with phosphate analysis to measure these lipid categories (Table 1).
Unfortunately, very few studies on cell membrane composition exist and these used older methods
very different to LC/MS/MS, as well as very different cell types. Nonetheless, it is useful to compare
these with SARS-CoV2, as shown in Table 1 (see Discussion). For both virus preparations, the molar
ratio of cholesterol:PL was similar, at 0.0005 or 0.00061 mol:mol, A549 or Vero, respectively. This
indicates that the membrane is virtually devoid of cholesterol, in combination with a high PL content.
Additionally, the mol% of SM and PS are relatively low (Table 1). Overall, the data characterises SARS-
CoV2 as a membrane highly enriched in PL, primarily PE, PC and PI.
Next the individual molecular species within categories were compared. Within each cell type, the
levels of specific lipids were very similar, indicating that the viral lipidome is relatively stable (Figure
2, 3A). However, significant differences were seen between Vero versus A549-derived virus across
many lipids, when comparing fatty acyl (FA) composition (Figure 2,3A). Consistently, levels of PL with
the low abundant FA 20:1 and 20:2 were more predominant in Vero than A549 cells, across PE, PG
and PI lipids. The pattern was reversed for 20:3 and 20:4, which were more abundant in A549 cells
for PE and PI species of PL (Figure 3 B). Aside from this, for more abundant PL species, the pattern
was variable with some higher in Vero and others higher in A549 cells (Figure 2, 3A). Notably, for
both virus preparations, the most abundant FAs detected were 16:0, 18:0, and 18:1 (Figure 2, 3A).
This profile was maintained strongly across all PL classes, as well as lysoPLs.
Generation of an untargeted lipidomics dataset for future lipid mining.
Next, to generate an untargeted dataset, virus lipids from Vero cultures were separated using
hydrophilic interaction liquid chromatography (HILIC) in triplicate, subtracting extracted blanks,
scanning from 50-2000 amu, at 20K resolution. Retention time windows were identified using internal
standards for PC, PE, PG, PI, lysoPC, lysoPE, lysoPG, lysoPI, glycerides, SM and Cer. Since electrospray
ionisation high resolution mass spectroscopy (ESI-HRMS) runs contain large numbers of artefactual
ions including in source fragments, isotope peaks, common contaminant ions in blanks, salt clusters,
ion stacks and other features, two informatics approaches were applied to clean up the dataset. First,
XCMS was used to align and integrate peaks, before a full clean up using LipidFinder 2.0 was performed
(36,37). LipidFinder is designed to remove as many of these artefacts as possible while retaining real
lipids, and also subtracts blank signals to correct for background. Large numbers of ions were returned
in the dataset and putative matches are provided from the LIPID MAPS Structure Database (LMSD)
Bulk search, mapped to the LIPID MAPS classification (41,42) (Supplementary Data2.xls). Using
internal standards, we isolated ions matched to specific categories as described above, and putative
matches that fell outside retention time windows were moved to the Unknown category, and names
Journ
al Pre-
proof
15
removed. Since this analysis is based on precursor mass only, bulk annotation should be used, and
putative matches are provided as unvalidated examples of potential structure, where shorthand
annotation is not available (e.g. prenols, polyketides, saccharolipids) (42). We recommend if this data
is to be used that investigators rigorously confirm structures of interest using MS/MS and we would
be able to provide lipid extracts on request in order to help such an endeavour.
Overall, our lipidomics data establish SARS-CoV2 membrane as highly enriched in PL, particularly PC,
PE and PI, but with rather low levels of cholesterol, PS and SM. They also show that the membrane is
influenced to some extent by the host cell of origin in relation to specific molecular species of lipids
detected.
The SARS-CoV2 lipid membrane external leaflet is unable to maintain asymmetry of
phosphatidylethanolamine (PE) and phosphatidylserine (PS).
Mammalian membranes maintain asymmetry via the action of flippases and floppases which retain
aPL on the inner membrane (43). Here, we determined the proportion of PE and PS molecular species
on the surface of viral particles using derivatisation-LC/MS/MS (38). Adding together the molecular
species measured, the external levels of aPL were 48% or 52% for virus from A549 or Vero cells
respectively. However, for Vero cells, the % of PS externalised was consistently lower, around 27%,
versus 56% for A549, with the level of PS 18:1_18:1 being significantly reduced (Figure 4 A). For PE,
the overall external levels were 52% for both cell types. Generally, the pattern of external aPL was
similar for both virus preparations, with around half of the aPL being exposed on the external leaflet
(Figure 4A). Thus, unlike mammalian cells, SARS-CoV2 particles are unable to maintain asymmetry of
aPL. As a comparison, we previously showed that when platelets are thrombin activated, calcium-
dependent scramblase externalises PE/PS, to only around 3-4 mol%, from around 0.2-0.5%
basally(43). This is sufficient to support complete binding and activation of coagulation factors,
leading to haemostasis and thrombosis(43). Thus, considering the total virus levels of PE and PS
(Figure 1 C), with the proportions detected externally (Figure 4 A), these particles will expose some
external facing PS, along with very high levels of external PE, far higher than would be present on
platelets during physiological or pathological haemostasis.
SARS-CoV2 virions enhance plasma coagulation.
Given the key role of external facing PE and PS in together supporting blood clotting, we next tested
whether virus could regulate the ability of plasma to coagulate in vitro. Gradient purified virions were
added to plasma in the presence of CaCl2 and the Activated Partial Thromboplastin Time (APTT) was
measured as outlined in Methods. Here, the presence of a glass surface stimulates the “contact” or
Journ
al Pre-
proof

16
intrinsic pathway, resulting in a cascade of factor activation and eventually fibrin clot formation.
Virions dramatically reduced the time taken for clot formation in a concentration dependent manner,
at minimum concentrations of ~6x10⁵ PFU/ml (Figure 4 B). Although data is not available on blood
virus levels in severe disease, we note that the levels able to enhance clot formation are well within
the range of levels detected in saliva, BAL and subglottic aspirates in patients, who frequently carry
loads of 106-107, and can even be above 108 PFU/ml (44).
Lipid-disrupting oral rinses reduce viral infectivity in vitro achieving EN14476 virucidal standards.
Having characterised the envelope composition, we next investigated whether it was possible to
disrupt the lipid envelope using oral rinses that have been designed to be antimicrobial, but also
contained constituents potentially capable of targeting generic PL based membranes. To define
biological activity, we assessed viral infectivity in vitro, in the presence of a soil load to mimic the
components of the nasal/oral cavity. To examine the activity of a range of products, seven
formulations were tested (Table 2) including rinses containing cetylpyridinium chloride (CPC, Dentyl
Dual action, Dentyl Fresh Protect, SCD Ultra), chlorhexidine (Corsodyl), ethanol/ethyl lauroyl arginate
(LAE) (Listerine®Advanced Defence Gum Therapy), ethanol/essential oils (Listerine®Cool Mint) and
povidone iodine (Videne). The impact of a 30 second exposure of virus to rinse formulation was
assessed by plaque assay.
The assay was optimised to: (i) exclude potential for mouthwash to interfere with plaque assay
through direct toxicity towards host cells, (ii) prevent persistence of effect on virus beyond the 30 sec
exposure time and (iii) consider the choice of soil load to best model human oropharynx conditions.
An important refinement was the use of VeroE6 which stably overexpress ACE2 and TMPRSS2. This
significantly improves viral infectivity, with SARS-COV2 entering >1log10 more efficiently than
parental VeroE6, significantly enhancing assay sensitivity (35). Rather than BSA alone, our soil load
comprised mucin (type I-S), BSA and yeast extract (as in (29)) to better mimic the charged polymeric
mucin matrix lining the oral and nasal mucosa. Mucin type I-S is generated in salivary glands and
interacts with oral mucosa, food and microbiome. To exclude a direct impact of mouthwash on cells,
host cell viability was measured with/without the addition of dilutions of mouthwash for 1 hr (the
time taken to infect the cells with SARS-CoV2), in the absence of virus, but the presence of soil load.
Five of the seven products reduced cell viability when added undiluted. This cytotoxicity was
concentration-dependent and reduced via serial-dilution (Figure 4 C). To address this problem, size-
exclusion chromatography (SEC) was employed to remove mouthwash from virus prior to plating on
cells. This also ensured that anti-viral activity did not continue while virus was diluted and titrated.
Purification of the virus on S-400 HR Microspin® columns under control conditions (no mouthwash),
Journ
al Pre-
proof

17
resulted in minimal (3.5-fold) loss of infectivity (Figure 4 D). When mouthwashes (without virus)
underwent SEC, the flow-through was non-toxic against the cell monolayer for all products with the
exception of SCD Ultra (Figure 4 C). SEC was therefore used for all in vitro mouthwash testing. These
optimisations enabled the detection of a >5-log10 decrease in virus titre, with the exception of SCD
Ultra for which a >4-log10 decrease was measurable. This is above the 4-log10 reduction in activity
specified by EN14476, allowing the testing of mouthwash to international virucidal standards, as
detailed below.
Next, the ability of mouthwash to reduce virus infectivity, after a 30-second exposure in a soil load,
was tested using the optimised plaque assay. Two CPC-containing mouthwashes (Dentyl Dual Action,
Dentyl Fresh Protect) and a mouthwash containing 23% v/v ethanol/LAE (Listerine® Advanced DGT)
eradicated the virus completely, giving >5-log10 reduction in viral titres, and thus met EN14476 as a
virucide. In contrast, only moderate effects (~3-log10 fold reduction) were observed with PVP-I
(Videne), CPC/sodium citric acid/benzoate (SCD Ultra) and 21 % v/v alcohol/essential oils (Listerine®
Cool Mint) (Figure 4 E), which failed to meet EN14476. Chlorhexidine (Corsodyl; <2 log10 fold
reduction) was least effective.
Oral rinse formulations exhibit differential selectivity in virus- and host cell inactivation.
For products with antiviral activity, it is relevant to determine selectivity for the virus as opposed to
host cells, since potential toxicity in vivo should be considered. We showed that the SARS-CoV2
membrane is similar to ER/Golgi in terms of PL composition (Table 1), and unlike plasma membrane is
extremely low in cholesterol and SM. However, whether this is sufficient to reveal differential impacts
of oral rinses needed to be experimentally determined. We compared the sensitivity of VeroE6 cells
with SARS-CoV2 virions, to dilutions of the two formulations showing the highest efficacy i.e. CPC
(Dentyl Fresh Protect) or ethanol/LAE (Listerine®Advanced DGT) following 30 second exposure in the
presence of soil load (Figure 4 F). In vitro cell toxicity varied 8-fold between the virucidal mouthwashes
(Dentyl Fresh Protect and Listerine® Advanced DGT). Listerine® Advanced DGT showed higher
selectivity for virus over cultured cells than Dentyl Fresh Protect, as shown by calculated IC50s (Figure
5 A) which was approximately 2 times more potent at inactivating virus (Figure 4 F). Thus, while
neither product demonstrated a high selective index for virus versus cells, the SARS-CoV2 envelope
lipid composition may, in principle, enable selection of more targeted formulations with lower impact
on host cells.
Surfactants in oral rinses provide the strongest antiviral effects.
Despite all mouthwashes containing antibacterial compounds, they demonstrated widely varying
abilities to inactivate SARS-CoV2, indicating that careful selection for clinical use may be important.
Journ
al Pre-
proof
18
To determine which components were responsible for this activity, SARS-CoV2 was exposed to active
constituents (alone or combined) from the relevant rinses, using concentrations found in individual
formulations (Figure 5 B, Table 2). CPC, the active component in Dentyl Fresh Protect, eradicated live
virus at both concentrations tested (Figure 5 B). Dentyl Dual Action contains CPC/isopropyl myristate
(IPM) in a biphasic aqueous-oil system that requires shaking before use. CPC is predominantly in the
aqueous phase, while IPM is predominantly in the oil layer. The fully-shaken rinse completely
eradicated live virus (Figure 5 B). The aqueous CPC layer (without prior mixing) was also effective, as
was the aqueous layer obtained after shaking followed by 2 min settling (to ensure IPM saturation of
the CPC layer) (Figure 5 B). Thus, CPC alone can eradicate SARS-CoV2 and IPM isn’t required.
Listerine®Advanced DGT contains ethanol at 23 % v/v and LAE (3.3 mM), while other formulations
(e.g. Listerine®Cool Mint) contain ethanol with essential oils: thymol, menthol and eucalyptol. Whilst
23 % v/v ethanol alone had no consistent impact, the addition of thymol (5 mM) resulted in a 3-log
reduction in virus titres (Figure 5 B). This indicates that Listerine®Cool Mint reduces virus titres due to
the essential oils, with ethanol mainly providing oil solubility. Aqueous solutions of LAE below (3.3
mM) and above (9.9 mM) the critical micelle concentration (cmc, 4.9 mM (45)), completely eradicated
SARS-CoV2, mirroring the potent anti-viral activity of Listerine® Advanced DGT, which contains 3.3
mM LAE (Figure 5 B). This was seen with or without 23 % ethanol inclusion, indicating that LAE is
responsible for the antiviral activity of this product. To determine the potential effect of charge on
molecular interactions with the viral lipid membrane, in addition to CPC and LAE (cationic surfactants),
the effect of the anionic surfactant dodecylbenzensulfonate (DBS) was tested and found to completely
eradicate infectivity (Figure 5 B).
One mouthwash (SCD Ultra) showed only a 3-log reduction in virus titres despite containing CPC
(Figure 4 E). This formulation also contains citrate and benzoate. When these were separately added
to CPC, citrate had no effect, however benzoate reduced the ability of CPC to kill virus (Figure 5 C).
Therefore, while surfactants such as CPC are essential for antiviral activity, additional mouthwash
components may reduce this effectiveness in inactivating SARS-CoV2.
CPC-containing mouthwashes reduce the salivary viral load of SARS-CoV2 in COVID 19 patients
Although a subset of mouthwashes were effective in vitro, it was important to determine their
effectiveness in vivo, where virus is being shed continually in the oropharynx. A randomised clinical
trial was undertaken to measure the antiviral efficacy of mouthwashes following a 30 second rinse.
78 hospital in-patients with PCR-diagnosed COVID 19 were recruited, following invitation of over 400
to participate. Despite a positive PCR test in the preceding 14 days, only 27/78 patients had live SARS-
CoV2 present in their baseline saliva. Recent studies show that live virus is almost never detected
Journ
al Pre-
proof
19
beyond 9 days post-symptom onset in immunocompetent patients (48). As our patients were ill
enough to be admitted to hospital, many were likely beyond this timepoint. Unfortunately, this was
not known at the time sample collection was initiated and only became evident towards the end, with
the study terminated at 6 months. By then, new UK daily cases had decreased from 55,892 (31st Dec
2020) to 4,052 (31st March 2021), hospitalised patient numbers were declining and co-morbidity and
ventilatory support in these patients rendered them ineligible for randomisation
(https://coronavirus.data.gov.uk), making further recruitment impossible. Amongst patients with
live virus, saliva was collected before rinsing (baseline), and at 1-, 15-, 30-, and 60-minutes post-
rinsing, with mouthwashes containing either containing CPC/IPM (Dentyl Dual Action, n = 8),
CPC/benzoate (SCD Ultra, n = 7), PVP-I (Videne, n = 6) or 0.9% w/v NaCl (Normasol, n = 6). Data is
shown as both log2-fold reduction from baseline (Figure 5 D) and as individual patient data (Figure 6).
Across the entire cohort, baseline salivary viral load varied widely, from 120 PFU/ml to 2.8 x 10⁷
PFU/mL (Supplementary Data1.xls). All four mouthwashes reduced salivary viral load 1-minute post-
rinsing, with the smallest reduction being from Normasol® (median 3.9 log2 fold reduction from
baseline) and the largest Dentyl Dual Action where 6/7 patients recorded no live virus (median 14.3
log2 reduction from baseline) (Figure 5 D, Tables 3,4). The persistence of the effects varied with rinse.
No significant reduction in salivary viral load was seen with Videne at any of the time-points, while for
Normasol® a significant reduction was apparent only at 60 minutes. For SCD Ultra, a significant
reduction in viral load was seen at 1 minute only (median 8.9 log2 reduction from baseline, Figure 5
D). Dentyl Dual Action was the only product to demonstrate a persistent effect, with a significant
reduction evident throughout at 1, 15, 30 and 60 minutes respectively (medians 14.3, 11, 8.8, 9, log2
reduction from baseline). Impressively, in 3/8 patients treated with Dentyl Dual Action, no live virus
was recovered at any timepoint after the initial rinse (Figure 6).
Journ
al Pre-
proof

20
Discussion
While vaccines and antivirals have targeted the proteins or replication cycle of SARS-CoV2, there has
been very little research into the lipid envelope to date. Indeed, there is very little known about lipid
membranes of any enveloped viruses, hindering development of strategies targeted directly at the
lipids themselves. To address this information gap, a lipidomic analysis of the viral membrane using
untargeted and targeted approaches was undertaken. Old studies using thin layer chromatography
and total phosphorous analysis, reporting mol% values of rat liver membranes, suggest that PS and
SM are enriched in mammalian plasma membranes, versus ER membrane (9,49) (Table 1). On the
other hand, PC and PI are enriched in ER vs plasma membrane (9,49). Golgi membranes are generally
intermediate between ER and plasma membrane in terms of mol% composition, and are mainly
comprised of PC, PE and PI. The cholesterol/PL ratio is highest for plasma membrane, and very low for
ER (Table 1). Coronaviruses have long been known to be generated on the ERGIC membrane (3-8),
however, how this related to their lipid composition was so far unknown.
Here, we found that the SARS-CoV2 membrane is primarily comprised of PC, PE and PI, while having
low levels of free cholesterol, PS and SM. This appears most similar to ER, although with even lower
proportion of PS, SM and cholesterol than previously reported for that membrane compartment,
using older methods. In the mammalian plasma membrane, cholesterol is often concentrated in
specialised regions which support receptor dependent signalling, called lipid rafts (50). Our data
suggest these will be absent from the viral envelope. Furthermore, the cholesterol in plasma
membranes regulates fluidity and reduces permeability to small molecules, while SM is also important
for reducing fluidity(51-53). Thus, the viral envelope and plasma membrane will be very different
biophysically. Similarly, bacterial membranes are also considered to be devoid of cholesterol. In this
context, this is exploited therapeutically since cholesterol protects host cells from disruption by anti-
microbial peptides which directly insert in the bacterial membrane (54). Having described the virion
envelope in detail, it is now possible to test targeted strategies using liposomes that mimic the SARS-
CoV2 membrane, for example by generating liposomes with the exact lipid molecular composition.
Furthermore, we demonstrate that the virion membrane contains lysoPL, from PG, PE and PC, noting
that these are known bioactive lipid signalling mediators, and their presence in the envelope could
impact on host inflammatory responses to infection. It was recently reported that coronaviruses exit
via lysosomal secretion instead of the biosynthetic secretory pathway(55). Lysosomes contain high
levels of SM and cholesterol (Table 1), thus the lack of these lipids indicates that lysosomal passage of
virus doesn’t appear to impact envelope composition. Examining the different lipid categories at the
molecular species level, a high proportion of saturated/monounsaturated FAs were noted, with little
Journ
al Pre-
proof

21
PUFA evident. This most likely reflects the typical FA composition of cultured cells which tend to be
lower in PUFA than primary tissues. In human disease, the SARS-CoV2 virus will be actively replicating
in oral, nasal and airway epithelia. Studies on airway and tracheal cells have shown their FA
composition to be similar to what was seen here, but with significantly more 18:2 and 20:4, which
becomes lowered during cell culture (56,57). Thus, virus generated in human airways in vivo may have
more PUFA than found herein, but this remains to be determined. Notably, we found significant
differences in SARS-CoV2 virus lipids, depending on the host cell in which they were generated. This
may relate to subtle differences in host cell ER membranes between the cell types. Importantly,
inflammation has a significant impact on host cell lipid metabolism, and how this influences virion
envelope composition now needs to be tested. Furthermore, whether lipid composition is different
in other strains of SARS-CoV2 is also unknown. This question is being currently addressed for multiple
variants of concern (VOC) in our laboratory.
Here, we showed that SARS-CoV2 exposes around 50% of its total molecular species of aPL on the
surface of the particle (Figure 4B). As a caveat of the method, membrane proteins or sugars could in
theory hinder derivatisation of aPL, and so this value may be a lower-level estimate. In primary cells,
energy-dependent processes maintain asymmetry of plasma membranes. This ensures that very low
mol% of PE and PS are exposed on the surface, for example, only 3 - 4 % is present on platelets
following thrombin activation (43). This is because PE and PS promote coagulation, complement
binding and uptake of apoptotic cells through their electronegative interactions with Ca2+ ions and
various proteins (3,20,43). Although the overall amounts of PS appear to be rather low in virions, PE
levels are similar to plasma membrane (Table 1). Thus, exposure of 50 % of aPL on the surface will
result in levels of external PE that are around 12-fold-higher than activated platelets(43). In line with
this, we found that purified virions significantly accelerate plasma coagulation in vitro (Figure 4 B),
although we stress that in vivo there will be many sources of membrane in inflamed tissue in COVID
which may contribute to thrombosis. In addition, a recent study showed (using a less specific ELISA)
that levels of PS on the surface of SARS-CoV2 are sufficient to support PS-receptor dependent viral
entry (17). Our work extends this significantly by reporting on the ng amounts of PS and PE present,
the proportions of PE and PS that are externalised, and the specific molecular species of PE and PS in
the membrane. In addition to SARS-CoV2, PS has been implicated in the cellular uptake of several
other viruses, thus knowing how much and which molecular species are external facing on the
envelope is relevant to other infectious diseases (10-16). In summary, our study and others suggest
that targeting aPL could support anti-thrombotic, anti-inflammatory or anti-viral strategies for
COVID19.
Journ
al Pre-
proof
22
Our findings could also be relevant for other enveloped respiratory viruses such as influenza which
has long been considered to trigger thrombotic complications of atherosclerosis, including myocardial
infarction. Winter peaks in influenza are often followed two weeks later by a peak in ischemic heart
disease, hypertension and cerebrovascular disease deaths. Furthermore, many acute vascular events
follow upper respiratory infections (reviewed in detail in (58)). A recent study found that emergency
department visits for respiratory illness were both associated with, and predictive of, cardiovascular
disease mortality in adults >65 yrs (59). Furthermore, in a meta-analysis, influenza vaccination was
associated with lower risk of adverse cardiovascular events (60). The mechanisms are unknown and
a vascular inflammatory component is very likely to play a role. Thus, other enveloped viruses are
also strongly associated with thrombotic events, however whether virions themselves directly
contribute to coagulation has never been evaluated. Future studies are now needed to investigate
whether the virus membranes and/or particles in the circulation could contribute to coagulation, and
which membranes support coagulation during infection, including blood cells and inflamed tissue.
SARS-CoV-2 RNAemia has been reported in severe cases (61), and whilst it is unclear whether this
represents virus particles, both viral genome and proteins have been detected broadly distributed
throughout the body; indicating at least some systemic transfer in severe disease (62-64). These
studies will also need to delineate the molecular mechanisms involved, including the participation of
PS/PE. Nevertheless, knowing the levels and proportion of PE and PS on the outside of the virion
envelope is a novel finding that will help further our understanding of the biology of the virus, and
could be applicable to other respiratory enveloped viruses, such as influenza.
Having determined the composition of the lipid membrane, we next tested the impact of common
mouthwash formulations, focusing on surfactants which we reasoned would effectively target a PL-
rich membrane. Our data significantly extends other recent studies on enveloped viruses. For
example, dequalinium/benzalkonium chloride, PVP-I and ethanol/essential oils reduced SARS-CoV2
infectivity in vitro by up to 3-log10 (29), while infectivity of HCoV229E was reduced by 3-4-log10 using
CPC, ethanol/essential oils and PVP-I (27,30). Also, a moderate (3-log10) antiviral effect of
thymol/ethanol is consistent with an in vivo study on Listerine®Cool Mint against HSV
(40,65). However up to now, only one of the products (Listerine®Antiseptic, 26.9% ethanol/essential
oils) has achieved 4-log10 kill required to pass EN14476 as a virucidal, although this was tested against
HCoV229E rather than SARS-CoV2(30). Here, we employed live SARS-CoV2 England2 strain, and
demonstrated that several mouthwashes (Listerine®Advanced DGT, Dentyl Fresh Protect, Dentyl Dual
Action) pass EN14476 against this virus.
Importantly, efficacy was not dependent on ‘classical’ antibacterial components of mouthwashes, but
instead was critically dependent on the presence of surfactant (CPC/LAE). Whether any of the lipid
Journ
al Pre-
proof
23
disrupting components would function in this way was not predictable from the outset; efficacy is
determined by both molecular makeup and concentration, with some detergents (e.g. Tween20) not
inactivating SARS-CoV2 even at 0.5 %, while others (e.g. Triton X-100) lyse it completely at 0.1 % (66).
Thus, our finding that components such as essential oils do not eliminate infectivity, is equally
important as the finding that CPC and LAE in mouthwashes do. CPC-containing mouthwashes were
previously reported to reduce infectivity of other enveloped viruses, including HSV (67) and influenza
(46), while LAE has shown antiviral activity towards HSV-1, vaccinia virus and bovine parainfluenzae 3
(68). Thus, our results may be generally applicable to all enveloped viruses. The finding that LAE is
virucidal both above and below cmc, and with or without ethanol, suggests that the virucidal activity
of LAE is independent of micellar self-aggregation, and that the transfer of individual surfactant
molecules into the viral envelope destabilises the bilayer. The ability of CPC alone, at two
concentrations above its cmc (1 mM), to fully inactivate SARS-CoV2 is likely due to micelle-forming
surfactants having a very different “packing parameter” than the lipids in the viral bilayer (69). Mixing
the surfactant with lipids may increase the local curvature, causing formation of separate micelles,
effectively dissolving the bilayer. This is in line with reports showing evidence from electron
microscopy that CPC disrupts the viral envelope (46,47). Finally, the effect of surfactant was not
charge-dependent as both cationic and anionic surfactants were virucidal (Figure 5 B, Figure 7).
Whilst surfactants are highly antiviral in isolation, other mouthwash components may reduce their
effectiveness. Benzoate can bind with CPC, dramatically reducing its cmc, without changing its micellar
morphology (70,71). Such interactions are typical for combinations of cationic surfactants and
aromatic anions (72). A reduced cmc indicates a lower concentration of non-aggregated surfactant.
The reduction in virucidal effect of CPC caused by benzoate in SCD Max may therefore be due to it
reducing the concentration of monomeric CPC. Taken together, our data indicate that whilst product
selection is typically made on the basis of individual principal components e.g. CPC, chlorhexidine, or
iodine, interactions between ingredients need to be carefully considered.
To address the theoretical potential for toxicity of mouthwash with long term use, we compared cell
disruption with viral infectivity and found some minor differences (Figure 4 F). These could be due to
the fact that the virus membrane is deficient in some lipids that are known to be enriched in host
plasma membrane (e.g. cholesterol, SM). Notably however, >25 % of UK adults use mouthwashes
daily with no ill effects reported, while mouthwash was used by almost 200 million Americans in 2020
(73) (https://www.statista.com/statistics/286902/usage-mouthwash-dental-rinse-us-trend/). While
CPC-containing mouthwashes can show cytotoxicity against monolayers in vitro, the lack of observed
toxicity in vivo likely reflects the complex, differentiated, multicellular nature of primary oral epithelia
(74). Furthermore, studies have demonstrated the effectiveness of CPC-containing mouthwashes in
Journ
al Pre-
proof

24
safely reducing gingival inflammation, despite concerns regarding perturbation of the oral
microbiome (75,76). In patients with COVID19, increased disease severity was recently shown to be
associated with moderate/severe periodontal disease (77). Associations between periodontal
inflammation, cytokine release, and altered lipid metabolism have also been established in a range of
co-morbidities that associate with poorer COVID19 outcome, including neurodegeneration, diabetes
and cardiovascular disease (78). Thus, as part of maintaining routine oral health, mouthwash use has
potential to impact transmission and disease through both direct and indirect mechanisms.
In many parts of the world, clinical investigations of the oropharynx, including in primary care,
dentistry, ENT, and maxillofacial surgery, have been severely curtailed due to the risk of SARS-CoV2
transmission from pre-clinical asymptomatic patients. Here, interventions to reduce the salivary load
in patients might be of benefit. Ideally, a large-scale trial would assess the ability of oral rinsing to
impact on disease transmission and disease severity however this was not possible in the pandemic
situation. Instead, we tested the in vivo efficacy of mouthwash on hospitalised ‘moderate’ COVID
patients (not requiring intensive medical support or ventilation) and showed a strong impact of
surfactant-containing oral rinses on live virus load in saliva. Only three other studies have attempted
to address these effects in vivo during the pandemic and both were inconclusive due to small numbers
of patients, and the use of qPCR rather than live virus titration to determine virus load (28,79,80).
Our clinical study was designed in the early part of the pandemic, prior to data becoming available
showing that throat virus falls to undetectable levels by 9 days post symptom onset (48). Thus, our
study was challenged by recruitment (inability to provide informed consent and provide salivary
samples), co-morbidity and the inability to predict patients with saliva containing live virus (<40% of
patients). The study was concluded at 6 months with 78 patients randomised; the largest sample to
date of any study, with 27 patients having live virus in their saliva. While all mouthwashes were
generally beneficial at 1 minute, the CPC mouthwash (Dentyl Dual Action), was the most effective,
significantly reducing live viral load over the entire time course, and completely eliminating it for 1h
in multiple patients. An important caveat is that mouthwash use will not target virus in the lower
respiratory tract. Whilst it remains unclear whether transmissable virus arises from the upper- or
lower respiratory tract, we have shown that infectious virus is found more commonly in the upper
than the lower respiratory tract (44). Nevertheless, it remains the case that mouthwashes can destroy
enveloped viruses in the oral cavity for sufficient time to enable a dental or oral investigation. Future
trials will be required to ensure that this effect is consistent in larger cohorts. However critically,
current WHO guidance proposes the use of hydrogen peroxide and PVP-I mouthwashes in dental
surgery during the COVID19 pandemic (https://www.who.int/publications/i/item/who-2019-nCoV-
oral-health-2020.1). However hydrogen peroxide only weakly inactivates SARS-CoV2 (81), and our
Journ
al Pre-
proof

25
data shows that surfactant-containing mouthwash is more effective than PVP-I both in vitro and in
vivo. Therefore, there may be a need to re-evaluate this advice.
In summary, we characterise the lipid membrane of SARS-CoV2, as being primarily comprised of PC,
PE and PI, with a high proportion of external aPL, and show that the FA molecular species present may
vary depending on host cell. Importantly, an inability to maintain asymmetry in the lipid envelope
results in live virus being highly pro-coagulant. We also show that surfactant mouthwash that targets
the lipid membrane may be a useful component of infection prevention and control strategies for
respiratory enveloped viruses (e.g. influenza, SARS, MERS, in addition to SARS-CoV2), during a
pandemic. They have the potential to lessen the risk of transmission from asymptomatic carriers to
healthcare professionals performing oropharynx investigations, as well as transmission within the
wider population, in a similar manner as to how they are being tested against pathogenic oral bacteria
(82-86). Larger population-based studies are now warranted to determine the impact of this biological
effect on transmission. Importantly, the anti-viral activity of oral rinses is not dependent on classical
antibacterial components, but instead depends on the sensitivity of the lipid envelope to surfactants
as membrane-disrupting agents, which can be made cheaply and easily in LMICS. The membrane of
enveloped viruses is likely to remain susceptible to this approach irrespective of mutations that impact
vaccine efficacy.
Disclosure: Venture Life Group plc and Johnson & Johnson provided information on mouthwash
formulations employed in the in vitro study. Venture Life Group part-funded the clinical study, but
had no input in study design, data analysis, or drafting of the manuscript. The investigators declare
no direct conflicts exist.
Funding information: RJS was partly funded by UKRI/NIHR through the UK Coronavirus Immunology
Consortium (UK-CIC). VJT, DW, MP and PDSR are supported in part by the Welsh Government/EU Ser
Cymru Programme. MBP was funded by a Wellcome Trust GW4CAT Training Fellowship
(216278/Z/19/Z) and RM and MJP are Welsh Clinical Academic Training Fellows. VOD was a Royal
Society Wolfson Merit Award Holder. AZ was funded by BBSRC (BB/W003376/1). Venture Life Group
part-funded the clinical study, but had no input in study design, data analysis, or drafting of the
manuscript.
Author contributions. MBP, VJT, DW, PDSR, JAJ, AZ conducted lipidomics analysis, VOD, RCM, HK,
WJG reviewed lipidomics data, DWT, MP and AA designed the clinical study, AA, DWT, JH, RM, DO,
CAL supervised the clinical recruitment and sample-collection in individual Heath Boards. NJB
Journ
al Pre-
proof
26
prepared and provided surfactant solutions, and designed experiments. VOD, RJS, DWT designed the
study, supervised the data collection and analysis and drafted the manuscript. ZS, ES, AR, KB, RJS
performed all in vitro analysis and preparation of samples. RGN undertook independent statistical
analysis. All authors edited and approved the manuscript. We acknowledge intellectual input from
Matthew Conroy, LIPID MAPS Biocurator, technical support from Valeria Grossini, and Professor
Adrian Maunder for his help in clinical study design. We gratefully acknowledge expert input from
Paul Baker, Sciex, for support setting up HILIC analysis
Data availability. All data are included within the manuscript.
Journ
al Pre-
proof

27
References
1. Garoff, H., K. Simons, and B. Dobberstein. 1978. Assembly of the Semliki Forest virus membrane glycoproteins in the membrane of the endoplasmic reticulum in vitro. J Mol Biol 124: 587-600
2. Gerl, M. J., J. L. Sampaio, S. Urban, L. Kalvodova, J. M. Verbavatz, B. Binnington, D. Lindemann, C. A. Lingwood, A. Shevchenko, C. Schroeder, and K. Simons. 2012. Quantitative analysis of the lipidomes of the influenza virus envelope and MDCK cell apical membrane. J Cell Biol 196: 213-221
3. Paidassi, H., P. Tacnet-Delorme, V. Garlatti, C. Darnault, B. Ghebrehiwet, C. Gaboriaud, G. J. Arlaud, and P. Frachet. 2008. C1q binds phosphatidylserine and likely acts as a multiligand-bridging molecule in apoptotic cell recognition. Journal of immunology 180: 2329-2338
4. Cohen, J. R., L. D. Lin, and C. E. Machamer. 2011. Identification of a Golgi complex-targeting signal in the cytoplasmic tail of the severe acute respiratory syndrome coronavirus envelope protein. J Virol 85: 5794-5803
5. McBride, C. E., J. Li, and C. E. Machamer. 2007. The cytoplasmic tail of the severe acute respiratory syndrome coronavirus spike protein contains a novel endoplasmic reticulum retrieval signal that binds COPI and promotes interaction with membrane protein. J Virol 81: 2418-2428
6. Perrier, A., A. Bonnin, L. Desmarets, A. Danneels, A. Goffard, Y. Rouille, J. Dubuisson, and S. Belouzard. 2019. The C-terminal domain of the MERS coronavirus M protein contains a trans-Golgi network localization signal. J Biol Chem 294: 14406-14421
7. Tooze, J., S. A. Tooze, and S. D. Fuller. 1987. Sorting of progeny coronavirus from condensed secretory proteins at the exit from the trans-Golgi network of AtT20 cells. J Cell Biol 105: 1215-1226
8. Tooze, S. A., J. Tooze, and G. Warren. 1988. Site of addition of N-acetyl-galactosamine to the E1 glycoprotein of mouse hepatitis virus-A59. J Cell Biol 106: 1475-1487
9. van Meer, G. 1998. Lipids of the Golgi membrane. Trends Cell Biol 8: 29-33 10. Amara, A., and J. Mercer. 2015. Viral apoptotic mimicry. Nat Rev Microbiol 13: 461-469 11. Birge, R. B., S. Boeltz, S. Kumar, J. Carlson, J. Wanderley, D. Calianese, M. Barcinski, R. A.
Brekken, X. Huang, J. T. Hutchins, B. Freimark, C. Empig, J. Mercer, A. J. Schroit, G. Schett, and M. Herrmann. 2016. Phosphatidylserine is a global immunosuppressive signal in efferocytosis, infectious disease, and cancer. Cell Death Differ 23: 962-978
12. Chen, Y. H., W. Du, M. C. Hagemeijer, P. M. Takvorian, C. Pau, A. Cali, C. A. Brantner, E. S. Stempinski, P. S. Connelly, H. C. Ma, P. Jiang, E. Wimmer, G. Altan-Bonnet, and N. Altan-Bonnet. 2015. Phosphatidylserine vesicles enable efficient en bloc transmission of enteroviruses. Cell 160: 619-630
13. Feng, Z., L. Hensley, K. L. McKnight, F. Hu, V. Madden, L. Ping, S. H. Jeong, C. Walker, R. E. Lanford, and S. M. Lemon. 2013. A pathogenic picornavirus acquires an envelope by hijacking cellular membranes. Nature 496: 367-371
14. Mercer, J., and A. Helenius. 2008. Vaccinia virus uses macropinocytosis and apoptotic mimicry to enter host cells. Science 320: 531-535
15. Moller-Tank, S., A. S. Kondratowicz, R. A. Davey, P. D. Rennert, and W. Maury. 2013. Role of the phosphatidylserine receptor TIM-1 in enveloped-virus entry. J Virol 87: 8327-8341
16. Morizono, K., and I. S. Chen. 2014. Role of phosphatidylserine receptors in enveloped virus infection. J Virol 88: 4275-4290
17. Bohan, D., H. Van Ert, N. Ruggio, K. J. Rogers, M. Badreddine, J. A. Aguilar Briseño, J. M. Elliff, R. A. Rojas Chavez, B. Gao, T. Stokowy, E. Christakou, P. Kursula, D. Micklem, G. Gausdal, H.
Journ
al Pre-
proof

28
Haim, J. Minna, J. B. Lorens, and W. Maury. 2021. Phosphatidylserine receptors enhance SARS-CoV-2 infection. PLoS Pathog 17: e1009743
18. Makide, K., A. Uwamizu, Y. Shinjo, J. Ishiguro, M. Okutani, A. Inoue, and J. Aoki. 2014. Novel lysophosphoplipid receptors: their structure and function. J Lipid Res 55: 1986-1995
19. Maceyka, M., and S. Spiegel. 2014. Sphingolipid metabolites in inflammatory disease. Nature 510: 58-67
20. Heemskerk, J. W., E. M. Bevers, and T. Lindhout. 2002. Platelet activation and blood coagulation. Thromb Haemost 88: 186-193
21. Aiyar, N., J. Disa, Z. Ao, H. Ju, S. Nerurkar, R. N. Willette, C. H. Macphee, D. G. Johns, and S. A. Douglas. 2007. Lysophosphatidylcholine induces inflammatory activation of human coronary artery smooth muscle cells. Mol Cell Biochem 295: 113-120
22. Li, Y. F., R. S. Li, S. B. Samuel, R. Cueto, X. Y. Li, H. Wang, and X. F. Yang. 2016. Lysophospholipids and their G protein-coupled receptors in atherosclerosis. Front Biosci (Landmark Ed) 21: 70-88
23. Matsumoto, T., T. Kobayashi, and K. Kamata. 2007. Role of lysophosphatidylcholine (LPC) in atherosclerosis. Curr Med Chem 14: 3209-3220
24. Yang, L. V., C. G. Radu, L. Wang, M. Riedinger, and O. N. Witte. 2005. Gi-independent macrophage chemotaxis to lysophosphatidylcholine via the immunoregulatory GPCR G2A. Blood 105: 1127-1134
25. O'Donnell, V. B., D. Thomas, R. Stanton, J. Y. Maillard, R. C. Murphy, S. A. Jones, I. Humphreys, M. J. O. Wakelam, C. Fegan, M. P. Wise, A. Bosch, and S. A. Sattar. 2020. Potential Role of Oral Rinses Targeting the Viral Lipid Envelope in SARS-CoV-2 Infection. Function (Oxf) 1: zqaa002
26. Meng, L., F. Hua, and Z. Bian. 2020. Coronavirus Disease 2019 (COVID-19): Emerging and Future Challenges for Dental and Oral Medicine. J Dent Res 99: 481-487
27. Green, A., G. Roberts, T. Tobery, C. Vincent, M. Barili, and C. Jones. 2020. In vitro assessment of the virucidal activity of four mouthwashes containing Cetylpyridinium Chloride, ethanol, zinc and a mix of enzyme and proteins against a human coronavirus. bioRxiv: 2020.2010.2028.359257
28. Martinez Lamas, L., P. Diz Dios, M. T. Perez Rodriguez, V. Del Campo Perez, J. J. Cabrera Alvargonzalez, A. M. Lopez Dominguez, J. Fernandez Feijoo, M. Diniz Freitas, and J. Limeres Posse. 2020. Is povidone iodine mouthwash effective against SARS-CoV-2? First in vivo tests. Oral Dis n/a
29. Meister, T. L., Y. Bruggemann, D. Todt, C. Conzelmann, J. A. Muller, R. Gross, J. Munch, A. Krawczyk, J. Steinmann, J. Steinmann, S. Pfaender, and E. Steinmann. 2020. Virucidal Efficacy of Different Oral Rinses Against Severe Acute Respiratory Syndrome Coronavirus 2. The Journal of infectious diseases 222: 1289-1292
30. Meyers, C., R. Robison, J. Milici, S. Alam, D. Quillen, D. Goldenberg, and R. Kass. 2021. Lowering the transmission and spread of human coronavirus. J Med Virol 93: 1605-1612
31. Tadakamadla, J., E. Boccalari, V. Rathore, C. Dolci, G. M. Tartaglia, and S. K. Tadakamadla. 2021. In vitro studies evaluating the efficacy of mouth rinses on Sars-Cov-2: A systematic review. J Infect Public Health 14: 1179-1185
32. Rodríguez-Casanovas, H. J., M. D. la Rosa, Y. Bello-Lemus, G. Rasperini, and A. J. Acosta-Hoyos. 2022. Virucidal Activity of Different Mouthwashes Using a Novel Biochemical Assay. Healthcare 10: 63
33. da Silva Santos, P. S., B. da Fonseca Orcina, R. R. G. Machado, F. V. Vilhena, L. M. da Costa Alves, M. S. R. Zangrando, R. C. de Oliveira, M. Q. S. Soares, A. N. C. Simão, E. C. I. N. Pietro, J. P. G. Kuroda, I. A. de Almeida Benjamim, D. B. Araujo, S. H. Toma, L. Flor, K. Araki, and E. L. Durigon. 2021. Beneficial effects of a mouthwash containing an antiviral phthalocyanine derivative on the length of hospital stay for COVID-19: randomised trial. Scientific reports 11: 19937
34. Gutiérrez‑García, R., J. C. De La Cerda‑Angeles, A. Cabrera‑Licona, I. Delgado‑Enciso, N. Mervitch‑Sigal, and B. A. Paz‑Michel. 2022. Nasopharyngeal and oropharyngeal rinses with
Journ
al Pre-
proof
29
neutral electrolyzed water prevents COVID‑19 in front‑line health professionals: A randomized, open‑label, controlled trial in a general hospital in Mexico City. Biomed Rep 16: 11
35. Rihn, S. J., A. Merits, S. Bakshi, M. L. Turnbull, A. Wickenhagen, A. J. T. Alexander, C. Baillie, B. Brennan, F. Brown, K. Brunker, S. R. Bryden, K. A. Burness, S. Carmichael, S. J. Cole, V. M. Cowton, P. Davies, C. Davis, G. De Lorenzo, C. L. Donald, M. Dorward, J. I. Dunlop, M. Elliott, M. Fares, A. da Silva Filipe, J. R. Freitas, W. Furnon, R. J. Gestuveo, A. Geyer, D. Giesel, D. M. Goldfarb, N. Goodman, R. Gunson, C. J. Hastie, V. Herder, J. Hughes, C. Johnson, N. Johnson, A. Kohl, K. Kerr, H. Leech, L. S. Lello, K. Li, G. Lieber, X. Liu, R. Lingala, C. Loney, D. Mair, M. J. McElwee, S. McFarlane, J. Nichols, K. Nomikou, A. Orr, R. J. Orton, M. Palmarini, Y. A. Parr, R. M. Pinto, S. Raggett, E. Reid, D. L. Robertson, J. Royle, N. Cameron-Ruiz, J. G. Shepherd, K. Smollett, D. G. Stewart, M. Stewart, E. Sugrue, A. M. Szemiel, A. Taggart, E. C. Thomson, L. Tong, L. S. Torrie, R. Toth, M. Varjak, S. Wang, S. G. Wilkinson, P. G. Wyatt, E. Zusinaite, D. R. Alessi, A. H. Patel, A. Zaid, S. J. Wilson, and S. Mahalingam. 2021. A plasmid DNA-launched SARS-CoV-2 reverse genetics system and coronavirus toolkit for COVID-19 research. PLOS Biology 19: e3001091
36. Smith, C. A., E. J. Want, G. O'Maille, R. Abagyan, and G. Siuzdak. 2006. XCMS: processing mass spectrometry data for metabolite profiling using nonlinear peak alignment, matching, and identification. Anal Chem 78: 779-787
37. Alvarez-Jarreta, J., P. R. S. Rodrigues, E. Fahy, A. O'Connor, A. Price, C. Gaud, S. Andrews, P. Benton, G. Siuzdak, J. I. Hawksworth, M. Valdivia-Garcia, S. M. Allen, and V. B. O'Donnell. 2021. LipidFinder 2.0: advanced informatics pipeline for lipidomics discovery applications. Bioinformatics 37: 1478-1479
38. Thomas, C. P., S. R. Clark, V. J. Hammond, M. Aldrovandi, P. W. Collins, and V. B. O'Donnell. 2014. Identification and quantification of aminophospholipid molecular species on the surface of apoptotic and activated cells. Nat Protoc 9: 51-63
39. Medicine, S. (2021) Activated Partial Thromboplastin Time [APTT]. in Practical-Haemostasis.com, A Practical Guide to Haemostasis
40. Meiller, T. F., A. Silva, S. M. Ferreira, M. A. Jabra-Rizk, J. I. Kelley, and L. G. DePaola. 2005. Efficacy of Listerine Antiseptic in reducing viral contamination of saliva. J Clin Periodontol 32: 341-346
41. Sud, M., E. Fahy, D. Cotter, A. Brown, E. A. Dennis, C. K. Glass, A. H. Merrill, Jr., R. C. Murphy, C. R. Raetz, D. W. Russell, and S. Subramaniam. 2007. LMSD: LIPID MAPS structure database. Nucleic Acids Res 35: D527-532
42. Liebisch, G., E. Fahy, J. Aoki, E. A. Dennis, T. Durand, C. S. Ejsing, M. Fedorova, I. Feussner, W. J. Griffiths, H. Kofeler, A. H. Merrill, Jr., R. C. Murphy, V. B. O'Donnell, O. Oskolkova, S. Subramaniam, M. J. O. Wakelam, and F. Spener. 2020. Update on LIPID MAPS classification, nomenclature, and shorthand notation for MS-derived lipid structures. J Lipid Res 61: 1539-1555
43. Clark, S. R., C. P. Thomas, V. J. Hammond, M. Aldrovandi, G. W. Wilkinson, K. W. Hart, R. C. Murphy, P. W. Collins, and V. B. O'Donnell. 2013. Characterization of platelet aminophospholipid externalization reveals fatty acids as molecular determinants that regulate coagulation. Proceedings of the National Academy of Sciences of the United States of America 110: 5875-5880
44. Saud, Z., M. Ponsford, K. Bentley, J. M. Cole, M. Pandey, S. Jolles, C. Fegan, I. Humphreys, M. P. Wise, and R. Stanton. 2021. Mechanically ventilated patients shed high titre live SARS-CoV2 for extended periods from both the upper and lower respiratory tract. medRxiv: 10.1093/cid/ciac170
45. Asker, D., J. Weiss, and D. J. McClements. 2009. Analysis of the interactions of a cationic surfactant (lauric arginate) with an anionic biopolymer (pectin): isothermal titration calorimetry, light scattering, and microelectrophoresis. Langmuir 25: 116-122
Journ
al Pre-
proof

30
46. Popkin, D. L., S. Zilka, M. Dimaano, H. Fujioka, C. Rackley, R. Salata, A. Griffith, P. K. Mukherjee, M. A. Ghannoum, and F. Esper. 2017. Cetylpyridinium Chloride (CPC) Exhibits Potent, Rapid Activity Against Influenza Viruses in vitro and in vivo. Pathog Immun 2: 252-269
47. Steyer, A., M. Marušić, M. Kolenc, and T. Triglav. 2021. A Throat Lozenge with Fixed Combination of Cetylpyridinium Chloride and Benzydamine Hydrochloride Has Direct Virucidal Effect on SARS-CoV-2. COVID 1: 435-446
48. Cevik, M., M. Tate, O. Lloyd, A. E. Maraolo, J. Schafers, and A. Ho. 2021. SARS-CoV-2, SARS-CoV, and MERS-CoV viral load dynamics, duration of viral shedding, and infectiousness: a systematic review and meta-analysis. Lancet Microbe 2: e13-e22
49. Vance, J. E. 2015. Phospholipid synthesis and transport in mammalian cells. Traffic 16: 1-18 50. Simons, K., and E. Ikonen. 1997. Functional rafts in cell membranes. Nature 387: 569-572 51. Ikonen, E. 2008. Cellular cholesterol trafficking and compartmentalization. Nat Rev Mol Cell
Biol 9: 125-138 52. de Meyer, F., and B. Smit. 2009. Effect of cholesterol on the structure of a phospholipid
bilayer. Proceedings of the National Academy of Sciences 106: 3654-3658 53. Shinitzky, M., and Y. Barenholz. 1974. Dynamics of the hydrocarbon layer in liposomes of
lecithin and sphingomyelin containing dicetylphosphate. J Biol Chem 249: 2652-2657 54. Brender, J., A. McHenry, and A. Ramamoorthy. 2012. Does Cholesterol Play a Role in the
Bacterial Selectivity of Antimicrobial Peptides? Frontiers in Immunology 3 55. Ghosh, S., T. A. Dellibovi-Ragheb, A. Kerviel, E. Pak, Q. Qiu, M. Fisher, P. M. Takvorian, C. Bleck,
V. W. Hsu, A. R. Fehr, S. Perlman, S. R. Achar, M. R. Straus, G. R. Whittaker, C. A. M. de Haan, J. Kehrl, G. Altan-Bonnet, and N. Altan-Bonnet. 2020. beta-Coronaviruses Use Lysosomes for Egress Instead of the Biosynthetic Secretory Pathway. Cell 183: 1520-1535 e1514
56. Alpert, S. E., R. W. Walenga, C. M. Kramer, C. L. Silski, and P. B. Davis. 1992. Tracheal epithelial cell fatty acid composition modulates prostaglandin E2 and cAMP production. Am J Physiol 262: L192-197
57. Holtzman, M. J., D. Grunberger, and J. A. Hunter. 1986. Phospholipid fatty acid composition of pulmonary airway epithelial cells: potential substrates for oxygenation. Biochim Biophys Acta 877: 459-464
58. Madjid, M., I. Aboshady, I. Awan, S. Litovsky, and S. W. Casscells. 2004. Influenza and cardiovascular disease: is there a causal relationship? Tex Heart Inst J 31: 4-13
59. Nguyen, J. L., W. Yang, K. Ito, T. D. Matte, J. Shaman, and P. L. Kinney. 2016. Seasonal Influenza Infections and Cardiovascular Disease Mortality. JAMA Cardiol 1: 274-281
60. Udell, J. A., R. Zawi, D. L. Bhatt, M. Keshtkar-Jahromi, F. Gaughran, A. Phrommintikul, A. Ciszewski, H. Vakili, E. B. Hoffman, M. E. Farkouh, and C. P. Cannon. 2013. Association between influenza vaccination and cardiovascular outcomes in high-risk patients: a meta-analysis. JAMA 310: 1711-1720
61. Zheng, S., J. Fan, F. Yu, B. Feng, B. Lou, Q. Zou, G. Xie, S. Lin, R. Wang, X. Yang, W. Chen, Q. Wang, D. Zhang, Y. Liu, R. Gong, Z. Ma, S. Lu, Y. Xiao, Y. Gu, J. Zhang, H. Yao, K. Xu, X. Lu, G. Wei, J. Zhou, Q. Fang, H. Cai, Y. Qiu, J. Sheng, Y. Chen, and T. Liang. 2020. Viral load dynamics and disease severity in patients infected with SARS-CoV-2 in Zhejiang province, China, January-March 2020: retrospective cohort study. BMJ 369: m1443
62. Deinhardt-Emmer, S., D. Wittschieber, J. Sanft, S. Kleemann, S. Elschner, K. F. Haupt, V. Vau, C. Haring, J. Rodel, A. Henke, C. Ehrhardt, M. Bauer, M. Philipp, N. Gassler, S. Nietzsche, B. Loffler, and G. Mall. 2021. Early postmortem mapping of SARS-CoV-2 RNA in patients with COVID-19 and the correlation with tissue damage. Elife 10
63. Trypsteen, W., J. Van Cleemput, W. V. Snippenberg, S. Gerlo, and L. Vandekerckhove. 2020. On the whereabouts of SARS-CoV-2 in the human body: A systematic review. PLoS Pathog 16: e1009037
64. Madden, P. J., Y. Thomas, R. V. Blair, S. Samer, M. Doyle, C. C. Midkiff, M. E. Becker, M. S. Arif, M. D. McRaven, L. M. Simons, A. M. Carias, E. Martinelli, R. Lorenzo-Redondo, J. F. Hultquist,
Journ
al Pre-
proof
31
F. J. Villinger, R. S. Veazey, and T. J. Hope. 2022. An immunoPET probe to SARS-CoV-2 reveals early infection of the male genital tract in rhesus macaques. bioRxiv: 2022.2002.2025.481974
65. Astani, A., J. Reichling, and P. Schnitzler. 2010. Comparative study on the antiviral activity of selected monoterpenes derived from essential oils. Phytother Res 24: 673-679
66. Welch, S. R., K. A. Davies, H. Buczkowski, N. Hettiarachchi, N. Green, U. Arnold, M. Jones, M. J. Hannah, R. Evans, C. Burton, J. E. Burton, M. Guiver, P. A. Cane, N. Woodford, C. B. Bruce, A. D. G. Roberts, and M. J. Killip. 2020. Analysis of Inactivation of SARS-CoV-2 by Specimen Transport Media, Nucleic Acid Extraction Reagents, Detergents, and Fixatives. J Clin Microbiol 58
67. Shishu, S. Rajan, and Kamalpreet. 2009. Development of novel microemulsion-based topical formulations of acyclovir for the treatment of cutaneous herpetic infections. AAPS PharmSciTech 10: 559-565
68. Bonvila Xavier, R., F. Roca Sergi, and R. Segret Pons. (2009) ANTIVIRAL USE OF CATIONIC SURFACTANT. NOVACYT
69. Israelachvili, J. N., D. J. Mitchell, and B. W. Ninham. 1976. Theory of Self-Assembly of Hydrocarbon Amphiphiles into Micelles and Bilayers. Journal of the Chemical Society-Faraday Transactions Ii 72: 1525-1568
70. Mahmoud, F. Z., S. D. Christian, E. E. Tucker, A. A. Taha, and J. F. Scamehorn. 1989. Semiequilibrium dialysis study of the solubilization of benzoate anion by aqueous hexadecylpyridinium chloride. The Journal of Physical Chemistry 93: 5903-5906
71. Mukhim, T., J. Dey, S. Das, and K. Ismail. 2010. Aggregation and adsorption behavior of cetylpyridinium chloride in aqueous sodium salicylate and sodium benzoate solutions. J Colloid Interface Sci 350: 511-515
72. Buurma, N. J. 2017. Aggregation and reactivity in aqueous solutions of cationic surfactants and aromatic anions across concentration scales. Current Opinion in Colloid & Interface Science 32: 69-75
73. Macfarlane, T. V., M. M. Kawecki, C. Cunningham, I. Bovaird, R. Morgan, K. Rhodes, and R. Watkins. 2011. Mouthwash use in general population: results from adult dental health survey in grampian, Scotland. J Oral Maxillofac Res 1: e2
74. Muller, H. D., S. Eick, A. Moritz, A. Lussi, and R. Gruber. 2017. Cytotoxicity and Antimicrobial Activity of Oral Rinses In Vitro. Biomed Res Int 2017: 4019723
75. Joshipura, K. J., F. J. Munoz-Torres, E. Morou-Bermudez, and R. P. Patel. 2017. Over-the-counter mouthwash use and risk of pre-diabetes/diabetes. Nitric Oxide 71: 14-20
76. Rosing, C. K., J. Cavagni, E. J. Gaio, F. Muniz, N. Ranzan, H. J. R. Oballe, S. A. Friedrich, R. M. Severo, B. Stewart, and Y. P. Zhang. 2017. Efficacy of two mouthwashes with cetylpyridinium chloride: a controlled randomized clinical trial. Braz Oral Res 31: e47
77. Marouf, N., W. Cai, K. N. Said, H. Daas, H. Diab, V. R. Chinta, A. A. Hssain, B. Nicolau, M. Sanz, and F. Tamimi. 2021. Association between periodontitis and severity of COVID-19 infection: A case-control study. J Clin Periodontol
78. Holmstrup, P., C. Damgaard, I. Olsen, B. Klinge, A. Flyvbjerg, C. H. Nielsen, and P. R. Hansen. 2017. Comorbidity of periodontal disease: two sides of the same coin? An introduction for the clinician. J Oral Microbiol 9: 1332710
79. Yoon, J. G., J. Yoon, J. Y. Song, S. Y. Yoon, C. S. Lim, H. Seong, J. Y. Noh, H. J. Cheong, and W. J. Kim. 2020. Clinical Significance of a High SARS-CoV-2 Viral Load in the Saliva. J Korean Med Sci 35: e195
80. Costa, D. D., C. Brites, S. N. Vaz, D. S. de Santana, J. N. Dos Santos, and P. R. Cury. 2021. Chlorhexidine mouthwash reduces the salivary viral load of SARS-CoV-2: A randomized clinical trial. Oral Dis
81. Davies, K., H. Buczkowski, S. R. Welch, N. Green, D. Mawer, N. Woodford, A. D. Roberts, P. J. Nixon, D. W. Seymour, and M. J. Killip. 2020. Effective <em>in-vitro</em> inactivation of SARS-CoV-2 by commercially available mouthwashes. bioRxiv: 2020.2012.2002.408047
Journ
al Pre-
proof

32
82. Van Dijck, C., A. Tsoumanis, A. Rotsaert, B. Vuylsteke, D. Van den Bossche, E. Paeleman, I. De Baetselier, I. Brosius, J. Laumen, J. Buyze, K. Wouters, L. Lynen, M. Van Esbroeck, N. Herssens, S. Abdellati, S. Declercq, T. Reyniers, Y. Van Herrewege, E. Florence, and C. Kenyon. 2021. Antibacterial mouthwash to prevent sexually transmitted infections in men who have sex with men taking HIV pre-exposure prophylaxis (PReGo): a randomised, placebo-controlled, crossover trial. Lancet Infect Dis 21: 657-667
83. Chow, E. P., B. P. Howden, S. Walker, D. Lee, C. S. Bradshaw, M. Y. Chen, A. Snow, S. Cook, G. Fehler, and C. K. Fairley. 2017. Antiseptic mouthwash against pharyngeal <em>Neisseria gonorrhoeae</em>: a randomised controlled trial and an in vitro study. Sexually Transmitted Infections 93: 88-93
84. Chow, E. P. F., D. A. Williamson, J. S. Hocking, M. G. Law, K. Maddaford, C. S. Bradshaw, A. McNulty, D. J. Templeton, R. Moore, G. L. Murray, J. A. Danielewski, R. Wigan, M. Y. Chen, R. J. Guy, L. Zhang, B. Donovan, A. E. Grulich, J. M. Kaldor, D. M. Whiley, V. J. Cornelisse, B. P. Howden, D. A. Lewis, T. R. H. Read, and C. K. Fairley. 2021. Antiseptic mouthwash for gonorrhoea prevention (OMEGA): a randomised, double-blind, parallel-group, multicentre trial. Lancet Infect Dis 21: 647-656
85. Fairley, C. K., L. Zhang, and E. P. F. Chow. 2018. New thinking on gonorrhoea control in MSM: are antiseptic mouthwashes the answer? Current opinion in infectious diseases 31: 45-49
86. de Vries, H. J. C., and M. F. S. van der Loeff. 2021. Antiseptic mouthwashes against sexually transmitted infections. Lancet Infect Dis 21: 583-584
Figure Legends Figure 1. Nanoparticle tracking analysis and western blotting confirm purity of SARS-CoV2
preparations, while targeted lipidomics demonstrates the membrane as a PL rich membrane mainly
comprised of PE, PC and PI. Panel A-B purity analysis of gradient purified viral preparations. (A)
Gradient purified virus was analysed by nanoparticle tracking analysis and particle size plotted. (B)
Proteins was solubilised in NuPAGE LDS buffer then separated by size on Bis-Tris gels, before being
transferred to nitrocellulose and blotted for the indicated proteins, as outlined in Methods (see
Supplementary Figure 1 for uncropped gels) Panel C. Lipidomics analysis of the total amounts of lipids
in each category in Vero and A549 cells. Lipids were extracted from 3 preparations of virus from either
Vero or A549 cells, and analysed using LC/MS/MS, as indicated in Methods. The relative % of all
detected lipid categories for all 3 preparations, with molecular species within each category combined
to provide total values are shown. Amounts (ng) of all individual molecular species were added
together for each preparation then converted to molar amounts using an average mass value per
Journ
al Pre-
proof

33
category. Molar% was then calculated following totalling of all lipid categories (n = 3, mean +/- SEM).
Unpaired Students T test.
Figure 2. Comparison of lipid molecular species detected in SARS-CoV2 derived from Vero or A549
cells shows some cell-dependence in FA composition across the cell types. Lipids were totalled
within each category (ng) then expressed as % for n = 3 preparations/analyses, mean +/- SEM, as
outlined in Methods. Unpaired Students T test, followed by Benjamini Hochberg correction where
there were >20 variables.
Figure 3. Comparison of lipid molecular species detected in SARS-CoV2 derived from Vero or A549
cells shows some cell-dependence in FA composition across the cell types. Panel A. Lipids were
totalled within each category (ng) then expressed as % for n = 3 preparations/analyses, mean +/- SEM,
as outlined in Methods. Unpaired Students T test, followed by Benjamini Hochberg correction where
there were >20 variables. Panel B. Species of PL (PC, PE, PI, PG) that were determined to contain FA
with 20:1, 20:2, 20:3 or 20:4 were totalled to generate a comparison for A549 versus Vero cells.
Figure 4. SARS-CoV2 membranes externalise large proportions of PE and PS on the surface of the
particles, virus can enhance plasma coagulation, and virions are sensitive to inactivation by
surfactants in widely available oral rinses beyond the level required for EN14476 standard. Panel
A. High external exposure of aPL on the surface of SARS-CoV2. External PS and PE were determined
as described in Methods for 3 preparations of SARS-CoV2 (n = 3, mean +/- SEM) using virus from A549
or Vero cells as indicated, unpaired Students T test. Panel B. Virions enhance plasma coagulation.
Virus was added to normal human plasma as outlined in Methods, and time to gel/clot formation
measured. PBS was added to control samples. n=3, +/- SEM, one way ANOVA with Tukey Post Hoc
test. Panel C. Size exclusion chromatography (SEC) can remove mouthwash to prevent any direct
impact on cell viability during infectivity testing. Mouthwashes were mixed with DMEM and synthetic
Journ
al Pre-
proof

34
salivary secretions, then 100µl of the mixture purified through a S-400 HR spin column, diluted by
serial 10-fold dilution in DMEM/10, and inoculated onto VeroE6/ACE2/TMPRSS2. After 72h, overlays
were removed and monolayers were fixed and stained with crystal violet, then toxicity was scored
based on visual inspection of monolayer integrity (mean, n = 2, representative of 3 independent
experiments). Panel D. Removal of mouthwash using SEC has little impact on viral infectivity. 100l
virus was purified through a S-400 HR spin column, and live virus measured by plaque assay on
VeroE6/ACE2/TMPRSS2 (n = 3 – 4, mean +/- SEM). Panel E. Several mouthwashes can significantly
reduce infectivity, while some totally eradicate the virus, achieving the EN14476 standard. Virus was
mixed with synthetic salivary secretions and mouthwash, then purified by SEC after 30 seconds, before
being titrated by plaque assay on VeroE6/ACE2/TMPRSS2 as described in methods (n = 2, mean +/-
SD, representative of 3 independent experiments). Panel F. Comparing selectivity for virus inactivation
versus host cell toxicity reveals differential effects. For cell toxicity, serial 2-fold dilutions of dental
fresh protect (DFP) or Listerine Advanced Gum Defence (LAGD) were made, then added to
VeroE6/ACE2/TMPRSS2 monolayers for 30 seconds, washed off, and replaced with media. 3 days
later, monolayers were stained with crystal violet and scored for toxicity. For virus infectivity, serial 2-
fold dilutions of mouthwashes were made, then incubated with SARS-CoV2 and a soil load for 30
seconds. After purification by SEC, samples were titrated by plaque assay on VeroE6/ACE2/TMPRSS2.
Inhibition was calculated relative to virus incubated with media alone (n = 1 (virus toxicity) or 2 (cell
toxicity, mean), representative of 3 independent experiments).
Figure 5. IC50 values for cell versus virus toxicity, antiviral efficacy of mouthwash components, and
SARS-CoV2 salivary load is differentially reduced following a brief oral rinse.
Panel A. IC50 values were calculated from data in Figure 4, Panel F using Graphpad Prism. Panels B,C.
Surfactants are responsible for the highest virucidal activity in mouthwash formulations. 100l virus
was mixed with synthetic salivary secretions and the indicated components from different mouthwash
formulations, for 30 seconds. Virus was purified through a S-400 HR spin column, and live virus
Journ
al Pre-
proof
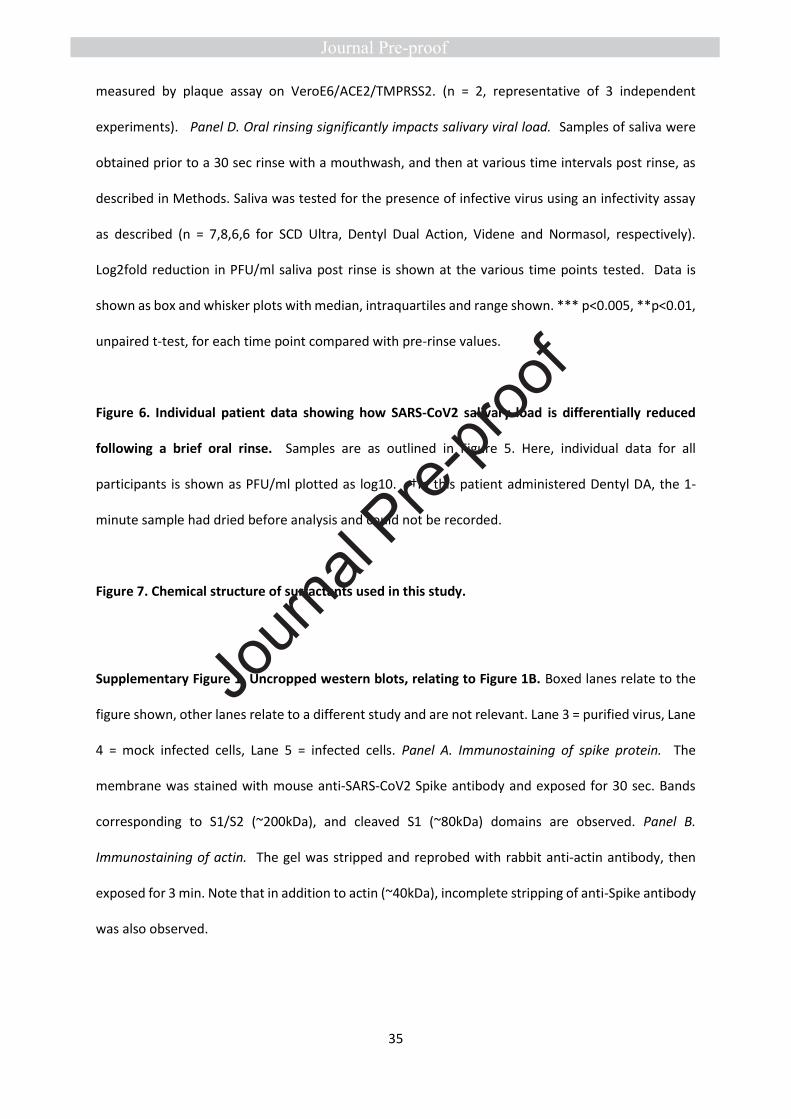
35
measured by plaque assay on VeroE6/ACE2/TMPRSS2. (n = 2, representative of 3 independent
experiments). Panel D. Oral rinsing significantly impacts salivary viral load. Samples of saliva were
obtained prior to a 30 sec rinse with a mouthwash, and then at various time intervals post rinse, as
described in Methods. Saliva was tested for the presence of infective virus using an infectivity assay
as described (n = 7,8,6,6 for SCD Ultra, Dentyl Dual Action, Videne and Normasol, respectively).
Log2fold reduction in PFU/ml saliva post rinse is shown at the various time points tested. Data is
shown as box and whisker plots with median, intraquartiles and range shown. *** p<0.005, **p<0.01,
unpaired t-test, for each time point compared with pre-rinse values.
Figure 6. Individual patient data showing how SARS-CoV2 salivary load is differentially reduced
following a brief oral rinse. Samples are as outlined in Figure 5. Here, individual data for all
participants is shown as PFU/ml plotted as log10. †In this patient administered Dentyl DA, the 1-
minute sample had dried before analysis and could not be recorded.
Figure 7. Chemical structure of surfactants used in this study.
Supplementary Figure 1. Uncropped western blots, relating to Figure 1B. Boxed lanes relate to the
figure shown, other lanes relate to a different study and are not relevant. Lane 3 = purified virus, Lane
4 = mock infected cells, Lane 5 = infected cells. Panel A. Immunostaining of spike protein. The
membrane was stained with mouse anti-SARS-CoV2 Spike antibody and exposed for 30 sec. Bands
corresponding to S1/S2 (~200kDa), and cleaved S1 (~80kDa) domains are observed. Panel B.
Immunostaining of actin. The gel was stripped and reprobed with rabbit anti-actin antibody, then
exposed for 3 min. Note that in addition to actin (~40kDa), incomplete stripping of anti-Spike antibody
was also observed.
Journ
al Pre-
proof

1
Vance (49)
Lipid ER Mito inner
Mito outer
Lysosomes Nuclei Golgi Plasma membrane
Vero A549
PC 57 41 49 42 52 45 43 61 40
PE 21 38 34 21 25 17 21 19 23
SM 4 2 2 16 6 12 23 0.024 0.009
PI 9 2 9 6 4 9 7 18 37
PS 4 1 1 1 6 4 4 0.013 0.005
CL 0 16 5 0 0 0 0
Other 5 <1 <1 14 7 13 2 1.75 0.33
Chol/PL molar ratio
0.07 0.06 0.06 0.49 0.15 0.76 0.0006 0.0005
Van Meer (9)
PC 58 50 39
PE 22 20 23
SM 3 8 16
PI 10 12 8
PS 3 6 9
Chol/PL molar ratio
0.08 0.16 0.35
Table 1. Phospholipid composition of SARS-CoV2, compared with rat liver membranes, reproduced from Vance (49) and Van Meer (9). Approximate phospholipid content is given as % total lipid phosphorus, data is averaged from several sources in both studies, as described.
Journ
al Pre-
proof

2
Product Active Ingredients Other active ingredients
Corsodyl 7 % (v/v) ethanol, 0.2 % (w/v) chlorhexidine
Peppermint oil
Dentyl Dual Action 0.05 %-0.1 % (w/v) cetylpyridinium chloride
isopropyl myristate, Mentha Arvensis extract
Dentyl Fresh Protect 0.05 %-0.1 % (w/v) cetylpyridinium chloride
xylitol
Listerine® Cool Mint 21 % (v/v) ethanol
thymol 0.064 %, eucalyptol 0.092 %, methyl salicylate 0.060 % and menthol 0.042 % (all w/v)
Listerine® Advanced Defence Gum Treatment
23 % (v/v) ethanol
ethyl lauroyl arginate HCI (LAE) 0.147% w/v
SCD Ultra 0.07-0.1 % (w/v) cetylpyridinium chloride (0.05-0.1%), sodium citrate - citric acid 0.15 %, sodium benzoate 0.1 % (all w/v)
sodium monofluorophosphate
Videne 7.5% iodinated povidone equivalent to 8.25 mg/ml iodine
Table 2. Formulations of mouthwash products used in the study
Journ
al Pre-
proof
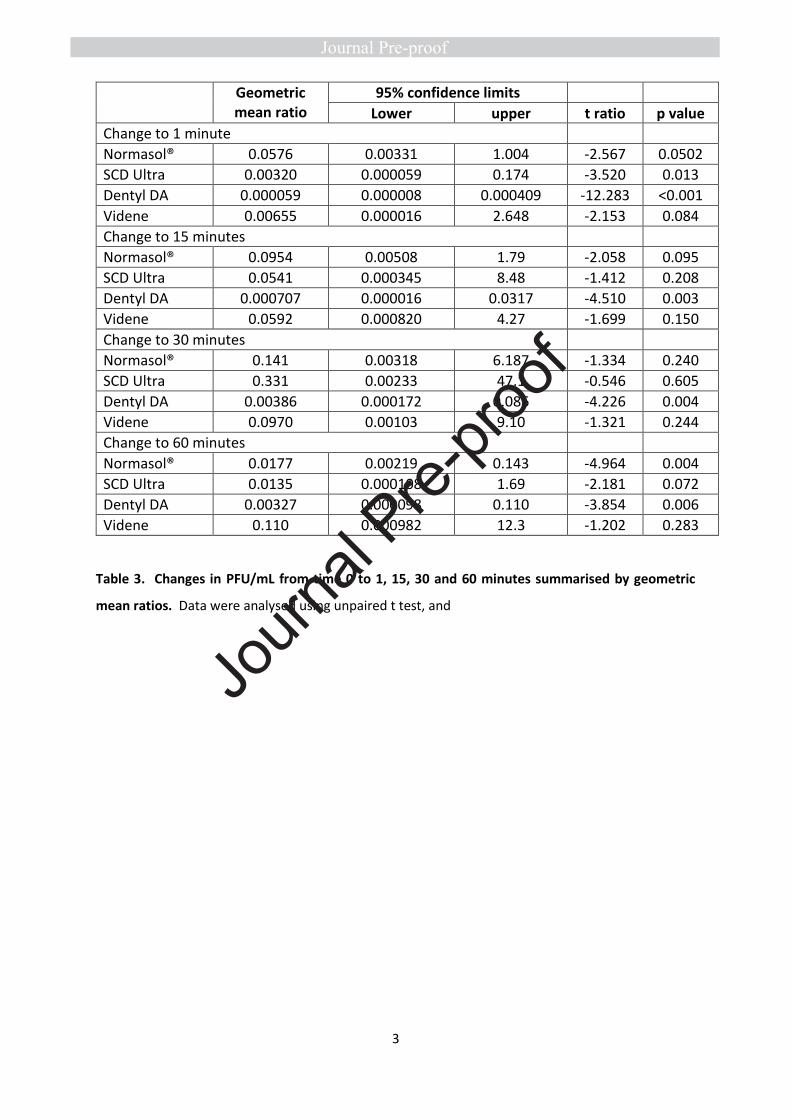
3
Geometric mean ratio
95% confidence limits
Lower upper t ratio p value
Change to 1 minute
Normasol® 0.0576 0.00331 1.004 -2.567 0.0502
SCD Ultra 0.00320 0.000059 0.174 -3.520 0.013
Dentyl DA 0.000059 0.000008 0.000409 -12.283 <0.001
Videne 0.00655 0.000016 2.648 -2.153 0.084
Change to 15 minutes
Normasol® 0.0954 0.00508 1.79 -2.058 0.095
SCD Ultra 0.0541 0.000345 8.48 -1.412 0.208
Dentyl DA 0.000707 0.000016 0.0317 -4.510 0.003
Videne 0.0592 0.000820 4.27 -1.699 0.150
Change to 30 minutes
Normasol® 0.141 0.00318 6.187 -1.334 0.240
SCD Ultra 0.331 0.00233 47.1 -0.546 0.605
Dentyl DA 0.00386 0.000172 0.086 -4.226 0.004
Videne 0.0970 0.00103 9.10 -1.321 0.244
Change to 60 minutes
Normasol® 0.0177 0.00219 0.143 -4.964 0.004
SCD Ultra 0.0135 0.000108 1.69 -2.181 0.072
Dentyl DA 0.00327 0.000098 0.110 -3.854 0.006
Videne 0.110 0.000982 12.3 -1.202 0.283
Table 3. Changes in PFU/mL from time 0 to 1, 15, 30 and 60 minutes summarised by geometric
mean ratios. Data were analysed using unpaired t test, and
Journ
al Pre-
proof

4
Log2 Fold-change
n Mean Std. Deviation Median Minimum Maximum
1 min Normasol 6 -4.12 3.93 -3.94 -10.34 1.21
SCD Ultra 7 -8.29 6.23 -8.97 -14.61 3.48
Dentyl DA 7 -14.06 3.03 -14.29 -18.07 -10.29
Videne 6 -7.25 8.25 -5.119 -22.74 2
15 min Normasol 6 -3.39 4.04 -2.67 -10.34 0.62
SCD Ultra 7 -4.21 7.89 -4.91 -14.61 9.97
Dentyl DA 8 -10.47 6.56 -10.99 -18.07 1.17
Videne 6 -4.08 5.88 -2.98 -14.77 1.58
30 min Normasol 6 -2.84 5.21 -3.62 -10.34 4.6
SCD Ultra 7 -1.6 7.74 -2.94 -14.61 9.97
Dentyl DA 8 -8.02 5.37 -8.76 -18.07 -2.32
Videne 6 -3.37 6.24 -1.66 -13.64 2.74
60 min Normasol 6 -5.82 2.87 -5.44 -10.34 -1.74
SCD Ultra 7 -6.21 7.53 -5.06 -14.61 5.64
Dentyl DA 8 -8.26 6.06 -9.05 -18.07 0
Videne 6 -3.18 6.49 -1.37 -15.1 2.32
*Zero counts were replaced with a value of 4; the lower limit of detection of the assay being 5 pfu/mL
Table 4. Log2 fold changes of PFU/mL comparing time 0 (baseline) to 1, 15, 30 and 60 minutes, as
plotted in Figure 3 A.
Journ
al Pre-
proof

5
Analyte Mass Biotinylated mass
m/z [M-H]–
Biotinylated MRM
DP (V) CE (V) CXP (V)
PE 14:0_14:0 635 861 860 860→227 −135 −60 −13
PS 14:0_14:0 679 905 904 904→591 −150 −42 −17
PE 18:0p_20:4
751 977 976 976→303 −160 −60 −5
PE 18:0a_20:4
767 993 992 992→303 −170 −58 −5
PE 16:0p_20:4
723 949 948 948→303 −160 −60 −5
PE 18:0a_18:1
745 971 970 970→281 −170 −58 −5
PE 18:1p_20:4
749 975 974 974→303 −160 −60 −5
PS 18:0a_18:1
789 1,015 1,014 1,014→701 −140 −44 −23
PS 18:1a_18:1
787 1,013 1,012 1,012→699 −150 −46 −23
PS 18:0a_20:4
811 1,037 1,036 1,036→723 −145 −42 −23
Table 5. Multiple reaction monitoring (MRM) transitions and instrument settings for the aPL analysed in negative ion mode
Journ
al Pre-
proof

0
0.5
1
1.5
2
2.5
3
3.5
Cer
DH
Cer
LPC
PG
0
10
20
30
40
50
60
70
SM Cer
DH
Cer
LPC
PC
LPE
PE
PE-
O
PE-
P
LPG
PG PI
PS
Ch
ol
CE
TAG
Spike
Actin
Pu
rifi
edVir
us
Mock
Infe
cte
dC
ell
Infe
cte
dC
ell
0 100 200 300 400 500 600 700 800 900 1000
Size (nm)
Co
nce
ntr
atio
n (
pa
rtic
les / m
l)
0
0.2
0.4
0.6
0.8
1.0
1.2
1.4
1.6
1.8
Figure 1
BA
Rel
ativ
e ab
un
dan
ce (
mo
lar%
)
0
0.1
0.2
0.3
LPE
LPG PS
Ch
ol
0
0.004
0.008
0.012
0.016
0.02
SM CE
TAG
0.007
0.015
0.002
0.00040.004
0.003
0.003 0.001
0.053
0.0004 0.004 0.002 0.0070.015
C
A549 cell-derived virus
Vero cell-derived virus
245kDa180kDa
48kDa
35kDa
Journ
al Pre-
proof

Figure 2
0
5
10
15
20
25
30
35
40
SM 3
2:1
;2
SM 3
4:1
;2
SM 3
6:1
;2
SM 3
6:2
;2
SM 3
8:1
;2
SM 3
8:2
;2
SM 4
0:1
;2
SM 4
0:2
;2
SM 4
2:1
;2
SM 4
2:2
;2
SM 4
4:1
;2
SM 3
4:0
;2
SM 4
4:2
;2
SM 3
4:2
;2
SM 3
5:1
;2
SM 3
8:0
;2
SM 4
0:0
;2
SM 4
1:1
;2
SM 4
2:3
;2
Sphingomyelins
Rel
ativ
e ab
un
dan
ce (
%, n
g)
0
5
10
15
20
25
30
35
40
Cer
18
:1;O
2_1
4:0
Cer
18
:1;O
2_1
6:0
Cer
18
:1;O
2_1
8:0
Cer
18
:1;O
2_2
2:0
Cer
18
:1;O
2_2
2:1
Cer
18
:1;O
2_2
4:0
Cer
18
:1;O
2_2
4:1
Ceramides
Rel
ativ
e ab
un
dan
ce (
%, n
g)
0
10
20
30
40
50
Cer
18
:0;O
2_1
6:0
Cer
18
:0;O
2_1
8:0
Cer
18
:0;O
2_2
0:0
Cer
18
:0;O
2_2
2:1
Cer
18
:0;O
2_2
4:0
Cer
18
:0;O
2_2
4:1
DHCeramides
0
10
20
30
40
50
60
LPC
16
:0
LPC
16
:1
LPC
18
:0
LPC
18
:1
LPC
18
:2
LPC
20
:0
LPC
20
:1
LPC
20
:2LysoPC
0
10
20
30
40
50
PC
16
:0_1
6:0
PC
16
:0_1
6:1
PC
16
:0_1
8:0
PC
16
:0_1
8:1
PC
16
:0_2
0:4
PC
16
:1_1
8:1
PC
18
:0_1
6:1
PC
18
:0_1
8:1
PC
18
:1_1
8:1
PC
18
:1_1
8:2
PC
0.0
02
0.0
06
0.0
02
7
0.0
01
0.0
08 2
.7E-
5
8.8
E-5
0.0
05
0.0
03
0.0
00
6
7.3
E-5
0.0
00
04
0.0057
3.3
E-5
0.0
01
0.022 0.024
0.0
1 0.0
09
0.0
06
0.0
05
0.0
02
3.6
E-5
0.0
23
Rel
ativ
e ab
un
dan
ce (
%, n
g)
Rel
ativ
e ab
un
dan
ce (
%, n
g)
Rel
ativ
e ab
un
dan
ce (
%, n
g)
0
10
20
30
40
50
LPE
16
:0
LPE
16
:1
LPE
18
:0
LPE
18
:1
LPE
18
:2
LPE
20
:0
LPE
20
:1
LPE
20
:2
LPE
20
:3
LPE
20
:4
LysoPE
0
10
20
30
40
50
60
PE
16
:0_1
6:1
PE
16
:0_1
8:1
PE
18
:0_2
0:3
PE
18
:0_2
0:4
PE
18
:1_1
6:1
PE
18
:1_1
8:1
PE
18
:1_1
8:2
PE
18
:1_2
0:1
PE
18
:1_2
0:2
PE
18
:1_2
0:3
PE
18
:1_2
0:4
PE
0
10
20
30
40
50
PE
O-1
6:0
_16
:0
PE
O-1
6:0
_16
:1
PE
O-1
6:0
_18
:1
PE
O-1
6:0
_18
:2
PE
O-1
6:0
_18
:3
PE
O-1
6:0
_20
:2
PE
O-1
6:0
_20
:3
PE
O-1
6:0
_20
:4
PE
O-1
6:0
_22
:4
PE
O-1
6:0
_22
:5
PE
O-1
6:0
_22
:6
PE
O-1
8:0
_22
:4
PE
O-1
8:0
_22
:5
O-PE
Rel
ativ
e ab
un
dan
ce (
%, n
g)
0.0
06
0.0
05
0.0
01
10.0
00
5
0.0
00
4
0.0
04
5
3.6
E-6
0.0
41
0.0
00
4
0.0
00
3 0.0
04
9
0.0
02
5
0.0
14
0.0
09
8
0.0
02
2
0.0
11
6.7
E-5
0.0
00
89
0.0
00
12
0.0
00
79
0.0
01
5
A549 cell-derived virus
Vero cell-derived virus
Journ
al Pre-
proof
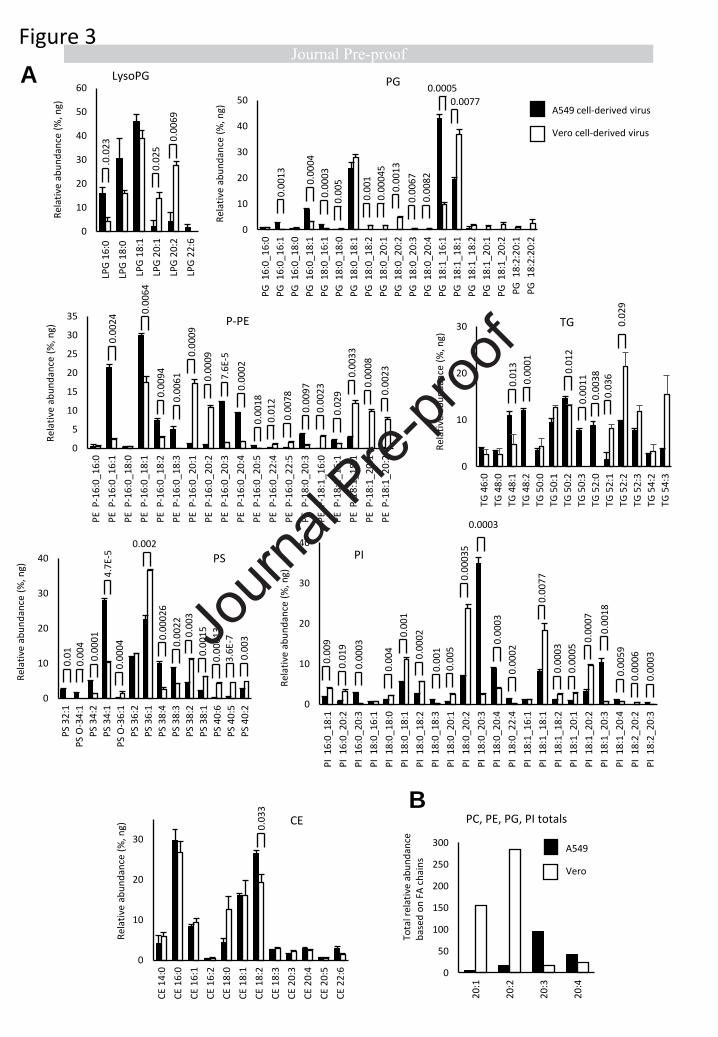
0
5
10
15
20
25
30
35
PE
P-1
6:0
_16
:0
PE
P-1
6:0
_16
:1
PE
P-1
6:0
_18
:0
PE
P-1
6:0
_18
:1
PE
P-1
6:0
_18
:2
PE
P-1
6:0
_18
:3
PE
P-1
6:0
_20
:1
PE
P-1
6:0
_20
:2
PE
P-1
6:0
_20
:3
PE
P-1
6:0
_20
:4
PE
P-1
6:0
_20
:5
PE
P-1
6:0
_22
:4
PE
P-1
6:0
_22
:5
PE
P-1
8:0
_20
:3
PE
P-1
8:1
_16
:0
PE
P-1
8:1
_16
:1
PE
P-1
8:1
_18
:1
PE
P-1
8:1
_20
:1
PE
P-1
8:1
_20
:2
P-PE
Rel
ativ
e ab
un
dan
ce (
%, n
g)Figure 3
0.0
02
4 0.0
06
4
0.0
09
4
0.0
06
1
0.0
00
9
0.0
00
9
7.6
E-5
0.0
00
2
0.0
01
8
0.0
12
0.0
07
8
0.0
09
7
0.0
02
3
0.0
29
0.0
03
3
0.0
00
8
0.0
02
3
0
10
20
30
40
50
PG
16
:0_1
6:0
PG
16
:0_1
6:1
PG
16
:0_1
8:0
PG
16
:0_1
8:1
PG
18
:0_1
6:1
PG
18
:0_1
8:0
PG
18
:0_1
8:1
PG
18
:0_1
8:2
PG
18
:0_2
0:1
PG
18
:0_2
0:2
PG
18
:0_2
0:3
PG
18
:0_2
0:4
PG
18
:1_1
6:1
PG
18
:1_1
8:1
PG
18
:1_1
8:2
PG
18
:1_2
0:1
PG
18
:1_2
0:2
PG
18
:2:2
0:1
PG
18
:2:2
0:2
PG
0.0
01
3
0.0
00
4
0.0
00
3
0.0
05
0.0
01
0.0
00
45
0.0
01
3
0.0
08
2
0.0
06
7
0.0005
0.0077
0.0003
0
10
20
30
40
PI
16
:0_
18
:1
PI
16
:0_
20
:2
PI
16
:0_
20
:3
PI
18
:0_
16
:1
PI
18
:0_
18
:0
PI
18
:0_
18
:1
PI
18
:0_
18
:2
PI
18
:0_
18
:3
PI
18
:0_
20
:1
PI
18
:0_
20
:2
PI
18:0
_2
0:3
PI
18
:0_
20
:4
PI
18
:0_
22
:4
PI
18
:1_
16
:1
PI
18
:1_
18
:1
PI
18
:1_
18
:2
PI
18
:1_
20
:1
PI
18:1
_2
0:2
PI
18
:1_
20
:3
PI
18
:1_
20
:4
PI
18
:2_
20
:2
PI
18
:2_
20
:3
PI
Rel
ativ
e ab
un
dan
ce (
%, n
g)
0.0
09
0.0
19
0.0
00
3
0.0
04
0.0
01
0.0
00
2
0.0
01
0.0
05
0.0
00
35
0.0
00
3
0.0
00
2
0.0
07
7
0.0
00
3
0.0
00
5
0.0
00
7
0.0
01
8
0.0
05
9
0.0
00
6
0.0
00
3
0
10
20
30
40
PS
32
:1
PS
O-3
4:1
PS
34
:2
PS
34
:1
PS
O-3
6:1
PS
36
:2
PS
36
:1
PS
38
:4
PS
38
:3
PS
38
:2
PS
38
:1
PS
40
:6
PS
40
:5
PS
40
:2
PS
Rel
ativ
e ab
un
dan
ce (
%, n
g)
0.0
10
.00
4
0.0
00
1
4.7
E-5
0.0
00
4
0.002
0.0
00
26
0.0
02
20
.00
3
0.0
01
5
0.0
00
13
3.6
E-7
0.0
03
0
10
20
30
CE
14
:0
CE
16
:0
CE
16
:1
CE
16
:2
CE
18
:0
CE
18
:1
CE
18
:2
CE
18
:3
CE
20
:3
CE
20
:4
CE
20
:5
CE
22
:6
CE
0.0
33
0
10
20
30
TG 4
6:0
TG 4
8:0
TG 4
8:1
TG 4
8:2
TG 5
0:0
TG 5
0:1
TG 5
0:2
TG 5
0:3
TG 5
2:0
TG 5
2:1
TG 5
2:2
TG 5
2:3
TG 5
4:2
TG 5
4:3
TG
0.0
13
0.0
00
1
0.0
12
0.0
01
10
.00
38
0.0
36
0.0
29
0
10
20
30
40
50
60
LPG
16
:0
LPG
18
:0
LPG
18
:1
LPG
20
:1
LPG
20
:2
LPG
22
:6
LysoPG
.0.0
23
0.0
25
0.0
06
9
B
A
A549 cell-derived virus
Vero cell-derived virus
0
50
100
150
200
250
300
20
:1
20
:2
20
:3
20
:4
PC, PE, PG, PI totals
Rel
ativ
e ab
un
dan
ce (
%, n
g)
Rel
ativ
e ab
un
dan
ce (
%, n
g)
Rel
ativ
e ab
un
dan
ce (
%, n
g)
Rel
ativ
e ab
un
dan
ce (
%, n
g)
Tota
l rel
ativ
e ab
un
dan
ce
bas
ed o
n F
A c
hai
ns
A549
Vero
Journ
al Pre-
proof

% P
E o
r P
S e
xte
rnaliz
ed o
n s
urf
ace
Figure 4
Dilu
tion r
equired t
o p
reven
t to
xic
ity
1.E+00
1.E+01
1.E+02
1.E+03
1.E+04
1.E+05
1.E+06
1.E+07
1.E+08
PF
U/m
l
Vir
us t
itre
PF
U/1
00 m
l
A
C D
E F
Limit of detection
1.E+00
1.E+01
1.E+02
1.E+03
1.E+04
1.E+05
1.E+06
Ctr
l
Lis
terine C
ool M
int
Cors
odyl
Vid
ene
SC
D M
ax
Den
tyl D
ua
l A
ction
Den
tyl F
resh P
rote
ct
Lis
terine A
dvanced
1
10
100
1000
Cors
odyl
Den
tyl D
ua
l A
ction
Den
tyl F
resh P
rote
ct
Lis
terine A
dvanced G
um
Defe
nce
Lis
terine C
oolm
int
SC
D M
ax
Vid
ene
Before SEC
After SEC
Cell
toxic
ity (
%m
onola
yer
rem
ain
ing)
Or
% r
eduction in v
iral in
fectivity
Dilution
0
20
40
60
80
100
120
1 2 4 8 16 32 64 128 256
DFP (cell tox)
LAGD (cell tox)
DFP (virus inhibition)
LAGD (virus inhibition)
0
50
100
150
200
viruscontrol
Tim
e to
clo
t fo
rmat
ion
(se
c)
PFU virus added
B
0.001 0.001 0.001
SCD
Ult
ra
SCD
Ult
ra
0
20
40
60
80
100
120
PS
18
:1_1
8:1
PS
18
:0_1
8:1
PS
18
:0_2
0_4
PE
P-1
6:0
_20
:4
PE
18
:0_1
8:1
PE
P-1
8:1
_20
:4
PE
P-1
8:0
_20
:4
PE
18
:0_2
0:4
PE
18
:1_1
8:1
PE
18
:0_1
8:1
PE
18
:0_2
0:2
PE
18
:1_2
0:1
PE
18
:1_2
0:2
PE
P-1
6:0
_20
:1
PE
P-1
6:0
_18
:1
PE
P-1
6:0
_20
:2
PE
P-1
8:0
_20
:2
PE
P-1
8:1
_18
:1
PE
P-1
8:1
_20
:1
A549 derived virus
Vero derived virus
0.05
Journ
al Pre-
proof
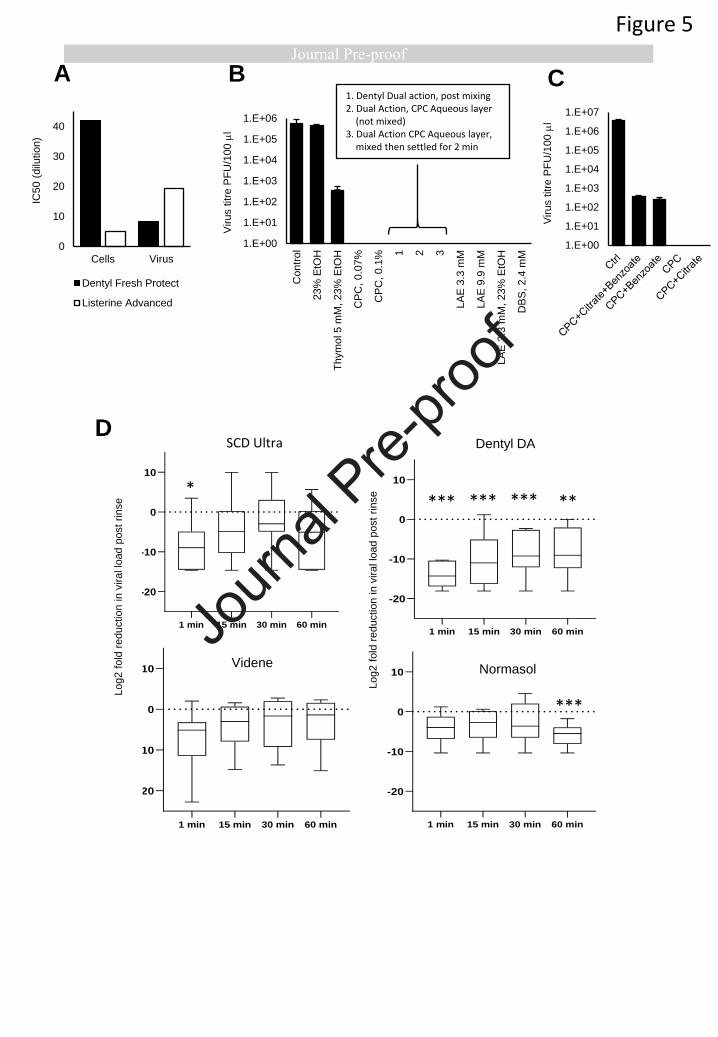
0
10
20
30
40
Cells Virus
Dentyl Fresh Protect
Listerine Advanced
IC50 (
dilu
tion)
Vir
us t
itre
PF
U/1
00 m
l
Vir
us t
itre
PF
U/1
00 m
l
CA B1. Dentyl Dual action, post mixing2. Dual Action, CPC Aqueous layer
(not mixed)3. Dual Action CPC Aqueous layer,
mixed then settled for 2 min
1.E+00
1.E+01
1.E+02
1.E+03
1.E+04
1.E+05
1.E+06
Con
trol
23%
EtO
H
Th
ym
ol 5 m
M, 23%
EtO
H
CP
C,
0.0
7%
CP
C,
0.1
% 1 2 3
LA
E 3
.3 m
M
LA
E 9
.9 m
M
LA
E 3
.3 m
M, 23%
EtO
H
DB
S, 2.4
mM
1.E+00
1.E+01
1.E+02
1.E+03
1.E+04
1.E+05
1.E+06
1.E+07
Figure 5
1 min 15 min 30 min 60 min
-20
-10
0
10
Normasol
Lo
g2
fo
ld r
ed
uc
tio
n i
n v
ira
l lo
ad
po
st
mo
uth
wa
sh
Videne
D
1 min 15 min 30 min 60 min
-20
-10
0
10
Videne
Lo
g2
fo
ld r
ed
uc
tio
n i
n v
ira
l lo
ad
po
st
mo
uth
wa
sh
1 min 15 min 30 min 60 min
-20
-10
0
10
SDC max
Lo
g2
fo
ld r
ed
uc
tio
n i
n v
ira
l lo
ad
po
st
mo
uth
wa
sh
1 min 15 min 30 min 60 min
-20
-10
0
10
Dentyl DA
Lo
g2
fo
ld r
ed
uc
tio
n i
n v
ira
l lo
ad
po
st
mo
uth
wa
sh
SCD max Dentyl DA
Normasol
Log2 f
old
reduction in v
iral lo
ad p
ost
rinse
Log2 f
old
reduction in v
iral lo
ad p
ost
rinse*
*** *** *** **
***
SCD Ultra
Journ
al Pre-
proof
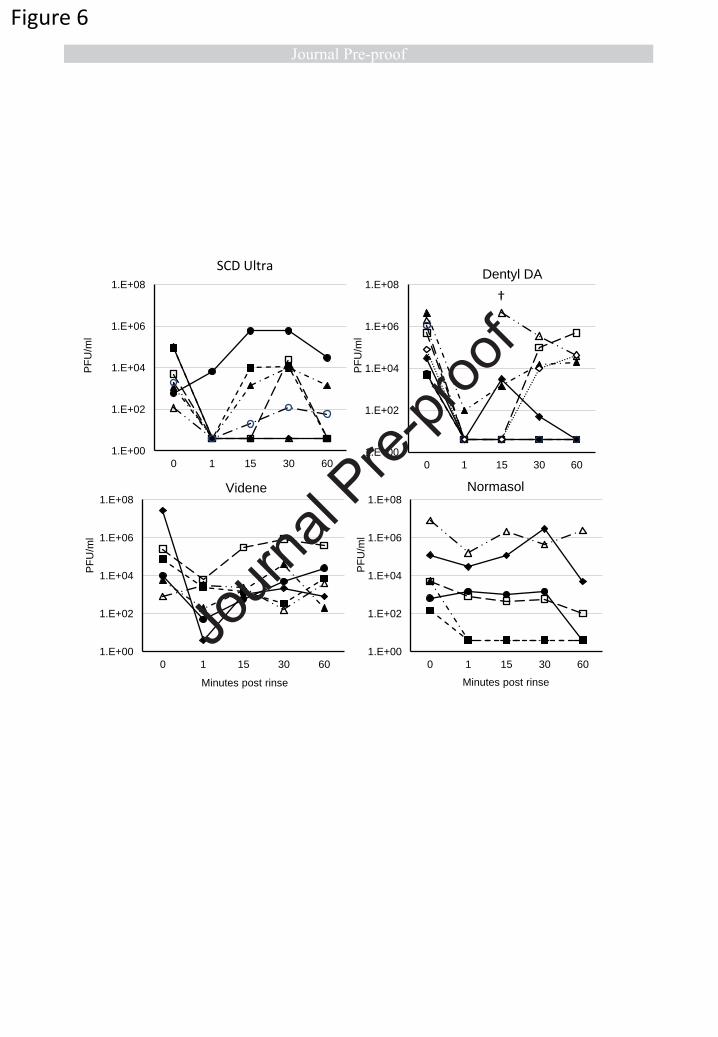
1.E+00
1.E+02
1.E+04
1.E+06
1.E+08
0 1 15 30 60
SCD max
1.E+00
1.E+02
1.E+04
1.E+06
1.E+08
0 1 15 30 60
Dentyl DA
1.E+00
1.E+02
1.E+04
1.E+06
1.E+08
0 1 15 30 60
Videne
1.E+00
1.E+02
1.E+04
1.E+06
1.E+08
0 1 15 30 60
Normasol
PF
U/m
lP
FU
/ml
PF
U/m
lP
FU
/ml
Minutes post rinse Minutes post rinse
†
Figure 6
SCD Ultra
Journ
al Pre-
proof

Figure 7
Journ
al Pre-
proof

Supplementary Figure 1
Journ
al Pre-
proof

Zack Saud: Investigation, Data Curation, Visualization. Victoria J Tyrrell: Investigation, Data Curation,
Visualization. Andreas Zaragkoulias: Investigation, Visualization. Majd B Protty: Investigation,
Visualization. Evelina Statkute: Investigation. Anzelika Rubina: Investigation. Kirsten Bentley:
Investigation. Daniel A. White: Investigation. Patricia Dos Santos Rodrigues: Investigation. Robert C
Murphy: Methodology, Formal Analysis, Data Curation. Harald Köfeler: Methodology, Formal
Analysis, Data Curation. William J Griffiths: Methodology, Formal Analysis, Data Curation, Review &
Editing. Jorge Alvarez-Jarreta: Investigation. Richard William Brown: Investigation. Robert G
Newcombe: Investigation, Formal Analysis, Data Curation. James Heyman: Investigation. Manon
Pritchard: Investigation, Formal Analysis, Visualisation. Robert WJ Mcleod: Investigation. Arvind
Arya: Investigation. Ceri-Ann Lynch: Investigation. David Owens: Investigation. P Vince Jenkins:
Methodology, Conceptualisation. Niklaas J. Buurma: Conceptualisation, Methodology, Investigation,
Writing – Review & Editing. Valerie B O’Donnell: Conceptualisation, Methodology, Formal Analysis,
Investigation, Data Curation, Writing – Original Draft, Visualisation, Supervision, Project
Administration, Funding Acquisition. David W. Thomas: Conceptualisation, Methodology, Formal
Analysis, Investigation, Data Curation, Writing – Original Draft, Visualisation, Supervision, Project
Administration, Funding Acquisition. Richard J. Stanton: Conceptualisation, Methodology, Formal
Analysis, Investigation, Data Curation, Writing – Original Draft, Visualisation, Supervision, Project
Administration, Funding Acquisition.
Journ
al Pre-
proof


![On Mountains and Molehills [final pre-proof copy of paper published in Constellations, 2015]](https://static.fdokumen.com/doc/165x107/6316154b3ed465f0570be034/on-mountains-and-molehills-final-pre-proof-copy-of-paper-published-in-constellations.jpg)