Proceedings - Sandip Institute of Engineering and Management
328
Proceedings 2 nd National Conference On “Recent Innovations in Engineering, Science & Technology”
-
Upload
khangminh22 -
Category
Documents
-
view
3 -
download
0
Transcript of Proceedings - Sandip Institute of Engineering and Management

Proceedings
2nd National Conference
On
“Recent Innovations in Engineering,
Science & Technology”

Sandip Institute of Engineering and Management
Department of Computer Engineering
2nd National Conference on
“Recent Innovations in Engineering, Science & Technology”
Chief Patron
Hon. Dr. Sandip Kumar N. Jha Chairman, Sandip Foundation
Patron
Prof. Ms. Mohini P. Patil General Manager
Sandip Foundation
Prof. Dr. Prakash I. Patil Mentor
Sandip Foundation
Prof. Dr. Dipak P. Patil Principal
SIEM
Guest of Honor
Chief Guest
Key Note Address
Prof. (Dr.) Varsha H. Patil BOS Chairman, Computer Engg
SPPU Pune Vice Principal, MCOERC, Nasik
Prof. (Dr.) Gajanan K. Kharate Principal, MCOERC, Nasik
Ex-Dean, Engineering, SPPU, Pune
Prof. Manoj V. Bhalerao Professor & Head, Electrical Engg
KKWIEER, Nasik
Convener
Dr. Kamini C. Nalavade Head
Department of Computer Engineering
Coordinators
Prof. Datta S. Shingate Assistant Professor
Department of Computer Engineering
Prof. Pramod C. Patil Assistant Professor
Department of Computer Engineering

Advisory Committee Members Executive Committee Members
Dr. B. B. Meshram(Professor, VJTI, Mumbai) Prof. A. S. Maheshwari(Dean Academics, SIEM, Nashik)
Dr. P. K. Khare(Prof & Dean,Faculty of Science,R.D.V.V., Jabalpur) Prof. K. T. Phalak(Dean Administration, SIEM, Nashik)
Dr. G. K. Kharate(Principal,MCERC, Nashik & Ex-Dean, SPPU, Pune) Dr. G. N. Shelke(Dean R & D, SIEM, Nashik)
Dr. S. S. Sane( Prof. & Head, Comp. Engg., KKWIEE&R, Nashik) Dr. K. V. Bhadane(Dean Project, SIEM,Nashik)
Dr.(Mrs.) V. H. Patil (BOS Chairman, Comp. Engg., SPPU Pune) Dr. A.S. Dube(Head Mechanical Engineering, SIEM, Nashik)
Dr. V. B. Virulkar (BOS Member,Gondwana University) Prof. K. L. Bidkar(Head Civil Engineering, SIEM, Nashik)
Dr. M. U. Kharat (Prof. & Head, Comp. Engg., MET IOE, Nashik) Prof. H.R. Kulkarni(Head Electrical Engineering, SIEM, Nashik)
Dr. K.V. Chandratre (BOS Member Mechanical Engg.,SPPU, Pune) Prof. Y. R. Risodkar (Head E&TC Engineering, SIEM, Nashik)
Dr. P. D. Jadhao (Prof & Head Civil Engg., KKWIEE&R, Nashik) Prof. R. J. Nayak(Head Applied Science, SIEM, Nashik)
Dr. P. N. Mahalle (BOS Member, Comp. Engg., SPPU, Pune)
Dr. P. D. Patil (BOS Member, Comp. Engg., SPPU, Pune)
Col. Dr. N. Ramachandran(Vice-Chancellor,SU,Nashik)
Dr. A. K. Dwivedi (Dean, Sandip University, Nashik)
Dr. S. T. Gandhe(Principal, SITRC, Nashik)
Dr. A. G. Jadhav (Principal, SIPS, Nashik)
Prof. P. N. Patil (Principal, SP, Nashik)
Prof. S.D. Pawar (Principal, SIP, Nashik)
Organizing Committee Members
Dr. S. P. Ahirrao (Asso. Prof. Civil Engg.) Dr. M.R. Gadekar (Asst. Prof. Civil Engg.)
Dr. Hanuman Prasad (Asst. Prof. Electrical Engg.) Prof. Mosam Sangole (Asst. Prof. E&TC Engg.)
Dr. T.A. Rajput (Asst. Prof. ESH Engg.) Prof. Sushant Pawar (Asst. Prof. E&TC Engg.)
Dr. (Mrs) L. N. Patil (Asst. Prof. ESH Engg.) Prof. Tabish Shah (Asst. Prof. Electrical Engg.)
Prof. S.J. Chede (Asst. Prof. Mechanical Engg.) Prof. V.T. Bhendwade (Asst. Prof. Mechanical Engg.)
Prof. A. R. Gaidhani(Asst. Prof. Computer Engg.) Prof. A. C. Taskar (Asst. Prof. Computer Engg.)
Prof. A. G. Patil (Asst. Prof. Computer Engg.) Prof. P. R. Kulkarni(Asst. Prof. Computer Engg.)
Prof. M. V. Korade(Asst. Prof. Computer Engg.) Prof. R. S. Sahane (Asst. Prof. Computer Engg.)
Prof. A. R. Potdar(Asst. Prof. Computer Engg.) Prof. P. G. Aher(Asst. Prof. Computer Engg.)
Prof. M. S. Deshmukh (Asst. Prof. Computer Engg.)

INDEX
Sr.
No.
Paper
ID
Paper Title
Authors Name
Page
No.
TRACK 1 [Computer]
3 3
Exploring Techniques For
Converting Handwritten
Mathematical Expression
Pawan Wankhede, Pradip Narsale,
Manish Patil, Prajwal Dikonda
1
6 11
Physician Recommendation
System Using Preference
Learning Algorithm
Mohit Patil, Shrikant Bargal ,
Abhishek Sonawane ,Datta
Shingate
5
8 13
An Urban Renewal And
Retrofitting Approach To
Smart Cities
Prof.Piyush Kulkarni, Pratiksha
Borse , Nilam Borse ,Rucha
Khambekar
8
9 15
Cancer Detection
Application By Using
GLCM Algorithm
Prof.R.R. Bhandari
Tanushree Sonar , MayuriPatil ,
ManjushaGalande ,
PratikshaBhadke
12
10 17 Home Interior Designing Pooja Vora, Pooja Sharma, Shivam
Wagh , Prof. A. C. Taskar
18
11 18 Iot Based Smart Vehicle For
Fuel Consumption
Gauri A. Patil, Gayatri
A.Patil,Priyanka S.Sangle,
Prof.M.V.Korade
21

12 19 Privacy And Protecting
Content For Social Sites
Prof. P. G.Aher, Ashita Choudhury,
Bhakti Pardeshi
24
13 20 Smart Student Card
Pratik Kadoli, Akanksha Borse ,
Shridhar Gaiwkad,Avinash Singh,
Prof. A.R.Gaidhani
28
14 21 Smart System For Blind
People
Prof. Reena Sahane, Brijgopal
Dixit, Saloni Aggarwal, Prakash
Jha , Suvidha Pawar
31
16 30
V2v And V2i
Communication For
Prevention
Of Road Accidents
Yash Mali, Shraddha Deore,
Pratiksha Rakholiya, Prof. Mr.
A.C.Taskar
34
17 33 Android Application For
Disaster Recovery
Supriya Badwar, Mayuri Shirore,
Shweta Shinde , Ashwini Pawar,
Prof. A.G. Patil
38
18 35
Review: Water Quality
Monitoring System Using
Iot
Harshal Pawbake,Ankit
Sharma,Hetal Patel,Prof.A.R.Potdar
43
19 36 Hi-Tech Traffic Signal
System
Anish. B. Deore, Prasanna. H.
Janve , Gourav. S. Kakad , Dr. K.
C. Nalavade
46
20 37 Safety Tracking System For
School Students
Tejas S.Shah, R.Pratik,Wajid
S.Shaikh, Bhushan
S.,Sonawane,Dr.K.C.Nalavade5
49
21 38
Mood Detector Using
Image Processing, Ai And
Machine Learning
Sudhakar Vishwakarma, Sayali
Mane, Komal Kadlag,Pallavi Aher
53
22 39 Uid Based Voting System-
Extension To Evm
Prof.P.C.Patil, Pooja Aski , Kiran
Hire3 , Saloni Ambekar
57
23 41
Hi-Tech Farm Pond
Monitoring And
Management System
Ashwini Daund, Rutuja Boarade,
Moksha Chopda , Dr K. C.
Nalavade
61
24 43 Sentiment Analysis Chandan Raghav, Leena Nandan, 65

Forbusiness Intelligence
Buildup
Chetan Chaudhari , Aayushi Shah ,
Prof. D.S. Shingate
25 44 Review: Forest Fire And
Notification System
Pratik Kulkarni ,Rupali Wadlekar,
Anuja Shinde,Prof. A.R. Gaidhani
68
26 45 Smart Helmet
Prof. M.V.Korade, Snehal Jare,
Arefa Shaikh , Yashi Thakur,
Megha Gupta
71
27 49
Car Security System – A
Review
Prof. Sagar Rajebhosale 1, Juzer Bhagat
2, Riddhi Patel33 , Rasika Nimonkar 4
,Vaibhav Patil
75
29 67
Proposed Secure Content
Modeling Of Web Software
Model
Madhuri N. Gedam,Bandu B.
Meshram
80
30 72
Automated Crowd
Surveillance Using Drone
And Ai
Prof. Mohan Nikam, Mahesh
Navle, Vaibhav Gavhane, Akash
Mahajan Dipak Desai
84
33 87 Wakeup My India Neha Tupe, Komal Kumavat,
Saurabh Raut,Saurabh Shrivastava
90
41 97 New Approach To
Strengthen The Password
Wagh Snehal, Kame Apeksha,
Gandhi Shruti, Tonpe Smita,
Thombare Manisha
94
42 99
Automatic Solar Tricycle
For Physically Challenged
People
Leena.S.Nikam,Sayali.R.Shinkar,Ni
kita.P.Wadile, Varsha.D.Bhamare
98
43 100 Digital Car Parking System
Aarti N. Nerkar,Preeti S.
Netke,Akanksha S. Ahire,Pratiksha
S. Nikam,Ms. Madhuri V. Malode
101
44 101 Smart Tool Dispenser
Machine Using Ai And Iot
Neha Chavan ,Neha
Darade,Piyusha Kapadnis,Shikha
Gupta,Prof.S.A.Talekar
103
45 112 Automatic Scheduling
System Using Ai
Apurva D Kolhe, Chaitali D Patil,
Mitali A. Aherrao, Riyanka S. Rai,
107

Ms. D. L. Tidke
TRACK 2 [Mechanical]
46 5
A Review On Fiber
Reinforced Hybrid
Composites
Jagdale Shubham, Sawant Suresh
1
47 46
Energy Harvesting Speed
Breaker
Prof. Dr.Amol D. Lokhande,
Nishant Nikam, Hemant Mishra,
Rushikesh Sathe, Ganesh Kokate
7
48 48
Design And Development
Of Mecanum Wheel With
Forklift Application
Prof. Dr.Amol D. Lokhande,
Khagesh D. Patil, Bhushan P.
Jangale, Lokesh A. Ambekar ,
Shubham S. Ingole5
13
49 51
Reclaimation Of Exhaust
Gas From Pneumatic
System
Chede Sachin, Rana Aishwary,
Kakade Bhushan, Choudhary
Shivank, Ranalekar Harshad
19
50 52
Review Of Solar Operated
Vapour Absorption
Refrigeration System
Siddhant Sandeep Arote
23
51 53 Automatic Human
Following Trolley
Prof.S.M.Mahajan, S.A.Dheringe ,
P.D.Harde, P.V.Gaware ,S.D.Ahire
26
52 54 Solar Automated Lawn
Mower
Prof. Dr. G. G. Waghmare,
D. R. Khairnar, D. S. Kale , G. R.
Gangurde ,R. S. Aher
28
53 55
Design And Manufacturing
Of Camphor Tablet Making
Machine
Prof. Chetan Patil ,Mr. Rahul
Pawar,Mr. Shubham Waghchaure,
Mr. Shubham Mahale
,Mr. Amol Pawar
31
54 56
Design & Fabrication Of
Railway Track Detection
&Ballast Cleaning System
Prof.C.R.Patil, Akash Thete, Tejas
Said, Vrushabh Dhatrak, Jayesh
Kadam
35

55 57 Universal Shock Absorber
Test Rig
Prof. K.U. Shinde, Bhushan Wagh,
Rutuja Phadol, Mansi Hirve,
Mangesh Pawar
39
56 58
Performance Of Solar Dryer
With Phase Change
Material
Prof. P.P. Kulkarni, Amit R.
Mahajan, Vaibhav S. Nikumbh,
Akshay S. Bachhav, Kaliprasad
Sonone
43
57 59
A Review On Solar Dryers
Prajwal Mahajan, Rajesh Tomar,
Mandar Deshpande,Mayuresh
Lohgaonkar,Gajanan Shelke
46
59 62 Supply Chain Management Milind Pawar, Aniket Patil,
Rameshwari Nile, Nitin Patil
49
61
64
Review On 3d Machine
Vision System And It’s
Application
Prof. S. B. Ambekar,Mr. Mankar
Abhishek Ashok,Mr. Ingale Akash
Prakash
54
63 69 Analysis Of Weld Strength
For Pressure Vessel
Chetan Kukawalkar, Abdallah
Madaoo, Danish Ansari , Prashant
Bharti, Prof. Prakash Sutar
62
64 71
Weld Analysis Of
Dissimilar Grade Metals
Using Fea Software
Prof. Susheel S. Pote, Ankita
Deore, Rushikesh Vyavahare,
Rohan Sonawane, Pranavesh Patil
71
65 73 Design And Fabrication Of
Energy Efficient Treadmill
Prof. S. J. Chede, Gaurav Shirsat,
Sanket Thakur, Akshay Kadam,
Siddhesh Thakare
76
67 79 Design And Manufacturing
Of Yoke Crane
Prof. C. R. Patil, Mr. Uday Amode ,
Mr. Siddhesh Kumbharde, Mr.
Vivek Kamble
80
69 82
Experimentation To
Analyze The Effect Of
Coating On Gauge And
Tool Materials
Sachin Chede, Sahil Dushing,
Abhishek Jagzap, Vikas Khalkar,
Sachin Rahane
84
70 83
Design And Fabrication Of
Eddy Current Braking
System
Prof.S.M.Mahajan, Suyog R.
Chaudhari, Akshay B. Fartale,
Pranav K. Gosavi,
Rahul D. Vidhate
88

75 103
Design,Fabrication And
Performance Analysis Of
Solar Dryer With High
Temperature Solar Collector
Kiran More, Rohit Khairnar, Ashish
Kadam, Vikas Satkar , Nikhil
Shinde
90
76 106 Study Of Anti-Reflection
Coating
Prof. Dr. Manish D. Pasarkar,Prof.
Kunal U. Shinde,Devendra P.
Birari,Tejas P. Bandavane,
Kedar V. Walekar,Susmit N.
Datrange
93
78 108
Design & Fabrication Of
Grease Filling Machine For
Universal Joint Cross
Prof.S.M.Mahajan,G. V. Malviy,
P.A.Jadhav,K.B. Bagul,
A.M.Bhandari
96
79 110 Hydrate Based
Refrigeration Syatem
Prof. Ankit .K.Mishra, Mr. Rutik
Shalik Hyalinge
99
80 111
Electronic Stability Control
Prof. P. P. Kulkarni, Mr.
Kothawade Saurabh Ravindra2
103
83 115 Needle Filling Machining Prof. T. D. Patil, Mayur Shinde,
Pavan Bachhav, Amit Kanse
110
84 116
Sensing And Control Of
Temperature, Humidity And
Water Level In A Poultry
Farm
Prof. Kiran D. More,Sanket
Gangurde,Sushil Jadhav,Nilesh
Ghuge,Vishal Pawar
114
TRACK 3 [Civil]
85 7 A Review On Fly Ash
Slope Stability Prajwala Chachadi,Prasanna Patil
1
86 8
A Review On Contaminant
Transport Through Layered
Soils
Rajeshwari M. Puranik,Prasanna
Patil
5
87 10 Use Of Steel Slag To
Increase Bearing Capacity
Ravindra N. Patil1, Kailash T.
Phalak2, Kisan L. Bidkar3
10

Of Soil In
Road Construction
88 16
Seismic Vulnerability
Assessment Of Rc Structure
Using Incremental Dynamic
Analysis
Prof. Dilip Chaudhri, Khushboo
Damkondwar
13
89 77
Seismic Assessment Of Rc
Frames With Various
Bracing Systems
Dr. S. K. Hirde, Shubham K.
Nagmoti
18
90 78 Performance Based Seismic
Design Of Open Ground
Prof. Dilip J. Chaudhari, Rahul S.
Agarwal
23
91 105
Use Of Different Modified
Dual Piezo Configurations
On Rc Beam Using Emi
Technique
S. N. Khante, Saurabh M. Bhoir
30
TRACK 4 [Electrical]
95 28
Interconnection Protection
For Wind Power Distributed
Generation Based On
Distance Relaying
Madhuri D.Bagade, Rajani
M.Sahare
1
98 68 Plc Based Automatic Car
Washing System
Sagar Patil, Pushpak Patil,
Maheshwari Patil
5
100 74
Iot And Can Based
Industrial Parameter
Monitoring And Controlling
Prof. Piyush M. Desai, Akshay K.
Nigal, Rushikesh R. Dargude ,
Kamlesh P. Muluk, Aniket S.
Doiphode5
11
102 84 Intellectual Earthing System
Sanket Suresh Nawale, Komal
Sham Dabhade, Shrutika Ranjit
Landage, Shantanu Vinayak Aher,
Prof. Tabish Shah
14
103 104
Distance Protection Scheme
For Series Compensated
Transmission Line Based
On Mutual Impedance
Sabiha Naz, Rajani M. Sahare
18

TRACK 4 [E&TC]
105 27 Logistic Management In
Fuel Tankers
Dr. Mithra V., Radhika Prajapati,
Priya Vats, Shruti Chandra
1
106 40 Biometric Door Unlock
Using Fingerprint Sensor
Dhamane Ketan Ashok , Jathar
Rohit Kiran , Patil Shailesh Dilip
9
108 47 Digital Fuel Level Indicator
Radha Khade, Arti Kothule,Manasi
Shah,
Dipti More
11
TRACK 5 [ESH]
110 50
Cognitive Radio Spectrum
Sensing With Ofdm: An
Investigation
Md. Shahnawaz Shaikh,Dr. P.K.
Khare 1
111 109
Utilisation Of Spectroscopic
Techniques For The Study
Of Structural, Spectral,
Opticaland Electrical
Characterization Of
Polymers
Rashmi J Nayak, Jyotiprakash G
Nayak ,P K Khare 6
112 117
An Investigation Of
Acoustical Resonance In
Humans Through
Determination Of Individual
Natural Frequency
Nivedita Azad, Anirvan Gupta 11

National Conference On “Recent Innovations In Engineering Science & Technology" April 2019
1 Computer Engineering
the techniques such as using Character
Segmentation(CSeg),Character Recognition(OCR), Structural
Exploring Techniques for Converting Handwritten
Mathematical Expression Pawan Wankhede1, Pradip Narsale2, Manish Patil3, Prajwal Dikonda4
1st [email protected], 2nd [email protected], 3rd [email protected],
School of Computer Engineering and Technology. MIT Academy of Engineering (SPPU), Pune,
Maharashtra, India.
Abstract—Digitizing mathematical expression while
submitting a problem is very necessary, but at many times
recognition systems fails to accurately convert the special
symbols such as Phi or Psi as they are not used frequently in
natural language documents. Also, natural text converters fails
to while handling complicated mathematical structures and
grouping between the symbols. For writing problem sets and
research papers, lot of people first write a draft and then they
later type it manually. It takes a brief time to learn LaTeX
and it takes a brief time for typing up mathematical documents.
This project will find different approaches to create a system
which will convert handwritten mathematical expressions into
digital counterparts, which further could be used in near future
for converting expression in real time. The input of the system
are the handwritten expression. And use of a Support Vector
Machine for segmenting expression traces into required
mathematical characters along with Neural Network for
recognizing characters. The output is the expression in LaTeX.
Keywords—Support Vector Machine, Neural Network,
Digitizing, LaTeX, Character Recognition.
I. INTRODUCTION
The LaTeX holds an important ability to automate work and
enhances users efficiency. As when we type a formulae and
scientific syntax the person who types even more than two
expressions in a report should consider using LaTeX. As the
learning curve for using LaTex at it's full efficiency is undoubtedly
high. And for learning how to use mathematical expression into
LaTeX requires a brief time to get a grip onto LaTeX syntax [11].
Recently there has been an increase in usage of the digital
documents in academia. There is already some work done in this
area but it cannot produce accurate results. For writing a research
paper or any official document first people write the expression
onto a paper and then they convert it into LaTeX syntax. Many
applications are developed in the field of recognizing pattern such
as face, character and speech recognition. The motive for the
research is for finding an efficient method for character
recognition. It is a complex task to develop a system which can
convert any type of document character's into machine readable
form. Whereas recognition of handwritten character is always a
fascinating topic for the researchers all around the world. As every
person have different way of writing they are differentiated by
different characteristics such as speed, style, size, positions of
characters which results in many different variations for the same
word. Even the same person cannot write the same sentence as it is
because it depends onto the different situations different tools used
and so on. To overcome these set of challenges many researchers
provided different solution to make the results more accurate [12]. II. RELATED WORK
This section explores the various techniques for recognition of
‘Handwritten Mathematical Expression’.
Chang, Joseph et al.[1] proposed a technique for converting
handwritten and electronic documents into LaTeX source code,
using Optical Character Recognition along with Machine Learning.
For applying the methods they divided the task into subtasks with
Analysis (SA), lexing and Parsing. Dataset used for training was the
data crawled using python scripts. Using the above method the
result for the CSeg provided with 92% accuracy. OCR was trained
by partitioning the data for training, validation and testing by
percentage of 60%, 20%, 20% respectively. OCR represents error
percentage of 8.817%. The confusion between 1 and l, 0 and o is
hard to be classified via OCR. Overall the system provides
operational using RPCC, SVM and grammar focused approach.
Richard Zannibi and James R. Cordy [2] proposed a technique for
recognizing mathematical expression using Tree Transformation.
The system uses three successive passes. The first pass is ‘Layout
Pass’ which builds a Baseline Structure Tree which describes the
two-dimensional position of input symbols. Reading the order of
operator and it's precedence both are used for allowing efficient
recognition of the symbol layout even when the symbols changes
greatly from their required positions. And then the ‘Lexical Pass’
produces a lexed Baseline Structure Tree (BST) from the first BST
by creating a group of tokens with multiple input symbols, these

National Conference On “Recent Innovations In Engineering Science & Technology" April 2019
2 Computer Engineering
have function names , decimal numbers, with symbols consisting of
non-overlapping primitives similar to “=”. Lexical Pass labels
vertical structures present such as fractions. This Lexed BST is
now converted into LaTeX. The BST after lexing BST is
transformed into an ‘Operator Tree’, which later explains the scope
with order of operations present in the expression given as input.
The tree changing that is manipulation used in every pass are
represented in compact form using tree transformations. The
system architecture is compiler like which allows efficient handling
of unexpected input, increasing the scalability of system, along
with providing the groundwork to handle the mathematical
notations.
Masakazu Suzuki, et al.[3] proposed an OCR system for
recognizing mathematical documents, called INFTY. INFTY uses
four ways to perform, which are character recognition, layout
analysis, and structural analysis of mathematical expressions, and
manual error correction. In all these procedures, many techniques
are used for efficient recognition. Results gained are on 500 pages
of mathematical documents which acquired high recognition of
character percentage on mathematical expressions as well as on
simple texts, and sufficient performance output on the structure
analysis of the mathematical symbols and expressions. The result
achieved onto 476 pages of documents with the recognition rates up
to 98.51% and 89.6% of mathematical expressions are perfectly
analyzed with no error.
Christopher Malon, et al.[4] proposed solution for challenges in
recognition of Mathematical formulas with an OCR system with a
variety of similar looking symbols whose bold, calligraphic
varieties must be recognized differently for each one of them,
though the fonts that are present in an article are not known
previously. The solution for that this paper describes the use of a
support vector machines (SVM) to learn and then predict about 300
classes of symbols and styled characters. The base of this solution
is for avoiding the confusion of the letters such as 1 and l. They
used Naive classifier, Linear SVM and then Gaussian SVM for
better classification of the data. It is concluded that even the
simplest kernel, the support vector method is strong enough to
achieve better accuracy result which overcomes the difficulty for
simpler classification used in an OCR system.
In the review paper, Masayuki Okamoto and Bin Miao[5] focused
on layout structures of symbol without parsing them. As parsing
methods require the precise syntax definitions of expressions which
can be difficult for a wide variety of expressions. This method finds
an expression structure from the two-dimensional relative positions
of symbol within the expression. The basic principle used here is
partitioning the given expression into components by recursive
horizontal and vertical cutting. Text recognition and Documents are
understood by using the partitioning of the expressions into
components. The processing speed achieved by this method is
higher than that of the traditional methods.
Yassine Charjri, et al.[6] the author describes all the details
concerning the necessary steps of recognition approach for
handwritten mathematical expressions recognition. There are
two large sets present in the era of document recognition: text
analysis and graphical components analysis. The system begins
by a set of pre-processing techniques in order to ameliorate the
quality of the image and then making the features extraction
efficient. The next step in the system process is expression
segmentation into individual symbols based totally on the
connected component algorithm. To extract the features, Here
they applied the ‘Radon Transform’ for exploiting its ability to
extract lines from the images. With symbols classification by
using Support Vector Machines (SVM).For pre-processing they
used techniques as Normalization, Filtering, Binarization, and Skew
Detection and Correction. Recognition rate achieved were:
Mathematical logic with 90%, mathematical analysis 68%,
mathematical algebra 82% and mathematical probability of 72%.
Richard Zannibbi and Dorothon Blostein[7] proposed surveys in the
different recognition and conversion of mathematical expressions,
which revolves around four key problems in math recognition as
query construction, indexing, normalization and relevance
feedback, and four problems present in the math recognition that is
detecting the expressions, detecting and classifying different
symbols, analyzing the layout of symbol, and then constructing a
representation of meaning. Via optimizing the component
algorithms in a mathematical expression recognition system, and
with creation of effective indexing, relevance and retrieval
feedback algorithms for math retrieval. And as described another
important problem is for developing user interfaces which
efficiently integrate recognition and retrieval. Michael Shilman, et al.[8] proposed step by step means to
recognizing graphics and textual data. This gives us augmentation
of a sketched shape along with the symbolic meaning, enabling
various different features. This spatial recognition method acquires
a search-based optimization on a large space of possible groupings
from parallel groups and recognized sketches of the given shapes.
The optimization uses a classifier which gives a class label to a
collection of strokes which are similar in context. The overall
grouping optimization without a proof assumes the properties of the
classifier so that if the classifier is scale and rotation invariant the
optimization will be as well. The present invention uses a variant of
AdaBoost to facilitate in recognizing or classifying symbols. It also
facilitates dynamic programming and A-star search for
optimization. The proposed technique presented applies to both
shape sketches made by hand and printed handwritten text, and
even heterogeneous mixtures of the two.
Bluche and Théodore[9] proposed a system using different machine
learning techniques, using neural networks and fuzzy logic. A
binary image which represents a mathematical expression is
segmented, and the recognition is carried out using the symbol
bounding boxes. An iterative algorithm with use of a multi-
classifier system finds and recognizes the structure and via finding
structure classifies the symbols as their categories. The results of
the proposed techniques proved that the context of a symbol, when
used can help to classify the symbol. The structure recognition
along with the use of a non-recursive algorithm with very few
backtracking gave good results. This survey proved that the
symbols identity is not required for the structure analysis. But, the
structure recognition gives very useful but very little information
for classification of symbol. The machine learning approach
produced a flexible system, able to adapt to not known symbols and
vivid writing styles.
Martin Thoma, et al.[10] proposed a thesis in which they used
multiple systems that used information and order of strokes and
pen trajectory to classify the handwritten symbols. Five pre
processing steps, one data augmentation algorithm, five features
and five variants for multilayer Perceptron training were processed
using 166898 recordings which were collected with two crowd
sourcing projects. The evaluation created the result of all these 21
experiments were used for the creation of an optimized recognizer
which has a TOP-1 error that is less than 17.5% and then a TOP-3
error of 4.0%. This is an improvement of 18.5% for the TOP1 error
and 29.7% for the TOP-3 error.

National Conference On “Recent Innovations In Engineering Science & Technology" April 2019
3 Computer Engineering
III. DISCUSSION
TABLE 1 – Comparative analysis for character recognition systems.
Authors Approach / Techniques Features Pros Cons
Chang Joseph Optical Character Recognition
along with Machine Learning.
Electronics documents -Operation level accuracy.
-Converts documents
directly to LaTeX syntax.
-Error prone to
handwritten symbols.
-Ambiguity between
characters is not resolved
with leads to error in
conversion.
et. Al.[1] can directly be converted to LaTeX
source code.
Richard Mathematical expression Successive passes like a
compiler.
- Layout pass.
-Lexical pass.
-Tree transformation.
-Due to compiler like
design system is robust to
unexpected input.
-Robustness increases
scalability of the system.
-Overfitting
Zannibi and recognition
James R. using ‘Tree Transformation’.
Cordy [2]
Masakazu Optical Character Recognition
system for mathematical
documents using procedures
such as Layout analysis,
structural analysis and
Character recognition.
-Simultaneous character -Faster computation time
from the traditional OCR
systems.
-Manual error correction is
required for result with an
error.
Suzuki, et al. recognition.
[3] -Separation of
mathematical
expression.
Christopher Support Vector Machine for
recognition of mathematical
symbols.
-Use of kernel functions
for classification of data.
-Simple SVM can
produces strong
generalization accuracy.
-Confusion between
Malon, et al. [4]
similar looking characters is possible which leads to
error prone results.
Masayuki Mathematical expression -Less complicated to
apply.
-Does not require precise
syntax for parsing the
symbols.
-Recognizes almost all the
mathematical symbols
correctly.
-Fails to recognize some
symbols such as ‘limits’.
-Not all the expressions
can be recognized by the
system.
Okamoto and recognition by partitioning the
Bin Miao[5] given expression into components by recursive
horizontal and vertical cutting.
Bluche and Machine Learning Techniques -Robust -System can correct itself
using the answers from the
quiz.
-Use of fuzzy logic
improves the results.
-Symbols with less context
for recognition are hard to
classify.
Théodore[9] -Intelligent system with self learning ability
Martin Online Recognition via
recording strokes of the letters.
-Real time -Real time conversion of
handwritten expression
using the information of
strokes and trajectory.
-Due to less no of training
example system fails to
recognize some symbols. Thoma, et al.
[10] -Simple to use

National Conference On “Recent Innovations In Engineering Science & Technology" April 2019
4 Computer Engineering
Character Recognition system can be implemented in 2 ways asOffline and Online Recognition system and they have different approaches for implementing such systems proposed by Yassine Charjri, et al.[6]. Offline OCR system along with Machine learning is proposed by Chang, Joseph et al.[1], is used to convert physical and handwritten documents into a digital form. But it is more effective for the printed documents as there is ambiguity and problems with the grouping of characters. These challenges are discussed by Christopher Malon, et al.[4] providing different approaches for dealing and improving results. The OCR systems can improved by using machine learning effectively using methodologies such as reinforcement learning and optimizing the recognition algorithm as proposed by Richard Zannibbi and Dorothon Blostein[7]. Use of symentic means for recognizing text and graphic was proposed by Michael Shilman, et al.[8] using the information of strokes and grouping of characters the system assignes the class labels for the strokes. This approach can be applied for handwritten as well as printed documents. But with use of fuzzy logic using the machine learning algorithm we achieve
better results proposed by Bluche and Théodore[9]. A more
generic model was proposed by Martin Thoma, et al.[10],
where they used pen trajectories for classification of handwritten
symbols with pre processing techniques for character recognition.
IV. CONCLUSION
Much research has been done on character recognition
systems. Most systems use OCR and Machine Learning, few
systems use both techniques combined and some uses different
optimization techniques for better results. Machine Learning has
been used effectively in various systems to improve the
performance of the system and to achieve better results in
character recognition systems. As any recognition system have
two approaches as offlineand online recognition the effective and
correct results are achieved by using online recognition as it
records the trajectory, pressure and strokes of writing to
recognition of symbols.
V. REFERENCES
[2] Richard Zannibi, et. al."Recognizing Mathematical Expressions Using
Tree Transformation" IEEE Computer Society.
[3] M. Suzuki, et al. “Infty: an integrated ocr system for mathematical documents,” ACM
symposium on Document engineering, 2003.
[4] Christopher Malon. "Support Vector Machines for Mathematical Symbol
Recognition" Kyushu University.
[5] Masayuki Okamoto, et. al. "Recognition of Mathematical Expressions by
Using the Layout Structure of Symbols". IAPR-TC11
[6] Yassine Chajri, Belaid Bouikhalene "Handwritten Mathematical Expressions Recognition"
Laboratory of Information Processing and Decision Aids, Faculty of Science and
Technology.
[7] Richard Zanibbi, et al. "Recognition and Retrieval of Mathematical
Expressions".
[8] Michael Shilman, et al. "Spatial Recognition and Grouping Of Text and
Graphics" App No. 10/927,452 Pub. Date, Mar. 2, 2006. [9] Bluche, Théodore.
Mathematical Formula
RecognitionusingMachineLearningTechniques. Diss. Universityof Oxford,
2010.
[10] Thoma, Martin. "On-line Recognition of Handwritten Mathematical
Symbols." arXiv preprint arXiv:1511.09030 (2015).
[11] Amit Schechter, Norah. “Converting Handwritten Mathematical
Expression into LaTeX”. December 15, 2017.

National Conference On “Recent Innovations In Engineering Science & Technology" April 2019
5 Computer Engineering
Physician Recommendation System Using
Preference Learning Algorithm
Mohit Patil1, Shrikant Bargal 2, Abhishek Sonawane 3 Datta Shingate 4
1st [email protected], 2nd [email protected], 3rd [email protected] [email protected]
Computer Department
Sandip Institute Of Engineering & Management,
Nashik
Abstract— Web-based appointment system are emerging in
health care industry providing with convenient and diversified
services, among physician recommendation becoming more
and more popular to make assignment. Currently patients
with heterogeneous illness conditions, and then patients could
select one physician for appointment according to their
preferences capturing patient preferences is essential for
physician recommendation delivery; however it is also
challenging due to lack of data on patient preferences. In this
review paperwe studied physician recommendation problem
by preference learning algorithm that will optimized the
recommendation and learn.
Keywords—Distributed System – Client Server Physician
Recommendation System – Patient – Physician
I. INTRODUCTION
Now day’s health is the most important assets in life and
whenever we fill illness patient need to get good treatment by
physician.Currently whenever patient comes to general
practitioner,he/she suggest physician manually to patient that
can be harmful to patient. We are come with solution when
patient goes to general practitioner, practitioner will upload
symptoms three physician. To suggest physician we are
using preference learning algorithm. This algorithm suggest
physician on the basis of physician experience and patient
information.
II. HISTORY & BACKGROUND
There is no doubt that we live in a technology-obsessed
world, with our reliance on the Internet, tablets and
computers, the newest smartphones, and other gadgets that
promise to make our lives easier, let us have a little more fun,
or even help us get more organized. From our personal lives
to professional lives and everywhere in between, technology
has established its place in society and continues to evolve
faster than most of us can even believe.
There are a lot of different industries where technology is
paramount, like in manufacturing, electronics, and education,
but there are some industries where technology is responsible
for improving and saving lives.
In the medical world, our habitutaion on technology is as
important as ever, and thanks to its ever-evolving
advancements, healthcare practitioners can continue to find
ways to better diagnose diseases, perform complicated
surgeries with laser-like precision, and improve patient care
more than ever before. The impact of medical technology on
the world of healthcare will continue to greatly influence the
lives of people around the world.
By Implementing the substanstial algorithms we are trying to
overcome the difficulties which can occure in day to day lifes
of people.
III. MATHEMATICAL MODEL
MATH OR EQUATION
– Input: patient information and symptoms
– Output:recommended list of physicians
– Let S is the system for Doctors
S=(I,D,F,O)
I = set off INPUTS D
= Database
F = Process on data and give o/p using preference learning
algorithm

National Conference On “Recent Innovations In Engineering Science & Technology" April 2019
6 Computer Engineering
O = Set of OUTPUTS
I = (i1)
I1 = Upload Patient Information
D = d1,d2
d1 = Physician location.
d2 = Physician Experience.
O = Three Physician List.
Formula:-
Dp= Distance Percentage.
Ep= Experience Percentage.
Xi= Physician Distance.
Yi= Physician Experience.
dp=(xi/∑xi)×100
ep=(yi/∑yi)×100
Rank=(dp+ep)/2
Fig: venn diagram
Fig. 3. A (Architecture diagram).
Patient will open the application and create the account
after creating account patient will upload basic information
and upload symptoms and after uploading symptoms
preference learning algorithm process that symptoms and
will suggest a physician and will give physician list.

National Conference On “Recent Innovations In Engineering Science & Technology" April 2019
7 Computer Engineering
Fig: Flow Chart
Fig. Flow Chart
IV. RESULT AND ANALYSIS
Analysis is the process of considering something carefully
or using statisical methods in order to understanding it or
explain it so in Following table and line graph contains the
physician Experience and location information (latitude and
longitude) From this latitude and longitude we are
generating the line graph.
experience latitude longitude
13 19.969235 73.84946
15 20.004917 73.73387
8 19.938235 73.58148
9 19.969592 73.84946
10 19.964602 73.76503
6 19.951212 73.76494
Fig: Table
V. CONCLUSION
A system is implemented using preference learning
algorithm,
.By using these algorithm application can suggest
appropriate physician to patient by analyzing symptoms
uploaded by patient. It will save the time of patient in
choosing physician.
REFERENCES
[1] Author:Jie Song ; Yunzhe Qiu ; Zekun Liu,Integrating Optimal
Simulation Budget Allocation and Genetic Algorithm to Find the
Approximate Pareto Patient Flow Distribution
[2] Xiang Zhong ; Jingshan Li ; Philip A. Bain ; Albert J.
MusaElectronic Visits in Primary Care: Modeling,
Analysis, and Scheduling Policies
[3] Benjamin Stark, Constanze Knahl, Mert Aydin, Mohammad
Samarah, Karim O. ElishBetterChoice: A migraine drug
recommendation system based on Neo4J
[4] K. Zhou, G. R. Xue, H. Zha, and Y. Yu ”Learning to rank with
ties, Proceedings of the 31st annual international ACM SIGIR
conference”
[5] C Boutilier, R I Brafman, C Domshlak, H H Hoos, D Poole, CP-
nets A tool for representing and reasoning with conditional ceteris
paribus preference statements,”.
[6] Mrs. S. A. Bhavsar Mr. Dattatray S. Shingate “Securing Mobile
System Locations by Anonymous Server Design based on k Optimal Principle”, international journal of pure and applied
research in engineering and technology Volume 02,Issue 08 PP
208-218
National Conference On “Recent Innovations In Engineering Science & Technology" April 2019
8 Computer Engineering
An Urban Renewal and Retrofitting approach to Smart
Cities Prof.Piyush Kulkarni
1, Pratiksha Borse
2, Nilam Borse
3,Rucha Khambekar
4
1
1 , 2
nd [email protected], 3
rd [email protected], 4
Department of Computer Engineering
Sandip Intitute of Engineering and Management.
Abstract— This system takes one step forward towards the smart
city. It offers a view of the city where service providers use
information technologies to engage with the citizens to create
more effective urban organizations and systems that can
improve the quality of life. Integrated cloud-oriented
architecture of networks, software, sensors, human interfaces,
and data analytics are essential for value creation. In this
system mainly focuses on roadways,bus stations,parking
systems,signal stations and a smart way of electricity generation.
Keywords— Software Prototyping ,Microcontroller,Display
unit, Pollution detection,Green electricity generation on
road, Automatic parking system.
I. INTRODUCTION
The smart city system concept represents a com pelling
platform for IT-enabled service in novation. The emerging
Internet of Things (IoT) model is foundational to the
development of smart cities. IoT smart-connected products
and the services they provision will become essential for the
future development of smart cities This system will explore
the smart city concept and propose a strategy development
model for the implementation of IoT systems in the smart city
context
In this system manually turning on of street light is converted
into automatic street light being turned on. If there is
darkness in the atmosphere then only the street light will be
turned on and also these lights will turn on up to 30 percent
of brightness only if there is no vehicle or person.If there is
any vehicle or person present on the road, then the
brightness of street light will automatically be 100 percent.
Using a pollution detection sensors, we detect pollution rate.
These sensors are placed near the signal or bus stations and
the pollution rate is displayed on the display board. On this
display boards there will also be some other social updates
or articles those are helpful to the people.
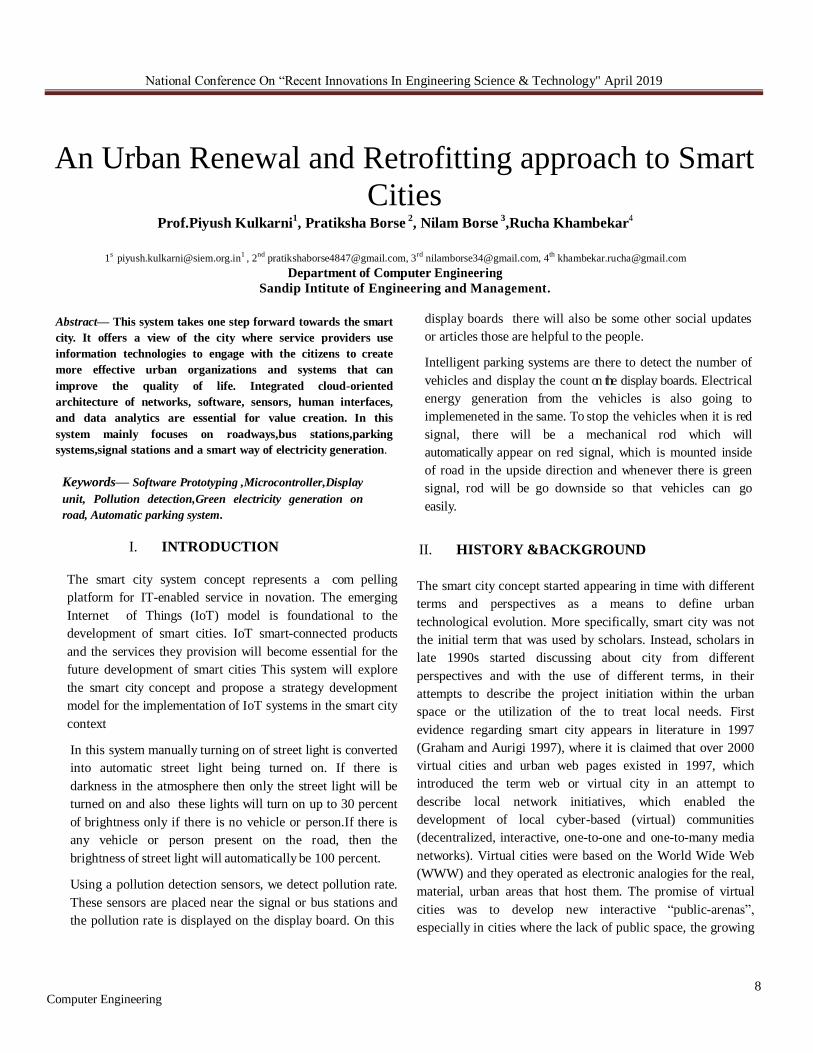
Intelligent parking systems are there to detect the number of
vehicles and display the count on the display boards. Electrical
energy generation from the vehicles is also going to
implemeneted in the same. To stop the vehicles when it is red
signal, there will be a mechanical rod which will
automatically appear on red signal, which is mounted inside
of road in the upside direction and whenever there is green
signal, rod will be go downside so that vehicles can go
easily.
II. HISTORY &BACKGROUND The smart city concept started appearing in time with different
terms and perspectives as a means to define urban
technological evolution. More specifically, smart city was not
the initial term that was used by scholars. Instead, scholars in
late 1990s started discussing about city from different
perspectives and with the use of different terms, in their
attempts to describe the project initiation within the urban
space or the utilization of the to treat local needs. First
evidence regarding smart city appears in literature in 1997
(Graham and Aurigi 1997), where it is claimed that over 2000
virtual cities and urban web pages existed in 1997, which
introduced the term web or virtual city in an attempt to
describe local network initiatives, which enabled the
development of local cyber-based (virtual) communities
(decentralized, interactive, one-to-one and one-to-many media
networks). Virtual cities were based on the World Wide Web
(WWW) and they operated as electronic analogies for the real,
material, urban areas that host them. The promise of virtual
cities was to develop new interactive “public-arenas”,
especially in cities where the lack of public space, the growing

National Conference On “Recent Innovations In Engineering Science & Technology" April 2019
9 Computer Engineering
violence, fear alienation and the reduction in civic associations
do not enable public interaction, but instead they enhance
“urban privatism”. Web or Virtual cities drew smart city
conceptual system. The Rise of the Smart City together all web
activities in a city or simulated a city on the web and they were
configured as little more than urban databases that provided
public information for the municipal authorities to even
transport and leisure data, cultural events and tourist guides.
Virtual cities concerned the first attempt that utilized the
potential of the Internet for supporting local democracy and
enabled urban marketing, new types of electronic municipal
service delivery, local inter-firm networking, and social and
community development within cities. However, an absence of
citizens was documented, whose feedback was supposed to be
necessary to establish.
III. MATHEMATICAL MODEL
cd =cloud data
Fig: Venn Diagram
IV. SYSTEM ARCHITECTURE
Input: Collecting input from various sensors and generate
electricity
using rollers.
Output: Show collected information on display screen, count
the per-
centage of pollution, use of generated electricity for various
domain e.g
Smart bus stop, signal station etc.
Functions :Verification of collected data with the help of
database.
System=(Sa,Sb,Sr)
Where ,
S=system
Sa=system records/application
Sb=smart bus stop
Sr=smart roadways
Sa=fPs,lcd,ps,rs,cdg
Where,
ps= Pollution Sensor
lcd=Liquid Crystal Display
ps=power supply
rs=RFID system
cd=cloud data
Sb=flm,ps,ws,cdg
Where,
lm=LCD module
ps=Power supply/electricity
ws=wi_ stationcd= cloud
data Sr=fps,pd,cdg Where,
ps =sensors for pollution detetection
pd =power distribution
We are using IR sensors (or Ultrasonic sensor) for detection of
High density traffic and then convert it to normal density
traffic. IR sensors are mounted on the road facing in upside
direction to collect reading of vehicles. If IR sensors get the
continuous reading of vehicles for 20 seconds on a particular
lane then that lane switched to green signal for 10 seconds and
remaining lanes switched to red signal. Due to this the high
density traffic at that lane is reduced to normal density. After
the completion of 10 seconds, regular execution of signal is
resumed. For Emergency vehicle detection, we are using two
RFID readers (RC 522), one is mounted at the traffc signal and
another is mounted at some distance from the signal to detect
the Emergency vehicles arrival.

National Conference On “Recent Innovations In Engineering Science & Technology" April 2019
10 Computer Engineering
Fig. System Architecture for the Smart city model
There is a RFID Tag (Passive RFID tag) with unique ID
tached to every Emergency vehicle and this ID is stored is
database. When any Emergency vehicle that is arrived at
particular lane then RFID reader will detect the RFID tag and it
will matched the data stored in that RFID tag. If data is matched
with stored data then the signal for that lane is switched to
green and other lanes get red signal. Because of this the traffic
at the signal is removed before the arrival of Emergency vehicle.
After that, the Emergency vehicle crosses the signal rapidly and
safely. Emergency vehicle is again detected by RFID reader
which is mounted at signal and after that detection regular
execution of traffic signal is resumed. One RFID Reader is
mounted at the signal to detect any vehicle which is crossing
the red signal. The RFID tag of every vehicle contains
information of vehicle including vehicle number.When RFID
reader detect the RFID tag of particular vehicle crossing red
signal, it sends the information of vehicle to the traffic control
system and then respective action will be taken by Department
of R.T.O.This system will work on microcontroller board like
arduino, raspberry pi, etc. The programming for overall system
is developed with the help of Arduino software which is based
on C/C++ language.
V. RESULT AND ANALYSIS
The above graph represents a weekly count of the cars coming
in the parking area.By examining this chart we can decide on
the average count of cars present in the parking area.We can
also decide on the several changes that eed to be made
according to the count of cars.s
The above graph shows the weekly pollution levels for four
weeks.here the pollution threshold value is considered as 30,all
the pollution values above 30 will be considered as pollution
detected.They will be displayed on the display boards
provided on various locations such as bus stations. The values
which are below threshold value will be taken as no pollution
detected.
VI. CONCLUSION
As we move into the future and technology becomes even
more advanced, the majority of capital cities will become
‘smart cities’.Smart technologies can provide solutions for
cities by helping them save money, reduce carbon emissions
and manage traffic flows. A smart city uses the internet of
things (IoT), data, and technology to streamline services to
make a city more connected, efficient, manageable, and cost
effective. Smart cities drive innovation, have connected
residents, optimise governance, and make better use of
precious resources.
REFERENCES
[1] H. Chourabi, C. Nam, S. Walker etal. Has proposed An Understanding
smart cities: An integrative framework. On (HICSS-45), 2012.
[2] R. E. Hall etal. Has proposed ”The vision of a smart city”,
Proceedings of the 2nd International Life Extension Technology
Workshop, 2000.
[3] A. Markkanen etal. Has proposed ”The Internet of
Things Will Drive Wireless Connected De-vices ”. On March
2014.
[4] T. Nam, T. A. Pardo etal. Proposed ”Conceptualizing smart city with
dimensions of technology people and institutions”, Proceedings of the
12th Annual International Conference on Digital Government Research:
Digital

National Conference On “Recent Innovations In Engineering Science & Technology" April 2019
11 Computer Engineering
[5] Rico, J., Sancho, J., Cendon, B., Camus, M. Have proposed Parking
easier by using context information of a smart city: Enabling fast search
and management of parking resources. International Conference IEEE
On March, 2013.R Belaroussi, D Gruyer, ”Impact of reduced visibility
from fog on traffic sign detection”, Intelligent Vehicles Symposium
Proceedings, pp. 1302-1306, 2014.
[6] E. Nugroho and A. Sahroni, ZigBee and wif network interface on
Wireless Sensor Networks, in Proceedings of the Makassar International
Conference on Electrical Engineering and Informatics (MICEEI 14), pp.
54 58, Makassar, Indonesia, November2014.
[7] V. Albino, U. Berardi, R. M. Dangelico, ”Smart cities: Definitions
dimensions performance and initiatives”, Journal of Urban Technology,
vol. 21, 2014.
[8] T. Nam, T. A. Pardo etal. Proposed ”Conceptualizing smart city with
dimensions of technology people and institutions”, Proceedings of the
12th Annual International Conferenc Digital Government Research.
[9] R M Abde1-Aty, A A Ekram, H Huang, ”A study on crashes
related to visibility obstruction due to fog and smoke”, Accident
Analysis Prevention, vol. 43, no. 5, pp.
1730-1736, 2011.

National Conference On “Recent Innovations In Engineering Science & Technology" April 2019
Computer Engineering 12
Cancer Detection Application By Using
GLCM Algorithm
Prof.R.R. Bhandari Tanushree Sonar , MayuriPatil , ManjushaGalande ,
PratikshaBhadke
Department of SNJB’s KBJ COE Chandwad.
Abstract- Now a days android service technology is
widely used to integrate heterogeneous system and
develop new applications. Our application highlights
some of the limitation of medical system. Our purpose
arisen regarding tumor detection using Biomedical
image processing which is growing and demanding field .
It comprises many different type of imaging method like
CT-scan , X-ray & MRI . Several simultaneous local
features extraction for modalities of cancer images, which
required and expertise that is not widespread in clinical
practice. Our project is going to use pre-processing,
segmentation, optimization and feature extraction. Our
project having trained data in which system trains the
CT-scan image and MRI image from cancer specialist
doctors . Our system is useful to expert doctors, beginner
doctor and normal user . User can also get symptoms
and precautions of particular cancer . Cancer detection is
generally carried out manually by trained professionals.
Manual technique are majorly helpful in the advanced
stage detection . It also involves very tedious procedure
which highly dependent on given information. Manual
technique introduces the high possibility of human error
in the detection process. This system successfully
overcomes the drawbacks in earlier cancer detection
system . This system increases speed of the services.
Implementing this system gives detection of cancer
through automated process to minimize human errors.
Keyword :-Biomedical Image Processing, Heterogeneous
system, Segmentation, Feature extraction.
I .INTRODUCTION
Cancer is group disease involving abnormal cell growth
with the potential to attach or spread other parts of the
body. In all type of cancer division of cells in the body
are nonstopable and rapidly spread to tissue around it.
Our human body is compound of trillion of cells. When
cells are grow old or become damaged ,they die and
new cells are form to perform their role.
Cancer cell are different from normal cells in
many ways. So that they grow out of control and
become attacking. Cancer cells are matured in
various uncontrolled function where normal cells
grows in specific function. Cancer cells are ignored
the signals which is giving them to stop their
division. Cancer cells may be able to affect normal
cells molecule and blood vessels that surround feed tumor. This area is called as microenvironment .
Cancer cells may forced to other normal cells around
it to form blood vessels that provide oxygen and
nutrient to it that cancerous cells.
Cnacer cells are able to avoid the immune system ,a
network of organs ,tissues and specialized cells.
These all parts are used to protected our body from
infection and other damages. Immune system also
removes damaged and unwanted cells from our body.
But some cancerous cells has the ability to hide
themselves from immunity system. 22% of cancer
death having the cause as tobacco. Another 10% are due to obesity, poor diet, lack of physical activity ,or
exercise drinking of alcohol. Cancer causing cell
called as malignant tumor and non-cancerous cell
are called as benign tumor.
In our paper we are studying about lung cancer and
brain cancer detection by using an application which
we are going to made. Generally cancer tumor is
detected by using magnetic resonance imaging (MRI)
and computed tomography . But first let study about
these both types.
Cells are grow old or become damaged ,they die and
new cells are form to perform their role.
Cancer cell are different from normal cells in
many ways. So that they grow out of control and become
attacking. Cancer cells are matured in various
uncontrolled function where normal cells grows in
specific function. Cancer cells are ignored the signals
which is giving them to stop their division. Cancer cells
may be able to affect normal cells molecule and blood
vessels that surround feed tumor. This area is called as
microenvironment . Cancer cells may forced to other normal cells around it to form blood vessels that provide
oxygen and nutrient to it that cancerous cells.
Canacer cells are able to avoid the immune system ,a
network of organs ,tissues and specialized cells.
These all parts are used to protected our body from
infection and other damages. Immune system also
removes damaged and unwanted cells from our body.
But some cancerous cells has the ability to hide
themselves from immunity system. 22% of cancer
death having the cause as tobacco. Another 10% are
due to obesity, poor diet, lack of physical activity ,or
exercise drinking of alcohol. Cancer causing cell
called as malignant tumor and non-cancerous cell are called as benign tumor.

National Conference On “Recent Innovations In Engineering Science & Technology" April 2019
Computer Engineering 13
In our paper we are studying about lung cancer and
brain cancer detection by using an application which
we are going to made. Generally cancer tumor is
detected by using magnetic resonance imaging (MRI)
and computed tomography . But first let study about
these both types.
C Lung cancer
Lung cancer is also called lung carcinoma . It is a
cancerous lung tumor . The cancer which started in lung
are called as lung carcinoma. There are having two
types of lung cancer. Small cell lung carcinoma
(SCLC)and non-small cell lung carcinoma (NSCLC)[4]. Lung cancer is leading cause of cancer all over the world
[3].Lung cancer next spread to breast cancer in woman
and prostate cancer in men. About 80% of lung cancer
patient observed having advanced stage disease and are
not able to operate due to loco regional tumor extension ,
e extra thoracic spread or poor physical condition at the
time of diagnosis[2].
Automatic process of tumor detection would
assist the physician to detect tumor very quickly[4].
However automating the process is challenging due to
high diversity in appearance of tumor tissue among different patients and in many cases , similarity
between tumours and normal tissue because of the low
contrast in CT scan images[1]. According to this 80 %
cancer are NSCLC and 15% are SCLC[4].
1.2 Brain Cancer
The brain tumor occurs when occurs when
abnormal cells forms within the brain [5].
Cancerous tumor is divided in to primary tumor which
start within the brain and secondary tumor which have spread from elsewhere known as brain metastasis
tumor [6]. The symptoms of brain tumor are depend on,
which part is included in that tumor. The symptoms may
be headaches(Pain anywhere in the region of the head
and neck), seizures(Is a period of symptoms due to
abnormally excessive or synchronous neuronal activity
in the brain problem with vision, vomiting and mental
changes[7].
Other symptoms may include difficult walking,
speaking or with sensation. As the disease advances,
unconsciousness may occur. The cause of most brain
tumor is not known. Uncommon risk factors in includes inherited neurofibromatosis(Is a group of three condition
in which tumor grow in the neuron system),exposure to
vinyl chloride ,Epstein-Barr virus &Ionizing radiation(Is
radiation that carries enough energy to detach electrons
form atoms molecules, thereby ionizing them.)
detachelectrons form atoms molecules, thereby
ionizing them.).
Ionizing radiation is made up of aggressive
subatomic particles, ions or atoms moving at high
speed and electromagnetic waves on the high energy end of the electromagnetic spectrum. The most
common type of primary tumours in adult are
meningnous( its typically slow growing tumor that
design from the meninges the membranous layers
surrounding the brain and spinal cord)and
astrocytoma’s( is a type of cancer which originate in
the particular glial cell ,star shaped brain cell in the
cerebrum called astrocytes).
In children most common type is a malignant
medulloblastoma is a most common type of malignant
primary tumor originating in the part of the brain that
is towards the back and the bottom on the floor of skull,in the cerebellum. The sign and symptoms of
brain tumor are broad.
Let’s study about MRI and CT scan.
MRI is called as magnetic resonance imaging and
CT scan is called as computed tomography
MRI It is non-invasive and painless procedure.
Raymond Damadianorganize the first MRI full body
scanner which he
uses large magnet radio waves and a computer to
create a detailed cross sectional image of internael
organs and structures. The scanner itself typically
resembles a large tube with a table in the middle
,allowing the patient to slide in [9]
II. .LITERATURE SURVEY
Brain tumour is the main cause of brain cancer. A
tumour can be defined as any mass caused by
abnormal or uncontrolled growth of cells. This mass of
tumour increases within the skull, due to which normal
brain activity is hampered. Which is if not detected in
earlier stage, can take away the person’s life. Hence, it
is very essential to detect the brain tumour as early as
possible. To detect the brain tumour, first we have to
read the MRI image of brain and then we can apply segmentation on the image
. But in the MRI brain image, some confidential
information of patients is always there. To apply
segmentation, this irrilevant information has to be
removed, as it can be considered as noise.
Here we present an adequate method for removing
noise from the MRI image of brain using Region
Filling method Firstly, they started with image
acquisition, and then noise is removed from the noisy
image. 1. According to them, noise means in MRI
images there will be some information regarding the institute etc.,

National Conference On “Recent Innovations In Engineering Science & Technology" April 2019
Computer Engineering 14
2. So all that unnecessary information which is treated
as noise will be removed. 3. Then they converted RGB
to Grey scale image. 4. After this, they started to apply
region filling, means they selected some particular
region of interest, then they filled that area. 5. Finally
applied some low range filters. To modify an image in
some way which includes blurring, de-blurring,
locating certain features within an image is used.
Automatic Segmentation framework for primary
tumours from Brain
MRIs using Morphological Filtering techniques
Author: Ananda Resmi S.,Tessamman Thomas
YEAR:2012
This paper describes a novel framework for automatic segmentation of primary tumours and
itsboundary from brain MRIs using morphological
filtering techniques. This method uses T2
weighted and T1 FLAIR images. This approach is very
simple, more accurate and less time consuming than
current
methods. This method is tested by fifty patients of
different tumor types, shapes, image intensities, sizes
and produced
better results. The results were validated
withground truth images by the radiologist.
Segmentation of the tumor and boundary detection is
important because it can be used for surgical planning,
treatment planning, textural analysis, 3- Dimensional
modelling and volumetric
analysis Used a weighted algorithm. 1. Firstly to the
image identified, the intensity is adjusted. 2. Then they
performed Morphological Erosion Morphological
dilation. 3. This process is further followed by Image
subtraction, then they found the threshold value by
making use of some histogram techniques. 4. Thus they performed Binary thresholding continued by
morphological labelling. 5. Finally the segmented
tumor is processed or known clearly by image
masking.
A Survey on Brain Tumor Detection Using Image
Processing
TechniquesAuthor:LuxitKapoor ,Sanjeev
Thakur Year:2017
Interpretation of bio-medical image contents is one
of the most challenging field in computer vision for
medical diagnosis. In context to that it has received
much awareness of researchers to meet the
challenges. The purpose of Image segmentation is
to partition an image into meaningful regions with respect to a particular application. Edge is a basic
as well as an important feature of an image. For
further processing, detecting edges is one of the
most important aspects in image segmentation. It is
a process of identifying and locating sharp
discontinuities in an image. In this paper, the brain
image is considered for analysis and detection.
Initially the region of interest is found, that helps to
detect the particular content of the image and set
the boundary of it.Basic morphological operations
is used for edge detection. For this purpose the
thresholding using histogram is done. The result obtained using Gaussian filter shows better
performance than other methods. Comparison
measure shows for MSE, PSNR SSIM Three major
phases, namely, 1. Pre-processing, (includes steps
like converting it to grey from a colour image
followed by type-casting the image) 2. Image
segmentation, (followed the concept of
Thresholding technique and edge.

National Conference On “Recent Innovations In Engineering Science & Technology" April 2019
Computer Engineering 15
4.1.1 Trained Data :
It is the data which is stored in database by admin
which is collected from user .
Add cancer image (): Through this
function admin can insert the images as
reference of different type of cancer.
Add prevention (): With the help of this
function expert going to add prevention
for cancer
Add Symptoms():This function is used to
insert symptoms of the that related cancer.
So that user can specify that it, are they
really having cancer or not.
4.1.2 Detect cancer : In this part we are going to match the trained
cancer image with image inserted by user. Here
some processing is done on the image in which
segmentation, filtering , & post-processing will be
done on image. In this , that data matching is
performed by GLCM algorithm. This algorithm
will going to study in next section as Image
Processing. That matched or not matched result
will be generated and store on server and send
message to user as any cancer detected there or not.

National Conference On “Recent Innovations In Engineering Science & Technology" April 2019
Computer Engineering 16
4.2User:
This is the another major component of our
system. Through this user can insert their MRI
report .In our project also providing username and
password to the user.
Now let’s see what is Image Processing
GLCM Algorithm
Gray-Level Co-occurrence Matrices (GLCMs)
Consider image given below, if we use position operator one pixel to the right and pixel to the
down then we get the grey level co-concurrence
matrix.
To understand this concept,consider 2 bit data .the
lower the GL (digital no.) the darker the image
appears.
Consider the image given below:
Example of GLCM Algorithm:
3322
2220
1100
1100
In GLCM algorithm three texture calculations are
use : 1)first order
2)second order
3)third order
Here we are using second order texture calculated
series for GLCM
First order:
It is an statisticalcalculations from original image
value, like variance and do not consider pixel
neighbour relationship.
Second order: It consider relationship between to neighbour two
pixel group in the original image. Third order:
It is complicated order because it cannot commonly
implemented and it takes too much time for
calculation .
Framework for the GLCM :
Let us study about the point which are consider in
framework.
1. Special relationship between two pixel:
GLCM takes in consideration the relation
between two pixels that arereference and neighbour
pixel. In the below explanation, it states that how
neighbour pixel is chosen to be the one of the east
(right) of the each reference pixel.They can be
expressed as (1,0) relation. The reference pixel can be made as the upper left
corner and proceeding to the lower right. The pixel
which are at the right edge have no right hand
neighbour,so they are not used for this count.
2. Separation between two pixel :
In above example it uses 1 pixel offset.
Large offset is possible if the size of window is
large enough. In thenumber of pixel combination
will just be smaller for a given window size.
This is the only time that the labels in the
top row and left column will be shown .
How to read matrix framework?
The top left cell having count of the combination of ( 0,0) occurs, i.e. , how many time within the
image neighbour pixel (gray level 0) and reference
pixel(gray level 0) is occurs.
Neighbour
PixelValue->
Reference
pixel
0 1 2 3
0 0,0 0,1 0,2 0,3
1 1,0 1,1 1,2 1,3
2 2,0 2,1 2,2 2,3
3 3,0 3,1 3,2 3,3
Properties of GLCM Algorithm:
Correlation: It passes the calculation of the
interrelationship of a pixel and its neighbour over
the whole image means it figures out the linear
need of gray levels of each other on those of neighbouring pixels.
Energy: Sinceenergy is used for doing work that is
arrangements.It makes useof the texture that
calculates orders in an image.It delivers the sum of
square elements in GLCM. It isfullyoffbeat from
entropy.When the window is trainedorderly,energy
value is high.

National Conference On “Recent Innovations In Engineering Science & Technology" April 2019
Computer Engineering 17
Contrast:
It’s epitome is CON.It can aslo called as ’Sum of
Square Variance’.It extends the calculation of the
intensity contrastaccosiating pixel and its
neighbour over the gross image.Atunbroken image
contrast value is 0.In contrast measure,weight
increases exponentially(0,1,4,9) as pursues from
the diagonal.
Homogeneity:In short term it is going by the name of HOM.It passes the value that calculates the
closeness of dissemination of the elements in the
GLCM to the GLCM diagonal.For diagonal GLCM
its value is 1 and its scope is [0,1]. Contrast weight
and homogeneity weight values are both
completely different,with weight shrinks
exponentially loosefrom the diagonal.
III. CONCLUSION:
We have studied our problem statement. For its
solution we have also studied references given
below. So observation and overall study says that
to detect cancerous tumor through an application
by using GLCM algorithm is useful. There are
many algorithm are available for feature extraction
but we are preferring this because this algorithm helps us to convert colour image into gray level
image matrix. We don’t have to take separately. By
using it’s properties, it’s easy to extract features of
the image.
REFERNCES [1]Nailon ,W.H: Texture analysis method for medical image
Characterization biomedical in tech (2010)75-100
[2] Mir Rayat Imtiaz Hossain, Imran Ahmed, Md. Hasanul
Kabir .Automatic lung tumor detection Based on GLCM feature.
[3] Jemal A; Siegal R., Xu J., Ward E; Cancer statistics CA
Cancer J Clin 60(2010)277-300
[4] http://www.cancer.org/cancer/small-cell-lung-
cancer/about/what is small cell lung cancer .html accessed
[5] “General information about adult brain tumors”. NCL 14
April 2014 . Archieved from the original on 5 July 2014.
Retrieved from 8 June 2014.
[6] “Adult Brain tumor treatment”-NCL 28 Feb 2014.Archived
from the original on 5 July 2014. Retrieved from 8 June 2014.
[7] Longo, Dan L(2012).”369 sizures and Epilepsy” Harrisons
Principles of internal medicine(18thed) MC Graw-Hill. P.3258
ISBN 978-0-07-1748872-2.
[8] “Chapter 5.16”. World cancer report 2014. World Health
orgenizaton.2014 ISBN 9283204298. Archived from the
original on 19 Sept. 2016.
[9] https://www.medicalnewstoday.com/MRIScans : Definition,
Uses and procedure. 24 July 2018.
[10] https://ucgalary.ca/The Grey level co-occurrence Matrix,
GLCM (also called the gray tone spatial Dependency Matrix)
[11] https://www.researchgate.net GLCM Texture: A tutorial
V. 30 March 2017 Research.net.
[12]Er.Kanchan Sharma, Er. Priyanka, Er.Aditi Kalsh,
Er.KulbeerSaini: GLCM and its Feature.

National Conference On “Recent Innovations In Engineering Science & Technology" April 2019
Computer Engineering 18
HOME INTERIOR DESIGNING
Pooja Vora1, Pooja Sharma 2, Shivam Wagh 3, Prof. A. C. Taskar4
[email protected], [email protected], [email protected], [email protected]
Computer Department.
Sandip Institute of Engineering and Management.
Abstract— Home Interior Designing is a system proposed for
better analysis of articles to be pasted in various organizations,
institutes, resorts or residences. Up till now, there is no such
system particularly for interior decoration articles like blind,
flooring, wallpaper or film. So, the proposed system captures
image of the room/area where the item is to be applied and will
process the image of which it will display a virtual layout after
applying the selected item, which gives a clear idea of the
room/area according to the exact requirement of the
user/customer.
Keywords— Image Processing, Edge Detection
I. INTRODUCTION
Home Interior Designing is a project to be developed
for the ease of the customer to choose an appropriate interior
decoration article. It isn’t necessary that always the product
chosen by the customer would match with other articles in his
room such as the furniture or colors of the wall. And as it’s not
possible for everyone to replace it or purchase new article
again. Thus, this system will help the customer to avoid such
problems while selecting articles for customer’s interior
It gives the customer a proper illustration of the room
with the selected article placed in it. Thus, it becomes less
troublesome for the customer to decide what and how or which
is the most appropriate article to be picked at its own
satisfactory level.
With the help of image processing techniques, the portion
where the article is to be placed will be placed will be selected
and the desired article from the palette, handpicked by the
customer will be pasted in the selected area. In this way, the
customer can get a clear idea of the article to be selected
undoubtedly and can make a perfect decision with minimum
efforts.
Fig. System Architecture
II. RELATED WORK
Diamond International, Asian Paints, Dulux are some of the
applications that presently have the same idea implemented for
their product like for paints, cornices and moldings.The
number of product available for comparison are only few that
are related for the interior decoration.
MATHEMATICAL MODEL
S = (I, FN, SE, O)
Where, S = system,
I = input = image of room, image of wall, image of floor,
image of window,

National Conference On “Recent Innovations In Engineering Science & Technology" April 2019
Computer Engineering 19
FN = function = wallpaper (), paints (), flooring (), blinds (),
films (),
SE = server = sample details, admin_details,
O = output = image of room with applied samples, estimate
amount.
III. PROPOSED SYSTEM
An interior design tells client the origin of design and
demonstrates ability to create a symbiotic relationship between
physical elements. Each designer has their own way of
composing and formatting an interior design. Rêve Intérieurs
is going to be an application for the customers of interior
shops providing various options for decorating the house.
Initially the application is going to work on 2D images and
later 3D images processing will also be implemented.
Selecting your patterns in one step and next step is deciding
how they will be used in your room, is the biggest question in
front of the customer. Importance of texture, everything from
fabrics and furniture to decorative accessories bring different
textures into a space. Texture can be used to enhance a room’s
features or provide added dimensions. It will impart a
reflective, smooth finish color is a key element of interior
design.
Users only need to take a picture of the room/space and
upload it onto the system. Now user can select a portion of the
room like wall, window, flooring, etc. for the selected portion
user will choose the item from the available list and apply it on
the picture. Thus, user can easily make a choice about the most
suitable item for the portion of the room. This will help users
to decorate their dream house. On the admin side there will be
an authentication process for theowners of the shop. Admins
will be able to add, remove, and modify the list of items
according to the availability.
IV. MODULE SPECIFICATION
AUTHENTICATION
Login for admin: The admin authentication process will be
for owners of the shop. Admins will be able to add, edit, and
remove the list of items according to the availability.
Login for user: Users can upload the picture and use the
system to check for the visualization of the products.
FILE UPLOAD
The users need to upload the picture of the space/area/room to
process it and add elements to it for the composition of room
with new articles.
VIEW
It is to view the image which the user is uploaded.
SELECT A PORTION/SECTION FROM IMAGE
Select the area/portion/section in the room/hall/space where
the article is to be applied.
Select an item from shop.
Select the desired type of item.
APPLY SELECTED ITEM TO SELECTED PORTION
Apply the item you selected from the shop in the selected area
for illustration of the space/area/room.
V.PLAN OF PROJECT EXECUTION
As an implementation of the proposed system we are
going to develop an application which will help the customer
to get review of the room which can be easier for selection of
perfect sample. So, in order to finalize the product first of all
the dealer will upload the sample from its log in and feed the
prices. The below steps will be required to perform to design
the desired room.
Following steps are performed by the customer
Step 1: UPLOAD the IMAGE of room
Step 2: SELECT PRODUCT to buy
Step 3: SELECT SAMPLE of product to apply
Step 4: Wait for it to get created.
Step 5: APPLY and COMPARE with more samples
Step 6: Get ESTIMATE AMOUNT
Step 7: SAVE IMAGE
Following steps are performed by dealer
Step 1: LOG IN to Dealer ACCOUNT
Step 2: UPLOAD NEW samples
Step 3: SAVE AMOUNT of updated sample
Step 4: DELETE OLD samples
VI. CONCLUSION AND FUTURE SCOPE
CONCLUSION
This software will help to efficiently convey the customer’s
imagination and vision for their room’s interior. And there
would be a psychological level of perfect product selection.

National Conference On “Recent Innovations In Engineering Science & Technology" April 2019
20 Computer Engineering
FUTURE SCOPE
Adding more items like furniture.
3D image and VR view.
REFERENCES
[1] Ng Geok See and Chan Khue hiang, “Edge Detection using supervised
Learning and voting scheme”. Nanyang Technological University, National
university of Singapore, Singapore.
[2] Sabina Priyadarshini, GadadharSahoo, “A New Edge Detection Method
based on additions and Divisions”, International Journal of Computer
Applications (0975 – 8887) Volume 9, No.10, November 2010.
[3] Md. Shoiab Bhuiyan, Yuiji Iwahori, and Akira Iwata. “Optimal edge
detection under difficult imaging conditions”. Technical report, Educational
Center for information Processing and Dept. of Electrical and Computer
Engineering, Nagoya institute of Technology, Showa, Nagoya, 466-8555,
JAPAN.
[4] Ursula Kretschmer, Maria S. Orozco, Oscar E. Ruiz and Uwe Jasnoch,
“Edge and corner identification for tracking the line of sight”.
[5] Renyan Zhang, Guolin Zhao, Li Su. “New edge detection method in
image processing”. College of Autom., Harbin Engineering University,
China 2009.
[6] Umesh Sehgal, ” Edge Detection technique in digital image processing
using Fuzzy Logic “,IJAER 2012, Vol. No. 3, Issue No. I, January
[7] Li Bin, Mehdi Samieiyeganeh, “Comparison for Image Edge Detection
Algorithms,” IOSR Journal of Computer Engineering, Vol. 2, No. 6, 2012.
[8] Y.Ramadevi, T.Sridevi, B.Poornima, B.Kalyani, “Segmentation and
Object Recognition using Edge Detection Techniques”, International Journal
of Computer Science & Information Technology (IJCSIT), Vol 2, No 6,
December 2010.
[9] Shihu Zhu, “Edge Detection Based on Multi-structure Elements
Morphology and Image Fusion”, ICIE, IEEE 2nd International Conference
Vol. 2, 2011.
[10] Hamid R. Ezhoosh, “Fast Fuzzy Edge Detection”. Pattern Recognition
and Machine Intelligence Lab SystemsDesign Engineering, University of
Waterloo Waterloo, Ontario, N2L 3G1, Canada.,2010
[11] Tzu-Heng Henry Lee, “Edge Detection Analysis”, IJCSI International
Journal of Computer Science Issues, Vol. 5, Issue 6,No 1, September 2012.
[12] E.Manjusha Singh & Abhishek Misal,“Various Visual Image
Segmentation Techniques”,IJCSMR,Vol:2,Issue-1,Jan-2013.

National Conference On “Recent Innovations In Engineering Science & Technology" April 2019
21 Computer Engineering
IoT Based Smart Vehicle for Fuel Consumption
Gauri A. Patil1, Gayatri A. Patil2,Priyanka S. Sangle3, Prof. M.V.Korade4
[email protected], [email protected] 2, [email protected] , [email protected]
Sandip Institute of Engineering and Management
Computer Department, Nashik
Abstract— In today's world, actual record of fuel filled and
fuel consumption in vehicles is not maintained. It results in a
financial loss. To avoid this we are implementing for sensing the
amount of fuel filled in the vehicle. So as soon as agent starts
filling petrol in your bike/car, using the Loadcell. The basic
Objective of this project is to know exact amount of the petrol
remaining in the fuel tank and how much distance it can travel
.Also we can find near by petrol pumps and also it will indicate
that the petrol pumps are out of petrol or not .The graphical
display will show how much fuel is there and how much was
added as well and total amount of fuel in the fuel tank this will be
evidence of any kind of cheating is done by the ones fillings the
fuel. this will nearly eradicate any kind of tricks pulled off by the
petrol pumps. This flow sensor will be active till flow ends. Once
flow ends it will calculate the amount of fuel filled and directly
notify on your Dashboard an IOT fuel monitoring system and
the Many a times while travelling, people get stuck in the
middle of nowhere due to an empty fuel tank. Our project aims
at eliminating this problem by searching and showing the nearest
petrol pump to the user. We have developed an android
application will notify us whenever petrol will go lower than
particular level that the vehicle can travel how much km or
distance in that petrol and it will also indicate the nearby
petrol pumps and the petrol pumps are out of petrol or not.
previously the vehicles have traditional fuel indicator meter that
show the petrol level but the accuracy was not there so this system
will give us the accuracy. To stop the frauds at the petrol
pumps. To improve the accuracy in the petrol
measurement.To reduce the amount of time to for finding the
nearby petrol pumps. Keywords— Sensors and Actuator,
location based Services, software prototyping, database web
servers.
I. INTRODUCTION
The Equipment, such as cars, motorcycles, trucks, genera- tors, and
compressors ,which is powered by internal combustion engine needs
a means of refueling so that it can run for as long and efficiently as
possible. The problems associated with this equipment are to know
how to contain fuel, to know how much fuel is left, and to know how
best the fuel should be stored for users’ safety, security, and benefits
Presently most of the motor vehicles display the amount of fuel in the
fuel tank with the help of some or the other kind of indication
showing the E (empty), H (half) and F(full) indicators. The
manufacturer provides the specification that E,H and F bar maps
corresponding to the liters of fuel approximately. In daily life we
might have experienced the problem of improper measurements of
the fuel level in the tank with the existing system. Today in this
digitized world if the analog fuel indicators in the vehicles are
replaced by 1digital system then it will help us to know the exact
amount of fuel present in the tank. Currently the fuel indicator system
for the most of the vehicles are analog and they do not show the exact
amount of fuel present in the tank.So this problem is taken into consideration in this work for developing the digital fuel indicator
system for two Wheeler’s which shows exact amount of fuel in terms
of milliliter. All internal combustion engines running on liquid fuel
have to be very fuel efficient from economic point of view. All these
engines are equipped with most advanced automated fuel indication
devices. These are system built devices. There should be some
provision at the user level to know the quantity of fuel at all times.
The safety and security of fuel is of utmost importance. In the recent
years, escalating oil demands and costs of fuel are increasing. This
indirectly increases the overheads of many businesses and those with
large vehicle fleets. Global oil supply and demand forecasts for 2015
have changed significantly recently, but these changes have largely
cancelled each other out. The outlook is still one of a market roughly
in balance. However, it is at times of rapid market change that
forecasting becomes most difficult. In July of 2014, before crude
prices collapsed, forecasts from the International Energy Agency, US
Energy Information Administration and OPEC suggested that world
oil demand would rise by about 1.35 million b/d in 2015 and that the
global supply/demand balance would be very slightly positive. To
cater the needs of fuel savings due to a one of the few above
mentioned problems, the SIM 900 GSM module is used over a
Global System for Mobile Communications (GSM) effective remote
fuel-level monitoring system.
II. HISTORY & BACKGROUND
With rising prices of oil, fuel theft has become a very common
incidence. From economic point of view a system is devised that will
take care of these practices. This system makes use of smart fuel theft
detection with GSM alert and GPS tracking system. Using the ARM7
microcontroller, the real time position of vehicle and its fuel content
is sent to owners mobile in case of intrusion. The system includes
GPS module, Microcontroller, GSM module, LCD and a keypad. The GPS module transmits coordinates to the microcontroller that
converts the data which is sent to the user in text format. This text
message contains longitude and latitude of the location. This smart
system gives 24x7access to fuel consumption, alerts when fuel drains
and storage tank leaks immediately identified. The user can access
the quantity of fuel in the tank through this GSM and GPS
technology. The keypad is unlocked using the secret password. A signal is sent for fuel verification. If fuel is beyond the range of the
sensor the buzzer will go “on” for two minutes and simultaneously a
text message is sent to the owner. The intruder can’t stop the buzzer
and if the buzzer is not stopped within two minutes then it will be
treated as a theft of fuel and vehicle and a message is sent to the
police station and to previously stored numbers with co-ordinates of that location. [1] The utilization of vehicles is rapidly increasing now

National Conference On “Recent Innovations In Engineering Science & Technology" April 2019
22 Computer Engineering
a days and it leads to a huge problem of fuel availability. Often
humans forgot to check the fuel level before taking vehicles and it
will run out of fuel in half a way. All petrol and diesel filling bunkshave digital displays to indicate the amount of fuel added. The
users don’t know whether it is showing the accurate value or not. To
overcome this problem, this paper suggests a load cell based fuel
measurement which gives exact level of fuel while fuel filling process
and also in the travelling time. Nonstop monitoring of fuel level is
attained by attaching the load cell below the fuel tank with the use of Arduino Uno and display unit fixed with dash board. The current
speed of vehicle is indicated by the speedometer which is arranged
with Arduino and it also calculates the mileage which helps the
vehicle user to know about the remaining kilometres of vehicle will
pass through based on current speed with the available fuel. The
measured fuel levels can be sent through GSM module to the owners
of the hiring vehicles by messages through electronic gadgets for their verification purposes. By interfacing GPS module with Arduino
board it can show the vehicle’s position with help of satellites. The
proposed idea of fuel measurement using load cell with Arduino is
very cost efficient and easy to use. It may be enhanced with any
microcontrollers and can be implemented in all types of vehicles. By
using this method petrol bunk frauds can be avoided. This project can be enhanced by interfacing GPS with arduino to track vehicle’s
location in case of any emergency situations.[5] The increasing
corruption in fuel filling process, as well as the increasing vehicle
theft, has become a big deal to the society. Thus, this paper has
proposed a product that serves beneficiary to both these issues. The
corruption in fuel filling process is rectified through fuel level measurement using a load cell. Though there are numerous methods
to measure the fuel level including those like mechanical float,
optical sensors, ultrasonic etc., the accuracy in measurement is met
by the use of load cell involving Arduino Uno microcontroller. Here
the precision in measurement is made even in a millilitre of added
fuel. The measured output is sent via the global system for mobile communication (GSM) technology to the user mobile so that
verifiable record can be created. Thus, a permanent record of filled
fuel can be maintained. This would help the owners of transportation
network companies to maintain an individual record of their vehicles
that are run by their paid drivers. Apart from the level measurement,
vehicle theft is overcome by the Global positioning system (GPS)
technology. The GPS system fitted to the vehicle would share the accurate location of the vehicle to the registered user. In case of theft,
the location of the filling station along with the measured fuel is sent
to the registered network through the GSM technology. Thus the
paper produces a complete design of the fuel cell that is implemented
in a GPS and GSM enabled vehicle. Thus, the proposed systems
measures the fuel level added in the petrol bunk and sends the measured value to the display unit on the dashboard and also send an
SMS alert to the owner about how much level of fuel is added along
with the location. From this design, corruption in the petrol bunk is
avoided and owner is alerted with SMS. We implemented this design
in real time and it was a success. [11]
III. PROPOSED SYSTEM
Presently most of the motor vehicles display the amount of fuel in the
fuel tank with the help of traditional meter In daily life we might
have experienced the problem of improper measurements of the fuel
level in the tank with the existing system Currently the fuel
indicator system for the most of the vehicles are analog and they do
not show the exact amount of fuel present in the tank. So this
problem is taken into consideration in this work for developing
the digital fuel indicator system for vehicles which shows exact
amount of fuel. The proposed method is a best alternative to fuel
measurement techniques to help the users with low cost and
requirements. It is an efficient one and also applicable in all types
of vehicles. This system can overcome the demerits of existed
system and give accurate values to the users. Instead of using fuel
sensors to detect the fuel level, here
load cell is used. The load cell is attached with base of fuel tank
and measures the weight of tank. These values are given to
Arduino and it converts weight values into litres. The respective
fuel added at petrol bunk and remaining fuel will be displayed
in display unit. The vehicle user can get correct quantity of
fuel for their paid amount. The LCD display is interfaced with the
microcontroller in such a way that when the microcontroller is
switched on the current value of fuel is displayed. The
microcontroller then checks for the quantity of fuel in the tank and
accordingly asks the user to enter the quantity of fuel to be filled.
The user can then enter the quantity of fuel to be filled through the
keypad which is also interfaced to the microcontroller. After the
user gives input time delay is given for the filling of fuel in the
tank. After the tank is filled the microcontroller checks for the
quantity of fuel and if the volume of fuel is not filled properly as
specified then the microcontroller is programmed in such a way
that the remaining amount of fuel to be filled is displayed in
the LCD. The process ends when the volume of fuel filled is as per
specifications of the user. The LCD display will show us the
remaining amount of fuel and the amount of distance it can
travel and the Android App will show us the nearby petrol pumps
and they are out of petrol or not.
Figure 1. System Architecture
Whenever the fuel will pour in the tank the loadcell will
calculate the total amount of the fuel in the tank this will be the
analog value and this will be converted in the digital one with the
help of HX711 converter then it will sent to the Arduino board
and the GSM and GPS will also used the Tx pin will connect to
the Rx pin of android and the Rx pin will connect to Tx pin of the Arduino and same with the GPS and the Android application will
use the GPS and GSM to locate the user and to find the nearby
petrol pumps the GSM will send the message to that will be
simple message and it will use the latitude and longitude that is
values of petrol and distance it can travel and the app will show
us the Map and the user location and the nearby petrol pumps and the petrol pump are out of petrol or not.

National Conference On “Recent Innovations In Engineering Science & Technology" April 2019
23 Computer Engineering
IV. RESULT AND ANALYSIS
Fig. 2. Screenshot of Admin Login
The above Fig.2 display a the Admin login page.
Fig. 3. Screenshot of login page
The above Fig.3 display a login page for the admin, user or fpr
the petrol pump owner.
Fig. 4. Screenshot of user login
The above Fig.4 display a login page for the user login.
V. CONCLUSION
The System will indicate the fuel level and at the accuracy will be
better than the existing systems also how much distance it can travel
With the help of the Android Application person will know the
nearby petrol pump and the availability of petrol whenever the petrol
will get lower than particular level. The measurements are taken so
the accuracy level is of percent 95 to 98.Thusit is an efficient device
made by keeping in mind the petroleum thefts at the various petrol
pumps at the time of filling of tanks. The existing traditional and the
micro controller based float type measurement techniques are far
from exact and are on the conservative. A more efficient and reliable
sensing technology is the ultrasonic range sensing system with a
micro controller which has corrective action code inbuilt that is
applied to the fuel sensor signal based on measurements to
provide highly accurate measurement of the level of fuel in tank.
REFERENC ES
[1] Nandini Hiremath , Mrunali Kumbhar1, Aakriti Singh Pathania 1 “Smart
Fuel Theft Detection using Microcontroller ARM7” Electronics and
Telecommunication Engineering Department, Bharati Vidyapeeth Deemed
University College of Engineering, Pune-411043, India. Vinod Patil Faculty,
Electronics and Telecommunication Engineering Department, Bharati
Vidyapeeth Deemed University College of Engineering, Pune-411043, India.
[2] Sandeep S.R1, Adarsh B S2, Rohan Kumar M3, Santosh Kulkarni4,
Manjesh C “Automatic Monitoring of Fuel in Vehicles Using ATMEGA328
Microcontroller.”D5 Asst. Professor, Dept. of Electrical and Electronics
Engineering, SJBIT, Karnataka, India BE Student, Dept. of Electrical and
Electronics Engineering, SJBIT, Karnataka, India
[3] Giovanni Betta, Member, IEEE, Antonio Pietrosanto and Antonio
Scaglione. “A Digital Liquid Level Transducer Based on Optical Fiber”.IEEE
transactions on Instrumentation and Measurements, VOL. 45, NO. 2, APRIL
1996.
[4] LingtaoMeng, Yunqi Liu, Tingyun Wang. “A Novel Liquid Level
Monitoring Sensor System using Fiber Bragg Grating”. IET International
Conferernce on Smart and Sustainable C City 2013( ICSSC 2013).

National Conference On “Recent Innovations In Engineering Science & Technology" April 2019
24 Computer Engineering
Privacy and Protecting Content for Social Sites
Prof. P. G. Aher1, Ashita Choudhury
2, Bhakti Pardeshi
3
3,
Computer Department.
Sandip Institute of Engineering and Management .
Abstract— Study and investigate the role of social context, image
content and metadata. We will propose two-level frameworks
which according to the available history on the site. Base on the
history it allots the best privacy and policies available for the
user’s image being uploaded. Our system relies on image
classification framework for image categories which may be
related with similar policies on site and on a policy predication
algorithm through which automatic policy will be generated for
newly uploaded images. Also sometime user social feature are also
used.
Keywords—Privacy, Policies, Protection, Social Context, Image
Content and Metadata.
I. INTRODUCTION
Most social content sharing sites allow users to enter their
privacy preferences. Unfortunately, recent studies give result
as that users struggle to set up and maintain such privacy
settings.
Shared information in this process can be slow and error-
prone. Therefore, there is need of policy recommendation
systems which can help users to easily assign and properly
configure privacy settings.
We propose an Interchangeable Privacy Policy Prediction
(I3P) system which aims to provide users problem free privacy
settings experience by automatically generating personalized
policies. The I3P system handles user uploaded images, and
factors in the following criteria that is useful for one’s privacy
settings of images:
Example: Photo clicked on beach
User uploads an image and it is handled as an input image. The
properties of the newly uploaded image is compared with the
properties of images in the current image database. To find the
class of the uploaded image, first find the p closest matches.
Then the class of the uploaded image is calculated as the class
to which majority of the p images belong. If no primary class
is found, a new primary class is created for the image. Later
on, if the predicted policy for this new image turns out correct,
the image will be inserted into the image category in the image
database, to help refine future policy prediction.
1) The impact of social environment and personal
characteristics.
User’s profile information and relationships with others may
provide useful information regarding user’s privacy
preferences i.e the social context.
For example: Users interested in photography may share their
photos with other photographers.
One may upload several photos of his kids and specify privacy
that only his family members are allowed to see these photos.
2) The role of images content and metadata.
Similar images often sustain similar privacy preferences,
mainly when people appear in the images.
II. HISTORY & BACKGROUND
According to the history of our project some of the authors
tried to explained the system they developed but there are
some disadvantages which we have overcomed in our project.
A. Recommendation System
From the previous studies according to J.yu,et.al.,(2009) [1]
developed three features to characterized image in social
media, image content, user tagging activity and user
communication activity. Thus they explained their system by
giving the example of Flickr group.
According to K. Lerman, et.al., [2] proposed two methods for
personalizing results of images search in Flickr .The two
methods were ,First improve the search precision by filtering
the tags by user’s contact. And in Second method described
the probabilistic model. Both methods depends on metadata
users create through everyday activities on Flickr.
According to D. Liu,et.al., [3] described the retagging scheme
that improves the quality of tags associated with social images.
Thus described the consistency between “visual similarity” and
“semantic similarity” in social images.
According to P. Klemperer,et.al,.[4] explained the example of
Flickr in which a photographer uploads his clicked images on
his site and thus share with others. Only Sharing images
doesn’t make any social interaction it is important get critical
feedbacks. For positive feedbacks it is important to choose
correct community. So this paper explains the criteria of
selecting Community or groups. Hence forth this is a study of

National Conference On “Recent Innovations In Engineering Science & Technology" April 2019
25 Computer Engineering
comprehensive evaluation of CF (collaborative Filtering)
algorithm for Flickr group recommendation.
B. Privacy Configuration System
According to M. D. Choudhury,et.al., [5] will provide the
particular “suites” for the uploaded images. These suites are
predefined preferences and that can be selected by others i.e
either by friends or trusted experts and also can be given by
users if he wish to modify them.
According to J. Bonneau,et.al., [6] which proposed a technique
called “Social Circles Finder” for generating social circles list
automatically. For Particular circles fixed privacy are allotted. If
any changes made it will be assign to whole group. According to
A. Kapadia, et.al., [7] worked on the tagged images of users by
checking their keywords and captions and thus which can be
easily used by users for creating and maintaining access control
policies. It mainly focuses on Tag-based access control.
III. DESIGN ISSUES
MATHEMATICAL MODEL
Using Graphical, numerical, symbolic and verbal techniques to
describe and explore real-world data and phenomena of the
proposed system.
Where,
S= System I=Input P=Processing O= output
I=UP, DS Where,
UP= Upload Image DS= Old Dataset
P=IC,PM,PP, AC, SG Where
IC= Image Classification PM= Policy Mining PP=Policy
Prediction
AC= Analyze Social Context SG= Social Group
O=SP, AR Where,
SP= Suggested Policy AR= Accept/ Reject Policy
Fig.III.1 Mathematical Model
IV. SYSTEM ARCHITECTURE
Fig.IV.1 System Architecture
A. System Construction Module
The I3P system consists of two main components: I3P-core and
I3P-social. The overall data flow is the following.
When a user uploads an image, the image will be first sent to the
component I3P-core. The I3P-core then classifies the image and
determines whether there is a need to invoke the I3P-social or
not. In most cases, the I3P-core predicts policies for the users
directly based on their historical behavior/past used policies.
If one of the following two cases is true, I3P-core will invoke
I3Psocial:
1) The user do not have enough data to predict the policy for
uploaded image;
2) The I3P-core detects the recent changes among the users
community about their privacy practices along with users
increase of social networking activities i.e addition of new
friends, new posts on one’s profile etc.
B. Content-Based Classification: To obtain groups of images
that do not have metadata will be grouped only by content. It is
based on hierarchical classification that gives a higher priority
to image content and minimizes the influence of missing tags.
It is also possible that some images are included in multiple
categories as long as they contain the typical content features or
metadata of those categories.
C. Metadata-Based Classification: In metadata-based
classification groups images into subcategories. The process
consists of three main steps.
I) Extract the keywords from the metadata associated with an
image. The metadata considered in our project
are tags, captions, and comments. Classify this metadata in
noun, verb and adjectives.
II) Derive a representative hypernym (denoted as h) from each
metadata vector.
III) Find a subcategory that an image belongs to. This is an
incremental procedure.
At the beginning, the first image forms a subcategory as itself
and the representative hypernyms i.e make subcategories of

National Conference On “Recent Innovations In Engineering Science & Technology" April 2019
26 Computer Engineering
subcategories based on the similarity and non-similarities. If
new value of noun comes so check the closest threshold
value and add in that subcategory.
ACTIVITY DIAGRAM:
Fig.IV.2 Activity Diagram
V. RESULT AND ANALYSIS
Fig.V.1 Home page
Fig.V.1 shows that introductory page of the website.This
page is set as a default or startup page on a browser.
Fig.V.2 Registration page
Fig.V.2 shows the registration form contains a list of fields
that the user will input data into and submit the details for
futurelogin purpose.
Fig.V.3 Login
page
Fig.V.3 shows the Login page , In order to access the
system the respected user has to login by providing
username and password

National Conference On “Recent Innovations In Engineering Science & Technology" April 2019
27 Computer Engineering
Fig.V.4 Login Success page
Fig.V.4 shows that the login will be successful only when
the user enters the valid username and password which
he/she entered at the time of registration.
Fig.V.5 Login Failure Page
Fig.V.5 shows that the login will be failed when the user
enters the invalid username and password.
Fig.V.6 Friend Request Page
Fig.V.6 shows that a request is send to a person on a social
media or social networking website to be their friend.
Fig.V.7 shows that a website used to store and share photo.
Users upload their pictures to the site, which are stored on the
server and made available to friends and family via personal
Web pages.
VI. CONCLUSION
Thus we have projected an Interchangeable Privacy Policy
Prediction (I3P) scheme that helps users computerize the
privacy policy settings for their uploaded images.
The I3P structure provides a structure that will provide
privacy preferences based on the in order available for a
given user.
Automatic Image illustration helps to overcome the issue of
metadata information of images being uploaded.
REFERENCES
[1] J. Yu, D. Joshi, and J. Luo,“Connecting people in photo-sharing sites by
photo content and user annotations,” in Proc. IEEE Int. Conf. Multimedia
Expo, ,pp.1464–1467,2009.
[2] K. Lerman, A. Plangprasopchok, and C. Wong, “Personalizing image
search results on flickr,” CoRR, vol. abs/0704.1676, 2007.
[3] D. Liu, X.-S. Hua, M. Wang, and H.-J. Zhang, “Retagging social images
based on visual and semantic consistency,” in Proc. 19thACM Int.Conf.
World Wide Web, pp.1149–1150,2010.
[4] P. Klemperer, Y. Liang, M. Mazurek, M. Sleeper, B. Ur, L. Bauer, L. F.
Cranor, N. Gupta, and M. Reiter, “Tag, you can see it!: Using tags for access
control in photo sharing,” in Proc. ACM Annu. Conf. Human Factors
Comput. Syst., pp. 377–386,2012.
[5] M. D. Choudhury, H. Sundaram, Y.-R. Lin, A. John, and D. D.
Seligmann, “Connecting content to community in social media via image
content, user tags and user communication,” in Proc. IEEE Int. Conf.
Multimedia Expo, pp.1238–1241,2009.
[6] J. Bonneau, J. Anderson, and L. Church, “Privacy suites: Shared privacy
for social networks,” in Proc. Symp. Usable Privacy Security,2009.
[7] A. Kapadia, F. Adu-Oppong, C. K. Gardiner, and P. P. Tsang, “Social
circles: Tackling privacy in social networks,” in Proc. Symp. Usable Privacy
Security,2008.
Fig.V.7 Share Photo

National Conference On “Recent Innovations In Engineering Science & Technology" April 2019
28 Computer Engineering
SMART STUDENT CARD
Pratik kadoli1, Akanksha Borse
2, Shridhar Gaiwkad
3,Avinash Singh
4 Prof. A.R.Gaidhani5
Pratikkadoli1998@gmail,com1, [email protected], [email protected],
[email protected],[email protected]
Computer Department.
Sandip Institute of Engineering and Management.
Abstract— The project that we are going to make is to help
the college to avoid maintaining the registry book. This project
uses a barcode scanner. We use Barcode scanner to retrieve the
documents of students which they want as per their uses. Each
student’s ID card will have a barcode at the back side of it.
This barcode contains unique data of the student such as
collage id no., roll number, branch and year. Etc. The display
screen will show the documents of the respective student after
scanning the barcode. For more Security we have provided Face
Recognition System so that student can't proxy their
Identification. Teachers and administrator will only have access
to the system with their respective login ID’s and passwords
Keywords— Barcode/Qrcodes, Face Recognition.
I. INTRODUCTION
Barcode is a visual representation of information in the
form of bars and spaces on a surface. The bars and spaces are
designed with different widths and consist of numbers, characters
and symbols such as dot, colon and others. Different combinations of
these alphanumeric characters are used to represent information.
There are various types of barcodes in use today. The successful of
barcode technology has been constantly improving in order to
accommodate more information in the minimum possible space.
Today barcodes are widely used on books and at retail
stores in order to keep track of the products available and easy
checkout of the products. In facilitating numerous identification
processes Barcodes have played a great role since their invention in
1952. In fact for machine readable digital data storing on product
packages or paper, barcode is a cost-effective and simple method.
Even faster data transfer as pressing needs and there have been
many improvements with high reliability have emerged on the
original barcode design that was made.
For these cost-effective codes as well as their application
opened a new front by invention of HC2D barcodes in scenarios like
storing contact information which transfer more complex data, URLs
among other things, there have become increasingly popular in
which QR codes. Barcode is a visual representation of information in the form of bars
and spaces on a surface. The bars and spaces are designed with
different widths and consist of numbers, characters and symbols
such as dot, colon and others.
Different combinations of these alphanumeric characters are
used to represent information. There are various types of barcodes in
use today. The successful of barcode technology has been constantly
improving in order to accommodate more information in the
minimum possible space. Today barcodes are widely used on books
and at retail stores in order to keep track of the products available
and easy checkout of the products. In facilitating numerous
identification processes Barcodes have played a great role since their
invention in 1952. In fact for machine readable digital data storing
on product packages or paper, barcode is a cost-effective and simple
method. Even faster data transfer as pressing needs and there have
been many improvements with high reliability have emerged on the
original barcode design that was made. For these cost-effective
codes as well as their application opened a new front by invention of
HC2D barcodes in scenarios like storing contact information which
transfer more complex data, URLs among other things, there have
become increasingly popular in which QR codes.
Fig. System Architecture

National Conference On “Recent Innovations In Engineering Science & Technology" April 2019
29 Computer Engineering
II . LITERATURE SURVEY
Smart Card use the concept of DigiLocker which already
been implemented by various companies like BHIM (Bharat
Interface for Money), CBECGST etc. DigiLocker is a "digital
locker" service operated by the Government of India that enables
Indian citizens to store certain official documents on the cloud. The
service is aimed towards reducing the need to carry physical
documents, and is part of the government's Digital India initiative.
Hence our idea of creating Smart Card is influenced by DigiLocker
in which we are enhancing the DigiLocker by adding a barcode or QR code with Facial Recognition. Facial Recognition will provide
the security and barcode or QR code will act as key for our digital
data storage
MATHEMATICAL MODEL
S=(I,O,F).
Where s : System.
I=D are set of inputs ,
Where,
D : Data from Camera Module and Barcode scanner.
F=MD,UD are set of functions.
MD : Matching Data. UD :
Unmatched Data. O=AG,AD
are set of outputs. AG : Access
Granted.
AD : Access Denied.
III. PROPOSED SYSTEM
QR Code Detection:
Through creation of links between Internet resources and physical
objects, there enable rich context interaction by applications of
Quick Response (QR) codes. There are this kind of barcode
applications are not common in spite of the widespread use for
people and robots which are visually impaired because during
image acquisition that the symbol is properly by existing
decoders framed are assumed. To perform accurate detection of
QR code symbols a two-stage component-based approach
proposed by this work in arbitrarily acquired images. With the
help of the framework which detect the objects proposed by Viola-
Jones to detect parts of the symbol is trained, a cascade
classifier in the first stage. In the second stage, in order to
evaluate the detected patterns are aggregated if they are spatially
arranged with the components of a QR code symbol in a way
that is geometrically consistent. With the help of the framework
which detect the objects proposed by Viola-Jones to detect parts
of the symbol is trained, a cascade classifier in the first stage.
In the second stage, in order to evaluate the detected patterns
are aggregated if they are spatially arranged with the components
of a QR code symbol in a way that is geometrically consistent.
There was performed an extensive study of both stages parameter
variation and in terms of computational efficiency, recall and
precision the results were analysed. With precision of 76: 8%
there achieved average recall of 91: 7% by the proposed QR
code detector while at 22 fps being capable of processing a 640
by 480 pixels video stream.
IV. MODULE SPECIFICATION
AUTHENTICATION
Login for admin: The admin authentication process will be
for respective to institute/organization. Admins will be able to
add, edit, and remove the list of items according to the
availability.
Login for user: Users can upload the picture ,there
documents ,any important papers i.e results etc.
FILE UPLOAD
The users need to upload the documents to the database with
user friendly user interface.
VIEW
Can view their documents as there folders kept .
V .PLAN OF PROJECT
EXECUTION
As the implementation of the proposed system we have
developed application which will help us to store the documents of
the student in the database which can be access by them anytime
and anywhere from the database according to their login ids. So in
order to identify whether student is there in the database or not first
of all we have to enrol the student in the database of our system. So
when the student is going to enrol in the database our system will
perform sum number of enrolment steps which are mentioned
below.
Following steps are performed in order to register in the
database
Step 1: GET THER USER NAME AND PASSWORD
Step 2: CREATE A NEW ROW IN DATABASE
Step 3: CHECK IF USERNAME IS ALREADY PRESENT
IF YES GO TO STEP 8.
Step 4: REGESTER THE USERNAME AND PASSWORD
IN DATABASE .
Step 5: PRATICULAR SPACE ALLOCATED TO THAT
USER.
Step 6: USERNAME EXISTS GO TO STEP 2 .
Step 7: SAVE TO DATABASE.

National Conference On “Recent Innovations In Engineering Science & Technology" April 2019
30 Computer Engineering
Following steps are performed by
users
Step 1: LOG IN TO
STUDENT
Step 2: UPLOAD NEW
DOCUMENTS
Step 3: SAVE DOCUMENTS TO
DATABASE
Step 4: DELETE IF YOU WANT FROM THE DATABASE
VI. CONCLUSION AND FUTURE CONCLUSION
Smart Student Card (SSC) simplifies the work of college system
as well as student.SSC provides simpler way to maintain
the documents of the student.Smart Student Card (SSC) can
also be used as student attendance system.It helps in making
paper less transaction. It’s a step towards Digital India.
FUTURE SCOPE
Adding otp and some more verification secure
system
REFERENCES
[1] X.Liu,D.Doermann,andH.Li,―Vcode-pervasive data transfer using
video barcode,‖ IEEE Trans. Multimedia, vol. 10, no. 3, pp. 361–371, Apr.
2008.
[2] S. D. Perli, N. Ahmed, and D. Katabi, ―Pixnet: In terference-free
wireless links using LCD-camera pairs, ‖ in Proc. MobiCom, 2010, pp. 137–148.
[3] [3] J. Memeti, F. Santos, M. Waldburger, and B. Stiller, ―Data
transfer using a camera and a three dimensional code,‖ Praxis der Informationsverarbeitung und Kommunikation, vol. 36, no. 1, pp. 31–
37,
2013.
[4] C. Pei, Z. Zhang, and S. Zhang, ―Softoc: Real-time projector-wall-
camera communication system,‖ in Proc. ICCE, Jan. 2013, pp. 100–101.
[5] S. Kuzdeba, A. M. Wyglinski, and B. Hombs, ―Prototype
implementation of a visual communication system employing video
imagery, ‖ in Proc. CCNC, 2013, pp. 184–189.
[6] M. Mondal and J. Armstrong, ―Impact of linear misalignment on a
spatial OFDM based pixelated system,‖in Proc. 18th Asia-Pacific Conf.
Commun., Oct. 2012, pp. 617–622.
[7] M. Mondal and J. Armstrong, ―The effect of defocus blur on a
spatial OFDM optical wireless communication system, ‖ in Proc. 14th
Int. Conf. Transparent Opt. Netw., Jul. 2012, pp. 1–4.
[8] M. R. H. Mondal and J. Armstrong, ―Analysis of the effect of
vignetting on mimo optical wireless systems using spatial OFDM, ‖ J.
Lightw. Technol., vol. 32, no. 5, pp. 922–929, Mar. 1, 2014.
[9] R. Gonzalez and R. Woods, Digital Image Processing, 3rd ed.
UpperSaddle River, NJ, USA: Pearson Education, 2007.

National Conference On “Recent Innovations In Engineering Science & Technology" April 2019
31 Computer Engineering
SMART SYSTEM FOR BLIND PEOPLE
Prof. Reena Sahane, Brijgopal Dixit, Saloni Aggarwal, Prakash Jha , Suvidha Pawar
[email protected], [email protected], [email protected] 2, [email protected],
Computer Engineering.
Sandip Institiute of Engineering and Management.
Abstract— Visually impaired persons have difficulty to
interact and feel their environment. The blind people’s life
and activity is greatly restricted by loss of their eyesight. So
because of this we have developed a system in which we
have done image processing ,which will identify the objects
in front of blind person.To do so we have used Deep
Learning, CIFAR10 Library and the concept of
Convolutional Neural Network.
Keywords—Image Processing, Deep Learning, CIFAR10 Library ,
Convolution Neural Network, CUDA, Rasberry PI 3 Model B,
Supervised Learning
I. INTRODUCTION
Blind people face several problems in their life, one of these
problems that is the most important one is detection the
obstacles when they are walking. In this research, we suggest a
system where a camera is placed on the person’s glasses and
their duty is to take images from the surrounding. This image
is passed to our trained model. In out trained model we are
using CIFAR10 dataset which consists of 10 classes, 50,000
training images and 10,000 testing images. Also we use
Convolutional Neural Network which is concept of Deep
Leaning for the prediction of the images using Supervised
Leaning. For the optimization of the algorithm we have used
back propogation.
Firstly, we capture an image using the raspberry pi 3
model B camera module. Now using python we save the
captured image in the database and that image is passed to our
trained model. That image is now converted into pixels matrix
which uses 3 channels RGB. Then this matrix is multiplied by
weight function to calculate the score for the prediction
Fig 1: Parametric Approach
II. HISTORY & BACKGROUND
According to the history of our project some of the authors
tried to explained the system they have developed for blind
person in their published papers. But there were some
disadvantages in the developed systems which we have
overcomed in our project. The paper [1] published in May,
2015 presents a Smart system for visually impaired, that make
use of ultrasonic sensor and RF transceiver as assistive
devices. This system is based on embedded technology. It
makes use of ultrasonic sensor and RF transceiver simulator.
The paper [2] published in 2016 describes about the Visually
impaired to find their navigation as they often lack the needed
information for by passing obstacles and hazards. Electronic
Travel Aids (ETAs) are devices that use sensor technology to
assist and improve the blind user’s mobility in terms of safety
and speed. The paper [3] published in September, 2016
focuses mainly in the development of the computer vision
module of the Smart Vision system. The main component of
this system is the infrared sensor which is used to scan a
predetermined area around blind by emitting-reflecting waves
path. They are using buzzer and vibrator, two output modes to
user. The paper [4] published in 2017 in which the project that
they have designed has a new system consisting of a camera
attached to the micro controller. This camera has to be placed
over the book and it will read the pages and information's will
be given by the loud speaker. This project makes the use of

National Conference On “Recent Innovations In Engineering Science & Technology" April 2019
32 Computer Engineering
Arduino UNO, Web Cam, Optical character recognition, Text
to Speech Engine, Audio amplifier. The paper named as [5]
explains about Active Noise Cancellation (ANC) is a classical
area where noise in the environment is canceled by producing
anti-noise signals near the human ears. This paper brings IoT
to active noise cancellation by combining wireless
communication with acoustics. Some of the keywords are
Noise Cancellation, Acoustics, Internet of Things, Wearable,
Edge Computing, Adaptive Filter, Smart Home, and Earphone.
In paper [6] designed a project in which the circuit takes in an
ambient noise signal through a microphone, is processed by
our circuit’s filter system, inverted, and finally added with an
incoming audio signal and sent to the headphones. The results
indicate the possibility for complete functionality. However,
this design is a prototype and does not meet the original goal
of an in-ear device.
the incorrect predictions look very close to what they model
thought it is.
Test Image Prediction Image
Test Image Prediction Image
Test Image Prediction Image
III. DESIGN ISSUES
1) Network Connection : If there in no proper internet
connection then the system would not work.
2) CIFAR10: CIFAR10 library consists only 10 classes
whereas CIFAR100 consists of 100 classes but it
requires high computation GPU which is more costly.
3) Our system recognizes image of only one class at a
time which reduces its accuracy.
4) The image captured by the camera must be clear as
blur image will result in wrong output.
FIGURE AND TABLE
The system architecture of our model is as below
IV. RESULT AND ANALYSIS
Now that we have a trained neural network, we can use it!
We then made the model interpret 50000 unknown images
of10 classes and got an accuracy of 95%. Its also
interesting that

National Conference On “Recent Innovations In Engineering Science & Technology" April 2019
33 Computer Engineering
Test Image Prediction Image Test Image Prediction Image
Fig 2: Sample of correct predictions
V. CONCLUSION
Hence, we are able to capture images from the raspberry pi
camera and then our trained system process the captured image
using deep learning and supervised learning. Henceforth our
system achieve 95% accuracy using convolutional neural
network.
REFERENCES
[1] M K Pushpa1, Shunmuga Priya M, Nandini T G, Shilpa C K, Sunitha,
“Smart Guiding System for Blind”, International Journal of Innovative
Research in Electrical, Electronics, Instrumentation and Control
Engineering Vol. 3, Issue 5, May 2015.
[2] R.Mohanapriya,U.Nirmala,C.Pearlin Priscilla, “Smart Vision for Blind
People”, International Journal of Advanced Research in Electronics and
Communication Engineering (IJARECE) Volume 5, Issue 7, July 2016.
[3] Prof. Seema Udgirkar, Shivaji Sarokar, Sujit Gore, Dinesh Kakuste,
Suraj Chaskar, “Object Detection System for Blind People”,
International Journal of Innovative Research in Computer and
Communication Engineering Vol. 4, Issue 9, September 2016

National Conference On “Recent Innovations In Engineering Science & Technology" April 2019
34 Computer Engineering
Abstract— The number of accidents in India are highest in the
world. The actual number of accident number may be higher
than documented. One person dies in every 4 min. In India now-
a-days safety on roads has become a serious issue as well as all
over in the world. At some places accidents occur like crossings,
diversions on highways, sharp Turn. The accidents on highways
can be prevented by providing the notification of infrastructure
to the driver before they arrive. It is a project with innovative
ideas for safety on roads and highways. An Internet of Things
(IOT) with sensors is used to transmit the entire data collected
by sensors communicate through wireless protocol. In this
Project we are presenting an electronic system which is based
on embedded and Internet of Things (IoT).
Keywords— Wireless Communication, WSN, RF433MHz, vehicle,
road, Infra-structure
I. INTRODUCTION
The presence of devices in an
automobile that connect the device to other device within the vehicle or devices networks and services outside the car
including other car, home, office or infrastructure. Connected
vehicles safety applications are designed to increase situation
awareness for accidents though vehicle to vehicle (V2V) and
Vehicle to Infrastructure (V2I) communications.This project
has idea of prevention of accidents. In this Project all this
communication is done with IOT (Internet of things)[1]. The
IOT Technology can be used for providing communication &
Interaction among vehicles & Infrastructure along the road
side. By connecting vehicles & road side Infrastructure to the
Internet real time communication, monitoring, controlling & notifications (early warning system) can be achieved.
Due to road accidents many
people loss there life in the world in every year, and much
more people have been injuring and maiming. The main
reason of these accidents is a limitation in view of roadway
emergency events that can be due to the distances, darkness,
and existence of an inhibiter in the road. Road and traffic
safety can be improved is drivers have the ability to hear
further outside the road and Know if a collision has occurred.
This can become possible if the drivers and vehicles
communicate with each other. If Infrastructures information
was provided to drivers the road would be safer and travelling on them would become more efficient. We are
proposing the V2V and V2I communication link to prevent
the road accidents. There are some issue regarding to current
system so we are developing this Iterative system for
Preventing Road Accident.
Here Communication is established between vehicle
to vehicle and vehicle to infrastructure so that driver will able
to drive more easily. Radio Frequency is used for Communication between vehicle to vehicle and vehicle to
Infrastructure. We are using IOT sensor such as Ultrasonic,
Proximity, and DHT11 for sensing data and some of the data
is send on cloud. This project has idea of prevention of
accidents. In this Project all this communication is done with
IOT (Internet of things). The IOT Technology can be used
for providing communication & Interaction among vehicles
& Infrastructure along the road side[6]. By connecting
vehicles & road side Infrastructure to the Internet real time
communication, monitoring, controlling & notifications
(early warning system) can be achieved.
The purpose of this system is to assess the readiness for application of vehicle-to-vehicle (V2V) communications,
a system designed to transmit basic safety information
between vehicles to facilitate warnings to drivers concerning
impending crashes.
Objective of our project are 1. Early warning
regarding any vehicle coming from left or right on the cross
road where visibility is poor due to the presence of buildings
or other infra-structure along the cross road. 2. Information
regarding approaching on vehicle in the fog & heavy rain. 3.
Information regarding any obstacle lying on the road during
night. 3. Early warning regarding bridge & other structure during night.
II. HISTORY & BACKGROUND
[2]Swati B. Raut developed a VANET to reduce the
collision of the vehicles and congestion control in the intersection of the roads efficient monitoring of vehicles is
need of time for smooth traffic flow. It uses Intelligent
Control Unit (ICU) and Vehicle to Vehicle communication to
predict the collision probability at highway intersection. The
scheme is implemented at open street map, on location of
interest and makes use of warning system based on collision
probabilities. Simulation results show the collision
probability for near crash, no crash and crash.
In VANET, Problems are Analysis of the existing
VANET protocols [11]-[13], [16], [18, 19] demonstrated that
most of them result in performance bottleneck during high
V2V and V2I Communication for Prevention
of Road Accidents
Yash Mali1, Pratiksha Rakholiya2, Shraddha Deore3, Prof. Mr. A.C.Taskar4
1st [email protected] 1, 2nd [email protected] 2, 3rd [email protected] 3 ,4th [email protected]
Department of Computer Engineering
Sandip Foundation’s Sandip Institute of Engineering and Management, Nashik.

National Conference On “Recent Innovations In Engineering Science & Technology" April 2019
35 Computer Engineering
traffic conditions. The main problem with these protocols is
the large packet size, that results in increased cryptographic
and communication overheads. The above situation
motivated this research to look for a reliable solution to support both V2I and V2V communications, yet by reducing
the above said overheads that are not properly addressed by
other studies. The main concern of this research is, to
propose an efficient protocol that can satisfy the scalability
requirements and lower the message loss.
[3]GOH CHIA CHIEH proposes a novel Vehicle to
Vehicle (V2V) communication system for collision
avoidance which merges four different wireless devices
(GPS, Wi-Fi, Zigbee and 3G) with a low power embedded
Single Board Computer (SBC) in order to increase
processing speed while maintaining a low cost. Collision
avoidance data processing includes processing data for vehicles on express ways, roads, tunnels, traffic jams and
indoor V2V communication such as required in car parks.
Wi-Fi Based System: - In Wi-Fi based system there is
limitations of user in high traffic conditions. Wi-Fi hotspot
only communicate with 10 users at a time. In Wi-Fi based
system at first time user have to manually connect with
hotspot for communication. In High Traffic condition there is
chance of delay in notification and collapse of network.
a. Survey of Country: A serious road accident in the country occurs every minute
and 16 dies in Indian roads every hour. 1214 road crashes
occur every day in India. Two wheelers account for 25%
total road accident deaths. 20 children under the age of 14 die
every day due to road crashes in the country[4]. 377 people die every day, equivalent to a jumbo jet crashing every day.
b. Survey of Maharashtra: Every day, on an average, as many as 115 road accidents take place in Maharashtra and 37 people die in these mishaps,
reveals the annual crime report released by the Crime
Investigation Department. Pune, on an average, witness’s
four accidents per day and three deaths every 48 hours, states
the report. The maximum number of road accidents 3,123
took place in Aurangabad in 2017, followed by Mumbai
(2,551) and Navi Mumbai (2,223). Mumbai tops the list of
road accident deaths 611 followed by Pune, which saw 543
such deaths. In 2017, Maharashtra witnessed 42,250
accidents, in which 13,685 people died and 39,301 were
injured[5]. In 2016, the state saw 44,382 road accidents, in
which 13,529 persons were killed and 43,668 injured. While the number of accidents fell by 4.8%, the number of
accident-related deaths increased by 1.15 %.
According to World Health Organizations (WHO),
road accidents annually cause approximately 1.2 million
deaths worldwide. Also, about 50 million persons are injured
in traffic accidents. Western Europe a mere 5 km/h decrease
in average vehicle speeds could result in 25% decrease in
deaths.
The National Highway Traffic Safety
Administration helps to reduce deaths, injuries, and
economic losses resulting from motor vehicle crashes by
setting and enforcing safety performance standards for motor
vehicles and motor vehicle equipment. Vehicle
manufacturers respond to NHTSA’s standards by building
safer vehicles. Combined with State and local government efforts, market effects, and driver behaviour improvements,
NHTSA’s standards have contributed to a significant
reduction in annual highway fatalities and injuries, from
52,627 fatalities in 1970, to 32,479 fatalities in 2011. Safety
technology has developed rapidly since NHTSA began
regulating the auto industry – vehicles protect occupants
much better in the event of a crash due to advanced structural
techniques propagated by more stringent crashworthiness
standards, and some crash avoidance technologies are now
standard equipment. Between existing crashworthiness and
required standard crash avoidance technologies, motor
vehicles are safer now than they have ever been. However, a significant number of annual crashes
remains that could potentially be addressed through
expanded use of more advanced crash avoidance
technologies. The agency estimates there are approximately
five million annual vehicle crashes, with attendant property
damage, injuries, and fatalities. While it may seem obvious,
if technology can help drivers avoid crashes, the damage due
to crashes simply never occurs[7]. The agency’s push thus
far for adoption of crash avoidance technologies, like
electronic stability control, has helped vehicles react to crash-
imminent situations, but has not yet been able to help the driver react ahead of time.
Before Intelligent Transportation Systems (ITS), the
United States developed, planned, and built the interstate
highway system. The interstate highway system has provided
a high level of mobility for citizens as well as the efficient
movement of goods. From the 1950s through the 1980s, the
vision of highway transportation was focused on building
roads. Yet issues began to emerge as the interstate system
was being built: about traffic congestion, especially in our
urban canters; about highway-related fatalities and injuries
due to crashes; and about the impacts on energy consumption and air quality. The discussions culminated in a workshop
held in Dallas, Texas, in 1990. During the workshop,
participants invented the Intelligent Vehicle Highway
Systems (IVHS) concept, which was later renamed to ITS.
The overall precept was that new transportation efficiencies
could be found if current infrastructure could be married with
advanced technology. New developments in computing,
sensors, information systems, and advanced mathematical
methods could be used to increase the operational capacity of
the system, and achieve better overall transportation network
operations.
The ITS concept became an integral part of the 1991 Intermodal Surface Transportation Efficiency Act (ISTEA).
The Act allocated $660 million of funds for ITS research,
development, and operational tests over six years. In
addition, just before the Act was adopted, the Intelligent
Vehicle Highway Society of America advisory organization
was established; later renamed Intelligent Transportation
Society of America. This advisory organization developed
the first strategic plan for ITS in 1992. The plan called for the
integrated operation of the system using technology to bring
together information about modes and current conditions,

National Conference On “Recent Innovations In Engineering Science & Technology" April 2019
36 Computer Engineering
and discussed how institutions can be organized to operate
the total transportation network.
V2V communications research initially began under
the Vehicle Infrastructure Integration Initiative in 2003, but its origins date back to the Automated Highway System
(AHS) research of the 1990s. The actual initiation of
advanced technology research was mandated by the
ISTEA[8]. The Act called for the development of an
automated intelligent vehicle highway prototype that would
use technology to make highway driving efficient, safe, and
predictable.
The vision of this system is to test V2V safety
applications in real-world driving scenarios to support
estimation of their effectiveness at reducing crashes, and to
ensure that the devices are safe and do not unnecessarily
distract motorists or cause unintended consequences. The Model Deployment is evaluating everyday drivers’ reactions,
both in a controlled environment through driver clinics, and
on actual roadways with other vehicles through the real-
world model deployment.
As this paper focuses on the basis and potential of
applying V2V technology to light vehicles, it important to
note the agency is also heavily involved in V2V research
related to heavy vehicles, pedestrians, and motorcycles.
Fig. 1. Existing System
III. DESIGN ISSUES
Mathematical Model:
S= (V, C, M, X)
Where
S: system V= As, Us, G
are set of service of vehicles
where
As: audio system
Us: ultra-service
G: gateway
C= VI, MI, XI
are set of Database Information
where
VI: vehicle service
MI: module service
XI: Sensor Service
M= T, B, F, O, Ts, v
are set of modules
Where
T: turn
B: bridge
F: fog
O: obstacle
Ts: traffic signal
V: vehicle
X= U, P Are set of Sensors
Where
U: Ultrasonic Sensor
P: Proximity Sensor
MODEL
Fig. 2.Transmitter Model
Fig. 3. Receiver Model
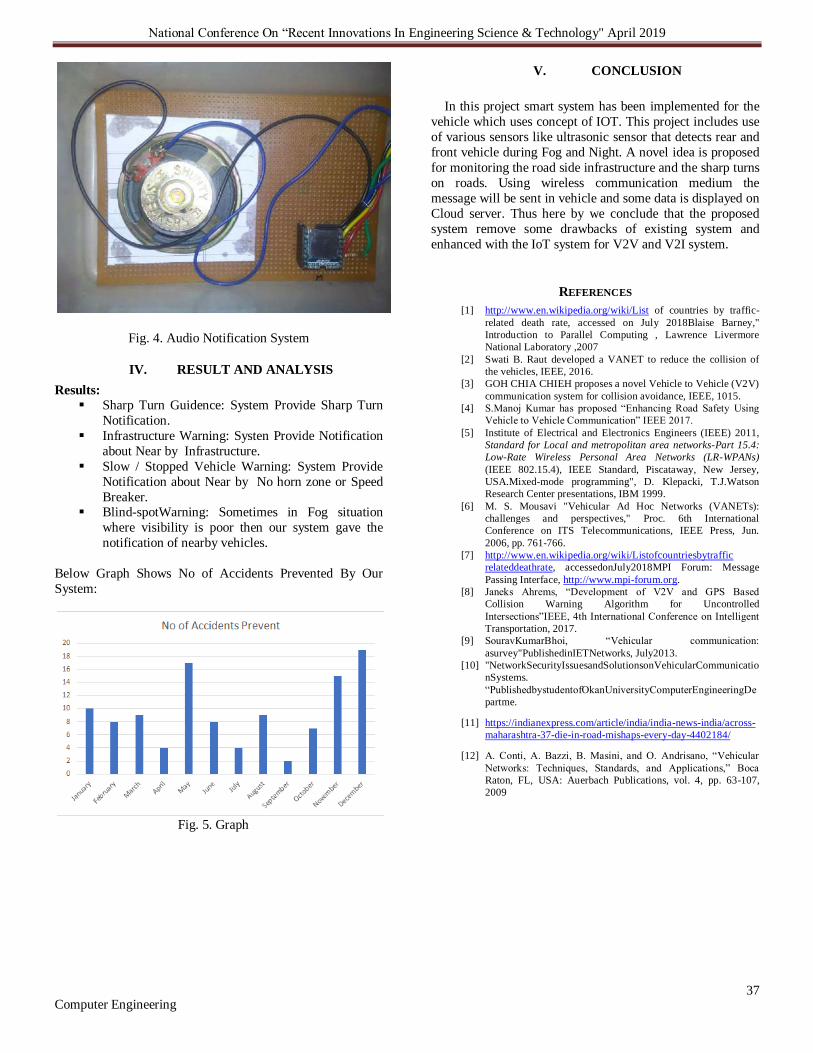
National Conference On “Recent Innovations In Engineering Science & Technology" April 2019
37 Computer Engineering
Fig. 4. Audio Notification System
IV. RESULT AND ANALYSIS
Results:
Sharp Turn Guidence: System Provide Sharp Turn
Notification.
Infrastructure Warning: Systen Provide Notification
about Near by Infrastructure.
Slow / Stopped Vehicle Warning: System Provide
Notification about Near by No horn zone or Speed
Breaker. Blind-spotWarning: Sometimes in Fog situation
where visibility is poor then our system gave the
notification of nearby vehicles.
Below Graph Shows No of Accidents Prevented By Our
System:
Fig. 5. Graph
V. CONCLUSION
In this project smart system has been implemented for the
vehicle which uses concept of IOT. This project includes use
of various sensors like ultrasonic sensor that detects rear and
front vehicle during Fog and Night. A novel idea is proposed
for monitoring the road side infrastructure and the sharp turns
on roads. Using wireless communication medium the
message will be sent in vehicle and some data is displayed on
Cloud server. Thus here by we conclude that the proposed
system remove some drawbacks of existing system and
enhanced with the IoT system for V2V and V2I system.
REFERENCES
[1] http://www.en.wikipedia.org/wiki/List of countries by traffic-
related death rate, accessed on July 2018Blaise Barney,"
Introduction to Parallel Computing , Lawrence Livermore
National Laboratory ,2007
[2] Swati B. Raut developed a VANET to reduce the collision of
the vehicles, IEEE, 2016.
[3] GOH CHIA CHIEH proposes a novel Vehicle to Vehicle (V2V)
communication system for collision avoidance, IEEE, 1015.
[4] S.Manoj Kumar has proposed “Enhancing Road Safety Using
Vehicle to Vehicle Communication” IEEE 2017.
[5] Institute of Electrical and Electronics Engineers (IEEE) 2011,
Standard for Local and metropolitan area networks-Part 15.4:
Low-Rate Wireless Personal Area Networks (LR-WPANs)
(IEEE 802.15.4), IEEE Standard, Piscataway, New Jersey,
USA.Mixed-mode programming", D. Klepacki, T.J.Watson
Research Center presentations, IBM 1999.
[6] M. S. Mousavi "Vehicular Ad Hoc Networks (VANETs):
challenges and perspectives," Proc. 6th International
Conference on ITS Telecommunications, IEEE Press, Jun.
2006, pp. 761-766.
[7] http://www.en.wikipedia.org/wiki/Listofcountriesbytraffic
relateddeathrate, accessedonJuly2018MPI Forum: Message
Passing Interface, http://www.mpi-forum.org.
[8] Janeks Ahrems, “Development of V2V and GPS Based
Collision Warning Algorithm for Uncontrolled
Intersections”IEEE, 4th International Conference on Intelligent
Transportation, 2017.
[9] SouravKumarBhoi, “Vehicular communication:
asurvey"PublishedinIETNetworks, July2013.
[10] "NetworkSecurityIssuesandSolutionsonVehicularCommunicatio
nSystems.
“PublishedbystudentofOkanUniversityComputerEngineeringDe
partme.
[11] https://indianexpress.com/article/india/india-news-india/across-
maharashtra-37-die-in-road-mishaps-every-day-4402184/
[12] A. Conti, A. Bazzi, B. Masini, and O. Andrisano, “Vehicular
Networks: Techniques, Standards, and Applications,” Boca
Raton, FL, USA: Auerbach Publications, vol. 4, pp. 63-107,
2009

National Conference On “Recent Innovations In Engineering Science & Technology" April 2019
38 Computer Engineering
Android Application for Disaster Recovery Supriya Badwar
1, Mayuri Shirore
2, Shweta Shinde
3, Ashwini Pawar
4, Prof. A.G. Patil
5
[email protected], [email protected], [email protected] , [email protected], [email protected]
Department of Computer Engineering.
Sandip Institute of Engineering & Management, Nashik
Abstract— We design how to use networks with smart phones for
providing communications in disaster recovery. By lessening the
communication gap among different kinds of wireless networks,
we have designed and implemented a system, which provides
Android phones the capabilities on communications in disaster
helper. Application consists of two components: a messaging
system between rescue worker and the victim and a self-rescue
system. The messaging system between rescue worker and victim
integrates cellular networking enables proper communication.
The self-rescue system finds different communication network
ways for trapped survivors. Such a group of Android phones can
cooperatively get a notification and send out emergency messages
in an energy-efficient manner with their location and position
information so as to help rescue operations. We have implemented
application as a prototype application on the Android platform
and deployed it on all types of smartphones. We are creating
application with a centralized server for communication. First for
the admin who will monitor victim and rescue worker and other
two for rescue worker and disaster victim.
Keywords— Smartphones, Routing, Disaster Recover, Wi-Fi,
Bluetooth.
I. INTRODUCTION Today mobile and mobile based applications have become an integral part of our day to day life. With the revolution in mobile computing, many great features were added to the field and the mobiles got smaller, faster and better as the decade passed. It gave rise to the introduction of new mobile-based operating systems where the programmers were presented with an open source operating system
named “ANDROID”. With the introduction of android, the programmers were free to program freely and with the much-awaited programming language as the programmers did not have to learn anything new. The android was a handsome mixture of java and mobile computing Thus a model integration of ANDROID platform with a desktop application can be utilized for disaster management applications and disaster management which can be of many types varying from natural disaster, accident, fire, theft. So we are thinking
of in cooperating various constraints in our application like, Injuries due to accidents are among the leading causes of hospitalization in elderly persons, often resulting in a rapid decline in functionality and death. The fast and unique response can improve the victim's outcome, but this is often lacking when the injured person lives alone and the nature of the injury is so bad to call for help.
The lack of efficient disaster management system that will help in
times of need. One common scenario during disasters is that the
activity of rescue and relief is not well-coordinated. This increases a
need for a well-coordinated disaster management system that can be
coordinated by a central entity such as administrator. Since the use of
Android smartphones has attracted millions of people, the disaster
management system was implemented as a smartphone application
using Google’s Android operating system. The disaster management
system monitor both victim and rescue worker. It finds out the rescue
worker which is nearest to the victim and sends him an alert to help
the victim.
II. HISTORY & BACKGROUND
Considering worldwide systems for emergency reporting regardless of their communication method where it’s wired or wireless, majorly we studied some unique parameters of the systems which will help us to define the strong objectives about our proposed systems. Below listed generation wise systems gives us the fair idea about the survey we had
done.
A. Closed-Circuit Television (CCTV) Closed-circuit television (CCTV) is the use of cameras and its wired or wireless network to transmit a signal to its DVR. It can be deployed as a point to point or point to multipoint links between camera and monitor [6]. These are mainly used in surveillance areas where they are needed from shops to airports etc. In mechanical and production plants, these video cameras are used to monitor and take decisions accordingly while at one room only [2]. Some places like the heavy
heat generated while molding metal or another area where worker can’t sustain that environment that time such CCTV are more useful and most suited one. Depends upon the requirement these CCTV operate continuously or time being to a monitor [1]. Now a day we have advanced Digital Video Recorders (DVRs), which records 24 hours for many years. It can continuously run and record it in some storage like disk or tape [4]. Also, these CCTV supports IP based monitoring and centralized network-based storage such as cloud [6].
Advantage and disadvantage: 1] It can work and may be placed anywhere. 2] DVR should always be on. B. Smoke Detectors Smoke detector systems are Emergency detection system in case of fire which generates smoke first. Such detectors are widely used in areas where there are big facilities like factories and hotels [1]. These
systems report the issue to some kind of audible alarm to alert public around it [3]. Older smoke detectors were using the physical process of ionization whereas latest technology enables us to use the photoelectric diode sense the smoke in the air and send an alarm after it [9]. In large areas like factories, it runs mainly on the power supply and not on batteries [10]. Advantage and disadvantage: 1] It can detect fire easily and accurately. 2] It can do it only once not repeatedly.
C. Natural Disaster Monitor App (Developed by Dominic925)
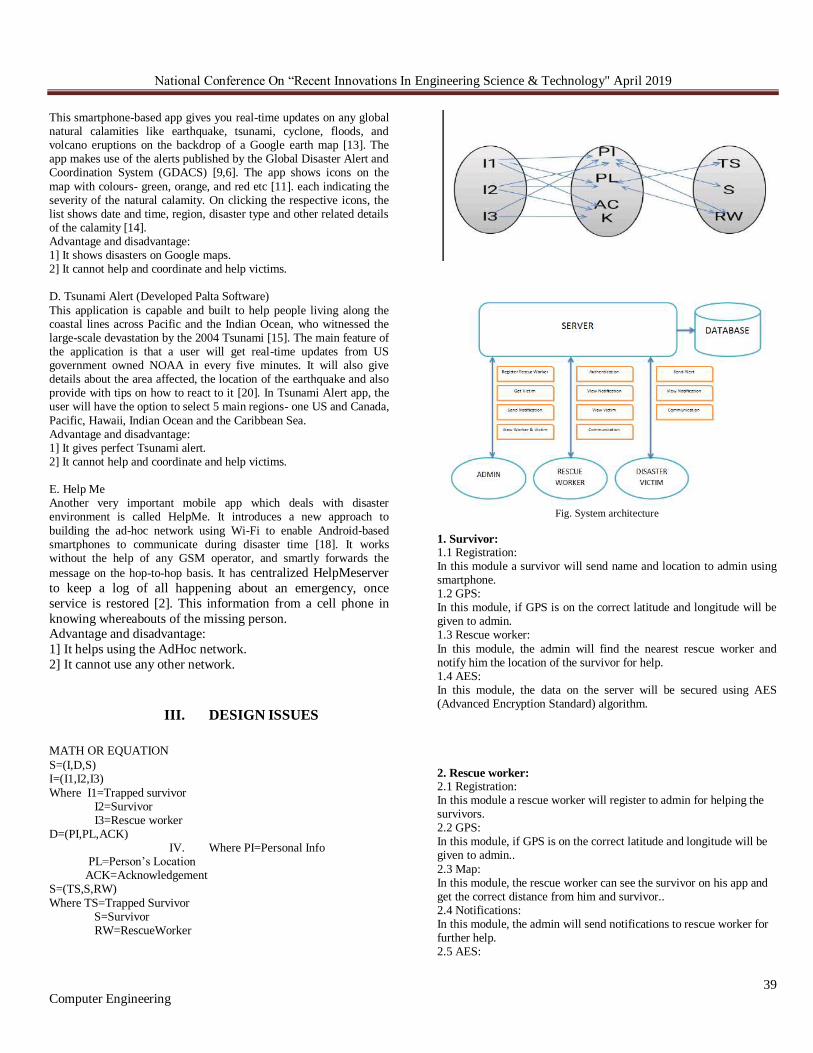
National Conference On “Recent Innovations In Engineering Science & Technology" April 2019
39 Computer Engineering
This smartphone-based app gives you real-time updates on any global natural calamities like earthquake, tsunami, cyclone, floods, and volcano eruptions on the backdrop of a Google earth map [13]. The app makes use of the alerts published by the Global Disaster Alert and Coordination System (GDACS) [9,6]. The app shows icons on the
map with colours- green, orange, and red etc [11]. each indicating the severity of the natural calamity. On clicking the respective icons, the list shows date and time, region, disaster type and other related details of the calamity [14]. Advantage and disadvantage: 1] It shows disasters on Google maps. 2] It cannot help and coordinate and help victims. D. Tsunami Alert (Developed Palta Software)
This application is capable and built to help people living along the coastal lines across Pacific and the Indian Ocean, who witnessed the large-scale devastation by the 2004 Tsunami [15]. The main feature of the application is that a user will get real-time updates from US government owned NOAA in every five minutes. It will also give details about the area affected, the location of the earthquake and also provide with tips on how to react to it [20]. In Tsunami Alert app, the user will have the option to select 5 main regions- one US and Canada,
Pacific, Hawaii, Indian Ocean and the Caribbean Sea. Advantage and disadvantage: 1] It gives perfect Tsunami alert. 2] It cannot help and coordinate and help victims. E. Help Me Another very important mobile app which deals with disaster environment is called HelpMe. It introduces a new approach to
building the ad-hoc network using Wi-Fi to enable Android-based smartphones to communicate during disaster time [18]. It works without the help of any GSM operator, and smartly forwards the
message on the hop-to-hop basis. It has centralized HelpMeserver
to keep a log of all happening about an emergency, once
service is restored [2]. This information from a cell phone in
knowing whereabouts of the missing person. Advantage and disadvantage:
1] It helps using the AdHoc network.
2] It cannot use any other network.
III. DESIGN ISSUES
MATH OR EQUATION
S=(I,D,S) I=(I1,I2,I3)
Where I1=Trapped survivor I2=Survivor I3=Rescue worker D=(PI,PL,ACK)
IV. Where PI=Personal Info PL=Person’s Location ACK=Acknowledgement S=(TS,S,RW)
Where TS=Trapped Survivor S=Survivor RW=RescueWorker
Fig. System architecture
1. Survivor: 1.1 Registration: In this module a survivor will send name and location to admin using smartphone. 1.2 GPS: In this module, if GPS is on the correct latitude and longitude will be given to admin. 1.3 Rescue worker:
In this module, the admin will find the nearest rescue worker and notify him the location of the survivor for help. 1.4 AES: In this module, the data on the server will be secured using AES (Advanced Encryption Standard) algorithm.
2. Rescue worker: 2.1 Registration: In this module a rescue worker will register to admin for helping the survivors. 2.2 GPS: In this module, if GPS is on the correct latitude and longitude will be given to admin..
2.3 Map: In this module, the rescue worker can see the survivor on his app and get the correct distance from him and survivor.. 2.4 Notifications: In this module, the admin will send notifications to rescue worker for further help. 2.5 AES:

National Conference On “Recent Innovations In Engineering Science & Technology" April 2019
40 Computer Engineering
In this module, the data on the server will be secured using AES (Advanced Encryptio Standard)algorithm.
3. Admin: 3.1 Survivor Monitoring:
In this module the admin will continue monitor survivor where abouts on his app. 3.2 Rescue Worker Monitoring: In this module, the admin will continue monitor rescue worker and see if he is really near the survivor. 3.3 Notifications: In this module, the admin will find the nearest rescue worker and send him to the survivor by sending notifications about the location of survivor and alert the survivor that help is coming.
3.4 AES: In this module, AES algorithm will be used to handle encryption and decryption of data from the server.
4. Algorithm
RESULT AND ANALYSIS

National Conference On “Recent Innovations In Engineering Science & Technology" April 2019
41 Computer Engineering
CONCLUSION
In this paper, we propose android app, which is designed to network smartphones in disaster recovery. App is implemented as a prototype application on the Android platform using the WiFi interface and cellular interface to provide several ways of communications. App can accomplish various message transmissions with affordable power consumption and delay, and greatly reduce the energy consumption of sending out emergency messages by grouping and wake-up schedule. In our project, we have developed an android based smartphone
application for use in post disaster relief work. Our application works on wireless technology Wi-fi Hotspot or routing, which do not depend on any fixed infrastructure but on device’s network. This application is of great utility for sending messages & enabling communication in disaster affected areas, but it also involves various security issues. Security issues are arising in such communication need to be taken care of in future. One more vital issue is smart phone battery. As these technology consumes much power & in disaster affected area there
may be no power supply, the application remains of no use if battery goes down. So, we need to find ways to minimize energy requirement for communication in such environments. Also, this whole system can be implemented by using lock button of smartphones.

National Conference On “Recent Innovations In Engineering Science & Technology" April 2019
42 Computer Engineering
References
[1] K. Lorincz, D. Malan, T. Fulford-Jones, A. Nawoj, A. Clavel,V.
Shnayder, G. Mainland, M. Welsh, and S. Moulton, “Sensornetworks for
emergency response: challenges and opportunities,” Pervasive Computing,
IEEE, vol. 3, no. 4, pp. 16–23, 2004.
[2] S. George, W. Zhou, H. Chenji, M. Won, Y. O. Lee, A. Pazarloglou,R.
Stoleru, and P. Barooah, “Distressnet: a wireless ad hoc andsensor network
architecture for situation management in disaster response,” Communications
Magazine, IEEE, vol. 48, no. 3, pp. 128–136, 2010.
[3] G. Zussman and A. Segall, “Energy efficient routing in ad hocdisaster
recovery networks,” in Proc. IEEE INFOCOM, 2003, pp.682–691.
[4] A. Fujihara and H. Miwa, “Disaster evacuation guidance using
opportunisticcommunication: The potential for opportunity-basedservice,” in
Big Data and Internet of Things: A Roadmap for SmartEnvironments, 2014,
pp. 425–446.
[5] “Powerful quake ravages china, killing thousands”
http://www.nytimes.com/2008/05/13/world/asia/13china.html.
[6] X. Sun, Z. Lu, W. Hu, and G. Cao, “Symdetector: Detecting
soundrelatedrespiratory symptoms using smartphones,” in Proc.
ACMUbiComp, 2015, pp. 97–108.
[7] M.-R. Ra, B. Liu, T. F. La Porta, and R. Govindan, “Medusa:
Aprogramming framework for crowd-sensing applications,” in Proc.ACM
MobiSys, 2012, pp. 337–350.
[8] C. Shi, V. Lakafosis, M. H. Ammar, and E. W. Zegura,
“Serendipity:enabling remote computing among intermittently
connectedmobile devices,” in Proc. ACM MobiHoc, 2012, pp. 145–154.

National Conference On “Recent Innovations In Engineering Science & Technology" April 2019
43 Computer Engineering
Review: Water Quality Monitoring System Using
IOT
Harshal Pawbake
BE Computer
SIEM
Mahiravani, Nashik
Ankit Sharma
BE Computer
SIEM
Mahiravani, Nashik
Hetal Patel
BE Computer
SIEM
Mahiravani,Nashik
Prof.A.R.Potdar
Computer Department
SIEM
Mahiravani, Nashik
Abstract—Water is a most essential element required for
humans to survive and therefore there must be some mechanisms put in place to test the quality of drinking water in real time. This paper proposes a system for water quality monitoringsystem using IOT. The system consists of various physiochemical sensors which can measures the physical and chemical parameters of the water such as Temperature, Turbidity, pH and Flow. By these sensors, water contaminants are detected. The sensor values processed by Raspberry pi and send to the cloud. The sensed data is visible on the cloud using cloud computing and the flow of the water in the pipeline is controlled through IoT.
Keywords—Water quality monitoring and controlling; IoT; Physiochemical sensors; Cloud; Cloud Computing.
I. INTRODUCTION
The most valuable resource for human is clean drinking water. Compromising with water quality would lead to seri- ously affect the health condition of humans. These days drink- ing water utilities are facing various challenges in real timedue to limited water resources, global warming, growing popula- tion and pollution. Hence, there is need of better methodologies for real time water quality monitoring. Conventional method of water quality monitoring involves the manual collection of the water at different areas and this water is tested in labo- ratory. This approach takes long time and high cost.Although the current methodologies have so many drawbacks: viz a) Laborious b) absence of water quality information in real time c) poor spatial coverage d) lack of controlling unit to control the flow of the water in pipeline for safe supply of the drinking water. The online water monitoring technologies have made a significant progress for source water surveillance and water plant operation. The use of their technologies having high cost associated with installation and calibration of a large distributed array of monitoring sensors. The algorithm proposed on the new technology must be suitable for particular area and for large system is not suitable. By concentrating on the above issues, this paper designed and developed low cost system for real time water quality monitoring and controlling using IoT. In our design, physical and chemical parameters of the water are measured by physiochemical sensors. The sensed values are processed by core controller. ESP32 is used as core controller for this design. The IoT module access processed
data from the core controller to internet. The sensed data can be observed in the internet browser with special IoT account. Water flow in the pipeline is controlled depending on quality of the water through IoT. In addition to that the controlling and monitoring is observed through mobile by using Wi-Fi provided by IoT module.
II. LITERATURE SURVEY
The Internet of Things (IoT), is a concept that describes how objects that we are used in daily life will interact and negotiate with other objects over the internet [1]. This paper deals with real time water quality assurance with the perspective of IoT. This section reviews some relevant research works. Li Zhenan et.al [2], introduced an intelligent water quality and control system based on wireless sensor networks to measure the quality of water. This system used the mobile wireless sensors to monitor water quality in a remote fashion and can detect pollutant location. Wireless controlled UAVs are integrated for the marking, separation and removal of pollutant. The technical challenges such as sensor selection and wireless control are addressed with customized novel algorithms. But UAV control algorithm is not efficient method for control wireless systems. Mithila Barabde1 et.al [3] proposed new system for water quality assurance. This system is based on wireless sensor network (WSN) which makes use of ZigBee. Another important fact of this system is the easy installation of the system that is the base station can be placed at the local residence close to the target area and the monitoring task can be done by any person with very less training at the beginning of the system installation. One important aspect is the system should work in different environment in more effective way, but using this system it is difficult to get reliable results in every situation. A. Fredrick et.al [4], developed new prototype based on IEEE 802.15.2.4 and solar energy for water quality monitoring is described. The prototype used ECHERP routing protocol for energy conservation purposes and solar panels are used instead of batteries to ensure the system will last in a long period of time. But evidently solar energy technologies remain to be very costly alternative. The fabrication of solar modules and their installation entail large amount of resources. Main drawbacks of this system are costly and difficult to deploy the system. Akila U et.al [5], presented a water quality monitoring system based on wireless sensor network.

National Conference On “Recent Innovations In Engineering Science & Technology" April 2019
44 Computer Engineering
presented in this work. Thamarai Selvi D et.al [6], presented a design of real time monitoring of drinking water quality system at consumer sites. The proposed system consist of several in- pipe water quality sensors. These are low power, lightweight and capable to process of data. The System is validated to enable these sensor nodes to make decisions and trigger alarms when anomalies are detected. This automated water utility billing system will overcome the difficulties in existing Water distribution system. The total costing of the meters is supposed to reduce so as the system will be economical along with power consumption reduction will be achieved by programming. Proposed system as per user requirement that is for monthly billing cycle it will be in active mode once in a month and rest of the time it will be sleep mode. But these systems are bulky and remain cost prohibitive for large scale deployments such systems can take frequent samples of the water quality at a very limited number of locations. Amruta Boyne et.al [7], did the detailed study of embedded PLC and its pros and cons. Later, they developed a new system to measure the quality of water. Extra hardwares like camera, LCD, SD card, Ethernet, LAN with many allied techniques were used in that system. The sensors pH and TDS (Total Dissolved Salt) will be kept in the river water surface and the data captured by the sensor will be given to Arm cortex M3 - Microcontroller and then data is captured and transmitted to an authentic source. After calculating the vital inference from the sensed data its analyzed. But microcontroller is specific to particular application and also this system has more complex architecture than the system which is developed using Raspberry Pi 2. From the survey, following are the drawbacks identified in the existing systems: Investment for the system is high. Size of the system is large The control system is not user friendly The systems are not real time and not able to measure the quality of water efficiently To overcome these drawbacks, our system uses simple devices that are small in size. The investment for the system is comparatively very less. The mechanism we implemented is too simple and effective. This system works with an internet connection. The system will measure the temperature, pH and turbidity of water in real time. This system is user friendly which sends text messages for registered user if predefined values of water exceeded.
III. SYSTEM ARCHITECTURE
The water quality measurement system uses pH, turbidity and TDS sensors to measure the standard of water. These sensors measure the corresponding values in the water. These
three sensors are connected to Raspberry Pi. The Measured information send to Raspberry Pi. the output of the pH sensor is analogue in nature, so, it is converted in to digital using ADC (analog to digital converter). System uses wireless network for communication with the control centre. It’s a real time system and it doesn’t required any man machine interaction. The systematic arrangements of the components are shown in the Fig 1. The Raspberry Pi is a small sized single-board computer. All Raspberry Pis included the same Video Core IV GPU and either a single core ARMv6-compatible CPU or an ARMv7-compatible quad-core one. Pi is also included the 1 GB of RAM or a Micro SDHC one for boot media. In this work Raspberry Pi 2 model is used. The pH sensor, Temperature
sensor and Turbidity sensor are connected to Raspberry Pi as shown in the Figure 1. Python programming language is used to connect various sensors. PHP and html languages are used for Graphical User Interface. For information storage and retrieval MySql is used. The pH Electrode BNC is used to measure the pH value of the water. It is a gel-filled combination pH electrode designed to make measurements in the pH range of 0 to 14.The body that extends below the glass sensing bulb of the electrode makes this probe ideal for making measurements in the environment.
IV. MATHEMATICAL MODEL
• S = I, O, F, Success, Failure
I = Set of INPUTS
O = Set of OUTPUTS
F = Set of FUNCTIONS
Success = Success case
Failure = Failure case
• I =( i1, i2, i3, i4,i5)
ı1 = Ph sensor data
i2 = Turbidity sensor data
i3 = Flow sensor data
i4 = Temperature sensor data
i5 = TDS sensor data
• O = (i1, o2)
o1 = Show data on
Display o2 = Send
data on cloud
• F = (f1, f2)
f1 = Store data on
database f2 = Predict
purity
• Failure = System not showing accurate
information.

National Conference On “Recent Innovations In Engineering Science & Technology" April 2019
45 Computer Engineering
• Success = System showing accurate information.
Fig2.Venn
Diagram
V. CONCLUSION
Monitoring of Turbidity, PH Temperature of Water makes use of water detection sensor with unique advantage and existing GSM network. The system can monitor water quality automatically, and it is low in cost and automatic. So the water quality testing is likely to be more convenient and fast. The system has good flexibility. Only by replacing the corresponding sensors and changing the relevant software programs, this system can be used to monitor other water quality parameters. The operation is simple. By keeping the embedded devices in the environment for monitoring enables self protection to the environment.
REFERENCES
[1] ikhil Kedia, Water Quality Monitoring for Rural Areas- A Sensor Cloud Based Economical Project, in 1st International Conference on Next Generation Computing Technologies (NGCT-2015) Dehradun, India, 4- 5 September 2015. 978-1-4673-6809-4/15/31.00 2015 IEEE.
ayti Bhatt, Jignesh Patoliya, Iot Based Water Quality Monitoring System, IRFIC, 21feb,2016.
[2] ichal lom, ondrej priby miroslav svitek, Internet 4.0 as a part of smart cities,978-1-5090-1116-2/16/31.00 2016 IEEE.
[3] okratis Kartakis, Weiren Yu, Reza Akhavan, and Julie A. McCann, 2016 IEEE First International Conference on Internet-of-Things Design and Implementation, 978-1-4673-9948-7/16 2016IEEE
[4] ithaila Barabde, shruti Danve, Real Time Water Quality
Monitoring System, IJIRCCE, vol 3, June 2015.
[5] kanksha Purohit, Ulhaskumar Gokhale, Real Time Water
Quality Measurement System based on GSM , IOSR (IOSR-JECE) Volume 9, Issue 3, Ver. V (May - Jun. 2014).
[6] oin OConnell, Michael Healy, Sinead OKeeffe, Thomas Newe,
and Elfed Lewis, IEEE sensors journal, vol. 13, no. 7, July 2013, 1530-437x/31.00 2013 IEEE
[7] idal Nasser, Asmaa Ali, Lutful Karim, Samir Belhaouari, 0792-
2/13/31.00 2013 IEEE
[8] iel Andre cloete, Reza Malekian and Lakshmi Nair, Design of
Smart Sensors for Real-Time Water Quality monitoring, 2016 IEEE conference.
[9] hanwei Sun, Chi Harold Liu, Chatschik Bisdikia, JoelW.
Branch and Bo Yang, 2012 9th Annual IEEE Communications Society Conference on Sensor, Mesh and Ad Hoc Communications and Networks.

National Conference On “Recent Innovations In Engineering Science & Technology" April 2019
46 Computer Engineering
Hi-Tech Traffic Signal System
Anish. B. Deore1, Prasanna. H. Janve 2, Gourav. S. Kakad 3, Dr. K. C. Nalavade 3
[email protected], [email protected], [email protected]
Computer Department.
Sandip Institute of Engineering and Management.
Abstract— According to Traffic Density the proper changes
in the Signal the system is done and traffic is
maintained and well manage through this system.
Switching from one lane to another, first, it checks for
High Density of traffic for remaining lanes, if there is high
density, then Green signal shifted to that lane having a
high density for few seconds to bring that lane to the
normal traffic and after that signal came back to the lane
from which signal is switched. When any Emergency
Vehicle suddenly appears on the lane, then it will be
detected 300-400 meter before the signal station and on that
lane green signal is activated. After the passing of
Emergency Vehicle form signal station then only the green
signal of that lane turn ON and after that signal came back
to the lane from which signal is switched. If any jumps the
signal or Signal Violation occurs, in that case, the vehicle
no. and other owner information is detected immediately
and send to the traffic control room through the web
portal automatically and next action will be taken by the
RTO. By sending the message to this vehicle owner. Full
accuracy is maintained in this system.
Keywords— Surveys and overviews, Scanners, Sensors and
actuators, Hardware-software codesign, Board- and system-
level test, Sensor networks.
I. INTRODUCTION
Living in 21st Century we all have latest technologies which
are useful in every field but we did not have any fully
automatic technology at traffic signal which will reduce the
traffic, open a route for Emergency vehicles like Ambulance
and collect the number of vehicle which crosses red signal.
Now-a-days controlling traffic is very difficult due to
increasing number of vehicles. 20% of emergency patient
deaths are blamed on Traffic Jam Delays. Sometime there is
traffic on only one lane due to insufficient timing of traffic
signal. So we developed a Hi-Tech traffic signal system based on I.O.T technology which will give the solutions for all
problems mentioned above. To reduce high density traffic to
normal traffic from any lane using IR sensors. We are using
RFID reader and RFID Tag to detect Ambulance or any kind
of emergency vehicle to make a way for them before they
arrive at a traffic signal. We are using RFID Reader to scan
the RFID tag of a particular vehicle to detect a number of
vehicle and then RFID Reader sends the information of
vehicle to the traffic control system. Some of Objectives are :
1) To control the lane which has maximum number of vehicles
by giving green signal as per priority.
2) Control and remove the traffic from the lane if any
emergency vehicle is detected. 3) Send the information of vehicle which jumps the red signal to the Department of R.T.O .
II. HISTORY & BACKGROUND
For our project, we collected some important information from
various research papers. This research papers contains
information about microcontroller board like traditional traffic
signal system, IR and Ultrasonic sensors, RFID reader and
RFID tag, arduino, raspberry pie, etc. We also get an idea
about how to develop a system using Arduino software. So we
mentioned some important papers from which we can able to
develop our system. A. Strategies for Traffic Signal Control in Indian Cities. Published year : 2015. Intelligent Transportation System Workshop, COMSNETS. Author Gitakrishnan Ramadurai has proposed that Most Indian cities face oversaturated flow conditions during peak periods. In this, researcher revisit the traffic signal control to improve urban network performance. Three novel strategies that address congested heterogeneous traffic flow are presented. The first two strategies keeping intersection signal cycle times shorter and bottleneck metering - are derived from field observed data while the third exclusive lanes and storage area near intersections for two wheelers - is supported based on a micro-simulation model.Potential improvements are presented based on the strategies. While most recent studies
have focused on area wide / network signal control.
improvements this paper shows potential for significant
improvement even at the level of an isolated signal[1]. B. IoT-based Visitor Detection System. Published year : 2016.

National Conference On “Recent Innovations In Engineering Science & Technology" April 2019
47 Computer Engineering
2016 International SoC Design Conference (ISOCC)
Authors Hyoung-Ro Lee et al. proposed an IoT-based visitor
detection system. It uses an IR sensor to detect human body
and two ultrasonic sensors to locate visitor servo motor under
the position. When a visitor is detected it drives camera
module to locate the visitor. Recoded video and sensor data are stored in the Database.It can track the visitor moving route
and minimize the blind spots of the camera. And sensor data
and recoded video are checked internet possible all remote
location[2].
C. An Introduction to RFID Technology.
Published year: 2006.
IEEE Pervasive Computing
Author Roy Want has proposed that the RFID enables
identification from a distance, and unlike earlier bar-code
technology, it does so without requiring a line of sight. In this
paper, the author introduces the principles of RFID, discusses its primary technologies and applications, and reviews the
challenges organizations will face in deploying this
technology[3]. D. Ultrasonic and Infrared Sensors Performance in a Wireless Obstacle Detection System.
Published year : 2017
First International Conference on Artificial Intelligence,
Modelling & Simulation Authors Baharuddin Mustapha et al. proposed that an Ultrasonic (US) and infrared (IR) sensors are broadly used in mobile applications for distance measurements. In this system of researchers, an obstacle detection system is built based on these two types of sensors. The system is intended for use by the elderly and people with vision impairment. The prototype developed has been tested to detect obstacles and shows accuracies of 95% to 99% for distance measurements if the sensor circuits are calibrated properly and their output
linearized. The system also demonstrates good detection for
different obstacle materials (e.g., wood, plastic, mirror,
plywood and concretes) and colors. The minimum size of an
obstacle that the system can detect is 5 cm x 5 cm[4].
III. DESIGN ISSUES
Mathematical Model
Input : Collecting input from sensors and RFID reader. Output : Execution of appropriate signal. Functins : Verification of collected data with the help of database. S = (I,O,F) Where S : System
I = D are set of Input
Where, D : Data from sensors and RFID F = MD, UD are set of functions MD : Matching Data UD : Unmatched Data
O = GS, NC are set of output
GS : Green signal
NC : No Change
We are using IR sensors (or Ultrasonic sensor) for detection of
High density traffic and then convert it to normal density traffic. IR sensors are mounted on the road facing toward
upside to collect reading of vehicles. If IR sensors get the
continuous reading of vehicles for 20 seconds on a particular
lane then that lane switched to green signal for 10 seconds and
remaining lanes switched to red signal. Due to this the high
density traffic at that lane reduced to normal density. After the
completion of 10 seconds, regular execution of signal is
resumed. For Emergency vehicle detection we are using 2 RFID readers (RC 522), one is mounted at the traffic signal and another is mounted at some distance from the signal to detect Emergency vehicles arrival. There is a RFID Tag (Passive RFID tag) with unique ID attached to every Emergency vehicle and this ID is stored in database. When any Emergency vehicle is arrived at particular lane then RFID reader will detect the RFID tag and it will matched the data stored in that RFID tag. If data is matched with stored data
then the signal for that lane is switched to green and other
lanes get red signal. Because of this the traffic at the signal is
removed before the arrival of Emergency vehicle. After that, the Emergency vehicle crosses the signal rapidly and safely.
Emergency vehicle is again detected by RFID reader which is
mounted at signal and after that detection regular execution of
traffic signal is resumed. One RFID Reader is mounted at the
signal to detect any vehicle which is crossing the red signal.
The RFID tag of every vehicle contains information of vehicle
including vehicle number. When RFID reader detect the RFID
tag of particular vehicle crossing red signal, it sends the
information of vehicle to the traffic control system and then
respective action will be taken by Department of R.T.O.
Fig. 1. System Architecture
IV. RESULT AND ANALYSIS
Before we start developing this project, we collected some
information. From the collected information we have two
graphs. Following graph shows the number of vehicles jumpes
the red signal in every month.

National Conference On “Recent Innovations In Engineering Science & Technology" April 2019
48 Computer Engineering
Fig. 2. Number of vehicles jumpes the red
signal
Following graph shows the traffic density with
respect to every day from Monday to Sunday.
Fig. 3. Traffic
Density
From the analysis of this information we come to know that
which signal have more traffic density and which have
normal traffic density. So from this result and analysis we
managed to develop our project with flexibility.
V. IMPLEMENTATION
We are going to built a mobile application for this
system.This application will contain the information such
as vehicle details, documents like license, traffic rules, etc.
There will be a feature of online fine payment if anyone
disobeyed traffic rules. Limitation of this project is that
RFID tag should be attached on all the vehicles for the
implementation of Signal violation module.
VI. CONCLUSION
Thus we conclude that, this system will give full accuracy
and system is fully automatic also. So to overcome the
manual work of traffic police (sometimes Traffic Police
handles traffic by switching off the signal) and make
smart traffic signal system. Emergency vehicle like
ambulance will get the route and we can reduce the time
wasted in traffic also. Because of this system no one can
dare to cross the red signal. We will built a mobile
application for this system.This application willcontain the
information such as vehicle details, documents like license,
traffic rules, etc. There will be a feature of online fine
payment if anyone disobeyed traffic rules. In future we
can link people’s bank account.
REFERENCES
[1] Gitakrishnan Ramadurai, “Strategies for Traffic Signal Control in
Indian Cities”, Intelligent Transportation System Workshop,
COMSNETS, May 2015.
[2] Hyoung-Ro Lee, Chi-Ho Lin, Won-Jong Kim, “Development of an
IoT- based Visitor Detection System”, 2016 International SoC Design
Conference (ISOCC), October 2016
[3] Roy Want, “An Introduction to Technology”, IEEE
Pervasive
Computing, February 2006.
[4] Baharuddin Mustapha, Aladin Zayegh, Rezaul K. Begg, “Ultrasonic
and Infrared Sensors Performance in a Wireless Obstacle Detection System”, First International Conference on Artificial Intelligence,
Modelling & Simulation, December 2013.
[5] Mehal Zaman Talukder, Sheikh Shadab Towqir, Arifur Rahman
Remon, Hasan U. Zaman, “An IoT Based Automated Traffic
Control System With Real-Time Update Capability”,8th International
Conference on Computing, Communication and Networking
Technologies (ICCCNT), July 2017.
[6] Yusuf Abdullahi Badamasi, “The working principle of an
Arduino”, 11th International Conference on Electronics, Computer and
Computation (ICECCO), December 2014.
[7] A.Carullo, M. Parvis, “An ultrasonic sensor for distance measurement
in
automotive applications”, IEEE Sensors Journal, August 2001.
[8] M Sowmiya, R.S Sabeenian, “Security and monitoring system by using RFID tags and multiple sensors”, IEEE International Conference on
Electrical, Instrumentation and Communication Engineering (ICEICE),
December 2017. [9] Sandra Dominikus, Manfred Aigner, Stefan Kraxberger, “Passive
RFID
technology for the internet of things”, International Conference
forInternet Technology and Secured Tr

National Conference On “Recent Innovations In Engineering Science & Technology" April 2019
49 Computer Engineering
Abstract— The system has a developed GSM based
database-driven application that facilities its management
and provides useful information about the children to
authorized person through SMS using GSM. The system
consists of two main units, first one bus unit and second
one school unit. The bus unit system is used to detect when
a child boards or leaves the bus. This information is
communicated to the school unit that identifies which of
the children did not board or leave the bus and issues an
alert message accordingly. A complete prototype of the
proposed system was implemented and tested to validate
the system functionality.The results show that the system is
promising for daily transportation safety.RFID-based
detection unit located inside the bus detects the RFID tags
worn by the children. It then sends via a GSM modem, the
relevant data to the system database server. The system
checks and detects which child did not board or leave the
bus and issues an alert message to this effect. In addition,
the system checks the children attendance and updates the
database. The parents can log into system website and
monitor the details of their children.
Keywords— Sensors and actuators ,Software Prototyping ,
Database Query Languages (Principles),Bootstrapping,
Database web servers, Database design and models.
I. INTRODUCTION Nowadays, most of the cases regarding child kidnaping and
rape cases of small girls is increasing .So in our proposed
system we are developing a band for the school children to
reduce the cases for the same. If in case the child is lost or
does not reach the school or back to home from school then
the system will notify alert to the concerned authorities.
Manual attendance of the student is done in the current system but in our system the attendance is marked automatically when
the student enters school premises. If student band is lost or
stolen, an alert notification is sent to the concerned authorities.
This system has ability to uniquely identify and take
attendance of the students. The users only need to present in
school premises for marking their attendance. They do not
need to go through the long list to look for their name. Hence,
it is a very time effcient system. In recent years, RFID is one
of the automatic identification technologies. There is a wide
research and development in this area trying to take maximum
advantage of this technology, and in coming years many new
applications and research areas will continue to appear. RFID system has been successfully applied to different areas as
diverse as transportation, healthcare, agriculture, and
hospitality industry to name a few. RFID also brings about
some concerns, mainly the security and privacy of those who
work with or use tags in their everyday life which is proposed
in. RFID is used to uniquely identify tagged objects or people.
RFID systems have been widely used in many application
areas such as inventory control, product tracking through
manufacturing and assembly, parking lot access and control,
Bank Locker Security System, Automatic Toll Collection
System (ATCS), Library Management system (LMS),
Attendance Management System etc. The aim of this paper is
to monitor student's attendance by using RFID for
administration. Notification will be sent to parents as well as
school's authority in case of absence of students.
Commercially available antitheft devices are very expensive not affordable. The developed system makes use of an
embedded system based on GSM, GPS, and RFID technology.
The designed developed system can install in the student's
band. GSM is the most popular accepted standard for mobile
phones in the world. The band is provided with the RFID
reader.
II. HISTORY & BACKGROUND
A.Gowtham,R.Mohanraj, A.Anadhan , S.Mohan, has proposed
Implementation Of School Children Tracking System and
Transportation Safety Enhancement by Using RFID
Technique. The system has a developed GSM based database-
driven application that facilities its management and provides useful information about the children to authorized person
through SMS using GSM. The system consists of two main
units, first one bus unit and second one school unit. The bus
unit the system is used to detect when a child boards or leaves
the bus. This information is communicated to the school unit
that identifies which of the children did not board or leave the
bus and issues an alert message accordingly [1]. Vishaka
Asundkar ,Prof.S.P.Godse, has proposed Enhance Safety
Security and Tracking System for School Bus and Children. A
system monitors the daily transportation service for school
going children to enhance the security and safety of the children. The system consists of three main units, bus unit,
parent unit and school unit. The bus unit consist of hardware
parts. The bus unit is used to detect when a child enters/exits
from the bus using RFID Card. This information is
communicated to the parent unit and school unit that identifies
the children did/did not enter/exit the bus. The notification like
the students whose next stop is, sent to the parent who stays on
the next stop using Geofence. The system enhances the
security of the children like the bus hijacked, extracting the
location and instantly sending notification to the admin as well
as the nearest police station using SOS and Spherical Cosine
Rule. The system develops an android application for the parent for getting notifications and live tracking of the bus and
web based application for the admin that facilitate the
management and provides useful information about the
children and some specific details like routing, allocating
stops, scheduling, optimized route and reports. The system
Safety Tracking System for School Students Tejas S.Shah
1, R.Pratik
2,Wajid S.Shaikh
3, Bhushan S. Sonawane
4 Dr.K.C.Nalavade
5
Computer Department, Nashik
Sandip Institute of Engineering and Management

National Conference On “Recent Innovations In Engineering Science & Technology" April 2019
50 Computer Engineering
tracks the school bus by the GPS Module and also gets an alert
if the bus crosses the speed limit [2].
C.Deenadayalan,M.Mural,L.R.Baanupriya, has proposed
Implementing Prototype Model for School Security System
(SSS) Using RFID. Now days, the number of crime over
children is increasing day by day .the implementation of
School Security System(SSS) via RFlD to avoid crime, illegal
activates by students and reduce worries among parents. The
project is the combination of latest Technology using RFID,
GPS/GSM, image processing, WSN and web based
development using PHP, VB. net language apache web server and SQL. By using RFID technology it is easy track the
student thus enhances the security and safety in selected zone.
The information about student such as in time and out time
from Bus and campus will be recorded to web based system
and the GPS/GSM system automatically sends information
(SMS / Phone Call) to other parents [3].
Anusha R, Dr.R.China,Appala Naidu ,has proposed GPS and
RFID Based School Children Tracking System. The
educational institutions are unable to trace the students who
don’t attend college during regular working hours. To resolve
this, in this paper we have implemented a new system which will help the parents to identify whether their kid reached the
educational organization at correct time or not. In this paper
the system keep track of the wards who board the bus and
reach college or who manage to get down on the way to
college or back home. To trace the students we implemented a
system which uses an RFID, GPS, GSM and ARM processor.
In this paper we have shown the results which are
implemented and tested in our own organization [4].
Judy Thyparampil Raj ,Jairam Sankar ,has proposed IoT
Based Smart School Bus Monitoring and Notification System.
It is important for every school to have a trustworthy and
secure transportation service to ensure the safety of the students. It helps the school administration to effectively
manage their bus fleet and potentially reduce mishaps. This is
where vehicle monitoring takes effect. The proposed system
provides real time information about various parameters of the
vehicle like the location, the route, the speed, the list of
passengers, the adherence of drivers to schedule and much
more. The system further allows the parents to be notified
when their ward alights or boards the bus. In this system, we
make use of RFID and GPS technologies and connect them to
a remote server over WiFi using an ESP8266
microcontroller[5]. Jisha R.C, Aiswarya Jyothindranath, Sajitha Kumary L has
proposed IOT Based School Bus Tracking and Arrival Time
Prediction. Nowadays, parents are perturbed about school
going children because of the increasing number of cases of
missing students. On occasion, students need to wait a much
longer time for arrival of their school bus. There exist some
communication technologies that are used to ensure the safety
of students. But these are incapable of providing efficient
services to parents. This paper presents the development of a
school bus monitoring system, capable of providing
productive services through emerging technologies like
Internet of Things (Iota). The proposed IoT based system
tracks students in a school bus using a combination of
RFID/GPS/GSM/GPRS technologies [6].
Vinoth Rengaraj ,Prof. Kamal Bijlani ,has proposed a study
and implementation of Smart ID card with M-Learning and
Child Security. Among the Organized crime, Human
trafficking hold third place where as the first and second or
drug and weapon trade across the globe. Human trafficking is
a shame on Humanity. As per the report of Human Rights
commission of India over 40,000 children are reported missing every year of which 11000 are untraced Another statics report
saying 80% of human trafficking is done for sexual
exploitation and rest is for bonded labors [7].
III.PROPOSED SYSTEM
Our system contains AVR microcontroller, IoT Cloud, GPS +
GSM ,RFID (Active), Proximity Sensor.The AVR
Microcontroller is used to process and control the overall
proposed system .The IoT cloud(Internet of Things)is a
Salesforce platform which stores large amount of data. It
stores all data and it will only pass the details of those students to the concerned authorities whose notification has to be send.
GPS is used for continuous tracking of student and GSM is
used for sending data to the cloud and sends notification to the
concerned authorities .Through active RFID identification of
the bus and school is done. Further the bus id and school id is
used for tracking the bus and marking automatic attendance
of students according to student id. Proximity Sensor is used
to sense the safety band which is on students hand .Android
application used to display the details of students which is
send by IOT cloud.The message will sent from Cloud to the
local server and from local sever to respective parents cell.
IV. MATHEMATICAL MODEL
Let S is the system for tracking the student with student
wearing a band in his/her hand.
S = (I, SR,O)
Where,
S:System
I =ST,BU,SC
Are set of inputs
Where,
ST : Student
BU : Bus SC : School
SR=SDB,BDB,CDB
Are set of database servers
Where
SDB : Student Database
BDB : Bus Database
CDB : School Database
O=LT,N,AT
Are set of outputs

National Conference On “Recent Innovations In Engineering Science & Technology" April 2019
51 Computer Engineering
Where LT : Location Track N : Notification Message
AT :Automatic Attendance
Fig. 1.Venn Diagram
Fig. 2. System Architecture
Where, Pid : Parent Identity Cid : Classroom Identity
Sid : Student Identity Bid : Bus Identity.
V. RESULT AND ANALYSIS
Fig. 3.Attendance Analysis Graph.
In the above graph attendance of the students of a particular
class is been graphically presented .From the above graph, the
highest attendance month of the year and lowest attendance
month of the year can be analyzed . A meeting with the
parents and the school authorities can be conducted to discuss
the issues on why the student’s attendance is lowest in that
particular month of the year.
Similarly, the graphs for various classes can be graphically presented and analyzed .The school authorities can also
compare the attendance of a class with the other classes and
award some credits to the class having the highest attendance
compared to each other.
Through this the students would be motivated to attend the
school regularly to earn the credits at the end of the year.
Fig. 4. Screenshot of Attendance
0
20
40
60
80
100
Attendance (2015)

National Conference On “Recent Innovations In Engineering Science & Technology" April 2019
52 Computer Engineering
The above Fig.4 display a automatic text message sent to the
concerned authorities about the ward being present or absent
on that day.
Fig. 5. Screenshot of Location
The above Fig.5 display a automatic text message sent to the concerned authorities about the details of the bus and the
ward’s pickup point to assure the safety of the war during the
travelling time period from home to school and vice-versa.
Fig. 6. Screenshot of track monitoring message
The above Fig.6 display a automatic text message sent to the
concerned authorities about the ward’s bus is went to wrong
track or out of track .
VI. FUTURE SCOPE This system is going to be helpful for the parents as well as
school system.Students are kept on tracking and the current
location of a student can be detected using this system in any
case of the mishap or kidnapping case of a child.
Vi VII. CONCLUSION
In our proposed system we have design the safety band to
track the students and send the notification to the concerned
authorities and in this way we are contributing towards society
to save the children from being targeted by the criminals.
REFERENCES
[1] A.Gowthaman , R.Mohanraj, A.Anadhan, S.Mohan, Implementation Of
School Children
Tracking System and Transportation Safety Enhancement by Using RFID
Technique.
[2] Vishaka Asundkar,PROF.S.P.Godse, Enhance Safety Security and
Tracking System for School
Bus and Children.
[3]C.Deenadayalan,M.Mural,L.R.Baanupriya, Implementing Prototype
Model for School
Security System (SSS) Using RFID.
[4] Anusha R, Dr.R.China,Appala Naidu , GPS and RFID Based School
Children Tracking
System.
[5] Judy Thyparampil Raj ,Jairam Sankar , IoT Based Smart School Bus
Monitoring and
Notification System.
[6] Jisha R.C, Aiswarya Jyothindranath, Sajitha Kumary L IOT Based School
Bus Tracking and
Arrival Time Prediction

National Conference On “Recent Innovations In Engineering Science & Technology" April 2019
53 Computer Engineering
Mood Detector Using Image Processing, AI and
Machine Learning
Prof.Dattatray Shingate1 , Sudhakar Vishwakarma
2 , Sayali Mane
3 , Komal Kadlag
4 ,Pallavi Aher
4 ,
1st [email protected],[email protected] 2, 3rd [email protected] 3 ,4th [email protected] 4
Computer Department
Sandip Institute Of Engineering & Management
Abstract— Behavior, Action, Poses, facial expression and speech;
these are considered as channels that convey human emotions.
Extensive re- search has being carried out to explore the
relationships between these channels and emotions. This paper
proposes a prototype system which automatically recognizes the
emotion represented on a face. Thus a neural network based
solution combined with image processing is used in classifying
the universal emotions: Happiness, Sadness, Anger, Dis- gust,
Surprise and Fear. Colored frontal face images are given as
input to the prototype system. After the face is detected, image
processing based feature point extraction method is used to
extract a set of selected feature points. Finally, a set of values
obtained after processing those extracted feature points are given
as input to the neural network to recognize the emotion
contained. Computational analysis of emotions has been
considered a challenging and interesting task. Researchers rely
on various cues such as physiological sensors and facial
expressions to identify human emotions. However, there are few
prior works who work with textual input to analyze these
emotions. This survey attempts to summarize these diverse
approaches, datasets and resources that have been reported for
emotional analysis from text. We feel that there is an essential
need to have a collective understanding of the research in this
area. There- fore, we report trends in emotion analysis research.
We also present a research matrix that summarizes past work,
and list pointers to future work.
Keywords— Image Processing, Artificial Intelligence, Mood Detection, Natural Language Processing (NLP), Machine Learning.
I. INTRODUCTION What is an emotion? An emotion is a mental and physiological state which is subjective and private it involves
a lot of behaviors, actions, thoughts and feelings of humans.
Initial research carried out on emotions can be traced to the
book ‘The Expression of the Emotions in Man and Animals’
by Charles Darwin. He believed emotions to be species-
specific rather than culture-specific. In 1969, after recognizing
a universality among emotions in different groups of people
despite the cultural differences, Ekman and Friesen captured
six emotional expressions to be universal happiness, sadness,
despite the cultural differences, Ekman and Friesen captured
six emotional expressions to be universal happiness, sadness,
disgust, surprise and fear. Facial expressions can be
considered not only as the most natural form of displaying
human emotions but also as a key non-verbal communication
technique. If efficient methods can be brought about to
automatically recognize these facial expressions, striking
improvements can be achieved in the area of human computer
interaction. Research in facial emotion recognition has being
carried out in hope of attaining these enhancements. In fact,
there exist other applications which can benefit from automatic facial emotion recognition. Artificial Intelligence
has long relied on the area of facial emotion recognition to
gain intelligence on how to model human emotions
convincingly in robots. Recent improvements in this area have
encouraged the research first extend the applicability of facial
emotion recognition to areas like chat room avatars and video
conferencing avatars. The ability to recognize emotions can be
valuable in face recognition applications as well. Suspect
detection systems and intelligence improvement systems
meant for children with brain development disorders are some
other beneficiaries.
II. History & Background
Rituparna Halder et. All, [1] From this paper Behaviors,
actions, poses, facial expressions and speech; these are
considered as channels that convey human emotions.
Extensive research has being carried out to explore the relationships between these channels and emotions. This paper
proposes a prototype system which automatically recognizes
the emotion represented on a face. Thus a neural network
based solution combined with image processing is used in
classifying the universal emotions: Happiness, Sadness,
Anger, Disgust, Surprise and Fear. Colored frontal face
images are given as input to the prototype system. After the
face is detected, image processing based feature point
extraction method is used to extract a set of selected feature
points. Finally, a set of values obtained after processing those
extracted feature points are given as input to the neural network to recognize the emotion contained.
Kun-Yi Huang et. all [2], This paper, an extended subjective
self-report method is generally used for measuring emotions.
Even though it is commonly accepted that speech emotion

National Conference On “Recent Innovations In Engineering Science & Technology" April 2019
54 Computer Engineering
perceived by the listener is close to the intended emotion
conveyed by the speaker, research has indicated that there still
remains a mismatch between them. In addition, the individuals
with different personalities generally have different emotion expressions. Based on the investigation, in this study, a
support vector machine (SVM)-based emotion model is first
developed to detect perceived emotion from daily
conversational speech. Then, a denoising autoencoder (DAE)
is used to construct an emotion conversion model to
characterize the relationship between the perceived emotion and the expressed emotion of the subject for a specific
personality. Finally, along short-term memory (LSTM)- based mood model is constructed to model the temporal fluctuation
of speech emotions for mood detection. Experimental results
show that the proposed method achieved a detection accuracy
of 64.5compared to the HMM based method.
Tsung-Hsien Yang, et. all [3], In this paper In mood disorder
diagnosis, bipolar disorder (BD) patients are often
misdiagnosed as unipolar depression (UD) on initial
presentation. It is crucial to establish an accurate distinction
between BD and UD to make an accurate and early diagnosis,
leading to improvements in treatment. In this work, facial
expressions of the subjects are collected when they were
watching the eliciting emotional video clips. In mood disorder
detection, first, facial features extracted from the DISFA
database are used to train a support vector machine (SVM) for generating facial action unit (AU) profiles. The modulation
spectrum characterizing the fluctuation of AU profile
sequence over a video segment are further extracted and then
used for mood disorder detection using an ANN model.
Comparative experiments clearly show the promising
advantage of the modulation spectrum features for mood
disorder detection.
Bhuiyan et. all [4],In this paper We present EmoTxt,a toolkit
for emotion recognition from text, trained and tested on a gold
standard of about 9K question, answers, and comments from online interactions. We provide empirical evidence of the
performance of EmoTxt. To the best of our knowledge,
EmoTxt is the first open-source toolkit supporting both
emotion recognition from text and training of custom emotion
classification models
Shadi Shaheen et. all [5] ,In this paper the growth of the
Internet community, textual data has proven to be the main
tool of communication in human-machine and human-human
interaction. This communication is constantly evolving
towards the goal of making it as human and real as possible.
One way of humanizing such interaction is to provide a framework that can recognize the emotions present in the
communication or the emotions of the involved users in order
to enrich user experience. For example, by providing insights
to users for personal preferences and automated
recommendations based on their emotional state. In this work,
we propose a framework for emotion classification in English
sentences where emotions are treated as generalized concepts
extracted from the sentences. We start by generating an
intermediate emotional data representation of a given input sentence based on its syntactic and semantic structure. We
then generalize this representation using various ontologies
such as WordNet and Concept Net, which results in an
emotion seed that we call an emotion recognition rule (ERR).
Finally, we use a suite of classifiers to compare the generated
ERR with a set of reference ERRs extracted from a training
set in a similar fashion. The used classifiers are k-nearest
neighbors (KNN) with handcrafted similarity measure, Point
Mutual Information (PMI), and PMI
with Information Retrieval (PMI-IR). When applied on
different datasets, the proposed approach significantly
outperformed the existing state-of-threat machine learning and rule-based classifiers with an average F-Score of 84%.
III. MATHEMATICAL MODEL
System Description:
S = (I,O,F)
Where,
1.1) System.
I=(I1, I2) are set of Inputs
Where,
1) I1 : Textual data.
2) I2 : Human Face.
F = (F1, F2, F3, F4) are set of Function
Where,
A.A.1 F1 : Image Processing.
A.A.2 F2 : Natural Language Processing.
A.A.3 F3 : Machine Learning From Data.
F4 : Data Sending.
O = (O1, O2 ) are set of Output
O1 : Mood Detection.
O2 : Refreshment.

National Conference On “Recent Innovations In Engineering Science & Technology" April 2019
55 Computer Engineering
Success Condition : To do proper facial Recognition, Perform proper Natural lan-guage processing, data sending for refresh-ment.
Failure Condition : No database, No internet connection.
Fig2. Venn Diagram
IV. SYSTEM ARCHITECTURE
This system is an automated system which will help many people to get over multiple emotional barriers which are been caused because of stress or any other emotional attachment. It will make a clear view about human behaviour and can be used for further study of human behavioural synthesis. In this system we will have a user whose mood is to be detected that is going to be done in two ways one is with the help of his facial expressions and other is based on the textual data. In textual data it will involve chat box through which the user can chat and the system will respond to the text using the artificial intelligence and it will send data such as funny videos and funny text messages etc.
Fig. System Architecture
V. IMPLEMNTATION DETAILS
The basic requirement of the system is to improve the existing situation of mental pressure and stress. This will try to reduce the mental stress and other emotional barriers which are caused to human. There could be number of factors which could effect on human emotions so he can use this system to analyze as well as to get over their own emotions. Other thing is that people can enjoy with this system as this system is made to make people emotionally stable and fresh. We have used EEM and SSIM algorithms which will be used in image processing and detection of human mood. System Analysis : 1. Image Processing:- In computer science, digital image processing is the use of computer algorithms to perform image processing on digital images. As a subcategory or field of digital signal processing, digital image processing has many advantages over analog image processing. It allows a much wider range of algorithms to be applied to the input data and can avoid problems such as the build-up of noise and signal distortion during processing. Since images are defined over two dimensions (perhaps more) digital image processing may be modeled in the form of multidimensional systems. 2. Natural Language Processing (NLP):- Natural language processing (NLP) is the ability of a computer program to understand human language as it is spoken. NLP is a component of artificial intelligence (AI).It is an area of computer science and artificial intelligence concerned with the interactions between computers and human (natural) languages, in particular how to program computers to process and analyze large amounts of natural language data. Challenges in natural language processing frequently involve speech recognition, natural language understanding, and natural language generation. 3. Artificial Intelligence:- AI (artificial intelligence) is the simulation of human intelligence processes by machines, especially computer systems. These processes include learning (the acquisition of information and rules for using the information), reasoning (using rules to reach approximate or definite conclusions) and self-correction. Particular applications of AI include expert systems, speech recognition and machine vision.
VI. RESULT AND ANALYSIS
Consider the current situation in which multiple people get
emotionally as well as mentally disturbed because of lots of
stress and work load as well as there are many other problems
rather than stress which usually happens while we are in a stressful situation.So to overcome or to get proper judgement
of the persons emotional behavior this system will be useful

National Conference On “Recent Innovations In Engineering Science & Technology" April 2019
56 Computer Engineering
and it will also give him or her proper guidance on what
precaution or what could be done to overcome such a
condition.
VII. CONCLUSION
This system is going to give a new way of human relaxation because of which people could focus on many new things intheir life. People working in the offices will also be relaxed and they will work more efficiently. The time which was used by the employees for refreshment will be done on their desk so time will also be saved and people could concentrate on their work more. This system can also be used in medical field to analyse human behaviour because of which people suffering through many mental disorders can be monitored. So all over I conclude this system as very beneficial for all.
REFERENCES
Rituparna Halder,Sushmit Sengupta,Arnab Pal.”Real Time Facial Emotion
Recog nition based on Image Processing and Machine Learning”,International
Journal of Computer Applications (0975 8887) Volume 139 No.11, April
2016.
[2] Kun-Yi Huang, Chung-Hsien Wu, Ming-Hsiang Su and Hsiang-Chi
Fu,”MOOD DETECTION FROM DAILY CONVERSATIONAL SPEECH
USING DENOISING AU-
TOENCODER AND LSTM”,978-1-5090-4117-6/17/2017 IEEE.
[3] Tsung-Hsien Yang, Chung-Hsien Wu, Ming-Hsiang Su, and Chia-Cheng
Chang,”DETECTION OF MOOD DISORDER USING MODULATION
SPECTRUM OF FACIAL ACTION UNIT PROFILES”,2016
[4] Bhuiyan, M. A.-A., Ampornaramveth, V., Muto, S., and Ueno, H., Face
detection and facial feature localization for human-machine interface. NII
Journal, (5):2539, 2003.
[5] Brunelli, R., and Poggio., T., Face recognition: features versus templates.
IEEE Transactions on Pattern Analysis and Machine Intelligence,
15(10):10421052, 1993.
[6] Busso, C., Deng, Z., Yildirim, S., Bulut, M., Lee, C. M., Kazemzadeh, A.,
Lee, S., Neumann, U., and Narayanan, S., Analysis of emotion recognition
using facial expressions,
speech and multimodal information. In ICMI 04: Proceedings of the 6th
international conference on Multimodal interfaces, pages 205211, New York,
NY, USA, 2004. ACM
[7] Cohen, I., Garg, A., and Huang, T. S., Emotion recognition from facial
expressions using multilevel hmm. In Neural Information Processing
Systems, 2000.
[8] Dailey, M. N., Cottrell, G. W., Padgett, C., and Adolphs, R., Empath: A
neural network that categorizes facial expressions. J. Cognitive Neuroscience,
14(8):11581173,
2002.
[9] Deng, X., Chang, C.-H., and Brandle, E., A new method for eye extraction
from facial image. In DELTA 04: Proceedings of the Second IEEE
International Workshop on Electronic Design, Test and Applications, page 29,
Washington, DC, USA, 2004.
IEEE Computer Society
[10] Dumasm, M., Emotional expression recognition using support vector
machines. Technical report, Machine Perception Lab, Univeristy of
California, 2001
[11] Ekman, P., Facial expression and emotion. American Psychologist,
48:384392, 1993.
[12] Gu, H., Su, G., and Du, C., Feature points extraction from faces. 2003.
11) Lisetti,C. L., and Rumelhart, D. E., Facial expression recognition using a
neural network.
In Proceedings of the Eleveth International FLAIRS Conference. Menlo Park,
pages328332. AAAI Press, 1998.
[13] J. Bonneau, J. Anderson, and G. Danezis, Prying data out of a social
network, in Proc. Int. Conf. Adv. Soc. Netw. Anal. Mining., 2009, pp.249254.
[14] H.-M. Chen, M.-H. Chang, P.-C. Chang, M.-C. Tien, W. H. Hsu,and J.-
L. Wu, Sheepdog: Group and tag recommendation for flickr photos by
automatic search-based learning, in Proc. 16th ACM Int. Conf. Multimedia,
2008, pp. 737740.
[15] aG.C. Dandy, A.R. Simpson, L.J. Murphy, An improved genetic
algorithm for pipe
network optimization Water Resources Research, 32 (2) (1996), de Berg et
al., 2013,
pp. 449-458

National Conference On “Recent Innovations In Engineering Science & Technology" April 2019
57 Computer Engineering
Prof.P.C.Patil1, Pooja ski
2, Kiran Hire
3 , Saloni Ambekar
4
1st [email protected], 2nd [email protected], 3rd [email protected] 3, 4th [email protected]
Computer Department
Sandip Institute of Engineering & Management
Abstract: In India, the traditional voting system is based on
EVM machine. Every polling booth is having EVM setup and the
voter casts his vote by validating the name available in a voter
list. The possibility of fake voting might be occur due to a
dummy identity proof . Irrespective of all authentication process
, it also becomes difficult to identify the voter who are voting for
more than one time. So a need is to create a secure, authentic,
robust and sustainable system which overcomes all the
limitations of existing system.
A new software application will be linked to the database of the
main server. Where in the database voters AADHAR details are
stored. With the help of these details it would be possible to
detect the identity of a voter. This system will be solution for the
problem of malpractices in traditional voting system. Also a
person who is not living in his/her hometown where he has his
voting registration will be able to vote without any difficulty with
the help of his Aadhar number which would enable him to vote
from any city or town. The main motto of our system is to
overcome the limitations of the traditional voting system.
KEYWORDS: Voter, voting, EVM, Aadhar-number,
biometrics.
I . INTRODUCTION
Nowadays, election plays a very important role in a democratic country. The election is a process for selection of a good candidate who will lead all the good thing. In democracy, people choose their leader by giving their vote. Recently, in India electronic voting system with EVM Machines is used. In this system the availability of the voter in the city during the time of voting is important. This is major drawback of electronic voting system. A voting system in which the voter can vote from anywhere is the solution to this problem. Each and every vote of the citizen is important. Due to many reasons the citizens is not able to vote, which reduces the voting count.
An effective voting system can bring a huge difference in the efficiency and count of the votes. A voting system should be hassle free, it should verify and authenticate the voter and lastly it should securely cast the vote without any malpractices. By observing the present voting system and the limitations faced by it, we have proposed a UID based voting system which will overcome all the limitations yet keeping the EVM at its place.
Thus in this paper, we are discussing about the existing system and proposed system with future scope of improvements.
II . HISTORY & BACKGROUND
Predecessors of online voting can be identified in the use of voting
machines, which date back to the late 19th century in England and
the US. The controversies surrounding online voting today are
mirrored in the controversies surrounding this early use of voting
machines. In the 1980s developments around the term teledemocracy
made voting possible making use of TV sets via teletext.
The discussion about electronic voting picked up momentum in
the early 1990s through the increasingly popular access to the
internet and the rapid development of the World Wide Web. The
USA and Switzerland, relying on their experience in direct
democracy, voting machines and postal voting, were among the
forerunners of developing online voting. Somewhat surprisingly,
Estonia was the first country to employ online voting in national
pariamentary elections in 2007.between, technology has established
its place in society and continues to evolve faster than most of us can
even believe.
By Implementing the AES encryption algorithms we are trying to
overcome the difficulties which can occur in election time
In the traditional voting system the voter first has to register
himself in the voter registration list by an authorized person. Now the voter can do the registration process by himself with the help of online registration. After the registration, the voter gets his voter ID. At the time of election the voter goes to the polling booth which comes under his area(ward number). The voter shows his/her voter
ID to the authorized person at the polling booth. The authorized person checks his voter Id and checks for his name in the voter’s list. After the verification is done and the voter is authorized to vote, he/ she goes to the polling booth and casts the vote. But there are a few limitations that are observed in the traditional voting system. The limitations of the existing system are as follows:
1. Any person who looks similar to the voter can vote using
the fake identity proof.
UID Based Voting System- An Extension to EVM

National Conference On “Recent Innovations In Engineering Science & Technology" April 2019
58 Computer Engineering
2. A voter has his name in multiple regions voter lists i.e Redundancy in voting
3. Distant voters do not come for voting.
I. Motivation for proposing a new system
Elections are important in any country. It has been observed that
due to the limitations mentioned above , most of the citizens do not go for voting. It causes reduction of the count of voting as well as increases the number of malpractices in the voting system. Presently, the voting system works on EVM and for verification of the voter, voter Id is used. There is an observation that in this traditional method of voting system, a lot of fake identity of some other person
and voting under his/her name , voting for more than once that is redundant voting and invalid voting takes place. Thus to overcome these challenges a new system is proposed which is,’UID Based Biometric Voting System’. The main motivation behind proposing a UID based voting system is to enhance the vote count and reduce the level of malpractices in voting.
III .SYSTEM OVERVIEW
Fig 1. System Flow
.Technical specifications:-
1. UID - UID simply stands for user identification. A unique
identification (UID) is a numeric or alphanumeric string
that is associated with a single entity within a given system. UIDs make it possible to address that entity, so that it can be accessed and interacted with. It is a way to establish a separate identity for all registered candidates. We are using UID to uniquely maintain the records of the
voters and the candidates in the database. 2. Biometrics - Biometrics refers to technology used to detect
and recognize human physical characteristics. There are several types of biometric authentication. Common examples include fingerprint scanningBiometrics in our system is used to uniquely identify each and every voter. Just by giving a fingerprint it can be possible to verify the voter. We are using Biometric in our system for the verification
of the voter to avoid fake identity. 3. EVM – The EVM simply stands for Electronic Voting
Machine. In technical terms it can also be defined as‚ A combination of mechanical, electromechanical, or electronic equipment that is used to define ballots; to cast and count votes; to report or display election results. EVM is used in the traditional voting system as well as it is used in our proposed UID based biometric voting system which
is an extension to EVM (traditional voting system). EVM in our project is used for the purpose of voting and the functionality of it remains the same.
4. AES – For the voters who are not able to reach at his constituency or ward to cast the vote can go to nearest polling booth or at tehsil office (here the vote is casted online). For the secure online voting AES algorithm can be used. AES (Advanced Encryption Standard) is a U.S government encryption standard supported by the National
Institute of Standards & Technology (NIST). AES is a cryptographic cipher that uses a block length of 128 bits and key lengths of 128, 192 or 256 bits. We are using AES algorithm to secure the online voting.
Fig 2. Voter Registration Process for online mode

National Conference On “Recent Innovations In Engineering Science & Technology" April 2019
59 Computer Engineering
Fig 3. Voting Process for online mode
Fig.4. Declaring Result
A. Uploading voter Information
In the online voting system, all the information of each voter is
added/ uploaded in main database of Election Commission of India according to AADHAAR Identity Number. This AADHAAR Identity number is unique for every citizen or voter of India. This AADHAAR Identity number has been introduced by government of India and this also recognizes the constituency of the voter. But the registration of the voter should be completed only after the verification of all documents by the field officer. The field officer also verifies AADHAAR Identity Number from the main
AADHAAR card database. After completing verification, the registration of the voter should be complete and the voter will get auto generated e-mail which has all these information of the voter with the system generated password. The Voter can use this password for login and he/she can also change the system generated old password. Voter can also set the verification keys to ensure security. There should be restriction to use ly virtual/on screen keyboard to type password or to change password. Main purpose of
using virtual/on screen keyboard is to stop capturing password, if voter changes his/her password from some public place.
B.Voting from polling booth
When the voter stays in his constituency of voting, he can go to the respective polling booth for voting. He goes and his
verification is done using biometrics. After verification, he proceeds with the voting by traditional method that is through
EVM (Electronic Voting Machine).
C. Voting where voter is present at his constituency
When the voter is not staying his constituency of voting, he/she can go to the nearest polling booth(if elections are held at that
peeriod) or he can go to the tehsil/ Election Commission office. The voter’s verification is done through biomettrrics. Ad after
verification, he/she votes on a system secretively to his/her favourite candidate. And that vote is submitted in the main
database. This voting is secured using security algorithms. We are using AES algorithm. Considering the current voting system’s limitations we have developed two methods of voting to solve the problem and to
overcome the limitations. The first method simply works according to the folloing steps:
1. The voter registers himself through the election commission authorities using UID.
2. The system generates a username and password.This credential can be used for verification purpose.
3. Voter goes to the polling booth for casting a vote. 4. The authorised person authenticates him by taking his
biometrics, thus verifying his identity and will also check if he has voted before.
5. The voter goes and casts his vote.
B. Voting where voter is not present at his constituency
The second method is provided for the distant voters. This system works according to the following steps:
1. The voter has to complete the registration process like any other regular voter.
2. At the day of voting the voter can go to the nearest polling booth or the election commission or tehsil office
(in case the elections are being not conducted in the state or region where the voter is staying but his name appears in the voter list of other region).
3. The voter can get himself verified by giving his biometrics.
4. The voter can cast his vote online.
IV .CONCLUSION
Electronic Voting Machine (EVM) is the most powerful device in
today’s voting system. But to solidify it more, use of biometric fingerprint, various security algorithms and making the process easier for the voter is necessary. Hence, the voting system can be made much more powerful, if it is digitalized and made kiosk free.

National Conference On “Recent Innovations In Engineering Science & Technology" April 2019
60 Computer Engineering
REFERENCES
[1] Dr.Z.A.Usmani, Kaif Patanwala, Mukesh Panigrahi, Ajay Nair, Multi-purpose platform Independent online voting system, 2017 International conference on Innovations and Information,Embedded and Comunication System(ICIIECS). [2] Rohan Patel,Vaibhav Ghorpade, Vinay Jain, Mansi Kambli, Fingerprint
based e-voting system using Aadhar database, International Journal for Research in Emerging Science Technology,volume-2, issue-3, March 2015(IJREST).
[3] Rakesh S Raj, Raghavendra A, Madhushree K R, Bhargavi D, An online
voting system using Biometric Fingerprint and Aadhar card, International Journal of Computing And Technology, Volume 1, Issue 4, May 2014(IJCAT). [4] Himanshu Agarwal and G.N.Pande, Online voting system for India based on Aadhar ID, Eleventh International conference on ICT and Knowledge
Engineering, 2013. [5]Smita B Khairnar, P.Sanyasi Naidu, Reena Kharat, Secure Authentication
for online voting system.

National Conference On “Recent Innovations In Engineering Science & Technology" April 2019
61 Computer Engineering
Hi-Tech Farm Pond Monitoring and Management
System
Ashwini Daund1, Rutuja Boarade
2, Moksha Chopda
3 , Dr K. C. Nalavade
4 ,
[email protected], [email protected], [email protected], [email protected]
Department of Computer Engineering. Sandip Institute of Engineering and Management Abstract— The project one step take towards the Village
Empowerment . The system can help to automate the farm
Pond activities which will increase the income of farmer
and one of the most important purpose of project is that to
save the life of living that fall in farm pond like Human,
animals, birds. The system can also help to regulates
quality of pond water, which is necessary for farm
activities to increase the crop production. The last module
is that system can helps to provide water to crops as per
the requirements.
Keywords— Software Prototyping ,Microcontroller,Rain Drop
Sensor, Moisture Sensor, Water Quality Moitoring GSM module
,Automatic Motor ON/OFF.
I. INTRODUCTION This project is one-step taken towards village empowerment. The system can helps to automate the farm pond activities,
which will increase the farmer income and also serve the
purpose to save the life (human, animals, garbage, etc.) fall in
the farm pond. The system can also help to regulate the
quality of pond water, which is necessary for farming
activities to increase crop production. There are three modules
in our system:
1. Security for Farm Pond
2. Management for crop production
3. Monitoring for water quality
This is fully automated system.It reduces manual work of farmers and helps to increase there crop production and
income rate. Now a days farmers are operatingfarm pond
manually which causing many man made mistakes, the water
quality of farm pond is also not maintained due to some
avoidable circumstances. Some applications of system are
given below:
1.To increase the income of farmer income as per the crop
Production.
2.It Regulates the quality of water for the crop Production.
3.It saves the life of living things like Human, Animals.
II. HISTORY AND BACKGROUND
Currently in India especially in Maharashtra state farmers are
facing number of problems including, less crop production,
bad quality of crops and irregular rain water which some time
result in famers suicide. In such problems government of
Maharashtra providing the support to farmers in many ways,
such as providing the subsidy to farmers to dug a farm pond
which will store the rain water and can be use during summer
time where there is no/less water. A farm pond is a large hole
dug out in the earth, usually square or rectangular in shape, which harvests rainwater and stores it for future use.[1] But,
due to manual operation of farm pond has many
disadvantages, such as, less quality and quantity crop
production, less farmer income, water containment,
human/animal causalities. The purpose of our project is to
automate the farm pond and farming activities in order to
increase crop quality and quantity, to maintain water quality
and to save human/animal life.[1] Author Peng Jiang et al. has
proposed ”Design of a Water Environment Monitoring
System Based on Wireless Sensor Networks”. A water
environmental monitoring system based on a wireless sensor network is proposed. It consists of three parts: data monitoring
nodes, data base station and remote monitoring center. This
system is suitable for the complex and large-scale water
environment monitoring, such as for reservoirs, lakes, rivers,
swamps, and shallow or deep groundwaters. This paper is
devoted to the explanation and illustrationfor our new water
environment monitoring system design.[3] The system had
successfully accomplished the online auto-monitoring of the
water temperature and pH value environment of an artificial
lake. The system’s measurement capacity ranges from 0 to 80
C for water temperature, with an accuracy of 0.5C; from 0 to
14 on pH value, with an accuracy
of 0.05 pH units[4]. Sensors applicable to different water
quality scenarios should be installed at the nodes to meet the
monitoring demands for a variety of water environments and
to obtain different parameters. The monitoring system thus
promises broad applicability prospects. [2]Author SitiAsmah
Daud et al. has proposed ”Infrared Sensor Rig in Detecting

National Conference On “Recent Innovations In Engineering Science & Technology" April 2019
62 Computer Engineering
Various Object Shapes” This paper describes the application
of infrared sensor installed in a sensor rigto measure the
distance of the object located at the centre of the plate.[5] Data
received by the sensor rig that is fully controlled by Arduino as a microcontroller, is then saved in a text file using
CoolTerm terminal application. Post processing of the data is
fully run using the Matlab software to reconstruct the image
from the data obtained by infrared sensor.[2] Most of the
objects used throughout this research are polygon shapes such
as cylinder, rectangle, hemisphere, oval, trefoil, and
curvilinear. The sensitivity of the infrared sensor used during
the experiment should be considered in order to obtain
accurate result and reduce the noise during the data captured
process.[1] The closest distance of infrared sensor from the
measured object is set into 5 cm. Results show that this sensor
is capable to detect any changes in distance measurement and image from the object can be reconstructed.
III .DESIGN ISSUES
Mathematical Model
Input: Collecting input from sensors and GSM Module.
Output: Execution of appropriate Alert Message and Level Of
Water .
Functions : Verification of Water Level ,Moisture Level,
Identify the object. S = (I,O,F)
Where S : System
I = D1, D2 are set of Input
Where, D1,D2 : Data from sensors and GSM Module
F = ML, WL, WQ, OD are set of functions
ML: Moisture Level
WL: Water Level
WQ: Water Qual
OD: Object Detection
O=AM, RM are set of output
AM : Alert Message RM: Rain Message
Fig. 1. A (if any). Venn Daigram
Farming mostly depends on rain water which is
irregular.Human and animal causalities in unsecure manually
operated farm pond.
Irregular electricity supply and mostly available at night hours in villages. Bad or not suitable water quality decreases the
crop production.And many more problems….
In such problems government of Maharashtra providing the
support to farmers in many ways, such as providing the
subsidy to farmers to dug a farm pond which will store the
rain water and can be use during summer time where there is
no/less water.A farm pond is a large hole dug out in the earth,
usually square or rectangular in shape, which harvests
rainwater and stores it for future use.But, due to manual
operation of farm pond has many disadvantages, such as, less
quality and quantity crop production, less farmer income,
water containment, human/animal causalities.The purpose of our project is to automate the farm pond and farming activities
in order to increase crop quality and quantity, to maintain
water quality and to save human/animal life.
Fig.2. System Architecture
Basically there are three model in our system Security,
Monitoring and Management which covers all farming
activity
1. Security Model: IR sensor is used to detect object fall in
farm pond and alert the concern user by alert SMS on mobile.
The farm pond gate is operated by passcode system and which get closed automatically after 10 sec.

National Conference On “Recent Innovations In Engineering Science & Technology" April 2019
63 Computer Engineering
2. Monitoring Model: This module will helps to regulate the
water quality by using PH sensor.The moisture sensor will
detect the moisture percentage of soil. As to produce good
quality and quantity crop it require specific moisture level.
3. Management Model: This module will monitor the water
level of well. If well water level goes down below the set
threshold level then system will start water motor in the farm
pond to fill the well.The system also fulfil the requirement of
the crops which require regulated water supply by detecting
the rainfall to take necessary action by farmer.
IV RESULT AND ANALYSIS
Before we start developing this project, we collected some
information. From the collected information we have two

National Conference On “Recent Innovations In Engineering Science & Technology" April 2019
64 Computer Engineering
graphs.Following graph shows the number of vehicles jumpes
the red signal in every month.
Fig.3. Detecting the level of rain water(rain drop sensor)
The above figure which describe the rain water level which
gives the rain warning to the user
Fig.4. Moisture Level(Soil Moisture sensor)
The above fig which shows the how much amount water
present in the soil and gives moisture percentage
Fig.5. Water level of well(ultrasonic sensor)
The above fig which shows the water level of well when it
goes down the below particular frequency
We are developing the wireless systm using solar panel ,we
use the different sensor to make the system affordable to the
user. We are going to built a mobile application (Android
app)for this system.This application will also implemented for
fish pond.There will be a wireless Connection for the sensors
This system will work on microcontroller board like arduino,
GSM Module, etc. The programming for overall system is developed with the help of Arduino software which is based
on C/C++ language.
V . CONCLUSION
Thus we concluded our project is one step towards Village
Empowerment and which will solves many problems of
farmers if implemented in real time. By the use of the system
the income of the farmer get increased as farmer can able to
use available water e_ectively to do the farming. In this way if
all Engineering Students think about new innovation ideas
towards the Nation to reduce the poverty and suicide attempts
of farmers.
REFERENCES
[1] Peng Jiang,Hongbo Xia has proposed Design of a Water Environment
Monitoring System Based on Wireless SensorNetworks. 19 August 2009
[2] SitiAsmah Daud,NasrulHumaimi Mahmood Pei Ling Leow,
FauzanKhairiChe Harun.has proposed Infrared Sensor Rig in Detecting-
Various Object Shapes.Vol. 2, Issue 10, October 2013
[3] Amita Kapoor,Suruchi Chawla, Shakshi Bachhtey, Veni Gupta has
proposed Low Cost Soil Moisture Sensorsand their Application in Automatic
IrrigationSystem.September
2016
[4] Shruti Sridharan has proposed Water Quality Monitoring System Using
Wireless Sensor Network.(IJARECE) Volume 3, Issue 4, April 2014
[5] Vandana Pandya, Deepali Shukla has proposed GSM Modem Based Data
Acquisition System.(ijceronline.com) Vol. 2 Issue.5

National Conference On “Recent Innovations In Engineering Science & Technology" April 2019
65 Computer Engineering
Sentiment Analysis for Business Intelligence Buildup
Chandan Raghav
1, Leena Nandan
2, Chetan Chaudhari
3 , Aayushi Shah
4 , Prof. D.S. Shingate
5
[email protected], [email protected], [email protected] , [email protected] ,
Computer Department
Sandip Institute Of Engineering & Management,
Nashik
Abstract— Ubiquitous presence of internet, advent of web
has made social media tools like blogs, Facebook, Twitter
very popular and effective. People interact with each other,
share their ideas, opinions, interests and personal
information. These user comments are used for finding the
sentiments and also add financial, commercial and social
values. However, due to the enormous amount of user
generated data, it is an expensive process to analyze the
data manually. Increase in activity of opinion mining and
sentiment analysis, challenges are getting added every day.
There is a need for automated analysis techniques to
extract sentiments and opinions conveyed in the user
comments. Sentiment analysis, also known as opinion
mining is the computational study of sentiments and
opinions conveyed in natural language for the purpose of
decision making.
Keywords: Machine learning; opining mining; sentiment analysis;
sentiment classification.
I. INTRODUCTION
Due to the huge growth of social media on the web, opinions
extracted in these media are used by individuals and
organizations for decision making. Each site contains a large
amount of opinioned text which makes it challenging for the
user to read and extract information [1]. This problem can be
overcome by using sentiment analysis techniques. The main
objective of sentiment analysis is to mine sentiments and
opinions expressed in the user generated reviews and
classifying it into different polarities. The output is the data
annotated with sentiment labels. Machine learning techniques
are widely used for the classification of sentiment.
II. HISTORY & BACKGROUND
This system presents an approach to opinion mining, where
the product opinions are mined from the Website and analyzed using natural language processing techniques.
Opinions are classified into positive and negative sentiments
by the algorithm, while feature opinions and context are
considered as well. Twitter and social media have gained
popularity in sentiment analysis in previous years. Top three
papers emphasize on working with Twitter data. present a
method for automatic collecting of a corpus from microblogs
and use it to build a sentiment classifier. In this instance, the
corpus is retrived from Twitter. The authors claim that the
approach can be adapted to multiple languages, but in their
work, it is only used with the English language. After examining around 100,000 tweets from Twitter as a
prediction for election results.They conclude that the
proportion of mentions of parties and distinguished
politicians mirror the election results quite closely, but having
less accuracy than opinion polls. Another attention-grabbing
finding was that 40% of the messages were denote by the 4%
of the users. knowledge from Twitter has additionally been
accustomed gauge popular opinion in statistic. whereas the
correlation between sentiment activity and poll knowledge
varies across completely different knowledge sets, the broad
trends are captured by the sentiment analysis.

National Conference On “Recent Innovations In Engineering Science & Technology" April 2019
66 Computer Engineering
III. MATHEMATICAL MODEL
MATH OR EQUATION
– Input: Set of Hashtags or Tweets
– Output: Sentiment Analysis
– Let S is the system for Tweets
S=(I,O,F)
Where,
S= System
I =H,C set of INPUTS
Where
H = Hashtags created by organization
C = Comments by users
F=CL,T,S are set of function
Where,
CL= classification of tweets
T= Text mining
S= Summarization of tweets
O= G,A set of output
G= graph of tweets
A= analysis of tweets
Fig: venn diagram
Fig. 3. A (Architecture diagram).
User will open the application and create an account, after
creating account user will enter hashtag for which he need the
analysis. Then the system will extract the data from twitter
database and store the review of that hashtag in mongodb
database.From there it will extract the features of every tweet
and give it as input with the training data to naïve bayes
algorithm. After that the hashtag will be classified.
Fig: Flow Chart
National Conference On “Recent Innovations In Engineering Science & Technology" April 2019
67 Computer Engineering
IV. RESULT AND ANALYSIS
We collected dataset containing positive and negative
data. That knowledge was trained data and was
classified using the Naïve Bayes Classifier algorithm.
Before training the classifier unnecessary words,
punctuations, meaningless word was cleaned to get pure
data. To determine the positive and negative feature of
tweets we collected data using twitter API. Those data
held on the database and then retrieved back to get rid
of those redundant words and punctuations for pure
data.
V. CONCLUSION
The Proposed Sentiment analysis based system is of
tremendous use to the people and industries which are
based on sentiment analysis. For example, Sales Marketing,
Product Marketing etc. in this system, the tweets are not
stored which is cost-effective as no storage space is needed.
Also, all the analysis is done on tweets real-time. So the
user is assured that, getting new and relevant results.
REFERENCES
[1] Savitha Mathapati, S H Manjula Venugopal K R "Sentiment
Analysis and Opinion Mining from Social Media
: A Review"Global Journal of Computer Science and Technology: C
Software Data Engineering.
[2] Prerna Mishra, Dr. Ranjana Rajnish, Dr,Pankaj Kumar"Sentiment
Analysis of Twitter Data:Case Study on Digital
India" 2016 international conference on information technology (InCITe)
[3] Chae Won Park, Dae Ryong Seo "Sentiment Analysis of Twitter
Corpus Related to Artificial Intelligence Assistants " 2018 5th
International Conference on Industrial Engineering and Applications
[4] Kudakwashe Zvarevashe, Oludayo O Olugbara "A Framework for
Sentiment Analysis with Opinion Mining of Hotel Re-
views" 2018 Conference on Information Communications Technology and
Society (ICTAS).
[5] Xiaobo Zhang, Qingsong Yu "Hotel Reviews Sentiment Analysis
Based on Word Vector Clustering " 2017 2nd IEEE Inter-national
Conference on Computational Intelligence and Applications.
National Conference On “Recent Innovations In Engineering Science & Technology" April 2019
68 Computer Engineering
Review: Forest Fire And Notification System
Pratik Kulkarni Rupali Wadlekar Anuja Shinde Prof. A.R. Gaidhani BE Computer BE Computer BE Computer Computer Department
SIEM SIEM SIEM SIEM
Mahiravani, Nashik Mahiravani, Nashik Mahiravani, Nashik Mahiravani, Nashik
Abstract— - Forest fires generally occur in wild areas due to
human carelessness and change in an environment. They
cause the environment and may result in human and wild
animal’s deaths. So that, forest fires must be detected early
to prevent greater damages. There are many existing
system like Satellite Systems, CCD CAMERAS, wired
system and Bluetooth technology Perhaps these systems
provides a complete image of the earth but after a long
scan period .This is not much accurate method because it
prevents fire detection just at a time, the fire starts.
Compared with the traditional methods of forest fire
detection, a wireless sensor network was proposed. WSN’s
are used for various applications such as habitat
monitoring, automation, agriculture, and security. This
article presents the design of a system for detection of
temperature and humidity and smoke to prevent a disaster
(forest fire) that could lead to loss of a significant number
of natural threads. In this project, several tests had been
conducted in order to prove the viability of the system.
Keywords— Forestfire, Monitoring, Detection, Wireless Sensor
Network, Forests, GSM, Arduino
I. INTRODUCTION
Wildfire is a kind of fire that occurs in the forests or reserved
national parks. It starts as small fire but eventually turns into a
huge fire due to some favorable con-ditions such as presence
of dry trees and grasses as well as strong winds in the forests.
The outcome may be due to failure of responsible authorities
of getting early information about fire as soon as it starts so
that they could be able to control before it turns into a huge
fire. Human activities like clearing field for cultivation,
charcoal burning or smoking can cause wildfire to occur.
Broken glasses can be another source of wildfire because
sometimes they can act as collective lens focusing sun light on a smallspot for a length of time, a condition that could trigger
fire.Economic activities such as tourism can be affected in a
negative way by wildfires due to damages it causes to the
vegetation of ecosystems. Wildfires are a constant threat to
ecological systems of forests and human safety especially in
regions which present hot climate. Just like other countries,
Tanzania is affected by wildfires each year causing deaths of people and wild animals as well as damage to valuable
infrastructures leading to loss of some valuable plants and
animal species. According to the reported analysis of 2012 for
Tanzania using MODIS (Moderate Resolution Imaging
Spectroradiometer), in average Tanzania loses over 11 million
hectares offorests and woodlands each year (ranging between
8.5 and 12.9 million hectares) This is equivalent to about 9% -
14% of Tanzania’s total land area. In another
study conducted in Tanzania by Finnish government in
collaboration with Tanzania’sgovernment funded by FAO
(Food and Agriculture Organization), it points out that
between the year 2000 and 2012 there have been over 900,000
cases of wildfire detected by satellite with the number of fires
occurring each year reasonably consistent .
forest monitoring and wildland early fire detection system by a
hierarchical wireless sensor network was reported. The research work adopts a standard wireless sensor network approach using two levels for the nodes, central nodes and sensor nodes, and some optimization techniques to minimize power requirements. During network deployment, each sensor would record its delocalization based on GPS (Global Positioning System) information. Sensor nodes capture data from the environment that are uploaded to the central nodes, which transfer all the information to the system middleware.
The transfer of sensor data from the central node to the
middleware for this system is in terms of packets, so for it to
function there has to be internet coverage which is a
disadvantage if the system has to be implemented in Tanzania
due to unreliable nature of internet services in forests and
remote areas. Also to realize the full potential of the system it
has to be integrated with all key players in firefighting
operations such as fire brigades, communication systems, and
aerial, coordination, and land means so the cost of
implementation is high.

National Conference On “Recent Innovations In Engineering Science & Technology" April 2019
69 Computer Engineering
II. LITERATURE SURVEY
Forest is considered as one of the most important and
indispensable resource, furthermore, as the protector of the
Earth’s ecological balance. However, forest fire, affected by
some human uncontrolled behaviour in social activities and
abnormal natural factors, occurs occasionally. Forest fire
was considered as one of the severest disasters.
In forest fire detection, it is essential to know how fire
affects the soil mantle, stems and treetops, as well as how to
detect underground fires. The sensor network must cover
large areas, distributing high amount of sensing nodes,
inexpensive sensors are needed to achieve cost reduction.
Video cameras sensitive in visible spectrum based on smoke
recognition during the day and fire flame recognition during
the night, Infrared thermal imaging cameras based on
detection of heat flux from the fire, IR spectrometer which identifies the spectral characteristics of smoke gases, and
“Light detection and ranging” system which measures laser
light backscattered by smoke particles. Infrared and laser-
based systems have higher accuracy than the other systems.
General1y if the infrared level exceeds a predetermined
threshold, an alarm 1s sent; but this methodology has some
drawbacks that affect detection capability and reliability.
Detection capabilities 1s negatively influenced by the fact
that often fires are not directly visible from the sensor
because during the first phases they grow up in the
underbrush and are occluded from the vegetation. On the other hand the smoke (water vapour plus carbon monoxide),
copiously produced during the wood drying process, is
perfectly transparent in the infrared region (3-7 pm) so it
cannot be detected by means of IR sensors. To become
directly IR-visible, generally a fire must be at the tree top, so
that when it can be detected is already widely extended from
the fire starting instant.
Handling uncertainty due to data aggregation and missing information requires space-time synthesis in rigorous
formalism. Information granulation is at the heart of rough
set theory. Rough set theory offers an attribute reduction
algorithm and the dependency metric for feature selection.
Meteorological data and images are parameters that change
over space and time with relatively high frequency. The
change of meteorological data could be recognized in hour
scale, and the change of image data, taking into account only
information connected to forest fires, in minute scale. Also
for the forest fire prediction system, meteorological data
history (archive values) is quite important. In order to monitor meteorological parameters and collect images in
real time, the sensory network has to be established.
The most critical issue in a forest fire detection system is
immediate response in order to minimize the scale of the
disaster. This requires constant surveillance of the forest
area. Current medium and large-scale fire surveillance
systems do not accomplish timely detection due to low
resolution and long period of scan. Therefore, there is a need
for a scalable solution that can provide real-time fire
detection with high accuracy. We believe that wireless
sensor networks can potentially provide such solution.
Recent advances in sensor networks support our belief that
they make a promising framework for building near real time
forest fire detection systems. Currently, sensing modules can
sense a variety of phenomena including temperature, relative
humidity, and smoke which are all helpful for fire detection systems
III. SYSTEM ARCHITECTURE
The proposed system consist of two modules viz. IoT
sensor node and web application deployed in the central
location. The IoT sensor node is designed and integrated with
Raspberry Pi. Here all the sensors are integrated with the
Raspberry PI. The proposed architecture of Forest fire
detection is shown in the Fig 1. The various steps of proposed
work are explained in this subsection. The first step of forest
fire detection is, before the fire starts ignited it monitor the
temperature level of the battery and the sensors integrated in
the Raspberry pi such as Temperature sensor, Smoke sensor, Fire sensor, Rain sensor. If there is any raise in temperature or
it reaches above the threshold value it push the notification
SMS to the forest department. Simultaneously it can be
detected by using the various sensors such as rain, fire, smoke.
If there are any such natural calamities like lightening, burning
waste material sensors integrated in the Raspberry PI detects
and sends signal to the Wi Fi inbuilt shield of GSM modem.
The signals from the Raspberry PI are not directly send to the
GSM modem it converts into Analog to Digital and then it
sends into the GSM modem from which the signals are
processed. And then send information to the admin if there is a high increase of temperature. With the help of temperature
sensor it detects and sends the signal to the admin. According
to sensor behavior all the Detected signals are sent to the
forest department admin. Signals from the GSM modem are
Processed and sent in to the server side application. Then in
the second step of forest fire detection. By using IoT battery
we can calculate how long the sensor battery will sustain. To
monitor IoT battery there is a component called battery level
indicator, by using this we can detect the battery life time of
the sensors. If the battery level goes down it push the
notification to the forest department. Finally all the sensor
related values are stored in Database server for future purpose so that Forest department admin can login and can retrieve the
details regarding forest fire. So that they can ensure the sensor
values that to be set as a threshold hold value for a future
purpose.

National Conference On “Recent Innovations In Engineering Science & Technology" April 2019
70 Computer Engineering
Server application
DB
Forets Dept
LM 35 Rain V. CONCLUSION
Wi-Fi Shield
GSM MODEM
Fire sensor
RPI
Smoke sensor
In this work the system is designed and evaluated for its
effectiveness as well as scalability due to the improvement of
sensor technology In this work, the latest technology can help
to reduce catastrophic accidents caused due to fire. With the
improvement of IoT sensor technology, the system is more
efficient and useful.
Level Detector
Battery
level
IOT Battery
REFERENCES
[1] Imteaj, Rahman , Husain, M. K., Alam, M. S., & Rahat, S. A. (2017,
February) „An IoT based fire alarming and authentication system for
workhouse using Raspberry Pi
3‟In Electrical, Computer and Communication
Engineering (ECCE), International Conference on (pp.
899-904). IEEE
[2] Firoz Siddiqui, and Mirza Ataullah Baig. IOT ENABLED FOREST
FIRE DETECTION AND ONLINE MONITORING SYSTEM.‟
[3] Owayjan, Freiha, Achkar, Abdo & Mallah, (2014, April)
„Firoxio: Forest fire detection and alerting system‟ In Mediterranean
Electro technical Conference (MELECON), 2014 17th IEEE (pp. 177-
181). IEEE.
[4] Kirubaharan, Sunder, Ramesh, & Dhinakar, (2014).
„Intruder Detection and Forest Fire Alert System with Using Wireless
Sensor Network‟ International Advanced Research Journal in Science,
Engineering and Technology.
[5] Akash V. Bhatkule1 Ganesh, Anand, Arun, Dinesh, Gunaseelan, &
Karthik, R. (2013) „Forest fire detection using optimized solar–
powered ZigBee wireless sensor networks‟ International journal of
scientific and engineering research, 4, 586-596.
[6] Sathishkumar, R., Vinothkumar, M., Devaraj Varatharaj, S., &
Gowthaman, S. M. (2016) „Design And Development Of Automatic
Fire Detection Using Sms And Voice Alert System‟ International
Journal of Scientific & Engineering Research, 7(5), 114-117. [6]
Jadhav, P. S& Deshmukh, V. U. (2012) „Forest fire monitoring system
based on ZIG-BEE wireless sensor network‟ International Journal of
Emerging Technology and Advanced Engineering, 2(12), 187-191.
[7] Alkhatib,(2013) „Wireless sensor network for forest fire
detection and decision making‟ International Journal of
Advance Engineering Science and Technology, 2(3),
299-309

National Conference On “Recent Innovations In Engineering Science & Technology" April 2019
71 Computer Engineering
Smart Helmet Prof. M.V.Korade
1, Snehal Jare
2, Arefa Shaikh
3, Yashi thakur
4, Megha Gupta
5
[email protected], [email protected], [email protected], [email protected], [email protected]
Computer Department
Sandip Institute of Engineering & Management
Abstract: The main cause of death in two-wheeler drivers is over-
speeding, drunken driving and careless driving. Numerous lives
might be saved if emergency medical service might get accident
info and reach in time to the scene.
To resolve these current issues we are developing a helmet which
gives best solution. These main issues motivate us for developing
this project. The objective of our project is to design a low-cost
intelligent helmet that is capable of identifying alcohol
consumption and preventing road accidents. The main purpose
of this smart helmet is to provide safety for rider. This is
implemented by using advance features like alcohol detection,
accident identification, location tracking, and fall detection. In
our project, its compulsory to wear helmet, without helmet
ignition switch cannot turn ON. If rider is drunk or if accident
takes place, then automatically ignition switch is locked, and a
message will be send automatically to their registered number
with their current location. One more objective is to reduce the
fatality of the accidents by sending a message to the riders’
relative about the accident.
Keywords: Smart Helmet, Alcohol Detection, IoT, GPS, Sensors,
Accidents Prevention, Message, Bikers
I. INTRODUCTION
Traffic accidents in India have increased year by year. As per Section129 of Motor Vehicles Act, 1988 makes it required for every single riding a two-wheeler to wear protective headgear to follow the standards of the BIS (Bureau of Indian Standards). In India drunken drive case is a criminal offense of The Motor Vehicle act 1939, which states that the bike rider will get punished. In existence bike rider easily gets escaped from law. Close to one fourth of the deaths concerned in accidents square measure motorcyclists. The main cause of death in two-wheeler drivers is over-speeding, drunken driving and careless driving. Various lives could have been saved if the emergency medical service could get accident information and reach in time to the accident scene. To resolve these current issues we are developing a helmet which gives best solution. Most of the countries are forcing the motorists to wear a helmet, however rules are being violated by uncivilized citizens. Thus the target of this project is to wear helmets then ride bikes. Another objective is to make sure that the rider isn’t drunk. The rider won’t be ready to ride the bike if he's drunk.
II. LITERATURE SURVEY
The primary goal of a motorcycle helmet is to protect the rider's head during impact, thus preventing or reducing head injury and saving
the rider's life. Some helmets offer further conveniences, such as ventilation, face shields, ear protection, etc. Motorcyclists are at a very high risk in traffic crashes. A 2008 systematic review examined studies on bike riders United Nations agency had crashed Associate in Nursing checked out helmet use as an intervention. The review ended that helmets scale back the chance of head injury by around sixty nine and death by around forty second. Although it absolutely was once speculated that carrying a bike
helmet accrued neck and spinal injuries in an exceedingly crash, recent evidence has shown the opposite to be the case, that helmets defend against cervical spine injury, which Associate in Nursing often-cited little study chemical analysis to the mid-1980’s, used blemished applied math reasoning. According to the Research paper in 2015 titled ‘Micro-controller based smart wear for driver safety’, author has discussed on the speed of the vehicle. In this application the project will be monitoring
the areas in which the vehicle will be passing. On entering any cautionary areas like schools, hospitals, etc. the speed of the vehicle will be controlled to a predefined limit. LCD screen is used for showing the numerous types of messages after wearing the helmet. The author has worked only on the concept of accident which is generally happens due to drunk and drive. But as we know that the accident in the area is not happens only due to consuming alcohol but also other parameters like speed are also responsible. According to the Research paper in 2016 titled ‘Smart Helmet’, the main objective
of author is to force the rider to wear the helmet. In this competitive world one of the survey says that the death trolls due to motor bike accidents are increasing day by day out of which most of these casualties occurs because of the absence of helmet. Traffic police cannot cover remote roads of city. That’s why over primary objective is to make the usage of the helmet for two wheelers” ”compulsory“. Thus, no one other than the owner himself, who doesn’t have the password which is created by the owner, can use the bike. In this
author has proposed the feature that the bike will not start unless the bike rider does not wear the helmet .The other this module basically deals with the check-sum of rider if he is wearing the helmet or not on first place to achieve this ultrasonic sensor is been used. Based on this the signal are been sent to the next module voice recognition module use for authentication purpose of helmet. Traffic police cannot cover remote roads of city. That’s why over primary objective

National Conference On “Recent Innovations In Engineering Science & Technology" April 2019
72 Computer Engineering
is to make the usage of the helmet for two wheelers “compulsory. Thus, no one other than the owner himself, who doesn’t have the password which is created by the owner, can use the bike. In this author has proposed the feature that the bike will not start unless the bike rider does not wear the helmet .The other this module basically
deals with the check-sum of rider if he is wearing the helmet or not on first place to achieve this ultrasonic sensor is been used .based on this the signal are been sent to the next module voice recognition module use for authentication purpose.
III . MATHEMATICAL MODEL
Input: Bike Start, Left or right turn, Accident, Vehicle Stolen Output: Ignition stop, Led indications, Message to the registered number, GPS Tracker Functions :Helmet Detection, Turn and break signals, Alcohol Detection
S=(I,O,F) Input:\I1,I2,I3,…..In\ Output:\O1,O2,O3…..On\
Functions : \F1,F2,F3….Fn \ Success Conditions: Vehicle started successfully Failure Conditions: Ignition stop.
Fig. Venn Diagram
I. IMPLEMENTATION DETAILS
The WeMos D1 is a ESP8266 Wi-Fi based board that uses the Arduino layout with an operating voltage of 3.3V. The Wemos D1 appears like the conventional Arduino board with an equivalent pin layout because the Uno, which implies all of the shields which may be used with the Arduino Uno, can connect seamlessly with the Wemos D1. While the association is one issue, the shields should have matching
libraries is working with the esp8266 platform therefore on be ready to establish simple communication between the Wemos and the shield.
Fig. Micro-controller (WeMos D1)
Alcohol Sensor (MQ-3) will be used to detect if the person is drunk and the bike will not start in such case. An alcohol detector detects the attentiveness of alcohol gas within the air and an analog voltage is an output reading. The detector will activate at temperatures starting from -10 to 50° C
with an influence offer is a smaller amount than 150 Ma to 5V. The sensing vary is from zero.04 mg/L to 4 mg/L, which is suitable for breathalyzers.
Fig. MQ-3(Alcohol) Sensor
HC-SR04 Ultrasonic (US) sensor is a 4 pin module, whose pin names are Vcc, Trigger, Echo and Ground respectively. This detector may be an extremely popular detector utilized in several applications wherever measurement distance or sensing objects are needed. The module has 2 eyes like comes within the front that forms the inaudible transmitter and Receiver.
Fig. Ultrasonic Sensor
A vibration detector or electricity detector may be a device that uses the piezo effect, to measure the changes in pressure, acceleration, temperature, strain, or force by converting them to an electrical charge. Piezoelectric sensors are versatile tools for the activity of varied processes. They are used for quality assurance, process control, and for research and development in many industries

National Conference On “Recent Innovations In Engineering Science & Technology" April 2019
73 Computer Engineering
Fig. Vibration Sensor
4-channel relay module 4-channel relay module may be a 5V 4-
channel relay interface board, and each channel needs a 15-20mA driver current. It are often wont to management varied appliances and instrumentality with massive current. It is equipped with high-current relays that job below AC250V 10A or DC30V 10A. It has a regular interface that may be controlled directly by microcontroller.
Fig. 4 Channel Relay Module
IV . SYSTEM STRUCTURE
We are using micro-controller as Arduino Wemos D1 which is used for controlling all the functions of the overall system. This is connected to ultrasonic sensor, vibration sensor, alcohol sensor and 4 Channel Relay Module. The 4 Channel Relay Module is responsible
to stop the bike if the person is not wearing the helmet. It detects the head by ultrasonic sensor. Ultrasonic sensors measure distance by using ultrasonic waves. The sensor head emits an ultrasonic wave and receives the wave reflected back from the target. Ultrasonic Sensors measure the distance to the target by measuring the time between the emission and reception. Alcohol sensor will be used to detect if the person is drunk and the bike will not start in such case. An alcohol sensor detects the attentiveness of alcohol gas in the air
and an analog voltage is an output reading. The sensor can activate at temperatures ranging from -10 to 50° C with a power supply is less than 150 Ma to 5V. The sensing vary is from zero.04 mg/L to 4 mg/L,
which is suitable for breathalyzers. 4 Channel Relay Module board is used to stop the bike in case of drunk and drive and if no helmet is detected, 4 Channel Relay Module board is used to interface any Micro-controller with Electrical Appliances/Loads.
Vibration sensors, also known as piezoelectric sensors, are versatile tools for the measurement of various processes. These sensors use the piezo effect, which measure changes in pressure, acceleration, temperature, strain or force by converting them to an electrical charge. A vibration sensing element can even be wont to verify aromas within the air by at the same time mensuration resonance and capacitance. An android application will be built that shows the navigation and location tracking.
Fig. System Structure for Smart Helmet
I. FEASIBILITY CHECK
Technical Feasibility: All the components that are required to make this project are easily available. For example: FSR Sensor, Bluetooth Sensor, Alcohol Sensor, etc. all are easily available and tested.
Economical Feasibility: The project is economical feasible as instead of using microcontroller
and other expensive hardware, we are using advanced GPS tracker that is economically feasible which makes our project cost effective.
Safety Feasibility: Our project is built for safe riding and the project is embedded in the helmet thus if any of the functions fail to work, it won’t harm any human life but will work as simple helmet which acts as safety instrument for the rider.
V . RESULT AND ANALYSIS
By implementing this system a safe 2 wheeler journey is feasible which might decrease the top injuries throughout accidents caused

National Conference On “Recent Innovations In Engineering Science & Technology" April 2019
74 Computer Engineering
from the absence of helmet and in addition cut back the accident rate. This system is extremely effective for the security purpose of the user.The outcome of project says that the bike ignition will start if the helmet is worn.
Fig. Proposed System
VI . CONCLUSION
This will decrease the impact from accident and it will avoid bike from stealing. User has to wear helmet to ride two wheeler vehicle and hence traffic rules will be followed with this. This system is under pocket control i.e .Ride 2 wheeler vehicle having safety in hand and in budget conjointly. Easy functioning to operate this
system. It provides a better security to the biker. The project are often increased by adding Google Glass Technology. Through this technology, biker can see the upcoming road before reaching that particular place. It will stop biker from pits and pitiful condition of roads. Also, biker will see navigation on that and may alert him whereas taking sharp turns. Further, it can be implemented on cars also. People will use seat belt to begin ignition of automobile which might enhance the security of the motive force.
REFERENCES
1. Abhinav Anand, Kumar Harsh, Kushal Kumar, Sourav Gouthi, “MICRO-
CONTROLLER BASED SMART WEAR FOR DRIVER SAFETY”,
2015
2. Lakshmi Devi, Bindushree, Deekshita, Jeevan, Likhith Blaise,
“HELMET USING GSM AND GPS TECHNOLOGY FOR ACCIDENT
DETECTION AND REPORTING SYSTEM”, 2016
3. Ping Li, Ramy Meziane, Martin J.-D. Otis, “A SMART SAFETY
HELMET USING IMU AND EEG SENSORS FOR WORKER
FATIGUE DETECTION”, 2014
4. G. Sasikala, Kiran Padol, Aniket A. Katekar, Surender Dhanasekaran,
Vel Tech University, India, "SAFEGUARDING OF MOTORCYCLISTS
THROUGH HELMET RECOGNITION, 2010.
5. Shabina S.,“SMART HELMET USING RF AND WSN TECHNOLOGY
FOR UNDERGROUND MINES SAFETY”, 2014
6. Muthiah M, Sathiendran R K, Aswin Natesh V, “SMART HELMETS
FOR AUTOMATIC CONTROL OF HEADLAMPS, 2015.
7. Pranjal Hazarika Department of Electrical Engineering, Jorhat
Engineering College, India “IMPLEMENTATION OF SMART
SAFETY HELMET FOR COAL MINE WORKERS”, 2015
8. G. Sasikala, Kiran Padol, Aniket A. Katekar, Surender Dhanasekaran,
“SAFEGUARDING OF MOTORCYCLISTS THROUGH HELMET
RECOGNITION”, 2015.

National Conference On “Recent Innovations In Engineering Science & Technology" April 2019
75 Computer Engineering
Car Security System – A Review
Prof. Sagar Rajebhosale 1, Juzer Bhagat 2, Riddhi Patel33 , Rasika Nimonkar 4 ,Vaibhav Patil
[email protected], [email protected]
,[email protected], [email protected],
Information Technology
Sandip Institute of Technology and Research Center
Abstract— In this current world where technology is growing up
day by day and scientific researchers are presenting new era of
discoveries, the need for security is also increasing in all areas. At
present, the vehicle usage is basic necessity for everyone.
Simultaneously, protecting the vehicle against theft is also very
important.The main goal of this paper is to study how to protect
the vehicle from any unauthorized access, using fast,easy-to-use,
clear, reliable and economical methods.If the person is certified,
vehicle access is allowed. This paper involves techniques like using
alarms, SAM, GSM,GPS modules etc. This vehicle security system
intimates the status of the vehicle to the authoritative person. This
paper highlights the advantages of internet of things and shows
how it can be use for realizing smart car security.
Keywords— SAM, GSM,GPS,unauthorized,economical
I. INTRODUCTION
Vehicles have been utilized in one frame or other since the
innovation of wheel. With the creation of wheel, came in the
second most cutting edge innovation, The Steam Engine. With
the improvement of steam motor vehicle appeared as what we see today. In prior occasions wrench shaft system were utilized
to touch off the vehicles. Abandoning that ordinary technique
came in the idea of touching off the vehicles utilizing key.
What's more, now, Keys are being supplanted by Push begin
catches. This undertaking was begun with the sole reason for
killing keys as ordinary technique for beginning the vehicle. The
four noteworthy techniques utilized in Biometrics are: Palm,
Fingerprint, Iris, Voice, Face and so on. There are numerous
more techniques, however these four are the most imperative.
Biometrics are utilized in Schools, Banks, Colleges, and
Universities and so on. One of the developing enterprises is the
car business. One of the main organizations to present unique finger impression acknowledgment in autos was Mercedes,
which was then trailed by Volkswagen. Yet, now a days all the
auto producers are executing Biometric based security. Unique
finger impression sensors are very shoddy in contrast with other
Biometric sensors. Furthermore, they are moderately simpler to
keep up too. The purpose behind going into primary reason for
this task. First being the disposing of the
utilization of key totally to light the vehicle. Moreover even
the section into the automobiles should be possible
without the utilization of keys by utilizing an innovation called
AFIS( Automatic Fingerprint Recognition System).
II. HISTORY & BACKGROUND
A. An Embedded Fingerprint Authentication System
Author: Alilla, A.; Faccio, M.; Vali, T.; Marotta, G.; DeSantis, L.
An automatic fingerprint authentication system is based on Field
Programmable Gate Array (FPGA).[4] The system is able to process a fingerprint image in less than 1
second.
Working of system works on 2 stages :
1. Enroll Stage
In this stage the user’s fingerprint characteristics are measured
and stored as a template in the database
2. Authentication Stage
In this stage the user’s fingerprint characteristics are measured
again and stored as a template in the database . Finally the system
outputs the authentication result.[3]
B. Fingerprint Recognition based Access Controlling System For Automobiles
Author: Zhaoxia Zhu , Fulong Chen
Traditional identifying system of automobiles includes key
system, door controlling system, UHF, alarm system. Biometric
recognition technologies can overcome this shortcoming. As an
Automatic Fingerprint Identification System (AFIS), fingerprint recognition-based access control system of automobiles, in which
fingerprint encryption technique is utilized, has some advantages
such as smartness, security, low power, low cost, etc. Embedded
systems can be defined as information processing systems
embedded into these enclosing products.[7]
The whole process of fingerprint recognition is based on
Acquirement of fingerprint
Fingerprint Processing
Saving of fingerprint minutiae Fingerprints matching
.
1) Acquirement of fingerprint

National Conference On “Recent Innovations In Engineering Science & Technology" April 2019
76 Computer Engineering
The quality of fingerprint is important . In AFIS , fingerprint
image sensors include optics sensor , silicon crystal sensor and
ultrasonic sensor.
2) Fingerprint Processing
After acquiring the fingerprint , the image has to be enhanced
.The recommended technique to enhance the image of
fingerprint is the wavelet-based method .
3) Saving of fingerprint minutiae
In this step the user’s ID data is initially acquired, assessed
processed and stored in the form of Template .
4) Fingerprint matching
The matching process involves the comparison of a verification
template , created when the user provides the fingerprint with the template stored in the database at the time of registration in
the system .If the templates match then the user is authorized , if
not then the user is not given access to the system. This
technique has some advantages like smartness , security , low
cost .[5]
C. Study of Biometric Approach for Vehicle Security System Using Fingerprint Recognition.
Author: N. Kiruthiga and L. Latha
The framework is actualized utilizing inserted framework
alongside Global System for Mobile (GSM) and Fingerprint
Recognition. The primary part (BRAIN) of the security
framework is PIC (Peripheral Interface Controller)
microcontroller and screens and creates the sources of info and
yields individually and yield of the framework will be shown on
LCD of SMS entry status also, arrangement and so on.[15] The security framework component contains two modes: first, if the
framework is dynamic and an unapproved individual endeavors
to turn on the vehicle, at that point ready message will be sent to
the enrolled client in framework and vehicle will be in OFF
condition. In second mode, approved individual can will be
verified and given access. This paper exhibited the execution
investigation for unique mark biometric. It presents clear
favorable circumstances over secret key and token-based
security. Proper LCD show is acquired through programming
and LCD interface outline. Absolutely three preliminaries will
be given to the client and if the sweep matches access will be given. Else if interloper is utilizing and three preliminaries are
fizzled at that point ready message will be sent to the
proprietor's vehicle. On get SMS from proprietor; the disturbing
framework will be enacted. If there should be an occurrence of
system mistake on the proprietor position, the second alarm
message might be sent to close-by police headquarters.[20][15]
D. Car surveillance Security System
Author: Aleesha Susan Jacob, Vandita Chaurasiya,Vagmayee
Sharda, Shubhra Dixit
In this paper consists of a mini central processing unit, motion
detecting sensor including with a camera module and buzzer.
They monitor and control the car wireless using GSM. They have
used Putty software which senses motion, triggers the buzzer, takes the picture and mails it to the owner. The common platform
used here is the ‘Raspberry Pi’ which interfaces all the embedded
peripherals simultaneously, so that vehicle can be managed
through mobile phones.
Raspberry Pi 3 is interfaced with the GSM module. The main
parts that will be needed are the ‘Raspberry-Pi mini CPU
processing unit, camera, GSM module and PIR sensors. The
software mainly waits for the camera module to provide an input
as an image. [12][15]
The GSM module will perform the text message sending
function. The camera is interfaced with PIR sensors. The sensors
distinguish movement and the camera interfaced to it in a split second snaps a photo. All the peripherals are interfaced through
General purpose input Output pins also known as GPIO pins.
when the camera gives a picture, the raspberry pi will begin the
picture preparing. It sends the photo as an email alert to the
proprietor. The messages can likewise be seen in a program and
messages are matched up crosswise over devices. Notifications
are additionally sent on any caution state change.
The following commands to trigger certain activities:
stop: Disables the administration until re empowered.
begin: Enables the administration after it being incapacitated.
In this paper, the programming was done successfully in the Raspberry PI Python 2.7.5 integrated design environment. The
tiff-images were processed and then analyzed so that it can be
converted into an email attachment and be sent to the owner
respectively.
Initially problems were encountered during interfacing the GSM
module as it was overheating but it was overcome after trial and
error. Voltage adapter was used with the GSM module to give it a
separate power. The owner can immobilize the car through his
phone by a one-word text message.[2]
E. Authenticating Vehicles And Drivers in Motion Based on Computer Vision and RFID Tags
Author:A. Makarov, M. Španović and V. Lukić
A framework comprising of a vehicle inside mounted gadget and
a supporting foundation is intended to enable approved drivers
and approved vehicles to get too confined regions of the airplane
terminals, and also government, office and private stopping
offices. In vehicular confirmation, client benefits can be
conceded to either a vehicle or its driver, or both. In security-
basic circumstances, confirming both the driver and the vehicle is
ideal. This methodology would forestall criminals of an approved
vehicle to get to confined regions and administrations. In the meantime, such a framework would likewise monitor the driver's
character, and subsequently of her or his own risk in these
circumstances. Moreover, the framework verifying a vehicle and
its driver and getting their ID information is relied upon to build
up a relationship of trust, i.e., it ought to likewise confirm itself
to the vehicle.

National Conference On “Recent Innovations In Engineering Science & Technology" April 2019
77 Computer Engineering
To secure the vehicle and the driver ID information from
listening in and altering, the correspondence between the vehicle
and the roadside unit must be scrambled. Also, the roadside unit
should validate to the vehicle too before accepting the encoded information.
The framework for validating a vehicle and a driver comprises
of the accompanying segments:
1. On-board (vehicle interior-mounted) RFID subsystem
2. Computer vision subsystem (CVS)
3. Roadside unit (RSU)
4. Public key infrastructure (PKI)
5. Back-end servers
The locally available RFID subsystem speaks with RSU through
a radio channel.[14] The traded information is encoded and marked utilizing open key foundation (PKI) innovation. The
PKI is additionally utilized in scrambling pictures gained by
CVS before they are sent to back-end servers, and additionally
in verification of information sources. Specifically, CVS verifies
to the back-end and the other way around, keeping in mind the
end goal to guarantee the protection of the ID and action
information.Both out in the open and private applications, (for
example, get to control), the vehicle and driver confirmation
undertaking would be encouraged and quickened via robotized
recovery of their descriptors. As the encasing electronic
distinguishing proof records seem to be "incorporated circuit cards with electrical contacts" (as per standard ISO/IEC 7816),
they require a physical contact with a reader, which is
profoundly unrealistic for validation of vehicles and drivers in
movement. In private applications, for example, access to office
stopping offices, a representative identification could be utilized
rather than a driving permit, yet than once more, worker get to
identifications, notwithstanding when contactless, i.e., closeness
cards (e.g., as indicated by ISO/IEC 14443 standard), are not
reasonable for long-run information correspondence vital for
vehicles in movement.
The arrangement lies in a gadget that reads contact ISO/IEC-7816 as well as ISO/IEC-14443 cards and transmits the required
information over a long-extend correspondence channel
(commonly 10 to 100 meters) to a close-by roadside unit.
With the end goal of the work introduced in this paper, a gadget
equipped for perusing two ISO/IEC-7816 cards has been
produced. One card is accepted to contain descriptors of the
driver, while the other one contains the vehicle descriptors.
Since perusing encoded information from driving licenses and
vehicle enlistment cards is dependent upon the administration
approval, a worker gets to the identification, and a Security
Authentication Module (SAM) card have been utilized.
SAM card (ID-000 configuration, 25 x 15mm) covered up inside the gadget lodging uncovers the enthusiasm for applications
where the presence of vehicle check is obscure to pariahs and
potential gatecrashers to an association. The descriptors put
away on this card are Vehicle Identification Number (VIN),
license plate number, make, model and colour, as well as the
card digital certificate signed by the issuing organization.
Descriptors put away in the coordinated circuit card are the
driver's name, confront picture and the unique mark particulars
information. Note that the protection of holder's biometric data is
safeguarded since the unique mark never leaves the card. Specifically, before beginning the motor, the driver embeds
her/his card and swipes his finger over the straight capacitive
unique mark scanner. the unique mark picture is changed over to
particulars. The got details are contrasted and the ones put away
on the ISO/IEC 19794-2 coordinated circuit of the driver's card.
Just the carefully marked aftereffect of the coordinating
procedure leaves the card and the on-load up gadget, staying
away from any danger of the biometric wholesale fraud.[14]
At the point when a vehicle is in motion, it is extremely hard to
outwardly check the Vehicle Identification Number (VIN): it is
either composed in little characters behind the windshield or
emblazoned on different parts of the motor square, outwardly out of reach from outside. In an across the nation framework,
mechanized solicitations can be created by the street side unit to
national databases of enrolled vehicles keeping in mind the end
goal to bring different descriptors of the vehicle, for example, the
license plate number, make, model and color. So also, in a private
framework, the last highlights have been recorded in a
neighbourhood information base amid the vehicle enlistment for
the expected administration, which lessens the convenience of
VIN.license plates are perceived with the most astounding
precision, ordinarily over 85%,The characters which move
between consecutive frames, likely to belong to a moving vehicle, are detected according to the algorithm[16]. The
tesseract software is used for license plate identification.There
are around one hundred vehicle makers on the planet[18]. They
regularly utilize exclusive paints with various shading names for
shading vehicle bodies and occasionally change shading palettes.
colors can be caught with the these days generally sent True-
Color cameras, for functional reasons, activity specialists restrict
the palette they use in recognizing vehicle colors to under 32
colors.z
The first RGB picture is first edited to a little region around the
beforehand recognized tag, where districts containing glass, tires and the encompassing foundation are overlooked and where the
pixels already appointed to the tag are evacuated. This
consequently trimmed picture is mapped to a lessened
consistently quantized shading space of 10 hues. Pixels doled out
to every one of these hues are checked, and the hues are
positioned in diminishing request as for the quantity of pixels
doled out to them. The three best positioning hues in the picture
are then spoken to by their RGB segment esteems so as to make
an arrangement of 9 highlights for each picture which is utilized
as info esteems to a neural system based classifier with one
concealed layer and 17 yields.
At the point when the RSU identifies a vehicle in its range, it transmits a RF flag which contains another session number. The
vehicle acknowledges session number and produces the message
containing plate number and session number. This message is
then carefully marked with the private key of the gadget (put
away on SAM). The on-board gadget sends this structure
alongside the computerized signature and with the chain of

National Conference On “Recent Innovations In Engineering Science & Technology" April 2019
78 Computer Engineering
declarations (with a gadget testament toward the finish of the
chain). The RSU approves these information by checking the
advanced mark with the general population key of the gadget.
After the approval is expert, the RSU can settle on choices in light of the personality of the auto. The character can be
moreover affirmed by contrasting the plate number with the
number read from the camera picture (OCR). While trading the
information thought to be private or delicate, the RSU produces
a symmetric key, scrambles it with general society key of the
on-board gadget and sends it to the gadget. The gadget decodes
this key with its private key which is known just to the gadget.
Presently, the two sides in this correspondence have a similar
key which is known just to them and the touchy data would now
be able to be traded through this scrambled channel.[16]
F. Real Time Biometrics based Vehicle Security System with GPS and GSM Technology
Author:N.Kiruthiga.
Different enemy of burglary frameworks have been created over
the couple of decades. An Engine Control Unit (ECU) is
associated with the Info-Security Circuit Board and sensors
inside the vehicle transport.[3] The transport conveys with
different vehicles, street side transportation and cell phones with
remote interfaces. The inadequacy of this framework is that the
information convenience and system deferrals to catch
dependable secure auto interchanges Biometrics is the strategy for distinguishing human by their own one of a kind attributes.
There are different biometric designs which incorporate face,
iris, unique mark, DNA, retina, palm print, ear, voice, signature,
hand shape, composing beat and step. In any case, no single
biometric has yet been turned out to be splendidly solid or
secure. For delineation, palm prints are normally frayed; Voice,
signature, hand shapes and iris pictures are effectively
manufactured; Due to different helping conditions and face-lifts,
confront acknowledgment will result in poor precision. Also,
iris and face acknowledgment are powerless to ridiculing
assaults. The Fingerprint biometrics is the skilled biometric design for individual recognition as far as security and
dependability.[6] It is hard to produce or take. It is
acknowledged around the world. Live unique mark perusers in
light of optical, warm and ultrasonic methodology are
utilized.[5]
VI. LITERATURE SURVEY TABLE
Table 1.1 Table of Literature Survey
Sr
N
o.
Name
of
Author
Proposed System Drawbacks / Findings
1. Ms.Archana.S.
Shinde
Prof.Varsha
Bendre
An Embedded
Fingerprint
Authentication System
Response time is of
fingerprint scanner is
delayed in real time
OS does not support the real time
constraints
2. Zhaoxia Zhu , Fulong
Chen
Fingerprint
Recognition
based Access
Controlling
System For Automobiles
The accesss control
system is not
interconnected with
other systems such as
lighting system,engine
system , GPS
navigation
system,multimedia system for
automobiles through
Controller Area
Network (CAN) bus.
3. N.
Kiruthi
ga and
L. Latha
Study of
Biometric
Approach for
Vehicle Security
System Using Fingerprint Recognition.
In this system
embedded technology
is used along with
GSM technology.
This system efficiently identifies the
fingerprint pattern of
the person, using
Feature Extraction.The
output is displayed on
the LCD screen.
If person is not
authorised then an
alert message is sent to
the owner.
4. Aleesh
a Susan
Jacob,
Vandit
a
Chaura
siya,Va
gmayee
Sharda,
Shubhr
a Dixit
Car surveillance
Security System
Data analytics and
visualization is not
used hence monitoring
and management of
IOT devices is not
efficient.
5. A.
Makaro
v, M.
Španov
ić and
Authenticating
Vehicles And
Drivers in Motion
Based on
Computer Vision
This system consists
of various complex
modules which are not
in use.

National Conference On “Recent Innovations In Engineering Science & Technology" April 2019
79 Computer Engineering
V.
Lukić
and RFID Tags
6. N.Kirut
higa Real Time
Biometrics based
Vehicle Security
System with
GPS and GSM
Technology
The fingerprint
recognition system is
based on ultrasonic
sensors which avoids
fake authentication
At the time of threat
the authorized person
is made aware through
GPS and GSM
module. GPS showing
the location of the
vehicle and GSM Technology to send
the alert message to
the owner as well as
the nearby police
station.
IV CONCLUSION
Security is major criteria in all sort of utilizations. This
undertaking is gone for enhancing the level of security for
vehicles.This paper is aimed for enhancing the level of security
for vehicles. This is a one of a kind technique for scheming and
gathering a minimal effort, pressed in burglary control
framework for a vehicle which is very dependable.Customized
vehicles will not only provide a more interesting drive but also
safer one.
REFERENCES
[1] Vehicle Ignition using Fingerprint Sensor-Kiran Rana Gill,Joel Sachin
[2] Aleesha Susan Jacob, Vandita Chaurasiya,Vagmayee Sharda, Shubhra
Dixit , "Car surveillance Security System ", ICECA 2017, 978-1-5090-
5686-6/17 IEEE 2017.
[3] Ms. Archana S. Shinde ,Prof. Varsha Bendre, "An Embedded Fingerprint
Authentication System" ,ICCUBEA, 978-1-4799-6892-3/15, 2015 IEEE
[4] Alilla, A.; Faccio, M.; Vali, T.; Marotta, G.; DeSantis, L., "A new low cost
fingerprint recognition system on FPGA", Industrial Technology (ICIT),
2013 IEEE International Conference on , vol., no., pp.988,993, 25-28 Feb.
2013
[5] Real Time Biometrics based Vehicle Security System with GPS and GSM
Technology-N.Kiruthiga.
[6] Zhaoxia Zhu , Fulong Chen , “Fingerprint Recognition-Based Access
Controlling System For Automobiles.”
[7] A. Albert and W. Gerth.Migration from CAN to TTCAN for a Distributed
Control System.9th international CAN Conference, iCC 2003, Munich:9-
16
[8] A. Makarov, M. Španović and V. Lukić -Authenticating Vehicles And
Drivers in Motion Based on Computer Vision and RFID Tags
[9] K. A. Amusa “DESIGN OF SMS–ENABLED CAR SECURITY SYSTEM”
Transnational Journal of Science and Technology, Volume 2 November
2012.
[10] Sukeerti Singh and Ayushi Mhalan, Vehicle Theft Alert System using GSM,
Int. Journal of Engineering Science and Technology
(IJEST), May 2013
[11] M.Sunitha, V.Vinay Kumar and G. Raghu, Embedded Car Security System,
Int. Journal of Engineering Development and Research (IJEDR), 2012
[12] Z. M. Win and M. M. Sein, Fingerprint recognition system for low quality
images, presented at the SICE Annual Conference,
Waseda University, Tokyo, Japan, Sep. 13-18, 2011.
[13] Upendran Rajendran and Albert Joe Francis, Anti Theft Control System
Design Using Embedded System, Proc. IEEE, vol. 85,2011
[14] A Study of Biometric Approach for Vehicle Security System Using
Fingerprint Recognition-N. Kiruthiga and L. Latha,International Journal of
Advanced Research Trends in Engineering and Technology (IJARTET)
Vol. 1, Issue 2, October 2014.
[15] K.I.Kim, K.Jung, and J.H. Kim, “Texture-Based Approach for Text
Detection in Images Using Support Vector Machines and Continuously
Adaptive Mean Shift Algorithm”, IEEE Transactions On Pattern Analysis
and Machine Intelligence, Vol. 25, No. 12, december 2003., pp. 1631-1639.
[16] ]S. Hamidreza Kasaei, S. Mohammadreza Kasaei, S. Alireza Kasaei, New
Morphology-Based Method for Robust Iranian Car Plate Detection and
Recognition, International Journal of Computer Theory and Engineering,
Vol. 2, No. 2, April, 2010.
[17] The Tesseract OCR software code is available at
http://code.google.com/p/tesseract-ocr/downloads/list
[18] R. Smith, “An Overview of the Tesseract OCR Engine”, Proc. Ninth Int.
Conference on Document Analysis and Recognition (ICDAR), IEEE
Computer Society (2007), pp. 629-633
[19] S. Malathi and C. Meena, “An efficient method for partial
fingerprint recognition based on Local Binary Pattern”, in
Proc.Communication Control and Computing Technologies, pp. 569-572,
IEEE, 2010.

National Conference On “Recent Innovations In Engineering Science & Technology" April 2019
80 Computer Engineering
Proposed Secure Content Modeling
of Web Software Model Madhuri N. Gedam#1, Varshapriya J. N.*2, Bandu B. Meshram#3
#1,2 Research Scholar, Department of Computer Engineering, Veermata JijabaiTechnological Institute(VJTI), Mumbai, India
#3 Professor, Department of Computer Engineering, Veermata JijabaiTechnological Institute(VJTI), Mumbai, India
Abstract — The tremendous growth of web applications gave rise to
number of cyber crimes in the real world. This has necessitated the
consideration of security features of web application at the beginning
stage itself rather than at later stages of web application as it is a very
time consuming task and it increases the cost of software system
exponentially. The security aspects need to be considered at the
planning phase of web application modeling stage. The unique web
engineering process content model is proposed to capture all the
security requirements through Class diagram and State Transition
Diagram in the web-based software application development. The
various notations are proposed to provide security requirements in
content modeling of Web Engineering. The proposed content
modeling of Web Engineering is simulated by the case study- “Smart
Agriculture Monitoring System”.
Keywords — Content modelling, WebML, Security
Requirements, UMLSec.
I. INTRODUCTION
Software engineering deals with the process of developing
web applications using standard steps and methods [2]. Web
engineering is generally defined as ‘‘the application of a
systematic, disciplined, quantifiable approach to the
development, operation and maintenance of web systems’’
[1][5]. Web engineering consists of different methods, techniques and efficient tools for different activities to be carried
out at various stages of product life cycle [5]. Unified Modeling
Language (UML) is general-purpose modeling language for the
design of a system and Object Management Group(OMG)
standard [19]. There are many web analysis and design methods
like Object-Oriented Hypermedia Design Method (OOHDM)
[20], Web Search and Data Mining (WSDM), Web Modeling
Language (WebML), W2000 Hypertext Design Model (HDM),
Object Oriented Web Solution (OOWS), HERA and Web
Software Architecture (WebSA), UML based Web Engineering
(UWE) for building the Web Information Systems. This paper is
organised as follows - Section 2 discusses the detailed literature
survey related to Web Software Model. Section 3 describes
proposed secure Content Modelling for Web Engineering. Section 4 deals with the case study on Smart Agriculture
Monitoring System to simulate the proposed secure content
model.
II. LITERATURE SURVEY
This section presents detailed literature survey on web
engineering methods.
UML is a graphical language to visualize the system design
portraying system behavior and its structure. UML is largely
adopted but it lacks security specification notions. UMLSec is an
extension of UML providing security features in analysis and design of modern information systems resulting into
development of secure software [6]. UMLSec provides security
against attacks in system development [9][10]. Security
specifications can be provided using stereotypes, tags and
constraints in UML diagrams such as use case diagram, class
diagram, state machine diagram, sequence diagram, activity
diagram and deployments diagram [21]. Security extensions can
be easily added to UML which led to the development of
UMLsec, SecureUML and UMLpac [11].
In our proposed work we are providing security in class
diagram and state transition diagram with UML notations [21].
Fig. 1 UMLSec Security checklist
B. WEB ENGINEERING METHODS

National Conference On “Recent Innovations In Engineering Science & Technology" April 2019
81 Computer Engineering
Web Modeling Language (WebML) is considered as notation
and a web-design methodology to serve complex data, process
and service intensive web software applications. It is a visual Domain Specific Language (DSL) containing formal
specifications of design process. It specifies the content
structure of a high quality web software application. It describes
web applications at three layers like content layer, navigation
layer (hypertext) and presentation layer (look and feel). Content
layer is presented with Entity-Relationship (ER) diagram or
UML class and state transition diagram[3] [4]. Earlier, WebML,
UWE or OOHDM [20] which are Model-Driven Web
Engineering (MDWE) [25] methods that were providing mature
solutions to the development of web software applications. The
visualization of high level web applications into models can be
done through these methods using Model Driven Development (MDD) concepts. The classic MDWE approach consists of the
following steps – develop a domain object content model,
defining hypertext model for navigation and define the web
application's look and feel for presentation purpose [25].
III. PROPOSED SECURE CONTENT MODELLING OF WEB
SOFTWARE MODEL
This section describes proposed notations for content
modelling of Web engineering using notations in the case study.
Web Engineering Model comprises of Content Modelling,
Functional Modelling, Hypertext Modelling, Navigation
Modelling. In this paper we are providing security in content modelling through the secure Class Diagram and secure State
Transition Diagram.
C. CASE STUDY: SMART AGRICULTURE MONITORING SYSTEM
In this section, detailed discussion is given on Secure Content
Modelling of web software model to consider security -
Confidentially, Integrity and Availability with secure notations
in class diagram and state transition diagram. Smart agriculture
monitoring system is an automated system using the concept of
Internet of Things (IoT). A combination of Internet, wireless communication mechanism and Remote Monitoring System
(RMS) is used to get instant overview of the field. GPS-Based
remote controlled monitoring, sensing of moisture and
temperature, scaring the intruders, security, wetness of the leaf
and proper irrigation facilities [26]. This system is designed to
use sensors working on wireless networks for capturing
properties of the soil and weather patterns on a real-time basis.
The control of these parameters are done through any remote
device or internet services and interfacing sensors, Wi-Fi,
camera with micro-controller are used to perform the operations.
It is used to provide easy access to farm facilities such as prompt messages using Short Messaging Service (SMS) and it provides
different suggestions on weather patterns, crops, etc. In this
paper content modelling is built for this case study [26][27].
D. CONTENT MODELING
The formalisation of functional requirement of requirement
engineering into a model is called Content modelling. Database
design and an object model can be constructed through content
modeling. The purpose of database design and object model is to
provide a base for the business logic of the system [8]. Content
modelling produces both the structural aspects of the content and behavioural aspects of the system in the form of a class diagram,
and state transition diagrams [21].
WebML is used to capture the detailed information about the
contents of the web application. The most important features of
WebML are like – it considers workflows involving multiple
actors and controlling many types of activity flows through use
of objects [8].
Content Model = Class Diagram + State Transition Diagram
In this model, we used security notations for class diagram as
well as state transition diagram to secure the content model
known as secure content modeling as shown in Figure 2. The use
of notations is simulated with the case study of Smart Agriculture Monitoring System.
Fig. 2 Secure Content Modelling of web software model
E. CREATE USE CASE AND MISUSE CASE DIAGRAM WITH
SECURITY FEATURES
The Figure 3 (Appendix B) describes the use case and misuse case diagram with the functional requirements and its associated
actors [7]. Use Case diagrams are used to visualize, specify and
document the behaviour of an element [18]. Misuse cases are
widely used in UML to elicit security requirements [14][15][17].
It explains the expected malfunctioning to be done by attackers to
pose threat to the web applications. It also shows the
relationships between the activities which are compromised and
original use cases. has The advantages of Misuse case are they
provide visual explicitness; understand ability, and their drawing
is
simple. It has limitations like representation of high-level threats only. It does not specify the detailed process and it is not suitable
conviniently to reuse it [16].
In Figure 3 (Appendix B), security use cases are used as
defence mechanism to provide security in Farmer Registration
class diagram in Smart Agriculture Monitoring System [13].
F. SECURE CLASS DIAGRAM WITH SECURITY NOTATIONS
The secure class diagram notations are shown in Table 1(
Appendix A). The most basic and largely used UML diagram is
Class Diagram [19]. A class diagram depicts a static view of a
system containing classes, their interrelationships with each
other, operations and properties of the classes [19]. The analysis

National Conference On “Recent Innovations In Engineering Science & Technology" April 2019
82 Computer Engineering
object model instantiates Entity, Control, Boundary (ECB)
pattern. The simplified version of Model View Controller
pattern (MVC) is ECB [24]. New security related semantic
constructs are used in state chart [36] to provide security. These stereotypes are also used in class diagram.
Eg. <<Vulnerable>>, <<Defensive>>, <<Secure>>,
<<Threatened>>, <<Compromised>>, <<Quarantine>>, <<Recovery>>
Common input tampering attacks can be prevented through
well defined input validation. The security at high level of abstraction is provided through input validation. It solves the
problem of poor security background for further development
[11]. UMLpac integrates security into UML Class Design.
UMLpac uses third party security packages. The security goal
in UMLpac is provided by keeping a level of abstraction
between the class diagram of a system and their security features
[23]. Also, the Author S. Almutairi has suggested in [7] paper,
the Confidentiality and Integrity in the class can be protected by
mentioning keywords CONF, INT respectively before the class name to facilitate web developers [7].
UML modeller can use Object Constraint Language (OCL). It
specifies constraints related to application in their models. It
defines Five Primary Security Input Validation Attributes
(FPSIVA) which can be used in the design phase of software engineering [11]. The foundation for applying FPSIVA in web
design phase is OCL. Input validation can be done FPSIVA parameters for secure software development are as follows [16] –
(1) var.type : < type> - To validates the input data type and
checks whether it is acceptable <type>.
e.g.: mobile_no.type : integer (2) var.format : < pattern> - To validate the input data format
and to check whether it is acceptable <pattern>.
e.g.: Format of a mobile no. is like : %d%d%d %d.
(3) var.length : < number> - To validate the input data length.
e.g.: mobile_no.length : 10
(4) var. Charset : < pattern> - To check characters with its
<pattern>
e.g.: mobile_no.charset : [0-9]
(5) var.value : < reasonableness> - To check reasonable values
of input data .
e.g.: age. Value>0 The confidentiality of the class can be protected using CONF
in front of the class name. The integrity of the class can be
protected using INT in front of the class name. This will help
web developers to know which objects are to be protected during
the transmission [7]. For example Farmer Registration Class is
simulated in figure 4 (Appendix B).
The class diagram of Farmer Registration contains address,
mobile_no., Email_id and password as attributes of class and the
methods are BlockedRegistration(), SendSMS( ), CaptureOTP(
), EncryptionTech( ), Nonmodifiable( ) and Submit( ). These
methods provide defence mechanism in the Use Case diagram.
The Confidentiality and Integrity in the class can be protected by mentioning CONF, INT respectively in front of the class name
there by facilitating web developers [30]. Modelling security in
proposed class diagram can be done using Five Primary Security
Input Validation Attributes (FPSIVA) in Input Validation [11]. In
the Framer Registration Class Diagram of Content Model in Web Engineering, Input Validation parameter can be exposed to
different threats like SQL Injection. Vulnerabilities are usually
occured in SQL, NoSQL queries, OS commands, SMTP headers,
XML parsers, ORM queries, LDAP, Xpath and expression
languages. These threats can be mitigated through FPSIVA,
UMLPac, Used tag as CONF and INT [7][11][22].
G. SECURE STATE TRANSITION DIAGRAM
The secure state transitions diagram notations are shown in
Table 2 Appendix A. State chart diagrams show the changes in the state through an object’s life cycle. Security state charts
describe the complex dynamics of security threats. It provides
risk and impact analysis. UMLsec stereotypes [9][10][11][16]
states requirements to be followed after analyzing defects in the
model. If stereotype <<compromised>> is specified in the state,
analyst has to identify requirements that will help to avoid entry
into the compromised state. However stereotype does not specify
what those requirements will be [22].
Security state charts describe the complex dynamics of security
threats. The risk and impact analysis is supported by state charts.
The state charts are enhanced by using UML stereotypes. These stereotypes will also support analyst in finding out defects in the
model [22].
Fig. 3 State Chart Diagram of Smart Agriculture Monitoring
System
The State Transition Diagram of Content Model in Web
Engineering, Session management can be exposed to different
threats like Session Hijacking. These threats can be mitigated
through Vulnerable State Stereotype, Secure State Stereotype.
Sensitive data can be exposed to threat such as sensitive data

National Conference On “Recent Innovations In Engineering Science & Technology" April 2019
83 Computer Engineering
exposure which can be mitigated through access control of
critical storage data, blocking network sniffing and prevention
from manipulation of data [7][11][22].
IV. CONCLUSIONS
A high-level approach to provide the security requirement in
content modeling of Web Software Model has been discussed. The extensive literature survey done on UMLSec on the basis of
that we have formalized various notations of class diagram and
state transition diagram. The security has been provide by
incorporating notations and security policies in Class Diagram
and State Transition Diagram.
REFERENCES
[2] D. Lowe, W. Hall,“Hypermedia and Web:An Engineering Approach”,
John Wiley &Sons, 1999.
[3] H. Elminir, M. Elsoud, A. EI-Halawany,“Uml-based Web Engineering
framework for Modelling Web application”, Journal of Software
Engineering,2011.
[4] Ceri, S., Fraternali, P., Brambilla, M., Bongio, A., Comai, S., and Matera,
M.,”Designing data-intensive web applications”, (Morgan Kaufmann,
2002).
[5] N. Moreno, P. Fraternali and A. Vallecillo,“WebML modelling in UML”,
IET Softw., 2007, 1, (3), pp. 67–80
[6] Paloma Dı´az , Ignacio Aedo, “Towards efficient web engineering
approaches through flexible process models”, The Journal of Systems
and Software 80 (2007) 1375–1389, 2006, Elsevier.
[7] V. Tran, N. Truong, A. Nguyen,“An Approach to the Specification of
Security Concerns in UML”, Information and Communication
Technology, Griffith University, Nathan, QLD 4111, Australia, Springer-
Verlag Berlin Heidelberg 2013.
[8] S. Almutairi,“An Enhancement on Class Diagram to Model a Secure
Context Aware System”, IEEE, 2017
[9] D. Ingle, Dr. B.B. Meshram, “HybridAnalysis and Design Model for
Building Web Information System”, IJCSI International Journal of
Computer Science Issues, Vol. 9, Issue 4, No 3, July 2012.
[10] M. Umair, A. Khan, M. Zulkernine,“A Survey on Requirements and
Design Methods for Secure Software Developments”, Queen’s University
Kingston, Ontario, Canada K7L 3N6.
[11] M. Hussein, M. Zulkernine,“UMLintr: A UML Profile for Specifying
Intrusions”, 13th Annual IEEE International Symposium and Workshop
on Engineering of Computer Based Systems (ECBS’06), IEEE 2006.
[12] P. Hayati, N. Jafari, S. Mohammad, S. Sarenche, “Modeling Input
Validation in UML”, IEEE, pp. 663–672, 2008.
[13] J. Jurjen,“UMLsec: presenting the profile” In: 6th Workshop on
Distributed Objects and Components Security. March 18-21, 2002.
[14] L. Deng, W. Xu , S. Frezza. “A Resource-based Approach to Extend
UML Diagrams for Web Applications”, USA, IEEE ,2011.
[15] G.Sindre, A. Opdahl,“Eliciting security Requirements with Misuse case”
Requirement Engineering, vol.10 No.1 Jan, 2005, pp-34-44.
[16] A. Opdahl, G. Sindre,“Experimental Comparison of Attack trees and
misusecases for Threat Identification”, Information and Software
Technology, vol.51, 2009, pp.916-932.
[17] M. Diallo, J. Romero-marion ,S. Sim D. Richard,“A Comparitive
evaluation of three approaches to identify security requirements” in
proceeding of the REFSQ’06, Luxembourg , 2006.
[18] T. Stålhane, G. Sindre,“ A Comparison of two approaches to safety
analysis based on Use cases”, in proceeding of conceptual modelling E-R
2007 lecture Notes in Computer Science, vol.4801, 2007, pp-423-433.
[19] S. Sengupta ,S. Bhattacharya, “Formalization ofUML Use Case Diagram-
A Z Notation Based Approach’’, 2006, IEEE.
[20] M. Szlenk,“Formal Semantics and Reasoning about UML Class Diagram”,
Proceedings of the International Conference on Dependability of Computer
Systems, 2006 IEEE.
[21] D. Schwabe, G. Rossi,“The Object-Oriented Hypermedia Design Model”,
Communications of the ACM August 1995/Vol. 38, No. 8, ACM August
1995.
[22] M. Khan,“ Representing security specifications in UML state machine
diagrams”, International Workshop on Enterprise Web Application
Dependability, Elsevier ,EWAD 2015.
[23] M. Attar, H. Luqman, P. Karpati, G. Sindre, A. Opdahl, “Extending the
UML Statecharts Notation to Model Security Aspects”, IEEE Transactions
on Software Engineering, vol. 41,no.7, pp.661–690, July 2015.
[24] M. J. Peterson, J. B. Bowles, C. M. Eastman, “UMLpac: An Approach for
Integrating Security into UML Class Design”, IEEE, pp.267–272,2006.
[25] pdf link, “Entity Control Boundary pattern”,

National Conference On “Recent Innovations In Engineering Science & Technology" April 2019
84 Computer Engineering
Automated Crowd Surveillance using Drone and AI
Prof. Mohan Nikam1, Vaibhav Gavhane 2,Mahesh Navle3, Akash Mahajan4
Dipak Desai5
Assistant Professor1, UG Student2,3,4,5.
Department of Information Technology1,2,3,4,5,
SITRC, Nashik , India
[email protected], [email protected], [email protected],
[email protected], [email protected]
Abstract—Understanding and dealing with safety aspects of
crowd dynamics in mass gatherings of people related to
sports, religious and cultural activities is very important,
specifically with respect to crowd risk analysis and crowd
safety. In this regard, efficient monitoring and other safe
crowd management techniques have been used to minimize
the risks associated with such mass gathering. The system
will deploy crowd monitoring technique using real-time
images taken by Drone. A color-based segmentation method
has been implement to detect, identify and map crowd
density under different camera positions and orientations.
The proposed system is a valuable tool in terms of
facilitating timely decisions, based on highly accurate
information. We are proposing a video-based crowd density
analysis and prediction system for wide-area surveillance
applications using the drone.
Keyword: Video Surveillance, Raspberry pi, Crowd
Detection and managing.
I. INTRODUCTION
Recently, there has been a high degree of attention paid to
drones in civil applications. Unmanned aerial vehicles, which
are widely referred to as drones, have been considered one of the
top technologies of the first decade of the 21st century by
drones, as they can be used to provide a larger view of the whole
location.
Drones could also provide the possibility of creating share-
able and link-able networking points between rescue teams who
are attending the emergency location. Adding cloud capacity is a
modern way of designing and implementing systems, as the
cloud offers several benefits that include high performance and accessing a large pool of sources, including storage and
computational capacity.
In addition to the benefits that can be gained from cloud
resources (e.g. Storage and cores), the cloud can play an
important role as it can provide a centralized solution to the
whole system. Notifications can be sent through the cloud to
alert a management department of an emergency event that has
occurred or might be occurring based on processing the photos
collected by drones. The cloud can also add the ability to send
commands directly to drones, such as taking more photos of a
particular location. Finally, drones can be controlled remotely from the cloud to undertake certain jobs without human
involvement, in order to provide a fully automated solution.
II. Crowd Monitoring
Various investigations have been directed towards developing
an approach that provides a comprehensive solution for crowd
management and analysis. These studies have focused on three main principles of crowd analysis including estimation of the
density of a group of people per square meter, finding the
direction of motion of the crowds and Geo-referencing the crowd
images in the real world coordinate system. It can be noticed that
most of the studies have been conducted in either computer
vision or navigation disciplines. Thus, crowd analysis
approaches have been based on images processing and
positioning solutions. In this regard, several sensors such as
camera (color, infrared), GPS and IMU (Inertial management
Unit) have usually been
mounted on a moving vehicle to detect and analyze the
density along with the motion of the crowd in a specific location.
In recent years, UAVs have been extensively used for crowd
analysis due to its low cost and fast, autonomous and flexible
flying ability. Thus, crowd motion have been tracked via UAVs
sensors. Talukder et al. [12] used optical flow and dense stereo as
a combination technique for estimating object background
motion at each pixel. This, in turn, increased the probability of
detection of small or low texture objects where feature selection
schemes might fail. While Rodriguez-Canosa et al. [7] proposed
a real-time approach to detect and track moving objects from
UAV. This approach was entirely dependent upon creating
artificial optical flow by estimating the camera motion between two subsequent video frames and then comparing the artificial
flow with the real optical flow directly obtained from the video
feed.

National Conference On “Recent Innovations In Engineering Science & Technology" April 2019
85 Computer Engineering
The process of estimation of density and the people count
per square meter have been investigated in detail in various
studies (e.g., Hinz [13]; Sirmacek and Reinartz [14]; Perko et al.
[6]). Hinz [13] estimated the background by applying a gray-level bounded region-growing approach based on sequential
overlapped images. In order to filter out less crowded objects, a
blob detector was used on the foreground pixels. The crowd
density was then estimated by using Gaussian smoothing kernel
with a fixed standard deviation/ bandwidth process. Sirmacek
and Reinartz [14] proposed an automated detection technique
based on FAST (Features from Accelerated Segment Test)
features detector to detect the images of blob-shaped and
cornered structures. Using airborne video recordings, Perko et
al. [6] presented a novel framework for estimating human
density and motion,based on custom tailored object detection
techniques, a regression based density estimation and a total
variation based optical flow extraction.
Other studies focused on sensor fusion techniques for direct
Geo-referencing. They presented an overview of understanding
algorithms developed at CMU Carnegie Mellon University) to
perform cooperative and multi sensor surveillance. A network of
smart sensors was deployed that are independently capable of
performing real-time, autonomous object detection, tracking,
classification, and gait analysis. Attya et al. [15] proposed by a
new framework based on the constructing a 3D model of the
desired location, and then used this model for Geo-referencing
the collected images and finally used the same for estimation of
the crowd volume.
In the same line of this research, Helbing et al. [9] used
video recordings of the crowd disaster incident in Mina/Makkah
during the Hajj in 2006. This was to analyze the time frame of
the crowd as well as the reason behind it.
III. Methodology of Crowd Estimation
In this paper, we focused on estimating and Geo-
referencing the crowd density levels through using image
processing tools. This includes image segmentation for people
detection, crowd density estimation and finally geo-referencing for mapping the crowd levels.
3.1 Image Segmentation
This process has been initiated in computer vision which
basically changes the image into such feature that can be easily
identified. Various methods have been proposed for image
segmentation's. In this paper,L*a*b* color space method have
been used to classify the content of the image into readable
features. This method consists of three-colored channel namely
“L*” indicating the luminosity, and the other two channels “a*”
and “b*” indicating the chromaticity. Thus, the color is either full along “a*” (red-green axis) or “b*”(the blue-yellow axis)
space.
In order to classify the content of an image into “a*” and
“b*”, a space reference must be selected first. This reference
includes a color region as a sample and hence the average of
each sample’s region is calculated in terms of “a*” and “b*”
space. Then each image pixel is classified using nearest neighbor
rule. This will allow to identify each color marker with respect to
“a*” or “b*” value. The smallest distance will tell that the pixel most closely matches that color marker. Detailed information
about LAB method can found in Bora et al. [16].
3.2 Estimation of Crowd Density
The density of crowd has been estimated through converting
the segmented image into a binary image. The crowd in the
image appears as white region while other image features appear
in black color. Since the black and white image (BW) allows to
calculate image properties (e.g, area), the density of crowd is
measured through calculating the ratio between the white and
black regions. Thus, crowd level density per meter square can be
measured. Regardless the number of people in the scene, the density is simply classified into low, moderate, and high.
3.3 Geo-referencing and Mapping Levels of Crowd
Density
For mapping the levels of crowd density, the need for
mapping is to find out the object coordinates. Note that each
region is considered as an object and then it is Geo-referenced
through using GCPs (ground control points). With known GCPs,
a triangulation can be performed through mapping the XYZ of
image objects with XYZ coordinates of the real world object. The
point of Geo-referencing is to show each object coordinate in order to identify the particular area with respect to the crowd
level density. When UAV equipped with GPS and INS, direct
Geo-referencing can be achieved without need of GCPs. In this
case, an automatic system for real-time crowd monitoring is
realistic. In this paper, however; due to lack of UAV sensory
data, we investigated indirect Geo-referencing for mapping the
crowd density.
3.4 Anomalies Detection
In any image processing procedures, anomalies/ outliers may
occur in the new segmented images which may lead to ambiguous information. In color-based segmentation method,
classification process becomes difficult due to the similarity of
colored-classes between features. For example, the color which is
basically used to identify people might classify other features as
people too. This problem leads to the introduction of a technique
that distinguishes between feature classes. In this paper,
parameters like size, shape and position of the object have been
used to achieve such tasks. A constrain based on these parameters
is conditioned in the classifications. For example, the position of
the crowd in the image is normally shown in flat areas (e.g.,
streets), thus surrounding environments such as buildings, trees
and vehicles can be eliminated from image segmentation process.

National Conference On “Recent Innovations In Engineering Science & Technology" April 2019
86 Computer Engineering
Iv.SYSTEM ARCHITECTURE
Fig 1. The architecture of Proposed System.
The main objective of this system is to detect the crowd and to
have video surveillance on the crowd. The Proposed system
consist of camera which captures the videos and images from
which we can have surveillance on the crowd and the ultrasonic sensors that detects any barrier to protects the drone from
crashing. Our system will be useful for crowded places like
kumbhamela, live concerts, etc.
Fig 2. Drone connection
The proposed system has the following modules:
6. Drone module.
7. Camera module.
BLDC (Brushless DC Motors): electronically commuted
motors (i.e. ECMs motors). BLDC motor are synchronous motor
powered by DC electricity. Rated in KV, where it rotates
1000rpm per 1 volt supplied to it (if its rating is 1 KV). It offers
several advantages over brushed DC motors like more reliability, low noise, reduction in EM Interference (EMI), high
torque per watt etc.
Fig 3. BLDC Motor
Arduino: The Arduino/Genuino Uno has a number of facilities
for communicating with a computer, another Arduino/Genuino
board, or other microcontrollers. The ATmega328 provides
UART TTL (5V) serial communication, which is available on
digital pins 0 (RX) and 1 (TX). An ATmega16U2 on the board
channels this serial communication over USB and appears as a
virtual com port to software on the computer.
Fig 4. Arduino uno
Raspberry pi : The latest Raspberry Pi 3 Model B+ has a faster
64-bit 1.4GHz quad core processor, 1GB of RAM, faster dual-
band 802.11 b/g/n/ac wireless LAN, Bluetooth 4.2, and
significantly faster 300Mbit/s Ethernet.
1.4GHz 64-bit quad-core ARM Cortex-A53 CPU
(BCM2837)
1GB RAM (LPDDR2 SDRAM)
On-board wireless LAN - dual-band 802.11 b/g/n/ac
(CYW43455)
On-board Bluetooth 4.2 HS low-energy (BLE)
(CYW43455)
4 x USB 2.0 ports
300Mbit/s ethernet
40 GPIO pins
Full size HDMI 1.3a port
Combined 3.5mm analog audio and composite video
jack

National Conference On “Recent Innovations In Engineering Science & Technology" April 2019
87 Computer Engineering
Camera interface (CSI)
Display interface (DSI)
microSD slot
VideoCore IV multimedia/3D graphics core @
400MHz/300MHz
Fig 5. Raspberry pi 3b+
Transmitter and Receiver: Radio transmitter uses radio signal to remotely control quad copter in wireless way, the commands
given by transmitter are received by a radio receiver connected
to flight controller. The no of channels in transmitter determine
how many actions of aircraft can be controlled by pilot.
Minimum of four channels are needed to control a quad-copter
(which includes pitch. Roll, throttle, yaw). The stick control on
radios transmitter is known as gimbal. RC receiver used operates
on 2.4GHz of radio frequency (unless you do not have any
specific need for a different frequency).
Fig 6. Transmitter
ESC (Electronic speed controller): Four 30A ESCs (electronic
speed controllers) are used in proposed Quad copter. It convert
the PWM signal received from flight controller or radio receiver
and then drives the brush less motor by providing required electrical power. Thus ESC is an electric circuit that control the
speed and direction of electric motor by varying the magnetic
forces created by the windings and magnets within the motor.
Gyroscope: Quad copter requires a flight stability sensors that
stabilizes quad copter during its flight mode. MPU6050
gyroscope is low power sensor with a sensing element and an
IC interface (able to provide the measured angular rate to users
through digital interface 12C/SPI).
Fig 7. Gyroscope
Details of Camera: GPS assisted flight features, let you
concentrate on getting great images while the drone helps you fly
safely.You can achieve advanced camera perspectives with the
Point of Interest, Follow Me and Waypoints modes. Fly up to 25
minutes with the included intelligent battery.
Now, coming to the popular feature, the camera is inbuilt and
gives you some of the crispest and stable pictures from up high. You do not even need to be a professional, or have that much
experience with photography.
Fig 8. Camera module v2
The ultra-intelligent camera of this device can do the job for
you. The 2.7K video camera can capture pictures from mid-air at
12 megapixels. This means that pictured are 3 times clearer than
the images displayed on your HD TV. The camera comes packed
with a 20mm equivalent lens coupled with the f/2.8 aperture for
best results. The lens comes with 9 elements that also include an a spherical element.
V. ALGORITHMS AND DATABASE
Blob method:
Aided by the estimated pedestrian size, we perform region
growing on the patches of different categories. For example, we

National Conference On “Recent Innovations In Engineering Science & Technology" April 2019
88 Computer Engineering
scan all the green patches from up to down, left to right. A blob
is growing from one patch at a certain position in the image to a
connected component of patches. It stops growing when the
number of patches reaches the estimated size of the pedestrian at this position, or there are no longer any connected patches. In
this way, all the green patches in one frame are grouped into
green blobs. The similar patch grouping is performed to all blue
patches. ll blobs (both green and blue) in pseudo-colour, with
the black crosses denoting their centre. Although each blob does
not exactly fit the boundary of every pedestrian, it captures the
correct category label (green or blue) of each pedestrian and its
neighbour. Thus this blob representation has the contextual
information of pedestrians and ensures meaningful contextual
analysis.
K-Means Clustering Algorithm: k-means clustering is a method of vector quantization,
originally from signal processing, that is popular for cluster
analysis in data mining. k-means clustering aims to partition n
observations into k clusters in which each observation belongs
to the cluster with the nearest mean, serving as a prototype of
the cluster.
Our algorithm works as follows, assuming we have inputs
x1,x2,x3,...,xnx_1, x_2, x_3, ..., _nx1 ,x2 ,x3 ,...,xn and value of
K
Fig 9. K-means algorithm
Step 1 - Pick K random points as cluster centers called
centroids.
Step 2 - Assign each xix_ixi to nearest cluster by
calculating its distance to each centroid.
Step 3 - Find new cluster center by taking the average
of the assigned points.
Step 4 - Repeat Step 2 and 3 until none of the cluster
assignments change.
Step 1:
We randomly pick K cluster centers(centroids). Let’s assume
these are c1,c2,...,ckc_1, c_2, ..., c_kc1,c2,...,ck, and we can say
that;
C=c1,c2,...,ckC = c_1, c_2,..., c_kC=c1,c2,...,ck CCC is the set
of all centroids.
Step 2:
In this step we assign each input value to closest center. This
is done by calculating Euclidean(L2) distance between the point
and the each centroid. argminci∈Cdist(ci,x)2\arg \min_c_i
\in C dist(c_i, x)^2argci∈Cmindist(ci,x)2
Where dist(.)dist(.)dist(.) is the Euclidean distance.
Step 3:
In this step, we find the new centroid by taking the average of
all the points assigned to that cluster.
Step 4:
In this step, we repeat step 2 and 3 until none of the cluster
assignments change. That means until our clusters remain stable,
we repeat the algorithm.
VI. RESULTS
The expected results are as follows:
Sr.no Test case Expected
Output
Actual Output
1 Flying drone Properly flying
drone.
Drone can
stable and fly.
2 Camera After drone
flying camera
on capture
video and
images.
Video and
image are
clearly
display.
3 Cowed Surveillance
Search cowed in send
massage are
security guard
.
Properly display cowed
density and
flow.
Actual Output:

National Conference On “Recent Innovations In Engineering Science & Technology" April 2019
89 Computer Engineering
Fig.10 Count of Density
VII. CONCLUSION
Our research work yielded a successful development of
Quadcopter at cheaper and low amount. It can be used as alternative to various applications which includes surveillance in
crowded area, crowd flow direction detection and maintain the
data. The system will be provided with barrier detection sensor
for safety of the Drone. It will also detect the crowd Density. It
can be also used for other sensitive places nation border, etc.
with high level of precision.
REFERENCES
[1] Jing Wang, Zhijie Xu ,“Crowd Anomaly Detection for Automated
Video Surveillance”,2015 IEEE.
[2]. Fan Jiang, Ying Wu, Aggelos K. Katsaggelos,“Detecting contextual
anomalies of crowd motion in surveillance video”,978-1-4244-5654-3/09/ 2009
IEEE.
[3]. Muhammed Anees V,G. Santhosh Kumar,“Direction Estimation of Crowd
Flow in Surveillance Videos”,2017 IEEE Region 10 Symposium (TENSYMP).
[4]. Gardzinski, Krzysztof Kowalak, Lukasz Kaminski, S´ Lawomir Mackowiak,
“Crowd Density Estimation Based on Voxel Model in Multi-View Surveillance
Systems”, 2015 IEEE.
[5]. CAO Lijun, HUANG Kaiqi, “Video-Based Crowd Density Estimation and
Prediction System for Wide-Area Surveillance”, China Communications, May
2013.
[6]. E Yueguo Zhang, Lili Dong, Zhengmin Xia1, Jianhua Li,“ Evolution of
crowd behavior in Surveillance Video”,2015 IEEE International Symposium on
Broadband Multimedia Systems and Broadcasting (mm15-109).
[7]. Hazzaa N. Alshareef,Dan Grigoras, “Multi-service cloud of drones for
multi-purpose applications”, 2017 IEEE 16th International Symposium on
Parallel and Distributed Computing.
[8]. Victor Olivares,Felisa Cordova,“ Design of Drone Fleet Management Model
in A Production
System of Customized Products”, 2016 6th International Conference on
Computers
Communications and Control (ICCCC).
[9]. Azade Fotouhi, Ming Dingˆa and Mahbub Hassan, “Understanding
Autonomous Drone
Maneuverability for Internet of Things Applications” 978-1-5386-2723-5/17/
2017 IEEE
[10]. Adriano Garcia, Edward Mattison and Kanad Ghose,“ High-speed Vision-
based Autonomous
Indoor Navigation of a Quadcopter” 2015 International Conference on Unmanned
Aircraft
Systems (ICUAS) Denver Marriott Tech Center Denver, Colorado, USA, June 9-
12, 2015
[11]. Lukas Sada Arihta Sinulingga,Fatwa Ramdani, “Spatial Multi-Criteria
Evaluation to Determine
Safety Area Flying Drone” International Symposium on Geoinformatics 2017
Department of Information Technology, SITRC, Nashik 59
[12]. Akbar, Dayu, Pemanfaatan Drone di Berbagai Bidang, [online], 2014,
Available in : https://www.pcplus.
[13]. Omahdrone. Yang Harus Diperhatikan Sebelum Menerbangkan Drone.
2016.
[14]. M. J. Roshtkhari and M. D. Levine,“ An on-line, realtime learning method
for detecting
anomalies in videos using spatio-temporal compositions”, Computer Vision and
Image Understanding,
vol. 117, pp. 1436-1452, 2013.
[15]. R. Mehran, A. Oyama, and M. Shah, “Abnormal crowd behavior detection
using social force

National Conference On “Recent Innovations In Engineering Science & Technology" April 2019
90 Computer Engineering
Wakeup My India Neha Tupe
1, Komal Kumavat
2, Saurabh Raut
3,Saurabh Shrivastava
1st [email protected], 2ndkomaldilipkumavat@gmailcom2, 3rd [email protected],[email protected]
Computer Department
Sandip Institute Of Engineering & Management
Abstract— The past decade has seen a dramatic rise in
natural disasters and inclement weather conditions leading
to catastrophic loss of human life. In order to curtail the
loss of lives in the advent of any disaster, it is important to
have a system in place which can alert the general public
well in advance so that they can be evacuated from the
endangered area before the actual disaster strikes. In this
paper we have designed and proposed a ‘Smart Alert’
mobile application which is capable of alerting the users
during the development of a disaster or a threat. The
proposed system is intended to provide timely help to the
affected victims by navigating them to safe place before the
disaster strikes. The system provides the alert to user in
real time directly on their smartphones and informs them
regarding the threat they are under. It further navigates
them using a map to the nearest safe house so that they can
be rescued by the disaster rescue team[3].
Keywords— Distributed System, Disaster Management System,
Disaster alert, emergency services, Client Server.
I. INTRODUCTION
Smart Alert has been created with an aim of reaching out to
maximum number of people in shortest span of time and the
reason why mobile application was deemed fit for the purpose
for alerting the user during the development of any disaster was
based on the statistical data on how people use their mobile
phones. Numerous studies and research on human habits and
lifestyle have found that an average person checks his/her
mobile 85 times a day or approximately once every 3 hours.
This means that a mobile alert is the best way to warn person
of upcoming disaster. Information from varied and unofficial
sources may lead to unwanted panic and confusion[1]
II. HISTORY & BACKGROUND
Intelligent disaster warning and response system with
dynamic route selection for evacuation Smart Alert
Application has many features
that make it a useful and lifesaving tool. It is mainly based
on the concept of having safe houses. Safe houses are places
which are not located in the area where the threat has been
issued and these places serve as emergency shelters until the
rescue team arrives for further support. The notification
system notifies the user as soon as an alert is issued. This is
seen as a notification on the mobile phone. Seeing this, the
user can know that an alert has been issued and more detailed
information can be found by the user in the form of a card
when he/she opens the application[3]. The navigation system of Smart Alert Application is conceptualized and designed to
accept real time information and then dynamically navigate
the victim to a safe house. If a person gets a disaster alert they
can tap the disaster and they would be automatically
navigated to a safe house the only thing the victim has to do
is, follow the navigation instructions and he/she would reach
a safe house People are navigated through different routes to
reduce traffic and bottleneck problems. Also safe house
capacity is taken into account while selecting the safe house.
The application also lists the nearby hospitals and medical[3].
III. EXISTING SYSTEM
Due to the increased frequency and unpredictability of
climate in the 21st century owing to Global warming and
climate change the frequency of natural disasters such as flash
floods,tsunamis, tornedos have increased leading to
cataclysmic loss of human life. Thus a centralized management of disaster is necessary to
preserve life and to minimize the disruption in the advent of
any such disaster. A mobile alert is the best way to warn a
person of upcoming disaster. Information from varied and
unofficial sources may lead to unwanted panic and confusion.
This can be solved by having a system which provides us
with accurate information prior to any disaster so that the
people are ready and prepared for the nature’s fury. Smart
Alert

National Conference On “Recent Innovations In Engineering Science & Technology" April 2019
91 Computer Engineering
Application navigates the user to a safe location by using
location based tracking. This leads to safe passage way to
multiple people as the information given is precise and
concise. The aim is to navigate people away from the endangered area once an alert has been issued.
Limitations:
Smart Alert is an android based mobile application which
forms the basic framework of our disaster management strategy.
This application serves as the primary mode of communication during the event of any disaster. It is a
standalone application capable of alerting the user in case of an
emergency and navigating him/her to nearest Safe House or the
Emergency Shelter. The application provides the following
functionalities to the user:
Tracking and Alerting the User in real time
The proposed application relies on the alerts and data issued
by the agencies such as National disasterManagement
authority of India (NDMA) to get information regarding the
possible disaster threat pertaining to a particular area.
This reliance on the agencies authenticates the threat and makes sure that no fallacious alerts are sent out to public.
Once the validity of any possible threat is confirmed from
the government authority, the app issues an alert
notification along with the SOS sound to all those users who
are currently located in the endangered area. Endangered area
here refers to the area for which a disaster threat has been
issued. Detailed information regarding the alert can be found by
the user under the “Alert” tab of the application.
The Alert Tab within the application, has been specifically
designed to update the user with regards to the issued alert. Here
the user would be able to find the meticulous information such
as: Type of threat
Location of threat
Area affected by the Disaster
Severity of Threat
By providing a large scale real time alert to the users present
in the endangered area directly on their smartphones in two
languages which are English and Hindi we can reach out to
larger number of people in short span of time thereby reducing
the number of casualties.
Navigating the User out of the Endangered area using
dynamic alogorithm. The Alert issued under the “Alert” tab of the application
asks the user to click on the alert in order to start the navigation
to nearest Safe House or the Emergency shelter.
Once the user clicks on the “Alert” Card, the application
gets the geo-coordinates of the current location of the user and
at the same time it dynamically fetches the geo-
coordinates of the nearest Safe House or the emergency
shelter from the our backend server. Once the
coordinates are decided by the server, the user will see
a map on the screen with the destination already set as
the location of the nearest safe house and the
navigation would start.
The selection of the safe house would be done by
the sever dynamically by considering the following
parameters in
real time:
a) Proximity to the user’s current location
b) The maximum accomodation capacity of safe house
The application therefore provides an easy mechanism to
navigate the people from the endangered area to
relatively safe
areas before the actual calamity strikes.
A. Keeping track and count of affected people in real
time During the occurrence of any disaster the toughest task
that lies ahead of the rescue workers is to track the number
of casualties in any particular area but such a problem is
taken care off by the Smart Alert application[1].
IV. SYSTEM ARCHITECTURE
The application is based on a web platform. The
advantages of using a web platform are:
The fact that the communication protocol has already
been implemented and tested on an international scale
(HTTP/HTTPS);
At the user level, no specialized software is required; a
web browser is the only requirement; thus, the architecture
can be implemented on a large number of systems with no
particular configuration of these stations; The system upgrading is a simple operation and requires
just a single modification of the segments in the specified
system. Data transmission security is ensured by using the
HTTPS, which provides a secure channel between the user
station and the system residing on the server.
The user requires a minimum number of software
applications, which, as we shall see below, are rather
inexpensive:
Web browser (Firefox, Internet explorer >5.5, Netscape)
– toaccess the system residing on the server;
The access to the host server (intranet, internet) – to ensure this interconnectivity for this station. Any
communication media may be usually employed, from wire
to wireless technologies;
Hardware requirements are those of the abovementioned
software application.
The server software requirements are the following: a)
Operation System: Linux Based – better stability both in
terms of security and performance; b) Programming
language: PHP 5.x; c) SGBD: MySQL 5.x; d) WEB
Server: Apache 2.x. The optimum system hardware will be
specified only when the solution has been implemented on the host system. The higher the number of users, the more
powerful should the hardware be to ensure optimum
performance.

National Conference On “Recent Innovations In Engineering Science & Technology" April 2019
92 Computer Engineering
Specialized Hardware
The GSM communication is ensured by a GSM
Modem and if the number of SMS messages is to high, a
the Bulk SMS Message service provided by a local mobile operator could be a good choice. The Bulk SMS Message
service is a service provided by certain mobile operators
which ensures the interconnection between the local
system and the mobile operator. One of the drawbacks of
such a system is the fact that the connection may be
interrupted for implementation reasons (cable faults), but
on the other hand this system is able to send a large number
of SMS alerts[1].
How it works:
When external event has been occurred,its data is forwarded o
the local user.As local users can also feed data to the
portal.Through HTTPS connection data is forwarded to tht
internet server.
Then this data goes to main server,as it will have the
database which contains telephone number of the
people in charge.Then it will go to Modem GSM.
The alerts can be sent to the affected area’s teephone by
tracing their location which can get possible by using
GSM.This system will help the people who are in
disaster-prone area, also provide them a safe location.
Fig. 3.Architecture diagram.
External Event: an event that requires a warning alert
(flooding, earthquakes, etc.)
Local Operator: Human operator who acknowledges the
external event and sends the alert request to those in charge.
Main Server: server where the request is processed.
GSM Modem: specialized hardware component that transfers
the alert message to the mobile communication network.
Telephone of the people in charge: personal telephone of the
person in charge (mayor, prefect, etc.)[1].
V. ADVANTAGES
Smart Alert is an android based mobile application which
forms basic framework of our disaster management
strategy.This application serves as the primary mode of
communication during the event of any disaster.
It is a standalone application capable of alerting user in
case of an emergency and navigating him/her to nearest
Safe House or the Emergency Shelter.The Smart Alert
Application system works in a very easy way.
It is developed in understanding manner and as such can be
used by virtually anyone[3].
VI. RESULT AND ANALYSYS
As nothing is perfect in this world, our system can be
definitely developed and improved; our project team, in
the event that this project should be continued, has
focused on the important aspects: The possibility that the
person in charge to send back to the
server a code through which the system would be able to
make decisions (create new alerts, distribute the alert to
other levels); -
Adding sensors to the system that would help sending alerts
automatically, or at least in an aided manner.
VII. CONCLUSION
A well planed system can handle any crisis / disaster
in a better way if a digitized alarm system is available.
Making peoples aware of the disasterous situation can
incres
e their life saving rate by 40%.
A alarm system connected to GPS and that too connected
with smart phones is the best solution for this type of
situations.

National Conference On “Recent Innovations In Engineering Science & Technology" April 2019
93 Computer Engineering
REFERENCES
[1] Dastgir Pojee, Farooq Shaikh, Mohd. Abbas Meghani, Sajjad
Zulphekari, “Intelligent disaster warning and response system with
dynamic route selection for evacuation,”pp. 383- 387,April 2017. [1st
IEEE international Conference on Industrial and Information Systems]
[2] “SMS Disaster Alert System
Programming ”http://SMSdisasteralert.org/teams/sms-disaster-
system-sers/
[3] “Intelligent disaster warning and response system with
dynamic route selection for evacuation,” Proceedings of the International
Conference on Intelligent Sustainable Systems (ICISS 2017)
[4] http://www.itu.int/pub/T-FG-DRNRR-2013 (Technical Report on
Telecommunications and Disaster Mitigation).
[5] AnasAloudat and Katina Michael, “Toward the Regulation of
Ubiquitous Mobile Government: A Case Study on Location-Based
Emergency Service in Australia,” Journal of Electronic Commerce
Research, Vol. 11, Issue 1, Article 3, pp. 31-74, Jan. 2011.

National Conference On “Recent Innovations In Engineering Science & Technology" April 2019
94 Computer Engineering
Abstract— User authentication becomes more and more
important to protect the data of the users, with the rapid
development of internet technologies, social networks, and other
related areas. For legal users and defence against intruders
password authentication is one of the widely used methods to
achieve authentication. Many password cracking methods
developed during the time, and people have been designing the
counter measures against password cracking all the time. Many
organizations enforce complicated password-creation rules and
require that passwords include numeric and special characters
to guard against such attacks. It has been already demonstrated
that as long as passwords are not difficult to remember, they
remain vulnerable to smart dictionary attacks. Using tools such
as dictionaries or probabilistic models, attackers and password
recovery tools reduces the number of attempts that are needed
to guess a password. To move with this strategy we are
presenting a password scheme that achieves this goal. The
proposed system is based on intermixing between a fixed text
(conventional part of a password) and a free random text (newly
added) at different pre-defined indices having different per-
defined lengths. The extension of the random text adds an
additional level of difficulty in breaching the password. We also
added three more techniques to strengthen the proposed
password scheme. We are also using CAPTCHA, keystroke
pattern and security questions along with salt segment. We are
trying to have more secure system combining this four
techniques.
Keywords— OTP, GPS, OMG, ERP, Captcha.
I. INTRODUCTION Authentication can be defined as verifying the validity of a
user by using at least one form of the identification methods.
To grant access to the system, the users identity should be
verified by determining the following factors:
1) Knowledge-based factors: It is defined as what the user knows.Some of them are any forms of a password, personal identification number, answer to the secret questions and many more.
2) Possession-based factors: It is defined as what the user has.Some of them are an identification card, security token, device token or any unique hardware identifier.
3) Inherence-based factors: It is defined based on what the user is or how he does. Some of the physiological factors are fingerprint, iris and DNA patterns and some of the behavioural factors are biometric identifiers, signatures, voice and face Authentication can be a combination of the above. The types of authentication categories include:
• Single-factor authentication: To authenticate the user trying to login to the system only one factor is used. It is more prone to different cyber attacks.
• Two-factor authentication: Two authentication factors combines to increase the level of security in the system. A practical example of this implementation is the real-time banking login where some banks generate a onetime password (OTP) while the user logins in by typing the correct password. OTP gets generated,when the password entered is valid and if the user enters the generated number from his device correctly, he has the access to the system.
• Multi-factor authentication: Many authentication mechanisms combines to form a layered approach. The plethora of functionalities offered by multi-factor authentication includes protection from intrusion, enhancement of security, and reliable false proof system. Our system focuses more on this multi-factor authentication to develop a robust system to identify the users via using machine learning algorithms. The basic idea is to add three factors of authentication by correctly entering the password, verifying the device, and then identifying the user’s typing pattern.
A strong authentication procedure goes by typing a
password, which is strongly resistant to the cyber attacks and
also the way of typing it. This double-layer protection offers
more security from all Internet attacks such as brute-force,
dictionary attack, and physical shoulder surfing. In brute-
force attack, a hacker tries out all the possible password
New Approach To Strengthen The Password
Wagh Snehal, Kame Apeksha, Gandhi Shruti, Tonpe Smita, Thombare Manisha
[email protected], [email protected], [email protected], [email protected], [email protected].
Computer Engineering Department.
Nashik District Maratha Vidya Prasarak Samaj's
Karmaveer Adv. Baburao Ganpatrao Thakare College of Engineering, Gangapur Road, Nashik 422005.

National Conference On “Recent Innovations In Engineering Science & Technology" April 2019
95 Computer Engineering
combinations and are more easily guessable if the attacker
knows what we know. The dictionary attack consists of
trying the common passwords in the world which work in
most of the cases [6]. In Shoulder surfing, the attacker looks
for the password while one is typing it. One of the best
solutions for all these attacks is to combine the various
authentication schemes. By doing so, even if the attacker
looks at or knows our password he or she cannot break all
authentication schemes at once.
II. HISTORY & BACKGROUND
Chowdhury E. M. W. R., Rahman M. S. and Islam A.
B. M. A. A. [1] performed a study on Traditional
password system which is completely deterministic.
Therefore, when a person looks at a password, he knows
the complete information about the password that is
worth of being copied and later used as is. However, what
if some salt was added to the secret password so that parts of the password remain deterministic (the secret text),
while some other parts become arbitrary (the salt)? Salty
Secret, a novel authentication system, which enables use
of aribtrary characters in user specified parts of password.
The remaining parts, which contain the actual secret
password, remain deterministic.
Reeder, R. and Schechter S. [2] developed a Secret questions (a.k.a password recovery questions) have been
widely used by many web applications as the secondary
authentication method for resetting the account password
when the primary credential is lost.
Zhao P., Bian K., Zhao T., Song X., Jerry Park J. M.,
Li, X., Yan W. [3] have also conducted studies on a
secrete questions are generated by using the short term smartphone usage by the users.When an user forgot the
password and trying to recover the password, most
system uses the secrete questions to recover the
password. But the secrete questions which most systems
are using are gussable by the persons which are very
close to users. But here smartphones short term usage are
recorded and through this secrete questions are generated
like How many apps are currently installed? Who was
your most frequent contact last week? etc. Blank-filling,
true/false, and multiple-choice questions are used to
generate using smartphones battery, app, call, sms
calender, GPS, etc.
Krishnamoorthy S., Rueda L., Saad S. and Elmiligi H.
[4] designed keystroke dynamics based authentication
was tested using .tie5Roanl password and the best
classification performance metrics obtained were from
the random forest classifier.
Yohan Muliono, Hanry Ham, Dion Darmawan [5] The
proposed method is that to implement an authentication
system using keystroke typing behaviour1. Keystroke
typing behaviour can be defined as the unique
characteristic of each user in typing each keystroke
provided in the keyboard.
Dailey M. and Namprempre C. (n.d.).[6] Author
propose a new construct, the Text-Graphics Character
(TGC) CAPTCHA, for preventing dictionary attacks
against password authenticated systems allowing remote
access via dumb terminals.
Baykara M., Alniak F., and Cinar K, [7] An image
based CAPTCHA was developed. In this captcha method,
which is created with high noise value, it is very difficult
to solve with OCR because the noise does not decrease
even when the picture is converted to binary.
VII. PRESENT SYSTEM
1.INTRODUCTION :
In computer systems, the most frequently used method,
textbased password system is the authentication method. A
common threat model is an attacker who steals a list of hashed passwords, enabling him to attempt to crack them
offline at his leisure.
It is believed that password composition makes password
hard in guessing and hence make them more secure, different
password composition policies or the individual requirements
have provided the level of resistance to guessing that
researchers has struggled to quantify [9].
Our approach is use of multi-factor authentication
system. In this approach we are going to use multiple
authentication schemes insted of traditional password
approach. We are mainly using the salt generated scheme
which generated the password in two parts, one is provided
by user and another part will be generated by system. A
combination of users password with salt will produces the password which will defend the password attacks. With the
salt generation we are also added the key stroke analysis and
CAPTCHA scheme to stregthen the password scheme. For
recovering the password we had proposed the secrete
question approach to recover the password.
The objectives of this system include: • Strengthen the password based system.
• Balancing the user friendliness of password with its strength.
• Combining static and continuous authentication.
A. SYSTEM ARCHITECTURE :
We are mainly using the salt generated scheme which
generated the password in two parts, one is provided by
user and another part will be generated by system.
Fig. 1. System Architecture

National Conference On “Recent Innovations In Engineering Science & Technology" April 2019
96 Computer Engineering
B. MODULES DESCRIPTION : (A) Salt Generation: System will generate the salt with users password, salt will be generated randomly by system. Every time salt password is different than previous one to make sure that noff one guess the password as previous and current password is di erent every time.
(B) Key stroke analysis: Key stroke pattern are recorded of the user at the time of registration and are match every time when user enter the username while accessing the system. If pattern are matched then only access is granted.
(C) CAPTCHA: Text CAPTCHA are generated randomly, user need to give proper input otherwise system will generated the message about wrong CAPTCHA entered
(D) Security Questions: When user forgot the password, to recover the password he/she has to answer the security questions. We store the answers of security question at the time of registration
III. (A) WORKING OF CAPTCHA
CAPTCHA stands for Completely Automated Public Turing
Test to Tell Computers and Humans Apart which is also
known as a type of Human Interaction Proof (HIP).
Fig. 2. Flow of CAPTCHA
Its goal is to check whether a user (of an app or a
website) is a real person or a bot. For that, it completely
relies on specific traits that people have but machines
don’t. It’s most widely used in the web industry as a good protection against spam, bots or DOS attacks. The most
common example is the DOS (The Denial of Service),
which is a type of attack which is focused on making a
resource unavailable. The attacker sends a large amount of
requests to the server to make it incapable to return results.
It simply blocks your website. This attack done by an
individual, by a real person, would be a horror. It would be
boring, exhausting and impossible. The person can’t
manually make the efficient amount of requests, but
computers don’t get exhausted or bored. They make
hundreds of requests every second. CAPTCHA helps you to identify these behaviours and block them.
This scheme is simple. You can type some data or you can perform any other action and then confirm it by just passing a CAPTCHA test. The most common type of test is an image of a lots of distorted letters. Humans are easily able to read the above words and write them down, while for computers it’s just a mass of zeros and ones. You always have to remember how machines work.
CAPTCHAs challenges shouldn’t be limited to any fixed number but if they are it would be easy to teach a computer which text corresponds to a given image. Hence, many creators use sophisticated algorithms to generate their distorted texts in random manner. Creators of reCAPTCHA figured out another idea by using the process of digitalizing books and also asked users to decrypt the short pieces.
III. (B) KEY STROKE PATTERN ANALYSIS
Verification phase is all about checking the identity of the
user. The pattern of the user to be verified is compared with the person’s individual template. Keystroke verification techniques are grouped under two domains:
• Static
• Dynamic or Continuous
Static verification: approaches analyse keystroke verification characteristics only at specific instances, thus proving as additional security besides traditional username/password as in the case of user login sequence.
Keystroke dynamics: is a biometric based on the assumption that diverse people type in matchless characteristic manners. Keystroke dynamics is mostly applied to verification but identification can also be made possible.
This authentication system consists of three steps:
• Feature Extraction
• Pre-processing
• Feature Subset Selection (GA)
Feature Extraction: The input data is usually represented by a sequence of typed keys, together with appropriate timing information expressing the exact time at which keys have

National Conference On “Recent Innovations In Engineering Science & Technology" April 2019
97 Computer Engineering
been depressed and released. From the input data, some of the features will be extracted.
– Duration of typed keys (how long a key is held down)
– Latency between two consecutive keystrokes (the elapsed timebetween the release of the first key and the depression of the second key)
– Digraph
– Tri-graph– Pressure of keystroke – Force of keystroke. Following Figure shows the extracted features: keystroke
duration (duration) and keystroke latency (interval) of the word IVAN.” The complexity label is assigned as CL= (1, 1, 1).i.e. the distance from I and V, V and A, A and N is longer.
Fig. 3.Extracted features of the Keystroke Dynamics
IV. RESULT AND ANALYSIS
This system is designed for the private organizations or
companies where security is the main aspect.Suppose some
client of the company wants to upload some file then firstly,
he would register as a new client and would go through the 4
features i.e primarily he would go through key stroke
analysis. Later,through salt generation, captcha and unique security question whose answers are known to authorized
user only. This system tries to maintain tight security aspect
so that if anyone tries to breach the password then also they
can’t login successfully.
The Result Analysis of the system is as follows:
1] Keystroke Analysis: It is the initial stage where client
registers and when they set the username and password for
their account at the back end the time of key pressed and key
released is stored in the database.Later the average time is
calculated each time when the user login.This calculated time
is compared with time stored in the database at the initial stage.For the comparison a particular threshold range is set, if
the time matches the threshold value then only the system
ask for the password.
2]Salt Generation: It is a random password generated by
the system each time.After entering the user password ,the
system password is generated and at the back end a
combination of user and salt password is made.Even after
getting the newly generated salt password it is difficult for
an unauthorized user to predict the user password.This is the
second phase of authentication process.
Example: If user password :amol12
Salt generated password:Vmea32koglr1
3]CAPTCHA: After the password validation the third
phase is captcha where it is used to verify whether the user is
human and not a bot.CAPTCHA is used in both the cases while registering and while login.CAPTCHA can be of
various types but we are using the image captcha with tilted
line.
4]Security Questions: As we know they are many basic
security questions but we are using unique question whos
answers are known to authentic user only where the answers
are stored in the database itself.When the user forgets
password it can be recovered using the security questions.
Example:What is the brand of your first phone?
V. CONCLUSION
Many web based applications are still using password
based authentication system; we need to provide the strength
to the system. So we propose a new way to strengthen the
password with randomly generated salty password ,where a
different combination each time is made for the system. We
also check the keystroke pattern in background with
CAPTCHA in front end.Though an unauthorized user tries to login he can be detected in the first stage itself. Which
provides more secured way to the user. If user forgots
password we make the use of security questions for recovery
of password. Combining all this techniques our system gives
more secured authentication environment model.
REFERENCES
[13] Chowdhury E. M. W. R., Rahman M. S. & Islam A. B. M. A.
A.,"Salty Secret: Let us secretly salt the secret", International
Conference on Networking, Systems and Security (NSysS) ,
2017
[14] Reeder R., & Schechter S. "When the Password Doesnt
Work:Secondary Authentication for Websites" 2011.
[15] Zhao P., Bian K., Zhao T., Song X., Jerry Park J.M., Li, X.,
Yan, W. "Understanding Smartphone Sensor and App Data for
Enhancing the Security of Secret Questions" IEEE Transactions
on Mobile Computing, 2017.
[16] Krishnamoorthy S., Rueda L., Saad S. & Elmiligi H.
"Identification of User Behavioral Biometrics for
Authentication Using Keystroke Dynamics and Machine
Learning". Proceedings of the 2018 2nd International
Conference on Biometric Engineering and Applications -
ICBEA 18.
[17] Yohan Muliono, Hanry Ham, Dion Darmawan,"Keystroke
Dynamic Classification using Machine Learning for Password
Authorization",3rd International Conference on Computer
Science and Computational Intelligence 2018, ICCSCI 2018,
07-08 September 2018, Jakarta, Indonesia.
[18] Dailey M. & Namprempre C. (n.d.), "A text-graphic character Captcha forpassword identification". 2004 IEEE Region 10 Conference TENCON 2004.
[19] Baykara M., Alniak F. & Cinar K.,"Review and comparison of captchaapproaches and a new captcha model". 2018 6th International Symposium on Digital Forensic and Security (ISDFS).
[20] Tari F., Ozok A. A. & Holden S. H., "A comparison of perceived and realshoulder-surfing risks between alphanumeric

National Conference On “Recent Innovations In Engineering Science & Technology" April 2019
98 Computer Engineering
Automatic Solar tricycle for Physically Challenged
People Prof.P.P.Shinde,Varsha Bhamare ,Sayali Shinkar ,Leena Nikam ,Nikita Wadile
[email protected], [email protected], [email protected],nikitawadile1997 @gmail.com [email protected]
Department of Computer Engineering
NDMVP’S KBT CoE, Nashik.
Abstract— The percentage of handicap peoples in India as well as in world it’s a big problem. But that handicap people can be work efficiently and regular life as all leave. So here in this paper we have survey different technologies and vehicle systems presently available for handicap people[6]. Also we have compared their advantages and disadvantage of the different vehicle systems. Proposed system report to design and built tricycle prototype that is capable of driving automatically. The existing tricycles are not efficient for disable person and it is inconvenient to cover long distance for them. Considering different disable persons needs, our proposed model come with features which will reduce the human effort and make their life easy. The automatic tricycle will employ use of solar panel to charge battery which will be used to run motor .Also it automatically handle headlight according to light intensity. It will check light intensity of surrounding and based on light intensity, headlight will be automatically on or off .It will detect obstacle and will get stop automatically. The turns of tricycle are controlled by user and this will be done by using hand gesture. So, proposed tricycle will give comfort to disable person and also normal person .
Keywords—Solar panel, Raspberry-pi, Pi-camera, Tricycle, Motor ,Python.
I. INTRODUCTION
Our project review is about tri-cycles which operate on solar energy. Today’s time electricity plays vital role in our day to day life. To generate electricity is the main challenge and it’s
important for human being for living effortless life. To generate electricity solar is the best, easily available, cost free and eco-friendly option. Tri-cycle used by immobilized persons as well as daily workers also. Lots of solar tri-cycles are present in market but those have many disadvantages. Paddling solar tricycle is present at market which requires human effort to drive[5]. It requires man power to drive the
cycle. . A motorized tricycle requires fuel to drive. Fossil fuels are Non-renewable, costly, combustible source which act as pollutant. Combustion of fossil fuels play important role in pollution which causes global warming. An electric motor cycle requires electricity for operating. As per Fuel electricity is also significant. it is costly. All this information collected by
studying of different paper maintained in references. So overcome these disadvantages we are planning to develop a
solar tri-cycle which is instructed by hand gesture. We will use solar panel to charge battery. This battery is use to run motor which is use to run tricycle. We are using ultrasonic sensor to detect obstacle. After detecting obstacle it will stop automatically. Movements (turns) of tricycle will controlled by user. User can control turns of tricycle by using his/her hand movement[4]. If he/she indicate finger to right then tricycle will turn to right automatically and if indicate to left then
tricycle will turn to left automatically. Also headlight will on/off automatically. . When light intensity is low then headlight will turn on automatically and if high then headlight will turn off automatically. Switches also provided to tricycle.If hand gesture did not recognized then user can use switches for taking turns.
II. RELATED WORK:
Solar panel and battery Solar power is the conversion of energy from sunlight into electricity, either directly using photovoltaic indirectly using concentrated solar power, or a combination[1]. We are using solar panel to convert the solar energy to the electrical energy by using solar cells, then converting this electrical energy to mechanical energy.
Ultrasonic Sensor(USN): As the name indicates, ultrasonic sensors measure distance by using ultrasonic waves. The sensor head emits an ultrasonic wave and receives the wave reflected back from the target. Ultrasonic Sensors measure the distance to the target by measuring the time between the emission and reception. So we are using USN for object detection. When obstacle is detected by USN then interrupt is generated and raspberry pi stops working and so tricycle will stop automatically.
Light dependent resistor(LDR): LDR is basically a photocell that works on the principle of photo-conductivity. The passive component is basically a resistor whose resistance value decreases when the intensity of light decreases. This optoelectronic device is mostly used in light varying sensor circuit, and light and dark activated switching circuits. In our project LDR will check light intensity of surrounding and based on light intensity headlight will automatically on/off.
Pi Camera:
The Raspberry Pi camera module can be used to take high-definition video, as well as stills photographs. It’s easy to use for beginners, but has plenty to offer advanced users if you’re

National Conference On “Recent Innovations In Engineering Science & Technology" April 2019
99 Computer Engineering
looking to expand your knowledge. There are lots of examples online of people using it for time-lapse, slow-motion and other video cleverness. You can also use the libraries we bundle with the camera to create effects. We are using pi camera for capturing hand gesture images.
III.METHODOLOGY:
System Architecture:
System architecture is conceptual model that defines the structure, behaviour and more views of system. System architecture can consist of system components and systems developed that will work together to implement overall system.
Fig.1. System Architecture
Fig 1.System architecture
Block Diagram: A block diagram is diagram of a system in which principal
parts or function are represented by blocks connected by lines
that show relationships of blocks..
Fig 2.Block diagarm
Handgesture diagram: Gestures a non-verbal form of communication provides the HCI interface.The goal of gesture recognition is to create a
system which can identify specific human gestures and use them to convey information or for device control[2][3].
Fig 3.Handgesture diagram
IV.ADVANTAGES:
It will reduce human effort as tricycle will operated through hand gestures.
Tricycle will be easy to handle..
As tricycle will stop automatically when obstacle is detected. So accident risk will reduce.
As using solar panel in our tricycle, It will not create any type of pollution.
Solar energy is better replacement for oil.
V. LIMITATIONS:
This system has following limitation:
Hand gestures will not be recognised properly when light intensity is low.
Although solar energy is an unlimited resource, it is not always available when its needed.
It will not be useful for blind people.
VI.APPLICATIONS:
Applicable for:
• Designed tricycle will useful for physically disabled person.
• Tricycle will also be useful for normal person.
• Proposed tricycle model can be used as green vehicle.
VII.CONCLUSION: By studying of different papers and techniques we decide to make project on Hand gesture controlled solar tricycle which removes different disadvantages.We will produce a tricycle that will be effective in providing mobility for a persons who have physical

National Conference On “Recent Innovations In Engineering Science & Technology" April 2019
100 Computer Engineering
disabilities.Proposed Tricycle model can be used as a green vehicle in developing countries due to its zero pollution effect nature.Hand gesture can recognized easily, and action performed depends on gesture movement is primary focus of our project. Also obstacle can be detected using ultrasonic sensor and cycle will stop automatically.
VIII.FUTURE WORK:
In future, this robotic vehicle can be enhanced by adding following functions:
• In future,tricycle can be modified into bicycle which will
be balance automatically.
• By adding map features we can also used tricycle for transportation purpose.
REFERENCES:
[1] Mahadi Hasan Masud, Md. Shamim Akhter, Sadequl Islam,
Abdul Mojid Parvej, Sazzad Mahmud “Design, Construction and Performance Study of a Solar Assisted Tri-cycle”, October 2017..
[2] Yanan Xu , Yunhai Dai “Review of Hand Gesture Recognition
Study and Application”,May 2017.
[3] Samata Mutha, Dr. K.S.Kinage “Study on Hand Gesture Recognition”, January 2015.
[4] G. Pires, U. Nunes “A wheelchair steered through voice
commands and assisted by a reactive fuzzy-logic controller”, May 2013.
[5] Alisaa, K., Ankita R., Shivangi, S. ”Solar Powered Vehicle.”
International Journal of Electronics Electrical and Computational System. 3(3), pp. 110-115. 2014.
[6] Bachche, A. B., Hanamapure, N. S. ”Design and Development of
solar assisted Bicycle.” International Journal of Engineering and
Innovative Technology (IJEIT). 2(6), pp. 452-457. 2012.April-2013.

National Conference On “Recent Innovations In Engineering Science & Technology" April 2019
101 Computer Engineering
DIGITAL CAR PARKING SYSTEM
Aarti Nerkar, Preeti Netke,Pratiksha Nikam,Akanksha Ahire, Madhuri Malode
[email protected] , [email protected] , [email protected] , [email protected] ,
Computer Engineering
NDMVPS’s KBTCOE, Nashik
Abstract— With the help of Internet of Things many devices and
services are able to connect at any time in any place. Now a days
population is increasing at a rapid pace and so aretechnologies. Due
to this use of vehicles is also increasing. People are facing the issues
regarding to the parking of their vehicles. So, we approach a special
system for smart car parking reservation and security maintenance in
a car parking area. This system mainly designed to avoid unnecessary
time consumption to and an empty slot in a car parking area. By the
same case we can also save more than 80 percentage of fuel wastage
in a car parking area to find the empty parking slots. The reservation
process is happening only by user. Hence the user find an empty
parking slot and makes the action of reservation through an internet
access with driver's own knowledge. For this use of cloud is done for
data processing. We have proposed a system with multi-processing
queuing mechanism (MPQM) to avoid Multi-user approach Problem
(MUAP) during reservation process in our smart parking reservation
system.
Keywords— RFID (Radio Frequency Identification), MPQM (Multi-processing Queuing Mechanism), MUAP ( Multi-user Approach Problem), IoT (Internet of Things), QR Code (Quick Response Code)
I. INTRODUCTION
The parking problem in big cities, especially the mega-cities, has
become one of the key causes of the city traffic congestion, driver
frustration and air pollution. In the future, it is expected to have
an increase in the demand for the intelligent parking service
because of the rapid growth in world population as well as the
automotive industries. An effective solution to this service can be
provided by many new technologies. First, the nearest parking
area will be found. After finding nearest car park, we can directly
search only nearest car park for an empty spot. By doing this, we
directly skip the car parks which are not close enough to driver.
This method makes the search easier, faster and more efficient.
Time is the most valuable metric in our project . we consume less
time while finding nearest empty spot in car park. Saving time
while parking a car means that we save energy, fuel, even less
CO2 emission. As a
summary, main objective of this project is not only saving
time but also wrapping different locations or areas with a
common software and investing the land or area for parking
vehicles in a fraction of seconds. This will revolutionize the
business perspective.
II . HISTORY & BACKGROUND
[1]In 2016,Abhirup Khanna and Rishi Anand address the issue
of parking and present an IoT based Cloud integrated parking
system and propose the system provides real time information
regarding availability of parking slots in a parking area. Users
from remote locations could book a parking slot for them by
the use of our mobile application. [2] In 2017, D. Vakula ,
Yeshwanth Krishna Kolli proposed a paper Low Cost Smart
Car Parking System. In this ,studying and analysing the
current parking problems in various cities and problems are
categorized as Search of Parking space and Parking Fees. In
this paper, an online based parking booking and management
system are presented to address the parking issues in city and
for deployment in Smart Cities. [3] The authors Burak
Kizilkaya, Mehmet Caglar, Fadi Al-Turjman explain about an
Intelligent Car Park Management System based on Smart
parking system, green IoT , smart cities, android parking
describes the use of android application and smart phones for
the purpose of parking ,in 2018.
III. PROPOSED SYSTEM ARCHITECTURE
We are proposing a system for parking the vehicles safely
which includes three types of users-
[21] Admin [22] Parking slot owner [23] Vehicle owner.

National Conference On “Recent Innovations In Engineering Science & Technology" April 2019
102 Computer Engineering
the parking slot owner , viewing the book or unbook the slots,
viewing all the transactions and feedbacks. 2. Parking slot owner
can add the slots ,delete the slots ,view book or unbook slots ,can
see all previous transactions ,add user to blacklist and can also
view the feedbacks. 3.User will use an android application for
booking the parking slots in nearby locations. We can book the
slots from home without actually going to the location just by
entering the user's information. The car before entering the
parking area will scan the QR Code which was sent to the email
of the user. The payment regarding to this will be done after the
car departures the parking area which can be manual or online
depending on the choice of the user.
Fig. 1. System Architecture
IV. RESULT In Digital Car Parking System, user can pre-book the parking
slot using an Android application without actually going to the
location and can park his/her vehicle safely. Also,by using QR Code the payment can be done according
to the choice of user.The LIVE update (car) is provided hence
security is provided hence security is maintained.
CONCLUSION The concept of IoT concept is going to become an important
part of our daily life, and work life. It can be employed
e_ciently to create more comfortable environment and living
spaces. On the other hand, our planet needs some green
solutions because energy e_ciency is a very important concept
nowadays as we are running out of energy resources.So
introduces an energy and time e_cient approach which can be
used in car parking applications.Development of the Smart
Parking System that typically obtain the information about
available parking spaces in college areas and placing the
vehicle in a real time at available position by making the use
of sensors like Ultrasonic sensors, RFID tags and the concept
like QR code, etc.
REFERENCES [2] Abhirup Khanna, Rishi Anand, IOT based car parking system",
International Conference on Internet of Things and
Applications(IOTA)2016, IEEE. [3] D.Vakula and Yashwanth Krishna Kolli, Low Cost Smart Parking
System for Smart Cities",in 2017. [4] B. Kizilkaya , M. Caglar, “An Intelligent Car Park Management
System", Hierarchical Placement Algorithm based on nearest location in
2018. [5] Sun, Xiang, and Nirwan Ansari. "Dynamic Resource Caching in the IoT
Application Layer for Smart Cities." IEEE Internet of Things Journal in
2017. [6] D. Kanteti , D. V. Srikar , T. K. Ramesh, Intelligent Smart Parking
Algorithm, CMOS Sensors , Speed Sensors ",in 2017.Mixed-mode
programming", D. Klepacki, T.J.Watson Research Center presentations,
IBM 1999. [7] S. Lee; D. Yoon, A. Ghosh, Intelligent parking lot application using
wireless sensor networks", on Collaborative Technologies and
Systems2008,pp. 8-57,19-23 May 2008, Chicago

National Conference On “Recent Innovations In Engineering Science & Technology" April 2019
103
Computer Engineering
Smart tool dispenser machine using AI and IoT
Prof.S.A.Talekar,Neha Chavan ,Neha Darade,Piyusha Kapadnis,Shikha Gupta
[email protected], [email protected], [email protected],[email protected]
Department of Computer Engineering NDMVP’S KBT CoE, Nashik.
Abstract— In most cases, regardless of sector or industry, the
most common areas waste in business is inventory wastage
especially on product-based businesses, inventory can be massive
waste. These might occur due to materials are not being used
effectively or throwing out excess inventory that perishes or
expires. Currently available vending machines don't provide
facility to control stock and real time analysis for Business
Intelligence. Proposed system is designed to give more user
friendly experience to employee by voice user interface along
with proper tool dispenser. It will provide real time alerts in over
stock and understock conditions which helps for efficient stock
management. System will also work 24*7 so the productivity will
get increase. Digital signage helps to generate new revenue
sources. Real time report generation will provide better offering
by identifying top required and least required tools.
Keywords— Artificial Intelligence, Business Intelligence, Digital
signage, Internet of Things, Stock management
I. INTRODUCTION
The modern vending machine comes in a drastic range of shapes and sizes, but most people know how to use them. This is because the steps in using vending machines are universal: insert money, and then press buttons corresponding to an item's label [1]. However, the overall design of vending machines has AWS. First, all interactions with vending machines are based on visual clues and physical interaction. This interaction model causes
problems for persons who are visually impaired. Furthermore, those people who have trouble pressing buttons will struggle using vending machines. Second, it is impossible on most, if not all, vending machines to order multiple items at once due to the constraints of the steps and logic operating the machine. Additionally, these vending machines no longer feel ″modern," and some users describe them as ″boring"[2]. With the explosive growth in computer vision, hearing, and other artificial
intelligence technologies, it is surprising that vending machines have been left behind. To help make vending machines more accessible to users, convenient, state-of-the-art, and generally fun to use, we set out to create Smart tool dispenser machine. Through a system of voice and intent recognition, as well as a system for gesture detection, users no longer need to manually
press buttons, but can instead order snacks as if they were interacting with a cashier. Recently, this vending machine culture is changing its phase from a simple ″convenient
unmanned shop" to a station providing several services such as a) food supply to disaster area b) various kinds of information c)support to emergency patients d) security service for outskirts etc. Similarly to increase the market sharing of the industry, as a critical issue of business strategy, improvement and enhancement of supply chain management is a must to provide a better and user-friendly products or services [3]. However, in vending machines industry, a better replenishment schedule is a
key component to fit in with a frequency and quantity control. Thus, it is important for the industry to review the replenishment policy and system of the vending machines. Traditional replenishment process is based on the estimation from historical inventory records. The main problem of the existing approach is using periodic review policy to replenish the goods of the vending machines. Periodic review policy is suitable only when the demand is very stable and the replenishment cost is very
high [4]. However, the periodic review policy is not suitable to fit in the vending machine industry. The demand of the products of vending machine is very fluctuating and the cost of replenishment is quite high. The problems of the existing approach caused by periodic review policy are (i) Stockout occur frequently, (ii) Unreliable inventory control, (iii) Unreliable replenishment policy and (v) Low cost effectiveness. Thus, accurate and instant inventory information is another
important issue to enable a reliability of product availability. Supplier can use the realistic information to better anticipate future demand. Therefore, it is critical for the vending service companies to construct a real time information network to perform a better supply chain management with a better replenishment strategy.
II. History & Background
It is said that the origin of the vending machine goes back to B.C.
So vending machine is basically designed to provide services to many people and call it as `convenient unmanned shop'. The reference paper given below describes several services which existing system
provide to the customers. [5] Toshio Yokouchi, in "Today and

National Conference On “Recent Innovations In Engineering Science & Technology" April 2019
104
Computer Engineering
Tomorrow of Vending Machine and its Services in Japan", 2016. The above system is having environmental issue like power consumption. The system mentioned in the next reference overcomes the previous drawback thereby reducing a power consumption.[6] T.C.Poon, K.L.Choy,S.I.Lao in,"A real-time replenishment system for vending
machine industry",2010 Also stock-out occur frequently which causes unreliable inventory control therefore accurate and instant tracking of inventory information is dificult.[7] kwan-gsoo kim dong-hwan park1, in "smart coffee vending machine using sensor and actuator networks",2014 this system is able to store the information related to coffee which previous system was unable to store. As the wired network is installed on the machine which is costly this might be the limitation of such system. [8] robert gruen, erich liang,"nuivend - next generation vending machine",2016 the nuivend
system mentioned in the above reference is providing a natural user interface (nui) through system of voice and intent recognition which overcomes the previous system drawback of manual operation. This system may cause error while processing natural language. So we are trying to achieve NLP in our proposed system without fail.
III. DESIGN ISSUES
Automation is most important need nowadays which reduces human efforts and improve correctness of operations. Using feature of Internet Of Things(IoT) like QR code scanning we are going to provide security to tool dispenser machine .One of the Artificial Intelligence feature like Natural Language processing is a way to recognize human voice and take appropriate actions based on that so proposed system provide voice user interface which allow smooth interaction between human and machine.Sppech recognition and
speech synthesis API provided by google are to be used in this system which uses Hidden Markov Model algorithm for speech recognition[9] Proposed system is to make intelligent and robust (continuous operation with very low downtime, failure rate ,high insensitivity to continuous changing environment) device which allow customer to achieve great user experience, 24* 7 service and real time reports for business intelligence. Natural language processing algorithm of
artificial intelligence will be provided to convert employee voice commands into text for recognition of tools. Security and safety will be provided by QR-code identification which helps to only authorized employee can unlock the machine. In this way AI and IoT helps to increase productivity and decrease employee downtime.
Fig.1. System Architecture
Proposed system architecture as shown in Fig.1 consist of following modules:
i. QR CODE SCANNING/UNLOCK MACHINE In this module employees scan QR-code to unlock the machine and employee get login access. Details of employee are checked at the back-end and authorized employee get permission for further
operations ii. VOICE USER INTERFACE After successful login of employee selection panel will display all the available tools and give user choice of selecting required tool. User can required tool by giving proper voice commands. Using Natural language processing [10] which is application of AI for speech recognition user voice command is converted into machine understandable format for tool recognition. iii. TOOL RECOGNITION AND DISPENSE
By converting voice command into machine understandable code availability of particular tool is check at the backend and if available dispense tool and update database. iv. ANALYSIS AND REPORT Using database at backend tool which is most required by employee are analyze and accordingly stock management notifications will be provided based on availability. Also personnel accountability is maintain to recognize which
employee used which tool most of the time. Detail workflow of proposed system is explain in Figure 2.
Fig 2. Workflow of proposed system

National Conference On “Recent Innovations In Engineering Science & Technology" April 2019
105
Computer Engineering
IV . RESULT AND ANALYSIS
As the tools are dispensed tools count get decresed and is updated in
database and displayed at admin side.The following Fig 3 shows the pie-chart of overall tools dispensed monthly in year 2018.The different colours helps to identity months and the total tools dispensed are shown in percentage format.
Fig 3. Pie-chart The following Fig 4 shows the chart of tools count monthly wise.In any particular month how many tools dispensed (i.e count) which is shown spline chart.The count helps to manage stock from overall stock.
Fig 4. Spline-chart When user speak the tool name the machine records the sound and
give proper reply to user but when the machine can’t able to
recognize the sound due to some factors then the machine will display proper message to user. We have tested for different users input with respect to external parametrs like far from microphone,external noise,wrong ascent etc. which is summarized in below table Table.1
Table 1.NLP Responses
V. CONCLUSION
Proposed system will help to achieve maximum productivity by
providing real time alerts for stock management and efficient use of stock. Maximum profit will be achieve by reducing stock wastage and digital signage when machine is inactive. Machine will work 24*7 which help to reduce employee downtime. By using NLP we will customize user experience by providing voice user interface and real time reports will be generated for BI.
REFERENCES
[1] Blue ,″Using a Vending Machine." Online video clip. YouTube.YouTube, 29 July 2015. 28 September 2016.
[2] McGlaun, Shane. "VendScreen Gives Boring Plain Vending Machines Touchscreen Coolness." SlashGear. SlashGear,
22 Sept. 2011. Web. 10 Oct. 2016. [3] Rusdiansyah, A. and Tsao, D. B. (2005), "An integrated model
of the periodic delivery problems for vending-machine supply chains", Journal of Food Engineering,Vol. 70(3), pp. 421 – 434
[4] W. B. (2007), ″Wireless technologies for logistic distribution process", Journal of Manufacturing Technology Management, Vol. 18 (7), pp. 876 - 888.
[5] Toshio Yokouchi ,"Today and Tomorrow of Vending Machine and its Services in Japan ",2010.
[6] T. C. Poon, K. L. Choy, C. K. Cheng, S. I. Lao ,"A real-time replenishment system for vending machine industry ",2010.
[7] Kwangsoo Kim, Dong-Hwan Park1, Hyochan Bang1, Geonsoo Hong, and Seong-ilJin,"Smart Co_ee Vending Machine Using Sensor and Actuator Networks ",2014.
[8] Robert Gruen, Erich Liang ,"NuiVend - Next Generation Vending Machine",2016.

National Conference On “Recent Innovations In Engineering Science & Technology" April 2019
106
Computer Engineering
[9] Zoubin Ghahramani, Michael I. Jordan,”Factorial Hidden Markov Models “,2002
[10] Chandhana Surabhi.M,″ Natural Language Processing
Future″,2013.
.

National Conference On “Recent Innovations In Engineering Science & Technology" April 2019
107
Computer Engineering
Automatic Scheduling System Using AI
Apurva D Kolhe, Chaitali D Patil, Mitali A. Aherrao, Riyanka S. Rai, Ms. D. L. Tidke
[email protected], [email protected], [email protected], [email protected], [email protected]
Department of Computer Engineering
NDMVPS KBTCOE, Nashik – 422013, Maharashtra, India.
Abstract— The traditional method of manually creating a
timetable is very tedious and time consuming, due to this many times
different problems occur like various classes may clash, extra load on
certain teachers and this all may ultimately affect the curriculum of
students. To overcome all these problems we propose an automated
timetable scheduling system. This system will be capable of handling
both hard and soft constraints which are specially required for
preparing timetables in colleges where there is a large number of
students and limited classrooms, labs, and faculties as well as limited
time to complete the curriculum considering the exam period. We
propose a system which will take faculty details, allocated subjects
and number of classrooms and labs available as well as hours
allocated by the university as an input. Once the final timetable is
generated, separate timetables for faculty, labs and different classes
will be available as an output. It will also keep a track of previous
year’s generated timetables.
Keywords: Agile, Genetic Algorithm, Hard constraints, Random
Adaptive Search, Soft constraints.
I. INTRODUCTION
Today almost every facility and institute needs a timetable to
execute any work in a timely and orderly fashion. Especially
in educational institutes where there are different courses, a
large number of students and few teachers. The traditional
method of creating a timetable includes a staff member who is
responsible for creating the timetable; he/she would manually
create the timetable and try satisfying the required structure.
Now usually the person would refer the previous year’s
timetables and with that would create the new one. One
problem with this is that the same old format of timetable
would be repeated again and again with some minute changes.
This would be unfair to that faculty who would have the same
time slot, again and again, every semester or year. We would
primarily look into engineering colleges, where there are
different branches and many times for some classes the
faculties of different branches are also required. In this case, it
becomes very difficult to efficiently create a timetable which
would satisfy all the needs. This process would take a
considerable time of the faculty as well as efforts which rather
could have been used at another important task. It also
requires a lot of paperwork, and in a time like today where
there is such advancement in reducing human efforts in almost
every field then why not here?
The timetable scheduling is considered as a Constraint
Satisfaction Problem (CSP) in Artificial Intelligence because
to generate a single timetable we need to satisfy many
different constraints or conditions, only by which we would be
able to generate an efficient timetable for the required job.
Even during scheduling simplest and smallest constraint can
cause a huge problem because of which an optimal timetable
is even harder to create and find. Hence this problem is also an
NP-Complete problem.
Automatic Scheduling System is a Java-based software
used to generate the university timetable automatically. The
system would help to manage all the periods automatically. It
would make sure that no faculty is given extra load in a day or
treated unfairly. The system will need different inputs like the
details of staff, rooms, labs, subject allocated to the staff as
well as time allotted to each subject from the university. The
constraints to generate the timetable will already be set
according to the specific institute and can be changed later
onwards if institute requests for it. These constraints can be
soft as well as hard. Hard constraints are those which the
system has to satisfy and cannot generate a timetable without
them. Soft constraints can be avoided if they are violating any
hard ones. The system would try to satisfy all the hard
constraints and maximum of the soft ones. While dealing with
the leave request, the system will check which faculty can
substitute the faculty on leave and try to minimize their load.
The system will display the list of prospects and the admin has
to decide which faculty will be best suited for that subject and
the system will generate the new timetable. Selecting a faculty
as a substitute it allows viewing timetable of that faculty to
ensure that the faculty is free at that particular period.
II. History & Background
Timetable generation problem is a highly constrained one, but
above all the problem differs greatly for different colleges,
institutions, and others. It is hard to generate the timetable for
all of these diverse applications based on a single problem.
There exist a lot of different timetabling problems like
university timetable, exam timetable, school timetable, sports
timetable, and worker timetable. Also, there exist different
approaches to problem-solving which use meta-heuristics like
a genetic algorithm, Backtracking, Constraint Logic
Programming. In recent years two major approaches have

National Conference On “Recent Innovations In Engineering Science & Technology" April 2019
108
Computer Engineering
proved beneficial namely Local Search Procedures and
Constraint programming.
Heuristic Procedures
Different heuristic methods are used for solving
computationally hard optimization problems within a
reasonable time frame which is good enough for the problem.
Local Search algorithms like a genetic algorithm, the traveling
salesman problem are also heuristic in nature. These
algorithms move from solution to solution in the space of
candidate solution by applying local changes until an optimal
solution is found. Heuristic methods do not guarantee that the
solution found will be optimal [1][5][6].
Constraint-Based Approaches
One major advantage of constraint programming is that
clear definitions of the constraints serve beneficial for solving
the given problem. This enables the program easy to adjust.
The main disadvantages of this approach are:
1. The difficulty with expressing soft constraints
2. The potential problems that occur while enhancing the
initial basic solution.
The capability to convey composite constraints in a simple,
declarative way is critical for establishing the specification of
the colleges and university timetable problem into the program
and is critical for their successful result [6].
Constraints
There are two types of constraints namely Hard and Soft
Constraints. Hard constraints are those constraints which
while solving any problem cannot be violated in any case. We
can obtain the desired solution when all of these hard
constraints are satisfied. On the other hand, the maximum of
the soft constraints’ satisfaction will be the goal [5].
Different constraints for the timetabling problem are as
follows: Basic mandatory constraints:
1) At a particular slot a teacher, classroom or lab
cannot be allocated more than once.
2) During the break time, no lecture should be scheduled.
3) Teacher's working hours cannot exceed the
institute timings. 4) A load of every teacher must be balanced
weekly.
Some Hard Constraints are as follows:
1) A Teacher must teach a particular class every
morning for a certain time.
2) A specific day’s working hours for a teacher is
fixed.
3) Class Y’s hours are from 5 pm to 7 pm Monday to Friday.
4) Room R is not available on Saturdays.
Some examples of secondary constraints are:
1) If possible, total working hours for a teacher
between 8 am to 5 pm should not exceed 4
hours. 2) If possible, a teacher should not be required to
come in the morning at 8 am more than 3 days a
week.
3) If possible, there should be at least a 30-minute gap between any two lectures for every teacher.
4) If possible, a Teacher or student need not come
to college for a single lecture.
DESIGN ISSUES
There are different methods which can be followed to get a
feasible solution for the timetabling problem. One approach is
to create a semi-automatic timetable. To create effective
timetable requires hybrid approach and therefore the
semiautomatic two-phased user interactive approach is
discussed by Aditya Bhatt and Lakshmi Kurup [2] that first
creates an initial population and then the mutation is done on a
selected solution in the second phase by combining best
approaches.
There is extensive use of hash tables in this approach. Hash
tables are used to store slot availability of each entity and the
constraints associated with it. Here entities are nothing but the
rooms, labs, faculties, etc. They not only simplify the
development but also help in running the algorithm faster as
the time required to search for availability is reduced.
The Hash Tables can be used to store the unavailability or
availability of different entities. For these, availability hash
tables will look like this
For an entity Room R:
Slots from 6 to 8 are removed and slots from 11 to 16
removed.
For Lectures L:
Slots after 6 and before 9 are removed because the lecture L
cannot be allotted in those slots.
Another famous method to solve the timetabling problem is to
use the genetic algorithm completely or to use in combination
with other algorithms.

National Conference On “Recent Innovations In Engineering Science & Technology" April 2019
109
Computer Engineering
Genetic Algorithms are inspired by Darwin’s evolutionary
theory. GA comes under the class of Evolutionary algorithms
that use the principle of natural selection to derive a set of
solutions towards the optimal solution. It is a search heuristic
which generates solutions to optimization problems using
techniques inspired by natural evolution like mutation,
inheritance, crossover, and selection [1].
Initially, the genetic algorithm starts with a set of solutions
which are called as the population. Solutions from one
generation of the population are taken and then used to form a
new generation of the population. This is done in hope that the
new population will be better than the old
population(stronger). The new solutions are selected based on
their fitness to form new solutions (offspring); suitable
solutions will have a higher chance to produce more suitable
solutions and so on. This is repeated until all the constraints
are satisfied.
Algorithm: Genetic Algorithm (GA)
BEGIN
INITIALISE population with random candidate solution.
EVALUATE each candidate;
REPEAT UNTIL (termination condition) is satisfied DO
1. SELECT parents;
2. RECOMBINE pairs of parents;
3. MUTATE the resulting offspring;
4. SELECT individuals or the next generation;
END.
The reasons to use a genetic algorithm for finding the fittest
solution are:
1) There are multiple local optima.
2) The objective function is not smooth (so derivative
3) cannot be applied)
4) The number of parameters is very large
5) The objective function is noisy or stochastic
6) A large number of parameters can be a problem for
derivative-based methods when you don’t have the
definition of the gradient. In this type of situation,
you can find an acceptable solution through GA
which can be improved with a derivative based
method.
GA is able to find fit solutions in very less time. Here fit
solutions are solutions which are good according to the
defined heuristic. Due to the random mutation, we can obtain a
wide range of solutions.
VIII. Result and analysis
The resulting system would have a model as shown in figure 1.
Advantages of the system
1) Eliminate Paper-based process: Manual creation
of timetable involves a huge amount of paperwork as well as manually scheduling the
timetable which would involve many errors. Due
to this, delays may occur and waste resources as well as the time of the institute.
2) Intuitive & User-friendly: It is simple and easy
to use. Very less technical knowledge is required
to operate it. It is very easy to implement in any institutions of any size.
3) Customization & Flexibility: Timetable software
can be fully customized to meet the unique class scheduling needs and suggestions of the
institution
4) Optimal Resource Allocation: Assign teachers and classrooms for periods and optimize the allocation
of resources in the best manner possible.
IX. Limitations
1) It may not be fair in terms of slot generation for
all staff and students.
2) Incomplete data provided by admin would lead to
3) Invalid Constraint specification may lead to faulty algorithm generation.
X. CONCLUSION
The proposed system concludes that for automated
generation of timetable many different approaches are
available like meta- heuristic methods as well as
constraint satisfaction methods. Depending on the
user’s interaction with the system and the system’s
requirements any algorithm can be followed or a
hybrid one can also be created. Thus to get an optimal
solution different algorithms can be used at different phases.

National Conference On “Recent Innovations In Engineering Science & Technology" April 2019
REFERENCES
[24] Deeksha C S, A Kavya Reddy, Nagambika A, Akash Castelino, K
Panimozhi, “Automatic Timetable Generation System”, Journal of
Emerging Technologies and Innovative Research, 2015.
[25] Aditya Bhatt, Lakshmi Kurup, “Interactive Selection of Timetables
Generated Using Evolutionary Multi-Objective Optimization”,
Institute of Electrical and Electronics Engineers,2017.
[26] Anuja Chowdhary, Priyanka Kakde, Shruti Dhoke, Sonali Ingle,
Rupal Rushiya, Dinesh Gawande, “Timetable Generation System”,
IJCSMC, Vol. 3, Issue. 2, February 2014.
[27] Anirudha Nanda, Manisha P. Pai, and Abhijeet Gole, “An
Algorithm to Automatically Generate Schedule for School Lectures
Using a Heuristic Approach”, International Journal of Machine
Learning and Computing, Vol. 2, No. 4, August 2012.
[28] Prof Er. Shabina Sayed, Ansari Ahmed, Ansari Aamir, Ansari
Zaeem, “Automated Timetable Generator”, International Journal
for Innovative Research in Science & Technology—Volume 1—
Issue 11—April 2015.
[29] Akshay puttaswamy, H M Arshad Ali Khan, Chandan S.V, Parkavi.
A, “A Study On Automatic Timetable Generator”, International
Journal Of Science And Innovative Engineering & Technology.

National Conference On “Recent Innovations in Engineering, Science and Technology” April 2019
1
Abstract— In this world of innovation, supportive structures to
implement ever increasing technology are needed. Hybrid
composites are now in huge demand in various fields like aerospace,
marine, automotive, sports, etc and can be used when single fiber
material does not have all the desired properties. Many researchers
studied various hybridization possibilities which revealed
mechanism at the micro level of composites. Different combinations
in different orientation increased the research work to be done for
overcoming future demands. This review paper discusses in details
about hybrid composites with its effect on different parameters.
Discussing work in three types of hybrid composite viz. natural-
natural, synthetic-synthetic and natural-synthetic hybrid composites.
Keywords—Hybrid composites, Natural Hybrid composites,
Synthetic Hybrid composites.
I. INTRODUCTION
Composites can be defined as a structure made out
of different constituents i.e. reinforcement and matrix which
are not soluble with each other. Since the stone-age, mankind
has been using composite materials like for building houses
which were made up of mud and straw or grass. Previously
coconut fiber/ latex rubber was used for automotive
applications but this was substituted by newly developed
synthetic fibers having good performance. Each and every
component of a composite will contribute to its overall
properties [1-5]. The vital thing which makes composite an
ideal component for a structural application is manufacturing
ability to withstand the extreme condition [6]. Composite
materials have taken over the conventional materials in recent
times in various fields like automotive, aerospace, marine,
sports, biomedical, defence industries. Due to ever increase in
demand of specific strength, specific modulus, resistance to
fracture, fatigue, impact, and creep, composites are preferred
in most applications.
Composite materials are generally made up of fibers
and matrix, in which fibers are generally synthetic like glass
fiber, carbon fiber, aramid fiber on the other hand in some
applications. Natural fibers like coir, sisal, cotton, flax, jute,
abaca, banana, hemp, etc. Synthetic fibers are preferred over
natural fibers where strength and high load carrying capacity
are required. But the cost of synthetic fibers is high compared
to natural and also non-degradable in nature. The important
parameters which contribute to the composite of fiber are
fiber length, weight ratio, fiber orientation and interfacial
adhesion between fiber and matrix [7]. It noteworthy that the
principal load carrier in the composites are fibers and on the
side, matrix keeps the fibers orientated and at a desired
location, acts as load carrying medium and protects fibers
from the environmental damage [8].
A huge changeover was reported on the usage of
natural fibers all over the world for the production of
composites [9-11]. Natural fibers are abundantly available
across the world such as jute, coir, sisal, pineapple, ramie,
bamboo, banana, etc. These are generally used in low load
applications like panels, panel roofing sheets, packaging,
automobile components, and railway coach interiors. Some
research shows that natural fibers can easily replace the use of
glass fiber in some application which will reduce the cost of
composite [12-13]. Natural fibers are used in different forms
in fiber-reinforced polymer composites, such as continuous,
randomly oriented and as woven fabric mat [14] The
advantage of natural fiber in context of glass fiber, it is
lightweight, low energy production, and environment-
friendly. The use of natural fibers reduced the weight by 10%
and also reduces the required energy for production by 80%
as compared to glass fiber reinforced composite [15]. Natural
fibers are more focused due to their property of recyclable
and biodegradability. On the other hand, it has some
disadvantages of moisture absorption, thermal stability, and
variations in quality.
Hybrid composites include the composition of two
or more natural or synthetic fibers or both with a matrix to get
the expected properties for a given application. Hybridization
of different fibers in a composite has proved to be effective in
designing structures [16]. In recent times, more research is
been going in the hybrid composites, to overcome the
drawbacks of individual synthetic as well as natural fiber
composites. The hybridization of fibers comes with three
possibilities: Natural – natural fibers; Natural – synthetic
fibers; Synthetic – synthetic fibers. The mechanical properties
of hybrid composites of short fiber can be theoretically
evaluated by the rule of hybrid mixtures (ROHM) [17-18].
The hybridization approach is intended for cost reduction of
composites
In this review, research work done with various
combinations of different fibers has been presented regarding
the mechanical properties of hybrid composites.
II.Natural Natural Hybrid Composites
Most of the Natural- Natural Hybrid composites are used
for low loading condition whereas some of them are
specifically used for medium loading conditions. The main
reason for the failure of such hybrid composite is the
interfacial failure at the fiber and matrix due to cellulose and
lignin present in natural fibers. In most of the natural fibers,
cellulose content is present which acts as a barrier to the fiber
and matrix interfacial bond. Treatment of natural fibers with
A Review on Fiber Reinforced Hybrid Composites
Jagdale Shubham1, Sawant Suresh
2
[email protected], [email protected]
Department of Mechanical Engineering
Rajarambapu Institute Of Technology

National Conference On “Recent Innovations in Engineering, Science and Technology” April 2019
2
appropriate methods has shown an increase in the strength
and elastic modulus. The banana fibers reinforced composite
showed a significant increase in their properties when fibers
are chemically treated than untreated fibers [19-24]. Cao et al.
[25] gave heat treatment to kenaf fibers which resulted in
improvement of tensile strength by 60%. Also, heat treatment
of sisal fibers increased the tensile strength by 37% [26].
Fiber strength can also be improved by alkali treatment [27-
28]. The fiber treatment is done to improve the fibers
hydrophobic, interfacial bonding, roughness, wettability, and
also decreasing the moisture absorption percentage to
enhance the tensile properties of composite [29-33].
M. Boopalan et al[34], experimented on jute and banana
fiber reinforced unidirectional epoxy hybrid composites,
fabricated using hand lay-up followed by a compression
molding technique. The tensile, flexural, impact properties for
this hybrid composite was found maximum at 50/50 weight
ratio of jute and banana fibers. The addition of banana fibers
increased the tensile strength by 17%, 4.3% in flexural and
35.5% in impact.
The weaving of natural fibers in different orientations
makes the composites stronger and comparable to those of
synthetic fibers [35-36]. A. Alavudeen et al. [37], investigated
mechanical properties of banana polyester, kenaf/polyester,
and banana/kenaf fiber-reinforced hybrid polyester
composites using woven fabric with different weaving
patterns and found that the weave with plain pattern showed
more tensile strength than twill pattern irrespective of the type
of fiber used. The hybrid composite showed a significant
increase in tensile strength than both banana/polyester and
kenaf/polyester, this increase can be attributed to the load
sharing properties of both banana and kenaf fibers. Also, a
randomly oriented composite was compared with the plain
weaved composite and thus as expected the plain weave
composite had more tensile strength due to stress transferring
properly. On the other side, flexural properties also showed
hybrid composite better than individual fiber composites.
Research has shown that flexural properties of hybrid
properties are influenced by composition and adhesion level
of fibers[38]. Also, a fractography analysis was done to check
the failure analysis at the micro level thus showing that better
fiber-matrix adhesion present in hybrid composites due to
interlocking of fibers.
N. Venkateshwaran et al. [39] investigated the
mechanical and water absorption behaviour of banana/sisal
reinforced hybrid composites for which it was observed that
addition of sisal fiber in the composite, results in 16%
increase in tensile strength, 4% increase in flexural strength
and 35% increase in impact strength whereas for moisture
absorption study of hybrid composite shows the minimum
moisture uptake was by 50:50 hybrid composite.
Less research work has been observed in the natural-
natural hybrid composite. As observed that there is a need for
treatment of natural fibers. Also, the strength of these hybrids
is only limited to low scale applications. Moisture absorption
in such fibers can weaken the structural aspects
III.Natural-Synthetic Fiber Hybrid
Composites
A hybridisation of natural fiber composite by another
natural fiber does not yield superior mechanical properties as
hybridization by glass fiber and carbon fiber [40]. M.Ramesh
et al. [41], compared properties of sisal - glass fiber
reinforced composite with jute - glass fiber reinforced
composite with matrix as an epoxy and found that the sisal –
glass fiber composite gives more tensile strength as compared
to jute – glass fiber composite, whereas jute – glass fiber and
sisal/ glass fiber show slight change in values of flexural
strength. Such composite is used for such application which
requires medium strength.
Kasama and Nitina [42] investigated the effect of
hybridization of glass fiber and sisal fiber with polypropylene
composite and observed that the addition of glass fiber
increases thermal, mechanical and water absorption
properties. Thwe et al. [43] investigated the properties of
bamboo/glass fiber polymer matrix hybrid composite and
observed that the tensile strength and elastic modulus reduced
after ageing. The tensile strength of jute fibers is directly
proportional to the area of cross section of fiber[44].
Banana fiber has more tensile strength than neat
polyester resin and can be used for industrial applications like
packaging and panels[45]. The flexural and impact properties
of the banana composite is high than the hybrid
composite[46].
V.S. Srinivasan et al. [47] evaluated the thermal and
mechanical properties of banana- flax fiber hybrid composite
by structural build-up such that the banana fiber composite is
sandwiched between two flax fiber composite with the help of
hand lay-up method of manufacturing. Glass fiber reinforced
composite on the other most layer for lamination on both
sides. Due to glass fiber lamination, the overall mechanical
properties of hybrid composite also increases. Results were as
per ASTM standards and observed that hybrid composite has
better mechanical properties than single fiberglass fiber
composite under various loads like impact and flexural loads
and also found that hybrid composites have good strength
than single glass fiber composite.
V.P. Arthanarieswaran et al[48] worked on bananas and
sisal fiber with glass fiber hybrid composite with different
composition laminates for a different test which was
fabricated with the compression molding process. Different
mechanical properties were found, the maximum tensile
strength was 104MPa in laminates of banana-sisal hybrid
combination with three layers of the combination. The
laminates with banana–sisal fibers as a sandwich and glass
fibers at the extreme layers show better performance on the
flexural strength and it withstands up to 192 MPa. The impact
energy of 13.3 J was withstand by the sisal fiber laminate
with three alternate glass fibers layers. Such hybrid composite
can be used of applications like automobile panels.
R. Bhoopathi et al[49], investigated banana-hemp-glass
fiber reinforced composites and found that banana/glass fiber
composite has more tensile strength up to 39.5 MPa, the
maximum flexural strength is 0.51 kN by banana-hemp-glass
composite and 0.50kN by the banana-glass composite and
impact strength varied from 5.33 joules to 8.66 joules.

National Conference On “Recent Innovations in Engineering, Science and Technology” April 2019
3
Atiqah Afzaluddin et al[50], investigated the mechanical
properties of sugar palm/glass fiber reinforced thermoplastic
polyurethane hybrid composites with the total volume
fraction of the fibers to be 40%. The tensile and impact
properties of the composite increased when 30% sugar palm
and 10% glass fiber content was included. Flexural strength
was observed to be increased when the glass fiber content was
increased to 40 %. Yongli Zhang et al[51], studied
mechanical behaviors of unidirectional flax-glass fiber
reinforced hybrid composite and concluded that tensile
properties will be increased when the glass fiber content is
increased. The stacking sequence of the laminates shows
great influence on the tensile strength of hybrid composites.
Sreekala et.al [52] studied the mechanical behavior of oil
palm fiber with glass fiber and used phenol formaldehyde as a
resin and concluded that the maximum mechanical
performance is observed at 40% loading.
The natural fiber has significantly contributed to this
type of hybrid composite for the application of medium scale
loading. More such research studies are possible by
hybridizing various natural fibers. As seen above, much
research has not been observed in the hybridization of carbon
with natural fiber.
IV.Synthetic-Synthetic Fiber Hybrid Composite
Nowadays, synthetic- synthetic fiber hybrid composite is
much widely discussed world as it has found applications in
various critical as well as complicated problems in design.
There have been significant efforts taken by researchers to
achieve the positive hybrid effect with tough and brittle fiber
to reinforce composite for enhancing the mechanical
properties [53-54]. HaNa Yu et al[55], manufactured
intermingled hybrid composites using aligned discontinuous
fibers to achieve pseudo ductility. The specimens were made
with semi-closed and cured at 90o
C for 135min in an
autoclave using vacuum molding. The intermingled hybrid
composite with 0.25 relative carbon ratio gave the maximum
pseudo-ductile strain, 1.1%, with a 110 GPa tensile modulus.
Moreover, the initial modulus of the intermingled hybrids
with 0.4 relative carbon ratio is 134 GPa, 3.5 times higher
than that of E-glass/epoxy composites.
Yentl Swolfs et al. [56], observed the effect of fiber
dispersion on initial failure strain and cluster development in
unidirectional carbon/glass hybrid composites by adding glass
fibers to carbon fiber composites. After adding glass fiber, the
failure strength is observed to be increased. Different
orientations of fibers were observed. The hybrid effect for a
composition of 10/90 carbon/glass hybrid is 32%. The bundle
of 50/50 carbon/glass fiber hybrid with alternating layers of
carbon and glass fiber hybrid gave a maximum of 16%
hybridization effect. The result indicated that the thin ply
hybrids have more potential for large hybrid effects than
comingled hybrids. M.R. Wisnom et al. [57], experimentally
suggested that there is an enhancement in strain at failure of
up to 20% for very thin plies, but no significant effect for
thicker plies. For this experiment, M. R. Wisnom, modeled
specimens of S-glass and carbon fibers with varying
proportions and found that the magnitude of the hybrid effect
depends on the ply thickness. For the carbon/S-glass–epoxy
there is a hybrid effect of up to 20% at the first knee on the
stress-strain curve when the carbon is only 29 µm thick, but
there is no significant effect for plies over 80 µm thick.
Chensong Dong et al. [58], studied the flexural strength of
bidirectional hybrid epoxy composites reinforced by E glass
and T700S carbon fibers. Test specimens were made up by
hand lay-up method, modeled numerically using finite
element analysis and also analytically by classic lamination
theory approach. The flexural strength decreases when partial
laminas from a carbon/epoxy laminate are replaced by
glass/epoxy laminas. Also, concluded that the bidirectional
hybrid composites have the advantage of balanced 2-D
flexural strength, which is more robust when there are
variations in loading orientations.
Figure 1. Stacking configurations of carbon fiber (C) and
glass fiber (G) plies[58].
Figure 2. Flexural moduli from experiments, FEA, and CLT
[58]
Jun Hee Song[59], studied the pairing effect and tensile
properties of laminated high-performance hybrid composites
prepared using carbon/glass and carbon/aramid fibers with the
VARTM process. For the tensile test, both the hybrids
showed properties intermediate as shown in fig(3). Although,
both the aramid and glass fiber has different properties the
mechanical properties of the hybrid composites were
dominated by the carbon fiber due to larger strength and
rigidity. Delamination was not observed in aramid/carbon
composite but was well observed in glass/carbon composite.
Since the carbon fiber layers were accumulated in the central
region, the tensile strength was high. Hence, central
laminating condition plays an important role in deciding the

National Conference On “Recent Innovations in Engineering, Science and Technology” April 2019
4
pairing or stacking sequence of a hybrid composite to be
designed.
Figure 3. (CG and CA are carbon/glass and carbon/aramid
stacking) Stress and strain curves of samples laminated by 1
ply pairing [59].
Kedar S. Pandya et al[60] investigated the behavior
on carbon and glass woven fabric hybridization in quasi-static
loading conditions, a significant rise in properties were
observed, supportive to central laminating to higher
properties. Limited studies have been done over woven fabric
hybridization and hybridization is a trade-off between the
increase in ultimate strain and impact resistance and a
decrease in in-plane strengths of hybrid composites compared
with high modulus fiber composites. It is shown that placing
glass fabric in exterior and carbon fabric in the interior
significantly increases the ultimate tensile strain and tensile
strength than placing the glass fabric in interior and carbon
fabric in the exterior. Hence, the percentage gain in ultimate
tensile strain is higher than the percentage loss in tensile
strength in hybrid composites. Hybrid composites may be
produced in many different arrangements like an intra-ply,
inter-ply, sandwich or intimately mixed [61]. However,
research into the mechanical properties of hybrids has limited
to configurations in which fibers have been intimately mixed
within the matrix, or arranged in a purposeful manner.
Chensong Dong and Ian J. Davies[62] studied
flexural and tensile properties of S – 2 glass and T700S
Carbon using both finite element analysis (FEA) and classical
lamination theory (CLT). This investigation showed that
flexural modulus increases as the span to depth ratio increases
from 16 to 32 and then becomes stable. The flexural modulus
decreases rapidly as the carbon fiber composite on the
outermost layers decreases. This is due to the maximum
tensile and compressive stresses occur at the two faces of the
laminate in bending, and the stresses around the mid-plane are
close to zero.Unfortunately, the setback of typical CFRP
composites is that they possess a low ratio of compressive to-
tensile strength, which can hinder the performance of the
composites [63]. Jin Zhang et al. [64] conducted research on
the tensile, flexural and compressive properties of woven
hybrid composites by using different arrangement and
varying glass and carbon ratio. The results showed that the
ratios of glass/carbon FRP composites in 50:50 have
improved the tensile, flexural and compressive strength
effectively. Irina M.M.W et al[65], evaluated the mechanical
properties of glass/carbon hybrid fiber reinforced polymer
composite with vacuum assisted resin transfer molding
(VARTM) method of fabrication. Besides that, vacuum
assisted resin transfer molding (VARTM) process also shows
its ability to fabricate high volume fraction composites panel.
This believed to produce better mechanical properties,
uniform thickness, and lower void than the wet hand lay-up
process[66].
Recently, a new class of materials for reinforcement has
been introduced. Basalt fiber has excellent physical and
mechanical properties, such as good sound insulation, high
heat resistance, strong chemical resistance and low water
absorption [67]. Basalt fiber is produced by extrusion
continuously from high temperature melting basalt stones
which is available abundantly in the earth‘s crust, has the
advantage of more eco-friendly, greener and lower cost [68].
Basalt fiber is a good replacement for glass fiber. For this
reason, basalt fibers have been introduced into carbon fiber
composites which will lower the costs with comparable or
even better mechanical properties in comparison with
carbon/glass hybrid composite. Guangyong Sun et al. [69],
studied the mechanical properties of hybrid composites
reinforced by carbon and basalt fibers. The specimens were
made up of carbon plain weave fabric and basalt plain fabric.
Seven specimens were fabricated with vacuum assisted resin
transfer molding (VARTM) process where four specimens
with the same orientation and varying fiber content and rest of
the specimens with different orientations. Thus, found that
hybrid composites show more progressive failure mode than
pure carbon composite. On the other side, basalt fibers show a

National Conference On “Recent Innovations in Engineering, Science and Technology” April 2019
5
toughening effect which prevented crack propagation through
the thickness.
V. CONCLUSION
This review showed many research has given
impetus to more development of hybrid composites which has
made a significant improvement in various application. The
hybrid composite material not only enhances the properties
but also shows a unique stacking sequence. More such
research is to be expected in the coming days.
Many of the research have fabricated the hybrid composite
with hand lay-up method. Fabrication with other different
methods may give better results. New fibers, which are
introduced recently must be considered for hybridization.
Classical Lamination Theory and Finite Element Models
predict the failure modes in the hybrids which can be helpful
for considering the experimental data produced. Currently,
only two fibers have been added to hybrid composite, this
raises questions about what effects will occur when used
more than two fibers. Similarly, orientation, stacking
sequence and at different test environments more such
researches are possible. Use of carbon nanotubes in hybrids
may be effective for many applications.
REFERENCES
[1] F. C. Campbell, ―Manufacturing Processes for Advanced
Composites‖, Elsevier, Oxford, 2003, pp: 1–2.
[2] W. F. Smith, ―Principles of Material Science and Engineering‖, McGraw- Hill, New York, 2nd ed, 1990.
[3] M. R. Kessler, ―Polymer matrix composites: A perspective for a
special issue of polymer reviews. Polymer Reviews‖, 52 (3), 2012, pp: 229-233.
[4] R. Komanduri, B. Zhang, C. M. Vissa, ―Machining of fiber
reinforced composites Machining Science and Technology‖, (1991), 1 (1), pp: 113-152.
[5] W. D. Callister, ―Fundamentals of materials science and
engineering: an interactive e. text‖, Vol. 5. New York: Wiley, 2001. [6] Meysam Toozandehjani, Nuruldiyanah Kamarudin, Zahra
Dashtizadeh, E. Yee Lim, Ashen Gomes, Chandima Gomes.
Conventional and Advanced Composites in Aerospace Industry: Technologies Revisited. American Journal of Aerospace Engineering.
Vol. 5, No. 1, 2018, pp. 9-15.
[7] John K, VenkataNaidu S. Effect of fiber content and fiber treatment on flexural properties of sisal fiber/glass fiber hybrid composites. J
Reinf Plast Compos 2004;23(15):1601–5.
[8] Justiz Smith Jr Nilza G, Virgo, Buchanan Vernon. Potential of Jamaican banana, coir, bagasse fiber as composite materials. Mater
Charact 2008;59:1273–8.
[9] John Maya Jacob, Thomas Sabu. Biofibers and biocomposites. Carbohydr Polym 2008;71(3):343–64.
[10] Uma Devi L, Bhagawan SS, Sabu Thomas. Mechanical properties of
pineapple leaf fiber-reinforced polyester composites. J Appl Polym Sci. 1997;64(9):1739–48.
[11] Murali Mohan Rao K, Mohana Rao K, Ratna Prasad AV. Fabrication
and testing of natural fiber composites: vakka, sisal, bamboo and
banana. Mater Des. 2010;31(1):508–813.
[12] Shaikh and S A Channiwala. To Study the Characteristics of Jute
Polyester Composite for Randomly Distributed Fibre Reinforcement. Proceedings of the World Congress on Engineering 2010, Vol II WCE
2010, London, (2010).
[13] Dieter H Mueller and Andreas Kaobjilowski. New Discovery in the Properties of Composites Reinforced with Natural Fibres. J. Ind.
Textiles. 2003; 33 (2): 111-130.
[14] Ahemed KS, Vijayarangan S. Experimental characterization of woven jute– fabric-reinforced isothalic polyester composites. J Appl Polym
Sci 2007;104(4):2650–62. [15] Geethamma VG, Thomas Mathew K, Lakshminarayanan R, Sabu
Thomas.Composite of short coir fibers and natural rubber: Effect of
chemical. modification, loading and orientation of fiber. Polymer 1998;6:1483–90.
[16] Fu S, Lauke B, Mader E, Yue C, Hu X, Mai YW. J Mater Sci.
2001;36:1243. [17] Fu SY, Xu G, Mai YW. On the elastic modulus of hybrid
particle/short-fiber polymer composites. Compos B – Eng
2002;33(4):91–299. [18] Mirbagheri J, Tajvidi Mehdi, Ghasemi Ismaeil, Hermanson John C.
Tensile properties of wood flour/kenaf fibre/polypropylene hybrid
composites. Appl Polym Sci 2007;105(5):3054–9. [19] Pothan L.A., Thomas S., Polarity parameters and dynamic mechanical
behavior of chemically modified banana fiber reinforced polyester
composites, Composites Science and Technology; 2003; 63: 1231–1240.
[20] Paul S.A., Joseph K., Gem Mathew G.D., Pothen L.A., Thomas S.,
Influence of polarity parameters on the mechanical properties of composites from polypropylene fiber and short banana fiber,
Composites: Part A; 2010; 41(10):1380-1387.
[21] Venkateshwaran N., Perumal A.E., Arunsundaranayagam D., Fiber surface treatment and its effect on mechanical and visco-elastic
behavior of banana/epoxy composite, Materials and Design; 2013; 47:
151–159. [22] Benítez A.N., Monzón M.D., Angulo I., Ortega Z., Hernández P.M.,
Marrero M.D., Treatment of banana fiber for use in the reinforcement
of polymeric matrices, Measurement; 2013; 46: 1065–1073. [23] Pothan L.A., Thomas S., Groeninckx G., The role of fiber/matrix
interactions on the dynamic mechanical properties of chemically
modified banana fiber/polyester composites, Composites: Part A; 2006; 37: 1260–1269.
[24] Pothan L.A., George J., Thomas S., Effect of fiber surface treatments
on the fiber–matrix interaction in banana fiber reinforced polyester composites, Composite Interfaces; 2002; 9(4): 335-353. DOI:
10.1163/156855402760194692.
[25] Cao Y, Sakamoto S, Goda K. Effects of heat and alkali treatments on mechanical properties of kenaf fibers. Presented at 16th international
conference on composite materials, 8–13 July, 2007, Kyoto, Japan.
[26] Rong MZ, Zhang MQ, Liu Y, Yang GC, Zeng HM. The effect of fiber treatment on the mechanical properties of unidirectional sisal-
reinforced epoxy composites. Compos Sci Technol 2001;61(10):1437–
47. [27] Beckermann GW, Pickering KL. Engineering and evaluation of hemp
fibre reinforced polypropylene composites: fibre treatment and matrix
modification. Composites Part A 2008;39(6):979–88. [28] Bera M, Alagirusamy R, Das A. A study on interfacial properties of
jute-PP composites. J Reinf Plast Compos 2010;29(20):3155–61.
[29] Lee BH, Kim HJ, Yu WR. Fabrication of long and discontinuous natural fibre reinforced polypropylene biocomposites and their
mechanical properties. Fiber Polym 2009;10:83–90. [30] Li X, Panigrahi S, Tabil LG. A study on flax fiber-reinforced
polyethylene biocomposites. Appl Eng Agr 2009;25:525–31.
[31] Panigrahy BS, Rana A, Chang P, Panigrahi S. Overview of flax fibre reinforced thermoplastic composites. Can Biosyst Eng J 2006;06–
165:1–12.
[32] Lopez Manchado MA, Arroya M, Biagiotti J, Kenny JM. Enhancement of mechanical properties and interfacial adhesion of
PP/EPDM/Flax Fibre Composites using maleic anhydride as a
compatibilizer. J Appl Polym Sci 2003; 90: 2170–2178. [33] Santos EF, Mauler RS, Nachtigall SMB. Effectiveness of maleated-
and salinized-PP for coir fiber-filled composites. J Reinf Plast Compos
2009;28:2119–29
[34] Chensong Dong, Ian J. Davies. Flexural strength of bidirectional
hybrid epoxy composites reinforced by E glass and T700S carbon
fibres. Composites: Part B 72 (2015) 65–71 [35] Dittenber DB, Ganga Rao HVS. Critical review of recent publications
on use of natural composites in infrastructure. Composites Part A
2012;43(8):1419–29. [36] Faruk O, Bledzki AK, Fink HP, Sain M. Biocomposites reinforced
with natural fibers. Progr Polymer Sci 2012;37(11):1552–96.

National Conference On “Recent Innovations in Engineering, Science and Technology” April 2019
6
[37] A. Alavudeen, N. Rajini, S. Karthikeyan, M. Thiruchitrambalam, N. Venkateshwaren. Mechanical properties of banana/kenaf fiber-
reinforced hybrid polyester composites: Effect of woven fabric and random orientation. Materials and Design 66 (2015) 246–257.
[38] Peijs AAJM, Catsman P, Govaert LE, Lemstra PJ. Hybrid composites
based on polyethylene and carbon fibres Part 2: influence of composition and adhesion level of polyethylene fibres on mechanical
properties. Composites 1990;21(6):513–21
[39] N. Venkateshwaran, A. ElayaPerumal, A. Alavudeen, M. Thiruchitrambalam. Mechanical and water absorption behaviour of
banana/sisal reinforced hybrid composites. Materials and Design 32
(2011) 4017–4021. [40] Noorunnisa Khanam P, Abdul Khalil HPS, Jawaid M, Ramachandra
Reddy G, Surya Narayana C, Venkata Naidu S. Sisal/carbon fibre
reinforced hybrid composites: Tensile, flexural and chemical resistance properties. J Polym Environ 2010;18:727–33.
[41] M. Ramesh, K. Palanikumar, K. Hemachandra Reddy. Mechanical
property evaluation of sisal–jute–glass fiber reinforced polyester composites. Procedia Engineering 51 ( 2013 ) 745 – 750.
[42] Kasama Jarukumjorn, Nitinat Suppakarn. Effect of glass fiber
hybridization on properties of sisal fiber – polypropylene composites. Compos Part B. 2009:623–7.
[43] Thwe MM, Liao. Durability of bamboo–glass fiber reinforced polymer
matrix hybrid composites. Compos Sci Technol 2003;63:375–87. [44] Thi-Thu Loan Doan, Shang-Lin Gao, Edith Mader. Jute/polypropylene
composites I. Effect of matrix modification. Compos Sci Technol
2006;66:952–63. [45] M. Boopalan, M. Niranjanaa, M.J. Umapathy. Study on the
mechanical properties and thermal properties of jute and banana fiber
reinforced epoxy hybrid composites. Composites: Part B 51 (2013) 54–57.
[46] Vijaya Ramanth B, Junaid Kokan S, Niranjan Raja R,
Sathyanarayanan R, Elanchezian C, Rajesh S. Properties and performance analysis of woven roving composite laminates for
automotive panel board applications. Adv Mater Res 2013;683:21–4.
[47] V.S. Srinivasan, S. Rajendra Boopathy, D. Sangeetha, B. Vijaya Ramnath. Evaluation of mechanical and thermal properties of banana–
flax based natural. Materials and Design 60 (2014) 620–627.
[48] V.P. Arthanarieswaran, A. Kumaravel, M. Kathirselvam. Evaluation of mechanical properties of banana and sisal fiber reinforced epoxy
composites: Influence of glass fiber hybridization. Materials and
Design 64 (2014) 194–202. [49] R. Bhoopathia, M. Ramesha, C. Deepab. Fabrication and Property
Evaluation of Banana-Hemp-Glass Fiber Reinforced Composites.
Procedia Engineering 97 ( 2014 ) 2032 – 2041. [50] Afzaluddin A, et al. Physical and mechanical properties of sugar
palm/glass fiber reinforced thermoplastic polyurethane hybrid
composites. J Mater Res Technol. 2018. [51] Yongli Zhang, Yan Li, Hao Ma, Tao Yu. Tensile and interfacial
properties of unidirectional flax/glass fiber reinforced hybrid
composites. Composites Science and Technology 88 (2013) 172–177. [52] Sreekalaa MS, Jayamol George, Kumaran MG, Sabu Thomas. The
mechanical performance of hybrid phenol-formaldehyde-based composites reinforced with glass and oil palm fibres. Compos Sci
Technol 2002;62:339–53.
[53] Dong C , Davies IJ . Flexural strength of bidirectional hybrid epoxy composites rein- forced by E glass and T700S carbon fibres.
Composites Part B 2015;72:65–71.
[54] Czél G, Wisnom MR . Demonstration of pseudo-ductility in high performance glass/epoxy composites by hybridisation with thin-ply
carbon prepreg. Composites Part A 2013;52:23–30.
[55] HaNa Yu, Marco L. Longana, Meisam Jalalvand, Michael R. Wisnom, Kevin D. Potter. Pseudo-ductility in intermingled carbon/glass hybrid
composites with highly aligned discontinuous fibres. Composites: Part
A 73 (2015) 35–44.
[56] Yentl Swolfs, Robert M. McMeeking, Ignaas Verpoest, Larissa
Gorbatikh. The effect of fibre dispersion on initial failure strain and
cluster development in unidirectional carbon/glass hybrid composites. Composites: Part A 69 (2015) 279–287.
[57] M.R. Wisnom, G. Czél, Y. Swolfs, M. Jalalvand, L. Gorbatikh, I.
Verpoest. Hybrid effects in thin ply carbon/glass unidirectional laminates: Accurate experimental determination and prediction.
Composites: Part A 88 (2016) 131–139.
[58] Chensong Dong, Ian J. Davies. Flexural strength of bidirectional hybrid epoxy composites reinforced by E glass and T700S carbon
fibres. Composites: Part B 72 (2015) 65–71. [59] Jun Hee Song. Pairing effect and tensile properties of laminated high-
performance hybrid composites prepared using carbon/glass and
carbon/aramid fibers. Composites Part B 79 (2015) 61-66. [60] Kedar S. Pandya, Ch. Veerraju, N.K. Naik. Hybrid composites made
of carbon and glass woven fabrics under quasi-static loading. Materials
and Design 32 (2011) 4094–4099. [61] Kretsis G. A review on the tensile, compressive, flexural and shear
properties of hybrid fibre-reinforced plastics. Composites
1987;18(1):13–23.
[62] Chensong Dong, Ian J. Davies. Flexural and tensile moduli of
unidirectional hybrid epoxy composites reinforced by S-2 glass and T700S carbon fibres. Materials and Design 54 (2014) 893–899.
[63] C. Dong, Sudarisman, and I. J. Davies, ―Flexural Properties of E Glass
and TR50S Carbon Fiber Reinforced Epoxy Hybrid Composites,‖ J. Mater. Eng. Perform., vol. 22, no. 1, pp. 41–49, 2013.
[64] J. Zhang, K. Chaisombat, S. He, and C. H. Wang, ―Hybrid Composite
Laminates Reinforced With Glass / Carbon Woven Fabrics For Light Weight Load Bearing Structures,‖ Mater. Des., vol. 36, pp. 75–80,
2012.
[65] Irina M.M.W, A.I. Azmi, Tan C.L., Lee C.C. and A.N.M Khalil. Evaluation of Mechanical Properties of Hybrid Fiber Reinforced
Polymer Composites and Their Architecture. Procedia Manufacturing
2 ( 2015 ) 236 – 240. [66] C. Dong, Sudarisman, and I. J. Davies, ―Flexural Properties of E Glass
and TR50S Carbon Fiber Reinforced Epoxy Hybrid Composites,‖ J.
Mater. Eng. Perform., vol. 22, no. 1, pp. 41–49, 2013. [67] Lopresto V , Leone C , De Iorio I. Mechanical characterisation of
basalt fibre reinforced plastic. Composites Part B 2011;42:717–23.
[68] Dhand V , Mittal G , Rhee KY , Park S-J , Hui D . A short review on basalt fiber reinforced polymer composites. Composites Part B
2015;73:166–80.
[69] Guangyong Sun, Shaowei Tong, Dongdong Chen, Zhihui Gong, Qing Li. Mechanical properties of hybrid composites reinforced by carbon
and basalt fiber. International Journal of Mechanical Sciences 148
(2018) 636–651.

National Conference On “Recent Innovations in Engineering, Science and Technology” April 2019
7
ENERGY HARVESTING SPEED BREAKER
Prof. Dr.Amol D. Lokhande1, Nishant Nikam
2, Hemant Mishra
3, Rushikesh Sathe
4, Ganesh Kokate
5
[email protected], [email protected], [email protected], [email protected]
Sandip Institute of Engineering & Management,
Mechanical Department
Abstract— Energy can neither be created nor be destroyed but
can be transformed from one form to another. Pressure is a kind
of energy that is exerted almost all the time as force can be either
reused within the same process or transferred to another process.
Force or pressure when it converts into energy, it is called
potential energy and free of charge energy. Thus, this energy can
reduce the operating cost and can increase the output
productivity. Pressure has large opportunities and stronger range
of force recovery on the road. Therefore, this project utilizes
force created from vehicle hump as an alternative and new
renewable energy source. A model of road speed breaker which
uses power hump technology is used as device to harness
force created from applied pressure from the heavy vehicles
hitting the speed breaker which act as the input. The speed
breaker is used as it can function into two different uses such as
for slowing of road vehicles and hence generating energy by
harnessing applied force into electrical energy. The electrical
energy produced can either be used to power up street lights or
stored in a battery for emergency purposes.
I.
INTRODUCTI
ON
In the present scenario power becomes the major need for
human life .The availability and its per capita
consumptions are regarded as the index of national
standard of living in the present day civilization. Energy is
an important input in all the sectors of any countries
economy. Energy crisis is due to two reasons, firstly the
population of the world has been increased rapidly and
secondly standard of living of human beings has increased.
India is the country, which majorly suffers with lack of
sufficient power generation.
Electricity is the form of energy. It is the flow of electrical
power. Electricity is a basic part of nature and it is one of
our most widely used forms of energy. Before electricity
generation began slightly over 100 years ago, houses were
lit with kerosene lamps, food was cooled in iceboxes, and
rooms were warmed by wood-burning or coal-burning
stoves. Direct current (DC) electricity had been used in arc
lights for outdoor lighting. In the late-1800s, Nikola Tesla
pioneered the generation, transmission, and use of
alternating current (AC) electricity, which can be
transmitted over much greater distances than direct
current. Tesla's inventions used electricity to bring indoor
lighting to our homes and to power industrial machines.
Electricity generation was first developed in the
1800's using Faradays dynamo generator. Almost 200
years later we are still using the same basic principles to
generate electricity, only on a much larger scale.Now we
are throwing some light on the very new and innovative
concept i.e. generating electricity
from a speed breaker. Producing electricity from a speed
breaker is a new concept that is undergoing research.
Fig.1. Summary of global oil demand
India's installed capacity is nearly 20 per cent of
China's capacity though both countries have billion plus
people. There is roughly 12 per cent power deficit in the
peak hours. Tariffs are set by the state governments so
power firms are not allowed to pass on rising fuel costs to
consumers. Banks are burdened with loans to loss-making
state-run electricity distribution firms and are unwilling to
lend to new projects that do not have assured fuel supply.
India has nearly 10 per cent of the world's coal reserves
but lack of environmental clearances and other disputes
have hindered production. Shortage of domestic supply
has resulted in costlier imports.
India‘s oil demand is expected to rise by 5.8
million barrels per day (bpd) by 2040, accounting for
about 40% of the overall increase in global demand during
the period, OPEC‘s secretary general said on during the
weekend.
India is set to overtake China as the biggest source of
growth for oil demand by 2024, according to a forecast

National Conference On “Recent Innovations in Engineering, Science and Technology” April 2019
9
announced Monday by research and consultancy group
Wood Mackenzie. The country's oil demand is set to
increase by 3.5 billion barrels per day from 2017 to2035,
which will account for a third of global oil demand
growth.
India's expanding middle class will be a key
factor, as well as its growing need for mobility, according
to Wood Mackenzie. On the other hand, China —
currently the second-largest oil consumer in the world —
may soon need less oil. In 2017, it overtook the U.S. as the
biggest importer of crude oil, but it's set to see a decline in
oil demand growth from 2024 to 2035, Wood Mackenzie
research director Sushant Gupta told CNBC. For India, as
demand grows, an oil shortage is already imminent.
The number of vehicles on road is increasing
rapidly and if we convert some of the potential energy of
these vehicle into the rotational motion of generator then
we can produce considerable amount of electricity, this is
the main concept of this project. At present we are facing
shortage of electricity. Electricity can be generated using
speed breakers. The benefits from this idea will be to
generate electricity for the streetlights, hoardings and then
for other use. Generally when vehicle is in motion it
produces various forms of energy like, due to friction
between vehicle‘s wheel and road i.e. rough surface heat
energy is produced, also when vehicle traveling at high
speed strikes the wind then also heat energy is produced
which is always lost in environment and of which we can‘t
make use of or directly we can say that all this energy that
we can‘t make use of is just the wastage of energy that is
abundantly available around us. In this project we are just
trying to make use of such energy in order to generate an
electrical energy. This project will work on the principle of
―potential energy to electrical energy conversion‖.
II. LITERATURE SURVEY
Recently several attempts and models have been
suggested and tested for harnessing kinetic energy of
vehicles via a speed bump. Mechanisms which include
springs by A.K. Singh, Deepak S., Madhawendra K.
and V. Pandit [1], Rack and Pinion by
Aswathaman. V and Priyadharshini.M in ―Every speed
breaker is now a source of power‖ [2]; by Shakun
Srivastava , Ankit Asthana in ―Produce electricity by the
use of speed breakers‖[3] and by Ankit Gupta, Kuldeep
Chaudhary & B.N Agrawal in ―An experimental study of
generation of electricity using speed breaker‖[4] and slider
crank by Noor Fatima and Jiyaul Mustafa in
―Production of electricity by the method of road power
generation‖ [5] have been suggested for producing
electricity. Electrodynamics based models by Ankita and
Meenu Bala in ‖Power generation from speed breaker‖ [6]
have also been suggested, but are not only expensive to
fabricate but involve complicated calculations and can‘t be
used a large scale very easily. Totaram [7] uses a platform
plate which is kept inclined on a raised base level to
allow vehicles to pass over the raised surface. This system
will not work till a vehicle passes on road way. Energy
harvesting is the process where the energy is harnessed
from other sources like traffic energy which is unused and
depleted, which is then converted to a more usable form.
Energy harvesters provide power for low energy
electronics in a very small amount. The source of energy
for the energy harvesters is free without depleting the
natural resources. There are some researches on the traffic
energy harvesting in the pavement engineering field.
Andriopoulou (2012) had discussed on the technologies
for traffic energy harvesting that have been studied such
as asphalt solar collector combined with piping system,
photovoltaic applications in the road infrastructure,
embedded piezoelectric sensors and so on. For asphalt
solar collector,
the solar energy are being extracted and
converted into thermal or electrical energy. The warmth of
the asphalt pavement is captured by the water piping
system and the energy is stored. As for the PV system, it is
embedded into the pavement infrastructure. It captures the
solar energy and converts it into electrical energy which is
then being stored. Then, for the embedded piezoelectric
sensors in the pavement infrastructure, it generates
electrical voltage due to the alteration to its dimension
when there are mechanical stresses. However, in this
paper, traffic harvesting through speed breaker is being
introduced and studied. This is because this mechanism
has a high energy efficiency and cost effective to be
implemented.
There are different types of mechanism
developed for generation of electricity from speed breaker.
Among these, the popular ones are rack and pinion,
roller and crankshaft mechanism. For rack and pinion
and crankshaft mechanism, basically, it involves weight
from vehicles that exerted a force upon the speed breaker.
The potential energy from the compression of the dome of
the speed breaker is converted into kinetic energy through
these mechanisms where the motion is transfer into a
generator to generate electricity. In roller mechanism, the
friction force due to the vehicle movement acted upon the
roller is then transmitted to chain sprocket arrangements
where the rotary motion is then transfer into a
generator for electricity generation.
Anyaegbunam, F.N.C concluded that in coming
days, demand for electricity will be very high. Speed
breaker power generator will prove a great innovation to
world. This research is to develop another green power
generation and to use the wasted energy of
automobiles.[10]
Shah Mohazzem Hossain, C.K. Das, Md. Shahdat
Hossain, Sams Jarin concluded that Advancement of
nation depends on use of electricity, but due to increasing
population present power generation does not meet the
requirement. This study shows feasibility of using ―power
generating speed breaker‖. Due to increasing vehicles on-
road this system will be effective to shorten the energy
crisis to some extent. Mohamad Ramadan, Mahmoud
Khaled, Hicham El Hage concluded that Speed breaker
power generator is a system that is capable of using
kinetic energy of vehicles & converting it into electric
energy. In this work, a prototype is constructed and an
experimental study is performed. It was concluded that

National Conference On “Recent Innovations in Engineering, Science and Technology” April 2019
10
26.2 to 44.7 W can be generated from this system when
masses of 65 to 80 kg are applied. An average of
0.37W/kg forms a promising sign for performance of such
system in real applications.[17]
Pravin K Ghule suggested that in this project we
discover technology to generate electricity from speed
breakers in which the system used is reliable and this
technique will help conserve our natural resources. In
coming days, this will prove a great boon to the world,
since it will save a lot of electricity of power plants that
gets wasted in illuminating the street lights. In coming
days, this will prove a great boon to the world since it will
save a lot of electricity of power plants that gets wasted in
illuminating the street lights. As the conventional sources
are depleting very fast, it‘s high time to think of alternative
resources. We got to save the power gained from the
conventional sources for efficient use. So this idea not
only provides alternative but also adds to the economy of
the country.[16]
Iyen, C., Anyiin P., Umar, I., Jaafaru, S. , Wansah, J.F.,
Iseh, A., Akeredolu, B. concluded that designing energy
recovery systems that are pollution free has become a
significant goal within the research
community. One of numerous systems that have been
proposed is Speed Bump Power Generator (SBPG)
system that produces electrical power by utilizing the
movements of commuting vehicles on highways,
boulevards, and streets. When vehicles pass over a SBPG
system, the system translates vertically. Consequently,
a kinetic energy is produced and transferred into
electrical power. In this project, an experimental analysis
is performed on the rackand- pinion system. Results show
that electrical power of upto 1.9 kw can be generated
from the designed system.[13]
Kuldeep Singh Chauhan, Ayushi Tomar, Dheeraj kumar,
Gaurav kumar explained that the energy crisis is any
great bottleneck in the supply of energy resources to an
economy. The studies to sort out the energy crisis led to
the idea of generating power using speed breaker. Firstly,
South African electrical crisis has made them
implemented this method to light up small villages of the
highway. The idea is basic physics, to convert the kinetic
energy into electrical energy that gone wasted when the
vehicle runs over speed-breaker. Since then, a lot has
been done in this field. An amateur innovator, Kanak
Gogoi in Guwahati has developed a similar contraption to
generate power, when a vehicle passes over speed-
breaker. The idea has caught the eye of IIT-Guwahati,
which funded the pilot project related to generate
electricity from speed-breakers. They has evaluated the
machine and recommended to the Assam government.
Their work has provided the need to think on this
alternative to generate electricity on the large scale, as it
proves to be a boon to the economy of the country.
Amal Abraham, Cibin Geevarghese Jacob, Glen Martin
Thomas & Jobby George concluded that for the vehicular
flow per day, which includes 2/3/4/6/8 wheelers, the
energy produced will be much more significant
compared to the experimental results obtained, thus
making it a good energy producing setup as energy of
vehicles on impact with the speed breakers is anyway
lost. This is lost to heat and sound. This energy can be
tapped, stored and used as back up or for small
applications. Improvements have to be made in the setup
to increase the efficiency which is discussed in following
section. This method have many advantages such as
power generation does not require any fuel input,
Running cost is very less, this is a nonconventional form
of energy and therefore very useful in the present
scenario of energy crisis. [15]
Mohamad Ramadana, Mahmoud Khaleda, Hicham El
Hagea experimentally studied about use of speed breaker
for power generation. One of numerous systems that have
been proposed is Speed Bump Power Generator SBPG
system that produces electrical power by utilizing the
movements of commuting vehicles on highways,
boulevards, and streets. When vehicles pass over a SBPG
system, the system translates vertically. Consequently,
a kinetic energy is produced and transferred into
electrical power. In this paper, different types of SBPG
systems are presented. An experimental analysis is
performed on the rack-and-pinion system. Results have
shown that electrical power up to 45 W generated when a
mass of 80 kg is applied to SBPG system considered.
Extrapolation of results confirms around 0.56 kW powers
can be produced when various vehicles with different
masses pass through the bumps. [12] Mr. Amol Sheshrao
Fawade concluded that the growth of any nation depends
on utilization of energy and this paper helps for that. It is
successfully produced electricity and compressed air by
using speed breaker. This electricity can store in battery
in day time and we
can use it in night time for high way illumination, signal
system on road, tollbooth or any other useful work and
compressed air can use for cleaning purpose in tollbooth
and refilling of air in tires. This paper helps for
conservation of natural resources. [18]
Anand Kumar Pandey suggested that rack and pinion
arrangement is a mechanism which is used to convert the
reciprocating motion to rotary motion. Whenever a
vehicle would pass over the breaker, it would push it

National Conference On “Recent Innovations in Engineering, Science and Technology” April 2019
11
down. So rack will move downward and will rotate the
gears. A gear train is used to increase the speed ratio at
shaft of generator. Then the springs will push the breaker
upside to its initial position and again it will rotate the
gears. As the shaft of D.C. generator starts rotating, it
produces electricity. This electricity is stored in a battery.
This project will work on the principle of ―conversion of
mechanical energy into electrical energy‖, mechanical
energy can be thought of as energy stored within a
physical system. During daytime electricity is not needed
for lightening the streets, so we are using a control
switch which is manually operated .This control switch
is connected by wire to the output of the battery. The
control switching mechanism allows the current to
flow when needed. [14]
III. METHODOLOGY
Energy harvesting from speed breaker is a system design
to capture waste and kinetic energy from all vehicles.
This device converts the kinetic energy of the vehicles
into electric energy. This project explains the mechanism
of electricity generation from speed breakers. The load
of vehicle induced on speed breaker acts as input for
mechanism which gives reciprocating motion to slider.
Slider is attached to speed breaker and supported by a
linear bearing for smoother reciprocation. A circular
stationary bar fixed to ground surface is attached to
speed breaker by means of spring. The spring is used to
control return stroke. The slider reciprocates around
the circular bar. Slider is connected to crank. In this way
linear motion is converted to rotary motion. Crank is
mounted on shaft. This shaft is connected to flywheel
which is further connected to gear drive. Gear drive is
used for increasing rpm of shaft. In this way kinetic
energy of mechanism is converted to electrical energy
which can be stored in battery or directly used for
different applications.
Fig.2.Energy flow diagram
IV. CONCLUSION
With the help of this work we discover technology
to generate electricity from speed breaker. The system
used is reliable and this technique will help to conserve
our natural resources. The generation of electricity using
the weight of vehicle can be considered as an input in
power generation at speed breaker using various
mechanisms. We have designed a model and collected
the data about speed and weight of the vehicle. It was
found that a slower and heavier vehicle can produce
much energy at speed breaker than a lighter weight and
fast moving vehicle. This application can be helpful
to government for economic purpose and it gives the
way to utilize the waste pressure energy for other
purposes.
REFERENCES
[1]. Alok Kumar Singh, Deepak Singh, Madhawendra Kumar,
Vijay Pandit, Generation of Electricity through speed breaker
mechanism; International Journal of Innovations in Engineering and
Technology (IJIET,2(2), 2013, 20-24.
[2]. Aswathaman. V, Priyadharshini.M, Every speed breaker is
now a source of power; International Conference on Biology,
Environment and Chemistry (IPCBEE), 1, 2011, 234 - 236.
[3]. Shakun Srivastava , Ankit Asthana, Produce electricity by the
use of speed Breakers; Journal of Engineering Research and Studies
, 2(1), 2011,163 – 165.
[4]. Ankit Gupta, Kuldeep Chaudhary & B.N Agrawal, An
Experimental study of Generation of Electricity using speed breaker,
International Journal of Mechanical Engineering (IJME ), 1(1), 2012,
35-40.

National Conference On “Recent Innovations in Engineering, Science and Technology” April 2019
12
[5]. Noor Fatima ,Jiyaul Mustafa, Production of electricity by the
method of road power generation, International Journal of Advances in
Electrical and Electronics Engineering, 1(1), 9-14.
[6]. Ankita, Meenu Bala, Power generation from speed breaker,
International Journal Of Advance Research In Science And Engineering
(IJARSE), 2 (2), 2013.
[7]. Totaram Ingle Devanand, System of Generating Electricity;
Patent publication No. WO 2013011519 A1, 2013.
[8]. Aniket Mishra, Pratik Kale, Atul Kamble, Electricity Generation
from Speed Breakers, The International Journal Of Engineering
And Science (IJES), 2(11), 2013, 25 – 27.
[9]. IRC86,Geometric Design Standards for Urban Roads in Plains, Indian Roads ongress,1991.
[10]. Anyaegbunam F.N.C., Power Generation from a Renewable
Energy Source – Speed Breaker Generators IOSR Journal of
Engineering (IOSRJEN), Issue 09 (September. 2015), PP 17-21.
[11]. Harish Kumar Patel, Sumit Kumar Dutta, Praveen Sahu &
Keshav Das, Production of Electricity by the Method of Road Power
Generation, International Journal of Research (IJR), Volume 2, Issue
05, May 2015, PP763-767.
[12]. Mohamad Ramadana, Mahmoud Khaleda, Hicham El Hagea,
Expermiental Study of power generation using speed breaker,
Energy Procedia 75 ( 2015 ) PP 867 – 872.
[13]. Iyen, C., Anyiin P., Umar, I., Jaafaru, S., Wansah, J.F., Iseh, A.,
Akeredolu, B., Design and Construction of a Speed Bump Power
Generator, International Journal of Innovative Research in Electronics
and Communications (IJIREC) Volume 4, Issue 2, 2017, PP 1-5.
[14]. Anand Kumar Pandey, Green energy generation from speed
breaker, International Journal of Development Research Vol. 07, Issue,
08, PP14275-14277.
[15]. Amal Abraham, Cibin Geevarghese Jacob, Glen Martin
Thomas & Jobby George, Eco- friendly power generation from speed
breaker, International Journal for Innovative Research in Science &
technology, Vol.3, Issue 11, April 2017, PP 227-230.
[16]. Pravin K. Ghule, Electricity generation by speed breaker using rack
& pinion mechanism, International journal of Advanced
Research & Innovative Ideas inEducation, Vol.2, Issue 6, 2016, PP
1594-1597.
[17]. Shah Mohazzem Hossain, C.K. Das, Md. Shahdat Hossain,
Sams Jarin ,Electricity from Wasted Energy of the Moving Vehicle
Using Speed Breaker, Jurnal Teknologi •
March 2015, PP 129-134.
[18]. Amol Fawade,Air compression & Electricity generation by using
speed breaker with rack & pinion mechanism, International Journal
of Modern Engineering Research, Vol.5, Issue 1, Jan. 2015, PP 23-28.

National Conference On “Recent Innovations in Engineering, Science and Technology” April 2019
14
Design and Development of Mecanum Wheel
with Forklift Application
Prof. Dr.Amol D. Lokhande1, Khagesh D. Patil2, Bhushan P. Jangale3, Lokesh A. Ambekar4 , Shubham S. Ingole5
[email protected], [email protected] , [email protected], [email protected], [email protected]
Mechanical Department
Sandip Institute of Engineering & Management
ABSTRACT -In this paper, review researches on
multi-directional automobile vehicle design with
Mecanum wheel as component in the forklift vehicle.
Multi-directional automobile vehicle has vast advantages
over conventional design likes differential drive in term
of mobility in congested environments. Multi-directional
automobile wheel can perform various types of work in
small spaces, such as those commonly found in
manufacturing floor, hospitals and offices. There are
variety of applications of mecanum wheel can be possible
as per work. A variety of designs of Mecanum wheel
installed forklift have been developed in recent years
in order to improve their Multi-directional movement
and practical applications. These features are expanded
at the expense of improved mechanical complication and
increased complexity in control mechanism. Mecanum
wheel systems work by applying rotating motion of each
individual wheel in one direction similar to regular
wheels with a different. Mecanum wheel systems are able
to move freely in a different direction. They can slide
frequently perpendicular to the torque vector. The main
advantage of using Mecanum wheel systems is that it
can move or slide in any required
Fig Mecanum wheel based on Ilon‘s concept.
direction with respect to each wheel rotaion in narrow
spaces. By replacing conventional wheel with
mecanum wheel the time and space required to handle
a product or work is reduced.
I.
INTRODUCTION
One of the common Omni-directional wheel designs is
Mecanum Wheel or Ilon wheel. Mecanum wheel was design
and invented in Sweden in 1975 by Bengt Ilon, an engineer
with Swedish company Mecanum. Mecanum wheel is based
on the principle of a central wheel with a number of roller
placed at an angle around the periphery of the wheel. The
angled peripheral roller translates a portion of the force in
the rotational direction of the wheel to force normal to the
wheel directional. Depending on each individual wheel
direction and speed, the resulting combination of all these
forces produces a total force vector in any desired direction
thus allowing the platform to move freely in direction of
resulting force vector, without changing the direction of the
wheel. Figure 1 shows a traditional Mecanum wheel design
by Ilon with the peripheral roller with 45° degree slope held
in place from the outside.This design only can operate in
even work surface. When encountering an inclined or an
uneven work surface, the rim of the wheel can make contact
with the surface instead of the roller, thus preventing the
wheel from operating correctly. To encounter this problem a
simple alternative design, also proposed by Ilon, which
consist two spilt roller mounted centrally on the periphery of
the wheel as shown in figure.

National Conference On “Recent Innovations in Engineering, Science and Technology” April 2019
15
Fig Mecanum wheel with centrally mounted rollers.
This design ensures that the rollers are always in contact
with the work surface, thus allowing better performance on
uneven surfaces. Using four of Mecanum wheels provides
Omni-directional movement for a vehicle without needing
a conventional steering system. Slipping is a common
problem in the Mecanum wheel as it has only one roller
with a single point of ground contact at any one time. Due
to the dynamics of the Mecanum wheel, it can create force
vectors in both the x and y-direction while only being
driven in the y-direction. Positioning four Mecanum
wheels, one at each corner of the chassis (two mirrored
pairs), allows net forces to be formed in the x, y and
rotational direction. Refer to Figure 1.3. A difficulty with
this strategy is that there are four variables to control three
degrees-of-freedom. In this case the system is said to be
over determined and it is possible to create conflicts in the
actuation. As a result of the constraints associated with the
Mecanum wheel some form of controller is required to
produce satisfactory motion.
II. LITERATURE SURVEY
Olaf Fiegel, Aparma Badve, Glen Bright, et al. ― Improved
Mecanum Wheel Design for Omni directional Robots‖ in
proc.australasian conference on robotics and
automataion,27-Nov 2002 , Omnidirectional is used to
describe the ability of a system to move instantaneously in
any direction from any configuration. Omnidirectional
robotic platform have was advantages over conventional
design in terms of mobility in congested environment.
They are capable of easily performing task in environment
congested with Static and dynamic obstacles
and narrow aisles .This environment are commonly found
in factory workshop, offices, warehouse, hospitals and
elderly care facilities. This paper proposes and improved
design for a Macanum Wheel for omnidirectional robot.
This design will improve the efficiency mobile robots by
reducing frictional forces and thereby improving
performance
Tough an ingenious system the traditional mecanum wheel is
somewhat inefficient in its use of energy. The addition of the
ability to lock the mecanum wheel peripheral roller increase
this efficiency when travelling in a forward direction. The
addition of the ability to dynamically adjust the angle of the
peripheral roller to base should the direction of travel to large
extent resolve the inefficiencies inherently present in the
traditional design. The AGV is able to move and perform
complex tasks within a congested factory environment while
having the ability of rapid movement over rough terrain. This
ability is invaluable during material transfer and handling.
J.A Cooney, W.L. Xu, Glen Bright, ―Visual Dead-
Reckoning for Motion Control of a Mecanum-Wheeled
Mobile Robot ― Given an omni-directional mobile platform
using four Mecanum wheels requires further a capability to
be programmed to achieve various motion behaviors and
intelligence. This paper describes an undergraduate
solution to the problem involving both hardware and software
developments. With a path following behavior as the aim, the
research focused predominantly upon; sensors for dead-
reckoning, motor drive, closed-loop feedback control, and
microcontroller interfacing and programming. A four channel
high power MOSFET and relay H-Bridge driver circuit board
was designed for driving four motors. Two optical mice were
attached to the front and rear of the robot giving positional
feedback for closed-loop control and dead-reckoning for
navigation. A Mitsubishi M16C/62 microcontroller was
interfaced to these TTL compatible devices and subsequently
programmed to implement various robotic behaviours. A
closed-loop control scheme using three independent PID
controllers was implemented to follow three degrees-of-
freedom motions, i.e., x- and y-movement and rotation
motions. The path following performance of the robot was
tested in both open-loop and closed-loop modes and the
optical mice were found to be a promising but inexpensive
sensor, providing dead-reckoning for robot motion control
Stephen L. Dickerson, Brett D. Lapin, ―Control of An Omni-
directional Robotic Vehicle with Mecanum Wheels‖, Georgia
Institute of technology The authors explore three aspects of
the Mecanum wheeled vehicles, the ability to maneuver in
congested spaces, the kinematics of wheel design, and
considerations for wheel loading and traction. It is shown
how omni-directional capability greatly reduces the amount

National Conference On “Recent Innovations in Engineering, Science and Technology” April 2019
16
of area and time required for maneuvers, and how the
Mecanum wheel in particular reduces time because of the
absence of singularities. The algorithms to convert desired
motions to required wheel motions do not require excessive
computation even in the case where they include
compensation for wheel slip detection and correction. The
authors also present some novel concepts, the multiple row
driven wheel and the screw type variation of the Mecanum
wheel.
P. Viboonchaicheep, A. Shimada, Kosaka, ―Position
Rectification Control for Mecanum Wheeled Omni-
directional Vehicles‖, In recent years, an omni-directional
vehicle system using Mecanum wheels has been developed
and used in wheel-chairs. It should be more widely utilized
as a kind of robot for intelligent wheelchairs or vehicle
robots for hazards by making the best use of its unique
features. This paper presents a position rectification
method during position and orientation control with multi-
sampling periods. The control system is based on unique
kinematics, which are under holonomic constraints. The
idea for the proposed rectification method consisting of
symptomatic rectification and preventive rectification has
been borrowed from medical science.
Jonathan J. Plumpton, M. John D. Hayes, Robert G.
Langlois and Bruce V. Burlton, Department of Mechanical
and Aerospace Engineering, Carleton University, Ottawa,
ON, Canada , ―Atlas Motion Platform Mecanum Wheel
Jacobian In The Velocity And Static Force Domains ―,In
this paper, novel generalized kinematic and static force
models for the Atlas spherical platform, actuated with
Mecanum wheels, and has been presented. The model was
first formulated at the static force level leading
Jun Qian , Bin Zi , Daoming Wang , Yangang Ma and Dan
Zhang , ―The Design and Development of an Omni-
Directional Mobile Robot Oriented to an Intelligent
Manufacturing System‖, The mechanical system of the
mobile robot is made up of three separable layers so as to
simplify its combination and reorganization. Each
modularized wheel was installed on a vertical suspension
mechanism, which ensures the moving stability and keeps
the distances of four wheels invariable, the mobile robot
was integrated in an intelligent manufacturing system for
material conveying. Experimental results show that the
Omni-directional mobile robot can move stably and
autonomously in an indoor environment.
Ramirez-Serrano, A., Kuzyk, R., ― Modified Mecanum
Wheels for Traversing Rough Terrain‖, 6th International
Conference on Autonomic and Autonomous Systems,
IEEE Computer Society, Mecanum wheels give vehicles
and robots autonomous omni-directional capabilities, while
regular wheels don‘t. The omni-directionality that such
wheels provide makes the vehicle extremely maneuverable,
which could be very helpful in different indoor and outdoor
applications. However, current Mecanum wheel designs
can only operate on flat hard surfaces, and perform very
poorly on rough terrains. This paper presents two modified
Mecanum wheel designs targeted for complex rough
terrains and discusses their advantages and disadvantages
in comparison to regular Mecanum wheels. The wheels
proposed here are particularly advantageous for
overcoming obstacles up to 75% of the overall wheel
diameter in lateral motion which significantly facilitates
the lateral motion of vehicles on hard rough surfaces and
soft soils such as sand which cannot be achieved using
other types of wheels. The paper also presents control
aspects that need to be considered when controlling
autonomous vehicles/robots using the proposed wheels
Bengt Erland Ilon, the inventor of the Ilon wheel. The
Mecanum wheel is a design for a wheel which can move a
vehicle in any direction. It is sometimes called after its
inventor, who came up with the idea in when he was an
engineer with the Swedish company Mecanum AB. The
US-Patent was filled on the 13 November 1972.

National Conference On “Recent Innovations in Engineering, Science and Technology” April 2019
17
III. METHODOLOGY
METHODOLOGY FOR MECHANICAL DESIGN A)
DESIGN OF WHEEL
One of the more common omni-directional wheel designs is
that of the Mecanum wheel, invented in 1973 by Bengt Ilon,
an engineer with the Swedish company Mecanum AB (Ilon,
1975). The wheel itself consists of a hub 1 carrying a number
of free moving rollers 2 angled at 45° about the hub‘s
circumference (Fig. 1). Because the solution shown in Fig. 1
is more difficult to manufacture, a simpler wheel hub has
been chosen. The angle between rollers axis and central
wheel axis could have any value but in the case of
conventional Swedish wheel it is 45˚. The angled peripheral
rollers translate a portion of the force in the rotational
direction of the wheel to a force normal to the wheel
direction. Depending on each individual wheel direction
and speed, the resulting combination of all these forces
produce a total force vector in any desired direction thus
allowing the platform to move freely in the direction of the
resulting force vector, without changing of the wheels
themselves.
B) CONSTRUCTION AND TESTING
Selection of proper manufacturing methods
Working as per process scheduling and plan
Testing of equipment on field
Error analysis
Repair If Any
C) DEPLOYMENT
Comparing the paper with the designed output
Preparation of testing results
IV. DESIGN PROCEDURE
Roller Type Bush
Body Material Aluminium
Internal Diameter of Roller 22mm
Length of Roller 38mm
Load Capacity Per Wheel 15kg
Net Weight 600gm
Number of Plates 2
Numbers of Roller / Wheel 15
Outer Diameter 152mm
Roller Material Nylon+TPR
Spacer Material Nylon
Wheel Width 46.06mm
Plate Thickness 2.5mm
Diameter of Holes 5mm(MS Bolt)
Holes of Mountings PCD 47.5mm
Nut Type HEX Nyloc Nut
Table:- Design Specification
V. CONCLUSION
In this paper, the design of Omni-directional mobile robot
using Mecanum wheel. The strength of this wheel is the
enhanced maneuverability of the forklift that needs
extreme maneuverability in congested environment. The
paper also presents some research that being carried out in
Mecanum wheel fork lift in order to improve the wheel
design and practical application using Mecanum Wheel
forklift.
VI. REFERENCES
1)Olaf Fiegel, Aparma Badve, Glen Bright, et al. ― Improved Mecanum
Wheel Design for Omnidirectional Robots‖ in Proc. Australasian
Conference on Robotics and Automation, 27-29
Nov 2002. 2)J.A Cooney, W.L. Xu, Glen Bright, ―Visual Dead- Reckoning for Motion
Control of a Mecanum- Wheeled Mobile Robot‖, Massey University.
3)Stephen L. Dickerson, Brett D. Lapin, ―Control of An Omni-directional
Robotic Vehicle with Mecanum Wheels‖, Georgia Institute of Technology.

National Conference On “Recent Innovations in Engineering, Science and Technology” April 2019
18
4)P. Viboonchaicheep, A. Shimada, Y. Kosaka, ―Position
Rectification Control for Mecanum Wheeled Omni-directional Vehicles‖,
Hashimodotai Polytechnic University.
5) Jonathan J. Plumpton, M. John D. Hayes, Robert G. Langlois and Bruce V. Burlton, Department of Mechanical and Aerospace
Engineering, Carleton University, Ottawa, ON, Canada , ―Atlas Motion
Platform Mecanum Wheel Jacobian In The Velocity And Static Force
Domains‖
6)Jun Qian , Bin Zi , Daoming Wang , Yangang Ma and DanZhang , ―T
he Design and Development of an Omni-Directional Mobile Robot
Oriented to an Intelligent Manufacturing System‖
7) Ramirez-Serrano, A., Kuzyk, R., „ModifiedMecanum Wheels for Traversing Rough Terrain‖,6th International Conference on
Autonomic andAutonomous Systems, IEEE Computer Society,2010,
doi: 10.1109/ICAS.2010.35
8)Thomas Braunl, 2003 Embedded Robotics: Mobile Robot Design and
Applications with Embedded Systems, First Edition. Springer-Verlag,
Berlin.
9)Resource Materials Omni-Directional Robot by Universityof
South Australia on http://robotics.ee.uwa.edu./eyebot/omni.html
10)Rource Materials Omni-Directional Vehicle (ODV) by the
U.S. Navy on the: http://www.robotics.com/robomenu/odv.html.
11) http://rtreport.ksc.nasa.gov/techreports/98report/09 -ar/ar06.html 12) http://www.robotics.com/robomenu/odv.html 13) http://www.architectureandvision.com

National Conference On “Recent Innovations in Engineering, Science and Technology” April 2019
19
Reclaimation of Exhaust Gas From Pneumatic System
Chede Sachin1, Rana Aishwary2, Kakade Bhushan3, Choudhary Shivank4, Ranalekar Harshad5
[email protected], [email protected] , [email protected], [email protected] ,
Mechanical Engineering
Sandip Institute of Engineering & Management,Mahiravani,Nashik.
Abstract— Pneumatic systems are one of the mostly used systems
in various industrial setups related to manufacturing, automation etc.
It is being implemented in press shops, automatic production lines,
mechanical clamps etc. Pneumatic system uses constant supply of
compressed air to transmit and control energy. The air is provided by
compressor and supply through various valves and after completion
of work, it is exhausted to the atmosphere. To compress air lots of
electrical energy is being consumed, as compressor efficiency is
relatively much lower i.e. 25-30%. So by reclaiming exhaust gases
from pneumatic system can cause a significant drop in energy
consumption, as it already is in compressed form. In this Project
work, we propose to optimize the energy consumption in Pneumatic
system by reclaiming and reusing the exhaust air for various other
applications, as per the available exhaust air pressure.
Keywords— Exhaust air reclaimation, Reclaimation system
automation, optimization of reclaimation system
I. INTRODUCTION
A pneumatic system is a system that uses compressed air to
transmit and control energy. Pneumatic systems are used
extensively in various industries. Most pneumatic systems rely
on a constant supply of compressed air to make them work.
This is provided by an air compressor. The compressor sucks
in air from the atmosphere and stores it in a high pressure tank
called a receiver. This compressed air is then supplied to the
system through a series of pipes and valves and then exhausted
to atmosphere. Compressed air is the air from the atmosphere
which is reduced in volume by compression thus increasing its
pressure. [1] It is used as a working medium normally at a
pressure of 10 bar to 20 bar. For using pneumatic systems,
maximum force up to 50 kN can be developed. Actuation of
the controls can be manual, pneumatic or electrical actuation.
Compressed air is mainly used to do work by acting on a
piston or vane.
In working cycles of pneumatic cylinders, the air with certain
pressure in the discharging chamber is usually exhausted into
the atmosphere directly. If a part of the exhausted-air could be
reclaimed, great energy would be saved for an industrial
pneumatic system. For this, a simple and direct method is to
develop a system in which the discharging chamber of a
cylinder should be connected with an air receiver and the
exhaust air is reclaimed into the receiver for reuse. However,
there might be some potential problems for this system. On
the one side, when the pressure in the receiver is increased
near the pressure in the discharging chamber, the remaining air
in the discharging chamber could not be reclaimed to the
receiver and it should be discharged into the atmosphere.
Moreover, the pressure in the receiver would vary with the
increasing or decreasing of the air mass in it. Therefore, it is
necessary to control the connecting of the discharging chamber
with the receiver and the air discharging from the cylinder (for
short, expressed as exhaust switch). On the other side, the
cylinder velocity characteristics might be changed when the
cylinder circuit attached with an additional air-reclaiming
device. Therefore, in order to reclaim more energy and make
less influence on the cylinder velocity characteristics, the
suitable control criterion and the switching-point for
controlling the reclaiming process should be carefully studied
and determined. Moreover, the reclaiming system should be
simple in structure and low in cost. In following contents, the
constitution of the reclaiming system is introduced and the
mathematical model of the system has been studied. Through
theoretical analysis and experimental research, the varying law
of the cylinder velocity characteristics when with reclaiming
device is discussed and the criterion of control differential
pressure at the switch points is determined. [7]
II. HISTORY & BACKGROUND
Pneumatic system used in industry powered by compressed air
or gases. A centrally located and electrically powered
compressor power cylinder, air motor and pneumatic devices.
The existences of pneumatic system in industrial work was
first introduced in mid of 18th century.
Both pneumatic and hydraulic system works on fluid power.
Pneumatic system uses pressure between 550 KPa to 690 KPa,
whereas it ranges between 6.9 MPa to 34.5 MPa and more in

National Conference On “Recent Innovations in Engineering, Science and Technology” April 2019
20
hydraulic system. But hydraulic system has problem of
leakage, slow velocity of piston etc. which are overcome by
pneumatic system.
Pneumatic system has drawbacks like un-precise control of
piston, dumping of exhaust air to atmosphere, noisy operation
etc. In which dumping of exhaust air has vital effect on
efficiency of pneumatic system. Exhaust air is a pure form of
energy as it is in compressed form and if reused can increase
overall efficiency of system because the compressor efficiency
is much lower i.e. 25-35% only. Thus we aim to reclaim
exhaust air without effecting the performance of pneumatic
system.
In this project we refer various research paper and scientific
journals of various authors‘ who has contributed their work in
various aspects of pneumatic system.
P. Goyal et.al [1] Worked on the project which deals with the
design of pneumatically controlled small scale punching
machine to carry out piercing operation on thin sheets (1-2
mm) of different material (aluminium and plastic). Reduction
in punching force requirement was the main aim of this
project. This was obtained by modification in punch tool
design i.e. by provision of shear on punch face. Subsequently
it resulted in reduction in amount of punching force
requirement.
Sudeep Kelaginamane et.al [2] Worked on the design and
fabrication of automatic sheet metal punching machine
controlled by Programmable Logic Controller (PLC). It also
described the working principle and the hardware structure of
the system. By automating the punching system one can have
greater control over the whole process. This system can
replace existing manual feed and operated punching machines.
By interfacing PLC, it was possible to get good results in the
form of increased safety of the worker, reduced manufacturing
lead time and reduced angular misalignment.
Anand Kumar et.al [3] The purpose of this paper was to
reduce the cycle time by replacing drilling machine and
riveting machine by special purpose machine(SPM) for
drilling and riveting operation. The concept was that the plate
having different size and thickness are drill on drilling spindle
first and then riveted on orbital riveting spindle. Both the
operation performed on same machine having two separate
spindles. this paper gave the detail information of design,
fabrication and analysis of special purpose machine and
compare the cycle time with conventional method. This
machine was containing automation by using pneumatic
system. Modelling was done using CAD software and analysis
by FEA tool. The design was analysed for induced stress on
work piece due to various load condition.
Rohit Kumbhar et.al [4] This research article presented the
advanced method design and development of pneumatic
operated washer making machine. The pneumatic system has
gained a large amount of importance in last few decades. This
project work was mainly included the main components of
designs of pneumatic operated washer making machine such
as: design of cylinder, selection of direction control valve, and
selection of tube, design of aluminium sheet, plastic sheet, tar
felt sheet and pneumatic circuit design. Design analysis also
done by using CATIA software. Fabrication and
implementation included: fabrication of frame and
components. This importance was due to its accuracy and cost.
Due to ease of operation, handiness, and expediency in
operating the pneumatic system has made them to design and
fabricate this unit as their project. This pneumatic operated
washer making machine unit could be operated easily with
partially skilled operators also.
S.Y. Lee et.al [5] Worked on the Concept of recirculation
system in recycling the compressed air in a pneumatic system
for increasing the compressing efficiency. This system
consisted compressor, regulator, reservoir, pneumatic artificial
muscle (PAM), Re-valve, gage pressure sensor, control board
and power supply. A pneumatic actuator ensured the safety of
the wearable robots due to its compliant characteristics and
high force density. However, the pneumatic actuator had the
following problems: low compressing efficiency, low control
bandwidth, and high noise. To overcome these problems, they
have proposed the recirculation system. The concept was
recycling high-pressure exhausted air in order to increase
compressing efficiency.
Ming Hung Tsai et.al [6] Worked on pneumatic control
systems that have played the important roles in the industrial
automation equipment owing to the following advantages - low
cost, clean of the working environments, easy in power
transfer, and so on. In recent years, high accuracy and high
speed systems were growing up rapidly, and were important in
high-tech industry. However, the precise position control of a
pneumatic cylinder was very difficult due to the
compressibility of air, nonlinear behaviour of the air flow rate
through the servo valve, the friction force between the cylinder
and the piston, and the stick slip effect at the low speed of the
system. This paper was mainly to study the precision
performance of positioning to the vertical pneumatic cylinder
under vertical loading. In this paper, the friction force and the
vertical loading had the great effect on the positioning
accuracy.
III. DESIGN OF RECLAIMATION SYSTEM
Design of reclaimation system is based on the following two
philosophies
3.1. Research Philosophy: - Our project is based on realism philosophy. By referring to
different scientific literature and papers we can conclude that,
in working cycle of pneumatic cylinder, the air with certain
pressure in discharging chamber usually is exhausted in the
atmosphere directly. This reduce the efficiency of the system
by great extent. Thus by overcoming this problem by various
means we can extend the working efficiency of the pneumatic
system to its optimum level.
3.2. Research Strategy: - For this a simple and direct method is to develop a system in
which the discharging chamber of the cylinder should be
connect to the receiver, so that the air can be reclaimed and
reused for other various purposes. However, there might be
some potential problem in this system.

National Conference On “Recent Innovations in Engineering, Science and Technology” April 2019
21
Airflow capacity Receiver tank volume
(cfm) (lpm) (gal)
10 283.2 10
20 566.4 20
30 849.6 30
40 1132.8 40
50 1416 50
75 2124 75
100 2832 100
150 4248 150
200 5664 200
Design Procedure
Steps to be involved for reclaimation of exhaust air from
pneumatic system are
Table no. 3.1 Reservoir Selection
Fig.No.3.1.Construction of the exhausted-air reclaiming system
STEP 1: - To find following parameters of pneumatic system
a. Find out the velocity of piston:
Velocity = length of travel by piston/time taken
V = L/t (mm/sec)
b. Flow rate of piston:
Q = LAN/60 (m3/sec)
Where, L = length of travel of piston in cylinder
A = area of cylinder
N = no. of reciprocation in a minute or 60
sec
c. Find out pressure out outlet of exhaust:
This can be known by using pressure gauges
STEP 2: - Now as per data is obtained from the exhaust of pneumatic
system in above calculations, design a reservoir as per the
requirement. Below chart suggest selection of air reservoir;
Air reservior should be atleast 2.5 to 3 times bigger in capacity
as per the output requirement of flow rates. All saftey measure
should e installed on reservior like, pressure relive valve,
pressure guage etc.
Fig. 3. 2 Flow Chart for Exhaust Gas Reclamation System

National Conference On “Recent Innovations in Engineering, Science and Technology” April 2019
22
STEP 3: - Check whether the velocity of piston is affected because of the
back pressure. For this, install sensor on cylinder of pneumatic
system. Displacement sensors are used to find velocity. ―Hall
effect sensor‘‘ is used for cylinder having magnetic piston and
―Ultrasonic sensor‖ for non-magnetic piston in pneumatic
system.
STEP 4: - If velocity of piston is uniform then connect output of exhaust
to input of pneumatic system as in fig3.1.If velocity is non-
uniform and its performance is affected then find the position
uptill which piston is displacing with uniform velocity in
working stroke. This point is known as ‗Switch point‘. Uptill
this point the exhaust air is stored in reservior and after this
point the exhaust air is released into the atmosphere.
STEP 5 :-
Connect exhaust of pneumaic system to 3/2 solenoid operated
DCV as in fig3.2.Design an IC 555 timer circuit which will
operate 3/2 solenoid operated DCV at the switch point attach
muffler to exhaust port of 3/2 DCV valve. Inputs to IC 555
circuits form sensors.
STEP 6:- Connect the output of 3/2 solenoid operated DCV to the input
of non-return valve.
STEP 7: - Ensure all the attachments towards non-return valve are ok.
STEP 8: - Connect the non-return valve to the input of air reservoir.
IV. RESULT AND ANALYSIS
We conducted an experiment as per available power press
machine operated through clutch of maximum 200 tonne
capacity and air pressure required to operate clutch is
maximum of 5.5 bar. In this experiment we are able to collect
pressure upto 3 to 4 bar.if we are able to reclaim pressure of
5.5 bar and above in higher pressure arrangements then it will
be more useful for operation of power tools and other
applications.
V. CONCLUSION
As we know that the air has potential to work as medium to do
the useful work.The pressurize air can be used after
completing regular operations of system as its exhaust pressure
is upto 5.5 bar.The system which we have developed has
capacity to store air upto a pressure of 3.5 bar at the output of
5.5 bar of system exhaust. And by this we are achieving
efficiency upto 63 %. If we get some other high pressure
arrangements then we will be able to recover upto 6 bar
pressure which will be more useful in power tools applications
like grinding,finishing,painting etc.
REFERENCES
1) P. Goyal, G. Srivastava, R. Singh, N. Singh ―Review on Pneumatic
Punching Machine and Modification in Punch Tool to Reduce Punching
Force Requirement‖ IJETSR, ISSN 2394–3386,Volume 2 Issue 2.
2) Sudeep Kelaginamane, Sridhar D. R. Department of Mechanical
Engg, MITE, Moodabidri, India ―PLC Based Pneumatic
Punching Machine‖ Journal of Mechanical Engineering and
Automation 2015,
5(3B): 76-80,DOI: 10.5923/c.jmea.2015.02.15.
3) Anand Kumar Singh, Mitesh L Patel ―Design and Development of
Pneumatic Punching Machine‖International Journal For Technological
Research In Engineering Volume 4, Issue 11, July-
2017 ISSN: 2347 - 4718.
4) Kumbhar Rohit Bhimrao, Lugade Ajinakaya Rajaram, Mullani Kamal
Dilwar, Patil Appaji Pundalik, Patil Tushar Ballu, Mahadev G.
Reddy, Duradundi Sawant Badkar, Department of Mechanical
Engineering ―Design and Development Pneumatic Operated Washer
Making Machine‖ Trends in Machine Design, ISSN: 2455-3352
,Volume 4, Issue 3.
5) S. Y Lee1, K.H Han1 and D. Shin1,Chung-AngUniversity,
Seoul,06974, Korea ―Design of Recirculation System and Re-valve
for Increasing the Compressing Efficiency‖ 2017 14th International
Conference on Ubiquitous Robots and Ambient Intelligence (URAI),
June 28 - July 1, 2017 at Maison Glad Jeju, Korea.
6) Ming-Hung Tsai, Chi-Neng Cheng, and Ming-Chang Shih Department of
Mechanical Engineering, National Cheng Kung University Tainan,
Taiwan, R.O.C ―Design and Control for the Pneumatic Cylinder
Precision Positioning Under Vertical Loading‖.
7) Yunxu SHI, Xiaoning LI and Yan TENG SMC Pneumatics Nanjing
Center, School of Mechanical Engineering, Nanjing University of
Science & Technology Nanjing, 210094 china ―Research on pneumatic
cylinder‘s exhausted-air reclaiming control devices‖ Proceedings of the
6th JFPS International, Symposium on Fluid Power, Tskuba
2005,November 7-10, 2005.
8) Utkarsh Sharma UG Student, Dept. of Mechanical Engineering, Sikkim
Manipal Institute of Technology, Sikkim, India ―Design of Automatic
Pneumatic Hole Punching Machine‖ IRJET, e-ISSN: 2395 -0056
Volume: 02 ,Issue: 09 - Dec-2015,p-I
National Conference On “Recent Innovations in Engineering, Science and Technology” April 2019
23
Review of Solar Operated Vapour absorption
Refrigeration System Siddhant Sandeep Arote1
Department of Mechanical Engineering
Sandip Institute of Engg. And Management
Abstract— At the present time refrigeration plays a very
important role in our daily as well as industrial life. But due to
some problems like, refrigerant of CFC is also affecting our
ecosystem very rapidly. So there is need of working on these
systems in order to avoid such harms. Vapour absorption
Refrigeration System acts as an alternative to existing systems as
it requires low grade of energy for example; solar energy as it's
renewable and present in enormous amount. So, in recent times a
lot of research is going on to improve such systems that affects
least to the environment and humanity but acts for same purpose
in very efficient manner. As the energy is the backbone of the
technology it affects the price of product as well as the overall
economy of the industry
Keywords- Absorber, Aqua-Ammonia Vapour, Coefficient
of Performance, Generator, Solar Energy, Tonnage of Refrigeration
I. INTRODUCTION
Refrigeration is the process of removing heat from enclosed
system or space and rejects it to another system or
surrounding. The refrigeration is used to lower the
temperature of the enclosed system. A vapour absorption
refrigeration system is similar to a vapour compression
refrigeration system. The vapour absorption system
comprises of all the processes in the vapour compression
refrigeration system like compression, Condensation,
expansion and evaporation. In the vapour absorption system
the refrigerant used is ammonia-water or lithium-bromide.
The refrigerant gets condensed in condenser and evaporated
in evaporator. The refrigerant produces cooling effect in the
evaporator and release the heat to the atmosphere through the
condenser. The difference between the two systems is the
method of the suction and compression of the refrigerant in
the VARS cycle. In the vapour compression system, the
compressor sucks the refrigerant from the evaporator and
compresses it to the high pressure. The compressor is also
enables the flow of the refrigerant through the complete
refrigeration cycle. In the vapour absorption cycle the
process of suction and compression are carried out by two
different devices called as absorber and generator. Thus the
absorber, generator and the pump replace the compressor in
the vapour absorption cycle. The absorbent enable the flow
of refrigerant from the absorber to the generator by
absorbing heat. In the vapour absorption system the energy
input is in the form of heat this can be from the excess
system from the process or hot water.
The heat can be created by another source like natural gas,
kerosene, heater etc. Though these sources are only in the
small system. The above sources are conventional and are
being used extensively in such way that their known
reserves have been depleted to a great extent. At same time
it is becoming increasingly difficult to find and exploit
their new deposits of petroleum on our country will get
exhausted by the few decades and their reserves are
expected to last for another some years. But here we are
using the solar energy to heat the water. Because the solar
energy the abundant source of energy. Solar energy
systems allow you to absorb free sunlight and convert it
into usable power in your system. Unlike conventional
power, solar produces no harmful emissions that hurt the
environment. Solar energy will save your money each
month. In addition, the investment that you made in solar,
will improves property value. Vapour absorption system is
basically uses the low grade energy such as waste heat and
solar energy coming in the nature from thousands of years.
II. HISTORY & BACKGROUND
Attempts have been made to run vapour absorption systems
by solar energy with concentrating and flat plate solar
collectors. Several small solar absorption refrigeration
systems have been made around 1950s in several countries.
Professor G.O.G. Lf of America is one of the pioneers in the
area of solar refrigeration using flat plate collectors. A solar
refrigeration system that could produce 250 kg of ice per day
was installed in Tashkent, USSR in 1953. This system used a
parabolic mirror of 10 sq m area for concentrating the solar
radiation. F. Trombe installed an absorption machine with a
cylindro-parabolic mirror of 20 sq m at Montlouis, France,
which produced 100 kg of ice per day. Serious consideration
to solar refrigeration systems was given since 1965. Due to
the scarcity of fossil fuel based energy sources. LiBr- water
based systems have been developed for air conditioning
purposes. The first solar air conditioning system was
installed in an experimental solar house in University of
Queensland, Australia in 1966. After this several systems
based on solar energy were built in many parts of the world
including India. In 1976, there were about
500 solar absorption systems in USA alone. Almost all
these were based on LiBr-water as these systems do not

National Conference On “Recent Innovations in Engineering, Science and Technology” April 2019
24
require very high heating temperatures. These systems were
mainly used for space air conditioning. Intermittent
absorption systems based on solar energy have also
been built and operated successfully. In these systems, the
coolingeffect is obtained during the night time, while the
system gets ―charged‖ during the day using solar energy.
Though the efficiency of these systems is rather poor
requiring solar collector area, they may find applications in
remote and rural areas where space is not a constraint. In
addition, these systems are environment friendly as they
use eco-friendly refrigerants and run on clean and
renewable solar energy.
FIGURE AND TABLE
An absorption refrigerator is a refrigerator that uses a heat
source (e.g., solar energy, a fossil-fueled flame, waste heat
from factories, or district heating systems) to provide the
energy needed to drive the cooling process.
Absorption refrigerators are often used for food
storage in recreational vehicles. The principle can also
used to air- condition buildings using the waste heat from a
gas turbine or water heater. Using waste heat from a gas
turbine makes the turbine very efficient because it first
produces electricity, then hot water, and finally, air-
conditioning (called cogeneration/tri-generation).
Both absorption and compressor refrigerators use a
refrigerant with a very low boiling point (less than −18 °C
(0 °F)). In both types, when this refrigerant evaporates
(boils), it takes some heat away with it, providing the cooling
effect. The main difference between the two systems is the
way the refrigerant is changed from a gas back into a liquid
so that the cycle can repeat. An absorption refrigerator
changes the gas back into a liquid using a method that needs
only heat, and has no moving parts other than the refrigerant
itself.
Fig. - Vapor Absorption Refrigeration System
III. RESULT AND ANALYSIS
This paper describes about the utilization of solar energy by
concentric collector tracking mechanism for
domestic refrigeration purposes. Power of the sun can be
effi- ciently used to harness energy for need for various
applications. Different systems are available to collect or
utilize the solar energy, but the incident angle of
direct radiation keeps changing vis-a-vis the day length. So,
we cannot use the solar energy to full extent with
the fixed collector. To attain the incident angle nearly per-
pendicular to the collector, need to deal with the
moving collector system. Thus we employed for mechanic-
ally operated automatic tracking system which gives ease in
operation. An „Electrolux refrigeration system‟ used in this
present work is a three fluid system namely Ammonia, water
& hydrogen. Instead of a compressor it uses low grade
energy to run a generator, as opposed to a standard
refrigerator.
IV. CONCLUSION
Vapour absorption refrigeration system with R-717 as
refrigerant and water as working fluid have been studied
theoretically. Consistently increasing CO2 emission and
ozone depletion from CFC‘s are serious environmental
issues challenging scientific community. In conventional
refrigeration system, compression machines are employed,
which requires high-grade energy as input and this is in the
form of electricity. Therefore it is better to use the Vapour
absorption refrigeration system which gives scope of
utilizing low grade energy source i.e. solar panel for
generating cooling effect which is dominated by high grade
energy driven compression technology. Absorption
refrigeration system provides large potential for reducing
heat pollution of the environment. Therefore, in future it is
decided to compare the performance between
conventional systems and vapour absorption system using
solar thermal energy.
REFERENCES
[1] Dillip Kumar Mohanty, ―Thermodynamic Performance Analysis of a Solar Vapour Absorption Refrigeration System‖ International Journal of Enhanced Research in Science Technology & Engineering, ISSN: 2319-7463 Vol. 4 Issue 4, April-2015 pg. 103-109. [2] Anil Sharma, et al., "Configuration of Capacity Absorption Refrigeration System Driven By Low Grade Energy Source" International Journal of Metallurgical & Materials Science And Engineering Vol. 2 pg. 56-59 [3 ]Ajay Sankar N R, Dr. S. Sankar, ―Design and Performance Analysis of a Solar Thermal Assisted Vapour Absorption Air Conditioning System‖ International Journal of Innovative Research in Science, Engineering and Technology (An ISO 3297: 2007 Certified Organization), Vol. 4, Issue 4, April 2015 [4] Upadhyay N. To Study the Effect of Sub-Cooling and Diffuser on the Coefficient of Performance of Vapour Compression Refrigeration System. International Journal of Research in Aeronautical and Mechanical Engineering, Vol. 2, Issue. 6, June 2014 Pg. 40-44 [5]Bajpai V.K., Design of Solar Powered Vapour Absorption System, World Congress on Engineering 2012 Vol III WCE 2012, July 4 - 6, 2012, and London, U.K. Pg. 86-89

National Conference On “Recent Innovations in Engineering, Science and Technology” April 2019
25
[6]Preethu Johnson and K. B. Javare Gowda, FABRICATION OF SOLAR THERMALVAPOUR ABSORPTION REFRIGERATION SYSTEM, (IRJET) p-ISSN: 2395-0072 Volume: 02 Issue: 05 | Aug-2015. [7]Sachin Kaushik, Dr. S. Singh, ―Thermodynamic Analysis of Vapor Absorption Refrigeration System and Calculation of COP‖ International Journal for Research in Applied Science and Engineering Technology (IJRASET)), Vol. 2 Issue II, February 2014, ISSN: 2321-9653.
National Conference On “Recent Innovations in Engineering, Science and Technology” April 2019
26
Automatic human following trolley
Prof.S.M.Mahajan1, S.A.Dheringe 2, P.D.Harde3, P.V.Gaware 4,S.D.Ahire5
[email protected] 1, [email protected] 2 [email protected] 3, [email protected] 4 ,
Mechanical Engineering
Department
Sandip Institute of Engineering and Management, Nashik
Abstract— In this paper we tried to accomplish an automatic or
smart trolley system which can carry any amount of specified weight.
Our aim is to design a trolley which will follow the human being and
can carry the weight so as to reduce the effort required by human
being. During shopping we have to carry shopping cart all over the
mall,So the human following trolley can follow the shopper
anywhere the shopper goes without any actual effort.The primary
goal of our work is to design and fabricate a trolley that not only
tracks the target but also moves towards. Smart trolley system works
with help of Bluetooth and GPS module which are used to identify
the presence of a user. Aurdino UNO is the main programmable part
that bluetooth and GPS detect the user‘s position with respect to
trolley. In order to make things simpler, Trolley will locate the
smartphone of the user. All the processing is carried out by the
microprocessor while the control of the motors is carried out by the
controller.
Keywords—Human following trolley, Bluetooth, GPS, Aurdino
UNO, position.
I. INTRODUCTION
Every day we see shopping carts in the supermarket
customers usually push the carts with both hands, and so, if the
customer had only one hand or had to carry a child, then
pushing shopping carts becomes a real burden .Thus, in order
to improve the situation and assist those with disability,
we plan to develop a trolley system that follows the user.
Enabling disabled people to enjoy shopping with the need for
human assistance . There are certain stages in life that people
needs help from others to carry their loads. This project aims
to help those people to avoid asking others for help. A Trolley
will help in carrying heavy loads and follow the person in a
convenient way without disturbing their attention in
shopping.GPS on the smartphone of the user will detect the
person‘s location from the trolley. The programmable
application called blynk is used to communicate and transfer
data between trolley and the smartphone. The Bluetooth on the
user smartphone will act as sender and the Bluetooth receiver
is integrated in the trolley. The Bluetooth signal will be sent
from the smartphone and the receiver will locate and calculate
the distance from the user. Aurdino will process the data and
will command the relay and according to the distance between
person and trolley current is supplied to motor, and the motor
speed is varied. Four wheel trolley mechanism on top to hold
the various types of heavy loads. The trolley will have the
drive and steering mechanism being motorized and is backed
by DC batteries. The sensor will sense the person who is in
front and in the predefined range of the sensor area. The
sensor is continuously connected via Bluetooth hence giving
the approximate distance of the person.. If the person moving
forward towards the trolley, the sensor will sense the distance
between them and gives signal to arduino about the distance.
Arduino will execute the program by moving the motors in
forward direction and hence if the person moves towards
trolley it will tend to move away from the person. If the person
moves backward the trolley will tends to come closer to the
person. If the person stops suddenly, the trolley will move at
specific distance from the user.[1]
II. HISTORY & BACKGROUND
Shopping trolleys in mall require a great effort to carry around,
The smart trolley will help reduce this effort. The human
following trolley motion can be achieved by using various
sensors and arrangements. Such as camera, ultrasonic sensor,
RFID, LRF. Muhammad Sarmad Hassan, ‗Design and
development of human following robot‘ paper stated the
method of a human following robot based on tag identification
and detection by using a camera. Intelligent tracking of
specified target is carried out by the use of different sensors
and modules i.e. ultrasonic sensor, magnetometer, infrared
sensors and camera. An intelligent decision is being made by
the robot control unit based on the information obtained from
the above sensors and modules, hence finding and tracking the
particular object by avoiding the obstacles and without
collision with the target. The biggest advantage of their

National Conference On “Recent Innovations in Engineering, Science and Technology” April 2019
27
method was that their algorithm worked in complex
environments as well. System consists of a three wheel robotic
vehicle mounted with a separate microprocessor and control
unit along with different sensors and modules. It can assist the
public in shopping malls. So there it can act as a luggage
carrier, hence no need to carry up the weights or to pull that.
Using this algorithm the robot will automatically follow that
person. But this implementation has its limitations. Range of
the implementation is limited and environmental lighting affect
the tag detection.
COMPONENTS
III. DESIGN ISSUES
Arduino UNO & Genuino UNO, L298n Motor Driver,
Parallax PAM-7Q GPS Module, HC-05 Bluetooth Module,
12V battery, 4 Wiper motor .
The Arduino Uno and a 12v battery to power the sensors,
Bluetooth, and control logic. A 12v lead acid battery was used
to power the motors. A HC-05 Bluetooth module was mounted
at the front of the platform for better range. The rest of the
components including a L298N motor driver, PAM-7Q GPS,
were mounted inside and connected to the Arduino through the
breadboard.The compass works with I2C, so we connected the
SLC and SDA pins to A5 and A4 respectively. The rest of the
pins were connected through digital I/O. The motors are
powered by attaching them the L298N motor driver board. The
battery is connected as the main power source and the
Arduino power source for control logic.Once everything
configured , verify and upload the code to your Arduino. It
will take a few seconds for the GPS to acquire a satellite lock.
Once it does, it will begin flashing while the android device is
paired with HC-05 bluetooth module.
FIGURE AND TABLE
Fig. 1.Circuit diagram
Fig.2.Base structure of trolley
REFERENCES
[1] Muhammad Sarmad Hassan, Mafaz Wali Khan, Ali Fahim Khan,
―Design And Development Of Human Following Robot‖, Student
Research Paper Conference Vol-2, No-15, July 2015.
[2] Bonda Venna Pradeep, Rahul E S, Rao R Bhavani, ―Follow Me Robot
using Bluetooth based position Estimation.‖, 2017 International
Conference on Advances in Computing, Communications and
Informatics (ICACCI)
[3] A Laser Range Scanner‘‘, International Conference On Intelligent
Robots And Systems I& Hawaii, USA, Oct. 29 - NOV. 03,2001
[4] Takashi Yoshimi, Manabu Nishiyama, Takafumi Sonoura, Hideichi
Nakamoto, Seiji Tokura,Hirokazu Sato, Fumio Ozaki And Nobuto
Matsuhira, ―Development Of A Person Following Robot With Vision
Based Target Detection‖, International Conference On Intelligent
Robots And Systems October 9 - 15, 2006, Beijing, China

National Conference On “Recent Innovations in Engineering, Science and Technology” April 2019
28
Solar Automated Lawn Mower
Prof. Dr. G. G. Waghmare,
D. R. Khairnar1, D. S. Kale 2, G. R. Gangurde 3,R. S. Aher4
[email protected], [email protected], [email protected], [email protected],
Mechanical Engineering
Sandip Institute of Engineering and Management
Abstract— Good growth of various high-tech efficient tools and
equipment makes our jobs done comfortable and sophisticated. These
days we are facing the problems like pollution, power cut problem
etc. In order to overcome these problems, we have thought about the
device, which can be performing its functions without causing any of
these problems. The project aims at fabricating a grass cutting
machine system which uses solar energy for its power requirement. A
solar powered grass cutter is designed and developed, based on the
general principle of mowing. This project deal‘s with design of solar
powered grass cutter comprises of direct current (D.C) motor, are
rechargeable battery, solar panel, a shearing action blade and IOT
based control system. The solar powered grass cutter is operated by
the switch on the board which closes the circuit and allows the flow
of current to the motor which in turn drive the blade used for
mowing. All the switching is automatic and can be done through the
smart devices. The battery recharges through the solar charging
controller.
Keywords— Cutter, Solar Panel, DC Motor, lead acid battery
I. INTRODUCTION
A lawn mower (also named as mower or lawnmower) is a
machine utilizing one or more revolving blades to cut a grass
surface to an even height. The height of the cut grass may be
fixed by the design of the mower, but generally is adjustable
by the operator, typically by a single master lever, or by a
lever or nut and bolt on each of the machine's wheels.[3] The
blades may be powered by muscle, with wheels mechanically
connected to the cutting blades so that when the mower is
pushed forward, the blades spin, or the machine may have a
battery-powered or plug-in electric motor. The most common
power source for lawn mowers is a small (typically one
cylinder) internal combustion engine. Smaller mowers often
lack any form of propulsion, requiring human power to move
over a surface; "walk-behind" mowers are self-propelled,
requiring a human only to walk behind and guide them. Larger
lawn mowers are usually either self-propelled "walk-behind"
types, or more often, are "ride-on" mowers, equipped so the
operator can ride on the mower and control it. A robotic lawn
mower ("lawn-mowing bot", "mowbot", etc.) is designed to
operate either entirely on its own, or less commonly by an
operator by remote control. [1]
Two main styles of blades are used in lawn mowers. Lawn
mowers employing a single blade that rotates about a single
vertical axis are known as rotary mowers, while those
employing a cutting bar and multiple blade assembly that
rotates about a single horizontal axis are known as cylinder or
reel mowers (although in some versions, the cutting bar is the
only blade, and the rotating assembly consists of flat metal
pieces which force the blades of grass against the sharp cutting
bar).
. II. HISTORY & BACKGROUND
There are several types of mowers, each suited to a particular
scale and purpose. The smallest types, non-powered push
mowers, are suitable for small residential lawns and gardens.
Electrical or piston engine-powered push-mowers are used for
larger residential lawns (although there is some overlap).
Riding mowers, which sometimes resemble small tractors, are
larger than push mowers and are suitable for large lawns,
although commercial riding lawn mowers (such as zero-turn
mowers) can be "stand-on" types, and often bear little
resemblance to residential lawn tractors, being designed to
mow large areas at high speed in the shortest time possible.
The largest multi-gang (multi-blade) mowers are mounted on
tractors and are designed for large expanses of grass such as
golf courses and municipal parks, although they are ill-suited
for complex terrain.
III. DESIGN OF COMPONENTS
Cutter
The cutter is main component which actually cut the lawn. It
will be mounted on face side of the lawn mower. The cutter
design consists of two components namely base and upper
cutter. The lower cutter called base is to grab the grass like in
comb in it and hold it straight while cutting. Besides holding it
performs one more operation helping cutting upper cutter. The
motor will be mounted base cutter which will help to
reciprocate laterally upper cutter on it. The cutter will be

National Conference On “Recent Innovations in Engineering, Science and Technology” April 2019
29
rested on base cutter and the contact between them is very
smooth. The friction between these upper and lower cutter is
kept minimal by optimizing design. The upper and lower
cutters are fairly similar in design with slots made by milling.
The slot will be of rectangular shape which are of 5mm in
breadth. And the slots lies throughout the length of blade and
the studs are provided to hold the cutter on chassis. The lower
base will be mounted on the chassis and the upper base is fixed
on the lower base by mean of hinge type joints which give only
one degree of freedom to the upper blade. The cutter act as a
scissor lime multiple scissor working to gather as it makes a
sense because our ancestors taught us to cut grass first hold it
and then cut it same wise we cut the grass. The lower cutter
hold the grass and then upper cutter cuts the grass. Than it cuts
the grass with excellent perfection. In rotary cutters the cutter
is unable to cut the grass uniformly because the cutter itself
bents the grass and that‘s why the cutting becomes inefficient
.in this cutter this problem is solved and the base part of cutter
thus it holds the grass to cut it. The grass cutter material
selection will be done on basis of the strength of the grass to
be cut the different grasses has different tensile and lateral
strength this all parameters depends on the nature condition in
that particular area so material should be accommodate to all
the type of grasses so that in polymers the thermosetting
polymers can be used and in the metals aluminium of brasses
and bronzes can be uses to avoid the corrosion because in case
of copper and iron the problem of the corrosion will be there
because the dew drops will be there on grass and the grass
itself release the liquids water while cutting and the mover
have to work in the sunny environments the corrosion rate are
higher in the sunny environments. To avoid this, aluminium
and thermosetting polymers will be the perfect choice for the
cutter.
Chassis
Chassis mainly consist of frame and components like solar
panel, battery, wheels, motors, etc. Frame is made from hollow
pipes of lightweight material.[1] It will provide housing for
battery and collect lawn which is cut. On top of the frame solar
panel is to mounted to collect solar energy. Chassis is divided
in two compartments for battery and to store the collected
lawn. Stress concentration is well distributed to carry the loads
of other components and the collected lawn. Wheels are placed
so that they carry load concentration evenly. Chassis have
mechanism to adjust the height of cutter for desired cutting or
cutting in aesthetic manner.
FIGURE AND TABLE
Fig. Pro-E Model of cutter
Fig. Pro-E Model of Chassis
IV. OTHER COMPONENTS
Node MCU
It is open source Iot based platform which runs esp8266 wifi
SoC from Espressif system, and the hardware which is based
on ESP-12 module. It is default firmware. It provides access to
12 GPIO pins and the connections can be done with this pins
and this runs on 3.7V and the input can be given from the Vcc
pin.[4] The program uploaded through Arduino IDE sketching
software and the connecting is provided by micro-usb.
Motor Control Unit L298N
L298N is capable of controlling multiple motors at same time
with providing alternate polarities. This is with the help of
embedded dual H bridge configuration. It supplies required
input power to the motors. Also provides power input to
firmware like Arduino, Node MCU, etc. It can take inputs in
the range 3V to 35V and produce 5V power supply for Node
MCU or Arduino upto the current rating of 2A.[6]
Circuit Digram

National Conference On “Recent Innovations in Engineering, Science and Technology” April 2019
30
Fig. Circuit Digram and Pin Connections of Node MCU with
Motor Control Unit L298N
V. CONCLUSION
The mower gives very precise cutting of grass due to adjustable blade design. As per design optimisations lawn mower consumes less power. The cost is also less due simple construction of chassis. The cost will be reduced even more for mass production. The mower is also efficient for commercial use for big lawns. REFERENCES
[1] N. Nagarajan, N. S. Sivakumar and R. Saravanan, "Design and
Fabrication of Lawn Mower", Asian Journal of Applied Science and
Technology, Vol 1, Issue 4, Pg 50-54, May 2017.
[2] S. G. Chauhan "DESIGN OF POWER AUTONOMOUS SOLAR
POWERED LAWN MOWER", IJMET, Vol 8, Issue 5, Pg 113-123,
May 2017.
[3] D. Satwik, Mr. N. Ramalingeswara Rao, Sreeram Reddy, "Design and
Fabrication of Lever Operated Solar Lawn Mower and Contact Stress
Analysis of Spur Gears" IJSETR, Vol 4, Issue 8, August 2015.
[4] https://en.wikipedia.org/wiki/NodeMCU
[5] A. Deo, A. Kumar, A. Shrivastava , A. Tiwari, N. Sharma,
"Fully
Automated Solar Grass Cutter", IJSRD, Vol 5, Issue 01, 2017. [6]
https://en.wikipedia.org/wiki/H_bridge
[7] Okafor, Ehujuo, Igbokwe, "Development of Solar Powered Lawn
Mower", IJET, Vol 6, Issue 3, March 2016.

National Conference On “Recent Innovations in Engineering, Science and Technology” April 2019
31
Design and Manufacturing of Camphor Tablet Making
Machine
Prof. Chetan Patil1, Mr. Rahul Pawar
2, Mr. Shubham Waghcahure
3,Mr. Shubham Mahale
4
Mr. Amol Pawar 5
[email protected], [email protected],[email protected], [email protected], [email protected]
Mechanical Engineering.
Sandip Institute of Engineering and Management
Abstract— This entire work focuses on the Manufacturing of Tablet
making Machine. It is run or operated by using the Mechanical
drive. Tablet making Machine are most commonly used in
pharmaceutical industry. This Tablet making Machine is use for
making the tablets of camphor. Camphor (Kapur) have been used in
sweets, incest repellent, anti Rusk coat on tools, anti microbicidal
balls, local aesthetics, vapour based camphor gels (Vicks). Camphor
is widely used in Hindu religious ceremonies. Camphor Based
substances are important part of various pharmacy products.
Camphor has been widely used as a fragrance in cosmetics, as a food
flavoring, as a common ingredient in household cleaners, as well as
in topically applied analgesics and rubefacients for the treatment of
minor muscle aches and pains. Using this machine the production rate is increased the operating
cost is also optimised as the production rate is increase the cycle
time is reduced. Initially we design the machine using software.
Later on in order to verify or to check the design finite element
method is used modelling in catia is done and also meshing is
initially done and by using structural analysis software. So that
maximum stress as well as maximum deflection induced in the
various components is checked this also verifies the design of parts.
Keywords— Tablet, Machine, Camphor, production, cost.
I. INTRODUCTION Press work is a method of mass production involving the
cold working of material, usually in the form of thin sheet or
powder. It may be defined as the chipless manufacturing
process by which various components are made from layer of
camphor powder. These processes are also termed as cold
stamping. The machine used for press working is called press.
It is one of the extensively employed methods of fabricating
parts of intricate shapes with thin walls. It uses large forces by
press tools for short time interval which results in cutting or
shaping the camphor layer.
The requirements of high productivity, reduced costs and
guarantee of high product quality to which all manufacturing
companies are exposed, applies particularly to companies in
the field of press working. This situation leads to reconsider
the press drive mechanism in use up to now. The new drive
for the camphor presses with camshaft described here allows
us to optimize the kinematics of simple mechanical presses.
This means that the cycle time is shortened to achieve high
productivity and the kinematics follows the requirements of
the punching and blanking processes.
II. HISTORY & BACKGROUND
The controlling parameters in compression molding
method to develop superior and desired properties of the
composite. All the three dimensions of the model (pressure,
temperature and time of application) are critical and have to
be optimized effectively to achieve tailored product as every
dimension of the model is equally important to other one. If
time of application of these factors (pressure and temperature)
is not sufficient (high or low), it may cause any of defects
associated with insufficient pressure or temperature. The
other manufacturing factors such as mold wall heating,
closing rate of two matched plates of the plates and de-
molding time also affect the production process. The overall
properties of camphor differ to a large extent from
thermoplastics and other materials. Therefore, it is important
to consider properties while designing the mould which will
affect mould parameters. Dimensional accuracy of molded
camphor parts is very important and in such cases, the design
of the mould must allow for shrinkage of the parts. Linear
shrinkage values can be obtained from test molded samples of
flat camphor sheets and can be used as a rough guideline to
mould design values for very simple parts only. Analyzing the
above properties of given camphor sample and mould
parameters, we have to design and manufacture the camphor
compression mould. Hydraulic system should be avoided
because hydraulic oil leakage may affect the production
vigorously. Hydraulic oil may react with camphor and it is
highly undesirable, thus instead of hydraulic system cam and
follower operated mechanical system is very much suitable
and suggested to use.
The project work start with identification of problem, as the
camphor is chemically reactive towards the hydraulic oil thus
we cannot use hydraulic press for the operation which is
generally prefer for press operation on the other hand we have

National Conference On “Recent Innovations in Engineering, Science and Technology” April 2019
32
option of pneumatic press but as the camphor is sublimatory
substance which will vaporize the camphor material when
come in contact with air and pneumatic system also have high
initial investment as well as complicated components like
pump ,direction control valve, actuators, FRL unit etc. and
those are need to be handled with skilled and experience
operator so the press operation must be carried out using the
mechanical system which includes the various mechanisms
like cam and follower, speed reduction using gears,
reciprocating motion for press operation uses the slider crank
mechanism.
The next step is literature survey after identification of
problem the papers related to chemical properties of camphor,
papers on design of cam and follower, research papers on the
slider crank and spring design etc are referred. On addition to
that we have use the reference books based on design of
machine element. The detailed literature survey is given
further in the same report.
After the literature survey we studied about the various
compression mould and compression moulding machine
which are using in market by various companies. Through the
market survey we decided our design and started the pre
design work which includes drafting and analysis using the
software. We use the CATIA V5 for drafting and use the
ANSYS 18.2 for structural and dynamic analysis.
We are done with the base and support structure of
machine and further work will be selection of spring and
gears according to design. We are also generating the NC
code for path generation on gear using VMC. At last we are
going to assemble the all components and then we will carry
few test on it for the quality inspection.
III. DESIGN ISSUES
As our compression moulding machine is mechanically
operated there are various mechanical components are use
those are need to be design and analyze structurally and
dynamically according to boundary conditions which are
depends upon the Force and rotational velocity of
components.
A. Crankshaft for punch holder
Fig. 1 Crankshaft for punch holder
The above fig shows the crankshaft for punch holder this
shaft is coupled to motor through the gear pair which does the
work of speed reduction. this crankshaft is located at the top
of the assembly into the holding post. It convert the rotary
motion of motor into the reciprocating motion it is one of the
link of slider crank mechanism. The force transmitted by
motor and the is converted into press force using the
crankshaft.
B. Punch holder
Fig. 2 Punch holder.
IV. RESULT AND ANALYSIS
Structural analysis of Punch holder assembly.
The assembly includes crank shaft, punch holder and punch.
From these components the punch holder material is weakest
thus it is become a necessary to carry out the structural
analysis on the punch holder to avoid the failure during the
operation
Boundary conditions Force on punch holder = 10 KN vertically upward
Rotational velocity = 500 RPM
Fig. 3 stress induced in the material with extreme boundary
conditions.
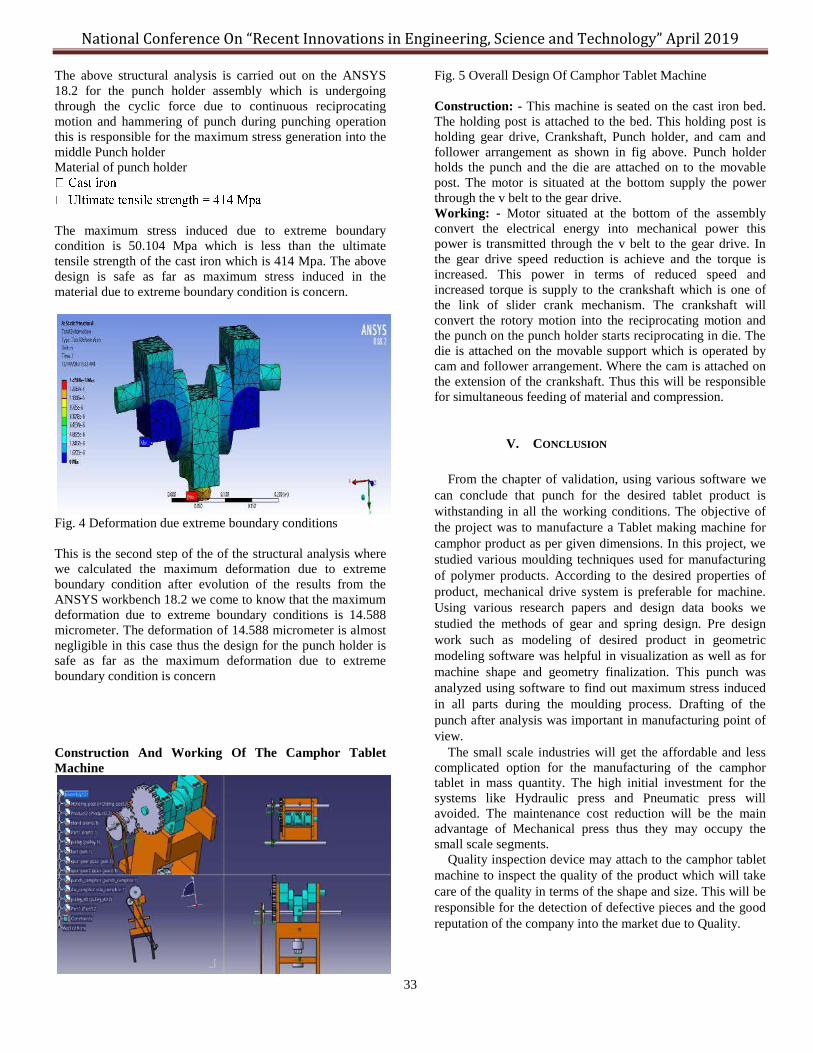
National Conference On “Recent Innovations in Engineering, Science and Technology” April 2019
33
The above structural analysis is carried out on the ANSYS
18.2 for the punch holder assembly which is undergoing
through the cyclic force due to continuous reciprocating
motion and hammering of punch during punching operation
this is responsible for the maximum stress generation into the
middle Punch holder
Material of punch holder
The maximum stress induced due to extreme boundary
condition is 50.104 Mpa which is less than the ultimate
tensile strength of the cast iron which is 414 Mpa. The above
design is safe as far as maximum stress induced in the
material due to extreme boundary condition is concern.
Fig. 4 Deformation due extreme boundary conditions
This is the second step of the of the structural analysis where
we calculated the maximum deformation due to extreme
boundary condition after evolution of the results from the
ANSYS workbench 18.2 we come to know that the maximum
deformation due to extreme boundary conditions is 14.588
micrometer. The deformation of 14.588 micrometer is almost
negligible in this case thus the design for the punch holder is
safe as far as the maximum deformation due to extreme
boundary condition is concern
Construction And Working Of The Camphor Tablet
Machine
Fig. 5 Overall Design Of Camphor Tablet Machine
Construction: - This machine is seated on the cast iron bed.
The holding post is attached to the bed. This holding post is
holding gear drive, Crankshaft, Punch holder, and cam and
follower arrangement as shown in fig above. Punch holder
holds the punch and the die are attached on to the movable
post. The motor is situated at the bottom supply the power
through the v belt to the gear drive.
Working: - Motor situated at the bottom of the assembly
convert the electrical energy into mechanical power this
power is transmitted through the v belt to the gear drive. In
the gear drive speed reduction is achieve and the torque is
increased. This power in terms of reduced speed and
increased torque is supply to the crankshaft which is one of
the link of slider crank mechanism. The crankshaft will
convert the rotory motion into the reciprocating motion and
the punch on the punch holder starts reciprocating in die. The
die is attached on the movable support which is operated by
cam and follower arrangement. Where the cam is attached on
the extension of the crankshaft. Thus this will be responsible
for simultaneous feeding of material and compression.
V. CONCLUSION
From the chapter of validation, using various software we
can conclude that punch for the desired tablet product is
withstanding in all the working conditions. The objective of
the project was to manufacture a Tablet making machine for
camphor product as per given dimensions. In this project, we
studied various moulding techniques used for manufacturing
of polymer products. According to the desired properties of
product, mechanical drive system is preferable for machine.
Using various research papers and design data books we
studied the methods of gear and spring design. Pre design
work such as modeling of desired product in geometric
modeling software was helpful in visualization as well as for
machine shape and geometry finalization. This punch was
analyzed using software to find out maximum stress induced
in all parts during the moulding process. Drafting of the
punch after analysis was important in manufacturing point of
view.
The small scale industries will get the affordable and less
complicated option for the manufacturing of the camphor
tablet in mass quantity. The high initial investment for the
systems like Hydraulic press and Pneumatic press will
avoided. The maintenance cost reduction will be the main
advantage of Mechanical press thus they may occupy the
small scale segments.
Quality inspection device may attach to the camphor tablet
machine to inspect the quality of the product which will take
care of the quality in terms of the shape and size. This will be
responsible for the detection of defective pieces and the good
reputation of the company into the market due to Quality.

National Conference On “Recent Innovations in Engineering, Science and Technology” April 2019
34
VI. REFERENCES
[1] Michael Levin, ―Tablet Press Instrumentation‖ Marcel Dekker, Inc.
270 Madison Avenue • New York, NY 10016
[2] Chandranath.M, Dr G Mallesh and Dr. D. Ramegowda, ― Designing of
Punch and Die for Blanking‖ International Journal of Trend in
Research and Development, Volume 3(4), ISSN: 2394-9333
[3] Ravi Mangukiya, Mihir Mendapara, M. B. Vaghela, ―Analysis Of
Crank Shaft Used In Power Press‖ Department of Mechanical
Engineering, B.H. Gardi College of Engineering and Technology,
Rajkot, Gujarat, India
[4] Mr. Prabhavalkar M.S. Prof. Ghewade D.V., Mr. Raut A.S.3, Mr.
Dhole N.S. ―Design And Prototyping Of Cam Based Power Press‖,
International Journal Of Advanced Engineering Technology. E-
ISSN0976-3945.
[5] Mr. N. S. Patel ―Modeling Design and Analysis of Cam and Follower‖,
International Journal of Engineering Studies And Technical
Approach ISSN no. 2395-0900.
[6] Pravin P.Thakare1, Vijay L. Kadlag, ―Design and Analysis of Helical
Compression Spring for Special Purpose Application‖, IJARIIE-
ISSN (O)-2395-4396.
[7] M. M. Billah, M. S. Hossain, M. R. Islam And M. A. Rahman,
―Selection Of V-Belt For Power Transmission In Machinery‖, ISSN
1017-8139.
[8] Mr. P.S.Valsange.―Design Of Helical Coil Compression Spring‖,
International Journal of Engineering Research and Applications,
ISSN: 2248-9622.
[9] Stiel, D.M.; Browski, C.R.; Neugroschel, E.; Williams, J.J. Tablet
Press US Patent 4,100,598, 1978.
[10] Norton Robert L., Design of machinery, Tata McGraw-Hill
Publishing Company Ltd., New Delhi, 2005.
[11] Khanna O.P., Lal M., A text book of Production Technology, Dhanpat
Rai Publications (P) Ltd., New Delhi, 2001.

National Conference On “Recent Innovations in Engineering, Science and Technology” April 2019
35
Fabrication Of Railway Track Detection &Ballast
Cleaning System 1Prof.C.R.Patil, 2AkashThete, 3VrushabhDhatrak,4Tejas Said,5JayeshKadam
1 Assistant Professor, ME Dept, Sandip Institute Of Engineering & Management, Nashik Maharashtra ,India
2,3,4&5School of Final Year Student ME Dept, Sandip Institute Of Engineering & Management, Nashik Maharashtra,India56
Abstract:
India rail transport is rapidly growing day by day and it occupies
tremendous position in transport facility the most eye catching thing
that Indian railway is 4th largest network in the world .but if we
consider about the safety and reliability of it, the Indian railway is
lacking behind. The main problem associates is the railway accidents
which is caused due to cracks in tracks and till there is no remedial
option to overcome such serious problem in India. Manual detection f
track is cumbersome and not fully effective owing to much time
consumtion and requirement of skilled technicians.Also the Ballast
Cleaning is nessessery railway track.This article also presents an
overview of the recent advancement in the identification of subsurface
rail track problems using geophysical methods and conventional track
monitoring and cleaning.the Indian railway follows coarser ballast
gradation and conventional procedure to identify the rai track
subsurface problems.Many advanced methods need to be
experimented in Indian rail tracks to modernize the railway track
foundations for the fat transportation of goos and passangers.
Keywords: GSM,GPS, IR Sensor, Tilt Sensor,Ballast.
1. INTRODUCTION
The Indian Railway network is the largest rail-passenger
transport and most of the commercial transport is being
carried out by the railway network because it is being
cheapest mode of transportation preffered over all other
means of transportation such as buses ,flights etc. Economic
prosperity has always been dependent on increasing capacity
and rationality of transport.But the infrastructure and
operation of transport has great impact on land and largest
resource of energy making transport sustainability and safety
a major issue. The crack and other problems with the rails
generally go unnoticed due t improper maintainence and
irregular manual track line monitoring that is being carried
out in the current situation.Nowdays system have some
limitation, if the bridge or track damaged, that information
goes to railway authority people, they notifies and informs to
the corresponding train it will take more time inforing those
information ,Also soil removing from track is major issue.
This project relates to design system in a such away that
developed combine system railway track crack detection
system and Ballast Cleaning System together. In track
detection railway carriage carrying the control equipment is
provided with IR sensor oriented to detect the crack and tilt
sensor used to detect alignment of track.When crack is
detected its latitude and longitude values are send as a
message to mobile phone.an arrangement for cleaning of
ballast and its control.These was design by collaborator .The
unit has three cabin, one cabin is for keeping hydraulic tank
and accessories ,control panel ,workbench etc. another cabin
is rear cabin with drive control and breaking of vehicle.Third
cabin is hanging cabin with excavation and cleaningcontrol
for movement during cleaning, track lifting ,breaking etc.
This will help in maintainance and monitoring the condition
of railway track without any error and their by maintaining
track in good condition, preventing train accidents to very
large extent.
2. METHODOLOGY
In this project, we have used the two tracks; each track will
be monitored by one IR obstacle sensor. Whenever there is a
crack on the track, the IR obstacle sensor senses the crack
and activates GPS. The location Latitude and Longitude
coordinates of the crack is sent to the pre-defined number
with the help of SIM inserted into GMS module. Once the
crack has been successfully identified and message is sent,
the vehicle moves further on the model path till next crack is
detected. The designed Railways Track Crack Detection
Autonomous Vehicle has been successfully tested on the
model track and the detected location has been sent to the
phone number which is 4km away from the prototype. This
vehicle can be used to detect the track and send GPS
coordinates in SMS form to even longer distance provided
the GSM signals areintact.
The function of ballast cleaning machine is to carry out
cleaning of ballast by removing muck, thereby improving
drainage of track and elasticity of the ballast bed. Basically,
the machine excavates and picks up ballast by means of
cutter chain and carries it to a set of vibrating screens where
muckisseparatedandthrownoutbyachuteandcleanballast is
transferred back to thetrack.
3. COMPONENT ANDDESCRIPTION
The main components of the railway track crack detection

National Conference On “Recent Innovations in Engineering, Science and Technology” April 2019
36
system with ballast cleaning vehicle are
Microcontroller89c52
Ultrasonicsensor
GSMSIM900
16x2 CharacterLCD
IRSensor
TiltSensor
GPS
ExcavitingUnit
ScreeningUnit
Conveyor system with Distribution of ballast and
disposal ofmuck
Track lifting and slewingunit
Recordingunit
MICROCONTROLLER 89C52
Compatible with MCS-51® Products 4K Bytes of In-System
Programmable (ISP) Flash Memory
– Endurance: 1000 Write/EraseCycles
4.0V to 5.5V OperatingRange
Fully Static Operation: 0 Hz to 33MHz
Three-level Program MemoryLock
128 x 8-bit InternalRAM
32 Programmable I/OLines
Two 16-bitTimer/Counters
Six InterruptSources
Full Duplex UART SerialChannel
Low-power Idle and Power-downModes
Interrupt Recovery from Power-downMod
Ultrasonicsensor
Ultrasonic ranging module HC SR04 provides 2cm
400cm non contact measurement function,the
ranging accuracy can reach to 3mm. The modules
includes ultrasonic transmitters, receiver and control
circuit.
The basic principle of work using IO trigger for at
least 10us high level Signal. The Module
automatically sends eight 40 kHz and detectwhether
there is a pulse signalback.
IF the signal back, through high level, time of high
output IO duration is the time from sending
ultrasonic to returning.
Test distance = (high level time X velocity of
sound(340M/S)/2
GSM SIM900
The SIM 900 GSM module has been chosen to
achieve the SMSfunctionality.
Featuring an industry -standard interface,the
SIM 900 delivers voice, SMS, data and Fax in a
small form factor.
The leading features of SIM900 make it deal fir
virtually unlimited application, such asWLL
applications, M2M application, handhold devices
and much more.
16 x 2 CharactersLCD
5x 8 dots withcursor
Built-in controller (KS 0066 orEquivalent)
1/16 dutycycle
B/Ltobedrivenbypin1,pin2orpin15,pin16or
A.K (LED)
N.V. optional for + 3V powersupply
IRSensor
High radiantintensity
Peak wavelengthp=940nm.
2.54mm Leadspacing
This product itself will remain within RoHS
compliantversion.
TiltSensor
A tilt sensor can measure the tilting in often two axes
of a reference plane in two axes. In contrast, a full
motion would use at least three axes and often
additional sensors.
One way to measure tilt angle with reference to the
earths ground plane, is to use an accelerometer.
Typical applications can be found in the industry
and in gamecontrollers.
GPS
High tracking sensitivity of-159dBm
Frequency L1, 1575.42MHz
Channel 66 channels
Altitude Maximum 18,000m (60,000feet)
Velocity Maximum 515m/s
Acceleration Maximum4G
Baud Rate 9600 bps (default) Hardware powersaving
control pin allowing poweroff.
The components of Ballast Cleaning vehicle :
ExcavatingUnit
ScreeningUnit
Conveyer system for distribution of ballast and
disposal ofmuck
Track lifting and slewingunit.
4. WORKINGPRINCIPLE
Part I - Crack Track Detection System:
When the vehicle is Powered On, it moves along the
model track. The IR Obstacle sensors monitors the
condition of the tracks When a crack is detected by the
IR sensor the vehicle stops at once, and the GPS receiver
triangulates the position of the vehicle to receive the
Latitude and Longitude coordinates of the vehicle
position, from satellites.

National Conference On “Recent Innovations in Engineering, Science and Technology” April 2019
37
The Latitude and Longitude coordinates received by
GPS are converted into a text message which is done
by PICmicrocontroller.
The GSM module sends the text message to the
predefined number with the help of SIM card that is
inserted into the module. Once the message has been
successfully sent to the number, the vehicle resumes its
movement forward depending on the type of crack.
Fig.Block Diagram of Train track crack detection system
Part II- Working of Ballast Cleaning Machine:
The function of ballast cleaning machine is to carry out
cleaning of ballast by removing muck, thereby
improving drainage of track and elasticity of the ballast
bed. Basically, the machine excavates and picks up
ballast by means of cutter chain and carries it to a set of
vibrating screens where muck is separated and thrown
out by a chute and clean ballast is transferred back to
the track.
Ballast Cleaning Machines have following basic Units:
Fig: Ballast cleaning Machine
i) ExcavatingUnit
ii) ScreeningUnit
iii) Conveyer system for distribution of ballast and
disposal ofmuck
iv)Track lifting and slewingunit.
v) Recordingunit.
The excavating ballast,there is endless scrapper chain
located between bogies and running under the track
when working. excavation chain is guided in two
slanted channel, one is horizontal and one is incline.
The beginning of work at a site, cutter is inverted
underneath the sleepers and connected to lateral
guides by quick action hoist. Also at end of particular
site, cutter is removed. In conveyor system for
distribution of clean ballast and distribute it evenly
across entire surface of track right behind excavating
chain. From the underneath screening unit,waste drop
to conveyor belt. The waste can be discharged
outside track by means of tilting waste conveyor belt.
The track lifting and slewing unit is located next to
cutter for adjusting excavation depth and for avoiding
obstacle.
Ballast regulation and profiling becomes necessary
primarily due to the following:
i)After a maintainance operation such as tamping oftrack
ii) After relaying oftrack
iii) After training outballast
These machines have their main application in ballast
transfer, spreading and profiling operations. For this
purpose, a front mounted one pass transfer plow, left
and right ballast wings and a rear mounted track broom
are provided as standard equipment. The machine can
move ballast towards center of track or away from
center of track transfer ballast across the track and
transfer ballast from a surplus zone to deficient zone..
5. ADVANTAGES
Ballast Cleaning Machine
[1] It is an automatic machine that is it required less
number ofstaff.
[2] It takes less time of cleaning in ballast with respect to
manualoperation.
[3] It is highly efficient with respect to manual cleaning
of ballast.
TrackDetection
[1] Costeffective

National Conference On “Recent Innovations in Engineering, Science and Technology” April 2019
38
[2] Accurate crack detection compare to the other
detection system.
6. RESULT ANDANALYSIS
[1] 20 March, 2014 – Six coaches of a local train at
Titwala station got uncoupled from the rest of the
train. It derailed and killed an 18-year-old student
and nine others.
[2] May 4, 2014 - 50105 Diva Junction-Sawantvadi
Passenger train derailed between Nagothane and
Roha stations killing near about 20 passengers and
injuring 100 others.
[3] July 10, 2011 – 71 people were killed by the
derailing of Kalka mail at Malwastation.
[4] May 28,2010 – Naxals derailed Jyaneshwari Express
and killed 148people.
[5] June 22, Mumbai Central Holiday Special‘s three
coaches and engine got derailed near Vaibhavwadi
station in Maharashtra.2003 – In a first major
accident 53 people were killed and 25 were injured
when the Karwar
7. FUTURESCOPE
The Proposed system in future can be more enhanced by
using the garbage collector system to it because the garbage
is more seen on tracks and if we use the garbage collector
system to it. Ultimately with a cracks detection we can also
able to clean the rail tracks environment dustfree.
In our project model we can use compressor or blower for
prototype purpose because in actual practice while moving
Railway on track in either forward or backward direction air
flowing in opposite direction so passengers throw garbage
from window so we can used collector and garbage collect
in tank which are located at both sides of Each Railway
couch.
8. CONCLUSION
By using this automatic combine system of vehicle is
related to design system in a such way that developed
combine system railway track detection and inspection
system and ballast cleaning system together.
In a ballast cleaning machine cleaning of ballast by
removing musk, thereby improving drainage of bricks and
elasticity of bed. Basically it will have great impact in the
maintenance of the track which will help in preventing train
accidents to a very large extent. the region where manual
inspection is not possible like in deep coal mines,
mountains regions and dense thick forest region can be
easily done using this vehicle. by using this system in
ballast cleaning machine excavates and pick up ballast by
means of cutter chain and carries it to a set of vibrations
screens where muck is separated and thrown out by chute.
in railway track inspection and detection system tilt sensor
and ultrasonic sensor is used tilt sensor is used to detect the
alignment of track and IR sensor oriented to detect the
crack in track. When crack is detecting its latitude and
longitude values are send a message to mobile phone. This
will help maintains and monitoring the condition of railway
track without any errors. This vehicle design in such way
that it detects the crack or deformities on track which when
rectified in time will reduce trainaccidents.
9. REFERENCES
[1] Imperial Journal of Interdisciplinary Research (IJIR) Vol-3, Issue-4,
2017 ISSN: 2454-1362, Automatic Railway Track Crack Detection
System1 Er.NisthulG,2 Lijo George,3Nelson Varghese,4 Sebin
Jose,5 Nithin John & 6 Nandhumon KR
[2] International Journal Of Engineering And Computer Science
ISSN:2319-7242 Volume 6 Issue 5 May 2017, Implementation of
Railway Track Crack Detection and Protection N.Karthick1,
R.Nagarajan2,S.Suresh3,
R.Prabhu4
[3] ISSN 2321-8665 Vol.03,Issue.03, July-2015,
Automatic Railway Track Crack Detection using GSM & GPS
PRASHANTHI ANTARI1, MIRZA SAJID ALI BAIG2,
NARSAPPAREDDY3
[4] International Journal of Engineering Trends and Technology
(IJETT) – Volume 21 Number 6 – March 2015 ISSN: 2231-5381
An Enhanced Crack Detection System for Railway Track
V.Muralidharan#1,
V.Dinesh *2, P.Manikandan #3
[5] Asian Journal of Applied Science and Technology (AJAST)
Volume 1, Issue 6, Pages 82-84, July 2017 Title-Railway Track
Fault Detection System by Using IR Sensors and Bluetooth
Technology Author-B.Siva Rama Krishna1, D.V.S Seshendra2,
G.Govinda Raja3, T.Sudharshan4 andK.Srikanth5

National Conference On “Recent Innovations in Engineering, Science and Technology” April 2019
39
UNIVERSAL SHOCK ABSORBER TEST RIG
Prof. K.U. Shinde1, Bhushan Wagh2, Rutuja Phadol3, Mansi Hirve4, Mangesh Pawar5
[email protected], [email protected], [email protected], [email protected],
Mechanical Department
Sandip Institute of Engineering & Management
Abstract—. Shock absorber is one of important component in a
vehicle suspension system. The shock control spring motion by
damping energy from the spring. This paper was focused on the
dynamic characteristics of an automotive shock absorber. The design
of interchangeable shock absorber test rig was developed and
fabricated for the dynamics measurement system. It is an example of
under damped vibration system which absorbs maximum amount of
kinetic energy and sometimes potential energy. Main purpose of our
research is to measure transmissibility of shock absorber and to
analyze it for different loads and speeds. Effectiveness of the
vibration absorber can be measured by transmissibility. And for
measurement of transmissibility shock absorber test rig is designed
and developed. an experiment on test rig is carried out at various
loads and speeds which results to output in the form of sinusoidal
waveform on paper by using stylus. The waveform is used to find out
the transmissibility at various load-speed combinations. It gives the
behavior of shock absorber at various speeds and loads.
I. INTRODUCTION
Shock absorber is the necessary element of every automobile.
It absorbs some amount of force and motion and transmits
remaining force and motion to the person who is sitting on
vehicle. Input force and motion is given by due to uneven
path like speed breakers, ditches etc. The shock absorber
testing rig estimates that how much force that shock absorber
absorbs and how much motion it transmits. To control the
vibrations of suspension system of every automobile Shock
absorber is used. If this vibrations are uncontrolled can lead to
apocalyptic results like Excessive stresses, Undesirable noise,
Looseness of parts, probability of happening accidents
increased in very big extent, to minimize these effects proper
testing of shock absorber is necessary.
The main objectives of the design of shock absorber are: To
determine dynamic characteristics like displacement, vibration
etc. of automotive shock absorber system, to test and indicate
the condition of shock absorber in automotive vehicle, to
calculate accuracy of shock absorber.
Force transmissibility is defined as the amplitude ratio of the
transmitted force to the impressed force. In order to reduce as
much as possible the amount of force transmitted to the seat of
the vehicle due to the vibration of the vehicle because of
interaction with the roads, vehicles are usually isolated from
the roads by means of wheels and suspension system which
involves the shock absorber and
the spring damper system in it. As a result the force
transmitted to the seat of vehicle is the sum of the spring & the
damper force of the shock absorber. i.e. Ft = kx + cx
Force transmissibility is defined as the amplitude ratio of the
transmitted force to the impressed force. The formula for the
force transmissibility is given as per equation 1
Tr = [1+(2/)2
/[1−(2/)2]2+[2/]2]1/2
Where, r = (ω/ωn) = frequency ratio, ξ = damping factor
The transmissibility curve of the fig gives us a lot of useful
information. The first thing is that, we see is that all the curve
starts from unity value of transmissibility, pass through the unit
transmissibility at (w / wn) = 2 & after that they tend to zero as
(w / wn ). These curves can be divided into the three distinct
frequency region as shown in the lower part of the fig. (1.3.a).
Fig 1.1. Transmissibility Vs Frequency ratio7
These regions are respective control by the three parameters
of the system, mass, damping & stiffness. The region where the
isolation is really effective is when (w /wn) is large. These
are the mass controlled region. Larger mass gives low natural
frequency & consequently higher value of (w /wn). Damping in
this region deteriorates the performance of the system. This is
controlled region. Larger stiffness gives high value of natural
frequency & consequently low value of frequency ratio. The
middle region always to be avoided is the damping control
region.

National Conference On “Recent Innovations in Engineering, Science and Technology” April 2019
40
II. LITERATURE SURVEY
Recently several attempts and models have been suggested
and tested for shock absorber test rig. HYDRAULIC DAMPER
USING SINUSOIDAL TESTING by Hitesh K. Tare1, C.S.
Dharankar2 [1], Design of Shock Absorber Test Rig for
UNSW@ADFA Formula SAE Car by Carl D Heritier1
[2]Vibration Damping Modelling for a Passive Car Shock
Absorber by AukaszKonieczny [3] DESIGN AND ANALYSIS
OF A SHOCK ABSORBER by Pinjarla.Poornamohan1,
Lakshmana Kishore.T2 [4] Development and
Implementation of Load Cell by T. Shi Kee1, Brenda C. T.
Lee2, F.Y.C. Albert1 [5] Shock Absorber Test Rig by
Chaudhari Arati G.1, Shilawat Pooja S.2, Butte Vinod Y.3,
Dhage Pradip U.4,Prof.Londhe B.C5 [6] Shock absorber
device is generally used in all automobiles. It is an example of
under damped vibration system which absorbs maximum
amount of kinetic energy and sometimes potential energy. Main
purpose of our research is to measure transmissibility of shock
absorber and to analyze it for different loads and
speeds. Effectiveness of the vibration absorber can be measured
by transmissibility. And for measurement of transmissibility
shock absorber test rig is designed and developed. an
experiment on test rig is carried out at various loads and speeds
which results to output in the form of sinusoidal waveform on
paper by using stylus. The waveform is used to find out the
transmissibility at various load- speed combinations. It gives
the behavior of shock absorber at various speeds and loads.
The elements that constitute a vibratory system are shown in
fig. They are idealized & called the mass, the spring, the
damper θ& the excitation. The mass ‗m‘ is assumed to be a
rigid body. It executes the vibration can gain or lose kinetic
energy in accordance with the velocity changes of the body.
The spring ‗k‘ possesses elasticity & is assumed to be the
negligible mass. Spring forces exist if the spring is deformed,
such as the extension or a compression of a coil spring.
Therefore, the spring force exists only there is a relative
displacement between the two of the spring. The damper ‗c‘
has neither mass nor elasticity. Damping force exist only if
there is a relative motion between the ends of the dampers. The
work or the energy input to the dampers is converted into
heat. Hence the element is neoconservative. Energy enters in
a system through the application of the excitation. An excitation
force may be applied to mass or motion applied to the spring &
the damper. Mechanical exciter to determine transmissibility
and natural frequency by Akash S. Nandurdikar, Anuraj R.
Naik, S.S. Pachpore, Padmanabh A. Manurkar, Vivek S.
Nalawade.[7]
Ankit Kumar Dixit*, Aradhya Saxena, Arpit Gupta,
Chandransh Pandey, Prashant Chauhan concluded that The
concept of a universal testing procedure has been projected by
this paper. Determining, analyzing & rating the performance of
shock-absorbers is discussed in this paper. The concept
discussed enables the industry to evaluate, compare and choose
between various shock-absorber systems and help them
improve their damping system and vehicle performance. It is a
thorough analysis and a full report generation approach which
will help the industry to know more about the shock-absorbers.
The concept is in operation and would not be suitable for mass
testing or where accuracy and exact values are not major
concern. However, this conceptual approach is lengthy, vast and
detailed which further
makes it complex and time consuming. The concept can be
materialized and implemented to obtain experimental results
and development of data-base in future. The concept will
benefit future researches and complement other projects based
on suspension systems greatly.[8]
Rutuja Deshmukh1, Prof. Sumant S. Patil2,Prof. Amol
Kokare3 concluded that From this Suspension testing setup
we can test multiple numbers of suspensions at different loads
and different speeds. Also we can use suspensions of different
height.
By changing different suspensions and oils we can find out
optimum motion transmissibility. With ultimate objective of
studying and plotting dynamic characteristics for Hero Splendor
suspension and Honda Shine suspension using single wheel
model of suspension analysis to produced large number of
results. However it concludes the project work with following
points:
1. The suspension system gives best performance when
designed to be slightly under-damped.
2. From experimental results and graphs we can conclude
that for good ride, transmissibility should be as low as possible
and this can be attained by using low damping constant and
high spring stiffness and Honda Shine suspension gives the
better results as compared to Splendor suspension [9]
Sagar D. Shinde1, Jeevan J. Jagdale 2, Ashish A. Salunkhe 3,
Aditya V. Shinde4, Sushant R. Koli5 concluded that Shock
absorber is one of important component in a vehicle suspension
system. The shock control spring motion by damping energy
from the spring. This paper was focused on the dynamic
characteristics of an automotive shock absorber. The design of
interchangeable shock absorber test rig was developed and
fabricated for the dynamics measurement system. This test
setup integrated with the computer systems to record the signal.
An experiment was conducted to identify the stiffness and
damping parameter for 850 cc and 1600 cc shock absorber.
Simulation study was performed utilizing the COSMOS Motion
software. It can be seen from the results that there is a good
agreement between the experimental and simulated results in
terms of stiffness and damping value except few discrepancy.
The acquired results show that the range of discrepancy within
10%. The good range of stiffness of the passenger vehicle shock
absorber is 20 N/mm to 60 N/mm while the damping of
passenger vehicle shock absorber is 1 Ns/mm to 6
Ns/mm.[10]
III. METHODOLOGY The concept is vast and complex. It needs to simplified in
order to understand. The method of testing and rating a shock-
absorber can be divided into three segments: Input, Processing
and Output.
In this project following parts are used :-
1. Motor: - This motor does not require any mathematical
design because it is required to produce necessary torque
to rotate the circular plates through a gear box at certain r.p.m.

National Conference On “Recent Innovations in Engineering, Science and Technology” April 2019
41
2. Gear box: - Gear box of reduction ratio 1:10 is used to
slow down the r.p.m. of circular plate and to eliminate the force
acting on the motor.
3. Circular plate: - the plate is used to support cam and shock
absorber. It is used to transmit force from motor shaft to shock
absorber. Circular plate is given a particular thickness to
support large loads and diameter is selected to ensure easy
movement of
bushes. If diameter of plate increased beyond the certain
limits, this will increase the distance between pillars. This
will give resistance to the easy movement of bushes.
4. Cam: - The main purpose of cam is to give shock to the
shock absorber. Cam is having the exactly the radius of
curvature for the easy lifting of shock absorber. Particular
height is given to cam so as to get sufficient measurable
displacement at output. The length of the cam is 20-30
percent of the diameter of plate for easy lifting of shock
absorbers. The thickness of bearing is to avoid sleeping.
Fig. 3.1. Conceptual design of shock absorber test rig
5. Bush: - Inner diameter of bush is approximately same as
that of outer diameter of pillar with permissible tolerances for
easy movement. Outer diameter is selected in such way
that welding should not affect the inner diameter of inner
surface of bush. Height of the bush is in the required limits. If
the height is larger than the initial load on the shocker/plate
will be more and also the friction between the pillars &
bushes will be more. If the height is not sufficiently large,
problem to hold shock absorber may occur.
6. C-channels (base of set up): - Selection of C-channel is
decided on the basis of weight of the machine (mainly two
large heavy pillars). The standard size of C-channel is
selected from the steel table.
7. Indicator mechanism: - This set up is totally
mechanically operated, so as it is provided with a
mechanically operated indicator mechanism.
8. This mechanism is cheap as well as light in weight. It
consists of graph-paper or paper/scale pen/ pencil, connecting
rod, pen / pencil holder etc.
9. Weights: - Shock absorber of vehicle is used to set up, so
the scientific weights (around 50 kg) are used (which are
equivalent to an average weight of a man).

National Conference On “Recent Innovations in Engineering, Science and Technology” April 2019
42
IV. CONCLUSION
This mechanism converts rotary motion of the circulating
disc into the linear motion of the shock absorber. At various
loads and speeds combinations the readings on the test rig can
taken with the help of stylus mounting on test rig and by
using the data, characteristics of shock absorber can calculate.
Thus the shock absorber test rig design is very important for
characteristics of shock absorber and to find effectiveness. It
is done by conceptually.
REFERENCES
[1]. Hitesh K. Tare1, C.S. Dharankar2 1, Determination Of Damping
Coefficient Of Automotive Hydraulic Damper Using Sinusoidal Testing,
PG Student, AISSMS COE, PUNE. 2Assistant Professor, AISSMS COE,
PUNE.. [2].. Carl D Heritier1, Design of Shock Absorber Test
Rig for UNSW@ADFA Formula SAE Car,University of New South
Wales at the Australian Defence Force Academy.
[3].AukaszKonieczny, Analysis of Simplifications Applied in Vibration
Damping Modelling for a Passive Car Shock
Absorber,FacultyofTransport,SilesianUniversityofTechnology,Krasi´nskiego
8,40019Katowice,Poland..Received22October2015;Revised24January2016;
Acc epted27January2016
[4]. Pinjarla.Poornamohan1, Lakshmana Kishore.T2 1 M.Tech (student), 2
,DESIGN AND ANALYSIS OF A SHOCK ABSORBER ,M.Tech
(Associate Professor), Mechanical Department, GIET, Andhra Pradesh,
India
[5]. C. Huang Shen, Development and Implementation of Load Cell in
Weight Measurement Application for Shear Force,Department of
Electrical and Electronic Engineering, UCSI University, Cheras, 56000
Kuala Lumpur, Malaysia, T. Shi Kee1, Brenda C. T. Lee2, F.Y.C. Albert1
1Department of Electrical and Electronic Engineering, UCSI University,
Cheras, 56000 Kuala Lumpur, Malaysia 2Department of Civil Engineering,
UCSI University, Cheras, 56000 Kuala Lumpur, Malaysia
[6]. AKASH S NANDURDIKAR, DESIGN OF SHOCK ABSORBER
TEST RIG USING MECHANICAL EXCITER TO DETERMINE
TRANSMISSIBILITY AND NATURAL FREQUENCY , ANURAJ R
NAIK ,S. S. PACHPORE Assistant Professor, Mechanical Engineering,
JSPM NTC, Narhe, Pune, PADMANABH A MANURKAR ,VIVEK S
NALAWADE ,NOVATEUR PUBLICATIONS International
Journal of Research Publications in Engineering and Technology
[IJRPET] ISSN: 2454-7875 VOLUME 3, ISSUE 3, March-2017.
[7]. Chaudhari Arati G.1, Shilawat Pooja S.2, Butte Vinod Y.3, Dhage
Pradip U.4,Prof.Londhe B.C5, A Review of Design of Shock Absorber Test
Rig ,1,2,3,4BE Student, Department of Mechanical Engineering, SND
COE &RC, Maharashtra, India 5Professor, Department of Mechanical
Engineering, SND COE &RC, Maharashtra, India., International Research
Journal of Engineering and Technology (IRJET) e-ISSN:
2395 -0056 Volume: 04 Issue: 03 | Mar -2017 www.irjet.net
[8]. Ankit Kumar Dixit*, Aradhya Saxena, Arpit Gupta, Chandransh
Pandey, Prashant Chauhan, Concept of Shock Absorber Test Rig and
Approaching towards a Universal Testing Procedure,Department of
Mechanical Engineering, J.S.S Academy of Technical Education,
Noida, India
[9]. Rutuja Deshmukh1, Prof. Sumant S. Patil2,Prof. Amol Kokare3 1,
2,3, Design and Transmissibility Investigation of Shock Absorber
Test Rig.,Department of Mechanical Engineering 1, 3 JSCOE, Hadapsar, Pune 2 AISSMS COE, Pune. IJSART - Volume 3 Issue 8 –AUGUST 2017
[10]. Sagar D. Shinde1, Jeevan J. Jagdale 2, Ashish A. Salunkhe 3, Aditya
V. Shinde4, Sushant R. Koli5., SHOCK ABSORBER TEST
SET- UP,1,2,3,4,5 Department of Mechanical Engineering, D.I.E.T.
Sajjangad, Satara, Maharashtra, India.

National Conference On “Recent Innovations in Engineering, Science and Technology” April 2019
43
Performance of Solar Dryer with Phase Change
Material
Prof. P.P. Kulkarni1, Amit R. Mahajan2, Vaibhav S. Nikumbh3, Akshay S. Bachhav4,
Kaliprasad Sonone5
[email protected] , [email protected] 2, [email protected] , [email protected] 3,
Mechanical Department
Sandip Institute of Engineering and Management
ABSTRACT- In the recent years there has been a growing
interest in agricultural products dryer from the point of view of
the commercial value for farmers and reduction in the wastage.
Solar dryer base on thermal energy storage materials is quite
effective for continuously drying agriculture and food products
at steady state in the temperature range (40°C-60°C). Storage
materials utilized in these dryers can store energy during the
sunshine hour and deliver the stored energy during off-sun
shines. It reduces the existing load on the gap between energy
demand and supply, hence plays a vital role in energy
sustainability. A number of studies have been done in last few
decades for drying agriculture and food products with a solar
dryer based on thermal energy storage concept. This paper
mainly presents a review on the important contributions made
so far in the field of solar drying systems based on the thermal
energy storage medium, with a focus on recent updates in
thermal energy storage technology available in terms of
materials capable of storing heat as sensible and latent heat.
Keywords - Solar Dryer, Thermal energy Storage, Solar Energy,
Phase change material.
I. INTRODUCTION
The drying is the basic process to reduce moisture from a
product, which is one of the oldest techniques used for food or
agricultural products storage Food products, particularly fruits
and vegetables require hot air in the temperature range of 45–
60 °C for safe drying i.e. drying the products so as to keep
their edible and nutritious properties intact. Requisite moisture
content and superior quality of the product can be achieved
under controlled conditions of temperature and humidity. In
the case of vegetables, which is the main nutrients product
generally contain 50% moisture, the moisture contain can be
reduced with the help of drier .Vegetables can be further used
for the feeding of the animals. Moreover, the transportation
cost of vegetables is also reduced due to reduction in the
weight and size of such dried product. It has been studied that
lack of appropriate technology, inappropriate farming,
fertilization, the non-existence of marketing channels,
inappropriate transportation, high post-harvest losses etc.,
cause a food loss in the range of 10 to 40%. Hence, food
preservation is the need of the hour to reduce the food loss and
drying is widely accepted as an important tool in this
direction, since a long time. Therefore efficient drying
technologies are required to reduce moisture content from
food and vegetables for preservation. Well-designed solar
dryers may provide a much-needed suitable substitute for
drying of some of the agricultural crops in developing
countries.
Application of solar energy in the agricultural area has
enlarged due to fluctuation in the price of fossil fuels,
environmental concerns and expected running down of
conventional fossil fuels.
II. HISTORY & BACKGROUND
The phase change material (PCM) has the ability to store large
amount of excess thermal energy during its melting
process and benefit of it under constant temperature later,
makes it excellent device to enhance thermal performance of
the solar drying system. In this work, for the first time,
Valeriana rhizomes are dried at its prescribed drying
temperature (40 °C) in an indirect solar dryer, in which the
PCM storage unit is located at the bottom of the drying
compartment to provide isothermal heating [1]. An
experimental study to test the effectiveness of continuous
solar dryer combined with desiccant thermal energy
storage for drying cocoa beans. The experimental setup
consists of three main components namely: Solar collector,
drying chamber and thermal energy storage [2]. the
performance of indirect solar dryer using Phase Change
Material as an energy storage medium for drying Nerium
Oleander. The ISD implementing PCM was tested using
the test rig shown in Fig. 4. The experiments were
conducted outdoors during October 2013. The global solar
radiation on a (30o) tilted surface, I, was measured using
a high precision Pyranometer model MS-802 (sensitivity of
7.03 (μvolts/W m2)). Calibrated K-Type thermocouples (0 to
1100
ºC) coupled with KYORITSU KEW1011 multimeter were
used to measure the temperatures at different locations of the

National Conference On “Recent Innovations in Engineering, Science and Technology” April 2019
44
heater and drying compartment[3]. An experimental
investigation of shell and tube latent heat storage for
solardryer using paraffin wax as heat storage material. By
using paraffin wax as a thermal storage the temperature inside
the chamber is maintained at 41°C-45°C. After performing
experiment Agarwal et al. concluded that melting rate is faster
at the uppermost section due to buoyant effect and Time
required for discharging of LHS is longer compared to time
required for charging of LHS due to low heat transfer rate
between PCM and HTF during discharging[4]. Developed a
solar dryer integrated with PCM for drying grapes. The
developed solar dryer consist of the different components like
flat plate collector based solar air heater, thermal energy
storage system, dryer cabinet and blower. On the basis of the
criteria mentioned, the design of the individual component was
prepared and corresponding parameter (i.e.flat plate collector,
dryer cabinet and PCM storage) were calculated[5].
However, power consumption by a chip is given by the
equation P = C × V2 × F, where P is power, C is the
capacitance being switched per clock cycle (proportional to
the number of transistors whose inputs change), V is voltage,
and F is the processor frequency (cycles per second). Increases
in frequency increase the amount of power used in a processor.
Increasing processor power consumption led ultimately to
Intel's May 2004 cancellation of its Tejas and Jayhawk
processors, which is generally cited as the end of frequency
scaling as the dominant computer architecture paradigm [6].
III. METHODOLOGY
FIGURE
Fig. 5. A schematic diagram of the experimental setup
1-Solar air heater; 2-Pyranometer; 3-The room wall; 4-The
room roof; 5-Flowing air; 6-PVC tube; 7-Inverter; 8-Three
phase induction motor coupled with fan; 9-Pitot tube; 10-U
tube manometer; 11-Drying compartment; 12-PCM; 13-Trays;
14-Thermocouple positions
The ISD implementing PCM was tested using the test rig
shown in Fig. 5. The global solar radiation on a (30°) tilted
surface, I, was measured using a high precision Pyranometer
model MS-802 (sensitivity of 7.03 (μvolts/Wm2)). Calibrated
K-Type thermocouples (0 to 1100 ºC) coupled with
KYORITSU KEW1011 multimeter were used
To measure the temperatures at different locations of the
heater and drying compartment as seen in Fig. 5. The
temperatures of the drying air at each tray were measured and
its average value was obtained. A three-phase induction motor
(Type K 120 T, 0.75 HP, 2.5 A, 390 V, 50 Hz, 2610 r/min)
coupled with a fan (0.3 m diameter) was used to blow the air
to the drying compartment. The air flow rate was controlled
and measured with the help of SJ 300 Hitachi inverter and
pitot tube, respectively.
In order to determine the initial moisture content, the
plants were weighed while they were fresh then dried at
electric oven for 48 hours on 70ºC and the dried products were
weighed for the second time. A digital balance, type 300-
9213/b 125A, of readability 0.0001 gm was used to measure
the mass of the sample every 60 minutes until it reaches a
constant weight.
Use of Software In Solar Drying System
Solar dryers exist in a variety of designs and sizes
depending on the requirement and drying capability. To
investigate a dryer, it is important to calculate its complete and
relative performance with the other similar dryers. The
investigation results provide the related facts to the
researchers, producers and end consumers. The use of software
has proved to be very significant in developing and analyzing
the mathematical models to forecast the performance of
different types of solar dryers. The design of solar dryer can be
improved with the help of software and it saves time which
otherwise is spent in
Performing real-time experiments. It is also useful for
predicting the moisture content, crop temperature and drying
rate, texture drying kinetics, and color of the crop.
Computational fluid dynamics (CFD) can be used for the
analysis and investigation of air flow rate, temperature
distribution pattern and humidity inside the solar dryer,
through appropriate simulation of energy and momentum
equations and heat and mass transfer in both gaseous and solid
phases. It is also very helpful to investigate the melting of
PCMs used in solar dryers. The commonly used software tools
for such studies are Ansys, Comsol Multi-physics, CFX,
FORTRAN etc. MATLAB is successfully used to investigate
the crop temperature, air temperature, the moisture evaporated
and for forecasting the thermal performance of the solar dryer.
IV. SELECTION CRITERIA
Melting temperature in the desired operating temperature
range High latent heat of fusion per unit volume
High specific heat, high density and high thermal
conductivity Small volume changes on phase
transformation and small vapor pressure at operating
temperatures to reduce the containment problem
Congruent melting
Kinetic properties

National Conference On “Recent Innovations in Engineering, Science and Technology” April 2019
45
High nucleation rate to avoid super cooling of the liquid
phase High rate of crystal growth, so that the system can
meet demands of heat recovery from the storage system
V. CONCLUSION
The present study gives an overview of solar dryers based on
thermal energy storage materials. The effective thermal energy
storage technology in solar dryers for drying of products is an
area, where existing information should be consolidated to
better facilitate the end user in cost effective manner. For a
better thermal performance of solar dryers, a PCM with a high
latent heat of fusion and with a large surface area for heat
transfer is mandatory and is currently explored widely. The
poor thermal conductivity characterizes a common problem to
most of the PCMs. A number of studies are currently
underway to investigate
REFERENCES
[1] A.K. Bhardwaj, Ranchan Chauhan, Raj Kumar, Muneesh Sethi, Adit
Rana Experimental investigation of an indirect solar dryer
integratedwith phase change material for drying valeriana jatamansi
(medicinal herb).
[2] Sari FarahDina, HimsarAmbarita, FarelH.Napitupulu, HidekiKawai
Study on effectiveness of continuous solar dryer integrated with
desiccant thermal storage for drying cocoa beans.
[3] S. M. Shalaby and M. A. Bek Drying Nerium Oleander in an Indirect
Solar Dryer Using Phase Change Material as an Energy Storage
Medium.
[4] Ashish Agarwal , R.M. Sarviya An experimental investigation of shell
and tube latent heat storage for solar dryer using paraffin wax as heat
storage material
[5] Mr. Avesahemad Sayyadnaimutulla Husainy,Prof. P. R. Kulkarni
Performance analysis of a solar grape dryer with thermal energy storage
by PCM International Research Journal of Engineering and Technology
(IRJET) Volume: 02 Issue: 07 |Oct-2015 International Research Journal
of Engineering and Technology (IRJET) e-ISSN: 2395 -0056 Volume:
02 Issue: 07 |Oct-2015
[6] Karunesh Kant , A. Shukla, Atul Sharma Ternary mixture of fatty acids
as phase change materials for thermal energy storage applications.

National Conference On “Recent Innovations in Engineering, Science and Technology” April 2019
46
A Review On Solar Dryers
Prajwal Mahajan1, Rajesh Tomar 2,Mandar Deshpande³,Mayuresh Lohgaonkar4 , Gajanan
Shelke5
[email protected], [email protected], [email protected]³ , mayurlkr1993@gmail .com4
Department of Mechanical Engineering
Sandip Institute Of Engineering
and
Management,Nasik,Maharashtra
.
Abstract— In order to improve the life of the agricultural products,
dryers have been developed and used. Greater emphasis is given to
solar energy sources in this process as the high prices of fossil fuels
and their deficiency. Solar drying is one of the simplest and most
conventional forms of drying known to mankind. The use of solar
dryer in drying of agriculture products significantly reduces or
eliminates product wastage, food contamination and boost the
productivity of the farmers. Hence there is need of developing
efficient and low cost solar operated dryers. There are various types
of solar dryers. These dryers are classified on the basis of mode of
circulation of the air e.g., natural circulation and forced circulation;
type of operation e.g., batch or continuous. In this paper, we
reviewed how these dryers are better over open sun drying and also
all different enhancement techniques applied to them, in order to
improve their efficiency and reduce the drying time.
(Keywords—solar dryer,mode of circulation)
I. INTRODUCTION
Drying, used to preserve food grains, is a complex process
which involves heat and mass transfer between the product
surface and its surrounding medium and also within the
product. Drying is high energy consuming process. Farmers
make use of solar energy or the energy for the drying or heat
energy from bio mass is used for drying. In open sun drying,
products are spread on ground where they get exposed to
direct sunlight. But this method has a drawback.
losses takes place during this drying process because of
some influences such as rodents, birds, insects, rain and
microorganisms. Solar dryers have thus been developed to
overcome these problems of open sun drying.
Pranav C. Phadke et at.[1] analysed the properties of
various types of dryers and came to conclusion that though
the mixed mode type of dryers are more efficient but they
have the disadvantage that they expose the product direct to
the radiation also the natural convection dryers doesn‘t
require external power source and they are easy to develop
and low in cost.
Hariprasath et al.[2] concluded that efficiency of solar
drying system is affected by moisture content, size, shape
and geometry and also surrounding conditions like solar
radiation and temperature, relative humidity, velocity and
atmospheric pressure of ambient air.
A. DEVELOPMENT OF SOLAR DRYER :
BENA ET AL[3] observed that a direct-type natural
convection solar dryer and a simple biomass burner
have been combined to demonstrate a drying technology
suitable for small-scale processors of dried fruits and
vegetables in non-electrified areas of developing countries.
The capacity of the dryer found to be 20 to 22 Kg.
approximately. This solar dryer has advantage that it can
work in
night (or in absence of sunlight) as it involves biomass back-
up heater. The drying process of product involves natural
convection. The viability of a simple natural convection
solar dryer for small- scale commercial producers of dried
fruits and vegetables in non- electrified locations will be
improved if it is combined with a suitable biomass back-up
heating system.
Kumar and Rajesh [4] proposed that Solar dryer is the best
alternative technology to avoid disadvantages of
conventional drying methods. Solar dryer is designed
for a particular crop and atmospheric conditions of
location. Various types like mixed mode, natural circulation,
forced circulation, green house type and tunnel type of solar
dryer are reviewed with design parameters and performance.
In mixed mode of drying the product may dry in less time
compared to direct and indirect mode drying. But indirect
mode of product drying will essential whenever requires
avoiding direct exposure of product to the solar radiation.
Forced circulation solar drying shows better result with
reduced drying time than open air solar drying and natural
circulation solar drying. But natural and forced circulation
solar drying should use for limited quantity of product.
For large quantity of product drying, it is better to use the
greenhouse type solar dryers.
WANDRA AND HUSSAIN [5] concluded some
experimental observation, shows that the solar dryer can be
used as an alternative in case of food preservation and the
efficiency is also acceptable. The people can make it in their
homes, especially in the developing countries where the
energy demand is skyrocketing. It can be handy in times of
recession .The food stuffs can be stored in this dryer and

National Conference On “Recent Innovations in Engineering, Science and Technology” April 2019
47
used for days without wasting it. The data concluded
while performing this experiment was, the final moisture
content for grapes was 58% while for green chilies was 64%
and that of Apple was
60%.
Basunia and Abe [6] observed that the drying rates of rough
rice in a natural convection solar drying system have been
determined. In this the range of average drying air
temperature was 22.3±34.9°C, and the relative humidifies
were between 34.5% and 57.9%. The initial moisture
contents were in the range of 37.07±37.69% dry-basis. In
this experiment, a mix mode natural convection solar grain
dryer is used. The data of sample weight and dry- and wet-
bulb temperatures of the drying air were recorded
continuously from morning to evening for each test.
B.CLASSIFICATION OF DRYERS
Solar dryers mainly classified as natural convection dryer or
forced convection dryers.
(Fig 1)Classification of solar dryers[7]
1) Sun dryers:
It is traditional method of drying. In this method grains are
spread in field for drying. Sun heats up the grains and
surrounding air due to this moisture from the grains get lost.
It is the most preferred conventional method in Asia. it takes
3-4 days for drying. Also in night it is not useful and climate
conditions are the big obstacle for this method. Temperature
control for this is very difficult and there may be the chances
of over drying due to extra heat.
2) Direct solar dryers:
It is like sun drying but in this process direct contact
between grains and solar radiation is avoided by placing
transport sheets or panels.
3) Indirect solar dryers:
In this type of dryers air is first heated in the chamber and
then passed over the product which is to be dried.
4) Mixed type solar dryers: In these dryers solar radiation incident directly on the material to be
dried and the pre-heated air in the solar air heater furnishes the
energy required for drying process.
APPLICATIONS
Berinyuy et al [8] designed and develop double pass solar
tunnel dryer integrated with heat storage using local
materials and evaluated it for drying leafy vegetables and
other agro products (figure 2). Face of the dryer kept in
south with an inclination of 6º. Solar radiation falling on
dryer was estimate to 12.13 KJ/m2 per day. Heat storage
system used helps to maintain temperature 5ºc above
ambient temperature even after sunset.the dryer was capable
of drying 17kg of cabbage from 95% moisture content wet
basis falls to 9% in five days. Efficiency of this dryer was
found to be 17.68% wiyh the moisture extraction
efficiency 79.15% and air flow of 9.68 m3/hr.
Fig.2 double pass natural convection solar tunnel dryer [8]
E. Tarigan and P. Tekasakul [9] proposed the mixed mode
natural convection of solar dryer integrated with a simple
biomass burner and bricks for storing heats. This dryer is
combined with a simple biomass burner and bricks heat
storage as back-up heating system. It can work in absence of
sunlight too.in day time the heat from sun radiations is
absorbed by the stones used in layer and this heat is used up
for removing moisture from grains.in night use of burner is
made for the heat energy production. (Fig 3).

National Conference On “Recent Innovations in Engineering, Science and Technology” April 2019
48
(fig. 3 ) Dryer developed by tagarian .(side view)
[9]
Jithinraj and Karim [10] develop solar dryer (fig.4)
and made conclusion that the drying of grapes in the open
sun takes 20 to 25 days during clear sunny weather
conditions. However, it only takes 7 days in the multi pass
solar dryer with aluminum absorber plates and granite
sheet as heat storage medium but the same two pass solar
dryer without granite sheet as heat storage medium takes
10 days to dry the grapes under similar weather
conditions. From that we could conclude that the granite
sheet acts as good thermal storage medium and gives extra
drying time in the evening. Here we get an extra drying
time of one hour in the evening and the heat of the granite
gets reduced slowly throughout the night and keeps the
grapes warm and dry at night. Also, the quality of dried
grapes is remarkably better in two pass solar dryer
compared to open sun drying as the product is protected
from dust and insects.
(Fig 4 )Experimental setup layout [10]
CONCLUSION
Solar dryers are simple construction and can developed with
ease. Variation is available in the dryers according to size
and loading capacity. These dryes were used to dry
vegetables,agro products, medicinal herbs,seeds etc. solar
dryers are best alternatives for the open sun drying process.
Use of solar dryer reduces the drying time.efficiency of dryer
is affected by the properties of product which is to be dried
e.g.moisture content,size,shape also the ambient conditions
like temperature,solar radiation, air velocity,relative
humidity.
References
[1] Pranav C. Phadke, P. V .Walke, V. M. Kriplani, ―Direct type
natural convection solar dryer :a review‖ IJARSE, Vol. No.4,
Issue No.02, February 2015
[2] Hariprasath , Pradeepkumar, Meiyappan, Ravikumar ―
A Review on Solar Drying System and its Applications‖
IJSRD ,Vol. 5, Issue 01, 2017
[3] BENON BENA and R. J. FULLER ―Natural convection
solar
dryer with biomass back up heater” ELSEVIER (2001)
[4] Sivakumar E, Rajesh K “different tyepes of solar dryer
for agriculture and marine products‖ IJRST(2016)
[5] Rahul Wandra1, Taliv Hussain, Anugrah Soy, Sarvasindhu
Mishra,Rishabh Yadav “Application and effectiveness of low cost
solar cabinet dryer: Experimental Investigation”IOSR
[6] M.A. Basunia a, T. Abe ―Thin-layer solar drying
characteristics of rough rice under natural Convection‖
ELSEVIER (2000)
[7] UmeshToshniwal, S.R Karale ―A review paper on Solar
Dryer‖ IJERA ISSN: 2248-9622 www.ijera.com Vol. 3, Issue 2,
March - April 2013
[8] J. E. Berinyuy, J. K. Tangka, G. M. Weka Fotso
―Enhancing natural convection solar drying of high moisture
vegetables with heat storage‖(2012)
[9] E. Tarigan & P. Tekasakul ―A Mixed-Mode Natural
Convection Solar Dryer with Biomass Burner and Heat Storage
Back-up Heater‖ANZES (2005)
[10] Jithinraj , Aftab A Karim “experimental analysis on multi pass
flat plate collector solar air dryer” International Journal of
Emerging Engineering Research and Technology (2014)

National Conference On “Recent Innovations in Engineering, Science and Technology” April 2019
49
Abstract— India is the fourth largest country in
terms of Purchasing Power Parity and constitutes one of
the fastest growing markets in the world. Globalization of
businesses, infrastructural bottlenecks, increasing
uncertainty of supply chain networks, shortening of
product life cycles and proliferation of product variety
have forced Indian firms to look beyond their four walls.
They face issues related to choosing and working with the
right supply chain partners (suppliers, customers and
logistics service providers), fostering trust between them
and designing the right system of gauging performance.
In this paper, we present a snapshot picture of
logistics and Supply Chain Management (SCM) practices
in India. It is borne out of the felt need by managers,
expert professionals and academicians to address logistics
and supply chain practices at the national level. Our
exploratory study is based on both field visits and
secondary data. We capture facts, figures as well as
qualitative responses about the logistics infrastructure and
supply chain practices. We focus on supply chain
collaboration and partnerships, supply chain structure,
facilities network design, transportation and logistics and
the role of Information and Communications
Technologies (ICT). Field visits to at least one major
facility of 25 firms were carried out during 2005. We
analyze and assess existing logistics and SCM practices
and discern emerging trends as well as areas of concern.
The paper gives insights into how far the firms and their
supply chains in India have come in dealing with major
logistics and supply chain issues, the practices they focus
on or need to focus on. We also highlight and address a
few issues related to supply chain managers and policy
makers.
INTRODUCTION
A few years ago, SCM was seen as necessary evils
in India; today they are seen as a matter of survival and
competitive advantage. As companies look at logistics
and SCM strategically, they turn to specialized service
providers to cut out non-core activities from within. A
rising focus on outsourcing is leading to a surge in
business performance for logistics service providers.
The essential point is to identify and describe a
domain of theory and practice where there is potential for
some additional gain by reconceptualising it in a
particular way. The important idea captured at least in
part by ―supply strategy‖ (or ―strategic supply
management‖) is that a mode of thinking and action
which encompasses, and seeks to exploit, interlocking
relationships could potentially be used as a powerful lever
for competitive advantage. It is apparent that much of the
focus in the increasingly voluminous literature on supply
strategy, operations strategy and supply chain
management is directed at meaning making. Often this
comprises assertions about what it essentially ―is‖. The
precepts of SCM as currently portrayed are a mixture of
three elements: description, prescription and the
identification of alleged trends.
Previously manufacturers were the drivers of the
supply chain - managing the pace at which products were
Manufactured and distributed. Today, customers are
calling the shots, and manufacturers are scrambling to
meet customer demands for options/styles/ features, quick
order fulfillment, and fast delivery. Manufacturing quality
- a
longtime competitive differentiator - is approaching parity
across the board, so meeting customer‘s specific demands
for product delivery has emerged as the next critical
opportunity for competitive advantage. Companies that
learn how to improve management of their supply chain
will become the new success stories in the global market
place. Study on Benchmarking shows significant cost
differences between organizations that exhibit best-in-
class performance and those with average performance.
Traditionally, Supply Chain Management (SCM) has
been a melting pot of various aspects, with influences
from logistics and transportation, operations management
and materials and distribution management, marketing, as
well as purchasing and information technology (IT).
Ideally, the all encompassing philosophy of SCM
embraces each of these functions to produce an overall
Supply Chain Management
Milind Pawar*, Aniket Patil*, Rameshwari Nile*, Nitin Patil*
Department of Mechanical Engineering, Sandip Institute of Engineering and Management, Mahiravani,
Nashik.

National Conference On “Recent Innovations in Engineering, Science and Technology” April 2019
50
supply chain strategy that ultimately enhances firm
performance. In actuality, the literature is still very
fragmented and although several studies purport to
discuss supply chain issues, most of the existing research
only examines one link of the chain, or most importantly
only focuses on one ingredient in the supply chain
performance mix. Six major movements can be observed
in the evolution of supply chain management studies.
Creation, Integration, Globalization, Specialization
Phases One and Two, and SCM 2.0 These phases are
given in Table 1. The six stage evolutionary era depicts
that in a particular era which strategy was emphasized.
For instance in the sixth era information Technology was
given priority and IT enabled supply chain was the
burning issue.
LITERATURE REVIEW
Literature portrays logistics and SCM practices
from a variety of different perspectives with a common
goal of ultimately improving performance and
competitiveness. Based on literature, we find that the
important supply chain practices concerns are mainly
related to:
1. Supply Chain Collaboration and Partnership
with various stakeholders such as the product developers,
suppliers, channel partners and end-users.
2. Supply Chain Structure including facilities
network design taking into account related transportation
and logistics.
3. Forecasting and Demand Management to cope
with supply chain complexity in a cost-effective and
delivery-efficient way.
While there is plenty of published literature that
explains or espouses SCM, there is a dearth of empirical
studies examining logistics and SCM practices. Galt and
Dale (1991) study ten organizations in the UK and find
that they are working to reduce their supplier base and to
improve their communications with the suppliers. Ferine
(1995) carries out an international comparison of SCM in
the grocery retailing industry. He finds significant
differences in inventory held in the supply chain by the
US and European grocery retailers, which could be
explained by difference in degrees of their SCM adoption.
Tan and Wisner (2000) compare SCM in the US and
Europe. Tan (2002) relates SCM practices and concerns
to firm‘s performance based on data from US companies.
He lists nine important supply chain concerns such as lack
of sophisticated ICT infra-structure, insufficient
integration due to lack of trust and collaboration among
the supply chain stakeholders and thereby lack of supply
chain effectiveness and efficiencies. Basnet et al. (2003)
report the current status of SCM in New Zealand, while
Sahay et al. (2003) discuss supply chain strategies and
structures in India. These surveys rank the perceived
importance of some SCM activities, types of hindrances
and management tools on the success of SCM using
representative samples mostly from manufacturing.
Quayle (2003) surveys supply chain management practice
in UK industrial SMEs (Small Manufacturing Enterprises)
while Kemppainen and Vepsalainen (2003) probe current
SCM practices in Finnish industrial supply chains through
interviews of managers in six supply chains. They analyze
the change of SCM both in terms of operational practices
and organizational capabilities. Chin et al. (2004) conduct
a survey that examines the success factors in developing
and implementing supply chain management strategies for
Hong Kong manufacturers. Moberg et al. (2002) state that
there is little literature on information exchange.
Feldmann and Muller (2003) examine the problem of how
to establish an incentive scheme to furnish reliable and
truthful information in supply chains.
There is little literature on logistics and SCM
practices in India. Available literature focuses either on
the best practices (Joshi and Chopra, 2004) or on re-
engineering of internal operations of the firms (Deshmukh
and Mohanty, 2004, Kankal and Pund, 2004). In context
of ICT, Saxena and Sahay (2000) compare the
manufacturing intent to be an agile manufacturer and their
Information Technology (IT) infrastructure in terms of
scope of use, extent of use and integration of IT-based
systems. The more recent studies are mainly based on
questionnaire surveys and secondary data sources (Sahay
and Mohan, 2003, www.etintelligence.com, Sahay et al.,
2006). Vrat (2004) discusses some issues and challenges
as well as the potential of SCM in India. All these studies
find Indian firms generally lagging behind their
counterparts in the developed countries.
Richard Lamming (1996) has given a general review on
lean supply chain in which Lean supply has been
characterized as ―beyond partnership‖. Lean supply is the
system of purchasing and supply chain management
required to underpin lean production. Ben-Daya et al.
(2008) explored the topic in a particular context, i.e. The
industrial district (ID), that constitutes a specific
production model where complex SC networks can be
identified. SC cooperation may take on several forms in
IDs and may produce several benefits (e. g. Upgrading
quality and
reducing costs). Vaart and Pieter (2003) drawn
conclusions on the need for aninter-disciplinary approach,
combining the technical and relational aspects from the
respective fields of system dynamics and collaboration in
order to deliver superior order replenishment
performance. Gunasekaran and Ngai (2005) indicated that
E-Business, product, and service-quality, all have a
significant direct effect on customer behavioral intentions
to purchase again. Balakrishnan and Cheng (2005)
reviewed and update the methodology based on

National Conference On “Recent Innovations in Engineering, Science and Technology” April 2019
51
spreadsheet that provided enhanced solutions in complex
environments with multiple products and bottleneck
situations. Nagarajan and Sosic (2004) reviewed literature
dealing with buyer vendor coordination models that have
used quantity discount as coordination mechanism under
deterministic environment and classified the various
models. of SCM, the existing literature was examined, in
an effort to identify the extent to which these underlying
elements were present in SCM academic research to date.
A review of previous literature studies, as highlighted in
Table 3 (Appendix A), provides the
basis for how this review extends our understanding of
SCM research. Burgess et.al. (2006) reviewed 100
randomly selected articles from 614 usable articles found
in the ABI/Inform Database across a 19 year (1985 to
2003) period.. Their sample addressed manufacturing and
consumer goods industries, and the research articles
reviewed by them focused on a more narrowly defined
operations management approach to Supply Chain
Management. They classified the articles into four groups,
namely (1) Descriptive features of SCM, (2) Definition
issues, (3) Theoretical concerns and (4) Research
methodological issues. They found SCM to be a relatively
young field with exponential growth in interest from
researchers in the recent past. The importance of this
research in contrast to Burgess et al. (2006) is that instead
of sampling 100 articles from a pool of 614 over a 5-year
period, we examined 588 articles over 18 years. This not
only makes for a more in-depth review, but provides a
larger base from which to chart the maturation of the
SCM field. It also helps to assess gaps in the literature and
project future trends, thereby underscoring the importance
and robustness of this study. Finally, Burgess et al.,
include books, manuscripts and conference proceedings
while this research focuses solely on published articles in
peer reviewed SCM journals.
OBSERVATIONS & DISCUSSION
It is seen from the preliminary discussion that 588 articles
were found in 13 journals after selecting for multi-faceted
ness of the articles, and approximately 370 articles were
dropped from the analysis, as they pertained to treatment
of
only one single parameter. It is seen from Table 6 that 64.
50% of the selected articles appeared in only 04 Journals,
out of which also, The Journal of Supply Chain
Management contributed the lion‘s share – 138 articles
forming 23.46% of all the 588 articles across 13 journals.
However the wide ranging interest and activity in SCM is
evinced by the fact that there are ten Journals with twenty
or more articles. The data of Table 7 depicts that
Exploratory Research Method (43.37%) that makes
observations of supply management for the purpose of
developing theories, but leaves the testing of the theories
for other studies, dominated over other methods and
closely followed by Normative study Earlier literature
reviews provided the basis of selecting the relevant
journals, which was supplemented by an intelligent
internet scanning of the journals to determine those where
articles on SCM appeared during the review period. A
journal-wise count of the short listed SCM articles
appearing in these journals (25.31%) that examines what
ought to be and what individuals and organizations ought
to do‖ (Mentzer and Kahn 1995). After that Methodology
Reviews (15.15%),
This indicates that more research is needed in hypothesis
testing research method. A journal-wise, year-wise
categorization of the 588 articles is presented in Table 8.
The Table 8 shows that the topic of SCM has seen a major
research thrust over the recent years, and 30% of the
selected articles have appeared in the last 2 years only,
54.08% in the last 4 years.
SUPPLY CHAIN MANAGEMENT STRATEGY
Given the relative recency of SCM for researchers, as
well as how it continues to evolve, Supply Chain Strategy
SCM Frameworks, Trends and Challenges should remain
an important topic going forward. In other words, at some
point in the future, the lines between categories such as
these may become blurred because IT and e-commerce
are continually integrated into the frameworks and
strategies of supply chainGiunipro et al. (2008) in his
review of SCM literature up to 2006 observed that articles
on e- commerce peaked in 2004. The authors find from
their data which specifically looks at only those papers
which address multiple aspects of supply chain gained in
numbers only from 2005 and 7, 7, 10 and 8numbers of
papers were published in year 2005, 2006, 2007 and 2008
respectively. This shows that the impact of rapid
development of Information Technology has manifested
in development in supply chain field and further
developments in multidimensional aspects of scm will
increase in terms of their value to SCM researchers and
managers in the coming years. For a successful integrated
supply chain continuous flow of information is necessary.
Our study confirms the observation of Giunipro et al.
(2008) that traditional areas such as Quality, Human
resource and Supplier Development areas have remained
fairly stable, and this trend continues.
However, the field of Environmental and Social
Responsibility has seen an increased activity, reflecting
the
heightened government and public concerns and industry
awareness in these areas. (Cruz, 2008). Literature on
green

National Conference On “Recent Innovations in Engineering, Science and Technology” April 2019
52
supply chain is emerging (Zhu and Sarkis, 2004) and
gaining prominence and represents a research area with a
huge
potential. There was very little discussion on the global
supply chain up to 2006 (Giunipro et al., 2008). Our study
found no appreciable increase in numbers of papers
published in this field in 2007 (publication =4) and in year
2008 (publication =3). Therefore this field is still
developing and has a lot of potential for research. This
confirms the findings of Giunipro et al (2008) that this
field should continue to see increased activity given the
increased emphasis on global business. Integrating supply
chain strategy with the overall firm strategy is an
important consideration to maximize profitability (Tan et
al. 1998). This has resulted in a sharp increase in the
literature concerning SCM Strategy, and 21.6% of the
articles included in our literature review are seen to
belong to this category, even though Time-based
strategies have been separately categorized and add an
additional 6.71%, making the attention on Strategy as
28.31% of the total articles. The articles dealing with
strategy are observed to be concentrating on various
aspects, mainly on Risk Management in Supply Chains,
Competitive Advantages, Resource based Views and
Agency theory, Strategic Alliances, Strategic Alliances
(Sandelands 1994; Carr and
Pearson 1999), Strategic Performance Measures
(Tan,Kannan and Handfield 1998; Gunasekaran, Patel and
Tirtiroglu 2001) and Supply Chain Forecasting
(McCarthy and Golicic 2002). Gong (2008) highlights
flexibility as an important determinant of Strategy and
proposes an economic model for evaluation of Supply
Chain Flexibility.
Also, most of these articles only investigated strategy
alignment between the firm and one key supplier rather
than
a chain investigation. The idea of a supply chain
organization has been presented (Ketchen and Giunipero
(2004), but this has yet to be systematically investigated.
Additionally, there is still considerable work yet to be
done in terms of merging existing strategic management
literature with theoretical work being conducted in the
SCM field.
IV. SCM FRAMEWORKS, TRENDS AND
CHALLENGES
SCM Frameworks, Trends and Challenges represent the
second largest area of recent growth within the supply
chain field.101 of the 588 total articles, or approximately
17.38%, fall into this category. While SCM has, in some
form or other, existed for several decades, the true value
of SCM to the organization‘s growth and profitability
targets has been realized only recently with the emergence
of global supply chains and information technology
advances. The development and mechanics of supply
chains have become very complex, and Blackhurst et al.
(2005) showed as to how supply chain complexity can
make the modeling of the chain a multifaceted task. The
authors have concentrated only on those articles which
focus on the multi-faceted aspects of the Supply Chain
and examinethe inter-dependence and co-ordination of
two or more facetsof the Supply Chain. Several authors
have examined several aspects of the SCM and
contributed to enhance overall understanding of
multifaceted SCM. This category also includes several
definitions and frameworks which were developed for
multi-dimensional SCM (Sanders et.al. (2007). Jüttner
and Baker (2007) examine aspect of integrating marketing
and supply chain management. Sanders et.al. (2007)
suggested a Multidimensional Framework for
Understanding Outsourcing
Arrangements. Frizelle and Efstathiou (2007) report a
study the impact of operational complexity on the cost in
customer. supplier systems. Zhao et.al. (2007) discuss the
value of early order commitment in a two-level supply
chain. Adhitya et.al. (2007) developed a model-based
rescheduling framework for managing abnormal supply
chain events.
V. SUPPLIER ALLIANCES/RELATIONSHIPS
The resurgence of publications in this area was observed
by Giunipro et al. (2008) and explained as a result of a
general trend within industries of moving away from
simple transaction and contractual-based relationships,
and toward more long-term relational forms of
collaboration between parties involved in supply chain
activities. The development of these long-term, strategic
relationships between buyers and sellers within the supply
chain has been previously shown to offer opportunities to
create considerable competitive advantage (Tanner 1999).
Ghosal and Moran (1996) cautioned that many firms were
recognizing these implications and as a result were
attempting to adopt a more collaborative and trusting
relationship between the two parties. The publication of
relationship-oriented SCM articles is seen to more than
double within a decade from 5. 88% in 1998 to 13. 64%
in 2008, underlining the growing importance of this field.
The authors feel that a substantial activity will be seen in
the coming years in this field as more and more
companies from the developing world go global.
FUTURE AREAS FOR RESEARCH
As evident from the literature, supply chain management
has been the topic of interest for researchers in recent
past. It offers almost unlimited possibilities of exploration
as the market dynamics are widely varying among
economies, regions, climate zones, time zones, political
systems, countries, population demographics, markets,

National Conference On “Recent Innovations in Engineering, Science and Technology” April 2019
53
and so on. The field will continue to grow as the world is
integrated into one great global marketplace, and the
researchers are faced with new scenarios from time to
time. Supply chain management is an exploding field,
both in research and in practice. Major international
consulting firms have developed large practices in the
field of supply chain, and the number of research papers
in the field is growing rapidly. Firms operate in global
environments, deal with multiple suppliers and customers,
are required to manage inventories in new and innovative
ways, and are faced with possible channel restructuring.
The field promises to continue growing as the research
advances and as firms continue to apply new knowledge
in their global networks. It would be almost impossible to
foray into the unknown and predict the future course
research in SCM is likely to take. However, there are a
few issues within SCM which are identified as suitable
and appropriate for further research exploration.
1. Demand Driven Supply Chains
Aligning supply and demand in today‘s complex and
dynamic manufacturing environment can be challenging
at
best. Many companies spend much amount of time and
resources in an attempt to better predict demand. But still,
static forecasts are often out of date within hours of
creation, making some question the real value of
traditional planning tools as it relates to near-term demand
volatility.
2. Supply chain in Food and Service industry is also a
prominent field of research.
While the objectives to be addressed by future research
are outlined broadly above, certain barriers exist to deter
the
research in these fields. With the expansion of the supply
chain to a global status, the average researcher is left high
and dry, with little or no access to the corporate data,
problems and with little resource to look into the status
and
devise solutions. Large MNC‘s tend to be severely
confidential and closed, and fend for their own,
particularly
in the developing economies where the possibilities of
research largely exist. Due to this reason, most research
has
been limited to individual aspects of SCM with limited
data, and mostly has been empirical research. Large
consultants do have access to corporate working and data,
and that is perhaps one reason that more and more
information is sought by researchers on the Internet,
where one can find secondary and processed data like the
reports of major consultants like McKinsey. The
researcher community needs to find a way around this
problem.
Geographic distances between the different parts of a
supply chain present another problem. A normal
researcher can work at one location, and trade, tariff,
financial and diplomatic barriers often prevent the
researcher from
accessing the other parts of a global supply chain. Earlier
research has suffered from a major drawback pointed out
in Giunipero et.al. (2008) who cited Malhotra and Grover
(1998) as reporting that 30% of the operations
management survey studies they assessed suffered from
statistical conclusion errors due to small sample sizes.
Tanner (1999) suggested involving trade associations to
increase access to more companies and increase sample
sizes.
CONCLUSION
There is an increased interest in SCM and Internet by
academicians and practitioners. Some directions for
further research that we have identified are: to conduct
empirical studies about the impact of Internet on several
e-SCM processes. Another important area of research is
the application of decision models and technologies on
Internet. As more and more firms have high quality and
real-time information available, the use of these decision
technologies will increase, since they add significant
value to the members of a supply chain. The SCM is
continuously redefining itself. Past literature reviews
provided valuable results, they were based upon the
random selection of articles, book chapters and
conference proceedings. Other literature reviews were
either more focused on operations management or
examined a single journal. A review of suspended data
collection in 2003 was carried out. The aim of this study
was to provide an up-to-date and extensive review of the
SCM literature that was focused on a broad definition of
the SCM concept. Also, the most recent literature review
was given by Giunipero et al (2008) in which they had
given past present and future implications of SCM. It is
our hope that researchers will use the gaps identified
herein to generate much needed conceptual and empirical
work in the SCM literature, thereby creating a body of
literature that is more heavily influenced by a deeper
analysis of the supply chain on a chain wide or network
basis.
REFERENCES
1. Adhitya A., Srinivasan R. and Karimi I. A., ―A model-
based rescheduling framework for managing abnormal
supply chain events‖, Journal of Computers and Chemical
Engineering, (31: 5/6), 2007, pp. 496-518.
2. Agatz N. A. H. And Fleischmann M. And Nunen J. A.
E. E. V., ―E-fulfillment and multi-channel distribution –
A review‖, European Journal of Operational Research
(2007).

National Conference On “Recent Innovations in Engineering, Science and Technology” April 2019
54
REVIEW ON 3D MACHINE VISION SYSTEM
AND IT’S APPLICATION
Prof. S. B. Ambekar1,Mr. Mankar Abhishek Ashok
2,Mr. Ingale Akash Prakash
3
1Assistant Professor, [email protected]
2UG Student, [email protected]
3UG Students, [email protected]
Department Of Mechanical Engineering
Sandip Institute of Engineering & Management (SIEM).
Abstract
The availability of robust sensing devices, image processing,
hardware and advanced system design increased the use of
computer vision systems. Image analysis is generally based on
the 2D binary system, 3D vision system and color image
become standard sensors for various applications in Industrial
automation, navigation, remote sensing, food industries,
biomedical fields.
This report is about new machine vision system application from
recent progress has been made in field. It based on
methodologies of image processing, like 3D sense Analysis for
quality control, Image Sequence and motion analysis, 3D
Modeling, Human Interface techniques. Machine vision is
concerned with the concept behind artificial systems
incorporates image processing. Machine vision systems based
on extracting images of the objects which are to be inspected
and processing them to retrieve the required data.
1. INTRODUCTION
Machine Vision is the technology used to provide image-
based analysis for applications such as automatic
inspection, process control and robot guidance in
industry. Machine Vision Systems analyze images to
perform appearance inspections, positioning, and defect
inspections. The machine vision systems can be used in a
wide range of applications because of their flexibility and
versatile features. The use of vision systems in inspection
and motion control applications imposes several real-time
constraints on image processing. However, constantly
increasing performances and decreasing costs of machine
vision software and hardware make vision measuring
systems more advantageous than the conventional
measuring systems. These vision systems can be used to
precisely measure variables such as distance, angle,
position, orientation, Etc.
The main advantage of a machine vision based system is
its non-contact inspection principle, which is important in
the cases where it is difficult to implement contact
measurements. Also Machine Vision technology helps to
achieve better productivity and aids in the overall quality
management, thus posing a prominent competition to
other industries which do not implement vision systems.
The scope of Vision based systems is not only limited to
the fields it extends widely to much more industries such
a welding industries, Automobile industries where
Machine vision is used to identify and classify weld
defects in welding environments, sparkplug gap where
human inspection is not efficient.

National Conference On “Recent Innovations in Engineering, Science and Technology” April 2019
55
Image 1. Basic working of 3D Machine vision system
2. LITERATURE REVIEW
Mohan 1989, IEEE, pp. 91-96, describes the paper
regarding design growth and difficulties of vision system.
It can perform a variety of examination and manipulation
task. Robot first identifying the accurate position of the
section using a camera calibration program and after that
computer vision system can be developed an objective
position map for a range of devices on the panel. These
code displayed on LCD meter specifies the inspection or
task to be performed. To test the system robustness and
accuracy we have more than 100 experiment involving
varying condition and performance geometry [1].
Crevier, Daniel in 1996, IEEE, pp. 90-92, introduces
experimentation color coordinate system, Hough
transform, stereo vision and related component analysis. .
It can also be verify that there is a large dissimilarity
across any given object in the passion component, but
remain approximately constant within each object or can
still different from one object to another. This experiment
is realizing on hardware that implementation of efficient
algorithm for practical application of computer vision [2].
Cristina in ‗Control of an Industrial Desktop Robot Using
Computer Vision and Fuzzy Rules‘. 2005, IEEE, pp.
1297-1302. discussed that in how flexibility engineering
production, equipment must become usual to varying the
manufactured goods demands and to product style with
short life cycle. To solve the problem image data
processing concept on source of fuzzy logic are applied to
engineering application to increase its flexibility. This
approach the evaluation the system of performance and
growing the processing speed. To control inspection
counting: finding of surface flaws and infected,
authentication of the presence of the section and whole
location [3].
Frank in his ‗A Study of Using 2D Vision System for
Enhanced Industrial Robot Intelligence.‘ 2005, IEEE, pp.
1185-1189. discussed the recent improvement in business
developed aimed at humanizing elasticity and intelligent
of manufacturing robot application using the method of
applying two-dimensional vision technique and include
methods of camera calibration, vision dimension and
vision statement to robot. It can accumulate the camera on
the robot arm or move the camera to unusual in view
position for identify the true position of a three
dimensional objective on plane [4].
Hyoung-Seok in his ‗Development of Computer-
visionbased Pipe Inspection system.‘ 2006, IEEE, pp.
403-406 discuss measuring rate and precision of the
examination, a computer-aided measuring and
investigation method is highly desirable. Because not
possible to test the error of all parts. It can be edge finding
is processed by using Laplace operator. Conventional
person-vision based examination causes a lot of problems
such as eye overtiredness, concentration decrease,
incompatible criterion, and high labor costs. The
inspection algorithm detects line segments from side-view
image using Hough transform and calculate pipe angle,
eccentricity, and diameter. In view inspection algorithm
calculates center points, inner and outer diameters of pipe
by using a line-scanning method. It can be used to
analyze the pre-processed image modified Hough
transform and line scanning method, and from which the
status of the pipe is determined to be good or defective
[5].
Toal ‗Review of Machine Vision Applications in
unmanned underwater vehicles.‘ 2006, IEEE, pp. 1-6
investigated the study of the application machine vision in
the control of UUV. Spatial intensity incline of the images
is filtered to show up nothing crossings using a Laplacian
of Gaussian clean. Filtering in this case is an effort to
highlight image texture and decrease the achieve of sound
and non-uniform clarification. Today currently available

National Conference On “Recent Innovations in Engineering, Science and Technology” April 2019
56
solutions for underwater navigation, it is perceptible that
there is a require for more elasticity and preference [6].
Jonathan in ‗Robust Machine Vision Based Parts
Inspection: Intelligent Neuro-Fuzzy versus Threshold
Based.‘ 2007, IEEE, pp. 1-9. presented in manufacturing
for inspection system requirement for a robust system.
Need to be an intelligent neuro-fuzzy based image
processing algorithm was developed. The neuro-fuzzy
systems to classify accept and reject images, and then use
the method to sort new images. Goal of this research get
better the parts inspection based on the intelligent neuro-
fuzzy system [7].
Jia and Jiancheng at current immediate, complex
mechanized systems require the growth of mechanization
technologies that can be proficiently integrated into the
system. Because production need to preserve high levels
of superiority while maximizing production to transport
their products at a ready for action price. It can result on
the design and can be integrated into industrialized
arrangement for the dimension, inspection, confirmation
of geometrical magnitude, and part integrity and provided
that a lot of worth and image information during the
operation for superiority [8].
Heyer ‗Human-Robot Interaction and Future Industrial
Robotics and Application.‘ 2010, IEEE, pp. 18-22.
discuss application in present oil and gas industries to
improve protection and good organization and decrease
green collision recommend the use of engineering
robotics. Robots can perform ordinary field worker tasks
in dangerous and intolerable environments. For example,
robots are used in factory to transfer equipment, and
recent versions planned to purpose in dynamic
environments and are able to be check impact. A few
cases proactively direction in the region of obstacles.
Nowadays industrial robots have a long well-known
record for given that consistent, exact and well-organized
service in the industrialized production [9].
3. 3D MACHINE VISION SYSTEM
It is automatic extraction of information from digital
images. If we consider steady flow production line we
need camera and optical system on a production line with
a enough lighting to capture details. From this camera
catches digital images of product and analyse as per
criteria.
We prefer Machine Vision system over Human Inspection
1.It works faster.
2.It is more Consistent.
3.It works longer period of time.
4. HISTORY
Machine vision technology is started earlier in 1950. But
it started uses in industries more specificly in between
1970s and 1980s.
Image 2. 1st Demonstration od machine vision system
The photo Shows 1st demonstration of Machine Vision
System in 1983 by automatrix. It shows pioneering
Demonstration. Now it is part of Microscan.
After that machine vision system comes long way and
now it uses in various applications like 1.High speed
inspection 2.Check for completeness 3.Shape inspection
4.Pattern comparison 5.Measurement 6.position Detection
7.OCR reading .
5. FEATURES
It works basically on 4 common types

National Conference On “Recent Innovations in Engineering, Science and Technology” April 2019
57
Layout 1. Features of machine vision system
5.1.Measurement
Machine Vision System is widely uses for Measurement .
It can check the measurement upto its specific tolerance.
Image 3. spark plug
We are checking spark plug gap from many years to
ensure vehicle work carefully. For that we can use
Machine vision system by which we can take Digital
images of spark plug for measurement and eliminate the
need of person to be there for everytime.It can be done
accurately and easily without wasting of time.
5.2.Counting
It is the feature which helps to know No. of parts or No.
of features on the part to be machined. It help us to know
about any missing parts or No. of parts are assembled
accurately.
If we take example on job we need to drill 8 holes and we
exactly drill 8 holes it means we dobe our job accuretly
and correctly.
And in another example there are 8 pack of sodas and 1 of
that missing we immediately know that pack is
incomplete. It done very quickely so that if we want to see
the process we need to slow down the process.
5.3.Location
Machine vision system it also uses for knowing the
orientation and loctaion of job and also to check the
specified tolerance of the job.
Image 4. Locate position and orientation
When we inspect the job on production line they can lie in
any direction but we can take digital image of that and
stretch the image and run our machine vision system
precesses.
It also uses unique patterns to identify product. For
example Tomato ketchup bottle where we locate
TOMATO name by unique pattern and identify the
product.
5.4.Decoding
Decoding is about the 1D,2D. It is about the linear
barcodes, stacked symbologies and 2D symbologies, OCR
optical character recognition fonts. It makes simultaneous
human and machine readable.
Thw barcode or that symbologi contains the historical
data of that part from No. of partsthat part goes to No. of
process are carried away. It uses for track down the fault
in process and take the immediate action as per history of
product.
Decoding is last process which consists data of
Measurement, Counting and Location. It uses this data to
validate the product.
For example scanning the OCR code on vegetable canes
to ensure that right vegetable on right cane and it only
recognize by code.
6. Working
There are 5 key components on machine vision system on
which it works.
Machine
Vision
Measuremen
t
Counting
Location
Decoding
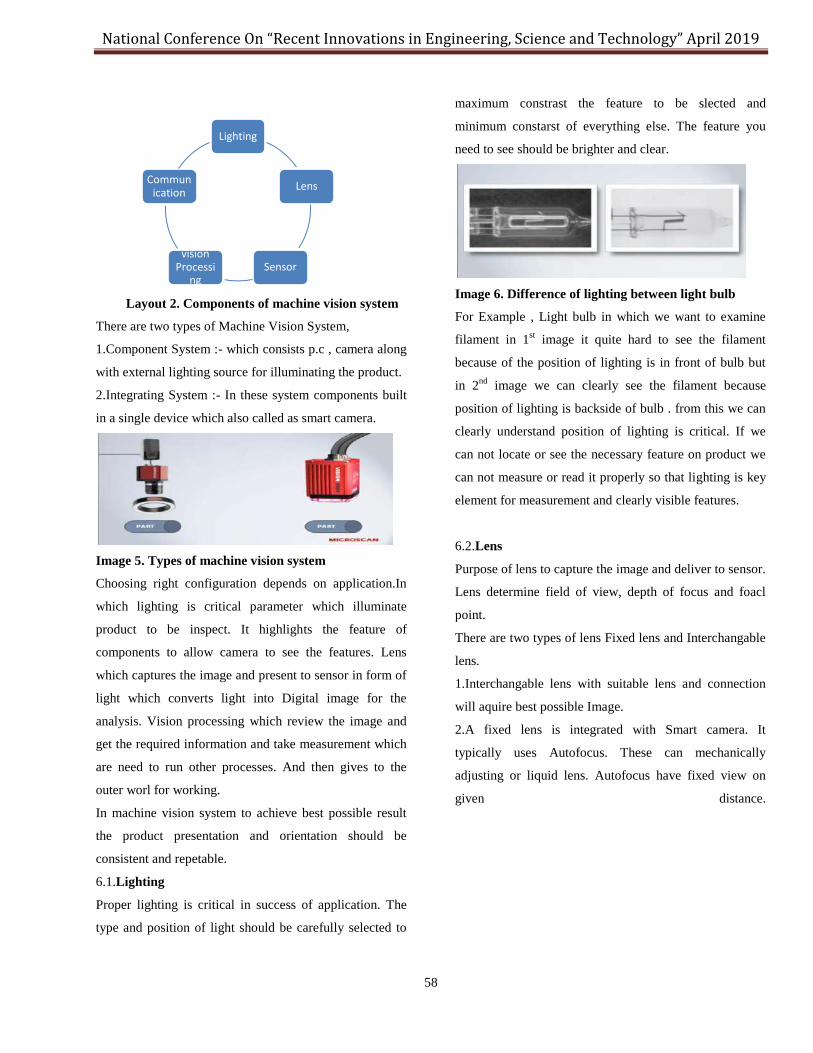
National Conference On “Recent Innovations in Engineering, Science and Technology” April 2019
58
Layout 2. Components of machine vision system
There are two types of Machine Vision System,
1.Component System :- which consists p.c , camera along
with external lighting source for illuminating the product.
2.Integrating System :- In these system components built
in a single device which also called as smart camera.
Image 5. Types of machine vision system
Choosing right configuration depends on application.In
which lighting is critical parameter which illuminate
product to be inspect. It highlights the feature of
components to allow camera to see the features. Lens
which captures the image and present to sensor in form of
light which converts light into Digital image for the
analysis. Vision processing which review the image and
get the required information and take measurement which
are need to run other processes. And then gives to the
outer worl for working.
In machine vision system to achieve best possible result
the product presentation and orientation should be
consistent and repetable.
6.1.Lighting
Proper lighting is critical in success of application. The
type and position of light should be carefully selected to
maximum constrast the feature to be slected and
minimum constarst of everything else. The feature you
need to see should be brighter and clear.
Image 6. Difference of lighting between light bulb
For Example , Light bulb in which we want to examine
filament in 1st image it quite hard to see the filament
because of the position of lighting is in front of bulb but
in 2nd
image we can clearly see the filament because
position of lighting is backside of bulb . from this we can
clearly understand position of lighting is critical. If we
can not locate or see the necessary feature on product we
can not measure or read it properly so that lighting is key
element for measurement and clearly visible features.
6.2.Lens
Purpose of lens to capture the image and deliver to sensor.
Lens determine field of view, depth of focus and foacl
point.
There are two types of lens Fixed lens and Interchangable
lens.
1.Interchangable lens with suitable lens and connection
will aquire best possible Image.
2.A fixed lens is integrated with Smart camera. It
typically uses Autofocus. These can mechanically
adjusting or liquid lens. Autofocus have fixed view on
given distance.
Lighting
Lens
Sensor vision
Processing
Communication

National Conference On “Recent Innovations in Engineering, Science and Technology” April 2019
59
Image 7. Difference between two lenses
If we uses different lens for ex. Curcuit . In which 1st
image shows 12mm with wide angle lens which provides
larger field view and less magnification than 2nd
image in
which image take by 25mm lens.
If we use lens with longer focal length we can magnify
image and reduce field view. Lens delivers the image to
sensor in the form of light.
Image 8. Conversion of light into Digital image
6.3.Sensor
In sensor it uses CCD or CMOS technologies to capture
this light and convert into Digital Image And when we
zoom on that Image will see the collection of pixels. Low
light produces dark pixels and bright light create brighter
pixels.Camera should have suitable sensor as per
application.
Image 9. Two images capture by Two different sensors
1st Image is capture is taken by 0.3MP sensor which also
known as VGA sensor and the 2nd
image which is also
same captured by 2MP sensor
1st Image has much less resolution and it is more
pixelated. Higher the resolution higher the detail image
we have and there more accurate measurement.
6.4.Vision Processing
Processing process is core of Machine vision process.
Extracting the information that required from application.
Processing the image may take place externally on PCB
system or Internally in smart camera.
Vision processing is done by software which have wide
varity of interfaces and tools available .some common
tools are Locate, Count, Measure and Decode. This are
use to achieve desire result.
Image10.Processing on software
Typical example is to locate the cap on bottle. Then
measure tool is use to measure its height and check it
properly sitted on bottle.Vision Processing consists
several steps or algorithm perform by software.Image is
aquire by sensor before that pre-processing take place to
optimise the
Flowchart1. Flowprocess of Machine vision system
Image and ensure all necessary features are stand out.
Then software find the features which is to look for then
run measurement and compares it with specification.
After that result is communicate as pass or fail.
6.5.Communication

National Conference On “Recent Innovations in Engineering, Science and Technology” April 2019
60
The purpose of machine vision to extract information
from digital images and communicate that data. This done
by either Discrete I/O or Data communication.
Image11.Indicator Stack light
The discrete I/O points are connected to PLC for use the
information to control work or as a indicator stack light or
Direct to solenoid. Which might use to trigger or reset the
mechanism.
Data Communication by serial communication is
conventional RS-232 serial or Ether-net. It use at higher
level industries to provide visual conformation.
Which connected HMI screen to provide visual
conformation that system is running.
Image12.Visual Communication
The working of Machine Vision system with all
components work together.
Image13.Actual process of machine vision system
7. Benefits and Application of Machine Vision
System
By using Machine vision system we can get no. of
different applications. And the motivation for doing so
generally like to save money and increase the profitability
and this can achieve in several ways.
Layout 3. Benefits of machine vision system
Reduce Defects
Machine Vision system can reduce the defects . fewer bad
parts getting out to the world in the coustmers hand which
could damage company reputation and lead to recall
costly parts. Another problem is product is match does
match its packing label and with this mislabel product
create unhappy coustmer and it cause company reputation
and may leads to safety risks. Because in pharmaceutical
companies this mislabel product can harm the coustmer
which have allergies.this common reason to recall the
products. For this barcodes shoud be check properly to
ensure the product is correctly filled.
Increase Yield
It is another incentive to turn raw material in product and
more saleable. If we catch defect in early stages of
production then we can reduce wastage.
Because defected products can identified and eliminated
before larger assembly . it will reduce the scrapping.
It helps to reduce downtime of production. It will helps to
ensure that product fit accurately on production line if it is
not then it will jam the production line and loss of
product.
Machine Vision
Reduce Defect
Increase Yield
Track and
Trace
Comply With
Regulation

National Conference On “Recent Innovations in Engineering, Science and Technology” April 2019
61
Image 14. Aligining of Baked goods
In this machine vision ensuring that the baked goods are
alligned with conveyor and products which are out of
tolerance they can done system jam they are removed.
Track and Trace
We all well known about product tracking. In this
uniquely identified product so that can track and trace the
manufacturing process. If we know all the parts that are
required and which are needed in production. Then we
needed less stock of products and can use JIT
Manufacturing Process.
Decoding system is use to track down the products by
OCR code. It will reduce product shortage by reducing
inventory and Delivery time. It also perform some other
tasks such as alignment, measurement in addition with
reading barcode OCR for ex. Reading datamatrix code on
PCB and verify its location on board.
Comply with Regulations
It will help to reduce cost. If you not follow the rule then
you not able to participate in the market.
In pharmaceutical companies earlier uses the machine
vision system. In this industry it should follow strict
government regulations to ensure coustmer safety. In this
common verification of Date, lot , Datamatrix and other
code formats . it not only read the codes but also verify it
should printed accurately. And also readable to supply
chain.
Main advantage of machine vision over Human inspector
1.Machine vision work tirelessly. They can do repetitive
tasks and once they do the setup it work allday and
everyday. Where human inspector get tired and distracyed
after 20 or 30 min.
2.Machine vision works faster.
3.Machine vision is more consistent than human
inspeactor. Once role is set it works until it stops. Where
human tendency to change the rules as per there comfort
level.
8. Future Scope
1. The monochrome (gray scale) camera line of force is
towards faster cameras and interfaces, and larger sensors,
if sensor pixel defects can be eliminated. Some machine
vision tasks, such as location or defect detection, could
benefit from color or 3-D information, but monochrome
cameras are used because of their low cost and higher
resolution. The use of color and 3-D will continue to grow
and new technology and markets will accelerate this
growth.
2. Currently, most color machine vision cameras use
colored filters over camera pixels. This is inexpensive but
leads to errors when making color measurements. I think
there will be a new color camera technology that will give
us much better accuracy, at a competitive price, perhaps
using programmable filters to sequentially take red, green
and blue images. Perhaps this would be a substantial cost
reduction in multi-layer sensors. The result would be a
much larger market share for color machine vision
systems.
3. ‗Smart‘ cameras move vision processing into the
camera and return results rather than, or in addition to,
images. Smart cameras must use low-power processors
and the development of these processors is driven by huge
consumer demand for mobile computing devices, such as
tablet computers.
4. Windows is currently the operating system of choice
for machine vision systems, but the Linux line of force is
growing stronger. Linux variants are used in most mobile
computers and so, again, consumer demand is driving the
adoption of Linux.
5. Vision for automotive safety is used in high-end
Volvos and Mercedes, and will migrate ‗down market‘.

National Conference On “Recent Innovations in Engineering, Science and Technology” April 2019
62
Back-up cameras will soon be mandated and that will
help reduce the cost of adding collision detection. Despite
successful autonomous vehicle demonstrations, I think
fully autonomous vehicles are well beyond my five-year
window.
9. CONCLUSION
It works on low operating cost. This helps to reduce
overall cost of inspection it helps to improve
manufacturing and its inspection.
It based on finding flaws and surface cracks which leads
to harmful accidents which damage company reputation.
So it need to install M/c vision system to detect those
flaws and find solution on it.
We can use smart cameras to compact the M/c vision
system. And do 100% inspection on the job so that no
flaws occur in final product.
REFERENCES [1] M. Trivedi, ChuXin Chen, Suresh B. Marapane. A vision system
for robotic inspection and manipulation. Mohan 1989, IEEE, pp.
91-96.
[2] Crevier, Daniel. Educational Experiments in Machine Vision.
1996, IEEE, pp. 90- 92.
[3] Cristina M. Peixoto Santos, Manuel Jo˜ao Ferreira. Control of an
Industrial Desktop Robot Using Computer Vision and Fuzzy
Rules. 2005, IEEE, pp. 1297-1302.
[4] Frank S. Cheng, Andrew Denman. A Study of Using 2D Vision
System for Enhanced Industrial Robot Intelligence. 2005, IEEE,
pp. 1185-1189.
[5] Hyoung-Seok Kim, Byung-Ryong Lee, Rak-Jin Kim.
Development of Computer-visionbased Pipe Inspection system.
2006, IEEE, pp. 403-406.
[6] Toal, Jonathan Horgan & Daniel. Review of Machine Vision
Applications in unmanned underwater vehicles. 2006, IEEE, pp.
1-6.
[7] Jonathan Killing, Brian W. Surgenor, Chris K. Mechefske.
Robust Machine Vision Based Parts Inspection: Intelligent
Neuro-Fuzzy versus Threshold Based. 2007, IEEE, pp. 1-9.
[8] Jia, Jiancheng. A Machine Vision Application for Industrial
Assembly Inspection. 2009, IEEE, pp. 172-176.
[9] Heyer, Clint. Human-Robot Interaction and Future Industrial
Robotics and Application. 2010, IEEE, pp. 18-22.

National Conference On “Recent Innovations in Engineering, Science and Technology” April 2019
63
Analysis of Weld Strength for Pressure Vessel
Chetan Kukawalkar1, Abdallah Madaoo2, Danish Ansari 3, Prashant Bharti4, Prof. Prakash Sutar5
[email protected], [email protected], [email protected], [email protected], [email protected]
Department of Mechanical Engineering
Sandip Institute of Engineering & Management
Abstract— A pressure vessel defined as a container. The inside
pressure is usually higher than the outside. Pressure vessels
often have a combination of high pressures together with
high temperatures, and in some cases flammable fluids or
highly radioactive materials. Because of such hazards it is
imperative that the design be such that no leakage can occur. In the
present work, the pressure vessel nozzle has been analysed for cases
of loading. In this case a welded area of the nozzle region is
considered to find the strength .Initially the welded model is built
using shell approach and thickness is assigned as real properties,
nozzles are built as per the drawing and analysis is carried out for
all major nozzles as per the load specifications for the problem.
The nozzle regions are fine meshed to obtain accurate results as
the solution accuracy depends on the finer size of the mesh. The
results for equivalent stress are captured due to the ductile nature
of the pressure vessel system. The stresses are concentrated near the
nozzle opening regions as per the observation.
Keywords— finite element analysis, pressure vessel nozzle,
weld strength
I. INTRODUCTION
A pressure vessel is a container designed to hold gases or
liquids at a pressure substantially different from the
ambient pressure. Pressure vessels accidents can be
dangerous and fatal have occurred in the history of their
development and operation. Consequently pressure vessel
design, manufacture, and operation are regulated
by engineering authorities backed by legislation. Design
involves parameters such as maximum safe
operating pressure and temperature, factor of safety,
corrosion allowance and minimum design temperature
(for brittle fracture). Pressure Vessel Related
Accidents Below is some examples of major accidents
involving pressure vessels that have occurred in the past
few years: A pressure vessel weighing 22680 kg
(50,000 pounds) exploded at Marcus Oil in 2004, a
Chemical plant in Houston, Texas, throwing heavy
fragments into the community, which damaged a church,
shattered car windows, nearby buildings experienced
significant structural and interior damage due to
improper modification and faulty welds of the vessel.
The Buncefield (UK‟s fifth largest depot) accident
on Sunday 12 December 2005 that injured 43 people
readily comes to the mind. Twenty petrol tanks were
involved in he Buncefield blaze rage; each held three
million gallons of fuel. Over 2,000 people were
evacuated from the neighbourhood of the depot during
the accident.
Pressure vessel failure in Houston, United States,
in the summer of 2008 killed a veteran supervisor when
a heat exchanger exploded in a resin-production facility.
Two employees killed at an oil refinery in southeast
New Mexico, USA and two others critically injured
after a storage tank exploded into flames on 03 March
2010.Nozzles or opening are necessary in the pressure
vessels to satisfy certain requirements such as inlet or
outlet connection, manholes, vents & drains etc. If
geometrical parameters of nozzle connections
significantly vary even in one pressure vessel,
nozzles cause geometric discontinuity of the vessel
wall. Therefore a stress concentration is created around
the opening and junction may fail due to these high

National Conference On “Recent Innovations in Engineering, Science and Technology” April 2019
64
stresses. It is well known that high residual stresses
occur after any welding process due to the high thermal
gradient and mechanical history at the heat affected
zone during the welding
process. These residual stresses, especially the tensile stresses, have
a significant effect on the material strength, fatigue strength and
resistance to corrosion cracking. For this reason, it is important that
some knowledge of the internal stress state be deduced either from
measurements or from modeling predictions. However, prediction
of distortions remains difficult, as it requires simulations, which
take accurate account of the constraining conditions induced by the
weld bead. Moreover, the problem is far more difficult when
considering multi-pass welding. Indeed, computation of residual
stresses and distortions induced by these processes, using the usual
finite element method, requires very a refined mesh to correctly
describe the properties and stress gradients in the heat-affected
zone along the path of the weld. Butt welding is a welding
technique used to connect parts which are nearly parallel and don't
overlap. It can be used to run a processing machine continuously, as
opposed to having to restart such machine with a new supply of
metals. Butt-welding is an economical and reliable way of joining
without using additional components. Usually, a butt-welding joint
is made by gradually heating up the two weld ends with a weld
plate and then joining them under a specific pressure. This process
is very suitable for prefabrication and producing special fittings.
Afterward, the material is usually ground down to a smooth finish
and either sent on its way to the processing machine, or sold as a
completed product. This type of weld is usually accomplished
with an arc or MIG welder. It can also be accomplished by
brazing. With arc welding, after the butt weld is complete, the
weld itself needs to be struck with a hammer forge to remove slag (a
type of waste material) before any subsequent welds can be applied.
This is not necessary for MIG welds however, as a protective gas
removes any need for slag to appear. Another with a MIG welder is
that a continuous copper coated wire is fed onto the stock, making
the weld virtually inexhaustible Fillet welding notation is important
to recognize when reading blueprints. The use of this notation
tells the welder exactly what is expected from the
manufacturer.
II. LITERATURE REVIEW
V. Anand Rao (2014) et al, aims at the analysis and optimization of
joining similar grades of stainless steel by TIG welding. The
parameters like current, filler materials, welding speed are the
variables in the study. The mechanical properties and
microstructure of 310austenitic stainless steel welds are
investigated, by using stainless steel filler material of different
grades. Higher tensile strength was achieved with a current 120A
and 309L filler rod and also the weld has fewer defect.
Experiments were carried out with
accuracy in order to keep the error minimum and determine
the results appropriately. The results are prone to deviations due
to some uncontrolled conditions, but are not taken into
consideration during this work. Welding current 120A and
electrode 309L has produced greater tensile strength of
454.6MPa while a welding current 80A and electrode 316L has
produced minimum tensile strength of 51.79MPa for the
specimen studied. In bend test the welding current with 120A and
electrode 316L has produced maximum bending strength of
646.55MPa while the same welding current with electrode 347
has produced minimum bending strength of211.37MPa for the
specimen studied. The filler material 309L has produced better
tensile and bending strength. The ultrasonic test results showed
defects of penetration, but in general results indicate that the defect
does not create much impact. Microstructure images show that
309L has prominent second phase formation because of varying
chromium percentage retarded transformation and uncontrolled
heat input. [1] A. R. Deshmukh (2014) et al, present work shows
the effect of weld penetration levels on the stress level and the
fatigue life at the weld joints. Finite element analysis was used to
estimate stress pattern of welded joints having different levels of
penetration for ―Bend Loading‖ and ―Tensile loading‖ were
selected for studies. Specimens with variation in the penetrated
throat length between 1.80mm to 0.60 mm were selected. Study
has clearly highlighted the corresponding fluctuations observed in
the fatigue life with change in weld penetrations. A side loading
will be more detrimental than a tensile loading. Theoretically, an
empirical formula cannot be generated for accurately defining
depth of the penetration required at the various locations for the
targeted fatigue life. However, the above study has clearly
highlighted the corresponding fluctuations observed in the
fatigue life with change in weld penetrations. It is observed that the
lack of penetration allows a natural stress riser from which a
crack may propagate. Measures should be taken to ensure that the
weld attains sufficient penetration. Another conclusion which is
evident from this study is detrimental effect of type of loading. [2]

National Conference On “Recent Innovations in Engineering, Science and Technology” April 2019
65
R. K. Kesharwani (2014) et al, presents multi objective
optimization of parameters affecting weld quality in tailored friction
stir butt welding of 2.0mm thin dissimilar sheets of AA5052-H32
and AA5754-H22 using Taguchi grey based approach. The L9
orthogonal array has been used to design the experiments, and the
experiments have been conducted in a laboratory stage vertical
milling machine by varying tool rotational speed, worktable
translational speed, tool shoulder diameter and tool pin geometry.
After welding, the weld strength and percentage elongations have
been evaluated using uniaxial tensile test. Based on the
experimental data, empirical
relations among the parameters correspond to each output feature
has been developed using simple regression method. Optimum
levels of parameters have been identified using grey relation
grade. The analysis presents effect of tool rotational speed,
worktable translational speed, tool shoulder diameter and tool pin
geometry on weld quality. Based on the analysis following
conclusions can be made. According to applied grey based
approach, 1800 rpm of tool rotational speed, 50 mm/min work table
translational speed, 20 mm of tool shoulder diameter and square
pin geometry are the optimum parameters for fabrication of
AA5052-H32 and AA5754-H22 dissimilar 2.0 mm thin tailored
friction stir butt welded blanks. FSW using 1800 rpm of tool
rotational speed, 50 mm/min of worktable translational speed, 20
mm of tool shoulder diameter and square tool pin geometry gives
maximum weld strength (UTS = 175 MPa, approx.) and
maximum % elongation (13.854, approx.). Location of fracture in
uniaxial tensile test of the welded sample using optimized
parameters is at TMAZ, which confirms relatively higher strength of
the weld NZ. [3] Mohammed Asif. M (2015) et al, says that
Solid state joining techniques are increasingly employed in joining
duplex stainless steel materials due to their high integrity.
Continuous drive friction welding is a solid state welding
technique which is used to join similar and dissimilar materials.
This joining technique is characterized by short cycle time, low heat
input and narrow heat affected zones. The simulation becomes an
important tool in friction welding because of short welding cycle. In
the present work, a three dimensional non-linear finite element
model was developed. The thermal history and axial shortening
profiles were predicted using ANSYS, a software tool. This
numerical model was validated using experimental results. The
results show that the frictional heating stage of the process has more
influence on temperature and upsetting stage has more impact on
axial shortening. The knowledge of these parameters would lead to
optimization of input parameters and improvement of design and
machine tools. Continuous drive friction welding of duplex stainless
steel was simulated using 3D non-linear finite element model
developed in ANSYS. The thermal history and axial shortening
were studied using experimental and numerical results. The
following conclusions were drawn from the study. The simulation
results of temperature distributions, peak temperatures and axial
shortening showed a fair agreement with actual experimental results.
Online temperature measurement was done using infrared
thermometer. It was found that the highest temperature rise occurred
during frictional heating stage. The peak temperatures are
much below the melting point of the material. A large amount of
axial shortening is obtained in the upsetting stage as compared to
heating
stage due to high temperature forging of the material. From the
metallurgical characterization, it is confirmed that no intermetallic
phases are formed after welding. The thermal effects are dominant
as compared to mechanical worked effect. This was confirmed from
the hardness measurements. [4] P. Schumann (2013) et al, states
Multi- wire submerged arc welding (SAW) process is
conventionally used for long welds with large cross sections in
tubular steel tower manufacturing. By applying non-vacuum
electron beam welding (NVEBW), the number of passes and the
heat input can be notably reduced. For plate thicknesses of 20
mm or more the continuous appearance of solidification cracks
inside the weld cross section rouse a great challenge. The fatigue
resistance is reduced significantly and the safety of the
component cannot be ensured. In this paper analytical and
experimental investigations are discussed for predicting fatigue life
of defective welds. [5] P. Mithilesh (2014) et al, investigates the
weld ability, metallurgical and mechanical properties of the
dissimilar joints of Inconel 625 and AISI 304.Dissimilar joints were
obtained by gas tungsten arc welding process employing
ERNiCrMo-3. Tensile fracture occurred at the parent metal of
AISI
304 in all the trials. The structure-property relationships on
these dissimilar weldments were evaluated using the combined
techniques of optical microscopy and SEM /EDAX techniques. The
typical filler metal ERNiCrMo-3 was used to obtain dissimilar
Inconel 625/304 austenitic stainless joint using the gas tungsten arc
welding process. The following conclusions can be drawn from the
results. Successful weldments of Inconel 625 and AISI 304 could

National Conference On “Recent Innovations in Engineering, Science and Technology” April 2019
66
be obtained by the GTA welding process employing ERNiCrMo-3.
The weld microstructure was fully austenitic; Segregation effects
have been witnessed at the interface of AISI304. Hot cracking
tendency was totally avoided on using Mo rich filler wire and the
lower heat input employed in the GTA welding. In all the trials of
tension tests, the GTA weldments undergo ductile fracture with
considerable amounts of plastic deformation. [6] John A. Francis
(2014) et al, SA508 steels are typically used in civil nuclear
reactors for critical components such as the reactor pressure
vessel. Nuclear components are commonly joined using arc
welding processes, but with design lives for prospective new build
projects exceeding 60 years, new welding technologies are being
sought. In this exploratory study, for the first time, autogenous laser
welding was carried out on 6 mm thick SA508
Cl.3 steel sheets using a 16 kW fibre laser system operating at
a power of 4 kW. The microstructure and mechanical properties
(including micro hardness, tensile strength, elongation, and Charpy
impact toughness) were characterized and the microstructures were
compared with those produced through arc welding. A
three-
dimensional transient model based on a moving volumetric
heat source model was also developed to simulate the laser
welding thermal cycles in order to estimate the cooling rates
included by the process. Preliminary results suggest that the laser
welding process can produce welds that are free of macroscopic
defects, while the strength and toughness of the laser welded joint
in this study matched the values that were obtained for the parent
material in the as-welded condition. The conclusions can be drawn
from this work are, the laser welding process produced welds with
acceptable weld profiles in 6 mm thick SA508 steel plates over a
relatively wide range of welding parameters. The welds were free of
macroscopic defects. In the as- welded condition, the mechanical
performance of the laser weld in a 6 mm thick SA508 steel plate
was similar to the performance of an autogenous GTA weld. Cross-
weld tensile specimens fractured in the parent material away from
the weld region. The absorbed energies of the fusion zone in the
laser weld were found to be comparable to those of the parent
material, based on sub-size Charpy specimens. The hardness in
the fusion zone and HAZ for both the laser and GTA welded
samples, in the as-welded condition, was approximately double
that of the base material, with the measured values for the laser
weld being slightly higher (430 HV0.3) than those for the GTA
weld (410 HV0.3). FEM modelling established that the cooling
rates during laser welding in the absence of preheat were between
20 and
40 times higher than the critical cooling rate for martensite
formation. This suggests that martensitic microstructures will
almost always form in SA508 steel as a consequence of laser
welding. These findings were confirmed in experimental work,
in which the as- welded microstructures in the fusion zone and
HAZ of the laser welded joint were found to comprise
martensite mixed with some self-tempered martensite. While these
preliminary results are encouraging, further work is now required to
assess the properties of laser welds in SA508 steel in the post-
weld heat treated condition, and it is also essential that this work is
extended to assess the performance of laser welded joints in thicker
sections of material. [7] Raghuram Karthik Desu (2016) et al,
Austenitic Stainless Steel grade
304L and 316L are very important alloys used in various high
temperature applications, which make it important to study their
mechanical properties at elevated temperatures. In this work, the
mechanical properties such as ultimate tensile strength (UTS), yield
strength (YS), % elongation, strain hardening exponent (n) and
strength coefficient (K) are evaluated based on the experimental
data obtained from the uniaxial isothermal tensile tests performed at
an interval of 50 C from 50 C to 650 C and at three different
strain rates (0.0001, 0.001 and 0.01 s−1). Artificial Neural
Networks (ANN)
are trained to predict these mechanical properties. The trained ANN
model gives an excellent correlation coefficient and the error
values are also significantly low, which represents a good accuracy
of the model. The accuracy of the developed ANN model also
conforms to the results of mean paired t-test, F-test and
Levene‘s test. In this work, the mechanical properties, viz., UTS,
YS, % elongation, n and K for ASS 304L and ASS 316L are
evaluated based on the experimental data obtained from uniaxial
isothermal tensile tests. To predict these properties at any unknown
temperature and strain rate, feed forward back propagation ANN
models have been developed.
85% of the data is used to train the ANN model and 15% data is
used for testing it. Based on the machine learning techniques,
the best ANN architecture is found to be [2-6-5] for ASS 304L
and [2-17-5] for ASS 316L. The ANN model accuracy is validated
based on the statistical parameters such as correlation coefficient,
average absolute error and its standard deviation. The results of
these statistical parameters indicate the highly accurate predictions

National Conference On “Recent Innovations in Engineering, Science and Technology” April 2019
67
Material
Min
Tensile
Strength
(MPa)
Min
Yield
Strength
(MPa)
Strength
at Design
Temp
(MPa)
Strength
at
Working
Temp
(MPa)
Young’s
Modulus
(GPa)
SA 304L 485 170 110 110 200
SA-508 550 345 158 158 205.77275
SA-533 620 485 259 259 210
Nozzle
Fx
Fy
Fz
Mx
My
Mz
1000
666.667
866.667
200000
166700
181200
of ANN models. The goodness of fit of these models is also verified
by conducting the hypothesis testing using mean paired t-test, F-test
and Levene‘s test. Finite element (FE) analysis in simulating the
various processes, like drawing requires the mechanical properties at
various temperatures. The current practice in FE simulations is to
feed the values of these mechanical properties manually at different
temperatures. [8]
III. METHODOLOGY
A. Specification of Nozzle
Outside Diameter of Nozzle= 89mm
Inside Diameter of Nozzle = 84.8mm
Flange Diameter = 210mm
Thickness of Flange = 31mm
Thickness of Nozzle = 2mm
B. Selection of Materials for Pressure
Vessels
1. SA508 Steel
The life span and safe operation of the pressure vessel (PV), which
is one of most critical components in nuclear power plant, depends
on durability of the PV materials in high temperature, high pressure
and radioactive environments. The need for materials with
higher strength, toughness and resistance to irradiation
embrittlement is rising due to increases in the power
generation capacity and the design lives of nuclear power plants.
SA508 steel grades have been used in the manufacture of many
PV's for pressurized water reactors because they offer the
combination of strength, good ductility,
fracture toughness, homogeneity with respect to mechanical
properties, and they are economic.
2. SA 533
SA533 low-alloy steel is the material mainly used for the pressure
vessels (PV) of nuclear power plants. This is mainly focused on the
effects of strain amplitude, dissolved oxygen content in feed
water and fatigue frequency on the low-cycle fatigue (LCF)
behavior of SA533 pressure vessel steel in a high temperature,
high pressure water environment. The test results show the fatigue
life is significantly decreased with increasing the strain amplitude.
From the observations, it can be inferred that the fatigue-corrosion
interaction plays a significant role in determining the fatigue life of
SA533 PV steel.
3. Properties of SA 533 and SA 508
The demands placed on pressure vessel (PV) steels are severe. They
must be manufactured in required sizes and thicknesses, be of
sufficient strength and toughness, show little deterioration
under irradiation, allow the production of high quality welds and be
compatible with the cladding. SA533 and SA508 and similar grade
steels have become well established. Both grades are of the vacuum
treated, quenched and tempered type of 600 N/mm strength class.
The specific requirements for PV steels are to give, even to large
size component materials of PVs, higher values of the
following properties:- Uniformity and isotropy of mechanical
properties, including less mass effect in the mid-section
- High fracture toughness
-Lessinternal efects
-Good eldability
-Resistivity to neutron irradiation brittlement
Some further items were added during the past two decades
primarily for the purpose of easier execution of non-destructive
examinations both pre-service and in-service. These are:
- Fewer weld seams in PV
- Larger and more integral design of component materials
The requirements have been steadily realized. With respect to
the weld, improvements have been made by adequate selection of
flux in combination with requirements on the chemical composition
of the weld wire, welding parameters such as weld bead size and
sequence to minimize the coarse grained areas in the heat affected
zone (HAZ).Table 1 Properties of Material
C. Boundary Condition According To Design
Table 2 Design & Working Conditions
D. 3D Model of Nozzle
kg/cm) Table 3 Force and Moment on Nozzle

National Conference On “Recent Innovations in Engineering, Science and Technology” April 2019
68
E. Design of Experiment
IV. RESULT AND ANALYSIS
A. Nozzle Analysis:
For SA 304L Material:
Stress at welded region of nozzle:
Figure. Equivalent Stress
For Material SA 508:
Stress at welded region of nozzle:
Figure. Equivalent Stress
For SA 533
Material:
Stress at welded region
of nozzle:
Figure. Equivalent Stress
Result Table:
For Nozzle
Sr.
No.
Material
Equivalent
Stress
(MPa)
Total
Deformation
(mm)
Total Strain
1
SA 304L
280.12
0.70165
0.0014093
2
SA 508
280.12
0.682
0.0013699
3 SA 533 279.69 0.66541 0.0013506
From the analysis of nozzle we came to know that
the maximum stress developed is in material SA 304L.
SA 533 has the minimum induction of stress as

National Conference On “Recent Innovations in Engineering, Science and Technology” April 2019
69
Material
Min
Tensile
Strength
(MPa)
Min
Yield
Strength
(MPa)
Strength at Design
Temp (MPa)
Strength
at
Working
Temp
(MPa)
Yougs
Modulus
(GPa)
SA 304L 485 170 110 110 200
SA-508 550 345 158 158 205.77275
SA-533 620 485 259 259 210
Ratio Yield/Ultimate 0.7822581 Spl 388.5
Ratio greater than 0.7
compare to other materials. Total deformation induced is
o.6654 mm which is least among the materials. SA 508 has
less stress induction than SA 304L but have
comparativelyhigherstress and deformation than SA 533. We
conclude Nozzle is safe for
SA 533
B. Finite Element Analysis of the Nozzle with Shell base using the
recommended material
C. Find optimized result from FEA and recommend the material
Calculations of Safe Stress
temperature is less than 0.7, else allowed stress has to be "3xSavg
only"
*
Stress At Min Operating Temp 259 MPa
Stress At Max Operating Temp 259 MPa
Savg 259 Mpa
Sps = 777 MPa
Various Stresses associated with Analysis
Where, SPL = 1.5*S or Sy (1.5*S shall be used when the ratio of the
minimum specified yield strength to ultimate tensile strength exceeds
0.70)
4.5.2 Stress Analysis Calculations
SPS Calculation
1. The allowable stress for Induced Primary+Secondary stresses as "3
x average of stresses allowed at minimum (38°C) and at maximum
(Input design temperature)"
2. The limitation of use of 2xYield avg (Yield Average is average
of maximum & minimum operating temperature of material Yield
limit) is when ratio of min yield strength and ultimate strength
at room

National Conference On “Recent Innovations in Engineering, Science and Technology” April 2019
70
Stress comparisons are made as per ASME Sect VIII, Div. 2, and
Figure 5.1
PL + Pb + Q is compared with SPS. (According to ASME Sect
VIII, Div. 2, Annex 5-F.3.10)
PLiscomparedwithSPL.
•Stress induced in channel will be compared with the yield
limit of material. Where,
• S = allowable stress limit for material
• SPL = 1.5*S or Sy (1.5*S shall be used when the
ratio of the minimum specified yield strength to
ultimate tensile strength exceeds 0.70)
• Sps = allowable stress for primary and secondary
stresses
(ASME Sect VIII, Div. 2, Part 5.5.6.1.d)
PL + Pb + Q
314.067
Less Than Sps
Safe
PL
133.44
Less Than Spl
Safe
V. CONCLUSION
This Project includes the analysis of the stress state in the
cylindrical shells of pressure vessel with nozzles. Stress state has
been provoked by the load on the free end of the nozzle by the
torque moment. Formula for determination of tangential stress
which occurred as the consequence of the force couple action on
cross section consoles has been used. Based on the obtained
results of conducted regressive analysis, it can be concluded
that proposed procedure for determination of maximum stress
on the cylindrical shell near the nozzle loaded at the free end by
the torque moment, can be successfully applied in
technicalpractice. Maximum stresses as well as its value
appearing on the envelope near the nozzle, and which can be
determined by the method proposed in this article can be used as
the initial basis or further analyses which would include high cycle
fatigue, low cycle fatigue, and linear behavior material. It is
important to mention that the whole procedure of stress state
analysis is conducted for the structures made of carbon steel.
1) We have done investigating the joint with respect to fatigue
life with ASME and IIW standards.
2) Analyzing the model for critical location with the aid of FEA
tool is done
3) Found the variation of results with FEA and practical
approach to reduce the error using FEA.
REFERENCES
[1] V. Anand Rao, Dr. R. Deivanathan, ―Experimental Investigation For
Welding Aspects Of Stainless Steel 310 For The Process Of TIG Welding‖,
12th Global Congress On Manufacturing And Management, GCMM
2014, Pp. 902-908.
[2] A. R. Deshmukh, G. Venkatachalam, Hemant Divekar, M. R.
Saraf, ―Effect of Weld Penetration on Fatigue Life‖, 12th Global Congress
on Manufacturing and Management, GCMM 2014, pp. 783-789.
[3] R. K. Kesharwani, S. K. Panda, S. K. Pal, ―Multi Objective
Optimization of Friction Stir Welding Parameters for Joining of Two
Dissimilar Thin Aluminium Sheets‖, 3rd International Conference on
Materials Processing and Characterisation (ICMPC 2014), pp. 178-187.
[4] Mohammed Asif. M, Kulkarni Anup Shrikrishana, P. Sathiya, ―Finite
Element Modelling And Characterization Of Friction Welding On
UNS S31803 Duplex Stainless Steel Joints‖, Engineering Science and
Technology, an International Journal, June 2015, pp. 704-712.
[5] P. Schaumann, M. Collmann, ―Influence of Weld Defects on the Fatigue
Resistance of Thick Steel Plates‖, 5th Fatigue Design Conference, Fatigue
Design 2013, pp. 62-72.
[6] P. Mithilesh, D. Varun, Ajay Reddy Gopi Reddy, K. Devendranath
Ramkumar,
N.
Arivazhagan, S. Narayanan, ―Investigations on Dissimilar Weldments of
Inconel 625 and AISI 304‖, 7th International Conference on Materials for
Advanced Technologies 2014, pp. 66-70.
[7] Wei Guo, Shiyun Dong, Wei Guo, John A. Francis, Lin Li,
―Microstructure And Mechanical Characteristics Of A Laser Welded Joint
In SA508 Nuclear Pressure Vessel Steel‖, Materials Science &
Engineering, November 2014, pp. 65-80.
[8] Raghuram Karthik Desu, Hansoge Nitin Krishnamurthy, Aditya
Balu, Amit Kumar Gupta, Swadesh Kumar Singh, ―Mechanical Properties
Of Austenitic Stainless Steel304L And 316L At Elevated Temperatures‖
Journal of Materials Research and Technology, April 2015, pp. 1-8.

National Conference On “Recent Innovations in Engineering, Science and Technology” April 2019
71
WELD ANALYSIS OF DISSIMILAR GRADE
METALS USING FEA SOFTWARE Prof. Susheel S. Pote
1, Ankita Deore
2, Rushikesh Vyavahare
3, Rohan Sonawane
4, Pranavesh Patil
5
[email protected], [email protected], [email protected], [email protected],
Mechanical Department
Sandip Institute of Engineering & Management
Abstract— In this paper we are analyzing the cracks found on
wheel rim. The wheel rim should not fail during its working. The
wheel rim must withstand a various loading conditions to achieve
better performance and quality. The wheel rim is the main component
in the vehicle and has to meet all safety required for driver. Finite
element analysis of dissimilar metal joints are also analyzed and
compared with experimental work. Experiments are performed to
study about the, Tensile stresses and equivalent stresses found in
wheel rim. the wheel rim designer and producers use a number of
testsrotating bending test, radial fatigue test, and rim impact test to
insure it meets the standards. The wheel rim tests are time much
expensive and consumes lot of time. Computer simulation and Finite
Element analysis of these tests can reduce the time and cost required
to perform a wheel rim design at significant level. In this paper we
discussed the simulation and Finite Element Analysis of wheel rim
using Radial Fatigue test.
I. INTRODUCTION As we know, The modern age demands fast production of
structures. Hence welding is an efficient process where two
materials whether same or different composition are joint
together permanently. By considering design point of view
the strength and fatigue life are the main issue. Hence load
generated during the assembly may cause significant levels
of stress in the component. The main component of wheel is
rim and disc. Rim is part where tyre is installed. And disc is
part of the wheel rim where it is fixed to the axle hub of
vehicle. Offset is a distance between wheel mounting
surface where it is bolted to hub and the centerline of rim.
The flange is a part of rim, which holds the both beads of
the tyre. Bead seat comes in contact with the bead face and
is a part of rim, which holds the tyre in a radial direction.
An excellent weld is that which have adequate tensile
strength and ductility so that the joint which is formed to the
welding of materials will not fail.
Welding is a manufacturing process of creating a permanent
joint obtained by the fusion of the surface of the parts to be
joined together, with or without the application of pressure
and a filler material. The materials to be joined may be similar
or dissimilar to each other. The heat required for the fusion of
the material may be obtained by burning of gas or by an
electric arc. The latter method is more extensively used
because of greater welding speed. In order to reduce costs,
design for light-weight and limited-life is increasingly being
used for all vehicle components. In the actual product
development, the rotary fatigue test is used to detect the
strength and fatigue life of the wheel. Therefore, a reliable
design and test procedure is required to guarantee the service
strength under operational conditions and full functioning of
the wheel. Loads generated during the assembly may cause
significant levels of stress in components. Under test
conditions, these high levels of stress alter the mean stress level
which in turn, alters the fatigue life and critical stress area of
the components as well. The inclusion of clamp load improves
the prediction of the critical stress area and fatigue life of
aluminum wheels for a new wheel, the failure probability of the
dynamic radial fatigue test can be read directly from this
probability contour drawn from the test data. In dissimilar
welds, weldability is determined by crystal structure, atomic
diameter and compositional solubility of the parent metals in
the solid and liquid states. Diffusion in the weld pool often
results in the formation of intermetallic phases, the majority of
which are hard and brittle and are thus detrimental to the
mechanical strength and ductility of the joint. The thermal
expansion coefficient and thermal conductivity of the materials
being joined are different, which causes large misfit strains and
consequently the residual stresses result in cracking during
solidification. as a gear tooth or to repair a worn surface such as
a bearing surface.
Study of the mechanical properties of the weld is very
important because the main purpose of the welding is to
strongly join the two metals together as the application of the
welded structure may be at sensitive place. It is important to
check the tensile strength of the weld and the factors affecting
the strength of the weld. The major problem occurs with
dissimilar metal welds is formation of inter-metallic
compounds at the interface which affect the properties and
efficiency of the weld. In order to improve the strength of the
dissimilar metals weld intermediate layers at the interface can
be used. The trends of light weighting, higher performance and
increased functionality are some of the drivers for multi-
material, hybrid structures and the need for joining of
dissimilar materials. Different material properties are utilized to
achieve improvements not possible with a single material. This
paper has reviewed selected joining processes suitable for the
joining of dissimilar materials. Selection criteria, modelling and

National Conference On “Recent Innovations in Engineering, Science and Technology” April 2019
72
inspection/testing of joints have been discussed.
II. LITERATURESURVEY
Abid Ali Khan et al. (2018) studied that, welding process
can be performed on similar or dissimilar metals. Welding
of dissimilar metals involves different types of metals with
distinct chemical composition. The two dissimilar metals
involve in welding process have different mechanical
properties and microstructures which in turn may affect
welding parameters like weld current, hold time, weld force
etc. When a structure or component of a machine is build or
undergo any repair procedure this change in chemical
composition of metals get prominent. The difference in
chemical composition of metals may be due to several
factors such as age hardening, oxidation etc. The study of
mechanical properties of welding is important because
welded structure may be installed at highly sensitive and
risky place. Problem of formation of inter-mettalic
compound may arise which affect the weld quality. In this
paper a brief review has been given on the work done on
mechanical characterization, microstructure properties of
welded joints [1].
Study of the mechanical properties of the weld is very
important because the main purpose of the welding is to
strongly join the two metals together as the application of
the welded structure may be at sensitive place. It is
important to check the tensile strength of the weld and the
factors affecting the strength of the weld. The major
problem occurs with dissimilar metal welds is formation of
inter-metallic compounds at the interface which affect the
properties and efficiency of the weld. In order to improve
the strength of the dissimilar metals weld intermediate
layers at the interface can be used [1]. K.Martinsen et
al.(2015) says that, Emerging trends in manufacturing such
as light weighting, increased performance and functionality
increases the use of metamaterial, hybrid structures and thus
the need for joining of dissimilar materials. The properties
of the different materials are jointly utilised to achieve
product performance. The joining processes can, on the
other hand be challenging due to thesame different
properties. This paper reviews and summarizes state of the
art research in joining dissimilar materials. Current and
emerging joining technologies are reviewed according to
the mechanisms of joint formation, i.e.; mechanical,
chemical, thermal, or hybrid processes. Methods for process
selection are described and future challenges for research on
joining dissimilar materials are summarized [2]. The trends
of light weighting, higher performance and increased
functionality are some of the drivers for multi-material,
hybrid structures and the need for joining of dissimilar
materials. Different material properties are utilized to
achieve improvements not possible with a single material.
This paper has reviewed selected joining processes suitable
for the joining of dissimilar materials. Selection criteria,
modelling and inspection/testing of joints have been
discussed. There are, however still many challenges to be
solved and need for further research. The authors wish by
this paper to contribute to closer collaboration between the
manufacturing research and joining research communities,
and to raise the awareness of the importance of innovations
in this area [2]. Mr. Kapil Banker et al. (2014) studied
that, welding of dissimilar metals has attracted attention of
the researchers worldwide, owing to its many advantages
and challenges. There is no denial in the fact that dissimilar
welded joints offer more flexibility in the design and
production of the commercial and industrial components.
Many welding techniques have been analyzed to join
dissimilar metal
combinations. The objective of this paper is to review two
such techniques – Laser welding and Friction stir welding.
Laser beam welding, a high power density and low energy-
input process, employs a laser beam to produce welds of
dissimilar materials [3].
Friction Stir welding and Laser beam welding processes are
widely used for the welding of dissimilar metals and alloys.
Significant parameters in LBW are power of the laser
source, welding/scanning speed, beam spot diameter and
the focal length from the workpieces. The clamping of the
workpieces is also considered important [3].
Paul Kah et al. (2014) studied that, the welding of
dissimilar materials finds a wide variety of applications in
the fields of industrial construction and manufacturing,
where the characteristic the combination of steel and
aluminum alloy has been increasing in fabricating vehicles
features of the different materials are optimized for the
desired application to result in cost effectiveness and value
addition. Non-fusion welding methods such as solid state
welding and high energy beam welding are more popular
for welding dissimilar metal combinations, due to fewer
complications, than fusion welding, which melts the base
metal and forms brittle intermetallic compounds (IMCs)
that may lead to failure. Various factors have to be
considered when assessing the feasibility of welding
dissimilar metals and producing a sound weld joint. This
paper presents a broad classification of the most commonly

National Conference On “Recent Innovations in Engineering, Science and Technology” April 2019
73
used welding processes for dissimilar materials, discusses
some of the commonly used welding processes with
examples of some common material combinations, critical
factors for good welding, and practical difficulties arising
from the physical and chemical properties of materials.
From the findings, it can be inferred that continuous
improvement and research is still required in the field of
dissimilar metal welding, particularly in the light of
increasing demand for tailored material for modern
engineering and industrial applications [4]. The desire to
integrate the various beneficial properties of different
materials for the purposes of cost and weight reduction,
improved resistance to high temperatures and corrosive
environmental conditions, and better abrasive resistance
resulting from a need for longevity in machine components
has created a necessity to join dissimilar materials. Various
joining methods such as welding, brazing, mechanical
riveting, and soldering are used for joining dissimilar
materials. Of the various welding methods available,
methods that involve the least amount of melting, with only
one of the metals turning into a liquid, minimum
intermixing of dissimilar materials and reduced formation
of IMC are to be favored in the welding of dissimilar
materials [4].Raimo Suoranta et al. (2013) studied that,
Techniques for joining lightweight dissimilar materials,
particularly metals and polymers, are becoming
increasingly important in the manufacturing of hybrid
structures and components for engineering applications.
The recent drive towards lightweight construction in the
aerospace and automotive industries has led to increased
exploitation of lightweight metallic and non-metallic
materials with the aim of achieving specifically optimized
versatility. Hence, suitable joining methods are necessary in
order to reliably join these dissimilar materials and to
integrate them in engineering structures. Understanding of
the various joining technologies that exist for multi-material
metal-to-metal, polymer-to polymer, and metal-to-polymer
hybrid structures is consequently important. The objective
of this current study is to examine and summarize
information and results from previous research and
investigations on techniques for joining dissimilar
materials. The findings presented serve to further
understanding of the various joining techniques available
and optimization of processes for metal-to-metal, polymer-
to polymer and metal to-polymer hybrid joints [5]. This
paper discussed joining methods for metal-to metal,
polymer-to-polymer and metal-to-polymer hybrid
components. Different joining techniques were presented
and their advantages and disadvantages examined, along
with adaptations of the processes. Mechanical joining
guarantees a reliable joint and high joint resistance when
joining metal and polymer, typically with rivet joining.
However, the process has limitations due to poor flexibility
in terms of joint design, since the joint shape and position is
usually fixed mechanically, and the production rate is
therefore relatively slow. Adhesive joining techniques are
undoubtedly the most used process for joining plastic to
metal [5].
III.METHODOLOGY
1. Selection of material: Material selection is the step in the
process of designing any physical object in context of
product design, the main goal of material selection is to
minimize cost while meeting product performance goals. The
materials selected are C1008 and C1010 and their properties
are as follows:
i. Chemical properties: -
Elements C1008 C1010
Carbon, C 0.10% Max 0.08-0.13%
Manganese, Mn 0.30-0.50% 0.30-0.60%
Sulfur, S 0.050% 0.050%
Phosphorous, P 0.040% 0.040%
Table no. 1. Chemical properties of materials
START
Selection of material
Design of experiment
Finite element analysis according to design of experiment
Deciding the optimize level
FINISH

National Conference On “Recent Innovations in Engineering, Science and Technology” April 2019
74
ii.Mechanical properties: -
Properties C1008 C1010
Tensile strength 340 Mpa 365 Mpa
Yield strength 285 Mpa 305 Mpa
Elongation 20% 20%
Reduction in area 45% 40%
Brinell Hardness 95% 105%
Table no. 2. Mechanical properties of materials
2.Design of Experiment: - The welding parameters for
C1008 and C1010 are as follows
3. Finite Element Analysis according to design of
experiment:
The practical experimentation is analyzed on the design
software ANSYS. In this the stresses and deformation are
calculated on the basis of same chemical and mechanical
properties of the materials selected with same dimension.
4. Deciding the optimize level:
The two cases are analyzed for two filler materials i.e. C1008
and C1010. In first case the filler material is C1008 and in
second case the filler material is C1010.
IV. FINITE ELEMENT ANALYSIS
Finite element analysis has been done in the case of this
welding to predict stresses and the location where failure is
most likely to occur.Analysis by using a finite number of
elements is the latest method to analyze complicated shapes.
Using simple analytical methods analysis of simple structures
is done. But to analyze more and more complicated
structures, we need to approximate the analytical methods and
do various combinations of simple shapes to get the results of
the machine member. This method is not accurate, and the
errors in the analysis increase at every step. The entire
continuum is divided into discrete elements. Analysis is
performed on each element. This method is more accurate and
gives good result. The process of solving design problems by
using finite element methods is a tedious and confusing
process, but the results are very much accurate. Analysis
Process The analysis
process consists of designing, modeling and analysis.
The finite element analysis is done on wheel rim having
40% weld length and the material for rim, disc and weld is
C1008, C1010 and C1010 respectively.
Fig 1. Equivalent stress for experiment 1(40-1)
Fig 2. Maximum shear stress for experiment 1(40-1)
Sr.No Rim Disc Weld
40% 1 C1008 C1010 C1010
2 C1008 C1008 C1008
50% 1 C1008 C1010 C1010
2 C1008 C1008 C1008
100% 1 C1008 C1010 C1010
2 C1008 C1008 C1008
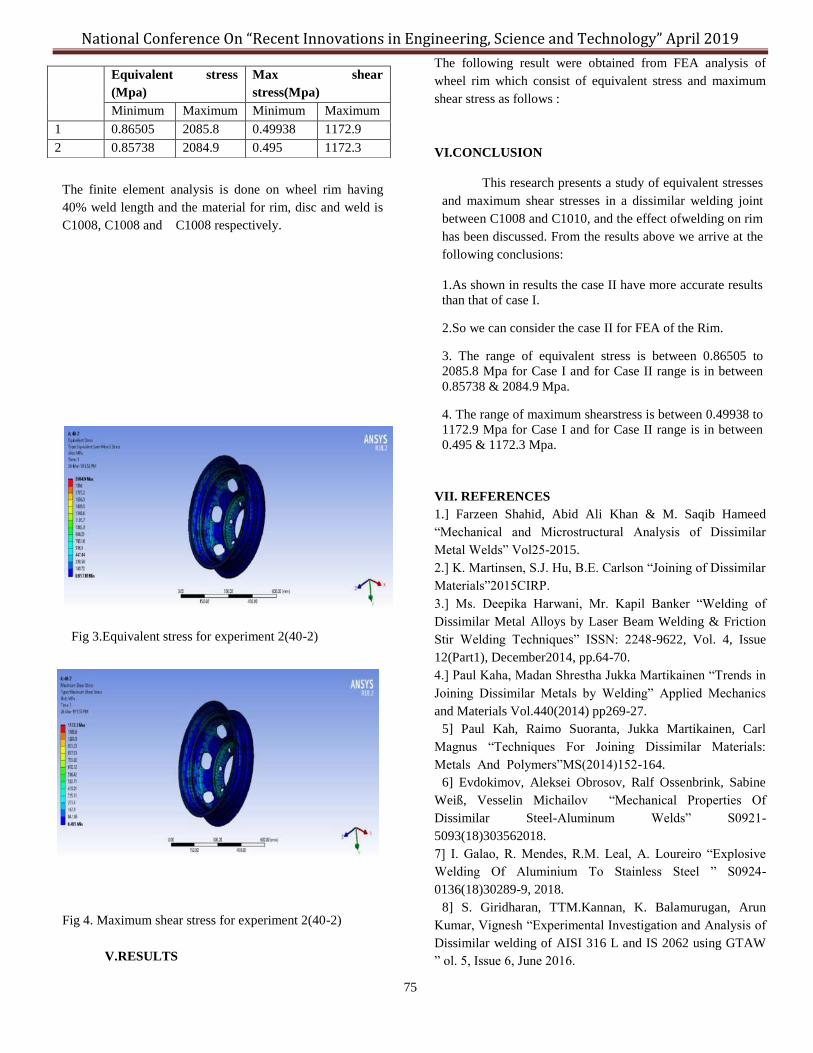
National Conference On “Recent Innovations in Engineering, Science and Technology” April 2019
75
The finite element analysis is done on wheel rim having
40% weld length and the material for rim, disc and weld is
C1008, C1008 and C1008 respectively.
Fig 3.Equivalent stress for experiment 2(40-2)
Fig 4. Maximum shear stress for experiment 2(40-2)
V.RESULTS
The following result were obtained from FEA analysis of
wheel rim which consist of equivalent stress and maximum
shear stress as follows :
VI.CONCLUSION
This research presents a study of equivalent stresses
and maximum shear stresses in a dissimilar welding joint
between C1008 and C1010, and the effect ofwelding on rim
has been discussed. From the results above we arrive at the
following conclusions:
1.As shown in results the case II have more accurate results
than that of case I.
2.So we can consider the case II for FEA of the Rim.
3. The range of equivalent stress is between 0.86505 to
2085.8 Mpa for Case I and for Case II range is in between
0.85738 & 2084.9 Mpa.
4. The range of maximum shearstress is between 0.49938 to
1172.9 Mpa for Case I and for Case II range is in between
0.495 & 1172.3 Mpa.
VII. REFERENCES
1.] Farzeen Shahid, Abid Ali Khan & M. Saqib Hameed
―Mechanical and Microstructural Analysis of Dissimilar
Metal Welds‖ Vol25-2015.
2.] K. Martinsen, S.J. Hu, B.E. Carlson ―Joining of Dissimilar
Materials‖2015CIRP.
3.] Ms. Deepika Harwani, Mr. Kapil Banker ―Welding of
Dissimilar Metal Alloys by Laser Beam Welding & Friction
Stir Welding Techniques‖ ISSN: 2248-9622, Vol. 4, Issue
12(Part1), December2014, pp.64-70.
4.] Paul Kaha, Madan Shrestha Jukka Martikainen ―Trends in
Joining Dissimilar Metals by Welding‖ Applied Mechanics
and Materials Vol.440(2014) pp269-27.
5] Paul Kah, Raimo Suoranta, Jukka Martikainen, Carl
Magnus ―Techniques For Joining Dissimilar Materials:
Metals And Polymers‖MS(2014)152-164.
6] Evdokimov, Aleksei Obrosov, Ralf Ossenbrink, Sabine
Weiß, Vesselin Michailov ―Mechanical Properties Of
Dissimilar Steel-Aluminum Welds‖ S0921-
5093(18)303562018.
7] I. Galao, R. Mendes, R.M. Leal, A. Loureiro ―Explosive
Welding Of Aluminium To Stainless Steel ‖ S0924-
0136(18)30289-9, 2018.
8] S. Giridharan, TTM.Kannan, K. Balamurugan, Arun
Kumar, Vignesh ―Experimental Investigation and Analysis of
Dissimilar welding of AISI 316 L and IS 2062 using GTAW
‖ ol. 5, Issue 6, June 2016.
Fig No
Equivalent stress
(Mpa)
Max shear
stress(Mpa)
Minimum Maximum Minimum Maximum
1 0.86505 2085.8 0.49938 1172.9
2 0.85738 2084.9 0.495 1172.3

National Conference On “Recent Innovations in Engineering, Science and Technology” April 2019
76
Design and Fabrication of Energy Efficient Treadmill
Prof. S. J. Chede1, Gaurav Shirsat
2, Sanket Thakur
3, Akshay Kadam
4, Siddhesh Thakare
5,
[email protected],[email protected], [email protected], [email protected],
Mechanical Department
Sandip Institute of Engineering and
Managemant .
Abstract— The current scenario in transportation is, we use
vehicles that run on fossil fuels. Fossil fuels are non-renewable
energy sources. The continuous use of these fossil fuels results in
their depletion. These fuels are responsible for polluting the
environment by emitting gases like carbon byproducts and nitrates
which are responsible for global warming. So now it is a high time
to come up with a new way to counter these issues. Electrical
vehicle is one the solution to the scarcity of fossil fuels. These
vehicles run on electrical energy supplied by a DC battery. Its initial
cost is high but has low running cost as compared to conventional IC
engine vehicles. Today‘s busy and fast like causes a huge toll on a
person‘s life. People find very little time for exercising in their daily
schedule. Also, the combined effects of an unhealthy diet and fast
food causes serious issues like obesity, heart diseases etc. exercises
are advised for health promotion and prophylaxis for many
cardiovascular diseases.
The mobile treadmill is a new way of moving which is designed for
exercising and it is also an eco-friendly mode of transportation. This
equipment has a simple mechanism operated with gear chain,
wheels, bearings, shaft and link arrangement. In this equipment, the
conversion of linear motion into rotary motion is done by gear and
wheel mechanism the rotary motion is again converted into linear
motion through mechanical linkages. This mechanism helps to
convert mechanical energy into electrical energy which, can further
be stored in the form of batteries.
Keywords— Fossil fuel, Non-renewable energy sources, Global
warming, Electrical vehicle, Health problems, Treadmill bike.
I. INTRODUCTION
The Mechanical devices globally used for running and
walking at a stationary position is ‗Treadmill‘. This
fascinating device was introduced in the 19th century to
harness and convert human as well as animal efforts into
mechanical energy. Treadmills are not just used to harness
power but as stationary exercise equipment. Rather than the
user powering the mill while exercising, the machine
provides a moving platform with a wide conveyor belt driven
by an electric motor and a flywheel. The belt moves to the
rear, requiring the user to walk or run at a speed matching
that of the belt. The rate at which the belt moves is the rate of
walking or running. Thus, the speed of running may be
controlled and measured. The more expensive, heavy-duty
versions are motor-driven (usually by an electric motor). The
simpler, lighter, and less expensive versions passively resist
the motion, moving only when walkers push the belt with
their feet. The latter is known as manual treadmill.
II. HISTORY & BACKGROUND
First models of electric bicycles appeared in the late 19th
century. US Patent office registered several e-bike patents
from 1895 to 1899. Ogden Bolton patented battery-powered
bicycle in 1895. Models with torque sensors and power
controls became available during the late 1990s. One of the
first commercially successful e-bike models appeared in 1997
with the name ―Select‖. Year after that there were over 49
different e-bike models available on the market. In the early
2000s, two big Japanese companies Yamaha and Panasonic
became their worldwide mass producers.
Treadmills were introduced before the development of
powered machines, to harness the power of animals or
humans to do work, often a type of mill that was operated by
a person or animal treading steps of a treadwheel to grind
grain. In later times, treadmills were used as punishment
devices for people sentenced to hard labor in prisons. The
terms treadmill and treadwheel were used interchangeably for
the power and punishment mechanisms. In the 1960s, Dr.
Kenneth Cooper demonstrated the health benefits of aerobic
exercise. After that treadmill was commonly used for
exercising purpose.
In this project we refered various research papers and
scientific journals of various authors who had contributed
their share of work in treadmill bike.
Kirtish Bondare et.al [1] The authors described the
methodology for conversion of conventional bicycle into
treadmill bicycle in the year2016. They had completely
modified the bicycle frame and place a treadmill in between

National Conference On “Recent Innovations in Engineering, Science and Technology” April 2019
77
the two wheels on which the user could walk. As the user
walks or jogs on the treadmill it causes the belt to slide over
the roller. At the rear roller a RPM sensor is attached which
can sense the speed of roller and it can signal the motor
accordingly. The drive of motor is transmitted to rear wheels,
it causes the rear wheels to rotate, in turn propels the vehicle
forward. A manufacturing technique called DFM i.e. Design
for Manufacturing was used which helps in designing the
product in such a way that it eases the manufacturing process.
DFM describes the process of designing the product for
facilitating the manufacturing process and reducing its
manufacturing cost. In DFM, the potential problems are fixed
in the design phase, which is the least expensive place to
address them. Other factors that may affect manufacturing
are: type of raw material, the form of raw material,
dimensional tolerance and secondary processing such as
finishing.
Juned Barade et.al [2] stated that the treadmill is completely
new way of moving designed for people who love exercising
outdoor. Typically use of a treadmill is similar to running,
hiking or walking. The use of treadmill indoors can be quite
boring at times and people may feel the urge to walk outside.
Also the problem faced while riding a bike are different type
of terrain, potholes and speed bumps. The treadmill bicycle
significantly over comes these problems as the treadmill bike
is an equipment to be used outdoor and it gives the same the
result as using a treadmill, also treadmill bike would provide
the rider a well-balanced position the entire time. Since it
uses no fuel it is a very conventional option for people in their
busy schedule to take care of their health.
Sourabh Borchate et.al [3] This work is focused on generating
electricity by use of manual treadmill. Due to ever-increasing
demand for energy and to come up with a solution for this, an
attempt was made to build a small equipment which could be
used as power source for household application. The idea was
to modify a manual treadmill as a power generating unit. For
the purpose of generating electricity a controller display
circuit was used to indicate parameters like timer, speed,
distance, pulse rate and calories. With the provision of AC
motor attached to manual treadmill and a series of gear
mechanism for transmission of motion, the power is
harnessed from motion of user performing exercise and
transmitted to AC motor. The electrical power generated is to
be stored in battery by converting AC current into DC by
rectifier circuit. The manual treadmill which can only rotate
when the user push the belt with his feet while running or
walking. But the addition is that there is an installation of AC
motor to harness electrical power whose moving parts are
mechanically coupled or connected with the moving parts of
machine (roller) which moves when belt of treadmill is
moving. When the rotor of AC motor starts moving or
rotating it will produce EMF across its output terminals.
This generated EMF can be used for charging of battery and
other purposes.
III. DESIGN
3.1 Research Philosophy:-
Our project is based on the generation of electricity by using
conventional modes of traveling along with health benefits for
the people. The model of the energy efficient treadmill is
designed in UG-annex software. The model is designed
considering all the aspects like the height of users, road
conditions etc.
3.2 Design Procedure:-
Steps tobe involved in fabrication of Treadmill bicycle are as
follows;
Step 1:-
Selection of material for frame we use CRC pipes of
diamension 50*20, cut this into 900*500 mm size.
After that drill the 15 holes of diameter 12mm on crc pipe.
For belt we used high strength Canvas cloth of length
1500mm.
Step 2:-
Selection of appropriate motor and battery
Motor: we use 24V, 250W, 9.78N-m geared motor of std.
speed 750 rpm and 350 rpm actual rpm.
Battery: For this we used 12V(x2) batteries of 15 Amph.
Step 3:-
Chain and chain sprocket
For transmitting the power from motor to rear wheel.
We used 5 number of sprocket. Smaller sprocket having 18
theeth and larger wheel consist of 22 no. of teeths.
We use two chains for transmission.
Step 4:-
Selection of rollers and bearings
Here we use U-pvc pipes for rollers ,as they give good
performance with ligtht weight.
For rollers dimensions of Upvc pipe is 36mm ID and 43mm
in length.
After considering the load which is fully acted upon bearings
we use Ball bearing 6301 (12*36*12).these bearings are good
on load bearing capacity.
Step 5:-
We used two wheels of different diameters, front wheel is
26mm in diameter and rear wheel is 20mm in diameter for
better equilibrium condition,
For handle we use bicycle handle assembly.
Step 6:-
Joining all the parts and install all the components to make a
complete assembly of Treadmill.

National Conference On “Recent Innovations in Engineering, Science and Technology” April 2019
78
mounted on roller 1 and there is no relative motion between
the flywheel and roller 1. Thus V-grooved flywheel rotates
with roller 1. The diameter of the V-grooved flywheel is kept
5 times more than the diameter of the v-pulley mounted on
the shaft of the generator. If flywheel rotates at 200 r.p.m. the
generator shaft will rotate at 1000 r.p.m. and electricity will
be generated which may be used to charge the battery or it
may be used to run the portable MP3 player, low voltage CFL
etc.
Components
Fig. 1. Cad model of Treadmill Bicycl
For design of treadmill bicycle methodological approach was
adopted.
Design components
a) Treadmill chassis – Rectangular frame of
900*500(mm) of CRC material
b) Rollers – Total 15 rollers of UPVC pipe.
First roller of dia.42mm & length 432mm,
Last roller of dia. 42mm & length 457mm.
IV.WORKING
When someone walks/runs on the walking belt, flywheels run
at 200 rpm. This flywheel rotation is used to generate
electricity. For mounting, the Electricity Generator support is
welded on the left upright.
An Electricity Generator is mounted on this support and a v-
pulley is fixed on the generator shaft. A walking belt is
wrapped around roller 1 and roller 2. Roller 1 is mounted on
the left and right upright and roller 2 is mounted on the lower
end of the base frame. A V-grooved flywheel is mounted on
the left side of the roller 1 and another flywheel is mounted
on the right and of the roller 1. The V-Grooved Flywheel is
connected with the V-Pulley mounted on Generator shaft
through a V-belt. When someone walks/runs on the walking
belt roller 1 and 2 rotate. As the V- grooved flywheel is
V.RESULT AND ANALYSIS
After carrying out simulations on the model we got the
following results:-
i. Range/charge : 25 km per charge
ii. Speed : 12 km/hr
iii. Loading Capacity : 80-100 kg iv.
Charging Time : 12 hours
v. Power : 250 Watts
vi. Torque : 9 N-m
VI.CONCLUSION
Exercise
Treadmill bicycle helps in maintaining proper physique.
Physical fitness is of utmost importance in day to day life.
People often get bored while exercising in a closed room
such as gym. By using treadmill bicycle one can exercise
outdoors in fresh air.
Fuel saving
People often use vehicle for travelling over short
distance. This causes unnecessary wastage of fuel. Due to
Use

National Conference On “Recent Innovations in Engineering, Science and Technology” April 2019
79
treadmill bicycle over short distance a large amount of
fuel can be saved.Travelling Treadmill bicycle can be used
for travelling over short distances. One can also exercise
while travelling over short distance.
Eco- friendly
Treadmill bicycle does not require any fuel. Therefore it
does not emit any pollutants. So it is an eco-friendly
vehicle.
VII.REFERENCES
[1] Kirtish Bondre, Sanket Beradpatil, S. J. Thorat ―Design and
Fabrication Of Treadmill Bicycle‖ vol.5, Issue 6, June 2016.
[2] Juned Barade , Anup Janwe2, Kashif Ali Nawab , Saif Khan ― Project
On Treadmill Bicycle‖. Vol.4,Issue no 03, Mar 2017.
[3] Suhasinee Ravindra Deshmukh, Namita Vishnu Sanap, Rahul Eknath
Dhoble ―Design Of Walking Bike‖ vol.2 Issue 5, May 2016.
[4] Mr. Sourabh Borchate , Amit Gaikwad, Ajay Jadhav, Prasad Dhage
―Design Of Treadmill To Generate Electricity By Using Mechanical
Energy‖vol.5 Issue6 2017.
[5] R.K. Upadhyay , L.A. Kumaraswamidhas, Md.Sikandar Azam
―Rolling element bearing failure analysis: A case study‖
[6] Swapnil R. Abhang, D.P.Bhaskar, ―Design and Analysis of Disc
Brake‖ vol 8 no 4- feb 2014.

National Conference On “Recent Innovations in Engineering, Science and Technology” April 2019
80
Design and Manufacturing of Yoke Crane PROF. C. R. PATIL
1,MR. UDAY AMODE
2, MR. SIDDHESH KUMBHARDE
3, MR. VIVEK KAMBLE
4
nd [email protected], 3
1Mechanical Engineering, SIEM
2Mechanical Engineering, SIEM
3Mechanical Engineering, SIEM
4Mechanical Engineering, SIEM
Abstract —The project deals with finding the solution in the
industry.The present project focused on improvements in internal
materials handling management, approaching the case of a large
company in the automotive industry. Material handling systems is
used for continuous movement of material from one point to another.
Material is conveyed everywhere in a factory or warehouse before,
during, and after processing. Material handling work should be
minimized without compromising production or the level of quality
required of the operation. The yoke shaft having weight
approximately 25kg worker handling manually. This problem is
trying to solve by providing automation.
Automation will improve operational efficiency, increase reaction,
improve uniformity and unavoidability, decrease operating costs,
and eliminate recurring or potentially unsafe manual labor, operation
time near about 70% will be save.
Keywords-Mini electric hoist, Machine, gripper, manufacturing,
cost
I.INTRODUCTION Mitesh auto ancillary private limited provides engineering
service. Mitesh auto is mainly manufacturing automobile
parts, spares and accessories components in mass quantities
as per customer requirement by using highly automatic
machinery. In company material handling process is manual.
Need of the present day, equipment to handle heavy loads
with fast speed, reliability, safety, economy etc. So the crane
is used. Crane is one of the most important equipment used in
the industries. It works as a material handling equipment or
device.
Material handling (MH) involves ―short-distance movement
that usually takes place within the confines of a building such
as a plant or a warehouse and between a building and a
transportation agency.‖ It can be used to create ―time and
place utility‖ through the handling, storage, and control of
material, as distinct from manufacture ng (i.e. fabrication and
assembly operations), which creates ―form utility‖ by
changing the shape, form, and makeup of material.
It is often said that MH only adds to the cost of a product, it
does not add to the value of a product. Although MH does not
provide a product with form utility, the time and place utility
provided by MH can add real value to a product, i.e., the
value of a product can increase after MH has taken place.
Applications of material handling device is a prime
consideration in the construction industry for the movement
of material, in the manufacturing industry for the assembling
of heavy equipment, in the transport industry for the loading
and unloading and in shipping etc. This device increase
output, improve quality, speed up the deliveries and therefore,
decrease the cost of production. The utility of this device has
further been increased due to increase in labor costs and
problems related to labor management.
Crane is a combination of separate hoisting mechanism with a
frame for lifting or a combination of lifting and moving load.
There is very much useful to pick up a load at one point and
be able to transport the object from one place to another place
to increase human comfort.
II. PROBLEM STATEMENT
The relevance of materials handling stems from the intrinsic
relationship that it has with production flow. When it presents
an imbalance, there is formation of extra stock or rupture in
supply. When the flow does not have enough velocity, transit
time is long and the system is not capable of serving the
customers when they need it.
Company is mainly manufacturing automobile parts, spares
and accessories components in mass quantities as per
customer requirement by using highly semiautomatic
machinery. Material handling process in company is
manually. Manually material handling use of the human body
to lift the load due to this human suffering caused by injuries,
fatigue, pain in shoulder upper back, lower back and knee and
it‘s also effect on less production rate, more labor work
required, production cost.
This problem is trying to solve by providing automation.
Crane is one of the most important equipment used in the
industries. Crane helps to handle heavy loads with fast speed,
reliability, safety, economy etc. Automation will improve
operational efficiency, increase reaction, improve uniformity
and unavoidability, decrease operating costs, and eliminate
recurring or potentially unsafe manual labor.
III.METHODOLOGY The project work start with identification of problem,Hoisting
is the process of lifting something or some load from lower
position to higher position with the help of some device or
mechanism. The Electric Overhead Traveling Crane consists
essentially of a girder, or girders, supported at each end on

National Conference On “Recent Innovations in Engineering, Science and Technology” April 2019
81
tracks capable of traveling on elevated fixed tracks. And a
trolley equipped with hoisting and other mechanism, capable
of traversing from end to end of such girder or girders. Such
cranes vary in lifting capacity from about 2 tons to 400 tons,
and in span from 20 ft. to 150 ft., or more. For capacities of
10 tons and upwards an independent auxiliary hoist rated at
1/5 to 1/3 that of the main hoist is frequently provided. The
computer Aided Design facilitates gives alternative
parameters and thus calculates the unknown parameter which
speeds up the design process. In the computerization the
scope for providing cabins fixed to bridge is eliminated thus
reducing the cost andspace.
IV. PRINCIPLES OF MATERIAL HANDLING
Although there are no definite ―rules‖ that can be followed
when designing an effective MHS, the following ―Ten
Principles of Material Handling,‖ as compiled by the College-
Industry Council on Material Handling Education (CIC-
MHE) in cooperation with the Material Handling Institute
(MHI), represent the distillation of many years of
accumulated experience and knowledge of many practitioners
and students of material handling:
Planning:
Define the needs, strategic performance objectives and
functional specification of the proposed system and
supporting technologies at the outset of the design. The plan
should be developed in a team approach, with input from
consultants, suppliers and end users, as well as from
management, engineering, information systems, finance and
operations.
Standardization:
All material handling methods, equipment, controls and
software should be standardized and able to perform a range
of tasks in a variety of operating conditions.
Work:
Material handling processes should be simplified by reducing,
combining, shortening or eliminating unnecessary movement
that will impede productivity. Examples include using gravity
to assist in material movement, and employing straight-line
movement as much as possible.
Ergonomics: Work and working conditions should be adapted to support
the abilities of a worker, reduce repetitive and strenuous
manual labor, and emphasize safety.
Unit load: Because less effort and work is required to move several
individual items together as a single load (as opposed to
moving many items one at a time), unit loads—such as
pallets, containers or totes of items—should be used.
Environment:
Energy use and potential environmental impact should be
considered when designing the system, with reusability and
recycling processes implemented when possible, as well as
safe practices established for handling hazardous materials.
Automation:
To improve operational efficiency, responsiveness,
consistency and predictability, automated material handling
technologies should be deployed when possible and where
they make sense to do so.
Life cycle cost:
For all equipment specified for the system, an analysis of life
cycle costs should be conducted. Areas of consideration
should include capital investment, installation, setup,
programming, training, system testing, operation,
maintenance and repair, reuse value and ultimate disposal.
V. DIMENSION ANALYSIS OF YOKE SHAFT
Note: All dimension in meter
D = 0.845 D = 0.722
2.87
1.47
1.75
Fig. 1: Yoke shaft drawing
VI. REASONS FOR SELECTING MINI ELECTRIC
HOIST
Fig. 2: Mini electric hoist
High mobility
High capacitive strength
Custom heights
Less cost than other automation material handling
equipment
Work on electricity hence it is automatic
Working speed is more than other material handling
equipment

National Conference On “Recent Innovations in Engineering, Science and Technology” April 2019
82
VII. REASONS FOR SELECTING MECHANICAL
GRIPPER
Fig.3: Gripper design
Simple in construction.
Less power required.
Easy to handle.
Cost effective.
Less number of moving parts as compared to pneumatic and
hydraulic.
Wide varieties available.
Moderate maintenance.
VIII. DESIGN AND ANALYSIS OF MACHINE
COMPONENTS
A. Gantry Crane Structure
Fig. 4: Gantry crane structure
The above fig shows thegantry Crane structural design for
mini electric hoist.The assembly includes I section beam,
electric hoist, mechanical gripper. From these components the
mechanical gripper material is weakest thus it is become a
necessary to carry out the structural analysis on the I section
beam to avoid the failure during the operation.
B. Structural Analysis of I Section Beam
Boundary conditions
Force on punch holder = 0.785 KN vertically upward
Hoisting speed = 1 m/min
Fig. 5:Stress induced in the material with extreme
boundary conditions
The above structural analysis is carried out on the ANSYS
18.2 for the I section assembly which is undergoing through
the cyclic force due to continuous reciprocating motion and
loading of electric hoist during lifting operation this is
responsible for the maximum stress generation into the end of
the I section.
Mild steel
Ultimate tensile strength = 841 Mpa The maximum stress induced due to extreme boundary
condition is 423.22Mpa which is less than the ultimate tensile
strength of the cast iron which is 841 Mpa. The above design
is safe as far as maximum stress induced in the material due
to extreme boundary condition is concern.
Fig. 6: Deformation due extreme boundary conditions
This is the second step of the of the structural analysis where
we calculated the maximum deformation due to extreme
boundary condition after evolution of the results from the
ANSYS workbench 18.2 we come to know that the maximum
deformation due to extreme boundary conditions is 14.588
micrometer. The deformation of 14.588 micrometer is almost
negligible in this case thus the design for the electric hoist is
safe as far as the maximum deformation due to extreme
boundary condition is concern.
IX. CONCLUSION
After implementation of this technique there will be 70% time
saving in material handling, as manual material handling
takes too much time for placing the work piece and then
removing it to the inspection table. Also the ergomics factor
for human whose working on machine will be reduced. Due
to this automation continuous jobs will be produced which
will give desired output. It will increase the overall
productivity. Due this automation there are less possibilities
of accidents.

National Conference On “Recent Innovations in Engineering, Science and Technology” April 2019
83
X. REFERENCES
1. Dhaval H. Kanjariya1,―A Review on Design and Analysis of Hoisting
Machinery in EOT Crane‖ International Journal of Trend in Research and Development, Vol. 3, Issue 02, 2015 | ISSN (online): 2321-0613
2. Mr. AnkitPrakashlalji Jaiswal1, Prof. S.J. Parihar2, ―Review of Computer Aided Analysis and Design of Crane Hook of a Chain Block
System‖, International Journal of Trend in Research and Development,
Vol. 5, Issue 02, 2017 | ISSN (online): 2321-0613
3. Vikas Gupta1, Rajesh Bansal2, Vineet Kumar Goel3, ―A REVIEW ON
MATERIAL HANDLING EQUIPMENT AND THEIR SELECTION FOR POTENTIAL APPLICATIONS‖ International Journal of Trend in
Research and Development, Vol. 2, Issue 1, Mar-Apr 2013
4. PatakotaVenkata Prasad Reddy1* and V V N Satya Suresh1, ―A
REVIEW ON IMPORTANCE OF UNIVERSAL GRIPPER IN
INDUSTRIAL ROBOT APPLICATIONS‖, International Journal of Trend in Research and Development, Vol. 2, No. 2, April 2013
5. ShyamLal Sharma1*, Tasmeem Ahmad Khan1, Md. Parvez1 and Kamlesh Kumari2, ―COMPUTER AIDED ANALYSIS AND DESIGN
OF HOISTING MECHANISM OF AN EOT CRANE‖, International
Journal of Trend in Research and Development, Vol. 2, No. 3, July 2013
6. Mr. S.N Tripathy1, Sachin Kumar2, Krupasindhu Munda3, Prassana
Bauri4, ―FABRICATION OF MINI HOISTING DEVICE‖, Volume:03, Issue:04, Apr 2016
7. Indian standard Design, erection and testing (structural portion) of cranes and hoists code of practice (second revision). IS 807:2006
8. Indian standard code of practice for Electric Overhead Travelling cranes and gantry cranes other than steel work cranes (second revision).
IS 3177:1999
9. J. D. Tew, S. Manivannan, D. A. Sadowski, And A. F. Seila
ByGajananaNadoli, Devadas Pillai, Simulation In Automated Material
Handling Systems Desig, Proceedings Of The 1994 Winter Simulation Conference Ed.
10. J. S. Noble , C. M. Klein, A. Mid ha, An Integrated Model of the Material Handling System and Unit Load Design Problem, 802 / Vol.
120, ASME

National Conference On “Recent Innovations in Engineering, Science and Technology” April 2019
Experimentation to Analyze the Effect of Coating on
Gauge and Tool Materials Sachin Chede1, Sahil Dushing2, Abhishek Jagzap 3, Vikas Khalkar 4, Sachin Rahane5
[email protected], [email protected], [email protected], [email protected], [email protected]
Mechanical Engineering
Sandip Institute of Engineering & Management,Mahiravani,Nashik.
Abstract— Although many coating methods and material are
available for tools, very few are available on gauges. Different types
of coating materials and methods of coatings can be tested to
investigate the performance analysis on gauge materials. Present
work aims to analyze the coating material and method of coating for
tool material like HSS M2 grade and gauge materials like HSS M2
grade, OHNS or D2 material. So Improvement in performance of
cutting tool for high speed machining of hard and difficult to cut
material has remained a problem for quality and economy of
production. Hard coatings are well known to improve the
performance of cutting tools in machining applications. Physical and
chemical vapor deposition techniques have found increasingly wider
use in such applications in recent years. To improve the lifetime of a
tool for which it functions properly, the cutting tool has to be
protected, often by coatings that are specifically designed to prevent
certain damage modes that occur in particular applications. In fact,
over 90% of all cemented carbide inserts are currently coated using
Chemical Vapor Deposition (CVD), Physical Vapor Deposition
(PVD), or their combination.
Keywords—TiN Coating, PVD, HSS, OHNS, D2
I. INTRODUCTION
In applications, like tools and gauges using coatings is an
effective and relatively economical measure to reduce friction
and protect the substrate surface from wear. However,
selecting the appropriate coating for a given application is still
difficult and complicated because the response of a coating
system depends on many factors (coating properties,
counterpart, substrate, interface and running conditions).
Additionally, many new deposition techniques and new
coatings are being continuously developed, which provides a
wide range for the selection of coatings. One of the most
revolutionary changes in the metal cutting industry over the
last 30 years has been thin-film hard coatings and thermal
diffusion processes. These methods find ever increasing
applications and brought significant advantages to their users.
Today, 50% of HSS, 85% of carbide and 40% of super-hard
tools used in industry are coated. A great number of coating
materials, methods and regimes of application on substrates or
whole tools and multi-layer coating combinations are used.
Carbides are excellent substrates for all coatings such as TiN,
TiAlN, TiCN, solid lubricant coatings and multilayer coatings.
Coatings considerably improve tool life and boost the
performance of carbide tools in high-productivity, high speed
and high-feed cutting or in dry machining, and when
machining of difficult to-machine materials. Coatings: (a)
provide increased surface hardness, for greater wear, (b)
increase resistance (abrasive and adhesive wear, flank or crater
wear), (c)reduce friction coefficients to ease chip sliding,
reduce cutting forces, prevent adhesion to the contact surfaces,
reduce heat generated due to chip sliding etc., (d)reduce the
portion of the thermal energy that flows into the tool, (e)
increase corrosion and oxidation resistance, (f) improve crater
wear resistance and (g) improved the surface quality of
finished parts. Common coatings for carbides applied in
single-or multi-layers are shown in Figure.3.TiN: general-
purpose coating for improved abrasion resistance, Colour-
gold, hardness HV (0.05) – 2300, friction coeficient – 0.3,
thermal stability– 600°C.
II. HISTORY & BACKGROUND
It was pointed out that there are basically four major groups of
coating materials on the market.The most popular group is
titanium based coating materials as TiN, TiC and Ti(C,N). The
metallic phase is often supplemented by other metals such as
Al and Cr, which are added to improve particular properties
such as hardness or oxidation resistance.
The second group represents ceramic-type coatings as AL2O3
(alumina oxide). The third group includes super-hard coatings,
such as chemical vapor deposition (CVD) diamond. The fourth
group includes solid lubricant coating such as amorphous
metal-carbon. Additionally, to reduce extensive tool wear
during cut-in periods, some soft coatings as MoS2 or pure
graphite are deposited on top of these hard coatings. The basic
physical vapor deposition (PVD) coatings are listed in Table 1.
D2 steel is an air hardening, high-carbon, high-chromium tool
steel. It has high wear and abrasion resistant properties. It is
heat treatable and will offer a hardness in the range 55-62
HRC, and is machinable in the annealed condition.

National Conference On “Recent Innovations in Engineering, Science and Technology” April 2019
D2 steel shows little distortion on correct hardening. D2
steel‘s high chromium content gives it mild corrosion
resisting properties in the hardened condition.
Recently Oil Hardened Non Shrinkable (OHNS) steel
finding many applications in Manufacturing parts like
Shaft, Gears, Dies, Tooling due to their excellent
Mechanical properties.
III. RESEARCH METHODOLOGY
In this project work, we are going to prepare specimen for
Pin on Disc apparatus according to the requirement of
dimensions. After preparing specimens on CNC, these
specimens were sent for the heat treatment process. The
process which was used for heat treatment is vaccum
hardening.The next step was to sent the specimens for sub
zero treatment process, the soaking time used was 120
minutes. After receiving the specimens from the process
we had to do surface finishing of specimens which was in
microns , so we had to use buffing wheel for finishing of
the specimens. When these specimens were properly
finished ,we sent the material for Titanium nitride (TiN)
coating.The process that will be used for coating is
physical vapour deposition method (PVD) as shown in
fig.1.The material to be deposited is converted into vapour
by physical means. The vapor is transported across a
region of low pressure from its source to the substrate.
Vapor undergoes condensation on the substrate to form the
thin film. The flowchart of the process is shown in fig.2.
FIGURES AND TABLES
Fig.1 PVD Process Fig.2 Flowchart

National Conference On “Recent Innovations in Engineering, Science and Technology” April 2019
Fig.3 Modern
Coatings
Fig.4 Pin on Disc
Apparatus
Fig.5 Heat Treated Samples of OHNS, D2 and HSS M2
Table 1. Basic PVD Coatings
IV. FUTURE SCOPE
After taking trial on pin on disc test setup we can conclude
the wear analysis of the TiN coated and uncoated Tool and
gauge materials. To analyze the effect of coating on life of
tools and gauges after the whole experimentation is carried
out.
V. CONCLUSION
Increase the tool and gauge life by using TiN coating
on commonly used materials i.e. HSS M2, D2, OHNS grade
using PVD coating method. To recommend appropriate
gauge material with TiN coating from the available materials
used for gauges such as HSS M2, OHNS and D2 material.
To compare the characteristics of coated and uncoated tool
and gauge materials.
REFERENCES
[1] Ramesh G, Rahul R, Pradeep M, Sreehari P, Ramesh Kumar
S (Evolution of microstructure and mechanical properties of D2 tool
steel during annealing heat treatment), Materials Today:
Proceedings 5 (2018) 2733–2737.
[2] Luis Daniel Aguilera Camacho, Santos García Miranda, Karla Judith Moreno( Tribological performance of uncoated and TiCN-
coated D2, M2and M4 steels under lubricated condition)
(Journal of Iron and Steel Research, International 24(2017) 823-829
[3] Fla´vio J. da Silva, Sine´sio D. Franco, Alisson R. Machado,
Emmanuel O. Ezugwu, Antˆonio M. Souza Jr. (Performance of
cryogenically treated HSS tools) (Elsevier Wear 261 (2006) 674–685)
[4] H. Caliskan, P. Panjan, C. Kurbanoglu, (Hard Coatings on
Cutting
Tools and Surface Finish), 2017.
[5] Nirmal S Kalsi, Rakesh Sehgal and Vishal Sharma (Effect of
tempering after cryogenic treatment of tungsten carbide–cobalt
bounded inserts), Bull. Mater. Sci., Vol. 37, No. 2, April 2014, pp.
327–335.
[6] M. Arun, N. Arunkumar, R. Vijayaraj, B. Ramesh (Investigation on the
performance of deep and shallow cryogenic treated tungsten carbide drills
in austenitic stainless

National Conference On “Recent Innovations in Engineering, Science and Technology” April 2019
Design And Fabrication of Eddy Current Braking
System
Prof.S.M.Mahajan
1, Suyog R. Chaudhari
2, Akshay B. Fartale
3, Pranav K. Gosavi
4,
Rahul D. Vidhate5.
[email protected], [email protected], [email protected], [email protected], [email protected]
Mechanical Department
Sandip Institute Of Engineering And Management
Abstract— An eddy current brake is a new and revolutionary
concept. . The frequency of accidents is now-a-days increasing due to
inefficient braking system.Electromagnetic braking system is a
modern technology braking system used in light motor & heavy
motor vehicles. This system is a combination of electro-mechanical
concepts.
Keywords— Brakes, Eddy current, Magnetic field, Electromagnetic
brakes,Test rig.
I. INTRODUCTION
Brakes are the device, which is used to retard the
motion of moving vehicle for purpose of decreasing the speed
and to avoid the accidents. Conventional brakes are not
efficient in wet conditions. In conventional brakes, the kinetic
energy converted into heat energy with the help of friction
between the brake pads and brake disk. In this tremendous
amount of heat is generated and lost to the environment, which
in turns mitigate the life of brake pads, also they are prone to
wear and tear, due to friction.
To avoid such energy losses and to make process
more economical standard/conventional braking system is
replaced by the more advance frictionless electromagnetic
braking system, which works on the principal of
electromagnets. There are many advantages of using
electromagnetic controlled brake systems. The properties and
behavior of the brake will be easy to adapt by simply changing
software parameters and electrical outputs instead of adjusting
mechanical components. This also allows easier integration of
existing and new control features such as anti-lock braking
system (ABS), vehicle stability control (VSC), electronic
parking brake (EPB), etc., as well as vehicle chassis control
(VCC) and adaptive cruise control (ACC).
II. HISTORY & BACKGROUND
In 1902 at the road in New York City called
Riverside drive, Ransom E. Olds had arranged to test a new
brake system against the tire brake of a four-horse coach and
the internal drum brake of a Victoria horseless carriage. His
Oldsmobile sported a single flexible stainless-steel band,
wrapped around a drum on the rear axle. When the brake pedal
was applied, the band contracted to grip the drum. In the test,
the Oldsmobile stopped in 21.5 ft. brake system, stopped in 37
ft. with the same speed of 14 mph. By 1903, most of other
automotive manufacturer had adopted the car‟s braking
system. And by 1904, practically all became all-dominant in
the United State. meanwhile its rival, Victoria that use
expanding car maker manufactured cars with an external brake
on each rear wheel and -shoe internal drum design and the
coach‟s tire
In Europe, during the „50s, particularly in Great
Britain, the disk brake became more or less standard on the
people cars. And only about 20 years, somewhere about year
1973, American car manufacturer adopted this kind of
technology.
In 1902, a patent was issued to F. W. Lanchester for
a nonelectric spot disk braking system that‟s similar in
principle to what we have today but it use copper linings.
Intense screech noise was produce when the linings make
contact with the metal disk. By 1907, another Englishman
named Herbert Frood, came up with the idea of lining pads
with asbestos. With noise problem when braking is solved, car
manufacturer quickly adapted this technology on both drum
and disk brakes.
The application of hydraulic in braking emerged in
1918 from a young inventor named Malcolm Lougheed. This
idea came because of the need of higher braking power due to
fast driving behavior by community. He used cylinder and
tubes to transmit fluid pressure against brake shoes, pushing
the shoes against the drums. The Model ADuesenberg is the
first passenger car to be equipped with fourwheel hydraulic
brakes. Back in 1958, the new technology in braking system
was developed by Road Research Laboratories in Great
Britain called antiskid braking 7 system or as known as
antilock braking system (ABS). The Jensen FF sports sedan
was first applied with this ABS in 1966.
The braking technology still blooming and
research are continuously made to achieve braking system that
more reliable. Therefore, the braking-by-wire technology is
now actively developed due to electric and hybrid cars that use

National Conference On “Recent Innovations in Engineering, Science and Technology” April 2019
electric power. After year 2010, there is probability that
automotive industry in the world will start to change the usage
of the conventional hydraulic brake system to brakeby-wire,
according to research study by Frost & Sullivan. With brake-
by-wire, drivers have advantage over the vehicle in controlling
the vehicle particularly in case of sheer emergency.
III. DESIGN ISSUES
Design Calculations:
Design of shaft:
Firstly we have select the material for shaft is Mild Steel. Material selection for shaft is steel i.e., 1090
Table no.1 -Properties of shaft.
Designation Yield Strength Ultimate
strength
1090 247 Mpa 841 Mpa
Asumptions,
Factor of safety( FOS)=2
Brinell hardness number(BHN)=255
Weight of pulley (Wp) =6.6375 N
Weight of Tyre (Wt) = 267.68 N
(Forces along Y direction) = reaction at
bearing A - weight of tyre – weight of pulley
+ reaction at bearing B.
FY=Ra -Wt – Wp + Rb
=Ra+Rb=274.31N
Moment about pt. A ,
Ma=(143*267.68) + (6.63*286) - (Rb*430)
Reaction at B (Rb) = 93.42N
Reaction at A (Ra) = 180.88N
Resultant reaction (R) =Ra^2+Rb^2) = 203.58 N
Maximum moment,
M=Ra*143
=180.88*143
=25865.84 N. mm
Maximum Torque,
T= F*Dp/2
=274.3*76/2
=10423.4 N.mm
Fig - Bending Moment Diagram.
Table no.2-values of shock and fatigue factors.
SR.
NO
Application Kb Kt
1 Load gradually applied. 1.5 1.0
2 Load applied with minor
shock.
1.5-2.0 1.0-1.5
3 Load applied with heavy
shock.
2.0-3.0 1.5-3.0
Select the value of shock and fatigue factors, i.e Kb and Kt for
heavy shock
Kb=2 Kt=1.5
Equivalent torque,
Te=54042.78 N.mm
Allowable shear stresses,
=0.3Syt
or (Whichever is smaller)
0.18Sut
=74.1
or
=151.38
=74.1 N/mm^2
Maximum torque,
d = 15.48 mm
Diameter of the shaft (d) = 15 mm
2 Design of Bearing: According Diameter of shaft is 15 mm,

National Conference On “Recent Innovations in Engineering, Science and Technology” April 2019
89
Dia of
shaft
Outer Dia
of bearing
(D)
Inner dia
of
bearing
Dynamic load
capacity (C)
Static load
capacity (Co)
Designati
on
15 24 5 1560 815 61802
15 32 9 5850 2850 6002
15 35 11 7800 3550 6202
15 42 13 11400 5400 6302
(Fa/Co) (Fa/Fra)>e (Fa/Fra)>e e
0.025 0.56 2.0 0.22
0.040 0.56 1.8 0.24
0.070 0.56 1.6 0.27
Table no.3 - dimensions and static and dynamic load
capacities of bearing.
Given: D=32 mm b= 9mm
Co=2.85 KN C=5.85 KN
Radial force (Fra) = 180.88 N
Axial force ( Fa) = 90.44 N
Fa/Fra=0.5 Fa/Co=0.0317
Fa/Fr>e
Table no.4-X and Y factors for bearing.
From Table, X=0.0317 Y=?
X1=0.025 Y1=2
X2=0.0 Y2=1.8
So by
Interpolation, Y=1.910
X=0.0317
Equivalent dynamic load, Pe
= (XVFr+YFa)*Ka
=267.71 N.
Rated bearing life (in million revolutions),
L10==300 Million revolution.
Using Load Life Relationship
L10=(C/Pe)^a
Here a=3(for Ball
bearing)
(300)^1/3*267.71=C
=1.792
1.792< 5.85
Hence, the design is safe.
FIGURE
IV. CONCLUSION
In this paper we have presented the design of eddy current
braking system.Eddy current brakes are non contact type
frictionless brakes. We can conclude that it works effectively
without wear and tear of brakes. Thus we studied the various
magnetic forces responsible for braking and magnetic laws on
which eddy current braking system works.
REFERENCES
[1] Umang S. Modi1, Swapnil C. Bhavasar (June-2015) ―Current trends
in Electro-magnetic Braking System‖
[2] SagarWagh, Aditya Mahakode, Abhishek Mehta and Vaneela Pyla
(June- 2017) has done research work ―Electromagnetic Braking
System in Automobile‖
[3] Potapov L.A., Fedyaeva G.A., Smorudova T.V. (2016) has done
research work on ―Modeling Electromagnetic Processes in
Electromagnetic Brakes and Slip Clutches with Hollow
Ferromagnetic Rotors‖
[4] G.L. Anantha Krishna1, K.M. Sathish Kumar (2018) has done
research work on ―Experimental Investigation of Influence of
Various Parameters on Permanent Magnet Eddy Current Braking
System‖.
[5] Yusuf Yasaa, Eyyup Sincarb, BarisTugrul ,Ertugrulb, ErkanMese
(July 2016) has done research work on ―A multidisciplinary design
approach for electromagnetic brakes‖.
[6] Design Data Book – by V.B.Bhandari. [7] Braking System- Wikipedia

National Conference On “Recent Innovations in Engineering, Science and Technology” April 2019
90
Design, Fabrication and Performance Analysis of
SolarDryer with High Temperature Solar Collector Kiran More
1, Rohit khairnar
2, Ashish kadam
2, Vikas satkar
2 , Nikhil shinde
2
[email protected] , [email protected], [email protected], [email protected],
Mechanical Engineering Department
Sandip Institute of engineering and Management.
Abstract— The solar air dryer used these days are heavy and
bulky in nature. It also has low efficiency compared to its
weight. Our project is to reduce the weight of the system and
also achieve high temperature. For this purpose we have used
DTH dish which has a single focal point about 10 cm in
diameter. This dish is been covered with metalised
polyproplyn tephthelet film for optimum reflectivity. The use
of dish type collector increases the heat flux at the receiver to
get maximum temperature. the overall weight of the setup is
very low and compact in size. We aim to dry food products
like chillies dates, grapes etc. We have used a bolwer which
vane type to circulate air through the system whose discharge
is about1.2 m3/min at 0.18HP. The chame used for drying has
capacity of 0.46m×0.33m×0.59m Further we can also use a
solar photovoltaic cell to reduce the power requirement of
blower.
I. INTRODUCTION
The need for fossil fuel is increasing day by day so it is
important to emphesis upon non conventional energy sources
such as solar energy, wind energy, bio-gas. This paper focuses
upon use of solar energy for drying purpose many researches
were made in the field of solar drying but there efficiency as
well as economy is low also they are bulky and heavy in
construction. Over aim is to reduce the weight of system and
also achive maximum temperature to dry food products like
chillies, dates, grapes. We also emphesise upon use of
parabolic dish instead of flat plate collector. Parabolic dish
collector gives high heat flux at single focal point and it is
compact and light in weight compare to flat plate collector.
Principle of drying- Drying is basically a phenomena of removal of liquid by
evaporation from a solid. Mechanical methods for separating a
liquid from a solid are not generally considered drying. In the
following section an attempt is made to provide a concise
overview of the fundamental principles of drying process for
agricultural products. These principles are applied, in general,
to mechanical conventional drying and here concerned mainly
with solar drying. However in general, must be noted that
conventional drying principles and phenomena are
independent of the type of energy used. A major part of energy
consumption during drying is for the evaporation of liquid
water in to its vapour (2258 kJ/kg at 101.3 kPa). The water
may be contained in the solid in various forms like free
moisture or bound form which directly affects the drying rate.
Moisture content is expressed either on dry or wet basis, e.g.
moisture content in wet () basis is the weight of
moisture per unit of wet material
II. HISTORY & BACKGROUND
Decades ago people use to dry food product in direct sun light.
The drawback of this process is that controlled drying can not
be achived. Researches were made for control drying of food
products at initial stage flat plate collector came in existence,
the efficiency of flat plate collector in concentrating sun-light
is also low, it also suffered from scaricity of sun light in winter
and mansoon season further researches were made.
Literature review Development of a parabolic solar dryer for efficient solar
energy use in the rural areas in Ghana-Maame Tabuah Duah
A comparative analysis of the drying rate of the solar dryer
and open sun drying concludes that the open dryer performed
poorly.
Review of solar-energy drying systems II: an overview of solar
drying technology- O.V. Ekechukwu and B. Norton
From this paper we studied different types of dryer and drying
method also their comparative study.
Energy, exergy, economic and environmental (4E) analyses of
flat-plate and V-groove solar air collectors based on
aluminium and copper- Ahmed Soliman
This study was conducted to evaluate energy- exergy and
economic environment performance of different type SACs in
Manisa Province Turkey.

National Conference On “Recent Innovations in Engineering, Science and Technology” April 2019
91
Mechanical study of metallized polyethylene terephthalate
(PET) films-Manasvi Dixit
This paper gives information about metalized film and its
different reflective properties.
III. DESIGN ISSUES
The main key component of our system is Receiver, parabolic
-dish, pump and Drying chamber.
Parabolic Dish: It is a simple DTH dish with focal point at a
distance of 300mm from the most shallow point from the dish.
It is covered with Metallized polyethylene terephthalate
(MPET) which is high reflective film and is readily available
in market. DTH dish are available in two typer one is single
focal which is eound in shape and second one is bi-focal dish
whish is elliptical in shape700×500 mm . we have spacifically
used a bifocal dish so thst we could get more heat flux at the
focalpoint.
Figure 3(B). Model of Reciever
Pump: It is centrifugal pump which is run by electric motor,
0.18 HP, 2800rpm, 220V.
It suck the hot air from receiver and discharges it to the drying
chamber.
Drying chamber: The drying chamber is the place where the
drying function takes place. It is fabricated with plywood to
minimize heat loss. The material has been chosen since
plywood is a poor conductor of heat and it has smooth surface
finish and also heat loss by radiation is minimum. The outer
portion of the drying chamber is black
Description Specification
Dimensions 0.46m×0.33m×0.59m
Material Plywood
Number of doors 1
Number of Trays 3
Chamber Capacity 10Kg
Number of air vent 1
Figure 3(A). Parabolic Dish (Actual)
Receiver: It is manufactured from Galvanised sheet metal.
The thickness of sheet metal is 1mm. its specific heat is around
0.49 kJ/kgᵒC. The cross section is taper in shape with inlet to
the lager end and outlet is to the smaller end.The larger
diameter is 3 inches and small diameter is 1.5 inches. For
heating purpose at the inlet, air is passed over over copper
coil covered in galvanized steel mesh which is placed exactly
at the entry of receiver. The receiver is covered with foam
insulation of optimum thickness to avoid any heat transfer due
to convection.
Working: The soul Objective of over project is to heat the air
for drying food products using solar energy. To achive this we
have used parabolic diah coated with MPET, this dish focuses
the solar radiation on the receiver where the copper coils at the
inlet of receiver gets heated. By using pump we draw air from
the receiver which get heated due to the coils. This air is
pumped to the drying chamber via air drying unit. Air drying
unit removes moisture from the air which may deteriorate the
food products After this the air is exhausted to the atmosphere.

National Conference On “Recent Innovations in Engineering, Science and Technology” April 2019
92
III. Result and analysis
Sr.No Time Temperature(ºC)
T1 T2 T3 T4 T5
1 11.30 103 70 63 61 31
2 12.00 110 73 65 63 32
3 12.30 113 78 69 65 33
4 1.00 117 80 70 66 36
Where, T1- Temp. at Focal point.
T2- Temp. at Pump
Inlet. T3-Temp. at
Pump Outlet.
T4- Temp. in Drying
Chamber. T5- Ambient
Temperature.
IV. FIGURES
Figure 4. Setup Diagram.
V. CONCUSION
1.Parabolic dish collector of small size gives same heat flux
as that of large flat plate collector.
2.The temperature achive at the drying chamber is higher
than that of flat plate collector system.
3.For a given tempature our system is much efficient
considering the weight and size as compere to flat plate
collector.
Future scope- 1.Tracking system can be integrated for more
efficient working.
2. System can be scaled for various
capacity.
3.Higher temperature can be obtained by increasing
the number of dishes
VI. REFERENCES
[1] Review of solar-energy drying systems II: an overview of solar
drying technolog, B. Norton.
[2] DEVELOPMENT OF A PARABOLIC SOLAR DRYER
FOR EFFICIENT SOLAR ENERGY USE IN THE RURAL AREAS
IN GHANA, Maame Tabuah Duah.
[3] Mechanical study of metallized polyethylene terephthalate (PET)
film, Sandhya Gupta.
[4] Solar dish concentrator for desalting water, Gustavo Otero Prad.
[5] Review of solar-energy drying systems I: an overview
of drying principles and theory,O.V. Ekechukwu
[6] Comarative drying performance study of natural convection solar
drying with traditional grapes drying method,Dillip R Pangavhane
[7 Evaluation of Solar Dryer/Air Heater Performance
and the Accuracy of the Result, Sandeep Mishra [8] Solar drying of agricultural products: A review, A.A. El-Sebai

National Conference On “Recent Innovations in Engineering, Science and Technology” April 2019
93
Study of Anti-reflection Coating
Prof. Dr. Manish D. Pasarkar Prof. Kunal U. Shinde Devendra P. Birari
Mechanical Engineering Department, Sandip Institute of Engineering and
Mechanical Engineering Department, Sandip Institute of Engineering and
Mechanical Engineering Department, Sandip Institute of Engineering and
Management, Nashik Management, Nashik Management, Nashik
[email protected] [email protected] [email protected]
Tejas P. Bandavane Kedar V. Walekar Susmit N. Datrange
Mechanical Engineering Department, Mechanical Engineering Department, Mechanical Engineering Department, Sandip Institute of Engineering and Sandip Institute of Engineering and Sandip Institute of Engineering and
Management, Nashik Management, Nashik Management, Nashik [email protected] [email protected] [email protected]
Abstract—An antireflection coating is type of optical coating
applied to the surfaces of lenses and other optical elements to
reduce reflection. It improves efficiency since less light is loss
due to reflection. The primary benefit is elimination of reflection
itself. Many coatings consist of transparent thin film structure
with alternating layers of contrasting refractive index.
Antireflection coating vastly improves efficiency by increasing
transmission. The antireflection coatings are especially important
if the system contains many transmitting optical elements also
many lowlight systems incorporate antireflection coated optics to
allow the efficient use of light. Antireflection coating method
is conventional method use to form the layer on the glass surface
to enhance its reflection properties. The antireflection layers
decrease the reflection of light over a broad spectrum. These
films are generally deposited on an outermost surface of an
image display device. Anti-reflection coatings are developed to
obtain the better refractive index to improve the performance.
Antireflection coatings are used in wide variety of applications
where light passes through an optical surface, and low loss or
low reflection is desire. The antireflection coating widely
implements on corrective lenses, camera lens elements and solar
cell, which is used to reduce loss due to reflection. This coating is
useful in situation where high transmission through a surface is
unimportant or undesirable but low reflectivity is required. It
produces very low reflectance.
Keywords—anti-reflection coating, improve efficiency,
refractive index.
I. INTRODUCTION
Light reflection is an undesirable phenomenon in various
optical instruments such as eye wears lenses sensors. The
idea of antireflection coating was quite incidentally
constructed by Lord Rayleigh in 19th century when he
observed that the tarnishing on glass increasing its
transmittance instead of reducing it this lead to strategy of
achieving anti-reflectivity by gradually varying the
refractive index Researchers are trying to reduce these
undesirable lights by using different strategies, etching
methods or patterning the surface with a film known as
antireflection coating to lessen the reflectance and
enhancing the transmission. Anti-reflective coating is
coherent layer formed from single or multiple application of
a coating material to substrate. A coating material in liquid,
past or powder which, when applied forms a protective
decorative coating. it includes complex chemical
subsequent, improving in enhancing the light transmittance
and reducing the reflective light has been achieved by
appropriate AR coatings. The transmission properties of
coating are dependent upon wavelength of light being used,
the substrates index of refraction, the index of refraction of
coating, the thickness of coating and the angle of incident
light. Destructive interference between two reflected beams
occurs, cancelling the both beam before exit of the surface.
The optical thickness of coating must be of odd number of
quarter wavelength.
As light passes through an uncoated glass substrate,
approximately 4% will be reflected at each interface. This
results in a total transmission of only 92% of the incident
light. Applying an AR coating on each surface will increase
the throughput of the system and reduce hazards caused by
reflections travelling backwards through the system.
To reduce the reflectance rate is to gradually reduce the
refractive index of the film from refractive index of
substrate to the refractive index of air. The refractive index
of a material is a dimensionless number that describes how
fast light propagates through the material.
II. LITERATURE REVIEW
¨Ozlem DUYAR, H¨useyin Zafer DURUSOY, had studied
and design the antireflection and optical coating. He used to
deposit the both side of glass substrate were deposited a
two-layer coating of MgO/MgF2 via electron vapor
deposition to produce an antireflective coating in the visible
and near infrared region. The order of high and low indices
of film layer is crucial parameter for designing highly
reflective optical coating. Quartz glasses were taken as
substrate for simulation of multilayer film. TiO2 and MgF2
increases high refractive index. The reflectance rapidly
approaches to increasing number of layers. This increases
National Conference On “Recent Innovations in Engineering, Science and Technology” April 2019
94
the efficiency but in order to this will increases the number
of layers [1]
Khuram Ali*, Sohail A. Khan, M. Z. Mat Jafri, Studied the
effect of double layer SiO2/TiO2 antireflective coating on
silicon solar cell. Silicon based solar cell have been
fabricated for single layer SiO2 and double layer SiO2/TiO2
antireflective coating using rf sputtering technique. a
reflection spectrum of DLAR was measured which shows
minimum reflection of 2.3% of 630nm. Double layer of
SiO2/TiO2 coating could be valuable in achieving highly
absorbent surfaces in opt electron devices and producing
high efficiency low cost silicon solar cell. It prepared using
3-5`Ωcm boron doped monocrystalline Si wafer with one
side polished. Si substrate initially removed by RCA
method. Deionized water rinse and N2 blow emitter region
was fabricated by thermal diffusion of phosphorous atom in
a quartz tube furnace at 1000C. it may difficult to achieve
desire film thickness so it possesses low efficiency. This can
make the environment more toxic and also the encountered
the base material properties [2]
Feng Zhan, Zhipeng Li, Xiaoming Shen, Huan He, Jianmin
Zeng designed the multi-layer antireflection coating for
terrestrial solar panel cell. The reflectivity at normal
incident Sio2/ZnS double layer anti-reflection coating is
typically implement on the Al film. It implements by the
transfer matrix method to models the reflectance of the
system as this approach to analyses the multilayer film. In
this method the refractive index and thickness can be
determined by using interference matrix to each layer
analyzed. In these two different layers of SiO2 and ZnS are
deposited by the or the optimized by EAR [effective average
reflectance] and WAR [weighted average reflectance]. This
study shows that the optimization of antireflective coating
by effective average reflectance is more convenient and
more feasible. This method gives the uniform thickness on
the base surfaces. This will not hammer the subject [3].
Vikas, Surya Narain Diksit studied the antireflection coating
for highly efficient solar cell. He used different technique to
obtain better result for this. Antireflection coating are
applied to photovoltaic cells to ensure gradual increase of
refractive index as incident photons transverse from the air
through to absorber to reduce backward reflection losses.
application of the thin film of SiO2 and TiO2 using Sol-gel
process where it utilized as antireflection coating on
monocrystalline silicon wafer. sol-gel process is the method
for producing small solid material from small molecules.
Sol-gel provides uniform distribution of antireflection
material on substrate than the plasma enhances chemical
vapor deposition. Solar cell efficiency reduces because of
reflection of light from surface silicon surface reflects light
about 30% and gas reflects 32.58% [4].
Sajjadi, Seyed Pooyan studied durable thin films with a
variety of properties can be deposited on a substrate by spin-
coating or dip-coating. When the "sol" is cast into a mould,
a "wet gel" will form. With further drying and heat
treatment, the "gel" is converted into dense materials. If the
liquid in a wet "gel" is extracted under a supercritical
condition, a highly porous and extremely low-density
material called "aerogel" is obtained. The sol gel process is
most promising technique to produce the uniform coating of
the nanomaterials. One of disadvantages of the sol-gel
process is its moisture sensitivity, which results in short
shelf life of the solutions, viscosity and coating thickness
variations with ambient conditions. Polycondensation may
continue during storage, which is dependent also on storage
temperature [5].
Medugu D. W., Adisa A. B., Burari F. W. and Abdul‘Azeez
M. A, studied the correlation between measured and
predicted values of solar radiation was made. A series of
daily measurements of the global solar radiation on a
horizontal surface was recorded in Mubi with the aid of a
constructed pyranometer. The monthly average value was
determined. The monthly average daily solar radiation on
horizontal surface was also determined using sunshine
duration. These parameters were input in some radiation
models to compute the solar radiation. Finally, a prediction
of the global solar radiation from climatological data has
been attempted. The predicted values have been compared
with the corresponding measured values. Predictions and
measurements were found to be in rather good agreement.
These results indicate that the pyranometer developed may
be used satisfactorily for the measurement of solar radiation
in the world‖ [6].
C. K. Pandey and A. K. Katiyar presents a brief account of
the general introduction, principle, experimental technique,
measurements of solar radiation data, and review of
literature of solar radiation models and describes present
trend of solar energy modelling which is of major interest to
solar energy engineers, architects, designing building, and
thermal devices for optimum and efficient utilization of this
nonconventional energy resource [7].
Che-Chun Lin, Dong-Sing Wuu, Jung-Jie Huang, to
improve the silicon nanowires solar cell of conversation
efficiency is one of the most important and challenging
problems, the antireflection coatings and surface passivation
technique were very important. In this investigation,
aluminium oxide coatings were deposited on silicon
nanowires by using liquid phase deposition. The deposition
solution of aluminium sulphate and sodium bicarbonate
were used for aluminium oxide deposition. The Al2O3 film
can cause different surface passivation at different annealing
temperatures, allowing the Al2O3/SiNWs interface to form
different amounts of negatively charged AlO4 and
positively charged SiOx, that the mutually suppressing
action of the two oppositely charged structure. Under the

National Conference On “Recent Innovations in Engineering, Science and Technology” April 2019
95
optimal condition, the reflectance and effective minority
carrier lifetime of liquid phase deposited aluminium oxide
film were 0.97% and 31 μs, respectively. The aluminium
oxide films were used herein to fabricate antireflection
coating and passivation film to ensure low cost, good
uniformity, favourable adhesion, mass producibility, and the
formation of large-area thin film; thus, the liquid phase
deposition-antireflection coating film was highly favourable
for silicon based solar cells [8].
Jogender Singh, Farhat Quli, Douglas E. Wolfe, J. T.
Schriempf and Jason Singh, metallic and ceramic coatings
including chromium, molybdenum, titanium carbide (TIC),
and yttria partially stabilized zirconia (YSZ) coatings
deposited by electron beam-physical vapor deposition (EB-
PVD) will be presented along with their potential
applications. Coatings are often applied on a variety of
materials to extend the life of components under severe
thermal, corrosion, wear, and oxidation environments.
Interest in replacing chromium electroplating has sparked
the use of EB-PVD technology for the repair of navy
landing gear due to the high deposition rates of the EB-PVD
process. The surface morphology, microstructure, and
texturing of TiC films produced by reactive ion beam-
assisted, EB-PVD will also be discussed for wear resistant
applications in the cutting tool industry. [9]
Vikas kumar, Surya Narain Diksit, efficiency of solar cell is
a big issue in the present time. Anti-Reflection Coating
plays very important role in improving the efficiency of
solar cell. Anti-Reflection coating is typically specified by
either the maximum allowable reflectance at a single
wavelength or by the average allowable reflectance over a
specified wavelength range. Anti-Reflection coatings
intended for a single wavelength or a single angle of
incidence and very high performance can be obtained less
than 0.1% reflectance per surface at visible wavelengths on
glass substrates. A single layer of thin film of thickness
around 100nm of Silicon Dioxide (SiO2) and Titanium
Dioxide (TiO2), increases solar cell efficiencies by 3-4%
and a triple-layer coating can improve its efficiency by 39-
40%. The reflectance of solar cell can be reducing up to
3.2% by using Anti-reflection coating. So, multilayer coatings
of SiO2 and TiO2 can be used for highly conversion of
solar spectrum into electrical energy‖ [10].
uniformity, so according to field of application the material
for antireflective coating and suitable method is used to
develop these coatings.
III. CONCLUSION
We have studied the various methods to fabricate the anti-
reflective coating. Antireflective coating has evolved into
highly reflectance and glare reducing components for
various optical and optoelectrical equipment. The different
types of AR coating were studied and their fabrication
techniques were described. Some methods are used to
increase the strength where as some method increases the
REFERENCES
[1] Ozlem Duyar, Huseyin Zafer Durvsoy, Design and
preparation of Antireflection and reflection optical
coating.
[2] Khuram Ali, Sohail A. Khan, M. Z. Mat Jafri,
Effect of Double Layer (SiO2/TiO2) Anti-
reflection Coating on Silicon Solar Cells,
International of Journal Electrochemical Science, 9
(2014) 7865 – 7874.
[3] Feng Zhan, Zhipeng Li, Xiaoming Shen, Huan He,
Jianmin Zeng, Design Multilayer Antireflection
Coatings for Terrestrial Solar Cells, Hindawi
Publishing Corporation the Scientific World
Journal Volume 2014, Article ID 265351, 5 pages
http://dx.doi.org/10.1155/2014/265351.
[4] Vikas, Surya Narain Diksit, Anti-Reflection
coatings for highly efficient solar cells, Conference
Paper November 2015.
[5]
[6]
Sajjadi, Seyed Pooyan, Sol-gel process and its
application in Nanotechnology, Journal of Polymer
Engineering and Technology, 2005, 13, 38-41.
Medugu D. W., Adisa A. B., Burari F. W. and Abdul‘Azeez M. A. ‗Solar radiation: Correlation
between measured and predicted values in Mubi,
Nigeria‘ International Journal of Science and
Technology Education Research Vol. 4(1), pp. 11-
17, January 2013 [7] C. K. Pandey and A. K. Katiyar ‗Solar Radiation:
Models and Measurement Techniques‘, Hindawi
Publishing Corporation Journal of Energy Volume 2013, Article ID 305207, 8 pages
[8] Che-Chun Lin, Dong-Sing Wuu, Jung-Jie Huang
‗Antireflection and passivation property of
aluminium oxide thin film on silicon nanowire by
Coatings Technology (2018), liquid phase
deposition‘. Lin, C.-C., Surface &

National Conference On “Recent Innovations in Engineering, Science and Technology” April 2019
96
DESIGN & FABRICATION OF GREASE
FILLING MACHINE FOR UNIVERSAL
JOINT CROSS
Prof. Sunil M Mahajan1, Gaurav Malviy
2, Akshik Bhandari
3, Pratik Jadhav
4, Kapil Bagul
5
[email protected], [email protected],[email protected], [email protected],
Mechanical Department
Sandip Institute of Engineering & Management
Abstract— To Improve the efficiency, increase the
accuracy ,reduce the cycle time, increase productivity
and reduce the fatigue load caused to the worker while
filling grease manually in the universal joint cross
which is the most use in propeller shaft used in truck
& other four wheeler vehicles. As the grease filling in
Universal joint cross is done by manually in the
industries we design & fabricated a machine which
would semi-automatically filling the amount of grease
required in the universal joint cross. The result would
be accurate amount of grease being filled in universal
joint cross and the fatigue load on worker would be
reduced significantly.
Keywords: Grease, UJ cross, Linear Guide, Ultra
sonic Sensor, Ball screw.
III. INTRODUCTION
Grease is the semi-solid substance used for lubrication in
various fields in the industries .It is used in part where
friction occurs so as to avoid friction, wear and tear. In
many application it plays such vital role that it‘s in
accurate used can cause on lead to serve damages. In this
concept grease is filled manually in UJ cross. This
manual practice is carried out since a very long time. UJ
is used in propeller shaft, where axis of the shaft in
vehicle are in clinged to each other by some angle, to
transmit torque and rotational motion from one shaft to
another.While doing this work manually many
complications occur we got to know about these
complications while doing the survey company -
Mahindra sona limited which is situated in MIDC
NashikMaharashtra 422002. In this company the grease
filling in up cross is done by workers manually. 8 hours
work shift is done, cycle time of each job is 35 sec to fill
grease in all four holes. Expected outcome manually by
each person per shift 714 jobs. But considering the
fatigue load on workers and the pace of work only 610-620 jobs
are achieved by one
person.Thus it indicates that something is needed to be
done for reducing eliminating the fatigue load and even
reducing the cycle time. So, here we will be concentrating
on the following
Factors:-
1) Reducing/ eliminating fatigue load on workers
2) Increase Efficiency and Accuracy
3) Increase Productivity
4) Reducing Cycle Time
we will be making a semiautomatic machine which will
consist of a micro controller, 2-DC Motors, Grease tank
power supply, Two Channel Relay module Quick
Connector, Ultrasonic Sensor, single ferule Coupling,
Linear Rail guide, Flexible bushings and a mechanism to
bring the nozzles towards and away from center. In this
Machine the UJ cross will be set at a position after which
the sensor will be sense if the job placed well and then the
grease will be dispensed in all four holes with the help of
nozzles. The movement of nozzle will take place with the
help of a D.C motor which will be controlled by the
microcontroller for storing grease a tank will be used a
mechanism controlled/worker with the help of a D C motor
will provide the pumping flow of grease in the supply
lines. Even this motor will be controlled by the
microcontroller with the help of C++ language we will be
programming code/instructions & feeding that to
microcontroller which will control the systematic working
of the machine
Below are a few companies in which the manual working
of grease filling in UJ cross is currently done
1-Mahindra Sona limited, Nashik.
2-Hindustan hardy Spicer limited, Nashik.
A visit to Mahindra Sona limited which is situated in
MIDC Nashik Maharashtra,422007 for a survey we
observe the following conclusion .One JOB requires about
35sec to fill required (6grams) of grease in each four holes.
Thus, in one hour about 102 jobs approximate can be
achieved.

National Conference On “Recent Innovations in Engineering, Science and Technology” April 2019
97
The current Scenario is time consuming as the cycle
time required for a single job is approximately 35sec
which ultimately according to the calculations
completes hardly 100jobs.The manual process is
carried out in such a manner that the UJ is held by the
worker in left hand and then the grease pouch is
pricked from one end and then it is pressed and the
grease is filled inside the hole. BUT, this practice
involves uneven filling of grease at times excess or at
times less. This may lead to losses or damage of the
UJ in working conditions.
In order to avoid this damage at the customer end we
have planned a machine which will tend to satisfy
6grams of exact proportion perfectly and also increase
the productivity.
PROBLEM STATEMENT
The universal joint used in propeller shaft is held
together using UJ cross. Since UJ cross is a
continuously moving sub component of the main
assembly of propeller shaft, it needs to be greased
before assembly. The greasing process currently is
carried by hand i.e. the grease is filled in pouches and
filled in the cross manually. The problem occurring
during this manual fill is uneven amount of grease is
dispensed. As per ASME standards for propeller shafts
6 gms of grease should be present in one hole of UJ
cross.
I. Indentations And Equations
Axial force
Axial force = (π/4)*100^2*40 Mpa
=314159.26 N (Blind area)
(¼) BSP Thread OD = 13mm
Area = (π/40)*13^2 =132.73 mm^2
4 no.of couplings:
Total area = 4*132.73
= 530.92mm^2
Projected area = ((π/4)*100^2)—530.92 mm^2
=7853.98 –530.92 mm^2
=7323.06 mm^2
As per SKF shaft seat catalogue 0.34 Mpa pressure for
cylinder design pressure for:
Force Force = P * A
= 0.34 * 7323.06
Force =2486.4404 N (Axial)
Cylinder operating height
(h)= 150 mm
Volume:
= (π/4) *100^2 *180*10^-9
= 1.178*10^-3 (m^3)
Mass:
= 1.178*10^-3 * (980 Kg/m^3)
= 1.1191 Kg (For Prototype cylinder)
Design of cylinder Rod:
Material: AISI 1018 CS
Sut=410 Mpa
Syt=370 Mpa
Axial compressive load =2486.44
FOS =2
Allowable stress (compressive) = 370/2
= 185 Mpa
σ=F (axial)/Area = 2486.44/ (π/4)*(d) ^2
185=2486.44/ (π/4)*(d) ^2
d=4.136 mm
As this value is not practical to manufacture a rod, we have to consider
the rod dia. As 20 mm
BALL SCREW SELECTION:-
-From PMI ball screw catalogue
- Ball screw size
IN KGF =254.9291
Required screw size is OD= 14 mm
But
Standard Available screw size is 16 mm so we are ordered 16mm lead
=5mm standard Length is 300 mm.
Torque Required for Rotation of Screw:-
T= (Fa * l) / (2π*ƞ)
Here:
Fa= Axial load
l = lead of screw
ƞ= efficiency of ball
screw
T= (2486.44 * 5)/ (2π*0.9)
= 2198.04956 Nmm
= 2.198 N –m
IN Kg-cm
T= 22.4133 Kg-cm
Standard available grease motor torque =105 Kg-cm
Selection okay
PISTON & DISPLACEMENT FOR 24 gm:-
For 24 gm (6* 4 no‘s)
2.5263*10^-5 m^3 for 24 gm
25263 mm^3 is required displacement required height to be displayed
is
25263= (π/4)*(100^2)*(h)
h= (25263*4)/ (π*100^2)
h= 3.216 mm
Linear guide Selection:-
FOS =2
M= (2486.44)*(200)
M= 497288 N-mm

National Conference On “Recent Innovations in Engineering, Science and Technology” April 2019
98
M=0.745 KN-m
FIG:-Grease Filling Layout.
CONCLUSION
Thus we conclude that the cycle time is
reduced for filling grease in single Universal Joint-
Cross. As we see while filling the grease in Universal
Joint-Cross manually the time required for a single
piece is 35 seconds, while the same piece requires only
15 seconds by using machine. Thus 20 seconds are
reduced to complete one piece. Hence reducing the
cycle time. The time required to complete one job
manually is more than twice the time required to
complete one job by using machine. As a result the
production will be more than double. Thusincreasing
the efficiency. Accurate metered quantity of grease is
filled leading to minimizing the errors and also
minimizing the variations. As there is very less human
interference operator fatigue is also reduced
significantly.
Acknowledgements The authors of this paper sincerely thank our
honorable Prof.S M Mahajan to support and guide for
the project.
. REFERENCE
https://www.google.com/search?q=DESIGN+%26+
FABRICATION+OF+GREASE+FILLING+MACH
INE+FOR+UNIVERSAL+JOINT+CROSS&rlz=1C
1ZKTG_enIN812IN812&oq=DESIGN+%26+FABR
ICATION+OF+GREASE+FILLING+MACHINE+
FOR+UNIVERSAL+JOINT+CROSS&aqs=chrome
..69i57.1249j0j8&sourceid=chrome&ie
https://www.google.com/search?hl=en&source=hp
&ei=2xeaXPuJM5iHyAObvb6ICQ&q=design+of+
machine+elements+by+vb+bhandari+pdf&oq=desi
gn+of+machin&gs_l=psy-
ab.1.2.0i20i263l2j0l8.796.4981..8096...0.0..0.239.3493
.0j5j12......0....1..gws-
wiz.....0..35i39j0i67j0i131.vL0qu-ja_ww
https://shankar9119.files.wordpress.com/2013/07/do
me-bhandari.pdf
https://www.ijarse.com/images/fullpdf/1457440971_
738H.pdf
DESIGN, DEVELOPMENT AND STRUCTURAL
ANALYSIS OF UNIVERSAL
JOINT (Dhananjay S Kolekar, 2Abhay M. Kalje,
3Swapnil S Kulkarni).
Research on the Lubrication Mechanism of Grease for
High Speed Bearings. (Takayuki kawamuras.)

National Conference On “Recent Innovations in Engineering, Science and Technology” April 2019
99
HYDRATE BASED REFRIGERATION
SYSTEM
Prof. Ankit .K.Mishra1, Mr. Rutik Shalik Hyalinge,
Department of Mechanical Engineering
Sandip Institute of Engineering & Management (SIEM)
Abstract:
A novel refrigeration system called hydrate-based
refrigeration system was proposed, The system consisted of
five parts, compressor/pump, hydrate formation tank,
hydrate dissociation tank, expander and gas/liquid
separator. Compared with conventional compression
refrigeration cycle, hydrate-based refrigeration system uses
hydrate formation tank to replace condenser to achieve
heat release; hydrate dissociation tank for evaporator of
achieve refrigeration. Methyl fluoride,
cyclopentane/monofluoro cyclopentane and water were
used to form hydrate
as the working fluids.
1 INTRODUCTION
HBRS Cool supply was achieved through hydrate
dissociation at 278–282 K. Heat release was achieved by
hydrate formation at 303 K. Difluoromethane and
cyclopentane mixture can used as the working medium of
hydrate refrigeration system.Air conditioning power
consumption occupied a large proportion nowadays. A
refrigeration system is proposed which called hydrate-
based refrigeration system. HBRS, instead of evaporation
and condensation of conventional air conditioner, cooled
space through hydrate formation and dissociation. In
recent years
some researchers begun to utilize hydrate to change the
cooling cycle. Hydrate was mainly applied on cool storage
air conditionings design, flow performance,
thermodynamic and capability of cold storage. Douzet et
al. designed a real size air-conditioning system using a
tetrabutyl ammonium
bromide (TBAB) semiclathrate hydrate slurry as
secondary two- phase refrigerant. Delahaye et al. studied
the rheological properties of tetra-n-butyl phosphonium
bromide (TBPB) and carbon dioxide (CO2) worked as the
cold storage media. Lin et al.] made research on the
thermodynamic properties of semiclathrate.
.
2.LITERATURE REVIEW
• Author - Wenxiang Zhang, Yanhong Wang,
Xuemei Lang, Shuanshi Fan.
• Year of published – 2017
• Description - Air conditioning power
consumption occupied a large proportion
nowadays. A refrigeration system is proposed
which called hydrate-based refrigeration system.
HBRS, instead of evaporation and condensation
of conventional air conditioner, cooled space
through hydrate formation and dissociation.
2.1 HYDRATE-BASED REFRIGERATION
SYSTEMS
HBRS Cool supply was achieved through
hydrate dissociation at 278–282 K. Heat release was
achieved by hydrate formation at 303 K. Ohmura et al.
found that the difluoromethane and cyclopentane mixture
hydrate can form at 280.45–299.75 K and

National Conference On “Recent Innovations in Engineering, Science and Technology” April 2019
100
0.027–1.544 MPa through thermodynamic model
calculation and experimental test, which means
difluoromethane and cyclopentane mixture can used as
the working medium of hydrate refrigeration system.
Imai et al. reported the pair of difluoromethane and
cyclopentane was one of the promising guest
candidates suitable for a hydrate- based refrigerant.
Mori et al. verified hydrate could work as cool supply
medium in the air conditioning system through gas and
water reacting to form hydrate on high ambient
temperature, 303–308 K. The hydrate-based
refrigeration system achieved cool supply directly. In this
paper, three kinds of the hydrate-based refrigeration
system were proposed, HBRS-A is multiphase
compressor system, HBRS-B is single phase compressor
with single phase pump (mixed cooling), and HBRS-C is
single phase compressor with single phase pump
(separated cooling).
2.2 HBRS-A. (MULTIPHASE COMPRESSOR
SYSTEM)
Fig. showed the flow sheet of HBRS-A. Hydrate
dissociation tank worked as evaporator. Hydrate formation
tank worked as condenser. Both of the gas and liquids were
compressed by multiphase compressor. After multiphase
compressor, mixture of pressurized gas and liquids flew
into hydrate formation tank. Hydrate formed and
heat was released to the environment. Then
decompression, it flew into hydrate dissociation tank for
refrigeration. Hydrate dissociation occurred in dissociation
tank to absorb heat from cooling region and achieve
refrigeration. And the cycle was achieved.
2.3 HBRS-B.
(SINGLE PHASE COMPRESSOR
WITH SINGLE PHASE PUMP- MIX
COOLING
Fig. showed the flow sheet of HBRS-B. Hydrate
dissociation tank and hydrate formation tank also worked
as evaporator and condenser respectively. Low pressure
gas and liquids flew each own tubes. Gas compressor
flew the gas and liquid pump flew the liquids
separately. Pressurized gas and liquids mixed into the
hydrate formation tank to form hydrate, heat release
achieved. Formed hydrate flew into hydrate dissociation
tank through decompression. Hydrate dissociated with
heat absorption, and cooling was achieved. Gas and
liquids after hydrate dissociation was separated through
gas-liquid separator. Gas came into the
2.4 HBRS-C.
(SINGLE PHASE COMPRESSOR WITH
SINGLE PHASE PUMP- SEPERATED
COOLING)

National Conference On “Recent Innovations in Engineering, Science and Technology” April 2019
101
HBRS-C was similar to HBRS-B, shown in Fig..
The difference was that gas and liquids released heat
divided. Pressurized gas flowed into condenser to release
the heat to the circumstance. Then it flowed into
hydrate formation tank, mixed with liquids to form
Hydrate.
3.1 WORKING MEDIUM
phase equilibrium on methyl fluoride
(CH3F/R41), cyclopentane (CP)/monofluoro
cyclopentane (FCP) and water (H2O). Experimental
data was showed in Fig. With the addictive of CP or
FCP, it could moderate hydrate formation condition.
Hydrate formation pressure was relatively lower
under high temperature. In view of the experimental
data, 4 points was selected, (305.9 K, 2.988 MPa) and
(293.0 K, 0.336 MPa) for the system of R41, CP and
H2O, (306.2 K, 2.051 MPa) and (293.3 K, as hydrate
formation condition and dissociation condition of
the HBRS performance simulation. The dissociation
enthalpy of hydrate was calculated through the
Clapeyron equation. The dissociation enthalpy of
R41 + CP + H2O system under the condition of
(305.9 K, 2.988 MPa) was 269.6 kJ/ kg, while for R41
+ FCP + H2O system under the condition of (306.2
K, 2.051 MPa) was 247.2 kJ/kg.
The dissociation enthalpy of this hydrate was
higher than some other energy storage materials, such as
organic phase change materials, inorganic phase
change materials and eutectics And hydrate had a
sufficient long term stability, while many phase change
material had poor stability during thermal cycling Mass
concentration of CP or FCP was set to be 50 wt%, and
hydrate crystal presented type II. It was 16 small cages, 8
big cages and 136 water molecules. Big cages involved
28 water molecules, the rest formed small cages.
molecular structure of hydrate was
8C5H10_28H2O16CH3F_108H2O.
0.206 MPa) for the system of R41, FCP and H2O. It
was selected .
4.1 COEFFICIENT OF PERFORMANCE
• COP was the main index to reflect the
capacity of refrigeration systems.
• The effect of temperature and unit on the
COP of HBRS was as follow.
• for hydrate-based refrigeration systems find that
coefficient of performance was three or four times of
the conventional compression refrigeration.
• In hydrate-based refrigeration systems, the large
proportion in total power consumption is used in
compressing fluids, which hinders the improvement
of the coefficient of performance of the
hydratebased refrigeration system.
• Coefficient of performances of different types of
hydrate-based refrigeration systems are changed with
the ambient temperature.
• The highest coefficient of performance was
8.01–8.97, which is HBRS using methyl fluoride,
monofluoro cyclopentane and water.

National Conference On “Recent Innovations in Engineering, Science and Technology” April 2019
102
5. CONCLUSION
• The large proportion in total power
consumption is used in compressing fluids, which
hinders the improvement of the coefficient of
performance of the hydratebased refrigeration
system.
• For hydrate-based refrigeration systems find that
coefficient of performance was three or four times of
the conventional compression refrigeration.
• Highest coefficient of performance was
8.01–8.97.
6. REFERENCES
[1] Wang DC, Zhang JP, Yang QR, et al. Study of
adsorption characteristics in silicagel–water adsorption
refrigeration. Appl Energy 2014;113:734–41.
[2] Sarbu I, Sebarchievici C. Review of solar
refrigeration and cooling systems.Energy Build
2013;67:286–97.
[3] Perez-Lombard L, Ortiz J, Pout C. A review on
buildings energy consumptioninformation. Energy Build
2008;40(3):394–8.
[4] The National Energy Administration of China
released the total electricity consumption in 2015.
The National Energy Administration of China; 2016.
p. 1.
[5] Ge TS, Dai YJ, Wang RZ. Performance study of
desiccant coated heat exchangerair conditioning system
in winter. Energy Convers Manage 2016;123:559–68.
[6] Sag Nagihan Bilir, Ersoy H Kursad. Experimental
investigation on motive nozzle throat diameter for an
ejector expansion refrigeration system. Energy Convers
Manage 2016;124:1–12.
[7] Liu Jian, She Xiaohui, Zhang Xiaosong.
Experimental study of a novel double temperature chiller
based on R32/R236fa. Energy Convers Manage
2016;124:618–26.
[8] Jafari Rahim, Okutucu-Özyurt Tuba, Ünver
Hakkı Özgür, et al. Experimental investigation of surface
roughness effects on the flow boiling of R134a in
microchannels. Exp Therm Fluid Sci 2016;79:222–
30.[9] Jemaa Radhouane Ben, Mansouri Rami,
Boukholda Ismail, et al. Experimental investigation and
exergy analysis of a triple fluid vapor absorption
refrigerator. Energy Convers Manage 2016;124:84–91.
[10] Bellos Evangelos, Tzivanidis Christos,
Antonopoulos Kimon A. Exergetic and energetic
comparison of LiCl-H2O and LiBr-H2O working
pairs in a solar absorption cooling system. Energy
Convers Manage 2016; Energy Convers Manage
2016;110:436–47. 123:453–61.
[11] Singh Omendra Kumar. Performance
enhancement of combined cycle power
plant using inlet air cooling by exhaust heat operated
ammonia-water absorption refrigeration system.
Appl Energy 2016;180:867–79.
[12] Gogoi TK, Konwar D. Exergy analysis of a
H2O–LiCl absorption refrigeration system with
operating temperatures estimated through inverse
analysis. Energy Convers Manage 2016;110:436–47.
[13] Douzet J, Kwaterski M, Lallemand A, et al.
Prototyping of a real size airconditioning system
using a TBAB semiclathrate hydrate slurry as
secondary two-phase refrigerant – experimental
investigations and modeling. Int J Refrigerator
2013;36(6):1616–31.
[14] Clain Pascal, Delahaye Anthony, Fournaison
Laurence,

National Conference On “Recent Innovations in Engineering, Science and Technology” April 2019
103
ELECTRONIC STABILITY CONTROL Prof. P. P. Kulkarni
1, Mr. Kothawade Saurabh Ravindra
2
1Assistant Professor,[email protected]
2UG Student, [email protected]
Department Of Mechanical Engineering
Sandip Institute of Engineering & Management (SIEM).
Abstract: ESC (Electronic Stability Control) was introduced on the mass market in 1998. Since then, several studies showing the positive effects of ESC has been presented .In this study, data from crashes occurring in Sweden during 1998 to 2004 were used to evaluate the effectiveness of ESC on real life crashes. To control for exposure, induced exposure methods were used, where ESC-sensitive to ESC-insensitive crashes and road conditions were matched in relation to cars equipped with and without ESC .Cars of similar or in some cases identical make and model were used to isolate the role of ESC. The study shows that the positive and consistent effects of ESC overall and in circumstances where the road has low friction. The overall effectiveness on all injury crash types except rear end crashes was 16.7 +/- 9.3 %, while for serious and fatal crashes; the
effectiveness was 21.6 +/- 12.8 %. The corresponding estimates for crashes with injured car occupants were 23.0+/-9.2% and26.9+/-13.9%.For serious and fatal loss-of control type crashes on wet roads the effectiveness was 56.2 +/- 23.5 % and for roads covered with ice or snow the effectiveness was 49.2+/-30.2%. It was estimated that for Sweden, with a total of 500 vehicle related deaths annually, that 80-100 fatalities could be saved annually if all cars hadESC.On the basis of the results, it is recommended that all new cars sold should have ESC as standard equipment. Key Words :Electronic stability control, Vehicle behaviour, Wheel force, Understeer, Oversteer.
1.INTRODUCTION Electronic Stability Program (ESP) is an in-vehicle active control system which acts in loss of control situations to stabilise the vehicle. ESP technology has surpassed both Antilock Brake Systems (ABS) and traction control systems in enhancing the ability of in-vehicle technology to reduce the likelihood of unintended or unsafe vehicle behaviour. In simple terms, ESP uses a combination of systems and sensors to monitor four aspects of vehicle dynamics and intervene to prevent vehicle spin (loss of control) through selective braking and acceleration (Dang,2004; van Zanten, 2002). This Preliminary Regulatory Impact Analysis examines the impact of the proposal to establish Federal Motor Vehicle Safety Standard (FMVSS) No. 126, Electronic Stability Control Systems (ESC). ESC has been found to be highly effective in preventing single-vehicle loss-of-control, run-off-the road crashes, of which a significant portion are rollover crashes. Fig 1:- DOF of Vehicle(Hindwadi Publication corporation)
In recent years, the benefits of ESP technology have received much attention in the media and many road safety experts and advocates have recognised the likely benefits to road safety in Australia. Several international studies have evaluated the crash reduction abilities of ESP. Table 1 presents a brief summary of some of the related research and their findings. As can be seen, the crash reduction ability of ESP is well supported, with every study finding a substantial reduction, most notably for single vehicle crashes and those involving SUVs.
2. LITERATURE REVIEW.
There are some points worth considering which may limit the real world applicability of some
of this research, particularly to the Australian context. Much of the research is based on comparisons between the crash rates of specific vehicle models before and after the introduction of standard and optional ESP technology (for example, Aga & Okada, 2003; Dang, 2004; Page & Cuny, 2006). According to Farmer (2004), there is currently insufficient evidence to take into account differences in the effectiveness of ESP technologies between different manufacturers.

National Conference On “Recent Innovations in Engineering, Science and Technology” April 2019
104
Author Region Scope Findings
Dang (2004) U.S. 1997- • Passenger All states 2003 Cars: 30%
Fatal reduction in
crash single vehicle
data crashes
• SUVs: 63%
reduction in
single vehicle
crashes
Lie, Tingvall, Sweden 1998- • All crashes excluding rear-
end: 16.7 (±
9.3%) reduction
• Serious/fatal crashes excluding rear end: 26.9 (± 13.9%)
Krafft, & 2004
Kullgren (2006) Crash
data
Aga & Okada Japan 1994- • Single car (2003) 2000 accidents: 35%
(5 year reduction
vehicle • Head-on
life collisions: 30%
spans reduction
in • Severe damage
this crash: 50%
period) reduction
Crash • Moderate
data damage crash: 40% reduction • Casualty rate, single and head- on accidents: 35% reduction.
Farmer (2006) U.S. 2001- • Passenger 10 states 2003 Cars: 33%
Crash reduction in
data single vehicle
crashes
• SUVs: 49%
reduction in
single vehicle
crashes
Page & Cuny France 2000- • 44% reduction in relative risk of being involved in an ESP pertinent accident for ESP-equipped cars than
comapred
to other cars
(2006) 2003
ESC Today, drivers rely on much more technologically- advanced systems to help them while in motion, Antilock Brake Systems (ABS) are the first of braking technology developments, This is a four-wheel system that prevents wheel locking by modulating the brake pressure when the driver makes an emergency stop. Traction Control System (TCS) is the second technology. It deals with front to rear loss of friction between the tyres and the road during acceleration. [6] Electronic Control System (ECS) forms by incorporating the first two technologies, ABS and TCS, with additional capabilities. These are stability enhancement systems that have been designed to improve the car‘s lateral stability by electronically correcting and automatically assisting drivers in critical situations like under steer and over steer and in unfavorable conditions like rain, snow, sleet, ice. ESC systems have sensors that monitor the speed, the steering wheel angle, the yaw rate, and the lateral acceleration of the vehicle. Data from the sensors are used to compare a driver‘s intended course with the vehicle‘s actual movement to detect when a driver is about to lose control of a vehicle and automatically intervene in split seconds by applying the brakes to individual wheels and possibly reducing engine torque to provide stability and help the driver stay on course. 3. HISTORY Electronic Stability Program was invented by Bosch in 1995 and launched in the market with Mercedes Benz S600 coupe (ESP) and BMW 7 series E38 (DSC). At first, only luxury cars came with this feature. Many studies have reported the positive effects of ESC, also referred to as electronic stability program (ESP) or Dynamic Stability Control (DSC). Name of this technology varies with companies for example BMW refers to its system as Dynamic Stability Control (DSC), Mercedes calls it Electronic Stability Program (ESP), Toyota calls its Vehicle Stability Control (VSC), Ford calls it Advance Trac, and General Motors uses the name StabiliTrak, Active Handling, and Precision Control, Honda call its Vehicle Stability Assist. In this paper we would use the term ESC for sake of uniformity throughout the paper.[6] D. ESC: Past, Present, and Future Three technologies have been major in the realm of vehicle stability control: anti‐lock braking (ABS), traction control(TCS), and electronic stability Control (ESC).The development of ESC began in 1978 when Bosch introduced the world‘s first Anti-lock Braking (ABS). ABS was the first step in vehicle stability control. With the help of an electronic controller and brake hydraulic modulator, this system increased vehicle stability during heavy braking by preventing the wheels from locking. This system is very helpful while braking on slippery surfaces. ABS functions by using the wheel speed sensors to monitor each wheel and send that information to the central Electronic Control Unit (ECU). If the ECU detects an indication of any wheel locking up from the speeds of other wheels, it will use the hydraulic modulator to adjust the braking force applied to
the desired wheel. The best way ABS Is utilized is on slippery surfaces. There are three primary objectives of ABS: reduction in stopping distances ,improvement on stability, and steer ability during braking.
The next step in the development of vehicle stability control was Traction control system (TCS) by Bosch in 1987. The goal of traction control is to stabilize the vehicle during acceleration by preventing the wheels from spinning

National Conference On “Recent Innovations in Engineering, Science and Technology” April 2019
105
out of control. TCS seeks to improve traction of the wheels while accelerating. TCS uses all of the same components as previous ABS systems with the addition of engine management. By selectively applying the brakes to wheels that are slipping, TCS is able to increase the amount of traction for that wheel. This is especially important when the wheels are on surfaces with varying levels of friction. In addition to using the brakes to control the wheels while accelerating, TCS also uses engine management to control the vehicle. By communicating with the engine controller, the TCS system is able to control the amount of torque that is sent to the wheels. If the system detects that a wheel has almost no traction with the road and is simply spinning, the TCS system reduces the torque delivered to that wheel. The engine management system adjusts the amount of torque by controlling airflow to the engine ,fuel injection, and spark timing. By adjusting all of these elements, TCS is capable of greatly increasing or decreasing the amount of torque delivered to a wheel .Engine management greatly has reduced the dependence on braking systems, thus the amount of wear and tear on the brakes as well as the size of brakes necessary on the vehicle arereduced. 4.1 Understeer & Oversteer. Understeer occurs when you go around a corner too fast and the front wheels don‘t have enough traction. As a result you end up going forward instead of turning. Understeer is common on front wheel drive cars. Oversteer is the opposite, the car turns more than the driver intended to causing the rear wheels to slide out and the car to spin. Oversteer is common on rear wheel drive cars.
Fig.2 Understeer & Oversteer
4.2. Yaw Yaw describes the rotation of the car about the z-axis. Yaw angle is the angle between a line pointing in the direction the car is moving and the car's x-axis (which is the direction the car is pointed).
Fig 3: Various Car axes and alignments
5. SENSORS USED:- 5.1Hydraulic unit with attached control unit . The hydraulic unit executes the commands from the control unit and regulates, via solenoid valves, the pressure in the wheel brakes. The hydraulic modulator is the hydraulic connection between the master cylinder and the wheel cylinders. It is located in the engine compartment. The control unit takes over the electrical and electronic tasks as well as all control functions of the system.
Fig.4 Various Sensor Used In Cars

National Conference On “Recent Innovations in Engineering, Science and Technology” April 2019
106
5.2Wheel Speed Sensor
Fig 4. Wheel Speed Sensor. The control unit uses the signals from the wheel-speed sensors to compute the speed of the wheels. Two different operating principles are used: passive and active wheel- speed sensors (Inductive and Hall-effect sensors). Both measure the wheel speed in a contact-free way via magnetic fields. Nowadays active sensors are mostly employed. They can identify both the direction of rotation and the standstill of a wheel.
5.3Steering angle sensor.
Fig 5. Steering Angle Sensor
Fig 5. Steering Angle Sensor
The task of the steering-angle sensor is to measure the position of the steering wheel by determining the steering angle. From the steering angle, the vehicle speed and the desired braking pressure or the position of the accelerator

National Conference On “Recent Innovations in Engineering, Science and Technology” April 2019
107
pedal, the driving intention of the driver is calculated (desired state).
5.4 Yaw Speed Sensor
Fig 6. Yaw Speed
Sensor
A yaw-rate sensor registers all the movements of the vehicle around its vertical axis. In combination with the integrated lateral-acceleration sensor, the status of the vehicle (actual state) can be determined and compared with the driver‘s intention. 5.5 Communication with engine management ECU. Via the data bus, the ESP control unit is able to
communicate with the engine control unit. In this way, the engine torque can be reduced if the driver accelerates too much in certain driving situations. Similarly, it can compensate for excessive slip of the driven wheels provoked by the engine drag torque. 6. WORKING ESC is an always active system. A microcomputer or Electronic Control Unit monitors the signals from the ESC sensors and checks 25 times a second, whether the driver‘s steering input corresponds with the actual direction in which the vehicle is moving. If the vehicle is moving in a different direction, ESC detects the critical situation and responds instantly, independent of the driver. It uses the vehicle‘s braking system to ―steer‖ the vehicle back on the intended path. With these braking interventions, ESC generates the desired counteracting force so that the car reacts as the driver intends. ESC can also intervene on the engine side to accelerate the driven wheels, so that the car is kept safely on the desired track. ESC utilizes speed sensors to monitor the road wheels, as well as a yaw speed sensor to detect its level of movement through the z axis (spinning) and a steering wheel angle sensor. It also uses traction control and anti-lock braking systems as it can‘t work all on its own. Traction Control is used in order to drop acceleration from the wheel hat is deemed to be slipping. ESC also uses ABS to activate the brakes on individual wheels at the required level to prevent the driver from losing control.
6.1 Oversteer
You are approaching an obstacle unknowingly, as
the obstacle becomes visible you steer hard in the
other lane and to regain control you steer back to get
into your lane. This creates a moment across the z-
axis of the car and the rear wheels start, under forces
of inertia, skid off and slide causing the condition of
oversteer. This can even lead to Rollover if the speed
is high.

National Conference On “Recent Innovations in Engineering, Science and Technology” April 2019
108
Fig 7. Oversteer
If ESC is switched on, this condition can be completely avoided. ESC measures the changes in Yaw and communicates this data to ECU. The ECU uses the steering input that shows the intended direction of the driver, yaw that shows the direction the car is going in and applies brakes to the outer front wheel to compensate the yaw torque which was oversteering the car. This braking of outer front wheel creates a counter torque to bring the car back to the intended course/path and the crash is avoided all together. 6.2 Understeer. You are approaching a turn at a higher speed than the turning friction at your front wheels allow, now if you turn hard in your intended direction, the car will not be able to steer adequately and keep going in the direction it was going before due to inadequate friction at front wheels.
Fig 8. Understeer
If ESC is switched on, this condition can be completely avoided. ESC measures the changes in Yaw and communicates this data to ECU. The ECU uses the steering input that shows the intended direction of the driver, yaw that shows the direction the car is going in and applies brakes to the inner rear wheel to compensate the yaw torque which was understeering the car. This braking of inner rear wheel creates a counter torque to bring the car back to the intended course/path and the crash is avoided all together. 7. Features 7.1Hill Hold Control Hill starts are difficult when the vehicle is heavily loaded. The driver has to operate brake, accelerator and clutch pedals very fast in order to prevent the vehicle from rolling backwards. The ESC Hill Hold Control facilitates a hill start by keeping the brakes applied for about two more seconds after the driver has already released the brake pedal. The driver has enough time for switching from brake to accelerator pedal without using the handbrake. The vehicle drives off comfortably and without rolling backwards.
7.2. Hydraulic Brake Assist In critical driving situations, drivers often brake too hesitantly. The Hydraulic Brake Assist identifies a possible emergency braking situation by monitoring the pressure on the brake pedal as well as the pressure gradient. If the driver does not brake strongly enough, the Hydraulic Brake Assist increases the braking force to a maximum. The stopping distance is hence reduced. 7.3. Load Adaptive Control The volume and position of a commercial vehicle‘s load can vary considerably from trip to trip. The load has an important impact on the braking, the traction, the cornering ability and the roll-over tendency. The ESC Load Adaptive Control identifies changes in the vehicle mass and center of gravity along the longitudinal axis of the vehicle and adapts the interventions of the safety systems ABS, TCS and ESC to the vehicle load. In this way, Load Adaptive Control optimizes braking effectiveness, traction and stability. In addition, it reduces the risk of roll over via the improved utilization of Roll Over Mitigation and minimizes brake- pad wear by optimizing the distribution of braking forces. 7.4. Roll Over Mitigation The loading and the higher center of gravity of light commercial vehicles make them reach a critical lateral acceleration faster than passenger cars. The risk of roll
over is thus considerably higher. The Roll Over Mitigation function constantly monitors the vehicle behavior with the help of the ESC sensors and intervenes when the vehicle threatens to roll over. Roll over Mitigation brakes individual wheels and reduces the driving torque to prevent roll over and to stabilize the vehicle. 7.5Tyre Pressure Monitoring System A loss of tyre pressure leads to a deviant rotation speed of the wheel concerned. By comparing the wheel speeds a potential tyre deflation is detected. This value-added function permits tyre pressure monitoring without the use of pressure sensors in the tyres. 7.8Trailer Sway Mitigation Trailers sway easily. A minor steering error, a gust of wind or a bump on the road surface can cause a critical increase in the swaying movement. The counter steering and the acceleration of the towing vehicle make the critical situation even worse. With the help of the ESC sensors, Trailer Sway Mitigation identifies these swaying movements of the trailer and intervenes by braking individual wheels of the towing vehicle. The vehicle and trailer are slowed down to an uncritical speed and stabilized. 8. BENEFITS & ADVANTAGES.

National Conference On “Recent Innovations in Engineering, Science and Technology” April 2019
109
1. At least 40 percent of fatal road accidents are the result of skidding. Studies show that Electronic Stability Control (ESC) would reduce skidding accidents by up to 80 percent. In the European Union it is estimated that ESC could prevent more than 4,000 deaths and 100,000 injuries each year. In the US, these figures could raise to 10,000 deaths and 240,000 injuries.
2. If ESC is installed in a car, the risk of a fatal
accident is decreased by 25%. The risk of accidents
in which serious injuries occur are reduced by
11%, and overall, all accidents are reduced by 7%.
Fig 9. Reduction of accidents with ESC
3. ESC is particularly effective at preventing
crashes in slippery conditions, with 20% less risk of
a crash in icy conditions, 9% in wet
conditions, and 5% in dry conditions. 4. If 10% of cars were to be fitted with ESC, 779 crashes could be prevented every year, saving £96 million. This saving would rise to a total of 7800 prevented crashes, which would save £959 million per year. 5. Studies of the effects of ESC show differing levels of benefit for different countries. For instance in America, a report by the Insurance Institute for Highway Safety suggested that the risk of overturning a car would reduce by 77%. Similarly, a University of Michigan report suggested that ESC could reduce the likelihood of non-fatal crashes on wet ,snowy, or icy roads by 75% for cars, and 88% for SUVs, along with a reduction on dry roads of 40% forcars and 53% for SUVs. 9. CONCLUSIONS. - ESC was found to reduce crashes with personal
Injuries, especially serious and fatal injuries. - The effectiveness ranged from at least 13% for Car occupants in all types of crashes with serious or Fatal outcome to a minimum of 35% effectiveness For single/oncoming/overtaking serious and fatal Crashes on wet or icy road surface.
10. Reference.
.1. Anders LieSwedish Road Administration
Claes TingvallSwedish Road Administration, Monash University Accident Research Centre
Paper number 05-0135.(2005)
2. National Highway Traffic Safety Administration. (2006). PROPOSED FMVSS No. 126 Electronic
Stability Control Systems. Washington: National Highway Traffic Safety Administration
3. Dale Steinhardt, Andrew Wills, & Andry Rakotonirainy
Centre for Accident Research and Road Safety – Queensland (CARRS-Q), Institute of Health and Biomedical Innovation (IHBI), Queensland University of Technology (QUT).(2007)
4. Hindawi Publishing Corporation Discrete Dynamics in Nature and Society
Volume 2015, Article ID 251207, 8 pages
http://dx.doi.org/10.1155/2015/251207
5. International Journal of Automotive Technology, Vol. 16, No. 3, pp. 435−445 (2015)
DOI 10.1007/s12239−015−0045−y.
6. International Journal of Science, Engineering and Technology Research (IJSETR) Volume 5, Issue 9, September 2016

National Conference On “Recent Innovations in Engineering, Science and Technology” April 2019
110
Needle Filling Machining
Prof. T. D. Patil, Mayur Shinde, Pavan Bachhav, Amit Kanse,
Department Of Mechanical Engineering.
Sandip Institute of Engineering and Management
Nashik.
Abstract— Needles plays an important role in various types of
bearings. Needles felicitate easy and smooth joint movement.
Needles are the integral part of bearing cups used in universal
joints. These bearing cups consist of a metallic cup, needles,
rubber washer and an oil seal at the top. There are various
manufactures of bearing cups in India. The needle filling process
is one of the tedious and time consuming process. This process
requires a lot of man power and manual work. In this process an
empty cup is taken and then grease is applied to the bearing cup
at its inner periphery. Once grease is applied needles are placed
one by one manually. This paper aims to develop a mechanism for
the above stated process. This mechanism will reduce the human
efforts and time. The concept behind development of mechanism
is using the adhesive nature of grease. Since grease has high
viscosity the needles get stick to it. We are developing mechanism
in which the needles will get stick to the bearing cup in one
stroke. Also we are planning to develop a mechanism for
automatic refilling of needle in the fixture used for sticking
needles in the bearing cup. The expected outcomes of this idea
are to decrease the cycle time required for needle filling, to reduce
human efforts which are currently wasted, to increase the
productivity and to increase the profit of the company.
Keywords— bearing cups, Needles, automatic refilling, cycle time,
human efforts etc.
I. INTRODUCTION
1.1 Problem Statement-
Universal joints used in propeller shafts generally has a
sub assembly in both ends. This sub assembly consists of
flange, stub, UJ cross bearing cups etc. The bearing cups used
have a sub assembly too. The sub assembly of bearing cup
consists of a metallic cup, a layer of grease, needles & oil seal.
There is a standard procedure of bearing cup sub assembly.
Initially the inner side of bearing cup is applied with grease.
After applying grease the needles are placed in the bearing cup
one by one by hand. After placing the needles, the bearing is
fitted with an oil seal in order to retain the grease and needles.
This oil seal is pressed using a hand press. The above stated
process is very tedious and time consuming. Also it requires a
lot of man power as the production requirements are high.
Hence we are planning to develop a machine which will make
the process of needle filling easy and less time consuming.
1.2 Objectives-
To reduce the time required for needle filling into the
bearing cups.
To reduce the human efforts wasted in tedious job of
needle filling.
To increase the productivity of the assembly line.
To help in improvement in OEE i.e. Overall
Equipment Efficiency of the line.
II. History & Background
2.1 Paper no 1: Failure Analysis of Bearing Cup
Power transmission system has different constructive
features according to the vehicle‗s driving type which can be
front wheel drive, rear wheel drive or four wheel drive. In rear
wheel drive system, elements of the system include clutch,
transmission system, propeller shaft, joints, differential, drive
shafts and wheels. Each element has many different designs
and construction properties depending on the brands of
vehicles. The carden shaft also called drive shaft is used to
transmit motion from gear box to differential. The problem
identified after critical analysis of the drive shaft assembly. In
that bearing cup assembly was getting cracked during
assembly operation in universal joint assembly. This was
highest rejection, hence it was decided to eliminate bearing
cup failure in drive shaft assembly with cost effective solution.
This paper will highlight the methodology adopted for
finalizing the solution to this problem by means of the FEA
analysis supported by logical reasoning. Various Heat
Treatment processes are compared and it was found that
Carbonitriding process is the optimum solution which will
reduce the failure of bearing cup as well as reduce the overall
manufacturing cost.
.
III. DESIGN ISSUES
3.1 Design Of Shaft:
3.1.1 Shear Stress in a shaft

National Conference On “Recent Innovations in Engineering, Science and Technology” April 2019
112
Shear stress, SS =
Where,
T = torque= Force x Radial distance.
Force= power of motor= 1kW
1 kW= 1000 N
Therefore,
Torque T= 1000 N x 0.008 m
T= 8 Nm
Now,
SS= 3.125x10⁷ N/m
2
D = diameter of the shaft =
D= 0.005 m
i.e. D= 5 mm
Considering FOS as 1.5
Final Dia. DF = D x FOS
Therefore,
DF= 5 x 3.1 = 15.5 mm≈≈ 16 mm (AT ROCKER END)
Table for Factor Of Safety:
General Recommendations:
FIGURE AND TABLE
Rough CAD Drawing of Shaft to be used:
IV. RESULT AND ANALYSIS
After implementing this mechanism we have reduced the
needle filling timing from 56 secs to 18 secs. This has
improved the efficiency of the process by 135.74 %. This
mechanism has saved manpower and improved the OEE
(Overall Equipment Efficiency)

National Conference On “Recent Innovations in Engineering, Science and Technology” April 2019
113
V.CONCLUSION
From this paper we successfully conclude that the
mechanism has effectively reduced the cycle time with
increasing the productivity by 135.74 %.
VI. REFERENCES
[1]Failure Analysis of Bearing Cup, Sachin Shelke 1,
Pradnya Kosbe 2 P.G. Student, Department of
Mechanical Engineering, JSPM College, Pune,
Maharashtra, India1 Associate Professor,
Department of Mechanical Engineering, JSPM
College, Pune, Maharashtra, India.
[2]Simplified modeling for needle roller bearings to
analyze engineering structures by FEM, Laszlo
Molnár,Károly Varadi, Gabor Bodai, Péeer
Zwierczyk , Laszlo Oroszvary.
[3]Investigation of Bearing Fatigue Damage Life
Prediction Using Oil Debris Monitoring, Paula J.
Dempsey, Glenn Research Centre, Cleveland, Ohio
Nathan Bolander and Chris Haynnes Satient
Corporation.
[4]New Product Development Time Reduction In
Indian Bearing Industry By Concurrent
Engineering Between Tool Design And Tool
Manufacturing, Sandeep Naga, Meenal Dadarwal,
Man Mohan Singh Sodhi,Victor Gambhir.
[5]Technology study report on bearing industry,
MSME Development institute india

National Conference On “Recent Innovations in Engineering, Science and Technology” April 2019
114
Sensing and Control of Temperature,
Humidity and Water Level in a
Poultry Farm
Prof. Kiran D. More1,Sanket Gangurde
2,Sushil Jadhav
3,Nilesh Ghuge
4,Vishal Pawar
5
[email protected],[email protected],[email protected],[email protected],[email protected] om.
Mechanical Department
Sandip Institute of Engineering and Management
ABSTRACT - The chicken production in the world has been
increasing gradually because of standardized farming
management and good manufacturing practices.
According to world‘s agricultural produce survey, chicken is
the most favourite produce, since it is a nutrient rich food
providing high protein, low fat and low cholesterol, and lower
energy than other kinds of poultries. Nowadays automation
plays very important role in our life. Here we concentrate on
the combination of wireless sensors and mobile system
network to manage and remotely monitor environmental
parameters in poultry farm.
The environmental parameters like temperature, humidity and
water level are monitored and controlled automatically. The
person in-charge can able to get the knowledge regarding the
interior atmosphere of poultry farm by receiving a message on
his mobile number. Based on the message received the owner
can take appropriate action to control the parameters. In
addition we have also designed to control and monitor the food
valve so that sufficient food is always available in the plate.
The environmental conditions monitoring and control‘s ability
is crucial and demands a good level of research in fields
ranging from the change in climatic conditions in agriculture
and zoology. According to world‘s agricultural produce
survey, chicken is among the most favorite produce, since it
is a nutrient rich food providing high
protein, low fat, low cholesterol, and low energy than
other kinds of poultries.
INTRODUCTION
In the growth of the chicken climate plays a vital role.
Smart poultry farm is designed in such a way that
the climate can be changed by ventilation, cooling fan and
exhaust fan. The parameters temperature, humidity, and
water level are monitored and controlled with the help of
PIC microcontroller. In contemporary world automation
plays a vital role. Automation of poultry farm by using
wireless sensor network and mobile communication
system. Chicken is the most favourite produce in today‘s
world because it is a nutrient rich food with high protein,
low fat and low cholesterol than other poultries.
Environmental parameters of a poultry farm such as
temperature, humidity and water level are monitored and
controlled automatically to increase the productivity of
chicken. Food valve also controlled and monitored
with the help of DC motor without human interference.
By connecting all the sensor modules to the
microcontroller all sensor values are acquired then using
Wi-Fi module it will be uploaded to the web page. The
person in-charge of the poultry farm can get the
internal environmental situation of poultry farm
through PC or mobile phone
using internet. This system will control temperature,
ammonia gas and intensity of light with the help of
respectively cooling fan, ventilation window and light
ON/OFF without human interference. Based on the
threshold values it will switch on the devices. System
design provides automated poultry, reduces man
power and increases production of healthy chicken.

National Conference On “Recent Innovations in Engineering, Science and Technology” April 2019
115
From the last few decades, around the globe, there
has been an increased level of awareness regarding the
food safety and there has been a high demand for better
quality food. This has forced many countries to adopt
new protocols to change all manual farms into automated
farm. In this way, smart poultry farm has a great
impact on increasing productivity of chicken. This paper
focused on modern technologies for a poultry farming to
control all environmental parameters which effects on the
growth of the chickens. If environmental condition is not
up to the mark then there may be harmful for digestive,
respiratory and behavioural change in the chickens. If
chickens may get suitable atmosphere and proper water
then it may grow rapidly and health of chickens will be
good so the weight of the chickens will be increases. In
the growth of the chicken climate plays a vital role.
Smart poultry farm is designed in such a way that the
climate can be changed by ventilation, cooling fan and
exhaust fan. Environmental parameters are monitored and
controlled with the help of microcontroller. Monitored
sensor values can know the internal environment of
poultry farm through mobile. Poultry farming is the
process of raising domesticated birds such as chickens,
ducks, turkeys and geese for the purpose of farming meat
or eggs for food. This research focused on modern
technologies for poultry farming to control all
environmental parameters like temperature, humidity,
ammonia gas that affects on the growth of the chickens.
If the environmental condition is not up to the mark then
there may be harmful for digestive, respiratory and
behavioral change in the chickens. If chickens may get
suitable atmosphere and proper food then it may grow
rapidly and health of chickens will be good so their
weights will increase. Climate plays quite important
role in the growth of the chicken.
LITERATURE SURVEY
Archana M P1, P.G. Student, Department of Computer
Science and Engineering, P.E.S. College of
Engineering, Mandya, Karnataka, India. The system
could work on the application of the smart phones
helping the owner to monitor real time environmental
contexts such as temperature, humidity, ammonia gas,
light instance etc. It describes an Integrated Solution
for Smart Poultry Monitoring Using WSN. [1]
Eric Hitimana, Gaurav Bajpai , Louis Sibomana.
Department of Computer and Software Engineering ,
Richard Musabe PhD student .control mechanism
helps to provide time to time water supply to the
chickens as well as help to avoid the wastage of
water. Usage of IoT helps the farmer to monitor the
internal environment of poultry farm and also get all
details about the farm from anywhere and anytime. [2]
SiwakornJindarat, et.al.. To solve the problem author
as utilized Raspberry Pi and Arduino Uno. This
framework should screen the encompassing
parameters of poultry condition counting moistness,
temperature, atmosphere quality and the channel fan
switches. This framework is discovered exceptionally
basic and valuable for farmers, as they can
successfully control the poultry cultivate whenever
and from anywhere [3].
RupeshI.Muttha, et.al. With the assistance of present
day strategy it is additionally conceivable to screen
the ecological conditions like moistness and
temperature. For an entire care of chicken it is
essential to screen and control the earth of poultry
for the better development of chickens [4].
Boopathy.S, et al. has elaborated the performance of
poultry farm using an embedded automation. This
system discussed the measurement of different
environmental
parameters of the poultry farm such as temperature,
humidity, level of water and valve control [5].
Rupali B. Mahale, et al. The system highlight the
technology based solution for low cost, asset saving,
quality oriented and productive management of
poultry farming. This system intended to explore
utilizing an intelligent system using embedded
framework for design of smart farm [6].

National Conference On “Recent Innovations in Engineering, Science and Technology” April 2019
116
O. M. Olaniyi, et al. has studied Associate in
Nursing Intelligent Poultry Feed and Water Dispensing
System victimization mathematical logic management
Technique. Fuzzy logic system able to provide feed
and water for birds during specific interval of time.
System reduces workload of poultry workers, cost
benefits has increased [7].
Sneba. M. et al proposed an integration of wireless
sensors and mobile system network to control and
monitor following environmental parameters:
temperature, relative humidity, air impurity levels in a
poultry farm. They used DHT22 sensor module for
temperature and relative humidity, MQ135 sensor
module for air pollution level all of those measurements
are remotely monitored through the internet. [8].
Mohannad Ibrahim, et al described an approach to build a
cost-effective standardized environmental monitoring
device using the Raspberry-Pi (R-Pi) single-board
computer. The system was designed using Python
Programming language and can be controlled and
accessed remotely through and Internet of Things. It‘s
also designed to detect earthquakes through an assembled
seismic sensor [9].
Ms. Minal Goswami, Kirit Bhatt presented the design and
development of CC3200-based Claud IoT for
measuring
humidity and temperature. CC3200 is the first
SimpleLink WIFI internet-on-chip LaunchPad
developed by Texas instruments, USA in 2014. The
HRT393 sensor is used for measuring humidity and
temperature. Measured parameters are sent to the
Cloud servers of AT&TM2X Cloud technology
(HTTPS) [10].
Gerard Corkery et al discussed about using smart
sensing technologies into the poultry industry to
monitor critical environmental parameters which are
relevant to poultry production include inter alia air
temperature, relative humidity, light, air speed and air
quality (in particular CO2 and NH3
concentrations).[11]
METHODOLOGY
PIC has been used as a controller and ESP8266 is
used as wifi module. DHT11 has been used as a
temperature sensor, which can monitor and
observed the environmental temperature and send the
information to the microcontroller which can send the
current data and perform action according to that.
When temperature goes beyond threshold value then
automatically cooling fan will be ON to control
the internal temperature of poultry. The threshold
value of temperature is 40.6 degree to 41.7 degree
Celsius. Once, the temperature is below the threshold
value cooling fan will automatically turn OFF.
Similarly, DHT11 is used as a humidity sensor. This
can monitor and observed the environmental humidity
and send the information to the microcontroller which
can sense the data and perform action according to
current value of humidity in a poultry farm. When
humidity goes beyond threshold value then to control
that humidity Exhaust fan will automatically ON.
Once, internal humidity of poultry farm is under
control then fan will automatically turn OFF.
Water level control mechanism for a poultry farm has
been designed. It has been able to provide water to the
chickens as per the requirement. So water should not
get waste and health of the chicken will
automatically monitor. Similarly, Level Sensor has
fixed in a water tank to
measure the level of water. The threshold value of water
level has fixed. Once, the water level goes beyond that
fix level then water may fill in that the tank. All the
environmental data should be display on the LCD
display. It displays the data like temperature, humidity,
and water level as in the signed language which helps
workers of poultry farm to know the details of internal
environment of poultry farm easily. Acquired all the

National Conference On “Recent Innovations in Engineering, Science and Technology” April 2019
117
sensor values are uploaded to the web page. The person
incharge of poultry farm can see these data to their
mobile phone or personal computer using internet from
anywhere at any time.
CONCLUSION
The embedded system is an innovative technology
for chicken farming, which changes a traditional farm to
a ―Smart Farm‖ or ―Intelligent Farm‖. In addition,
the system could work on the application of the smart
phones helping the owner to monitor real time
environmental contexts such as temperature, humidity,
water level etc. It describes an Integrated Solution
for Smart Poultry Monitoring Using WSN
(wireless Sensor Network). Monitoring
environmental parameters in a real time industry
are crucial. Various environmental parameters for
effective growth of chickens have been identified
and defined. It also explains the method of Food
Control Mechanism for a poultry farm.
Threshold values of temperature, lighting, and food are
monitor and control by the microcontroller. As well as
remote monitoring is done and with the help of this
facility, the person in-charge can observe the situation
of
internal structure of poultry by sitting in a one
room as data will be display on a web portal.The
intelligent system can reduce cost, time, and labour is
highly user friendly to the farmers. This ideal system
will improve the human food requirements by
improving quality and quantity of chicken. This
system will also help in decreasing environment
pollution and improving health of poultry labour and
chicken consumer.
RESULT Temperature
Reading
Time (min) Temperature
(deg.celsius)
15.45 29
16 31.9
16.15 33
Humidity Reading
Time (min) Humidity (%)
15.45 45
16 32
16.15 29

National Conference On “Recent Innovations in Engineering, Science and Technology” April 2019
118
REFERENCES
Archana M P1, P.G. Student, Department of Computer Science and
Engineering, P.E.S. College of Engineering, Mandya, Karnataka, India.
Uma S K2 Associate Professor, Department of Computer Science and
Engineering, P.E.S. College of Engineering, Mandya, Karnataka, India.
Raghavendra Babu T M3 Assistant Professor, Department of Computer
Science and Engineering, P.E.S. College of Engineering, Mandya,
Karnataka, India3. [1]
Eric Hitimana, Gaurav Bajpai , Louis Sibomana. Department of
Computer and Software Engineering , Richard Musabe PhD student
ACEIoT 4Department of Electrical and Electronics Engineering
University of Rwanda, Kigali, Rwanda. [2]
SiwakornJindarat and PongpisittWuttidittachotti.―Smart
Farm Monitoring Using Raspberry Pi and Arduino‖. IEEE
2015 International Conference on Computer, Communication, and Control
Technology (I4CT 2015), April 21 - 23 in Imperial Kuching Hotel,
Kuching, Sarawak, Malaysia, 2015.[3]
RupeshI.Muttha, SanketN.Deshpande, Megha A. Chaudhari and Prof.
NiveditaP.Wagh, ―PLC Based Poultry Automation System‖,
International Journal of Science and Research, volume: 3, Issue: 3, June
2014.[4]
Boopathy.S 1, Satheeshkumar.M 2, Mohamed Feroz.A 3, Dinesh.R 4 PG
Student, Department of Embedded System Technologies‘ Anna
University, Regional Centre, Coimbatore, India1, 2 ,3, 4, ―Performance
Optimization of Poultry Farm By Using Instrumentation with Help of
Embedded Automation‖, International Journal of Innovative Research in
Science, Engineering and Technology An ISO 3297: 2007 Certified
Organization, Volume 3, Special Issue 1, February 2014 International
Conference on Engineering Technology and Science- (ICETS‘14).[5]
Rupali B. Mahale, Dr. S. S. Sonavane, ―Smart Poultry Farm
Monitoring Using IOT And Wireless Sensor Networks‖, International
Journal of Advance Research In Computer Science, Volume-7, No. 3,
May-June 2016. ISSN No. 0976-5697.[6]
O M Olaniyi, A. F. Salami, O. O. Adewumi, O. S. Ajibola, ―Design of an
Intelligent Poultry Feed and Water Dispensing System Using Fuzzy Logic
Control
Technique‖, Control Theory and Informatics www.iiste.org ISSN
2224-5774 (Paper) ISSN 2225-0492 (Online) Vol.4, No.9, 2014. [7]
Sneh. M, T. N. Raghavendra, Dr. H. Prasanna Kumar, ―Internet
Based Smart Poultry Farm using LabView‖, International Research
Journal of Engineering and Technology (IRJET), e-
ISSN: 2395 -0056, 2016. [8]
Mohannad Ibrahim, Adbelghfor Elgamri, Sharief Babiker, Ahmed
Mohamed, ―Internet of Things based Smart Environmental Monitoring
using the Raspberry-Pi Computer‖, IEEE, Fifth International on
Digital Information Processing and Communications (ICDIPC),
2015, pg 159-164, 2015. [9]
Ms. Minal Goswami, Kirit Bhatt, ―IOT Based Smart Greenhouse and
Poultry Farn Environment Monitoring and Controlling Using LAMP
Server and Mobile Application‖, IJARIIE, ISSN(O)-2395- 4396, vol-
3, Issue-
2, 2017. [10]
Corkery, Gerard; Ward, Shane; Kenny, Colum; Hemmingway, Phil,
―Monitoring environmental parameters in poultry production
facilities‖, Computer Aided Process Engineering - CAPE Forum 2013,
2013. [11]

National Conference On “Recent Innovations In Engineering Science And Technology”, April 2019 A REVIEW ON FLY ASH SLOPE STABILITY Prajwala Chachadi1, Rajeshwari M. Puranik2& Prasanna Patil3
[email protected], [email protected] [email protected] Department Of Civil Engineering Basaveshwar Engineering College ,Bagalkot Karnataka ,India 587103 Abstract: Fly ash is a by product of coal based thermal power plant and it’s disposal causes several environment and ecological problems. Proper utilization of flyash is major concern in India. Fly ash can be used as backfill material for low lying area. The laboratory model tests can be conducted with and without reinforcement in flyash to check strength and stability of fly ash slope . Fly ash is used as filling material and plastic scraps and different geo-synthetics are used as reinforcement materials. The square and different footings are rest at various position on steep slope of different angles .From experimental works load carrying capacity,settlement and deformations of flyash slopes are determined and from the data, load –settlement curves have been reported. It is concluded that load carrying capacity is high in case of reinforced flyash slopes to unreinforced flyash slopes and numerical analysis is carried using PLAXIS 2D software . Keywords: Fly ash ,slope stability, Plastic scraps, Geo synthetic, Steep slope, PLAXIS 2D.
I. INTRODUCTION Most of the thermal power plants in India are facing difficulty for disposal and utilization of fly ash. The effective uses of the industrial wastes which are used as a substitute for natural soil in the construction not only solve the problems of disposal and environmental pollution but also help to preserve the natural soil. One of the industrial wastes used as a construction material is the fly ash. In India utilization of Fly ash is less than 25% of the total fly ash produced. In this direction over the past few years many researchers have attempted to convert this waste into useful civil engineering construction material. Hence, the proper utilization fly ash is major concerned in India. It may be used in embankment. Steepened slopes can reduce the cost up to 50 % as compared to retaining walls. Fly ash can be utilized as a fill material in many civil engineering applications, mainly in the construction of roads and embankments. Fly ash provides an economical and suitable alternative to good earth for construction of embankments. The performance of such materials can substantially improved by introducing reinforcing element such as geo grid. Reinforced soil slopes have broad applicability in the construction of highways. The objective of the study is to check the feasibility of using Plastic recycled polymers with fly ash in construction of steep slopes so that a innovative methodology could be adopted for its utilization. The experimental analysis and validation using finite element method for the methodology II. LITERATURE REVIEW The study of effect on stabilityof slope observed in various literatures. Several experimental, analytical and numerical analyses were performed with different reinforcement materials and geo-synthetic materials of the slope stability and bearing capacity by various authors. S.Adhana et.al(2011): The model tests were conducted in the laboratory without and with reinforcement in fly ash steep slopes on soft foundation to check the stability of steep slope. In this two types of reinforcement were used: (a) Three dimensional circular Geocell strip made from waste plastic bottles and (b) polyester geo grid strip, with test box of 70*50*40cm were used. From the experiments, load and settlement have measured. From these data, load -settlement curves have reported. It has been observed from test results that load carrying capacity of geo-cell is more than that of geo grid strip. The deformation of geo cell is slightly more than that of geo grid strip. Using PLAXIS 2D the failure pattern, deformations and factor of safety are reported based on analytical programme. The results from experimental data and analytical programme compared and reported.[5] K.S. Gillet.al(2012) : There is difficulty due to poor load-bearing capacity of fly ash, when footings rest on the top of the fly ash fill slope; but inclusion of polymeric reinforcements as horizontal sheets within the fill may be advantageous in improving the load-bearing capacity of reinforced fly ash slope. The aim of present investigation is to find out the efficacy of multi layer reinforcements in improving the load-bearing capacity when incorporated within the body of fly ash embankment. In model slope there is increase in load bearing capacity was observed in the laboratory. The experimental results were compared with the numerical findings obtained from the finite element analysis using software PLAXIS 2D [6] Tushar Vasant Salunkhe et.al (2014):The model tests were conducted in laboratory without and with Plastic Recycled Polymer (PRP) infly ash steep slopes on soft foundation soil (fly ash) to check the stability of slope. In this experiment fly ash was used as a slope filling material and Plastic Recycled Polymers made from waste plastic products (lower grade plastic products). From the experimental investigation, load and settlement were measured. From these data, load-

National Conference On “Recent Innovations In Engineering Science And Technology”, April 2019 settlement curves have been reported. It has been observed from test results that load carrying capacity of fly ash mixture with plastic recycled polymers slope is more than that of fly ash slope. The deformation of Plastic Recycled Polymers slope is slightly more than that of fly ash slope. The experimental results were validated with a Finite Element Software (PLAXIS 2Dversion). The failure pattern, deformation sand factor of safety are reported based on analytical program (Bishop’s simplified method) and Finite Element Method (FEM). The results from experimental data and analytical programme are compared [7] Tarun Kumar Rajak(2016): In this shear strength parameters of the soil stabilized with fly ash. The soil has been mixed with 10%, 20%, 30% and 40% fly ash by dry weight for conducting compaction test and direct shear test. The experimental results indicate that the dry density and cohesion value of soil decreases where as the angle of internal friction increases with increase in the percentage of fly ash. The analysis is done by using FLAC slope software. Parametric study has been done to calculate the factor of safety by considering different slope height at constant slope angle . The addition of fly ash enhances the strength and provides resistance to slope instability . It has been found from the analysis that the factor of safety increases with increase in percentage of fly ash at a particular height. 30% fly ash is obtained as optimum amount as stabilizer for a slope of certain height [9] Dr. A.I.Dhatrak et.al(2016): The laboratory model tests were conducted with and without reinforcement in fly ash to check the strength and stability of fly ash slope. Geogrid is used as reinforcement to improve the bearing capacity of slope. The square footing is rest at various position on steep slope of 60 and bearing capacity is checked. From the experimental study, load and settlement were measured. For optimum configuration the same test were conducted on circular footing .From test results it is observed that the load carrying capacity of fly ash slope reinforcedwithgeogrid is more than that of unreinforced slope.[10] z
FIG 1: EXPERIMENTAL SET UP Karthik.S(2016):Soil is a peculiar material. Some waste materials such Fly Ash, rice husk ash, pond ash may use to make the soil to be stable. Addition of such materials will increase the physical as well as chemical properties of the soil. Some expecting properties to be improved are CBR value, shear strength, liquidity index, plasticity index, unconfined compressive strength and bearing capacity etc. The objective of this study was to evaluate the effect of Fly Ash derived from combustion of sub-bituminous coal at electric power plants in stabilization of soft fine-grained red soils. California bearing ratio (CBR) and other strength property tests were conducted on soil. The soil is in range of plasticity, with plasticity indices ranging between 25 and 30. Tests were conducted on soils and soil–Fly Ash mixtures prepared at optimum water content of 9% .Addition of Fly Ash resulted in appreciable increases in the CBR of the soil. For water contents 9% wet of optimum, CBRs of the soils are found in varying percentage such that 3,5,6and 9.We will found optimum CBR value of the soil is 6%.Increment of CBR value is used to reduce the thickness of the pavement and increasing the bearing capacity of soil.[11]
Summary Of The Literature Survey It is concluded from the literature review that a significant number of studies have been carried out on the footing located on the fly ash slope with reinforcement layer using numerical, analytical and experimental procedures, but the very few studies are reported on the footing located on the fly ash slope with different proportion of soil and plastic scraps and geo synthetics using as reinforcement layer III. Case Study Jindal Power Open Cast Coal Mine is almost flat with small undulations from surface. The lithological section comprises about 3-4 m unconsolidated loose soil/alluvium. Below the top soil there is weathered shale/sandstone up to 6–8 m depth. The weathered shale and sandstone are comparatively loose in nature and can be excavated without blasting. Below weathered zone (which varies from 3 – 10 m), the rock is hard, compact and massive in nature and can be excavated only after blasting. Thus the average depth of the excavation of these excavations, which can be removed, is about 16 m. In the sub-block IV/2 & IV/3 only lower groups of Gondwana sediments have been deposited. and almost uniform throughout the block. JPL admixture with OB, design of dump geometry, filed application and field monitoring for more than three years for the first time in India. Jindal Power Limited, Tamnar has already have captive thermal power plants of 1000 MW and generating fly ash, a solid coal combustion residue form due to the burning of coal, of nearly 16000 tons per day. Therefore, quantity of fly ash generated requires large area for its dumping. In last two decades it was realized that fly ash is no more a waste. Fig 2: Decks with Fly ash as admixture in overburden material after compaction

National Conference On “Recent Innovations In Engineering Science And Technology”, April 2019 Fig 3: A view of ash in OB site at JPL mines Fig 4: Grain size distribution of typical overburden (OB) and fly ash Table1:Shear parameters for the overburden, soil and Mixture of fly ash and OB
Fig 5:Compaction characteristics of mixture of overburden and fly ash (25%)
• Slope stability Analysis of JPL Mines The stability of dumped slope is analyzed by PLAXIS software, Version 9 using the geotechnical parameters. Finite element program for geotechnical applications in which Mohr- Coloumb models are used to simulate the behavior of dump material. Its implementation consists of three stages, known as input stage, calculation stage and post processing (curves) stage. Input stage contains model design, assigning the material parameters, boundary conditions, loading and meshing. In the present analysis 15-node triangular element is considered for meshing which contains 12 stress points. In the calculation stage, analysis type is chosen such as Plastic, dynamic, consolidation and phi-c reduction. The assigned loads are activated in this stage and analyzed. In the post processing stage, curves are plotted between various calculated parameters such as load Vs displacement. In PLAXIS Phi-c reduction method is used to compute factor of safety (FOS) for dump slope stability. The total multiplier ΣMsf is used to define the value of the dump material strength parameters at a given stage in the analysis. (1) The safety factor is then defined as the value of ΣMsf at failure, provided that at failure more or less constant value is obtained for a number of successive load steps. Different trials were made with overburden and mixture of overburden and fly ash with overall slope angle of 27. The compaction control may be periodically checked for proper compaction of overburden and fly ash mixture. Slope stability of the overburden dump after mixing of fly ash, it was observed that on the application of 25% fly ash mixture safety factor has increased to 1.78, which was only 1.32 with 8% fly ash mixture with overburden. Fig 6:Failure surface with factor of safety 1.75 as per PLAXIS analysis

National Conference On “Recent Innovations In Engineering Science And Technology”, April 2019 Fig.7. A view of the plantation over the admixture of OB and Fly ash at Jindal Power Limited, Tamnar • Conclusion Of The Case Study Field measurements conducted using total station monitoring system in a typical coal mine for the first experimental trial in India with admixture for fly ash and Overburden material indicated stability of dumps over one year period and also unwrapped the scope of new areas of application of research introducing wireless sensor Networks for evaluation of slope stability. Dump with alternative layer of overburden and overburden mixed with fly ash (only 25%) are found to be stable with safety factor more than 1.2 for total height of the dump. Displacement pattern of the monitoring stations during one-year period indicated no significant displacement in the Overburden dumps with fly ash ensuring stability of the dump near majority of the stations. Wireless Network system along with Time Domain Reflectometry (TDR) is also recommended, and attempts are being made for online and real-time monitoring of stability of slope in other opencast mines as sponsored by the Ministry of Mines, Government of India.[12]
• Transitioning from state of the art to state of the practice Fly ash is waste material ,it can be used as back filling material. Using fly ash model slope the stability and settlement can be checked using unreinforcement and reinforcements as plastic scraps and geo synthetic materials and experimental values are compared with PLAXIS 2D software. IV.Conclusion Based on study the conclusions are made • Fly ash can be used successfully as an embankment fill material. • Fly ash will solve the problem of its disposal leading to a better utilization of the product which does not decompose with time. • Bearing capacity of square footing on Fly ash slope is more than circular footing on slope.
• The MDD of the sample decreases whereas OMC increases with increase in the percentage of fly ash. It may be due to the lower density and lower specific gravity of fly ash REFERENCES 1. Krishnaswamy N.R ,Rajagopal.KandLathaG.M “Model Studies On Geocell Supported Embankment constructed Over Soft Clay Foundation”Geotechnical testing journal, No 23, Vol 1,pp 45-54(2000) 2. Yoo, C “Laboratory Investigation Of Bearing Capacity Behavior Of Strip Footing On Geogrid Reinforced Sand Slope” Geotextiles and Geomembranes ,pp 279–298(2001) 3. Mandal,J.N., and Bhardwaj,D.K“Study on polypropylene fibre reinforced fly ash slopes”12th international conference of international associationfor computer methods and advances in geomechnics, Goa, India,Vol 3,pp 3778-3786(2008) 4. Choudhary A.K, Jha J.N, Gill K.S “Laboratory Investigation Of BearingCapacity Behavior Of Strip Footing On Reinforced Fly Ash Slope”Geotextiles and Geomembranes, 28(4), pp 393-402( 2010) 5. S.Adhana& J.N.Mandal “Reinforced Fly Ash Slope Using Geo Different Synthetics” Geotechnical Conference ,pp 553-556(2011) 6. K.S.Gillet.al “ Load Bearing Capacity Of Footing Resting On The Fly Ash Slope With Multi Layer Reinforcement” Geo congress, pp 4262-4271(2012) 7. TusharVasant Salunkhe “Stabilization Of Fly Ash Slope Using Plastic Recycled Polymer.” International Journal Of Scientific & Engineering Research, Vol 5,ISSN 2229-5518,pp 248-252(2014) 8. Alamshahi, S. and Hataf, N “Bearing Capacity of Strip Footings on Sand Slopes Reinforced with Geogrid and Grid-Anchor”Geotextiles and Geomembrane,Vol-5,pp217-226(2014) 9. Tarun Kumar Rajak “Analysis Of Slope Stability Of Fly Ash Stabilized Soil Slope”Springer publictions(2016) 10. Dr.A.I.Dhatrak “ Bearing Capacity Of Footing On Reinforced Fly Ash Slope” International journal of Engineering research and application ,ISSN:2248-4622,Vol 6,pp 56-61(2016) 11. Kartik S et. al “ Soil Stabilization By Using Fly Ash” IOSR Journal of Mechanical and Civil Engineering e-ISSN: 2278-1684,p-ISSN: 2320-334X, Volume 10, Issue 6 , PP 20-26.(2016) 12. Singam Jayanthu “ Recent advances in testing and field investigation on stability of Fly as as backfilling material in opencast mines”Conference paper. (2016)

National Conference On “Recent Innovations In Engineering Science And Technology”, April 2019 A Review on Contaminant Transport through layered Soil Rajeshwari M. Puranik1, Prajwala Chachadi2 & Prasanna Patil3 [email protected], 2. [email protected] , 3. [email protected] Department of Civil Engineering , Basaveshwar Engineering College, Bagalkot, Karnataka, India 587103
Abstract— Analytical and experimental methods help the civil and geotechnical engineering to understand the physical and chemical process in contaminant transport through layered soil. For analysis, the two-dimension advection dispersion equation can be used. Using finite element method modeling of contaminant transport based on Geo-studio international Ltd-CTRAN/w software can be utilized to study soil properties. For better prediction of the results comparison of experimental and numerical/analytical studies of layered soil which helps in understanding contaminant flow in soils. Based on the literature review there is a need for development of MS excel program/sheet for obtaining analytical solutions of two dimensional transport of contaminants in layered soil which fastens the process of understanding the behaviour of layered soil. Keywords—Contaminant transport, Advection, Dispersion, Finite element method, Geo-studio international Ltd-CTRAN/w
I. INTRODUCTION Groundwater is found in the voids of the saturated zone of the earth’s crust. Engineers and scientists study groundwater for a variety of reasons. Groundwater makes up only a tiny fraction, just 0.06 %, of the Earth’s available water. However, this very small volume is critically important because it represents 98% of the fresh water readily accessible to humans. In many parts of the world, groundwater resources are under increasing threat from growing demands, wasteful use and contamination. To face this challenge, good planning and management practices are needed. A key to the management of groundwater is the ability to model the movement of fluids and contaminants in the subsurface environment. The contamination of subsurface resources has been and still a major issue all over the world. The transient sources of groundwater and soil contamination include: agricultural infiltration (Nitrogenous fertilizer, pesticides), leachate from chemicals stored above ground, infiltration from pits, ponds and lagoons, landfill leachate (municipal, industrial) and infiltration, leaks from underground storage tanks, septic tanks or sewer lines, spills (Jet fuels, industrial chemicals, waste oils, etc.), hazardous industrial waste in buried drums or landfills (petrochemicals, chlorinated solvents, manufactured gas plants etc.) and nuclear waste. When groundwater pollution occurs, the restoration to the original, non-polluted state is more difficult. It is obvious that the contaminant source activities cannot be completely eliminated and perhaps our water bodies will continue to serve as receptors of vast quantities of waste. This goal can be achieved only if control and management is based on definitive knowledge of the transport and fate of pollutants in the aqueous environment. Numerical modeling of contaminant transport is indeed of particular relevance in this regard. In recent years, numerical methods have been used extensively to simulate the movement of contaminants in soil and groundwater.[6] 1.1 Contaminants Contamination of groundwater has become a key environmental issue particularly with the ever increasing demand for energy and resource development. Geotechnical engineers as result are more and more faced with the difficult task of designing waste management facilities that prevent the contamination of groundwater. To design such facilities requires an understanding of processes that govern tile transport of contaminants. The complexities of designing these structures are compounded by the lengthy required de-sign life which may be hundreds or even thousands of years. The purpose of this paper is to review and discuss the mass transport phenomenon from a geotechnical point of view and to demonstrate the signifi- cance of the processes by analyzing the contaminant migration from a uranium tailings management facility. CTRAN/W is a finite element software product that can be used to model the movement of contaminants through porous materials such as soil and rock. The comprehensive formulation of CTRAN/W makes it possible to analyses problems varying from simple particle tracking in response to the movement of water, to complex processes involving diffusion, dispersion, adsorption, radioactive decay and density dependencies. Currently, CTRAN/W does not deal with air phase transport. 1.2 Typical applications CTRAN/W can be used to model many groundwater contaminant transport problems. This section pre-sents examples of the types of problems that can be analyzed using CTRAN/W. It should be noted that CTRAN/W is designed to use the seepage flow velocities computed due to flow in both the saturated and unsaturated zones. The next section provides a review of contaminant transport processes to facilitate the later discussion of the applications for which CTRAN/W can be used.

National Conference On “Recent Innovations In Engineering Science And Technology”, April 2019 1.3 Contaminant Transport Processes The factors which govern the migration of a contaminant can be considered in terms of transport processes and attenuation processes. The transport processes can be mathematically represented by equations based on flow laws. These equations can be combined into a mass balance equation with those processes causing the attenuation of the contaminant; this yields the general governing differential equation for contaminant migration. Transport processes The two basic transport processes are advection and dispersion. Advection is the movement of the contaminant with the flowing water. Dispersion is the apparent mixing and spreading of the contaminant within the flow system. The advection and dispersion transport process-es can be illustrated by considering a steady flow of water in a long pipe filled with soil. II. LITERATURE REVIEW The study of effect on contaminant transport by different type of soils and different layered soil is observed in various literatures. Several experiment, analytical and numerical analyses were performed on contaminant transport through layered soil by various author.
Robert D. (2001) he studied the effects of investigate the effects on saturated hydraulic conductivity of the interactions between soil type (sand, clay loam) and anionic surfactants. Saturated hydraulic conductivities of two sand and clay loam were measured in constant-head laboratory columns. Results indicate that potential surfactant assisted hydraulic conductivities losses should be considered prior to in-situ surfactant remediation.[1] P.R.Kumar (2006) he studied the calibration was done for soil contaminant detector. They use the 2 type of soils, silty soil and kaolin soil then corresponding mixed with 2 solutions are distilled water and sodium hydroxide solution of different concentration. For modeling the contaminant transport through the soil mass in the centrifuge tests. They prepared the three detachable concentric Perspex cylinders. Cylinder size was inner cylinder is 60mm inner diameter and middle cylinder is 94mm inner diameter are 150mm length outer cylinder is 112mm diameter is 50mm long. Then cylinder is also help for preparing the 75mm long soil sample. By using centrifuge tests fabricated for detection and movement of contaminant in the soil mass noticed very efficiently. While increasing centrifugation time and acceleration level the sodium hydroxide concentration at given point will increases the particular prototype length[2]. ZHANG Hong-mei (2007) study was carried to fluorine transport solutes in soil and ground water. The soil is mainly sandy soils. To test soil a consider the fine sand, a mixture of kaolin and fine sand in the ra-tio1:6.25 and a mixture of kaolin and course sand in the ratio of 1:10.they determined the distribution of grain size test. soil column is made of organic glass, inner diameter was 23cm and height of volume 50cm, perforated plate at the bottom of the soil column covered with a single sheet of thin geotechnical fabric prevented the soil from leaching. Bottom of the soil column was linked to a tapered funnel connected to an outflow tube. For each layered geosynthatic fabric where used is of 3cm. The first part of the breakthrough curve fitted better than the second part. The main reason is that fluorine does not always ex-ist in the form of florin ions in groundwater. Given the long test time, florin ions possibly react with other ions in the soil solution to form complex water-soluble fluorine compounds. Only the retardation factor and source-sink term have been considered in our numerical model, which may leads to errors of computed values. But as a whole the migration rules of fluorine ions are basically correct, which indicates that the established numerical model can be used to simulate the transport rules of fluorine contaminants in unsaturated stratified soils.[3]
P.K.Sharma (2014) he used the soil column experiment is used to study the solute transport through saturated multilayer soil. Sodium chloride was used as a conservative chemical and sodium fluoride as a re-active chemical use in experiment. For numerical analysis they use finite different method was used to get the solution of advection dispersive transport equation for solute transport through multi-layered soil. The results were the water saturated multilayered soil column regardless of soil water and solute characteristics, the order of soil layering does not affect the effluent concentration distributions. The developed numerical model can be used for simulating the migration of contaminants through the landfill sites/ subsurface porous media.[7] Figure 1. Details of one-dimensional soil column experiment The experimental set-up consists of a column, made up of an acrylic pipe with a wall thickness of 6 mm, 100 mm diameter, and 600 mm length. The cross-sectional area of pipe was 78.50 cm2. A schematic sketch of the experimental set-up of the soil column is shown in Fig.1. Sand was collected from Bahadarabad near Haridwar, India. The nat-ural soil and silt were collected from depths of 50 and 150 cm, respectively, below the ground sur-face in the campus of Indian Institute of Technol-ogy, Roorkee, India. The particle-size distribution curves of sand, silt, and natural soil other proper-ties of these

National Conference On “Recent Innovations In Engineering Science And Technology”, April 2019 soils are reported in Different combi-nations of soil were used in the soil column during the experiment. Anand M. Hulagabali, G.R.Dodagoudar (2014) The study was carried to understand the two-dimensional contaminant transport through satu-rated porous media using a finite difference meth-od and finite element method. For analysis, the two-dimensional advection dispersion equation with sorption is considered. MATLAB code is de-veloped to obtain the numerical solutions. CTRAN/w is also used for modeling of contami-nant transport based on finite element method. Results of FEM and FDM is compared and it is found that they agree well.[6] Rupali S.S (2015) He studied a numerical mod-el of two-dimensional contaminant transport through stratified saturated porous media has been analyzed using mesh free method called element free galerkin method. For analysis two dimension-al form of advection diffusive transport equation for a multi-layered soil. For numerical solution A FORTRAAN program has been used. Result where validated with result in the literature. After studying of parameter, the effect of change in the parameter concentration of contaminant has been observed. The parameter including change in dis-persion, velocity, porosity, distribution co-efficient and thickness of layer.[8]
III. CASE STUDY
Performance of compacted clay liner portion in a composite landfill liner. The lagoon under study was situated in a landfill located in Ontario, Canada (Lake and Rowe 2005). Non-hazardous industrial, municipal and commercial wastes were being placed in this multi-cell landfill that is lined with a compacted clay liner and leachate collection system. Below the landfill lies the Rochester Shale Formation, consisting of thin beds of aphanite shale and shale duotones. Schematic cross-section of the landfill is shown in Figure 3.47. The original location of the lagoon was temporary and served the landfill for 14 years at which time a new lagoon was constructed and the original lagoon decommissioned. Lagoon storage capacity was approximately 2500 m3 (side slopes of 3:1) and were lined with a 1.5 mm high density polyethylene (HDPE) geomembrane over a compacted clay liner (2.9 m thick) situated above the quarry’s shale floor. Leachate heights in the lagoon averaged 3 m above the bottom of the lagoon. The water table in the shale was estimated at approximately 3 m below the bottom of the compacted clay. Lysimeters have been installed under the clay liner of the lagoon and landfill to
Table 3.11 Data Used for Case Study of the Keele Valley Landfill Parameter Value Chloride Sodium Hydraulic conductivity (m/year) Length of the reach (cm) Dispersion coefficient (cm2/year) Retardation coefficient Total duration of simulation (years) Time step (∆t) (year) Number of divisions in length direction Initial concentration (mg/L) Concentration at source boundary (mg/L) 0.0015 80 205 1.0 4.25 0.85 20 50 4500 0.0015 80 47 1.46 4.25 0.85 20 – 1600 Fig 3.11 Pore Fluid Concentration Profiles for Chloride and Sodium ions at 4.25 years, Keele Valley Liner: Mesh free Methods and Field Data

National Conference On “Recent Innovations In Engineering Science And Technology”, April 2019 monitor leachate constituents migrating through the liners Investigation of the geomembrane revealed 82 cracks, holes and patches over a total area of 1350 m2 (600 defects per hectare for the 14 year period of operation of the lagoon) after decommission. Even though the majority of the holes, cracks and patches were above the leachate levels in the lagoon, the defects below the leachate level appear to have been sufficient to allow leachate to migrate between the geomembrane and clay under low effective stress conditions. Continuous, 75 mm diameter soil samples were taken of the compacted clay liner at the base of the lagoon at five locations with sampling depths ranging from 1.1 - 2.1 m. The soil was visually classified as light brown clay of low plasticity during sampling with no indication of fractures present. Pour water samples for each borehole (at various depths) were obtained using a pneumatic pore squeeze apparatus by applying 25 MPa pressure to the selected soil samples. Pour water obtained from the samples was analyses for sodium, potassium, magnesium and calcium using an atomic absorption spectrometer and chloride using a specific ion electrode. Illustrate the pore fluid concentration profiles for chloride and sodium through the compacted clay liner at each borehole. When comparing boreholes data, there is some scatter, possibly the result of non-uniform distribution of defects found on the geomembrane liner (holes, tears, wrinkles) occurring at different time periods, producing differences in ionic pore water concentrations between boreholes. Also of note is the apparent back diffusion of chloride and sodium and possibly calcium, potassium and magnesium from the compacted clay into the lagoon. For contaminant migration through the compacted clay liner, the bottom boundary condition was considered infinitely thick for modeling purposes. The top boundary condition of the leachate in the lagoon was assumed to be a constant concentration over each of the three different time periods, i.e. 0-4.5 years, 4.5-9.5 years and 9.5-14 years. Fig 3.12 Schematic Cross-section of Leachate Lagoon Geometric mean values of chloride and sodium concentrations in leachate lagoon for three time periods are presented in Table 3.12 along with the other parameters considered in the analysis for calculating the concentrations in the compacted clay liner (CCL). To evaluate the effectiveness of the geomembrane, contaminant transport modeling using the EFGM and RPIM is performed for five different time periods i.e. 0, 4, 6, 8 and 10 years, assuming that the geomembrane ceased to be effective and allowed leachate into direct contact with the clay liner. To account for back-diffusion of ions for the one month prior to the field investigation, it was assumed that dilution of the small amount of liquid at the bottom of the lagoon during this time caused a linear decrease in leachate concentrations of 20% over this time period. n the mesh free model, the domain [0, 2.5] is discretized into 20 cells. A time step (∆t) of 0.5 year is used in the simulation. the spatial solute distribution curves obtained from the mesh free methods are compared with the pore fluid concentrations obtained from the field investigation. A comparison of the observed chloride and sodium profiles with the mesh free results, assuming that the geomembrane is ineffective at different times after construction suggests that the geomembrane ceased functioning effectively somewhere between 0 and 4 years after construction, which is in concordance with the findings of Lake and Rowe (2005). Table 3.12 Data Used for Case Study 3: CCL Parameter Value Chloride sodium Darcy velocity (m/year) Porosity 0.00-0.25 m 0.25-0.50 m 0.50-2.50 m Dry density (g/cm3) 0.00-0.25 m 0.25-0.50 m 0.50-2.50 m Leachate lagoon concentration (mol/m3) 0-4.5 years 4.5-9.0 years 9.0-14.0 years Effective dispersion coefficient (m2/year) Distribution coefficient (cm3/g) Total duration of simulation (years) No.of divisions in length direction Time step (∆t) (year) 0.13 0.48 0.42 0.38 1.4 1.5 1.7 7.17 17.37 14.57 0.022 0 2.5 14 20 0.5 0.13 0.48 0.42 0.38 1.4 1.5 1.7 61.95 150 46.86 0.013 0.2 2.5 14 20 0.5

National Conference On “Recent Innovations In Engineering Science And Technology”, April 2019 IV. SUMMARY OF LITERATURE Most of the study reported in literature is based on analytical, experimental and numerical modeling of contaminant transport through the layered soil. Experiment and numerical analysis simulation study are given to understand the physical and chemical processes that influence contaminant transport through layered soil. Soil column experiment has been developed for the experiment solutions of a contaminant movement through soil layers. The modeling of contaminant migration through landfill liners and natural soil deposits in Geoenvironmental engineering is an important task, as the landfills have to contain the waste till their design life. A few case studies dealing with contaminant transport through the landfill liners are also reviewed and presented in the chapter. A CTRAN/w software based on finite element method has been developed for the numerical solution of a contaminant movement through a soil layers. TRANSITIONING FROM STATE-OF-THE-ART TO STATE-OF-THE-PRACTICE Black cotton soil is collected from the quarry near vidyagiri, Bagalkot. That is having some contaminants, using soil column experiment contaminant transport through the layered soil is checked in that sand also used to strength the soil property with different percentage. Two types of contaminants is used, these are sodium chloride and fluoride with varying concentration. This experiment result is compared with CTRAN/w software.
V. CONCLUSIONS The above study has examined the modeling of contaminant transport through the saturated and unsaturated homogeneous porous media and landfill liners using mesh free techniques. The applicability and performance of the mesh free methods have been studied through numerical investigations using a few numerical examples and case study. The following conclusions are drawn from the study: • A new methodology based on mesh free techniques, such as EFGM and RPIM has been developed for modeling contaminant transport through the saturated and unsaturated homogenous porous media. • Computer implementation of both the mesh free methods has also been made and validated against analytical solutions, experimental results and field investigation data. The results of the mesh free methods are also compared with the finite element solutions. A very good agreement is obtained between the results of the mesh free methods, analytical and finite element solutions for the numerical examples considered. •Three case study examples, involving the contaminant transport through the compacted clay liners of landfills are considered to test the practical applicability and performance of the EFGM and RPIM. A good agreement is obtained between the results of the meshfree methods and the field investigation data. It is concluded that both the meshfree methods perform well in predicting the concentration values in the case of real world contaminant transport problems. • The proposed mesh free methods EFGM and RPIM generated stable and convergent results for advection-dominated transport problems; because these methods do not depend on spatial and temporal discretization thus they are insensitive to Peclet and Courant constraints. • Based on the convergence analysis, it is concluded that for the EFGM, the scaling parameter dmax gives convergent results for the range 1 ≤ dmax ≤ 1.5 and for the RPIM the parameter q 1.25 produces convergent results. ≅ • The mesh free methods provide an attractive alternative to the finite element method for contaminant transport problems wherein the advection dominates. In such cases, the FEM requires alternative stabilization techniques in the form of mesh and time step refinement to obtain the stable and accurate results.
REFERENCES 13. Robert D. “ Variation of soil hydraulic conductivity by anionic surfactants in soil column” Geosciences Journal Vol. 5, No. 4, PP. 287-291, 2001. 14. Lake, C. B., and Rowe, R. K.. “The 14-year performance of a compacted clay liner used as part of a composite liner system for a leachate lagoon.” Geotechnical. Geol. Eng., Vol no. 23, PP. 657-678, 2005. 15. P.R.Kumar. “An Experimental Methodology for Monitoring Contaminant Transport through Geotechnical Centrifuge Model” Journal of Environmental Monitoring and Assessment, Vol no. 117, PP. 215–233, 2006. 16. ZHANG Hong-mei . “ Experimental Study of Fluorine Transport Rules in Unsaturated Stratified Soil” Journal of China University of Mining & Technology, Vol. 17, No. 3, PP. 1-6, 2007. 17. A.A.Javadi.“ Numerical modeling of contaminant transport through soils: case study” Journal of Geotechnical and Geoenvironmental Engineering ASCE, Vol. 134, PP. 214-230, 2009. 18. S.A.Mirbagheri. “Pesticide transport and transformation modeling in soil column and groundwater contamination prediction” International Journal Environ. Sci. Tech, Vol. 6 (2), PP. 233-242, spring 2009. 19. G.R.Dodagoudar and Anand M. Hulagabali. “ Contaminant Transport Modeling through Saturated Porous Media using Finite Difference and Finite Element Method” IOSR Journal of Mechanical and Civil Engineering (IOSR-JMCE) e-ISSN: 2278-1684, p-ISSN: 2320-334X, PP 2933, 2014. 20. P.K. Sharma. “ Experimental and numerical simulation of contaminant transport through layered soil” International Journal of Geotechnical Engineering, Vol. 84, PP. 345-35, 2014. 21. Rupali S.S.“Two Dimensional Contaminant Transport Through Layered Soil using Element Free Galerkin Method.” Indian Geotechnical Journal, Vol. 4 , PP. 1-14, 2015. 22. I.M.H. Rashwan. “ A study on control of contaminant transport through the soil using equal double sheet pile. Ain shams engineering journal, Vol. 7, PP. 21-29, 2015. 23. S.Rupali.“ Contaminant Transport Through Geomembrane Overlying Clay and Sand Using Element Free Galerkin Method.”International Journal of Geosynthatic and Ground Engineering, Vol. 2, pp. 1-14, 2016.

National Conference On “Recent Innovations In Engineering Science And Technology”, April 2019 Use of Steel Slag To Increase Bearing Capacity of Soil In Road Construction Ravindra N. Patil1, Kailash T. Phalak2, Kisan L. Bidkar3
[email protected], 2 [email protected], 3 [email protected] 1,2,3 Department of Civil Engineering, Sandip Institute of Engieering & Management, Nashik, Maharastra, India.
Abstract— Roads are an integral part of the transport system. A country’s road network should be efficient in order to maximize economic and social benefits.Roads are built up in several layers, consisting of sub-grade, sub-base, base and surface layer. There are formation of cracks, settlement of road and potholes due to heavy vechicular traffic and bad climatic condition .Weak foundation soils subgrade are a common problem in road construction. Whether it is a temporary access road or a permanent road built over soft subgrade, a large deformation of the subgrade will lead to deterioration of the paved or unpaved surface. To avoid these problems steel slag is used. The steel slag shows good technical and ecological properties, thus being used for the manufacturing of aggregates required by road construction. The reuse steel making slags for road construction must comply with an essential requirement, namely their volumetric stability .The high stability of steel slag mixes offers a distinct advantage where rutting resistance is required and this has been demonstrated in industrial areas. The aim of this work is to study the effect of addition of steel slag on bearing capacity of soil & its variation according to percentage of steel slag. Also to check if the steel slag replace natural materials, there by resulting in protection of natural, non-renewable resources and a reduction in energy requirements.As well as to reduce environmental pollution due to changes in current practice.and to study the utilization of steel slag in road construction as sub-grade material along with black cotton soil . Different tests on soil should perform like – Specific gravity, liquid limit , plastic limit , proctor test , CBR test. And tests perform on steel slag are – specific gravity, fineness test. Test perform on soil and steel slag with different percentage are proctor test and CBR test. . Keywords— Steel Slag, Soil Bearing Capacity, CBR Test etc.
I. INTRODUCTION Engineers are often faced with the problem of constructing roadbeds on or with soils, which do not possess sufficient strength to support wheel loads imposed upon them either in construction or during the service life of the pavement. It is, at times, necessary to treat these soils to provide a stable subgrade or a working platform for the construction of the pavement. Use steel slag is one of the methods used to improve performance of soil subgrade. Steel slags play a significant part in modern pavement design and maintenance techniques. The growth in their use worldwide for transportation applications in particular, has been nothing short of phenomenal. Steel slag used in subgrade has proven to be among the most versatile and cost-effective ground modification materials. Roads play a significant role in achieving national development and contributing to the overall performance and social functioning of the community. It is acknowledged that roads enhance mobility, taking people out of isolation and therefore poverty. The steel slag shows good technical and ecological properties, thus being used for the manufacturing of aggregates required by road construction. Slags are by-products of metallurgical processes. Steel- and iron making industries generate different types of slags. Civil engineers require large quantities of free draining material to raise the load bearing capacity of the sub-strata for new structures. Coarse graded steel slag, in the size range of 300 mm to 50 mm is also ideal for this application particularly on or near the surface where good mechanical interlock and mud free characteristics prevent pumping and inhibit lateral movement.
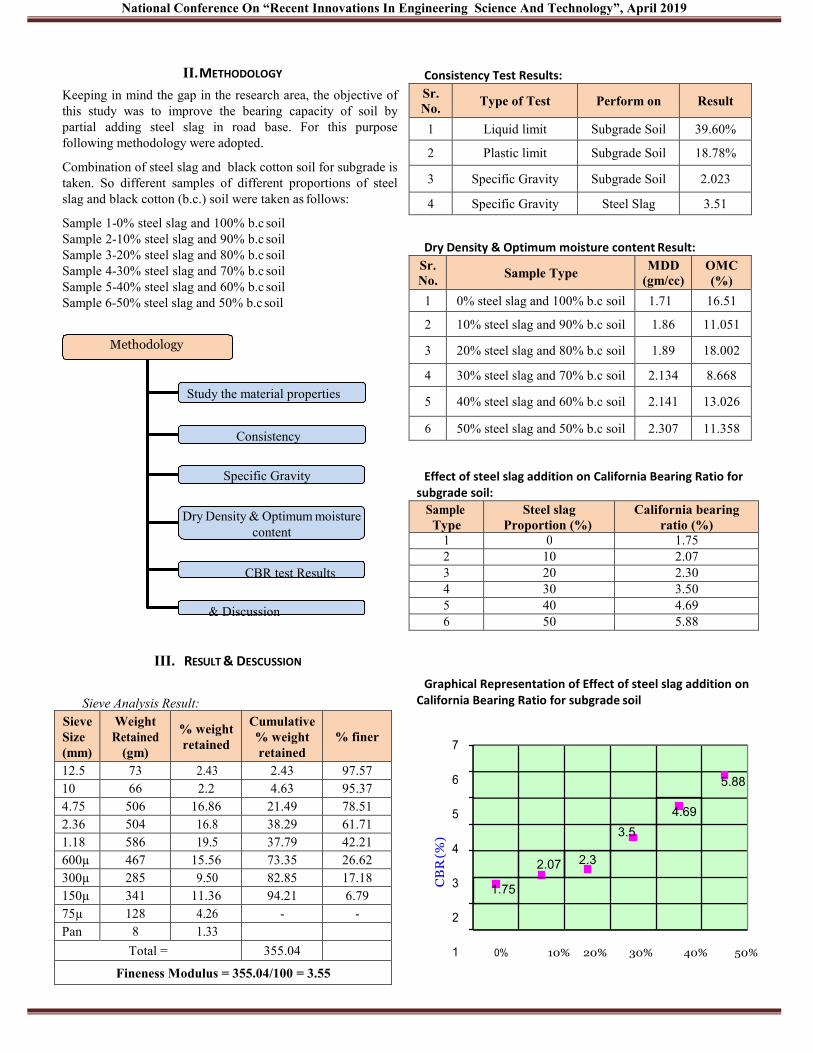
National Conference On “Recent Innovations In Engineering Science And Technology”, April 2019 Methodology Study the material properties Consistency Specific Gravity Dry Density & Optimum moisture content CBR test Results & Discussion II. METHODOLOGY Keeping in mind the gap in the research area, the objective of this study was to improve the bearing capacity of soil by partial adding steel slag in road base. For this purpose following methodology were adopted. Combination of steel slag and black cotton soil for subgrade is taken. So different samples of different proportions of steel slag and black cotton (b.c.) soil were taken as follows: Sample 1-0% steel slag and 100% b.c soil Sample 2-10% steel slag and 90% b.c soil Sample 3-20% steel slag and 80% b.c soil Sample 4-30% steel slag and 70% b.c soil Sample 5-40% steel slag and 60% b.c soil Sample 6-50% steel slag and 50% b.c soil III. RESULT & DESCUSSION Sieve Analysis Result:
Consistency Test Results: Sr. No. Type of Test Perform on Result 1 Liquid limit Subgrade Soil 39.60% 2 Plastic limit Subgrade Soil 18.78% 3 Specific Gravity Subgrade Soil 2.023 4 Specific Gravity Steel Slag 3.51
Dry Density & Optimum moisture content Result: Sr. No. Sample Type MDD
(gm/cc) OMC (%) 1 0% steel slag and 100% b.c soil 1.71 16.51 2 10% steel slag and 90% b.c soil 1.86 11.051 3 20% steel slag and 80% b.c soil 1.89 18.002 4 30% steel slag and 70% b.c soil 2.134 8.668 5 40% steel slag and 60% b.c soil 2.141 13.026 6 50% steel slag and 50% b.c soil 2.307 11.358
Effect of steel slag addition on California Bearing Ratio for subgrade soil: Sample Type
Steel slag Proportion (%)
California bearing ratio (%) 1 0 1.75 2 10 2.07 3 20 2.30 4 30 3.50 5 40 4.69 6 50 5.88
Graphical Representation of Effect of steel slag addition on California Bearing Ratio for subgrade soil 7 6 5 4 3 2 1 0% 10% 20% 30% 40% 50%
1.75 2.3 2.07 3.5 4.69 5.88 CB
R (%
)
Sieve Size (mm)
Weight Retained
(gm)
% weight retained
Cumulative % weight retained
% finer 12.5 73 2.43 2.43 97.57 10 66 2.2 4.63 95.37 4.75 506 16.86 21.49 78.51 2.36 504 16.8 38.29 61.71 1.18 586 19.5 37.79 42.21 600µ 467 15.56 73.35 26.62 300µ 285 9.50 82.85 17.18 150µ 341 11.36 94.21 6.79 75µ 128 4.26 - - Pan 8 1.33 Total = 355.04
Fineness Modulus = 355.04/100 = 3.55

National Conference On “Recent Innovations In Engineering Science And Technology”, April 2019
IV. DISCUSSION The main aim of this work was to study the utilization of steel slag in road construction as sub-grade material along with black cotton soil . Different tests on soil were performed like – Specific gravity, liquid limit , plastic limit , proctor test , CBR test. And tests performed on steel slag were – specific gravity, fineness test. Test performed on soil and steel slag with different percentage were proctor test and CBR test. The combinations of steel slag – soil were – 0% - 100% , 10% - 90% , 20 % - 80% , 30 % - 70% , 40 % - 60 % , 50 % - 50 %. The Conclusions made from the experimental analysis are as follows. The CBR value obtained for the Sample 1 having combination 0 % steel slag and 100 % soil is 1.75%, for 2.5 mm penetration and 1.69 % for 5 mm penetration. The CBR value obtained for the Sample 2 having combination 10 % steel slag and 90 % soil is 2.07 %, for 2.5 mm penetration and 2.01 % for 5 mm penetration. The CBR value obtained for the Sample 3 having combination 20 % steel slag and 80 % soil is 2.30 % for 2.5 mm penetration and 2.28 % for 5 mm penetration . The CBR value obtained for the Sample 4 having combination 30 % steel slag and 70 % soil is 3.5 % for 2.5 mm penetration and 3.39 % for 5 mm penetration . The CBR value obtained for the Sample 5 having combination 40 % steel slag and 60 % soil is 4.69% for 2.5 mm penetration and 4.56 % for 5 mm penetration. The CBR value obtained for the Sample 6 having combination 50 % steel slag and 50 % soil is 5.88 % for 2.5 mm penetration and 5.83 % for 5 mm penetration. It can be seen from the test results that as we increase the percentage of steel slag in the soil, the CBR ratio is increasing. That means as we increase percentage of steel slag in soil, the bearing capacity of soil goes on increasing. Moreover the graph plotted % of steel slags to cbr %also shows that the bearing capacity goes on increasing. V. CONCLUSION Tests carried and the report studied concluded that the steel slag can be successfully used for increasing bearing capacity of soil. It is effective method that can be adopted for construction of road pavement in a area having low bearing capacity like black cotton soil region, marshy land etc. Also by using this method effective use of waste product can be achieved; similarly it helps to obtain zero waste criteria for steel industries & steel related workshops. As we increase % of steel slag in soil, the bearing capacity of soil goes on increasing. But as steel slag is added above 30- 33% some technical as well as economical problems are observed. The cost of project increases as we increase the percentage of steel slag in soil as compared to other methods of soil stabilization. When we go beyond a this limit the steel slag creates different problem like corrosion of steel slag, thermal expansion etc.
REFERENCES [1] Ahmedzade P. ,Sengoz B., “ Evaluation of steel slag coarse aggregate in hot mix asphalt concrete” Journal of Hazardous Materials, pp. 300-305 (2009). [2] Shen D.H., “ Laboratory investigation of basic oxygen furnace slag for substitution of aggregate in porous asphalt mixture, Construction and Building Materials’’,pp. 453–461 (2009). [3] Xue Y., Hou H., Zha, J., “Experimental investigation of basic oxygen furnace slag used as aggregate in asphalt mixture” Journal of Hazardous Materials, pp. 261-268 (2006). [4] Motz H., Geiseler J., “Products of steel slags an opportunity to save natural resources” Waste Management, pp. 285-293(2001). [5] De Bock L. P., Van de Bergh H., “ Stainless steel slags in hydraulic bound mixtures for road construction”, 2 case studies in Belgium congress pp. 295. [6] Mahieux P. Y., Aubert J. E., Escadeillas G. “Utilization of weathered basic oxygen furnace slag in the production of hydraulic road binders” Construction and Building Materials, pp. 742– 747(2009). [7] IS : 2720 ( Part 16 ) – “ Indian Standard methods of part16 laboratory (Second test for soil determination of CBR”(1987). [8] Steel slag base and sub base aggregates- Product information. nationalslagassoc.org [9] Slag in history nationalslag.org/slaghistory. [10] Steel slag “A premier construction aggregate’’ www.nationalslagassoc.org [11] Praveen Kumar, “Performance of granulated blast furnace slag in road construction – A Case study”, Indian Highways, pp. 27-349( July 1999). [12]T.K. Bhadra and R.R. Sandhwar, “Design of road using waste products from steel plants”, Indian Highways, pp. 41-47 (Sep 2002). [13] Dr. Praveen Kumar, Ashwini Kumar and R.K. Swami, “Construction of Road using steel industry waste – a case study”, Indian Highways, pp. 21-24, 33-34(Feb. 2001). [14] C. E. G. Justo and Khanna,”Highway Engineering”, Nem Chand & Bros Roorkee, India. [15] Purushottam Raj “Ground Improvement Techniques”, Laxmi Publications, Delhi, pp. (117-250) ( 2011).

National Conference On “Recent Innovations In Engineering Science And Technology”, April 2019 Seismic Vulnerability Assessment of RC Structure Using Incremental Dynamic Analysis Prof. Dilip Chaudhri1, Khushboo Damkondwar 2 [email protected], [email protected] Applied Mechanics Government College of Engineering, Amravati
Abstract— Incremental Dynamic Analysis (IDA) is a powerful and more accurate method for evaluating the seismic performance of structural systems. While performing IDA, ground motion records are scaled in accordance with a certain seismic intensity level up until the limit of collapse of the structure is reached. Present study deal with existing RC Moment resisting frame located in Zone III. 12 storey structure, symmetric in plan is used to study Incremental Dynamic analysis using seismostrut-2018. Finite element program used for the analysis is SEISMOSTRUCT 2018. IDA curves are developed with respect to spectral acceleration (Sa (T1, 5%)). Performance stages of the buildings such as yielding and collapse are defined with respect to Sa (T1, 5%) of the considered earthquake from the IDA curves. Sixteen real ground motion pairs were selected and scaled, then applied to the buildings to perform the Incremental Dynamic Analysis (IDA). For the development of fragility curves, guidelines given by HAZUS MH MR-4 technical manual have been used. The Fragility Curves are plotted considering Spectral acceleration for IDA. Keywords— Seismostruct-2018,Nonlinear Time History Method, Incremental dynamic analysis, Fragility curves, HAZUS MH MR4 etc.
I. INTRODUCTION Developing mega cities leads to increase population in the city and there are not sufficient spaces provided by large number of buildings to accommodate the increasing population. High-rise buildings address this challenge as one of the solutions for the developing countries and mega cities. In addition, high-rise buildings give aesthetic to cities and they are signs of modern development. High-rise buildings exhibit far more complex dynamic properties that require careful study and a complete understanding before they can be confidently resided in. Reinforced Concrete (RC) is a common building material which have been used to construct high-rise buildings for several decades. Earthquakes are one of the most hazardous natural disasters that attacks human and cause large damages especially in regions where defined as high-seismic zone by geologists. Various seismic analysis approaches were proposed including both static and dynamic methods. Although seismology has been continuously advancing during the century, it is impossible to predict future earthquakes’ severity and time of attacking. Therefore previous earthquake data are still widely used to analyze buildings resulting in robust buildings for future earthquakes. In addition to uncertainties in seismic loads, uncertainties associated with building material, design process, building geometry, and construction will also lead to the use of probability to predict building responses. Fragility curve assessment is one of the probabilistic methods which shows the conditional probability of exceeding a certain damage level. Fragility assessment has been widely adopted in earthquake engineering to understand the seismic performance of different building To prevent the seismic risk, it is necessary to assess the vulnerability of existing structures. To do that, several methods have been proposed, starting from different approaches. One of the tool used to evaluate the performance of structures against seismic actions is the Incremental Dynamic Analysis (IDA) proposed by Vamvatsikos & Cornell. The main purpose of IDA is to obtain a measure of damage in the structure by increasing the intensity of the action record, in this case the peak ground acceleration. IDA allows obtaining the dynamic response of a structure for increasing seismic actions. The main result of this work is the quantitative assessment of the expected randomness of the structural response, defined by its fragility curves. II. LITERATURE REVIEW Vamvatsikos D. and Cornell C(2010) studied application of Incremental Dynamic Analysis to Performance-Based Earthquake Engineering (PBEE) and used it to define limit states such as immediate occupancy, collapse prevention. Gaikwad et al. studied performance of incremental dynamic analysis of structures using SAP 2000 subjected to several scaled ground motions scaled using SEISMOMATCH 2018. Marra et al. used discrete rigid blocks interacting through nonlinear elastic damageable interfaces to model the global behavior of a medieval masonry tower under seismic actions. The seismic vulnerability assessment is carried out by nonlinear static analysis (NSA) and incremental dynamic analysis (IDA), whose results are compared. Rojit Shahi et al presents findings from an investigation which was aimed at determining what ground motion parameters are most suitable for use as IM whilst allowing the frequency content of the earthquake to vary in an IDA. Hosseinpour et al. studied aim to overcome previous limitations and derive fragility curves for three RC (reinforced concrete) buildings with different number of stories under multiple earthquakes.

National Conference On “Recent Innovations In Engineering Science And Technology”, April 2019 Melani et al. determined financial risk assessment on the basis of results of incremental dynamic analysis (IDA) of reinforced concrete frames analyzed using nonlinear time history analyses on IDARC platform with a suite of 20 ground motion records used by Vamvatsikos and Cornell (2002) for mid-rise buildings Seung -Wori Lee et al. proposes the procedure to estimate seismic fragility curves using an incremental dynamic analysis (IDA) rather than the method adopting a Capacity Spectrum Method (CSM).These is because IDA method can properly capture the structural response beyond yielding rather than the CSM and can directly calculate higher mode effects XLII. SYSTEM DEVELOPMENT
3.1 Steps involved in Incremental Dynamic Analysis 1 Appropriate modeling of the building 1. Selection of intensity measure of earthquake like peak ground acceleration 2. Selection of response measure like interstorey drift ratio, base shear 3. Selection ground motions according to zone the building is situated in. 4. Generation of IDA curves by interpolation 5. Plotting of Fragility Curves.
3.2 Incremental Dynamic Analysis of G+11 story building a) Building Description Floor Height = 3.06m Column Dimension = (700x700) mm Beam Dimension = (300x500) mm Slab thickness = 110 mm Building Location = Zone III Boundary Condition = fixed on ground Material properties = M25, Fe415 Size of Column 700X700 steel 4#20, Size of Beam 300X500 steel 3#16 at top, 3#16 at bottom b) Material used SEISMOSTRUCT has eleven material models ranging from concrete, steel, fibered reinforced plastic to shape memory alloy. In this research, the nonlinear steel and nonlinear concrete models were used to model the RC buildings. c) Load Applied on building 1. Live Load = 2KN/m2 2. Floor Finish = 1 KN/m2
Fig 3.1 Plan of G+11 building(SeismoBuild Model)
Fig. 3.2 Model of the building SeismoStruct model 3.3 Incremental Dynamic Analysis In this chapter, building capacity is found out by using incremental dynamic analysis. Graph of spectral acceleration to maximum inter-storey drift from incremental dynamic analysis is plotted. Time History used for analysis are listed below
Table 3.1: 16 Ground Motion Record
Earthquake Name
Year
Station Name
Magnitude
PGA Helena Montana 1935 Carroll College 6 0.505 Humbolt Bay 1937 Ferndale City 5.8 0.245 Northern Calif-01 1941 Ferndale City 6.4 0.336 Borrego 1942 El Centro Array 6.5 0.237 San Francisco 1957 Golden Gate Park 5.28 0.328 Hollister-01 1961 Hollister City Hall 5.6 0.262 Parkfield 1966 Cholame - Shandon Array 6.19 0.341

National Conference On “Recent Innovations In Engineering Science And Technology”, April 2019 Lytle Creek 1970 Castaic - Old Ridge Route 5.33 0.301 Managua Nicaragua-01 1972 Managua ESSO 6.24 0.24 Hollister-03 1974 Gilroy Array 5.14 0.29 Oroville-01 1975 Oroville Seismograph Station 5.89 0.23 Friuli_ Italy-01 1976 Barcis 6.5 0.36 Santa Barbara 1978 Cachuma Dam Toe 5.92 0.22 Norcia Italy 1979 Bevagna 5.9 0.238 Coyote Lake 1979 Coyote Lake Dam 5.74 0.286 Imperial Valley-07 1979 Bonds Corner 5.01 0.21 3.4 IDA Curve IDA curve visualizes the structural responses and shows structural behavior subjected to ground motions. Buildings have different IDA curve shapes depending on their capacities (i.e. strength, stiffness, ductility) to resist seismic loads. In addition, researchers choosing different IM and DM values based on their research objectives, will resulting in different IDA curves. Collapse of the IDA curves having hardening property is calculated from end part of the curve which become flat line. Finally, the IM values at collapse and different damage values indicates the seismic capacity of a building model. For example, curve (a) has the lowest value of IM and curve (d) has the highest value of IM among the four curves shown in Fig 3.2 Performance level or limit state of the IDA curves is an important part in assessing building seismic response. Buildings are usually evaluated at the limit states of the IDA curves and the fragility curves are constructed based on those limit states. Limit states are defined as collapse, immediate occupancy or other limit states depending on the performance type. Fig 3.3 Four different behavior of IDA curves (Vamvatsikos and
Cornell,2005). 3.5 Fragility Curve Fragility curve is defined as the conditional probability which exceeds a specified limit state and evaluates seismic vulnerability of the structure. Fragility curve shows the probability of structure damage as a function of ground motion intensity measure (IM) such as Peak Ground Acceleration (PGA), spectral acceleration at the fundamental building period with 5% damping 1 (T1,5%) or any other intensity measures. Fig 4-1 shows an example of a fragility curve. Fragility curve can be expressed as:
fDS (IM) = P (DS/ IM) where, IM = the ground motion intensity measure. DS = the damage state. P= the probability of exceeding a damage level. In this study, the analytical fragility curve method was used to develop fragility curve using IDA. Procedure for Creating Fragility Curve In this study, the following procedure was used to create the fragility curves 1. Analyze the building models using the IDA and create the IDA curves for the sixteen ground motions in both directions. Determine the value of IM which are Sa(T1,5%) of the building responses from the IDA curves of the 16 ground motions and these values are used as the ground motion parameters in the fragility curve (i.e. horizontal axis). 2. To obtain the fragility curve assumption (i.e. all variables log normally distributed), natural logarithmic shall be taken Ln(X) for ground motion parameters. 3. Calculate the mean and the standard deviation for Ln(x) λ = ξ = Where, λ = mean of Ln(x). ζ = standard deviation of Ln(x). x = ground motion parameters could be Sa(T1,5%), base shear or any IM of IDA curve. 4. Calculate s of the lognormal data s = 5. Apply the standard normal distribution for the probability function and CDF which is denoted as Φ P(≤ D)=∅( s)
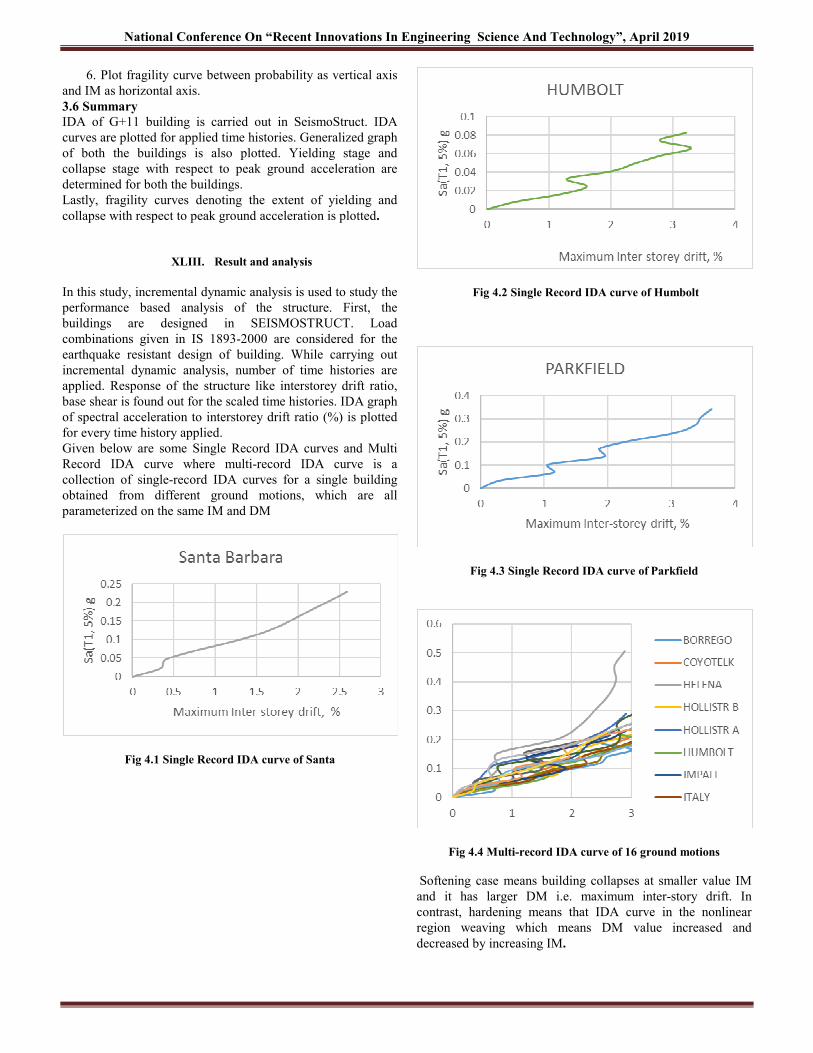
National Conference On “Recent Innovations In Engineering Science And Technology”, April 2019 6. Plot fragility curve between probability as vertical axis and IM as horizontal axis. 3.6 Summary IDA of G+11 building is carried out in SeismoStruct. IDA curves are plotted for applied time histories. Generalized graph of both the buildings is also plotted. Yielding stage and collapse stage with respect to peak ground acceleration are determined for both the buildings. Lastly, fragility curves denoting the extent of yielding and collapse with respect to peak ground acceleration is plotted.
XLIII. Result and analysis In this study, incremental dynamic analysis is used to study the performance based analysis of the structure. First, the buildings are designed in SEISMOSTRUCT. Load combinations given in IS 1893-2000 are considered for the earthquake resistant design of building. While carrying out incremental dynamic analysis, number of time histories are applied. Response of the structure like interstorey drift ratio, base shear is found out for the scaled time histories. IDA graph of spectral acceleration to interstorey drift ratio (%) is plotted for every time history applied. Given below are some Single Record IDA curves and Multi Record IDA curve where multi-record IDA curve is a collection of single-record IDA curves for a single building obtained from different ground motions, which are all parameterized on the same IM and DM
Fig 4.1 Single Record IDA curve of Santa
Fig 4.2 Single Record IDA curve of Humbolt
Fig 4.3 Single Record IDA curve of Parkfield
Fig 4.4 Multi-record IDA curve of 16 ground motions Softening case means building collapses at smaller value IM and it has larger DM i.e. maximum inter-story drift. In contrast, hardening means that IDA curve in the nonlinear region weaving which means DM value increased and decreased by increasing IM.

National Conference On “Recent Innovations In Engineering Science And Technology”, April 2019 In above plot of Multirecord IDA curve, curves are weavy in nature in non linear region which clearly shows that hardnening is reached by building Fragility curves denoting the extent of yielding and collapse with respect to spectral acceleration are also plotted. Building susceptibility i.e. whether the building can sustain the considered earthquake or nor is found out using IDA.
Fig 4.5 Fragility curves of 12 storey RC Building at different Limit states. Following are the observations and conclusions that can be drawn from the study
4.1 Observations 1. IDA curve helps in studying the behaviour of building under a particular earthquake and define the performance stages of the structure such as yield and collapse. 2. In this study; G+11 building sustains all the earthquakes. For the G+11 building considered in this study, building is safe from all the earthquakes. If the yield and collapse acceleration of the structure for the considered earthquake is more than the original un-scaled acceleration, we can say that building sustains the considered earthquake. 3. Next, serviceability criteria given in IS 1893:2000 is also taken into consideration in the analysis. G+11 building satisfies the serviceability criteria. 4. Fragility curves denoting percentage of yielding and collapse for G+11 building is plotted. These curves denote the percentage of yielding and collapse with respect to spectral acceleration of the considered earthquakes. V. CONCLUSION Building susceptibility can be easily studied using incremental dynamic analysis. We can find out whether the building can fail to the considered earthquake or not. If building is failing to the considered earthquake or failing to satisfy the criteria of serviceability, stiffness of the structure needs to be increased by increasing column dimensions. Incremental dynamic analysis is accurate than other analysis methods because response of the structure is plotted by applying actual available earthquake data. So, response of the building from incremental dynamic analysis is actual response generated from the considered earthquake. If the structure is of much importance and high accuracy is needed, then only incremental dynamic analysis should be preferred as Incremental dynamic analysis is tedious and very much time consuming than other available methods.
REFERENCES A.Melani, Khare, R. K., Dhakal, R. P., and J.B.Mander (2016). "Seismic risk assessment of low rise RC frame structure." ELSEVIER, 10. 1. Barkhordary, M., and Tariverdilo, S. (2011). "Vulnerability of ordinary moment resistant concrete frames." EARTHQUAKE ENGINEERING AND ENGINEERING VIBRATION, 10, 15. 2. Hosseinpour, F., and Abdelnaby, A. E. (2017). "Fragility curves for RC frames under multiple earthquakes." ELSEVIER, 13. 3. Maniyar M. “Incremental Dynamic analysis of 3 storey RCC building” Ph.D. Thesis SGSITS, Indore, 2009. 4. Khaloo, A., Nozhati, S., Masoomia, H., and Faghihmaleki, H. (2016). "Influence of earthquake record truncation on fragility curves of RC frames with different damage indices." ELSEVIER, 8. 5. Lee, S.-W., Lee, J. S., Won-Jik Yang, and Kim, H.-J. (2015). "Seismic Fragility Functions of RC Moment Frames Using Incremental Dynamic Ana lyses." International Journal of Civil, Structural, Construction and Architectural Engineering, 9, 4. 6. Vamvatsikos, D., & Fragiadakis, M. (2010). Incremental dynamic analysis for estimating seismic performance sensitivity and uncertainty. Earthquake engineering & structural dynamics, 39(2), 141-163. 7. Vamvatsikos, D. (2002). Seismic performance, capacity and reliability of structures as seen through incremental dynamic analysis (Doctoral dissertation). Stanford University. Stanford, California 8. Vazurkar, U. Y., and Chaudhari, D. J. (2016). "Development of Fragility Curves for RC Buildings." International Journal of Engineering Research, 4. 9. Seung-Won Lee et. al., “Seismic Fragility Function of RC Moment Frames using Incremental Dynamic Analysis”, International Journal of Civil, Environmental, Structural, Construction and Architectural Engineering Volume: 9, No: 2, 2015 10. IS:1893 Indian standard criteria for earthquake resistant design of Structures, part 1 general provision and building. New Delhi: Indian standards Institution;2002. 11. BIS 1893 (2002), Bureau of Indian Standards, “Criteria for Earthquake Resistant Design of Structures Part – 1: General Provisions and Buildings”, Standard IS 1893 (Part 1):2002, New Delhi, (India). 12. National Institute of Building Sciences (2004). Multi-hazard loss estimation methodology earthquake model: HAZUS MH-MR4 Technical manual. Washington, DC: Federal Emergency Management Agency.

National Conference On “Recent Innovations In Engineering Science And Technology”, April 2019 Seismic Assessment of RC Frames with Various Bracing Systems Dr. S. K. Hirde1, Shubham K. Nagmoti2 [email protected], [email protected] Department of Applied Mechanics. Government College of Engineering, Amravati, India, 444604.
Abstract— Steel bracing is one of the best way for enhancing earthquake resistance of RC frames. Steel bracing is viable solution as a lateral load resisting system to improve seismic performance of RC frame as it is economical and has ability to meet required strength. IS 1893 (Part 1):2016 mentioned same response reduction factor (R factor) for all special braced frames (SBF) and also increased the value of R factor in recent revision. In this present study, R factor of RC frame with different bracing systems have been evaluated. The symmetrical four storey RC frames having three bays with X bracing, V bracing and chevron bracing have been modelled in SAP2000 as per IS codes. Pushover (nonlinear static) analysis is performed on the models and response reduction factor has been calculated by using static pushover curves obtained in SAP2000. Keywords— RC frame; bracing; pushover analysis; nonlinear static analysis; response reduction factor; special braced frames
I. INTRODUCTION Special concentric braced frames (SBF) are one of the most economical lateral load resisting systems used in buildings worldwide to improve seismic performance of RC frames. These frames provide adequate lateral strength and stiffness to the structural systems so that they meet the serviceability and operability criteria for small frequent earthquakes and failure criteria for high infrequent type earthquakes. Steel bracings provide adequate energy dissipation and ductility to the structural system through their inelastic deformations to resist the earthquake forces effectively. The response reduction factor (R) represents the ratio of the maximum lateral force (Ve) which would develop in a structure if structure remains elastic under the ground motion, to the lateral force (Vd) which it has been designed to withstand. R factor depends on the perceived seismic damage performance of the structure, characterized by ductile or brittle deformations, redundancy in the structure, or overstrength inherent in the design process [6]. R factor for building with SBF having concentric braces is given as 4.5 in IS 1893:2016 and it is 4.0, common for SBF and ordinary concentric braced frame (OBF), in IS 1893:2002 [7]. The R factor is expressed as a function of various parameters of the structural system, such as strength, ductility, damping and redundancy as shown in fig. 1 and can be calculated from equation 1: ζµRRRRR rs= …..…..(1) Where,
sR is the overstrength factor, rR is the redundancy factor, µR is the ductility factor, ζR is the damping factor. Fig. 1. Concept of response reduction factor [13] Parameters of R factor are explained in detail as follows: The damping factor, ζR , is generally assigned a value equal to 1.0 for structures, not provided with supplemental energy dissipating devices, for 5% damping and is excluded from the explicit components of R factor [13]. From nonlinear static pushover curves, overstrength, redundancy and ductility factor can be calculated by using definitions and equations given in FEMA P695 [5] which are stated in the following equations: Overstrength factor, sR , can be calculated using equation 2:
s
ys V
VR = ……….(2) Redundancy factor, rR , can be calculated using equation 3:

National Conference On “Recent Innovations In Engineering Science And Technology”, April 2019 y
er V
VR = ……….(3) Ductility factor, µR ,also called as period-based ductility and can be calculated using equation 4: y
R∆∆
= maxµ ……….(4) Where, yV is the actual, maximum strength of fully-yielded system, sV is the seismic base shear required for design, eV is the force level that would be developed in the seismic-force-resisting system, if the system remained entirely linearly elastic for design earthquake ground motions, max∆ is the maximum absolute relative displacement, y∆ is the displacement at first significant yield point.
II. HISTORY & BACKGROUND In previous few years, researches have been carried out on bracing systems. Maheri et. al. [9] presented results of pushover experiments conducted on 1:3 scaled models of ductile RC frames, directly braced by steel X and knee braces which indicate that the yield capacity and the strength capacity of a ductile RC frame can be increased and its global displacements can be decreased to the desired levels by directly adding bracing system to the frame. Metre et. al. [10] analyzed 25 storey steel frame for the rectangular plan of 25m x 15m by considering Z-II and Z-V for soil type-II. They concluded that bracing structures gives more resistance to lateral deflection and also it suitable in earthquake prone areas and effectively reduces the lateral displacement and drift. Upreti and Mallik [12] concluded that the position of bracing is found to best when bracings are placed at corners. Hence, steel bracing is one of the best way for enhancing earthquake resistance of RC frames. Mirando [1] evaluated strength-reduction factors that are used to reduce linear elastic design spectra to account for the hysteretic energy dissipation of the structure. The paper recommended that strength-reduction factors to be used in design be specified as a function of the period and inelastic capacity of the structure and of soil conditions and simplified expressions to compute strength-reduction factors are proposed. Hirde and Nakhate [11] performed pushover analysis on symmetrical frames with 3, 5 and 7 numbers of storey with four bays are designed and detailed as OMRF and SMRF. They concluded that both the OMRF and SMRF frames achieve the respective target value of R factor recommended by IS1893 and R factor changes with change in storey of building. In the sixth revision-IS 1893 (part I):2016, IS 1893 increased value of R factor for SBF from 4.0 to 4.5. Hence, this paper presents evaluation of R factor for RC frames with different bracing systems and checked for recent revision of IS 1893. XLIV. BUILDING MODELLING AND DETAILS Four storey RC frame having three bays in X direction and three bays in Y direction with X bracing (as shown in fig. 3.1), V bracing (as shown in fig. 3.2) and Chevron bracing (as shown in fig. 3.3) modelled in SAP2000 for the analysis. K braces increases shear demand on column and can cause brittle shear failure. Therefore, some design codes prohibit use of K braces in earthquake resistant design [2]. OBF shall not be used in seismic zone V and while designing SBF, the maximum slenderness ratio of the braces is checked not to exceed 160 [8]. Bracings are placed at corners of frame [12]. Plinth beams are provided at periphery of RC frames for supporting V braces. All the details regarding modelling of four storey RC frame with bracing is given in table I: Table I: Modelling details
Sr. No. Parameters values 1 Total height of building 12m 2 Height of each storey 3m 3 Typical bay width 3m 4 Size of beam 300mm X 450mm 5 Size of column 450mm X 450mm 6 Depth of slab 150mm 7 Grade of concrete M25 8 Grade of reinforcing steel Fe500 9 Size of bracing ISMB225 10 Grade of steel Fe250 11 Support condition Fixed Seismic data used for analysis is given in table II [6]: Table II: Seismic details Sr. No. Parameters values 1 Seismic zone V 2 Zone factor 0..36 3 R factor for SBF 4.5 4 Importance factor (I) for Residential buildings 1.2 5 Soil type: Medium soil II 6 Damping 5% 7 Fundamental period (Ta ) 0.516 sec Loading data is given in table III: Table III: Loading details Sr. No. Type of Loading Loads (kN/m2) 1 Live load on floors 3 2 Live load on roof 1.5 3 Floor finish 1.5
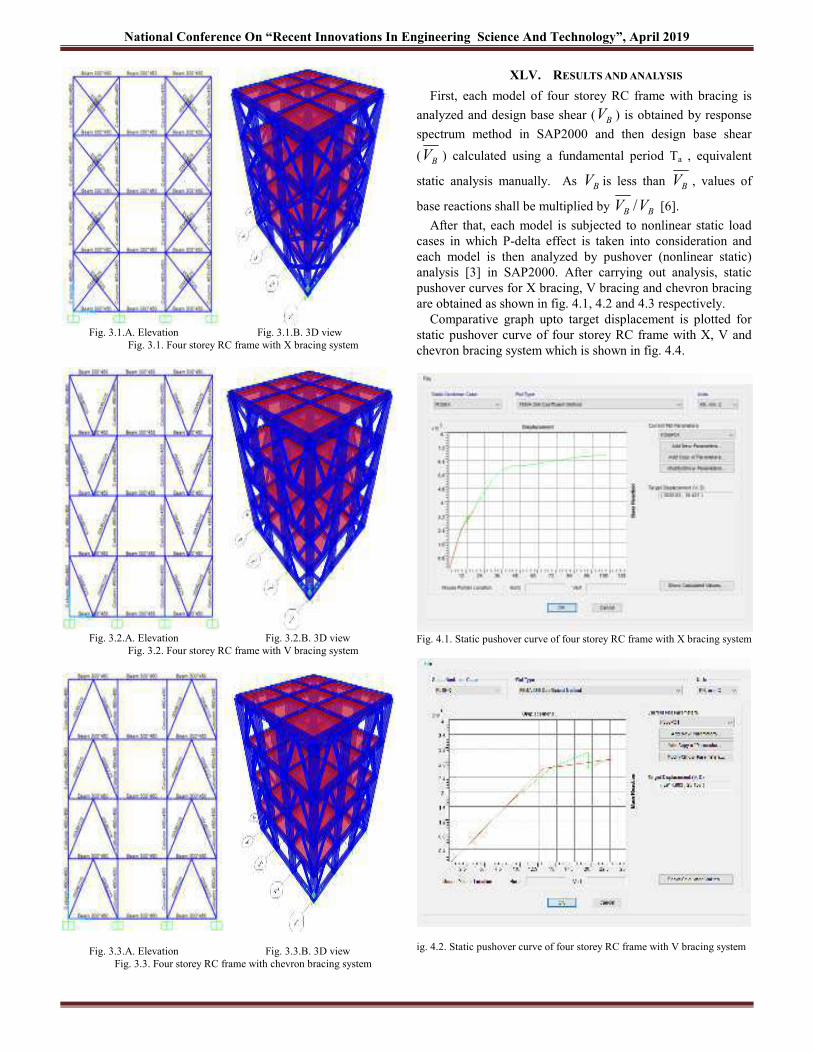
National Conference On “Recent Innovations In Engineering Science And Technology”, April 2019 Fig. 3.1.A. Elevation Fig. 3.1.B. 3D view Fig. 3.1. Four storey RC frame with X bracing system Fig. 3.2.A. Elevation Fig. 3.2.B. 3D view Fig. 3.2. Four storey RC frame with V bracing system Fig. 3.3.A. Elevation Fig. 3.3.B. 3D view Fig. 3.3. Four storey RC frame with chevron bracing system XLV. RESULTS AND ANALYSIS First, each model of four storey RC frame with bracing is analyzed and design base shear ( BV ) is obtained by response spectrum method in SAP2000 and then design base shear ( BV ) calculated using a fundamental period Ta , equivalent static analysis manually. As BV is less than BV , values of base reactions shall be multiplied by BB VV / [6]. After that, each model is subjected to nonlinear static load cases in which P-delta effect is taken into consideration and each model is then analyzed by pushover (nonlinear static) analysis [3] in SAP2000. After carrying out analysis, static pushover curves for X bracing, V bracing and chevron bracing are obtained as shown in fig. 4.1, 4.2 and 4.3 respectively. Comparative graph upto target displacement is plotted for static pushover curve of four storey RC frame with X, V and chevron bracing system which is shown in fig. 4.4. Fig. 4.1. Static pushover curve of four storey RC frame with X bracing system ig. 4.2. Static pushover curve of four storey RC frame with V bracing system
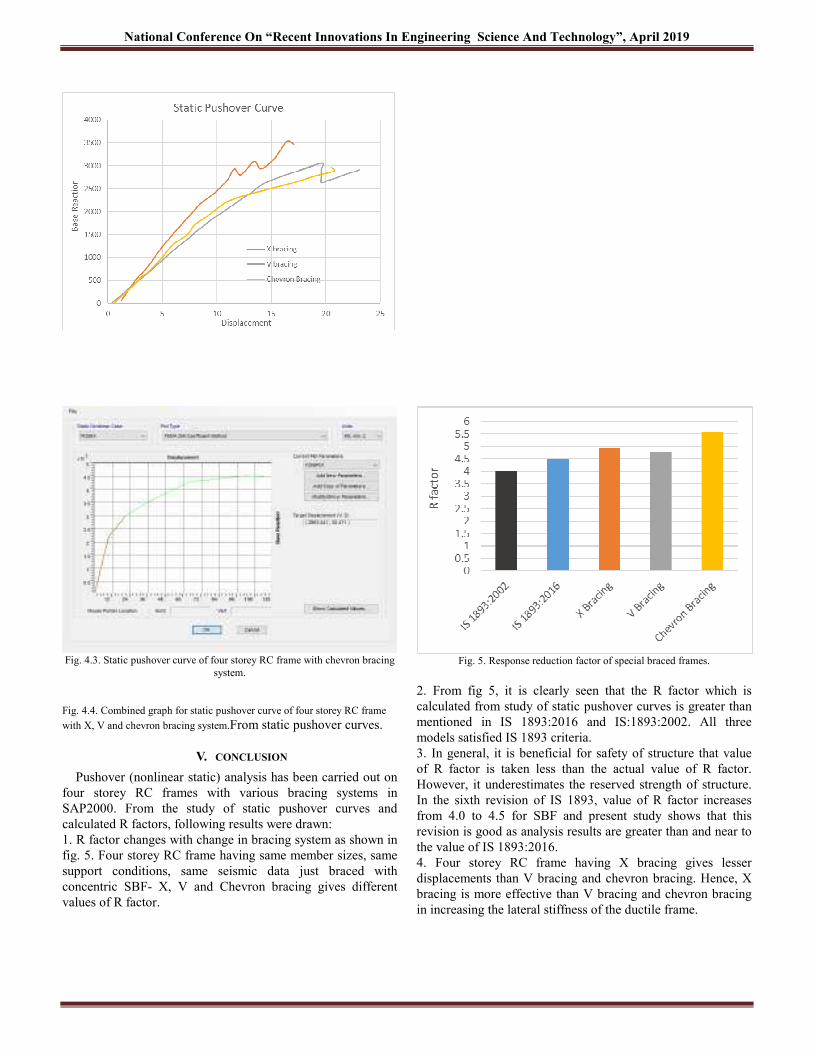
National Conference On “Recent Innovations In Engineering Science And Technology”, April 2019 Fig. 4.3. Static pushover curve of four storey RC frame with chevron bracing system. Fig. 4.4. Combined graph for static pushover curve of four storey RC frame with X, V and chevron bracing system.From static pushover curves. V. CONCLUSION Pushover (nonlinear static) analysis has been carried out on four storey RC frames with various bracing systems in SAP2000. From the study of static pushover curves and calculated R factors, following results were drawn: 1. R factor changes with change in bracing system as shown in fig. 5. Four storey RC frame having same member sizes, same support conditions, same seismic data just braced with concentric SBF- X, V and Chevron bracing gives different values of R factor. Fig. 5. Response reduction factor of special braced frames. 2. From fig 5, it is clearly seen that the R factor which is calculated from study of static pushover curves is greater than mentioned in IS 1893:2016 and IS:1893:2002. All three models satisfied IS 1893 criteria. 3. In general, it is beneficial for safety of structure that value of R factor is taken less than the actual value of R factor. However, it underestimates the reserved strength of structure. In the sixth revision of IS 1893, value of R factor increases from 4.0 to 4.5 for SBF and present study shows that this revision is good as analysis results are greater than and near to the value of IS 1893:2016. 4. Four storey RC frame having X bracing gives lesser displacements than V bracing and chevron bracing. Hence, X bracing is more effective than V bracing and chevron bracing in increasing the lateral stiffness of the ductile frame.

National Conference On “Recent Innovations In Engineering Science And Technology”, April 2019 Table IV. Determination of R factor from static pushover curves.
Sr. No.
Bracing system sV
(kN) y∆
(mm) yV
(kN) max∆
(mm) eV
(kN) sR rR µR ζR R 1 X bracing 1946.66 7.918 2352.935 16.421 4622.78 1.209 1.965 2.074 1.0 4.927 2 V bracing 1733.33 13.174 2647.73 23.107 4699.52 1.528 1.775 1.754 1.0 4.757 3 Chevron bracing 1808.366 9.42 2180.06 20.471 4621.17 2.12 1.208 2.173 1.0 5.565 5. Four storey RC frame having chevron bracing gives maximum value of R factor than X bracing and V bracing. Chevron bracing gives 23.66% and 39.125%, X bracing gives 9.49% and 23.175% and V bracing gives 5.71% and 18.925% higher value of R factor than mentioned in IS 1893:2016 and IS 1893:2002 respectively. Present study concludes that R factor is not same for various bracing systems as mentioned in IS 1893. Also, there is change in parameters of R factor with change in bracing system. In future, R factor can be evaluated for different height and aspect ratios of RC frame with chevron bracing.
REFERENCES 1. Miranda Eduardo, “Site-Dependent Strength-Reduction Factors”, Journal of Structural Engineering, vol. 119 (12):3503-3519, ASCE, ISSN 0733-9445/1993/119:12-3503. 1993 2. C. V. R. Murty, Rupen Goswami, A. R. Vijayanarayanan and Vipul V. Mehta “Some Concepts in Earthquake Behaviour of Buildings”, Gujarat State Disaster Management Authority, Government of Gujarat, September 2012 3. FEMA 356. “Prestandard and Commentary for the Seismic Rehabilitation of Buildings”, Federal Emergency Management Agency, Washington, DC, November 2000 4. FEMA 440. “Improvement of Nonlinear Static Seismic Analysis Procedures”, Applied Technology Council, Redwood City, California, June 2005. 5. FEMA P695, “Quantification of Building Seismic Performance Factors”, Applied Technology Council, Redwood City, California, June 2009. 6. IS 1893 (Part I): 2016, “Criteria for Earthquake Resistant Design of Stuctures”, Bureau of Indian Standards, Manak Bhavan, 9 Bahadur Shah Zafar Marg, New Delhi 11002, India., December 2016. 7. IS 1893 (Part I): 2002, “Criteria for Earthquake Resistant Design of Stuctures”, Bureau of Indian Standards, Manak Bhavan, 9 Bahadur Shah Zafar Marg, New Delhi 11002, India., December 2016. 8. CSI 2017, “Steel Frame Design Manual IS 800:2007 for SAP2000”, Computers and Structures INC, USA, February 2017 9. M. R. Maheri, R. Kousri and M. Razazan, “Pushover tests on steel X-braced and knee-braced RC frames”, Engineering Structures 25 (2003) 1697–1705, June 2003. 10. 11. Sachin Metre, Shivanand Ghule and Ravi Kiran, “Comparative Study of Different Types of Bracing Systems by Placing at Different Locations”, International Research Journal of Engineering and Technology, Vol. 4, Issue 8, August 2017. 12. Suchita K. Hirde and Deval S. Nakhate, “Seismic Response of Multistorey RC Frames”, International Journal of Engineering Technology Science nd Research, ISSN 2394-3386, Volume 5, Issue 3, March 2018. 13. Rabindra Upreti and R. K. Mallik, “Effectiveness of Bracing on RC Moment Resisting Frame Building”, Proceedings of IOE Graduate Conference, 2017, Volume: 5 ISSN: 2350-8914, 2350-8906. 14. Patel Nirav and Vasanwala, Sandip A., “Evaluation of Response Reduction Factor for Un-reinforced Masonry-Infilled RC Buildings”, Inovations in Infrastructure, Advances in Intelligent systems and Computing 757, 525–535, doi:10.1007/978-981-13-1966-2_47, 2018.

National Conference On “Recent Innovations In Engineering Science And Technology”, April 2019 Performance Based Seismic Design of Open Ground Storey Building Considering Soil Effects Prof. Dilip J. Chaudhari1, Rahul S. Agarwal 2 [email protected], [email protected] Department of Applied Mechanics Government College of Engineering, Amravati.
Abstract— Open ground storey buildings are typical and unavoidable trend in modern construction practices. Past earthquakes have emphasized that RC framed buildings with open ground storey are extremely vulnerable under earthquake shaking. Generally, bare frame analysis is used to design open ground storey buildings with a multiplication factor which varies for different codes. The flexibility of the soil below the structure is often not considered while analyzing and designing a structure. The soil structure interaction alters the response of the structure including base shear, lateral displacement and storey drift. In the present study, an extensive computational study has been carried out on a five storied open ground storey RC framed building using performance based seismic design (PBSD) procedures and standards. Nonlinear time history analysis method has been adopted. The soil has been modelled using equivalent spring constants as per FEMA 356. Equivalent diagonal strut method has been used to model the infill masonry walls. Building has been designed for selected performance objective. Keywords— Open Ground Storey, Nonlinear Dynamic Analysis, Performance Based Seismic Design, Time History Analysis, Equivalent diagonal strut, Soil Structure Interaction.
I. INTRODUCTION In metropolitan cities especially, where land space is a major hassle, efficient utilization of space has become a major concern due to rapid urbanization and population growth. Many such buildings constructed in recent times have a special feature – the ground story is left open for the purpose of parking. In such buildings, the ground storey is built without any infill walls. It allows easy movement of vehicles but the upper storeys are covered with infill walls. Such buildings are often called “Open Ground Story” buildings or buildings on stilts. Open ground story buildings have consistently shown poor performance during past earthquakes across the world (for example during 1999 Turkey, 1999 Taiwan and 2003 Algeria earthquakes); a significant number of them have collapsed. As per IS:1893(Part-1): 2002, “A soft storey is one in which the lateral stiffness is less than 70% of that in the storey above or less than 80% of the average lateral stiffness of three stories above”. A weak storey is defined as one in which the storey’s lateral strength is less than 80 percent of that in the storey above. Fig. 1 illustrates the behavior of an open ground storey building when subjected to seismic excitation. The OGS building behaves as an inverted pendulum due to drastic change in the relative stiffness at the ground floor and the floors above. Fig. 1. Open ground storey building behavior. (IITK, Earthquake Tip) Often, the buildings are designed and analyzed based on the bare frame considerations which is not appropriate as actual response of the building is completely different. Also it is a common practice to consider the supports as fixed while analyzing and designing the structure which may not match the actual foundation strata. The consideration is acceptable in case of hard rock soil but cannot be applicable in case of flexible soil underneath the structure. The modelling of soil below the structure can be performed using two methods namely, Direct method, and Substructure method. The direct method requires to model the soil and the structure as a continuum using finite element method. It is a complex method and it may not be warranted for building structures. The substructure method is relatively simpler. In this method, soil material properties are used for incorporation of springs to represent the stiffness at the soil foundation interface. Sub-structure method is computationally more efficient than the direct method as regards complexity and time required. Performance Base Seismic Design (PBSD) is a relatively new concept. Performance based seismic design is a procedure for designing new buildings or seismic up-gradation of existing buildings, which includes a specific intent to achieve defined performance objectives in future earthquakes [4]. Performance objectives are Operational (O), Immediate occupancy (IO), Life Safety (LS), Collapse Prevention (CP), as per FEMA 356. Fig. 2 shows various building performance levels under seismic event as per FEMA 356.
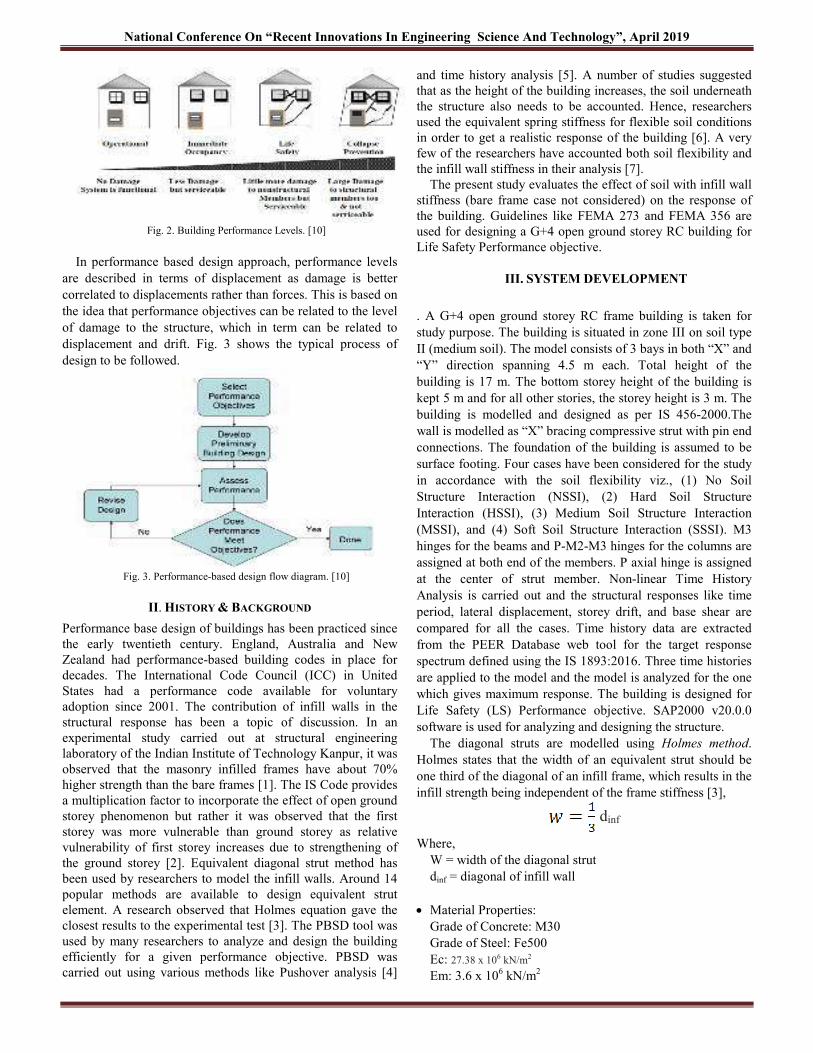
National Conference On “Recent Innovations In Engineering Science And Technology”, April 2019 Fig. 2. Building Performance Levels. [10] In performance based design approach, performance levels are described in terms of displacement as damage is better correlated to displacements rather than forces. This is based on the idea that performance objectives can be related to the level of damage to the structure, which in term can be related to displacement and drift. Fig. 3 shows the typical process of design to be followed. Fig. 3. Performance-based design flow diagram. [10] II. HISTORY & BACKGROUND Performance base design of buildings has been practiced since the early twentieth century. England, Australia and New Zealand had performance-based building codes in place for decades. The International Code Council (ICC) in United States had a performance code available for voluntary adoption since 2001. The contribution of infill walls in the structural response has been a topic of discussion. In an experimental study carried out at structural engineering laboratory of the Indian Institute of Technology Kanpur, it was observed that the masonry infilled frames have about 70% higher strength than the bare frames [1]. The IS Code provides a multiplication factor to incorporate the effect of open ground storey phenomenon but rather it was observed that the first storey was more vulnerable than ground storey as relative vulnerability of first storey increases due to strengthening of the ground storey [2]. Equivalent diagonal strut method has been used by researchers to model the infill walls. Around 14 popular methods are available to design equivalent strut element. A research observed that Holmes equation gave the closest results to the experimental test [3]. The PBSD tool was used by many researchers to analyze and design the building efficiently for a given performance objective. PBSD was carried out using various methods like Pushover analysis [4] and time history analysis [5]. A number of studies suggested that as the height of the building increases, the soil underneath the structure also needs to be accounted. Hence, researchers used the equivalent spring stiffness for flexible soil conditions in order to get a realistic response of the building [6]. A very few of the researchers have accounted both soil flexibility and the infill wall stiffness in their analysis [7]. The present study evaluates the effect of soil with infill wall stiffness (bare frame case not considered) on the response of the building. Guidelines like FEMA 273 and FEMA 356 are used for designing a G+4 open ground storey RC building for Life Safety Performance objective.
III. SYSTEM DEVELOPMENT . A G+4 open ground storey RC frame building is taken for study purpose. The building is situated in zone III on soil type II (medium soil). The model consists of 3 bays in both “X” and “Y” direction spanning 4.5 m each. Total height of the building is 17 m. The bottom storey height of the building is kept 5 m and for all other stories, the storey height is 3 m. The building is modelled and designed as per IS 456-2000.The wall is modelled as “X” bracing compressive strut with pin end connections. The foundation of the building is assumed to be surface footing. Four cases have been considered for the study in accordance with the soil flexibility viz., (1) No Soil Structure Interaction (NSSI), (2) Hard Soil Structure Interaction (HSSI), (3) Medium Soil Structure Interaction (MSSI), and (4) Soft Soil Structure Interaction (SSSI). M3 hinges for the beams and P-M2-M3 hinges for the columns are assigned at both end of the members. P axial hinge is assigned at the center of strut member. Non-linear Time History Analysis is carried out and the structural responses like time period, lateral displacement, storey drift, and base shear are compared for all the cases. Time history data are extracted from the PEER Database web tool for the target response spectrum defined using the IS 1893:2016. Three time histories are applied to the model and the model is analyzed for the one which gives maximum response. The building is designed for Life Safety (LS) Performance objective. SAP2000 v20.0.0 software is used for analyzing and designing the structure. The diagonal struts are modelled using Holmes method. Holmes states that the width of an equivalent strut should be one third of the diagonal of an infill frame, which results in the infill strength being independent of the frame stiffness [3], dinf Where, W = width of the diagonal strut dinf = diagonal of infill wall • Material Properties: Grade of Concrete: M30 Grade of Steel: Fe500 Ec: 27.38 x 10⁶ kN/m2 Em: 3.6 x 10⁶ kN/m2

National Conference On “Recent Innovations In Engineering Science And Technology”, April 2019 • Sectional Properties: Beam: (a) first floor = 400*450 (b) second floor = 400*450 I other floor = 250*300 Column: (a) ground floor = 400*450 (b) other floor = 300*450 Slab thickness: 0.12 m Wall thickness: (a) External = 0.23 m (b) Internal = 0.15 m Diagonal strut: (a) External = 0.23*1.8 m (b) Internal = 0.15*1.8 m • Load Consideration: Floor Finish: 2 kN/m2 Roof Finish: 2 kN/m2 Live Load: 4 kN/m2 Response spectra: IS 1893(I) 2016 • Load Combinations: In limit state design of RC structure, following 13 combinations are considered as per IS 1893:2016. Building is designed for maximum loading combination. 1) 1.5 DL+1.5 LL 2) 1.2 DL+ 1.2 LL + 1.2 Eqx 3) 1.2 DL+ 1.2 LL – 1.2 Eqx 4) 1.5 DL + 1.5 Eqx 5) 1.5 DL – 1.5 Eqx 6) 0.9 DL + 1.5 Eqx 7) 0.9 DL – 1.5 Eqx 8) 1.2 DL+ 1.2 LL + 1.2 Eqy 9) 1.2 DL+ 1.2 LL – 1.2 Eqy 10) 1.5 DL + 1.5 Eqy 11) 1.5 DL – 1.5 Eqy 12) 0.9 DL + 1.5 Eqy 13) 0.9 DL – 1.5 Eqy • Seismic Properties: Seismic zone: III Response Reduction Factor: 5 Importance Factor: 1.5 Fig. 4 gives the plan, elevation, and 3D view of the modeled OGS building. (a) (b) (c) Fig. 4. (a) Plan of the building. (b) Elevation of the building. (c) 3D view of the building.
• Soil Idealization In the present study, we will use the Substructure method to model the soil. Shallow isolated footing has been considered. The movement around three orthogonal directions have been considered and the interaction between the soil and the foundation is taken into account by equivalent spring stiffnesses. Three translational springs are applied in two horizontal and one vertical direction i.e., X-Y-Z direction, and three rotational spring stiffness are applied in X-Y-Z direction. Fig. 5 shows the translational and rotational spring stiffnesses. Fig. 5. Soil stiffness spring systems at the foundation. [9] FEMA 356 (George Gazetas 1991) provides us with the soil spring stiffness equations for all the six degrees of freedom. Fig. 6 shows the equivalent spring equations for shallow isolated footing at the surface. Fig. 6. Equivalent Spring constants for shallow foundation. [9] The soil parameters for all the considered soil profiles i.e., hard, medium, and soft soil are provided in Table. I. Table. I. Soil parameters considered. Soil Type Shear Wave Velocity (m/s) SPT Mass Density (kN/m3) Poisson Ratio Shear Modulus (kN/m2) S.B.C (kN/m2) Hard Soil 600 ≥ 30 20 0.45 68965.51 250 Medium Soil 320 10 to 30 18 0.45 17241.37 160 Soft Soil 150 ≤ 10 16 0.45 5172.41 120 Table. II give the values for different degrees of freedom for different soil conditions i.e., hard, medium, and soft soil.

National Conference On “Recent Innovations In Engineering Science And Technology”, April 2019 These values are then provided in SAP2000 v20.0.0 to incorporate the soil effect for respective soil profile. Table. II. Equivalent soil spring stiffness. Hard Soil Medium Soil Soft Soil KX (kN/m) 295566.5 153503.8 23025.57 KY (kN/m) 295566.5 153503.8 23025.57 KZ (kN/m) 398530.2 221003 33150.446 KXX (kN/rad) 190785.7 105799.3 15869.89 KYY (kN/rad) 192312 106645.7 15996.85 KZZ (kN/rad) 242068.9 121034.4 18155.159
• Time History Three time histories have been selected and scaled on the basis of defined target response from IS 1893:2016. Matching and scaling was done using MSE (Mean Squared Error) method on PEER web tool. Fig. 7 shows the X and Y direction component of the three selected time histories. Fig. 7. Time histories considered for the analysis. IV. RESULT AND ANALYSIS The results in terms of natural time period, lateral displacement, storey drift, and base shear are presented for different soil profile models like NSSI, HSSI, MSSI, and SSSI. An effort is made to investigate the effect of soil flexibility on the structure. The OGS building is designed for LS performance objective.
• Lateral displacement Lateral displacement of the G+4 OGS building was calculated for all the soil profiles (NSSI, HSSI, MSSI, SSSI) with initial sections being constant for all the cases. It was observed that as we go from rigid to soft base, the lateral displacement of the building increases. Fig. 8 shows the lateral displacement for all the soil types. Fig. 8. Lateral displacement of G+4 OGS building. • Time Period It is observed that as the soil stiffness decreases, the time period of the building increases. Fig. 9 shows the time period variation for different soil profiles. Fig. 9. Time period of G+4 OGS Building • Storey drift Storey drift is the relative displacement between the floors. Typically for OGS buildings, it is observed that the maximum storey drift is for the first floor where the stiffness irregularity occurs. Fig. 10 shows the storey drift for diffrent soil profiles. It can be observed that as the soil stiffness decreases, the storey drift increases. Fig. 10. Storey drift for G+4 OGS building. • Base Shear The base shear is a function of mass, stiffness, height, and the natural period of the building structure. The change in base shear with change in soil stiffness is plotted in Fig. 11. It can be observed that as we go from rigid to soft soil condition, the base shear decreases.

National Conference On “Recent Innovations In Engineering Science And Technology”, April 2019 Fig. 11. Base shear for G+4 OGS building. • Criteria for Performance Objective FEMA 273 has made an effort in quantifying the damages and has laid down few criterias to categorise the performance of the building. a) Storey drift. FEMA 273 provides storey drift criteria to define the performance objective. Storey drift of given model should be within the prescribed limit. Table. III gives the storey drift criteria. Table. III. Storey drift criteria. [8] Performance Level Operational Immediate Occupancy Life Safety Collapse Prevention Storey Drift < 0.2% < 0.5% < 1.5% < 2.5% b) Plastic rotation. The limiting value for given performance objective are provided by FEMA 273. If the plastic rotation values for a given performance objective goes beyond the prescribed value, then the sections need to be revised. Table. III gives the plastic rotation criteria. Table. IV. Plastic rotation criteria. [8] Structural System IO LS CP Beam 0.01 0.02 0.025 Column 0.005 0.015 0.02 • PBSD for Life Safety (LS) Performance Objective Nonlinear direct time history analysis was carried out on G+4 OGS building for all the soil profiles. Initially, few members went beyond the LS objective. After a number of trials, the LS objective was attained. Fig. 12 shows the hinges formed for respective soil type at LS performance objective. Fig. 12. Hinge results at LS for (a)NSSI (b)HSSI (c)MSSI (d)SSSI Lateral displacement and storey drift of the OGS building for LS performance objective for all soil profiles are described in Table. V and Table. VI respectively. Table. V. Lateral displacement for LS. Lateral Displacement (m) Storey NSSI HSSI MSSI SSSI 0 0 0 0 0 1 0.031808 0.045726 0.067143 0.073391 2 0.056954 0.077651 0.112311 0.115743 3 0.089401 0.096767 0.157968 0.153299 4 0.112453 0.112011 0.178078 0.184858 5 0.117534 0.117059 0.182988 0.187698 Table. VI. Storey drift for LS. Storey Drift (m) Storey NSSI HSSI MSSI SSSI 0 0 0 0 0 1 0.031808 0.045726 0.067143 0.073391 2 0.025146 0.031925 0.044168 0.042352 3 0.032447 0.019116 0.044657 0.037556 4 0.023052 0.015244 0.02011 0.031559 5 0.005081 0.005048 0.00491 0.00284

National Conference On “Recent Innovations In Engineering Science And Technology”, April 2019 Table. VII gives the final sections and area of steel for the G+4 OGS building with different soil profiles i.e., NSSI, HSSI, MSSI, and SSSI for LS performance objective. Table. VII. Final sections for all the soil profiles.Section Storey Level Soil Profile Section Size NSSI Section Size HSSI Section Size MSSI Section Size SSSI Area of Steel Area of Steel Area of Steel Area of Steel Beam 1 400*600 704.137 Top 400*600 811.323 Top 400*600 874.398 Top 450*700 948.215 Top 630.976 Bottom 630.976 Bottom 630.976 Bottom 828.157 Bottom 2 400*500 525.814 Top 400*500 525.814 Top 400*500 525.814 Top 400*600 630.976 Top 525.814 Bottom 525.814 Bottom 525.814 Bottom 630.976 Bottom 3 350*500 460.087 Top 350*500 460.087 Top 350*500 460.087 Top 400*500 525.814 Top 460.087 Bottom 460.087 Bottom 460.087 Bottom 525.814 Bottom 4 350*500 460.087 Top 350*500 460.087 Top 350*500 460.087 Top 350*500 460.087 Top 460.087 Bottom 460.087 Bottom 460.087 Bottom 460.087 Bottom 5 250*400 262.907 Top 250*400 262.907 Top 250*400 262.907 Top 250*400 262.907 Top 262.907 Bottom 262.907 Bottom 262.907 Bottom 262.907 Bottom Column 1CC 500*650 2600 500*650 2600 500*650 2600 850*850 5780 1OC 500*600 2400 500*600 2400 500*600 2400 850*850 5780 2 450*550 1980 450*550 1980 450*550 1980 750*750 4500 3 350*450 1260 350*450 1260 350*450 1260 500*550 2200 4 300*450 1080 300*450 1080 300*450 1080 300*450 1080 5 300*450 1080 300*450 1080 300*450 1080 300*450 1080 V. CONCLUSION In this study, non-linear time history analysis is carried out on a G+4 OGS Building. Different soil profiles are incorporated with the OGS building and comparison is made. For all cases infill effect has been considered and no variation of infill has been incorporated. Also bare frame case has not been considered. PBSD is performed by following the guidelines provided by FEMA 273 and FEMA 356. The buildings are designed for Life Safety performance objective. Final section sizes and area of steel are provided for all considered cases. Based on the results, following conclusions are drawn, 1) It is observed that the fundamental natural period of the building increases as the soil stiffness decreases. Maximum natural period is observed for building with SSSI. 2) Base shear is found to be decreasing as the soil stiffness decreases. Decrease in the base shear was observed to be 15.21%, 25.278%, 44.355% for HSSI, MSSI, and SSSI with respect to NSSI respectively. Maximum base shear was observed for building with NSSI while minimum was observed for building with SSSI. 3) Lateral displacement of building was found to be increasing with decrease in soil stiffness. Increase in lateral displacement was observed to be 22.23%, 35.68%, 42.29% for HSSI, MSSI, and SSSI with respect to NSSI respectively. Maximum displacement was recorded for building with SSSI. 4) It is observed that the maximum storey drift of the open ground storey building occurs at first floor for all the considered cases. Increase in storey drift was observed to be 16.23%, 22.97%, and 31.82% for HSSI, MSSI, and SSSI with respect to NSSI respectively The storey drift increases with decrease in soil stiffness. 5) Soil Structure Interaction (SSI) cannot be ignored and must be accounted while analyzing and designing important structures like nuclear power plants, important buildings, dams, bridges etc. SSI should be incorporated

National Conference On “Recent Innovations In Engineering Science And Technology”, April 2019 for structures in higher seismic zone and on medium to soft soil base.
REFERENCES 1. C V R Murty and Sudhir K Jain (2000), “Beneficial Influence of Masonry Infill Walls on Seismic Performance of RC Frame Buildings”, 12WCEE 2000. 2. D. J. Chaudhari, Prajakta T. Raipure, “Seismic Performance of Open Ground Storey RC Buildings for Major International Codes”, Journal of Civil Engineering and Environmental Technology, volume 2. 2015 3. Amalia, “Comparative study on diagonal equivalent methods of masonry infill panel”, AIP Conference Proceedings 2017, https://doi.org/10.1063/1.4985481.
4. Chaudhari D.J. and Dhoot G.O, “Performance Based Seismic Design of Reinforced Concrete Building”, Open Journal of Civil Engineering, 2016, 6, 188-194. 5. Dilip J.Chaudhari, Sandip S. More, “Performance Based Seismic Design of Reinforced Concrete Building by Non-Linear Dynamic Analysis”, International Conference on emerging trends in engineering technology, science and management, 2017. 6. Prof. Dilip J. Chaudhar, Nikhil N. Chopade, “Performance Based Seismic Design of RC Building with Consideration of Soil Structure Interaction”, International Research Journal of Engineering and Technology (IRJET), Volume: 05, 2017. 7. Amar R Chougule, S S Dyavanal, “Seismic Soil Structure Interaction of Buildings with Rigid and Flexible Foundation”, International Journal of Science and Research (IJSR), ISSN (Online): 2319-7064, 2013. 8. FEMA 273, Nehrp Guidelines for the Seismic Rehabilitation of Buildings, 1997. 9. FEMA 356, Prestandard and Commentary for The Seismic Rehabilitation of Buildings, 2000. 10. FEMA 445, Next-Generation Performance Based Seismic Design Guidelines, 2006.

National Conference On “Recent Innovations In Engineering Science And Technology”, April 2019 Use of Different Modified Dual Piezo Configurations on RC Beam using EMI Technique S. N. Khante1, Saurabh M. Bhoir 2 [email protected], [email protected] Department of Applied Mechanics Government College of Engineering, Amravati
Abstract— Real time structural health monitoring along with damage detection and assessment of reinforced concrete members becomes essential since engineers often face the problem of detecting hidden damage. The Electromechanical Impedance (EMI) technique, which employs piezoelectric–ceramic Lead–Zirconate–Titanate (PZT) patches as impedance transducers, has emerged as a powerful non-destructive evaluation technique during the last few years. In conventional EMI technique employes the same piezo patch as the sensor as well as the actuator. A new versions of piezo configurations is used here it is called as Modified Dual Piezo Configuration (MDPC). It is applied in such a way that central patch acts as sensor and surrounding patches acts as actuator yielding to better results and larger sensing zone which was introduced by Adhikari & Bhalla [3]. In present work performance of different piezo configurations, namely, surface-bonded Single Piezo Configuration (SPC), surface-bonded Modified Dual Piezo Configuration (MDPC) and Embedded Modified Dual Piezo Configurations (EMDPC) are applied to reinforced concrete beams which are then subjected to destructive loading condition and tested. RMSD indices are calculated and their results are compared for effectiveness of all configurations using EMI technique. It is established that MDPC detects damage most effectively. Keywords— Structural Health Monitoring (SHM), Electro-mechanical Impedence (EMI), Single Piezo Configuration (SPC), Modified Dual Piezo Configuration (MDPC), Reinforced Concrete Beam.
I. INTRODUCTION Concrete structures have been used extensively in civil infrastructural systems. However, as compared with metallic or other composite structures, the Non-Destructive Evaluation (NDE) technologies of concrete structures are relatively undeveloped. Furthermore, due to their extensive and complex nature, conventional NDE methods might be very tedious, expensive, or unreliable. Therefore, more reliable and automated NDE techniques are being investigated for real-time health monitoring of concrete structures. The automated NDE techniques that enable continuous health monitoring ofconcrete structures while in operation require the development of a built-in diagnostic system. Such a built-in diagnostic system would be placed practically anywhere, even in remote and inaccessible locations to actively monitor the conditions of various types of structures. In particular, an impedance-based damage detection technique which uses a smart piezoelectric ceramic material Lead–Zirconate–Titanate (PZT) has emerged as a potential tool for the implementation of a built-in diagnostic system. This technique utilizes high-frequency structural excitations, which are typically higher than 20 kHz from the surface bonded PZT patches to monitor the changes in the structural mechanical impedance [6]. A basic principle of the impedance-based damage detection method is to track an electrical point impedance of the PZT patch bonded onto the structure. Physical changes in the structure may cause changes in the structural mechanical impedance, which may induce changes in the electrical impedance of the PZT patch. Those changes in the impedances of the PZT patches are used to identify incipient damage in the structure. The incipient damages, which are otherwise difficult to detect by various conventional techniques, can be successfully detected by the EMI technique [7]. II. HISTORY & BACKGROUND The EMI technique was first invented by Liang et al [1]. In this technique, a PZT patch is bonded to the surface of the structure using high strength adhesive and subjected to an alternating voltage excitation from an impedance analyzer or Inductance Capacitance Resistance (LCR) meter, sweeping through a particular frequency range, generally 30 to 400 kHz, as shown in Fig. 1(a). At the given frequency, the patch actuates the structure and the response is sensed by the patch itself in terms of electro-mechanical admittance, which consists of real and imaginary components, the conductance and susceptance respectively. Any damage to the structure manifests itself as a deviation in the admittance signature, which is directly obtained in the frequency domain [8]. Due to the use of frequency in kilohertz range, the input signals have very small wavelength (typically of the order of few mm to cm). When any micro-crack appears in the structure, the path

National Conference On “Recent Innovations In Engineering Science And Technology”, April 2019 (a) (b) (c) Fig. 1. (a) Conventional EMI technique (b) Dual piezo confguration (DPC) (c) Modified Dual Piezo Configuration (MDPC) [3] of the waves is disturbed, which causes deviation in the signature, thereby giving a direct indication of damage. The governing one-dimensional wave equation for the generic system comprising one half of the patch and the structure, was solved by Liang et al. [1] for SPC using the impedance approach. The expression for electrical admittance as formulated by Liang can be further divided into two parts, active admittance and passive admittance, as given by [ ] )1.......(..........tan2 2)()()( 231 23133
++
−=+=
klklYd
ZZZ
hwlj
YdhwljYYY
E
as
a
ETAp
ω
εωωωω where, is the passive component and the active component of admittance, the angular frequency, the width of PZT patch, the half length of PZT patch, the thickness of PZT patch, the complex electric permittivity of the PZT material at constant stress, the actuator impedance, the mechanical impedance of the structural system, is the piezoelectric strain coefficient, the complex Young’s modulus of the PZT patch at constant electric field, and the wave number given by Despite having high sensitivity to locate the incipient damage, simultaneous excitation and sensing of the PZT patch makes it difficult to capture very small structural responses especially from the large and stiff host structures [2]. As can be observed from the equation (1), the passive component of the admittance solely depends on the properties of the PZT patch. During damage, the impedance parameters of the host structure get affected. Hence, only the active part undergoes change whereas the passive component is not influenced. This is because the mechanical admittance of the host structure couples itself with mechanical admittance of the PZT patch in the active part only. Therefore, the active component of the admittance is recommended for the damage diagnosis. In the paper by Song et al [2] they developed the Dual Piezo Configuration (DPC), as illustrated in Fig. 1(b), on the contrary, strives to obtain the active component of the signature directly. For this purpose, the DPC employs two concentric PZT transducers, as shown in Fig. 1(b), which can be activated independently and simultaneously for excitation and sensing purpose. The outer segment (ring) is used for excitation and the inner (disc) is used for sensing. One can go for the reverse way also, but as the outer ring is bigger, it is more advantageous to use it for excitation. Song et al. derived an expression for the admittance of DPC as )2...(..........)( 231
++=
baS
aE
ZZZZYd
hwljY ωω where, is the mechanical impedance of the actuator PZT patch, that of the sensing PZT patch and that of the structure. From above equation, it is observed that the passive component of the conventional admittance (see equation 1) is no longer the part of the dual PZT admittance. Unlike the SPC, the passive component automatically filters out in case of DPC. Hence, the active admittance is directly measured, which leads to improved damage diagnosis, marked with higher sensitivity and larger zone of influence. The associated temperature fluctuations do not cause any disturbance to the admittance signatures. In addition, due to the use of dedicated actuator patch, DPC achieves a higher quality and better repeatability of admittance signatures even for large structures than the SPC. However, lack of easy commercial availability of concentric PZT patches limits the practical application of DPC. Therefore, Adhikari and Bhalla [3] proposed to modify DPC by replacing the concentric PZT patches with four square PZT patches which are easily available as shown in Fig 1(c). They

National Conference On “Recent Innovations In Engineering Science And Technology”, April 2019 Fig. 2. Experimental Setup of RC beam of Universal Testing Machine demonstrated improved SHM of a small aluminium block (48*48*10 mm3) via MDPC employing a surface-bonded single PZT patch for sensing and four PZT patches (connected in parallel) for actuation. Kaur and Bhalla [4] extended the application of the MDPC to a more practical scenario considering a real-life-sized simply supported RC beam with a set of five embedded Concrete Vibration Sensors (CVS), each encapsulating a square PZT patch. The objective of this study is to investigate the performance of three different piezo configuration namely SPC, surface bonded MDPC and Embedded MDPC (EMDPC) for SHM of a RC structure. XLVI. EXPERIMENTATION DETAILS Detailed experiments were carried out in the laboratory to integrate and compare the different types of piezo configurations introduced above for SHM of an RC beam. The complete instrumentation detail is shown in Fig. 2 and the physical and mechanical properties of all beams are shown in Table 1. Three identical beams were casted in the lab and kept for curing period of 28 days. On the beam 1 three PZT patches were directly bonded on the surface of the beam (as SSPC) out of which two patches are attached at L/6 from either end and one at the distance of L/2, using two-part Araldite epoxy adhesive so that each patch will cover 1/3rd of the beam as shown in Fig 3. One end of coaxial cable is attached to the electrodes of surface bonded PZT patch where the other end of the cable are kept free for inserting it into LCR meter to take the readings. On beam 2 five set of commercially available square shaped PZT patches are surface bonded to beam at the center where center PZT patch acts as sensor and other four PZTs connected in parallel acts as a actuator making it modified version of SPC called as MDPC with one sensor and four actuators (S+4A) as shown in Fig 4, with cable connection given to each PZT patch. Table 1- Properties of RCC Beam
Property Value Length (mm) 1000 Cross-section (b x d) (mm2) 100 x 120 Characteristic Strength of Concrete (fck) (N/mm2) 20 Yield Strength of Reinforcement (fy) (N/mm2) 500 Main Reinforcement 2 bars at top and bottom of 8 mm Dia Stirrups 6 mm Dia @ 100 mm c/c For the third beam total three no of CVS were first casted with dia of 30 mm and depth of 20 mm [5]. After 7 days of curing CVS were embedded inside the RC beam flushing at the distance of 30 mm from soffit near the center along the length of beam at the time of casting of RC beam. Out of which one CVS is placed at the centre acting as sensor (S) and two adjacent CVSs acting as actuators (A). This orientation is called as Embedded Modified Dual Piezo Configuration (EMDPC). The complete experimental set-up is shown in Figure 2. It consisted of a simply supported laboratory sized RC beam of span 1 m. A two-point (290 mm apart) concentrated load was applied with the help of loading frame on the simply supported beam by Universal testing machine as shown in Fig 5. Commercial raw PZT patches procured from Central Electronics Limited (CEL) [10], were used in this experiment. The admittance signature of the PZT patches was obtained using conventional LCR meter, model E4980AL for the SSPC, MDPC and EMDPC. Two-point and four-point connections of LCR meter were used for SPC and MDPC respectively. The Undamaged/Healthy stage for RC beam has been taken as Day 28 after casting. The theoretical ultimate load for the RC beam under two-point concentrated load was computed to be 36 kN.

National Conference On “Recent Innovations In Engineering Science And Technology”, April 2019 After the undamaged state signature or healthy signature of the beams are taken and recorded beams are loaded on UTM for flexural loading. LVDT is used to measure the central point deflection of beam. Fig. 3. Arramngment of PZTs on Beam 1 (SPC) Fig. 4. Arrangment of PZTs on Beam 2 (MDPC) Fig. 5. Loading Arrangement of simply supported RC beam IV. RESULT AND DISCUSSION The performance of all three variants SSPC, MDPC, and EMDPC attached to RC beams under flexure test up to failure, was monitored experimentally by EMI technique. The readings of the beam at 28 days of casting were taken which are considered as healthy signature. After the application of the load cracks were developed at the bottom fibers and then extended towards top. The cracks appeared on the RC beam under the concentrated two-point loading in flexure. Most of the cracks were vertical flexural cracks varying from 1 to 8 cm in length. Minor cracks initiated at the lower part at load ranging between 20 to 25 kN and then gradually emerged and distributed to other parts of the beam; as the applied load increases further, the existing cracks propagated upwards and at the same time new cracks also appeared. During the final stage, the visible cracks at the mid-section reached near the top surface, restricting it to withstand further load and causing its ultimate failure due to concrete collapse in tension. Load is gradually applied till the point where no more load was taken by the beam. The readings of conductance (G) and susceptance (B) signature of damaged beams were recorded using LCR meter and their graph is plotted. The signature of healthy and damaged condition is compared and for better comparison root mean square deviation (RMSD) indices is calculated using the following relation )3........(..........)((%) 21 212
∑∑ −
=G
GGRMSD Here, is the conductance after the damage at any specific frequency and is the conductance at pristine state at the same frequency. For all three beams maximum load at failure taken in flexure and the central point deflection in mm recorded by LVDT is given in table 2.

National Conference On “Recent Innovations In Engineering Science And Technology”, April 2019 Table 2- Max. load at failure and deflection of RC beams PZT Configuration Max Load Taken (kN) Central point Deflection (mm) Beam 1 SPC 41 16.3 Beam 2 MDPC 42.5 19.1 Beam 3 EMDPC 37 17.7 Damage detection of Beam 1 The conductance signature of healthy and damaged beam for beam 1 all three PZT patches (SPC) are shown by the Fig 6, 8, 10 respectively & their susceptance signature of the same are shown in Fig 7, 9, 11 respectively. From figures it can be observed that as most of major cracks appeared near the middle part of the beam, hence conductance of PZT 2 shows large shift in signature and comparatively less change of signature in PZT 1 and 2. Susceptance of all patches shows no significant change hence cannot be considered for damage detection.
Fig. 6. Conductance signature of Beam 1 PZT 1 Fig. 7. Susceptance signature of Beam 1 PZT 1 Fig. 8. Conductance signature of Beam 1 PZT 2 Fig. 9. Susceptance signature of Beam 1 PZT 2 Fig. 10. Conductance signature of Beam 1 PZT 3 Fig. 11. Susceptance signature of Beam 1 PZT 3
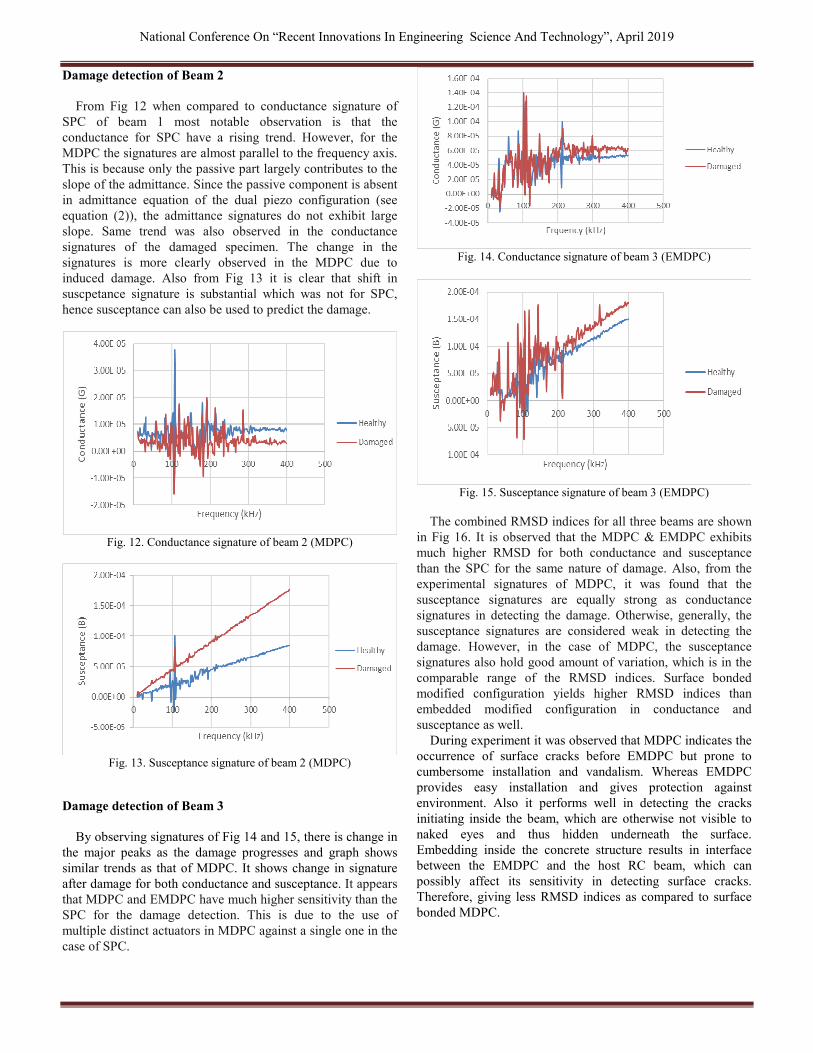
National Conference On “Recent Innovations In Engineering Science And Technology”, April 2019 Damage detection of Beam 2 From Fig 12 when compared to conductance signature of SPC of beam 1 most notable observation is that the conductance for SPC have a rising trend. However, for the MDPC the signatures are almost parallel to the frequency axis. This is because only the passive part largely contributes to the slope of the admittance. Since the passive component is absent in admittance equation of the dual piezo configuration (see equation (2)), the admittance signatures do not exhibit large slope. Same trend was also observed in the conductance signatures of the damaged specimen. The change in the signatures is more clearly observed in the MDPC due to induced damage. Also from Fig 13 it is clear that shift in suscpetance signature is substantial which was not for SPC, hence susceptance can also be used to predict the damage.
Fig. 12. Conductance signature of beam 2 (MDPC) Fig. 13. Susceptance signature of beam 2 (MDPC) Damage detection of Beam 3 By observing signatures of Fig 14 and 15, there is change in the major peaks as the damage progresses and graph shows similar trends as that of MDPC. It shows change in signature after damage for both conductance and susceptance. It appears that MDPC and EMDPC have much higher sensitivity than the SPC for the damage detection. This is due to the use of multiple distinct actuators in MDPC against a single one in the case of SPC.
Fig. 14. Conductance signature of beam 3 (EMDPC) Fig. 15. Susceptance signature of beam 3 (EMDPC) The combined RMSD indices for all three beams are shown in Fig 16. It is observed that the MDPC & EMDPC exhibits much higher RMSD for both conductance and susceptance than the SPC for the same nature of damage. Also, from the experimental signatures of MDPC, it was found that the susceptance signatures are equally strong as conductance signatures in detecting the damage. Otherwise, generally, the susceptance signatures are considered weak in detecting the damage. However, in the case of MDPC, the susceptance signatures also hold good amount of variation, which is in the comparable range of the RMSD indices. Surface bonded modified configuration yields higher RMSD indices than embedded modified configuration in conductance and susceptance as well. During experiment it was observed that MDPC indicates the occurrence of surface cracks before EMDPC but prone to cumbersome installation and vandalism. Whereas EMDPC provides easy installation and gives protection against environment. Also it performs well in detecting the cracks initiating inside the beam, which are otherwise not visible to naked eyes and thus hidden underneath the surface. Embedding inside the concrete structure results in interface between the EMDPC and the host RC beam, which can possibly affect its sensitivity in detecting surface cracks. Therefore, giving less RMSD indices as compared to surface bonded MDPC.

National Conference On “Recent Innovations In Engineering Science And Technology”, April 2019 Fig. 16. RMSD indices for all Beam SPC, MDPC, EMDPC V. CONCLUSION In this study laboratory–based experimental study has been presented to compare various piezo configurations including SPC, MDPC, and EMDPC for 1 m span RC beam. From the results following conclusions can be drawn: - 1. For Beam 1 with SPC as major cracks are near center of beam i.e. near PZT 2 hence RMSD Indices of PZT 2 is maximum amongst all three patches. 2. MDPC and EMDPC are effective configurations when compared with conventional SPC. 3. MDPC by surface bonding rather than embedding gives higher value of damage index both in conductance and susceptance at the time of failure. 4. Remarkably, in the case of MDPC, both susceptance and conductance signatures can be used for damage detection. 5. During damage detection of the large structures, the variation of the admittance signatures, which is otherwise feeble in SPC, can be remarkably seen in MDPC. Thus, the MDPC can be used for the damage detection of the large structures. 6. The results obtained from the experiments clearly support the greater utility of the proposed MDPC and EMDPC in EMI technique than the conventional approach. REFERENCES
1. Liang C, Sun FP, Rogers CA (1994) Coupled electro-mechanical analysis of adaptive material systems-determination of the actuator power consumption and system energy transfer. J Intell Mater Syst Struct 5:12–20. 2. Song H, Lim HJ, Sohn H (2013) Electromechanical impedance measurement from large structures using a dual piezoelectric transducer. J Sound Vib 332:6580–6595. 3. Adhikari S and Bhalla S (2018) A modified dual piezo configuration for improved structural health monitoring. Experimental Techniques. February 2018, Volume 43, Issue 1, pp 25–40. 4. Kaur N, Li LF, Bhalla S, et al. (2017) Integration and evaluation of multiple piezo configurations for optimal health monitoring of RC structures. Journal of Intelligent Material Systems and Structures. 5. Gedam, S.R. and Khante, S.N. (2016) Experimental Investigation on Sensitivity of Smart Aggregate Embedded in Reinforced Concrete Beam. Open Journal of Civil Engineering , 6, 653-669. 6. Bhalla S, Soh CK (2003) Structural impedance based damage diagnosis by Piezo-transducers. Earthq Eng Struct Dyn 32(12): 1897–1916. 7. Kaur N, Bhalla S, Panigrahi R, et al. (2016) Evaluation of miniature impedance chip for structural health monitoring of prototype steel/RC structures based on EMI technique. Experimental Techniques 40: 981–992. 8. AktanAE, Catbas FN, GrimmelsmanKA, Tsikos CJ (2000) “Issues in infrastructure health monitoring for management”, Journal of Engineering Mechanics. ASCE 126(7):711–724. 9. Keysight Technologies (2016) LCR meters & impedance measurement products. Available at: http://www.keysight.com 10. http://www.celindia.co.in

1
National Conference On “Recent Innovations In Engineering Science And Technology” April 2019
Interconnection Protection for Wind Power
Distributed Generation Based on Distance
Relaying
Madhuri D.Bagade1, Rajani M.Sahare
2
[email protected], [email protected]
2
Electrical Engineering Department Government
College of Engineering, Amravati,
Maharashtra, India
Abstract – A new method based on distance relaying is proposed to
analyze and improve the performance of interconnection protection for wind power Distributed Generation (DG) in distribution systems. A back-Electromotive-Force (EMF) model reference adaptive system (MRAS)-based sensor less control scheme is proposed for a grid-connected doubly-fed induction generator (DFIG). Based on the stator-side and the
rotor-side dynamic models of the DFIG, both the reference
model and the adaptive model of the proposed back-EMF-
based DFIG are investigated. Of particular importance,
distance protection that uses the concept of pre-fault voltages
as reference quantities found to have issues with intermittent
behavior of wind power DG. This concept is normally used in
different distance protective relaying applications in order to
increase the fault resistance coverage capability of the distance
relays as well as ensure selectivity, dependability and security
under extreme under voltages. Wind generation can have a
significant impact on power flow, voltage profile, and stability
and continuity of power. The increasing wind penetration
would translate into more interconnections and longer lines,
which would move the system closer to its limits unless
expensive reinforcements are implemented. The main purpose
of this paper is to analyze this issue and propose a method to
enhance the performance of distance protection to overcome
this issue.
Keywords- Power Systems, Distributed Power Generation,
Distribution Systems, Power System Protection, Power System
Faults, Wind Energy.
INTRODUCTION
The electric power system is rapidly evolving into a
decentralized industry with competitive participants and
high penetration of renewable energy. The assumptions
once made for a centralized grid and radial feeder
networks may not remain valid as distributed generation
continues to increase. Wind power DGs are often
connected to relatively weak distribution and sub-
transmission system, which raise concerns regarding
system load ability, stability, voltage regulation and
post-fault disturbances. Over the past decades, wind
energy has been acknowledged as a mature and cost-
effective way to integrate renewable energy resources
into the bulk power grid [1], [2]. Among various existing
wind-turbine-generators (WTG) systems, the variable-
speed WTG using a doubly-fed induction generator
(DFIG) has been recognized as the state-of-the-art
technology due to its maximum power tracking ability,
improved flexibility, and significant reduction in weight,
size and the rated capacity of the required power
electronic converter. As a result, numerous dynamic
modelling and control strategies for DFIG systems have
been proposed in the literature. Even though the
traditional sensor-based control offers a straightforward
solution, this approach suffers from reduced robustness
and requires additional expenditures involved in
maintenance and cabling between the speed transducers
and the controllers. Consequently, a significant amount
of research has been devoted towards sensor less control
for grid-connected DFIG systems.
Open-loop methods are the most widely
adopted techniques for sensor less control of grid-
connected DFIG systems.
In summary, previous studies [1]–[7] indicated
that: a) fault characteristics of wind power DGs have
different behavior compared with synchronous based
DGs, b)Wind power DGs do not provide sustained short-
circuit currents during fault, c) short-circuit current is
pertinent to wind speed, penetration levels and number
and type of wind turbine generator, d) relay selectivity is difficult to obtain with source impedance variation and bidirectional fault currents, e) excessive fault-
clearing times jeopardize distributed generator stability,
and f) traditional protection schemes limit distributed
generation connection capacity.
These characteristics could result in DGs interconnection
protection issues including sensitivity, security,
selectivity, and dependability. As a result, recent
recommendations of using of distance relaying in DG
interconnections can minimize the aforementioned issues
by providing shorter fault-clearing times and allowing
larger amounts of DGs to be connected to distribution
system circuits. This paper introduces a methodology to

2
National Conference On “Recent Innovations In Engineering Science And Technology” April 2019
analyze and enhance the impact of penetration levels of
wind power in distribution systems on the dynamic
performance of distance relays that use the concept of
pre-fault voltages (memory voltage) as polarizing
(reference) quantities. This concept is normally used in
different protective relaying applications in order to: a)
increase the fault resistance coverage capability of the
distance relays for close in faults and b) detect bus faults
occurring behind the relay location.
LITERATURE REVIEW
The impact of distributed generation on power
systems in general and distribution networks in
particular has been of interest of many researchers. In
particular, Distributed Generation (DG) impacts the
distribution system protection depending on the DG
technology, the penetration level and the nature of
disturbances. Their effect on the protection systems is
well studied [1]-[10]. Different techniques were reported
to analyze and compensate the effect of wind power DGs
on distance protection. Articles [2], [3] provide extended
literature reviews which identify the impact of fault
current contribution from different types of DGs on the
protection performance. The disturbing factors for
proper operation of distance protection and further the
impact of fault currents on those factors are identified.
The research works in [4]- [8] discuss the
impact of DGs and wind power characteristics on
distance relays performance in distribution and sub-
transmission networks. While addressing various
challenges for wind generation facilities, the works in
[4], analyzes the response of conventional protection
schemes for Type 3 using real-time by hardware-in-the-
loop simulation. [7] proposed a methodology for the
application of distance relaying to feeders in distribution
systems and how it can be assisted with embedded
distributed resources.
The work in [8] presented 11kV distribution
network protection scheme based on distance relaying. It
has been indicated that the use of distance relaying can
minimize selectivity issues and provide shorter fault-
clearing times. The research work in [9] studied the
impact of wind power integration on distance protection
based on closed-loop protection relay with RTDS testing
platform. Results showed that protection based on
distance principles are impacted severely over
differential protection schemes.
THE PROBLEM FORMULATION
The basic concept of the pre-fault voltage polarization is
that it produces a short duration output voltage for low
voltage faults at the relay location. The polarizing unit
contains a memory that captures the pre-fault voltage
long enough for the relay to make its correct decision.
As a result, the dynamic characteristic of a distance relay
expands as a function of the source impedance behind
the relay location and then shrinks as the memory action
decays.
In wind farms DGs, power sources are normally
made up of the aggregation of a large number of small
wind turbines feeding a common bus that couples with
the area electrical power system (AEPS). The equivalent
source impedance of these turbines can have direct
impact on the dynamic performance characteristics of
these types of distance relays. The variations of this
impedance can be related to the varying wind production
patterns, the penetration levels and the configuration of
wind turbine generators. These variations take place
from the short-term (minutes) to the long-term (hours).
The consequences of these variations on relays
performance characteristics are reduction of the fault
resistance coverage capability and miscoordination of
protection schemes. For distance relays, the measured
apparent impedance seen by a relay R1 is given by the
following equation
The tripping characteristic for a Mho relay with a
positive sequence voltage polarization can be expressed
by a two-input comparator with the phasors and as
follows COMPENSATING THE EFFECT OF WIND POWER INTERMITTENCY Wind power intermittency impacts the distance zone
characteristics. In this section, we will develop an
algorithm to compensate this impact. Fig will be used to
show the proposed compensation and study the effect of
wind power variations.
In the proposed algorithm, the polarization
voltage S2 will be dynamically changed according to the
value of Zwc so as to compensate for variations of wind
power source impedance (Zsw) in such a way that the
dynamic characteristic of a distance relay would be
independent of wind power intermittency. This requires
modifying the polarization quantity S2 by adding a
compensating voltage proportional to the Zwc according
to (6).
Figure 1.The concept of the proposed compensation
impedance.

3
National Conference On “Recent Innovations In Engineering Science And Technology” April 2019
The required level of compensation Zwc for any
given value of wind penetration (wp) and wind speed
(ws) is determined by substituting the value of SIR. The
Zwc value is updated online whenever there is change in
wind penetration and/or wind speed
( )
Where:
is the desired maximum source impedance [Ω];
is the source impedance due to variation in wind power penetration [Ω];
is the required level of compensation impedance [Ω]
due to variation in wind power penetration;
is relay current [A];
is the positive-sequence memory voltage;
SIMULATION AND RESULTS
A. Objective
The objective of this study is to investigate the
impact of wind generation and to enhance the distance
protection performance, at the relay R1 (in Fig. 2), under
different fault types within a specified range of wind
power penetration and wind speed.
Figure 2. System simulation (distance relay)
B. Analysis of Relay Source Impedance Variations
Figure 3. Source impedance variations of relay R1 under
different wind power penetration levels operating at
wind speed of 10m/s.
The Source impedances are estimated within 2
cycles of 3-phase short circuit at local bus of line 1. As
indicated in the Fig. 3, source impedance decreases with
increasing of the wind power penetration level.
Normally, distance relay performance is defined in terms
of reach accuracy and operating time. However, reach
accuracy, in particular, depends on the level of the relay
voltage under fault conditions which, in fact, depends on
the System Impedance Ratio (SIR) at the relay.
Figure 4. SIR of relay R1 versus wind penetration levels
and wind speeds
From fig.4 one can observe the following:
1) The SIR is inversely proportional with the wind
penetration level (WP). This is expected, and is due to
the fact that as numbers of connected wind turbines
within the wind farm increase, the equivalent source
impedance behind the relay at R1 will, consequently,
decrease. Fig.5. SIR of relay R1 versus wind penetration
levels and wind speeds; where x in the fitting equations
is the wind penetration level (WP).
2) The rate-of-change is decreasing exponentially and
independent of wind speeds. The 6th order fitting
equations are given in Fig. 5 for each wind speed.
3) The rate at which SIR decrease is higher (4.95 pu) for
(10% ≤ WP ≤ 40%) compared with lower (0.498 pu) for
(40 % ≤ WP ≤ 100%).
4) There is a relatively small difference between
responses at maximum and nominal speeds compared to
minimum speed.
C. Impact on Dynamic Distance Relay Characteristics
Fig. 5 shows the R1 relay current behavior
during the fault duration of three-phase short circuit at
the relay location (F1).
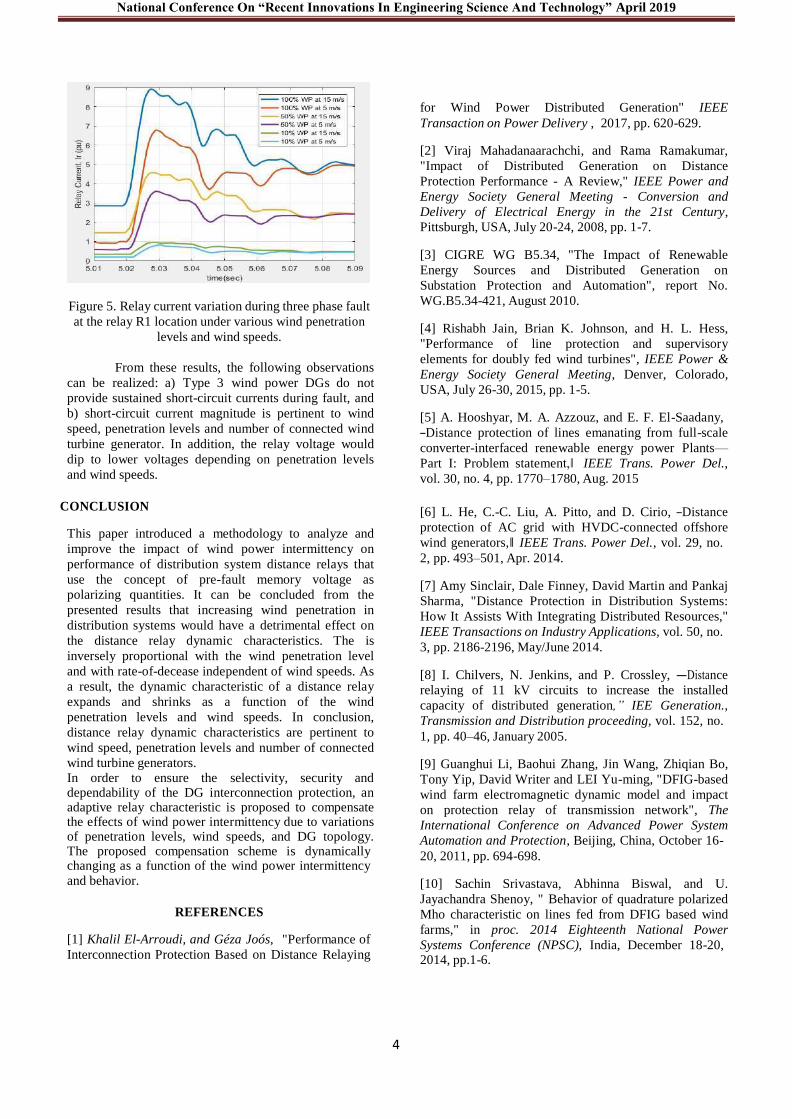
4
National Conference On “Recent Innovations In Engineering Science And Technology” April 2019
Figure 5. Relay current variation during three phase fault
at the relay R1 location under various wind penetration
levels and wind speeds.
From these results, the following observations
can be realized: a) Type 3 wind power DGs do not
provide sustained short-circuit currents during fault, and
b) short-circuit current magnitude is pertinent to wind
speed, penetration levels and number of connected wind
turbine generator. In addition, the relay voltage would
dip to lower voltages depending on penetration levels
and wind speeds.
CONCLUSION
This paper introduced a methodology to analyze and
improve the impact of wind power intermittency on
performance of distribution system distance relays that
use the concept of pre-fault memory voltage as
polarizing quantities. It can be concluded from the
presented results that increasing wind penetration in
distribution systems would have a detrimental effect on
the distance relay dynamic characteristics. The is
inversely proportional with the wind penetration level
and with rate-of-decease independent of wind speeds. As
a result, the dynamic characteristic of a distance relay
expands and shrinks as a function of the wind
penetration levels and wind speeds. In conclusion,
distance relay dynamic characteristics are pertinent to
wind speed, penetration levels and number of connected
wind turbine generators. In order to ensure the selectivity, security and dependability of the DG interconnection protection, an adaptive relay characteristic is proposed to compensate the effects of wind power intermittency due to variations of penetration levels, wind speeds, and DG topology. The proposed compensation scheme is dynamically changing as a function of the wind power intermittency and behavior.
REFERENCES
[1] Khalil El-Arroudi, and Géza Joós, "Performance of
Interconnection Protection Based on Distance Relaying
for Wind Power Distributed Generation" IEEE
Transaction on Power Delivery , 2017, pp. 620-629.
[2] Viraj Mahadanaarachchi, and Rama Ramakumar,
"Impact of Distributed Generation on Distance
Protection Performance - A Review," IEEE Power and
Energy Society General Meeting - Conversion and
Delivery of Electrical Energy in the 21st Century,
Pittsburgh, USA, July 20-24, 2008, pp. 1-7.
[3] CIGRE WG B5.34, "The Impact of Renewable
Energy Sources and Distributed Generation on
Substation Protection and Automation", report No.
WG.B5.34-421, August 2010.
[4] Rishabh Jain, Brian K. Johnson, and H. L. Hess,
"Performance of line protection and supervisory
elements for doubly fed wind turbines", IEEE Power &
Energy Society General Meeting, Denver, Colorado,
USA, July 26-30, 2015, pp. 1-5.
[5] A. Hooshyar, M. A. Azzouz, and E. F. El-Saadany,
―Distance protection of lines emanating from full-scale
converter-interfaced renewable energy power Plants—
Part I: Problem statement,‖ IEEE Trans. Power Del.,
vol. 30, no. 4, pp. 1770–1780, Aug. 2015
[6] L. He, C.-C. Liu, A. Pitto, and D. Cirio, ―Distance
protection of AC grid with HVDC-connected offshore
wind generators,‖ IEEE Trans. Power Del., vol. 29, no.
2, pp. 493–501, Apr. 2014.
[7] Amy Sinclair, Dale Finney, David Martin and Pankaj
Sharma, "Distance Protection in Distribution Systems:
How It Assists With Integrating Distributed Resources,"
IEEE Transactions on Industry Applications, vol. 50, no.
3, pp. 2186-2196, May/June 2014.
[8] I. Chilvers, N. Jenkins, and P. Crossley, ―Distance
relaying of 11 kV circuits to increase the installed
capacity of distributed generation,” IEE Generation.,
Transmission and Distribution proceeding, vol. 152, no.
1, pp. 40–46, January 2005.
[9] Guanghui Li, Baohui Zhang, Jin Wang, Zhiqian Bo,
Tony Yip, David Writer and LEI Yu-ming, "DFIG-based
wind farm electromagnetic dynamic model and impact
on protection relay of transmission network", The
International Conference on Advanced Power System
Automation and Protection, Beijing, China, October 16-
20, 2011, pp. 694-698.
[10] Sachin Srivastava, Abhinna Biswal, and U.
Jayachandra Shenoy, " Behavior of quadrature polarized
Mho characteristic on lines fed from DFIG based wind
farms," in proc. 2014 Eighteenth National Power
Systems Conference (NPSC), India, December 18-20, 2014, pp.1-6.

5
National Conference On “Recent Innovations In Engineering Science And Technology” April 2019
PLC Based Automatic Car Washing
System
Sagar Patil1, Pushpak Patil
2, Maheshwari Patil
3
[email protected], [email protected]
3
Department Of Electrical Engineering
Sandip Institute Of Engineering And Management, Nashik
Abstract--Currently necessity of man is to live life in
automatic way so as to perform tasks at higher speed.
Technology is best interconnecting channel in each part
of world with means of transportation or communication
or business which led to a highly increase in the number
of cars. So how to maintain or clean those? using
automated washing system? All peoples face big issue
called as Time i.e. time consumption essential for
cleaning these vehicles or cars etc. Time management is
directly proportional to reduction of maintenance cost. So
in short, automation is a need of era. Today in this
present era, automation serves us to preserve time,
expense as well as manpower. It is significant to have
smooth and effective system for sustain the vehicles
cleanliness. Our project concentrates on car washer
system using PLC. Our car washer system has three
capital processes namely wash, cleansing and drying,
Hence the external of the car will be washed by detecting
the car on conveyor belt and further controlled by PLC.
This mechanism serves us to use a conveyor belt on
which patron stops the car. After that, inductive
proximity sensor is used for detecting the car, then the
conveyor belt begin running. Sensor plays essential role
on conveyor belt for car detection. As early as car is
sensed functioning of conveyor assembly invokes. After
mention delay for all activities to accomplish conveyor
get suspend. The main objective of this project is to
perform exterior car washing automatically using
Programmable Logic Controller integrated with PLC
sends information like arrival or departure of vehicle. Car
washing technique is collection of various things as
spraying solution of detergent, cleaning with water and
brushes, & then completing task with forced air drying
fans.
Keywords--: PLC, Finer Motor, Conveyer Belt,
Brushes, Inductive Proximity Sensors, Switch,
Shower, Cleaner, Dry Fan, SMPS.
I. Introduction
Car washer is single activity done in mandate to
keep the external of the car clean. Mostly it is done
manually in locomotive garage, this manual way
of cleansing car arise in more waste of water,
manpower and time. The automatic car washer
system diminishes the utility of water and also man
power need. Our car washer system utilizes control
using PLC. There are three procedures involved in
our car washer system namely wash, cleansing and
drying. Cycles of washer includes wash with
detergent, and then with water.
A PLC is a controller which can control most of the
machines very easily. Installing a program and
setting it up is very easy in a PLC. The programs
written in ladder language can be authenticated and
checked before ultimate installation and also it can
be edited at any time without disturbing any
physical apparatus of the project. The best part of
using a PLC is that it does not need any typical
wiring and rewiring if some changes are made in
the previously installed program. A programmable
logic controller performs mainly three functions
which are continuously repeated in a proper
sequence. The three main functions are (1) Testing
the input (2) Execution of the program (3)
Updating the output. In a PLC there is a provision
of input terminals for connecting the input devices
and output terminals for connecting the output.
II. Components Description
A. PLC: A PLC (Programmable Logic Controller) is usually called as Programmable controller. It is a solid-state, digital, Industrial Computer. Upon first look, a PLC may seem to be no more than a black box with wires bringing signals in and other wires sending signals out.

6
National Conference On “Recent Innovations In Engineering Science And Technology” April 2019
-Supply Voltage : 24V
-RPM : 200 rpm
Fig 1: Siemens Logo PLC
PLC Specifications :-
Manufacturer: Siemens
Model: Logo PLC 8DI-4DO
Input Power Supply: 230 V AC
Number of digital inputs: 8
Number of digital outputs: 4
PLC to PLC Communication: Ethernet Cable
Cable Length: 2 meters (6.5 ft)
Display type: Digital
Programming Language Used: Ladder logic
Software Used: Logo Comfort
B. DC MOTOR:
A DC motor is any of a class of electrical machines
that converts direct current electrical power into
mechanical power. In this mechanism it is used for
rotating the conveyor belt and also finers are
connected to the motor which makes fuction of
brushing
C. Solenoid Valve:
A solenoid valve is an electromechanically
operated valve. The valve is controlled by an
electric current through a solenoid: in the case
of a two-port valve the flow is switched on or
off; in the case of a three-port valve, the
outflow is switched between the two outlet
ports. Multiple solenoid valves can be placed
together on a manifold.
Specifications:
Operating Voltage:- 24 V DC
Simple ON-OFF
2 Way Valve
D. Proximity Sensor:
Proximity Sensor includes all sensors that
perform non-contact detection in comparison
to sensors, such as limit switches, that detect
objects by physically contacting them.
Fig 2: DC MOTOR

7
National Conference On “Recent Innovations In Engineering Science And Technology” April 2019
Fig 4: Inductive Proximity Sensor
Proximity sensor convert information on the
movement or presence of an object into an
electrical signal. There are three types of
detection systems that do this conversion:
systems that use the eddy currents that are
generated in metallic sensing objects by
electromagnetic induction, systems that
detect changes in electrical capacity when
approaching the sensing object, and systems
that use magnets and reed switches.
E. Dryer Fan:
A blow Dryer or Dryer is an
electromechanical device designed to blow
cool or hot air over wet or damp car, in order
to accelerate the evaporation of water
particles and dry the car. It is used to remove
the water drops and make the car dry within
less time. The supply required for dryer is
12v DC.
Fig 5: Dryer Fan
A conveyor system is an common piece of
mechanical handling equipment That moves
materials from one location to another.
Conveyors are especially useful in
applications involving the transportation of
heavy or bulky materials. Conveyor systems
allow quick and efficient transportation for a
wide variety of materials.
F. Conveyor:
III. Working Of Automatic Car Washing
System
Fig 7: Block Diagram of Automatic Car
Washing System
The figure shows the block diagram of
Automatic Car Washing System. A 230V AC
Supply is given as input to the SMPS for
obtaining 24V DC, since PLC can operate at
24V DC. Terminal Block is used for multi
inputs and outputs.

8
National Conference On “Recent Innovations In Engineering Science And Technology” April 2019
PLC is connected to PC through ethernet cable for
downloading or uploading the program. Conveyor is used for
shifting the car through various stages of washing. We use 30
rpm DC motors for driving the conveyor belt via pulley and
for driving brushes When conveyor`s components are in good
condition and well aligned, it will operate properly. Proper
clamping of car wheels on the conveyor is needed in order to
avoid displacement. Generally brushes are now either cloth
(which is not harmful to a cars finish, as long as it is flushed
with plenty of water to remove the grit from previous
washes), or a brush, which does not hold dirt or water. Thus it
does not harm any painted finish. It provides a gentle
polishing effect to leave the paint much shinier. High
pressure nozzles are pointed at various position for spraying
soap solution and water to clean difficult to reach parts of the
vehicle. At the end, hot steam air is generally used for drying
the car. Construction of this system is depends upon the
requirement. A visual programming language known as the
Ladder Logic was used to program the PLC. An inductive
proximity sensor is used which detects the metal object. Once
the electromagnetic field is cut by the car an input
signal is given to PLC. As an input signal is received, PLC
starts executing the Ladder Program.
First the conveyor moves by fixing a timer for few sec. After
that, it stops at the stage of washing. In general process, Car is
cleaned by spraying soap solutions, rinsing, brushing, drying,
waxing, etc. depends on the requirement of customer. We
have chosen spraying water, Brushing and finally drying for
cleaning the car.
Each activity is carried out for a certain time period.
Water is sprayed for few sec and nozzle is closed. Then
four brushes rotate for few sec and stops. Now the
conveyor starts moving to next stage. After few sec, it
stops for drying. Two fans are used for drying the car up
to few sec. Then the conveyor carrying car moves to the
exit level. Again an IR sensor senses the car and sends an
input signal to Programmable logic controller.
Timings are set by using timers in ladder
programming. These timings can be varied
depending upon the requirement.
V. Result Analysis
In Automatic Car Washing System, we can
successfully performed operations required
for cleaning the car by using PLC. By
installing this system, car washing will be
cost effective, time saving, pollution free. By
using this system we can clean car upto 90%.
A. Advantages:
1. Efficiently reduces the time for
washing.
2. The System is easy to operate
3. Very less maintenance as PLC is more
durable than other electro-mechanical
systems
4. It reduces Man Power
5. Proper utilization of foam and water.
B. Disadvantages:
. Primary cost is high 2. Use of chemical shampoos is harmful.
C. Applications:
1. In service stations
2. In car manufacturing companies, after final assembly of car.
VI. Conclusion
After studying whole automatic car
washing system, one can conclude that the
proposed prototype of controlling
automatic car washing helps in
eliminating the errors that exist in existing
process which leads us to obtain error free
and efficient washing.This prototype helps
us in performing car washing
automatically and results in high quality
end product. It will also helps in saving
water and pollution free operation.

National Conference On “Recent Innovations In Engineering Science And Technology” April 2019
10
REFERENCES
[1] Janik, A. Kupiec,” Trends in Modern Car Washing”
Polish J. of Environ. Stud. Vol. 16, No.6 (2007)
[2] John W. Webb and Ronald A. Reis,”
Carmating Manufacturing Systems with
PLCs,Hugh Jack Publishing year: 2008
Hardware platform: Allen Bradley
[3] Introduction to PLC controllers Author: Nebojsa Matic
Publisher
[4] International Journal of engineering science
and computing Automatic car washing system using PLC
volume 6, issue 5, may 2016.
[5] International Journal of engineering research and
technology Manufacturing of automatic car washing system
volume 8, November 2015.
[6] Muhammadali.V.V, “Seminar on Automatic
Car Washing System”.
[7] K.Vidyasagar, R.R.Prasad, P Nagasekhar;
“RFID-GSM Autonomous Car”.
[8] International Journal of innovative research and
technology Automatic car washing system using PLC Volume
3, issue 9 ,feb 2017.

National Conference On “Recent Innovations In Engineering Science And Technology” April 2019
11
IOT AND CAN BASED INDUSTRIAL PARAMETER MONITORING AND CONTROLLING
Prof. Piyush M. Desai1, Akshay k. Nigal2, Rushikesh R. Dargude 3, Kamlesh P. Muluk4, Aniket S. Doiphode5
[email protected], [email protected], [email protected], [email protected], [email protected]
Electrical Engineering Department
Sandip Institute of Engineering & Management, Nashik
Abstract—The main objective of this project work is to design an
automated system which is sensor based for smart monitoring and
controlling of industrial applications. Automated system helps in
reducing the human effort and provides better monitoring and
controlling to reduce the faults in the system. In the Present project, a
new solution is adopted for the traditional monitoring and controls of
Industrial applications through the implementation of Internet of
things (IOT) and CAN bus. IOT is a network of devices connected via
communications technologies to form systems that monitor, collect,
exchange and analyse data. In the industries fields many parameters
like temperature, humidity, light, fire, water level needs to be monitor
and control. For this purpose AVR controller interface with CAN. A
Visual Basic application is included in the system which will be
monitor and controlling all the activities of the system in user
controlled mode or system controlled mode.
Key words: IOT, AVR Controller, CAN Bus, V.B. Software,
ESP8266, SSR
I. INTRODUCTION
The industrial field monitoring requires more manual power to
monitor and control the industrial parameters such as
temperature, humidity, fire, water level, light etc. This is one of
the most upcoming issues in the industrial sectors. If these
parameters are not monitored and controlled properly, it leads
to a harmful situations. Many industries are facing these kinds
of situation because of some manual mistakes. And in that kind
of harmful situations, again the manual power is required to
control the parameters. Sometimes, if this control process not
handled properly, it results in an occurrence of major accidents.
With the implementation of upcoming technologies, it is very
easy to overcome the greater issues in the industrial automation.
In the industrial monitoring fields, the various sensors such as
fire sensor, temperature sensor and light sensor are used for
sensing the parameters and these sensed values are processed
by the AVR microcontroller. The processed values are then
displayed through V.B. on PC. Finally, with the help of CAN
bus communication the overall industrial parameters are
monitored through a single PC. The CAN bus communication
is a wired communication and it is working under the priority
of the message i.e., CAN is a message based protocol. The
speed of CAN controller MCP2515 is 1MbpS up to 420 meters
and it will change with change or variation in length of system.
II. OBJECTIVE
The objective of this project is to design the monitoring and
control system for industrial parameters by connecting sensor
devices to AVR for detecting the errors and automatically
correct the error using CAN bus communication and internet of
things. This system helps in reducing the high manpower
requirement in the industrial monitoring fields by monitoring
the overall industrial parameters through a single PC (V.B.).
III. EXISTING SYSTEM
Olden methods, the industrial parameters are monitored
through individual LCD displays. With the help of various
sensors, the parameters are sensed and the values are processed
by the controllers. Then, the processed values are displayed in
the individual LCD displays which are connected to the
controllers. But with existing system very few parameters can
be monitored and controlled. That parameters are controlled
through Arm controller, PIC controller and Raspberry pi
controller. For monitoring the parameters in different locations,
the individual microcontrollers and LCD displays are required.
In some systems parameters are just monitored through 16x2
LCD display, without controlling actions. The parameters have
to be monitored continuously. If the sensed parameter value
exceeds certain value at the instant of monitoring, the control
process will be handled by the workers of the industry.
IV. PROPOSED SYSTEM
In this system, various sensors are connected to AVR
microcontroller. The implementation of CAN bus protocol with
AVR microcontroller and generated data monitored and
controlled through V.B. software and which can be observed

National Conference On “Recent Innovations In Engineering Science And Technology” April 2019
12
and controlled though IOT. This system helps to monitor and
control overall parameters from single PC as well as from
internet through IOT. This system reduces the high human
Fig. 1. A Proposed system block diagram
power requirement for all this purpose and automatic control
over all parameters through CAN bus save time as well. The
industrial parameters are temperature, humidity, fire, water
level or fuel level, light control by above systems. These five
parameters are analog quantities. The interfacing of CAN
controller and AVR done with Proteus and Ares software. In
this system on board 7 parameters are interfaced with each
other. The parameters are CAN controller, MCP 2515, AVR,
SSR (Solid State Relay) and TTL converter C.P., Sensor, ESP
8266(for IOT), P.C. (for V.B. software). The main advantage of
these method is that all parameter interfacing is consist of on
board programming. There is no need of removing the AVR IC
for programming. Mainly we set one threshold value for each
parameter, if the parameter value increases over the threshold
or specified value then the value firstly sensed by AVR
microcontrollers and controlling actions take place through
SSR, and all system monitored and controlled though internet,
and can show these on LCD display and visual basics software.
The internet of things takes a look and control actions as well
through IOT servers. The data is uploaded on internet through
the Node MCU ESP8266. This is connected with internet
through the WIFI and uploads these data on IOT server
(thinkspeak.com). All parameters monitor and control in real
time which makes the system even smarter.
Fig. 1. B Proposed system block diagram
V. SOFTWARE USED
Visual basics 6.0 Software Arduino IDE software Proteus and Ares software
Internet of things
VI. OPERATION AND WORKING
The main purpose of this project is to monitoring and controls the
industrial parameters using internet of things and CAN protocol
interfacing with AVR microcontroller and V.B. software. This project
is used to reduce the human power with monitoring overall parameters
through single PC an internet with help of CAN bus communication
system and increase the safety in an industries as well. After
monitoring these parameters the controlling action takes place
automatically without help of human worker or manual operations.
The operation of each sensor interfaced with separate AVR
microcontroller and CAN controller as well. These CAN controller
acts as slave controller and connected to the one master CAN
controller.
Fig. 2. Circuit diagram for temperature sensor
These CAN controllers give provision to controlling devices to
communicate with each other, the CAN controller work on the priority
base so it automatically make priority for control each parameter. The
maximum speed for this operation is 1MbpS. Then these data
transmitted to the computer (V.B.) through RS232 cable and with help
of ESP-8266 data transmitted to internet server so we can monitor and
take controlling actions through the internet over anywhere. Another
thing is to take appropriate control action over the parameters and
devices. The parameter senses the analog values, and then this value
processed with help of the AVR microcontroller and same value
displayed on the LCD. The main function is to set threshold value of a
parameter. If the parameter value increases from threshold value or set
value then several devices take action on it with the help of AVR
microcontroller. For example, if the temperature decreases to 45oC and
the set threshold point is 50oC then the heater will turn on and making
that temperature above 50oC. This same system applied for all
equipment. For humidity sensor water sprayers are there, for
light sensor light intensity controllers are there, for fire control
water sprinklers are there, for water level indicator level
indicators and pump controller are there. This controlling action
takes place from visual basics software from the PC which
having user control mode and automatic control mode (system
control) and from internet of things server as well. The
generated data linked with the server through ESP-8266 module
and data showed in the form of graph system. With the help of
this monitoring and controlling the industrial parameters the
manual mistakes made by the workers can be avoided.
Therefore the workers in industry will work on the safe zone.
And the big control room concept will be avoided by using
CAN communication protocol and industrial internet of things

National Conference On “Recent Innovations In Engineering Science And Technology” April 2019
13
and visual basics. Since CAN bus is wired network so its use in
limited areas but with help of IOT we increased its area of
operation and control. The industrial database and servers have
to be in safe zone for avoiding its misuse.
Fig. 2. Board for temperature sensor with CAN and AVR
interfacing
VII. CONCLUSION
As a conclusion, the objective of this system to monitoring and
controlling the temperature, humidity, light, fire and water
level in several locations through a single Personal Computer
can be possible with the help of various sensors, AVR
microcontrollers, by the application of CAN bus
communication, Visual Basics and IOT. Our project also
eliminate the concept of huge control room, complicated wired
network required for monitoring and controlling above
parameters. This system also provides automatic control over
the parameters increases safe value, so the harmful situation
can be avoided through this project.
REFERENCES
[1]B. Meena Kumari, M. Satya Sailaja ,―Industrial Automation
and Process Control System Using Can Bus‖, International
Journal of Science and Research (IJSR) ISSN (Online): 2319-
7064 Index Copernicus Value (2013): 6.14 Impact Factor
(2014): 5.611
[2] Ubaid Saudagar ,―Implementation of CAN Protocol for
Industrial Automation‖ , ISSN 2319-8885 Vol.03,Issue.31
October-2014, Pages:6105-6111
[3] Yeshwant Deodhe, Swapnil Jain,
Ravindra
Gimonkar,―Implementation of Sensor Network using
Efficient CAN Interface‖, IJCAT - International Journal of
Computing and Technology Volume 1, Issue 1, February 2014
[4] Dr. S.W Mohod, Rohit S Deshmukh, Prof. Ram Meghe,
―Internet of Things for Industrial Monitoring and Control
Applications‖, International Journal of Scientific &
Engineering Research, Volume 7, Issue 2, February-2016
ISSN 2229-5518
[5] Sanket N. Gore, Apeksha Sakhare, ―Design and automation
of industrial machine using esp8266 module‖ IJRET,
Volume:06
[6] Abdulkadir Baba HASSAN, Matthew Sunday
ABOLARIN, Onawola Hassan JIMOH, ―The Application of
Visual Basic Computer Programming Language to
Simulate Numerical Iterations‖ Leonardo Journal of Sciences
ISSN 1583-0233
[7] R.Hari Sudhan, M.Ganesh Kumar, A.Udhaya Prakash,
S.Anu Roopa Devi, P. Sathiya,―Arduino Atmega-328
Microcontroller‖ International Journal Of Innovative
[8] Mr. Sushil K. Jadhav, Dr. Dipak V. Nehete, ―IIOT and
CAN Based Industrial Parameters Monitoring And
Control‖ International Research Journal of Engineering and
Technology (IRJET) Volume:
06 Issue: 01 Jan 2019

National Conference On “Recent Innovations In Engineering Science And Technology” April 2019
14
INTELLECTUAL EARTHING SYSTEM Sanket Suresh Nawale
1, Komal Sham Dabhade
2, ShrutikaRanjit Landage
3, ShantanuVinayak Aher
4,Prof.
Tabish Shah5
[email protected], [email protected], [email protected], [email protected], [email protected]
Electrical Engineering Department
Sandip Institute of Engineering & Management, Nashik
I. ABSTRACT
This paper is a case study of an earthing
system implementation, the associated error
and how effectively they can be
compensated. When resistance of earth is
taken into account it is being realized that
there are many factors that can influence the
performance of system as well as earthing.
The fundamental aim of this project is to
operate the relay with change in magnitude
of current if the fault is occurring in three
phase induction motor, transformer,
transmission line. A low price and reliable
protection scheme has been designed which
monitors the parameter earthing system like
soil moisture level, earth resistance,
magnitude of fault current level of
protection required. System measures these
parameter by soil moisture sensor, display,
controller, CT. The sensor and CT provide
data to controller and then the collected data
will calibrated with accuracy of system
data through microcontroller. LCD will
show the measurable value of soil
resistance if the measured value will cross
the given limit then valve will operated with
allowable flow of water so the required
value of resistance may be obtained.
Keywords:- LCD, CT, DC, ADC
II. INTRODUCTION
In Electrical power system Earthing is very
important factor, since majority of faults are
caused by poor earthing. The purpose of
earthing is to minimize potential transient
over voltage, in compliance with standard
for personal safety requirements also to
assist within the rapid detection and
isolation in the fault areas. Earthing
connection is accomplished by driving
electrode in several places in the earth. Earth
electrode is often a metal plate, material
generally used for earth electrodes are
copper, aluminium, mild steel and
galvanized iron in order of preference as
shown in fig. (a).
The factors that influence the earthing
resistance of an electrode or group of
electrodes includes the composition of the
soil, the temperature of soil, the moisture
content of the soil and the depth of
electrode. Based on previous study by
Megger researchers, two facts lead to the
logical conclusion that an increase
temperature will decrease resistivity and
decrease the moisture content in the soil.
Moreover the depth of electrode also
influence the ground resistance due to soil
layer in which the upper layer of the soil
have higher resistivity than lower

National Conference On “Recent Innovations In Engineering Science And Technology” April 2019
15
Type of soil
Resistivity( /m)
Calculated
Electrode
resistance( )
Clay 40 7.99
Ground well &
spring water
50 9.99
Clay & sand
mix
100 19.98
Peat and mud 150 29.98
Lake & Brook
water
250 49.96
IV. RESISTANCE IN SOIL
Dimensional and grid electrodes are used for the
measurement of ground resistance near a residential
area. It is apparent that there is no uniqueness in the
soil property. Below the data is given of resistance at
different level of moisture in soil.
Fig. (a) Equipment earthing.
The soil types are very different in every part of the
world and resistivity also differs compared to other.
The resistivity of soil also depends on the type soil.
Single rod installation may not be enough to decrease
the resistivity to overcome this problem; another rod
is connected in parallel. But it needs maximum area
whereas spacing between the each rod is 6 foot away.
The provision of good and effective electrical
grounding system is necessary to safeguard living
being as well as equipment from high magnitude
current through earth. Besides this, this system also
gives reliability in supply services, as it provides Fig. (b) Soil resistivity vs. soil moisture.
stability in voltage conditions preventing excessive voltage peaks, during disturbances and discharges lightening surges.
In recent years, many newspaper published report of
substation equipment thefts and it is increasing dby
day. This leads to disturbance in supply system,
utilities are hugely affected due such activities.
Usually ground electrode is made of copper. As we
know copper is economically costlier and causes theft
of copper electrodes. Therefore copper is replaced by
galvanized iron rod which is cheaper than copper.
Galvanized iron has good electrical characteristics.
III. OBJECTIVE
To ensure the working of earthing according forprotection of electrical appliances required.
To provide continuous monitoring of conventional
earthing system by implementing automation.
To maintain moisture level by pouring
water periodically so that resistivity in soil
is as per IEEE norms. Table:-Soil type and resistance [6]

National Conference On “Recent Innovations In Engineering Science And Technology” April 2019
16
V. MODELLING
1. Regulated power supply:-
The d.c.voltage available across the output terminals
of a given power supply depends on load current. If
the load current Idc is increased by decreasing RL
there is higher voltage drop in the power supply and
hence lower D.C. output voltage will be obtained and
vice-versa will happen if the load current decreases.
In this kit Transformer of 9-0-9V regulated to get
12V supply.
2. Microcontroller ATMEGA328:-
This IC is the important part of project. It functions
as memory of the project where different function
such as input, output and controlling is performed.
Input to the controller is 9v. Port B is an 8-bit bi-
directional I/O port with internal pull-up registers
(selected for each bit).If port pin is configured as an
input pin and PortX as logic 1 than pull-up register is
activated. If Port B pin is activated as output and
PortX has logic zero then pull-up register is
inactivated. If RESET condition is activated the port
pins are tri-stated. The Port B output buffers have
symmetrical drive characteristics with high sink and
supply capability. A VCC is the supply voltage pin for
the ADC, PC3:0, and ADC7:6. It must be externally
connected to VCC, though ADC is not used, but if the
ADC is used, it must be connected to VCC with the
help of low-pass filter. We need program
Microcontroller according to our need. When soil
moisture is reduced it will be displayed through
microcontroller functioning. PD2 is connected to
submersible motor. As soon as moisture reduces
which is sensed by soil moisture sensor connected to
the pin no. PC3 motor will pump water in earth pit.
Pin no.PD5 is connected to buzzer for periodic
warning.
3. Soil moisture sensor:-
Soil moisture sensors measure the volumetric water
content in soil. This is a simple low price soil
moisture sensor or probe which can be used to find
out the moisture in soil and gives proportional
analog output. The sensor may be directly connected
to Arduino or any controller within built Analog to
Digital convertor (ADC). It can also be connected to
an opamp as a comparator & gives digital output. It is
Plug and play sensor. Operating Voltage: 3.3 - 5
Volts.
4. LCD display:- A Liquid Crystal Display commonly abbreviated as
LCD is basically a display unit built using Liquid
crystal Technology. Here 16 Characters * 2 Lines
LCD display is used. LCD will display the value of
soil moisture and resistance of soil. This brings
adequacy and accuracy in performing work at
substation or in industry.
5. Motor:-
Ultra Mini DC 12V Brushless Motor Submersible
Water Pump.
DC Voltage: - 12V
Maximum lift:-40-110cm / 15.75"-43.4"
Flow rate: - 80-120L/H
Outside diameter of water outlet: 7.5mm / 0.3"
Inside diameter of water outlet: 5mm / 0.2".
Application of Project is,
Automatic Irrigation System,
Automatic Plant watering.
VI. BLOCK DIAGRAM

National Conference On “Recent Innovations In Engineering Science And Technology” April 2019
17
VII. CONCLUSION
In this paper we studied what is soil moisture sensing its
types, operation. Using this system we are able to
efficiently analyze soil moisture and resistance and
smartly provide solution to the conventional problems.
It is one of the efficient way and one can easily understand
the working.
REFERENCES
1) Base Paper: -Hooman Dehbonei, Anthony
Kracyla, Power Earth Technologies, ―Power System
Earthing- It’s Commissioning and Test Error.
2) IEEE Guide For Measuring Earth Resistivity,
Ground Impedance And Earth Surface Potential Of A
Ground System, IEEE std 81-2012
3) IEEE std 81-1983-IEEE Guide For Measuring Earth
Resistivity, Ground Impedance &Earth Surface
Potential Of Ground System.
4) Laughton, M.A, Say, Ma (2013) Electrical
Engg. Reference Book Elsevier P.32.
5) Arnold, James E. ―Soil Moisture‖, NASA.
Retrieved 15 June 2015.
6) M. Nassereddine, J.Rizk, A. Hellany’s, High Voltage
Earthing System Design Areas: Relation between
these areas.
7) ENA EGI – 2006: Substation Earthing Guide.
8) IEEE standards 80-2000-Guide for Safety in AC
Substation Grounding.
9) Chang C.N. ―Computation of current-division
factors and assessment of earth-grid safety at
161/69kv indoor-type and outdoor-type substations‖
IEEE proc:- Gener. Transm. Distrib., Vol. 152, Issue
6, PP. 837-848,2005.
10) AS/NZS The calculation of short-circuit currents in
three-phase AC system, AS/NZS Std
3851-1991
11) Hans R., ―A Practical approach for computation of
Grid current‖ ,IEEE Transactions on Power delivery,
Vol. 14 Issue 3, PP. 897-902, 1999
12) Sullivian J.A . ―Alternative earthing calculations for
grid and rods‖ IEEE pro. Gener. Transm. Distrib. Vol.
145, Issue 3, PP. 271-280,1998
13) Ch. Remph: ―A technical report on service life of
ground Rod electrodes‖, Erico Publ.2003

National Conference On “Recent Innovations In Engineering Science And Technology” April 2019
18
Distance Protection Scheme for Series Compensated
Transmission Line based on Mutual Impedance
Sabiha Naz1, Rajani M. Sahare 2
Electrical Engineering Department
Government College of Engineering, Amravati, Maharashtra, India
Abstract – Abstract: In conventional distance protection
scheme, positive sequence impedance is used to protect a
transmission line against short circuit faults. Due to the
presence of series-compensation the positive-sequence
impedance of the fault path is affected, due to this the distance
relay mal-operate. In order to overcome this drawback of
distance relay, the concept of mutual impedance-based relaying
is proposed as a new protection scheme. Since mutual
impedance does not get affected by presence of series-
compensation. In this paper mutual impedance-based distance
protection scheme is presented for series-compensated
transmission lines. The mutual impedance between the relay
and fault point is computed using the current and voltage at
both the ends of the line. The protection scheme gives reliable
results when it is tested against single- line-to-ground faults
and double-line-to-ground faults. The performance of the
proposed scheme is evaluated and compared with conventional
distance protection scheme with computer simulations using
MATLAB.
Keywords- Mutual impedance, distance protection,
series-compensated transmission line.
INTRODUCTION
Series compensation mostly used for long transmission
lines, such as those found in the Western United States,
in South America, and other locations where the
transmission distances are great and where large power
transfers are required. Series-compensated transmission
lines cancel a portion of the inductive reactance of the
line by utilizing series capacitors, and improve the power
transmission capability of the line. The use of series
compensation increases the load-ability of transmission
line and hence the power system stability also got
improve. It also provides a better voltage profile along
the transmission line [1]. The distance relays protect the
transmission line and interconnected distribution
networks [2]. The predefined positive sequence
impedance is set as reference for the operation of
distance relays. Due to series compensation reach and
directionality of distance relays get affected. The major
problems regarding the reach of distance relays are: 1) relay reliability get decreases because of the reduction in
series inductance of line causes disturbance in the locus
of fault impedance, and 2) sub-synchronous resonance
introduce remarkable delays in the response of digital
phasor estimation methods [3]. The effects of series
compensation on the performance of directional relay are
examined in ]4[. The metal oxide varistor )MOV)
protects the capacitor against transient over voltages in
series compensation, and the voltage drop along series
compensation is used in ]5[, with some other parameters
for making distance relay accurate and fast for zone one
protection. For preventing malfunctioning of the main
line and its adjacent line relays Pilot protection scheme
are described in ]6[. A new directional relaying scheme
is presented in ]7[ which uses the phase difference
between the pre-fault and post fault current. In this paper
a new scheme of distance protection is proposed, which
is based on the mutual impedance of line. The proposed
scheme gives reliable results only for single line to
ground and double line to ground faults. The positive
sequence impedance gets affected by series
compensation of line, but mutual impedance does not
have any effect of series compensation hence this
scheme gives reliable result for protection of series
compensated line. The remaining paper is arranged as
follows: Section ]II[ gives the effect of series
compensation on the performance of distance relay. In
section III computation of mutual impedance for the
proposed scheme is given. Proposed protection scheme
is presented in section IV. Simulation results are verified
in Section V shows the. Finally, the paper is concluded
in Section VI.
2. EFFECTS OF SERIES COMPENSATION ON
DISTANCE RELAY An uncompensated transmission line is shown in fig 1.
where Za, Zb and Zc denote the self-impedances of the
phases a, b, and c, respectively, while Zab, Zbc, and Zac
represent the mutual impedances between each of these
two phases. The suffixes x and y represent the sending
end and receiving end parameter respectively.
Figure 1: Simple transmission line
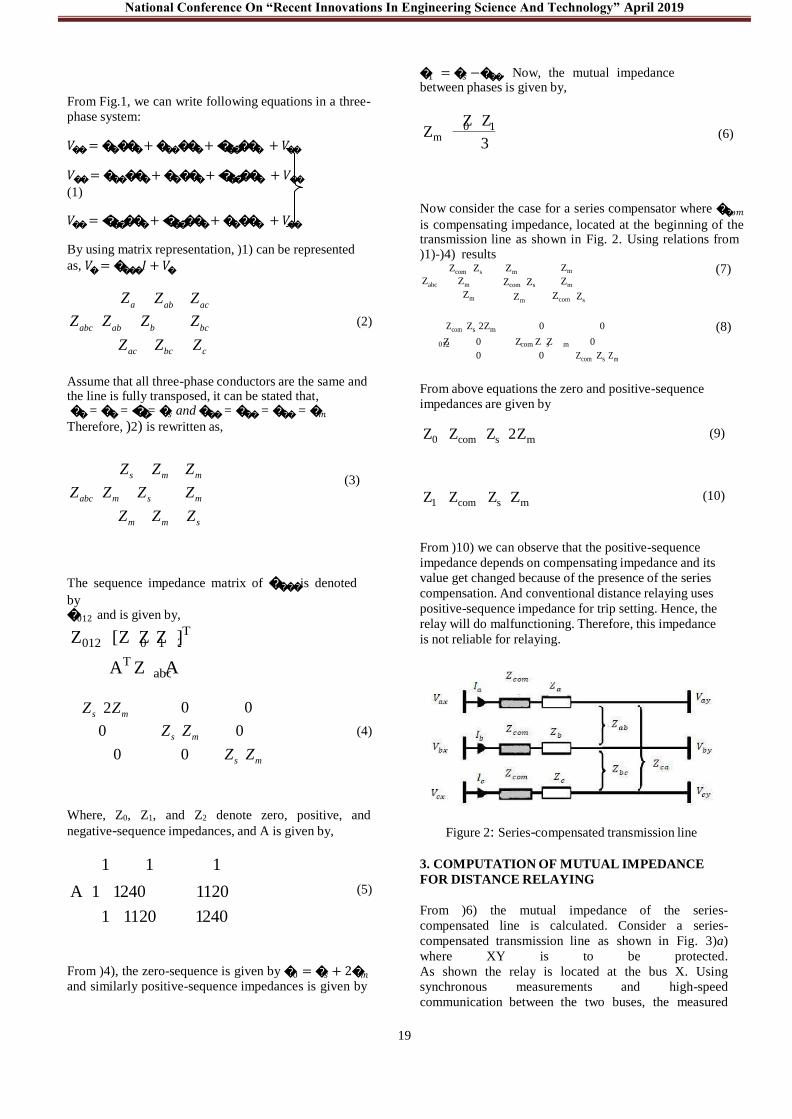
National Conference On “Recent Innovations In Engineering Science And Technology” April 2019
19
abc
012 0 1 2
From Fig.1, we can write following equations in a three-
phase system:
1 = 𝑠 −. Now, the mutual impedance between phases is given by,
Z Z 𝑉 = + + + 𝑉
𝑉 = + + + 𝑉
(1)
Zm 0 1
3
(6)
𝑉 = + + + 𝑉
By using matrix representation, )1) can be represented
Now consider the case for a series compensator where 𝑜𝑚
is compensating impedance, located at the beginning of the transmission line as shown in Fig. 2. Using relations from )1)-)4) results
as, 𝑉 = 𝐼 + 𝑉 Zcom Zs Zm Zm (7)
Za
Zab
Zac
Zabc Zm
Zm
Zcom Zs
Zm
Zm
Zcom
Zs
Zabc
Zab
Zb Z
bc (2)
Zcom Zs 2Zm
0 0 (8)Z
0 Z Z Z 0 Zac Zbc Zc
012
com s m 0 0 Zcom Zs Zm
Assume that all three-phase conductors are the same and the line is fully transposed, it can be stated that, = = = 𝑠 and = = = 𝑚
Therefore, )2) is rewritten as,
From above equations the zero and positive-sequence
impedances are given by
Z0 Zcom Zs 2Zm
(9)
Zs Zm Zm
(3)Zabc Zm Zs
Zm Z1 Zcom Zs Zm (10)
Zm Zm Zs
The sequence impedance matrix of is denoted
by 012 and is given by,
Z [Z Z Z ]T
AT Z A
From )10) we can observe that the positive-sequence
impedance depends on compensating impedance and its
value get changed because of the presence of the series
compensation. And conventional distance relaying uses
positive-sequence impedance for trip setting. Hence, the
relay will do malfunctioning. Therefore, this impedance
is not reliable for relaying.
Zs 2Zm 0 0
0 Zs Zm 0 (4)
0 0 Zs Zm
Where, Z0, Z1, and Z2 denote zero, positive, and
negative-sequence impedances, and A is given by,
1 1 1
Figure 2: Series-compensated transmission line
3. COMPUTATION OF MUTUAL IMPEDANCE
FOR DISTANCE RELAYINGA 1 1240
1 1120
11201240
(5) From )6) the mutual impedance of the series-
compensated line is calculated. Consider a series-
compensated transmission line as shown in Fig. 3)a)
where XY is to be protected.From )4), the zero-sequence is given by 0 = 𝑠 + 2𝑚
and similarly positive-sequence impedances is given by As shown the relay is located at the bus X. Using
synchronous measurements and high-speed
communication between the two buses, the measured

National Conference On “Recent Innovations In Engineering Science And Technology” April 2019
20
voltage and current signals at the receiving end Y are
available in the sending end X. Fig. 3)b) shows the
Where, m = )Z0y – Z1y)/Z1y. Hence Z0y = KZ1y. Where
K = m + 1. Hence )11), can be written as
V0x = V0y – K0yZ0y + I0x )Zcom + Z0x) (14)
V0 x V0 y kI0 y Z1y
)15)
Z0x Zcom I0x
Now,
From )12), we get
Z Z V1x V1y I1y Z1y
1x com I 1x
(16)
Z Z V0 x V0 y kI0 y Z1y
V1x V1y I1y Z1y
1x 0x I I 0x 1x
(17)
Subtracting )15) from )16) results
Comparing )6) and )17) we get that the mutual
impedance between phases of the series-compensated
line XY is given by
Zmx
V0 x V0 y kI0 y Z1y V1x V1y I1y Z1y
3I0x 3I1x
(19)
Fig. 3. )a) Series-compensated transmission line. )b) Corresponding sequence circuit for a single-phase-to-ground
fault
sequence circuits for a single line to ground fault in the phase a. Where, the suffixes 0, 1 and 2 stands for the zero, positive and negative-sequence components respectively. Using Fig. 3)b), we can write the following equations.
V0x = V0y – I0yZ0y+ I0x )Z com + Z0x) (11)
V1x = V1y – I1yZ1y+ I1x )Z com + Z1x) (12)
Relay Ry measured the positive-sequence impedance to
fault i.e. Z1y which is by the and is given by
4. PROPOSED SCHEME
The calculated mutual impedance is proportional to the
distance between the relay and fault point similar to the
positive sequence impedance. Hence, similar to the
conventional distance protection, the concept of
protective zone can be applied to the proposed
protective scheme. Since mutual impedance is mainly
inductive in nature, relay characteristics similar to the
reactance relay can be used. Fig. 4 shows a typical relay
characteristic where Xpick-up is set at 85% of mutual
reactance of the main protected line which gives first
zone of protection. By setting the mutual reactance
according to reach of the relay the second and third
zones of protection can be achieved. The proposed
scheme can protect the 85% of the line length
instantaneously if relay pick-up value X pick-up is set to 85% of mutual reactance of the line. While remaining line length is protected in zone 2 with a definite time
delay. At normal operating conditions, all three phases
are symmetrical. Hence only positive sequence network
is present and zero and negative-sequence networks are
Z1y I
Vay
ay mI0y
(13) open circuited, i.e. zero and negative-sequence
impedance is zero. Hence according to )17) and )18), is not possible to calculate mutual impedance during

National Conference On “Recent Innovations In Engineering Science And Technology” April 2019
21
Parameter Value
System Voltage 500 kV
System Frequency 50 Hz
Lines Positive Seq. Series Impedance
0.0185 + j0.3766 Ω/km
Lines Positive Seq. Capacitive Reactance
0.2279 MΩ-km
Lines Zero Seq. Series Impedance
0.3618 + j1.2277 Ω/km
Lines Zero Seq. Capacitive Reactance
0.34513 M Ω-km
Sources Positive Seq. Impedance
1.43 + j16.21 Ω
Sources Zero Seq. Impedance
3.068 + j28.746 Ω
MOV Reference current 10 kA
MOV Reference Voltage 338 kV
normal operating conditions. The mutual impedance
calculation is done only in faulty conditions. For this
purpose, conventional fault detection methods can be
applied. Similarly, this method fails during three-phase
faults and phase-to-phase faults, since the zero-
sequence network will not present in such cases. Hence
the proposed scheme cannot be used under these
conditions.
START Initial
Setting
Acquire voltage and current sample of both the lines
protection may fail to operate for close-in faults and the
dependability may be lost, while Fig. 10(b) and (d)
implies that the proposed scheme remains dependable in
series-compensated lines.
Fig 6 Three-phase voltages and Three-phase currents
Compute the difference between samples
of local end current in one cycle (Δi)
NO
Percentage of 8 consecutive
Δi >5 ?
YES
Phasor estimation of voltages and
currents of the both line ends
Compute Zm (a) (b)
NO Zm locates inside the trip
region?
YES
TRIP
Fig 4. Flow chart of proposed scheme
This scheme can protect the transmission line against
single line to ground faults and double line to ground
faults only. Practically the proposed scheme is used
against single line to ground fault, because most of the
faults are single line to ground fault. Hence it is better to
use proposed scheme as backup protection since it fails
to protect the transmission line against three phase and
phase-to-phase faults. The proposed scheme is used for
zone 1 protection and it can be easily implemented for
zones 2 and 3.
5. SIMULATION RESULTS
The simulated system is shown in Fig. 5. The
corresponding system data are given in Table 2. The
proposed scheme relay is shown by Rx. It is assumed that transmission line XY have a length of 100 km.
Figure 5: Simulated system
As shown in Fig. 10(a) and (b), when the line is
not compensated, both methods operate correctly and
detect the internal fault. However, Fig. 10(c)
shows that in the series-compensated line, the
conventional distance
(c) (d) Fig 7. Simulation results for an internal fault. )a) Distance protection without SC. )b) Proposed protection without SC. )c)Distance protection with SC. )d) Proposed protection with SC.
Table 2
Simulated System Data

National Conference On “Recent Innovations In Engineering Science And Technology” April 2019
22
6. CONCLUSION
A new backup distance protective scheme is proposed
for series-compensated transmission lines, which uses
the mutual impedance between phases and independent
on positive-sequence impedance for relaying operation.
This scheme gives protection against single phase and
double-phase-to-ground faults. Hence it can be used as
back up protection of transmission system. Performance
of the proposed scheme is evaluated by various
simulation studies. It is shown from obtained result that
this scheme performs more reliably than conventional
distance protection in series-compensated transmission
lines.
REFERENCES
1) S. M. Hashemi, M. T. Hagh, and H. Seyedi, ―A
Novel backup distance protection scheme for
series-sompensated transmission line‖ IEEE
Trans. Power Del., vol. 29, no. 2, pp.699–707,
Apr. 2014.
2) J. Berdy, ―Protection of circuits with series
capacitors,‖ IEEE Trans. Power App. Syst., vol.
PAS-81, no. 3, pp. 929–935, Feb. 1963.
3) E. Rosolowki, J. Izykowski, P. Pierz, M. M.
Saha, P. Balcerek, and M. Fulczyk,
―Optimization of distance protection algorithm
for series compensated transmission line,‖ in
Proc. IEEE Trondheim PowerTech, 2011, pp. 1–7.
4) D. Novosel, A. Phadke, M. M. Saha, and S.
Lindahl, ―Problems and solutions for
microprocessor protection of series
compensated lines,‖ in Proc. Develop. Power
Syst. Protect., 1997, pp. 18–23. 5) P. Jena and A. K. Pradhan, ―A positive-
sequence directional relaying algorithm for series-compensated line,‖ IEEE Trans. Power Del., vol. 24, no. 4, pp. 2288–2298, Oct. 2010.
6) P. Jafarian and M. Sanaye-Pasand, ―High-speed superimposed-based protection of series- compensated transmission lines,‖ Inst. Eng. Technol. Gen. Transm. Distrib., vol. 5, no. 12, pp. 1290–1300, 2011.
7) S. M. Hashemi, M. T. Hagh, and H. Seyedi,
―Transmission-line protection: A directional
comparison scheme using the average of
superimposed components,‖ IEEE Trans.
Power Del., vol. 28, no. 2, pp. 955–964, Apr.
2013.

National Conference On “Recent Innovations In Engineering Science And Technology” April 2019
23

National Conference On “Recent Innovations In Engineering Science And Technology” April 2019
24

National Conference On “Recent Innovations In Engineering Science And Technology” April 2019
25

National Conference On “Recent Innovations In Engineering Science And Technology”, April 2019 1 Logistic Management In Fuel Tankers Dr. Mithra V., Radhika Prajapati, Priya Vats, Shruti Chandra Associate Professor, E&TC Dept, D.Y. Patil Institute of Technology, Pimpri, Pune-18 UG Students, E&TC Dept, D.Y. Patil Institute of Techonology, Pimpri, Pune-18 Abstract-The paper develops the system for the secure distribution of fuel through tankers. Fuel security refers to the connection between fuel market and national security in the production, transmission and use of fuel. Security of the fuel in tankers is done through locking and unlocking of the valve by some means of security code. The fuel indicator in the tanker will help to know the exact amount of fuel available. Source and destination is used for the transportation of fuel. In between source and destination, if any other user tries to unlock the valve then the owner will be notified and the alarm will be raised. When the tanker reaches the destination then the message will be sent to the owner and how much fuel is being withdrawn. During this process, the driver is continuously notified about the level of fuel in the tanker after every short duration via LCD. The owner is informed about the same via wireless module. Fuel oils are mainly a blend of oils and other components. Fuel mixing results in calculation errors in product quantities resulting in incorrect blends. Mixture of components in the fuel tankers can be detected through comparator. The comparator compares two signals coming from the power supply and chip on board amplifies that signal and process it. In our work, the system locks or unlocks the tank valve of the tanker from petrol owner to destination. Keywords-Microcontroller, keypad, level measuring system, power supply, LCD, LED, DC motor, smart phone, buzzer. 1. INTRODUCTION 1.1 Logistic Management Fuel is one of the most essential thing in today’s world.We can see number of petrol pumps around us. Our aim is to develop the system for the tankers of petroleum company. The aim of the system is to open and close the tank valve of the tanker from DC motor. One unit of the system is placed at the tanker which will monitor the fuel level in the tank. The amount of fuel filled at particular petrol pump and petrol pump ID will be send to central office. Our aim is to develop the system for the secure distribution of fuel through tankers. Fuel security refers to the connection between fuel market and national security in the production, transmission and use of fuel. Security of fuel in the tankers is done through locking and unlocking of the valve by means of some security code. The fuel indicator in the tankers will help to know the exact amount of fuel available. Source and destination is used for the transportation of fuel. In between the source and destination, if any other user tries to unlock the valve then the owner will be notified and an alarm will be raised. When the tanker reaches the destination then the message will be sent to the owner and how much fuel is being withdrawn. During this process, the driver is continuously notified about the level of fuel in the tanker after every short duration via LCD. The owner is informed about the same via wireless module. Fuel oils are mainly a blend of oils and other components. Fuel mixing results in calculation errors in product quantities resulting in incorrect blends. Mixture of components in the fuel tankers can be detected through comparator. The comparator compares two signals coming from the power supply and chip on board amplifies that signal and process it, In our work, the system locks or unlocks the tank valve from petrol owner to the destination.
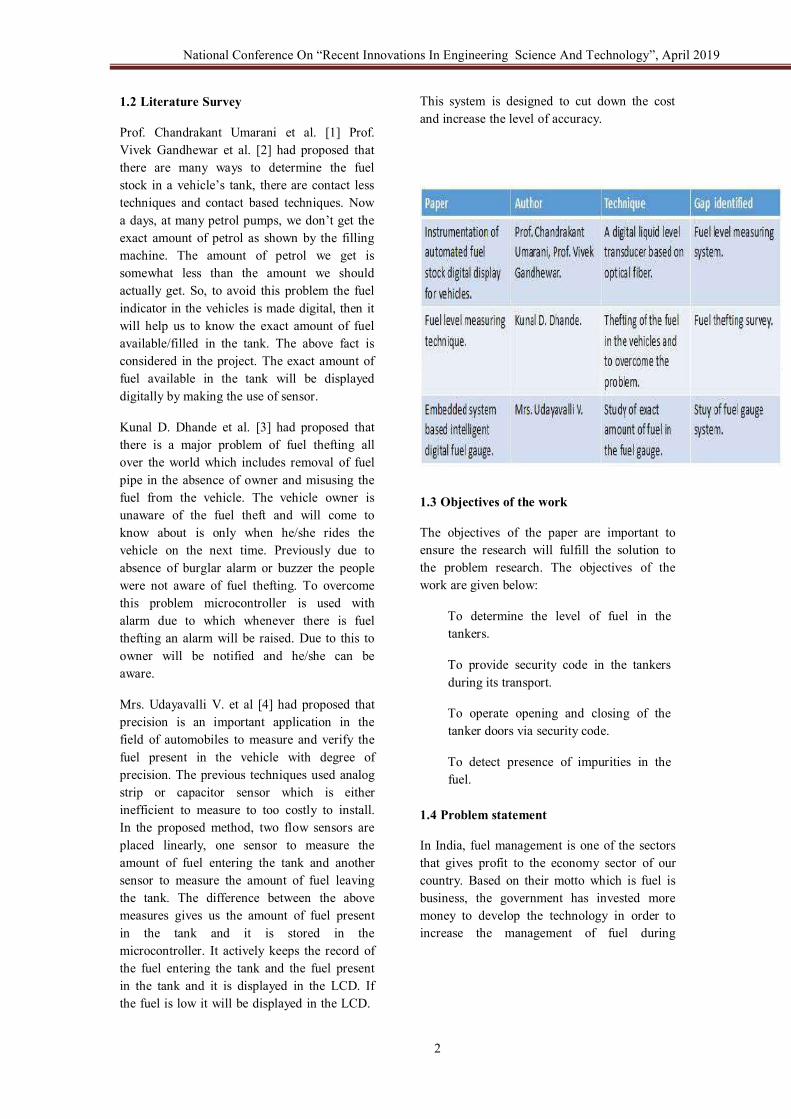
National Conference On “Recent Innovations In Engineering Science And Technology”, April 2019 2 1.2 Literature Survey Prof. Chandrakant Umarani et al. [1] Prof. Vivek Gandhewar et al. [2] had proposed that there are many ways to determine the fuel stock in a vehicle’s tank, there are contact less techniques and contact based techniques. Now a days, at many petrol pumps, we don’t get the exact amount of petrol as shown by the filling machine. The amount of petrol we get is somewhat less than the amount we should actually get. So, to avoid this problem the fuel indicator in the vehicles is made digital, then it will help us to know the exact amount of fuel available/filled in the tank. The above fact is considered in the project. The exact amount of fuel available in the tank will be displayed digitally by making the use of sensor. Kunal D. Dhande et al. [3] had proposed that there is a major problem of fuel thefting all over the world which includes removal of fuel pipe in the absence of owner and misusing the fuel from the vehicle. The vehicle owner is unaware of the fuel theft and will come to know about is only when he/she rides the vehicle on the next time. Previously due to absence of burglar alarm or buzzer the people were not aware of fuel thefting. To overcome this problem microcontroller is used with alarm due to which whenever there is fuel thefting an alarm will be raised. Due to this to owner will be notified and he/she can be aware. Mrs. Udayavalli V. et al [4] had proposed that precision is an important application in the field of automobiles to measure and verify the fuel present in the vehicle with degree of precision. The previous techniques used analog strip or capacitor sensor which is either inefficient to measure to too costly to install. In the proposed method, two flow sensors are placed linearly, one sensor to measure the amount of fuel entering the tank and another sensor to measure the amount of fuel leaving the tank. The difference between the above measures gives us the amount of fuel present in the tank and it is stored in the microcontroller. It actively keeps the record of the fuel entering the tank and the fuel present in the tank and it is displayed in the LCD. If the fuel is low it will be displayed in the LCD. This system is designed to cut down the cost and increase the level of accuracy. 1.3 Objectives of the work The objectives of the paper are important to ensure the research will fulfill the solution to the problem research. The objectives of the work are given below: To determine the level of fuel in the tankers. To provide security code in the tankers during its transport. To operate opening and closing of the tanker doors via security code. To detect presence of impurities in the fuel. 1.4 Problem statement In India, fuel management is one of the sectors that gives profit to the economy sector of our country. Based on their motto which is fuel is business, the government has invested more money to develop the technology in order to increase the management of fuel during

National Conference On “Recent Innovations In Engineering Science And Technology”, April 2019 3 transportation and its mixture avoidance. Management of fuel can be done by providing security during its transportation. The exact amount of fuel filled in the tanker is to be known to the owner and how much fuel is to be taken out at each station. This process can be successful by providing wireless module during transportation of the fuel. Fuel theft is the major problem during transportation. O, security is provided at the tanker doors via valves, which opens and closes when command is given via keypad. The owner also faces a major problem in mixture of fuel. So, mixture can be detected by providing comparator at the tanker which compares the values and then chip on board amplifies the signals and provides output by mixture detection. 1.5 Scope of the work Data logging facility can be included in case of recording historical data, special data, special events and system data. Computer can be interfaced for more complex and precise application. System reliability can be improved. Speed control of vehicle- Using this technique the vehicle can’t exceed above predefined speed level. Alcohol detector_ Due to that there should be safety transportation of fuel accomplish 1.6 Need of the work Eliminates the continuously monitoring, it facilitates 24 hours a day, 365 days in a year communication between system and user. Commands can be given through remote place, directly to the machine. By further modification security system can be added. Entire control is password protected. Easy to install and simple in operation. Low cost, high reliability and flexibility.
2. METHODOLOGY 2.1 Block Diagram Fig 2.1: Block diagram of main station Fig2.2:Block diagram of tanker station

National Conference On “Recent Innovations In Engineering Science And Technology”, April 2019 4 2.2 Working of the system In this project we are mainly dealing with the transportation of fuel through the tankers. As we know that now a days, many thefting of fuel is going on. So we have made a system for the secure distribution of fuel through tankers. In this, when the fuel is filled in the tank and taken for distribution then the valves of the tanks are open and closed via a security code which is provided by the keypad. Keypad is placed at the tanker doors. When the correct security code is provided then the tanker doors is opened and closed with the help of DC motors. The DC motor will rotate forward and backward when the doors are open and closed. Level measuring system is used to determine the level of fuel in the tanker. LCD is used to display the amount of fuel after every short interval of time. When transporting the fuel form one place to other, if any unauthorized user tries to unlock the tanker door (valve) then an alarm will be raised by voice announcement module. Through wireless module the information of the tanker will be known to the owner after every short duration. LED determines the amount of fuel in the tank at each pre-defined level. For the mixing avoidance in the fuel comparator compares two values coming from the power supply which will be supplied to chip on board. The signals coming out from the chip on board will be given to relay and buzzer. 2.3 Description of the System 2.3.1 PIC16F877A- PIC 16F877A is most advanced microcontroller from microchip.This controller widely used in various experiment and application because of its low price,high quality,and ease of availability. The pic 16F877A features all the components which modern microcontrollers have. Fig2.3:PIC16F877A
2.3.2 LCD- An LCD is used to display the status of entire work. The main idea is to make this project is cost-effective, a 16 by 2 LCD is sufficient enough. We have many bit LCD available but model we are using is HAD44780. This display is a dot matrix display which is used to display character, alphanumeric, symbol etc. The LCD unit receives character code from microcontoller, send the code to the display data RAM, transform each character code into 5*7dot matrix character pattern, display the character on LCD screen. Fig2.4:LCD

National Conference On “Recent Innovations In Engineering Science And Technology”, April 2019 5 2.3.3 LED- A light-emitting diode (LED) is a two-lead semiconductor light source. It is a p– n junction diode that emits light when activated. When a suitable current is applied to the leads, electrons are able to recombine with electron holes within the device, releasing energy in the form of photons. Fig 2.5 LED 2.3.4 Buzzer- Piezo buzzer is an electronic devise use to produce sound. Its light wright, simple construction and low price make it usable in various applications. Piezo is based on inverse principle of piezo electricity discovered by Jacques and pierre curie. It is the phenomena of generating electricity when mechanical pressure is applied to certain materials and the vice versa is also true. Such materials are called piezo electric materials. Piezo electric materials are either naturally available or manmade. Fig 2.6 Buzzer 2.3.5 Keypad- A keypad is a set of buttons arranged in a block or "pad" which bear digits, symbols or alphabetical letters. Pad which containing numbers are called a numeric keypad. Numeric keypads are found on alphanumeric keyboards and on other devices which require mainly numeric input such as calculators, push-button telephones, vending machines, ATMs, Point of Sale devices, combination locks, and digital door locks. A computer keyboard usually has a small numeric keypad on the side, in addition to the other number keys on the top, but with a calculator-style arrangement of buttons that allow more efficient entry of numerical data. This number pad is usually positioned on the right side of the keyboard because most people are right-handed. Many laptop computers have special function keys which turn part of the alphabetical keyboard into a numerical keypad as there is insufficient space to allow a separate keypad to be built into the laptop's chassis. Separate external plug-in keypads can be purchased. Fig2.7 Keypad
2.3.6 Digital Fuel Level Indicator- The sending unit is located in the fuel tank of the car. It consists of a float, usually made of foam, connected to a thin, metal rod. The end of the rod is mounted to a variable resistor. A resistor is an electrical device which control the electricity. The flow of current is inversely proporstional to resistance. In a fuel tank, the variable resistor consists of a strip of resistive material connected on one side to the ground. A wiper connected to the gauge slides along this strip of material, conducting the current from the gauge to the resistor. If the wiper is close to the grounded side of the strip, there is less resistive material in the path of the current, so the resistance is small. If the wiper is at the other end of the strip, there is more resistive material in the current's path, so the resistance is large. When the float is near the

National Conference On “Recent Innovations In Engineering Science And Technology”, April 2019 6 top of the tank, the wiper on the variable resistor rests close to the grounded (negative) side, which means that the resistance is small and a relatively large amount of current passes through the sending unit back to the fuel gauge. As the level in the tank drops, the float sinks, the wiper moves, the resistance increases and the amount of current sent back to the gauge decreases. Fig2.8 Digital fuel level indicator 2.3.7 Bluetooth- Bluetooth is a wireless technology use for exchanging the data over a short distance (using short- wavelength UHF radio waves in the ISM band from 2.400 to 2.485 GHz[3]) from fixed and mobile devices, and building personal area networks (PANs). Bluetooth is managed by the Bluetooth Special Interest Group (SIG), which has more than 30,000 member companies in the areas of telecommunication, computing, networking, and consumer electronics.[5] The IEEE standardized Bluetooth as IEEE 802.15.1, but no longer maintains the standard. A manufacture must need to reach the blutooth SIG standards to launch it as a bluetooth device in the market. A network of patents apply to the technology, which are licensed to individual qualifying devices. 2.3.8Smart Phones- A mobilephone, cellphone or handphone, sometime shorted to simply mobile, cell or just phone, is a portable telephone that can make and receive calls while user is moving within a telephone service area. Morden mobile telephone services use a cellular network architecture, and, therefore, mobile telephones are called cellular telephones or cell phones. In addition to telephony, 2000s-era mobile phones support a variety of other services, such as text messaging, MMS, email, Internet access, short-range wireless communications (infrared, Bluetooth), business applications, video games, and digital photography. Mobile phones offering only those capabilities are known as feature phones; mobile phones which offer greatly advanced computing capabilities are referred to as smartphones.
2.3.9 DC Motor- A DC motor is a rotary electrical machine that converts direct current electrical energy into mechanical energy. The most common types relay on the forces produced by magnetic fields. Nearly all types of dc motors have some internal mechanism either electromechanical or electronic, to periodically change the direction of current flow in part of the motor. . DC Motorscould be powered from existing direct current lightning power distribution systems. A DC Motor’s speed can be controlled over a wide range, using either a variable supply voltage or by changing the strength of current in its field windings. Small DC Motors are used in toys tools and appliances. The advent of power electronics has made replacement of DC motors with AC motors possible in many applications. Fig2.9 DC Motor

National Conference On “Recent Innovations In Engineering Science And Technology”, April 2019 7 2.3.10 Crystal oscillator- A crystal oscillator is an electronic oscillator circuit that use mechanical resonance of a vibrating crystal of piezoelectric material to create an electrical signal with a precise frequency. This frequency is often used to keep track of time, as in quartz wristwatches, to provide a stable clock signal for digital integrated circuits, and to stabilize frequencies for radio transmitters and receivers. The most common type of piezoelectric resonator used is the quartz crystal, so oscillator circuits incorporating them became known as crystal oscillators, but other piezoelectric materials including polycrystalline ceramics are used in similar circuits. A crystal oscillator, particularly one made of quartz crystal, works by being distorted by an electric field when voltage is applied to an electrode near or on the crystal. This property is known as electrostriction or inverse piezoelectricity. When the field is removed, the quartz - which oscillates in a precise frequency - generates an electric field as it returns to its previous shape, and this can generate a voltage. The result is that a quartz crystal behaves like an RLC circuit. Quartz crystals are manufactured for frequencies from a few tens of kilohertz to hundreds of megahertz. More than two billion crystals are manufactured annually]. Most are used for consumer devices such as wristwatches, clocks, radios, computers, and cell phones. Quartz crystals are also found inside test and measurement equipment, such as counters, signal generators, and oscilloscopes. 2.3.11 Reset Circuit- A power on reset generator is a microcontroller or microprocessor peripheral that generates a reset signal when power is applied to the device. It ensures that the device starts operating in a known state. . In VLSI devices, the power on reset is an electronic device incorporated into the integrated circuit that detects the power applied to the chip and generates the reset impulse that goes to the entire circuit placing it into a known state. A POR uses the charging of a capacitor, in series with a resistor, to measure a time period during which the rest of the circuit is held in a reset state. One of the issues with using RC network to generate POR pulse is the sensitivity of the R and C values to the power-supply ramp characteristics. When the power supply ramp is rapid, the R and C values can be calculated so that the time to reach the switching threshold of the Schmitt trigger is enough to apply a long enough reset pulse. When the power supply ramp itself is slow, the RC network tends to get charged up along with the power-supply ramp up. So when the input Schmitt stage is all powered up and ready, the input voltage from the RC network would already have crossed the Schmitt trigger point. This means that there might not be a reset pulse supplied to the core of the VLSI.
3. RESULTS In this project, due to the use of transistorised fuel level sensor exact amount of fuel can be detected by the use of digital process. Mixing of fuel can also be detected. If there is any thefting of fuel, buzzer will be on. So, by using this system thefting and mixing will be stopped. Opening and closing of valve is controlled by the DC motor. Wireless module like Bluetooth is also useful in sending the information to driver how much amount of fuel is detected. Android application is used which can lock or unlock the valve of the tankers. In this system, we provide security in the tanker and also provide good controlling for government and private sectors. Stilling of fuel like petrol, diesel etc. and unauthorized petrol selling by distributor is controlled by this process. Mixing of impure and improper items in fuel is overcome. It reduces manual interference and it is user-friendly process. 4. CONCLUSIONS Hence in our project we have developed the system for the secure distribution of fuel through tankers. Mixing of impure and

National Conference On “Recent Innovations In Engineering Science And Technology”, April 2019 8 improper items in fuel is controlled by this system. This process can be successful by providing wireless module durimg transportation of the fuel. Fuel mixing results in calculation errors in product quantities resulting in incorrect blends. In our project, the system makes lock or unlock the tank-valve of the tanker from petrol and also send tanker position to main position. 5. FUTURE SCOPE Data logging facility can be included in case of recording historical data, special data, special events and system data. Computer can be interfaced for more complex and precise application. System realibility can be improved. Speed control of vehicle-using that technique the vehicle can’t exceed above predefined speed level. Alcohol detector-Due to that there should be safety transportation of fuel accomplish REFERENCES [1] Prof, Chandrakant Umarani ‘Instrumentation of automated fuel stock digital display for vehicles’ [2] Prof Vivek Gandhewar ‘Instrumentation of automated fuel stock digital display for vehicles’ [3] Kunal D. Dhande ‘Fuel level measuring technique’ [4] [4] Mrs Udayavalli V. ‘Embedded system based intelligent digital fuel gauge’ [5] B.K. Konstantinos Domdouzis and C. Anuba, “An experimental study of the effects of different medium on the performance of rfid system,” vol. 21. Advanced Engineering Informatics,2011. [6] K. Finkenzeller, Fundamentals and Applications in Contactless Smart Cards and Identification. John Wiley and Sons Ltd,2003. [7] M. Mazidi, 8051 Microcontroller and Embedded Systems. Pearson Education India, 2007 [8] K.M.R. SudeepDogra, “Radio frequency identification (RFID) applications; A brief introduction, advanced engineering in formatics.” The IUP journal

National Conference On “Recent Innovations In Engineering Science And Technology”, April 2019 9 Biometric Door Unlock Using Fingerprint sensor Dhamane Ketan Ashok , Jathar Rohit Kiran , Patil Shailesh Dilip [email protected] , [email protected] , [email protected] Electronics and Telecommunication Engineering Sandip Institute Of Engineering & Management,Nashik Abstract— Now a days security is a major concern of our life, and digital locks have become an important part of these security systems. There are many kinds of security systems available to protect our place. Some examples are RFID based Security System ,Password based security system, bio-matrix systems. In this project, we will Interface a Fingerprint Sensor Module with Arduino and will build a Fingerprint based Biometric Security System with door locking. Finger Print is considered one of the safest key to lock or unlock any system as it can recognize any person uniquely and can’t be copied easily. Keywords—– Arduino , fingerprint module(R 307 ) , solenoid lock , LCD Display I. INTRODUCTION This system focuses on the use of fingerprints for door opening and closing. The fingerprint recognition software enables fingerprints of authorised users to be enrolled in a database. Before any user want to open the door , his/her fingerprint image is matched against the fingerprints in the database while The users with no match in the database are prevented from unlock the door .A microcontroller stores the data equivalent of fingerprint of the master user. Comparison between this enrolled fingerprint and the fingerprint of the person who is about to unlock the door is done by the microcontroller. If both the fingerprints are identical control circuitry of the microcontroller sends appropriate signals to the solenoid valve through relay to operate unlock the door. If the fingerprints are not identical microcontroller sends signals to LCD Display “ Unvalid User” and door remain closed. II. Literature survey Amuda F.A,Tennyson D.I This research highlights the development of fingerprint verification system using Arduino. Verification is completed by comparing the data of authorized fingerprint image with incoming fingerprint image. Martin Magdin , stefan koprda Author proposed a system for protection against unauthorized access. The main goal was to create a system that is capable of recognizing fingerprints from a user and then processing them. The main part of this system is the microcontroller Arduino Yun with an external interface to the scan of the fingerprint with a name Adafruit R305 (special reader) Tintu Pious, Sujina K, Sneha K An important and very reliable human identification method is fingerprint identification Onyan AO, Enalume KO The system is reliable in view of the fact that fingerprints are unique to each individual and fingerprint is always available for use unlike the mechanical key that is sometimes forgotten or even misplaced. Subhankar Chattoraj, Karan Vishwakarma The biometric finger print system provides good solution to the security. A novel architecture for an economic Finger print biometric technology is proposed and implemented in this paper. Adeolu Afolabi, Oke Alice This mechanism can be usefull / implemented on a door where there is restriction of access. B. Anubala, M. Rahini, T. Bavithra our system which makes it more comfortable to use than any other existing systems. Also it is built with open source hardware which makes it cheaper. III. SYSTEM MODEL Finger Print Sensor Module is a module which captures finger’s print image and then converts it into the equivalent template and saves them into its memory on selected ID (location) by Arduino. Here all the process is instructed by Arduino like taking an image of finger print, convert it into templates and storing location etc. In this Arduino based biometric door unlock Project , we have used Fingerprint Sensor Module to take finger or thumb impression as input to the system. Here we are used four push buttons to add/back, Delete/OK, UP/Match and Down/Match. Every key has dual features. Add key is used for adding new finger data into the system and back

National Conference On “Recent Innovations In Engineering Science And Technology”, April 2019 10 function as well. Means when the user wants to add new finger then he/she needs to press add key then LCD asks for the ID or Location where user wants to store the finger print output. Now if at this time user do not want to proceed further then they can press add/back key again to go back (this time enroll key behave as Back key). Means add key has both adding and back function. Delete/OK key also has same dual function like when user add new finger then they need to select finger ID or Location by using another two key namely UP/MATCH AND DOWN/MATCH (which also has dual function) now user needs to press DEL/OK key (this time this key behaves like OK) to proceed with selected ID or Location. UP/DOWN keys also support Finger print match function. IV. DESIGN In this project, we used solenoid lock that will be open when we placed stored finger at the fingerprint module. First of all, the user needs to enroll finger with the help of enroll button. To do this user need to press enroll button & then LCD ask for entering location ID where finger will be a stored. So now user need to enter ID by using up/down button. After selecting location ID user need to press OK (Delete button). Now LCD will ask for placing finger over finger print module. Now user need to put his finger over finger print module. Now finger print module take an image and convert it into templets and store it by selected location in finger print module memory. V. RESULT AND ANALYSIS First of all user is asked to enroll his fingerprint . After enrollment the user’s identification is done .If the person is authorised ,the door automatically opens. After a set time delay , the door automatically closes. This system focuses on the use of fingerprints for door opening and closing. The fingerprint recognition software enables fingerprints of valid users to be enrolled in a database. Before any user want to unlock the door , his/her fingerprint image is matched against the fingerprints in the database while users with no match in the database are prevented from unlocking the door. A microcontroller stores the data equivalent of fingerprint of the master user. Comparison between this enrolled fingerprint and the fingerprint of the person who is about to unlock the door is done by the arduino. If both the fingerprints are identical control circuitry of the microcontroller sends appropriate signals to the relays operating the door lock . VI. CONCLUSION Fingerprint identification enhances the security of a door and makes it possible only for some selected people to used. Thus by implementing this relatively cheap and easily available system on a door , one can ensure much greater security and exclusivity than that offered by a conventional lock and key.It can be deduced that the use of biometric security systems offers a much better and fool proof means of restricting the uses by unauthorized users . REFERENCES 1] Amuda F.A , Tennyson D.I 1,2 Electrical Engineering Department Hussaini Adamu Federal Polytechnic, Kazaure Jigawa State, Nigeria IOSR Journal of Engineering (IOSRJEN) 2]Martin Magdin, Stefan Koprda University_of_Constantinus_the_Philosophe r_in_Nitra- Univerzita_Konstantna_Filozofa_v_Nitre 3] Tintu Pious, Sujina K, Sneha K B Tech Students , Dept. of EEE, Mar Athanasius College of Engineering, Kerala, India(International Journal of Advanced Research in Electrical, Electronics and Instrumentation Engineering) 4] Ajinkya Kawale International Journal of Scientific & Engineering Research, Volume 4, Issue 5, May-2013 899 ISSN 2229- 5518 5] Onyan AO, Enalume KO Department of Electrical and Electronics Engineering, Federal University of Petroleum Resources, Effurun, Delta State, Nigeria(Journal of Biostatistics and Biometric Applications) 6] Subhankar Chattoraj, Karan Vishwakarma IOSR Journal of Electrical and Electronics Engineering (IOSR- JEEE) Department of Electronics & Communication/Bio Technology Engineering Techno India University,Salt Lake Main Campus, 7] Adeolu Afolabi, Oke Alice Department of Computer Science and Engineering Ladoke Akintola University of Technology, Ogbomoso. Nigeria 8] B. Anubala, M. Rahini, T. Bavithra International Journal of Engineering Research and Applications (IJERA) ISSN: 2248-9622 Department of Information Technology, Velammal College of Engineering and Technology, Madurai. 9] Anu Department of Biomeducal Engineering, J. C. Bose Block, Deenbandhu Chhotu Ram University Of Science & Technology.Murthal Haryana,India. 10] Dinesh Bhatia Department of Biomeducal Engineering, (NEHU) , Shilong, Meghalaya, India.

National Conference On “Recent Innovations In Engineering Science And Technology”, April 2019 11 DIGITAL FUEL LEVEL INDICATO R
1. Radha Khade‘[email protected]’ 2. Arti Kothule ‘[email protected]’ 3. Manasi Shah ‘hetalshah3097@gmail 4. Dipti More '[email protected]'
Electronics & Tele- communications Sandip Institute of Engineering and
Management Nasik. ……………………………………………………………………………………
Abstract— The existing fuel indicators install in vehicles are having the petrol indication in the form of points and the analog meters which are leads to miscalculations to what distance vehicle can go with the present fuel in tank.
The precision is always being welcomed by the peopl all over the world. Precision is very important in the field of automobiles where exact value is to be known.
In our project we have found out a proper solution for indicating the accurate availability of fuel in the tank digitally. In this digitalized world where everything is becoming digital, if the fuel level indicator in automobiles is also made digital it will help to know the exact amount of fuel available in the tank. We are showing the measure of fuel in tanks in liters. This incentive in liters will be in numerical digits (ex. 1.2, 2.3,4.5)
In our work, we are using a float sensor which measu the exact amount of fuel present in the tank and it is stored in the Arduino uno micro controller. Further the measure of fuel stored in the Arduino is displayed using LCD display. We have used an LED and Buzzer connected to Arduino uno. It is used to indicate if the fuel is low in the tank, so the user will refuel it as soon as possible. So, this issue is considered for our work of building up the computerized fuel level indicator. For bikes which indicates correct measure of fuel regarding liters and to increase the level of accuracy. Keywords: Arduino uno micro controller, LCD, Float sensor, Fuel tank, Buzzer, Led.
I. INTRO DUCTIO N In recent times, petrol bunk frauds were very common. In
many of the petrol bunks, the pumps were manipulated such that it used to display the amount as entered, but in reality the quantity of fuel filled in customers tanks were much lesser than displayed value. The pumps are cheated for the benefit of the petrol bunks owner. This resulted in huge profits for the petrol bunks but at the same time the customer was being cheated.
Now a days everything is digital in all over fields. The fuel meter which is implemented in two wheeler does not show the exact fuel level which is present in the tank. They show the amount of fuel in terms of bars which oscillates between
E(Empty) and F(Full) and not in numbers or digits like liters or milliliters. Due to this, we only get approximate level of fuel and not the exact value of fuel. This fact is considered in our project. The goal of our work is to observe the level of the fuel in the fuel tank of the vehicle and to automatically show the level of fuel digitally through LCD. This helps in cross checking the quantity of fuel filled at the petrol bunk. And it will also help us to deal with common problems like petrol pumps theft cases and the misinterpretation of the amount of fuel left by the drivers.
II. LITERATURE SURVEY
Anirudha Mule, Ujwal Patil, Anil More , S.R.Kale published a paper with title “Study of Digital Fuel Meter and Fuel Theft Detection” in March 2016(ISSN:2454- 9665).In this paper author has given detail explanation of Digital Fuel Meter. The discussed system can be implemented using PIC16F Microcontroller and GSM module. The GSM system can be used for applications like SMS control, Data transfer, and remote control for wireless data transmission. [ 2]
Mrs.P.Geetabai, L.Deepika, M.Dharani, P.Haripriya, G. Lavanya proposed a “GSM based Digital Fuel meter & Fuel theft detection system” in IO SR Journal. This system shows the digital fuel level as well as gear level on LCD display. [ 3]
Mandar Milind Gijre, Ramchandra Gadade and Arjun Mane give the idea under title “Smart fuel level Indication System”. This paper explains the various technique used for sensing and indicating fuel level. The whole system is built in Arduino uno and Ultrasonic Sensor. This paper was published on GRD Journalsvol.2, Issue 6, May 2017(ISSN: 2455- 5703). [ 1]
III.BACKGROUND The accuracy of the fuel level measurement has not
been an important factor till now. In all over the world all the vehicles are having an analog fuel
meter. This meter bar oscillates between three states of fuel which are empty, half and full. It does not give us the exact value of fuel present in the tank. Henceforth we cannot say the remaining fuel present in the tank. Due to this we can undergo into low fuel problem.

IJETT ISSN: 2350
National Conference On “Recent Innovations In Engineering Science And Technology”, April 2019 Fig.1: Analog Fuel Meter As considering previous analog system, implement the advanced system. In oudoing digital fuel level meter. In thipresent in the tank will be displayed dinumerical digits in liters. IV DESIGN: In our project we have implemented Diindic This system will increase the precise lesystem will also be capable of identificatiolevel and amount of fuel in fuel tank. When ignition switch is turn on it will invehicle is in the O N state, whenever some qis added then the total amount of fuel is dispdisplay. And when ignition switch is turn O Fthat the vehicle is stop. Then the remaining will be stored in Arduino memory. When fdown at time the Buzzer will be O N. If the fuel level is below the thresholdled will glow which detects that vehicle is incondition. FLO AT SENSO R: use for detecting or slevel in the fuel tank. Fig.2: Float Sensor
LED: use for the indication purpose. Fig.3: LED
1. Red led: when fuel level is below the threshred led will glow
2. Green led: when fuel level is above the thregreen led will glow
BUZZER: It will turn on whenever there is low
2350 – 0808 | March 2019 | Volume 2 | Issue 1 |
National Conference On “Recent Innovations In Engineering Science And Technology”, April 2019 , we are going to ur system we are is the fuel level digitally that is in FIG.4: BU igital fuel level evel of fuel. The on of threshold ndicate that quantity of fuel played on LCD FF it will indicate amount of fuel fuel level goes d level then Red n RESERVE sensing the fuel r
hold level then
eshold level
fuel in the
FIG.5: BLO CFUEL LEVEL National Conference On “Recent Innovations In Engineering Science And Technology”, April 2019 UZZER
CK D IAGRAM O F D IGITAL L INDICATO R

IJETT ISSN: 2350 – 0808 | March 2019 | Volume 2 | Issue 1 |
National Conference On “Recent Innovations In Engineering Science And Technology”, April 2019 V CO NCLUSION: In this paper we have made digital fuel meter, which shows the level of fuel in exact numeric digits. It gives high accuracy than the analog meter. The precise value of fuel content in the tank is the advantage of this system. Thus, due to this we will now be able to judge that how long distance can be traveled by the remaining fuel in tank. Also fuel theft detection can be done. REFERENCES [ 1] Mandar Milind Gijre , Ramchandra Gadade and Arjun Mane gives the idea under title “Smart Fuel Level Indication System” [ 2] Anirudha mule, Ujwal Patil, Anil more, S.R.kale, study of digital fuel meter and fuel theft detection. International journal of innovative research in science and engineering. [3]Mrs.p.Geethabai,l.Deepika,M.Dharani,p.Haripriya,G.Lavanya, [ 4] Design and implementation of GSM based digital fuel meter. [ 5] S.Dado,L.Bejeck and A.Platil,Flow an level measurement.(inCzech [ 6] G.kiran kumar, M.venkat bharadwaj,k.Ashol reddy ,digital fuel meter international journal and magazine of engineering,technology,management and research.

National Conference On “Recent Innovations In Engineering Science And Technology” April 2019 Page 1 Cognitive Radio Spectrum Sensing with OFDM: An Investigation Md. Shahnawaz Shaikh1 and Dr. P.K. Khare2
Rani Durgavati Vishwavidyalaya Jabalpur-4820011,2, Assistant Professor, S.D.I.T.S Khandwa1 Abstract—Wireless communication applications are exponen- tially enhancing their utilization in the various streams. This huge technological development requires wide frequency spec- trum availability with fast and secure wireless communication technology. In this approach bandwidth scarcity might creates an important obstacle in the progress of wireless communication applications. Cognitive Radio (CR) and Orthogonal Frequency Division Multiplexing (OFDM) are the two novel emerging tech- nologies, enhancing the capacity of wireless communication appli- cations. This paper explain, CR systems with their requirements of the physical layer are discussed.Orthogonal frequency division multiplexing (OFDM) technique also investigated as a premier candidate transmission technology for CR. The challenges that arise from employing OFDM in CR systems are identified. I. INTRODUCTION
In this era, cognitive radio (CR) has been used as an effective method to compromise the conflict between spectrum scarcity and spectrum utilization. It has congenital ability to sense the wireless communication channels and immediately
the radio with ability to sense reserved, idle communication spectra which can be utilized by secondary users for other applications during its idle period. CR performs dynamic spectrum allocation. CR unit continuously senses the unused licensed user (LUs) spectrum and make avail it to unlicensed user for a short time untill licensed user become active to do transmission. This unused spectrum can be utilized for other applications of non licensed user [3], [4], [5], [6], [7], [8], [9].
III. OFDM Orthogonal frequency division multiplexing (OFDM) is
multicarrier, wideband modulation scheme to transfer the data at high rate and eliminate the inter symbol interference (ISI). The key advantages of OFDM that it, preserve scalability, robustness against narrowband interference (NBI), high spec- tral efficiency, and easy implementation using fast Fourier transform (FFT) [3], [4], [5], [6], [7], [8], [9]. Ndtake the decision to adapt necessary requirements of the
system [1], [2]. Intelligence, adaptability, awareness, reliability xm(n) = r Es N 2 X Im(k)e jπnk/Nd
, learning, and efficiency are the built in features of CR. Effective spectrum utilization and to provide highly reliable
d k= Nd − 2 2πfq (n−τ )communications is the core principle behind cognitive radio, whenever and wherever needed [3].
Number of problems got the solutions by using a high speed, wideband multicarrier modulation data transmission technique, that can be used in Cognitive Radio systems. OFDM, has the capability to combat with multipath fading and mitigate inter- symbol interference (ISI) as well as inter carrierinterference (ICI). OFDM becomes popular communication technology in current and next-generation communication systems, such as WiMAX, WiFi, and LTE. [1], [2], [3], [4], [5], [6],
This paper is organized as follows: Section I introduce to our paper. Section II briefly explains cognitive radio, with its importance. OFDM also discussed in section III. Section IV
ym(n) = e−j Nd+θ0elaborate CR-OFDM technology with associated challenges in section V. Section VI concluded the paper.
II. COGNITIVE RADIO
Cognitive radio (CR) concept can be applied to many ad- vanced and challenging communication as well as networking systems. The word cognitive means, pertained to cognition or the action or process of knowing. It also means, the mental
process of getting knowledge through thought, experience and the senses. Thus, in communication systems CR defines

National Conference On “Recent Innovations In Engineering Science And Technology” April 2019 Page 2 Fig. 1. OFDM Block Diagram
IV. CR WITH OFDM
The basic problem like time dispersion experienced by high bit rate communication can be
overcome by multicarrier modulation technique OFDM. The several splitted lower data rate symbol streams are modulated and transmitted through different carriers. This splitted stream appended with cyclic prefix (CP) to prevent ISI in result of increased symbol length.
It reduces the need of complex equalizers [3], [4], [5], [6], [7], [8], [9].
Fig. 2. OFDM based CR system A. Spectrum Sensing and Awareness Important elements of the CR concept comprises ability to
measure, sense, learn, and be aware of important operating conditions including parameters related to the availability of spectrum, interference temperature, radio channel character- istics, and radios operational environments.This also includes available networks infrastructures and nodes, local policies and other operating restrictions. The system should be aware of user requirements and applications as well as CR should be able to identify and exploit the unused parts of the spectrum in a fast and efficient way [2].
In OFDM systems, using FFT time domain to frequency domain conversion is achieved.There is no need of extra hardware or computation scanning of all the points in the time-frequency grid of the done. Using simple hypothesis testing, the selection of bins that are available for exploita- tion (spectrum holes) can be carried out. FFT calculation of received signal in OFDM systems reduces the computational requirements of the spectrum sensing algorithm as it requires [2]. B. Spectrum Shaping
Spectrum shaping is the next step, after a CR system scans the spectrum and identifies available opportunities. As cogni- tive users are expected to be allowed freely to use available spectrum. It needs flexible spectrum mask and control over waveform parameters such as signal bandwidth, power level, and center frequency. OFDM signals can be masked adaptively to fulfill the requirment by disabling a set of subcarrier [2].
Figure 3 shows using the output of FFT block the two LUs are detected and interferring subcarriers are removed from the spectrum.Then transmitter uses the unoccupied part of the spectrum for transmission. signal transmission. C. Adapting to the Environment
CR can perform various task by using collected information and knowledge from existing system. CR has excellent adap- tion capabilities like It can adapt waveform to interoperate with

National Conference On “Recent Innovations In Engineering Science And Technology” April 2019 Page 3 other communication devices, choose the most appropriate transmission network and channel to transmit cognitive user information. CR also compensate channel fading and nullify interferring signals. In this regard OFDM offeres desired flex- ibility as it can adaptively change the transmit power, coding, and modulation order of each individual subcarrier based on user needs or the channel quality. This increases system throughput, reduces bit error rate (BER), limits interference to LUs, increases coverage or to prolong unit battery life. To reduce inter-carrier interference (ICI) or peak-to-average- power ratio (PAPR), OFDM system can adaptively change the subcarrier spacing [2].
Fig. 3. Spectrum sensing and shaping using OFDM D. Multiple Accessing and Spectral Allocation Cognitive system shares the available resources among the
users. To achiev this task several techniques can be utilized. OFDM offer supports to time division multiple access
(TDMA), frequency division multiple accessing (FDMA) and carrier sense multiple accessing (CSMA). Moreover, OFDM can be used together with code division multiple access (CDMA). It is called multi-carrier code division multiple ac- cess (MC-CDMA) or multicarrier direct spread code division multiple access (DS-CDMA) [2]. E. Interoperability
It is the quality of two or more systems or components to share information and to use the information that has been shared. CR systems deal with different cognitive users, its ability detect and encode existing users signals can improve adaption capability and performance of CR systems. OFDM is one of the best technique which offer interoperability. OFDM has been used in short range as well as long range commu- nication systems. It has been successfully used in WiMAX, digital video broadcasting (DVB), digital audio broadcasting (DAB), IEEE 802.11a, IEEE 802.11g Wireless LAN standards [2].
V. OFDM-CR SYSTEM CHALLENGES
CR with OFDM offering future wireless communication techniques with promise resolve various communication prob- lems. However this emerging technology introduces some challenges in addition with existing challenges associated with
OFDM and CR. Some of the major challenges are defined as A. Multiband OFDM System Design Figure 3 shows single band CR-OFDM system in which
available portion of spectrum ocuppied by single OFDM signal and CR system shapes the OFDM signal. For the systems uti- lizing wide band spectrum it is more advantageous to divided wider band into smaller bands. This approach simplifies the system design and processing. Multiband signalling reduces the hardware requirment as it seperately process small portion of spectrum[2]. B. Location Awareness
Locationbased services can be enable by utilising ge- olocation information. This can be grouped in four ways i.e. locationbased services, network optimization, transceiver algorithm development and optimization, and environment characterization. To obtain the geolocation information in CR, OFDM signaling can be used with no need of any external positioning systems. OFDM signaling can be used to obtain the geolocation information in CRs without the need for any external positioning systems. Pilot sequences (preambles) used in OFDM systems can be utilised for acquisition and tracking of units locations[2]. C. Signaling the Transmission Parameters In a CR system, to improve communication link, commu-
nication units sense and collected useful surrounding channel information.This information is used to select various trans- mission parametersuch as LU bands, spectral mask, operat- ing frequency, coding, and modulation. Other than the local sensing, information distribution among communication units reduces the complexity and improves the performance of the system. So it is very important for sucessful transmission of CR[2].
To exchange the sensed and measured information among cognitive units one of the approach is to dedicate a commu- nication channel for it. However this channel would be li- censed.This will oppose the basic principle of CR to adaptively operate within any given unlicensed band. This distributed information creates the overhead which increases with the increase in quantity of communication units. It will increase the load on dedicated channel. This problem can be solved by reducing the overhead size
In OFDM systems, by turning off some subcarriers of scanned channel, it can exploits the available spectrum holes (figure 3). The receivers gets informed about detected spec- trum holes information about deactivated subcarriers. It re- duces the overhead by sending a vector containing infoamtion about disabled subcarriers, rahter than sending information about spectrum holes. The activation/deactivation of subcar- riers is performed over a block of subcarriers instead of individual subcarriers which inturn reduces signaling overhead

National Conference On “Recent Innovations In Engineering Science And Technology” April 2019 Page 4 by a factor of the block size. Tone boosting can also be used to reduce overhead size. CR unit send a tone with maximum power and of but very short time duration over the detected signal band as it detects a LU signal within the band. This informs to other users that a LU occupied this band to reduce the probability of interference with LUs. D. Synchronization Conventional synchronization methods become deficient
to address OFDM with CR. To avoid interference, and to maintain orthogonality between subcarriers, all users should be synchronized to the receiver. It needs longer overheads rather than conventional systems. However this longer overhead may be cause of narrowband interference[2]. E. Mutual Interference
There is possibility of power leakage from OFDM signals to adjacent channels due to the large sidelobes of modu- lated OFDM subcarriers. This power leakage from the used subcarriers to nulled subcarriers known as mutual interfer- ence to LUs. To prevent the mutual interference, the time domain OFDM symbols can window to improve spectrum shape. However it needs longer OFDM symbol duration which reduces the spectrum efficiency of the system. One more approach in this way to increase quantity of nulled subcarriers to achieve lower interference levels to LU bands, but it also reduces spectral efficiency. There is a powerfull method to reduce mutual interference with high spectrum efficiency by subcarrier cancellation.To reduce subcarrier sidelobes inside
spectrum holes the cancellation subcarriers are pre-calculated. It gains substantial reduction in mutual interference. However calculation of cancellation carrier values for each symbol increase overall system complexity. This complexity increases with the increase in spectrum hole to keep the desired inter- ference level[2].
VI. CR-OFDM APPLICATIONS
Recently developed standards are attracting more towards CR due to keen interest in dDynamic frequency selection (DFS), transmit power control (TPC), and spectrum sensing. Thsese standards can be seems to future of CR-OFDM tech- nology. Some examples are: A. IEEE 802.16
IEEE 802.16 (WiMAX) is showing interest in both academia and industry. OFDMA PHY mode, in which users can be assigned transmit power, different bandwidths, received signal strength indicator (RSSI) or the available bandwidth, time durations, levels, and modulation orders based on vari- ous parameters such as user carrier-to-interference-plus-noise ratio (CINR), is the the most interesting mode supported by WiMAX [2]. B. IEEE 802.22
IEEE 802.22 standard is a CR standard possess cognitive features. These cognitive features admit DFS, LUs detection, TPC and channel sensing. IEEE 802.22 standard still not
finalized while proposal drafted for OFDM based CR tech- nology. This standard is designed and developed for point-to- multipoint communication topology. Spectrum sensing strat- egy of IEEE 802.22 standard based on two stages: fast and fine sensing. A common algorithm like energy detector is employed in fast sensing, while the fine sensing stage is depends on the previous stage results [2].C. IEEE 802.11 IEEE 802.11 is the WLAN standard known as OFDM- based standard. This standard is designed to estimate channel characteristics and DFS with TPC. IEEE 802.11 standard also defines radio resource management. Measurements like noise histogram report, channel load report and station statistics report deines by this standard [2].
VII. CONCLUSION Spectrum scarcity can be resolved using the
CR-OFDM technology. It can be considered a a reliable, promising and op- portunistic way of wieless communication. CR-OFDM system offer adaptive, aware and flexible systems that can interoperate with current technologies. Various recently develop

National Conference On “Recent Innovations In Engineering Science And Technology”, April 2019 [Applied Science] Page 5 wireless communication technologies are adopting CR-OFDM due to its inherent benifits.
REFERENCES
[1] Zhenguo Shi , Des McLernon , Mounir Ghogho , and Zhilu Wu, “Improved spectrum sensing for OFDM cognitive radio in the presence of timing offset, ” EURASIP Journal onWireless Communications and Networking 2014, 2014:224.
[2] Hisham A. Mahmoud, Tevfik Yucek, and Huseyin Arslan, “, OFDM for Cognitive Radio: Merits and Challenges ” IEEE Wireless Communica- tions May 2009.
[3] Efe Orumwense, Ireyuwa Igbinosa “, An Investigation of Orthogonal Frequency Division Multiplexing Modulation Technique as a Candidate for Cognitive Radio Networks, ” International Journal of Information Technology and Electrical Engineering, Volume 3, Issue 5, October 2014, ISSN: - 2306-708X.
[4] agsir Singh and Jaswinder Singh “, An Investigation of the Various Challenges of OFDM-based Cognitive Radio,” Advances in Wireless and Mobile Communications. ISSN 0973-6972 Volume 10, Number 5 (2017), pp. 925-932
[5] Gh. Rasool Begh and Ajaz Hussain Mir, “, OFDM for Cognitive Radios: An overview Present Solutions and Future Directions, ” International Journal of Computing and Digital Systems, ISSN (2210-142X) Int. J. Com. Dig. Sys. 4, No.4 (Oct-2015)
[6]Geethu.T.George, Mrs.M.Jayasheela “, Performance of OFDM-Based Cognitive Radio, ” International Journal of Engineering Science Inven- tion, Volume 2 Issue 4 April. 2013 PP.51-57, ISSN (Online): 2319 6734
[7] Abhijit Rajashekar D, M. Girish Chandra, K.V. Narayanaswamy, “, Implementation of OFDM Scheme for Cognitive Radio ” SASTECH, Volume 6, No.2, September 2007
[8] Anna Vizziello, Ian F. Akyildiz, Ramon Agusti, Lorenzo Favalli, Pietro Savazzi, “, OFDM Signal Type Recognition and Adaptability Effects in Cognitive Radio Networks, ” IEEE Communications Society, IEEE Globecom 2010 proceedings, 978-1-4244-5638-3/10/26.002010IEEE.
[9] Maryam HAGHIGHAT, Houshang FATHI, Seyed Mohammad-Sajad SADOUGH, “, Robust Resource Allocation for OFDM-based Cognitive Radio in the Presence of Primary User Emulation Attack, ” RADIOENGINEERING, VOL. 21, NO. 4, DECEMBER 2012.
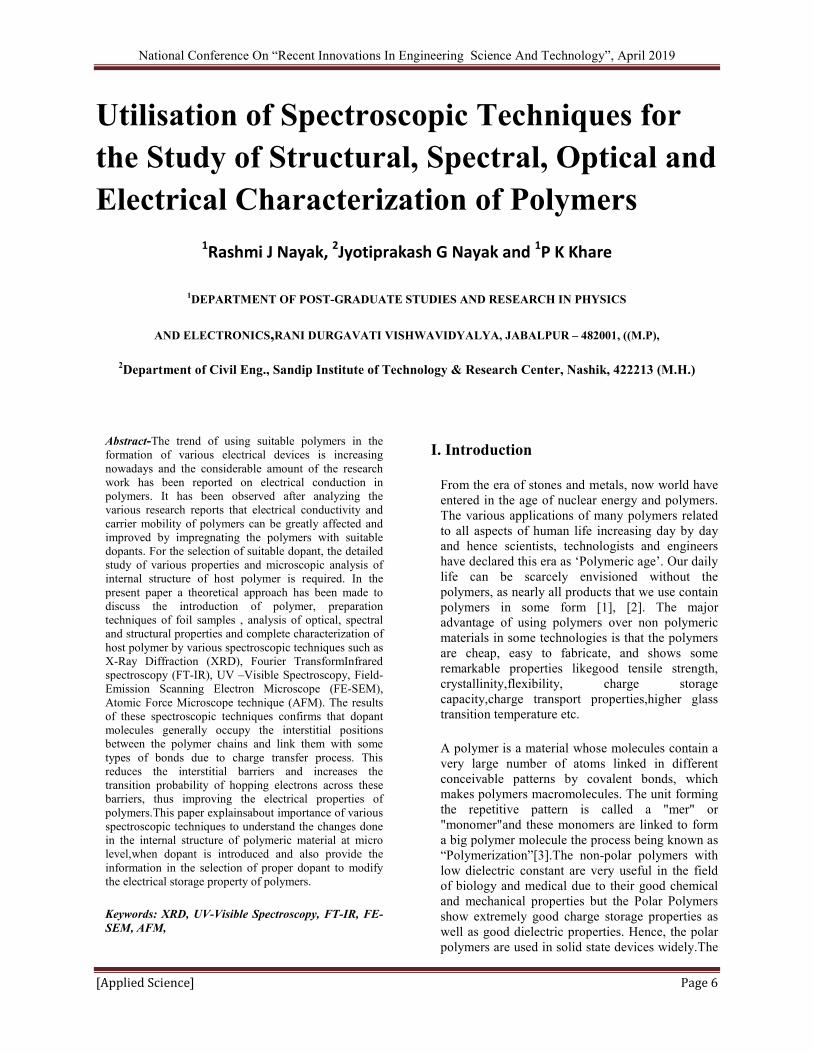
National Conference On “Recent Innovations In Engineering Science And Technology”, April 2019 [Applied Science] Page 6 Utilisation of Spectroscopic Techniques for the Study of Structural, Spectral, Optical and Electrical Characterization of Polymers 1Rashmi J Nayak, 2Jyotiprakash G Nayak and 1P K Khare 1DEPARTMENT OF POST-GRADUATE STUDIES AND RESEARCH IN PHYSICS AND ELECTRONICS,RANI DURGAVATI VISHWAVIDYALYA, JABALPUR – 482001, ((M.P), 2Department of Civil Eng., Sandip Institute of Technology & Research Center, Nashik, 422213 (M.H.)Abstract-The trend of using suitable polymers in the formation of various electrical devices is increasing nowadays and the considerable amount of the research work has been reported on electrical conduction in polymers. It has been observed after analyzing the various research reports that electrical conductivity and carrier mobility of polymers can be greatly affected and improved by impregnating the polymers with suitable dopants. For the selection of suitable dopant, the detailed study of various properties and microscopic analysis of internal structure of host polymer is required. In the present paper a theoretical approach has been made to discuss the introduction of polymer, preparation techniques of foil samples , analysis of optical, spectral and structural properties and complete characterization of host polymer by various spectroscopic techniques such as X-Ray Diffraction (XRD), Fourier TransformInfrared spectroscopy (FT-IR), UV –Visible Spectroscopy, Field-Emission Scanning Electron Microscope (FE-SEM), Atomic Force Microscope technique (AFM). The results of these spectroscopic techniques confirms that dopant molecules generally occupy the interstitial positions between the polymer chains and link them with some types of bonds due to charge transfer process. This reduces the interstitial barriers and increases the transition probability of hopping electrons across these barriers, thus improving the electrical properties of polymers.This paper explainsabout importance of various spectroscopic techniques to understand the changes done in the internal structure of polymeric material at micro level,when dopant is introduced and also provide the information in the selection of proper dopant to modify the electrical storage property of polymers. Keywords: XRD, UV-Visible Spectroscopy, FT-IR, FE-SEM, AFM,
I. Introduction From the era of stones and metals, now world have entered in the age of nuclear energy and polymers. The various applications of many polymers related to all aspects of human life increasing day by day and hence scientists, technologists and engineers have declared this era as ‘Polymeric age’. Our daily life can be scarcely envisioned without the polymers, as nearly all products that we use contain polymers in some form [1], [2]. The major advantage of using polymers over non polymeric materials in some technologies is that the polymers are cheap, easy to fabricate, and shows some remarkable properties likegood tensile strength, crystallinity,flexibility, charge storage capacity,charge transport properties,higher glass transition temperature etc. A polymer is a material whose molecules contain a very large number of atoms linked in different conceivable patterns by covalent bonds, which makes polymers macromolecules. The unit forming the repetitive pattern is called a "mer" or "monomer"and these monomers are linked to form a big polymer molecule the process being known as “Polymerization”[3].The non-polar polymers with low dielectric constant are very useful in the field of biology and medical due to their good chemical and mechanical properties but the Polar Polymers show extremely good charge storage properties as well as good dielectric properties. Hence, the polar polymers are used in solid state devices widely.The

National Conference On “Recent Innovations In Engineering Science And Technology”, April 2019 [Applied Science] Page 7 minturization of solid state devices has opened up yet another field for use of polymer, which is very vast fascinating and promising [4],[5].Polymers offer unique properties, application prospects , diversity , novelty and versatility which is not found in any other class of material. Today, the polymer industry has grown to be larger than aluminum, copper and steel industries combined. So Polymers are useful in all the fields related to human life .In this paper the application of polymers in the field of formation and improvement of efficiency of electronic devices have been considered ,since polymers show extremely good charge storage capabilities. The electrical properties of polymers can be improved by doping the polymer with most suitable dopant of low molecular weight compound. Characterization of pure and doped polymeric sample is needed for the study of selection of suitable dopant and its effect on electrical properties of polymers through most advanced spectroscopic techniques, which are explain in this paper.[6],[7]. II. Preparation of Sample The isothermal immersion technique will be utilized for preparing samples in foil form. The solution will be prepared in a glass beaker by dissolving known amount of polymer in chemically pure solvent and this solution will be kept for 24 hours to get a homogeneous and transparent solution. The solution thus prepared will then be poured onto an optically plane cleaned glass plate floating on mercury. The solvent will be allowed to evaporate in an oven at high temperature for 24 hours to yield the desired samples. This will be followed by room temperature out gassing at 10-5torr for a further period of 12 hours to remove any residual solvent. The plate will be then drawn slowly out of the solution, leaving a uniform film on the plate. Samples thus obtained will be uniformly smooth and can be easily peeled from the glass surface.The same process will be followed to prepare the doped sample by introducing suitable dopant in polymeric solution as per required and calculated ratio. The thickness of the foil film depends upon concentration of solution, itstemperature, nature of the substrate and the time for which the substrate is kept immersed in the liquid. III. Spectroscopic Studies for the Characterization Spectroscopic analysis is the study of interaction of electromagnetic radiation with a chemical substance or matter [8],[9].The nature of the interaction depends upon the properties of the substances. When radiation passes through a sample, certain frequencies of the radiation are absorbed by the molecules of the substance leading to the molecular vibrations. The frequencies of absorbed radiation are unique for each molecule which provides the characteristics of a substance. Spectroscopy is the powerful tool for studying the structure, mechanism of action of molecule against electromagnetic radiation .Spectroscopic studies also includes, modification occurring in original structure of pure polymeric material after introducing the doping, copolymerization, substitution and blend formation etc. In order to obtain optimum benefit from this tool and to use it with perfection, a basic understanding of spectroscopy is needed. The most advanced and useful spectroscopic studiesused for complete characterization of pure and doped polymeric material are explained below. A.X-Ray Diffraction (XRD) The X-Ray diffraction (XRD) is one of the most important nondestructive tool used to analyze internal atomic structure of all kinds of matter ranging from fluids, to powder, films and crystals. XRD is a versatile technique that reveals detailed information about the chemical composition and crystallographic structure of natural and manufactured materials.XRD is a rapid analytical technique primarily used for phase identification of a crystalline material and can provide information on unit cell dimensions. This technique generally leads to an understanding of material due to its authentic results which explain the molecular structure at micro level [10]. When an incident beam of monochromatic X-rays interacts with a target material is scattering of those X-rays from atoms within the target material. In materials with regular structure (i.e. crystalline), the scattered X-rays undergo constructive and destructive interference. This is the process of diffraction. The diffraction of X-rays by crystals is described by Bragg’s Law [Fig.1], nλ= 2d sinθ. Bragg’s law formulated the condition of constructive interference. The directions of possible diffractions depend on the size and shape of the unit cell of the material. The intensities of the diffracted waves depend on the kind and arrangement of

National Conference On “Recent Innovations In Engineering Science And Technology”, April 2019 [Applied Science] Page 8 atoms in the crystal structure. For X- Ray diffraction only short wavelength X-Rays in the range of few angstromsto 0.1 angstrom are used as it should be comparable to size of atoms. Fig.1 Bragg’s Law Copper is the most common target material for X-Ray diffraction, with CuKα radiation =1.54 Ao. Theses X-Rays are collimated and directed into sample. As target and detector are rotated, the intensity of reflected X-Rays is recorded.[Fig-2]. A detector records and processes this X-Ray signal and converts it into a count rate ; a graph between 2θ versus count is plotted and peak is visible if the reflected X-Ray satisfies the condition of constructive interference according to Bragg’s law. Fig. 2 Schematic diagram of beam path The crystallite size is an important parameter , which can be determined from width of the Bragg’s reflection and is given by Scherrer equation. t= Where t is the crystallite size, λ is wavelength of X-Ray, is full width at half maximum (FWHM), θ is the Bragg’s reflection angle. B.Ultra Violet -Visible Spectroscopy (UV) UV- visible spectroscopy is the study of absorption and transmission of radiation produced by the material when electromagnetic radiation of UV Range (effectively from 2000 to 4000A.U.) passes through it. It is the measurement of the attenuation of a beam of light with wavelength after it passes through a sample. When the Ultra Violet radiation passes through the material, the energy of radiation is absorbed by the electrons and theses electrons (σ, π, n*) are promoted from ground state to higher energy state. Thus, light radiation on leaving the sample after absorption will be either less intense or its intensity may be completely lost. A record of the amount of light absorbed by the sample as a function of the wavelength of light in mµ (1µ=10-4 cm,) or nm is called absorption spectrum which generally consists of absorption bands. The schematic diagram of UV spectroscopy is given in Fig.3. Fig. 3 Schematic diagram of UV spectroscopy This spectroscopy is very useful to measure the number of conjugated double bonds and also aromatic conjugation within the various molecules. It also distinguishes between conjugated and non- conjugated system.This technique also provide the information about detection of functional group available in material, identification of unknown compound, presence of impurity available , selection of suitable doping material etc. C. Fourier TransformInfrared Spectroscopy (FT-IR) Fourier Transform Infrared Spectroscopy (FT-IR) is an analysis technique that provides information about the chemical bonding or molecular structure of material, whether organic or inorganic [11]. It

National Conference On “Recent Innovations In Engineering Science And Technology”, April 2019 [Applied Science] Page 9 provides information about the functional groups of an organic molecule and is used to identify unknown materials and material phases present in a specimen. The technique works on the fact that groups of bond of material vibrates at particular frequency of radiation when passes through sample. A molecule that is exposed to infrared rays absorbs infrared energy at frequencies that are characteristic to the molecule. Infra-red absorbance is due to the interaction between the electric field vector and the molecule dipole transition moments due to molecular vibrations. Functional groups found in polymers include hydroxyl, carboxyl, ester, double-bond, epoxy, phenol and aromatic ring etc.The absorbance is at a maximum when the electric field vector and the transition moments are parallel to each other, and zero when the orientation is perpendicular. The schematic diagram of FT-IR [Fig. 4] is shown bellow. Fig.4 Schematic diagram of FT-IR Hook’s law states that the IR frequency at which a chemical bond absorbs is inversely proportional to the square root of the reduced mass of the bonded atoms and the equation is ʋ= Where ʋ= frequency in cm-1, µ=reduced mass, (m1 &m2are atomic masses of two elements of the bond) , k= force constant . The absorption bands for more organic and inorganic compounds are found in infrared region. Any absorption band can be characterized by two parameters: the wavelength at which maximum absorption occurs and the intensity of absorption at this wavelength. By measuring the specific frequency over time , changes in the character or quantity of particular bond can be measured. This is especially useful in measuring the degree of polymerization in polymers and effect of blending or doping in pure material. D. Field Emission Scanning Electron Microscope (FE-SEM) FE – SEM uses electrons instead of light to form an image. Electrons are liberated from a field emission source and accelerated in a high electrical field gradient. Within the high vacuum column these so-called primary electrons are focused and deflected by electronic lenses to produce a narrow scan beam that bombards the object. As a result secondary electrons are emitted from ech spot on the object. The angle and velocity of these secondary electrons relates to the surface structure of the object. A detector catches the secondary electrons and produces an electronic signal. This signal is amplified and transformed to a video scan-image that can be seen on a monitor or to a digital image that can be saved and processed further[12]. A sample analyzed in SEM should be conducting .If the sample is non conducting then coating of sample by conducting material can be done. The schematic diagram is shown bellow [Fig. 5]. Fig. 5 The schematic diagram of FE-SEM A FE-SEM is used to visualize very small topographic details on the surface or entire or fractioned objects. FE-SEM is widely used for revealing information about the microstructures and orientation of sample. E. Atomic Force Microscopy (AFM) AFM is a very high-resolution type of scanning probe microscopy, with demonstrated resolution on the order of fractions of a nanometer, more than 1000 times better than the optical diffraction limit. The
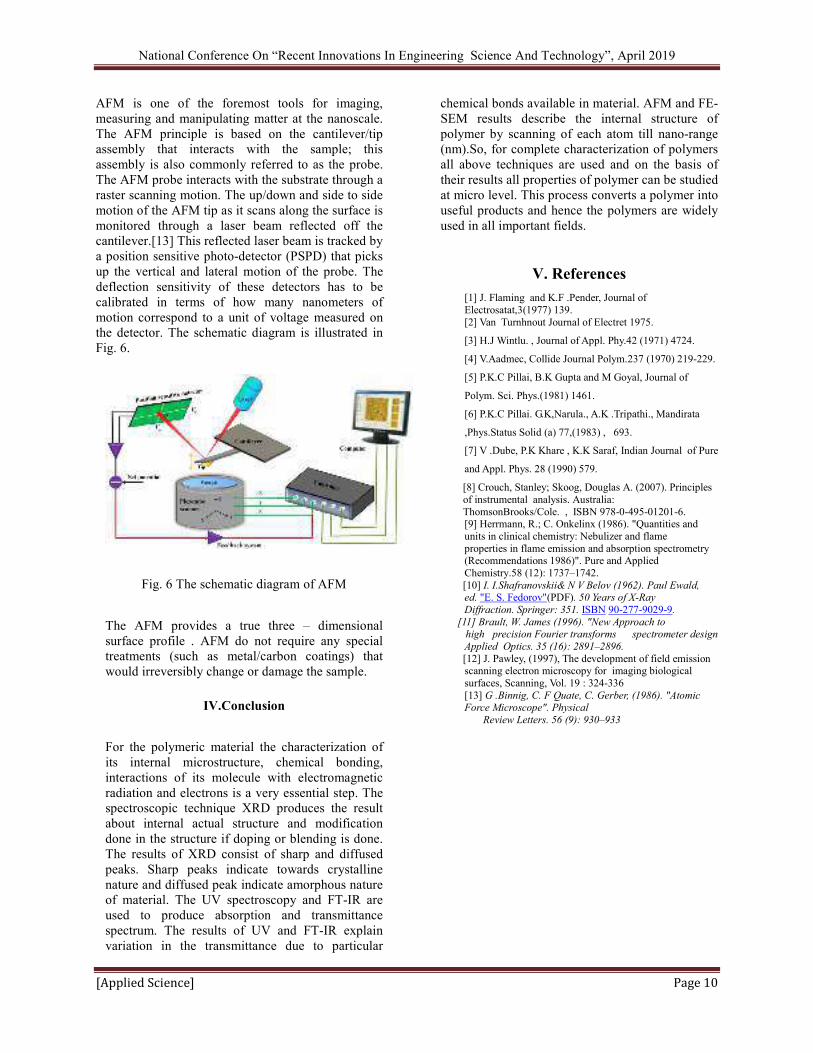
National Conference On “Recent Innovations In Engineering Science And Technology”, April 2019 [Applied Science] Page 10 AFM is one of the foremost tools for imaging, measuring and manipulating matter at the nanoscale. The AFM principle is based on the cantilever/tip assembly that interacts with the sample; this assembly is also commonly referred to as the probe. The AFM probe interacts with the substrate through a raster scanning motion. The up/down and side to side motion of the AFM tip as it scans along the surface is monitored through a laser beam reflected off the cantilever.[13] This reflected laser beam is tracked by a position sensitive photo-detector (PSPD) that picks up the vertical and lateral motion of the probe. The deflection sensitivity of these detectors has to be calibrated in terms of how many nanometers of motion correspond to a unit of voltage measured on the detector. The schematic diagram is illustrated in Fig. 6. Fig. 6 The schematic diagram of AFM The AFM provides a true three – dimensional surface profile . AFM do not require any special treatments (such as metal/carbon coatings) that would irreversibly change or damage the sample. IV.Conclusion For the polymeric material the characterization of its internal microstructure, chemical bonding, interactions of its molecule with electromagnetic radiation and electrons is a very essential step. The spectroscopic technique XRD produces the result about internal actual structure and modification done in the structure if doping or blending is done. The results of XRD consist of sharp and diffused peaks. Sharp peaks indicate towards crystalline nature and diffused peak indicate amorphous nature of material. The UV spectroscopy and FT-IR are used to produce absorption and transmittance spectrum. The results of UV and FT-IR explain variation in the transmittance due to particular chemical bonds available in material. AFM and FE-SEM results describe the internal structure of polymer by scanning of each atom till nano-range (nm).So, for complete characterization of polymers all above techniques are used and on the basis of their results all properties of polymer can be studied at micro level. This process converts a polymer into useful products and hence the polymers are widely used in all important fields. V. References [1] J. Flaming and K.F .Pender, Journal of Electrosatat,3(1977) 139. [2] Van Turnhnout Journal of Electret 1975. [3] H.J Wintlu. , Journal of Appl. Phy.42 (1971) 4724. [4] V.Aadmec, Collide Journal Polym.237 (1970) 219-229. [5] P.K.C Pillai, B.K Gupta and M Goyal, Journal of Polym. Sci. Phys.(1981) 1461. [6] P.K.C Pillai. G.K,Narula., A.K .Tripathi., Mandirata ,Phys.Status Solid (a) 77,(1983) , 693. [7] V .Dube, P.K Khare , K.K Saraf, Indian Journal of Pure and Appl. Phys. 28 (1990) 579. [8] Crouch, Stanley; Skoog, Douglas A. (2007). Principles of instrumental analysis. Australia: ThomsonBrooks/Cole. , ISBN 978-0-495-01201-6. [9] Herrmann, R.; C. Onkelinx (1986). "Quantities and units in clinical chemistry: Nebulizer and flame properties in flame emission and absorption spectrometry (Recommendations 1986)". Pure and Applied Chemistry.58 (12): 1737–1742. [10] I. I.Shafranovskii& N V Belov (1962). Paul Ewald, ed. "E. S. Fedorov"(PDF). 50 Years of X-Ray Diffraction. Springer: 351. ISBN 90-277-9029-9.
[11] Brault, W. James (1996). "New Approach to high precision Fourier transforms spectrometer design
Applied Optics. 35 (16): 2891–2896. [12] J. Pawley, (1997), The development of field emission scanning electron microscopy for imaging biological surfaces, Scanning, Vol. 19 : 324-336 [13] G .Binnig, C. F Quate, C. Gerber, (1986). "Atomic Force Microscope". Physical Review Letters. 56 (9): 930–933

National Conference On “Recent Innovations In Engineering Science And Technology”, April 2019 [Applied Science] Page 11 An Investigation of Acoustical Resonance in Humans through Determination of Individual Natural Frequency Nivedita Azad#, Anirvan Gupta*, #Department of Botany, Smt. Devkiba Mohansinhji Chauhan College of Commerce and
Science , Silvassa *Department of Physics, Sandip Institute of Engineering and
Management, Nashik
Abstract — In the auditory channel, humans are highly attuned to emotional signals in speech and music that arise from shifts in the frequency spectrum and intensity of sound. In this study, responses of human beings from various age groups were observed by exposing them to sinusoidal tones of frequency within human hearing range. Similar to a mechanical resonant system, human body also has a internal cavity, which, when exposed to an external frequency equal to its natural frequency, vibrates with maximum amplitude. An attempt was made to estimate the resonant frequency of an indi vidual. The study is expected to throw light on acoustic environment most suited for an individual to make him realize a state of contentment when he is in an enclosure meant for worship or meditation. The study may also support people from medical background to treat a person through acoustical techniques. Keywords — auditory channel, frequency spectrum, sound intensity, resonance I. INT RODUCTION In technical sense, resonance is a relat ionship that exists between two bodies vibrating at the same frequency or a mu ltip le thereof. In other words, the vibrations emanating fro m one body cause the other body to start vibrating in tune with it. A resonator may be defined as a second vibrator which is set into mot ion by the main v ibrator and wh ich adds its own characteristics to the generated sound waves [1]. Two kinds of resonance that may occur in human body are: the sympathetic resonance and forced resonance. Sympathetic refers to free resonance while forced resonance refers to conductive resonance [2]. II. METHODOLOGY Thirty subjects, fifteen males and fifteen females, fro m various age groups were exposed to sound notes of frequencies in the human audible range. A particular frequency at which an individual experiences maximu m vibrations fro m within was noted. Th is frequency could then be related to the resonant frequency of the human body’s inner cavity. Figure 1 : An illustration of the graphical representation of sound note used during experimentat ion III. OBJECTIVE M EASUREM ENTS A. Vibrations within human body The subjects were exposed to sinusoidal tones of frequency in the range starting from a frequency of 100 Hz. The sampling rate used was 44.1 kHz and lasting for 50 seconds. The subjects were asked to enchant the sound of ‘OM’ (or AUM ). The acoustical significance of enchanting ‘OM’ lies in the fact that it results in stabilization of brain, removal of unnecessary thoughts and increase of energy [3]. Since subjects were asked to enchant the OM sound, the vibrations felt fro m within must be forced vibrations. The waves originated by the airflow modulated by the vibrating vocal folds travel along the bones, cartilages, muscles of neck and head, and upper chest, causing them to vibrate by forced resonance. These same forced

National Conference On “Recent Innovations In Engineering Science And Technology”, April 2019 [Applied Science] Page 12 Sr. No. Age Group (in Years) Height (m) Weight (Kg) Re sonant Fre quency (Hz) 1 15-20 1.5748 45 155 2 20-25 1.7018 57 145 3 20-25 1.5748 49 115 4 20-25 1.6764 51 152 5 20-25 1.5748 40 145 6 20-25 1.5748 39 155 7 20-25 1.55 55 114 8 25-30 1.5748 51 142 9 25-30 1.6764 55 122 10 30-35 1.5494 60 125 11 35-40 1.5494 63 137 12 35-40 1.6002 59 120 13 40-45 1.63 70 145 14 40-45 1.397 56 130 15 45-50 1.6002 55 125 vibrations may serve as sensation guides for the person, regardless of their effect on external sound. These sensations may provide evidence to the enchanter that their vocal folds are forming strong primary vibrations which are being carried through the chest and head. Thus, these vibratory sensations can supply sensory feedback about the efficiency of the whole phonetory process to the person [6]. The inner cavity may therefore vibrate as a whole or in any of its parts. The vibrations may take place in several ways, all at once. The objective is to find a part icular frequency at which maximu m vibrations is felt by the subjects. B. Factor affecting vibrations There are many factors which may affect the vibrations in the human body. Few of them are age of the person, height, weight, physical and emot ional condit ion, season, weather, time of the day, and temperature. Although these parameters are subjective and may not be controlled during experimentation, it has been tried to keep the amb ient conditions as close as possible. Fo r this purpose, all the observations were carried out during afternoon, 12.00 p m to 4.00 p m with subjects not suffering fro m any health ailment during experimentation. These factors would also affect the physical structure of the body cavity such as its shape, size, composition etc. The frequency of resonance may appreciably change by rather small variat ions in these conditions and parameters. C. Vocal resonators in a human body There are possible seven vocal resonators in a human body. These are the chest, the tracheal tree, the laryn x, the pharynx, the oral cavity, the nasal cavity, and the sinuses [4]. The human vocal tract is a non-uniform tube about 175 mm long in man (this g ives the distance between the glottis and the lips) [7]. Its cross-sectional area varies from 0 to 20 cm2 under the control for vocalizat ion. A nasal tract with a total volu me of 60 cm3 is coupled to the vocal tract. Nasal sounds such as /m/ and /n/ are normally excited by the vocal cords and resonated in the nasal cavity. Nasal sounds are generated by closing the soft palate and lips, not to radiate air fro m the mouth, but to resonate the sound in the nasal cavity. The closed vocal tract works as a lateral branch resonator and also has effects of resonance characteristics to generate nasal sounds. Based on the difference of articulatory positions of tongue and mouth, the /m/ and /n/ sounds can be distinguished with each other [5]. IV. OBSERVATIONS AND CALCULATIONS A. Estimation of resonant frequency of the body cavity To estimate the resonant frequency of body cavity, a simp lified version of the cavity in the fo rm of a hollow tube, closed at one end (the glottis end - the part of the laryn x consisting of the vocal cords and the opening between them. It affects voice modulation through expansion or contract ion) and open at other end (the lip end) is approximated. The diameter of such a tube may be considered small co mpared to the wavelength of sound. Hence, sound through this tube will only propagate down the length of the tube, and any spherical propagation may be ignored. Figure 2 : Vocal resonating cavity of a human body (Source :http://www.mtosmt.org/issues/mto.16.22.1/heidemann_ examples.php?id=1&nonav=true) TABLE I RESONANT FREQUENCY MEASUREMENT IN FEMALES

National Conference On “Recent Innovations In Engineering Science And Technology”, April 2019 [Applied Science] Page 13 Ht : Wt ratio Ht : Rf Wt : Rf BMI 0.03 0.010 0.290 18.15 0.03 0.012 0.393 19.68 0.03 0.014 0.426 19.76 0.03 0.011 0.336 18.15 0.04 0.011 0.276 16.13 0.04 0.010 0.252 15.73 0.03 0.014 0.482 22.89 0.03 0.011 0.359 20.56 0.03 0.014 0.451 19.57 0.03 0.012 0.480 24.99 0.02 0.011 0.460 26.24 0.03 0.013 0.492 23.04 0.02 0.011 0.483 26.35 0.02 0.011 0.431 28.69 0.03 0.013 0.440 21.48 Sr. No. Age Group (in Ye ars) Height (m) Weight (Kg) Re sonant Fre quency (Hz) 16 15-20 1.651 57 130 17 20-25 1.778 70 144 18 20-25 1.7272 68 154 19 20-25 1.7272 71 127 20 20-25 1.71 61 152 21 20-25 1.8034 73 153 22 25-30 1.6256 87 145 23 25-30 1.8034 73 138 24 25-30 1.6764 72 144 25 25-30 1.6764 57 155 26 30-35 1.6764 63 145 27 30-35 1.7018 76 153 28 30-35 1.7018 90 155 29 35-40 1.7018 73 128 30 35-40 1.7272 66 141 Ht : Wt ratio Ht : Rf Wt : Rf BMI 0.03 0.013 0.438 20.91 0.03 0.012 0.486 22.14 0.03 0.011 0.442 22.79 0.02 0.014 0.559 23.80 0.03 0.011 0.401 20.86 0.02 0.012 0.477 22.45 0.02 0.011 0.600 32.92 0.02 0.013 0.529 22.45 0.02 0.012 0.500 25.62 0.03 0.011 0.368 20.28 0.03 0.012 0.434 22.42 0.02 0.011 0.497 26.24 0.02 0.011 0.581 31.08 0.02 0.013 0.570 25.21 0.03 0.012 0.468 22.12 TABLE III RESONANT FREQUENCY MEASUREMENT IN MALES The relat ion between wavelength of sound and its frequency is given by, λ = c / f, where c is the speed of propagation of sound in air ( appro ximately 335 m/s). Approximat ing the cavity to be a tube closed at one end, that is a quarter-wavelength resonator [8], the frequency of resonance may be given by f = c / λ = c / 4L = (33500 cm/s) / 4 (17.5 cm) = 478.57 Hz. However, the human vocal tract is a co mplex tube, and not a simp le tube closed at one end. Its co mplexity in shape may be described as a series of cross -sectional area measurements. This can be modified in a variety of ways in humans. V. RESULT S AND DISCUSSION It is observed that, the resonant frequencies are different fro m the above calculated value. This frequency may be a harmonic to the resonant frequency actually obtained through subjective measurements. It is also noted that the frequencies obtained may be either fundamental or any harmonic of the fundamental. Due to limitation on the frequency response of the speakers used, frequencies lower than 100 Hz could not be checked. In case of consideration of closed tube at one end model, the harmonics are all odd multip les of fundamental. It is also believed that females in particular, have a tonal frequency higher than males. Ho wever, such conclusion could not be drawn fro m the observations. The tables also show that height or weight and the BMI of a person do not correlate to the resonant frequency of an individual. More co mplex study is needed to develop any correlation between frequency and body size. ACKNOWLEDGMENT The authors wish to express their gratitude to all the volunteers for participating in the experimental work. The authors would also like to thank Principals of both the institutes and colleagues for their encouragement and support.REFERENCES [1]. McKinney, James C. (1994). The Diagnosis and Correction of Vocal Faults. Nashville, Tennessee : Genovex Music Group. ISBN 978-1-56593-940-0 [2]. McCoy, Scott (2004). Your Voice : An Inside View. Princeton, NJ, Inside ViewPress.

National Conference On “Recent Innovations In Engineering Science And Technology”, April 2019 [Applied Science] Page 14 [3]. Gurjar, Ajay et al (2009). Analysis of Acoustic of OM Chant to Study its Effect on Nervous System. Int J Comp Sci and Network Security, 9(1). [4]. Greene, M.C.L. and Mathieson, L. (1992) The Voice and Its Disorders (5th ed), Child Language T eaching and T herapy, 8(2), 216–217. [5]. Higashimoto, Toshio & Sawada, Hideyuki. (2003). A mechanical voice system: construction of vocal cords and its pitch control. [6]. **https://www.ims.uni- stuttgart.de/institut/arbeitsgruppen/phonetik/EGG/page10.htm [7]. Fitch, William (1994). Vocal Tract Length Perception and the Evolution of Language, Department of Cognitive and Linguistic Sciences, Brown University [8].**http://astro.pas.rochester.edu/~aquillen/phy103/Lectures/C_Col umnAir.pdf

National Conference On “Recent Innovations In Engineering Science And Technology”, April 2019 [Applied Science] Page 15

National Conference On “Recent Innovations In Engineering Science And Technology”, April 2019 [Applied Science] Page 16

National Conference On “Recent Innovations In Engineering Science And Technology”, April 2019 [Applied Science] Page 17

National Conference On “Recent Innovations In Engineering Science And Technology”, April 2019 [Applied Science] Page 18

National Conference On “Recent Innovations In Engineering Science And Technology”, April 2019 [Applied Science] Page 19