proceedings of the second annual advanced polymer ...
178
PL-TR-92-3018 Vol. 3 of 3 PL-TR-92-3018 Vol. 3 of 3 * PROCEEDINGS OF THE SECOND ANNUAL ADVANCED POLYMER COMPONENTS SYMPOSIUM. VOL. III. John J. Rusek PHILLIPS LABORATORY OLAC PL/RKCP Edwards AFB CA 93523-5000 July 1992 Interim Report APPROVED FOR PUBLIC RELEASE; DISTRIBUTION UNLIMITED mumm 19950123 048 PHILLIPS LABORATORY Propulsion Directorate AIR FORCE MATERIEL COMMAND EDWARDS AIR FORCE BASE CA 93524-7001
-
Upload
khangminh22 -
Category
Documents
-
view
3 -
download
0
Transcript of proceedings of the second annual advanced polymer ...

PL-TR-92-3018 Vol. 3 of 3
PL-TR-92-3018 Vol. 3 of 3
*
PROCEEDINGS OF THE SECOND ANNUAL ADVANCED POLYMER COMPONENTS SYMPOSIUM. VOL. III.
John J. Rusek
PHILLIPS LABORATORY OLAC PL/RKCP Edwards AFB CA 93523-5000
July 1992
Interim Report
APPROVED FOR PUBLIC RELEASE; DISTRIBUTION UNLIMITED mumm
19950123 048 PHILLIPS LABORATORY Propulsion Directorate AIR FORCE MATERIEL COMMAND EDWARDS AIR FORCE BASE CA 93524-7001

NOTICE
When U.S. Government drawings, specifications, or other data are used for any purpose other than a definitely related Government procurement operation, the fact that the Government
may have formulated, furnished, or in any way supplied the said drawings, specifications, or other data, is not to be regarded by implication or otherwise, or in anyway licensing the holder or any other person or corporation, or conveying any rights or permission to manufacture, use or sell any patented invention that may be related thereto.
k
FOREWORD
The work reported in this Phase I Interim report was performed under JON: 573000R9 with the OLAC PL/RKFE Branch at the Phillips Laboratory, Edwards AFB CA 93523-5000. OLAC PL Project Manager was Dr. John J. Rusek.
The report has been reviewed and is approved for release and distribution in accordance with the distribution statement on the cover and on the SF Form 298.
lUg./&~*- DR. JOHN J. RUSEK Project Manager
STEPHEN L. RODGERS Chief, Emerging Technologies Branch
RANNEY G.ADAMS Public Affairs Director
}i-y_^ 14-JC£

Chaffee, K.
DeRose, G.
Economy, J.
Elkins, T.
Elliott, D.
Etheridge, J.
Frank, C.
Guest, B.
Hicks, R.
Hoffman, R.
Jones, P.
Kipp. B.
Kaslusky, A.
Kranbuehl, D.
Larson, R.
Lichtenhan, J.
INDEX AUTHORS
180 Lieb, S.
199 Lindauer, M
6 Lydon, M. 498 Mather, R 135 Nguyen, H. 391 Noel, C. 451
Oldham, R 457
70
163, 199
Pearson, D.
Rusek, J.
40 Saebo, D.
211 Saebo, S.
528 Sawyer, L.
211 Simmon, R.
368 Small, S.
475, 486 Zorman, C.
112
407
397
368
524
486
55, 70, 90
368
1,40, 180
55, 70, 90
90
354
397
407
163, 199
A-l

TABLE OF CONTENTS Volumes 1-3
Volume 1
Preface
Attendance List
Symposium Agenda
Glossary
The Advanced Polymer Components Initiative J. Rusek
Thermotropic Liquid Crystalline Polymers J. Economy
Synthesis and Thermal Analysis of Thermotropic Polyesters J. Rusek; P Jones
Deternination of the Number Average Molecular Weight of Aromatic Thermotropic Liquid Crystalline Polyesters By Drift Spectroscopy
P. Oldham; D. Saebo
NMR Studies of Aromatic Liquid Crystalline Polyesters D. Saebo; P. Oldham; R. Hicks
The Structure and Conformation of 4-Hydroxyphenyl Terephthalate: A Model Compound for a Liquid Crystalline Polyester
D. Saebo; P. Oldham; S. Saebo
Thermotropic Polymers; Theory and Experiment S. Lieb
A Study of Thermotropic Liquid Crystal Polymers D. Elliott
Ion Beam analysis Techniques Applied to Polymer Samples C. Zorman; R. Hoffman
n
vi
ix
1
6
40
55
70
90
112
135
163
Volume 2
EXAFS of Halogenated Liquid Crystal Polymers K. Chaffee; J. Rusek
Development and Testing of a Curved Mica X-Ray Focusing Spectrometer for Extended X-Ray Absorption Fine Structure Studies
C. Zorman; G. DeRose; R. Hoffman
Characterization, FDEMS Sensing and In situ Process Monitoring of the Physical Changes Occurring with Time and Temperature During Cure of High Temperature Liquid Crystal Thermotropes
D. Kranbuehl; B. Kipp
180
199
211

REPORT DOCUMENTATION PAGE Form Approved OMB No 0704-0188
Public reporting burden for this collection of information is estimated to average 1 hour per response, including the time for reviewing instructions searching existing data sources gathering and maintaining the data needed, and completing and reviewing the collection of information. Send comments regarding this burden estimate or any other aspect of this collection of information, including suggestions for reducing this burden to Washington Headquarters Services, Directorate for Information Operations and Reports, 1215 Jefferson Davis Highway, Suite 1204, Arlington, VA 22202-4302, and to the Office of Management and Budget, Paperwork Reduction Project (0740-0188), Washington DC 20503, 1. AGENCY USE ONLY (LEAVE BLANK 2. REPORT DATE
July 1992 3. REPORT TYPE AND DATES COVERED
Interim
4. TITLE AND SUBTITLE
Proceedings of the Second Annual Advanced Polymer Components Symposium
6. AUTHOR(S)
John J. Rusek
5. FUNDING NUMBERS
C:
PE: 62302F PR: 5730
TA: 00R9
7. PERFORMING ORGANIZATION NAME(S) AND ADDRESS(ES)
Phillips Laboratory OLAC PL/RKFE Edwards AFB CA 93523-5000
8. PERFORMING ORGANIZATION REPORT NUMBER
PL-TR-92-3018
9. SPONSORING/MONITORING AGENCY NAME(S) AND ADDRESS(ES) 10. SPONSORING/MONITORING AGENCY REPORT NUMBER
11. SUPPLEMENTARY NOTES
COSATI CODE(S):21/06; 21/08/01; 21/09/01; 21/08/02; 21/09/02; 07/05; 07/06
12a. DISTRIBUTION/AVATLABILITY STATEMENT
Distribution approved for public release; Distribution is unlimited.
12b. DISTRIBUTION CODE
13. ABSTRACT (MAXIMUM 200 WORDS)
Advanced propulsion concepts rely on advanced propulsion materials. The Phillips Laboratory is aggressively pursuing advanced polymeric materials for use in Solid, Liquid, and Nuclear propulsion component applications. Traditional composite materials have high specific strengths, but suffer from high cost and labor intensive processing. The APC program is currently exploring thermotropic liquid crystal polymers; these materials have high specific strength and can be economically processed by traditional high volume routes such as injection molding and blow molding. Applications envisioned for these materials include rocket nozzles, pressure cases, propellant tanks and conduits, nuclear propulsion containment, fairings, high pressure tanks and orbit-processed habitats for interplanetary voyages. These proceedings contain the papers given at the Second Annual Advanced Polymer Components Symposium, which was held at the United States Air Force Academy at Colorado Springs CO.
14. SUBJECT TERMS
Liquid Crystal Polymers; Liquid Propulsion Synchrotron Radiation; Advanced Materials; Solid Propulsion; Neutron Diffraction; Thermotropic Polyester; Nu- clear Propulsion; Polyester Synthesis
IS. NUMBER OF PAGES
1«. PRICE CODE
17. SECURITY CLASSIFICATION OF REPORT
Unclassified
18. SECURITY CLASSIFICATION OF THIS PAGE
Unclassified
19. SECURITY CLASSIFICATION
OF ABSTRACT
Unclassified
20. LIMITATION OF ABSTRACT
SAR
NSN 7540-010280-5500 i/ii
Standard Form 298 (Rev 2-89) Prescribed by ANSI Std 239-18 298-102

Structure-Property Relationships of VECTRA Liquid Crystal Polymers L. Sawyer
354
Volume 3
Contrasting Shear-Flow Behavior of Tumbling and Flow-Aligning Nematics R Mather; D. Pearson; R. Larson
Wiley Organics and Organic Technologies J. Etheridge
Hybrid Sounding Rocket Development at the Unite States Air Force Academy
M. Lydon; R. Simmon
Investigation of the Annealing Effects on DUPONTHX-4000 Liquid Crystalline Polymer
M. Lindauer; S. Small
Advanced Polymer Processing and Mold Design C. Frank
Final Report of Predator Motorcase Adhesive Bonding Screen B. Guest
Modern Ablatives. The Design, Development, and Application of Hybrid Polymers
J. Lichtenhan
A Preliminary Investigation Into the Nature of a Graded Propellant/lnsulation Interface in Solid Rocket Motors
C. Noel; J. Lichtenhan
Design and Analysis of the Air Force Academy Solid Booster T Elkins
Liquid Crystal Polymer AFA Booster Motor Development: Propellant Development, Motor Design and Preliminary Testing
H. Nguyen
ADP: Hoechst Celanese Property Data
INDEX AUTHORS
Accesion For
NTIS CRA&l DTIC TAB Unannounced Justification
D
368
391
397
407
451
457
475
486
498
524
528
542
By Distribution
Availability Codes
Dist
\B±
Avail and/or Special
B

Contrasting Shear-Flow Behavior of Tumbling and Flow-Aligning Nematics
P.T. Mather*, D.S. Pearson, and R.G. Larsont Materials Department, U.C. Santa Barbara, CA 93106
tAT&T Bell Laboratories, Murray Hill, NJ 07016
Abstract Monodomain samples of small-molecule nematic 5CB and 8CB were subjected to
shearing flow in an instrument equipped with optical microscopic observation. The torsional shearing geometry was used with circular glass disks which were treated homeotropic (normal) director orientations. We found that increasing the angular velocity of the moving disk from zero, the director configuration in the cell was different for the two materials. Most remarkable was the observation that, while the director stays in the shearing plane for 5CB, the director rotates out of the shearing plane to an orientation nearly orthogonal to the shearing direction for 8CB. At high rotation speeds, disclinations of strength lsl=l/2 and lsl=l were created in both 5CB (0:3 negative) and 8CB (0:3 positive). The disclination density averaged over the cell gap, pA=length/area, was measured using image analysis techniques. We compare the two materials based on measured disclination density and its dependence on experimental conditions.
L Introduction Liquid crystalline materials in shear flow are known to exhibit disclination
production1-2. Disclinations are line defects across which the preferred molecular orientation (the director) of the nematic changes abruptly. Even quiescent samples of nematic liquid crystals are characterized by copious quantities of disclination lines and this optical characteristic is referred to as the "threaded texture"3. This texture, unlike the "Schlieren" texture of thin samples, consists of a multitude of disclination lines in the form of loops and interconnections. The lines usually have core strengths of 1 ("thicks") or 1/2 ("thins") with the relative populations depending, in the static case, on ratios of elastic constants for the particular material and temperature. Here we have adopted the nomenclature originally due to Nehring4. The difference between these defects is the severity of the director distortion around their backbone - their core structure. The core structure metric is the strength5 which for thicks is ±1 and for thins is ±1/2. For a review on the static properties of liquid crystals see, e.g., Kleman6 or Saupe7.
The threaded texture can be coarsened to a "monodomain", a sample free of disclinations, by using either field8 or surface alignment9 methods. Here we are concerned
368

with the creation of disclinations in such disclination-free samples with imposition of a
shearing flow.
It is generally believed that the presence of disclinations modifies a material's
rheological behavior10, particularly the elasticity (storage modulus, normal stress
differences, etc.) but also the viscosity (region I behavior). The mechanism by which these
material properties are affected by disclinations or the presence of texture is largely
unknown. One possibility is that the Frank elasticity associated with director curvature
may become significant relative to molecular elasticity when the density of disclinations is
large. Alternatively, the role of disclinations in LCP rheology may be through the
macroscopic director randomization they cause.11-12 This would cause the macroscopic
properties to be an average over a length scale much larger than the average distance
between disclinations. While some theoretical support exists for the former13, parallel
superposition experiments14 suggest support for the latter. In addition to the rheological
motivation for studying disclinations under flow, the expected influence of defects trapped
in solid polymeric liquid crystals on mechanical behavior provides still further motivation.
The "threaded" texture has been observed for many years in flowing liquid crystals, but
a satisfactory understanding of their production has remained elusive. One school of
thought is that nematics of the tumbling type should be candidates for disclination
production10 because of their propensity for various flow instabilities15. Indeed, optical
observations during shearing flow of tumbling nematics have shown production of
disclinations2'16. Here, tumbling refers to the rotation of the average molecular orientation
with time due to a non-vanishing viscous torque density. Materials for which the viscous
torque density does vanish for a particular director orientation are called flow aligning.
Most small-molecule liquid crystals are of this type. In fact, shear flow of a flow aligning
nematic, MBB A, has also been shown to produce disclinations1. It is therefore unclear
whether or not there is a connection between the tumbling phenomenon and disclination
production.
While it is straightforward to determine which shear flow class {tumbling vs. flow
aligning) a particular small molecule nematic belongs to, only a few polymers have been
classified in this way. Most small-molecule liquid crystals aieflow aligning; however, it is
beginning to appear that many polymeric liquid crystals are tumbling. For rod-like liquid
crystals (as opposed to disk-like), the classification is reduced to the determination of the
sign of one of the Leslie parameters, (X3. The principal reason that few polymeric liquid
crystals have been classified in terms of their flow type is that planar alignment is much
more difficult to achieve due to their typically high viscosity.
369

The goal of this research is to determine the correlation between tumbling and
disclination production in shear flow by comparing the shear flow behavior of small-
molecule nematics possessing similar chemical structure, but of differing sign of 03. As a
framework for their comparison, we monitor the director orientation qualitatively using polarizing microscopy and measure the density of disclinations (projected length/area)
present in each material under varying flow conditions.
H. Experimental Method
Materials
5CB and 8CB (4,4-n-pentylcyanobiphenyl and4,4'-n-octalcyanobiphenyl) were
purchased from BDH and used as received. The optical17, elastic18-19, and viscous20'21
properties have been measured as functions of temperature. 5CB has the phase sequence:
k 22.4°C n 34.5°C i, while 8CB has an additional smectic-A phase: k 20.5°C a 33.3°C n
40.1°C i. The existence of the smectic phase in 8CB is believed to affect the dynamics of
the nematic phase through the renormalization of one of the Leslie viscosities22*23.
Flow Cell
We have constructed a torsional shear cell, shown schematically in figure 1, which
is mounted in a thermostated environment and enables optical observations using
conventional light microscopy24. The bottom disk is fixed to a rotational bearing table
using a retaining ring and the table is connected to a DC servo motor rotating in a
controlled steady mode using feedback from the motor tachometer. The top plate is
separated from the bottom disk and made parallel by manipulation with a kinetic mount
consisting of three micrometers, each with .5 \im resolution, configured as a tripod.
Parallelism is obtained by zeroing the micrometers of the tripod with the top and bottom
plate in intimate contact. The cell is filled by lifting the top plate/tripod jig, pouring a
predetermined quantity of liquid crystal in the middle of the bottom disk, and replacing the
top plate. The sample thickness is then adjusted, if necessary, until the liquid crystal
meniscus meets the disk edge.
The temperature of the samples is controlled using foil heaters (aluminum on
Kapton™) above and below the cell, each with a radial slot for optical access. Power to
the heaters (Lambda LLS6018) is regulated using PID control (Eurotherm 808) with J-
type thermocouple sensing. A guard heater is placed at the cell periphery to prevent heat
loss at the edge. This guard heater consists of water circulated from a thermostated bath
(Fisher 9000) through copper tubing embedded in an aluminum ring. Temperature
370

uniformity is confirmed by checking that the nematic/isotropic transition occurs
throughout the cell with a .1 °C temperature jump. The actual temperature is also
calibrated with this transition.
Each disk is optically flat (<X/4) and approximately 43 mm in diameter. The disk
surfaces are treated to obtain homeotropic alignment using the standard method of lecithin
deposition9. The disks is secured to its aluminum mounting using simple retaining springs
which apply force on the beveled edge of the disk.
Optical Microscopy
Optical observations are made with a modified NIKON polarizing microscope.
Flowing samples can be observed along the radial heater slits which extend from the cell
center to the edge. The optical components were mounted on a single-axis translation
stage. Focusing is achieved through manipulation of the optics above the sample, rather
than the sample itself, using a modular focus mount (NIKON). Video imaging is achieved
using a CCD camera (Sony CCD Iris) connected to a monitor (Sony GVM1300), VCR
(JVC BR-3200U), and frame grabber (Matrox MVP-AT). The flow cell was designed to
allow integration with the translating microscope. Samples were illuminated with light
from a tungsten source which is polarized.
To measure disclination density, light was polarized normal to the shear plane.
With this polarization state, disclinations of both "thick" and "thin" types appear optically
similar. Our method of disclination density measurement relies on the intensity contrast
between the disclination lines and the background nematic fluid. The aperture below the
condensing lens was adjusted to maximize this contrast. The illuminated sample is viewed
with a low power objective lens (5x or lOx) and no analyzer is used.
Image Processing
Threaded images are analyzed to determine the line length per unit viewing area.
The observed length is the sum through the objective depth of focus of all length in the
viewing area as projected on a horizontal plane. To compute this length a simple image
processing algorithm, described next, is implemented. 8-bit raw images are converted to 1-
bit, or binary, using an intensity threshold selected so as to separate the dark disclination
lines from the brighter background. Binary images are next dilated, to correct for
imperfect threshold selection, and finally thinned such that the remaining image consists
solely of lines one pixel wide. This thinned image is used to calculate the disclination line
length. By measuring the viewing area and the length/pixel using a calibration slide
(NIKON Objective Micrometer), the length/area can be computed. To obtain statistically
371
meaningful disclination densities, we have found that many images from samples under
identical conditions must be made and averaged. In all of our experiments, the depth of
focus is large enough to observe all of the disclinations present through the gap.
Experiments
Our experimental goals include answering the following: (1) Why do disclinations
form in shear flow? (2) What controls the density of disclinations? and (3) How do the
answers to (1) and (2) differ for flow-aligning and tumbling nematics. A motivating
observation is found in the work of Wahl and Fischer25, where it was observed that after
prolonged shear of MBB A, disclinations were produced. As mentioned previously, the
intrinsic stability of this material in shear flow makes this observation of shear-flow-
induced disclinations puzzling.
Investigating the origin of disclination production necessarily involves "scouting"
experiments which are qualitative in nature. For this purpose, we employ the methods of
rheological microscopy in which we visualize director dynamics under shear flow using
optical microscopy. Because disclinations have been found to appear upon increasing the
applied shear rate or Er, we monitor the samples in torsional shear flow under conditions
of increasing rotation speed. Various optical configurations are used and will be explained
as the results are described.
To answer the question of what controls the density of disclinations, we have
measured the disclination density, as described above, under a wide range of conditions.
We also make qualitative observations, using microscopy, of the mechanisms by which the
disclination density changes. In this manuscript, we focus solely on the disclination density
measurements.
372

TTT. Results and Discussion
5CB The creation of disclinations in 5CB features interesting hysteresis behavior. When
the rotation speed is ramped "slowly" from rest, disclinations do not appear until a critical
rotation speed (for a given gap thickness) is reached. Once this critical condition is met,
disclinations appear in large quantities, first near the cell edge, then quickly spreading
radially throughout the cell. The fact that the cell fills radially with disclinations indicates
that there is hysteresis, in that shear rates lower than the critical shear rate (edge shear rate
at the transition) support disclinations. Further increase of the rotation speed gradually
increases the disclinations at each radial position. When the rotation speed is decreased,
the disclination density decreases, as expected, but significant numbers of disclinations
remain even below the threshold observed during the previous ramp. Shown in figure 2
are disclination density measurements, pA=length/area, for increasing (•) and decreasing (
O) shear rate, viewed near the cell edge (r=16.75 mm) showing the dramatic level of
hysteresis present If the step-size of the rotation speed (A9) used in the ramp is increased, the critical
shear rate for disclination creation is decreased as shown in the inset to figure 2. This
indicates that the instability is affected by the amplitude of noise (transient director
response to a step in shear rate) present The effect of noise was not investigated further,
but a systematic study would likely consist of superposition of random noise of varying
amplitude on the motor control signal and observing the dependence of the transition point
on the relative amplitude of the noise. At this point, the meaning of the observed quantity, pA, requires some discussion.
The length of disclination lines, L, observed using a given objective lens with a depth-of-
focus, dp includes the contour length of disclinations within the field of view, projected on
a horizontal (velocity-vorticity) plane, and summed over the depth of focus. Twojregimes
of interpretation exist with respect to the relative magnitude of df and the width, X, of the
disclination density distribution across the gap. For d^cX, the observed length, L, can be
interpreted as the volumetric disclination density, pv, calculated as U(Adf), where L is the
observed length and A is the field of view. For dp>X, pv is unknown unless an additional
measurement of X is made. In this case, only pA= L/A, here termed the area-based
disclination density, is reported. In the instances that the relative magnitudes of dj and X
are unknown as in figure 2, it is appropriate to report pA with the understanding that the
quantity may be modified if further measurements indicated that d^<X. The disclination
density data reported below was taken using a 5x objective lens for which df was
measured to be 760±10|im, when used without condensed sample illumination. Therefore,
373

since all of our sample thicknesses were smaller than this, h<o\, all measurements made with this lens yield the area-based disclination density, pA. Later, we will report
measurements of the distribution of disclination density across the gap which utilize the
20x objective lens, enabling measurement of pv with vertical resolution.
We now present the results of a systematic investigation of the dependence of disclination density on shear rate and radial position. Shear rate sweeps during which pA is
measured yield curves which depend on the radial position in the cell. To gather data in this form, the observation radius is swept for a range of rotation speeds. This procedure was used to rninimize long settling times which are necessary due to a long response time of disclination density to a change in shear rate. The dependence of pA on radial position
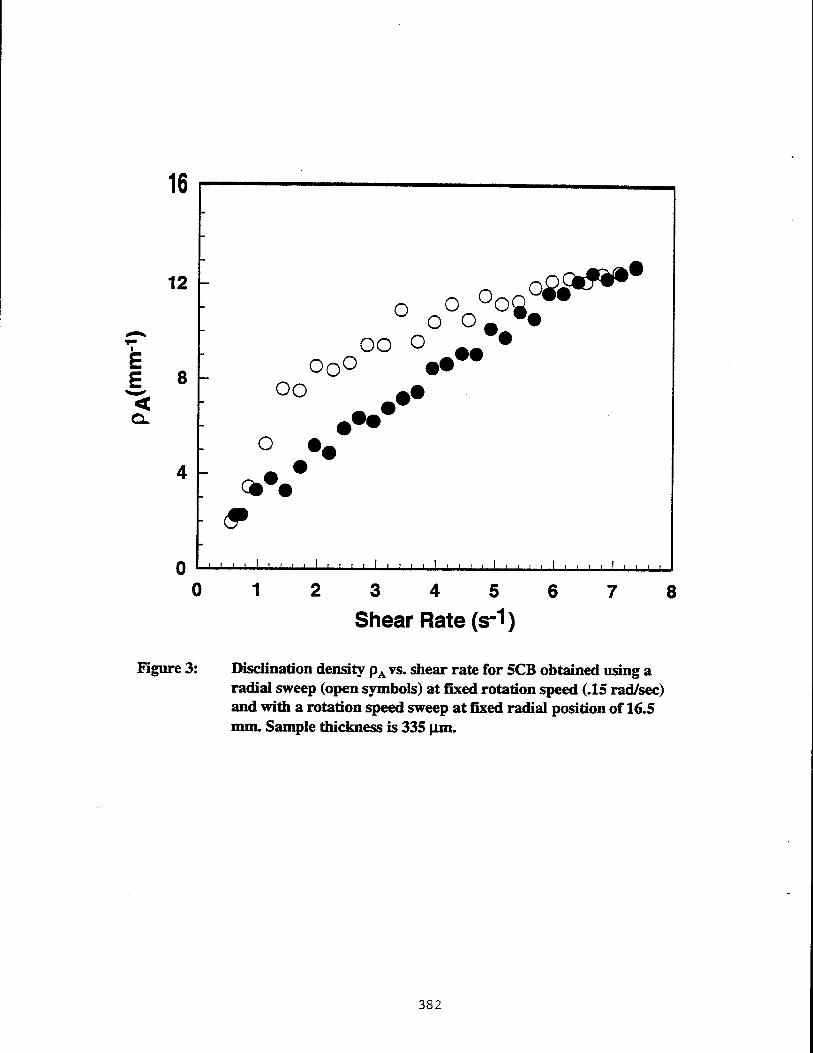
suggests that curvature effects are important An example plot showing a manifestation of the radial dependence of disclination
density is shown in figure 3. Here, pA is plotted versus shear rate where the data was
obtained using a radial sweep (open symbols) at a fixed rotation speed 0 =.15 rad/sec and rotation rate sweep (filled symbols) at a fixed radius of 16.5 mm. The disclination density is larger at smaller radial positions than would be expected based on shear rate alone. The effects of shear rate, radius, and gap thickness on disclination density are reflected in the an empirical relationship which we now develop. It is first necessary to discuss the dimensional analysis of the problem. Several dimensional quantities in these experiments exist radial position (r), axial position (z), gap thickness (h), shear rate (y), and
disclination density (pA). From this set four dimensionless quantities can be constructed: f =r/h, z=z/h, Er=(Y1/K3)^i2, and pA=pAh. Here, Er represents the Ericksen number
which, in the usual sense, is a measure of the relative influence of hydrodynamic and elastic stresses. In defining Er, the choice of the material constants is somewhat arbitrary and we chose the twist viscosity (y1 =cc3 +|cc2|) and the bend elastic constant K3. The
bend elastic constant is used because deviations of the director from the homeotropic boundary conditions are met with resistance due to bend elastic torque. At any rate, all experiments were performed at a given temperature, 32.5 °C, where the material constants are fixed, so the appropriateness of our selection is not tested. Additionally, other choices would yield a (T|/K) ratio of the same order of magnitude.
Given this simple dimensional analysis, one expects the general relationship:
pA=f(Er,f). (1)
It is recalled that in the measurement of pA, the axial position, z, is effectively averaged
374

over and therefore z does not appear in equation 4.1. Finally, the dimensional analysis implies that plots of pA vs. Er should superpose for fixed f .
Data was gathered for a range of thicknesses, including 150,250,300, and 400 |im. An example scaled plot for r =30 appears in figures 4, where superposition of data for fixed f is obtained. Also, a power-law dependence (solid line) of pA on Er emerges
with the parameters of the power law containing the dependence of pA on r . Power law fits were performed on data from samples of four thicknesses: 150,
250,300 and 400 \im, and with r ranging from 14 to 117. With the power-law expressed
as,
pAh=a(r)Erß(?). (2)
The dependence of a (filled symbols) and ß (open symbols) on f is shown in figure 5.
From this figure, one can identify three regions within the torsional shear cell: (I) the inner region, r <20, within which disclination density is negligible, (II) a transition region 20<r <70, where the dependence of disclination density on r is greatest, and (HI) an outer or "local scaling" region, f >90, where disclination density depends only on Er. In the local scaling regime, region (HI), we find that a -> 7.5• 10-3, and ß -> 0.635.
8CB 8CB forms roll cells above a critical Ericksen number and disclinations are
nucleated from this roll cell structure. At a fixed Ericksen number above the threshold for roll cell formation, the density of disclinations increases with time, so much so that the phase grating caused by the roll cells is virtually unobservable. A further increase in Er leads to a marginal increase in disclination density. As with 5CB, the density of disclinations remains significant when Er is lowered past the threshold for their formation on increasing Er. Shown in figure 6 is an example of the hysteretic behavior of disclination density where pA is plotted as a function of shear rate for a 400 um sample. The large overshoot and undershoot observed following the threshold for disclination formation is accompanied by the observation that the transition occurs locally, at first,
with disclinations being created in large quantities within a narrow range of radial positions. As Er is further increased, the region of disclinations localized to a small range of radial positions suddenly spreads out to encompass most of the ceU. It is at this point that the disclination density suddenly drops significantly. Still further increase in Er, and passage of time, returns the measured disclination density to the steady state curve which
375

is measured for decreasing Er. The exact shape of the curve for increasing Er depends on the ramping rate, with the overshoot and undershoot being eliminated for very small ramping rates.
For 8CB, plots of disclination density, pA, versus applied shear rate, y, feature
curves which depend on the sample thickness, as shown in figure 7. In general the levels of disclination density in 8CB are larger than in the case of 5CB over a similar range of shear rate. In contrast with 5CB, however, data from various thicknesses and radial positions superpose when plotted as pAh vs. Er, indicating a lack of explicit dependence of disclination density on the radial position. Figure 8 show a plot of dimensionless disclination density, pAh, versus Er for several gap thicknesses (250[A], 300[0], 350[O], and 400[D] (im) along with region m 5CB data (V). Much information can be extracted
from this figure; however, the most striking feature is the contrast in magnitude of
disclination density between the two materials. The density of disclinations in 8CB is an order-of-magnitude higher than in 5CB.
For all thicknesses of 8CB studied, with the exception of 250 jim, we find a cross-
over in scaling behavior from a power-law exponent of 0.5 for Er<2000 to a larger value
tending toward 1.0 for Er>2000. We regard this cross-over in exponents as an indication that the behavior of disclinations in the shear flow of 8CB changes from 2-dimensional at low Er to 3-dimensional at high Er. This is peculiar, considering the large thicknesses of the samples and in light of the absence of an exponent cross-over for the smallest sample thickness, 250 Jim, which has an exponent near 1.0 for the full range of Er investigated. Consistent with this observation, however, is the dependence of the width of the disclination density distribution on Er. In figure 9 we plot the width of the distribution of disclinations (determined to be the width at 1/5 height) as a function of Er for 8CB samples of thickness 400(0) and 250(«) urn. We find that coincident with the cross-over from 2D to 3D behavior of the 400 urn sample is the occurrence of saturation of the distribution width. The 250 urn sample, on the other hand, possessed distribution widths comparable to those of the 400 |im sample for 3D behavior for Er values below the cross-
over. This is consistent with the observation that no 2D to 3D cross-over behavior is observed for this thickness. The relevance of the distribution width to the scaling dimensionality will be addressed in the section that follows.
Table 1 below summarizes the observed scaling behavior demonstrated in figure
4.0, from the formula pAh=a • Er^. The following section will attempt to explain the
observed scaling behavior within the framework of "Marrucci Scaling".
376

Table 1; Power-law parameters for 8CB and 5CB
a ß 8CB - 2D 0.149 0.5 8CB - 3D 3.24-10-3 1.0 5CB (free) 7.41103 0.635 5CB (fixed) 2.1410-2 05
Scaling Behavior We now check for agreement between our disclination density data and "Marrucci
scaling"26, in which it is assumed that there exists a limiting value of the texture-based Ericksen number, Er^ -7a2 —Er^, which should be considered a material property.
Here, Ertex is a measure of the ratio of hydrodynamic stresses to elastic stresses from Frank elasticity due to the presence of "texture" characterized by a length scale, a. As described by Burghardt and Fuller27, nematics may respond to any attempt to raise the local (textural) Ericksen number through increased shear stress by decreasing the characteristic length scale by creating defects. The parameter varied in the experiments is Er , which uses the cell thickness as the length scale. The two Ericksen numbers are
related, h2
E^x --5-=EW (3) a.
One can define a two-dimensional texture length scale a® = l/pA, which could be
interpreted as the lateral spacing between disclination cores, leading to:
Er^pJ^Er^,, (4)
where pA =pAh. This 2D version of Marrucci scaling then predicts:
PA=#**/Er^. (5)
This gives a slightly weaker Ergap dependence compared with our findings in the local scaling limit of 5CB where and exponent of 0.635 was found, but shows good agreement with the 8CB data for Er<2,000. In both cases we can calculate Ertex from a (=Er^/2),
fixing ß at .5 for the 5CB case. Doing this, we find Ertex~2,200 for 5CB, while for 8CB
377

Ertex~50. The latter is in agreement with the numerical simulation study of Burghardt and Fuller27 on transient flow of tumbling nematics.
In an analogous fashion, one can define a 3-dimensional texture length scale such
that pv=y(a(3)) , recalling that pv is the volumetric disclination density. The right-hand
side of this expression may be interpreted as the number of disclination cores per unit area of the gradient-vorticity plane. In the limit of large Er, we expect the disclinations to fill the gap such that pv =pA/h. In this limit, our definition of a<3> reads pA =h/(a(3))2,
leading to the prediction,
PA =~TL- (6)
This agrees with our 8CB data for Er>2000, and for the entire Er range for the 250 Jim
8CB sample. We note that a scaling exponent of 1.0 is also predicted for the case where the disclinations do not completely fill the gap, but fill a fraction of the gap, X = m • h,
where X, is the width of the distribution and m<l. For the simple case of a uniform distribution, pv =pA/mh, and we find the prediction
Er pA=m.-^. (7)
We have observed that the distribution of disclinations across the gap for both materials is approximately Gaussian with a width-at-half-height, in the case of 3D 8CB, of 0.333-h. Finally, we find from the 3D 8CB data that Erttx~100.
Inspection of the raw pA measurements indicates a range 5<pA<35 mm-1
corresponding to an average spacing between projected disclinations (1^,) in the range 25-djjp^OO |im. In an order of magnitude sense, one can estimate the vertical spacing (X,) and lateral spacing QJ between neighboring disclinations. lh is estimated to be 1^,, from 25 to 200 pm, while lv is on the order of 50-60 \im (^WHH^)- Therefore, the nearest-
neighbor core-core interactions are roughly isotropic. However, since core-core interactions are long ranged (F-d-1), an assessment of the total forces that a test disclination line feels must account for many-body interactions. Although a given disclination feels an isotropic force field from its nearest neighbors, the total force it feels may be highly anisotropic due to the planar contribution from the pseudo-infinite flat sea of other disclinations. Here we have neglected hydrodynamic forces.
378

In the limit of very large anisotropy, 2D behavior is expected. For 5CB we argue
that for the range 500<Er<5000, disclinations feel forces which are highly anisotropic,
being larger horizontally than vertically. Because we detect a cross-over from 2D to 3D
scaling in 8CB samples (except for 250 |im) on increasing Er, the increasing disclination
density itself may be the cause of the cross-over. At very low Er, disclinations are
localized at the sample mid-plane due to the symmetry of the image forces from the
bounding disks. As the disclination density is increased with increased Er, the disclinations
pack near the mid-plane until the density become large enough that the disclinations begin
to pile-up about the mid-plane. If the disclinations pile up to an extent equal or larger to
the screening length of the core-core interaction forces, then the force on a test
disclination is rendered isotropic and 3D scaling is expected.
IV. Concluding Remarks Our experiments revealed some important aspects of disclination production in
sheared nematics, including,
(1) Observation of disclinations in a nematic liquid crystal cannot be used to classify the material as a tumbling liquid crystal,
(2) Shear flow creates roughly ten times the density of disclinations in 8CB in comparison to 5CB, and
(3) The scaling of disclination density with Ericksen number under goes a transition from 2D to 3D under certain conditions.
Future work in this area will focus on the creation of disclinations in polymeric
liquid crystals (PLC's).
379

|> am 4 3 ■■ m II—i
v ,©
D. *
ss o « e ©" e « a 12 s S g. s © 5 £ © u 11 it Si g» *
•55 1 8 >»
5 'S S ° 2 &• E s-,
If si ^*
•> s
3 o es s b c
S « °" % a £
£ £
g*2
at
M ST «* > S
- 5 e £*2 « i| Si
tn « £ es >» u
C
* 'S b. es
73 oi
S- «■> -'
en a
_ „ S 2* 2 C Oft«
£ s J5 ** Ä^2 8^2 'S Ä 08
a» 68 ■»
si* S a ~ •a § £ a '—' 08 •5 «I C u Ä ^ 08 « w S «JS es «S as «'S T5 = iS >- es ^»\ z t. e> S* «5 ~ ©
S-'S •=
s 08
380

15
£ E
12
12 - u
1 ' '
0.0005 A9
0.001
O CD aft*£ g«
<2 6
a»
^Q^ Ad o
- ® CD ^
J—L.
12 14 16
Figure 2:
2 4 6 8 10
Shear Rate (s-1) Hysterisis of scaled area-based disclination density in 5CB for h=250 \un. Closed symbols are for rising shear rate and open symbols are for decreasing shear rate.
381
16
12
£ E 8
O O °OQ 02&***
oo o o0° ••
oo ,•
o
c*%
0 ' ' ■ ■ ' [ ■ ' ' ' ' ' ' ' ' ' ' ' ' ' * ' ' ' ' ' ' ' ' ' ' ' ' ' ' ' '
2 3 4 5 6 Shear Rate (s-1)
8
Figure 3: Disclination density pA vs. shear rate for 5CB obtained using a radial sweep (open symbols) at fixed rotation speed (.15 rad/sec) and with a rotation speed sweep at fixed radial position of 16.5 mm. Sample thickness is 335 \im.
382

< Q.
1,000 10,000
Er gap Figure 4: Dimensionless disclination density pAh vs. Ergap for 5CB at
32.5 °C and r =30 for gap thicknesses of 250 ^m (O), 300 um (•), and 400 \im (0). The solid line represents a power law fit to the 400 (im data.
383

0.015
0.010 - A
0.005 -
0.000
• ▼
▼ ▼
i i i r I i i ii
' 8 DO n
H V V _v v V
11 11 I I ■ I I I I I 11 I I I I ■■ 11 I I- ■ 11 I ■ I I 11 I I I ■ 11 I I I I I ■■ I
1.50
1.25
1.00 co.
0.75
0.50 0 10 20 30 40 50 60 70 80 90 100 110 120
r/h
Figure 5: Pre-exponential factor, a (filled symbols), and exponent, ß (open symbols), vs. f =r/h for 150 fim (V), 250 um (O), 300 um (•), and 400 \un (A).
384

1000 2000 3000 4000
Ericksen Number
5000
Figure 6: Hysterias of area-based disdination density for h=400 Jim. Closed symbols are for rising Er and open symbols are for decreasing Er.
385

100
50
20
E 1° <
Q.
2 -
<Pc*> iu*§ ^ d>A A A
A A*
D A A\ A A
0.5 1.0 2.0
Shear Rate (s'1)
5.0
Figure 7: Raw plot of disdination density versus shear rate for three sample thicknesses h=250 \im(A), 300 \im(0), 350 |im(O),400 nm(D).
386

20.0
10.0
5.0
< 2.0 CL
-Er1
-Er0-5
C.0.635
□ *>
O0OJ
9- O
Figure 8: Dimensionless disclination density vs. gap Ericksen number for three sample thicknesses h= 250(A), 300(0), 350(0), and 400 (D) jim. The solid line represents a best fit of the data (except 250 fim) with the exponent fixed at 1/2 (2D scaling) while the single dashed line is the best fit the exponent fixed at 1 (3D scaling). Also shown are the results for 5CB in the local-scaling limit (r/h=117) for comparison.
387

1.00
0.75
\t< 0.50
0.25
0.00
' 400 (im
-i i i i i i i i i '''''''''''
1000 1500 2000 2500 3000 3500
Er
Figure 9 Dependence of X, the average thickness of the disclination- containing slab, on Ericksen number.
388
References
1 DJ. Graziano and MJR. Mackley, "Disclinations Observed During the Shear of MBB A", Mol. Cryst Liq. Cryst, 1984, vl06,103-119.
2 P.E. Cladis, S. Torza, "Flow Instabilities in Couette Flow in Nematic Liquid Crystals", Colloid and Interface Science, 1976, v4,487-499.
3 D. Demus and L. Richter, Textures of Liquid Crystals", Verlag Chemie, New York, 1978
4 J. Nehring, "Calculation of the Structure and Energy of Nematic Threads", Phys. Rev. A, v7, n5,1973,1737-1748.
5 P.G. DeGennes, The Phvsics of Liquid Crystals. 1985.
6 M. Kleman, "Defects in Liquid Crystals", Rep. Prog. Phys., 1989, v52,555-654.
7 A. Saupe, "Disclinations and Properties of the Directorfield in Nematic and Cholesteric Liquid Crystals", Mol. Cryst Liq. Cryst., 1973, v21,211-238.
8 M. Srinivasarao, PhD Dissertation, Carnegie Mellon University, 1990.
9 J. Cognard, "Alignment of Nematic Liquid Crystals and Their Mixtures," Mol. Cryst Liq. Cryst, Suppl.1,1985.
10 G. Marrucci and F. Greco, "Flow Behavior of Liquid Crystalline Polymers", Adv. Chem. Phys., v86,1993, Wiley.
11 R.G. Larson, M. Doi, "Mesoscopic Domain Theory for Textured Liquid Crystalline Polymers", J. ofRheology, 1991, v35, n4,539-563.
12 G. Marrucci and P.L. Maffetone, "Nematic Phase of Rodlike Polymers. IL Polydomain Predictions in the Tumbling Regime," J. Rheol, 1990, v34, n8,1231- 1244.
13 W.R. Burghardt, "Oscillatory Shear How of Nematic Liquid Crystals", Journal of Rheology, 1991, v35, nl, 49-62.
14 P. Moldenaers, J. Mewis, "On the nature of viscoelasticity in polymeric liquid crystals", Jo. Rheology, 1993, v37, n2,367-380.
15 E. Dubois-Violette, G. DurancLE. GuyonJP. Manneville, P. Pieranski, "Instabilities in Nematic Liquid Crystals", Solid State Physics Suppl. 14,1978,147-208.
389

16 C. Gähwiller, "Temperature Dependence of Flow Alignment in Nematic Liquid Crystals", Phys. Rev. Letters, 12 June 1972, v28, n24,1554-1556.
17 P.P. Karat and N.V. Madhusudana, "Elastic and Optical Properties of Some 4'-n- AJkyl-4-Cyanobiphenyls", Mol Cryst Liq. Cryst., v36,1976,51-64.
18 P.P. Karat and N.V. Madhusudana, "Elastic and Orientational Order in Some 4'-n- Alkyl-4-Cyanobiphenyls: Part II", Mol Cryst. Liq. Cryst., v40,1977,239-245.
19 S. Morris, P. Palffy-Muhory, D.A. Balzarini, "Measurements of the Bend and Splay Elastic Constants of Octyl-Cyanobiphenyl", Mol. Cryst Liq. Cryst., vl39,1986, 263-280.
20 H. Kneppe, F. Schneider, N.K. Sharma, "Rotational Viscosity Ji of Nematic Liquid Crystals", J. Chem. Phys., v77, n6,1982,3203-3208.
21 H. Herba, A. Szymanski, A. Dnymala, "Experimental Test of Hydrodynamic Theories for Nematic Liquid Crystals", Mol. Cryst Liq. Cryst, vl27,1985,153- 158.
22 C.R. Safinya, E.B. Sirota, RJ. Piano, "Nematic to Smectic-A Phase Transition under Shear Flow: A Nonequilibrium Synchrotron X-Ray Study", Physical Review Letters, 15 April 1991, v66, nl5,1986-1989.
23 R.F. Bruinsma, C.R. Safinya, "Landau Theory of the Nematic Smectic-A Phase Transition under Shear How," Phys. Rev. A, 1991, v43, nlO, 5377-5404.
24 P.T. Mather and D.S. Pearson, manuscript in preparation.
25 J. Wahl, F. Fischer, "Elastic and Viscosity Constants of Nematic Liquid Crystals from a New Optical Method", Mol. Cryst. Liq. Cryst, 1973, v22, 359-373.
26 Manned, G., "Rheology of Liquid Crystalline Polymers," Pure Appl. Chem., 1985, v57, 1545-1552.
27 W.R. Burghardt, G.G. Fuller, "Transient Shear Flow of Nematic Liquid Crystals: Manifestations of Director Tumbling", Journal of Rheology, 1990, v34, n6,959- 992.
390

WILEY ORGANICS AND
ORGANIC TECHNOLOGIES
CONTENTS
HISTORY
TECHNOLOGY AND SERVICES
391

HISTORY
FROM OHIO STATE UNIVERSITY TO CHEMICAL SAMPLES COMPANY
Wiley Organics has a unique background in the manufacture of organic research and development compounds. In 1951, Vincent G. Wiley joined the American Petroleum Institute's project at Ohio State University, then directed by Dr. Kenneth W. Greenlee. The project was sponsored by the American Petroleum Institute for the purpose of producing pure hydrocarbons in order to gain a better understanding of the relationship between molecular structure and fuel octane numbers. Over the life of the project, from 1938 to 1963, over 350 pure hydrocarbons were synthesized for the engine testing program and for the standard samples program at Carnegie Technical Institute, in conjuction with the National Bureau of Standards for the certification of pure hydrocarbons. In 1962, the hydrocarbon lab was moved to Oklahoma State University. Since neither Ken Greenlee or Vincent Wiley were interested in moving to Oklahoma, and since they believed the market would support a private enterprise, they founded Chemical Samples Company. They built new research and development laboratories for the manufacture of hydrocarbons and related compounds in 1963. By 1969, Chemical Samples Company had published a catalog listing of over 1800 research chemicals and their molecular structures. Chem-SampCo pioneered in the market by certifying the purity and identity of almost all of the 1800 research chemicals which they manufactured and sold. They quickly gained international recognition as the world's largest supplier of pure hydrocarbons, supplying the petroleum industry with analytical standards for the identification of petroleum components.
392
CHEM SAMP-CO'S EXPERIENCE MAKING PHEROMONES
Because of years of experience in manufacturing of specific complex molecules requiring multiple-step synthesis, Chemical Samples Company had required the expertise necessary for the production of commercial quantities of pheromones, the sex attractant compounds critical to the mating process of insects. ChemSampCo was the first company to successfully scale-up the manufacture of these complex compounds.
CHEMSAMPCO IS SOLD TO ALBANY INTERNATIONAL
ChemSampCo became a world leader in the production of pheromones by 1978. They were instrumental in supplying pheromones for the control of the Pink Boll worm cotton pest in Arizona and California. Potential foreign markets also included those in Egypt, Brazil and Israel. Albany International was ChemSampCo's largest customer and they were committing millions of dollars to the development of new feild application systems each year for many different insect pests. Albany International felt they would strengthen their market postion by the purchase of ChemSampCo. This purchase was completed in 1978, at which time Albany International was projecting a very rapid expansion of the pheromone technology throughout the world. These projections required a large expansion of the chemical production facilities.
NEW ALBANY INTERNATIONAL PRODUCTION PLANT IS BUILT
A new S10 million facility was built on the west side of Columbus, Ohio specifically for the manufacture of pheromones. The plant was designed and built under the direction of Vincent G. Wiley, as general manager, And David B. Wiley, as project manager. David went on to become plant manager. The plant was operational in late 1979, and successfully began manufacturing commerial quantities of several pheromones.
393

WILEY FAMILY BUYS BACK RESEARCH CHEMICALS BUSINESS
In 1980, Albany International made a decision to sell the research
organics business to the Wileys. Subsequently, the Wileys left and started Wiley Organics with the catalog inventory, small scale synthesis and distillation equipment, and experience. In July, 1981, Wiley Organics leased a 13,000 square foot warehouse and moved in over 30,000 bottles, cans, and drums of the valuable organic inventory used to support the fine chemicals business. The largest production equipment, at that time, had only 25 gallons capacity. By 1985, Wiley Organics had increased its production capacity^ 00, 300, 800, and 1800 gallon production vessels, with associated purification/distillation columns up tp 1800 gallon batch capacity.
NEW PLANTS IN COSHOCTON AND NEWARK PURCHASED
As demand for Wiley Organic's services and products grew, an intensive search for a larger plant facility was begun. In the fall of 1986 a 50,000 square foot facility was located in Coshocton, Ohio. Refurbishment of the plant was begun in February 1987 and in June the first distillation column was brought on stream. By the fall of 1987 reaction vessels of 2000 and 4000 gallons capacity had been put in place, in addition to reboilers of 1200, 2200, and 10,000 gallons feeding 40 to 50 foot, high efficiency, packed columns of up to 20" in diameter. In 1989 another facility was purchased in Newark, Ohio and brought on stream by a newly created division of the company, Organic Technologies. The Organic Technologies unit has focused on pharmaceutical and polymer intermediates as well as other custom synthesis and distillation work. Wiley Organics now has production capabilities for tonnage volumes of a number of specialty custom products. The larger facilities now available have allowed greater diversification and economies of scale to be realized. They also have allowed accelerated development of a number of proprietary products and processes along with greater capabilities for custom product development services for other major manufacturers.
394

TECHNOLOGY AND SERVICES
ORGANIC SYNTHESIS Wiley Organics has experience in the synthesis of over 1000 organic
compounds by various routes. This expertise makes the organization especially well suited for custom organic synthesis and process development. They are experts in Grignard-type reactions, as many of the hydrocarbons they manufacture start with one or more Grignard steps. In fact, the company may well have run more different Grignard reactions than virtually any other domestic company. They are experts in all types of liquid ammonia reactions, and perform oxidations, low pressure and high pressure hydrogenations, high temperature vapor-phase reactions, halogenations, and a variety of specific condensation reactions.
DISTILLATION AND PURIFICATION Over the years, Wiley Organics has developed an exceptional capability
in fractional distillation, routinely producing compounds of 99.9% purity from the lowest to the highest molecular weight hydrocarbons. Separations of compounds with boiling point differentials of only one degree Celsius are feasible. Pressure distillations as high as 65 psi, and vacuum distillations down to .01 mm are performed. Wiley Organics also frequently does custom distillation for customers who have been unable to purify a product by conventional means or who need a quntity not suited to the customers existing equipment. Their experience with azeotropic distillations and extractive distillations, enable them to achieve purification in difficult cases.
MONOMERS AND POLYMERS Wiley Organics has been synthesizing and developing purification processes for specialty monomers for about ten years. The company has participated collaboratively in the development of new liquid crystalline polymer (LCP) systems and/or monomers for the same. Currently, programs to supply developmental quantities of monomers for polyimides, high temperature thermosets are underway.
395

EQUIPMENT
Wiley Organics is proficient in the utilization, design, and installation of
practically all types of process equipment used in the chemical industry, including glass and stainless steel equipment with capacities up to 4,000 gallons, distillation equipment of all types including highly efficient 120+ theoretical plate columns, wiped film evaporators. Reaction vessels of up to 4000 gallons (15,000 liters) are currently operational.
CUSTOMERS
Wiley Organics' customers encompass nearly all major institutions involved in advanced chemical research and development; included would be virtually all the major universities with programs in advanced chemistry, all the major petroluem companies and those pharmaceutical and chemcial manufactures involved in basic research and product development relying on petroleum-based starting materials and intermediates. A large number of their catalog items are also supplied to the major domestic fine chemical resellers such as Aldrich Chemical Company, ICN-K&K Laboratories and Pfaltz & Bauer. Large foreign customers include Fluka, Jannsen and Tokyo-Kasai.
396

HYBRID SOUNDING ROCKET DEVELOPMENT AT THE UNITED STATES AIR FORCE ACADEMY
Capt. M. C. Lydon Capt. R. J. Simmons
United States Air Force Academy
Abstract
The United States Air Force Academy (USAFA) has developed a LOx-HTPB (Liquid Oxygen-Hydroxyl Terminated Polybutadiene) powered sounding rocket. USAFA has proven the use of hybrid rockets as a forgiving instrument to teach the fundamentals of aerospace system engineering at the undergraduate level. A rocket motor has been designed which will deliver 1000 lbs. of thrust for 10-15 seconds and power the vehicle to approximately 20,000 ft. The rocket will be recovered via parachute and system performance will be recorded with an onboard data acquisition system. The main subsystems have been tested successfully and a launch is expected this summer.
I Background
USAFA has been involved in hybrid research since 1989. During the last four years the Academy has developed the capability to fire 2.5 in diameter gaseous Oxygen powered hybrid rocket motors. In 1991 the Academy launched a small GOx-HTPB rocket designed by a systems engineering class offered by the Department of Astronautics. It was the first Department of Defense land-based hybrid rocket launch. During the two years that followed the successful first launch, a team of cadets and officers designed and built a larger and more powerful rocket, dubbed Chiron (see fig 1).
The overriding goal of the research effort is to give the students 'hands on' experience in design, test, integration and operation of an aerospace vehicle. A hybrid rocket was chosen as the research subject due to its inherent safety and the renewed interest shown by NASA and industry in the technology in recent years.
The research goals were also very broad, to fly a multi-port sounding rocket to an altitude of 30,000 ft and recover it safely. This paper will describe the rocket's sub-systems, design constraints and design choices that were made during the process. It will discuss the performance modeling and test results, and draw a conclusion as to the efficacy of this type of program in the undergraduate environment.
II. Propulsion
Chiron is powered by a three-port HTPB and liquid oxygen hybrid rocket motor (see fig 2). The motor is 6 inches in diameter and 42 inches long. It is designed with a two inch pre-combustion chamber and a four inch post-combustion chamber. To test a multi-port motor, three pie-shaped ports were designed with a Plexiglas web-stiffener in the walls between the ports.
The test motor cases were made of 6061 aluminum with 1/2" flanges welded on each end. The flight motor is constructed of stainless steel to minimize the possibility of motor case burn through. Insulation on the chamber walls is provided by unburned HTPB.
The motor was designed early in the program usingNetzer's model for hybrid combustion "\ The original model used was
r = aGox8 1.
where Gox = "V+ "Jfiiei a is an empirically A _, . .
determined regression constant and r is regression rate in inches per second, and A is the port cross sectional area.. Academy research with the 2.5 in motors, and recent industry experiments, indicate a more accurate model of hybrid regression rate is
r = aG-5 2.
where G=^L . An internal study using Eq. 2 as the A
model indicates the motor will produce approximately 1000 lbs of thrust for 15 seconds. This prediction will be verified in the next test.
The oxidizer feed system is a simple regulated blowdown system using helium (He) as a pressurant (see fig. 3). The helium is stored in a commercially available SCUBA tank at 3000 psi.
The system is activated by a solenoid valve below the He tank. Opening the valve allows the gas to pass to the regulator and then to the LOx tank. The regulator reduces the He pressure to approximately 900 psi.
397

The LOx tank is a welded 1/8" aluminum tank designed and built by Dave Crisalli of Rocketdyne. It holds 30 lbm of LOx, and is insulated with a water heater tank blanket.
He Tank
Solenoid
C ]) Ball Valve
LOx Tank
Burst Disk
Filter
Venturi/Injector
Fig. 3 Chiron LOx Feed System
Below the LOx tank fill port is the burst disk system. Burst disks were chosen over a solenoid valve due to simplicity, LOx compatibility and low cost. In retrospect, a valve would have been simpler and less expensive. Home made burst disks were used on a number of early system blowdown tests and were notorious for not bursting at a predictable pressure. Thus, commercial burst disks were acquired, at an exorbitant cost. Acquiring a LOx solenoid valve would have saved weeks of time and hundreds of dollars and will be a priority for next semester. Line pressure is isolated from the combustion chamber through the use of a cavitating venturi welded to the injector. The injector is a simple shower head non-impinging injector with a three clustered orifice pattern designed to inject an equal amount of LOx down each port. The injector is made of 302 stainless steel, has 27 orifices, each with a diameter of .0406 in and a vaporization length of 4.17% of the combustion chamber length.
The LOx feed system looks like the proverbial "camel designed by committee", because it was designed by three groups of students over four
semesters. The concession is that the parts are very inexpensive, readily available from any valve and fitting distributor or simple to build in the Academy machine shop.
Below the combustion chamber is a convergent-
divergent graphite nozzle coated with silicon- carbide. The nozzle was designed using an axisymetric method of characteristics computer model to design a bell-shaped nozzle set for perfect expansion at 16,500 ft.
III. Structure
The rocket structure is composed of six separate load bearing shroud segments. These segments house the combustion chamber, liquid oxygen tank, gaseous helium tank, data collection, main chute, and drogue chute (see fig 1). The structure was designed to bear the launch, flight, and recovery loads predicted by computer modeling, while having a minimum safety factor of 1.50. The inner diameter of the vehicle, 8.25 inches, was selected to house the largest tank.
Two structural loads are experienced during powered flight. The first is an axial load of approximately 1,000 Ibf created by vehicle thrust. This load is the smaller of the flight loads and did not size any of the structural members. The next design load is created by a five degree side slip angle at maximum dynamic pressure. Max Q occurs at 1,100 ft/s at 10,000 ft MSL; this creates a load of roughly 1,250 lbf on each fin. This load condition required that both the fins and the combustion chamber shroud be 0.19 inches in thickness to avoid shroud failure and tear through of bolts.
The final design loads are experienced during the opening of the drogue and main chutes. Since little was known about the opening sequence when the skin was designed, a maximum of 10 g's was assumed for the opening of both chutes. Since the rocket is stable, deployment of the drogue after apogee will cause the vehicle to transition from a nose down to a nose up attitude. This considerable bending moment required the remainder of the shroud segments to be 0.10 inches thick. Main chute deployment was assumed to create a purely axial load.
The construction material was selected to minimize total vehicle weight. Several different materials were investigated including various aluminums, steels, and super alloys. Calculating the skin thickness to bear the required loads is an iterative process. First, a skin thickness is guessed; the vehicle weight and center of gravity are
398

calculated. With this information, chute opening loads, moments, and the necessary skin thickness can then be determined. This process continues until the skin thickness converges to the minimum required.
Of the materials investigated, Al 7075-T6 was selected for a low overall vehicle weight and availability at reasonable prices. It should be noted that very few seamless tubes greater than six inches in outer diameter can be purchased in any metal without paying sizable die fees. Therefore, the vehicle is made of rolled sheet aluminum with a bolted seam.
A semi-monocoque structure was selected to minimize fabrication complexity and maintain a reasonable weight. In this design, nine bulkheads and five shroud connections are placed throughout the 20.5 ft length to minimize buckling of the skin.
A finite element analysis of the vehicle was accomplished to determine the load at which the structure buckled and calculate stress concentrations that the initial static analysis could not predict. The finite element analysis determined that a load of 2350 lbf applied perpendicular to the centerline at the base of the nose cone would buckle the vehicle. This equates to approximately 7.6 g's of drogue opening shock, so the opening sequence was modified accordingly. The rocket is predicted to fail at approximately 50,000 lbf of axial load, which is well above any expected flight loads.
Two ports are located in the structure; one in each tank shroud section. These ports allow for final plumbing assembly, oxygen tank charging, and oxygen bleed immediately prior to launch. Each port interface is non-sparking to minimize fire hazard once the oxygen tank is charged.
To minimize the vehicle deadweight, lighter materials will be used to build a larger next generation rocket with composite tanks, body, and combustion chamber. A goal of the next class will be to reduce the deadweight fraction to 25%.
IV. Recovery
The recovery system is designed to return the rocket to earth within a defined landing area and without any significant system damage. These two basic requirements and the need to have a reliable, repeatable system drove the design of the current two stage recovery system.
The design began by attempting to make a one-stage recovery system (drogue and main deployed at the same altitude) satisfy the system constraints. Unfortunately, little information was
readily available on opening forces and terminal velocities for a variety of chutes, deployment sequences, altitudes, and vehicle weights. To find this information, a computer program was written based on the Pflanz method (2\ Parameters such as line stretch time and inflation time were better estimated with the aid of a master rigger at the Academy (3). The computer simulation for a five foot diameter, zero porosity, spherical drogue chute from an apogee of 27,000 ft MSL is tabulated below.
At(s) Alt. (ft) V,s (ft/s) G's 0.0 27000 105 0.7 6.7 26000 209 2.9 10.7 25000 303 6.2 13.6 24000 388 10.5
where: At = elapsed time since apogee Vls = velocity at line stretch
Table 1 Opening Shock as a Function of Time
This data shows that the rocket would fail if the chutes were deployed more than ten seconds after apogee. It was decided that at least the drogue chute would need to be deployed slightly after apogee with the aid of an apogee detection circuit (to be discussed later). Furthermore, the zero porosity drogue chute was modified with capped vent holes to decrease opening shock while maintaining the same decent rate.
A second computer simulation was created to determine the predicted landing footprint of the rocket under parachute. This code calculated the footprint of the vehicle accounting for two standard deviations in wind velocity, wind direction, flight path angle, and launch azimuth. The most valuable lesson learned from this code is the strong correlation between footprint size altitude at which the main was deployed. Figure 4 shows the footprint for a launch from Fort Carson, Co to a 27,000 foot apogee. This simulation accounts for standard winds in the month of June with two standard deviations on winds at various altitude blocks and +/- 2.0 degrees of azimuth and flight path angle. All altitudes are AGL.
This simulation vividly illustrates that a single stage recovery system is not acceptable because deployment of the main at apogee would require a range at least 16 mi. from east to west. Our impact rage is half that size so the main must be deployed below 15,000 ft AGL. An altitude of
399

10,000 fit AGL was selected for main deployment to provide adequate tracking time.
Finally, the main opening shock was investigated to determine if any damage is likely to occur to sensitive data collection systems. If main
deployment caused too high a load, the drogue could be increased in size to decrease its terminal velocity. However, increasing drogue size would increase drogue opening shock. Main opening was investigated at 500 ft increments for drogue chutes from 4 to 6 ft in diameter. Results for a 10,000 ft deployment are summarized in Table 2 .
Dia (ft) Vtd (ft/s) G's 4.0 188 8.1 5.0 150 5.3 5.5 137 4.5 6.0 125 3.8
where: V^ = terminal velocity, under drogue at 10,000 ft AGL.
Table 2 Main Opening with Various Drogues
The main chute opening shock is based on a standard C-9 opening sequence. Based on this data, the C-9 opening time was increased to eliminate possible chute damage; the current design has an opening shock of 3.5 g's for a five foot drogue. A five foot diameter drogue was selected for its reasonable loads from both drogue and main deployment.
The deployment of the two stage system begins at apogee. A commercially purchased apogee detector signals that static pressure is increasing and the drogue should be deployed. Logic within the system eliminates premature chute deployment from an increase in static pressure during supersonic flight. After apogee is determined, the nose cone is separated from the vehicle with a large spring compressed between two kick plates. The drogue chute is pulled from the nose cone then inflates. The rocket, with nose cone attached, falls until below 10,000 ft AGL. The spring and kicker plates return to Earth under their own chute.
At 10,000 ft an Automatic Activation Device (AAD) senses the corresponding barometric pressure and pulls the main chute release pin. The drogue chute then removes the main from the body tube and its storage bag. Once the main chute inflates, the nose cone and drogue chute will rest on the apex of the main. The vehicle will descend in this configuration until ground impact at a velocity of 21 ft/s.
To back up the apogee detector, a second AAD is in line with the drogue chute release pin. If the apogee detector fails to function properly, the AAD will be used to deploy the drogue 3,000 ft after apogee. This requires that the apogee prediction
model is run on the launch date with the most recent thrust and weight data as well as current atmospheric temperatures.
V. Test Results
The propulsion system test program used a building block approach to gear up for the flight configuration motor test. Three separate test phases were conducted over the course of the semester, including LOx feed system blowdown tests, shroud free motor fire and flight configuration motor fire.
All propulsion system tests were conducted on a test stand built by the Academy in an uninhabited area north of the campus. The test stand is 18 ft tall on a 4 ft by 8 ft concrete pad (see fig 5). The motor is vertically stacked and exhaust is diverted by a duct on to the splash pad. For the blowdown tests and the first two hot fire tests, the system was stacked without the shroud by bolting each tank assembly to the stand separately.
The blowdown tests were conducted using liquid nitrogen (LNi). LNi's properties are very similar to LOx but without the fire hazard of working with oxygen. In these test the LOx feed system was stacked on the test stand down to the injector (fig 5). Pressure data was taken in below the regulator and at the injector face. The blow down test goals were as follows: test the LOx feed system for leaks and cryogenic compatibility, gaining experience loading the tanks and using cryogenic materials and characterizing the ability of the blowdown system to provide the motor with the design oxidizer flow rate.
Due to various failures that cropped up, four separate blowdown tests were required. Lessons learned from the test series included: home made burst disks were not reliable for use in our system, the system was not mass flow limited in any of the fittings and provided 10 seconds of LNi and a He purge of about 4 seconds. One shortfall in the system design was that there was no accurate way of determining the fluid level in the tank. This problem was never solved and will be a priority for next semester.
The next phase of the test program was a motor test fire without the shroud (see fig 6). This was accomplished so as to not endanger the $10,000 shroud in a cataclysmic test failure, and to keep the test as simple as possible. The test goals were to
400

ignite the motor, verify the feed system performance and data acquisition system. Ignition was to be accomplished using three Thermalite ignitor wires in parallel. The LOx tank was to be partially filled for
a 4-5 second burn. The nozzle was another experiment in low cost
rocketry. Due to budget constraints, a single graphite nozzle was purchased. Concern about erosion over the three tests and a flight, and the nsk of using the $1000 chunk of graphite on the first test, inspired the milling of a laminated oak nozzle by the machinist at the Academy. Since the test set-up did not allow thrust data to be acquired, a high performance nozzle was not needed. It was believed the wood would ablate slowly enough to survive a
five second test fire. The difficulty of determining the LOx tank level
caused a change in plan. With frustration levels high, the decision was made to attempt the test by filling the tank to the top to make sure enough LOx was in the tank to give a valid test.
Pressure data for Test 1 is shown in fig 7. The engine burned for 17 seconds instead of the design 10 second. The nozzle throat ablated to the wall by 10 seconds, as can be seen in rapid decrease in combustion chamber pressure. Due to the longer than anticipated burn, the HTPB burned down to the aluminum and caused a combustion case burn- through (see fig 8). The large pressure spikes shown in the chart are assumed to be caused by transmission interference in the lines.
Though not a complete success, the test validated the design goals or gave enough data to effect a re-design. The motor exhibited smooth combustion with no bad startup transients. The thickness of the HTPB insulating fuel on the outer wall of the combustion ports and pre and post- combustion chambers was too thin. This was increased 1/2" on the chamber walls and approximately 1 " in the pre and post combustion chamber. The design chamber pressure of 300 psi was not achieved. A greater than anticipated pressure drop across the venturi/injector assembly is the suspected cause. The regulated pressure was stepped up to compensate. The inherent safety of hybrid rockets was shown by the burn through; when the LOx was depleted the fire went out, and no explosion occurred. The final lesson learned was that oak may make a nice table or a roaring fire, but shouldn't be used in a rocket nozzle.
Test 2 was configured similar to the first test except for a change in the ignitor wire configuration. Following a test failure due to the ignitors failing to light, a single wire configuration, stapled in a
circular pattern around the pre-combustion chamber
was adopted. Pressure data from test 2 is shown in fig 9. As
can be seen in the data, the major discrepancy is a two second delay in ignition. The ignitor was burning but did not light the HTPB. A series of ignitor wire configuration tests is planned to solve this problem. Another problem which occurred was the cracking of the graphite nozzle, the cause of the crack is being investigated. A third note is that again the oxidizer flow rate was lower than desired; a combustion chamber pressure of only 200 psi was achieved. Design changes to increase the chamber pressure are being investigated.
The recovery system was also extensively tested. The test series was performed as follows: 1. Pin-spring-pusher plate test. The pull force required to pull the pin out of the spring and fire the spring was quantified. 2 AAD-Pin-Spring tests. The AAD was wired into the system to test the capability of the AAD to pull
the pin 3 Parachute deployment test. The drogue/main parachute and bag assemblies were dropped from the academy UV-18 jump plane, to test the inflation rates and configuration of the parachutes Two recovery system tests are to be accomplished: 1 Apogee detector-AAD test. The Apogee detector will be wired to the AAD and put into a barometric chamber to test the detectors ability to activate the
AAD. 2. Recovery system drop test. The recovery system including AAD, drogue and main parachutes, and spring plate assembly will be dropped from the UV- 18 to test the entire recovery section.
The recovery system testing building block approach will give a high confidence that the system will work on the first launch.
V. Cost
For a program like Chiron, cost is one of the over riding design drivers. Normal DOD/NASA contractors such as Martin or General Dynamics have been bypassed in favor of smaller, more flexible contractors such as Dangerous Dave's Handmade Composite Stuff (nose cone), Vulcan Systems (motor) or Adept rocketry (apogee detector).
An interesting source for low cost rocketry component suppliers has been the Tripoli Rocketry Magazine Advertisements. The underground high powered amateur rocket builders have a suprising array of companies catering to their needs.
401

A summary of the major cost items is shown in Table 3. As can be seen, nearly half of the budget went into the custom built shroud. Finding a supplier of extruded 8 inch diameter tube was impossible for less than tens of thousands of dollars.
A more cost effective design method would have been to find a supplier of extruded aluminum at a given diameter and designing the tanks and plumbing around that constraint.
Part Cost
Shroud Sections $10,000 Graphite Nozzle $1000 7075-T6 Aluminum $2887 Nosecone $275 Test Pad $542 Fittings and Plumbing $1624 He Tank $360 LOx/LNi/He $1547 Burst Disks $512.8 Pour Motors $2350
Total Cost Spr 93 $25,079
References
1. Wetzer D.W., "Hybrid Rocket Internal Ballistics", National Technical Information Service,
Jan 1972, AD-754769
2. Knacke T.W., "Parachute Recovery Systems, Design Manual, Chapter 5", Defense Technical Information Center, AD-A183191, June 1987
3. Personal Conversation with Bill Wenger, 94th ATS, USAFA Parahute Training Squadron, Jan-May 1993
Table 3 Parts Cost Breakdown (Some parts not included in table)
Conclusions
The Chiron project has been a safe, effective and exciting method to teach students about the design and testing of an aerospace system. Over the past two years the students and faculty have developed the capability to design, test and fly small sounding rockets. The students have generated code and design techiques for such areas as propulsion, apogee predictions, parachute deployments and wind drift. A axisymetric nozzle design code was also written.
As a research project, the capability to flight test hybrid rockets, cheaply and with a quick turn around will be invaluable to the hybrid community. Small demonstrator rockets such as the Academy's will help prove the value and simplicity of the technology.
As with most experimental programs, Chiron is "over budget and over-weight". Unfortunately, the rocket size and weight is nearly 75 lbs over the predicted weight, this will impact the design goal of a 30,000+ ft apogee. The latest predicted apogee is between 15-20,000 ft. Even with the predicted shortfall, the Academy cadets have done an outstanding job, and on a shoe string budeget, to get this rocket in the air.
402

SH4: SH3: SH5: Flight Helium
Nosecone Recovery Data Tank
-O-r J..LL
Vital statistics
Vehicle Length: 17.62 ft *
" - Diameter: 8.5 in ". Weight: 260 lbs
Propulsion system Thrust: 1300 Ibf nominal Duration: 10 sec Fuel/Oxidizer: HTPB/LOx
Chamber Pressure: 260 PSI
SH2: LOX Tank
SH1: / Propulsion
T 20.000 " 36.000 13.000 35.100^ ' '48.250 i
. - .. ~211_46.
59.115
Fig 1 Chiron Sounding Rocket Overview
n
^v'\
V ^S^#" o
o
o
Fig 2 Motor Case Dimensions and Port Geometry
403

Lending Location
Fig 4 Landing Footprint as a Function of Main Deployment Altitude
<iSK&**^xw^<isi&8%$yi^'0f&&W$$
Fig 5 Test Stand Fig 6 Static Test Fire
404

0 -r
(Combustion Chamber Pressure
Ipnr
10 15
time (sec)
Fig 7 Static Test 1
20 25
Fig 8 Motor Case Bum Through
405

900
800
700
600
& 500 a a £ 400
300
200
100
I
■ \ Regulated Pressure \
.
. v
-
; / ^^-Injector Pressure
; /
i ^^ (Combustion Chamber Pressure x^ V'VU i
! ■' 1 ^"~~~7"~ —- "T"-^:'-\ i ! i / | \ : '\ ^
10 15
Time (sec)
Fig 9 Static Test 2
20 25 30
406

INVESTIGATION OF THE ANNEALING EFFECTS ON DUPONT HX-4000 LIQUID CRYSTALLINE POLYMER*
M. L. LINDAUER**
S. MALL***
Department of Aeronautics and Astronautics Air Force Institute of Technology
Wright-Patterson AFB, OH 45433
ABSTRACT
Liquid crystalline polymer's unique high-temperature properties show great promise for high-temperature structural applications. To date little is known about their molecular behavior at elevated temperature or its effects on mechanical properties. DuPont HX-4000 appears to increase in strength and temperature resistance after some heating above its a transition temperature as a result of molecular interdigiting. However, excessive heating will decrease its strength. The rates at which these processes occur with respect to temperature and time at temperature is still unknown.
This research investigates the rates at which the material properties of DuPont HX-4000 change as a result of heat treating. Specimens of HX-4000 are annealed to different time and temperature specifications, then tensile tested. Ultimate strength, strain to fracture and modulus of elasticity are compared for each group of specimens. Further research will determine the rate of change in properties with respect to the annealing temperature, and the activation energies for microstructural changes will be calculated. The overall goal is to define these changes as a function of temperature by an Arrhenius equation.
SPONSOR: Dr. John D. Rusek United States Air Force Astronautics (Phillips) Laboratory /RKC Edwards AFB, CA 93523
This paper was presented at the Second Annual Polymer Components Symposium, 13-17 September 1993, at the United States Air Force Academy, Colorado Springs, Colorado.
Part-time graduate student, currently with the 4950th Test Wing, Wright-Patterson AFB, Ohio.
Professor and Head, Department of Aeronautics and Astronautics, Air Force Institute of Technology, Wright-Patterson AFB, Ohio.
407

TABLE OF CONTENTS
1.0 INTRODUCTION
1.1 HISTORY OF LCP SCIENCE
1.2 DESCRIPTION OF LCPs
2.0 OBJECTIVES
3.0 PROCEDURES
3.1 SPECIMEN PREPARATION
3.2 EXPERIMENTAL PROCEDURE
4.0 RESULTS
4.1 UNWANTED VARIABLES
4.1.1 SUB-OPTIMAL MOLDING PROCESS
4.1.2 LONG AND VARIED POST-ANNEAL COOLING
4.2 EXTERIOR APPEARANCE
4.3 FRACTURE DESCRIPTION
4.4 EXPERIMENTAL RESULTS
4.4.1 300°C ANNEAL
4.4.2 260°C ANNEAL
4.5 QUENCH EFFECT
4.6 EFFECT OF INVALID FRACTURES
5.0 CONCLUSIONS
6.0 RECOMMENDATIONS
REFERENCES
APPENDIX I DATA TABLES
APPENDDC II STRESS-STRAIN DIAGRAMS
APPENDDC III TEST EQUIPMENT
410
410
411
413
415
415
416
416
416
417
417
417
418
421
421
424
425
425
426
427
428
430
442
450
408

TABLE OF FIGURES
FIGURE 1 - Examples of LCP Chemical Structures 2
FIGURE 2 - Specimen Cross-Section 3
FIGURE 3 - Heirarchical Fibrous Microstructure 4
FIGURE 4 - Test Matrix 7
FIGURE 5 - Fracture Samples 10
FIGURE 6 - Injection Melt Flow 11
TABLE OF GRAPHS
GRAPH 1 - Strength vs. Anneal Time (300°C) 12
GRAPH 2 - Strain vs. Anneal Time (300°C) 13
GRAPH 4 - Strength vs. Anneal Time (260°C) 14
GRAPH 5 - Strain vs. Anneal Time (260°C) 15
GRAPH 6 - Modulus vs. Anneal Time (260°C) 16
409

1.0 INTRODUCTION
During the last few decades, vast amounts of research have focused on developing high strength, high temperature polymers. A large group of liquid crystalline polymers
(LCP) composed of semi-rigid rod-like molecules show promise to fulfill these
requirements. When these materials are formed with a high shear process, such as fiber
drawing and thin section injection molding, the molecules align into a highly ordered
hierarchical fibrous microstructure. [1,2,3] This structure has very anisotropic properties
which exploit the strength of polymers' covalent bonds along the molecules' backbones. It
also allows very close packing with a high degree of hydrogen bonding between
molecules. The result is a very stable structure that has impressive strength and stiffness in
the fiber direction, very low thermal conductivity perpendicular to the fiber direction,
excellent high temperature properties and the potential to customize mechanical properties
with heat treating. Liquid crystalline polymers, including DuPont HX-4000, show great
potential to fill many high strength and high temperature applications.
1.1 HISTORY OF LCP SCIENCE - Liquid crystalline polymers were
unwittingly discovered as early as 1888 [4] when the botanist Friedrich Reinitzer noted
that esters of cholesterol exhibit two melting points. He observed that this strange liquid
showed iridescent colors and birefringence between these melting points. [5] In 1890,
Otto Lehmann of Aachen University described these new materials as "Crystalline
Liquids." [6] Research continued to spread throughout Europe over the next three
decades to understand this liquid crystalline phase. Researchers eventually realized that
there are several forms of the liquid crystalline phase. At Strasbourg in 1922, George
Friedel defined the three forms of these liquid crystalline phases. To supplement the term
"cholesteric," he coined the terms "nematic" and "smectic," from Greek roots, to describe
different "mesophases" of these liquids. [7]
The first advances toward engineering materials came in the early 1920s when
Staudinger suggested the possibility of long chain molecules. Then Vorlander of Halle
began experimenting with increasing chain length. He synthesized rods of multiple
benzene rings "para-linked" by ester groups. In 1923, he noted that the increasing chain
length increased the transition temperatures of the resulting materials. The ultimate
example of this was poly(p-benzamine) (PBA) which would char without softening. [8]
For his work, Vorlander can be considered the father of Liquid Crystalline Polymers. [9]
410

The 1950s saw great progress in the science of liquid crystalline polymers.
Onsager was the first to introduce Liquid Crystalline Polymer theory and explained the
biphasic nature of solutions of rigid molecules in 1949. [10] Isihara [11] and Flory
[12,13] further developed theories relating to the packing of rigid rod-like molecules. [14]
Independently, in an effort to develop synthetic silk, Robinson documented the structure
and phase equilibria of lyotropic solutions of polyglutamates. [15] These phase diagrams
confirmed the work that Flory's model theoretically predicted.
Successful commercial products did not come until the 1960s. Ballard developed
a method to spin fibers for lyotropic solutions of poly(y-benzyl-L-glutamate) (PBLG) in
1958, but no commercial products were developed. [16] Finally, Kwolek and her team at
DuPont developed the aromatic amide fiber named Kevlar, [17] which is spun from a solid
lyotropic solution of 20% polymer in 99.8% pure sulfuric acid, then rinsed in a
coagulating water bath. [18] With the prospect of marketable products, research into
liquid crystalline polymers greatly broadened. Today there are many different products on
the market in many different forms including a wide range of fiber products and moldable,
thermotropic bulk materials, most notably Kevlar from DuPont, and the Vectra family of
materials from Hoechst Celanese.
1.2 DESCRIPTION OF LCPs - Two basic types of molecules compose the
majority of structural LCPs; smooth, semi-rigid rods and semi-rigid rods with side
groups, sometimes called hairy rods. (Figure 1) Vectra is an example of the smooth, semi-
rigid rod variety while Kevlar and HX-4000 are of the side group type.
— O
Hoechst - Cenanese "Vectra" LCP Polyester
DuPont "HX-4000" LCP Polyester
Figure 1 The chemical structures for the common semi-rigid rod LCP, Vectra, and for HX-4000, a semi-rigid rod LCP with side groups. [19]
411

Three major microstructural regions compose an injection molded LCP part: the
skin, the fibrous intermediate region under the skin and the core at the center. (Figure 2)
Each of these regions are suspected to have different microstructures relating to the
environments within the injection mold. The skin of the injection molded part is usually
rapidly quenched by the cold inner surface of the mold. In polymers, including LCPs, this
often results in an amorphous, glassy structure on the surface of the resulting part. The
thickness of this skin will vary depending on the relative temperature of the mold and the
nature of the polymer. Under the skin is the fibrous intermediate region. This region is
subject to the high shear rate of the laminar melt flow near the surface of the mold. It is
suspected that this shear flow causes LCPs to align into their characteristic fibrous
microstructure. (Figure 3) At the center of the part is the core. Less is known about the
microstructure of this region than the others. Many suspect that in LCPs, these molecules
do not align to a great degree, but exhibit somewhat random local crystallization and do
not contribute their optimal strength.
Il^fediate inner core
(1/2 inch)
Figure 2 Cross-section of a DuPont HX-4000 specimen showing skin, fibrous intermediate region and inner core.
Many liquid crystalline polymers show changes in mechanical properties after
exposure to high temperatures for extended periods of time. The high temperature allows
the molecules to move and realign within the material. The temperature where these
molecules become free to move is referred to as the materials' a transition temperature.
[20] Under the proper conditions, they may further align into a more highly ordered,
fibrous microstructure and possibly, in some materials, the side groups may interlock or
interdigit. Often these microstructural changes significantly improve the strength of the
material. Interdigiting is suspected to be a mechanism in Kevlar, DuPont HX-4000 and
other materials with chemical side groups extending from each mer unit. However,
neither these mechanisms nor their effects on mechanical properties are well understood.
The heat treating effects on the mechanical properties of these materials have not
been extensively studied to date. Very little has been done to quantify these effects at the
macroscopic level in engineering terms (stress, strain and modulus). The primary focus of
research in this area has been to understand the materials' physical microstructures and
412

molecular behavior. This research is intended to quantify the effects of heat treating in
DuPont HX-4000 in these engineering terms.
Enlarged view of microfibriis
Figure 3 An expanded structural model is shown for the thermotropic and lyotropic LCPs, with more detail of the microfibril sizes, shapes and order. [21]
This paper presents initial findings from data collected to date from this research.
More testing is necessary to support these initial findings and to derive any mathematical
relationships. To date, only two annealing temperatures have, been tested. This alone is
not enough to draw any conclusions about the affects of annealing on HX-4000's
mechanical properties. Another annealing temperature will be tested along with
thermodynamic tests to support theories about HX-4000's microstructural changes.
2.0 OBJECTIVES
The goal of this research is to mathematically relate the changes in DuPont HX-
4000 mechanical properties to the heat treating parameters. It is suspected that the
mechanical properties of a liquid crystalline polymer change because, above the a
transition temperature, the molecules further organize into the fibrous microstructure.
413

This reorganization is assumed to be similar to the diffusion of atoms, molecules and
imperfections in other materials. Diffusion has been shown to relate to the thermal energy,
or temperature, of the material by the Arrhenius equation:
Rate = c0 exp (-—) K 1
where c0 is a constant, R is the gas constant (1.987 cal/mol • K), T is the absolute
temperature (K), and Q is the activation energy (cal/mol) required to allow the molecules
to move. [22] Once armed with this information, the engineer could specify the optimum
heat treating process for the desired mechanical properties.
This paper presents the data collected to date as part of this thesis research. These
tests are designed to quantify the macroscopic effects of the annealing process on DuPont
HX-4000. Three or four batches of annealed DuPont HX-4000 will be tested for tensile
strength, strain and elastic modulus. Each batch of specimens will be annealed at a
different temperature. Within each batch, groups of specimens will be annealed for
different durations.
Other material tests will be performed to supplement the tensile test data. Elastic
modulus will be measured with ultrasound. These "Sonic Modulus" tests should yield
more reliable data than those obtained from the tensile tests, but the effects of possible
modulus variation between the fibrous intermediate region and core regions are unknown.
Thermo-mechanical Analysis (TMA), Thermo-gravimetric Analysis (TGA), Dynamic
Mechanical Analysis (DMA) and Differential Scanning Calorimeter (DSC) will reveal
valuable information about structural and phase transitions of the material and how they
change with annealing. Finally, Scanning Electron Microscopy (SEM) of the fracture
surfaces should illuminate various microstructures inside these specimens. All these tests
should reveal microstructural changes related to the annealing process. Hopefully, these
results will correlate with the tensile test results and reveal structural behaviors and explain
the mechanical changes.
To date, two batches of specimens have been tensile tested: 300°C and 260°C.
Annealing times ranged from non-annealed to 32 hours. Preliminary results indicate that
longer annealing times are necessary to verify suspected trends. The next batch will be
annealed at 220°C for up to 100 hours; an additional group will be annealed for 100 hours
at 260°C to investigate trends in those data.
414

3.0 PROCEDURES
3.1 SPECIMEN PREPARATION - All specimens were injection molded ASTM
D638-84 tensile specimens (Dog Bones) with neck dimensions of 12.7 x 3.175 x 76.2 mm
(1/2 x 1/8 x 3 inches). The following processes were used by RTP company, Winona,
Minnesota to mold them:
1. Drying Hopper dried, 3-4 hours, 121°C (250°F)
Moisture Content to 0.015%
2. Melt Temperature 337 - 354°C (640 - 670°F)
3. Barrel Temperature Typically a flat profile 335 - 349°C (635 - 660°F)
4. Mold Temperature 77 - 149°C (170 - 300°F) [23] 5. Fill Speed Fast - less than 25 mm (1 inch) per second
6. Screw Rotation/ Minimum - only high enough to maintain uniform
Back Pressure retraction. Upon screw retraction, the mold open
cycle should begin, initiating a new cycle.
7. Injection/Hold Pressures 5000 -15,000 psi [24]
All heat treated (annealed) specimens were annealed using approximately the same process
as follows:
1. Parts placed in furnace
2. Argon purge for 20 min
3. Heat applied for annealing time
Slow Argon trickle
4. Heat removed, allow to cool
Slow Argon trickle
5. Part removed when oven reached 160°C
The 300°C batch was allowed to cool to 107°C
160°C was considered to be an adequate cooling temperature since that is the a transition
temperature for HX-4000. It is assumed that no additional annealing occurs below 160°C.
The observed variations in cooling time resulted from annealing different groups in
different sized furnaces and starting with cold versus pre-heated furnaces. The effects of
these variations will be discussed in RESULTS (section 4.1.2).
Fiberglass tabs were attached to the grip surface of most specimens to minimize
damage from the tensile machine's grips. New grip teeth were installed into the test
fixture between the 300°C and 260°C specimen tests. The new grips had very sharp,
415
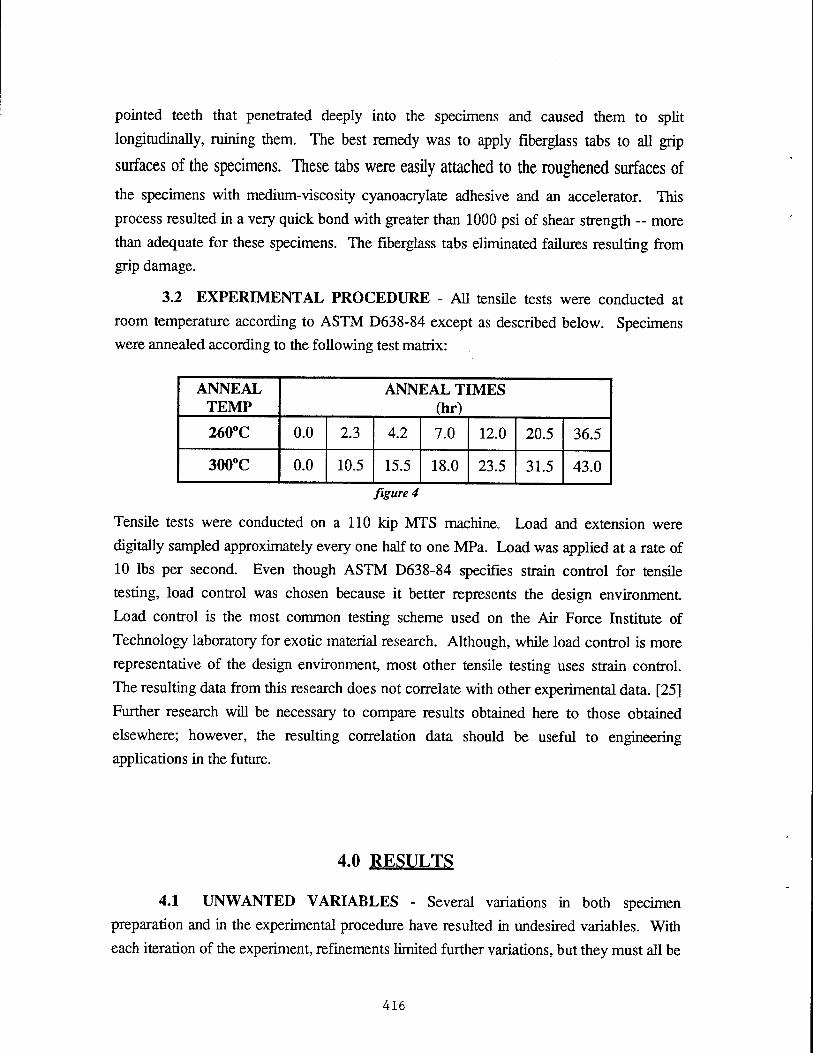
pointed teeth that penetrated deeply into the specimens and caused them to split
longitudinally, ruining them. The best remedy was to apply fiberglass tabs to all grip
surfaces of the specimens. These tabs were easily attached to the roughened surfaces of
the specimens with medium-viscosity cyanoacrylate adhesive and an accelerator. This
process resulted in a very quick bond with greater than 1000 psi of shear strength -- more
than adequate for these specimens. The fiberglass tabs eliminated failures resulting from
grip damage.
3.2 EXPERIMENTAL PROCEDURE - All tensile tests were conducted at
room temperature according to ASTM D638-84 except as described below. Specimens
were annealed according to the following test matrix:
ANNEAL TEMP
ANNEAL TIMES (hr)
260°C 0.0 2.3 4.2 7.0 12.0 20.5 36.5
300°C 0.0 10.5 15.5 18.0 23.5 31.5 43.0
figure 4
Tensile tests were conducted on a 110 kip MTS machine. Load and extension were
digitally sampled approximately every one half to one MPa. Load was applied at a rate of
10 lbs per second. Even though ASTM D638-84 specifies strain control for tensile
testing, load control was chosen because it better represents the design environment
Load control is the most common testing scheme used on the Air Force Institute of
Technology laboratory for exotic material research. Although, while load control is more
representative of the design environment, most other tensile testing uses strain control.
The resulting data from this research does not correlate with other experimental data. [25]
Further research will be necessary to compare results obtained here to those obtained
elsewhere; however, the resulting correlation data should be useful to engineering
applications in the future.
4.0 RESULTS
4.1 UNWANTED VARIABLES - Several variations in both specimen
preparation and in the experimental procedure have resulted in undesired variables. With
each iteration of the experiment, refinements limited further variations, but they must all be
416

considered. It is impossible to exactly determine the effects of these variations, but
analysis of the results indicates they were not critical.
4.1.1 SUB-OPTIMAL MOLDING PROCESS - The first batch of specimens
Gater annealed at 300°C) were molded under constantly varying parameters. The molding
process had not been refined before their manufacture, so injection parameters had to be
constantly varied to obtain the best possible specimens. The melt temperature and
injection speed varied from 371°C to 385 °C (700°F to 725°F) and from 25 to 35 mm/sec
respectively. Additionally, the injection tool could only be heated to 68°C (155°F). From
experience the best specimens come from molds heated between 107-149°C (225°F-
300°F). [26] Most of these specimens could not be used due to obvious, visible flaws and
inconsistencies.
All subsequent specimens were molded by RTP company, Winona, Minnesota,
who specialize in molding exotic polymers. Their injection process (outlined in section
3.1) was uniform and produced very uniform specimens.
4.1.2 LONG AND VARDZD POST-ANNEAL COOLING - Consistent
annealing proved to be another challenge. The first batches of specimens were annealed in
three different furnaces, normally used to heat treat large metal parts. The furnace
controllers were very precise and accurate, but the cooling times were different for each
furnace. It took from 6.0 to 7.5 hours to cool the specimens in the furnace from 300°C to
160°C, except one group which took 23 hours. All subsequent specimens were annealed
in only one furnace; unfortunately, the shortest groups annealed at 260°C were annealed
first, starting with a cold-soaked furnace. The resulting times to cool from 260°C to
160°C were short for the first group (1 hour) and got longer with each subsequent group.
The cooling time for that furnace stabilized at about 4.5 hours. To remedy this variation
all future batches will be annealed in the same furnace, with the longest annealing cycles
first to thoroughly heat-soak the furnace.
The different cooling times had to be accounted for in this analysis. The chosen
method was to add the cooling time to the annealing time to obtain a total duration of
exposure to temperatures above 160°C. Subsequent mechanical properties were
compared using this total annealing time and the maximum annealing temperature. This
method yielded apparently good results with no noticeable correlation between the short
cooling times and the resulting mechanical properties.
4.2 EXTERIOR APPEARANCE - Both batches of specimens manufactured to
date have very different visual appearance. The first specimens, molded at Hill AFB,
417

Utah, were medium dark gray with a slight greenish tint. Many of these specimens had a
worm-like pattern that coiled in the upper grip area (the injected end) and often extended
through the neck. This "Worm Fill" appeared to be only a skin effect on most specimens,
however in some, a "worm" of greatly degraded material, the thickness of the specimen,
extended through the neck. All specimens that showed obvious visible flaws like this were
rejected.
These specimens darkened noticeably after annealing at 300°C, even for the
shortest duration annealing cycles. Many of these specimens were warped to some
degree, and some appeared to be melted or degraded on the ends. Again, all specimens
that had obvious visible damage were rejected.
The second batch of specimens, molded at RTP company, were much lighter gray
in color with less obvious green tint. These specimens appeared to have thinner skin with
well-behaved flow characteristics. Hair-like filaments could be raised on the surface when
scratched and could be peeled several inches. This indicates that good fibrous
crystallization was obtained even at the surface. Annealing at 260°C did not have any
visible effects on these specimens. There was no discoloration and very little if any
warpage. None of these specimens had to be rejected due to visible defects.
4.3 FRACTURE DESCRIPTION - Generally, much information about a
material's microstructure can be gained by examining its fracture surfaces. In this research
as well, visual inspection of the fractures and the number of invalid failures illustrate some
important characteristics of injection molded HX-4000.
The specimens from both batches tested to date had similar physical structure.
The exterior of each specimen looked glassy and showed evidence of injection flow. The
first batch (300°C anneal) had a thick skin that often bubbled up from the underlying
structure during the anneal. However, these flaws did not appear to affect the fracture or
resulting mechanical properties. The later specimens (260°C anneal) had a much thinner
skin which did not separate. Note that the higher temperature of the mold for these
specimens resulted in better surface structure.
All specimens had a very distinct fibrous intermediate region under the skin with a
similar color. This fibrous region appeared to be about 1 mm thick on the faces of each
specimen and about 1 - 2 mm thick at the edges. (Figure 2) Its thickness was
approximately the same regardless of the mold conditions or annealing temperature. It
was visibly fibrous with a very irregular fracture surface, somewhat like a dry wood
418

fracture. Most fractures exhibited a layered appearance. (Figure 5) This region is very
different from the core of the specimen.
At the center of each part was a core with a completely different appearance and
fracture surface for all specimens. This core was a much lighter gray without the greenish
tint of the exterior. Its fracture looked like satin and did not appear to be fibrous. Its
fracture surface was smooth, tapered and regular with a blunt tip, usually pulled out from
one side of the fracture. (Figure 5) The microstructure of this core appeared to be vastly
different from that of the fibrous outer region and appeared to fracture independently.
These differences were reflected in both their physical appearance and their fracture
characteristics.
figure 5 Photos of typical fractures, a) fractures in the throat, b) fractures in the fillet of the grip.
The majority of the specimens had similar fracture surfaces. The typical fracture
surfaces resembled stair stepped pyramids in shape, like the end of a weathered wood
plank. The core usually protruded 10 to 15 mm from one side of the fracture with the
fibrous outer region tapering down from there. (Figure 5) The mating sides of the fracture
usually fit snugly back together, characteristic of a brittle fracture. When the failures were
in the fillet or the grip of the specimen, the protruding core tended to be lyre-shaped.
419
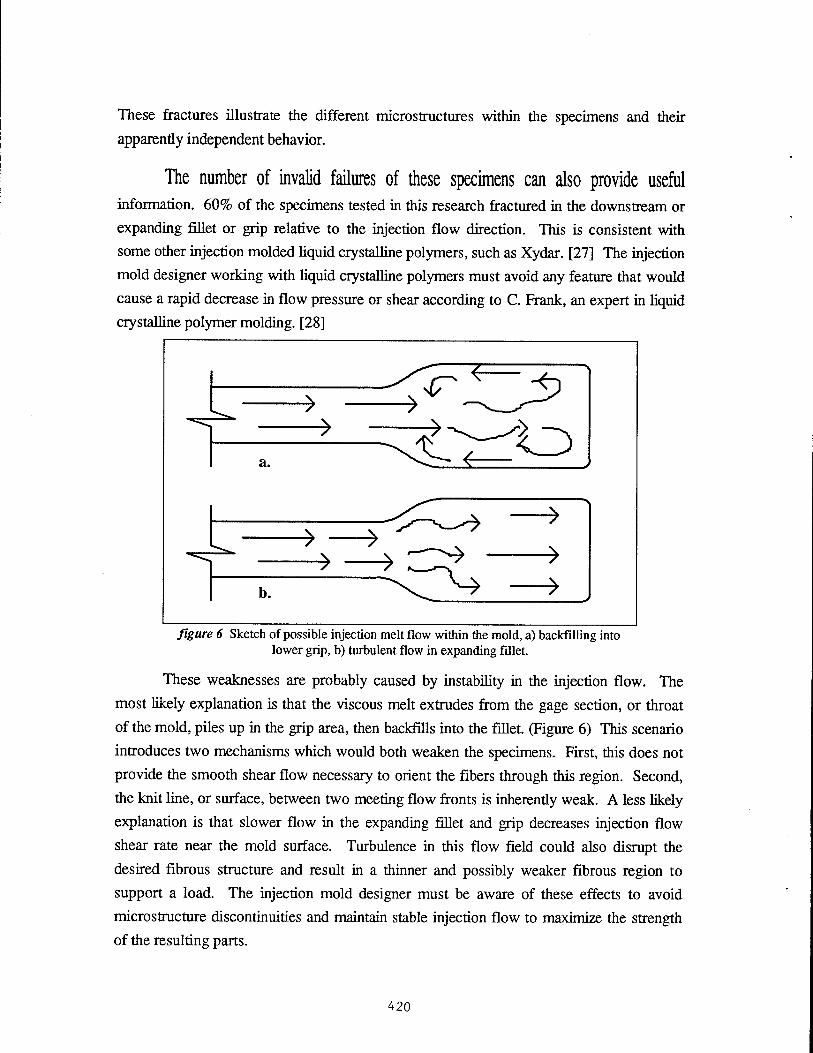
These fractures illustrate the different microstructures within the specimens and their
apparently independent behavior.
The number of invalid failures of these specimens can also provide useful information. 60% of the specimens tested in this research fractured in the downstream or
expanding fillet or grip relative to the injection flow direction. This is consistent with
some other injection molded liquid crystalline polymers, such as Xydar. [27] The injection
mold designer working with liquid crystalline polymers must avoid any feature that would
cause a rapid decrease in flow pressure or shear according to C. Frank, an expert in liquid
crystalline polymer molding. [28]
figure 6 Sketch of possible injection melt flow within the mold, a) backfilling into lower grip, b) turbulent flow in expanding fillet.
These weaknesses are probably caused by instability in the injection flow. The
most likely explanation is that the viscous melt extrudes from the gage section, or throat
of the mold, piles up in the grip area, then backfills into the fillet. (Figure 6) This scenario
introduces two mechanisms which would both weaken the specimens. First, this does not
provide the smooth shear flow necessary to orient the fibers through this region. Second,
the knit line, or surface, between two meeting flow fronts is inherently weak. A less likely
explanation is that slower flow in the expanding fiUet and grip decreases injection flow
shear rate near the mold surface. Turbulence in this flow field could also disrupt the
desired fibrous structure and result in a thinner and possibly weaker fibrous region to
support a load. The injection mold designer must be aware of these effects to avoid
microstructure discontinuities and maintain stable injection flow to maximize the strength
of the resulting parts.
420

Proper mold design, and gate location, orientation and type are critical in most
injection mold applications. Row direction and other characteristics around structural
features can either introduce weaknesses or exploit a material's strength. Knit lines are a
common source of weaknesses. Anisotropie materials like HX-4000 are even more
sensitive to these injection phenomena since their strength depends on well aligned
crystallization. The designer must take great care to engineer the melt flow as carefully as
other design factors.
4.4 EXPERIMENTAL RESULTS - To date, 2 batches of specimens have been
tested for a total of 98 tensile tests. These specimens were annealed at either 300°C and
260°C for varying annealing durations. The resulting mechanical properties were affected
proportionally by each annealing process. Annealing at these temperatures, at least for the
durations tested, actually weakened the specimens compared to the non-annealed ones.
However, positive trends in the results indicate that there may be potential to improve the
properties of the HX-4000 by heat treating.
ST R E NGTH vs ANNE AL TIME (300 deg Q
E s tirrrted N crvAmeded S iren^h
80.00 ■
70.00"
60.00 ■
S 50.00 ■
Lxj 40.00 ■
30.00 -
20.00 ■
10.00 -
w ~\ _^_. £
» — — *
X ~~~~
* MTS Stren^h
• AvgMTS Strength
1 o K
HOURS ABOVE 160d»gC
X)
Graph 1
4.4.1 300°C ANNEAL - This temperature clearly diminishes the mechanical
properties of HX-4000. The longer the specimens were exposed to this temperature, the
weaker and more brittle they became. After 31.5 hours annealed above 160°C, their
average ultimate strength decreased 32.5% to 56.4 from 83.5 MPa** at 300°C. (Graph 1)
Much of the strength lost, resulted from the first 10.5 hours of annealing: 17.1% to 69.2
MPa. Likewise, their average strain at fracture decreased 42.1% (became more brittle) to
421

3239xl0"6 from 5592xl0"6* mm/mm. (Graph 2) However, the initial strain after the first
10.5 hours was marginally greater than the non-annealed value, but well within the
statistical scatter. There is no data below the 10.5 hour anneal, so this trend cannot be
extrapolated. **Note that the non-annealed properties are only estimates; there were no
successful tests of non-annealed specimens.
The change in properties due to annealing appeared to follow a logarithmic rate.
When plotted on a semi-log scale, all strength data fell within approximately 10% of a
straight line. (Graph 1) The strain data was more scattered than the strength data, but it
also plotted very close to a line on the semi-log scale. There was significant scatter at one
test point, but the averages at each point never strayed from the best straight line by more
than 6%. (Graph 2) The logarithmic relationship is clear for these data with the exception
on one test point not included above.
STRAINvs ANNEAL TIME OOOdegQ
60.00.;
SO.OO •
^- 40.00 ■ X
pE 30.00 ■
20.00 -
10.00 -
10
* Esflmatet NavAnn EKfedSt am
"j-^-^.-
**^*"*^^ «
■^^ * ~"*
x SorrpiodSfrdn
* Avg S arrpted Strain
1 0 IC
HOURS ABOVE 160 dog C
Graph 2
One group of specimens annealed at 300°C was much different from the others.
These specimens were annealed in a very large furnace with a very large thermal mass. As
a result, the specimens took 23 hours to cool from 300°C to 160°C following their 20 hour
anneal time. This long cooling time allowed the material to react to the lower
temperatures during cooling. In affect, this was like a very long anneal a lower than
300°C.
422

These specimens recovered much of their estimated non-annealed strength
(Graph 1) and strain (Graph 2) compared to the others (88.1% and 82.1% of the non-
annealed strength and strain, respectively). Their properties seemed to be unrelated to the
other specimens except that they were still weaker and more brittle than the non-annealed
benchmark. Perhaps the lower temperatures in the cooling cycle allowed the molecules to
align into a more organized structure than the other annealed specimens. Whatever the
mechanism, the long cooling time clearly enhanced the properties of this one group of
specimens.
These results indicate that much of the strength lost in the 300°C anneal is
recoverable. Permanent damage would indicate possible depolymerization during
annealing. However, something happens at lower temperatures which positively affects
the material. Perhaps at 300°C the material loses some of its hierarchical fibrous structure
and randomizes or becomes more amorphous. The lower temperatures may allow it to
recover its fibrous structure. The planned thermodynamic testing will be needed to help
understand these mechanisms.
STRENGTH vs ANNEAL TIME (260degQ
120.00 -
Average Noo-Annec edStrenglh *
. »
g X s - c
>
C/3
X
" MTS Strength
• AvgMTS Strength
0.00 -
HOURS ABOVE 160 dag C
Graph 4
It is also important to note that there were no successful tests of the non-annealed
specimens from this batch. Ten specimens were tested, and all of them broke in either the
grip area or in the fillet. After only one hour of heat treating (four hours with cooling),
the success rate jumped to 40%. This may indicate that annealing allows the structure to
recover from the flow irregularities induced by the expanding cross section of the mold;
423

however, there was no trend in the successful test rates which would indicate further
improvements. It does not appear that the mechanism responsible for this "healing"
progresses any further after the initial annealing.
4.4.2 260°C ANNEAL - This annealing temperature shows that there is some
potential to improve the mechanical properties of HX-4000 or at least not diminish its
properties as much as 300°C. The specimens annealed at 260°C were not as strong as the
non-annealed specimens, 26.9% of their strength was lost after 2.3 hours above 160°C
(from 93.2 to 68.2 MPa), but their strength did increase to within 4.6% of their non-
annealed strength, 88.9 MPa, with further annealing. (Graph 4) These data appear to
reinforce the notion that annealing facilitates structural changes that may improve the
material's properties. Similarly, elastic modulus for these specimens initially decreased
13.9% upon annealing (from 7380 to 6353 mm/mm), but seemed to improve as annealing
durations increased (Graph 6). However, there is too much scatter in the strain (Graph 5)
and modulus data (Graph 6) to draw any strong conclusions about these trends.
STRAINvs ANNEAL TIME (260degQ
K X
Average Ncn- Ameated Strain
-
X «e •
E
*
X K
* SanrtedStrdn
* AvgSarrpted Strain
HOURS ABOVE 160 deg C
Graph 5
Again, the mechanical property changes appeared to follow logarithmic functions.
While 80% of the valid strength data fit within 18% of a best fit line plotted on a semi-log
scale, the averages at each test point were within 10%. There is more scatter in the
modulus data, but they also indicate an increasing trend. The strain data are too scattered
to conclude a relationship. While annealing at 260°C clearly had a detrimental effect on
424
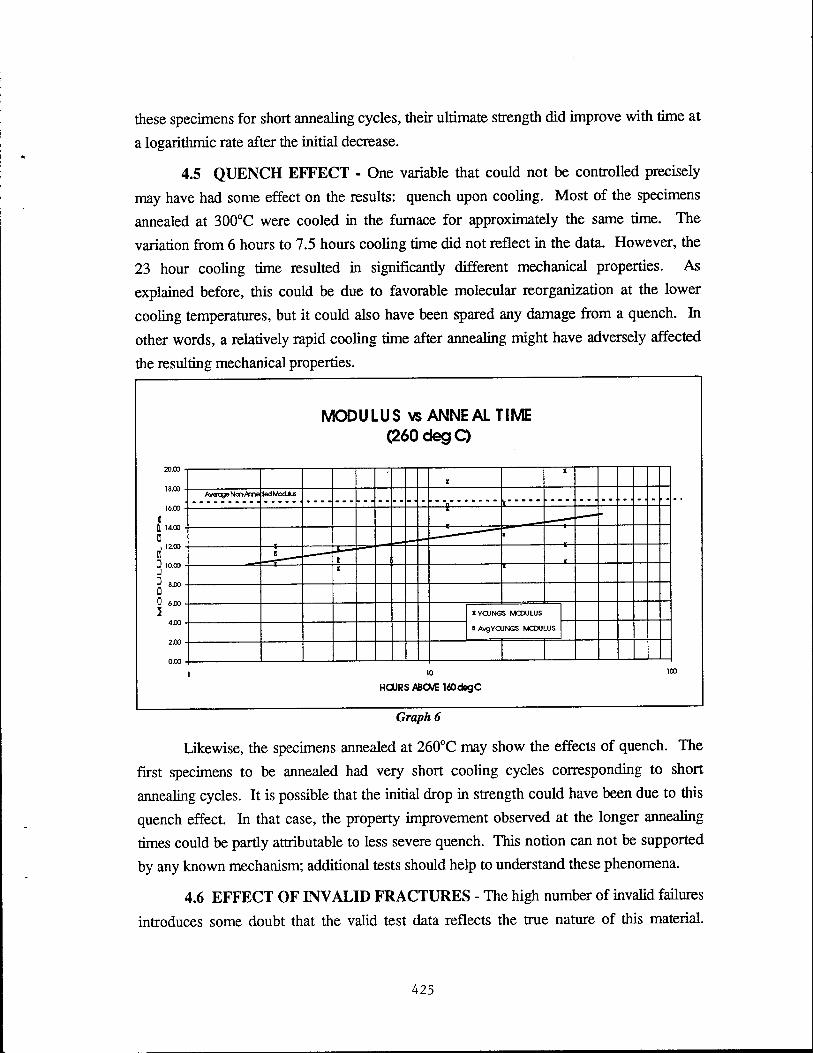
these specimens for short annealing cycles, their ultimate strength did improve with time at
a logarithmic rate after the initial decrease.
4.5 QUENCH EFFECT - One variable that could not be controlled precisely
may have had some effect on the results: quench upon cooling. Most of the specimens
annealed at 300°C were cooled in the furnace for approximately the same time. The
variation from 6 hours to 7.5 hours cooling time did not reflect in the data. However, the
23 hour cooling time resulted in significantly different mechanical properties. As
explained before, this could be due to favorable molecular reorganization at the lower
cooling temperatures, but it could also have been spared any damage from a quench. In
other words, a relatively rapid cooling time after annealing might have adversely affected
the resulting mechanical properties.
MODULUS vs ANNE AL TIME (260degO
20.00 -I
X
<
Average Ncn-Arne JedModJus
16.00 - —i
D
a _ I * X
IYCUNGS MCDUIUS
o AvgYOUNGS MCDULUS
2:00 -
003 -
HOURS ABOVE UOdogC
Graph 6
Likewise, the specimens annealed at 260°C may show the effects of quench. The
first specimens to be annealed had very short cooling cycles corresponding to short
annealing cycles. It is possible that the initial drop in strength could have been due to this
quench effect. In that case, the property improvement observed at the longer annealing
times could be partly attributable to less severe quench. This notion can not be supported
by any known mechanism; additional tests should help to understand these phenomena.
4.6 EFFECT OF INVALID FRACTURES - The high number of invalid failures
introduces some doubt that the valid test data reflects the true nature of this material.
425
60% of the 98 specimens failed in the downstream, expanding part of the specimen
relative to the injection flow direction. It is known that such low pressure discontinuities
should be avoided in injection mold design. If the specimens fractured in this acknowledged weak area, the true strength of the specimen can not be determined. How
strong was the material in the gage length? It appears that the valid data presented in this
research may reflect the weaker end of the strength distribution for this material.
A possible contribution to this high number of failures is the test method. Most
tensile testing research is conducted according to ASTM D638-84 which specifies that
specimens be puUed at a constant strain rate during tensile tests; this is called "strain
control." These tests were conducted under "load control," loaded at a constant load rate
regardless of strain, i.e. 10 pounds per second. This procedure introduces a relative shock
to the specimen when strain rates increase, especially near fracture. In fibrous materials
such as HX-4000, small fractures occur when individual fibers break, thus applying
instantaneous shocks and higher strain rates. These shocks may be responsible for the
high invalid failure rate.
The data in this paper cannot be correlated with other studies because of the
different loading scheme. These specimens were not allowed the sustained plastic
deformations normally associated with ductile metals. While a load dependent situation
more accurately simulates the application environment, the resulting data does not
correspond with other research.
5.0 CONCLUSIONS
Clearly this research is not yet complete. One or two more annealing temperatures
must be tested as well as sonic modulus, TMA, TGA, DMA, DSC and SEM to learn as
much as possible about the material changes that result from the annealing process. These
tests will support the goal to mathematically relate these material changes to the
temperature and duration of the annealing process on HX-4000.
Regardless of how preliminary this research is, some important understanding can
be drawn from it. Mold design and fabrication processes are critical to make good parts
with HX-4000 as with many other liquid crystalline polymers. The number of invalid
failures of these specimens reinforces the importance of proper mold design. Low
pressure and low shear rate regions in the melt flow, like rapidly expanding sections, must
426
be avoided since they create weak areas in the resulting parts. The injection molds must
also be very hot to minimize the thickness of the amorphous skins. The fibrous
microstructure of HX-4000 greatly contributes to its strength; therefore, thick amorphous
skins are detrimental. Proper mold design and injection processes are important with all
injection molding, but they are critical with HX-4000.
The annealing process is also critical to HX-4000, but ideal conditions are not yet
obvious. It is clear, however, that 300°C is too hot to improve mechanical properties in
HX-4000. This temperature caused parts to lose significant strength and become more
brittle. It also caused these specimens to warp, sometimes severely. Mechanical property
improvements were not obtained at 260°C either; however, they recovered some of their
non-annealed mechanical properties. Hopefully, longer annealing cycles at 260°C or
different annealing temperatures will produce some positive results.
6.0 RECOMMENDATIONS
It is already clear that some changes are necessary for further work in this area.
First, tests should be conducted according to ASTM standards. The results from such
testing can be directly compared to other research, and traditional analysis of the results
will be meaningful. The results from these tests can not be directly correlated to other
tests, and the stress-strain results are difficult to interpret Second, straight tensile bars (or
possibly ASTM D638-84 Type II "Dog Bones") should be used for tensile testing of HX-
4000 versus the ASTM D638-84 Type I specimens used in this work. ASTM D638-84
recommends the Type II specimens when a material frequently fractures outside the
desired gage length; however, the gage length in the Type II specimens are only half the
cross-section area. These specimens may still experience failures since it appears that any
expansion after a narrower sections would be inherently weak. Straight tensile bars would
circumvent this problem altogether. The weakness caused by the expanding flair in the
grip area wasted time, material and possibly lots of good data.
427

REFERENCES
1 C. SAWYER, and M. JAFFE, /. Mater. Sei. 21 (1986) 1897.
2 Idem, in "High Performance Polymers," edited by E. Baer and A. Moet (Carl Hanser, Germany, 1991) p. 56.
3 C. SAWYER and D. T. GRUBB, "Polymer Microscopy" (Chapman and Hall, London, 1987).
4 A. M. DONALD and A. H. WINDLE, "Liquid Crystalline Polymers" (Cambridge University Press, 1992) p. 1.
5 F. REINITZER, Manatsch 9 (1888) 421.
6 O. LEHMANN, Z. Phys. Chem. 5 (1890) 427.
7 G. FRffiDEL, Ann. Physique 18 (1922) 273.
8 D. VORLANDER, Z. Phys. Chem. 105 (1923) 211.
9 A. M. DONALD and A. H. WINDLE, "Liquid Crystalline Polymers" (Cambridge University Press, 1992) p. 2.
10 L. ONSAGER, N.Y. Acad. Sei. 51 (1949) 627.
11 A. ISIHARA, /. Chem. Phys. 19 (1951) 1142.
12 J. FLORY, Proc. Roy. Soc. A234 (1956) 73.
13 Idem, in "Polymer Liquid Crystals", edited by A. Ciferri, W.R. Krigbaum and R.B. Meyer (Academic Press, New York, 1982).
14 C. SAWYER, R. T. CHEN, M. G. JAMIESON, I. H. MUSSELMAN and P. E. RUSSELL, /. Mater. Sei. 28 (1993) 225.
15 C. ROBINSON, Trans. Faraday. Soc. 52 (1956) 571.
16 D. G. H. BALLARD, Courtaulds Ltd, UK Patent BP 864, 962 (1058).
17 S. L. KWOLEK, DuPont, US Patent 3 600 350 (1971).
428

18 A. M. DONALD and A. H. WINDLE, "Liquid Crystalline Polymers" (Cambridge University Press, 1992) p. 84.
19 "Liquid Crystal Polymers," NMAB 453, MDA903-89-K-0078, National Academy of Science, February 28,1990, p. 19.
20 D. E. KRANBUEHL, CoUege of William and Mary, "Characterization, FDEMS Sensing and In Situ Process Monitoring During Cure of High Temperature Liquid Crystal Thermotropes" (Advanced Plymer Components Symposium, 1993).
21 C. SAWYER, R. T. CHEN, M. G. JAMIESON, I. H. MUSSELMAN and P. E. RUSSELL, J. Mater. Sei. 28 (1993) 235.
22 D. R. ASKELAND, "The Science and Engineering of Materials" (PWS-KENT Publishing Co, Boston, 1989) p. 118.
23 Use high temperature mold for good surface finish, thin wall and hard to fill sections. Use lower temperatures for complex parts with slicking problems.
24 J. NIELSEN, Technical Service, RTP co., Winona, Minnesota.
25 D. ELLIOT, Arkansas Technical University, "A Study of Thermotropic Liquid Crystalline Polymers" (Advanced Plymer Components Symposium, 1993).
26 Inem
27 C. FRANK, Advanced Composites Program Office, McClellen Air Force Base, California
28 Inem
429

Appendix I
DATA TART.ES
430

^^ o ^B- ^-B ^_ HH ^B* ^M
a. o o o o o o co ^*l^ ""■*«fc
3 > > > > > > 3 z a a Q 5 Q Q
Q Q O =«* * * * «: * Ul o > ? Q£ CO
^■v Ul Q (5 z o
o > x
o > 5
5 >
p >
5 >
o >
o > Q
* * **: * * * a.
c z JO o , ,_ o o IO CM , r-. «o r-- l»N CM "tf O i— •>a- s o 3 CM 2 o CO CM r». ^r »— CN co CO ^— IO c5 t> CM CO
o CO t> ^r r~- IO °i ,^- iq "O O O CO •*T "i IO •^r o W h: <j •O io IO ^j ^T n IO ■^ CO ■«* "tf •« IO CO ■^T <«t CO CO CO
—1 </>
< Q 1 LLI z UJ
Of
</> < Ul 2
co z i—
o a 2
CM o <o •>g- ,_ CO r— o o CO "tf ^» 8 CO
CM ,— I— ■f CO t—
< o (!) z
Ul
O CO O
CO ö «o
CO O
CM CO
«o
CM (> IO
cd CO
«©
O CO IO lO r-.
P>.
CM O
«o CO
CM
2 IO CM IO IO
co T3 o 8: r^ co 8 O «o o O CM ■^ r— ^» o •o CO r«s IO O CN =T CO <o CM T CM °1 IO IO o o O CO IO r-. ^ o 2 $ CO r"s CM' Ö <> IO CO CO CO CM CM" Ö Ö s ö cd <> ^j o o « o r-. «o -o IO o •o IO IO CO r~. t*. IO T IO
<o
Ul Ul ul Ul Ul Ul Ul o O O 0 o 0 a. 2 * CO CO
CO 2 Ul c>
co 3 ul
o CM <3- IO 2 Ul
[■-. CM 3
Ul CO CO
iO C^- CM 3
Ul CM O 3
Ul < > > > > > > to < < < < < <
Ul 2
1— i—
o £ io IO
•Ö IO IO IO O O o O IO
1-^ IO. CO
CM CO CM
CO CM
CO CM
vo IO iq
O Q_ 1—
O Ü
i/> Ul ►- Ul
> o Ü
0) IO io IO IO IO IO CO CO CO CO IO iq co CO CO CO IO iq iq
cQ <
TJ ö Ö o IO IO IO CO CM
co CM T ^T T •«a- CO CO cö
o i— «o
1 "
431

O c/> a. o o p o o p o o o o o o o o O O o C3 P 3 0 ""-,.
> > > > > > > > > > > > > > > > > > > «o 5 Z Q Q a Q Q a O Q Q a Q a Q a Q a Q Q a z O
2 */> (!)
o =*= -*= * * -*= -*= * -* * * =»= * =*= * =fe =*: =*- -*= *
o «o
"a > z a. o o O o o o o p^ o p o o o o o O o o p UJ 3 a o
> > > > > > > > > > > > > > > > > > > >
> X
a a Q Q Q Q Q Q a a Q a Q Q Q a a Q a * =**- % -* -%= * * •*■ =*= * =*= * * % -*= *- * * *
< a.
fc Z ,E
z 3 E
E 5s- CO o
-P 5s- CO O
5? m lO
-P 5s- r-.
-P 5s- r-.
5s- 00
-p 5s- r-. CO
-P 5- "-! O
CO O
8« CO 8
o > <>
^9 •O
--2 5s- m CO
--9 5s-
r--
5f CO o
_I O g u F
•o i (O CO • co ■-«* r-. CM
CO ■
CO CM
i ■O CM
Ö CM CM i 1 CM in in
i CO
< LU § z z <
2 O 2
-p 5s- oo o
-P 5s- CO p
55
2 -p 0s- CO r-.
-P 5s- CO Is-.
öS OO
-p 5s-
O
-P
O
^9
5 5«
«o
»-P
8 5 > O
O
-~9 -O
-p 5s-
CO 5s- -o CO
o5
•o CO
5« o r*.
Ü O) a>
o o
LI- CK < >
0 z UJ
o a. 2
CM CM CM lri ■ in cd CO cd in rx Ö * •^ Ö
i
n •o •o" 1 c>
=> O a. 2
-P 5s- m •O
o
--P 5s- -o CM
-p •o CM
IO GO
--P 5s-
s O ^9
8 ->9
8 o >
^9 •-9 5s- f--. CM
--9 5s- CO
5s-
lO 5« m CM
•»9 5s- m CM
•o
• ■— CM" -o" i •o CO c\i <>
i <j *6 Ö a T' CD T "»" CO CO 1
^ <o
Ul Ul Ul Ul Ul Ul UJ —1 0 0 0 (5 O 0 a.
< CO
* CO CO CO Ul £ CO 2
Ul o Is-. CM S 2
Ul CM 2
Ul
CO CO
in Is--.
C~ CM 2
Ul
CM Is--.
o Is-«. 2
Ul > > > > > > < < < < < <
Ul
2 1— z _l
o IT)
•o m •o
in r-.
in in -o •o o «o in m CO CM
CO CM
CO CM
CO CM
in in in r-.
O a. i—
o o CO Ul Ul
§ Ü Ol a> lO w m in m m
00 CO CO CO m m
CO CO CO CO in in in
m "D Ö Ö ö lri in iri CO CO ■q- T ■^T "-r •—* r— •■~
< o *"""- r~~ r~~ ^-~ r~~ r~~ CM CM CO CO CO
t— o
432

LU
z < o o CO
< UJ o Z Ö) < 0 CO 73 > O
00
CD
< S K
x
MTS
Stre
ngth
• A
vg M
TS S
treng
th
> fd x
i
c . 2 T3 ■ CD . O CD i c . c • <, c . o ■ Z i
o ■ Ei
"c/5 ■ UJ
X ©
<
Ü D> Q>
T3 O
UJ > O CD <
O X
8888888888 QOOQQOOOOO C>oor~-OiO'3'co<M'—
DdlAI 'H10N3Ü1S
433
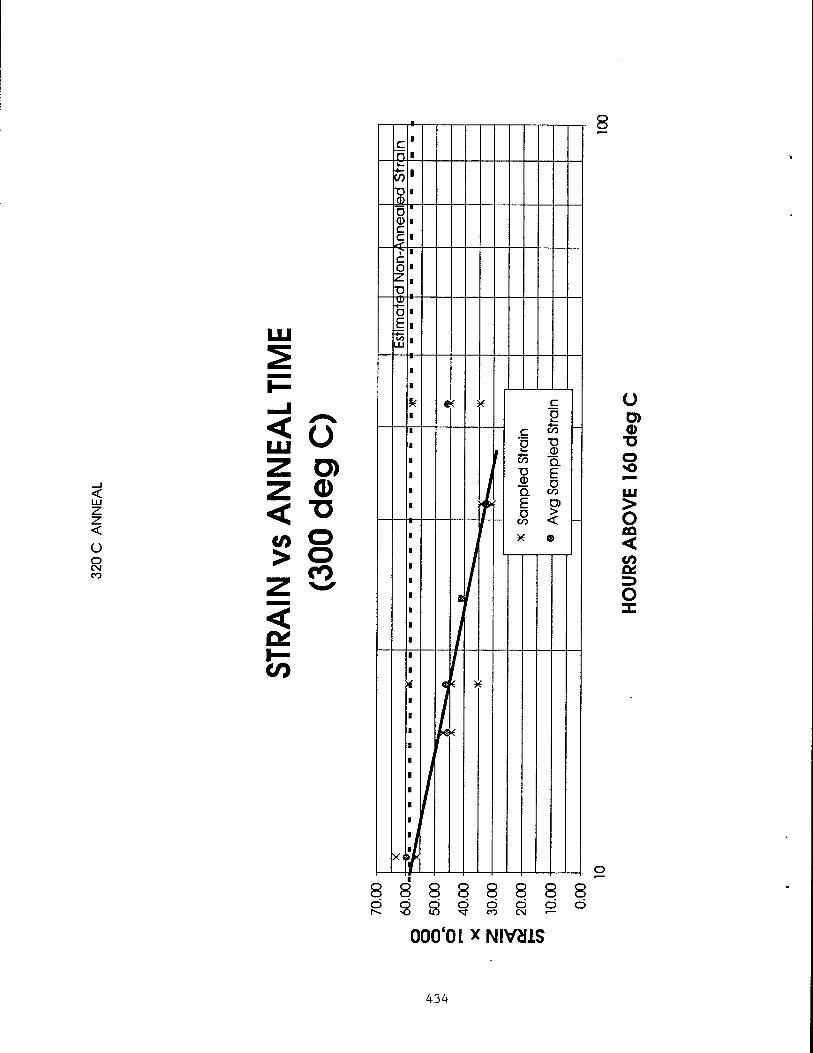
< ü o CM CO
< LU ü z ö> 2J o < "ü c/> o > o
00 Z < c* </>
c "n 4-
o <D c c
C o z
D E
«*— LU
fc e ; <;
* S
ampl
ed S
train
• A
vg S
ampl
ed S
train
-
1
X<!
i ) c
o ö> a>
■ö o »o
> O CD < CO oc
o
8888 8 888 öööööööö N * O <j n CM ■-
OOO'OLXNIVcIlS
434

< o o CM CO
5ü
c/> "O
CD CO
C£ F= </> .J
LLI <
CD <
UJ
UJ Z z <
> «0 < >
.c B c a>
©
£ o CO
> <
CO
T3
a £ o co O) > <
8
o Ö) 0)
•D o o LU > O CD <
OL
o
888888888 S R 2 8 O O Ö o o
<3" CO CN <—
000'OLXNIVaiS DdiAi 'HioNaais
435

0 M M M ^ «M MB ^m 0. O C3 C3 o o O O o > > > > > >
—. >
3 Q O z Q Q Q o Q o a o CO
* * * * * * *
5 co (!) o o.
O z O >-
s CM oo 00 oo m 8 2 rx rx ■o rx -O 8 8 to CM o CO oo
oo oo
CO CO
1^ m CM tx
CO CO oo CO 00
CO CO
-o CO m rx oo
£ •o ' «ö o* Ö CM © r— f> Ö Ö © &■ <> CS od iri CO u> <5 <> C4 rx ■— C> CM'
X
<
Q.
£ i^ < z £
E 2
o 8 o o o O CO 8 O o o o o o LO o o o o o o O O o in O o 2 co
o 00 i— CO CM LO O 1— CM CO CM pM CM CO OO pa IX. O. CM CM CO
_, •o CO
OO
co rx o od
O co rx rx
oq rx rxT
rx
•o CO
CO rx
■o
LO "5 CO
rx
od o «d m iri
CM O od CO-
< o LU z F z < X
5 z LU
2 o a.
LO •q- LO O T m 00 O O "3- CM OO CM T m rx CM s iri
2 iri
p— rx o 00 CO CM
CM O
CM 0O CO 00 o' rx
CM co
LO
CO
CO <5 CO Ö
O CO ■xf
CO «O p CO oq lO rx
od CM
CO
p ci
rx
<> rx
CO o o oo o» rx rx in »o o rx OO rx rx rx r^ i^ ix. ■O o o IX o 5 rx rx oo oo 2
co T3 1— 0 a.
CM oo u> co ^T o p— 8 in 0O ■xT O- ■<tf •^r o. O oo m •o ,— CM CM CO in rx LO —1 ID
O O ■"^ CM -O 0O o o oo «O m •o o o Px o *— ■— «o -o rx °i O 2 od co _! ^f .—" CO o" ■— ö ■—- rx' CM" CO CO rJ cd r-^ CM' Tf CO Ö ^J 8 cd ,-J <d O O oo o» rx rx ■o o o rx oo rx 1** o i^ rv o o o rx o CO rx rx OO CO CM
LU LU 2 ■J
< t— lO .— CM -o I— CM -O rx CM ^ oo CM r^ oo CO 1 1
CO I l
<> 2 < co
z LU 6
i 6
1 i
1
1
1
1
1
CM i
1
CM 1
1
CM i
i
CM 1
l 1
i ■
1
0O I
■ oo
i
OO 1
o 1 1
CM CO
1
CM CO
I
CM CO
I
_l u_
LU 2
r- o o CO CO CO CM CM CM CM CO CO CO ■"3- ■^r •^r m m m m m
*— o *~~ 1 ■ CM CM CM' CM T' ■^f ^ •^ ■ST
Z o O Ü n V) LU o LU > a 1— o a> o CO co CO CO CM CM CM CM CM CM CM C\J CM
m m m m m m m fiQ < o
o o CM CM oi CM ■^ -tf ■sf ^f ■x-'
l~- 1^- r^ ix. ö CM ö CM ö CM CO
-o CO
•o CO
•o CO
1— *o
LU LU LU LU LU LU LU < 0 0 o to o o (D LU z 1— o o 3 ,— i— ,— 2 CM CM CM CM 2 T T "3- 3 oo 0O oo 3 •o •O 3 CM CO
CM CO
CM CO 3 z LU LU LU LU LU LU LU
> > > > > > > ^ < < < < < < < 1 p 1 1 1
436
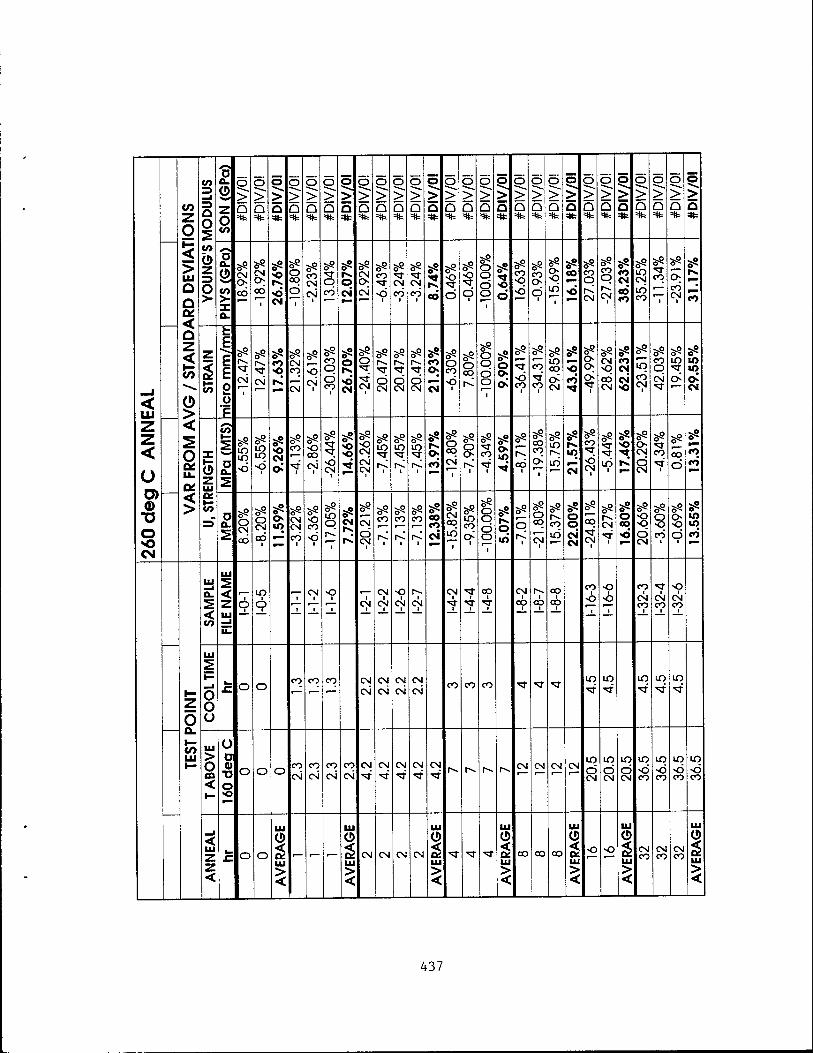
< Ul Z Z <
Ü © ■o o »o CM
z O
> UJ
Q O DC
<
1 O u. OS
co _l
a O
D D.
o z o (O
Ö > Ö > o >
o >
=tfe
O > Q
O
> JO
>
*
O > Q
O
> a O
> Q
O > Q
JO
>
O > d > Q =tfe
d > o > *
CD
>
o >
o > Q
C3
> d > Q
d > Q > o
d > Q
d > Q
O
> Q =tfe
>
b Z
o >-
D 0.
O to > X o.
5? CM O
CM O od
5« «o IS.
«6 CM
5S o CO
d 1
CO CM
CM i
^9 3-
o CO
5« is. o tN
»~9 3"* CM O
CM
^9 CO
<) i
'a- CM
CO •
CM
CO i to
^9
Ö
S5 O
d •
~9 CD O d o
■
Ö
^9
CO O
<5
59 CO O d
^9
O •O
to 5« CO P CM
^9 CO P CM
sS CO CM to CO
m CM in CO
59
CO
i
^9
CO CM
hs
CO
z 3 tO
fc E £ E o u Ü
F
-*9
CM i
3-
CM
CO >©
l>!
~-5 s- CM CO
CM
C>
CM ■
3~ CO O Ö CO
i
5S O is.
M$ CM
-*9
O
CM i
Ö CM
~9 ,^- Ö CM
v9
1^ ^• Ö CM
CO
°5 CM
-~9
O CO
<j i
^9
O CO
^9
O O
d o 1
S5 o -~9
^C5 CO
1
--9
CO
CO 1
^9
in CO
<> CM
M3
CO "9
--9
O O <>
■
»•9
CM O CO CM
CO CM CM
-~9
in
CO CM
59 CO P CM'
~-9
m <>
5? u> u> o^ CM
X 0 z UJ OS K- <0
55 »—
D 0.
2
~-9
LO in
-o
~-9 3- in
-o o CM t>
-~9 CO
1
~9 O CO
CM i
~-9 3"--
"sT
-6 CM
t
o »-9 3- O CM
CM CM
i
^9
i
^9
lO
i
^9
■
t>
^9
O CO
CM
i
»■9
CO
^9
cd
~9 CO CO C>
i
m If)
5« is. lO
CM
^9 CO
•O CM
i
~9
iri ■
«o ^# rs
O CM
d CM
^9
CO
i
~9
OO d CO
o 2
o^ O CM
CO
3~ o CM
CO 1
o» -5 3^ CM CM
CO i
59 o CO
•o
^•9 3- m p CM rs"
3-
CM
Ö CM
i
--9
CO co
i
~9 CO
i
to CO CM
-~9
CM CO
l£> 1
--9
m CO
<> 1
^9 O O
d o I
5«
O
»-9
q i
59 O CO
CM i
^9
r^ CO
in
?" o o CM CM
^9
CM i
^9 r^ CM
1
5« o CO
«6
->9
O O
d CM
~-9
O o CO
i
^9 o^ O
d I
m U) CO
1—
Z O Q.
to Ul
LU
Q_
< to
UJ
< z Ul
IE
i
O to
1 o t
i
CM i
i
-o I
I
i
CM t
CM 1
CM 1
1
CM i
■
CM i
CN l
i
1
1
CO I
•
CM i
CO i
cö CO
i
CO
CO i <) o
1 CO
i
CM CO
1
CM CO
•o 1
CM CO
Ul
•— _i
o o o
£ o o CO CO CO CM
CM
CM
CM
CM
CM
CM
CM' CO CO CO ■<a- T *T
m ■sf m
Ul > o CD
< 1—
Ü D 0) Tf O «o
o o o CO CM
CO
CM
CO
CM
CO
CM
CM CM CM •"7
CM CM r^ r^ r-^ 1^ CM CM CM CM m d CM
m d CM
m d CM
m ■o CO
m •o CO
m •o CO
in •o CO
_l
< Ul z z <
o o
Ul o Ul — - —
UJ
o Ul
CM CM CM CM
Ul
1 UJ T ■^r ■<^
UJ
O Ul
CO CO CO
UJ
CD
UJ
o -o
Ul
O Ul
CM CO
CM CO
CM CO
Ul
O Ul
437

LU
< o o o CM
< LU z O 2 D> < (1) </> "O > O X
0 CM
z LU QÜ
to
X '®4x
*
MTS
Str
engt
h
® A
vg M
TS S
tren
gth
1 © X
* L *x
*: «at > ■ _ —
< 0
Di 5. 2
XE* x
<
51
3)1 0) 0« Si >
Ü D> O T3 O o LU > O GO <
O X
8 8 8 8 8 8 8 o CM
O CO s o o
CM
Ddl/M 'H10N3älS
438

LU
< IXI
< o o o CM
< o Z O)
< ^
<
X X« , x
X , e X
» ® X
yK
x S
ampl
ed S
train
9
Avg
Sam
pled
Stra
in
>€»£< a x
X I
1 * 2 *
H <i ■
jl 5
) 5
Ü O) a>
o
2 > O GO <
ex.
O X
8 8 8 8 8 8 8 o CM
O CO
O O O CN
000'OlXNIVdlS
439

< Ä
£ 6 iß •t O
JC O co
O i
< <
2 ö> < <D co "O > O
3 CM ^ji ^
Q O
i
i
i
x Y
OU
NG
'S
MO
DU
LUS
a
Avg
YO
UN
G'S
MO
DU
LUS
i
i
i
X IT J l X
Si In <
X ■c 16 5 i \
4n x to1
D Dl O 1X
D' <D, O ©• c. r*
) mV
<i i c. o"
& CD, >
8
ü ö> o "ö O «O
LU > o CO <
CD O) D 0.
88888888888 <i 'i N ö o -ci <j
öd© 'smnaow
OCOOTCMOCOOTCNO CM — •— — — —
440

</>
o
H= CM
<
o o CN
0 j z < LU UJ
£ Z co Z in ^ 0 <2 < >
CO
B r -g c •£ O 9> 2 |
CÖ cö T-, "O "O <D
nple
nple
asur
CO co 2 G> o> a>
■ 8 3 3 £ ■ 94
■4
■ « -4
■ © ■4
m > « 1
i ■ e •*
8
O o> o T3 o o
> O CO < </> DC ID o
O O Q Q oo r»» -O u>
O O O O O T CO CM ■—
Ddo 'smnaow 000'OLXNIVaiS odi^i 'HiONaais
441

Appendix II
STRESS-STRAIN DIAGRAMS
442

STRESS vs STRAIN NON-ANNEALED
CO Q_
CO to LU C£ h- CO
100.00
90.00
80.00
70.00
60.00
50.00
40.00
30.00
20.00
10.00
0.00
—
- y'
t
-
/
s ^*~"**
y y'
,y y
.^-''7
/ /
/
S
v y y y
y*
-
/
/ / /
/ V y A
y y
y /
y
-
/ / f /
/A
\
w
f s ■V /
-
f/f
/y ///
/
;
I I I I I I i i I I i i
O T- o o o o Ö Ö
CNJ CO o o o o Ö Ö
■<* to <o o o o o o o
h- 00 o o o o
CT> O O T- o o
STRAIN (mm/mm)
o Ö
CN
o Ö
443

STRESS vs STRAIN 1 Hr ANNEAL® 260 degC
100.00
90.00
80.00
70.00
60.00
50.00
40.00
30.00
20.00
10.00
0.00
» —__^_—— 1
—
- y
/ y
<*
/ y
/ /
s--
/■■■
< y /
> 6«
' 4 \
y ////
- im 1
•<JBMT
Jßr'
\ I ! I ! i 1 ! T T
0.000 0.001 0.002 0.003 0.004 0.005 0.006 0.007 0.008 0.009 0.010 STRAIN (mm/mm)
444

100.00
90.00
80.00
70.00
60.00 >
0 0 Ü t 0
50.00
40.00
30.00
20.00
10.00
STRESS vs STRAIN 2 hr ANNEAL @ 260 deg C
0.00
1 *
— / f. 0
- /
A
A
/ I
- i
/ t
/ f
i /
/
*
/ / /
/ /
/ s''
<
& A-
- /
/ f /
t /
1 / J
/ J / /
M / JyM
-IT' IT
/
/ 4 ,'4M^9V|^*
/ / / ,.
' Am
/ «K
I ! ! 1 1 ! i ! I !
0.000 0.001 0.002 0.003 0.004 0.005 0.006 0.007 0.008 0.009 0.010 STRAIN (mm/mm)
445

100.00
90.00
80.00
STRESS vs STRAIN 4 hr ANNEAL @ 260 degC
0.000 0.001 0.002 0.003 0.004 0.005 0.006 0.007 0.008 0.009 0.010 STRAIN (mm/mm)
446

100.00
90.00
80.00
70.00
L 60.00 >
0 0 Ü n 0
50.00
40.00
30.00
20.00
10.00
0.00
STRESS vs STRAIN 8 hr ANNEAL @ 260 deg C
• ' — .„ , ,...— , . '■— ' » > ■■ -■■
•
x/ s-
r *
••■
, t
/ A
4
■'
— ■■ 1
mi
M / W /
W t AT / 0 If /
-
M t ä
if // fJ // I f £ ■ /
/
M i
J / ff * • " -
m m A ß Jjr f/Jk
V /
1
•
»■
m
»-■ } ' ! \ 1 ! l ! I ! 1 1
0.000 0.001 0.002 0.003 0.004 0.005 0.006 0.007 0.008 0.009 0.010 STRAIN (mm/mm)
447

STRESS vs STRAIN 16 hr ANNEAL® 260 degC
100.00
90.00
80.00
70.00
60.00
50.00
40.00
30.00
20.00
10.00
0.00 —«
0.000 0.001 0.002 0.003 0.004 0.005 0.006 0.007 0.008 0.009 0.010 STRAIN (mm/mm)
448

STRESS vs STRAIN 32 hr ANNEAL @ 260 deg C
CO CO LU <r h- CO
100.00
90.00
80.00
70.00
60.00
50.00
40.00
30.00
20.00
10.00
0.00
»■■ ■ — ■ ■ -■■■ ■ ■ ■■ '-'" > i
y'i
-
s
- /
/ j7/7
^2.
[ / f J »
J/ A, /Jt
t/ t ? J '/ / * y / yAj
y '/>
M fJJyy
r*y ff
i/Ä I&9
/yr y
\ ! ! I i ! i I I I
0.000 0.001 0.002 0.003 0.004 0.005 0.006 0.007 0.008 0.009 0.010 STRAIN (mm/mm)
449

Appendix in
TEST EQUIPMENT LIST
TENSILE TEST EQUIPMENT: All tensile testing was accomplished in the mechanics laboratory of the Air Force Institute of Technology, Wright-Patterson AFB, Ohio.
Apparatus
Controllers
Transducers
DESCRIPTION £ARU
MTS 110 kips Hydraulic Press 810 MTS Hydraulic Grips 641.37
MTS MicroConsole™ 458.20 MTS MicroProfiler™ 458.91 MTS DC Controller (load, strain) 458.11 MTS AC Controller (head displacement) 458.13
MTS 110 kips Load Cell 661.23C-01 MTS Needle Extensometer (.5 in gage) 632.53E-04 with Ceramic Rods
Other Equipment Omega Solid State Temperature/Humidity Recorder CT485 R5
Zenith 248 Personal Computer (data collection)
450
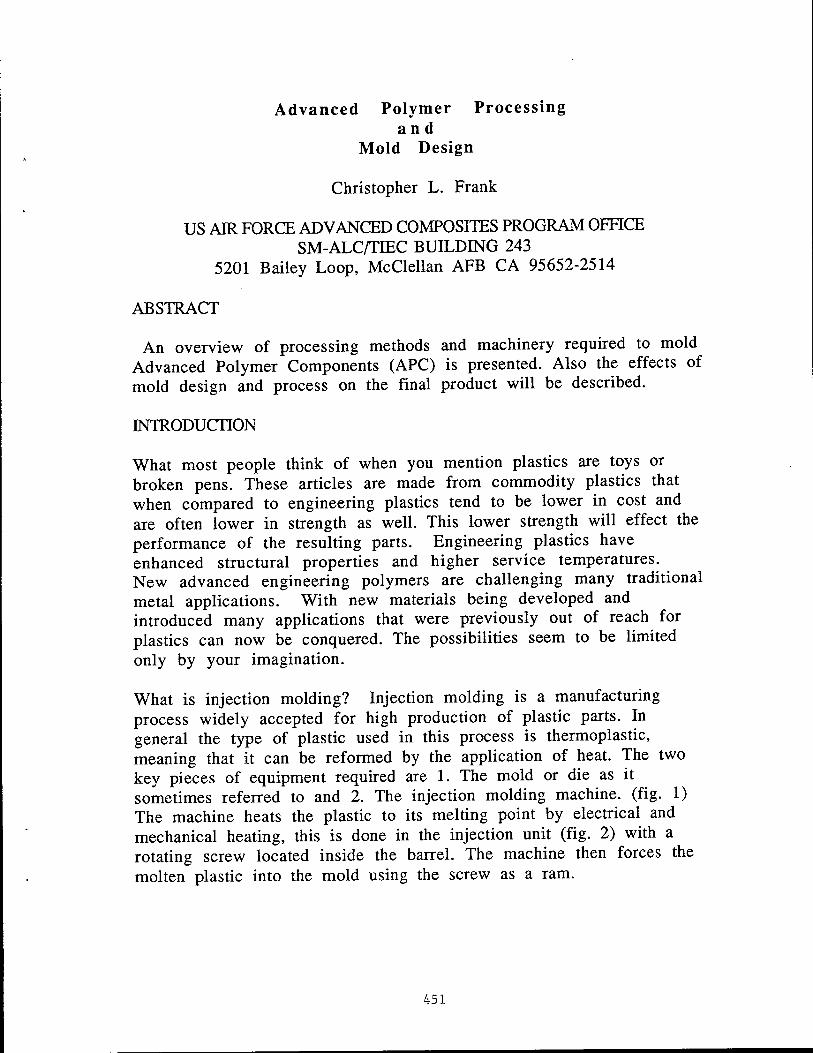
Advanced Polymer Processing and
Mold Design
Christopher L. Frank
US AIR FORCE ADVANCED COMPOSITES PROGRAM OFFICE SM-ALC/TIEC BUILDING 243
5201 Bailey Loop, McClellan AFB CA 95652-2514
ABSTRACT
An overview of processing methods and machinery required to mold Advanced Polymer Components (APC) is presented. Also the effects of mold design and process on the final product will be described.
ESfTRODUCTION
What most people think of when you mention plastics are toys or broken pens. These articles are made from commodity plastics that when compared to engineering plastics tend to be lower in cost and are often lower in strength as well. This lower strength will effect the performance of the resulting parts. Engineering plastics have enhanced structural properties and higher service temperatures. New advanced engineering polymers are challenging many traditional metal applications. With new materials being developed and introduced many applications that were previously out of reach for plastics can now be conquered. The possibilities seem to be limited only by your imagination.
What is injection molding? Injection molding is a manufacturing process widely accepted for high production of plastic parts. In general the type of plastic used in this process is thermoplastic, meaning that it can be reformed by the application of heat. The two key pieces of equipment required are 1. The mold or die as it sometimes referred to and 2. The injection molding machine, (fig. 1) The machine heats the plastic to its melting point by electrical and mechanical heating, this is done in the injection unit (fig. 2) with a rotating screw located inside the barrel. The machine then forces the molten plastic into the mold using the screw as a ram.
451

Injection Unit Hopper
Clamp Unit
Frame
Figure 1
This force is sometimes very high (as much as 20,000 psi.) Therefore a large clamping force is required to keep the mold from opening or deforming while the plastic is being forced into the mold. The clamp section of the machine is designed to maintain uniform pressure on the mold to keep it closed and in place, (fig. 3)
TYPICAL INJECTION UNIT Figure 2
After the plastic is injected into the mold the clamping force keeps the mold closed until the plastic cools. The mold is then opened and the molded parts are removed by hand or by a mechanical ejection system. All of this happens each time a part is molded.
452

1 k f
IS ^n
R5 * D D
—■ ' ' 1 1=
CLAMP SECTION OF MACHINE Figure 3
The mold which defines the part, usually made of steel, this item must retain it's shape while being subjected to extreme pressures and temperatures. The mold is a nearly solid block of metal. In the center is a cavity which defines the shape of the part. The tool must withstand hundreds or thousands of cycles of opening and closing, heating and cooling during which it must maintain all the accurate dimensions.
Using this process, very intricate parts can be made, as thin as .010 of an inch with a high degree of detail. What really controls the intricacy of the part is the mold, of course the more detailed the part, the more detailed the tool and the more expensive it becomes. If the number of parts to be molded is small, aluminum can be used but if a large number of parts are required or the tool has sliding details or actions then steel is the only choice.
The most striking advantage of injection molding is repeatability over large numbers of parts and the detail that can be included in the primary process of molding. A good deal of details such as tabs, holes, and threads can be defined at molding thereby reducing the amount of post processing required. Also after the tooling is paid for the cost per part for manufacturing remains relatively low. Molds can be of three styles; Manual, Semi-automatic and Automatic Dies. The factors in determining style are quantity of job and cost. Manual dies are usually a single cavity and are put together and removed by hand. This is a time consuming operation. The mold has to be assembled and disassembled by hand, while the parts are cooling in the die. These dies are best suited to very short runs less than 25 parts. Typically these would run on a small prototyping
453
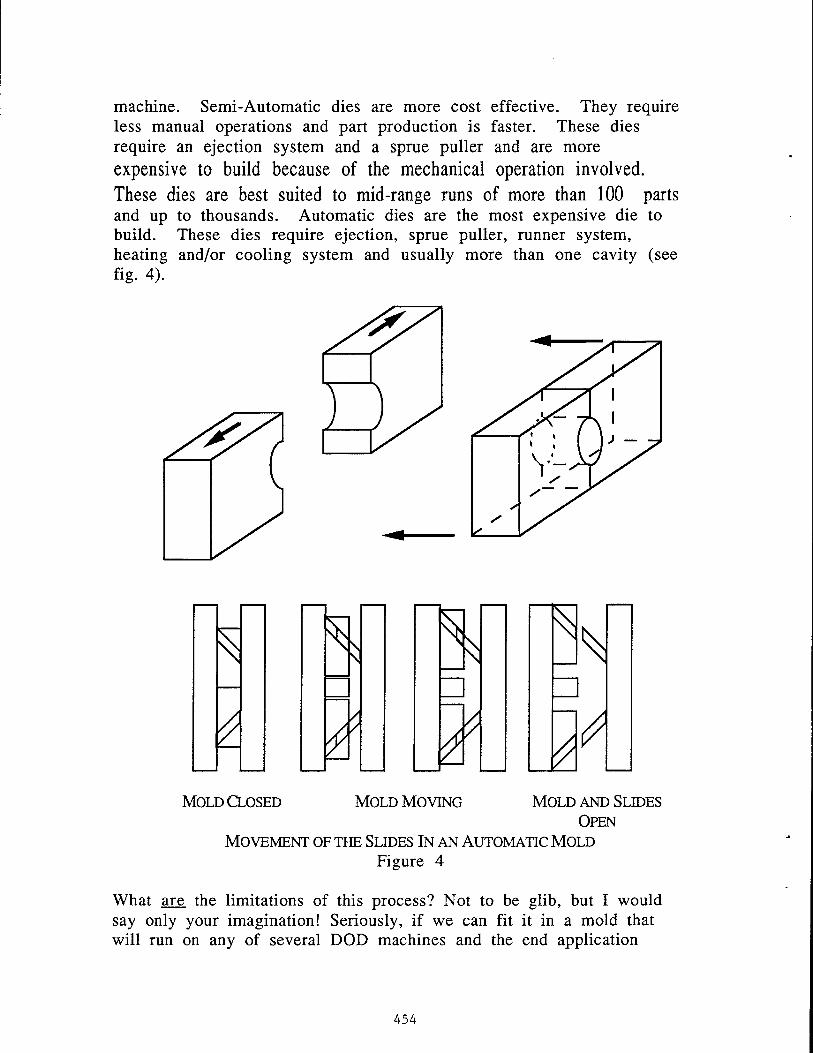
machine. Semi-Automatic dies are more cost effective. They require less manual operations and part production is faster. These dies require an ejection system and a sprue puller and are more expensive to build because of the mechanical operation involved. These dies are best suited to mid-range runs of more than 100 parts and up to thousands. Automatic dies are the most expensive die to build. These dies require ejection, sprue puller, runner system, heating and/or cooling system and usually more than one cavity (see fig. 4).
^ s
ß / /
\ \
d *
^
^
^
^
MOLD CLOSED MOLD MOVING MOLD AND SLIDES
OPEN
MOVEMENT OF THE SLIDES IN AN AUTOMATIC MOLD
Figure 4
What are the limitations of this process? Not to be glib, but I would say only your imagination! Seriously, if we can fit it in a mold that will run on any of several DOD machines and the end application
454

temperatures and strengths are compatible with the chosen material almost any part can be molded.
PROCESSING
Once a mold for the motors was built, an injection molding process had to be developed using current commercial data, and information based on previous test results. The resulting molding process cycle produced acceptable parts and follows most of the manufacturers recommendations. A typical injection speed profile is shown below(fig. 5).
Q
CO
J J E EU O
100
80
60
40
20
58 i—i—i—i—i—i—T 50 40 30 20
CENTIMETERS OF SCREW MOVEMENT (SHOT SIZE)
Figure 5
T" 10
THE RESULTS
Compared with typical injection molding runs, a very small number of articles (approx. 50 of each material) were produced. For this reason a fully developed process may not have been achieved. This may have resulted in the production of articles with less strength than was mathematically predicted. We felt that the drooling in the mold contributed to some of the lower test results. Due to those results new motors will be produced and new tests will be performed. In spite of this, the results remain quite impressive for a thermoplastic as are shown elsewhere in this report.
Without a doubt teamwork is a key element of any project. Doug Bennet, Richard Griffin and the others are very supportive of the projects we work on and often provide great insights for myself and
455

other engineers on machining and tooling. We couldn't ask for a better group of people to work with than these folks.
There is an additional process that is of interest to the APC group, stretch blow molding. In this process a preform is injection molded usually in the form of a test tube shape, (fig. 6)
AN INJECTION MOLDED TUBE HAS LONGITUDINAL ORIENTATION AND STRENGTH
Figure 6
The preform is then heated and blown to shape inside a larger tool stretching the tube like a balloon, thus producing the stretch in the hoop direction, (fig. 7) This process is currently used to produce 1 and 2 liter soda bottles out of PET material. Using LCPs it is hoped that this process could produce pressure vessels for fuel or gaseous storage.
STRETCHED/BLOWN ALIGNMENT STRENGTH
MOLDED ALIGNMENT STRENGTH
ONCE THE TUBE IS BLOWN THE RESULT IS HOOP AND LONGITUDINAL ORIENTATION AND STRENGTH
Figure 7
456
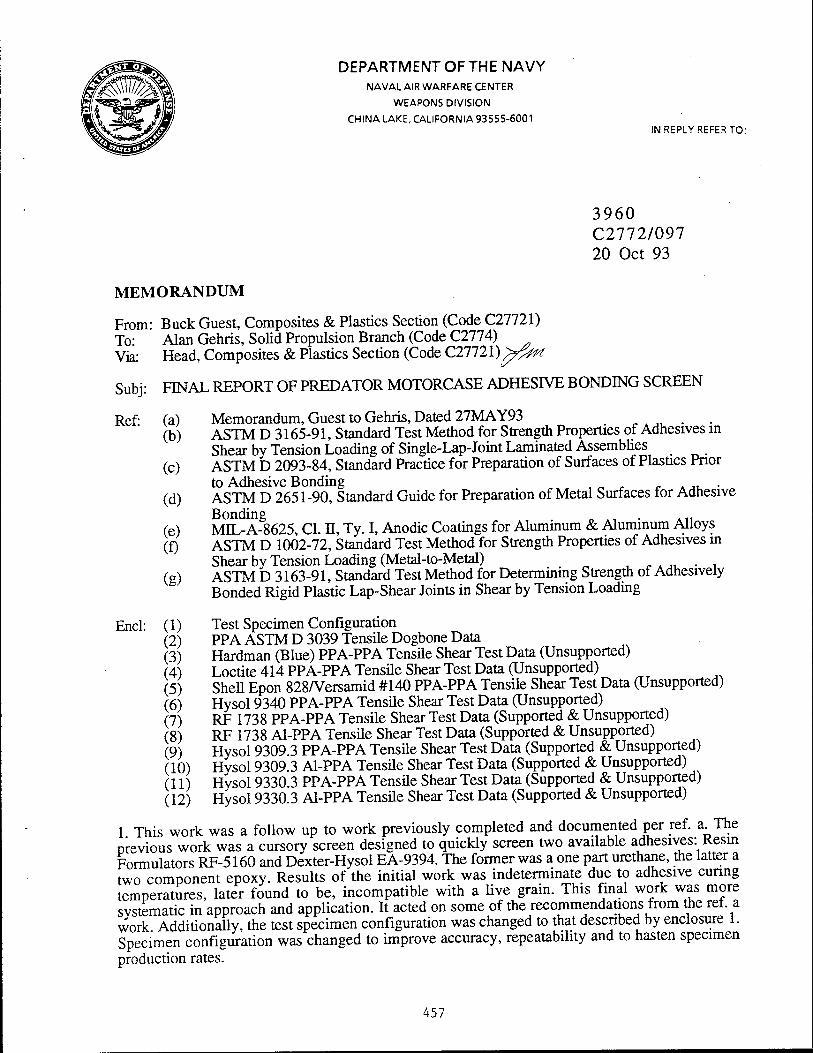
DEPARTMENT OF THE NAVY NAVAL AIR WARFARE CENTER
WEAPONS DIVISION
CHINA LAKE, CALIFORNIA93555-6001 IN REPLY REFER TO:
3960 C2772/097 20 Oct 93
MEMORANDUM
From: Buck Guest, Composites & Plastics Section (Code C27721) To: Alan Gehris, Solid Propulsion Branch (Code C2774) Via: Head, Composites & Plastics Section (Code C2772 X)^tftK
Subj: FINAL REPORT OF PREDATOR MOTORCASE ADHESIVE BONDING SCREEN
Ref (a) Memorandum, Guest to Gehris, Dated 27MAY93 „._„_. (b) ASTM D 3165-91, Standard Test Method for Strength Properties of Adhesives in
Shear by Tension Loading of Single-Lap-Joint Laminated Assemblies (c) ASTM D 2093-84, Standard Practice for Preparation of Surfaces of Plastics Prior
to Adhesive Bonding . (d) ASTM D 2651 -90, Standard Guide for Preparation of Metal Surfaces for Adhesive
Bonding . ... (e) MIL-A-8625, Cl. H, Ty. I, Anodic Coatings for Aluminum & Aluminum Alloys (£) ASTM D 1002-72, Standard Test Method for Strength Properties of Adhesives in
Shear by Tension Loading (Metal-to-Metal) . (g) ASTM D 3163-91, Standard Test Method for Determining Strength of Adhesively
Bonded Rigid Plastic Lap-Shear Joints in Shear by Tension Loading
End- (1) Test Specimen Configuration (2) PPA ASTM D 3039 Tensile Dogbone Data (3) Hardman (Blue) PPA-PPA Tensile Shear Test Data (Unsupported) (4) Loctite 414 PPA-PPA Tensile Shear Test Data (Unsupported) (5) Shell Epon 828/Versamid #140 PPA-PPA Tensile Shear Test Data (Unsupported) (6) Hysol 9340 PPA-PPA Tensile Shear Test Data (Unsupported) (7) RF 1738 PPA-PPA Tensile Shear Test Data (Supported & Unsupported) (8) RF 1738 Al-PPA Tensile Shear Test Data (Supported & Unsupported) (9) Hysol 9309.3 PPA-PPA Tensile Shear Test Data (Supported & Unsupported) (10) Hysol 9309 3 Al-PPA Tensile Shear Test Data (Supported & Unsupported) (11) Hysol 9330 3 PPA-PPA Tensile Shear Test Data (Supported & Unsupported) (12) Hysol 9330.3 Al-PPA Tensile Shear Test Data (Supported & Unsupported)
1 This work was a follow up to work previously completed and documented per ref. a The previous work was a cursory screen designed to quickly screen two available adhesives: Resin Formulators RF-5160 and Dexter-Hysol EA-9394. The former was a one part urethane, the latter a two component epoxy. Results of the initial work was indeterminate due to adhesive curing temperatures, later found to be, incompatible with a live grain. This final work was more systematic in approach and application. It acted on some of the recommendations from the ret. a work Additionally, the test specimen configuration was changed to that described by enclosure 1. Specimen configuration was changed to improve accuracy, repeatability and to hasten specimen production rates.
457

Subj: FINAL REPORT OF PREDATOR MOTORCASE ADHESIVE BONDING SCREEN
2. The adhesive screen had four objectives:
* Bond the compression molded phenolic nozzle into the aft end of the flight motorcase * Bond the Al alloy forward closure into the case * Demonstrate tensile shear strength in excess of 1700 PSI for Al & PPA substrates * Demonstrate, via hydrostatic testing, motorcase breaking bonds
These objectives will be achieved without archaic use of cheater fasteners.
3. Success criteria included satisfying the 1.1 Mean Expected Operating Pressure MEOP (1595 PSI) hydrostatic test requirement or failure of the motorcase material, whichever was less.
4. Three adhesives were screened based on the following requirements:
* Demonstrate >1700 PSI in tensile shear * Cure between room temperature- 140°F * Bond well to PPA & Al * High elongation to failure, -2% * Demonstrate consistent bond performance as a function of variable bondline thickness
Four additional adhesives were tested because they were either cheap, available or fresh.
5. The major assumption made during this test was that bond performance between PPA adherends approximates that of PPA-phenolic adherends.
6. The adhesive candidates and cure conditions were as follows:
Adhesive Chemistry Cure Schedule
Hardman (Blue) Loctite#414 Shell Epon 828/Versamid #140 Hvsol 9340
Urethane, 2 Component Cyanoacrylate Epoxy Epoxy. 2 Part
Room Temperature Room Temperature 140OF, 2 Hours Room Temperature
Hysol 9309.3 Hysol 9330.3 RF 1738-2
Epoxy, 2 Part Epoxy, 2 Part Urethane, 2 Component
140°F, 2 hours 140°F, 2 hours 140°F, 2 Hours
The last three adhesives, listed above, were of primary concern as they are high performance structural adhesives capable of meeting the adhesive requirements.
7. Test specimens were configured per ref. b, and illustrated by enclosure 1. While numerous joint configurations were referenced (ref. (f) & (g)), this joint was selected because it closely simulated the joint configuration of the predator motorcase. As such, it can be used to develop design allowables. Additionally, this joint allowed for rapid assembly and machining which was critical throughout the experiment. Bondline thickness was nominally set for 0.0045". This was set by simply using masking tape to establish the bondline. It worked well as it allowed for easy and rapid assembly. Final bondline thickness and variation was a function of the adhesive and was noted in each enclosure.
458

Subj: FINAL REPORT OF PREDATOR MOTORCASE ADHESIVE BONDING SCREEN
8. The adherends were prepared using ref. c and ref. d as a guide. Ref. d contains a callout for sulfuric anodizing, per ref. e, for non-clad Al adherends. This step was not completed as the Al forward closure did not receive a conversion coating. It was important the test joint configuration closely represent the actual service joint. Adherend preparation was the most time consuming part of the task as it required patience and spotless prep and assembly areas. All specimens were solvent wiped w/ 1,1,1-trichloroethane until the wiping rag remained clean. An abrasive blast treatment of all faying surfaces was next. The adherends were then treated to a hot soap and water scrub and rinse. At this point, the specimens were tested for a water break free surface. They were then oven dried @ 120°F for an hour. Subsequent to drying, numerous samples were randomly selected and again tested for water break. All passed, indicating the surface to be clean and chemically active.
9. Al adherends rapidly form an invisible oxide film which degrades adhesive bond performance. To minimize this, specimen assembly was completed within 2 hours (usually w/in 1 hour) of final preparation. Had the adherends been sulfuric anodized, oxidation would not be an issue. Specimens were assembled and machined using a locally manufactured assembly and machining jig. These shop aids greatly improved throughput and specimen quality.
10. Specimens were tested by the Metallic Material Section, Code C25471. They were tested at room temperature at a crosshead speed of 0.0507minute. The specimens, where noted, were tested with an ASTM D 695 compression fixture clamped to the specimen, 1 in-lb at one end, zero clearance at the other end. The D 695 fixture was used to quantify the difference between apparent and true shear stress among specimens. The results of this test was significant and is discussed with the data.
11. To achieve baseline tensile properties, five injection molded tensile dogbones were tested. Results are listed as enclosure 2. These specimens were highly consistent as expected. Average tensile strength was -43,000 PSI v 46,000 PSI per manufacturers data. Standard deviation among specimens was -2.2%. Less confidence was placed in the modulus measurements, standard deviation among specimens was -18%. Modulus was measured with an extensometer. It was possible that the knife edges may have moved slightly. Tensile modulus was -5 MSI v 5.5 MSI per manufacturers data.
12. Hardman (Blue) urethane was tested PPA-PPA. As this adhesive was not of primary importance, only three specimens were tested. Test results were as expected and are listed as enclosure 3. Lap shear averaged -2100 PSI with a low standard deviation of -5%. Failure mode was -50/50 cohesive and adhesive, respectively. Bondline thickness ranged from 0.010"-0.012".
13. Loctite 414 was tested and reported as enclosure 4. Three specimens were tested, PPA-PPA, for the same reason as para 12. It performed better than expected, lap shear values averaging -2000 PSI. Standard deviation was wider, - 16%. Failure mode was -75/25 cohesive and adhesive, respectively. Bondline thickness ranged from 0.0025"-0.005".
14. A mixture of Shell Epon 828 50% catalyzed w/ Versamid #140 was tested PPA-PPA. This adhesive did not perform nearly as well as expected based on previous experience. Shear strength, reported in enclosure 5, averaged 1100 PSI. Failure mode was an ideal 100% cohesive on two specimens and indeterminate on the third. Standard deviation was -2.5%. Bondline thickness ranged from 0.010"-0.012". Previous experience with this adhesive predicted lap shear of -3000- 4000 PSI, depending on adherend composition.
459

Subj: FINAL REPORT OF PREDATOR MOTORCASE ADHESIVE BONDING SCREEN
15. Hysol 9340 was tested PPA-PPA and reported as enclosure 6. Lap shear, based on three specimens, averaged -1400 PSI. Standard deviation was a close 2.3%. Failure mode ranged from 75-90 % cohesive. Bondline thickness varied from 0.005"-0.0075".
16. Resin Formulators #1738 was tested PPA-PPA, both supported with the ASTM D 695 fixture and unsupported. Five specimens were tested supported, three specimens unsupported. RF-1738 is composed of two low viscosity components which formed a thick gel immediately upon mixing. Resulting bondline thickness ranged from 0.014"-0.020". Test results are included as enclosure 7. Lap shear strength (supported) averaged -2100 PSI w/ -13% standard deviation. Failure mode was universally poor, 100% adhesive. This adhesive proved a disappointment, as it was highly recommended and previous positive experience w/ single component urethanes. The adhesive failure mode was largely responsible for the low lap shear values. Perhaps an alternate joint preparation schedule would allow this adhesive to perform to expectations. The adhesive performed poorly regardless of adherend composition. Lap shear strength (unsupported) also averaged -2100 PSI w/ -11% standard deviation. Failure mode was also 100% adhesive. Bondline thickness ranged from 0.010"-0.016". This adhesive was deselected from further consideration due to time constraints.
17. Resin Formulators #1738 was then tested Al-PPA, both supported with the ASTM D 695 fixture and unsupported. Five specimens were tested supported, three specimens unsupported. Test results are included as enclosure 8. Lap shear strength (supported) averaged -1800 PSI w/ -21% standard deviation. Failure mode was 100% adhesive. Bondline thickness ranged from 0.018"-0.021". Lap shear strength (unsupported) averaged -1600 PSI w/ -17% standard deviation. Failure mode was 100% adhesive. Bondline thickness ranged from 0.015"-0.021".
18. Dexter-Hysol 9309.3 was tested PPA-PPA and performed as expected. Supported specimens, with a one inch lap length, demonstrated adherend breaking bonds. The adhesive was stressed to - 3800 PSI when the adherends failed. Data spread among these specimens was -1.3%. Bondline thickness varied between 0.0045"-0.005". The lap shear specimens were prepared before the tensile specimens were tested. From previous experience it was expected the tensile specimens would fail at 23,000-25,000 PSI, instead they failed at 43,000 PSI. The last three specimens were tested unsupported and clearly illustrated the difference in lap shear values between supported and unsupported specimens. The unsupported specimens failed at -1300 PSI with a data spread of -2.5%. Bondline thickness varied between 0.0045"-0.006". The supported specimens recorded lap shear averages in excess of 3x greater than unsupported specimens. The difference between the two sets of data was due to the difference between true and apparent shear. As the unsupported specimens were put in tension the adherends deformed out-of-plane. This resulted in a combination of non uniform shear, tensile (normal), cleavage and peel stresses introduced into the bondline, especially at the ends of the overlap. The joint failed largely as a result of excessive tensile stress in the adhesive, not shear stress. This data was reported as enclosure 9.
19. To follow up on the work described by para. 18, Dexter-Hysol 9309.3 was tested Al-PPA . These specimens were prepared w/ 0.5" lap to stress the adhesive to failure while maintaining adherend integrity. Thicker adherends if available, would serve the same function. Additionally, they would reduce the difference in (apparent) lap shear values between the supported and unsupported specimens due to reduced out-of-plane deformation. With the 0.5" lap length, the supported specimens were able to shear the adhesive. This data is reported as enclosure 10. Supported specimens demonstrated average lap shear values of -4300 PSI with a standard deviation of -5%. Bondline thickness varied from 0.0045"-0.010". Failure mode ranged from 25-
460

Subj: FINAL REPORT OF PREDATOR MOTORCASE ADHESTVE BONDING SCREEN
45% cohesive. Unsupported specimens demonstrated -2800 PSI average lap shear with a wider data spread of-8.6%. Bondline thickness varied from 0.0045"-0.011". Failure mode ranged from 25-40% cohesive.
20. Dexter-Hysol 9330.3 was tested PPA-PPA and also performed as expected. Supported specimens universally broke the motorcase material before the adhesive was stressed to ultimate. These specimens were also prepared before the tensile specimens were tested. The adhesive was stressed to - 3900 PSI when the adherends failed. Data spread among these specimens was -1.3%. Bondline thickness varied between 0.004"-0.009". Specimen #5 demonstrated a wedge shaped bondline which varied from 0.004"-0.012". This was a workmanship error. Regardless, it still failed the motorcase material @ 3968 PSI. Specimens #6-#8 were tested unsupported and also illustrated the difference in lap shear values between supported and unsupported specimens. The unsupported specimens failed at -1300 PSI with a data spread of -6.2%. Bondline thickness varied between 0.006"-0.010". The supported specimens also recorded lap shear averages in excess of 3x greater than unsupported specimens. The difference between the two sets of data was explained in para. 18. This data was provided as enclosure 11.
21. Dexter-Hysol 9330.3 was tested Al-PPA . These specimens were prepared w/ 0.5" lap. Supported specimens demonstrated average lap shear values of -4000 PSI with a standard deviation of -4.7%. Bondline thickness varied from 0.006"-0.008". Failure mode was 100% adhesive for most specimens. Specimen #6 was substituted when specimen #5 was destroyed in machining. Two unsupported specimens, #7 , demonstrated -2800 PSI average lap shear with a data spread of -1.7%. Bondline thickness varied from 0.0011"-0.015". Failure mode ranged 80-85% cohesive. This data was provided as enclosure 11. This completed the mechanical testing.
22. All references to standard deviations and coefficients of variation should be used only as an indicator of process control. The sample population was too small to be construed as hard statistical data.
23. Of the primary adhesives screened, two of them met or exceeded the objectives set forth in para. 2. These adhesives were both Dexter Hysol: EA 9330.3 & EA 9309.3.
24. To validate the experiment two flight motorcases were assembled for hydrostatic testing. One motorcase was prepared as net molded, the other was filament wound with two layers of S-2 glass tow wetted with Shell Epon 826. One layer was a hoop, the other an -22° helical. The Epon 826 was catalyzed with 80-90 phr Nadic Methyl Anhydride and accelerated with 0.5 phr 2-Ethyl-4- Methyl Imidizole. The resin mixture was step cured culminating in a 250°F cure. EA 9309.3 was chosen to bond in both the phenolic nozzle and the forward closure. All components were prepared duplicating the process of the test coupons. Assembly was straight forward except for the glass wound case. The filament overwound case was cured at the glass transition temperature of the motorcase. Three to five pounds of winding tension caused deformation at the open end of the case resulting in a 0.007" out-of-round condition. This does not sound like much, but it meant the difference between scraping off the adhesive or having a liquid shim in lieu of a bondline. Additionally, significant disbonds were apparent, both visually and on x-ray, between the S-2 windings and the motorcase. The disbond, of -0.009", was due to the high coefficient of thermal expansion (-1.2E-5 in/in/°F) of the motorcase material. Approaching the gelation temperature, the resin began to fuse which effectively locked the S-2 tows at a larger diameter. Upon cooling, the motorcase contracted resulting in disbonds between the case and windings. Assembling this case required machining the forward closure -0.006" to eliminate an interference fit caused by the out-
461

Subj: FINAL REPORT OF PREDATOR MOTORCASE ADHESIVE BONDING SCREEN
of-round condition. Resulting bondlines for both cases ranged 0.007"-0.014". Nominal bond line for the nozzle end was 0.008" for both cases. The cases were instrumented with strain gages, installed in the test rig, LVDT's positioned and tested hydrostatically.
25. The S-2 glass wrapped case failed, due to rupture of the motorcase material, @ 1075 PSI. The net molded case failed, also due to rupture of the motorcase, @ 1094 PSI.
26. In summary, the Hysol EA 9309.3 achieved or exceeded each objective in this phase of the test program. The experiment demonstrated on two test articles that the bonded joint possessed sufficient margin to fail the motorcase material. The fact that the glass wrapped case failed at a slightly lower case load than the net molded case was statistically meaningless. However, the success criteria of satisfying the 1.1 MEOP requirement was not demonstrated.
27. The following actions are recommended for the next phase of the program:
* Select a room temperature or low elevated (<160°F) cure resin to eliminate case distortion and disbonds, assuming a fiber overwrap is required at all
* Rework mold core and cavity to incorporate pending configurational improvements
* Conduct moisture & chemical resistance, durability and accelerated adhesive aging tests
* Improve case performance to adequately test bonded joint integrity to 1.1 MEOP
BUCK GUEST
Copy to:
C2774 (Pritchard) C2547 (Kline, Kauffman) C2711 (Heumann) C2891 (Sanford, Hicks) Edwards, AFB (Dr. Rusek) McClellan, AFB (Chris Frank) Naval Surface Warfare Center (Rinco)
462

Test Specimen Configuration
0.25"
* Based on ASTM D 3165-91
* Supported & Unsupported w/ASTMD 695 Fixture
IT HI
0.0045" Nominal Bondline'
PPA-to-PPA or PPA-Al Adherend
.031 TYP
TIN 25 TYP
.250
i-Ü.
II i i
|—1.000—-|
r .062
.281 DRILL THRU (4 PLACES)
.250 TYP GR
-+
ASTM D 695 Fixture
GR o m
.250 -| |- Enclosure 1

ADHEREND TENSION TEST RESULTS
REQUESTER BUCK GUEST
CODE C27721
PHONE 939-8897 JO 1270803FYH
MATERIAL ADHEREND: PPA 40% CARBON FILLED INJECTION MOLDED DATE 8/16/93
TENSILE TEST RESULTS IN ACCORDANCE WITH ASTM D3039 MAXIMUM
SAMPLE WIDTH INCHES
THICKNESS INCHES
AREA SQIN
MAX LOAD LBS
TENSILE STRENGTH
PSI
DELTA LOAD LBS
DELTA STRAIN IN/IN
TENSILE MODULUS
MSI
T-1 T-2 T-3 T-4 T-5
0.4910 0.4915 0.4915 0.4920 0.4910
0.1200 0.1200 0.1200 0.1200 0.1200
0.0589 0.0590 0.0590 0.0590 0.0589
2500 2600 2500 2580 2620
42,430 44,083 42,387 43,699 44,467
1000 5000 2000 2000 2000
0.0038 0.0146 0.0057 0.0077 0.0084
4.47 5.81 5.95 4.40 4.04
AVERAGE STANDARD DEVIATION COEFFICIENT OF VARIATION
43,413 956
2
4.93 0.88 18
C. F. KLINE JR. y C25471 I
939-1945
464 ENCL (2)

SHEAR BY TENSION OF SINGLE-LAP-JOINT TEST RESULTS
REQUESTER BUCKGUEST CODE C27721 PHONE 939-8897
JO 1270803FYH MATERIAL ADHERENDS: PPA 40% CARBON FILLED INJECTION MOLDED
ADHESIVE: HARDMAN BLUE, 2 PART URETHANE, ROOM TEMPERATURE OVERNIGHT CURE DATE 8/16/93
PPA - PPA
SPECIFICATION: ASTMD3165 MAXIMUM
BONDUNE MAX SHEAR NATURE OF FAILUF SAMPLE THICKNESS WIDTH LENGTH AREA LOAD STRENGTH % COHESIVE %ADI-
INCHES INCHES INCHES SQIN LBS PSI
U-1 0.010 0.4975 1.0050 0.5000 1000 2,000 50 50 U-2 0.012 0.4960 1.0060 0.4990 1040 2,084 50 50 U-3 0.012 0.4980 1.0050 0.5005 1100 2,198 50 50
AVERAGE 1,047 2,094 STANDARD DEVIATION 50 99 COEFFICIENT OF VARIATION 5 5
C. F. KLINE JR. C25471
939-1945
ENCL (3) 465

SHEAR BYTENSION OF SINGLE-LAP-JOINT TEST RESULTS
REQUESTER BUCK GUEST CODE PHONE
JO MATERIAL
DATE
C27721 939-8897 1270803FYH ADHERENDS: PPA 40% CARBON FILLED INJECTION MOLDED ADHESIVE: LOCTITE SUPERBOND 414 CYANOACRYLATE ESTER, 1 PART, ROOM
TEMPERATURE OVERNIGHT CURE 8/16/93
PPA - PPA
SPECIFICATION: ASTMD3165 MAXIMUM
BONDUNE MAX SHEAR NATURE OF FAII -URE SAMPLE THICKNESS WIDTH LENGTH AREA LOAD STRENGTH % COHESIVE %/ \DHE
INCHES INCHES INCHES SQIN LBS PSI
414-1 0.0050 0.4980 1.0000 0.4980 1125 2,259 75 25 414-2 0.0025 0.4970 1.0020 0.4980 980 1,968 75 25 414-3 0.0040 0.4980 1.0070 0.5015 820 1,635 75 25
AVERAGE 975 1,954 STANDARD DEVIATION 153 312 COEFFICIENT OF VARIATION 16 16
C. P Kl IMP.IR 'I C. F. KLINE JR. C25471
939-1945
ENCL (4)
466
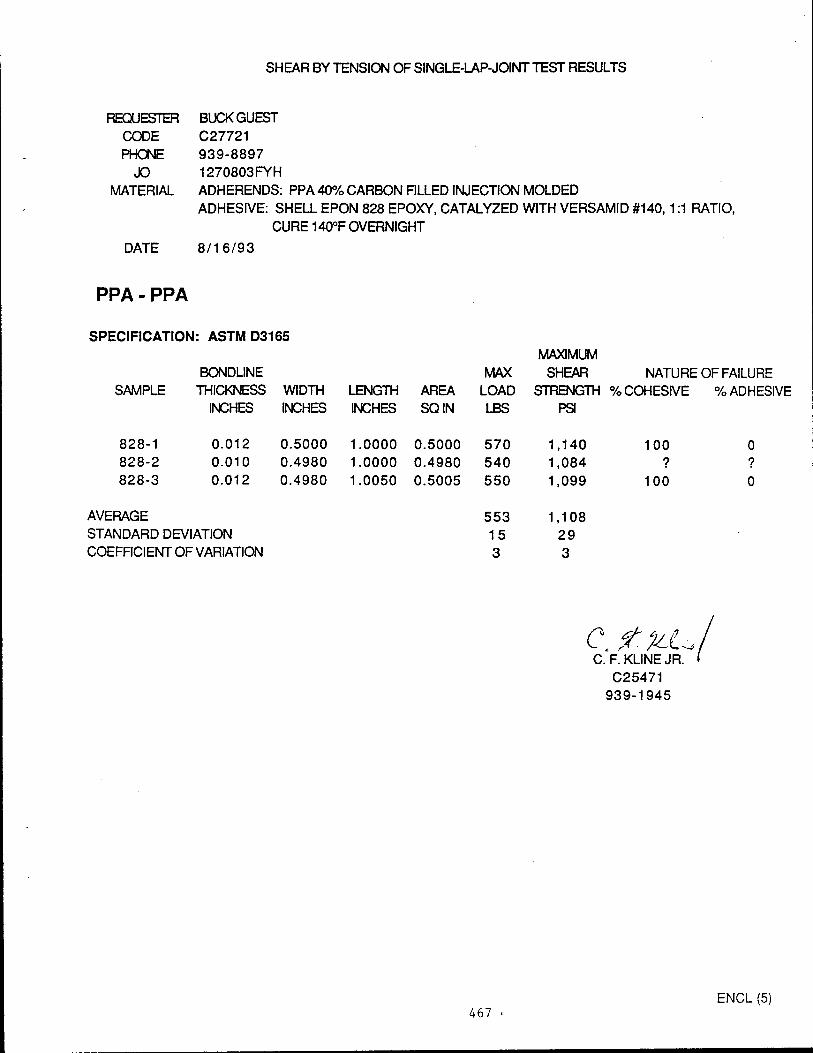
SHEAR BY TENSION OF SINGLE-LAP-JOINT TEST RESULTS
REQUESTER BUCK GUEST CODE PHONE
JO MATERIAL
DATE
C27721 939-8897 1270803FYH ADHERENDS: PPA 40% CARBON FILLED INJECTION MOLDED ADHESIVE: SHELL EPON 828 EPOXY, CATALYZED WITH VERSAMID #140, 1:1 RATIO,
CURE 140°F OVERNIGHT
8/16/93
PPA - PPA
SPECIFICATION: ASTM D3165
BONDUNE MAX SHEAR SAMPLE THICKNESS WIDTH LENGTH AREA LOAD STRENGl
INCHES INCHES INCHES SQIN LBS PSI
828-1 0.012 0.5000 1.0000 0.5000 570 1,140 828-2 0.010 0.4980 1.0000 0.4980 540 1,084 828-3 0.012 0.4980 1.0050 0.5005 550 1,099
AVERAGE 553 1,108 STANDARD DEVIATION 15 29 COEFFICIENT OF VARIATION 3 3
MAXIMUM NATURE OF FAILURE
% COHESIVE % ADHESIVE
100 ?
100
0 ?
0
C. t'M-L-J C.F.KLINE JR. I
C25471 939-1945
ENCL (5) 467

SHEAR BY TENSION OF SINGLE-LAP-JOINT TEST RESULTS
REQUESTER CODE PHONE
JO
MATERIAL
DATE
BUCK GUEST C27721 939-8897
1270803FYH
ADHERENDS: PPA 40% CARBON FILLED INJECTION MOLDED ADHESIVE: HYSOL 9340, 2 PART EPOXY, 1:1 RATIO, CURE 140°F 2 HOURS 8/16/93
PPA-PPA
SPECIFICATION: ASTM D3165
SAMPLE BONDLINE
THICKNESS INCHES
WIDTH INCHES
LENGTH INCHES
AREA SQIN
MAX LOAD LBS
MAXIMUM SHEAR
STRENGTH P9
NATURE OF FAILURE % COHESIVE % ADHESIVE
9340-1 0.0075 0.4970 1.0000 0.4970 700 1,408 9340-2 0.0050 0.4980 1.0050 0.5005 710 1,419 9340-3 0.0070 0.4970 1.0000 0.4970 675 1^358
90 75 90
10 25 10
AVERAGE STANDARD DEVIATION COEFFICIENT OF VARIATION
695 18 3
1,395 32 2
jt.VMl C C.F.KLINE JR.
C25471 939-1945
468 ENCL (6)

SHEAR BY TENSDN OF SINGLE-LAP-JOINT TEST RESULTS
REQUESTER BUCK GUEST CODE C27721 PHONE 939-8897
JO 1270803FYH
DATE 9/3/93 MATERIAL ADHERENDS: PPA 40% CARBON FILLED INJECTDN MOLDED
ADHESIVE: RESIN FORMULATORS #RF 1738,2 PART URETHANE, 12 RATIO, CURE 140°F OVERNIGHT
PPA - PPA
SPECIFICATION: ASTM D3165 AND USING ASTM D695 FIXTURE TO MAINTAIN SAMPLE STRAIGHTNESS
BONDLINE SAMPLE THICKNESS WIDTH LENGTH AREA
INCHES INCHES INCHES SQIN
MAXIMUM MAX SHEAR NATURE OF FAILURE
LOAD STRENGTH % COHESIVE % ADHESIVE LBS FS
1738-1 0.017 0.4960 0.5080 0.2520 400 1,588 0 1738-2 0.017 0.4960 0.5130 0.2544 560 2,201 0 1738-3 0.014 0.4970 0.5060 0.2515 560 2,227 0 1738-4 0.016 0.4970 0.5060 0.2515 570 2,267 0 1738-5 0.020 0.4960 0.5080 0.2520 545 2,163 0
100 100 100 100 100
AVERAGE STANDARD DEVIATION COEFFICIENT OF VARIATION
527 72 14
2,089 283 14
SAME AS ABOVE EXCEPT NO FIXTURE USED MAXIMUM
BONDLINE MAX SHEAR NATURE OF FAILUR
SAMPLE THICKNESS WIDTH LENGTH AREA LOAD STRENGTH % COHESIVE %ADHE INCHES INCHES INCHES SQIN LBS PS!
1738-6 0.010 0.4960 0.4990 0.2475 460 1,859 0 100 1738-7 0.014 0.4960 0.5110 0.2535 585 2,308 0 100
1738-8 0.016 0.4950 0.5140 0.2544 565 2,221 0 100
AVERAGE 537 2,129 STANDARD DEVIATION 67 238 COEFFICIENT OF VARIATION 13 1 1
C. F. KLINE JR. ' C25471
939-1945
469 ENCL (7)

SHEAR BY TENSION OF SINGLE-LAP JOINT TEST RESULTS
REQUESTER BUCK GUEST CODE C27721
PHONE 939-8897
JO 1270803FYH
DATE 9/3/93 MATERIAL ADHERENDS: PPA 40% CARBON FILLED INJECTION MOLDED
AND 6061-T6 ALUMINUM ADHESIVE: RESIN FORMULATORS #RF 1738,2 PART URETHANE, 1:2 RATIO,
CURE 140°F OVERNIGHT
ALUMINUM - PPA
SPECIFICATION: ASTM D3165 AND USING ASTM D695 FIXTURE TO MAINTAIN
SAMPLE STRAIGHTNESS
MAXIMUM BONDUNE MAX SHEAR NATURE OF FAILUR
SAMPLE THICKNESS WIDTH LENGTH AREA LOAD STRENGTH % COHESIVE %ADHE> NCHES NCHES NCHES SQIN LBS PS 4
A/P1738-1 0.020 0.4960 0.5080 0.2520 360 1,429 0 100 A/P1738-2 0.018 0.4960 0.5120 0.2540 590 2,323 0 100 A/P1738-3 0.021 0.4960 0.5090 0.2525 430 1,703 0 100 A/P1738-4 0.018 0.4960 0.5090 0.2525 515 2,040 0 100 A/P1738-5 0.020 0.4960 0.5030 0.2495 365 1,463 0 100
AVERAGE 452 1,792 STANDARD DEVIATION 99 385 COEFFICIENT OF VARIATION 22 21
SAME AS ABOVE EXCEPT NO FIXTURE USED
SAMPLE BUNUUNfc
THICKNESS NCHES
WIDTH NCHES
LENGTH NCHES
AREA SQIN
MAX LOAD LBS
SHEAR STRENGTH %(
PSI
A/P1738-6 A/P1738-7 A/P1738-8
0.021 0.015 0.022
0.4960 0.4970 0.4960
0.5070 0.5110 0.5120
0.2515 0.2540 0.2540
470 370 350
1,869 1,457 1,378
0 0 0
AVERAGE STANDARD DEVIATION
397 64
1,568 * F 264
AIL
COEFFICIENT Of -VARIATION 16 1 7
MAXIMUM
NATURE OF FAILURE % ADHESIVE
100 100 100
FAILURES: ALUMINUM TO ADHESIVE
0. Jt %LiJ C. F. KLINE JR. I
C25471 939-1945
470 ENCL (8)

SHEAR BYTENSDN OF SINGLE-LAP-JOINT TEST RESULTS
REQUESTER BUCK GUEST CODE C2891 PHONE 939-8897
JO 1270803FYH MATERIAL ADHERENDS: PPA 40% CARBON FILLED INJECTION MOLDED
ADHESIVE: HYSOL EA 9309.3 N/A, 2 PART EPOXY, 10022 RATIO, CURE 140°F OVERNIGHT
DATE 8/19/93
PPA - PPA
SPECIFICATION: ASTM D3165 AND USING ASTM D695 FIXTURE TO MAINTAIN
SAMPLE BONDUNE
THICKNESS INCHES
SAMPLE STRAIGHTNESS
WIDTH INCHES
LENGTH INCHES
AREA SQIN
MAXIMUM MAX SHEAR NATURE OF FAILURE
LOAD STRENGTH % COHESIVE % ADHESIVE LBS PSI
9309.3-1 9309.3-2
9309.3-3 9309.3-4
9309.3-5
0.0045 0.0050 0.0045
0.0050
0.0050
AVERAGE STANDARD DEVIATION COEFFICIENT OF VARIATDN
0.4970 1.0060 0.5000 0.4960 1.0040 0.4980 0.4970 1.0040 0.4990 0.4970 0.9960 0.4950 0.4970 0.9940 0.4940
1930 3,860 1880 3,775 1920 3,848 1870 3,778 1920 3,886
1,904 3,829 27 50
1 1
ADHEREND FAILED INTENSION ADHEREND FAILED INTENSION ADHEREND FAILED IN TENSION ADHEREND FAILED IN TENSION ADHEREND FAILED INTENSION
SAME AS ABOVE EXCEPT NO FIXTURE USED
BONDUNE MAX SHEAR SAMPLE THICKNESS WIDTH LENGTH AREA LOAD STRENGl
INCHES INCHES INCHES SQIN LBS PSI
9309.3-6 0.0050 0.4970 1.0010 0.4975 580 1,166 9309.3-7 0.0045 0.4970 1.0010 0.4975 670 1,347 9309.3-8 0.0060 0.4960 0.9970 0.4945 630 1,274
AVERAGE 627 1,262 STANDARD DEVIATION 45 91 COEFFICIENT OF VARIATION 7 7
MAXIMUM NATURE OF FAILURE
% COHESIVE % ADHESIVE
THESE THREE SAMLES DID NOT PART COMPLETELY AND WERE
NOT EVALUATED
C.F.KLINE JR. 1
C25471
939-1945
471 ENCL (9)

SHEAR BY TENSION OF SINGLE-LAP-JOINT TEST RESULTS
REQUESTER CODE PHONE
JO
MATERIAL
DATE
BUCK GUEST C27721 939-8897
1270803FYH
ADHERENDS: PPA 40% CARBON FILLED INJECTION MOLDED AND 6061-T6 ALUMINUM
ADHESIVE: HYSOL EA 9309.3 N/A, 2 PART EPOXY, 100:22 RATIO. CURE 140°F OVERNIGHT
8/26/93
ALUMINUM - PPA
SPECIFICATION: ASTM D3165 AND USING ASTM D695 FIXTURE TO MAINTAIN
SAMPLE STRAIGHTNESS
BONDUNE MAX SHEAR NATURE OF FA ILUR SAMPLE THICKNESS WIDTH LENGTH AREA LOAD STRENGTH % COHESIVE %/ ̂ DHE
INCHES INCHES INCHES SQIN LBS PS **
A/P9309.3-1 0.0090 0.4960 0.5060 0.2510 1100 4,383 45 55 A/P9309.3-2 0.0100 0.4960 0.5020 0.2490 1030 4,137 30 70 A/P9309.3-3 0.0045 0.4960 0.5060 0.2510 1180 4,702 25 75 A/P9309.3-4 0.0060 0.4960 0.5010 0.2485 1050 4,225 25 75 A/P9309.3-5 0.0050 0.4960 0.5030 0.2495 1055 4,229 25 75
AVERAGE 1,083 4,335 STANDARD DEVIATION 60 223 COEFFICIENT OF VARIATION 6 5
SAME AS ABOVE EXCEPT NO FIXTURE USED
BONDUNE SAMPLE THICKNESS WIDTH LENGTH AREA
INCHES INCHES INCHES SQIN
** COHESIVE FAILURE IN PPA
MAXIMUM MAX SHEAR NATURE OF FAILURE
LOAD STRENGTH % COHESIVE % ADHESIVE LBS FS
A/P9309.3-6 0.0045 0.4960 A/P9309.3-7 0.0110 0.4960 A/P9309.3-8 0.0100 0.4970
0.4910 0.2435 0.5090 0.2525 0.5030 0.2500
AVERAGE STANDARD DEVIATION COEFFICIENT OF VARIATION
740 725 640
702 54 8
3,039 2,872 2,560
2,823 243
9
25 40 40
75 60 60
COHESIVE FAILURE IN PPA
C. F. KLINE JR. C25471
939-1945
472 ENCL (10)

SHEAR BY TENSION OF SINGLE-LAP-JOINT TEST RESULTS
REQUESTER BUCK GUEST CODE C27721 PHONE 939-8897
JO 1270803FYH
DATE 9/3/93 MATERIAL ADHERENDS: PPA 40% CARBON FILLED INJECTION MOLDED
ADHESIVE: HYSOL 9330.3,2 PART EPOXY, 100:33 RATIO, CURE 140°F OVERNIGHT
PPA - PPA
SPECIFICATION: ASTM D3165 AND USING ASTM D695 FIXTURE TO MAINTAIN
SAMPLE BONDUNE
THICKNESS INCHES
SAMPLE STRAIGHTNESS
WIDTH INCHES
LENGTH INCHES
AREA SQIN
MAXIMUM MAX SHEAR NATURE OF FAILURE
LOAD STRENGTH/o COHESIVE % ADHESIVE LBS PSJ
9330.3-1 9330.3-2 9330.3-3 9330.3-4 9330.3-5
0.0100 0.0090 0.0050 0.0045
0.004-0.012
0.4960 0.4960 0.4960 0.4960 0.4960
1.0060 1.0080 0.9960 1.0070 1.0060
0.4990 1960 0.5000 1990 0.4940 1955 0.4995 1925 0.4990 1980
3,928 ADHEREND FAILED IN TENSDN 3,980 ADHEREND FAILED IN TENSDN 3,957 ADHEREND FAILED IN TENSION 3,854 ADHEREND FAILED IN TENSION 3,968 ADHEREND FAILED IN TENSION
AVERAGE STANDARD DEVIATION COEFFICIENT OF VARIATION
1,962 25
1
3,938 51
1
SAME AS ABOVE EXCEPT NO FIXTURE USED
BONDUNE MAX SHEAR SAMPLE THICKNESS WIDTH LENGTH AREA LOAD STRENG-
INCHES INCHES INCHES SQIN LBS pa
9330.3-6 0.006-0.010 0.4970 1.0040 0.4990 680 1,363 9330.3-7 0.0080 0.4970 1.0040 0.4990 600 1,202 9330.3-8 0.0090 0.4970 1.0030 0.4985 640 1,284
AVERAGE 640 1,283 STANDARD DEVIATION 40 80 COEFFICIENT OF VARIATION 6 6
MAXIMUM NATURE OF FAILURE
.COHESIVE % ADHESIVE
THESE THREE SAMLES DID NOT PART COMPLETELY AND WERE
NOT EVALUATED
C.J?.%U, C. F. KLINE JR.
C25471 939-1945
473 ENCL (11)
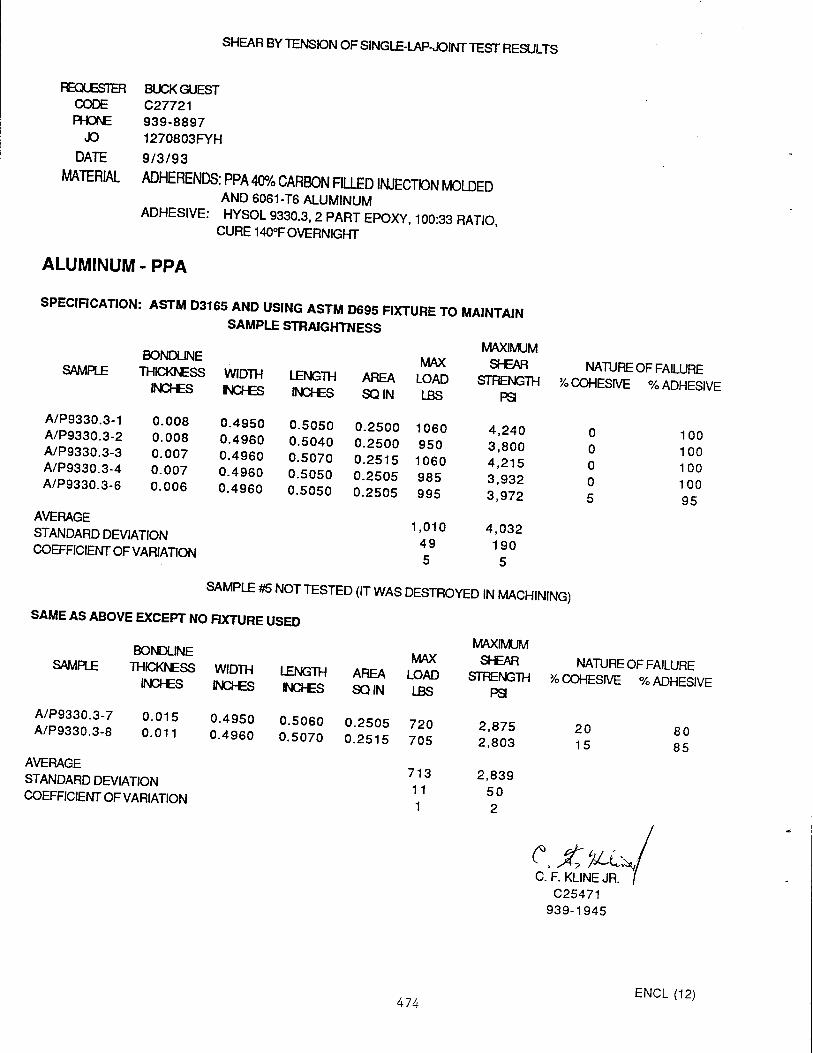
SHEAR BY TENSION OF SINGLE-LAP-JOINT TEST RESULTS
REQUESTER CODE PHONE
JO
DATE
MATERIAL
BUCK GUEST C27721 939-8897 1270803FYH
9/3/93
ADHERENDS: PPA 40% CARBON FILLED INJECTION MOLDED AND 6061-T6 ALUMINUM
ADHESIVE: HYSOL 9330.3, 2 PART EPOXY, 100:33 RATIO CURE 140°F OVERNIGHT
ALUMINUM - PPA
SPECIFICATION: ASTM D3165 AND USING ASTM D695 FIXTURE TO MAINTAIN SAMPLE STRAIGHTNESS
BONDUC ^ ™ SAMPLE TH^SS WDM LENGTH AKEA LOAD »
INCHES INCHES INCHES SO IN LBS FS
NATURE OF FAILURE 5/o COHESIVE % ADHESIVE
A/P9330.3-1 A/P9330.3-2 A/P9330.3-3 A/P9330.3-4 A/P9330.3-6
0.008 0.008 0.007 0.007 0.006
0.4950 0.4960 0.4960 0.4960 0.4960
0.5050 0.5040 0.5070 0.5050 0.5050
0.2500 0.2500 0.2515 0.2505 0.2505
1060 950 1060 985 995
4,240 3,800 4,215 3,932 3,972
AVERAGE
STANDARD DEVIATION 1,010 4,032
COEFFICIENT OF VARIATION 49 5
190 5
0 0 0 0 5
100 100 100 100 95
SAMPLE #5 NOT TESTED (IT WAS DESTROYED IN MACHINING)
SAME AS ABOVE EXCEPT NO FIXTURE USED
SAMPLE BONDLINE
THICKNESS INCHES
WIDTH INCHES
LENGTH INCHES
AREA SQIN
MAX LOAD LBS
MAXIMUM SHEAR
STRENGTH pa
NATURE 5/o COHESIVE
A/P9330.3-7 A/P9330.3-8
0.015 0.011
0.4950 0.4960
0.5060 0.5070
0.2505 0.2515
720 705
2,875 2,803
20 15
AVERAGE
STANDARD DEVIATION COEFFICIENT OF VARIATION
713 11 1
2,839 50 2
C. F. KLINE JR. C25471
939-1945
% ADHESIVE
80 85
474 ENCL (12)

Modern Ablatives. The Design, Development, and Application of Hybrid Polymers
Joseph D. Lichtenhan
Phillips Laboratory
(Emerging Technologies Branch, Rocket Propulsion Directorate)
Edwards AFB, California, 93524
The economic and environmental demands associated with modern rocket propulsion
have forced scientists and engineers to make continued decreases in the manufacturing costs of
systems, while simultaneously improving their performance, reliability, maintainability, and
environmental acceptability. Consequently, this has pushed the existing materials technology to
its critical performance limits and has antiquated a significant number of well established
manufacturing processes and materials. Because space and rocket propulsion will remain a
"mission critical" area for the Air Force and related agencies, a search for new materials and
processes which can be used to either replace or retrofit those currently in application has been
actively pursued by the DoD and its contractors. These new requirements have significantly
affected the solid rocket propulsion community in terms of the acceptability of various ablative
and insulative materials used in applications such as internal and external solid motor insulations,
antenna windows, nozzles and throats. The hybrid polymer applications program at the Phillips Laboratory is focused on the
development of new classes of ablative materials to meet the current and future needs of rocket
propulsion. This research is driven by the demand for ablative materials which offer low cost
automatable processing, improved system reliability, design flexibility, environmentally
acceptable technology, and improved ablation performance (reduced erosion rates).
This paper focuses on the development of internal ablative thermal insulation for solid
rocket motors. Solid rocket motor insulation serves three main system functions: to position the
propellant relative to the case and nozzle during system transport and operation, to control the
amount of combustible propellant surface area during system operation, and to protect the motor
case and payload from thermal damage. During a motor firing, internal insulation is subjected to temperatures that may exceed
2000 °C and pressures of 1000 psi or greater. The insulation will experience a variety of
operational stresses (compressive, tensile, shear) and a chemically oxidizing atmosphere with gas
and paniculate velocities that may range from Mach 0.1 to 10+.
475

A number of materials have been engineered to provide acceptable levels of thermal
protection in such environments. The most widely used class of materials are elastomeric
composites. These consist of a rubbery matrix (such as NBR, PI, EPDM, etc.) which has been
reinforced with various fibers (asbestos, carbon, glass, PBI, etc.) and fillers (silica, coal, etc.). These composite elastomers derive their insulative behavior by producing decomposition gases
and by the production of an insulative char layer which results from decomposition reactions
between the residual polymer matrix, fibers and fillers.
The chars produced from such ablatives are structurally weak and susceptible to removal
by mechanical erosion. To reduce mechanical erosion and aid in char retention, fibers are
typically added to the virgin material. Provided that the char remains intact, it is still susceptible
to removal via thermal and chemical ablation.
The composite-like nature of this class of ablatives also severely limits their
processability and requires them to be pattern cut, and laid into place by hand. This not only
significantly increases overall system production costs but also generates significant amounts of
scrap material (as much as 50 %) that cannot be reused. Recently a number of environmental
issues have become of concern regarding the disposal of hazardous scrap and the use of solvents
and adhesives required to glue composite insulation to the motor case and propellant. Additional
issues pertaining to the integrity of the material interfaces (traditionally called bondlines)
between the case-insulation-propellant and regarding the performance, predictability, and
durability of the insulative char have all served to lower customer confidence in the reliability of
solid propulsion systems.
Recent advances in the synthesis of polymeric hybrid materials provides an opportunity
to take advantage of a unique class of evolving materials which combine the favorable properties
of both organic and inorganic substances (hence the term hybrid).1 Hybrids show excellent
potential as ablative materials because upon pyrolysis they can be converted into a ceramic char
which may promise significantly increased resistance to oxidation and mechanical erosion than
current char forming carbon based ablative materials (Figure l).2
In addition to providing increased ablation resistance, polymeric hybrid materials can be
designed to possess enhanced material processability and thereby facilitate the reduction of
scrap-waste material. Hybrid polymers can potentially be cast, flame sprayed, extruded, or
injection molded and if necessary, recast into a variety of forms. The processability of hybrid
1 (a) Lichtenhan, J. D.; Vu, N. Q.; Carter, J. A.; Gilman, J. W.; Feher, F. J. Macromolecules 1993,26,2141-2142. (b) "Thermoplastic Elastomer Blends Prepared from Polycarbosilane and Polysilastyrene Preceramic Polymers" Joseph D. Lichtenhan, Alan G. Bolf Polymer Preprints in press, (c) "Synthesis and Characterization of Polyhedral Oligosilsesquioxane Polymers Incorporating Transition Metals" Joseph D. Lichtenhan, Timothy S. Haddad Polymer Preprints in press. 2 "Advanced Propulsion Materials: New Classes of Ablative Materials Based on Hybrid Silicon Polymers," Lichtenhan, J. D.; Haddad, T. S. 1993 Project Report, PL-TR -93-#; UDRI-TR-93-#.
476

polymers is obviously desirable from a manufacturing point of view and is more environmentally
sound because of the recycling and solventless processing options.
IlllJilaRENT ABLATIVE INSULATION
Fibers + Rubber Composite Insulation
Weak Carbon char layer
Rocket Motor Firing^
Stocket Motor Exhaust Flow
SUI mffliWfflmmMMQamxm": I
Rocket Motor Firing >
Hybrid Insulation: Preceramic Polymer
Figure 1. Conventional -Vs- hybrid materials as internal ablative solid rocket motor
insulation.
The processability of polymeric hybrid materials coupled with their unique chemical
compositions may also enable the design of compatible interfaces between the ablative insulation
and the polymeric propellants used in solid rocket motors. This capability manifests itself in the
potential for elimination of bondlines in solid rocket motor systems.3 Considering that over half
of the known solid rocket motor failures result from bondline / interfacial failures, the impact that
hybrid materials may have on system reliability and performance would be considerable.4
We have approached the development of ablative hybrid insulations through the use of
empirical ablation studies and experimental synthetic inorganic polymer chemistry.
3 (a) "Preliminary Investigation of a Graded Interface Between Solid Rocket Motor Propellant and Insulation," Joseph D. Lichtenhan, Tommy W. Hawkins, Kevin P. Chaffee^ Proceedings of the High»Energy Iteug'Matter (HEDM) Contractor's Conference, T. L. Thompson ED., November 1993, PL-TR-93-3041 450-453. (b) "Experimental Investigation into the Nature of a Graded Propellant/Insulation Interface in Solid Rocket Motors, Charles J. Noel, Joseph D. Lichtenhan. The Advanced Polymeric Components Symposium Proceedings 1993. 4 Unclassified data taken from both classified and unclassified documents supports that over half of all know solid rocket motor failures results from either failure of the insulation or from material failures at the propellant-insulation or insulation-case interfaces.
477

EMPIRICAL MODELING STUDIES
Empirical models useful for modeling and ultimately predicting the ablative performance of various materials are well known.5 Predicting the ablative performance of carbon based
systems has been the focus of most studies. This reflects the recent interest and largely
successful efforts by the aerospace industry to replace metallic components in rocket and space
vehicle propulsion systems with carbon composites. Consequently, a sound empirical and
experimental foundation covering the performance of carbon-based ablatives exists to which we
can compare the relative performance of the proposed hybrid materials.
The initial starting point in our empirical ablation studies has been to identify char
compositions that will show more chemical and thermal stability than carbon in the solid rocket
motor environment.6 Table 1 contains the relative performance data for a series of silicon based
chars, two forms of carbon char, and several more exotic char compositions. Note that the
availability and cost of suitable precursors to the latter chars makes their development and
application challenging.
Table 1. Theoretical values for various char compositions.
Char Ave Eros Rate Surface Temp Surface Species3
Z1O2 0.00 mil/sec 3271 K Zr02
ZrC 0.00 3396 ZrC
A1N 0.03 3456 AI2O3
SiC 0.48 3133 Si
B4C 0.82 3316 BN
C(PR) 0.96 3124 C
Si3N4 1.49 3328 Si
BN 2.01 3348 BN
C(ph) 2.63 3189 C
Si02 2.99 3398 Si02
ph = from phenolic precursors, pg = pyrolytic graphite, a = after a 30 sec exposure
5 Acurex Corp., "Aerotherm Charring Material Thermal Response and Ablation Program" Aerotherm division (1987) 6 Propellant used in this study was an HTPB based 88/19. Typical oxidizing exhaust species include: O2,0, CO2, OH, HC1,
478

The performance data represents the response of the char after exposure to a rocket motor
environment with a chamber pressure of 1270 psi and a flame temperature of 3632 K for 30
seconds.7 The erosion rates were determined by first calculating a non dimensional ablation rate
that is based upon a chemical equilibrium between the surface species on the char with those in
the exhaust gas stream.8 Dimensional ablation rates were then calculated by determining the
energy and mass balance at the surface of each char. Surface species, temperatures, and average
erosion rates corresponding to the initial char compositions are listed in the table above.
Table 2. Material values for the theoretical char compositions.
Char K»> Cpa Density Melt
C(ph) 0.227 x IO-3 0.47 1.14 g/cc 3593 °C
Si02 0.225 x IO-3 0.23 2.32 1704
Zr02 0.209 x IO-3 0.16 5.75 2710
SiC 0.472 x 10"2 0.31 3.22 2500
B4C 0.441 x 10"2 0.22 2.51 2470
Si3N4 0.375 x 10⁻² 0.15 3.18 1900
ZrC 0.329 x 10"2 0.08 6.66 3532
C(PR) 0.39 x 10⁻¹ 0.38 2.22 3593
BN 0.292 x lO"1 0.17 2.27 3000
A1N 0.265 x 10"1 0.17 3.26 2235
ph = from phenolic precursors, pg = pyrolytic graphite, a = Btu/lb °F, b = Btu/sec ft °F
The data in Table 1 primarily represent chemical ablation rates and have not been
corrected for any kinetic effects on the equilibrium nor have the values been corrected for
material loss that would arise due to mechanical erosion or thermal ablation. Despite the
potential for material loss from other ablative mechanisms, the erosion rates for C (ph) and C
7 The A/A* was 51.0. Boundary layer conditions were as follows: Recovery Enthalpy = 1059.7 BTU/lb; Radiation Heating Rate = 608.3 Qradin Btu/ft2 sec; Heat Transfer Coefficient = 0.1231. 8 All values for the rate constants were taken from tabulated values listed in the JANNAF thermochemistry tables.
479

(pg) are within 5 % of that observed experimentally.9 In general, surface reactions of the char
with gas stream species in rocket motor exhaust are primarily responsible for the ablation of
insulations in the low mach regions of a motor (head-end and side walls). Thermal effects on the
erosion rate data listed above can "qualitatively" be assumed to increase if the melt transition of the char is lower than the calculated surface temperature. Table 2 contains a partial listing of the
material properties for the chars.
The relative insulating performance of the chars listed above are shown in Figure 2. This
plot shows the thermal profiles of each of the materials listed examined in this study. All
compositions were thermally saturated at the end of a 30 second exposure so for comparative
purposes only 10 second profiles are shown.
7D00
-0,1 0,0 0.1 0.2 0.J
Distance (inch)
Figure 2. Thermal profiles for various char compositions.
9 This is true only for material exposure in static or low mach region of a solid rocket motor.
480

The data in Figure 2 point out the importance that thermal conductivity values (K) for
various char compositions will have on their insulative performance. In general as the value for
the thermal conductivity of the char increases the thermal profile becomes flat. Thermal
saturation of the char layer will likely not be desirable in hybrid ablatives for it may result in
conversion of the remaining virgin material into char (see Figure 1). This could potentially place
the rocket motor case or payload at risk from thermal damage.
Comparison of the predicted erosion rate data in Table 1 to the thermal profiles in Figure
2 provides a preliminary measure of guidance for the development of char producing ablative
hybrid materials.10 A ranking of the char compositions relative to the best overall combination
of insulative capacity and erosion rate for exposures over 10 seconds would be as follows: Zr02,
SiC, Si02, C. Missions requiring under 10 seconds of ablative insulation exposure may consider
usage of Zr02, ZrC, SiC, SiC-2, C, B4C, and Si3N4-
Combinations between various char compositions may also be useful in yielding ablatives
that will satisfy engineering requirements. For example, creating an ablative composed of
alternating layers of different char compositions could potentially take advantage of chars with
low erosion rates while offsetting any undesirable high thermal conductivity through the use of a
second more insulative material layer Ablative materials on current propulsion systems like shuttle and on various ballistic
missiles are over engineered to account for material loss that will occur during system operation.
This necessary engineering consideration increases both the dead weight and volume of such
systems. Reducing the inert component volume and improving ablative material efficiency
would increase the available propellant volume and improve operational performance of rocket
and space vehicle propulsion systems. Additional studies are underway to advance our understanding of ablative hybrid
materials. We are hopeful that at some point these studies will provide insights that will impact
our synthetic efforts aimed at developing new classes of ablative materials.
10 The ablative effects from gases produced upon conversion of the virgin material into the predicted chars will also contribute to the overall ablative performance The magnitude of such an effect for systems, and predicted ablation rates for the materials of interest here have not yet been verified experimentally.
481

POLYMERIC HYBRID MATERIAL SYNTHESIS
We are exploring two synthetic approaches toward the preparation of polymeric hybrid
materials with thermoplastic elastomeric properties.11 The first involves the synthesis of a new
family of preceramic copolymers for which one can tailor the mechanical and thermal properties.
This class of materials has been developed through the polymerization of appropriately
functionalized inorganic polyhedra. Polyhedral oligosilsesquioxane (POSS) compounds have
been employed as macromers in polymerizations with a variety of organic and inorganic
comonomers (Figure 3).
R ^OH R
Si-O—Si- R R AxO ' J
R-1-Si-O-l-Si-R
Si—O-Si
R
Si-O—Si
Si—O-SiT-R R-1-Si-O-l-Si-R
Si—O—Si
o
1 2 Figure 3. Polymerizable POSS Macromers
Using standard polymerization techniques and through variation of comonomeric
reagents, the composition and properties of the resulting polymers can be rationally controlled
(Figure 4). In general, the POSS segment acts as a hard (rigid) block in these linear polymeric
systems.
V X-Si—X
-2HX R-|-Si—O-l-Si-p
-Si \ R
.o-k jr-4 Jn
Si—o- /
la
R
O
THF, Cat. > a Si r,
RR'U/ R
Si \ R
Figure 4. POSS-based Homopolymers.
11 In general, desirable material properties for virgin ablatives include 5-30 % elasticity at low temperatures (-40 °F) and creep resistance at elevated temperatures (160 °F), tensile strengths from 750 -3000 psi. Specific requirements do vary with system.
482

POSS segments can enhance thermal stability, abrasion resistance, and alter a material's
thermal and mechanical properties. In particular it can be used to promote TP and TPE behavior.
POSS-based materials can also be cured via chemical or photochemical methods which serve to
crosslink the POSS group. In linear polymeric systems POSS segments may also act as branch
points and impart a material with composite like characteristics. This has been observed in the
stress-strain curves of POSS-Siloxane copolymers (Figure 5).
4*OQ
3, ©3
3,OT
iUB*
"I T I
""""' "'iTi"*"v-n
Cy-|-Si—O-I-Si-Cy
Si— O— Si
c/ \,
1b
; i s ..; i «da{f>lBcamtn:L *'% ieH
Figure 5. Plot of load -v- displacement for a POSS-Siloxane TPE copolymer.
The initial region of the curve represents elastomeric behavior (deformation to stress) of the
material. The latter portion of the curves show that the material is undergoing increased strain
without a significant amount of increase stress. Similar curves are observed for fiber or
paniculate reinforced composite materials. In POSS-based polymers this behavior has been
attributed to the POSS group restricting the alignment of individual polymer chains within the
stressed material thereby enabling the material to yield like a composite.
In addition to the above mentioned properties the POSS-based materials can also be
converted into SiC based ceramics following pyrolysis at high temperatures. Typical char yields
range from 50-70 % depending on the amount of POSS incorporation. Our second approach toward developing ablative thermoplastic hybrid materials seeks to
tailor the properties of commercially available preceramic materials (e.g. polycarbosilane,
483
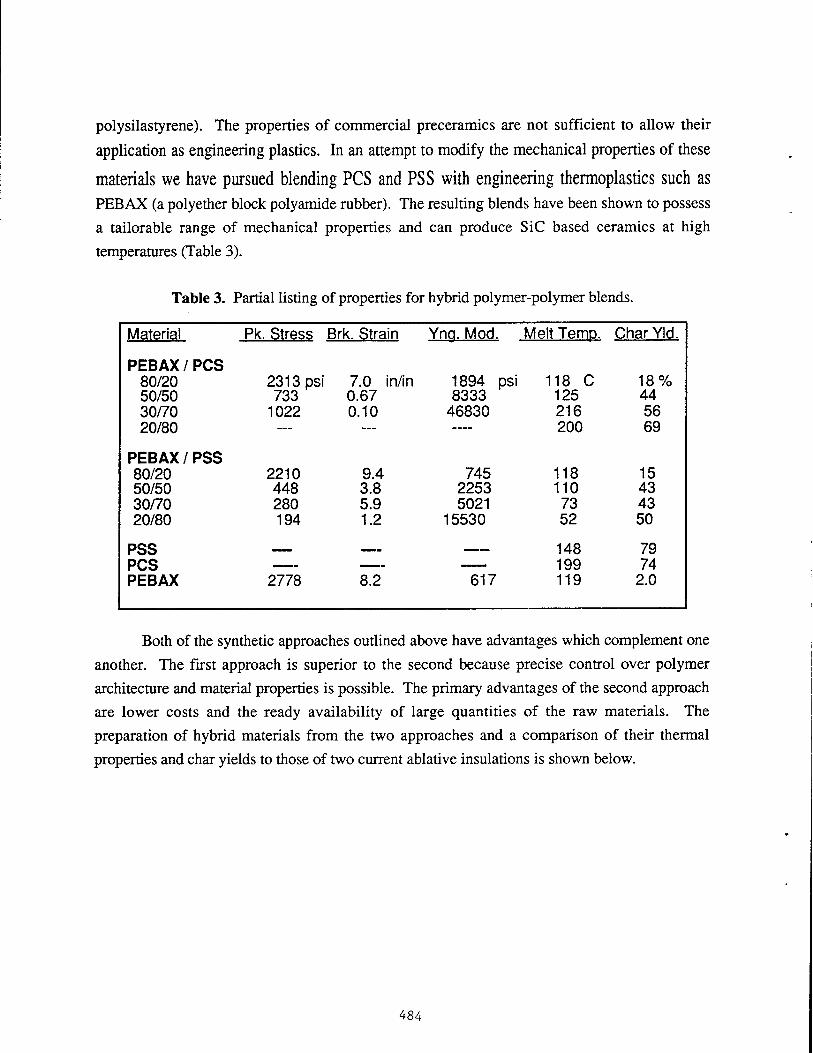
polysilastyrene). The properties of commercial preceramics are not sufficient to allow their
application as engineering plastics. In an attempt to modify the mechanical properties of these
materials we have pursued blending PCS and PSS with engineering thermoplastics such as PEBAX (a polyether block polyamide rubber). The resulting blends have been shown to possess
a tailorable range of mechanical properties and can produce SiC based ceramics at high
temperatures (Table 3).
Table 3. Partial listing of properties for hybrid polymer-polymer blends.
Material Pk. Stress Brk. Strain Yna. Mod. Melt Temp. Char Yld.
PEBAX/PCS 80/20 2313 psi 7.0 in/in 1894 psi 118 C 18% 50/50 733 0.67 8333 125 44 30/70 1022 0.10 46830 216 56 20/80 — — — 200 69
PEBAX/PSS 80/20 2210 9.4 745 118 15 50/50 448 3.8 2253 110 43 30/70 280 5.9 5021 73 43 20/80 194 1.2 15530 52 50
PSS MMM1 M». 148 79 PCS __- — ■ 199 74 PEBAX 2778 8.2 617 119 2.0
Both of the synthetic approaches outlined above have advantages which complement one
another. The first approach is superior to the second because precise control over polymer
architecture and material properties is possible. The primary advantages of the second approach
are lower costs and the ready availability of large quantities of the raw materials. The
preparation of hybrid materials from the two approaches and a comparison of their thermal
properties and char yields to those of two current ablative insulations is shown below.
484

Table 4. Comparison of hybrid polymer properties to ablative insulations.
Material Decomp. Temp. CharYld. (@ioooo Melt Temp.
EPDMIns 200 26% x-linked
POSS-1a 400 65 x-linked
TPE Ins 300 C
POSS-1bTPE 400
50/50 PCS Blend 380
50/50 PSS Blend 375
8%
51
44
39
120 C
110
125
110
In addition to matching the melt transitions of the polymeric hybrids to those of conventional insulations, the hybrid systems also show enhanced decomposition temperatures
and char yields. Investigations are underway to further the development and application of polymeric
hybrids as new ablative materials.
485
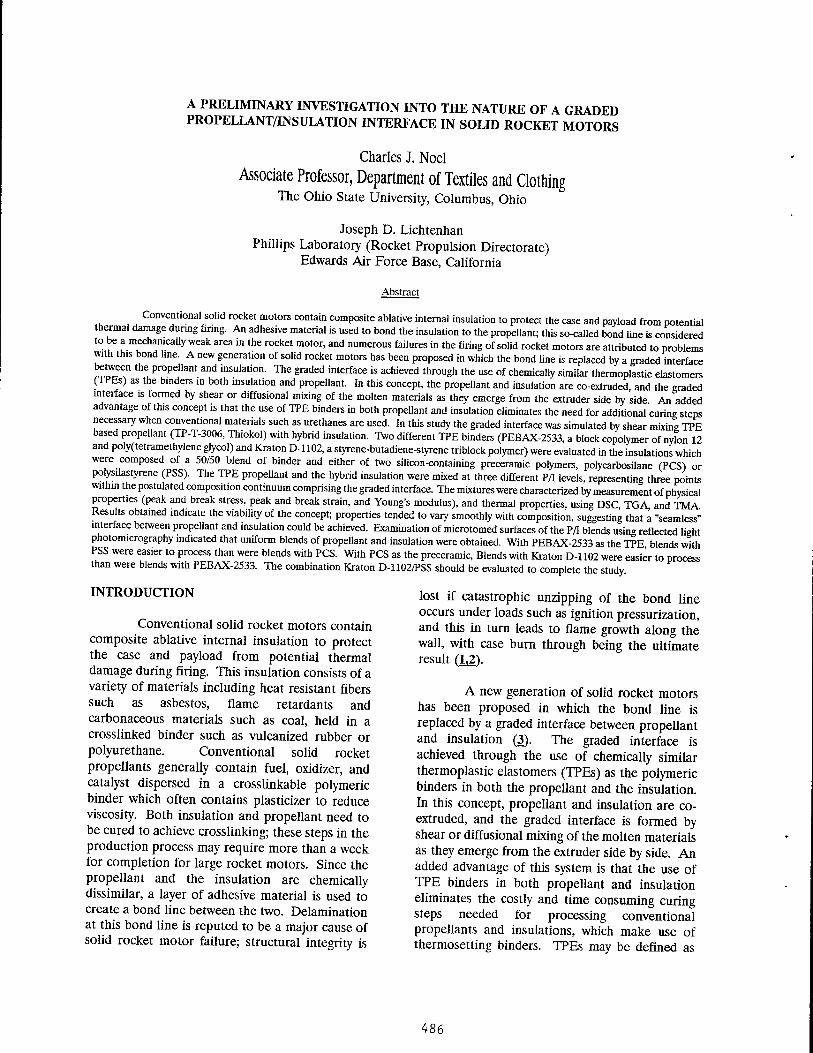
A PRELIMINARY INVESTIGATION INTO THE NATURE OF A GRADED PROPELLANT/INSULATION INTERFACE IN SOLID ROCKET MOTORS
Charles J. Noel
Associate Professor, Department of Textiles and Clothing The Ohio State University, Columbus, Ohio
Joseph D. Lichtenhan Phillips Laboratory (Rocket Propulsion Directorate)
Edwards Air Force Base, California
Abstract
Conventional solid rocket motors contain composite ablative internal insulation to protect the case and payload from potential thermal damage during firing. An adhesive material is used to bond the insulation to the propellant; this so-called bond line is considered to be a mechanically weak area in the rocket motor, and numerous failures in the firing of solid rocket motors are attributed to problems with this bond line. A new generation of solid rocket motors has been proposed in which the bond line is replaced by a graded interface between the propellant and insulation. The graded interface is achieved through the use of chemically similar thermoplastic elastomers (IPbs) as the binders in both insulation and propellant. In this concept, the propellant and insulation are co-extruded, and the graded interface is formed by shear or diffusional mixing of the molten materials as they emerge from the extruder side by side An added advantage of this concept is that the use of TPE binders in both propellant and insulation eliminates the need for additional curing steps necessary when conventional materials such as urethanes are used. In this study the graded interface was simulated by shear mixing TPE based propellant (TP-T-3006, Thiokol) with hybrid insulation. Two different TPE binders (PEBAX-2533, a block copolymer of nylon 12 and poly(tetramethylene glycol) and Kraton D-1102, a styrene-butadiene-styrene triblock polymer) were evaluated in the insulations which were composed of a 50/50 blend of binder and either of two silicon-containing preceramic polymers, polycarbosilane (PCS) or polysilastyrene (PSS). The TPE propellant and the hybrid insulation were mixed at three different P/I levels, representing three points within the postulated composition continuum comprising the graded interface. The mixtures were characterized by measurement of physical properties (peak and break stress, peak and break strain, and Young's modulus), and thermal properties, using DSC TGA, and TMA. Results obtained indicate the viability of the concept; properties tended to vary smoothly with composition, suggesting that a "seamless" interface between propellant and insulation could be achieved. Examination of microtomed surfaces of the P/I blends using reflected light photomicrography indicated that uniform blends of propellant and insulation were obtained. With PEBAX-2533 as the TPE blends with PSS were easier to process than were blends with PCS. With PCS as the preceramic, Blends with Kraton D-1102 were easier to process than were blends with PEBAX-2533. The combination Kraton D-1102/PSS should be evaluated to complete the study
INTRODUCTION
Conventional solid rocket motors contain composite ablative internal insulation to protect the case and payload from potential thermal damage during firing. This insulation consists of a variety of materials including heat resistant fibers such as asbestos, flame retardants and carbonaceous materials such as coal, held in a crosslinked binder such as vulcanized rubber or Polyurethane. Conventional solid rocket propellants generally contain fuel, oxidizer, and catalyst dispersed in a crosslinkable polymeric binder which often contains plasticizer to reduce viscosity. Both insulation and propellant need to be cured to achieve crosslinking; these steps in the production process may require more than a week for completion for large rocket motors. Since the propellant and the insulation are chemically dissimilar, a layer of adhesive material is used to create a bond line between the two. Delamination at this bond line is reputed to be a major cause of solid rocket motor failure; structural integrity is
lost if catastrophic unzipping of the bond line occurs under loads such as ignition pressurization, and this in turn leads to flame growth along the wall, with case burn through being the ultimate result (Ij2).
A new generation of solid rocket motors has been proposed in which the bond line is replaced by a graded interface between propellant and insulation (3). The graded interface is achieved through the use of chemically similar thermoplastic elastomers (TPEs) as the polymeric binders in both the propellant and the insulation. In this concept, propellant and insulation are co- extruded, and the graded interface is formed by shear or diffusional mixing of the molten materials as they emerge from the extruder side by side. An added advantage of this system is that the use of TPE binders in both propellant and insulation eliminates the costly and time consuming curing steps needed for processing conventional propellants and insulations, which make use of thermosetting binders. TPEs may be defined as
486

materials which combine the processing characteristics of thermoplastics with the physical properties of vulcanized rubber (4). TPEs are comprised of block copolymers in a variety of forms; one of the blocks is a "soft" block with a glass transition temperature usually well below room temperature, and the other is a "hard" crystallizable block with a relatively high melting point. Properties of the 1PE can be engineered by varying the nature, the arrangement, the molecular weights, and the relative amounts of the two blocks. Unlike vulcanized rubbers, TPEs are not crosslinked, but the aggregation of the hard blocks act as crosslinks at use temperatures. These associations disappear at elevated temperatures, enabling the material to be processed.
Nahlovsky, Hargis, and Raterman (5) reviewed the work done in various government, industry, and university laboratories to develop solid rocket propellants based on TPE binders, both inert and energetic. Their work concluded that polyethylene block copolymers which contained crystalline end blocks obtained by hydrogenation of low-vinyl polybutadiene and soft blocks obtained by hydrogenation of polyisoprene or high-vinyl polybutadiene would work well in this area. Palopoli et fl/.(6) report on the successful development of a solid rocket propellant using commercially available TPE binders. Propellants having up to 88% solids were obtained using Shell's Kraton D-1102, a triblock of the SBS type, where the hard end blocks are polystyrene and the soft middle block is polybutadiene. Over 250kg of a propellant designated TP-T-3006 was continuously processed on a twin-screw mixer/extruder in a demonstration of the feasibility of the concept. This propellant was selected as the TPE based propellant for use in this study.
Preceramic or hybrid polymers are a unique evolving class of materials which combine the favorable properties of both organic and inorganic substances (7). Upon pyrolysis, preceramic materials can be converted to a ceramic which is more resistant to oxidation and mechanical erosion than conventional char from organic based ablative systems. Two commercially available silicon-containing preceramic polymers are polycarbosilane (PCS) and polysilastyrene (PSS). Polycarbosilane is formally poly(methylene methylsilane) but in fact is slightly crosslinked. Polysilastyrene is a linear 1/1 copolymer of
dimethylsilane and methylphenylsilane, presumed to be more or less alternating. These two preceramics were both included in this study. Promising materials for future evaluation are hybrid polymers based on substituted polyhedral oligosilsesquioxanes (POSS) (7). These are currently unavailable in sufficient quantities for blending studies, but work is underway to scale up their production.
The purpose of this study was to characterize the graded interface which would be expected to form when molten TPE based propellants and insulations are co-extruded. The graded interface would be driven to form by either shear or diffusional mixing of the melts as they emerge side by side from an extruder or extruders. On one side of the graded interface, one would find 100% insulation and on the other, 100% propellant. Properly formed, the graded interface would consist of a continuum of blend levels, ranging all the way from 99P/1I to IP/991. It was decided to "sample" this continuum by preparing three different P/I blends at 75/25,50/50, and 25/75 by mixing presoftened propellant with presoftened insulation in a high-shear mixer. A Morton- Thiokol propellant, TP-T-3006, was chosen as the propellant. No attempt was made to optimize an insulation formulation at this time; insulations evaluated were 50/50 blends of either of two preceramics (PCS or PSS) with either of two commercially available TPEs. PEBAX-2533 was selected because of its prior use in propellants, while Kraton D-1102 was chosen because it is the TPE used in the selected propellant. It was intended to evaluate four insulations, combining each preceramic with each TPE, but the Kraton/PSS combination could not be made because additional PSS could not be obtained from its original supplier. By the time an alternate supplier was identified, it was too late to include this insulation in this study. The work is planned to be completed when the new batch of PSS is received.
METHODOLOGY
Preparation of Insulation The insulation materials used in this study were 50/50 blends of a TPE with a silicon-containing preceramic polymer. Two TPEs were used: PEBAX-2533 (Elf Atochem) is a block copolymer of nylon 12 (hard block) and poly(tetramethylene-
487

glycol) (soft block); Kraton D-1102 (Shell) is a SBS (styrene-butadiene-styrene) triblock polymer. Two silicon-containing preceramic polymers were also used: polycarbosilane (PCS) (Dow-Corning) and polysilastyrene (PSS) (Hüls). The materials were used as received from their suppliers. Blends were prepared by adding 50.0g TPE and 50.0g preceramic to lOOOmL solvent (500mL dichloro- methane ad 500mL tetrahydrofuran) in a 2.0L resin kettle. The mixture was allowed to stand for 60m; at this time the TPE was either dissolved (Kraton) or swollen (PEBAX). The resulting mix was heated to the boil while being stirred with a Ross high-shear emulsifier. Mixing continued for 60m, then the solution was poured into a Teflon coated dish (ll"x 9"x 5/8") and the solvent was allowed to evaporate. When the material appeared to be dry, it was treated in a vacuum oven at 80°C overnight to remove residual solvent. The resulting sheets were cut into pellets for blending with propellant. Three 50/50 blends of TPE with preceramic were prepared: PEBAX/PCS, PEBAX/PSS, and Kraton/PCS. The fourth blend, Kraton/PSS, was not prepared because of difficulty in procuring additional PSS from Hüls; an alternate source was located and material has been ordered so that this blend will be prepared and evaluated in the near future.
Propellant The propellant TP-T-3006 was used as received from Morton-Thiokol. The propellant contains 88% solids and 12% TPE binder system. The reported composition of the propellant is (6):
Solids:
Binder
Shellflex 71 (Shell) is a plasticizer, while Endex 160 (Shell) is a poly-ct-methylstyrene filler. The propellant was cut into pellets to facilitate blending with insulation.
Preparation of P/I Blends Blends of propellant and insulation were prepared using a quarter-pint Baker-Perkins mixer. Materials were preheated at 130°C for 30m prior to mixing. Blends of propellant and insulation
Al 21.0% NH4C104 38.7% NaN03 28.1% Fe203 0.2% Kraton D-1102 3.0% Shellflex 71 7.5% Endex 160 1.5%
were prepared in 120g batches at three different levels, 75/25, 50/50, and 25/75, corresponding to three points in the hypothesized composition continuum comprising the graded P/I interface. For the 75/25 P/I blends, 90.0g preheated propellant was placed in the bowl of the mixer and was stirred alone for 30m at 130-135°C. The bowl was then lowered, the blades scraped down, and 30.0g preheated insulation was added. This was then mixed for an additional 30m at 130-135°C. At this time, the material in the bowl appeared to be homogeneous, so no further mixing was done. The blended material was cast into lab-scale slabs (4"x 3"x 0.18") using preheated Teflon molds. The 50/50 and 25/75 P/I blends were prepared in the same manner, except that in the case of the 25/75 blends, the insulation was added in three 30.0g increments with 15m mixing for each addition of insulation.
Characterization of Materials Mechanical properties of the materials were measured using an Instron Series 1123 Tester equipped with Series IX Automated Materials Testing System 1.15. Testing was carried out at ambient conditions (23°C, 50%RH) using the JANNAF Standard Mini-Dog Bone Test. The 1.0" minibones were elongated at the rate of 1.07m. Data obtained included peak and break load, peak and break stress, peak and break strain, and Young's modulus. At least eight minibones were broken for each P/I blend.
Thermal properties were measured using a DuPont (TA) Thermal Analysis System, which included a DSC 912 module, a TGA 951 module, a TMA 2940 module, and a Model 2000 Thermal Analyst controller. Heating rates were 10°C/m for the DSC and TGA, and 3.0°C/m for the TMA The TMA was operated with a 10g weight in the penetration probe mode, and a 2g weight in the expansion probe mode.
Scanning electron micrographs of materials were taken using an International Scientific Instruments Model CL6 equipped with a LaB6 filament. Photo- micrographs were taken using a Jennalumar research microscope equipped with the Datex-Man Automatic-2 photographic system, using both ASA 64 color film for slides and ASA 100 color print film.
488
RESULTS AND DISCUSSION
In this study, an effort was made to characterize the nature of the graded interface between propellant and insulation in solid rocket motors. The graded interface is postulated to form when the thermoplastic propellant and insulation are extruded side by side and the two melts are driven to mix by shear forces. The graded interface consists of a continuum of compositions ranging from 100% propellant on one side to 100% insulation on the other. To characterize this interface, mixes of propellant and insulation were made at the 75/25, 50/50, and 25/75 levels, representing three points within the composition continuum. The experiment was designed to evaluate for different insulations, made by blending either of two TPEs with either of two preceramics at the 50/50 blend level. The two TPEs were PEBAX-2533, a block copolymer of poly- (dodecanoic lactam) (nylon 12) and poly- (tetramethylene glycol), and Kraton D-1102, an SBS (styrene-butadiene-styrene) triblock copolymer. The two preceramics were poly- carbosilane (PCS) and polysilastyrene (PSS), which is a 50/50 copolymer of dimethylsilane and methyl- phenylsilane. Three of the four insulations were evaluated; the fourth, Kraton/PSS, will be evaluated in the near future to complete the study.
Preheated metal plates were then placed on top of the material in the mold to assist the material in filling the cavity in the mold. When cool, standard JANNAF mini-dog bones were cut from these molded slabs for physical testing. Since the minibones were all cut using a standard die, the length and width of all the minibones were close to being the same. Cross-sectional areas of the minibones were determined for the calculation of stress and modulus values. Since the widths of the minibones were fairly constant, most of the variation in the values of the calculated areas may be attributed to differences in the thicknesses of the individual specimens. Increased thickness and increased variability in thickness resulted when material was more difficult to spread. Table 1 shows the area measurements for the P/I blends as a function of blend level and composition. The data shown support the qualitative observations on processability; the thinnest minibones were obtained with P/I blends containing PEBAX/PSS insulation, and the area (and hence thickness) tended to increase with insulation content. The high coefficient of variation for the 50/50 P/I blend with PEBAX/PSS insulation is due to a bimodal distribution; five of the tested minibones had an average cross-sectional area of 0.0094 in2 (0.35% C.V.), while the other four tested had an area of 0.0162 in2 (1.84% C.V.).
Before discussing the results of physical testing and thermal analysis, some qualitative observations regarding the processability of the P/I blends should be reported. All mixes were made at 130-135°C using a Baker-Perkins high-shear mixer operating at 50 rpm, with the exception of the 25/75 P/I blend with PEBAX/PCS as the insulation. This material could only be mixed at 30 rpm because its viscosity was apparently too high for the mixer. (One fuse was blown attempting to mix at 50 rpm.) After mixing, all P/I blends were hand cast into preheated Teflon molds by scooping a spatula full of material out of the bowl of the mixer, and spreading the material onto the mold. P/I blends at the 75/25 level were invariably easier to spread than either 50/50 or 25/75 blends; 50/50 blends were generally easier to spread than 25/75 blends. Blends containing Kraton/PCS insulation all spread easier than the corresponding blends containing PEBAX/PCS insulation. However, all the blends containing PEBAX/PSS insulation spread easier than any of the other blends, regardless of P/I blend level.
The results obtained from the physical testing of materials are shown in Table 2. This table contains the results obtained for the P/I blends as well as the results obtained for the propellants and the insulations alone. The physical properties of solid rocket propellants most often reported in the literature are the Peak Stress, Break Strain, and Young's Modulus. These values are given in Table 2 along with values for Break Stress, Peak Strain, Peak and Break Load, and the ratios of Peak to Break Stress (PS/BS) and Peak to Break Strain (PE/BE). Examination of the data for the P/I blends shows that Peak and Break Load and Peak and Break Stress increase with increasing insulation content in every case, and that the values of Peak and Break Stress for these blends fall between the values obtained for the propellant and the pertinent insulation. Plots of Peak Stress vs. Insulation Content show a smooth increase from 0 to 100% Insulation in all three cases, with the measured values being below values calculated by use of an additive law of mixing for the two insulations containing PCS, and above those calculated values for the PEBAX/PSS insulation.
489

TABLE 1
CROSS-SECTIONAL AREA OF JANNAF MINI-DOG BONES FOR PHYSICAL TESTING
Insulation P/I Number Area (in2) Std. Dev. (in2) C.V. (%)
PEBAX/PCS 75/25 50/50 25/75
8 8 9
0.0354 0.0302 0.0420
0.0029 0.0066 0.0078
8.21 21.90 18.59
Kraton/PCS 75/25 50/50 25/75
8 8 8
0.0349 0.0364 0.0355
0.0029 0.0010 0.0037
8.38 2.78
10.43
PEBAX/PSS 75/25 50/50 25/75
8 9
10
0.0122 0.0124 0.0145
0.0008 0.0036 0.0016
6.38 29.25a
10.68
aBimodal distribution
The PEBAX/PSS insulation had the lowest Peak Stress of any of the three insulations studied. Peak Strain also increased with increasing insulation content in every case, as did Break Strain, with the single exception of the 50/50 P/I blend with PEBAX/PCS insulation. This composition reached its Peak Stress at a strain of 9.1% (0.091 in/in) but did not break until a strain of 158.7% was reached. Plots of Break Strain vs. Insulation Content show a smooth increase from 0 to 100% Insulation in all three cases, with the single exception noted above; the measured values were slightly below values calculated using a simple additive law of mixing for the compositions where the insulation contained PCS, but were far below these calculated values for blends containing the PEBAX/PSS insulation. The Young's Modulus data show no clear trend with increasing insulation content. The propellant itself, having 88% solids and only 12% TPE binder system (which is less than half polymer) showed low Young's Modulus (750 - 1325 psi). Of the materials tested, only the unblended TPE PEBAX- 2533 showed a lower Young's Modulus (581 psi). When PCS is blended with PEBAX at the 50/50 level to form a hybrid insulation, the modulus increased tremendously, from 581 to 8333 psi, but when PSS is used with PEBAX, the modulus only increased from 581 to 2253 psi. The unblended TPE Kraton D-1102 had a higher modulus than the neat PEBAX (2132 vs. 581 psi); the Kraton/PCS insulation had the same modulus as the unblended Kraton (2175 vs. 2132 psi).
Whatever the modulus of the unblended insulation, the 75/25 P/I blends all had much higher modulus than the propellant alone. There was no further identifiable trend with increasing insulation content. For P/I blends with PEBAX/PCS insulation, Stayed high and fairly constant as insulation increased from 25 to 100%. For P/I blends with Kraton/PCS insulation, modulus was lower than for the PEBAX/PCS blends, and appeared to decrease with insulation content over the same range. For P/I blends with PEBAX/PSS insulation, modulus values were comparable to those obtained with PEBAX/PCS, except for the 50/50 P/I blends, where the PEBAX/PSS composition had a lower modulus; there was no clear trend over the composition range. The modulus data showed a fair amount of scatter within the samples of 8 to 10 minibones. Coefficients of Variation for Young's Modulus ranged from 10.33% (50/50 P/I blend with Kraton/PCS) to 39.11% (75/25 P/I blend with PEBAX/PCS), and averaged 19.73% for all P/I blends tested. Svob (8) reports that it is common for the C.V. for Young's Modulus to approach 15%; many of the data reported here seem to show more scatter.
The ratios of peak stress to break stress (PS/BS) and peak strain to break strain (PE/BE), taken with the actual values of the stresses and strains, provide some information regarding the shapes of the stress-strain curves. The
490

co CO
CO CL
<N co r-v CO N W ■— O CO Ö Ö Ö
O CO CO o o o co •<q- ■—
•— r-~ <— ■— o o CM CO O Ö Ö Ö
CO CM O l-v O CO r-~ co O
CO -S3- "3- o o •— |-~- N CO odd
■— CM lO CO CO CM m co co
CO -o o in CO CO
o CO O
r~- CM CM -O OO o
•o -o co co o o
o o o o o o o
CM CM lO CO •— CO
CM CM O
O co
■— o
CO in
<
co Q Z UJ
g 5
"ö o
B £. co ^~ ^ c
CO =0
Q_
CO
CO
•o O O
CO o
c o -»= c co ^r
CL
T3 O
" O
CL
CM o o CM T O O in O r- r- in
CM N O r~- co -o CM lO CO o'-ci
co ■—■ iq CO CO •— in r^ m
■— CM
in CM co
o •— m CM iri ö
o •— r^ co o o o o co d ö d
■o in •-; SOD* CO
co o ■— CM CM
m ■— o CO <— 1
CO CO o M o co OON T CO <—
o o m co i— o CO N N ö ^ co"
-q cq to co Ö O ■^ MO
•— CO
■— O CO •— CO o in CM -o
» 0O N rv o in o -^r m ö ■-: CO
~P °: •—. CO N o' o o o ■— ■— CO
00 r- r^ CM
<l N « CO CM <— -O T O co co m
-O CO CM O T r-~ <— T r-v O O O
O-O CO
Ö l< ^ o -"a- in ■— CM CO
CO CO O co O oo o — o
o -o in i— CO CO CM in UJ T CM CO co m co r-. r^ O CO lO CO CM ■— i—
'— •— CO CM CM CM
co in
-O T r-» CO CO CM i— co -O
ö ö d
CO lO CO
s ■-: cci ■<3- •^ m CM CO T
i~~ in o qcN-q co" "T -Ö
co O
co O
< LU
O UJ at o. UJ o_
Q
<
o in CM
CM ■O CO
o O ^ ■— ONO in o co
•"3- CM CO o o o
o o o co O co •o in
CM
CO o o'
O CO CO <> CO M- O* I-». rj- CM 11
67
595
o CO CO co co
-o o r-~ co
CM d CO •— CO CO o CM
CO CM o
CM CO CM m •q- in
co CM
N CO CO CO O CO
o o
8 ^ CO ^T O- CM
CO O CO
r-. o in o O m <— r^ o •— O CO ■T •— o CO *—
oo o ■^ CO
O CM CO CM ^r ^o
CM -°. o
O CO o •^r o CM
Q.
o a.
O
E o © o o
CL -o °8
üi II O F= "T in as a. >■ LU I— O a. T m 2cc a. O 5 -rj "Ö O
O O «2
c
CO
E o
o 2
CL
a E o
CO
mom CM m r-»
mom NION
m o CM to
m mom CM m N
mom MOW
mom MON
m o r^ m
m CM
mom N m CM
co co co O O U D_ Q. CL
CO CO CO o o o CL CL CL CL CL CL
CO CO CO CO CO CO CL CL CL
PE
BA
X/
PE
BA
X/
PE
BA
X/
Kra
ton
Kra
ton
Kra
ton
PE
BA
X/
PE
BA
X/
PE
BA
X/
Kra
ton
Kra
ton
Kra
ton
NO
Ol
N00
2 N
003 T m o
o o o o o o z z. z. N
007
N00
8 N
009 C
LON
S
ION
ILO
N
ooo ouo oou oou
o u. o co
Cü UJ a. o a. —i < g co > X a.
<D > "a> > D
1- (1 ® o Q. <r>
2 O F
CL o T5
o u <D V o U) F SI o <r> 1— £
F F F o o
LL u_
^ LL. ^ -n •n o
888 CO CO CO
o o m m o o m m
CO CO
CM 9- CL
CL CL CL CO CO CO UJ LU UJ CL CL CL
O O m m O O m m
CM o
<?<?<? <:<:$ oo l-r >-r i-r cococo 7^7^
CO U CL
c o
2 2 2 :£ M £:
491

PEBAX/PSS and Kraton/PCS insulations tended to reach maximum stress very close to their breaking points; this peak stress is only 2-5% higher than the break stress and is reached at an extension
within 4%of the extension at break. This behavior is very similar to that of the two TPEs, and these two insulations have high break strains as do the two TPEs. By contrast, the PEBAX/PCS insulation has a peak stress nearly 12% higher than its stress at break, and reaches this at only 83% of its break extension, which itself is relatively low (67%). The TP-T-3006 propellant itself has a stress-strain curve similar in shape to that of the PEBAX/PCS insulation; peak stress is 15% greater than stress at break, and is reached at 89% break extension. The values for peak stress and break strain for the propellant are of course much lower for the propellant than for this insulation, as well as for the other two insulations, since most of the mass of the propellant (>95%) is not load-bearing. With 75/25 P/I blend ratio, and either PEBAX/PCS or Kraton/PCS insulation, peak stresses are 90- 180% greater than stresses at break, and these peak stresses are attained at only 18-21% of break extension. The most unusual stress-strain curve was exhibited by the 50/50 blend of propellant with PEBAX/PCS insulation; the peak stress was 40% higher than the stress at break, and the peak stress was reached at an extension which was, on average, only 7.8% of the extension at break. By contrast the 50/50 P/I blend with Kraton/PCS insulation had a peak stress 36% higher than the break stress, but this was reached at 87% of break extension. At the 25/75 P/I blend levels the PS/BS and PE/BE ratios were similar to propellant for the PEBAX/PCS insulation, and similar to insulation for the Kraton/PCS insulation. For the PEBAX/PSS insulation, the PS/BS ratio was greater for the 75/25 P/I blend than for the propellant alone, then decreased steadily as insulation content increased from 25 to 100%. The PE/BE ratios showed the opposite behavior. Even at the 25/75 P/I blend level, both ratios were more similar to those of propellant than those of insulation.
The data in Table 2 point out that the propellant is not particularly heat stable. Data taken from reference 6 for peak stress, break strain and Young's modulus are reported in this table, as well as two sets of data obtained in the course of this study. Minibones were cut from slabs machined from bricks of propellant which had been stored at Edwards AFB for over one year.
Minibones were also cut from slabs which were cast from propellant given the same treatment as the P/I blends: preheated at 130°C for 30m, mixed alone for 30m at 130°C, then cast into preheated
Teflon molds. Test results from these samples are also included in Table 2. The results obtained from the stored material suggest a slight deterioration in properties; peak stress for stored material was 93 psi compared to 100 psi reported in reference 6, break strain was 16% compared to 25%, and Young's modulus was 1046 psi compared to 750 psi. An increase in modulus is consistent with a decrease in elongation. In comparison to the stored material, the processed (remixed) material was badly degraded. Peak stress decreased from 93 to 25 psi, break strain decreased from 25 to only 3.6%, and modulus increased from 1046 to 1325 psi. The polymeric TPE binder may be undergoing slow degradation through contact with the propellant's oxidizers on storage; this degradation is accelerated by processing the propellant at elevated temperatures. It is recommended that a property profile over time be maintained for stored propellant to see how serious a problem this might be. The accelerated degradation upon heating is not a problem, since the graded P/I interface would be formed at the time the propellant is first extruded; it is not intended that previously formed propellant would be reprocessed in the co-extrusion model. In all property comparisons discussed above, values for stored propellant were used. Values reported above for all P/I blends may be lower than those which would actually be obtained in a graded interface, since the propellant component of the blend has undergone degradation. The TPEs in the insulations in the P/I blends could also possibly undergone some degradation during the long contact with the propellant's oxidizers during the mixing at 130°C.
To evaluate the uniformity of the blends obtained, scanning electron microscopy and reflected light photomicrography of microtomed surfaces were both used. The scanning electron micrographs taken at magnifications of 500-1250X were difficult to interpret. Uniformity appeared good but the field of view was so small that this was hard to judge. Paniculate matter was visible in both surface and cross-sectioned specimens; the amount of particulates decreased with increasing insulation content in the blends. No evidence for or against phase separation could be inferred. Photomicrographs taken at about 75X
492

magnification taken using light reflected from microtomed surfaces showed the propellant and insulation to be well mixed, at least at the macro level. The aluminum particles in the propellant were clearly visible, as were large and small clear crystals of the ammonium perchlorate and sodium nitrate oxidizers. Tiny bright orange crystals, presumably of ferric oxide, could be seen in some fields of view. The aluminum particles and oxidizer crystals appeared to be uniformly distributed over each specimen viewed, and were definitely in proportion to the level of propellant in the blends. Based upon these qualitative observations, the conclusion was reached that the mixing procedure used did produce uniform blending of propellant and insulation.
The results obtained by thermal analysis are summarized in Table 3. This table includes results obtained by Thermogravimetric Analysis (TGA), and by Differential Scanning Calorimetry (DSC). The onset temperature determined by TGA represents the temperature at which the first evidence of weight loss was detected, while the onset temperature determined by DSC represents the temperature for the first clear deviation from the baseline. The decomposition temperature determined by TGA was obtained by constructing tangents to the initial and steepest portions of the weight-temperature curve, and determining the temperature of their intersection; this roughly corresponded to the temperature at which the specimen weight loss was 10%. The decomposition temperature determined by DSC was taken as the peak temperature of the first significant exotherm; usually there were additional exotherms at higher temperatures and these were generally smaller than the first. The glass transition temperatures determined by DSC were taken as the temperatures where baseline shifts occurred, representing a change in specimen heat capacity. Glass transition temperatures by Thermomechanical Analysis (TMA) and by Dynamic Mechanical Analysis (DMA) will be measured as will softening temperatures by TMA. Percent Char by TGA as reported in Table 3 was the weight of the residue after heating the specimen from room temperature to 1000°C at the rate of 10°C/m, expressed as a percentage of the original weight of the specimen.
The propellant TP-T-3006 showed first evidence of weight loss at 195°C, with rapid weight loss commencing at 242°C. By DSC, all samples
containing any propellant showed a small but characteristic "signature" endotherm at 243°C, followed immediately by a significant exotherm apparently associated with decomposition. The hybrid insulations alone all exhibited higher temperatures for initial weight loss, compared to propellant, and much higher decomposition temperatures, by TGA The two insulations made with PEBAX as the TPE had decomposition temperatures of 375-381°C while the Kraton/PCS insulation had a decomposition temperature of 443°C, by TGA TGA decomposition temperatures for P/I blends with PEBAX/PCS insulation did not increase with increasing insulation content as expected, but TGA decomposition temperatures for P/I blends with both Kraton/PCS and PEBAX/PSS did increase with increasing insulation content. Residues from P/I blends with all three insulations, reported as % Char by TGA, tended to approach or exceed the values obtained for the insulations alone, and were always higher than the residue from the propellant alone. The residue from the propellant alone was a silvery gray powder; the residues from the P/I blends and the insulations alone were hard and sometimes brittle black ceramic-like material. Qualitative elemental analysis of these residues by ED AX showed that the residue from the propellant alone contained aluminum and oxygen, but no sodium or chlorine; residues from P/I blends contained aluminum, sodium, silicon, and oxygen, but no chlorine; and residue from insulations alone contained only silicon and oxygen. Since the propellant contains aluminum as fuel and both ammonium perchlorate and sodium nitrate as oxidizers, it was expected that its residue would consist of aluminum oxide and sodium chloride; the alumina was detected but the salt was not. The preceramic polymers in the hybrid insulations should convert to ceramic materials by pyrolysis and oxidation, yielding silicon oxide, silicon carbide, and silicon oxycarbide. The silica was detected, but the carbon derivatives were not.
Glass transition temperatures as determined by DSC were well below room temperatures, as would be expected for elastomeric materials. The values were determined by analysis of the DSC baseline in the temperature range from -150°C to 100°C. A shift in the baseline is indicative of a change in the heat capacity of the material being tested; this shift was very small in all cases where it was detected, and the shift was not detected every time. About one out of every
493

TABLE 3
THERMAL ANALYSIS OF PROPELLANT, INSULATION, AND P/I BLENDS
% Ins. T-onset T-decom % Char Tg T-onset T-decom (TGA) (TGA) (TGA) (DSC) (DSC) (DSC)
TP-T-3006/(PEBAX-2533/PCS) 0 195°C 242°C 34.3 -92°C 243°C 300°C
25 171 246 43.1 -83 243 287 50 187 250 49.9 -69 243 284 75 168 238 46.9 -71 243 419
100 225 381 43.5 -67 327 425
TP-T-3006/(Kraton D-1102/PCS) 0 195 242 34.3 -92 243 300
25 191 333 43.1 -104 243 315 50 180 398 42.8 -79 244 345 75 245 440 45.1 -78 245 354
100 238 443 38.5 -79 270 379
TP-T-3006/(PEBAX-2533/PSS) 0 195 242 34.3 -92 243 300
25 197 266 37.1 -71 243 271 50 183 264 47.3 -91 243 270 75 226 356 42.1 -87 243 264
100 285 375 42.2 -66 235 409
six traces did not show a measurable base line shift. The DSC glass transition temperatures reported are the average of at least two detectable shifts. The values for the insulations were all lower than that for the propellant; values for the P/I blends showed no readily apparent trends with composition. Additional thermal characterization of these materials is being carried out, using both DMA, and TMA equipped with an expansion probe to determine glass transition temperatures, and TMA equipped with a penetration probe to determine softening temperatures. Both TMA and DMA make use of larger test specimens than are used in DSC (4-6mg), and may provide better measurements of glass transition temperatures than were obtained by DSC.
SUMMARY AND CONCLUSIONS
This study was undertaken to characterize the graded interface between propellant and insulation which is postulated to form when TPE- based propellant and insulation are co-extruded side by side in the making of the rocket motor of
the future. The graded interface is driven to form by the shear forces present as the melts emerge from their extruder(s), and could be augmented by diffusional mixing of the melts. The graded interface is the material between 100% insulation on one side and 100% propellant on the other, having a continuously graded composition throughout. To characterize this interface, propellant and insulation were mixed at three different levels, 75P/25I, 50P/50I, and 25P/75I, representing a sampling of the interface's postulated composition continuum. Mixes were accomplished using a high shear mixer at elevated temperatures (130-135°C) where the TPE binders in both propellant and insulation exhibit thermoplastic behavior. The resulting P/I blends were evaluated using standard physical and thermal analysis tests. Four hybrid insulations, each a 50/50 blend of one of two TPEs with one of two silicon-containing preceramic polymers, were to be evaluated to demonstrate the effect of materials on the properties of the interface; because of the unavailability of one of the preceramics, only three were actually cone. The fourth will be evaluated in
494

the near future when additional preceramic is procured.
Photomicrographs taken using light reflected from microtomed surfaces indicated that the propellant and insulation were well mixed, at least at the macro level. Scanning electron micrographs showed no clear evidence of phase separation, but these were difficult to interpret. During mixing and casting of the mixed materials, it was noted that ease of processing of the blends followed the order:
(PEBAX/PSS) > > (Kraton/PCS) > (PEBAX/PSS)
and that within a given composition, processability decreased with increasing insulation content. Support for this qualitative observation was gained by examination of the minibones cut for physical testing; cross-sectional area differences in the minibones are largely due to thickness differences, and thinner test slabs are made from materials which are easier to process. It is recommended that measurements of viscosity and the viscosity- temperature relationship be made for these blends to quantify differences in processability. The striking improvement in processability shown by the PA blends made with the PEBAX/PSS insulation over those made with insulations containing PCS may be due to the fact that PSS is a linear polymer, while PCS, although formally linear, is actually crosslinked to some extent. The presence of a network polymer in the melt would significantly increase viscosity and make processing more difficult.
Peak and break stress, peak and break strain, and Young's modulus were determined for the materials using standard JANNAF procedures. Peak and break stress and peak strain varied smoothly through the interface as did break strain with one exception; the 50/50 P/I blend with PEBAX/PCS insulation had an unusually high break strain. Young's modulus showed no clear trend with insulation content through the interface for any of the insulations, except that the modulus values for the 75/25 P/I blends were all higher than the modulus of the propellant itself, and that the moduli of the blends containing higher levels of insulation tended to move toward the moduli of the pertinent insulations. One point to keep in mind while examining the stress-strain data is that the TPE is the load-bearing material in the system. For the propellant, there is only 3.0% TPE by
weight; this value increases to 14.8%, 26.5%, and 38.3% as the insulation level in the blends increases to 25%, 50% and 75%, respectively. The hybrid insulation contains 50% TPE.
The ratios of peak to break stress (PS/BS) and peak to break strain (PE/BE) were used to characterize the shapes of the stress-strain curves of the materials. For all the materials tested, stress reached a maximum value at a particular value of strain (extension), then decreased with further strain until the test specimen ruptured. The two TPEs used to make the hybrid insulations both achieved maximum stress at an extension very near the break strain, and this peak stress was only slightly higher than the break stress, i.e., PS/BS was slightly above 1.0 and PE/BE was slightly below 1.0. Two of the insulations (PEBAX/PSS and Kraton/PCS) behaved in a similar manner while the third (PEBAX/PCS) had a higher PS/BS and a lower PE/BE. The TP-T-3006 propellant alone had ratios similar to the PEBAX/PCS insulation, although the absolute values of the stresses and strains were naturally much lower for the propellant. The 75/25 P/I blends all showed much higher values of PS/BS and much lower values of PE/BE, compared to either propellant or insulation alone. This corresponds to the large increase in Young's modulus observed for these 75/25 blends compared to unblended propellant. At higher levels of insulation in the P/I blends, the PS/BS ratios tend to decrease and the PE/BE ratios tend to increase toward the values of the insulations, with the exception of the 50/50 P/I blend with PEBAX/PCS insulation, where peak stress was reached at very low extension, as noted above. These data indicate that the hybrid insulations tend to behave like the TPEs used to make them and that, for the most part, the behavior of the propellant/insulation blends becomes more rubber-like as the insulation content increases.
Decomposition temperatures measured by TGA tended to increase with increasing insulation content through the graded interface. Decomposition temperatures measured by DSC were lower for P/I blends than for either propellant or insulation when the blends contained insulations made with PEBAX, but increased with insulation content for blends made with the Kraton/PCS insulation. All the P/I blends exhibited the "signature" endotherm of the TP-T-
495

3006 propellant, at 243°C, by DSC. The presence of insulation in the blends increased the amount of residue or char remaining at 1000°C, by TGA, compared to propellant alone, and changed the nature of the residue from powder to ceramic.
One important observation made in this study is that the propellant itself is degraded by continued exposure to elevated temperatures (preheating and mixing at 130°C) and possibly by long term storage under ambient conditions. Properties measured on stored propellant showed slightly lower peak stress, lower break elongation, and higher Young's modulus than reported by the manufacturer. Propellant which was preheated to soften, then "mixed" alone showed much lower values for peak stress and break strain and higher values of modulus than the stored propellant. Slow degradation on storage is potentially a more serious problem than the more extensive degradation observed on heating, since it is expected that, in making solid rocket motors with graded interfaces, the propellant and insulation will be co-extruded as the propellant is formulated, and the motor will not be made by re-extruding softened previously formed propellant with molten insulation as was done in this study. It is recommended that a long term property-time profile be established for this propellant.
The work reported here demonstrates that fairly smooth transitions in most properties are observed in blends representing a sampling of the composition continuum postulated to occur in the formation of a graded interface between propellant and insulation, i.e., that the concept of a graded interface possesses validity. No information was developed concerning the actual dimension (thickness) of the graded interface; it is presumed that this dimension could be engineered and controlled by proper selection of materials and processing conditions. Further, no attempt was made in this study to develop an optimized formulation for the insulation to facilitate formation of the graded interface. In conventional solid rocket motors (having propellants based on thermoset binders rather than TPE binders), plasticizers are incorporated into the propellant formulations. On storage, these plasticizers migrate or diffuse from the propellant through the bond line into the insulation, changing the physical properties of both. This is reputed to be a major cause of failures in the firing of solid rocket
motors (1,2). Since the TPE-based propellant used in this study also contains plasticizer to provide proper viscosity for processing (6), it is proposed that an optimized formulation for a TPE-based hybrid insulation would also incorporate plasticizer for two important reasons. First, the driving force for the diffusion of plasticizer from propellant to insulation in solid rocket motors is the concentration gradient which exists between the plasticizer-rich propellant and the plasticizer-poor insulation. Incorporation of plasticizer in the insulation would reduce or even eliminate this gradient, and thereby minimize the extent of diffusion and the resultant property changes. Second, the presence of plasticizer in the insulation would reduce its viscosity and improve its processability, and would probably promote the shear mixing of propellant and insulation, aiding in the formation of the graded interface. It should also be possible to incorporate a higher loading of preceramic polymer in the insulation, giving higher char yields and improved insulation performance. Since plasticizer is incorporated at the 7.5% level in the TP-T-3006 propellant, if the insulation is formulated with 7.5% plasticizer the concentration gradient would be zero, and there would essentially be no plasticizer diffusion through the graded interface. Preceramic and TPE could be optimized to a total of 92.5%, providing the best compromise between processability and insulation performance, using standard statistical optimization procedures.
REFERENCES
1. Oberth, AE. Principles of Solid Propellant Development, CPIA Publication 469, September 1987.
2. Schreuder-Stacer, H.L. and Stacer, R.G. Bonded Interface Technology Development for Solid Rocket Motors, Report AL-TR- 89-082, September, 1991.
3. Lichtenhan, J.D., Hawkins, T.W. and Chaffee, K.P. Preliminary Investigation of a Graded Interface Between Solid Rocket Motor Propellants and Insulations, Phillips Laboratory Internal Report, July, 1993.
4. Holden, G. Application of Thermoplastic Elastomers, in Legge, N.R., Holden, G. and Schroeder, H.E., (Eds.) Thermoplastic Elastomers, Hanser Publishers, N.Y., 1987.
496

5. Nahlovsky, B.D., Hargis, LG. and Ratermann, AL. Thermoplastic Elastomer Development, Report AL-TR-89-010, August, 1989.
6. Palopoli, S.F., Hartwell, J.A. and Polleck, R.R. TPE Propellant Development, Report PL-TR-91-3096, June, 1992.
7. Lichtenhan, J.D., Vu, N.Q., Carter, J.A., Gilman, J. W. and Feher, F.J., Silsesquioxane-Siloxane Copofymers from Polyhedral Silsesquioxanes, Macromolecules, 1993, 26, 2141-2142.
8. Svob, G.J. Propellant Mechanical Properties Evaluation, in Oberth, A.E., op. cit.
497

DESIGN AND ANALYSIS OF THE AIR FORCE ACADEMY SOLID BOOSTER
T. A. Elkins U.S. Air Force - Phillips Laboratory
Edwards AFB, CA 93524-7190
ABSTRACT
The Advanced Polymer Components Initiative11 ] (APC) of the Phillips Laboratory was structured to investigate the application of Liquid-Crystal Polymers (LCPs) to rocket propulsion systems. Small test articles all the way up to a full solid booster system were examined to test the material and structural properties of the LCPs and the feasibility of their application. This paper will discuss the Air Force Academy Solid Booster application, the design concerns that had to be addressed, the analyses involved, vehicle construction techniques, testing, and the results of the research121.
BACKGROUND
In 1989 the director of the Air Force Astronautics Laboratory (now Phillips Laboratory) presented his vision for the future of rocketry - an all non-metal rocket. That vision spawned a series of technology demonstration programs focusing on materials and concepts that would make that vision a reality. Among the programs was the Advanced Polymer Components Initiative (APC) headed by Dr. John Rusek. The APC program was a 4 year effort to investigate the properties and potential application of Liquid-Crystal Polymers (LCPs) to rocket propulsion systems. LCPs have numerous desirable properties which make them excellent candidates to satisfy the Space Program's need for strong, lightweight, inexpensive, high-temperature materials. Polymer characterization, synthesis, and tests of small injection-molded articles laid the groundwork for further investigation and a feasibility study.
APPROACH
The feasibility study looked at a direct metal-to-plastic replacement without taking into consideration the properties of the LCPs or the manufacturing considerations for molded plastics. For this study the simple geometry of the 2x4 motor case was selected. The 2x4 cases were injection-molded, propellant was cast into the case, and the propellant was ignited. The tests showed that the materials could withstand direct plume contact with flame temperatures of at least 5000°F for 1-2 seconds and that LCP pressure vessels could contain fairly high pressures on the order of lOOOpsi.
With the success of the 2x4 tests the members of the APC team began directing their attention to the Air Force Academy Booster. The AFA solid booster is an educational tool used by the Air Force Academy to aid the cadets in understanding rocket propulsion systems. The existing system consists of a paper/phenolic case, a separate paper/phenolic forward bulkhead, and a machined graphite nozzle (see Figure 1). The case and bulkhead are prepared by hand. The assembled booster system is inserted into a launch vehicle to provide the thrust needed to lift the vehicle, booster, guidance system, recovery system, and payload.
The primary goals of the research were to determine what components of the booster system, if any, could be replaced with LCP parts without compromising safety, reliability or performance. Additional goals to reduce the cost and labor involved in manufacturing the boosters were proposed. These goals and the results of the previous research and tests formed the framework for the design.
498

Figure 1. Technology Demonstration 4rticles For The APC Initiative
IB
5 S a
UJ Q.
S DL
^ O g «u
499'

DESIGN ISSUES
MATERIAL LIMITATIONS
From the 2x4 study and other research it was determined that the LCP fibers, the
source of the material's strength, form in the direction of molten flow due to the high shear fields within the mold. As a result the molded LCP material is highly anisotropic. Pressure vessels, like the booster's case, require sufficient hoop strength to handle the high pressures of the combustion process as well as longitudinal strength to combat the acceleration forces of the launch and boost phases. Previous research in the APC program revealed that material properties transverse to the molten flow were on the order of 50% of the properties in the flow direction. Other material characterization discovered a skin-and- core effect which produced highly oriented fibers along the skin of the molded part, and a more isotropic structure in the center of the part. The critical parts of the booster were designed to be as thin as possible to maximize the strength of the skin region while still maintaining structural integrity and manufacturability.
STRUCTURAL REQUIREMENTS
The booster system will be used by inexperienced cadets at the Air Force Academy in their study of rocket propulsion systems. For that reason the safety factors for the structural requirements are quite high, and this is a fairly small component which must fit inside a launch vehicle, so all of the structural members must fit in a compact volume. The existing system provides a performance benchmark that the new system must meet or exceed.
The propulsion system transfers its thrust to the main vehicle by pushing against a flat bulkhead inside the vehicle, requiring a flat surface on the forward end of the booster. The requirement for also having a hemispherical pressure dome in the same area poses a problem - large volume changes in plastic parts can cause the plastic to warp and shrink, and an isotropic volume will form which considerably reduces the strength. A series of four ribs provides the flat surface as well as strengthens the forward pressure dome without compromising the overall material properties.
MANUFACTURING LIMITATIONS
Blow-molding an entire vehicle would provide the least expensive and strongest solution to the problem; the blow-molding process would produce a biaxially oriented part which would provide the proper hoop and longitudinal strength, the nozzle and forward dome would be integrated with the case to eliminate joints and seals, and the labor involved would be negligible. Blow molding, however, would have required a significant capital investment which was not a goal of the program, and the annoying technicality of not being able to cast the solid propellant into the case defeated the goal of reducing labor. It was decided that injection-molding, a well established manufacturing process, would yield the desired degree of reliability and producibility while remaining within a reasonable budget. It was decided that the forward pressure dome and case could be injection-molded as one piece, and the nozzle as a separate part.
Injection-molding cylindrical parts, such as the booster case and nozzle, requires that the parts be filled from end to end to prevent weld, or "knit," lines; however, as was mentioned above, the LCP fibers form in the direction of the flow within the mold. The resulting anisotropy prohibits the formation of hoop load-bearing members in cylindrical structures. From the 2x4 tests, though, it was shown that a LCP case with no hoop reinforcement could withstand pressures in excess of the operating pressures of the existing
500

Figure 2.3D Model Of The Initial Nozzle Design
„nüilfi! ' \fr -J$M
■ W^BJHHiliPirr M ,r ~ :-:*g?fte»gliB»WM ^^^^■■sy^^^MJt^^^r --^^^^ r h flWII ^^■HP^'i ^tti^s^
■■■I ™.
i
o to n-
CD Q Q
r* 7T CD
^az3 i cr o o EU 3 DCD IP D
7^ d- 0 — -s
a c CD
To
ID ' n
Wsam K
H im
■ISBw
Efeftfrflifflfflttat 111 H
■■I
Q
CTJ
mm. HI
m 111111
m Baa
buiiWi i u 'juri ■Bsp!
0)
-J^
■ill ms Q
11111111*
"ftiiai«teBiLijL^
en
on
501

Figure 3. Initial Nozzle Design (dimensions in inches)
502

AFA booster system. Further reinforcement of the case would be desirable to increase reliability, but that was beyond the scope of the research. The converging-diverging shape of the nozzle provided an avenue for conquering the manufacturing limitation while maintaining the dimensional limits. External structural members (the longitudinal and circumferential ribs) provided the hoop load-bearing supports for the nozzle at the expense of manufacturing complexity (see Figures 2 & 3). Injecting the plastic from one end of the nozzle, though, would force the plastic to flow longitudinally through the supports, defeating the purpose of having the supports in the first place. The injection gate was moved to the throat of the nozzle to allow the plastic to flow properly through the nominal wall and force the flow to change direction at the support ribs, and no weld lines would be formed.
Plastics tend to shrink as they cool which can cause the molded part to shrink onto the tool preventing the part from being ejected from the mold. To avoid this problem parts with cavities are molded with an interior "draft angle" which provides a mechanism for shrinking parts to eject themselves from the mold core. The nozzle shape, by default, has interior angles so this was not a problem. The case, however, had to be designed with a draft angle, which caused a couple of problems:
1. The forward end of the nozzle inserts into, and must be flush with, the aft end of the case. The exterior of the nozzle was given the same draft angle as the interior of the case so that the nozzle would fit flush against the case when fully inserted.
2. The conical propellant geometry would alter the thrust profile. Various alternatives were considered and tested, including casting the propellant into a cylindrical tube which would slide into the case,
One method to reduce the costs involved in a research and development program is to identify multiple customers for the product, so additional applications of the AFA booster components were considered and incorporated into the design. Before any major capital investment was made, analyses on the design were performed.
ANALYSES
PRODUCIBILITY ANALYSIS
The 2x4 test, as well as the injection-molding team's experience, provided the knowledge necessary for manufacturing the booster case. The nozzle, however, required a more detailed analysis to determine if the part could be injection molded. A second reason for the producibility analysis was to determine if the nozzle could use the same mold base as the 2x4 motor case. The overall dimensions of the two parts are close enough that using the same mold base with different core and cavity pieces would make economical sense. A finite element model of the 2x4 mold's filling and cooling system were modeled and the nozzle model was inserted into place (see Figure 4). A filling and cooling analysis showed that the 2x4 mold base could be used to mold and cool the nozzle in about 16 seconds and that the molten plastic would flow through the structural members in the proper orientation (see Figures 5 & 6).
STRUCTURAL ANALYSIS
A 2-dimensional structural analysis was performed to see if the plastic nozzle could withstand the pressures of the environment. The pressure load and resulting mach profile were calculated using a 2D gas kinetics code (TDK) (see Figures 7-9). The analysis showed that the forward ribs would fail at the pin bosses due to a compressive load induced by the
503

Figure 4. Model Of The Nozzle With Filling And Cociine Svsfem

Figure 5. Part Cooling Analysis Results
r r — iri *j x « - - e* * • . • * es 3
-J ^ » ** -^ «* ~
505

Figure 6. Moid Filing Analysis - Checking Proper How OrientatJaa
« —
506

PLOT 1 17.55.54 SUN 16 FEB, 1992 ^l^fcur^PSTA^ JssPLa li.o
!°
10 o
Ol
0
o
öl
D Ü
I] Öl Jß
5" . JO
3* bi t) 3
O-
Ol
T IO
3
Ol
ro-fl] bi
Ml]
bi |l]
o'
250 500 l
750 1000 1250 I
1500 1750 l
2000 l
0
[]
[]
-e-
Figure 7. Pressure Profile For Pc=2000psi
507
o 73
o N N CD
CO f+
0) o ■■■■■
D o m _H
"0 ■^
CD D C ' n CO c Q CD I T- N> -^ *>, O —4* >
CD i
o a m CO o c «^
o 3

PLOT ! 18.08.31 SUN 16 FEB, 1992
0 0.5 1 1.5
JO. meh-rauwrtssr
JO 6
a ?0
in
oi
[]
DISSPLfl U.O
3.5 i
4 _l_
4.5 5 _J
o D m 2 o
■Ö
o
O "U Z o N N CD
CO
5"
o
O D m CO o
Figure 8. Expected Mach Profile For Nozzle @ Pc=2000psi
508

Figure 9. Finite Element Modei Of Nozzle With Applied Prrasiirp T nnA And Pin Restraints 2. O Q
ru vC = ^ r n ! : O O O
I - =i ■" '~ -pry
; — o o r-~,
—; □ ■_
—i _J ID 'Si
fC
-J_J
Ja.
fD r-^ ^"1 — U> LÜ C
Ja. T3 i-f- —^
LJ
509

Figure 10. Morale Displacement Results Of 2B Analysis
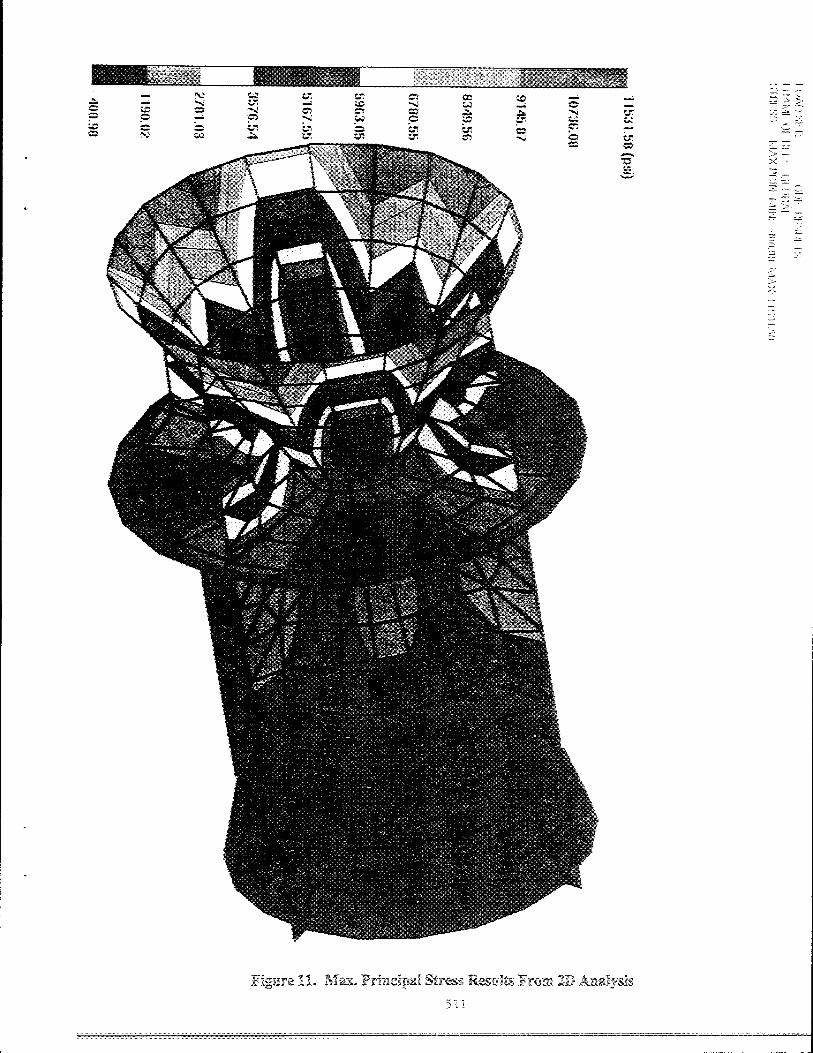
Figure il. »lax, Fniieroai ress Basalts From 2B. 511
m&wsm

Figure 12. Redesigned Nozzle With Additional Forward Rib
mm 3212
<o O «ft XT *» u-H XT • » • rfjr •
wossr I «TOO
o* a sen fta
c<3d i
tji^«l
.125\
j\
1^*22 0"3 fvo
—*r-o> en
r^o
C3~> CO
<_r»
rr~>:
~^S^ .,18575-
■1.-84-120—*
■2.12500-
Li
* • o < x- •• cr «a. • • s a o H- a* m
p
U e is n
t o n > u
o
o
s
/: f ■ • to • 8 -
"^ s
■ÄM^
512

Figure 13. 3D Analysis - Pc=l OOOpsi, No Extra Rib
— 3 3
O m -t-
3
!J1
CD en ü
i — s ~ i_n : O f^r
i— " r- n
o - CO c _ o _ ~
01 3
5-i;
I— LTiLC
r—1
LO
r^ ' 1
ft
x
— Q. -■ 3 ai LA 3 — T3
C3 Q
^ 3
i> i» _.
J CD
513

Figure 14. 3D Analysis - Pc=1250psi, No Extra Rib
>-.n -j '~j ^ Lu •71 LVI ITI ^ - UJ cn
CO CTi JV
r.i -i ■n
—i 70 Q 7Ü 3 X' i' ^/ 01 m Ü" r_n
a n "H -i
r KS a n !_^C
CQ a [J 01 ui — — TO
— -r 5C (_n LQ LT! C" (-"■ ~ ^ j
r- r n .■o i-i — -ir- o
o ": ~^ O <"' G n CD a —
en 3 _ i—1 a — r- 3
o
•_n
5 ID
X?
£ Q_ —
i ,J1 CC Q CD _,r
*V iSsfg»
514
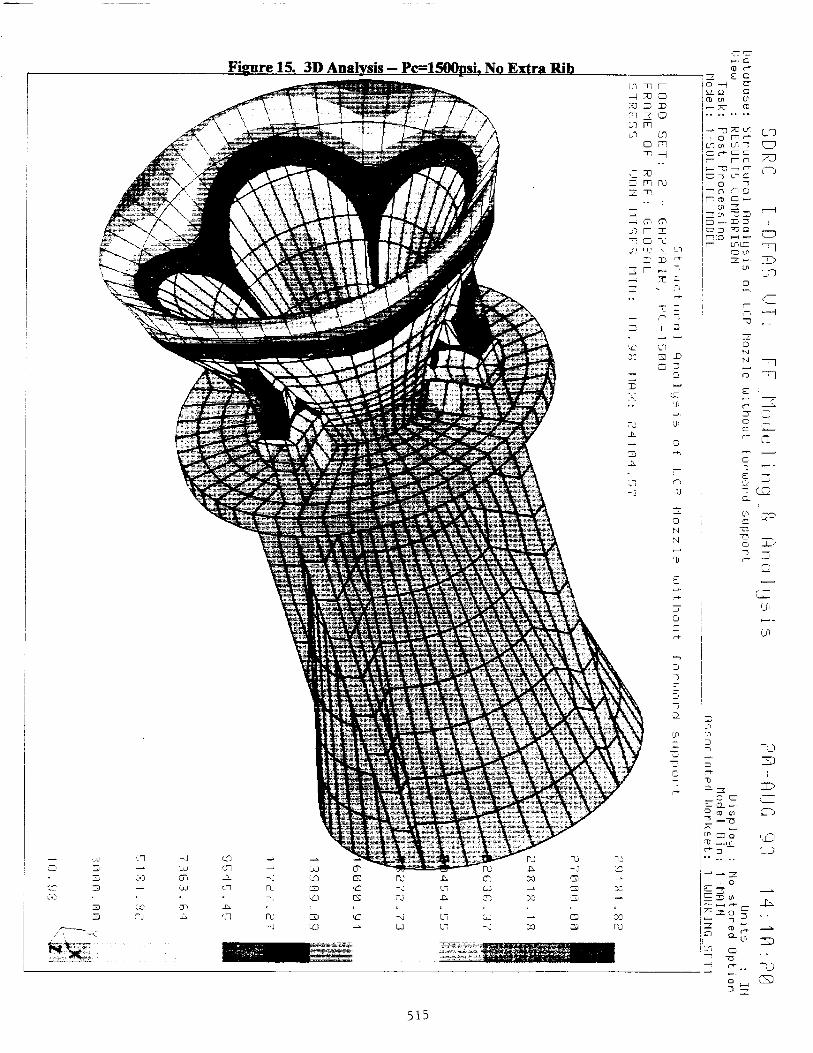
Figure 15. 3D Analysis - Pc=1500psi. No Extra Rib
XI —j T>
H ~? a 'S) m Ü1 LT
o n
.-■ c rp r-r
~T £ O O — CT £2- Q a 0> tn IS> ■— 7C CD
I O CO
LO en LTi -j k ;
1— r~ n TO M "C —f r^ C~"j O T tn c
o "^ ^1 o :~ G n » O —
en 3 oi 3-, i—i □ — 3D 3 i c; 3 7j 2 CT r-no HH ■— r— m
IZ r— i> in
UT o
-3 !_■ C _
rc
'-J_!
^Z^^ -fc.
C3
515

Figure 16. 3D Analysis - Pc=2000psi, No Extra Rib
H\
r: ~n —
^ X! 33
33 33
n ü a
, ^T^ r n 1 : o HI I—
i_. ' i LI '■.« IT. "j _) "n — ;— ' r- n 73
■ — ( ,-r — . ^ C ~. LH C
, j : pi -~ 0 "- ; "H
Mi zz . ! :_ — E _j
.TJ
ID
_ o o :=_ Q_ -- '-1 fD [fi
X>
CJO
- -o !=T
CD
O , . "^ n- P. 'J
o , , en
51«
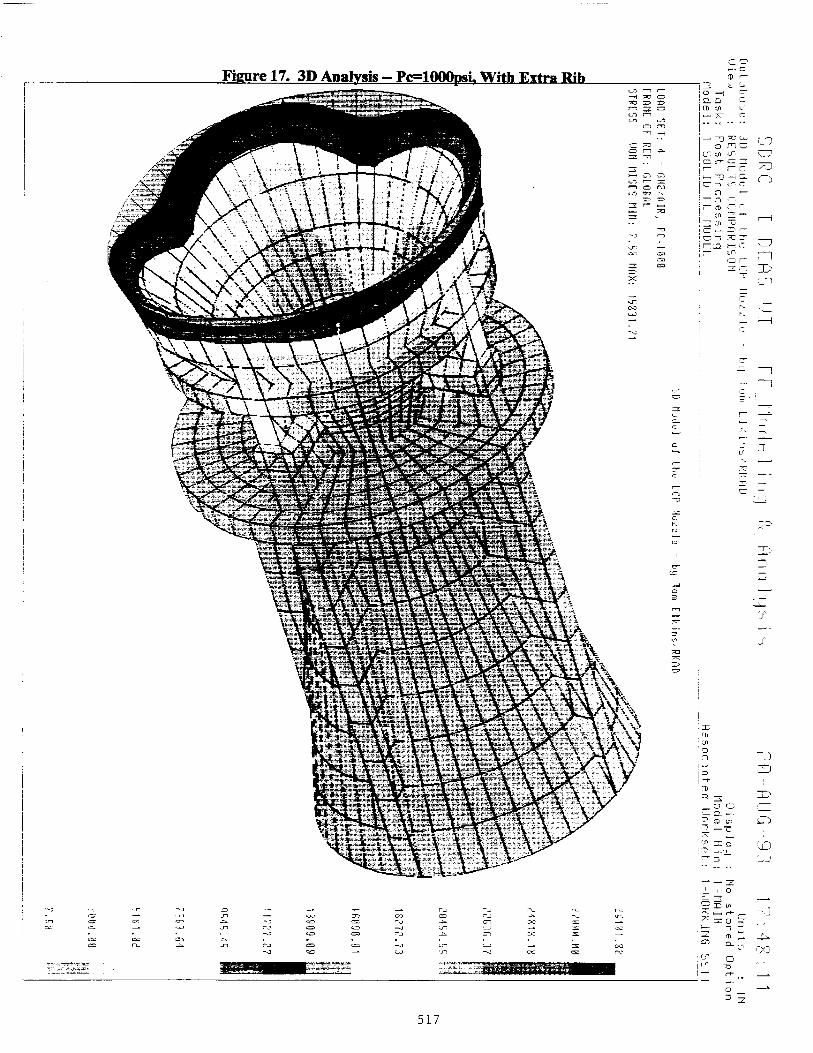
Figure 17. 3D Analysis - Pc=1000psi. With Extra Rih
k— 7n
ZS. ca
one '- ^
^3
I O —
i c — :D < ii— —; T- ;
-•2 -jj.
2 so in J. — ~o
-J
a -T3
517
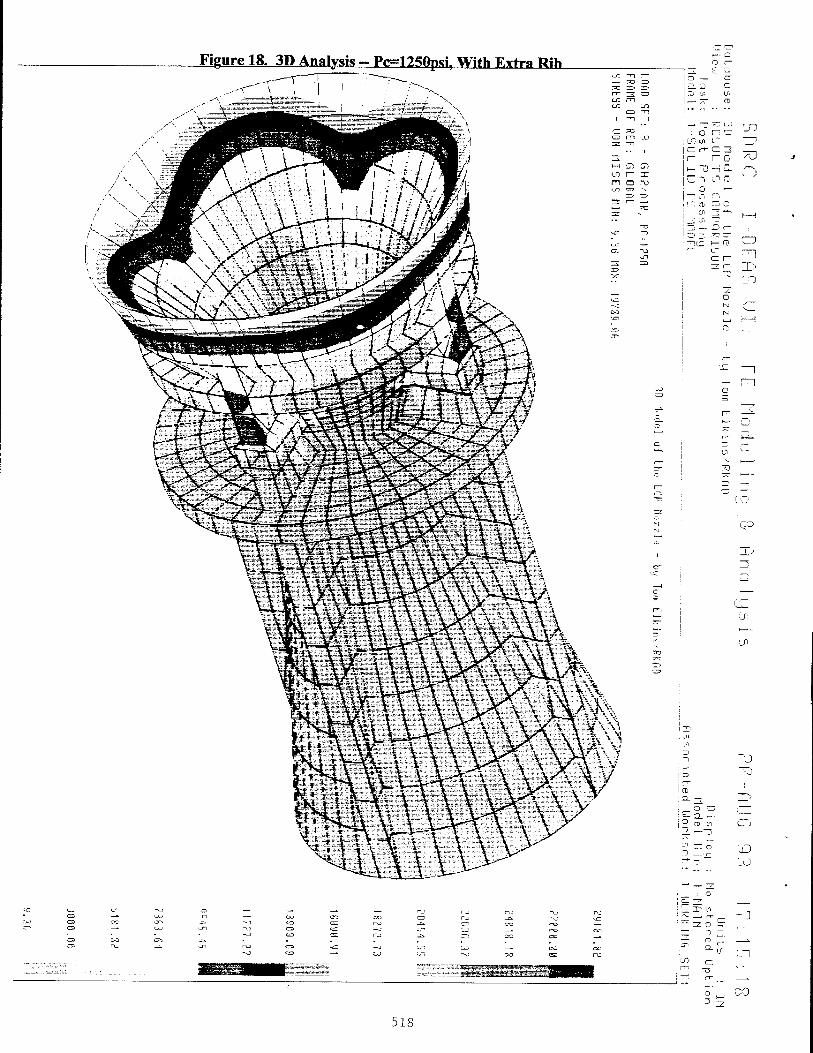
Fignre 18. 3D Analysis - Pc=1250psiT With Extra Rih
H a 'S co i— x n o .-o
— ^ Ä] CJ ; O n
r- r G
~ -i L" n
i ~ d □ c
7J
O
2- ID
5 ^ re
,_ o c ;■
^~ Q- ~ ^ CD en
1
en —; ,-, CD Z..£
—* — — o
E 55 '/> d -J
— fD —■ j.
--■^B^B^W^^^i
CO
514

Figure 19. 3D Analysis - Pc=150Qpsi. With Extra Rib (D n- 2i £ o o — cr a. a G CD en U! — 7T <B
X3 ÜJ n o LO
CO <n Ul C_-' O f c= Zi TO i— o l-i T —i Q. o ~ -> c*' c
O »— -n o t"
rr <D a o
— cs — ■_!_' 'jn —. 00 CT3 CO CD ru _& 'O cs cr> -Ci ^j <o SI ru -fc en cc —* 131 —» i_o en ro CD C£D —j u-t t. ■> _»
C-J
cs 00 c-> rs -O (£2 S3 ru Jb. en CO CD —
es ru _&. <J-I nj C=3 «3 -0 <J"l CJJ _» CB OO
^ - ■
-NJ C0
ijl
CjJ ^J PO CS nj
TÄÜ.i.i ■ÜÜ^S! ""^^Wjljj^f
-^ 1—1 e- ,_ •_; J
s >-<
'J"l
519
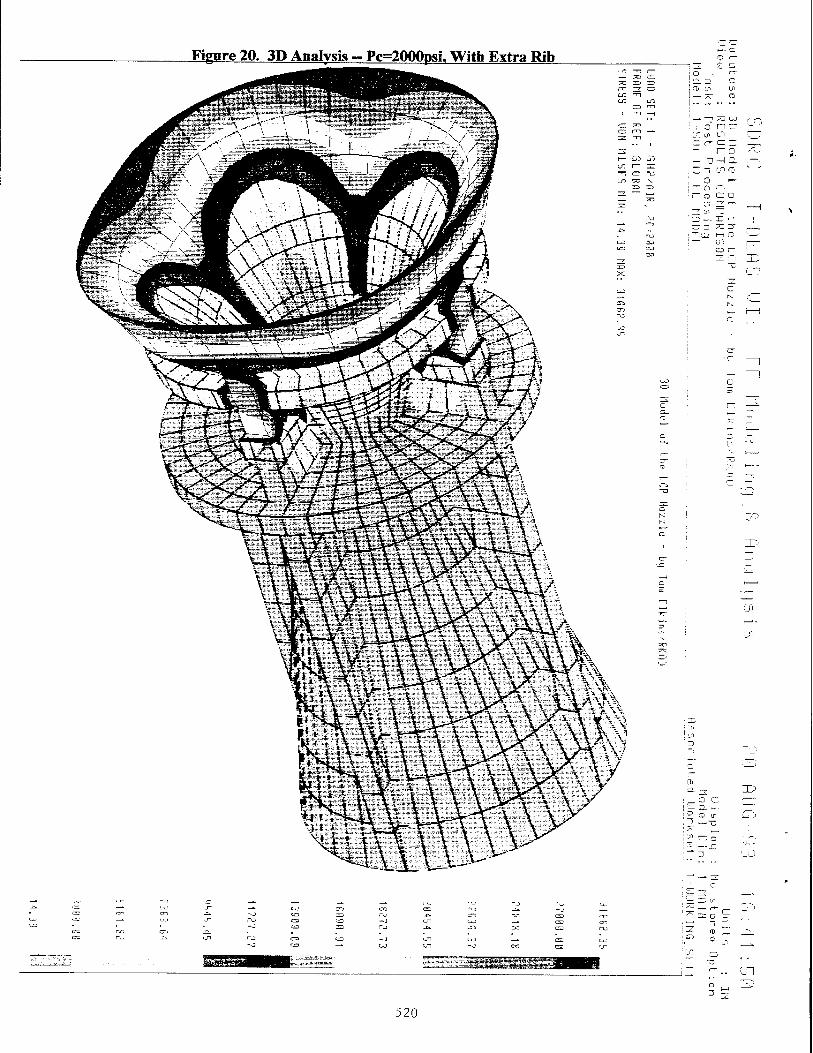
Figure 20. 3D Analysis - Pc=2000psi. With Extra Rib
i— ü} ^ LC r r rr a ro w TO \
; CD yi LA ! — — o
; ! o nc 1 CD r«- CI 3 \r- no
! c ~ en a) :_o _«- ! ~ CD GO
O m
< 1
X:'
I O ( ID
CI> LT1 i_; .1
■.. en
520

expected 2000psi chamber pressure against the inlet wall (see Figures 10 & 11). The ribs would buckle and fail at the pin bosses. The design was modified to include a second circumferential rib forward of the pin bosses to strengthen the inlet area and distribute the compressive load over the circumference (see Figure 12). In addition the second rib would provide another mating surface on which an epoxy could be applied to reinforce the seal between the nozzle and case. A 3-dimensional analysis with and without the second rib confirmed the corrective action (see Figures 13-20). With the analyses completed it was time to build and test the system.
CONSTRUCTION
To reduce the costs even further, all of the injection molding was performed at Hill AFB, and the ammonium perchlorate (AP) propellant was specially mixed and prepared at Phillips Lab - Edwards AFB. Several booster configurations were prepared and documented with the reduction of labor being the key. The following are the steps that were involved in building a test article.
1. The propellant cylinder could be inserted into the case and locked into place with a phenolic spacer, or, when a binder was applied to the inside of the case, the propellant could be cast directly into the case. The propellant geometry was simplified to a circular bore to improve safety and reduce labor (the old grain geometry required the students to cut slots in the grain with a hacksaw). The combination of a circular bore and the interior draft angle of the case generated a progressive burn profile.
2. The gate material was removed from the nozzle throat and the throat cleaned. The nozzle was inserted into the case and pinned with standard rivets. The nozzle/case interface was sealed with a urethane epoxy.
3. Simple igniters were made with a small piece of propellant wrapped with igniter wire and inserted about two-thirds of the way into the case.
TESTING
(see Figure 21) The booster was inserted nozzle-up into a steel "cup" mounted to a load cell. Pins were used to center the booster in the container; however, the case expanded against the pins and ruptured. The early igniters clogged the throat, causing an overpressurization of the case and resulting in the failure of the pin bosses (as per the analysis). Initially the propellant tubes were cut into three segments; however, the segments shifted at the ignition pulse causing two failure modes:
1. The aft propellant segment was pushed into the throat. Cardboard from the segment was attached to the inlet area near the throat and the inlet was charred.
2 A structural-ballistic interaction occured causing the forward segment to deform and create an aerodynamic nozzle. Pressures above 16,000psi were recorded and the center and aft propellant segments showed no sign of burning.
The segmented grain concept was replaced by a single tube with a phenolic spacer placed at the aft end to prevent the grain from moving into the nozzle. The next failure involved the burn-through of the nozzle which led to the use of a stainless steel insert to protect the inlet and throat areas. The stainless insert, however, vaporized indicating that the pressure and temperature at the throat were higher than expected.
521

Figure 21. Testing Apparatus And Failure Modes
O Q </» ft
1
JO < 0 3f
iIllilllÄiil-^ PT3
•.•.•.•:v..»:-:.>:-s»^^L *:*«^ j>r
M
CO
3 D
a (Ü Q
</>
z o 0 (D N D N <D <D
O" 3 (Q
5 (D
«A
^ </> ^: s. O C
i V ■ii
3 </» <D CO
(D a o Q
(D
i V
"O Q O (D
522

RESULTS
Case Bulkhead
Nozzle Manufacturing
Assembly Time Total Weight Inert Weight
Thrust (Burn)
Cost
Old Booster Paper/Phenolic Paper/Phenolic
Graphite By hand
2+ hours 351g 70%
60lbf (.9sec)
-$30
New Booster LCP
LCP integrated w/ case LCP
Injection molded < 5 minutes
776g 37%
41 -209lbf (1.88sec) 125 Ibf average
$5-$10
CONCLUSIONS
The research has shown that LCPs can be used as structural materials if the material properties and manufacturing limitations are examined and understood upfront. The design must answer the concerns of the metal-to-plastic replacement without compromising structural or performance requirements.
Software tools exist that aid in the decision-making process before any capital investment is made. Simulation and analysis can be performed on nearly every step of the manufacturing and operation processes and can point out potential problems, alternative ways of doing things, and even optimize the manufacturing process to minimize costs and increase reliability.
The injection-molding process is a well established process which lends itself well to mass production, pushing production costs down. The automation aspects of the industry reduces the labor involved in manufacturing and provides reproducibility to the system.
As uses of the LCPs increase the cost of the raw material will drop, further reducing the costs of manufacturing with these materials.
The research from this program, and others like it, highlight a wide range of applications and industries which will spawn further research in materials and processing techniques and provide high reliability, high performance, low cost products.
1. Rusek, J. J-, Components Symposium", TR-92-3018, July 1992
REFERENCES
et al, "Proceedings of the First Annual Advanced Polymer Phillips Laboratory, Edwards AFB, CA, Technical Report No. PL-
2. Elkins, T. A., Frank, C, "Design and Analysis of a Liquid-Crystal Polymer Rocket Nozzle", JANNAF Structures and Mechanical Behavior Subcommittee Meeting, November, 1992
523

LIQUID CRYSTAL POLYMER AFA BOOSTER MOTOR DEVELOPMENT: PROPELLANT DEVELOPMENT, MOTOR DESIGN
AND PRELIMINARY TESTING
Hieu T. Nguyen Phillips Laboratory
Edwards AFB, CA 93524-7160
ABSTRACT
The Phillips Laboratory is currentiy testing a new booster rocket motor for the United States Air Force Academy. The original AFA booster motor the Phillips Lab had been manufacturing was labor intensive. The phenolic case and the graphite nozzle had to be individually machined. The new motor being tested has an injection molded liquid crystal polymer (LCP) case and nozzle. The motor is also larger and has almost twice the total impulse.
INTRODUCTION
The original objectives of the task were to 1) develop three non-aluminized propellants with three different bum rates (low (0.25 in/sec), medium (0.35 in/sec) and high (0.5 in/sec)), 2) design a cartridge loaded, neutral burning propellant charge, and 3) test and determine the performance of the motors. Aluminum fuel was not used in the propellants in order lower the throat erosion rate of the LCP nozzles. Three different burn rates were designed to provide three different thrust levels. The cartridge-loaded type propellant grain was selected in order to reduce production time and cost. The AFA motors were static tested to determine thrust vs. time and also total impulse.
PROPELLANT DEVELOPMENT
All three propellants contained hydroxy-terminated polybutadiene (HTPB) binder cured with dimeryl diisocyanate (DDI). This binder also served as the fuel. The plasticizer used to ease processing and improve mechanical properties was dioctylazelate (DOZ). Three different ammonium perchlorate (AP) oxidizer sizes and ratios were used to achieve the three desired bum rates. Iron oxide was used to help increase burn rate and ammonium nitrate (a low burn rate oxidizer) was used to decrease burn rate. Additives such as copper ammonium chlorate, potassium perchlorate and strontium nitrate provided different plume colors. The formulations of the three propellants are shown in Table 1.
The burn rates of all three propellants were characterized However, only the high burn rate propellant was used in the AFA motors. The low and medium bum rate propellants were abandoned due to processing difficulties. Apparently, the ammonium nitrate in the low burn rate propellant and the boron in the medium burn rate propellant caused extremely high end-of-mix viscosity, which prevented vacuum casting.
524
mwomzM MEDIUM HIGH
wmmmimimmmmmmmm. BURN RATE BURN RAT£ BURN RATE
(%> <%) <%>
HTPB 10.46 10.46 10.46
DOZ 2.15 2.15 2.15
DDI 2.39 2.39 2.39
AP (400 microns) 40.00 27.11 24.93
AP (200 microns) 20.00 27.11 24.93
AP (25 microns) 20.78 24.93
AN 15.00
Iron Oxide 0.20
Copper Ammonium Chlor 2.00 Potassium Perchlorate 8.00 Strontium Nitrate 10.00
Boron 10.00
Table 1
PROPELLANT GRAIN DESIGN AND INITIAL MOTOR TESTING
The AFA booster motor was originally designed to have three neutral-burning cartridge loaded propellant grains (see Figure 1). However, this design had a variety of problems which were discovered during test firings. A total of 18 motors with the cartridge loaded type grains were tested and all failed due a combination of problems.
After the first three motors failed to overpressurization, it was discovered that following ignition the propellant grain closest to the nozzle was pushed into the nozzle entrance. Apparently die pressure at the forward end of this grain was much higher the pressure at the end facing the nozzle. The pressure difference thus pushed the grain into the nozzle entrance, squeezing the diameter of the grain and center perforation down to the point of choking the flow of the propellant exhaust. This apparently caused overpressurization and motor failure.
Figure 1. AFA Motor Design with Three Propellant Cartridges
525

A phenolic spacer was placed between the grain and the nozzle to prevent the grain movement problem (see Figure 2). However, when the motors with this design was test fired, they also overpressured. Inspection of the remains showed that the case as well as the grain segment next to the phenolic spacer had burst. This failure mode was apparently also caused by uneven pressure buildup. Since the inside of the case was tapered and the propellant cartridge was not, there was a significant gap between the grain and the inner wall of the case near the nozzle entrance. During ignition, the pressure difference between the center perforation and the outside of the grain was high enough burst the grain. The extra bum surface area of the damaged grain caused higher gas output and overpressurization.
Figure 2. AFA Motor Design with Three Propellant Cartridges and Phenolic Spacer
The cartridge loaded propellant grain design was abandoned and the more conventional case-bonded grain design was used (see Figure 3). When motors with this design were test fired, the grain performed as expected. However, the nozzle throat burned through after about 1.5 seconds into the firing. The nozzle was later fitted with stainless steel throat insert to attempt to delay throat erosion (see Figure 4). This nozzle design also failed, however. The nozzle throat burned through after about 1 second into the firing. The stainless steel throat insert design was also abandoned. The nozzle was later redesigned to be significantly thicker at the throat to take into account the high erosion rate (see Figure 5).
Figure 3. AFA Motor with Case-bonded Propellant Grain
526

Figure 4. Nozzle with Throat Insert Figure 5. Nozzle with Increased Throat Thickness
CONCLUSION
The final AFA booster motor design has a conventional case-bonded propellant grain, a non-aluminized propellant, LCP case and nozzle. Four types of LCP's were used: Vectra B420, Vectra B950, Vectra B230 and Vectra A950. A band clamp was also added to the nozzle attachment point for reinforcement. The motor has a total impulse of 110 lb- sec, which is almost double the impulse of the original AFA booster motor. Manufac- turing is also much less labor intensive since several hundred cases and nozzles can be injection molded in one day.
527

Liquid Crystal Polymers: A Primer
Anne Kaslusky Hoechst Celanese Corporation
Reprinted from Advanced Materials & Processes®, December 1993

A relatively new family Of -y iquid crystal polymers (LCPs) are dis- high-performance plastics offers I ^f h<? fr°m °ther. piftics ]>y *eir
o i J r JJ m rodlike rracrostructure in the melt phase. excellent Stability at high m J Other resins have randomly oriented
temperatures, high rigidity and moJecuLles ™ the. m(:lt Phas^' but wJ?en LCPs
' ° ° J melt, their long, rigid molecules can align mto a Strength at low temperatures, highly ordered configuration that produces a num-
superior chemical resistance, and ber of uni(iue features- Tbeseinclude low heat of
/•..j j- • ji .,, crystallization, extremely high flow, and sienifi- little dimensional change with cant melt strength. ^ moLuiar structure has
Varying temperature and humidity. such a profound effect on properties and proc- essing characteristics that LCPs are best treated as a polymer category separate from amorphous and semi- crystalline resins. In spite of their unique properties, however, LCPs can be processed by all conven- tional thermoplastic form- ing techniques.
Liquid crystal polymers may cost as much as $18 to $44/kg ($8 to $20/lb), but they offer processing and performance advantages that often result in lower overall cost than less ex- pensive resins. They can, for instance, easily flow into molds for very thin or highly complex parts, re- duce cycle time in mold- ing, produce parts with little molded-in stress, eliminate deflashing and
other secondary finishing steps, and reduce part breakage during assembly. These benefits can raise finished assembly or system yields 3% or more, which can more than offset the higher resin cost.
LCPs are especially suited for small-to- medium size parts with complex shapes or thin walls, which must hold tight tolerances during manufacture or end use. In the electronics indus- try, for example, these benefits plus the resin's resistance to soldering temperatures as high as 230°C (450°F) give it an edge over other high- performance plastics in many surface-mounted interconnect devices, minibobbins, and other components. In the medical equipment industry, the resin is replacing stainless steel in a growing number of surgical instruments and sterilization trays because it can be molded into long, com- plex shapes, and it can withstand repeated ster- ilization cycles. LCPs have also been fabricated into a broad range of components in applications such as engine fuel systems, fiber optics, chemi- cal equipment, and photocopiers.
Vectra LCP was selected as the material for the collar of this fiber optic connector because of its ability to fill thin-wall sections, provide dimensional stability at 200°C (400°F), and virtually eliminate shrinkage.
LIQUID CRYSTAL
POLYMERS A Primer
Anne Kaslusky Hoechst Celanese Corporation
Summit, N.J.

Injection molding LCPs LCPs suitable for injection molding applica-
tions have been commercially available for about eight years, primarily from Hoechst Celanese and Amoco Chemical Co., Chicago, 111. Parts and tools for injection-molded LCP parts must be carefully designed to control how the resin flows as it fills the mold. To a great extent, the flow pattern determines the mechanical properties, shrinkage, points of weakness, and other key part characteristics.
As an LCP enters a mold tool, its surface molecules line up in the flow direction and form a "skin" that generally is 15 to 30% of the part's thickness (the thinner the part, the greater the percentage). This surface layer reinforces the part, giving it exceptional flexural strength, elas- tic modulus, and tensile performance. For exam- ple, a commonly used Hoechst Celanese LCP (Vectra LCP A130) has 35 to 70 MPa (5 to 10 ksi) greater tensile strength, and about 7 GPa (1 mil- lion psi) more stiffness than comparable engi- neering resins.
The high degree of molecular alignment makes finished parts anisotropic; that is, their mechanical properties depend on both the de- gree and direction of orientation of the rodlike molecules in the polymer. In most molded LCP parts, strength and stiffness are significantly higher in the flow direction than across the flow. Designers use cavity shape and gate placement to control the filling pattern and "build in" re- quired flexural and tensile properties.
The amount of shrinkage during molding is also affected by the molecular alignment. LCPs have little or no shrinkage in the direction of flow, and hold exceptional tolerances along this axis, but they have a cross-flow shrinkage close to that of conventional polymers. Shrinkage is most dependent on molecular orientation, some- what less dependent on part thickness, and al- most independent of processing conditions. Shrinkage in other polymers, by contrast, is pri- marily determined by processing conditions. Shrinkage typically ranges from 0 to 0.01 mm/cm (0 to 0.001 in./in.) in the flow direction, compared to about 0.05 mm/cm (0.005 in./in.) across the flow. As shrinkage along the flow de-
This socket for a computer's single inline memory module (SIMM) has a latch made of Vectra LCP. The material gives the latch optimum flexibility and strength, as well as the ability to withstand soldering tem- peratures as high as 230°C (450°F).
Metal replacement application Vectra LCP was the only plastic identified by Altronics
Connector Corp., Gardena, Calif., that could replace steel in the latches of a new socket for a computer's single inline mem- ory module (SIMM). Conventional SIMM sockets have a steel latch that holds circuit boards firmly in place in an insulator (usually made of LCP). The latch functions as a stiff spring, flexing to receive the board and hold it firmly in place.
Vectra LCP gave the latch optimum flexibility and strength because it has 12 to 65% higher tensile strength and up to 67% higher flexural modulus than the other resins tested. These in- cluded another LCP, polyether sulfone (PES), polyphenylene sulfide (PPS), and a high-temperature polyester (PCT). The LCP also has a heat deflection temperature of 254°C (489°F), so it withstands soldering temperatures as high as 230°C (450°F) when SIMMs are joined to "motherboards." Its low melt viscosity allows it to fill the mold at injection pressures typically half those of comparable semicrystalline resins such as PCT and PPS. It also has half the cycle time of such resins.
In considering alternative materials, Altronics found that the competing LCP was more brittle and intolerant of tem- perature variations than the Vectra material. PES has good "spring," but it lacks the needed rigidity, and has relatively poor processing characteristics. PPS has a high potential for residual stress problems, and could not meet the high-flow mold-filling requirement, while PCT's disadvantages were re- sidual stress, water absorption, mold filling, and flash.
Comparison of thermoplastics Amorphous Semicrystalline Liquid crystal
Examples: polyarylate, acrylonitrile- butadiene-styrene, polycarbonate, polysulfone, polyetherimide. No sharp melting point. Soften gradually. Random chain orientation in solid and melt phases. Do not flow as easily as other two types. Reinforcement improves load bearing capability only below Tg.* Can give transparent parts.
Examples: polyester, polyphenylene sulfide, polyamide, polyacetal. Relatively sharp melting point. Ordered arrangement of molecules, and regular recurrence of molecular structure in solid phase. Flow easily above melt temperature. Reinforcement lowers anisotropy and improves load bearing capability between Tgand7V Part is usually opaque.
Examples: wholly aromatic copolyesters. Melting range. Low heat of fusion. High chain continuity. Extremely ordered molecular structure in both melt and solid phases. Flow well under shear or around melting range. Reinforcement improves load bearing capability, esp. in highly crystalline forms between Tg and Tm.* Part is always opaque.
h Tg is the glass transition temperature, above which the polymer is ductile and below which it is brittle. Tm is the melting point.

The nature of polymers Polymers are classed as either thermosets or ther-
moplastics, based on their response to heat. Thermosets cannot be reheated or remolded because they undergo an irreversible two-stage polymerization reaction. In the first stage, the material supplier forms a linear- chain polymer with reactive end groups; in the second, the molder applies heat in the molding press, which cross-links the end groups. Shorter chains with many cross-links form rigid thermosets; longer chains with fewer cross-links form more flexible ones. Exposure to high temperatures for too long a time degrades the plastic by breaking its chains.
Thermoplastics, by contrast, can be remolded be- cause they remelt when heated beyond a certain point. They have linear molecular chains with some branch- ing, but little or no cross-linking. Those with a wide range of chain lengths are easier to process, while those with a narrow range have more uniform properties.
Thermoplastics generally have higher impact resis- tance, are easier to process, and are better suited to complex designs than thermoset polymers. Ther- moplastics are divided into three groups based on mo-
lecular structure: amorphous, semicrystalline, and liq- uid crystalline.
Amorphous polymers have randomly oriented chains in both melt and solid phases. Semicrystalline polymers have randomly oriented chains in the melt phase, but upon cooling can become partially ordered, resulting in a structure consisting of both crystalline and amorphous regions.
Semicrystalline polymers have lower melt viscosities than amorphous polymers. They also have a more com- pact molecular structure, and have higher shrinkage and warpage in molded parts. Liquid crystal polymers are highly ordered in both liquid and solid states. As a group, LCPs have excellent processability that leads to short cycle times, high flowability in thin sections, and exceptional repeatability of dimensions. Molded parts exhibit very low warpage and shrinkage, along with high dimensional stability, even when heated to 200 to 250°C (390 to 480°F). The rigid-rod nature of LCP mole- cules results in a microstructure that resembles the physical orientation of the fibers in a reinforced ther- moplastic.
Crystalline Amorphous Liquid crystalline
Melt
Solid
Amorphous
Two-dimensional representations of the structures of crystalline, amorphous, and liquid crystalline thermoplastics.
creases, shrinkage across the flow increases. If part shrinkage in the flow direction is much
less than that across the flow, the part can warp. However, the differential can be controlled by relocating areas of greatest difference to noncriti- cal sections through adjustment of the filling pat- tern. It can also be controlled by part shape: The shrinkage differential is lowest in a disk filled by diverging, radial flow, and greatest in an end- gated bar.
How resin properties affect molding LCPs are the easiest to process of all high-per-
formance plastics, in part because they have the
highest melt flow and shortest cycle time. They can be processed in conventional equipment by all conventional methods, and can be com- pounded with most reinforcements and fillers. The resin's unique properties affect processing in several important ways:
Melt viscosity is extremely low because the rigid-rod molecules move past each other easily. The high flow allows the resin to fill intricate parts and thin walls at relatively low injection pressures. Although pressure varies with part design, mold layout, and machine settings, the resin generally needs cavity pressures of only 7 to 35 MPa (1 to 5 ksi), well below those of other

engineering resins. Low pressure reduces molded- in stress, so molders need not extend cooling time to counter warpage from such stress.
Mold cycle time for LCPs is generally half that of other high-per- formance resins —10 to 30 seconds for LCPs versus 20 to 60 seconds or more. Exact cycle time for an LCP part de- pends on parameters such as size, shape, thickness, mold layout, and machine settings.
One reason for the short cycle time is that LCPs can rapidly transi- tion between melt and solid phases because both have a similar or- dered structure. The rod- like microstructure in both phases shortens the time needed to melt the resin before injection and the time required for it to solidify in the mold.
Many other factors inherent to LCPs also contribute to the short cy- cle time. Low viscosity speeds mold fill, and good stiffness at elevated temperatures permits parts to be ejected while still hot. Low molded-in stresses eliminate the need for slow cooling to prevent stress buildup.
Shear thinning is a decrease in melt viscosity as shear increases. LCPs are more sensitive to shear thinning than other engineering plastics, which gives molders a powerful way to alter flow. Molders can improve the resin's ability to fill long, thin, or highly complex parts by increasing injection velocity. With other polymers, molders generally must increase temperature to reduce viscosity, which can degrade the polymer.
Use of regrind lowers material and disposal cost because sprues, runners, and other produc- tion scrap can be reground and reused. The re- ground LCP retains most of the properties of the virgin resin, except that the impact resistance of reground glass-filled grades may decrease be- cause of fiber breakage. In practice, manufactur- ers mix 50% regrind with virgin resin. Parts should be tested to verify satisfactory performance. ■
Advantages of LCPs End-use advantages
• Excellent thermal stability: UL (Underwriters Laboratory) relative thermal in- dex up to 240°C (464°F), depending on the grade of LCP.
• High rigidity and strength: typical modulus from 10 to 24 GPa (1.4 to 3.5 mil- lion psi), tensile strength from 125 to 255 MPa (18 to 37 ksi), and notched impact en- ergy from 2.2 to 7.5 J (1.6 to 5.5 fMbf.
• Little dimensional change as temperature or humidity changes. Coefficient of thermal expansion is less than 10 X 10-V°C (6 X 10-yoF) in the flow direction. Mois- ture absorption is less than 0.03%.
• Retains 70% of its notched impact value down to about -270°C (~450°F). Most other plastics are extremely brittle at these temperatures.
• Inert to acids, bleaches, chlorinated organic solvents, alcohols, and fuels. • Low gas permeation rates versus commercial packaging films. • Ionic extractables are well below those needed for corrosion-free environments
in integrated-circuit chip applications. • Inherently flame retardant, low smoke density, and relatively nontoxic prod-
ucts of combustion.
Processing advantages • Extremely low shrinkage and warpage in molding, and exceptional repeatabil-
ity of dimensions. • High melt strength for versatility of fabrication. • Low melt viscosity for high flow in thin sections and in intricate parts. • Low heat of fusion for fast melting and rapid cooling, which shortens cycle
times in injection molding. • High stiffness at high temperatures allows ejection from the mold with mini-
mum cooling time. • Little or no flash because of the low injection pressures and the shear-sensitiv-
ity of viscosity.

Hoechst Celanese Locations
Advanced Materials Group and High Performance Polymers Unit 26 Main Street Chatham, New Jersey 07928 Tel: (201) 635-2600 Fax: (201)635-4330
Engineering Thermoplastics Unit 1601 WestLBJ Freeway Dallas, Texas 75234 Tel: (214)277-3900 Fax:(214)277-3910
Custom Compounding Inc. 50 Milton Drive Aston, Pennsylvania 19014 Tel: (215)497-8899 Fax:(215)494-7050
Polymer Composites Inc. 4610 Theurer Boulevard P.O. Box 30013 Winona, Minnesota 87 Tel: (507) 454-4150 Fax:(507 454-6116
New Jersey 26 Main Street Chatham, New Jersey 07928 Tel: (201) 635-4375 Fax:(201)635-4308
Michigan 1195 Centre Road Auburn Hills, Michigan 48326 Tel: (313)377-2700 Fax:(313)377-2981 Toll Free: (800) 962-7448
Illinois 901 Mittel Drive Wood Dale, Illinois 60191 Tel: (708) 616-2100 Fax:(708)616-2162
Texas 1601 WestLBJ Freeway Dallas, Texas 75234 Tel: (214)277-3900 Fax:(214)277-3910 Toll Free: (800)241-3533
Canada Hoechst Celanese Corp. Advanced Materials Group 367 Woodland Road West - Unit 8 Guelph, Ontario, Canada N1H 7K9 Tel: (519) 766-4054 Fax: (519)766-9716
Mexico HCPP Mexicana, S.A. de C.V. Jose A. de Teresa No. 188 Col. Tlacopac 01040 Mexico D.F. Tel: 011-52-325-5630 Fax:011-52-548-7188
Brazil Hoechst do Brazil Quimica e Farmaceutica S.A. Avenida das Nacöes Unidas, 18001 Säo Paulo - SP - 047951 - Brazil Tel: 011-55-525-7795 Fax:011-55-525-7738
Germany Hoechst AG PO Box 80 03 20 D-6230 Frankfurt am Main 80 Germany Tel: 011-49-69-6600 Fax: 011-49-69-303665
Latin America Hoechst Celanese Advanced Materials Group 801 Bnckell Ave. Suite 923 Miami, Florida 33131 Tel: (305) 374-8226 Fax:(305)372-0189
New Jersey Hoechst Celanese 86 Morris Ave. Summit, New Jersey 07901 Tel: (908) 522-7500 Fax: (908) 522-7841
Brazil
Hoechst do Brazil Quimica e Farmaceutica S.A. Fabrica Suzano Suzano, S.A., Brazil Tel: 011-55-476-1222
Michigan Hoechst Celanese Automotive Development Center 1195 Centre Road Auburn Hills, Michigan 48326 Tel: (313)377-2700 Toll Free: (800) 962-7448 Fax: (313)377-2981
For Technical Information: (800) 833-4882
To place an order: (800) 526-4960
Values shown are based on testing of laboratory test specimens and represent data that fall within the normal range of properties for natural material Colorants or other additives may cause significant variations in data values. These values are not intended for use in establishing maximum, minimum, or ranges of values for specification purposes Any determination of the suitability of this material for any use contemplated by the users and the manner of such use is the sole responsibility of the users, who must assure themselves that the material as subsequently processed meets the needs of their particular product or use
To the best of our knowledge, the information contained in this publication is accurate; however, we do not assume any liability whatsoever for accurateness and completeness of such information Moreover, there is a need to reduce human exposure to many materials
to the lowest practical limits in view of possible long-term adverse effects. To the extent that any hazards may have been mentioned in this publication, we neither suggest nor guarantee that such hazards are the only ones which exist. We recommend that persons intending to rely on such recommendation or use any equipment, processing technique, or material mentioned in this publication should satisfy themselves that they can meet all applicable safety and health standards.
We strongly recommend that users seek and adhere to the manufacturers or suppliers current instructions for handling each material they use Please consult the nearest Hoechst Celanese Sales Office, or the Product Information Services phone number listed above, for the appropriate Material Safety Data Sheets (MSDS) before attempting to process this product. Infringement of any patents is the sole responsibility of the user
Celcon* Acetal Copolymer
Forlron* Polyphenylene Sulfide
Vectra* Liquid Crystal Polymer
Celanese* Nylon 6/6
Celanese* Nylon 6
Celanex* Thermoplastic Polyester
Vandar* Thermoplastic Alloys
Impet* Thermoplastic Polyester
Celstran* Long-Fiber Reinforced Thermoplastics
Hostaflon * Polytetrafluoroethylene
Encore" Reclaimed Thermoplastic Resins
Hoechst Celanese Advanced Materials Group Hoechst Celanese Corporation 26 Main Street Chatham, New Jersey 07928 (201)635-2600
Hoechst El * The Hoechst name, logo and Hostaflon are registered trademarks of Hoechst AG Encore™ is a trademark of Hoechst Celanese Corporation ® Registered trademark of Hoechst Celanese Corporation © 1993 Hoechst Celanese Corporation Fortron* is a registered trademark of Fortron Industries Inc.
Printed in U.S.A. 93-605/3M/0594
Vectra Liquid Crystal Polymer
Short Term Properties (VC-4)
Advanced Materials Group
Hoechst Celanese Hoechst

Vectra Liquid Crystal Polymer (LCP)
Introduction Vectra® Liquid Crystal Polymers (LCP) are a family of high performance plastic materials based on patented Hoechst Celanese Corporation technology. A variety of product grades are offered, each with its own unique characteristics tailored to meet demanding thermal and mechanical applications. They are used in place of metals, thermosets and other thermoplastics because of the following set of product advantages that cannot be provided by other materials:
Advantages Over Metal Excellent chemical and hydrolytic stability Excellent corrosion resistance Very high strength to weight ratio - tensile/flex moduli up to 2,500,000 psi Concentrates available for color-coding Opportunities for parts consolidation Eliminates secondary finishing operations Space/weight savings possible Mold complex parts without machining High precision molding Similar part dimensional stability and coeffi- cient of thermal expansion
Advantages Over Thermosets Processes very easily on both injection mold- ing and extrusion equipment Extremely high melt flow under shear - able to fill long and complicated flow paths Excellent dimensional stability and very low mold shrinkage No deflashing required for molded parts Able to use regrind for cost savings
■ 100% recyclable ■ Fast cycle times, increased productivity ■ Most grades have UL 94 V-0 flammability ratings,
and low smoke ratings ■ Products have extremely low oxygen and
moisture permeability
Advantages Over Other Thermoplastics ■ Superior thermal stability - UL Relative Thermal Index
ratings up to 460°F ■ UL 94 V-0 flammability ratings down to 1/64"
part thickness ■ Heat deflection temperatures as high as 518°F ■ Excellent organic solvent resistance ■ Low moisture permeability ■ Resistant to sterilization by radiation, steam,
or chemical processes ■ Excellent electrical insulation properties ■ Excellent creep resistance at elevated temperature ■ Excellent dimensional stability, precision moldability ■ Shortest molding cycle times, increased productivity
Additional Features
Extrusion Grades Available Specific Vectra LCP grades are recommended for extrusion of rod, profile, film and sheet, pipe, tubing, fiber, and overcoating of optical glass fiber Extruded products are highly anisotropic and are very strong in the machine direction Products have excellent thermal, chemical, and insulative properties.
Regulatory Listings Grades are available which have: ■ Drug and Device Master files - USP Class VI
compliance ■ Military and Federal specifications listings ■ Underwriters Laboratories listings ■ JEDEC Electronic listing
Other Products Available Film and Vectran® fiber made from Vectra LCP are available
For more information on these applications or products, contact your local Hoechst Celanese Sales Office, or Product Information Services at (800) 833-4882.

Vectra Liquid Crystal Polymer (LCP) - Grade Characteristics
A115 Low glass content reinforced, general purpose grade. Very easy to process; parts have very low notch sensitivity; slightly tougher than A130 but some part configurations may warp slightly more.
A130 General purpose grade with excellent balance of properties including superior thermal stability, mechanical, and electrical properties, good chemical resistance. Inherently flame retardant without addi- tives. Very easy to process; no mold flash. Suitable for vapor phase surface mount electrical and electronic devices. USP Class VI compliant for use in medical devices. Resistant to radiation and steam sterilization.
A150 High glass content reinforced, general purpose grade. Parts exhibit low shrinkage and are highly creep resistant over time. Some part configurations exhibit lower warpage than A130.
A230 General purpose carbon fiber reinforced grade; excellent stiffness, hydrolytic, and chemical stability. Electrically conductive. Recommended for bearings, wear-resistant parts. USP Class VI compliant for use in medical devices.
A410 A glass/mineral filled grade used where minimal warpage is required in molded parts. Slightly more difficult to process than an all glass-reinforced grade.
A420 This grade is similar in properties and process- ing to A410, but contains graphite flake for improved lubricity and wear resistance.
A422 This grade is similar in properties and process- ing to A130, but contains graphite flake for improved lubricity and wear resistance.
A430 This grade is similar in properties and process- ing characteristics to A130, but contains PTFE fluoro- carbon for improved lubricity. Molded parts exhibit excellent electrical properties such as arc resistance, even at high frequencies.
A435 This grade is similar in processing characteris- tics to A430, but is stiffer. It also contains PTFE fluoropolymer for enhanced lubricity. It has excellent electrical properties including the best High Current Arc Ignition values.
A515 This grade has a low level of mineral filler, for a good balance of toughness, hydrolytic stability, and easy processability. Parts made from A515 are in compliance with USP Class VI for medical devices.
A530 The mineral filler in A530 confers excellent surface smoothness and good toughness and hydrolytic stability on molded parts. Products are resistant to radiation and steam sterilization. Parts made from A530 are in compliance with USP Class VI for medical devices.
A540 This grade contains additional mineral filler compared to A530, which increases stiffness at the expense of a slight reduction in processability.
A625 This grade is highly filled with graphite flake for a good balance of toughness, wear resistance, chemical resistance, and hydrolytic stability.
A700 This grade is glass reinforced for good mechanical properties and has electrostatic dissip tive properties as well.
B130 This is a glass reinforced grade based on a polymer with enhanced strength and stiffness com- pared to A130, with a very low coefficient of thermal expansion and low part shrinkage during molding. It processes less easily than A130.
B230 This grade is reinforced with carbon fiber for metal-like strength and stiffness values, and is electri- cally conductive. It is highly suitable for metal replace- ment applications.
B420 This grade is glass/mineral/graphite filled for enhanced strength and stiffness compared to A420. It produces parts with excellent creep resistance and long-term dimensional stability.
C115 C115 is a glass reinforced product similar in mechanical properties to A115 but with higher thermal stability. It processes very well.
C130 This grade has similar properties to A130, but with higher thermal stability and slightly greater dimensional stability, making it useful for parts exposed to vapor phase soldering temperatures.
C150 C150 has excellent strength and stiffness properties, coupled with greater thermal stability com- pared to A150. Compared to C130, it offers improved creep resistance and long-term dimensional stability. Some part designs show reduced warpage compared to C130.
C550 This grade is highly mineral filled for high temperature applications, especially where cost is a factor.
E130 E130 is a glass reinforced grade having the highest temperature resistance for surface mount technology applications. It processes extremely easily and readily fills thin wall parts.
V140 This product is a unique alloy with processability and dimensional stability comparable to standard LCP products. It provides high heat distortion, superior weld line strength, and low warpage for parts exposed to infra-red and vapor phase reflow soldering conditions.
Vectra" Liquid Crystal Polymer (LCP) - Typical Properties
Property ASTM Test
Method
Units Eng. (S.I.)
A115 A130 A150 A230
Physical
Specific Gravity D792
Water Absorption, Immersion to Equilibrium D570
Mold Shrinkage Flow/Transverse (4" Disk) D995
/o
/o
1.50 1.61 1.79 1.49
0.02
0.0/0.2
0.02
0.1/0.2
0.01 0.03
0.2/0.2 0.1/0.2
Mechanical @ 73°F (23°C)
Tensile Strength at Break
Tensile Modulus
D638 103psi(MPa) 28(195)
Elongation at Break
Flexural Strength
Flexural Modulus
Compressive Strength (1% Deflection)
Compressive Modulus
Shear Strength
Izod Impact Strength, Notched
Tensile Impact Strength
Taber Abrasion
Rockwell Hardness
Coefficient of Friction Against Metal:
Dielectric Constant: 1 KHz
1 MHz
D638 106psi(GPa)
D638 0/ /o
D790 103psi(MPa)
D790
D695
106psi(GPa)
1.9(13.1)
3.0
30 (207)
1.6(11)
_30(207)
2.4(16.6)
2.2
37 (254)
2.1(15)
26(180)
3.2 (22)
28(193)
4.5(31)
1.3 1.1
36 (248) 37 (225)
2.9 (20) 3.5 (24)
103psi(MPa) 5.9(41) 20(140) 22.5(155) 18(124)
D695
D732
106psi(GPa)
103psi(MPa)
1.7(12) 2.2(15) 2.5(17.2)
D256 ft - lb/in (J/m) 5.5 (290)
17.8(123)
2.8(150) 1.7(90)
17.5(121)
1.2(64)
D1822
D1044
ft- lb/in2 (kJ/nf) 40 (84) 40 (84) 25 (53) 30 (63)
mg/1000 cycles 7.4 5.8
D785 M scale 87 93 83 (80)
Dynamic — — 0.11 0.14 0.19 0.13
Static — — 0.11 0.19 0.16 0.16
Thermal Heat Deflection Temperature:
66 psi, 0.46 N/mm2 D648 °F (°C) — 489 (254) 484(251) —
264 psi, 1.82 N/mm2 D648 °F(°0 430 (220) 446 (230) 449 (232)
5
430(221)
Coeff. of Linear Thermal Expansion: (-50°C to 200°C), Flow Direction D696
cm/cm/°C x106 — 5 -2
Transverse to Flow D696 cm/cm/°Cx
106 — 65 60 65
Melting Point — °F CO 536 (280) 536 (280) 536 (280) 536 (280)
Electrical
Volume Resistivity D257 ohm-cm 1016 1015 5x10¹⁵ —
Dielectric Strength, Short Term, 1.5mm Thickness: 23°C, 50% RH D149 V/mil (kV/mm) — 1100(43) 870 (34) —
Comparative Tracking Index D3638 volts
— 175 175 — -
Arc Resistance D495 seconds 137 181 — x.
D150
D150 3.2
4.1
3.7
4.3
3.9
1 GHz —. 1
D150 — — 3.7 3.9 — i_—__—_„—_
1
Dissipation Factor: 1 GHz — — 0.006 0.006 — ?
Flammability ^-\ Underwriters Laboratories Ratings, All UL94V0 @ minimum thickness
in. (mm)
0.033 (0.85)
0.018 (0.45)
0.018 (0.45)
0.016 (0.43)
Limiting Oxygen Index, (LOI) D2863 — — 37 37 —

A410 A420 A422 A430 A435 A515 A530 A540 A625 A700
1.84__
0.02_
0.2/0.3
24.5(169)
1.89
0.02
0.1/0.2
21.5(149)
_3.0_(2_1)
1.8
3.1 (21)
1.4
1.68_
_0102__
0.1/0.3
_25J173)_
2.3
1.50 1.62
24.5(169) : 25.1^173)_
1.52 1-65_
0.02 I _j^
0.3/0.4 I —
27(185) i 27(186)_
1.76
0.02
0.2/0.4
27 (145)
1.54_
0.03
1.1(7.6)
5.2
1.6(11) 1.7(12)
_34 (232) 31(214) 33JJ230) , 18.5(128)
3.0
29 (200)
3.9
Z_0_(14)_
4.7
2.5(17.2)
3.5 T 23.5(161) I 27(186)_; 26(181) : 21 21 (146)
2.7(19) 2.9 (20) 2.2(15) 1.0(7.2) 1.4(9.6)_ 1.4(10)
18.5(127) | 20.5(140) : 2^(145) 11.5(79)
1.7(11.7) I 2:2(15)_J_JL5_(10:3)_
14.5(100) ', 10.5(74)^
2.2(15)
76
0.21
0.21
437 (225)
50
1015
840 (33)
175
163
4.5
4.2
4.1
0.004
Or 0.016 (0.45)
37
2.8 (20) 2.0(14) 1.4(9.6) 2.0(14) 1.4(9.6)
1.6(85) i 1.9(100) | 2J5 034) 3.8(203) I 2.1 (112)^_67(358)_j_5^J294)_
36 (76)
1.3(70)
20 (42)
1.8_(95)_
40 (84)
79 63 63 62
0.18
0.20
0.17
0.18
_o._ii
0.11
0.15
0.20
0.14
0.13
0.12 0.15
0.12 0.21
437 (225) I 43JJ22^)_^5^(178J_^15i225)_^6M185)^392i2001
50 55 65
1.61
0.1/0.3 —
I 23.5(162)^ 20(138)
1.5(10.3) , 2.0(14)
6.6 I 1.4
400(204) | j&CH180)_u428_(22J
9 6 I —
536(280) T~536(280) I 536(280) ' 538(280) : 538(280) 536(280) 538(280) | 536(280) 536(280) ' 538(28
101;
890 (35) 570 (22)
175
137
175
100
175
163
4.2 3.3
3.8 3.9
3.9
0.035 (0.91)
0.004
0.018 (0.45)
0.125 (3.18)
0.02 (0.46)
0.067 (1.68)
33 37

B130 B230 B420 C115 C130 C150 C550 E130 V140
I
1.61 1.49 1.89 1.50 1.61 1.79 1.89 — 1.67
0.02 0.03 — — 0.02 0.01 0.02 — 0.02
0.0/0.1 0.0/0.0 — 0.0/0.2 0.1/0.2 0.2/0.2 0.3/0.4 — 1.2/4.5
32(221) 35(241) 17(117) 23(159) 23(161) 24(165) 16.5(115) 18(124) 24(165)
3.5(24.1) 5.4 (37) 3.0(20.7) 1.5(10.3) 2.1 (14.5) 3.0 (20.7) 2.7(18.6) 2.0(14) 2.5(17.3)
1.2 1.0 0.6 2.8 1.7 1.2 2.0 1.7 1.4
43.5 (300) 46(317) 26(179) 28.7(198) 31 (212) 32 (220) 23.5(163) 25(174) 36 (248)
2.7(19) 4.6 (32) 3.0 (20.7) 1.4(9.6) 1.9(13.1) 2.8(19) 2.5(17.2) 2.0(14) 2.4(16.6)
28(192) 34.5 (238) — — 18(124) — — — —
2.1 (20) 4.8(33.1) — 1.7(20) — — — —
*9.1 (132) — — — 2.9 (20) — — — —
1.7(90) 1.4 (75) 0.6 (32) 4.0(214) 2.4(125) 1.6 (85) 1.0(54) 2.0(107) 1.5
25 (53) 20 (42) — — 35 (74) — 25 (53) — —
— — — — — — — — —
— 99 93 — — — — — —
— - — — — — — — — —
— — — — — — — — I — !
— — — — 543 (284) — — — —
446 (230) 440 (227)
3
410(210) 455 (235) 469 (243) 485 (252) 429(221) 518(270) 265(510)
2 — — 6 7 12 — 9
50 45 — — 70 60 65 — 42
536 (280) 536 (280) 536 (280) 620 (327) 620 (327) 620 (327) 620 (327) 670 (355) 580 (305)
— — — 1016 — — 1015 1016
— — — — 1110(43) — — 1200(47) 600 (23)
— — — — 175 — — 200 175
— — — — 137 — — 140 160
— — — — 4.1 — — 3.7 3.7
— — — — 3.7 — — —
— — — — 3.8 — — — —
— — — — 0.004 — — 0.006 0.003
0.017 (0.43)
0.033 (0.81)
0.017 (0.43)
37
0.018 (0.45)
37
0.033 (0.84)
0.016 (0.40)