Create an ETD Using Adobe Acrobat Lesson 2: Create a 1 Create a
Upload
khangminh22Category
view
0download
0
-[ PC -5 ]-- nTTTT
International Polymer Conference of Thailand
PROGRAM BOOK
International Polymer Conference of Thailand
Annual Polymer Conference June 18-19, 2015
Pathumwan Princess Hotel, Bangkok Thailand
by
International Polymer Conference of Thailand
PCT-5: Another Step of Thai Polymer Society, A Strong
International Network
Suwabun Chirachanchai, Ph.D.
Professor
President of Polymer Society of Thailand
PCT-5 Chairman
The Polymer Society of Thailand (PST). PST was founded in 1999 by Thai academic and industrial
polymer scientists. The society plays its important role to be the catalyst among the scientists so that
the research, development and innovation of polymer science and engineering in the country can go
beyond. In order to achieve this goal, we realize the conference as an important stage to motivate and
accelerate the advancement of polymers along with updating information including the strengthen of
people network through the Plenary and Keynote lectures, general oral and poster presentations, and
the recreation programs. It is also the stage where we express our recognition to award the young
polymer scientists in the country, so-called 'Thai Polymer Society Rising Star'. Therefore, the Polymer
Conference of Thailand (PCT) has been held annually for the past 4 years. And for this year, the PST
is going to another step where we aim for the strong international networking and this results in the
International Polymer Conference of Thailand, PCT-5.
I would like to take this opportunity to acknowledge the guests from abroad who make the conference
be the real international one, the Plenary Speakers; Prof. Dr. Andreas Greiner (Universität Bayreuth,
Germany), Dr. Michel Wong Chi Man (Institut Charles Gerhardt Montpellier, France), Dr. Piyada
Charoensirisomboon (BASF Advanced Chemicals Co., Ltd. Shanghai, China), the Keynote Speakers;
Prof. Dr. Jun Li (National University of Singapore, Singapore), Prof. Dr. Rusli bin Daik (Universiti
Kebangsaan Malaysia), Asst. Prof. Dr. Michiya Matsusaki (Osaka University, Japan), Assoc. Prof. Dr.
Seiichi Kawahara (Nagaoka University of Technology, Japan), Prof. Dr. Masahiro Ohshima (Kyoto
University, Japan), Assoc. Prof. Dr. Moon Jeong Park (Pohang University of Science and Technology,
Korea), Prof. Dr. Yun Yan (Peking University, China), Prof. Dr. Seema Agarwal (Universität
Bayreuth, Germany), Prof. Dr. Masayuki Yamaguchi (Japan Advanced Institute of Science and
Technology, Japan) and Prof. Dr. Yuko Ikeda (Kyoto Institute of Technology, Japan).
The appreciations are also to the Thai Keynotes, the speakers from industries, the general participants,
who fill up the talk in two-day conference. I am also happy to see the instrument companies join the
talk by bringing in the updated information about instrumentation for the effective and efficient
research.
I, personally, look forward to the 'Rising Stars 2015' to be announced on the conference day and the
best poster awards which represent the research quality of the country.
On behalf of the Thai Polymer Society, I would like to express my deepest gratitude to the sponsors,
which are the Gold from the SCG Chemicals Company Limited, the BASF (Thai) Limited and the
PTT Global Chemical Public Company Limited, the Silver from the Thailand Convention and
Exhibition Bureau and the Bronze from the Bruker BioSpin AG.
International Polymer Conference of Thailand
Board of Polymer Society of Thailand
Advisory board
Asst. Prof. Dr. Krisda Suchiva
National Metal and Materials Technology Center (MTEC)
Prof. Dr. Pattarapan Prasassarakich
Department of Chemical Technology, Chulalongkorn University
Prof. Dr. Supawan Tantayanon
Department of Chemistry, Chulalongkorn University
Prof. Dr. Suda Kiatkamjornwong
Faculty of Science, Chulalongkorn University
President Prof. Dr. Suwabun Chirachanchai
The Petroleum and Petrochemical College, Chulalongkorn
University
Vice President Assoc. Prof. Dr. Pranee Phinyocheep
Department of Chemistry, Mahidol University
Vice President Dr. Veerapat Tantayakom
PTT Global Chemical Public Company Limited
Secretary Asst. Prof. Dr. Varawut Tangpasuthadol
Department of Chemistry, Chulalongkorn University
Treasurer Asst. Prof. Dr. Kanoktip Boonkerd
Department of Material Science, Chulalongkorn University
Committee Assoc. Prof. Dr. Ittipol Jangchud
Department of Chemistry, King Mongkut’s Institute of Technology
Ladkrabang
Committee Asst. Prof. Dr. Winita Punyodom
Department of Chemistry, Chiang Mai University
Committee Assoc. Prof. Dr. Pakorn Opaprakasit
Sirindhorn International Institute of Technology, Thammasat
University
Committee Dr. Asira Fuongfuchat
National Metal and Materials Technology Center (MTEC)
continued
International Polymer Conference of Thailand
Board of Polymer Society of Thailand (continued)
Committee Asst. Prof. Dr. Kannika Sahakaro
Faculty of Science and Technology, Prince of Songkla University,
Pattani Campus
Committee Dr. Prakaipetch Kitiyanan
BASF (Thai) Limited
Committee Dr. Pasaree Laokijcharoen
National Metal and Materials Technology Center (MTEC)
Committee Dr. Narin Kaabbuathong
PTT Public Company Limited
Committee Dr. Warayuth Sajomsang
National Nanotechnology Center (NANOTEC)
Committee Assoc. Prof. Dr. Vuthichai Ervithayasuporn
Department of Chemistry, Mahidol University
Committee Dr. Wonchalerm Rungswang
SCG Chemicals Company Limited
International Polymer Conference of Thailand
Committee Chairman Prof. Dr. Suwabun Chirachanchai The Petroleum and Petrochemical College,
Chulalongkorn University
International Advisory and Scientific Committee Prof. Dr. William H. Daly, Louisiana State University, USA Prof. Dr. Avraam I. Isayev, The University of Akron, USA Dr. Patrick Brant Exxon Mobil Chemical, USA Prof. Dr. Garry L. Rempel, University of Waterloo, Canada Prof. Dr. Yusuf Yagci Istanbul Technical University, Turkey Prof. Dr. Seema Agarwal Universität Bayreuth, Germany Prof. Dr. Andreas Greiner Universität Bayreuth, Germany Dr. Klaus Tauer Max Planck Institute of Colloids and Interfaces,
Germany Prof. Dr. Laurent Fontaine Université du Maine, France Prof. Dr. Philippe Daniel Université du Maine, France Dr. Michel Wong Chi Man Institut Charles Gerhardt Montpellier, France Prof. Dr. Masahiro Ohshima Kyoto University, Japan Prof. Dr. Masayuki Yamaguchi Japan Advanced Institute of Science and Technology,
Japan Prof. Dr. Yuko Ikeda Kyoto Institute of Technology, Japan Assoc. Prof. Dr. Seiichi Kawahara Nagaoka University of Technology, Japan Assoc. Prof. Dr. Yoshimasa Yamamoto Tokyo National College of Technology, Japan Asst. Prof. Dr. Michiya Matsusaki Osaka University, Japan Prof. Dr. Changwoon Nah Chonbuk National University, Korea Prof. Dr. In Joo Chin Inha University, Korea Prof. Dr. Hyoung Jin Choi Inha University, Korea Assoc. Prof. Dr. Moon Jeong Park Pohang University of Science and Technology, Korea Prof. Dr. Hongzhi Liu Shandong University, China Prof. Dr. Yun Yan Peking University, China Prof. Dr. Jun LI, National University of Singapore, Singapore Prof. Dr. Chi Wu Chinese University of Hong Kong, Hong Kong Prof. Dr. Braja Gopal Bag Vidyasagar University, India Assoc. Prof. Dr. Kinsuk Naskar Indian Institute of Technology Kharagpur, India Prof. Dr. Rusli bin Daik Universiti Kebangsaan Malaysia, Malaysia Assoc. Prof. Dr. Zulkifli Mohammad Ariff Universiti Sains Malaysia, Malaysia
Scientific Committee Mahidol University Assoc. Prof. Dr. Pranee Phinyocheep Chair of Scientific Committee Department of Chemistry Assoc. Prof. Dr. Vuthichai Ervithayasuporn Department of Chemistry Assoc. Prof. Dr. Taweechai Amornsakchai Department of Chemistry Assoc. Prof. Dr. Sombat Thanawan Department of Chemistry
Chulalongkorn University Prof. Suwabun Chirachanchai The Petroleum and Petrochemical College Prof. Dr. Pattarapan Prasassarakich Department of Chemical Technology Prof. Dr. Suda Kiatkamjornwong Faculty of Science Asst. Prof. Dr. Varawut Tangpasuthadol Department of Chemistry
Asst. Prof. Dr. Kanoktip Boonkerd Department of Material Science
International Polymer Conference of Thailand
King Mongkut’s Institute of Technology Ladkrabang Assoc. Prof. Dr. Ittipol Jangchud Department of Chemistry Asst. Prof. Dr. Chonlada Ritviruth Department of Chemistry Asst. Prof. Dr. Suparat Rukchonlatee Department of chemistry
Thammasat University Assoc. Prof. Dr. Pakorn Opaprakasit Sirindhorn International Institute of Technology Asst. Prof. Dr. Suwadee Kongparakul Department of Chemistry Dr. Nopparat Plucktaveesak Department of Chemistry Assoc. Prof. Dr. Cattaleeya Pattamaprom Department of Chemical Engineering Asst. Prof. Dr. Siwarutt Boonyarattanakalin Sirindhorn International Institute of Technology Asst. Prof. Dr. Wanwipa Siriwatwechakul Sirindhorn International Institute of Technology
Rajamangala University of Technology Thanyaburi Asst. Prof. Dr. Amorn Chaiyasat Department of Chemistry
Chiang Mai University Asst. Prof. Dr. Winita Punyodom Department of Chemistry Asst. Prof. Dr. Kanarat Nalampang Department of Chemistry Asst. Prof. Dr. Saengrawee Sriwichai Department of Chemistry Dr. Robert Molloy Department of Chemistry Dr. Kiattikhun Manokruang Department of Chemistry Dr. Paralee Waenkaew Department of Chemistry Dr. Patnarin Worajittiphon Department of Chemistry Dr. Runglawan Somsunan Department of Chemistry Asst. Prof. Dr. Jantrawan Pumchusak Department of Industrial Chemistry Dr. Datchanee Pattavarakorn Department of Industrial Chemistry
Naresuan University Assoc. Prof. Dr. Metha Rutnakornpituk Department of Chemistry,
Maejo University Asst. Prof. Dr. Tithinun Rattanaplome Faculty Engineering and Agro-Industry Dr. Worawan Pechurai Faculty Engineering and Agro-Industry Dr. Achara Kleawkla Department of Chemistry
University of Phayao Dr. Wijitra Meelua Department of Chemistry Dr. Boontharika Thapsukhon School of Science
Mae Fah Luang University Dr. Patchara Punyamoonwongsa School of Science
Rajamangala University of Technology Lanna Dr. Chinanat Witthayaprapakorn Faculty of Sciences and Agricultural Technology
Mahasarakham University Assoc. Prof. Dr. Yodthong Baimark Department of Chemistry
Suranaree University of Technology Assoc. Prof. Dr. Yupaporn Ruksakulpiwat School of Polymer Engineering Asst. Prof. Dr. Chantima Deeprasertkul School of Polymer Engineering Asst. Prof. Dr. Kasama Jarukumjorn School of Polymer Engineering Asst. Prof. Dr. Pranee Chumsamrong School of Polymer Engineering Asst. Prof. Dr. Wimonlak Sutapun School of Polymer Engineering Dr. Tatiya Trongsatitkul School of Polymer Engineering
Prince of Songkla University Assoc. Prof. Dr. Varaporn Tanrattanakul Department of Materials Science and Technology,
Hatyai Campus
International Polymer Conference of Thailand
Asst. Prof. Dr. Kannika Sahakaro Faculty of Science and Technology, Pattani Campus Asst. Prof. Dr. Anoma Titithammawong Faculty of Science and Technology, Pattani Campus Asst. Prof. Dr. Natinee Lopattananon Faculty of Science and Technology, Pattani Campus Dr. Sunisa Suchart Faculty of Science and Industrial Technology,
Suratthani Campus
Songkhla Rajabhat University Asst. Prof. Dr. Polphat Ruamcharoen Program of Rubber and Polymer Technology,
National Metal and Materials Technology Center Asst. Prof. Dr. Krisda Suchiva Dr. Asira Fuongfuchat Dr. Pasaree Laokijcharoen Dr. Chureerat Prahsarn Dr. Patcharee Larpsuriyakul
National Nanotechnology Center Dr. Warayuth Sajomsang
Private sectors Dr. Prakaipetch Kitiyanan BASF (Thai) Limited Dr. Veerapat Tantayakom PTT Global Chemical Public Company Limited Dr. Narin Kaabbuathong PTT Public Company Limited Dr. Wonchalerm Rungswang SCG Chemicals Company Limited
Organizing Committee Asst. Prof. Dr. Krisda Suchiva National Metal and Materials Technology Center Prof. Dr. Suda Kiatkamjornwong Faculty of Science, Chulalongkorn University Prof. Dr. Pattarapan Prasassarakich Department of Chemical Technology, Chulalongkorn
University Prof. Dr. Supawan Tantayanon Department of Chemistry, Chulalongkorn University Assoc. Prof. Dr. Pranee Phinyocheep Department of Chemistry, Mahidol University Assoc. Prof. Dr. Ittipol Jangchud Department of Chemistry, King Mongkut’s Institute
of Technology Ladkrabang Assoc. Prof. Dr. Pakorn Opaprakasit Sirindhorn International Institute of Technology,
Thammasat University Assoc. Prof. Dr. Vuthichai Ervithayasuporn Department of Chemistry, Mahidol University Asst. Prof. Dr. Kannika Sahakaro Faculty of Science and Technology, Prince of Songkla
University, Pattani Campus Asst. Prof. Dr. Winita Punyodom Department of Chemistry, Chiang Mai University Asst. Prof. Dr. Varawut Tangpasuthadol Department of Chemistry, Chulalongkorn University
Asst. Prof. Dr. Kanoktip Boonkerd Department of Material Science, Chulalongkorn University
Dr. Asira Fuongfuchat National Metal and Materials Technology Center Dr. Pasaree Laokijcharoen National Metal and Materials Technology Center Dr. Warayuth Sajomsang National Nanotechnology Center Dr. Prakaipetch Kitiyanan BASF (Thai) Limited Dr. Veerapat Tantayakom PTT Global Chemical Public Company Limited Dr. Narin Kaabbuathong PTT Public Company Limited Dr. Wonchalerm Rungswang SCG Chemicals Company Limited
Regional Organizing Committee Dr. Robert Molloy Department of Chemistry, Chiang Mai University Assoc. Prof. Dr. Yodthong Baimark Department of Chemistry, Mahasarakham University Assoc. Prof. Dr. Metha Rutnakornpituk Department of Chemistry, Naresuan University
International Polymer Conference of Thailand
Assoc. Prof. Dr. Jatuphorn Wootthikanokkhan Division of Materials Technology, King Mongkut’s University of Technology Thonburi
Asst. Prof. Dr. Chiraphon Chaibundit Department of Materials Science and Technology, Prince of Songkla University, Hat-Yai Campus
Asst. Prof. Dr. Chaiwat Ruksakulpiwat Department of Chemistry, Khon Kaen University Asst. Prof. Dr. Suttinun Phongtamrug Department of Industrial Chemistry, King Mongkut's
University of Technology North Bangkok Asst. Prof. Dr. Preeyaporn Chaiyasat Department of Chemistry, Rajamangala University of
Technology Thanyaburi Asst. Prof. Dr. Polphat Ruamcharoen Program of Rubber and Polymer Technology,
Songkhla Rajabhat University Asst. Prof. Dr. Rapee Gosalawit School of Chemistry, Suranaree University of
Technology Asst. Prof. Dr. Rukkiat Jitchati Department of Chemistry, Ubon Ratchathani
University Asst. Prof. Dr. Wanvimol Pasanphan Department of Materials Science, Kasetsart
University Dr. Sunisa Suchart Faculty of Science and Industrial Technology, Prince
of Songkla University, Suratthani Campus Dr. Achara Kleawkla Department of Chemistry, Maejo University Dr. Boontharika Thapsukhon School of Science, University of Phayao Dr. Patchara Punyamoonwongsa School of Science, Mae Fah Luang University Dr. Nattakan Soykeabkaew School of Science, Mae Fah Luang University
International Polymer Conference of Thailand
International Polymer Conference of Thailand
Contents
page
Main Event Program 1
Parallel Program 3
Plenary Lectures 8
PL-I Nanofibers by electrospinning – from a forgotten method to a major technique 9 Andreas Greiner
PL-II Bridged polysilsesquioxanes: synthesis and application fields 10 Michel Wong Chi Man
PL-III Creating chemistry for sustainable future in Asia 11 Piyada Charoensirisomboon
PST Rising Star Award Lecture 12
RS Amine-decorated polymeric colloidal particles :From syntheses to applications
13
Panya Sunintaboon
I. Session: Biomedical and Environmentally Friendly Polymers 14
KN-BIOEN-1 Supramolecular self-assembled polymers as novel biomaterials 15 Jun Li
KN-BIOEN-2 Control of cell surfaces by polymer/protein LbL films for fabrication of 3D-human tissue models
16
Michiya Matsusaki KN-BIOEN-3 Enzymatic degradation of oil palm empty fruit bunch biomass 17
Rusli Bin Daik KN-BIOEN-4 Chitosan dispersion as a pharmaceutical coating material 18
Satit Puttipipatkhachorn BIOENO Oral presentations 19
BIOENP Poster presentations 24
II. Session: Advances in Polymer Characterization 59
KN-CHAR-1
Preparation and properties of natural rubber with organic- inorganic nanomatrix structure
60
Seiichi Kawahara KN-CHAR-2 Chemically controlled self-assembly of gold nanoparticles by
site-selective protein immobilization: A model for antimalarial drug screening 61
Palangpon Kongsaeree
III. Session: Polymer Composites and Nanocomposites 62
KN-COMP-1 Interphase transfer of nanoparticles between immiscible polymer blends
63
Masayuki Yamaguchi KN-COMP-2 Hybrid porous polymers derived from octavinylsilsesquioxane 64
Hongzhi Liu
KN-COMP-3 Natural fiber reinforced rubber: recent advances toward high performance rubber matrix composites using pineapple leaf fiber
65
Taweechai Amornsakchai KN-COMP-4 Performance of aramid fiber in rubber compounds 66
Jutarat Phanmai
COMPO Oral presentations 67
COMPP Poster presentations 83
International Polymer Conference of Thailand
Contents
page
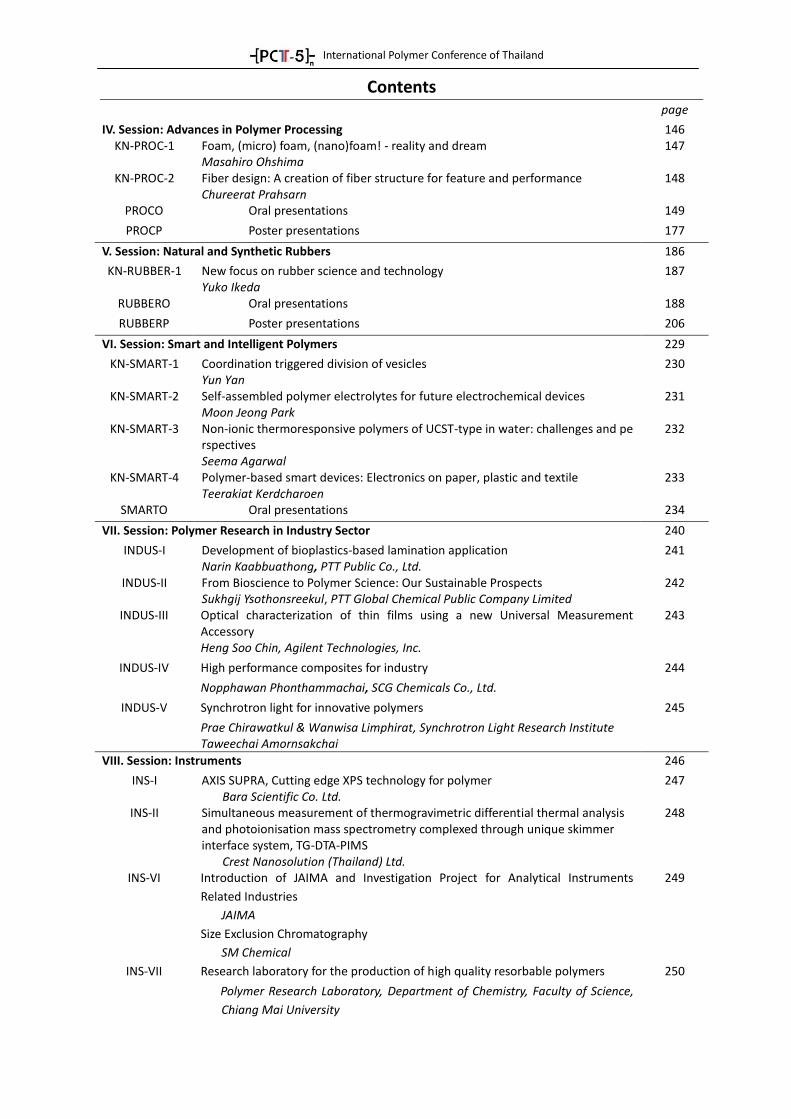
IV. Session: Advances in Polymer Processing 146 KN-PROC-1 Foam, (micro) foam, (nano)foam! - reality and dream 147
Masahiro Ohshima KN-PROC-2 Fiber design: A creation of fiber structure for feature and performance 148
Chureerat Prahsarn PROCO Oral presentations 149
PROCP Poster presentations 177
V. Session: Natural and Synthetic Rubbers 186
KN-RUBBER-1 New focus on rubber science and technology 187 Yuko Ikeda
RUBBERO Oral presentations 188
RUBBERP Poster presentations 206
VI. Session: Smart and Intelligent Polymers 229
KN-SMART-1 Coordination triggered division of vesicles 230 Yun Yan
KN-SMART-2 Self-assembled polymer electrolytes for future electrochemical devices 231 Moon Jeong Park
KN-SMART-3 Non-ionic thermoresponsive polymers of UCST-type in water: challenges and perspectives
232
Seema Agarwal KN-SMART-4 Polymer-based smart devices: Electronics on paper, plastic and textile 233
Teerakiat Kerdcharoen SMARTO Oral presentations 234
VII. Session: Polymer Research in Industry Sector 240
INDUS-I Development of bioplastics-based lamination application 241 Narin Kaabbuathong, PTT Public Co., Ltd.
INDUS-II From Bioscience to Polymer Science: Our Sustainable Prospects 242 Sukhgij Ysothonsreekul, PTT Global Chemical Public Company Limited
INDUS-III Optical characterization of thin films using a new Universal Measurement Accessory
243
Heng Soo Chin, Agilent Technologies, Inc.
INDUS-IV High performance composites for industry 244
Nopphawan Phonthammachai, SCG Chemicals Co., Ltd.
INDUS-V Synchrotron light for innovative polymers 245
Prae Chirawatkul & Wanwisa Limphirat, Synchrotron Light Research Institute Taweechai Amornsakchai
VIII. Session: Instruments 246
INS-I AXIS SUPRA, Cutting edge XPS technology for polymer 247 Bara Scientific Co. Ltd.
INS-II Simultaneous measurement of thermogravimetric differential thermal analysis and photoionisation mass spectrometry complexed through unique skimmer interface system, TG-DTA-PIMS
248
Crest Nanosolution (Thailand) Ltd. INS-VI Introduction of JAIMA and Investigation Project for Analytical Instruments
Related Industries
249
JAIMA
Size Exclusion Chromatography
SM Chemical
INS-VII Research laboratory for the production of high quality resorbable polymers 250
Polymer Research Laboratory, Department of Chemistry, Faculty of Science,
Chiang Mai University
International Polymer Conference of Thailand
1
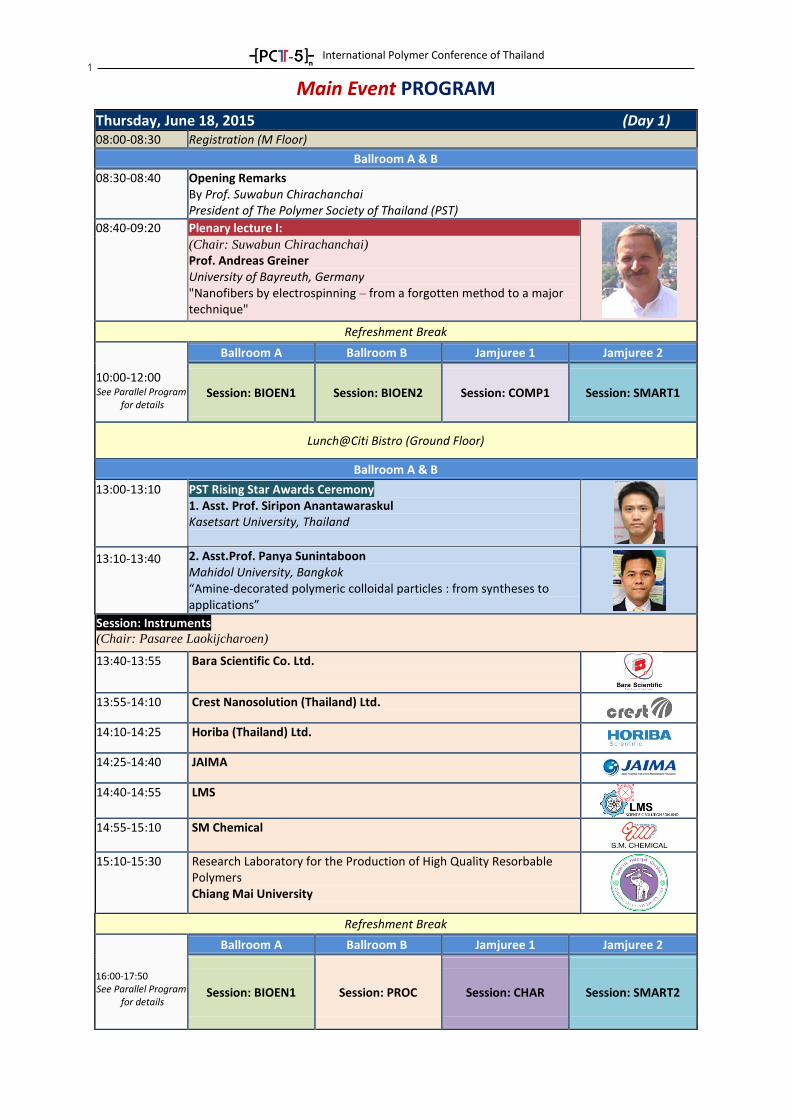
Main Event PROGRAM
Thursday, June 18, 2015 (Day 1) 08:00-08:30 Registration (M Floor)
Ballroom A & B
08:30-08:40 Opening Remarks By Prof. Suwabun Chirachanchai President of The Polymer Society of Thailand (PST)
08:40-09:20 Plenary lecture I:
(Chair: Suwabun Chirachanchai) Prof. Andreas Greiner University of Bayreuth, Germany "Nanofibers by electrospinning – from a forgotten method to a major technique"
Refreshment Break
10:00-12:00 See Parallel Program
for details
Ballroom A Ballroom B Jamjuree 1 Jamjuree 2
Session: BIOEN1 Session: BIOEN2 Session: COMP1 Session: SMART1
Lunch@Citi Bistro (Ground Floor)
Ballroom A & B
13:00-13:10 PST Rising Star Awards Ceremony 1. Asst. Prof. Siripon Anantawaraskul Kasetsart University, Thailand
13:10-13:40 2. Asst.Prof. Panya Sunintaboon Mahidol University, Bangkok “Amine-decorated polymeric colloidal particles : from syntheses to applications”
Session: Instruments (Chair: Pasaree Laokijcharoen)
13:40-13:55 Bara Scientific Co. Ltd.
13:55-14:10 Crest Nanosolution (Thailand) Ltd.
14:10-14:25 Horiba (Thailand) Ltd.
14:25-14:40 JAIMA
14:40-14:55 LMS
14:55-15:10 SM Chemical
15:10-15:30 Research Laboratory for the Production of High Quality Resorbable Polymers Chiang Mai University
Refreshment Break
16:00-17:50 See Parallel Program
for details
Ballroom A Ballroom B Jamjuree 1 Jamjuree 2
Session: BIOEN1 Session: PROC Session: CHAR Session: SMART2
International Polymer Conference of Thailand
2
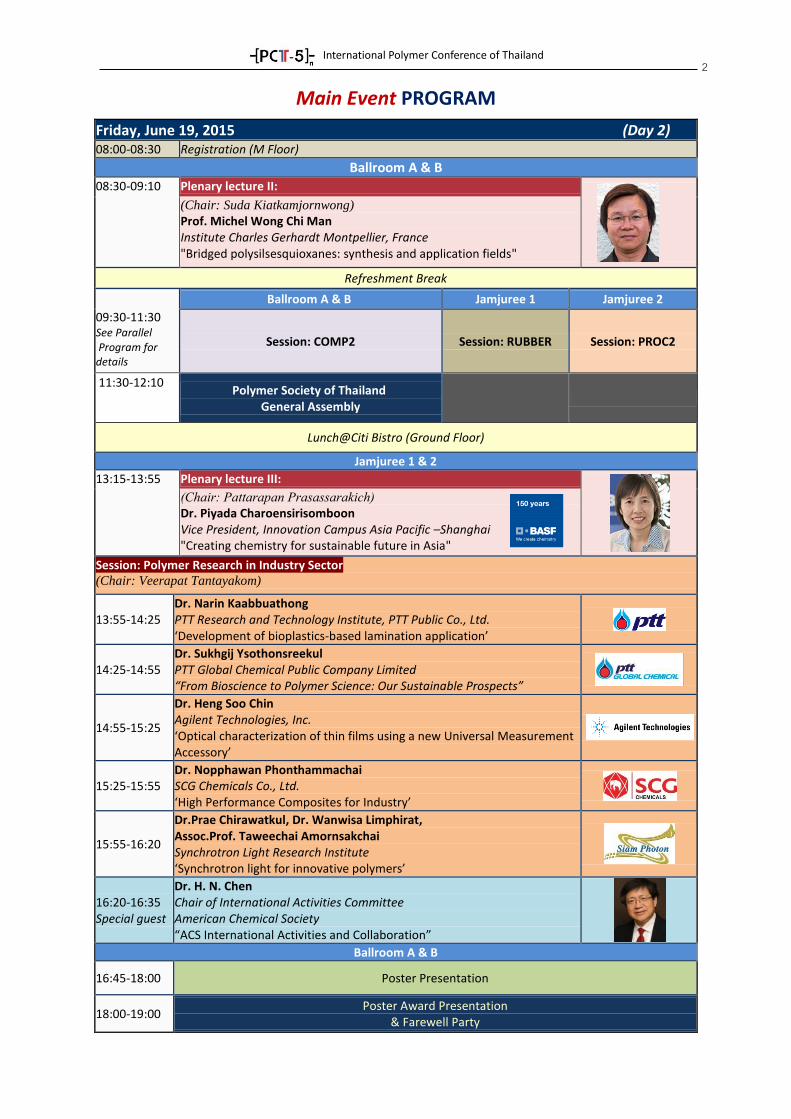
Main Event PROGRAM
Friday, June 19, 2015 (Day 2) 08:00-08:30 Registration (M Floor)
Ballroom A & B 08:30-09:10 Plenary lecture II:
(Chair: Suda Kiatkamjornwong) Prof. Michel Wong Chi Man Institute Charles Gerhardt Montpellier, France "Bridged polysilsesquioxanes: synthesis and application fields"
Refreshment Break
09:30-11:30 See Parallel Program for details
Ballroom A & B Jamjuree 1 Jamjuree 2
Session: COMP2 Session: RUBBER Session: PROC2
11:30-12:10 Polymer Society of Thailand
General Assembly
Lunch@Citi Bistro (Ground Floor)
Jamjuree 1 & 2
13:15-13:55 Plenary lecture III:
(Chair: Pattarapan Prasassarakich)
Dr. Piyada Charoensirisomboon Vice President, Innovation Campus Asia Pacific –Shanghai "Creating chemistry for sustainable future in Asia"
Session: Polymer Research in Industry Sector (Chair: Veerapat Tantayakom)
13:55-14:25 Dr. Narin Kaabbuathong PTT Research and Technology Institute, PTT Public Co., Ltd. ‘Development of bioplastics-based lamination application’
14:25-14:55 Dr. Sukhgij Ysothonsreekul PTT Global Chemical Public Company Limited “From Bioscience to Polymer Science: Our Sustainable Prospects”
14:55-15:25
Dr. Heng Soo Chin Agilent Technologies, Inc. ‘Optical characterization of thin films using a new Universal Measurement Accessory’
15:25-15:55 Dr. Nopphawan Phonthammachai SCG Chemicals Co., Ltd. ‘High Performance Composites for Industry’
15:55-16:20
Dr.Prae Chirawatkul, Dr. Wanwisa Limphirat, Assoc.Prof. Taweechai Amornsakchai Synchrotron Light Research Institute ‘Synchrotron light for innovative polymers’
16:20-16:35 Special guest
Dr. H. N. Chen Chair of International Activities Committee American Chemical Society “ACS International Activities and Collaboration”
Ballroom A & B
16:45-18:00 Poster Presentation
18:00-19:00 Poster Award Presentation
& Farewell Party

International Polymer Conference of Thailand
3
Parallel PROGRAM
BIOEN: Biomedical and Environmentally Friendly Polymers
Thursday, June 18, 2015 (Day 1)
Ballroom A BIOEN1 (Chair: Metha Rutnakornpituk) 10:00-10:20 BIOENO-01
A novel host-guest system and its supramolecular self-assembly and thermoresponsive micellization
Xia Song National University of Singapore, Singapore
10:20-10:40
BIOENO-02 Dual performances of benzoxazine dimers as metal ligand catalyst and as initiator for high efficient ring opening polymerization of lactide and branching poly(lactide)
Choltirosn Sutapin Chulalongkorn University, Thailand
10:40-11:10 KN-BIOEN-1 Supramolecular self-assembled polymers as novel biomaterials
Jun Li National University of Singapore, Singapore
11:10-11:30
BIOENO-03 Synthesis and characterization of medical grade poly(L- lactide-co-glycolide) for biomedical use as absorbable nerve guides
Pimwalan Techaikool Chiang Mai University, Thailand
11:30-11:50
BIOENO-04 Bioconjugation of anionic magnetite nanoparticle (MNP) with pyrrolidinyl peptide nucleic acid (PNA) for molecular biology technique
Sudarat Khadsai Naresuan University, Thailand
Ballroom B BIOEN2 (Chair: Warayuth Sajomsang) 10:00-10:20 BIOENO-5
Active ingredients with different water solubility loaded in fatty acid liposomes for sustained delivery
Han-Choi Yew University of Malaya, Malaysia
10:20-10:50 KN-BIOEN-2 Control of cell surfaces by polymer/protein LbL films for fabrication of 3D-human tissue models
Michiya Matsusaki Osaka University, Japan
10:50-11:10 BIOENO-06 Preparation and characterization of porous PEG/PEGDMA/GMA hydrogel scaffolds
Tharinee Theerathanagorn National Metal and Materials Technology Center, Thailand
11:10-11:30
BIOENO-07 Modulating the autofluorescence of silk to enhance analysis of cells and proteins by fluorescence imaging on silk-based biomaterials
Puay Yong Neo National University of Singapore, Singapore
11:30-11:50 BIOENO-08 Synthesis of positively charged poly(lactic acid) for preparation of electrospun fiber
Thanin Chalermbongkot Chulalongkorn University, Thailand
BIOEN continued
International Polymer Conference of Thailand
4
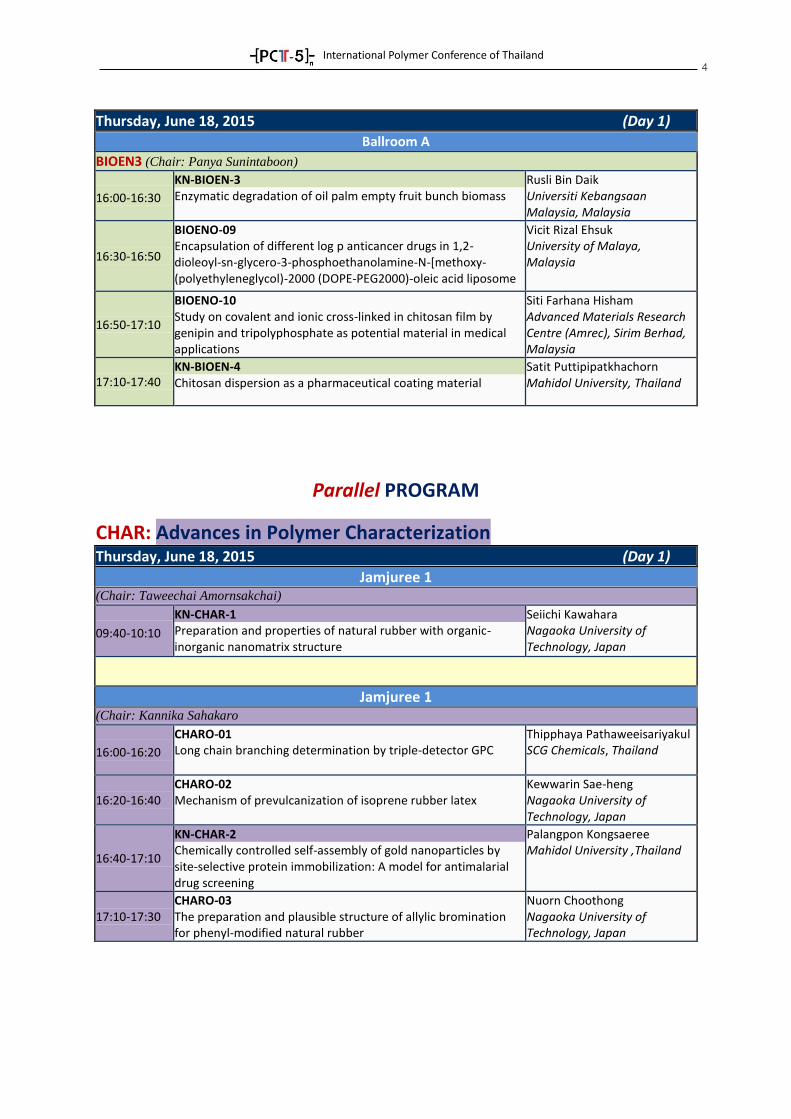
Thursday, June 18, 2015 (Day 1)
Ballroom A
BIOEN3 (Chair: Panya Sunintaboon)
16:00-16:30
KN-BIOEN-3 Enzymatic degradation of oil palm empty fruit bunch biomass
Rusli Bin Daik Universiti Kebangsaan Malaysia, Malaysia
16:30-16:50
BIOENO-09 Encapsulation of different log p anticancer drugs in 1,2- dioleoyl-sn-glycero-3-phosphoethanolamine-N-[methoxy- (polyethyleneglycol)-2000 (DOPE-PEG2000)-oleic acid liposome
Vicit Rizal Ehsuk University of Malaya, Malaysia
16:50-17:10
BIOENO-10 Study on covalent and ionic cross-linked in chitosan film by genipin and tripolyphosphate as potential material in medical applications
Siti Farhana Hisham Advanced Materials Research Centre (Amrec), Sirim Berhad, Malaysia
17:10-17:40 KN-BIOEN-4 Chitosan dispersion as a pharmaceutical coating material
Satit Puttipipatkhachorn Mahidol University, Thailand
Parallel PROGRAM
CHAR: Advances in Polymer Characterization
Thursday, June 18, 2015 (Day 1)
Jamjuree 1 (Chair: Taweechai Amornsakchai)
09:40-10:10
KN-CHAR-1 Preparation and properties of natural rubber with organic- inorganic nanomatrix structure
Seiichi Kawahara Nagaoka University of Technology, Japan
Jamjuree 1 (Chair: Kannika Sahakaro
16:00-16:20
CHARO-01 Long chain branching determination by triple-detector GPC
Thipphaya Pathaweeisariyakul SCG Chemicals, Thailand
16:20-16:40 CHARO-02 Mechanism of prevulcanization of isoprene rubber latex
Kewwarin Sae-heng Nagaoka University of Technology, Japan
16:40-17:10
KN-CHAR-2 Chemically controlled self-assembly of gold nanoparticles by site-selective protein immobilization: A model for antimalarial drug screening
Palangpon Kongsaeree Mahidol University ,Thailand
17:10-17:30 CHARO-03 The preparation and plausible structure of allylic bromination for phenyl-modified natural rubber
Nuorn Choothong Nagaoka University of Technology, Japan
International Polymer Conference of Thailand
5
Parallel PROGRAM
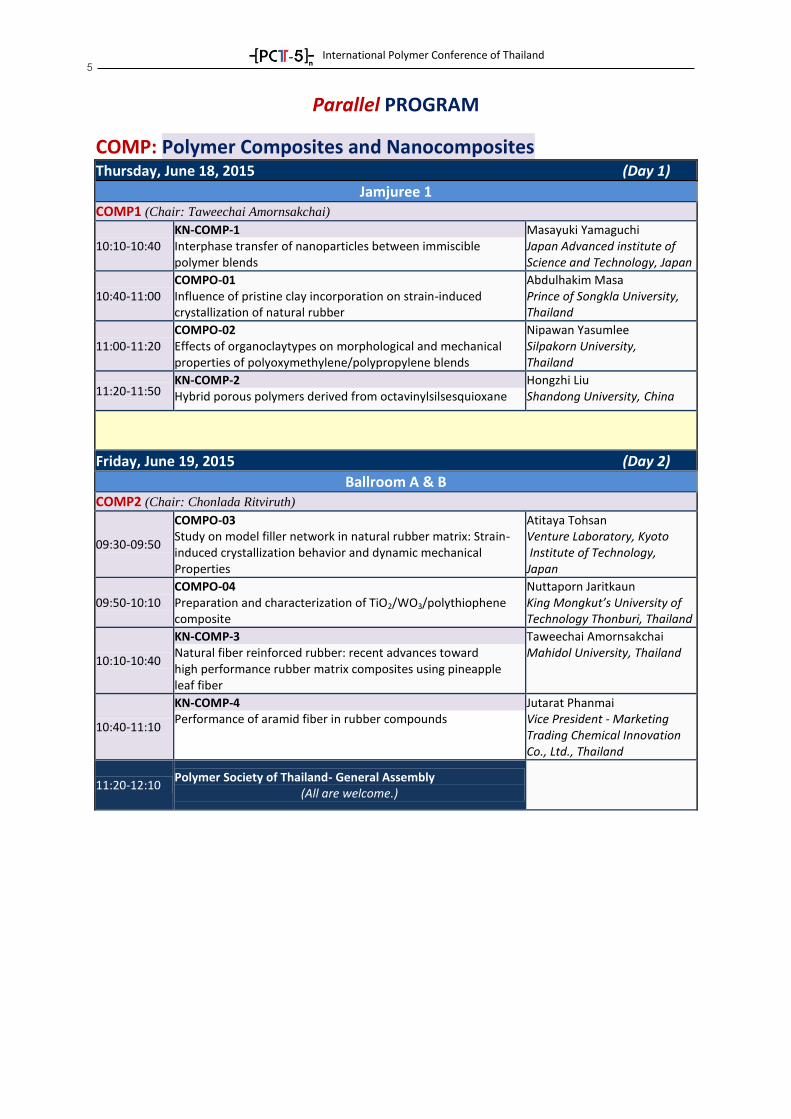
COMP: Polymer Composites and Nanocomposites
Thursday, June 18, 2015 (Day 1)
Jamjuree 1 COMP1 (Chair: Taweechai Amornsakchai)
10:10-10:40 KN-COMP-1 Interphase transfer of nanoparticles between immiscible polymer blends
Masayuki Yamaguchi Japan Advanced institute of Science and Technology, Japan
10:40-11:00 COMPO-01 Influence of pristine clay incorporation on strain-induced crystallization of natural rubber
Abdulhakim Masa Prince of Songkla University, Thailand
11:00-11:20 COMPO-02 Effects of organoclaytypes on morphological and mechanical properties of polyoxymethylene/polypropylene blends
Nipawan Yasumlee Silpakorn University, Thailand
11:20-11:50 KN-COMP-2 Hybrid porous polymers derived from octavinylsilsesquioxane
Hongzhi Liu Shandong University, China
Friday, June 19, 2015 (Day 2)
Ballroom A & B COMP2 (Chair: Chonlada Ritviruth)
09:30-09:50
COMPO-03 Study on model filler network in natural rubber matrix: Strain- induced crystallization behavior and dynamic mechanical Properties
Atitaya Tohsan Venture Laboratory, Kyoto Institute of Technology, Japan
09:50-10:10 COMPO-04 Preparation and characterization of TiO2/WO3/polythiophene composite
Nuttaporn Jaritkaun King Mongkut’s University of Technology Thonburi, Thailand
10:10-10:40
KN-COMP-3 Natural fiber reinforced rubber: recent advances toward high performance rubber matrix composites using pineapple leaf fiber
Taweechai Amornsakchai Mahidol University, Thailand
10:40-11:10
KN-COMP-4 Performance of aramid fiber in rubber compounds
Jutarat Phanmai Vice President - Marketing Trading Chemical Innovation Co., Ltd., Thailand
11:20-12:10 Polymer Society of Thailand- General Assembly
(All are welcome.)
International Polymer Conference of Thailand
6
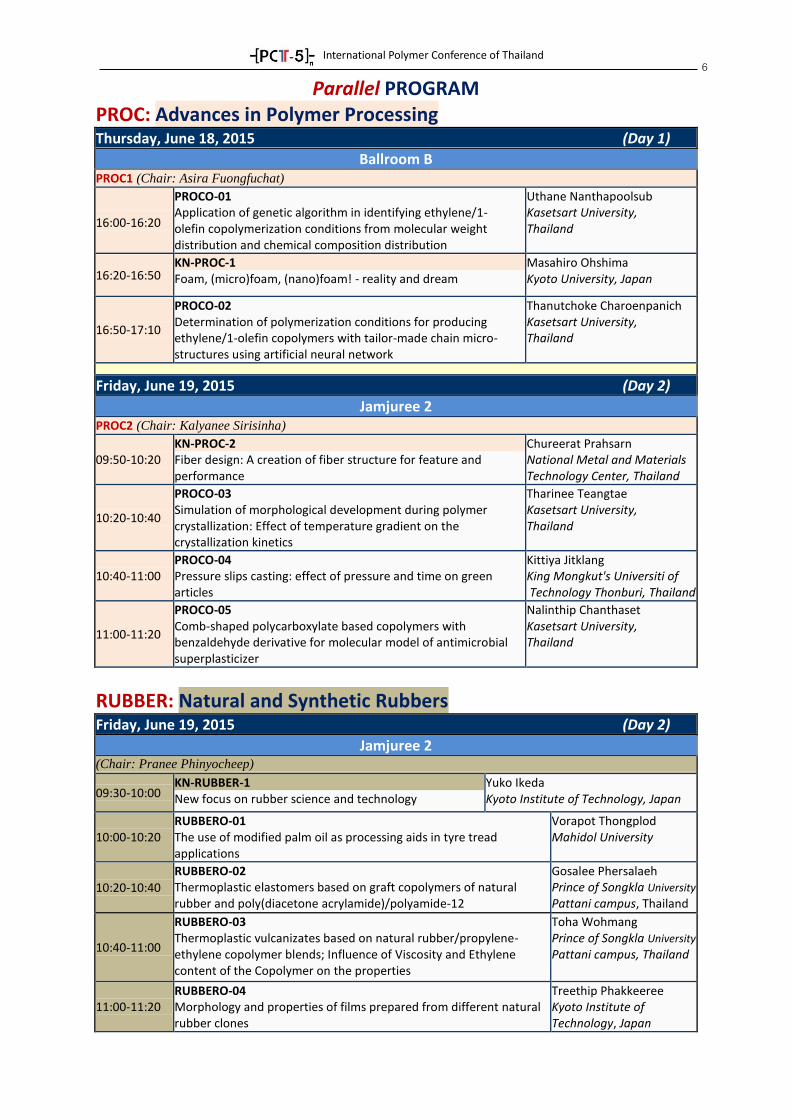
Parallel PROGRAM PROC: Advances in Polymer Processing
Thursday, June 18, 2015 (Day 1)
Ballroom B PROC1 (Chair: Asira Fuongfuchat)
16:00-16:20
PROCO-01 Application of genetic algorithm in identifying ethylene/1- olefin copolymerization conditions from molecular weight distribution and chemical composition distribution
Uthane Nanthapoolsub Kasetsart University, Thailand
16:20-16:50 KN-PROC-1 Foam, (micro)foam, (nano)foam! - reality and dream
Masahiro Ohshima Kyoto University, Japan
16:50-17:10
PROCO-02 Determination of polymerization conditions for producing ethylene/1-olefin copolymers with tailor-made chain micro- structures using artificial neural network
Thanutchoke Charoenpanich Kasetsart University, Thailand
Friday, June 19, 2015 (Day 2)
Jamjuree 2 PROC2 (Chair: Kalyanee Sirisinha)
09:50-10:20 KN-PROC-2 Fiber design: A creation of fiber structure for feature and performance
Chureerat Prahsarn National Metal and Materials Technology Center, Thailand
10:20-10:40
PROCO-03 Simulation of morphological development during polymer crystallization: Effect of temperature gradient on the crystallization kinetics
Tharinee Teangtae Kasetsart University, Thailand
10:40-11:00 PROCO-04 Pressure slips casting: effect of pressure and time on green articles
Kittiya Jitklang King Mongkut's Universiti of Technology Thonburi, Thailand
11:00-11:20
PROCO-05 Comb-shaped polycarboxylate based copolymers with benzaldehyde derivative for molecular model of antimicrobial superplasticizer
Nalinthip Chanthaset Kasetsart University, Thailand
RUBBER: Natural and Synthetic Rubbers
Friday, June 19, 2015 (Day 2)
Jamjuree 2 (Chair: Pranee Phinyocheep)
09:30-10:00 KN-RUBBER-1 New focus on rubber science and technology
Yuko Ikeda Kyoto Institute of Technology, Japan
10:00-10:20 RUBBERO-01 The use of modified palm oil as processing aids in tyre tread applications
Vorapot Thongplod Mahidol University
10:20-10:40
RUBBERO-02 Thermoplastic elastomers based on graft copolymers of natural rubber and poly(diacetone acrylamide)/polyamide-12
Gosalee Phersalaeh Prince of Songkla University Pattani campus, Thailand
10:40-11:00
RUBBERO-03 Thermoplastic vulcanizates based on natural rubber/propylene- ethylene copolymer blends; Influence of Viscosity and Ethylene content of the Copolymer on the properties
Toha Wohmang Prince of Songkla University Pattani campus, Thailand
11:00-11:20 RUBBERO-04 Morphology and properties of films prepared from different natural rubber clones
Treethip Phakkeeree Kyoto Institute of Technology, Japan
International Polymer Conference of Thailand
7
Parallel PROGRAM
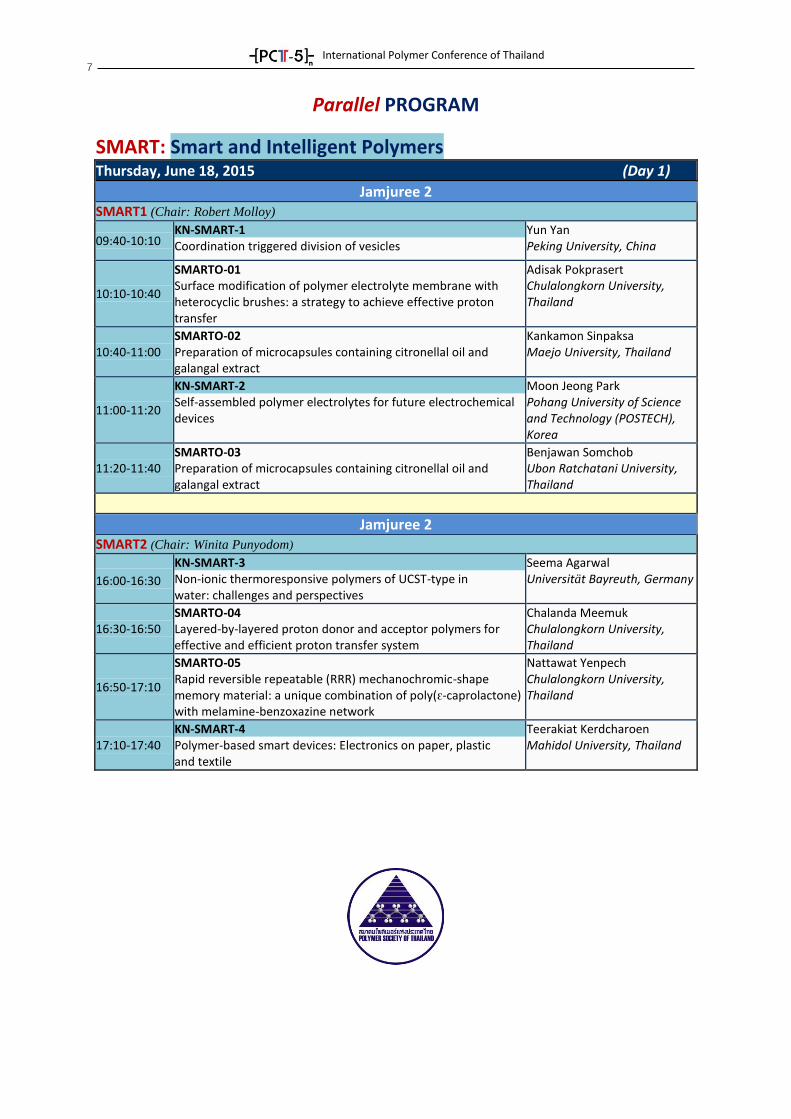
SMART: Smart and Intelligent Polymers
Thursday, June 18, 2015 (Day 1)
Jamjuree 2 SMART1 (Chair: Robert Molloy)
09:40-10:10 KN-SMART-1 Coordination triggered division of vesicles
Yun Yan Peking University, China
10:10-10:40
SMARTO-01 Surface modification of polymer electrolyte membrane with heterocyclic brushes: a strategy to achieve effective proton transfer
Adisak Pokprasert Chulalongkorn University, Thailand
10:40-11:00 SMARTO-02 Preparation of microcapsules containing citronellal oil and galangal extract
Kankamon Sinpaksa Maejo University, Thailand
11:00-11:20
KN-SMART-2 Self-assembled polymer electrolytes for future electrochemical devices
Moon Jeong Park Pohang University of Science and Technology (POSTECH), Korea
11:20-11:40 SMARTO-03 Preparation of microcapsules containing citronellal oil and galangal extract
Benjawan Somchob Ubon Ratchatani University, Thailand
Jamjuree 2 SMART2 (Chair: Winita Punyodom)
16:00-16:30
KN-SMART-3 Non-ionic thermoresponsive polymers of UCST-type in water: challenges and perspectives
Seema Agarwal Universität Bayreuth, Germany
16:30-16:50 SMARTO-04 Layered-by-layered proton donor and acceptor polymers for effective and efficient proton transfer system
Chalanda Meemuk Chulalongkorn University, Thailand
16:50-17:10
SMARTO-05 Rapid reversible repeatable (RRR) mechanochromic-shape memory material: a unique combination of poly(ԑ-caprolactone) with melamine-benzoxazine network
Nattawat Yenpech Chulalongkorn University, Thailand
17:10-17:40 KN-SMART-4 Polymer-based smart devices: Electronics on paper, plastic and textile
Teerakiat Kerdcharoen Mahidol University, Thailand

Plenary Lectures
International Polymer Conference of Thailand 9
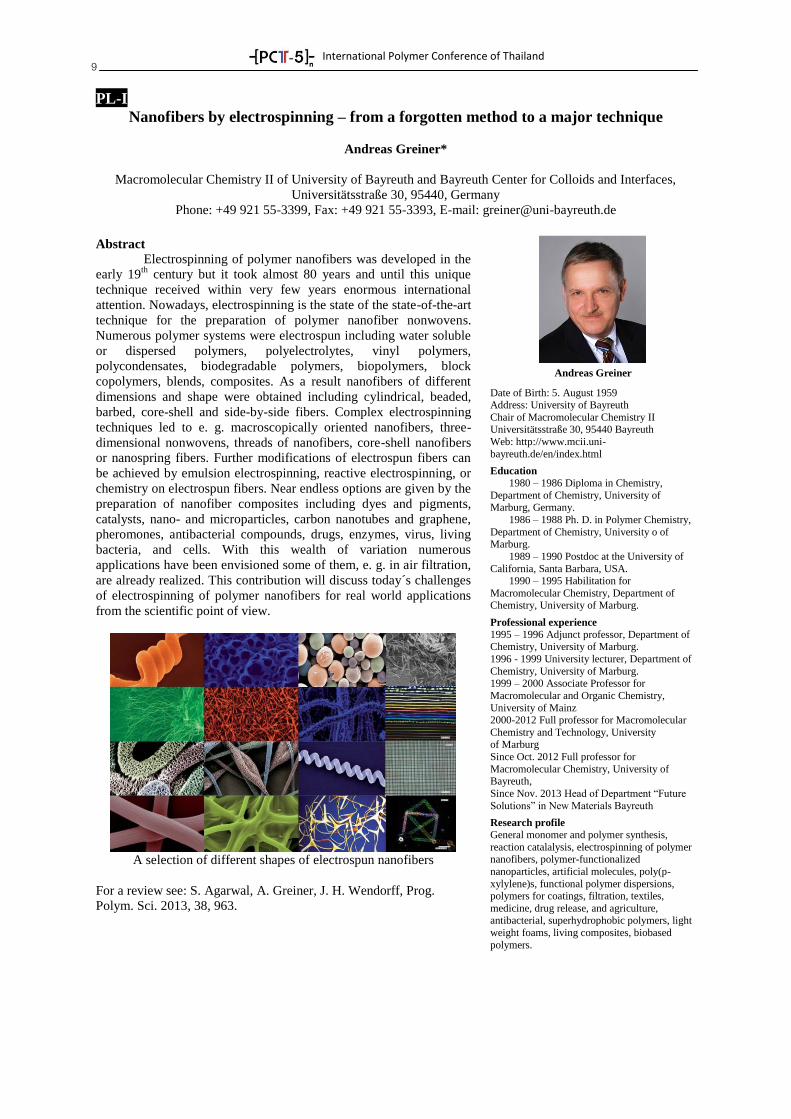
PL-I
Nanofibers by electrospinning – from a forgotten method to a major technique
Andreas Greiner*
Macromolecular Chemistry II of University of Bayreuth and Bayreuth Center for Colloids and Interfaces,
Universitätsstraße 30, 95440, Germany
Phone: +49 921 55-3399, Fax: +49 921 55-3393, E-mail: [email protected]
Abstract Electrospinning of polymer nanofibers was developed in the
early 19th
century but it took almost 80 years and until this unique
technique received within very few years enormous international
attention. Nowadays, electrospinning is the state of the state-of-the-art
technique for the preparation of polymer nanofiber nonwovens.
Numerous polymer systems were electrospun including water soluble
or dispersed polymers, polyelectrolytes, vinyl polymers,
polycondensates, biodegradable polymers, biopolymers, block
copolymers, blends, composites. As a result nanofibers of different
dimensions and shape were obtained including cylindrical, beaded,
barbed, core-shell and side-by-side fibers. Complex electrospinning
techniques led to e. g. macroscopically oriented nanofibers, three-
dimensional nonwovens, threads of nanofibers, core-shell nanofibers
or nanospring fibers. Further modifications of electrospun fibers can
be achieved by emulsion electrospinning, reactive electrospinning, or
chemistry on electrospun fibers. Near endless options are given by the
preparation of nanofiber composites including dyes and pigments,
catalysts, nano- and microparticles, carbon nanotubes and graphene,
pheromones, antibacterial compounds, drugs, enzymes, virus, living
bacteria, and cells. With this wealth of variation numerous
applications have been envisioned some of them, e. g. in air filtration,
are already realized. This contribution will discuss today´s challenges
of electrospinning of polymer nanofibers for real world applications
from the scientific point of view.
A selection of different shapes of electrospun nanofibers
For a review see: S. Agarwal, A. Greiner, J. H. Wendorff, Prog.
Polym. Sci. 2013, 38, 963.
Andreas Greiner
Date of Birth: 5. August 1959 Address: University of Bayreuth
Chair of Macromolecular Chemistry II Universitätsstraße 30, 95440 Bayreuth
Web: http://www.mcii.uni-
bayreuth.de/en/index.html
Education
1980 – 1986 Diploma in Chemistry,
Department of Chemistry, University of Marburg, Germany.
1986 – 1988 Ph. D. in Polymer Chemistry,
Department of Chemistry, University o of Marburg.
1989 – 1990 Postdoc at the University of
California, Santa Barbara, USA. 1990 – 1995 Habilitation for
Macromolecular Chemistry, Department of Chemistry, University of Marburg.
Professional experience
1995 – 1996 Adjunct professor, Department of Chemistry, University of Marburg.
1996 - 1999 University lecturer, Department of
Chemistry, University of Marburg. 1999 – 2000 Associate Professor for
Macromolecular and Organic Chemistry,
University of Mainz 2000-2012 Full professor for Macromolecular
Chemistry and Technology, University of Marburg
Since Oct. 2012 Full professor for
Macromolecular Chemistry, University of Bayreuth,
Since Nov. 2013 Head of Department “Future
Solutions” in New Materials Bayreuth
Research profile
General monomer and polymer synthesis,
reaction catalalysis, electrospinning of polymer nanofibers, polymer-functionalized
nanoparticles, artificial molecules, poly(p-
xylylene)s, functional polymer dispersions, polymers for coatings, filtration, textiles,
medicine, drug release, and agriculture, antibacterial, superhydrophobic polymers, light
weight foams, living composites, biobased
polymers.
International Polymer Conference of Thailand 10
PL-II
Bridged Silsesquioxanes: Synthesis and Application Fields
Michel Wong Chi Man
Laboratoire Architectures et Matériaux Nanostructurés, Institut Charles Gerhardt Montpellier, Ecole Nationale
Supérieure de Chimie de Montpellier, 34296 Montpellier (France)
Phone +33 467147219, Fax +33 467144322, *E-Mail: [email protected]
Abstract
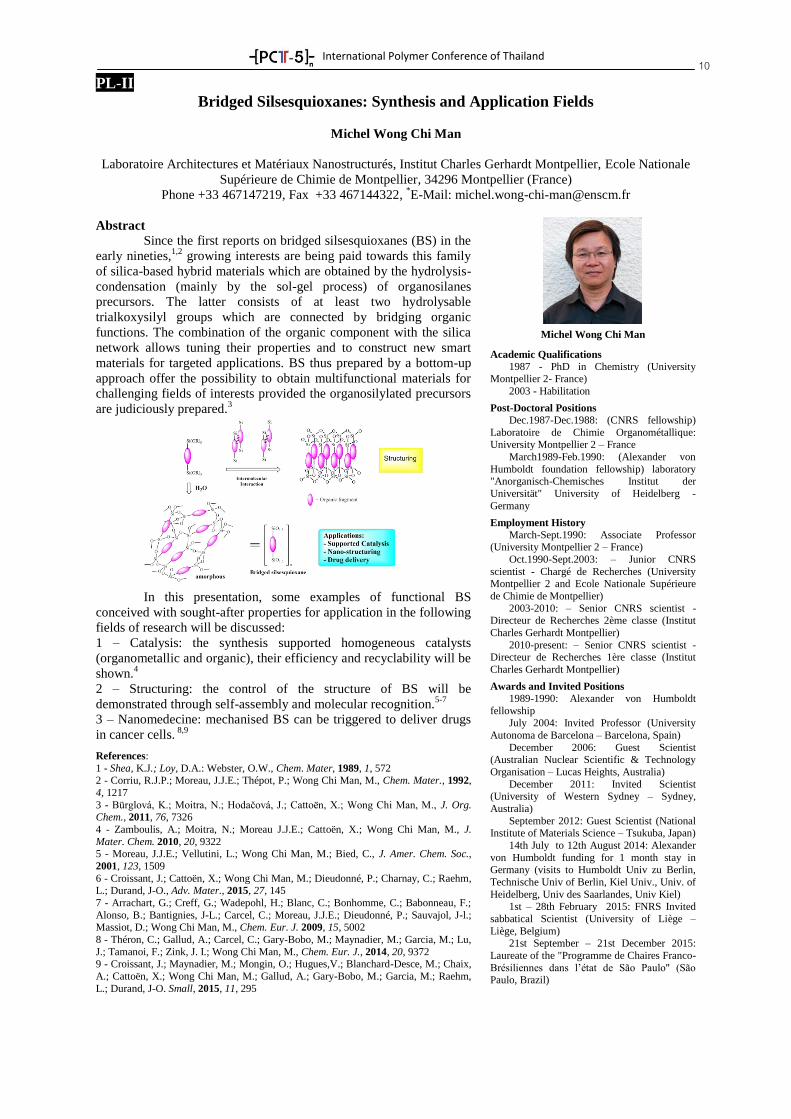
Since the first reports on bridged silsesquioxanes (BS) in the
early nineties,1,2
growing interests are being paid towards this family
of silica-based hybrid materials which are obtained by the hydrolysis-
condensation (mainly by the sol-gel process) of organosilanes
precursors. The latter consists of at least two hydrolysable
trialkoxysilyl groups which are connected by bridging organic
functions. The combination of the organic component with the silica
network allows tuning their properties and to construct new smart
materials for targeted applications. BS thus prepared by a bottom-up
approach offer the possibility to obtain multifunctional materials for
challenging fields of interests provided the organosilylated precursors
are judiciously prepared.3
In this presentation, some examples of functional BS
conceived with sought-after properties for application in the following
fields of research will be discussed:
1 – Catalysis: the synthesis supported homogeneous catalysts
(organometallic and organic), their efficiency and recyclability will be
shown.4
2 – Structuring: the control of the structure of BS will be
demonstrated through self-assembly and molecular recognition.5-7
3 – Nanomedecine: mechanised BS can be triggered to deliver drugs
in cancer cells. 8,9
References:
1 - Shea, K.J.; Loy, D.A.: Webster, O.W., Chem. Mater, 1989, 1, 572 2 - Corriu, R.J.P.; Moreau, J.J.E.; Thépot, P.; Wong Chi Man, M., Chem. Mater., 1992,
4, 1217
3 - Bürglová, K.; Moitra, N.; Hodačová, J.; Cattoën, X.; Wong Chi Man, M., J. Org. Chem., 2011, 76, 7326
4 - Zamboulis, A.; Moitra, N.; Moreau J.J.E.; Cattoën, X.; Wong Chi Man, M., J.
Mater. Chem. 2010, 20, 9322 5 - Moreau, J.J.E.; Vellutini, L.; Wong Chi Man, M.; Bied, C., J. Amer. Chem. Soc.,
2001, 123, 1509
6 - Croissant, J.; Cattoën, X.; Wong Chi Man, M.; Dieudonné, P.; Charnay, C.; Raehm, L.; Durand, J-O., Adv. Mater., 2015, 27, 145
7 - Arrachart, G.; Creff, G.; Wadepohl, H.; Blanc, C.; Bonhomme, C.; Babonneau, F.;
Alonso, B.; Bantignies, J-L.; Carcel, C.; Moreau, J.J.E.; Dieudonné, P.; Sauvajol, J-l.; Massiot, D.; Wong Chi Man, M., Chem. Eur. J. 2009, 15, 5002
8 - Théron, C.; Gallud, A.; Carcel, C.; Gary-Bobo, M.; Maynadier, M.; Garcia, M.; Lu,
J.; Tamanoi, F.; Zink, J. I.; Wong Chi Man, M., Chem. Eur. J., 2014, 20, 9372 9 - Croissant, J.; Maynadier, M.; Mongin, O.; Hugues,V.; Blanchard-Desce, M.; Chaix,
A.; Cattoën, X.; Wong Chi Man, M.; Gallud, A.; Gary-Bobo, M.; Garcia, M.; Raehm,
L.; Durand, J-O. Small, 2015, 11, 295
Michel Wong Chi Man
Academic Qualifications
1987 - PhD in Chemistry (University
Montpellier 2- France)
2003 - Habilitation
Post-Doctoral Positions
Dec.1987-Dec.1988: (CNRS fellowship)
Laboratoire de Chimie Organométallique: University Montpellier 2 – France
March1989-Feb.1990: (Alexander von
Humboldt foundation fellowship) laboratory "Anorganisch-Chemisches Institut der
Universität" University of Heidelberg -
Germany
Employment History
March-Sept.1990: Associate Professor (University Montpellier 2 – France)
Oct.1990-Sept.2003: – Junior CNRS
scientist - Chargé de Recherches (University Montpellier 2 and Ecole Nationale Supérieure
de Chimie de Montpellier)
2003-2010: – Senior CNRS scientist - Directeur de Recherches 2ème classe (Institut
Charles Gerhardt Montpellier)
2010-present: – Senior CNRS scientist - Directeur de Recherches 1ère classe (Institut
Charles Gerhardt Montpellier)
Awards and Invited Positions
1989-1990: Alexander von Humboldt
fellowship July 2004: Invited Professor (University
Autonoma de Barcelona – Barcelona, Spain)
December 2006: Guest Scientist (Australian Nuclear Scientific & Technology
Organisation – Lucas Heights, Australia)
December 2011: Invited Scientist (University of Western Sydney – Sydney,
Australia)
September 2012: Guest Scientist (National Institute of Materials Science – Tsukuba, Japan)
14th July to 12th August 2014: Alexander
von Humboldt funding for 1 month stay in Germany (visits to Humboldt Univ zu Berlin,
Technische Univ of Berlin, Kiel Univ., Univ. of
Heidelberg, Univ des Saarlandes, Univ Kiel) 1st – 28th February 2015: FNRS Invited
sabbatical Scientist (University of Liège –
Liège, Belgium) 21st September – 21st December 2015:
Laureate of the "Programme de Chaires Franco-
Brésiliennes dans l’état de São Paulo" (São Paulo, Brazil)
International Polymer Conference of Thailand 11
PL-III
Creating Chemistry for Sustainable Future in Asia
Piyada Charoensirisomboon
BASF Advanced Chemicals Co., Ltd., GM/S 200137 Shanghai, China
Abstract
In 2050, more than nine billion people will live on our
planet. The world population and its demands will keep growing,
while the planet’s resources are finite. BASF looks ahead how we as a
company contribute to a sustainable future. BASF will continue to
develop, to innovate, to meet new challenges, to take advantage of
new opportunities and to succeed. Future-oriented innovation requires
market-driven research and development. BASF is building up
research platforms with a new focus and is creating a more global
research and development organization. This will enable BASF to
specifically address customer needs even better. The first phase of the
Innovation Campus Asia Pacific Shanghai has been inaugurated at the
end 2012 and the expansion of phase two is in good progress.
Innovation Campus Asia Pacific Shanghai is one of major steps on
BASF globalization of R&D. The Innovation Campus will help
intensifying the development of local scientific and technical talent
and to foster collaboration with universities and scientific institutes in
Asia Pacific. Scientists in close proximity to local markets work in
international and multi-disciplinary project teams. Example of
innovation will be given to restate the vision of creating innovation
from Asia for Asia and also for the world.
Piyada Charoensirisomboon
Vice President – Advanced Materials Innovation Campus Asia Pacific -Shanghai
• Strategic Business Management : St. Gallen
Business School
• Ph.D –Polymeric Materials, Tokyo Institute of
Technology
• Master- Materials Science & Engineering, Tokyo Institute of
Technology
• BSc –1st class honor, Industrial Chemistry KMITL
Professional Career at BASF
2013 Vice President – Innovation Campus Asia Pacific-Shanghai BASF Advanced
Chemicals Co, Ltd Shanghai, CHINA
2010 Global Business Manager – Internal
Start-Up, New Business Development-
Performance Chemicals BASF SE, GERMANY
2005.Head of Global R&D Styrenic Thermoplastics Group Global Polymer
Research BASF SE, GERMANY
2001 Regional Marketing Manager BASF
South East Asia Pte Ltd., SINGAPORE
2000 Research Fellow, BASF AG, GERMANY
Patents & Sci Publication: More than 25
patent & patent applications and 22 publications

PST Rising Star Award Lecture

International Polymer Conference of Thailand 13
RS
1. Asst.Prof.Dr. Siripon Anantawaraskul Department of Chemical Enginering
Faculty of Engineering, Kasetsart University
B.Eng. (2nd Honour, Chem. Eng.), Kasetsart University
M.Eng. (Chem. Eng.), McGill University
Ph.D. (Dean's Honour List, Chem. Eng.), McGill University
Visiting Scholar (Chem. Eng.), Univerity of Waterloo
Research areas:
Polyolefin Chain Microstructure and Characterization
Polyolefin Reaction Engineering
Modelling and Simulation in Polymer Science and Engineering
2. Asst.Prof.Dr. Panya Sunintaboon
Graduate Program Director (Polymer Science and Technology),
Department of Chemistry Faculty of Science, Mahidol University
B.Sc. (Chemistry) Chulalongkorn University (1997)
M.Sc. (Organic Chemistry) Chulalongkorn University(1999)
Ph.D. (Polymer Science) University of Akron, USA (2004)
Research areas:
Fabrication of amine-functionalized polymeric particles; Emulsifier-free emulsion polymerization.
Amine-decorated Polymeric Colloidal Particles: From Syntheses to Applications
Panya Sunintaboon
*
1 Polymer Science and Technology Program, Department of Chemistry, Faculty of Science, Mahidol University,
Salaya, Nakhon Pathom 73170, Thailand
Phone: +66-2441-9816, Fax : +66-2441-0511, *E-mail: [email protected]
Abstract
Polymeric colloidal particles bearing amine groups on their outer peripheries have attracted great deal
of attention because of their versatility for several applications, such as biomedicine (targeting drug/gene
delivery, diagnostics, and tissue engineering), chemo- or bio-sensor, catalysis, coatings, wastewater treatment ,
and so on . Thus, the fabrication of such particles with controllable characteristics (e.g. size and size
distribution) and well-defined amine accessibility is quite challenging and desirable. In this present work, the
syntheses of amine-functionalized colloidal particles via several pathways are illustrated. A wide variety of
particles’ physical and chemical properties (e.g. rigid, soft, pH-sensitive, thermo-sensitive, water swellable,
magnetic, or biocompatible) can possibly be tailored. In addition, some promising applications of the resulting
amine-functionalized colloidal particles prepared from these synthetic methods are presented.
Keywords: colloidal particle, amine-functionalized, scaffold, carrier, surfactant-free, microgel.

Biomedical and Environmentally Friendly Polymers
SESSION 1
International Polymer Conference of Thailand
15
KN-BIOEN-1
Supramolecular Self-assembled Polymers as Novel Biomaterials
Jun Li1,2*
1Department of Biomedical Engineering, National University of Singapore, Singapore 117574
2Institute of Materials Research and Engineering, A*STAR, Singapore 117602
Phone +65 6516 7273, Fax +65 6872 3069, E-Mail: [email protected]
Abstract The phenomena of molecular self-assembly have inspired
interesting development of novel functional materials for various
applications. Recently, we have successfully demonstrated the methods
for constructing self-assembled macromolecular systems based on
amphiphilic block copolymers and interlocked cyclodextrins (-CD, -
CD, and -CD), which can function as nano-carriers for potential drug
and gene delivery [1]. We developed a series of supramolecular
hydrogels formed by -CD and various triblock copolymers comprising
PEG and hydrophobic polyester blocks for controlled release of drugs,
as well as gene delivery. Amphiphilic star-block copolymers based on
polyester and PEG with adamantyl end-functionalization were
synthesized, which self-assembled into nanogel-like large compound
micelles, and transformed into vesicular nanostructures under the
direction of host-guest interaction between the adamantyl end and
dimethyl-β-CD [2]. The intracellular uptake of anticancer drug-loaded
nano-vesicles indicates that the nanovesicles could be potential drug
carriers for cancer therapy. We developed novel cationic
supramolecules self-assembled from cyclodextrins and block
copolymers as a new class of polymeric gene delivery vectors [3,4]. We
also developed redox-sensitive and targeted gene delivery systems for
cancer therapy, and multifunctional hybrid nano-carrier for
simultaneous dual therapeutics delivery and cellular imaging [5-6].
Other supramolecular polymer self-assembled nanostructures
developed in our lab include supramolecular nanocapsules based on
threading of CDs over polymer on gold nanoparticles [7],
supramolecular hydrogels formed by pyrene-terminated PEG star
polymers and -CD [8], and the star-star supramolecular architecture
and its thermosensitive hydrogel formation [9]. Most recently, we
demonstrated a supramolecular approach for building a multifunctional
gene carrier system with the functions of reduction-responsive
degradation and zwitterionic phosphorylcholine based extracellular
stabilization and favorable cellular uptake, and the supramolecular gene
carrier was applied to deliver the therapeutic p53 anti-cancer gene in
MCF-7 cells, showing great potential for cancer gene therapy
application. Compared to traditional covalent conjugation approach, the
supramolecular approaches are more convenient in building
complicated architectures with multiple functionalities integrated within
one system [10].
Keywords: Supramolecules, self-assembly, cyclodextrins, biomaterials
References [1] Li J and Loh XJ, Adv. Drug Deliv. Rev. 60, 1000 (2008).
[2] Zhu J, Liu KL, Zhang ZX, Zhang ZX, Li J, Chem. Commun. 47, 12849 (2011). [3] Li J, Yang C, Li HZ, et al., Adv. Mater. 18, 2969 (2006).
[4] Ping Y, Liu CD, Zhang ZX, Liu KL, Chen JH, and Li J, Biomaterials 32, 8328
(2011). [5] Ping Y, Hu Q, Tang G, and Li J, Biomaterials 34, 6482 (2013).
[6] Zhao F, Yin H, Li J, Biomaterials 35, 1050 (2014).
[7] Wu YL, Li J, Angew. Chem. Int. Ed. 48, 3842 (2009). [8] Chen B, Liu KL, Zhang ZX, Ni X, Goh SH, Li J, Chem.Commun. 48, 5638 (2012).
[9] Zhang ZX, Liu KL, Li J, Angew. Chem. Int. Ed. 52, 6180 (2013).
[10] Wen Y, Zhang Z, Li J, Adv. Funct. Mater., 24, 3874 (2014).
Jun Li
Department of Biomedical Engineering Faculty of Engineering
National University of Singapore
Singapore
Dr. Jun Li received his MSc in 1992
and PhD in 1995 in Macromolecular Science from Osaka University, Japan. From 1995 to
1998 he was a Special Postdoctoral
Researcher at RIKEN Institute in Japan. In 1998, he joined the Institute of Materials
Research and Engineering in Singapore as a
Research Scientist. From 2002, he became an Assistant Professor at Department of
Biomedical Engineering, National University
of Singapore, and was promoted to Associate Professor in 2007 and Professor in 2015. His
research interests include novel
supramolecular structures and block
copolymers as functional materials for
biomedical applications. He has developed
novel macromolecules with the ability to self-assemble into supramolecular structures
based on cyclodextrin/polymer complexes
and amphiphilic biodegradable block copolymers, as biomaterials (hydrogels,
nano-particles, micelles, nano-vesicles,
micro- and nano-encapsulation, surface coatings, etc.) for various applications such as
drug and gene delivery, and tissue
engineering. He has published 150 papers in SCI-indexed international journals, which
have received more than 8,600 citations with
an h-index of 49. He also holds 9 patents and a few book chapters.
International Polymer Conference of Thailand
16
KN-BIOEN-2
Control of Cell Surfaces by Polymer/Protein LbL Films for Fabrication of 3D-Human
Tissue Models
Michiya Matsusaki and Mitsuru Akashi
Graduate School of Engineering, Osaka University
2-1 Yamadaoka, Suita, Osaka 565-0871, Japan
E-mail: [email protected]
Abstract In vitro development of highly-organized three dimensional
(3D)-engineered tissues consist of multiple types of cells and ECM,
which possess a similar structure and function as natural tissues, is a
key challenge for tissue engineering and pharmaceutical assay.
Especially modulation of 3D-cell-cell interaction inside the 3D-
artificial tissues is one of the significant issues.
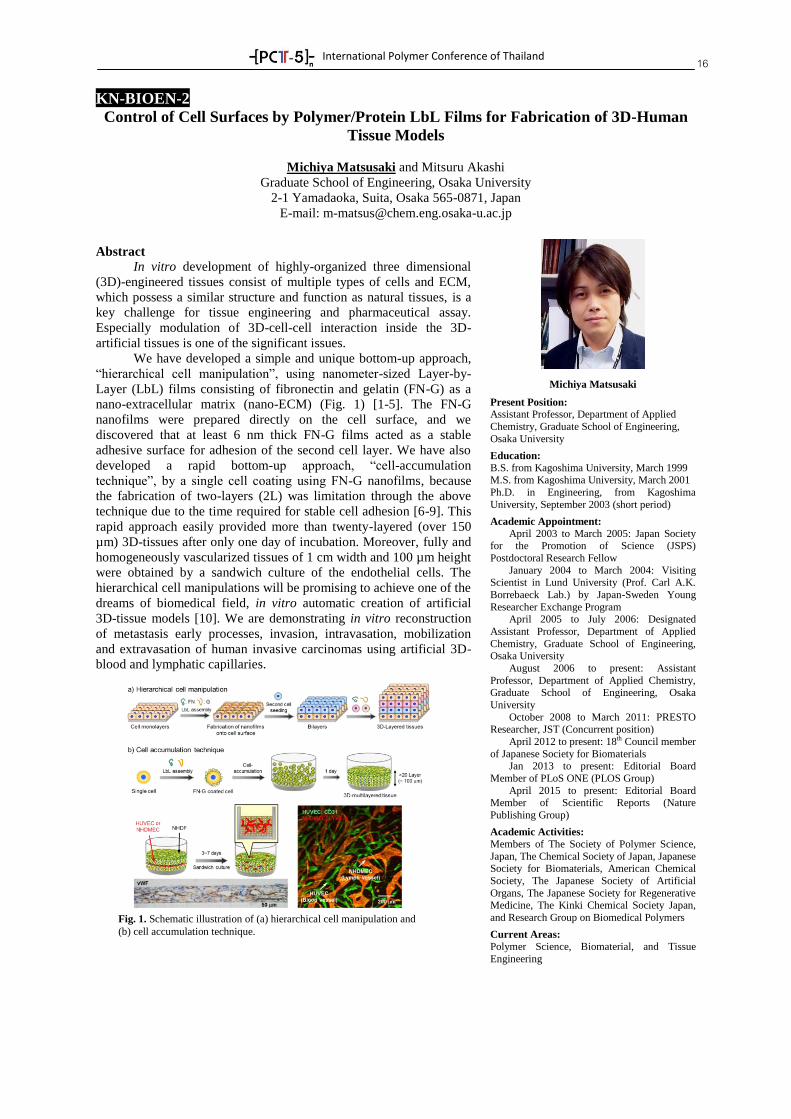
We have developed a simple and unique bottom-up approach,
“hierarchical cell manipulation”, using nanometer-sized Layer-by-
Layer (LbL) films consisting of fibronectin and gelatin (FN-G) as a
nano-extracellular matrix (nano-ECM) (Fig. 1) [1-5]. The FN-G
nanofilms were prepared directly on the cell surface, and we
discovered that at least 6 nm thick FN-G films acted as a stable
adhesive surface for adhesion of the second cell layer. We have also
developed a rapid bottom-up approach, “cell-accumulation
technique”, by a single cell coating using FN-G nanofilms, because
the fabrication of two-layers (2L) was limitation through the above
technique due to the time required for stable cell adhesion [6-9]. This
rapid approach easily provided more than twenty-layered (over 150
µm) 3D-tissues after only one day of incubation. Moreover, fully and
homogeneously vascularized tissues of 1 cm width and 100 µm height
were obtained by a sandwich culture of the endothelial cells. The
hierarchical cell manipulations will be promising to achieve one of the
dreams of biomedical field, in vitro automatic creation of artificial
3D-tissue models [10]. We are demonstrating in vitro reconstruction
of metastasis early processes, invasion, intravasation, mobilization
and extravasation of human invasive carcinomas using artificial 3D-
blood and lymphatic capillaries.
Michiya Matsusaki
Present Position:
Assistant Professor, Department of Applied
Chemistry, Graduate School of Engineering,
Osaka University
Education:
B.S. from Kagoshima University, March 1999 M.S. from Kagoshima University, March 2001
Ph.D. in Engineering, from Kagoshima
University, September 2003 (short period)
Academic Appointment:
April 2003 to March 2005: Japan Society for the Promotion of Science (JSPS)
Postdoctoral Research Fellow
January 2004 to March 2004: Visiting Scientist in Lund University (Prof. Carl A.K.
Borrebaeck Lab.) by Japan-Sweden Young
Researcher Exchange Program April 2005 to July 2006: Designated
Assistant Professor, Department of Applied
Chemistry, Graduate School of Engineering, Osaka University
August 2006 to present: Assistant
Professor, Department of Applied Chemistry, Graduate School of Engineering, Osaka
University
October 2008 to March 2011: PRESTO Researcher, JST (Concurrent position)
April 2012 to present: 18th Council member
of Japanese Society for Biomaterials Jan 2013 to present: Editorial Board
Member of PLoS ONE (PLOS Group)
April 2015 to present: Editorial Board Member of Scientific Reports (Nature
Publishing Group)
Academic Activities:
Members of The Society of Polymer Science,
Japan, The Chemical Society of Japan, Japanese Society for Biomaterials, American Chemical
Society, The Japanese Society of Artificial
Organs, The Japanese Society for Regenerative Medicine, The Kinki Chemical Society Japan,
and Research Group on Biomedical Polymers
Current Areas:
Polymer Science, Biomaterial, and Tissue
Engineering
Fig. 1. Schematic illustration of (a) hierarchical cell manipulation and
(b) cell accumulation technique.
International Polymer Conference of Thailand
17
KN-BIOEN-3
Enzymatic Degradation of Oil Palm Empty Fruit Bunch Biomass
Satriani Aga Pasma, Rusli Daik, Suria Ramli and Mohamad Yusof Maskat
School of Chemical Sciences and Food Technology
Faculty of Science and Technolgy
Universiti Kebangsaan Malaysia
43600 UKM Bangi, Selangor, Malaysia
Abstract
The objective of the study is to optimize the production of lignin
degradation products. Lignin from oil palm empty fruit bunch
(OPEFB) was extracted by using organosolv method and
directly isolated by three methods of isolation. Powder of lignin
was isolated from organsolv black liquor by using methanol,
acidified water and deionized water. Enzymatic hydrolysis was
carried on the lignin powder using laccase and cutinase. The
reaction was conducted in an incubator shaker for 24 hours with
phenol, water, and buffer as mediators. A total of 9 compounds
were found as Lignin OPEFB degradation products. They were
hydroxybenzoic acid, hydroxybenzaldehyde, vanillic acid,
vanillin, syringic acid, syingaldehyde, coumaric acid, ferulic
acid, and guaiacyl alcohol. Different mediators affected the
yield of degradation products. In water, ferulic acid was the
product found with the highest concentration (466 mg/L), and
this was followed by hydroxybenzoic acid (201 mg/L).
Whereas, vanillic acid was the product with the highest
concentration (126 g/L ) found in phenol. Guaiacyl alcohol was
detected in small amount when laccase was used in water and
phenol. For the cutinase, major compounds produced were
syringaldehyde (2493 mg/L) and syringic acid (4994 mg/L). For
the characterization of lignin and degradation products,
Thermogravimetric Analysis (TGA), Fourier transform infrared
(FTIR), and Field emission scanning electron microscope
(FESEM) were used. High Performance Liquid Chromatography
(HPLC) and Gel Permeation Chromatography (GPC) were used
to determine the quantity and molecular weight of degradation
products produced.
Professor Dr. Rusli Daik graduated from
Universiti Kebangsaan Malaysia (The
National University of Malaysia) majoring
in Chemistry. He obtained his PhD degree in
Polymer Synthesis from Durham University,
United Kingdom. A part from polymer
synthesis his research interest includes
polymer nanoparticle, polymer
nanocomposite, electroactive polymer,
biodegradable polymer from biomass-
derived monomer, colloidal polymer and
polymer nanofluid. Throughout his career he
published more than 200 research
manuscripts, and owned three patents. He
has also edited 5 books and written 15 book
chapters. He has received more than 20
awards / recognitions from national as well
as international organizations. He is an
Associate Editor of the Malaysian Polymer
Journal (published by Plastics and Rubber
Institute of Malaysia), and the Chief Editor
of the Journal of Polymer Science and
Technology (published by Polymer
Research Center, Universiti Kebangsaan
Malaysia). He is currently the Deputy Dean
(Research and Innovation) of the Faculty of
Science and Technology, Universiti
Kebangsaan Malaysia. He is also the
President (founding president) of the
Malaysia Polymer Society, and a Council
Member of the Federation of Asian Polymer
Societies representing Malaysia since 2012.

International Polymer Conference of Thailand
18
KN-BIOEN-4
Chitosan Dispersion as a Pharmaceutical Coating Material
Satit Puttipipatkhachorn1,2
1Department of Manufacturing Pharmacy, Faculty of Pharmacy, Mahidol University, Bangkok 10400
2Center of Excellence in Innovative Drug Delivery and Nanomedicine, Faculty of Pharmacy, Mahidol
University, Bangkok 10400
Phone +66 2644 8702, Fax +66 2644 8702, *E-Mail: [email protected]
Abstract
Chitosan is derived from chitin, the second most abundant
biopolymer in the nature. It is used as an excipient for pharmaceuticals;
for example, film former, binder, controlled releasing agent and a
carrier in drug delivery system. There is a drawback in using chitosan
as a pharmaceutical coating material as an acid is needed in preparation
of chitosan solution. This leads to a remaining of residual acid in
chitosan film which might activate a degradation of acid labile drugs
and cause an unpleasant smell as well as a damage of coating
equipment. These problems can be solved by converting conventional
chitosan solution to chitosan colloidal dispersion.
Aqueous chitosan colloidal dispersion composed of chitosan,
cetyl alcohol and polyvinyl alcohol were developed. Free films were
prepared using casting evaporation technique. Residual acetic acid
residue was analyzed by HPLC. The mechanical properties, water
vapor permeability, water uptake, weight loss and drug permeability
across free films were determined. In addition, the aqueous chitosan
colloidal dispersion was used to coat on acetaminophen tablets and drug
release studies in simulated gastric fluid and simulated intestinal fluid
were carried out. All experiments were compared with chitosan solution
in acetic acid. The free films with minimal remaining acid residue could
be obtained from aqueous chitosan colloidal dispersion. These free
films had higher tensile strength, higher percent elongation at break,
lower water vapor permeability, lower water uptake and weight loss,
and lower drug permeability than those prepared from chitosan solution
in acetic acid. The tablets coated with aqueous chitosan colloidal
dispersion had slower drug release rate in both simulated gastric fluid
and simulated intestinal fluid than those coated with the chitosan
solution in acetic acid.
In conclusion, the aqueous chitosan colloidal dispersion
provided free films with better characteristics such as improved
mechanical properties and reduced drug permeability, when compared
to the chitosan solution in acetic acid. The study demonstrated that
aqueous chitosan colloidal dispersion can be used as pharmaceutical
film coating material to produce modified release dosage form.
Keywords: Chitosan dispersion, Coating, Film, Drug permeability,
Drug release
Satit Puttipipatkhachorn
Dr. Satit Puttipipatkhachorn is currently
the Head of Department of Manufacturing Pharmacy and associate professor in
Pharmaceutics at Faculty of Pharmacy,
Mahidol University, Thailand. He obtained a B. Pharm. with the first class honors from
Chiang Mai University, Thailand (1979-
1984), M.Sc. in Industrial Pharmacy from Mahidol University, Thailand (1984-1987),
and Ph.D. in Pharmaceutical Sciences from
Chiba University, Japan (1987-1991). During Ph.D. study, he received the Japanese
Government Scholarship (Monbusho). After
graduation, he was trained at Sankyo Pharmaceutical Co.Ltd., and gained a short
experience in pharmaceutical R&D and
GMP. He started his academic career as a lecturer at Department of Manufacturing
Pharmacy, Faculty of Pharmacy, Mahidol
University in 1991 and was promoted to be Assistant Professor and Associate Professor
in 1993 and 1997, respectively. For
administrative work, he has been Head of Department of Manufacturing Pharmacy
(2001-2004, 2014-present) and Deputy Dean
on Graduate Studies (2004-2008). His research interest is in the area of
Soild Pharmaceutics, especially
physicochemical properties of drug substances and excipients, drug-polymer
interaction, relevance of physicochemical
properties and molecular interaction in the solid dosage form on drug product
performance including dissolution, stability and recently nanoparticle formation. Another
area of research is oral controlled-release
drug delivery system, nanoparticulate drug delivery system and new pharmaceutical
excipients from polysaccharides. To present,
he has published over 90 original articles in international journals. With recognition in his
research achievement, he received the
Ishidate Award in Pharmaceutical Research from the Federation of Asian Pharmaceutical
Associations (FAPA) in 2004, and also the
Research Award from the National Research Council of Thailand in 2005, 2006 and 2008.
Apart from academic work, he also gave
a contribution to pharmacy profession of Thailand as a secretary general of
Pharmaceutical Association of Thailand
(1992-2010).
International Polymer Conference of Thailand
19
BIOENO-08
Synthesis of Positively Charged Poly(Lactic Acid) for Preparation of Electrospun Fiber
Thanin Chalermbongkot, Worawan Bhanthumnavin and Varawut Tangpasuthadol
*
Organic Synthesis Research Unit, Department of Chemistry, Faculty of Science, Chulalongkorn University,
Bangkok 10330
Abstract
Poly(lactic acid), a biodegradable and biocompatible polyester, is used widely in many applications. The
high hydrophobic characteristic of PLA is, however, a drawback for some works that directly contact with water
such as drug delivery, or tissue engineering. Therefore, in order to enhance the hydrophilicity of PLA
electrospun fiber, PLAs having two positively charged end groups (PLAdi+) were synthesized by incorporating
glycidyl trimethylammonium chloride (GTMAC) into the polymer chain ends. Commercially available PLAs
doped with three types of PLAdi+, different in chain lengths, were electrospun to afford improved
hydrophilicity PLA fiber mats. The fiber diameter of PLA doped with 10 %wt PLAdi+ was found to decrease
with increasing amounts of the dopant, or with decreasing the molecular weight PLAdi+ used, as determined by
SEM of the fibers. Moreover, the hydrophilicity of the PLA doped with PLAdi+ was increased compared with
corresponding PLA fiber without doping, as measured by air-water contact angle measurement. The thin and
hydrophilic PLA fibers were successfully prepared and could potentially be used in applications related to
aqueous environment.
Keywords: Poly(lactic Acid), Electrospinning, Hydrophillicity, Quaternary ammonium salt.
1. Introduction
In recent years, poly(lactic acid) (PLA) has
received much attention due to its biodegradable and
biocompatible properties, which provide important
economic benefits. PLA is a biopolymer and renewable
polyester, which has been widely used in several
applications such as packaging materials, biomedical
materials, and fibers. However, PLA is highly
hydrophobic which provide less efficiency when used in
biomedical and biomaterial field that related to aqueous
media. Therefore, PLA having positive charges in its
structure should be one way to increase its
hydrophilicity, and thus incorporating other benefits such
as bactericidal properties.
Electrospinning is a key versatile method to
produce the non-woven nanofibers providing high
surface area. Using electrospinning technique, smaller
size and high surface area fibers were electrospun, which
are applied to various applications, for example, scaffold,
water filter, and wound dressing bandage.
Consequently, in this work, the PLA was
positively charged by modifying the polymer chain ends
via ring opening reaction between the chain ends of PLA
and GTMAC. Subsequently, the PLAdi+ was mixed into
commercial-grade PLA. The polymer mixture was then
electrospun into the nanofibers. Polymer concentration,
amounts of PLAdi+ dopant, and PLAdi+ species were
varied to assess the effect on electrospinning and
morphology of the fibers, which the no bead-like and the
smaller fibers will be obtained.
2. Experimental Methods
2.1. PLAdiCOOH Synthesis
The polymers were prepared as shown in Scheme
1 using a revised synthesis method as described in
previous work [1]. Firstly, 88 wt% lactic acid solution,
succinic acid, and half-portioned para-toluenesulfonic
acid (pTSA) as catalyst were weighed and put into three-
neck round bottom flask. Then, the reaction was firstly
carried out at 110OC with partial reduced pressure for 2
to 10 hours. This step was called dehydration or
oligomerization. The reaction was further proceeded to
140OC, 160
OC for 1 and 2 hours, respectively, with step-
wise reducing the pressure to remove water from the
reaction. The polymerization was further carried out at
180OC for 4 to 12 hours with reduced pressure until
reaching high vacuum while SnCl2.2H2O and another
half-portioned pTSA were added into the flask as co-
catalyst and catalyst. After the reaction was finished, the
polymer was cooled down and dissolved in
International Polymer Conference of Thailand
20
dichloromethane before precipitating in cold ethanol for
purification. The crude polymer was precipitated twice,
fully dried in vacuum and then characterized by nuclear
magnetic resonance (NMR) and gel permeable
chromatography (GPC) and finally calculated for their
molecular weight and yield.
2.2. PLAdi+ Synthesis
The synthesis scheme of PLAdi+ is shown in
Scheme 1. PLAdiCOOH was weighed into a three-neck
round bottom flask with 3 equivalents GTMAC, 1
equivalent triethylamine, and DMSO as solvent. The
flask was mounted with CaCl2 tube to trap the moisture
from the reaction. The reaction was performed at 70OC
for 24 hours. The resulting polymer was washed with DI
water and then centrifuged 3-5 times in order to purify
the polymer and remove the unreacted GTMAC before
freeze-dried and characterized by NMR.
2.3. Electrospinning
Commercial PLA, Mw = 103 kDa (Ingeo™ 4043D,
NatureWorks LLC) served as the major component of
the polymer blends due to its high molecular weight and
consequent high viscosity to afford the chain
entanglements and the ability to be electrospun
efficiently. The PLAdi+, were used as the dopants for the
electrospinning. All polymers were thoroughly dissolved
in chloroform/methanol mixture (3:1) before loading into
a 5 ml plastic syringe equipped tightly with disposable
26G blunt needle tip (0.45 mm diameter). The syringe
was immediately placed into the syringe pump and the
solution was electrospun horizontally at 1 ml/h flow rate,
20 kV voltage applied from a high voltage power supply,
and tip-to-collecter distance was 20 cm. The electrospun
fiber jet was collected consequently onto a 10cm x 10cm
aluminum foil as a ground collector. Electrospun mats
were carefully left to dry at ambient temperature
overnight and further dried via high vacuum for 4 hours
before investigation.
2.4. Characterization and Morphology Investigation
The synthesized PLAdiCOOH and PLAdi+ were
characterized by NMR and GPC. 1
H NMR integrations
of the methylene protons of succinic acid and PLA
methine protons were compared to determine the
repeating unit and molecular weight as well.
To assess the fiber size and diameter, fiber
morphology was characterized using a JEOL JSM-
6610LV field emission scanning electron microscope
(SEM). The reported fiber diameters of each sample
were averaged from 80 different measuring points in the
SEM micrographs.
2.5. Air-water Contact angle measurement
In order to determine the wettability and
hydrophilicity of prepared PLA electrospun mats, static
and dynamic contact angle were measured using Ramé-
hart™ standard goniometer. The water droplets were
carefully controlled to be equal in each sample.
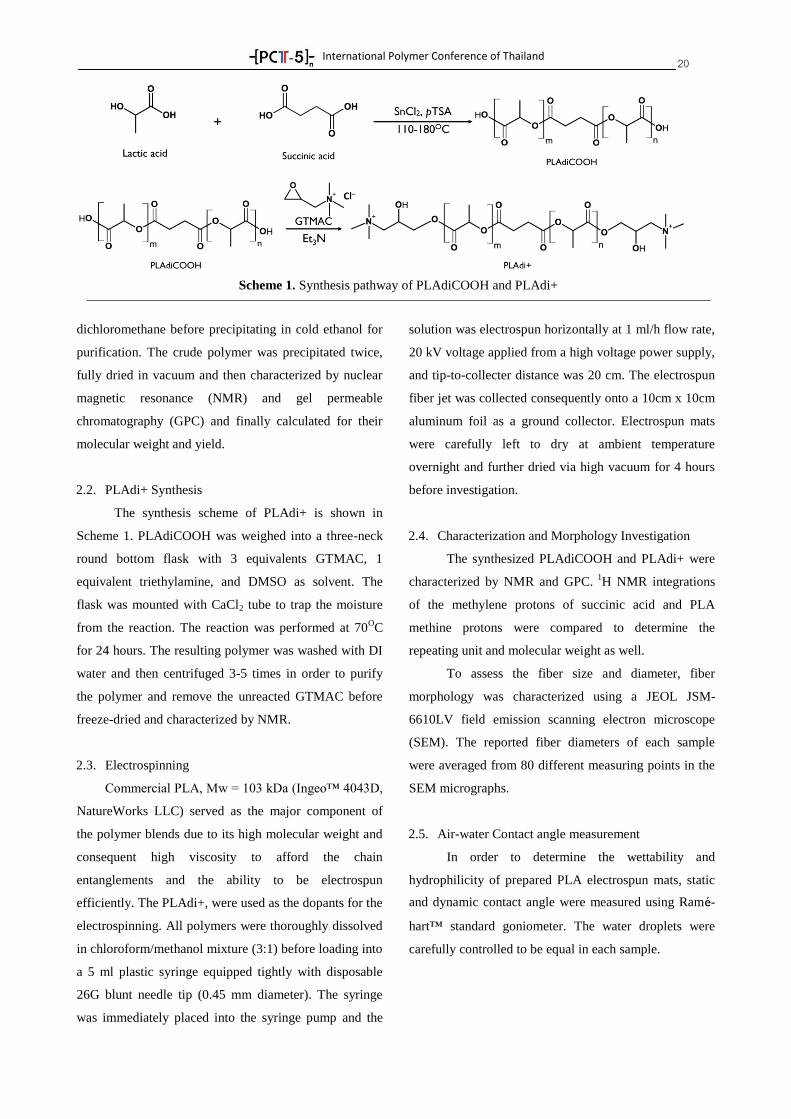
Scheme 1. Synthesis pathway of PLAdiCOOH and PLAdi+
International Polymer Conference of Thailand
21 3. Results and Discussion
3.1. Synthesis
The dicarboxyl ends PLAs, PLAdiCOOHs, were
synthesized from lactic acid monomer and succinic acid
at 110OC to 180
OC using tin-catalyzed polycondensation
(Scheme 1). Dehydration time, mol% of succinic acid
added into reaction, and polymerization time were varied
to produce PLAdiCOOHs with high molecular weight as
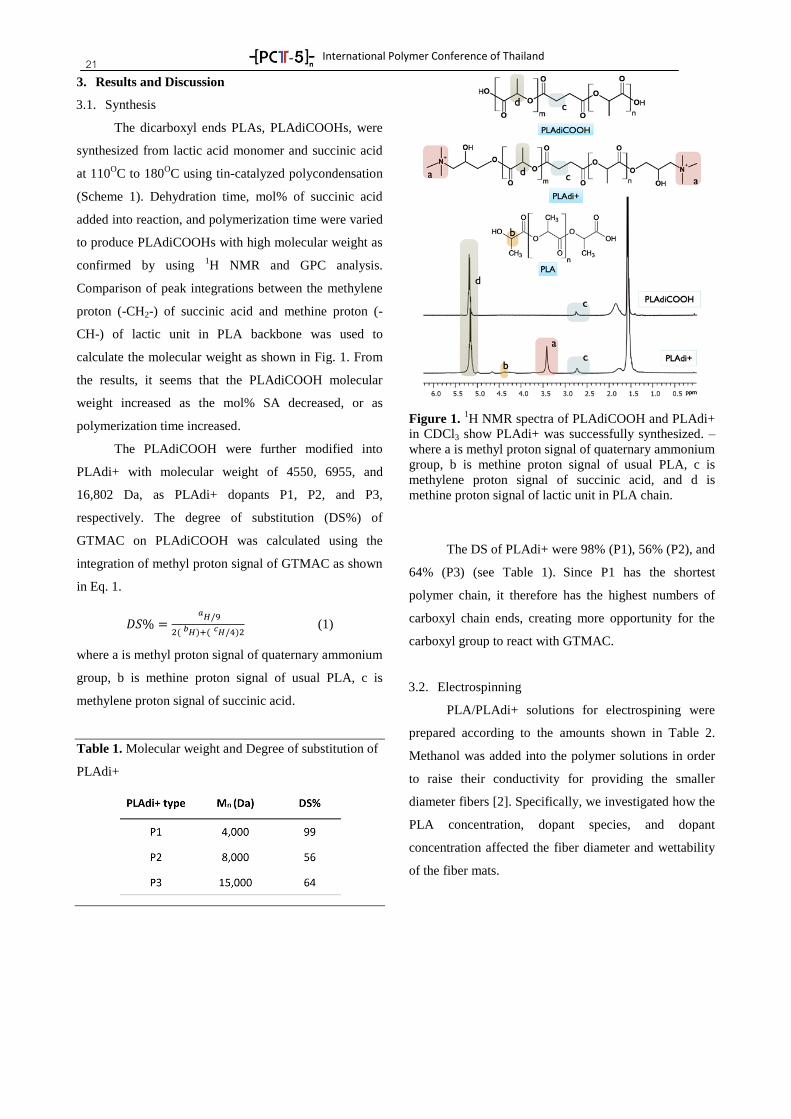
confirmed by using 1H NMR and GPC analysis.
Comparison of peak integrations between the methylene
proton (-CH2-) of succinic acid and methine proton (-
CH-) of lactic unit in PLA backbone was used to
calculate the molecular weight as shown in Fig. 1. From
the results, it seems that the PLAdiCOOH molecular
weight increased as the mol% SA decreased, or as
polymerization time increased.
The PLAdiCOOH were further modified into
PLAdi+ with molecular weight of 4550, 6955, and
16,802 Da, as PLAdi+ dopants P1, P2, and P3,
respectively. The degree of substitution (DS%) of
GTMAC on PLAdiCOOH was calculated using the
integration of methyl proton signal of GTMAC as shown
in Eq. 1.
(1)
where a is methyl proton signal of quaternary ammonium
group, b is methine proton signal of usual PLA, c is
methylene proton signal of succinic acid.
Table 1. Molecular weight and Degree of substitution of
PLAdi+
Figure 1. 1H NMR spectra of PLAdiCOOH and PLAdi+
in CDCl3 show PLAdi+ was successfully synthesized. –
where a is methyl proton signal of quaternary ammonium
group, b is methine proton signal of usual PLA, c is
methylene proton signal of succinic acid, and d is
methine proton signal of lactic unit in PLA chain.
The DS of PLAdi+ were 98% (P1), 56% (P2), and
64% (P3) (see Table 1). Since P1 has the shortest
polymer chain, it therefore has the highest numbers of
carboxyl chain ends, creating more opportunity for the
carboxyl group to react with GTMAC.
3.2. Electrospinning
PLA/PLAdi+ solutions for electrospining were
prepared according to the amounts shown in Table 2.
Methanol was added into the polymer solutions in order
to raise their conductivity for providing the smaller
diameter fibers [2]. Specifically, we investigated how the
PLA concentration, dopant species, and dopant
concentration affected the fiber diameter and wettability
of the fiber mats.
International Polymer Conference of Thailand
22 Table 2. Electrospinning conditions of PLA and
PLA/PLAdi+
According to Figure 2, SEM images of
electrospun fibers reveal that the fiber diameter
decreased apparently as the polymer concentration was
reduced, due to the low polymer content and was
consistent with results obtained in previous studies [3].
As a results, PLA concentration at 5%w, entry 2, was
chosen for further test because it gave acceptably small
fiber diameter.
0.604 ± 0.121µm 0.688 ± 0.167µm 1.090 ± 0.146µm
Figure 2. SEM images of PLA fibers show effect of
concentration on the fiber diameters, the fiber diameter
increases with increasing the polymer concentration. (a)
entry 1, 3% PLA; (b) entry 2, 5% PLA; and (c) entry 3,
7% PLA.
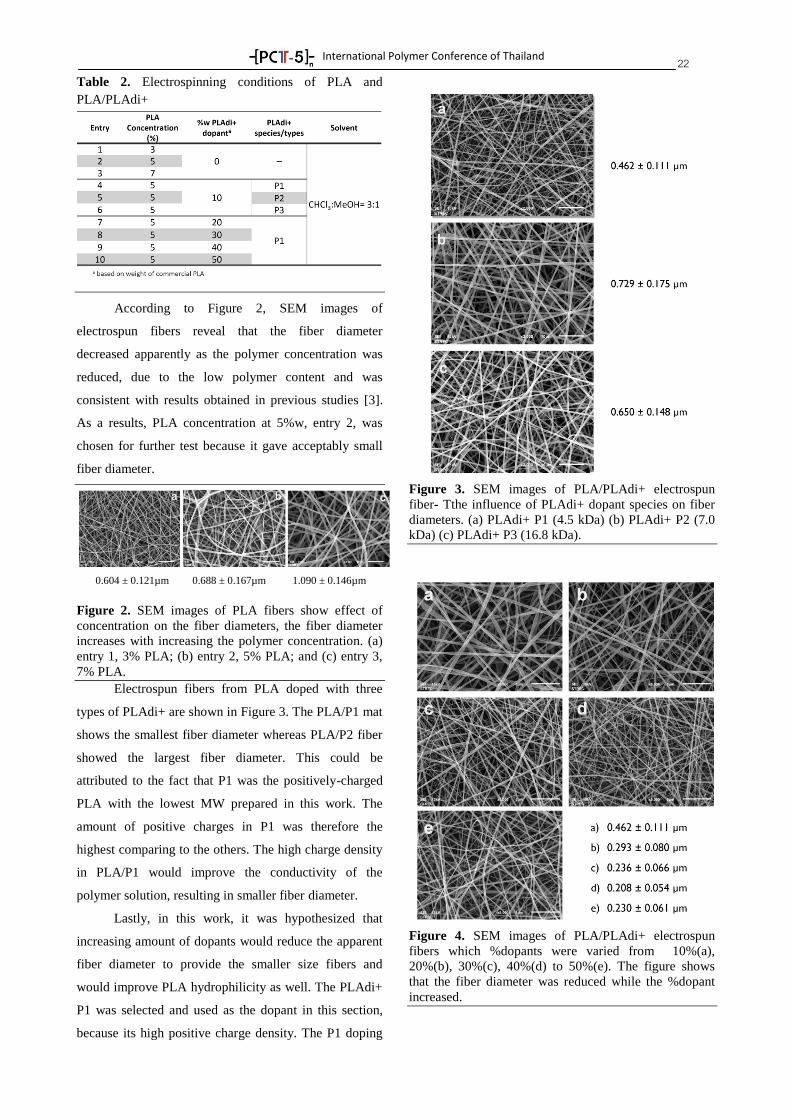
Electrospun fibers from PLA doped with three
types of PLAdi+ are shown in Figure 3. The PLA/P1 mat
shows the smallest fiber diameter whereas PLA/P2 fiber
showed the largest fiber diameter. This could be
attributed to the fact that P1 was the positively-charged
PLA with the lowest MW prepared in this work. The
amount of positive charges in P1 was therefore the
highest comparing to the others. The high charge density
in PLA/P1 would improve the conductivity of the
polymer solution, resulting in smaller fiber diameter.
Lastly, in this work, it was hypothesized that
increasing amount of dopants would reduce the apparent
fiber diameter to provide the smaller size fibers and
would improve PLA hydrophilicity as well. The PLAdi+
P1 was selected and used as the dopant in this section,
because its high positive charge density. The P1 doping
Figure 3. SEM images of PLA/PLAdi+ electrospun
fiber- Tthe influence of PLAdi+ dopant species on fiber
diameters. (a) PLAdi+ P1 (4.5 kDa) (b) PLAdi+ P2 (7.0
kDa) (c) PLAdi+ P3 (16.8 kDa).
Figure 4. SEM images of PLA/PLAdi+ electrospun
fibers which %dopants were varied from 10%(a),
20%(b), 30%(c), 40%(d) to 50%(e). The figure shows
that the fiber diameter was reduced while the %dopant
increased.
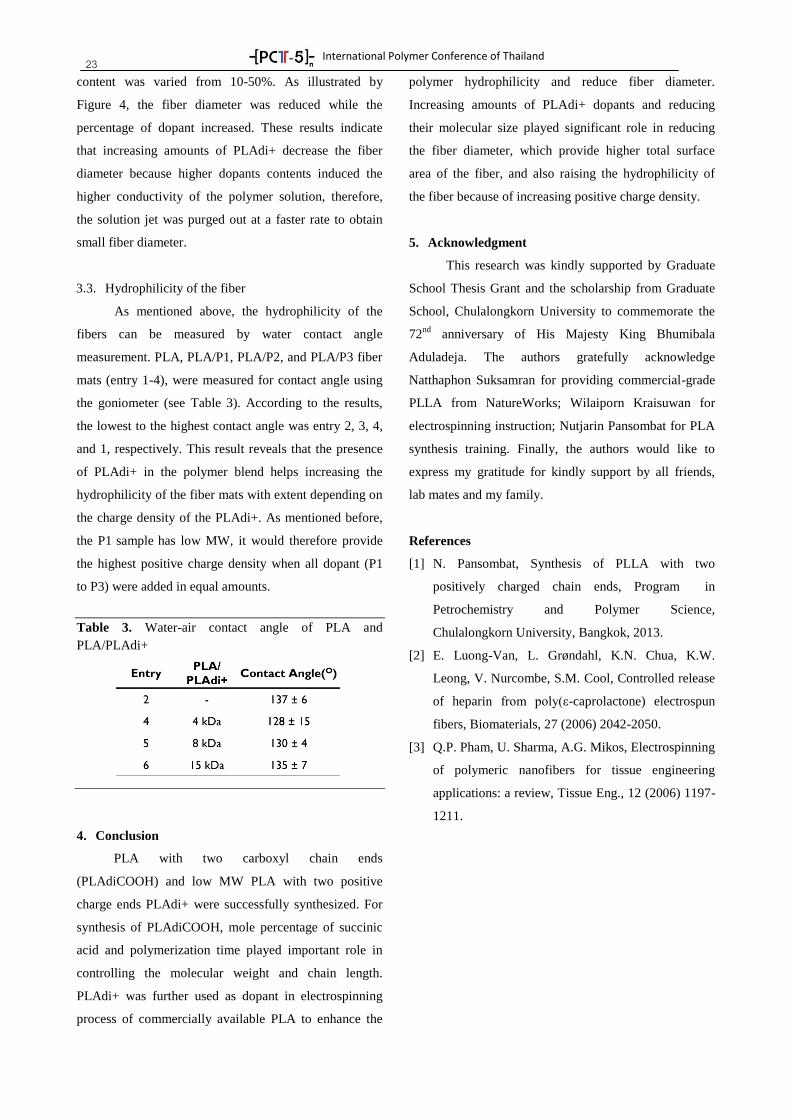
International Polymer Conference of Thailand
23 content was varied from 10-50%. As illustrated by
Figure 4, the fiber diameter was reduced while the
percentage of dopant increased. These results indicate
that increasing amounts of PLAdi+ decrease the fiber
diameter because higher dopants contents induced the
higher conductivity of the polymer solution, therefore,
the solution jet was purged out at a faster rate to obtain
small fiber diameter.
3.3. Hydrophilicity of the fiber
As mentioned above, the hydrophilicity of the
fibers can be measured by water contact angle
measurement. PLA, PLA/P1, PLA/P2, and PLA/P3 fiber
mats (entry 1-4), were measured for contact angle using
the goniometer (see Table 3). According to the results,
the lowest to the highest contact angle was entry 2, 3, 4,
and 1, respectively. This result reveals that the presence
of PLAdi+ in the polymer blend helps increasing the
hydrophilicity of the fiber mats with extent depending on
the charge density of the PLAdi+. As mentioned before,
the P1 sample has low MW, it would therefore provide
the highest positive charge density when all dopant (P1
to P3) were added in equal amounts.
Table 3. Water-air contact angle of PLA and
PLA/PLAdi+
4. Conclusion
PLA with two carboxyl chain ends
(PLAdiCOOH) and low MW PLA with two positive
charge ends PLAdi+ were successfully synthesized. For
synthesis of PLAdiCOOH, mole percentage of succinic
acid and polymerization time played important role in
controlling the molecular weight and chain length.
PLAdi+ was further used as dopant in electrospinning
process of commercially available PLA to enhance the
polymer hydrophilicity and reduce fiber diameter.
Increasing amounts of PLAdi+ dopants and reducing
their molecular size played significant role in reducing
the fiber diameter, which provide higher total surface
area of the fiber, and also raising the hydrophilicity of
the fiber because of increasing positive charge density.
5. Acknowledgment
This research was kindly supported by Graduate
School Thesis Grant and the scholarship from Graduate
School, Chulalongkorn University to commemorate the
72nd
anniversary of His Majesty King Bhumibala
Aduladeja. The authors gratefully acknowledge
Natthaphon Suksamran for providing commercial-grade
PLLA from NatureWorks; Wilaiporn Kraisuwan for
electrospinning instruction; Nutjarin Pansombat for PLA
synthesis training. Finally, the authors would like to
express my gratitude for kindly support by all friends,
lab mates and my family.
References
[1] N. Pansombat, Synthesis of PLLA with two
positively charged chain ends, Program in
Petrochemistry and Polymer Science,
Chulalongkorn University, Bangkok, 2013.
[2] E. Luong-Van, L. Grøndahl, K.N. Chua, K.W.
Leong, V. Nurcombe, S.M. Cool, Controlled release
of heparin from poly(ε-caprolactone) electrospun
fibers, Biomaterials, 27 (2006) 2042-2050.
[3] Q.P. Pham, U. Sharma, A.G. Mikos, Electrospinning
of polymeric nanofibers for tissue engineering
applications: a review, Tissue Eng., 12 (2006) 1197-
1211.
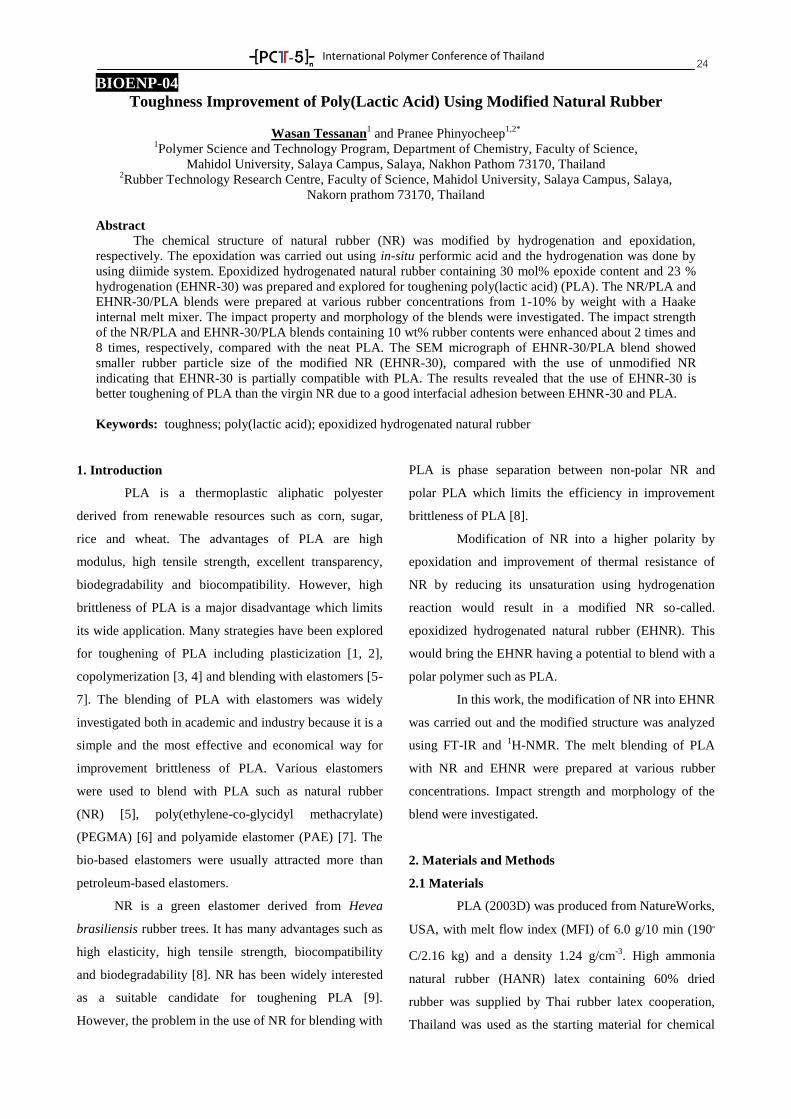
International Polymer Conference of Thailand
24 BIOENP-04
Toughness Improvement of Poly(Lactic Acid) Using Modified Natural Rubber
Wasan Tessanan1 and Pranee Phinyocheep
1,2*
1Polymer Science and Technology Program, Department of Chemistry, Faculty of Science,
Mahidol University, Salaya Campus, Salaya, Nakhon Pathom 73170, Thailand 2Rubber Technology Research Centre, Faculty of Science, Mahidol University, Salaya Campus, Salaya,
Nakorn prathom 73170, Thailand
Abstract
The chemical structure of natural rubber (NR) was modified by hydrogenation and epoxidation,
respectively. The epoxidation was carried out using in-situ performic acid and the hydrogenation was done by
using diimide system. Epoxidized hydrogenated natural rubber containing 30 mol% epoxide content and 23 %
hydrogenation (EHNR-30) was prepared and explored for toughening poly(lactic acid) (PLA). The NR/PLA and
EHNR-30/PLA blends were prepared at various rubber concentrations from 1-10% by weight with a Haake
internal melt mixer. The impact property and morphology of the blends were investigated. The impact strength
of the NR/PLA and EHNR-30/PLA blends containing 10 wt% rubber contents were enhanced about 2 times and
8 times, respectively, compared with the neat PLA. The SEM micrograph of EHNR-30/PLA blend showed
smaller rubber particle size of the modified NR (EHNR-30), compared with the use of unmodified NR
indicating that EHNR-30 is partially compatible with PLA. The results revealed that the use of EHNR-30 is
better toughening of PLA than the virgin NR due to a good interfacial adhesion between EHNR-30 and PLA.
Keywords: toughness; poly(lactic acid); epoxidized hydrogenated natural rubber
1. Introduction
PLA is a thermoplastic aliphatic polyester
derived from renewable resources such as corn, sugar,
rice and wheat. The advantages of PLA are high
modulus, high tensile strength, excellent transparency,
biodegradability and biocompatibility. However, high
brittleness of PLA is a major disadvantage which limits
its wide application. Many strategies have been explored
for toughening of PLA including plasticization [1, 2],
copolymerization [3, 4] and blending with elastomers [5-
7]. The blending of PLA with elastomers was widely
investigated both in academic and industry because it is a
simple and the most effective and economical way for
improvement brittleness of PLA. Various elastomers
were used to blend with PLA such as natural rubber
(NR) [5], poly(ethylene-co-glycidyl methacrylate)
(PEGMA) [6] and polyamide elastomer (PAE) [7]. The
bio-based elastomers were usually attracted more than
petroleum-based elastomers.
NR is a green elastomer derived from Hevea
brasiliensis rubber trees. It has many advantages such as
high elasticity, high tensile strength, biocompatibility
and biodegradability [8]. NR has been widely interested
as a suitable candidate for toughening PLA [9].
However, the problem in the use of NR for blending with
PLA is phase separation between non-polar NR and
polar PLA which limits the efficiency in improvement
brittleness of PLA [8].
Modification of NR into a higher polarity by
epoxidation and improvement of thermal resistance of
NR by reducing its unsaturation using hydrogenation
reaction would result in a modified NR so-called.
epoxidized hydrogenated natural rubber (EHNR). This
would bring the EHNR having a potential to blend with a
polar polymer such as PLA.
In this work, the modification of NR into EHNR
was carried out and the modified structure was analyzed
using FT-IR and 1H-NMR. The melt blending of PLA
with NR and EHNR were prepared at various rubber
concentrations. Impact strength and morphology of the
blend were investigated.
2. Materials and Methods
2.1 Materials
PLA (2003D) was produced from NatureWorks,
USA, with melt flow index (MFI) of 6.0 g/10 min (190๐
C/2.16 kg) and a density 1.24 g/cm-3
. High ammonia
natural rubber (HANR) latex containing 60% dried
rubber was supplied by Thai rubber latex cooperation,
Thailand was used as the starting material for chemical
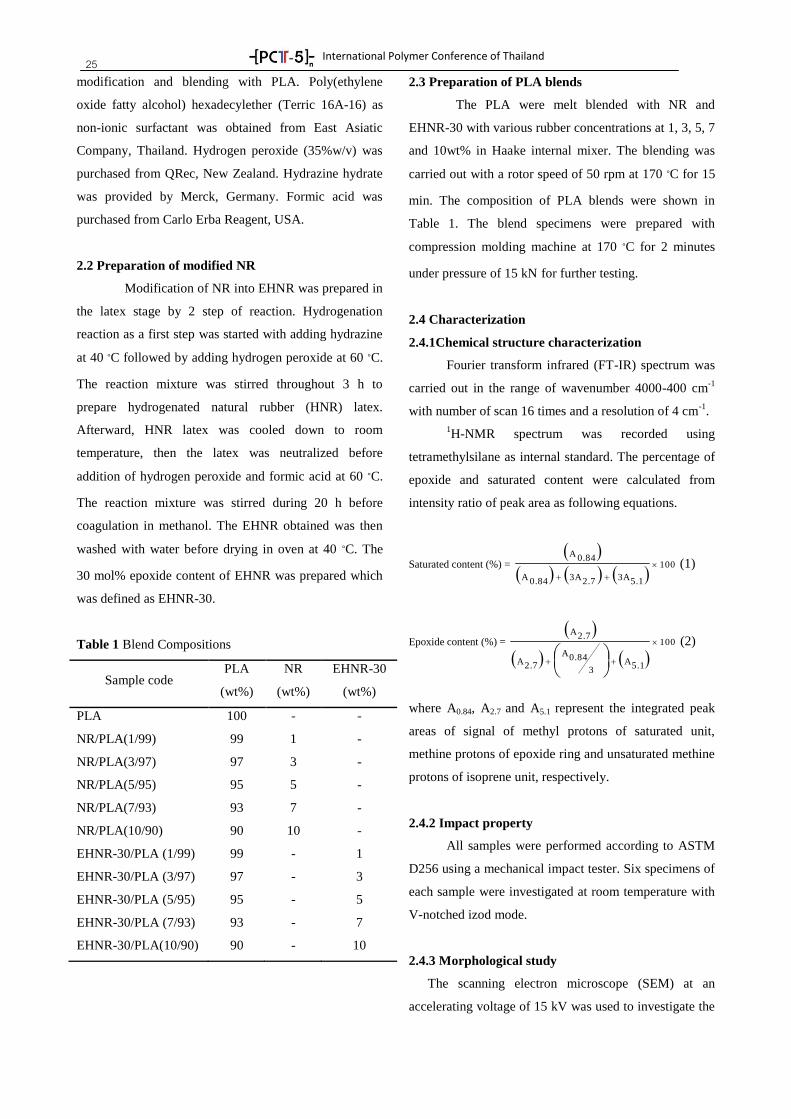
International Polymer Conference of Thailand
25 modification and blending with PLA. Poly(ethylene
oxide fatty alcohol) hexadecylether (Terric 16A-16) as
non-ionic surfactant was obtained from East Asiatic
Company, Thailand. Hydrogen peroxide (35%w/v) was
purchased from QRec, New Zealand. Hydrazine hydrate
was provided by Merck, Germany. Formic acid was
purchased from Carlo Erba Reagent, USA.
2.2 Preparation of modified NR
Modification of NR into EHNR was prepared in
the latex stage by 2 step of reaction. Hydrogenation
reaction as a first step was started with adding hydrazine
at 40 ๐C followed by adding hydrogen peroxide at 60 ๐C.
The reaction mixture was stirred throughout 3 h to
prepare hydrogenated natural rubber (HNR) latex.
Afterward, HNR latex was cooled down to room
temperature, then the latex was neutralized before
addition of hydrogen peroxide and formic acid at 60 ๐C.
The reaction mixture was stirred during 20 h before
coagulation in methanol. The EHNR obtained was then
washed with water before drying in oven at 40 ๐C. The
30 mol% epoxide content of EHNR was prepared which
was defined as EHNR-30.
Table 1 Blend Compositions
Sample code PLA
(wt%)
NR
(wt%)
EHNR-30
(wt%)
PLA
NR/PLA(1/99)
NR/PLA(3/97)
NR/PLA(5/95)
NR/PLA(7/93)
NR/PLA(10/90)
EHNR-30/PLA (1/99)
EHNR-30/PLA (3/97)
EHNR-30/PLA (5/95)
EHNR-30/PLA (7/93)
EHNR-30/PLA(10/90)
100
99
97
95
93
90
99
97
95
93
90
-
1
3
5
7
10
-
-
-
-
-
-
-
-
-
-
-
1
3
5
7
10
2.3 Preparation of PLA blends
The PLA were melt blended with NR and
EHNR-30 with various rubber concentrations at 1, 3, 5, 7
and 10wt% in Haake internal mixer. The blending was
carried out with a rotor speed of 50 rpm at 170 ๐C for 15
min. The composition of PLA blends were shown in
Table 1. The blend specimens were prepared with
compression molding machine at 170 ๐C for 2 minutes
under pressure of 15 kN for further testing.
2.4 Characterization
2.4.1Chemical structure characterization
Fourier transform infrared (FT-IR) spectrum was
carried out in the range of wavenumber 4000-400 cm-1
with number of scan 16 times and a resolution of 4 cm-1
.
1H-NMR spectrum was recorded using
tetramethylsilane as internal standard. The percentage of
epoxide and saturated content were calculated from
intensity ratio of peak area as following equations.
Saturated content (%) =
100
5.13A2.73A0.84A
0.84A
(1)
Epoxide content (%) =
100
5.1A3
0.84A
2.7A
2.7A
(2)
where A0.84, A2.7 and A5.1 represent the integrated peak
areas of signal of methyl protons of saturated unit,
methine protons of epoxide ring and unsaturated methine
protons of isoprene unit, respectively.
2.4.2 Impact property
All samples were performed according to ASTM
D256 using a mechanical impact tester. Six specimens of
each sample were investigated at room temperature with
V-notched izod mode.
2.4.3 Morphological study
The scanning electron microscope (SEM) at an
accelerating voltage of 15 kV was used to investigate the
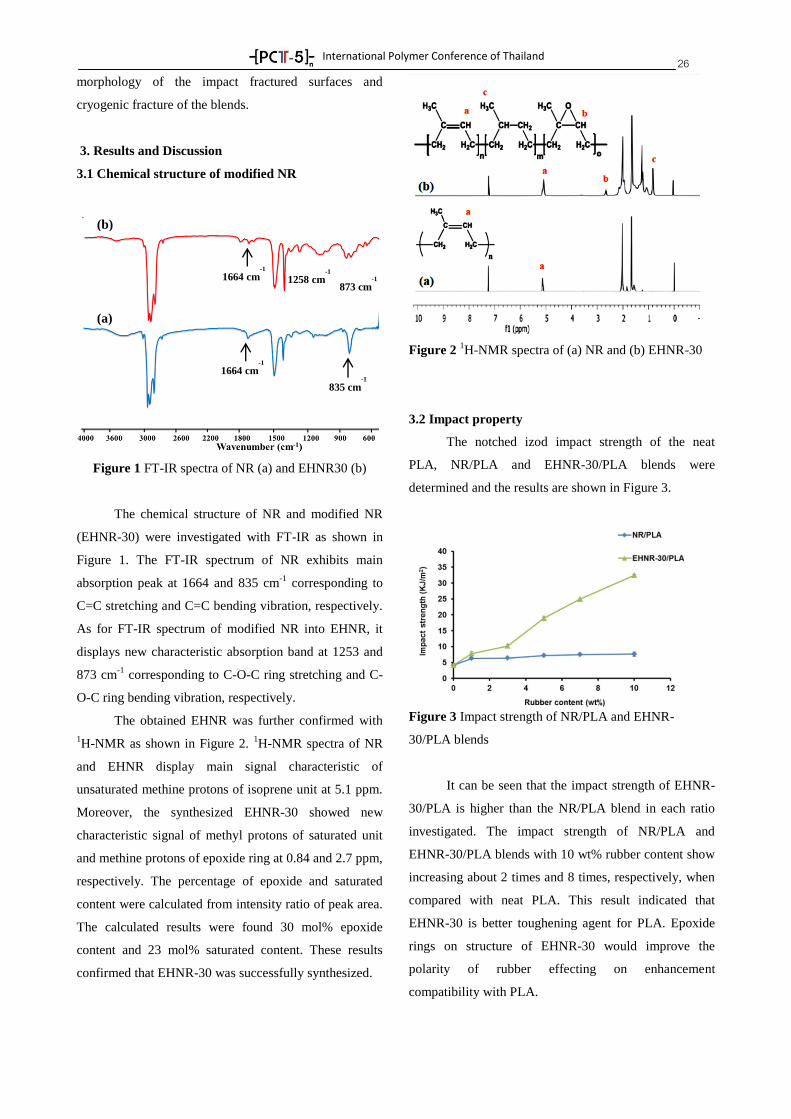
International Polymer Conference of Thailand
26 morphology of the impact fractured surfaces and
cryogenic fracture of the blends.
3. Results and Discussion
3.1 Chemical structure of modified NR
Figure 1 FT-IR spectra of NR (a) and EHNR30 (b)
The chemical structure of NR and modified NR
(EHNR-30) were investigated with FT-IR as shown in
Figure 1. The FT-IR spectrum of NR exhibits main
absorption peak at 1664 and 835 cm-1
corresponding to
C=C stretching and C=C bending vibration, respectively.
As for FT-IR spectrum of modified NR into EHNR, it
displays new characteristic absorption band at 1253 and
873 cm-1
corresponding to C-O-C ring stretching and C-
O-C ring bending vibration, respectively.
The obtained EHNR was further confirmed with
1H-NMR as shown in Figure 2.
1H-NMR spectra of NR
and EHNR display main signal characteristic of
unsaturated methine protons of isoprene unit at 5.1 ppm.
Moreover, the synthesized EHNR-30 showed new
characteristic signal of methyl protons of saturated unit
and methine protons of epoxide ring at 0.84 and 2.7 ppm,
respectively. The percentage of epoxide and saturated
content were calculated from intensity ratio of peak area.
The calculated results were found 30 mol% epoxide
content and 23 mol% saturated content. These results
confirmed that EHNR-30 was successfully synthesized.
Figure 2 1H-NMR spectra of (a) NR and (b) EHNR-30
3.2 Impact property
The notched izod impact strength of the neat
PLA, NR/PLA and EHNR-30/PLA blends were
determined and the results are shown in Figure 3.
Figure 3 Impact strength of NR/PLA and EHNR-
30/PLA blends
It can be seen that the impact strength of EHNR-
30/PLA is higher than the NR/PLA blend in each ratio
investigated. The impact strength of NR/PLA and
EHNR-30/PLA blends with 10 wt% rubber content show
increasing about 2 times and 8 times, respectively, when
compared with neat PLA. This result indicated that
EHNR-30 is better toughening agent for PLA. Epoxide
rings on structure of EHNR-30 would improve the
polarity of rubber effecting on enhancement
compatibility with PLA.
(a)
(b)
1664 cm-1
1664 cm-1
873 cm-1
1258 cm
-1
835 cm-1
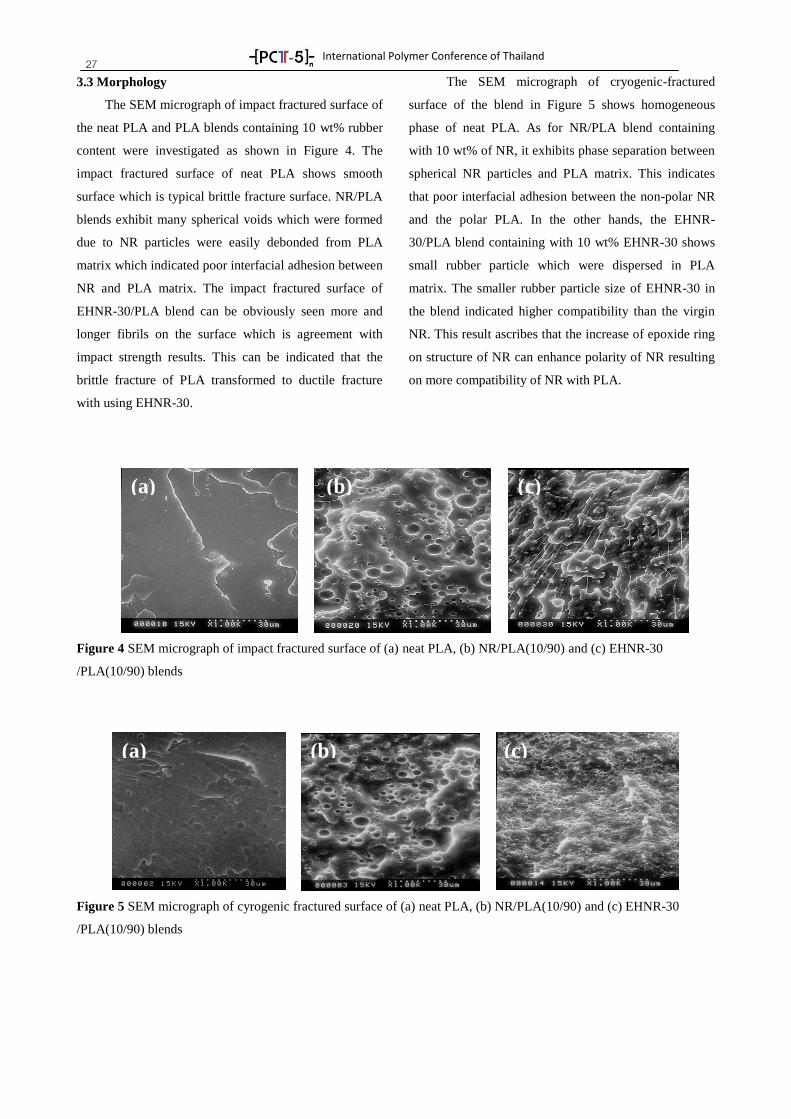
International Polymer Conference of Thailand
27 3.3 Morphology
The SEM micrograph of impact fractured surface of
the neat PLA and PLA blends containing 10 wt% rubber
content were investigated as shown in Figure 4. The
impact fractured surface of neat PLA shows smooth
surface which is typical brittle fracture surface. NR/PLA
blends exhibit many spherical voids which were formed
due to NR particles were easily debonded from PLA
matrix which indicated poor interfacial adhesion between
NR and PLA matrix. The impact fractured surface of
EHNR-30/PLA blend can be obviously seen more and
longer fibrils on the surface which is agreement with
impact strength results. This can be indicated that the
brittle fracture of PLA transformed to ductile fracture
with using EHNR-30.
The SEM micrograph of cryogenic-fractured
surface of the blend in Figure 5 shows homogeneous
phase of neat PLA. As for NR/PLA blend containing
with 10 wt% of NR, it exhibits phase separation between
spherical NR particles and PLA matrix. This indicates
that poor interfacial adhesion between the non-polar NR
and the polar PLA. In the other hands, the EHNR-
30/PLA blend containing with 10 wt% EHNR-30 shows
small rubber particle which were dispersed in PLA
matrix. The smaller rubber particle size of EHNR-30 in
the blend indicated higher compatibility than the virgin
NR. This result ascribes that the increase of epoxide ring
on structure of NR can enhance polarity of NR resulting
on more compatibility of NR with PLA.
Figure 4 SEM micrograph of impact fractured surface of (a) neat PLA, (b) NR/PLA(10/90) and (c) EHNR-30
/PLA(10/90) blends
Figure 5 SEM micrograph of cyrogenic fractured surface of (a) neat PLA, (b) NR/PLA(10/90) and (c) EHNR-30
/PLA(10/90) blends
(a) (b) (c)
(a) (b) (c)
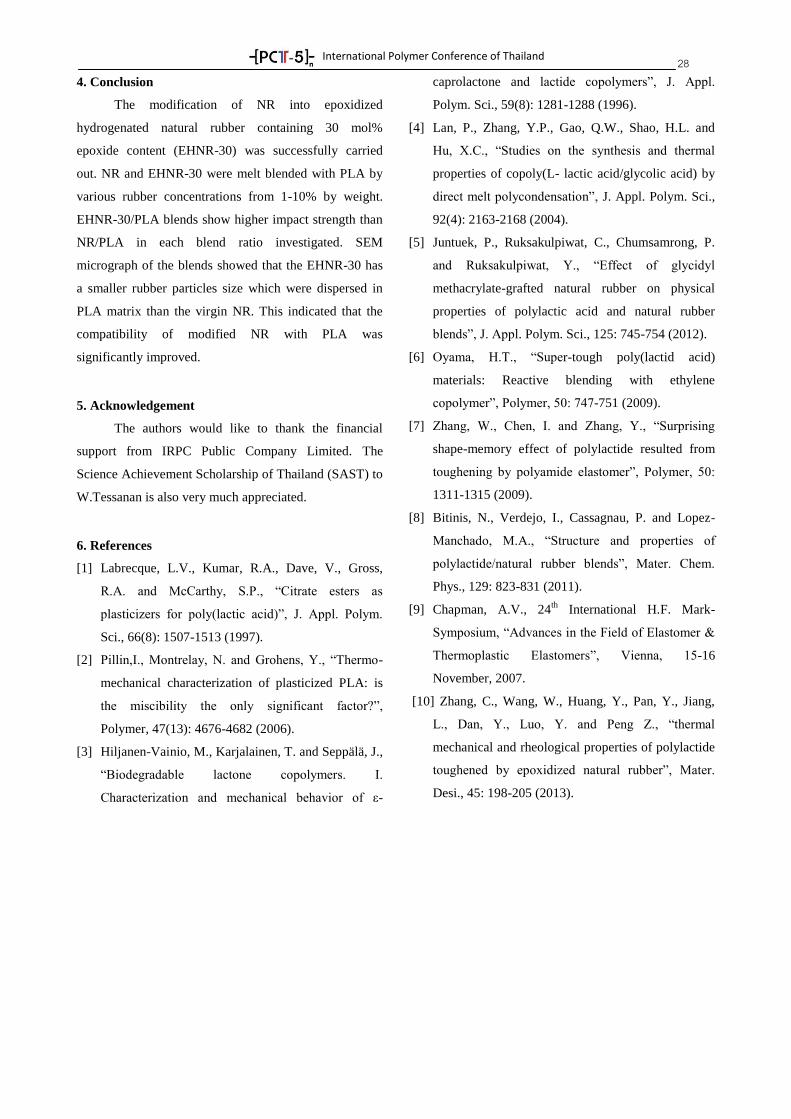
International Polymer Conference of Thailand
28 4. Conclusion
The modification of NR into epoxidized
hydrogenated natural rubber containing 30 mol%
epoxide content (EHNR-30) was successfully carried
out. NR and EHNR-30 were melt blended with PLA by
various rubber concentrations from 1-10% by weight.
EHNR-30/PLA blends show higher impact strength than
NR/PLA in each blend ratio investigated. SEM
micrograph of the blends showed that the EHNR-30 has
a smaller rubber particles size which were dispersed in
PLA matrix than the virgin NR. This indicated that the
compatibility of modified NR with PLA was
significantly improved.
5. Acknowledgement
The authors would like to thank the financial
support from IRPC Public Company Limited. The
Science Achievement Scholarship of Thailand (SAST) to
W.Tessanan is also very much appreciated.
6. References
[1] Labrecque, L.V., Kumar, R.A., Dave, V., Gross,
R.A. and McCarthy, S.P., “Citrate esters as
plasticizers for poly(lactic acid)”, J. Appl. Polym.
Sci., 66(8): 1507-1513 (1997).
[2] Pillin,I., Montrelay, N. and Grohens, Y., “Thermo-
mechanical characterization of plasticized PLA: is
the miscibility the only significant factor?”,
Polymer, 47(13): 4676-4682 (2006).
[3] Hiljanen-Vainio, M., Karjalainen, T. and Seppälä, J.,
“Biodegradable lactone copolymers. I.
Characterization and mechanical behavior of ε-
caprolactone and lactide copolymers”, J. Appl.
Polym. Sci., 59(8): 1281-1288 (1996).
[4] Lan, P., Zhang, Y.P., Gao, Q.W., Shao, H.L. and
Hu, X.C., “Studies on the synthesis and thermal
properties of copoly(L- lactic acid/glycolic acid) by
direct melt polycondensation”, J. Appl. Polym. Sci.,
92(4): 2163-2168 (2004).
[5] Juntuek, P., Ruksakulpiwat, C., Chumsamrong, P.
and Ruksakulpiwat, Y., “Effect of glycidyl
methacrylate-grafted natural rubber on physical
properties of polylactic acid and natural rubber
blends”, J. Appl. Polym. Sci., 125: 745-754 (2012).
[6] Oyama, H.T., “Super-tough poly(lactid acid)
materials: Reactive blending with ethylene
copolymer”, Polymer, 50: 747-751 (2009).
[7] Zhang, W., Chen, I. and Zhang, Y., “Surprising
shape-memory effect of polylactide resulted from
toughening by polyamide elastomer”, Polymer, 50:
1311-1315 (2009).
[8] Bitinis, N., Verdejo, I., Cassagnau, P. and Lopez-
Manchado, M.A., “Structure and properties of
polylactide/natural rubber blends”, Mater. Chem.
Phys., 129: 823-831 (2011).
[9] Chapman, A.V., 24th
International H.F. Mark-
Symposium, “Advances in the Field of Elastomer &
Thermoplastic Elastomers”, Vienna, 15-16
November, 2007.
[10] Zhang, C., Wang, W., Huang, Y., Pan, Y., Jiang,
L., Dan, Y., Luo, Y. and Peng Z., “thermal
mechanical and rheological properties of polylactide
toughened by epoxidized natural rubber”, Mater.
Desi., 45: 198-205 (2013).
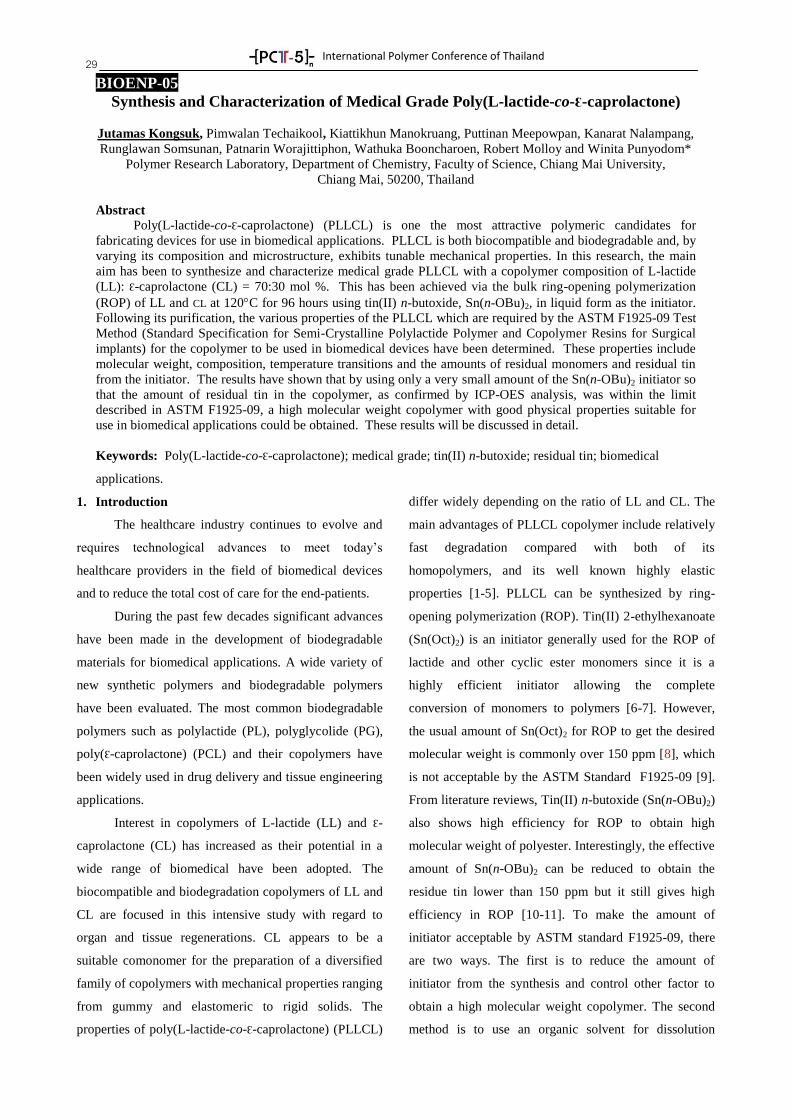
International Polymer Conference of Thailand
29 BIOENP-05
Synthesis and Characterization of Medical Grade Poly(L-lactide-co-Ɛ-caprolactone)
Jutamas Kongsuk, Pimwalan Techaikool, Kiattikhun Manokruang, Puttinan Meepowpan, Kanarat Nalampang,
Runglawan Somsunan, Patnarin Worajittiphon, Wathuka Booncharoen, Robert Molloy and Winita Punyodom*
Polymer Research Laboratory, Department of Chemistry, Faculty of Science, Chiang Mai University,
Chiang Mai, 50200, Thailand
Abstract
Poly(L-lactide-co-Ɛ-caprolactone) (PLLCL) is one the most attractive polymeric candidates for
fabricating devices for use in biomedical applications. PLLCL is both biocompatible and biodegradable and, by
varying its composition and microstructure, exhibits tunable mechanical properties. In this research, the main
aim has been to synthesize and characterize medical grade PLLCL with a copolymer composition of L-lactide
(LL): Ɛ-caprolactone (CL) = 70:30 mol %. This has been achieved via the bulk ring-opening polymerization
(ROP) of LL and CL at 120C for 96 hours using tin(II) n-butoxide, Sn(n-OBu)2, in liquid form as the initiator.
Following its purification, the various properties of the PLLCL which are required by the ASTM F1925-09 Test
Method (Standard Specification for Semi-Crystalline Polylactide Polymer and Copolymer Resins for Surgical
implants) for the copolymer to be used in biomedical devices have been determined. These properties include
molecular weight, composition, temperature transitions and the amounts of residual monomers and residual tin
from the initiator. The results have shown that by using only a very small amount of the Sn(n-OBu)2 initiator so
that the amount of residual tin in the copolymer, as confirmed by ICP-OES analysis, was within the limit
described in ASTM F1925-09, a high molecular weight copolymer with good physical properties suitable for
use in biomedical applications could be obtained. These results will be discussed in detail.
Keywords: Poly(L-lactide-co-Ɛ-caprolactone); medical grade; tin(II) n-butoxide; residual tin; biomedical
applications.
1. Introduction
The healthcare industry continues to evolve and
requires technological advances to meet today’s
healthcare providers in the field of biomedical devices
and to reduce the total cost of care for the end-patients.
During the past few decades significant advances
have been made in the development of biodegradable
materials for biomedical applications. A wide variety of
new synthetic polymers and biodegradable polymers
have been evaluated. The most common biodegradable
polymers such as polylactide (PL), polyglycolide (PG),
poly(Ɛ-caprolactone) (PCL) and their copolymers have
been widely used in drug delivery and tissue engineering
applications.
Interest in copolymers of L-lactide (LL) and Ɛ-
caprolactone (CL) has increased as their potential in a
wide range of biomedical have been adopted. The
biocompatible and biodegradation copolymers of LL and
CL are focused in this intensive study with regard to
organ and tissue regenerations. CL appears to be a
suitable comonomer for the preparation of a diversified
family of copolymers with mechanical properties ranging
from gummy and elastomeric to rigid solids. The
properties of poly(L-lactide-co-Ɛ-caprolactone) (PLLCL)
differ widely depending on the ratio of LL and CL. The
main advantages of PLLCL copolymer include relatively
fast degradation compared with both of its
homopolymers, and its well known highly elastic
properties [1-5]. PLLCL can be synthesized by ring-
opening polymerization (ROP). Tin(II) 2-ethylhexanoate
(Sn(Oct)2) is an initiator generally used for the ROP of
lactide and other cyclic ester monomers since it is a
highly efficient initiator allowing the complete
conversion of monomers to polymers [6-7]. However,
the usual amount of Sn(Oct)2 for ROP to get the desired
molecular weight is commonly over 150 ppm [8], which
is not acceptable by the ASTM Standard F1925-09 [9].
From literature reviews, Tin(II) n-butoxide (Sn(n-OBu)2)
also shows high efficiency for ROP to obtain high
molecular weight of polyester. Interestingly, the effective
amount of Sn(n-OBu)2 can be reduced to obtain the
residue tin lower than 150 ppm but it still gives high
efficiency in ROP [10-11]. To make the amount of
initiator acceptable by ASTM standard F1925-09, there
are two ways. The first is to reduce the amount of
initiator from the synthesis and control other factor to
obtain a high molecular weight copolymer. The second
method is to use an organic solvent for dissolution
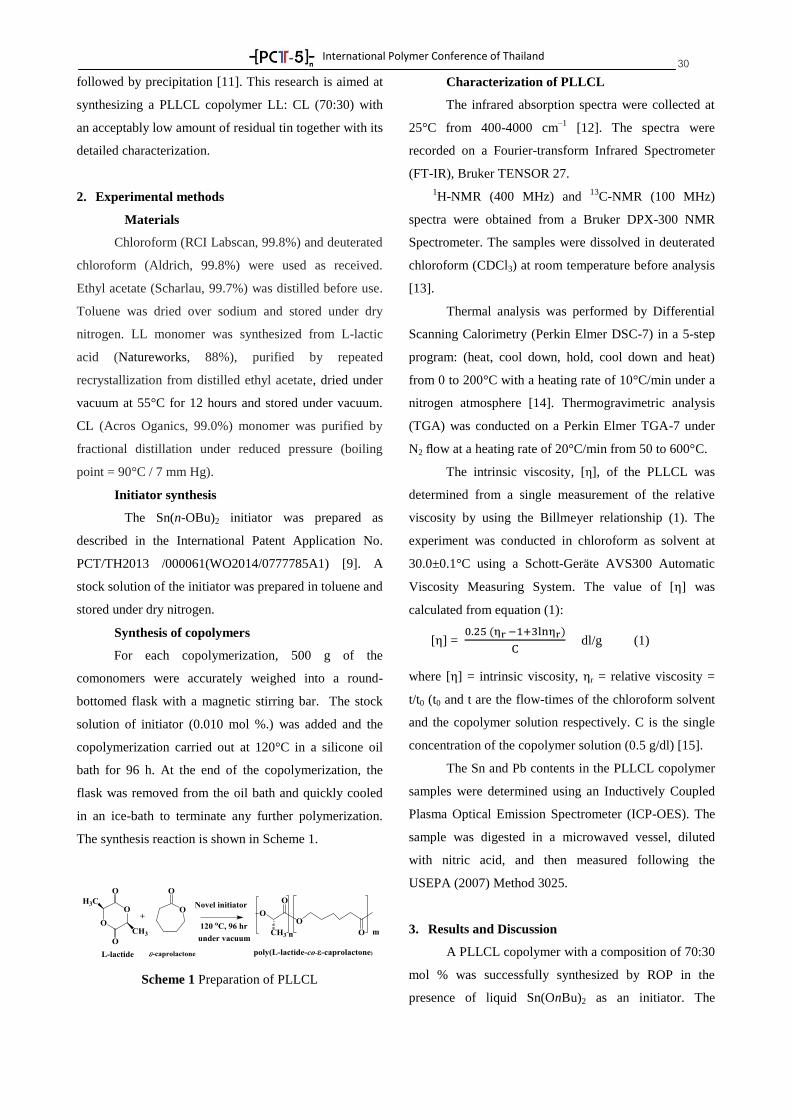
International Polymer Conference of Thailand
30 followed by precipitation [11]. This research is aimed at
synthesizing a PLLCL copolymer LL: CL (70:30) with
an acceptably low amount of residual tin together with its
detailed characterization.
2. Experimental methods
Materials
Chloroform (RCI Labscan, 99.8%) and deuterated
chloroform (Aldrich, 99.8%) were used as received.
Ethyl acetate (Scharlau, 99.7%) was distilled before use.
Toluene was dried over sodium and stored under dry
nitrogen. LL monomer was synthesized from L-lactic
acid (Natureworks, 88%), purified by repeated
recrystallization from distilled ethyl acetate, dried under
vacuum at 55°C for 12 hours and stored under vacuum.
CL (Acros Oganics, 99.0%) monomer was purified by
fractional distillation under reduced pressure (boiling
point = 90°C / 7 mm Hg).
Initiator synthesis
The Sn(n-OBu)2 initiator was prepared as
described in the International Patent Application No.
PCT/TH2013 /000061(WO2014/0777785A1) [9]. A
stock solution of the initiator was prepared in toluene and
stored under dry nitrogen.
Synthesis of copolymers
For each copolymerization, 500 g of the
comonomers were accurately weighed into a round-
bottomed flask with a magnetic stirring bar. The stock
solution of initiator (0.010 mol %.) was added and the
copolymerization carried out at 120°C in a silicone oil
bath for 96 h. At the end of the copolymerization, the
flask was removed from the oil bath and quickly cooled
in an ice-bath to terminate any further polymerization.
The synthesis reaction is shown in Scheme 1.
Scheme 1 Preparation of PLLCL
Characterization of PLLCL
The infrared absorption spectra were collected at
25°C from 400-4000 cm–1
[12]. The spectra were
recorded on a Fourier-transform Infrared Spectrometer
(FT-IR), Bruker TENSOR 27.
1H-NMR (400 MHz) and
13C-NMR (100 MHz)
spectra were obtained from a Bruker DPX-300 NMR
Spectrometer. The samples were dissolved in deuterated
chloroform (CDCl3) at room temperature before analysis
[13].
Thermal analysis was performed by Differential
Scanning Calorimetry (Perkin Elmer DSC-7) in a 5-step
program: (heat, cool down, hold, cool down and heat)
from 0 to 200°C with a heating rate of 10°C/min under a
nitrogen atmosphere [14]. Thermogravimetric analysis
(TGA) was conducted on a Perkin Elmer TGA-7 under
N2 flow at a heating rate of 20°C/min from 50 to 600°C.
The intrinsic viscosity, [η], of the PLLCL was
determined from a single measurement of the relative
viscosity by using the Billmeyer relationship (1). The
experiment was conducted in chloroform as solvent at
30.0±0.1°C using a Schott-Geräte AVS300 Automatic
Viscosity Measuring System. The value of [ ] was
calculated from equation (1):
[ ] =
dl/g (1)
where [ ] = intrinsic viscosity, r = relative viscosity =
t/t0 (t0 and t are the flow-times of the chloroform solvent
and the copolymer solution respectively. C is the single
concentration of the copolymer solution (0.5 g/dl) [15].
The Sn and Pb contents in the PLLCL copolymer
samples were determined using an Inductively Coupled
Plasma Optical Emission Spectrometer (ICP-OES). The
sample was digested in a microwaved vessel, diluted
with nitric acid, and then measured following the
USEPA (2007) Method 3025.
3. Results and Discussion
A PLLCL copolymer with a composition of 70:30
mol % was successfully synthesized by ROP in the
presence of liquid Sn(OnBu)2 as an initiator. The
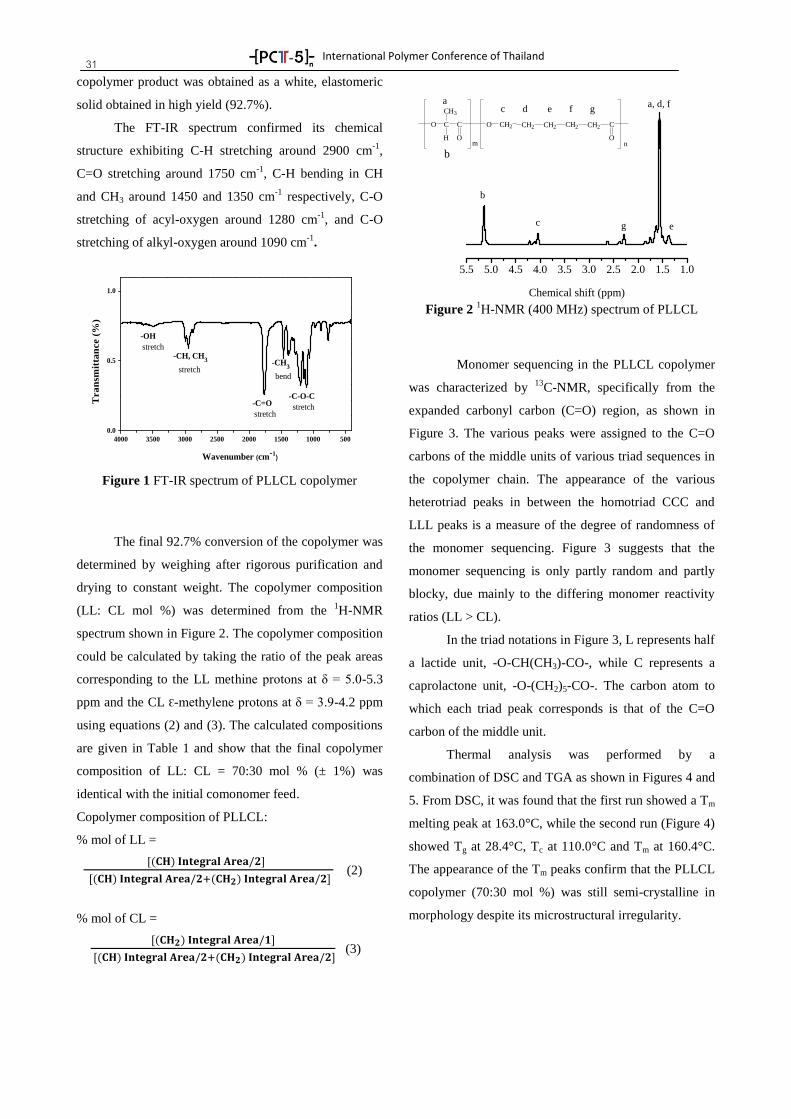
International Polymer Conference of Thailand
31 copolymer product was obtained as a white, elastomeric
solid obtained in high yield (92.7%).
The FT-IR spectrum confirmed its chemical
structure exhibiting C-H stretching around 2900 cm-1
,
C=O stretching around 1750 cm-1
, C-H bending in CH
and CH3 around 1450 and 1350 cm-1
respectively, C-O
stretching of acyl-oxygen around 1280 cm-1
, and C-O
stretching of alkyl-oxygen around 1090 cm-1
.
5001000150020002500300035004000
0.0
0.5
1.0
-CH3
bend
-C-O-C
stretch-C=O
stretch
-CH, CH3
stretch
-OH
stretch
Wavenumber (cm-1)
Tra
nsm
itta
nce (
%)
Figure 1 FT-IR spectrum of PLLCL copolymer
The final 92.7% conversion of the copolymer was
determined by weighing after rigorous purification and
drying to constant weight. The copolymer composition
(LL: CL mol %) was determined from the 1H-NMR
spectrum shown in Figure 2. The copolymer composition
could be calculated by taking the ratio of the peak areas
corresponding to the LL methine protons at δ = 5.0-5.3
ppm and the CL Ɛ-methylene protons at δ = 3.9-4.2 ppm
using equations (2) and (3). The calculated compositions
are given in Table 1 and show that the final copolymer
composition of LL: CL = 70:30 mol % (± 1%) was
identical with the initial comonomer feed.
Copolymer composition of PLLCL:
% mol of LL =
(2)
% mol of CL =
(3)
1.01.52.02.53.03.54.04.55.05.5
a
b
c d e f g
egc
b
a, d, f
O C C
CH3
H O
O CH2 CH2 CH2 CH2 CH2 C
Onm
Chemical shift (ppm)
Figure 2 1H-NMR (400 MHz) spectrum of PLLCL
Monomer sequencing in the PLLCL copolymer
was characterized by 13
C-NMR, specifically from the
expanded carbonyl carbon (C=O) region, as shown in
Figure 3. The various peaks were assigned to the C=O
carbons of the middle units of various triad sequences in
the copolymer chain. The appearance of the various
heterotriad peaks in between the homotriad CCC and
LLL peaks is a measure of the degree of randomness of
the monomer sequencing. Figure 3 suggests that the
monomer sequencing is only partly random and partly
blocky, due mainly to the differing monomer reactivity
ratios (LL > CL).
In the triad notations in Figure 3, L represents half
a lactide unit, -O-CH(CH3)-CO-, while C represents a
caprolactone unit, -O-(CH2)5-CO-. The carbon atom to
which each triad peak corresponds is that of the C=O
carbon of the middle unit.
Thermal analysis was performed by a
combination of DSC and TGA as shown in Figures 4 and
5. From DSC, it was found that the first run showed a Tm
melting peak at 163.0°C, while the second run (Figure 4)
showed Tg at 28.4°C, Tc at 110.0°C and Tm at 160.4°C.
The appearance of the Tm peaks confirm that the PLLCL
copolymer (70:30 mol %) was still semi-crystalline in
morphology despite its microstructural irregularity.
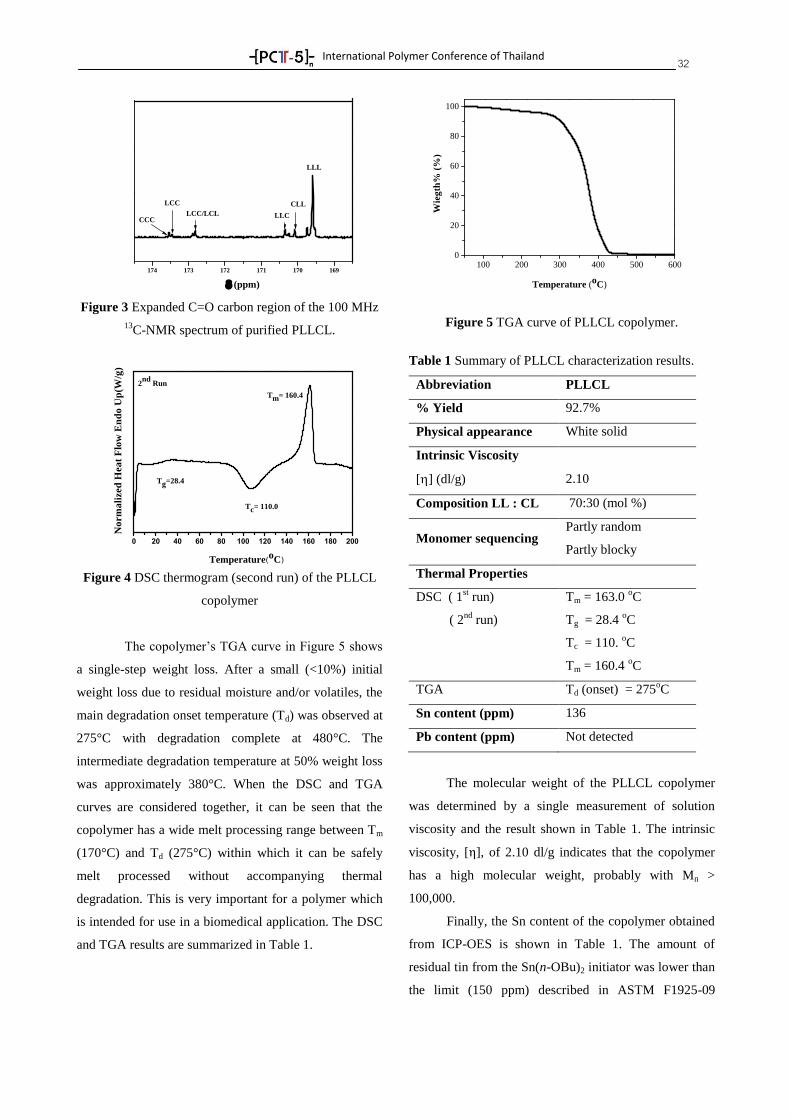
International Polymer Conference of Thailand
32
169170171172173174
(ppm)
LLL
CLL
LLCLCC/LCL
LCC
CCC
Figure 3 Expanded C=O carbon region of the 100 MHz
13C-NMR spectrum of purified PLLCL.
0 20 40 60 80 100 120 140 160 180 200
Tm= 160.4
Tc= 110.0
Tg=28.4
2nd
Run
N
orm
ali
zed
Hea
t F
low
En
do
Up
(W/g
)
Temperature(oC)
Figure 4 DSC thermogram (second run) of the PLLCL
copolymer
The copolymer’s TGA curve in Figure 5 shows
a single-step weight loss. After a small (<10%) initial
weight loss due to residual moisture and/or volatiles, the
main degradation onset temperature (Td) was observed at
275°C with degradation complete at 480°C. The
intermediate degradation temperature at 50% weight loss
was approximately 380°C. When the DSC and TGA
curves are considered together, it can be seen that the
copolymer has a wide melt processing range between Tm
(170°C) and Td (275°C) within which it can be safely
melt processed without accompanying thermal
degradation. This is very important for a polymer which
is intended for use in a biomedical application. The DSC
and TGA results are summarized in Table 1.
100 200 300 400 500 6000
20
40
60
80
100
Wie
gth
% (
%)
Temperature (oC)
Figure 5 TGA curve of PLLCL copolymer.
Table 1 Summary of PLLCL characterization results.
Abbreviation PLLCL
% Yield 92.7%
Physical appearance White solid
Intrinsic Viscosity
[] (dl/g)
2.10
Composition LL : CL 70:30 (mol %)
Monomer sequencing Partly random
Partly blocky
Thermal Properties
DSC ( 1st run)
( 2nd
run)
Tm = 163.0 oC
Tg = 28.4 oC
Tc = 110. oC
Tm = 160.4 oC
TGA Td (onset) = 275oC
Sn content (ppm) 136
Pb content (ppm) Not detected
The molecular weight of the PLLCL copolymer
was determined by a single measurement of solution
viscosity and the result shown in Table 1. The intrinsic
viscosity, [ ], of 2.10 dl/g indicates that the copolymer
has a high molecular weight, probably with Mn >
100,000.
Finally, the Sn content of the copolymer obtained
from ICP-OES is shown in Table 1. The amount of
residual tin from the Sn(n-OBu)2 initiator was lower than
the limit (150 ppm) described in ASTM F1925-09
International Polymer Conference of Thailand
33 specifications for a medical grade material. There was no
lead (Pb) content.
4. Conclusions
In this paper, the successful synthesis of a PLLCL
70: 30 mol % copolymer with a low amount of residual
tin has been described. The results have shown that the
ring-opening polymerization (ROP) of LL and CL
initiated by tin(II) n-butoxide (Sn(n-OBu)2) can be scaled
up to the 500 g scale of the comonomers with high %
conversion and molecular weight. The residual tin
content of 136 ppm, which is lower than the limit of 150
ppm set by the ASTM F1925-09 standard specifications,
shows that this synthesis and purification procedure is
suitable for the preparation of medical grade PLLCL for
use in biomedical applications.
5. Acknowledgments
This research was supported by the National
Research Council of Thailand (NRCT), National
Innovation Agency (NIA), Public Company Limited
(PTT), Chiang Mai University (CMU) and the Graduate
School, Chiang Mai University.
6. References
[1] Sodergard A, Stolt M. Properties of lactic acid based
polymers and their correlation with composition.
Prog Polym Sci 2002; 27: 1123-63.
[2] Bendix D. Chemical synthesis of polylactide and its
copolymers for medical applications. Polym Degrad
Stab 1998; 59: 129-35.
[3] Fernandez J, Etxeberria A, Sarasua JR. Effects of
repeat unit sequence distribution and residual
catalyst on thermal degradation of poly(L-lactide/Ɛ-
caprolactone) statistical copolymers. Polym Degrad
Stab 2013; 98: 1293-9.
[4] Woodruff MA, Hutmacher DW. The return of a
forgotten polymer-polycaprolactone in the 21st
century. Prog Polym Sci 2010; 35: 1217-56.
[5] Arbaoui A, Redshaw C. Metal catalysts for Ɛ-
caprolactone polymerisation. Polym Chem 2010; 1:
801-26.
[6] Sobczak M, Kolodziejski W. Polymerization of
cyclic esters initiated by carnitine and tin(II) octoate.
Molecules 2009; 14: 621-32.
[7] Nalampang K, Molloy R, Punyodom W. Synthesis
and characterization of poly(L-lactide-co-Ɛ-
caprolactone) copolymers: influence of sequential
monomer addition on chain microstructure. Polym
Adv Technol 2007; 18: 240-8.
[8] Thapsukhon B, Daranarong D, Meepowpan P, Suree
N, Molloy R, Inthanon K, Wongkham W,
Bunyodom W. Effect of topology of poly(L-
lactideco-ε-caprolactone)scaffolds onthe response
of cultured human
umbilical cord Wharton’s jellyderivedmesenchymal stem
cells andneuroblastoma cell lines. J Biomater Sci,
Polym Ed 2014; 25:1028-44.
[9] American Society for testing and Materials
(ASTM). 2009. Standard Specification for Semi-
Crystalline Poly(lactide) Polymer and Copolymer
Resins for Surgical Implants: F1925-09.
[10] Meepowpan, P.; Punydom, W.; Molloy, R.
International Patent Application No.
PCT/TH2013/000061 (WO 2014/0777785 A1)
2014.
[11] Dumklang M, Pattawong N, Punyodom W,
Meepowpan P, Molloy R, Hoffman M. Novel tin(II)
butoxides for use as initiators in the ring-opening
polymerisation of Ɛ-caprolactone. Chiang Mai J Sci
2009; 36: 136-48.
[12] Stjerndahl A, Wistrand AW, Albertsson AC.
Industrial utilization of tin-initiated resorbable
polymers: synthesis on a large scale with a low
amount of initiator residue. Biomacromolecles 2007;
8: 937-40.
[13] American Society for testing and Materials (ASTM).
2013. Standard Practice for General Techniques for
Obtaining Infrared Spectra for Qualitative
Analysis1: E1252-98.
[14] American Society for testing and Materials (ASTM).
2011. Standard Practice for Data Presentation
Relating to High-Resolution Nuclear Magnetic
Resonance (NMR) Spectroscopy1: E386-90.

International Polymer Conference of Thailand
34 [15] American Society for testing and Materials (ASTM).
2012. Standard Test Method for Transition
Temperatures and Enthalpies of Fusion and
Crystallization of Polymers by Differential Scanning
Calorimetry1: D3418 − 12
Ɛ1.
[16] American Society for testing and Materials (ASTM).
2011. Standard Test Method for Determining
Inherent Viscosity of Poly(Ethylene Terephthalate)
(PET) by Glass Capillary Viscometer1: D4603-03.
International Polymer Conference of Thailand
35
BIOENP-06
Synthesis and Characterization of Polylactide-Poly(ethylene glycol)-Polylactide ABA-
Triblock Copolymers for Use in Medical Applications
Tichakorn Thornsri1,2
, Puttinan Meepowpan1,2
, Winita Punyodom1,2
and Kanarat Nalampang1,2*
1Department of Chemistry, Faculty of Science, Chiang Mai University, Chiang Mai 50200
2Materials Science Research Center, Faculty of Science, Chiang Mai University, Chiang Mai 50200
Abstract
Polylactide-poly(ethylene glycol)-polylactide (PLLA-PEG-PLLA) triblock copolymers, one of
biodegradable polymers, have been widely used in medical applications due to their biodegradability,
biocompatibility and tailor-made properties. In this work, PLLA-PEG-PLLA triblock copolymers were
synthesized by bulk ring-opening polymerization (ROP) of L-lactide and PEG at 120˚C for 24 hours using
stannous octoate (Sn(Oct)2) as a catalyst. The chemical structure and composition of obtained triblock
copolymers were characterized by various techniques such as Fourier transform infrared spectroscopy (FTIR)
and proton nuclear magnetic resonance spectroscopy (1H-NMR). Effect of molecular weight of PEG ( =
2000, 4000, 6000 and 8000) and effect of ratio between ethylene oxide (EO) and lactate (LA) (2:1 and 3:1) on
microstructure of copolymers were investigated. Moreover, thermal properties of copolymers were examined
by differential scanning calorimetry (DSC) technique. The results have shown that the copolymers were semi-
crystalline materials. Tm and ∆Hm were observed on dependence of block lengths of either PLLA or PEG in
copolymers.
Keywords: Biodegradable polymers; polylactide-poly(ethylene glycol)-polylactide; triblock copolymer
1. Introduction
Biodegradable polymers have been widely used in
medical applications. The advantages of biodegradable
polymers are not requiring surgical removal after they
serve their purposes. Poly(lactide) (PLA) and their
copolymers PLA are the most commonly used
biodegradable polymers. In general, the biodegradable
polyesters are strongly hydrophobic and this has caused
some limitations in certain applications. Hydrophilic,
poly(ethylene glycol) (PEG) is one of the most widely
employed, has been incorporated into the biodegradable
polyesters to modify the hydrophilicity. The advantages
of PEG are water-soluble polymer, non-toxic, non ionic,
biocompatible characteristic, and can be easily
eliminated from the body. Therefore, block copolymers
consisting of a hydrophobic polyester segment and a
hydrophilic PEG segment have been attracted large
attention due to their biodegradability, biocompatibility
and tailor-made properties [1-3].
Various types of block copolymer consisting of a
hydrophobic polyester segment and a hydrophilic PEG
segment have been developed such as AB diblock, ABA,
BAB- triblock, multi-block,
branched block, star-shaped
block, and graft block copolymers, A is a hydrophobic
block as biodegradable polyesters and B is a hydrophilic
PEG [4-11].
In this work, we focus on PLLA-PEG-PLLA
triblock copolymer. The obtained block copolymers were
synthesized by bulk ring-opening polymerization of L-
lactide and PEG using Sn(Oct)2 as a catalyst and
characterized by FTIR and 1H-NMR techniques. Effect
of molecular weight of PEG ( = 2000, 4000, 6000 and
8000) and various molar ratio of EO:LA (2:1 and 3:1)
were investigated. Moreover, thermal properties of
copolymer were examined by DSC technique. These
triblock copolymers will provide further benefits for use
as medical applications.
2. Experimental
2.1 Materials: Ethyl acetate (Scharlau) and
dichloromethane (J.T.Baker) was distilled before use.
PEG2000 (Aldrich), PEG4000 and PEG6000 (Ajax
Finechem), PEG8000 (Acros) and diethyl ether (ACI
Labscan) were used as received. Stannous octoate
(Aldrich) was distilled under reduced pressure to remove
octanoic acid before use. L-lactide was synthesized from
L-lactic acid (Aldrich) using Sn(Oct)2 as a catalyst [12].
The monomer was purified few times by recrystallization
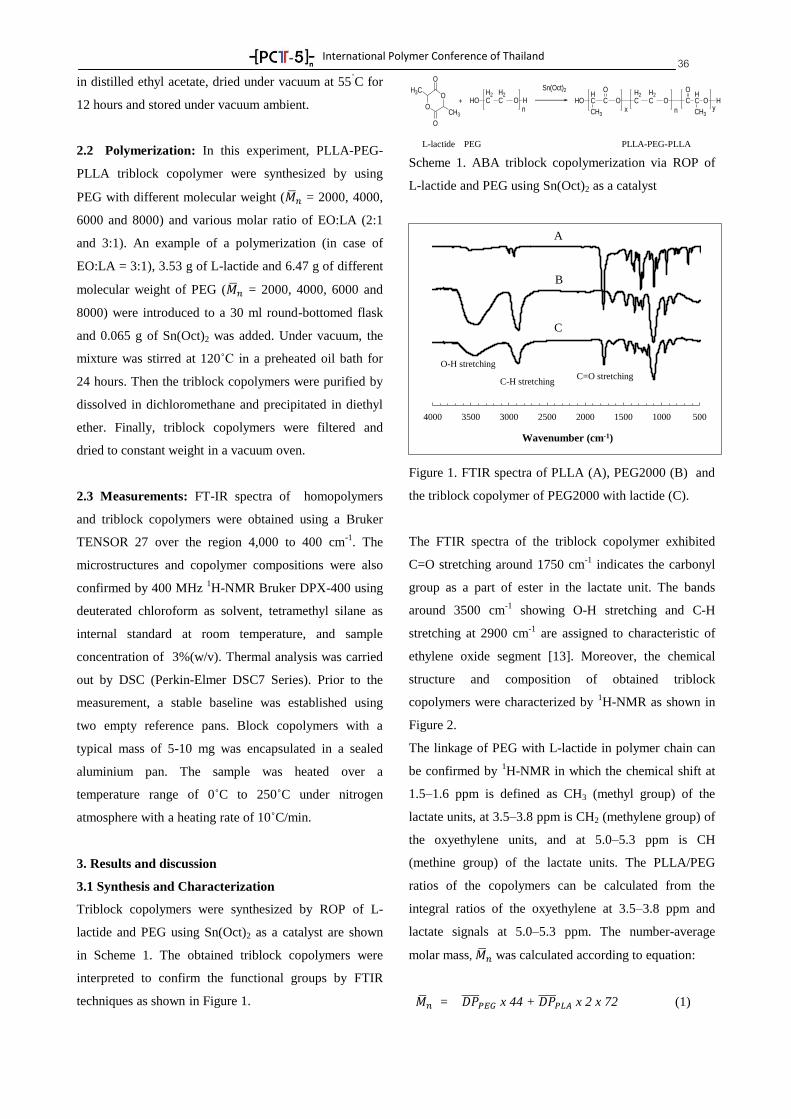
International Polymer Conference of Thailand
36 in distilled ethyl acetate, dried under vacuum at 55
˚C for
12 hours and stored under vacuum ambient.
2.2 Polymerization: In this experiment, PLLA-PEG-
PLLA triblock copolymer were synthesized by using
PEG with different molecular weight ( = 2000, 4000,
6000 and 8000) and various molar ratio of EO:LA (2:1
and 3:1). An example of a polymerization (in case of
EO:LA = 3:1), 3.53 g of L-lactide and 6.47 g of different
molecular weight of PEG ( = 2000, 4000, 6000 and
8000) were introduced to a 30 ml round-bottomed flask
and 0.065 g of Sn(Oct)2 was added. Under vacuum, the
mixture was stirred at 120˚C in a preheated oil bath for
24 hours. Then the triblock copolymers were purified by
dissolved in dichloromethane and precipitated in diethyl
ether. Finally, triblock copolymers were filtered and
dried to constant weight in a vacuum oven.
2.3 Measurements: FT-IR spectra of homopolymers
and triblock copolymers were obtained using a Bruker
TENSOR 27 over the region 4,000 to 400 cm-1
. The
microstructures and copolymer compositions were also
confirmed by 400 MHz 1H-NMR Bruker DPX-400 using
deuterated chloroform as solvent, tetramethyl silane as
internal standard at room temperature, and sample
concentration of 3%(w/v). Thermal analysis was carried
out by DSC (Perkin-Elmer DSC7 Series). Prior to the
measurement, a stable baseline was established using
two empty reference pans. Block copolymers with a
typical mass of 5-10 mg was encapsulated in a sealed
aluminium pan. The sample was heated over a
temperature range of 0˚C to 250˚C under nitrogen
atmosphere with a heating rate of 10˚C/min.
3. Results and discussion
3.1 Synthesis and Characterization
Triblock copolymers were synthesized by ROP of L-
lactide and PEG using Sn(Oct)2 as a catalyst are shown
in Scheme 1. The obtained triblock copolymers were
interpreted to confirm the functional groups by FTIR
techniques as shown in Figure 1.
O
O
O
O
H3C
CH3
+ HOH2C
H2C O H
n
Sn(Oct)2
HOHC C O
H2C
CH3
O H2C O C
x n
OHC
CH3
O Hy
L-lactide PEG PLLA-PEG-PLLA
Scheme 1. ABA triblock copolymerization via ROP of
L-lactide and PEG using Sn(Oct)2 as a catalyst
Figure 1. FTIR spectra of PLLA (A), PEG2000 (B) and
the triblock copolymer of PEG2000 with lactide (C).
The FTIR spectra of the triblock copolymer exhibited
C=O stretching around 1750 cm-1
indicates the carbonyl
group as a part of ester in the lactate unit. The bands
around 3500 cm-1
showing O-H stretching and C-H
stretching at 2900 cm-1
are assigned to characteristic of
ethylene oxide segment [13]. Moreover, the chemical
structure and composition of obtained triblock
copolymers were characterized by 1H-NMR as shown in
Figure 2. The linkage of PEG with L-lactide in polymer chain can
be confirmed by 1H-NMR in which the chemical shift at
1.5–1.6 ppm is defined as CH3 (methyl group) of the
lactate units, at 3.5–3.8 ppm is CH2 (methylene group) of
the oxyethylene units, and at 5.0–5.3 ppm is CH
(methine group) of the lactate units. The PLLA/PEG
ratios of the copolymers can be calculated from the
integral ratios of the oxyethylene at 3.5–3.8 ppm and
lactate signals at 5.0–5.3 ppm. The number-average
molar mass, was calculated according to equation:
= x 44 + x 2 x 72 (1)
500 1000 1500 2000 2500 3000 3500 4000
Wavenumber (cm-1)
C=O stretching C-H stretching
O-H stretching
A
B
C
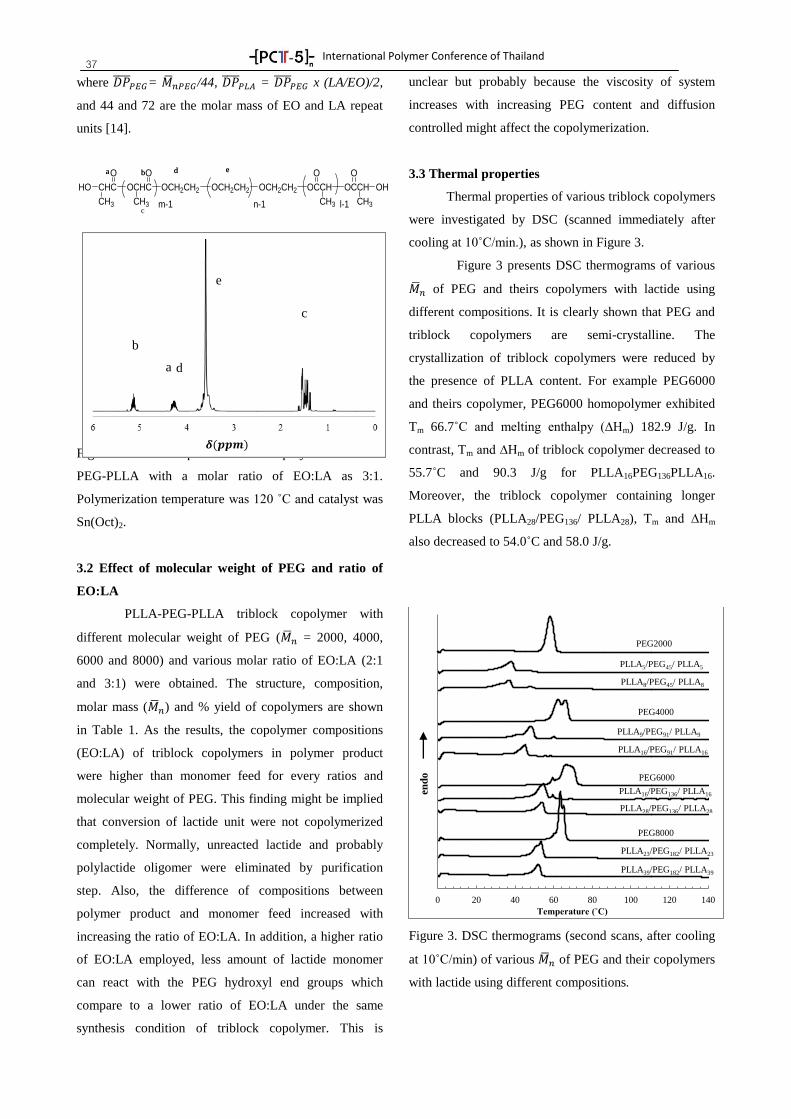
International Polymer Conference of Thailand
37 where = /44, = x (LA/EO)/2,
and 44 and 72 are the molar mass of EO and LA repeat
units [14].
HO CHC
O
CH3
OCHC
CH3
O
OCH2CH2 OCH2CH2 OCH2CH2 OCCH
O
CH3
OCCH
O
CH3
OH
m-1 n-1 l-1
Figure 2. 1H-NMR spectrum of the copolymer of PLLA-
PEG-PLLA with a molar ratio of EO:LA as 3:1.
Polymerization temperature was 120 ˚C and catalyst was
Sn(Oct)2.
3.2 Effect of molecular weight of PEG and ratio of
EO:LA
PLLA-PEG-PLLA triblock copolymer with
different molecular weight of PEG ( = 2000, 4000,
6000 and 8000) and various molar ratio of EO:LA (2:1
and 3:1) were obtained. The structure, composition,
molar mass ( ) and % yield of copolymers are shown
in Table 1. As the results, the copolymer compositions
(EO:LA) of triblock copolymers in polymer product
were higher than monomer feed for every ratios and
molecular weight of PEG. This finding might be implied
that conversion of lactide unit were not copolymerized
completely. Normally, unreacted lactide and probably
polylactide oligomer were eliminated by purification
step. Also, the difference of compositions between
polymer product and monomer feed increased with
increasing the ratio of EO:LA. In addition, a higher ratio
of EO:LA employed, less amount of lactide monomer
can react with the PEG hydroxyl end groups which
compare to a lower ratio of EO:LA under the same
synthesis condition of triblock copolymer. This is
unclear but probably because the viscosity of system
increases with increasing PEG content and diffusion
controlled might affect the copolymerization.
3.3 Thermal properties
Thermal properties of various triblock copolymers
were investigated by DSC (scanned immediately after
cooling at 10˚C/min.), as shown in Figure 3.
Figure 3 presents DSC thermograms of various
of PEG and theirs copolymers with lactide using
different compositions. It is clearly shown that PEG and
triblock copolymers are semi-crystalline. The
crystallization of triblock copolymers were reduced by
the presence of PLLA content. For example PEG6000
and theirs copolymer, PEG6000 homopolymer exhibited
Tm 66.7˚C and melting enthalpy (∆Hm) 182.9 J/g. In
contrast, Tm and ∆Hm of triblock copolymer decreased to
55.7˚C and 90.3 J/g for PLLA16PEG136PLLA16.
Moreover, the triblock copolymer containing longer
PLLA blocks (PLLA28/PEG136/ PLLA28), Tm and ∆Hm
also decreased to 54.0˚C and 58.0 J/g.
Figure 3. DSC thermograms (second scans, after cooling
at 10˚C/min) of various of PEG and their copolymers
with lactide using different compositions.
-2
3
8
13
18
23
28
33
38
43
0 20 40 60 80 100 120 140
en
do
Temperature (˚C)
PEG2000
PLLA5/PEG45/ PLLA5
PLLA8/PEG45/ PLLA8
PEG4000
PLLA9/PEG91/ PLLA9
PLLA16/PEG91/ PLLA16
PEG6000
PLLA16/PEG136/ PLLA16
PLLA28/PEG136/ PLLA28
PEG8000
PLLA23/PEG182/ PLLA23
PLLA39/PEG182/ PLLA39
a b d e
𝜹
e
b
a d
c
a b d e
c
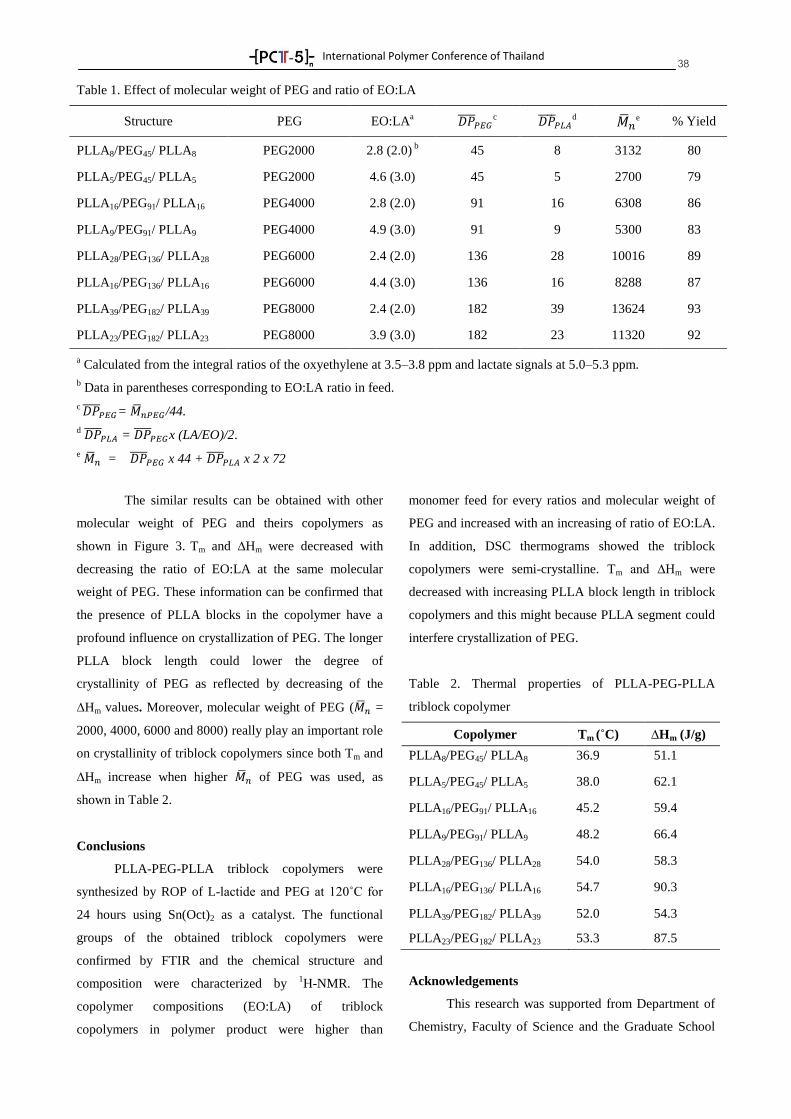
International Polymer Conference of Thailand
38
The similar results can be obtained with other
molecular weight of PEG and theirs copolymers as
shown in Figure 3. Tm and ∆Hm were decreased with
decreasing the ratio of EO:LA at the same molecular
weight of PEG. These information can be confirmed that
the presence of PLLA blocks in the copolymer have a
profound influence on crystallization of PEG. The longer
PLLA block length could lower the degree of
crystallinity of PEG as reflected by decreasing of the
∆Hm values. Moreover, molecular weight of PEG ( =
2000, 4000, 6000 and 8000) really play an important role
on crystallinity of triblock copolymers since both Tm and
∆Hm increase when higher of PEG was used, as
shown in Table 2.
Conclusions
PLLA-PEG-PLLA triblock copolymers were
synthesized by ROP of L-lactide and PEG at 120˚C for
24 hours using Sn(Oct)2 as a catalyst. The functional
groups of the obtained triblock copolymers were
confirmed by FTIR and the chemical structure and
composition were characterized by 1H-NMR. The
copolymer compositions (EO:LA) of triblock
copolymers in polymer product were higher than
monomer feed for every ratios and molecular weight of
PEG and increased with an increasing of ratio of EO:LA.
In addition, DSC thermograms showed the triblock
copolymers were semi-crystalline. Tm and ∆Hm were
decreased with increasing PLLA block length in triblock
copolymers and this might because PLLA segment could
interfere crystallization of PEG.
Table 2. Thermal properties of PLLA-PEG-PLLA
triblock copolymer
Copolymer Tm (˚C) ∆Hm (J/g)
PLLA8/PEG45/ PLLA8 36.9 51.1
PLLA5/PEG45/ PLLA5 38.0 62.1
PLLA16/PEG91/ PLLA16 45.2 59.4
PLLA9/PEG91/ PLLA9 48.2 66.4
PLLA28/PEG136/ PLLA28 54.0 58.3
PLLA16/PEG136/ PLLA16 54.7 90.3
PLLA39/PEG182/ PLLA39 52.0 54.3
PLLA23/PEG182/ PLLA23 53.3 87.5
Acknowledgements
This research was supported from Department of
Chemistry, Faculty of Science and the Graduate School
Table 1. Effect of molecular weight of PEG and ratio of EO:LA
Structure PEG EO:LAa
c
d
e % Yield
PLLA8/PEG45/ PLLA8 PEG2000 2.8 (2.0) b 45 8 3132 80
PLLA5/PEG45/ PLLA5 PEG2000 4.6 (3.0) 45 5 2700 79
PLLA16/PEG91/ PLLA16 PEG4000 2.8 (2.0) 91 16 6308 86
PLLA9/PEG91/ PLLA9 PEG4000 4.9 (3.0) 91 9 5300 83
PLLA28/PEG136/ PLLA28 PEG6000 2.4 (2.0) 136 28 10016 89
PLLA16/PEG136/ PLLA16 PEG6000 4.4 (3.0) 136 16 8288 87
PLLA39/PEG182/ PLLA39 PEG8000 2.4 (2.0) 182 39 13624 93
PLLA23/PEG182/ PLLA23 PEG8000 3.9 (3.0) 182 23 11320 92
a Calculated from the integral ratios of the oxyethylene at 3.5–3.8 ppm and lactate signals at 5.0–5.3 ppm.
b Data in parentheses corresponding to EO:LA ratio in feed.
c = /44.
d = x (LA/EO)/2.
e = x 44 + x 2 x 72
International Polymer Conference of Thailand
39 of Chiang Mai University (CMU). National Research
Universities (NRU) Project under Thailand’s office of
the Higher Education Commission are also acknowledge.
References
[1] L. Chen, Z. Xie, J. Hu, X. Chen and X. Jing, Journal
of Nanoparticle Research, 9, 777–785 (2007).
[2] R. H. Kricheldorf and I. Kreiser, Macromolecular
Chemistry, 188, 1861- 1873 (1987).
[3] Ph. Dubois, C. Jacobs, R. JBrSme and Ph. TByssie,
Macromolecules, 24, 2266-2270 (1991).
[4] A. Beletsi, L. Leontiadis, P. Klepetssanis, D. S.
Ithakission and K. Avgoustakis, International
Journal of Pharmaceutics, 182, 187-197 (1999).
[5] T. Kissel, Y. Li and F. Unger, Advanced Drug
Delivery Reviews, 54, 99-134 (2002).
[6] B. Jeong, Y. H. Bae and S. W. Kim, Journal of
Controlled Release, 63, 155-163 (2000).
[7] K.M. Huh and Y. H. Bae, Polymer, 40, 6147-6155
(1999).
[8] Y. H. Bae, K. M. Huh, Y. Kim, K. H. Park, Journal
of Controlled Release, 64, 3-13 (2000).
[9] J. S. Hrkach, M.T. Peracchia, A. Domb, N. Lotan
and L. Robert, Biomaterials, 18, 27-30 (1997).
[10] A. Breitenbach, Y. X. Li and T. Kissel, Journal of
Controlled Release, 64, 167-178 (2000).
[11] C. W. Lee, T. I. Manoshiro, Y. I. Hsu and Y.
Kimura, Macromolecular Chemistry and Physics,
213, 2174-2180 (2012).
[12] D.K. Yoo and D. Kim, Macromolecular Research,
14, 510-516 (2006).
[13] Y. J. Du, P. J. LemstraJ and A. J. Nijenhuis,
Macromolecules, 28, 2124-2132 (1995).
[14] S. Li and M. Vert, Macromolecules, 36, 8008-8014
(2003).
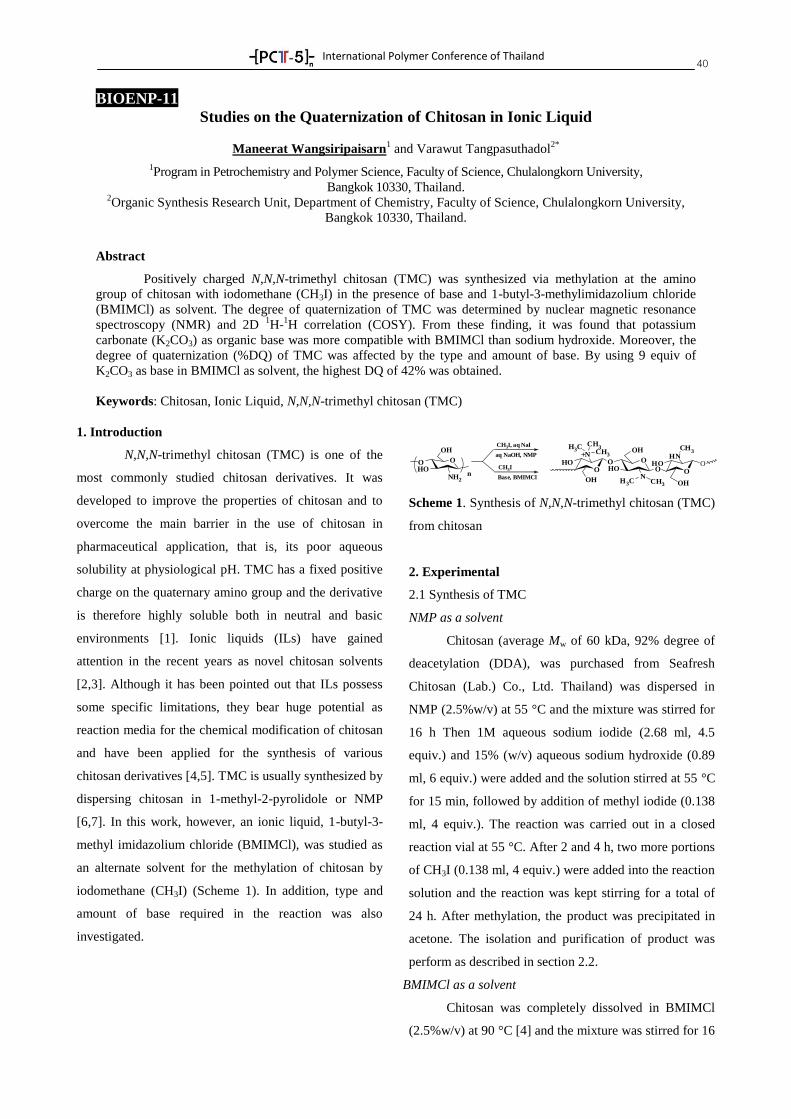
International Polymer Conference of Thailand
40
BIOENP-11
Studies on the Quaternization of Chitosan in Ionic Liquid
Maneerat Wangsiripaisarn1 and Varawut Tangpasuthadol
2*
1Program in Petrochemistry and Polymer Science, Faculty of Science, Chulalongkorn University,
Bangkok 10330, Thailand. 2Organic Synthesis Research Unit, Department of Chemistry, Faculty of Science, Chulalongkorn University,
Bangkok 10330, Thailand.
Abstract
Positively charged N,N,N-trimethyl chitosan (TMC) was synthesized via methylation at the amino
group of chitosan with iodomethane (CH3I) in the presence of base and 1-butyl-3-methylimidazolium chloride
(BMIMCl) as solvent. The degree of quaternization of TMC was determined by nuclear magnetic resonance
spectroscopy (NMR) and 2D 1H-
1H correlation (COSY). From these finding, it was found that potassium
carbonate (K2CO3) as organic base was more compatible with BMIMCl than sodium hydroxide. Moreover, the
degree of quaternization (%DQ) of TMC was affected by the type and amount of base. By using 9 equiv of
K2CO3 as base in BMIMCl as solvent, the highest DQ of 42% was obtained.
Keywords: Chitosan, Ionic Liquid, N,N,N-trimethyl chitosan (TMC)
1. Introduction
N,N,N-trimethyl chitosan (TMC) is one of the
most commonly studied chitosan derivatives. It was
developed to improve the properties of chitosan and to
overcome the main barrier in the use of chitosan in
pharmaceutical application, that is, its poor aqueous
solubility at physiological pH. TMC has a fixed positive
charge on the quaternary amino group and the derivative
is therefore highly soluble both in neutral and basic
environments [1]. Ionic liquids (ILs) have gained
attention in the recent years as novel chitosan solvents
[2,3]. Although it has been pointed out that ILs possess
some specific limitations, they bear huge potential as
reaction media for the chemical modification of chitosan
and have been applied for the synthesis of various
chitosan derivatives [4,5]. TMC is usually synthesized by
dispersing chitosan in 1-methyl-2-pyrolidole or NMP
[6,7]. In this work, however, an ionic liquid, 1-butyl-3-
methyl imidazolium chloride (BMIMCl), was studied as
an alternate solvent for the methylation of chitosan by
iodomethane (CH3I) (Scheme 1). In addition, type and
amount of base required in the reaction was also
investigated.
Scheme 1. Synthesis of N,N,N-trimethyl chitosan (TMC)
from chitosan
2. Experimental
2.1 Synthesis of TMC
NMP as a solvent
Chitosan (average Mw of 60 kDa, 92% degree of
deacetylation (DDA), was purchased from Seafresh
Chitosan (Lab.) Co., Ltd. Thailand) was dispersed in
NMP (2.5%w/v) at 55 °C and the mixture was stirred for
16 h Then 1M aqueous sodium iodide (2.68 ml, 4.5
equiv.) and 15% (w/v) aqueous sodium hydroxide (0.89
ml, 6 equiv.) were added and the solution stirred at 55 °C
for 15 min, followed by addition of methyl iodide (0.138
ml, 4 equiv.). The reaction was carried out in a closed
reaction vial at 55 °C. After 2 and 4 h, two more portions
of CH3I (0.138 ml, 4 equiv.) were added into the reaction
solution and the reaction was kept stirring for a total of
24 h. After methylation, the product was precipitated in
acetone. The isolation and purification of product was
perform as described in section 2.2.
BMIMCl as a solvent
Chitosan was completely dissolved in BMIMCl
(2.5%w/v) at 90 °C [4] and the mixture was stirred for 16
OOHO
OH
NH2n
CH3I, aq NaI
aq NaOH, NMP
CH3I
Base, BMIMCl
O
O
O
ON
N
HN
O
CH3
CH3
H3C
HO
OH CH3H3C
CH3
HO
OH
OH
HO O
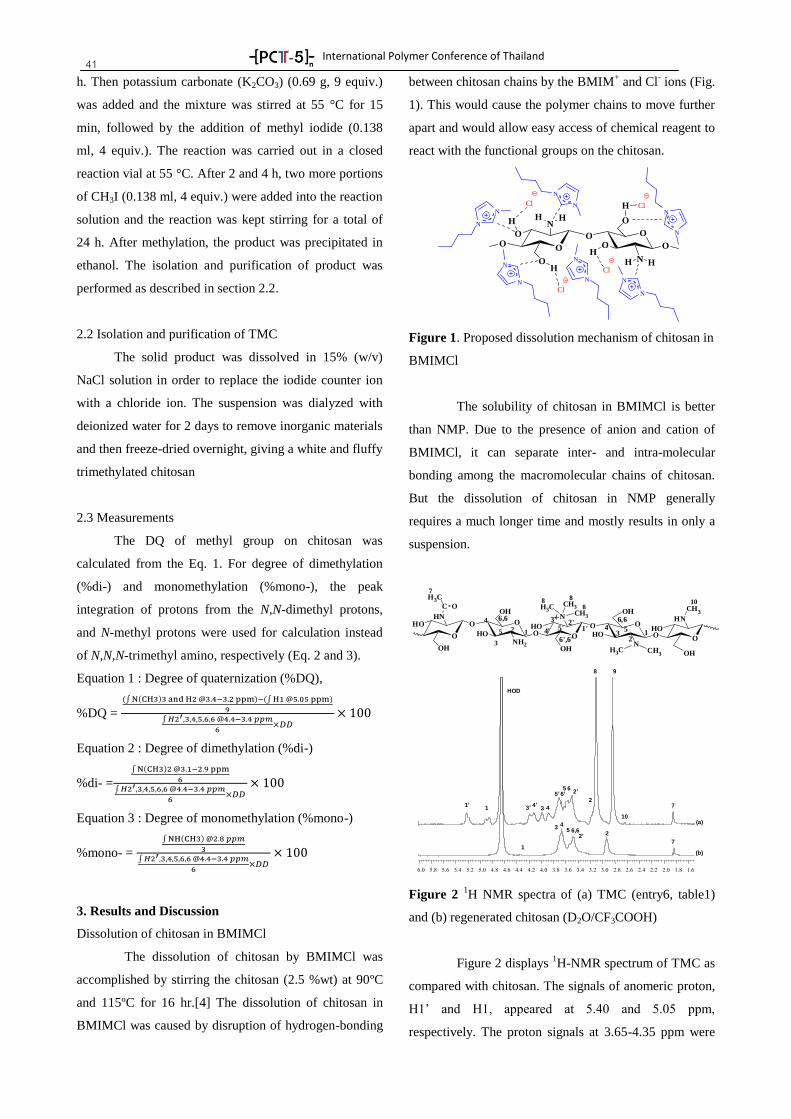
International Polymer Conference of Thailand
41 h. Then potassium carbonate (K2CO3) (0.69 g, 9 equiv.)
was added and the mixture was stirred at 55 °C for 15
min, followed by the addition of methyl iodide (0.138
ml, 4 equiv.). The reaction was carried out in a closed
reaction vial at 55 °C. After 2 and 4 h, two more portions
of CH3I (0.138 ml, 4 equiv.) were added into the reaction
solution and the reaction was kept stirring for a total of
24 h. After methylation, the product was precipitated in
ethanol. The isolation and purification of product was
performed as described in section 2.2.
2.2 Isolation and purification of TMC
The solid product was dissolved in 15% (w/v)
NaCl solution in order to replace the iodide counter ion
with a chloride ion. The suspension was dialyzed with
deionized water for 2 days to remove inorganic materials
and then freeze-dried overnight, giving a white and fluffy
trimethylated chitosan
2.3 Measurements
The DQ of methyl group on chitosan was
calculated from the Eq. 1. For degree of dimethylation
(%di-) and monomethylation (%mono-), the peak
integration of protons from the N,N-dimethyl protons,
and N-methyl protons were used for calculation instead
of N,N,N-trimethyl amino, respectively (Eq. 2 and 3).
Equation 1 : Degree of quaternization (%DQ),
%DQ =
Equation 2 : Degree of dimethylation (%di-)
%di- =
Equation 3 : Degree of monomethylation (%mono-)
%mono- =
3. Results and Discussion
Dissolution of chitosan in BMIMCl
The dissolution of chitosan by BMIMCl was
accomplished by stirring the chitosan (2.5 %wt) at 90ºC
and 115ºC for 16 hr.[4] The dissolution of chitosan in
BMIMCl was caused by disruption of hydrogen-bonding
between chitosan chains by the BMIM+ and Cl
- ions (Fig.
1). This would cause the polymer chains to move further
apart and would allow easy access of chemical reagent to
react with the functional groups on the chitosan.
Figure 1. Proposed dissolution mechanism of chitosan in
BMIMCl
The solubility of chitosan in BMIMCl is better
than NMP. Due to the presence of anion and cation of
BMIMCl, it can separate inter- and intra-molecular
bonding among the macromolecular chains of chitosan.
But the dissolution of chitosan in NMP generally
requires a much longer time and mostly results in only a
suspension.
Figure 2 1H NMR spectra of (a) TMC (entry6, table1)
and (b) regenerated chitosan (D2O/CF3COOH)
Figure 2 displays 1H-NMR spectrum of TMC as
compared with chitosan. The signals of anomeric proton,
H1’ and H1, appeared at 5.40 and 5.05 ppm,
respectively. The proton signals at 3.65-4.35 ppm were
O
O
OO
O
ON
N HH
OO
H
N
N
HHH
H
H
N
N
Cl
Cl Cl
Cl
N
N
N
NN
N
O
N
N
O
O
OH
OH
HO
HONH2
HN
C O
H3C
O12
3
4
5
7
O O
O
O
O
6',6'
6,66,6 N
N
HN
O
CH3
CH3
H3C
HO
OH CH3
H3C
CH3
HO
OH
OH
HO
2
3'4
2'
34' 5' 5
8 8
810
11'
HOD
1
2
5 6
3 44’1’
5’ 6’
3
3’
2’
2
8 9
10
7
4 (a)
5 6,62’
7
(b)1
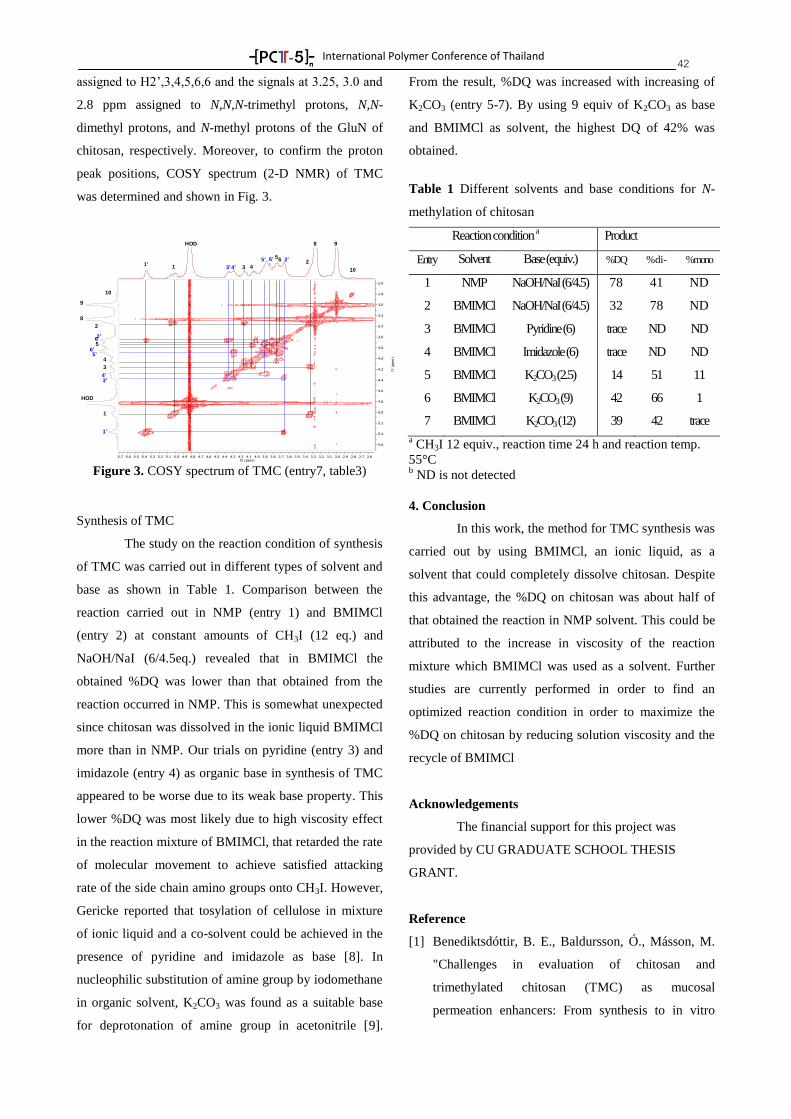
International Polymer Conference of Thailand
42 assigned to H2’,3,4,5,6,6 and the signals at 3.25, 3.0 and
2.8 ppm assigned to N,N,N-trimethyl protons, N,N-
dimethyl protons, and N-methyl protons of the GluN of
chitosan, respectively. Moreover, to confirm the proton
peak positions, COSY spectrum (2-D NMR) of TMC
was determined and shown in Fig. 3.
Figure 3. COSY spectrum of TMC (entry7, table3)
Synthesis of TMC
The study on the reaction condition of synthesis
of TMC was carried out in different types of solvent and
base as shown in Table 1. Comparison between the
reaction carried out in NMP (entry 1) and BMIMCl
(entry 2) at constant amounts of CH3I (12 eq.) and
NaOH/NaI (6/4.5eq.) revealed that in BMIMCl the
obtained %DQ was lower than that obtained from the
reaction occurred in NMP. This is somewhat unexpected
since chitosan was dissolved in the ionic liquid BMIMCl
more than in NMP. Our trials on pyridine (entry 3) and
imidazole (entry 4) as organic base in synthesis of TMC
appeared to be worse due to its weak base property. This
lower %DQ was most likely due to high viscosity effect
in the reaction mixture of BMIMCl, that retarded the rate
of molecular movement to achieve satisfied attacking
rate of the side chain amino groups onto CH3I. However,
Gericke reported that tosylation of cellulose in mixture
of ionic liquid and a co-solvent could be achieved in the
presence of pyridine and imidazole as base [8]. In
nucleophilic substitution of amine group by iodomethane
in organic solvent, K2CO3 was found as a suitable base
for deprotonation of amine group in acetonitrile [9].
From the result, %DQ was increased with increasing of
K2CO3 (entry 5-7). By using 9 equiv of K2CO3 as base
and BMIMCl as solvent, the highest DQ of 42% was
obtained.
Table 1 Different solvents and base conditions for N-
methylation of chitosan
Reaction condition a Product
Entry Solvent Base (equiv.) %DQ %di- %mono
1 NMP NaOH/NaI (6/4.5) 78 41 ND
2 BMIMCl NaOH/NaI (6/4.5) 32 78 ND
3 BMIMCl Pyridine (6) trace ND ND
4 BMIMCl Imidazole (6) trace ND ND
5 BMIMCl K2CO3 (2.5) 14 51 11
6 BMIMCl K2CO3 (9) 42 66 1
7 BMIMCl K2CO3 (12) 39 42 trace
a CH3I 12 equiv., reaction time 24 h and reaction temp.
55°C b ND is not detected
4. Conclusion
In this work, the method for TMC synthesis was
carried out by using BMIMCl, an ionic liquid, as a
solvent that could completely dissolve chitosan. Despite
this advantage, the %DQ on chitosan was about half of
that obtained the reaction in NMP solvent. This could be
attributed to the increase in viscosity of the reaction
mixture which BMIMCl was used as a solvent. Further
studies are currently performed in order to find an
optimized reaction condition in order to maximize the
%DQ on chitosan by reducing solution viscosity and the
recycle of BMIMCl
Acknowledgements
The financial support for this project was
provided by CU GRADUATE SCHOOL THESIS
GRANT.
Reference
[1] Benediktsdóttir, B. E., Baldursson, Ó., Másson, M.
"Challenges in evaluation of chitosan and
trimethylated chitosan (TMC) as mucosal
permeation enhancers: From synthesis to in vitro
12
3 4
5
6
1’2’
3’4’
5’ 6’
1’
2’
3’4’
5’6’
1
3
4
2
5
6
8
8
9
9
10
10
HOD
HOD
International Polymer Conference of Thailand
43 application", Journal of Controlled Release, 173,
18-31 (2014).
[2] Liu, L., Zhou, S., Wang, B., Xu, F., Sun, R.
"Homogeneous acetylation of chitosan in ionic
liquids", Journal of Applied Polymer Science, 129,
28-35 (2013).
[3] Wang, Z., Zheng, L., Li, C., Zhang, D., Xiao, Y.,
Guan, G., Zhu, W. "Modification of chitosan with
monomethyl fumaric acid in an ionic liquid
solution", Carbohydrate Polymers, 117, 973-979
(2015).
[4] Hua, D., Jiang, J., Kuang, L., Jiang, J., Zheng, W.,
Liang, H. "Smart Chitosan-Based Stimuli-
Responsive Nanocarriers for the Controlled Delivery
of Hydrophobic Pharmaceuticals", Macromolecules,
44, 1298-1302 (2011).
[5] Peng, P., Cao, X., Peng, F., Bian, J., Xu, F., Sun, R.
"Binding cellulose and chitosan via click chemistry:
Synthesis, characterization, and formation of some
hollow tubes", Journal of Polymer Science Part A:
Polymer Chemistry, 50, 5201-5210 (2012).
[6] Verheul, R. J., Amidi, M., van der Wal, S., van Riet,
E., Jiskoot, W., Hennink, W. E. "Synthesis,
characterization and in vitro biological properties of
O-methyl free N,N,N-trimethylated chitosan",
Biomaterials, 29, 3642-3649 (2008).
[7] Benediktsdóttir, B. E., Gaware, V. S., Rúnarsson, Ö.
V., Jónsdóttir, S., Jensen, K. J., Másson, M.
"Synthesis of N,N,N-trimethyl chitosan
homopolymer and highly substituted N-alkyl-N,N-
dimethyl chitosan derivatives with the aid of di-tert-
butyldimethylsilyl chitosan", Carbohydrate
Polymers, 86, 1451-1460 (2011).
[8] Gericke, M., Schaller, J., Liebert, T., Fardim, P.,
Meister, F., Heinze, T. "Studies on the tosylation of
cellulose in mixtures of ionic liquids and a co-
solvent", Carbohydrate Polymers, 89, 526-536
(2012).
[9] Vedejs, E., Kongkittingam, C. "Solution-Phase
Synthesis of a Hindered N-Methylated Tetrapeptide
Using Bts-Protected Amino Acid Chlorides:
Efficient Coupling and Methylation Steps Allow
Purification by Extraction", The Journal of Organic
Chemistry, 65, 2309-2318 (2000).
International Polymer Conference of Thailand
44 BIOENP-12
Synthesis and characterization of hyper-branched poly(L-lactide) by using polyglycidol
Nichakorn Pathumrangsan1, Atitsa Petchsuk
2 and Pakorn Opaprakasit
1*
1 School of Bio-Chemical Engineering and Technology, Sirindhorn International Institute of Technology (SIIT),
Thammasat University, Pathum Thani, 12121, Thailand 2 National Metals and Materials Technology Center (MTEC), Pathum Thani, 12120, Thailand
Abstract
Hyper-branched poly(L-lactide) (hbPLLA)s with various arm lengths are synthesized by ring-opening
polymerization of L-lactide (LLA) using polyglycidol (PG) as a macro-initiator. hbPLLAs are blended with linear
PLLA (l-PLLA) by varying the LLA branch content. Thermal and rheological properties, and optical transparency of
hbPLLAs and their blends with l-PLLA are investigated. All l-PLLA/hbPLLAs blends show slightly changes in of Tg
values, whereas the Tm is significantly unchanged. A single Tg is observed in all blends, indicating a completely
miscible system. All blends exhibit an increase in crystallinity, as the branch structure act as nucleating agent for
crystallization of l-PLLA. Viscosity of the blends decreases with the addition of l-PLLA. This provides easy processing
conditions. The blends also show high optical transparency, comparable to neat l-PLLA. Given these properties and
their biocompatibility, the blends can be used in biomedical applications.
Keywords: Polylactide, Branch structure, Rheology, Blend, Polyglycidol
1. Introduction
Nowadays, polylactide (PLA) has received much
attention, due to serious environmental problems on
plastic wastes. PLA is one of well-known degradable
polymers, which provides many good properties, such as
high mechanical strength, transparency, and
biocompatibility [1-3]. PLAs are widely used in many
applications, especially in biomedical field [4-6].
However, PLA-based materials possess certain
disadvantages which limit their use in some applications,
e.g., brittleness, and difficulty in controlling degradation
rates. Many approaches have been performed to
overcome these drawbacks, such as stereocomplexation,
introduction of branch-structured PLA, and blending
with other polymers. Among these, introducing of branch
structures into PLA matrix is a promising method to
solve these problems. Polymers with branch architectures
typically have lower glass transition temperature (Tg) and
melt viscosity than their linear counterparts of similar
molecular weight. Moreover, branch length is an
important parameter that affects the viscoelasticity of
fluidity range and crystallinity [7]. The use of various
hydrophilic cores have been reported in preparation of
branched PLA copolymers, such as, poly(ethylene glycol)
(PEG), poly(ethylene oxide) (PEO)[8-10], poly(amido amine)
(PAMAM) [11], and polyglycidol (PG) [7, 12-13]
In this study, hyper-branched PLLA (hbPLLA) is
developed for intended use in biomedical applications.
PG is chosen as a hydrophilic core because of its multi-
functionality, which can be used as a macro-initiator for
polymerization of PLA, and its biocompatibility [12].
Ring-opening polymerization in bulk is employed. The
resulting hbPLLAs is blended with linear PLLA (l-
PLLA) to optimize its physical and rheological
properties.
2. Experimental
2.1 Materials
L-Lactide (LLA) and tin octoate (Sn(Oct)2) were
purchased from Wako (Japan). Linear PLLA (l-PLLA)
( = 178 000 g/mol) was supplied by PURAC
(Netherland). PG macro-initiator was synthesized
according to a methodology reported earlier[14]. Ethyl
acetate, chloroform, ethanol and toluene solvents were
purchased from Lab Scan (Thailand).
2.2 Synthesis of hbPLLAs
The synthesis of hbPLLAs was performed by a
ring-opening polymerization in bulk, using Sn(Oct)2
catalyst and PG macro-initiator. Essentially, PG was
dried in a reactor under vacuum at 70oC for 1 h. After
drying, Sn(Oct)2 (1 %wt of macro-initiator) was added,
and the mixture was heated to 80oC for 1 h. After that,
LLA was added and reaction was further kept at 130oC
for 24 h. The feed ratios of LLA to PG were varied at
10/1, 20/1, 50/1, and 100/1. Finally, the reaction mixture
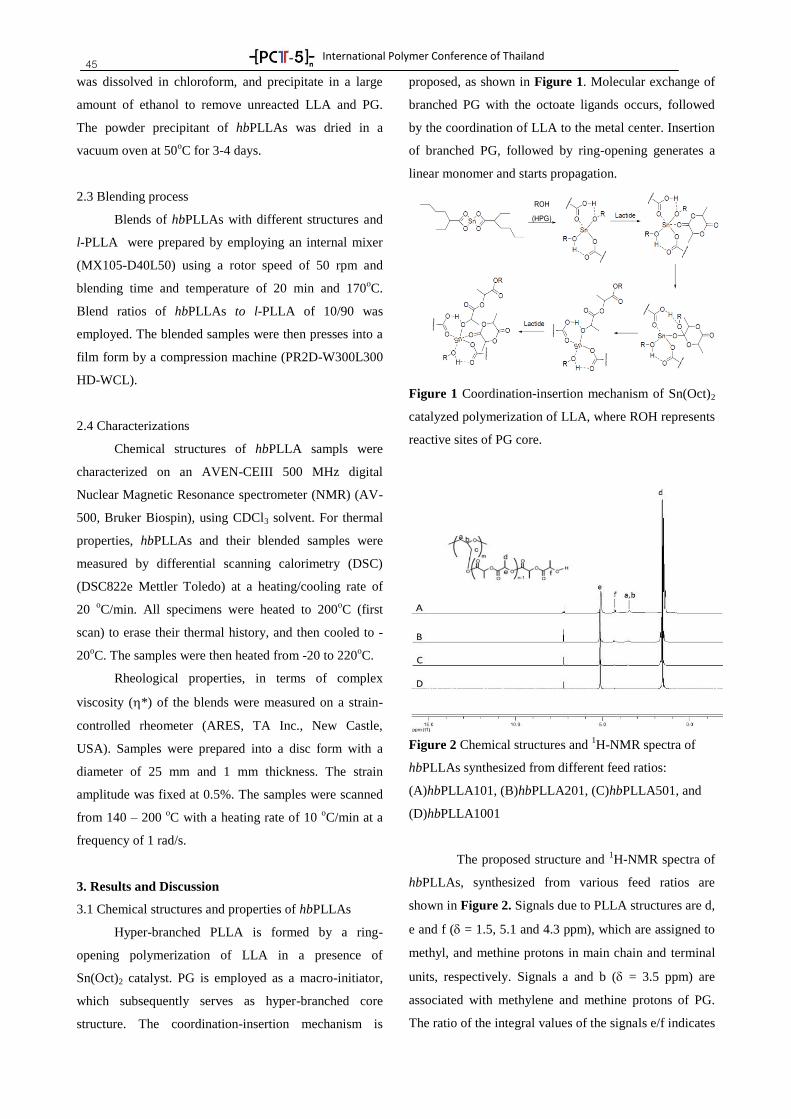
International Polymer Conference of Thailand
45 was dissolved in chloroform, and precipitate in a large
amount of ethanol to remove unreacted LLA and PG.
The powder precipitant of hbPLLAs was dried in a
vacuum oven at 50oC for 3-4 days.
2.3 Blending process
Blends of hbPLLAs with different structures and
l-PLLA were prepared by employing an internal mixer
(MX105-D40L50) using a rotor speed of 50 rpm and
blending time and temperature of 20 min and 170oC.
Blend ratios of hbPLLAs to l-PLLA of 10/90 was
employed. The blended samples were then presses into a
film form by a compression machine (PR2D-W300L300
HD-WCL).
2.4 Characterizations
Chemical structures of hbPLLA sampls were
characterized on an AVEN-CEIII 500 MHz digital
Nuclear Magnetic Resonance spectrometer (NMR) (AV-
500, Bruker Biospin), using CDCl3 solvent. For thermal
properties, hbPLLAs and their blended samples were
measured by differential scanning calorimetry (DSC)
(DSC822e Mettler Toledo) at a heating/cooling rate of
20 oC/min. All specimens were heated to 200
oC (first
scan) to erase their thermal history, and then cooled to -
20oC. The samples were then heated from -20 to 220
oC.
Rheological properties, in terms of complex
viscosity (*) of the blends were measured on a strain-
controlled rheometer (ARES, TA Inc., New Castle,
USA). Samples were prepared into a disc form with a
diameter of 25 mm and 1 mm thickness. The strain
amplitude was fixed at 0.5%. The samples were scanned
from 140 – 200 oC with a heating rate of 10
oC/min at a
frequency of 1 rad/s.
3. Results and Discussion
3.1 Chemical structures and properties of hbPLLAs
Hyper-branched PLLA is formed by a ring-
opening polymerization of LLA in a presence of
Sn(Oct)2 catalyst. PG is employed as a macro-initiator,
which subsequently serves as hyper-branched core
structure. The coordination-insertion mechanism is
proposed, as shown in Figure 1. Molecular exchange of
branched PG with the octoate ligands occurs, followed
by the coordination of LLA to the metal center. Insertion
of branched PG, followed by ring-opening generates a
linear monomer and starts propagation.
Figure 1 Coordination-insertion mechanism of Sn(Oct)2
catalyzed polymerization of LLA, where ROH represents
reactive sites of PG core.
Figure 2 Chemical structures and 1H-NMR spectra of
hbPLLAs synthesized from different feed ratios:
(A)hbPLLA101, (B)hbPLLA201, (C)hbPLLA501, and
(D)hbPLLA1001
The proposed structure and 1H-NMR spectra of
hbPLLAs, synthesized from various feed ratios are
shown in Figure 2. Signals due to PLLA structures are d,
e and f ( = 1.5, 5.1 and 4.3 ppm), which are assigned to
methyl, and methine protons in main chain and terminal
units, respectively. Signals a and b ( = 3.5 ppm) are
associated with methylene and methine protons of PG.
The ratio of the integral values of the signals e/f indicates
ROH (HPG)
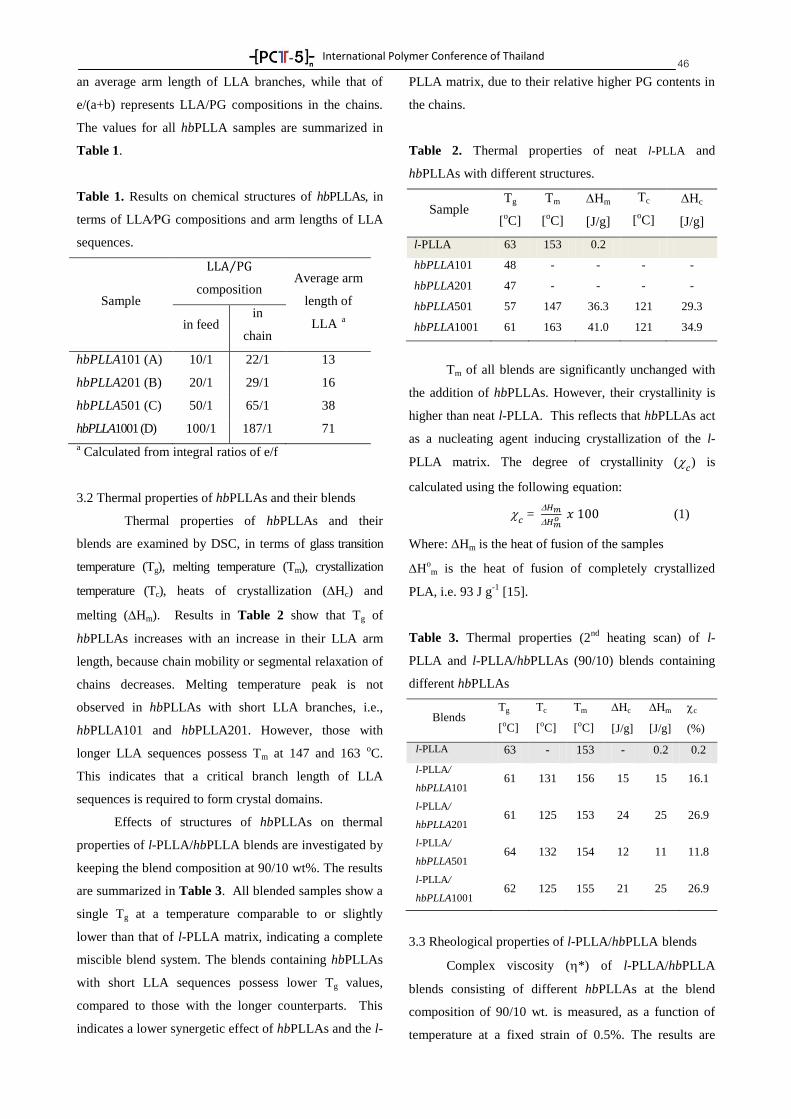
International Polymer Conference of Thailand
46 an average arm length of LLA branches, while that of
e/(a+b) represents LLA/PG compositions in the chains.
The values for all hbPLLA samples are summarized in
Table 1.
Table 1. Results on chemical structures of hbPLLAs, in
terms of LLA⁄PG compositions and arm lengths of LLA
sequences.
Sample
composition Average arm
length of
LLA a
in feed in
chain
hbPLLA101 (A) 10/1 22/1 13
hbPLLA201 (B) 20/1 29/1 16
hbPLLA501 (C) 50/1 65/1 38
hbPLLA1001 (D) 100/1 187/1 71
a Calculated from integral ratios of e/f
3.2 Thermal properties of hbPLLAs and their blends
Thermal properties of hbPLLAs and their
blends are examined by DSC, in terms of glass transition
temperature (Tg), melting temperature (Tm), crystallization
temperature (Tc), heats of crystallization (Hc) and
melting (Hm). Results in Table 2 show that Tg of
hbPLLAs increases with an increase in their LLA arm
length, because chain mobility or segmental relaxation of
chains decreases. Melting temperature peak is not
observed in hbPLLAs with short LLA branches, i.e.,
hbPLLA101 and hbPLLA201. However, those with
longer LLA sequences possess Tm at 147 and 163 oC.
This indicates that a critical branch length of LLA
sequences is required to form crystal domains.
Effects of structures of hbPLLAs on thermal
properties of l-PLLA/hbPLLA blends are investigated by
keeping the blend composition at 90/10 wt%. The results
are summarized in Table 3. All blended samples show a
single Tg at a temperature comparable to or slightly
lower than that of l-PLLA matrix, indicating a complete
miscible blend system. The blends containing hbPLLAs
with short LLA sequences possess lower Tg values,
compared to those with the longer counterparts. This
indicates a lower synergetic effect of hbPLLAs and the l-
PLLA matrix, due to their relative higher PG contents in
the chains.
Table 2. Thermal properties of neat l-PLLA and
hbPLLAs with different structures.
Sample Tg
[oC]
Tm
[oC]
Hm
[J/g]
Tc
[oC]
Hc
[J/g]
l-PLLA 63 153 0.2
hbPLLA101 48 - - - -
hbPLLA201 47 - - - -
hbPLLA501 57 147 36.3 121 29.3
hbPLLA1001 61 163 41.0 121 34.9
Tm of all blends are significantly unchanged with
the addition of hbPLLAs. However, their crystallinity is
higher than neat l-PLLA. This reflects that hbPLLAs act
as a nucleating agent inducing crystallization of the l-
PLLA matrix. The degree of crystallinity ( ) is
calculated using the following equation:
=
(1)
Where: Hm is the heat of fusion of the samples
Ho
m is the heat of fusion of completely crystallized
PLA, i.e. 93 J g-1
[15].
Table 3. Thermal properties (2nd
heating scan) of l-
PLLA and l-PLLA/hbPLLAs (90/10) blends containing
different hbPLLAs
Blends Tg
[oC]
Tc
[oC]
Tm
[oC]
Hc
[J/g]
Hm
[J/g]
c
(%)
l-PLLA 63 - 153 - 0.2 0.2
l-PLLA/
hbPLLA101 61 131 156 15 15 16.1
l-PLLA/
hbPLLA201 61 125 153 24 25 26.9
l-PLLA/
hbPLLA501 64 132 154 12 11 11.8
l-PLLA/
hbPLLA1001 62 125 155 21 25 26.9
3.3 Rheological properties of l-PLLA/hbPLLA blends
Complex viscosity (*) of l-PLLA/hbPLLA
blends consisting of different hbPLLAs at the blend
composition of 90/10 wt. is measured, as a function of
temperature at a fixed strain of 0.5%. The results are
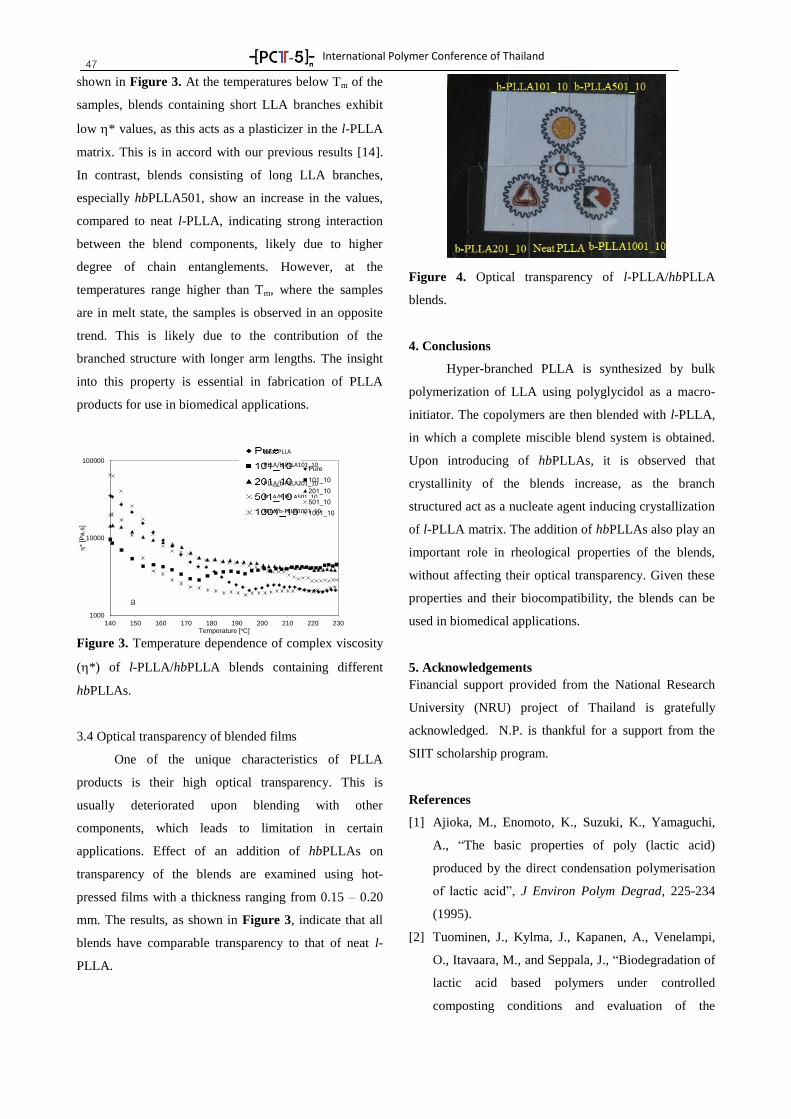
International Polymer Conference of Thailand
47 shown in Figure 3. At the temperatures below Tm of the
samples, blends containing short LLA branches exhibit
low * values, as this acts as a plasticizer in the l-PLLA
matrix. This is in accord with our previous results [14].
In contrast, blends consisting of long LLA branches,
especially hbPLLA501, show an increase in the values,
compared to neat l-PLLA, indicating strong interaction
between the blend components, likely due to higher
degree of chain entanglements. However, at the
temperatures range higher than Tm, where the samples
are in melt state, the samples is observed in an opposite
trend. This is likely due to the contribution of the
branched structure with longer arm lengths. The insight
into this property is essential in fabrication of PLLA
products for use in biomedical applications.
Figure 3. Temperature dependence of complex viscosity
(*) of l-PLLA/hbPLLA blends containing different
hbPLLAs.
3.4 Optical transparency of blended films
One of the unique characteristics of PLLA
products is their high optical transparency. This is
usually deteriorated upon blending with other
components, which leads to limitation in certain
applications. Effect of an addition of hbPLLAs on
transparency of the blends are examined using hot-
pressed films with a thickness ranging from 0.15 – 0.20
mm. The results, as shown in Figure 3, indicate that all
blends have comparable transparency to that of neat l-
PLLA.
Figure 4. Optical transparency of l-PLLA/hbPLLA
blends.
4. Conclusions
Hyper-branched PLLA is synthesized by bulk
polymerization of LLA using polyglycidol as a macro-
initiator. The copolymers are then blended with l-PLLA,
in which a complete miscible blend system is obtained.
Upon introducing of hbPLLAs, it is observed that
crystallinity of the blends increase, as the branch
structured act as a nucleate agent inducing crystallization
of l-PLLA matrix. The addition of hbPLLAs also play an
important role in rheological properties of the blends,
without affecting their optical transparency. Given these
properties and their biocompatibility, the blends can be
used in biomedical applications.
5. Acknowledgements
Financial support provided from the National Research
University (NRU) project of Thailand is gratefully
acknowledged. N.P. is thankful for a support from the
SIIT scholarship program.
References
[1] Ajioka, M., Enomoto, K., Suzuki, K., Yamaguchi,
A., “The basic properties of poly (lactic acid)
produced by the direct condensation polymerisation
of lactic acid”, J Environ Polym Degrad, 225-234
(1995).
[2] Tuominen, J., Kylma, J., Kapanen, A., Venelampi,
O., Itavaara, M., and Seppala, J., “Biodegradation of
lactic acid based polymers under controlled
composting conditions and evaluation of the
1000
10000
100000
140 150 160 170 180 190 200 210 220 230
*
[Pa.s
]
Temperature [oC]
Pure
Neat PLLA
PLLA/b-PLLA101_10
PLLA/b-PLLA201_10
PLLA/b-PLLA501_10
PLLA/b-PLLA1001_10
a
International Polymer Conference of Thailand
48 ecotoxicological impact”, Biomacromolecules,445-
455 (2002).
[3] Yujiang, F., Haruo, N.,Yoshihito, S., Yutaka, T.,
Takeshi, E., “Thermal degradation behaviour of
poly(lactic acid) stereocomplex”, Polym Degrad
and Stabil, 197-208 (2004).
[4] Uurto, I., Mikkonen, J., Parkkinen, J., Keski-Nisula,
L., Nevalainen, T., Kellomäki, M., Törmälä, P.,
Juha-Pekka, S., “Drug-eluting biodegradable poly-
D/L-lactic acid vascular stents: An Experimental
Pilot Study”, J Endovasc Ther, 371–379 (2005).
[5] John, A.O., and Patrick, W.S.S., “Bioabsorbable
Coronary Stents”, Circ Cardiovasc Interv, 255-260
(2009).
[6] Rahul, M.R., Amol, V.J., Douglas, E.H.,
“Poly(lactic acid) modifications”, Progress in
Polymer Science, 338–356 (2010).
[7] Tatsuro, O., Shunsuke, I., Yuichi, O., “Synthesis of
branched poly(lactide) using polyglycidol and
thermal, mechanical properties of its solution-cast
film”, Polymer, 429–434 (2006).
[8] Young, K. C., You, H. B., Sung, W. K., “Star-
shaped poly(ether-ester) block copolymers:
synthesis, characterization, and their physical
properties”, Macromolecules, 8766 – 8774 (1998) .
[9] Pistel, K.F., Bittner, B., Koll, H., Winter, G., Kissel,
T., “Biodegradable recombinant human
erythropoietin loaded microspheres prepared from
linear and star-branched block copolymers:
influence of encapsulation technique and polymer
composition on particle characteristics”, J
Controlled Release, 309 – 325 (1999).
[10] Salaam, L.E., Dean, D., Bray, T.L., “In vitro
degradation behavior of biodegradable 4-star
micelles”, Polymer, 310–318 (2006).
[11] Cai, Q., Zhao, Y., Bei, J., Xi, F., Wang, S. ,
“Synthesis and properties of star-shaped polylactide
attached to poly(amidoamine) dendrimer”,
Biomacromolecules, 828-34 (2003).
[12] Kainthan, R.K., Janzen, J., Levin, E., Devine, D.V.,
Brooks, D.E.., “Biocompatibility testing of branched
and linear polyglycidol”, Biomacromolecules, 703-
709 (2006).
[13] Jeffrey, L. A., Sergey, V., “Thermal properties and
degradation behavior of linear and branched poly(L-
lactide)s and poly(L-lactide-co-glycolide)s”,
Macromol Chem Phys, 924−929 (2012).
[14] Petchsuk, A., Buchathip, S., Supmak, W.,
Opaprakasit, M., Opaprakasit, P., “Preparation and
properties of multi-branched poly(D-lactide) derived
from polyglycidol and its stereocomplex blends”,
Express Polym Lett, 779-789 (2014).
[15] Phuphuak, Y., Chirachanchai, S., “Simple
preparation of multi-branched poly(L-lactic acid)
and its role as nucleating agent for poly(lactic
acid)”, Polymer, 572–582 (2013).
International Polymer Conference of Thailand
49
BIOENP-13
Synthesis and properties of hyper-branched polylactide employing polyethylene imine core
Narisara Jaikaew1, Atitsa Petchsuk
2, Pakorn Opaprakasit
1,*
1 School of Bio-Chemical Engineering and Technology, Sirindhorn International Institute of Technology (SIIT),
Thammasat University, Pathum Thani, 12121, Thailand 2 National Metals and Materials Technology Center (MTEC), Pathum Thani, 12120, Thailand
Abstract Hyper-branched polylactide (hbPLA)s with various branched lengths are synthesized by ring-opening
polymerization of L-lactide (LLA) in bulk using poly(ethylene imine) (PEI) as a core macro-initiator. The polymer’s
branched lengths are varied by adjusting the PEI:LLA feed ratios. The synthesized hbPLLAs are used as additives for
properties enhancement of commercial linear PLLA (l-PLLA) by melt blending. Miscibility, thermal and rheological
properties of the resulting hbPLLA/l-PLLA blends consisting of different hbPLLAs are investigated. All blend samples
exhibit lower glass transition temperature (Tg), crystalline melting temperature (Tm), and complex viscosity than neat l-
PLLA, which can provide many advantages in processing of the materials. The blends properties can also be further
optimized for specific applications by varying the branched structured component.
Keywords: Degradable polymer, Hyper-branched polylactide, Poly(ethylene imine), Polymer blends
1. Introduction
Degradable polyesters, whose major advantages
being biocompatible and degradable, are a group of
materials of interest in biomedical, pharmaceutical, and
environmental applications for replacing traditional non-
degradable polymers. [1, 2]. These materials are
thermoplastic polymers consisting hydrolysable linkages
in their backbone [3]. Among these, polylactide or poly
(lactic acid) (PLA), which is classified as thermoplastic
aliphatic polyester, is one of the most attractive
materials, due to its degradability, good plasticity,
suitable processability, high mechanical strength,
relatively low cost of production, and renewability [4, 5].
PLA can be synthesized by either
polycondensation of lactic acid, or ring-opening
polymerization (ROP) of lactide, which is the most
effective process to obtain high molecular weight PLA.
However, the polymer exhibits poor thermal stability and
low melt strength. This limits its use in several ways [2,
6-8]. Recently, many attempts have been made to
improve PLA’s properties, such as copolymerization,
blending with other polymers or plasticizers, toughening
by rubber materials, introduction of branched structures,
stereocomplexation, and nano-composites reinforcement
[1, 9].
The introduction of branched structures into PLA
is proven as a promosing way to improve its properties
[2]. Branch-structured polymers, at the same molecular
weight, have lower solution and melt viscosity than its
linear-structured counterparts. An addition of these
materilas leads to improvements in physio-chemical
properties of the matrix [2, 10]. Dendrimic, and hyper-
branched polymers are macromolecules containing a
center core. This group of materials have received vast
attention, due to their unique properties of low viscosity
and a high degree of surface functionality, which can be
further designed and controlled. In addition, one of the
major advantages of hyper-branched polymers is that
they can be synthesized in a one-step process [11].
In this work, hyper-branched PLLAs
(hbPLLAs) are prepared by copolymerization of l-lactide
(LLA) using poly(ethylene imine) (PEI) as a macro-
initiator. The synthesized products are used to modify
properties of commercial l-PLLA by melt blending.
Effect of branching structures on properties of the blends
are studied by varying the PEI:LLA feed ratios. Thermal
and rheological properties of the blends as a function of
hbPLLA structures and compositions are investigated.
2. Experimental
2.1 Materials
L-Lactide (LLA) and l-PLLA (4043D) were
supplied by PURAC (Netherlands). Poly(ethylene imine)
(PEI) (Mn ~1,800 by GPC) was purchased from Aldrich

International Polymer Conference of Thailand
50 (USA). Ethyl acetate, chloroform, ethanol, and toluene
solvents were purchased from Lab Scan (Thailand). Tin
(II) octoate catalyst, Sn(Oct)2, was obtained from Wako
(Japan).
2.2 Synthesis and characterization
hbPLLAs were synthesized by ROP using PEI as
a macro-initiator and Sn(Oct)2 catalyst. The reaction was
performed in a round-bottom flask, equipped with a
condenser. The macro-initiator and monomer were first
dried for 2 hours under vacuum before polymerization.
The weight ratio of PEI to LLA was varied from 1:10,
1:20 to 1:100. PEI was stirred at 70˚C for 1 hour in the
reaction flask, before dissolving in dried THF. Sn(Oct)2
catalyst was then added, and the mixture was stirred at
80˚C for 2 hours, before adding LLA monomer. The
polymerization was kept at 110 ˚C for 5 hours with
continuous stirring. The mixture was finally dissolved in
chloroform, and then precipitated in a large amount of a
methanol/hexane mixture to obtain solid hbPLLA
products and remove unreacted LLA and PEI. The
synthesized products were blended with a commercial l-
PLLA by melt blending in an internal mixer at 170 ˚C for
20 minutes. The hbPLLA contents were varied from 5 to
20 %wt.
Chemical structures of hbPLLA products were
investigated by an AVEN CEIII 500 MHz digital nuclear
magnetic resonance spectrometer (AV-500, Bruker
Biospin), using CDCl3 (for hbPLLAs) and D2O (for PEI)
solvents. Thermal property of the products was evaluated
by differential scanning calorimetry (DSC822e Mettler
Toledo). The evaluation was performed by a heat-cool-
heat standard method from -20 to 200˚C, at a heating and
cooling rate of 20˚C/min. The first heating step is
employed to erase the sample’s thermal history.
Dynamic rheological measurements were carried out
using a strain-controlled rheometer (ARES, TA Inc.,
New Castle, USA) with a torque transducer capable of
measurement over the range of 2–200 g.cm. The strain
amplitude for dynamic measurements was fixed at 0.5%.
The samples were prepared by a compression molding
machine (Chareon Tut, Thailand) into a disc shape with a
diameter of 25 mm and 1 mm thickness. The shear
function mode for frequency dependence test was also
performed from low to high shear forces, at a constant
temperature of 180°C.
3. Results and Discussion
3.1 NMR spectroscopy
Chemical structures of hbPLLAs synthesized at 3
different PEI:LLA feed ratios are examined by 1
H NMR
spectroscopy. Figure 1 shows 1H NMR spectrum of the
materials obtained from a 1:10 ratio (denoted as
hbPLLA10). The spectrum shows characteristic
chemical shifts at 5.13 ppm (a, b), assigned to methine
protons in the main-chain repeat units, with the
integration of 1.00. The signal at 4.32 ppm(c) is assigned
to methine protons in terminal units of hbPLLA, whose
integration is 0.098. The chemical shifts at 1.55 ppm (d,
e) are assigned to the methyl group. A broad signal
covering the region of 2-3 ppm is associated with CH2
protons of PEI. This is compared with a 1H NMR
spectrum of neat PEI, as shown in Figure 2. The
integration ratios of these characteristic signals are
employed in the evaluation of chemical structures of the
products, in terms of LLA branch lengths ( ) and
PLLA/PEI molar ratios in the hyper-branched copolymer
chains ( ). The results are summarized in Table
1.
Figure 1. 1H NMR spectrum and chemical structure of
hbPLLA10.
(2)
International Polymer Conference of Thailand
51
Figure 2. 1H NMR spectrum and chemical structure of
PEI.
Table1. Results on average LLA lengths and PLLA/PEI
molar ratio in hbPLLA chains.
Sample PEI: LLA
feed
ratios
Average LLA
branch length
(units)
PEI :LLA
molar ratios
(in chain)
hbPLLA10 1:10 10 1:5
hbPLLA20 1:20 12 1:9
hbPLLA100 1:100 19 1:11
3.2 Thermal property
Thermal properties of the resulting hbPLLAs
are examined, in which their DSC thermograms are
shown in Figure 3. The results indicate that the
properties are strongly dependent on the polymer’s
chemical structures. hbPLLA with short LLA arm’s
length (i.e. hbPLLA10 and hbPLLA20) are complete
amorphous, as no crystalline characteristics are observed
in their DSC thermograms. In contrast, the copolymer
with longer arm’s length (i.e. hbPLLA100) processes a
semi-crystalline structure, where a melting characteristic
peak (Tm) is observed at 162°C. The glass transition
temperature (Tg) of the hyper-branched copolymer
increases with the length of LLA sequences from 36 to
45 and 47°C, as a result from a decrease in the chain
flexibility.
Thermal properties of l-PLLA/hbPLLA blends
containing various hbPLLAs, as a function of the blend
compositions, are investigated. All blends show lower Tg
and Tm than neat l-PLLA. Both Tg and Tm values
decrease with an increase in the hbPLLA content, and
also increase when the LLA arm’s length further
increases.
Figure 3. DSC thermogram (2nd
heating scan) of (a)
HbPLLA100, (b) HbPLLA20 and (c) HbPLLA10.
DSC thermograms of l-PLLA/hbLLA10 blends
as a function of the blend compositions are shown in
Figure 4. Single Tg is observed in all samples, indicating
complete miscible blend systems at all compositions. No
melting characteristic peak is observed in the
thermogram of hbPLLA10, due to its short LLA arm
length, while neat l-PLLA exhibits a Tm at 150°C. Up on
adding of hbPLLA10, a decrease in ΔHm of the blends is
observed. The degree of reduction in the values increase
with an increase in the hbPLLA10 content from 5 to
20 %wt, reflecting that this short-branched structure has
high synergic effect with the l-PLLA matrix, which
inhibits the crystal formation of the l-PLLA domains.
The corresponding thermograms of blends
consisting of hbPLLA100, which possess long LLA
sequences, are shown in Figure 5. Single Tg is also
observed in all samples, reflecting complete miscible
blend systems. hbPLLA100 exhibits a Tm at 162 °C,
which is higher than that of neat l-PLLA. This is likely
because its crystalline domains are derived from a close
packing of branches with optimum length. When the
copolymer is blended with l-PLLA, double Tm peaks
appear at the temperatures corresponding those of the 2
components. This indicates formation of 2 distinct
crystalline domains originated from hbPLLA100 and the
l-PLLA matrix.
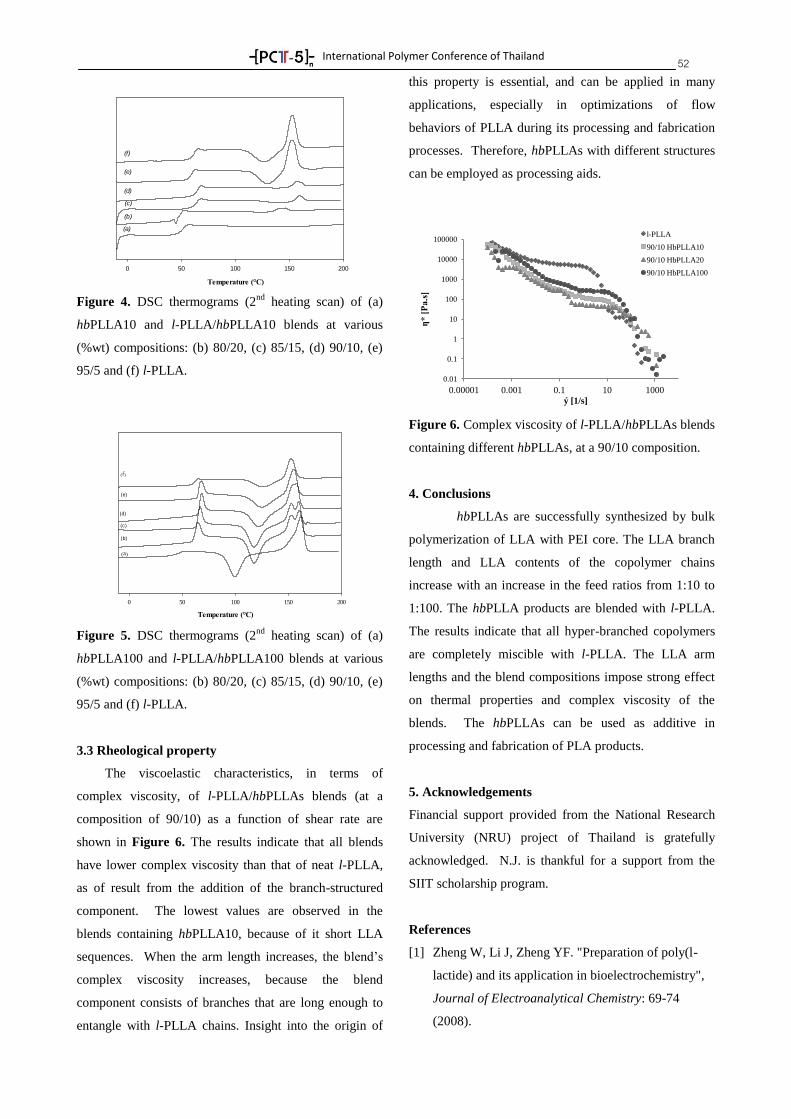
International Polymer Conference of Thailand
52
Temperature (°C)
0 50 100 150 200
(a)
(b)
(c)
(d)
(e)
(f)
Figure 4. DSC thermograms (2nd
heating scan) of (a)
hbPLLA10 and l-PLLA/hbPLLA10 blends at various
(%wt) compositions: (b) 80/20, (c) 85/15, (d) 90/10, (e)
95/5 and (f) l-PLLA.
0 50 100 150 200
(f)
(e)
(d)
(c)
(b)
(a)
Temperature (°C)
Figure 5. DSC thermograms (2nd
heating scan) of (a)
hbPLLA100 and l-PLLA/hbPLLA100 blends at various
(%wt) compositions: (b) 80/20, (c) 85/15, (d) 90/10, (e)
95/5 and (f) l-PLLA.
3.3 Rheological property
The viscoelastic characteristics, in terms of
complex viscosity, of l-PLLA/hbPLLAs blends (at a
composition of 90/10) as a function of shear rate are
shown in Figure 6. The results indicate that all blends
have lower complex viscosity than that of neat l-PLLA,
as of result from the addition of the branch-structured
component. The lowest values are observed in the
blends containing hbPLLA10, because of it short LLA
sequences. When the arm length increases, the blend’s
complex viscosity increases, because the blend
component consists of branches that are long enough to
entangle with l-PLLA chains. Insight into the origin of
this property is essential, and can be applied in many
applications, especially in optimizations of flow
behaviors of PLLA during its processing and fabrication
processes. Therefore, hbPLLAs with different structures
can be employed as processing aids.
Figure 6. Complex viscosity of l-PLLA/hbPLLAs blends
containing different hbPLLAs, at a 90/10 composition.
4. Conclusions
hbPLLAs are successfully synthesized by bulk
polymerization of LLA with PEI core. The LLA branch
length and LLA contents of the copolymer chains
increase with an increase in the feed ratios from 1:10 to
1:100. The hbPLLA products are blended with l-PLLA.
The results indicate that all hyper-branched copolymers
are completely miscible with l-PLLA. The LLA arm
lengths and the blend compositions impose strong effect
on thermal properties and complex viscosity of the
blends. The hbPLLAs can be used as additive in
processing and fabrication of PLA products.
5. Acknowledgements
Financial support provided from the National Research
University (NRU) project of Thailand is gratefully
acknowledged. N.J. is thankful for a support from the
SIIT scholarship program.
References
[1] Zheng W, Li J, Zheng YF. "Preparation of poly(l-
lactide) and its application in bioelectrochemistry",
Journal of Electroanalytical Chemistry: 69-74
(2008).
0.01
0.1
1
10
100
1000
10000
100000
0.00001 0.001 0.1 10 1000
ƞ* [
Pa.s
]
ý [1/s]
l-PLLA
90/10 HbPLLA10
90/10 HbPLLA20
90/10 HbPLLA100
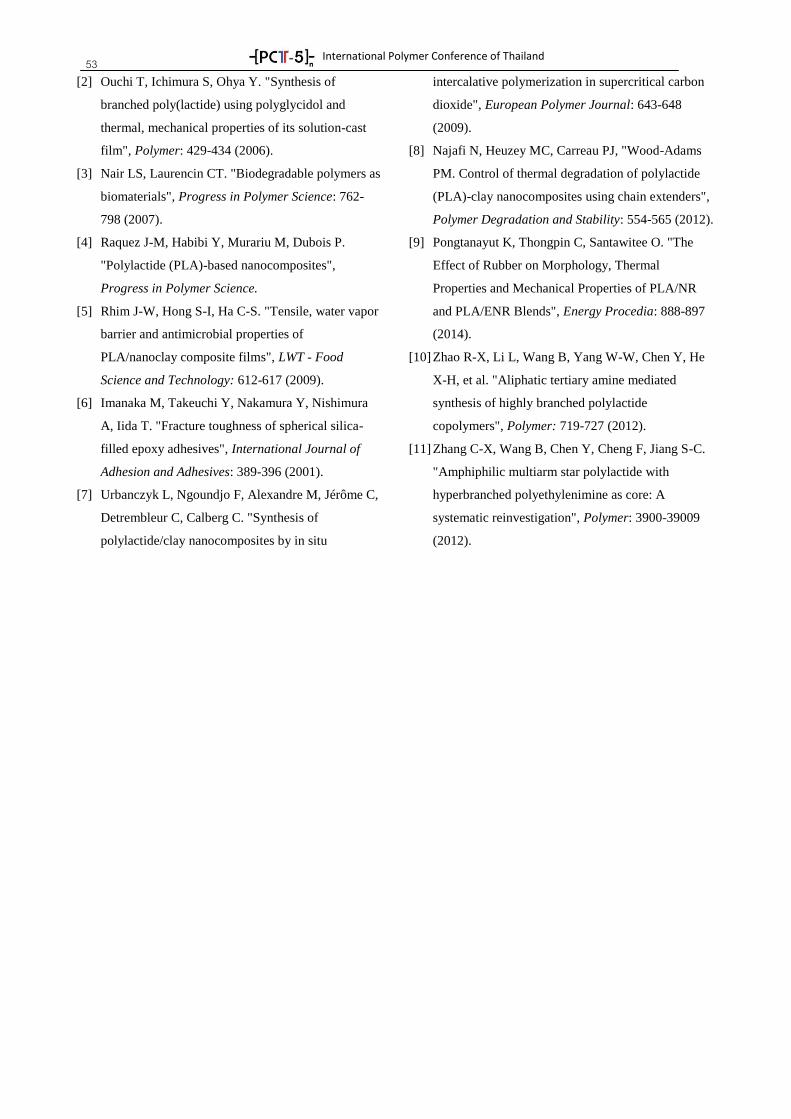
International Polymer Conference of Thailand
53 [2] Ouchi T, Ichimura S, Ohya Y. "Synthesis of
branched poly(lactide) using polyglycidol and
thermal, mechanical properties of its solution-cast
film", Polymer: 429-434 (2006).
[3] Nair LS, Laurencin CT. "Biodegradable polymers as
biomaterials", Progress in Polymer Science: 762-
798 (2007).
[4] Raquez J-M, Habibi Y, Murariu M, Dubois P.
"Polylactide (PLA)-based nanocomposites",
Progress in Polymer Science.
[5] Rhim J-W, Hong S-I, Ha C-S. "Tensile, water vapor
barrier and antimicrobial properties of
PLA/nanoclay composite films", LWT - Food
Science and Technology: 612-617 (2009).
[6] Imanaka M, Takeuchi Y, Nakamura Y, Nishimura
A, Iida T. "Fracture toughness of spherical silica-
filled epoxy adhesives", International Journal of
Adhesion and Adhesives: 389-396 (2001).
[7] Urbanczyk L, Ngoundjo F, Alexandre M, Jérôme C,
Detrembleur C, Calberg C. "Synthesis of
polylactide/clay nanocomposites by in situ
intercalative polymerization in supercritical carbon
dioxide", European Polymer Journal: 643-648
(2009).
[8] Najafi N, Heuzey MC, Carreau PJ, "Wood-Adams
PM. Control of thermal degradation of polylactide
(PLA)-clay nanocomposites using chain extenders",
Polymer Degradation and Stability: 554-565 (2012).
[9] Pongtanayut K, Thongpin C, Santawitee O. "The
Effect of Rubber on Morphology, Thermal
Properties and Mechanical Properties of PLA/NR
and PLA/ENR Blends", Energy Procedia: 888-897
(2014).
[10] Zhao R-X, Li L, Wang B, Yang W-W, Chen Y, He
X-H, et al. "Aliphatic tertiary amine mediated
synthesis of highly branched polylactide
copolymers", Polymer: 719-727 (2012).
[11] Zhang C-X, Wang B, Chen Y, Cheng F, Jiang S-C.
"Amphiphilic multiarm star polylactide with
hyperbranched polyethylenimine as core: A
systematic reinvestigation", Polymer: 3900-39009
(2012).
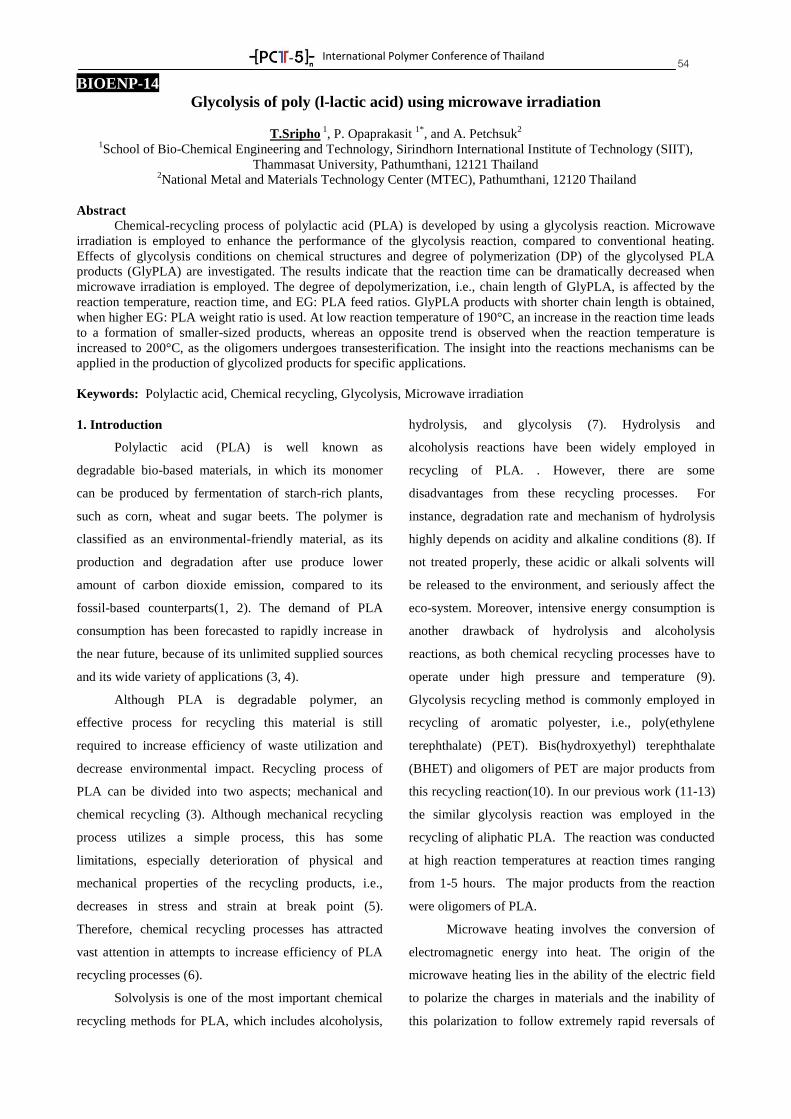
International Polymer Conference of Thailand
54 BIOENP-14
Glycolysis of poly (l-lactic acid) using microwave irradiation
T.Sripho 1, P. Opaprakasit
1*, and A. Petchsuk
2
1School of Bio-Chemical Engineering and Technology, Sirindhorn International Institute of Technology (SIIT),
Thammasat University, Pathumthani, 12121 Thailand
2National Metal and Materials Technology Center (MTEC), Pathumthani, 12120 Thailand
Abstract
Chemical-recycling process of polylactic acid (PLA) is developed by using a glycolysis reaction. Microwave
irradiation is employed to enhance the performance of the glycolysis reaction, compared to conventional heating.
Effects of glycolysis conditions on chemical structures and degree of polymerization (DP) of the glycolysed PLA
products (GlyPLA) are investigated. The results indicate that the reaction time can be dramatically decreased when
microwave irradiation is employed. The degree of depolymerization, i.e., chain length of GlyPLA, is affected by the
reaction temperature, reaction time, and EG: PLA feed ratios. GlyPLA products with shorter chain length is obtained,
when higher EG: PLA weight ratio is used. At low reaction temperature of 190°C, an increase in the reaction time leads
to a formation of smaller-sized products, whereas an opposite trend is observed when the reaction temperature is
increased to 200°C, as the oligomers undergoes transesterification. The insight into the reactions mechanisms can be
applied in the production of glycolized products for specific applications.
Keywords: Polylactic acid, Chemical recycling, Glycolysis, Microwave irradiation
1. Introduction
Polylactic acid (PLA) is well known as
degradable bio-based materials, in which its monomer
can be produced by fermentation of starch-rich plants,
such as corn, wheat and sugar beets. The polymer is
classified as an environmental-friendly material, as its
production and degradation after use produce lower
amount of carbon dioxide emission, compared to its
fossil-based counterparts(1, 2). The demand of PLA
consumption has been forecasted to rapidly increase in
the near future, because of its unlimited supplied sources
and its wide variety of applications (3, 4).
Although PLA is degradable polymer, an
effective process for recycling this material is still
required to increase efficiency of waste utilization and
decrease environmental impact. Recycling process of
PLA can be divided into two aspects; mechanical and
chemical recycling (3). Although mechanical recycling
process utilizes a simple process, this has some
limitations, especially deterioration of physical and
mechanical properties of the recycling products, i.e.,
decreases in stress and strain at break point (5).
Therefore, chemical recycling processes has attracted
vast attention in attempts to increase efficiency of PLA
recycling processes (6).
Solvolysis is one of the most important chemical
recycling methods for PLA, which includes alcoholysis,
hydrolysis, and glycolysis (7). Hydrolysis and
alcoholysis reactions have been widely employed in
recycling of PLA. . However, there are some
disadvantages from these recycling processes. For
instance, degradation rate and mechanism of hydrolysis
highly depends on acidity and alkaline conditions (8). If
not treated properly, these acidic or alkali solvents will
be released to the environment, and seriously affect the
eco-system. Moreover, intensive energy consumption is
another drawback of hydrolysis and alcoholysis
reactions, as both chemical recycling processes have to
operate under high pressure and temperature (9). Glycolysis recycling method is commonly employed in
recycling of aromatic polyester, i.e., poly(ethylene
terephthalate) (PET). Bis(hydroxyethyl) terephthalate
(BHET) and oligomers of PET are major products from
this recycling reaction(10). In our previous work (11-13)
the similar glycolysis reaction was employed in the
recycling of aliphatic PLA. The reaction was conducted
at high reaction temperatures at reaction times ranging
from 1-5 hours. The major products from the reaction
were oligomers of PLA.
Microwave heating involves the conversion of
electromagnetic energy into heat. The origin of the
microwave heating lies in the ability of the electric field
to polarize the charges in materials and the inability of
this polarization to follow extremely rapid reversals of
International Polymer Conference of Thailand
55 the changing electric field. The field interaction with the
molecular dipoles and charged ions causes rapid rotation
of these molecules or ions. Friction of this motion leads
to a heat evolution and increased temperature in the
materials(14, 15). There are many studies using
microwave irradiation in polymerized of PLA. However,
reports on effects of microwave irradiation in de-
polymerization of PLA are very rare. Hirao et al. studied
the utilization of microwave in de-polymerization of
PLA using hydrolysis and alcoholysis reactions. The
results showed that the microwave irradiation leaded to a
decrease in reaction time, compared to other
conventional heating processes (3, 16, 17).
The aim of this study is to enhance chemical
recycling efficiency of PLA by glycolysis reaction
employing microwave heat source. Effects of glycolysis
condition, which influence to chemical structure and
length of polymer chain, were studied.
2. Experimental
2.1. Materials and chemicals
PLA resin (Nature Work4043D), with weight-
average molecular weight (Mw) and number-average
molecular weight (Mn) of 300,000, and 84,000 g mol-1
,
respectively, was used as a starting material for
glycolysis reaction. All chemicals, including ethylene
glycol (EG), chloroform, and methanol, obtained from
Carlo Erba, were used without further purification.
2.2 Glycolysis reaction
A domestic microwave oven (Samsung, ME81Y
model, 850 watt) was used as a heating source in the
glycolysis reaction. The reaction flask was placed in the
oven, in which the top part of the compartment was
modified to connect with an external condenser. PLA
resin was treated with EG using different PLA: EG
weight ratios (1:2 and 1:0.5) via heterogeneous reaction.
Effects of temperatures and reaction times on structures
and properties of the glycolysed products (GlyPLA) were
studied. At a completion of reaction, GlyPLA was
recovered by dissolving the products in chloroform and
re-precipitating in methanol. The precipitant was further
dried to a constant weight in a vacuum oven at 60°C for
18 hours.
2.3 Characterization
Chemical structures of the products were
characterized by a 500 MHz nuclear magnetic resonance
spectrometer (AV-500, Bruker Biospin) using CDCl3
solvent. Average molecular weight (Mn, Mw), and
degree of polymerization (DP) were characterized by
using a gel permeation chromatography (GPC), Waters
e2695 separations modules, using a combination of
differential viscometer (Viscotek model 270) and
refractive index (Viscotek model 3580) detectors. A
calibration curve was constructed using polystyrene
standards with average molecular weight between 4,490
and 1,112,000 g/mol. The samples were dissolved in
tetrahydrofuran (THF) (2 mg/ml) and filtered using a
nylon 66 membrane (pore size 0.45 μm). A mobile
phase flow rate of 1.0 ml/min was used.
3. Results and Discussion
3.1 Chemical structure of GlyPLA
Following Figure1, results from 1H-NMR spectra
of products from all glycolysis reaction conditions
illustrate a similar pattern, in which a selected spectrum
is shown in Figure 1. Four characteristic chemical shifts
are observed at 1.6, 3.8, 4.2 and 5.1 ppm. The signals
located at 1.6 and 5.1 ppm also appear in the original
PLA resin, which are assigned to resonances of methane
(-OCHCH3C=O) at 5.1 ppm and methyl (-
OCHCH3C=O) at 1.6 ppm. The signals at 3.8 ppm
(O=COCH2CH2OH) and 4.2 ppm (O=COCH2CH2 OH)
are only observed in the GlyPLA products, but not in the
starting material. These chemical shifts are associated
with methylene protons of EG. A 1H-NMR spectrum of
GlyPLA also shows another chemical shift at 4.3 ppm,
assigned to (HOCHCH3C=O) end groups. The proposed
mechanism of PLA glycolysis reaction via
transesterification and chemical structures of GlyPLA
products are shown in Figure 2, which agrees with our
previous reports (12, 13).
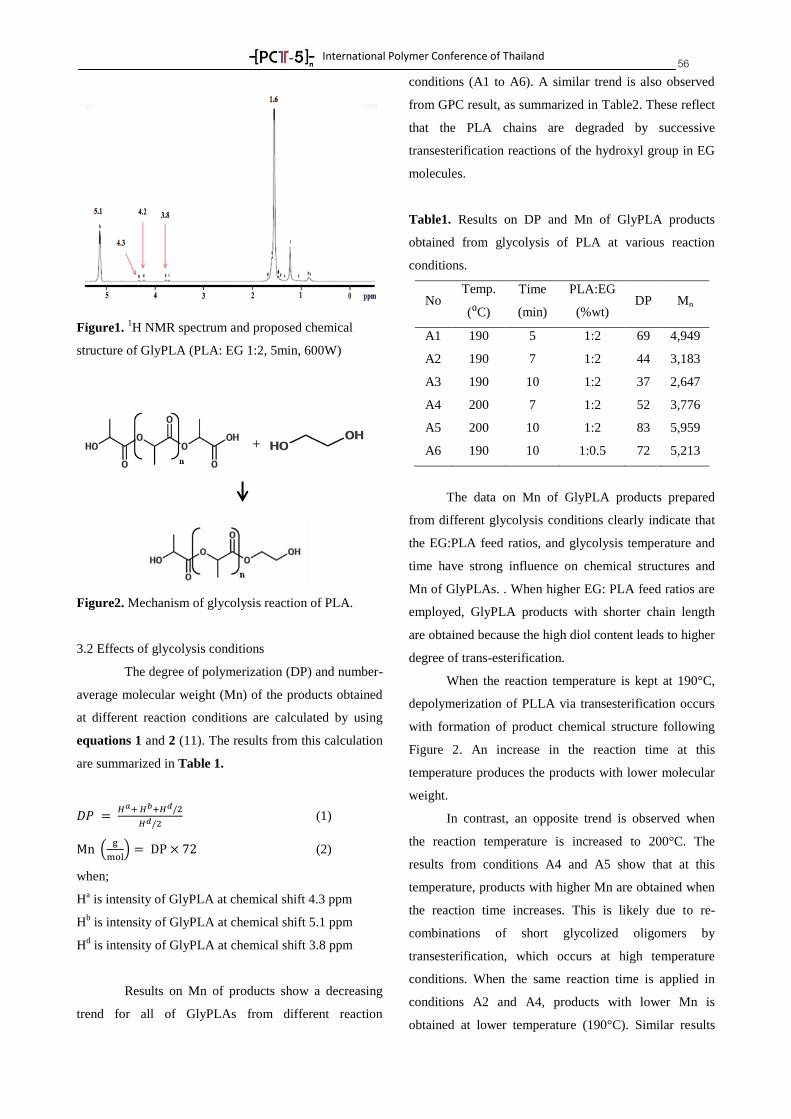
International Polymer Conference of Thailand
56
Figure1. 1H NMR spectrum and proposed chemical
structure of GlyPLA (PLA: EG 1:2, 5min, 600W)
Figure2. Mechanism of glycolysis reaction of PLA.
3.2 Effects of glycolysis conditions
The degree of polymerization (DP) and number-
average molecular weight (Mn) of the products obtained
at different reaction conditions are calculated by using
equations 1 and 2 (11). The results from this calculation
are summarized in Table 1.
(1)
(2)
when;
Ha is intensity of GlyPLA at chemical shift 4.3 ppm
Hb is intensity of GlyPLA at chemical shift 5.1 ppm
Hd is intensity of GlyPLA at chemical shift 3.8 ppm
Results on Mn of products show a decreasing
trend for all of GlyPLAs from different reaction
conditions (A1 to A6). A similar trend is also observed
from GPC result, as summarized in Table2. These reflect
that the PLA chains are degraded by successive
transesterification reactions of the hydroxyl group in EG
molecules.
Table1. Results on DP and Mn of GlyPLA products
obtained from glycolysis of PLA at various reaction
conditions.
No Temp.
(⁰C)
Time
(min)
PLA:EG
(%wt) DP Mn
A1 190 5 1:2 69 4,949
A2 190 7 1:2 44 3,183
A3 190 10 1:2 37 2,647
A4 200 7 1:2 52 3,776
A5 200 10 1:2 83 5,959
A6 190 10 1:0.5 72 5,213
The data on Mn of GlyPLA products prepared
from different glycolysis conditions clearly indicate that
the EG:PLA feed ratios, and glycolysis temperature and
time have strong influence on chemical structures and
Mn of GlyPLAs. . When higher EG: PLA feed ratios are
employed, GlyPLA products with shorter chain length
are obtained because the high diol content leads to higher
degree of trans-esterification.
When the reaction temperature is kept at 190°C,
depolymerization of PLLA via transesterification occurs
with formation of product chemical structure following
Figure 2. An increase in the reaction time at this
temperature produces the products with lower molecular
weight.
In contrast, an opposite trend is observed when
the reaction temperature is increased to 200°C. The
results from conditions A4 and A5 show that at this
temperature, products with higher Mn are obtained when
the reaction time increases. This is likely due to re-
combinations of short glycolized oligomers by
transesterification, which occurs at high temperature
conditions. When the same reaction time is applied in
conditions A2 and A4, products with lower Mn is
obtained at lower temperature (190°C). Similar results
+
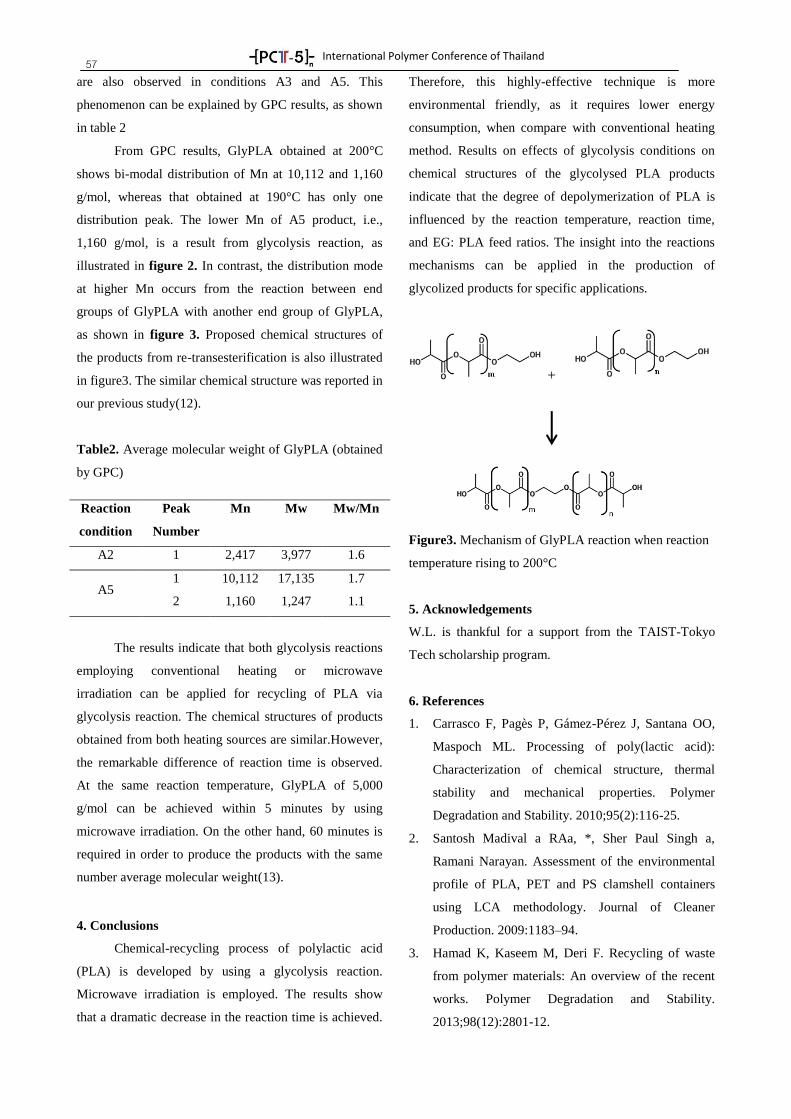
International Polymer Conference of Thailand
57 are also observed in conditions A3 and A5. This
phenomenon can be explained by GPC results, as shown
in table 2
From GPC results, GlyPLA obtained at 200°C
shows bi-modal distribution of Mn at 10,112 and 1,160
g/mol, whereas that obtained at 190°C has only one
distribution peak. The lower Mn of A5 product, i.e.,
1,160 g/mol, is a result from glycolysis reaction, as
illustrated in figure 2. In contrast, the distribution mode
at higher Mn occurs from the reaction between end
groups of GlyPLA with another end group of GlyPLA,
as shown in figure 3. Proposed chemical structures of
the products from re-transesterification is also illustrated
in figure3. The similar chemical structure was reported in
our previous study(12).
Table2. Average molecular weight of GlyPLA (obtained
by GPC)
The results indicate that both glycolysis reactions
employing conventional heating or microwave
irradiation can be applied for recycling of PLA via
glycolysis reaction. The chemical structures of products
obtained from both heating sources are similar.However,
the remarkable difference of reaction time is observed.
At the same reaction temperature, GlyPLA of 5,000
g/mol can be achieved within 5 minutes by using
microwave irradiation. On the other hand, 60 minutes is
required in order to produce the products with the same
number average molecular weight(13).
4. Conclusions
Chemical-recycling process of polylactic acid
(PLA) is developed by using a glycolysis reaction.
Microwave irradiation is employed. The results show
that a dramatic decrease in the reaction time is achieved.
Therefore, this highly-effective technique is more
environmental friendly, as it requires lower energy
consumption, when compare with conventional heating
method. Results on effects of glycolysis conditions on
chemical structures of the glycolysed PLA products
indicate that the degree of depolymerization of PLA is
influenced by the reaction temperature, reaction time,
and EG: PLA feed ratios. The insight into the reactions
mechanisms can be applied in the production of
glycolized products for specific applications.
Figure3. Mechanism of GlyPLA reaction when reaction
temperature rising to 200°C
5. Acknowledgements
W.L. is thankful for a support from the TAIST-Tokyo
Tech scholarship program.
6. References
1. Carrasco F, Pagès P, Gámez-Pérez J, Santana OO,
Maspoch ML. Processing of poly(lactic acid):
Characterization of chemical structure, thermal
stability and mechanical properties. Polymer
Degradation and Stability. 2010;95(2):116-25.
2. Santosh Madival a RAa, *, Sher Paul Singh a,
Ramani Narayan. Assessment of the environmental
profile of PLA, PET and PS clamshell containers
using LCA methodology. Journal of Cleaner
Production. 2009:1183–94.
3. Hamad K, Kaseem M, Deri F. Recycling of waste
from polymer materials: An overview of the recent
works. Polymer Degradation and Stability.
2013;98(12):2801-12.
Reaction
condition
Peak
Number
Mn Mw Mw/Mn
A2 1 2,417 3,977 1.6
A5 1 10,112 17,135 1.7
2 1,160 1,247 1.1
+
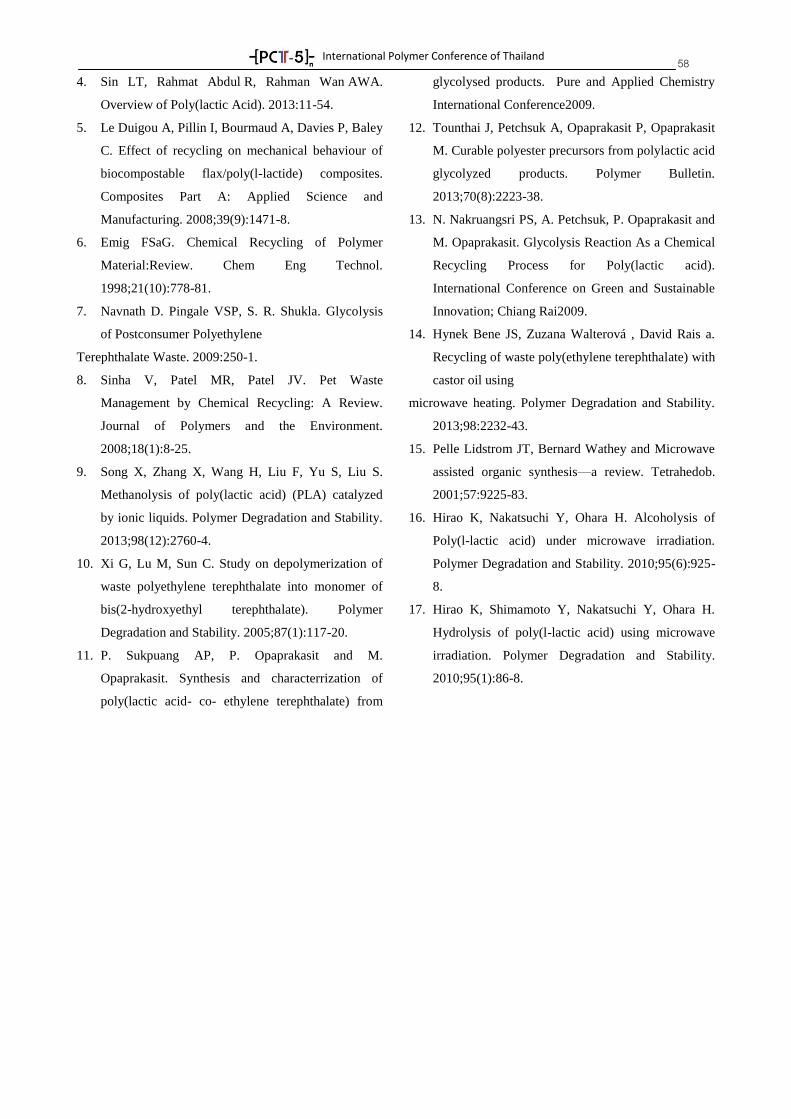
International Polymer Conference of Thailand
58 4. Sin LT, Rahmat Abdul R, Rahman Wan AWA.
Overview of Poly(lactic Acid). 2013:11-54.
5. Le Duigou A, Pillin I, Bourmaud A, Davies P, Baley
C. Effect of recycling on mechanical behaviour of
biocompostable flax/poly(l-lactide) composites.
Composites Part A: Applied Science and
Manufacturing. 2008;39(9):1471-8.
6. Emig FSaG. Chemical Recycling of Polymer
Material:Review. Chem Eng Technol.
1998;21(10):778-81.
7. Navnath D. Pingale VSP, S. R. Shukla. Glycolysis
of Postconsumer Polyethylene
Terephthalate Waste. 2009:250-1.
8. Sinha V, Patel MR, Patel JV. Pet Waste
Management by Chemical Recycling: A Review.
Journal of Polymers and the Environment.
2008;18(1):8-25.
9. Song X, Zhang X, Wang H, Liu F, Yu S, Liu S.
Methanolysis of poly(lactic acid) (PLA) catalyzed
by ionic liquids. Polymer Degradation and Stability.
2013;98(12):2760-4.
10. Xi G, Lu M, Sun C. Study on depolymerization of
waste polyethylene terephthalate into monomer of
bis(2-hydroxyethyl terephthalate). Polymer
Degradation and Stability. 2005;87(1):117-20.
11. P. Sukpuang AP, P. Opaprakasit and M.
Opaprakasit. Synthesis and characterrization of
poly(lactic acid- co- ethylene terephthalate) from
glycolysed products. Pure and Applied Chemistry
International Conference2009.
12. Tounthai J, Petchsuk A, Opaprakasit P, Opaprakasit
M. Curable polyester precursors from polylactic acid
glycolyzed products. Polymer Bulletin.
2013;70(8):2223-38.
13. N. Nakruangsri PS, A. Petchsuk, P. Opaprakasit and
M. Opaprakasit. Glycolysis Reaction As a Chemical
Recycling Process for Poly(lactic acid).
International Conference on Green and Sustainable
Innovation; Chiang Rai2009.
14. Hynek Bene JS, Zuzana Walterová , David Rais a.
Recycling of waste poly(ethylene terephthalate) with
castor oil using
microwave heating. Polymer Degradation and Stability.
2013;98:2232-43.
15. Pelle Lidstrom JT, Bernard Wathey and Microwave
assisted organic synthesis—a review. Tetrahedob.
2001;57:9225-83.
16. Hirao K, Nakatsuchi Y, Ohara H. Alcoholysis of
Poly(l-lactic acid) under microwave irradiation.
Polymer Degradation and Stability. 2010;95(6):925-
8.
17. Hirao K, Shimamoto Y, Nakatsuchi Y, Ohara H.
Hydrolysis of poly(l-lactic acid) using microwave
irradiation. Polymer Degradation and Stability.
2010;95(1):86-8.
SESSION 2
Advances in Polymer Characterization
International Polymer Conference of Thailand
60 KN-CHAR-1
Preparation and Properties of Natural Rubber with
Organic-Inorganic Nanomatrix Structure
Seiichi Kawahara
Department of Materials Science and Techonology, Faculty of Engineering,
Nagaoka University of Technology, 1603-1, Kamitomioka, Nagaoka,
Niigata 940-2188, Japan.
Abstract Natural rubber with filler nanomatrix structure was prepared
by forming chemical linkages between natural rubber particles and
filler nano-particles. The filler nanomatrix structure was formed by
graft-copolymerization of vinyltriethoxysilane (VTES) onto natural
rubber particles in the latex stage followed by casting of the latex to
prepare an as-cast film. The silica nano-particles were produced
during the graft-copolymerization through hydrolysis and
condensation, i.e. sol-gel reaction; as such, they linked to the natural
rubber particles. The nanomatrix structure was observed by
transmission electron microscopy, in which the natural rubber
nanomatrix. Tensile properties were significantly improved by
forming filler nanomatrix structure. The loss modulus and loss tangent
of the natural rubber with the filler nanomatrix structure were almost
independent of deformation frequency in the rubbery plateau region,
which was explained to be due to both the energetic elasticity and
entropic elasticity characteristics of the nanomatrix structure.
Seiichi Kawahara
Affiliation: Department of Materials
Science and Technology, Facluty of
Engineering, Nagaoka University of
Technology
Education:
1988 Bachelor, Faculty of Technology,
Tokyo University of Agriculture and
Technology
1992 Doctor, Graduate School of
Engineering, Tokyo University of
Agriculture and Technology
Job:
1992 Research Associate, Tokyo
University of Agriculture and Technology
1998 Associate Professor, Nagaoka
University of Technology
(1996-1997 Visiting Scientist, The
University of Akron)
Awards:
2000 Best Paper Award, The Society of
Rubber Industry, Japan
2004 The Award of Distinguished
Research Work, The Society of Rheology,
Japan
2006 Best Paper Award, The Society of
Rubber Industry, Japan
2010 Malaysian Rubber Board Service
Award
2010 Best Paper Award, Journal of
Rubber Research
2011 Wiley Award, The Society of
Polymer Science, Japan
2012 Best Presentation Award, The
Society of Rubber Science and
Technology, Japan
2014 Sparks-Thomas Award, Rubber
Division, American Chemical Society
2015 Science and Technology Award, The
Society of Rubber Science and
Technology, Japan
Keywords on Research work
Rubber, Elastomer, Rheology, NMR,
Characterization, Mechanical Properties,
Ion Conductivity, Nano-phase separated
structure
International Polymer Conference of Thailand
61
KN-CHAR-2
Chemically Controlled Self-assembly of Gold Nanoparticles by Site-selective Protein
Immobilization: A Model for Antimalarial Drug Screening
Palangpon Kongsaeree, Vasujin Numphud, Pattarapol Khongsuk
Department of Chemistry and Center for Excellence in Protein Structure and Function, Faculty of Science,
Mahidol University, Bangkok 10400, Thailand
E-mail: [email protected]
Methods to efficiently control the activity of proteins in cells are
very useful to explore a variety of biological processes. Chemically
induced dimerization (CID) has proven used to be a powerful tool for
modulating protein-protein interactions by bringing two proteins of
interest into close proximity. Herein, a novel CID system with
synthetic ligands of methotrexate, a tight-binding ligand of
dihydrofolate reductase, was developed to investigate intermolecular
interactions on the surface of gold nanoparticles. Gold nanoparticles
can be used in various sensitive analytical purposes due to its high
molar absorption coefficient. In this work, dihydrofolate reductase-
functionalized gold nanoparticles (AuNP-DHFR) were prepared by
site-specific immobilization. Upon the addition of methotrexate-
based CID ligands, self-assembly of AuNP-DHFR was specifically
induced through the ligand-protein interactions, resulting in a clear
optical change of the colloidal color from red to violet-blue. This
surface plasmonic resonance (SPR) change was clearly observed by
naked eye and this phenomenon was concentration dependent of the
CID ligands. The aggregation of the AuNP-DHFR nanoparticles was
analyzed by transmission electron micrograph, zeta potential,
hydrodynamic radius, etc. Ultimately, a simple label-free
antimalarial assay based on this CID-SPR platform could be further
developed.
Palangpon Kongsaeree
Associate Professor Education
Ph.D., Cornell University , USA, 1998
Research Area
Chemical biology, X-ray crystallography,
Nanomaterials
Awards
The Royal Thai Government
scholarship under the Development and
Promotion of Science and Technology
Talent Project (DPST), 1985-1998;
Research assistance, Department of
Chemistry, Cornell University, 1992-
1997;
Young Scientist Award from
Foundation for Promotion of Science
and Technology under the Patronage of
H. M. the King, 2003
SESSION 3
Polymer Composites and Nanocomposites
International Polymer Conference of Thailand
63
KN-COMP-1
Interphase Transfer of Nanoparticles between Immiscible Polymer Blends
Masayuki Yamaguchi
School of Materials Science, Japan Advanced Institute of Science and Technology
Abstract
The nanofiller transfer technique was demonstrated, which can
be applicable to novel polymeric materials having nanoparticles on
surface and/or phase-separated polymer blends with uneven distribution
of fillers. It was found that nanoparticles immigrate from one polymer
to another owing to the difference in the interfacial tension. For
example, multi-walled carbon nanotubes (CNTs), which prefer
polycarbonate (PC) to polypropylene (PP), moved from PP to PC in the
molten state of the polymers. Since the transfer process requires
Brownian motion, more CNTs were transferred at high temperature and
for a long exposure time of annealing. The laminated sheets were
separated without any difficulty because of thin interfacial thickness
between the immiscible polymers. Consequently, a PC sheet having
CNTs only in the surface region was prepared. A similar phenomenon
was detected for nanoparticles of silica in the laminated sheets
composed of butadiene rubber (BR) and styrene-butadiene rubber
(SBR), in which silica particles moved from SBR to BR, and showed
nucleating ability for BR crystallization.
Masayuki Yamaguchi
Japan Advanced Institute of Science and
Technology
School of Materials Science
Professor, Doctor of Engineering
Director, Research Center for Highly
Environmental and Recyclable Polymers
Vice President of Japan Society of Polymer
Processing
Editor in chief, Journal of Society of
Polymer Processing
B.D. in Kyoto Univ. in 1987
M.S. in Kyoto Univ. in 1989 Tosoh Corporation from 1989 to 2005
Doctor degree in Kyoto Univ. in 1999 under
late Prof. Toshiro Masuda The Polymer Processing Institute in New
Jersey (USA) as a visiting scientist from 2000
to 2002. 2005, Associate professor in JAIST
2009, Professor in JAIST
Major research areas are polymer rheology and processing
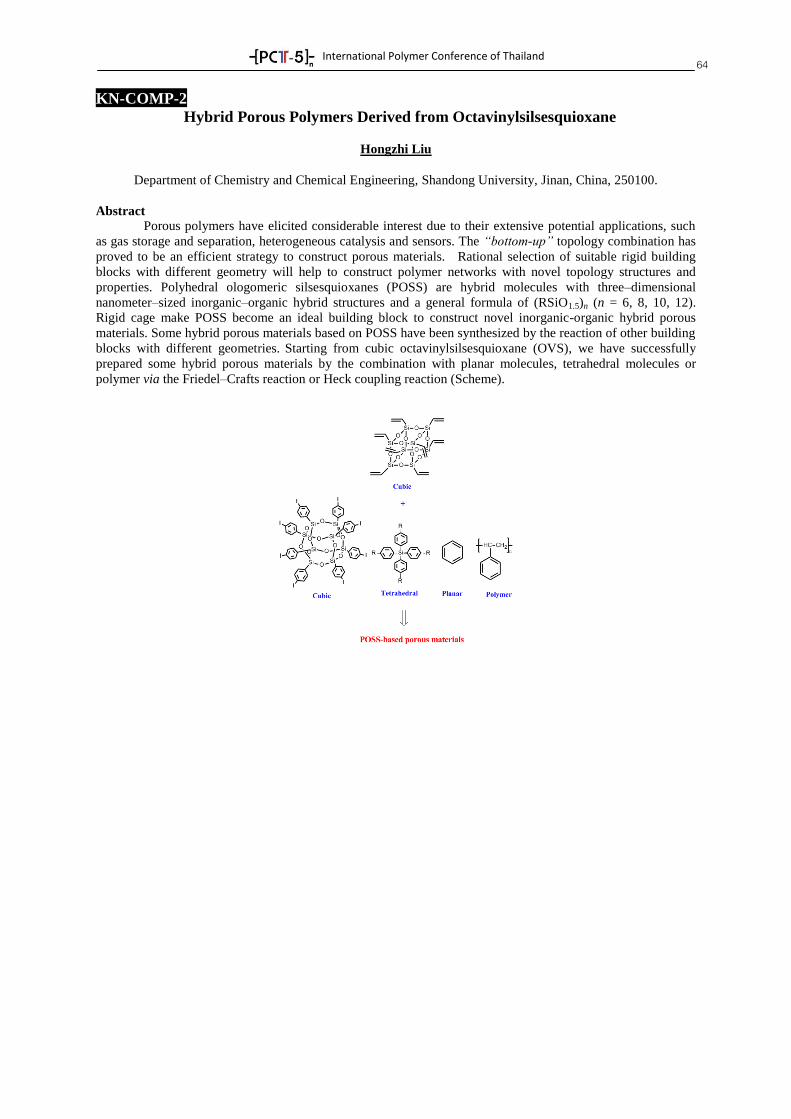
International Polymer Conference of Thailand
64
KN-COMP-2
Hybrid Porous Polymers Derived from Octavinylsilsesquioxane
Hongzhi Liu
Department of Chemistry and Chemical Engineering, Shandong University, Jinan, China, 250100.
Abstract
Porous polymers have elicited considerable interest due to their extensive potential applications, such
as gas storage and separation, heterogeneous catalysis and sensors. The “bottom-up” topology combination has
proved to be an efficient strategy to construct porous materials.
Rational selection of suitable rigid building
blocks with different geometry will help to construct polymer networks with novel topology structures and
properties. Polyhedral ologomeric silsesquioxanes (POSS) are hybrid molecules with three–dimensional
nanometer–sized inorganic–organic hybrid structures and a general formula of (RSiO1.5)n (n = 6, 8, 10, 12).
Rigid cage make POSS become an ideal building block to construct novel inorganic-organic hybrid porous
materials. Some hybrid porous materials based on POSS have been synthesized by the reaction of other building
blocks with different geometries. Starting from cubic octavinylsilsesquioxane (OVS), we have successfully
prepared some hybrid porous materials by the combination with planar molecules, tetrahedral molecules or
polymer via the Friedel–Crafts reaction or Heck coupling reaction (Scheme).
International Polymer Conference of Thailand
65
KN-COMP-3
Natural Fiber Reinforced Rubber: Recent Advances toward High Performance Rubber
Matrix Composites using Pineapple Leaf Fiber
Taweechai Amornsakchai
Polymer Science and Technology Program, Department of Chemistry and
Center of Excellence for Innovation in Chemistry and
Center of Sustainable Energy and Green Materials,
Faculty of Science, Mahidol University,
Phuttamonthon 4 Road, Salaya, Phuttamonthon,
Nakhon Pathom 73170, Thailand
Abstract
Short fiber provides uniquely characteristic reinforcement to
rubber, i.e. a sharp rise in stress at relatively low strains, which is not
obtainable from particulate fillers. It can be incorporated directly
along with other additives into the rubber compound and further
processed using standard rubber-processing equipment. This makes it
more convenient and economical. Now the use of natural fiber has
attracted a great deal of attention due to environmental and
sustainability issues. In addition, some natural fibers have greater
modulus than fibers that are normally used in the rubber industry.
Thus by using natural fiber as the reinforcement, greener and higher
performance rubber composite should be obtained. Since rubber
matrix has extremely low stiffness and very high extensibility
compared to the reinforcing fiber, there can be various practical
problems in obtaining good rubber composites. In this presentation,
various approaches to development of high performance rubber
composite from short and fine pineapple leaf fiber (PALF) will be
presented. These include the use of microfiber, hybridization with
some particulate fillers and changing the vulcanization systems.
Taweechai Amornsakchai
Department of Chemistry, Faculty of Science,
Mahidol University, Phuttamonthon 4 Road,
Salaya, Nakhon Pathom 73170 Thailand
Educations 1989 B.Sc. (Industrial Chemistry) King
Mongut's Institute of Technology (First class
honor) Ladkrabang
1994 Ph.D. (Polymer Physics) University of Leeds
Working experiences 1994 Lecturer Dept. Chemistry, Faculty of
Science, Mahidol University.
1998 Assistant Professor Dept. Chemistry,
Faculty of Science, Mahidol University. 2003 Associate Professor Dept. Chemistry,
Faculty of Science, Mahidol University.
Research Experiences 1. Ph. D. training on the thesis entitled “A
study of the tensile properties and structure of polyethylene fibres” under the supervision of
Professor I. M. Ward.
2. JSPS Visiting scientist to Department of Chemistry, Gunma University, Japan for a
collaborated work with Associate Professor H.
Kubota on “Photo-grafting of some vinyl monomers on highly oriented polyethylene”.
3. EPSRC visiting fellowship to polymer physics group, JJ Thomson Physical
Laboratory, University of Reading, UK,
working on ‘structure and properties of new generation polyethylenes’ with Professors D. C.
Bassett (Reading) and I. M. Ward (Leeds)
4. JSPS Visiting scientist to Institute for Chemical Research, Kyoto University, Japan
for a collaborated work with Professor
Fumitaka Horii on “Solid state 13C NMR investigation of highly drawn polyethylenes”.
International Polymer Conference of Thailand
66
KN-COMP-4 Performance of Aramid Fibre in Rubber Compounds
Jutarat Phanmai
Chemical Innovation Co., Ltd., 18 Soi Ramkhamhaeng 30 (Ban Rao), Huamark, Bangkapi, Bangkok 10240
Phone +66 2375 5197, Fax +662374 6503, E-mail: [email protected]
Abstract
Aramid fibres are used in many applications such as automotive
components (brake pads, clutch, gasket and tires), antiballistic, and
fiber optic cable. The benefits of them are high strength, low
elongation, good heat resistance property, and light weight. The aim of
present work is to observe physical, mechanical, and rheological
properties of NR and NBR compounds containing aramid fibres. It was
found that modulus and tear resistance increased while tensile strength
dropped at high loading. Tan δ at 50 °C didn’t show any improvement
while that at 100 °C exhibits increment of the performance.
Keywords: Aramid fibres, High strength, Heat resistance, NR
compounds and NBR compounds.
Jutarat Phanmai
Education
1991-1994: Master’s Degree (Master of
Science in Polymer Science)
Mahidol University, Bangkok, Thailand Thesis: A Study of Toughed Epoxy
Adhesives with Epoxidised Liquid Natural
Rubber (ELNR) 1987-1990: Bachelor’s Degree (Bachelor of
Science in Chemistry)
Mahidol University, Bangkok, Thailand Senior Project: Polymerization of Stars
Polymer
Work Experiences
Jul. 2001-Present: Chemical Innovation
Co., Ltd. - Trading Company, Bangkok Vice President (Marketing Trading,
Jan. 2011-Present) Marketing Manager (Feb. 2006-Dec.
2010)
R&D Manager (Jul. 2004-Jan. 2006) Technical Manager (Jul. 2001-Feb.
2004)
Sept. 2000 -Jun. 2001: Siam Nippon Steel Pipe Manufacturer Steel pipe Manufacturer,
Bangkok
Section Chief (Marketing) Jan.1995 -Feb. 1999: PI Industry Ltd.-
Rubber Compounder, Bangkok
Research and Development Assistance Manager
Jul. 1994 -Dec. 1994 Chemical Innovation
Co., Ltd.-Trading Company, Bangkok Research and Development Assistance
Manager
Research and development areas
Cogents in P/O Cure
Metallic Cogent in Sulfur Cure
UV Curing Technology for Coating
Application
Rubbers & Chemicals Compounding Technology Coupling agents in Plastics Composite
Coupling agents in Biodegradable Polymer
Adhesion Promoters in Rubber
Compounds Aramid fibre in Rubber Compound
International Polymer Conference of Thailand
67
COMPO-01
Influence of Pristine Clay Incorporation on Strain-Induced Crystallization of Natural Rubber
Abdulhakim Masa,1 Hiromu Saito,
2 Tadamoto Sakai,
3 Azizon Kaesaman
1 and Natinee Lopattananon
1*
1 Department of Rubber Technology and Polymer Science, Faculty of Science and Technology,
Prince of Songkla University, Pattani 94000 Thailand. 2 Department of Organic & Polymer Materials Chemistry, Tokyo University of Agriculture and Technology,
Koganei-shi, Tokyo 184-8588, Japan. 3 Shizuoka University, 3-3-6 Shibaura, Minato, Tokyo, 108-0023, Japan.
Abstract
Strain-induced crystallization behavior of cured natural rubber (NR) nanocomposite filled with 5 phr clay was
investigated by means of tensile test and wide X-ray diffraction (WAXD) measurements. The dispersion of clay was
revealed by using X-ray diffraction (XRD) analysis. The uncured NR/clay nanocomposite and cured pure NR samples
were also prepared for comparison. It was found that the clay was intercalated by NR chains. Addition of clay
drastically affected the tensile behavior by changing the pattern of stress-strain curves. By comparing with the cured
neat NR, the stress upturn, corresponding to strain-induced crystallization, was developed at lower strain with the
presence of clay. WAXD results also showed that the onset strain for strain-induced crystallization of NR was
accelerated and the crystallinity was enhanced due to collaborative strain-induced crystallization by clay and
crosslinking point.
Keywords: natural rubber / clay / nanocomposite / strain-induced crystallization / WAXD
1. Introduction
Natural rubber (NR) is a renewable material, which
has been used to manufacture a wide range of industrial
products, i.e., automobile tires, vibration isolators,
medical gloves, etc. The interest in NR is basically
attributed to its ability to crystallize upon deformation
(strain-induced crystallization), which gives natural
rubber high tensile strength, resistance to cutting, tearing,
and abrasion [1], and stops crack propagation at ultimate
strain [2]. The strain-induced crystallization mechanism
of cured pure NR was explained on the basis of
inhomogeneous distribution of the network chain length,
i.e., highly crosslinked network region would favor the
molecular orientation of chains to induce crystallization
[3]. In NR-based nanocomposites, ability of strain-
induced crystallization was accelerated and increased in
the presence of clay [4, 5]. However, the change in
strain-induced crystallization behavior and the increase
of crystallization was not discussed. Therefore, in this
article the structure-property relationship of the cured
NR nanocomposite, uncured NR nanocomposite and neat
cured NR was examined in order to understand the
influence of clay on the development of strain-induced
crystallization process and the change in crystallization
behavior of the NR.
2. Experimental
Suspension of clay (Kunipia-F®, Kunimine
Industries Co., Ltd., Japan) in water was added into NR
latex (Yala Latex Co., Ltd., Thailand). The NR and clay
were mixed thoroughly under vigorous stirring at
ambient temperature for 30 min, and dried at 50C for 3
days to obtain uncured NR/clay nanocomposite. The
NR/clay nanocomposite was then compounded with
phenolic crosslinking agent (HRJ-10518) (Schenectady
International Inc., USA) and catalyst (SnCl22H2O)
(Carlo Erba Reagent, France) in a mixing chamber of a
miniature mixing machine (IMC-18D7, Imoto
Machinery Co., Ltd., Japan) at rotor speed of 140 rpm
and temperature of 100 °C for 20 min. The sample was
later melt pressed in a small hot-press machine (Imoto
Machinery Co., Ltd., Japan) at 180°C to obtain the cured
NR/clay nanocomposite film with a thickness of 1 mm.
In this study, the clay content was fixed at 5 phr. The
uncured and cured pure NR specimens were also
prepared by using the same procedure outlined above for
the preparation of the uncured and cured NR
nanocomposites, respectively. The samples were
characterized by using tensile test and wide angle X-ray
diffraction (WAXD) measurements.
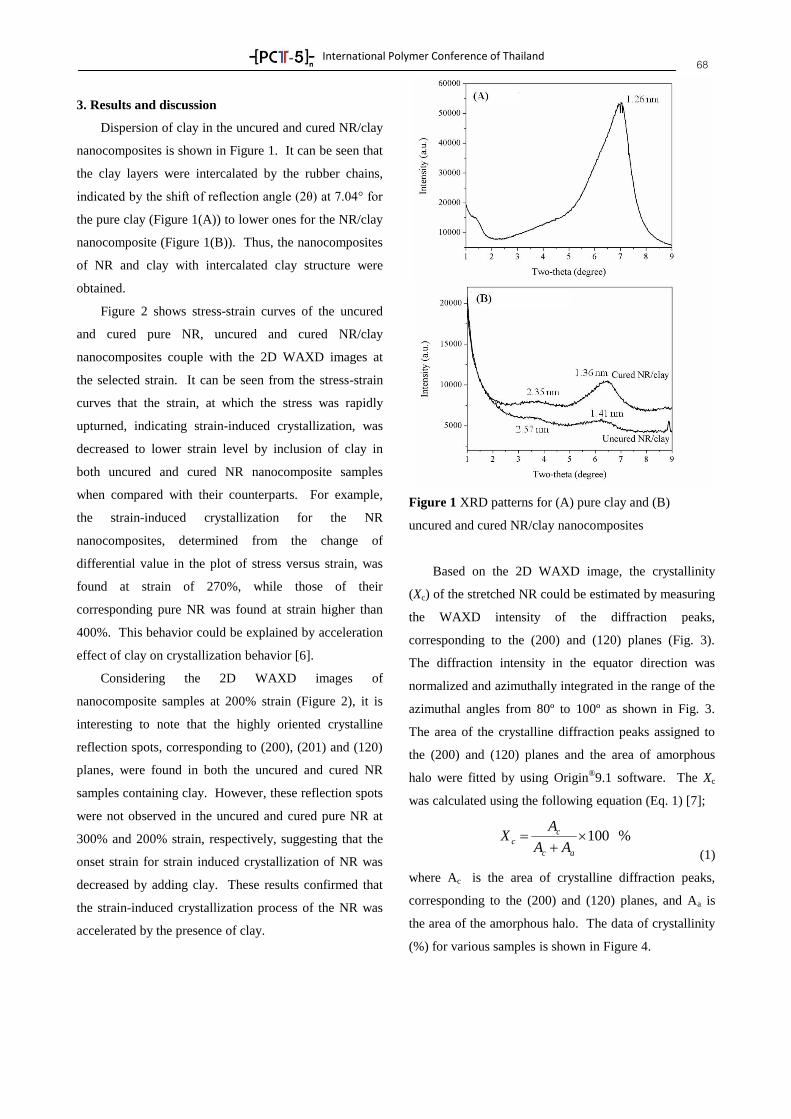
International Polymer Conference of Thailand
68
3. Results and discussion
Dispersion of clay in the uncured and cured NR/clay
nanocomposites is shown in Figure 1. It can be seen that
the clay layers were intercalated by the rubber chains,
indicated by the shift of reflection angle (2θ) at 7.04° for
the pure clay (Figure 1(A)) to lower ones for the NR/clay
nanocomposite (Figure 1(B)). Thus, the nanocomposites
of NR and clay with intercalated clay structure were
obtained.
Figure 2 shows stress-strain curves of the uncured
and cured pure NR, uncured and cured NR/clay
nanocomposites couple with the 2D WAXD images at
the selected strain. It can be seen from the stress-strain
curves that the strain, at which the stress was rapidly
upturned, indicating strain-induced crystallization, was
decreased to lower strain level by inclusion of clay in
both uncured and cured NR nanocomposite samples
when compared with their counterparts. For example,
the strain-induced crystallization for the NR
nanocomposites, determined from the change of
differential value in the plot of stress versus strain, was
found at strain of 270%, while those of their
corresponding pure NR was found at strain higher than
400%. This behavior could be explained by acceleration
effect of clay on crystallization behavior [6].
Considering the 2D WAXD images of
nanocomposite samples at 200% strain (Figure 2), it is
interesting to note that the highly oriented crystalline
reflection spots, corresponding to (200), (201) and (120)
planes, were found in both the uncured and cured NR
samples containing clay. However, these reflection spots
were not observed in the uncured and cured pure NR at
300% and 200% strain, respectively, suggesting that the
onset strain for strain induced crystallization of NR was
decreased by adding clay. These results confirmed that
the strain-induced crystallization process of the NR was
accelerated by the presence of clay.
Figure 1 XRD patterns for (A) pure clay and (B)
uncured and cured NR/clay nanocomposites
Based on the 2D WAXD image, the crystallinity
(Xc) of the stretched NR could be estimated by measuring
the WAXD intensity of the diffraction peaks,
corresponding to the (200) and (120) planes (Fig. 3).
The diffraction intensity in the equator direction was
normalized and azimuthally integrated in the range of the
azimuthal angles from 80º to 100º as shown in Fig. 3.
The area of the crystalline diffraction peaks assigned to
the (200) and (120) planes and the area of amorphous
halo were fitted by using Origin®9.1 software. The Xc
was calculated using the following equation (Eq. 1) [7];
%100
ac
cc
AA
AX
(1)
where Ac is the area of crystalline diffraction peaks,
corresponding to the (200) and (120) planes, and Aa is
the area of the amorphous halo. The data of crystallinity
(%) for various samples is shown in Figure 4.
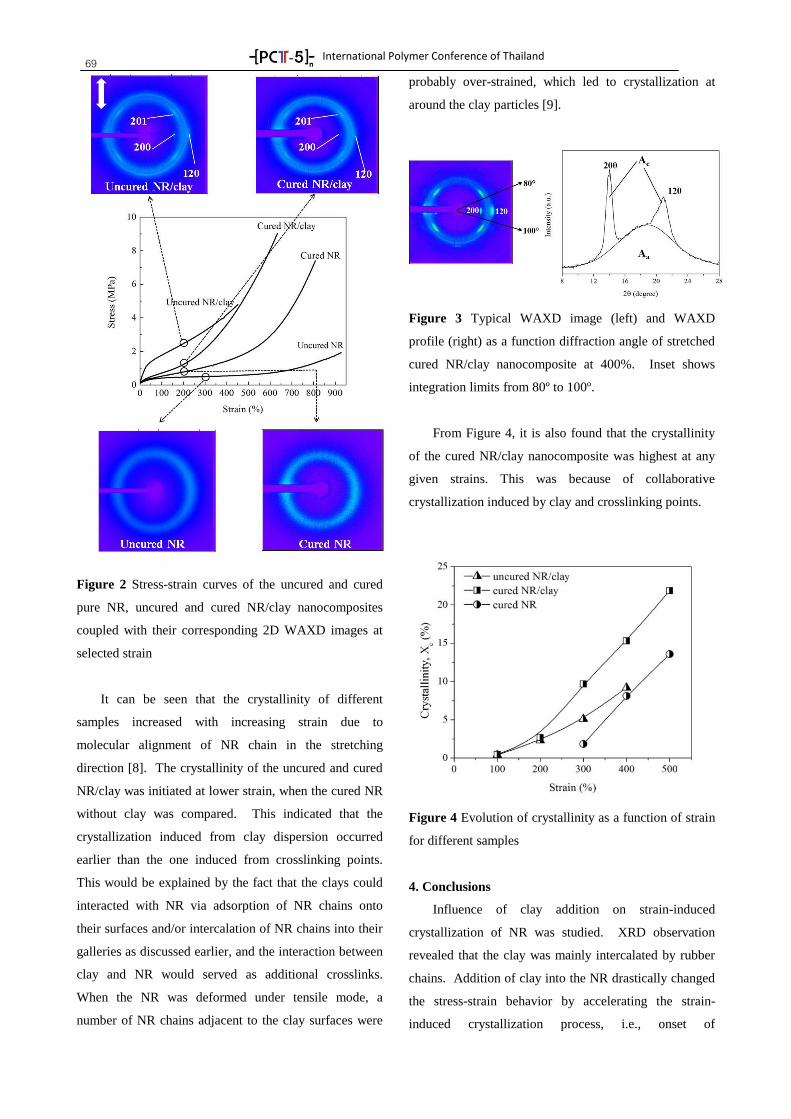
International Polymer Conference of Thailand
69
Figure 2 Stress-strain curves of the uncured and cured
pure NR, uncured and cured NR/clay nanocomposites
coupled with their corresponding 2D WAXD images at
selected strain
It can be seen that the crystallinity of different
samples increased with increasing strain due to
molecular alignment of NR chain in the stretching
direction [8]. The crystallinity of the uncured and cured
NR/clay was initiated at lower strain, when the cured NR
without clay was compared. This indicated that the
crystallization induced from clay dispersion occurred
earlier than the one induced from crosslinking points.
This would be explained by the fact that the clays could
interacted with NR via adsorption of NR chains onto
their surfaces and/or intercalation of NR chains into their
galleries as discussed earlier, and the interaction between
clay and NR would served as additional crosslinks.
When the NR was deformed under tensile mode, a
number of NR chains adjacent to the clay surfaces were
probably over-strained, which led to crystallization at
around the clay particles [9].
Figure 3 Typical WAXD image (left) and WAXD
profile (right) as a function diffraction angle of stretched
cured NR/clay nanocomposite at 400%. Inset shows
integration limits from 80º to 100º.
From Figure 4, it is also found that the crystallinity
of the cured NR/clay nanocomposite was highest at any
given strains. This was because of collaborative
crystallization induced by clay and crosslinking points.
Figure 4 Evolution of crystallinity as a function of strain
for different samples
4. Conclusions
Influence of clay addition on strain-induced
crystallization of NR was studied. XRD observation
revealed that the clay was mainly intercalated by rubber
chains. Addition of clay into the NR drastically changed
the stress-strain behavior by accelerating the strain-
induced crystallization process, i.e., onset of
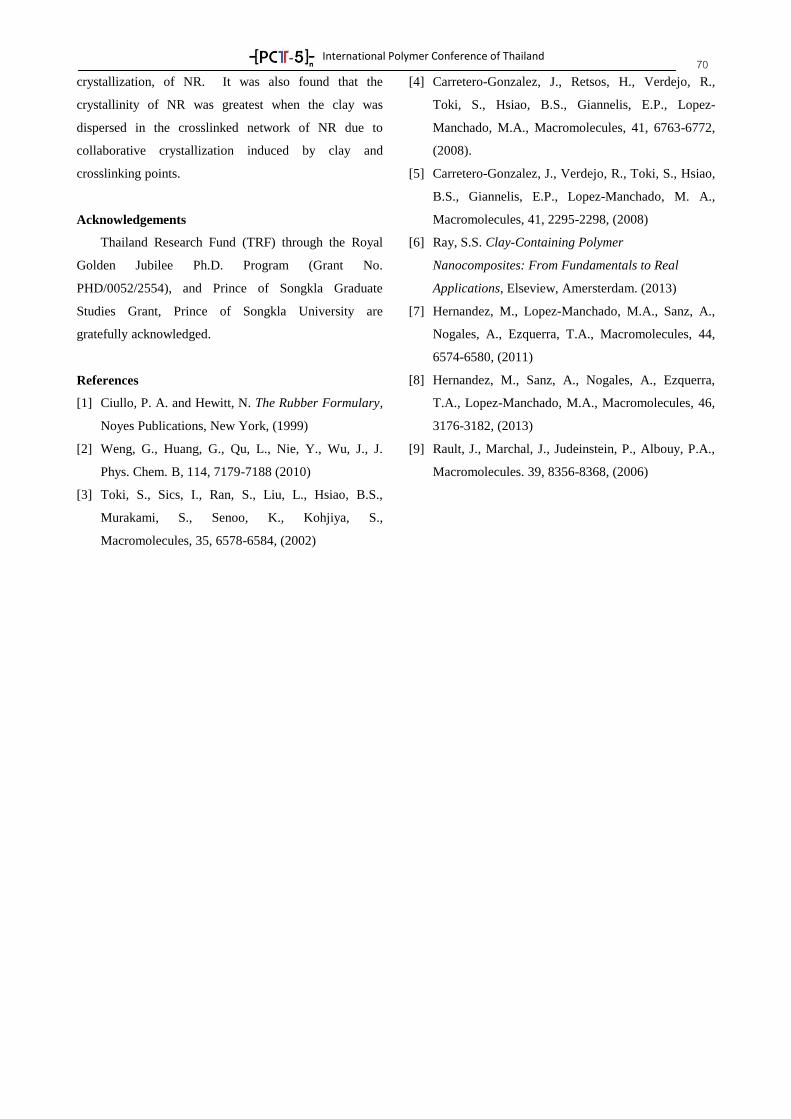
International Polymer Conference of Thailand
70 crystallization, of NR. It was also found that the
crystallinity of NR was greatest when the clay was
dispersed in the crosslinked network of NR due to
collaborative crystallization induced by clay and
crosslinking points.
Acknowledgements
Thailand Research Fund (TRF) through the Royal
Golden Jubilee Ph.D. Program (Grant No.
PHD/0052/2554), and Prince of Songkla Graduate
Studies Grant, Prince of Songkla University are
gratefully acknowledged.
References
[1] Ciullo, P. A. and Hewitt, N. The Rubber Formulary,
Noyes Publications, New York, (1999)
[2] Weng, G., Huang, G., Qu, L., Nie, Y., Wu, J., J.
Phys. Chem. B, 114, 7179-7188 (2010)
[3] Toki, S., Sics, I., Ran, S., Liu, L., Hsiao, B.S.,
Murakami, S., Senoo, K., Kohjiya, S.,
Macromolecules, 35, 6578-6584, (2002)
[4] Carretero-Gonzalez, J., Retsos, H., Verdejo, R.,
Toki, S., Hsiao, B.S., Giannelis, E.P., Lopez-
Manchado, M.A., Macromolecules, 41, 6763-6772,
(2008).
[5] Carretero-Gonzalez, J., Verdejo, R., Toki, S., Hsiao,
B.S., Giannelis, E.P., Lopez-Manchado, M. A.,
Macromolecules, 41, 2295-2298, (2008)
[6] Ray, S.S. Clay-Containing Polymer
Nanocomposites: From Fundamentals to Real
Applications, Elseview, Amersterdam. (2013)
[7] Hernandez, M., Lopez-Manchado, M.A., Sanz, A.,
Nogales, A., Ezquerra, T.A., Macromolecules, 44,
6574-6580, (2011)
[8] Hernandez, M., Sanz, A., Nogales, A., Ezquerra,
T.A., Lopez-Manchado, M.A., Macromolecules, 46,
3176-3182, (2013)
[9] Rault, J., Marchal, J., Judeinstein, P., Albouy, P.A.,
Macromolecules. 39, 8356-8368, (2006)

International Polymer Conference of Thailand
71
COMPO-02
Effects of Organoclay Types on Morphological and Mechanical Properties of
Polyoxymethylene/Polypropylene Blends
Nipawan Yasumlee, Sirirat Wacharawichanant*
Department of Chemical Engineering, Faculty of Engineering and Industrial Technology, Silpakorn University
NakhonPathom 73000, Thailand
Abstract
This work studied the effects of organoclay surface modified with three different types of dimethyl dialkyl (C14-
C18) amine (organoclay-DDA), trimethylstearyl ammonium (organoclay-TSA) and methyl dihydroxyethyl
hydrogenated tallow ammonium (organoclay-DHA) on mechanical and morphological properties of polyoxymethylene
(POM)/polypropylene (PP) blends. Scanning electron microscopy (SEM) results revealed the size of dispersed PP
phase decreased with increasing organoclay content. X-ray diffraction (XRD) results showed the formation of
exfoliated structure for POM/PP/organoclay (80/20/5phr) at all types of organoclay. Incorporation of organoclay
improved the Young’s modulus but dropped the percent strain at break of the blends. The POM/PP blends containing
organoclay-DHA revealed the highest tensile strength due to better exfoliated structure in the POM/PP/organoclay-
DHA
Keywords: Polyoxymethylene; Polypropylene; Organoclay; Morphology; Mechanical properties
1. Introduction
The polymer blends have been studied for many
years, develop new polymeric materials. However, most
polymer blends are immiscible and phase separation
leading to poor mechanical properties. Several articles
reported that the improvement miscible between polymer
blends by reduce interfacial tension of two phases, which
results in improved material properties [1].
Recently, several research groups have studied
about the application of organoclay in the polymer
blends.
By the incorporation of organoclay in blends, the
morphology can be affected by several factorssuch as the
composition of the dispersed phase, viscosity ratio and
the elasticity of the each phases [2]. For example, the
study of effect of organoclay in polypropylene
(PP)/polystyrene (PS) blends found that the addition
small amounts (2-5 wt%) of an organoclay to the blends
can reduce the dispersedsize of PS phase and improve
interfacial adhesion between two polymers.
From SEM study, it was found that the morphology of
the blends displays very fine particle size and good
interfacial adhesion between phases after of organoclay
addition. This indicates that the improvement elongation
at break of the PS/PP blends due to organoclay plays the
role of interfacial active agent.Sung et al. [3] studied the
effect of organoclay on the morphology of
poly(acrylonitrile-butadiene-styrene) (ABS) and PP.
They found that the dispersed PP phase changed from a
sphere to elongated structure, when the organoclay
content was increased due to the viscosity ratios of the
PP and ABS/clay decreased. Transmission electron
microscopy (TEM) and x-ray diffraction (XRD) results
found that the most of the organoclay existed in ABS
phase because of the good affinity between the ABS and
clay. Anup et al. [4] studied the morphology of PP/high-
density polyethylene (HDPE) blends by the addition of
organoclay. Form SEM results found that the addition of
the organoclay reduced the dispersed HDPE phase
because of the barrier effect of organoclay in a matrix,
including decrease in the viscosity ratio of HDPE and
PP. Sumana Mallick et al. [5] showed that the presence
organoclay improved the miscibility between Nylon6
and HDPE in Nylon6/HDPE blends. From XRD results
revealed that the organoclay were exfoliated in the
nylon6 and intercalated in HDPE matrix, indicating to
improve in tensile properties.
The incorporation of clay modification on the
mechanical properties of polyamide 6/PP showed that the
increase ofstiffness and storage modulus in the blends
[6]. Bitinis et al. [7] reported that the addition of the
organoclay in poly (lactic acid) (PLA)/ natural rubber
(NR) blends. They found that the elongation at break,
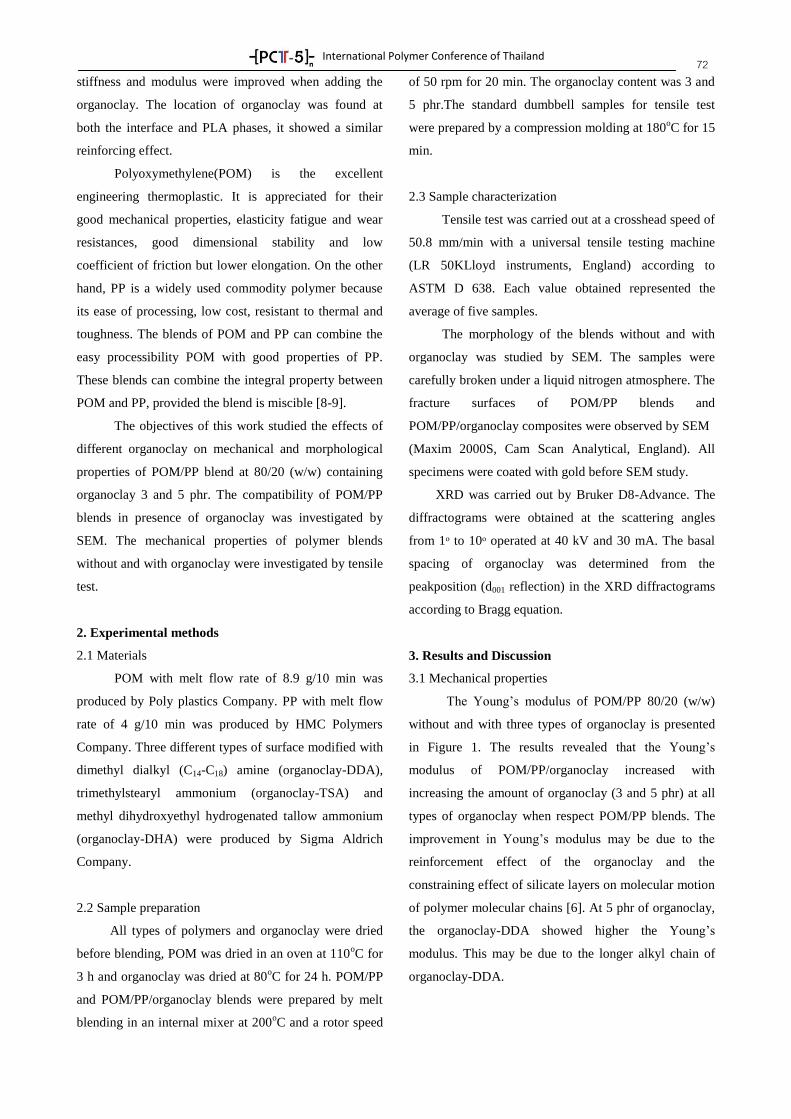
International Polymer Conference of Thailand
72 stiffness and modulus were improved when adding the
organoclay. The location of organoclay was found at
both the interface and PLA phases, it showed a similar
reinforcing effect.
Polyoxymethylene(POM) is the excellent
engineering thermoplastic. It is appreciated for their
good mechanical properties, elasticity fatigue and wear
resistances, good dimensional stability and low
coefficient of friction but lower elongation. On the other
hand, PP is a widely used commodity polymer because
its ease of processing, low cost, resistant to thermal and
toughness. The blends of POM and PP can combine the
easy processibility POM with good properties of PP.
These blends can combine the integral property between
POM and PP, provided the blend is miscible [8-9].
The objectives of this work studied the effects of
different organoclay on mechanical and morphological
properties of POM/PP blend at 80/20 (w/w) containing
organoclay 3 and 5 phr. The compatibility of POM/PP
blends in presence of organoclay was investigated by
SEM. The mechanical properties of polymer blends
without and with organoclay were investigated by tensile
test.
2. Experimental methods
2.1 Materials
POM with melt flow rate of 8.9 g/10 min was
produced by Poly plastics Company. PP with melt flow
rate of 4 g/10 min was produced by HMC Polymers
Company. Three different types of surface modified with
dimethyl dialkyl (C14-C18) amine (organoclay-DDA),
trimethylstearyl ammonium (organoclay-TSA) and
methyl dihydroxyethyl hydrogenated tallow ammonium
(organoclay-DHA) were produced by Sigma Aldrich
Company.
2.2 Sample preparation
All types of polymers and organoclay were dried
before blending, POM was dried in an oven at 110oC for
3 h and organoclay was dried at 80oC for 24 h. POM/PP
and POM/PP/organoclay blends were prepared by melt
blending in an internal mixer at 200oC and a rotor speed
of 50 rpm for 20 min. The organoclay content was 3 and
5 phr.The standard dumbbell samples for tensile test
were prepared by a compression molding at 180oC for 15
min.
2.3 Sample characterization
Tensile test was carried out at a crosshead speed of
50.8 mm/min with a universal tensile testing machine
(LR 50KLloyd instruments, England) according to
ASTM D 638. Each value obtained represented the
average of five samples.
The morphology of the blends without and with
organoclay was studied by SEM. The samples were
carefully broken under a liquid nitrogen atmosphere. The
fracture surfaces of POM/PP blends and
POM/PP/organoclay composites were observed by SEM
(Maxim 2000S, Cam Scan Analytical, England). All
specimens were coated with gold before SEM study.
XRD was carried out by Bruker D8-Advance. The
diffractograms were obtained at the scattering angles
from 1ᵒ to 10ᵒ operated at 40 kV and 30 mA. The basal
spacing of organoclay was determined from the
peakposition (d001 reflection) in the XRD diffractograms
according to Bragg equation.
3. Results and Discussion
3.1 Mechanical properties
The Young’s modulus of POM/PP 80/20 (w/w)
without and with three types of organoclay is presented
in Figure 1. The results revealed that the Young’s
modulus of POM/PP/organoclay increased with
increasing the amount of organoclay (3 and 5 phr) at all
types of organoclay when respect POM/PP blends. The
improvement in Young’s modulus may be due to the
reinforcement effect of the organoclay and the
constraining effect of silicate layers on molecular motion
of polymer molecular chains [6]. At 5 phr of organoclay,
the organoclay-DDA showed higher the Young’s
modulus. This may be due to the longer alkyl chain of
organoclay-DDA.
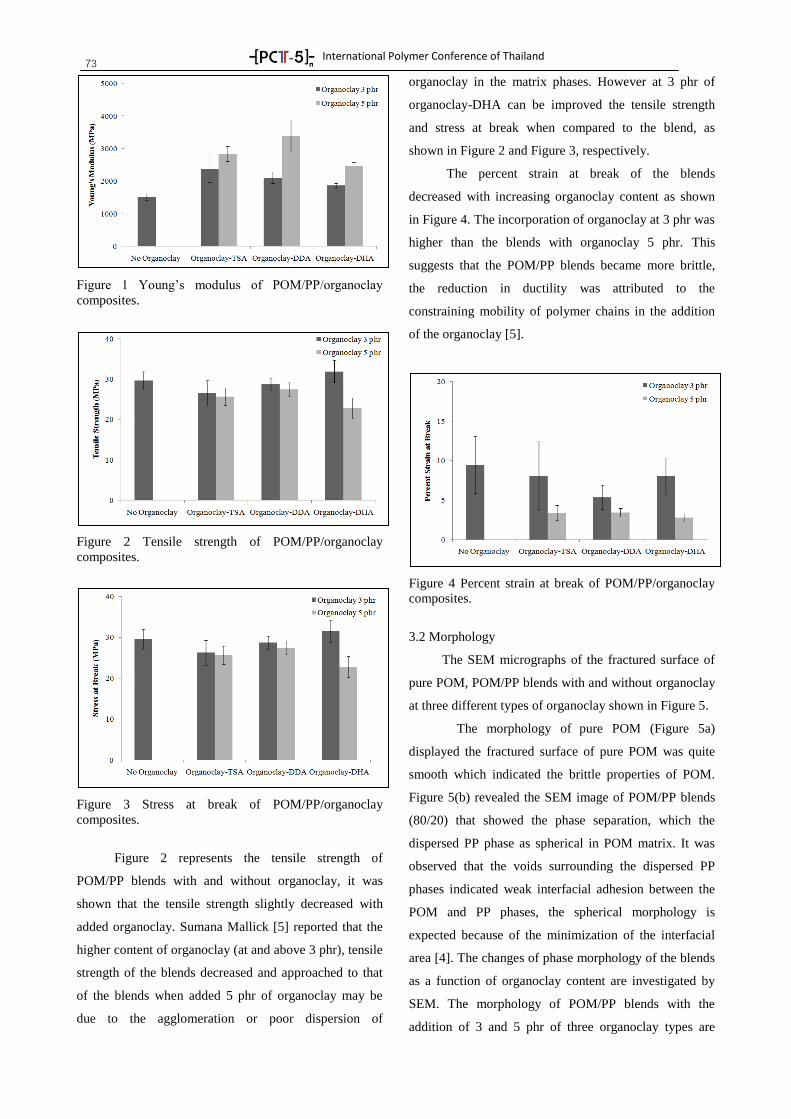
International Polymer Conference of Thailand
73
Figure 1 Young’s modulus of POM/PP/organoclay
composites.
Figure 2 Tensile strength of POM/PP/organoclay
composites.
Figure 3 Stress at break of POM/PP/organoclay
composites.
Figure 2 represents the tensile strength of
POM/PP blends with and without organoclay, it was
shown that the tensile strength slightly decreased with
added organoclay. Sumana Mallick [5] reported that the
higher content of organoclay (at and above 3 phr), tensile
strength of the blends decreased and approached to that
of the blends when added 5 phr of organoclay may be
due to the agglomeration or poor dispersion of
organoclay in the matrix phases. However at 3 phr of
organoclay-DHA can be improved the tensile strength
and stress at break when compared to the blend, as
shown in Figure 2 and Figure 3, respectively.
The percent strain at break of the blends
decreased with increasing organoclay content as shown
in Figure 4. The incorporation of organoclay at 3 phr was
higher than the blends with organoclay 5 phr. This
suggests that the POM/PP blends became more brittle,
the reduction in ductility was attributed to the
constraining mobility of polymer chains in the addition
of the organoclay [5].
Figure 4 Percent strain at break of POM/PP/organoclay
composites.
3.2 Morphology
The SEM micrographs of the fractured surface of
pure POM, POM/PP blends with and without organoclay
at three different types of organoclay shown in Figure 5.
The morphology of pure POM (Figure 5a)
displayed the fractured surface of pure POM was quite
smooth which indicated the brittle properties of POM.
Figure 5(b) revealed the SEM image of POM/PP blends
(80/20) that showed the phase separation, which the
dispersed PP phase as spherical in POM matrix. It was
observed that the voids surrounding the dispersed PP
phases indicated weak interfacial adhesion between the
POM and PP phases, the spherical morphology is
expected because of the minimization of the interfacial
area [4]. The changes of phase morphology of the blends
as a function of organoclay content are investigated by
SEM. The morphology of POM/PP blends with the
addition of 3 and 5 phr of three organoclay types are
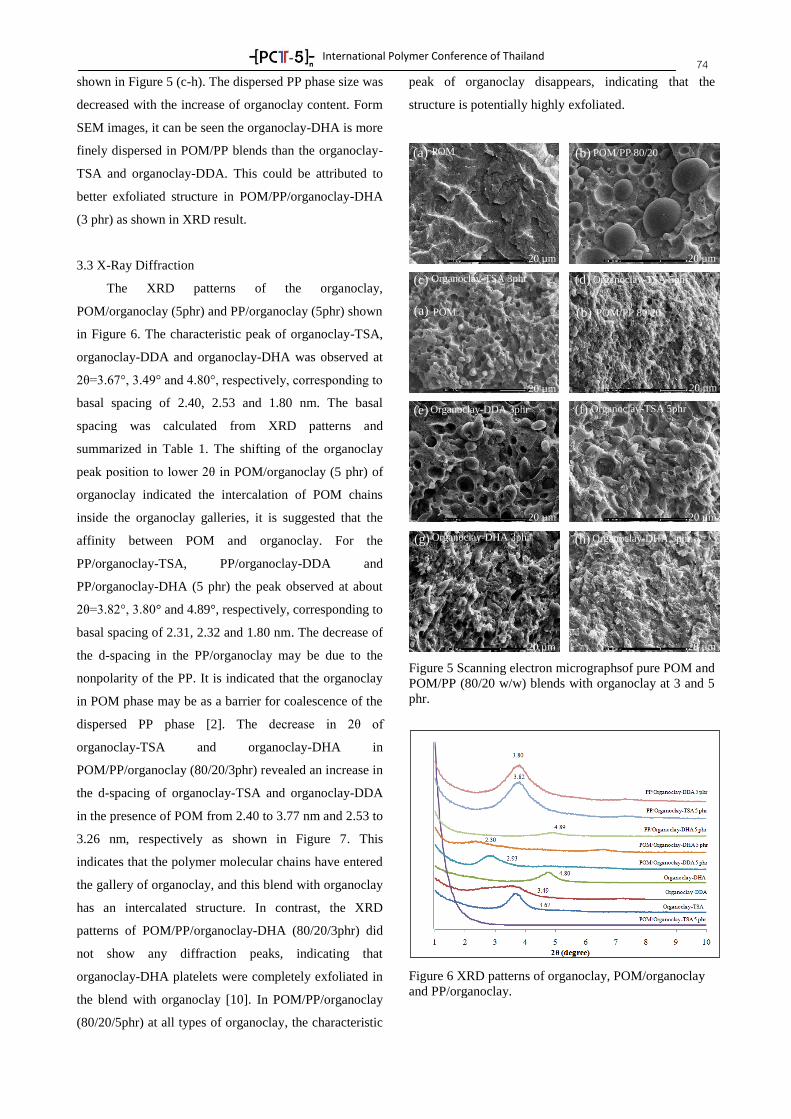
International Polymer Conference of Thailand
74 shown in Figure 5 (c-h). The dispersed PP phase size was
decreased with the increase of organoclay content. Form
SEM images, it can be seen the organoclay-DHA is more
finely dispersed in POM/PP blends than the organoclay-
TSA and organoclay-DDA. This could be attributed to
better exfoliated structure in POM/PP/organoclay-DHA
(3 phr) as shown in XRD result.
3.3 X-Ray Diffraction
The XRD patterns of the organoclay,
POM/organoclay (5phr) and PP/organoclay (5phr) shown
in Figure 6. The characteristic peak of organoclay-TSA,
organoclay-DDA and organoclay-DHA was observed at
2θ=3.67°, 3.49° and 4.80°, respectively, corresponding to
basal spacing of 2.40, 2.53 and 1.80 nm. The basal
spacing was calculated from XRD patterns and
summarized in Table 1. The shifting of the organoclay
peak position to lower 2θ in POM/organoclay (5 phr) of
organoclay indicated the intercalation of POM chains
inside the organoclay galleries, it is suggested that the
affinity between POM and organoclay. For the
PP/organoclay-TSA, PP/organoclay-DDA and
PP/organoclay-DHA (5 phr) the peak observed at about
2θ=3.82°, 3.80° and 4.89°, respectively, corresponding to
basal spacing of 2.31, 2.32 and 1.80 nm. The decrease of
the d-spacing in the PP/organoclay may be due to the
nonpolarity of the PP. It is indicated that the organoclay
in POM phase may be as a barrier for coalescence of the
dispersed PP phase [2]. The decrease in 2θ of
organoclay-TSA and organoclay-DHA in
POM/PP/organoclay (80/20/3phr) revealed an increase in
the d-spacing of organoclay-TSA and organoclay-DDA
in the presence of POM from 2.40 to 3.77 nm and 2.53 to
3.26 nm, respectively as shown in Figure 7. This
indicates that the polymer molecular chains have entered
the gallery of organoclay, and this blend with organoclay
has an intercalated structure. In contrast, the XRD
patterns of POM/PP/organoclay-DHA (80/20/3phr) did
not show any diffraction peaks, indicating that
organoclay-DHA platelets were completely exfoliated in
the blend with organoclay [10]. In POM/PP/organoclay
(80/20/5phr) at all types of organoclay, the characteristic
peak of organoclay disappears, indicating that the
structure is potentially highly exfoliated.
Figure 5 Scanning electron micrographsof pure POM and
POM/PP (80/20 w/w) blends with organoclay at 3 and 5
phr.
Figure 6 XRD patterns of organoclay, POM/organoclay
and PP/organoclay.
(a) (b)
(c) (d)
(e) (f)
(g) (h)
20 µm 20 µm
20 µm 20 µm
20 µm 20 µm
20 µm 20 µm
POM POM/PP 80/20
Organoclay-TSA 3phr Organoclay-TSA 5phr
Organoclay-DDA 3phr Organoclay-TSA 5phr
Organoclay-DHA 3phr Organoclay-DHA 5phr
(a) (b) POM POM/PP 80/20
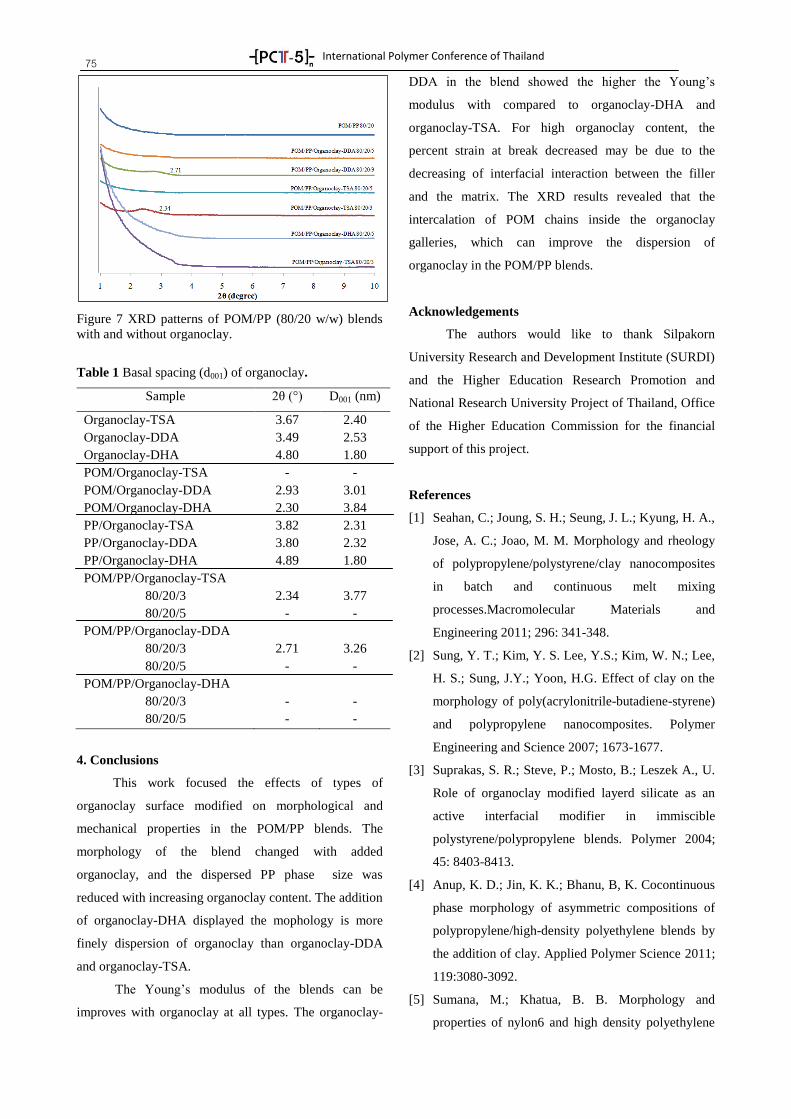
International Polymer Conference of Thailand
75
Figure 7 XRD patterns of POM/PP (80/20 w/w) blends
with and without organoclay.
Table 1 Basal spacing (d001) of organoclay.
Sample 2θ (°) D001 (nm)
Organoclay-TSA
Organoclay-DDA
Organoclay-DHA
POM/Organoclay-TSA
POM/Organoclay-DDA
POM/Organoclay-DHA
PP/Organoclay-TSA
PP/Organoclay-DDA
PP/Organoclay-DHA
POM/PP/Organoclay-TSA
80/20/3
80/20/5
POM/PP/Organoclay-DDA
80/20/3
80/20/5
POM/PP/Organoclay-DHA
80/20/3
80/20/5
3.67
3.49
4.80
-
2.93
2.30
3.82
3.80
4.89
2.34
-
2.71
-
-
-
2.40
2.53
1.80
-
3.01
3.84
2.31
2.32
1.80
3.77
-
3.26
-
-
-
4. Conclusions
This work focused the effects of types of
organoclay surface modified on morphological and
mechanical properties in the POM/PP blends. The
morphology of the blend changed with added
organoclay, and the dispersed PP phase size was
reduced with increasing organoclay content. The addition
of organoclay-DHA displayed the mophology is more
finely dispersion of organoclay than organoclay-DDA
and organoclay-TSA.
The Young’s modulus of the blends can be
improves with organoclay at all types. The organoclay-
DDA in the blend showed the higher the Young’s
modulus with compared to organoclay-DHA and
organoclay-TSA. For high organoclay content, the
percent strain at break decreased may be due to the
decreasing of interfacial interaction between the filler
and the matrix. The XRD results revealed that the
intercalation of POM chains inside the organoclay
galleries, which can improve the dispersion of
organoclay in the POM/PP blends.
Acknowledgements
The authors would like to thank Silpakorn
University Research and Development Institute (SURDI)
and the Higher Education Research Promotion and
National Research University Project of Thailand, Office
of the Higher Education Commission for the financial
support of this project.
References
[1] Seahan, C.; Joung, S. H.; Seung, J. L.; Kyung, H. A.,
Jose, A. C.; Joao, M. M. Morphology and rheology
of polypropylene/polystyrene/clay nanocomposites
in batch and continuous melt mixing
processes.Macromolecular Materials and
Engineering 2011; 296: 341-348.
[2] Sung, Y. T.; Kim, Y. S. Lee, Y.S.; Kim, W. N.; Lee,
H. S.; Sung, J.Y.; Yoon, H.G. Effect of clay on the
morphology of poly(acrylonitrile-butadiene-styrene)
and polypropylene nanocomposites. Polymer
Engineering and Science 2007; 1673-1677.
[3] Suprakas, S. R.; Steve, P.; Mosto, B.; Leszek A., U.
Role of organoclay modified layerd silicate as an
active interfacial modifier in immiscible
polystyrene/polypropylene blends. Polymer 2004;
45: 8403-8413.
[4] Anup, K. D.; Jin, K. K.; Bhanu, B, K. Cocontinuous
phase morphology of asymmetric compositions of
polypropylene/high-density polyethylene blends by
the addition of clay. Applied Polymer Science 2011;
119:3080-3092.
[5] Sumana, M.; Khatua, B. B. Morphology and
properties of nylon6 and high density polyethylene
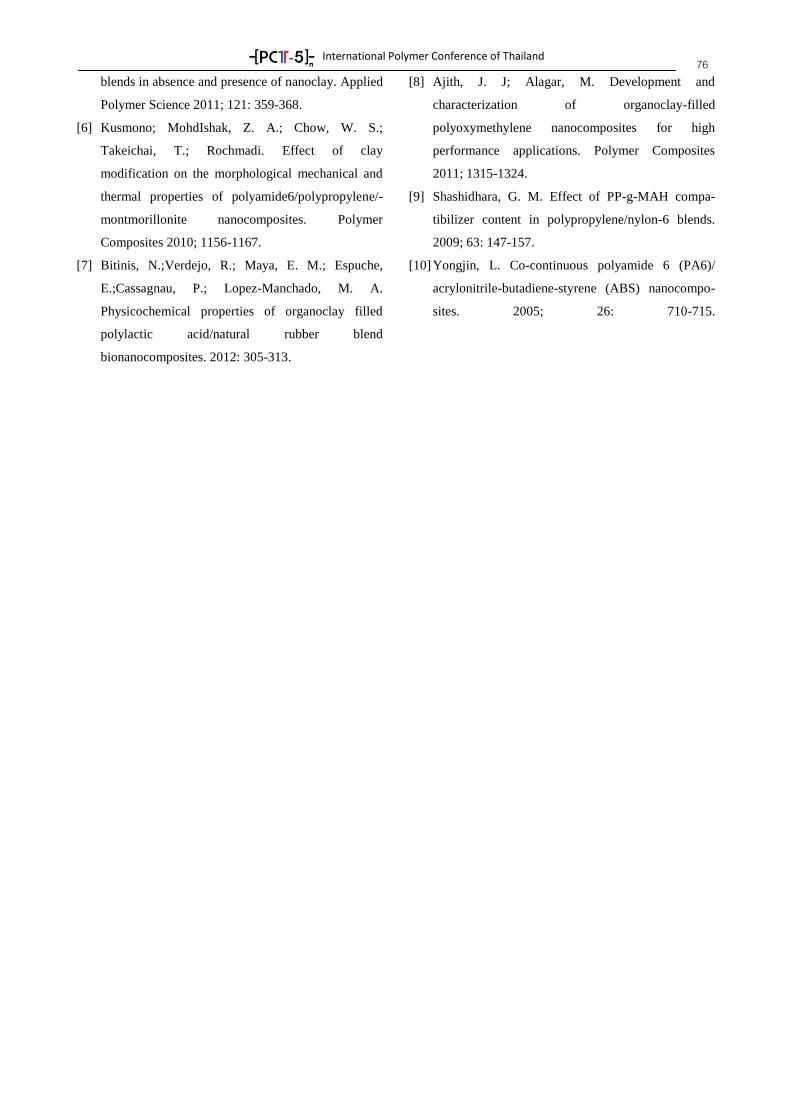
International Polymer Conference of Thailand
76 blends in absence and presence of nanoclay. Applied
Polymer Science 2011; 121: 359-368.
[6] Kusmono; MohdIshak, Z. A.; Chow, W. S.;
Takeichai, T.; Rochmadi. Effect of clay
modification on the morphological mechanical and
thermal properties of polyamide6/polypropylene/-
montmorillonite nanocomposites. Polymer
Composites 2010; 1156-1167.
[7] Bitinis, N.;Verdejo, R.; Maya, E. M.; Espuche,
E.;Cassagnau, P.; Lopez-Manchado, M. A.
Physicochemical properties of organoclay filled
polylactic acid/natural rubber blend
bionanocomposites. 2012: 305-313.
[8] Ajith, J. J; Alagar, M. Development and
characterization of organoclay-filled
polyoxymethylene nanocomposites for high
performance applications. Polymer Composites
2011; 1315-1324.
[9] Shashidhara, G. M. Effect of PP-g-MAH compa-
tibilizer content in polypropylene/nylon-6 blends.
2009; 63: 147-157.
[10] Yongjin, L. Co-continuous polyamide 6 (PA6)/
acrylonitrile-butadiene-styrene (ABS) nanocompo-
sites. 2005; 26: 710-715.
International Polymer Conference of Thailand
77
COMPO-04
Preparation and Characterization of TiO2/WO3/Polythiophene Composite
Nuttaporn Jaritkaun1, *
, Jatuphorn Wootthikanokkhan1, 2
, Pailin Ngaotrakanwiwat 2, 3
and Siriluk Chiarakorn1, 3
1School of Energy, Environment and Materials, King Mongkut's University of Technology Thonburi (KMUTT),
Bangkok 10140 2Nanotec-KMUTT Center of Excellence on Hybrid Nanomaterials for Alternative Energy (HyNAE), School of
Energy, Environment and Materials, King Mongkut’s University of Technology Thonburi, Bangkok 10140 3Department of Chemical Engineering, Burapha University, Chonburi 20131
Abstract
This research work has concerned a development of photocatalyst from hybrid metal oxides/polymer
composites. Titanium dioxide (TiO2) was blended with tungsten trioxide (WO3) at a molar ratio of 1/2 and
thiophene was in situ polymerized by using FeCl3 catalyst at 0.04 molar for 4 hours. The product was then
characterized by FTIR, TGA, XRD, SEM, EDX and UV/Visible spectroscopy techniques. Photocatalytic
activity of the composite catalysts under visible light illumination was then examined by following a
degradation of methylene blue as a function of time. It was found that photocatalytic activity of
TiO2/WO3/polythiophene composite was superior to that of the neat TiO2 and TiO2/WO3 (without polymeric
binder). The results were discussed in light of capability of the polymer in acting as a binder, facilitating charge
transport between metal oxides.
Keyword: Metal oxides, Conducting polymers, Polymerization, Binder, Photocatalysis
1. Introduction
Titanium dioxide (TiO2) is considered to be one
of the most widely used photocatalyst for pollution
abatement studies. This is because TiO2 is relatively
inexpensive, safe and chemically stable [1, 2, 3]. But its
band gap (Eg = 3.2 eV) is considerably high. This means
that it can be excited only by the ultraviolet light only.
However for indoor applications requiring the
degradation of organic compounds in visible light, some
modification of the metal oxide catalyst system is
necessary. In this regard, the use of TiO2 in combination
with the lower band gap transition metal oxides is of
interest and deserves consideration.
In this study, the use of WO3 coupled with TiO2 is of
interest. This is because bandgap energy value of TiO2
(3.2 eV) is higher than that of WO3 (2.6 eV) [4, 5], Upon
UV irradiation, photo-excited electron in the valence
band of TiO2 can transfer to the lower conduction band
of WO3. This means that WO3 can reduce a
recombination rate of the electron and hole.
In this regard, an intimate contact between TiO2
and WO3 (or the so-called active region) should be
created to ensure the charge transfer between the metal
oxide particles. To enhance the connectivity between
isolated metal oxide particles and the charge transfer
between phases, the use of a semiconducting polymer as
a polymeric binder for the hybrid metal oxides is
interesting and worth exploring.
Polythiophene (PTh) was used as a binder for
the TiO2/WO3 system in this study. This was due to the
fact that the energy band gap of PTh is lower than those
of many other conducting polymers [6].
In this study, the preparation, characterizations
and photocatalytic activity of TiO2/WO3/PTh composite
are of interest and focused on. An in situ oxidative
polymerization technique was used to prepare the hybrid
metal oxide/polymer composite. The aim of this work
was to investigate the effects of polythiophene on
photocatalytic activity of a TiO2/WO3/PTh composite
system under visible light. Comparisons of
photocatalytic activity of TiO2/WO3/PTh composite to
that of TiO2, and TiO2/WO3 (without polymeric binder),
are also of interest.
2. Experimental
2.1 Materials
Thiophene (99% reagent grade) was purchased
from Sigma-Aldrich. TiO2 nanoparticles (98.5% anatase
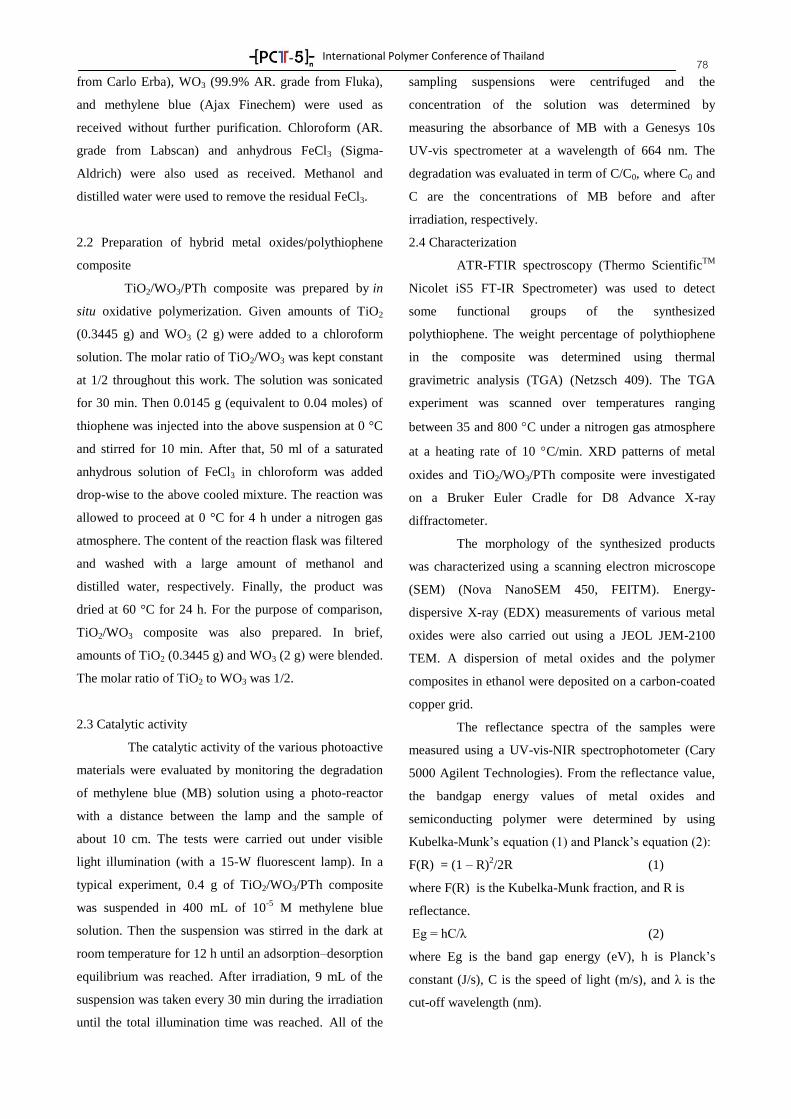
International Polymer Conference of Thailand
78 from Carlo Erba), WO3 (99.9% AR. grade from Fluka),
and methylene blue (Ajax Finechem) were used as
received without further purification. Chloroform (AR.
grade from Labscan) and anhydrous FeCl3 (Sigma-
Aldrich) were also used as received. Methanol and
distilled water were used to remove the residual FeCl3.
2.2 Preparation of hybrid metal oxides/polythiophene
composite
TiO2/WO3/PTh composite was prepared by in
situ oxidative polymerization. Given amounts of TiO2
(0.3445 g) and WO3 (2 g) were added to a chloroform
solution. The molar ratio of TiO2/WO3 was kept constant
at 1/2 throughout this work. The solution was sonicated
for 30 min. Then 0.0145 g (equivalent to 0.04 moles) of
thiophene was injected into the above suspension at 0 °C
and stirred for 10 min. After that, 50 ml of a saturated
anhydrous solution of FeCl3 in chloroform was added
drop-wise to the above cooled mixture. The reaction was
allowed to proceed at 0 °C for 4 h under a nitrogen gas
atmosphere. The content of the reaction flask was filtered
and washed with a large amount of methanol and
distilled water, respectively. Finally, the product was
dried at 60 °C for 24 h. For the purpose of comparison,
TiO2/WO3 composite was also prepared. In brief,
amounts of TiO2 (0.3445 g) and WO3 (2 g) were blended.
The molar ratio of TiO2 to WO3 was 1/2.
2.3 Catalytic activity
The catalytic activity of the various photoactive
materials were evaluated by monitoring the degradation
of methylene blue (MB) solution using a photo-reactor
with a distance between the lamp and the sample of
about 10 cm. The tests were carried out under visible
light illumination (with a 15-W fluorescent lamp). In a
typical experiment, 0.4 g of TiO2/WO3/PTh composite
was suspended in 400 mL of 10-5
M methylene blue
solution. Then the suspension was stirred in the dark at
room temperature for 12 h until an adsorption–desorption
equilibrium was reached. After irradiation, 9 mL of the
suspension was taken every 30 min during the irradiation
until the total illumination time was reached. All of the
sampling suspensions were centrifuged and the
concentration of the solution was determined by
measuring the absorbance of MB with a Genesys 10s
UV-vis spectrometer at a wavelength of 664 nm. The
degradation was evaluated in term of C/C0, where C0 and
C are the concentrations of MB before and after
irradiation, respectively.
2.4 Characterization
ATR-FTIR spectroscopy (Thermo ScientificTM
Nicolet iS5 FT-IR Spectrometer) was used to detect
some functional groups of the synthesized
polythiophene. The weight percentage of polythiophene
in the composite was determined using thermal
gravimetric analysis (TGA) (Netzsch 409). The TGA
experiment was scanned over temperatures ranging
between 35 and 800 C under a nitrogen gas atmosphere
at a heating rate of 10 C/min. XRD patterns of metal
oxides and TiO2/WO3/PTh composite were investigated
on a Bruker Euler Cradle for D8 Advance X-ray
diffractometer.
The morphology of the synthesized products
was characterized using a scanning electron microscope
(SEM) (Nova NanoSEM 450, FEITM). Energy-
dispersive X-ray (EDX) measurements of various metal
oxides were also carried out using a JEOL JEM-2100
TEM. A dispersion of metal oxides and the polymer
composites in ethanol were deposited on a carbon-coated
copper grid.
The reflectance spectra of the samples were
measured using a UV-vis-NIR spectrophotometer (Cary
5000 Agilent Technologies). From the reflectance value,
the bandgap energy values of metal oxides and
semiconducting polymer were determined by using
Kubelka-Munk’s equation (1) and Planck’s equation (2):
F(R) = (1 – R)2/2R (1)
where F(R) is the Kubelka-Munk fraction, and R is
reflectance.
Eg = hC/λ (2)
where Eg is the band gap energy (eV), h is Planck’s
constant (J/s), C is the speed of light (m/s), and λ is the
cut-off wavelength (nm).
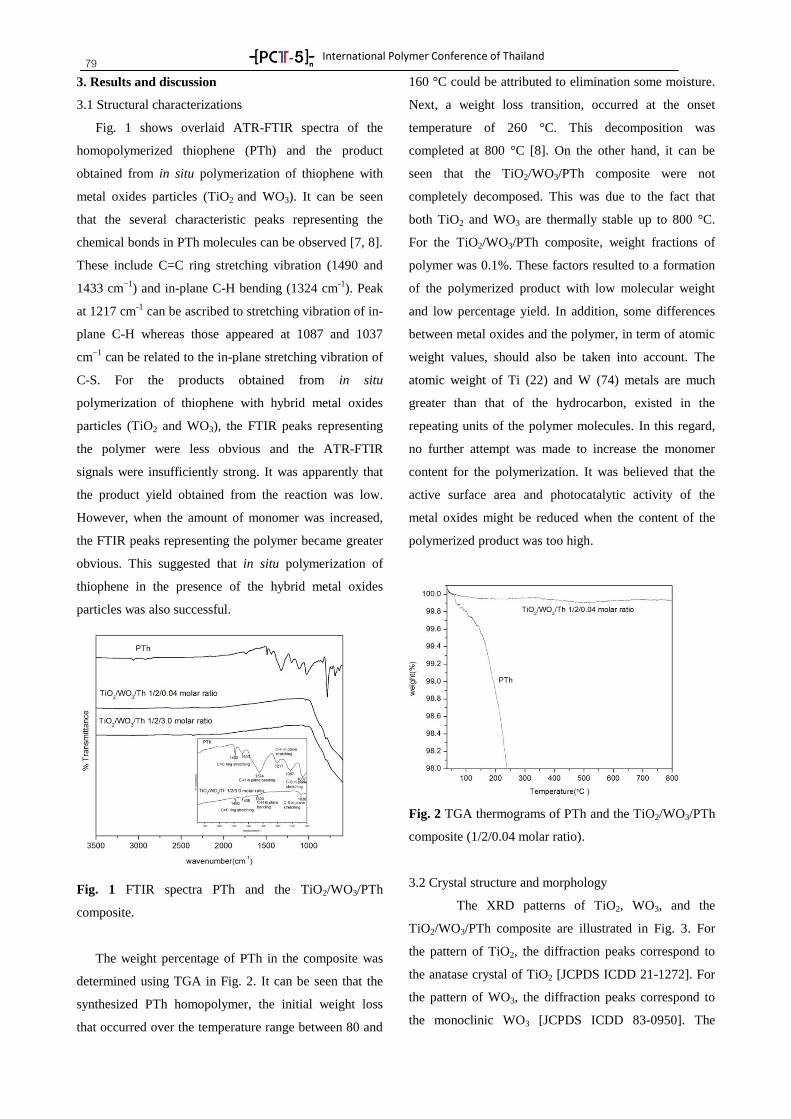
International Polymer Conference of Thailand
79 3. Results and discussion
3.1 Structural characterizations
Fig. 1 shows overlaid ATR-FTIR spectra of the
homopolymerized thiophene (PTh) and the product
obtained from in situ polymerization of thiophene with
metal oxides particles (TiO2 and WO3). It can be seen
that the several characteristic peaks representing the
chemical bonds in PTh molecules can be observed [7, 8].
These include C=C ring stretching vibration (1490 and
1433 cm−1
) and in-plane C-H bending (1324 cm-1
). Peak
at 1217 cm-1
can be ascribed to stretching vibration of in-
plane C-H whereas those appeared at 1087 and 1037
cm−1
can be related to the in-plane stretching vibration of
C-S. For the products obtained from in situ
polymerization of thiophene with hybrid metal oxides
particles (TiO2 and WO3), the FTIR peaks representing
the polymer were less obvious and the ATR-FTIR
signals were insufficiently strong. It was apparently that
the product yield obtained from the reaction was low.
However, when the amount of monomer was increased,
the FTIR peaks representing the polymer became greater
obvious. This suggested that in situ polymerization of
thiophene in the presence of the hybrid metal oxides
particles was also successful.
Fig. 1 FTIR spectra PTh and the TiO2/WO3/PTh
composite.
The weight percentage of PTh in the composite was
determined using TGA in Fig. 2. It can be seen that the
synthesized PTh homopolymer, the initial weight loss
that occurred over the temperature range between 80 and
160 °C could be attributed to elimination some moisture.
Next, a weight loss transition, occurred at the onset
temperature of 260 °C. This decomposition was
completed at 800 °C [8]. On the other hand, it can be
seen that the TiO2/WO3/PTh composite were not
completely decomposed. This was due to the fact that
both TiO2 and WO3 are thermally stable up to 800 °C.
For the TiO2/WO3/PTh composite, weight fractions of
polymer was 0.1%. These factors resulted to a formation
of the polymerized product with low molecular weight
and low percentage yield. In addition, some differences
between metal oxides and the polymer, in term of atomic
weight values, should also be taken into account. The
atomic weight of Ti (22) and W (74) metals are much
greater than that of the hydrocarbon, existed in the
repeating units of the polymer molecules. In this regard,
no further attempt was made to increase the monomer
content for the polymerization. It was believed that the
active surface area and photocatalytic activity of the
metal oxides might be reduced when the content of the
polymerized product was too high.
Fig. 2 TGA thermograms of PTh and the TiO2/WO3/PTh
composite (1/2/0.04 molar ratio).
3.2 Crystal structure and morphology
The XRD patterns of TiO2, WO3, and the
TiO2/WO3/PTh composite are illustrated in Fig. 3. For
the pattern of TiO2, the diffraction peaks correspond to
the anatase crystal of TiO2 [JCPDS ICDD 21-1272]. For
the pattern of WO3, the diffraction peaks correspond to
the monoclinic WO3 [JCPDS ICDD 83-0950]. The
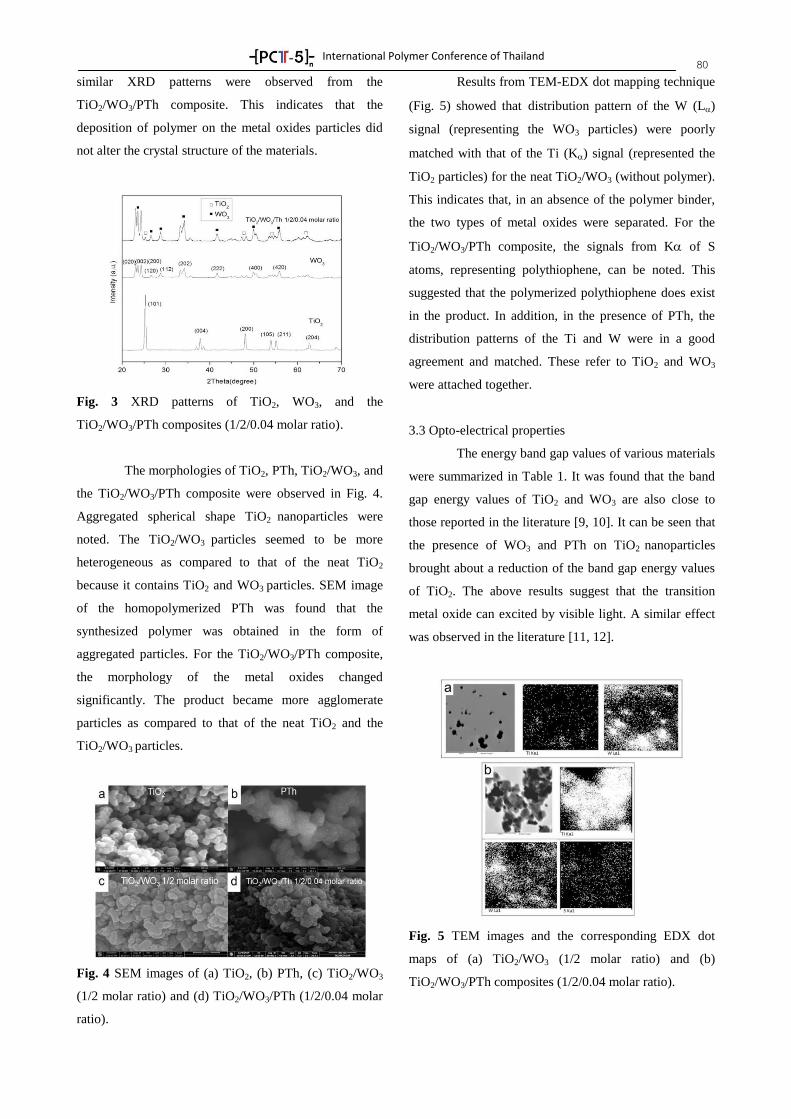
International Polymer Conference of Thailand
80 similar XRD patterns were observed from the
TiO2/WO3/PTh composite. This indicates that the
deposition of polymer on the metal oxides particles did
not alter the crystal structure of the materials.
Fig. 3 XRD patterns of TiO2, WO3, and the
TiO2/WO3/PTh composites (1/2/0.04 molar ratio).
The morphologies of TiO2, PTh, TiO2/WO3, and
the TiO2/WO3/PTh composite were observed in Fig. 4.
Aggregated spherical shape TiO2 nanoparticles were
noted. The TiO2/WO3 particles seemed to be more
heterogeneous as compared to that of the neat TiO2
because it contains TiO2 and WO3 particles. SEM image
of the homopolymerized PTh was found that the
synthesized polymer was obtained in the form of
aggregated particles. For the TiO2/WO3/PTh composite,
the morphology of the metal oxides changed
significantly. The product became more agglomerate
particles as compared to that of the neat TiO2 and the
TiO2/WO3 particles.
Fig. 4 SEM images of (a) TiO2, (b) PTh, (c) TiO2/WO3
(1/2 molar ratio) and (d) TiO2/WO3/PTh (1/2/0.04 molar
ratio).
Results from TEM-EDX dot mapping technique
(Fig. 5) showed that distribution pattern of the W (L)
signal (representing the WO3 particles) were poorly
matched with that of the Ti (K) signal (represented the
TiO2 particles) for the neat TiO2/WO3 (without polymer).
This indicates that, in an absence of the polymer binder,
the two types of metal oxides were separated. For the
TiO2/WO3/PTh composite, the signals from K of S
atoms, representing polythiophene, can be noted. This
suggested that the polymerized polythiophene does exist
in the product. In addition, in the presence of PTh, the
distribution patterns of the Ti and W were in a good
agreement and matched. These refer to TiO2 and WO3
were attached together.
3.3 Opto-electrical properties
The energy band gap values of various materials
were summarized in Table 1. It was found that the band
gap energy values of TiO2 and WO3 are also close to
those reported in the literature [9, 10]. It can be seen that
the presence of WO3 and PTh on TiO2 nanoparticles
brought about a reduction of the band gap energy values
of TiO2. The above results suggest that the transition
metal oxide can excited by visible light. A similar effect
was observed in the literature [11, 12].
Fig. 5 TEM images and the corresponding EDX dot
maps of (a) TiO2/WO3 (1/2 molar ratio) and (b)
TiO2/WO3/PTh composites (1/2/0.04 molar ratio).
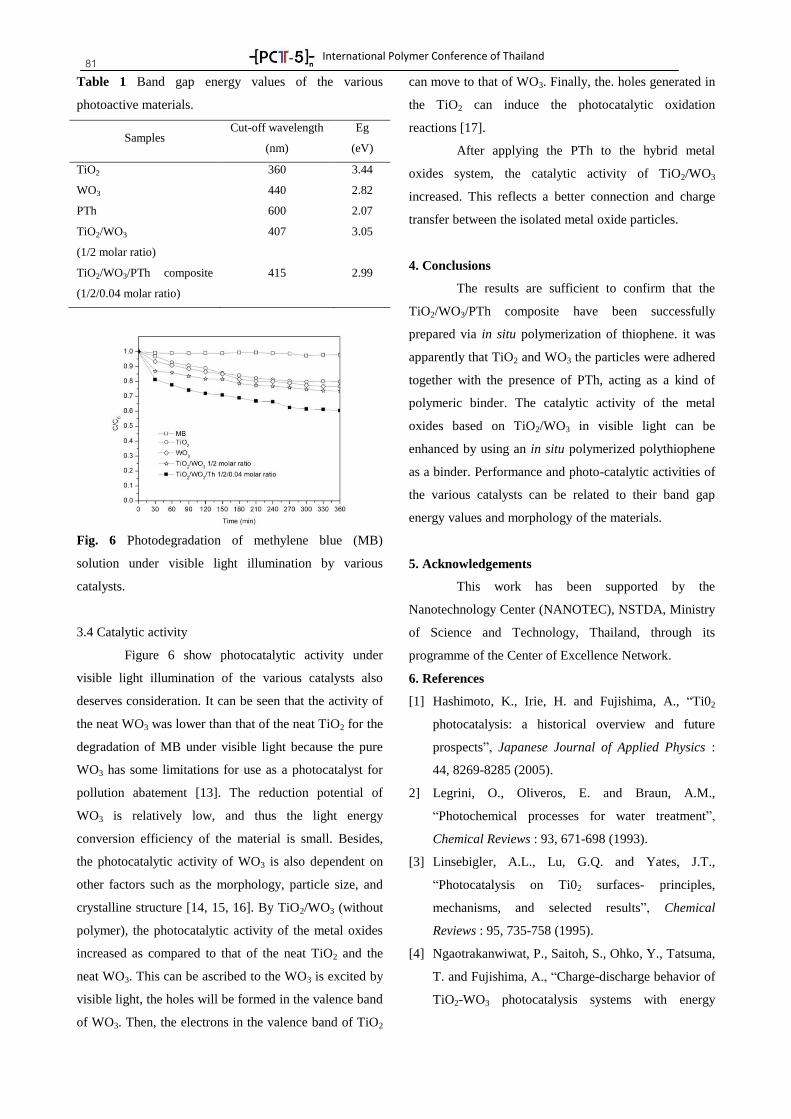
International Polymer Conference of Thailand
81 Table 1 Band gap energy values of the various
photoactive materials.
Samples Cut-off wavelength
(nm)
Eg
(eV)
TiO2 360 3.44
WO3 440 2.82
PTh 600 2.07
TiO2/WO3
(1/2 molar ratio)
407 3.05
TiO2/WO3/PTh composite
(1/2/0.04 molar ratio)
415 2.99
Fig. 6 Photodegradation of methylene blue (MB)
solution under visible light illumination by various
catalysts.
3.4 Catalytic activity
Figure 6 show photocatalytic activity under
visible light illumination of the various catalysts also
deserves consideration. It can be seen that the activity of
the neat WO3 was lower than that of the neat TiO2 for the
degradation of MB under visible light because the pure
WO3 has some limitations for use as a photocatalyst for
pollution abatement [13]. The reduction potential of
WO3 is relatively low, and thus the light energy
conversion efficiency of the material is small. Besides,
the photocatalytic activity of WO3 is also dependent on
other factors such as the morphology, particle size, and
crystalline structure [14, 15, 16]. By TiO2/WO3 (without
polymer), the photocatalytic activity of the metal oxides
increased as compared to that of the neat TiO2 and the
neat WO3. This can be ascribed to the WO3 is excited by
visible light, the holes will be formed in the valence band
of WO3. Then, the electrons in the valence band of TiO2
can move to that of WO3. Finally, the. holes generated in
the TiO2 can induce the photocatalytic oxidation
reactions [17].
After applying the PTh to the hybrid metal
oxides system, the catalytic activity of TiO2/WO3
increased. This reflects a better connection and charge
transfer between the isolated metal oxide particles.
4. Conclusions
The results are sufficient to confirm that the
TiO2/WO3/PTh composite have been successfully
prepared via in situ polymerization of thiophene. it was
apparently that TiO2 and WO3 the particles were adhered
together with the presence of PTh, acting as a kind of
polymeric binder. The catalytic activity of the metal
oxides based on TiO2/WO3 in visible light can be
enhanced by using an in situ polymerized polythiophene
as a binder. Performance and photo-catalytic activities of
the various catalysts can be related to their band gap
energy values and morphology of the materials.
5. Acknowledgements
This work has been supported by the
Nanotechnology Center (NANOTEC), NSTDA, Ministry
of Science and Technology, Thailand, through its
programme of the Center of Excellence Network.
6. References
[1] Hashimoto, K., Irie, H. and Fujishima, A., “Ti02
photocatalysis: a historical overview and future
prospects”, Japanese Journal of Applied Physics :
44, 8269-8285 (2005).
2] Legrini, O., Oliveros, E. and Braun, A.M.,
“Photochemical processes for water treatment”,
Chemical Reviews : 93, 671-698 (1993).
[3] Linsebigler, A.L., Lu, G.Q. and Yates, J.T.,
“Photocatalysis on Ti02 surfaces- principles,
mechanisms, and selected results”, Chemical
Reviews : 95, 735-758 (1995).
[4] Ngaotrakanwiwat, P., Saitoh, S., Ohko, Y., Tatsuma,
T. and Fujishima, A., “Charge-discharge behavior of
TiO2-WO3 photocatalysis systems with energy
International Polymer Conference of Thailand
82 storage ability”, Physical Chemistry Chemical
Physics : 5, 3234–3237 (2003).
[5] Tatsuma, T., Saitoh, S., Ngaotrakanwiwat, P., Ohko,
Y. and Fujishima, A., “Energy storage of TiO2-WO3
photocatalysis systems in the gas phase”, Langmuir :
18, 7777-7779 (2002).
[6] Dai, L., “Conducting Polymers”, In: 1 (ed.s)
Intelligent Macromolecules for Smart Devices:
From Materials Synthesis to Device Applications,
Engineering Materials and Processes, USA, acid-
free paper : 43 (2004).
[7] Gnanakan, S.R.P., Rajasekhar, M. and Subramania,
A., “Synthesis of polythiophene nanoparticles by
surfactant-assisted dilute polymerization method for
high performance redox super capacitors”,
International Journal of Electrochemical Science :
4, 1289–1301 (2009).
[8] Liu, R.C. and Liu, Z.P., “Polythiophene: synthesis in
aqueous medium and controllable morphology,
Chinese Science Bulletin : 54, 2028-2032 (2009).
[9] Geng, L., Huang, W., Zhao, Y., Li, P., Wang, S.,
Zhang, S. and Wu, S., “H2S sensitivity study of
polypyrrole/WO3 materials”, Solid-State
Electronics : 50, 723–726 (2006).
[10] Zhu, J., Wei, S., Zhang, L., Mao, Y., Ryu, J.,
Mavinakuli, P., Karki, A.B., Young, D.P. and Guo,
Z., “Conductive polypyrrole/tungsten oxide
metacomposites with negative permittivity”, Journal
of Physical Chemistry C : 114 16335–16342 (2010).
[11] Luo, Q., Li, X., Wang, D., Wang, Y. and An, J.,
“Photocatalytic activity of polypyrrole/TiO2
nanocomposites under visible and uv light”, Journal
of Materials Science : 46, 1646–1654 (2011).
[12] Dimitrijevic, N.M., Tepavcevic, S., Liu, Y., Rajh,
T., Silver, S.C. and Tiede, D.M. “Nanostructured
TiO2/polypyrrole for visible light photocatalysis”,
The Journal of Physical Chemistry C : 117, 15540–
15544 (2013).
[13] Asim, N., Badeiei,M., Ghoreishi, K.B., Ludin, N.A.,
Zonooz, M.R.F. and Sopian, K., “New
developments in photocatalysts modification: case
study of WO3”, Advances in Fluid Mechanics and
Heat & Mass Transfer : 110-116 (2012).
[14] Xin, G., Guo, W. and Ma, T., “Effect of annealing
temperature on the photocatalytic activity of WO3
for O2 evolution”, Applied Surface Science : 256,
165-169 (2009).
[15] Zhao, W., Wang, Z., Shen, X., Li, J., Xu, C. and
Gan, Z., “Hydrogen generation via
photoelectrocatalytic water splitting using a tungsten
trioxide catalyst under visible light irradiation”,
International Journal of Hydrogen Energy : 37, 908-
915 (2012).
[16] Purwanto, A., Widiyandari, H., Ogi, T. and
Okuyama, K., “Role of particle size for platinum-
loaded tungsten oxide nanoparticles during dye
photodegradation under solar-simulated
irradiation”,Catalysis Communication : 12, 525-529
(2011).
[17] Seung, Y.C., Yong, J.K. and Wan, I.L.,
"Photocatalytic WO3/TiO2 nanoparticles working
under visible light”, Journal of Electroceramics : 17,
909–912 (2006).
International Polymer Conference of Thailand
83
COMPP-02
Tensile Properties of Poly(Butylene Succinate) Reinforced with Rice Husk Silica
Apimook Laptippamon1, a
, and Pranut Potiyaraj2,b,*
1Interdisciplinary Program in Petrochemical & Polymer Science, Faculty of Science, Chulalongkorn University,
Bangkok 10330 Thailand 2Department of Materials Science, Faculty of Science, Chulalongkorn University, Bangkok 10330 Thailand
Abstract The objective of this study is to prepare rice husk silica reinforced poly(butylene succinate) composites
(PBS/silica). PBS composites were prepared by using a twin screw extruder. Glycidyl methacrylate grafted
poly(butylene succinate, PBS-g-GMA) were also used as a compatibilizer to improve the interfacial interaction
between PBS and silica. PBS composites were then processed into test specimens by injection molding. The
effect of type and ratio of silica on the tensile properties of the composites was investigated. It was found that
the tensile strength and elongation at break of composites without the compatibilizer was lower than neat PBS
due to agglomeration of silica. Nevertheless, tensile strength and Young’s modulus of PBS composites were
improved after the incorporation of PBS-g-GMA.
Keywords: poly(butylene succinate), silica, rice husk silica, composite, compatibilizer, mechanical property
Introduction
The development of biodegradable polymeric
materials with excellent material properties has received
much more attention worldwide. [1,2] Aliphatic
polyesters, such as poly(ε-caprolactone), poly(lactic
acid), poly(butylene succinate) (PBS), and poly(3-
hydroxybutyrate), are among the most promising
materials for the production of high-performance,
environmentally friendly, biodegradable materials. [3-5]
PBS, synthesized by the polycondensation of 1,4-
butanediol with succinic acid, has particularly attracted
increasing commercial interest because of its many
interesting properties, including biodegradability, melt
processability, and thermal and chemical resistance. [6]
However, its softness and low gas-barrier properties have
restricted further application of PBS. To improve PBS’s
properties, the conventional method is to use suitable
additives to improve its inferior attributes.
Rice husk, a waste product of the rice
production industry, is an environment threat causing
damage to the land and the surrounding area in which it
is dumped. However, rice husk contains about 20% of
ash which can be retrieved as amorphous, chemically
reactive silica. This rice husk ash (RHA) silica finds
broad applications such as filler, catalyst support,
adsorbent and a source for synthesizing high
performance silicon and its compounds. Various metal
ions and unburned carbon influence the purity and
color of the ash. Controlled burning of the husk after
removing these ions can produce white silica of high
purity. Husk contains 17%-20% silica in complex form
and RHA contains 85%-95% amorphous silica. [7]
The objective of this study is to prepare rice
husk silica reinforced poly(butylene succinate)
composites (PBS/silica). PBS-g-GMA was produced as a
compatibilizer via the reactive extrusion technique. The
compatibilizer was then used as a compatibilizer for
PBS/silica composites. The tensile properties of PBS
composites reinforced with rice husk silica and
commercial silica were then investigated and compared
with those of composites compatibilized by PBS-g-
GMA.
Experimental
Materials. PBS granules (AZ71TN) were of injection
grade purchased from Mitsubishi Chemical. PBS was
dried at 60°C for 24 h in a hopper dryer before use. Silica
(Siam silica Co.LTD) and ultrasil 9000 GR (Evonik
Industry AG) was dried at 60°C for 24 h and stored in
the desiccator before use. Dicumyl peroxide (DCP)
(Sigma Aldrich) was used as an initiator and glycidyl
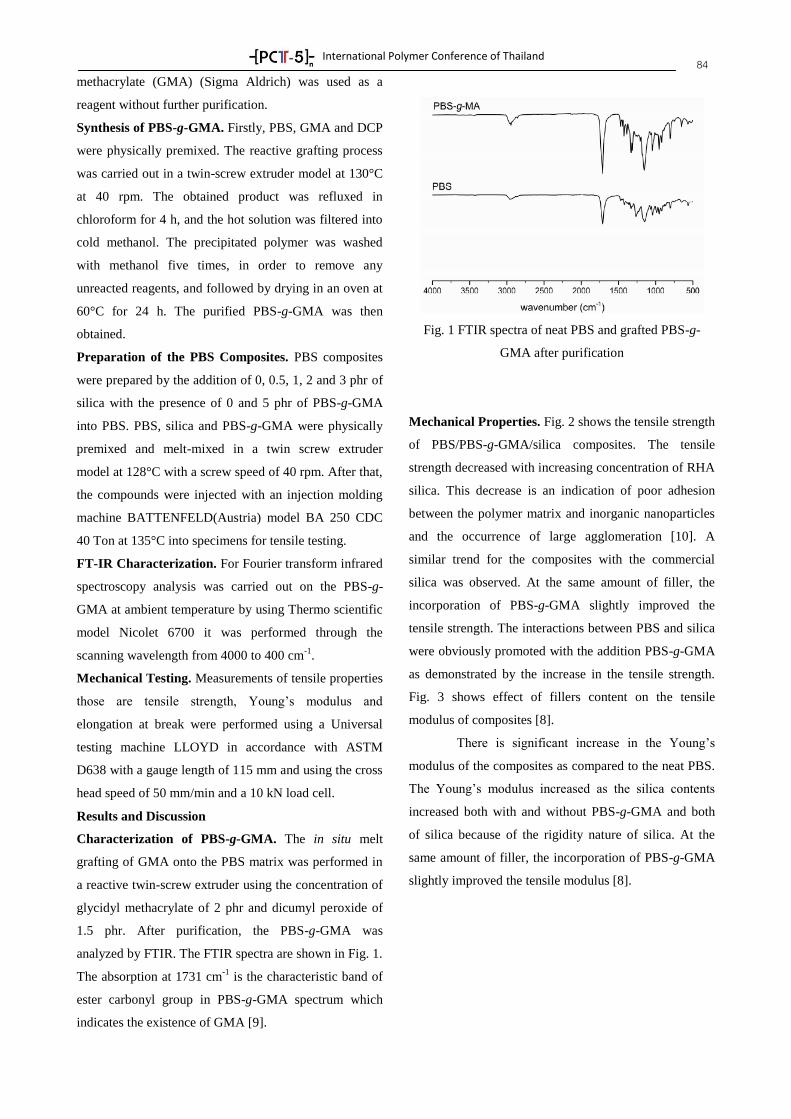
International Polymer Conference of Thailand
84 methacrylate (GMA) (Sigma Aldrich) was used as a
reagent without further purification.
Synthesis of PBS-g-GMA. Firstly, PBS, GMA and DCP
were physically premixed. The reactive grafting process
was carried out in a twin-screw extruder model at 130°C
at 40 rpm. The obtained product was refluxed in
chloroform for 4 h, and the hot solution was filtered into
cold methanol. The precipitated polymer was washed
with methanol five times, in order to remove any
unreacted reagents, and followed by drying in an oven at
60°C for 24 h. The purified PBS-g-GMA was then
obtained.
Preparation of the PBS Composites. PBS composites
were prepared by the addition of 0, 0.5, 1, 2 and 3 phr of
silica with the presence of 0 and 5 phr of PBS-g-GMA
into PBS. PBS, silica and PBS-g-GMA were physically
premixed and melt-mixed in a twin screw extruder
model at 128°C with a screw speed of 40 rpm. After that,
the compounds were injected with an injection molding
machine BATTENFELD(Austria) model BA 250 CDC
40 Ton at 135°C into specimens for tensile testing.
FT-IR Characterization. For Fourier transform infrared
spectroscopy analysis was carried out on the PBS-g-
GMA at ambient temperature by using Thermo scientific
model Nicolet 6700 it was performed through the
scanning wavelength from 4000 to 400 cm-1
.
Mechanical Testing. Measurements of tensile properties
those are tensile strength, Young’s modulus and
elongation at break were performed using a Universal
testing machine LLOYD in accordance with ASTM
D638 with a gauge length of 115 mm and using the cross
head speed of 50 mm/min and a 10 kN load cell.
Results and Discussion
Characterization of PBS-g-GMA. The in situ melt
grafting of GMA onto the PBS matrix was performed in
a reactive twin-screw extruder using the concentration of
glycidyl methacrylate of 2 phr and dicumyl peroxide of
1.5 phr. After purification, the PBS-g-GMA was
analyzed by FTIR. The FTIR spectra are shown in Fig. 1.
The absorption at 1731 cm-1
is the characteristic band of
ester carbonyl group in PBS-g-GMA spectrum which
indicates the existence of GMA [9].
Fig. 1 FTIR spectra of neat PBS and grafted PBS-g-
GMA after purification
Mechanical Properties. Fig. 2 shows the tensile strength
of PBS/PBS-g-GMA/silica composites. The tensile
strength decreased with increasing concentration of RHA
silica. This decrease is an indication of poor adhesion
between the polymer matrix and inorganic nanoparticles
and the occurrence of large agglomeration [10]. A
similar trend for the composites with the commercial
silica was observed. At the same amount of filler, the
incorporation of PBS-g-GMA slightly improved the
tensile strength. The interactions between PBS and silica
were obviously promoted with the addition PBS-g-GMA
as demonstrated by the increase in the tensile strength.
Fig. 3 shows effect of fillers content on the tensile
modulus of composites [8].
There is significant increase in the Young’s
modulus of the composites as compared to the neat PBS.
The Young’s modulus increased as the silica contents
increased both with and without PBS-g-GMA and both
of silica because of the rigidity nature of silica. At the
same amount of filler, the incorporation of PBS-g-GMA
slightly improved the tensile modulus [8].
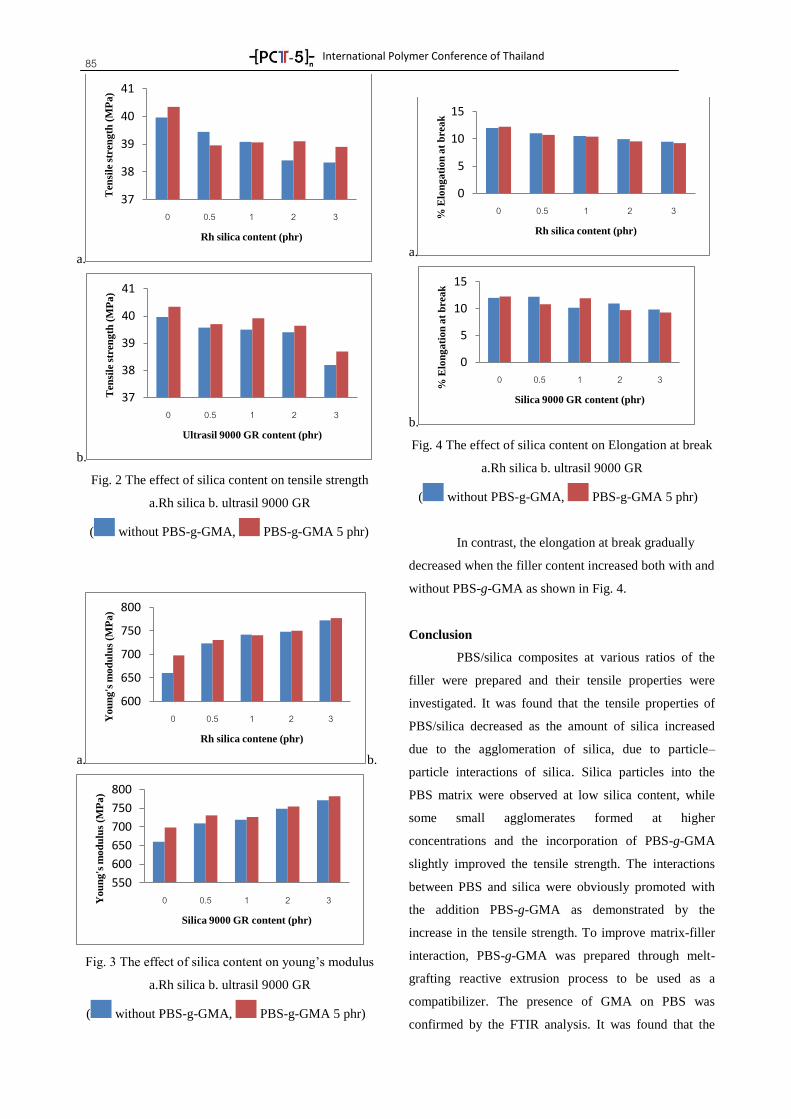
International Polymer Conference of Thailand
85
a.
b.
Fig. 2 The effect of silica content on tensile strength
a.Rh silica b. ultrasil 9000 GR
( without PBS-g-GMA, PBS-g-GMA 5 phr)
a. b.
Fig. 3 The effect of silica content on young’s modulus
a.Rh silica b. ultrasil 9000 GR
( without PBS-g-GMA, PBS-g-GMA 5 phr)
a.
b.
Fig. 4 The effect of silica content on Elongation at break
a.Rh silica b. ultrasil 9000 GR
( without PBS-g-GMA, PBS-g-GMA 5 phr)
In contrast, the elongation at break gradually
decreased when the filler content increased both with and
without PBS-g-GMA as shown in Fig. 4.
Conclusion
PBS/silica composites at various ratios of the
filler were prepared and their tensile properties were
investigated. It was found that the tensile properties of
PBS/silica decreased as the amount of silica increased
due to the agglomeration of silica, due to particle–
particle interactions of silica. Silica particles into the
PBS matrix were observed at low silica content, while
some small agglomerates formed at higher
concentrations and the incorporation of PBS-g-GMA
slightly improved the tensile strength. The interactions
between PBS and silica were obviously promoted with
the addition PBS-g-GMA as demonstrated by the
increase in the tensile strength. To improve matrix-filler
interaction, PBS-g-GMA was prepared through melt-
grafting reactive extrusion process to be used as a
compatibilizer. The presence of GMA on PBS was
confirmed by the FTIR analysis. It was found that the
37
38
39
40
41
0 0.5 1 2 3
Ten
sile
str
en
gth
(M
Pa
)
Rh silica content (phr)
37
38
39
40
41
0 0.5 1 2 3
Ten
sile
str
en
gth
(M
Pa
)
Ultrasil 9000 GR content (phr)
600
650
700
750
800
0 0.5 1 2 3 Yo
un
g's
mo
du
lus
(MP
a)
Rh silica contene (phr)
550
600
650
700
750
800
0 0.5 1 2 3 Yo
un
g's
mo
du
lus
(MP
a)
Silica 9000 GR content (phr)
0
5
10
15
0 0.5 1 2 3
% E
lon
ga
tio
n a
t b
rea
k
Rh silica content (phr)
0
5
10
15
0 0.5 1 2 3
% E
lon
ga
tio
n a
t b
rea
k
Silica 9000 GR content (phr)
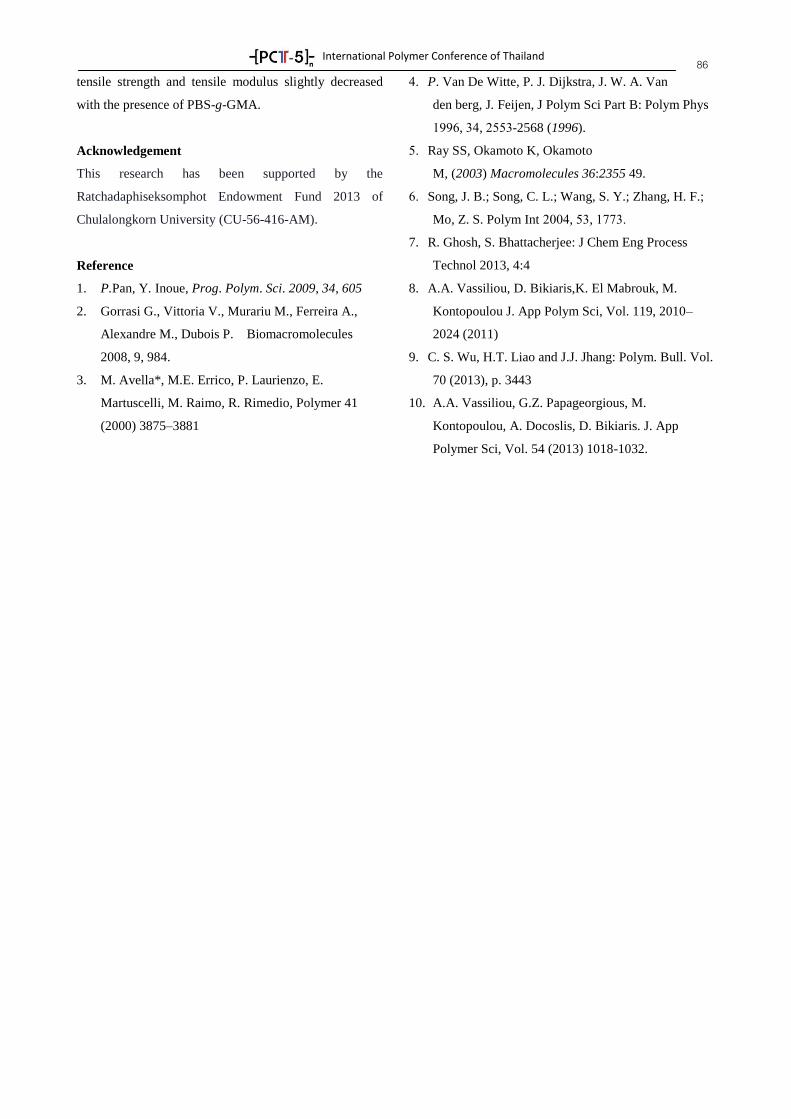
International Polymer Conference of Thailand
86 tensile strength and tensile modulus slightly decreased
with the presence of PBS-g-GMA.
Acknowledgement
This research has been supported by the
Ratchadaphiseksomphot Endowment Fund 2013 of
Chulalongkorn University (CU-56-416-AM).
Reference
1. P.Pan, Y. Inoue, Prog. Polym. Sci. 2009, 34, 605
2. Gorrasi G., Vittoria V., Murariu M., Ferreira A.,
Alexandre M., Dubois P. Biomacromolecules
2008, 9, 984.
3. M. Avella*, M.E. Errico, P. Laurienzo, E.
Martuscelli, M. Raimo, R. Rimedio, Polymer 41
(2000) 3875–3881
4. P. Van De Witte, P. J. Dijkstra, J. W. A. Van
den berg, J. Feijen, J Polym Sci Part B: Polym Phys
1996, 34, 2553-2568 (1996).
5. Ray SS, Okamoto K, Okamoto
M, (2003) Macromolecules 36:2355 49.
6. Song, J. B.; Song, C. L.; Wang, S. Y.; Zhang, H. F.;
Mo, Z. S. Polym Int 2004, 53, 1773.
7. R. Ghosh, S. Bhattacherjee: J Chem Eng Process
Technol 2013, 4:4
8. A.A. Vassiliou, D. Bikiaris,K. El Mabrouk, M.
Kontopoulou J. App Polym Sci, Vol. 119, 2010–
2024 (2011)
9. C. S. Wu, H.T. Liao and J.J. Jhang: Polym. Bull. Vol.
70 (2013), p. 3443
10. A.A. Vassiliou, G.Z. Papageorgious, M.
Kontopoulou, A. Docoslis, D. Bikiaris. J. App
Polymer Sci, Vol. 54 (2013) 1018-1032.
International Polymer Conference of Thailand
87
COMPP-06
Effect of PGA:STY Ratio and Reaction Temperature on Coating PGA-STY on EPS
Beads
Jittranuch Jirapathomkul1 and Surachai Pornpakakul
1,2*
1Program in Petrochemistry and Polymer Science, Faculty of Science, Chulalongkorn University, Bangkok
10330 2Department of chemistry, Faculty of Science, Chulalongkorn University, Bangkok 10330
Abstract
In this research, effect of PGA:STY ratio (STY 2.5-7.5%w/v) and reaction temperature (60-80°C) on
coating rate and size of PGA-STY/EPS beads were investigated. We found that ratio of PGA:STY affected the
size of PGA-STY/EPS beads and coating rate. Increasing PGA:STY ratio in polymerization process resulted in
increasing coating rate. Using 7.5%w/v of styrene monomer, the size of PGA-STY/EPS beads obtained was
smallest (1.77 mm) and percentage of PGA-STY loading up to 91.5%. Reaction temperature affected the
percentage of PGA-STY loading onto EPS beads which the higher reaction temperature resulted in the higher
polymerization rate. Moreover, the morphology of the PGA-STY/EPS beads characterized by scanning electron
microscopy showed that the PGA-STY was successfully coated onto the EPS beads.
Keywords: Expandable polystyrene beads, Polyglutaraldehyde-styrene, Copolymer
1. Introduction
Glutaraldehyde is a linear 5-carbon dialdehyde.
It is an oily, colorless clear liquid with a pungent, fruity
odor. It can be polymerized to generated
polyglutaraldehyde through aldol condensation of
glutaraldehyde under basic condition. As a result of the
condensation, the polyglutaraldehyde contains a presence
of carbon-carbon double bond in its backbone and non-
conjugated aldehyde and conjugated aldehyde [1]. In
many research, the polyglutaraldehyde has been used as
new reagent for the immobilization of protein such as
antibodies or enzyme on solid substrates [2]. Several
studies on copolymerization of styrene and
polyglutaraldehyde such as Dizge et al. have successfully
prepared styrene-divinylbenzene-polyglutaraldehyde
(STY-DVB-PGA) copolymer by using High Internal
Phase Emulsion Polymerization (polyHIPE) technique
for enzyme immobilization [3]. Thanaporn has
successfully prepared styrene-polyglutaraldehyde
copolymer coated on styrene bead as support for enzyme
immobilization [4]. Since expandable polystyrene bead
(EPS) contains pentane as a blowing agent and can be
expended by heating at any higher temperature, the rate
of copolymer polymerization and of
copolymer coating should be measured by comparison
with expansion rate of EPS bead and any desired sizes of
particle can be achieved depending on temperature.
Thus, expandable polystyrene bead (EPS) was used as
support in this research and effect of
polyglutaraldehyde:styrene ratio and reaction
temperature on coating onto EPS beads were
investigated.
2. Experimental methods
2.1 Preparation of polyglutaraldehyde (PGA) suspension
Polyglutaraldehyde suspension was obtained from
aldol condensation of glutaraldehyde solution (20%w/v)
catalyzed by 1 M NaOH solution at room temperature
for 5 min.
2.2 Preparation of polyglutaraldehyde-styrene coated
expandable polystyrene beads (PGA-STY/EPS beads)
Prior to use, the styrene monomer was treated
with 12% sodium hydroxide solution in a separatory
funnel three times in order to remove the anti-
polymerizer.
To mixture of styrene monomer, Tween 80® and
polyglutaraldehyde solution in a round bottom flask,
potassium persulfate as initiator was added. After rapid
stirring for 15 min, expandable polystyrene beads were
International Polymer Conference of Thailand
88 added and the mixture was continuously stirred at 60°C
for 2 h followed by heating at 80°C for the
polymerization time of 22 h. The flow chart of
experiment procedure was summarized as shown in
figure 1.
Figure 1 Flow chart for experimental procedure
2.3 Loading estimation
Percentage of polyglutaraldehyde-styrene coated
onto expandable polystyrene beads was calculated
as %loading using following equation:
2.4 Size of the polyglutaraldehyde-styrene coated
expandable polystyrene beads
The size of the polyglutaraldehyde-styrene coated
expandable polystyrene beads was measured by using
digital microscope (AD 4113TL-Dino-Lite Pro2) at 60
magnifications. The average diameter of the beads was
calculated by an image of one hundred support beads
from digital microscope photograph using dinocapture
2.0 software.
2.5 Attenuated total reflectance-Fourier transform
infrared spectroscopic (ATR-FTIR)
EPS beads and PGA-STY/EPS beads were
characterized by ATR-FTIR. The solid sample was
placed onto the Universal diamond ATR top-plate and
then applying pressure to a solid sample on the Universal
diamond ATR top-plate for characterization.
3. Results and Discussion
3.1 Characterization of PGA-STY/EPS beads
The ATR-FTIR spectra of EPS bead and PGA-
STY/EPS bead were compared as shown in Figure 2a,
2b. The spectrum of PGA-STY/EPS bead showed
absorption of aromatic and olefinic C-H stretching at
3079, 3056 and 3019 cm-1
, of aliphatic C-H stretching at
2924 and 2860 cm-1
, of C=O stretching at 1715 cm-1
for
non-conjugated aldehyde and at 1678 cm-1
for
conjugated aldehyde and C=C stretching at 1639 cm-1.
These results indicated that coating styrene-
polyglutaraldehyde onto EPS bead was successful
3.2 Effect of PGA:STY ratio and reaction temperature on
the size of PGA-STY/EPS beads
The effect of PGA:STY ratio and reaction
temperature were studied by using a fixed amount of
20%w/v polyglutaraldehyde, Tween 80®, K2S2O8 at 20
ml, 0.88 g and 2.59 mmol, respectively, and reaction
time of 24 h. The amount of styrene monomer was varied
from 2.5, 5 and 7.5%w/v and reaction temperature was
varied from 60, 70 and 80°C. The PGA-STY/EPS beads
prepared were shown in Figure 3
From Table 1 and Figure 3, it was found that
PGA:STY ratio affected the size of PGA-STY/EPS
beads. When the amount of styrene monomer was
increased at any reaction temperatures, the size of PGA-
STY/EPS beads was decreased from 2.53 to 1.77 mm.
These results suggested that the increasing styrene
monomer in polymerization process resulted in increase
of conversion of polymerization [5]. So the
polymerization rate of copolymer in condition 7.5%w/v
of STY monomer which coated on EPS beads was the
%loading =
amount of PGA-STY loaded
on polystyrene beads
amount of polystyrene beads
introduced
ˣ 100 (1)
Styrene 2.5%, 5%,
7.5%w/v
Tween 80® K2S2O8
GA
solution
20%w/v
Aldol condensation
of GA, at 25°C
for 5 min
EPS
beads
STY-PGA coating
PGA-STY/EPS
beads
PGA-STY/EPS
beads
PGA-STY/EPS
beads
T = 60°C
T = 70°C
T = 80°C
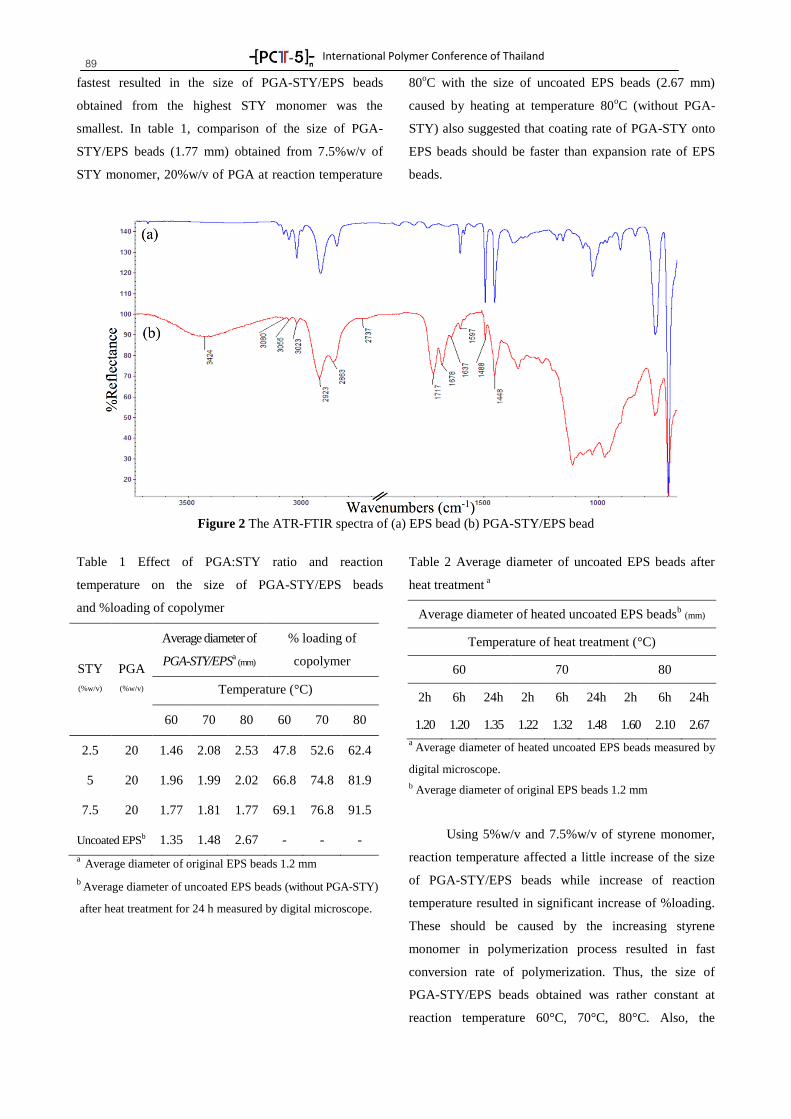
International Polymer Conference of Thailand
89 fastest resulted in the size of PGA-STY/EPS beads
obtained from the highest STY monomer was the
smallest. In table 1, comparison of the size of PGA-
STY/EPS beads (1.77 mm) obtained from 7.5%w/v of
STY monomer, 20%w/v of PGA at reaction temperature
80oC with the size of uncoated EPS beads (2.67 mm)
caused by heating at temperature 80oC (without PGA-
STY) also suggested that coating rate of PGA-STY onto
EPS beads should be faster than expansion rate of EPS
beads.
Figure 2 The ATR-FTIR spectra of (a) EPS bead (b) PGA-STY/EPS bead
Table 1 Effect of PGA:STY ratio and reaction
temperature on the size of PGA-STY/EPS beads
and %loading of copolymer
STY
(%w/v)
PGA
(%w/v)
Average diameter of
PGA-STY/EPSa (mm)
% loading of
copolymer
Temperature (°C)
60
70
80
60
70
80
2.5
20
1.46
2.08
2.53
47.8
52.6
62.4
5
20
1.96
1.99
2.02
66.8
74.8
81.9
7.5
20
1.77
1.81
1.77
69.1
76.8
91.5
Uncoated EPSb
1.35
1.48
2.67
-
-
-
a Average diameter of original EPS beads 1.2 mm
b Average diameter of uncoated EPS beads (without PGA-STY)
after heat treatment for 24 h measured by digital microscope.
Table 2 Average diameter of uncoated EPS beads after
heat treatment a
Average diameter of heated uncoated EPS beadsb (mm)
Temperature of heat treatment (°C)
60 70 80
2h 6h 24h 2h 6h 24h 2h 6h 24h
1.20 1.20 1.35 1.22 1.32 1.48 1.60 2.10 2.67
a Average diameter of heated uncoated EPS beads measured by
digital microscope.
b Average diameter of original EPS beads 1.2 mm
Using 5%w/v and 7.5%w/v of styrene monomer,
reaction temperature affected a little increase of the size
of PGA-STY/EPS beads while increase of reaction
temperature resulted in significant increase of %loading.
These should be caused by the increasing styrene
monomer in polymerization process resulted in fast
conversion rate of polymerization. Thus, the size of
PGA-STY/EPS beads obtained was rather constant at
reaction temperature 60°C, 70°C, 80°C. Also, the
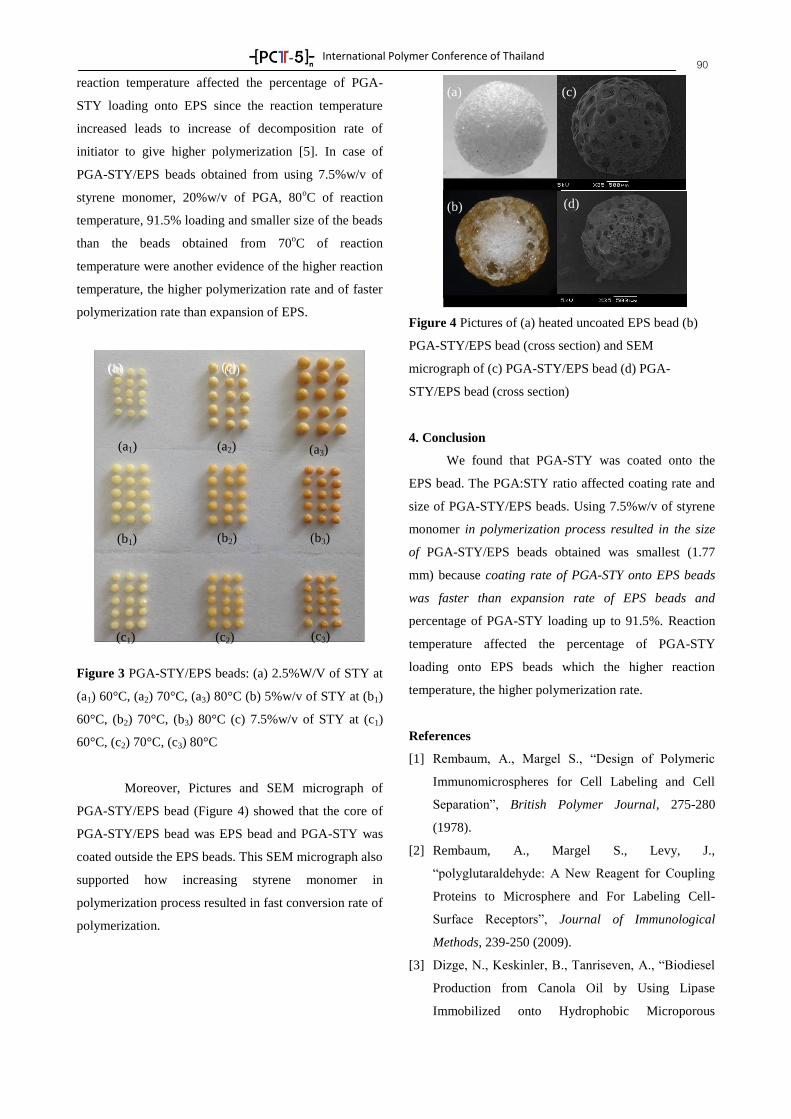
International Polymer Conference of Thailand
90 reaction temperature affected the percentage of PGA-
STY loading onto EPS since the reaction temperature
increased leads to increase of decomposition rate of
initiator to give higher polymerization [5]. In case of
PGA-STY/EPS beads obtained from using 7.5%w/v of
styrene monomer, 20%w/v of PGA, 80oC of reaction
temperature, 91.5% loading and smaller size of the beads
than the beads obtained from 70oC of reaction
temperature were another evidence of the higher reaction
temperature, the higher polymerization rate and of faster
polymerization rate than expansion of EPS.
Figure 3 PGA-STY/EPS beads: (a) 2.5%W/V of STY at
(a1) 60°C, (a2) 70°C, (a3) 80°C (b) 5%w/v of STY at (b1)
60°C, (b2) 70°C, (b3) 80°C (c) 7.5%w/v of STY at (c1)
60°C, (c2) 70°C, (c3) 80°C
Moreover, Pictures and SEM micrograph of
PGA-STY/EPS bead (Figure 4) showed that the core of
PGA-STY/EPS bead was EPS bead and PGA-STY was
coated outside the EPS beads. This SEM micrograph also
supported how increasing styrene monomer in
polymerization process resulted in fast conversion rate of
polymerization.
Figure 4 Pictures of (a) heated uncoated EPS bead (b)
PGA-STY/EPS bead (cross section) and SEM
micrograph of (c) PGA-STY/EPS bead (d) PGA-
STY/EPS bead (cross section)
4. Conclusion
We found that PGA-STY was coated onto the
EPS bead. The PGA:STY ratio affected coating rate and
size of PGA-STY/EPS beads. Using 7.5%w/v of styrene
monomer in polymerization process resulted in the size
of PGA-STY/EPS beads obtained was smallest (1.77
mm) because coating rate of PGA-STY onto EPS beads
was faster than expansion rate of EPS beads and
percentage of PGA-STY loading up to 91.5%. Reaction
temperature affected the percentage of PGA-STY
loading onto EPS beads which the higher reaction
temperature, the higher polymerization rate.
References
[1] Rembaum, A., Margel S., “Design of Polymeric
Immunomicrospheres for Cell Labeling and Cell
Separation”, British Polymer Journal, 275-280
(1978).
[2] Rembaum, A., Margel S., Levy, J.,
“polyglutaraldehyde: A New Reagent for Coupling
Proteins to Microsphere and For Labeling Cell-
Surface Receptors”, Journal of Immunological
Methods, 239-250 (2009).
[3] Dizge, N., Keskinler, B., Tanriseven, A., “Biodiesel
Production from Canola Oil by Using Lipase
Immobilized onto Hydrophobic Microporous
(d)
(c) (a)
(b)
(a1) (a2) (a3)
(b1) (b2) (b3)
(c1) (c2) (c3)
(a) (c) (b) (d)

International Polymer Conference of Thailand
91 Styrene-Divinylbenzene Copolymer”, Biochemical
Engineering Journal, 220-225 (2009) .
[4] Jitrasing, T., Pornpakakul, S., “Polyglutaraldehyde-
Styrene Copolymer Modified Polystyrene Beads for
Improvement of Polymer Supports”, The 4th
Science
Research Conference, 284-287 (2012).
[5] Lin, H.R., “Solution Polymerization of Acrylamide
Using Potassium Persulfate as an Initiator: Kinetic
Studies, Temperature and pH Dependence”,
European Polymer Journal, 1507-1510 (2001).
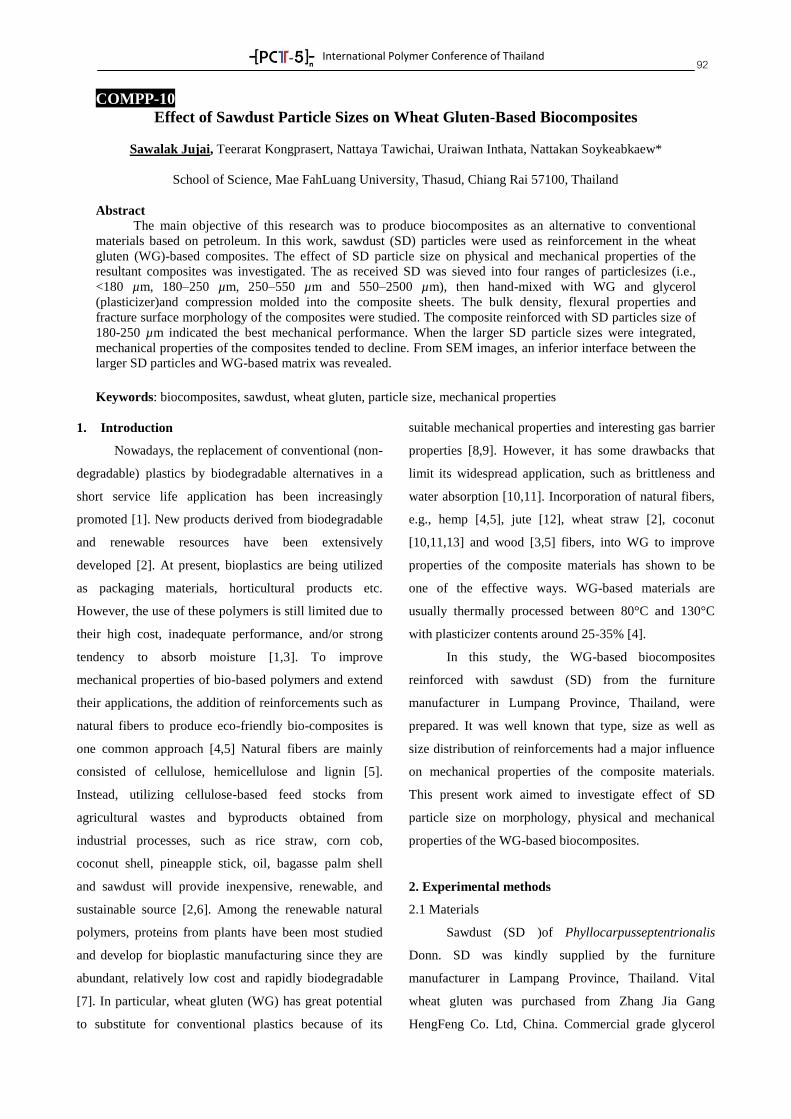
International Polymer Conference of Thailand
92
COMPP-10
Effect of Sawdust Particle Sizes on Wheat Gluten-Based Biocomposites
Sawalak Jujai, Teerarat Kongprasert, Nattaya Tawichai, Uraiwan Inthata, Nattakan Soykeabkaew*
School of Science, Mae FahLuang University, Thasud, Chiang Rai 57100, Thailand
Abstract
The main objective of this research was to produce biocomposites as an alternative to conventional
materials based on petroleum. In this work, sawdust (SD) particles were used as reinforcement in the wheat
gluten (WG)-based composites. The effect of SD particle size on physical and mechanical properties of the
resultant composites was investigated. The as received SD was sieved into four ranges of particlesizes (i.e.,
<180 µm, 180–250 µm, 250–550 µm and 550–2500 µm), then hand-mixed with WG and glycerol
(plasticizer)and compression molded into the composite sheets. The bulk density, flexural properties and
fracture surface morphology of the composites were studied. The composite reinforced with SD particles size of
180-250 µm indicated the best mechanical performance. When the larger SD particle sizes were integrated,
mechanical properties of the composites tended to decline. From SEM images, an inferior interface between the
larger SD particles and WG-based matrix was revealed.
Keywords: biocomposites, sawdust, wheat gluten, particle size, mechanical properties
1. Introduction
Nowadays, the replacement of conventional (non-
degradable) plastics by biodegradable alternatives in a
short service life application has been increasingly
promoted [1]. New products derived from biodegradable
and renewable resources have been extensively
developed [2]. At present, bioplastics are being utilized
as packaging materials, horticultural products etc.
However, the use of these polymers is still limited due to
their high cost, inadequate performance, and/or strong
tendency to absorb moisture [1,3]. To improve
mechanical properties of bio-based polymers and extend
their applications, the addition of reinforcements such as
natural fibers to produce eco-friendly bio-composites is
one common approach [4,5] Natural fibers are mainly
consisted of cellulose, hemicellulose and lignin [5].
Instead, utilizing cellulose-based feed stocks from
agricultural wastes and byproducts obtained from
industrial processes, such as rice straw, corn cob,
coconut shell, pineapple stick, oil, bagasse palm shell
and sawdust will provide inexpensive, renewable, and
sustainable source [2,6]. Among the renewable natural
polymers, proteins from plants have been most studied
and develop for bioplastic manufacturing since they are
abundant, relatively low cost and rapidly biodegradable
[7]. In particular, wheat gluten (WG) has great potential
to substitute for conventional plastics because of its
suitable mechanical properties and interesting gas barrier
properties [8,9]. However, it has some drawbacks that
limit its widespread application, such as brittleness and
water absorption [10,11]. Incorporation of natural fibers,
e.g., hemp [4,5], jute [12], wheat straw [2], coconut
[10,11,13] and wood [3,5] fibers, into WG to improve
properties of the composite materials has shown to be
one of the effective ways. WG-based materials are
usually thermally processed between 80°C and 130°C
with plasticizer contents around 25-35% [4].
In this study, the WG-based biocomposites
reinforced with sawdust (SD) from the furniture
manufacturer in Lumpang Province, Thailand, were
prepared. It was well known that type, size as well as
size distribution of reinforcements had a major influence
on mechanical properties of the composite materials.
This present work aimed to investigate effect of SD
particle size on morphology, physical and mechanical
properties of the WG-based biocomposites.
2. Experimental methods
2.1 Materials
Sawdust (SD )of Phyllocarpusseptentrionalis
Donn. SD was kindly supplied by the furniture
manufacturer in Lampang Province, Thailand. Vital
wheat gluten was purchased from Zhang Jia Gang
HengFeng Co. Ltd, China. Commercial grade glycerol
International Polymer Conference of Thailand
93 was used in this work. Magnesium nitrate salt used in the
controlled relative humidity (RH) chamber
of52.9%Mg(NO3)2 was supplied by Ajax Finechem Pty
Ltd., Australia.
2.2 Preparation of the biocomposites
The as received SD was firstly sieved into four
ranges of particlesizes, i.e., <180 µm, 180–250 µm, 250–
550 µm and 550–2500 µm. To prepare the
biocomposites, 62.5 g SD particles, 43.75 g wheat gluten
and 18.75 g glycerol (plasticizer) were hand-mixed until
homogeneous for 10 min. Then, the mixture was placed
into the metal mold with cavity size of 130 × 170 × 3.75
mm3. Each side of the mold was formerly covered with
the polyester sheets sprayed with mold release agent.
Next, the mold was deposited in the center of
compression molding machine (Labtech LP-S-80) heated
at 130°Cunder pressure of 26.6 MPa for 10 min, and
then, cooled for 5 min.
2.3 Characterization
2.3.1Bulk density
Bulk density (D) of the SD particles in each range
of particle sizes were measured by weighting them (M)
using a 4-digit balance (Denver instrument, SI-234)in
container of know volume (V). For the biocomposites,
the samples were cut into the sizes of 20 mm × 100mm
and weighed (M). Then, each specimen dimension
(length, width, and thickness) was measured using a
digital caliper (TCM) for determining its volume (V).The
bulk density (D) was then calculated according to the
following equation:
v
mD (1)
where D = density (g/cm3), M = mass (g), V = volume
(cm3).
2.3.2 Scanning electron microscopy (SEM)
Surface morphologies of the SD particles as well
as the fracture surfaces of all biocomposites after failure
under mechanical test were examined by a scanning
electron microscope (SEM, LEO 1450 VP). All sample
surfaces were coated with gold sputtering prior to SEM
observation. The accelerating voltage of 10 kV was used.
2.3.3 Mechanical tests
The flexural test (4-point bending) of the
biocomposite specimens was performed using an Instron
5560universal testing machine with a load cell of 1 kN.
The rate of crosshead motion was2 mm/min according to
ASTM D6109-13.Before testing, the samples were
conditioned at the controlled relative humidity (RH)
chamber of 52.9% using a chamber of saturated Mg
(NO3)2 solution at 25°C (according to ASTM E104) for
40 h.The values of Flexural strength (S), maximum strain
(r) and modulus of elasticity (E) were reported as the
mean ±SD of five replicates for each biocomposite.
Flexural strength (S) for each specimen was
calculated according to the following equation:
2bd
PLS (2)
where S = stress in outer fiber throughout load span, psi
(MPa), P = total load on beam at any given point on the
load deflection curve, lb (N), L = supports pan (mm), b =
width of beam (mm), and d = depth of beam
(mm).Maximum strain for each specimen was calculated
by the following equation:
2
70.4
L
Ddr (3)
where r = maximum strain, D = midspan (mm)
deflection, d = depth of the beam, in. (mm) and L =
support span, in. (mm)
Modulus of elasticity (E) was determined from
the slope of the straight line that joins the originand a
selected point on the stress strain was calculated by the
following equation:
r
sE (4)
where E = Modulus of elasticity (MPa),r = maximum
strain and s = Strength (MPa)
3. Results and discussion
The sawdust (SD) in four ranges of particle sizes,
i.e., <180 µm, 180–250 µm, 250–550 µm and 550–2500
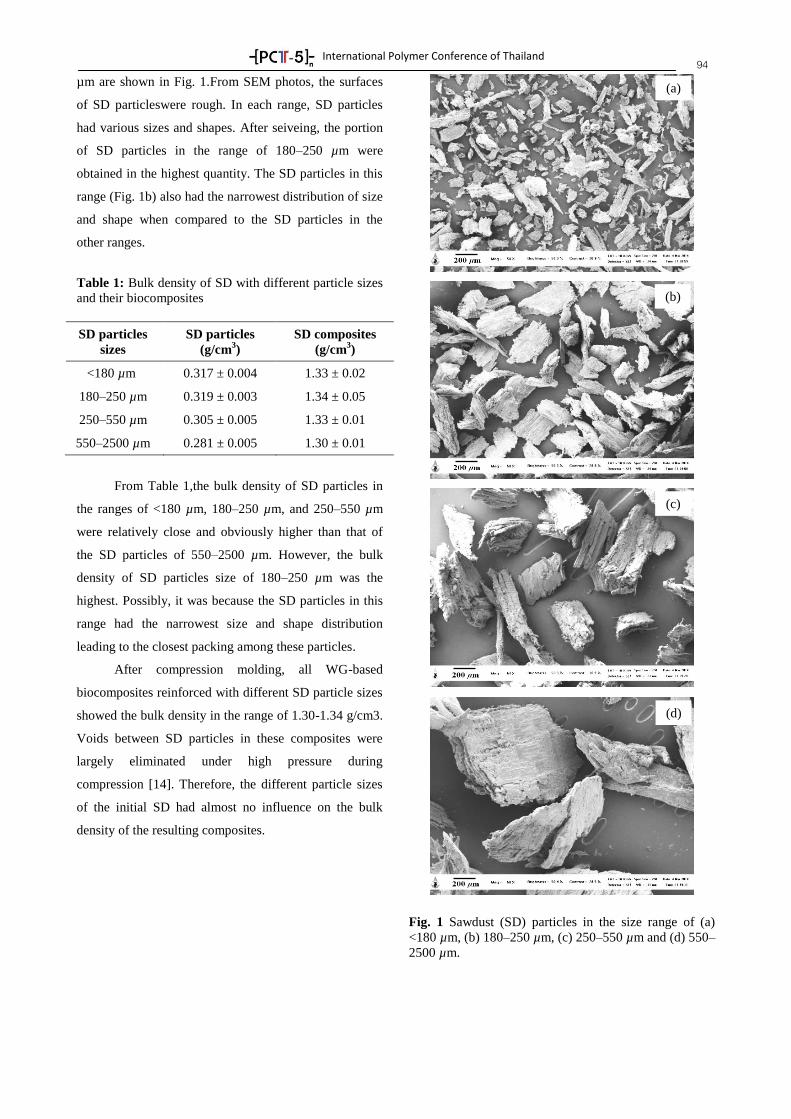
International Polymer Conference of Thailand
94 µm are shown in Fig. 1.From SEM photos, the surfaces
of SD particleswere rough. In each range, SD particles
had various sizes and shapes. After seiveing, the portion
of SD particles in the range of 180–250 µm were
obtained in the highest quantity. The SD particles in this
range (Fig. 1b) also had the narrowest distribution of size
and shape when compared to the SD particles in the
other ranges.
Table 1: Bulk density of SD with different particle sizes
and their biocomposites
SD particles
sizes
SD particles
(g/cm3)
SD composites
(g/cm3)
<180 µm 0.317 ± 0.004 1.33 ± 0.02
180–250 µm 0.319 ± 0.003 1.34 ± 0.05
250–550 µm 0.305 ± 0.005 1.33 ± 0.01
550–2500 µm 0.281 ± 0.005 1.30 ± 0.01
From Table 1,the bulk density of SD particles in
the ranges of <180 µm, 180–250 µm, and 250–550 µm
were relatively close and obviously higher than that of
the SD particles of 550–2500 µm. However, the bulk
density of SD particles size of 180–250 µm was the
highest. Possibly, it was because the SD particles in this
range had the narrowest size and shape distribution
leading to the closest packing among these particles.
After compression molding, all WG-based
biocomposites reinforced with different SD particle sizes
showed the bulk density in the range of 1.30-1.34 g/cm3.
Voids between SD particles in these composites were
largely eliminated under high pressure during
compression [14]. Therefore, the different particle sizes
of the initial SD had almost no influence on the bulk
density of the resulting composites.
Fig. 1 Sawdust (SD) particles in the size range of (a)
<180 µm, (b) 180–250 µm, (c) 250–550 µm and (d) 550–
2500 µm.
400 µm
(a)
(b)
(c)
(d)
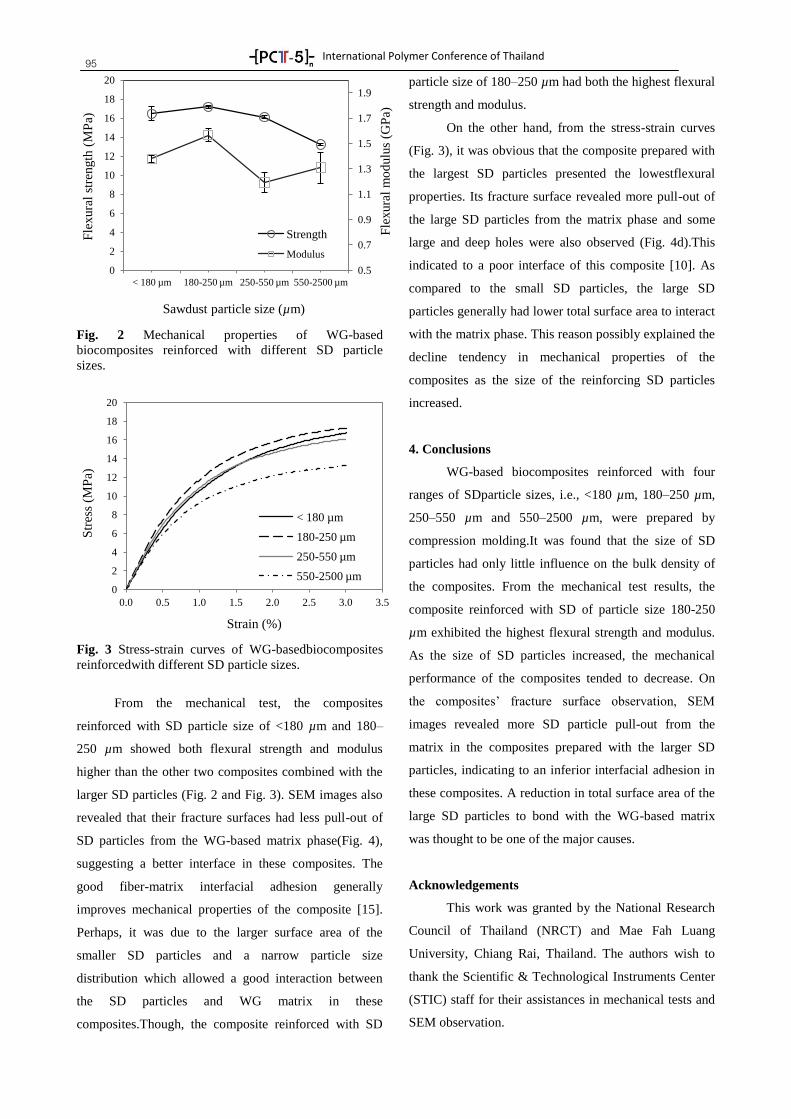
International Polymer Conference of Thailand
95
Fig. 2 Mechanical properties of WG-based
biocomposites reinforced with different SD particle
sizes.
Fig. 3 Stress-strain curves of WG-basedbiocomposites
reinforcedwith different SD particle sizes.
From the mechanical test, the composites
reinforced with SD particle size of <180 µm and 180–
250 µm showed both flexural strength and modulus
higher than the other two composites combined with the
larger SD particles (Fig. 2 and Fig. 3). SEM images also
revealed that their fracture surfaces had less pull-out of
SD particles from the WG-based matrix phase(Fig. 4),
suggesting a better interface in these composites. The
good fiber-matrix interfacial adhesion generally
improves mechanical properties of the composite [15].
Perhaps, it was due to the larger surface area of the
smaller SD particles and a narrow particle size
distribution which allowed a good interaction between
the SD particles and WG matrix in these
composites.Though, the composite reinforced with SD
particle size of 180–250 µm had both the highest flexural
strength and modulus.
On the other hand, from the stress-strain curves
(Fig. 3), it was obvious that the composite prepared with
the largest SD particles presented the lowestflexural
properties. Its fracture surface revealed more pull-out of
the large SD particles from the matrix phase and some
large and deep holes were also observed (Fig. 4d).This
indicated to a poor interface of this composite [10]. As
compared to the small SD particles, the large SD
particles generally had lower total surface area to interact
with the matrix phase. This reason possibly explained the
decline tendency in mechanical properties of the
composites as the size of the reinforcing SD particles
increased.
4. Conclusions
WG-based biocomposites reinforced with four
ranges of SDparticle sizes, i.e., <180 µm, 180–250 µm,
250–550 µm and 550–2500 µm, were prepared by
compression molding.It was found that the size of SD
particles had only little influence on the bulk density of
the composites. From the mechanical test results, the
composite reinforced with SD of particle size 180-250
µm exhibited the highest flexural strength and modulus.
As the size of SD particles increased, the mechanical
performance of the composites tended to decrease. On
the composites’ fracture surface observation, SEM
images revealed more SD particle pull-out from the
matrix in the composites prepared with the larger SD
particles, indicating to an inferior interfacial adhesion in
these composites. A reduction in total surface area of the
large SD particles to bond with the WG-based matrix
was thought to be one of the major causes.
Acknowledgements
This work was granted by the National Research
Council of Thailand (NRCT) and Mae Fah Luang
University, Chiang Rai, Thailand. The authors wish to
thank the Scientific & Technological Instruments Center
(STIC) staff for their assistances in mechanical tests and
SEM observation.
0.5
0.7
0.9
1.1
1.3
1.5
1.7
1.9
0
2
4
6
8
10
12
14
16
18
20
< 180 µm 180-250 µm 250-550 µm 550-2500 µm
Fle
xura
l m
od
ulu
s (G
Pa)
Fle
xura
l st
rength
(M
Pa)
Sawdust particle size (µm)
Strength
Modulus
0
2
4
6
8
10
12
14
16
18
20
0.0 0.5 1.0 1.5 2.0 2.5 3.0 3.5
Str
ess
(MP
a)
Strain (%)
< 180 µm
180-250 µm
250-550 µm
550-2500 µm
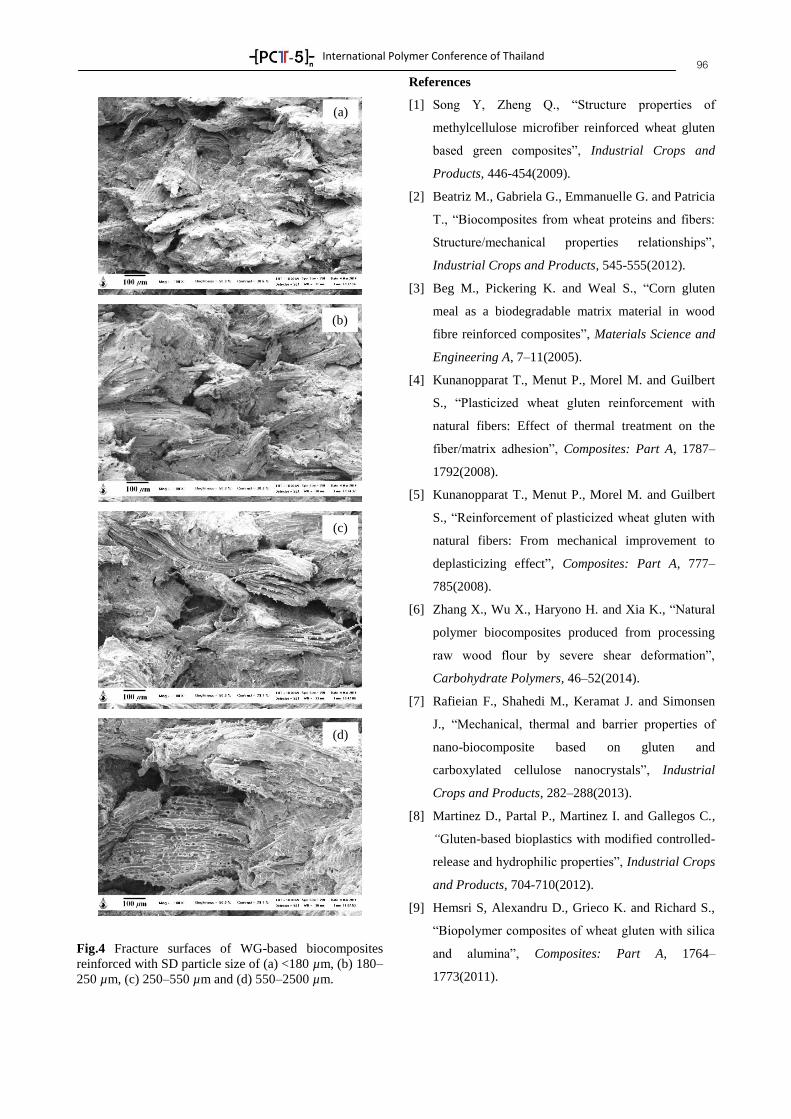
International Polymer Conference of Thailand
96
Fig.4 Fracture surfaces of WG-based biocomposites
reinforced with SD particle size of (a) <180 µm, (b) 180–
250 µm, (c) 250–550 µm and (d) 550–2500 µm.
References
[1] Song Y, Zheng Q., “Structure properties of
methylcellulose microfiber reinforced wheat gluten
based green composites”, Industrial Crops and
Products, 446-454(2009).
[2] Beatriz M., Gabriela G., Emmanuelle G. and Patricia
T., “Biocomposites from wheat proteins and fibers:
Structure/mechanical properties relationships”,
Industrial Crops and Products, 545-555(2012).
[3] Beg M., Pickering K. and Weal S., “Corn gluten
meal as a biodegradable matrix material in wood
fibre reinforced composites”, Materials Science and
Engineering A, 7–11(2005).
[4] Kunanopparat T., Menut P., Morel M. and Guilbert
S., “Plasticized wheat gluten reinforcement with
natural fibers: Effect of thermal treatment on the
fiber/matrix adhesion”, Composites: Part A, 1787–
1792(2008).
[5] Kunanopparat T., Menut P., Morel M. and Guilbert
S., “Reinforcement of plasticized wheat gluten with
natural fibers: From mechanical improvement to
deplasticizing effect”, Composites: Part A, 777–
785(2008).
[6] Zhang X., Wu X., Haryono H. and Xia K., “Natural
polymer biocomposites produced from processing
raw wood flour by severe shear deformation”,
Carbohydrate Polymers, 46–52(2014).
[7] Rafieian F., Shahedi M., Keramat J. and Simonsen
J., “Mechanical, thermal and barrier properties of
nano-biocomposite based on gluten and
carboxylated cellulose nanocrystals”, Industrial
Crops and Products, 282–288(2013).
[8] Martinez D., Partal P., Martinez I. and Gallegos C.,
“Gluten-based bioplastics with modified controlled-
release and hydrophilic properties”, Industrial Crops
and Products, 704-710(2012).
[9] Hemsri S, Alexandru D., Grieco K. and Richard S.,
“Biopolymer composites of wheat gluten with silica
and alumina”, Composites: Part A, 1764–
1773(2011).
(d)
(c)
(b)
(a)
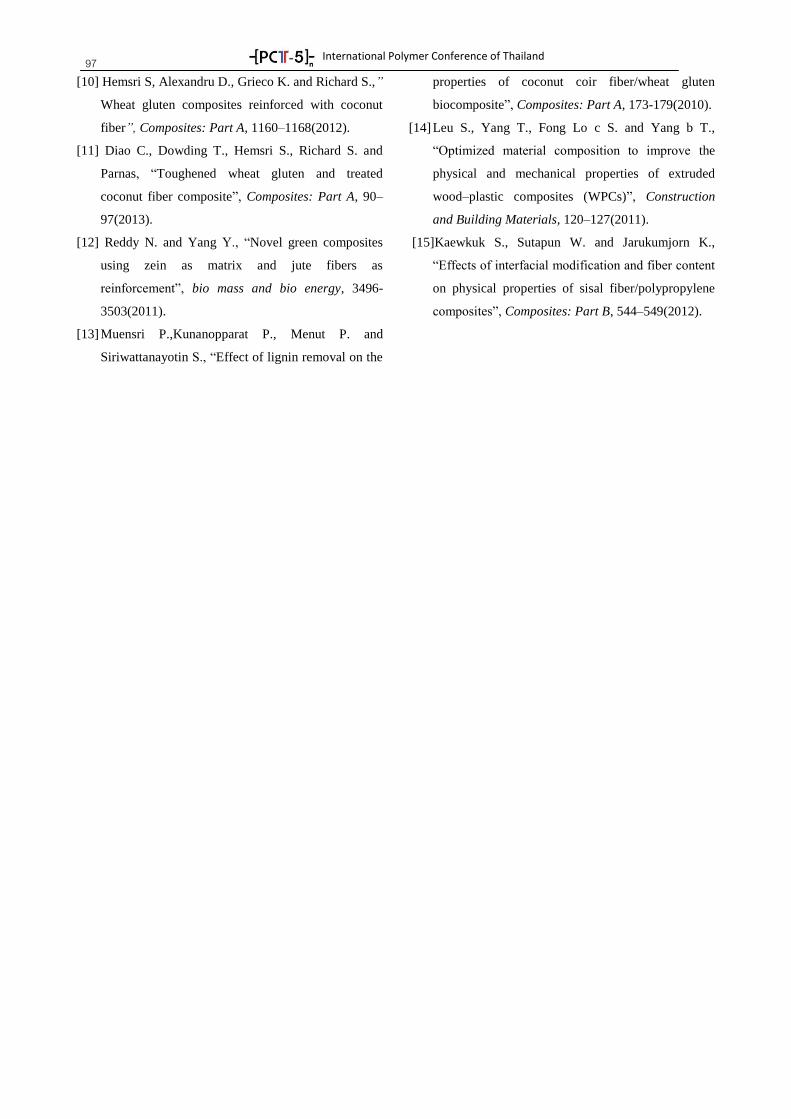
International Polymer Conference of Thailand
97 [10] Hemsri S, Alexandru D., Grieco K. and Richard S.,”
Wheat gluten composites reinforced with coconut
fiber”, Composites: Part A, 1160–1168(2012).
[11] Diao C., Dowding T., Hemsri S., Richard S. and
Parnas, “Toughened wheat gluten and treated
coconut fiber composite”, Composites: Part A, 90–
97(2013).
[12] Reddy N. and Yang Y., “Novel green composites
using zein as matrix and jute fibers as
reinforcement”, bio mass and bio energy, 3496-
3503(2011).
[13] Muensri P.,Kunanopparat P., Menut P. and
Siriwattanayotin S., “Effect of lignin removal on the
properties of coconut coir fiber/wheat gluten
biocomposite”, Composites: Part A, 173-179(2010).
[14] Leu S., Yang T., Fong Lo c S. and Yang b T.,
“Optimized material composition to improve the
physical and mechanical properties of extruded
wood–plastic composites (WPCs)”, Construction
and Building Materials, 120–127(2011).
[15]Kaewkuk S., Sutapun W. and Jarukumjorn K.,
“Effects of interfacial modification and fiber content
on physical properties of sisal fiber/polypropylene
composites”, Composites: Part B, 544–549(2012).
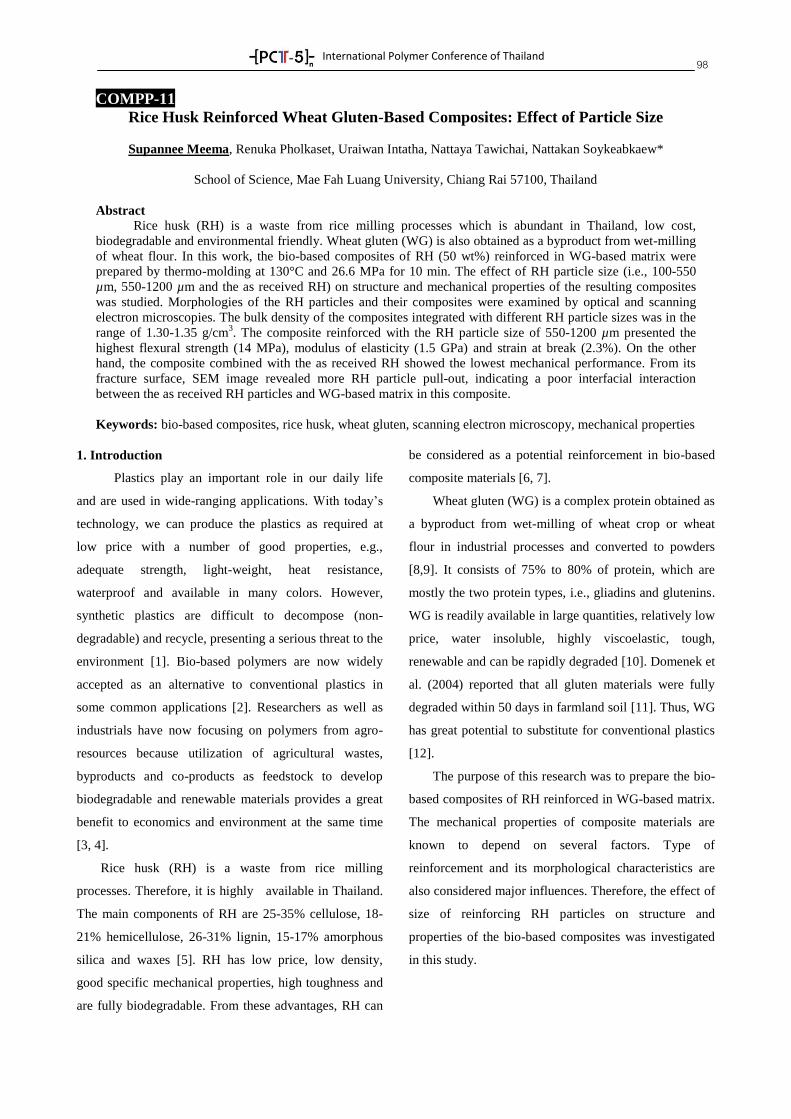
International Polymer Conference of Thailand
98
COMPP-11
Rice Husk Reinforced Wheat Gluten-Based Composites: Effect of Particle Size
Supannee Meema, Renuka Pholkaset, Uraiwan Intatha, Nattaya Tawichai, Nattakan Soykeabkaew*
School of Science, Mae Fah Luang University, Chiang Rai 57100, Thailand
Abstract
Rice husk (RH) is a waste from rice milling processes which is abundant in Thailand, low cost,
biodegradable and environmental friendly. Wheat gluten (WG) is also obtained as a byproduct from wet-milling
of wheat flour. In this work, the bio-based composites of RH (50 wt%) reinforced in WG-based matrix were
prepared by thermo-molding at 130°C and 26.6 MPa for 10 min. The effect of RH particle size (i.e., 100-550
µm, 550-1200 µm and the as received RH) on structure and mechanical properties of the resulting composites
was studied. Morphologies of the RH particles and their composites were examined by optical and scanning
electron microscopies. The bulk density of the composites integrated with different RH particle sizes was in the
range of 1.30-1.35 g/cm3. The composite reinforced with the RH particle size of 550-1200 µm presented the
highest flexural strength (14 MPa), modulus of elasticity (1.5 GPa) and strain at break (2.3%). On the other
hand, the composite combined with the as received RH showed the lowest mechanical performance. From its
fracture surface, SEM image revealed more RH particle pull-out, indicating a poor interfacial interaction
between the as received RH particles and WG-based matrix in this composite.
Keywords: bio-based composites, rice husk, wheat gluten, scanning electron microscopy, mechanical properties
1. Introduction
Plastics play an important role in our daily life
and are used in wide-ranging applications. With today’s
technology, we can produce the plastics as required at
low price with a number of good properties, e.g.,
adequate strength, light-weight, heat resistance,
waterproof and available in many colors. However,
synthetic plastics are difficult to decompose (non-
degradable) and recycle, presenting a serious threat to the
environment [1]. Bio-based polymers are now widely
accepted as an alternative to conventional plastics in
some common applications [2]. Researchers as well as
industrials have now focusing on polymers from agro-
resources because utilization of agricultural wastes,
byproducts and co-products as feedstock to develop
biodegradable and renewable materials provides a great
benefit to economics and environment at the same time
[3, 4].
Rice husk (RH) is a waste from rice milling
processes. Therefore, it is highly available in Thailand.
The main components of RH are 25-35% cellulose, 18-
21% hemicellulose, 26-31% lignin, 15-17% amorphous
silica and waxes [5]. RH has low price, low density,
good specific mechanical properties, high toughness and
are fully biodegradable. From these advantages, RH can
be considered as a potential reinforcement in bio-based
composite materials [6, 7].
Wheat gluten (WG) is a complex protein obtained as
a byproduct from wet-milling of wheat crop or wheat
flour in industrial processes and converted to powders
[8,9]. It consists of 75% to 80% of protein, which are
mostly the two protein types, i.e., gliadins and glutenins. WG is readily available in large quantities, relatively low
price, water insoluble, highly viscoelastic, tough,
renewable and can be rapidly degraded [10]. Domenek et
al. (2004) reported that all gluten materials were fully
degraded within 50 days in farmland soil [11]. Thus, WG
has great potential to substitute for conventional plastics
[12].
The purpose of this research was to prepare the bio-
based composites of RH reinforced in WG-based matrix.
The mechanical properties of composite materials are
known to depend on several factors. Type of
reinforcement and its morphological characteristics are
also considered major influences. Therefore, the effect of
size of reinforcing RH particles on structure and
properties of the bio-based composites was investigated
in this study.
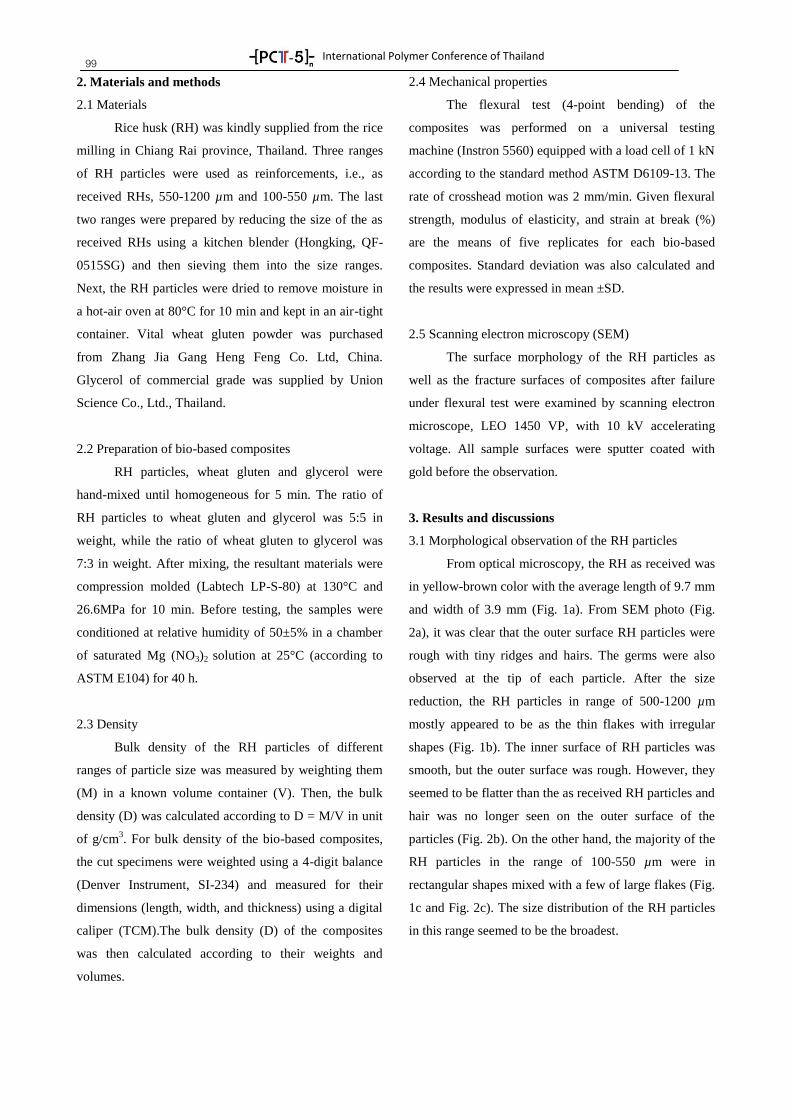
International Polymer Conference of Thailand
99 2. Materials and methods
2.1 Materials
Rice husk (RH) was kindly supplied from the rice
milling in Chiang Rai province, Thailand. Three ranges
of RH particles were used as reinforcements, i.e., as
received RHs, 550-1200 µm and 100-550 µm. The last
two ranges were prepared by reducing the size of the as
received RHs using a kitchen blender (Hongking, QF-
0515SG) and then sieving them into the size ranges.
Next, the RH particles were dried to remove moisture in
a hot-air oven at 80°C for 10 min and kept in an air-tight
container. Vital wheat gluten powder was purchased
from Zhang Jia Gang Heng Feng Co. Ltd, China.
Glycerol of commercial grade was supplied by Union
Science Co., Ltd., Thailand.
2.2 Preparation of bio-based composites
RH particles, wheat gluten and glycerol were
hand-mixed until homogeneous for 5 min. The ratio of
RH particles to wheat gluten and glycerol was 5:5 in
weight, while the ratio of wheat gluten to glycerol was
7:3 in weight. After mixing, the resultant materials were
compression molded (Labtech LP-S-80) at 130°C and
26.6MPa for 10 min. Before testing, the samples were
conditioned at relative humidity of 50±5% in a chamber
of saturated Mg (NO3)2 solution at 25°C (according to
ASTM E104) for 40 h.
2.3 Density
Bulk density of the RH particles of different
ranges of particle size was measured by weighting them
(M) in a known volume container (V). Then, the bulk
density (D) was calculated according to D = M/V in unit
of g/cm3. For bulk density of the bio-based composites,
the cut specimens were weighted using a 4-digit balance
(Denver Instrument, SI-234) and measured for their
dimensions (length, width, and thickness) using a digital
caliper (TCM).The bulk density (D) of the composites
was then calculated according to their weights and
volumes.
2.4 Mechanical properties
The flexural test (4-point bending) of the
composites was performed on a universal testing
machine (Instron 5560) equipped with a load cell of 1 kN
according to the standard method ASTM D6109-13. The
rate of crosshead motion was 2 mm/min. Given flexural
strength, modulus of elasticity, and strain at break (%)
are the means of five replicates for each bio-based
composites. Standard deviation was also calculated and
the results were expressed in mean ±SD.
2.5 Scanning electron microscopy (SEM)
The surface morphology of the RH particles as
well as the fracture surfaces of composites after failure
under flexural test were examined by scanning electron
microscope, LEO 1450 VP, with 10 kV accelerating
voltage. All sample surfaces were sputter coated with
gold before the observation.
3. Results and discussions
3.1 Morphological observation of the RH particles
From optical microscopy, the RH as received was
in yellow-brown color with the average length of 9.7 mm
and width of 3.9 mm (Fig. 1a). From SEM photo (Fig.
2a), it was clear that the outer surface RH particles were
rough with tiny ridges and hairs. The germs were also
observed at the tip of each particle. After the size
reduction, the RH particles in range of 500-1200 µm
mostly appeared to be as the thin flakes with irregular
shapes (Fig. 1b). The inner surface of RH particles was
smooth, but the outer surface was rough. However, they
seemed to be flatter than the as received RH particles and
hair was no longer seen on the outer surface of the
particles (Fig. 2b). On the other hand, the majority of the
RH particles in the range of 100-550 µm were in
rectangular shapes mixed with a few of large flakes (Fig.
1c and Fig. 2c). The size distribution of the RH particles
in this range seemed to be the broadest.
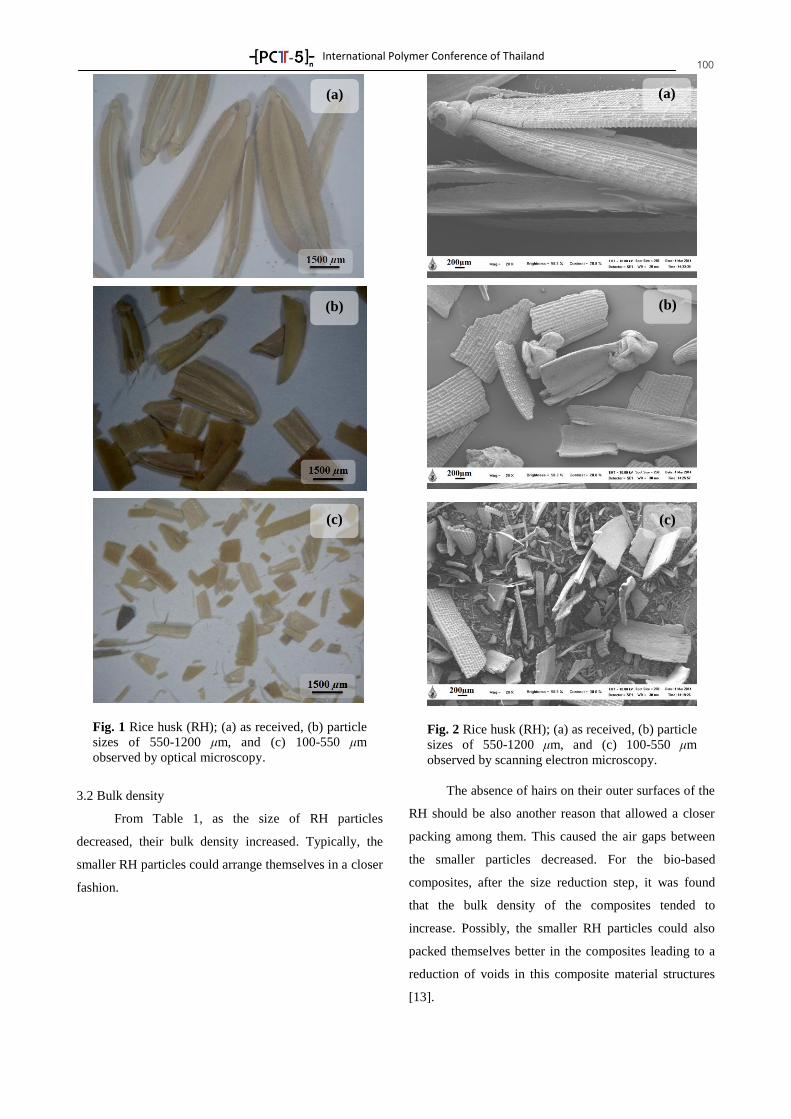
International Polymer Conference of Thailand
100
Fig. 1 Rice husk (RH); (a) as received, (b) particle
sizes of 550-1200 μm, and (c) 100-550 μm
observed by optical microscopy.
3.2 Bulk density
From Table 1, as the size of RH particles
decreased, their bulk density increased. Typically, the
smaller RH particles could arrange themselves in a closer
fashion.
Fig. 2 Rice husk (RH); (a) as received, (b) particle
sizes of 550-1200 μm, and (c) 100-550 μm
observed by scanning electron microscopy.
The absence of hairs on their outer surfaces of the
RH should be also another reason that allowed a closer
packing among them. This caused the air gaps between
the smaller particles decreased. For the bio-based
composites, after the size reduction step, it was found
that the bulk density of the composites tended to
increase. Possibly, the smaller RH particles could also
packed themselves better in the composites leading to a
reduction of voids in this composite material structures
[13].
(a)
(b)
(c)
(a)
(b)
(c)
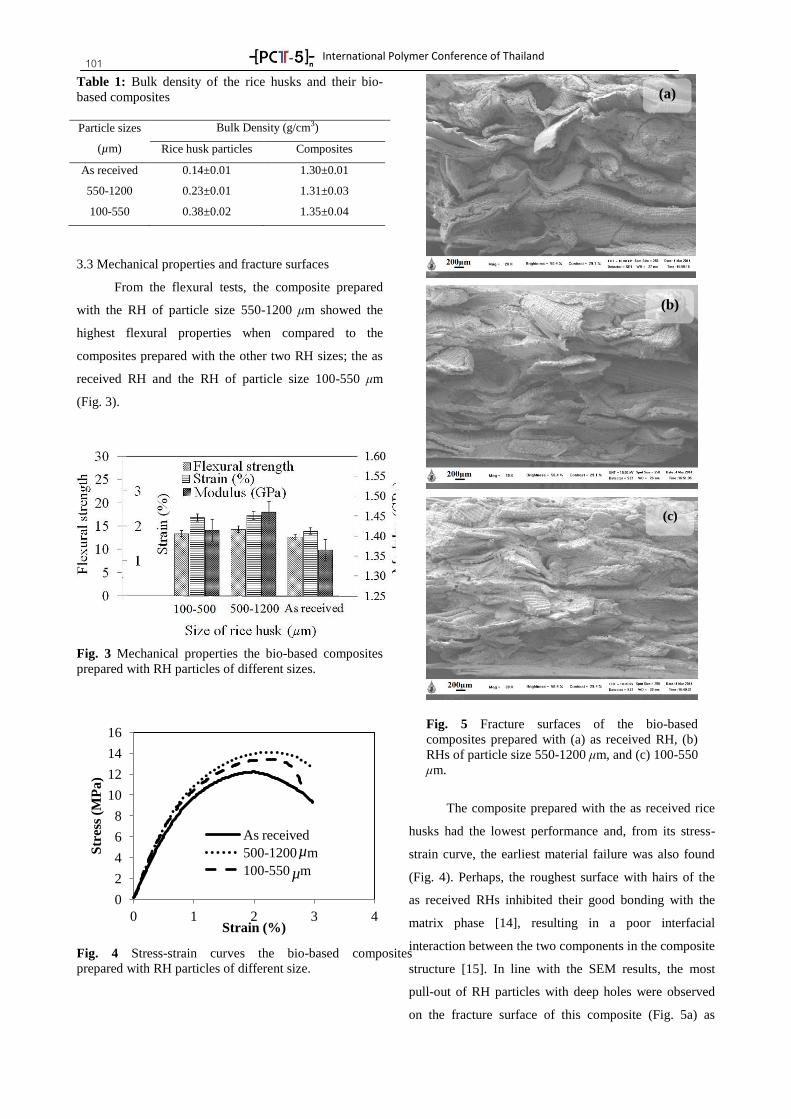
International Polymer Conference of Thailand
101 Table 1: Bulk density of the rice husks and their bio-
based composites
Particle sizes
(µm)
Bulk Density (g/cm3)
Rice husk particles Composites
As received 0.14±0.01 1.30±0.01
550-1200 0.23±0.01 1.31±0.03
100-550 0.38±0.02 1.35±0.04
3.3 Mechanical properties and fracture surfaces
From the flexural tests, the composite prepared
with the RH of particle size 550-1200 μm showed the
highest flexural properties when compared to the
composites prepared with the other two RH sizes; the as
received RH and the RH of particle size 100-550 μm
(Fig. 3).
Fig. 3 Mechanical properties the bio-based composites
prepared with RH particles of different sizes.
Fig. 4 Stress-strain curves the bio-based composites
prepared with RH particles of different size.
Fig. 5 Fracture surfaces of the bio-based
composites prepared with (a) as received RH, (b)
RHs of particle size 550-1200 μm, and (c) 100-550
μm.
The composite prepared with the as received rice
husks had the lowest performance and, from its stress-
strain curve, the earliest material failure was also found
(Fig. 4). Perhaps, the roughest surface with hairs of the
as received RHs inhibited their good bonding with the
matrix phase [14], resulting in a poor interfacial
interaction between the two components in the composite
structure [15]. In line with the SEM results, the most
pull-out of RH particles with deep holes were observed
on the fracture surface of this composite (Fig. 5a) as
0
2
4
6
8
10
12
14
16
0 1 2 3 4
Str
ess
(MP
a)
Strain (%)
As received
500-1200 m
100-550 m
(a)
(b)
(c)
µ
µ
International Polymer Conference of Thailand
102 compared to those of the other composites (Fig. 5b and
c).
Lastly, the composite prepared with the RH of
particle size 100-550 μm presented a slightly lower
flexural strength and modulus of elasticity than the one
prepared with particle size 550-1200 μm. This was
possibly due to the broad size distribution of the RH
particles in the range of 100-550 μm as previously seen
in Fig. 1c and Fig. 2c [16].
4. Conclusions
The bio-based composites reinforced with RH
particles in different sizes were prepared by thermo-
molding technique. The as received RHs were in yellow-
brown color and their outer surfaces were rough with
tiny ridges and hairs, whereas the inner surfaces of RH
particles were smooth. After the size reduction step, the
outer surface of RH particles became less rough with no
hair presented. The bulk density of the bio-based
composites prepared with different sizes of RH particles
was similar in the range of 1.30-1.35 g/cm3. From
mechanical test results, the composite reinforced with the
RH of particle size 550-1200 µm exhibited the highest
flexural properties. Meanwhile, the composite prepared
with the RH of particle size 100-550 µm presented a
slightly lower flexural strength and modulus possibly due
to the broad size distribution of the RH particles in this
range. On the other hand, the composite combined with
the as received RHs showed the lowest mechanical
performance. Perhaps, the roughest outer surface with
the presence hairs of the as received RHs inhibited their
good bonding with the WG-based matrix. SEM images
also revealed more pull-out of RH particles on the
fracture surface of this composite, indicating an inferior
interface when compared to the other two composites
prepared with the smaller RH particles.
Acknowledgements
This work was granted by the National Research
Council of Thailand (NRCT) and Mae Fah Luang
University, Chiang Rai, Thailand. The authors wish to
thank STIC staff for their assistances in mechanical tests
and SEM characterization.
References
[1] Mohanty A.K., Misra M., Drzal L.T. Sustainable
bio- composite from renewable resources:
Opportunities and challenges in the green materials
world, Journal of polymer and the environment, 10:
19-26 (2002).
[2] Duval A., Molina-Boisseau S,. Chirat C.
Comparison of Kraft lignin and lignosulfonates
addition to wheat gluten-based materials:
Mechanical and thermal properties, Industrial Crops
and Products, 49: 66-74 (2013).
[3] Reddy N., Yang Y. Novel green composites using
zein as matrix and jute fibers as reinforcement, Bio
mass and bio energy, 35: 3496- 3503 (2011).
[4] Zhang X., Wu X., Haryono H., Xia K. Natural
polymer biocomposites produced from processing
raw wood flour by severe shear deformation,
Carbohydrate Polymers, 113: 46-52 (2014).
[5] Johnson A.C., Yunus N.B. Particleboards from Rice
Husk: A Brief Introduction to Renewable Materials
of Construction. P. 12-15 (2009).
[6] Hemsri S., Grieco K., Asandei A.D., Parnas R.S.
Wheat gluten composites reinforced with coconut
fiber, Composites: Part A, 43: 1160-1168 (2012).
[7] Monta˜no-Leyva B., Silva G.G.D., Gastaldi E.,
Torres-Chávez P., Gontard N., Angellier-Coussy H.
Biocomposites from wheat proteins and fibers:
Structure/mechanical properties relationships,
Industrial Crops and Products, 43: 545-555 (2013).
[8] Yuan Q., Lu W., Pan Y. Structure and properties of
biodegradable wheat gluten/attapulgite
nanocomposite sheets, Polymer Degradation and
Stability, 95: 1581-1587 (2010).
[9] Zárate-Ramírez L.S., Romero A., Bengoechea C.,
Partal P., Guerrero A. Thermo-mechanical and
hydrophilic properties of polysaccharide/gluten-
based bioplastics, Carbohydrate Polymers, 112: 24-
31 (2014).
International Polymer Conference of Thailand
103 [10] Day L. Wheat gluten: production, properties and
application, Food and Nutritional Sciences, 10: 267-
288 (2006).
[11] Domenek S., Feuilloley P., Gratraud J., Morel M.,
Guilbert S. Biodegradability of wheat gluten based
bioplastics, Chemosphere, 54: 551-559 (2004).
[12] Diao C., Dowding T., Hemsri S., Parnas R.S.
Toughened wheat gluten and treated coconut fiber
composite, Composites: Part A, 58: 90-97 (2014).
[13] Tiago J.C.D. Effect of Rice Husk Ash Particle Size
in Lime Based Mortars, Instituto Superior Técnico,
P: 1-11 (2011).
[14] Sumaila M., Amber I., Bawa M. Effect of fiber
length on the physical properties and mechanical
properties of random oriented, nonwoven short
banana (musa blabisiana) fibre/ epoxy composite,
Mechanical Engineering Department, 2: 39-46
(2013).
[15] Syafri R., Ahmad I., Abdullah I. Effect of Rice Husk
Surface Modification by LENR the on Mechanical
Properties of NR/HDPE Reinforced Rice Husk
Composite, Sains Malaysiana, 44: 749-756 (2011).
[16] Zhang Y., Ghaly A.E., Li B. Physical properties of
Rice residues as affected by variety and climatic and
cultivation ondition in three conditions, American
Journal of Applied Sciences, 9: 1757-1768 (2012).
International Polymer Conference of Thailand
104
COMPP-12
Mechanical Properties of Poly(butylene succinate) Films Reinforced with Silica
Nanthaporn Sangviroon1 and Pranut Potiyaraj
2*
1Interdisciplinary Program in Petrochemical & Polymer Science, Faculty of Science, Chulalongkorn University,
Bangkok 10330 2Department of Materials Science, Faculty of Science, Chulalongkorn University, Bangkok 10330
Abstract
Poly(butylene succinate) or PBS is a biodegradable polymer which has good processability, chemical
resistance and environmental friendly However, the application was limited by its mechanical properties. The
aim of this research is to improve mechanical properties of PBS bioplastic films by reinforcing with silica. The
composite films were prepared with the presence of glycidyl methacrylate grafted poly(butylene succinate)
(PBS-g-GMA) as a compatibilizer at a fixed ratio of 5 wt%. PBS and silica were mixed in a twin screw extruder
at the amount of silica between 0-3 wt%. The obtained compounds were then processed into films by a chill roll
cast extruder. The effects of compatibilizer and silica loading on mechanical properties of the prepared
composite films were investigated. It was found that the mechanical properties of PBS/silica composite films
were improved when 1%wt of silica was added. However, the mechanical properties decreased with increasing
silica loading due to the agglomeration of silica particles. The results also indicated that the PBS/silica
composite films with the presence of PBS-g-GMA possessed improved mechanical properties over the films
without the compatibilizer.
Keywords: Poly(butylene succinate), Silica, Composite, PBS-g-GMA, Mechanical properties
Introduction
Nowadays, biodegradable polymeric materials
attract much more attention due to the fact that plastic
waste has caused the environment pollution.
Poly(butylene succinate) or PBS is an aliphatic
biodegradable polyester which is now commercially
available. PBS is synthesized by polycondensation of
succinic acid with 1,4-butanediol. Despite its good
processablity and chemical resistance, its softness and
poor barrier gas thus limit the applications of PBS. [1]
Some researchers have thus attempted to improve
properties of PBS by mixing with reinforcing filler i.e.
silica. However, it is difficult to disperse the silica
particles in polymer matrix homogeneously because silica
particles have strong tendency to agglomerate, which is
caused by the poor interaction between silica particles
and polymer matrix, resulting in reduced mechanical
properties. [2]
One way to overcome these drawbacks and to
prepare materials with enhanced properties is to
incorporate a compatibilizer in order to enhance the
dispersibility of silica particles and improve interfacial
adhesion between silica particles and polymer matrix. [3]
Glycidyl methacrylate grafted polymers have been
used as compatibilizer in some previous research because
of its epoxide functional groups, which is highly
electrophilic and capable of reacting with a variety of
functional groups such as carboxylic acids, amides, and
alcohols. [4]
In this study, PBS-g-GMA was prepared by the
reactive melt-grafting extrusion method. Then composites
were processed into films by a chill roll cast extruder.
The effects of PBS-g-GMA and silica loading on
mechanical properties of PBS/silica composite films were
investigated.
Experimental
Materials
PBS granules (GS PlaTM
FZ91PD) were of film
grade purchased from Mitsubishi Chemical. Silica
(ULTRASIL® 9000 GR) was kindly supported by Evonik
with a specific surface area of 235 m2/g and an average
particle size of 13.3 Dicumyl peroxide (DCP) (Sigma
Aldrich) was used as an initiator and glycidyl
methacrylate (GMA) (Sigma Aldrich) was used as a
reagent without further purification.
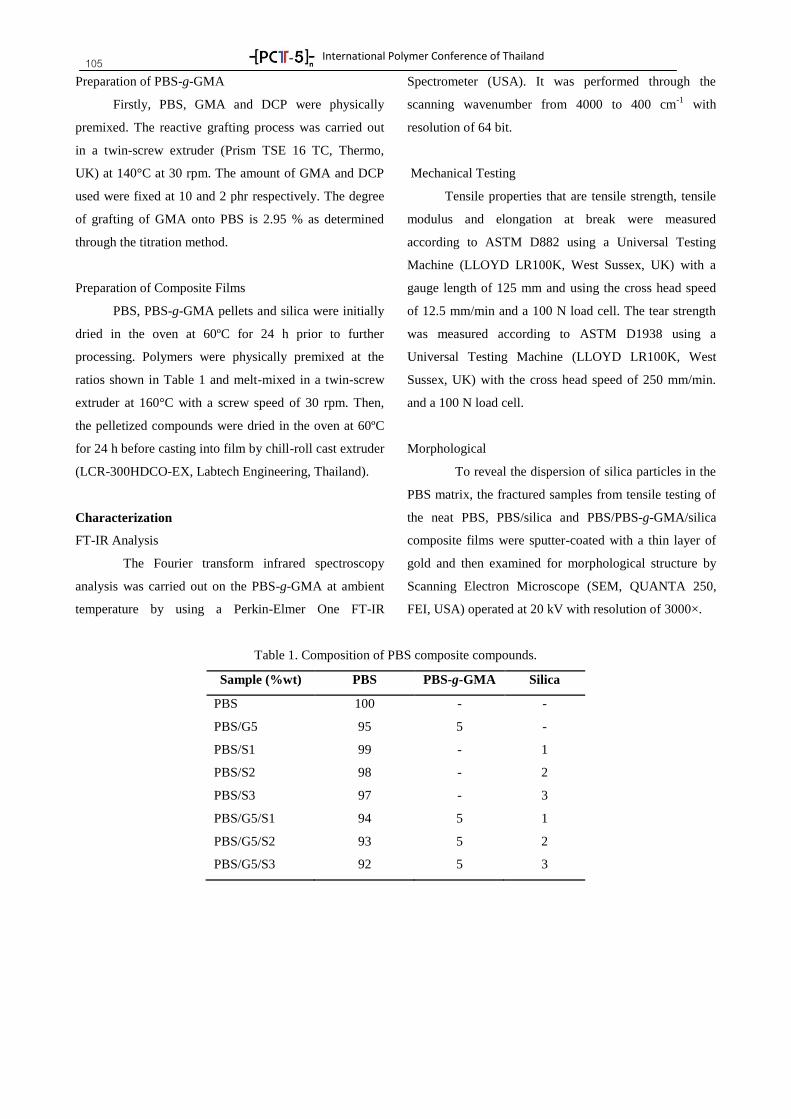
International Polymer Conference of Thailand
105 Preparation of PBS-g-GMA
Firstly, PBS, GMA and DCP were physically
premixed. The reactive grafting process was carried out
in a twin-screw extruder (Prism TSE 16 TC, Thermo,
UK) at 140°C at 30 rpm. The amount of GMA and DCP
used were fixed at 10 and 2 phr respectively. The degree
of grafting of GMA onto PBS is 2.95 % as determined
through the titration method.
Preparation of Composite Films
PBS, PBS-g-GMA pellets and silica were initially
dried in the oven at 60ºC for 24 h prior to further
processing. Polymers were physically premixed at the
ratios shown in Table 1 and melt-mixed in a twin-screw
extruder at 160°C with a screw speed of 30 rpm. Then,
the pelletized compounds were dried in the oven at 60ºC
for 24 h before casting into film by chill-roll cast extruder
(LCR-300HDCO-EX, Labtech Engineering, Thailand).
Characterization
FT-IR Analysis
The Fourier transform infrared spectroscopy
analysis was carried out on the PBS-g-GMA at ambient
temperature by using a Perkin-Elmer One FT-IR
Spectrometer (USA). It was performed through the
scanning wavenumber from 4000 to 400 cm-1
with
resolution of 64 bit.
Mechanical Testing
Tensile properties that are tensile strength, tensile
modulus and elongation at break were measured
according to ASTM D882 using a Universal Testing
Machine (LLOYD LR100K, West Sussex, UK) with a
gauge length of 125 mm and using the cross head speed
of 12.5 mm/min and a 100 N load cell. The tear strength
was measured according to ASTM D1938 using a
Universal Testing Machine (LLOYD LR100K, West
Sussex, UK) with the cross head speed of 250 mm/min.
and a 100 N load cell.
Morphological
To reveal the dispersion of silica particles in the
PBS matrix, the fractured samples from tensile testing of
the neat PBS, PBS/silica and PBS/PBS-g-GMA/silica
composite films were sputter-coated with a thin layer of
gold and then examined for morphological structure by
Scanning Electron Microscope (SEM, QUANTA 250,
FEI, USA) operated at 20 kV with resolution of 3000×.
Table 1. Composition of PBS composite compounds.
Sample (%wt) PBS PBS-g-GMA Silica
PBS 100 - -
PBS/G5 95 5 -
PBS/S1 99 - 1
PBS/S2 98 - 2
PBS/S3 97 - 3
PBS/G5/S1 94 5 1
PBS/G5/S2 93 5 2
PBS/G5/S3 92 5 3
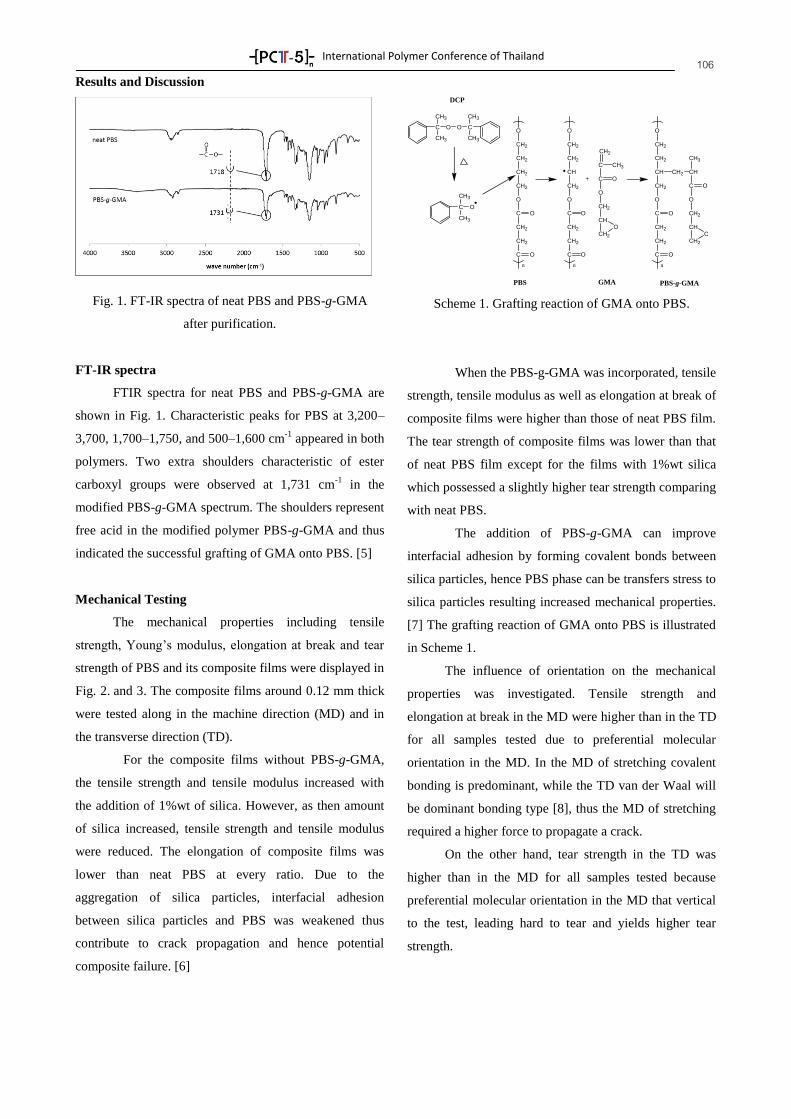
International Polymer Conference of Thailand
106 Results and Discussion
Fig. 1. FT-IR spectra of neat PBS and PBS-g-GMA
after purification.
FT-IR spectra
FTIR spectra for neat PBS and PBS-g-GMA are
shown in Fig. 1. Characteristic peaks for PBS at 3,200–
3,700, 1,700–1,750, and 500–1,600 cm-1
appeared in both
polymers. Two extra shoulders characteristic of ester
carboxyl groups were observed at 1,731 cm-1
in the
modified PBS-g-GMA spectrum. The shoulders represent
free acid in the modified polymer PBS-g-GMA and thus
indicated the successful grafting of GMA onto PBS. [5]
Mechanical Testing
The mechanical properties including tensile
strength, Young’s modulus, elongation at break and tear
strength of PBS and its composite films were displayed in
Fig. 2. and 3. The composite films around 0.12 mm thick
were tested along in the machine direction (MD) and in
the transverse direction (TD).
For the composite films without PBS-g-GMA,
the tensile strength and tensile modulus increased with
the addition of 1%wt of silica. However, as then amount
of silica increased, tensile strength and tensile modulus
were reduced. The elongation of composite films was
lower than neat PBS at every ratio. Due to the
aggregation of silica particles, interfacial adhesion
between silica particles and PBS was weakened thus
contribute to crack propagation and hence potential
composite failure. [6]
Scheme 1. Grafting reaction of GMA onto PBS.
When the PBS-g-GMA was incorporated, tensile
strength, tensile modulus as well as elongation at break of
composite films were higher than those of neat PBS film.
The tear strength of composite films was lower than that
of neat PBS film except for the films with 1%wt silica
which possessed a slightly higher tear strength comparing
with neat PBS.
The addition of PBS-g-GMA can improve
interfacial adhesion by forming covalent bonds between
silica particles, hence PBS phase can be transfers stress to
silica particles resulting increased mechanical properties.
[7] The grafting reaction of GMA onto PBS is illustrated
in Scheme 1.
The influence of orientation on the mechanical
properties was investigated. Tensile strength and
elongation at break in the MD were higher than in the TD
for all samples tested due to preferential molecular
orientation in the MD. In the MD of stretching covalent
bonding is predominant, while the TD van der Waal will
be dominant bonding type [8], thus the MD of stretching
required a higher force to propagate a crack.
On the other hand, tear strength in the TD was
higher than in the MD for all samples tested because
preferential molecular orientation in the MD that vertical
to the test, leading hard to tear and yields higher tear
strength.
O
CH2
CH2
CH2
CH2
O
C O
CH2
CH2
C O
n
O
CH2
CH2
CH
CH2
O
C O
CH2
CH2
C O
n
CH2
C CH3
C O
O
CH2
CH
CH2
O
O
CH2
CH2
CH
CH2
O
C O
CH2
CH2
C O
n
CH2 CH
CH3
C O
O
CH2
CH
CH2
O
C
CH3
CH3
O O C
CH3
CH3
C
CH3
CH3
O
+
DCP
PBS PBS-g-GMAGMA
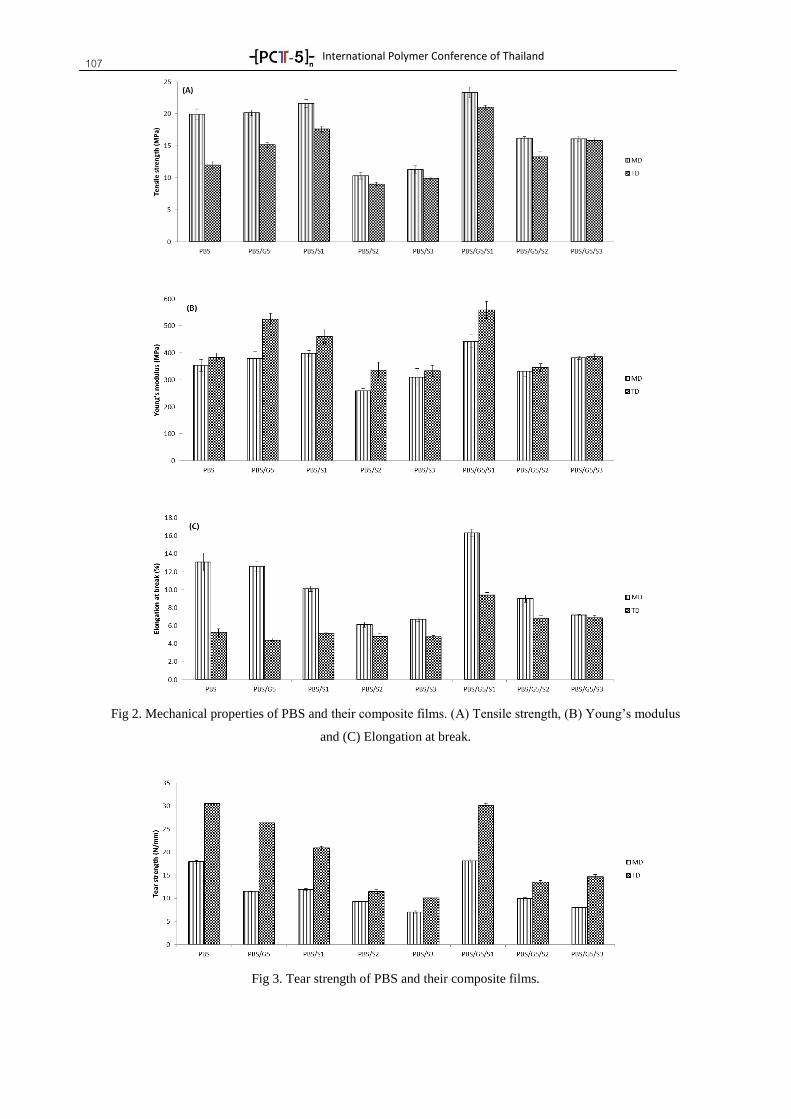
International Polymer Conference of Thailand
107
Fig 2. Mechanical properties of PBS and their composite films. (A) Tensile strength, (B) Young’s modulus
and (C) Elongation at break.
Fig 3. Tear strength of PBS and their composite films.
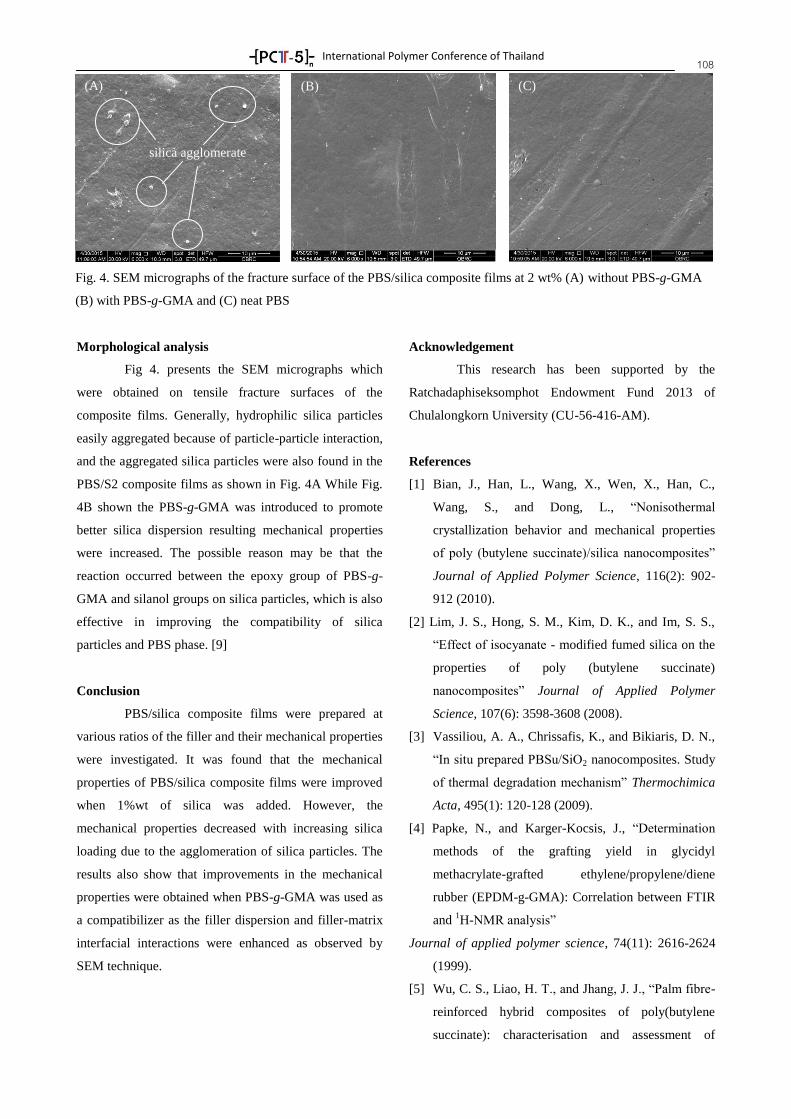
International Polymer Conference of Thailand
108
Fig. 4. SEM micrographs of the fracture surface of the PBS/silica composite films at 2 wt% (A) without PBS-g-GMA
(B) with PBS-g-GMA and (C) neat PBS
Morphological analysis
Fig 4. presents the SEM micrographs which
were obtained on tensile fracture surfaces of the
composite films. Generally, hydrophilic silica particles
easily aggregated because of particle-particle interaction,
and the aggregated silica particles were also found in the
PBS/S2 composite films as shown in Fig. 4A While Fig.
4B shown the PBS-g-GMA was introduced to promote
better silica dispersion resulting mechanical properties
were increased. The possible reason may be that the
reaction occurred between the epoxy group of PBS-g-
GMA and silanol groups on silica particles, which is also
effective in improving the compatibility of silica
particles and PBS phase. [9]
Conclusion
PBS/silica composite films were prepared at
various ratios of the filler and their mechanical properties
were investigated. It was found that the mechanical
properties of PBS/silica composite films were improved
when 1%wt of silica was added. However, the
mechanical properties decreased with increasing silica
loading due to the agglomeration of silica particles. The
results also show that improvements in the mechanical
properties were obtained when PBS-g-GMA was used as
a compatibilizer as the filler dispersion and filler-matrix
interfacial interactions were enhanced as observed by
SEM technique.
Acknowledgement
This research has been supported by the
Ratchadaphiseksomphot Endowment Fund 2013 of
Chulalongkorn University (CU-56-416-AM).
References
[1] Bian, J., Han, L., Wang, X., Wen, X., Han, C.,
Wang, S., and Dong, L., “Nonisothermal
crystallization behavior and mechanical properties
of poly (butylene succinate)/silica nanocomposites”
Journal of Applied Polymer Science, 116(2): 902-
912 (2010).
[2] Lim, J. S., Hong, S. M., Kim, D. K., and Im, S. S.,
“Effect of isocyanate - modified fumed silica on the
properties of poly (butylene succinate)
nanocomposites” Journal of Applied Polymer
Science, 107(6): 3598-3608 (2008).
[3] Vassiliou, A. A., Chrissafis, K., and Bikiaris, D. N., “In situ prepared PBSu/SiO2 nanocomposites. Study
of thermal degradation mechanism” Thermochimica
Acta, 495(1): 120-128 (2009).
[4] Papke, N., and Karger-Kocsis, J., “Determination
methods of the grafting yield in glycidyl
methacrylate-grafted ethylene/propylene/diene
rubber (EPDM-g-GMA): Correlation between FTIR
and 1H-NMR analysis”
Journal of applied polymer science, 74(11): 2616-2624
(1999).
[5] Wu, C. S., Liao, H. T., and Jhang, J. J., “Palm fibre-
reinforced hybrid composites of poly(butylene
succinate): characterisation and assessment of
silica agglomerate
(A) (B) (C)

International Polymer Conference of Thailand
109 mechanical and thermal properties” Polymer
Bulletin, 70(12): 3443-3462 (2013).
[6] Han, S. I., Lim, J. S., Kim, D. K., Kim, M. N., and
Im, S. S. “In situ polymerized poly (butylene
succinate)/silica nanocomposites: physical
properties and biodegradation” Polymer
Degradation and Stability, 93(5): 889-895 (2008).
[7] Karger-Kocsis, J., and Fakirov, S., “Nano- and
Micro-mechanics of polymer blends and
composites” Hanser: 107-113 (2009).
[8] Klein, R. “Material properties of plastics” Laser
Welding of Plastics: Materials, Processes and
Industrial Applications: 3-69 (2011).
[9] Xiuju, Z., Juncai, S., Huajun, Y., Zhidan, L., and
Shaozao, T. “Mechanical properties, morphology,
thermal performance, crystallization behavior, and
kinetics of PP/microcrystal cellulose composites
compatibilized by two different compatibilizers”
Journal of Thermoplastic Composite Materials,
24(6): 735-754 (2011).
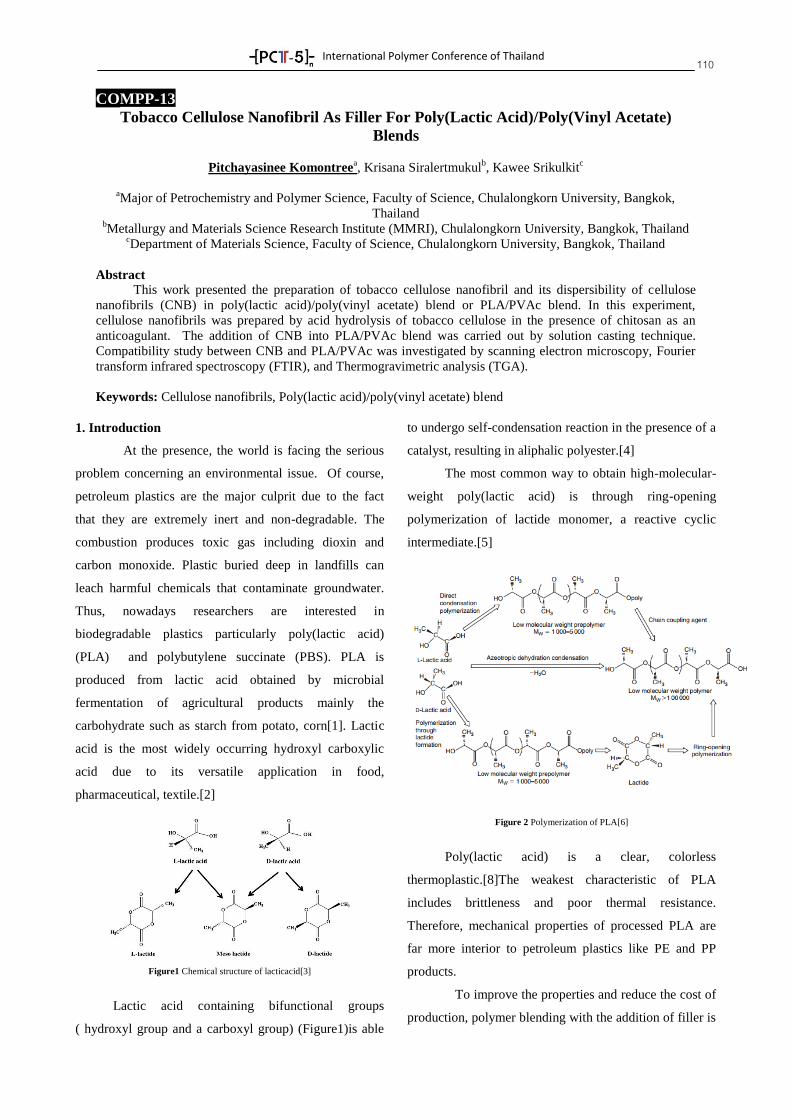
International Polymer Conference of Thailand
110
COMPP-13
Tobacco Cellulose Nanofibril As Filler For Poly(Lactic Acid)/Poly(Vinyl Acetate)
Blends
Pitchayasinee Komontreea, Krisana Siralertmukul
b, Kawee Srikulkit
c
aMajor of Petrochemistry and Polymer Science, Faculty of Science, Chulalongkorn University, Bangkok,
Thailand bMetallurgy and Materials Science Research Institute (MMRI), Chulalongkorn University, Bangkok, Thailand
cDepartment of Materials Science, Faculty of Science, Chulalongkorn University, Bangkok, Thailand
Abstract This work presented the preparation of tobacco cellulose nanofibril and its dispersibility of cellulose
nanofibrils (CNB) in poly(lactic acid)/poly(vinyl acetate) blend or PLA/PVAc blend. In this experiment,
cellulose nanofibrils was prepared by acid hydrolysis of tobacco cellulose in the presence of chitosan as an
anticoagulant. The addition of CNB into PLA/PVAc blend was carried out by solution casting technique.
Compatibility study between CNB and PLA/PVAc was investigated by scanning electron microscopy, Fourier
transform infrared spectroscopy (FTIR), and Thermogravimetric analysis (TGA).
Keywords: Cellulose nanofibrils, Poly(lactic acid)/poly(vinyl acetate) blend
1. Introduction
At the presence, the world is facing the serious
problem concerning an environmental issue. Of course,
petroleum plastics are the major culprit due to the fact
that they are extremely inert and non-degradable. The
combustion produces toxic gas including dioxin and
carbon monoxide. Plastic buried deep in landfills can
leach harmful chemicals that contaminate groundwater.
Thus, nowadays researchers are interested in
biodegradable plastics particularly poly(lactic acid)
(PLA) and polybutylene succinate (PBS). PLA is
produced from lactic acid obtained by microbial
fermentation of agricultural products mainly the
carbohydrate such as starch from potato, corn[1]. Lactic
acid is the most widely occurring hydroxyl carboxylic
acid due to its versatile application in food,
pharmaceutical, textile.[2]
Figure1 Chemical structure of lacticacid[3]
Lactic acid containing bifunctional groups
( hydroxyl group and a carboxyl group) (Figure1)is able
to undergo self-condensation reaction in the presence of a
catalyst, resulting in aliphalic polyester.[4]
The most common way to obtain high-molecular-
weight poly(lactic acid) is through ring-opening
polymerization of lactide monomer, a reactive cyclic
intermediate.[5]
Figure 2 Polymerization of PLA[6]
Poly(lactic acid) is a clear, colorless
thermoplastic.[8]The weakest characteristic of PLA
includes brittleness and poor thermal resistance.
Therefore, mechanical properties of processed PLA are
far more interior to petroleum plastics like PE and PP
products.
To improve the properties and reduce the cost of
production, polymer blending with the addition of filler is
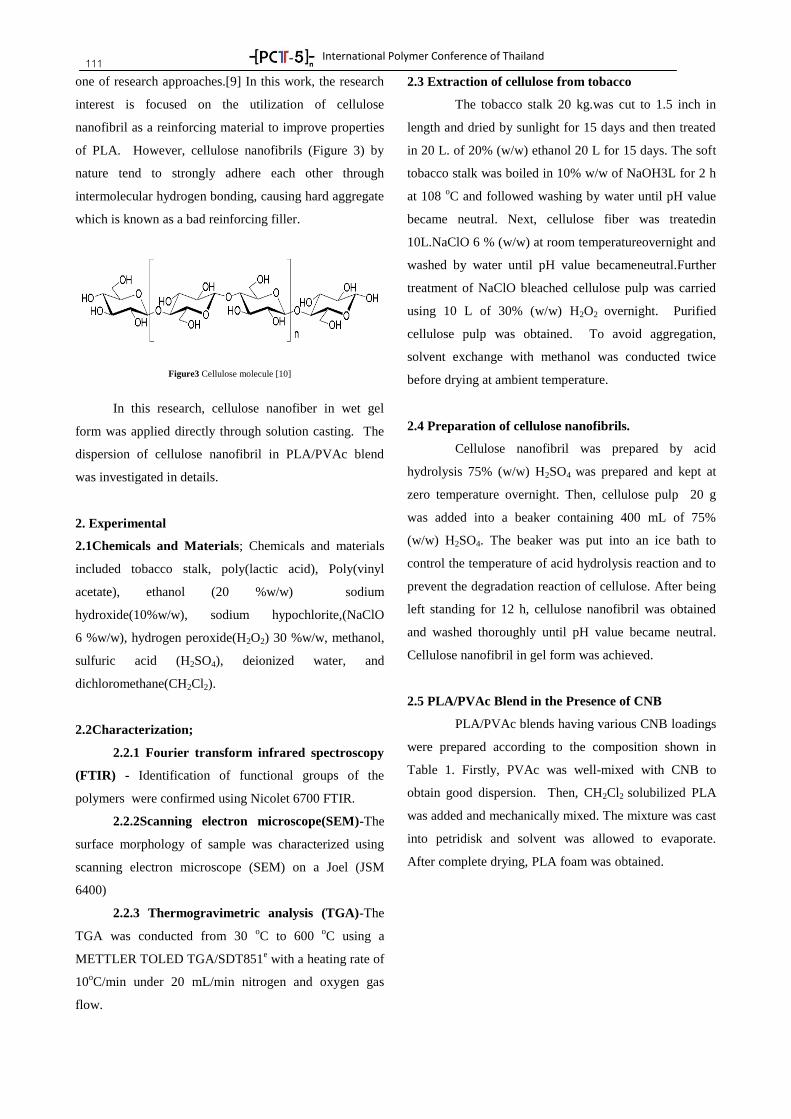
International Polymer Conference of Thailand
111 one of research approaches.[9] In this work, the research
interest is focused on the utilization of cellulose
nanofibril as a reinforcing material to improve properties
of PLA. However, cellulose nanofibrils (Figure 3) by
nature tend to strongly adhere each other through
intermolecular hydrogen bonding, causing hard aggregate
which is known as a bad reinforcing filler.
Figure3 Cellulose molecule [10]
In this research, cellulose nanofiber in wet gel
form was applied directly through solution casting. The
dispersion of cellulose nanofibril in PLA/PVAc blend
was investigated in details.
2. Experimental
2.1Chemicals and Materials; Chemicals and materials
included tobacco stalk, poly(lactic acid), Poly(vinyl
acetate), ethanol (20 %w/w) sodium
hydroxide(10%w/w), sodium hypochlorite,(NaClO
6 %w/w), hydrogen peroxide(H2O2) 30 %w/w, methanol,
sulfuric acid (H2SO4), deionized water, and
dichloromethane(CH2Cl2).
2.2Characterization;
2.2.1 Fourier transform infrared spectroscopy
(FTIR) - Identification of functional groups of the
polymers were confirmed using Nicolet 6700 FTIR.
2.2.2Scanning electron microscope(SEM)-The
surface morphology of sample was characterized using
scanning electron microscope (SEM) on a Joel (JSM
6400)
2.2.3 Thermogravimetric analysis (TGA)-The
TGA was conducted from 30 oC to 600
oC using a
METTLER TOLED TGA/SDT851e with a heating rate of
10oC/min under 20 mL/min nitrogen and oxygen gas
flow.
2.3 Extraction of cellulose from tobacco
The tobacco stalk 20 kg.was cut to 1.5 inch in
length and dried by sunlight for 15 days and then treated
in 20 L. of 20% (w/w) ethanol 20 L for 15 days. The soft
tobacco stalk was boiled in 10% w/w of NaOH3L for 2 h
at 108 oC and followed washing by water until pH value
became neutral. Next, cellulose fiber was treatedin
10L.NaClO 6 % (w/w) at room temperatureovernight and
washed by water until pH value becameneutral.Further
treatment of NaClO bleached cellulose pulp was carried
using 10 L of 30% (w/w) H2O2 overnight. Purified
cellulose pulp was obtained. To avoid aggregation,
solvent exchange with methanol was conducted twice
before drying at ambient temperature.
2.4 Preparation of cellulose nanofibrils.
Cellulose nanofibril was prepared by acid
hydrolysis 75% (w/w) H2SO4 was prepared and kept at
zero temperature overnight. Then, cellulose pulp 20 g
was added into a beaker containing 400 mL of 75%
(w/w) H2SO4. The beaker was put into an ice bath to
control the temperature of acid hydrolysis reaction and to
prevent the degradation reaction of cellulose. After being
left standing for 12 h, cellulose nanofibril was obtained
and washed thoroughly until pH value became neutral.
Cellulose nanofibril in gel form was achieved.
2.5 PLA/PVAc Blend in the Presence of CNB
PLA/PVAc blends having various CNB loadings
were prepared according to the composition shown in
Table 1. Firstly, PVAc was well-mixed with CNB to
obtain good dispersion. Then, CH2Cl2 solubilized PLA
was added and mechanically mixed. The mixture was cast
into petridisk and solvent was allowed to evaporate.
After complete drying, PLA foam was obtained.
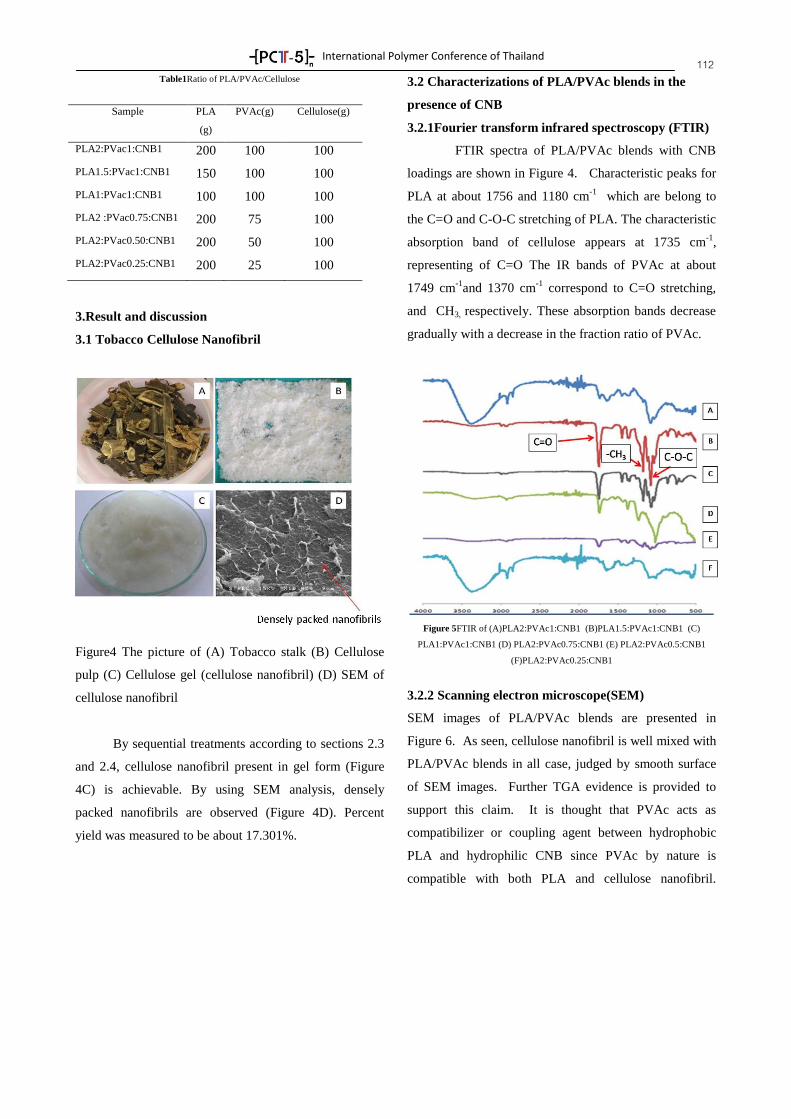
International Polymer Conference of Thailand
112 Table1Ratio of PLA/PVAc/Cellulose
3.Result and discussion
3.1 Tobacco Cellulose Nanofibril
Figure4 The picture of (A) Tobacco stalk (B) Cellulose
pulp (C) Cellulose gel (cellulose nanofibril) (D) SEM of
cellulose nanofibril
By sequential treatments according to sections 2.3
and 2.4, cellulose nanofibril present in gel form (Figure
4C) is achievable. By using SEM analysis, densely
packed nanofibrils are observed (Figure 4D). Percent
yield was measured to be about 17.301%.
3.2 Characterizations of PLA/PVAc blends in the
presence of CNB
3.2.1Fourier transform infrared spectroscopy (FTIR)
FTIR spectra of PLA/PVAc blends with CNB
loadings are shown in Figure 4. Characteristic peaks for
PLA at about 1756 and 1180 cm-1
which are belong to
the C=O and C-O-C stretching of PLA. The characteristic
absorption band of cellulose appears at 1735 cm-1
,
representing of C=O The IR bands of PVAc at about
1749 cm-1
and 1370 cm-1
correspond to C=O stretching,
and CH3, respectively. These absorption bands decrease
gradually with a decrease in the fraction ratio of PVAc.
Figure 5FTIR of (A)PLA2:PVAc1:CNB1 (B)PLA1.5:PVAc1:CNB1 (C)
PLA1:PVAc1:CNB1 (D) PLA2:PVAc0.75:CNB1 (E) PLA2:PVAc0.5:CNB1
(F)PLA2:PVAc0.25:CNB1
3.2.2 Scanning electron microscope(SEM)
SEM images of PLA/PVAc blends are presented in
Figure 6. As seen, cellulose nanofibril is well mixed with
PLA/PVAc blends in all case, judged by smooth surface
of SEM images. Further TGA evidence is provided to
support this claim. It is thought that PVAc acts as
compatibilizer or coupling agent between hydrophobic
PLA and hydrophilic CNB since PVAc by nature is
compatible with both PLA and cellulose nanofibril.
Sample PLA
(g)
PVAc(g) Cellulose(g)
PLA2:PVac1:CNB1 200 100 100
PLA1.5:PVac1:CNB1 150 100 100
PLA1:PVac1:CNB1 100 100 100
PLA2 :PVac0.75:CNB1 200 75 100
PLA2:PVac0.50:CNB1 200 50 100
PLA2:PVac0.25:CNB1 200 25 100
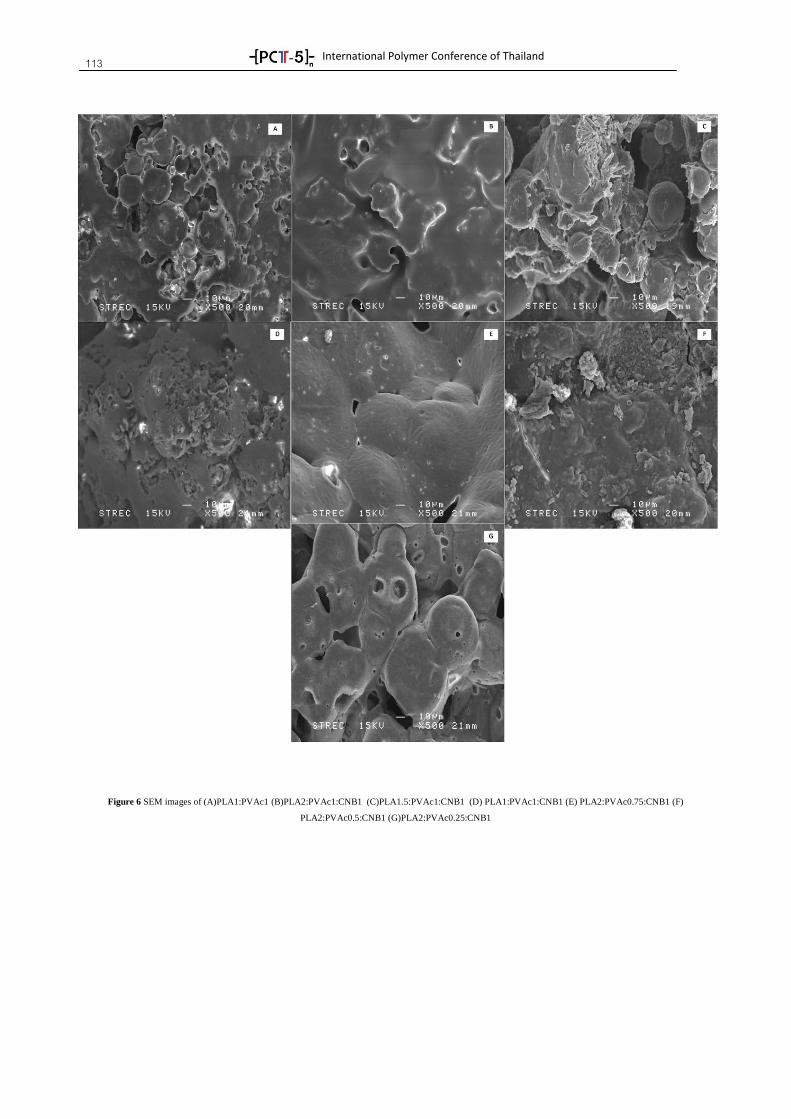
International Polymer Conference of Thailand
113
Figure 6 SEM images of (A)PLA1:PVAc1 (B)PLA2:PVAc1:CNB1 (C)PLA1.5:PVAc1:CNB1 (D) PLA1:PVAc1:CNB1 (E) PLA2:PVAc0.75:CNB1 (F)
PLA2:PVAc0.5:CNB1 (G)PLA2:PVAc0.25:CNB1
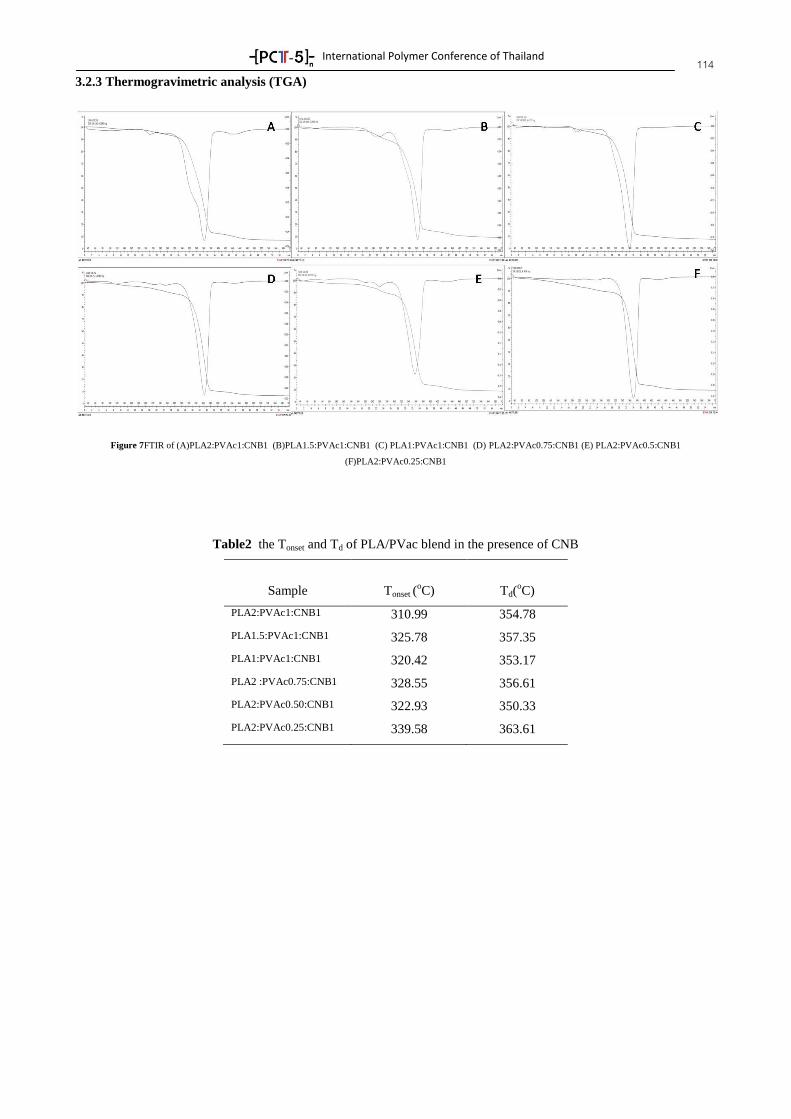
International Polymer Conference of Thailand
114 3.2.3 Thermogravimetric analysis (TGA)
Figure 7FTIR of (A)PLA2:PVAc1:CNB1 (B)PLA1.5:PVAc1:CNB1 (C) PLA1:PVAc1:CNB1 (D) PLA2:PVAc0.75:CNB1 (E) PLA2:PVAc0.5:CNB1
(F)PLA2:PVAc0.25:CNB1
Table2 the Tonset and Td of PLA/PVac blend in the presence of CNB
Sample
Tonset (oC)
Td(oC)
PLA2:PVAc1:CNB1 310.99 354.78
PLA1.5:PVAc1:CNB1 325.78 357.35
PLA1:PVAc1:CNB1 320.42 353.17
PLA2 :PVAc0.75:CNB1 328.55 356.61
PLA2:PVAc0.50:CNB1 322.93 350.33
PLA2:PVAc0.25:CNB1 339.58 363.61
International Polymer Conference of Thailand
115 Figure 3 shows TGA thermograms of PLA/PVAc
blends at various CNB loadings. Thermograms indicate
that percent weight loss curve exhibits a single step of
decomposition, indicating the homogenous blending.
Therefore, TGA results confirm that PLA, PVAc and
CNB could be homogenously mixed together.
Conclusion
From the experimental, the results showed that
tobacco cellulose nanofibril was achieved. Thus prepared
CNB was well-dispersed in PLA/PVAc blend. It was
believed that PVAc acted as a good compatibilizer.
Acknowledgment
The researchers are thankful to Department of
material science, Chulalongkorn university.
References
[1] John. R.P., Nampoothiri, A., 2006, Solid-state
fermentation for L-lactic acid production from agro
wastes using Lactobacillus using Lactobacilli. Appl.
Biochem (41) 759 – 763
[2] Vickroy, T. B., 1985. Lactic acid. In: Moo-Young,
Comprehensive Biotechnol. Pub: DicToronto:
Pergamon Press, pp. 761 – 776
[3] Nampoothiri, K. M., Nair, A. R., John, R. P., 2010,
An overview of the recent developments in
polylactide(PLA) research. BioresourceTehnology
(101) 8493 – 8501
[4] Sarasua, J. R., Prud’homme, R. E., Wisniewski, M.,
LeBorgne, A., Spassky, N., 1998. Crystallization
and melting behavior of polylactides.
Macromolecules (31) 3895 – 3905
[5] Gupta, A. P., Kumar, V., 2007. New emerging
trends in synthetic biodegradable polymer –
polylactide: a critique, Eur. Polym. J. (10) 4053 –
4074
[6] Averous, L., 2008, Polylacitc acid: synthesis,
properties and applications.(21) 433 – 435
[7] Schneider and Wilmington, 1955. Properties of high
melting lactide. US Patent (2) 771 – 777
[8] Auras, R., Harte, B., Selke, S., 2004, An overview
of polylactides as packaging materials.
Macromol.Biosci (4) 835 – 864
[9] Mohanty, A. K., Misra, M., Hinrichsen, G. 2000
Biofibers. Biodegradable polymers and
biocomposite: An overeview. Macromolecular
Materials and Engineering (276/277) 1 – 24
[10] Siqueira, G., Bras, J., Dufresne, A., 2010 cellulosic
Bionanocomposites: A Review of Preparation,
Properties and Applications. Polymers (2) 728 – 765
[11] Berglund, L., 2005 Natural fibres, Biopolymers and
Biocomposite. (pp. 808) CRC. Press
[12] Chabba. S., Mathews, G. F., Netravali, A. N., 2005
Green composites using cross-linked soy flour and
flax yarns. Green Chemistry, (2) 576 – 581
[13] Dufresne, A., Cavaille, J., Y., Vignon, M., R., 1997
Mechanical behavior of sheets prepared from sugar
beet cellulose microfibrils. Journal of Applied
Polymer Science (64) 1185 - 1194
International Polymer Conference of Thailand
116
COMPP-18
Effect of Fiber Treatment of oil Palm Mesocarp Fiber on the Properties of Wood
Composites
Polphat Ruamcharoen1*
,Chor Wayakorn Phetphaisit2 and Jareerat Ruamcharoen
3
1Rubber and Polymer Technology Program, Faculty of Science and Technology,
Songkhla Rajabhat University, Songkhla, 90000, Thailand 2Department of Chemistry, Faculty of Science, Naresuan University, Pitsnulok,65000, Thailand
3Department of Science, Faculty of Science and Technology, Prince of Songkla University,
Pattani campus, Pattani, 94000, Thailand
Abstract
This study focused on the effect of fiber treatment of oil palm mesocarp fiber (OPMF) on the properties
of OPMF-unsaturated polyester composites. OPMF has been treated with 5% sodium hydroxide solution for 24,
48 and 72 h. The fibers were first mixed with unsaturated polyester resin and shaped by compression moulding
technique. FTIR analysis for OPMF indicated that lignin and residue palm oil had been removed and SEM
micrographs showed the roughness of fiber surface. The change of physical properties with treatment time
related to the change in surface morphology. It was also found that the wood composites with 72 h treated
OPMF gave the best properties.
Keywords: oil palm kernel fiber, composite, treatment.
1. Introduction
Natural fibers are considered to be reinforcing
fillers in polymers. The possibility of using natural
fibers as reinforcement in composites has yielded to
studies indicating many advantages such as good
mechanical performances, low density and
biodegradability. In this study, the reinforcing filler used
was oil palm mesocarp fiber (OPMF). OPMF consists of
about 60% of cellulose and 11% of lignin [1]. Generally
OPMF is a waste material after oil extraction. This waste
material creates a significant environmental problem.
Currently, OPMF is used as a mulching medium, a boiler
fuel source, and as a fiber source for composite used in
furniture. Thus finding new useful utilization of the
OPMF will surely alleviate environmental problems
related to the disposal of oil palm wastes.
Unsaturated polyesters are extremely versatile in
properties and applications and have been a popular
thermoset used as the polymer matrix in composites.
They are widely produced industrially as they show
many advantages compared to other thermosetting resins
including low temperature cure capability, good
mechanical properties and transparency, and adaptability
to be transformed into large composite structures due to
no by-product is formed during the curing reaction.
The reinforcement of polyesters with cellulosic
fibers has been widely reported, for instance, polyester-
jute [2,3],polyester-sisal [4], polester-coir [5]. In general,
utilization of biomass in lignocellulosic composites has
been attributed to several advantages such as low
density, biodegradability and low cost. However, in
producing a good lignocellulosic composite, the main
obstacle to be
resolved is the compatibility between the fiber and
matrix. In addition, disadvantage of this material is oil
palm residue on the surface and smoothness of surface.
Chemical modifications lead to major changes in
the fibrillar structure of fibers and remove the amorphous
components causing changes in the deformation
behavior. In this paper, we present the influence of fiber
surface treatment by sodium hydroxide solution of
OPMF on the fiber structure and related physical
properties of OPMF composites.
2. Experimental Methods
2.1 Materials
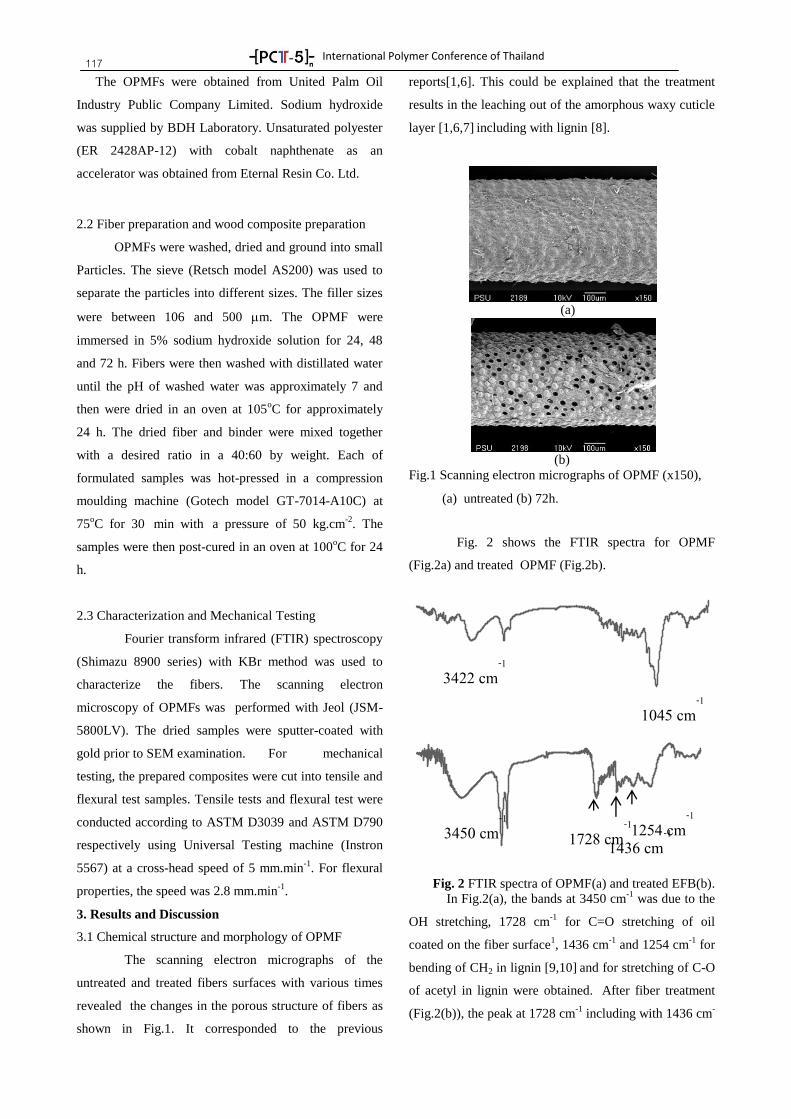
International Polymer Conference of Thailand
117 The OPMFs were obtained from United Palm Oil
Industry Public Company Limited. Sodium hydroxide
was supplied by BDH Laboratory. Unsaturated polyester
(ER 2428AP-12) with cobalt naphthenate as an
accelerator was obtained from Eternal Resin Co. Ltd.
2.2 Fiber preparation and wood composite preparation
OPMFs were washed, dried and ground into small
Particles. The sieve (Retsch model AS200) was used to
separate the particles into different sizes. The filler sizes
were between 106 and 500 m. The OPMF were
immersed in 5% sodium hydroxide solution for 24, 48
and 72 h. Fibers were then washed with distillated water
until the pH of washed water was approximately 7 and
then were dried in an oven at 105oC for approximately
24 h. The dried fiber and binder were mixed together
with a desired ratio in a 40:60 by weight. Each of
formulated samples was hot-pressed in a compression
moulding machine (Gotech model GT-7014-A10C) at
75oC for 30 min with a pressure of 50 kg.cm
-2. The
samples were then post-cured in an oven at 100oC for 24
h.
2.3 Characterization and Mechanical Testing
Fourier transform infrared (FTIR) spectroscopy
(Shimazu 8900 series) with KBr method was used to
characterize the fibers. The scanning electron
microscopy of OPMFs was performed with Jeol (JSM-
5800LV). The dried samples were sputter-coated with
gold prior to SEM examination. For mechanical
testing, the prepared composites were cut into tensile and
flexural test samples. Tensile tests and flexural test were
conducted according to ASTM D3039 and ASTM D790
respectively using Universal Testing machine (Instron
5567) at a cross-head speed of 5 mm.min-1
. For flexural
properties, the speed was 2.8 mm.min-1
.
3. Results and Discussion
3.1 Chemical structure and morphology of OPMF
The scanning electron micrographs of the
untreated and treated fibers surfaces with various times
revealed the changes in the porous structure of fibers as
shown in Fig.1. It corresponded to the previous
reports[1,6]. This could be explained that the treatment
results in the leaching out of the amorphous waxy cuticle
layer [1,6,7] including with lignin [8].
(a)
(b)
Fig.1 Scanning electron micrographs of OPMF (x150),
(a) untreated (b) 72h.
Fig. 2 shows the FTIR spectra for OPMF
(Fig.2a) and treated OPMF (Fig.2b).
Fig. 2 FTIR spectra of OPMF(a) and treated EFB(b).
In Fig.2(a), the bands at 3450 cm-1
was due to the
OH stretching, 1728 cm-1
for C=O stretching of oil
coated on the fiber surface1, 1436 cm
-1 and 1254 cm
-1 for
bending of CH2 in lignin [9,10] and for stretching of C-O
of acetyl in lignin were obtained. After fiber treatment
(Fig.2(b)), the peak at 1728 cm-1
including with 1436 cm-
1728 cm-1
1436 cm-1
1254 cm
-1 3450 cm
-1
3422 cm-1
1045 cm-1
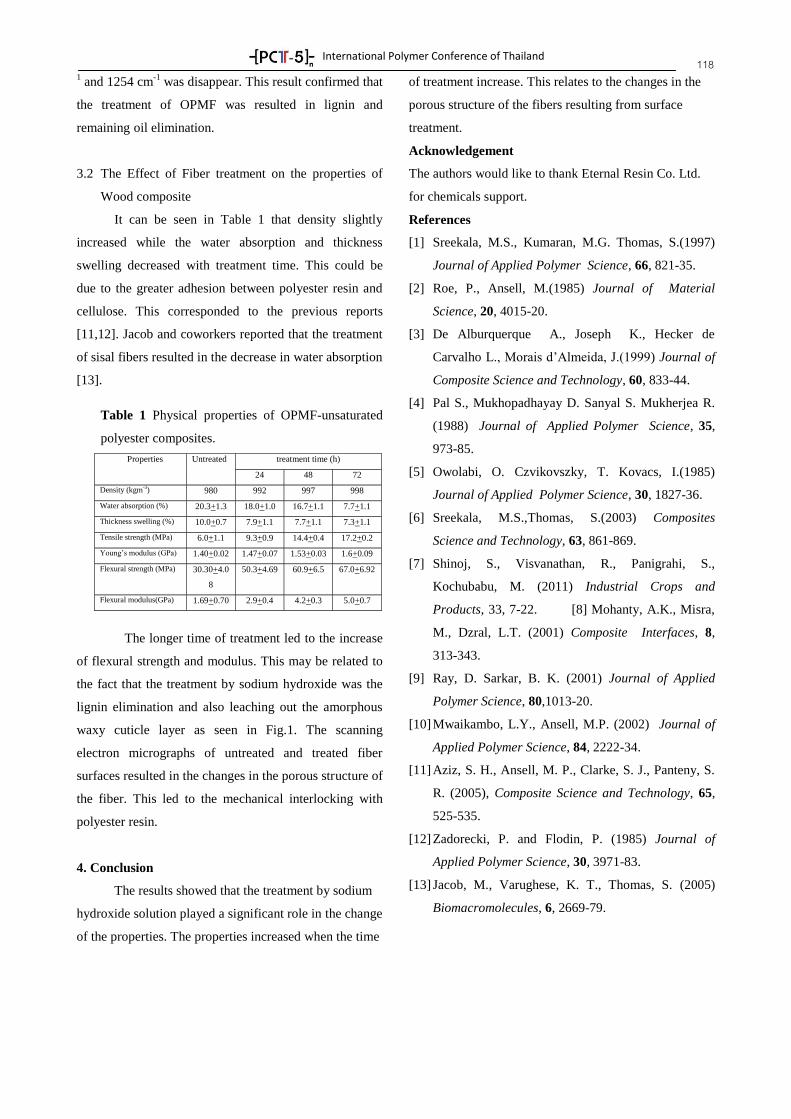
International Polymer Conference of Thailand
118 1 and 1254 cm
-1 was disappear. This result confirmed that
the treatment of OPMF was resulted in lignin and
remaining oil elimination.
3.2 The Effect of Fiber treatment on the properties of
Wood composite
It can be seen in Table 1 that density slightly
increased while the water absorption and thickness
swelling decreased with treatment time. This could be
due to the greater adhesion between polyester resin and
cellulose. This corresponded to the previous reports
[11,12]. Jacob and coworkers reported that the treatment
of sisal fibers resulted in the decrease in water absorption
[13].
Table 1 Physical properties of OPMF-unsaturated
polyester composites.
Properties Untreated treatment time (h)
24 48 72
Density (kgm-3) 980 992 997 998
Water absorption (%) 20.3+1.3 18.0+1.0 16.7+1.1 7.7+1.1
Thickness swelling (%) 10.0+0.7 7.9+1.1 7.7+1.1 7.3+1.1
Tensile strength (MPa) 6.0+1.1 9.3+0.9 14.4+0.4 17.2+0.2
Young’s modulus (GPa) 1.40+0.02 1.47+0.07 1.53+0.03 1.6+0.09
Flexural strength (MPa) 30.30+4.0
8
50.3+4.69 60.9+6.5 67.0+6.92
Flexural modulus(GPa) 1.69+0.70 2.9+0.4 4.2+0.3 5.0+0.7
The longer time of treatment led to the increase
of flexural strength and modulus. This may be related to
the fact that the treatment by sodium hydroxide was the
lignin elimination and also leaching out the amorphous
waxy cuticle layer as seen in Fig.1. The scanning
electron micrographs of untreated and treated fiber
surfaces resulted in the changes in the porous structure of
the fiber. This led to the mechanical interlocking with
polyester resin.
4. Conclusion
The results showed that the treatment by sodium
hydroxide solution played a significant role in the change
of the properties. The properties increased when the time
of treatment increase. This relates to the changes in the
porous structure of the fibers resulting from surface
treatment.
Acknowledgement
The authors would like to thank Eternal Resin Co. Ltd.
for chemicals support.
References
[1] Sreekala, M.S., Kumaran, M.G. Thomas, S.(1997)
Journal of Applied Polymer Science, 66, 821-35.
[2] Roe, P., Ansell, M.(1985) Journal of Material
Science, 20, 4015-20.
[3] De Alburquerque A., Joseph K., Hecker de
Carvalho L., Morais d’Almeida, J.(1999) Journal of
Composite Science and Technology, 60, 833-44.
[4] Pal S., Mukhopadhayay D. Sanyal S. Mukherjea R.
(1988) Journal of Applied Polymer Science, 35,
973-85.
[5] Owolabi, O. Czvikovszky, T. Kovacs, I.(1985)
Journal of Applied Polymer Science, 30, 1827-36.
[6] Sreekala, M.S.,Thomas, S.(2003) Composites
Science and Technology, 63, 861-869.
[7] Shinoj, S., Visvanathan, R., Panigrahi, S.,
Kochubabu, M. (2011) Industrial Crops and
Products, 33, 7-22. [8] Mohanty, A.K., Misra,
M., Dzral, L.T. (2001) Composite Interfaces, 8,
313-343.
[9] Ray, D. Sarkar, B. K. (2001) Journal of Applied
Polymer Science, 80,1013-20.
[10] Mwaikambo, L.Y., Ansell, M.P. (2002) Journal of
Applied Polymer Science, 84, 2222-34.
[11] Aziz, S. H., Ansell, M. P., Clarke, S. J., Panteny, S.
R. (2005), Composite Science and Technology, 65,
525-535.
[12] Zadorecki, P. and Flodin, P. (1985) Journal of
Applied Polymer Science, 30, 3971-83.
[13] Jacob, M., Varughese, K. T., Thomas, S. (2005)
Biomacromolecules, 6, 2669-79.
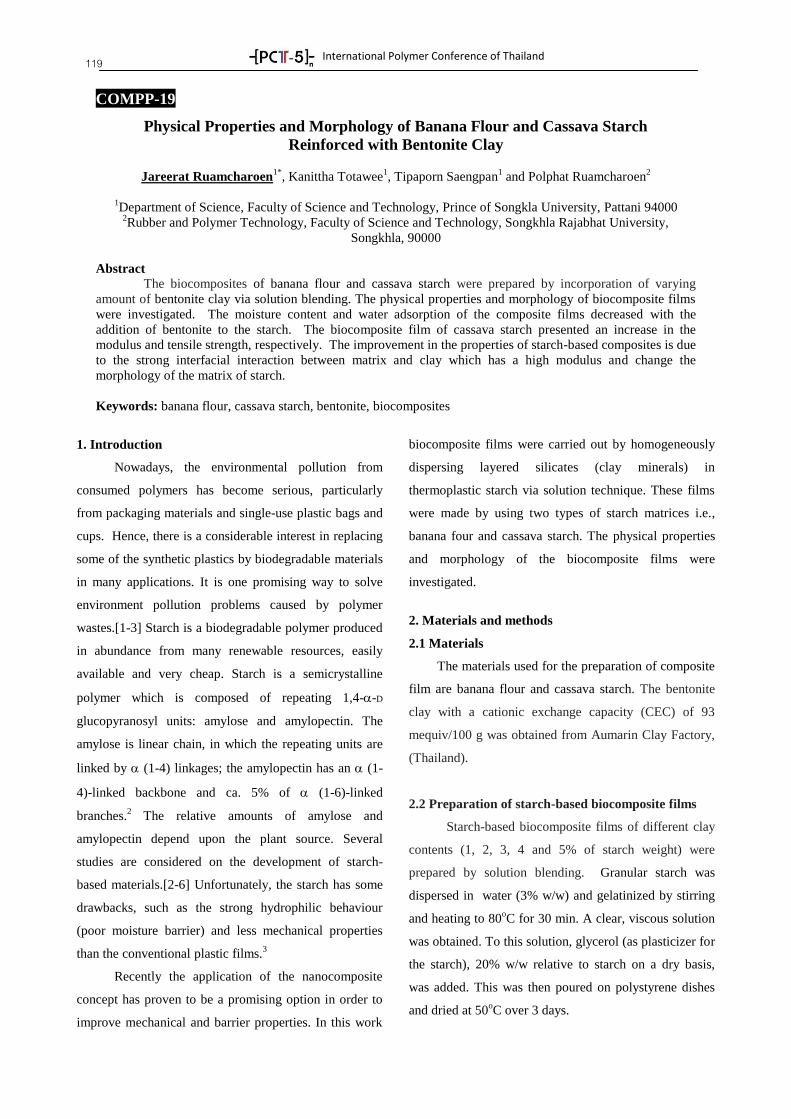
International Polymer Conference of Thailand
119
COMPP-19
Physical Properties and Morphology of Banana Flour and Cassava Starch
Reinforced with Bentonite Clay
Jareerat Ruamcharoen1*
, Kanittha Totawee1, Tipaporn Saengpan
1 and Polphat Ruamcharoen
2
1Department of Science, Faculty of Science and Technology, Prince of Songkla University, Pattani 94000 2Rubber and Polymer Technology, Faculty of Science and Technology, Songkhla Rajabhat University,
Songkhla, 90000
Abstract
The biocomposites of banana flour and cassava starch were prepared by incorporation of varying
amount of bentonite clay via solution blending. The physical properties and morphology of biocomposite films
were investigated. The moisture content and water adsorption of the composite films decreased with the
addition of bentonite to the starch. The biocomposite film of cassava starch presented an increase in the
modulus and tensile strength, respectively. The improvement in the properties of starch-based composites is due
to the strong interfacial interaction between matrix and clay which has a high modulus and change the
morphology of the matrix of starch.
Keywords: banana flour, cassava starch, bentonite, biocomposites
1. Introduction
Nowadays, the environmental pollution from
consumed polymers has become serious, particularly
from packaging materials and single-use plastic bags and
cups. Hence, there is a considerable interest in replacing
some of the synthetic plastics by biodegradable materials
in many applications. It is one promising way to solve
environment pollution problems caused by polymer
wastes.[1-3] Starch is a biodegradable polymer produced
in abundance from many renewable resources, easily
available and very cheap. Starch is a semicrystalline
polymer which is composed of repeating 1,4--D
glucopyranosyl units: amylose and amylopectin. The
amylose is linear chain, in which the repeating units are
linked by (1-4) linkages; the amylopectin has an (1-
4)-linked backbone and ca. 5% of (1-6)-linked
branches.2 The relative amounts of amylose and
amylopectin depend upon the plant source. Several
studies are considered on the development of starch-
based materials.[2-6] Unfortunately, the starch has some
drawbacks, such as the strong hydrophilic behaviour
(poor moisture barrier) and less mechanical properties
than the conventional plastic films.3
Recently the application of the nanocomposite
concept has proven to be a promising option in order to
improve mechanical and barrier properties. In this work
biocomposite films were carried out by homogeneously
dispersing layered silicates (clay minerals) in
thermoplastic starch via solution technique. These films
were made by using two types of starch matrices i.e.,
banana four and cassava starch. The physical properties
and morphology of the biocomposite films were
investigated.
2. Materials and methods
2.1 Materials
The materials used for the preparation of composite
film are banana flour and cassava starch. The bentonite
clay with a cationic exchange capacity (CEC) of 93
mequiv/100 g was obtained from Aumarin Clay Factory,
(Thailand).
2.2 Preparation of starch-based biocomposite films
Starch-based biocomposite films of different clay
contents (1, 2, 3, 4 and 5% of starch weight) were
prepared by solution blending. Granular starch was
dispersed in water (3% w/w) and gelatinized by stirring
and heating to 80oC for 30 min. A clear, viscous solution
was obtained. To this solution, glycerol (as plasticizer for
the starch), 20% w/w relative to starch on a dry basis,
was added. This was then poured on polystyrene dishes
and dried at 50oC over 3 days.
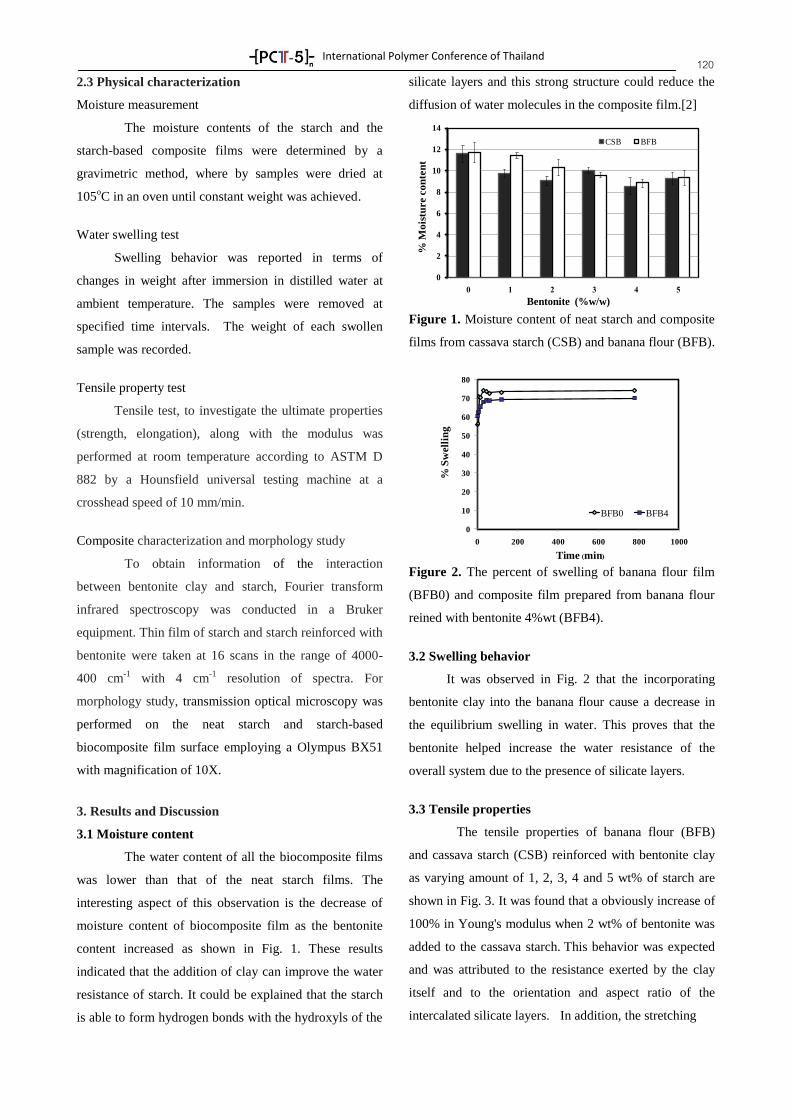
International Polymer Conference of Thailand
120 2.3 Physical characterization
Moisture measurement
The moisture contents of the starch and the
starch-based composite films were determined by a
gravimetric method, where by samples were dried at
105oC in an oven until constant weight was achieved.
Water swelling test
Swelling behavior was reported in terms of
changes in weight after immersion in distilled water at
ambient temperature. The samples were removed at
specified time intervals. The weight of each swollen
sample was recorded.
Tensile property test
Tensile test, to investigate the ultimate properties
(strength, elongation), along with the modulus was
performed at room temperature according to ASTM D
882 by a Hounsfield universal testing machine at a
crosshead speed of 10 mm/min.
Composite characterization and morphology study
To obtain information of the interaction
between bentonite clay and starch, Fourier transform
infrared spectroscopy was conducted in a Bruker
equipment. Thin film of starch and starch reinforced with
bentonite were taken at 16 scans in the range of 4000-
400 cm-1
with 4 cm-1
resolution of spectra. For
morphology study, transmission optical microscopy was
performed on the neat starch and starch-based
biocomposite film surface employing a Olympus BX51
with magnification of 10X.
3. Results and Discussion
3.1 Moisture content
The water content of all the biocomposite films
was lower than that of the neat starch films. The
interesting aspect of this observation is the decrease of
moisture content of biocomposite film as the bentonite
content increased as shown in Fig. 1. These results
indicated that the addition of clay can improve the water
resistance of starch. It could be explained that the starch
is able to form hydrogen bonds with the hydroxyls of the
silicate layers and this strong structure could reduce the
diffusion of water molecules in the composite film.[2]
Figure 1. Moisture content of neat starch and composite
films from cassava starch (CSB) and banana flour (BFB).
Figure 2. The percent of swelling of banana flour film
(BFB0) and composite film prepared from banana flour
reined with bentonite 4%wt (BFB4).
3.2 Swelling behavior
It was observed in Fig. 2 that the incorporating
bentonite clay into the banana flour cause a decrease in
the equilibrium swelling in water. This proves that the
bentonite helped increase the water resistance of the
overall system due to the presence of silicate layers.
3.3 Tensile properties
The tensile properties of banana flour (BFB)
and cassava starch (CSB) reinforced with bentonite clay
as varying amount of 1, 2, 3, 4 and 5 wt% of starch are
shown in Fig. 3. It was found that a obviously increase of
100% in Young's modulus when 2 wt% of bentonite was
added to the cassava starch. This behavior was expected
and was attributed to the resistance exerted by the clay
itself and to the orientation and aspect ratio of the
intercalated silicate layers. In addition, the stretching
0
2
4
6
8
10
12
14
% M
ois
ture c
on
ten
t
Bentonite (%w/w)
CSB BFB
0
10
20
30
40
50
60
70
80
0 200 400 600 800 1000
% S
well
ing
Time min
BFB0 BFB4
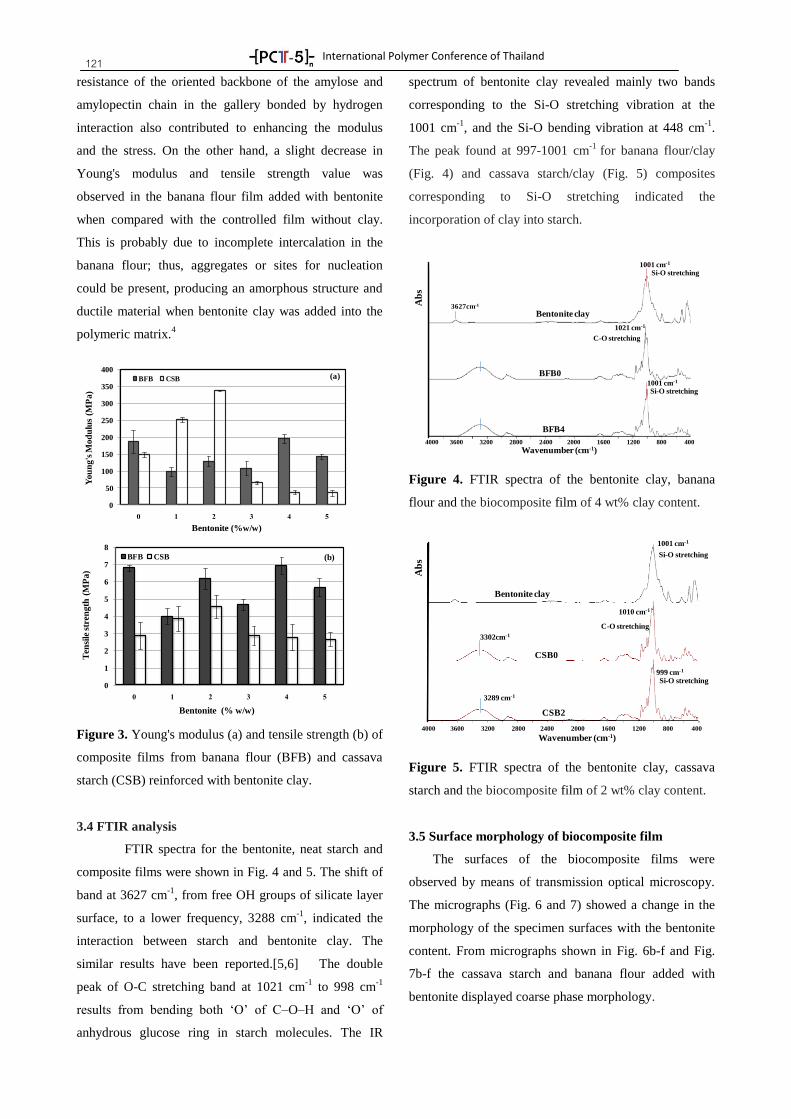
International Polymer Conference of Thailand
121 resistance of the oriented backbone of the amylose and
amylopectin chain in the gallery bonded by hydrogen
interaction also contributed to enhancing the modulus
and the stress. On the other hand, a slight decrease in
Young's modulus and tensile strength value was
observed in the banana flour film added with bentonite
when compared with the controlled film without clay.
This is probably due to incomplete intercalation in the
banana flour; thus, aggregates or sites for nucleation
could be present, producing an amorphous structure and
ductile material when bentonite clay was added into the
polymeric matrix.4
Figure 3. Young's modulus (a) and tensile strength (b) of
composite films from banana flour (BFB) and cassava
starch (CSB) reinforced with bentonite clay.
3.4 FTIR analysis
FTIR spectra for the bentonite, neat starch and
composite films were shown in Fig. 4 and 5. The shift of
band at 3627 cm-1
, from free OH groups of silicate layer
surface, to a lower frequency, 3288 cm-1
, indicated the
interaction between starch and bentonite clay. The
similar results have been reported.[5,6] The double
peak of O-C stretching band at 1021 cm-1
to 998 cm-1
results from bending both ‘O’ of C–O–H and ‘O’ of
anhydrous glucose ring in starch molecules. The IR
spectrum of bentonite clay revealed mainly two bands
corresponding to the Si-O stretching vibration at the
1001 cm-1
, and the Si-O bending vibration at 448 cm-1
.
The peak found at 997-1001 cm-1
for banana flour/clay
(Fig. 4) and cassava starch/clay (Fig. 5) composites
corresponding to Si-O stretching indicated the
incorporation of clay into starch.
Figure 4. FTIR spectra of the bentonite clay, banana
flour and the biocomposite film of 4 wt% clay content.
Figure 5. FTIR spectra of the bentonite clay, cassava
starch and the biocomposite film of 2 wt% clay content.
3.5 Surface morphology of biocomposite film
The surfaces of the biocomposite films were
observed by means of transmission optical microscopy.
The micrographs (Fig. 6 and 7) showed a change in the
morphology of the specimen surfaces with the bentonite
content. From micrographs shown in Fig. 6b-f and Fig.
7b-f the cassava starch and banana flour added with
bentonite displayed coarse phase morphology.
0
50
100
150
200
250
300
350
400
Yo
un
g's
Mo
du
lus
(MP
a)
Bentonite (%w/w)
BFB CSB (a)
0
1
2
3
4
5
6
7
8
Ten
sile
str
eng
th (
MP
a)
Bentonite (% w/w)
BFB CSB (b)
Bentonite clay
Ab
s
BFB0
BFB4
Wavenumber (cm-1)4000 3600 3200 2800 2400 2000 1600 1200 800 400
1001 cm-1
Si-O stretching
1021 cm-1
C-O stretching
1001 cm-1
Si-O stretching
3627cm-1
4000 3600 3200 2800 2400 2000 1600 1200 800 400
Wavenumber (cm-1)
Bentonite clay
CSB0
CSB2
Ab
s
3302cm-1
3289 cm-1
1001 cm-1
Si-O stretching
1010 cm-1
C-O stretching
999 cm-1
Si-O stretching
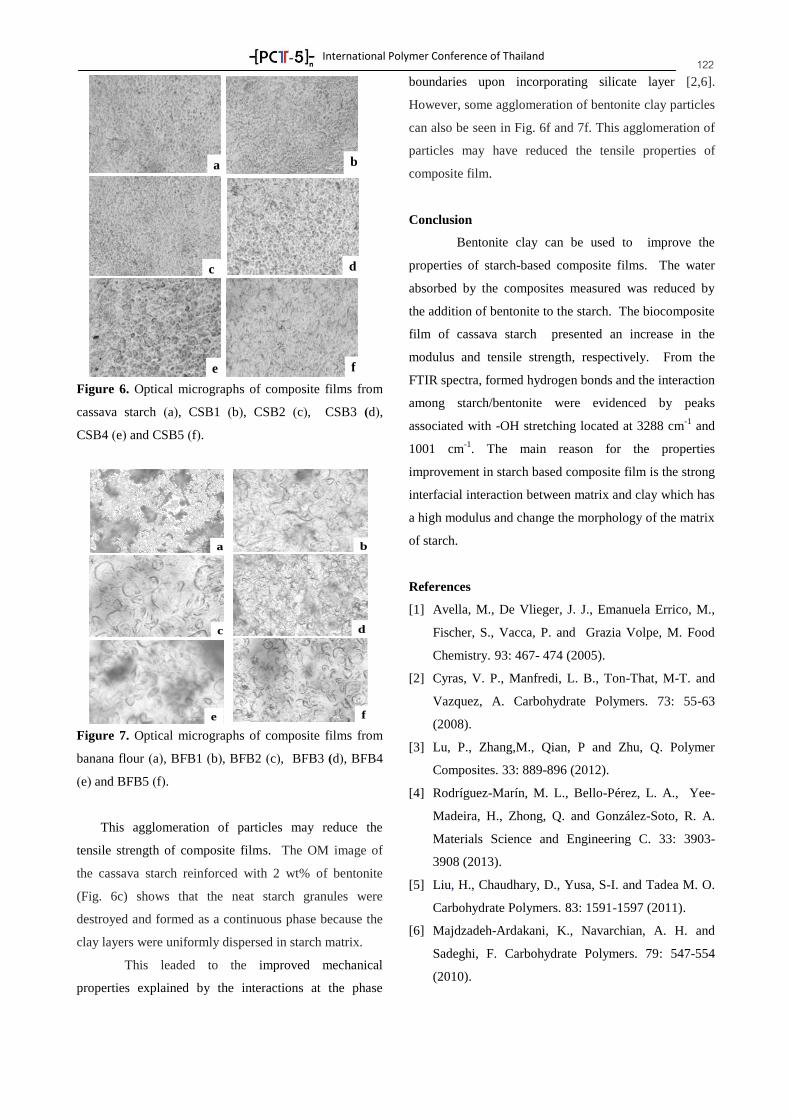
International Polymer Conference of Thailand
122
Figure 6. Optical micrographs of composite films from
cassava starch (a), CSB1 (b), CSB2 (c), CSB3 (d),
CSB4 (e) and CSB5 (f).
Figure 7. Optical micrographs of composite films from
banana flour (a), BFB1 (b), BFB2 (c), BFB3 (d), BFB4
(e) and BFB5 (f).
This agglomeration of particles may reduce the
tensile strength of composite films. The OM image of
the cassava starch reinforced with 2 wt% of bentonite
(Fig. 6c) shows that the neat starch granules were
destroyed and formed as a continuous phase because the
clay layers were uniformly dispersed in starch matrix.
This leaded to the improved mechanical
properties explained by the interactions at the phase
boundaries upon incorporating silicate layer [2,6].
However, some agglomeration of bentonite clay particles
can also be seen in Fig. 6f and 7f. This agglomeration of
particles may have reduced the tensile properties of
composite film.
Conclusion
Bentonite clay can be used to improve the
properties of starch-based composite films. The water
absorbed by the composites measured was reduced by
the addition of bentonite to the starch. The biocomposite
film of cassava starch presented an increase in the
modulus and tensile strength, respectively. From the
FTIR spectra, formed hydrogen bonds and the interaction
among starch/bentonite were evidenced by peaks
associated with -OH stretching located at 3288 cm-1
and
1001 cm-1
. The main reason for the properties
improvement in starch based composite film is the strong
interfacial interaction between matrix and clay which has
a high modulus and change the morphology of the matrix
of starch.
References
[1] Avella, M., De Vlieger, J. J., Emanuela Errico, M.,
Fischer, S., Vacca, P. and Grazia Volpe, M. Food
Chemistry. 93: 467- 474 (2005).
[2] Cyras, V. P., Manfredi, L. B., Ton-That, M-T. and
Vazquez, A. Carbohydrate Polymers. 73: 55-63
(2008).
[3] Lu, P., Zhang,M., Qian, P and Zhu, Q. Polymer
Composites. 33: 889-896 (2012).
[4] Rodríguez-Marín, M. L., Bello-Pérez, L. A., Yee-
Madeira, H., Zhong, Q. and González-Soto, R. A.
Materials Science and Engineering C. 33: 3903-
3908 (2013).
[5] Liu, H., Chaudhary, D., Yusa, S-I. and Tadea M. O.
Carbohydrate Polymers. 83: 1591-1597 (2011).
[6] Majdzadeh-Ardakani, K., Navarchian, A. H. and
Sadeghi, F. Carbohydrate Polymers. 79: 547-554
(2010).
ba
c d
e f
a b
c d
e f
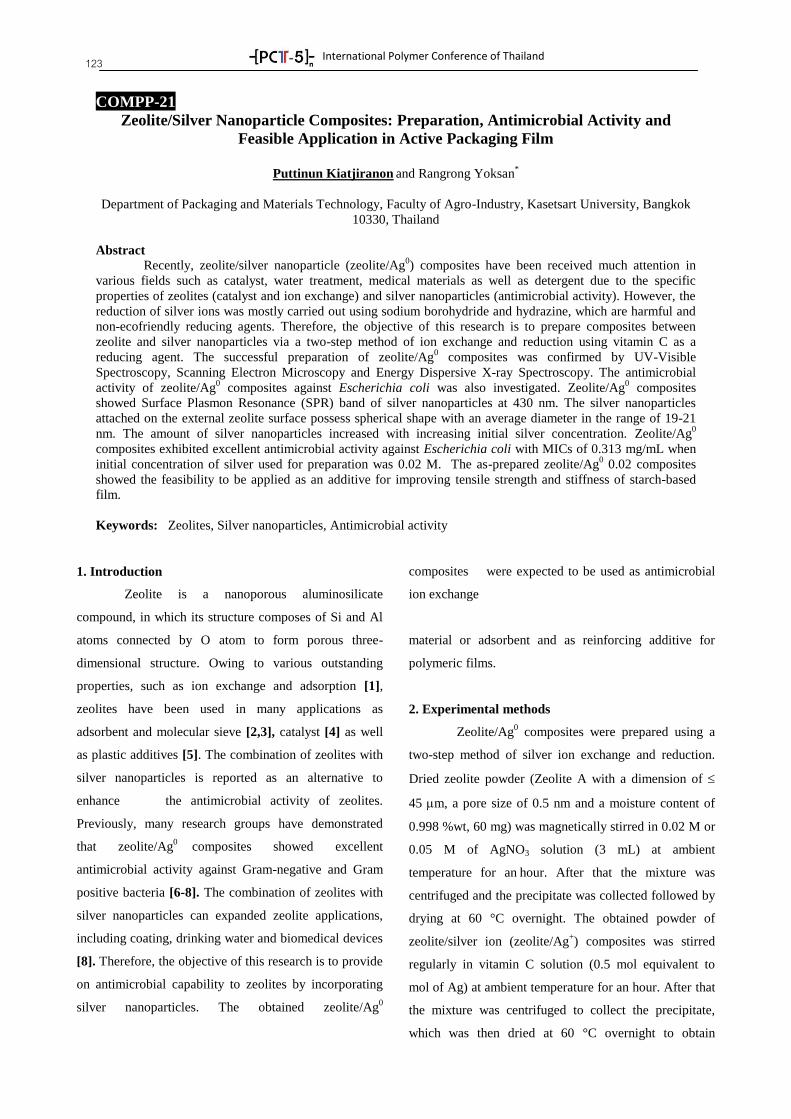
International Polymer Conference of Thailand
123
COMPP-21
Zeolite/Silver Nanoparticle Composites: Preparation, Antimicrobial Activity and
Feasible Application in Active Packaging Film
Puttinun Kiatjiranon
and Rangrong Yoksan
*
Department of Packaging and Materials Technology, Faculty of Agro-Industry, Kasetsart University, Bangkok
10330, Thailand
Abstract
Recently, zeolite/silver nanoparticle (zeolite/Ag0) composites have been received much attention in
various fields such as catalyst, water treatment, medical materials as well as detergent due to the specific
properties of zeolites (catalyst and ion exchange) and silver nanoparticles (antimicrobial activity). However, the
reduction of silver ions was mostly carried out using sodium borohydride and hydrazine, which are harmful and
non-ecofriendly reducing agents. Therefore, the objective of this research is to prepare composites between
zeolite and silver nanoparticles via a two-step method of ion exchange and reduction using vitamin C as a
reducing agent. The successful preparation of zeolite/Ag0 composites was confirmed by UV-Visible
Spectroscopy, Scanning Electron Microscopy and Energy Dispersive X-ray Spectroscopy. The antimicrobial
activity of zeolite/Ag0 composites against Escherichia coli was also investigated. Zeolite/Ag
0 composites
showed Surface Plasmon Resonance (SPR) band of silver nanoparticles at 430 nm. The silver nanoparticles
attached on the external zeolite surface possess spherical shape with an average diameter in the range of 19-21
nm. The amount of silver nanoparticles increased with increasing initial silver concentration. Zeolite/Ag0
composites exhibited excellent antimicrobial activity against Escherichia coli with MICs of 0.313 mg/mL when
initial concentration of silver used for preparation was 0.02 M. The as-prepared zeolite/Ag0 0.02 composites
showed the feasibility to be applied as an additive for improving tensile strength and stiffness of starch-based
film.
Keywords: Zeolites, Silver nanoparticles, Antimicrobial activity
1. Introduction
Zeolite is a nanoporous aluminosilicate
compound, in which its structure composes of Si and Al
atoms connected by O atom to form porous three-
dimensional structure. Owing to various outstanding
properties, such as ion exchange and adsorption [1],
zeolites have been used in many applications as
adsorbent and molecular sieve [2,3], catalyst [4] as well
as plastic additives [5]. The combination of zeolites with
silver nanoparticles is reported as an alternative to
enhance the antimicrobial activity of zeolites.
Previously, many research groups have demonstrated
that zeolite/Ag0
composites showed excellent
antimicrobial activity against Gram-negative and Gram
positive bacteria [6-8]. The combination of zeolites with
silver nanoparticles can expanded zeolite applications,
including coating, drinking water and biomedical devices
[8]. Therefore, the objective of this research is to provide
on antimicrobial capability to zeolites by incorporating
silver nanoparticles. The obtained zeolite/Ag0
composites were expected to be used as antimicrobial
ion exchange
material or adsorbent and as reinforcing additive for
polymeric films.
2. Experimental methods
Zeolite/Ag0 composites were prepared using a
two-step method of silver ion exchange and reduction.
Dried zeolite powder (Zeolite A with a dimension of
45 m, a pore size of 0.5 nm and a moisture content of
0.998 %wt, 60 mg) was magnetically stirred in 0.02 M or
0.05 M of AgNO3 solution (3 mL) at ambient
temperature for an hour. After that the mixture was
centrifuged and the precipitate was collected followed by
drying at 60 °C overnight. The obtained powder of
zeolite/silver ion (zeolite/Ag+) composites was stirred
regularly in vitamin C solution (0.5 mol equivalent to
mol of Ag) at ambient temperature for an hour. After that
the mixture was centrifuged to collect the precipitate,
which was then dried at 60 °C overnight to obtain
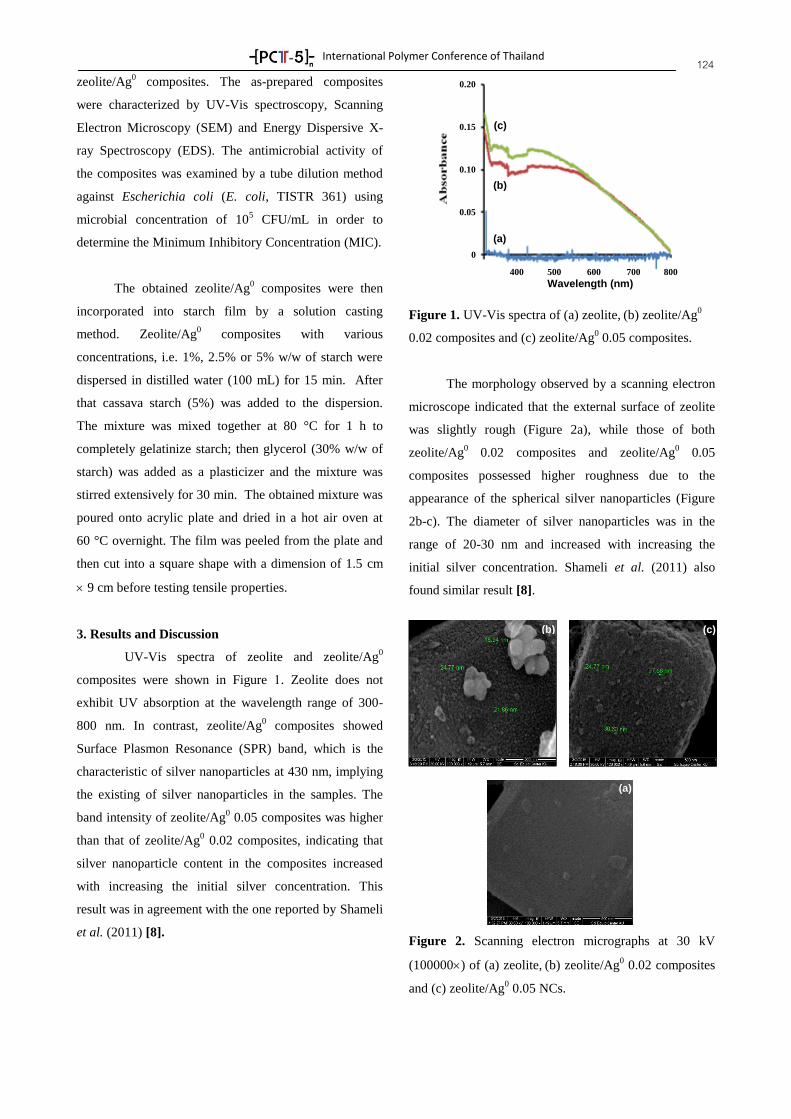
International Polymer Conference of Thailand
124 zeolite/Ag
0 composites. The as-prepared composites
were characterized by UV-Vis spectroscopy, Scanning
Electron Microscopy (SEM) and Energy Dispersive X-
ray Spectroscopy (EDS). The antimicrobial activity of
the composites was examined by a tube dilution method
against Escherichia coli (E. coli, TISTR 361) using
microbial concentration of 105 CFU/mL in order to
determine the Minimum Inhibitory Concentration (MIC).
The obtained zeolite/Ag0 composites were then
incorporated into starch film by a solution casting
method. Zeolite/Ag0 composites with various
concentrations, i.e. 1%, 2.5% or 5% w/w of starch were
dispersed in distilled water (100 mL) for 15 min. After
that cassava starch (5%) was added to the dispersion.
The mixture was mixed together at 80 °C for 1 h to
completely gelatinize starch; then glycerol (30% w/w of
starch) was added as a plasticizer and the mixture was
stirred extensively for 30 min. The obtained mixture was
poured onto acrylic plate and dried in a hot air oven at
60 °C overnight. The film was peeled from the plate and
then cut into a square shape with a dimension of 1.5 cm
9 cm before testing tensile properties.
3. Results and Discussion
UV-Vis spectra of zeolite and zeolite/Ag0
composites were shown in Figure 1. Zeolite does not
exhibit UV absorption at the wavelength range of 300-
800 nm. In contrast, zeolite/Ag0 composites showed
Surface Plasmon Resonance (SPR) band, which is the
characteristic of silver nanoparticles at 430 nm, implying
the existing of silver nanoparticles in the samples. The
band intensity of zeolite/Ag0 0.05 composites was higher
than that of zeolite/Ag0 0.02 composites, indicating that
silver nanoparticle content in the composites increased
with increasing the initial silver concentration. This
result was in agreement with the one reported by Shameli
et al. (2011) [8].
Figure 1. UV-Vis spectra of (a) zeolite, (b) zeolite/Ag0
0.02 composites and (c) zeolite/Ag0 0.05 composites.
The morphology observed by a scanning electron
microscope indicated that the external surface of zeolite
was slightly rough (Figure 2a), while those of both
zeolite/Ag0 0.02 composites and zeolite/Ag
0 0.05
composites possessed higher roughness due to the
appearance of the spherical silver nanoparticles (Figure
2b-c). The diameter of silver nanoparticles was in the
range of 20-30 nm and increased with increasing the
initial silver concentration. Shameli et al. (2011) also
found similar result [8].
Figure 2. Scanning electron micrographs at 30 kV
(100000) of (a) zeolite, (b) zeolite/Ag0 0.02 composites
and (c) zeolite/Ag0 0.05 NCs.
(a)
(b)
(c)
400 500 600 700 800
Wavelength (nm)
(b)
0.20
0.15
0.10
0.05
0
(a)
(c)
(a)
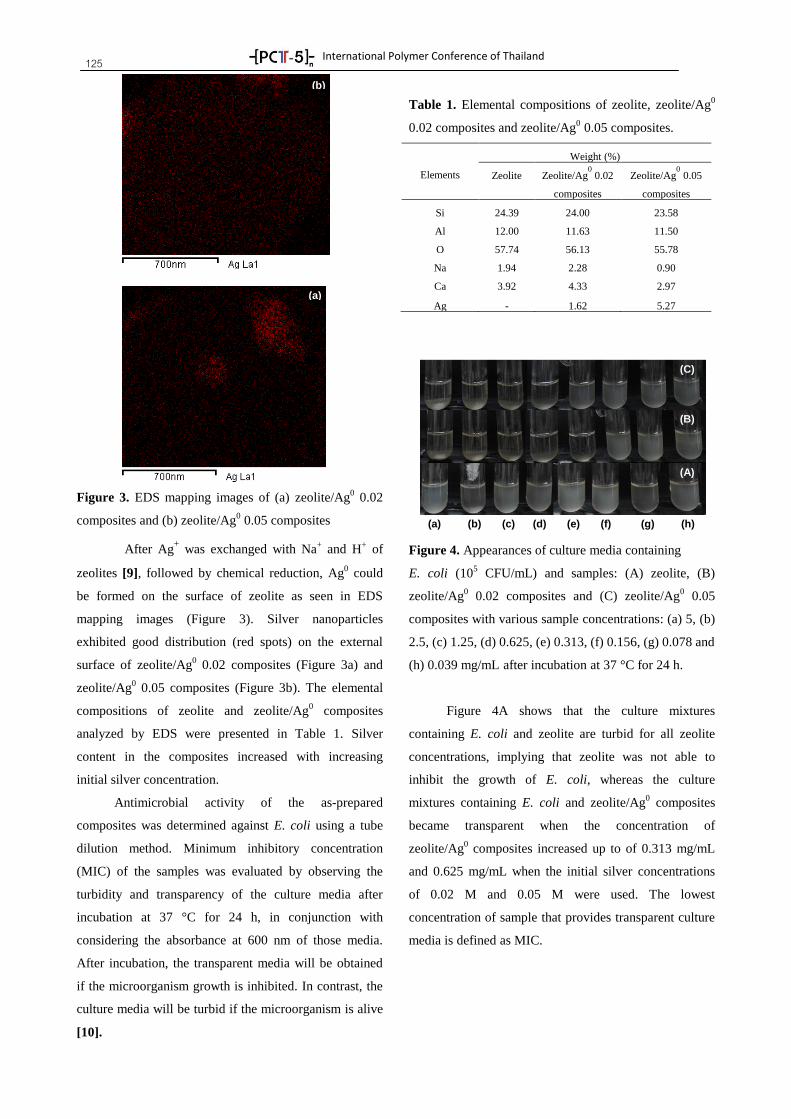
International Polymer Conference of Thailand
125
(a)
Figure 3. EDS mapping images of (a) zeolite/Ag0 0.02
composites and (b) zeolite/Ag0 0.05 composites
After Ag+ was exchanged with Na
+ and H
+ of
zeolites [9], followed by chemical reduction, Ag0 could
be formed on the surface of zeolite as seen in EDS
mapping images (Figure 3). Silver nanoparticles
exhibited good distribution (red spots) on the external
surface of zeolite/Ag0 0.02 composites (Figure 3a) and
zeolite/Ag0 0.05 composites (Figure 3b). The elemental
compositions of zeolite and zeolite/Ag0 composites
analyzed by EDS were presented in Table 1. Silver
content in the composites increased with increasing
initial silver concentration.
Antimicrobial activity of the as-prepared
composites was determined against E. coli using a tube
dilution method. Minimum inhibitory concentration
(MIC) of the samples was evaluated by observing the
turbidity and transparency of the culture media after
incubation at 37 °C for 24 h, in conjunction with
considering the absorbance at 600 nm of those media.
After incubation, the transparent media will be obtained
if the microorganism growth is inhibited. In contrast, the
culture media will be turbid if the microorganism is alive
[10].
Table 1. Elemental compositions of zeolite, zeolite/Ag0
0.02 composites and zeolite/Ag0 0.05 composites.
Elements
Weight (%)
Zeolite Zeolite/Ag0 0.02
composites
Zeolite/Ag0 0.05
composites
Si 24.39 24.00 23.58
Al 12.00 11.63 11.50
O 57.74 56.13 55.78
Na 1.94 2.28 0.90
Ca 3.92 4.33 2.97
Ag - 1.62 5.27
Figure 4. Appearances of culture media containing
E. coli (105 CFU/mL) and samples: (A) zeolite, (B)
zeolite/Ag0 0.02 composites and (C) zeolite/Ag
0 0.05
composites with various sample concentrations: (a) 5, (b)
2.5, (c) 1.25, (d) 0.625, (e) 0.313, (f) 0.156, (g) 0.078 and
(h) 0.039 mg/mL after incubation at 37 °C for 24 h.
Figure 4A shows that the culture mixtures
containing E. coli and zeolite are turbid for all zeolite
concentrations, implying that zeolite was not able to
inhibit the growth of E. coli, whereas the culture
mixtures containing E. coli and zeolite/Ag0 composites
became transparent when the concentration of
zeolite/Ag0 composites increased up to of 0.313 mg/mL
and 0.625 mg/mL when the initial silver concentrations
of 0.02 M and 0.05 M were used. The lowest
concentration of sample that provides transparent culture
media is defined as MIC.
(C)
(a) (b) (c) (d) (e) (f) (g) (h)
(B)
(A)
(b)
(a)
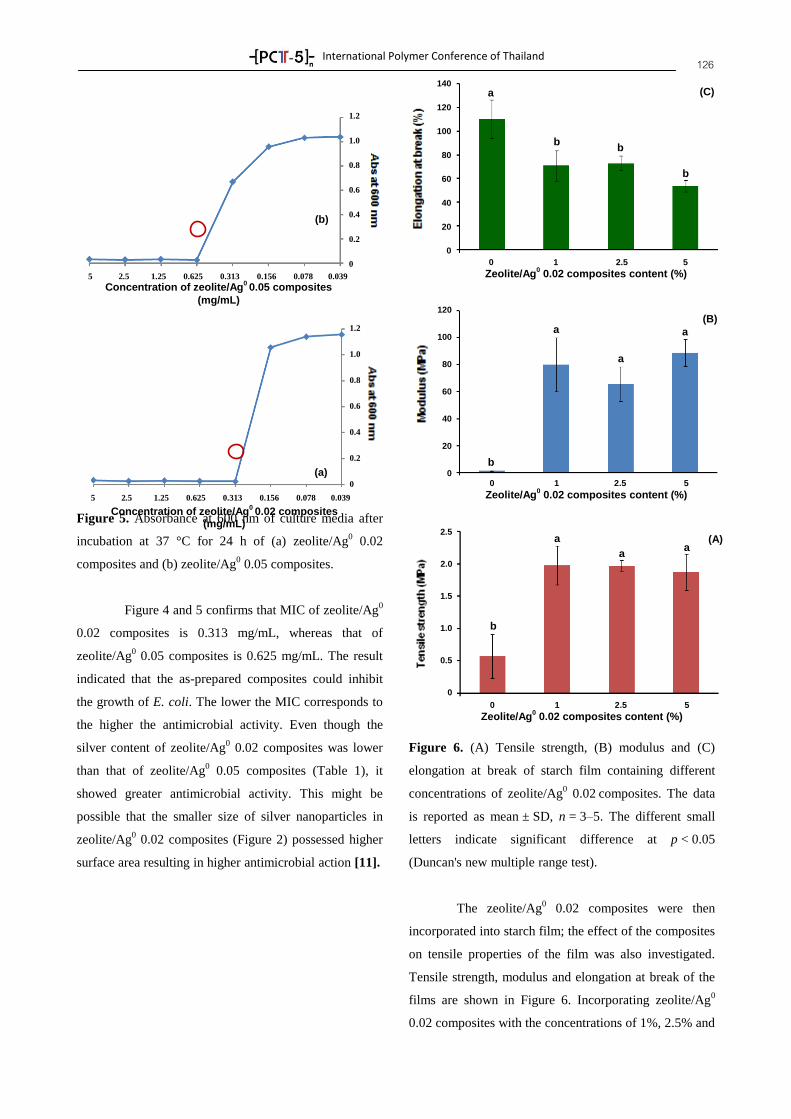
International Polymer Conference of Thailand
126
Figure 5. Absorbance at 600 nm of culture media after
incubation at 37 °C for 24 h of (a) zeolite/Ag0 0.02
composites and (b) zeolite/Ag0 0.05 composites.
Figure 4 and 5 confirms that MIC of zeolite/Ag0
0.02 composites is 0.313 mg/mL, whereas that of
zeolite/Ag0 0.05 composites is 0.625 mg/mL. The result
indicated that the as-prepared composites could inhibit
the growth of E. coli. The lower the MIC corresponds to
the higher the antimicrobial activity. Even though the
silver content of zeolite/Ag0 0.02 composites was lower
than that of zeolite/Ag0 0.05 composites (Table 1), it
showed greater antimicrobial activity. This might be
possible that the smaller size of silver nanoparticles in
zeolite/Ag0 0.02 composites (Figure 2) possessed higher
surface area resulting in higher antimicrobial action [11].
Figure 6. (A) Tensile strength, (B) modulus and (C)
elongation at break of starch film containing different
concentrations of zeolite/Ag0 0.02 composites. The data
is reported as mean ± SD, n = 3–5. The different small
letters indicate significant difference at p < 0.05
(Duncan's new multiple range test).
The zeolite/Ag0 0.02 composites were then
incorporated into starch film; the effect of the composites
on tensile properties of the film was also investigated.
Tensile strength, modulus and elongation at break of the
films are shown in Figure 6. Incorporating zeolite/Ag0
0.02 composites with the concentrations of 1%, 2.5% and
a
a
(B) a
b
120
100
80
60
40
20
0 0 1 2.5 5
Zeolite/Ag0 0.02 composites content (%)
(a)
a
b
0 1 2.5 5
Zeolite/Ag0 0.02 composites content (%)
140
120
100
80
60
40
20
0
(C)
b
b
(a)
b
2.5
2.0
1.5
1.0
0.5
0
0 1 2.5 5
Zeolite/Ag0 0.02 composites content (%)
a
a a
b
(A)
(b)
MIC
5 2.5 1.25 0.625 0.313 0.156 0.078 0.039
Concentration of zeolite/Ag0 0.05 composites
(mg/mL)
1.2
1.0
0.8
0.6
0.4
0.2
0
MIC (a)
1.2
1.0
0.8
0.6
0.4
0.2
0
MIC
5 2.5 1.25 0.625 0.313 0.156 0.078 0.039
Concentration of zeolite/Ag0 0.02 composites
(mg/mL)
(a)
(b)
International Polymer Conference of Thailand
127 5% resulted in increased tensile strength and modulus,
while decreased elongation at break. The concentration
of zeolite/Ag0 0.02 composites hardly affected tensile
properties of the film. The results implied that
zeolite/Ag0 0.02 composites could improve tensile
strength and stiffness. This might be explained by the
surface interaction through hydrogen bonds formed
between zeolites and polysaccharide chains, resulting in
strong interfacial adhesion in composites and reduced
starch chain mobility; as a result macroscopic rigidity of
the film was enhanced [11,12]. The reduction of
extensibility of starch film by incorporating zeolite/Ag0
0.02 composites was due to the interruption of polymer
chain mobility by zeolite [13].
Conclusions
Zeolite/Ag0 composites were successfully
prepared via a two-step method of silver ion exchange
and reduction, using vitamin C as a reducing agent. The
characteristic SPR band of silver nanoparticles in the
composites appeared at 430 nm. The average diameter of
the silver nanoparticles was in the range of 20-30 nm and
those silver nanoparticles showed good distribution on
the external zeolite surface. The diameter and content of
silver nanoparticles on the zeolite surface increased with
increasing the initial silver concentration. The
composites exhibited antimicrobial activity against the
growth of E. coli with the MICs of 0.313 mg/mL for
zeolite/Ag0 0.02 composites and 0.625 mg/mL for
zeolite/Ag0 0.05 composites. The incorporation of
zeolite/Ag0 0.02 composites into starch films led to
improvement of tensile strength and stiffness.
Antimicrobial activity of starch film incorporating
zeolite/Ag0 composites will be further studied.
References
[1] Lesthaeghe, D., Delcour, G., Speybroeck, V. V.,
Marin, G. B. and Waroquier, M., “Theoretical study
on the alteration of fundamental zeolite properties
by methylene functionalization”, Microporous and
Mesoporous Materials 96: 350-356 (2006).
[2] Tso, C. Y., Chan, K. C., Chao, C. Y. H. and Wu, C.
L., “Experimental performance analysis on an
adsorption cooling system using zeolite 13X/CaCl2
adsorbent with various operation sequences”,
International Journal of Heat and Mass Transfer 85:
343-355 (2015).
[3] Ahmed, M. J. and Theydan, S. K., “Modeling of
propane separation from light hydrocarbons by
adsorption on 4A molecular sieve zeolite”, Journal
of Natural Gas Science and Engineering 18: 1-6
(2014).
[4] Han, W., Zhang, P., Tang, Z. and Lu, G., “Low
temperature CO oxidation over Pd–Ce catalysts
supported on ZSM-5 zeolites”, Process Safety and
Environmental Protection 92: 822-827 (2014).
[5] Thipmanee, R. and Sane, A., “Effect of zeolite 5A
on compatibility and properties of linear low-density
polyethylene
[6] Ferreira, L., Fonseca, A. M., Botelho, G., Aguiar, C.
A. and Neves, I. C., “Antimicrobial activity of
faujasite zeolites doped with silver”, Microporous
and Mesoporous Materials 160: 126-132 (2012).
[7] Flores-López, N. S., Castro-Rosas, J., Ramírez-Bon,
R., Mendoza-Córdova, A., Larios-Rodríguez, E. and
Flores-Acosta, M., “Synthesis and properties of
crystalline silver nanoparticles supported in natural
zeolite chabazite”, Journal of Molecular Structure
1028: 110-115 (2012).
[8] Shameli, K., Ahmad, M. B., Zargar, M., Yunus W.
M. Z. W. and Ibrahim, N. A., “Fabrication of silver
nanoparticles doped in the zeolite framework and
antibacterial activity”, International Journal of
Nanomedicine 6: 331-341 (2011).
[9] Akgul, M., Karabakan, A., Acar, O. and Yurum, Y.,
“Removal of silver (I) from aqueous solutions with
clinoptilolite”, Microporous and Mesoporous
Materials 94: 99-104 (2006).
[10] Yoksan, R. and Chirachanchai, S., “Silver
nanoparticle-loaded chitosan–starch based films:
Fabrication and evaluation of tensile, barrier and
antimicrobial properties”, Materials Science and
Engineering C 30: 891-897 (2010).

International Polymer Conference of Thailand
128 [11] Ghosh, A., Ma, L. and Gao, C., “Zeolite molecular
sieve 5A acts as a reinforcing filler, altering the
morphological, mechanical, and thermal properties
of chitosan”, Journal of Materials Science 48:3926-
3935 (2013).
[12] Belibi, P. C., Daou, T. J., Ndjaka, J. M. B.,
Michelin, L., Brendlé, J., Nsom, B. and Bernard, D.,
“Tensile and water barrier properties of cassava
starch composite films reinforced by synthetic
zeolite and beidellite”, Journal of Food Engineering
115: 339-346 (2013).
[13] Chang, B. P., Akila, H. M. and Nasir, R. B.,
“Mechanical and tribological properties of zeolite-
reinforced UHMWPE composite for implant
application”, Procedia Engineering 68: 88-94
(2013).
International Polymer Conference of Thailand
129
COMPP-22
Extraction and characterization of cellulose nano-whiskers from rice bran waste
Witita Laosamathikul1, Kittiwut Kasemwong
2, and Pakorn Opaprakasit
1
1 School of Bio-Chemical Engineering and Technology, Sirindhorn International Institute of Technology (SIIT),
Thammasat University, Pathum Thani, 12121, Thailand 2National Nanotechnology Center, National Science and Technology Development Agency,
Pathum Thani, 12120, Thailand
Abstract
Rice bran waste (RBW), a residue from rice bran oil production process, is used as a raw material to
produce cellulose nanowhiskers (CNWs). Rice bran cellulose (RBC) was isolated from the raw material by
using alkali treatment and bleaching treatment to remove hemicellulose and lignin. The diameter of CNWs is
smaller than RBC and RBW with the highest aspect ratio, since amorphous domains are eliminated. This leads
to the higher crystallinity index of CNWs. TGA results suggest that CNWs has higher thermal property than its
starting materials. Given these properties and its biocompatibility, the materials can be used as reinforcing
agents for biodegradable polymers for use in biomedical or packaging applications.
1. INTRODUCTION
Rice bran oil is oil product extracted from hard outer
brown layers of rice after chaff (rice husk). This is very
popular cooking oil in many countries, since it provides
many health benefits such as cholesterol busting power,
cancer protection, immunity boost or antioxidant. 1.
There are some residues from rice bran oil process that
contain high amount of cellulose, which can be extracted
and used in many applications, especially cellulose and
its derivatives. Cellulose is one of the most interesting
materials for use in reinforced bio-composites, because
of its outstanding mechanical properties, low density,
and renewability.
Nano-sized cellulose is considered an attractive
reinforcing agent because of its good mechanical
properties, such as, high tensile strength, high flexural
strength, and high stiffness with low density 2,3
. Cellulose
nano-whiskers (CNWs) are generated by acid hydrolysis
to dissolve amorphous fractions off, leading to an
increase in the percentage of crystalline domains 4. There
are many reports on extractions of cellulose and
productions of CNWs from various types of plants and
even wastes, such as biomass and agricultural residuals 5-
7.
The aim of this research is to develop a process to
produce cellulose nano-whiskers from rice bran waste.
The material’s structures and properties are then
characterized for use as a reinforcing agent for bio-
materials.
Table 1 Rice bran waste composition
Composition Percentage (%)
Moisture 9.06
Protein 12.47
Fat 1.35
Ash 7.80
Total Carbohydrate 69.32
Dietary Fiber 27.14
2. EXPERIMENTAL
2.1 Materials
Rice bran waste (RBW) was supplied by a rice bran
oil production company in Nonthaburi, Thailand.
Sodium hydroxide pellets (AR grade, Quality Reagent
Chemical), Sodium Chlorite 80% (technical grade,
Sigma-Aldrich), Acetic acid glacial with more than 80%
acid by mass (Mallinckrodt Chemicals), Sulphuric acid
(96%, Carlo Erba Reagents) were used without further
purification.
2.2 Preparation of rice bran cellulose (RBC)
2.2.1 Alkali treatment
The alkali treatment is employed by using a modified
method reported by Deepa et al. the rice bran waste raw
material was sieved at 180 mesh, and then purified by
removing lignin and hemicellulose. 30 g of rice bran was
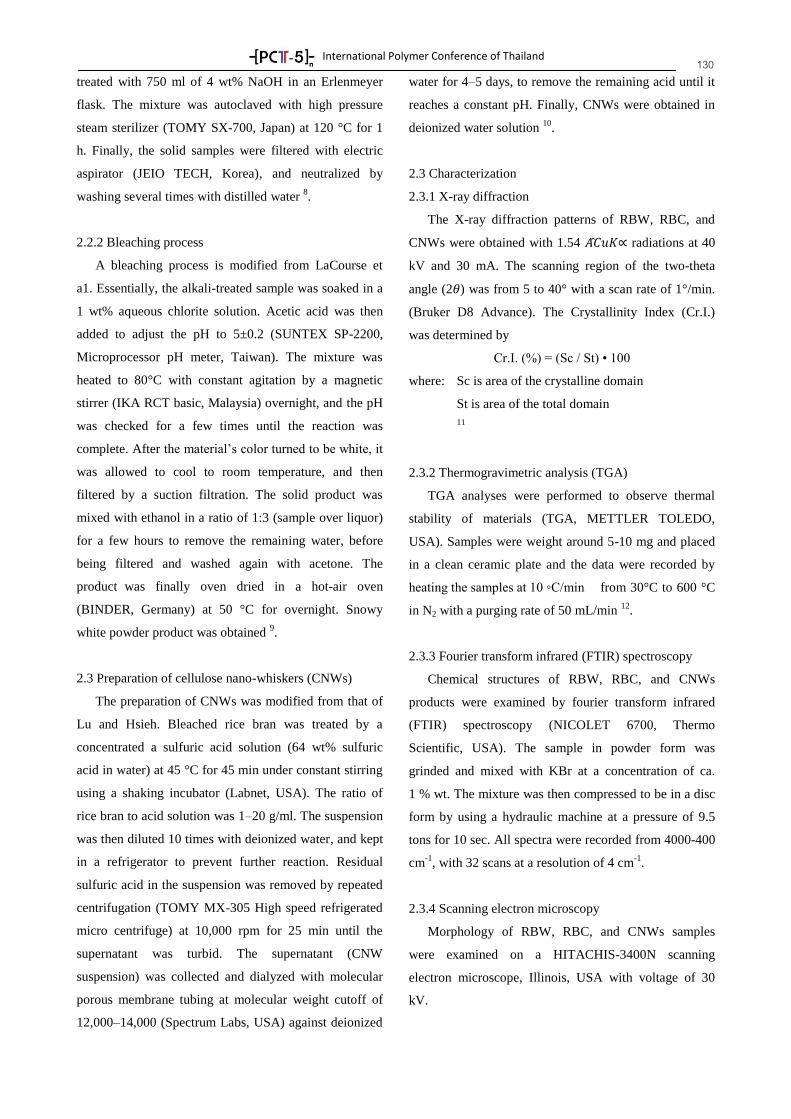
International Polymer Conference of Thailand
130 treated with 750 ml of 4 wt% NaOH in an Erlenmeyer
flask. The mixture was autoclaved with high pressure
steam sterilizer (TOMY SX-700, Japan) at 120 °C for 1
h. Finally, the solid samples were filtered with electric
aspirator (JEIO TECH, Korea), and neutralized by
washing several times with distilled water 8.
2.2.2 Bleaching process
A bleaching process is modified from LaCourse et
a1. Essentially, the alkali-treated sample was soaked in a
1 wt% aqueous chlorite solution. Acetic acid was then
added to adjust the pH to 5±0.2 (SUNTEX SP-2200,
Microprocessor pH meter, Taiwan). The mixture was
heated to 80°C with constant agitation by a magnetic
stirrer (IKA RCT basic, Malaysia) overnight, and the pH
was checked for a few times until the reaction was
complete. After the material’s color turned to be white, it
was allowed to cool to room temperature, and then
filtered by a suction filtration. The solid product was
mixed with ethanol in a ratio of 1:3 (sample over liquor)
for a few hours to remove the remaining water, before
being filtered and washed again with acetone. The
product was finally oven dried in a hot-air oven
(BINDER, Germany) at 50 °C for overnight. Snowy
white powder product was obtained 9.
2.3 Preparation of cellulose nano-whiskers (CNWs)
The preparation of CNWs was modified from that of
Lu and Hsieh. Bleached rice bran was treated by a
concentrated a sulfuric acid solution (64 wt% sulfuric
acid in water) at 45 °C for 45 min under constant stirring
using a shaking incubator (Labnet, USA). The ratio of
rice bran to acid solution was 1–20 g/ml. The suspension
was then diluted 10 times with deionized water, and kept
in a refrigerator to prevent further reaction. Residual
sulfuric acid in the suspension was removed by repeated
centrifugation (TOMY MX-305 High speed refrigerated
micro centrifuge) at 10,000 rpm for 25 min until the
supernatant was turbid. The supernatant (CNW
suspension) was collected and dialyzed with molecular
porous membrane tubing at molecular weight cutoff of
12,000–14,000 (Spectrum Labs, USA) against deionized
water for 4–5 days, to remove the remaining acid until it
reaches a constant pH. Finally, CNWs were obtained in
deionized water solution 10
.
2.3 Characterization
2.3.1 X-ray diffraction
The X-ray diffraction patterns of RBW, RBC, and
CNWs were obtained with 1.54 ∝ radiations at 40
kV and 30 mA. The scanning region of the two-theta
angle (2 ) was from 5 to 40° with a scan rate of 1°/min.
(Bruker D8 Advance). The Crystallinity Index (Cr.I.)
was determined by
Cr.I. (%) = (Sc / St) • 100
where: Sc is area of the crystalline domain
St is area of the total domain
11
2.3.2 Thermogravimetric analysis (TGA)
TGA analyses were performed to observe thermal
stability of materials (TGA, METTLER TOLEDO,
USA). Samples were weight around 5-10 mg and placed
in a clean ceramic plate and the data were recorded by
heating the samples at 10 ◦C/min from 30°C to 600 °C
in N2 with a purging rate of 50 mL/min 12
.
2.3.3 Fourier transform infrared (FTIR) spectroscopy
Chemical structures of RBW, RBC, and CNWs
products were examined by fourier transform infrared
(FTIR) spectroscopy (NICOLET 6700, Thermo
Scientific, USA). The sample in powder form was
grinded and mixed with KBr at a concentration of ca.
1 % wt. The mixture was then compressed to be in a disc
form by using a hydraulic machine at a pressure of 9.5
tons for 10 sec. All spectra were recorded from 4000-400
cm-1
, with 32 scans at a resolution of 4 cm-1
.
2.3.4 Scanning electron microscopy
Morphology of RBW, RBC, and CNWs samples
were examined on a HITACHIS-3400N scanning
electron microscope, Illinois, USA with voltage of 30
kV.
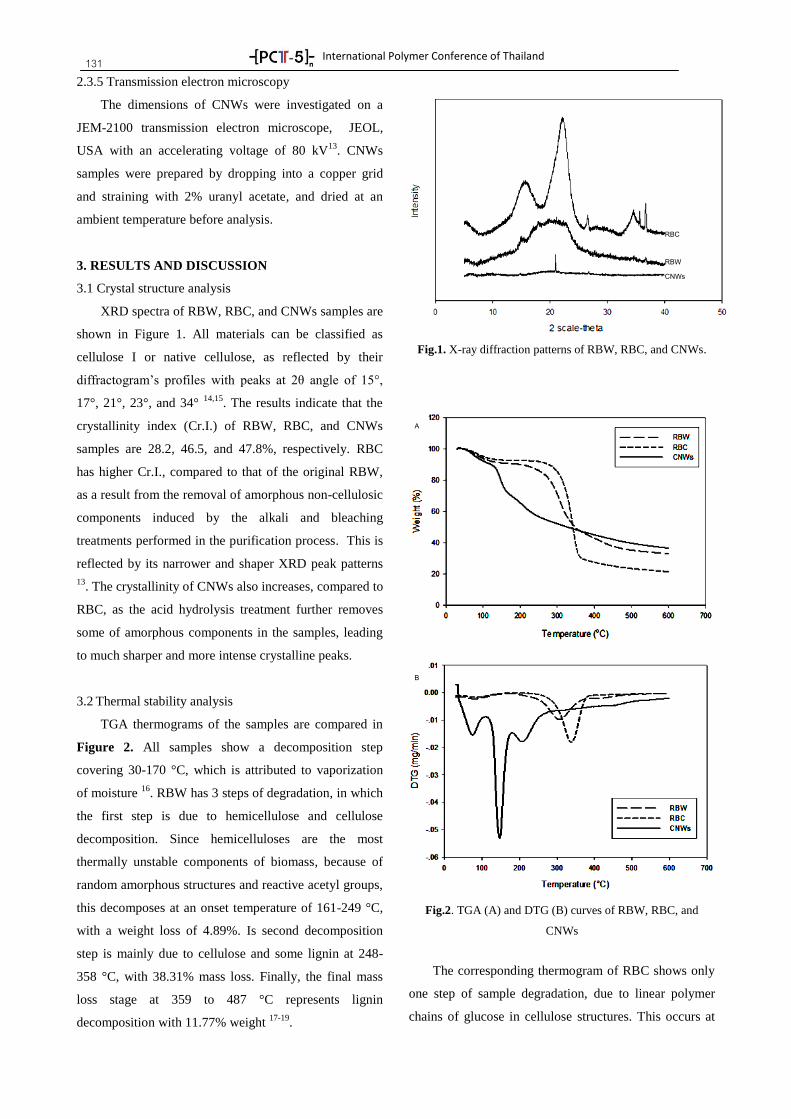
International Polymer Conference of Thailand
131 2.3.5 Transmission electron microscopy
The dimensions of CNWs were investigated on a
JEM-2100 transmission electron microscope, JEOL,
USA with an accelerating voltage of 80 kV13
. CNWs
samples were prepared by dropping into a copper grid
and straining with 2% uranyl acetate, and dried at an
ambient temperature before analysis.
3. RESULTS AND DISCUSSION
3.1 Crystal structure analysis
XRD spectra of RBW, RBC, and CNWs samples are
shown in Figure 1. All materials can be classified as
cellulose I or native cellulose, as reflected by their
diffractogram’s profiles with peaks at 2θ angle of 15°,
17°, 21°, 23°, and 34° 14,15
. The results indicate that the
crystallinity index (Cr.I.) of RBW, RBC, and CNWs
samples are 28.2, 46.5, and 47.8%, respectively. RBC
has higher Cr.I., compared to that of the original RBW,
as a result from the removal of amorphous non-cellulosic
components induced by the alkali and bleaching
treatments performed in the purification process. This is
reflected by its narrower and shaper XRD peak patterns
13. The crystallinity of CNWs also increases, compared to
RBC, as the acid hydrolysis treatment further removes
some of amorphous components in the samples, leading
to much sharper and more intense crystalline peaks.
3.2 Thermal stability analysis
TGA thermograms of the samples are compared in
Figure 2. All samples show a decomposition step
covering 30-170 °C, which is attributed to vaporization
of moisture 16
. RBW has 3 steps of degradation, in which
the first step is due to hemicellulose and cellulose
decomposition. Since hemicelluloses are the most
thermally unstable components of biomass, because of
random amorphous structures and reactive acetyl groups,
this decomposes at an onset temperature of 161-249 °C,
with a weight loss of 4.89%. Is second decomposition
step is mainly due to cellulose and some lignin at 248-
358 °C, with 38.31% mass loss. Finally, the final mass
loss stage at 359 to 487 °C represents lignin
decomposition with 11.77% weight 17-19
.
Fig.1. X-ray diffraction patterns of RBW, RBC, and CNWs.
Fig.2. TGA (A) and DTG (B) curves of RBW, RBC, and
CNWs
The corresponding thermogram of RBC shows only
one step of sample degradation, due to linear polymer
chains of glucose in cellulose structures. This occurs at
RBW
RBC
CNWs
A
B
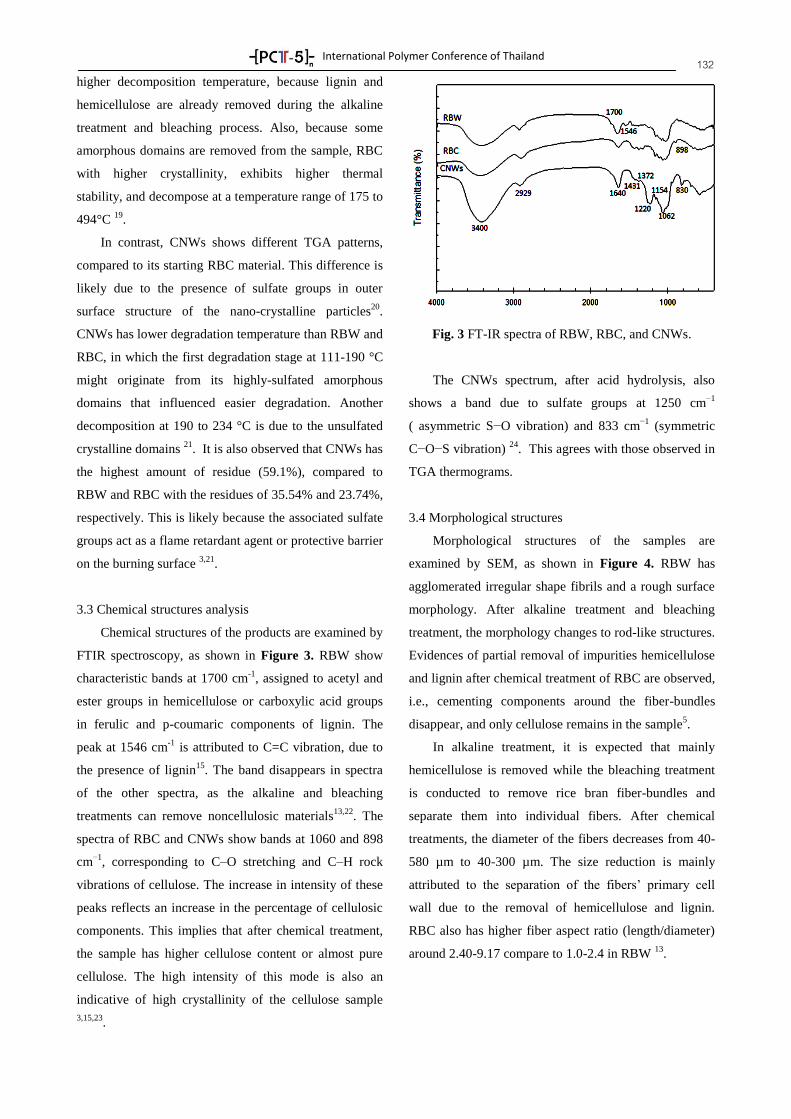
International Polymer Conference of Thailand
132 higher decomposition temperature, because lignin and
hemicellulose are already removed during the alkaline
treatment and bleaching process. Also, because some
amorphous domains are removed from the sample, RBC
with higher crystallinity, exhibits higher thermal
stability, and decompose at a temperature range of 175 to
494°C 19
.
In contrast, CNWs shows different TGA patterns,
compared to its starting RBC material. This difference is
likely due to the presence of sulfate groups in outer
surface structure of the nano-crystalline particles20
.
CNWs has lower degradation temperature than RBW and
RBC, in which the first degradation stage at 111-190 °C
might originate from its highly-sulfated amorphous
domains that influenced easier degradation. Another
decomposition at 190 to 234 °C is due to the unsulfated
crystalline domains 21
. It is also observed that CNWs has
the highest amount of residue (59.1%), compared to
RBW and RBC with the residues of 35.54% and 23.74%,
respectively. This is likely because the associated sulfate
groups act as a flame retardant agent or protective barrier
on the burning surface 3,21
.
3.3 Chemical structures analysis
Chemical structures of the products are examined by
FTIR spectroscopy, as shown in Figure 3. RBW show
characteristic bands at 1700 cm-1
, assigned to acetyl and
ester groups in hemicellulose or carboxylic acid groups
in ferulic and p-coumaric components of lignin. The
peak at 1546 cm-1
is attributed to C=C vibration, due to
the presence of lignin15
. The band disappears in spectra
of the other spectra, as the alkaline and bleaching
treatments can remove noncellulosic materials13,22
. The
spectra of RBC and CNWs show bands at 1060 and 898
cm−1
, corresponding to C–O stretching and C–H rock
vibrations of cellulose. The increase in intensity of these
peaks reflects an increase in the percentage of cellulosic
components. This implies that after chemical treatment,
the sample has higher cellulose content or almost pure
cellulose. The high intensity of this mode is also an
indicative of high crystallinity of the cellulose sample
3,15,23.
Fig. 3 FT-IR spectra of RBW, RBC, and CNWs.
The CNWs spectrum, after acid hydrolysis, also
shows a band due to sulfate groups at 1250 cm−1
( asymmetric S−O vibration) and 833 cm−1
(symmetric
C−O−S vibration) 24
. This agrees with those observed in
TGA thermograms.
3.4 Morphological structures
Morphological structures of the samples are
examined by SEM, as shown in Figure 4. RBW has
agglomerated irregular shape fibrils and a rough surface
morphology. After alkaline treatment and bleaching
treatment, the morphology changes to rod-like structures.
Evidences of partial removal of impurities hemicellulose
and lignin after chemical treatment of RBC are observed,
i.e., cementing components around the fiber-bundles
disappear, and only cellulose remains in the sample5.
In alkaline treatment, it is expected that mainly
hemicellulose is removed while the bleaching treatment
is conducted to remove rice bran fiber-bundles and
separate them into individual fibers. After chemical
treatments, the diameter of the fibers decreases from 40-
580 µm to 40-300 µm. The size reduction is mainly
attributed to the separation of the fibers’ primary cell
wall due to the removal of hemicellulose and lignin.
RBC also has higher fiber aspect ratio (length/diameter)
around 2.40-9.17 compare to 1.0-2.4 in RBW 13
.
International Polymer Conference of Thailand
133
Fig.4. Scanning electron micrograph of RBW (A) and RBC (B)
Figure 5 shows TEM image of CNWs. This
confirms that the size is reduced to nano-scale with the
shape like whiskers. The amorphous regions of cellulosic
microfibrils are removed as a result from the acid
hydrolysis, leaving behind only straight-shaped
crystalline domains13
. The results strongly reflect the
success of nano-whiskers formation.
Fig.5. Transmission electron micrograph of CNWs
4. CONCLUSIONS
Rice bran cellulose is extracted from rice bran waste
by alkali and bleaching treatments to remove non-
cellulosic constituents and break down microfibrils to
individual fibers. By using acid hydrolysis, amorphous
domains are removed, the remaining crystalline cellulose
presents in the form of cellulose nano-whiskers. The
materials can be used as reinforcing agents for
biomaterials, because of their high thermal stability,
crystallinity, hydrophilicity, and high aspect ratio with
small diameter. The materials can be used to composite
with biodegradable PLA to improve its physico-
mechanical properties for use in biomedical or packaging
applications.
5. ACKNOWLEDGEMENTS
W.L. is thankful for a support from the TAIST-Tokyo
Tech scholarship program.
REFERENCES
(1) Jhawer, M.; Vakil, D. E.; Medindia.
(2) Lee, J. H.; Park, S. H.; Kim, a. S. H.
Macromolecular Research 2013, 21, 1218.
(3) Haafiz, M. K. M.; Hassan, A.; Zakaria, Z.; Inuwa, I.
M. Carbohydrate Polymers 2014, 103, 119.
(4) Hebeish, A.; Farag, S.; Sharaf, S.; Shaheen, T. I.
Carbohydrate Polymers 2014, 102, 159.
(5) Rosa, M. F.; Medeiros, E. S.; Malmonge, J. A.;
Gregorski, K. S.; Wood, D. F.; Mattoso, L. H. C.;
Glenn, G.; Orts, W. J.; Imam, S. H. Carbohydrate
Polymers 2010, 81, 83.
(6) Wanrosli, W. D.; Rohaizu, R.; Ghazali, A.
Carbohydrate Polymers 2011, 84, 262.
(7) Maheswari, C. U.; Reddy, K. O.; Muzenda, E.;
Guduri, B. R.; Rajulu, A. V. BIomass and bioenergy
2012, 46, 555.
(8) Deepa, B.; Abraham, E.; Cherian, B. M.; Bismarck,
A.; Blaker, J. J.; Pothan, L. A.; Leao, A. L.; Souza,
S. F. d.; Kottaisamy, M. Bioresource Technology
2011, 102, 1988.
(9) LaCourse, N. L.; Chicalo, K.; Zallie, J. P.; Altieri, P.
A. United State, 1994; Vol. 5,350,593.
A
B
International Polymer Conference of Thailand
134 (10) Lu, P.; Hsieh, Y.-L. Carbohydrate Polymers 2012,
87, 564.
(11) Ciolacu, D.; Ciolacu, F.; Popa, V. I. Cellulose
Chemistry and Technology 2010, 45, 13.
(12) Lu, P.; Hsieh, Y.-L. Carbohydrate Polymers 2012,
87, 2546.
(13) Johar, N.; Ahmad, I.; Dufresnec, A. Industrial Crops
and Products 2012, 37, 93.
(14) Ford, E. N. J.; Mendon, S. K.; Thames, S. F.;
Rawlins, J. W. Journal of Engineered Fibers and
Fabrics 2010, 5, 10.
(15) Neto, W. P. F.; Silvério, H. A.; Dantas, N. O.;
Pasquini, D. Industrial Crops and Products 2013,
42, 480.
(16) Burhenne, L.; Messmer, J.; Aicher, T.; Laborie, M.-
P. Journal of Analytical and Applied Pyrolysis 2013,
101, 177.
(17) Rotliwala, Y. C.; Parikh, P. A. Korean Journal of
Chemical Engineering 2011, 28, 788.
(18) Ház, A.; Jablonský, M.; Orságová, A.; Šurina, I. In
Renewable Energy Sources High Tatras, Slovak
Republic, 2013.
(19) Jin, W.; Singh, K.; Zondlo, J. Agriculture 2013, 3,
12.
(20) Wang, N.; Ding, E.; Cheng, R. Polymer 2007, 48,
3486.
(21) Li, R.; Fei, J.; Cai, Y.; Li, Y.; Feng, J.; Yao, J.
Carbohydrate Polymers 2009, 76, 94.
(22) Trachea, D.; Donnotb, A.; Khimechea, K.;
Benelmirb, R.; Brosse, N. Carbohydrate Polymers
2014, 104, 223.
(23) Silvério, H. A.; Netoa, W. P. F.; Dantasb, N. O.;
Pasquini, D. Industrial Crops and Products 2013,
44, 427.
(24) Gu, J.; Catchmarka, J. M.; Kaiser, E. Q.; Archibald,
D. D. Carbohydrate Polymers 92 (2013) 1809–
1816 2013, 92, 1809.
International Polymer Conference of Thailand
135
COMPP-24
The Preparation of Vanadium Oxides Films via A Polymer Assisted Deposition
Onruthai Srirodpai1*
, Jatuphorn Woothikanokkhan1,3
and Saiwan Nawalertpanya 2,3
1School of Energy, Environment and Materials, King Mongkut's University of Technology Thonburi
(KMUTT), Bangkok 10140 2Department of Chemical Engineering, Faculty of Engineering, King Mongkut's University of Technology
Thonburi (KMUTT), Bangkok 10140 3Nanotec-KMUTT Center of Excellence on Hybrid Nanomaterials for Alternative Energy, Bangkok, 10140
Abstract
Vanadium dioxide films, to be used as a thermochromic material for smart glazing, were prepared and
fabricated on glass substrate via a polymer assisted deposition (PAD). Poly(vinyl pyrrolidone) (PVP) and
poly(vinyl alcohol) (PVOH) were used as the film former to control the viscosity of precursor solution and to
induce an interaction with vanadium ions. The film-forming mechanism, phase determination and surface
morphology were studied by using FT-IR, X-ray diffraction and scanning electron microscopy techniques,
respectively. The results showed that PVOH had greater interaction with VO2+
than PVP. A variety of other
vanadium oxides were found, including VO2 . The temperature had significant influence on morphology of VOx
films. In this study, the best condition that might be used to prepare VO2 (M) film is that by using the PVOH as
a precursor solution and annealing at 450oC for 3 h.
Keyword: vanadium dioxide film, polymer assisted deposition, poly (vinyl alcohol), poly (vinyl pyrrolidone)
1. Introduction
Nowadays, a smart or intelligent window
technology has been evolved and developed to decrease
the energy consumption and increase energy efficiency
in building [1,2]. Chromogenic glazing, is a kind of
smart glass capable of changing color upon an external
stimuli and controlling solar transmittance. These include
thermochromic, photochromic and electrochromic
glazing in which the color was changed with
temperature, light intensity and electricity, respectively
[3-5]. It has been reported that transmission of infrared
radiation through the thermochromic glazing is lower
than that through the photochromic glazing. The
development of thermochromic glazing is also less
expensive and the fabrication process is uncomplicated,
compared with those of the electrochromic glazing [3,6].
Several thermochromic materials have been
used to develop the smart glazing. These include V2O3,
V2O5, V5O9, V4O7, V6O13 Ti2O3 and VO2 [7, 23].
Particularly, VO2 is the most interesting because of its
lower transition temperature (68 oC) and capability of
exhibiting fully reversible phase transition between M
phase and R phase. Below the phase transition
temperature, it has a monoclinic lattice with the P21/c
space group (M phase). Above the phase transition
temperature, the monoclinic phase of VO2 transforms to
tetragonal lattice with the P42/mnm rutile space group (R
phase). This transformation change the electrical
conductivity, optical transmittance and reflectance in
near infrared region of the VO2. These properties can be
applied for smart window, temperature sensing device,
modulator, etc. Moreover phase transition temperature of
VO2 can be further reduced by doping it with some
metals such as tungsten (W) [7-11].
Techniques used to fabricate VO2 film can be
divided into two main systems. These are a vacuum
system and a solution based (or sol-gel) system. VO2
film obtained from vacuum system is highly uniform but
the process is complex and expensive. For the solution
based system, the fabrication is less complicated and
inexpensive. However, the obtained film is usually less
uniform and prone to cracking. Recently, a new solution
based technique, namely a polymer assisted deposition
(PAD), was developed to overcome the above
limitations. PAD is considered uncomplicated and
inexpensive, compared with vacuum system. The main
concept of PAD is the use of the polymer to bind metal
ions and to control the solution viscosity, leading to a
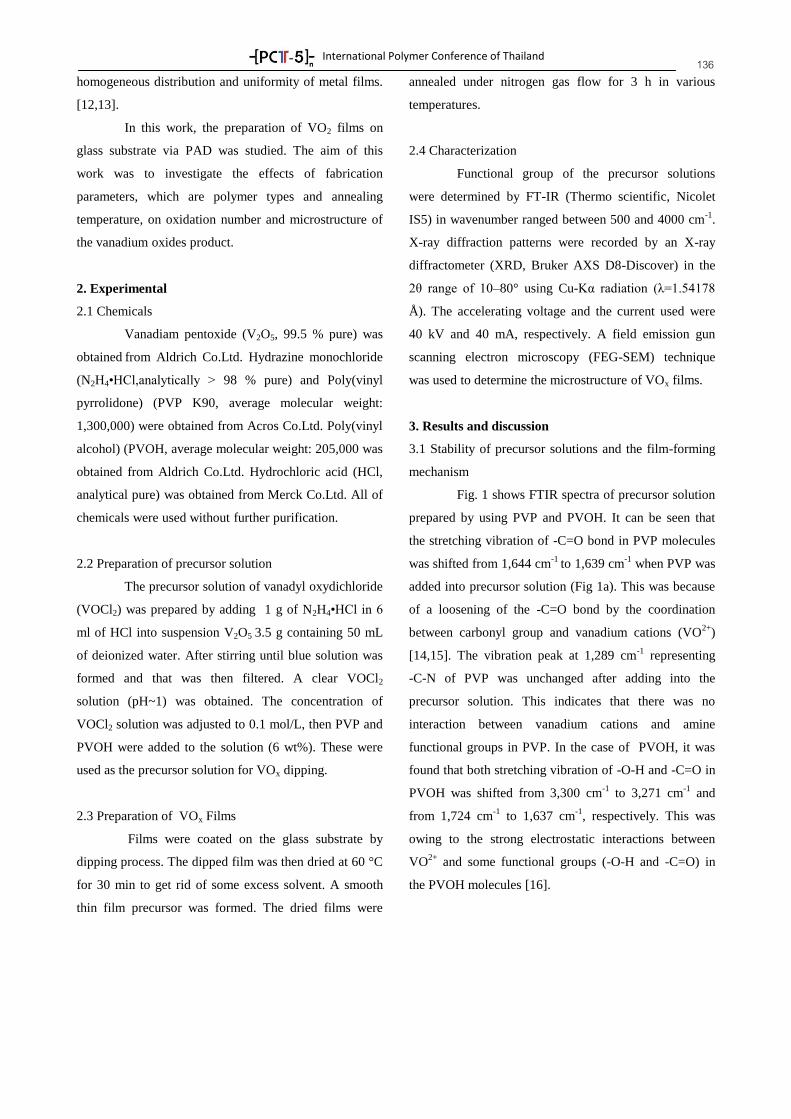
International Polymer Conference of Thailand
136 homogeneous distribution and uniformity of metal films.
[12,13].
In this work, the preparation of VO2 films on
glass substrate via PAD was studied. The aim of this
work was to investigate the effects of fabrication
parameters, which are polymer types and annealing
temperature, on oxidation number and microstructure of
the vanadium oxides product.
2. Experimental
2.1 Chemicals
Vanadiam pentoxide (V2O5, 99.5 % pure) was
obtained from Aldrich Co.Ltd. Hydrazine monochloride
(N2H4•HCl,analytically > 98 % pure) and Poly(vinyl
pyrrolidone) (PVP K90, average molecular weight:
1,300,000) were obtained from Acros Co.Ltd. Poly(vinyl
alcohol) (PVOH, average molecular weight: 205,000 was
obtained from Aldrich Co.Ltd. Hydrochloric acid (HCl,
analytical pure) was obtained from Merck Co.Ltd. All of
chemicals were used without further purification.
2.2 Preparation of precursor solution
The precursor solution of vanadyl oxydichloride
(VOCl2) was prepared by adding 1 g of N2H4•HCl in 6
ml of HCl into suspension V2O5 3.5 g containing 50 mL
of deionized water. After stirring until blue solution was
formed and that was then filtered. A clear VOCl2
solution (pH~1) was obtained. The concentration of
VOCl2 solution was adjusted to 0.1 mol/L, then PVP and
PVOH were added to the solution (6 wt%). These were
used as the precursor solution for VOx dipping.
2.3 Preparation of VOx Films
Films were coated on the glass substrate by
dipping process. The dipped film was then dried at 60 °C
for 30 min to get rid of some excess solvent. A smooth
thin film precursor was formed. The dried films were
annealed under nitrogen gas flow for 3 h in various
temperatures.
2.4 Characterization
Functional group of the precursor solutions
were determined by FT-IR (Thermo scientific, Nicolet
IS5) in wavenumber ranged between 500 and 4000 cm-1
.
X-ray diffraction patterns were recorded by an X-ray
diffractometer (XRD, Bruker AXS D8-Discover) in the
2θ range of 10–80° using Cu-Kα radiation (λ=1.54178
Å). The accelerating voltage and the current used were
40 kV and 40 mA, respectively. A field emission gun
scanning electron microscopy (FEG-SEM) technique
was used to determine the microstructure of VOx films.
3. Results and discussion
3.1 Stability of precursor solutions and the film-forming
mechanism
Fig. 1 shows FTIR spectra of precursor solution
prepared by using PVP and PVOH. It can be seen that
the stretching vibration of -C=O bond in PVP molecules
was shifted from 1,644 cm-1
to 1,639 cm-1
when PVP was
added into precursor solution (Fig 1a). This was because
of a loosening of the -C=O bond by the coordination
between carbonyl group and vanadium cations (VO2+
)
[14,15]. The vibration peak at 1,289 cm-1
representing
-C-N of PVP was unchanged after adding into the
precursor solution. This indicates that there was no
interaction between vanadium cations and amine
functional groups in PVP. In the case of PVOH, it was
found that both stretching vibration of -O-H and -C=O in
PVOH was shifted from 3,300 cm-1
to 3,271 cm-1
and
from 1,724 cm-1
to 1,637 cm-1
, respectively. This was
owing to the strong electrostatic interactions between
VO2+
and some functional groups (-O-H and -C=O) in
the PVOH molecules [16].
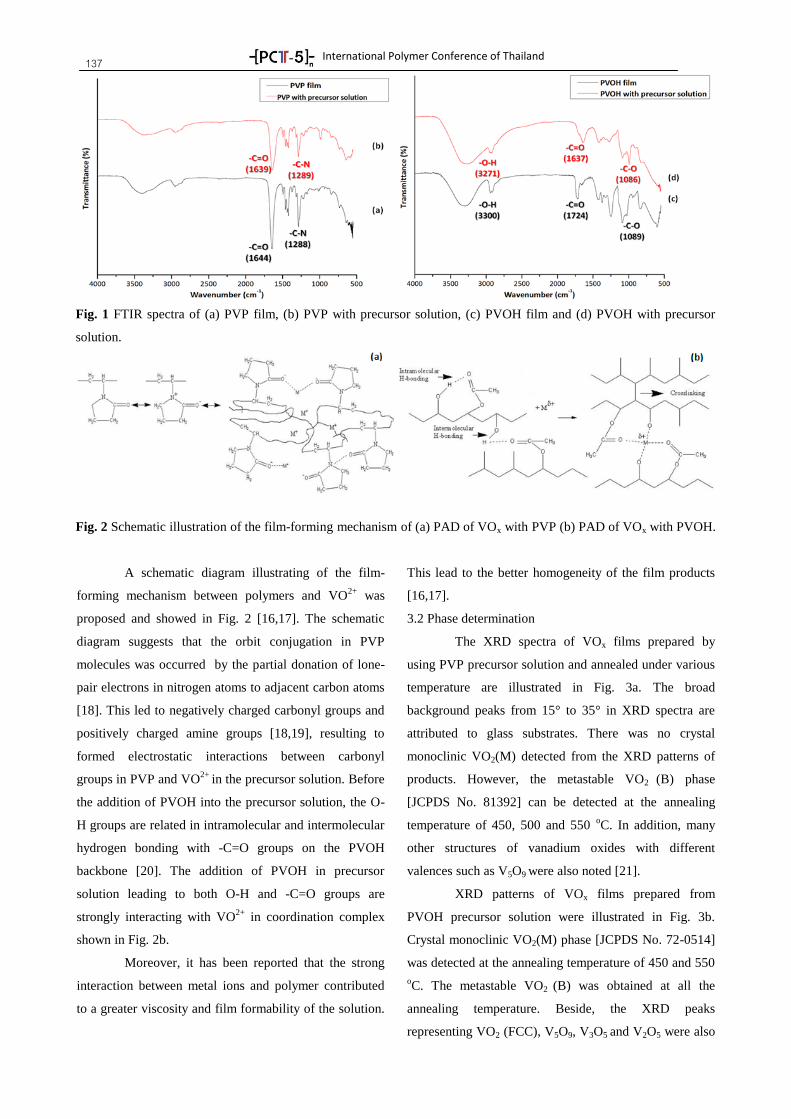
International Polymer Conference of Thailand
137
Fig. 1 FTIR spectra of (a) PVP film, (b) PVP with precursor solution, (c) PVOH film and (d) PVOH with precursor
solution.
Fig. 2 Schematic illustration of the film-forming mechanism of (a) PAD of VOx with PVP (b) PAD of VOx with PVOH.
A schematic diagram illustrating of the film-
forming mechanism between polymers and VO2+
was
proposed and showed in Fig. 2 [16,17]. The schematic
diagram suggests that the orbit conjugation in PVP
molecules was occurred by the partial donation of lone-
pair electrons in nitrogen atoms to adjacent carbon atoms
[18]. This led to negatively charged carbonyl groups and
positively charged amine groups [18,19], resulting to
formed electrostatic interactions between carbonyl
groups in PVP and VO2+
in the precursor solution. Before
the addition of PVOH into the precursor solution, the O-
H groups are related in intramolecular and intermolecular
hydrogen bonding with -C=O groups on the PVOH
backbone [20]. The addition of PVOH in precursor
solution leading to both O-H and -C=O groups are
strongly interacting with VO2+
in coordination complex
shown in Fig. 2b.
Moreover, it has been reported that the strong
interaction between metal ions and polymer contributed
to a greater viscosity and film formability of the solution.
This lead to the better homogeneity of the film products
[16,17].
3.2 Phase determination
The XRD spectra of VOx films prepared by
using PVP precursor solution and annealed under various
temperature are illustrated in Fig. 3a. The broad
background peaks from 15° to 35° in XRD spectra are
attributed to glass substrates. There was no crystal
monoclinic VO2(M) detected from the XRD patterns of
products. However, the metastable VO2 (B) phase
[JCPDS No. 81392] can be detected at the annealing
temperature of 450, 500 and 550 oC. In addition, many
other structures of vanadium oxides with different
valences such as V5O9 were also noted [21].
XRD patterns of VOx films prepared from
PVOH precursor solution were illustrated in Fig. 3b.
Crystal monoclinic VO2(M) phase [JCPDS No. 72-0514]
was detected at the annealing temperature of 450 and 550
oC. The metastable VO2 (B) was obtained at all the
annealing temperature. Beside, the XRD peaks
representing VO2 (FCC), V5O9, V3O5 and V2O5 were also
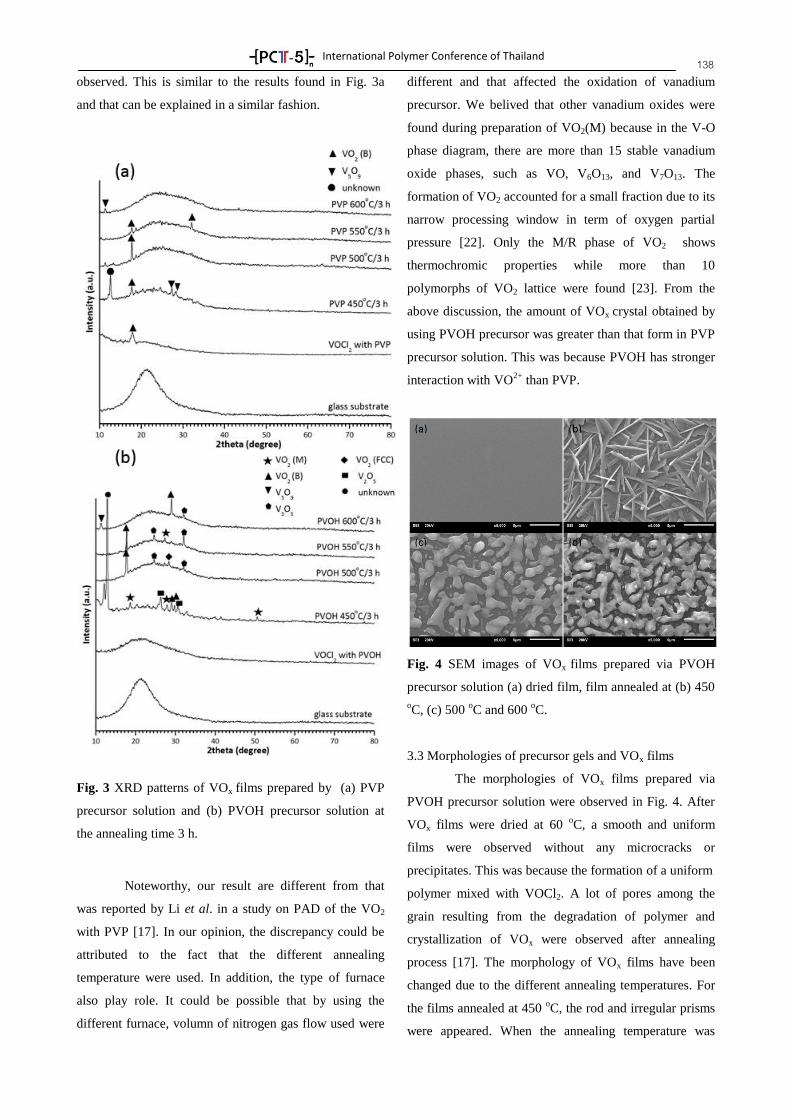
International Polymer Conference of Thailand
138 observed. This is similar to the results found in Fig. 3a
and that can be explained in a similar fashion.
Fig. 3 XRD patterns of VOx films prepared by (a) PVP
precursor solution and (b) PVOH precursor solution at
the annealing time 3 h.
Noteworthy, our result are different from that
was reported by Li et al. in a study on PAD of the VO2
with PVP [17]. In our opinion, the discrepancy could be
attributed to the fact that the different annealing
temperature were used. In addition, the type of furnace
also play role. It could be possible that by using the
different furnace, volumn of nitrogen gas flow used were
different and that affected the oxidation of vanadium
precursor. We belived that other vanadium oxides were
found during preparation of VO2(M) because in the V-O
phase diagram, there are more than 15 stable vanadium
oxide phases, such as VO, V6O13, and V7O13. The
formation of VO2 accounted for a small fraction due to its
narrow processing window in term of oxygen partial
pressure [22]. Only the M/R phase of VO2 shows
thermochromic properties while more than 10
polymorphs of VO2 lattice were found [23]. From the
above discussion, the amount of VOx crystal obtained by
using PVOH precursor was greater than that form in PVP
precursor solution. This was because PVOH has stronger
interaction with VO2+
than PVP.
Fig. 4 SEM images of VOx films prepared via PVOH
precursor solution (a) dried film, film annealed at (b) 450
oC, (c) 500
oC and 600
oC.
3.3 Morphologies of precursor gels and VOx films
The morphologies of VOx films prepared via
PVOH precursor solution were observed in Fig. 4. After
VOx films were dried at 60 oC, a smooth and uniform
films were observed without any microcracks or
precipitates. This was because the formation of a uniform
polymer mixed with VOCl2. A lot of pores among the
grain resulting from the degradation of polymer and
crystallization of VOx were observed after annealing
process [17]. The morphology of VOx films have been
changed due to the different annealing temperatures. For
the films annealed at 450 oC, the rod and irregular prisms
were appeared. When the annealing temperature was
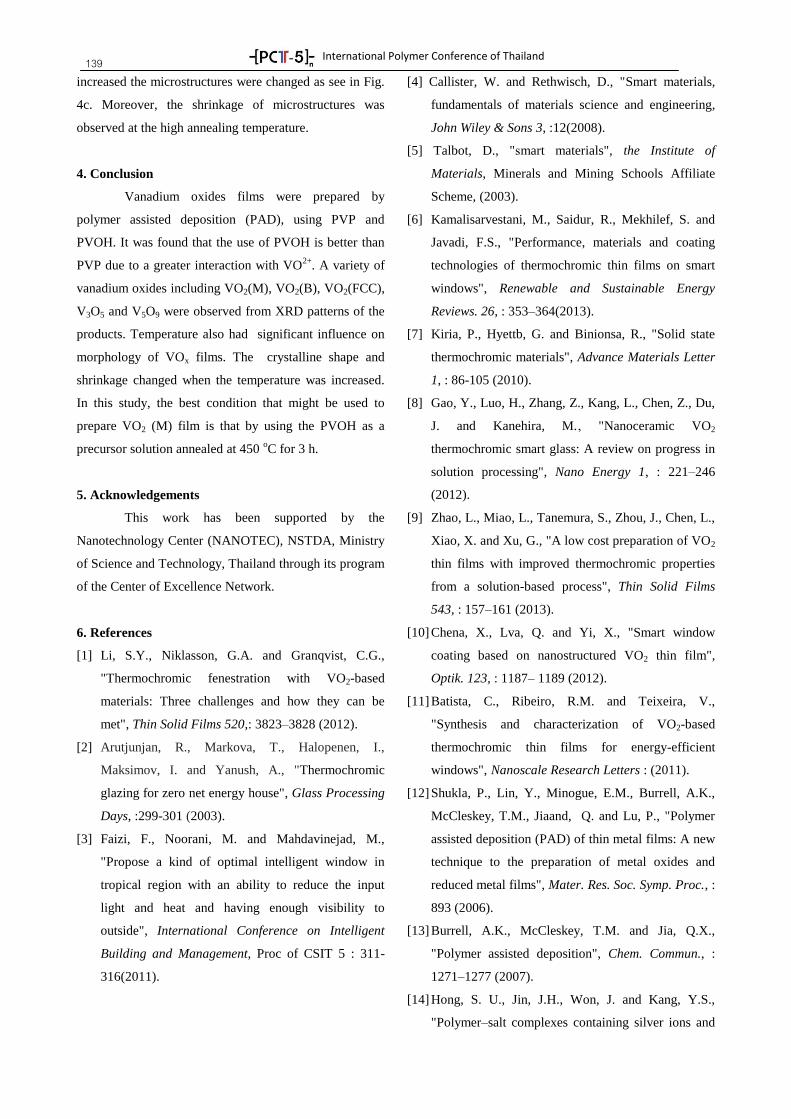
International Polymer Conference of Thailand
139 increased the microstructures were changed as see in Fig.
4c. Moreover, the shrinkage of microstructures was
observed at the high annealing temperature.
4. Conclusion
Vanadium oxides films were prepared by
polymer assisted deposition (PAD), using PVP and
PVOH. It was found that the use of PVOH is better than
PVP due to a greater interaction with VO2+
. A variety of
vanadium oxides including VO2(M), VO2(B), VO2(FCC),
V3O5 and V5O9 were observed from XRD patterns of the
products. Temperature also had significant influence on
morphology of VOx films. The crystalline shape and
shrinkage changed when the temperature was increased.
In this study, the best condition that might be used to
prepare VO2 (M) film is that by using the PVOH as a
precursor solution annealed at 450 oC for 3 h.
5. Acknowledgements
This work has been supported by the
Nanotechnology Center (NANOTEC), NSTDA, Ministry
of Science and Technology, Thailand through its program
of the Center of Excellence Network.
6. References
[1] Li, S.Y., Niklasson, G.A. and Granqvist, C.G.,
"Thermochromic fenestration with VO2-based
materials: Three challenges and how they can be
met", Thin Solid Films 520,: 3823–3828 (2012).
[2] Arutjunjan, R., Markova, T., Halopenen, I.,
Maksimov, I. and Yanush, A., "Thermochromic
glazing for zero net energy house", Glass Processing
Days, :299-301 (2003).
[3] Faizi, F., Noorani, M. and Mahdavinejad, M.,
"Propose a kind of optimal intelligent window in
tropical region with an ability to reduce the input
light and heat and having enough visibility to
outside", International Conference on Intelligent
Building and Management, Proc of CSIT 5 : 311-
316(2011).
[4] Callister, W. and Rethwisch, D., "Smart materials,
fundamentals of materials science and engineering,
John Wiley & Sons 3, :12(2008).
[5] Talbot, D., "smart materials", the Institute of
Materials, Minerals and Mining Schools Affiliate
Scheme, (2003).
[6] Kamalisarvestani, M., Saidur, R., Mekhilef, S. and
Javadi, F.S., "Performance, materials and coating
technologies of thermochromic thin films on smart
windows", Renewable and Sustainable Energy
Reviews. 26, : 353–364(2013).
[7] Kiria, P., Hyettb, G. and Binionsa, R., "Solid state
thermochromic materials", Advance Materials Letter
1, : 86-105 (2010).
[8] Gao, Y., Luo, H., Zhang, Z., Kang, L., Chen, Z., Du,
J. and Kanehira, M. , "Nanoceramic VO2
thermochromic smart glass: A review on progress in
solution processing", Nano Energy 1, : 221–246
(2012).
[9] Zhao, L., Miao, L., Tanemura, S., Zhou, J., Chen, L.,
Xiao, X. and Xu, G., "A low cost preparation of VO2
thin films with improved thermochromic properties
from a solution-based process", Thin Solid Films
543, : 157–161 (2013).
[10] Chena, X., Lva, Q. and Yi, X., "Smart window
coating based on nanostructured VO2 thin film",
Optik. 123, : 1187– 1189 (2012).
[11] Batista, C., Ribeiro, R.M. and Teixeira, V.,
"Synthesis and characterization of VO2-based
thermochromic thin films for energy-efficient
windows", Nanoscale Research Letters : (2011).
[12] Shukla, P., Lin, Y., Minogue, E.M., Burrell, A.K.,
McCleskey, T.M., Jiaand, Q. and Lu, P., "Polymer
assisted deposition (PAD) of thin metal films: A new
technique to the preparation of metal oxides and
reduced metal films", Mater. Res. Soc. Symp. Proc., :
893 (2006).
[13] Burrell, A.K., McCleskey, T.M. and Jia, Q.X.,
"Polymer assisted deposition", Chem. Commun., :
1271–1277 (2007).
[14] Hong, S. U., Jin, J.H., Won, J. and Kang, Y.S.,
"Polymer–salt complexes containing silver ions and
International Polymer Conference of Thailand
140 their application to facilitated olefin transport
membranes", Adv. Mater. 12, :968-971 (2000).
[15] Kima, J. H., Kimb, C. K., Wonc, J. and Kanga, Y.
S., "Role of anions for the reduction behavior of
silver ions in polymer/silver salt complex
membranes", Journal of Membrane Science 250, :
207–214 (2005).
[16] Roy, S., "Nanostructured PZT synthesized from
metal–polyvinyl alcohol gel: studies on metal–
polymer interaction", Journal of Applied Polymer
Science V 110 : 2693–2697(2008).
[17] Kang,L., Gao, Y. and Luo, H., "A novel solution
process for the synthesis of VO2 thin films with
excellent thermochromic properties", Applied
material and surface. 1, 2211–2218 (2009).
[18] Ningyi, Y., Jinhua, L. and Chenglu, L., "valence
reduction process from sol-gel V2O5 to VO2 thin
films". Applied surface science 191, :176-180
(2002).
[19] Zheng, C., Zheng, J., Luo., G., Ye, J. and Wu, M.,
"Preparation of vanadium dioxide powders by
thermolysis of a precursor at low temperature",
Journal of materials science 35, : 3425-3429 (2000).
[20] Bhajantri, R.F., Ravindrachary , V., Harisha, A.,
Crasta, V., Suresh, P.N. and Poojary, B.,
"Microstructural studies on BaCl2 doped poly(vinyl
alcohol)", Polymer 47 : 3591–3598 (2006).
[21] Lopeza, R., Boatner, L. A. and Haynes, T. E.,
"synthesis and characterization of size-controlled
vanadium dioxide nanocrystals in a fused silica
matrix", Journal of Applied Physics. 92, : 4031-4036
(2002).
[22] Nag, J. and Haglund Jr, R.F. "Synthesis of vanadium
dioxide thin films and nanoparticles", journal of
physics condensed matter: (2008).
[23] Cao, C, Gao,Y. and Luo, H., "Pure single-crystal
rutile vanadium dioxide powders: synthesis,
mechanism and phase-transformation property", J.
Phys. Chem. 112, : 18810–18814 (2008).
International Polymer Conference of Thailand
141
COMPP-25
Mechanical Properties and Thermal Resistance of Poly (Butylene Succinate) Reinforced
with Halloysite Nanotubes
Chanakarn Chucheapchuenkamol1 and Kalyanee Sirisinha
1,*
1Department of Chemistry, Faculty of Science, Mahidol University,
Phutthamonthon 4 Road, Salaya, Nakhon Pathom 73170.
Abstract
Poly (butylene succinate) (PBS)/halloysite nanotubes (HNTs) composites were fabricated via melt-
compounding in a twin-screw extruder. The effects of silanization of HNTs and stabilizer addition on the
mechanical and thermal properties of PBS were investigated using tensile and impact testings, heat distortion
temperature testing, differential scanning calorimetry, and thermogravimetric analysis. The results showed that
the reinforcement of PBS with HNTs increased both stiffness and toughness of PBS, without loss of tensile
strength. HNTs could serve as a nucleating agent for the PBS. The combined use of HNTs and mixed stabilizers
could enhance the thermal resistance of PBS significantly. The heat distortion temperature increased more than
10 C in the stabilized composite, compared to the neat PBS.
Keywords: Poly (butylene succinate), Composites, Halloysite nanotube, Properties
1. Introduction
In light of depleting landfill space and increasing
demand for disposal packaging usage, there is a need for
polymers that are biodegradable. Poly (butylene
succinate) or PBS is an aliphatic polyester which can be
degraded by hydrolysis pathway. Its properties are
similar to those of polyethylene. As with many
thermoplastics, PBS has a decreasing mechanical
strength with increasing temperature. Therefore, it would
be desirable to have biodegradable PBS-based products
which have greater resistance to deformation at higher
temperatures. This would be useful during storage and
transportation in summer time periods, and when
contacting with hot drink and hot food.
Halloysite nanotubes or HNTs are naturally
occurring inorganic nanotubes. They belong to kaolin
group of clay minerals and chemical formulation is
Al2(OH)4Si2O5.2H2O [1]. HNTs have high tensile
strength and modulus. They have been considered as
excellent reinforcing material for plastics. HNTs also
have lower density than other fillers such as talc and
calcite, making them convenient for preparing light-
weight polymer composites. Compared to carbon
nanotubes, the price of HNTs is much lower. Erdogan et
al. reported that the incorporation of 5% HNTs improved
the mechanical properties of polyamide-6 significantly
[2]. There is also a report on the effect of HNTs on
polypropylene where HNTs showed the direct stabilizing
effect on PP during thermal degradation [3,4].
This work aims to improve the mechanical
properties and thermal stability of PBS by using HNTs as
reinforcing filler. PBS/HNTs nanocomposites were
prepared via melt-compounding. The effects of HNTs
with and without surface modification on the properties
of the composites were compared. Also, the properties
changes as influenced by stabilizer addition were
included in this work. The composite properties were
characterized using universal tensile testing, impact
testing, thermogravimetric analysis, heat distortion
temperature testing, and differential scanning
calorimetry.
2. Experimental
2.1 Materials
Poly (butylene succinate), GS Pla FZ91PD, was
the product of Mitsubishi Chemical Corporation.
Halloysite nanotubes, DRAGONITE-XRTM
, were from
Applied Minerals Inc. Vinyl trimethoxysilane (VTMS)
was from Sigma-Aldrich. Two stabilizers used were
Irganox 1010 (Merit Solution Co., Ltd.) and Irgafos 168
(Ciba Specialty Chemicals.)
2.2 Surface modification of HNTs
HNTs were surface-treated with VTMS. The ratio
of VTMS to HNTs was 1:10. The silanization of HNTs
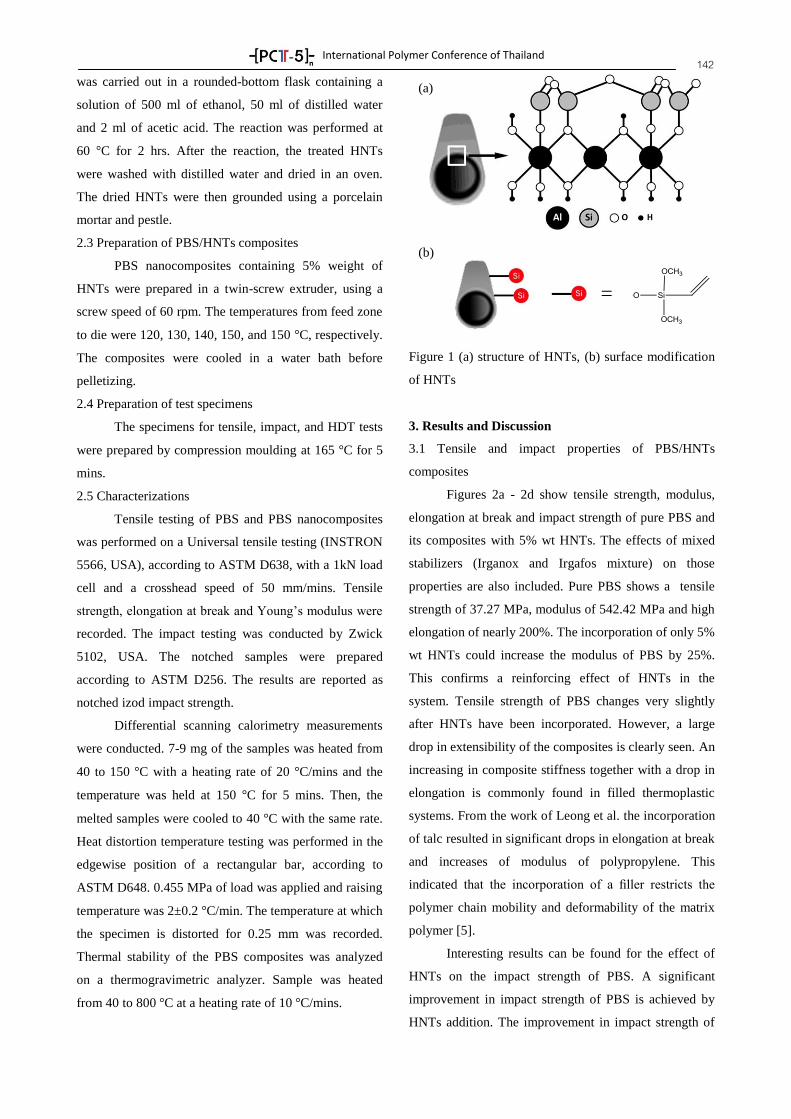
International Polymer Conference of Thailand
142 was carried out in a rounded-bottom flask containing a
solution of 500 ml of ethanol, 50 ml of distilled water
and 2 ml of acetic acid. The reaction was performed at
60 C for 2 hrs. After the reaction, the treated HNTs
were washed with distilled water and dried in an oven.
The dried HNTs were then grounded using a porcelain
mortar and pestle.
2.3 Preparation of PBS/HNTs composites
PBS nanocomposites containing 5% weight of
HNTs were prepared in a twin-screw extruder, using a
screw speed of 60 rpm. The temperatures from feed zone
to die were 120, 130, 140, 150, and 150 C, respectively.
The composites were cooled in a water bath before
pelletizing.
2.4 Preparation of test specimens
The specimens for tensile, impact, and HDT tests
were prepared by compression moulding at 165 C for 5
mins.
2.5 Characterizations
Tensile testing of PBS and PBS nanocomposites
was performed on a Universal tensile testing (INSTRON
5566, USA), according to ASTM D638, with a 1kN load
cell and a crosshead speed of 50 mm/mins. Tensile
strength, elongation at break and Young’s modulus were
recorded. The impact testing was conducted by Zwick
5102, USA. The notched samples were prepared
according to ASTM D256. The results are reported as
notched izod impact strength.
Differential scanning calorimetry measurements
were conducted. 7-9 mg of the samples was heated from
40 to 150 C with a heating rate of 20 C/mins and the
temperature was held at 150 C for 5 mins. Then, the
melted samples were cooled to 40 C with the same rate.
Heat distortion temperature testing was performed in the
edgewise position of a rectangular bar, according to
ASTM D648. 0.455 MPa of load was applied and raising
temperature was 2±0.2 C/min. The temperature at which
the specimen is distorted for 0.25 mm was recorded.
Thermal stability of the PBS composites was analyzed
on a thermogravimetric analyzer. Sample was heated
from 40 to 800 C at a heating rate of 10 C/mins.
Figure 1 (a) structure of HNTs, (b) surface modification
of HNTs
3. Results and Discussion
3.1 Tensile and impact properties of PBS/HNTs
composites
Figures 2a - 2d show tensile strength, modulus,
elongation at break and impact strength of pure PBS and
its composites with 5% wt HNTs. The effects of mixed
stabilizers (Irganox and Irgafos mixture) on those
properties are also included. Pure PBS shows a tensile
strength of 37.27 MPa, modulus of 542.42 MPa and high
elongation of nearly 200%. The incorporation of only 5%
wt HNTs could increase the modulus of PBS by 25%.
This confirms a reinforcing effect of HNTs in the
system. Tensile strength of PBS changes very slightly
after HNTs have been incorporated. However, a large
drop in extensibility of the composites is clearly seen. An
increasing in composite stiffness together with a drop in
elongation is commonly found in filled thermoplastic
systems. From the work of Leong et al. the incorporation
of talc resulted in significant drops in elongation at break
and increases of modulus of polypropylene. This
indicated that the incorporation of a filler restricts the
polymer chain mobility and deformability of the matrix
polymer [5].
Interesting results can be found for the effect of
HNTs on the impact strength of PBS. A significant
improvement in impact strength of PBS is achieved by
HNTs addition. The improvement in impact strength of
(b)
=
(a)
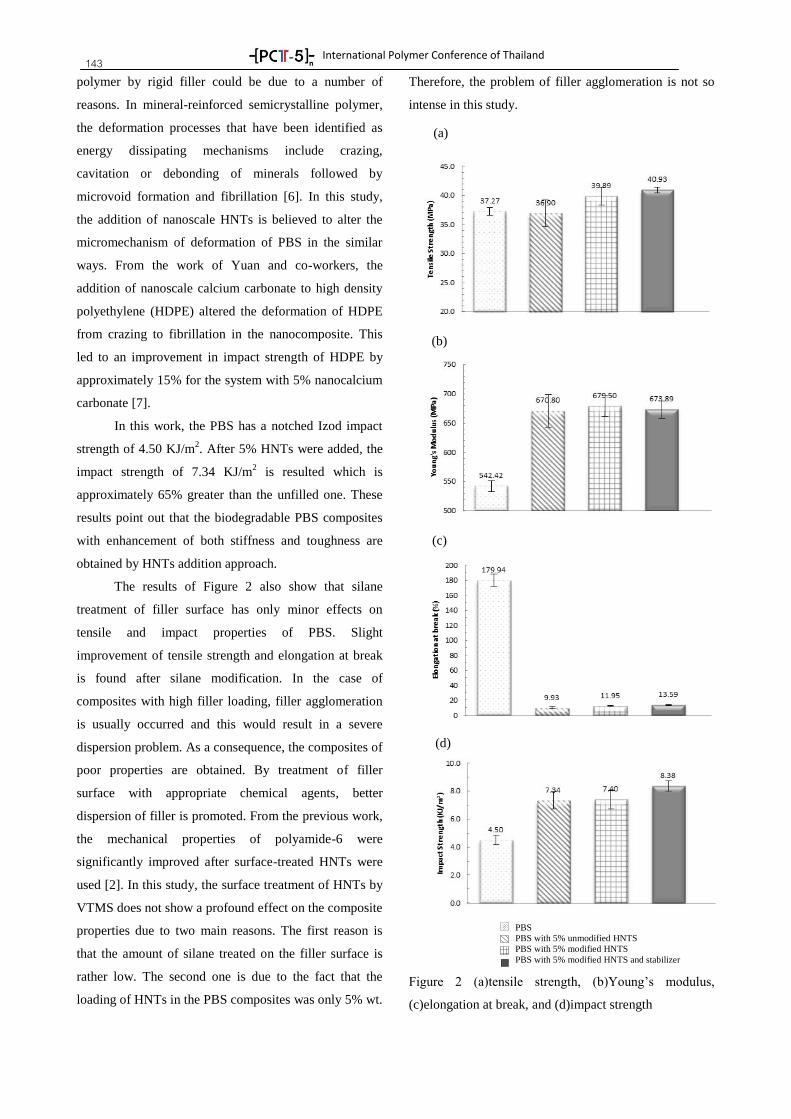
International Polymer Conference of Thailand
143 polymer by rigid filler could be due to a number of
reasons. In mineral-reinforced semicrystalline polymer,
the deformation processes that have been identified as
energy dissipating mechanisms include crazing,
cavitation or debonding of minerals followed by
microvoid formation and fibrillation [6]. In this study,
the addition of nanoscale HNTs is believed to alter the
micromechanism of deformation of PBS in the similar
ways. From the work of Yuan and co-workers, the
addition of nanoscale calcium carbonate to high density
polyethylene (HDPE) altered the deformation of HDPE
from crazing to fibrillation in the nanocomposite. This
led to an improvement in impact strength of HDPE by
approximately 15% for the system with 5% nanocalcium
carbonate [7].
In this work, the PBS has a notched Izod impact
strength of 4.50 KJ/m2. After 5% HNTs were added, the
impact strength of 7.34 KJ/m2 is resulted which is
approximately 65% greater than the unfilled one. These
results point out that the biodegradable PBS composites
with enhancement of both stiffness and toughness are
obtained by HNTs addition approach.
The results of Figure 2 also show that silane
treatment of filler surface has only minor effects on
tensile and impact properties of PBS. Slight
improvement of tensile strength and elongation at break
is found after silane modification. In the case of
composites with high filler loading, filler agglomeration
is usually occurred and this would result in a severe
dispersion problem. As a consequence, the composites of
poor properties are obtained. By treatment of filler
surface with appropriate chemical agents, better
dispersion of filler is promoted. From the previous work,
the mechanical properties of polyamide-6 were
significantly improved after surface-treated HNTs were
used [2]. In this study, the surface treatment of HNTs by
VTMS does not show a profound effect on the composite
properties due to two main reasons. The first reason is
that the amount of silane treated on the filler surface is
rather low. The second one is due to the fact that the
loading of HNTs in the PBS composites was only 5% wt.
Therefore, the problem of filler agglomeration is not so
intense in this study.
Figure 2 (a)tensile strength, (b)Young’s modulus,
(c)elongation at break, and (d)impact strength
(a)
PBS
PBS with 5% unmodified HNTS
PBS with 5% modified HNTS
PBS with 5% modified HNTS and stabilizer
(b)
(c)
(d)
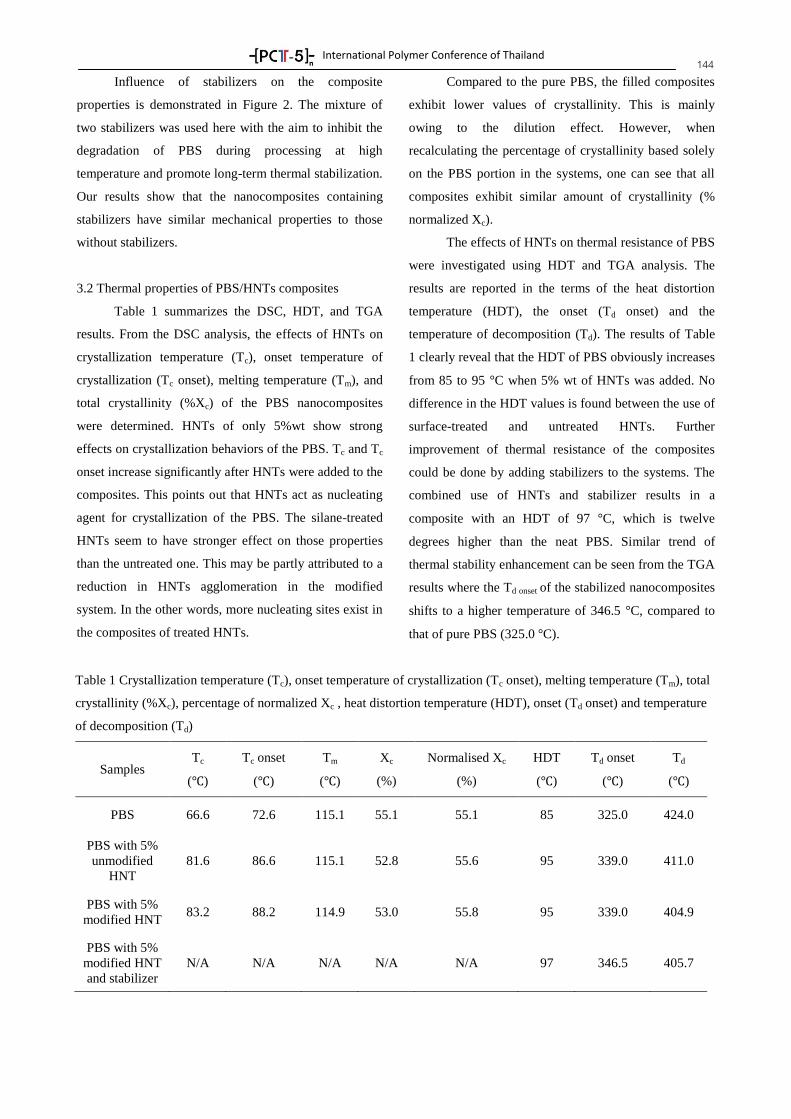
International Polymer Conference of Thailand
144 Influence of stabilizers on the composite
properties is demonstrated in Figure 2. The mixture of
two stabilizers was used here with the aim to inhibit the
degradation of PBS during processing at high
temperature and promote long-term thermal stabilization.
Our results show that the nanocomposites containing
stabilizers have similar mechanical properties to those
without stabilizers.
3.2 Thermal properties of PBS/HNTs composites
Table 1 summarizes the DSC, HDT, and TGA
results. From the DSC analysis, the effects of HNTs on
crystallization temperature (Tc), onset temperature of
crystallization (Tc onset), melting temperature (Tm), and
total crystallinity (%Xc) of the PBS nanocomposites
were determined. HNTs of only 5%wt show strong
effects on crystallization behaviors of the PBS. Tc and Tc
onset increase significantly after HNTs were added to the
composites. This points out that HNTs act as nucleating
agent for crystallization of the PBS. The silane-treated
HNTs seem to have stronger effect on those properties
than the untreated one. This may be partly attributed to a
reduction in HNTs agglomeration in the modified
system. In the other words, more nucleating sites exist in
the composites of treated HNTs.
Compared to the pure PBS, the filled composites
exhibit lower values of crystallinity. This is mainly
owing to the dilution effect. However, when
recalculating the percentage of crystallinity based solely
on the PBS portion in the systems, one can see that all
composites exhibit similar amount of crystallinity (%
normalized Xc).
The effects of HNTs on thermal resistance of PBS
were investigated using HDT and TGA analysis. The
results are reported in the terms of the heat distortion
temperature (HDT), the onset (Td onset) and the
temperature of decomposition (Td). The results of Table
1 clearly reveal that the HDT of PBS obviously increases
from 85 to 95 C when 5% wt of HNTs was added. No
difference in the HDT values is found between the use of
surface-treated and untreated HNTs. Further
improvement of thermal resistance of the composites
could be done by adding stabilizers to the systems. The
combined use of HNTs and stabilizer results in a
composite with an HDT of 97 C, which is twelve
degrees higher than the neat PBS. Similar trend of
thermal stability enhancement can be seen from the TGA
results where the Td onset of the stabilized nanocomposites
shifts to a higher temperature of 346.5 C, compared to
that of pure PBS (325.0 C).
Table 1 Crystallization temperature (Tc), onset temperature of crystallization (Tc onset), melting temperature (Tm), total
crystallinity (%Xc), percentage of normalized Xc , heat distortion temperature (HDT), onset (Td onset) and temperature
of decomposition (Td)
Samples Tc
( )
Tc onset
( )
Tm
( )
Xc
(%)
Normalised Xc
(%)
HDT
( )
Td onset
( )
Td
( )
PBS 66.6 72.6 115.1 55.1 55.1 85 325.0 424.0
PBS with 5%
unmodified
HNT
81.6 86.6 115.1 52.8 55.6 95 339.0 411.0
PBS with 5%
modified HNT 83.2 88.2 114.9 53.0 55.8 95 339.0 404.9
PBS with 5%
modified HNT
and stabilizer
N/A N/A N/A N/A N/A 97 346.5 405.7
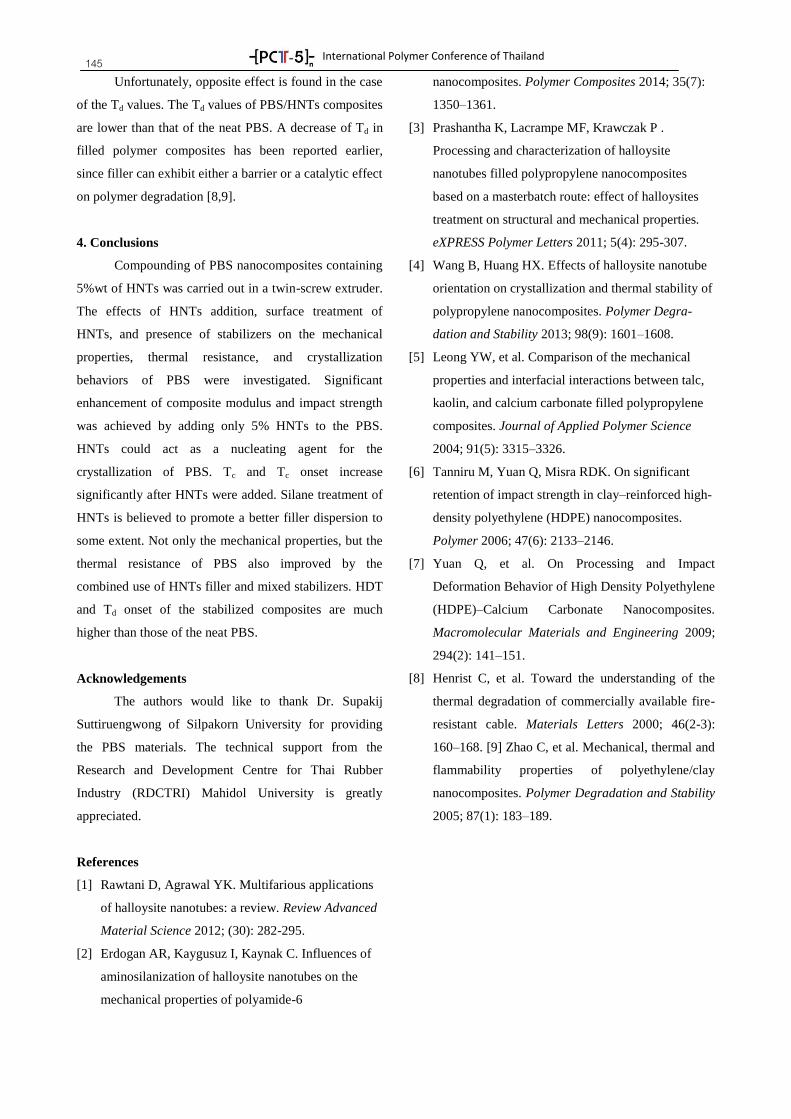
International Polymer Conference of Thailand
145 Unfortunately, opposite effect is found in the case
of the Td values. The Td values of PBS/HNTs composites
are lower than that of the neat PBS. A decrease of Td in
filled polymer composites has been reported earlier,
since filler can exhibit either a barrier or a catalytic effect
on polymer degradation [8,9].
4. Conclusions
Compounding of PBS nanocomposites containing
5%wt of HNTs was carried out in a twin-screw extruder.
The effects of HNTs addition, surface treatment of
HNTs, and presence of stabilizers on the mechanical
properties, thermal resistance, and crystallization
behaviors of PBS were investigated. Significant
enhancement of composite modulus and impact strength
was achieved by adding only 5% HNTs to the PBS.
HNTs could act as a nucleating agent for the
crystallization of PBS. Tc and Tc onset increase
significantly after HNTs were added. Silane treatment of
HNTs is believed to promote a better filler dispersion to
some extent. Not only the mechanical properties, but the
thermal resistance of PBS also improved by the
combined use of HNTs filler and mixed stabilizers. HDT
and Td onset of the stabilized composites are much
higher than those of the neat PBS.
Acknowledgements
The authors would like to thank Dr. Supakij
Suttiruengwong of Silpakorn University for providing
the PBS materials. The technical support from the
Research and Development Centre for Thai Rubber
Industry (RDCTRI) Mahidol University is greatly
appreciated.
References
[1] Rawtani D, Agrawal YK. Multifarious applications
of halloysite nanotubes: a review. Review Advanced
Material Science 2012; (30): 282-295.
[2] Erdogan AR, Kaygusuz I, Kaynak C. Influences of
aminosilanization of halloysite nanotubes on the
mechanical properties of polyamide-6
nanocomposites. Polymer Composites 2014; 35(7):
1350–1361.
[3] Prashantha K, Lacrampe MF, Krawczak P .
Processing and characterization of halloysite
nanotubes filled polypropylene nanocomposites
based on a masterbatch route: effect of halloysites
treatment on structural and mechanical properties.
eXPRESS Polymer Letters 2011; 5(4): 295-307.
[4] Wang B, Huang HX. Effects of halloysite nanotube
orientation on crystallization and thermal stability of
polypropylene nanocomposites. Polymer Degra-
dation and Stability 2013; 98(9): 1601–1608.
[5] Leong YW, et al. Comparison of the mechanical
properties and interfacial interactions between talc,
kaolin, and calcium carbonate filled polypropylene
composites. Journal of Applied Polymer Science
2004; 91(5): 3315–3326.
[6] Tanniru M, Yuan Q, Misra RDK. On significant
retention of impact strength in clay–reinforced high-
density polyethylene (HDPE) nanocomposites.
Polymer 2006; 47(6): 2133–2146.
[7] Yuan Q, et al. On Processing and Impact
Deformation Behavior of High Density Polyethylene
(HDPE)–Calcium Carbonate Nanocomposites.
Macromolecular Materials and Engineering 2009;
294(2): 141–151.
[8] Henrist C, et al. Toward the understanding of the
thermal degradation of commercially available fire-
resistant cable. Materials Letters 2000; 46(2-3):
160–168. [9] Zhao C, et al. Mechanical, thermal and
flammability properties of polyethylene/clay
nanocomposites. Polymer Degradation and Stability
2005; 87(1): 183–189.
SESSION 4Advances in Polymer Processing
Advances in Polymer Processing
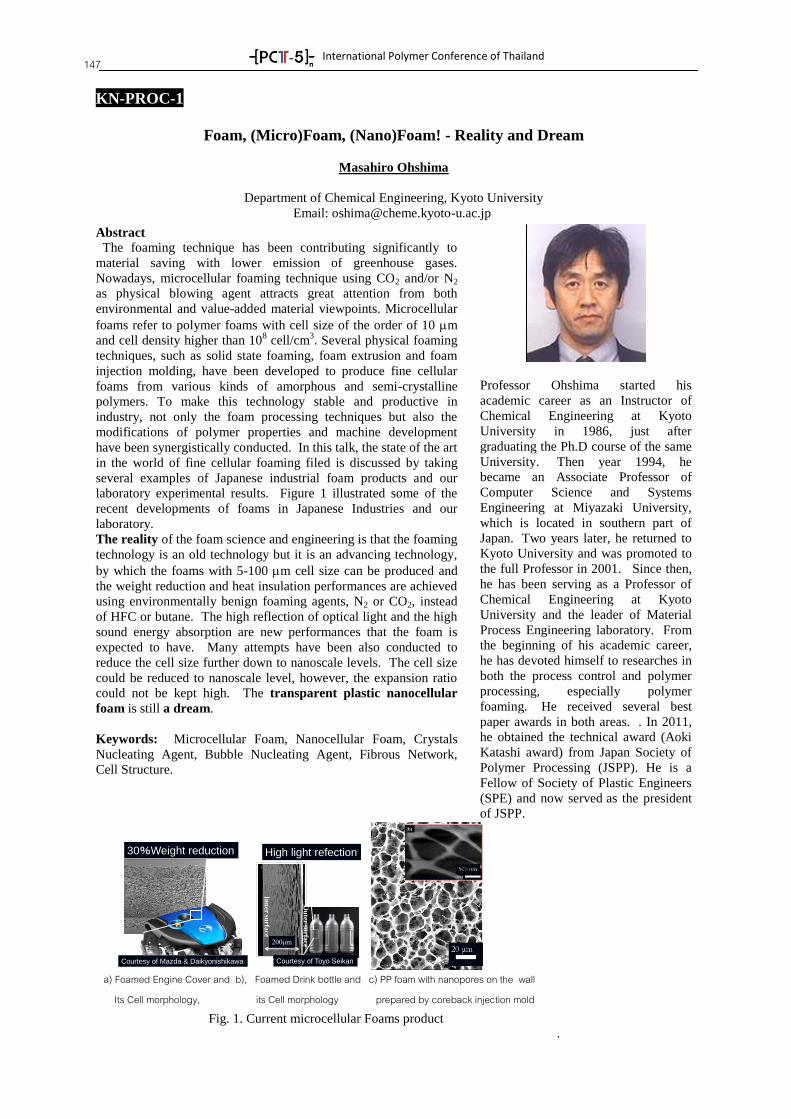
International Polymer Conference of Thailand
147
KN-PROC-1
Foam, (Micro)Foam, (Nano)Foam! - Reality and Dream
Masahiro Ohshima
Department of Chemical Engineering, Kyoto University
Email: [email protected]
Abstract
The foaming technique has been contributing significantly to
material saving with lower emission of greenhouse gases.
Nowadays, microcellular foaming technique using CO2 and/or N2
as physical blowing agent attracts great attention from both
environmental and value-added material viewpoints. Microcellular
foams refer to polymer foams with cell size of the order of 10 m
and cell density higher than 108 cell/cm
3. Several physical foaming
techniques, such as solid state foaming, foam extrusion and foam
injection molding, have been developed to produce fine cellular
foams from various kinds of amorphous and semi-crystalline
polymers. To make this technology stable and productive in
industry, not only the foam processing techniques but also the
modifications of polymer properties and machine development
have been synergistically conducted. In this talk, the state of the art
in the world of fine cellular foaming filed is discussed by taking
several examples of Japanese industrial foam products and our
laboratory experimental results. Figure 1 illustrated some of the
recent developments of foams in Japanese Industries and our
laboratory.
The reality of the foam science and engineering is that the foaming
technology is an old technology but it is an advancing technology,
by which the foams with 5-100 m cell size can be produced and
the weight reduction and heat insulation performances are achieved
using environmentally benign foaming agents, N2 or CO2, instead
of HFC or butane. The high reflection of optical light and the high
sound energy absorption are new performances that the foam is
expected to have. Many attempts have been also conducted to
reduce the cell size further down to nanoscale levels. The cell size
could be reduced to nanoscale level, however, the expansion ratio
could not be kept high. The transparent plastic nanocellular
foam is still a dream.
Keywords: Microcellular Foam, Nanocellular Foam, Crystals
Nucleating Agent, Bubble Nucleating Agent, Fibrous Network,
Cell Structure.
Professor Ohshima started his
academic career as an Instructor of
Chemical Engineering at Kyoto
University in 1986, just after
graduating the Ph.D course of the same
University. Then year 1994, he
became an Associate Professor of
Computer Science and Systems
Engineering at Miyazaki University,
which is located in southern part of
Japan. Two years later, he returned to
Kyoto University and was promoted to
the full Professor in 2001. Since then,
he has been serving as a Professor of
Chemical Engineering at Kyoto
University and the leader of Material
Process Engineering laboratory. From
the beginning of his academic career,
he has devoted himself to researches in
both the process control and polymer
processing, especially polymer
foaming. He received several best
paper awards in both areas. . In 2011,
he obtained the technical award (Aoki
Katashi award) from Japan Society of
Polymer Processing (JSPP). He is a
Fellow of Society of Plastic Engineers
(SPE) and now served as the president
of JSPP.
.
a) Foamed Engine Cover and b), Foamed Drink bottle and c) PP foam with nanopores on the wall Its Cell morphology, its Cell morphology prepared by coreback injection mold
Fig. 1. Current microcellular Foams product
30%Weight reduction
Courtesy of Mazda & Daikyonishikawa
200μm
Ou
ter surfa
ce
Inn
er surfa
ce
Courtesy of Toyo Seikan
High light refection
International Polymer Conference of Thailand
148
KN-PROC-2
Fiber design: A creation of fiber structure for feature and performance
Chureerat Prahsarn
National Metal and Materials Technology Center,
National Science and Technology Development Agency, Pathumthani, 12120
Phone +66 2564 6500, Fax +66 2546 6446, Email: [email protected]
Abstract
Functional fibers are recognized for their performances
suitable for the desired applications. Their features and
performances are achieved via structural design and fabrication.
In this talk, examples of structural design concept in natural and
man-made fibers will be given. Some of our research work on
fibers’ structural design and their resulting properties, such as
soft-to-touch fabrics, self-crimped fibers, and nonwoven of
microfibers, will also be discussed, based on selection of
polymers, additives, and fiber processing techniques.
Keywords: functional fibers, bicomponent fibers, shaped
fibers, nonwovens
Chureerat Prahsarn
Researcher (Polymer, Textiles)
National Metal and Materials Technology Center
(MTEC)
National Science and Technology Development
Agency
Ministry of Science, Technology and Environment,
Thailand.
Education
2001 Ph.D. in Fiber and polymer science,
College of Textiles, North Carolina State
University, USA. 1995 M.S. in Macromolecular science,
Case Western Reserve University, USA. 1992 B.Sc. (Chemistry), Faculty of
Science, Khon Kaen University, Thailand
Research and Professional Experience
2002-Present Researcher at National
Metal and Materials Center (Thailand)
Nov.-Dec. 2009 Guest researcher at The
National Institute of Advanced Industrial
Science and Technology, AIST (Japan)
2005-2007 Guest researcher at
Mitsui Chemicals, Inc. (Japan)
1998-2001 Research Assistant (College
of Textiles, North Carolina State
University)
Specialize: Fiber processing, Bicomponent
fibers, Textiles (moisture transport in
fabrics), Nonwovens
Interest: Functional fibers and nonwovens,
Structural and property design in fibers,
Nonwovens for technical textiles, Comfort-
related moisture transport in fabrics
International Polymer Conference of Thailand
149
PROCO-01
Application of Genetic Algorithm in Identifying Ethylene/1-Olefin Copolymerization
Conditions from Molecular Weight Distribution and Chemical Composition
Distribution
Uthane Nanthapoolsub and Siripon Anantawaraskul*
Department of Chemical Engineering, Kasetsart University, 50 Phaholyothin Rd, Jatujak, Bangkok, Thailand
10900.
Abstract
For a known polymerization system, chain microstructures of polymers produced at a certain
polymerization conditions can be estimated using the polymerization kinetic model. However, an inverse
problem of identifying adequate polymerization conditions for producing polymers with desired chain
microstructures is rather complicated as mathematically it cannot be solved directly. In this work, genetic
algorithm (GA) was proposed as an optimization tool for identifying polymerization conditions. The considered
chain microstructures include molecular weight distribution (MWD) and chemical composition distributions
(CCD). The approach was validated with the model two-site-type catalytic system of ethylene/1-butene
copolymerization. The results showed that GA can help adequately identify the copolymerization conditions
from given MWD and CCD information.
Keywords: Chemical composition distribution (CCD), Ethylene/1-olefin copolymerization, Genetic algorithm
(GA), Molecular weight distribution (MWD), Polyethylene.
1. Introduction
The physical properties of polyethylene depend on
chain microstructures, such as average molecular weight,
molecular weight distribution (MWD, average
comonomer content, and chemical composition
distribution (CCD) [1-3]. Catalytic system and
polymerization conditions can strongly affect these chain
microstructures. Therefore, relationships between
polymerization conditions and chain microstructures are
very important for tailor-making polymer structures and
properties.
Several approaches based on polymerization kinetic
model can be used to describe the effect of
polymerization conditions on chain microstructures [4-
7]. However, the inverse problem on identifying
polymerization conditions for producing polymers with
desired chain microstructures is a rather complex
problem that cannot be solved directly.
Although average chain microstructural information
(e.g., average molecular weight, average comonomer
content, polydispersity index) were generally used in
industry, this information is insufficient for determining
the polymerization conditions. This is because there are
several forms of MWDs and CCDs (from different
polymerization conditions) that produce polymers with
the same average microstructural information. This can
easily lead to the multiple solution problems.
MWD and CCD, which provided extensive detail
on chain microstructures, could be more appropriate
information for determining polymerization conditions.
MWD can typically be obtained from gel permeation
chromatography (GPC) [8] and CCD can be obtained
from temperature rising elusion fractionation (TREF) [9-
10] or crystallization analysis fractionation (Crystaf)
[10]. To identify the polymerization conditions for
producing polymers with specified MWD and CCD, one
can perform a large scale optimization with the help of
polymerization kinetic model. The objective function to
be minimized is the sum of square error between the
simulated and experimental MWD and CCD.
Genetic algorithm (GA) is a global optimization tool
based on the natural evolution process (i.e., inherit,
crossover, and mutation) that can efficiently solve a large
scale problem by performing a global search without
relying on initial guesses. GA has been applied to several
problems in polymer science and engineering [11-15].
In this work, a genetic algorithm was used to
perform global search to determine appropriate
polymerization conditions for producing polymers with
specified MWD and CCD. A series of the model data of
International Polymer Conference of Thailand
150 known ethylene/1-butene copolymerization with two-
site-type catalytic system were used to validate the
proposed method.
2. Mathematical modeling
Chain microstructures of copolymers produced on
each active site type were assumed to follow
Stockmayer’s bivariate distribution [17] (see Appendix
A and B). Flory’s distribution, which describes a weight
distribution function of kinetic chain lengths (r), can be
expressed as follows:
2( ) expj j jw r r r (1)
Where r is the chain length, j is number active site type,
j is related to the Mnj of site type j and calculated from
the polymerization reaction (see Appendix A and B).
Similarly, the CCD of polymer produced on each
site type can be described by using CCD component of
Stockmayer’s distribution as follows:
1 5/22
1 1
3( )
( - )4 2 1
2
j
j
j j
j j
w FF F
(2)
1 1 1 1 1 2(1- ) 1- 4 (1- )(1- )j j jj j j jF F F F r r (3)
F1 is the mole fraction of monomer, is the
average mole fraction of monomer made on site type j
and r1j and r2j are the reactivity ratios for
copolymerization.
Polymer chain microstructures produced on
multiple-site-type catalytic systems can be considered as
a mixture of polymer chain microstructures made on
each active site type. Therefore, the overall of MWD and
CCD were calculated by using the expressions:
1
( )n
j j
j
W r m w r
(4)
1
1
( )n
j j j
j
W F m w F
(5)
where n is the number of active site types and mi is the
mass fraction of polymers produced on site type j.
Genetic algorithm (GA) was developed to
minimize the objective function. The initial population
was randomly generated by uniform distribution in
search space. The number of population size of each
generation was 300 individuals for increasing
opportunity to search the best individual. Each individual
was a set of strings of estimated parameters (mi, [Co-cat],
[M1], [M2], [H2], Temp.). The search space was adjusted
to be in the range from 0 to 1 for all parameters. The
total parameter in each individual depends on the number
of catalytic size type as 5 + (j-1) because total
summation of mass fraction is equal to 1.
The MWD and CCD chain microstructures were
calculated from the individual by using rate reaction
equations of coordination polymerization model (see
Appendix A and B) and the individuals were evaluated
by the objective function as fitness function from chain
microstructures (MWD and CCD).
The objective function (i.e., the sum of the
squares of differences between model profiles and
simulation results) to be minimized is
1
2
model simulation
,
1Objective function
r F
W WN
(6)
where N is the total number of data for MWD or CCD. If
the criteria are not acceptable, this population was set as
a parent generation to generate the next generation using
three mechanisms: selection, crossover, and mutation.
The tournament selection was used to select the
parent for the crossover step. The individual as a player
was competed in tournament by using the objective
function. 4 randomly chosen individuals together with
individuals having the best fitness value (or lowest
objective function) were selected as parents in the
crossover step and maintained at 300.
In crossover step, 50% of parent is randomly
chosen for the crossover process. Heuristic crossover
was applied to create population of next generation. The
child was generated on the direction of the search
between two parents. It can specify distant of child from
the better parent by ratio (R=1.2). If Parent1 is better the
fitness value than Parent2. The child are created
according to
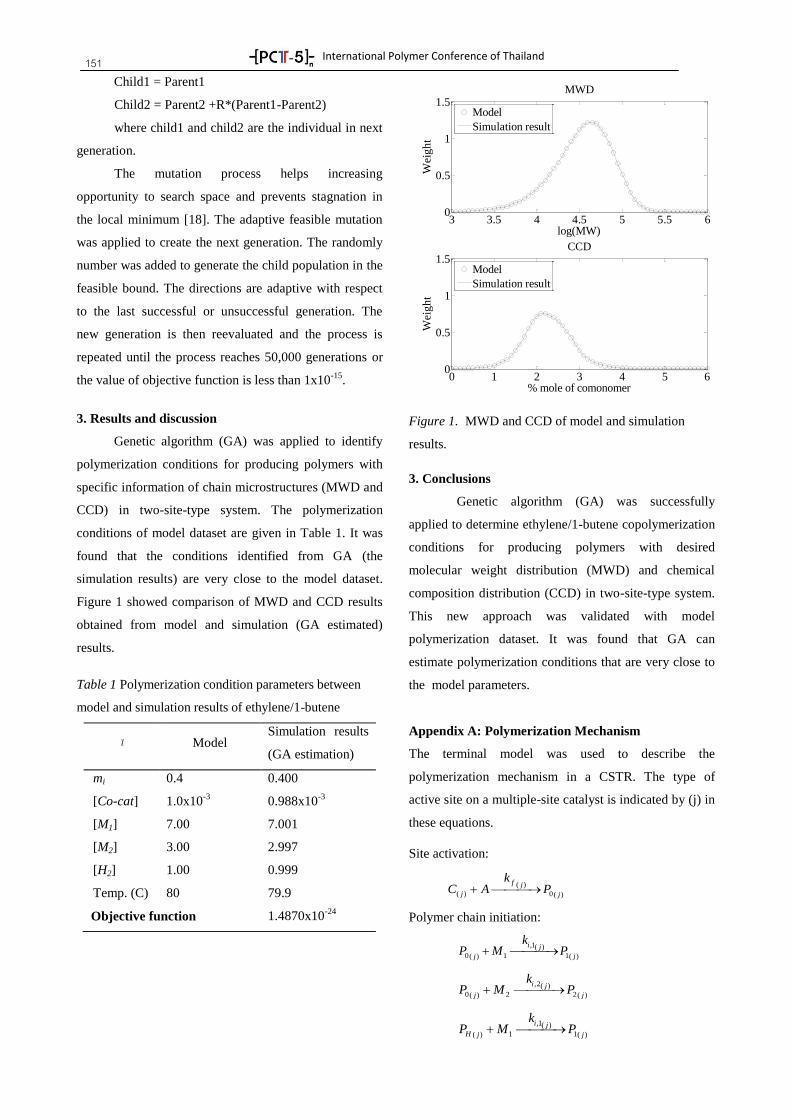
International Polymer Conference of Thailand
151 Child1 = Parent1
Child2 = Parent2 +R*(Parent1-Parent2)
where child1 and child2 are the individual in next
generation.
The mutation process helps increasing
opportunity to search space and prevents stagnation in
the local minimum [18]. The adaptive feasible mutation
was applied to create the next generation. The randomly
number was added to generate the child population in the
feasible bound. The directions are adaptive with respect
to the last successful or unsuccessful generation. The
new generation is then reevaluated and the process is
repeated until the process reaches 50,000 generations or
the value of objective function is less than 1x10-15
.
3. Results and discussion
Genetic algorithm (GA) was applied to identify
polymerization conditions for producing polymers with
specific information of chain microstructures (MWD and
CCD) in two-site-type system. The polymerization
conditions of model dataset are given in Table 1. It was
found that the conditions identified from GA (the
simulation results) are very close to the model dataset.
Figure 1 showed comparison of MWD and CCD results
obtained from model and simulation (GA estimated)
results.
Table 1 Polymerization condition parameters between
model and simulation results of ethylene/1-butene
x Model Simulation results
(GA estimation)
mi 0.4 0.400
[Co-cat] 1.0x10⁻³
0.988x10⁻³
[M1] 7.00 7.001
[M2] 3.00 2.997
[H2] 1.00 0.999
Temp. (C) 80 79.9
Objective function 1.4870x10⁻²⁴
Figure 1. MWD and CCD of model and simulation
results.
3. Conclusions
Genetic algorithm (GA) was successfully
applied to determine ethylene/1-butene copolymerization
conditions for producing polymers with desired
molecular weight distribution (MWD) and chemical
composition distribution (CCD) in two-site-type system.
This new approach was validated with model
polymerization dataset. It was found that GA can
estimate polymerization conditions that are very close to
the model parameters.
Appendix A: Polymerization Mechanism
The terminal model was used to describe the
polymerization mechanism in a CSTR. The type of
active site on a multiple-site catalyst is indicated by (j) in
these equations.
Site activation:
)(0
)(
)( j
jf
j Pk
AC Polymer chain initiation:
)(1
)(1,
1)(0 j
ji
jP
kMP
)(2
)(2,
2)(0 j
ji
jP
kMP
)(1
)(1,
1)( j
ji
jH Pk
MP
3 3.5 4 4.5 5 5.5 60
0.5
1
1.5
log(MW)
Wei
gh
t
MWD
Model
Simulation result
0 1 2 3 4 5 60
0.5
1
1.5
% mole of comonomer
Wei
gh
t
CCD
Model
Simulation result
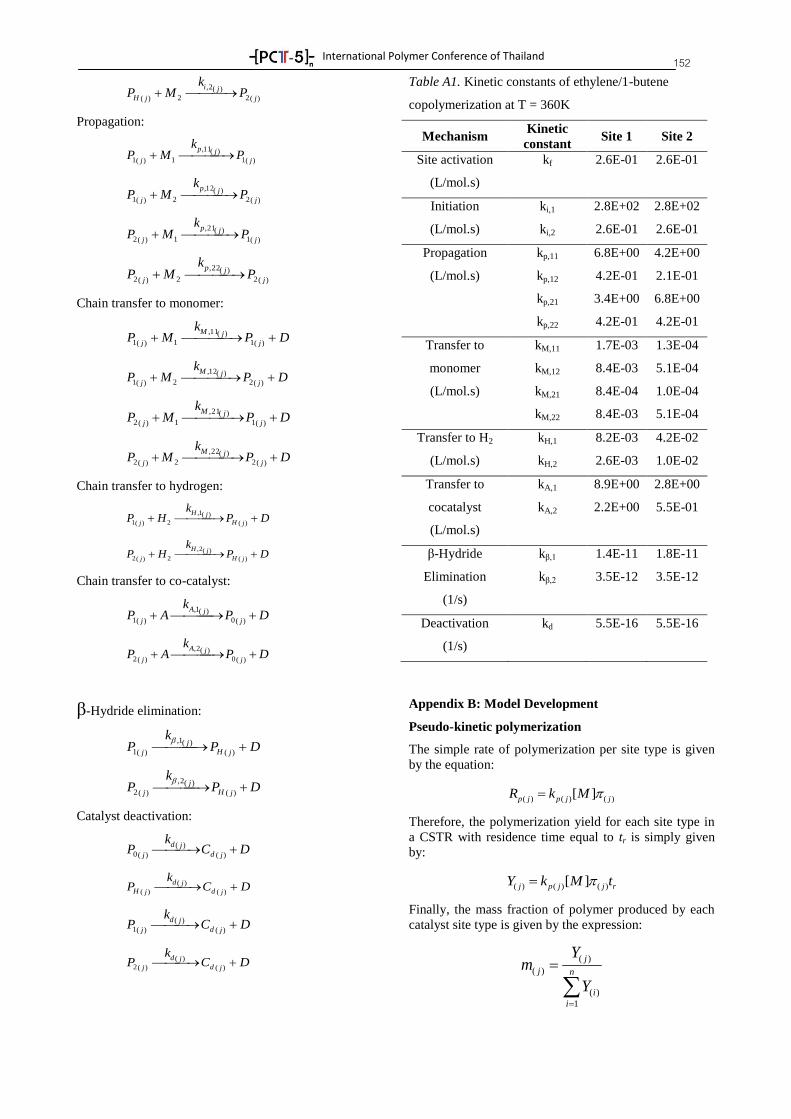
International Polymer Conference of Thailand
152
)(2
)(2,
2)( j
ji
jH Pk
MP
Propagation:
)(1
)(11,
1)(1 j
jp
jP
kMP
)(2
)(12,
2)(1 j
jp
jP
kMP
)(1
)(21,
1)(2 j
jp
jP
kMP
)(2
)(22,
2)(2 j
jp
jP
kMP
Chain transfer to monomer:
DPk
MPj
jM
j
)(1
)(11,
1)(1
DPk
MPj
jM
j
)(2
)(12,
2)(1
DPk
MPj
jM
j
)(1
)(21,
1)(2
DPk
MPj
jM
j
)(2
)(22,
2)(2
Chain transfer to hydrogen:
DPk
HPjH
jH
j
)(
)(1,
2)(1
DPk
HPjH
jH
j
)(
)(2,
2)(2
Chain transfer to co-catalyst:
DPk
APj
jA
j
)(0
)(1,
)(1
DPk
APj
jA
j
)(0
)(2,
)(2
β-Hydride elimination:
DPk
PjH
j
j
)(
)(1,
)(1
DPk
PjH
j
j
)(
)(2,
)(2
Catalyst deactivation:
DCk
Pjd
jd
j
)(
)(
)(0
DCk
Pjd
jd
jH )(
)(
)(
DCk
Pjd
jd
j
)(
)(
)(1
DCk
Pjd
jd
j
)(
)(
)(2
Table A1. Kinetic constants of ethylene/1-butene
copolymerization at T = 360K
Mechanism Kinetic
constant Site 1 Site 2
Site activation
(L/mol.s)
kf 2.6E-01
2.6E-01
Initiation ki,1 2.8E+02 2.8E+02
(L/mol.s) ki,2 2.6E-01 2.6E-01
Propagation kp,11 6.8E+00 4.2E+00
(L/mol.s) kp,12 4.2E-01 2.1E-01
kp,21 3.4E+00 6.8E+00
kp,22 4.2E-01 4.2E-01
Transfer to kM,11 1.7E-03 1.3E-04
monomer kM,12 8.4E-03 5.1E-04
(L/mol.s) kM,21 8.4E-04 1.0E-04
kM,22 8.4E-03 5.1E-04
Transfer to H2 kH,1 8.2E-03 4.2E-02
(L/mol.s) kH,2 2.6E-03 1.0E-02
Transfer to kA,1 8.9E+00 2.8E+00
cocatalyst
(L/mol.s)
kA,2 2.2E+00
5.5E-01
β-Hydride kβ,1 1.4E-11 1.8E-11
Elimination
(1/s)
kβ,2 3.5E-12
3.5E-12
Deactivation
(1/s)
kd
5.5E-16
5.5E-16
Appendix B: Model Development
Pseudo-kinetic polymerization
The simple rate of polymerization per site type is given
by the equation:
( ) ( ) ( )[ ]p j p j jR k M
Therefore, the polymerization yield for each site type in
a CSTR with residence time equal to tr is simply given
by:
( ) ( ) ( )[ ]j p j j rY k M t
Finally, the mass fraction of polymer produced by each
catalyst site type is given by the expression:
( )
( )
( )
1
j
j n
i
i
Ym
Y
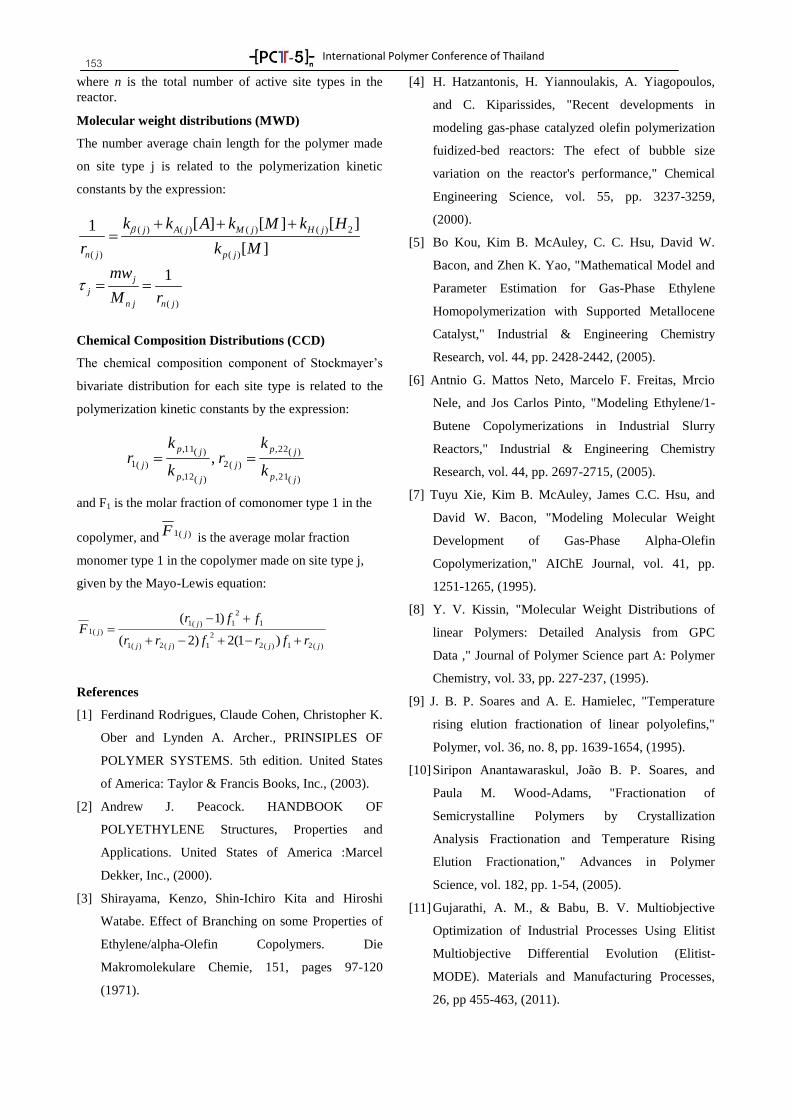
International Polymer Conference of Thailand
153 where n is the total number of active site types in the
reactor.
Molecular weight distributions (MWD)
The number average chain length for the polymer made
on site type j is related to the polymerization kinetic
constants by the expression:
( ) ( ) ( ) ( ) 2
( ) ( )
[ ] [ ] [ ]1
[ ]
j A j M j H j
n j p j
k k A k M k H
r k M
( )
1j
j
n j n j
mw
M r
Chemical Composition Distributions (CCD)
The chemical composition component of Stockmayer’s
bivariate distribution for each site type is related to the
polymerization kinetic constants by the expression:
)(21,
)(22,
)(2
)(12,
)(11,
)(1 ,
jp
jp
j
jp
jp
jk
kr
k
kr
and F1 is the molar fraction of comonomer type 1 in the
copolymer, and )(1 jF is the average molar fraction
monomer type 1 in the copolymer made on site type j,
given by the Mayo-Lewis equation:
)(21)(2
2
1)(2)(1
1
2
1)(1)(1
)1(2)2(
)1(
jjjj
jj
rfrfrr
ffrF
References
[1] Ferdinand Rodrigues, Claude Cohen, Christopher K.
Ober and Lynden A. Archer., PRINSIPLES OF
POLYMER SYSTEMS. 5th edition. United States
of America: Taylor & Francis Books, Inc., (2003).
[2] Andrew J. Peacock. HANDBOOK OF
POLYETHYLENE Structures, Properties and
Applications. United States of America :Marcel
Dekker, Inc., (2000).
[3] Shirayama, Kenzo, Shin-Ichiro Kita and Hiroshi
Watabe. Effect of Branching on some Properties of
Ethylene/alpha-Olefin Copolymers. Die
Makromolekulare Chemie, 151, pages 97-120
(1971).
[4] H. Hatzantonis, H. Yiannoulakis, A. Yiagopoulos,
and C. Kiparissides, "Recent developments in
modeling gas-phase catalyzed olefin polymerization
fuidized-bed reactors: The efect of bubble size
variation on the reactor's performance," Chemical
Engineering Science, vol. 55, pp. 3237-3259,
(2000).
[5] Bo Kou, Kim B. McAuley, C. C. Hsu, David W.
Bacon, and Zhen K. Yao, "Mathematical Model and
Parameter Estimation for Gas-Phase Ethylene
Homopolymerization with Supported Metallocene
Catalyst," Industrial & Engineering Chemistry
Research, vol. 44, pp. 2428-2442, (2005).
[6] Antnio G. Mattos Neto, Marcelo F. Freitas, Mrcio
Nele, and Jos Carlos Pinto, "Modeling Ethylene/1-
Butene Copolymerizations in Industrial Slurry
Reactors," Industrial & Engineering Chemistry
Research, vol. 44, pp. 2697-2715, (2005).
[7] Tuyu Xie, Kim B. McAuley, James C.C. Hsu, and
David W. Bacon, "Modeling Molecular Weight
Development of Gas-Phase Alpha-Olefin
Copolymerization," AIChE Journal, vol. 41, pp.
1251-1265, (1995).
[8] Y. V. Kissin, "Molecular Weight Distributions of
linear Polymers: Detailed Analysis from GPC
Data ," Journal of Polymer Science part A: Polymer
Chemistry, vol. 33, pp. 227-237, (1995).
[9] J. B. P. Soares and A. E. Hamielec, "Temperature
rising elution fractionation of linear polyolefins,"
Polymer, vol. 36, no. 8, pp. 1639-1654, (1995).
[10] Siripon Anantawaraskul, João B. P. Soares, and
Paula M. Wood-Adams, "Fractionation of
Semicrystalline Polymers by Crystallization
Analysis Fractionation and Temperature Rising
Elution Fractionation," Advances in Polymer
Science, vol. 182, pp. 1-54, (2005).
[11] Gujarathi, A. M., & Babu, B. V. Multiobjective
Optimization of Industrial Processes Using Elitist
Multiobjective Differential Evolution (Elitist-
MODE). Materials and Manufacturing Processes,
26, pp 455-463, (2011).
International Polymer Conference of Thailand
154 [12] Mu, Y., Zhao, G., Wu, X., & Zhang, C. An
optimization strategy for die design in the low-
density polyethylene annular extrusion process
based on FES/BPNN/NSGA-II. Journal of
Advanced Manufacturing Technology, 50, pp 517-
532, (2010).
[13] Nanthapoolsub, U., Anantawaraskul, S., &
Saengkhamkhom, K. Simultaneous Deconvolution
of MWD and CCD of Ethylene/1-Olefin
Copolymers Using Genetic Algorithm.
Macromolecular Symposium, 330, pp142-149,
(2013).
[14] Padhiyar, N., Bhartiya, S., & Gudi, R. D. Optimal
Grade Transition in Polymerization Reactors: A
Comparative Case Study. Industrial & Engineering
Chemistry Research, 45, pp 3583-3592, (2013).
[15] Yousefi, F., & Karimi, H. Application of equation
of state and artificial neural network to prediction of
volumetric properties of polymer melts. Journal of
Industrial and Engineering Chemistry, 19,pp 498-
507, (2013).
[16] Soares, J. B. Mathematical modelling of the
microstructure of polyolefins made by coordination
polymerization: a review. Chemical Engneering
Science, 56, pp 4131-4153, (2001).
[17] Stockmayer, W. H. Distribution of Chain Lengths
and Compositions in Copolymers. The Journal of
Chemical Physics, 13, pp 199-207, (1945).
[18] Singh, Gurmeet, Sukhdeep Kaur, Dhananjay G.
Naik, Virendra K. Gupta. Evolutionary Computing
Approach for Evaluating Flory Distribution Curves
in Gel Permeation Chromatography:Study of the
Poly(1-octene) System. Journal of AppliedPolymer
Science, Vol. 117, pp 3379-3385, (2010).
International Polymer Conference of Thailand
155 PROCO-02
Determination of Polymerization Conditions for Producing Ethylene/1-olefin
Copolymers with Tailor-made Chain Microstructures using Artificial Neural Network
Thanutchoke Charoenpanich1, Siripon Anantawaraskul
1,2* and João B. P. Soares
3
1Department of Chemical Engineering, Faculty of Engineering, Kasetsart University, Bangkok, Thailand 10900
2Center for Advanced Studies in Nanotechnology and Its Applications in Chemical, Food and Agricultural
Industries, Kasetsart University, Bangkok, Thailand 10900 3Department of Chemical and Materials Engineering, University of Alberta, Edmonton, Alberta, Canada T6G
2V4
Abstract
Two artificial neural network (ANN) models were developed for describing ethylene/1-butene
copolymerization with two-site-type catalytic system by using the datasets calculated from copolymerization
kinetic model. The forward model was first applied to mimic the kinetic model which predicts chain
microstructures (i.e., molecular weight distribution and chemical composition distribution) from defined
polymerization conditions (i.e., ethylene concentration, 1-butene concentration, cocatalyst concentration,
hydrogen concentration, and polymerization temperature). The results are in a good agreement with the
theoretical results. The inverse model was applied to predict the polymerization conditions from the desired
chain microstructures. Although the results showed large deviations due to the multiple patterns of solution, the
unique solution can be obtained by defining one of three key variables (ethylene concentration, 1-butene
concentration, and polymerization temperature) as a constant.
Keywords: artificial neural network (ANN), chemical composition distribution (CCD), copolymerization
kinetic model, ethylene/1-butene copolymerization, molecular weight distribution (MWD)
1. Introduction
Linear low density polyethylene (LLDPE),
synthesized by copolymerization of ethylene with α-
olefin, is one of the most widely used commodity
polymers. Its properties can be related to chain
microstructures that depend on copolymerization
conditions and catalytic system. Polymers with high
molecular weights and narrow molecular weight
distributions can be synthesized by using metallocene
catalysts, which have single-site-type nature. A
combination of two metallocene catalysts can be used for
controlling structure of polyolefin with high versatility.
Although the kinetic model of ethylene/1-olefin
copolymerization (typically as a system of ordinary
differential equations or algebraic equations) can be used
to estimate the chain microstructures from a specific set
of polymerization conditions in a given catalytic
system[1]
, it cannot be used in an inverse function to
determine appropriated conditions to yield desired chain
microstructures.
An artificial neural network (ANN) is a model
which mimics a pattern recognition process of the
nervous system. This model can be used to solve highly
non-linear problems by learning from examples, like a
human being. ANN needs only input and output datasets
and then can find optimum relationships between them
by training and testing process. Recently, the ANN
models have been applied to solve various problems in
polymer applications.[2, 3]
This non-phenomenological
model can predict the results with a high accuracy.
In this work, ethylene/1-butene copolymerization
with two single-site-type catalytic system was studied.
ANN was applied as both “forward model” and “inverse
model”. The forward model was used to predict the chain
microstructures obtained from a specific set of
polymerization conditions, mimicking the kinetic model.
On the other hand, the inverse model was used to
determine the polymerization conditions to produce
copolymers with desired chain microstructures. This
model can be used to tailor-make the final properties of
polymers by controlling polymerization conditions. The
steady state kinetic model of ethylene/1-butene
copolymerization was used to provide the input and
output datasets for training and testing process of ANN.
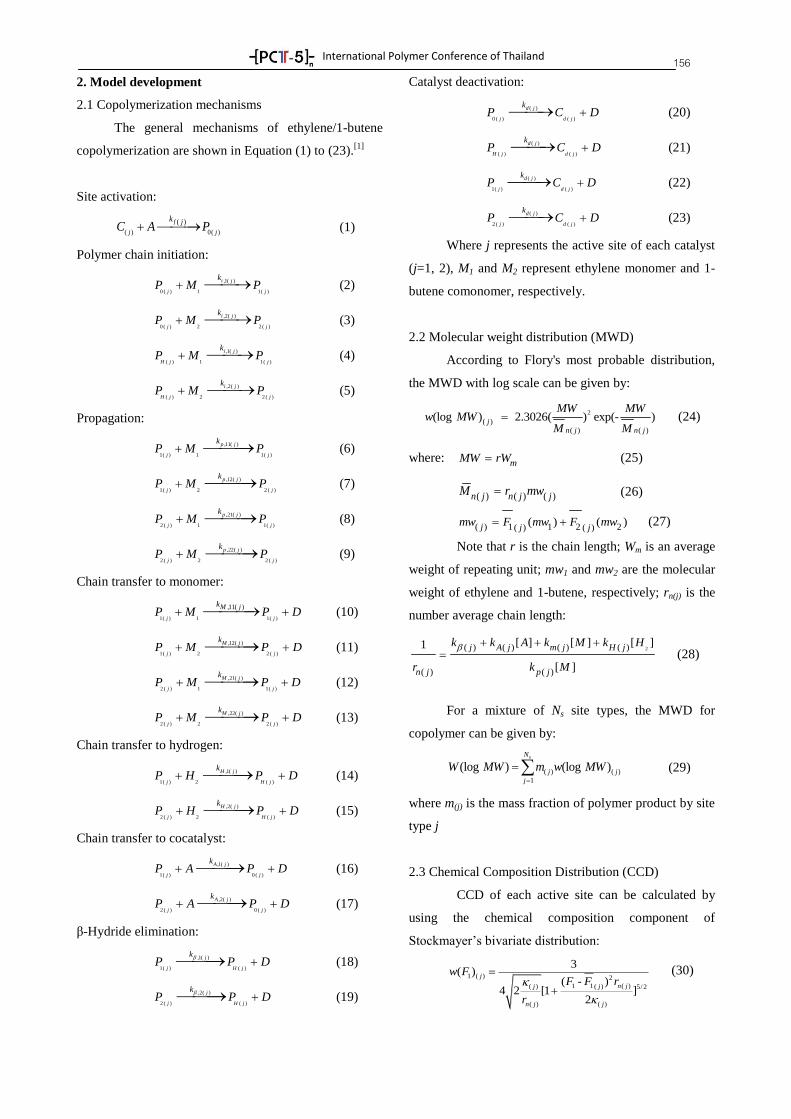
International Polymer Conference of Thailand
156 2. Model development
2.1 Copolymerization mechanisms
The general mechanisms of ethylene/1-butene
copolymerization are shown in Equation (1) to (23).[1]
Site activation:
( ) 0( )
( )f
j j
jkC A P
(1)
Polymer chain initiation:
0 ( ) 1 1( )
,1( )
j j
i jkP M P
(2)
0 ( ) 2 2 ( )
,2( )
j j
i jkP M P
(3)
( ) 1 1( )
,1( )
H j j
i jkP M P
(4)
( ) 2 2 ( )
,2( )
H j j
i jkP M P
(5)
Propagation:
1( ) 1 1( )
,11( )
j j
p jkP M P
(6)
1( ) 2 2 ( )
,12( )
j j
p jkP M P
(7)
2 ( ) 1 1( )
,21( )
j j
p jkP M P
(8)
2 ( ) 2 2 ( )
,22( )
j j
p jkP M P
(9)
Chain transfer to monomer:
1( ) 1 1( )
,11( )
j j
M jkP M P D
(10)
1( ) 2 2 ( )
,12( )
j j
M jkP M P D
(11)
2 ( ) 1 1( )
,21( )
j j
M jkP M P D
(12)
2 ( ) 2 2 ( )
,22( )
j j
M jkP M P D
(13)
Chain transfer to hydrogen:
1( ) 2 ( )
,1( )
j H j
H jkP H P D
(14)
2 ( ) 2 ( )
,2( )
j H j
H jkP H P D
(15)
Chain transfer to cocatalyst:
1( ) 0 ( )
,1( )
j j
A jkP A P D
(16)
2 ( ) 0 ( )
,2( )
j j
A jkP A P D
(17)
β-Hydride elimination:
1( ) ( )
,1( )
j H j
jkP P D
(18)
2 ( ) ( )
,2( )
j H j
jkP P D
(19)
Catalyst deactivation:
0 ( ) ( )
( )
j d j
d jkP C D
(20)
( ) ( )
( )
H j d j
d jkP C D
(21)
1( ) ( )
( )
j d j
d jkP C D
(22)
2 ( ) ( )
( )
j d j
d jkP C D
(23)
Where j represents the active site of each catalyst
(j=1, 2), M1 and M2 represent ethylene monomer and 1-
butene comonomer, respectively.
2.2 Molecular weight distribution (MWD)
According to Flory's most probable distribution,
the MWD with log scale can be given by:
2
( )( ) ( )
(log ) 2.3026( ) exp(- ) jn j n j
MW MWw MW
M M
(24)
where: mMW rW
(25)
( ) ( ) ( )n j n j jM r mw
(26)
( ) 1 1 2 2( ) ( )
( ) ( )j j jmw F mw F mw (27)
Note that r is the chain length; Wm is an average
weight of repeating unit; mw1 and mw2 are the molecular
weight of ethylene and 1-butene, respectively; rn(j) is the
number average chain length:
2( ) ( ) ( ) ( )
( ) ( )
[ ] [ ] [ ]1
[ ]
j A j m j H j
n j p j
k k A k M k H
r k M
(28)
For a mixture of Ns site types, the MWD for
copolymer can be given by:
( ) ( )
1
(log ) (log ) sN
j j
j
W MW m w MW
(29)
where m(j) is the mass fraction of polymer product by site
type j
2.3 Chemical Composition Distribution (CCD)
CCD of each active site can be calculated by
using the chemical composition component of
Stockmayer’s bivariate distribution:
1 ( ) 2
1 1 ( )( ) ( ) 5/2
( ) ( )
3( )
( - )4 2 [1 ]
2
j
n jj j
n j j
w FF F r
r
(30)
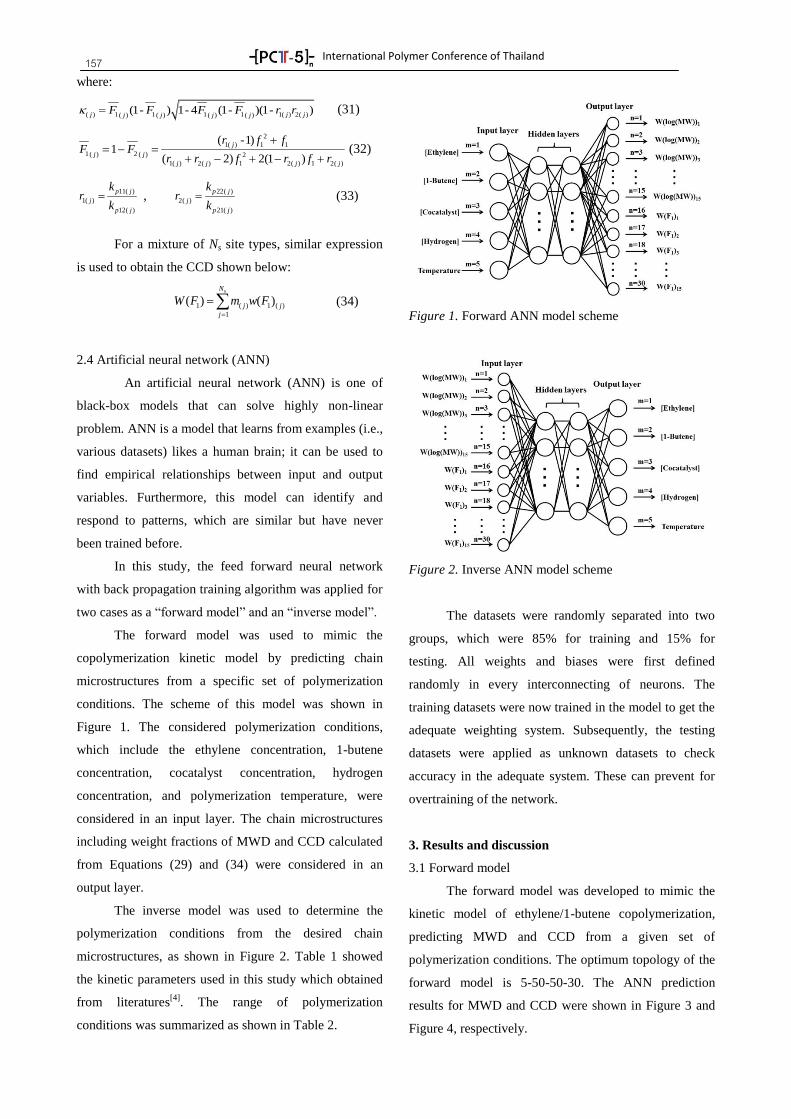
International Polymer Conference of Thailand
157 where:
( ) 1 1 1 1 1( ) 2( )( ) ( ) ( ) ( )(1- ) 1- 4 (1- )(1- )j j jj j j j
F F F F r r
(31)
2
1( ) 1 1
1 2( ) ( ) 2
1( ) 2( ) 1 2( ) 1 2( )
( -1)1
( 2) 2(1 )
j
j j
j j j j
r f fF F
r r f r f r
(32)
11( )
1( )
12( )
p j
j
p j
kr
k
, 22( )
2( )
21( )
p j
j
p j
kr
k (33)
For a mixture of Ns site types, similar expression
is used to obtain the CCD shown below:
1 ( ) 1 ( )
1
( ) ( ) sN
j j
j
W F m w F
(34)
2.4 Artificial neural network (ANN)
An artificial neural network (ANN) is one of
black-box models that can solve highly non-linear
problem. ANN is a model that learns from examples (i.e.,
various datasets) likes a human brain; it can be used to
find empirical relationships between input and output
variables. Furthermore, this model can identify and
respond to patterns, which are similar but have never
been trained before.
In this study, the feed forward neural network
with back propagation training algorithm was applied for
two cases as a “forward model” and an “inverse model”.
The forward model was used to mimic the
copolymerization kinetic model by predicting chain
microstructures from a specific set of polymerization
conditions. The scheme of this model was shown in
Figure 1. The considered polymerization conditions,
which include the ethylene concentration, 1-butene
concentration, cocatalyst concentration, hydrogen
concentration, and polymerization temperature, were
considered in an input layer. The chain microstructures
including weight fractions of MWD and CCD calculated
from Equations (29) and (34) were considered in an
output layer.
The inverse model was used to determine the
polymerization conditions from the desired chain
microstructures, as shown in Figure 2. Table 1 showed
the kinetic parameters used in this study which obtained
from literatures[4]
. The range of polymerization
conditions was summarized as shown in Table 2.
Figure 1. Forward ANN model scheme
Figure 2. Inverse ANN model scheme
The datasets were randomly separated into two
groups, which were 85% for training and 15% for
testing. All weights and biases were first defined
randomly in every interconnecting of neurons. The
training datasets were now trained in the model to get the
adequate weighting system. Subsequently, the testing
datasets were applied as unknown datasets to check
accuracy in the adequate system. These can prevent for
overtraining of the network.
3. Results and discussion
3.1 Forward model
The forward model was developed to mimic the
kinetic model of ethylene/1-butene copolymerization,
predicting MWD and CCD from a given set of
polymerization conditions. The optimum topology of the
forward model is 5-50-50-30. The ANN prediction
results for MWD and CCD were shown in Figure 3 and
Figure 4, respectively.
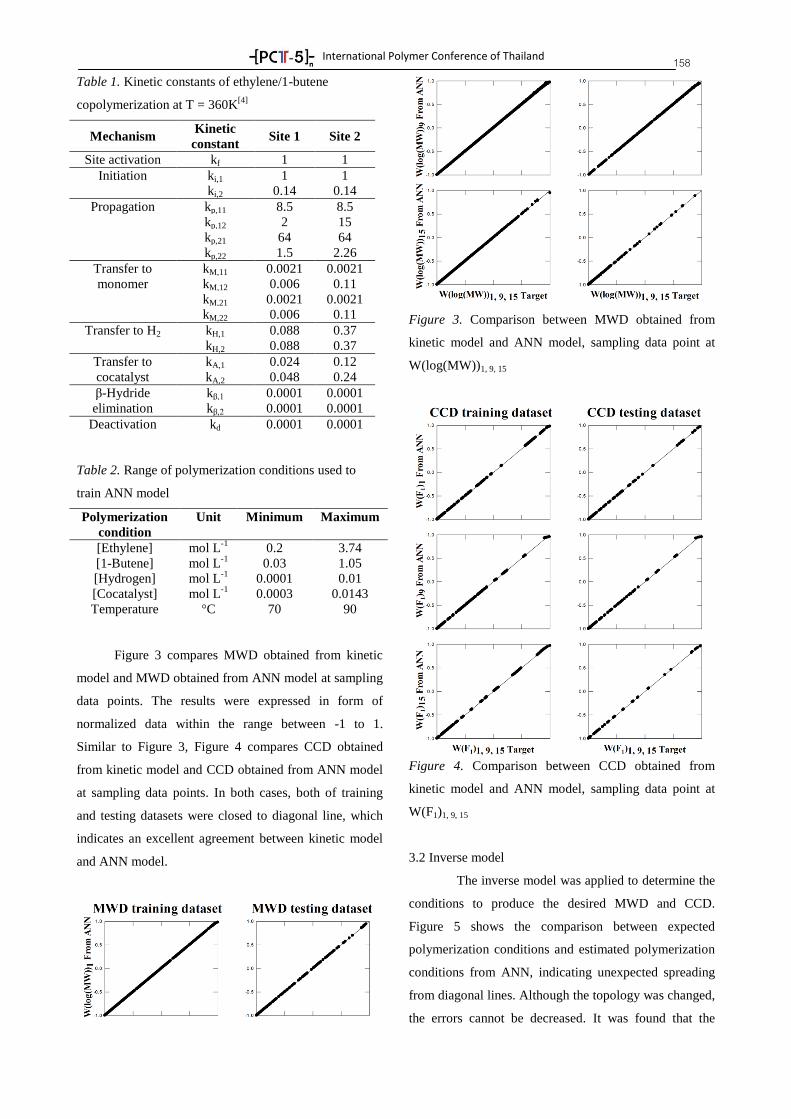
International Polymer Conference of Thailand
158 Table 1. Kinetic constants of ethylene/1-butene
copolymerization at T = 360K[4]
Mechanism Kinetic
constant Site 1 Site 2
Site activation kf 1 1
Initiation ki,1 1 1
ki,2 0.14 0.14
Propagation kp,11 8.5 8.5
kp,12 2 15
kp,21 64 64
kp,22 1.5 2.26
Transfer to kM,11 0.0021 0.0021
monomer kM,12 0.006 0.11
kM,21 0.0021 0.0021
kM,22 0.006 0.11
Transfer to H2 kH,1 0.088 0.37
kH,2 0.088 0.37
Transfer to kA,1 0.024 0.12
cocatalyst kA,2 0.048 0.24
β-Hydride kβ,1 0.0001 0.0001
elimination kβ,2 0.0001 0.0001
Deactivation kd 0.0001 0.0001
Table 2. Range of polymerization conditions used to
train ANN model
Polymerization
condition
Unit Minimum Maximum
[Ethylene] mol L-1
0.2 3.74
[1-Butene] mol L-1
0.03 1.05
[Hydrogen] mol L-1
0.0001 0.01
[Cocatalyst] mol L-1
0.0003 0.0143
Temperature °C 70 90
Figure 3 compares MWD obtained from kinetic
model and MWD obtained from ANN model at sampling
data points. The results were expressed in form of
normalized data within the range between -1 to 1.
Similar to Figure 3, Figure 4 compares CCD obtained
from kinetic model and CCD obtained from ANN model
at sampling data points. In both cases, both of training
and testing datasets were closed to diagonal line, which
indicates an excellent agreement between kinetic model
and ANN model.
Figure 3. Comparison between MWD obtained from
kinetic model and ANN model, sampling data point at
W(log(MW))1, 9, 15
Figure 4. Comparison between CCD obtained from
kinetic model and ANN model, sampling data point at
W(F1)1, 9, 15
3.2 Inverse model
The inverse model was applied to determine the
conditions to produce the desired MWD and CCD.
Figure 5 shows the comparison between expected
polymerization conditions and estimated polymerization
conditions from ANN, indicating unexpected spreading
from diagonal lines. Although the topology was changed,
the errors cannot be decreased. It was found that the
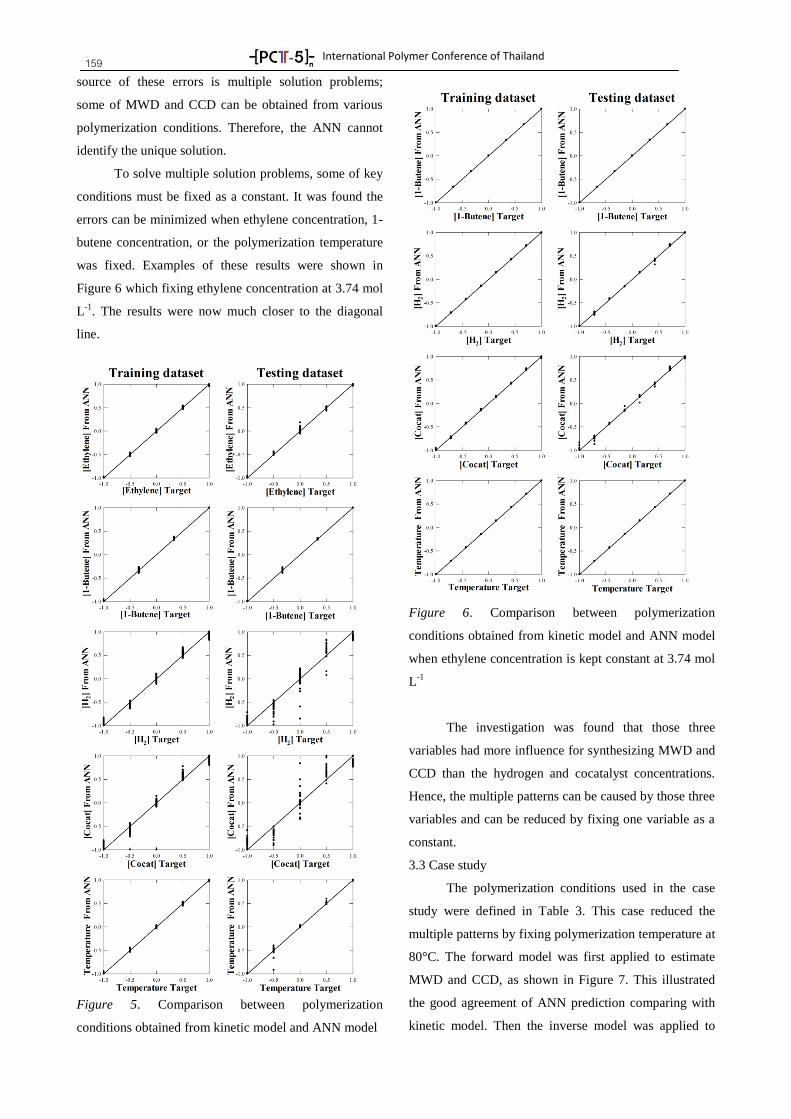
International Polymer Conference of Thailand
159 source of these errors is multiple solution problems;
some of MWD and CCD can be obtained from various
polymerization conditions. Therefore, the ANN cannot
identify the unique solution.
To solve multiple solution problems, some of key
conditions must be fixed as a constant. It was found the
errors can be minimized when ethylene concentration, 1-
butene concentration, or the polymerization temperature
was fixed. Examples of these results were shown in
Figure 6 which fixing ethylene concentration at 3.74 mol
L-1
. The results were now much closer to the diagonal
line.
Figure 5. Comparison between polymerization
conditions obtained from kinetic model and ANN model
Figure 6. Comparison between polymerization
conditions obtained from kinetic model and ANN model
when ethylene concentration is kept constant at 3.74 mol
L-1
The investigation was found that those three
variables had more influence for synthesizing MWD and
CCD than the hydrogen and cocatalyst concentrations.
Hence, the multiple patterns can be caused by those three
variables and can be reduced by fixing one variable as a
constant.
3.3 Case study
The polymerization conditions used in the case
study were defined in Table 3. This case reduced the
multiple patterns by fixing polymerization temperature at
80°C. The forward model was first applied to estimate
MWD and CCD, as shown in Figure 7. This illustrated
the good agreement of ANN prediction comparing with
kinetic model. Then the inverse model was applied to
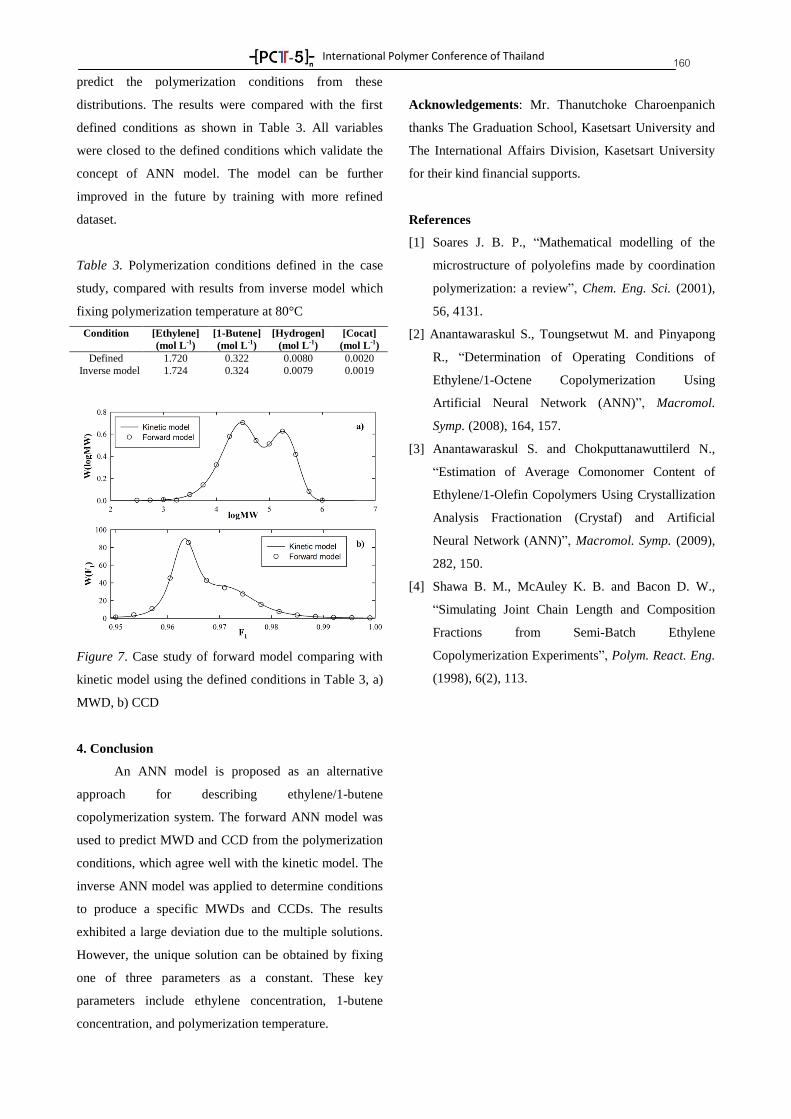
International Polymer Conference of Thailand
160 predict the polymerization conditions from these
distributions. The results were compared with the first
defined conditions as shown in Table 3. All variables
were closed to the defined conditions which validate the
concept of ANN model. The model can be further
improved in the future by training with more refined
dataset.
Table 3. Polymerization conditions defined in the case
study, compared with results from inverse model which
fixing polymerization temperature at 80°C
Condition [Ethylene]
(mol L-1)
[1-Butene]
(mol L-1)
[Hydrogen]
(mol L-1)
[Cocat]
(mol L-1)
Defined 1.720 0.322 0.0080 0.0020
Inverse model 1.724 0.324 0.0079 0.0019
Figure 7. Case study of forward model comparing with
kinetic model using the defined conditions in Table 3, a)
MWD, b) CCD
4. Conclusion
An ANN model is proposed as an alternative
approach for describing ethylene/1-butene
copolymerization system. The forward ANN model was
used to predict MWD and CCD from the polymerization
conditions, which agree well with the kinetic model. The
inverse ANN model was applied to determine conditions
to produce a specific MWDs and CCDs. The results
exhibited a large deviation due to the multiple solutions.
However, the unique solution can be obtained by fixing
one of three parameters as a constant. These key
parameters include ethylene concentration, 1-butene
concentration, and polymerization temperature.
Acknowledgements: Mr. Thanutchoke Charoenpanich
thanks The Graduation School, Kasetsart University and
The International Affairs Division, Kasetsart University
for their kind financial supports.
References
[1] Soares J. B. P., “Mathematical modelling of the
microstructure of polyolefins made by coordination
polymerization: a review”, Chem. Eng. Sci. (2001),
56, 4131.
[2] Anantawaraskul S., Toungsetwut M. and Pinyapong
R., “Determination of Operating Conditions of
Ethylene/1-Octene Copolymerization Using
Artificial Neural Network (ANN)”, Macromol.
Symp. (2008), 164, 157.
[3] Anantawaraskul S. and Chokputtanawuttilerd N.,
“Estimation of Average Comonomer Content of
Ethylene/1-Olefin Copolymers Using Crystallization
Analysis Fractionation (Crystaf) and Artificial
Neural Network (ANN)”, Macromol. Symp. (2009),
282, 150.
[4] Shawa B. M., McAuley K. B. and Bacon D. W.,
“Simulating Joint Chain Length and Composition
Fractions from Semi-Batch Ethylene
Copolymerization Experiments”, Polym. React. Eng.
(1998), 6(2), 113.
International Polymer Conference of Thailand
161
PROCO-03
Simulation of Morphological Development during Polymer Crystallization: Effect of
Temperature Gradient on the Crystallization Kinetics
Tharinee Teangtae, Siripon Anantawaraskul, Thitiporn Sooksod, and Chattong Pornpiriyayotha
Department of Chemical Engineering, Faculty of Engineering, Kasetsart University
Bangkok, Thailand, 10900
Abstract
Industrial processes of polymer solidification to form articles with desired shape often involve
crystallization under temperature gradient. During the crystallization, polymer morphology is developed. As
crystallization temperature affects both nucleation and crystal growth process, the temperature gradient could
significantly influence the crystallization kinetics and polymer morphology. This work investigated effect of
temperature gradient on crystallization kinetics and developed the theoretical parameter to evaluate the
crystallization rate. The results showed that temperature gradient significantly affects the crystallization kinetics,
average crystallite size and crystallite size distribution. The average Avrami rate constant corresponding to
relative crystallinity; therefore, it can be used to quantitatively evaluate the crystallization rate, especially at the
early crystallization.
Keywords: Avrami rate constant; Crystallize morphology; Crystallization Kinetics; Monte Carlo simulation
1. Introduction
The crystallization of semi-crystalline polymers is
a major field in polymer physics because the properties
of polymer products strongly depend on the morphology
formed and the extent of crystallization occurring during
the processing. [1]
Generally, the polymer crystallization
process consists of two steps: nucleation and crystal
growth. In the first step, nuclei are formed with a critical
size when the thermodynamic conditions are satisfied. [2]
Subsequently, the nuclei are growth as crystallites on the
crystalline region by adding other chains segment to the
nuclei center. Both of nucleation and crystal growth rate
are a function of crystallization temperature; therefore,
processing conditions can strongly influence
crystallization kinetics and final morphology.
In the industrial process, the crystallization
temperature not only depends on time for complete
crystallization but also depends on the position within a
bulk. Hence, the crystallization of polymer often relates
to temperature gradient, leading to complicate
crystallization kinetics. [3]
In this work, the effect of
temperature gradient on crystallization kinetics and
morphology was investigated in 2D simulation using
Monte Carlo model. The theoretical parameter to
evaluate the rate of crystallization was also developed.
2. Theoretical background
Avrami model is proposed to describe the kinetics
of polymer crystallization under an isothermal condition.
[4-5] The relative crystallinity, θ(t), is a function of
crystallization time, t, as follows:
1- exp - 0,1an
at k t
(1)
where ka is Avrami rate constant and na is Avrami
exponent (related to crystal geometry). The parameter ka
is related to the total concentration of the predetermined
nuclei (Ntot) and the crystal growth rate (G) according to
the following equation:
2
a totk N G (2)
To investigate the kinetics for semi-crystalline
polymer, the spherulite growth rate is assumed to depend
on only temperature and follows the Laurizen-Hoffman
theory:
*
0exp exp
g
c c
KUG G
R T T T T f
(3)
where G0 is a temperature-independent pre-exponential
factor, U*
is the activation energy for the transportation
of segments of molecules across the melt/solid surface
boundary (usually given a value of 1500 cal/mol), T
signifies the cessation of long-range molecular motion
(i.e.,g
T =T -30
, where Tg is the glass-transition
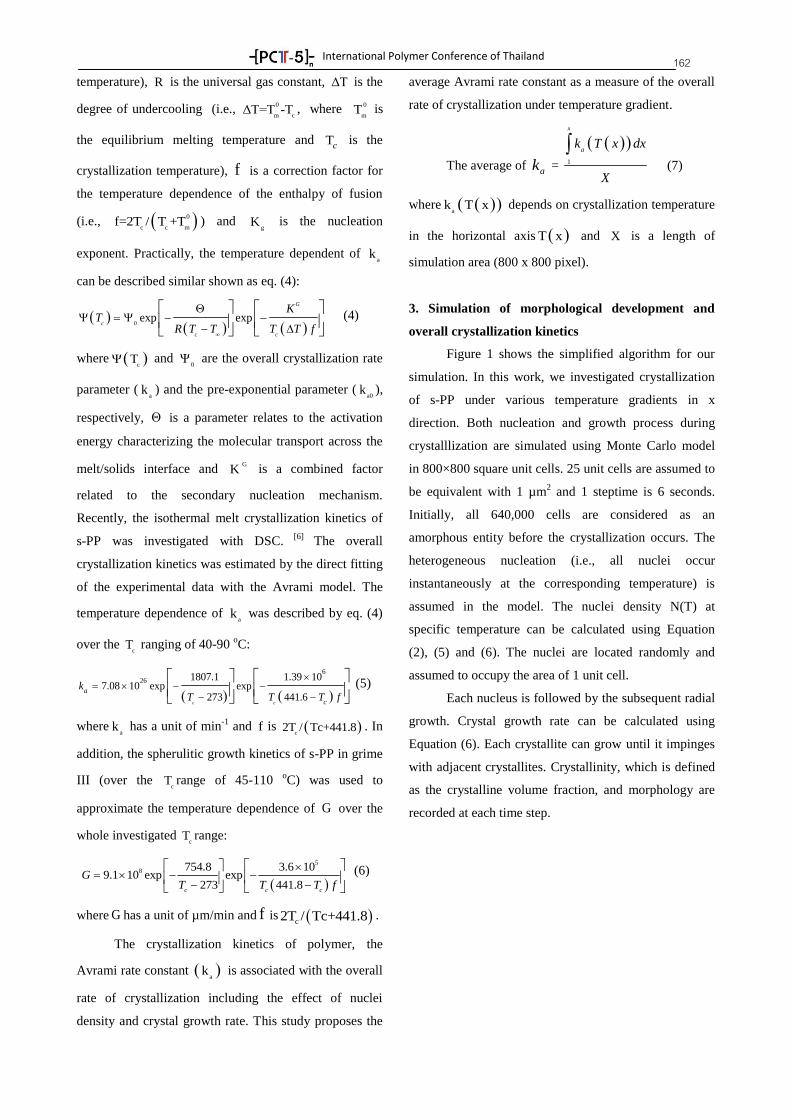
International Polymer Conference of Thailand
162 temperature), R is the universal gas constant, ΔT is the
degree of undercooling (i.e., 0
m cΔT=T -T , where
0
mT is
the equilibrium melting temperature and Tc is the
crystallization temperature), f is a correction factor for
the temperature dependence of the enthalpy of fusion
(i.e., 0
c c mf=2T / T +T ) and
gK is the nucleation
exponent. Practically, the temperature dependent of a
k
can be described similar shown as eq. (4):
0exp exp
G
c
c c
KT
R T T T T f
(4)
where c
Ψ T and 0
Ψ are the overall crystallization rate
parameter (a
k ) and the pre-exponential parameter (a0
k ),
respectively, is a parameter relates to the activation
energy characterizing the molecular transport across the
melt/solids interface and G
K is a combined factor
related to the secondary nucleation mechanism.
Recently, the isothermal melt crystallization kinetics of
s-PP was investigated with DSC. [6]
The overall
crystallization kinetics was estimated by the direct fitting
of the experimental data with the Avrami model. The
temperature dependence of a
k was described by eq. (4)
over the c
T ranging of 40-90 oC:
6
26 1807.1 1.39 107.08 10 exp exp
273 441.6c c
a
c
kT T T f
(5)
wherea
k has a unit of min-1
and f is c
2T / Tc+441.8 . In
addition, the spherulitic growth kinetics of s-PP in grime
III (over the c
T range of 45-110 oC) was used to
approximate the temperature dependence of G over the
whole investigated c
T range:
5
8 754.8 3.6 109.1 10 exp exp
273 441.8c c c
GT T T f
(6)
where G has a unit of µm/min and f is c2T / Tc+441.8 .
The crystallization kinetics of polymer, the
Avrami rate constant a
k is associated with the overall
rate of crystallization including the effect of nuclei
density and crystal growth rate. This study proposes the
average Avrami rate constant as a measure of the overall
rate of crystallization under temperature gradient.
The average of ak =
1
x
ak T x dx
X
(7)
where a
k T x depends on crystallization temperature
in the horizontal axis T x and X is a length of
simulation area (800 x 800 pixel).
3. Simulation of morphological development and
overall crystallization kinetics
Figure 1 shows the simplified algorithm for our
simulation. In this work, we investigated crystallization
of s-PP under various temperature gradients in x
direction. Both nucleation and growth process during
crystalllization are simulated using Monte Carlo model
in 800×800 square unit cells. 25 unit cells are assumed to
be equivalent with 1 µm2 and 1 steptime is 6 seconds.
Initially, all 640,000 cells are considered as an
amorphous entity before the crystallization occurs. The
heterogeneous nucleation (i.e., all nuclei occur
instantaneously at the corresponding temperature) is
assumed in the model. The nuclei density N(T) at
specific temperature can be calculated using Equation
(2), (5) and (6). The nuclei are located randomly and
assumed to occupy the area of 1 unit cell.
Each nucleus is followed by the subsequent radial
growth. Crystal growth rate can be calculated using
Equation (6). Each crystallite can grow until it impinges
with adjacent crystallites. Crystallinity, which is defined
as the crystalline volume fraction, and morphology are
recorded at each time step.
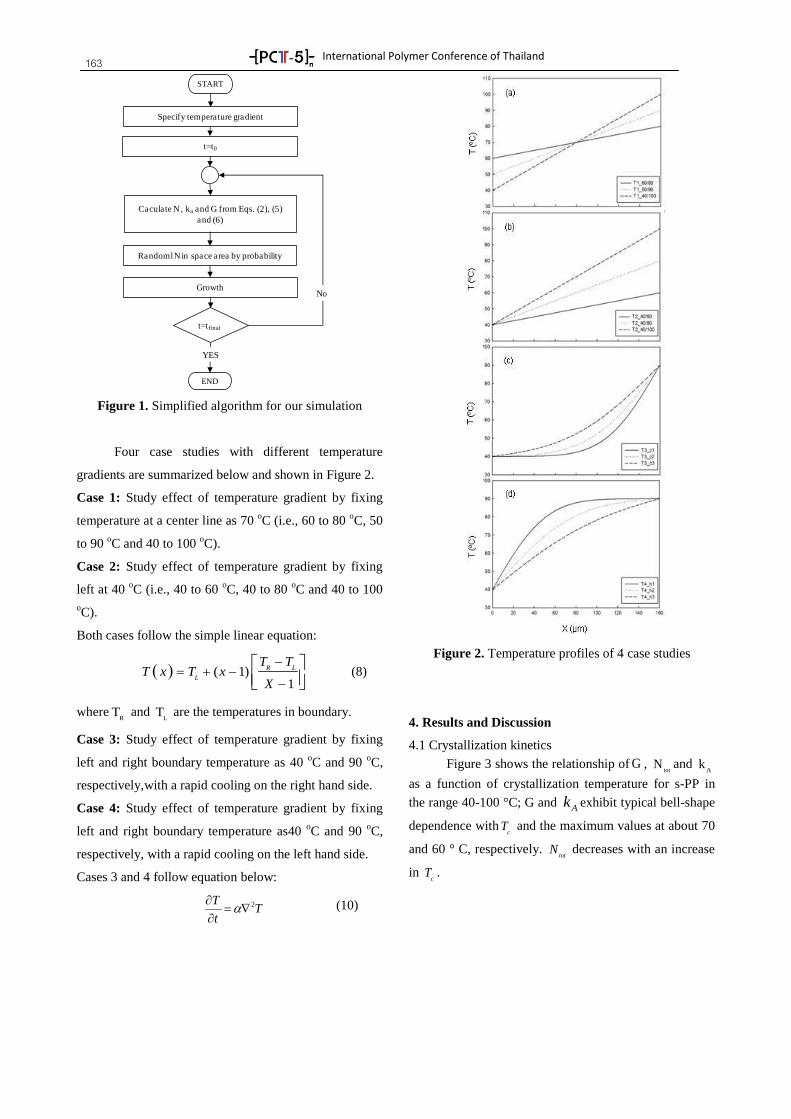
International Polymer Conference of Thailand
163
Figure 1. Simplified algorithm for our simulation
Four case studies with different temperature
gradients are summarized below and shown in Figure 2.
Case 1: Study effect of temperature gradient by fixing
temperature at a center line as 70 oC (i.e., 60 to 80
oC, 50
to 90 oC and 40 to 100
oC).
Case 2: Study effect of temperature gradient by fixing
left at 40 oC (i.e., 40 to 60
oC, 40 to 80
oC and 40 to 100
oC).
Both cases follow the simple linear equation:
( 1)1
R L
L
T TT x T x
X
(8)
whereR
T and L
T are the temperatures in boundary.
Case 3: Study effect of temperature gradient by fixing
left and right boundary temperature as 40 oC and 90
oC,
respectively,with a rapid cooling on the right hand side.
Case 4: Study effect of temperature gradient by fixing
left and right boundary temperature as40 oC and 90
oC,
respectively, with a rapid cooling on the left hand side.
Cases 3 and 4 follow equation below:
2TT
t
(10)
Figure 2. Temperature profiles of 4 case studies
4. Results and Discussion
4.1 Crystallization kinetics
Figure 3 shows the relationship of G , tot
N and A
k
as a function of crystallization temperature for s-PP in
the range 40-100 °C; G and Ak exhibit typical bell-shape
dependence withc
T and the maximum values at about 70
and 60 ° C, respectively. tot
N decreases with an increase
in c
T .
START
Specify temperature gradient
t=t0
Caculate N , ka and G from Eqs. (2), (5)
and (6)
Growth
RandomlN in space area by probability
END
t=tfinal
YES
No
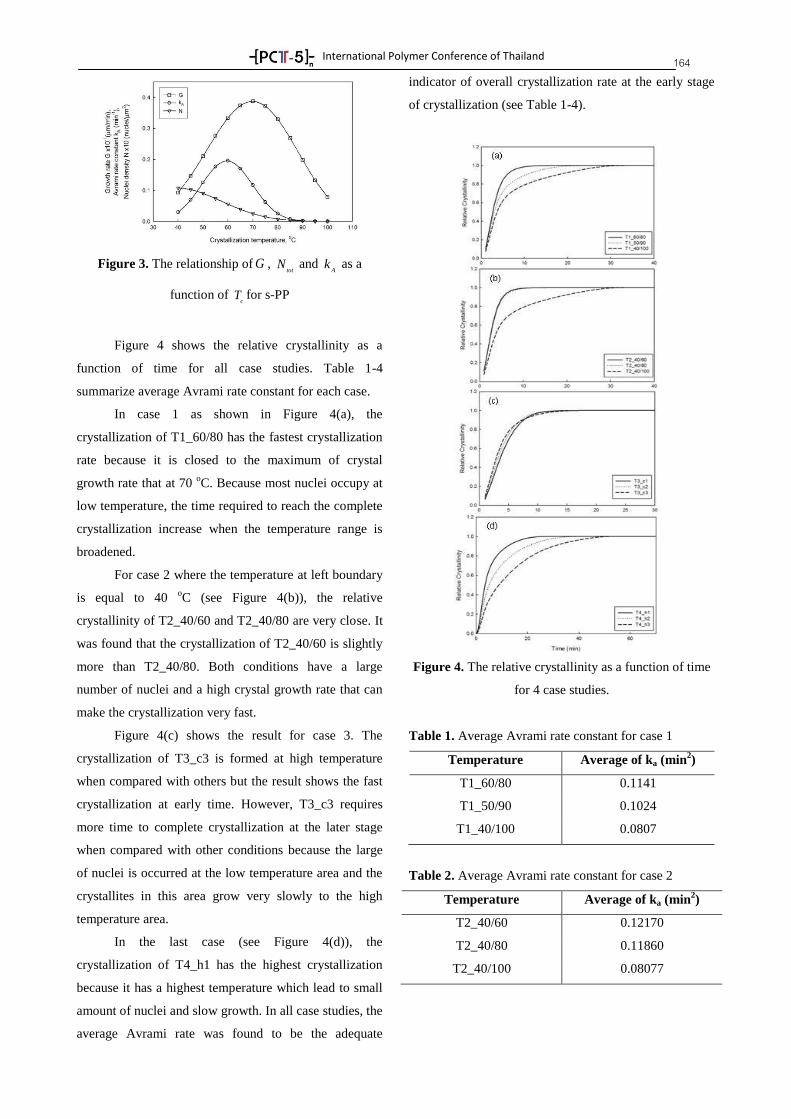
International Polymer Conference of Thailand
164
Figure 3. The relationship of G ,
totN and
Ak as a
function of c
T for s-PP
Figure 4 shows the relative crystallinity as a
function of time for all case studies. Table 1-4
summarize average Avrami rate constant for each case.
In case 1 as shown in Figure 4(a), the
crystallization of T1_60/80 has the fastest crystallization
rate because it is closed to the maximum of crystal
growth rate that at 70 oC. Because most nuclei occupy at
low temperature, the time required to reach the complete
crystallization increase when the temperature range is
broadened.
For case 2 where the temperature at left boundary
is equal to 40 oC (see Figure 4(b)), the relative
crystallinity of T2_40/60 and T2_40/80 are very close. It
was found that the crystallization of T2_40/60 is slightly
more than T2_40/80. Both conditions have a large
number of nuclei and a high crystal growth rate that can
make the crystallization very fast.
Figure 4(c) shows the result for case 3. The
crystallization of T3_c3 is formed at high temperature
when compared with others but the result shows the fast
crystallization at early time. However, T3_c3 requires
more time to complete crystallization at the later stage
when compared with other conditions because the large
of nuclei is occurred at the low temperature area and the
crystallites in this area grow very slowly to the high
temperature area.
In the last case (see Figure 4(d)), the
crystallization of T4_h1 has the highest crystallization
because it has a highest temperature which lead to small
amount of nuclei and slow growth. In all case studies, the
average Avrami rate was found to be the adequate
indicator of overall crystallization rate at the early stage
of crystallization (see Table 1-4).
Figure 4. The relative crystallinity as a function of time
for 4 case studies.
Table 1. Average Avrami rate constant for case 1
Temperature Average of ka (min2)
T1_60/80 0.1141
T1_50/90 0.1024
T1_40/100 0.0807
Table 2. Average Avrami rate constant for case 2
Temperature Average of ka (min2)
T2_40/60 0.12170
T2_40/80 0.11860
T2_40/100 0.08077
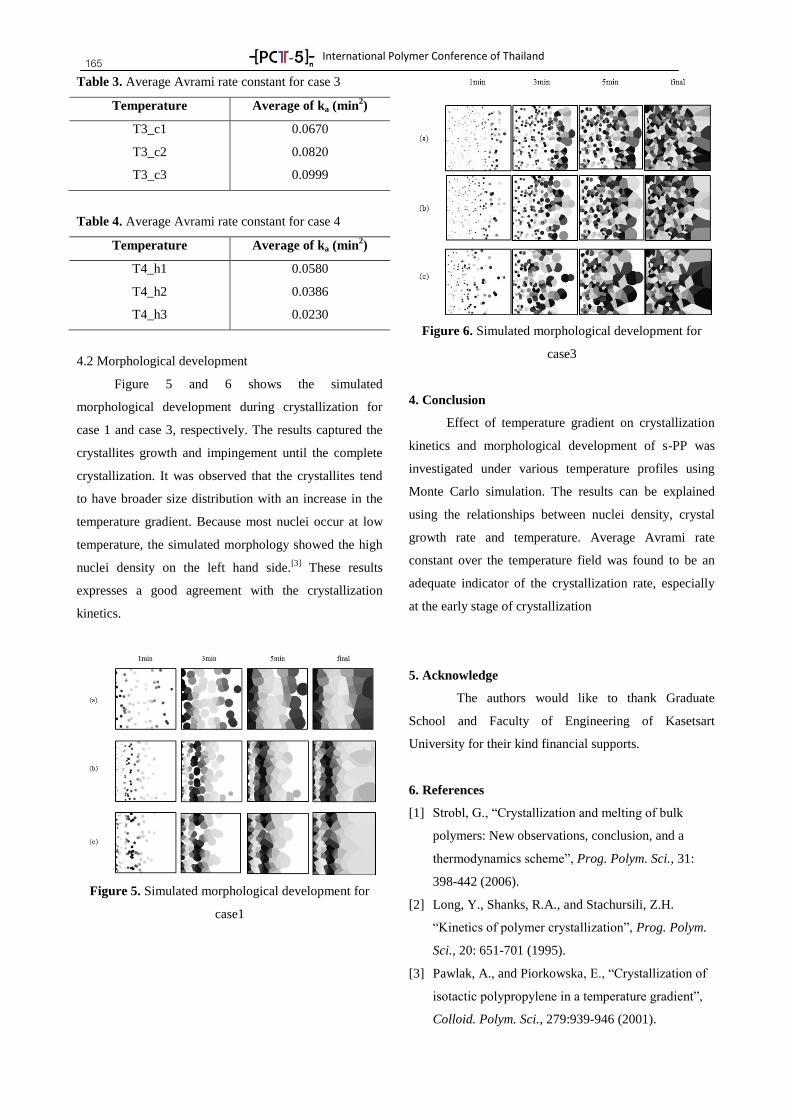
International Polymer Conference of Thailand
165 Table 3. Average Avrami rate constant for case 3
Temperature Average of ka (min2)
T3_c1 0.0670
T3_c2 0.0820
T3_c3 0.0999
Table 4. Average Avrami rate constant for case 4
Temperature Average of ka (min2)
T4_h1 0.0580
T4_h2 0.0386
T4_h3 0.0230
4.2 Morphological development
Figure 5 and 6 shows the simulated
morphological development during crystallization for
case 1 and case 3, respectively. The results captured the
crystallites growth and impingement until the complete
crystallization. It was observed that the crystallites tend
to have broader size distribution with an increase in the
temperature gradient. Because most nuclei occur at low
temperature, the simulated morphology showed the high
nuclei density on the left hand side.[3]
These results
expresses a good agreement with the crystallization
kinetics.
Figure 5. Simulated morphological development for
case1
Figure 6. Simulated morphological development for
case3
4. Conclusion
Effect of temperature gradient on crystallization
kinetics and morphological development of s-PP was
investigated under various temperature profiles using
Monte Carlo simulation. The results can be explained
using the relationships between nuclei density, crystal
growth rate and temperature. Average Avrami rate
constant over the temperature field was found to be an
adequate indicator of the crystallization rate, especially
at the early stage of crystallization
5. Acknowledge
The authors would like to thank Graduate
School and Faculty of Engineering of Kasetsart
University for their kind financial supports.
6. References
[1] Strobl, G., “Crystallization and melting of bulk
polymers: New observations, conclusion, and a
thermodynamics scheme”, Prog. Polym. Sci., 31:
398-442 (2006).
[2] Long, Y., Shanks, R.A., and Stachursili, Z.H.
“Kinetics of polymer crystallization”, Prog. Polym.
Sci., 20: 651-701 (1995).
[3] Pawlak, A., and Piorkowska, E., “Crystallization of
isotactic polypropylene in a temperature gradient”,
Colloid. Polym. Sci., 279:939-946 (2001).

International Polymer Conference of Thailand
166 [4] Avrami, M., “Kinetics of Phase Change. I. General
Theory”, J. Chem. Phys., 7: 1103-1112 (1939).
[5] Avrami, M., “Kinetics of Phase Change. II.
Transformation-time relations for random
distribution of nuclei”, J. Chem. Phys., 8:212-224
(1940).
[6] Supaphol, P. and Sprueill, J.E., “Thermal properties
and Isothermal crystallization of syndiotactic
polypropylene: Differential scanning calorimetry
and overall crystallization kinetics”, J. App. Polym.
Sci., 75:44-59 (2000).
International Polymer Conference of Thailand
167 PROCO-04
Pressure Slips Casting Using a Porous Plastic Mold: Effect of Pressure and Time on
Green Articles
Kittiya Jitklang1,a
and Dr.Somchoke Sontikaew 1,b
1King Mongkut’s University of Technology Thonburi (KMUTT)
126 Pracha Uthit Rd., Bang Mod, Thung Khru, Bangkok 10140, Thailand
Abstract
In this work, a porous plastic mold was developed for pressure slip casting of green ceramic articles.
PMMA microspheres with average diameter of 375 m and 30 m provided the porous plastic with average
pore size of 14-20 m. The porous mould was used to investigate effects of casting pressure and casting time on
weight, thickness, diameter, linear shrinkage, and green density of green ceramic disks. It was found that the wet
and dry weights of the green samples were pressure dependent at low casting pressure and became pressure
independent when the casting pressure was beyond 1 MPa. The casting time slightly affected the wet and dry
weights. The content of residual water in the green samples was independent of casting pressure and casting
time. The final content of residual water in the green samples was 50% by weight of water in a slip used. The
diameter, linear shrinkage, and green density of the green samples were merely pressure dependent.
Keywords: Pressure slip casting, Porous materials, Ceramic casting
1. Introduction
For several decades, high-pressure slip casting
process has shown a remarkable increase in productivity
and a considerable improvement in quality of ceramic
sanitary and tableware articles as compared to
conventional slip casting process using plaster of Paris as
a mold material [1]. In the former process, porous
polymer material has been used to make a mould to
extract water from slip through pores under high
pressures of 1-4 MPa [2, 3]. According to Sacmi
Whiteware resin moulds, the matrix of the porous mould
materials with average pore size of 20-25 micrometers
and % open porosity of 27-30 frequently is polymethyl
methacrylate (PMMA). The porous materials show
20 N/mm2 and 8 N/mm
2 in compressive strength and
blending tensile strength, respectively. The service life of
the mould material is around 20,000-40,000 casts. There
are a few works reported in the literatures about the
preparation, morphology and properties of porous
materials [4-6]. However, in these literatures,
investigation of using the porous polymer materials to
produce ceramic articles via the pressure slip casting
process has not been publicly reported yet.
In this work, PMMA porous plastic was
developed to investigate morphology and thickness-
forming capacity of the porous plastic. The porous
plastic obtained was used to make a pressure slip casting
mould to study effects of pressure and time on weight,
thickness, diameter, linear shrinkage, and green density
of green ceramic articles.
2. Experimental
2.1 Materials
The methyl methacrylate monomer (MMA)
with inhibitor of dimethyl-6-tertiary-butylphenol and a
minimum purity of 99.9% was purchased from Thai
MMA Co., Ltd. The polymerization initiator benzoyl
peroxide (BPO) was supplied by Sigma-Aldrich.
Ethylene Oxide/Propylene Oxide Copolymers (EO/PO),
Tergitol XD from DOW chemical, was used as a non-
ionic surfactant for emulsion polymerization of PMMA
porous material. Large and small PMMA beads with
diameter of 375 m and 30 m, respectively, were
kindly supplied by Diapolyacrylate Co., Ltd. (Mitsubishi
Rayon group). Distilled water purchased from RCI
labscan limited was used for suspension polymerization
and water-in-oil emulsion polymerization of PMMA. A
clay slip with a density of 1.49 (1.39) g/cm3
and pH value
of 8 and solid content of 49% used was supplied by Sin
Fa industrial, Thailand.
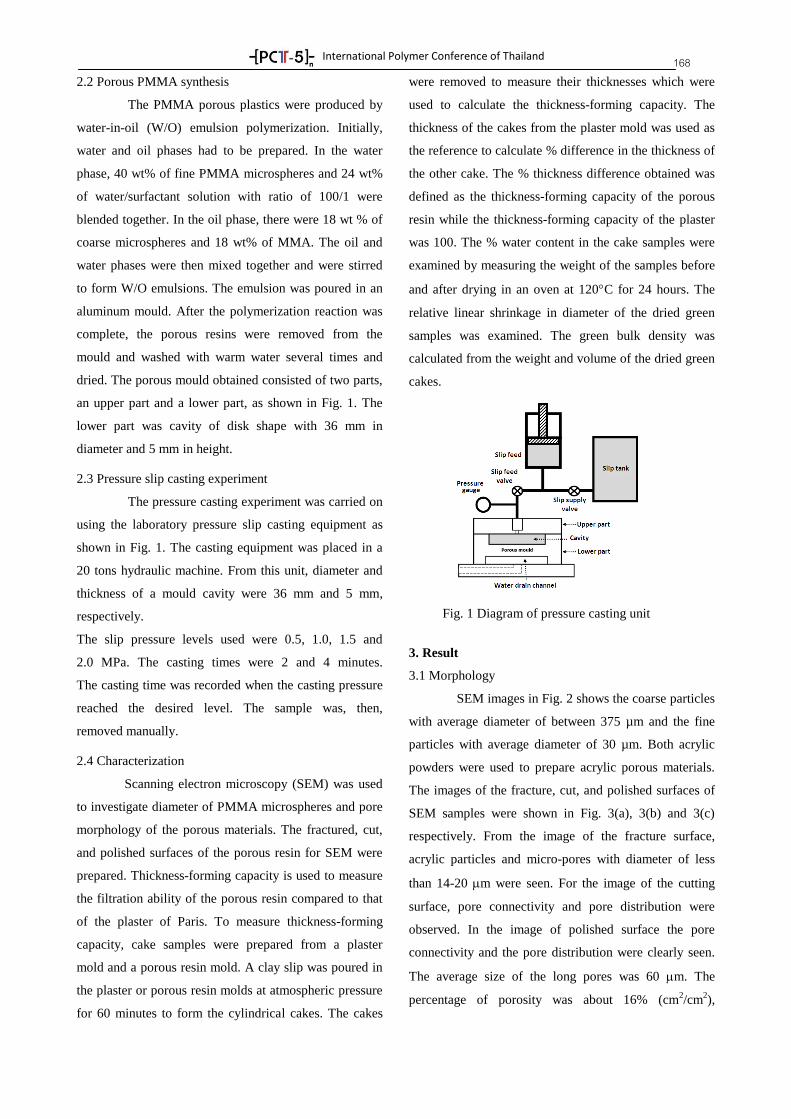
International Polymer Conference of Thailand
168 2.2 Porous PMMA synthesis
The PMMA porous plastics were produced by
water-in-oil (W/O) emulsion polymerization. Initially,
water and oil phases had to be prepared. In the water
phase, 40 wt% of fine PMMA microspheres and 24 wt%
of water/surfactant solution with ratio of 100/1 were
blended together. In the oil phase, there were 18 wt % of
coarse microspheres and 18 wt% of MMA. The oil and
water phases were then mixed together and were stirred
to form W/O emulsions. The emulsion was poured in an
aluminum mould. After the polymerization reaction was
complete, the porous resins were removed from the
mould and washed with warm water several times and
dried. The porous mould obtained consisted of two parts,
an upper part and a lower part, as shown in Fig. 1. The
lower part was cavity of disk shape with 36 mm in
diameter and 5 mm in height.
2.3 Pressure slip casting experiment
The pressure casting experiment was carried on
using the laboratory pressure slip casting equipment as
shown in Fig. 1. The casting equipment was placed in a
20 tons hydraulic machine. From this unit, diameter and
thickness of a mould cavity were 36 mm and 5 mm,
respectively.
The slip pressure levels used were 0.5, 1.0, 1.5 and
2.0 MPa. The casting times were 2 and 4 minutes.
The casting time was recorded when the casting pressure
reached the desired level. The sample was, then,
removed manually.
2.4 Characterization
Scanning electron microscopy (SEM) was used
to investigate diameter of PMMA microspheres and pore
morphology of the porous materials. The fractured, cut,
and polished surfaces of the porous resin for SEM were
prepared. Thickness-forming capacity is used to measure
the filtration ability of the porous resin compared to that
of the plaster of Paris. To measure thickness-forming
capacity, cake samples were prepared from a plaster
mold and a porous resin mold. A clay slip was poured in
the plaster or porous resin molds at atmospheric pressure
for 60 minutes to form the cylindrical cakes. The cakes
were removed to measure their thicknesses which were
used to calculate the thickness-forming capacity. The
thickness of the cakes from the plaster mold was used as
the reference to calculate % difference in the thickness of
the other cake. The % thickness difference obtained was
defined as the thickness-forming capacity of the porous
resin while the thickness-forming capacity of the plaster
was 100. The % water content in the cake samples were
examined by measuring the weight of the samples before
and after drying in an oven at 120C for 24 hours. The
relative linear shrinkage in diameter of the dried green
samples was examined. The green bulk density was
calculated from the weight and volume of the dried green
cakes.
3. Result
3.1 Morphology
SEM images in Fig. 2 shows the coarse particles
with average diameter of between 375 µm and the fine
particles with average diameter of 30 µm. Both acrylic
powders were used to prepare acrylic porous materials.
The images of the fracture, cut, and polished surfaces of
SEM samples were shown in Fig. 3(a), 3(b) and 3(c)
respectively. From the image of the fracture surface,
acrylic particles and micro-pores with diameter of less
than 14-20 m were seen. For the image of the cutting
surface, pore connectivity and pore distribution were
observed. In the image of polished surface the pore
connectivity and the pore distribution were clearly seen.
The average size of the long pores was 60 m. The
percentage of porosity was about 16% (cm2/cm
2),
Fig. 1 Diagram of pressure casting unit
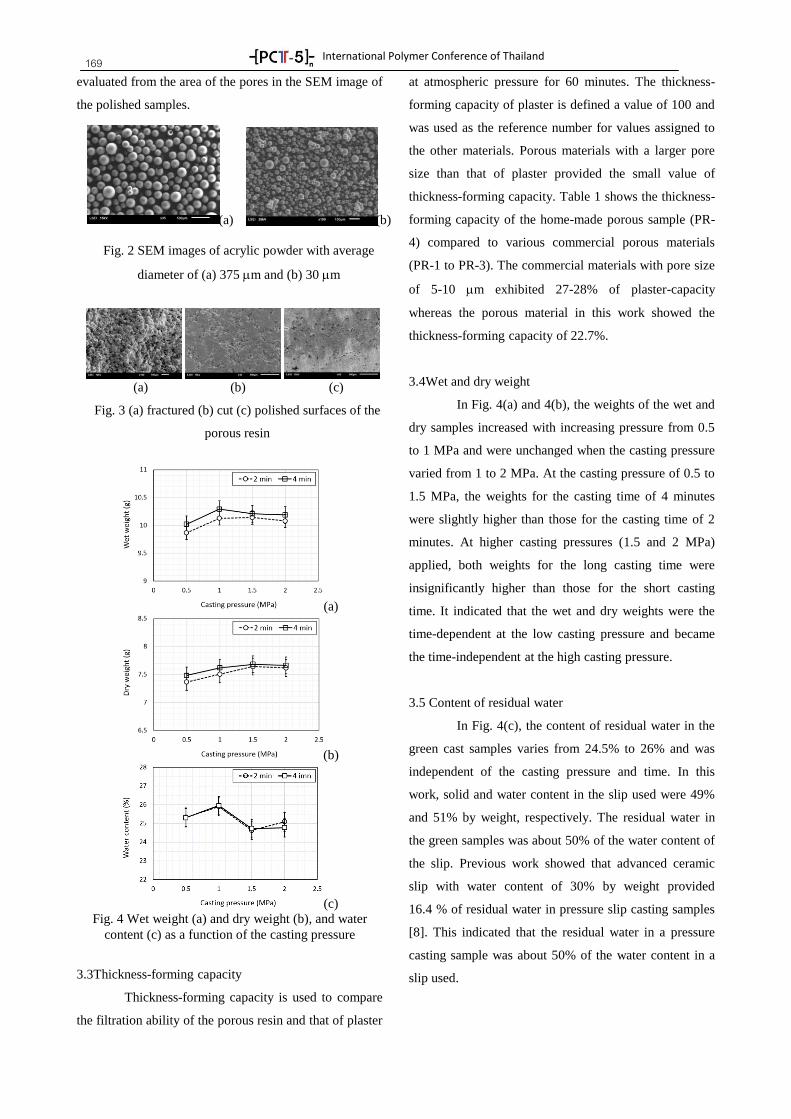
International Polymer Conference of Thailand
169 evaluated from the area of the pores in the SEM image of
the polished samples.
3.3Thickness-forming capacity
Thickness-forming capacity is used to compare
the filtration ability of the porous resin and that of plaster
at atmospheric pressure for 60 minutes. The thickness-
forming capacity of plaster is defined a value of 100 and
was used as the reference number for values assigned to
the other materials. Porous materials with a larger pore
size than that of plaster provided the small value of
thickness-forming capacity. Table 1 shows the thickness-
forming capacity of the home-made porous sample (PR-
4) compared to various commercial porous materials
(PR-1 to PR-3). The commercial materials with pore size
of 5-10 m exhibited 27-28% of plaster-capacity
whereas the porous material in this work showed the
thickness-forming capacity of 22.7%.
3.4Wet and dry weight
In Fig. 4(a) and 4(b), the weights of the wet and
dry samples increased with increasing pressure from 0.5
to 1 MPa and were unchanged when the casting pressure
varied from 1 to 2 MPa. At the casting pressure of 0.5 to
1.5 MPa, the weights for the casting time of 4 minutes
were slightly higher than those for the casting time of 2
minutes. At higher casting pressures (1.5 and 2 MPa)
applied, both weights for the long casting time were
insignificantly higher than those for the short casting
time. It indicated that the wet and dry weights were the
time-dependent at the low casting pressure and became
the time-independent at the high casting pressure.
3.5 Content of residual water
In Fig. 4(c), the content of residual water in the
green cast samples varies from 24.5% to 26% and was
independent of the casting pressure and time. In this
work, solid and water content in the slip used were 49%
and 51% by weight, respectively. The residual water in
the green samples was about 50% of the water content of
the slip. Previous work showed that advanced ceramic
slip with water content of 30% by weight provided
16.4 % of residual water in pressure slip casting samples
[8]. This indicated that the residual water in a pressure
casting sample was about 50% of the water content in a
slip used.
(a)
(b)
(c)
Fig. 4 Wet weight (a) and dry weight (b), and water
content (c) as a function of the casting pressure
(a) (b) (c)
Fig. 3 (a) fractured (b) cut (c) polished surfaces of the
porous resin
(a) (b)
Fig. 2 SEM images of acrylic powder with average
diameter of (a) 375 m and (b) 30 m
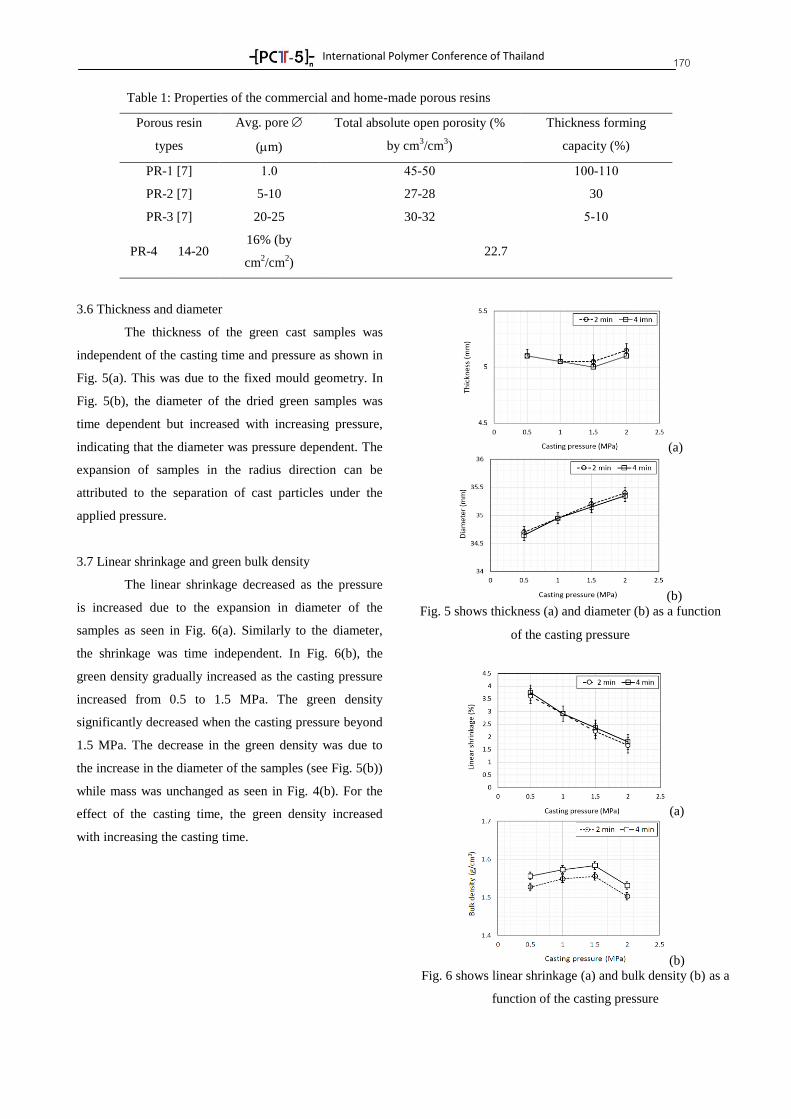
International Polymer Conference of Thailand
170
Table 1: Properties of the commercial and home-made porous resins
Porous resin
types
Avg. pore
(m)
Total absolute open porosity (%
by cm3/cm
3)
Thickness forming
capacity (%)
PR-1 [7] 1.0 45-50 100-110
PR-2 [7] 5-10 27-28 30
PR-3 [7] 20-25 30-32 5-10
PR-4 14-20 16% (by
cm2/cm
2)
22.7
3.6 Thickness and diameter
The thickness of the green cast samples was
independent of the casting time and pressure as shown in
Fig. 5(a). This was due to the fixed mould geometry. In
Fig. 5(b), the diameter of the dried green samples was
time dependent but increased with increasing pressure,
indicating that the diameter was pressure dependent. The
expansion of samples in the radius direction can be
attributed to the separation of cast particles under the
applied pressure.
3.7 Linear shrinkage and green bulk density
The linear shrinkage decreased as the pressure
is increased due to the expansion in diameter of the
samples as seen in Fig. 6(a). Similarly to the diameter,
the shrinkage was time independent. In Fig. 6(b), the
green density gradually increased as the casting pressure
increased from 0.5 to 1.5 MPa. The green density
significantly decreased when the casting pressure beyond
1.5 MPa. The decrease in the green density was due to
the increase in the diameter of the samples (see Fig. 5(b))
while mass was unchanged as seen in Fig. 4(b). For the
effect of the casting time, the green density increased
with increasing the casting time.
(a)
(b) Fig. 6 shows linear shrinkage (a) and bulk density (b) as a
function of the casting pressure
(a)
(b) Fig. 5 shows thickness (a) and diameter (b) as a function
of the casting pressure
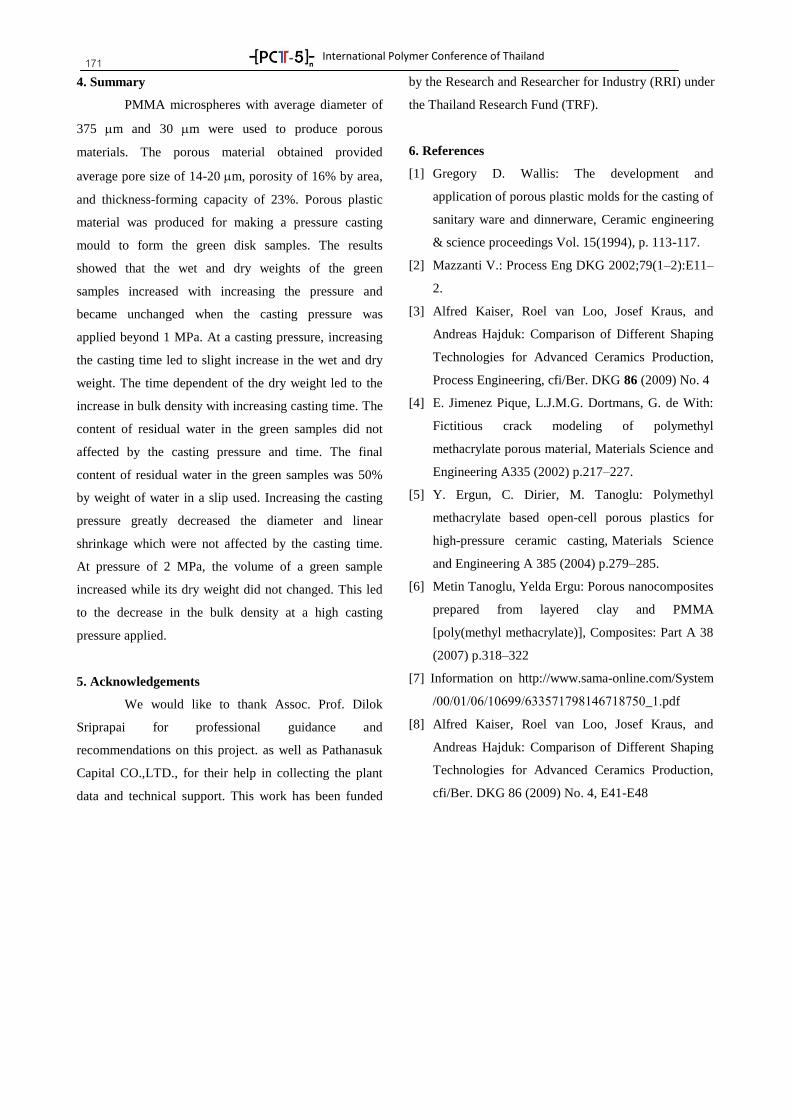
International Polymer Conference of Thailand
171 4. Summary
PMMA microspheres with average diameter of
375 m and 30 m were used to produce porous
materials. The porous material obtained provided
average pore size of 14-20 m, porosity of 16% by area,
and thickness-forming capacity of 23%. Porous plastic
material was produced for making a pressure casting
mould to form the green disk samples. The results
showed that the wet and dry weights of the green
samples increased with increasing the pressure and
became unchanged when the casting pressure was
applied beyond 1 MPa. At a casting pressure, increasing
the casting time led to slight increase in the wet and dry
weight. The time dependent of the dry weight led to the
increase in bulk density with increasing casting time. The
content of residual water in the green samples did not
affected by the casting pressure and time. The final
content of residual water in the green samples was 50%
by weight of water in a slip used. Increasing the casting
pressure greatly decreased the diameter and linear
shrinkage which were not affected by the casting time.
At pressure of 2 MPa, the volume of a green sample
increased while its dry weight did not changed. This led
to the decrease in the bulk density at a high casting
pressure applied.
5. Acknowledgements
We would like to thank Assoc. Prof. Dilok
Sriprapai for professional guidance and
recommendations on this project. as well as Pathanasuk
Capital CO.,LTD., for their help in collecting the plant
data and technical support. This work has been funded
by the Research and Researcher for Industry (RRI) under
the Thailand Research Fund (TRF).
6. References
[1] Gregory D. Wallis: The development and
application of porous plastic molds for the casting of
sanitary ware and dinnerware, Ceramic engineering
& science proceedings Vol. 15(1994), p. 113-117.
[2] Mazzanti V.: Process Eng DKG 2002;79(1–2):E11–
2.
[3] Alfred Kaiser, Roel van Loo, Josef Kraus, and
Andreas Hajduk: Comparison of Different Shaping
Technologies for Advanced Ceramics Production,
Process Engineering, cfi/Ber. DKG 86 (2009) No. 4
[4] E. Jimenez Pique, L.J.M.G. Dortmans, G. de With:
Fictitious crack modeling of polymethyl
methacrylate porous material, Materials Science and
Engineering A335 (2002) p.217–227.
[5] Y. Ergun, C. Dirier, M. Tanoglu: Polymethyl
methacrylate based open-cell porous plastics for
high-pressure ceramic casting, Materials Science
and Engineering A 385 (2004) p.279–285.
[6] Metin Tanoglu, Yelda Ergu: Porous nanocomposites
prepared from layered clay and PMMA
[poly(methyl methacrylate)], Composites: Part A 38
(2007) p.318–322
[7] Information on http://www.sama-online.com/System
/00/01/06/10699/633571798146718750_1.pdf
[8] Alfred Kaiser, Roel van Loo, Josef Kraus, and
Andreas Hajduk: Comparison of Different Shaping
Technologies for Advanced Ceramics Production,
cfi/Ber. DKG 86 (2009) No. 4, E41-E48
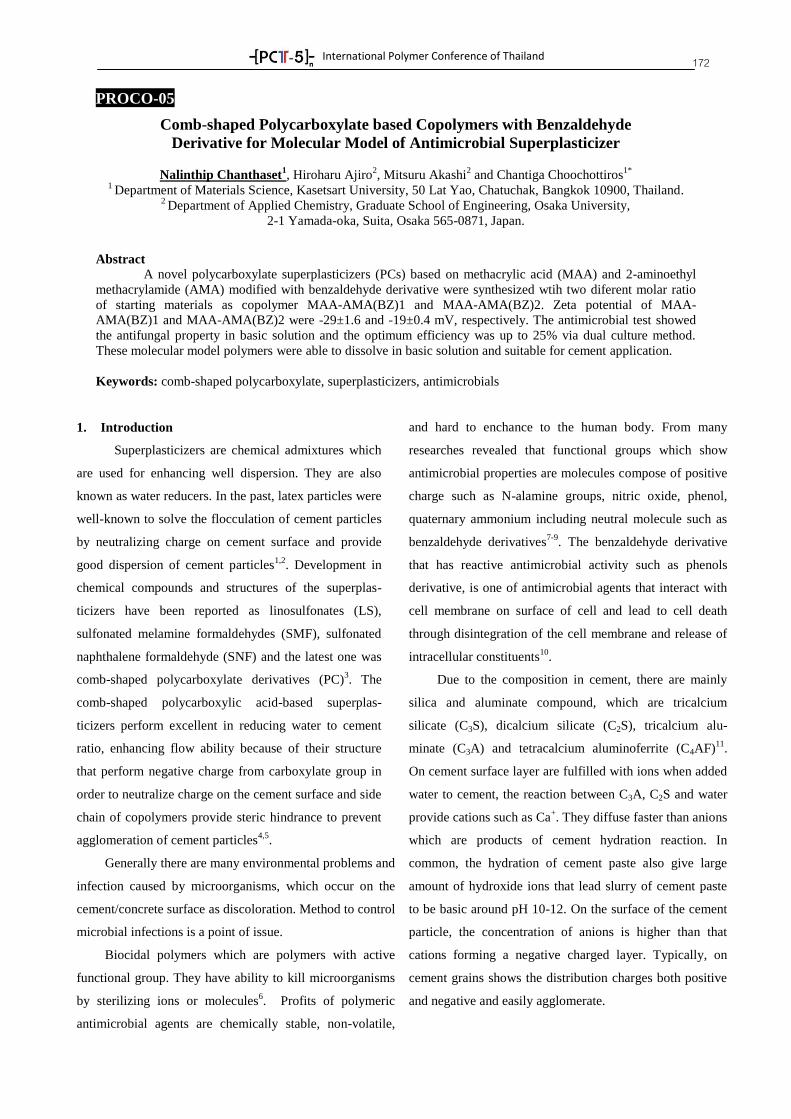
International Polymer Conference of Thailand
172
PROCO-05
Comb-shaped Polycarboxylate based Copolymers with Benzaldehyde
Derivative for Molecular Model of Antimicrobial Superplasticizer
Nalinthip Chanthaset1, Hiroharu Ajiro
2, Mitsuru Akashi
2 and Chantiga Choochottiros
1*
1 Department of Materials Science, Kasetsart University, 50 Lat Yao, Chatuchak, Bangkok 10900, Thailand.
2 Department of Applied Chemistry, Graduate School of Engineering, Osaka University,
2-1 Yamada-oka, Suita, Osaka 565-0871, Japan.
Abstract
A novel polycarboxylate superplasticizers (PCs) based on methacrylic acid (MAA) and 2-aminoethyl
methacrylamide (AMA) modified with benzaldehyde derivative were synthesized wtih two diferent molar ratio
of starting materials as copolymer MAA-AMA(BZ)1 and MAA-AMA(BZ)2. Zeta potential of MAA-
AMA(BZ)1 and MAA-AMA(BZ)2 were -29±1.6 and -19±0.4 mV, respectively. The antimicrobial test showed
the antifungal property in basic solution and the optimum efficiency was up to 25% via dual culture method.
These molecular model polymers were able to dissolve in basic solution and suitable for cement application.
Keywords: comb-shaped polycarboxylate, superplasticizers, antimicrobials
1. Introduction
Superplasticizers are chemical admixtures which
are used for enhancing well dispersion. They are also
known as water reducers. In the past, latex particles were
well-known to solve the flocculation of cement particles
by neutralizing charge on cement surface and provide
good dispersion of cement particles1,2
. Development in
chemical compounds and structures of the superplas-
ticizers have been reported as linosulfonates (LS),
sulfonated melamine formaldehydes (SMF), sulfonated
naphthalene formaldehyde (SNF) and the latest one was
comb-shaped polycarboxylate derivatives (PC)3. The
comb-shaped polycarboxylic acid-based superplas-
ticizers perform excellent in reducing water to cement
ratio, enhancing flow ability because of their structure
that perform negative charge from carboxylate group in
order to neutralize charge on the cement surface and side
chain of copolymers provide steric hindrance to prevent
agglomeration of cement particles4,5
.
Generally there are many environmental problems and
infection caused by microorganisms, which occur on the
cement/concrete surface as discoloration. Method to control
microbial infections is a point of issue.
Biocidal polymers which are polymers with active
functional group. They have ability to kill microorganisms
by sterilizing ions or molecules6. Profits of polymeric
antimicrobial agents are chemically stable, non-volatile,
and hard to enchance to the human body. From many
researches revealed that functional groups which show
antimicrobial properties are molecules compose of positive
charge such as N-alamine groups, nitric oxide, phenol,
quaternary ammonium including neutral molecule such as
benzaldehyde derivatives7-9
. The benzaldehyde derivative
that has reactive antimicrobial activity such as phenols
derivative, is one of antimicrobial agents that interact with
cell membrane on surface of cell and lead to cell death
through disintegration of the cell membrane and release of
intracellular constituents10
.
Due to the composition in cement, there are mainly
silica and aluminate compound, which are tricalcium
silicate (C3S), dicalcium silicate (C2S), tricalcium alu-
minate (C3A) and tetracalcium aluminoferrite (C4AF)11
.
On cement surface layer are fulfilled with ions when added
water to cement, the reaction between C3A, C2S and water
provide cations such as Ca+. They diffuse faster than anions
which are products of cement hydration reaction. In
common, the hydration of cement paste also give large
amount of hydroxide ions that lead slurry of cement paste
to be basic around pH 10-12. On the surface of the cement
particle, the concentration of anions is higher than that
cations forming a negative charged layer. Typically, on
cement grains shows the distribution charges both positive
and negative and easily agglomerate.
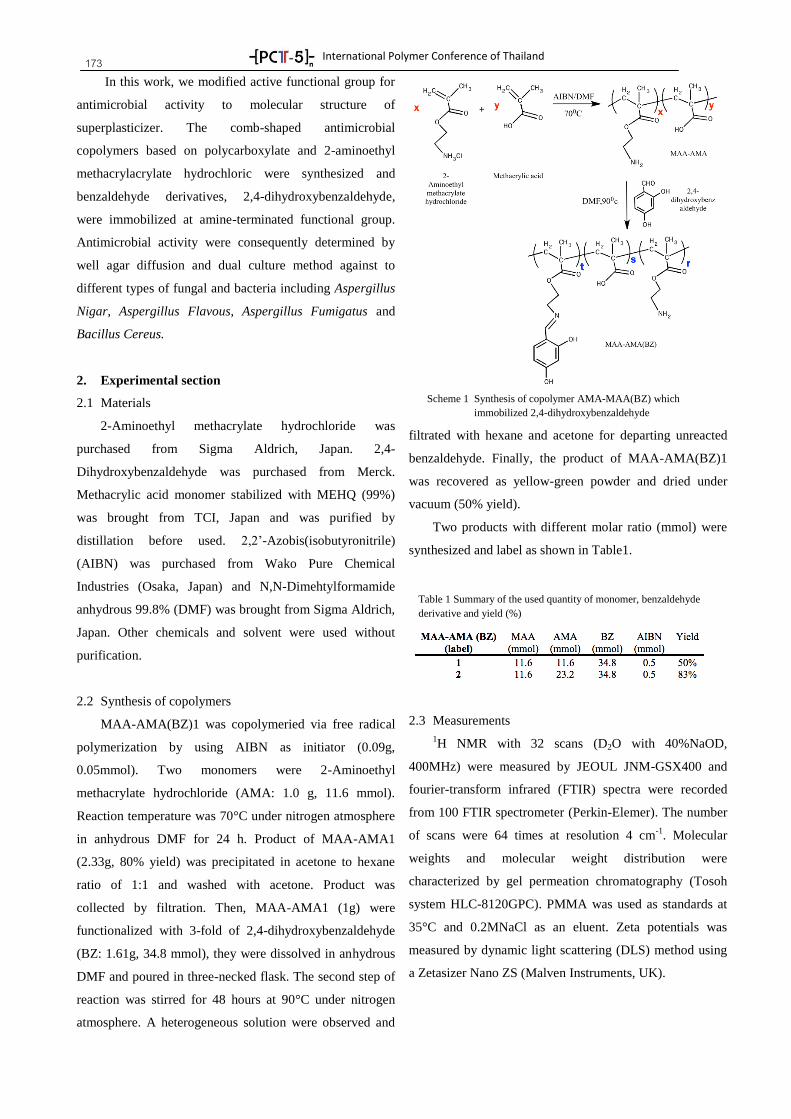
International Polymer Conference of Thailand
173 In this work, we modified active functional group for
antimicrobial activity to molecular structure of
superplasticizer. The comb-shaped antimicrobial
copolymers based on polycarboxylate and 2-aminoethyl
methacrylacrylate hydrochloric were synthesized and
benzaldehyde derivatives, 2,4-dihydroxybenzaldehyde,
were immobilized at amine-terminated functional group.
Antimicrobial activity were consequently determined by
well agar diffusion and dual culture method against to
different types of fungal and bacteria including Aspergillus
Nigar, Aspergillus Flavous, Aspergillus Fumigatus and
Bacillus Cereus.
2. Experimental section
2.1 Materials
2-Aminoethyl methacrylate hydrochloride was
purchased from Sigma Aldrich, Japan. 2,4-
Dihydroxybenzaldehyde was purchased from Merck.
Methacrylic acid monomer stabilized with MEHQ (99%)
was brought from TCI, Japan and was purified by
distillation before used. 2,2’-Azobis(isobutyronitrile)
(AIBN) was purchased from Wako Pure Chemical
Industries (Osaka, Japan) and N,N-Dimehtylformamide
anhydrous 99.8% (DMF) was brought from Sigma Aldrich,
Japan. Other chemicals and solvent were used without
purification.
2.2 Synthesis of copolymers
MAA-AMA(BZ)1 was copolymeried via free radical
polymerization by using AIBN as initiator (0.09g,
0.05mmol). Two monomers were 2-Aminoethyl
methacrylate hydrochloride (AMA: 1.0 g, 11.6 mmol).
Reaction temperature was 70°C under nitrogen atmosphere
in anhydrous DMF for 24 h. Product of MAA-AMA1
(2.33g, 80% yield) was precipitated in acetone to hexane
ratio of 1:1 and washed with acetone. Product was
collected by filtration. Then, MAA-AMA1 (1g) were
functionalized with 3-fold of 2,4-dihydroxybenzaldehyde
(BZ: 1.61g, 34.8 mmol), they were dissolved in anhydrous
DMF and poured in three-necked flask. The second step of
reaction was stirred for 48 hours at 90°C under nitrogen
atmosphere. A heterogeneous solution were observed and
filtrated with hexane and acetone for departing unreacted
benzaldehyde. Finally, the product of MAA-AMA(BZ)1
was recovered as yellow-green powder and dried under
vacuum (50% yield).
Two products with different molar ratio (mmol) were
synthesized and label as shown in Table1.
2.3 Measurements
1H NMR with 32 scans (D2O with 40%NaOD,
400MHz) were measured by JEOUL JNM-GSX400 and
fourier-transform infrared (FTIR) spectra were recorded
from 100 FTIR spectrometer (Perkin-Elemer). The number
of scans were 64 times at resolution 4 cm-1
. Molecular
weights and molecular weight distribution were
characterized by gel permeation chromatography (Tosoh
system HLC-8120GPC). PMMA was used as standards at
35°C and 0.2MNaCl as an eluent. Zeta potentials was
measured by dynamic light scattering (DLS) method using
a Zetasizer Nano ZS (Malven Instruments, UK).
Table 1 Summary of the used quantity of monomer, benzaldehyde
derivative and yield (%)
Scheme 1 Synthesis of copolymer AMA-MAA(BZ) which
immobilized 2,4-dihydroxybenzaldehyde
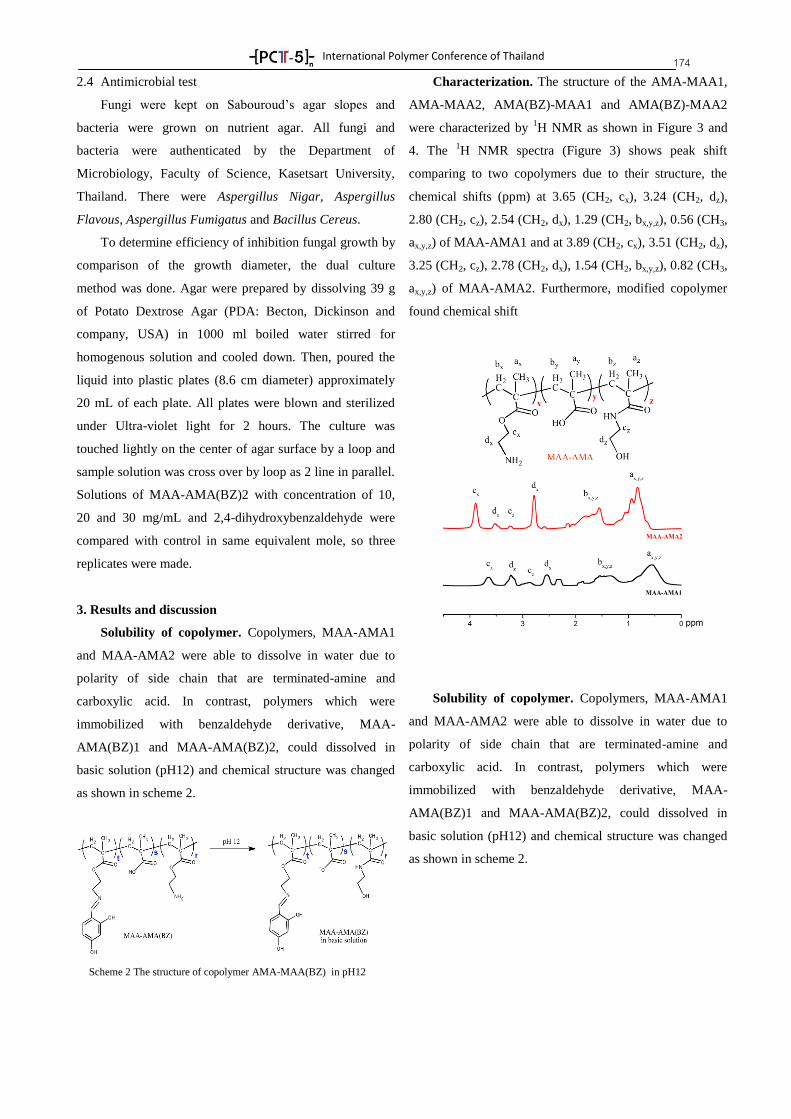
International Polymer Conference of Thailand
174 2.4 Antimicrobial test
Fungi were kept on Sabouroud’s agar slopes and
bacteria were grown on nutrient agar. All fungi and
bacteria were authenticated by the Department of
Microbiology, Faculty of Science, Kasetsart University,
Thailand. There were Aspergillus Nigar, Aspergillus
Flavous, Aspergillus Fumigatus and Bacillus Cereus.
To determine efficiency of inhibition fungal growth by
comparison of the growth diameter, the dual culture
method was done. Agar were prepared by dissolving 39 g
of Potato Dextrose Agar (PDA: Becton, Dickinson and
company, USA) in 1000 ml boiled water stirred for
homogenous solution and cooled down. Then, poured the
liquid into plastic plates (8.6 cm diameter) approximately
20 mL of each plate. All plates were blown and sterilized
under Ultra-violet light for 2 hours. The culture was
touched lightly on the center of agar surface by a loop and
sample solution was cross over by loop as 2 line in parallel.
Solutions of MAA-AMA(BZ)2 with concentration of 10,
20 and 30 mg/mL and 2,4-dihydroxybenzaldehyde were
compared with control in same equivalent mole, so three
replicates were made.
3. Results and discussion
Solubility of copolymer. Copolymers, MAA-AMA1
and MAA-AMA2 were able to dissolve in water due to
polarity of side chain that are terminated-amine and
carboxylic acid. In contrast, polymers which were
immobilized with benzaldehyde derivative, MAA-
AMA(BZ)1 and MAA-AMA(BZ)2, could dissolved in
basic solution (pH12) and chemical structure was changed
as shown in scheme 2.
Characterization. The structure of the AMA-MAA1,
AMA-MAA2, AMA(BZ)-MAA1 and AMA(BZ)-MAA2
were characterized by 1H NMR as shown in Figure 3 and
4. The 1H NMR spectra (Figure 3) shows peak shift
comparing to two copolymers due to their structure, the
chemical shifts (ppm) at 3.65 (CH2, cx), 3.24 (CH2, dz),
2.80 (CH2, cz), 2.54 (CH2, dx), 1.29 (CH2, bx,y,z), 0.56 (CH3,
ax,y,z) of MAA-AMA1 and at 3.89 (CH2, cx), 3.51 (CH2, dz),
3.25 (CH2, cz), 2.78 (CH2, dx), 1.54 (CH2, bx,y,z), 0.82 (CH3,
ax,y,z) of MAA-AMA2. Furthermore, modified copolymer
found chemical shift
Solubility of copolymer. Copolymers, MAA-AMA1
and MAA-AMA2 were able to dissolve in water due to
polarity of side chain that are terminated-amine and
carboxylic acid. In contrast, polymers which were
immobilized with benzaldehyde derivative, MAA-
AMA(BZ)1 and MAA-AMA(BZ)2, could dissolved in
basic solution (pH12) and chemical structure was changed
as shown in scheme 2.
Scheme 2 The structure of copolymer AMA-MAA(BZ) in pH12
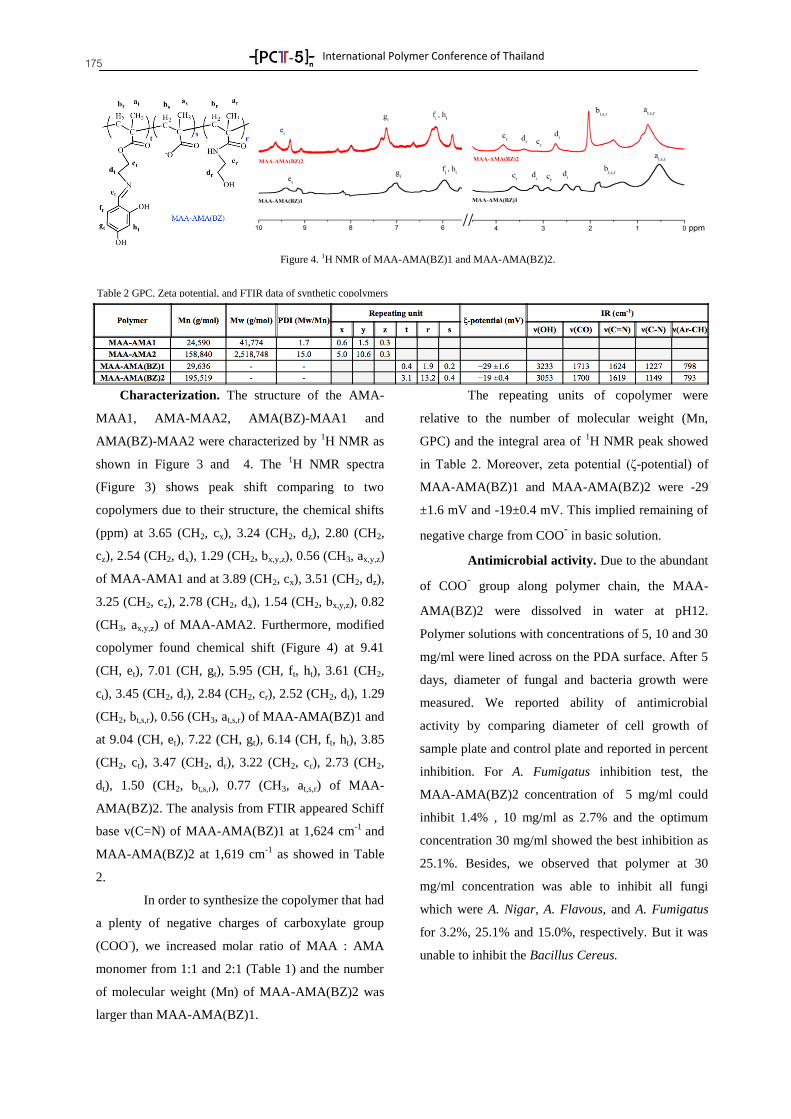
International Polymer Conference of Thailand
175
Characterization. The structure of the AMA-
MAA1, AMA-MAA2, AMA(BZ)-MAA1 and
AMA(BZ)-MAA2 were characterized by 1H NMR as
shown in Figure 3 and 4. The 1H NMR spectra
(Figure 3) shows peak shift comparing to two
copolymers due to their structure, the chemical shifts
(ppm) at 3.65 (CH2, cx), 3.24 (CH2, dz), 2.80 (CH2,
cz), 2.54 (CH2, dx), 1.29 (CH2, bx,y,z), 0.56 (CH3, ax,y,z)
of MAA-AMA1 and at 3.89 (CH2, cx), 3.51 (CH2, dz),
3.25 (CH2, cz), 2.78 (CH2, dx), 1.54 (CH2, bx,y,z), 0.82
(CH3, ax,y,z) of MAA-AMA2. Furthermore, modified
copolymer found chemical shift (Figure 4) at 9.41
(CH, et), 7.01 (CH, gt), 5.95 (CH, ft, ht), 3.61 (CH2,
ct), 3.45 (CH2, dr), 2.84 (CH2, cr), 2.52 (CH2, dt), 1.29
(CH2, bt,s,r), 0.56 (CH3, at,s,r) of MAA-AMA(BZ)1 and
at 9.04 (CH, et), 7.22 (CH, gt), 6.14 (CH, ft, ht), 3.85
(CH2, ct), 3.47 (CH2, dr), 3.22 (CH2, cr), 2.73 (CH2,
dt), 1.50 (CH2, bt,s,r), 0.77 (CH3, at,s,r) of MAA-
AMA(BZ)2. The analysis from FTIR appeared Schiff
base v(C=N) of MAA-AMA(BZ)1 at 1,624 cm-1
and
MAA-AMA(BZ)2 at 1,619 cm-1
as showed in Table
2.
In order to synthesize the copolymer that had
a plenty of negative charges of carboxylate group
(COO-), we increased molar ratio of MAA : AMA
monomer from 1:1 and 2:1 (Table 1) and the number
of molecular weight (Mn) of MAA-AMA(BZ)2 was
larger than MAA-AMA(BZ)1.
The repeating units of copolymer were
relative to the number of molecular weight (Mn,
GPC) and the integral area of 1H NMR peak showed
in Table 2. Moreover, zeta potential (ζ-potential) of
MAA-AMA(BZ)1 and MAA-AMA(BZ)2 were -29
±1.6 mV and -19±0.4 mV. This implied remaining of
negative charge from COO- in basic solution.
Antimicrobial activity. Due to the abundant
of COO- group along polymer chain, the MAA-
AMA(BZ)2 were dissolved in water at pH12.
Polymer solutions with concentrations of 5, 10 and 30
mg/ml were lined across on the PDA surface. After 5
days, diameter of fungal and bacteria growth were
measured. We reported ability of antimicrobial
activity by comparing diameter of cell growth of
sample plate and control plate and reported in percent
inhibition. For A. Fumigatus inhibition test, the
MAA-AMA(BZ)2 concentration of 5 mg/ml could
inhibit 1.4% , 10 mg/ml as 2.7% and the optimum
concentration 30 mg/ml showed the best inhibition as
25.1%. Besides, we observed that polymer at 30
mg/ml concentration was able to inhibit all fungi
which were A. Nigar, A. Flavous, and A. Fumigatus
for 3.2%, 25.1% and 15.0%, respectively. But it was
unable to inhibit the Bacillus Cereus.
Figure 4. 1H NMR of MAA-AMA(BZ)1 and MAA-AMA(BZ)2.
//
Table 2 GPC, Zeta potential, and FTIR data of synthetic copolymers
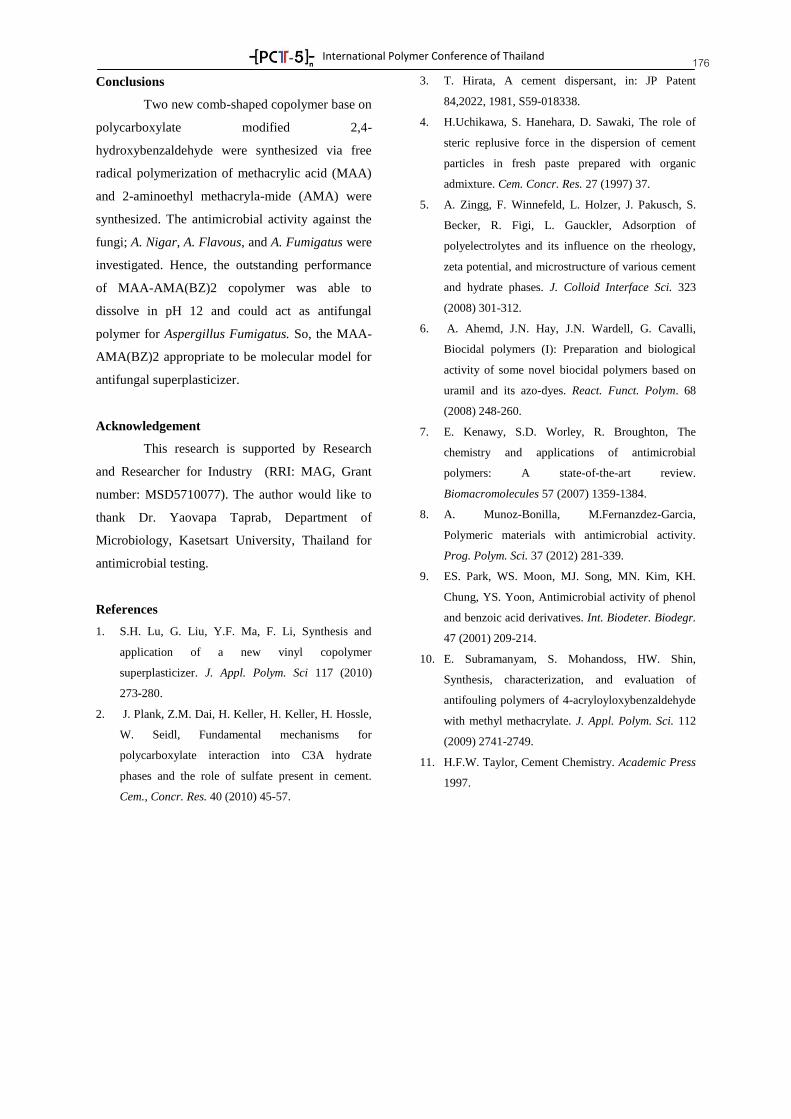
International Polymer Conference of Thailand
176 Conclusions
Two new comb-shaped copolymer base on
polycarboxylate modified 2,4-
hydroxybenzaldehyde were synthesized via free
radical polymerization of methacrylic acid (MAA)
and 2-aminoethyl methacryla-mide (AMA) were
synthesized. The antimicrobial activity against the
fungi; A. Nigar, A. Flavous, and A. Fumigatus were
investigated. Hence, the outstanding performance
of MAA-AMA(BZ)2 copolymer was able to
dissolve in pH 12 and could act as antifungal
polymer for Aspergillus Fumigatus. So, the MAA-
AMA(BZ)2 appropriate to be molecular model for
antifungal superplasticizer.
Acknowledgement
This research is supported by Research
and Researcher for Industry (RRI: MAG, Grant
number: MSD5710077). The author would like to
thank Dr. Yaovapa Taprab, Department of
Microbiology, Kasetsart University, Thailand for
antimicrobial testing.
References
1. S.H. Lu, G. Liu, Y.F. Ma, F. Li, Synthesis and
application of a new vinyl copolymer
superplasticizer. J. Appl. Polym. Sci 117 (2010)
273-280.
2. J. Plank, Z.M. Dai, H. Keller, H. Keller, H. Hossle,
W. Seidl, Fundamental mechanisms for
polycarboxylate interaction into C3A hydrate
phases and the role of sulfate present in cement.
Cem., Concr. Res. 40 (2010) 45-57.
3. T. Hirata, A cement dispersant, in: JP Patent
84,2022, 1981, S59-018338.
4. H.Uchikawa, S. Hanehara, D. Sawaki, The role of
steric replusive force in the dispersion of cement
particles in fresh paste prepared with organic
admixture. Cem. Concr. Res. 27 (1997) 37.
5. A. Zingg, F. Winnefeld, L. Holzer, J. Pakusch, S.
Becker, R. Figi, L. Gauckler, Adsorption of
polyelectrolytes and its influence on the rheology,
zeta potential, and microstructure of various cement
and hydrate phases. J. Colloid Interface Sci. 323
(2008) 301-312.
6. A. Ahemd, J.N. Hay, J.N. Wardell, G. Cavalli,
Biocidal polymers (I): Preparation and biological
activity of some novel biocidal polymers based on
uramil and its azo-dyes. React. Funct. Polym. 68
(2008) 248-260.
7. E. Kenawy, S.D. Worley, R. Broughton, The
chemistry and applications of antimicrobial
polymers: A state-of-the-art review.
Biomacromolecules 57 (2007) 1359-1384.
8. A. Munoz-Bonilla, M.Fernanzdez-Garcia,
Polymeric materials with antimicrobial activity.
Prog. Polym. Sci. 37 (2012) 281-339.
9. ES. Park, WS. Moon, MJ. Song, MN. Kim, KH.
Chung, YS. Yoon, Antimicrobial activity of phenol
and benzoic acid derivatives. Int. Biodeter. Biodegr.
47 (2001) 209-214.
10. E. Subramanyam, S. Mohandoss, HW. Shin,
Synthesis, characterization, and evaluation of
antifouling polymers of 4-acryloyloxybenzaldehyde
with methyl methacrylate. J. Appl. Polym. Sci. 112
(2009) 2741-2749.
11. H.F.W. Taylor, Cement Chemistry. Academic Press
1997.
International Polymer Conference of Thailand
177
PROCP-02
Properties and Stability of Poly(Vinyl Acetate-Co-Alkyl- Acrylate) Latex Modified with
Carbonyl- and Hydroxyl-containing Monomers Piyabutree Thongsook
1, Varawut Tangpasuthadol
1,2*
1Program of Petrochemical and Polymer Science, Faculty of Science, Chulalongkorn University, Bangkok
10330 2Department of Chemistry, Faculty of Science, Chulalongkorn University, Bangkok 10330
Abstract
The aim of this work was to study the effect of functional group types on the adhesion property and stability
of pressure sensitive adhesive (PSA) based on poly(vinyl acetate-co-alkyl acrylate) latex. The latex was
synthesized by the miniemulsion polymerization in semi-continuous process having vinyl acetate (10%wt) and
2-ethyl hexyl acrylate (90%wt) as major ingredients. The modification was carried out by adding 0-1.5% of one
or more monomer types that contained –COOH, i.e. -carboxyethyl acrylate, methacrylic acid, and acrylic acid,
or –OH group, i.e. 2-hydroxyl ethyl acrylate and 2-hydroxy ethyl methacrylate. Each final adhesive was tested
on stainless-steel substrate with adhesive film thickness of 20 m. The synthesized copolymer latexes with high
stability have the zeta potential values of -30 to -36 mV and, conductivity of 1.4510-3
to 3.1310-2
mS/cm. The
modified latex could be stored for as long as 6 months at ambient temperature. Adhesion properties of the
synthesized copolymer had the peel strength of > 0.7 kg/in and cohesion time of > 24 hr. These results indicated
that the improved PSAs gave the stronger adhesive bond and were more stable than the copolymers without an
addition of –COOH monomer.
Keywords: Pressure sensitive adhesive, Emulsion polymerization, Functional monomer, Peel strength and
Cohesion
1. Introduction
Adhesive is the bonding agent for joining the
surface of two solid materials. The strength of the
adhesive is affected by duration, heating, compression
which depends on the type of surface, surface energy,
contact angle, and type of the adhesive. There are 2 types
of the adhesive; permanent and transient types.
Industrial adhesives are latexes synthesized by
the emulsion polymerization of monomers, such as vinyl
acetate, styrene, or acrylate. The polymer synthesized
from each monomer is suitable for different applications.
This study focuses on vinyl acetate–alkyl acrylate
copolymer which is pressure sensitive adhesive or PSA
by which the materials will be adhered just applying
gentle press. PSAs are applied in many applications such
as tape, sticker, OPP tape, double side tape, etc. The
carboxyl and hydroxyl groups are the key functional
groups that affect the tack and the peel properties of the
latex, caused by the interaction from hydrogen bonds
between the two materials [1].
Each application needs different latex
properties. The latex particle surface can be improved by
using the monomers containing functional groups, for
instance, carboxyl, hydroxyl, amine, and epoxy. These
monomers can provide crosslinking and surface
modification of the latex particles. Carboxyl and
hydroxyl are interesting functional groups. Carboxyl
groups in, for example, acrylic acid and methyl acrylic
acid can improve the stability of the colloid, mechanical
properties, resistance to shear, and increase the hardness
of the film. The hydroxyl groups in, for example, 2-
hydroxy ethyl acrylate and 2-hydroxy ethyl methacrylate
can improve the stability of colloid and heat resistance.
Both functional groups improved adhesion of latex
particles due to their additional hydrogen bonding and
dipole-dipole attraction force [1, 3].
Therefore, in this work, the functional groups
on latex particles were modified by incorporating
additional monomers containing carboxylic (-COOH)
and hydroxyl (-OH) groups into the latex. The adhesion
property, colloidal property, and thermal property were
investigated. It was hypothesized that a new PSA would
have an improved adhesion property and would be more
stable than the commercial available products.
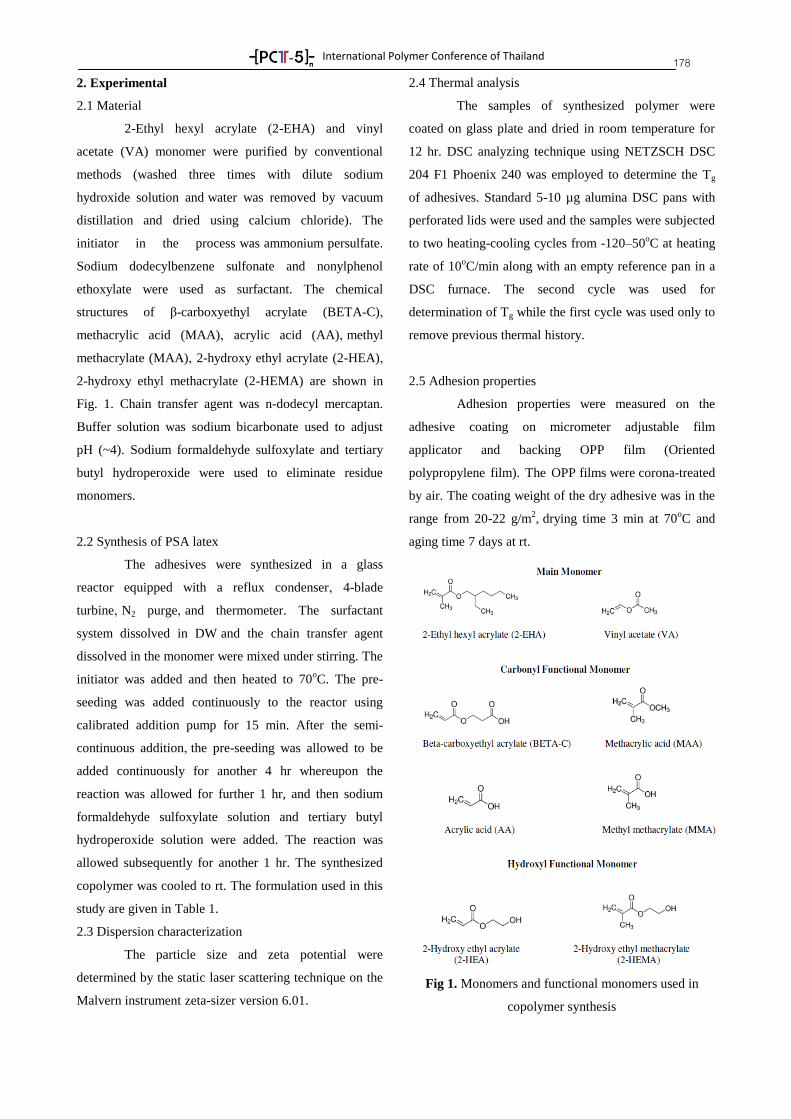
International Polymer Conference of Thailand
178 2. Experimental
2.1 Material
2-Ethyl hexyl acrylate (2-EHA) and vinyl
acetate (VA) monomer were purified by conventional
methods (washed three times with dilute sodium
hydroxide solution and water was removed by vacuum
distillation and dried using calcium chloride). The
initiator in the process was ammonium persulfate.
Sodium dodecylbenzene sulfonate and nonylphenol
ethoxylate were used as surfactant. The chemical
structures of β-carboxyethyl acrylate (BETA-C),
methacrylic acid (MAA), acrylic acid (AA), methyl
methacrylate (MAA), 2-hydroxy ethyl acrylate (2-HEA),
2-hydroxy ethyl methacrylate (2-HEMA) are shown in
Fig. 1. Chain transfer agent was n-dodecyl mercaptan.
Buffer solution was sodium bicarbonate used to adjust
pH (~4). Sodium formaldehyde sulfoxylate and tertiary
butyl hydroperoxide were used to eliminate residue
monomers.
2.2 Synthesis of PSA latex
The adhesives were synthesized in a glass
reactor equipped with a reflux condenser, 4-blade
turbine, N2 purge, and thermometer. The surfactant
system dissolved in DW and the chain transfer agent
dissolved in the monomer were mixed under stirring. The
initiator was added and then heated to 70oC. The pre-
seeding was added continuously to the reactor using
calibrated addition pump for 15 min. After the semi-
continuous addition, the pre-seeding was allowed to be
added continuously for another 4 hr whereupon the
reaction was allowed for further 1 hr, and then sodium
formaldehyde sulfoxylate solution and tertiary butyl
hydroperoxide solution were added. The reaction was
allowed subsequently for another 1 hr. The synthesized
copolymer was cooled to rt. The formulation used in this
study are given in Table 1.
2.3 Dispersion characterization
The particle size and zeta potential were
determined by the static laser scattering technique on the
Malvern instrument zeta-sizer version 6.01.
2.4 Thermal analysis
The samples of synthesized polymer were
coated on glass plate and dried in room temperature for
12 hr. DSC analyzing technique using NETZSCH DSC
204 F1 Phoenix 240 was employed to determine the Tg
of adhesives. Standard 5-10 µg alumina DSC pans with
perforated lids were used and the samples were subjected
to two heating-cooling cycles from -120–50oC at heating
rate of 10oC/min along with an empty reference pan in a
DSC furnace. The second cycle was used for
determination of Tg while the first cycle was used only to
remove previous thermal history.
2.5 Adhesion properties
Adhesion properties were measured on the
adhesive coating on micrometer adjustable film
applicator and backing OPP film (Oriented
polypropylene film). The OPP films were corona-treated
by air. The coating weight of the dry adhesive was in the
range from 20-22 g/m2, drying time 3 min at 70
oC and
aging time 7 days at rt.
Fig 1. Monomers and functional monomers used in
copolymer synthesis
International Polymer Conference of Thailand
179 Table 1 Monomer feed content in each latex formula
No
.
Monomer main
2-EHA/VA
Functional
Monomer(Ratio) Experimental
Carbonyl
group
Hydroxyl
group
1 90/10 1 0 PSA-1 to PSA-5
2 90/10 0 1 PSA-6 to PSA-8
3 90/10 1 0.5 PSA-9 to PSA-16
4 90/10 1.5 0.5 PSA-17 to PSA-
20
No.
Functional Monomer
BETA-
C MAA AA
MM
A
2-
HEA 2-HEMA
PSA_1 1.25 - - - - -
PSA_2 - 1.25 - - - -
PSA_3 - - 1.25 - - -
PSA_4 - - - 1.25 - -
PSA_5 0.31 0.31 0.31 0.31 - -
PSA_6 - - - - 1.25 -
PSA_7 - - - - - 1.25
PSA_8 - - - - 0.63 0.63
PSA_9 0.84 - - - 0.41 -
PSA_10 - 0.84 - - 0.41 -
PSA_11 - - 0.84 - 0.41 -
PSA_12 - - - 0.84 0.41 -
PSA_13 0.84 - - - - 0.41
PSA_14 - 0.84 - - - 0.41
PSA_15 - - 0.84 - - 0.41
PSA_16 - - - 0.84 - 0.41
PSA_17 - - 0.93 - 0.32 -
PSA_18 - - 0.93 - - 0.32
PSA_19 0.30 0.30 0.30 0.30 0.05 -
PSA_20 0.30 0.30 0.30 0.30 - 0.05
2.6 Fourier transfer infrared analysis
The Fourier transform infrared (FTIR) spectra
of the polymer were recorded using dry sample films on
a Perkin Elmer FTIR 1600 instrument for 16 scans from
600 to 4,000 cm-1
.
2.7 Stability test condition
Three conditions were carried out: stored at
room temperature for 6 months, freeze-thaw condition (-
20oC for 24 hr and room temperature for 6 hr for 15
cycles) and accelerated condition (60oC for 24 hr and
room temperature for 6 hr for 15 cycles)
2.8 Adhesion and cohesion test method
Five test methods were used: the peel adhesion
at 180o (FINAT test method 1), the probe test (Polyken
test) the peel adhesion at 90o (FINAT test method 2),
Initial ball tack (Pressure Sensitive Tape Council test
method 6), the shear resistance (FINAT test method 8)
and loop tack (FINAT test method 9).
3. Results and discussion
3.1 Characteristics of the copolymers
The characteristic FTIR bands of the carbonyl
group at 3,410-3,420 cm-1
(O-H stretch), 1,730- 1,870
cm-1
(C=O stretch), 1325-1,205 cm-1
(C–O stretch),
1,440-1,395 cm-1
and 950-910 cm-1
(O–H bend) were
observed. The characteristics of hydroxyl group was
3,550-3,200 cm-1
(-OH stretch). The bands at 2,800-
2,900 cm-1
(-CH2, -CH3 bend) 1,560 and 1,406-1,410 cm-
1 related to carboxylate group stretching of acrylate were
observed.
3.2 Tg Measurement
In general, PSA adhesion properties showed a
strong dependence on Tg. The Tg of the polymer depends
on the ratio of monomer in formula. In this work, it was
clear that adding just one type of the –COOH or –OH
containing monomers did not significantly affect their Tg
values (-53 to -50ºC) (Table 2; sample 1-7). The slight
reduction of Tg (to about -55 ºC) in sample 8-12 could be
caused by the length of pendent group in 2-HEA that
prevented closed chain packing. Adding more than one
monomer (sample 8-20) somewhat affected the Tg but
rather insignificantly.
International Polymer Conference of Thailand
180
3.3 Particle size and zeta potential measurement
The size of the copolymer prepared by
miniemulsion polymerization was 200 - 400 nm. Zeta
potential is the indicator of the stability of the colloidal
copolymer particles in the latex system. Since the zeta
potential governs the electrostatic stabilization and steric
stabilization of colloid. The more negative value of zeta
potential, the more stable of the colloid will be. From
this study, the zeta potential of latex no. 3, 4, 7, 16, 19
and 20 was acceptably lower than -30mV (Table 2).
Table 2 Testing results for PSA_1 to PSA_20
No.
%
Con-
versio
n
Tg (oC)
Z-Avg.
(nm)
Zeta
potential
(mV)
Conduc-
tivity
(mS/cm)
PSA_1 98.57 -49.8 318.5 0.9 6.42 x 10⁻⁴
PSA_2 96.92 -51.8 400.3 2.4 9.29 x 10⁻³
PSA_3 97.39 -51.3 277.8 -35.0 2.78 x 10⁻²
PSA_4 97.81 -52.9 284.0 -35.3 3.13 x 10⁻²
PSA_5 98.01 -52.8 368.8 4.3 6.25 x 10⁻⁴
PSA_6 97.58 -52.4 300.0 1.7 8.56 x 10⁻⁴
PSA_7 96.75 -51.5 366.2 -31.2 5.84 x 10⁻³
PSA_8 98.38 -56.2 390.1 0.6 4.08 x 10⁻³
PSA_9 96.54 -55.1 318.5 1.4 9.37 x 10⁻⁴
PSA_10 98.48 -55.4 315.2 1.8 9.02 x 10⁻⁴
PSA_11 98.03 -55.0 311.4 -33.5 2.98 x 10⁻²
PSA_12 97.19 -55.7 348.4 -32.4 3.12 x 10⁻²
PSA_13 98.15 -50.9 347.7 0.8 5.16 x 10⁻⁴
PSA_14 99.15 -50.4 389.1 2.7 8.57 x 10⁻⁴
PSA_15 98.47 -50.3 317.5 -19.8 1.97 x 10⁻²
PSA_16 98.15 -50.9 347.4 -35.4 3.10 x 10⁻³
PSA_17 96.40 -54.4 412.0 -10.2 9.81 x 10⁻⁴
PSA_18 97.88 -50.8 295.7 -20.4 2.47 x 10⁻²
PSA_19 98.17 -51.5 337.0 -34.0 2.72 x 10⁻³
PSA_20 99.45 -51.4 347.8 -36.2 1.45 x 10⁻³
3.4 Adhesion test
Tack, adhesion and cohesion properties can tell
the difference of the PSA. According to a results (Table
3), PSA_15 and PSA_16 have the highest tackiness since
they consist of AA (-COOH) or MMA (carbonyl in ester)
and hydroxyl (2-HEMA) in the ratio of 2:1, providing
the additional hydrogen bonding attraction between the
polymer chains. Furthermore, 2-HEMA structure was
steric at the pendent group and could initiate higher
tackiness more than the other formulas. However, the
others ratio were not significantly different.
From adhesion properties, i.e. 90º and
180º
peel strength,
the adhesive bond cannot be improved by either the
carboxylic or hydroxyl group (PSA_15 and PSA_16).
For cohesion properties, high cohesion properties were
achieved in the formula with both functional group types
that consist of AA and 2-HEA in the ratio of 2:1
(PSA_11), due to their intermolecular force as well as
the flexibility of the 2-HEA monomer. The results are
shown in Table 3.
3.5 Stability for PSA
The copolymers that were synthesized from monomers
containing functional groups as carbonyl (BETA-C/
MAA/ AA/ MMA) and hydroxyl (2-HEA/ 2-HEMA)
improved the stability of PSA_3, PSA_4, PSA_7,
PSA_16, PSA_19, and PSA_20, as shown in Table 3.
Zeta potential was -30 to -36 mV and conductivity was
1.4510-3
to 3.1310-2
mS/cm. However, the copolymers
PSA_1, PSA_2 and PSA_6 containing BETA-C, MAA,
2-HEMA were not stable (see Table 3). It was possible
that the monomers were not reacted and not incorporated
into the backbone of the copolymers.
4. Conclusions
This work showed that carbonyl and hydroxyl functional
group in the monomer can affect the adhesion and
stability properties of the latex. It was found in this work
that the –COOH was more effective in improving
adhesion than the –OH. The carboxylic group has
stronger dipole-dipole force due to the presence of both
carbonyl (C=O) and hydroxyl group (-OH). This and the
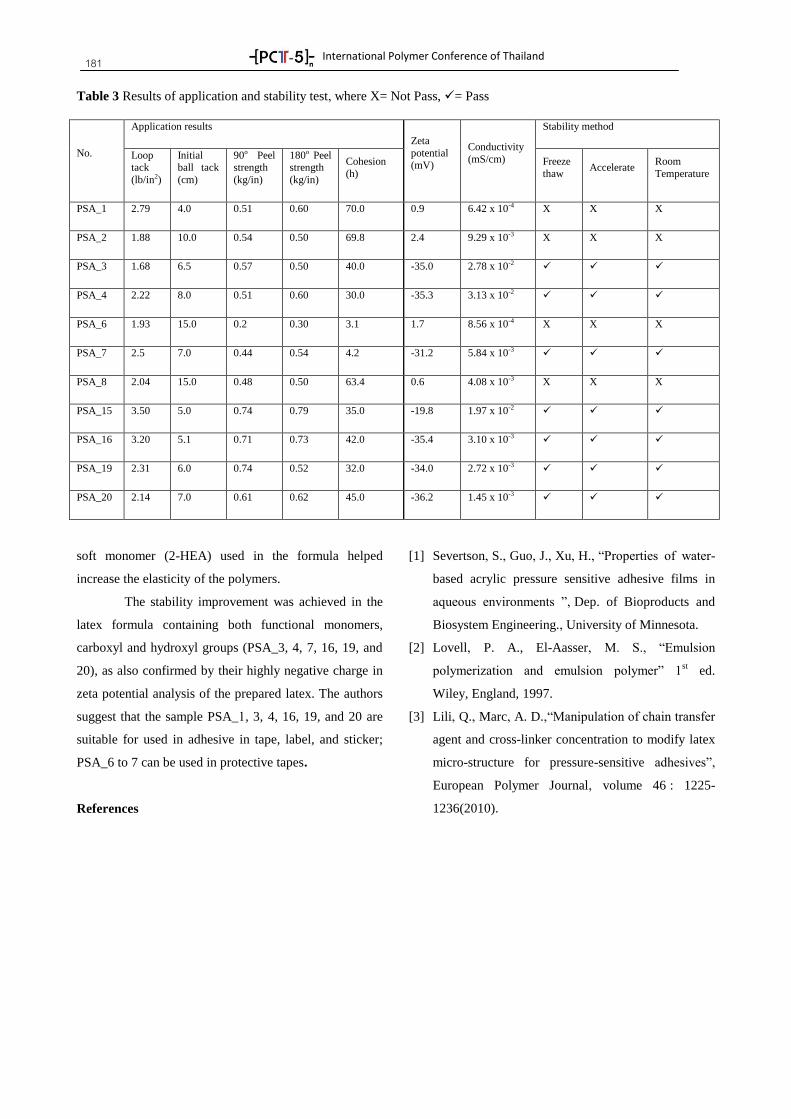
International Polymer Conference of Thailand
181
soft monomer (2-HEA) used in the formula helped
increase the elasticity of the polymers.
The stability improvement was achieved in the
latex formula containing both functional monomers,
carboxyl and hydroxyl groups (PSA_3, 4, 7, 16, 19, and
20), as also confirmed by their highly negative charge in
zeta potential analysis of the prepared latex. The authors
suggest that the sample PSA_1, 3, 4, 16, 19, and 20 are
suitable for used in adhesive in tape, label, and sticker;
PSA_6 to 7 can be used in protective tapes.
References
[1] Severtson, S., Guo, J., Xu, H., “Properties of water-
based acrylic pressure sensitive adhesive films in
aqueous environments ”, Dep. of Bioproducts and
Biosystem Engineering., University of Minnesota.
[2] Lovell, P. A., El-Aasser, M. S., “Emulsion
polymerization and emulsion polymer” 1st ed.
Wiley, England, 1997.
[3] Lili, Q., Marc, A. D.,“Manipulation of chain transfer
agent and cross-linker concentration to modify latex
micro-structure for pressure-sensitive adhesives”,
European Polymer Journal, volume 46 : 1225-
1236(2010).
Table 3 Results of application and stability test, where X= Not Pass, = Pass
No.
Application results
Zeta
potential (mV)
Conductivity
(mS/cm)
Stability method
Loop tack
(lb/in2)
Initial ball tack
(cm)
90o Peel strength
(kg/in)
180o Peel strength
(kg/in)
Cohesion
(h)
Freeze
thaw Accelerate
Room
Temperature
PSA_1 2.79 4.0 0.51 0.60 70.0 0.9 6.42 x 10⁻⁴ X X X
PSA_2 1.88 10.0 0.54 0.50 69.8 2.4 9.29 x 10⁻³ X X X
PSA_3 1.68 6.5 0.57 0.50 40.0 -35.0 2.78 x 10⁻²
PSA_4 2.22 8.0 0.51 0.60 30.0 -35.3 3.13 x 10⁻²
PSA_6 1.93 15.0 0.2 0.30 3.1 1.7 8.56 x 10⁻⁴ X X X
PSA_7 2.5 7.0 0.44 0.54 4.2 -31.2 5.84 x 10⁻³
PSA_8 2.04 15.0 0.48 0.50 63.4 0.6 4.08 x 10⁻³ X X X
PSA_15 3.50 5.0 0.74 0.79 35.0 -19.8 1.97 x 10⁻²
PSA_16 3.20 5.1 0.71 0.73 42.0 -35.4 3.10 x 10⁻³
PSA_19 2.31 6.0 0.74 0.52 32.0 -34.0 2.72 x 10⁻³
PSA_20 2.14 7.0 0.61 0.62 45.0 -36.2 1.45 x 10⁻³
International Polymer Conference of Thailand
182
PROCP-04
Comparative Study on Shear Flow of Olefin Multiblock Copolymers
Anan Sookbanthoeng, Phornsuda Phanjamnonk and Chantima Deeprasertkul*
School of Polymer Engineering, Institute of Engineering, Suranaree University of Technology,
Nakhon Ratchasima 30000
Abstract
Shear flow of olefin multiblock copolymers (OBCs) was investigated using capillary and parallel-plate
rheometers. Viscometric and linear viscoelastic properties of three different melt index OBCs were compared. It
was found that viscometric, after Bagley and Rabinowitsch corrections, and linear viscoelastic properties were
similar. This follows Cox-Merz rule. The entrance pressure loss though seemed to be negligible to all samples.
Time-temperature superposition (TTS) on linear viscoelastic properties failed at temperature of 220C. This
could suggest the presence of the mesophase structure in the melts.
Keywords: olefin multiblock copolymer, Bagley correction, Cox-Merz rule.
1. Introduction
Block copolymers are polymers comprising of two
or more monomers in a chain. Di- and tri-block
copolymers are typically obtained and have been widely
studied. Here the focus is on the olefin multiblock
copolymers (OBCs) which have recently been
synthesized1. These OBCs are ethylene-octene
copolymers which consist of crystallizable blocks (very
low comonomer content) alternating with amorphous
blocks (high comonomer content). With its unique chain
structure, many research on structure and property
relationship have been widely investigated. Interestingly,
mesophase separation transition occurring in these OBCs
has been observed using many techniques. Rheological
measurements was also applied and the presence of the
mesophase transition in the OBC melts have been
reported even at temperature well above the melting
point2,3
.
Many research work have focused on the structure
and property relationship which quite limits in the range
of low shear rates. While polymer processing techniques,
e.g. injection, extrusion, are typically in the high shear
rate range, the high shear behavior of the materials is
inevitable needed. In this work, shear results as obtained
from steady (viscometric properties) and small amplitude
oscillatory (linear viscoelastic properties) of three OBCs
with different melt indices were compared. Cox-Merz
rule was thus applied. By varying the aspect ratio of the
capillary die, entrance pressure loss was studied. Also,
effect of mesophase transition in the melt (if presence) in
the strong shear flow was also of interest.
2. Experimental methods
2.1 Materials
Three olefin multiblock copolymers (OBCs) with
the same density of 0.866 g/cm3 and different melt flow
indices were used. Melt flow index was measured
according to ASTM D1238 (2.16 kg, 190C). The
samples were designated to OBCx, where x is its MFI.
These Dow Chemicals polyolefins were purchased from
Chemical Innovation (Thailand).
2.2 Thermal analysis
Thermal behavior of OBCs was examined using
differential scanning calorimetry (Perkin Elmer DSC
Pyris Diamond). Nitrogen gas was purged throughout the
measurements. The sample was heated from 40 to 160C
(1st heating) and held for 5 min at 160C. Subsequently,
the sample was cooled to 40C (cooling) and heated
again to 160C (2nd
heating). The rate of heating/cooling
was 5C /min. Melting temperature (Tm) of OBCs was
determined.
2.3 Rheological measurements
Rheological measurements were conducted using
both capillary and parallel-plate rheometers. Capillary
shear flow (viscometric) was performed using Gottfert
RG20 rheometer equipped with circular die of 1 mm in

International Polymer Conference of Thailand
183 diameter. Three dies with aspect ratio (L/D) of 10, 20,
and 30 were used. All measurements were done at
190C. Bagley and Rabinowitsch corrections were
applied to obtain true viscosity. Rheometer (TA
Instrument AR-G2) equipped with 25 mm parallel-plate
geometry was used to obtain linear viscoelastic
properties. Small amplitude oscillatory shear (SAOS),
frequency sweep in a range of 0.1-100 rad/s within 2%
strain was carried out at temperatures 135, 150, 170, 190,
and 220C under nitrogen atmosphere. Master curve was
constructed at reference temperature 190C.
3. Results and discussion
3.1 Thermal properties
DSC thermograms of the samples are depicted in
Figure 1. Melting (from the 2nd
heating) and
crystallization temperatures determined at peak are listed
in Table 1. As seen, the samples melts completely at
below 130C. Rheological studies were conducted at
temperature ranging from 135 to 220C above their
melting temperatures.
Table 1 Physical Properties of OBCs used.
Samples MFI
(g/10min)
(g/cm3)
Tm1
(C)
Tm2
(C)
Tc
(C)
OBC1 1 0.866 - 119.4 90.1
OBC5 5 0.866 118.3 122.5 100.7
OBC15 15 0.866 118.3 122.5 101.8
3.2 Rheological properties
Using capillary rheometer equipped with die of
different L/D ratios (10, 20, and 30) and entrance angle
of 180, for all samples, significant difference in flow
was not noticed using different L/D. Bagley and
Rabinowitsch corrections were performed on the
apparent data. The true and the apparent viscosities were
compared as shown in Figure 2. As seen, the true data
did not much deviate from that apparent results for all
the samples. Though among them OBC1 may show
slightly more difference. The results suggested that there
is only minute entrance pressure loss for these OBC
samples. Bagley plots were shown in Figure 3. If the
mesophase was present in the melts, one would say the
high shear viscosity was not affected.
Figure 1. DSC thermograms of (a) OBC1 (b) OBC5 and
(c) OBC15 where the 1st heating, cooling and 2
nd heating
are bottom, middle and top curves.
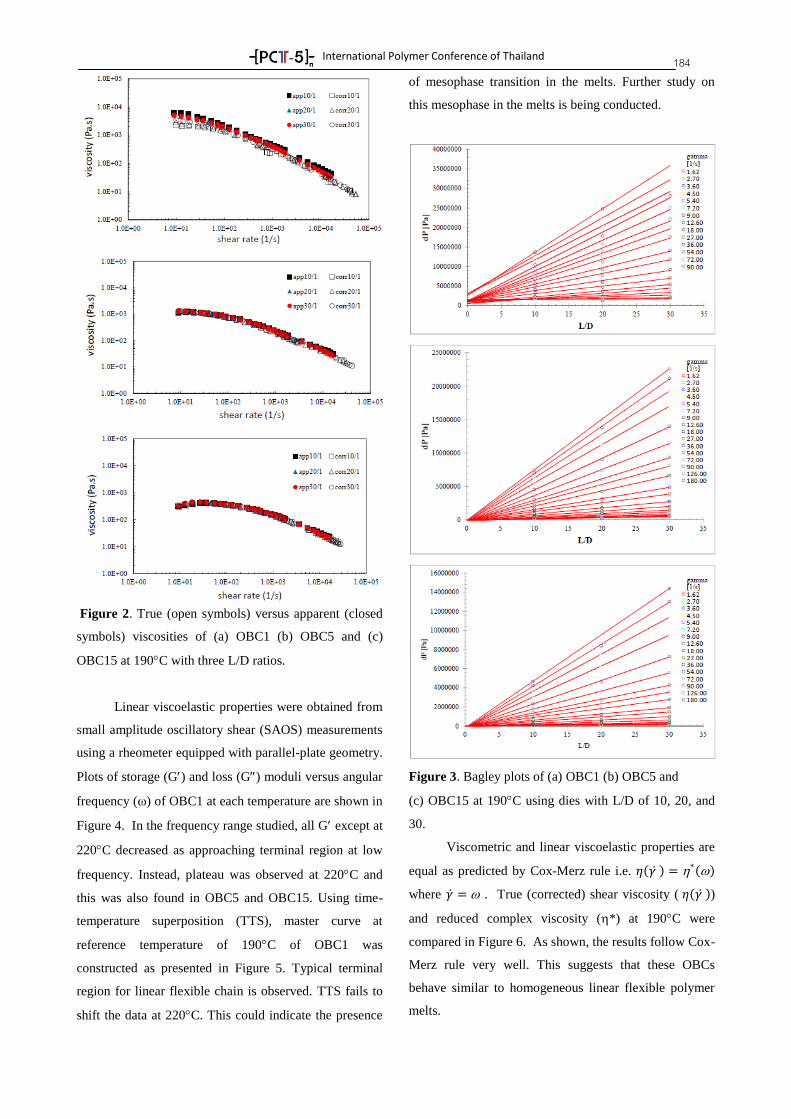
International Polymer Conference of Thailand
184
Figure 2. True (open symbols) versus apparent (closed
symbols) viscosities of (a) OBC1 (b) OBC5 and (c)
OBC15 at 190C with three L/D ratios.
Linear viscoelastic properties were obtained from
small amplitude oscillatory shear (SAOS) measurements
using a rheometer equipped with parallel-plate geometry.
Plots of storage (G) and loss (G) moduli versus angular
frequency () of OBC1 at each temperature are shown in
Figure 4. In the frequency range studied, all G except at
220C decreased as approaching terminal region at low
frequency. Instead, plateau was observed at 220C and
this was also found in OBC5 and OBC15. Using time-
temperature superposition (TTS), master curve at
reference temperature of 190C of OBC1 was
constructed as presented in Figure 5. Typical terminal
region for linear flexible chain is observed. TTS fails to
shift the data at 220C. This could indicate the presence
of mesophase transition in the melts. Further study on
this mesophase in the melts is being conducted.
Figure 3. Bagley plots of (a) OBC1 (b) OBC5 and
(c) OBC15 at 190C using dies with L/D of 10, 20, and
30.
Viscometric and linear viscoelastic properties are
equal as predicted by Cox-Merz rule i.e.
where . True (corrected) shear viscosity ( )
and reduced complex viscosity ( *) at 190C were
compared in Figure 6. As shown, the results follow Cox-
Merz rule very well. This suggests that these OBCs
behave similar to homogeneous linear flexible polymer
melts.
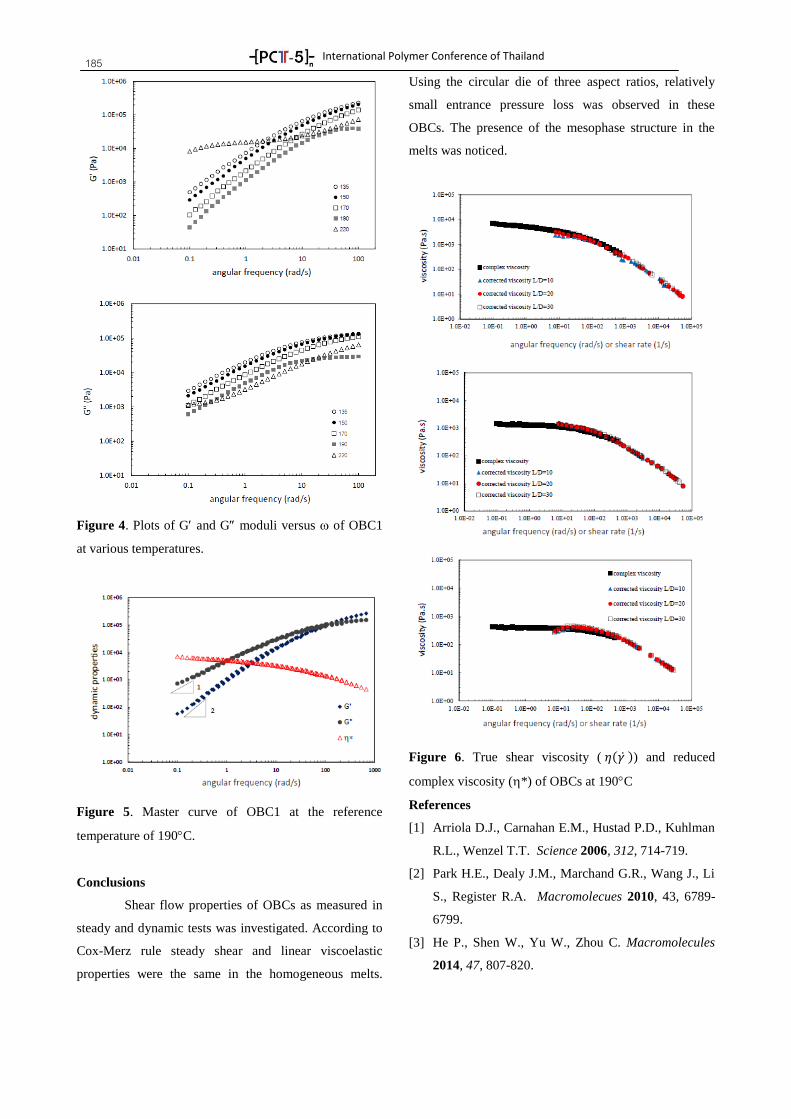
International Polymer Conference of Thailand
185
Figure 4. Plots of G and G moduli versus of OBC1
at various temperatures.
Figure 5. Master curve of OBC1 at the reference
temperature of 190C.
Conclusions
Shear flow properties of OBCs as measured in
steady and dynamic tests was investigated. According to
Cox-Merz rule steady shear and linear viscoelastic
properties were the same in the homogeneous melts.
Using the circular die of three aspect ratios, relatively
small entrance pressure loss was observed in these
OBCs. The presence of the mesophase structure in the
melts was noticed.
Figure 6. True shear viscosity ( ) and reduced
complex viscosity ( *) of OBCs at 190C
References
[1] Arriola D.J., Carnahan E.M., Hustad P.D., Kuhlman
R.L., Wenzel T.T. Science 2006, 312, 714-719.
[2] Park H.E., Dealy J.M., Marchand G.R., Wang J., Li
S., Register R.A. Macromolecues 2010, 43, 6789-
6799.
[3] He P., Shen W., Yu W., Zhou C. Macromolecules
2014, 47, 807-820.

SESSION 5Advances in Polymer Processing
Natural and Synthetic Rubbers
International Polymer Conference of Thailand
187
KN-RUBBER-1
New Focus on Rubber Science and Technology
Yuko Ikeda
Kyoto Institute of Technology, Matsugasaki, Sakyo, Kyoto 606-8585, JAPAN
Phone +81 724 7558, Fax +81 724 7558, * E-Mail: [email protected]
Abstract The sulfur cross-linking reaction of rubber, i.e., vulcanization is one
of the most important reactive processes in polymer technology. However, the
details for the reactions have not yet been conclusively clarified, because of the
complicated chemical reactions between rubber and cross-linking reagents at
each processing step. An important key to control the network formation by
sulfur cross-linking is still sought for the development of the rubber industry.
Ikeda et al. was inspired to clarify the vulcanization mechanism by smallangle
neutron scattering techniques, and reported the effects of the combination and
composition of the sulfur cross-linking reagents on rubber network
formations.1 The combination and composition of zinc oxide (ZnO) with other
reagents were found to be crucial to control the structural network
inhomogeneity in the N-(1,3-benzothiazol- 2-ylsulfanyl)cyclohexanamine
(CBS) accelerated vulcanization of isoprene rubber (IR) as shown in Fig. 1. The
mesh size (ξ) in a two-phase inhomogeneous structure of sulfur cross-linked
isoprene rubber was unexpectedly found to be controlled by the amounts of
ZnO and stearic acid (StH) used. A time-resolved zinc K-edge X-ray absorption
fine structure (Zn K-edge XAFS) spectroscopy supported the two-phase
network formation.2
The observations are very important for rubber science and
technology, but it has remained unclear why the combination of ZnO and StH
can be a key for controlling the CBS accelerated vulcanization. Generally, it is
thought that StH can be reacted with ZnO to form zinc stearate (ZnSt2) as an
essential cure activator. Zinc 1,3-benzothiazole-2-thiolate with ligands has long
been postulated to be generated from ZnO, StH, and CBS. It has been accepted
as an active intermediate, where stearate was thought to be one of the ligands.
However, the in situ details of the generated zinc salt of StH for sulfur cross-
linking during the vulcanization have not been well understood. Most studies
have focused on materials isolated from the vulcanization reactions. What is the
role of the zinc salt of StH in the vulcanization reaction? On the way to
determine this, the formation of a specific structural complex generated from
ZnO and StH at a high temperature was recently found by a combination of
time-resolved Zn K-edge XAFS spectroscopy and time-resolved infrared
spectroscopy.3,4 The structure is dominantly a bridging bidentate zinc/stearate
complex, the molar ratio of the zinc ion to stearate and the coordination number
of which are unexpectedly one and four, respectively. Combination with a
density functional calculation for identifying the intermediate predominantly
suggests that its most possible structure is (Zn2(μ-O2CC17H35)2)
2+(OH−)2·XY, where X and Y are water and/or a rubber segment. This
intermediate has been unknown despite the long history of rubber science and
technology. The newly observed zinc/stearate complex may play a role to
accelerate the sulfur cross-linking reaction of rubber like an enzyme because of
the high Lewis activity of the zinc ion.
A filler network, on the other hand, is also an important topic to
reveal a reinforcement effect by filler mixing for rubber materials. However, a
selective formation of clear filler network structure could not be achieved due
to various kinds of filler aggregation by the mechanical mixing. Recently, a
combination of in situ silica filling in the natural rubber (NR) latex and solution
casting was found to be a good method to produce the model nanocomposites
providing a filler network.5,6 Characteristic morphology conferred good
dynamic mechanical properties on the composites. Furthermore, the filler
network structure of the in situ silica-filled NR composites showed a unique
stepwise strain-induced crystallization behavior.7 Pure rubber phases in the
filler network were found to afford highly oriented amorphous segments and
oriented crystallites upon stretching.
These novel observations may be useful for resulting improvements
in performance of rubber materials such as tires in order to construct a green
sustainable society on the Earth.
Yuko Ikeda
Kyoto Institute of Technology
Faculty of Molecular Chemistry and
Engineering Hashigami-cho, Mastugasaki, Sakyo-ku, Kyoto 606-8585,
Japan
Education and Academic Career:
1984 Bachelor of Engineering from Kyoto
Institute of Technology
1986 Master of Engineering from the Graduate School, Kyoto Institute of
Technology 1986 Enrollment to the PhD Course at the
Graduate School of Agriculture Science,
Nagoya University 1988 Left the School
1988 Assistant Professor of Kyoto Institute
of Technology 1991 Doctor of Engineering from the School
of Engineering, Kyoto University. The
title is “Studies on Blood-Compatible Polyurethanes with Triblock Polyether
Soft Segments”
1991 Visiting Researcher at Hyogo Prefecture Technology Center (to 1997)
1993 Visiting Researcher at University of
Bayreuth, Germany Under Prof. Dr. Manfred Schmidt (for six months)
1996 Visiting Researcher at Texas Christian
University of U. S. A. Under Prof. C. D. Gutsche (for six months)
2007 Associate Professor of Kyoto Institute
of Technology 2015 Professor of Kyoto Institute of
Technology
Awards:
1986 Excellent Paper Award from Society
of Rubber Industry, Japan
1996 Excellent Paper Award from Society of Rubber Industry, Japan
2008 The 3rd Excellent Presentation Award
from Society of Rubber Industry, Japan 2014 The 29th Oenslager Award from
Society of Rubber Industry, Japan on
“Fundamental study on cross-linking of rubber”
Major Research Topics:
(1) Sulfur cross-linking of rubber (2) Synthesis, properties and morphology of
physically cross-linked elastomers
(3) Reinforcement of rubber (4) Preparation of functionality elastomeric
materials
Publications:
Original papers, 124; Books, 42; Reviews,
60; Patents, 21; Essays and the others, 26
International Polymer Conference of Thailand
188
RUBBERO-01
The Use of Modified Palm Oil as Processing Oils in Tyre Tread Applications
Vorapot Thongplod1
, Pongdhorn Sae-oui 2
and Chakrit Sirisinha1, 3
1Department of Chemistry, Faculty of Science, Mahidol University, Salaya Campus, Nakhon Pathom, 73170
2National Metal and Materials Technology Center, Thailand Science Park, Pathumthani, 12120
3Rubber Technology Research Centre (RTEC), Faculty of Science, Mahidol University, Salaya Campus,
Nakhon Pathom, 73170
Abstract
The present work focused on a preparation of Modified Palm Oil (MPO) as benzyl esters of fatty acids.
The MPO was then used as an alternative to petroleum-based Distillate Aromatic Extract (DAE). Fatty acids
were first prepared by a hydrolysis reaction of palm oils and thereafter esterified with benzyl alcohol in the
presence of sulphuric acid as a catalyst. The reaction based on fatty acid: benzyl alcohol: sulphuric acid molar
ratio of 1.5:1.0:0.04 gave high yield of benzyl esters (>70%). The characterisation of MPO was conducted by
FT-IR and 1H-NMR techniques. Blended oils with various ratios of MPO to DAE as well as MPO to TDAE
were prepared and used as Rubber Process Oils (RPOs). Properties of rubber compounds and vulcanisates were
measured. Referred to the overall results gained, the MPO was capable of partly substituting the petroleum-
based DAE in rubber tyre tread applications.
Keyword: Rubber process oil, Palm oil, Modification, Rubber compounding, Mechanical properties
1. Introduction
Rubber process oils (RPOs) are generally added
to rubber compounds for improving processability and
state-of-mix in some circumstances. Petroleum-based
oils are typically major sources of RPOs [1]. Distillate
aromatic extracts (DAE) with high content of polycyclic
aromatic hydrocarbons (PAHs) are widely used as
effective rubber process oils (RPOs) for rubber
manufacturing especially tyre tread applications. This is
because of their high compatibility between rubber
matrix (mostly SBR for tyre tread of passenger car tyres)
and RPOs leading to enhanced product performance.
However, the European legislation classified the DAE as
a carcinogenic substance [2, 3]. Non-carcinogenic
alternatives including treated distillate aromatic extract
(TDAE) and mild extraction solvate (MES) [4] have
been developed to replace DAE in rubber products
especially tyre tread applications. Nonetheless, both
TDAE and MES are still petroleum-based products
which are not renewable.
Palm oil as renewable oil or green oil has
therefore gained attention due to its environmental
friendliness. Recently, attempts to use the palm oil as
RPO have been carried out by modifying the palm oil via
chemical processes. In this work, the modification of as-
received palm oil with benzyl ester to prepare the
Modified Palm Oil (MPO) having low PAH was
conducted. Success of MPO utilisation as RPO by partly
substituting the petroleum-based RPOs was revealed and
discussed.
2. Experimental
2.1 Materials
Palm oil, DAE, TDAE were used as the rubber
process oils (IRPC Plc. Co., Ltd., Thailand).
Chemicals used for modification of palm oil
were as follows: NaOH, HCl and H2SO4 as supplied by
RCI Labscan Ltd., Thailand; benzyl alcohol and Na2CO3
anhydrous as supplied by Ajax Finechem Pty., Ltd.,
Australia.
Compounding ingredients were as follows:
styrene butadiene rubber (SBR 1502; styrene content of
23.5%, JSR Co., Ltd., Thailand), butadiene rubber (BR;
Kelton 2340A, The East Asiatic Plc. Co., Ltd.,
Thailand), carbon black (N330; Thai Carbon Product
Co., Ltd., Thailand), stearic acid (Petch Thai Chemical
Co., Ltd., Thailand), zinc oxide (Kitpiboon Chemical
Part Co., Ltd., Thailand), paraffin wax (Kitpiboon
Chemical Part Co., Ltd., Thailand) and N-t-butyl-2
benzothiazolesulfenamide (TBBS, (Kitpiboon Chemical
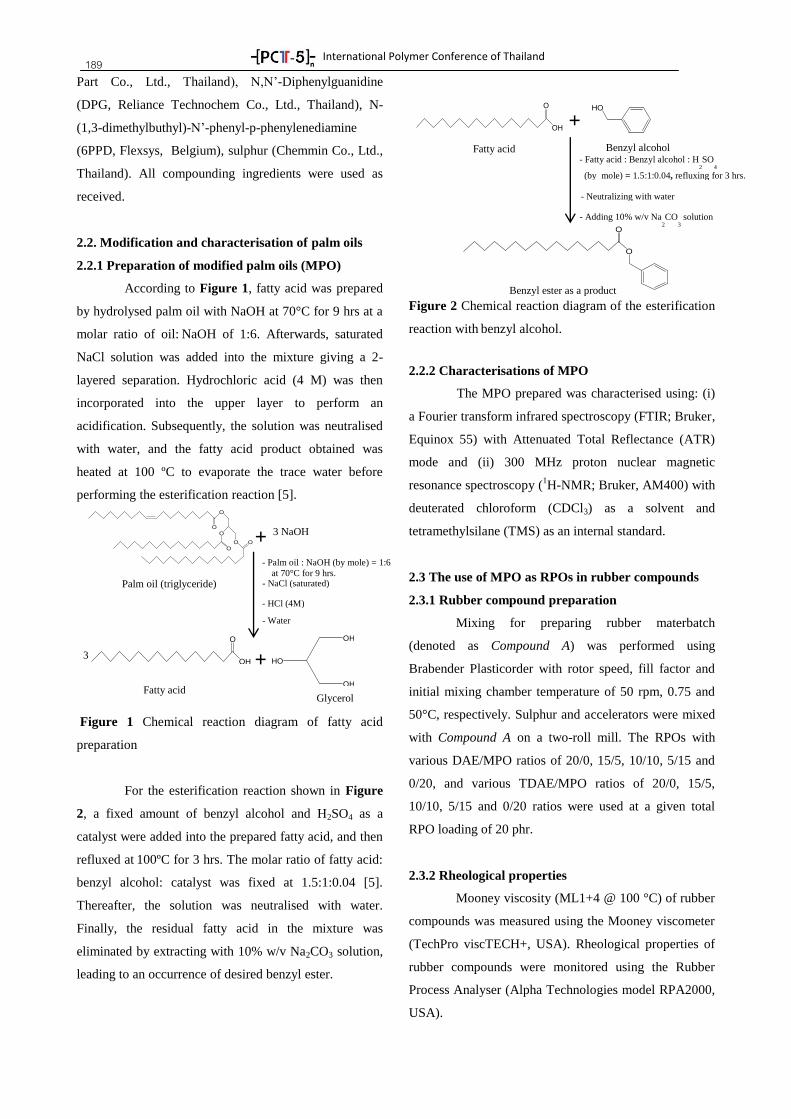
International Polymer Conference of Thailand
189 Part Co., Ltd., Thailand), N,N’-Diphenylguanidine
(DPG, Reliance Technochem Co., Ltd., Thailand), N-
(1,3-dimethylbuthyl)-N’-phenyl-p-phenylenediamine
(6PPD, Flexsys, Belgium), sulphur (Chemmin Co., Ltd.,
Thailand). All compounding ingredients were used as
received.
2.2. Modification and characterisation of palm oils
2.2.1 Preparation of modified palm oils (MPO)
According to Figure 1, fatty acid was prepared
by hydrolysed palm oil with NaOH at 70°C for 9 hrs at a
molar ratio of oil: NaOH of 1:6. Afterwards, saturated
NaCl solution was added into the mixture giving a 2-
layered separation. Hydrochloric acid (4 M) was then
incorporated into the upper layer to perform an
acidification. Subsequently, the solution was neutralised
with water, and the fatty acid product obtained was
heated at 100 ºC to evaporate the trace water before
performing the esterification reaction [5].
Figure 1 Chemical reaction diagram of fatty acid
preparation
For the esterification reaction shown in Figure
2, a fixed amount of benzyl alcohol and H2SO4 as a
catalyst were added into the prepared fatty acid, and then
refluxed at 100ºC for 3 hrs. The molar ratio of fatty acid:
benzyl alcohol: catalyst was fixed at 1.5:1:0.04 [5].
Thereafter, the solution was neutralised with water.
Finally, the residual fatty acid in the mixture was
eliminated by extracting with 10% w/v Na2CO3 solution,
leading to an occurrence of desired benzyl ester.
Figure 2 Chemical reaction diagram of the esterification
reaction with benzyl alcohol.
2.2.2 Characterisations of MPO
The MPO prepared was characterised using: (i)
a Fourier transform infrared spectroscopy (FTIR; Bruker,
Equinox 55) with Attenuated Total Reflectance (ATR)
mode and (ii) 300 MHz proton nuclear magnetic
resonance spectroscopy (1H-NMR; Bruker, AM400) with
deuterated chloroform (CDCl3) as a solvent and
tetramethylsilane (TMS) as an internal standard.
2.3 The use of MPO as RPOs in rubber compounds
2.3.1 Rubber compound preparation
Mixing for preparing rubber materbatch
(denoted as Compound A) was performed using
Brabender Plasticorder with rotor speed, fill factor and
initial mixing chamber temperature of 50 rpm, 0.75 and
50°C, respectively. Sulphur and accelerators were mixed
with Compound A on a two-roll mill. The RPOs with
various DAE/MPO ratios of 20/0, 15/5, 10/10, 5/15 and
0/20, and various TDAE/MPO ratios of 20/0, 15/5,
10/10, 5/15 and 0/20 ratios were used at a given total
RPO loading of 20 phr.
2.3.2 Rheological properties
Mooney viscosity (ML1+4 @ 100 °C) of rubber
compounds was measured using the Mooney viscometer
(TechPro viscTECH+, USA). Rheological properties of
rubber compounds were monitored using the Rubber
Process Analyser (Alpha Technologies model RPA2000,
USA).
O
O
O
O
O
O
OH
O OH
HO
OH
OH
O
O
O
HO
3 NaOH +
Palm oil (triglyceride)
Fatty acid Glycerol
- Palm oil : NaOH (by mole) = 1:6
at 70°C for 9 hrs. - NaCl (saturated)
- HCl (4M)
- Water
Benzyl ester as a product
Benzyl alcohol Fatty acid - Fatty acid : Benzyl alcohol : H
2SO
4
(by mole) = 1.5:1:0.04, refluxing for 3 hrs.
- Neutralizing with water
- Adding 10% w/v Na2CO
3 solution
+
+ 3
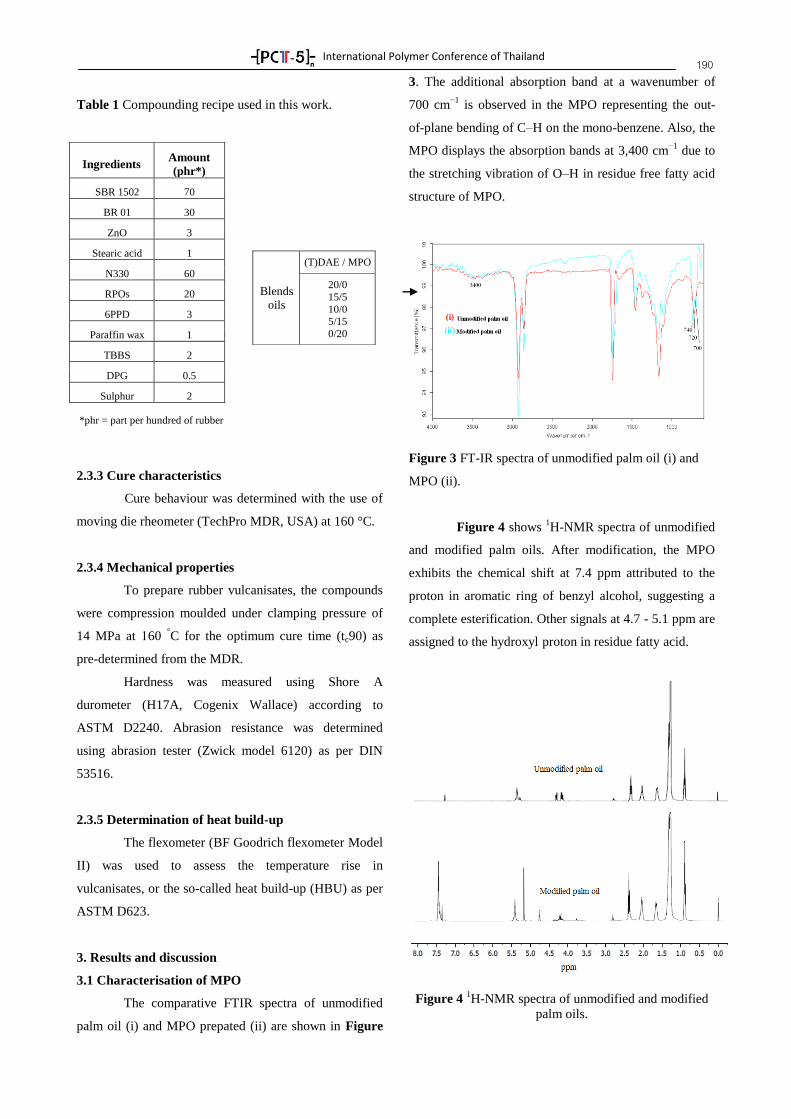
International Polymer Conference of Thailand
190
Table 1 Compounding recipe used in this work.
*phr = part per hundred of rubber
2.3.3 Cure characteristics
Cure behaviour was determined with the use of
moving die rheometer (TechPro MDR, USA) at 160 °C.
2.3.4 Mechanical properties
To prepare rubber vulcanisates, the compounds
were compression moulded under clamping pressure of
14 MPa at 160 °C for the optimum cure time (tc90) as
pre-determined from the MDR.
Hardness was measured using Shore A
durometer (H17A, Cogenix Wallace) according to
ASTM D2240. Abrasion resistance was determined
using abrasion tester (Zwick model 6120) as per DIN
53516.
2.3.5 Determination of heat build-up
The flexometer (BF Goodrich flexometer Model
II) was used to assess the temperature rise in
vulcanisates, or the so-called heat build-up (HBU) as per
ASTM D623.
3. Results and discussion
3.1 Characterisation of MPO
The comparative FTIR spectra of unmodified
palm oil (i) and MPO prepated (ii) are shown in Figure
3. The additional absorption band at a wavenumber of
700 cm−1
is observed in the MPO representing the out-
of-plane bending of C–H on the mono-benzene. Also, the
MPO displays the absorption bands at 3,400 cm−1
due to
the stretching vibration of O–H in residue free fatty acid
structure of MPO.
Figure 3 FT-IR spectra of unmodified palm oil (i) and
MPO (ii).
Figure 4 shows 1H-NMR spectra of unmodified
and modified palm oils. After modification, the MPO
exhibits the chemical shift at 7.4 ppm attributed to the
proton in aromatic ring of benzyl alcohol, suggesting a
complete esterification. Other signals at 4.7 - 5.1 ppm are
assigned to the hydroxyl proton in residue fatty acid.
Figure 4
1H-NMR spectra of unmodified and modified
palm oils.
Ingredients Amount
(phr*)
SBR 1502 70
BR 01 30
ZnO 3
Stearic acid 1
N330 60
RPOs 20
6PPD 3
Paraffin wax 1
TBBS 2
DPG 0.5
Sulphur 2
Blends
oils
(T)DAE / MPO
20/0
15/5
10/0 5/15
0/20
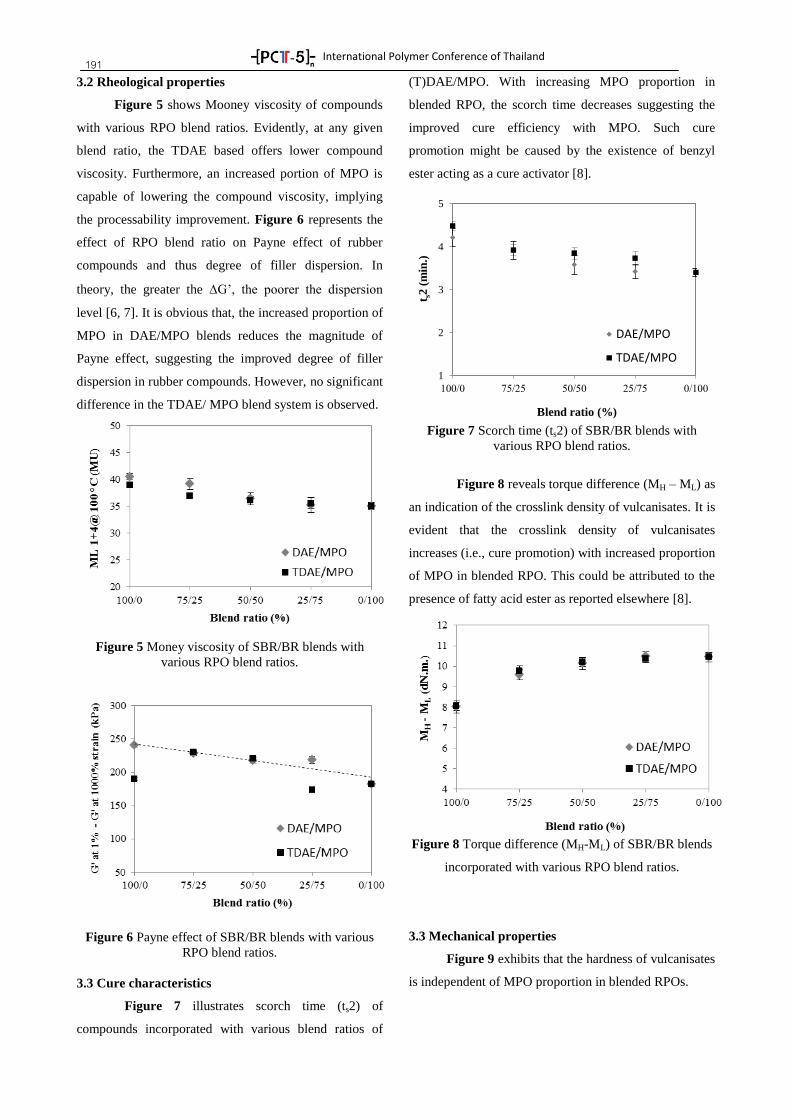
International Polymer Conference of Thailand
191 3.2 Rheological properties
Figure 5 shows Mooney viscosity of compounds
with various RPO blend ratios. Evidently, at any given
blend ratio, the TDAE based offers lower compound
viscosity. Furthermore, an increased portion of MPO is
capable of lowering the compound viscosity, implying
the processability improvement. Figure 6 represents the
effect of RPO blend ratio on Payne effect of rubber
compounds and thus degree of filler dispersion. In
theory, the greater the G’, the poorer the dispersion
level [6, 7]. It is obvious that, the increased proportion of
MPO in DAE/MPO blends reduces the magnitude of
Payne effect, suggesting the improved degree of filler
dispersion in rubber compounds. However, no significant
difference in the TDAE/ MPO blend system is observed.
Figure 5 Money viscosity of SBR/BR blends with
various RPO blend ratios.
Figure 6 Payne effect of SBR/BR blends with various
RPO blend ratios.
3.3 Cure characteristics
Figure 7 illustrates scorch time (ts2) of
compounds incorporated with various blend ratios of
(T)DAE/MPO. With increasing MPO proportion in
blended RPO, the scorch time decreases suggesting the
improved cure efficiency with MPO. Such cure
promotion might be caused by the existence of benzyl
ester acting as a cure activator [8].
Figure 7 Scorch time (ts2) of SBR/BR blends with
various RPO blend ratios.
Figure 8 reveals torque difference (MH – ML) as
an indication of the crosslink density of vulcanisates. It is
evident that the crosslink density of vulcanisates
increases (i.e., cure promotion) with increased proportion
of MPO in blended RPO. This could be attributed to the
presence of fatty acid ester as reported elsewhere [8].
Figure 8 Torque difference (MH-ML) of SBR/BR blends
incorporated with various RPO blend ratios.
3.3 Mechanical properties
Figure 9 exhibits that the hardness of vulcanisates
is independent of MPO proportion in blended RPOs.
1
2
3
4
5
100/0 75/25 50/50 25/75 0/100
t s2
(m
in.)
Blend ratio (%)
DAE/MPO
TDAE/MPO
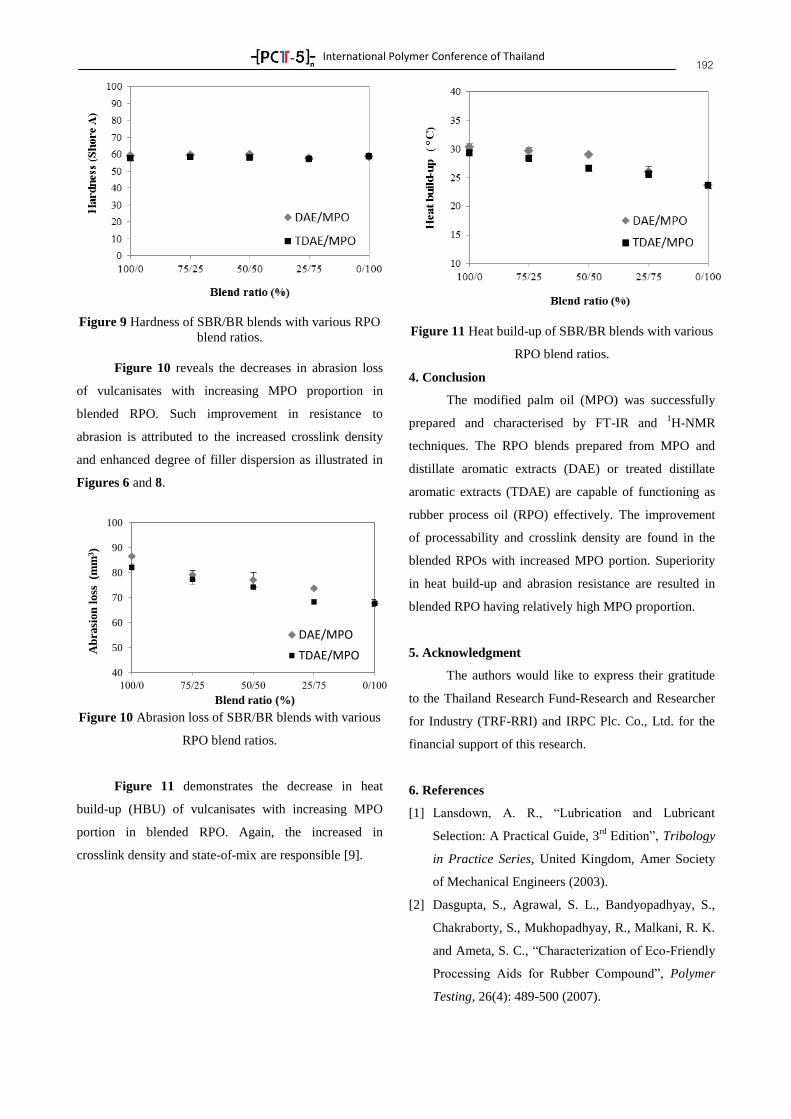
International Polymer Conference of Thailand
192
Figure 9 Hardness of SBR/BR blends with various RPO
blend ratios.
Figure 10 reveals the decreases in abrasion loss
of vulcanisates with increasing MPO proportion in
blended RPO. Such improvement in resistance to
abrasion is attributed to the increased crosslink density
and enhanced degree of filler dispersion as illustrated in
Figures 6 and 8.
Figure 10 Abrasion loss of SBR/BR blends with various
RPO blend ratios.
Figure 11 demonstrates the decrease in heat
build-up (HBU) of vulcanisates with increasing MPO
portion in blended RPO. Again, the increased in
crosslink density and state-of-mix are responsible [9].
Figure 11 Heat build-up of SBR/BR blends with various
RPO blend ratios.
4. Conclusion
The modified palm oil (MPO) was successfully
prepared and characterised by FT-IR and 1H-NMR
techniques. The RPO blends prepared from MPO and
distillate aromatic extracts (DAE) or treated distillate
aromatic extracts (TDAE) are capable of functioning as
rubber process oil (RPO) effectively. The improvement
of processability and crosslink density are found in the
blended RPOs with increased MPO portion. Superiority
in heat build-up and abrasion resistance are resulted in
blended RPO having relatively high MPO proportion.
5. Acknowledgment
The authors would like to express their gratitude
to the Thailand Research Fund-Research and Researcher
for Industry (TRF-RRI) and IRPC Plc. Co., Ltd. for the
financial support of this research.
6. References
[1] Lansdown, A. R., “Lubrication and Lubricant
Selection: A Practical Guide, 3rd
Edition”, Tribology
in Practice Series, United Kingdom, Amer Society
of Mechanical Engineers (2003).
[2] Dasgupta, S., Agrawal, S. L., Bandyopadhyay, S.,
Chakraborty, S., Mukhopadhyay, R., Malkani, R. K.
and Ameta, S. C., “Characterization of Eco-Friendly
Processing Aids for Rubber Compound”, Polymer
Testing, 26(4): 489-500 (2007).
40
50
60
70
80
90
100
100/0 75/25 50/50 25/75 0/100
Ab
rasi
on
loss
(m
m3)
Blend ratio (%)
DAE/MPO
TDAE/MPO
International Polymer Conference of Thailand
193 [3] Sahakaro, K. and Beraheng, A., “Epoxidized Natural
Oils as the Alternative Safe Process Oils in Rubber
Compounds”, Rubber Chemistry and Technology,
84(2): 200-214 (2011).
[4] Null, V., “Safe Process Oils for Tires with Low
Environmental Impact”, Raw Meterials and
Applications, KGK 52: 799-805 (1999).
[5] Boontawee, H., Nakason, C., Kaesaman, A.,
Thitithammawong, A. and Chewchanwuttiwong, S.,
“Application of Benzyl Ester of Modified Vegetable
Oils as Rubber Processing Oils”, Advanced
Materials Research, 415-417: 1164-1167 (2012).
[6] Takino, H., Iwama, S., Yamada, Y. and Kohjiya, S.,
“Effect of Processing Additives on Carbon Black
Dispersion and Grip Property of High-Performance
Tire Tread Compound”, Rubber Chemistry and
Technology, 70(1): 15-24 (1997).
[7] Byers, J. T., “Fillers for Balancing Passenger Tire
Tread Properties”, Rubber Chemistry and
Technology, 75(3): 527-548 (2002).
[8] Barlow, F. W., “Rubber Compounding, 2nd
Edition”,
Principles, Materials and Techniques, New York,
Marcel Dekker (1988).
[9] Sombatsompop, N. and Kumnuantip, C., “Rheology,
Cure Characteristics, Physical and Mechanical
Properties of Tire Tread Reclaimed Rubber/Natural
Rubber Compounds”, Journal of Applied Polymer
Science, 87(10): 1723-1731 (2003).
International Polymer Conference of Thailand
194 RUBBERO-02
Thermoplastic Elastomers Based on Graft Copolymers of Natural Rubber and
Poly(diacetone acrylamide)/Polyamide-12
Gosalee Phersalaeh1 Bencha Thongnuanchan
1*, Anoma Titithammawong
1 and Charoen Nakason
2
1Department of Rubber Technology and Polymer Science, Faculty of Science and Technology, Prince of
Songkla University, Pattani, 94000, Thailand 2Faculty of Science and Industrial Technology, Prince of Songkla University, Surat Thani, 84000, Thailand
Phone +66 07331 2213, *E-Mail: [email protected]
Abstract
The aim of the present study was to improve the compatibility in blends of natural rubber (NR) and
polyamide-12 (PA-12) by grafting hydrophilic monomer, diacetone acrylamide (DAAM), onto NR backbone.
Graft copolymers of NR and poly(DAAM) prepared using 10 wt% of DAAM (NR-g-PDAAM10) was first
synthesized. Blends of NR-g-PDAAM10/PA-12 was then prepared at a blend ratio of 60/40 (wt%) by simple
blend and dynamic vulcanization techniques. The mechanical and rheological properties of the resulting blends
were subsequently investigated and compared to those of the corresponding blends based on unmodified NR.
The results reveal that dynamic vulcanization led to a significant increase in both mechanical and rheological
properties of the blends. The size of vulcanized rubber particles in thermoplastic vulcanizate (TPV) based on the
NR-g-PDAAM10/PA-12 blend was found to be smaller than those in the NR/PA-12 TPV, which is probably
due to the compatibilizing effect of DAAM groups present in NR-g-PDAAM10 molecule. It was also observed
that the former exhibited higher tensile strength and elongation at break than the latter. These results indicate
that the interfacial adhesion between NR and PA-12 phases was improved by the presence of DAAM groups in
NR molecule.
Keywords: Thermoplastic Elastomers, Natural Rubber, Diacetone Acrylamide.
1. Introduction
Thermoplastic elastomers (TPEs) are materials
which possess the characteristics of both thermoplastics
and elastomers. These materials exhibit properties
similar to those of vulcanized rubbers at ambient
temperatures and they can be processed in the molten
state as thermoplastics. TPEs can be broadly classified
into two main groups: TPEs based on block copolymers
and those derived from rubber/thermoplastic blends
(blended TPEs). Thermoplastic natural rubber (TPNR) is
one of blended TPEs which have gained considerable
interest in recent years due to its relative ease of
preparation. TPNR can typically be made by blending
natural rubber (NR) with thermoplastics at temperatures
above the melting point for semi-crystalline polymers or
above the glass transition temperature for amorphous
polymers [1].
Polyamides (PAs) are semi-crystalline polymers
which contain the amide (-CONH-) linkage in their
backbone. The presence of polar amide groups along the
PAs backbones gives rise to inter-chain hydrogen bonds,
which account for good mechanical properties of PAs
[2]. However, the degree of compatibility in blending
PAs with hydrophobic NR is relatively low. This would
lead to the formation of incompatible blends with poor
mechanical properties due to dissimilarity in polarity.
Thus, the modified forms of NR, that bear functional
groups capable of interacting with the functional groups
of PAs (i.e., -NH2, -COOH, -NH-(C=O)-), is preferably
used for blending with PAs. Blending of epoxidized
natural rubber (ENR) with PAs (i.e., polyamide 6 [3] and
PA-12 [4]) is the most widely studied blending system.
Diacetone acrylamide is a functional monomer
containing polar amide and ketone groups in its
molecule. The hypothesis of the present study is that
grafting of hydrophilic DAAM monomer onto the NR
backbone would not only increase its polarity, but also it
would improve interfacial adhesion between PAs and
NR. It is expected that the polar functional groups in the
grafted poly(diacetone acrylamide), PDAAM, chains
would participate in hydrogen bonding with amide
groups in PAs chains (see Figure 1), resulting in better
blend compatibility.
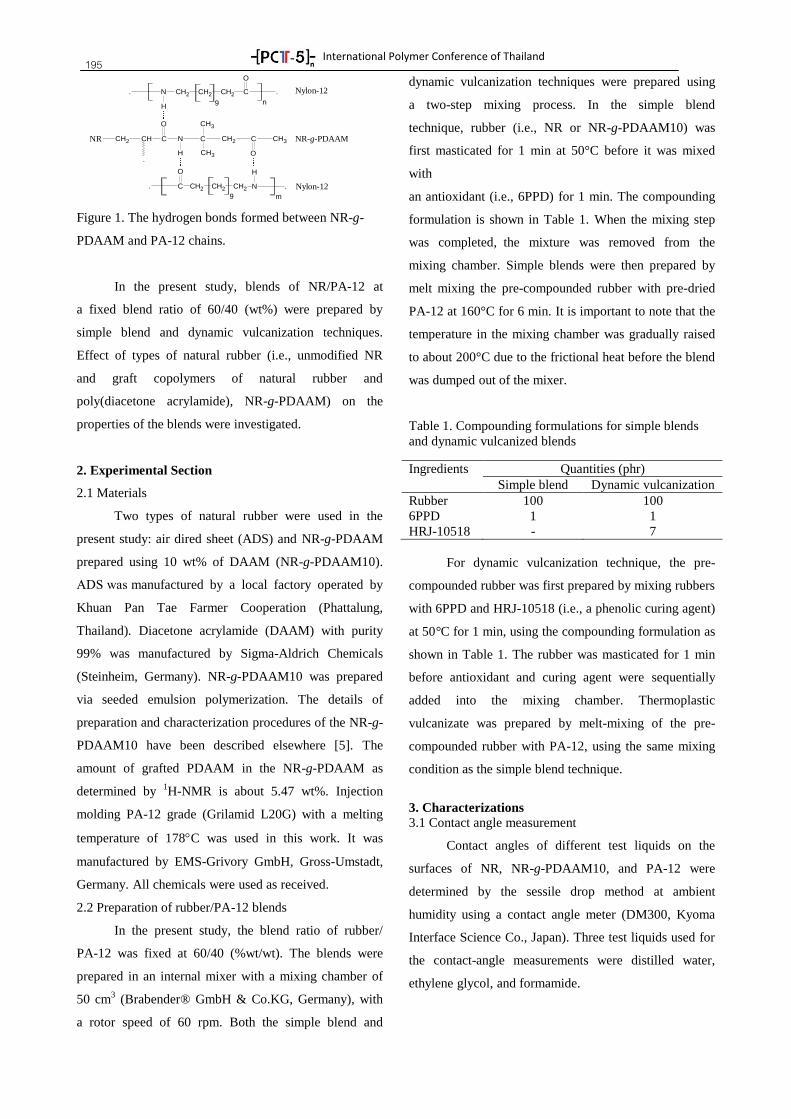
International Polymer Conference of Thailand
195
N CH2 CH2 CH2 C
O
H
. .
n9
CH C
O
N C
CH3
CH3
CH2 C
O
CH3
H
CH2
.
NR
NCH2CH2CH2C
O H
..
9 m
Nylon-12
Nylon-12
NR-g-PDAAM
Figure 1. The hydrogen bonds formed between NR-g-
PDAAM and PA-12 chains.
In the present study, blends of NR/PA-12 at
a fixed blend ratio of 60/40 (wt%) were prepared by
simple blend and dynamic vulcanization techniques.
Effect of types of natural rubber (i.e., unmodified NR
and graft copolymers of natural rubber and
poly(diacetone acrylamide), NR-g-PDAAM) on the
properties of the blends were investigated.
2. Experimental Section
2.1 Materials
Two types of natural rubber were used in the
present study: air dired sheet (ADS) and NR-g-PDAAM
prepared using 10 wt% of DAAM (NR-g-PDAAM10).
ADS was manufactured by a local factory operated by
Khuan Pan Tae Farmer Cooperation (Phattalung,
Thailand). Diacetone acrylamide (DAAM) with purity
99% was manufactured by Sigma-Aldrich Chemicals
(Steinheim, Germany). NR-g-PDAAM10 was prepared
via seeded emulsion polymerization. The details of
preparation and characterization procedures of the NR-g-
PDAAM10 have been described elsewhere [5]. The
amount of grafted PDAAM in the NR-g-PDAAM as
determined by 1H-NMR is about 5.47 wt%. Injection
molding PA-12 grade (Grilamid L20G) with a melting
temperature of 178C was used in this work. It was
manufactured by EMS-Grivory GmbH, Gross-Umstadt,
Germany. All chemicals were used as received.
2.2 Preparation of rubber/PA-12 blends
In the present study, the blend ratio of rubber/
PA-12 was fixed at 60/40 (%wt/wt). The blends were
prepared in an internal mixer with a mixing chamber of
50 cm3 (Brabender® GmbH & Co.KG, Germany), with
a rotor speed of 60 rpm. Both the simple blend and
dynamic vulcanization techniques were prepared using
a two-step mixing process. In the simple blend
technique, rubber (i.e., NR or NR-g-PDAAM10) was
first masticated for 1 min at 50°C before it was mixed
with
an antioxidant (i.e., 6PPD) for 1 min. The compounding
formulation is shown in Table 1. When the mixing step
was completed, the mixture was removed from the
mixing chamber. Simple blends were then prepared by
melt mixing the pre-compounded rubber with pre-dried
PA-12 at 160°C for 6 min. It is important to note that the
temperature in the mixing chamber was gradually raised
to about 200°C due to the frictional heat before the blend
was dumped out of the mixer.
Table 1. Compounding formulations for simple blends
and dynamic vulcanized blends
Ingredients Quantities (phr)
Simple blend Dynamic vulcanization
Rubber 100 100
6PPD 1 1
HRJ-10518 - 7
For dynamic vulcanization technique, the pre-
compounded rubber was first prepared by mixing rubbers
with 6PPD and HRJ-10518 (i.e., a phenolic curing agent)
at 50°C for 1 min, using the compounding formulation as
shown in Table 1. The rubber was masticated for 1 min
before antioxidant and curing agent were sequentially
added into the mixing chamber. Thermoplastic
vulcanizate was prepared by melt-mixing of the pre-
compounded rubber with PA-12, using the same mixing
condition as the simple blend technique.
3. Characterizations
3.1 Contact angle measurement
Contact angles of different test liquids on the
surfaces of NR, NR-g-PDAAM10, and PA-12 were
determined by the sessile drop method at ambient
humidity using a contact angle meter (DM300, Kyoma
Interface Science Co., Japan). Three test liquids used for
the contact-angle measurements were distilled water,
ethylene glycol, and formamide.
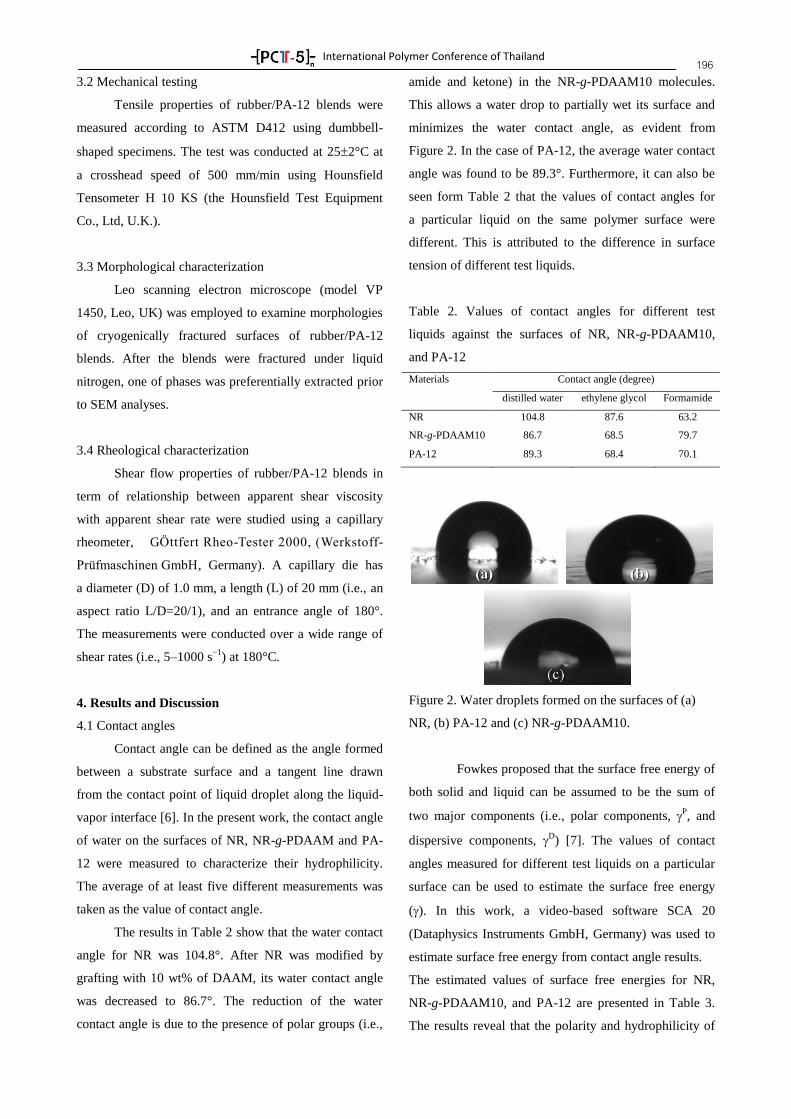
International Polymer Conference of Thailand
196 3.2 Mechanical testing
Tensile properties of rubber/PA-12 blends were
measured according to ASTM D412 using dumbbell-
shaped specimens. The test was conducted at 252°C at
a crosshead speed of 500 mm/min using Hounsfield
Tensometer H 10 KS (the Hounsfield Test Equipment
Co., Ltd, U.K.).
3.3 Morphological characterization
Leo scanning electron microscope (model VP
1450, Leo, UK) was employed to examine morphologies
of cryogenically fractured surfaces of rubber/PA-12
blends. After the blends were fractured under liquid
nitrogen, one of phases was preferentially extracted prior
to SEM analyses.
3.4 Rheological characterization
Shear flow properties of rubber/PA-12 blends in
term of relationship between apparent shear viscosity
with apparent shear rate were studied using a capillary
rheometer, G ttfert Rheo-Tester 2000, (Werkstoff-
Pr fmaschinen GmbH, Germany). A capillary die has
a diameter (D) of 1.0 mm, a length (L) of 20 mm (i.e., an
aspect ratio L/D=20/1), and an entrance angle of 180°.
The measurements were conducted over a wide range of
shear rates (i.e., 5–1000 s−1
) at 180°C.
4. Results and Discussion
4.1 Contact angles
Contact angle can be defined as the angle formed
between a substrate surface and a tangent line drawn
from the contact point of liquid droplet along the liquid-
vapor interface [6]. In the present work, the contact angle
of water on the surfaces of NR, NR-g-PDAAM and PA-
12 were measured to characterize their hydrophilicity.
The average of at least five different measurements was
taken as the value of contact angle.
The results in Table 2 show that the water contact
angle for NR was 104.8°. After NR was modified by
grafting with 10 wt% of DAAM, its water contact angle
was decreased to 86.7°. The reduction of the water
contact angle is due to the presence of polar groups (i.e.,
amide and ketone) in the NR-g-PDAAM10 molecules.
This allows a water drop to partially wet its surface and
minimizes the water contact angle, as evident from
Figure 2. In the case of PA-12, the average water contact
angle was found to be 89.3°. Furthermore, it can also be
seen form Table 2 that the values of contact angles for
a particular liquid on the same polymer surface were
different. This is attributed to the difference in surface
tension of different test liquids.
Table 2. Values of contact angles for different test
liquids against the surfaces of NR, NR-g-PDAAM10,
and PA-12
Materials Contact angle (degree)
distilled water ethylene glycol Formamide
NR 104.8 87.6 63.2
NR-g-PDAAM10 86.7 68.5 79.7
PA-12 89.3 68.4 70.1
Figure 2. Water droplets formed on the surfaces of (a)
NR, (b) PA-12 and (c) NR-g-PDAAM10.
Fowkes proposed that the surface free energy of
both solid and liquid can be assumed to be the sum of
two major components (i.e., polar components, P, and
dispersive components, D) [7]. The values of contact
angles measured for different test liquids on a particular
surface can be used to estimate the surface free energy
(). In this work, a video-based software SCA 20
(Dataphysics Instruments GmbH, Germany) was used to
estimate surface free energy from contact angle results.
The estimated values of surface free energies for NR,
NR-g-PDAAM10, and PA-12 are presented in Table 3.
The results reveal that the polarity and hydrophilicity of
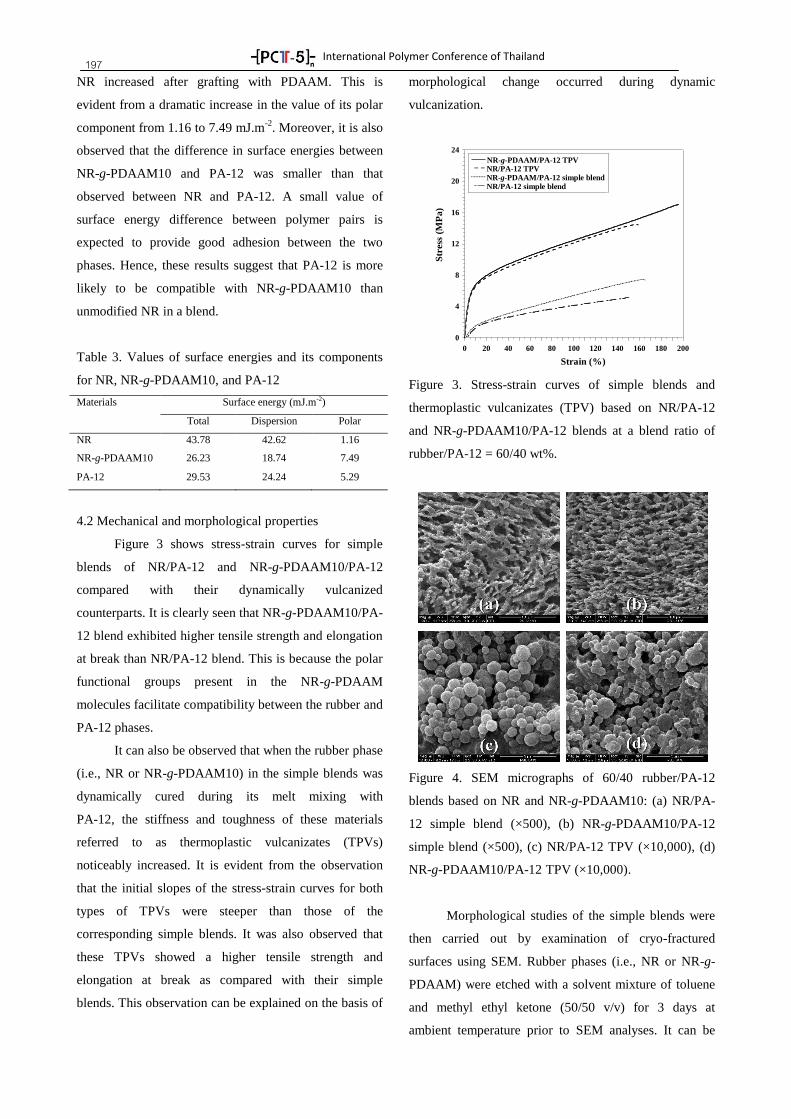
International Polymer Conference of Thailand
197 NR increased after grafting with PDAAM. This is
evident from a dramatic increase in the value of its polar
component from 1.16 to 7.49 mJ.m-2
. Moreover, it is also
observed that the difference in surface energies between
NR-g-PDAAM10 and PA-12 was smaller than that
observed between NR and PA-12. A small value of
surface energy difference between polymer pairs is
expected to provide good adhesion between the two
phases. Hence, these results suggest that PA-12 is more
likely to be compatible with NR-g-PDAAM10 than
unmodified NR in a blend.
Table 3. Values of surface energies and its components
for NR, NR-g-PDAAM10, and PA-12
Materials Surface energy (mJ.m-2)
Total Dispersion Polar
NR 43.78 42.62 1.16
NR-g-PDAAM10 26.23 18.74 7.49
PA-12 29.53 24.24 5.29
4.2 Mechanical and morphological properties
Figure 3 shows stress-strain curves for simple
blends of NR/PA-12 and NR-g-PDAAM10/PA-12
compared with their dynamically vulcanized
counterparts. It is clearly seen that NR-g-PDAAM10/PA-
12 blend exhibited higher tensile strength and elongation
at break than NR/PA-12 blend. This is because the polar
functional groups present in the NR-g-PDAAM
molecules facilitate compatibility between the rubber and
PA-12 phases.
It can also be observed that when the rubber phase
(i.e., NR or NR-g-PDAAM10) in the simple blends was
dynamically cured during its melt mixing with
PA-12, the stiffness and toughness of these materials
referred to as thermoplastic vulcanizates (TPVs)
noticeably increased. It is evident from the observation
that the initial slopes of the stress-strain curves for both
types of TPVs were steeper than those of the
corresponding simple blends. It was also observed that
these TPVs showed a higher tensile strength and
elongation at break as compared with their simple
blends. This observation can be explained on the basis of
morphological change occurred during dynamic
vulcanization.
Figure 3. Stress-strain curves of simple blends and
thermoplastic vulcanizates (TPV) based on NR/PA-12
and NR-g-PDAAM10/PA-12 blends at a blend ratio of
rubber/PA-12 = 60/40 wt%.
Figure 4. SEM micrographs of 60/40 rubber/PA-12
blends based on NR and NR-g-PDAAM10: (a) NR/PA-
12 simple blend (×500), (b) NR-g-PDAAM10/PA-12
simple blend (×500), (c) NR/PA-12 TPV (×10,000), (d)
NR-g-PDAAM10/PA-12 TPV (×10,000).
Morphological studies of the simple blends were
then carried out by examination of cryo-fractured
surfaces using SEM. Rubber phases (i.e., NR or NR-g-
PDAAM) were etched with a solvent mixture of toluene
and methyl ethyl ketone (50/50 v/v) for 3 days at
ambient temperature prior to SEM analyses. It can be
0
4
8
12
16
20
24
0 20 40 60 80 100 120 140 160 180 200
NR/PA-12 TPVNR-g-PDAAM/PA-12 simple blend
NR-g-PDAAM/PA-12 TPV
NR/PA-12 simple blend
Str
ess
(MP
a)
Strain (%)
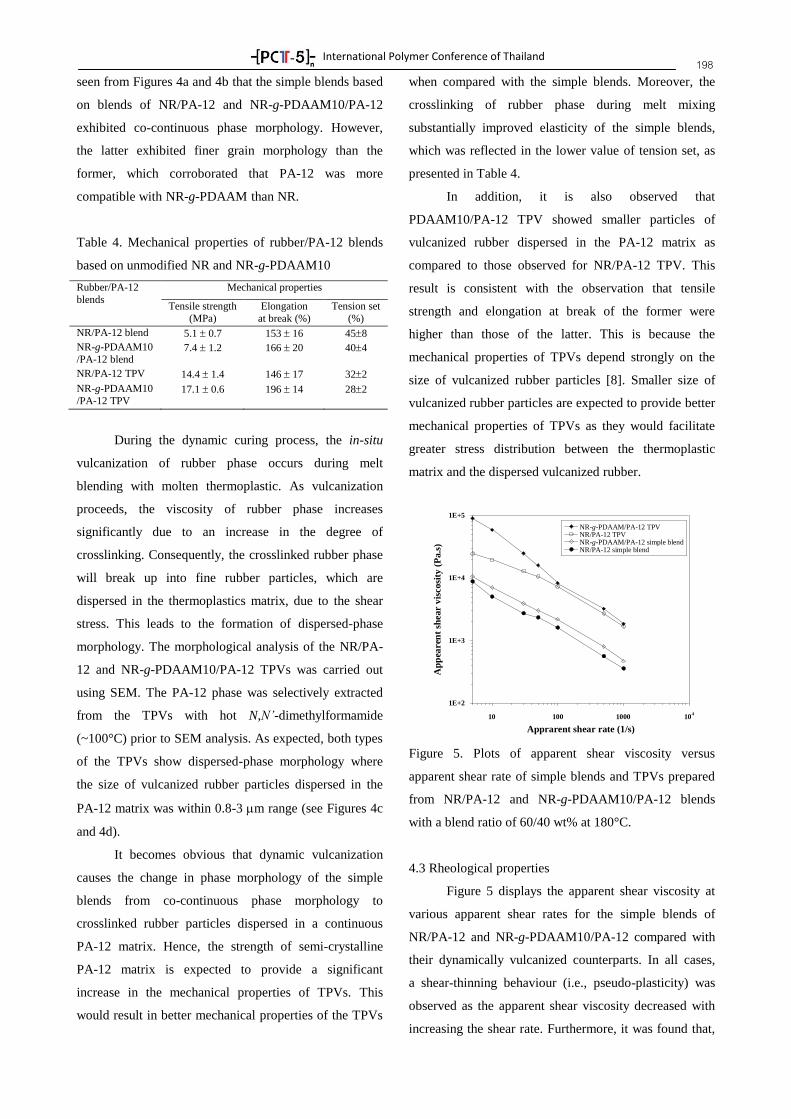
International Polymer Conference of Thailand
198 seen from Figures 4a and 4b that the simple blends based
on blends of NR/PA-12 and NR-g-PDAAM10/PA-12
exhibited co-continuous phase morphology. However,
the latter exhibited finer grain morphology than the
former, which corroborated that PA-12 was more
compatible with NR-g-PDAAM than NR.
Table 4. Mechanical properties of rubber/PA-12 blends
based on unmodified NR and NR-g-PDAAM10
Rubber/PA-12
blends
Mechanical properties
Tensile strength
(MPa)
Elongation
at break (%)
Tension set
(%)
NR/PA-12 blend 5.1 0.7 153 16 458
NR-g-PDAAM10
/PA-12 blend 7.4 1.2 166 20 404
NR/PA-12 TPV 14.4 1.4 146 17 322
NR-g-PDAAM10
/PA-12 TPV 17.1 0.6 196 14 282
During the dynamic curing process, the in-situ
vulcanization of rubber phase occurs during melt
blending with molten thermoplastic. As vulcanization
proceeds, the viscosity of rubber phase increases
significantly due to an increase in the degree of
crosslinking. Consequently, the crosslinked rubber phase
will break up into fine rubber particles, which are
dispersed in the thermoplastics matrix, due to the shear
stress. This leads to the formation of dispersed-phase
morphology. The morphological analysis of the NR/PA-
12 and NR-g-PDAAM10/PA-12 TPVs was carried out
using SEM. The PA-12 phase was selectively extracted
from the TPVs with hot N,N’-dimethylformamide
(~100°C) prior to SEM analysis. As expected, both types
of the TPVs show dispersed-phase morphology where
the size of vulcanized rubber particles dispersed in the
PA-12 matrix was within 0.8-3 m range (see Figures 4c
and 4d).
It becomes obvious that dynamic vulcanization
causes the change in phase morphology of the simple
blends from co-continuous phase morphology to
crosslinked rubber particles dispersed in a continuous
PA-12 matrix. Hence, the strength of semi-crystalline
PA-12 matrix is expected to provide a significant
increase in the mechanical properties of TPVs. This
would result in better mechanical properties of the TPVs
when compared with the simple blends. Moreover, the
crosslinking of rubber phase during melt mixing
substantially improved elasticity of the simple blends,
which was reflected in the lower value of tension set, as
presented in Table 4.
In addition, it is also observed that
PDAAM10/PA-12 TPV showed smaller particles of
vulcanized rubber dispersed in the PA-12 matrix as
compared to those observed for NR/PA-12 TPV. This
result is consistent with the observation that tensile
strength and elongation at break of the former were
higher than those of the latter. This is because the
mechanical properties of TPVs depend strongly on the
size of vulcanized rubber particles [8]. Smaller size of
vulcanized rubber particles are expected to provide better
mechanical properties of TPVs as they would facilitate
greater stress distribution between the thermoplastic
matrix and the dispersed vulcanized rubber.
Figure 5. Plots of apparent shear viscosity versus
apparent shear rate of simple blends and TPVs prepared
from NR/PA-12 and NR-g-PDAAM10/PA-12 blends
with a blend ratio of 60/40 wt% at 180°C.
4.3 Rheological properties
Figure 5 displays the apparent shear viscosity at
various apparent shear rates for the simple blends of
NR/PA-12 and NR-g-PDAAM10/PA-12 compared with
their dynamically vulcanized counterparts. In all cases,
a shear-thinning behaviour (i.e., pseudo-plasticity) was
observed as the apparent shear viscosity decreased with
increasing the shear rate. Furthermore, it was found that,
1E+2
1E+3
1E+4
1E+5
10 100 1000 104
NR-g-PDAAM/PA-12 TPVNR/PA-12 TPVNR-g-PDAAM/PA-12 simple blendNR/PA-12 simple blend
Ap
pea
ren
t sh
ear v
iscosi
ty (
Pa.s
)
Apprarent shear rate (1/s)
International Polymer Conference of Thailand
199 at a given shear rate, the rubber/PA-12 TPVs clearly
exhibited higher apparent shear viscosity than those of
the corresponding simple blends. This indicates that the
vulcanized rubber particles dispersed in the PA-12
matrix restrict the movement of polymer chains in the
direction of shearing flow, resulting in higher values of
apparent shear viscosity.
Additionally, it is also seen that the apparent shear
viscosity at low shear rates of the NR-g-PDAAM10/PA-
12 TPV were much higher than those of NR/nylon-12
TPV. This can be related to the presence of polar groups
in the NR-g-PDAAM molecule which make its more
compatible with nylon-12 than a non-polar NR.
Therefore, the NR-g-PDAAM/nylon-12 TPV is expected
to have better interfacial adhesion between polymeric
phases, leading to a higher melt viscosity. These results
provide supportive evidence that the DAAM groups
present in the NR-g-PDAAM10 molecules enhance the
blend compatibilization between NR and PA-12 phases
and, subsequently, improve properties of the blends.
5. Conclusion
In the present study, an attempt was made to
demonstrate that the grafting of NR with hydrophilic
DAAM improved its compatibility with PA-12. TPEs
based on blends of either unmodified NR or NR-g-
PDAAM10 with PA-12 were then prepared at a 60/40
(wt%) blend ratio of rubber/PA-12 by simple blend and
dynamic vulcanization techniques. Dynamic vulca-
nization of the rubber phase was shown to markedly
enhance the mechanical and rheological properties of the
blends. Smaller size of vulcanized rubber particles
dispersed in the PA-12 matrix was seen in the NR-g-
PDAAM10/PA-12 TPV. This is probably responsible for
the higher tensile properties of the NR-g-PDAAM10/PA-
12 TPV when compared with the NR /PA-12 TPV. It
was also observed that the apparent shear viscosities in
low shear regions of the NR-g-PDAAM10/PA-12 TPV
was much higher than those of the NR/PA-12 TPV.
These results indicate that the interfacial adhesion
between NR and PA-12 was improved by the presence of
DAAM groups in NR molecule.
Acknowledgments
This work was supported by the Higher Education
Research Promotion and National Research University
Project of Thailand, Office of the Higher Education
Commission.
References
[1] Ibrahim, A. and Dahlan, M. Prog. Polym. Sci. 1998,
23, 665-706.
[2] Baker, A-M. and Mead, J.L., “Thermoplstics”, In:
Harper, C. A. (ed) Handbook of Plastics Technologies,
New York, McGrawHill: 2.11-2.14 (2006).
[3] Narathichat, ., Kummerl we, C., Vennemann, N.
and Nakason, C. J. Appl. Polym. Sci. 2011, 12, 805–814.
[4] Tanrattanakul, V., Sungthong, N. and Raksa, P.
Polym. Test. 2008, 27, 794–800.
[5] Thongnuanchan, B., Ninjan, N., Kaesaman, A. and
Nakason, C. Polym. Bull. 2015, 72, 135–155.
[6] Yuan, Y. and Lee, T. R., “Contact Angle and
Wetting Properties”, In Bracco, G., and Holst, B. (ed.s)
Surface Science Techniques, New York ,Springer-Verlag
Berlin Heidelberg : 3-5 (2013).
[7] Fowke, F.M. Ind. Eng. Chem. 1964, 56, 40-52.
[8] Coran, A.Y. and Patel, R. Rubber Chem. Technol.
1983, 56, 1045-1060.
International Polymer Conference of Thailand
200
RUBBERO-03
Thermoplastic Vulcanizates Based on Natural Rubber/Propylene-Ethylene Copolymer
Blends: Influence of Viscosity and Ethylene Contents of the Copolymer on the Properties
T. Wohmang B. Thongnuanchan
and A. Kaesaman
*
Department of Rubber Technology and Polymer Science, Faculty of Science and Technology,
Prince of Songkla University, Pattani, 94000
Phone +6689 658 5892, Fax +66 73331099, *E-mail: [email protected]
Abstract
This work investigates the effect of viscosity and ethylene content of propylene-ethylene copolymer
(PEC) on the properties of thermoplastic vulcanizates (TPVs) based on natural rubber (NR) and PEC blends.
Blends of NR and PECs with different viscosities and ethylene contents were prepared at a blend ratio of
NR/PEC = 40/60 wt% by dynamic vulcanization. The results reveal that the properties of NR/PEC TPVs are
significantly influenced by the melt flow index (MFI), and ethylene content of the PECs. Tensile strength of the
TPVs decreases slightly but elongation at break increases with increasing the viscosity of PECs. It is also
observed that the apparent shear viscosity at various shear rates of the TPVs increases with a decrease in the
MFI of the PEC matrix. Increasing the ethylene content in the PEC results in a decreases in the tensile strength
of the TPVs whereas the elongation at break increases. The NR/PEC TPVs can be reprocessed, but deterioration
in their mechanical properties is observed.
Keywords: Thermoplastic vulcanizates (TPVs), Propylene – ethylene copolymer (PEC), Natural rubber (NR),
Dynamic vulcanization.
1. Introduction
In recent years, themoplastic vulcanizates (TPVs)
are materials which have drawn remarkable interests by
both academia and industry as they combine the ease of
processing of thermoplastics with the characteristics of
vulcanized rubber. The TPVs are normally phase
separated systems, in which one phase is soft and
rubbery at room temperature while the other is hard and
solid. The advantages of TPVs over rubbers are their
processing properties as they can be processed like the
conventional thermoplastic and so they can be recycled.
The materials are likely to be used to replace the
conventional vulcanizated rubber products wherever they
are applicable. TPVs can be applied for a variety of
products such as automotive parts, electronic devices,
medical equipment and industrial buildings, etc. [1].
TPVs based on blends of natural rubber (NR) and
polyolefins (i.e., polypropylene, PP, and polyethylene,
PE) is one of the most widely studied systems in the field
of thermoplastic elastomers. Polyolefins are widely used
for the preparation of TPVs due to their good mechanical
properties, chemical resistance, and relatively low cost
[2-3]. PP is often considered as the polymer of choice for
blending with NR as it has a higher softening
temperature (i.e.,105°C) than PE, resulting in a higher
service temperature for NR/PP blends. TPVs based on
NR/PP blends with different mechanical properties can
be typically prepared by varying the blend compositions.
Additionally, copolymers of propylene and ethylene
(PEC) are often used in place of PP homopolymer for
blending with NR when greater impact strength and
ductility at low temperatures are required. This is
because PP has relatively low impact strength at a
temperature below 0ºC. In the present work, TPVs based
on blends of NR and different grades of PEC were
prepared at a blend ratio of NR/PEC = 40/60 wt% by
dynamic vulcanization. PEC (Versify®, Dow Chemical)
is selected to blend with NR in order to produce TPVs.
PECs with different viscosities and ethylene contents
were investigated for their influence on the properties of
resulting TPVs
2. Experimental Section
2.1 Materials
Natural rubber (STR 5L) was supplied by Teck
Bee Hang, Thailand. PEC (Versify®) of various grades
(i.e., 2300, 3000, 3200, 3300, 3401 and 4301) was
supplied by Dow Chemical Company, USA and some of
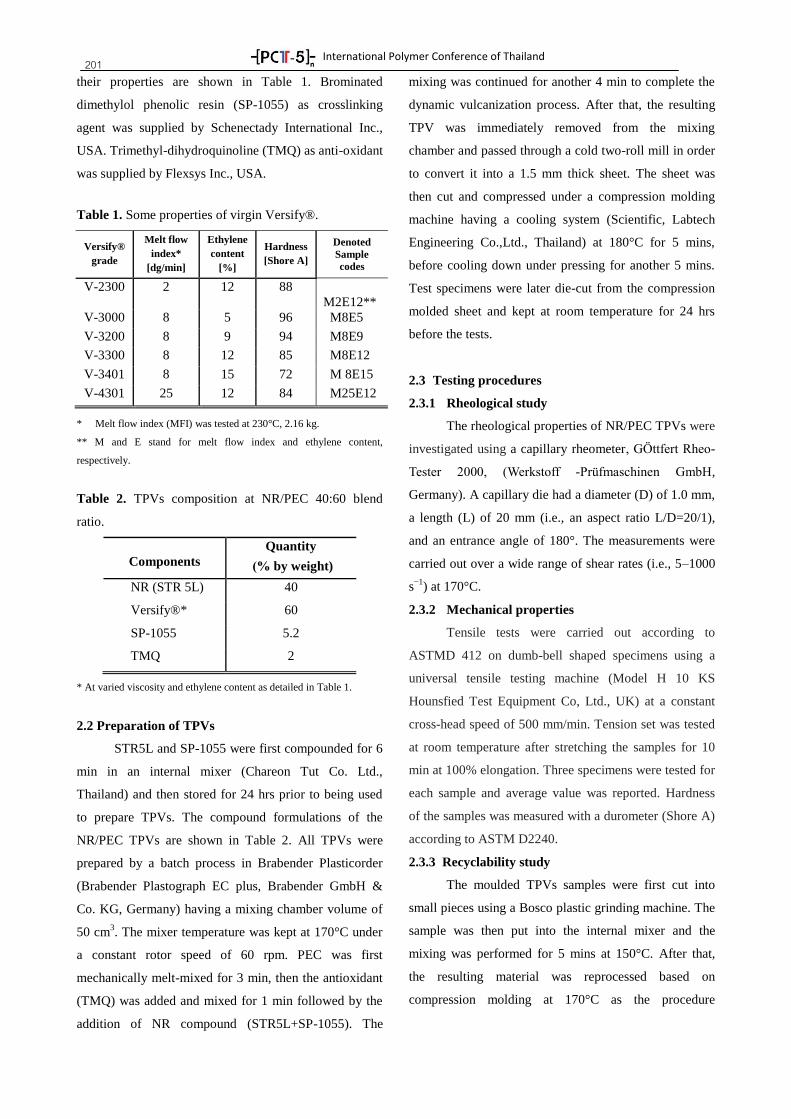
International Polymer Conference of Thailand
201 their properties are shown in Table 1. Brominated
dimethylol phenolic resin (SP-1055) as crosslinking
agent was supplied by Schenectady International Inc.,
USA. Trimethyl-dihydroquinoline (TMQ) as anti-oxidant
was supplied by Flexsys Inc., USA.
Table 1. Some properties of virgin Versify®.
Versify®
grade
Melt flow
index*
[dg/min]
Ethylene
content
[%]
Hardness
[Shore A]
Denoted
Sample
codes
V-2300 2 12 88
M2E12**
V-3000 8 5 96 M8E5
V-3200 8 9 94 M8E9
V-3300 8 12 85 M8E12
V-3401 8 15 72 M 8E15
V-4301 25 12 84 M25E12
* Melt flow index (MFI) was tested at 230°C, 2.16 kg.
** M and E stand for melt flow index and ethylene content,
respectively.
Table 2. TPVs composition at NR/PEC 40:60 blend
ratio.
Components
Quantity
(% by weight)
NR (STR 5L) 40
Versify®* 60
SP-1055 5.2
TMQ 2
* At varied viscosity and ethylene content as detailed in Table 1.
2.2 Preparation of TPVs
STR5L and SP-1055 were first compounded for 6
min in an internal mixer (Chareon Tut Co. Ltd.,
Thailand) and then stored for 24 hrs prior to being used
to prepare TPVs. The compound formulations of the
NR/PEC TPVs are shown in Table 2. All TPVs were
prepared by a batch process in Brabender Plasticorder
(Brabender Plastograph EC plus, Brabender GmbH &
Co. KG, Germany) having a mixing chamber volume of
50 cm3. The mixer temperature was kept at 170°C under
a constant rotor speed of 60 rpm. PEC was first
mechanically melt-mixed for 3 min, then the antioxidant
(TMQ) was added and mixed for 1 min followed by the
addition of NR compound (STR5L+SP-1055). The
mixing was continued for another 4 min to complete the
dynamic vulcanization process. After that, the resulting
TPV was immediately removed from the mixing
chamber and passed through a cold two-roll mill in order
to convert it into a 1.5 mm thick sheet. The sheet was
then cut and compressed under a compression molding
machine having a cooling system (Scientific, Labtech
Engineering Co.,Ltd., Thailand) at 180°C for 5 mins,
before cooling down under pressing for another 5 mins.
Test specimens were later die-cut from the compression
molded sheet and kept at room temperature for 24 hrs
before the tests.
2.3 Testing procedures
2.3.1 Rheological study
The rheological properties of NR/PEC TPVs were
investigated using a capillary rheometer, G ttfert Rheo-
Tester 2000, (Werkstoff -Pr fmaschinen GmbH,
Germany). A capillary die had a diameter (D) of 1.0 mm,
a length (L) of 20 mm (i.e., an aspect ratio L/D=20/1),
and an entrance angle of 180°. The measurements were
carried out over a wide range of shear rates (i.e., 5–1000
s−1
) at 170°C.
2.3.2 Mechanical properties
Tensile tests were carried out according to
ASTMD 412 on dumb-bell shaped specimens using a
universal tensile testing machine (Model H 10 KS
Hounsfied Test Equipment Co, Ltd., UK) at a constant
cross-head speed of 500 mm/min. Tension set was tested
at room temperature after stretching the samples for 10
min at 100% elongation. Three specimens were tested for
each sample and average value was reported. Hardness
of the samples was measured with a durometer (Shore A)
according to ASTM D2240.
2.3.3 Recyclability study
The moulded TPVs samples were first cut into
small pieces using a Bosco plastic grinding machine. The
sample was then put into the internal mixer and the
mixing was performed for 5 mins at 150°C. After that,
the resulting material was reprocessed based on
compression molding at 170°C as the procedure
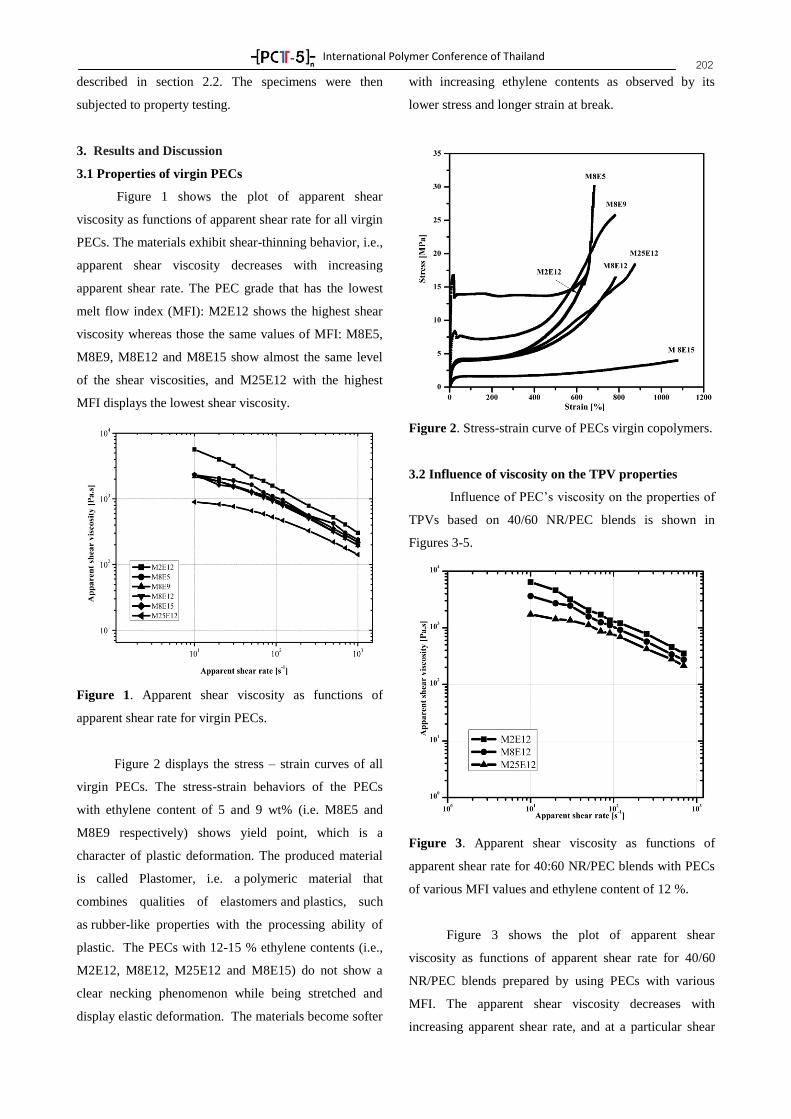
International Polymer Conference of Thailand
202 described in section 2.2. The specimens were then
subjected to property testing.
3. Results and Discussion 3.1 Properties of virgin PECs
Figure 1 shows the plot of apparent shear
viscosity as functions of apparent shear rate for all virgin
PECs. The materials exhibit shear-thinning behavior, i.e.,
apparent shear viscosity decreases with increasing
apparent shear rate. The PEC grade that has the lowest
melt flow index (MFI): M2E12 shows the highest shear
viscosity whereas those the same values of MFI: M8E5,
M8E9, M8E12 and M8E15 show almost the same level
of the shear viscosities, and M25E12 with the highest
MFI displays the lowest shear viscosity.
Figure 1. Apparent shear viscosity as functions of
apparent shear rate for virgin PECs.
Figure 2 displays the stress – strain curves of all
virgin PECs. The stress-strain behaviors of the PECs
with ethylene content of 5 and 9 wt% (i.e. M8E5 and
M8E9 respectively) shows yield point, which is a
character of plastic deformation. The produced material
is called Plastomer, i.e. a polymeric material that
combines qualities of elastomers and plastics, such
as rubber-like properties with the processing ability of
plastic. The PECs with 12-15 % ethylene contents (i.e.,
M2E12, M8E12, M25E12 and M8E15) do not show a
clear necking phenomenon while being stretched and
display elastic deformation. The materials become softer
with increasing ethylene contents as observed by its
lower stress and longer strain at break.
Figure 2. Stress-strain curve of PECs virgin copolymers.
3.2 Influence of viscosity on the TPV properties
Influence of PEC’s viscosity on the properties of
TPVs based on 40/60 NR/PEC blends is shown in
Figures 3-5.
Figure 3. Apparent shear viscosity as functions of
apparent shear rate for 40:60 NR/PEC blends with PECs
of various MFI values and ethylene content of 12 %.
Figure 3 shows the plot of apparent shear
viscosity as functions of apparent shear rate for 40/60
NR/PEC blends prepared by using PECs with various
MFI. The apparent shear viscosity decreases with
increasing apparent shear rate, and at a particular shear
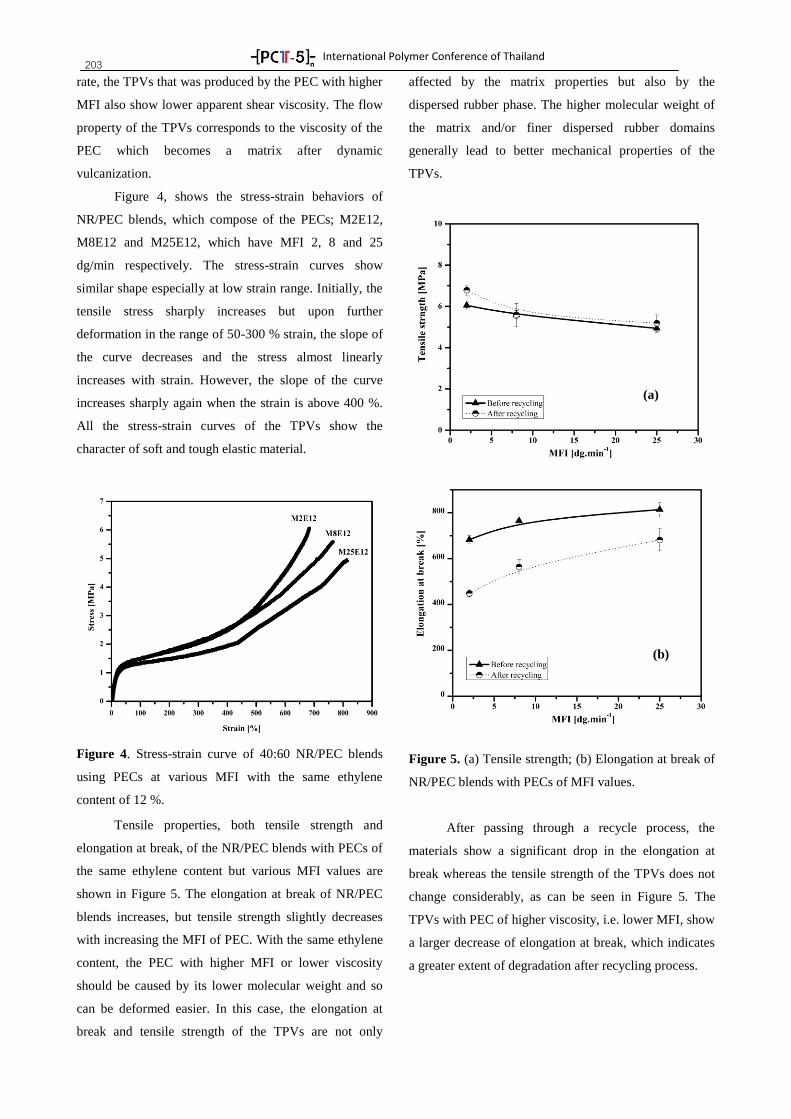
International Polymer Conference of Thailand
203 rate, the TPVs that was produced by the PEC with higher
MFI also show lower apparent shear viscosity. The flow
property of the TPVs corresponds to the viscosity of the
PEC which becomes a matrix after dynamic
vulcanization.
Figure 4, shows the stress-strain behaviors of
NR/PEC blends, which compose of the PECs; M2E12,
M8E12 and M25E12, which have MFI 2, 8 and 25
dg/min respectively. The stress-strain curves show
similar shape especially at low strain range. Initially, the
tensile stress sharply increases but upon further
deformation in the range of 50-300 % strain, the slope of
the curve decreases and the stress almost linearly
increases with strain. However, the slope of the curve
increases sharply again when the strain is above 400 %.
All the stress-strain curves of the TPVs show the
character of soft and tough elastic material.
Figure 4. Stress-strain curve of 40:60 NR/PEC blends
using PECs at various MFI with the same ethylene
content of 12 %.
Tensile properties, both tensile strength and
elongation at break, of the NR/PEC blends with PECs of
the same ethylene content but various MFI values are
shown in Figure 5. The elongation at break of NR/PEC
blends increases, but tensile strength slightly decreases
with increasing the MFI of PEC. With the same ethylene
content, the PEC with higher MFI or lower viscosity
should be caused by its lower molecular weight and so
can be deformed easier. In this case, the elongation at
break and tensile strength of the TPVs are not only
affected by the matrix properties but also by the
dispersed rubber phase. The higher molecular weight of
the matrix and/or finer dispersed rubber domains
generally lead to better mechanical properties of the
TPVs.
Figure 5. (a) Tensile strength; (b) Elongation at break of
NR/PEC blends with PECs of MFI values.
After passing through a recycle process, the
materials show a significant drop in the elongation at
break whereas the tensile strength of the TPVs does not
change considerably, as can be seen in Figure 5. The
TPVs with PEC of higher viscosity, i.e. lower MFI, show
a larger decrease of elongation at break, which indicates
a greater extent of degradation after recycling process.
(A) (b) (b)
(a)

International Polymer Conference of Thailand
204 3.3 Influence of ethylene content on the TPV
properties
The ethylene content of PECs has an influence
on the properties of TPVs as shown in Figures 6 - 8.
Figure 6 shows the plot of apparent shear viscosity
versus apparent shear rate of the 40/60 NR/PEC blends
with various ethylene contents in the PEC component. It
can be seen that apparent shear viscosity decreases with
increasing apparent shear rate. However, at a particular
shear rate, all the blends with different ethylene content
in the PEC component show similar shear viscosities as
those PECs have the same MFI values.
Figure 6. Apparent shear viscosity as function of
apparent shear rate for 40:60 NR/PEC blends with PECs
of various ethylene contents and MFI of 8 dg/min.
Figure 7 shows the stress-strain curves of
NR/PEC blends, containing the PECs of various ethylene
contents but the same MFI values. The result indicates
that the presence of ethylene in the PEC enhances the
molecular chain mobility and so the material can be
deformed easier. As seen in Table 1, the PECs with
different ethylene contents have different hardness, that
is, this polymer becomes softer with increasing ethylene
content. Additionally, the crystallinity of PECs also
decreases as the ethylene content in copolymers
increases. The values of crystallinity for PECs containing
5 (M8E5), 9 (M8E9), 12 (M8E12) and 15% ethylene
content (M8E15) are 44, 30, 17, and 14 wt%,
respectively, as reported by Dow Chemical Company.
Figure 7. Stress-strain curve of 40:60 NR/PEC blends
with PECs of various ethylene contents and MFI of 8
dg/min.
Choudhury and Bhowmick [6] reported that the
interphase interactions between the NR and PP phases
increased with the addition of ethylene propylene diene
monomer (EPDM) rubber into the NR/PP blend. This is
because EPDM has some structural similarity with PP
phase. Moreover, it is amorphous and elastomeric in
nature similar to NR. Thus, it is expected that PECs with
the lowest value of crystallinity, i.e. M8E15, is more
likely to be compatible with NR in a blend than the other
types of PECs. However, the results in Figure 8 show
that increasing the ethylene content of PEC in the
NR/PEC blends from 5 to 9, 12 and 15 %, the tensile
strength tends to decrease and elongation at break
increases respectively. These results indicate that the
tensile properties of the TPVs are strongly influenced by
the properties of the matrix.
It can also be seen from Figure 8a that the
NR/PEC blends with PECs of various ethylene contents
can be reprocessed without significantly affecting their
tensile strength. However, a significant drop in
elongation at break is observed for the TPVs with PEC
having ethylene contents higher than 5 % (i.e., M8E9,
M8E12, and M8E15) after recycling process (Figure 8b).
The decrease in the elongation at break of TPVs is
mainly attributed to thermal degradation of the PEC
matrix taking place during the recycling process since
the dispersed NR domains have already been
dynamically vulcanized. Hence, these results indicate
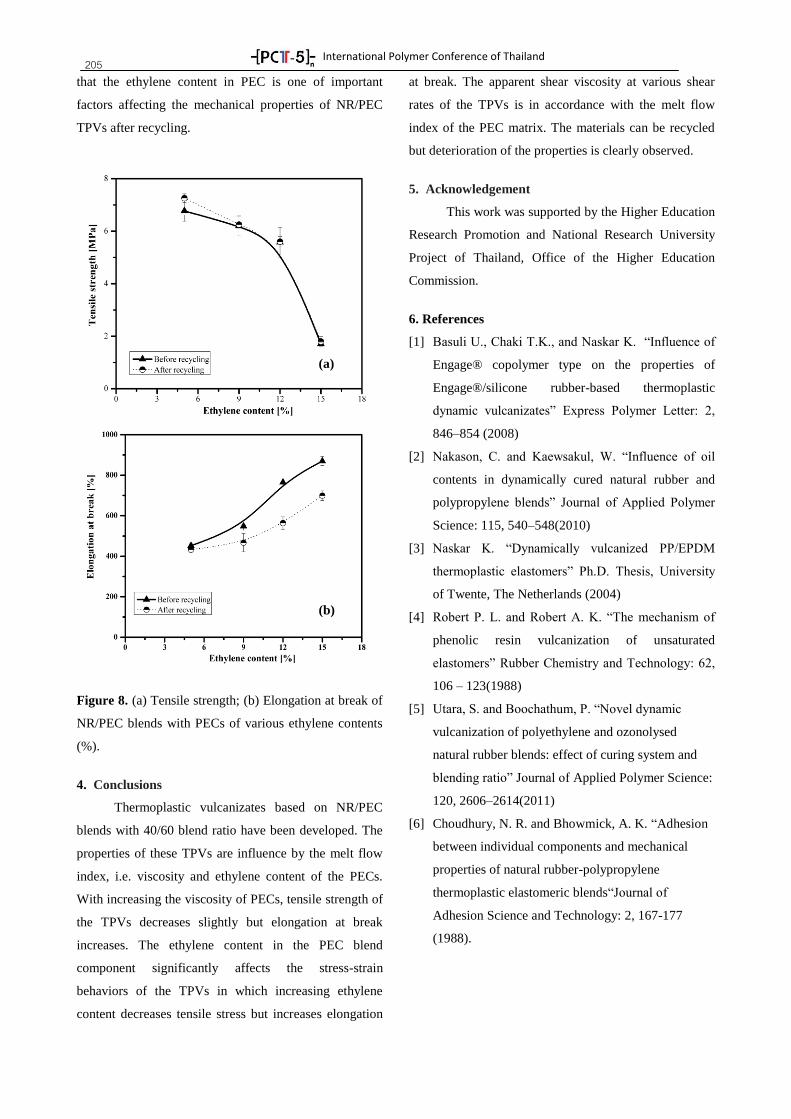
International Polymer Conference of Thailand
205 that the ethylene content in PEC is one of important
factors affecting the mechanical properties of NR/PEC
TPVs after recycling.
Figure 8. (a) Tensile strength; (b) Elongation at break of
NR/PEC blends with PECs of various ethylene contents
(%).
4. Conclusions
Thermoplastic vulcanizates based on NR/PEC
blends with 40/60 blend ratio have been developed. The
properties of these TPVs are influence by the melt flow
index, i.e. viscosity and ethylene content of the PECs.
With increasing the viscosity of PECs, tensile strength of
the TPVs decreases slightly but elongation at break
increases. The ethylene content in the PEC blend
component significantly affects the stress-strain
behaviors of the TPVs in which increasing ethylene
content decreases tensile stress but increases elongation
at break. The apparent shear viscosity at various shear
rates of the TPVs is in accordance with the melt flow
index of the PEC matrix. The materials can be recycled
but deterioration of the properties is clearly observed.
5. Acknowledgement This work was supported by the Higher Education
Research Promotion and National Research University
Project of Thailand, Office of the Higher Education
Commission.
6. References
[1] Basuli U., Chaki T.K., and Naskar K. “Influence of
Engage® copolymer type on the properties of
Engage®/silicone rubber-based thermoplastic
dynamic vulcanizates” Express Polymer Letter: 2,
846–854 (2008)
[2] Nakason, C. and Kaewsakul, W. “Influence of oil
contents in dynamically cured natural rubber and
polypropylene blends” Journal of Applied Polymer
Science: 115, 540–548(2010)
[3] Naskar K. “Dynamically vulcanized PP/EPD
thermoplastic elastomers” Ph.D. Thesis, University
of Twente, The Netherlands (2004)
[4] Robert P. L. and Robert A. K. “The mechanism of
phenolic resin vulcanization of unsaturated
elastomers” Rubber Chemistry and Technology: 62,
106 – 123(1988)
[5] Utara, S. and Boochathum, P. “Novel dynamic
vulcanization of polyethylene and ozonolysed
natural rubber blends: effect of curing system and
blending ratio” Journal of Applied Polymer Science:
120, 2606–2614(2011)
[6] Choudhury, N. R. and Bhowmick, A. K. “Adhesion
between individual components and mechanical
properties of natural rubber-polypropylene
thermoplastic elastomeric blends“Journal of
Adhesion Science and Technology: 2, 167-177
(1988).
(b)
(a)
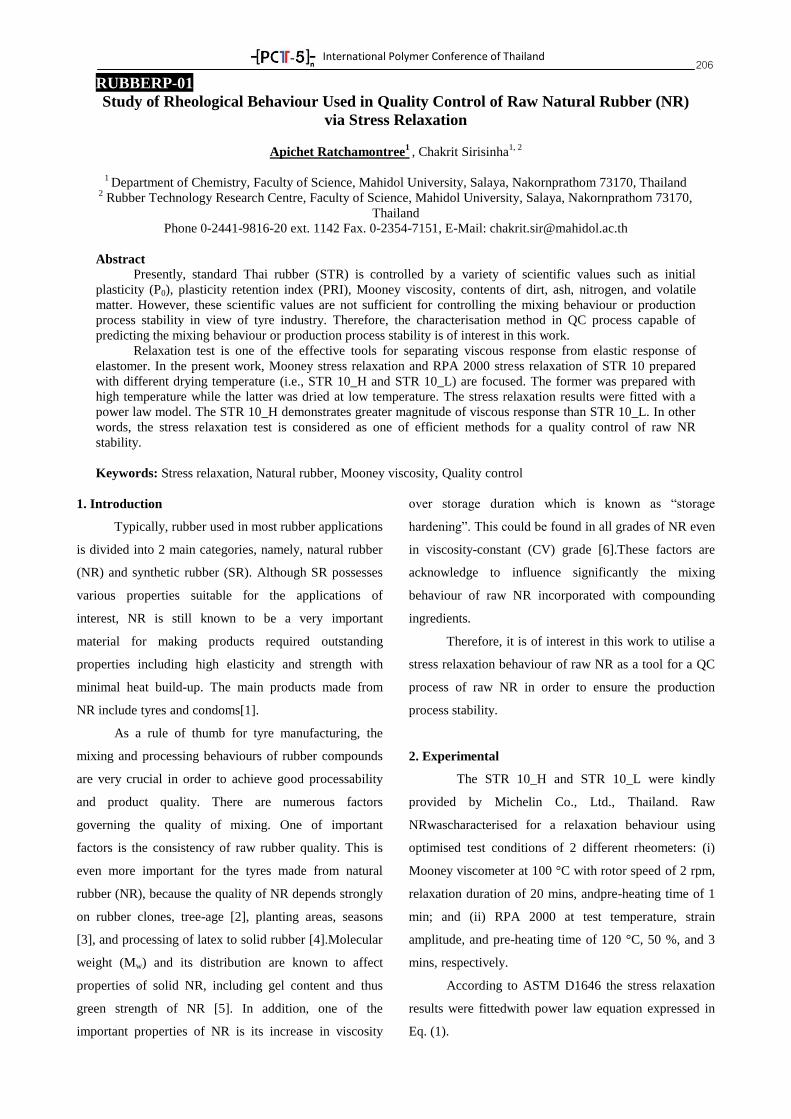
International Polymer Conference of Thailand
206 RUBBERP-01
Study of Rheological Behaviour Used in Quality Control of Raw Natural Rubber (NR)
via Stress Relaxation
Apichet Ratchamontree1 , Chakrit Sirisinha
1, 2
1 Department of Chemistry, Faculty of Science, Mahidol University, Salaya, Nakornprathom 73170, Thailand
2 Rubber Technology Research Centre, Faculty of Science, Mahidol University, Salaya, Nakornprathom 73170,
Thailand
Phone 0-2441-9816-20 ext. 1142 Fax. 0-2354-7151, E-Mail: [email protected]
Abstract
Presently, standard Thai rubber (STR) is controlled by a variety of scientific values such as initial
plasticity (P0), plasticity retention index (PRI), Mooney viscosity, contents of dirt, ash, nitrogen, and volatile
matter. However, these scientific values are not sufficient for controlling the mixing behaviour or production
process stability in view of tyre industry. Therefore, the characterisation method in QC process capable of
predicting the mixing behaviour or production process stability is of interest in this work.
Relaxation test is one of the effective tools for separating viscous response from elastic response of
elastomer. In the present work, Mooney stress relaxation and RPA 2000 stress relaxation of STR 10 prepared
with different drying temperature (i.e., STR 10_H and STR 10_L) are focused. The former was prepared with
high temperature while the latter was dried at low temperature. The stress relaxation results were fitted with a
power law model. The STR 10_H demonstrates greater magnitude of viscous response than STR 10_L. In other
words, the stress relaxation test is considered as one of efficient methods for a quality control of raw NR
stability.
Keywords: Stress relaxation, Natural rubber, Mooney viscosity, Quality control
1. Introduction
Typically, rubber used in most rubber applications
is divided into 2 main categories, namely, natural rubber
(NR) and synthetic rubber (SR). Although SR possesses
various properties suitable for the applications of
interest, NR is still known to be a very important
material for making products required outstanding
properties including high elasticity and strength with
minimal heat build-up. The main products made from
NR include tyres and condoms[1].
As a rule of thumb for tyre manufacturing, the
mixing and processing behaviours of rubber compounds
are very crucial in order to achieve good processability
and product quality. There are numerous factors
governing the quality of mixing. One of important
factors is the consistency of raw rubber quality. This is
even more important for the tyres made from natural
rubber (NR), because the quality of NR depends strongly
on rubber clones, tree-age [2], planting areas, seasons
[3], and processing of latex to solid rubber [4].Molecular
weight (Mw) and its distribution are known to affect
properties of solid NR, including gel content and thus
green strength of NR [5]. In addition, one of the
important properties of NR is its increase in viscosity
over storage duration which is known as “storage
hardening”. This could be found in all grades of NR even
in viscosity-constant (CV) grade [6].These factors are
acknowledge to influence significantly the mixing
behaviour of raw NR incorporated with compounding
ingredients.
Therefore, it is of interest in this work to utilise a
stress relaxation behaviour of raw NR as a tool for a QC
process of raw NR in order to ensure the production
process stability.
2. Experimental
The STR 10_H and STR 10_L were kindly
provided by Michelin Co., Ltd., Thailand. Raw
NRwascharacterised for a relaxation behaviour using
optimised test conditions of 2 different rheometers: (i)
Mooney viscometer at 100 °C with rotor speed of 2 rpm,
relaxation duration of 20 mins, andpre-heating time of 1
min; and (ii) RPA 2000 at test temperature, strain
amplitude, and pre-heating time of 120 °C, 50 %, and 3
mins, respectively.
According to ASTM D1646 the stress relaxation
results were fittedwith power law equation expressed in
Eq. (1).
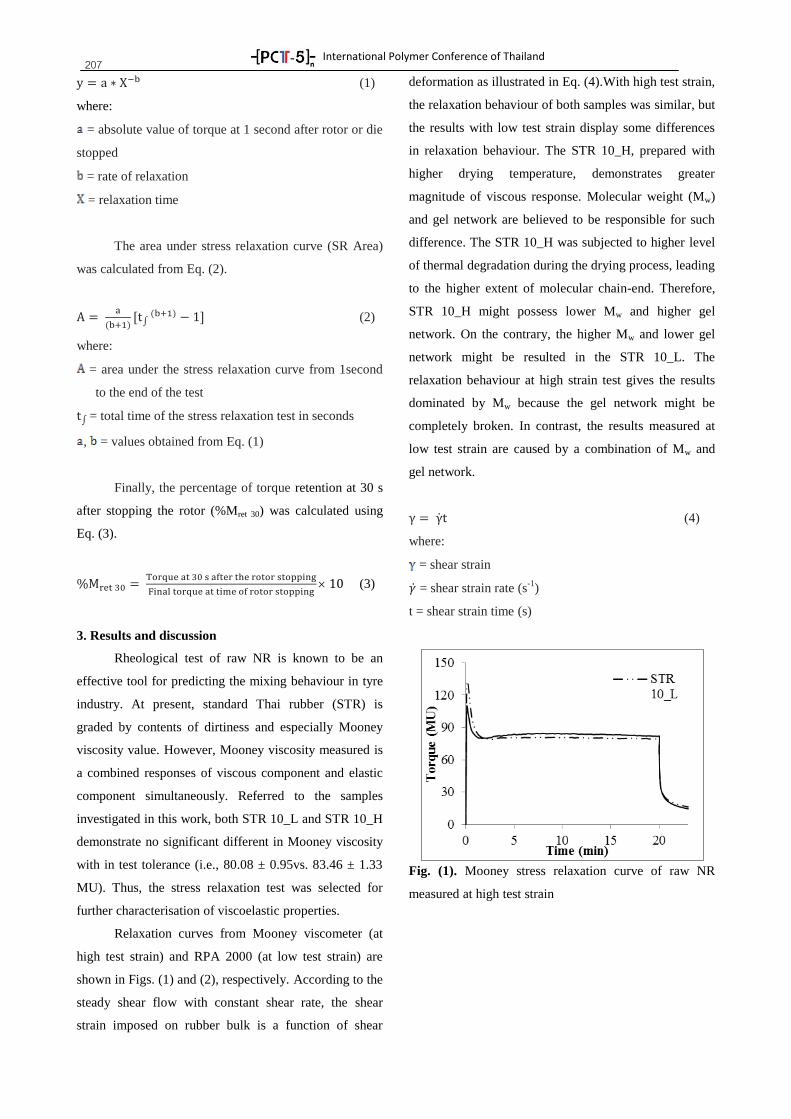
International Polymer Conference of Thailand
207 (1)
where:
= absolute value of torque at 1 second after rotor or die
stopped
= rate of relaxation
= relaxation time
The area under stress relaxation curve (SR Area)
was calculated from Eq. (2).
(2)
where:
= area under the stress relaxation curve from 1second
to the end of the test
= total time of the stress relaxation test in seconds
, = values obtained from Eq. (1)
Finally, the percentage of torque retention at 30 s
after stopping the rotor (%Mret 30) was calculated using
Eq. (3).
(3)
3. Results and discussion
Rheological test of raw NR is known to be an
effective tool for predicting the mixing behaviour in tyre
industry. At present, standard Thai rubber (STR) is
graded by contents of dirtiness and especially Mooney
viscosity value. However, Mooney viscosity measured is
a combined responses of viscous component and elastic
component simultaneously. Referred to the samples
investigated in this work, both STR 10_L and STR 10_H
demonstrate no significant different in Mooney viscosity
with in test tolerance (i.e., 80.08 ± 0.95vs. 83.46 ± 1.33
MU). Thus, the stress relaxation test was selected for
further characterisation of viscoelastic properties.
Relaxation curves from Mooney viscometer (at
high test strain) and RPA 2000 (at low test strain) are
shown in Figs. (1) and (2), respectively. According to the
steady shear flow with constant shear rate, the shear
strain imposed on rubber bulk is a function of shear
deformation as illustrated in Eq. (4).With high test strain,
the relaxation behaviour of both samples was similar, but
the results with low test strain display some differences
in relaxation behaviour. The STR 10_H, prepared with
higher drying temperature, demonstrates greater
magnitude of viscous response. Molecular weight (Mw)
and gel network are believed to be responsible for such
difference. The STR 10_H was subjected to higher level
of thermal degradation during the drying process, leading
to the higher extent of molecular chain-end. Therefore,
STR 10_H might possess lower Mw and higher gel
network. On the contrary, the higher Mw and lower gel
network might be resulted in the STR 10_L. The
relaxation behaviour at high strain test gives the results
dominated by Mw because the gel network might be
completely broken. In contrast, the results measured at
low test strain are caused by a combination of Mw and
gel network.
(4)
where:
= shear strain
= shear strain rate (s-1
)
t = shear strain time (s)
Fig. (1). Mooney stress relaxation curve of raw NR
measured at high test strain
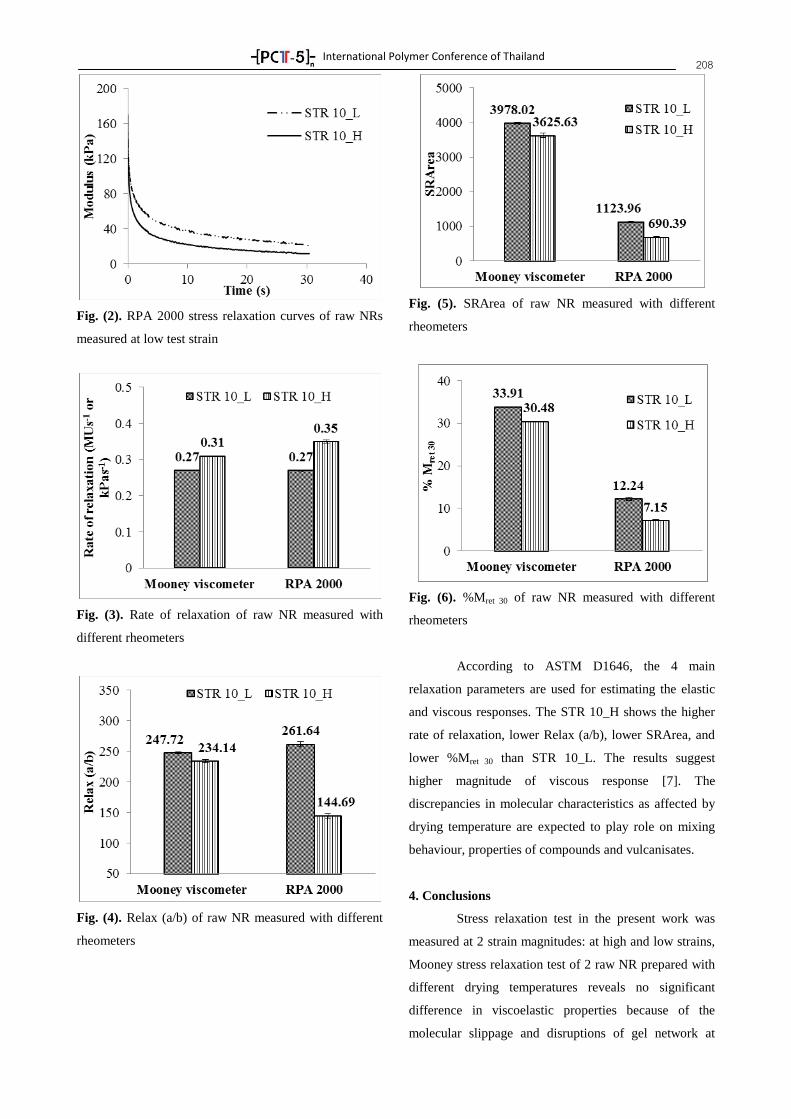
International Polymer Conference of Thailand
208
Fig. (2). RPA 2000 stress relaxation curves of raw NRs
measured at low test strain
Fig. (3). Rate of relaxation of raw NR measured with
different rheometers
Fig. (4). Relax (a/b) of raw NR measured with different
rheometers
Fig. (5). SRArea of raw NR measured with different
rheometers
Fig. (6). %Mret 30 of raw NR measured with different
rheometers
According to ASTM D1646, the 4 main
relaxation parameters are used for estimating the elastic
and viscous responses. The STR 10_H shows the higher
rate of relaxation, lower Relax (a/b), lower SRArea, and
lower %Mret 30 than STR 10_L. The results suggest
higher magnitude of viscous response [7]. The
discrepancies in molecular characteristics as affected by
drying temperature are expected to play role on mixing
behaviour, properties of compounds and vulcanisates.
4. Conclusions
Stress relaxation test in the present work was
measured at 2 strain magnitudes: at high and low strains,
Mooney stress relaxation test of 2 raw NR prepared with
different drying temperatures reveals no significant
difference in viscoelastic properties because of the
molecular slippage and disruptions of gel network at
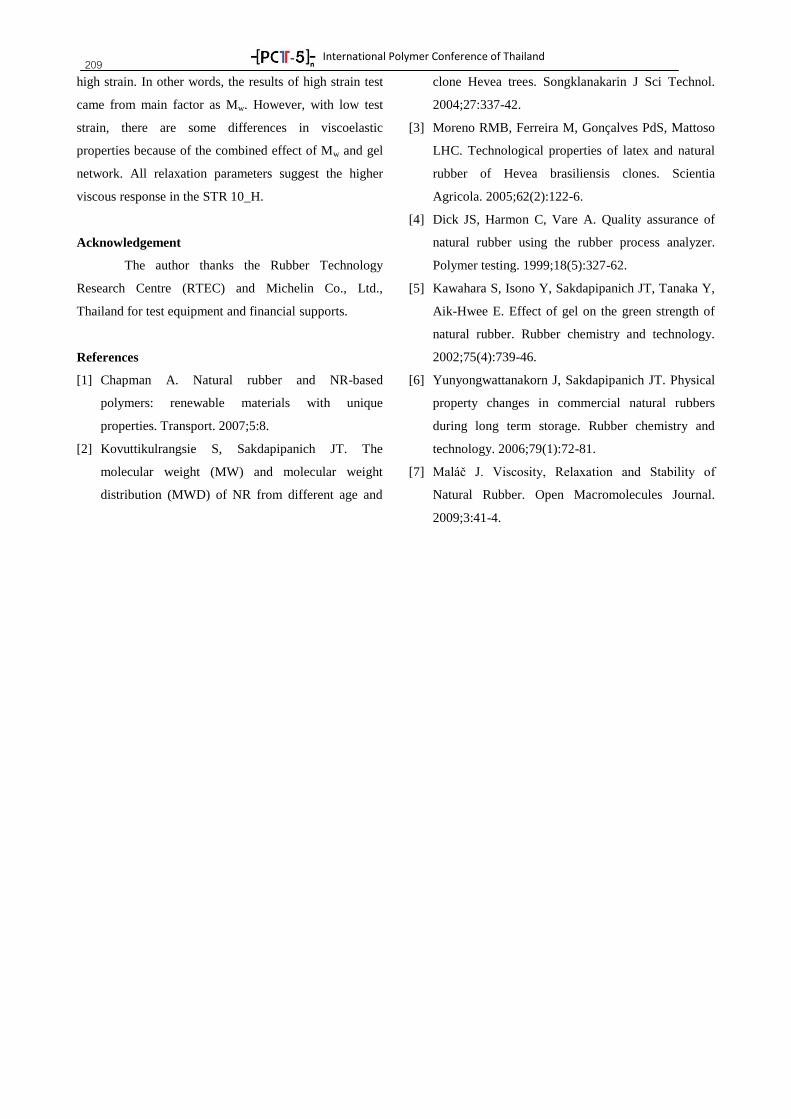
International Polymer Conference of Thailand
209 high strain. In other words, the results of high strain test
came from main factor as Mw. However, with low test
strain, there are some differences in viscoelastic
properties because of the combined effect of Mw and gel
network. All relaxation parameters suggest the higher
viscous response in the STR 10_H.
Acknowledgement
The author thanks the Rubber Technology
Research Centre (RTEC) and Michelin Co., Ltd.,
Thailand for test equipment and financial supports.
References
[1] Chapman A. Natural rubber and NR-based
polymers: renewable materials with unique
properties. Transport. 2007;5:8.
[2] Kovuttikulrangsie S, Sakdapipanich JT. The
molecular weight (MW) and molecular weight
distribution (MWD) of NR from different age and
clone Hevea trees. Songklanakarin J Sci Technol.
2004;27:337-42.
[3] Moreno RMB, Ferreira M, Gonçalves PdS, Mattoso
LHC. Technological properties of latex and natural
rubber of Hevea brasiliensis clones. Scientia
Agricola. 2005;62(2):122-6.
[4] Dick JS, Harmon C, Vare A. Quality assurance of
natural rubber using the rubber process analyzer.
Polymer testing. 1999;18(5):327-62.
[5] Kawahara S, Isono Y, Sakdapipanich JT, Tanaka Y,
Aik-Hwee E. Effect of gel on the green strength of
natural rubber. Rubber chemistry and technology.
2002;75(4):739-46.
[6] Yunyongwattanakorn J, Sakdapipanich JT. Physical
property changes in commercial natural rubbers
during long term storage. Rubber chemistry and
technology. 2006;79(1):72-81.
[7] aláč J. Viscosity, Relaxation and Stability of
Natural Rubber. Open Macromolecules Journal.
2009;3:41-4.
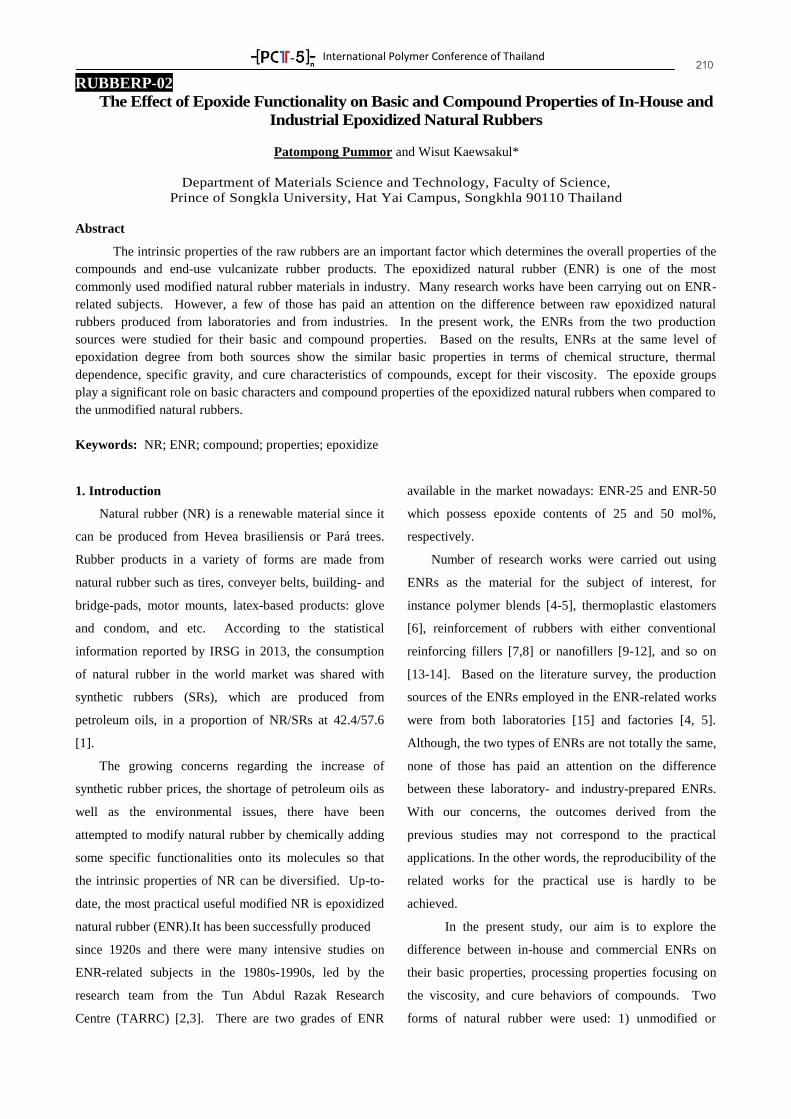
International Polymer Conference of Thailand
210 RUBBERP-02
The Effect of Epoxide Functionality on Basic and Compound Properties of In-House and
Industrial Epoxidized Natural Rubbers
Patompong Pummor and Wisut Kaewsakul*
Department of Materials Science and Technology, Faculty of Science,
Prince of Songkla University, Hat Yai Campus, Songkhla 90110 Thailand
Abstract
The intrinsic properties of the raw rubbers are an important factor which determines the overall properties of the
compounds and end-use vulcanizate rubber products. The epoxidized natural rubber (ENR) is one of the most
commonly used modified natural rubber materials in industry. Many research works have been carrying out on ENR-
related subjects. However, a few of those has paid an attention on the difference between raw epoxidized natural
rubbers produced from laboratories and from industries. In the present work, the ENRs from the two production
sources were studied for their basic and compound properties. Based on the results, ENRs at the same level of
epoxidation degree from both sources show the similar basic properties in terms of chemical structure, thermal
dependence, specific gravity, and cure characteristics of compounds, except for their viscosity. The epoxide groups
play a significant role on basic characters and compound properties of the epoxidized natural rubbers when compared to
the unmodified natural rubbers.
Keywords: NR; ENR; compound; properties; epoxidize
1. Introduction
Natural rubber (NR) is a renewable material since it
can be produced from Hevea brasiliensis or Pará trees.
Rubber products in a variety of forms are made from
natural rubber such as tires, conveyer belts, building- and
bridge-pads, motor mounts, latex-based products: glove
and condom, and etc. According to the statistical
information reported by IRSG in 2013, the consumption
of natural rubber in the world market was shared with
synthetic rubbers (SRs), which are produced from
petroleum oils, in a proportion of NR/SRs at 42.4/57.6
[1].
The growing concerns regarding the increase of
synthetic rubber prices, the shortage of petroleum oils as
well as the environmental issues, there have been
attempted to modify natural rubber by chemically adding
some specific functionalities onto its molecules so that
the intrinsic properties of NR can be diversified. Up-to-
date, the most practical useful modified NR is epoxidized
natural rubber (ENR).It has been successfully produced
since 1920s and there were many intensive studies on
ENR-related subjects in the 1980s-1990s, led by the
research team from the Tun Abdul Razak Research
Centre (TARRC) [2,3]. There are two grades of ENR
available in the market nowadays: ENR-25 and ENR-50
which possess epoxide contents of 25 and 50 mol%,
respectively.
Number of research works were carried out using
ENRs as the material for the subject of interest, for
instance polymer blends [4-5], thermoplastic elastomers
[6], reinforcement of rubbers with either conventional
reinforcing fillers [7,8] or nanofillers [9-12], and so on
[13-14]. Based on the literature survey, the production
sources of the ENRs employed in the ENR-related works
were from both laboratories [15] and factories [4, 5].
Although, the two types of ENRs are not totally the same,
none of those has paid an attention on the difference
between these laboratory- and industry-prepared ENRs.
With our concerns, the outcomes derived from the
previous studies may not correspond to the practical
applications. In the other words, the reproducibility of the
related works for the practical use is hardly to be
achieved.
In the present study, our aim is to explore the
difference between in-house and commercial ENRs on
their basic properties, processing properties focusing on
the viscosity, and cure behaviors of compounds. Two
forms of natural rubber were used: 1) unmodified or
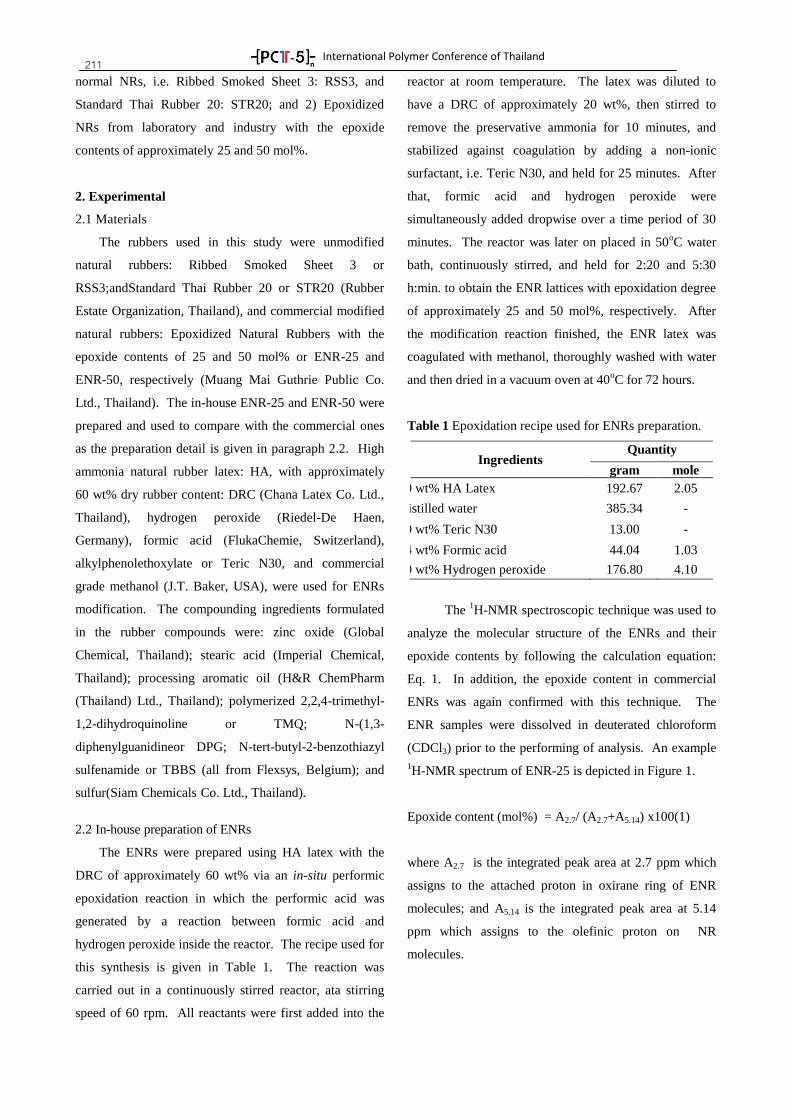
International Polymer Conference of Thailand
211 normal NRs, i.e. Ribbed Smoked Sheet 3: RSS3, and
Standard Thai Rubber 20: STR20; and 2) Epoxidized
NRs from laboratory and industry with the epoxide
contents of approximately 25 and 50 mol%.
2. Experimental
2.1 Materials
The rubbers used in this study were unmodified
natural rubbers: Ribbed Smoked Sheet 3 or
RSS3;andStandard Thai Rubber 20 or STR20 (Rubber
Estate Organization, Thailand), and commercial modified
natural rubbers: Epoxidized Natural Rubbers with the
epoxide contents of 25 and 50 mol% or ENR-25 and
ENR-50, respectively (Muang Mai Guthrie Public Co.
Ltd., Thailand). The in-house ENR-25 and ENR-50 were
prepared and used to compare with the commercial ones
as the preparation detail is given in paragraph 2.2. High
ammonia natural rubber latex: HA, with approximately
60 wt% dry rubber content: DRC (Chana Latex Co. Ltd.,
Thailand), hydrogen peroxide (Riedel-De Haen,
Germany), formic acid (FlukaChemie, Switzerland),
alkylphenolethoxylate or Teric N30, and commercial
grade methanol (J.T. Baker, USA), were used for ENRs
modification. The compounding ingredients formulated
in the rubber compounds were: zinc oxide (Global
Chemical, Thailand); stearic acid (Imperial Chemical,
Thailand); processing aromatic oil (H&R ChemPharm
(Thailand) Ltd., Thailand); polymerized 2,2,4-trimethyl-
1,2-dihydroquinoline or TMQ; N-(1,3-
diphenylguanidineor DPG; N-tert-butyl-2-benzothiazyl
sulfenamide or TBBS (all from Flexsys, Belgium); and
sulfur(Siam Chemicals Co. Ltd., Thailand).
2.2 In-house preparation of ENRs
The ENRs were prepared using HA latex with the
DRC of approximately 60 wt% via an in-situ performic
epoxidation reaction in which the performic acid was
generated by a reaction between formic acid and
hydrogen peroxide inside the reactor. The recipe used for
this synthesis is given in Table 1. The reaction was
carried out in a continuously stirred reactor, ata stirring
speed of 60 rpm. All reactants were first added into the
reactor at room temperature. The latex was diluted to
have a DRC of approximately 20 wt%, then stirred to
remove the preservative ammonia for 10 minutes, and
stabilized against coagulation by adding a non-ionic
surfactant, i.e. Teric N30, and held for 25 minutes. After
that, formic acid and hydrogen peroxide were
simultaneously added dropwise over a time period of 30
minutes. The reactor was later on placed in 50oC water
bath, continuously stirred, and held for 2:20 and 5:30
h:min. to obtain the ENR lattices with epoxidation degree
of approximately 25 and 50 mol%, respectively. After
the modification reaction finished, the ENR latex was
coagulated with methanol, thoroughly washed with water
and then dried in a vacuum oven at 40oC for 72 hours.
Table 1 Epoxidation recipe used for ENRs preparation.
Ingredients Quantity
gram mole
60 wt% HA Latex 192.67 2.05
Distilled water 385.34 -
10 wt% Teric N30 13.00 -
94 wt% Formic acid 44.04 1.03
50 wt% Hydrogen peroxide 176.80 4.10
The 1H-NMR spectroscopic technique was used to
analyze the molecular structure of the ENRs and their
epoxide contents by following the calculation equation:
Eq. 1. In addition, the epoxide content in commercial
ENRs was again confirmed with this technique. The
ENR samples were dissolved in deuterated chloroform
(CDCl3) prior to the performing of analysis. An example
1H-NMR spectrum of ENR-25 is depicted in Figure 1.
Epoxide content (mol%) = A2.7/ (A2.7+A5.14) x100(1)
where A2.7 is the integrated peak area at 2.7 ppm which
assigns to the attached proton in oxirane ring of ENR
molecules; and A5.14 is the integrated peak area at 5.14
ppm which assigns to the olefinic proton on NR
molecules.
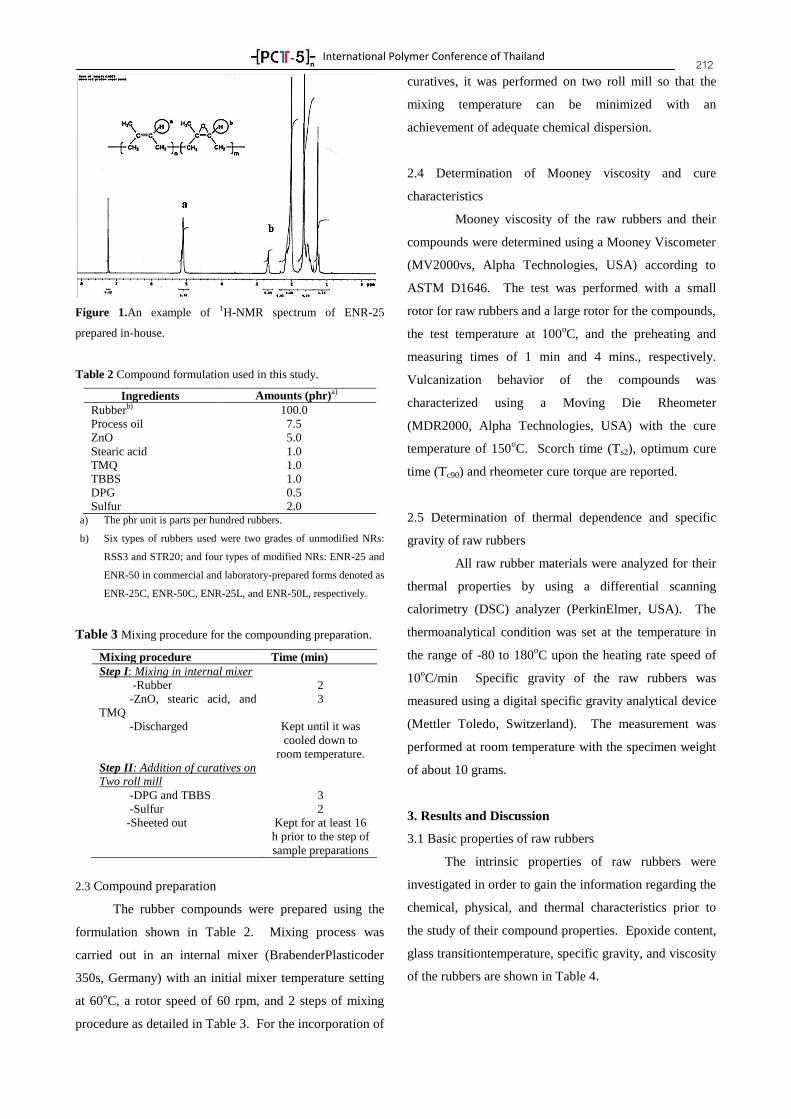
International Polymer Conference of Thailand
212
Figure 1.An example of 1H-NMR spectrum of ENR-25
prepared in-house.
Table 2 Compound formulation used in this study.
Ingredients Amounts (phr)a)
Rubberb) 100.0
Process oil 7.5
ZnO 5.0
Stearic acid 1.0
TMQ 1.0
TBBS 1.0
DPG 0.5
Sulfur 2.0 a) The phr unit is parts per hundred rubbers.
b) Six types of rubbers used were two grades of unmodified NRs:
RSS3 and STR20; and four types of modified NRs: ENR-25 and
ENR-50 in commercial and laboratory-prepared forms denoted as
ENR-25C, ENR-50C, ENR-25L, and ENR-50L, respectively.
Table 3 Mixing procedure for the compounding preparation.
Mixing procedure Time (min)
Step I: Mixing in internal mixer
-Rubber 2
-ZnO, stearic acid, and
TMQ
3
-Discharged Kept until it was
cooled down to
room temperature.
Step II: Addition of curatives on
Two roll mill
-DPG and TBBS 3
-Sulfur 2
-Sheeted out Kept for at least 16
h prior to the step of
sample preparations
2.3 Compound preparation
The rubber compounds were prepared using the
formulation shown in Table 2. Mixing process was
carried out in an internal mixer (BrabenderPlasticoder
350s, Germany) with an initial mixer temperature setting
at 60oC, a rotor speed of 60 rpm, and 2 steps of mixing
procedure as detailed in Table 3. For the incorporation of
curatives, it was performed on two roll mill so that the
mixing temperature can be minimized with an
achievement of adequate chemical dispersion.
2.4 Determination of Mooney viscosity and cure
characteristics
Mooney viscosity of the raw rubbers and their
compounds were determined using a Mooney Viscometer
(MV2000vs, Alpha Technologies, USA) according to
ASTM D1646. The test was performed with a small
rotor for raw rubbers and a large rotor for the compounds,
the test temperature at 100oC, and the preheating and
measuring times of 1 min and 4 mins., respectively.
Vulcanization behavior of the compounds was
characterized using a Moving Die Rheometer
(MDR2000, Alpha Technologies, USA) with the cure
temperature of 150oC. Scorch time (Ts2), optimum cure
time (Tc90) and rheometer cure torque are reported.
2.5 Determination of thermal dependence and specific
gravity of raw rubbers
All raw rubber materials were analyzed for their
thermal properties by using a differential scanning
calorimetry (DSC) analyzer (PerkinElmer, USA). The
thermoanalytical condition was set at the temperature in
the range of -80 to 180oC upon the heating rate speed of
10oC/min Specific gravity of the raw rubbers was
measured using a digital specific gravity analytical device
(Mettler Toledo, Switzerland). The measurement was
performed at room temperature with the specimen weight
of about 10 grams.
3. Results and Discussion
3.1 Basic properties of raw rubbers
The intrinsic properties of raw rubbers were
investigated in order to gain the information regarding the
chemical, physical, and thermal characteristics prior to
the study of their compound properties. Epoxide content,
glass transitiontemperature, specific gravity, and viscosity
of the rubbers are shown in Table 4.
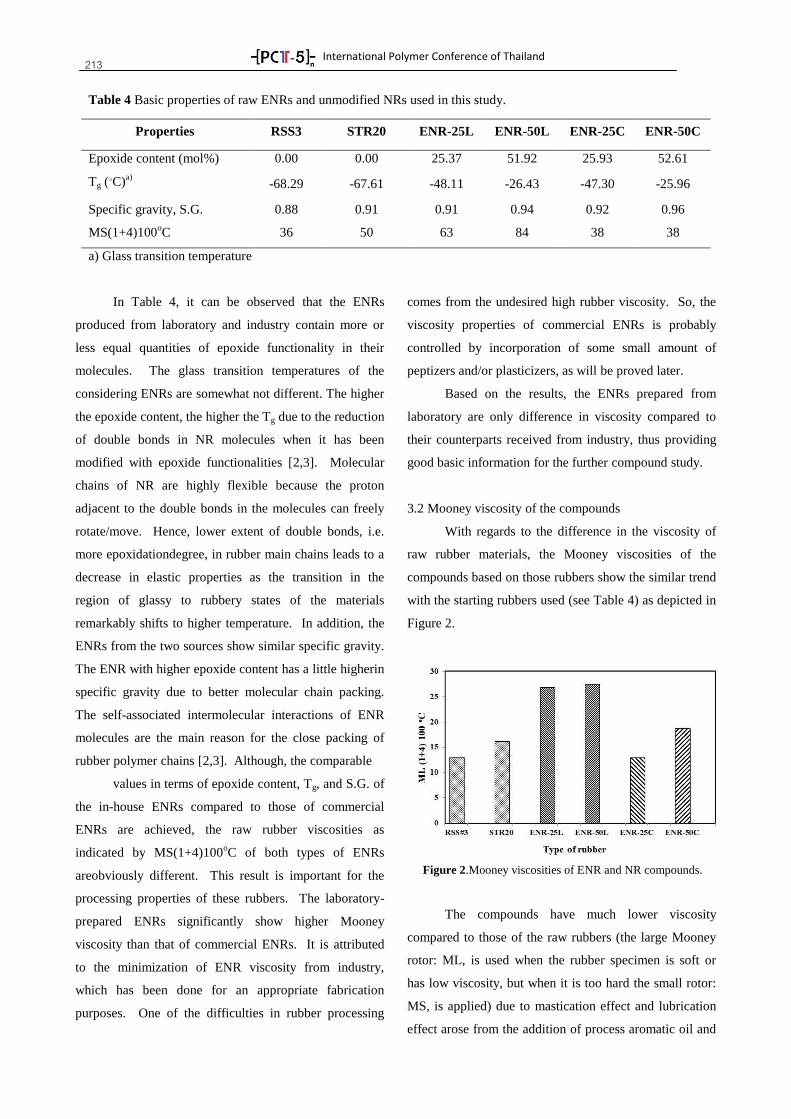
International Polymer Conference of Thailand
213
In Table 4, it can be observed that the ENRs
produced from laboratory and industry contain more or
less equal quantities of epoxide functionality in their
molecules. The glass transition temperatures of the
considering ENRs are somewhat not different. The higher
the epoxide content, the higher the Tg due to the reduction
of double bonds in NR molecules when it has been
modified with epoxide functionalities [2,3]. Molecular
chains of NR are highly flexible because the proton
adjacent to the double bonds in the molecules can freely
rotate/move. Hence, lower extent of double bonds, i.e.
more epoxidationdegree, in rubber main chains leads to a
decrease in elastic properties as the transition in the
region of glassy to rubbery states of the materials
remarkably shifts to higher temperature. In addition, the
ENRs from the two sources show similar specific gravity.
The ENR with higher epoxide content has a little higherin
specific gravity due to better molecular chain packing.
The self-associated intermolecular interactions of ENR
molecules are the main reason for the close packing of
rubber polymer chains [2,3]. Although, the comparable
values in terms of epoxide content, Tg, and S.G. of
the in-house ENRs compared to those of commercial
ENRs are achieved, the raw rubber viscosities as
indicated by MS(1+4)100oC of both types of ENRs
areobviously different. This result is important for the
processing properties of these rubbers. The laboratory-
prepared ENRs significantly show higher Mooney
viscosity than that of commercial ENRs. It is attributed
to the minimization of ENR viscosity from industry,
which has been done for an appropriate fabrication
purposes. One of the difficulties in rubber processing
comes from the undesired high rubber viscosity. So, the
viscosity properties of commercial ENRs is probably
controlled by incorporation of some small amount of
peptizers and/or plasticizers, as will be proved later.
Based on the results, the ENRs prepared from
laboratory are only difference in viscosity compared to
their counterparts received from industry, thus providing
good basic information for the further compound study.
3.2 Mooney viscosity of the compounds
With regards to the difference in the viscosity of
raw rubber materials, the Mooney viscosities of the
compounds based on those rubbers show the similar trend
with the starting rubbers used (see Table 4) as depicted in
Figure 2.
Figure 2.Mooney viscosities of ENR and NR compounds.
The compounds have much lower viscosity
compared to those of the raw rubbers (the large Mooney
rotor: ML, is used when the rubber specimen is soft or
has low viscosity, but when it is too hard the small rotor:
MS, is applied) due to mastication effect and lubrication
effect arose from the addition of process aromatic oil and
Table 4 Basic properties of raw ENRs and unmodified NRs used in this study.
Properties RSS3 STR20 ENR-25L ENR-50L ENR-25C ENR-50C
Epoxide content (mol%) 0.00 0.00 25.37 51.92 25.93 52.61
Tg (๐C)
a) -68.29 -67.61 -48.11 -26.43 -47.30 -25.96
Specific gravity, S.G. 0.88 0.91 0.91 0.94 0.92 0.96
MS(1+4)100oC 36 50 63 84 38 38
a) Glass transition temperature
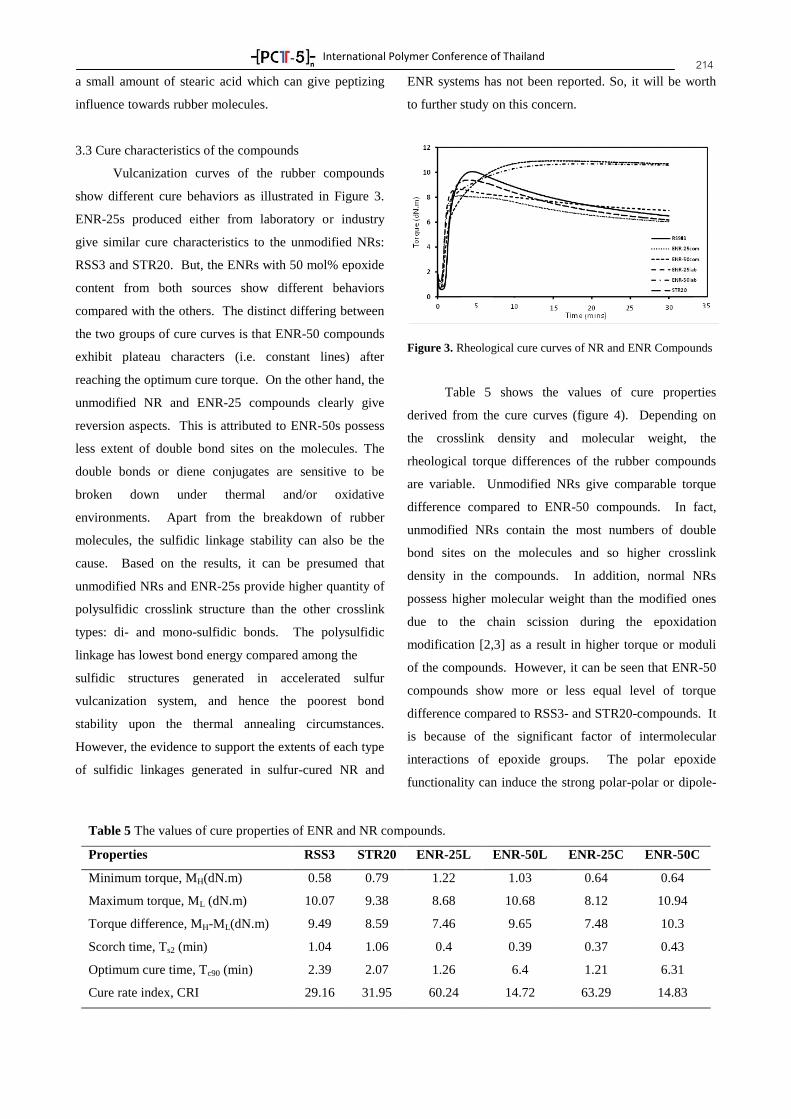
International Polymer Conference of Thailand
214 a small amount of stearic acid which can give peptizing
influence towards rubber molecules.
3.3 Cure characteristics of the compounds
Vulcanization curves of the rubber compounds
show different cure behaviors as illustrated in Figure 3.
ENR-25s produced either from laboratory or industry
give similar cure characteristics to the unmodified NRs:
RSS3 and STR20. But, the ENRs with 50 mol% epoxide
content from both sources show different behaviors
compared with the others. The distinct differing between
the two groups of cure curves is that ENR-50 compounds
exhibit plateau characters (i.e. constant lines) after
reaching the optimum cure torque. On the other hand, the
unmodified NR and ENR-25 compounds clearly give
reversion aspects. This is attributed to ENR-50s possess
less extent of double bond sites on the molecules. The
double bonds or diene conjugates are sensitive to be
broken down under thermal and/or oxidative
environments. Apart from the breakdown of rubber
molecules, the sulfidic linkage stability can also be the
cause. Based on the results, it can be presumed that
unmodified NRs and ENR-25s provide higher quantity of
polysulfidic crosslink structure than the other crosslink
types: di- and mono-sulfidic bonds. The polysulfidic
linkage has lowest bond energy compared among the
sulfidic structures generated in accelerated sulfur
vulcanization system, and hence the poorest bond
stability upon the thermal annealing circumstances.
However, the evidence to support the extents of each type
of sulfidic linkages generated in sulfur-cured NR and
ENR systems has not been reported. So, it will be worth
to further study on this concern.
Figure 3. Rheological cure curves of NR and ENR Compounds
Table 5 shows the values of cure properties
derived from the cure curves (figure 4). Depending on
the crosslink density and molecular weight, the
rheological torque differences of the rubber compounds
are variable. Unmodified NRs give comparable torque
difference compared to ENR-50 compounds. In fact,
unmodified NRs contain the most numbers of double
bond sites on the molecules and so higher crosslink
density in the compounds. In addition, normal NRs
possess higher molecular weight than the modified ones
due to the chain scission during the epoxidation
modification [2,3] as a result in higher torque or moduli
of the compounds. However, it can be seen that ENR-50
compounds show more or less equal level of torque
difference compared to RSS3- and STR20-compounds. It
is because of the significant factor of intermolecular
interactions of epoxide groups. The polar epoxide
functionality can induce the strong polar-polar or dipole-
Table 5 The values of cure properties of ENR and NR compounds.
Properties RSS3 STR20 ENR-25L ENR-50L ENR-25C ENR-50C
Minimum torque, MH(dN.m) 0.58 0.79 1.22 1.03 0.64 0.64
Maximum torque, ML (dN.m) 10.07 9.38 8.68 10.68 8.12 10.94
Torque difference, MH-ML(dN.m) 9.49 8.59 7.46 9.65 7.48 10.3
Scorch time, Ts2 (min) 1.04 1.06 0.4 0.39 0.37 0.43
Optimum cure time, Tc90 (min) 2.39 2.07 1.26 6.4 1.21 6.31
Cure rate index, CRI 29.16 31.95 60.24 14.72 63.29 14.83
International Polymer Conference of Thailand
215 dipole interactions between the ENR molecules. The
higher epoxide contents give the stronger intermolecular
interaction forces, and so contributing to the torque of the
rubber matrix. From the previous study [2,3], ENR
molecules can generate the molecular networking via the
self-association of opened oxirane rings [2,3], leading to
contribution to matrix moduli/torque.
Considering the rate of vulcanization reaction, the
ENR-25 compounds show fastest vulcanization rate as
indicated by highest values of cure rate index. According
to the report of Gelling et al. (1988) [2], methyl group
attached to the oxirane ring is able to boost the
vulcanization reaction because of its electron
donatability. Nevertheless, the ENR-50 compounds show
the lowest curing speed, attributed to less extent of
double bonds in ENR-50, and thus reducing in the
reaction potential between curatives and rubber
molecules.
4. Conclusions
The chemical structure, thermal dependence and
specific gravity of the raw epoxidized natural rubbers
with the same level of epoxide contents obtained from
laboratory and from industry show more or less similar
characteristics, except for the viscosities. ENRs produced
in-house have a significant higher in viscosity compared
to industrial ENRs. Their compounds show the same
trend of viscosity with the raw ENRs, but in lower values.
Vulcanization behaviors of the compounds based on
ENR-25s produced from both sources exhibit reversion
aspects like the unmodified NRs based compounds,
however ENR-25s provide a little lower in torque
difference. The ENR-50s from both production sources
show different cure behaviors and properties compared to
the ENR-25s and unmodified NRs as the cure curves tend
to be plateau after reaching the maximum cure torque.
The torque difference of the compounds prepared with
ENR-50s is comparable with the values of unmodified
NR compounds. In addition, the speeds of vulcanization
reaction of both ENR-50 compounds are rather slower
than those of ENR-25s and normal NRs based
compounds.
References
[1] International Rubber Study Group (IRSG). Statistical
Summary of World Rubber
Situation.http://www.rubberstudy.com/documents/W
ebSiteData_3.0b.pdf. Accessed on Feb. 20, 2015.
[2] Gelling I.R., Porter M. In: Robert AD, editor. Natural
rubber science and technology. Oxford: Oxford
University Press; 1988 [Chapter 10].
[3] Baker, C.S.L., Gelling, I.R. and Newell, R.
Epoxidized natural rubber. Rubber Chem. Technol.
1985;58:67-85.
[4] Zurina M., Ismail H., RatnamC.T..Characterization
of irradiation-induced crosslink of epoxidised natural
rubber/ethylene vinyl acetate (ENR-50/EVA) blend.
Polym.Degrad. Stab. 2006; 91: 2723-2730.
[5] Mohamad N., Zainola N.S., Rahima F.F., Hairul
E.M., Toibah A.R., Siti R.S., Azama M.A., Yaakuba
M.Y., Mohd F.B. Mechanical and morphological
properties of polypropylene/epoxidized natural
rubber blends at various mixing ratio. Procedia Eng.
2013; 68;439 – 445.
[6] Nakason C., Jarnthong M., Kaesaman A.,
Kiatkamjornwong S. Thermoplastic Elastomers
Based on Epoxidized Natural Rubber and High-
Density Polyethylene Blends: Effect of Blend
Compatibilizers on the Mechanical and
Morphological Properties. J. Appl. Polym Sci., 2008;
109; 2694–2702.
[7] Teh P.L.,.MohdIshak Z.A, Hashim A.S., Karger-
Kocsis J., IshiakuU.S.. Effects of epoxidized natural
rubber as a compatibilizer in melt compounded
natural rubber–organoclaynanocomposites.
Eur.Polym. j. 2004; 40; 2513–2521.
[8] Teh P. L., MohdIshak Z. A., Hashim A. S., Karger-
Kocsis J., Ishiaku U. S.. On The Potential of
Organoclay with Respect to Conventional Fillers
(Carbon Black, Silica) for Epoxidized Natural
Rubber Compatibilized Natural Rubber
Vulcanizates. J. Appl. Polym. Sci.2004; 94: 2438–
2445.
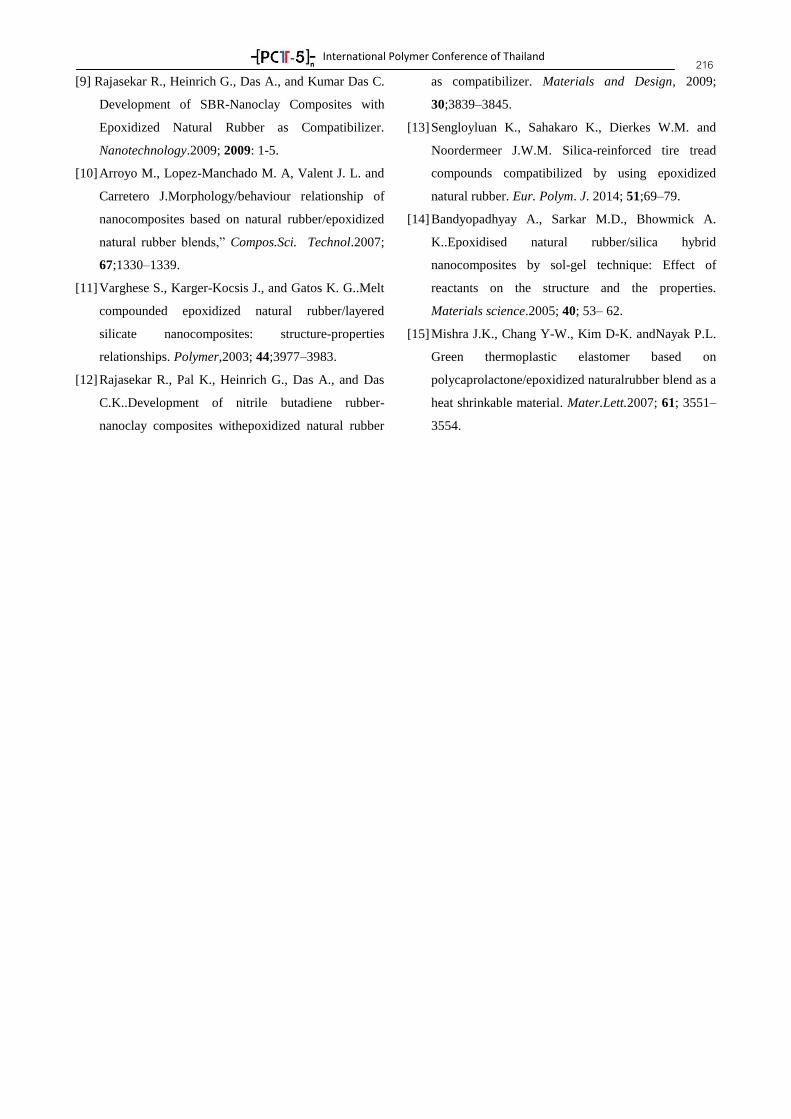
International Polymer Conference of Thailand
216 [9] Rajasekar R., Heinrich G., Das A., and Kumar Das C.
Development of SBR-Nanoclay Composites with
Epoxidized Natural Rubber as Compatibilizer.
Nanotechnology.2009; 2009: 1-5.
[10] Arroyo M., Lopez-Manchado M. A, Valent J. L. and
Carretero J.Morphology/behaviour relationship of
nanocomposites based on natural rubber/epoxidized
natural rubber blends,” Compos.Sci. Technol.2007;
67;1330–1339.
[11] Varghese S., Karger-Kocsis J., and Gatos K. G..Melt
compounded epoxidized natural rubber/layered
silicate nanocomposites: structure-properties
relationships. Polymer,2003; 44;3977–3983.
[12] Rajasekar R., Pal K., Heinrich G., Das A., and Das
C.K..Development of nitrile butadiene rubber-
nanoclay composites withepoxidized natural rubber
as compatibilizer. Materials and Design, 2009;
30;3839–3845.
[13] Sengloyluan K., Sahakaro K., Dierkes W.M. and
Noordermeer J.W.M. Silica-reinforced tire tread
compounds compatibilized by using epoxidized
natural rubber. Eur. Polym. J. 2014; 51;69–79.
[14] Bandyopadhyay A., Sarkar M.D., Bhowmick A.
K..Epoxidised natural rubber/silica hybrid
nanocomposites by sol-gel technique: Effect of
reactants on the structure and the properties.
Materials science.2005; 40; 53– 62.
[15] Mishra J.K., Chang Y-W., Kim D-K. andNayak P.L.
Green thermoplastic elastomer based on
polycaprolactone/epoxidized naturalrubber blend as a
heat shrinkable material. Mater.Lett.2007; 61; 3551–
3554.

International Polymer Conference of Thailand
217 RUBBERP-03
Processability of TiO2-Filled-Natural Rubber Threads.
Wallapa Lorcharoenraung1*
and Ploenpit Boochathum2
1,2Department of Chemistry, Faculty of Science King ongkut’s University of Technolygy Thonburi,
126 Prach-utis Road, Bangmod, Toong-kru, Bangkok 10140, Thailand
Phone +6683 905 4086,*E-Mail:[email protected]
Abstract This work studied on preparation of rubber product by injection, dipping and molding process.
Chloroacetated natural rubber (CNR) was chemically modified from natural rubber latex using formic acid and
hydrogen peroxide in the ratio of 1:0.25:0.25 by mole at 50°C for 3 hr. After the reaction, chloroacetic acid was
added when the mixture was cool down to room temperature and stirred for 1 hr. Rubber molding method can
be applied by filled the natural rubber latex compounds into the rectangular mold and control the condition of
molding at room temperature. Then, Rubber thread vulcanizates for a diameter of 1 x 2 mm2 should be cured
at33 ºC, 48 hr and cured at 120 ºC, 5 min. However, %Elongation at break and tensile strength of CNRafter
vulcanized decreasing when compare to NR after vulcanized. The tensile strength of CNR was found least than
NR because the numbers of double bonds in CNR were least than those of NR.
Keywords: Chloroacetated natural rubber, Dipping,Injection, Molding, Natural rubber thread
1. Introduction
The rubber thread industry is one of important
rubber industries. Main raw rubber which was used in
this thread industry is “Natural Rubber Latex”.
Nowadays, the textile industry are expanding both
domestically and abroad. Thailand is a major exporter by
the year 1998 with 2 export value of 197.24 billion U.S.
dollars[1].Rubber thread which typically is composed of
natural rubber has excellent resiliency and other
desirable properties such as high elongation. However,
the disadvantage for using natural rubber in cloth
products is the growing of microorganisms along the
natural rubber threads which causes the skin allergy[2,3].
Rubber thread is commonly used in a number of
products, including narrow elasticized fabric for textile
applications such as waist bands and shoulder straps of
foundation garments, for toys, and for braided
("bungee") cord. The production process of rubber latex
thread comprises the following steps; preparing
materials, filtering, extruding, forming, cleaning,
vulcanizing, drying, cooling, placing in a box and
packaging. The superfine and high-elastic rubber latex
thread is one of products of the most with wide market
prospects [4,5].Rubber thread has been made by cutting
narrow strips from sheet rubber, yielding thread with a
square cross-section. Another method involves streaming
uncoagulated latex compound through a small-aperture
nozzle or capillary into a bath of coagulant, e.g., acetic
acid, washing the coagulated thread in a water bath, and
drying and heat-curing the final product[6].
However, most applications of NR are limitation
due to the low stability when increase temperature,
oxygen, sunlight, etc. and the high solubility inmost
hydrocarbon/hydrophobic solvents includingoils.
Therefore, to improve the stability of natural rubber to be
used widely, it must modify the structure of NR latex[7].
The chemical modification of NR latex by introduction
of functional group and lead to hydrophilicity along NR
backbone such as addition of functional groups including
epoxy, hydroxyl and ester groups on NR become to
Chloroacetated natural rubber (CNR) are alternative
strategies to provide more interaction between NR and
titanium dioxide[8,9].Recently, the effect of the addition
of stabilizer such as Triton-X on latex coagulation and
results were shown that stabilizer which added into latex
would protect the appearance of latex coagulation during
preparation[10].
This research studied the appropriate rubber
thread processing maid from functionalized natural
rubber latex. Then preparation process of rubber thread
with addition of inorganic material i.e., titanium by
injection, dipping and molding were studied for
comparison.
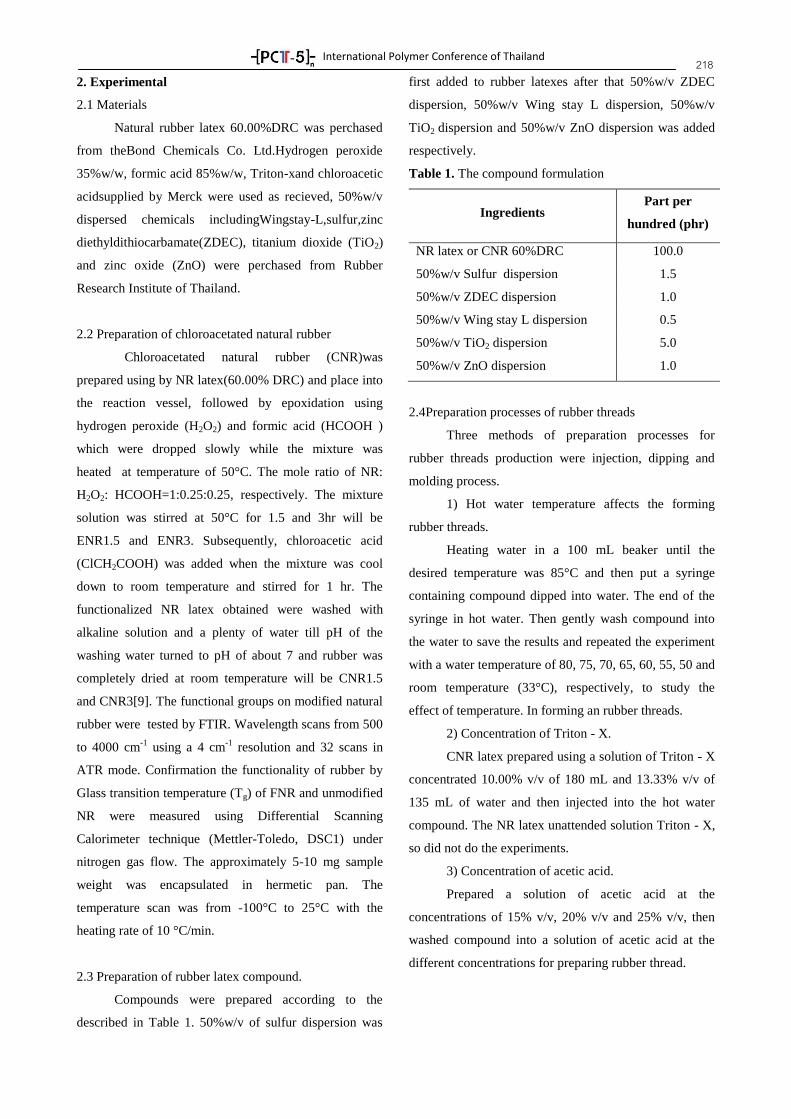
International Polymer Conference of Thailand
218 2. Experimental
2.1 Materials
Natural rubber latex 60.00%DRC was perchased
from theBond Chemicals Co. Ltd.Hydrogen peroxide
35%w/w, formic acid 85%w/w, Triton-xand chloroacetic
acidsupplied by Merck were used as recieved, 50%w/v
dispersed chemicals includingWingstay-L,sulfur,zinc
diethyldithiocarbamate(ZDEC), titanium dioxide (TiO2)
and zinc oxide (ZnO) were perchased from Rubber
Research Institute of Thailand.
2.2 Preparation of chloroacetated natural rubber
Chloroacetated natural rubber (CNR)was
prepared using by NR latex(60.00% DRC) and place into
the reaction vessel, followed by epoxidation using
hydrogen peroxide (H2O2) and formic acid (HCOOH )
which were dropped slowly while the mixture was
heated at temperature of 50°C. The mole ratio of NR:
H2O2: HCOOH=1:0.25:0.25, respectively. The mixture
solution was stirred at 50°C for 1.5 and 3hr will be
ENR1.5 and ENR3. Subsequently, chloroacetic acid
(ClCH2COOH) was added when the mixture was cool
down to room temperature and stirred for 1 hr. The
functionalized NR latex obtained were washed with
alkaline solution and a plenty of water till pH of the
washing water turned to pH of about 7 and rubber was
completely dried at room temperature will be CNR1.5
and CNR3[9]. The functional groups on modified natural
rubber were tested by FTIR. Wavelength scans from 500
to 4000 cm-1
using a 4 cm-1
resolution and 32 scans in
ATR mode. Confirmation the functionality of rubber by
Glass transition temperature (Tg) of FNR and unmodified
NR were measured using Differential Scanning
Calorimeter technique (Mettler-Toledo, DSC1) under
nitrogen gas flow. The approximately 5-10 mg sample
weight was encapsulated in hermetic pan. The
temperature scan was from -100°C to 25°C with the
heating rate of 10 °C/min.
2.3 Preparation of rubber latex compound.
Compounds were prepared according to the
described in Table 1. 50%w/v of sulfur dispersion was
first added to rubber latexes after that 50%w/v ZDEC
dispersion, 50%w/v Wing stay L dispersion, 50%w/v
TiO2 dispersion and 50%w/v ZnO dispersion was added
respectively.
Table 1. The compound formulation
Ingredients Part per
hundred (phr)
NR latex or CNR 60%DRC 100.0
50%w/v Sulfur dispersion 1.5
50%w/v ZDEC dispersion 1.0
50%w/v Wing stay L dispersion 0.5
50%w/v TiO2 dispersion 5.0
50%w/v ZnO dispersion 1.0
2.4Preparation processes of rubber threads
Three methods of preparation processes for
rubber threads production were injection, dipping and
molding process.
1) Hot water temperature affects the forming
rubber threads.
Heating water in a 100 mL beaker until the
desired temperature was 85°C and then put a syringe
containing compound dipped into water. The end of the
syringe in hot water. Then gently wash compound into
the water to save the results and repeated the experiment
with a water temperature of 80, 75, 70, 65, 60, 55, 50 and
room temperature (33°C), respectively, to study the
effect of temperature. In forming an rubber threads.
2) Concentration of Triton - X.
CNR latex prepared using a solution of Triton - X
concentrated 10.00% v/v of 180 mL and 13.33% v/v of
135 mL of water and then injected into the hot water
compound. The NR latex unattended solution Triton - X,
so did not do the experiments.
3) Concentration of acetic acid.
Prepared a solution of acetic acid at the
concentrations of 15% v/v, 20% v/v and 25% v/v, then
washed compound into a solution of acetic acid at the
different concentrations for preparing rubber thread.
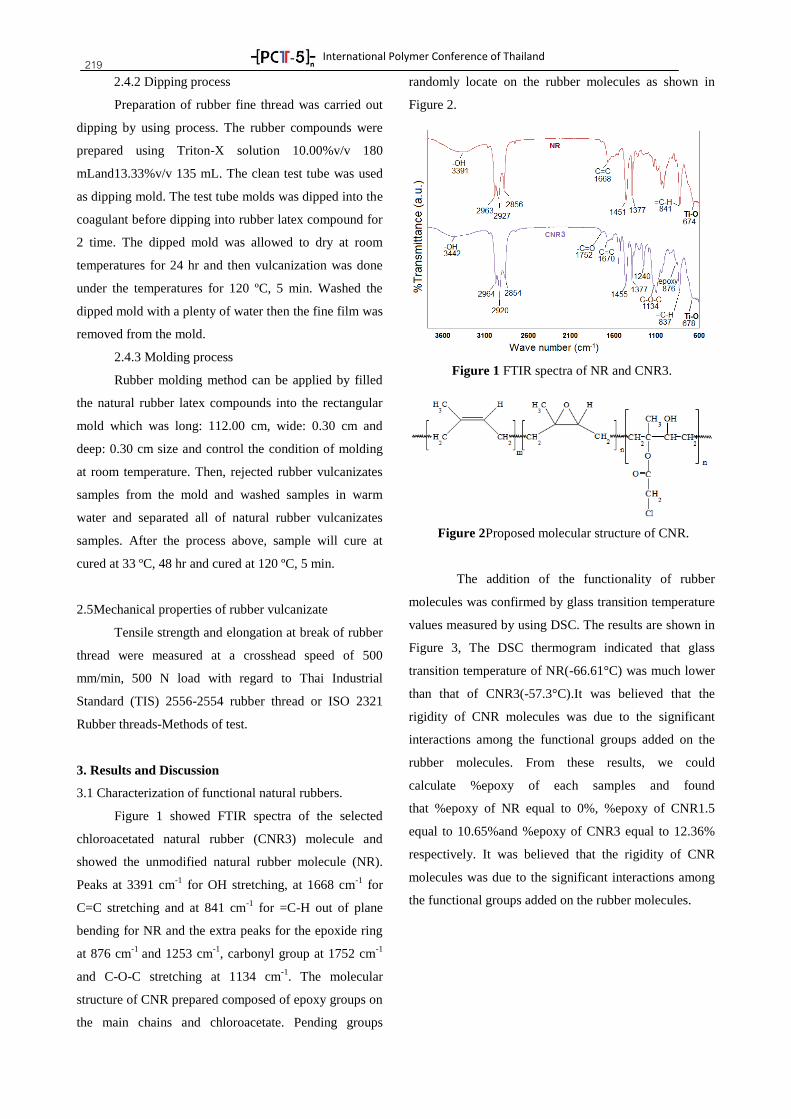
International Polymer Conference of Thailand
219 2.4.2 Dipping process
Preparation of rubber fine thread was carried out
dipping by using process. The rubber compounds were
prepared using Triton-X solution 10.00%v/v 180
mLand13.33%v/v 135 mL. The clean test tube was used
as dipping mold. The test tube molds was dipped into the
coagulant before dipping into rubber latex compound for
2 time. The dipped mold was allowed to dry at room
temperatures for 24 hr and then vulcanization was done
under the temperatures for 120 ºC, 5 min. Washed the
dipped mold with a plenty of water then the fine film was
removed from the mold.
2.4.3 Molding process
Rubber molding method can be applied by filled
the natural rubber latex compounds into the rectangular
mold which was long: 112.00 cm, wide: 0.30 cm and
deep: 0.30 cm size and control the condition of molding
at room temperature. Then, rejected rubber vulcanizates
samples from the mold and washed samples in warm
water and separated all of natural rubber vulcanizates
samples. After the process above, sample will cure at
cured at 33 ºC, 48 hr and cured at 120 ºC, 5 min.
2.5Mechanical properties of rubber vulcanizate
Tensile strength and elongation at break of rubber
thread were measured at a crosshead speed of 500
mm/min, 500 N load with regard to Thai Industrial
Standard (TIS) 2556-2554 rubber thread or ISO 2321
Rubber threads-Methods of test.
3. Results and Discussion
3.1 Characterization of functional natural rubbers.
Figure 1 showed FTIR spectra of the selected
chloroacetated natural rubber (CNR3) molecule and
showed the unmodified natural rubber molecule (NR).
Peaks at 3391 cm-1
for OH stretching, at 1668 cm-1
for
C=C stretching and at 841 cm-1
for =C-H out of plane
bending for NR and the extra peaks for the epoxide ring
at 876 cm-1
and 1253 cm-1
, carbonyl group at 1752 cm-1
and C-O-C stretching at 1134 cm-1
. The molecular
structure of CNR prepared composed of epoxy groups on
the main chains and chloroacetate. Pending groups
randomly locate on the rubber molecules as shown in
Figure 2.
Figure 1 FTIR spectra of NR and CNR3.
Figure 2Proposed molecular structure of CNR.
The addition of the functionality of rubber
molecules was confirmed by glass transition temperature
values measured by using DSC. The results are shown in
Figure 3, The DSC thermogram indicated that glass
transition temperature of NR(-66.61°C) was much lower
than that of CNR3(-57.3°C).It was believed that the
rigidity of CNR molecules was due to the significant
interactions among the functional groups added on the
rubber molecules. From these results, we could
calculate %epoxy of each samples and found
that %epoxy of NR equal to 0%, %epoxy of CNR1.5
equal to 10.65%and %epoxy of CNR3 equal to 12.36%
respectively. It was believed that the rigidity of CNR
molecules was due to the significant interactions among
the functional groups added on the rubber molecules.
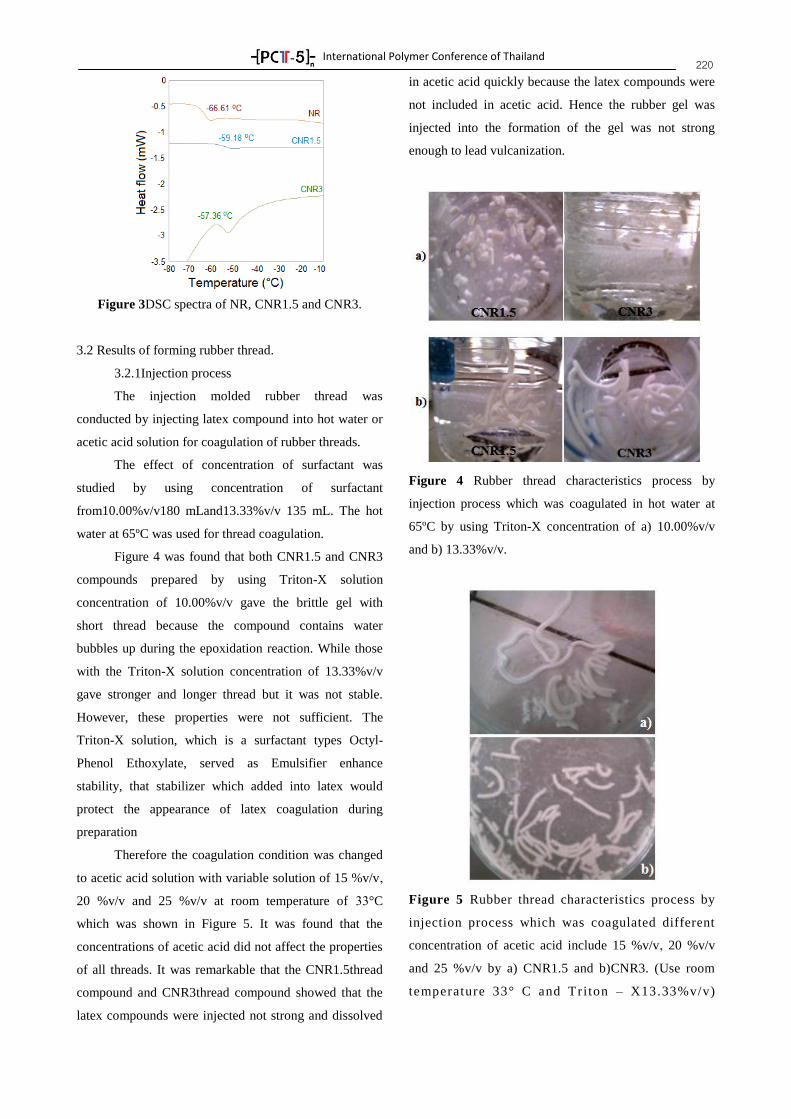
International Polymer Conference of Thailand
220
Figure 3DSC spectra of NR, CNR1.5 and CNR3.
3.2 Results of forming rubber thread.
3.2.1Injection process
The injection molded rubber thread was
conducted by injecting latex compound into hot water or
acetic acid solution for coagulation of rubber threads.
The effect of concentration of surfactant was
studied by using concentration of surfactant
from10.00%v/v180 mLand13.33%v/v 135 mL. The hot
water at 65ºC was used for thread coagulation.
Figure 4 was found that both CNR1.5 and CNR3
compounds prepared by using Triton-X solution
concentration of 10.00%v/v gave the brittle gel with
short thread because the compound contains water
bubbles up during the epoxidation reaction. While those
with the Triton-X solution concentration of 13.33%v/v
gave stronger and longer thread but it was not stable.
However, these properties were not sufficient. The
Triton-X solution, which is a surfactant types Octyl-
Phenol Ethoxylate, served as Emulsifier enhance
stability, that stabilizer which added into latex would
protect the appearance of latex coagulation during
preparation
Therefore the coagulation condition was changed
to acetic acid solution with variable solution of 15 %v/v,
20 %v/v and 25 %v/v at room temperature of 33°C
which was shown in Figure 5. It was found that the
concentrations of acetic acid did not affect the properties
of all threads. It was remarkable that the CNR1.5thread
compound and CNR3thread compound showed that the
latex compounds were injected not strong and dissolved
in acetic acid quickly because the latex compounds were
not included in acetic acid. Hence the rubber gel was
injected into the formation of the gel was not strong
enough to lead vulcanization.
Figure 4 Rubber thread characteristics process by
injection process which was coagulated in hot water at
65ºC by using Triton-X concentration of a) 10.00%v/v
and b) 13.33%v/v.
Figure 5 Rubber thread characteristics process by
injection process which was coagulated different
concentration of acetic acid include 15 %v/v, 20 %v/v
and 25 %v/v by a) CNR1.5 and b)CNR3. (Use room
temperature 33° C and Tri ton – X13.33%v/v)

International Polymer Conference of Thailand
221 The characteristics of different types of rubber
thread were produced from injection shown in Figure 6.
It was found that compounds from conventional natural
rubber latex (NR) cannot form into gel formation at all
temperatures study because NR no has heat-sensitive
agent. The latex compounds of CNR1.5 and CNR3 gave
longer rubber line at 65 ± 5ºC and 32 ± 2ºC while at the
higher temperature the shorter gel rubber thread because
increasing the water temperature was able to the rubber
gel was broken easily. The stability of rubber line of
compound CNR3 was better than rubber line of
compound CNR1.5 because CNR3 has more epoxy
groups.
Figure 6 Rubber thread characteristics process by
injection process which was coagulated in hot water at
different temperature at a) 80 ± 5ºC, b) 65 ± 5ºC, c) 50 ±
5ºC and d)32 ± 2ºC.
3.2.2 Dipping process.
At the Triton-X concentration of 10.00%v/v,the
rubber film from CNR1.5latex compound showed a
plentyof air bubble on the film. In addition the stabilizer
concentrtion of 10.00% v/v was found to be not enough
tostabilize CNR3 latex compound.For the Triton-X
solution of13.33% v/v, the rubber film was smooth and
without the presence of bubles. It was obvious that the
strenght of the vulcanized film still was in sufficient.
Figure 7 Rubber thread characteristics process by
dipping process which was coagulated on room
temperature 33°C by using Triton-X concentration of a)
10.00%v/v and b) 13.33%v/v.
3.2.3Molding process
The threads produced from the molding process
were in the dimension of the cross-section area of 2
mm2and 1120 mm
2in length, which was shown in figure
8.
The elongation at break of threads in figure 9,
produced from CNR latex was found to be slightly less
than that produced from the conventional NR latex. But
for tensile strength NR thread was higher than those of
CNR because of more numerous of the double bond in
molecular chains of NR These results confirmed more
numerous of cross-linking of NR prevail over CNR.
Figure 8 Wash chemicals that do not react out of rubber
threads and rubber threads forming
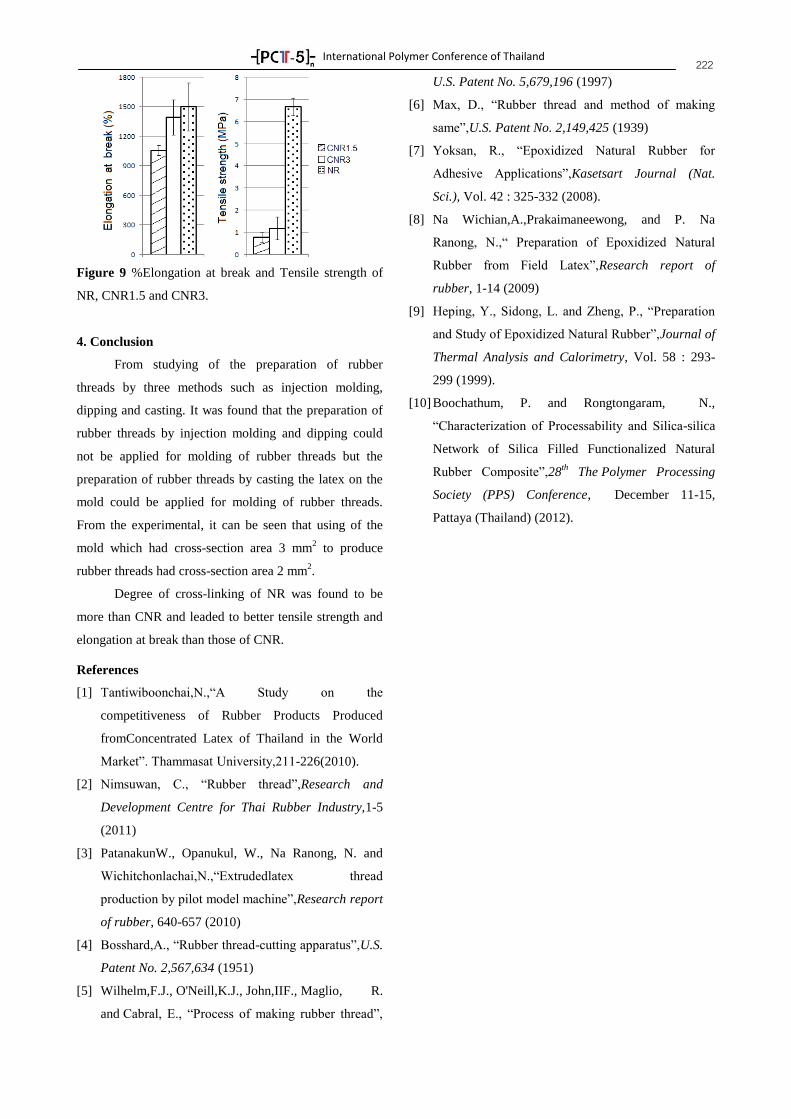
International Polymer Conference of Thailand
222
Figure 9 %Elongation at break and Tensile strength of
NR, CNR1.5 and CNR3.
4. Conclusion
From studying of the preparation of rubber
threads by three methods such as injection molding,
dipping and casting. It was found that the preparation of
rubber threads by injection molding and dipping could
not be applied for molding of rubber threads but the
preparation of rubber threads by casting the latex on the
mold could be applied for molding of rubber threads.
From the experimental, it can be seen that using of the
mold which had cross-section area 3 mm2 to produce
rubber threads had cross-section area 2 mm2.
Degree of cross-linking of NR was found to be
more than CNR and leaded to better tensile strength and
elongation at break than those of CNR.
References
[1] Tantiwiboonchai,N.,“A Study on the
competitiveness of Rubber Products Produced
fromConcentrated Latex of Thailand in the World
arket”. Thammasat University,211-226(2010).
[2] Nimsuwan, C., “Rubber thread”,Research and
Development Centre for Thai Rubber Industry,1-5
(2011)
[3] PatanakunW., Opanukul, W., Na Ranong, N. and
Wichitchonlachai,N.,“Extrudedlatex thread
production by pilot model machine”,Research report
of rubber, 640-657 (2010)
[4] Bosshard,A., “Rubber thread-cutting apparatus”,U.S.
Patent No. 2,567,634 (1951)
[5] Wilhelm,F.J., O'Neill,K.J., John,IIF., Maglio, R.
and Cabral, E., “Process of making rubber thread”,
U.S. Patent No. 5,679,196 (1997)
[6] ax, D., “Rubber thread and method of making
same”,U.S. Patent No. 2,149,425 (1939)
[7] Yoksan, R., “Epoxidized Natural Rubber for
Adhesive Applications”,Kasetsart Journal (Nat.
Sci.), Vol. 42 : 325-332 (2008).
[8] Na Wichian,A.,Prakaimaneewong, and P. Na
Ranong, N.,“ Preparation of Epoxidized Natural
Rubber from Field Latex”,Research report of
rubber, 1-14 (2009)
[9] Heping, Y., Sidong, L. and Zheng, P., “Preparation
and Study of Epoxidized Natural Rubber”,Journal of
Thermal Analysis and Calorimetry, Vol. 58 : 293-
299 (1999).
[10] Boochathum, P. and Rongtongaram, N.,
“Characterization of Processability and Silica-silica
Network of Silica Filled Functionalized Natural
Rubber Composite”,28th
The Polymer Processing
Society (PPS) Conference, December 11-15,
Pattaya (Thailand) (2012).
International Polymer Conference of Thailand
223 RUBBERP-04
Preparation and Properties of Epoxidized Natural Rubber/Carbon Nanotubes
Nanocomposites
Piyaphorn Mungmeechai *, Saowaroj Chuayjuljit
and Anyaporn Boonmahitthisud
Department of Materials Science, Faculty of Science, Chulalongkorn University, Bangkok 10330
Phone +6689239 6601, Fax +66 22185561, *E-Mail: [email protected]
Abstract
This research aimed to investigate the effects of carbon nanotubes (CNTs) on the tensile properties and
thermal stability of epoxidized natural rubber (ENR)/CNTs nanocomposites. ENRs with different levels of
epoxidation were prepared from concentrated natural rubber (NR) latex via in situ performic acid epoxidation
method using various molar ratios of formic acid and hydrogen peroxide (H2O2) at 50°C for 4 h. An ENR with
30–35 mol % epoxidation was prepared by using a molar ratio of 0.75:0.75 formic acid:H2O2, and this formic
acid:H2O2 molar ratio was further used in the preparation of ENR/CNTs nanocomposites with an inclusion of
five loadings of CNTs (0.5–2.5 parts per hundred parts of rubber) in the in situ epoxidation reaction of NR. The
tensile properties (tensile strength and modulus at 300% strain) and thermal stability of the prepared
nanocomposites were found to be improved with the inclusion of an appropriate loading of the CNTs as compared
to those of pure NR, but with a decrease in the elongation at break in a dose-dependent manner. However, the
elongation at break of the nanocomposites was largely retained, giving the values of between 591.2–691.6% as
compared with that of the pure NR (727%), since these CNTs reinforced ENR vulcanizates are soft
nanocomposites.
Keywords: Epoxidized natural rubber, Carbon nanotubes, In situ epoxidation, Nanocomposites
1. Introduction
Natural rubber (NR), one of the important renewable
natural polymers, has numerous advantage properties
such as high mechanical strength, low heat buildup and
excellent resilience and elasticity [1–3]. It is known that
NR has high tensile and tear strength due to its ability to
undergo strain crystallization [2]. However, NR has
some drawbacks such as poor ozone, thermal, weathering
and oil resistance owing to its unsaturation hydrocarbon
chain structure and non-polar nature, which limit its use
in many applications [3,4]. One of the straightforward
and convenient methods to solve these disadvantages is
the introduction of polar groups onto the NR backbones.
Epoxidation of NR is a simple reaction that can be
occurred in latex stage via in situ peracid epoxidation,
and is a well-known and effective method of improving
the oil and thermal resistance of NR [4–6]. As NR is
epoxidized, double bonds are randomly changed to
epoxide groups, leading to an increased polarity and
glass transition temperature with increasing level of
epoxidation, while the ability to strain crystallize can be
retained up to about 50% epoxidation [7,8]. The extent of
epoxidation is controlled by the peracid content, reaction
temperature and reaction time. The ENR of lower than
50 mol % epoxidation is a typical elastomer, while that
of higher epoxidation becomes harder and lower
resilience and elasticity [9]. The ENR can be vulcanized
by sulfur-cured systems similar to NR, and its
vulcanizate can retain some advantages of NR, including
high tensile and tear strength [2,8]. However, reinforcing
filler is still needed for rubber to gain appropriate
properties for specific applications, especially, nano-
sized reinforcing particles [10-12]. The present work
focused on the use of carbon nanotubes (CNTs) at a very
low loading (0.5–2.5 parts per hundred parts of rubber,
phr) to prepare ENR/CNT nanocomposites. CNTs are
valuable for nanotechnology due to their superior
properties such as very high aspect ratio (up to 104),
specific surface area, modulus (about 103 GPa) and tensile
strength (~ 50 GPa) and low density (~ 1.3 g/cm3)
[11,13]. In this study, ENR/CNT nanocomposites were
prepared via in situ performic acid epoxidation of NR
using formic acid and hydrogen peroxide (H2O2) in the
presence of CNTs. The curing characteristics and
properties of the vulcanizates in terms of the tensile
properties and thermal stability were examined.
International Polymer Conference of Thailand
224 2. Materials and Experimental methods
2.1 Materials
NR latex having 60% dry rubber content (DRC),
polyalcohol ethyleneoxide condensate (Terric 16A-16),
zinc oxide (ZnO), stearic acid, sulfur, n-cyclohexyl-2-
benzothaiazyl sulphenamide (CBS), Voltamol and bentonite
were obtained from Rubber Research Institute of Thailand
(Bangkok, Thailand). Formic acid (98%) and H2O2 (30%)
were purchased from Asian Scientific Co. (Bangkok,
Thailand). CNTs was supplied by EM-Power Co.
(Bangkok, Thailand). Sodium carbonate was purchased
from Merck Thailand Co. (Samutprakarn, Thailand).
Methanol was purchased from RCI Lab Scan Company
(Bangkok, Thailand). All materials were used as
supplied.
2.2 Preparation and characterization of ENR
ENR was prepared via in situ epoxidation of NR
using formic acid and H2O2. The NR latex was first diluted
to 20 % DRC with distilled water and stabilized with Terric
16A-16 under stirring for 1 h. The assigned amounts of
formic acid (0.25–1 M of isoprene unit) and H2O2 (0.25–
1 M of isoprene unit) were added into the stabilized NR
latex according to the formulation in Table 1. Formic
acid was fed drop by drop into NR latex within 10–15
min at 40°C, followed by raising the temperature to 50°C
within 15 min prior to adding the H2O2 within 5–10 min
with continuous stirring. The reaction was allowed to
proceed at 50°C for 4 h. The obtained product was
coagulated in methanol, filtered, washed with distilled
water, soaked in sodium carbonate solution (5%) for 5–10
min, washed again until neutral, pressed into thin sheet
(1.5–2 mm), and then dried at 60°C for 48 h.
Table 1. Formulation for epoxidation reaction of NR.
Formula
Ingredient 1 2 3 4 5 6 7
NR 100a 100 100 100 100 100 100
Terric
16A-16 3a 3 3 3 3 3 3
Formic
acid 0.75b 0.75 0.75 0.75 0.25 0.50 1
H2O2 0.25b 0.50 0.75 1 0.75 0.75 0.75
a dry content in g,
b content in M of isoprene unit
The extent of epoxidation was analyzed by Fourier
transform infrared spectroscopy (FT-IR) using a Nicolet
6700-FT-IR over a frequency range of 400–3400 cm-1
.
The mol % epoxidation was calculated from Eq. (1) using
data obtained from the characteristic FT-IR peaks at 870
and 835 cm-1
in according to Davey and Loadman [14].
Mol % epoxidation = [A870/(A870 + A835)] × 100 (1)
where A870 and A835 are the absorbancies at wavenumbers
870 and 835 cm-1
, respectively.
2.3 Preparation and characterization of ENR/CNTs
CNTs were first prepared in an aqueous dispersion
at 2 wt% using Voltamol (2 wt%) and bentonite (1 wt%)
as a dispersant of CNTs in distilled water by ball milling
at 200 rpm for 72 h. The ENR/CNTs nanocomposites
were then prepared via in situ epoxidation of NR with
various loadings of CNTs (0.5, 1, 1.5, 2 and 2.5 phr). The
CNTs was first added to the stabilized NR latex and the
formic acid and H2O2 were then added as previously
mentioned. The mol % epoxidation of ENR was also
examined by the FT-IR analysis and Eq. (1).
2.4 Compounding, cure characterization and
vulcanization
The NR, ENR and ENR/CNTs nanocomposites were
mixed with ZnO (5 phr), stearic acid (2 phr), CBS (1 phr)
and sulfur (2 phr) in an internal mixer (MX500-D75L90)
at 70°C for 9 min, followed by a two-roll mill for 1 min.
Curing behaviors in terms of scorch time (ts2) and
cure time (t90) were determined at 130°C according to
ASTM D2084 using a moving die rheometer (MDR)
(A0225-rheo Tech MD). At least three specimens were
determined for each composition, and the average value
was reported.
The compounded rubber was cured in a compression
molding machine (LP-S-20, LabTech Engineering) at
130°C using the t90 obtained from the MDR.
2.5 Tensile properties
The tensile test was performed on a dumbbell-shape
specimen in according to ASTM 412 (type D) using a
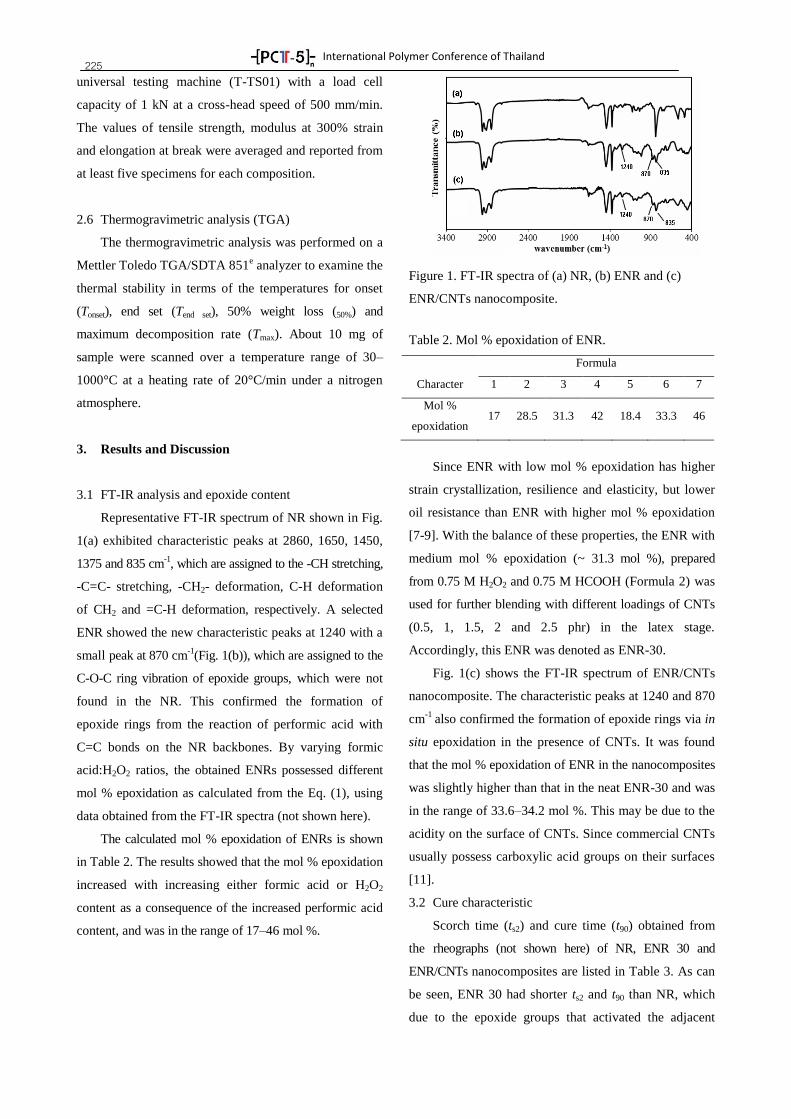
International Polymer Conference of Thailand
225 universal testing machine (T-TS01) with a load cell
capacity of 1 kN at a cross-head speed of 500 mm/min.
The values of tensile strength, modulus at 300% strain
and elongation at break were averaged and reported from
at least five specimens for each composition.
2.6 Thermogravimetric analysis (TGA)
The thermogravimetric analysis was performed on a
Mettler Toledo TGA/SDTA 851e analyzer to examine the
thermal stability in terms of the temperatures for onset
(Tonset), end set (Tend set), 50% weight loss (50%) and
maximum decomposition rate (Tmax). About 10 mg of
sample were scanned over a temperature range of 30–
1000°C at a heating rate of 20°C/min under a nitrogen
atmosphere.
3. Results and Discussion
3.1 FT-IR analysis and epoxide content
Representative FT-IR spectrum of NR shown in Fig.
1(a) exhibited characteristic peaks at 2860, 1650, 1450,
1375 and 835 cm-1, which are assigned to the -CH stretching,
-C=C- stretching, -CH2- deformation, C-H deformation
of CH2 and =C-H deformation, respectively. A selected
ENR showed the new characteristic peaks at 1240 with a
small peak at 870 cm-1
(Fig. 1(b)), which are assigned to the
C-O-C ring vibration of epoxide groups, which were not
found in the NR. This confirmed the formation of
epoxide rings from the reaction of performic acid with
C=C bonds on the NR backbones. By varying formic
acid:H2O2 ratios, the obtained ENRs possessed different
mol % epoxidation as calculated from the Eq. (1), using
data obtained from the FT-IR spectra (not shown here).
The calculated mol % epoxidation of ENRs is shown
in Table 2. The results showed that the mol % epoxidation
increased with increasing either formic acid or H2O2
content as a consequence of the increased performic acid
content, and was in the range of 17–46 mol %.
Figure 1. FT-IR spectra of (a) NR, (b) ENR and (c)
ENR/CNTs nanocomposite.
Table 2. Mol % epoxidation of ENR.
Formula
Character 1 2 3 4 5 6 7
Mol %
epoxidation 17 28.5 31.3 42 18.4 33.3 46
Since ENR with low mol % epoxidation has higher
strain crystallization, resilience and elasticity, but lower
oil resistance than ENR with higher mol % epoxidation
[7-9]. With the balance of these properties, the ENR with
medium mol % epoxidation (~ 31.3 mol %), prepared
from 0.75 M H2O2 and 0.75 M HCOOH (Formula 2) was
used for further blending with different loadings of CNTs
(0.5, 1, 1.5, 2 and 2.5 phr) in the latex stage.
Accordingly, this ENR was denoted as ENR-30.
Fig. 1(c) shows the FT-IR spectrum of ENR/CNTs
nanocomposite. The characteristic peaks at 1240 and 870
cm-1
also confirmed the formation of epoxide rings via in
situ epoxidation in the presence of CNTs. It was found
that the mol % epoxidation of ENR in the nanocomposites
was slightly higher than that in the neat ENR-30 and was
in the range of 33.6–34.2 mol %. This may be due to the
acidity on the surface of CNTs. Since commercial CNTs
usually possess carboxylic acid groups on their surfaces
[11].
3.2 Cure characteristic
Scorch time (ts2) and cure time (t90) obtained from
the rheographs (not shown here) of NR, ENR 30 and
ENR/CNTs nanocomposites are listed in Table 3. As can
be seen, ENR 30 had shorter ts2 and t90 than NR, which
due to the epoxide groups that activated the adjacent
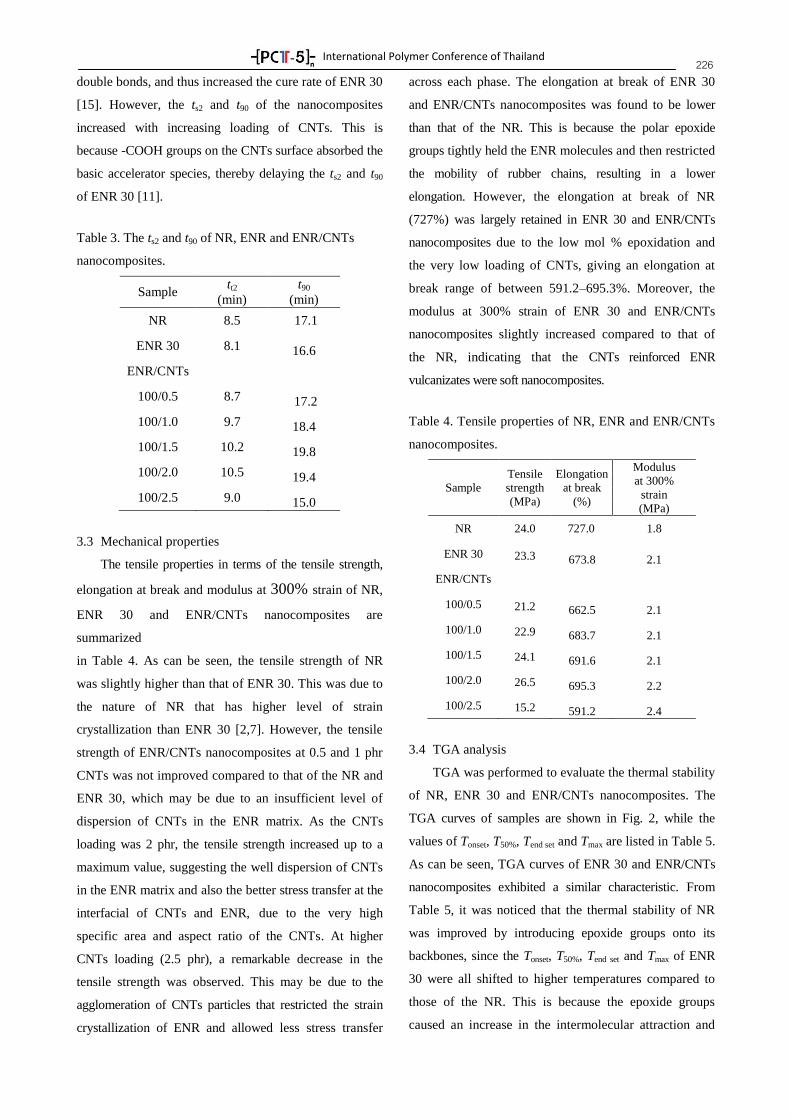
International Polymer Conference of Thailand
226 double bonds, and thus increased the cure rate of ENR 30
[15]. However, the ts2 and t90 of the nanocomposites
increased with increasing loading of CNTs. This is
because -COOH groups on the CNTs surface absorbed the
basic accelerator species, thereby delaying the ts2 and t90
of ENR 30 [11].
Table 3. The ts2 and t90 of NR, ENR and ENR/CNTs
nanocomposites.
Sample tt2
(min)
t90
(min)
NR 8.5 17.1
ENR 30 8.1 16.6
ENR/CNTs
100/0.5 8.7 17.2
100/1.0 9.7 18.4
100/1.5 10.2 19.8
100/2.0 10.5 19.4
100/2.5 9.0 15.0
3.3 Mechanical properties
The tensile properties in terms of the tensile strength,
elongation at break and modulus at 300% strain of NR,
ENR 30 and ENR/CNTs nanocomposites are
summarized
in Table 4. As can be seen, the tensile strength of NR
was slightly higher than that of ENR 30. This was due to
the nature of NR that has higher level of strain
crystallization than ENR 30 [2,7]. However, the tensile
strength of ENR/CNTs nanocomposites at 0.5 and 1 phr
CNTs was not improved compared to that of the NR and
ENR 30, which may be due to an insufficient level of
dispersion of CNTs in the ENR matrix. As the CNTs
loading was 2 phr, the tensile strength increased up to a
maximum value, suggesting the well dispersion of CNTs
in the ENR matrix and also the better stress transfer at the
interfacial of CNTs and ENR, due to the very high
specific area and aspect ratio of the CNTs. At higher
CNTs loading (2.5 phr), a remarkable decrease in the
tensile strength was observed. This may be due to the
agglomeration of CNTs particles that restricted the strain
crystallization of ENR and allowed less stress transfer
across each phase. The elongation at break of ENR 30
and ENR/CNTs nanocomposites was found to be lower
than that of the NR. This is because the polar epoxide
groups tightly held the ENR molecules and then restricted
the mobility of rubber chains, resulting in a lower
elongation. However, the elongation at break of NR
(727%) was largely retained in ENR 30 and ENR/CNTs
nanocomposites due to the low mol % epoxidation and
the very low loading of CNTs, giving an elongation at
break range of between 591.2–695.3%. Moreover, the
modulus at 300% strain of ENR 30 and ENR/CNTs
nanocomposites slightly increased compared to that of
the NR, indicating that the CNTs reinforced ENR
vulcanizates were soft nanocomposites.
Table 4. Tensile properties of NR, ENR and ENR/CNTs
nanocomposites.
Sample Tensile
strength
(MPa)
Elongation
at break
(%)
Modulus
at 300%
strain
(MPa)
NR 24.0 727.0 1.8
ENR 30 23.3 673.8 2.1
ENR/CNTs
100/0.5 21.2 662.5 2.1
100/1.0 22.9 683.7 2.1
100/1.5 24.1 691.6 2.1
100/2.0 26.5 695.3 2.2
100/2.5 15.2 591.2 2.4
3.4 TGA analysis
TGA was performed to evaluate the thermal stability
of NR, ENR 30 and ENR/CNTs nanocomposites. The
TGA curves of samples are shown in Fig. 2, while the
values of Tonset, T50%, Tend set and Tmax are listed in Table 5.
As can be seen, TGA curves of ENR 30 and ENR/CNTs
nanocomposites exhibited a similar characteristic. From
Table 5, it was noticed that the thermal stability of NR
was improved by introducing epoxide groups onto its
backbones, since the Tonset, T50%, Tend set and Tmax of ENR
30 were all shifted to higher temperatures compared to
those of the NR. This is because the epoxide groups
caused an increase in the intermolecular attraction and
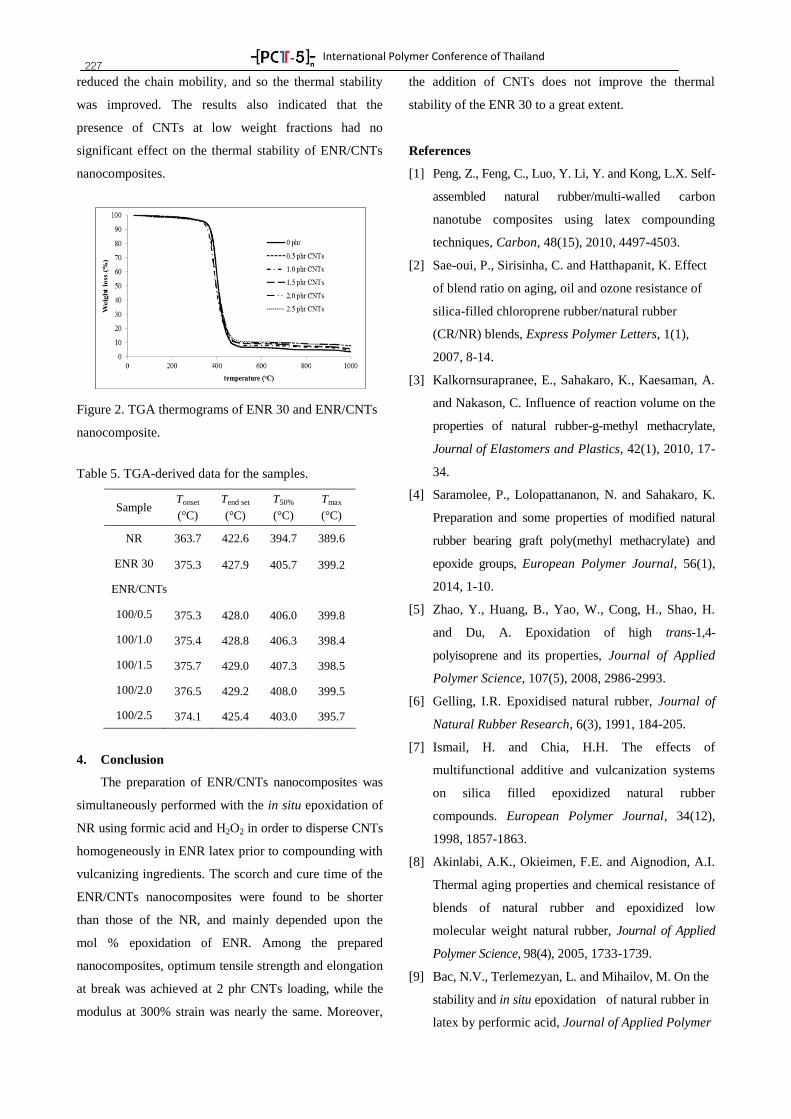
International Polymer Conference of Thailand
227 reduced the chain mobility, and so the thermal stability
was improved. The results also indicated that the
presence of CNTs at low weight fractions had no
significant effect on the thermal stability of ENR/CNTs
nanocomposites.
Figure 2. TGA thermograms of ENR 30 and ENR/CNTs
nanocomposite.
Table 5. TGA-derived data for the samples.
Sample Tonset
(°C)
Tend set
(°C)
T50%
(°C)
Tmax
(°C)
NR 363.7 422.6 394.7 389.6
ENR 30 375.3 427.9 405.7 399.2
ENR/CNTs
100/0.5 375.3 428.0 406.0 399.8
100/1.0 375.4 428.8 406.3 398.4
100/1.5 375.7 429.0 407.3 398.5
100/2.0 376.5 429.2 408.0 399.5
100/2.5 374.1 425.4 403.0 395.7
4. Conclusion
The preparation of ENR/CNTs nanocomposites was
simultaneously performed with the in situ epoxidation of
NR using formic acid and H2O2 in order to disperse CNTs
homogeneously in ENR latex prior to compounding with
vulcanizing ingredients. The scorch and cure time of the
ENR/CNTs nanocomposites were found to be shorter
than those of the NR, and mainly depended upon the
mol % epoxidation of ENR. Among the prepared
nanocomposites, optimum tensile strength and elongation
at break was achieved at 2 phr CNTs loading, while the
modulus at 300% strain was nearly the same. Moreover,
the addition of CNTs does not improve the thermal
stability of the ENR 30 to a great extent.
References
[1] Peng, Z., Feng, C., Luo, Y. Li, Y. and Kong, L.X. Self-
assembled natural rubber/multi-walled carbon
nanotube composites using latex compounding
techniques, Carbon, 48(15), 2010, 4497-4503.
[2] Sae-oui, P., Sirisinha, C. and Hatthapanit, K. Effect
of blend ratio on aging, oil and ozone resistance of
silica-filled chloroprene rubber/natural rubber
(CR/NR) blends, Express Polymer Letters, 1(1),
2007, 8-14.
[3] Kalkornsurapranee, E., Sahakaro, K., Kaesaman, A.
and Nakason, C. Influence of reaction volume on the
properties of natural rubber-g-methyl methacrylate,
Journal of Elastomers and Plastics, 42(1), 2010, 17-
34.
[4] Saramolee, P., Lolopattananon, N. and Sahakaro, K.
Preparation and some properties of modified natural
rubber bearing graft poly(methyl methacrylate) and
epoxide groups, European Polymer Journal, 56(1),
2014, 1-10.
[5] Zhao, Y., Huang, B., Yao, W., Cong, H., Shao, H.
and Du, A. Epoxidation of high trans-1,4-
polyisoprene and its properties, Journal of Applied
Polymer Science, 107(5), 2008, 2986-2993.
[6] Gelling, I.R. Epoxidised natural rubber, Journal of
Natural Rubber Research, 6(3), 1991, 184-205.
[7] Ismail, H. and Chia, H.H. The effects of
multifunctional additive and vulcanization systems
on silica filled epoxidized natural rubber
compounds. European Polymer Journal, 34(12),
1998, 1857-1863.
[8] Akinlabi, A.K., Okieimen, F.E. and Aignodion, A.I.
Thermal aging properties and chemical resistance of
blends of natural rubber and epoxidized low
molecular weight natural rubber, Journal of Applied
Polymer Science, 98(4), 2005, 1733-1739.
[9] Bac, N.V., Terlemezyan, L. and Mihailov, M. On the
stability and in situ epoxidation of natural rubber in
latex by performic acid, Journal of Applied Polymer
International Polymer Conference of Thailand
228 Science, 42(11), 1991, 2965-2973.
[10] Ranimol, S., Rosamma, A., Treesa, C., Siby, V.,
Kuruvilla, J. and Sabu, T. Rheological behavior of
nanocomposites of natural rubber and carboxylated
styrene butadiene rubber lattices and their blends,
Journal of Applied Polymer Science, 101(4), 2006,
2355-2362.
[11] Shanmugharaj, A.M. and Ryu, S.H. Influence of
aminsilane-functionalized carbon nanotubes on the
rheometric, mechanical, electrical and thermal
degradation properties of epoxidized natural rubber
nanocomposites, Polymer International, 62(10),
2013, 1433-1441.
[12] Teh, P.L., Ishak, Z.A.M., Hashim, A.S., Kocsis, J.K.
and Ishiaku, U.S. On the potential of organoclay with
respect to conventional fillers (carbon black, silica) for
epoxidized natural rubber compatibilized natural
rubber vulcanizates, Journal of Applied Polymer
Science, 94(6), 2004, 2438-2445.
[13] Zhou, X., Zhu, Y., Liang, J. and Yu, S. New fabrication
of styrene-butadiene rubber/carbon nanotubes
nanocomposite and corresponding mechanical
properties, Journal of Materials Science and
Technology, 26(12), 2010, 1127-1132.
[14] Davey, J.E. and Loadman, M.J.R. A chemical
demonstration of the randomness of epoxidation of
NR, British Polymer Journal, 16(3), 1984, 134-138.
[15] Sadequl, A.M., Ishiaku, U.S. and Poh, B.T. Cure index
and activation energy of ENR 25 compared with
SMR L in various vulcanization systems, European
Polymer Journal, 35(4), 1999, 711-719.
SESSION 6Advances in Polymer Processing
Smart and Intelligent Polymers
International Polymer Conference of Thailand
230
KN-SMART-1
Self-Assembly of Ultralong Polyion Nanoladders Facilitated by Ionic Recognition and
Molecular Stiffness
Yun Yan*
College of Molecular Engineering, Peking University, Beijing, 100871
Abstract
Ionic interaction has emerged as an important driving force for the
fabrication of ionic self-assembly. Well-known examples are the
polyion assemblies formed in water by pairs of oppositely charged
polyelectrolytes, which can be forced into films and capsules with
appropriate protocols, or made into micelles and vesicles by end-
attaching uncharged water-soluble blocks to (at least one of) the
polyelectrolytes. This is also the case when one of the polyelectrolytes
was replaced by reversible or “soft” coordination polymers, namely,
supramolecular chains in which organic bisligands and transition metal
ions alternate in a regular fashion. By proper choice of the bisligands,
one can even obtain supramolecular polyelectrolytes, which in turn can
form polyion assemblies just like ordinary polyelectrolytes. Usually,
polyion assemblies formed with covalent polylectrolytes or
coordination polymers have internally random structures, since the
polymers are flexible and the ionic interactions are isotropic between
the flexible chains. In this work we show that precise alignment of
polyelectrolyte chains inside polyion assemblies can be achieved by
imparting proper stiffness to the molecular tiles.
Yun Yan
Dr Yun Yan has been an associate
professor at Peking University, China,
since 2008.She earned her bachelor
degree at Northeast Normal University
(1997), China, and obtained the PhD
in physical chemistry at Peking
University. After two postdoctoral
studies in Bayreuth University
(Germany) and Wageningen
University (the Netherlands), she
joined Peking University as an
associate professor. Her current
interest is molecular self-assembly in
solutions, including 1) surfactant in
solution; 2) Self-assembly of
amphiphiles; 3) self-assembly based
on coordination chemistry; 3) adaptive
soft materials; 4) sevelopment of
efficient self-assembling methods for
functional materials.
She was selected into the New
Century Training Program for the
Talents by the State Education
Commission of China in 2009, Best
Researchers in Colloid Science of
China (2013), Teaching Award of
Peking University (2013), winner of
Outstanding Youth Science
Foundation, Natural Science
Fundation of China (NSFC, 2014),
Excellent doctoral thesis instructor of
Peking University (2014).
International Polymer Conference of Thailand
231
KN-SMART-2
Self-Assembled Polymer Electrolytes for Future Electrochemical Devices
Moon Jeong Park*
Department of Chemistry, Division of Advanced Materials Science,
Pohang University of Science and Technology (POSTECH), Pohang 790-784, Korea *E-Mail: [email protected]
Abstract
The global energy crisis and an increase in environmental
pollution in the recent years have drawn the attention of the scientific
community to develop innovative ways to improve energy storage and
find more efficient methods of transporting the energy. Polymers
containing charged species have the potential to serve as electrolytes in
next-generation energy systems and achieving high ionic conductivities
from these electrolytes is the key to improving the device efficiency.
Although the synthesis and characterization of a wide variety of
polymer electrolytes have been extensively reported over the last
decade, quantitative understanding of the factors governing the ion
transport properties of these materials is in its infancy. In this seminar, I
will present the underpinning of key factors affecting the
thermodynamics, morphologies and ion transport in polymer
electrolytes by focusing on the use of block copolymers and ionic
liquids (ILs). Various strategies for accessing improved ionic
conductivity and high cation transference number from IL-containing
block copolymers are elucidated. The major accomplishment of
obtaining well-defined nanoscale morphologies for these IL-containing
block copolymers is particularly emphasized as a novel means of
controlling the transport properties. The applications of IL-containing
block copolymers in high temperature fuel cells, lithium batteries, and
electro-active actuators are also enclosed.
Keywords: Block copolymers, Ionic liquids, Self-assembly.
References
(1) Hoon Kim, Joungphil Lee, Hyungmin Ahn, Onnuri Kim, Moon
Jeong Park*, "Synthesis of Three-Dimensionally Interconnected
Sulfur-Rich Polymers for Cathode Materials of High-Rate Lithium-
Sulfur Batteries" Nature Communications, 2015 AOP.
(2) Gyuha Jo, Hongchan Jeon, Moon Jeong Park*, "Synthesis of
Polymer Electrolytes Based on Poly(ethylene oxide) and an Anion-
Stabilizing Hard Polymer for Enhancing Conductivity and Cation
Transport" ACS Macro Lett., 2015, 4, 225−230.
(3) Hyungmin Ahn, Sungyeon Kim, Onnuri Kim, Ilyoung Choi, Chang-
Hoon Lee, Ji Hoon Shim, Moon Jeong Park*, "Blue-emitting Self-
assembled Polymer Electrolytes for Fast, Sensitive, Label-free
Detection of Cu(II)-ions in Aqueous Media" ACS Nano 2013, 7(7),
6162-6169.
(4) Onnuri Kim, Tae-Ju Shin, Moon Jeong Park*, "Fast Low-Voltage
Electroactive Actuators Using Nanostructured Polymer Electrolytes"
Nature Communications, 2013, 4, 2208. DOI:
10.1038/ncomms3208.
(5) S. Y. Kim, S. Kim, Moon Jeong Park*, "Enhanced Proton
Transport in Nanostructured Block Copolymer Electrolyte / Ionic
Liquid Membrane under Water Free Conditions". Nature
Communications, 2010, 1:88.
Education
2006: Ph.D. School of Chemical and
Biological Engineering, Seoul
National University; Mentor: K.
Char
2004 BK-21 Visiting Scholar,
University of Minnesota; Mentor:
T. P. Lodge
2002: M.S. School of Chemical
Engineering, Seoul National
University
2000: B.S. School of Chemical
Engineering, Seoul National
University
Professional Positions
Present Associate Professor,
Department of Chemistry, POSTECH
Mar. 2013 – present: Editorial Advisory
Board, Journal of Applied Polymer
Science
Mar. 2015 – present: Editorial Advisory
Board, Journal of Polymer Science:
Polymer Physics
Honors and Awards
• POSCO Technology Award, POSCO,
Korea, 2015
• Young Scientist Award, John Wiley
& Sons and The Korean Polymer
Society, 2013
• Chong-Am Science Fellowship for
Young Professors, 2011
• Best Lectureship at POSTECH, 2011
• Asia Excellence Award for Young
Scientists in Polymer Science, Osaka,
Japan, 2011
Research Interests
Synthesis and characterization of model
hard/soft materials to elucidate the
mechanisms of charge and ion transport
through these nanostructured materials-
Current efforts focus on correlating
nanoscale structures with ion transport
properties to establish prospective
avenues geared towards high
temperature polymer electrolyte
membrane fuel cells and electroactive
polymer actuators.
International Polymer Conference of Thailand
232
KN-SMART-3
Non-ionic thermoresponsive polymers of UCST-type in water: Challenges and
perspectives
Seema Agarwal
Faculty of Biology, Chemistry and Earth Sciences, Macromolecular Chemistry II and Bayreuth
Center for Colloids and Interfaces, University of Bayreuth, Universitätsstraße 30, 95440
Bayreuth, Germany
Abstract
Stimuli-responsive polymers or “smart” polymers exhibit a
predictive and sharp change in properties upon only small
changes in the environment (e.g. temperature, pH, ionic strength,
radiation, mechanical stimuli etc.). One class of smart polymers
are thermoresponsive polymers, the best known example being
Poly(N,N-isopropyl acrylamide) PNiPAAm which undergoes
phase separation from aqueous solution at approximately 33 °C.
In contrast to the LCST polymers, only few polymers are known
that show an upper critical solution temperature (UCST) in water
with a sharp phase transition. In most cases the UCST is either
based on ionic interactions or hydrogen bonding. The first is
observed for some polybetaines or quaternized polyurethanes.
However, ionic interactions are disturbed in electrolyte solution.
This is why novel polymer systems showing a sharp UCST over a
wide range of concentrations and being tolerant to electrolytes are
highly desirable. Such polymers can open new application
opportunities.
This presentation will highlight polymers and architectures
showing sharp UCST in water and biological fluids. The reasons
for slow research in this field of UCST polymers in contrast to
LCST polymers will also be discussed by taking few examples.
Seema Agarwal
Universität Bayreuth
Lehrstuhl für Makromolekulare Chemie II
Universitätsstraße 30, 95447 Bayreuth
Germany
Curriculum vitae
1995 PhD Polymer Chemistry, Indian
Institute of Technology (I.I.T.), Delhi, India.
1997 Post-doc at Philipps Universität,
Marburg, Germany.
2007 Habilitation for Macromolecular
Chemistry, Department of Chemistry,
Philipps-Universität Marburg, Germany.
Present Academic Director and Professor at
University of Bayreuth, Germany
Awards and Other Responsibilities
Since 2010 Guest Professor- Jiangxi Normal
University, Nanchang, China
1997–1999 Alexander von Humboldt
Fellowship, Germany
2009 Hermann-Schnell Award (GDCH),
Germany
2009–2011 Associate Editor: Polymers for
Advanced Technologies (Wiley)
Since 2013 Chief-Editor e-Polymers
(De Gruyter publisher)
Since 2013 Managing committee member and
scientific coordinator of a working group
COST 1206 (Electrospun Nano-fibres for bio
inspired composite materials and innovative
industrial applications
Research profile and projects
Functional biodegradable polymers for
biorelevant applications, antibacterial
polymers, thermoresponsive and
photoresponsive polymers, Special fiber
morphologies and properties by bicomponent
electrospinning, nanocomposites. Publications
Peer Reviewed journals: >150
International Polymer Conference of Thailand
233
KN-SMART-4
Polymer-Based Smart Devices: Electronics on Paper, Plastic and Textile
Teerakiat Kerdcharoen
Department of Physics and NANOTEC’s Center of Excellence, Faculty of science,
Mahidol University, Bangkok 10400, Thailand
E-mail: [email protected]
Abstract
Polymer has become basic material for infrastructure
development of human civilization in the past century. Recently,
polymer has been further upgraded to the next version, “Polymer
2.0”, in which advanced functionalities such as electronics and
logical functions can be embedded. In this lecture, we will
demonstrate various polymer-based smart devices based on the
paper, plastic and fabric substrates. Our devices are mostly
wearable including interactive data glove, wearable electronic
nose, gait monitoring and sniffing shoes and smelling shirts. As
focused on the gas sensors and electronic nose technology, we
will present the new concept of human health monitoring based
on the human body and wearable device.
Keywords: Printed electronics; gas sensor; electronic nose;
wearable intelligence
Teerakiat Kerdcharoen
Education:
1986-1989 B.Sc. (Chemistry)
Chulalongkorn University, Thailand
1990-1991 M.Sc. (Physical Chemistry)
Chulalongkorn University, Thailand
1992-1995 Dr.rer.nat (Physical
Chemistry) University of Innsbruck,
Austria
1999-2000 Postdoc (Materials Science &
Engineering) Technical University of
Munich, Germany
Awards :
1999-2000 DFG Postdoctoral Fellow,
Technical University of Munich
2001 Cherry L. Emerson Fellow, Emory
University, USA
2001 Thailand Young Scientist Award
2005 Thailand Toray Science &
Technology Aid Prize
2008 Thailand Research Fund’s
Outstanding Research Prize
2008 NECTEC’s Top Ten Outstanding
Research
2009 Mahidol University Publication
Prize
2014 1st Prize, Innovation for Crime
Combating Contest 2014
(Department of Special Investigation)
2015 Invention Award, National
Research Council of Thailand
Research Interests:
Hardware and software development of
smart devices
Chemical sensors, Electronic Nose
Precision Farming, Smart Farm
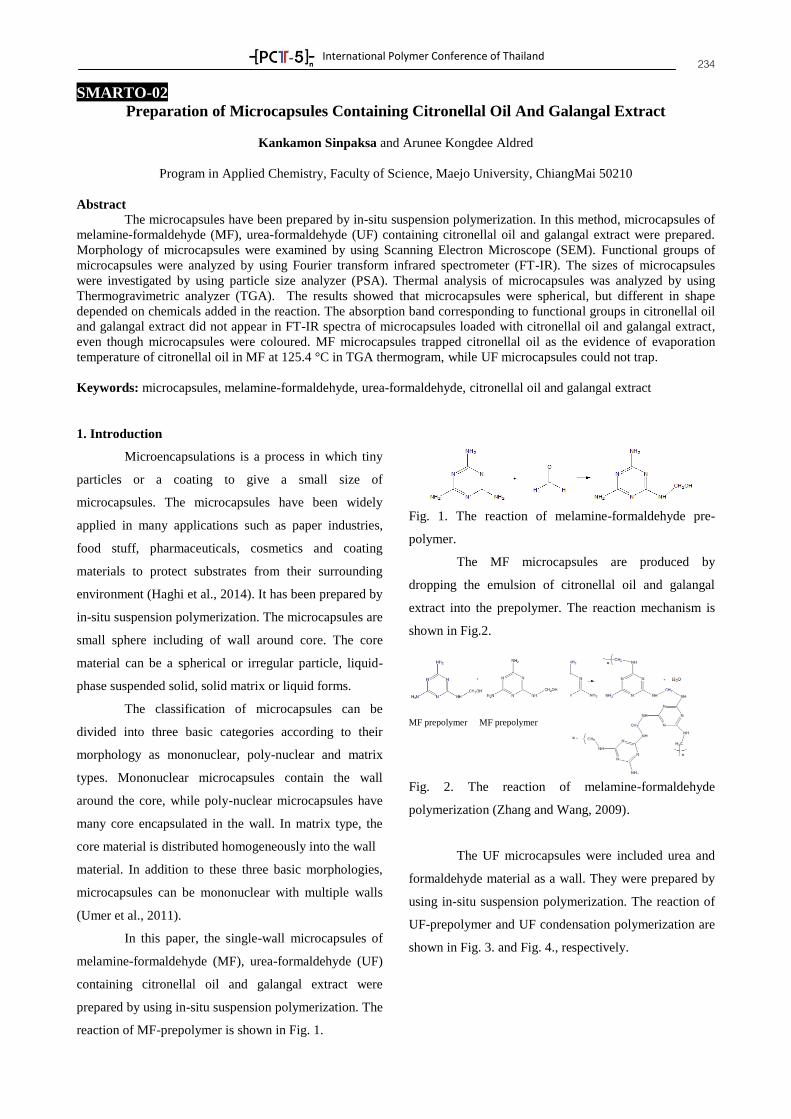
International Polymer Conference of Thailand
234
SMARTO-02
Preparation of Microcapsules Containing Citronellal Oil And Galangal Extract
Kankamon Sinpaksa and Arunee Kongdee Aldred
Program in Applied Chemistry, Faculty of Science, Maejo University, ChiangMai 50210
Abstract The microcapsules have been prepared by in-situ suspension polymerization. In this method, microcapsules of
melamine-formaldehyde (MF), urea-formaldehyde (UF) containing citronellal oil and galangal extract were prepared.
Morphology of microcapsules were examined by using Scanning Electron Microscope (SEM). Functional groups of
microcapsules were analyzed by using Fourier transform infrared spectrometer (FT-IR). The sizes of microcapsules
were investigated by using particle size analyzer (PSA). Thermal analysis of microcapsules was analyzed by using
Thermogravimetric analyzer (TGA). The results showed that microcapsules were spherical, but different in shape
depended on chemicals added in the reaction. The absorption band corresponding to functional groups in citronellal oil
and galangal extract did not appear in FT-IR spectra of microcapsules loaded with citronellal oil and galangal extract,
even though microcapsules were coloured. MF microcapsules trapped citronellal oil as the evidence of evaporation
temperature of citronellal oil in MF at 125.4 °C in TGA thermogram, while UF microcapsules could not trap.
Keywords: microcapsules, melamine-formaldehyde, urea-formaldehyde, citronellal oil and galangal extract
1. Introduction
Microencapsulations is a process in which tiny
particles or a coating to give a small size of
microcapsules. The microcapsules have been widely
applied in many applications such as paper industries,
food stuff, pharmaceuticals, cosmetics and coating
materials to protect substrates from their surrounding
environment (Haghi et al., 2014). It has been prepared by
in-situ suspension polymerization. The microcapsules are
small sphere including of wall around core. The core
material can be a spherical or irregular particle, liquid-
phase suspended solid, solid matrix or liquid forms.
The classification of microcapsules can be
divided into three basic categories according to their
morphology as mononuclear, poly-nuclear and matrix
types. Mononuclear microcapsules contain the wall
around the core, while poly-nuclear microcapsules have
many core encapsulated in the wall. In matrix type, the
core material is distributed homogeneously into the wall
material. In addition to these three basic morphologies,
microcapsules can be mononuclear with multiple walls
(Umer et al., 2011).
In this paper, the single-wall microcapsules of
melamine-formaldehyde (MF), urea-formaldehyde (UF)
containing citronellal oil and galangal extract were
prepared by using in-situ suspension polymerization. The
reaction of MF-prepolymer is shown in Fig. 1.
Fig. 1. The reaction of melamine-formaldehyde pre-
polymer.
The MF microcapsules are produced by
dropping the emulsion of citronellal oil and galangal
extract into the prepolymer. The reaction mechanism is
shown in Fig.2.
MF prepolymer MF prepolymer
Fig. 2. The reaction of melamine-formaldehyde
polymerization (Zhang and Wang, 2009).
The UF microcapsules were included urea and
formaldehyde material as a wall. They were prepared by
using in-situ suspension polymerization. The reaction of
UF-prepolymer and UF condensation polymerization are
shown in Fig. 3. and Fig. 4., respectively.
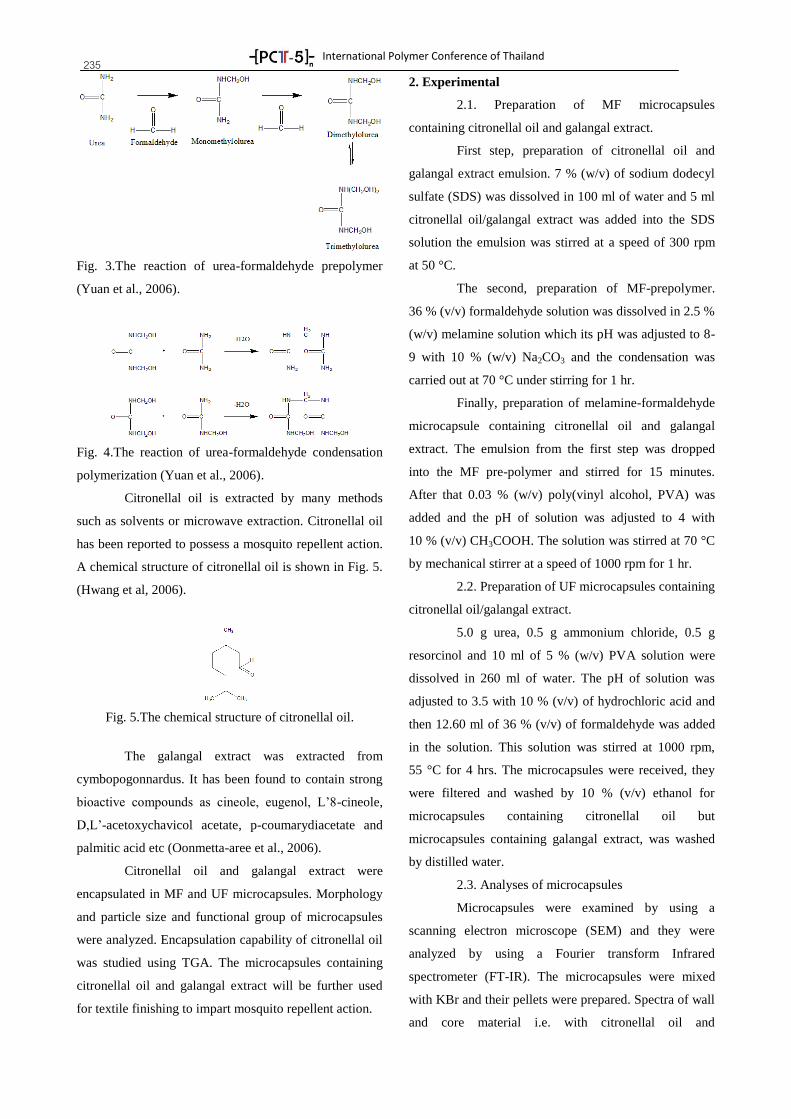
International Polymer Conference of Thailand
235
Fig. 3.The reaction of urea-formaldehyde prepolymer
(Yuan et al., 2006).
Fig. 4.The reaction of urea-formaldehyde condensation
polymerization (Yuan et al., 2006).
Citronellal oil is extracted by many methods
such as solvents or microwave extraction. Citronellal oil
has been reported to possess a mosquito repellent action.
A chemical structure of citronellal oil is shown in Fig. 5.
(Hwang et al, 2006).
Fig. 5.The chemical structure of citronellal oil.
The galangal extract was extracted from
cymbopogonnardus. It has been found to contain strong
bioactive compounds as cineole, eugenol, L’8-cineole,
D,L’-acetoxychavicol acetate, p-coumarydiacetate and
palmitic acid etc (Oonmetta-aree et al., 2006).
Citronellal oil and galangal extract were
encapsulated in MF and UF microcapsules. Morphology
and particle size and functional group of microcapsules
were analyzed. Encapsulation capability of citronellal oil
was studied using TGA. The microcapsules containing
citronellal oil and galangal extract will be further used
for textile finishing to impart mosquito repellent action.
2. Experimental
2.1. Preparation of MF microcapsules
containing citronellal oil and galangal extract.
First step, preparation of citronellal oil and
galangal extract emulsion. 7 % (w/v) of sodium dodecyl
sulfate (SDS) was dissolved in 100 ml of water and 5 ml
citronellal oil/galangal extract was added into the SDS
solution the emulsion was stirred at a speed of 300 rpm
at 50 °C.
The second, preparation of MF-prepolymer.
36 % (v/v) formaldehyde solution was dissolved in 2.5 %
(w/v) melamine solution which its pH was adjusted to 8-
9 with 10 % (w/v) Na2CO3 and the condensation was
carried out at 70 °C under stirring for 1 hr.
Finally, preparation of melamine-formaldehyde
microcapsule containing citronellal oil and galangal
extract. The emulsion from the first step was dropped
into the MF pre-polymer and stirred for 15 minutes.
After that 0.03 % (w/v) poly(vinyl alcohol, PVA) was
added and the pH of solution was adjusted to 4 with
10 % (v/v) CH3COOH. The solution was stirred at 70 °C
by mechanical stirrer at a speed of 1000 rpm for 1 hr.
2.2. Preparation of UF microcapsules containing
citronellal oil/galangal extract.
5.0 g urea, 0.5 g ammonium chloride, 0.5 g
resorcinol and 10 ml of 5 % (w/v) PVA solution were
dissolved in 260 ml of water. The pH of solution was
adjusted to 3.5 with 10 % (v/v) of hydrochloric acid and
then 12.60 ml of 36 % (v/v) of formaldehyde was added
in the solution. This solution was stirred at 1000 rpm,
55 °C for 4 hrs. The microcapsules were received, they
were filtered and washed by 10 % (v/v) ethanol for
microcapsules containing citronellal oil but
microcapsules containing galangal extract, was washed
by distilled water.
2.3. Analyses of microcapsules
Microcapsules were examined by using a
scanning electron microscope (SEM) and they were
analyzed by using a Fourier transform Infrared
spectrometer (FT-IR). The microcapsules were mixed
with KBr and their pellets were prepared. Spectra of wall
and core material i.e. with citronellal oil and
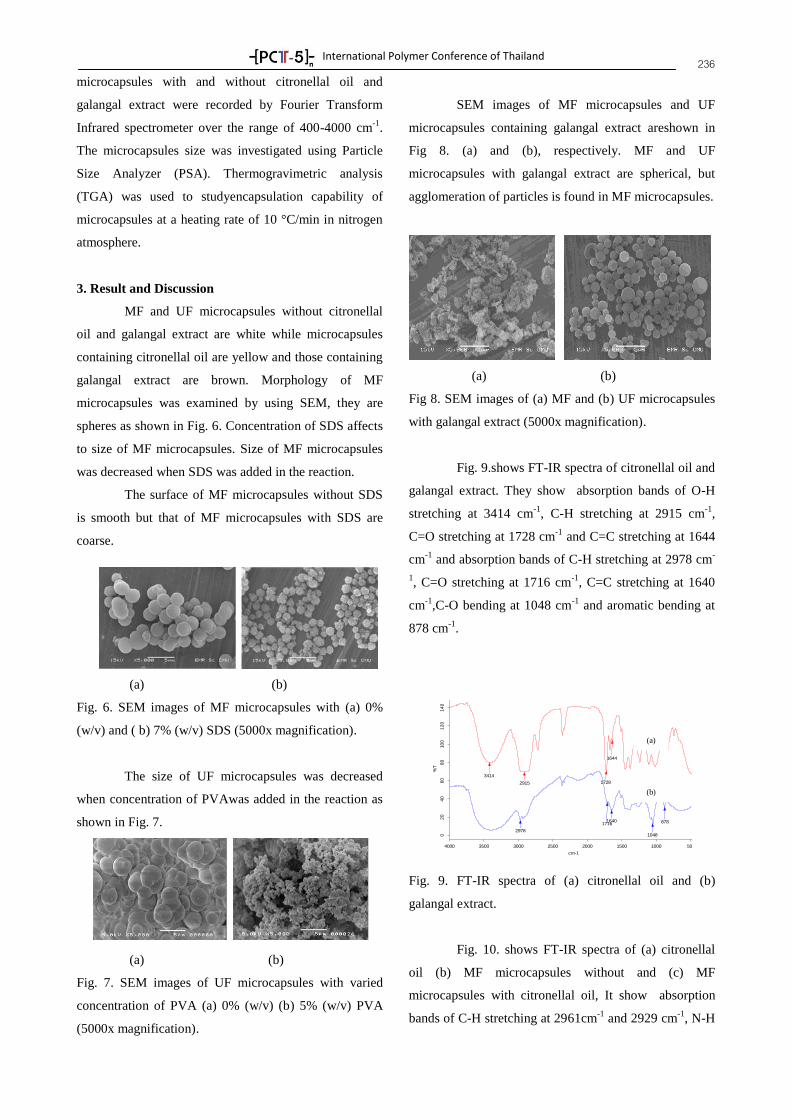
International Polymer Conference of Thailand
236 microcapsules with and without citronellal oil and
galangal extract were recorded by Fourier Transform
Infrared spectrometer over the range of 400-4000 cm-1
.
The microcapsules size was investigated using Particle
Size Analyzer (PSA). Thermogravimetric analysis
(TGA) was used to studyencapsulation capability of
microcapsules at a heating rate of 10 °C/min in nitrogen
atmosphere.
3. Result and Discussion
MF and UF microcapsules without citronellal
oil and galangal extract are white while microcapsules
containing citronellal oil are yellow and those containing
galangal extract are brown. Morphology of MF
microcapsules was examined by using SEM, they are
spheres as shown in Fig. 6. Concentration of SDS affects
to size of MF microcapsules. Size of MF microcapsules
was decreased when SDS was added in the reaction.
The surface of MF microcapsules without SDS
is smooth but that of MF microcapsules with SDS are
coarse.
(a) (b)
Fig. 6. SEM images of MF microcapsules with (a) 0%
(w/v) and ( b) 7% (w/v) SDS (5000x magnification).
The size of UF microcapsules was decreased
when concentration of PVAwas added in the reaction as
shown in Fig. 7.
(a) (b)
Fig. 7. SEM images of UF microcapsules with varied
concentration of PVA (a) 0% (w/v) (b) 5% (w/v) PVA
(5000x magnification).
SEM images of MF microcapsules and UF
microcapsules containing galangal extract areshown in
Fig 8. (a) and (b), respectively. MF and UF
microcapsules with galangal extract are spherical, but
agglomeration of particles is found in MF microcapsules.
(a) (b)
Fig 8. SEM images of (a) MF and (b) UF microcapsules
with galangal extract (5000x magnification).
Fig. 9.shows FT-IR spectra of citronellal oil and
galangal extract. They show absorption bands of O-H
stretching at 3414 cm-1
, C-H stretching at 2915 cm-1
,
C=O stretching at 1728 cm-1
and C=C stretching at 1644
cm-1
and absorption bands of C-H stretching at 2978 cm-
1, C=O stretching at 1716 cm
-1, C=C stretching at 1640
cm-1
,C-O bending at 1048 cm-1
and aromatic bending at
878 cm-1
.
Fig. 9. FT-IR spectra of (a) citronellal oil and (b)
galangal extract.
Fig. 10. shows FT-IR spectra of (a) citronellal
oil (b) MF microcapsules without and (c) MF
microcapsules with citronellal oil, It show absorption
bands of C-H stretching at 2961cm-1
and 2929 cm-1
, N-H
D:\§Ò¹¡Ô觷Ñé§ËÁ´\FTIR new\KHA.sp
D:\§Ò¹¡Ô觷Ñé§ËÁ´\§Ò¹ » â·\FT-IR citronellal\kankamon5604303001\(K)citronellal oil.sp
2013/8/21
2014/2/10
3414
2915 1728
1644
2978
17161640
1048
878
5001000150020002500300035004000
cm-1
02
04
06
08
01
00
12
01
40
%T
(a)
(b)
(a.)
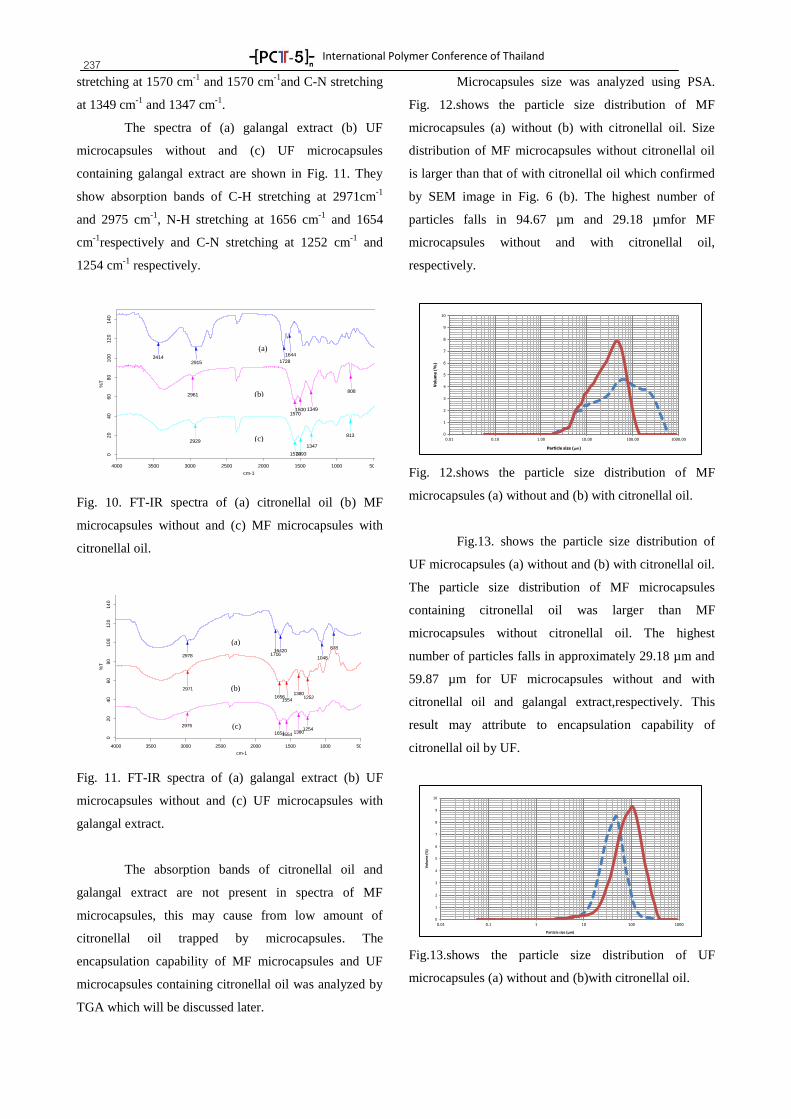
International Polymer Conference of Thailand
237
D:\§Ò¹¡Ô觷Ñé§ËÁ´\§Ò¹ » â·\FTIR ãËÁè\Mc citronella oil.sp
D:\§Ò¹¡Ô觷Ñé§ËÁ´\§Ò¹ » â·\FT-IR citronellal\kankamon5604303001\(K)MF+SDS7%.sp
D:\§Ò¹¡Ô觷Ñé§ËÁ´\§Ò¹ » â·\FT-IR citronellal\kankamon5604303001\(K)MF+oil 5ml.sp
2007/12/20
2014/2/10
2014/2/10
813
1347
14931570
2929
15701500 1349
2961808
1728
16443414
2915
5001000150020002500300035004000
cm-1
02
04
06
08
01
00
12
01
40
%T
stretching at 1570 cm-1
and 1570 cm-1
and C-N stretching
at 1349 cm-1
and 1347 cm-1
.
The spectra of (a) galangal extract (b) UF
microcapsules without and (c) UF microcapsules
containing galangal extract are shown in Fig. 11. They
show absorption bands of C-H stretching at 2971cm-1
and 2975 cm-1
, N-H stretching at 1656 cm-1
and 1654
cm-1
respectively and C-N stretching at 1252 cm-1
and
1254 cm-1
respectively.
Fig. 10. FT-IR spectra of (a) citronellal oil (b) MF
microcapsules without and (c) MF microcapsules with
citronellal oil.
Fig. 11. FT-IR spectra of (a) galangal extract (b) UF
microcapsules without and (c) UF microcapsules with
galangal extract.
The absorption bands of citronellal oil and
galangal extract are not present in spectra of MF
microcapsules, this may cause from low amount of
citronellal oil trapped by microcapsules. The
encapsulation capability of MF microcapsules and UF
microcapsules containing citronellal oil was analyzed by
TGA which will be discussed later.
Microcapsules size was analyzed using PSA.
Fig. 12.shows the particle size distribution of MF
microcapsules (a) without (b) with citronellal oil. Size
distribution of MF microcapsules without citronellal oil
is larger than that of with citronellal oil which confirmed
by SEM image in Fig. 6 (b). The highest number of
particles falls in 94.67 µm and 29.18 µmfor MF
microcapsules without and with citronellal oil,
respectively.
Fig. 12.shows the particle size distribution of MF
microcapsules (a) without and (b) with citronellal oil.
Fig.13. shows the particle size distribution of
UF microcapsules (a) without and (b) with citronellal oil.
The particle size distribution of MF microcapsules
containing citronellal oil was larger than MF
microcapsules without citronellal oil. The highest
number of particles falls in approximately 29.18 µm and
59.87 µm for UF microcapsules without and with
citronellal oil and galangal extract,respectively. This
result may attribute to encapsulation capability of
citronellal oil by UF.
Fig.13.shows the particle size distribution of UF
microcapsules (a) without and (b)with citronellal oil.
0
1
2
3
4
5
6
7
8
9
10
0.01 0.10 1.00 10.00 100.00 1000.00
Vo
lum
e (
%)
Particle size (µm)
0
1
2
3
4
5
6
7
8
9
10
0.01 0.1 1 10 100 1000
Vo
lum
e (
%)
Particle size (µm)
D:\§Ò¹¡Ô觷Ñé§ËÁ´\FTIR new\KHA.sp
D:\§Ò¹¡Ô觷Ñé§ËÁ´\Kingkii\Project king » µÃÕ\Kankamon 54\microcapsule+p5%-no sam.sp
D:\§Ò¹¡Ô觷Ñé§ËÁ´\Kingkii\Project king » µÃÕ\Kankamon 54\microcapsule+p5%+sam.sp
2013/8/21
2011/8/11
2011/8/11
165115541380
12542975
16561554
13801252
2971
2978 171616420
1048
878
5001000150020002500300035004000
cm-1
02
04
06
08
01
00
12
01
40
%T
(a)
(b)
(c)
(b)
(c)
(a)
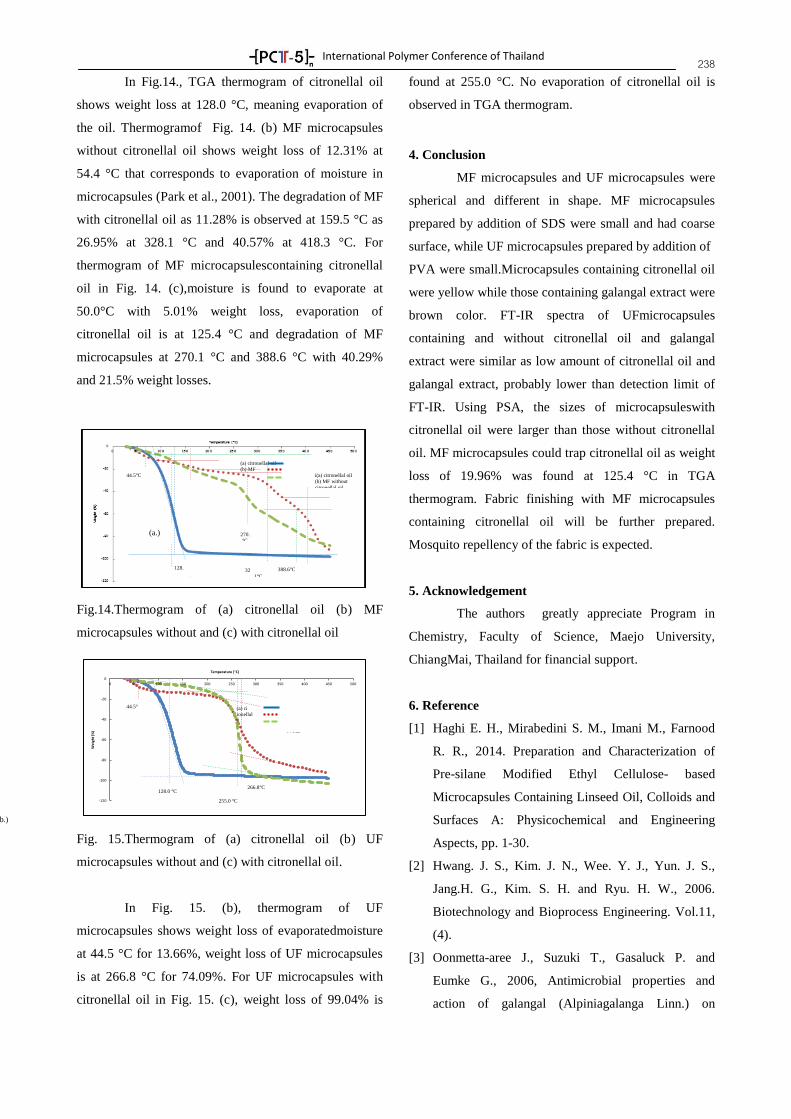
International Polymer Conference of Thailand
238 In Fig.14., TGA thermogram of citronellal oil
shows weight loss at 128.0 °C, meaning evaporation of
the oil. Thermogramof Fig. 14. (b) MF microcapsules
without citronellal oil shows weight loss of 12.31% at
54.4 °C that corresponds to evaporation of moisture in
microcapsules (Park et al., 2001). The degradation of MF
with citronellal oil as 11.28% is observed at 159.5 °C as
26.95% at 328.1 °C and 40.57% at 418.3 °C. For
thermogram of MF microcapsulescontaining citronellal
oil in Fig. 14. (c),moisture is found to evaporate at
50.0°C with 5.01% weight loss, evaporation of
citronellal oil is at 125.4 °C and degradation of MF
microcapsules at 270.1 °C and 388.6 °C with 40.29%
and 21.5% weight losses.
Fig.14.Thermogram of (a) citronellal oil (b) MF
microcapsules without and (c) with citronellal oil
Fig. 15.Thermogram of (a) citronellal oil (b) UF
microcapsules without and (c) with citronellal oil.
In Fig. 15. (b), thermogram of UF
microcapsules shows weight loss of evaporatedmoisture
at 44.5 °C for 13.66%, weight loss of UF microcapsules
is at 266.8 °C for 74.09%. For UF microcapsules with
citronellal oil in Fig. 15. (c), weight loss of 99.04% is
found at 255.0 °C. No evaporation of citronellal oil is
observed in TGA thermogram.
4. Conclusion
MF microcapsules and UF microcapsules were
spherical and different in shape. MF microcapsules
prepared by addition of SDS were small and had coarse
surface, while UF microcapsules prepared by addition of
PVA were small.Microcapsules containing citronellal oil
were yellow while those containing galangal extract were
brown color. FT-IR spectra of UFmicrocapsules
containing and without citronellal oil and galangal
extract were similar as low amount of citronellal oil and
galangal extract, probably lower than detection limit of
FT-IR. Using PSA, the sizes of microcapsuleswith
citronellal oil were larger than those without citronellal
oil. MF microcapsules could trap citronellal oil as weight
loss of 19.96% was found at 125.4 °C in TGA
thermogram. Fabric finishing with MF microcapsules
containing citronellal oil will be further prepared.
Mosquito repellency of the fabric is expected.
5. Acknowledgement
The authors greatly appreciate Program in
Chemistry, Faculty of Science, Maejo University,
ChiangMai, Thailand for financial support.
6. Reference
[1] Haghi E. H., Mirabedini S. M., Imani M., Farnood
R. R., 2014. Preparation and Characterization of
Pre-silane Modified Ethyl Cellulose- based
Microcapsules Containing Linseed Oil, Colloids and
Surfaces A: Physicochemical and Engineering
Aspects, pp. 1-30.
[2] Hwang. J. S., Kim. J. N., Wee. Y. J., Yun. J. S.,
Jang.H. G., Kim. S. H. and Ryu. H. W., 2006.
Biotechnology and Bioprocess Engineering. Vol.11,
(4).
[3] Oonmetta-aree J., Suzuki T., Gasaluck P. and
Eumke G., 2006, Antimicrobial properties and
action of galangal (Alpiniagalanga Linn.) on
(a) citronellal oil (b) MF
i(a) citronellal oil (b) MF without
citronellal oil (c) MF with
citronellal oil i54.4°C
F159.5°C
t125.4°C
270.1°C
o128.0 °C
i328.1°C
l388.6°C
418.3°C
-120
-100
-80
-60
-40
-20
0
0 50 100 150 200 250 300 350 400 450 500
We
igh
t (%
)
Temperature (°C)
(a) ci
ronellal
il
b) UF witho
t citronellal oil (c) UF with citronellal oil
(a)
(b)
(b.)
(
a
)
c
i
t
r
o
n
e
l
l
a
l
o
i
l (
b
)
U
F
w
i
t
h
o
u
t
c
i
t
r
o
n
e
l
l
a
l
o
i
l (
c
)
U
F
w
i
t
h
c
i
t
r
o
n
e
l
l
a
l
o
i
l 1128.0 °C
5266.8°C
9255.0 °C
.T2
(b.)
44.5°C
32
.1°C
128.
°C 4
1
8
.
3 (
b
)
U
F
w
i
t
h
o
u
t
c
i
t
r
o
n
e
l
l
a
l
o
i
l (
c
)
U
F
w
i
t
h
c
i
t
r
o
n
e
l
l
a
l
o
i
l °C
270.
°C
388.6°C
(a.) °C
44.5°
T2 128.0 °C
266.8°C
255.0 °C
(a.)
International Polymer Conference of Thailand
239 Staphylococcus aureus, LWT-Food Science and
Technology, vol. 39, pp.1214-1220.
[4] Park J. S., Shin S. Y., and Lee R. J., 2001,
Preparation and characterization of microcapsules
containing lemon oil, Colloid and Interface Science,
vol 241, pp. 502-508.
[5] Umer H., Nigam H., Tamboli M. A., Nainar M. S.
M., 2011. Microencapsulation: Process, Techiques
and Applications, Pharmaceutical and Biomedical
Sciences, vol 2, pp. 474-481.
[6] Yuan L., Liang G., Xie Q. J., Li L. and Guo J., 2006,
Preparation and characterization of poly(urea-
formaldehyde) microcapsules filled with epoxy
resins, Polymer, vol. 47, pp. 5338-5349.
[7] Zhang H., Wang X., 2009, Fabrication and
performances of microencapsulated phase change
materials based on n-octadecane core and resorcinol-
modified melamine–formaldehyde shell, Colloids
and Surfaces A: Physicochemical and Engineering
Aspects, vol. 332, p. 129-138.
SESSION 7Advances in Polymer Processing
Polymer Research in Industry Sector
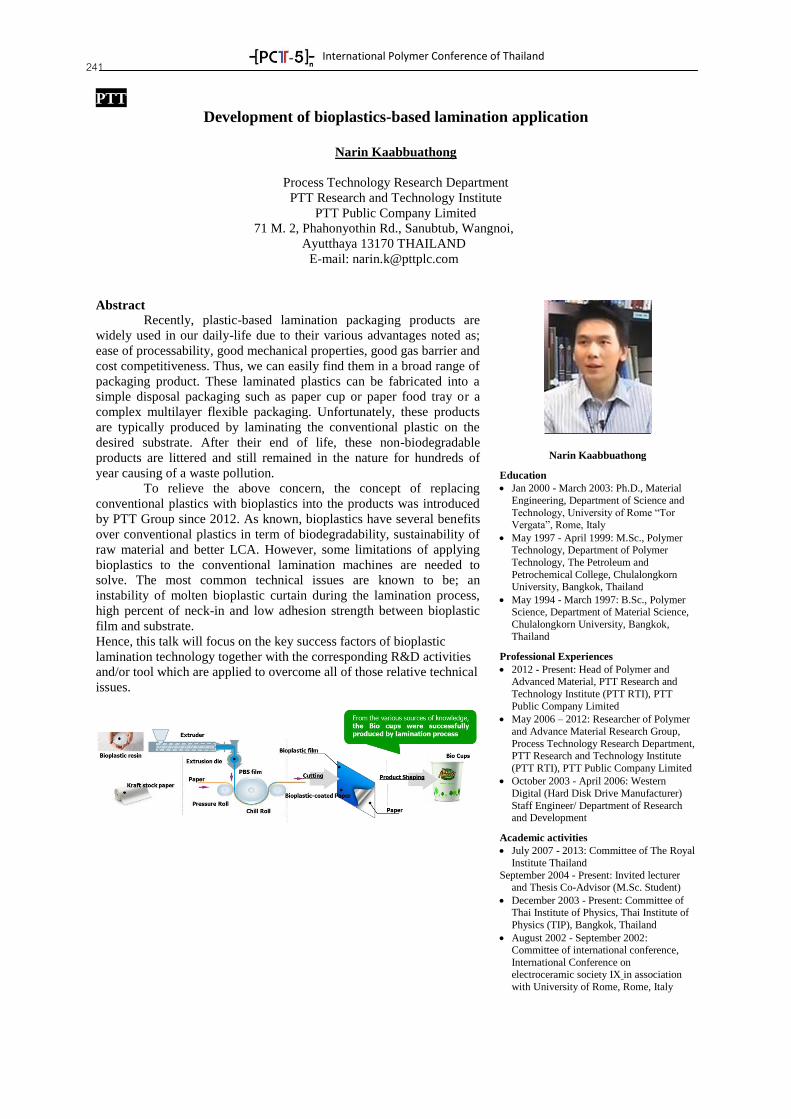
International Polymer Conference of Thailand
241
PTT
Development of bioplastics-based lamination application
Narin Kaabbuathong
Process Technology Research Department
PTT Research and Technology Institute
PTT Public Company Limited
71 M. 2, Phahonyothin Rd., Sanubtub, Wangnoi,
Ayutthaya 13170 THAILAND
E-mail: [email protected]
Abstract
Recently, plastic-based lamination packaging products are
widely used in our daily-life due to their various advantages noted as;
ease of processability, good mechanical properties, good gas barrier and
cost competitiveness. Thus, we can easily find them in a broad range of
packaging product. These laminated plastics can be fabricated into a
simple disposal packaging such as paper cup or paper food tray or a
complex multilayer flexible packaging. Unfortunately, these products
are typically produced by laminating the conventional plastic on the
desired substrate. After their end of life, these non-biodegradable
products are littered and still remained in the nature for hundreds of
year causing of a waste pollution.
To relieve the above concern, the concept of replacing
conventional plastics with bioplastics into the products was introduced
by PTT Group since 2012. As known, bioplastics have several benefits
over conventional plastics in term of biodegradability, sustainability of
raw material and better LCA. However, some limitations of applying
bioplastics to the conventional lamination machines are needed to
solve. The most common technical issues are known to be; an
instability of molten bioplastic curtain during the lamination process,
high percent of neck-in and low adhesion strength between bioplastic
film and substrate.
Hence, this talk will focus on the key success factors of bioplastic
lamination technology together with the corresponding R&D activities
and/or tool which are applied to overcome all of those relative technical
issues.
Narin Kaabbuathong
Education
Jan 2000 - March 2003: Ph.D., Material
Engineering, Department of Science and
Technology, University of Rome “Tor Vergata”, Rome, Italy
May 1997 - April 1999: M.Sc., Polymer Technology, Department of Polymer
Technology, The Petroleum and
Petrochemical College, Chulalongkorn University, Bangkok, Thailand
May 1994 - March 1997: B.Sc., Polymer Science, Department of Material Science,
Chulalongkorn University, Bangkok,
Thailand
Professional Experiences
2012 - Present: Head of Polymer and Advanced Material, PTT Research and
Technology Institute (PTT RTI), PTT
Public Company Limited
May 2006 – 2012: Researcher of Polymer
and Advance Material Research Group,
Process Technology Research Department, PTT Research and Technology Institute
(PTT RTI), PTT Public Company Limited
October 2003 - April 2006: Western
Digital (Hard Disk Drive Manufacturer)
Staff Engineer/ Department of Research and Development
Academic activities
July 2007 - 2013: Committee of The Royal
Institute Thailand
September 2004 - Present: Invited lecturer and Thesis Co-Advisor (M.Sc. Student)
December 2003 - Present: Committee of Thai Institute of Physics, Thai Institute of
Physics (TIP), Bangkok, Thailand
August 2002 - September 2002: Committee of international conference,
International Conference on electroceramic society IX in association
with University of Rome, Rome, Italy
International Polymer Conference of Thailand
242
PTTGC
From Bioscience to Polymer Science: Our Sustainable Prospects
Sukhgij Ysothonsreekul
Vice President for Scientific Research, Science and Innovation, PTT Global Chemical
PTT Global Chemical Public Company Limited
Abstract
It is indisputable that Thailand harbors abundant agricultural
resources waiting to be converted to precious molecules to
further chemically modified for polymer technology. PTT
Global Chemical Plc. (“PTTGC”) envisions such advantage
situation of Thailand, we have set path of our future and
sustainable growths, especially the polymer products, through
the integrated technology of biological science, chemistry,
and polymer science. Utilizing sustainable biomass combined
with the cutting-edge technology, PTTGC has moved forward
to become a leader in biopolymer business and confirmed to
create a sustainable future.
From molecular biology to genetically modified microbes,
fermentation technology to produce biomolecules of interest,
and chemical modification, to polymer science, our scientists
dedicated to produce novel/ high specialty materials to be
further used in variety of product applications. Not only the
Bio-based products such as proteins, carbohydrates,
polyunsaturated fatty acids, but also the chemical building
blocks such as succinic acid, lactic acid, muconic acid, adipic
acid, and ethanol can be produced via biotechnological route.
Through our acquired the US-based biotechnology company,
Myriant, and lessons-learned from the commercial scale
production of bio-succinic acid, PTTGC has become a front-
runner in committing to produce products in green business.
We have moved towards the using of our abundant biomass
available in Thailand as feedstock in the fermentation process
by the genetically engineered microbes from Myriant’s
sophisticated technology. A novel development of microbial
system should enable us to convert sugars contained in the
biomass into high value, high purity renewable chemicals
efficiently at commercial scale. Moreover, PTTGC has
enhanced our sustainability by using renewable bio-based
chemicals as monomers to produce biodegradable plastics and
high value specialty materials. Our research focused on
polymerization, compounding, and processing enables us to
produce biomaterials and bioplastics for film application, and
the future possibilities abound. With sustainability and social
responsibility mindsets, it is our commitment to be frontier in
utilization of our abundant agricultural biomass to produce
the environmental friendly products for society.
Ph.D. (Biochemistry) Kansas State University
Academic Positions:
1999-2003 Assistant Research Professor, University of
California, San Diego, USA 2004-2005 Associate Research Professor, University of
California, San Diego, USA
2006-2013 Associate Professor in Biochemistry, Naresuan University
2008-present Adjunct Professor, Graduate School of
Biomedical Sciences, University of North Texas Health Science Center, Fort Worth, Texas, USA
2011-present Invited Professor, University of Franche-
Comte, Besancon, France
Administrative Positions:
2006-2009 Associate Dean for Research and Graduate
Studies, Faculty of Medical Science, Naresuan University, Phitsanulok, Thailand
2006-2009 Director of Center for Forensic Sciences,
Faculty of Medical Science, Naresuan University, Phitsanulok, Thailand
2008-present Member of the Forensic Science Research
Board, Central Institute of Forensic Sciences, Ministry of Justice, Thailand
2008-present Genetic Specialist to Forensic Genetic
Laboratory, Royal Police Department 2010-2012 Vice President for Research and External
Relations, Naresuan University, Phitsanulok, Thailand
2010-2012 Chairman of Naresuan University Research Development Board
2010-2012 President of Toastmaster Club of Naresuan
University 2010-2013 Chairman of Naresuan University
International Development Board
2010-2013 Member of Naresuan University Human Resource Management Board
2010-2013 Member of Naresuan University
International College Board 2012-2013 Vice President for International Affairs,
Naresuan University, Phitsanulok, Thailand
2012-2013 Advisor to Naresuan University Research
Development Board
2012-2013 Advisor to Logistic and Supply Chain Curriculum Development, Naresuan University for the
Office of Higher Education Commission
2013-present Vice President for Scientific Research, Science and Innovation, PTT Global Chemical
International Polymer Conference of Thailand
243
AGILENT
Optical characterization of thin films using a new Universal Measurement Accessory
Heng Soo Chin
Applications Engineer, Agilent Technologies, Inc.
Abstract
Traditional approaches to thin film characterization have relied
on a single angle or a small set of angles, often measured with relative
reflectance accessories. This left thin film designers the task of
correcting results to absolute values or extrapolating data from a limited
angular set out to the angles of interest to estimate thin film response.
Also, the limited or lack of transmission data has resulted in
assumptions being made about the end product. The fine angular
control and automation of the new approach enable research to capture
both absolute reflectance and transmission at the designed angle,
removing the guess work and allowing for precise and detailed
validation of thin film designs.
Heng Soo Chin
Ms. Heng Soo Chin is currently an
Applications Chemist for Molecular
Spectroscopy with Agilent
Technologies, Singapore, covering
Singapore and ASEAN regions. She
addresses applications for FTIR
Spectroscopy, FTIR Microscopy, UV-
Vis, and UV-Vis-NIR systems. She
holds a BSc (Hons) in Chemistry and
MSc in Advanced Chemical
Engineering from Imperial College,
London. Prior to Agilent, Soo Chin
gained R&D experience in the aerospace
industry and technical experience from
the analytical industry.
International Polymer Conference of Thailand
244
SCG
High Performance Composites for Industry
Nopphawan Phonthammachai
Composite Research, R&D Center, SCG Chemicals Co., Ltd
10-I1 Road, Map Ta Phut Industrial Estate, Muang District
Rayong 21150, Thailand
Tel: +66 3891 2826, Fax: +66 3868 4676, Email: [email protected]
Abstract
Due to the tailor-made properties of composite materials, they
have been paid attentions by industries for advanced and innovative
product development satisfying customer’s requirements and global
trend. Examples on the replacement of steel and conventional materials
by composite have been shown more and more from aerospace to
automotive, infrastructure until electronic and consumer products;
driving the trend of composite development toward more specific
properties. With these movements, the concerns on processability, cost,
and relevant certified tests of composite materials have also been
raised.
Nopphawan Phonthammachai
Education 2001-2005: Doctor of Philosophy in
Polymer Science, The Petroleum and
Petrochemical College, Chulalongkorn University, Bangkok, Thailand in academic
partnership with Case Western Reserve
University, US 1997-2001: Bachelor of Science in
Chemistry, Naresuan University,
Phitsanulok, Thailand
Professional Experiences
2012 – Present: Senior Researcher Head
of Composite Research Group, SCG Chemicals, Thailand
2008 –2012: Scientist at Institute of
Materials Research and Engineering, Singapore
2005- 2008: Research Fellow at School
of Material Science and Engineering, Nanyang Technological University,
Singapore
Research Interest
1. Designing and tailoring the properties
of active nano-fillers for polymer-based composites
2. Development of low-cost, convenience
and effective methods to produce nano-fillers and composites
3. Surface modification and interfacial
study of nano-fillers and composites 4. Characterizations of nano-fillers and
composites
5. Correlated study between composition, process and property of composite
materials (deformation/failure mechanism,
interfacial interaction, screw design and processing condition, specific property)
6. Applications of composite materials
Awards and Honors
2004: Research Scholarship Award at the
Department of Macromoleular Science, Case Western Reserve University, Ohio,
USA
2004: The Outstanding Student Award of Chulalongkorn University
2001: Royal Golden Jubilee Scholarship
from Thai Research Found 2000: Research Scholarship Award at the
Department of Chemical Engineering,
University of Melbourne, Australia
International Polymer Conference of Thailand
245
SYNCHROTRONS
Synchrotron Light for innovative polymer
Prae Chirawatkul
Beamline Scientist
I have got a Ph.D. in Physics from the University of Bath, UK. I
started working at the Synchrotron Light Research Institute, SLRI, Thailand, in
2011. Between 2013-2014, I was working as a post-doctoral researcher for the
9A-USAXS (Ultra small angle x-ray scattering) beamline at the Pohang
Accelerator Laboratory (PAL), South Korea. Now I am a beamline scientist at
the SAXS (small angle x-ray scattering) beamline at the SLRI. Together with
the SAXS team, we provide technical support to our users. We help users to
plan their experiments and help them to familiarize themselves with the control
software and measurement protocols in the experimental station. My area of
interest is beamline instrumentation. I am also leading a project to construct a
new beamline which supports wide angle x-ray scattering technique in a
grazing incidence geometry and a coupling measurement between x-ray
absorption and x-ray scattering techniques.
Wanwisa Limphirat
(Pattanasiriwisawa)
Phone: +66-44-217 040
ext. 1480
Fax: +66-44-217 047
Address
Synchrotron Light Research Institute (Public Organization),
111 University Avenue, Muaeng, Nakhon Ratchasima 30000, Thailand
Education
1995-1998 Bachelor of Science (1st class honor), Kasetsart University,
Bangkok, Thailand
1999-2004 Doctor of Philosophy (Physics),
Suranaree University of Technology, Nakhon Ratchasima, Thailand
Research Interests
X-ray Imaging, X-ray Absorption Spectroscopy (XAS), Infrared
Microspectroscopy
Professional Experience
2005-present Researcher: Synchrotron Light Research Institute (SLRI),
Nakhon Ratchasima, Thailand
2010-2011 Beamline Manager (Beamline IR): Synchrotron Light Research
Institute (SLRI), Nakhon Ratchasima, Thailand
2008 Visiting Scholar: SOLEIL Synchrotron, Gis sur Yvette C_edex, France,
September 2008
2007 Visiting Scholar: High Energy Accelerator Organization (KEK),
Tsukuba, Ibaraki, Japan, 10-16 May 2007
2000-2002 Research Assistant: High Energy Accelerator Organization (KEK),
Tsukuba, Ibaraki, Japan
Scholarships/Award
1996-1999 Recipient of the Development and Promotion of Science and
Technology Talents Project (DPST) from The Institute for the Promotion of
Teaching Science and Technology
2000-2004 Recipient of the Royal Golden Jubilee (RGJ) scholarship from the
Thailand Research Found
2002 Recipient of the AIEJ scholarship from the Association of International
Education, Japan
1999 Recipient of Professor Dr. Tab award
1996-1998 Recipient of Kasetsart outstanding academic performance award
(every year)

SESSION 8Advances in Polymer Processing
Instruments session
International Polymer Conference of Thailand 247
Bara Scientific Co. Ltd. AXIS SUPRA, Cutting edge XPS technology for Polymer
Tan Teck Beng Assistant Sales Manager, Shimadzu Asia Pacific Pte Ltd
Abstract
Polymer characterization is done with most
of the basic techniques such as FTIR, GCMS or
many instruments. Especially polymers find usages
on to many fields especially coatings & coatings
with very thin films are always challenge to
characterize.
X-ray Photoelectron Spectroscopy (XPS)
is the most powerful technique for chemical
compound analysis on material surface. Polymers
are insulating materials & getting them analyzed
with good charg-neutralizer is key to obtain great
significant, dependable data. AXIS SUPRA is a
newly designed cutting edge technology from
KRATOS ANALYTICAL gives superb signal and
resolution on Polymer materials.
Tan Teck Beng
Assistant Sales Manager
Shimadzu Asia Pacific Pte Ltd
Tan Teck Beng is the Application Specialist in Shimadzu Asia
Pacific for XRF, XRD, ICP, SEM, SPM and ESCA. He has conducted Application Seminars and Workshops on RoHS at
Panasonic, Sharp, Sony, Pioneer, National Metal and Technology
Center (Thailand), Intertek (Hong Kong) and Hong Kong PSB. The countries where he has conducted Shimadzu RoHS Seminars
include Malaysia, Indonesia, Thailand, India, Philippines and
Singapore. Shimadzu is currently providing Application and Technical Support for their EDX for RoHS Screening to some 200
companies in Asia Pacific Region. He has an MSc in Materials
Science from National University of Singapore.
International Polymer Conference of Thailand 248
Crest Nanosolution (Thailand) Ltd.
Simultaneous Measurement of Thermogravimetric Differential Thermal Analysis and
Photoionisation Mass Spectrometry Complexed Through Unique Skimmer Interface System,
TG-DTA-PIMS
Tadashi Arii1 and Taisuke Yoshiki
2*
1 SBU-TA, Thermal Analysis Division, Rigaku Corporation, Tokyo 196-8666, Japan
2 X-ray Diffractometer & Thermal Analyzer, Rigaku Asia and Pacific Limited, Pathumthani 12130, Thailand
Phone +81-3-3479-0618, Fax +81-3-3479-6112, *E-Mail: [email protected]
Abstract
Although thermal analysis has wide range applications to understand
thermophysical and chemical changes at a macro-molecular level, it is necessary to
perform complex measurements such as hyphenated methodology combined with other spectroscopic methods to obtain specific micro-molecular information on reaction
products. Nowadays, one of the powerful complex techniques is well known as TG-DTA-
MS, which is a simultaneous measurement technique composed of thermogravimetric differential thermal analysis (TG-DTA) combined with mass spectrometry (MS) through
an interface system. It is suitable for the qualitative analysis of the different gases evolved
in response to heating a polymeric material in TG-DTA process. This presentation aims to
propose a novel thermoanalystical method that integrates a “skimmer-type interface” and
a “photoionization method”, in order to overcome the essential problems and the
limitations of conventional TG-DTA-MS. The traditional style of interface system in TG-DTA-MS employs a capillary
type which consists of a relatively long narrow tube (about 2m length) connecting both
devices, and it adopts the principle that the injection tube is maintained at a constant
temperature (< 300℃). The keeping temperature of the interface is determined by
considering re-condensation and transformation of the injected gases as well as the user’s safety. The gaseous products re-condense within the interface and are trapped internally if
the boiling points of the gasification products exceed the interface temperature, adversely
if the interface temperature is too high the gasification products cause the gas transformation due to secondary reactions between the activated pyrolysates, which often
interferes with the measurement results especially in the degradation analysis of
polymers. The proposed skimmer type interface consists of two concentric ceramic tubes
with orifices of the different diameters located into the furnace of the TG-DTA.[1] The
interface connects directly the two devices, one at atmospheric pressure of the sample in the TG-DTA and the other at high vacuum MS chamber. The sample position and two
orifices of skimmer interface as well as the MS ion source are arranged in a straight line.
The gas injection port of the skimmer interface is located in close proximity to the sample and is thermally programmed under the same environment up to maximum operation
temperature of the instrument. In this way, high-precision gas analysis becomes
fundamentally possible because the interface length is negligibly minimized. In the conventional MS, although a gaseous molecule is ionized by colliding with
an accelerated electron by the electron ionization (EI) method of 70eV, a part of the
generated molecule ion further decomposes, and consequently the molecule ion is observed simultaneously with the fragmented ions. The analyses of multiple complex
gases formed by the pyrolysis of polymeric materials using conventional TG-DTA-
(EI)MS become more difficult because many kinds of pyrolysates evolve simultaneously or continuously during heating. This means that the fragment ions generated as a result of
the higher ionization potential of EI often obstruct the identification of the gases formed
by heating process. In order to overcome such complex evolved gas analysis, one feasible approach is the use of a selective and soft fragment-less ionization method.
Single-photon ionization with a vacuum ultraviolet (VUV) light source with the
ionization potential of 10.2eV is a particularly soft and selective ionization method, suited well for detection of both aromatic and aliphatic organic species. The photoinization (PI)
is the simplest electron transfer reaction induced by photoabsorption. Consequently,
because only molecular (parent) ions of the gases are observed in the resulting fragment-less mass spectrum, it is possible to directly differentiate multiple gases evolved by using
the discrete information on their molecular ions.[2] With above-mentioned potential advantages, use of both of the skimmer type
interface and the PI method for the TG-DTA-MS analysis greatly enhances instrument
adaptability to broader classes of organic compounds including polymer resins and the features permit a better understanding of the thermal behavior and precise pyrolysates of
polymers. To demonstrate the effectiveness of the technique, the results of its application
to the TG-DTA-MS analysis of typical polymeric materials are presented with the direct characterization of polymer degradation products by focusing on the minute structural
difference between the samples.
References
[1] T. Arii J. Mass Spectrom. Soc. Jpn, 53, 211-216 (2005)
[2] T. Arii and S. Otake, J. Therm. Anal. Cal., 91, 419-426 (2008)
Tadashi Arii
Education:
1984 March B.E. in Chemistry,
Department of Materials Science and
Technology, Nagaoka University of Technology.
1997 March Ph.D. in Chemistry,
Department of Energy and Environment Science, Nagaoka University of Technology.
Awards:
2007 Research Award of the Mass
Spectrometry Society of Japan
Experience:
1984-Present Thermal Analysis Division, Rigaku corporation
Been in charge of Strategic Business
Unit Manager
Skills:
Thermal Analysis, Mass Spectrometry
International Polymer Conference of Thailand 249
JAIMA. Introduction of JAIMA and Investigation Project
for Analytical Instruments Related Industries
Goto Ryozo Japan Analytical Instruments Manufactures’ Association
Abstract JAIMA (Japan Analytical Instruments
Manufactures’ Association) consists of analytical
instruments related companies. JAIMA was founded
with 18 members in 1960, and now around 200
companies join the association at present.
Our menbers separated 2 group , one of A
(made and developed in Japan) and other B ( not
made in Japan but sale in Japan). Various
committees are organized within JAIMA to respond
to several requests from outside, and to submit the
advice and action proposals to the board of directors.
One of most important activity for JAIMA
is to held “JASIS”. JASIS is one of the Largest
Exhibitions in Asia for Analytical and Scientific
Instruments. JAIMA held JASIS every year (on
September, Makuhari near Tokyo). Now we research
“ the way of systematic human resource
development for Instrumental Analysis and
Analytical Science in ASEAN “ Today I introduce
our An organization and activity.
Graduate the HIROSHIMA University.
The doctor's degree (engineering section) is given.
The winners Prize in the Ion-Chromatography
technology (2009)
Received the Technical Lifetime for FIA
Achievement Award(2013)
Adviser for Technical Affairs Committee ,JAIMA
Research field: Ion Chromatography,
Electrochemical Analysis , Environmental Analysis ,
etc.
E-mail : [email protected]
SM Chemical
Abstract
Size exclusion chromatography (SEC) is a convenient and
reproducible method to analyze and determine relative molecular mass
and molecular mass distribution of polymers. It is widely used for R&D
and QC in polymer industry. We, Tosoh Corporation have a long
history to develop SEC columns and equipment since 40 years ago and
have been perusing high-throughput, reproducible and easy-to-use SEC
system. One of the key factor for especially high-throughput is column
technology and we developed polystyrene/divinylbenzene packing
materials with 3 micron as particle size and packed in semi-micro
columns (4.6 mm I.D. x 15 cm) few years ago. The columns achieved
high-throughput analysis for half measurement time of conventional
column (30 cm length) with the same or better resolution. Recently we
employed multi-pore size distribution technology on
polystyrene/divinylbenzene packing materials with 3 - 6 micron as
particle size and packed in semi-micro columns (4.6 mm I.D. x 15 cm)
and commercialized under the brand name of TSKgel
SuperMultiporeHZ columns. This newly employed technology enables
wide separation range of polystyrene calibration curves in
tetrahydrofuran with good linearity on identical packing materials and
no distortion on the chromatograms which are sometimes observed as
mixed-bed type columns or series of individual columns are used.
Using this column reproducible SEC was achieved in addition to high-
throughput and high resolution results.
Ivan Lim
Ivan Lim is the Regional Sales
Executive in Tosoh Asia (Bioscience
Separation Division). Tosoh is the leader in the development and production of gel
permeation chromatography system and
columns that are used extensively for analysis of polymers. Ivan was graduated with
Bachelor Degree in Applied Science
(Industrial Chemistry) from University of Science Malaysia and has been in the
chemical industry for 6 years in various
capacities. Currently, he is in charge of the chromatography product sales in Thailand,
India, Singapore, Malaysia, Indonesia,
Australia and Vietnam.
International Polymer Conference of Thailand 250
Chiang Mai University Research
Research Laboratory for the Production of High Quality Resorbable Polymers,
Chiang Mai University
Winita Punyodom
1*, Robert Molloy
1,2, Puttinan Meepowpan
1, Kanarat Nalampang
1, Runglawan Sonsunan
1,
Kiattikhun Manokruang1, Patnarin Worajittiphon
1, Nawee Kungwan
1, Wathuka Booncharoen
1, Donraporn
Daranarong1, Wootichai Khotasen
1, Vivan Thammongkol
3,
Narin Kaabbuathong3, Tuspon Thanpitcha
3, Chaiyapruk Katepetch
3
1
Polymer Research Laboratory, Department of Chemistry, Faculty of Science,
Chiang Mai University, Chiang Mai, 50200 2
Materials Science Research Center, Faculty of Science, Chiang Mai University, Chiang Mai, 50200 3PTT Research and Technology Institute, Wang Noi, Ayutthaya 13170, Thailand
Phone: +66-5394-3345, Fax : +66-5389-2277, *E-mail: [email protected]
Abstract
Bioplastics industry in Thailand can be regarded as the country’s
new-wave business due to the fact that there has not yet been the full-
cycle supporting the industry and the products have not been distributed
widely in the market. Chiang Mai University’s innovation aims to utilize
Thailand’s abundant raw materials to strengthen the country’s Bioplastics
industry in order to become a leader in the region. This research work can
be divided into 3 main areas, namely: (1) polymers for use in biomedical
applications, (2) polymers for environmental applications, and (3) novel
initiators/catalysts for the controlled ring-opening polymerization (ROP)
of cyclic esters. The polymers that are featured in this work are, for the
most part, what can be termed as “specialty polymers” which have been
purpose-designed to meet the specific requirements of various
applications. As such, they are value-added materials which, if they can
be commercialized, will reduce the country’s dependency on expensive
imported products. In its wider context, this research is aimed at
developing new materials for which there is a definite need in Thai
society and at an affordable cost. In the case of specialty polymers such
as these, their added value (as compared to commodity plastics) comes
mainly from the technological know-how involved in producing them
rather than from the cost of the materials themselves. This know-how is
gradually being developed through a combination of pure and applied
research together with close collaborations with end-users and industry.
Keywords: Specialty polymers; Bioplastics; Biomedical Applications;
High Quality Resorbable Polymers
Winita Punyodom
Education
1996-2000 PhD (Polymer Physics) IRC in
Polymer Science and Technology,
University of Leeds, Leeds, United
Kingdom 1990-1994 M.S. (Chemistry)
Chiang Mai University, Chiang Mai,
Thailand 1986-1990 B.S. (Chemistry)
Chiang Mai University, Chiang Mai,
Thailand
Fields of speciallization
• Polymer Chemistry
• Polymer Synthesis, Characterisations and
Testing
• Biodegradable Polymers for Use in
Biomedical Applications and as Bioplastics
List of Sponsors and Exhibitors
Gold Sponsors BASF (Thai) Limited SCG Chemicals CO., LTD. PTT Global Chemical Public Company Limited
Silver Sponsors Thailand Convention and Exhibition Bureau (TCEB)
Bronze Sponsors Bruker Biospin AG
Exhibitors Agilent Technologies (Thailand) Ltd. Bara Scientific Co., Ltd. Coax Group Corporation Ltd. Crest Nanosolution (Thailand) Limited HORIBA (Thailand) Limited LMS Instruments Co., Ltd. RI Technologies Ltd. SM Chemical Supplies Co., Ltd. Ulvac (Thailand) Ltd. Japan Analytical Instruments Manufacturers' Association (JAIMA) Chiang Mai University- Research Laboratory for the Production of High Quality Resorbable Polymers Synchrotron Light Research Institute
SPONSORS
Proceeding Publication
The proceeding for PCT-5 is published online, and can be downloaded from
Polymer Society of Thailand website:
http://www.thaipolymersociety.org/pst/
Polymer Society of Thailand
The Polymer Society of Thailand was founded on 15 November 1999 by a group of Polymers scientists
who realized the increasing importance of the rapidly growing local petrochemical and polymer industries.
Furthermore, with also the increasing of the number of polymer scientists and polymer degree courses to
support the rising needs of human resources of the industries, it was thought that the Thai Polymer
community would need a center for connecting different sectors in order to bring about effective
development of the Thai petrochemical and polymer industries. Thus, the Polymer Club was established in
1991 and was later changed to the Polymer Society of Thailand in 1999.
Objectives: 1. To be a focal point for
- coordinating collaborations among polymer scientists and interested persons or groups in both the
government and industrial sectors.
- disseminating information and news related to polymer activities in Thailand.
- representing the Thai polymer community in coordinating with relevant organizations domestically and
internationally.
2. To promote the development of polymer science, technology and engineering in Thailand to international
level.
Collaboration: -Memorandum of Collaboration Agreement with The Japan Society of Polymer Processing (JSPP)
-Member of Pacific Polymer Federation (PPF)
-Member of the Federation of Asian Polymer Societies (FAPS)
-Member of The International Rubber Conference Organization (IRCO)
Address:
73/1 room 416 NSTDA Building
Ministry of Science and Technology
Rama 6 Rd. Rajdathevi, Bangkok, THAILAND 10400
Email:
Copyright © 2022 FDOKUMEN