Advanced polymer membrane development in pervaporation ...
227
UCC Library and UCC researchers have made this item openly available. Please let us know how this has helped you. Thanks! Title Advanced polymer membrane development in pervaporation dehydration and lateral flow diagnostics Author(s) Flynn, Eoin J. Publication date 2013 Original citation Flynn, E. J. 2013. Advanced polymer membrane development in pervaporation dehydration and lateral flow diagnostics. PhD Thesis, University College Cork. Type of publication Doctoral thesis Rights © 2013, Eoin J. Flynn. http://creativecommons.org/licenses/by-nc-nd/3.0/ Embargo information No embargo required Item downloaded from http://hdl.handle.net/10468/1288 Downloaded on 2022-07-12T08:16:04Z
-
Upload
khangminh22 -
Category
Documents
-
view
0 -
download
0
Transcript of Advanced polymer membrane development in pervaporation ...

UCC Library and UCC researchers have made this item openly available.Please let us know how this has helped you. Thanks!
Title Advanced polymer membrane development in pervaporationdehydration and lateral flow diagnostics
Author(s) Flynn, Eoin J.
Publication date 2013
Original citation Flynn, E. J. 2013. Advanced polymer membrane development inpervaporation dehydration and lateral flow diagnostics. PhD Thesis,University College Cork.
Type of publication Doctoral thesis
Rights © 2013, Eoin J. Flynn.http://creativecommons.org/licenses/by-nc-nd/3.0/
Embargo information No embargo required
Item downloadedfrom
http://hdl.handle.net/10468/1288
Downloaded on 2022-07-12T08:16:04Z

Advanced Polymer Membrane Development in
Pervaporation Dehydration and Lateral Flow
Diagnostics
Eoin Flynn B.Sc. (Hons), PGDip. Sc.
Chemistry Department, University College Cork, Cork, Ireland
Environmental Research Institute, University College Cork, Lee Road, Cork, Ireland
Thesis presented to the national university of Ireland
for the degree of Doctor of Philosophy
June 2013
Work carried out under the supervision of
Prof. Michael A. Morris

1
Table of Contents
Table of Contents ................................................................................................. 1
List of Figures ...................................................................................................... 8
List of Tables ...................................................................................................... 14
List of Abbreviations ......................................................................................... 17
General Abbreviations ......................................................................... 17
Section 1.2 Abbreviations .................................................................... 17
Declaration ......................................................................................................... 19
Acknowledgements ............................................................................................ 20
List of Published Material ................................................................................. 23
Abstract .............................................................................................................. 24
1. Introduction ................................................................................................... 26
1.1. Membrane Processes: Pervaporation, Lateral Flow ................................. 30
1.1.1. Pervaporation .......................................................................... 30
Azeotropes .................................................................................. 31
Industry Overview ...................................................................... 33
1.1.2 Lateral Flow Diagnostics ......................................................... 34
Industry Overview ...................................................................... 35
1.2 Membrane Transport Theory .................................................................. 36
1.2.1 Solution-Diffusion ................................................................... 37
Proof of Solution-Diffusion Theory ............................................ 38
1.2.2 Lateral-Flow Theory ................................................................ 43

2
1.3 Membrane Structure & Formation .......................................................... 45
1.3.1 Pervaporation Membrane Categorisation ................................. 46
Polymeric membranes ................................................................. 46
Inorganic Membranes ................................................................. 48
Mixed Matrix Membranes (MMMs) ........................................... 49
1.3.2 Pervaporation Membrane Formation ........................................ 49
Support ....................................................................................... 49
Selective Layer Casting .............................................................. 49
1.3.3 Pervaporation Membranes: Structural Effects & Anomalies ..... 50
Skin Layers ................................................................................. 50
Plasticization............................................................................... 50
Crosslinking................................................................................ 51
Polymer Hydrophilicity/Hydrophobicity ..................................... 51
Glass Transition Temperature ..................................................... 52
Membrane Polymer Matrix Relaxation........................................ 53
1.4 Lateral-Flow Membrane Structure and Formation .................................. 54
1.4.1 Lateral-Flow Membrane Categorisation ................................... 54
Cellulose Nitrate ......................................................................... 54
1.4.2 Lateral-Flow Membrane Formation ......................................... 55
Support ....................................................................................... 55
Phase Inversion: Formation of Pore Structure ............................. 55
Cloud Point ................................................................................. 58
1.4.3 Lateral-Flow Membrane: Structural Effects and Anomalies ..... 58
Skin layers .................................................................................. 58
Demixing Front & Surface Tension............................................. 59
Macrovoids ................................................................................. 60
Nodules ...................................................................................... 61

3
1.5 Summary ................................................................................................ 62
References: Chapter 1 ........................................................................................ 64
2. Experimental .................................................................................................. 74
2.1 Membrane Preparation ........................................................................... 74
2.1.1 Materials ................................................................................. 74
Pervaporation Materials .............................................................. 74
Lateral Flow Materials ................................................................ 74
2.1.2 Pervaporation Membrane Polymer Solutions ........................... 75
Pristine Polymer Solutions .......................................................... 75
Polymer Blend Solutions............................................................. 75
Mixed Matrix Membrane Solutions ............................................. 76
2.1.3 Lateral Flow Membrane Polymer Solutions ............................. 77
Calculating Weight Percentages .................................................. 79
2.1.4 Membrane Casting ................................................................... 80
Pervaporation Membrane Casting ............................................... 81
Lateral-flow Membrane Casting .................................................. 83
2.2 Membrane Testing ................................................................................. 84
2.2.1 Pervaporation Membrane Testing ............................................ 84
Pervaporation Procedure ............................................................. 87
Pervaporation Membrane Flux and Selectivity
Calculations: ............................................................................... 90
2.2.2 Lateral-flow Membrane Testing ............................................... 90
2.3 Membrane Characterisation .................................................................... 91
2.3.1 Scanning Electron Microscopy ................................................ 91
2.3.2 Flexibility Testing ................................................................... 91
2.3.3 X-Ray Diffraction .................................................................... 92

4
2.3.4 Fourier Transform Infrared Spectroscopy ................................ 92
2.3.5 Differential Scanning Calorimetry/Thermogravimetric Analysis92
2.3.6 Mercury Porosimetry ............................................................... 93
2.3.7 Atomic Force Microscopy ....................................................... 93
2.3.8 Contact Angle Measurement .................................................... 93
References: Chapter 2 ........................................................................................ 94
3 Pervaporation Membrane Development ........................................................ 97
Abstract ............................................................................................................. 97
3.1 Introduction ............................................................................................ 98
3.2 Experimental .......................................................................................... 99
3.3 Results and Discussion ........................................................................... 99
3.3.1 Unsupported Pristine Membrane .............................................. 99
3.3.2 Supported Pristine Membranes ...............................................101
3.3.3 Polymer Blend Membranes .....................................................104
3.3.4 Polymer Blend Membrane Utilising Glycerol .........................107
3.4 Conclusion ............................................................................................109
3.5 Summary ...............................................................................................111
References: Chapter 3 .......................................................................................112
4 Lateral-flow Membrane Development ..........................................................115
Abstract ............................................................................................................115
4.1 Introduction ...........................................................................................116
4.2 Experimental .........................................................................................117
4.3 Results and Discussion ..........................................................................117
4.4 Conclusion ............................................................................................132
4.5 Summary ...............................................................................................134
References: Chapter 4 .......................................................................................135

5
5 Advanced Pervaporation Membranes: Control of Skin Layer ....................138
Abstract ............................................................................................................138
5.1 Introduction ...........................................................................................139
5.2 Experimental .........................................................................................141
5.3 Results and Discussion ..........................................................................141
5.3.1 DSC........................................................................................141
5.3.2 XRD: ......................................................................................141
5.3.3 SEM: ......................................................................................146
5.3.4 Pervaporation Results .............................................................150
5.4 Conclusions ...........................................................................................153
5.5 Summary ...............................................................................................155
References: Chapter 5 .......................................................................................156
6 Advanced Lateral Flow Membranes: Control of Pore Structure ................159
Abstract ............................................................................................................159
6.1 Introduction ...........................................................................................160
6.2 Experimental .........................................................................................161
6.2.1 Membrane Preparation ............................................................161
6.2.2 Lateral Flow Testing ...............................................................162
6.3 Results and Discussion ..........................................................................163
6.3.1 EtOH Content .........................................................................163
6.3.2 SEM .......................................................................................163
6.3.3 XRD .......................................................................................167
6.3.4 Mercury Porosimetry ..............................................................168
6.3.5 Lateral-Flow Rate ...................................................................169
6.3.6 Discussion ..............................................................................170

6
6.4 Conclusion: ...........................................................................................173
6.5 Summary ...............................................................................................174
References: Chapter 6 .......................................................................................175
7 Pervaporation Mixed Matrix Membranes ....................................................179
Abstract ............................................................................................................179
7.1 Introduction ...........................................................................................180
7.2 Experimental .........................................................................................182
7.2.1 Materials ................................................................................182
7.2.2 Membrane preparation ............................................................182
7.2.3 Pervaporation .........................................................................183
7.2.4 Characterization ......................................................................183
7.3 Results and Discussion: .........................................................................183
7.3.1 Characterisation ......................................................................183
7.3.2 Membrane Absorption ............................................................186
7.3.3 Pervaporation .........................................................................188
7.3.4 Discussion ..............................................................................191
7.4 Conclusion ............................................................................................193
7.5 Summary ...............................................................................................195
References: Chapter 7 .......................................................................................196
8 Closing Remarks & Future Work .................................................................202
Appendices ........................................................................................................207
A. Chapter 3 Supporting Information .......................................................208
A.1 Pristine Unsupported Membrane Data ........................................................208
A.2 Pristine Supported Membrane Data ............................................................209
A.3 Blend Membrane Data ...............................................................................209

7
A.4 Blend Membranes Utilising Glycerol Data .................................................210
A.5 Flexibility Data ..........................................................................................211
A.6 Absorption Data .........................................................................................211
B. Chapter 4 Supporting Information .......................................................212
B.1 SEM ..........................................................................................................212
B.2 Flexibility Testing .....................................................................................215
B.3 XRD .........................................................................................................216
B.4 AFM .........................................................................................................216
B.4.1 2 mm Melinex ..........................................................................217
B.4.1 4 mm Melinex ..........................................................................218
B.5 Contact Angle Measurements ....................................................................219
C. Chapter 5 Supporting Information .......................................................221
C.1 Membrane Selective Layer Data .................................................................221
C.2 Pervaporation Data: ....................................................................................222
D. Chapter 6 Supporting Information .......................................................223
D.1 XRD ..........................................................................................................223
D.2 Flow Rate Data ..........................................................................................223
D.3 SEM ..........................................................................................................224
D.4 Flexibility ..................................................................................................224
E. Chapter 7 Supporting Information .......................................................225
E.1 Absorption Data .........................................................................................225
E.2 Flexibility Data ..........................................................................................225

8
List of Figures
Chapter 1:
Figure 1.0: Membrane technologies timeline............................................................27
Figure 1.1: Pervaporation process ......................................................................... 30
Figure 1.2: Mechanism of lateral flow diagnostic strip .......................................... 34
Figure 1.3: Molecular level view of intermolecular forces acting on a molecule at
the surface of a liquid compared to those in the interior .......................................... 43
Figure 1.4: Flow of liquid up a narrow tube by capillary action and representation of
flow through tortuous pore structure of a membrane by same mechanism .............. 44
Figure 1.5: isotropic vs anisotropic membrane structures in porous and non-porous
membranes............................................................................................................. 45
Figure 1.6: Sodium alginate .................................................................................. 46
Figure 1.7: Poly(vinyl alcohol).............................................................................. 47
Figure 1.8: Supported pervaporation membrane structure...................................... 49
Figure 1.9: Solvent evaporation and polymer density in thick vs thin pervaporation
membrane .............................................................................................................. 50
Figure 1.10: Cellulose nitrate ................................................................................ 54
Figure 1.11: Cellulose ........................................................................................... 55
Figure 1.12: Phase inversion in polymer solution .................................................. 57
Figure 1.13: Binodal and spinodal in phase diagram ............................................. 57
Figure 1.14: Soluto-capillary convection macrovoid formation ............................. 61
Chapter 2:
Figure 2.1: K202 Control Coater ........................................................................... 81
Figure 2.2: Close wound (A) and spirally wound (B) coating bars ......................... 81
Figure 2.3: Glass plate and support fabric prepared for casting .............................. 82
Figure 2.4: K202 Control Coater diagram with casting bar and membrane support in
place ...................................................................................................................... 82
Figure 2.5: Mbraun GP 2202 PB single piece moulded glovebox and technical
drawings ................................................................................................................ 84
Figure 2.6: Sulzer Chemtech Laboratory 6” Test Cell (detailed on following 3
pages) .................................................................................................................... 86

9
Figure 2.7: Diagram of feed chamber of pervaporation unit (details in text; see
figure 2.6 for full pervaporation unit diagram) ....................................................... 87
Figure 2.8: Diagram of the membrane cell of pervaporation unit (details in text; see
figure 2.6 for full pervaporation unit diagram) ....................................................... 88
Figure 2.9: Diagram of feed pump and peripherals of pervaporation unit (details in
text; see figure 2.6 for full pervaporation unit diagram) .......................................... 89
Chapter 3:
Figure 3.1: Flux (3.1A) & selectivity (3.1B) vs. time for unsupported & supported
pristine pervaporation membranes. Flux (3.1C) and selectivity (3.1D) figures for
polymer blend pervaporation membranes. Flux figures given on linear scales,
selectivities given on logarithmic scales. .............................................................. 100
Figure 3.2: SEM surface images of pristine supported 5wt% NaAlg pervaporation
membrane showing cracks in membrane selective layer. ...................................... 102
Figure 3.3: SEM image of early PVA membrane with PAN support layer
delaminating from fabric support ......................................................................... 102
Figure 3.4: SEM images of supported polymer blend membranes: A, C and E show
cross sections of 7:3, 9:1 and 4:1 NaAlg:PVA blends respectively while G and I
show cross sections of 4:1 and 9:1 NaAlg:PVA blends utilising glyercol
respectively. B, D and F show exposed surface images of 7:3, 9:1 and 4:1
NaAlg:PVA blends respectively while H and J show surface images of 4:1 and 9:1
NaAlg:PVA blends utilising glyercol respectively. ............................................... 105
Figure 3.5: Plot of membrane flexibility where r = radius of cylinder (see section
2.3.2). 1/r utilised to facilitate understanding of data; unsupported PVA most flexible
membrane therefore, highest on graph. ................................................................. 107
Chapter 4:
Figure 4.1: SEM images of membranes produced from lacquers of 17 wt% CN
dissolved in 100 % acetone. Images A, B and C show cross section, cross-section
close-up and surface images respectively of the air dried membrane. Images D, E
and F show cross section, cross-section close-up and surface images respectively of
the oven dried membrane. .................................................................................... 119

10
Figure 4.2: SEM images of membranes produced from lacquers of 17 wt% CN
dissolved in 85 wt%:15 wt% acetone:water solvent mix and air dried. Images A and
B show surface and cross section images respectively of the membrane produced
from a lacquer not brought to cloud point. Images C and D show surface and cross
section images respectively of the membrane produced from a lacquer brought to
cloud point. .......................................................................................................... 120
Figure 4.3: SEM images of membranes produced from lacquers of 17 wt% CN
dissolved in 90 wt%:10 wt% acetone:water solvent mix and air dried. Images A and
B show surface and cross section images respectively of the membrane produced
from a lacquer not brought to cloud point. Images C and D show surface and cross
section images respectively of the membrane produced from a lacquer brought to
cloud point. .......................................................................................................... 123
Figure 4.4: SEM images of membranes produced from lacquers of 17 wt% CN
dissolved in 95 wt%:5 wt% acetone:water solvent mix. Images A, B and C show air
surface, backing surface and cross section images respectively of the air dried
membrane produced from a lacquer not brought to cloud point. Images D, E and F
show cross air surface, backing surface and cross section images respectively of the
air dried membrane produced from a lacquer brought to cloud point. ................... 124
Figure 4.5: XRD profile of the cellulose nitrate polymer before incorporation into
lacquer. Shows a sharp diffraction feature at approximately 45 o2θ (15,000 counts s-
1), a broad feature around 22 o2θ (11,000 counts s-1). Broad feature typical of
cellulose compounds. Also a relatively sharp diffraction feature around 12 o2θ
(5,700 counts s-1). ............................................................................................... 126
Figure 4.6: XRD profile of BasMemBCP shows no sharp diffraction features. Broad
feature typical of cellulose compounds observed around 22 o2θ (2,200 counts s
-1).
............................................................................................................................ 126
Figure 4.7: XRD profile of BasMemDCP. Sharp diffraction feature at around 45
o2θ, but this feature – unlike in the raw material – is of a lower intensity (5,500
counts s-1) than the broad feature around 22 o2θ. ................................................. 127
Figure 4.8: Plot of membrane flexibility where r = radius of cylinder (see section
2.3.2). 1/r utilised to facilitate understanding of data; unsupported PVA most flexible
membrane therefore, highest on graph. ................................................................. 128

11
Chapter 5:
Figure 5.1: Schematic of a diffusion profile across a pervaporation membrane .... 140
Figure 5.2: Upper image: DSC curve for the 4:1 ratio NaAlg:PVA selective
membrane. Lower image: XRD curves for same membrane with additional glycerol;
upper curve contains 5 g glycerol; lower curve contains 4 g (bottom) ................... 143
Figure 5.3: (A) XRD profiles of 60 um films with and without glycerol addition. (B)
XRD profiles of membrane films (with PVA and glycerol) as a function of cast
thickness as described in figure. ........................................................................... 144
Figure 5.4: SEM images of membranes prepared: Left are cross-sectional images
and right are top-down images. Thicknesses are shown in image. Magnifications as
shown. ................................................................................................................. 148
Figure 5.5: SEM images of membranes prepared: Left are cross-sectional images
and right are top-down images. Thicknesses are shown in image. Magnifications as
shown. ................................................................................................................. 149
Figure 5.6: Plots of pervaporation performance indicators versus time. A and B are
flux and C and D are selectivity. Various films were studied; the cast thickness is
indicated in the figure. Estimated errors in measurements are around 5% of value.
............................................................................................................................ 151
Figure 5.7: Plots of flux (A and B) and selectivity (C and D) against measured (A
and C) and cast (B and D) thickness. Estimated errors in measurements are around 5
% of value. ........................................................................................................... 152
Chapter 6:
Figure 6.1: Plot of non-solvent (water) required to reach cloud point versus ethanol
content in casting solution at cloud point .............................................................. 163
Figure 6.2: SEM images of the lateral flow membranes MesoACP – MesoCCP and
BasMemBCP (lettering follows sample labels see table 6.1). Images with the (i)
labels show membrane cross sectional morphology while those with label (ii) show
membrane surface morphology ............................................................................ 165
Figure 6.3: XRD profiles of MesoDCP and BasMemBCP (to see images
superimposed see appendix D, section D.1, figure D.1) ........................................ 167
Figure 6.4: MesoDCP and BasMemBCP porosimetry. As labelled in diagram. ... 169

12
Figure 6.5: Lateral flow rate against the ethanol content for each of the membranes
prepared here (for tabulated data see appendix D, section D.2, table D.1) ............ 170
Chapter 7:
Figure 7.1: A) mesoporous silica particles SEM image B) TEM image of pores
resulting from modified Stöber process ................................................................ 183
Figure 7.2: A) surface image of 15 wt% silica loaded PVA membrane B) surface
image of 10 wt% silica loaded PVA membrane .................................................... 185
Figure 7.3: Images A, B, C and D show surface of pervaporation membranes with 0
wt%, 5 wt%, 10 wt% and 15 wt% silica loading respectively. Images E,F and G
show cross section images of 0 wt%, 10 wt% and 15 wt% silica loaded membranes
respectively. ......................................................................................................... 186
Figure 7.4: Membrane absorption vs. time; shows absorption of a solution of 50
wt% EtOH and 50 wt% water into selective membrane over time. Maxima represent
point at which membrane becomes dissolute, i.e. loses membrane form and so
becomes unusable. (See appendix E, table E.1 for tabulated data) ........................ 187
Figure 7.5: A: Selectivity vs. time for membranes of particle loading from 0 wt% to
15 wt% silica loading. B: Flux vs. time for membranes of particle loading from 0
wt% to 15 wt% silica loading. C: Average flux of membrane vs. membrane silica
loading. D: Average selectivity of membrane vs. membrane silica loading. .......... 190
Appendices A-E:
Figure B.1: SEM images of a lateral flow membrane after treatment with surfactant
SDBS at 100 µm (image A) and 50 µm (image B) ............................................... 212
Figure B.2: SEM images of Melinex 100 % polyester backing material; surface in
contact with membrane (image A) and cross section (image B) ............................ 212
Figure B.3: SEM images of of Millipore HiFlow 120 lateral flow membrane; air
surface (image A), blet surface (image B) and cross section (image C) ................. 213
Figure B.4: SEM images of CN raw material at 200 µm (A), 100 µm (B), 50 µm (C)
and 20 µm (D). .................................................................................................... 214
Figure B.5: Skin formation at membrane support interface .................................. 214

13
Figure B.6: SEM images of linear pore patterns at membrane support interface:
Image A shows patterns in a membrane brought to cloud point with only acetone and
water in the solvent mix. Image B shows patterns in a membrane cast from the same
lacquer but not brought to cloud point .................................................................. 215
Figure B.7: XRD profile of BasMemD................................................................ 216
Figure B.8: AFM images of topography of three randomly chosen 10x10 μm
sections of 2 mm thick Melinex film .................................................................... 217
Figure B.9: AFM images of topography of three randomly chosen 10x10 μm
sections of 4 mm thick Melinex film .................................................................... 218
Figure B.10: Typical contact angle of water droplet on Melinex surface (specific
image: 4 mm Melinex sample B).......................................................................... 220
Figure B.11: Typical contact angle of acetone droplet on Melinex surface (specific
image: 4 mm Melinex) ......................................................................................... 220
Figure D.1: XRD profiles of MesoDCP and BasMemBCP .................................. 223
Figure D.2: SEM images of a lateral flow membrane after treatment with surfactant
SDBS at 100 µm (image A) and 50 µm (image B) ............................................... 224

14
List of Tables
Chapter 2:
Table 2.1: Polymer blend solutions ....................................................................... 76
Table 2.2: Pervaporation membrane casting solution compositions ....................... 77
Table 2.3: Basic Membrane Casting Solutions ...................................................... 78
Table 2.4: Meso-solvent (ethanol) containing membranes ..................................... 78
Table 2.5: wt% for components of glycerol and butanol casting solutions.
Abbreviations: Mem. (membrane), CN (cellulose nitrate), ace. (acetone), EtOH
(ethanol), gly. (glycerol), but. (butanol). Cloud Point (water added to reach cloud
point ...................................................................................................................... 79
Chapter 4:
Table 4.1: Tabulated data showing the water content of the lacquers (casting
solutions) of the basic lateral flow membranes (see chapter 2, section 2.1.3, table 2.3
for precise composition of lacquers) produced from lacquers at both cloud point and
not. The exact water content required to reach cloud point in the lacquer is shown as
is the water content of membranes not cast from lacquers at cloud point (definition of
lacquer cloud point given in chapter 2, section 2.1.3). Also shown is the presence of
a skin layer in the final membrane and flow rate, if any ........................................ 118
Chapter 6:
Table 6.1: Casting solution composition before/after cloud point ........................ 162
Chapter 7:
Table 7.1: Tabulated flux, selectivity, feed and permeate purity, and contact angle
data for membranes at different wt% silica particle loadings ................................ 189
Appendices A-E:
Table A.1: Pervaporation performance of unsupported pristine NaAlg membrane
cast from 2 wt% solution of NaAlg in water. Cast at 400 µm thickness ................ 208

15
Table A.2: Pervaporation performance of unsupported pristine PVA membrane cast
from 10 wt% solution of PVA in water. Cast at 150 µm thickness ........................ 208
Table A.3: Pervaporation performance of supported pristine NaAlg membrane cast
from 5 wt% solution of NaAlg in water. Cast at 100 µm thickness ....................... 209
Table A.4: Pervaporation performance of supported pristine PVA membrane cast
from 10 wt% solution of PVA in water. Cast at 100 µm thickness ........................ 209
Table A.5: Pervaporation performance of supported pristine PVA membrane cast
from 10 wt% solution of PVA in water. Cast at 100 µm thickness ........................ 209
Table A.6: Pervaporation performance of supported 4:1 NaAlg:PVA blend
membrane cast from 5 wt% solution of polymer blend in water. Cast at 100 µm
thickness .............................................................................................................. 210
Table A.7: Pervaporation performance of supported 7:3 NaAlg:PVA blend
membrane cast from 5 wt% solution of polymer blend in water. Cast at 100 µm
thickness .............................................................................................................. 210
Table A.8: Pervaporation performance of supported 9:1 NaAlg:PVA blend
membrane cast from solution of 5 g polymer blend + 5 g glycerol in 90 g water. Cast
at 100 µm thickness ............................................................................................. 210
Table A.9: Pervaporation performance of supported 4:1 NaAlg:PVA blend
membrane cast from solution of 5 g polymer blend + 5 g glycerol in 90 g water. Cast
at 100 µm thickness ............................................................................................. 211
Table A.10: Results of flexibility tests (method outlined in chapter 2, section 2.3.2)
............................................................................................................................ 211
Table A.11: Absorption data in solution of 50 wt% water/50 wt% ethanol for
supported polymer blend membranes (designated by PVA:NaAlg ratio). Points at
which mass data end represent points at which membranes dissolve..................... 211
Table B.1: Flexibility testing data of lateral flow membranes including industrial
standard ............................................................................................................... 215
Table B.2: Contact angle data.............................................................................. 219
Table C.1: Summary of SEM quantification and observations (P = partial, WD =
well developed; describe nature of the skin layer at surface)................................. 221
Table C.2: Thickness and flexibility data ............................................................ 221
Table C.3: Flux, selectivity and permeate water content figures for NaAlg based
membranes at 60 oC operating temperature and 90 wt% ethanol feed solution ...... 222

16
Table D.1: Lateral flow rates and ethanol content ................................................ 223
Table D.2: Flexibility testing data of lateral flow membranes .............................. 224
Table E.1: Absorption data in solution of 50 wt% water/50 wt% ethanol for MMMs.
Tabulated data of figure 7.4 (see chapter 7). Points at which mass data end represent
points at which membranes dissolve .................................................................... 225
Table E.2: Results of flexibility tests (method outlined in chapter 2, section 2.3.2)
............................................................................................................................ 225

17
List of Abbreviations
General Abbreviations
Ace. – Acetone
AFM – Atomic Force Microscopy
CN – Cellulose Nitrate
CP – Cloud Point
CRISP – Cryo-Rupture Imaging
Sample Preparation
DIPS – Diffusion Induced Phase
Separation
DMSO – DiMethylSulphOxide
DSC – Differential Scanning
Calorimetry
EtOH – Ethanol
Gly. – Glycerol
IIPS – Immersion Induced Phase
Separation
Meso-sol. – Meso-solvent
MMM – Mixed Matrix Membrane
NaAlg – Sodium Alginate
NG – Nucleation & Growth
Non-sol. – Non solvent
PAN – Poly(AcryloNitrile)
PET – Poly(EthyleneTerephthalate)
PTFE – Poly(TetraFluoroEthylene)
PVA – Poly(VinylAlcohol)
RIPS – Reaction Induced Phase
Separation
SD – Spinodal Decomposition
SDBS – Sodium Dodecyl
BenzeneSulphate
Sel. - Selectivity
SEM – Scanning Electron
Microscopy
Sol. – Solvent
SOP – Standard Operating Procedure
TEM – Transmission Electron
Microscopy
Tg – Glass transition temperature
TGA – ThermoGravimetric Analysis
TIPS – Thermally Induced Phase
Separation
VIPS – Vapour Induced Phase
Separation
XRD – X-Ray Diffraction
Section 1.2 Abbreviations
A – Area of membrane
c – Concentration
D – Diffusion coefficient
f (subscript) - Feed
G (superscript) – Gas phase
g – Local gravitational field
strength
h – Height of columnar glass vessel

18
i – Component of feed (water)
J – Flux
j – Component of feed (ethanol)
K – Sorption Coefficient
L – Coefficient of proportionality
(links chemical potential to flux)
L (superscript) – Liquid phase
m – Molecular weight
p – Partial pressure
n – Mole fraction
p (subscript) – Permeate
R – Universal gas constant
r - Radius
T – Temperature
W – Mass of permeate
x – Water/ethanol in feed
y – Water/ethanol in permeate
γ – Activity coefficient
θ – Contact angle
ρ – Density
µ - Chemical potential

19
Declaration
I, Eoin Flynn, certify that this is my own work and I have not obtained a degree in
this university or elsewhere on the basis of this PhD thesis
Eoin Flynn

20
Acknowledgements
Looking back on the duration of this PhD and my academic career before it, I must
admit that there is an element of luck to my life. I am very fortunate to have been
born in Ireland at a time when I could obtain a third level education for relatively
little expense. In addition to being plainly lucky, I have also had a great number of
people throughout my life who have helped, encouraged, advised and guided me.
Most likely, more people than I am capable of remembering. Reflecting on all of
that, I realise I am privileged more than most could ever hope for. I have
endeavoured to thank everyone I can think of. If you read these acknowledgements
and feel that I have somehow forgotten you I am profoundly sorry…
Thanks must go to my family: To my parents - Bernadette Flynn and Sean
Flynn - who have always provided for me and put me through the academic process
that has led to this PhD. To my grandparents - Mary Flynn and John Flynn - who
have doted on me and encouraged me as long as I can remember and who seem
absurdly proud of me without, to my mind, my having to do a whole lot to earn it.
Though their pride pales in significance when compared to my mother’s beaming
adoration of me. I never know how to react to it Mam, but I’m glad I’m something
you can be proud of. To my sisters - Sarah Flynn and Aoife Flynn - both of whom
have never ceased to make me feel like an over-achiever with their admiration of
their big brother; thank you. Special thanks must go to my father who, once upon a
time, heavily suggested - though never demanded - that I should choose a college
career in science and not one in English, as was my wish. A lack of maturity didn’t
let me see the wisdom in it then, but looking back; there are few moments in my life
that I can highlight and state so unequivocally that that was a turning point. Without
it I really and truly would not be able to submit this thesis. Thank you.
To those that I had the pleasure to work and socialise with during the PhD, past
and present, from labs 115 and 343 of the Kane Building in UCC’s chemistry dept.,
from the ERI, Tyndall and the CRAC lab, and the new guys from Limerick - Atul,
Atul “eile”, Barbara, Cian, Colm O’Mahony, Dave, Eoin Wilson, Eoin
McGillicuddy, Gil, Ian, JV, Keith, Michael, Olan, Pete, Raj, Sven, Riosín, Sankar,
Shelly, Sibu, Subhajit, Tandra and Tim; those directly involved in my work from the
same laboratories - Aoife Burke, Séamus Ó Riada, Donal Creedon; from CIT (who

21
kindly lent us the pervaporation unit) – Grainne Byrne and Cilian Ó'Súilleabháin;
from Glantreo Ltd. – John Hanrahan, Joseph Tobin and Jennifer Coakley; and from
Milipore – Mike Mansfield, Kami Beyzavi and Niamh Curran; those who made
significant contributions to my published material - Parvaneh Mokarian, Léa
Brothier, and Thomas Fitzgerald. Thank you to all of you. You made my PhD a
pleasure. An extra special thank you must go to Sheena O’Driscoll who, on the day I
got my underwhelming degree results, consoled me and advised me that I go and talk
to Prof. Mick Morris before I completely despaired. That was some very sound
advice. Thank you.
To the administrative staff in UCC - Pat, Mattie, Donnacha, Terry, Mick, Tony,
Johnny, Noel, Chrissy, Trevor, Rose - thank you.
To the lecturers who weren’t my direct supervisors but were happy to give me
advice and tips whenever I sought it - Justin Holmes, Dave Otway, Jeremy Glennon
and John Wenger - thank you. You’d be surprised how important some of those tips
turned out to be.
To Jovanna’s parents - Harry Mittelstadt and Marion Arndt – who were every
bit as encouraging as my own parents throughout my PhD and before it. Thank you.
To the people I am lucky to be able to call friends as well as colleagues - Colm
O’Regan, Colm “eile” McManamon, John Hayes, John O’Connell, Joseph Tobin,
Kamil Rahme, Mark Armstrong, Paul Delaney and Tom Fitzgerald. You are some of
the best people I’ve ever met (spare me the abuse when you read this, please!). I
could write another thesis on all the reasons I have to thank you lot. But this
inadequate paragraph will have to suffice. Thank you, really and truly.
The two people who did more than any others to help me in this PhD are my
professor, Mick Morris, and Donal Keane, who was leading my project at the
beginning. Mick, you gave me an opportunity to do a PhD when I didn’t think I’d
ever be able to and you’ve stuck your neck out for me, encouraged me and offered
me advice many times since. You even managed to prevent me panicking when I
thought all was lost while trying to get my first publication. I can never thank you
enough for all that. Donal, I’ve no doubt you’ll be far too humble to admit that you
did a lot for me. I can assure you, you did. You showed me the ropes when I was
starting the PhD; how to assimilate literature effectively, how to manage my

22
laboratory, how to objectively assess my results and generally how to be a better
scientist, and on top of all that you contributed more to my publications than anyone
bar myself. To both of you – Mick and Donal – you have my utmost respect and
thanks.
Finally to Jovanna; you’ve been with me throughout my PhD and since long
before that. You’ve never failed to raise my spirits at the worst times and you’ve
been the source of many of the best times. You’ve even got your name on one of my
papers through your help with my research. Despite my usual verbosity, for once, I
don’t have adequate words. You’ve been integral to my PhD and to my life. I know
you won’t think so, but, as much as anyone else - perhaps more - I could not have
done this without you. Thank you.

23
List of Published Material
Unusual trend of increasing selectivity and decreasing flux with decreasing
thickness in pervaporation separation of ethanol/water mixtures using sodium
alginate blend membranes
Eoin J. Flynn, Donal A. Keane, Justin D. Holmes, Michael A. Morris
Journal of Colloid and Interface Science, Volume 370, Issue 1, March 2012, Pages
176–182
Control of Pore Structure Formation in Cellulose Nitrate Polymer Membranes
Eoin J. Flynn, Jovanna Arndt, Léa Brothier, Michael A. Morris
Advances in Chemical Science Volume 2 Issue. 2, June 2013, Pages 9-18
Pervaporation performance enhancement through the incorporation of
mesoporous silica spheres into PVA membranes
Eoin J. Flynn , Donal A. Keane, Parvaneh M. Tabari, Michael A. Morris
Separation and Purification Technology, Volume 118, October 2013, Pages 73–80
Preparation of supported hydrophilic polymeric and mixed matrix membranes for
dehydration of ethanol by pervaporation
Donal A. Keane, Eoin J. Flynn , Michael A. Morris
Final Report for the Environmental Protection Agency STRIVE project: 2007-FS-
ET-13-S5, January 2010, ISBN: 978-1-84095-347-3

24
Abstract
The work in this thesis concerns the advanced development of polymeric membranes
of two types; pervaporation and lateral-flow. The former produced from a solution
casting method and the latter from a phase separation. All membranes were produced
from casting lacquers.
Early research centred on the development of viable membranes. This led to a
supported polymer blend pervaporation membrane. Selective layer: plasticized 4:1
mass ratio sodium-alginate:poly(vinyl-alcohol) polymer blend. Using this
membrane, pervaporation separation of ethanol/water mixtures was carefully
monitored as a function of film thickness and time. Contrary to literature
expectations, these films showed increased selectivity and decreased flux as film
thickness was reduced. It is argued that morphology and structure of the polymer
blend changes with thickness and that these changes define membrane efficiency.
Mixed matrix membrane development was done using spherical, discreet, size-
monodisperse mesoporous silica particles of 1.8 - 2µm diameter, with pore diameters
of ~1.8 nm were incorporated into a poly(vinyl alcohol) [PVA] matrix. Inclusion of
silica benefitted pervaporation performance for the dehydration of ethanol,
improving flux and selectivity throughout in all but the highest silica content
samples.
Early lateral-flow membrane research produced a membrane from a basic
lacquer composition required for phase inversion; polymer, solvent and non-solvent.
Results showed that bringing lacquers to cloud point benefits both the pore structure
and skin layers of the membranes. Advancement of this work showed that
incorporation of ethanol as a meso-solvent into the lacquer effectively enhances
membrane pore structure resulting in an improvement in lateral flow rates of the
final membranes.
This project details the formation mechanics of pervaporation and lateral-flow
membranes and how these can be controlled. The principle methods of control can
be applied to the formation of any other flat sheet polymer membranes, opening
many avenues of future membrane research and industrial application.

25
Chapter 1
Introduction

26
1. Introduction
Membranes have obtained a place of prominence within worldwide chemical
technologies in the past four decades due to the ever increasing diversity of
separations they can perform; separation of gaseous mixtures into constituent gases;
filtration of particulates from solutions; efficient separation of closely boiling liquids
from one another, to name a few. There is a broad range of processes in which such
separations can be utilized, from the largest industrial scale in pharmaceutical,
chemical and food science processes, down to the smallest personal and domestic
scale in water filters, pregnancy tests, and medical diagnoses.
It is this versatility of function that has seen membranes grow from origins in
the 18th
century into the global membrane industries seen today. Frenchman Abbé
Jean-Antoine Nollet is accredited with the first recorded observations of membranes.
He noted the permeability of a sealed pig bladder filled with wine and placed in a
barrel of water as early as 1748.[1] By the early 19th
century another Frenchman,
Henri Dutrochet, coined the term “osmosis” to describe the spontaneous flow of
liquid across a permeable barrier[2]. In the mid-19th century German scientist, Adolf
Fick, produced the first synthetic membrane from collodion (cellulose nitrate) and
defined Fick’s Law of Diffusion[3]. By the late 19th century the culmination of three
decades work by Polish chemist Moritz Traube [4] and German botanist Wilhelm
Pfeffer[5] – producing and testing numerous membranes – resulted in data which
was used by Dutch scientist Jacobus van’t Hoff in 1887 to develop the van’t Hoff
equation[6]. In the early 20th century further advances in membrane studies were
made that would lead to early industrialization. German scientist, Philip Adolf
Kober, identified, described and named pervaporation in cellulose nitrate bags, in
1917[7]. By the 1930’s the first commercial membranes were in production;
cellulose nitrate membranes used for microfiltration. By the end of the Second
World War membranes had been implemented by the U.S. Army for water filtration;
research into which was conducted by Millipore. Soon after, Dutch scientist W. J.
Wolf demonstrated in 1945 the first artificial kidneys for medical use: dialysis.

27
Figure 1.0: Membrane technology timeline

28
By the mid-point of the 20th century membranes had become fully industrialized and
from the 1960’s onwards the greatest advances in membrane technologies were
made; commercialisation of dialysis in medicine and controlled drug delivery
through membranes by Alza. This led to the development of microfiltration,
ultrafiltration, reverse osmosis and electrodialysis during the 1970’s. The final two
decades of the 20th
century saw the development of gas separation and pervaporation
membrane technologies and the establishment of the current membrane industry. The
21st century has seen further advances in membrane technologies, particularly
focussed on the areas of pervaporation and gas separation. As the industry currently
stands there are four established industrial membrane types; microfiltration,
ultrafiltration, reverse osmosis and electrodialysis; and two developing industrial
membrane processes; gas separation and pervaporation. All other membrane
technologies, such as facilitated transport though liquid membranes, are still at
research and development levels.
The vast majority of membranes used are composed of organic polymers and
are produced as thin films cast from polymer solutions (although production methods
have been developed to produce membranes of different structure to increase
membrane surface area, such as spirally wound and columnar membranes).
However, there are differences in precisely how these thin polymer films are formed
from solution. The simplest formulations involve the production of dense polymer
membranes - such as pervaporation and ion-exchange membranes - from a method
known as solution casting: Polymer solution is cast either onto a supporting
substrate/reinforcing framework, or is unsupported, and the solvent subsequently
evaporates from the cast solution which dries to form the thin film that will be the
membrane. By comparison, the formation of reverse osmosis and ultrafiltration
membranes is relatively complex: The process, known as the Loeb-Sourirajan
method [8] still involves casting a polymer solution onto a support and allowing the
solvent to evaporate to form the membrane but, while this process occurs a phase
separation process is occurring simultaneously: A polymer lean liquid phase and a
polymer rich liquid phase form and separate within the drying casting solution to
create a porous structure in the final membrane. An adapted form of this process is
used to form gas separation membranes, while yet another adaptation of the process

29
known as vapour induced phase separation is used to form microfiltration
membranes.
Common features of these formation processes are the initial solution casting
and the evaporation of solvent from the cast solution. All the membranes researched
in this work were produced by casting polymer solutions as thin polymer films. A
significant part of this thesis will show how control of the evaporation of solvents
from those cast polymer solutions provides a core means of manipulating the internal
structures and performance of the final membranes.
Two membrane types from the six dominant industrial membrane technologies
outlined above were chosen for study; pervaporation membranes and lateral flow
membranes (a type of microfiltration membrane); membranes with formation
processes from opposite ends of the scale of complexity. Pervaporation membranes
represent a simple formation process, namely the solution casting process, wherein
the entirety of formation is defined by evaporation of solvent from the cast polymer
solution, allowing the formation to be profoundly manipulated to affect the final
membrane characteristics. Lateral flow membranes by comparison, represent a
highly complex formation process in which the evaporation of solvent from the
membrane casting solution occurs simultaneously with complicated phase inversion
mechanisms to yield the final membrane, making manipulation of the formation
difficult.
These two membrane technologies, pervaporation and lateral-flow, are among
these least studied of all membranes; pervaporation being a relative newcomer to the
established membrane industries and lateral flow being long established industrially
but relatively poorly understood. The work herein aims to show how control of their
formation processes can enhance membrane performance. It will center on the
production of hydrophilic pervaporation membranes for the dehydration of ethanol
and on the production of porous cellulose nitrate microporous membranes for lateral
flow diagnostic strips.

30
1.1. Membrane Processes: Pervaporation, Lateral Flow
Membranes are produced to perform specific separations in industrial processes,
analyses, diagnostics, etc. How a membrane performs its intended task is the best test
of its efficacy. For this reason, a comprehensive knowledge of any process in which
a membrane will be utilized is required for a full understanding of a membrane’s
functionality. What follows is an outline of the pervaporation process into which
pervaporation membranes are incorporated and an outline of the function of lateral
flow diagnostic strips of which lateral flow membranes are the fundamental
components.
1.1.1. Pervaporation
Pervaporation – meaning permeation and evaporation – is a separation process which
permits the selective removal of one or more components from a multi-component
liquid. This separation is achieved by passing the multi-component liquid over a
polymeric membrane, of appropriate composition, that preferentially allows the
permeation of certain components in the liquid. The driving force of this permeation
is the use of a partial vacuum so that the permeate is removed as a vapour.
Maintenance of a lower vapour pressure on the permeate side of the membrane than
on the feed side induces transport of feed components through the membrane
polymeric matrix by solution diffusion[9–13]. This is shown in figure 1.1 below.
Figure 1.1: Pervaporation process

31
The current primary use of pervaporation is in the separation of azeotropic
solutions in solvent dehydration and solvent-solvent separation. Traditionally
azeotropic distillation has been the preferred method of achieving such separations,
but this method requires the use of entrainer compounds (benzene, cyclohexane, etc).
These chemicals remain in the separated liquids in trace amounts after separation and
contaminate whatever processes and/or ecosystems they find their way in to
afterwards. Entrainers are usually environmentally malign and with modern
environmental regulations placed on industry, the use of this means of separating
azeotropic solutions is not a feasible long term option. Another traditionally favoured
method of separating azeotropic solutions is pressure swing distillation which does
not utilize any harmful and/or contaminating entrainer compounds but does require
high pressures and temperatures rendering the process both expensive and potentially
dangerous. Pervaporation by comparison, is a clean process requiring no entrainers,
operates at safe temperatures and pressures, and is relatively inexpensive[11].
Pervaporation is potentially most important in rendering ethanol suitable for use
as a biofuel. Ethanol can only be used as a fuel in internal combustion engines at
purities higher than 99% otherwise knocking occurs causing damage to the engine
pistons. Since ethanol forms an azeotrope with water at 95.63 wt% ethanol to 4.37
wt% water, the only clean means of achieving a purity high enough for use as a fuel
is through pervaporation.
Azeotropes
An azeotrope is loosely defined as a binary (or ternary) liquid solution which, at a
certain critical composition, cannot be separated into its constituent liquids by
conventional distillation. Distillation results in vapours which upon condensation
will gradually approach the azeotrope limit. Once the azeotrope has been reached,
any further distillations will result in a vapour, and subsequent condensate, with the
composition of the azeotrope of the solution.
Azeotropes can be either homogenous or heterogeneous depending on the
miscibility of the constituent liquids of the solution[14].
Azeotropes are defined as positive or negative: A positive azeotrope will have a
boiling point lower than the pure boiling points of its constituents. A negative
azeotrope will have a boiling point higher than the pure boiling points of its

32
constituents. A positive azeotrope may also be referred to as a minimum boiling
mixture or a pressure maximum azeotrope. Likewise, a negative azeotrope may also
be referred to as a maximum boiling mixture or a pressure minimum azeotrope[15],
[16].
In terms of molar constituents, azeotropes differ from compounds in that the
molar ratios of their constituents cannot be expressed as small integers.
The positive and negative terminology refers to the deviation of an azeotrope
from ideal solution behaviour as defined by Raoult’s Law. It is this law by which we
accurately define an azeotrope. Azeotropic solutions are always non-ideal solutions.
Raoult’s Law expresses the vapour pressure of an ideal solution (i.e. a solution
in which the solute is non-volatile and so does not contribute to the vapour pressure
above the solution) as:
Psoln = solvent Po
solvent 1(i)
Where Psoln is the vapour pressure of the solution, solvent is the mole fraction
of the solvent in the solution and Po
solvent is the vapour pressure of the pure
solvent[17]. However in non-ideal solutions, where both constituents are volatile and
so contribute to the vapour pressure above the solution an adjustment to the above
equation must be made. Otherwise the figure obtained at the end will be greater or
lesser than the actual vapour pressure of a non-ideal solution. Let us take the
example of a solution of ethanol and water, where both are volatile solvents in
solution:
PTotal = PEtOH + PWater = EtOH Po
EtOH + Water Po
Water 1(ii)
PTotal is the total vapour pressure of the solution containing ethanol and water,
EtOH and Water are the molar fractions of ethanol and water in solution
respectively, Po
EtOH and Po
Water are the vapour pressures of pure ethanol and pure
water respectively, and PEtOH and PWater are the partial vapour pressures of ethanol
and water respectively contributing to the vapour pressure above the solution[18].
The figure obtained from this equation will differ from that obtained from equation
1(i). If we are dealing with an azeotropic solution and there is a negative deviation

33
from equation 1(i) by equation 1(ii) then it is a negative azeotrope. If the deviation
from equation 1(i) by equation 1(ii) is positive then it is a positive azeotrope[19].
The reason for the difference in vapour pressures and the deviation from ideal
behaviour and Raoult’s law is due to the interactions between molecules of the
constituents of a solution; van der Waals forces and hydrogen bonding. For example,
in a liquid solution containing liquid A and liquid B, nearly ideal behaviour is
approached when the A-A, B-B and A-B interactions are energetically similar.
However, if the molecules of A and B have a special affinity for one another, i.e.
they require less energy to interact than the energy required for A molecules to
interact with A or for B molecules to interact with B, then the molecules will have a
greater tendency to remain in the liquid solution rather than move into the vapour
phase which creates the vapour pressure[18], [20]. Thus, the solution will have a
lower vapour pressure than that predicted by Raoult’s law and so have a negative
deviation. Similarly, if the molecules of liquid A have a special affinity for others of
their own type (equally for molecules of B) then they well have a tendency to enter
the vapour phase, resulting in an increase in vapour pressure over what is predicted
by Raoult’s law, thus having a positive deviation[18], [20], [21].
Taking, once again, the example of a solution of ethanol and water; the
hydrogen bonding interactions between water molecules results in the water
molecules having a greater attraction for one another than the attraction between
ethanol molecules, or the attraction between ethanol and water molecules. This
results in a positive deviation from Raoult’s law and ideal behaviour as described
above.
From all of the above, it can be said that the solutions of ethanol and water used
in the pervaporation experiments of this work are homogenous, positive azeotropes.
The solution-diffusion process is the reason that azeotropes can be broken by
pervaporation membranes. This process is explained in section 1.1.2.
Industry Overview
The first industrial patents on pervaporation were registered by the German company
Gesellschaft fur Trenntechnik (GFT) Co. in 1982, after which, research into
pervaporation began to become more widespread. GFT’s membrane utilized a
hydrophilic poly(vinyl alcohol) (PVA) membrane on a fabric support. This

34
membrane makeup exhibited high-abrasion resistance, elongation, tensile strength,
and flexibility, with excellent water perm-selective properties [11].
Research since GFT’s success has yielded many more polymers which can be
effectively utilized for pervaporation through novel manipulation of the polymers
via, polymer blending, organic-inorganic hybridization and cross-linking among
others methods[22–31]. This has meant that pervaporation has developed a high
potential for a wide range of separations, however its most common use remains the
production of anhydrous ethanol.
Much research has gone into improving the process of purifying ethanol through
separation. This means making membranes that are more selective and have greater
flux. There is a trade-off that must be made between flux and selectivity; as
selectivity is increased, flux decreases. Efforts have gone into minimising this trade
off as much as possible. However where polymers have been found to be both
selective and exhibit high flux, mechanical and thermal stability have become
problems. For example, sodium alginate and chitosan are naturally occurring
polysaccharides which have been found to exhibit outstanding flux and selectivity
but are mechanically and thermally weak[11], [32]. Other polymers have been found
to have similar properties but also similar faults; sodium alginate seems to be the
most promising of all of these and has been researched extensively for the purpose of
ethanol dehydration. This is discussed in greater detail in section 1.3.
1.1.2 Lateral Flow Diagnostics
Cellulose nitrate (CN) lateral flow
membranes are a type of
microporous flat sheet membrane
used as a material in diagnostic
and filtration applications. Lateral-
flow refers to the transport of the
solution to be filtered and/or
analysed through the membrane as
described in section 1.2.1. This movement is driven by capillary flow through the
porous membrane polymer network. Membranes are typically surface functionalised
to retain certain compounds – in the case of filtration – or, to react to certain target
Figure 1.2: Mechanism of lateral flow diagnostic strip

35
analytes, usually in the form of a colour change – in the case of diagnostic strips (see
figure 1.2).
Industry Overview
The nineteen fifties saw the establishment of industrial CN membrane processes.
Initial uses for such microporous membranes were filtration applications that were
based on the membranes’ ability to retain microorganisms and particles from fluids.
These characteristics provided opportunities for use in new types of applications
based on the identification and quantification of microorganisms [33], [34], protein
contaminant removal, and the immobilization of proteins [35]; including blotting
techniques [36], enzyme-linked immunosorbent assay (ELISA) testing [37], and
lateral-flow immunochromatographic tests [38–42]. In immunodiagnostic tests,
proteins are the most common samples applied to a solid membrane surface;
therefore, the protein-binding capacity is a critical property of the membrane [43].
Cellulose nitrate membrane filters have also been used for solid phase extraction and
determination of trace elements in various media[44–48], where those comprised of
materials with a strong affinity for hydrophobic species in water are particularly
useful for retaining metal species by filtration[48]. The sensitive and accurate
determination of heavy metal ions at trace levels in natural samples, including
waters, biological fluids, soils and sediments is a very important part of
environmental and public health studies[49–51]. Pre-concentration and separation of
the trace analytes on the cellulose nitrate membrane filters addresses the interference
effects from sample matrices and inadequate detection limits often associated with
other techniques e.g. flame atomic absorption spectrometry (FAAS).
Lateral-flow cellulose nitrate membranes function as a transport medium to
carry target analyte and bind it together with the immobilizing antigen on the
membrane surface control line. Membrane surface properties and cross-sectional
morphology are important parameters in the production of effective immunological
assays for diagnostic and healthcare analysis. If the membrane surface and internal
layer structure could be controlled precisely, various types of immunological
analysis could be performed effectively and accurately[52]. To gain greater control
of the internal structure of these membranes requires a greater understanding of the
rhealogical factors involved in the membrane composition and of the membrane

36
internal structures and their formation. Control of membrane structure and properties
is the chief aim of this section of the project.
1.2 Membrane Transport Theory
The following is a detailed description of the mechanisms of permeation within
membranes. It will be apparent from this that the functionality of pervaporation
membranes is far more complex than that of lateral flow. This is in contrast with the
membrane formation processes which will be described later; those of lateral flow
membranes are far more complex than those of pervaporation membranes.
Membrane separation processes generally are described by two primary
theories: pore-flow, which describes, in part, the transport mechanism of lateral flow
membranes, and solution-diffusion, which describes the transport mechanism of
pervaporation membranes.
The difference between the solution-diffusion and pore-flow mechanisms is in
the relative size and volume of the membrane pores. In membranes with solution
diffusion functionality the free volume element (pores) of the membrane are - in
effect - spaces between the polymer chains of the membrane which are utterly
dependent on the random thermal motion of the polymer chains. The greater the
thermal motion the more these pores will appear and disappear in a dynamic manner
with the diameter of the pores varying constantly. In addition to this the pores are not
necessarily in contact with one another. This lack of permanent, defined pore
structure leads to the description of such membranes as non-porous. Membranes that
function in this manner have pore diameters in the region of 2-5 Å. This is typical of
reverse osmosis, gas separation and pervaporation membranes.
In membranes with pore-flow functionality the free volume element is relatively
large, of fixed position and volume, and is of networked structure with the pores
connected to one another. Membranes that function in this manner have pore
diameters of greater than 10Å. This is typical of ultrafiltration, Knudsen-flow gas
separation, and microfiltration (which includes lateral flow) membranes. Membranes
with pore size between 5 Å and 10 Å are known as intermediate membranes. This is
the domain of nanofiltration membranes and is only mentioned for posterity.

37
1.2.1 Solution-Diffusion
Diffusion is a process by which matter is transported from one part of a system to
another by a concentration gradient. If a concentration gradient of permeate
molecules is formed in a membrane medium, statistics show that a net transport of
matter will occur from the high concentration region to the low concentration region.
This was first described by Fick’s law of diffusion [3]:
Ji = -Di (dci /dx) 1(iii)
Where Ji is the rate of transfer (flux) of component i (g cm-2
s-1
), dci /dx is the
concentration gradient of i across the membrane, and Di is the diffusion coefficient
(cm2 s
-1). The negative sign in equation 1(iii) indicates the direction of diffusion;
down the concentration gradient. From the earlier description, it is known that the
solution diffusion occurs through randomly fluctuating, (in both diameter and
position) not necessarily networked pores in the polymer matrix of a membrane. As
such, diffusion is a slow process. Thus, speed is achieved in separations with
membranes that function through the use of very thin membranes and high
concentration gradients across them. The pressure, temperature and composition of
fluids on either side of a membrane determine the concentration of the diffusing
species at the membrane surface in equilibrium with the fluid and so affect the
concentration gradient[53]. The pervaporation process is driven by a vapour pressure
difference across a membrane between the relatively high vapour pressure of the
feed liquid and the low vapour pressure of the permeate vapour.
Solution-diffusion in pervaporation can best be described if one looks at an
individual molecule. Once a solution has dissolved into the non-porous polymer
matrix of a pervaporation membrane, individual molecules occupy the
fluctuating free volume holes (pores). These molecules can then diffuse through
the membrane by moving from one free volume hole to another. This movement
is permitted by the thermal motion of the polymer chains.
The advent of powerful computers has allowed these statistical fluctuations
in the volumes between polymer chains to be calculated[9]. Smit et al[54]
simulated the diffusion of a single carbon dioxide molecule through a polyimide
matrix. They showed that for the first 100 ps the carbon dioxide molecule
“bounced” around in the free volume hole in which it had been placed, never

38
moving more than 5 Å, i.e. the diameter of the free volume hole. After 100 ps
however, a random thermal movement of the polymer chains allowed sufficient
space for the carbon dioxide molecule to shift approximately 10 Å to an
adjacent free volume hole, where it remained until another random movement
of the polymer chains allowed it to move further.
The free volume holes of a membrane’s polymeric matrix will only allow the
passage of molecules small enough to pass through the holes. In the case of sodium
alginate used in pervaporation membranes in the dehydration of ethanol, the free
volumes formed in the polymer matrix are, on average, only large enough to allow
the passage of water molecules, while the holes are too small for ethanol molecules
to pass through, making it ideal for ethanol dehydration[32]. Flux is also governed
by these free volume holes; the larger and more numerous the holes, the more feed
solution can pass through a membrane. However, larger the holes get, i.e. the greater
the membrane free volume, the less selective a membrane becomes. This is the trade-
off that must be made between flux and selectivity and provides the much of the
impetus for our pervaporation research.
Proof of Solution-Diffusion Theory
Much of the following section is adapted from the book “Membrane Technology and
Applications” by Richard W. Baker[55].
A mathematical description of diffusion in membranes is based in thermodynamics,
on the proposition that pressure, temperature, concentration and electrical potential
are interrelated and the overall driving force of a permeant is the gradient in its
chemical potential. Thus, the flux, Ji, of a component i, is described by equation
1(iv):
Ji = -Li (dµi /dx) 1(iv)
where (dµi /dx) is the chemical potential gradient of i and Li is a coefficient of
proportionality linking chemical potential driving force to flux. In pervaporation, the
driving force is dictated by concentration and pressure, as such, chemical potential,
µi, can be expressed as in equation 1(v):
dµi = RTdln(γini) + υidp 1(v)

39
where γi is the activity coefficient (mol/mol) linking mole fraction with activity of i,
p is pressure, ni is the mole fraction (mol/mol) of i, and υi is the molar volume of i.
In incompressible phases such as liquids or a solid membrane - the scenario
encountered at the feed side of a pervaporation membrane - molar volume does not
change with pressure and so equation 1(v) can be rewritten as equation 1(vi):
µi = µio
+ RTln(γini) + υi(p – pisat ) 1(vi)
where µio is the chemical potential of pure i at reference pressure pi
o, where the
reference pressure is defined as the saturation vapour pressure of i, pisat .
In compressible phases, i.e. gases - the scenario encountered at the permeate
side of a pervaporation membrane - molar volume does change with pressure and so
equation 1(v) can be rewritten as equation 1(vii):
µi = µio + RT ln(γini) + RT ln(p/pisat ) 1(vii)
Several assumptions must be made for any permeation model, including for
pervaporation:
Fluids on either side of a membrane are in equilibrium with the
membrane surface with which they are in contact.
Rates of adsorption and desorption of permeant molecules are higher
than the rate of diffusion of permeant molecules through the membrane
(hence concentration polarization)
When pressure is applied across a dense membrane, pressure throughout
the membrane is constant at the highest value (therefore pressure within
a membrane is constant and chemical potential across a membrane is
only expressed as a concentration gradient)
In the solution-diffusion model, the pressure within the membrane is constant at
the high-pressure value (in the case of pervaporation the vapour pressure of the feed
side of the membrane, pf), and the gradient in chemical potential across the
membrane is expressed as a smooth gradient in solvent activity (γini). The flow that
occurs down this gradient is expressed by equation 1(v), but because no pressure
gradient exists within the membrane, equation 1(iv) can be rewritten by combining
equations 1(iv) and 1(v). Assuming γi is constant, this gives equation 1(viii):
Ji = -(RTLi /ni ).(dni /dx) 1(viii)

40
Using the term to express concentration of component i, ci, rather than the more
cumbersome mole fraction used above, equation 1(viii) can be rewritten as equation
1(ix):
Ji = -(RTLi /ci ).(dci /dx) 1(ix)
Since ci (g/cm3) can be expressed in terms of molar fraction of i, ni, molar density, ρ,
and molecular weight of i, mi as shown in equation 1(x):
ci = miρni 1(x)
and since equation 1(ix) has the same form as Fick’s law of diffusion (equation
1(iii), (RTLi /ci ) can be replaced by the diffusion coefficient Di to give equation
1(iii):
Ji = -Di (dci /dx) 1(iii)
From this, by integrating over the thickness of the membrane, we can obtain
equation 1(xi):
Ji ={Di(ci f (m) – ci p (m) )}/l 1(xi)
where l is the thickness of the membrane, the subscript m designates “…of the
membrane”, the subscript f designates the feed side and the subscript p designates
the permeate side.
Recalling the assumption made above, that fluids on either side of a membrane
are in equilibrium with the membrane surface with which they are in contact, it can
then be said that the chemical potential of a component i of a fluid is equal to its
chemical potential at the membrane surface with which it makes contact. Taking the
example of a pervaporation membrane, we can use this assumption to first express
this equilibrium at the feed side of the membrane as equation 1(xii):
µif = µif(m) 1(xii)
which using equation 1(vi) for incompressible liquids becomes equation 1(xiii):
µio + RTln(γif
L nif) + υif(pf – pisat )= µi
o + RTln(γif(m) nif(m)) + υif(m)(pf – pisat ) 1(xiii)
where the superscript L designates liquid phase (rather than G which designates gas
phase). Equation 1(xiii) which becomes equation 1(xiv):
RTln(γif
L nif)= RTln(γif(m) nif(m)) 1(xiv)

41
and thus to equation 1(xv):
nif(m) = (γif
L/ γif(m) ). Nif 1(xv)
Using equation 1(x), equation 1(xv) becomes equation 1(xvi):
cif(m) = (γif
L/ γif(m) ). Cif 1(xvi)
and from equation 1(xvi), one can define a sorption coefficient of component i in
liquid phase as in equation 1(xvii):
KiL = (γif
L/ γif(m) ) = cif(m) /cif 1(xvii)
Therefore, the concentration of permeant i, at the feed side of the membrane is
defined as the sorption coefficient times the concentration of i in the feed solution:
cif(m) = KiL. cif 1(xviii)
If one were to take the example of a dialysis membrane in which both sides of the
membrane are in contact with an incompressible liquid, then the above equations
would be applied to both sides - feed and permeate - to yield two concentration
figures (one for each side of the membrane) which could be substituted into equation
1(xi) to all cancel conveniently leaving us with an expression describing permeation
in a dialysis membrane. In the case of pervaporation however, one side of the
membrane is in contact with a liquid feed, which is described in equations 1(xii) -
1(xviii) above, while the other side of the membrane is in contact with a gaseous
permeate vapour and must be described using equations 1(vii) – 1(x), which is used
to describe chemical potential in compressible gases, as follows:
Equation 1(xix) equates the chemical potential of component i in the permeate
vapour with the chemical potential of component i at the membrane surface it
contacts:
µip = µip(m) 1(xix)
which using equation 1(vii) for compressible gases becomes equation 1(xx):
µio
+ RTln(γip
G nip) + RT ln(pp / pisat ) = µi
o + RTln(γip(m) nip(m)) + υip(m)(pp – pisat ) 1(xx)
This rearranges to give equation 1(xxi):
nip(m) = (γip
G / γip(m)).( pp / pisat).nip .exp[{-υip(m)(pp – pisat )}/RT] 1(xxi)
Since the exponent term in equation 1(xxi) is close to unity, it becomes:

42
nip(m) = (γip
G / γip(m)).nip .(pp / pisat) 1(xxii)
And since the term nip .pp is equivalent to the partial pressure of i in the permeate
vapour it can be written as pip to give equation 1(xxiii):
nip(m) = (γip
G / γip(m)). (pip / pisat) 1(xxiii)
Using equation 1(x), equation 1(xxiii) becomes equation 1(xxiv):
cip(m) = miρm.(γip
Gpip /γip(m) pisat) = Ki
Gpip 1(xxiv)
which gives us a figure for the gas phase sorption coefficient of i in terms of the
concentration of component i at the membrane surface in contact with the permeate
vapour.
If one were to take the example of a gas separation membrane in which both
sides of the membrane are in contact with a compressible gas, then the above
equations would be applied to both sides - feed and permeate - to yield two
concentration figures which could be substituted into equation 1(xi) to all cancel
conveniently leaving us with an expression describing permeation in a gas separation
membrane.
We now have an expression for the concentration of the permeating component,
i, at each surface of the pervaporation membrane. By substituting equations 1(xviii)
and 1(xxiv) into equation 1(xi) we obtain an equation for pervaporation membrane
flux, as shown in equation 1(xxv):
Ji ={Di(KiLci f - Ki
Gpip )}/l 1(xxv)
There is now a problem however: The equation above contains a sorption
coefficient in the liquid phase and another in the gas phase. They must be
interconverted. This is done by making another assumption in the theory, specific to
pervaporation, in addition to those already made in the general theory above: A
hypothetical vapor in equilibrium with the feed solution. This vapor–liquid
equilibrium can then be written:
µio + RTln(γi
L ni
L) + υi(pi – pisat )= µi
o + RTln(γi
G ni
G) + RT ln(pi / pisat ) 1(xxvi)
Following the same logic as that used to go from equation 1(xx) to equation
1(xxiii), equation 1(xxvi) becomes:
niL = γi
G pi/ γi
Lpisat 1(xxvii)

43
Using equation 1(x), this becomes:
ciL=miρ(γi
G pi/ γi
Lpisat ) 1(xxviii)
Which becomes:
ciL= (Ki
G/Ki
L).mi 1(xxix)
Substituting this into equation 1(xxv) yields:
Ji ={Di KiG(pi f - pip )}/l 1(xxx)
wherein pif and pip are the partial vapour pressures of component i on either side of
the membrane.
It should be noted that equation 1(xxix) links the concentration of a sorbed
vapor in the liquid phase(ciL)with the equilibrium partial pressure of the vapor. This
is known as Henry’s law and is more commonly written as:
Hi . ciL= pi 1(xxxi)
Equation 1(xxx) expresses the driving force in pervaporation as the difference in
vapour pressure across the membrane, as first described by Katoaka et al[56]. This
expression has been demonstrated experimentally [57], [58]. The agreement between
experiment and theory demonstrated is good evidence for the veracity of the
solution-diffusion model.
1.2.2 Lateral-Flow Theory
Mass transport in lateral flow membranes is described by capillary flow, with
retention of analyte particles
due to capture by Brownian
diffusion, membrane pore
tortuosity and the
incorporation of surface
charged groups on the
membrane.
Capillary Flow
Capillary flow, or capillary
action, is determined by the surface tension of a liquid which is in turn dependent on
Figure 1.3: Molecular level view of intermolecular forces acting on a molecule at the surface of a liquid compared to those in
the interior

44
its viscosity which is ultimately determined by the attractive forces between the
molecules of a liquid.
A molecule in a liquid is attracted equally in all directions by the molecules
surrounding it, however, for molecules at the liquid surface there can be no attractive
forces from above the liquid. This results in a net inward force on the molecules as
illustrated in figure 1.3.
The net inward force highlighted above pulls molecules from the surface into
the interior of the liquid. This reduces the surface area and causes the molecules at
the surface to pack more closely together than those in the bulk solution below. This
causes the liquid to behave as though it has a skin. The surface tension of a liquid is
the energy required to break this surface skin, represented by, γ. In addition to this
force there is an attraction between the molecules of the liquid and the vessel walls -
also highlighted in figure 3. This is a measure of how much a liquid will wet the
surface of the vessel and is quantified by contact angle, θ. These two forces can
allow us to predict the height, h, to which a liquid will rise when contained in a
columnar vessel of radius, r.
h = 2γcosθ / ρgr 1(xxxi)
where ρ is the density of liquid (mass/volume) and g is local gravitational field
strength (force/unit mass).
For a water-filled glass tube in air
at standard laboratory conditions, γ =
0.0728 N m-1
at 20°C, θ = 20°, ρ is
1000 kg m-3
, and g = 9.81 m s-2
the
height of the water column is: h ≈ (1.48
x 10-5
) / r. Thus for a 4m diameter glass
tube in the laboratory conditions given
above, the water would rise only
0.007 mm. However, for a 4 cm
diameter tube, the water would rise
0.7 mm, and for a 0.4 mm diameter tube, the water would rise 70 mm. This act of
water rising up a narrow tube, or capillary, is known as capillary action. It is by this
mechanism that a liquid travels through the tortuous pores of a lateral flow
Figure 1.4: Flow of liquid up a narrow tube by capillary action and representation of flow
through tortuous pore structure of a membrane by same mechanism

45
membrane, as illustrated in figure 1.5 below. The overall lateral direction of flow (as
distinct from than upward direction) is reliant upon the internal structure of the
membrane being isotropic (explained in section 1.3) and tortuous. It is the generation
of this internal structure to optimise lateral flow rate, which is the objective of this
work.
The means by which a target analyte is retained in the membrane is due to any
one, or all of; Brownian diffusion, membrane pore tortuosity and the incorporation of
surface charged groups on the membrane. In all three cases particles smaller than the
diameter of the pore are captured by adsorption of the particles to the internal surface
of the membrane. The membrane pore tortuosity is such that relatively large particles
cannot flow along the fluid flow lines through the membrane and so impact with the
pore walls and are captured by the specifically functionalized polymer. The retention
of smaller particles is due to Brownian diffusion primarily. Relatively small particles
are carried along the fluid flow lines in the membrane, but are subject to random
Brownian motion[59]. This random motion regularly brings these small particles into
contact with pore walls and they are subsequently captured by surface absorption.
Finally, many colloidal materials carry a small negative charge; through the
incorporation of positively charged surface groups on the membrane, such particles
are captured.
In the case of lateral flow cellulose nitrate membranes, target analyte capture is
achieved through immobilizing antigen on the membrane surface control line as
shown in figure 1.2 above.
1.3 Membrane Structure
& Formation
Membranes fall into two major
categories; isotropic (symmetric) and
anisotropic (asymmetric)[60].
Isotropic membranes have uniform
physical characteristics throughout
their structure, while anisotropic do
not (see figure 1.5). In the cases of the
membranes investigated in this work, they can be produced with either structure. As
Figure 1.5: isotropic vs anisotropic membrane structures in porous and non-porous membranes

46
was highlighted in the opening of this chapter, membranes are cast as thin films of
polymer solutions and then allowed to dry to form the final membrane. The manner
of - and the processes that occur during - drying determines the final membrane
structure. At the beginning of section 1.2 it was pointed out that the membrane
formation processes of lateral flow membranes are far more complex than those of
pervaporation membranes. For this reason this section will start by explaining the
formation of pervaporation membranes, the manipulation of their internal structures
by control of formation processes, outline any structural anomalies that occur and
explain the effect on membrane performance caused by structure. The same will then
be done for the more complicated lateral flow formations.
1.3.1 Pervaporation Membrane Categorisation
Pervaporation membranes can be divided into three groups based on their material
composition: polymeric, inorganic and mixed matrix membranes. All three can be
isotropic or anisotropic.
Polymeric membranes
Composed of dense non-porous polymers and polysaccharides such as poly(vinyl
alcohol) (PVA), poly(imide) (PI), sodium alginate (NaAlg), chitosan, silicon rubber,
etc. Those produced in this project are dense, non-porous, polymeric membranes
composed of sodium alginate, or PVA, or some blend of the two.
Sodium Alginate
Sodium alginate (NaAlg) has long been considered one of the most effective
materials for producing hydrophilic water selective pervaporation membranes for the
dehydration of ethanol. It is a
naturally occurring
polysaccharide obtained from the
cell walls of a class of brown
algae known as
phaeophyceae[61], [62]. With
environmental restrictions coming to bear on industry, ecologically benign materials
such as NaAlg are preferentially sought for industrial applications; its pervaporation
characteristics (high water selectivity with relatively high flux) make it ideal for use
Figure 1.6: Sodium alginate

47
in pervaporation membranes. However, it is mechanically unstable (Young’s
modulus: 5551Mpa [63]); and thin membranes cast from solutions of pure NaAlg are
brittle and prone to cracking, especially in relatively large diameter membranes like
those used in these experiments (membrane diameter: 0.158 m)
Poly(vinyl alcohol)
PVA is the material most commonly used in industrial pervaporation membranes for
the dehydration of alcohols. PVA membranes exhibit high tensile
strength (Young’s Modulus of approximately 1697 Mpa [63]),
elongation, high abrasion resistance and flexibility. Its hydrophilic
nature means it can be utilized as a pervaporation membrane material
but, in comparison with other polymer types it exhibits low water
permselecitivty. Only its mechanical durability has made it the
mainstay of industrial pervaporation membranes.
Polymer Blends
Polymer blend membranes are composed of multiple polymers blended together with
the aim of incorporating the desired features of said polymers (high flux, high
selectivity, structural and thermal stability) into one membrane while minimizing the
undesired features[64].
As was stated above, sodium alginate exhibits high flux and selectivity but is
mechanically weak. Polymer blend membranes are potentially a way of producing
pervaporation membranes with high flux and selectivity combined with durability.
Numerous combinations of materials have been studied with this goal in mind;
particularly the use of high selectivity/high flux polysaccharides with durable
synthetic polymers; chitosan/polysulfone[65], chitosan/polyacrylic acid[23],
chitosan/PVA[24], NaAlg/PVA[25], [63], [66–70], sericin/PVA[22] and
NaAlg/hydroxyehtylcellulose[26]. NaAlg/PVA blends will be produced in this
project with the aim of creating a membrane which has the flux and selectivity of
NaAlg combined with the physical durability of PVA.
Blending changes the properties of the polymers within the blend. A blend will
differ from its component polymers in Young’s moduli and glass transition
temperature as well as flux and selectivity.
Figure 1.7: Poly(vinyl alcohol)

48
Inorganic Membranes
Composed of solid, inorganic, porous materials, these are generally subdivided into
two types; ceramic membranes which are formed from silica; and zeolitic
membranes which are manufactured from aluminasilicates[71].
Ceramics
Ceramic materials are usually silica based although they can be produced from
alumina, titania and zirconia. They are thermally and chemically stable in
comparison with polymer membranes, with high melting points and the ability to
operate over a wide pH range. Being hard materials they also exhibit good
mechanical stability[11].
Chapman et al. [11] found that ceramic membranes do not show the same levels
of selectivity in pervaporation as polymeric membranes do. This property can be
explained by the fact that ceramic membranes contain permanent pores as were
described above.
In general pure ceramic membranes are not used for pervaporation. Instead
they are used as supports for polymers with inferior mechanical properties[27],
[28], [72].
Zeolites
Zeolites are aluminasilicates. They offer a good basis for separation materials
due to their highly ordered porous structure. The size of the pores in a zeolite
particle can vary depending on type. A range of different zeolite structures exist
with different aluminium to silica ratios and pore sizes ranging from 3 Å – 8 Å
[71]. The zeolite type used in this project was zeolite A (MCM41). The crystal
lattice carries a negative charge which is balanced by positive sodium ions
(cations) in the interstices. These cations make the particles very
hydrophilic[73].
As with ceramics; membranes comprised of zeolites exhibit good thermal
and chemical stability and high flux. They differ from ceramic membranes in
that they can exhibit high selectivities. Selectivity as high as 53,989 with a
zeolitic membrane using a water/ethanol feed solution has been reported[74].

49
The high selectivities exhibited by zeolite membranes is due to the molecular
sieving effect of their pores.
Mixed Matrix Membranes (MMMs)
Membrane hybrids incorporating materials from both polymeric and inorganic
membranes, with the aim of obtaining membranes with the best characteristics of
both while eliminating many of the flaws[75]. Those properties exhibited by ceramic
and zeolitic particles have led to much research into incorporating them into
polymeric membranes to increase flux, selectivity and, thermal and mechanical
stability. By incorporating ceramic or zeolitic particles into a polymeric matrix one
will reduce the non-porous nature of the polymer[29], [31], [76], [77]. The inherent
mechanical, chemical and thermal stability of these particles increases that of
polymeric membranes while the inherent brittleness of the ceramic and zeolitic
membranes is alleviated by the rubber-like properties of polymeric membranes.
Chapter 7 will discuss the formation of these membranes in detail.
1.3.2 Pervaporation Membrane Formation
Support
Pervaporation membranes can be
supported or unsupported depending on
the membrane requirements. Supports
provide increased structural integrity for
the selective polymer layer. Our
membranes utilize a 100% polyester
non-woven fabric material to provide structural support. The details of its
construction are outlined in chapter 2.
Selective Layer Casting
The formation of the pervaporation selective layer is through the evaporation of
solvent from the cast polymer solution resulting in densification and drying to yield
the final membrane, which is much thinner than the casting thickness. The rate of
evaporation affects the final structure of the membrane however, rendering it
isotropic or anistropic. (See chapters 5 and 6 for details)
Figure 1.8: Supported pervaporation membrane structure

50
1.3.3 Pervaporation Membranes: Structural Effects & Anomalies
Skin Layers
Yiotis et al have described how polymer films cast from solution are strongly
dependent on evaporation rate[78]. The force of evaporation of the solvent upwards
through the drying polymer matrix drags polymer molecules upwards, resulting in a
higher density of polymer at the air exposed side of the final membrane.
Figure 1.9: Solvent evaporation and polymer density in thick vs thin pervaporation membrane
The rate/force of evaporation is dependent upon the mass and area of the drying
membrane: The greater the area per mass of drying membrane the greater the force
of evaporation. Since the area of the membrane is fixed then only the mass can be
reduced to increase the force of evaporation. This is achieved through thinner
castings of the membrane polymer solution. The greater force of evaporation means
that over the course of the drying period a greater number of polymer molecules are
dragged to the air exposed surface of the thin membrane resulting in a greater
polymer density in the polymer matrix at that side of the membrane. This has the
effect of forming a denser surface layer, known as a skin layer (or diffuse layer). In
thicker cast membranes the skin layer is thinner while for thinner cast membranes
the opposite is true (see figure 1.9 and chapter 5).
Plasticization
Plasticization in a polymer is achieved through an additive plasticizing agent; a
molecule added to lower glass transition temperature, crystallinity or melting
temperature, thereby increasing elasticity[79]. It is believed that this is achieved
through the low molecular weight plasticizer’s thermal motion increasing the

51
polymer’s free volume, which increases the long-range segmental motion of the
polymer molecules (decreasing Young’s modulus)[62]. In the case of highly
hydrophilic polymers such as NaAlg, during pervaporation water can function as a
plasticizing agent as it solvates the membrane and increases polymer chain mobility.
Crosslinking
Crosslinking serves the opposite function of plasticization; where plasticizers
increase polymer chain mobility, crosslinking reduces it. This is achieved by
increasing the number of bonds (crosslinks) between the chains of a polymer to form
a network[62], [79].
Crosslinking can be achieved chemically through the use of additives or
thermally by simple heating[68], [80]. This brings about changes in the polymer
properties; if previously soluble the polymer will no longer dissolve (except when
ionically crosslinked), the glass transition temperature of the polymer is increased
and the flexibility of the polymer is reduced (increasing Young’s modulus). Many of
the properties of crosslinked amorphous polymers resemble those of crystalline
polymers because of the strong secondary forces arising from close chain packing in
crystalline polymers.
Polymer Hydrophilicity/Hydrophobicity
In this project pervaporation membranes are used for the dehydration of ethanol.
This requires that the pervaporation membranes used selectively remove water from
the feed. To aid in this membranes can be produced from polymers which have an
affinity for water, i.e. hydrophilic polymers.
The hydrophilicity of a polymer is determined by the functional groups of the
polymer backbone. Hydrophilicity is due to polarity in a molecule. The more polar a
functional group the more readily it can hydrogen bond with water molecules. In the
case of NaAlg, it is the –COO-Na
+ functional group which makes the polymer
hydrophilic and therefore useful for the dehydration of ethanol. The negative charge
on the oxygen which is stabilised by the sodium counter-ion creates a highly
polarized –COONa functional group which readily hydrogen bonds with water
molecules: Added to this are the numerous –OH functional groups on the polymer

52
backbone which are also polar and form hydrogen bonds. This renders NaAlg a
highly hydrophilic polymer[32].
However, the more hydrophilic a polymer the more water soluble it is. As more
water is absorbed into a membrane from the feed the membrane swells, which
reduces flux, and eventually the membrane begins to dissolve. There are ways of
reducing this without adversely affecting a membrane’s affinity for water: One way
is through cross linking, however, in the case of sodium alginate which has a
Young’s modulus of 5551 Mpa, this results in the polymer becoming too brittle to
use as a membrane material. The solution is to blend the membrane with a less
hydrophilic and more durable polymer such as PVA, as described in section 1.3.1.
Another problem brought about by water solubility is that water – by solvating a
hydrophilic membrane – effectively plasticizes the polymer and reduces the glass
transition temperature of the polymer as it is absorbed into the membrane[52].
Reduction of the glass transition temperature can result in a phase change across the
membrane during pervaporation. This can bring about problems with relaxation of
polymer chains in the glassy phase of membranes.
Glass Transition Temperature
Polymers typically exist in an amorphous state. Depending on thermal conditions a
polymer may exhibit properties of an amorphous glass or those more in common
with a rubber. When a polymer in a rubbery state is cooled, its kinetic energy
decreases; reducing the mobility of the polymer chains. As the temperature decreases
further the motion of the polymer chains becomes restricted to short range vibrations
and rotations and the polymer takes on the properties an amorphous glass. The
temperature at which this transition occurs is known as the glass transition
temperature (Tg)[62].
The Tg of a polymer can be changed by plasticization, crosslinking, blending or
solvation. In this project the membranes utilized are composed of PVA, NaAlg, or
some combination of both: The Tg of NaAlg is reported to be in the region of 119
oC[26], [68]. When combined with PVA in 4:1 ratio of NaAlg:PVA, according to
DSC results, the Tg is lowered to ~96 oC, (see chapter 5) although literature suggests
that it is ~90 OC[26]. The more permeant absorbed in the membrane the greater the
plasticization effect exerted on the polymer chain mobility, resulting in the Tg being

53
reduced[9]. Since pervaporation works through a mechanism of absorption-diffusion
and water is an effective solvent for both sodium alginate and poly(vinyl alcohol),
the Tg of the of the polymer blend is further lowered as the water in the feed solution
diffuses through the membrane polymer matrix. This lowers the Tg to a point where
the higher temperature at the feed side of the membrane is above the Tg meaning the
feed side is in a rubbery state while the permeate side of the membrane is at a
temperature lower than the Tg and so in a glassy state: It follows that there is also a
change in the Young’s modulus across the membrane.
This change in state across the membrane from an amorphous rubbery polymer
to an amorphous glassy polymer creates a common problem in pervaporation
membranes; “relaxation”.
Membrane Polymer Matrix Relaxation
According to Yeom et al[81], since a glass is not in a state of thermodynamic
equilibrium, its physical and mechanical properties change with time as the material
attempts to achieve equilibrium through changes in its molecular configuration
which can induce the release of the formed stress. The release of this formed stress is
known as relaxation, wherein the polymer structure is made denser by the
configurational rearrangement of polymer chains. This increased density brings the
polymer chains into greater proximity and so there is less polymer chain movement
due to entanglement.
The effect of this on the pervaporation performance of a polymer membrane is
that the reduced polymer chain movement and the increased polymer density reduces
the number and fluctuation of the free volume holes within the polymer matrix. This
limits the rate at which molecular diffusion can occur through the membrane;
decreasing the permeate flux of the membrane without any gain in selectivity.
As stated above, there is a change in the Young’s modulus across the membrane:
This ranges from extremely low on the rubbery feed side - meaning that the
relaxation process outlined above would occur almost instantly; to extremely high on
the glassy permeate side - where relaxation would occur over an almost infinite
period due to the lack of mobility of the side groups of the polymer chains. As a
result, equilibrium can never be fully achieved and is instead approached
asymptotically.

54
There is typically a gradual loss in flux over time in a pervaporation experiment:
As the feed solution circulates over the membrane a single component of that feed is
selectively removed. It follows that per unit time there is less of that single
component in the feed solution and so less permeate diffuses through the membrane
per unit time. However, there is an inverse relationship between flux and selectivity,
and as flux gradually decreases with time, selectivity gradually increases. Relaxation
effects are distinct from this typical flux loss in that they are evinced by a sudden and
significant loss in flux with no corresponding gain in selectivity.
1.4 Lateral-Flow Membrane Structure and Formation
1.4.1 Lateral-Flow Membrane Categorisation
Lateral-flow cellulose nitrate based membranes are microporous membranes, the
composition of which is defined by two things primarily; the polymer; cellulose
nitrate, which is derived from cellulose; and the structure, which is formed through a
polymer phase inversion process. As mentioned previously, the formation of lateral-
flow membranes is more complex than that of pervaporation membranes.
Cellulose Nitrate
Cellulose nitrate is prepared from cellulose and
nitric acid, usually in the presence of sulphuric acid,
although phosphoric or acetic acids may also be
used. The degree of nitration varies according to
application; cellulose containing 10 – 11 % nitrogen
is mainly used for lacquers or plastics, while
cellulose containing about 13.5 % is used for
explosives. Completely nitrated cellulose contains
about 14.14 % nitrogen, [62] and is hydrophobic[82][83].
Cellulose, a polysaccharide consisting of a linear chain of several hundred to
over ten thousand β(1→4) linked D-glucose units, is the most abundant organic
compound on the planet[62], being the structural component of the primary cell wall
of plants, many forms of algae and the oomycetes.
Figure 1.10: Cellulose nitrate

55
Approximately a third of all plant matter is cellulose, averaging about 50 % in
typical wood and comprising 85-90 % of cotton. Variability in the cellulose source
will produce variability in cellulose nitrate, the density of which can range, as a
result, from 1300 to 1400 kg m-3
. Achieving consistency in membrane characteristics
from batch to batch therefore becomes difficult, which is a primary concern for
industrial scale manufacturers.
1.4.2 Lateral-Flow Membrane Formation
Support
Cellulose nitrate lateral flow membranes produced in this project were formed on
supports. After formation they could be removed from these supports for analysis.
The support material used was a 100 % polyester film (Melinex). This provided
physically durable support material for the active membrane layer and polymer
solutions were cast directly onto it.
Phase Inversion: Formation of Pore Structure
The internal pore structure of CN lateral-flow membranes is formed through a
polymer phase inversion process. During a phase inversion the phases of a liquid-
liquid dispersion interchange such that the dispersed phase spontaneously inverts to
become the continuous phase and vice versa, under conditions determined by the
system properties, volume ratio and energy input[84].
Phase inversion was first identified in 1956 by Rodger et al[85]. However, the
precise physical processes which drive it have yet to be fully understood. No models
which can accurately describe the process have been developed. What has been
established is that phase inversion is a sensitive process, affected by many
Figure 1.11: Cellulose

56
parameters; solution concentration, viscosity, surface tension, density, temperature,
humidity, container geometry, agitation and flow[86].
Phase inversion can be regarded as an instability of the system, the stability of
the dispersion being least at the point of phase inversion (cloud point), beyond which
a spontaneous inversion of the phases of the solution occurs. The way in which a
phase inversion is precipitated dictates the morphology of the final structure of our
polymer.
Phase inversion mechanisms can generally be subdivided in three main
categories depending on the parameters that induce demixing. By changing the
temperature at the interface of the polymer solution, heat will be exchanged and
demixing can be induced (temperature induced phase separation or TIPS)[87]. The
polymer solution can also be subjected to a reaction which causes phase separation
(reaction induced phase separation or RIPS)[88]. The most used technique is based
on diffusion induced phase separation (DIPS); this method can be subdivided into
vapour induced phase separation (VIPS) [89] and immersion phase separation (IIPS).
By contacting a polymer solution to a vapour or liquid, diffusional mass exchange
will lead to a change in the local composition of the polymer film and demixing can
be induced. In this project, all effective CN membranes are formed through VIPS,
with atmospheric moisture acting as the non-solvent to precipitate the phase
inversion (by comparison, the PAN supports described in section 1.3.2 were
prepared by IIPS).
In all cases the phase inversion process is the same. When a polymer solution is
in a single phase the polymer is stable in the solvent. The addition of a nonsolvent
decreases the thermodynamic stability of the solution as the relative concentration of
the solvent decreases. At the critical concentration of nonsolvent, the polymer
desolves, the solution becomes thermodynamically unstable, and two liquid phases
are formed. The solid polymer rich phase forms the rigid matrix of the membrane
while the liquid polymer lean phase forms the pores of the membrane[90], finally the
loss of solvent precipitates the membrane morphology[91]. This process is outlined
in figure 1.12 below.

57
Figure 1.12: Phase inversion in polymer solution
All these factors, including the manner of phase inversion, determine the final
pore structure of the polymer. The general pore structure of a membrane is defined
by two processes; spinodal decomposition and nucleation and growth[89], [92], [93].
Spinodal Decomposition, Nucleation and Growth
Phase separation is thermodynamically possible in the unstable region of the phase
diagram. The unstable region is defined by the spinodal (see figure 1.13). When a
system has crossed this region, phase separation occurs spontaneously without the
presence of a nucleation step. This process is known as spinodal decomposition
(SD)[94]. It is also possible for this process to occur more slowly, where the polymer
solution system leaves the
thermodynamically stable
region and enters the
metastable between the
spinodal and binodal of the
phase diagram. Nucleation
and growth (NG) is the
expected mechanism here
(see figure 1.13). Dispersed
nuclei are formed and
become stable if the
activation energy for nuclei formation is higher than their surface free energy[92].
Figure 1.13: Binodal and spinodal in phase diagram

58
In the case of a polymer solution like those in this project the single phase is the
dissolved polymer casting solution while the dual phase consists of a polymer-rich
region (comprised of polymer and solvent) and a polymer-lean region (comprised of
the non-solvent; water). The nucleation and growth of the polymer-lean phase
precipitates the formation of pockets of nonsolvent. These non-solvent globules form
the nascent pores of the final membrane structure, while the surrounding polymer-
rich phase, upon drying, forms the polymer walls [95].
Cloud Point
The cloud point is defined as temperature/non-solvent concentration at which phase
separation occurs for a 1 wt% polymer solution due to the increased turbidity of the
system as this temperature/non-solvent concentration is reached[96]. Beyond this
point phase separation of the polymer solution occurs.
Despite the rigid definition given above, it has been found through
experimentation that the turbidity which defines the cloud point occurs over a range
of non-solvent concentration. Turbidity begins in solution but agitation through
stirring causes it re-dissolve [85]. While stirring the solution, turbidity will
eventually become permanent; beyond this point phase inversion occurs.
The closer to this point one takes a solution the more crystalline it becomes and
the more porous is the membrane produced. It also reduces diffuse layer formation,
for this reason, polymer solutions were brought to cloud point (taken as the time
when turbidity remains in solution for three minutes with stirring) using a burette to
add the non-solvent to the solution. For the sake of comparison a non-cloud point
solution equivalent was also produced and cast. By adding non-solvent with the
burette the original concentration of the non-solvent in the solution is, of course,
changed. The final figure for the percentage of non-solvent in the solution must be
adjusted accordingly using the titration figure.
1.4.3 Lateral-Flow Membrane: Structural Effects and Anomalies
Skin layers
The mechanism for skin-layer formation in a phase inverting polymer layer is
generally the same as that described in section 1.3.3 above, but with one notable
exception: In pervaporation membranes there is only a polymer dissolved in solvent

59
solution and the subsequent drying and solidification of the non-porous membrane;
in lateral flow membranes there is not only a polymer dissolved in solvent but also a
non-solvent to precipitate phase inversion; the affinity that the solvent and non-
solvent have for each other has a significant effect upon the formation of the diffuse
layer and therefore on the overall membrane structure.
Young et al [95] consider the diffusion ratio of the solvent and non-solvent from
the cast polymer solution in membrane formation and assume that the rate of
evaporation, i.e. the diffusion, of each from the membrane can be considered as a
single value which is a ratio of their respective diffusions:
k = ñ1/ñ2 1(xxxiii)
Where k is the diffusion ratio of solvent to non-solvent and n1 and n2 are the
diffusion fluxes of solvent and non-solvent respectively. When the solvent and non-
solvent have a high affinity for each other k has a low value and when they have a
low affinity for each other k has a large value.
The diffuse layer forms in the same manner as that described in pervaporation
membranes, once it has formed however, it effects the structure of the porous
membrane layer below it: If k is very large then the solvent diffuses rapidly from the
membrane; this creates a dense diffuse layer which will increase the barrier to
diffusion of solvent from the membrane structure below which creates an
asymmetric, anhomogenous membrane structure in the sub-layers. Conversely, if k
has a low value then solvent will diffuse more slowly and so the diffuse layer formed
will be less dense, presenting less of a barrier to solvent diffusion creating a more
symmetrically porous, homogenous membrane structure in the membrane sublayers.
Controlling the affinity that the solvent and non-solvent have for one another is
important as skin layers prevent lateral flow of fluids though the pore network of the
membrane, rendering them of little value.
Demixing Front & Surface Tension
The force of evaporation of the polymer solvent upwards through the drying polymer
matrix drags polymer molecules upwards with it. As the solvent evaporates from the
membrane the relative concentration of non-solvent increases in the solution until
demixing occurs resulting in phase inversion. This creates a demixing front which

60
passes down through the membrane from the air exposed surface. At the air exposed
surface of the membrane the rate of evaporation is at its highest, resulting in the
greatest density of polymer molecules which creates a diffuse or skin layer. The rate
of solvent evaporation decreases as the demixing front moves back from the air
exposed surface and layers of polymer build up above it[78]. As the polymer
solution solidifies there is an increase in surface tension at the demixing front above
that of the bulk polymer solution below it. Higher surface tension causes the
stretching of pores formed through NG, increasing their size significantly.
Macrovoids
According to Ahmad et al[52] macrovoids are channel like structures which form
within the internal structure of lateral flow membranes if the polymer solution is cast
above 800 µm thickness when utilising VIPS. Ahmad et al, contradict this in later
work where macrovoid formation is observed at under 200 µm cast thickness [97].
The proposed theory for macrovoid formation is that it is due to the diffusion
and displacement of solvent and non-solvent in the casting film. Therefore, when the
casting film is thin, there are no macrovoids formed in the sublayers of the
membrane due to insufficient space to allow the macrovoids to appear between the
film surface and bottom. A thicker initial casting film results in the formation of
higher numbers of macrovoids by lowering the initial solvent outflow in the
sublayers of the membrane [52].
As the polymer solution solidifies there is an increase in surface tension at the
demixing front above that of the bulk polymer solution below it. This generates a
surface-tension gradient through the polymer solution which generates a surface-
tension gradient along the macrovoid/casting solution interface that facilitates
macrovoid growth in conjunction with a viscous drag-force that resists macrovoid
growth; and a gravitationally induced body force that can either resist or promote
MV growth, depending on its orientation[16], [24]. This process is referred to as
solutocapillary convection [100], [101]. According to Khare et al,[98] it causes the
macrovoid/casting solution interface to experience motion from the leading edge
(low surface tension) to the trailing edge (high surface tension) of the macrovoid.
This results in a force on the growing macrovoid that propels it away from the
demixing front and into the underlying bulk solution. Continuity of velocity

61
requirements of the macrovoid/casting solution interface result in the development of
convection cells inside the macrovoid. The overall effect is to enhance the mass
transfer of non-solvent into the growing macrovoid. This is shown in figure 1.14.
Macrovoids, like skin layers, inhibit or retard lateral flow in the membrane, reducing
their efficacy.
Figure 1.14: Soluto-capillary convection macrovoid formation
Nodules
Within a polymer solution, the onset of crystallinity during drying (known as
nucleation), can occur. This process can occur randomly throughout the matrix as
polymer molecules begin to align (homogeneous nucleation) or at the interface of an
impurity (heterogeneous nucleation). Nucleation about an impurity results in a
number of semi-crystalline morphologies observed in membranes; spherulites -
which are aggregates of small hair-like strands called fibrils; epitaxials - which are
defined by one crystalline growth on another [62]. However, while these
morphologies can occur within a lateral flow membrane matrix they are rare in
comparison with another crystalline morphology; nodules.
Nodules are spherical morphologies that occur in membranes due to coarsening.
Coarsening occurs when the two separated phases in an instantaneous phase
inversion build up energy at interfacial regions between them, which makes the
solution unstable. Stability is regained by dissipating this energy into coarsening;
which is the formation of droplets of semi-crystalline polymer at the interfacial
regions. From these droplets nodules are formed[102]. The further from

62
instantaneous (or binodal) the phase inversion is, the less coarsening will occur.
Therefore, if the affinity of the solvent for the non-solvent is increased, the phase
inversion will proceed more through the spinodal region of nucleation and growth
[95] and reduce the degree of coarsening and so the eventual number of nodules.
However this effect is offset to a degree by the crystallinity of a polymer solution.
The formation of nodules in phase separating membranes is described by the
Ostwald ripening process, wherein two assumptions are made: the area fraction of
the dispersed phase is small, and the chemical potential of a coarsening droplet is
directly proportional to its curvature. Based on this second assumption, smaller
particles with high curvature are unstable, and larger particles tend to grow by
dissolution of the smaller particles in an evaporation-condensation mechanism[93],
[102].
By the logic stated above it is expected that as the solvent used in the production
of our membranes (ethanol/acetone) increases in affinity (by addition of ethanol) for
the non-solvent (water), the number of nodules should increase up to a maximum
concentration of ethanol. This is because ethanol increases the crystallinity of the
solution (as it is not an effective solvent for cellulose nitrate) thus increasing the
number of nodules (which are formed from crystalline polymer), while increasing
the affinity of the non-solvent (water) for the solvent, which decreases the
coarsening effect as the phase separation occurs more through the spinodal region,
countering the increase in the crystallinity of the solution: Thus once a point is
reached, beyond the maximum nodule formation, where the affinity of the solvent
for the non-solvent outweighs the increase in polymer crystallinity, there will be a
decrease in the number of nodules formed.
There is no literature evidence to suggest that nodules have any adverse effect
on lateral flow performance, however, they do create problems industrially; forming
a fine powder on membrane production lines.
1.5 Summary
When producing membranes from thin cast films of polymer solutions, the rate of
evaporation of solvent from the drying membrane is the predominant force is
defining the membrane structure. In the case of pervaporation membranes, the
formation process is relatively simple and the rate of evaporation is the only

63
significant force determining the final membrane structure. The force of evaporation
evinces itself in the formation of skin layers at the membrane surface. The force is
dictated by the rate of evaporation which can be controlled through the solvent
volatility or the volume:area ratio of the drying membrane. Skin layer density and
thickness can be controlled to enhance pervaporation performance.
By comparison, during the formation of lateral flow membranes the rate of
evaporation of solvent is not the only significant force present: The phase inversion
process has equal gravitas. As with pervaporation membranes the rate of evaporation
can lead to the formation of skin layers, and this rate is controlled as described
above. The evaporation process occurs separately and concurrently to SD and NG.
The higher the rate of solvent evaporation from the system, the greater the surface
tension at the demixing front, which has an effect on formed pores; stretching them.
This also has an effect if any macrovoids begin to form within the drying membrane,
as the increased surface tension contributes to their growth. Skin layers and
macrovoids are undesirable in lateral flow membranes as they inhibit and retard the
rate of lateral flow.
In summation, controlling the rate of solvent evaporation from drying castings
of polymer solutions is of paramount importance in determining the final structure of
the membrane to be formed as the membrane structures determine their efficacy in
pervaporation - in the case of pervaporation membranes - and as diagnostic materials
- in the case of lateral flow membranes.

64
References: Chapter 1
[1] A. J.-A. Nollet, “Investigations on the Causes for the Ebullition of Liquids,”
Histoire Académie Royale des Sciences, Math. et Phys., pp. 57–104, 1752.
[2] R. J. H. Dutrochet, “Nouvelles Observations sur l’Endosmose et l'Exosmose,
et sur la cause de ce double phénomène,” Annales de Chimie et de Physique,
vol. 35, pp. 393–400, 1827.
[3] A. Fick, “Uber Diffusion,” Annalen der Physik, vol. 170, no. 1, pp. 59–86,
1855.
[4] M. Traube, “Experimente zur Theorie der Zellenbildung und Endosmose,”
Archiv fúr Anatomie und Physiologie und wissenschaftliche Medizin, pp. 87–
128; 129–165, 1867.
[5] W. Pfeffer, Osmotische Untersuchungen: Studien zur Zeil-Mechanik.
Engelmann, Leipzig.
[6] J. H. Van’t-Hoff, “Die Rolle des osmotischen Druckes in der Analogie
zwischen Lösungen und Gasen,” Zeitschrift für Physikalische Chemie, vol. 1,
no. 1, pp. 481–508, 1887.
[7] P. A. Kober, “Pervaporation, perstillation and percrystallisation,” Journal of
the American Chemical Society, vol. April, no. 39, pp. 944–948, 1917.
[8] S. S. Sidney Loeb, “Sea Water Demineralization by Means of an Osmotic
Membrane,” in Saline Water Conversion—II, American Chemical Society,
1963, pp. 117–132.
[9] R. W. Baker, Membrane Technology and Applications, 2nd ed. John Wiley
and Sons, Ltd., 2007.
[10] R. Singh, Hybrid Membrane System for Water Purification, 1st ed. Elsevier,
2006, p. 291.
[11] P. D. Chapman, T. Oliveira, A. G. Livingston, and K. Li, “Membranes for the
dehydration of solvents by pervaporation,” Journal of Membrane Science, vol.
318, no. 1–2, pp. 5–37, Jun. 2008.
[12] A. Jonquières, “Industrial state-of-the-art of pervaporation and vapour
permeation in the western countries,” Journal of Membrane Science, vol. 206,
no. 1–2, pp. 87–117, Aug. 2002.
[13] P. Shao and R. Huang, “Polymeric membrane pervaporation,” Journal of
Membrane Science, vol. 287, no. 2, pp. 162–179, Jan. 2007.
[14] J. Gmehling, J. Menke, J. Krafczyk, and K. Fischer, Azeotropic Data, 2nd
Edition. 2004.

65
[15] J. Gmehling, B. Kolbe, M. Kleiber, and J. Rarey, Chemical Thermodynamics.
2012, pp. 82–90.
[16] J. Gmehling, J. Menke, J. Krafczyk, and K. Fischer, Azeotropic Data, 2nd
Edition. 2004.
[17] S. A. Zumdahl and S. A. Zumdahl, “11.4 Vapour Pressures of Solutions,” in
Chemistry, 8th ed., Charles Hartford, 2010, pp. 509–516.
[18] S. A. Zumdahl and S. A. Zumdahl, “11.4 Vapour Pressures of Solutions,” in
Chemistry, 8th ed., Charles Hartford, 2010, pp. 509–516.
[19] J. Gmehling, B. Kolbe, M. Kleiber, and J. Rarey, Chemical Thermodynamics.
2012, pp. 82–90.
[20] D. D. Ebbing and S. D. Gammon, “Chapter 12.5: Vapour Pressure of a
Solution,” in General chemistry, 9th ed., Charles Hartford, 2007, pp. 496–
500.
[21] D. E. Goldberg, “15.6 Colligative Properties,” in Fundamentals of Chemistry,
5th Editio., The McGraw-Hill Companies, 2007, pp. 417–419.
[22] M. Gimenes, L. Liu, and X. Feng, “Sericin/poly(vinyl alcohol) blend
membranes for pervaporation separation of ethanol/water mixtures,” Journal
of Membrane Science, vol. 295, no. 1–2, pp. 71–79, May 2007.
[23] Jyh-Jeng Shieh and R. Y. M. Huang, “Pervaporation with chitosan
membranes II. Blend membranes of chitosan and polyacrylic acid and
comparison of homogeneous and composite membrane based on
polyelectrolyte complexes of chitosan and polyacrylic acid for the separation
of ethanol-water mixture,” Journal of Membrane Science, vol. 127, no. 2, pp.
185–202, 1997.
[24] B. Li, Z. Xu, F. Alsalhyqusay, and R. Li, “Chitosan-poly (vinyl alcohol)/poly
(acrylonitrile) (CS–PVA/PAN) composite pervaporation membranes for the
separation of ethanol–water solutions,” Desalination, vol. 193, no. 1–3, pp.
171–181, May 2006.
[25] M. D. Kurkuri, U. S. Toti, and T. M. Aminabhavi, “Syntheses and
characterization of blend membranes of sodium alginate and poly(vinyl
alcohol) for the pervaporation separation of water + isopropanol mixtures,”
Journal of Applied Polymer Science, vol. 86, no. 14, pp. 3642–3651, Dec.
2002.
[26] B. Kumarnaidu, M. Sairam, K. Raju, and T. Aminabhavi, “Thermal,
viscoelastic, solution and membrane properties of sodium
alginate/hydroxyethylcellulose blends,” Carbohydrate Polymers, vol. 61, no.
1, pp. 52–60, Jul. 2005.

66
[27] T. Peters, C. Poeth, N. Benes, H. Buijs, F. Vercauteren, and J. Keurentjes,
“Ceramic-supported thin PVA pervaporation membranes combining high flux
and high selectivity; contradicting the flux-selectivity paradigm,” Journal of
Membrane Science, vol. 276, no. 1–2, pp. 42–50, May 2006.
[28] Y. Zhu, S. Xia, G. Liu, and W. Jin, “Preparation of ceramic-supported
poly(vinyl alcohol)–chitosan composite membranes and their applications in
pervaporation dehydration of organic/water mixtures,” Journal of Membrane
Science, vol. 349, no. 1–2, pp. 341–348, Mar. 2010.
[29] Z. Huang, Y. Shi, R. Wen, Y. Guo, J. Su, and T. Matsuura, “Multilayer
poly(vinyl alcohol)–zeolite 4A composite membranes for ethanol dehydration
by means of pervaporation,” Separation and Purification Technology, vol. 51,
no. 2, pp. 126–136, Sep. 2006.
[30] H. Guan, T. Chung, Z. Huang, M. Chng, and S. Kulprathipanja, “Poly(vinyl
alcohol) multilayer mixed matrix membranes for the dehydration of ethanol–
water mixture,” Journal of Membrane Science, vol. 268, no. 2, pp. 113–122,
Jan. 2006.
[31] M. Patil, R. Veerapur, S. Patil, C. Madhusoodana, and T. Aminabhavi,
“Preparation and characterization of filled matrix membranes of sodium
alginate incorporated with aluminum-containing mesoporous silica for
pervaporation dehydration of alcohols,” Separation and Purification
Technology, vol. 54, no. 1, pp. 34–43, Mar. 2007.
[32] R. Y. M. Huang, R. Pal, and G. Y. Moon, “Characteristics of sodium alginate
membranes for the pervaporation dehydration of ethanol–water and
isopropanol–water mixtures,” Journal of Membrane Science, vol. 160, no. 1,
pp. 101–113, Jul. 1999.
[33] L. Mocé-Llivina, J. Jofre, X. Méndez, D. Akkelidou, F. Lucena, and G. T.
Papageorgiou, “Counting cytopathogenic virus adsorbed to cellulose nitrate
membrane filters as a simple method for counting viruses in raw sewage and
sewage effluents.,” Journal of virological methods, vol. 102, no. 1–2, pp. 83–
92, Apr. 2002.
[34] G. T. Papageorgiou, L. Mocé-Llivina, C. G. Christodoulou, F. Lucena, D.
Akkelidou, E. Ioannou, and J. Jofre, “A Simple Methodological Approach for
Counting and Identifying Culturable Viruses Adsorbed to Cellulose Nitrate
Membrane Filters,” Applied and Environmental Microbiology, vol. 66, no. 1,
pp. 194–198, 2000.
[35] J. D. Czerwinski, S. C. Hovan, and D. P. Mascotti, “Quantitative nonisotopic
nitrocellulose filter binding assays: bacterial manganese superoxide
dismutase-DNA interactions.,” Analytical biochemistry, vol. 336, no. 2, pp.
300–4, Jan. 2005.
[36] M. S. Levy, I. J. Collins, J. T. Tsai, P. a Shamlou, J. M. Ward, and P. Dunnill,
“Removal of contaminant nucleic acids by nitrocellulose filtration during

67
pharmaceutical-grade plasmid DNA processing.,” Journal of biotechnology,
vol. 76, no. 2–3, pp. 197–205, Jan. 2000.
[37] R. Grunow, W. Splettstoesser, S. McDonald, C. Otterbein, T. O’Brien, C.
Morgan, J. Aldrich, E. Hofer, E.-J. Finke, and H. Meyer, “Detection of
Francisella tularensis in Biological Specimens Using a Capture Enzyme-
Linked Immunosorbent Assay, an Immunochromatographic Handheld Assay,
and a PCR,” Clinical and Diagnostic Laboratory Immunology, vol. 7, no. 1,
pp. 86–90, 2000.
[38] S. Aidoo, W. K. Ampofo, J. A. M. Brandful, S. V. Nuvor, J. K. Ansah, N. Nii-
Trebi, J. S. Barnor, F. Apeagyei, T. Sata, D. Ofori-Adjei, and K. Ishikawa,
“Suitability of a Rapid Immunochromatographic Test for Detection of
Antibodies to Human Immunodeficiency Virus in Ghana, West Africa,”
Journal of Clinical Microbiology, vol. 39, no. 7, pp. 2572–2575, 2007.
[39] H. Arai, B. Petchclai, K. Khupulsup, T. Kurimura, and K. Takeda,
“Evaluation of a Rapid Immunochromatographic Test for Detection of
Antibodies to Human Immunodeficiency Virus,” Journal of Clinical
Microbiology, vol. 37, no. 2, pp. 367–370, 1999.
[40] M. Guan, H. Y. Chen, S. H. Foo, Y.-J. Tan, P.-Y. Goh, and S. . Wee,
“Recombinant Protein-Based Enzyme-Linked Immunosorbent Assay and
Immunochromatographic Tests for Detection of Immunoglobulin G
Antibodies to Severe Acute Respiratory Syndrome (SARS) Coronavirus in
SARS Patients,” Clinical and Diagnostic Laboratory Immunology, vol. 11,
no. 2, pp. 287–291, 2004.
[41] S. K. Lam and P. L. Devine, “Evaluation of capture ELISA and rapid
immunochromatographic test for the determination of IgM and IgG antibodies
produced during dengue infection.,” Clinical and diagnostic virology, vol. 10,
no. 1, pp. 75–81, May 1998.
[42] R.-H. Shyu, H.-F. Shyu, H.-W. Liu, and S.-S. Tang, “Colloidal gold-based
immunochromatographic assay for detection of ricin.,” Toxicon : official
journal of the International Society on Toxinology, vol. 40, no. 3, pp. 255–8,
Mar. 2002.
[43] A. L. Ahmad, S. C. Low, S. R. A. Shukor, and A. Ismail, “Synthesis and
Characterization of Polymeric Nitrocellulose Membranes : Influence of
Additives and Pore Formers on the Membrane Morphology,” Journal of
Applied Polymer Science, vol. 108, no. 4, pp. 2550–2557, 2008.
[44] U. Divrikli, A. A. Kartal, M. Soylak, and L. Elci, “Preconcentration of Pb(II),
Cr(III), Cu(II), Ni(II) and Cd(II) ions in environmental samples by membrane
filtration prior to their flame atomic absorption spectrometric
determinations.,” Journal of hazardous materials, vol. 145, no. 3, pp. 459–64,
Jul. 2007.

68
[45] I. Narin, “Enrichment and determinations of nickel(II), cadmium(II),
copper(II), cobalt(II) and lead(II) ions in natural waters, table salts, tea and
urine samples as pyrrolydine dithiocarbamate chelates by membrane
filtration–flame atomic absorption spectrometry co,” Analytica Chimica Acta,
vol. 493, no. 2, pp. 205–212, Oct. 2003.
[46] T. Shimizu, “Extraction of Trace Amounts of Copper(II) on a Membrane
Filter Using 5,10,15,20-Tetraphenyl-21H,23H-porphinetetrasulfonic Acid for
the Determination by Solid-Phase Spectrophotometry.,” Analytical Sciences,
vol. 15, no. 2, pp. 153–157, 1999.
[47] M. Soylak and R. S. Cay, “Separation/preconcentration of silver(I) and
lead(II) in environmental samples on cellulose nitrate membrane filter prior to
their flame atomic absorption spectrometric determinations.,” Journal of
hazardous materials, vol. 146, no. 1–2, pp. 142–7, Jul. 2007.
[48] M. Soylak, U. Divrikli, L. Elci, and M. Dogan, “Preconcentration of Cr(III),
Co(II), Cu(II), Fe(III) and Pb(II) as calmagite chelates on cellulose nitrate
membrane filter prior to their flame atomic absorption spectrometric
determinations.,” Talanta, vol. 56, no. 3, pp. 565–70, Mar. 2002.
[49] A. Elik, “Heavy Metal Accumulation in Street Dust Samples in Sivas,”
Communications in Soil Science and Plant Analysis, vol. 34, no. 1&2, pp.
145–156, Feb. 2003.
[50] E. Kendüzler, “Atomic absorption spectrophotometric determination of trace
copper in waters, aluminium foil and tea samples after preconcentration with
1-nitroso-2-naphthol-3,6-disulfonic acid on Ambersorb 572,” Analytica
Chimica Acta, vol. 480, no. 2, pp. 259–266, Mar. 2003.
[51] N. Yunes, S. Moyano, S. Cerutti, J. Gasquez, and L. Martinez, “On-line
preconcentration and determination of nickel in natural water samples by flow
injection-inductively coupled plasma optical emission spectrometry (FI-ICP-
OES),” Talanta, vol. 59, no. 5, pp. 943–949, Apr. 2003.
[52] A. L. Ahmad, S. Low, and S. Shukor, “Effects of membrane cast thickness on
controlling the macrovoid structure in lateral flow nitrocellulose membrane
and determination of its characteristics,” Scripta Materialia, vol. 57, no. 8, pp.
743–746, Oct. 2007.
[53] J. G. Wijmans and R. W. Baker, “The solution-diffusion model : a review,”
Journal of Membrane Science, vol. 107, no. 1–2, pp. 1–21, 1995.
[54] M. Smit, H. V. Mulder, C. A. Smolders, H. Karrenbeld, J. Van Eerden, and D.
Feil, “Modelling of the diffusion of carbon dioxide in polyimide matrices by
computer simulation,” Journal of Membrane Science, vol. 73, no. 2, pp. 247–
257, 1992.

69
[55] R. W. Baker, “Chapter 2: Membrane Trasport Theories,” in Membrane
Technology and Applications, 2nd ed., John Wiley & Sons Ltd., 2007, pp. 15–
42.
[56] T. Kataoka, T. Tsuro, S.-I. Nakao, and S. Kimura, “Membrane Transport
Properties of Pervaporation and Vapor Permeation in an Ethanol–Water
System Using Polyacrylonitrile and Cellulose Acetate Membranes,” Journal
of Chemical Engineering, Japan, vol. 326, no. 24, 1991.
[57] F. W. Greenlaw, W. D. Prince, R. A. Shelden, and E. V. Thompson,
“Dependence of Diffusive Permeation Rates by Upstream and Downstream
Pressures,” Journal of Membrane Science, vol. 2, no. 141, 1977.
[58] J. G. Wijmans and R. W. Baker, “A Simple Predictive Treatment of the
Permeation Process in Pervaporation,” Journal of Membrane Science, vol.
101, no. 79, 1993.
[59] W. B. Russel, “Brownian Motion of Small Particles Suspended in Liquids,”
Annual Review of Fluid Mechanics, vol. 13, no. 1, pp. 425–455, 1981.
[60] J. M. Coulson and J. F. Richardson, “Chapter 8: Membrane Separation
Processes,” in Coulson an Richardson’s Chemical Engineering: Particle
Technology and Separation Processes, vol. 2, 5th ed., 5th ed., 2002, p. 437.
[61] L. Barsanti and P. Gualtieri, Algae: Anatomy, Biochemistry, and
Biotechnology, 1st ed. Taylor & Francis, 2006.
[62] M. P. Stevens, Polymer Chemistry: An Introduction, 1st ed. Oxford University
Press, Inc., 1999.
[63] R. Russo, M. Malinconico, L. Petti, and G. Romano, “Physical behavior of
biodegradable alginate-poly(vinyl alcohol) blend films,” Journal of Polymer
Science Part B: Polymer Physics, vol. 43, no. 10, pp. 1205–1213, May 2005.
[64] L. A. Utracki, Polymer Blends Handbook, Vol. 1-2, vol. 1. Kluwer Academic
Publishers, 2002.
[65] X. Feng and R. Y. M. Huang, “Pervaporation with chitosan membranes. I.
Separation of water from ethylene glycol by a chitosan/polysulfone composite
membrane,” Journal of Membrane Science, vol. 116, no. 1, pp. 67–76, 1996.
[66] T. Çaykara and S. Demirci, “Preparation and Characterization of Blend Films
of Poly(Vinyl Alcohol) and Sodium Alginate,” Journal of Macromolecular
Science, Part A, vol. 43, no. 7, pp. 1113–1121, Jul. 2006.
[67] C. K. Yeom and K.-H. Lee, “Characterization of sodium alginate and
poly(vinyl alcohol) blend membranes in pervaporation separation,” Journal of
Applied Polymer Science, vol. 67, no. 5, pp. 949–959, Jan. 1998.

70
[68] K. Miura, N. Kimura, H. Suzuki, Y. Miyashita, and Y. Nishio, “Thermal and
viscoelastic properties of alginate/poly(vinyl alcohol) blends cross-linked with
calcium tetraborate,” Carbohydrate Polymers, vol. 39, no. 2, pp. 139–144,
Jun. 1999.
[69] J. Jegal and K. H. Lee, “Pervaporation separation of water-ethanol mixtures
through PVA-Sodium alginate blend membranes,” Journal of Applied
Polymer Science, vol. 61, no. 2, pp. 389–392, Mar. 2003.
[70] K. Wu, Z. Xu, and Y. Wei, “Sodium alginate-polyvinyl alcohol/polysulfone
(SA-PVA/PSF) hollow fiber composite pervaporation membrane for
dehydration of ethanol-water solution,” Journal of Shanghai University
(English Edition), vol. 12, no. 2, pp. 163–170, May 2008.
[71] R. W. Broach, “Zeolite Types and Structures,” in Zeolites in Industrial
Separation and Catalysis, Wiley-VCH Verlag GmbH & Co. KGaA, 2010, p.
27.
[72] R. Kreiter, D. Wolfs, C. Engelen, H. Vanveen, and J. Vente, “High-
temperature pervaporation performance of ceramic-supported polyimide
membranes in the dehydration of alcohols,” Journal of Membrane Science,
vol. 319, no. 1–2, pp. 126–132, Jul. 2008.
[73] C.-Y. Chen, H.-X. Li, and M. E. Davis, “Studies on mesoporous materials: I.
Synthesis and characterization of MCM-41,” Microporous Materials, vol. 2,
no. 1, pp. 17–26, 1993.
[74] A. Vandenberg, L. Gora, J. Jansen, M. Makkee, and T. Maschmeyer, “Zeolite
A membranes synthesized on a UV-irradiated TiO coated metal support: the
high pervaporation performance,” Journal of Membrane Science, vol. 224, no.
1–2, pp. 29–37, Oct. 2003.
[75] C. Liu and S. Kulprathipanja, “Mixed - Matrix Membranes,” in Zeolites in
Industrial Separation and Catalysis, 2010, pp. 329–353.
[76] S. Bhat, B. Naidu, G. Shanbhag, S. Halligudi, M. Sairam, and T. Aminabhavi,
“Mesoporous molecular sieve (MCM-41)-filled sodium alginate hybrid
nanocomposite membranes for pervaporation separation of water –
isopropanol mixtures,” Separation and Purification Technology, vol. 49, no.
1, pp. 56–63, Apr. 2006.
[77] Z. Huang, H. Guan, W. Tan, X. Qiao, and S. Kulprathipanja, “Pervaporation
study of aqueous ethanol solution through zeolite-incorporated multilayer
poly(vinyl alcohol) membranes: Effect of zeolites,” Journal of Membrane
Science, vol. 276, no. 1–2, pp. 260–271, May 2006.
[78] A. G. Yiotis, I. N. Tsimpanogiannis, A. K. Stubos, and Y. C. Yortsos, “Pore-
network study of the characteristic periods in the drying of porous materials.,”
Journal of colloid and interface science, vol. 297, no. 2, pp. 738–48, May
2006.

71
[79] L. H. Sperling, Introduction to Physical Polymer Science, 4th ed. John Wiley
& Sons, Inc., 2006.
[80] G. Tillet, B. Boutevin, and B. Ameduri, “Chemical reactions of polymer
crosslinking and post-crosslinking at room and medium temperature,”
Progress in Polymer Science, vol. 36, no. 2, pp. 191–217, 2011.
[81] C. K. Yeom, J. G. Jegal, and K. H. Lee, “Characterization of relaxation
phenomena and permeation behaviors in sodium alginate membrane during
pervaporation separation of ethanol-water mixture,” Journal of Applied
Polymer Science, vol. 62, no. 10, pp. 1561–1576, Dec. 1996.
[82] M. A. Mansfield, “The use of Nitro-Cellulose Membranes in Lateral Flow
Assays,” in Forensic Science and Medicine: Drugs of Abuse: Body Fluid
Testing, 1st ed., Humana Press, Inc., 2005.
[83] a. Książczak, A. Radomski, and T. Zielenkiewicz, “Nitrocellulose porosity -
thermoporometry,” Journal of Thermal Analysis and Calorimetry, vol. 74, no.
1, pp. 559–568, 2003.
[84] S. Arirachakaran, K. D. Oglesby, M. S. Malinowsky, O. Shoham, and J. P.
Brill, “An Analysis of Oil/Water flow Phenomena in Horizontal Pipes,” in
society of Petroleum Engineers, Oklahoma, 1989.
[85] W. A. Rodger, V. G. Trice, and J. H. Rushton Jr., “The effect of fluid motion
on interfacial area of dispersions.,” Chemical Engineering Progress,, vol. 52,
no. 12, pp. 515–520, 1956.
[86] B. Hu, L. Liu, O. Matar, P. Angeli, G. Hewitt, and E. Perezdeortiz,
“Investigation of Phase Inversion of Liquid-Liquid Dispersions in Agitated
Vessels*,” Tsinghua Science & Technology, vol. 11, no. 2, pp. 202–206, Apr.
2006.
[87] T. Nishi, T. T. Wang, and T. K. Kwei, “Thermally Induced Phase Separation
Behavior of Compatible Polymer Mixtures,” Macromolecules, vol. 8, no. 2,
pp. 227–234, 1974.
[88] T. Inoue, “Reaction induced phase decomposition in polymer blends,”
Progress in Polymer Science, vol. 20, no. 94, pp. 119–153, 1995.
[89] H. Chae Park, K. Yoon Po, K. Hwa Yong, and K. Yong Su, “Membrane
formation by water vapor induced phase inversion,” Journal of Membrane
Science, vol. 156, no. 2, pp. 169–178, Apr. 1999.
[90] Y.-S. Kang, H.-J. Kim, Y.-H. Kim, and W.-H. Jo, “The Mechanism of
Assymetric Membrane Formation via Phase Inversion,” Polymer Society of
Korea, vol. 12, no. 3, pp. 279–287, 1988.
[91] J. P. Salamone, Polymeric Materials Encyclopedia, Vol. 6. CRC Press, 1996.

72
[92] S. P. Nunes and T. Inoue, “Evidence for Spinodal Decomposition and
Nucleation and Growth Mechanisms during Membrane Formation,” Journal
of Membrane Science, vol. 111, no. 1, pp. 93–103, 1996.
[93] I. Pinnau and W. J. Koros, “A qualitative skin layer formation mechanism for
membranes made by dry/wet phase inversion,” Journal of Polymer Science
Part B: Polymer Physics, vol. 31, no. 4, pp. 419–427, Mar. 1993.
[94] E. P. Favvas and A. Ch. Mitropoulos, “What is Spinodal Decomposition,”
Engineering Science and Technology Reveiw, vol. 1, no. 1, pp. 25–27, 2008.
[95] T. Young and L. Chen, “Pore formation mechanism of membranes from phase
inversion process,” Desalination, vol. 103, no. 3, pp. 233–247, Dec. 1995.
[96] K. Holmberg, B. Jonsson, B. Kronberg, and B. Lindman, Surfactants and
Polymers in Aqueous Solutions, 2nd ed. John Wiley & Sons Ltd., 2002.
[97] A. L. Ahmad, S. C. Low, S. R. Abd Shukor, A. Ismail, and A. R. Sunarti,
“Development of lateral flow membranes for immunoassay separation,”
Desalination and Water Treatment, vol. 5, no. November 2008, pp. 99–105,
May 2009.
[98] V. P. Khare, A. R. Greenberg, J. Zartman, W. B. Krantz, and P. Todd,
“Macrovoid growth during polymer membrane casting,” Desalination, vol.
145, no. 1–3, pp. 17–23, 2002.
[99] M. Pekny, a Greenberg, V. Khare, J. Zartman, W. Krantz, and P. Todd,
“Macrovoid pore formation in dry-cast cellulose acetate membranes:
buoyancy studies,” Journal of Membrane Science, vol. 205, no. 1–2, pp. 11–
21, Aug. 2002.
[100] S. S. Shojaie, W. B. Krantz, and A. R. Greenberg, “Dense polymer film and
membrane formation via the dry-cast process part II. Model validation and
morphological studies,” Journal of Membrane Science, vol. 94, no. 1, pp.
281–298, 1994.
[101] S. S. Prakash, L. F. Francis, and L. E. Scriven, “Microstructure evolution in
dry–wet cast polysulfone membranes by cryo-SEM: A hypothesis on
macrovoid formation,” Journal of Membrane Science, vol. 313, no. 1–2, pp.
135–157, Apr. 2008.
[102] C. K. Haas and J. M. Torkelson, “Two-dimensional coarsening and phase
separation in thin polymer solution films,” American physical Society:
Physical Review E, vol. 55, no. 3, pp. 3191–3201, Mar. 1997.

73
Chapter 2
Experimental Methods

74
2. Experimental
2.1 Membrane Preparation
The active polymer layers of all membranes in this work were cast from solutions of
polymer in an appropriate solvent.
2.1.1 Materials
Pervaporation Materials
Sodium alginate as a crystalline solid, dimethylsulphoxide (DMSO) (0.03%
approx.), glycerol (a.k.a glycerine) 85 % and molecular sieve type 4A, a form of
zeolite with pore size of 4 Å, were purchased from Sigma-Aldrich Chemie Gmbh,
Germany. Poly(vinyl alcohol) (PVA), molecular weight approximately 78,000 g
mol-1
, was purchased from Polysciences Inc. as a crystalline solid. Poly(acrylo
nitrile) (PAN) was obtained from Scientific Polymer Products Inc. as a fine powder
and casting solutions were made by dissolving in dimethylsulphoxide. Ethanol
(100% HPLC grade) was purchased from Carbon Group, Ringaskiddy, Co. Cork,
Ireland. For the production of silica particles, tetraethylorthosilicate (TEOS),
hexadecyltrimethylammonium bromide (CTAB), N,N-Dimethyldecylamine
(DMDA) >90 %, ammonium hydroxide solution 28.0–30.0 % (NH4OH) and sodium
hydroxide (NaOH) [reagent grade, >98 %], pellets (anhydrous) were obtained from
Sigma-Aldrich Chemie Gmbh, Germany. Methanol was supplied in-house. All
chemicals were used without further purification. 120 μm thick nonwoven fabric
(CraneCU414), made of 100 % polyester, was supplied by Crane and Company Inc.,
USA. All 25 cm2 glass plates were purchased from Water’s Glass, Togher, Cork
City, Cork, Ireland and Cork Glass Centre, Kinsale Road Business Park, Cork City,
Cork, Ireland.
Lateral Flow Materials
Cellulose nitrate (E80), the 50 µm and 100 µm thick 100 % polyester films
(Melinex) were provided by Millipore Ireland B.V. Glycerol (a.k.a glycerine) 85 %,
2-butanol (MW 74.12 g mol-1
) were obtained from Sigma-Aldrich Chemie Gmbh,
Germany. Acetone was supplied in-house. Ethanol (100 % HPLC grade) was
purchased from Carbon Group, Ringaskiddy, Co. Cork, Ireland. All chemicals were

75
used without further purification. All 25 cm2 glass plates were purchased from
Water’s Glass, Togher, Cork City, Cork, Ireland and Cork Glass Centre, Kinsale
Road Business Park, Cork City, Cork, Ireland.
2.1.2 Pervaporation Membrane Polymer Solutions
Membrane solutions were prepared for three distinct types of selective layer in
pervaporation membranes; pristine polymer membranes, polymer blend membranes
and mixed matrix membranes. A single solution type was prepared for the PAN
support layer.
Pristine Polymer Solutions
Pristine polymer pervaporation membranes were cast from solutions of polymers in
appropriate solvents at various weight percentages of polymer.
Sodium Alginate Solutions
The solvent used for NaAlg was deionised water. Solutions were produced at 2.5
wt%, 5 wt% and 6 wt% NaAlg in deionised water. Solutions above 6 wt% NaAlg
were too viscous for even dispersion when casting. Only 2 wt% yielded unsupported
membranes that could withstand pervaporation conditions for any length of time.
Supported membranes were produced from 5 wt% solutions of NaAlg in water.
Poly(vinyl alcohol) Solutions
The solvent used for PVA was deionised water. Solutions were produced at 5 wt%, 7
wt%, 10 wt%, and 12 wt% PVA in deionised water. Solutions below 5 wt% PVA
were too fluid for effective casting. Only solutions above 10wt% could be used for
casting unsupported membranes.
Pervaporation Membrane Support Solutions
All supports were cast using 7 wt% solutions of poly(acrylonitrile) in
dimethylsulphoxide (DMSO) solvent.
Polymer Blend Solutions
Blends of NaAlg and PVA were made from solutions of total mass of 100 g
composed of 5 g of polymers, 5 g of plasticizer (glycerol) and 90 g of solvent. The 5
g of polymers was composed of NaAlg and PVA in integer ratios of 9:1, 4:1 and 7:3.

76
This is shown in table 2.1. These blends were cast at various thicknesses in order to
study relaxation and diffuse layer formation effects in pervaporation membranes.
These thicknesses were dictated by the limits of the automated casting machine
utilised. A description of this machine can be seen below.
Table 2.1: Polymer blend solutions Polymer Ratio
in Blend Solution NaAlg
(g) PVA (g)
Glycerol (g)
Water (g)
9:1 4.5 0.5 0.0 95.0
9:1 Gly 4.5 0.5 5.0 90.0
4:1 4.0 1.0 0.0 95.0
4:1 Gly 4.0 1.0 5.0 90.0
7:3 3.5 1.5 5.0 90.0
Mixed Matrix Membrane Solutions
Mixed matrix membranes were prepared with two types of silica particles and one
type of zeolite particle: zeolite-A, an aluminosilicate particle with a pore size of ~4
Ǻ. Silica particles were produced by the method of Keane et al.[1] This yielded two
types of mono-disperse mesoporous silica spheres. Both silica types were of
approximately 1.5-2 μm in diameter but differed in pore size. In one particle type the
pore diameter was ~2 nm while the other particle type had a pore diameter of ~20
nm; a much reduced surface area.
Zeolite-A, large pore silica, and small pore silica particles were incorporated
into three polymer types: Pristine PVA, pristine NaAlg and a 4:1 NaAlg:PVA
polymer blend. Both the NaAlg and 4:1 NaAlg:PVA polymer blends proved too
brittle upon introduction of particles for practical use. In addition to this, the use of
pristine PVA proved advantageous. PVA possesses a high strain at fracture[2]
allowing for significant particle loadings without overly compromising the
mechanical stability of the membrane. (See chapter 7)
PVA solutions were prepared so: X g of particle + 12 g – X g of PVA + 88 g
water produced by combination of two initial solutions of 12 g – X g of PVA in 65 g
water (soln. 1) + X g particle in 23 g water (soln. 2). Soln. 2 is sonicated to ensure
the silica particles are dispersed and discreet within. This is then added to soln. 1.
The combined solutions are left to mix before a brief sonication. NaAlg and blend
membranes containing particles were prepared similarly but using 5 g rather than 12

77
g of polymer. Masses of components of final casting solutions listed in table 2.2
below.
Table 2.2: Pervaporation membrane casting solution compositions
Membrane
Polymer
Solvent Water
(g)
Particle
Casting Thickness
(µm)
Final Membrane
NaAlg (g)
4:1 NaAlg:PVA
Blend (g)
PVA (g)
Small Pore Silica
(g)
Large Pore Silica
(g)
Zeolite-A
(g)
4.75 - - 95 0.25 - - 100 Tested
4.50 - - 95 0.50 - - 100 Too brittle for
testing
4.75 - - 95 - 0.25 - 100 Tested
4.50 - - 95 - 0.50 - 100 Too brittle for
testing
4.75 - - 95 - - 0.25 100 Tested
4.50 - - 95 - - 0.50 100 Too brittle for
testing
- 4.75 - 95 0.25 - - 100 Tested
- 4.50 - 95 0.50 - - 100 Too brittle for
testing
- 4.75 - 95 - 0.25 - 100 Tested
- 4.50 - 95 - 0.50 - 100 Too brittle for
testing
- 4.75 - 95 - - 0.25 100 Tested
- 4.50 - 95 - - 0.50 100 Too brittle for
testing
- - 11.40 88 0.60 - - 100 Tested
- - 10.80 88 1.20 - - 100 Tested
- - 10.20 88 1.80 - - 100 Tested
- - 11.40 88 - 0.60 - 100 Tested
- - 10.80 88 - 1.20 - 100 Tested
- - 11.40 88 - - 0.60 100 Tested
- - 10.80 88 - - 1.20 100 Tested
2.1.3 Lateral Flow Membrane Polymer Solutions
Lateral-flow membranes were cast from solutions of increasing complexity,
beginning with the basic components for phase inversion of polymer solution:
solvent, non-solvent and polymer; acetone, water and cellulose nitrate respectively in
this instance; shown in table 2.3 below. A meso-solvent was then introduced
(ethanol) and solutions were produced for casting membranes; shown in table 2.4.
Finally, components were added based on knowledge of the casting processes used
industrially in an attempt to understand their functions. These components were
glycerol and butanol; shown in table 2.5.
For phase inversion to occur effectively casting solutions were required to be
brought to cloud point [3][4] (note: cloud point is a misnomer; cloud region is the
reality). This was done by the addition of non-solvent (water) up to a point where the
cloudiness of the polymer solution was maintained under stirring at 250 rpm at room

78
temperature (controlled at 24 oC) for a period of 3 mins. The apparent cloudiness of
the solution is caused by nucleation of polymer molecules within.
All casting solutions contained 17 wt% cellulose nitrate as this provided the
optimum viscosity for casting. The solvent, meso-solvent and non-solvent were
contained in the other 83 wt% of the casting solutions. Thus, if a solution is referred
to as containing a 95:5 ratio of solvent to non-solvent, this refers to the ratio of
acetone to water in this 83 wt% of the casting solution before being brought to
cloud-point.
Table 2.3: Basic Membrane Casting Solutions
Mem.
Initial Phase Inversion Solution
Non-sol. (H2O)
for CP. (g)
Solution Near Cloud Point
Poly. (CN) wt%
Sol. (ace) wt%
Non-solvent (water)
wt%
Poly. (CN) wt%
Sol. (ace) wt%
Non-solvent (water)
wt%
BasMemA 17 83.00 0 0 17 83.00 0
BasMemB 17 78.85 4.15 0 17 78.85 4.15
BasMemC 17 74.70 8.30 0 17 74.70 8.30
BasMemD 17 70.55 12.45 0 17 70.55 12.45
BasMemACP 17 83.00 0 2.76 14.39 70.23 15.38
BasMemBCP 17 78.85 4.15 2.30 15.12 70.14 14.73
BasMemCCP 17 74.70 8.30 2.01 14.73 66.36 18.52
BasMemDCP 17 70.55 12.45 1.77 15.35 63.73 20.92
Table 2.4: Meso-solvent (ethanol) containing membranes
Mem. Initial Phase Inversion Solution Non-sol. (H2O)
for CP. (g)
Solution Near Cloud Point
Poly. (CN) wt%
Sol. (ace) wt%
Meso-Sol. (EtOH)
wt%
Non-solvent (water)
wt%
Poly. (CN) wt%
Sol. (ace) wt%
Meso-Sol. (EtOH)
wt%
Poly. (CN) wt%
MesoA 17 58.10 20.75 4.15 0 17 58.10 20.75 4.15
MesoB 17 53.95 24.90 4.15 0 17 53.95 24.90 4.15
MesoC 17 49.80 29.05 4.15 0 17 49.80 29.05 4.15
MesoD 17 45.65 33.20 4.15 0 17 45.65 33.20 4.15
MesoE 17 41.50 37.35 4.15 0 17 41.50 37.35 4.15
MesoACP 17 58.10 20.75 4.15 5.30 13.03 44.53 15.90 26.53
MesoBCP 17 53.95 24.90 4.15 5.43 12.89 40.90 18.88 27.33
MesoCCP 17 49.80 29.05 4.15 5.55 12.80 37.50 21.87 27.83
MesoDCP 17 45.65 33.20 4.15 5.94 12.57 33.74 24.54 29.15
MesoECP 17 41.50 37.35 4.15 4.80 13.22 32.27 29.04 25.47

79
Table 2.5: wt% for components of glycerol and butanol casting solutions. Abbreviations: Mem. (membrane), CN (cellulose nitrate), ace. (acetone), EtOH (ethanol), gly. (glycerol), but. (butanol). Cloud Point (water added to reach cloud point
Mem.
Initial Phase Inversion Solution Cloud Point
(g) CN
wt% Ace. Wt%
H2O wt%
EtOH wt%
Gly. Wt%
But. Wt%
GlyA 17 45.650 4.15 32.785 0.415 - 6.01
GlyB 17 45.650 4.15 32.619 0.581 - 6.10
GlyC 17 45.650 4.15 32.453 0.747 - 6.19
GlyD 17 45.650 4.15 32.287 0.913 - 6.31
GlyE 17 45.650 4.15 32.121 1.079 - 6.29
GlyF 17 45.650 4.15 31.955 1.245 - 6.27
ButA 17 41.500 4.15 36.935 - 4.15 5.92
ButB 17 74.700 4.15 - - 4.15 2.12
ButSub 17 45.650 4.15 - - 33.2 5.39
Mem. Solution at Cloud Point
- CN wt%
Ace. Wt%
H2O wt%
EtOH wt%
Gly. Wt%
But. Wt%
GlyA 12.35 33.16 30.38 23.81 0.30 - -
GlyB 12.30 33.04 30.64 23.60 0.42 - -
GlyC 12.26 32.91 30.90 23.40 0.54 - -
GlyD 12.19 32.74 31.26 23.16 0.65 - -
GlyE 12.21 32.77 31.18 23.06 0.78 - -
GlyF 12.30 32.81 31.11 22.97 0.90 - -
ButA 12.40 30.27 30.08 26.94 - 3.03 -
ButB 14.95 65.63 15.79 - - 3.65 -
ButSub 12.77 34.26 28.05 - - 24.92 -
Calculating Weight Percentages
Casting solution final weight percentages were recalculated from the initial weight
percentages to account for the additional water required to reach solution cloud
point. An illustrative example, utilising membrane GlyA (seen in table 2.5 above)
follows:
Initially a solution of 100 g mass is made. This comprises 17 g of CN and 83
g of solvent mixture.
The solvent mixture is composed of 5 wt% of water, 0.5 wt% glycerol, 55
wt% acetone and 40.5 wt% of ethanol. When these percentages of 83 g are
worked out they give masses of 4.15 g water, 0.415 g glycerol, 45.65 g
acetone and 32.785 g ethanol.
This gives an initial solution (before cloud point) of 17 wt% CN, 4.15 wt%
water, 0.415 wt% glycerol, 45.65 wt% acetone and 32.785 wt% ethanol.

80
A 20 ml sample of this solution is taken and weighed, giving a solution
sample of mass 15.951 g.
To this solution 6.01 g of water are added to bring the solution to cloud point,
creating a solution of 21.961 g mass. The weight percentages of the
components of this solution must now be worked out.
Since only water was added, the masses of the other individual component
are unchanged, thus they can be worked out using their original weight
percentages applied to the mass of the 20 ml solution – 15.951 g. They
become:
Cellulose nitrate mass in final solution = 15.951 g x 0.17 = 2.712 g
Weight percentage in final solution = (2.712 g / 21.961 g) x 100 = 12.35 wt%
Acetone mass in final solution = 15.951 g x 0.4565 = 7.282 g
Weight percentage in final solution = (7.282 g / 21.961 g) x 100 = 33.16 wt%
Ethanol mass in final solution = 15.951 g x 0.32785 = 5.230 g
Weight percentage in final solution = (5.230 g / 21.961 g) x 100 = 23.81 wt%
Glycerol mass in final solution = 15.951 g x 0.00415 = 0.066 g
Weight percentage in final solution = (0.066 g / 21.961 g) x 100 = 0.30 wt%
Calculating the final weight percentage of water is slightly different, as
follows:
Water mass in solution before cloud point = 15.951 g x 0.0415 = 0.662 g
Water mass in final solution = 0.662 g + 6.010 g = 6.672 g
Weight percentage in final solution = (6.672 g / 21.961 g) x 100 = 30.38 wt%
This method of calculating solution weight percentages after solutions were
brought to cloud point was applied to all solutions used within this project.
2.1.4 Membrane Casting
Membrane casting, for all membrane types in this project, was done on an automatic
film applicator; model K202 Control Coater produced by RK Printcoat Instruments
Ltd., UK (see figures 2.1 and 2.2). This unit allows for a fully reproducible casting
method. The unit is comprised of:
A coating area of 325 mm x 250 mm
A latch mechanism for coating bars with adjustable weights to allow for
calibration to different substrate and coating thicknesses

81
An electrical drive allowing one to coat at
different rates
Spiral and close wound coating bars (see
figure 2.2) to allow one to coat at different
thicknesses
The casting thickness available are limited
by the bars to: 6, 12, 24, 40, 50, 60, 80,
100, 150, 200, 300, 400, and,500 µm. One
additional bar was manufactured for
specialised applications which casts at 570
µm but is not spirally wound.
Pervaporation Membrane Casting
Unsupported
Only the very earliest membranes were cast using this method: A casting solution is
poured onto a circular glass plate approximately 164 mm in diameter and left to dry
for 24 h – 72 h depending on thickness. Once dry, an incision is made in the edge of
the membrane and peeled back to facilitate easy removal of the membrane from the
plate. After removal from the plate, the membrane is cut to fit the pervaporation unit
cell.
Supported
The nonwoven polyester support fabric is cut to fit a 25 cm2 glass plate. One edge of
the fabric is taped down with waterproof “Duck” tape. DMSO (approx. 10 mls) is
placed beneath the fabric on the glass plate using a dropper. DMSO surface tension
Figure 2.1: K202 Control Coater
Figure 2.2: Close wound (A) and spirally wound (B) coating bars

82
helps adhere the fabric to the glass plate, while a ruler is used to remove air bubbles
from beneath to ensure even casting. The
opposing side of the fabric is then taped
down (see figure 2.3) DMSO is used in
this role rather than water as water would
cause the casting solution of PAN to phase
invert at the support side which would
adversely affect the support structure.
On to the prepared glass plate and
support fabric a solution of 7 wt% PAN in DMSO is cast with the K202 Control
Coater using a 150 µm casting bar calibrated to the height of the glass plate and
fabric. Once the bar has been clamped in place, a casting speed is set and the solution
is cast (see figure 2.4).
Once the PAN support layer is dry the selective layer can then be cast. The
K202 Control Coater is recalibrated for the support, a casting bar of desired
thickness is chosen and the polymer solution of the selective layer of the
pervaporation membrane is cast in the same manner as described above. This layer is
then dried in a manner appropriate to the cast solution to produce the final
pervaporation membrane. In some cases, where low volatility solvents such as
glycerol have been incorporated into the membrane, drying in an oven at a maximum
temperature of 40 oC is necessary.
Figure 2.4: K202 Control Coater diagram with casting bar and membrane support in place
Figure 2.3: Glass plate and support fabric prepared for casting

83
Lateral-flow Membrane Casting
Lateral-flow membranes are cast in a similar manner to that described above for
pervaporation membranes with the addition of inducing phase inversion before
drying to precipitate the final membrane.
The support material - a 100 % polyester film (Melinex) of 100, or 50 µm
thickness - is attached to a glass plate as described above, but no DMSO is required
to ensure that the film is free of air bubbles. The glass plate with attached Melinex is
then placed on the K202 Control Coater, a casting bar of desired thickness is chosen
and the unit is calibrated for the support with the casting bar. The casting solution for
the lateral flow membrane to be made is then cast on to the Melinex as described in
the pervaporation membrane casting procedure above.
Phase inversion of the cast solution must then be induced through VIPS
(described in section 1.4.2) by allowing the solution to phase separate in a controlled
humidity environment. Humidity is maintained at 35 % inside an Mbraun GP 2202
PB single piece moulded glovebox, supplied by Mbraun UK, Ltd (see figure 2.5).
Membranes were left in this environment for a minimum of 12 h to ensure complete
phase separation and drying, after which membranes were dried in an oven at 40 oC
to ensure any excess solvent, non-solvent or meso-solvent were removed.
Once cast the membranes must be rendered hydrophilic. This is done by placing
the membrane in solutions of 0.1 wt% of SDBS surfactant in deionised water for 20
mins, followed by drying the membrane at room temperature. Subsequent SEM
images of surfactant on the membrane surfaces (see appendix B, figure B1.) and
bestowment of hydrophilicity upon the membrane confirmed the presence and effect
of the surfactant treatment. This form of lateral flow test is an industrial SOP (for the
determination of efficacy of flow rate in a given membrane batch) making results
directly comparable with the stated flow rates of industrial membranes. The effect of
gravity on the flow rate is constant for all membranes so the relative differences in
flow between membranes serves to show improvement brought about through
changes in membrane structure.

84
Figure 2.5: Mbraun GP 2202 PB single piece moulded glovebox and technical drawings
2.2 Membrane Testing
As was highlighted in chapter 1, the testing of pervaporation membranes is a far
more complex process than the testing of lateral flow membranes. This is reflected in
the detailing of the procedures for both below.
2.2.1 Pervaporation Membrane Testing
Pervaporation experiments were conducted using a Sulzer Chemtech Laboratory 6”
Test Cell (see figure 2.6 for a schematic diagram), produced by Sulzer Chemtech
Gmbh, supplied by Cork Institute of Technology (CIT) where the Irish National
Institute for Membrane Technology is based.
Much of the literature cites the use of indigenous pervaporation units. In the
interests of reliability and reproducibility the Sulzer unit was chosen over an
indigenously produced unit. Despite the proliferation of indigenous units in some
published papers, a great number of publications use this unit and exhibit far more
reliable data in their papers[5–9].
The laboratory bench test unit is designed for testing of the performance of flat
sheet membranes for the removal of minor components from feed mixtures by means

85
of pervaporation. All parts in contact with the feed mixture are either stainless steel,
polytetrafluoroethylene (PTFE), the membrane, or appropriate elastomers. The unit
is comprised of
Heating bath with temperature control and recycling pump.
Closed feed tank, double jacketed, heated by circulation of the heat transfer
liquid from the heating bath through the double jacket.
Feed pump which circulates the feed from the feed tank through the test cell,
over the membrane and back to the tank.
Circular test cell with inner diameter of 158 mm, in which membrane is
contained. Test cell comprised of upper section – with connection for inlet
and outlet of feed mixture – and lower section – to which cold trap is
connected. During operation, upper and lower sections held together by four
clamps. Membrane is supported by a porous steel plate in lower section
through which permeating vapours can pass. Seal between feed side and
permeate side is achieved by means of an O-ring around circumference of the
membrane at the inner wall of bottom section of test cell.
Permeate condenser (cold trap) with vacuum connection and Dewar vessel
for liquid N2
Typical pervaporation tests were conducted for a minimum of 5 h to allow for
equilibration of the membrane within the cell with the feed solution. This took - on
average - 1 h, thus data after the first hour of testing was considered truly indicative
of a membrane’s performance. As such all average selectivity and flux figures given
in the subsequent chapters are calculated excluding the first hour of data.
Where membrane mechanical, thermal, or chemical stability caused it to fail
before the 5 h minimum test time was reached the membranes were tested for as long
as permitted by their physical characteristics. What follows is a detailed outlining of
the pervaporation unit operation.
It should be noted that the earliest membranes tested suffered from
concentration polarization effects which resulted in falsely positive selectivity
results; as such, static mixers were installed in the membrane housing to prevent this
effect.

86
Figure 2.6: Sulzer Chemtech Laboratory 6” Test Cell (detailed on following 3 pages)

87
Pervaporation Procedure
Start Up
For a pervaporation experiment to be conducted, an appropriate feed solutionis
required. Two feeds were used: 74 wt%, and 90 wt% ethanol in water solutions.
Figure 2.7: Diagram of feed chamber of pervaporation unit (details in text; see figure 2.6 for full pervaporation unit diagram)
From figure 2.7 is can be seen that introduction of feed solution to the feed chamber
of the pervaporation unit is done by fully opening valve H101 and closing valve
H102. A minimum of 1.5 L of the chosen feed solution is poured in through a
funnel into the feed chamber and valves H101 and H105 are closed.
In the event of changing feed solutions the feed chamber can be emptied by
opening valve H102 and letting the solution flow out into a storage vessel. In the
event of a pressure build up within the unit, a safety valve located above the feed
chamber releases pressure above the design threshold. The temperature of the feed
solution is controlled by using a heating bath to circulate heated water into the
jacket which surrounds the feed chamber internally.
Membrane Installation
Membranes are cut to fit the membrane cell of the pervaporation unit. Upon
installation a vacuum must be obtained by sealing the membrane in place with a
rubber O-ring. The vacuum is created by using a vacuum pump. As shown in figure

88
2.8, valves H201 and H202 are closed and valve H203 is opened causing the
membrane to flatten. The O-ring is then inserted to create a complete vacuum. If a
vacuum of less than 1.0 mbar cannot be created at this stage then the membrane
must be considered faulty.
Figure 2.8: Diagram of the membrane cell of pervaporation unit (details in text; see figure 2.6 for full pervaporation unit diagram)
Pervaporation Unit Set-up
The pervaporation experiment itself involves circulating the feed solution over the
upper side of the membrane in the cell and collecting permeate on the lower side in
a cold trap. The circulation of the feed requires the use of a pump. Once the above
procedures have been followed the pervaporation unit can undergo final setup for
initiation of an experiment.
Figure 2.9 shows valves H103 and H104 are half opened and valve H102 is
fully closed. The heat bath for the feed chamber is switched on and set to 60 0C (see
figure 2.7), liquid nitrogen is used to cool the cold trap (see figure 2.8), and the feed
pump is turned on. Once the pump is on valves H103 and H104 can be used to
adjust the flow of the feed. The flow rate can be read from the flow meter and
should be adjusted to approximately 80 l h-1
.

89
Figure 2.9: Diagram of feed pump and peripherals of pervaporation unit (details in text; see figure 2.6 for full pervaporation unit diagram)
Sampling
Permeate is collected in a cold trap (see figure 2.8). Before installing the cold trap it
is weighed. After an hour of collecting permeate the cold trap is removed and
replaced with another empty, pre-weighed cold trap. The removed cold trap
contains the permeate sample; trap and permeate are weighed and the weight of the
empty trap (previously determined) is subtracted to give the weight of the permeate,
from which we can determine the flux.
The removal of the cold trap is conducted by closing valves H201 and H202
and opening valve H203 (see figures 2.6 and 2.8). This maintains the vacuum in the
unit above H201 and releases the vacuum surrounding the cold trap, allowing for its
removal. The replacement cold trap is connected to the appropriate tubes and valve
H203 is closed, followed by opening valve H202. Finally valve H201 is opened
slowly so that sudden release of vacuum does not disrupt the membrane and/or O-
ring position, which would render the experiment a failure.
This procedure of collecting permeate every hour continues for the duration of
the pervaporation experiment. Samples are stored after weighing until they reach
room temperature, after which they can be characterised in terms of their
selectivities.

90
Pervaporation Membrane Flux and Selectivity Calculations:
Calculation of Membrane Flux
J = W/At 2(i)
Where J is flux of the membrane in g m-2
h-1
, W is the mass of permeate in grams, A
is the area of the membrane in metres squared and t is the time interval between
samples in hours.
Calculation of Membrane Selectivity
Α = (Yi/Yj)/(Xi/Xj) 2(ii)
Where α is the selectivity of the membrane (a ratio of ratios; no units), Yi is the
weight percentage water in the permeate, Xi is the weight percentage water in the
retentate, Yj is the weight percentage ethanol in the permeate and Xj is the weight
percentage ethanol in the retentate.
Calculation of Retentate and Permeate Densities
Ethanol concentration in a sample at a given temperature was calculated by the
programme Alcodens (version 2.1. copyright 2003-2009 Katmar Software) from
the density readings of the Mettler-Toledo DE40 Density Meter. This is a four place
digital density meter for measurement of density, specific gravity, API (petroleum),
BRIX (sugar), alcohol or concentration of aqueous solutions, designed for quality
control, general lab practice or general manufacturing practice.
2.2.2 Lateral-flow Membrane Testing
Lateral-flow membranes were tested using an industry standard testing method for
measuring the rate of lateral capillary flow of fluid through their internal pore
network.
Membrane lateral flow speeds determined by testing capillary flow rates of
water through the membranes. Membranes were cut into 12 mm x 28 mm strips. A
horizontal line was drawn 3 mm from the bottom; a second line was drawn 3mm
from the top; giving a region 22 mm in length between: An area of 264 mm2 or 2.64
cm2. The membrane strip was then placed vertically in a 2 mm depth of water. The
water flow was timed between the two marks and a flow speed determined to give
the lateral flow rates. The cellulose nitrate polymer was inherently hydrophobic and

91
little or no flow was observed. In order to render it hydrophilic and so fit for lateral
flow purposes, it was treated with surfactant. This was achieved by placing the
membrane in solutions of 0.1 wt% of sodiumdodecylbenzenesulfate (SDBS)
surfactant in deionised water for 20 mins, followed by drying the membrane at
room temperature. Subsequent SEM images of surfactant on the membrane surfaces
(Appendix B, figure B.1) and rendering of hydrophilicity upon the membrane
confirmed the presence and effect of the surfactant treatment. This form of lateral
flow test is an industrial SOP, making results directly comparable with the stated
flow rates of industrial membranes. The effect of gravity on the flow rate is
constant for all membranes so the relative differences in flow between membranes
serves to show improvement brought about through changes in membrane structure.
2.3 Membrane Characterisation
All characterisation methods were used for membranes of both pervaporation and
lateral-flow types unless otherwise stated.
2.3.1 Scanning Electron Microscopy
The morphologies of the cross sections and top surfaces of the membranes were
characterised using a Jeol model FEI FP 2031/11 Inspect F field emission scanning
electron microscope. All membrane samples were prepared for imaging by Cryo-
Rupture Imaging Sample Preparation (CRISP)[10] method, whereby a section of
membrane is immersed in liquid nitrogen and subsequently broken to preserve the
structural integrity of the cross section, which is typically destroyed by cutting the
sample with a blade. All polymer membrane samples required gold-coating to
provide a conductive surface to allow imaging. All coatings were approximately 45
nm thick.
2.3.2 Flexibility Testing
A method for testing membrane flexibility was developed by quantifying that of a
membrane composed of the most flexible polymer used in the study (PVA). An
unsupported PVA membrane can be bound around a cylinder of 2.0 mm radius
without suffering any damage to its polymer matrix that reduces pervaporation
performance in a discernible way. Such damage is typified by cracks which reduce
selectivity and falsely increase flux. Use of a cylinder of any lower radius than this

92
results in a reduction in pervaporation performance of the membrane. This was
used as the standard to which other membranes were compared in order to assess
their flexibility, e.g. it was found that a supported pristine sodium alginate
membrane could only be bound to a cylinder of minimum radius 42 mm without
suffering damage to its polymer matrix that results in a reduction in pervaporation
performance. This method was also applied to lateral flow membranes where a loss
in lateral flow was the critical factor. The data from this method will be presented
as r X in text, where r is radius and X is the length of the minimum radius of the
cylinder to which a membrane could be bound, in millimetres.
2.3.3 X-Ray Diffraction
Membrane crystallinity was determined by X-ray powder diffraction using a Philips
X’Pert MPD Pro diffractometer with Cu Kα radiation 1.540598 Å, utilizing
Panalytical X’Pert data collector and X’Pert Highscore. Samples were prepared by
attaching membranes to glass microscope slides. Scans were conducted in triplet
and the angular range for analysis of all membrane samples was 10 o to 80
o.
2.3.4 Fourier Transform Infrared Spectroscopy
FTIR analysis of membranes was conducted using a Thermo Scientific Nickolet
6700 – FTIR. Membrane samples were prepared by grinding membranes up in KBr,
the subsequent powder being placed in a press to produce a sample disk, which was
then analysed.
2.3.5 Differential Scanning Calorimetry/Thermogravimetric
Analysis
Sodium alginate based polymer of pervaporation membranes was tested using a
DSC/TGA Q1000 version 9.9 build 303 instrument from TA instruments, with a
Mettler Toledo Microgram balance. Analysis was conducted in a temperature range
of -40.10 oC to 397.10
oC, with a temperature gradient of 20.01
oC min
-1, and
conducted under nitrogen at 50 ml min-1
flow rate.

93
2.3.6 Mercury Porosimetry
Porosimetry was conducted on two lateral flow membranes (BasMemBCP and
MesoDCP, see above) using a mercury porosimeter model, Micromeritics AutoPore
IV 9500 V1.09 by MCA Services UK.
2.3.7 Atomic Force Microscopy
Membrane topographies were characterised using an Atomic Force Microscope
(AFM), SPM, Park systems, XE-10, operated in AC (tapping) mode under ambient
conditions using silicon microcantilever probe tips with a force constant of 60,000
N m-1
and a scanning force of 0.11 nN
2.3.8 Contact Angle Measurement
Membrane surface contact angle tests were conducted utilizing a sessile drop
system at 25 oC (goniometer/optical-subsystem angle measurement limits 15
o –
165 o). Samples were ~2.5 cm
2. Droplet size was 10 μl. Each film sample was
analysed with three drops.

94
References: Chapter 2
[1] D. A. Keane, J. P. Hanrahan, M. P. Copley, J. D. Holmes, and M. A. Morris,
“A modified Stöber process for the production of mesoporous Sub 2 micron
silica microspheres; applications in HPLC,” Journal of Porous Materials,
vol. 17, no. 2, pp. 145–152, Mar. 2009.
[2] R. Russo, M. Malinconico, L. Petti, and G. Romano, “Physical behavior of
biodegradable alginate-poly(vinyl alcohol) blend films,” Journal of Polymer
Science Part B: Polymer Physics, vol. 43, no. 10, pp. 1205–1213, May 2005.
[3] H. Sun, S. Liu, B. Ge, L. Xing, and H. Chen, “Cellulose nitrate membrane
formation via phase separation induced by penetration of nonsolvent from
vapor phase,” Journal of Membrane Science, vol. 295, no. 1–2, pp. 2–10,
May 2007.
[4] P. Van-de-Witte, “Phase separation processes in polymer solutions in
relation to membrane formation,” Journal of Membrane Science, vol. 117,
no. 1–2, pp. 1–31, Aug. 1996.
[5] Z. Huang, Y. Shi, R. Wen, Y. Guo, J. Su, and T. Matsuura, “Multilayer
poly(vinyl alcohol)–zeolite 4A composite membranes for ethanol
dehydration by means of pervaporation,” Separation and Purification
Technology, vol. 51, no. 2, pp. 126–136, Sep. 2006.
[6] Z. Huang, H. Guan, W. Tan, X. Qiao, and S. Kulprathipanja, “Pervaporation
study of aqueous ethanol solution through zeolite-incorporated multilayer
poly(vinyl alcohol) membranes: Effect of zeolites,” Journal of Membrane
Science, vol. 276, no. 1–2, pp. 260–271, May 2006.
[7] W. F. Guo, T.-S. Chung, and T. Matsuura, “Pervaporation study on the
dehydration of aqueous butanol solutions: a comparison of flux vs.
permeance, separation factor vs. selectivity,” Journal of Membrane Science,
vol. 245, no. 2, pp. 199–210, 2004.
[8] H.-M. Guan, T.-S. Chung, Z. Huang, M. L. Chang, and S. Kulprathipanja,
“Poly(vinyl alcohol) Multilayer Mixed Matrix Membranes for the
Dehydration of Ethanol-Water Mixture,” Journal of Membrane Science, vol.
268, no. 1, pp. 113–122, 2006.
[9] Q. G. Zhang, Q. L. Liu, A. M. Zhu, Y. Xiong, and L. Ren, “Pervaporation
performance of quaternized poly(vinyl alcohol) and its crosslinked
membranes for the dehydration of ethanol,” Journal of Membrane Science,
vol. 335, no. 1, pp. 68–75, 2009.
[10] E. J. Flynn, D. Keane, J. D. Holmes, and M. A. Morris, “Unusual trend of
increasing selectivity and decreasing flux with decreasing thickness in
pervaporation separation of ethanol/water mixtures using sodium alginate

95
blend membranes.,” Journal of Colloid and Interface Science, vol. 370, no.
1, pp. 176–82, Mar. 2012.

96
Chapter 3
Pervaporation Membrane
Development
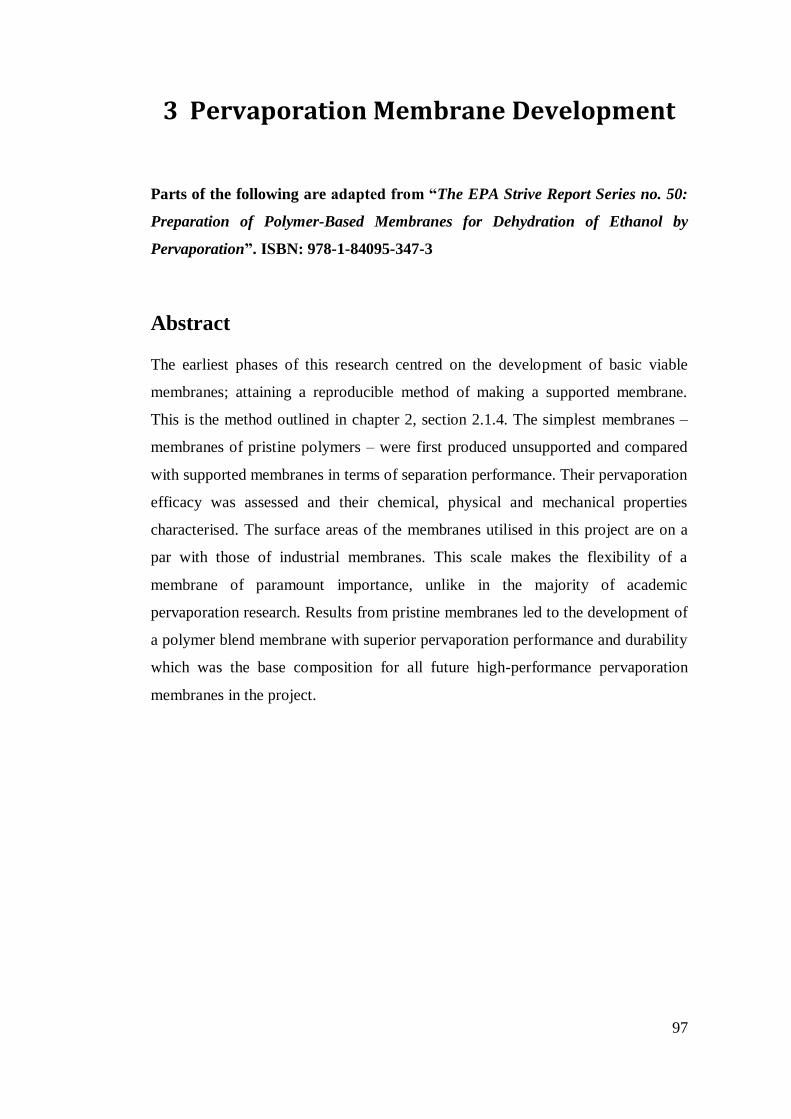
97
3 Pervaporation Membrane Development
Parts of the following are adapted from “The EPA Strive Report Series no. 50:
Preparation of Polymer-Based Membranes for Dehydration of Ethanol by
Pervaporation”. ISBN: 978-1-84095-347-3
Abstract
The earliest phases of this research centred on the development of basic viable
membranes; attaining a reproducible method of making a supported membrane.
This is the method outlined in chapter 2, section 2.1.4. The simplest membranes –
membranes of pristine polymers – were first produced unsupported and compared
with supported membranes in terms of separation performance. Their pervaporation
efficacy was assessed and their chemical, physical and mechanical properties
characterised. The surface areas of the membranes utilised in this project are on a
par with those of industrial membranes. This scale makes the flexibility of a
membrane of paramount importance, unlike in the majority of academic
pervaporation research. Results from pristine membranes led to the development of
a polymer blend membrane with superior pervaporation performance and durability
which was the base composition for all future high-performance pervaporation
membranes in the project.

98
3.1 Introduction
Literature suggests that the optimum membrane for pervaporation separation of
water-ethanol solution could be produced from pristine sodium alginate.[1–4] With
this in mind, the earliest membranes in the project were unsupported pristine
sodium alginate membranes. For comparison, an unsupported pristine PVA
membrane was also produced, as PVA is an industrial standard material. The
composition of the solutions from which these membranes were cast can be seen in
chapter 2 section 2.1.2.
It was immediately apparent that when NaAlg is used in membranes of the
area we utilize (0.0177 m2; the area of a full size industrial reactor membrane), the
inherently brittle polysaccharide had a tendency to crack: No great surprise when
one considers its reported Young’s modulus; 5551 Mpa.[5] Most literature on
pervaporation cites use of indigenous membranes of below 5cm diameter (0.0079
m2 area). At this relatively small scale brittleness is less of an issue. The use of
small area membranes gives unrealistic flux figures and can exaggerate
concentration polarization effects giving unrepresentative selectivity figures as well
as allowing brittle materials to be used for testing. All of this means that any results
obtained are incomparable with industrial membranes and so, impractical.
Unsupported pristine pervaporation membranes of PVA and NaAlg were
produced. It was found that the weight percentage of NaAlg that will dissolve in
water to yield a readily castible solution is limited to below 6 wt%. Above this,
solutions were too viscous for even casting of films. However, membranes formed
from 6 wt% casting solutions proved too brittle for practical use. Literature studies
suggested membranes formed from 3 wt% casting solutions [2] but, as highlighted
above, these were on membranes of much smaller area and when scaled up proved
unusable. PVA solutions were produced from 10 wt% solutions as solutions below
this weight percentage were too fluid for casting.
For comparison, supported pervaporation membranes were produced.
Supported NaAlg membranes were produced from 5 wt% solutions of NaAlg in
water. The use of a support (support material and production described in chapter 2
sections 2.1.2 and 2.1.4) allowed for higher weight percentage solutions of NaAlg

99
to be used which, according to literature [6], should increase the membrane
selective properties.
The results obtained from the membranes outlined above led to the
development of polymer blend membranes. Membranes were cast from 9:1
NaAlg:PVA, 4:1 NaAlg:PVA and 7:3 NaAlg:PVA solutions. The pervaporation
performances of these membranes are shown in tables A.5, A.6 and A.7 of
Appendix A. The compositions of the solutions from which the blend membranes
were cast are outlined in chapter 2, section 2.1.2, table 2.1.
Two more casting solutions of 9:1 NaAlg:PVA and 4:1 NaAlg:PVA with
glycerol plasticizer incorporated were produced, the compositions of which are
shown in chapter 2, section 2.1.2, table 2.1. Detailed pervaporation performance of
these membranes can be seen in tables A.8 and A.9 of Appendix A.
It was expected that the unsupported pristine membranes would exhibit high
selectivity figures due to their greater thickness compared to the supported
membranes, but that they would have correspondingly low flux. The supported
pristine membranes by comparison were expected to exhibit the opposite trend,
higher flux and lower selectivity.[7], [8]
It was also expected that the pristine PVA membranes would perform with
lower selectivity and higher flux than their pristine NaAlg counterparts, but that the
PVA membranes would be more durable.[2], [9–12]
It was hoped that the production of a polymer blend membrane would provide
enhanced durability and flux compared to the pristine NaAlg membranes - such as
PVA exhibits - while maintaining the NaAlg membranes’ reported high
selectivities.[12]
3.2 Experimental
See chapter 2 for details on all materials, apparatus and procedures.
3.3 Results and Discussion
3.3.1 Unsupported Pristine Membrane
Figure 3.1 shows the pervaporation performances of all membranes. Flux and
selectivity versus time for unsupported and supported pristine (3.1A and 3.1B) and
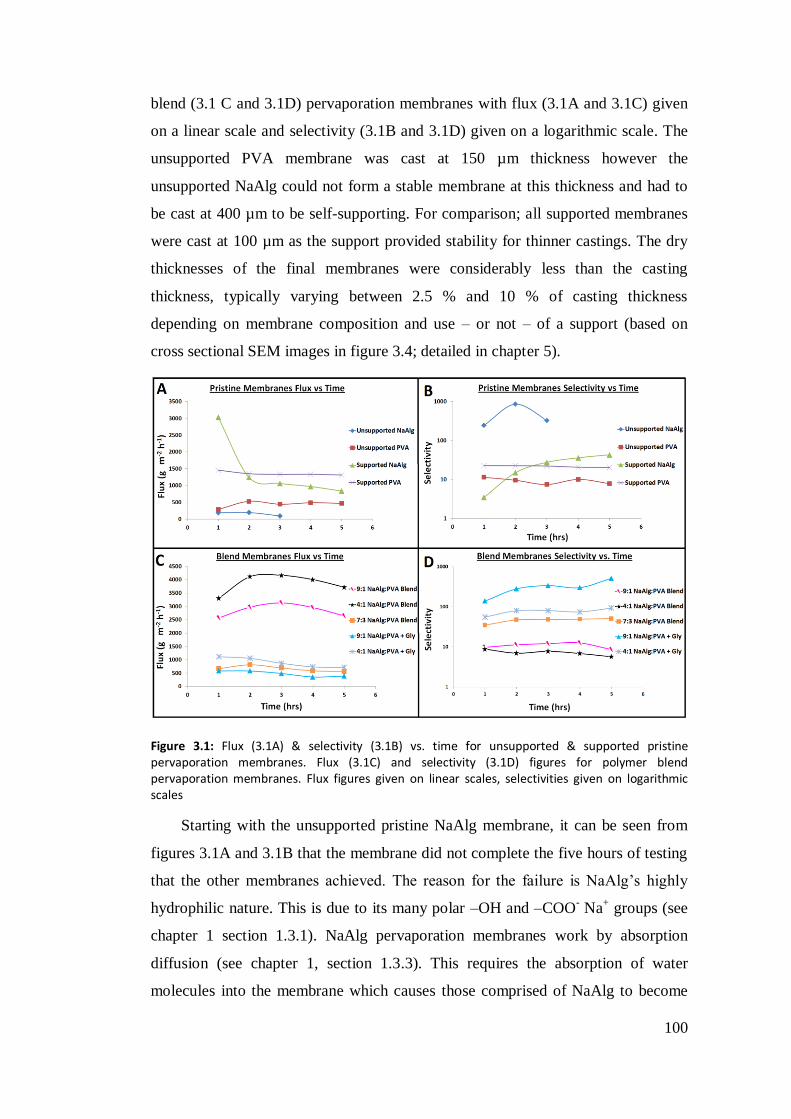
100
blend (3.1 C and 3.1D) pervaporation membranes with flux (3.1A and 3.1C) given
on a linear scale and selectivity (3.1B and 3.1D) given on a logarithmic scale. The
unsupported PVA membrane was cast at 150 µm thickness however the
unsupported NaAlg could not form a stable membrane at this thickness and had to
be cast at 400 µm to be self-supporting. For comparison; all supported membranes
were cast at 100 µm as the support provided stability for thinner castings. The dry
thicknesses of the final membranes were considerably less than the casting
thickness, typically varying between 2.5 % and 10 % of casting thickness
depending on membrane composition and use – or not – of a support (based on
cross sectional SEM images in figure 3.4; detailed in chapter 5).
Figure 3.1: Flux (3.1A) & selectivity (3.1B) vs. time for unsupported & supported pristine pervaporation membranes. Flux (3.1C) and selectivity (3.1D) figures for polymer blend pervaporation membranes. Flux figures given on linear scales, selectivities given on logarithmic scales
Starting with the unsupported pristine NaAlg membrane, it can be seen from
figures 3.1A and 3.1B that the membrane did not complete the five hours of testing
that the other membranes achieved. The reason for the failure is NaAlg’s highly
hydrophilic nature. This is due to its many polar –OH and –COO- Na
+ groups (see
chapter 1 section 1.3.1). NaAlg pervaporation membranes work by absorption
diffusion (see chapter 1, section 1.3.3). This requires the absorption of water
molecules into the membrane which causes those comprised of NaAlg to become

101
saturated, resulting in swelling and eventual disintegrating. Using a feed solution
with a density of 0.8199 g cm-3
(101pprox.. 90 wt% ethanol, 10 wt% water) the
membrane did precisely that, resulting in its disintegration and a subsequent
significant loss in flux (193.33 g m-2
h-1
to 91.69 g m
-2h
-1) and selectivity (853.72 to
323.78) figures in the third hour. This is indicative of total membrane failure;
confirmed upon removal of the membrane from the pervaporation unit. It was
found to have been partially – almost completely – dissolved, rendering it a gel.
By comparison, the unsupported PVA membrane withstood pervaporation
testing relatively well. Upon removal it was found the membrane had partially
dissolved, though not to the extent that the NaAlg membrane had. The data
suggests that while the membrane is more physically durable (withstood 5hrs
pervaporation testing compared to NaAlg unsupported membrane; 3hrs) and its
performance in terms of flux (avg. flux = 495.64 g m-2
h-1
) is superior to that of the
NaAlg membrane (avg. flux = 142.51 g m-2
h-1
) its selectivity is inferior (avg.
selectivity of unsupported PVA membrane = 8.76, avg. selectivity excluding first
hour of unsupported NaAlg membrane = 588.75).
In terms of tensile strength, both the unsupported membranes, as a result of
their relatively great thickness, proved to be quite flexible. From figure 3.5 (section
3.3.5 below) data; the unsupported pristine PVA membrane was bound to a cylinder
of 2.0 mm minimum radius (r 2.0) without suffering any loss in pervaporation
performance due to damage to its polymer matrix. The unsupported NaAlg
membrane was not as flexible, managing only r 6.5, but, as shall be seen below, this
represents a high flexibility for a NaAlg membrane. Details of how flexibility is
tested and quantified are contained in chapter 2 section 2.3.2. Tabulated data from
figure 3.5 contained in table A.10 of appendix A, section A.5.
The conclusion from the above was that in order to prevent total or almost total
dissolution of the membrane under pervaporation conditions, a support is required,
particularly in the case of NaAlg membranes
3.3.2 Supported Pristine Membranes
The use of a support yielded more physically durable membranes; both supported
NaAlg and PVA withstood pervaporation testing for 6 h. In the case of the
supported NaAlg there was a drop in selectivity (avg. selectivity = 32.836)

102
compared with the unsupported membrane (avg. selectivity = 588.75). It should be
noted that this average figure is unlikely to be representative of actual membrane
efficacy as, given the membrane’s 400 µm thickness, it was unlikely to have
reached stable condition within the pervaporation unit before critical failure.
Additionally, as can be seen from figure 3.2 below, the supported NaAlg membrane
contained many fractures after drying. This was due to it being brittle; flexibility
only r 42.0 compared to r 6.5 for the unsupported equivalent (see figure 3.5). These
fractures allow unselective passage of feed through the membrane, creating a false
negative selectivity figure. Note that at such a thickness as that of the unsupported
membrane, the flux is reduced to an impractical level (avg. 142.5 g m-2
h-1
). The
selectivity of the supported NaAlg membrane improves as the pervaporation testing
proceeds, rising to a maximum of 43.26 in the final hour of testing while the flux is
far superior to that of the unsupported NaAlg.
Figure 3.2: SEM surface images of pristine supported 5wt% NaAlg pervaporation membrane showing cracks in membrane selective layer
Figure 3.3: SEM image of early PVA membrane with PAN support layer delaminating from fabric support

103
The PVA membrane showed an increase in selectivity upon inclusion of a
support, going from an average selectivity of 8.76 in the unsupported membrane to
an average of 21.03 in the supported. This may be due to the increased density of
membrane skin layer [13]. Unsupported membranes are necessarily thicker. In these
instances the unsupported NaAlg and PVA membranes would have been much
thicker (approximately 400 µm when dry) than the supported equivalents
(approximately 25 µm when dry for NaAlg and 35 µm for PVA). A thicker
membrane provides a greater amount of polymer matrix through which diffusing
feed molecules must travel, leading to greater selectivity in theory. However, given
the drying processes of thin layers [14], [15] it would be expected that the thinner
supported membrane could have a greater density in the skin layer. This is due to
greater rate of evaporative loss of solvent from the greater exposed surface area
upon casting compared with the supported membrane[13]. From this, one might
expect to see an increase in selectivity with a decrease in thickness - down to a
minimum - below which the sheer quantity of selective material in a thick
membrane (such as in an unsupported membrane) would be more efficacious for
pervaporation separation. This is the subject of chapter 5 and will be discussed in
greater detail then.
As with the NaAlg membranes, there is an increase in flux for the supported
PVA membrane over its unsupported counterpart: supported PVA avg. flux =
1331.497 g m-2
h-1
, unsupported PVA avg. flux = 480.75 g m-2
h-1
. This is due
simply to the polymer layer being thinner which decreases diffusion time scales.
This is also the case with the NaAlg membranes.
Regarding flexibility, figure 3.5 shows the supported PVA membrane had r 3.5
flexibility compared to r 2.0 for the unsupported. It should be noted however, that
the 3.5mm minimum radius seen here was the point at which the PAN support layer
began to suffer damage – adversely affecting pervaporation performance – rather
than any damage being suffered to the selective PVA layer (flexibility testing;
chapter 2 section 2.3.2).
For the earliest membranes primary analysis was pervaporation testing to
establish a base for production of more complex membranes. The SEM images
obtained for membranes from this period show significant surface defects typified
by the cracks seen in figure 3.2. Such defects allow unselective passage of feed

104
solution through the polymer matrix which has a negative effect on selectivity
figures and gives falsely positive flux figures. Figure 3.3 illustrates the lamellar
structure of the supported membranes with a top surface of selective polymer and
the PAN layer delaminating from the support fabric.
SEM analysis and pervaporation performance led to the conclusion that the use
of pristine polymers produced membranes either too low in selectivity – as in the
case of PVA – or physically untenable – as in the case of NaAlg. Thus,
investigation into the production of a membrane produced from a blend of PVA and
NaAlg was undertaken.
3.3.3 Polymer Blend Membranes
Pervaporation results for membranes produced from blends of NaAlg and PVA can
be seen in figure 3.1C and 3.1D, which show flux and selectivity figures
respectively. The three which performed best are shown here; polymer blends of
7:3, 4:1 and 9:1 ratios of NaAlg:PVA. Addressing first the 7:3 membrane and the
flux data shown in figure 3.1C, it can be seen that it has the lowest flux (avg. =
662.797 g m-2
h-1
, max. = 811.977 g m-2
h-1
) and the highest selectivity (avg. =
48.687, max. = 50.638), despite having the highest low-selectivity polymer content
of the three. This is counter to what is expected from theory. The 7:3 membrane has
a much greater flexibility (r 4.0) than the 4:1 (r 12.5) or 9:1 (r 31.5) as seen from
figure 3.5 (flexibility testing; chapter 2 section 2.3.2). This difference in flexibility
explains the difference in flux and selectivity between the 7:3 and 9:1 membrane
(avg. flux = 2925.156 g m-2
h-1
, max. flux = 3128.927 g m-2
h-1
, avg. selectivity =
11.1, max. selectivity = 12.53): The 9:1 membrane was so brittle that fracturing
occurred in its selective layer allowing for non-selective passage of feed solution
through it. Looking at image C in figure 3.4 one can see that the cross sectional
structure of the 9:1 membrane is more porous than either the 7:3 (image A figure
3.4) or the 4:1 (image E figure 3.4) membrane. Porous structures in materials render
them brittle[16] which explains the formation of cracks and so the high flux and
low selectivity. However, the flux is not as high, nor is the selectivity as low, as the
4:1 membrane (avg. flux = 4001.752 g m-2
h-1
, max. flux = 4165.989 g m-2
h-1
, avg.
selectivity = 6.787, max. selectivity = 7.729), both of which would be expected
from the above analysis. Looking at image E of figure 3.4 it is clear that the cross

105
sectional structure of the 4:1 membrane is non-porous suggesting a greater
flexibility than the 9:1 membrane; which is confirmed from the flexibility figures
listed above.
Figure 3.4: SEM images of supported polymer blend membranes: A, C and E show cross sections of 7:3, 9:1 and 4:1 NaAlg:PVA blends respectively while G and I show cross sections of 4:1 and 9:1 NaAlg:PVA blends utilising glyercol respectively. B, D and F show exposed surface images of 7:3, 9:1 and 4:1 NaAlg:PVA blends respectively while H and J show surface images of 4:1 and 9:1 NaAlg:PVA blends utilising glyercol respectively

106
The explanation for this lies in how the membranes swell in combination with
the cracks in their structure caused by their being brittle. The functional groups of
NaAlg render it more water selective[1] than PVA but, also cause it to swell more
under pervaporation conditions as it is essentially water-soluble, as seen with the
pristine unsupported NaAlg membranes above. Thus, the greater the sodium
alginate content of a membrane the more it will swell under pervaporation
conditions. This can be seen from the absorption data shown in table A.11
(appendix A, section A.6). If a membrane can swell sufficiently it will close up
some of the cracks in the selective layer if they are of such a scale to allow this.
This is easily observed if one simply takes a cracked supported NaAlg membrane
and places it in water. Looking at the data in figure 3.5 it can be seen that the 9:1
membrane (r 31.5) is 2.52 times more brittle (taking r 2.0 as the zero point for the
calculation) than the 4:1 membrane (r 12.5) but contains only 1.125 times the
NaAlg content of the 4:1 membrane (flexibility testing; chapter 2 section 2.3.2).
This means that the 9:1 membrane will suffer larger scale fractures and more
extensively than the 4:1 membrane but will not swell by an equivalent margin.
Thus, the swelling of the membrane in insufficient to overcome it’s fracturing to the
same extent as is possible in the 4:1 membrane. Thus, the selectivity figures of the
9:1 membrane are poorer than those of the 4:1 membrane and the flux figures are
correspondingly higher explaining the trends observed in the data of figures 3.1C
and 3.1D, wherein the 9:1 membrane has lower selectivity and higher flux than the
4:1 membrane while both are inferior to the performance of the 7:3 membrane in
terms of flux and selectivity.
The conclusions drawn from this section of data are that while the 7:3
membrane is sufficiently flexible for practical use as a pervaporation membrane,
the flux and selectivity figures are not sufficiently high to merit further
investigation. The flux and selectivity figures obtained for the higher NaAlg content
membranes here - 4:1 and 9:1 - are not representative of the true performance of
these membranes as they are too brittle for practical use. Thus, a means of
producing a high NaAlg content membrane that has greater flexibility than the 4:1
and 9:1 membranes must be found.

107
3.3.4 Polymer Blend Membrane Utilising Glycerol
Figure 3.5: Plot of membrane flexibility where r = radius of cylinder (see section 2.3.2). 1/r utilised to facilitate understanding of data; unsupported PVA most flexible membrane therefore, highest on graph
In an effort to increase membrane flexibility without sacrificing selective
performance, a plasticizing agent was introduced; namely, glycerol. Glycerol was
chosen as it has “poor” solubility in the polymer blends being used. This reduces its
plasticizing effect on the final membrane but also, reduces its permanence within
the membrane, making it easier to remove by drying afterwards [17]. This is
important as a plasticizer with “good” solubility – and so greater permanence –
would require higher temperatures to remove, leading to inadvertent crosslinking of
the membrane; having the opposite effect desired.
The exact mechanism through which plasticizers work is subject to much
speculation, but certain general statements about them can be made: They are small
molecules added to soften a polymer by lowering its Tg [17] or reducing its
crystallinity or melting temperature[18]. In the case of most plasticizers, hydrogen
bonding between polymer chain functional groups and the plasticizing agent is the
primary factor in plasticization.[19]
Although the 7:3 membrane showed better pervaporation performance without
glycerol, it was expected that if the 4:1 and 9:1 membranes could be rendered more
flexible and so more durable through plasticization they would yield superior
performance.

108
Addressing flux first; the data from figure 3.1C shows that 4:1 + gly membrane
(“+ gly” denotes “with glycerol”) (avg. flux = 843.347 g m-2
h-1
, max. flux =
1054.632 g m-2
h-1
) achieved greater flux than the 7:3 membrane (avg. = 662.797g
m-2
h-1
, max. = 811.977 g m-2
h-1
) and the 9:1 + gly membrane (avg. = 343.588 g m-
2 h
-1, max. = 358.279 g m
-2 h
-1). Note that the 9:1+ gly membrane has a lower flux
than the 7:3 membrane.
Looking at selectivity (figure 3.1D), the 9:1 + gly membrane (avg. = 358.279,
max. = 513.858) and the 4:1 + gly membrane (avg. = 81.919, max. = 92.850) have
the highest and second highest selective performance respectively. This confirms
the expectation that these blends would offer superior performance upon inclusion
of a plasticizer. However whether the plasticizer has affected membrane
performance through an increase in polymer chain mobility or an increase in water
adsorption capacity is uncertain. Karbowiak et al, in a study on carrageenan -
another water soluble polysaccharide – membranes, have shown how the action of
glycerol on diffusion is not through direct plasticization but through enabling of
larger amounts of water to be adsorbed to the membrane surface.[20] This is
corroborated in other studies [21][22] and suggests that the plasticizing effect on
the membranes may be limited to increased flexibility, while the increase in
selectivity is due to any glycerol remaining in the membrane. In this instance the
major increase in selectivity is primarily due to the lack of cracks in the selective
layers of the glycerol utilising membranes, compared to those without it. Future
quantification of the increase in selective pervaporation performance of sodium
alginate membranes by incorporation of glycerol into their polymer matrices is
worthy of investigation.
The increase in membrane durability due to plasticization is quantified by the
flexibility data listed in figure 3.5: The 9:1 + gly membrane had r 22.0 flexibility
compared to r 31.5 for the 9:1 membrane. The 4:1 + gly membrane had r 9.5
flexibility compared to r 12.5 for the 4:1 membrane. While glycerol increased the
flexibility of the 9:1 membrane significantly, r 22.0 for the 9:1 + gly is still a
relatively brittle membrane (flexibility testing; chapter 2 section 2.3.2), rendering it
somewhat impractical for use, despite its impressive selectivity figures. The 4:1 +
gly membrane is relatively flexible and compares favourably with the unsupported
NaAlg membrane while having greater flux and selectivity. Its selectivity, while not

109
as high as that of the 9:1 + gly membrane, is still superior to all others tested and its
flux is relatively high for such a selective membrane; despite having the second
highest selectivity it does not have the second lowest flux as one might expect (see
figures 3.1C, 3.1D and 3.5).
SEM images of the 9:1 + gly (figure 3.4I and 3.4J) and 4:1 + gly (figure 3.4G
3.4H) membranes do not exhibit any significantly different characteristics to the
images of the 4:1 membrane. Both however exhibit a denser, non-porous structure
than the 9:1 membrane, again indicative of an increase in flexibility. Cross sectional
images of both membranes (figure 3.4G = 4:1 + gly and 3.4I = 9:1 + gly) exhibit
this dense structure clearly, while the surface images (figure 3.4H = 4:1 + gly and
3.4J = 9:1 + gly) show no surface fractures or defects. Pock-mark-like surface
defects are due to solvent pooling and/or trapped air forming bubbles in the drying
process.[23]
The combination of flexibility with relatively high selectivity and flux makes
the 4:1 + gly membrane ideal for general testing of high performance pervaporation
membranes on an industrial scale such as that used in our pervaporator (see chapter
2 section 2.2.1). As such it was adopted as the base membrane for all future high
performance pervaporation studies in the project.
3.4 Conclusion
Directly comparing pristine polymers; PVA is more flexible – and therefore more
durable – than NaAlg. PVA also exhibits marginally superior flux to that of NaAlg
but significantly inferior selectivity.
Regarding supports; they are essential: In order for an unsupported membrane
to be self-supporting it must necessarily be relatively thick, which significantly
reduces flux. Additionally, in the case of water selective membranes in a water-
containing feed, a support is required to prevent gelification and potential
dissolution of the membrane under pervaporation conditions. While unsupported
membranes are more flexible on account of their greater thickness, their flexibility
and therefore durability, is not so significantly greater than a supported equivalent
to overcome the substantial loss in flux that must be incurred by utilising them. A
support allows for the use of relatively thin selective layers which results in a large
gain in flux.

110
Given the higher surface-area to mass ratio of the selective layer in the
supported membrane, the rate of evaporative loss of solvent from the membrane
during drying should be increased, rendering the surface skin layer denser, which
should, in theory, offset the loss in selectivity compared to the unsupported
membrane. This will be investigated in chapter 5.
Regarding polymer blends: In order to obtain a membrane with comparable
durability to that of a PVA membrane and pervaporation performance comparable
with that of a NaAlg membrane, a polymer blend must be utilised. A polymer blend
with enough NaAlg to still have highly selective performance is too brittle for
practical use at an industrial scale. Therefore a plasticizer must be used in the
membrane production process; in this case; glycerol. The use of glycerol renders
the blend membrane durable enough to be used on a large scale while maintaining a
far higher performance than the industrial standard pristine PVA membrane. The
quantification and precise nature of the effect of plasticizing agents in general, and
glycerol specifically in this instance, on the selective performance is still unknown
and may be worthy of further investigation.
The overall conclusion to this section is that the polymer blend membrane
comprised of four parts NaAlg to one part PVA and utilizing glycerol plasticizing
agent and a support is the optimum membrane for high performance pervaporation
tests in this project. Though this membrane may not be suitable for mixed matrix
membrane tests (explained in chapter 7) it will be suitable for any other membrane
tests.

111
3.5 Summary
Membrane Support Essential
Optimum pervaporation membrane
Supported
Selective layer: plasticized polymer blend
Blend: 4:1 ratio of NaAlg:PVA
Plasticizer: Glycerol
Pristine PVA remains best material for testing particles for MMMs due to superior
mechanical properties

112
References: Chapter 3
[1] R. Y. M. Huang, R. Pal, and G. Y. Moon, “Characteristics of sodium alginate
membranes for the pervaporation dehydration of ethanol–water and
isopropanol–water mixtures,” Journal of Membrane Science, vol. 160, no. 1,
pp. 101–113, Jul. 1999.
[2] S. Kalyani, B. Smitha, S. Sridhar, and a Krishnaiah, “Pervaporation
separation of ethanol–water mixtures through sodium alginate membranes,”
Desalination, vol. 229, no. 1–3, pp. 68–81, Sep. 2008.
[3] C. K. Yeom, “Characterization of permeation behaviors of ethanol-water
mixtures through sodium alginate membrane with crosslinking gradient
during pervaporation separation,” Journal of Applied Polymer Science, vol.
69, no. 8, pp. 1607–1619, Aug. 1998.
[4] Y. Shi, X. Wang, and G. Chen, “Pervaporation characteristics and solution-
diffusion behaviors through sodium alginate dense membrane,” Journal of
Applied Polymer Science, vol. 61, no. 8, pp. 1387–1394, Aug. 1996.
[5] R. Russo, M. Malinconico, L. Petti, and G. Romano, “Physical behavior of
biodegradable alginate-poly(vinyl alcohol) blend films,” Journal of Polymer
Science Part B: Polymer Physics, vol. 43, no. 10, pp. 1205–1213, May 2005.
[6] C. K. Yeom and K.-H. Lee, “Characterization of sodium alginate and
poly(vinyl alcohol) blend membranes in pervaporation separation,” Journal
of Applied Polymer Science, vol. 67, no. 5, pp. 949–959, Jan. 1998.
[7] P. D. Chapman, T. Oliveira, A. G. Livingston, and K. Li, “Membranes for
the dehydration of solvents by pervaporation,” Journal of Membrane
Science, vol. 318, no. 1–2, pp. 5–37, Jun. 2008.
[8] A. Jonquières, “Industrial state-of-the-art of pervaporation and vapour
permeation in the western countries,” Journal of Membrane Science, vol.
206, no. 1–2, pp. 87–117, Aug. 2002.
[9] J. Jegal, “Pervaporation separation of water-ethanol mixtures through PVA-
Sodium alginate blend membranes,” Journal of Applied Polymer Science,
vol. 51, no. 2, pp. 253–392, Mar. 2003.
[10] R. Y. M. Huang and C. K. Yeom, “Pervaporation separation of aqueous
mixtures using crosslinked poly(vinyl alcohol)(pva). II. Permeation of
ethanol-water mixtures,” Journal of Membrane Science, vol. 51, no. 3, pp.
273–292, 1990.
[11] J. Chen, J. Huang, J. Li, X. Zhan, and C. Chen, “Mass transport study of
PVA membranes for the pervaporation separation of water/ethanol
mixtures,” Desalination, vol. 256, no. 1–3, pp. 148–153, Jun. 2010.

113
[12] C. K. Yeom, “Characterization of sodium alginate and poly(vinyl alcohol)
blend membranes in pervaporation separation,” Journal of Applied Polymer
Science, vol. 67, no. 5, pp. 949–959, Jan. 1998.
[13] E. J. Flynn, D. Keane, J. D. Holmes, and M. A. Morris, “Unusual trend of
increasing selectivity and decreasing flux with decreasing thickness in
pervaporation separation of ethanol/water mixtures using sodium alginate
blend membranes.,” Journal of Colloid and Interface Science, vol. 370, no.
1, pp. 176–82, Mar. 2012.
[14] B. Guerrier, C. Bouchard, C. Allah, C. Bknard, and P. M. Curie-universitc,
“Drying Kinetics of Polymer Films,” vol. 44, no. 4, 1998.
[15] A. G. Yiotis, I. N. Tsimpanogiannis, A. K. Stubos, and Y. C. Yortsos, “Pore-
network study of the characteristic periods in the drying of porous
materials.,” Journal of colloid and interface science, vol. 297, no. 2, pp.
738–48, May 2006.
[16] M. S. Widmer and A. G. Mikos, “Chapter II.5 Fabrication of Biodegradable
Polymer Scaffolds fo Tissue Engineering,” in Frontiers in Tissue
Engineering, Elsevier Science Ltd., 1998, pp. 107–116.
[17] M. P, “Chapter 4.10 Additives,” in Polymer Chemistry: An Introduction,
Oxford University Press, 1999, pp. 121–126.
[18] L. H. Sperling, “Chapter 1.5: Crosslinking, Plasticizers and Fillers,” in
Introduction to Polymer Science, 4th ed., John Wiley & Sons Ltd., 2006, p.
18.
[19] L. H. Sperling, “Chapter 8.2: Five Regions of Viscoelastic Behaviour,” in
Introduction to Polymer Science, 4th ed., John Wiley & Sons Ltd., 2006, p.
361.
[20] T. Karbowiak, H. Hervet, L. Léger, D. Champion, F. Debeaufort, and A.
Voilley, “Effect of plasticizers (water and glycerol) on the diffusion of a
small molecule in iota-carrageenan biopolymer films for edible coating
application.,” Biomacromolecules, vol. 7, no. 6, pp. 2011–9, Jun. 2006.
[21] N. Gontard, S. Guilbert, and J. Cuq, “Water and Glycerol as Plasticizers
Affect Mechanical and Water Vapor Barrier Properties of an Edible Wheat
Gluten Film,” Journal of Food Science, vol. 58, no. 1, pp. 206–211, 1992.
[22] J.-W. Rhim, “Physical and mechanical properties of water resistant sodium
alginate films,” LWT - Food Science and Technology, vol. 37, no. 3, pp.
323–330, May 2004.
[23] L. B. S. Seldon L. Dotson, “Hydrodynamic analysis of calenderable PVC
and ABS compounds,” Journal of Vinyl Technology, vol. 1, no. 2, pp. 76–83,
1995.

114
Chapter 4
Lateral-Flow Membrane
Development

115
4 Lateral-flow Membrane Development
Abstract
The earliest phases of lateral-flow membrane research centred on the development
of basic viable membranes and attaining a reproducible production method. The
simplest membranes were produced with the basic polymer solution composition
required for phase inversion; polymer, solvent and non-solvent. Membranes were
produced from such lacquers at near cloud point and non-cloud point. The resulting
membranes were characterised and assessed in terms of their lateral flow
performance. Results showed that – as is seen throughout the membrane work in
this thesis – control of skin layer formation in conjunction with control of pore
structure is essential to the efficacy of lateral flow membranes. Additionally,
bringing lacquers to cloud point is shown to have an effect on both the pore
structure and skin layers of the membranes.

116
4.1 Introduction
The industrial processes involved in developing porous lateral flow cellulose nitrate
membranes are long established but poorly understood. Manipulation of these
processes for the purposes of optimisation is thus, difficult. In recent years
increased competition and a consumer demand for high quality, specialised
membranes has driven research toward a greater understanding of the membrane
formation process i.e. the phase inversion process.
The aim of the work outlined in this chapter was to produce a viable, basic
lateral flow membrane, comparable with the industrial standard produced by
Millipore[1]. From there it is possible to study both how the membrane forms
through the phase inversion process and how that process, and therefore membrane
structure/performance, can be controlled. To do this one must manufacture a
membrane from the minimum components required for phase inversion.
The fundamentals of phase inversion are detailed in the Loeb-Sourirajan[2]
method (outlined in chapter 1, section 1.4.2). For the vapour induced phase
separation (VIPS)[3–5] three components are required; polymer, solvent and non-
solvent[5–7]. The solvent and non-solvent used are dictated by the choice of
polymer. Since the industrial standard lateral-flow membrane material is cellulose
nitrate (CN), that polymer was chosen to conduct this research (see chapter 1
section 1.4.1). This necessitated the use of acetone as the solvent and water as the
non-solvent for two reasons: 1) these are highly effective 2) they are what is used
industrially[1], [7]. Thus, the casting “lacquer” for these membrane was one
composed of CN (polymer), acetone (solvent) and water (non-solvent) in
percentages outlined in chapter 2, section 2.1.3, table 2.3. The drying process for
these membranes was done at room temperature (controlled at approximately 25
oC) and in an oven at elevated temperature (approximately 40
oC).
The resulting membranes were characterized by SEM and XRD, and tested for
lateral flow performance (where possible). These results are presented below
(supporting information to results contained in appendix B). In order to test the
lateral flow rate of a membrane it must be rendered hydrophilic: As was explained
in chapter 1, CN membranes are hydrophobic and must be treated with surfactant in
order to achieve this and thus allow for lateral flow of water across/through

117
them[8]. An SDBS surfactant is used; sodiumdodecylbenzenesulfate (see chapter 2
section 2.1.4 for details on procedure).
In the earliest stages of this work it was attempted to produce these membranes
without any support material by applying the lacquer directly to glass plates. It was
subsequently found that it was not possible to remove the membranes from the
glass without damaging them to a point where characterization and lateral flow
testing was impossible. Therefore, the membranes were produced on backing (from
which the membranes could later be removed easily and without suffering any
damage). The material used for backing was again chosen to parallel industrial
parameters as much as practically possible on the lab scale. The chosen material
was a 100% polyester film (Melinex) of 100, or 50 µm thickness which is used by
Millipore for the same purpose (see appendix B, figure B.2 for SEM images of
backing material). This material and the experimental procedure of its use are
described in chapter 2 section 2.1.4.
The final membranes produced were shown to have poor or, no lateral flow
when made from this basic composition of polymer, solvent and non-solvent. This
was due to the formation of skin layers which inhibit lateral flow[9]. The formation
of these layers and means of preventing them, along with all other results from this
section are discussed below.
4.2 Experimental
See chapter 2 for details on all materials, apparatus and procedures.
4.3 Results and Discussion
Table 4.1 shows the basic membranes’ lacquer water content for casting. Each
membrane was cast with a clear lacquer (BasMemX) and at cloud point
(BasMemXCP). Lacquers cast at cloud point have a higher water content than their
non-cloud point equivalents for reasons outlined in chapter 1, section 1.4.2. Table
4.1 also shows the flow rates – if any – of the membranes studied and whether or
not a skin layer is present.

118
Table 4.1: Tabulated data showing the water content of the lacquers (casting solutions) of the basic lateral flow membranes (see chapter 2, section 2.1.3, table 2.3 for precise composition of lacquers) produced from lacquers at both cloud point and not. The exact water content required to reach cloud point in the lacquer is shown as is the water content of membranes not cast from lacquers at cloud point (definition of lacquer cloud point given in chapter 2, section 2.1.3). Also shown is the presence of a skin layer in the final membrane and flow rate, if any
Membrane Water Content of Final Lacquer
(weight %)
Lacquer Brought to Cloud Point?
Flow Rate (cm2 s-1)
Skin Layer Present?
BasMemA 0 No - No
BasMemACP 15.38 Yes - -
BasMemB 4.15 No - Yes
BasMemBCP 14.73 Yes 0.005 Yes
BasMemC 8.30 No - Yes
BasMemCCP 18.52 Yes 0.002 Minimal
BasMemD 12.45 No - Yes
BasMemDCP 20.92 Yes - Yes
Examining BasMemA which was cast from 100 % acetone to make a lacquer
of 83 wt% acetone and 17 wt% CN; it can be seen from table 4.1 that no skin layer
data is present for BasMemACP. This is because the lacquer for this membrane
proved uncastable. BasMemA by comparison, was readily castable and produced
membranes characterized under SEM; shown in figure 4.1 (below). This lacquer
underwent phase inversion to produce final membranes at two temperatures; room
temperature (approx. 25 oC) and in an oven at approx. 40
oC. This was done to
ascertain the effect of temperature on the VIPS method used for our membranes
given the profound effect that temperature is reported to have on phase
inversion[10], [11].
What was found is that while the membranes produced at both temperatures
were too dense for lateral flow purposes the one produced at room temperature
appears less dense in cross section (figures 4.1A and 4.1B) than that produced at 40
oC (figures 4.1D and 4.1E). This is apparent from the respective pore sizes of the
membranes. The room temperature dried membrane has pore diameters in the
region of 0.2-0.4 µm while the oven dried membrane has pores of <0.2 µm in
diameter. Looking at the surface images the same thing is observed; no pore
structures in the oven dried membrane (suggesting some skin-layer formation,
though this is not observed in cross section; it may be very thin and difficult to
observe or, it may be of only slightly higher density than the bulk membrane
substructure) compared to pores of 2-4 µm diameter on the surface of the room
temperature membrane.

119
It is tempting to attribute the lack of/small pores in the oven-dried membrane
to the higher temperature in the oven and the increase in rate of evaporation of
solvent from the lacquer [12], [13]. However, given the nucleation and growth
mechanism by which VIPS and phase separation are understood to form pore
structures [14], it is likely that the lower amount of atmospheric moisture inside the
oven also contributes to the more dense membrane structure produced at 40 oC.
Figure 4.1: SEM images of membranes produced from lacquers of 17 wt% CN dissolved in 100 % acetone. Images A, B and C show cross section, cross-section close-up and surface images respectively of the air dried membrane. Images D, E and F show cross section, cross-section close-up and surface images respectively of the oven dried membrane

120
Given the respective densities of these membranes, it was concluded that
producing membranes at room temperature and humidity was preferable.
Considering the potential variability in humidity, future membranes were cast in a
controlled humidity environment inside the Mbraun GP 2202 PB single piece
moulded glovebox (see chapter 2, section 2.1.4) at 35 % humidity. Neither
membrane showed signs of lateral flow when tested.
A series of lacquers were then made in which 50-20 wt% water was used in the
solvent mixture with acetone. It was found that greater than 20 wt% water in the
mix rendered it ineffective for dissolving CN. Reasons for this are given below.
Figure 4.2: SEM images of membranes produced from lacquers of 17 wt% CN dissolved in 85 wt%:15 wt% acetone:water solvent mix and air dried. Images A and B show surface and cross section images respectively of the membrane produced from a lacquer not brought to cloud point. Images C and D show surface and cross section images respectively of the membrane produced from a lacquer brought to cloud point
Chronologically BasMemD and BasMemDCP were then produced. BasMemD
contained 85 wt% acetone and 15 wt% water in the solvent mix which was used to
dissolve CN. This yielded a lacquer of 17 wt% CN to 70.55 wt% acetone and 12.45
wt% water (see chapter 2 section 2.1.3, table 2.3). BasMemDCP was produced by

121
taking the aforementioned lacquer and bringing it to cloud point (see chapter 2
section 2.1.3 for details). This resulted in a final lacquer comprising 15.35 wt% CN,
63.73 wt% acetone and 20.92 wt% water (see chapter 2 section 2.1.3, table 2.3 for
details on calculations).
SEM images of these membranes are shown in figure 4.2 above and it is
immediately apparent that the surface structures of the two membranes differ. The
surface of BasMemC (figures 4.2C and 4.2D) is very different to the non-cloud
point equivalent (BasMemD; figures 4.2A and 4.2B). The surface image of
BasMemD shows the beginnings of pore structures but no open pores in the
surface. This is due to the presence of a skin layer which can be seen as a dense
region of polymer in the upper part of the cross sectional image (figure 4.2B)
separated from the bulk membrane by what appears to be a large macrovoid cavity
[11], [15] (although this cavity may simply be the result of the difference in
densities of the two regions causing delamination of the skin layer from the
membrane bulk). The bulk membrane shows some networked pore structure with
pores of approximately 1- 5 µm diameters, however lateral flow testing showed that
there was no flow through the membrane despite this; suggesting that the presence
of a skin layer inhibits lateral flow.
The structure of BasMemDCP showed a surface (figure 4.2C) that was very
open and similar in appearance to equivalent industrial membranes (see appendix
B, figure B.3) while the cross section (figure 4.2D) shows a deformed structure
which, unlike the industrial equivalents, has great variation in density. This
membrane also exhibited no lateral flow upon testing. The lacquer from which it
was cast contained over 20 wt% water. This meant that the CN did not dissolve
fully in the solvent mixture. The Hildebrand solubility parameters of acetone, and
water are 19 and 48Mpa1/2
respectively whilst CN is around 22 Mpa1/2
[16]. Given
the relatively similar solubility parameters of acetone and CN and their great
difference with that of water, one would expect that as the water content of the
solvent mixture increases the solubility of the CN in the solvent mix should
decrease, which is what is seen. This yields the fibrous structure seen in the surface
and cross sectional images of figure 4.2C and 4.2D. This structure results from the
fibrous, raw CN remaining undissolved (see appendix B, figure B.4; in particular
figure B.4D).

122
This is confirmed by examining the XRD profile of the membrane (figure 4.7
below) when compared to that of the raw material (figure 4.5 below) and that of the
optimum membrane produced in this series, BasMemBCP (figure 4.6 below). The
XRD profile of the raw material – CN (figure 4.5) – shows a sharp diffraction
feature at approximately 45 o2θ of greater intensity (15,000 counts s
-1) than the
broad feature observed around 22 o2θ (max. approx.. 11,000 counts s
-1). This broad
feature is typical of cellulose compounds[17], [18]. There is also a relatively sharp,
low intensity (5,700 counts s-1
) diffraction feature observed at around 12 o2θ. By
comparison, the XRD profile of BasMemBCP (the optimum membrane produced
as shown below) shows no sharp diffraction features. The overall signal intensity is
reduced and the broad feature typical of cellulose compounds is still observed
around 22 o2θ though with a reduced intensity (max. approx.. 2,200 counts s
-1)
compared to that observed in the raw material. The lack of sharp features suggests a
more amorphous compound with little or no crystalline nature, which would be
expected if the polymer is completely dissolved and the membrane produced by the
method outlined in chapter 2. The XRD profile of BasMemDCP sits between the
two, exhibiting crystalline features of the raw material; most notably a sharp
diffraction feature at around 45 o2θ, but this feature – unlike in the raw material – is
of a lower intensity (5,500 counts s-1
) than the broad feature around 22 o2θ. The
general intensity of the signal is higher than that of BasMemBCP but lower than
that of the raw material. This suggests that BasMemDCP – which contains 20.92
wt% water (see chapter 2 section 2.1.3, table 2.3 for details on calculations) – is
more crystalline than BasMemBCP but less so than the raw material, confirming
that the presence of high weight percentage non-solvent – in this instance; water –
in the lacquer resulted in raw material – CN – remaining undissolved within it,
yielding the membrane structures observed in the SEM images of BasMemDCP
(figure 4.2C and 4.2D). Regarding membranes not brought to cloud point; their
XRD profiles are similar to that seen for BasMemBCP; no sharp diffraction
features and a broad feature, typical of cellulose compounds, observed around 22
o2θ (see appendix B, figure B.7 for typical XRD profile of BasMemB). This sort of
profile is observed for any membrane in which the CN raw material is completely
dissolved in the lacquer.

123
Chronologically BasMemC and BasMemCCP were then produced; BasMemC
contained 90 wt% acetone and 10 wt% water in the solvent mix which was used to
dissolve CN yielding a lacquer of 17 wt% CN to 74.70 wt% acetone and 8.30
wt% water (see chapter 2 section 2.1.3, table 2.3). BasMemCCP was produced by
taking the aforementioned lacquer and bringing it to cloud point (see chapter 2
section 2.1.3 for details). This resulted in a final lacquer comprising 14.73 wt% CN,
66.36 wt% acetone and 18.52 wt% water (see chapter 2 section 2.1.3, table 2.3 for
details on calculations).
Figure 4.3: SEM images of membranes produced from lacquers of 17 wt% CN dissolved in 90 wt%:10 wt% acetone:water solvent mix and air dried. Images A and B show surface and cross section images respectively of the membrane produced from a lacquer not brought to cloud point. Images C and D show surface and cross section images respectively of the membrane produced from a lacquer brought to cloud point
Looking first at the surface of the cloud point (BasMemCCP; figure 4.3C)
membrane compared non-cloud point membrane (BasMemC; figure 4.3A) it can be
seen that there are pores present in the surface of BasMemCCP while there are no
open pore structures on the surface of BasMemC. This is evidence of a skin layer
on the surface of BasMemC and a lack of one, or a greatly reduced one, on the

124
surface of BasMemCCP. BasMemC exhibited no lateral flow when tested. The
surface pores on BasMemCCP are of 2-3 µm in diameter. In cross section it is
difficult to observe any difference between the two membranes.
Figure 4.4: SEM images of membranes produced from lacquers of 17 wt% CN dissolved in 95 wt%:5 wt% acetone:water solvent mix. Images A, B and C show air surface, backing surface and cross section images respectively of the air dried membrane produced from a lacquer not brought to cloud point. Images D, E and F show cross air surface, backing surface and cross section images respectively of the air dried membrane produced from a lacquer brought to cloud point
The bulk membrane structures look broadly similar, however the pores visible in
BasMemCCP are slightly larger (2-3 µm in diameter) than those of BasMemCCP

125
(1-2 µm in diameter). From table 4.1 it should be noted that BasMemCCP is the
first to exhibit any lateral flow with a flow rate of 0.002 cm-2
s-1
. This is dependent
on the use of less water in the lacquer than BasMemDCP but more than that used in
the lacquer for BasMemA or BasMemACP which effects the formation of skin
layers which inhibit lateral flow[9].
BasMemB and BasMemBCP were then produced at room temperature and 35
% humidity. The lacquer for BasMemB was made from a solvent mixture of 95
wt% acetone and 5 wt% water. This mixture was then used to dissolve CN to give a
lacquer comprising 17 wt% CN, 4.15 wt% water and 78.85 wt% acetone (see
chapter 2 section 2.1.3, table 2.3). BasMemBCP was produced by taking the
aforementioned lacquer and bringing it to cloud point (see chapter 2 section 2.1.3
for details). This resulted in a final lacquer comprising 15.12 wt% CN, 70.14 wt%
acetone and 14.73 wt% water (see chapter 2 section 2.1.3, table 2.3 for details on
calculations).
SEM images of these membranes are shown in figure 4.4 above. Surface
images of BasMemB (figure 4.4A) show that a skin layer formed, inhibiting the
formation of open pores at the membrane surface: Figure 4.4C confirms this; the
cross section showing a distinct layer of greater polymer density at the top of the
membrane. By comparison, the surface of BasMemBCP displays larger
morphologies (figure 4.4D) than those seen on the surface of BasMemB, however
they rarely seem to be open, suggesting – as was the case with BasMemCCP – that
there is a skin layer present although it is thinner than that seen in BasMemB. This
is confirmed in cross section by figure 4.4F which shows a region of denser
polymer at the surface of the membrane. This region is 4-5 µm in thickness in
BasMemBCP compared to 7-8 µm thickness in BasMemB. The cross sections of
figures 4.4C and 4.4F show that the pore network in the bulk membrane of
BasMemB is similar to that seen in BasMemCCP, while the bulk membrane pore
network structure of BasMemBCP is far more open than any other membrane
observed herein. This structure led to the best lateral flow results obtained from
these basic membranes, of 0.005 cm-2
s-1
flow rate (see table 4.1 above). The shapes
of the pores observed in the cross section image of BasMemBCP are oblong,
suggesting a collapse of the pore walls, which has been attributed to differences in
tensile strength elsewhere[19].

126
Figure 4.5: XRD profile of the cellulose nitrate polymer before incorporation into lacquer. Shows a sharp diffraction feature at approximately 45 o2θ (15,000 counts s-1), a broad feature around 22 o2θ (11,000 counts s-1). Broad feature typical of cellulose compounds. Also a relatively sharp
diffraction feature around 12 o2θ (5,700 counts s-1)
Figure 4.6: XRD profile of BasMemBCP shows no sharp diffraction features. Broad feature typical of cellulose compounds observed around 22
o2θ (2,200 counts s
-1)
0
2000
4000
6000
8000
10000
12000
14000
16000
0 10 20 30 40 50 60 70
Cellulose Nitrate
2θ angle (degrees)
Inte
nsi
ty (
cou
nts
per
se
con
d)
0
500
1000
1500
2000
2500
0 10 20 30 40 50 60 70 80
BasMemBCP
2θ angle (degrees)
Inte
nsi
ty (
cou
nts
per
se
con
d)

127
Figure 4.7: XRD profile of BasMemDCP. Sharp diffraction feature at around 45 o2θ, but this feature – unlike in the raw material – is of a lower intensity (5,500 counts s-1) than the broad feature around 22 o2θ
The collapse of the pores may be due to low crystallinity of the membrane
making it more malleable. The XRD profile of the membrane (figure 4.6 above)
shows a mostly amorphous material with no sharp diffraction features visible and a
broad feature observed around 22 o2θ (max. 127pprox.. 11,000 counts s
-1) the only
thing of note, suggesting an amorphous material.
The flexibility testing data shows that BasMemBCP is the most flexible of the
membranes brought to cloud point with a flexibility of r 3.5 (see figure 4.8 below,
and table B.1, appendix B), on a par with the highly flexible supported PVA
membranes and unsupported NaAlg membranes seen previously (see chapter 3).
This seems to corroborate the idea that the pore structures of the membrane
collapsed being more malleable, but looking at the flexibility data again it can be
seen that the non-cloud point membranes are all more flexible, so why does one not
see this same collapsing of pore structures within? The reason is simple, in the
membranes that were not brought to cloud point we see either no pore-formation
(BasMemA) or smaller pores (BasMemD and BasMemC) than in BasMemBCP.
This means they have thicker pore walls making them more resistant to collapse
(flexibility testing; chapter 2 section 2.3.2).
0
1000
2000
3000
4000
5000
6000
7000
0 10 20 30 40 50 60
BasMemDCP
Inte
nsi
ty (
cou
nts
pe
r se
con
d)
2θ angle (degrees)

128
Figure 4.8: Plot of membrane flexibility where r = radius of cylinder (see section 2.3.2). 1/r utilised to facilitate understanding of data; unsupported PVA most flexible membrane therefore, highest on graph
Looking at the rest of the flexibility data it can be seen that the membranes
brought to cloud point were all more brittle than those not brought to cloud point.
Additionally, the higher the initial lacquer water content before being brought to
cloud point the more brittle the membrane, with BasMemDCP being the most
brittle/least flexible with a flexibility of r 10.0. BasMemCCP was the next most
brittle membrane with flexibility of r 5.0, followed by the industrial membrane;
Milipore’s HiFlow at r 3.5, the same flexibility as observed for BasMemBCP and
BasMemD. BasMemC and BasMemB are the second most flexible membranes
both with flexibilities or r 3.0. Finally BasMemA is the most flexible membrane
with r 2.5. The XRD profiles of the membranes correlates with the flexibility data
in some ways; the most crystalline membrane; BasMemDCP is the least flexible,
which is as one would expect[20] (flexibility testing; chapter 2 section 2.3.2).
An unusual morphology was observed in the membranes once Melinex
backing was used. It was possible to remove the membranes from the Melinex
backing after production to observe the support interface surface. Four significant
observations were made; the pores that form at this surface seem to be more open
than the corresponding pores at the exposed surface (there is no significant

129
difference in pore diameter, only in pore volume); there appears to be a skin formed
from the flattening of the polymer at the support surface – particularly apparent
around the edges of pores (see figure 4.4B above and appendix B, figure B.5); a
residue is left behind on the backing material which is made up of the same
flattened polymer as observed on the membrane itself (this appears to be part of the
same skin layer observed on the underside of the membrane); there are distinct
linear patterns visible in the pore distributions (highlighted in figure 4.4B).
Addressing first the linear patterns seen in the membranes; these were only
observed in the membranes with acetone content greater than 95 wt% in the solvent
mix and were less apparent in membranes brought to cloud point (see appendix B;
figure B.6). The reason for them being less apparent is that the skin layer formed at
this surface, in the membranes brought to cloud point, maintains its integrity when
the membrane is removed from the support (see appendix B, figure B.6B),
obscuring the pore structure. The potential reasons for the thicker skin in the cloud
point membrane are discussed below. The reason for the formation of linear pore
patterns was believed to be connected with the nature of the Melinex backing.
Under SEM and AFM analysis the surface images and topographical images
respectively show lines in the poly(ethylene terephthalate) (PET) from which
Melinex is made. These lines form because of the process by which PET films, like
Melinex, are made; extruding and drawing of the polymer[21]. This produces the
PET film linearly which results in lines in the material. These are visible under
SEM (see appendix B, figure B.2A) and are particularly prominent in SEM cross
section (see appendix B, figure B.2B) and can most clearly be seen under AFM (see
appendix B, figures B.8 and B.9). It would seem that the lacquer is being
channelled along these lines thus forming pores in matching linear distributions
during phase inversion.
The greater pore volume at the support side of the membrane is due to the
evaporation of solvent from the membrane; the same process which causes skin
layer formation at the opposing surface[12], [13]. While the force of solvent
evaporation draws polymer molecules upwards, towards the exposed surface,
increasing polymer density, decreasing pore volume and creating a skin layer; at the
opposite, unexposed, support interface polymer molecules are being drawn away,
having the opposite effect and increasing pore volume. There is no significant

130
difference between the pore volume at this surface and that of the bulk membrane
due to the effect of the skin layer on evaporation rate once it has formed and the
demixing front has moved back through the membrane beyond it (see chapter 1,
section 1.4.3)[12].
The flattening of polymer at the support interface and the residue remaining on
the support after removal are related, as stated above. Initially the residue was
thought to be the result of detached nodules [22] (the occurrence of these
morphologies is explained in a later chapter) however upon examination it was
found to be the remnants of the thin skin layer formed at this surface. How this
layer formed was subject to much speculation: Initially it was thought to be the
result of the acetone in the polymer rich phase diffusing through/into the PET
support upon liquid-liquid demixing. This would result in a build-up of polymer at
the support interface as the acetone content in the polymer rich phase decreased
causing the polymer to desolve and create a skin layer.
In order to establish whether acetone would permeate the Melinex,
pervaporation tests were conducted using an acetone rich feed solution composed
of acetone and water, and Melinex as the membrane. It was found that there was no
permeation of the Melinex by acetone or water. The conclusion was that diffusion
through the membrane was not occurring. Swelling measurements before and after
pervaporation was also inconclusive.
Finally, contact angle measurements were obtained (see appendix B, table
B.2). These were conducted on both 50 µm and 100 µm thick Melinex. There was
no significant difference in the contact angle of water droplets between the two
thicknesses of Melinex: The average contact angle on the left side of a droplet for
the 2 mm thick Melinex was 77.82o (max. 90.9
o, min. 71.3
o) while that for the 4
mm Melinex was 80.92o (max. 86.9
o, min 74.7
o); a 3.1
o difference which represents
a 1.72% difference between the two (taking 180o to be the max. angle possible)
which is not statistically significant. The average contact angle on the right side of a
droplet for the 2 mm thick Melinex was 79.41o (max. 89.9
o, min. 63.2
o) while that
for the 4 mm Melinex was 81.71o
(max. 89.3o, min. 76.0
o); a 2.3
o difference which
represents a 1.28% difference between the two which is, again, not statistically
significant. All the acetone droplet measurements showed that the acetone had a
contact angle with the Melinex (regardless of thickness) of less than 15o. This was

131
below what was measurable by the goniometer but any measurement below 15o is
significantly less than that exhibited by the water droplet contact angles (>34.9 %
decrease in contact angle over droplet left side contact angle with 2 mm Melinex
and >33.0 % decrease over right side. >36.6 % decrease in contact angle over
droplet left side contact angle with 4 mm Melinex and >37.1 % decrease over right
side). Figures B.10 and B.11 of appendix B show images of a typical water droplet
measurement and a typical acetone droplet measurement and the difference
between the two is plain to see.
The conclusion here is that the Melinex support is more attractive to acetone
than it is hydrophilic. This may result in the formation of a thin layer of the
polymer rich phase (which contains the acetone) at the support interface during
liquid-liquid demixing with a polymer lean layer above it, which once phase
inversion is complete results in the easily detachable thin skin layers observed in
SEMs of the support interface of the lateral flow membranes. In membranes not
brought to cloud point the acetone content is higher which may result in the
formation of a thicker layer, this would explain why the skin layer at this surface
appears to have a greater integrity in membranes not brought to cloud point.
Regarding the general properties of lateral flow membranes produced lacquers
containing a mix of acetone solvent and water non-solvent; it is certain that
bringing the lacquer to cloud-point produces a more porous membrane. Membranes
utilising such lacquers develop skin layers at their exposed surface regardless of
whether or not the lacquer is brought to cloud point. However, the skin layer in
membranes produced from lacquers brought to cloud-point are significantly
reduced, which is directly linked to the formation of more open pore networks and
thus better lateral flow.
This is due to the higher water content of the membrane lacquers brought to
cloud point, which means that the phase inversion process occurs faster, thus the
evaporation of solvent from the membrane surface occurs in a smaller timeframe
before the demixing front moves back through the membrane, solidifying the skin
layer. This has the effect of reducing the skin layer thickness (as it has less time to
form) and, since the skin layer is solidified earlier, reducing the evaporation rate of
solvent from the bulk membrane below the skin layer, therefore increasing the

132
timeframe over which phase inversion occurs in the bulk membrane, thus allowing
more time for nucleation and growth and so a more open pore network[14].
4.4 Conclusion
Regarding the effect of the Melinex backing on the formation of linear pore
patterns; it is highly likely that the linear patterns in the Melinex itself are the
source of the linear pore distributions observed at the support interface of the
membranes. Future experiments utilising a Melinex film without these lines to
produce a lateral flow membrane and observe whether or not the linear pore
distributions are present would allow us to confirm this. However, no such film
exists to the best of our knowledge, due to the linear extrusion process by which
polyethylene terephthalate (PET) films of this type are produced. The pore
distributions have no discernible effect on lateral flow performance as they do not
occur throughout the bulk membrane but only in the immediate region above the
support interface.
Regarding the skin layer formed at the support interface; the evidence showing
the greater affinity for acetone than water of the Melinex backing explains this
phenomenon in part. Using an impermeable, hydrophilic support would, in theory
create a skin layer as well; through the formation of a polymer lean phase layer at
the support interface with a corresponding polymer rich phase layer above it, during
liquid-liquid demixing. In order to confirm that this is what is occurring, future
experiments would be conducted using an impermeable, non-polar support material
which would, theoretically, eliminate the skin layers. This would be a costly –
though simple – venture but, since the residue left by these skin layers on the
support material has been cited as a problem industrially it may be suitable for
further investigation.
Regarding the general properties of the lateral flow membranes; it is certain
that bringing the casting lacquer to cloud point produces a better lateral-flow
membrane. Greater control of the evaporation rate of solvent from the membrane,
through the control of the solvent and non-solvent affinities [23] for one another
may inhibit the formation of skin layer entirely, thus increasing pore size and the
openness of formed pore networks. An increase in the crystallinity of the polymer
in the final membrane may inhibit the collapse of the pore network structure as seen

133
in the membranes above. This is the subject of the investigations outlined in chapter
6.

134
4.5 Summary
Membrane must be supported
100µm thick Melinex support material
Casting lacquer must be brought to cloud point
Optimum lacquer composition
15.12wt% CN
70.14wt% Ace
14.73wt% water
Phase inversion - vapour induced phase separation (VIPS)
Lateral flow rate
0.005cm2 s-1
Skin layer present
Inhibits and retards lateral flow
Lateral flow rate poor compared to industrial standards
Fastest industrial membrane; Milipore HF075
flow rate: 0.053cm2 s-1
Greater control of evaporation rate of solvent from membrane required in prevent
skin layer formation
Control of solvent - non-solvent affinities is key

135
References: Chapter 4
[1] M. A. Mansfield, “Chapter 6: Nitrocellulose Membranes for Lateral Flow
Immunoassays: A Technical Treatise,” in Lateral Flow Immunoassay, 2009,
pp. 95–115.
[2] S. S. Sidney Loeb, “Sea Water Demineralization by Means of an Osmotic
Membrane,” in Saline Water Conversion—II, American Chemical Society,
1963, pp. 117–132.
[3] H. Chae Park, K. Yoon Po, K. Hwa Yong, and K. Yong Su, “Membrane
formation by water vapor induced phase inversion,” Journal of Membrane
Science, vol. 156, no. 2, pp. 169–178, Apr. 1999.
[4] O. K. Matar, G. F. Hewitt, and E. S. Ortiz, “Phase Inversion in Liquid-Liquid
Dispersions,” System, 1989.
[5] H. Sun, S. Liu, B. Ge, L. Xing, and H. Chen, “Cellulose nitrate membrane
formation via phase separation induced by penetration of nonsolvent from
vapor phase,” Journal of Membrane Science, vol. 295, no. 1–2, pp. 2–10,
May 2007.
[6] H. Chae, Y. Po, H. Yong, and Y. Soo, “Membrane formation by water vapor
induced phase inversion,” Journal of Membrane Science, vol. 156, no. 1, pp.
169–178, 1999.
[7] Millipore-Corporation, Rapid Lateral Flow Test Strips: Considerations for
Product Development. Lit. No. TB500EN00. Bedford, MA., 2002.
[8] K. Jones, “Chapter 7: FUSION 5: A New Platform For Lateral Flow
Immunoassay Tests,” in Lateral Flow Immunoassay, 2009, pp. 115–131.
[9] C.-C. Ho and A. L. Zydney, “Protein Fouling of Asymmetric and Composite
Microfiltration Membranes,” Industrial & Engineering Chemistry Research,
vol. 40, no. 5, pp. 1412–1421, Mar. 2001.
[10] C. K. Haas and J. M. Torkelson, “Two-dimensional coarsening and phase
separation in thin polymer solution films,” Physical Review E, vol. 55, no. 3,
pp. 3191–3201, 1997.
[11] P. Van De Witte, J. W. A. Van Den Berg, and J. Feijen, “Phase separation
processes in polymer solutions in relation to membrane formation,” Journal
of Membrane Science, vol. 117, pp. 1–31, 1996.
[12] A. G. Yiotis, I. N. Tsimpanogiannis, A. K. Stubos, and Y. C. Yortsos, “Pore-
network study of the characteristic periods in the drying of porous
materials.,” Journal of colloid and interface science, vol. 297, no. 2, pp.
738–48, May 2006.

136
[13] B. Guerrier, C. Bouchard, C. Allah, C. Bknard, and P. M. Curie-universitc,
“Drying Kinetics of Polymer Films,” vol. 44, no. 4, 1998.
[14] S. P. Nunes and T. Inoue, “Evidence for Spinodal Decomposition and
Nucleation and Growth Mechanisms during Membrane Formation,” Journal
of Membrane Science, vol. 111, no. 1, pp. 93–103, 1996.
[15] A. L. Ahmad, S. Low, and S. Shukor, “Effects of membrane cast thickness
on controlling the macrovoid structure in lateral flow nitrocellulose
membrane and determination of its characteristics,” Scripta Materialia, vol.
57, no. 8, pp. 743–746, Oct. 2007.
[16] A. F. M. Barton, CRC Handbook of Polymer-Liquid Interaction Parameters
and Solubility Parameters. CRC Press, 1990.
[17] S.-J. Kim, A. A. Dwiatmoko, J. W. Choi, Y.-W. Suh, D. J. Suh, and M. Oh,
“Cellulose pretreatment with 1-n-butyl-3-methylimidazolium chloride for
solid acid-catalyzed hydrolysis.,” Bioresource technology, vol. 101, no. 21,
pp. 8273–9, Nov. 2010.
[18] P. Bubner, J. Dohr, H. Plank, C. Mayrhofer, and B. Nidetzky, “Cellulases dig
deep: in situ observation of the mesoscopic structural dynamics of enzymatic
cellulose degradation.,” The Journal of biological chemistry, vol. 287, no. 4,
pp. 2759–65, Jan. 2012.
[19] G. C. Li, P. Zhang, H. P. Zhang, L. C. Yang, and Y. P. Wu, “A porous
polymer electrolyte based on P(VDF-HFP) prepared by a simple phase
separation process,” Electrochemistry Communications, vol. 10, no. 12, pp.
1883–1885, Dec. 2008.
[20] M. P. Stevens, “Chapter 3: Chemical Structure and Polymer Morphology,” in
Polymer Chemistry: An Introduction, Oxford University Press, Inc., 1999,
pp. 61–95.
[21] A. Peterlin, “Drawing and extrusion of semi-crystalline polymers,” Journal
of Colloid and Polymer Science, vol. 265, no. 5, pp. 357–382, 1987.
[22] C. K. Haas and J. M. Torkelson, “Two-dimensional coarsening and phase
separation in thin polymer solution films,” American physical Society:
Physical Review E, vol. 55, no. 3, pp. 3191–3201, Mar. 1997.
[23] T. Young and L. Chen, “Pore formation mechanism of membranes from
phase inversion process,” Desalination, vol. 103, no. 3, pp. 233–247, Dec.
1995.

137
Chapter 5
Advanced Pervaporation
Membranes:
Control of Skin-Layer

138
5 Advanced Pervaporation Membranes:
Control of Skin Layer
The following is adapted from “Unusual Trend of Increasing Selectivity and
Decreasing Flux with Decreasing Thickness in Pervaporation Separation of
Ethanol/Water Mixtures using Sodium Alginate Blend Membranes”. Journal of
Colloid and Interface Science, Volume 370, Issue 1, 15 March 2012, Pages 176–
182
Abstract
Pervaporation membranes were produced comprising a 4:1 sodium-
alginate:poly(vinyl-alcohol) polymer blend selective layer with a plasticizing agent
(glycerol). Membranes were supported on a poly(acrylonitrile) mesoporous support
layer and non-woven fabric base. Pervaporation separation of ethanol/water
mixtures was carefully followed as a function of film thickness and time. It was
found, contrary to what might be expected from literature, that these films showed
increased selectivity and decreased flux as film thickness was reduced. It is argued
that the morphology and structure of the polymer blend changes with thickness and
that these structural changes define the efficiency of the separation in these
conditions.

139
5.1 Introduction
Pervaporation is a membrane separation technology used industrially for solvent
dehydration and separation of organic mixtures and has a significant advantage
over other separation methods in that it can be used to effectively separate
azeotropic mixtures. Because of this, pervaporation may have considerable
importance in water-ethanol separation and thus, allow low water content, fuel
grade ethanol to be generated [1]. Sodium alginate (NaAlg), a naturally occurring
polysaccharide, is a suitable choice of membrane for water/ethanol separation
because it is partially soluble in water whilst it is insoluble in ethanol[2]. When
exposed to a water-ethanol mixture the membrane will swell with water molecules,
and in pervaporation, water will permeate through the membrane allowing
separation. Because of the vacuum on the permeate side of the membrane, there
will be a diffusion profile across it as shown in Figure 1. On the retentate side of the
membrane, swelling will be almost complete and the glass transition temperature
(Tg) of the of the polymer will be significantly lowered to a point where the feed
side of the membrane is above the effective Tg ensuring that it is in a rubbery state.
On the permeate side of the membrane, the water content is lower so that the
temperature is below Tg and so in a glassy state. Between, the two sides of the
membrane there will be a region where there is a transition between the two
polymer states.
Whilst NaAlg has an almost ideal chemistry for this separation, it is
mechanically unstable and thin membranes cast from solutions of pure NaAlg are
brittle and prone to cracking [3], while pervaporation membranes suffer from a loss
in performance over time due to relaxation [1], [4]. This limits the practicality of
the use of these systems in industrial environments. Relaxation is the process by
which residual stresses in a polymeric glass are released changing the polymer’s
physical and mechanical properties. These residual stresses are a result of non-
equilibrium derived from changes in structure and mobility of the polymer chain
matrix at the glass transition temperature (Tg)[5].

140
Figure 5.1: Schematic of a diffusion profile across a pervaporation membrane
As a polymer is cooled through the Tg the structural changes required to
maintain thermodynamic equilibrium cannot occur in the time scale of cooling and
residual stress is present. In a pervaporation process, the membranes are
particularly prone to relaxation related damage because of the variation in the
effective Tg and Young’s modulus across the membrane. It is important to note that
relaxation would occur almost instantly in the rubbery state and very slowly in the
glass state resulting in stress variation across the membrane.
The focus of our work described here has been to reduce membrane thickness,
thus minimising relaxation effects by limiting the thickness of the glassy phase.
This should enable development of a membrane synthesis procedure whereby
efficient separations can be achieved over long periods. The use of pristine sodium
alginate was the experimental ideal, but initial testing proved that the mechanical
and chemical stabilities of pristine sodium alginate membranes are too poor to
permit long periods of testing required for the membrane system to reach
equilibrium. This lack of stability becomes more of a problem as membrane
selective layer thickness decreases. As such, in order to achieve suitably thin
membrane layers it is necessary to use polymer blends and composition
modifications as well as membrane supports to provide mechanical robustness (see
chapter 2 section 2.1.2 for details). This means that the approach contrasts many
academic studies of these systems but the methodology is applicable to use in
commercial environments. In this chapter, it is demonstrated that this membrane
type produces highly unexpected results, with high performance characteristics,

141
while expected trends in pervaporation performance and film thickness were not
observed.
5.2 Experimental
See chapter 2 for details on all materials, apparatus and procedures.
5.3 Results and Discussion
The aspects of solution diffusion theory concerning diffusion in polymers have not
been fully explained in literature due to the difficulties with calculation of diffusion
coefficients in polymer membranes[4]. Observed decreases in flux with membrane
thickness are normally explained by relaxation theory as outlined by Yeom[1]. As
membrane thickness decreases, the relative increase in the glassy region results in a
flux decrease. However, the results here need this model to be refined to provide
understanding of the more complex variation in flux and selectivity with membrane
thickness.
5.3.1 DSC
It is highly important for operation of pervaporation membranes that the Tg exceeds
that of the operation temperature so that the combination of rubbery and glassy
properties described above are maintained. The Tg of NaAlg is 119 oC whilst PVA
is around 85 oC[7]. The Tg value of the selective membrane layers used here (i.e.
NaAlg + PVA + plasticizer) was 96oC as determined by DSC (see figure 2). This is
significantly higher than the 60oC operating temperature of pervaporation unit and
should ensure that the membrane has the correct structure during use. However, the
endotherm in the DSC is very broad and suggestive of considerable interactions or
cross-linking between the various components. The endotherm at 240 oC can be
assigned to a melting point. The value is significantly lower than that of NaAlg
(>300 oC) but greater than that of PVA (180 – 190
oC)[8]. This also suggests that
the systems are miscible with strong interactions or cross-linking between the
components.
5.3.2 XRD:
Powder XRD studies of the 24 μm as cast membranes were also made (figure 5.2)
and the data does suggest significant amounts of crystallization and possible cross-

142
linking have occurred confirming the DSC results. Three broad diffraction features
are seen at about 11.5, 20.8 (and a higher angle shoulder that can just be resolved
by fitting at about 23-25°) and 43.5 °2θ. Very similar broad features in positions
and with peak shapes close to this have been seen previously for calcium ion cross-
linked NaAlg-PVA membranes[9] as well as chemically cross-linked PVA-gelatine
membranes and are generally typical of amorphous or very weakly crystalline
samples[10]. Diols, dialdehydes and - particularly relevant - glycerol have all been
used to crosslink similar systems[11]. Cross-linked PVA can also produce some
very sharp features [9], [12] and the feature at 28 °2θ seen here suggest some highly
crystalline cross-linked material is present. The value of these sharp features (~ 28
°2θ) are significantly higher than for PVA alone (~ 20 °2θ) and does suggest there
has been structural modification by the NaAlg consistent with extensive cross-
linking. In figure 5.2, the data with the higher concentration of glycerol also shows
slightly narrower XRD features (since the peaks at 11.5 and 20.8 °2θ are better
resolved) and this does support the suggestion that the glycerol is acting as a cross-
linker. This is further confirmed in figure 5.3A where a 60 μm as cast film was
studied to compare with the usual preparation (containing glycerol) and one in the
absence of glycerol. It can be seen, that the presence of glycerol does very
significantly enhance the crystalline features and discrete, sharp and well-resolved
diffraction features are clearly observed.

143
Figure 5.2: Upper image: DSC curve for the 4:1 ratio NaAlg:PVA selective membrane. Lower image: XRD curves for same membrane with additional glycerol; upper curve contains 5 g glycerol; lower curve contains 4 g (bottom)
Interestingly, there is a variation of crystallinity with film cast thickness. This
is shown in figure 5.3B. Data was consistent for all samples studied but only cast
thicknesses of 40, 100 and 600 μm are shown for illustration purposes. At 40 μm
cast thickness, sharp diffraction features are very weak and almost undetectable. At
60 μm they become readily observed (figure 5.3A) but are much lower in intensity
than the broad feature around 20 °2θ. At a cast thickness of 100 μm they are now
around the same intensity as the broader feature at about 20 °2θ and this increasing
contribution of crystalline features increases with cast thickness until a thickness of
600 μm when they dominate the diffraction profile and suggest a highly crystalline
material is present.

144
Figure 5.3: (A) XRD profiles of 60 um films with and without glycerol addition. (B) XRD profiles of membrane films (with PVA and glycerol) as a function of cast thickness as described in figure
This is corroborated by the flexibility data shown in appendix C; as the
membrane selective layer thickness decreases, the membrane becomes more brittle,
suggesting a greater crystallinity in the polymer (see appendix C, table C.2).
NaAlg and PVA polymers are hydrogel forming systems[12], [13]. It is
generally accepted that these hydrogels consist of three components [12]; a porous
matrix (which stores water molecules), amorphous polymer walls (highly swollen
with water molecules) defining the porous structure, and crystalline cross-links that
define the links between the amorphous walls. The links are dense and essentially
not swollen due to the crystallinity and cross-linking present. NaAlg and PVA are
relatively easily crosslinked[9], [14–16].
Cross-links increase hydrophobicity and consequently decrease water
uptake[17][18]. Since the effectiveness of pervaporation membranes is related to
the ability of molecules to pass through the polymer matrix, solvent parameters,
which measure the surface cohesive energy and describe the chemical similarity

145
between molecules and their environment, are a useful method of understanding
this phenomena[19]. Various solvent parameters for polymers and solvents are
widely reported[8], [19]. If solvent parameters (δ) are similar, the materials will be
soluble. In the case of polymers, the polymer will swell in that material.
Hydrophobic systems have low values of δ and hydrophilic systems high values.
The solvent parameters of water and ethanol are 48 and 26.2 Mpa1/2
respectively.
The solvent parameter of sodium alginate is difficult to measure but it appears to be
at least 37 Mpa1/2
[20]. This explains why it is an effective pervaporation membrane
material, as the value indicates a highly hydrophilic material. Although glycerol
also has a high value of (36.2 Mpa1/2
), once it cross-links - removing hydroxyl
groups - the δ value will decrease towards that of polyglycerolic acid which has a
value of around 25 Mpa1/2
making it closer to that of ethanol (26.2 Mpa1/2
). It
would also be expected to reduce the δ value of the sodium alginate and PVA by
removal of the hydroxyl groups on these. Thus, cross-linking in this system might
be expected to decrease the hydrophilicity of the membranes as suggested above.
This relationship of cross-linking to hydrophobicity can be used to explain the
rather unexpected trends in selectivity with cast film thickness seen in figure 5.7
below. It would be expected that a highly hydrophilic membrane would selectively
swell and allow permeation of the most hydrophilic molecule (i.e. water) and, as
observed, the permeate flux would largely be water. As membrane thickness
increases it would be expected that the selectivity would also increase. However, as
the Yiotas model shows, the thicker films show enhanced relaxation and
densification because the solvent evaporation rate is slower[21]. If it is assumed
that this slow evaporation and densification also leads to increased cross-linking
and crystallization (as reaction time is increased) as shown in figure 5.3, it can be
suggested that the films of greatest cast thickness are also the most hydrophobic.
The solvent parameters of these hydrophobic films are considerably reduced
towards that of ethanol and the permeation of this molecule becomes more
probable, decreasing selectivity. In this way, selectivity increases with decreasing
cast thickness. The decrease of selectivity for the 24 µm film is probably related to
the small amount of material present which allows some ethanol penetration.

146
5.3.3 SEM:
Cross-sectional and top view SEM images of the as-prepared membranes are
provided in figure 5.4 (400, 150, 100 and 80 µm) and figure 5.5 (60, 50, 40 and 24
μm). At the bottom of each cross-section, the porous PAN support can be seen as a
disordered honeycomb type structure. The mottled film above it is the active
NaAlg:PVA membrane. This sometimes appears detached from the support; this is
believed to be a result of thermal shock on liquid nitrogen cooling in the CRISP
method (outlined in chapter 2). The structure of the bulk of this membrane layer is
reasonably consistent, composed of irregular and undulating strata or lamellae in a
direction approximately parallel to the surface plane. The upper surface (top-down
images) is not consistent and can vary from sample to sample and across the
samples. The films generally appear to be crack-free and - where seen - are thought
to result from sample preparation for microscopy studies. Some of the films appear
to be somewhat porous but there was no evidence of this porosity in the cross-
sections. When examined under higher magnification (e.g. 150 µm film, figure 5.4)
they appear to be crater-like structures resulting from solvent pooling. It is,
therefore, concluded that the surface is quite regular with little sign of penetrative
pore structures and at the surface the polymer has a denser structure than in the
bulk.
It is apparent from the cross-sectional data that the selective membrane
thickness attained on drying is much lower than the as-cast thickness due to solvent
removal during drying. However, a plot of selective layer thickness shows a well-
resolved minimum in terms of selectivity; clearly the selective layer formation is
more complex than expected. A simple formation process is expected to give a
linear variation of cast to measured thickness as the ratio of the volume of polymer
to the volume of solvent is constant. These data suggest that the selective
membrane is becoming less dense on average as the film thickness decreases (see
appendix C, table C.1). The distinct minimum in the selectivity figures (see figure
5.7) is due to decreasing density with film thickness (membrane films are thicker
than expected) and an opposing trend that film thickness decreases with as-cast
thickness. The relative density of the film (compared to a fully dense film) can be
calculated from the measured volume of the film per cm-2
and the theoretical
volume of polymer from the cast solution concentration. The variation of this
147
calculated relative density shows the 400µm film to be close to full density (~95%)
but as thickness decreases, density progressively reduces to a minimum value of
~6.7 %. The variation in the density of the membrane film with thickness can be
explained using the relaxation effects discussed above. Yiotis et al have described
how polymer films cast from solution are strongly dependent on evaporation
rate[21]. Relaxation effects should also be considered in these polymer film
models and it is suggested that membranes formed immediately after casting are
fully (solvent) swollen and the polymer chains are highly mobile and, hence,
contain significant free volume from both chain mobility etc. as well as solvent
inclusion. As solvent drying is limited by the surface area of the membrane thicker
membrane films will dry more slowly, this allows the films to move towards
equilibrium or relaxed structures, rendering them denser. For thinner films, drying
will be much more rapid and these very open polymer chain arrangements will be
‘frozen-in’ forming highly non-equilibrium structures. These different selective
membrane film structures will play an important role in determining pervaporation
performance. What also might be expected to change membrane separation
performance is the morphological variation observed in the SEM images (figures
5.3 and 5.4).

148
Figure 5.4: SEM images of membranes prepared: Left are cross-sectional images and right are top-down images. Thicknesses are shown in image. Magnifications as shown

149
Figure 5.5: SEM images of membranes prepared: Left are cross-sectional images and right are top-down images. Thicknesses are shown in image. Magnifications as shown

150
Examining these images reveal that that the surfaces of the selective
membranes have textures quite different from their bulk. In several of the cross-
sections a well resolved surface ‘skin’ can be observed. These surface ‘skins’ are
expected for polymer films cast from solution [21] and appear to be smooth and
dense compared to the bulk. The thicknesses of the skin layers decreases with cast
thickness until the thinnest membrane layers are produced. Increases in skin layer
thickness for thin films is expected following models outlined by Yiotis et al [21]
and are related to decreasing evaporation rates for thin films because of decreasing
strain in the film, substrate-film interface effects and effects of cracks and other
defects.
5.3.4 Pervaporation Results
All of these membranes were found to be highly selective for water permeation
during pervaporation. The permeate flux was found to be a minimum of 95 mass%
water (400 µm cast thickness after 5 h) and a maximum of 98.8 mass% water (40
µm cast thickness, 5 h). It is generally expected that these films will show a
decrease in flux and an increase in selectivity as membrane thickness increases
[15]. However, the variation in efficacy with cast film thickness could not be
readily described in this simple manner. In order to provide an understanding of the
fundamental properties (necessary to assess potential value of the membranes in
commercial operation) a detailed study of performance for each selective
membrane thickness was made.
The flux and selectivity results from membrane tests are described below.
Figure 5.6 describes the variation of flux and selectivity for each membrane cast
thickness. For each thickness studied, the pervaporation flux (figure 5.6A and 5.6B)
shows a similar variation with time; an increase between 1 h and 2 h followed by a
decrease before reaching an approximately consistent value at 5 h. The initial
increase may be due to slow swelling processes with the slower loss of flux being
due to polymer chain movement and densification of the selective membrane
layers. The pervaporation selectivity results for all membranes show an
improvement with time over the 5 h period. The thinnest and thickest membranes
appear to show the smallest change with time (around 30 %) with the greatest

151
change with time occurring for the 60 µm cast film. These results might be rather
simply explained in terms of the density, which has a profound effect on the
selective passage of material through the polymer system. The rather low increase
in selectivity with time for the 400 µm membrane thickness is probably related to
the limited amount of free volume present and so there is a smaller change in
measured density with time. The thinnest membrane, 24 µm, might also be
expected to show limited changes in density because the volume of the polymer in
the membrane is the lowest and changes in polymer structure will have a limited
effect on free volume.
Figure 5.6: Plots of pervaporation performance indicators versus time. A and B are flux and C and D are selectivity. Various films were studied; the cast thickness is indicated in the figure. Estimated errors in measurements are around 5% of value
Data showing the variation in selectivity and flux after 5 h of testing (i.e. at or
close to equilibrium) are described in figure 5.6 as a function of membrane
selective layer thickness and cast thickness. Plots of selectivity and flux as a
function of (measured) thickness shows little clear trend although it might be seen
that a general increase in selectivity with decreasing membrane thickness is
observed. Since flux is generally expected to decrease, and selectivity increase,

152
with thickness, it is clear that these membranes show considerable changes in
structure and/or chemistry. As seen above, the density is changing with thickness
and it might be expected that chemical changes are present because of the
possibility of PVA-NaAlg-glycerol reactions and the possibility of crystallisation
suggested by the XRD and DSC data.
The variation in flux with cast thickness does show more obvious trends as
described in figure 5.7B. The thickest cast membrane film (400 µm) shows a
relatively high flux (although the density is the highest) and this decreases until a
distinct maximum is seen at lower film thicknesses until the lowest thickness (24
µm) where a strong decrease in flux is observed. There has been no systematic
study of NaAlg – PVA chemistry as a function of cast thickness reported previously
to our knowledge and these results are unusual. The data suggest (as outlined
above) that the cross-linking of these selective membrane layers which affects their
chemical nature changes as a function of thickness.
Where chemical changes are present, it might be expected that selectivity would
also show an unusual dependence on cast film thickness. Indeed this is the case as
described in figure 5.6D. Unexpectedly, considering the thickness and density
Figure 5.7: Plots of flux (A and B) and selectivity (C and D) against measured (A and C) and cast (B and D) thickness. Estimated errors in measurements are around 5 % of value

153
(since these offer a barrier to diffusion of molecules), the 400 µm membrane film
shows the lowest selectivity. The selectivity then increases to a well-defined
maximum before decreasing for the 24 µm membrane. As the films decrease in cast
thickness, hydrophilicity increases and a hydrogel is formed, the interactions of
water molecules with other water molecules through polar forces causes the
permeation rate to decrease and so the flux decreases. At lower thicknesses, flux
begins to increase again due to the thinness of the membrane structure. At the
lowest thickness flux decreases. This might be due to the very well-defined skin
layer formed (figure 5.4). The formation of skin layers for low polymer film
thicknesses is well described by Yiotas[21]. These skin layers are dense and may
decrease flux.
The relationship of flux and cast thickness is more difficult to understand. It is a
complex variation as shown in figure 5.7 and may result from several factors.
Firstly, for the thickest cast films, flux may be high because they are hydrophobic
enough to not form a hydrogel and molecules pass through the polymer chains
rather quickly.
The flux after 5 h (600 – 800 g cm-1
h-1
) and the selectivity after a similar period
(800 – 1300) compare well with previous reports and are adequate for large scale
separation[22], [23]. The key advantage is that these membranes are made using
supports and processes to give membranes that would have physical properties to
survive in industrial conditions. It is important to note that the pervaporation
performance was measured after flux had stabilised (5 h) and survived periods of
14 h without compromising performance significantly. It is suggested that the
systems have potential for further development and work is underway.
5.4 Conclusions
Studies of the pervaporation performance of supported NaAlg-PVA membranes
have been made. These materials showed high selectivity (values) and flux (values)
and potential for commercial development. The structure of the films was complex
and density increased significantly as cast thickness was reduced. It is thought that
this was due to relaxation phenomena related to the variation in the rate of solvent
evaporation with cast thickness. It was observed that the pervaporation and flux
depended strongly on the cast thickness. A hitherto unreported increase in the
154
selectivity of the membranes with decreasing membrane thickness was also
observed. This can be explained by an increase in the polymer blend
hydrophobicity as the membrane thickness increases due to decreasing porosity and
longer periods during solvent evaporation allowing for extensive cross-linking to
occur. The results suggest that very significant care must be taken when studying
supported membrane systems where selective membrane film thicknesses can be
small and structural-chemical changes significant.

155
5.5 Summary
As membrane thickness decreased selectivity increased
This occurred down to a minimum thickness between 40 and 24µm
Previously unreported increase in the selectivity with decreasing membrane
thickness observed
Due to increase in the polymer blend hydrophobicity as membrane thickness
increases
Due to longer periods during solvent evaporation allowing for cross-linking to
occur

156
References: Chapter 5
[1] C. K. Yeom, J. G. Jegal, and K. H. Lee, “Characterization of relaxation
phenomena and permeation behaviors in sodium alginate membrane during
pervaporation separation of ethanol-water mixture,” Journal of Applied
Polymer Science, vol. 62, no. 10, pp. 1561–1576, Dec. 1996.
[2] P. Shao and R. Huang, “Polymeric membrane pervaporation,” Journal of
Membrane Science, vol. 287, no. 2, pp. 162–179, Jan. 2007.
[3] R. Russo, M. Malinconico, L. Petti, and G. Romano, “Physical behavior of
biodegradable alginate-poly(vinyl alcohol) blend films,” Journal of Polymer
Science Part B: Polymer Physics, vol. 43, no. 10, pp. 1205–1213, May 2005.
[4] R. W. Baker, Membrane Technology and Applications, 2nd
ed. John Wiley
and Sons, Ltd., 2007.
[5] M. P. Stevens, Polymer Chemistry: An Introduction, 1st ed. Oxford
University Press, Inc., 1999.
[6] C. K. Yeom and K.-H. Lee, “Characterization of sodium alginate and
poly(vinyl alcohol) blend membranes in pervaporation separation,” Journal
of Applied Polymer Science, vol. 67, no. 5, pp. 949–959, Jan. 1998.
[7] J. Brandrup, E. H. Immergut, and E. A. Grulke, Polymer Handbook, 4th
Edition. John Wiley and Sons, New York, 2003.
[8] C. A. D. Charles E. Wilkes, James W. Summers, PVC Handbook. Hanser
Gardener Publications, Inc., 2005.
[9] S. Hua, H. Ma, X. Li, H. Yang, and A. Wang, “pH-sensitive sodium
alginate/poly(vinyl alcohol) hydrogel beads prepared by combined Ca2+
crosslinking and freeze-thawing cycles for controlled release of diclofenac
sodium.,” International journal of biological macromolecules, vol. 46, no. 5,
pp. 517–23, Jun. 2010.
[10] K. Pal, A. K. Banthia, and D. K. Majumdar, “Preparation and
characterization of polyvinyl alcohol-gelatin hydrogel membranes for
biomedical applications.,” AAPS PharmSciTech, vol. 8, no. 1, p. 21, Jan.
2007.
[11] K. Fujimoto, M. Minato, and Y. Ikada, “Chapter 20, Poly(vinyl alcohol)
Hydrogels Prepared under Different Annealing Conditions and Their
Interactions with Blood Components,” in Polymers of Biological and
Biomedical Significance, American Chemical Society, 1994, pp. 228–242.
[12] B. Liu, D. Qiu, and C. Z. Zhao, “Effect of Mixture of Plasticizer on the
Thermoplastics Formability of Polyvinyl Alcohol (PVA),” Key Engineering
Materials, vol. 447–448, no. 1, pp. 652–656, 2010.

157
[13] R. Ricciardi, F. Auriemma, C. De Rosa, and F. Lauprêtre, “X-ray Diffraction
Analysis of Poly(vinyl alcohol) Hydrogels, Obtained by Freezing and
Thawing Techniques,” Macromolecules, vol. 37, no. 5, pp. 1921–1927, Mar.
2004.
[14] S. Kalyani, B. Smitha, S. Sridhar, and a Krishnaiah, “Pervaporation
separation of ethanol–water mixtures through sodium alginate membranes,”
Desalination, vol. 229, no. 1–3, pp. 68–81, Sep. 2008.
[15] K. Y. Lee, J. A. Rowley, P. Eiselt, E. M. Moy, K. H. Bouhadir, and D. J.
Mooney, “Controlling Mechanical and Swelling Properties of Alginate
Hydrogels Independently by Cross-Linker Type and Cross-Linking Density,”
Macromolecules, vol. 33, no. 11, pp. 4291–4294, 2000.
[16] A. R. Kulkarni, K. S. Soppimath, T. M. Aminabhavi, A. M. Dave, and M. H.
Mehta, “Glutaraldehyde crosslinked sodium alginate beads containing liquid
pesticide for soil application.,” Journal of controlled release : official journal
of the Controlled Release Society, vol. 63, no. 1–2, pp. 97–105, Jan. 2000.
[17] E. E. Shafee and H. . Naguib, “Water sorption in cross-linked poly(vinyl
alcohol) networks,” Polymer, vol. 44, no. 5, pp. 1647–1653, Mar. 2003.
[18] K. Pal, K. Banthia, and D. K. Majumdar, “Polymeric Hydrogels:
Characterization and Biomedical Applications,” Designed Monomers and
Polymers, vol. 12, no. 3, pp. 197–220, 2009.
[19] J. H. Hildebrand, “Solubility of non-electrolytes,” Journal of the Society of
Chemical Industry, vol. 55, no. 34, p. 665, 1936.
[20] A. F. M. Barton, CRC Handbook of Polymer-Liquid Interaction Parameters
and Solubility Parameters. CRC Press, 1990.
[21] A. G. Yiotis, I. N. Tsimpanogiannis, A. K. Stubos, and Y. C. Yortsos, “Pore-
network study of the characteristic periods in the drying of porous
materials.,” Journal of colloid and interface science, vol. 297, no. 2, pp.
738–48, May 2006.
[22] J. C. Richardson, P. W. Dettmar, F. C. Hampson, and C. D. Melia,
“Oesophageal bioadhesion of sodium alginate suspensions: particle swelling
and mucosal retention.,” European journal of pharmaceutical sciences :
official journal of the European Federation for Pharmaceutical Sciences,
vol. 23, no. 1, pp. 49–56, Sep. 2004.
[23] M. T. Bhat, D. Santoshkumar, Aminabhavi, “Pervaporation Separation Using
Sodium Alginate and Its Modified Membranes - A Review,” Separation and
Purification Reviews, vol. 36, no. 3, pp. 203–229, 2007.

158
Chapter 6
Advanced Later Flow
Membranes:
Control of Pore Structure

159
6 Advanced Lateral Flow Membranes:
Control of Pore Structure
The following is adapted from “Control of Pore Structure Formation in
Cellulose Nitrate Polymer Membranes”. Advances in Chemical Science Vol. 2
Issue. 2, June 2013
Abstract
Porous cellulose based membranes are commonly used for filtration and controlled
flow of fluid through the 3D pore network in the bulk (lateral flow). It has been
shown that the performance of cellulose nitrate membranes in terms of capillary
driven lateral flow of fluid through the system is inhibited by the formation of
surface skin layers and bulk macrovoids. These ‘defects’ are created during phase
inversion when the porous structure is formed using a water anti-solvent. The work
carried out in this study shows that the incorporation of ethanol as a meso-solvent
into the membrane casting solution for use in vapour induced phase seaparation
(VIPS) produced lateral flow membranes, effectively prevents the formation of
both skin layers and macrovoids while simultaneously increasing membrane
porosity resulting in an improvement in lateral flow rates of the final membranes. It
is shown that the improved performance is achieved through reduction of the rate of
evaporation of solvent from the membrane surface/demixing front during
membrane formation.

160
6.1 Introduction
Porous, lateral-flow, polymer membranes are the basis for the vast majority of
immunological and diagnostic assays. Cellulose derived polymers are most
commonly used for the production of lateral flow membranes. In particular,
cellulose nitrate (CN, often referred to by the misnomer nitrocellulose) is very
widely used[1–3]. However, despite widespread use, there has been relatively little
investigation into the formation of cellulose nitrate lateral flow membranes in
literature.
These porous membranes are formed through a process known as phase
inversion which defines their internal pore structure[4–6]. This is a phenomenon
whereby the phases of a liquid-liquid dispersion interchange such that the dispersed
phase spontaneously inverts to become the continuous phase and vice versa under
conditions determined by the system properties, volume ratio and energy input[7].
The phase inversion method utilised here is vapour induced phase inversion
(VIPS)[8] wherein diffusion of water from atmospheric humidity into the polymer
solution of CN in acetone induces demixing of the polymer from the solution to
form the solid porous CN matrix of the final membrane. When a polymer solution
is in a single phase the polymer is stable in the solvent. The addition of nonsolvent
(water) decreases the thermodynamic stability of the solution as it’s’ concentration
relative to the solvent (acetone) decreases. At a critical concentration (cloud point)
of nonsolvent the solution becomes thermodynamically unstable and two liquid
phases – a polymer rich phase, containing solvent and polymer, and a polymer lean
phase containing the non-solvent – are formed. Upon drying, the polymer rich
phase forms the rigid matrix of the membrane while the polymer lean phase forms
the pores[9]. Evaporative loss of solvent precipitates the final membrane
morphology[10]. Phase inversion is a sensitive process and can be affected by
many parameters; solution concentration, viscosity, surface tension, density,
temperature, humidity, container geometry, agitation and flow[11]. The sparse
literature on CN membranes (and membranes produced by phase inversion in
general) consistently shows the formation of skin layers [9], [12–15] and
macrovoids [3], [16–18] in the membrane cross sections (see chapter 1, section 1.4
for detailed explanation of phase inversion and lateral flow theory).

161
While methods for preventing macrovoid formation during the phase inversion
process have been documented and detailed studies exist [3], [14], prevention of the
formation of skin layers has not. Skin layers and macrovoids inhibit and retard
lateral flow in porous membranes respectively, limiting their properties and use.
The work in this study shows how the formation of both skin layers and macrovoids
can be successfully prevented through the use of an additional solvent that has
solvating properties somewhere between those of the solvent and non-solvent used
in preparation. This additional solvent (which is described here as the meso-solvent)
is also partially miscible with both the solvent and the non-solvent. In this case
ethanol is the meso-solvent to the basic phase inversion make-up of polymer (CN),
solvent (acetone) and non-solvent (water). The use of ethanol as a meso-solvent
increases the porosity of the membrane internal structures which also results in an
increase in lateral flow rates through the membranes.
Ethanol has been used as a quencher in the casting of similar membranes,[19]
but this role is distinct from the meso-solvent role and, in addition, was found to be
inferior to methanol as a quencher. To the best of our knowledge, the use of ethanol
as a meso-solvent in the production of membranes of the type herein has not been
covered in the literature and we present it here for scientific posterity.
6.2 Experimental
See chapter 2 for details on all materials, apparatus and procedures not mentioned
below.
6.2.1 Membrane Preparation
A series of membranes were produced from casting solutions. The content of these
solutions can be seen in table 6.1 below. The solvent/meso-solvent/non-solvent
mixture for each casting solution contained differing amounts of ethanol and
acetone with a constant water content (prior to addition of extra non-solvent to
bring solution near cloud point; for precise definition of what was considered
“near” see chapter 2 and chapter 4), ranging from 25 wt% ethanol/70 wt%
acetone/5 wt% water to 50 wt% ethanol/45 wt% acetone/5wt% water. Outside this
composition range membranes were either highly irreproducible or had poor
physical properties in terms of fragility, pore structure, porosity and skin formation.

162
Although it has previously been shown that near cloud-point compositions lead to
instantaneous skin formation[20], the inclusion of ethanol as a meso-solvent
negates this effect for reasons outlined below, allowing for casting and formation of
membranes without skin layers. The membranes in this series are labelled
MesoXCP; X denotes ethanol content, CP denotes cloud point and “Meso” denotes
the use of a meso-solvent; ethanol (EtOH). These membranes were then compared
with one produced using a simple solvent/non-solvent solution of 95 wt% acetone
and 5 wt% water in which 17 g CN was dissolved to provide a membrane produced
from a more typical phase inversion without a meso-solvent (development of this
membrane outlined in chapter 4). 2.3 g of water were added to bring this solution
near cloud point. The weight percentage composition can be seen in the final row of
table 6.1. This control membrane was labelled BasMemBCP (see chapter 2, section
2.1.2 for label details). Final membranes were produced with backing supports of
the 100 % polyester film by casting the near cloud point polymer solutions on to the
support material using the automatic film coater. This cast layer underwent VIPS in
the controlled glovebox atmosphere at 35 % humidity and ~24 oC and remained in
this environment for 12 h. Finally, the resulting membrane was dried at 30 oC for
approximately 4 h to remove excess solvent/meso-solvent/nonsolvent before
characterization.
Table 6.1: Casting solution composition before/after cloud point
Mem. Initial Phase Inversion Solution Non-sol. (H2O)
for CP. (g)
Solution Near Cloud Point
Poly. (CN) wt%
Sol. (ace) wt%
Meso-Sol.
(EtOH) wt%
Non-sol.
(H2O) wt%
Poly. (CN) wt%
Sol. (ace) wt%
Meso-Sol.
(EtOH) wt%
Non-sol.
(H2O) wt%
MesoACP 17 58.10 20.75 4.15 5.30 13.030 44.534 15.902 26.533
MesoBCP 17 53.95 24.90 4.15 5.43 12.890 40.904 18.878 27.328
MesoCCP 17 49.80 29.05 4.15 5.55 12.800 37.499 21.872 27.828
MesoDCP 17 45.65 33.20 4.15 5.94 12.565 33.740 24.540 29.153
MesoECP 17 41.50 37.35 4.15 4.80 13.220 32.272 29.043 25.465
BasMemBCP 17 78.85 0 4.15 2.30 15.123 70.142 0 14.733
6.2.2 Lateral Flow Testing
The effect of gravity on the flow rate is constant for all membranes so the relative
differences in flow between membranes serves to show improvement brought about
through changes in membrane structure.

163
6.3 Results and Discussion
6.3.1 EtOH Content
Figure 6.1 shows a graph of the required additional non-solvent (water) to bring the
casting solutions to near cloud-point versus their ethanol content. It can be seen
from this that there is an increase in the amount of water required as ethanol content
increases up to a maximum, beyond which the amount of water required decreases.
The Hildebrand solubility parameters of acetone, ethanol and water are 19, 26.2 and
48 Mpa1/2
respectively whilst CN is around 22 Mpa1/2
[22]. The maximum observed
in figure one as the water required to achieve cloud point, can be explained on the
basis of these. As ethanol concentration increases, hydrogen bonding with water
reduces the anti-solvent properties of the water, thus, requiring increased water
concentrations. At higher ethanol content, the reduced amount of acetone has a
more pronounced effect and the solubility of the CN decreases (since acetone is an
effective solvent for CN).
Figure 6.1: Plot of non-solvent (water) required to reach cloud point versus ethanol content in casting solution at cloud point
6.3.2 SEM
Figure 6.2, below, shows SEM image pairs of the membranes MesoACP to
MesoECP in images A-E respectively while pair F shows BasMemBCP. Each pair
is composed of a cross sectional membrane image (i) and an exposed membrane
surface image (ii). Images 6.F(i) and 6.F(ii) show cross sectional and surface
0
1
2
3
4
5
6
7
0 10 20 30 40
Cloud Point vs. EtOH Contents
Wat
er
req
uir
ed
to
re
ach
clo
ud
po
int
(g)
EtOH content in casting solution (wt%)

164
images respectively of BasMemBCP, which has no ethanol in its casting solution.
The cross section indicates some porosity but this is limited and there is little sign
of pores extended in the direction normal to the membrane surface. What pores are
visible appear to be largely 1D or 2D in nature and sandwiched between layers of
CN. Although bringing solutions near to cloud-point prior to casting is thought to
reduce skin layer formation by some,[18] (and refuted by others[20]) a well-formed
skin layer is clearly visible in the top-down image shown in figure 6.2F(ii). There is
little indication of open pores at the membrane surface although circular type
features can be seen of either surface indentations or sub-surface structures. The
observation of these is consistent with the formation of a closed 2D pore structure
in the film. The layered nature of CN and the pore structure is suggested to be due
to rapid solvent evaporation during casting as the solvent moves too rapidly through
the membrane to allow 3D formation of pores[23].
Images figure 6.2A(i) and 6.2A(ii) show MesoACP which has the lowest
meso-solvent (ethanol) content of 15.902 wt% in its casting solution (table 1). The
cross sectional image, 6.2A(i), still indicates distinct layer formation consistent
with a high rate of solvent evaporation. Again some inter-layer porosity is present.
However, the presence of the ethanol has begun to evolve a new form of 3D pore
structure that extends through the layers. This is largely seen as smaller pores of
around 1 to 5µm in size. These are marked with rings and are visible in both cross-
section and top-down images (through much larger pore openings). These small
pores seen in the surface are highly distorted into elliptical shapes and indicate
considerable strain at the surface during membrane formation. The surface image,
6.2A(ii), also shows a shows the formation of a 3D pore structure with very large
pore openings of approximately 100 µm in diameter. We suggest the large surface
morphologies are formed because of the same surface tension effects described
above that are causing some of these pores to be deformed[24].
Images in figure 6.2B(i) and 6.2B(ii) show cross sectional and surface images
respectively of MesoBCP, which has an ethanol content of ~18.9 wt% in its casting
solution (~3 wt% more than MesoACP). The cross sectional image shows a similar
structure to that observed in MesoACP, however, there is a less distinctive layered
structure, void formation and interconnectivity between layers is increasing. This
might suggest that the ethanol is decreasing the rate of membrane formation

165
(through reduction in the solvent evaporation rate) allowing more pore volume to
be included.
Figure 6.2: SEM images of the lateral flow membranes MesoACP – MesoCCP and BasMemBCP (lettering follows sample labels see table 6.1). Images with the (i) labels show membrane cross sectional morphology while those with label (ii) show membrane surface morphology
The interconnectivity of the layers and the progression of a 1D or 2D pore structure
into a 3D pore arrangement can be clearly seen in the top-down surface image, in
figure 6.2B(ii). Note that the size of the openings at the surface morphologies is

166
significantly reduced; about 60µm compared to similar features seen in MesoACP.
This is consistent with lower evaporation rate which would allow some of the
surface strain to be reduced during membrane formation. The smaller pores seen for
MesoACP are also observed and are around the same size but, as might be
expected, are significantly less strained and distorted at the surface.
Increasing the ethanol further to around 22 wt% (MesoCCP) continues the
trend seen for membranes discussed so far. Images shown in figures 6.2C(i) and
6.2C(ii) show cross sectional and surface images respectively. The formation of a
layered structure is barely observed and the pore volume is clearly increasing. It is
clear that the films membranes form by this methodology will always have
significant layered structure probably because of the way in which the solvent from
moves through the film during drying. Noticeable also is the appearance of quite
large spherical structures or nodules suggestive of some nucleation and growth
which is consistent with lower rates of membrane formation. The smaller pores can
be seen quite clearly in both top-down and cross-section images but it should be
noted that at the surface the pores are largely undistorted, consistent with low strain
resulting from lower rates of membrane formation.
Images figure 6.2D(i) and 6.2D(ii) show cross sectional and surface images
respectively of MesoCCP, which has an ethanol content of about 25 wt% in its
casting solution. The trends in morphologies observed in membranes MesoACP –
MesoCCP continue in MesoCCP. The cross section, image figure 6.2D(i), still
shows indications of layering but the layering appears to be very much 1D and
filamental in form. This is because there are large pore opening in the layers as can
be seen quite clearly in the corresponding top-down SEM (figure 6.2D(ii)). There is
now quite clear void formation between the layers and the small pores of (1-5µm)
can not only be seen as existing through the layers but within the material as well. It
is apparent that this is the most porous of the membranes seen thus far. The top-
down surface image, figure 6.2D(ii) reveals the 3D nature of the open porous
structure formed although their size is reduced a little compared to MesoCCP to an
approximate diameter of 25 µm. The size and shape is consistent with continued
slower membrane formation and strain release. While no nodules are observed in
cross section, they are present in the surface image.
2-θ angle / degrees

167
Images in figure 6.2E(i) and 6.2E(ii) detail the morphology of MesoECP
(about 29 wt% ethanol). The morphology of the membrane appears to be quite
close to that of MesoDCP in all respects and is observed in both cross-section and
top-down images. The only difference appears to be increased density and lower
void volume. This can be particularly seen in the upper region of the membrane in
figure 6.2E(i). The data, thus, suggest that MesoDCP is the most porous of those
studied.
6.3.3 XRD
Figure 6.3: XRD profiles of MesoDCP and BasMemBCP (to see images superimposed see appendix D, section D.1, figure D.1). Both membranes show a large broad feature around 22-32 o2θ and weaker features around 45 and 65
o2θ; consistent with a poorly ordered crystalline material.
MesoDCP material also shows to sharp diffraction features at 29.34 o2θ and 32.58
o2θ (as
highlighted)

168
In order to understand these changes in the membrane further, MesoDCP and
BasMemBCP were studied to assess and compare the non-ethanol containing
solvent and the most porous of the meso-solvent modified membranes. Figure 6.3
shows XRD data for the membranes. A large broad feature around 22-32 o2θ and
weaker features around 45 and 65 o2θ are consistent with a poorly ordered
crystalline material and the features are similar for both membranes[25]. However,
the MesoDCP material also shows to sharp diffraction features at 29.34 o2θ and
32.58 o2θ (as highlighted in the figure). These are consistent with the presence of
highly crystalline material as well as a majority of the poorly defined phase. These
are likely due to the increased presence of nodules seen in the SEM images, as
nodules are a crystalline morphology[26], [27]. The is evidence that increasing the
membrane casting solution ethanol content increases the final membrane
crystallinity and has a very direct effect on the kinetics of membrane formation.
Increased crystallinity is consistent with longer membrane formation times which
allow structural refinement during synthesis.
Flexibility data corroborates the XRD data showing that as the membrane
EtOH content increased the brittleness increased; evidence of a more crystalline
structure (see appendix D, section D.4, table D.2).
6.3.4 Mercury Porosimetry
To confirm the image analysis, mercury porosimetry data were recorded from
MesoDCP and BasMemBCP and these are recorded in figure 6.4. BET testing was
conducted using nitrogen and even argon gases. However, it was found that the
membranes retain too much gas to give an accurate measurement, leaving mercury
porosimetry as the only viable accurate means of obtaining porosity data. Figure
6.4A shows the cumulative intrusion of mercury in the membrane versus pressure
and the data clearly show that MesoDCP has a greater overall internal volume that
of BasMemBCP in agreement with the SEM analysis. Figure 6.4B shows the log
differential of mercury intrusion into the membrane versus pore size diameter. The
data shows that the ethanol meso-solvent increases the number of large pores (i.e.
>10µm) within the membrane. The data also show a well-defined peak below 10µm
which is consistent with the smaller pores seen in the SEM data from samples made

169
with ethanol included. Again all data are consistent with the analysis of the SEM
images in figure 6.2.
Figure 6.4: MesoDCP and BasMemBCP porosimetry. As labelled in diagram
6.3.5 Lateral-Flow Rate
The apparent changes in porosity with ethanol content should be reflected in the
lateral flow rate measured following surfactant treatment. The lateral flow rates

170
were measured for each membrane and plotted in figure 6.5. The data points show
the average flow rate calculated from ten samples at each membrane composition.
Figure 6.5: Lateral flow rate against the ethanol content for each of the membranes prepared here (for tabulated data see appendix D, section D.2, table D.1)
The BasMemBCP and MesoACP showed negligible flow rates in these
measurements. However, as the ethanol content in the preparation lacquer increases
the flow rate increases through MesoBCP (avg. 0.0165 cm2 s
-1 max. 0.018 cm
2 s
-1
min. 0.015 cm2 s
-1), MesoCCP (avg. 0.0282 cm
2 s
-1 max. 0.031 cm
2 s
-1 min. 0.026
cm2 s
-1) to a maximum in MesoDCP (avg. 0.0508 cm
2 s
-1 max. 0.054 cm
2 s
-1 min.
0.048 cm2 s
-1) before decreasing with MesoECP (avg. 0.0276 cm
2 s
-1 max. 0.030
cm2 s
-1 min. 0.025 cm
2 s
-1). The trend in lateral flow rate reflects the changes seen
in SEM images and the water needed for cloud point reported in figures 6.2 and 6.1
respectively. As might be expected, MesoDCP exhibits the highest lateral flow rate
and the highest water content in the synthesis lacquer. The decrease in lateral flow
seen between MesoDCP and MesoECP can be accounted for directly by the
decreased total amount of water present which (as the porogen) reflects the total
pore volume. However, although similar amounts of water are used in the formation
of membranes MesoACP – MesoCCP, this is not reflected in the lateral flow and
indicates that the pore morphology has a strong affect. This probably reflects the
changes seen in the SEM images with a progression from 1D to a 3D pore network.
6.3.6 Discussion
There are three issues worthy of detailed discussion here. Firstly, the change in
membrane structure observed; secondly, the role of ethanol in the membrane
synthesis reaction and, finally, the origin of the nodules formed.

171
Briefly, in this type of phase inversion synthesis process, the membrane forms
from a single phase, homogeneous solution which on addition of non-solvent
becomes a dual phase consisting of a polymer rich region (i.e. polymer and solvent)
and a polymer poor region (comprised of the non-solvent; water). The phase
separation of these leads to pockets of non-solvent which will form the nascent
pores of the final membrane structure, while the surrounding polymer rich phase,
upon solvent loss, forms the polymer walls[28]. In this sort of phase inversion
process, the membrane is precipitated by a combination of spinodal decomposition
(SD) and nucleation and growth (NG)[29–31]. The rate of evaporation is key to the
morphology of the membrane. In general, precipitation occurs because evaporation
leads to loss of solvent and de-stabilisation of the polymer rich phase[24]. If the
solvent evaporation is rapid, the evaporation forces bring polymer molecules to the
surface increasing their concentration and resulting in skin layers. Further, the “de-
mixing” front passes down through the membrane from the air exposed surface.
The rate of solvent evaporation decreases as the demixing front moves back from
the air exposed surface and layers of polymer build up above it[32]. This would
explain the appearance of the non-ethanol containing membrane. The formation of
macrovoids is also a result of rapid solvent evaporation as explained by Kahre et
al[16]. Briefly, the interface between the polymer rich and polymer poor phase
undergoes motion due to solvent evaporation. Any macrovoid formed by an
agglomeration of non-solvent undergoes a differential stress across the leading edge
of the void and the trailing edge. This results in convection currents within the
voids which in turn promote further non-solvent inclusion and void growth (see
chapter 1, section 1.4.3, figure 1.14). Ahmad et al have argued that macrovoids
inhibit lateral flow by increasing the bulk porosity of a membrane without
increasing the actual number of pores[3]. It is also clear that, above a critical size,
pores will not contribute to capillary flow. It is suggested that the synthesis of
membranes not containing meso-solvent is a direct result of rapid solvent loss. The
presence of a skin layer makes imaging macrovoids rather difficult but in
membrane MesoACP (with the lowest ethanol content), macrovoids can be clearly
seen (Figure 6.2A(i)). Further the direct effect of high evaporation rate related
surface stress can be seen on both the macrovoid and microvoid shapes and size.

172
Using these models it is possible to explain the results observed here. Acetone
has a low boiling point, 50.5 °C and a high evaporation rate from the polymer rich
component. Although water and acetone are miscible (because of hydrogen
bonding), the miscibility of the CN-acetone and water phases is limited. Thus,
evaporative loss from the polymer rich phase will be high. This evaporation results
in skin layer formation and production of relatively large macrovoids, as seen in
BasMemBCP. Ethanol can exist in both the polymer rich and polymer deficient
phases since the solubility parameter of ethanol and CN are similar. Ethanol and
acetone mixtures are miscible with no known azeotrope[33], [34]. Thus, the boiling
point of the solvent in the polymer rich phase will increase thereby decreasing
evaporation rate. This then leads to formation of less and smaller sized macrovoids,
decreased skin layer formation and reduced surface strain as seen in the SEM
images. At the highest concentration of ethanol, the effect is reduced because the
water content of the final mixture is reduced decreasing total porosity. Note also the
effect of having ethanol in the non-solvent (water) dominated, polymer deficient
phase. Ethanol forms an azeotrope with water. This leads to an increase the
concentration of CN in this phase, reducing the concentration gradient across the
phase front and so reducing layering and macrovoid formation.
Nodules: spherical morphologies that occur in membranes due to coarsening.
The number of these nodules depends on the degree of crystallinity of the
membranes. Coarsening occurs when the two separated phases in an instantaneous
phase inversion build up energy at interfacial regions between the two phases,
which makes the solution thermodynamically unstable. Stability is regained by
dissipating this energy into coarsening; which is the formation of droplets of semi-
crystalline polymer at the interfacial regions. From these droplets, nodules are
formed[35]. Naturally, the further from instantaneous the phase inversion is, the
less coarsening will occur; therefore, if the affinity of the solvent for the non-
solvent is increased (as it is through the use of a meso-solvent here), the phase
inversion will proceed more through the spinodal region of nucleation and growth
[28] and reduce the degree of coarsening and so the eventual number of nodules.
The formation of nodules seen in the solutions result from an Ostwald ripening
process occurring at the interface of a dispersed phase of the polymer rich and
deficient phases[35], [36]. Given that nodules, like other polymer structures such as

173
epitaxials and spherulites, are crystalline,[26], [27] it is unsurprising that the
appearance of the highly crystalline phase is only seen for ethanol containing
preparations. It is suggested that the ethanol addition promotes these phases
because the ethanol mediated interactions between the polymer rich and polymer
poor phases results in higher concentrations of dispersed phases (since the ethanol
could stabilise polymer rich phases in the non-solvent). In this way, decreased
layering and nodule formation rates are closely related.
It is tempting, given the morphologies observed in the SEM images, to say that
the effect of water upon on the final structure of the membranes is the dominant
effect. However, the structure of BasMemBCP in which no ethanol was used -
while the non-solvent treatment of the casting solution was maintained - shows
conclusively that the incorporation of the meso-solvent ethanol is essential to
yielding the structures that typify MesoDCP granting it greater lateral flow rate.
6.4 Conclusion:
The inclusion of ethanol in the membrane casting solution at cloud point of CN
lateral flow membranes prepared by phase inversion effectively prevents the
formation of both skin layers and macrovoids, as shown in SEM cross sectional and
surface images and mercury porosimetry data. In addition to the prevention of these
undesirable structural anomalies, the inclusion of ethanol also increases the porosity
of the CN membrane internal structure; increasing lateral flow rates significantly.
The inclusion of ethanol also increases the prevalence of nodules in membrane
formation and these spherical polymer structures remain in the final membrane.
Their increased numbers results in increased crystallinity of the polymer, as shown
in XRD analysis of the final membranes. The overall conclusion of the work
reported here is that all these controlled changes in membrane internal structure are
achieved through a reduction in the rate of evaporation of solvent from the
membrane air exposed surface/demixing front. The use of a meso-solvent to this
end should be applicable to any membrane production process utilizing polymer
VIPS and future work will be centred on such investigations.

174
6.5 Summary
Use of meso-sol. (EtOH) in casting lacquer:
Increases membrane porosity
Prevents skin layer formation (in conjunction with bringing lacquer to
CP)
Increases lateral-flow rate
Use of meso-sol. Also increases occurrence of nodules
No discernible effect on membrane performance

175
References: Chapter 6
[1] M. Ulbricht, “Advanced functional polymer membranes,” Polymer, vol. 47,
no. 7, pp. 2217–2262, Mar. 2006.
[2] M. Lönnberg and J. Carlsson, “Chromatographic performance of a thin
microporous bed of nitrocellulose.,” Journal of chromatography. B,
Biomedical sciences and applications, vol. 763, no. 1–2, pp. 107–20, Nov.
2001.
[3] A. L. Ahmad, S. Low, and S. Shukor, “Effects of membrane cast thickness
on controlling the macrovoid structure in lateral flow nitrocellulose
membrane and determination of its characteristics,” Scripta Materialia, vol.
57, no. 8, pp. 743–746, Oct. 2007.
[4] Y. Yip and a Mchugh, “Modeling and simulation of nonsolvent vapor-
induced phase separation,” Journal of Membrane Science, vol. 271, no. 1–2,
pp. 163–176, Mar. 2006.
[5] P. Vandewitte, P. Dijkstra, J. Vandenberg, and J. Feijen, “Phase separation
processes in polymer solutions in relation to membrane formation,” Journal
of Membrane Science, vol. 117, no. 1–2, pp. 1–31, Aug. 1996.
[6] B. F. Barton, J. L. Reeve, and a. J. McHugh, “Observations on the dynamics
of nonsolvent-induced phase inversion,” Journal of Polymer Science Part B:
Polymer Physics, vol. 35, no. 4, pp. 569–585, Mar. 1997.
[7] S. Arirachakaran, K. D. Oglesby, M. S. Malinowsky, O. Shoham, and J. P.
Brill, “An Analysis of Oil/Water flow Phenomena in Horizontal Pipes,” in
society of Petroleum Engineers, Oklahoma, 1989.
[8] H. Chae, Y. Po, H. Yong, and Y. Soo, “Membrane formation by water vapor
induced phase inversion,” Journal of Membrane Science, vol. 156, pp. 169–
178, 1999.
[9] Y.-S. Kang, H.-J. Kim, Y.-H. Kim, and W.-H. Jo, “The Mechanism of
Assymetric Membrane Formation via Phase Inversion,” Polymer Society of
Korea, vol. 12, no. 3, pp. 279–287, 1988.
[10] J. P. Salamone, Polymeric Materials Encyclopedia, Vol. 6. CRC Press, 1996.
[11] B. Hu, L. Liu, O. Matar, P. Angeli, G. Hewitt, and E. Perezdeortiz,
“Investigation of Phase Inversion of Liquid-Liquid Dispersions in Agitated
Vessels*,” Tsinghua Science & Technology, vol. 11, no. 2, pp. 202–206,
Apr. 2006.
[12] A. L. Ahmad, M. Sarif, and S. Ismail, “Development of an integrally skinned
ultrafiltration membrane for wastewater treatment : effect of different

176
formulations of PSf / NMP / PVP on flux and rejection,” Desalination, vol.
179, no. November 2004, pp. 257–263, 2005.
[13] A. L. Ahmad, S. C. Low, S. R. A. Shukor, and A. Ismail, “Synthesis and
Characterization of Polymeric Nitrocellulose Membranes : Influence of
Additives and Pore Formers on the Membrane Morphology,” Journal of
Applied Polymer Science, vol. 108, no. 4, pp. 2550–2557, 2008.
[14] T.-H. Young and L.-W. Chen, “Pore formation mechanism of membranes
from phase inversion process,” Desalination, vol. 103, pp. 233–247, 1995.
[15] J. Kim and K. Lee, “Effect of PEG additive on membrane formation by
phase inversion,” Rain, vol. 138, pp. 153–163, 1998.
[16] V. P. Khare, A. R. Greenberg, J. Zartman, W. B. Krantz, and P. Todd,
“Macrovoid growth during polymer membrane casting,” Desalination, vol.
145, no. 1–3, pp. 17–23, 2002.
[17] C. A. Smolders, A. J. Reuvers, R. M. Boom, and I. M. Wienk,
“Microstructures in phase-inversion membranes. Part 1. Formation of
macrovoids,” Journal of Membrane Science, vol. 73, no. 2–3, pp. 259–275,
1992.
[18] F. G. Paulsen, S. S. Shojaie, and W. B. Krantz, “Effect of evaporation step
on macrovoid formation in wet-cast polymeric membranes,” Journal of
Membrane Science, vol. 91, no. 3, pp. 265–282, 1994.
[19] J. Hao and S. Wang, “Calculation of Alcohol-Acetone-Cellulose Acetate
Ternary Phase Diagram and their Relevance to Membrane Formation,”
Jounral of Applied Polymer Science, vol. 80, pp. 1650–1657, 2001.
[20] S. C. Pesek and W. J. Koros, “Aqueous quenched asymmetric polysulfone
membranes prepared by dry/wet phase separation,” Journal of Membrane
Science, vol. 81, no. 1–2, pp. 71–88, 1993.
[21] E. J. Flynn, D. Keane, J. D. Holmes, and M. A. Morris, “Unusual trend of
increasing selectivity and decreasing flux with decreasing thickness in
pervaporation separation of ethanol/water mixtures using sodium alginate
blend membranes.,” Journal of Colloid and Interface Science, vol. 370, no.
1, pp. 176–82, Mar. 2012.
[22] A. F. M. Barton, CRC Handbook of Polymer-Liquid Interaction Parameters
and Solubility Parameters. CRC Press, 1990.
[23] A. G. Yiotis, I. N. Tsimpanogiannis, A. K. Stubos, and Y. C. Yortsos, “Pore-
network study of the characteristic periods in the drying of porous
materials.,” Journal of colloid and interface science, vol. 297, no. 2, pp.
738–48, May 2006.

177
[24] L. Pauchard and C. Allain, “Buckling instability induced by polymer
solution drying,” Europhysics Letters, vol. 62, no. 6, pp. 897–903, 2003.
[25] T. Thurn-Albrecht, R. Thomann, T. Heinzel, and S. Hugger,
“Semicrystalline morphology in thin films of poly(3-hexylthiophene),”
Colloid & Polymer Science, vol. 282, no. 8, pp. 932–938, Jun. 2004.
[26] M. P. Stevens, “Chapter 3: Chemical Structure and Polymer Morphology,” in
Polymer Chemistry: An Introduction, Oxford University Press, Inc., 1999,
pp. 61–95.
[27] P. Van-de-Witte, “Phase separation processes in polymer solutions in
relation to membrane formation,” Journal of Membrane Science, vol. 117,
no. 1–2, pp. 1–31, Aug. 1996.
[28] T. Young and L. Chen, “Pore formation mechanism of membranes from
phase inversion process,” Desalination, vol. 103, no. 3, pp. 233–247, Dec.
1995.
[29] S. P. Nunes and T. Inoue, “Evidence for Spinodal Decomposition and
Nucleation and Growth Mechanisms during Membrane Formation,” Journal
of Membrane Science, vol. 111, no. 1, pp. 93–103, 1996.
[30] H. Chae Park, K. Yoon Po, K. Hwa Yong, and K. Yong Su, “Membrane
formation by water vapor induced phase inversion,” Journal of Membrane
Science, vol. 156, no. 2, pp. 169–178, Apr. 1999.
[31] I. Pinnau and W. J. Koros, “A qualitative skin layer formation mechanism
for membranes made by dry/wet phase inversion,” Journal of Polymer
Science Part B: Polymer Physics, vol. 31, no. 4, pp. 419–427, Mar. 1993.
[32] A. G. Yiotis, I. N. Tsimpanogiannis, A. K. Stubos, and Y. C. Yortsos, “Pore-
network study of the characteristic periods in the drying of porous
materials.,” Journal of colloid and interface science, vol. 297, no. 2, pp.
738–48, May 2006.
[33] J. Gmehling, J. Menke, J. Krafczyk, and K. Fischer, Azeotropic Data,
Volume 1. Wiley-VCH, 2004.
[34] J. Gmehling, J. Menke, J. Krafczyk, and K. Fischer, Azeotropic Data,
Volume 2. Wiley-VCH, 2004.
[35] C. K. Haas and J. M. Torkelson, “Two-dimensional coarsening and phase
separation in thin polymer solution films,” Physical Review E, vol. 55, no. 3,
pp. 3191–3201, 1997.
[36] I. Pinnau and W. J. Koros, “A qualitative skin layer formation mechanism
for membranes made by dry/wet phase inversion,” Journal of Polymer
Science Part B: Polymer Physics, vol. 31, no. 4, pp. 419–427, 1993.

178
Chapter 7
Advanced Pervaporation
Membranes:
Mixed Matrix
Membranes

179
7 Pervaporation Mixed Matrix Membranes
The following is adapted from “Pervaporation Performance Enhancement
through the Incorporation of Mesoporous Silica Spheres into PVA membranes”.
Separation and Purification Technology, Volume 118, 30 October 2013, Pages
73–80
Abstract
Spherical, discreet, size-monodisperse mesoporous silica particles of 1.8 – 2 µm
diameter, with pore diameters of ~1.8 nm were incorporated into a poly(vinyl
alcohol) [PVA] polymer to produce composite pervaporation membranes. The
selective membrane layers were cast on polyacrylonitrile [PAN]/non-woven fabric
supports. The inclusion of particulate silica had beneficial effects on pervaporation
performance for the dehydration of ethanol, improving flux throughout the
composition range studied, as well as increasing selectivity in all but the highest
silica content samples. The unique pervaporation in mesoporous membranes is
discussed in terms of polarity and solubility data.

180
7.1 Introduction
Pervaporation is a membrane separation technology primarily used to dehydrate
and recover solvents and also to separate organic-organic mixtures[1–6]. It has
significant advantage over other separation techniques in that it can be used to
effectively ‘break’ azeotropes of mixtures without any of the typically associated
physical difficulties and negative environmental impacts of techniques such as
azeotropic distillation[7]. Consisting of a feed solution of solvent and water (or
solvent and solvent) to be separated and a suitable polymer, inorganic, or composite
material membrane that allows selective permeation of one of the feed molecules
via absorption/diffusion through the polymer[1]. A partial vacuum is maintained on
the permeate side, providing the driving force for diffusion by creating a vapour
pressure difference across the membrane. The size, motion and permanence of gaps
in the polymer chain matrix of the membrane define both the flux and
selectivity[1]. These two parameters have an inverse relationship to one another; as
flux increases selectivity decreases and vice versa (see chapter 1, section 1.2.1 for
detailed explanation of pervaporation theory). One method of improving membrane
flux without significantly compromising selectivity is by inclusion of porous
particles into the polymer matrix, e.g. zeolites[8]. In porous ceramic-polymer
membrane hybrids of this type the engineering of the particles, i.e. size, shape,
monodispersivity, pore size and surface chemistry, is important.
Incorporating ceramic materials into membranes (mixed matrix membranes
(MMM)) is a challenge of maintaining membrane mechanical integrity and
controlling free volume (other than the designed ceramic pore volume). Additional
free volume arises from polymer-particle interactions[9][10]. When a particle is
incorporated into a polymer matrix, chain entanglement of the particle occurs.
Since polymer chain segments are rigid and inflexible on the nanoscale [11], free
volumes form between the particle and the polymer matrix. Further, as in all
particulate systems, if the particles are not well-dispersed throughout the matrix, are
not monodisperse or, have ill-defined shape, extra free volume is created[12]. These
uncontrolled free volumes can significantly and unpredictably compromise
selectivity. Particle agglomeration related free volume can also act as stress raisers
and crack initiators, propagating defects quickly through the ceramic

181
particle/polymer network. For the sake of clarity in the data presented here and its’
subsequent discussion, the distinction between the different volumes that can occur
within the membrane should be carefully defined: pore-volume - the volume
contributed to the membrane by the presence of pores within the particle, free-
volume - the volume contribution from the space around particles created by
polymer chain entanglement and chain gaps - the fluctuating gaps between polymer
chains in the membrane matrix that allow for diffusion as described above.
Whilst microporous zeolitic composite membranes have been frequently
studied, mesoporous systems with pore sizes greater than 2 nm have been less
researched. The use of mesoporous silica for pervaporation application was first
reported by Cot et al.[13] using homogeneous membranes prepared by
alkyltrimethylammonium bromide templated silica. They carried out tests on a
polar/non-polar binary, ethanol–cyclohexane separation and observed a
pervaporation effect. Mesoporous silica has also been used in mixed matrix
membranes as a filler particulate in pervaporation and gas separation. Aminabhavi
et al.[14] reported an increase in both flux and selectivity when MCM-41 particles
were embedded in a cross-linked sodium alginate membrane for dewatering
isopropanol by pervaporation. MCM-41 nanoparticles have also been used in
polysulfone membranes for gas separation and have been found to increase gas
permeability without a loss in selectivity[15], [16]. In mesoporous materials the
pores are significantly larger than in zeolites but they are uni-directional and at
dimensions which favour molecular movement. Further, the shape and size of the
particles and the pores can be carefully engineered. Size/shape uniformity may
afford considerable advantage in terms of regular particle distribution as well as
membrane mechanical performance[17]. Further, they can be relatively easily
functionalised to change the surface chemistry to promote molecular
selectivity[18]. In this way, the particle synthesis methods used here afford many
advantages over traditional ceramic particulates. The mesoporous particles used in
this study are detailed in previous work by the group[17]. The process yields
discreet, monodisperse non-agglomerated mesoporous silica particles.
Incorporation of these particles into membranes results in high dispersion through
polymer matrices. This allows for reduction of free volume to a minimum and,
importantly, means the free volume created by their incorporation is approximately

182
the same for all membranes of common particle loading; something which has
hitherto been unachievable[16], [19]. This article focuses on the incorporation of
novel small-pore (1.8-2.0 nm diameter), spherical, monodispersive mesoporous
silica microspheres into PVA (poly(vinyl alcohol)) membranes for use in
pervaporation dehydration of azeotropic ethanol-water mixtures. PVA was chosen
as the base polymer as it possesses a high strain at fracture [20] allowing for
significant particle loadings without overly compromising mechanical stability.
PVA pervaporation membranes require careful crosslinking for optimum
performance[21]. This chapter does not centre on achieving the highest possible
membrane efficacy but rather on assessing the potential of these mesoporous silica
particles as enhancing agents in pervaporation membranes. A low selectivity
polymer is best used to observe the effect of introducing these novel materials into
a membrane matrix. With superselective membranes, where permeate water content
typically exceeds 98 %, the relative enhancement of performance by incorporated
particles constitutes a much lower percentage increase in selectivity. It becomes
difficult to ascertain whether an increase in performance is statistically relevant, as
small changes in retentate/permeate composition, permeate side vacuum, or feed
solution flow-rate can have a similarly significant effect on flux/selectivity figures.
However these effects can be random, irreproducible and unrelated to the particles
incorporated. Thus, cross-linked PVA was chosen over highly selective materials
like sodium alginate as the polymeric membrane matrix. Typical experimental
results are shown below.
7.2 Experimental
See chapter 2 for details on all materials, apparatus and procedures not mentioned
below.
7.2.1 Materials
Mesoporous silica particles were prepared using a modified Stöber process [17].
7.2.2 Membrane preparation
Membrane supports were prepared similar to a literature procedure[22].
Membranes were thermally crosslinked;[23–25] to provide the mechanical stability

183
required for assessing the potential of mesoporous materials as pervaporation
enhancers.
7.2.3 Pervaporation
Pervaporation experiments conducted using Laboratory 6” Test Cell produced by
Sulzer Chemtech. A detailed schematic diagram of this pervaporator can be found
elsewhere[26], [27].
7.2.4 Characterization
All membrane samples were prepared for imaging by the Cryo-Rupturing Image
Sample Preparation (CRISP) method[28].
7.3 Results and Discussion:
7.3.1 Characterisation
SEM and TEM of the silica particles are shown in figure 7.1 A and 7.1B. The
images show the spherical morphology. It is clear from figure 7.1A that the
particles have a highly monodisperse nature. The measured mean particle size was
1.8 - 2.0 µm. The porosity and pore structure has been characterized previously
using X-ray diffraction (XRD), electron microscopy and nitrogen adsorption[17].
Figure 7.1B shows a TEM image of particles produced by the same process as
those used in the membranes. Particles of smaller diameter are imaged here since
larger particles are less electron-transparent and direct imaging of the pore structure
is not readily achieved. However, the pore size of the particles is representative of
the larger particles as little variation from particle-to-particle is observed.
Figure 7.1: A) mesoporous silica particles SEM image B) TEM image of pores resulting from modified Stöber process

184
The pore structure of the particles is largely disordered as characterized by a broad
low angle XRD peak[17]. However, the presence of areas with local order is also
possible as shown by the channels visible in figure 7.1B. The average pore
diameters were measured at about 1.8 nm with an average pore volume of
approximately 0.45 cm3 g
-1 and the material had surface area of approximately 700
m2 g
-1 (from BET measurements reported previously[17]).
When these particles are placed in a solvent solution and subjected to
sonication, they form dispersions that are stable for several hours due to their
monodispersivity and small size. Particles of these dimensions and chemistry are
expected to exhibit relatively slow aggregation kinetics and, hence, form stable
dispersions[29–31]. Whilst the solvent mixtures used to prepare the membranes
exhibit good dispersions, the degree of dispersion in the cast and dried membrane
might not be the same due to aggregation effects during film formation and solvent
loss. Below a 15 wt% loading, the particles are observed to be well-dispersed and
very few areas of aggregated particles can be seen. However, at 15 wt% particle
loading and above, aggregation is obvious and extensive phase separation of
particles and polymer is clear. Illustrative SEM images are shown in figure 7.2.
Figure 7.2A shows an image of a PVA membrane with 15 wt% loading of silica
particles present. Particulate agglomeration can be observed (highlighted) as well as
extensive segregation of particles to the film surface. In regions of aggregation,
there appears to be a degree of close packing within the clusters. The cross-section
image of the same membrane in figure 7.3G confirms the poor integration; not only
is aggregation present but also extensive segregation to the surface is obvious. The
poor binding of the silica to the polymer chains is evident from the close proximity
and direct contact of silica particles to each other and also by surface segregation.
Poor binding of PVA to small silica particles has been seen previously and has been
explained by low PVA coverage at the nanoparticle surfaces and consequently
phase separation due to depletion effects[32].
In comparison to the 15 wt% samples, figure 7.2B and 7.3F show the surface
and cross section images respectively of a pervaporation membrane with 10 wt%
particle loading (the optimum membrane produced in terms of pervaporation
performance as described below). In contrast to the 15 wt% silica loaded materials,

185
the 10 wt% particles are very well dispersed through the membrane and there is no
sign of aggregation or segregation of the particles to the surface in the cross section.
Figure 7.2: A) surface image of 15 wt% silica loaded PVA membrane B) surface image of 10 wt% silica loaded PVA membrane
It can be seen that the particles appear to exhibit direct polymer attachment and
some particles appear to be in contact with the polymer over large areas of their
surface: This is markedly different to higher loadings as can be seen above. It can
be concluded from the data that at low silica content, the particles are well
distributed through the membrane but at 15 wt% and above aggregation occurs: A
maximum loading for good dispersion is present in this system. Similar aggregation
of particles was observed by Aminabhavi et al. upon incorporation of nanoparticles
into chitosan membranes[10].
A series of membranes of increasing silica content are shown in figure 7.3. In
each case, cross-section images confirm the top-down image analysis. Further,
these are consistent with good dispersion of particles at lower loadings. The
unloaded sample (figure 7.3A and 7.3E) has a dense film structure (and is
consequently much thinner than a membrane loaded particle) with no sign of
porosity. It has a film thickness about 5 µm. The 10 wt% silica containing sample
has a good film structure with little sign of segregation of particles to the surface
(figure 7.3C and 7.3F). The 5 wt% sample (figure 7.3D) also exhibited similar
dispersion of the added particles. The measured thicknesses are around 15 µm and
10 µm for the 10 wt% loaded and 5 wt% loaded membranes respectively, the

186
thickness increase being due to the material addition and the volume of the porous
particles.
Figure 7.3: Images A, B, C and D show surface of pervaporation membranes with 0 wt%, 5 wt%, 10 wt% and 15 wt% silica loading respectively. Images E,F and G show cross section images of 0 wt%, 10 wt% and 15 wt% silica loaded membranes respectively
The measured film thickness of the 15 wt% silica sample was measured at
about 25 µm, consistent with the trend observed. The increase in film thickness
seen is consistent with the volume of particles added. PVA has a density of ~1.1 g
cm-3
. Silica has a density of ~2.2 g cm-3
but these mesoporous particles have
porosity of approximately 75 % by volume and, hence, a density around half that of
the PVA. The pervaporation performance of these membranes was tested and
details are provided below.
7.3.2 Membrane Absorption
The absorption data for a section of membrane selective layer (70 mm x 50 mm x
20 µm), shows that in a solution of 50 wt% water to 50 wt% ethanol the rate at
which said solution is absorbed and the maximum absorption achieved before the
membrane becomes so swollen that it dissolves. Incorporation of silica particles
into the membrane polymer matrix results in increased rate and capacity, up to a
defined maximum between 10 wt% and 15 wt% loading of silica particles.
This can be seen from the data in figure 7.4: At 0 wt% silica particle loading,
the membrane dissolves after only 40 s in solution, at ~257 wt% of its original dry
mass. The average rate of absorption was 3.91 wt% s-1
; the membrane showed little

187
deviation from this rate before eventually dissolving. Incorporating 5 wt% silica
into the membrane matrix, figure 7.4 shows that the membrane dissolves after 50 s
in solution with a mass ~327 wt% of the original dry mass of the membrane,
suggesting an increase in the membrane matrix mechanical stability; a well-
documented benefit of incorporation of silica particles[33–35]. The rate at which
absorption occurs is increased to 4.51 wt% s-1
; an increase in hydrophilicity which
is due to the hydrophilic silanol groups on the silica particle surfaces and the high
surface area of the particles due to their porosity.
Figure 7.4: Membrane absorption vs. time; shows absorption of a solution of 50 wt% EtOH and 50 wt% water into selective membrane over time. Maxima represent point at which membrane becomes dissolute, i.e. loses membrane form and so becomes unusable. (See appendix E, table E.1 for tabulated data)
Increasing the particle loading to 10 wt% results in a further increase in the
capacity of the membrane before dissolving in solution at ~415 wt% of its original
dry mass over a period of 70s. The average rate of absorption of solution was 4.57
wt% s-1
. This data shows a positive trend in all parameters with the increase in
silica loading for the same reasons highlighted for the 5 wt% loading.
Increasing the silica loading to 15 wt%, the absorption capacity of the
membrane decreases to 399 wt% of its original dry mass over the same time period
0
50
100
150
200
250
300
350
400
450
0 10 20 30 40 50 60 70 80 90 100
0wt% Silica
5wt% Silica
10wt% Silica
15wt% Silica
Membranes Absorption vs. Time
Time (s)
Pe
rce
nta
ge I
ncr
eas
e in
Me
mb
ran
e M
ass

188
as the 10 wt% silica loaded membrane. The rate at which the membrane absorbs the
solution is also reduced from that of the 10 wt% loading, dropping to 4.44 wt% s-1
.
Some of the hydrophilic nature of the particles has been lost compared to the
expected increase based on the trend observed from 0 to 10 wt% loading. In
addition, the lower absorption capacity shows the degree of the mechanical
stabilization expected has been reduced. The reasons for this can be explained by
looking again at the SEM images of figures 7.2 and 7.3. It can be seen clearly that
in the 15 wt% silica loaded membrane, compared to the 10 wt% and 5 wt%, there is
a greater degree of agglomeration of particles. This agglomeration increases
particle-particle contact and so effectively reduces the available surface area as well
as the number of silanol groups thus, reducing the potential increase in
hydrophilicity. The reduction in mechanical stability is due to the increase in free
volume around large agglomerates compared to the increase from much smaller,
well dispersed single silica spheres at lower weight percentage loadings. This is due
to the limited motion of polymer chain segments, an effect that is enhanced with
larger, irregularly shaped particles, which is what the agglomerates formed at 15
wt% silica loading effectively are[11], [12]. It has been reported that after
incorporation of filler particles membrane swelling decreases with loading [36],
[37]. However in these instances the size and nature of the particles resulted in
greater bonding with the polymer chain matrix and/or occupation of interstitial
spaces within polymer matrix of the membrane.
7.3.3 Pervaporation
Pervaporation results are detailed in figure 7.5 which summarises flux and
selectivity data from four membranes prepared containing different weight
percentage loadings of silica ranging from 0 wt% to 15 wt%. Table 7.1 shows the
average selectivity and flux attained for each membrane over the duration of a
pervaporation test and the maximum selectivity and flux obtained during the test.

189
Table 7.1: Tabulated flux, selectivity, feed and permeate purity, and contact angle data for membranes at different wt% silica particle loadings
Mem: PVA Diameter: 0.158m
Area: 0.0177m2
Flux (g m
-2 h
1)
Selectivity Permeate H2O purity
(max)
Feed EtOH Purification (after 6 h)
Contact Angle
Silica (wt%) Avg. Max. Avg. Max. (wt%) (wt%) degrees 0 409.3 427.3 20.8 22.8 87.5 0.8 ~80
5 453.9 531.3 22.3 24.4 88.7 1.1 ~76
10 855.1 945.5 42.3 48.4 93.2 2.0 ~71
15 1193.4 1334.0 10.3 11.1 78.5 0.1 ~68
Figure 7.5(A) describes the selectivity of the membranes as a function of time.
The unloaded membrane shows an average selectivity of ~21 over the six hour
measurement and varies little throughout this period.
Inclusion of 5 wt% silica brings about a small increase in selectivity over the
unloaded membrane, with no significant change in flux. At 10 wt% loading, there is
a dramatic increase in selectivity to an average value of ~42, twice that of the lower
weight loading. The selectivity (and to some extent flux) appears to show a distinct
peak with time, having lower values at the start and end of the run. However, the
selectivity is always in excess of the non-silica containing PVA membrane. Such
variation in selectivity can be ascribed to conditioning[22] and relaxation effects
[20][24] which are particularly prevalent in PVA membranes. At a loading of 15
wt%, there is a significant decrease in selectivity to ~10.25, below that of the 0 wt%
membrane. This is related to the poor dispersion and segregation of the mesoporous
silica particles as seen in figure 7.3(D). The free-volume increase, described above,
resulting from particulate agglomerates such as those seen at 15 wt% loading,
results in facile, less selective diffusion of feed through the membrane. It is
suggested that the 10 wt% membrane represents close to the maximum amount of
silica that can be included without gross segregation and agglomeration effects
occurring, this is corroborated by the SEM images of figures 7.2 and 7.3 and by the
trends seen in the absorption data. The variation in selectivity observed is clearly
shown in figure 7.5C where average values as a function of silica loading are
plotted. The data suggest that the silica does have a beneficial effect on separation.
Whilst selectivities here were modest compared to other inorganic modified
membranes, the corresponding fluxes are higher than might be expected. Compared
with reported figures in which zeolites (the most commonly used and most effective
material incorporated into MMMs industrially) are incorporated into a PVA

190
membrane, the membranes produced here showed a considerable increase in the
average flux of the plain PVA membrane upon incorporation of 10 wt% loading of
silica[19], [22], [38].
Figure 7.5: A: Selectivity vs. time for membranes of particle loading from 0 wt% to 15 wt% silica loading. B: Flux vs. time for membranes of particle loading from 0 wt% to 15 wt% silica loading. C: Average flux of membrane vs. membrane silica loading. D: Average selectivity of membrane vs. membrane silica loading
The flux measured from the PVA membrane is ~410 g m-2
h-1
. While
selectivity values showed a distinct peak with loading amount, the flux shows a
continual increase (figure 7.5D). The increase in flux seen on 5 wt% loading, like
the selectivity, is limited with an average value of ~455 g m 2
h-1
. This suggests that
in the lower loaded sample that permeation through the PVA is dominant. At a
loading of 10 wt% the rise in flux is significant at about 855 g m-2
h-1
averaged over
the 6 h test period. It, thus, appears that a 10 wt% loading of mesoporous silica
particles increases both selectivity and flux considerably. The increase in flux seen
could be due to molecules being transported more efficiently through the pores
within the mesoporous silica matrix. At 15 wt% loading, the flux further increases
to an average value of 1194 g m-2
h-1
. However, since this occurs in conjunction
with a significant decrease in selectivity, the flux increase is also due in significant
part to the free volume introduced by increased interface void volume around
agglomerated particles which are not observed at lower particle loadings.

191
7.3.4 Discussion
The difference between the 10 and 15 wt% samples in terms of pervaporation
performance and membrane morphology is marked and they are related. The
morphological differences are significant, being well-dispersed and aggregated for
the 10 and 15 wt% samples respectively. The aggregation in the film derives from
particle-polymer interaction differences in the membrane formation process (since
in dry dense membrane structures particle movement is severely restricted). A
significant difference in the membrane synthesis solutions is the ionic strength and
it is suggested here that this plays a significant role in determining the particle
aggregation. The higher the silica content in PVA-SiO2 suspensions, the higher the
ionic strength is expected to be[39]. The bonding of PVA to silica surfaces has been
well explored and it is generally accepted that the PVA is attached through
hydrogen bonding and condensation with surface silanol groups[14], [40], [41].
However, the density of active silanol groups is related to the ionic strength and as
ionic strength increases, the activity of the silanol sites decreases due to ionization
of the –OH groups[39]. As a result the surface coverage of the polymer on the
particles will lessen. The coverage of PVA is important in deciding the degree of
aggregation[42], [43]. High molecular weight polymers attached to a surface form
pendant chains, chain loops, etc. The osmotic pressure (resulting from the free
volume between the polymer segments and various chain morphologies) acts as a
repulsive force (since free volume is associated with higher energy states) to keep
two approaching particles away from each other. In this way, as polymer coverage
at the particle increases, the repulsive forces between particles and resistance to
aggregation should also increase. Further, unsaturated surfaces, i.e. lower surface
coverage, can promote bridging and flocculation[39], [42], [43]. In this way, as
polymer is subjected to increased silica loadings, the PVA coverage will decrease
and favour particle aggregation as observed here. Decreases in membrane free
volume upon particle incorporation have been reported elsewhere,[37] contrary to
what is observed above. This decrease has been attributed to an increase in
membrane crosslink density due to the reinforcing effect of filler nanoparticles
(size 282-290nm) occupying interstitial spaces within the polymer matrix[37].
However, the particles used in this study with mean size diameters of 1.8 – 2.0 µm
are too large to occupy interstitial spaces between polymer chains[44].

192
Additionally, free volume increases in membranes have been observed upon
incorporation of filler particles but this has been attributed to aggregation of the
particles[10]. Given that polymer chain segments are rigid and inflexible on the
nanoscale,[11] when incorporating larger scale particles, such as those used here –
assuming they are discreet – polymer chains can conform more closely to the
particle shape as the extent to which the polymer chains must bend to do so is
within the limits of their flexibility. Thus the free volume formed from this is less
per mass of filler particles that with smaller particles, minimising the loss in flux
attributed to these free volumes. Further, with discreet particles the free volume
increase is consistent from membrane to membrane as discussed previously. Also,
this is achieved with minimal loss of active particle surface area suffered by the
formation of agglomerates.
The data from figure 7.5 shows conclusively that the incorporation of around
10 wt% of novel mesoporous silica particles into a PVA pervaporation membrane
matrix results in a considerable improvement in pervaporation performance in
terms of both flux and selectivity. The improvement of both selectivity and flux
simultaneously is relatively uncommon[36], [45]. The improvement in selectivity
with loading can only be explained by concluding that the silica particles are
themselves selective to diffusion of water molecules. Zeolite membranes and
particles are active ethanol-water pervaporation materials because of their
molecular sieving and adsorption properties[8]. Since the mesopore diameter here
(1.8 - 2.0 nm) is considerably greater than the effective diameter of both ethanol
(~0.40 nm) and water molecules (~0.28 nm), it can be concluded that there is little
molecular sieving effect through these pores. In this respect, the selection of
mesoporous materials in pervaporation is not theoretically obvious but still worthy
of further comment and reasoning.
It has been proposed that the polar groups in the membrane matrix, responsible
for the membrane hydrophilicity, act as the fixed carriers for mass transport in the
membrane[46]. In the case of dehydration of organic solvents, it is believed that
water transport in the membrane proceeds in a unique manner. Unlike the random
path of the less polar species, the water molecule jumps from one polar site to
another. The fixed-carrier theory implies that water and the less polar species in the
liquid mixture take different paths while diffusing through the membrane.
193
Mesoporous silica systems are known to both adsorb and transport water molecules
very efficiently[47].
Empirically, solubility and polarity data support this separation mechanism.
The use of such data has previously been used in polymeric membrane material
selection for pervaporation.[48] Water and ethanol have a Dimroth and Reichardt’s
solvent polarity ET(30) value of 264.01 kJ mol-1
and 217.15 kJ mol-1
respectively.
The Hildebrand solvent parameter of silica is measured at between 28 - 38 MPa1/2
[40] whilst water and ethanol are around 48 and 26 MPa1/2
respectively[41]. Both
sets of data suggest additional selectivity to water over ethanol. Furthermore, the
solubility parameter of mesoporous silica is expected to be increased over bulk
silica materials because of its very high reactivity to water[47].
The inclusion of the mesoporous component is also indicated by the increased
hydrophilicity of the membranes. This can be seen directly from contact angle
measurements made on the membrane (see table 7.1). These were 80, 76, 71 and 68
° from 0 to 15 wt% loading respectively. It is thus suggested that the improved
selectivity arises from the increased hydrophilicity/water adsorption properties of
the membranes. This is consistent with previous arguments [14], [19]. The
increased flux in these improved membranes is certainly due to the addition of the
pore volume.
7.4 Conclusion
This work shows that the incorporation of engineered mesoporous particles into
polymer pervaporation membranes can be highly beneficial and warrants extended
study to optimise performance and assess the ideal structural parameters such as
size, shape and pore dimensions. Results show that incorporation of spherical,
discreet, size-monodisperse mesoporous silica particles of 1.8 – 2 µm diameter and
with pore diameters of ~1.8 nm, when incorporated into a poly(vinyl alcohol)
[PVA] polymer to produce composite pervaporation membranes, resulted in
statistically significant increases in both flux and selectivity. Inexpensive
mesoporous synthesis routes as well as chemical functionalization treatments are
now available[18] and the cost should not be prohibitive. Unlike zeolitic systems,
mesoporous solids can be very controllably engineered to give a wide range of pore

194
sizes and chemistries and may provide new generations of membranes for various
pervaporation applications.

195
7.5 Summary
Incorporation 10 wt% of mesoporous silica particles results in improvement in flux
& selectivity
Improvement of both selectivity & flux simultaneously uncommon
Improvement in selectivity leads to conclusion that silica particles are themselves
selective to diffusion of water molecules
Improvement in performance achieved through particle polar surface silanol groups
- add to membrane hydrophilicity – increase fixed carrier capability of membrane

196
References: Chapter 7
[1] R. W. Baker, Membrane Technology and Applications, 2nd ed. John Wiley
and Sons, Ltd., 2007.
[2] A. Jonquières, “Industrial state-of-the-art of pervaporation and vapour
permeation in the western countries,” Journal of Membrane Science, vol.
206, no. 1–2, pp. 87–117, Aug. 2002.
[3] P. Van De Witte, J. W. A. Van Den Berg, and J. Feijen, “Phase separation
processes in polymer solutions in relation to membrane formation,” Journal
of Membrane Science, vol. 117, pp. 1–31, 1996.
[4] S. Kalyani, B. Smitha, S. Sridhar, and a Krishnaiah, “Pervaporation
separation of ethanol–water mixtures through sodium alginate membranes,”
Desalination, vol. 229, no. 1–3, pp. 68–81, Sep. 2008.
[5] R. Y. M. Huang, R. Pal, and G. Y. Moon, “Characteristics of sodium alginate
membranes for the pervaporation dehydration of ethanol–water and
isopropanol–water mixtures,” Journal of Membrane Science, vol. 160, no. 1,
pp. 101–113, Jul. 1999.
[6] S. Ray and S. K. Ray, “Separation of organic mixtures by pervaporation
using crosslinked and filled rubber membranes,” Journal of Membrane
Science, vol. 285, no. 1–2, pp. 108–119, Nov. 2006.
[7] V. Van Hoof, L. Van den Abeele, A. Buekenhoudt, C. Dotremont, and R.
Leysen, “Economic comparison between azeotropic distillation and different
hybrid systems combining distillation with pervaporation for the dehydration
of isopropanol,” Separation and Purification Technology, vol. 37, no. 1, pp.
33–49, Jun. 2004.
[8] T. Bowen, R. Noble, and J. Falconer, “Fundamentals and applications of
pervaporation through zeolite membranes,” Journal of Membrane Science,
vol. 245, no. 1–2, pp. 1–33, Dec. 2004.
[9] C.-L. Li, S.-H. Huang, W.-S. Hung, S.-T. Kao, D.-M. Wang, Y. C. Jean, K.-
R. Lee, and J.-Y. Lai, “Study on the influence of the free volume of hybrid
membrane on pervaporation performance by positron annihilation
spectroscopy,” Journal of Membrane Science, vol. 313, no. 1–2, pp. 68–74,
Apr. 2008.
[10] V. T. Magalad, G. S. Gokavi, M. N. Nadagouda, and T. M. Aminabhavi,
“Pervaporation Separation of Water - Ethanol Mixtures Using Organic -
Inorganic Nanocomposite Membranes,” Journal of Physical Chemistry C,
vol. 115, no. 1, pp. 14731–14744, 2011.

197
[11] P. Winberg, M. Eldrup, and F. H. J. Maurer, “Nanoscopic properties of silica
filled polydimethylsiloxane by means of positron annihilation lifetime
spectroscopy,” Polymer, vol. 45, no. 24, pp. 8253–8264, 2004.
[12] D. J. Shaw, Introduction to Colloid and Surface Chemistry: 4th Edition.
Butterworth - Heinemann, 1992.
[13] L. Cot, J. Durand, C. Guizard, N. Hovnanian, and A. Julbe, “Inorganic
membranes and solid state sciences,” Solid State Sciences, vol. 2, no. 3, pp.
313 – 334, 2000.
[14] S. Bhat, B. Naidu, G. Shanbhag, S. Halligudi, M. Sairam, and T.
Aminabhavi, “Mesoporous molecular sieve (MCM-41)-filled sodium
alginate hybrid nanocomposite membranes for pervaporation separation of
water – isopropanol mixtures,” Separation and Purification Technology, vol.
49, no. 1, pp. 56–63, Apr. 2006.
[15] S. Kim and E. Marand, “High permeability nano-composite membranes
based on mesoporous MCM-41 nanoparticles in a polysulfone matrix,”
Microporous and Mesoporous Materials, vol. 114, no. 1–3, pp. 129–136,
Sep. 2008.
[16] B. D. Reid, F. A. Ruiz-trevino, I. H. Musselman, K. J. Balkus, and J. P.
Ferraris, “Gas Permeability Properties of Polysulfone Membranes
Containing the Mesoporous Molecular Sieve MCM-41,” Chemistry of
Materials, vol. 13, no. 7, pp. 2366–2373, 2001.
[17] D. A. Keane, J. P. Hanrahan, M. P. Copley, J. D. Holmes, and M. A. Morris,
“A modified Stöber process for the production of mesoporous Sub 2 micron
silica microspheres; applications in HPLC,” Journal of Porous Materials,
vol. 17, no. 2, pp. 145–152, Mar. 2009.
[18] A. M. Burke, J. P. Hanrahan, D. A. Healy, J. R. Sodeau, J. D. Holmes, and
M. A. Morris, “Large pore bi-functionalised mesoporous silica for metal ion
pollution treatment.,” Journal of Hazardous Materials, vol. 164, no. 1, pp.
229–34, May 2009.
[19] M. Patil, R. Veerapur, S. Patil, C. Madhusoodana, and T. Aminabhavi,
“Preparation and characterization of filled matrix membranes of sodium
alginate incorporated with aluminum-containing mesoporous silica for
pervaporation dehydration of alcohols,” Separation and Purification
Technology, vol. 54, no. 1, pp. 34–43, Mar. 2007.
[20] R. Russo, M. Malinconico, L. Petti, and G. Romano, “Physical behavior of
biodegradable alginate-poly(vinyl alcohol) blend films,” Journal of Polymer
Science Part B: Polymer Physics, vol. 43, no. 10, pp. 1205–1213, May 2005.
[21] T. Uragami, K. Okazaki, H. Matsugi, and T. Miyata, “Structure and
Permeation Characteristics of an Aqueous Ethanol Solution of Organic-

198
Inorganic Hybrid Membranes Composed of Poly ( vinyl alcohol ) and
Tetraethoxysilane,” Macromolecules, vol. 35, no. 1, pp. 9156–9163, 2002.
[22] Z. Huang, Y. Shi, R. Wen, Y. Guo, J. Su, and T. Matsuura, “Multilayer
poly(vinyl alcohol)–zeolite 4A composite membranes for ethanol
dehydration by means of pervaporation,” Separation and Purification
Technology, vol. 51, no. 2, pp. 126–136, Sep. 2006.
[23] A. Svang-Ariyaskul, R. Y. M. Huang, P. L. Douglas, R. Pal, X. Feng, P.
Chen, and L. Liu, “Blended chitosan and polyvinyl alcohol membranes for
the pervaporation dehydration of isopropanol,” Journal of Membrane
Science, vol. 280, no. 1–2, pp. 815–823, Sep. 2006.
[24] A. S. E Otsuka, “Swelling Properties of Physically Cross-linked PVA Gels
Prepared by a Cast-drying Method,” Progress in Colloid and Polymer
Science, vol. 136, no. 2, pp. 121–126, 2009.
[25] R. Y. M. Huang and C. K. Yeom, “Pervaporation separation of aqueous
mixtures using crosslinked poly(vinyl alcohol)(pva). II. Permeation of
ethanol-water mixtures,” Journal of Membrane Science, vol. 51, no. 3, pp.
273–292, 1990.
[26] W. Kaminski, J. Marszalek, and A. Ciolkowska, “Renewable energy
source—Dehydrated ethanol,” Chemical Engineering Journal, vol. 135, no.
1–2, pp. 95–102, Jan. 2008.
[27] D. A. Keane, E. J. Flynn, and M. A. Morris, “Report Series No . 50
Preparation of Polymer-Based Membranes for Dehydration of Ethanol by
Pervaporation,” 2010.
[28] E. J. Flynn, D. Keane, J. D. Holmes, and M. A. Morris, “Unusual trend of
increasing selectivity and decreasing flux with decreasing thickness in
pervaporation separation of ethanol/water mixtures using sodium alginate
blend membranes.,” Journal of Colloid and Interface Science, vol. 370, no.
1, pp. 176–82, Mar. 2012.
[29] K. J. M. Bishop, C. E. Wilmer, S. Soh, and B. a Grzybowski, “Nanoscale
forces and their uses in self-assembly,” Small (Weinheim an der Bergstrasse,
Germany), vol. 5, no. 14, pp. 1600–30, Jul. 2009.
[30] P. Somasundaran, S. C. Mehta, X. Yu, and S. Krishnakumar, “Colloid
Systems and Interfaces Stability and Surfactant Adsorption,” in Handbook of
Surface and colloid Chemistry, 2009, pp. 155 – 196.
[31] M. Kobayashi, F. Juillerat, P. Galletto, P. Bowen, and M. Borkovec,
“Aggregation and charging of colloidal silica particles: effect of particle
size.,” Langmuir : the ACS journal of surfaces and colloids, vol. 21, no. 13,
pp. 5761–9, Jun. 2005.

199
[32] L. Guyard, J. Persello, J. Boisvert, and B. Cabane, “Relationship Between
the Polymer / Silica Interaction and Properties of Silica Composite
Materials,” Journal of Polymer Science Part B: Polymer Physics, vol. 44, pp.
1134–1146, 2006.
[33] J. Li, J. Suo, and R. Deng, “Structure, Mechanical, and Swelling Behaviors
of Poly(vinyl alcohol)/SiO2 Hybrid Membranes,” Journal of Reinforced
Plastics and Composites, vol. 29, no. 4, pp. 618–629, Mar. 2009.
[34] P. D. Chapman, T. Oliveira, A. G. Livingston, and K. Li, “Membranes for
the dehydration of solvents by pervaporation,” Journal of Membrane
Science, vol. 318, no. 1–2, pp. 5–37, Jun. 2008.
[35] S. G. Adoor, L. S. Manjeshwar, S. D. Bhat, and T. M. Aminabhavi,
“Aluminum-rich zeolite beta incorporated sodium alginate mixed matrix
membranes for pervaporation dehydration and esterification of ethanol and
acetic acid,” Journal of Membrane Science, vol. 318, no. 1–2, pp. 233–246,
Jun. 2008.
[36] S. D. Bhat and T. M. Aminabhavi, “Novel sodium alginate composite
membranes incorporated with SBA-15 molecular sieves for the
pervaporation dehydration of aqueous mixtures of isopropanol and 1,4-
dioxane at 30°C,” Microporous and Mesoporous Materials, vol. 91, no. 1–3,
pp. 206–214, Apr. 2006.
[37] V. T. Magalad, G. S. Gokavi, C. Ranganathaiah, M. H. Burshe, C. Han, D.
D. Dionysiou, M. N. Nadagouda, and T. M. Aminabhavi, “Polymeric blend
nanocomposite membranes for ethanol dehydration—effect of morphology
and membrane–solvent interactions,” Journal of Membrane Science, vol.
430, no. 1, pp. 321–329, Mar. 2013.
[38] Y. Ma, J. Wang, and T. Tsuru, “Pervaporation of water/ethanol mixtures
through microporous silica membranes,” Separation and Purification
Technology, vol. 66, no. 3, pp. 479–485, May 2009.
[39] J. Persello, J. Boisvert, A. Guyard, and B. Cabane, “Structure of Nanometric
Silica Clusters in Polymeric Composite Materials,” J. Phys. Chem. B, vol.
108, no. 10, pp. 9678–9684, 2004.
[40] R. F. Grossman, The Mixing of Rubber. Chapman and Hall, 1997.
[41] A. F. M. Barton, CRC Handbook of Polymer-Liquid Interaction Parameters
and Solubility Parameters. CRC Press, 1990.
[42] A. A. Zaman, “Effect of polyethylene oxide on the viscosity of dispersions
of charged silica particles: interplay between rheology, adsorption, and
surface charge,” Colloid & Polymer Science, vol. 278, no. 12, pp. 1187–
1197, Dec. 2000.

200
[43] S. K. Pattanayek and V. a. Juvekar, “Prediction of Adsorption of Nonionic
Polymers from Aqueous Solutions to Solid Surfaces,” Macromolecules, vol.
35, no. 25, pp. 9574–9585, Dec. 2002.
[44] M. Smit, H. V. Mulder, C. A. Smolders, H. Karrenbeld, J. Van Eerden, and
D. Feil, “Modelling of the diffusion of carbon dioxide in polyimide matrices
by computer simulation,” Journal of Membrane Science, vol. 73, no. 2, pp.
247–257, 1992.
[45] Z. Huang, H. Guan, W. Tan, X. Qiao, and S. Kulprathipanja, “Pervaporation
study of aqueous ethanol solution through zeolite-incorporated multilayer
poly(vinyl alcohol) membranes: Effect of zeolites,” Journal of Membrane
Science, vol. 276, no. 1–2, pp. 260–271, May 2006.
[46] P. Shao and R. Huang, “Polymeric membrane pervaporation,” Journal of
Membrane Science, vol. 287, no. 2, pp. 162–179, Jan. 2007.
[47] R. A. Farrell, K. Cherkaoui, N. Petkov, H. Amenitsch, J. D. Holmes, P. K.
Hurley, and M. A. Morris, “Physical and electrical properties of low
dielectric constant self-assembled mesoporous silica thin films,”
Microelectronics Reliability, vol. 47, no. 4–5, pp. 759–763, Apr. 2007.
[48] A. Jonquières, D. Roizard, J. Cuny, and P. Lochon, “Solubility and polarity
parameters for assessing pervaporation and sorption properties. A critical
comparison for ternary systems alcohol/ether/polyurethaneimide,” Journal of
Membrane Science, vol. 121, no. 1, pp. 117–133, 1996.

201
Chapter 8
Closing Remarks &
Future Work

202
8 Closing Remarks & Future Work
Addressing pervaporation membranes first; this work has shown that sodium
alginate is among the best, if not the best material for production of pervaporation
membranes, possessing an unrivalled combination high flux and high selectivity. It
is however, physically/mechanically unsuitable. As such it must be blended with a
more physically durable polymer, such as poly(vinyl alcohol), and a plasticizing
agent – glycerol. The results of the work in chapter 3 show that the optimum
combination of these is a 4:1 mass ratio of sodium alginate to poly(vinyl alcohol)
plus glycerol.
It was also established in chapter 3 that the use of a support is essential to
produce a high flux membrane. The necessary thickness of an unsupported
membrane is so great that it reduces diffusion time to an unfeasible degree,
resulting in poor flux. Producing an unsupported membrane of a thickness similar
to that of the selective layers of supported membranes is also unfeasible as the
membrane thickness renders it physically fallible. Furthermore, the use of a support
reduces the chance of catastrophic membrane failure when utilizing highly
hydrophilic polymers such as sodium alginate. These polymers tend to swell to
such a degree that they can break up within the pervaporation membrane cell if
unsupported. While flexibility tests show that unsupported membranes are slightly
more flexible than their supported equivalents; this slight increase in durability does
not justify their use when one considers their inferior performance in all other
aspects. All of these facts lead to the conclusion that pervaporation membranes
must be supported at the industrial scale.
Chapter 5 took the optimum membrane described in chapter 3 and attempted to
show how the effect of relaxation can be minimized by making the membrane
selective layer thinner (down to a minimum, beyond which the effect is absent).
This had the unanticipated benefit of increasing membrane selectivity without
reducing flux; an effect which was due to changes in the density and thickness of
the membrane skin layers. This was due to the rate at which solvent evaporated
from the cast polymer solution during drying: Polymer density increases at the air
exposed surface with increased rate of evaporation. This rate was increased by
increasing the surface area to volume ratio of the membrane, i.e. reducing

203
membrane thickness. Understanding of skin layers has proven to be central to
understanding the formation mechanics of both membrane types throughout the
work. Chapter 5 and the work published from it represent our biggest cognitive leap
in that understanding.
Chapter 7 deals with the incorporation of filler particles into a polymer
membrane matrix to produce a mixed matrix membrane. In this instance the filler
particles in question were mesoporous silica particles. A pristine poly(vinyl
alcohol) membrane was used as it offered the most physically durable membrane
type. The aim of the work was to assess the effect of the particles on pervaporation
performance of the membrane, not to produce the best possible performing
membrane. Results showed conclusively that the incorporation of engineered
mesoporous silica particles into the poly(vinyl alcohol) membrane matrix conferred
greater selectivity upon the membrane without sacrificing flux. This was due to the
discreet and highly monodisperse nature of the silica particles. Particle discretion
was only possible below 15 wt% loadings however. The nature of the particles does
allow for a greater degree of reproducibility in the mixed matrix membranes
produced from them, than previously seen due to how they increase membrane free
volume.
Moving on to the other type of membrane studied: Chapter 4 established basic
requirements for producing lateral-flow membranes; skin layer formation needs to
be controlled and lacquers must be brought to near cloud-point before casting.
While this chapter did not establish absolutely how to control skin-layer formation
in lateral-flow membranes it did determine that their presence inhibits formation of
the membrane pore network in the bulk membrane beneath. Also conclusively
shown was that skin-layers inhibit and retard lateral-flow. It would take the
application of the understanding of skin-layer formation established from the work
in chapter 5 to achieve complete prevention of skin-layer formation.
The need to bring casting lacquers to near cloud-point was established as it not
only reduces skin layer formation (partially, not entirely) but also improves pore
network structure in the bulk membrane. This was due to the fact that having the
casting lacquer near cloud-point renders the phase inversion of the uppermost parts
of the membrane complete in a shorter time-frame, giving less time for skin layers
to form. The formation of the skin layer earlier in the formation process reduces the

204
evaporation rate of solvent from the bulk membrane below it, therefore increasing
the timeframe over which phase inversion occurs in the bulk membrane, thus
allowing more time for nucleation and growth and so a more open pore network.
The conclusion drawn here is that reducing the rate of loss of solvent from the
lacquer would produce a more open pore structure and so a better lateral flow
membrane, but this must be done without a skin layer.
This was achieved in the work of chapter 6 where the “meso-solvent” (ethanol)
was introduced to the lacquer makeup. This had the effect of increasing the affinity
of the polymer lean phase for the polymer rich phase during liquid-liquid demixing
which reduced the rate of solvent evaporation from the casting lacquer, resulting in
greater and more open pore network formation. This reduction in evaporation rate
also inhibited the formation of macrovoids.
While the addition of ethanol on its own did not completely prevent the
formation of skin-layers it did reduce them. Thus, when used in combination with
bringing the lacquer to near cloud-point, as in chapter 4, skin-layer formation was
completely prevented, as seen in membrane MesoDCP. The work of chapter 6
resulted in the production of a lateral flow membrane comparable with the top
industrial equivalents.
Despite the obvious differences between the two membrane types; one
produced from simple drying of polymer solutions (pervaporation), the other from a
complex phase inversion process (lateral-flow); this project has served to highlight
the parallels between the formation mechanics of the two and how these can be
controlled. In particular, control of the formation of skin layers is applicable to both
membrane formations. The principle methods of that control, determined in this
thesis, could be applied to the formation of any other flat sheet polymer membranes
produced from polymer solutions. This opens up many avenues of future membrane
research; porous filtration membranes such as ultrafiltration, microfiltration and
nanofiltration - where the desired isotropic structures are dependent on not forming
skin layers; gas separation, reverse osmosis and ion-exchange membranes; where
an anisotropic nature, such as that seen in pervaporation membranes, is of benefit to
selectivity.

205
In the specific case of the lateral-flow membrane research, the ability to
control pore structure of membranes formed via phase inversion of cast polymer
solutions, through control of the cloud point of the solution and the use of meso-
solvents could be applied to any system in which membranes are formed by phase
inversion. This is the production method of almost all porous polymeric filtration
membranes and so applicable to industrial research.
More specific future work will continue on from some of the results described
here.
Chapter 4 offered a theory on the cause of skin layer formation at the support
interface; that is was due to the greater affinity of the Melinex backing material for
the solvent acetone than for the non-solvent water. In order to confirm that this is
what is occurring future experiments would be conducted using an impermeable,
non-polar support material which would, theoretically, eliminate the skin layers.
This would be a costly – though simple - venture but, since the residue left by
these skin layers on the support material has been cited as a problem industrially, it
may be suitable for further investigation.
While the results of chapter 6 showed how skin layers can be prevented and
pore network structure can be made more open; increasing lateral flow rate, the
resolution of the flow front in such membranes is poor due to the uneven pore size
distribution within the bulk lateral flow membrane. This requires refinement of the
lacquer polymer/solvent/meso-solvent/non-solvent system. However success in this
venture would be of interest to industry and results would be highly publishable
given the dearth of academic information on the subject.
Further work on the protein binding abilities of the porous-lateral flow
membranes is also desirable, as this is the obvious next step beyond refinement of
the pore structures. These results are directly applicable to any research into porous,
flat-sheet, polymeric membranes using polymers other than cellulose nitrate; most
notably poly(methylmethacrylate) lateral-flow membrane research, as the meso-
solvent principle applicable to any phase inversion system.
Given the equipment and expertise available within this research group, future
pervaporation research should focus on two main avenues: Incorporation of novel
filler particles into mixed matrix membranes and production of membranes for

206
other separations, in particular organic-organic separations. Future mixed matrix
membrane research should begin with the incorporation of the silica particles
utilized in chapter 7 into the optimum membrane produced in chapter 5. This is a
highly publishable follow-up to the published work of chapter 7. Moving on from
there, work should focus the use of novel filler particles such as synthetic zeolites
which are more monodisperse than those obtained from natural sources. These have
been produced within the group already which should facilitate the work. An initial
feasibility study should be conducted incorporating the particles into a pristine PVA
matrix as done in chapter 5. This work would be publishable for its novelty alone.
Should it prove to have some significant benefit to performance then a second
publication would be possible by incorporating the same particles into a high
performance membrane matrix such as that refined in chapter 5. Different types of
separations could be achieved through the use of novel polymers. Of particular
interest would be the use of bio-polymers; polysaccharides from various natural
sources.
Pervaporation research worldwide, due to the method’s versatility, is moving
in the direction of solvent reclamation; in particular, difficult organic-organic
solvent separation through the use of polyamides in the membrane selective layer.
The use of filler particles in organic-organic pervaporation separations is an area of
great interest and functionalized silica could prove very effective. The laboratory is
already set up to conduct such research without the need for new equipment.

207
Appendices

208
A. Chapter 3 Supporting Information
NOTE I: All average figures shown for pervaporation performance data below are
calculated excluding data from the first hour of testing as the membrane has not
reached equilibrium with the feed solution before this time.
NOTE II: The selectivity data for the pristine unsupported PVA membrane in table
A.2 is the earliest pervaporation data obtained in the entire project and was
determined using a different precision setting on the density meter than in later
membrane tests, as such selectivity data is only given to one decimal place.
NOTE III: Data given for membranes that were physically capable of undergoing
the full five hours of testing represents the averages of the data for five tests of each
membrane type.
A.1 Pristine Unsupported Membrane Data
Table A.1: Pervaporation performance of unsupported pristine NaAlg membrane cast from 2 wt% solution of NaAlg in water. Cast at 400 µm thickness
Run (hr)
Mass of Flux
(g)
Flux (g m-2 h-1)
Retent. Density (g cm-3)
Retentate (%) Perm. Density (g cm-3)
Permeate (%) Select.
Water Xi
Ethanol Xj
Water Yi
Ethanol Yj
1 3.337 188.53 0.8187 6.96 93.04 0.9908 94.81 5.19 243.56
2 3.422 193.33 0.8177 6.68 93.32 0.9958 98.39 1.61 853.72
3 1.623 91.69 0.8172 6.55 93.45 0.9913 95.78 4.22 323.78
Average Flux and Selectivity Figures 142.51 588.75
Table A.2: Pervaporation performance of unsupported pristine PVA membrane cast from 10 wt% solution of PVA in water. Cast at 150 µm thickness
Run (hr)
Mass of Flux
(g)
Flux (g m-2 h-1)
Retent. Density (g cm-3)
Retentate (%) Perm. Density (g cm-3)
Permeate (%) Select.
Water Xi
Ethanol Xj
Water Yi
Ethanol Yj
1 5.067 286.3 0.8560 25.00 75.00 0.9667 79 21 11.3
2 9.358 528.7 0.8555 25.00 75.00 0.9315 76 24 9.5
3 7.817 441.6 0.8549 24.00 76.00 0.9358 70 30 7.4
4 8.594 485.5 0.8537 24.00 76.00 0.9625 76 24 10.0
5 8.270 467.2 0.8530 23.00 77.00 0.9540 70 30 7.8
Average Flux and Selectivity Figures
480.75 8.7

209
A.2 Pristine Supported Membrane Data
Table A.3: Pervaporation performance of supported pristine NaAlg membrane cast from 5 wt% solution of NaAlg in water. Cast at 100 µm thickness
Run (hr)
Mass of
Flux (g)
Flux (g m-2 h-1)
Retent. Density (g cm-3)
Retentate (%) Perm. Density (g cm-3)
Permeate (%) Select.
Water Xi
Ethanol Xj
Water Yi
Ethanol Yj
1 53.603 3028.470 0.8523 23.62 76.38 0.9173 51.56 48.44 3.442
2 21.930 1238.980 0.8492 22.34 77.66 0.9700 81.03 18.97 14.848
3 18.811 1062.770 0.8470 21.44 78.56 0.9749 88.22 11.78 27.440
4 17.145 968.644 0.8435 20.02 79.98 0.9818 89.95 10.05 35.756
5 14.760 833.898 0.8406 18.84 81.16 0.9831 90.87 9.13 42.876
Average Flux and Selectivity Figures
1026.073 30.23
Table A.4: Pervaporation performance of supported pristine PVA membrane cast from 10 wt% solution of PVA in water. Cast at 100 µm thickness
Run (hr)
Mass of
Flux (g)
Flux (g m-2 h-1)
Retent. Density (g cm-3)
Retentate (%) Perm. Density (g cm-3)
Permeate (%) Select.
Water Xi
Ethanol Xj
Water Yi
Ethanol Yj
1 25.79 1457.062 0.8540 24.32 75.68 0.9790 87.92 12.08 22.648
2 23.90 1350.282 0.8513 23.24 76.76 0.9780 87.17 12.83 22.441
3 23.54 1329.944 0.8509 23.02 76.98 0.9775 86.82 13.18 22.028
4 23.60 1333.333 0.8507 22.95 77.05 0.9764 85.95 14.05 20.538
5 23.23 1312.429 0.8505 22.87 77.13 0.9761 85.76 14.24 20.311
Average Flux and Selectivity Figures
1331.497 21.330
A.3 Blend Membrane Data
Table A.5: Pervaporation performance of supported pristine PVA membrane cast from 10 wt% solution of PVA in water. Cast at 100 µm thickness
Run (hr)
Mass of
Flux (g)
Flux (g m
-2 h
-1)
Retent. Density (g cm-3)
Retentate (%) Perm. Density (g cm-3)
Permeate (%) Select.
Water Xi
Ethanol Xj
Water Yi
Ethanol Yj
1 45.454 2568.023 0.8530 23.89 76.11 0.9622 75.34 24.66 9.73
2 52.600 2971.751 0.8525 23.68 76.32 0.9656 77.77 22.23 11.28
3 55.382 3128.927 0.8502 22.77 77.23 0.9660 78.06 21.94 12.06
4 52.330 2956.500 0.8486 22.09 77.91 0.9660 78.04 21.96 12.53
5 46.789 2643.446 0.8479 21.83 78.17 0.9546 70.44 29.56 8.53
Average Flux and Selectivity Figures
2925.156 11.1

210
Table A.6: Pervaporation performance of supported 4:1 NaAlg:PVA blend membrane cast from 5 wt% solution of polymer blend in water. Cast at 100 µm thickness
Run (hr)
Mass of
Flux (g)
Flux (g m-2 h-1)
Retent. Density (g cm-3)
Retentate (%) Perm. Density (g cm-3)
Permeate (%) Select.
Water Xi
Ethanol Xj
Water Yi
Ethanol Yj
1 58.475 3303.672 0.8537 2419 75.81 0.9598 73.73 26.27 8.796
2 72.856 4116.158 0.8531 23.95 76.05 0.9515 68.63 31.37 6.940
3 73.738 4165.989 0.8485 22.06 77.94 0.9515 68.63 31.37 7.729
4 70.891 4005.141 0.8483 21.97 78.03 0.9463 65.74 34.26 6.815
5 65.839 3719.718 0.8434 21.07 78.93 0.9434 60.19 39.81 5.664
Average Flux and Selectivity Figures
4001.752 6.787
Table A.7: Pervaporation performance of supported 7:3 NaAlg:PVA blend membrane cast from 5 wt% solution of polymer blend in water. Cast at 100 µm thickness
Run (hr)
Mass of
Flux (g)
Flux (g m-2 h-1)
Retent. Density (g cm-3)
Retentate (%) Perm. Density (g cm-3)
Permeate (%) Select.
Water Xi
Ethanol Xj
Water Yi
Ethanol Yj
1 11.826 668.1356 0.8162 9.34 90.66 0.9851 78.23 21.77 34.881
2 14.372 811.977 0.8138 9.12 90.88 0.9871 82.54 17.46 47.107
3 12.274 693.446 0.8117 8.88 91.12 0.9868 82.35 17.65 47.876
4 10.380 586.441 0.8098 8.69 91.31 0.9847 82.38 17.62 49.126
5 9.900 559.322 0.8080 8.49 91.51 0.9845 82.45 17.55 50.638
Average Flux and Selectivity Figures
662.797 48.687
A.4 Blend Membranes Utilising Glycerol Data
Table A.8: Pervaporation performance of supported 9:1 NaAlg:PVA blend membrane cast from solution of 5 g polymer blend + 5 g glycerol in 90 g water. Cast at 100 µm thickness
Run (hr)
Mass of
Flux (g)
Flux (g m-2 h-1)
Retent. Density (g cm-3)
Retentate (%) Perm. Density (g cm-3)
Permeate (%) Select.
Water Xi
Ethanol Xj
Water Yi
Ethanol Yj
1 10.326 583.390 0.8136 8.38 91.62 0.9858 92.70 7.30 138.836
2 10.277 580.621 0.8112 7.50 92.50 0.9907 95.79 4.21 280.620
3 8.615 486.723 0.8101 7.10 92.90 0.9915 96.27 3.73 337.707
4 6.306 356.441 0.8089 6.66 93.34 0.9903 95.55 4.45 300.929
5 6.913 390.565 0.8076 6.20 93.80 0.9930 97.14 2.86 513.858
Average Flux and Selectivity Figures
343.588 358.279

211
Table A.9: Pervaporation performance of supported 4:1 NaAlg:PVA blend membrane cast from solution of 5 g polymer blend + 5 g glycerol in 90 g water. Cast at 100 µm thickness
Run (hr)
Mass of
Flux (g)
Flux (g m-2 h-1)
Retent. Density (g cm-3)
Retentate (%) Perm. Density (g cm-3)
Permeate (%) Select.
Water Xi
Ethanol Xj
Water Yi
Ethanol Yj
1 19.728 1114.576 0.8159 9.23 90.77 0.9750 84.88 15.12 55.207
2 18.667 1054.632 0.8130 8.15 91.85 0.9786 87.62 12.38 79.850
3 15.374 868.588 0.8104 7.21 92.79 0.9767 86.19 13.81 80.321
4 13.000 734.463 0.8082 6.41 93.59 0.9734 83.64 16.36 74.645
5 12.668 715.706 0.8072 6.04 93.96 0.9760 85.65 14.35 92.850
Average Flux and Selectivity Figures
843.347 81.919
A.5 Flexibility Data
Table A.10: Results of flexibility tests (method outlined in chapter 2, section 2.3.2)
Membrane
Selective layer (µm) (approx.) Support
PAN layer (µm) (approx.)
Cylinder radius (mm) Cast Dry Cast Dry
PVA 400 35 No - - 2.0 PVA 150 13 Yes 150 100 3.5
NaAlg 400 25 No - - 6.5 NaAlg 150 9 Yes 150 100 42.0
7:3 150 12 Yes 150 100 4.0 4:1 150 12 Yes 150 100 12.5 9:1 150 10 Yes 150 100 31.5
4:1 + Gly 150 12 Yes 150 100 9.5 9:1 + Gly 150 12 Yes 150 100 22.0
A.6 Absorption Data
Table A.11: Absorption data in solution of 50 wt% water/50 wt% ethanol for supported polymer blend membranes (designated by PVA:NaAlg ratio). Points at which mass data end represent points at which membranes dissolve
Time Absorbing
(s)
Membrane
7:3 4:1 9:1
Mem. Mass
(g)
Mem. Mass (%)
Mem. Mass
(g)
Mem. Mass (%)
Mem. Mass
(g)
Mem. Mass (%)
0 0.155 100 0.160 100 0.158 100
10 0.221 143 0.232 145 0.230 146
20 0.315 203 0.307 192 0.321 203
30 0.398 257 0.405 253 0.412 261
40 0.451 291 0.481 301 0.499 316
50 - - - - - - 60 - - - - - -

212
B. Chapter 4 Supporting Information
B.1 SEM
Figure B.1: SEM images of a lateral flow membrane after treatment with surfactant SDBS at 100 µm (image A) and 50 µm (image B)
Figure B.2: SEM images of Melinex 100 % polyester backing material; surface in contact with membrane (image A) and cross section (image B)

213
Figure B.3: SEM images of of Millipore HiFlow 120 lateral flow membrane; air surface (image A), blet surface (image B) and cross section (image C)

214
Figure B.4: SEM images of CN raw material at 200 µm (A), 100 µm (B), 50 µm (C) and 20 µm (D).
Figure B.5: Skin formation at membrane support interface

215
Figure B.6: SEM images of linear pore patterns at membrane support interface: Image A shows patterns in a membrane brought to cloud point with only acetone and water in the solvent mix. Image B shows patterns in a membrane cast from the same lacquer but not brought to cloud point
B.2 Flexibility Testing
Table B.1: Flexibility testing data of lateral flow membranes including industrial standard
Membrane
Selective layer (µm) (approx.)
Solvent Ratio Acetone(wt%):Water(wt%)
Cylinder radius (mm) Cast Dry
BasMemA 565 20 100:0 2.5 BasMemB 565 30 95:5 3.0 BasMemC 565 20 90:10 3.0 BasMemD 565 80 85:15 3.5
BasMemACP - - 100:0 - BasMemBCP 565 20 95:5 3.5 BasMemCCP 565 40 90:10 5.0 BasMemDCP 565 100 85:15 10.0
HiFlow120 - 135 - 3.5

216
B.3 XRD
Figure B.7: XRD profile of BasMemD
B.4 AFM
Atomic force microscopy images were taken of the PET (Melinex) surfaces. Both 2
mm and 4 mm thick Melinex were scanned. 31 scans were taken on the 2 mm thick
film surface and 25 scans of the 4 mm thick film were taken surface. The areas that
were examined were taken at random across the films. The films were cut into ~1.5
cm x ~1.5 cm samples mounted on silicon wafer to prevent films from bending;
disrupting measurement. Measurements of 10 x 10 μm were taken for the AFM
images.
0
500
1000
1500
2000
2500
3000
3500
4000
0 10 20 30 40 50 60 70 80
BasMemB
2θ angle (degrees)
Inte
nsi
ty (
cou
nts
per
se
con
d)

217
B.4.1 2 mm Melinex
Figure B.8: AFM images of topography of three randomly chosen 10x10 μm sections of 2 mm thick Melinex film
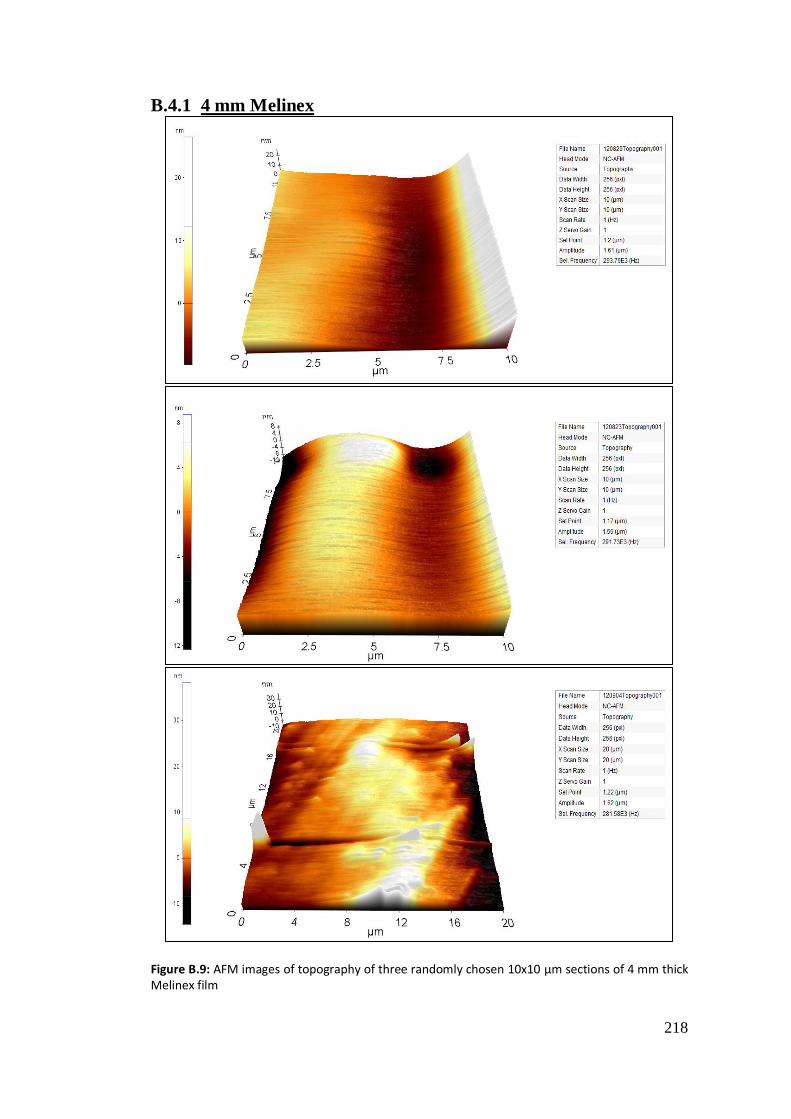
218
B.4.1 4 mm Melinex
Figure B.9: AFM images of topography of three randomly chosen 10x10 μm sections of 4 mm thick Melinex film

219
B.5 Contact Angle Measurements
Melinex film of 2 mm and 4 mm thickness were analysed to find their
hydrophobicity. Samples were ~2.5 cm2. Droplet size was 10 μl. Each film sample
was analysed with three drops. Results are as follows:
Table B.2: Contact angle data
2 mm Melinex 4 mm Melinex
Left Angle of Droplet (degrees)
Right Angle of Droplet (degrees)
Left Angle of Droplet (degrees)
Right Angle of Droplet (degrees)
Water contact angle test
Sample A
90.9 89.9 86.7 85.0
86.1 87.5 74.7 76.0
83.3 85.5 79.4 80.3
Sample B
76.3 77.8 80.3 79.3
73.3 74.4 79.4 78.3
61.6 63.2 84.0 85.6
Sample C
77.3 80.2 79.7 89.3
71.3 76.7 83.1 80.6
80.3 79.5 81.0 81.0
Acetone contact angle test
<15.0 <15.0 <15.0 <15.0
Acetone drop measurements were taken but were found to be under 15 which
cannot be measured by equipment goniometer. Images of samples shown below for
comparison:

220
Figure B.10: Typical contact angle of water droplet on Melinex surface (specific image: 4 mm Melinex sample B)
Figure B.11: Typical contact angle of acetone droplet on Melinex surface (specific image: 4 mm Melinex)

221
C. Chapter 5 Supporting Information
C.1 Membrane Selective Layer Data
Table C.1: Summary of SEM quantification and observations (P = partial, WD = well developed; describe nature of the skin layer at surface)
Film cast thickness (µm)
400 150 100 80 60 50 40 24
Apparent thickness (µm, +/- 0.5 µm)
5.86 5.41 4.57 4.47 3.4 2.92 3.53 4.97
Cast/apparent thickness ratio 68.3 28.1 21.9 17.9 17.6 17.1 11.3 4.8
Surface skin appearance P P P WD WD P WD WD
Surface skin thickness (µm, +/- 0.05µm)
0.41 0.37 0.31 0.32 0.29 0.25 0.275 0.485
Table C.2: Thickness and flexibility data
Selective layer Thickness (µm) (approx.)
Cylinder radius (mm)
Cast Dry
9:1 Gly 400 5.86 8.0
9:1 Gly 150 5.41 9.5
9:1 Gly 100 4.57 9.5
9:1 Gly 80 4.47 9.5
9:1 Gly 60 3.4 10.0
9:1 Gly 50 2.92 10.5
9:1 Gly 40 3.53 11.0
9:1 Gly 24 4.97 12.0

222
C.2 Pervaporation Data:
Table C.3: Flux, selectivity and permeate water content figures for NaAlg based membranes at 60 oC operating temperature and 90 wt% ethanol feed solution
Mem. (µm)
Time (hrs)
Flux (g cm-1h-1)
Selectivity Mass % water
400 1 668.1356 115.218 89.87
2 811.977 156.880 90.97
3 693.446 168.744 91.77
4 588.441 115.186 91.97
150 1 381.864 192.111 95.00
2 502.09 330.894 96.74
3 452.034 465.549 97.43
4 371.243 488.389 97.44
100 1 383.898 281.083 96.27
2 281.808 375.163 96.97
3 348.079 624.077 98.00
4 282.26 692.437 98.05
5 341.265 753.657 98.05
80 1 716.271 14.803 59.09
2 600.904 357.187 97.03
3 539.605 457.842 97.49
4 459.100 598.117 97.84
5 406.836 784.138 98.16
60 1 984.350 260.615 96.33
2 1058.588 515.104 97.94
3 827.401 673.747 98.22 4 722.090 810.843 98.33
5 611.864 928.333 98.38
50 1 348.192 403.201 97.66 2 493.842 605.682 98.33
3 441.638 371.356 97.14
4 351.525 933.706 98.22
5 387.514 995.057 98.60
40 1 603.955 191.537 94.62
2 812.316 586.372 97.94
3 667.91 796.101 98.27
4 553.399 1157.592 98.66
5 472.26 1305.153 98.66
24 1 379.492 200.31 94.50
2 491.695 770.03 98.38
3 437.288 963.765 98.60
4 401.073 1016.014 98.55
5 348.757 1023.000 98.44

223
D. Chapter 6 Supporting Information
D.1 XRD
Figure D.1: XRD profiles of MesoDCP and BasMemBCP
D.2 Flow Rate Data
Table D.1: Lateral flow rates and ethanol content
Membrane EtOH Content (wt%)
Lateral Flow (cm2
s-1)
BasMemBCP 0 0
MesoACP 15.902 0
MesoBCP 18.878 0.016
MesoCCP 21.872 0.028
MesoDCP 24.540 0.051
MesoECP 29.043 0.028
0
500
1000
1500
2000
2500
3000
0 20 40 60 80
Inte
nsi
ty (
cou
nts
per
sec
on
d)
MesoDCP BasMemBCP

224
D.3 SEM
Figure D.2: SEM images of a lateral flow membrane after treatment with surfactant SDBS at 100 µm (image A) and 50 µm (image B)
D.4 Flexibility
Table D.2: Flexibility testing data of lateral flow membranes
Membrane EtOH Content
(wt%) Cylinder radius (mm)
BasMemBCP 0 3.5
MesoACP 15.902 5.0
MesoBCP 18.878 5.0
MesoCCP 21.872 5.5
MesoDCP 24.540 6.0
MesoECP 29.043 7.0

225
E. Chapter 7 Supporting Information
E.1 Absorption Data
Table E.1: Absorption data in solution of 50 wt% water/50 wt% ethanol for MMMs. Tabulated data of figure 7.4 (see chapter 7). Points at which mass data end represent points at which membranes dissolve
Time Absorbing
(s)
Membrane (expressed as wt% particle loading)
0wt% 5wt% 10wt% 15wt%
Mem. Mass
(g)
Mem. Mass (%)
Mem. Mass
(g)
Mem. Mass (%)
Mem. Mass
(g)
Mem. Mass (%)
Mem. Mass
(g)
Mem. Mass (%)
0 0.153 100 0.141 100 0.163 100 0.156 100
10 0.203 133 0.210 149 0.240 147 0.217 139
20 0.264 173 0.278 197 0.323 198 0.280 179
30 0.321 210 0.333 236 0.405 248 0.353 226 40 0.393 257 0.400 284 0.478 293 0.428 274
50 - - 0.461 327 0.554 340 0.504 323
60 - - - - 0.620 380 0.577 370
70 - - - - 0.676 415 0.623 399
80 - - - - - - - -
E.2 Flexibility Data
Table E.2: Results of flexibility tests (method outlined in chapter 2, section 2.3.2)
Membrane
Selective layer (µm) (approx.)
PAN layer (µm) (approx.)
Cylinder radius (mm)
Cast Dry Cast Dry
0 wt% 150 ~12 150 100 9.5 5 wt% 150 ~14 150 100 11.5
10 wt% 150 ~16 150 100 14.0 15 wt% 150 ~16 150 100 20.0