Investigating Pervaporation as a Process Method for ... - MDPI
14
C 2020, 6, 42; doi:10.3390/c6020042 www.mdpi.com/journal/carbon Supplementary Materials Investigating Pervaporation as a Process Method for Concentrating Formic Acid Produced from Carbon Dioxide Section S1. Pervaporation equipment and experimental data Figure S1. Experimental FA-H2O pervaporation test system arrangement. Figure S2. Experimental pervaporation cell configuration schematic - side view.
-
Upload
khangminh22 -
Category
Documents
-
view
1 -
download
0
Transcript of Investigating Pervaporation as a Process Method for ... - MDPI

C 2020, 6, 42; doi:10.3390/c6020042 www.mdpi.com/journal/carbon
Supplementary Materials
Investigating Pervaporation as a Process Method for Concentrating Formic Acid Produced from Carbon Dioxide
Section S1. Pervaporation equipment and experimental data
Figure S1. Experimental FA-H2O pervaporation test system arrangement.
Figure S2. Experimental pervaporation cell configuration schematic - side view.

C 2020, 6, 42 2 of 14
Figure S3. The 25 cm2 pervaporation cell assembled outside view shown in (a). The pervaporation
cell internal view is shown in (b), showing one of the membranes (Targray) being positioned in the
cell for testing.
.
Figure S4. Photos of the various microporous and ion exchange membranes tabulated in Table 1.
The membranes are: (a) Targray SD425101, (b) Nafion® N324, (c) Lydall Solupor® 4PO4A, (d)
Sustainion® 37-50 anion exchange membrane, and (e) Sustainion® 37-50 T ePTFE reinforced anion
exchange membrane.
C 2020, 6, 42 www.mdpi.com/journal/carbon
Membrane Temp Collection
Time
Feed
Composition
(wt%)
Permeate
Composition
(wt%)
Permeability
Separation
Factor
Total
Permeate
Collected
Permeate
Composition
Collected
Permeation Flux or Rate of Water
and FA through Membrane
H2O/FA
Flux Ratio
°C h H2O (A) FA (B) H2O (A) FA (B) αab A/B* g H2O (g) FA
(g) kg/m2ˑh kg/m2ˑh
Nafion® 324 22 24.00 90.78 9.22 96.36 3.64 2.69 14.91 14.37 0.54 H2O 0.239 FA 0.009 26.5
Nafion® 324 40 24.00 90.77 9.23 96.74 3.26 3.02 28.71 27.77 0.94 H2O 0.463 FA 0.016 29.7
Nafion® 324 60 24.00 88.31 11.69 96.9 3.10 4.14 44.51 43.13 1.38 H2O 0.719 FA 0.023 31.3
Nafion® 324 60 3.25 79.85 20.15 91.75 8.25 2.81 5.10 4.68 0.42 H2O 0.576 FA 0.052 11.1
Nafion® 324 60 2.17 70.02 29.98 86.42 13.58 2.72 3.55 3.07 0.48 H2O 0.566 FA 0.089 6.4
Nafion® 324 60 3.83 59.85 40.15 79.39 20.61 2.58 6.98 5.54 1.44 H2O 0.579 FA 0.150 3.9
Nafion® 324 60 3.33 40.6 59.4 65.44 34.56 2.77 3.51 2.30 1.21 H2O 0.276 FA 0.146 1.9
Targray SD425101 22 24.00 89.07 10.93 95.86 4.14 2.84 13.45 12.89 0.56 H2O 0.215 FA 0.009 23.2
Targray SD425101 40 24.00 89.73 10.27 96.14 3.86 2.85 50.02 48.09 1.93 H2O 0.801 FA 0.032 24.9
Targray SD425101 60 5.00 89.9 10.10 95.49 4.51 2.38 7.22 6.89 0.33 H2O 0.552 FA 0.026 21.2
Targray SD425101 60 5.00 80.22 19.78 93.62 6.38 3.62 8.50 7.96 0.54 H2O 0.637 FA 0.043 14.7
Targray SD425101 60 5.00 65.2 34.8 83.98 16.02 2.80 8.50 7.14 1.36 H2O 0.571 FA 0.109 5.2
Targray SD425101 60 3.00 39.9 60.1 54.88 45.12 1.83 5.45 2.99 2.46 H2O 0.399 FA 0.328 1.2
Sustainion® 37-50 T
ePTFE Reinforced 60 3.00 79.95 20.05 85.78 14.22 1.51 10.10 8.66 1.44 H2O 1.155 FA 0.191 6.0
Sustainion® 37-50 T
ePTFE Reinforced 60 1.83 39.9 60.10 57.9 42.10 2.07 4.90 2.84 2.06 H2O 0.620 FA 0.451 1.4
Lydall 4PO4A 60 1.25 79.95 20.05 90.3 9.70 2.33 1.30 1.17 0.13 H2O 0.376 FA 0.040 9.3
Sustainion® 37-50 60 3.00 79.95 20.05 89.92 10.08 2.24 5.70 5.13 0.57 H2O 0.683 FA 0.077 8.9
Sustainion® 37-50 60 3.50 90.06 9.94 93.37 6.63 1.55 6.98 6.52 0.46 H2O 0.745 FA 0.053 14.1
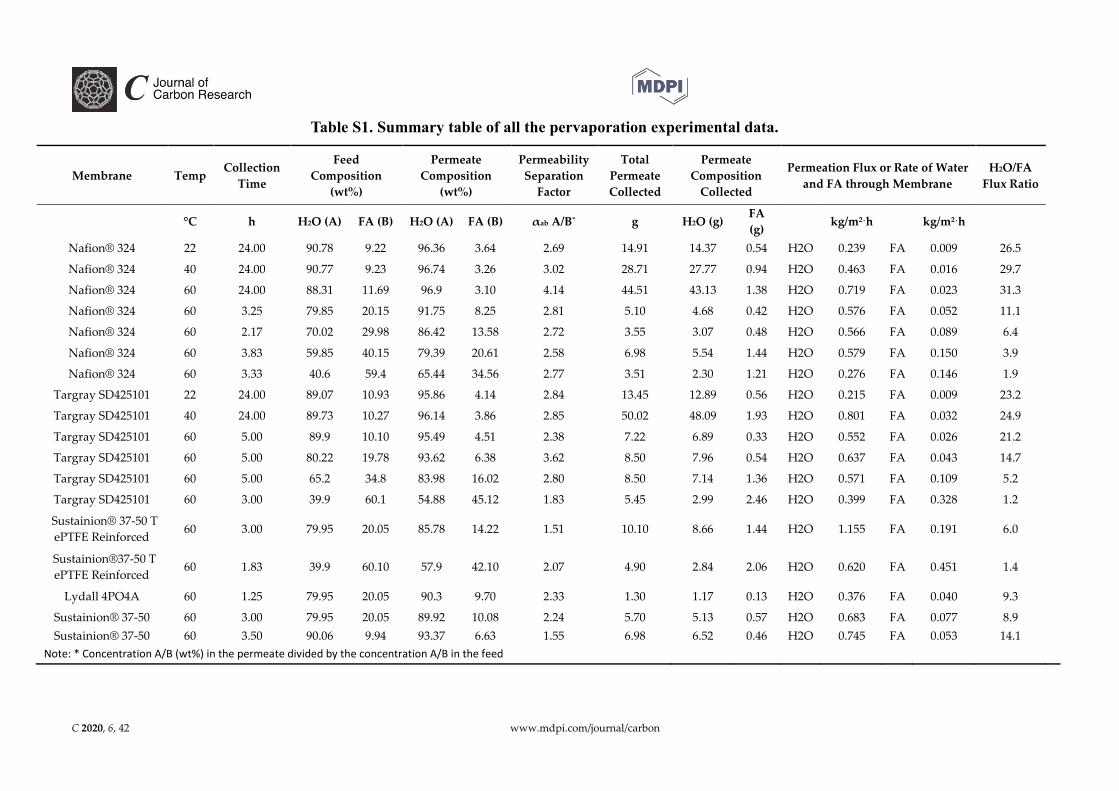
Note: * Concentration A/B (wt%) in the permeate divided by the concentration A/B in the feed
Table S1. Summary table of all the pervaporation experimental data.

C 2020, 6, 42 www.mdpi.com/journal/carbon
Table S2. Batch permeation calculation for a starting 1 tonne 10 wt% FA feed solution using a 100 m2
Targray membrane area pervaporation cell module, and operation for a 9.5 hour period at a
temperature of about 40°C to produce a 32.1 wt% FA product concentration.
Constant Flux
Rate kg/m2.h
Time
Increment
in h
Feed Mass in kg
Feed
Composition
FA wt%
Permeate
Mass Change
in kg per time
interval
Cumulative
Permeate
Mass in kg
Permeate
Composition
FA wt%
FA H2O FA H2O FA H2O FA H2O
0.026 0.78 0.0 100.0 900 10.0 0.00 0.0 0.0 0 3.23
0.5 98.7 861.0 10.3 1.30 39.0 1.3 39.0 3.23
Membrane Area 1.0 97.4 822.0 10.6 1.30 39.0 2.6 78.0 3.23
100 m2 1.5 96.1 783.0 10.9 1.30 39.0 3.9 117.0 3.23
2.0 94.8 744.0 11.3 1.30 39.0 5.2 156.0 3.23
Temp: 40°C 2.5 93.5 705.0 11.7 1.30 39.0 6.5 195.0 3.23
3.0 92.2 666.0 12.2 1.30 39.0 7.8 234.0 3.23
3.5 90.9 627.0 12.7 1.30 39.0 9.1 273.0 3.23
4.0 89.6 588.0 13.2 1.30 39.0 10.4 312.0 3.23
4.5 88.3 549.0 13.9 1.30 39.0 11.7 351.0 3.23
5.0 87.0 510.0 14.6 1.30 39.0 13.0 390.0 3.23
5.5 85.7 471.0 15.4 1.30 39.0 14.3 429.0 3.23
6.0 84.4 432.0 16.3 1.30 39.0 15.6 468.0 3.23
6.5 83.1 393.0 17.5 1.30 39.0 16.9 507.0 3.23
7.0 81.8 354.0 18.8 1.30 39.0 18.2 546.0 3.23
7.5 80.5 315.0 20.4 1.30 39.0 19.5 585.0 3.23
8.0 79.2 276.0 22.3 1.30 39.0 20.8 624.0 3.23
8.5 77.9 237.0 24.7 1.30 39.0 22.1 663.0 3.23
9.0 76.6 198.0 27.9 1.30 39.0 23.4 702.0 3.23
9.5 75.3 159.0 32.1 1.30 39.0 24.7 741.0 3.23

C 2020, 6, 42 2 of 14
Figure S5. Theoretical calculated concentration change in the FA feed solution and permeate in a
batch permeation run starting with a 10 wt% FA feed solution. Assumptions were for a 100 m2
permeation membrane area stack, operation for a 9.5 hour period at a temperature of about 40°C, and
constant permeation mass flux rates of water and FA of 0.78 kg/m2ˑh and 0.028 kg/m2ˑh respectively.
Section S2. Azeotropic distillation and CHEMCAD 6.01 azeotropic distillation simulation runs
S2.1 Azeotropic distillation and CHEMCAD 6.01 azeotropic distillation simulation runs
Formic acid -water solutions have a temperature- maximum azeotropic composition with a
composition of 77.5 wt% formic acid (0.56 mole fraction FA) with a boiling point of 107.3°C at
101.325 kPa (1 atm) absolute pressure. Formic acid-water solutions also have a pressure-minimum
azeotropic composition of 54.6 wt% FA (0.32 mole fraction FA) at an absolute pressure of 2.75 kPA
(0.0271 atm).
Figure S6 shows a schematic of one simplified system configuration where the formic acid
product output from the electrochemical reduction of CO2 to formic acid electrolyzer is used as a
feed to an azeotropic pressure distillation unit to produce commercial concentrations of formic acid
of 80% or greater [1-4].
0.0
5.0
10.0
15.0
20.0
25.0
30.0
35.0
0.0 2.0 4.0 6.0 8.0 10.0
Pervaporation Batch Time / hr
Fo
rmic
Ac
id C
on
ce
ntr
ati
on
/ w
t%
Formic Acid Feed wt%
Formic Acid Permeate wt%

C 2020, 6, 42 3 of 14
Figure S6. Conceptual system using the electrochemical FA cell integrated with pervaporation units
and a single high pressure azeotropic distillation unit to produce commercial concentrations of FA.
Table S3. shows the azeotropic formic acid-water composition and boiling points as a function
of pressure tabulated from reference [5]. Some of the issues with operating an azeotropic distillation
at the higher pressures, where the right materials of construction have to be utilized and the impact
of higher formic acid decomposition losses at operating at higher temperatures.
Table S3. Azeotropic formic acid-water composition and boiling point (BP) as a function of
pressure (in bar) from reference [5].
Pressure
bar
BP of Azeotropic Mixture
°C
Formic Acid Content
wt%
0.093 48.6 66.2
0.267 72.3 70.5
1.013 107.6 77.6
2.026 128.7 84
3.140 144 85

C 2020, 6, 42 4 of 14
S2.2 Azeotropic Distillation Simulation Runs Using CHEMCAD 6.01
Azeotropic distillation simulation runs were conducted using a CHEMCAD version 6.01
chemical process simulation software (Chemstations, Inc., Houston, TX). Figures S7 – S9 show the
simulation azeotropic runs conducted at pressures of 110, 220.6, and 330.9 kPa with the feed stream
having an FA concentration of 20 wt% FA and showing the overhead and bottoms final product
concentration results. The simulations used the NRTL model for the thermodynamic data and
internal data sets. Figure S10 shows the simulation at a pressure of 330.9 kPa employing a heat
exchanger on the overhead water product stream to preheat the FA solution feed. A second heat
exchanger on the FA product bottoms was not added in this simulation.
Figure S7. CHEMCAD 6.01 azeotropic distillation simulation modeling of the FA-water system at a
pressure of 110 kPA maximizing the formic acid product concentration and minimizing FA in the
overhead water product. The FA product output stream was 66.9 wt% at these conditions, not
reaching the expected 77.5 wt% at these simulation conditions.
Figure S8. CHEMCAD 6.01 azeotropic distillation simulation modeling of the FA-water system at a
pressure of 220.6 kPA maximizing the formic acid product concentration and minimizing FA in the
overhead water product. The FA product output stream was 80.6 wt% at these conditions.

C 2020, 6, 42 5 of 14
Figure S9. CHEMCAD 6.01 azeotropic distillation simulation modeling of the FA-water system at a
pressure of 330.9 kPA maximizing the formic acid product concentration and minimizing FA in the
overhead water product. The FA product output stream was 85.8 wt% at these conditions.
Figure S10. ChemCad 6.01 azeotropic distillation simulation modeling of the FA-water system at a
pressure of 330.9 kPA maximizing the formic acid product concentration and minimizing FA in the
overhead water product. The modeling had the addition of a heat exchanger to preheat the FA
solution feed from the overhead water product stream.
Table S4. Summary of the Azeotropic distillation simulation column overhead and bottoms FA
and H2O wt% composition.
Column Section Azeotropic Distillation Column Operating Pressure
110 kPA 220.6 kPA 330.9 kPA
FA wt% H2O wt% FA wt% H2O wt% FA wt% H2O wt%
Column Overheads
Composition 0.24 99.76 0.04 99.96 0.16 99.84
Column Bottoms
Composition 66.92 33.08 80.59 19.41 85.75 14.25

C 2020, 6, 42 6 of 14
Section S3. Generated NRTL ChemCad VLE data for formic acid/water at various constant
temperatures
ChemCad was used to generate the formic acid-water Txy equilibrium plots at various constant
temperatures. The data shows how the azeotropic composition shifts to a higher FA concentration
with increasing temperature.
Figures S11 and S12 show the Txy calculated results at a constant temperature of 22°C
Figures S13 and S14 show the Txy calculated results at a constant temperature of 40°C
Figures S15 and S16 show the Txy calculated results at a constant temperature of 60°C
Figures S17 and S18 show the Txy calculated results at a constant temperature of 80°C
Figures S19 and S20 show the Txy calculated results at a constant temperature of 100°C
Figure S11. Formic acid-water Txy vapor equilibrium plot at a constant temperature of 22°C
generated using ChemCad generated NRTL data. The circle shows the pressure-minimum azeotrope
composition.

C 2020, 6, 42 7 of 14
Figure S12. Formic acid-water Txy vapor equilibrium plot at a constant temperature of 22°C
generated using ChemCad generated NRTL data. The circle shows the azeotrope composition at that
temperature.
Figure S13. Formic acid-water vapor Txy equilibrium plot at a constant temperature of 40°C
generated using ChemCad generated NRTL data. The circle shows the pressure-minimum azeotrope
composition.

C 2020, 6, 42 8 of 14
Figure S14. Formic acid-water vapor Txy equilibrium plot at a constant temperature of 40°C
generated using ChemCad generated NRTL data. The circle shows the azeotrope composition at
those conditions.
Figure S15. Formic acid-water Txy vapor equilibrium plot at a constant temperature of 60°C
generated using ChemCad generated NRTL data. The circle shows the pressure-minimum azeotrope
composition.

C 2020, 6, 42 9 of 14
Figure S16. Formic acid-water Txy vapor equilibrium plot at a constant temperature of 60°C
generated using ChemCad generated NRTL data. The circle shows the azeotrope composition at
those conditions.
Figure S17. Formic acid-water Txy vapor equilibrium plot at a constant temperature of 80°C
generated using ChemCad generated NRTL data. The circle shows the pressure-minimum azeotrope
composition.

C 2020, 6, 42 10 of 14
Figure S18. Formic acid-water Txy vapor equilibrium plot at a constant temperature of 80°C
generated using ChemCad generated NRTL data. The circle shows the azeotrope composition at
those conditions.
Figure S19. Formic acid-water vapor Txy equilibrium plot at a constant temperature of 100°C
generated using ChemCad generated NRTL data. The circle shows the pressure-minimum azeotrope
composition.

C 2020, 6, 42 11 of 14
Figure S20. Formic acid-water Txy vapor equilibrium plot at a constant temperature of 100°C
generated using ChemCad generated NRTL data. The circle shows the azeotrope composition at
those conditions.
Section S4. References
1. Yang, H.; Kaczur, J. J.; Sajjad, S. D.; Masel, R. I., Electrochemical conversion of CO2 to formic acid
utilizing Sustainion™ membranes. Journal of CO2 Utilization 2017, 20, 208-217.
2. Yang, H.; Kaczur, J. J.; Sajjad, S. D.; Masel, R. I., CO2 Conversion to Formic Acid in a Three
Compartment Cell with Sustainion™ Membranes. ECS Transactions 2017, 77 (11), 1425-1431.
3. Kaczur, J. J.; Yang, H.; Sajjad, S. D.; Masel, R. I. Method and system for electrochemical production of
formic acid from carbon dioxide. U.S. Patent 10,047,446 (2018).
4. Kaczur, J. J.; Yang, H.; Sajjad, S. D.; Masel, R. I. In (437f) Modeling Methods for Concentrating a Formic
Acid Product Generated from a Novel Electrochemical Reduction of CO2 Cell Design AIChE 17th
Annual Conference, Minneapolis, MN, Minneapolis, MN, 2017.
5. Hietala, J.; Vuori, A.; Johnsson, P.; Pollari, I.; Reutemann, W.; Kieczka, H., Formic Acid. In Ullmann's
Encyclopedia of Industrial Chemistry, 2016; pp 1-22.