PROCEEDINGS IUFRO Kanazawa 2003 INTERNATONAL ...
185
PROCEEDINGS IUFRO Kanazawa 2003 INTERNATONAL SYMPOSIUM “Forest Insect Population Dynamics and Host Influences” Joint meeting of IUFRO working groups: 7.01.02 Tree Resistance to Insects 7.03.06 Integrated management of forest defoliating insects 7.03.07 Population dynamics of forest insects 14-19 September 2003 Kanazawa Citymonde Hotel, Kanazawa, Japan Kanazawa University 21st-Century COE Program Kanazawa University Editors: Naoto KAMATA Andrew M. LIEBHOLD Dan T. QUIRING Karen M. CLANCY
-
Upload
khangminh22 -
Category
Documents
-
view
2 -
download
0
Transcript of PROCEEDINGS IUFRO Kanazawa 2003 INTERNATONAL ...
PROCEEDINGS IUFRO Kanazawa 2003 INTERNATONAL SYMPOSIUM “Forest Insect Population Dynamics and Host Influences”
Joint meeting of IUFRO working groups: 7.01.02 Tree Resistance to Insects 7.03.06 Integrated management of forest defoliating insects 7.03.07 Population dynamics of forest insects
14-19 September 2003 Kanazawa Citymonde Hotel, Kanazawa, Japan
Kanazawa University 21st-Century COE Program Kanazawa University Editors: Naoto KAMATA Andrew M. LIEBHOLD Dan T. QUIRING Karen M. CLANCY
International Symposium of IUFRO Kanazawa 2003
“Forest Insect Population Dynamics and Host Influences”
14-19 September 2003
Kanazawa Citymonde Hotel, Kanazawa, Japan
Joint meeting of IUFRO working groups: WG 7.01.02 "Tree Resistance to Insects" Francois LIEUTIER, Michael WAGNER ———————————————————————————————————— WG 7.03.06 "Integrated management of forest defoliating insects" Michael MCMANUS, Naoto KAMATA, Julius NOVOTNY ———————————————————————————————————— WG 7.03.07 "Population Dynamics of Forest Insects" Andrew LIEBHOLD, Hugh EVANS, Katsumi TOGASHI Symposium Conveners Dr. Naoto KAMATA, Kanazawa University, Japan Dr. Katsumi TOGASHI, Hiroshima University, Japan
Proceedings: International Symposium of IUFRO Kanazawa 2003
“Forest Insect Population Dynamics and Host Influences”
Edited by Naoto KAMATA, Andrew M. LIEBHOLD, Dan T. QUIRING, Karen M. CLANCY
Published by Kanazawa University, Kakuma, Kanazawa, Ishikawa 920-1192, JAPAN March 2006 Printed by Tanaka Shobundo, Kanazawa Japan ISBN 4-924861-93-8 For additional copies: Kanazawa University 21st-COE Program, Kakuma, Kanazawa, Ishikawa 920-1192, Japan FAX: +81-76-234-6844, [email protected] or Naoto Kamata ([email protected]) You can download PDF files from a web site at http://kamatan.uf.a.u-tokyo.ac.jp/symp/iufro2003kanazawa/proceedings/

IUFRO Kanazawa 2003
PROCEEDINGS
INTERNATONAL SYMPOSIUM “Forest Insect Population Dynamics and Host Influences”
Joint meeting of IUFRO working groups:
7.01.02 Tree Resistance to Insects 7.03.06 Integrated management of forest defoliating insects
7.03.07 Population dynamics of forest insects
Kanazawa Citymonde Hotel, Kanazawa, Japan 14-19 September 2003
Sponsored by: IUFRO-J
Ishikawa Prefecture
Kanazawa City
21st-COE Program of Kanazawa University
Editors Naoto KAMATA
Andrew M. LIEBHOLD Dan T. QUIRING
Karen M. CLANCY

FOREWORD
This meeting was the first occasion that IUFRO units 7.01.02 “Tree Resistance to Insects”, 7.03.06 “Integrated management of forest defoliating insects”, and 7.03.07 “Population dynamics of forest insects” have met jointly. The meeting was attended by 100 delegates representing 15 countries (Belgium, Canada, Finland, France, Hungary, Iran, Japan, Lithuania, New Zealand, Poland, Portugal, Slovakia, Switzerland, Sweden, USA). There were 31 oral papers presented and 40 poster presentations. Topics for these presentations covered population dynamics of forest insects, insect-tree interactions, effects of insects and diseases in forest ecosystems, integrated management of forest insects, and biological control of forest insects. The meeting also included an all-day trip to Ishikawa and Fukui Prefectures where extensive damage caused by Japanese oak wilt disease was observed, and trees killed by the pine would nematode. Following the meeting, there was an optional 2-day post-conference tour of regional sites of cultural and biological interest. The proceedings document the efforts of many individuals: those who made the meeting possible, those who made presentations, and those who compiled and edited the proceedings. Co-sponsorship of the meeting was also provided by IUFRO-J, Ishikawa Prefecture, Kanazawa City, and the 21st-COE Program of Kanazawa University. I would like to thank to all of these. I must apologize to all contributors for a great delay of publishing the proceedings. I received a bulk of mails asking the timing of publishing. It was tough work for me to have the meeting. After the meeting I experienced burnout and needed a rest. I will relocate to the University of Tokyo since April 2006. I gave a big pressure to other editors because time for editing was limited. I feel very sorry for them. Now, everything is my treasured memory. Thank you for all. Naoto KAMATA, Chief Editor March 2006

CONTENTS
Full Papers Pine Wilt Disease: Various Biological Relationships and Resulting Events ……… 1 Kazuyoshi FUTAI Invasive Alien Species Issues ………………………………………………………… 6 Keizi KIRITANI Rich Biota in the Forests of Yanbaru, Northern Montane Part of Okinawa Island, Japan, and Imminent Extinction Crisis of the Endangered Species……………… 11 Yosiaki ITÔ Thanasimus formicarius (Coleoptera: Cleridae): Why a Large Range of Prey for a Specialized Predator?…………………………………………………………………16 Nathalie WARZEE, Jean-Claude GREGOIRE Host Preference of Tomicus piniperda and Tomicus destruens for Three Pine Species………………………………………………………………………………… 19 Teresa VASCONCELOS, Neusa NAZARÉ, Manuela BRANCO, Carole KERDELHUE, Daniel SAUVARD, François LIEUTIER The Effect of Acid Rain on the Defense Response of Pines to Pinewood Nematodes ………………………………………………………………………………………… 22 Ei-ichiro ASAI, Kazuyoshi FUTAI How Do Birch Defenses Operate?……………………………………………………26 Erkki HAUKIOJA What Causes Spatio-Temporal Variations in Leaf Herbivory Levels within a Canopy of Fagus crenata?…………………………………………………………… 31 Michimasa YAMASAKI Effects of Ortet Genotype and Western Spruce Budworm Defoliation on Foliar Nutrients in Douglas-fir Clones………………………………………………………37 Karen M. CLANCY, Zhong CHEN, Thomas E. KOLB Intra- and Interspecific Variations in the Balance between Ant and Non-Ant Defenses in Macaranga ……………………………………………………………… 45 Masahiro NOMURA, Aya HATADA, Takao ITIOKA Leaf Longevity and Defense Characteristics in Trees of Betulaceae………………53 Takayoshi KOIKE, Sawako MATSUKI, Dongsu CHOI, Takeshi MATSUMOTO, Yasuaki SAKAMOTO, Yutaka MARUYAMA
Three Pistachio Species Evaluated For Resistance to the Common Pistachio Psylla, Agonoscena pistaciae ………………………………………………………………… 58 M.Reza MEHRNEJAD Finding the Area of Origin of the Horse-Chestnut Leaf Miner: a Challenge …… 63 M. KENIS, S. GIRARDOZ, N. AVTZIS, J. FREISE, W. HEITLAND, G. GRABENWEGER, F. LAKATOS, C. LOPEZ VAAMONDE, A. SVATOS, R. TOMOV The Genetic Background of Three Introduced Leaf Miner Moth Species - Parectopa robiniella Clemens 1863, Phyllonorycter robiniella Clemens 1859 and Cameraria ohridella Deschka et Dimic 1986…………………………………………67 Ferenc LAKATOS, Zoltán KOVÁCS, Christian STAUFFER, Marc KENIS, Rumen TOMOV, Donald R. DAVIS Preliminary Results on Predation of Gypsy Moth Pupae during a Period of Latency in Slovakia ………………………………………………………………… 72 Marek TURČÁNI, Július NOVOTNÝ, Andrew M. LIEBHOLD, Michael MCMANUS Ecosystem Function and the Prediction of Tree Resistance to Defoliators ……… 78 M.K. (Nod) KAY, Stephen D. WRATTEN Growth Responses and Mortality of Scots Pine (Pinus sylvestris L.) after a Pine Sawfly Outbreak………………………………………………………………………81 Päivi LYYTIKÄINEN-SAARENMAA, Pekka NIEMELÄ, Erkki ANNILA Application of Balsam Fir Sawfly Nucleopolyhedrovirus against its Natural Host Neodiprion abietis (Hymenoptera: Diprionidae)…………………………………… 86 Christina S. CAMPBELL, Dan T. QUIRING, Edward G. KETTELA, Christopher J. LUCAROTTI Seed-insect fauna in pre-dispersal acorns of Quercus variabilis and Q. serrata and its impact on acorn production……………………………………………………… 90 Hiroshi FUKUMOTO, Hisashi KAJIMURA Characteristics of the Resistance of Pinus armandii var. amamiana, an Endangered Pine Species in Japan, to Pine Wilt Disease…………………………………………94 Katsunori NAKAMURA, Mitsuteru AKIBA, Seiichi KANETANI Spruce Bark Beetle (Ips typographus L.) Risk Based on Individual Tree Parameters ………………………………………………………………………………………… 96 Paulius ZOLUBAS Efficiency of Different Types of Pine Trap Trees……………………………………98 Artūras GEDMINAS, Jurate LYNIKIENE
Outbreaks of Pine Defoliating Insects and Radial Growth ………………………100 Artūras GEDMINAS Effects of Chemical and Biological Insecticides on the Community and Diversity of Litter Insects………………………………………………………………………… 103 Jurate LYNIKIENE, Paulius ZOLUBAS Comparison of Foliar Defense by Chemical Analysis and Bioassay in Betulaceae Seedlings …………………………………………………………………………… 107 Sawako MATSUKI, Hirohumi HARA, Takayoshi KOIKE Population Fluctuation of the Stink Bug, Plautia crossota stali, as Affected by Cone Production of Japanese Cedar………………………………………………………110 Masahiko MORISHITA Ontogenetic Resistance in Pinus ponderosa to Rhyacionia neomexicana (Lepidoptera: Tortricidae): Role of Anatomical Features ……………………… 112 Michael R. WAGNER, Zhong CHEN Stand-Level Defoliation Ratio by Herbivorous Insects along Altitudes, between Geological Features, and between Topography on Mt. Kinabalu, Borneo……… 116 Shizuo SUZUKI, Kanehiro KITAYAMA, Shin-ichiro AIBA, Masaaki TAKYU, Kihachiro KIKUZAWA Do Ectomycorrhizal Mutualists Influence Douglas-fir Resistance to Defoliation by the Western Spruce Budworm? …………………………………………………… 120 Karen M. CLANCY, Barbara L. PALERMO, George W. KOCH Effects of Simulated Partial Cotyledon Herbivory on Seedling Growth in Quercus crispula Acorns……………………………………………………………………… 124 Naoya WADA, Naoto KAMATA Water Relations of Quercus mongolica Seedlings Inoculated with Raffaelea quercivora: Ambrosia Fungi Related with Mass Mortality of Oaks in Japan……128 Mariko YAMATO, Toshihiro YAMADA, Kazuo SUZUKI Defense Responses of Oak Trees against the Fungus Raffaelea quercivora Vectored by the Ambrosia Beetle Platypus quercivorus………………………………………132 Toshihiro YAMADA, Yu ICHIHARA, Keko HORI
Abstracts
Periodical Cicada Brood Borders are Maintained by Competition and Allee Dynamics …………………………………………………………………………… 136 Andrew LIEBHOLD, Richard KARBAN Induced Response of Oak Trees to Raffaelea quercivora as a Possible Defense
against Japanese Oak Wilt Caused by the Ambrosia Fungus Carried by an Ambrosia Beetle …………………………………………………………………… 137 Kenryu KATO, Hisahito OANA, Nobuko KAKIUCHI, Masayuki MIKAGE, Naoto KAMATA, Kojiro ESAKI, Tohru MITSUNAGA, Shin-ichiro ITO Study of Quercus crispula Wood Extractives Damaged from Platypus quercivorous Attack…………………………………………………………………………………138 Miwa KASAI, Shin-ichiro ITO, Tohru MITSUNAGA, Naoto KAMATA Sensory Cues for Shelter Use ……………………………………………………… 139 Niklas BJÖRKLUND Population Dynamics of Willow Leaf Beetles in Managed and Natural Willow Stands…………………………………………………………………………………140 Peter DALIN Harvesting Disrupts Biological Control of Leaf Beetles in Short-Rotation Coppice Willows ……………………………………………………………………………… 141 Christer BJÖRKMAN Reproductive Success of the Spruce Bark Beetle Ips typographus and Impact of Natural Enemies in Five Years Following a Storm-Felling ……………………… 142 Martin SCHROEDER, Åke LINDELÖW Temporal Patterns in Epirrita autumnata Dynamics: Parasitoids and Other Possible Factors………………………………………………………………………143 Helena BYLUND, Olle TENOW Is the Parasitoid Perilitus areolaris a Significant Mortality Factor for Adult Pine Weevils?………………………………………………………………………………144 Helena BYLUND, Henrik NORDENHEM and Göran NORDLANDER Relationships between Defensive Characteristics of Fagus crenata Galls and the Timing of Gall Fall ………………………………………………………………… 145 Kenji TOKUNAGA, Naoto KAMATA Linking Ecosystem Ecology to Insect Population Ecology: Nitrogen Cycling, Foliage Properties, and Insect Outbreaks………………………………………… 146 Naoto KAMATA, Yuki KUNIHISA, Lina KOYAMA, Naoya WADA Semiochemical Diversity and Niche Partitioning among Scolytids and the Generalist Bark-Beetle Predator, Thanasimus formicarius (Coleoptera: Cleridae) ……………………………………………………………………………………… 147 Nathalie WARZEE, Jean-Claude GREGOIRE, Hervé JACTEL, Pierre MENASSIEU, Christian MALOSSE
Utilization of the Symbiotic Fungus Propagated in Host-Tree before Oviposition by a Woodwasp, Urocerus japonicus (Hymenoptera: Siricidae) …………………… 148 Hideshi FUKUDA, Akira SANO Reaction of the Ambrosia Beetle Platypus quercivorus to Gallic Acid and Ellagic Acid in Oak Sapwood ……………………………………………………………… 149 Hisahito OANA, Nobuko KAKIUCHI, Masayuki MIKAGE, Naoto KAMATA, Kojiro ESAKI, Tohru MITSUNAGA, Shin-ichiro ITO Volatile Compounds Related to Attractant of Platypus quercivorus (Murayama) from Quercus crispula ……………………………………………………………… 150 Hiroyuki TAKEMOTO, Shin-ichiro ITO, Tohru MITSUNAGA, Naoto KAMATA, Masahide KOBAYASHI Stand-Level Distribution and Movement of Platypus quercivorus Adults and Spatial Patterns of Attacks ………………………………………………………… 151 Kojiro ESAKI, Kenryu KATO, Naoto KAMATA Influence of Light Condition on the Spatial Distribution of an Ambrosia Beetle Platypus quercivorus (Murayama) (Coleoptera: Platypodidae) Flying in a Natural Secondary Broad-Leafed Forest…………………………………………………… 152 Yutaka IGETA, Kenryu KATO, Naoto KAMATA, Kojiro ESAKI Analysis of Japanese Oak Wilt Spread Using Aerial Photography and GIS…… 153 Ryotaro KOMURA, Naoto KAMATA, Ken-ichiro MURAMOTO, Andrew LIEBHOLD, Koujiro ESAKI Missing Oral Papers…………………………………………………………………154 Missing Poster Papers……………………………………………………………… 156 Program………………………………………………………………………………157 Poster Awards ……………………………………………………………………… 165 Photos…………………………………………………………………………………166 List of Participants ………………………………………………………………… 173
Pine Wilt Disease: Various Biological Relationships and Resulting Events
Kazuyoshi FUTAI
Graduate School of Agriculture, Kyoto University, Kyoto, 606-8502, JAPAN Abstract – Pine wilt disease is one of the most serious forest diseases in East Asian countries. The infection chain of this disease, which is filled with various biological relationships, is briefly reviewed. The affinity between host pine trees and pathogenic nematodes, one of the most decisive phases of the disease, is subsequently examined in a series of experiments.
I. Introduction
Pine wilt disease is one of the most serious forest epidemics in the world, especially in East Asian countries. Since the first discovery of the pathogenic nematode in 1970, a great number of papers have been published to explain the biological relationships included in this epidemic. Among them are the relationships between the pathogenic nematode and its’ host pine species, those between the pathogenic nematode and its’ vector beetle, and those between the beetle and pine species. In all of these relationships, microorganisms play important roles as food sources of the nematode, or as natural enemies of the organisms in these relationships.
II. The Epidemic Manner of Pine Wilt Spread
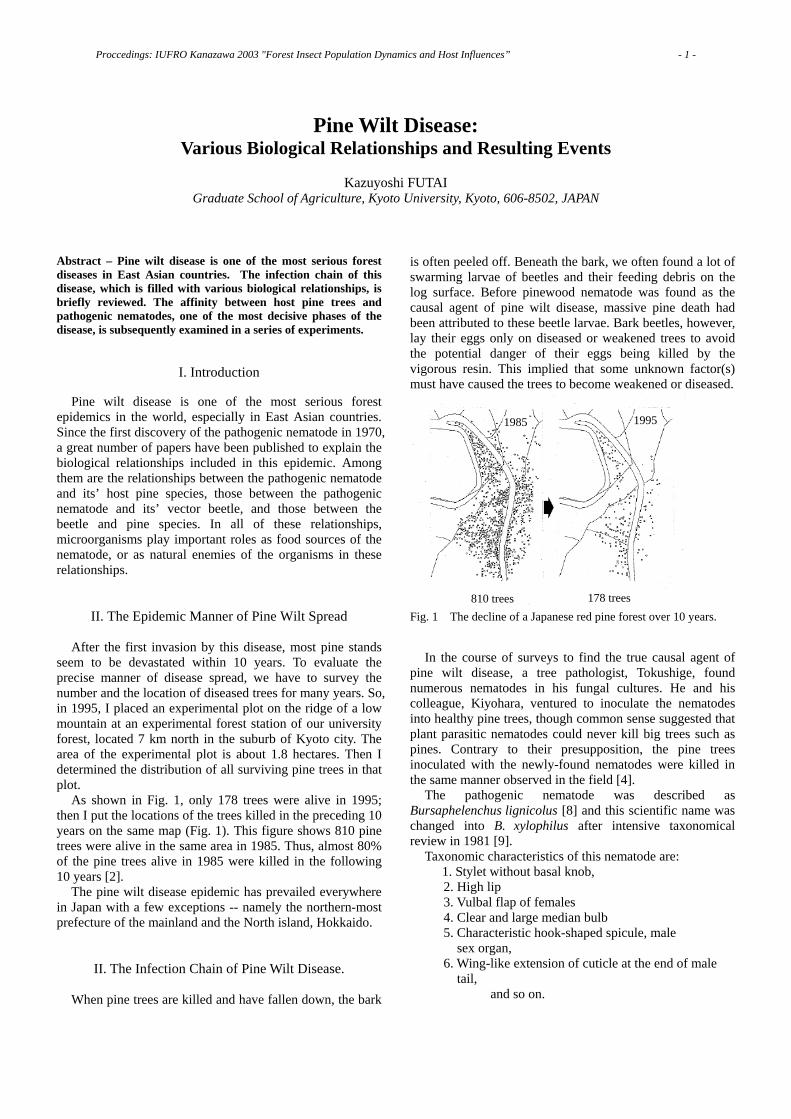
After the first invasion by this disease, most pine stands seem to be devastated within 10 years. To evaluate the precise manner of disease spread, we have to survey the number and the location of diseased trees for many years. So, in 1995, I placed an experimental plot on the ridge of a low mountain at an experimental forest station of our university forest, located 7 km north in the suburb of Kyoto city. The area of the experimental plot is about 1.8 hectares. Then I determined the distribution of all surviving pine trees in that plot.
As shown in Fig. 1, only 178 trees were alive in 1995; then I put the locations of the trees killed in the preceding 10 years on the same map (Fig. 1). This figure shows 810 pine trees were alive in the same area in 1985. Thus, almost 80% of the pine trees alive in 1985 were killed in the following 10 years [2].
The pine wilt disease epidemic has prevailed everywhere in Japan with a few exceptions -- namely the northern-most prefecture of the mainland and the North island, Hokkaido.
II. The Infection Chain of Pine Wilt Disease.
When pine trees are killed and have fallen down, the bark
is often peeled off. Beneath the bark, we often found a lot of swarming larvae of beetles and their feeding debris on the log surface. Before pinewood nematode was found as the causal agent of pine wilt disease, massive pine death had been attributed to these beetle larvae. Bark beetles, however, lay their eggs only on diseased or weakened trees to avoid the potential danger of their eggs being killed by the vigorous resin. This implied that some unknown factor(s) must have caused the trees to become weakened or diseased.
1985 1995
810 trees 178 trees
Fig. 1 The decline of a Japanese red pine forest over 10 years.
In the course of surveys to find the true causal agent of
pine wilt disease, a tree pathologist, Tokushige, found numerous nematodes in his fungal cultures. He and his colleague, Kiyohara, ventured to inoculate the nematodes into healthy pine trees, though common sense suggested that plant parasitic nematodes could never kill big trees such as pines. Contrary to their presupposition, the pine trees inoculated with the newly-found nematodes were killed in the same manner observed in the field [4].
The pathogenic nematode was described as Bursaphelenchus lignicolus [8] and this scientific name was changed into B. xylophilus after intensive taxonomical review in 1981 [9].
Taxonomic characteristics of this nematode are: 1. Stylet without basal knob,
2. High lip 3. Vulbal flap of females 4. Clear and large median bulb 5. Characteristic hook-shaped spicule, male sex organ, 6. Wing-like extension of cuticle at the end of male tail, and so on.
Proccedings: IUFRO Kanazawa 2003 "Forest Insect Population Dynamics and Host Influences” - 1 -
This nematode can feed on both fungal and plant cells by thrusting its’ stylet into fungal or plant cells. Thus this nematode is myco- and phytophagous, so it can be cultured on some fungal species such as Botrytis, Fusalium, Pestalotia, and so on [5, 6]. This characteristic enabled us to carry out mass-culture, and thereby we could easily do inoculation tests.
The method we use to inoculate nematodes on saplings of Japanese black pine is as follows: 1. First, we peel off a small part of bark, which simulates
feeding wounds made by the vector beetle, M. alternatuss,
2. Fix a cotton swab on the scar, 3. Pipett an aliquot of nematode suspension into the cotton
swab, 4. Then, cover with parafilm so it is not washed away by
rain. When inoculated in July, early symptoms appear in late
August to September. Old needles change their color to yellow, then to brown. In September to October, needles droop and change their color to brown, suggesting they are dead.
Thus, pathogenicity of the newly-found nematode was confirmed. But their size of just 1 mm long is too tiny to explain the epidemic spread of this disease, which had been reported to extend 10 km or more a year. So, people started to search for the vector of the nematode.
Among the various species of insects related to dead pine trees, three groups of beetles are dominant; they are longhorn beetles, bark beetles, and weevils.
After intensive surveys for nematode vectors, only one species of longhorn beetle, Monochamus alternatus,was identified as the effective vector of the pinewood nematode.
M. alternatus belongs to tribe Lamini of the family Cerambicidae, and is distributed over eastern Asia, including Japan, Korea, China, and Taiwan. Adults of M. alternatus feed on the twigs of some genera of Pinacea including Pinus, Larix, Picea, and Cedrus, and lay their eggs on the trunks of such host trees after cessation of resin exudation.
When the adult Monochamus beetles emerge, their reproductive organs are not yet well-developed. So they have to keep on feeding to make their reproductive organs mature. The beetles move from dead pine trees to healthy ones, and feed on young branches for this maturation feeding.
Several days after the maturation feeding of the beetle M. alternatus starts, pathogenic nematodes of B. xylophilus harbored in the trachea of the beetle are transmitted to the pine trunk and they invade the host tree through the feeding wound.
Three to four weeks after nematode infection, the pine tree ceases its’ resin exudation, and it starts to emit volatiles such as ethanol and monoterpenes. These volatiles attract matured M. alternatus to the diseased pine trees, where they mate and then lay their eggs after making egg niches.
Female Monochamus lay one egg per a nitch, producing about 100 eggs in total during three months. After a week, the eggs hatch into larvae. Ten days later the 1st instar larva
molts into a 2nd, then 3rd, and 4th instar larva. Juvenile larvae make shallow tunnels just beneath the bark, but in September to October, matured larvae bore deep into the sapwood.
In late autumn, the mature 4th instar larva makes a large cavity at the end of the tunnel, then it plugs the outlet of the cavity with wood debris, and overwinters there. We call this cavity a “pupal chamber”, because the larvae pupate in this cavity the following spring. A few species of fungi proliferate over the wall of this pupal chamber,. Among them are blue stain fungi, Ophiostoma spp., which are early colonizers of dead pine trees. The pinewood nematodes feed on the fungi, and propagate around the pupal chamber. But some fungi such as Trichoderma spp. and Verticillium spp. cohabitate with the Ohiostoma fungi, and they suppress the propagation of Ophiostoma and/or B. xylophilus as antagonists. So, the number of nematodes carried by a vector beetle is partly determined by the fungal flora around the pupal chamber [7].
When nematodes become overpopulated, their food becomes limited, and their environment deteriorates due to their own excrement. Under these conditions, a special stage of nematodes appear in the population. This stage is called the dispersal 3rd juvenile; it contains a lot of fatty granules in its’ body. When the 3rd stage juveniles aggregate around the vector’s body, they molt again to another characteristic stage, the so-called “dauer juveniles or disparsal 4th
juveniles”. In the next year, from May throughout June,
Monochamus beetles pupate in their pupal chambers. After pupation the beetle’s body color changes from white to amber, and eye color changes from red to black. Two to three weeks later, the pupa ecloses in the chamber. It stays in the chamber for several days as a callow adult. During this period, nematodes of the dauer juvenile stage (= dispersal 4th stage) transmit into the Monochamus vector’s respiratory organ, the tracheal system. When the tracheal system was first dissected from the Monochamus beetle’s body under water, the whole trachea began to move just like a living organism. At first, the insect’s trachea seemed to keep its activity even after death. After a while, however, it was disclosed that this movement was due to the nematodes occupying the tracheal tubes.
The dauer larvae of B. xylophilus are a really characteristic stage, which lack digestive organs such as stylets, median bulbs, and mouth openings, suggesting they are not parasitic to the vector beetle but are mere passengers. Their body is covered with a thick cuticle and a sticky surface substance. These must be adaptive characteristics for being vectored.
From June to early July, Monochamus beetles emerge from dead pine tree through round holes, carrying pinewood nematodes in their respiratory organ.
Thus, the infection chain of Pine Wilt Disease consists of three major organisms; the pine tree as a host, the pinewood nematode as a fatal pathogen, and the Monochamus beetle as the vector of the pathogen. Various species of fungi are also included in this infection chain as
Proccedings: IUFRO Kanazawa 2003 "Forest Insect Population Dynamics and Host Influences” - 2 -
food resources, predators, antagonists, and so on.
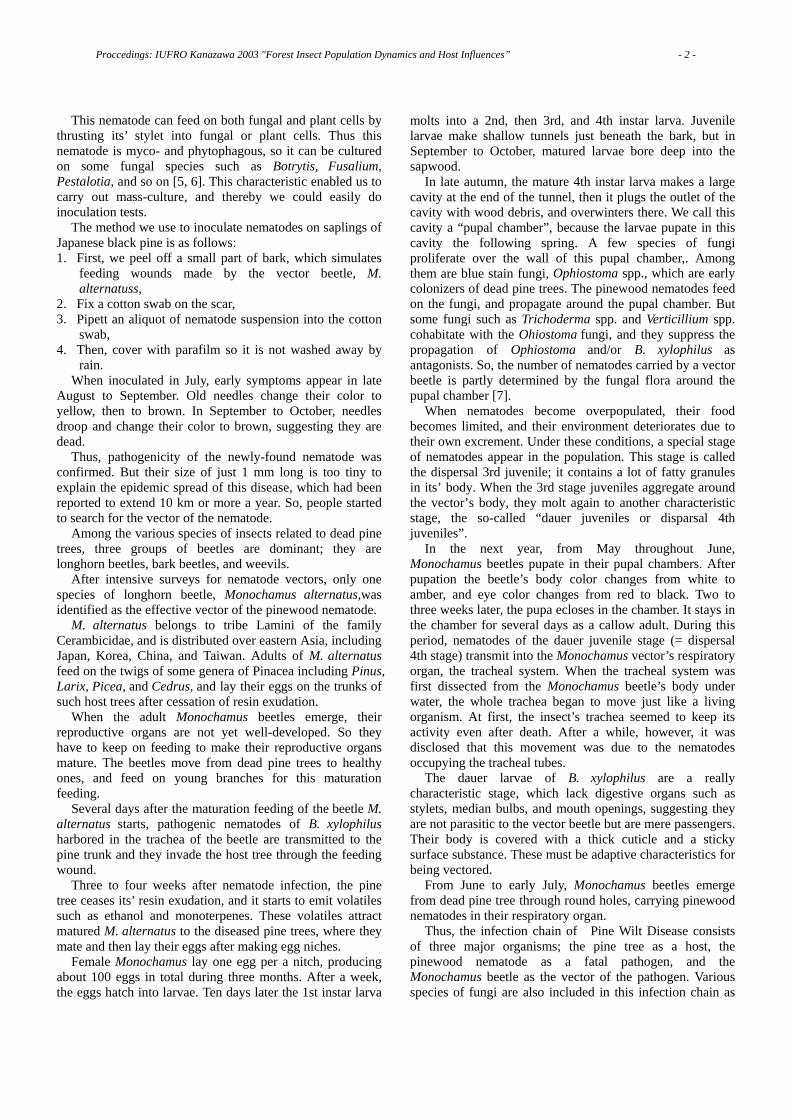
III. Host resistance and susceptibility. Once, in an experimental forest station of Kyoto University at Wakayama prefecture, some exotic pine species were planted in the field. A stand of slash pine, P. elliottii and another stand of Japanese black pine, P. thunbergii were located side by side. The stand of native pine, P. thunbergii, had been damaged very seriously, while the neighboring stand of slash pine had scarcely been damaged. This difference in damage between two pine species could be attributed to the vector’s host preference. But there was no difference in the number of feeding marks on the young branches between the two pine species. Differences in damage could also be attributed to differences in resistance of the host pine species to the pathogenic nematode. Actually, when inoculated with pine wood nematodes, P. thunbergii showed high susceptibility to nematode infection. Alternatively, Pinus taeda, loblolly pine, was very resistant to inoculation with nematodes even when they received three times as many nematodes as P. thunbergii trees did. Which factor(s) determine host resistance to Pine Wilt Disease? To examine the role of host substances in Pine Wilt Disease resistance, I used the folloing method as shown in Fig. 2 and have reported the results elsewhere [1]. Here, I would like to briefly summarize the methods and the results. (1) Shoots of pine species 8 to 10 mm in diameter were cut
into 10 mm long segments. One third of the shoot segments were immersed in absolute ethyl ether, another one third in 95% ethyl alcohol and the remaining one third in distilled water.
(2) Two shoot segments treated with each solvent and two untreated segments were placed on an agar plate 3 cm from the center in a 9 cm diameter Petri dish.
(3) A known number of nemtodes of either B. xylophilus or B. mucronatus was placed in the midst of the four shoot segments, then incubated for 12 hours at 25º C.
(4) Nematodes were recovered from bark, wood, and the agar disk beneath the segment, separately.
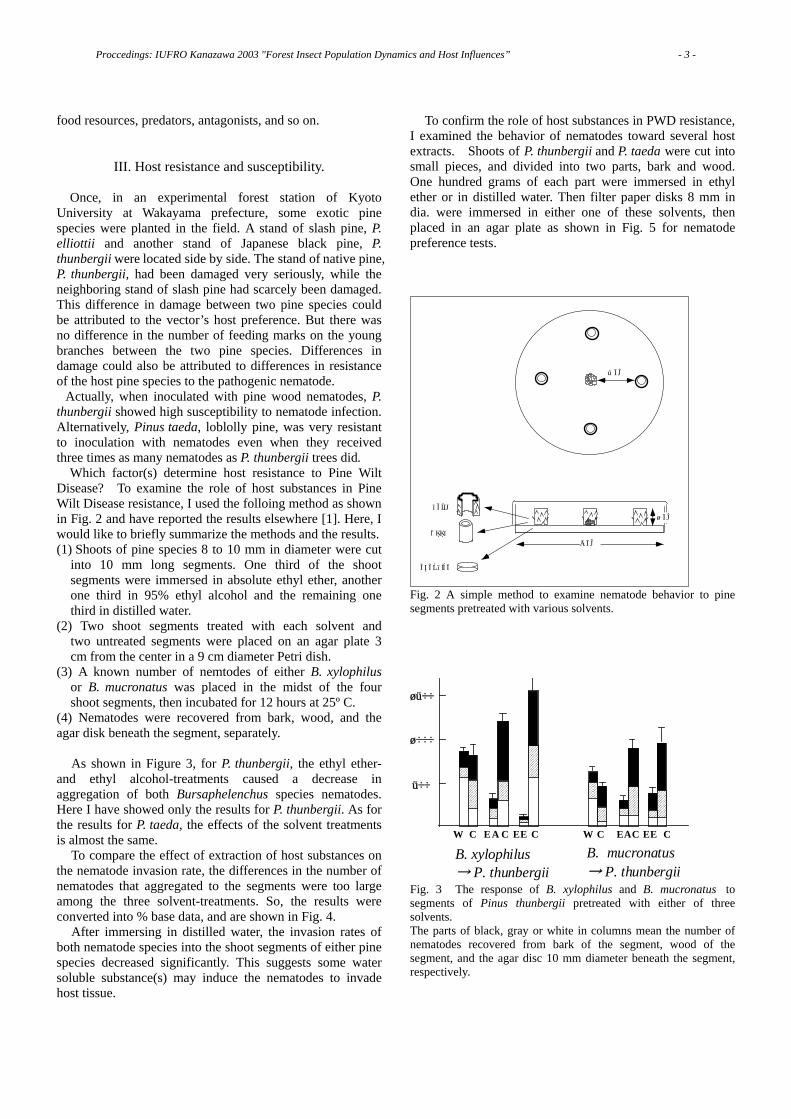
As shown in Figure 3, for P. thunbergii, the ethyl ether-
and ethyl alcohol-treatments caused a decrease in aggregation of both Bursaphelenchus species nematodes. Here I have showed only the results for P. thunbergii. As for the results for P. taeda, the effects of the solvent treatments is almost the same.
To compare the effect of extraction of host substances on the nematode invasion rate, the differences in the number of nematodes that aggregated to the segments were too large among the three solvent-treatments. So, the results were converted into % base data, and are shown in Fig. 4.
After immersing in distilled water, the invasion rates of both nematode species into the shoot segments of either pine species decreased significantly. This suggests some water soluble substance(s) may induce the nematodes to invade host tissue.
To confirm the role of host substances in PWD resistance, I examined the behavior of nematodes toward several host extracts. Shoots of P. thunbergii and P. taeda were cut into small pieces, and divided into two parts, bark and wood. One hundred grams of each part were immersed in ethyl ether or in distilled water. Then filter paper disks 8 mm in dia. were immersed in either one of these solvents, then placed in an agar plate as shown in Fig. 5 for nematode preference tests.
3 cm
1 cm
9 cm
bark
w ood
agardisc
Fig. 2 A simple method to examine nematode behavior to pine segments pretreated with various solvents.
W C EA EE W EA EEC CC C C
B. xylophilus→ P. thunbergii
B. mucronatus→ P. thunbergii
1500
1000
500
Fig. 3 The response of B. xylophilus and B. mucronatus to segments of Pinus thunbergii pretreated with either of three solvents. The parts of black, gray or white in columns mean the number of nematodes recovered from bark of the segment, wood of the segment, and the agar disc 10 mm diameter beneath the segment, respectively.
Proccedings: IUFRO Kanazawa 2003 "Forest Insect Population Dynamics and Host Influences” - 3 -

C
W
EA
EE
C
W
EA
EE
C
W
EA
EE
C
W
EA
EE
B. xylophilus - P. thunbergii B. xylophilus - P. taeda
B. mucronatus - P. thunbergii B. mucronatus - P. taeda
Fig. 4 The invasion rates of B. xylophilus and B. mucronatus into pine segments previously immersed in distilled water (w), ethyl alcohol (EA) and ethyl ether (EE) and into ones with no treatment (C).
C
BbW
wCB b
W
w
C
CN 3 cm
9 cm
Fig. 5 Arrangement of paper disks holding various pine extracts on agar plate to examine the preference of B. xylophilus and B. mucronatus for the pine extracts. N: nematode inoculum, B: water extract of bark, b: ethyl ether extracts of bark, W: water extract of wood, w: ethyl ether extracts of wood, C: control (treated with water).
B .xylop hilu s →P.th un bergii
B . m u c ro n atu s→ P . th u n b e rg ii
B .m ucro natu s→ P.taeda
B .xylophilu s→ P.taeda
Fig. 6 The aggregation of two Bursaphelenchus species to paper disks holding different extracts from P. thunbergii and P. taeda. The distance from the height of right shoulder of each column to that of left one means the standard error of 10 replicates.
Preferences of both of the Bursaphelenchus nematodes is represented in Fig. 6 as values relative to the number of nematodes that aggregated to the disks with the distilled water treatment (control).
As shown in Figure 6, (1) both B. xylophilus and B. mucronatus preferentially aggregated to the ethyl ether extracts from the wood of both P. thunbergii and P. taeda. (2) Water extact from the bark of P. taeda repelled the nematodes of both Bursaphelenchus species.
From the above-mentioned results, I conclude that aggregation and invasion by two species of Bursaphelenchus seems to be controlled by separate substances; i.e., both Bursaphelenchus species aggregate to the hydro-phobic host substance(s), while their invasion of host tissues is controlled by hydrophilic host substance(s).
The resistance of P. taeda could partly be explained by the hydrophilic repellants contained in its’ bark.
When I conducted inoculation tests, and compared resistance among pine species, I found that host resistance to Pine Wilt Disease is different among tree species in the genus Pinus, and the differences seem to reflect their phylogenetic relationships in the genus. For example, many species of subsection Sylvestres such as P. densiflora and P. thunbergii are susceptible to this disease. .Furthermore, most specie of subsection Australes such as P. taeda and P. rigida are highly resistant [3].
If we plot pine species with various resistances on a map of the world, susceptible pine species are distributed both in east Asia and Europe. In North America, most pine species distributed along the East coast are resistant, whereas, those distributed along the West coast are rather or highly susceptible to Pine Wilt Disease.
As I mentioned previously, a forest epidemic, “Pine Wilt Disease” includes various biological relationships. Most of them may seem to be understood. However, several important issues remain unresolved, and wait for challenge by scientists.
References [1] K. Futai, “Responses of two species of Bursaphelenchus to the extracts from pine segments immersed in different solvents,” Japanese Journal of Nematology Vol. 9, pp. 54-59, 1979. [2] K. Futai, “The epidemic manner of pine wilt spread in a Japanese red pine stand,” Forest Research Vol. 71, pp. 9-18, 1999. [3] K. Futai, T. Furuno, “The variety of resistances among pine species to pine wood nematode, Bursaphelenchus lignicolus,” Bulletin of Kyoto University Forests Vol. 51, pp. 23-36, 1979. (in Japanese with English summary). [4] T. Kiyohara, Y. Tokushire, “Inoculation experiments of a nematode, Bursaphelenchus sp., onto pine trees,” Journal of Japanese Forestry Society Vol. 53, pp. 210-218, 1971. [5] T. Kobayashi, K. Sasaki, Y. Mamiya, “Fungi associated with Bursaphelenchus lignicolus, the pine wood nematode (1),” Journal of Japanese Forestry Society Vol. 56, pp. 136-145, 1974. [6] T. Kobayashi, K. Sasaki, Y. Mamiya, “Fungi associated with Bursaphelenchus lignicolus, the pine wood nematode (2),” Journal of Japanese Forestry Society Vol. 57, pp. 184-193, 1975. [7] N. Maehara, K. Futai, “Factors affecting the number of
Proccedings: IUFRO Kanazawa 2003 "Forest Insect Population Dynamics and Host Influences” - 4 -

Bursaphelenchus xylophilus (Nematoda: Aphelenchoididae) carried by several species of beetles. Nematology, Vol. 4, pp. 653-658, 2002. [8] Y. Mamiya, “Description of Bursaphelenchus lignicolus N. sp. (Nematoda: Aphelenchoididae) from pine wood and histopathology of nematode-infested trees,” Nematologica Vol. 18, pp. 120-124, 1972. [9] W. R. Nickle, A. M. Golden, Y. Mamiya, W. P. Wergin, On the taxonomy and morphology of the pine wood nematode, Bursaphelenachus xylophilus (Steiner & Buhrer 1934) Nickle 1970,” Journal of Nematology Vol. 13, pp. 385-392, 1981.
Proccedings: IUFRO Kanazawa 2003 "Forest Insect Population Dynamics and Host Influences” - 5 -

Invasive Alien Species Issues
Keizi KIRITANI Loisir Izukogen, 1020-292 Futo, Itou City, Shizuoka 413-0231, JAPAN
Abstract – I address three important issues with regard to invasive alien species. First, the rate of introduction of alien species is rising sharply in association with increased trade, transportation and tourism. Second, the consequences of biological invasions are very difficult to predict as exemplified by the fall webworm, the rice water weevil and the pine wood nematode in Japan. Third, biological invasions have resulted in faunal homogenization worldwide of stored product and greenhouse pest fauna.
I. Introduction
Biological invasions are one of the most important issues in this century in terms of the conservation of biodiversity.
The title of this paper is not simply ” Invasive Alien Species” (IAS), but I have added the word “Issues”. What is the difference between IAS and IAS issues? I address three points as issues. Presently, changes in environmental factors are incomparable in the rate and dimensions with anytime in the past. Secondly, consequences of biological invasions are very difficult to predict. Finally, biological invasions result in faunal homogenization and loss of biodiversity.
First of all, I define “alien” by reference to a cut-off date, which is the beginning of the Meiji era (1868) when Japan opened the door to foreign countries after 200 years of national isolation policy. If the date is farther back in history, virtually all native species may be defined as alien, because the Japanese archipelago was originally part of a continent before its’ geographical separation. Therefore, we classify species without any obvious record of introduction as “native”, including pre-Meiji invasions.
The world population is expected to be 9 billion in 2050, increasing by 3 billion in 50 years. Ten thousands years ago, it was only less than 6 million. Currently our human population increases at a rate of one million every 4 days [1]. In addition, IPCC predicts that global-mean surface temperature will increase 1.4-5.8℃ by the year 2100 as compared to 1990. Because the temperature rise during the last 10,000 years was 5℃, the speed at which current global warming proceeds is 10 to 100 times faster than 10,000 years ago [2].
The rate of introduction of alien species beyond their natural range is rising sharply with increased transport, trade, travel and tourism between different countries and continents. These increases are not only in quantity but also in speed of movement. Increases in the speed of cargo ships made transport of insect pests possible across the equator where they would have otherwise been killed by high
temperatures. These examples strongly suggest that our environment is
changing at an accelerating rate both in scale and speed. Therefore, the essentials of environmental issues should be viewed in terms of changing rates of biological processes in space and time.
II. Increase in Vectors and Pathways for Invasion
The number of alien species that were introduced unintentionally differs greatly among the areas of Japan. Those areas where alien species usually do not first occur, for example, Shikoku Island and the Amami and the Miyako Islands, lack international air- and seaports. In other words, the alien insects invaded these areas after they became established elsewhere in Japan [3].
The economic status of alien species was examined for the 260 species in Japan. Pest, non-pest and beneficial insects accounted for 191(74%), 57(22%) and 12(4%), respectively [4]. On the other hand, pest species account only for 8% of the native insect fauna [5]. This means that exotic insects are pestiferous at a rate of almost 10 times higher than among native insects. Only a small percentage of introduced species, however, become invasive. Kiritani [6] designated only 22 species as Invasive Alien Species, which accounted for 5% of the total 413 alien species in Japan.
Biological invasions are composed of four phases: introduction, establishment, spread, and naturalization. It is often insisted that island communities are more easily invaded or that mainland species are better colonists. It may be, however, that mainland species simply have more opportunities to invade islands than vice versa. We should discriminate between the vulnerability of island communities and the opportunity of invasions.
III. Vulnerability of Islands to Biological Invasions
The total land area of the southern islands including the Nansei and Ogasawara islands accounts for only 1.2% of the total Japanese land, but 43% of the alien insects invaded Japan are found in the southern islands. Therefore, we examined the balance of import and export concerning vegetables and fruit between Okinawa prefecture and the Japanese mainland. Obviously, Okinawa has always run a trade deficit for these agricultural products. These trade gaps may partly explain why islands had so many invasive insect species compared to the mainland. In fact, out of 98 exotic
Proccedings: IUFRO Kanazawa 2003 "Forest Insect Population Dynamics and Host Influences” - 6 -

species in Okinawa, 26 species were translocated from the mainland, while only 3 species invaded the mainland from Okinawa [4,7,8].
The Ogasawara Islands were put under the trusteeship of the United State from 1945 to 1968. Fourteen insect species, most of which are agricultural pests, invaded these islands after 1968. Twelve of them probably came from the mainland in association with the import of agricultural products [9]. There are no records of insect species that became established in the mainland from Ogasawara. But clearly other factors such as subtropical climate and the poor biological community represented by oceanic islands like Ogasawara may influence the process.
IV. Species Interchange between Japan and the USA
The international trade system of agricultural products between Japan and the United States was examined [8]. The amount of agricultural products imported from the US to Japan was 20,000 times that exported from Japan to the US. Kiritani [10] has published a comprehensive list of the insect species that have invaded the US from Japan, and those that have invaded Japan from the US. Afterward some species were added to the list. The cumulative number of alien insects that came from the US amounted to 54 species during the past 140 years after the beginning of the Meiji era. The invasion frequency during the last 30 years (1970-1999) was 10 times higher than that before World War II. Currently, one species originating from the US is becoming established in Japan every year (Table 1).
The number of species that invaded the US from Japan is 58. This almost equal number of alien species exchanged between the two countries, viz. 54 from the US and 58 to the US, seems rather strange in view of the big trade gap. If we look at the time when these alien insects invaded, however, the present imbalance in trade is clearly reflected. Invasions of the US by Japanese species show a peak in the 1920s. In contrast, more than one half of the species that have invaded Japan from the US were during the last 30 years [8].
V. IAS from the United States
Performance of alien species in newly established areas is often very difficult to predict. For example, the Japanese beetle, Popillia japonica, has become one of the most widespread and destructive agricultural pests in the eastern
United States. Adults feed on more than 300 plant species [11]. In Japan, the pest status of this beetle is so minor that the damage has seldom been reported. A review article on the Japanese beetle by Potter and Held [11] contains 200 references with only eight (4 percent) papers published in Japan.
Among 54 species from the US, the fall webworm, Hyphantria cunea (introduced in 1945), the rice water weevil, Lissorhoptrus oryzophilus (introduced in 1976) and the pine wood nematode, Bursaphelenchus xylophilus (which was introduced in 1905, and the causal agent of pine wilt diseases transmitted by the Japanese pine sawyer, Monochamus alternatus) are the most outstanding pests. Cherry, rice, and pine are the plants representative of Japanese scenery. Each of these plants has been seriously damaged by these invasive species, and the magnitude of the damage was not predicted before their invasions [12].
Generally speaking, as was the case for the Japanese beetle, alien species often invade new areas unaccompanied by their natural enemies. Secondly, all arthropod invasions consist of a small number of tiny organisms with a restricted distribution. The inability to detect them in the process of invasion makes it difficult to eradicate them. Our analyses suggested that invasive insects have a latent period of at least 4-10 years after initial colonization before they were detected [3].
Human activities play an important role by providing alien insects with favorable habitats that have been altered and created by humans. In contrast, biological characteristics of insects, such as the rate of population increase and dispersal ability, play an important role when they expand their distribution range within a country.
Several attempts have been made to characterize successful and unsuccessful invaders [13, 14, 15]. Characteristics of successful invaders such as being polyphagous, multivoltine, parthenogenetic, associated with humans, and having good dispersal capability are generally accepted as appropriate. However, there are so many exceptions that it is not justified to use these characteristics as reliable indicators of a species potential to invade [14,15]. Indeed, the rice water weevil represents a typical example (Table 2).
Table 1. The number of species invaded Japan from the US.
Period No.species No.species/year1860-1939 7 0.091940-1969 12 0.41970-1999 32 1.1 Characteristics
of successfulinvader
Pine wood nematode/Japanese pine sawyer Fall webworm
Rice waterweevil
Polyphagous X/X O X
Multivoltine O/X O X
Parthenogenic X/X X O
Anthropogenic X/X O ±
Good dispersal X/X X Oability 4.2 km/year [28] Hitchhike 28-47km/year
Table 2. Are the characteristics of successful invaders useful topredict potential invasive alien species?
X: yes, O: no, ±: neutral
Proccedings: IUFRO Kanazawa 2003 "Forest Insect Population Dynamics and Host Influences” - 7 -
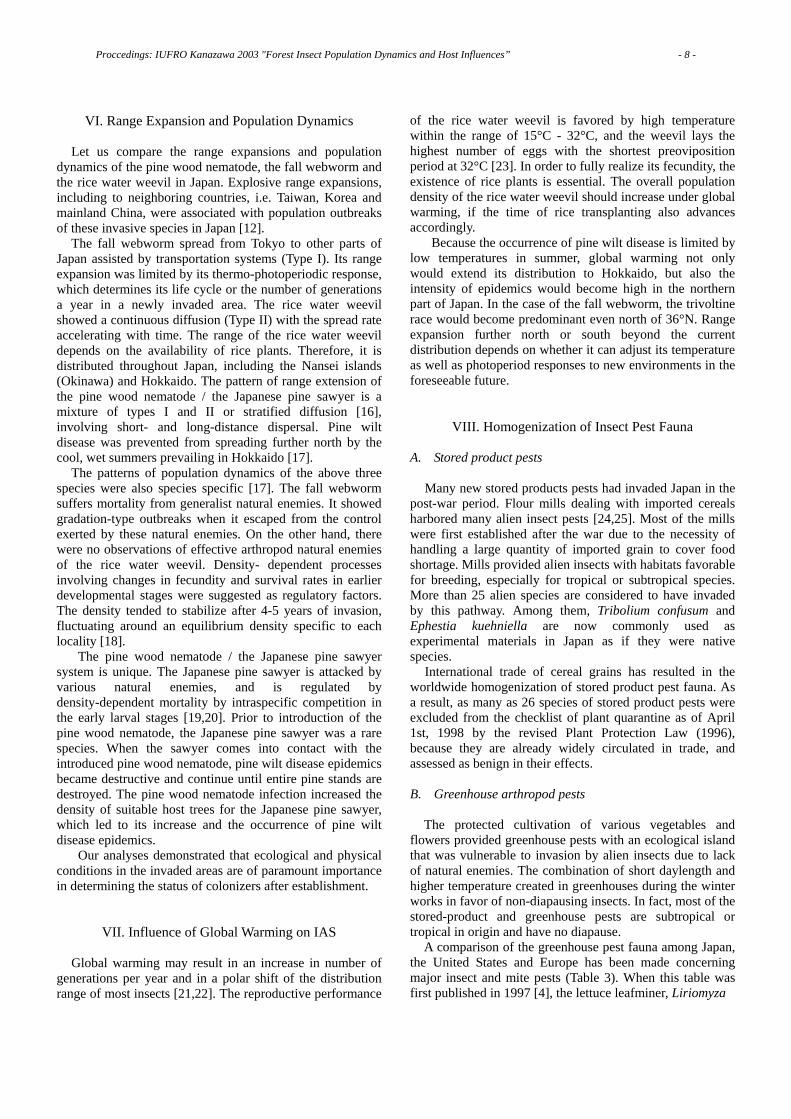
VI. Range Expansion and Population Dynamics
Let us compare the range expansions and population dynamics of the pine wood nematode, the fall webworm and the rice water weevil in Japan. Explosive range expansions, including to neighboring countries, i.e. Taiwan, Korea and mainland China, were associated with population outbreaks of these invasive species in Japan [12].
The fall webworm spread from Tokyo to other parts of Japan assisted by transportation systems (Type I). Its range expansion was limited by its thermo-photoperiodic response, which determines its life cycle or the number of generations a year in a newly invaded area. The rice water weevil showed a continuous diffusion (Type II) with the spread rate accelerating with time. The range of the rice water weevil depends on the availability of rice plants. Therefore, it is distributed throughout Japan, including the Nansei islands (Okinawa) and Hokkaido. The pattern of range extension of the pine wood nematode / the Japanese pine sawyer is a mixture of types I and II or stratified diffusion [16], involving short- and long-distance dispersal. Pine wilt disease was prevented from spreading further north by the cool, wet summers prevailing in Hokkaido [17].
The patterns of population dynamics of the above three species were also species specific [17]. The fall webworm suffers mortality from generalist natural enemies. It showed gradation-type outbreaks when it escaped from the control exerted by these natural enemies. On the other hand, there were no observations of effective arthropod natural enemies of the rice water weevil. Density- dependent processes involving changes in fecundity and survival rates in earlier developmental stages were suggested as regulatory factors. The density tended to stabilize after 4-5 years of invasion, fluctuating around an equilibrium density specific to each locality [18].
The pine wood nematode / the Japanese pine sawyer system is unique. The Japanese pine sawyer is attacked by various natural enemies, and is regulated by density-dependent mortality by intraspecific competition in the early larval stages [19,20]. Prior to introduction of the pine wood nematode, the Japanese pine sawyer was a rare species. When the sawyer comes into contact with the introduced pine wood nematode, pine wilt disease epidemics became destructive and continue until entire pine stands are destroyed. The pine wood nematode infection increased the density of suitable host trees for the Japanese pine sawyer, which led to its increase and the occurrence of pine wilt disease epidemics.
Our analyses demonstrated that ecological and physical conditions in the invaded areas are of paramount importance in determining the status of colonizers after establishment.
VII. Influence of Global Warming on IAS
Global warming may result in an increase in number of generations per year and in a polar shift of the distribution range of most insects [21,22]. The reproductive performance
of the rice water weevil is favored by high temperature within the range of 15°C - 32°C, and the weevil lays the highest number of eggs with the shortest preoviposition period at 32°C [23]. In order to fully realize its fecundity, the existence of rice plants is essential. The overall population density of the rice water weevil should increase under global warming, if the time of rice transplanting also advances accordingly.
Because the occurrence of pine wilt disease is limited by low temperatures in summer, global warming not only would extend its distribution to Hokkaido, but also the intensity of epidemics would become high in the northern part of Japan. In the case of the fall webworm, the trivoltine race would become predominant even north of 36°N. Range expansion further north or south beyond the current distribution depends on whether it can adjust its temperature as well as photoperiod responses to new environments in the foreseeable future.
VIII. Homogenization of Insect Pest Fauna A. Stored product pests
Many new stored products pests had invaded Japan in the post-war period. Flour mills dealing with imported cereals harbored many alien insect pests [24,25]. Most of the mills were first established after the war due to the necessity of handling a large quantity of imported grain to cover food shortage. Mills provided alien insects with habitats favorable for breeding, especially for tropical or subtropical species. More than 25 alien species are considered to have invaded by this pathway. Among them, Tribolium confusum and Ephestia kuehniella are now commonly used as experimental materials in Japan as if they were native species.
International trade of cereal grains has resulted in the worldwide homogenization of stored product pest fauna. As a result, as many as 26 species of stored product pests were excluded from the checklist of plant quarantine as of April 1st, 1998 by the revised Plant Protection Law (1996), because they are already widely circulated in trade, and assessed as benign in their effects. B. Greenhouse arthropod pests
The protected cultivation of various vegetables and flowers provided greenhouse pests with an ecological island that was vulnerable to invasion by alien insects due to lack of natural enemies. The combination of short daylength and higher temperature created in greenhouses during the winter works in favor of non-diapausing insects. In fact, most of the stored-product and greenhouse pests are subtropical or tropical in origin and have no diapause.
A comparison of the greenhouse pest fauna among Japan, the United States and Europe has been made concerning major insect and mite pests (Table 3). When this table was first published in 1997 [4], the lettuce leafminer, Liriomyza
Proccedings: IUFRO Kanazawa 2003 "Forest Insect Population Dynamics and Host Influences” - 8 -
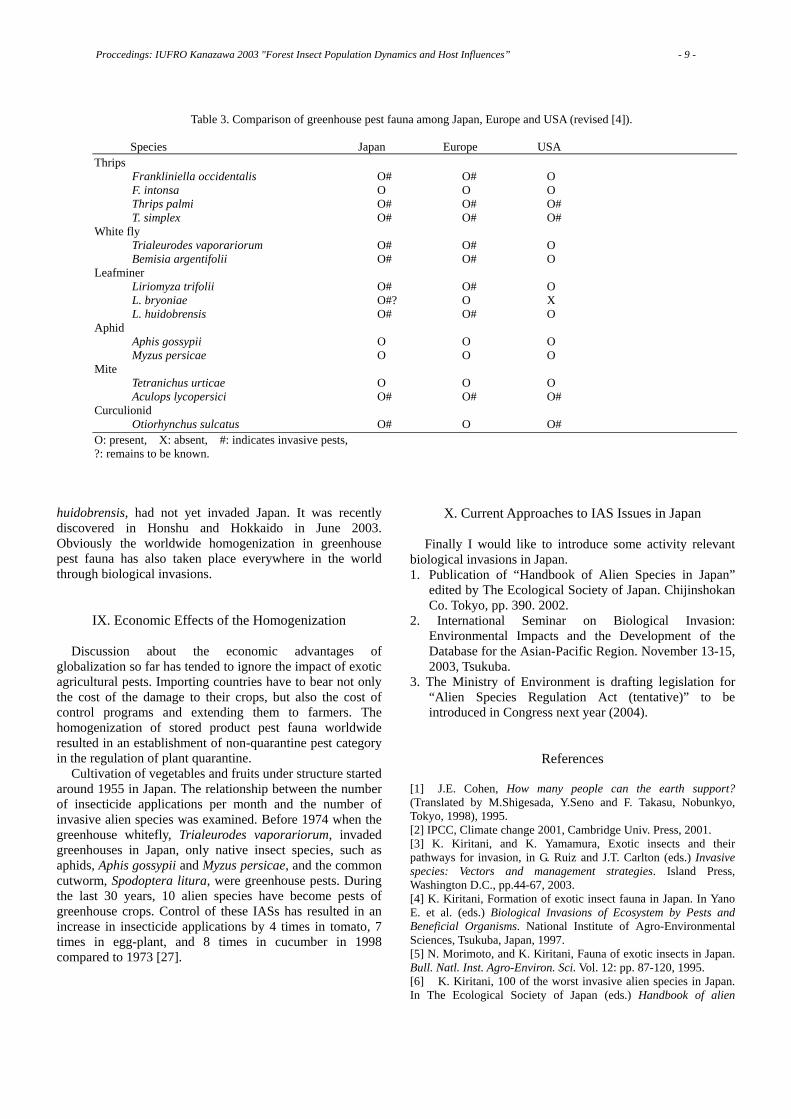
Table 3. Comparison of greenhouse pest fauna among Japan, Europe and USA (revised [4]).
Species Japan Europe USA Thrips Frankliniella occidentalis O# O# O F. intonsa O O O Thrips palmi O# O# O# T. simplex O# O# O# White fly Trialeurodes vaporariorum O# O# O Bemisia argentifolii O# O# O Leafminer Liriomyza trifolii O# O# O L. bryoniae O#? O X L. huidobrensis O# O# O Aphid Aphis gossypii O O O Myzus persicae O O O Mite Tetranichus urticae O O O Aculops lycopersici O# O# O# Curculionid Otiorhynchus sulcatus O# O O# O: present, X: absent, #: indicates invasive pests, ?: remains to be known.
huidobrensis, had not yet invaded Japan. It was recently discovered in Honshu and Hokkaido in June 2003. Obviously the worldwide homogenization in greenhouse pest fauna has also taken place everywhere in the world through biological invasions.
IX. Economic Effects of the Homogenization
Discussion about the economic advantages of globalization so far has tended to ignore the impact of exotic agricultural pests. Importing countries have to bear not only the cost of the damage to their crops, but also the cost of control programs and extending them to farmers. The homogenization of stored product pest fauna worldwide resulted in an establishment of non-quarantine pest category in the regulation of plant quarantine.
Cultivation of vegetables and fruits under structure started around 1955 in Japan. The relationship between the number of insecticide applications per month and the number of invasive alien species was examined. Before 1974 when the greenhouse whitefly, Trialeurodes vaporariorum, invaded greenhouses in Japan, only native insect species, such as aphids, Aphis gossypii and Myzus persicae, and the common cutworm, Spodoptera litura, were greenhouse pests. During the last 30 years, 10 alien species have become pests of greenhouse crops. Control of these IASs has resulted in an increase in insecticide applications by 4 times in tomato, 7 times in egg-plant, and 8 times in cucumber in 1998 compared to 1973 [27].
X. Current Approaches to IAS Issues in Japan
Finally I would like to introduce some activity relevant biological invasions in Japan. 1. Publication of “Handbook of Alien Species in Japan”
edited by The Ecological Society of Japan. Chijinshokan Co. Tokyo, pp. 390. 2002.
2. International Seminar on Biological Invasion: Environmental Impacts and the Development of the Database for the Asian-Pacific Region. November 13-15, 2003, Tsukuba.
3. The Ministry of Environment is drafting legislation for “Alien Species Regulation Act (tentative)” to be introduced in Congress next year (2004).
References [1] J.E. Cohen, How many people can the earth support? (Translated by M.Shigesada, Y.Seno and F. Takasu, Nobunkyo, Tokyo, 1998), 1995. [2] IPCC, Climate change 2001, Cambridge Univ. Press, 2001. [3] K. Kiritani, and K. Yamamura, Exotic insects and their pathways for invasion, in G. Ruiz and J.T. Carlton (eds.) Invasive species: Vectors and management strategies. Island Press, Washington D.C., pp.44-67, 2003. [4] K. Kiritani, Formation of exotic insect fauna in Japan. In Yano E. et al. (eds.) Biological Invasions of Ecosystem by Pests and Beneficial Organisms. National Institute of Agro-Environmental Sciences, Tsukuba, Japan, 1997. [5] N. Morimoto, and K. Kiritani, Fauna of exotic insects in Japan. Bull. Natl. Inst. Agro-Environ. Sci. Vol. 12: pp. 87-120, 1995. [6] K. Kiritani, 100 of the worst invasive alien species in Japan. In The Ecological Society of Japan (eds.) Handbook of alien
Proccedings: IUFRO Kanazawa 2003 "Forest Insect Population Dynamics and Host Influences” - 9 -
species in Japan, 2002 (in Japanese). [7] K. Kiritani, Exotic insects in Japan, Entomological Science, Vol. 1: pp. 291-298, 1998. [8] K. Kiritani, Invasive insect pests and plant quarantine in Japan, FFTC Extension Bulletin Vol. 498, 2001. [9] T. Oobayashi, Alien insects in the Ogasawara islands. In The Ecological Society of Japan (eds.) Handbook of alien species in Japan, pp.239-240, 2002 (in Japanese). [10] K. Kiritani, Insect invasions in the world. Insectarium Vol. 37: pp. 224-235, 2001 (in Japanese). [11] D. A. Potter, and D.W. Held, Biology and management of the Japanese beetle. Annual Review of Entomology Vol. 47: pp. 175-205, 2002. [12] N. Morimoto and K. Kiritani, Pests from North America: the pine wood nematode, the fall webworm and the rice water weevil. Insect and Nature Vol. 37, No. 3: pp.4-7, 2002 (in Japanese). [13] K. Kiritani, Colonizing insects: What makes a successful colonizer? Insectarium Vol. 20: pp. 310-317, 1983 (in Japanese). [14] P. R. Ehrlich, Attributes of invaders and the invading processes: vertebrates. In Drake, J.A. et al. (eds.) Biological invasions: a global perspective, John Wiley & Sons, Chichester, Great Britain, pp. 315-328, 1989. [15] J.C. van Lenteren, Frequency and consequences of insect invasions. In H.M.T. Hokkanen and J.M. Lynch (eds.) Biological control: Benefits and Risks, Cambridge University Press, UK, 1995. [16] B. Hengeveld, Dynamics of biological invasions. Chapman and Hall Ltd. N.Y. USA, 1989. [17] K. Kiritani and N. Morimoto, Invasive insect and nematode pests from North America. Global Environmental Research Vol. 8: pp. 75-88, 2004. [18] J. Kayumi et al., Studies on the population dynamics of the rice water weevil, Lissorhoptrus oryzophilus Kuschell. Jap. Jour. Appl. Entomol. Zool. Vol. 28: pp. 274-281, 1984 (in Japanese with English summary). [19] F. Kobayashi, The Japanese pine sawyer. In A.A. Berryman (ed.) Dynamics of forest insect populations, Plenum Pub. Co. N.Y. pp.432-454, 1988. [20] F. Kobayashi, A. Yamane and T. Ikeda, The Japanese pine sawyer beetle as the vector of pine wilt disease. Annual Review of Entomology Vol. 29: pp. 115-135, 1984. [21] N. Morimoto, O. Imura and T. Kiura, Potential effects on global warming on the occurrence of Japanese pest insects. Appl. Entomol. Zool. Vol. 33: pp. 147-155, 1998. [22] K. Yamamura and K. Kiritani, A simple method to estimate the potential increase in the number of generations under global warming in temperate zones. Appl. Entomol. Zool. Vol. 33: pp. 289-298, 1998. [23] N. Morimoto, unpublished. [24] K. Kiritani, T. Muramatu and S. Yoshimura, Characteristics of mills in faunal composition of stored product pests: Their role as a reservoir of new imported pests. Jap. Jour. Appl. Entomol. and Zool. Vol. 7: pp. 49-58, 1963. [25] K. Kiritani Insect infestation of stored rice in Japan. Proc. XII Intl. Congr. Entomol. London, 630-631, 1965. [26] M. Matsuzaki, and K. Kiritani, A perspective on the integrated control of greenhouse pests. Nogyo oyobi Engei Vol. 47: pp. 1-7 1972 (in Japanese). [27] K. Kiritani,.Toward IBM in paddy ecosystems. Tsukiji-syokan, Tokyo, pp.192, 2004 (in Japanese). [28] F. Takasu, N.Yamamoto, K. Kawasaki, K. Togashi, Y. Kishi and N. Shigesada, Modeling the expansion of an introduced tree disease. Biological Invasions Vol. 2: pp. 141-150, 2000.
Proccedings: IUFRO Kanazawa 2003 "Forest Insect Population Dynamics and Host Influences” - 10 -
Rich Biota in the Forests of Yanbaru, Northern Montane Part of Okinawa Island, Japan, and Imminent Extinction Crisis of the Endangered Species
Yosiaki ITÔ 2-2908, Kaguyama, Nisshin, Aichi 470-0134, JAPAN
Abstract - Yanbaru, the northern montane portion of Okinawa Island, has historically been dominated by evergreen bloadleaf forests with remarkably rich biota, but many parts of the forest are now being destroyed as a result of government policy. Although there are many endemic animals and plants in the remaining natural forests, many of them are now in imminent risk of extinction. The status of populations of vertebrate animals listed in the Red List is described. Species diversity in Yanbaru forests is possibly highest among all Japanese forests, and this may be a dominant cause of the evolution and maintenance of many endemic species. However, the diversity has been diminished by forest cutting and removal of forest undergrowth by government subsidies. Suspension of clear-cutting and undergrowth removal, and change of proposed helipad sites from natural forest areas are necessary to preserve the unique biota of this area.
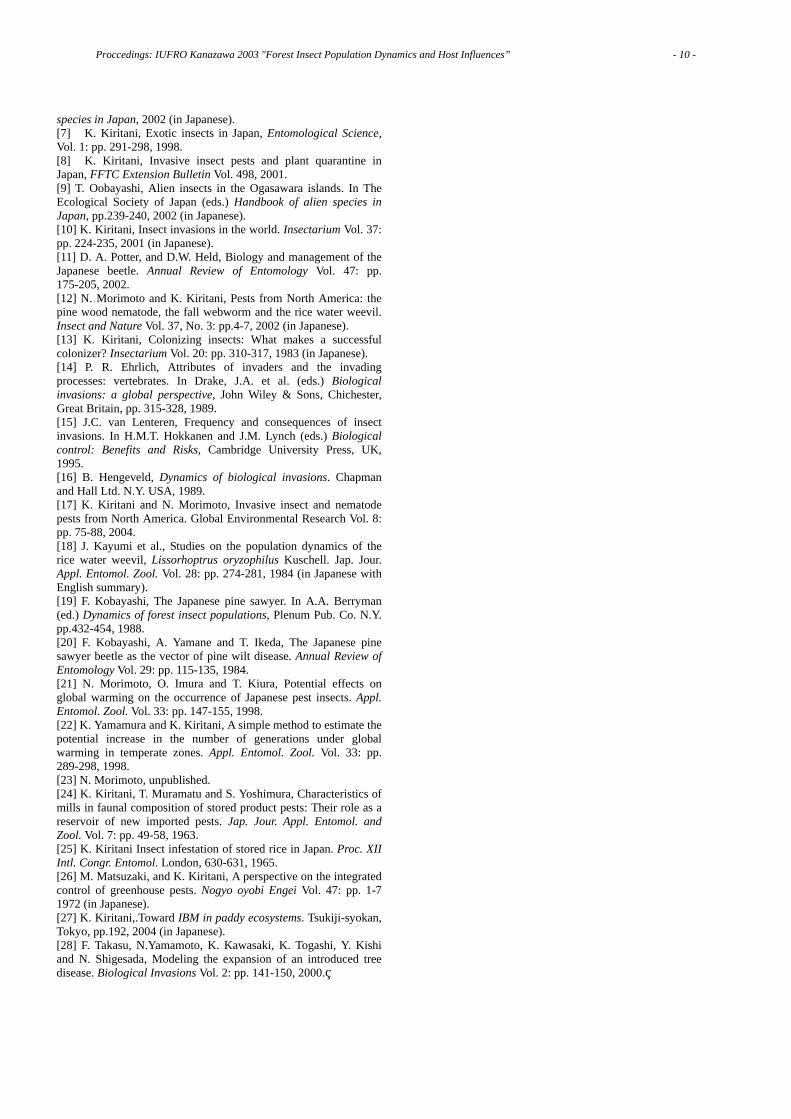
I. Introduction Yanbaru, the northern montane portion of Okinawa Island (Okinawa Hontô), the largest island of the Ryukyu Archipelago of Japan, is an important area from the viewpoint of nature conservation, because it supports a number of specialized endemic animals and plants. The Ryukyu Archipelago (hereafter RA) is situated in southwestern sea between Kyushu and Taiwan (Formosa). It exists in the Oriental Region in a different biogeographic division from mainland Japan, which is in the Palearctic Region. Climax vegetation of RA consists of evergreen bloadleaf forests, usually dominated by the evergreen oak, Castanopsis sieboldii. RA is one of a small number of wet subtropic areas which includes Taiwan, northern Thailand and the Florida Peninsula (the climate of most other subtropic areas is dry). However, due to destruction of much of the natural forests during World War II and serious exploitation since the return of Okinawa to Japan, large natural forests are now remain in only three areas, Amani-Toku Area (including two islands, Amani-Oshima and Tokunosima), Yanbaru, and Iriomote Island. As shown in Figure 1, many parts of natural forest of Yanbaru were cut (denoted as secondary forests), except the area occupied by the US Marine Corps Northern Training Area. Although true virgin forest is restricted to a few small sites because a large part of Yanbaru forest was subjected to thinning or clear-cutting, forest sections that were thinned or cut 40-50 years ago have recovered the basic features of the climax community. Following the definition of the Nature
Conservation Society of Japan [1], we refer to the parts of the Yanbaru forest dominated by Castanopsis sieboldii trees older than 30 years as natural forests. Here, I report on the rich biota of Yanbaru, the imminent extinction crisis of endangered endemic animals, and high species diversity which has supported the endemic animals.
Fig. 1. Map of Yanbaru, showing natural forests, US Marine Corps Northern Training Area and areas proposed for establishment of Marine Corps helipads (A and B).
Proccedings: IUFRO Kanazawa 2003 "Forest Insect Population Dynamics and Host Influences” - 11 -
II. Number of Vertebrate Species and Their Extinction Crisis in Yanbaru
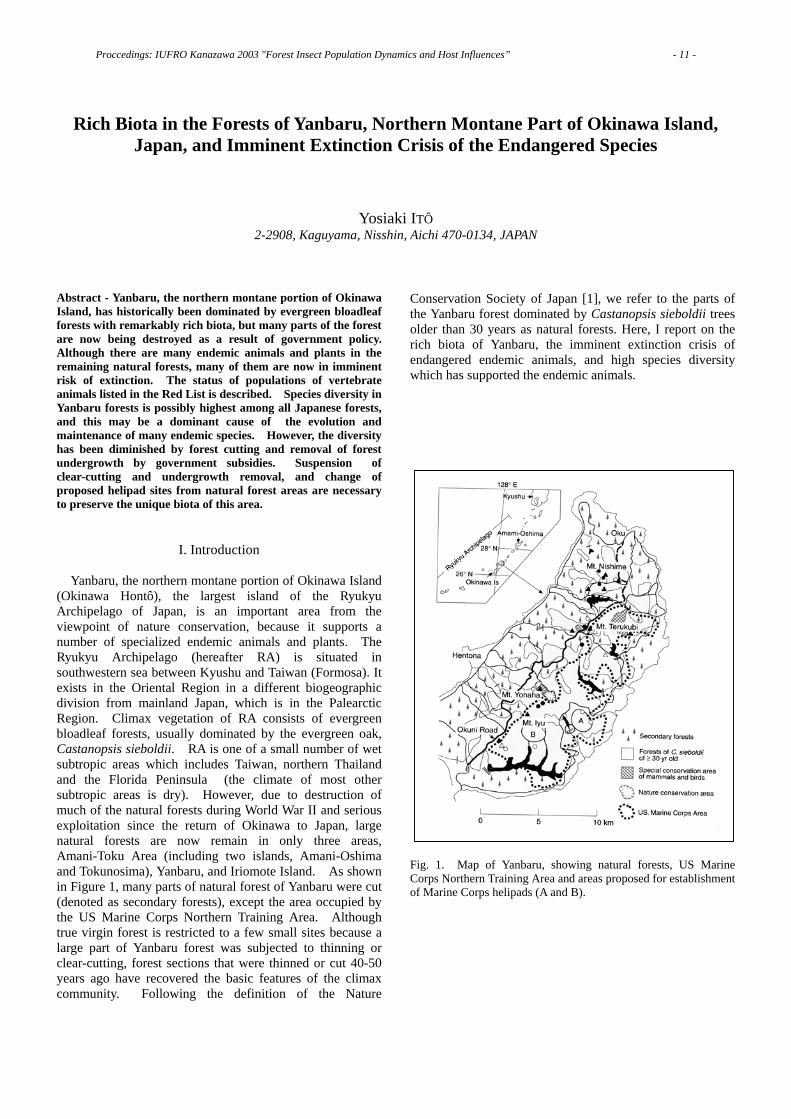
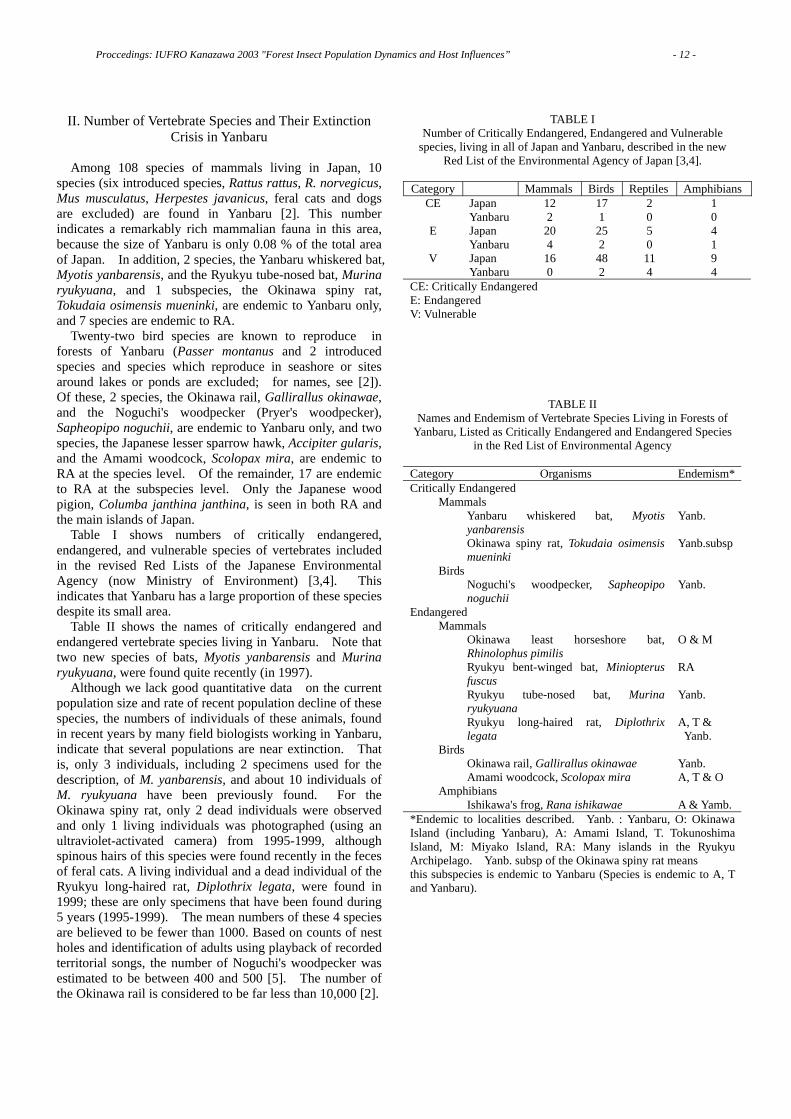
Among 108 species of mammals living in Japan, 10 species (six introduced species, Rattus rattus, R. norvegicus, Mus musculatus, Herpestes javanicus, feral cats and dogs are excluded) are found in Yanbaru [2]. This number indicates a remarkably rich mammalian fauna in this area, because the size of Yanbaru is only 0.08 % of the total area of Japan. In addition, 2 species, the Yanbaru whiskered bat, Myotis yanbarensis, and the Ryukyu tube-nosed bat, Murina ryukyuana, and 1 subspecies, the Okinawa spiny rat, Tokudaia osimensis mueninki, are endemic to Yanbaru only, and 7 species are endemic to RA. Twenty-two bird species are known to reproduce in forests of Yanbaru (Passer montanus and 2 introduced species and species which reproduce in seashore or sites around lakes or ponds are excluded; for names, see [2]). Of these, 2 species, the Okinawa rail, Gallirallus okinawae, and the Noguchi's woodpecker (Pryer's woodpecker), Sapheopipo noguchii, are endemic to Yanbaru only, and two species, the Japanese lesser sparrow hawk, Accipiter gularis, and the Amami woodcock, Scolopax mira, are endemic to RA at the species level. Of the remainder, 17 are endemic to RA at the subspecies level. Only the Japanese wood pigion, Columba janthina janthina, is seen in both RA and the main islands of Japan. Table I shows numbers of critically endangered, endangered, and vulnerable species of vertebrates included in the revised Red Lists of the Japanese Environmental Agency (now Ministry of Environment) [3,4]. This indicates that Yanbaru has a large proportion of these species despite its small area. Table II shows the names of critically endangered and endangered vertebrate species living in Yanbaru. Note that two new species of bats, Myotis yanbarensis and Murina ryukyuana, were found quite recently (in 1997). Although we lack good quantitative data on the current population size and rate of recent population decline of these species, the numbers of individuals of these animals, found in recent years by many field biologists working in Yanbaru, indicate that several populations are near extinction. That is, only 3 individuals, including 2 specimens used for the description, of M. yanbarensis, and about 10 individuals of M. ryukyuana have been previously found. For the Okinawa spiny rat, only 2 dead individuals were observed and only 1 living individuals was photographed (using an ultraviolet-activated camera) from 1995-1999, although spinous hairs of this species were found recently in the feces of feral cats. A living individual and a dead individual of the Ryukyu long-haired rat, Diplothrix legata, were found in 1999; these are only specimens that have been found during 5 years (1995-1999). The mean numbers of these 4 species are believed to be fewer than 1000. Based on counts of nest holes and identification of adults using playback of recorded territorial songs, the number of Noguchi's woodpecker was estimated to be between 400 and 500 [5]. The number of the Okinawa rail is considered to be far less than 10,000 [2].
TABLE I Number of Critically Endangered, Endangered and Vulnerable
species, living in all of Japan and Yanbaru, described in the new Red List of the Environmental Agency of Japan [3,4].
Category Mammals Birds Reptiles Amphibians
CE Japan 12 17 2 1 Yanbaru 2 1 0 0
E Japan 20 25 5 4 Yanbaru 4 2 0 1
V Japan 16 48 11 9 Yanbaru 0 2 4 4
CE: Critically Endangered E: Endangered V: Vulnerable
TABLE II Names and Endemism of Vertebrate Species Living in Forests of
Yanbaru, Listed as Critically Endangered and Endangered Species in the Red List of Environmental Agency
Category Organisms Endemism*Critically Endangered Mammals Yanbaru whiskered bat, Myotis
yanbarensis Yanb.
Okinawa spiny rat, Tokudaia osimensis mueninki
Yanb.subsp
Birds Noguchi's woodpecker, Sapheopipo
noguchii Yanb.
Endangered Mammals Okinawa least horseshore bat,
Rhinolophus pimilis O & M
Ryukyu bent-winged bat, Miniopterus fuscus
RA
Ryukyu tube-nosed bat, Murina ryukyuana
Yanb.
Ryukyu long-haired rat, Diplothrix legata
A, T & Yanb.
Birds Okinawa rail, Gallirallus okinawae Yanb. Amami woodcock, Scolopax mira A, T & O Amphibians Ishikawa's frog, Rana ishikawae A & Yamb.*Endemic to localities described. Yanb. : Yanbaru, O: Okinawa Island (including Yanbaru), A: Amami Island, T. Tokunoshima Island, M: Miyako Island, RA: Many islands in the Ryukyu Archipelago. Yanb. subsp of the Okinawa spiny rat means this subspecies is endemic to Yanbaru (Species is endemic to A, T and Yanbaru).
Proccedings: IUFRO Kanazawa 2003 "Forest Insect Population Dynamics and Host Influences” - 12 -

III. Biodiversity in Yanbaru Forests
Species diversity is one of the most important aspects of the biodiversity, and high species diversity may be an important factor of evolution and maintenance of many endemic animals and plants in small islands. Many indices have been proposed to measure species diversity, including species richness and heterogeneity of numbers of individuals among species in a community. We used three indices, log (1/D), 1−D, and H' ;
∑ −
−=
)1()1(
NNnn
D ii
and ∑ ⋅−=′ )./(log)/( 2 NnNnH ii
N is the total number of individuals and ni is the number of individuals of ith species. 1−D and log(1/D) were recommended for comparison of species diversity of different communities by Lande [6] and Itô and Sato [7], respectively. Large values of these indices indicate high species diversity (but for 1−D, the maximum value is 1). Although H' has most frequently been used for this purpose, this index has a weakness, namely that is strongly affected by the sample size [6, 7, 8]. However we still used this index because this is sensitive to changes in rare species in the community, in contrast to 1−D and log (1/D), which are
sensitive to changes in the most abundant species [9]. Table III shows the number of species, total number of individuals, and species diversity calculated for trees, insects living in the forest floor, ground ants and oribatid mites living in soil. As shown here, the diversity of tree species in the natural forests (> 50 years old) of Yanbaru is much higher than that of the deciduous broadleaf forests of Hokkaido, and higher than the evergreen broadleaf forests of Kyushu (see [10] for detailed explanation). Table III also demonstrates that tree species diversity of the secondary forests (< 20 years old) of Yanbaru is lower than that of natural forests. Tree species diversity of the forests of Yanbaru is possibly the highest among Japanese forests (near that of tropical rain forest [10]). Three diversity indices show similar trends in relation to localities, ages and conditions of forests, not only for trees but also for insects and mites, but values of log (1/D) may be best indicator. The natural forests of Yanbaru show high species diversity of insects ([11], for values of "no u. g.", see later), similar to the natural forests on Iriomote Island. The value for secondary forests on Iriomote is lower than for natural forests. The species diversity of ants, using data collected from 30 min counts of nests, also show a far higher diversity in Yanbaru than in Hokkaido [12].
TABLE III Number of species (S), total number of individuals (N), and species diversity indices [log(1/D), 1–D and H' ] of some groups of plants and animals in Yanbaru and some other places. Mean ±s.d. was shown for data of three or more samples. DBH: Diameter at breast height.
Regarding insects, ants and oribatid mites, "natural" means natural evergreen forests while "no u. g." means forests from which the undergrowth was completely cut and removed.
Group and area S N log(1/D) 1−D H' Trees (DBH > 4.5 cm). Surveyed area: 4 a in Yanbaru and Kyushu, 5 a in Hokkaido
Yanbaru natural forests(>50 yr old) 29.4±2.5 149±26 1.10±0.04 0.92±0.01 3.66 Yanbaru secondary forests (<20 yr old) 23.7±10.4 191±92 0.79±0.19 0.83±0.07 3.31 Hokkaido 5 80.5 0.48 0.34 0.96 Kyushu 12.8±2.4 181±4 0.68±0.30 0.79±0.10 2.85
Insects (sweep net survey, Lepidoptera, Hymenoptera and Diptera are excluded) Yanbaru, natural 75.7±3.1 282±47 16.5±5.7 0.94±0.02 5.03 Yanbaru, no u. g. 66.7±4.5 553±200 7.3±2.9 0.85±0.06 4.12 Iriomote, natural 58 202 15.8 0.94 4.94 Iriomote, secondary 53 256 6.6 0.85 4.00
Ants (Counting of nests during 30 minutes) Yanbaru, natural 14 43 10.0 0.90 3.41 Hokkaido 7 183 1.50 0.33 1.08 Iriomote 16 46 7.29 0.86 3.35
Oribatid mites (Tullgren extraction of 3 soil samples of 10 X10 X 5 cm) Yanbaru, natural 38±8 161±31 15.0±5.3 0.93±0.03 4.38 Yanbaru, no u. g. 33±10 293±176 9.30±0.73 0.89±0.01 3.84
Proccedings: IUFRO Kanazawa 2003 "Forest Insect Population Dynamics and Host Influences” - 13 -

IV. Destruction of the Yanbaru Forest Since 1972, when Okinawa was returned to Japan, the natural forests of Yanbaru have been seriously damaged in two ways: (1) by large scale clear-cutting, and (2) by undergrowth removal [2]. The extent of Yanbaru forests cut during the 13 years from 1979 to 1991 was 2,443 ha. Nearly half of all natural forests outside of the US Marine Corps Area was clear-cut. Complete cutting and removal of undergrowth (i.e. tree seedlings, shrubs and herbs smaller than 2 - 3 m) was also carried out under a government subsidy through the "Natural Forest Improvement Project". The undergrowth was removed from 3,069 ha of the forest over a 21-year period from 1972 to 1992. Although this area includes some secondary forests, we estimated that the undergrowth was removed from about a half of the natural forests [2, 10]. Large scale clear-cutting of the forests completely deprives the endemic biota of the natural habitat. Even the removal of undergrowth affects populations of ground animals such as the Okinawa spiny rat, the Ryukyu long-haired rat, the Okinawa rail, and small animals living in the forest floor. Table III shows that the species diversity of insects and mites in 'no undergrowth forests' is always lower than that of intact natural forests. Although the total number of individuals (N) in forests without undergrowth was apparently larger than that in the intact forests, this was due to an outbreak of some insect species, which are not normal inhabitants of the natural forests, but are aliens feeding on rotten logs or herbs invaded into the 'gaps' of forests without undergrowth. The values of species diversity indices, however, are not the only important consideration; the characteristics of the species found in the natural forests are important as well. Table IV shows that all of the oribatid mite species affected by the removal of undergrowth (except for Pergalumna intermedia) are known only from RA or Yanbaru (including 2 newly-described species), while all those unaffected by undergrowth removal (except for Dimidiogalumna azumai) are cosmopolitan or widely-distributed species. This fact suggests that many endemic small animals have been seriously damaged by the removal of undergrowth, and some of them might have become extinct already. Another problem associated with clear-cutting and undergrowth removal is soil erosion. Erosion of soil into the coastal ecosystem has killed corals and inhibits their recovery (corals around Okinawa have historically been one of 18 most species-rich corals in the world, but are now undergoing serious destruction [14]). The estuaries of about 80 percent of rivers in Yanbaru area have been blocked by the soil and sand [2]. Although water can pass into the sea through infiltration, diadromous fish and crustaceans, including several endemic species, became unable to swim up to rivers or to return to the sea. During the 20th century, US Marine Corps Area provided large natural areas for the conservation of biodiversity and endemic species (see Fig. 1). However a new problem arose
in 1999. According to the Special Action Committee on Okinawa, by the governments of Japan and USA, the northern portion of the Marine Corps Area will be returned to Japan. Following a request from the US government, the Defense Facilities Administration Agency of Japan is planning to construct seven new helipads in southern part of the Marine Corps Area, in place of their location in secondary forests to be returned to Japan. Two sites proposed are shown in Figure 1; both lie in Yanbaru's best natural forest areas. If this proposal is carried-out, construction activities and noise from helicopters may interrupt breeding activities of endemic animals. For the preservation of nature and avoidance of extinction of endemic animals and plants in Yanbaru, suspension of clear-cutting and undergrowth removal and relocation of proposed helipads sites are necessary. The Ecological Society of Japan repeatedly has requested these actions to the national and prefectural governments, and some foreign societies, such as the American Bird Conservancy assisted this action. But the destruction is still continuing. We sincerely wish for the attention and assistance of scientists in IUFRO with this problem.
TABLE IV Distribution of oribatid mite species affected by undergrowth
removal and those relatively un-affected by it. (n. s.) shows species newly described during our survey [13].
Distribution Species A. Species of which number of individuals were remarkably decreased by undergrowth removal Endemic to Ryukyus Perscheloribates clavatus torquatus Galmna glanalata Trichotocepheus amamiensis Hokkaido & Okinawa Pergalumna intermedia Yanbaru only Yambaramerus itoi (n. s.) Allogalumna rotundiceps (n. s.) B. Species of which number of individuals were not decreased (or increased) by undergrowth removal Cosmopolitic species Oppiella nova Rostrozetes ovulum Mainland & Okinawa Eremovelba japonica Hammerella pectinata Arcoppia vioerea Yoshiobodes nakatamarii Zetorchestes aokii Dolicheremaeus baloghi Yanbaru only Dimidiogalumna azumai (n. s.)
Proccedings: IUFRO Kanazawa 2003 "Forest Insect Population Dynamics and Host Influences” - 14 -
References [1] Anon., "Forests of Yanbaru", Nature Conservation (Tokyo), Supplement to Volume for 1995 (In Japanese). [2] Y. Itô, K. Miyagi, H. Ota, "Imminent extinction crisis among the endemic species of the forests of Yanbaru, Okinawa, Japan", Oryx, Vol. 34, pp. 305-316, 2000. [3] Anon., “Revision of Red List of Amphibians and Reptiles”, The Environmental Agency of Japan, 1997 (In Japanese). [4] Anon., “Revision of Red List of Mammals and Birds”, The Environmental Agency of Japan, 1998 (In Japanese). [5] Y. Azama, "Present status of the Pryer's woodpecker, Sapheopipo noguchii, and measures preserve it", Abstract of Special Lectures on the Preservation of Bird Species in Okinawa. The Ornithological Society of Japan, Tokyo, 1996 (In Japanese). [6] R. Lande, "Statistics and partitioning of species diversity, and similarity among multiple communities", Oikos, Vol. 56, pp. 5-13, 1996. [7] Y. Itô, K. Sato, "Problems around the indices of species diversity for comparison of different communities", Seibutsu Kagaku (Biological Sciences), Vol. 53, pp. 204-220, 2002 (In Japanese). [8] M. Morisita, "On the influence of the sample size upon the values of species diversity", Japanese Journal of Ecology, Vol. 46, pp. 269-289, 1996 (In Japanese with English summary). [9] R. K. Peet, "The measurement of species diversity", Annual Review of Ecology and Systematics, Vol. 5, pp. 285-307, 1974. [10] Y. Itô, "Diversity of forest tree species in Yanbaru, the northern part of Okinawa Island", Plant Ecology, Vol. 133, pp. 125-133, 1997. [11] S. Azuma, T. Sasaki, Y. Itô, "Effects of undergrowth removal on the species diversity of insects in natural forests of Okinawa Hontô", Pacific Conservation Biology, Vol. 3, pp. 156-1650, 1997. [12] Itô, Y., H. Takamine, K. Yamauchi, " Abundance and species diversity of ants in forests of Yanbaru, the northern part of Okinawa Hontô with special reference to effects of undergrowth removal", Entomological Scicnece, Vol. 1, pp. 347-355, 1998. [13] Y. Itô, J. Aoki, " Species diversity of soil-inhabiting oribatid mites in Yanbaru, the northern part of Okinawa Hontô, and the effects of undergrowth removal on it", Pedobiologia, Vol. 43, pp. 110-119, 1999. [14] C. M. Robert et al., "Marine biodiversity hotspots and conservation priorities for tropical reefs", Science, Vol. 295, pp. 1280-1284, 2002.
Proccedings: IUFRO Kanazawa 2003 "Forest Insect Population Dynamics and Host Influences” - 15 -

Thanasimus formicarius (Coleoptera: Cleridae) : Why a Large Range of Prey for a Specialized Predator ?
Nathalie WARZEE, Jean-Claude GREGOIRE Biological Control and Spatial Ecology, Lab CP 160/12, Free University of Brussels, 50 avenue F.D. Roosevelt,B-1050
Brussels, BELGIUM Abstract - Thanasimus formicarius (L.) (Coleoptera : Cleridae) is a generalist predator of many scolytid species in spruce, pine and broadleaf stands. We tested here the hypothesis that, having a protracted adult life, the predators must leave pine stands, most favourable for their development and forage in other types of forest stands to find suitable prey during their whole flight period. The results reported here (data from continuous passive trapping of pine, spruce and broad-leaf bark beetles), showed continuous presence of bark beetles in the pine stand, which would allow the predators to remain in pine stands during their whole life. However, we observed changes in species composition and abundance during our two-year experiment, suggesting that uncertainties in prey supply could explain T. formicarius' wider range of prey.
I. Introduction
Thanasimus formicarius (L.) (Coleoptera: Cleridae) is one of the most common and best known predators of bark beetles [1]. Adults of T. formicarius live 4 to 10 months [2] and respond to bark-beetle pheromones [3,4,5] and to host-tree volatiles [6]. They land on trees that have been attacked by bark beetles, feed on the bark-beetle adults and lay eggs on the bark. Their larvae enter the scolytid galleries and feed on the immature stages of the bark beetles. Finally, pupation occurs in niches in the outer bark. T. formicarius is known to respond to the pheromones of Ips typographus, the spruce bark beetle [3]. In Belgium however, it was very seldom found associated with Ips typographus in spruce stands and was rarely caught in traps baited with I. typographus’ pheromone [7,8,9]. Moreover, T. formicarius was trapped in high numbers in pines. Past experiments suggested that bark thickness could be a critical factor limiting pupation of T. formicarius on spruce (J.C. Grégoire, in prep.). T. formicarius feeds on 27 bark-beetle species belonging to 15 genera (Dendroctonus, Dryocoetes, Hylastes, Hylesinus, Hylurgops, Hylurgus, Ips, Leperesinus, Orthotomicus, Pityogenes, Pityokteines, Polygraphus, Scolytus, Tomicus and Trypodendron) which infest coniferous (pine, spruce, larch, Douglas fir, …), and broad-leaved trees (oak, ash, poplar, …) [2,5,10].
We tested the hypothesis that T. formicarius develops more successfully on pine but, having a protracted adult life, must move to spruce or to other tree species to find suitable prey during periods corresponding to empty windows in the phenology of pine bark beetles. We monitored the flight periods of all bark-beetle species in three different types of stand (pines, spruces and broad-leaves) and compared them with the predators' flight period.
II. Material and method
Groups of five window traps were set-up from 22 March to 30 October 2001 and from 8 March to 31 October 2002, in several stands in the South of Belgium -- a pine (Pinus sylvestris L.) stand and a spruce (Picea abies L.) stand in 2001 and in 2002 and, additionally, an oak and beech stand in 2002. Each group of traps surrounded a pile of freshly cut logs, coming from the same stand. This pile of logs was replaced in the middle of the trapping period. The traps were inspected weekly and all scolytids were identified [11] and counted.
III. Results
There were more bark beetles and T. formicarius caught in the pine than in the spruce stand and the oak/beech broad-leaved stand (Table 1). There were also much higher catches in 2001 than in 2002. There were more "large" bark-beetle species (longer than 2 mm) trapped among pines (17) than among spruces (14) or broad-leaves (7).
TABLE I Total catches of bark beetles and T. formicarius
Bark beetles T. formicarius
2001 2002 2001 2002
pines 41,552 14,875 56 24
spruces 7,149 1,814 15 6
broad-leaves NA 853 NA 0
Proccedings: IUFRO Kanazawa 2003 "Forest Insect Population Dynamics and Host Influences” - 16 -
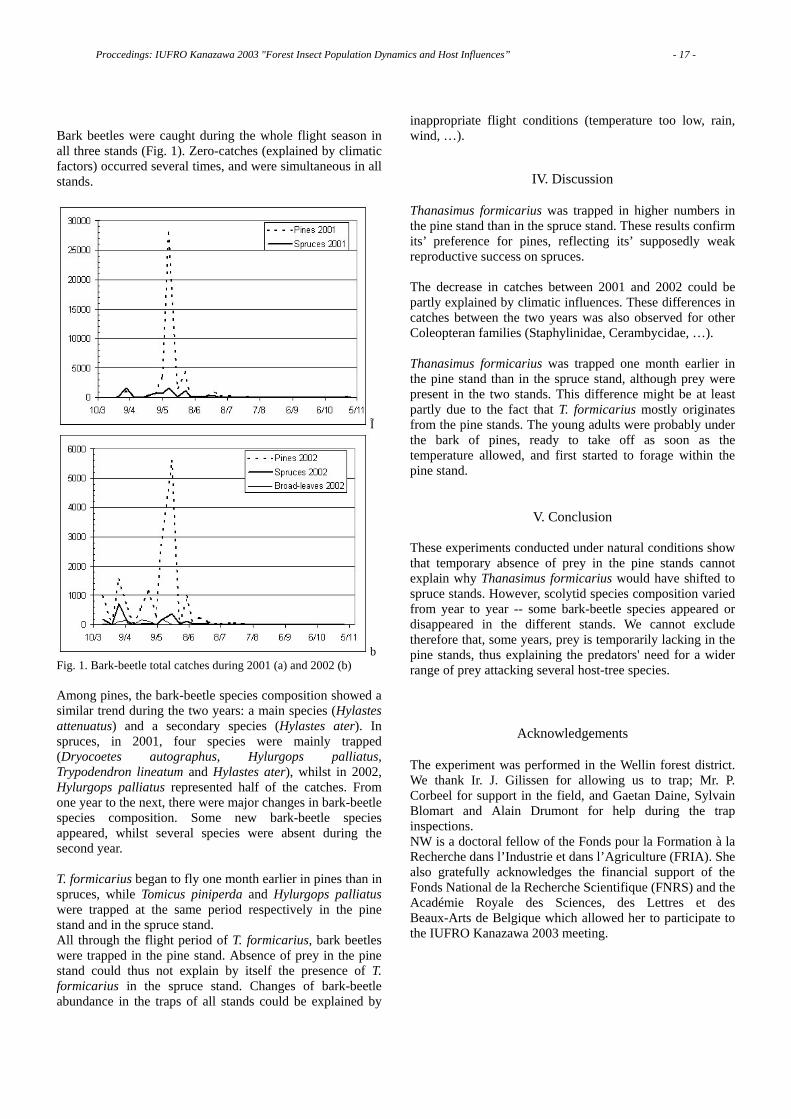
Bark beetles were caught during the whole flight season in all three stands (Fig. 1). Zero-catches (explained by climatic factors) occurred several times, and were simultaneous in all stands.
a
b Fig. 1. Bark-beetle total catches during 2001 (a) and 2002 (b) Among pines, the bark-beetle species composition showed a similar trend during the two years: a main species (Hylastes attenuatus) and a secondary species (Hylastes ater). In spruces, in 2001, four species were mainly trapped (Dryocoetes autographus, Hylurgops palliatus, Trypodendron lineatum and Hylastes ater), whilst in 2002, Hylurgops palliatus represented half of the catches. From one year to the next, there were major changes in bark-beetle species composition. Some new bark-beetle species appeared, whilst several species were absent during the second year. T. formicarius began to fly one month earlier in pines than in spruces, while Tomicus piniperda and Hylurgops palliatus were trapped at the same period respectively in the pine stand and in the spruce stand. All through the flight period of T. formicarius, bark beetles were trapped in the pine stand. Absence of prey in the pine stand could thus not explain by itself the presence of T. formicarius in the spruce stand. Changes of bark-beetle abundance in the traps of all stands could be explained by
inappropriate flight conditions (temperature too low, rain, wind, …).
IV. Discussion
Thanasimus formicarius was trapped in higher numbers in the pine stand than in the spruce stand. These results confirm its’ preference for pines, reflecting its’ supposedly weak reproductive success on spruces. The decrease in catches between 2001 and 2002 could be partly explained by climatic influences. These differences in catches between the two years was also observed for other Coleopteran families (Staphylinidae, Cerambycidae, …). Thanasimus formicarius was trapped one month earlier in the pine stand than in the spruce stand, although prey were present in the two stands. This difference might be at least partly due to the fact that T. formicarius mostly originates from the pine stands. The young adults were probably under the bark of pines, ready to take off as soon as the temperature allowed, and first started to forage within the pine stand.
V. Conclusion These experiments conducted under natural conditions show that temporary absence of prey in the pine stands cannot explain why Thanasimus formicarius would have shifted to spruce stands. However, scolytid species composition varied from year to year -- some bark-beetle species appeared or disappeared in the different stands. We cannot exclude therefore that, some years, prey is temporarily lacking in the pine stands, thus explaining the predators' need for a wider range of prey attacking several host-tree species.
Acknowledgements
The experiment was performed in the Wellin forest district. We thank Ir. J. Gilissen for allowing us to trap; Mr. P. Corbeel for support in the field, and Gaetan Daine, Sylvain Blomart and Alain Drumont for help during the trap inspections. NW is a doctoral fellow of the Fonds pour la Formation à la Recherche dans l’Industrie et dans l’Agriculture (FRIA). She also gratefully acknowledges the financial support of the Fonds National de la Recherche Scientifique (FNRS) and the Académie Royale des Sciences, des Lettres et des Beaux-Arts de Belgique which allowed her to participate to the IUFRO Kanazawa 2003 meeting.
Proccedings: IUFRO Kanazawa 2003 "Forest Insect Population Dynamics and Host Influences” - 17 -
References [1] J. Weslien, J. Regnander, “The influence of natural enemies on brood production in Ips typographus (Col.:Scolytidae) with special reference to egg-laying and predation by Thanasimus formicarius (Col.:Cleridae),” Entomophaga, Vol. 37, Issue 2, pp. 333-342, 1992. [2] R. Gauss, “Der Ameisenbuntkäfer Thanasimus formicarius Latr. als Borkenkäferfeind,” pp. 417-429 in G. Wellenstein (ed.), Die grosse Borkenkäferkalamität in Südwest-Deutschland 1944-1951, 1954. [3] A. Bakke, T. Kvamme, “Kairomone response in Thanasimus predators to pheromone components of Ips typographus,” J. Chem. Ecol., Vol. 7, Issue 2, pp. 305-312, 1981. [4] U. Kohnle, J.P. Vité, “Bark beetle predators: strategies in the olfactory perception of prey species by clerid and trogositid beetles,” Z. Ang. Entomol, Vol. 98, pp. 504-508, 1984. [5] B.A. Tommeras, “The clerid beetle Thanasimus formicarius is attracted to the pheromone of the ambrosia beetle Trypodendron lineatum,” Experientia, Vol. 44, pp. 536-537, 1988. [6] J.A. Rudinsky, V. Novak, P. Svihra, “Pheromone and terpene attraction in the bark beetle Ips typographus (L.),” Experientia, Vol. 27, pp. 161-162, 1971. [7] J. Merlin, J.C. Grégoire, “Les moyens de lutte contre les scolytes de l’épicéa et leurs effets sur l’entomofaune associée,” Actes du colloque “Gérer la nature ? ”, Vol. 15, Issue 2, pp. 813-826, 1990. [8] A. Drumont, R. Gonzalez, N. De Windt, J.C. Grégoire, M. De Proft, E. Seutin, “Semiochemicals and the integrated management of Ips typographus (L.) (Col.: Scolytidae) in Belgium,” J. Appl. Entomol., Vol. 114, Issue 4, pp. 333-337, 1992. [9] J.C. Grégoire, L. Raty, A. Drumont, N. De Windt, M. De Proft, “Ips typographus, Natural Enemies and the Forester,” pp. 202-207 in F.P. Hain, S.M. Salom, W.F. Ravlin, T.L. Payne, K.F. Raffa (eds.), Behavior, population dynamics and control of forest insects, proceedings of an IUFRO Joint Conference, Maui, Hawaii (1994) – USDA Forest Service General Technical Report NC-183, 644 pp., 1995. [10] N.J. Mills, “The natural enemies of scolytids infesting conifer bark in Europe in relation to the biological control of Dendroctonus spp. in Canada,” Biocontrol News and Information, Vol. 4, Issue 4, pp. 305-328, 1983. [11] A. Balachowsky, Faune de France 50 – Coléoptères Scolytides, Editions Paul Lechevalier, Paris, 320 pp., 1949.
Proccedings: IUFRO Kanazawa 2003 "Forest Insect Population Dynamics and Host Influences” - 18 -
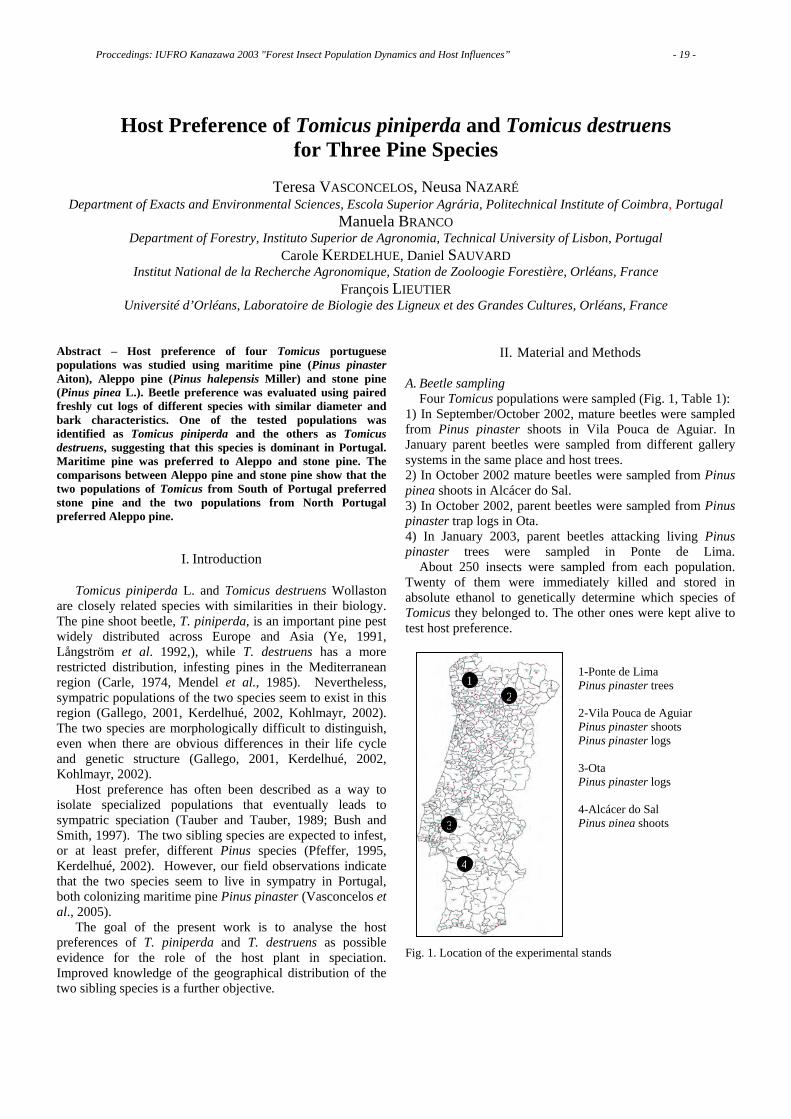
Host Preference of Tomicus piniperda and Tomicus destruens for Three Pine Species
Teresa VASCONCELOS, Neusa NAZARÉ
Department of Exacts and Environmental Sciences, Escola Superior Agrária, Politechnical Institute of Coimbra, Portugal Manuela BRANCO
Department of Forestry, Instituto Superior de Agronomia, Technical University of Lisbon, Portugal Carole KERDELHUE, Daniel SAUVARD
Institut National de la Recherche Agronomique, Station de Zooloogie Forestière, Orléans, France François LIEUTIER
Université d’Orléans, Laboratoire de Biologie des Ligneux et des Grandes Cultures, Orléans, France
Abstract – Host preference of four Tomicus portuguese populations was studied using maritime pine (Pinus pinaster Aiton), Aleppo pine (Pinus halepensis Miller) and stone pine (Pinus pinea L.). Beetle preference was evaluated using paired freshly cut logs of different species with similar diameter and bark characteristics. One of the tested populations was identified as Tomicus piniperda and the others as Tomicus destruens, suggesting that this species is dominant in Portugal. Maritime pine was preferred to Aleppo and stone pine. The comparisons between Aleppo pine and stone pine show that the two populations of Tomicus from South of Portugal preferred stone pine and the two populations from North Portugal preferred Aleppo pine.
I. Introduction
Tomicus piniperda L. and Tomicus destruens Wollaston are closely related species with similarities in their biology. The pine shoot beetle, T. piniperda, is an important pine pest widely distributed across Europe and Asia (Ye, 1991, Långström et al. 1992,), while T. destruens has a more restricted distribution, infesting pines in the Mediterranean region (Carle, 1974, Mendel et al., 1985). Nevertheless, sympatric populations of the two species seem to exist in this region (Gallego, 2001, Kerdelhué, 2002, Kohlmayr, 2002). The two species are morphologically difficult to distinguish, even when there are obvious differences in their life cycle and genetic structure (Gallego, 2001, Kerdelhué, 2002, Kohlmayr, 2002). Host preference has often been described as a way to isolate specialized populations that eventually leads to sympatric speciation (Tauber and Tauber, 1989; Bush and Smith, 1997). The two sibling species are expected to infest, or at least prefer, different Pinus species (Pfeffer, 1995, Kerdelhué, 2002). However, our field observations indicate that the two species seem to live in sympatry in Portugal, both colonizing maritime pine Pinus pinaster (Vasconcelos et al., 2005). The goal of the present work is to analyse the host preferences of T. piniperda and T. destruens as possible evidence for the role of the host plant in speciation. Improved knowledge of the geographical distribution of the two sibling species is a further objective.
II. Material and Methods A. Beetle sampling Four Tomicus populations were sampled (Fig. 1, Table 1): 1) In September/October 2002, mature beetles were sampled from Pinus pinaster shoots in Vila Pouca de Aguiar. In January parent beetles were sampled from different gallery systems in the same place and host trees. 2) In October 2002 mature beetles were sampled from Pinus pinea shoots in Alcácer do Sal. 3) In October 2002, parent beetles were sampled from Pinus pinaster trap logs in Ota. 4) In January 2003, parent beetles attacking living Pinus pinaster trees were sampled in Ponte de Lima. About 250 insects were sampled from each population. Twenty of them were immediately killed and stored in absolute ethanol to genetically determine which species of Tomicus they belonged to. The other ones were kept alive to test host preference.
Fig. 1. Location of the experimental stands
4
12
3
1-Ponte de Lima Pinus pinaster trees 2-Vila Pouca de Aguiar Pinus pinaster shoots Pinus pinaster logs 3-Ota Pinus pinaster logs 4-Alcácer do Sal Pinus pinea shoots
Proccedings: IUFRO Kanazawa 2003 "Forest Insect Population Dynamics and Host Influences” - 19 -
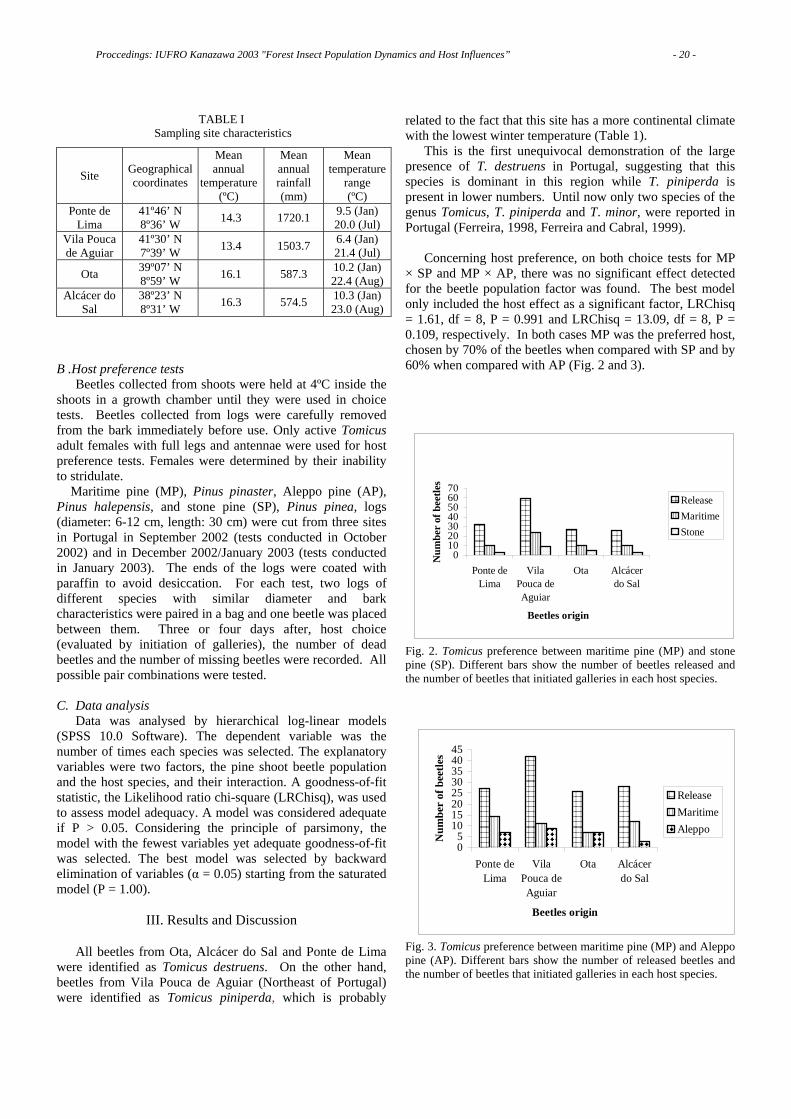
TABLE I Sampling site characteristics
Site Geographical coordinates
Mean annual
temperature (ºC)
Mean annual rainfall (mm)
Mean temperature
range (ºC)
Ponte de Lima
41º46’ N 8º36’ W 14.3 1720.1 9.5 (Jan)
20.0 (Jul)Vila Pouca de Aguiar
41º30’ N 7º39’ W 13.4 1503.7 6.4 (Jan)
21.4 (Jul)
Ota 39º07’ N 8º59’ W 16.1 587.3 10.2 (Jan)
22.4 (Aug)Alcácer do
Sal 38º23’ N 8º31’ W 16.3 574.5 10.3 (Jan)
23.0 (Aug) B .Host preference tests Beetles collected from shoots were held at 4ºC inside the shoots in a growth chamber until they were used in choice tests. Beetles collected from logs were carefully removed from the bark immediately before use. Only active Tomicus adult females with full legs and antennae were used for host preference tests. Females were determined by their inability to stridulate. Maritime pine (MP), Pinus pinaster, Aleppo pine (AP), Pinus halepensis, and stone pine (SP), Pinus pinea, logs (diameter: 6-12 cm, length: 30 cm) were cut from three sites in Portugal in September 2002 (tests conducted in October 2002) and in December 2002/January 2003 (tests conducted in January 2003). The ends of the logs were coated with paraffin to avoid desiccation. For each test, two logs of different species with similar diameter and bark characteristics were paired in a bag and one beetle was placed between them. Three or four days after, host choice (evaluated by initiation of galleries), the number of dead beetles and the number of missing beetles were recorded. All possible pair combinations were tested. C. Data analysis Data was analysed by hierarchical log-linear models (SPSS 10.0 Software). The dependent variable was the number of times each species was selected. The explanatory variables were two factors, the pine shoot beetle population and the host species, and their interaction. A goodness-of-fit statistic, the Likelihood ratio chi-square (LRChisq), was used to assess model adequacy. A model was considered adequate if P > 0.05. Considering the principle of parsimony, the model with the fewest variables yet adequate goodness-of-fit was selected. The best model was selected by backward elimination of variables (α = 0.05) starting from the saturated model (P = 1.00).
III. Results and Discussion All beetles from Ota, Alcácer do Sal and Ponte de Lima were identified as Tomicus destruens. On the other hand, beetles from Vila Pouca de Aguiar (Northeast of Portugal) were identified as Tomicus piniperda, which is probably
related to the fact that this site has a more continental climate with the lowest winter temperature (Table 1). This is the first unequivocal demonstration of the large presence of T. destruens in Portugal, suggesting that this species is dominant in this region while T. piniperda is present in lower numbers. Until now only two species of the genus Tomicus, T. piniperda and T. minor, were reported in Portugal (Ferreira, 1998, Ferreira and Cabral, 1999). Concerning host preference, on both choice tests for MP × SP and MP × AP, there was no significant effect detected for the beetle population factor was found. The best model only included the host effect as a significant factor, LRChisq = 1.61, df = 8, P = 0.991 and LRChisq = 13.09, df = 8, P = 0.109, respectively. In both cases MP was the preferred host, chosen by 70% of the beetles when compared with SP and by 60% when compared with AP (Fig. 2 and 3).
Fig. 2. Tomicus preference between maritime pine (MP) and stone pine (SP). Different bars show the number of beetles released and the number of beetles that initiated galleries in each host species.
Fig. 3. Tomicus preference between maritime pine (MP) and Aleppo pine (AP). Different bars show the number of released beetles and the number of beetles that initiated galleries in each host species.
010203040506070
Ponte deLima
VilaPouca deAguiar
Ota Alcácerdo Sal
Beetles origin
Num
ber
of b
eetle
s
ReleaseMaritimeStone
05
1015202530354045
Ponte deLima
VilaPouca deAguiar
Ota Alcácerdo Sal
Beetles origin
Num
ber
of b
eetle
s
ReleaseMaritimeAleppo
Proccedings: IUFRO Kanazawa 2003 "Forest Insect Population Dynamics and Host Influences” - 20 -

These results suggest that for both species of Tomicus and all the populations we tested, MP is a very attractive host, preferred to the two other Mediterranean pine species. Maritime pine is the dominant pine species in Portugal, covering about 90% of the pine stands in the country. A regional adaptation of Tomicus populations to the local dominant pine species may have occurred. Siegert and McCullough (2001) observed similarly that T. piniperda sampled in North America prefers Scots pine, Pinus sylvestris, one of the main pine hosts in this region. On the other hand, our results do not agree with the hypothesis that T. piniperda and T. destruens infest different pine species (Kohlmayr, 2002). Furthermore, they indicate that host preference is probably independent of maternal effects as we observed that beetles sampled from a SP stand still preferred MP. For the AP × SP tests, the beetle population, the host tree species and their interaction were all significant effects. Further analysis showed that the two Tomicus populations from South Portugal (Ota and Alcácer do Sal) preferred SP (LRChisq = 0.49, df = 2, P = 0.783) while the two populations from North Portugal (Vila Pouca de Aguiar and Ponte de Lima) preferred AP (LRChisq = 3.37, df = 2, P = 0.185) (Fig. 4).
Fig. 4. Tomicus preference between Aleppo pine (AP) and stone pine (SP). Different bars show the number of beetles released and the number of beetles that initiated galleries in each host species. Therefore intraspecific differences may exist between Tomicus populations regarding their host preference. Our results are not very conclusive about such differences between T. piniperda and T. destruens, and further experiments are necessary on this subject. We found one population of T. destruens (Ponte de Lima) breeding in January, although this species is supposed to breed during autumn (Gallego, 2001). One explanation could be the existence of T. destruens sister broods that extended through the winter.
This preliminary work has provided interesting results, but further work will be needed to clarify life cycle differences between T. piniperda and T. destruens.
References [1] G. Bush, J. Smith, The sympatric origin of phytophagous insects, Ecological Studies, Vol. 130, pp. 3-19, 1997. [2] P. Carle, The decline of Pinus pinaster in Provence. Role of insects in changing the biological equilibrium of forests invaded by Matsucoccus feytaudi, Annales des Sciences Forestières, Vol. 31: 1, pp. 1-26, 1974. [3] M.C. Ferreira, Manual dos Insectos Nocivos às Plantações florestais, Plátano Edições Técnicas, Lisboa, 1998. [4] M.C. Ferreira, M.T. Cabral, Pragas do pinhal, Ed. Estação Florestal Nacional, Lisboa, 159 p., 1999. [5] D. Gallego, J. Galian, The internal transcribed spacers (ITS1 and ITS2) of the rDNA differentiates the bark beetle forest pests Tomicus destruens and T. piniperda, Insect Molecular Biology, Vol. 10, pp. 415-420, 2001. [6] C. Kerdelhué, G. Roux-Morabito, J. Forichon, J.M. Chambon, A. Robert, F. Lieutier, Population genetic structure of Tomicus piniperda L. (Curculionidae: Scolytinae) on different pine species and validation of T. destruens (Woll.), Molecular Ecology, Vol. 11, pp. 483-494, 2002. [7] B. Kohlmayr, M. Riegler, R. Wegensteiner, C. Stauffer, Morphological and genetic identification of the three pine pests of the genus Tomicus (Coleoptera, Scolytidae) in Europe, Agricultural and Forest Entomology, Vol. 4, pp. 151-157, 2002. [8] B. Långström, C. Hellqvist, A. Ericsson, R. Gref, Induced defence reaction in Scots pine following stem attacks by Tomicus piniperda, Ecography, Vol. 15, pp. 318-327, 1992. [9] Z. Mendel, Z. Madar, Y. Golan, Comparison of the seasonal occurrence and behavior of seven pine bark beetles (Coleoptera: Scolytidae) in Israel, Phytoparasitica, Vol. 13: 1, pp. 21-32, 1985. [10] A. Pfeffer, Zentral- und Westpalaarktische Borken- und Kernkäfer (Coleoptera: Scolytidae, Platypodidae), Pro Entomologica: Naturhistorisches Museum Basel, 310, 1995. [11] N.W. Sieger, D.G. McCullough, Preference of Tomicus piniperda (Coleoptera: Scolytidae) parent adults and shoot-feeding progeny adults for three pine species, The Canadian Entomologist, Vol. 133, pp. 343-353, 2001. [12] C. Tauber, M. Tauber, Sympatric speciation in insects, In: Speciation and its consequences (Eds Otte D, Endler JA), pp. 307-344, Sinauer, Sunderland, 1989. [13] T. Vasconcelos, M. Branco, M. Gonçalves, T. Cabral, Observation on flying activity of Tomicus spp. in Portugal during a long period. In: Entomological Research in Mediterranean Forest Ecosystems, (Eds Lieutier, L., Ghaioule D.), INRA-Editions, Versailles, France, 2005. [14] H. Ye, On the bionomy of Tomicus piniperda (L.) (Col., Scolytidae) in the Kunming region of China, Journal of applied Entomology, Vol. 112, pp. 366-369, 1991.
01020304050
Ponte deLima
VilaPouca deAguiar
Ota Alcácer doSal
Beetles origin
Num
ber
of b
eetle
s
ReleaseAleppoStone
Proccedings: IUFRO Kanazawa 2003 "Forest Insect Population Dynamics and Host Influences” - 21 -

The Effect of Acid Rain on the Defense Response of Pines to Pinewood Nematodes
Ei-ichiro ASAI, Kazuyoshi FUTAI Graduate School of Agriculture, Kyoto University, Kyoto, 606-8502, JAPAN
Abstract - We examined the invasion rate of virulent and avirulent isolates of the pinewood nematode to Japanese black pine seedlings pretreated with simulated acid rain (SAR) at pH 3 and 2. Pretreatment with SAR at pH 3 reduced the invasion rate of virulent nematodes compared to control seedlings in both juvenile seedlings and 1-year-shoot segments of 3-year-old seedlings. This suggests that acid rain at pH 3 activates some defense response(s) of pines to the nematodes.
I. Introduction
Almost 30 years have passed since the pinewood nematode, Bursaphelenchus xylophilus (Steiner et Bühler) Nickle, was ascertained to be the pathogen causing pine wilt disease [1]. This epidemic forest disease, however, is still devastating pine forests in Japan, and is now spreading throughout the East Asian countries.
Some environmental factors, such as high temperature [1], water stress [2], or low light intensity [3] are known to increase the incidence of pine wilt disease or accelerate the disease development. Among the environmental factors affecting the epidemic of pine wilt disease, the impacts of air pollution have been the subject of debate. We have studied the effects of simulated acid rain (SAR) on the development of pine wilt disease, because acid rain is especially common to most developed countries and is one of the causes of forest decline in European and North American countries [4]. The effects of acid rain on the development of pine wilt disease are rather complex. For example, repeated exposure to pH 3 SAR retarded the appearance of symptoms after nematode inoculation, though the seedlings pretreated with SAR ceased resin exudation from the stem earlier than those pretreated with tap water [5]. Bolla and Fitzsimmons [6] reported that Scots pine seedlings lost tolerance to Vpst-1, the white pine-specific pathotype of pinewood nematode, after exposure to SAR, whereas exposure to SAR delayed the development of symptoms in white pine seedlings inoculated with the same nematode isolate. These results imply that exposure to acid rain not only increases the damage to pines caused by pine wilt disease, but delays the development of the disease.
Our previous study showed that the effects of simulated acid rain on the development of pine wilt disease could be explained by two factors: the effect on the mortality velocity of pines and on the resistance of pines to the nematodes [7]. Previous experiments suggested that seedling mortality velocity after the nematode infection depends on the
population growth rate of the nematodes in the seedlings [7][8]. However, another determinant, the resistance of pines to the nematodes, still remains unclear.
Several studies give possible answers to this question. In general, resistance of plants to endoparasitic nematodes is thought to be determined by (i) whether or not the parasite can invade the plant, and (ii) the ability of the pathogen to reproduce [9]. As for pine wilt disease, Futai [10][11] found that the invasion rate of pinewood nematodes in susceptible pines was higher than that in resistant pines. Based on these results, we hypothesized that the processes of nematode invasion and establishment are possible stages in which SAR affects the resistance of pines to the nematodes. Consequently, we examined the effect of SAR on the invasion of Japanese black pine by virulent and avirulent isolates of pinewood nematodes.
II. Materials and Methods Exp. 1. Nematode invasion of juvenile seedlings
Ten juvenile Japanese black pine seedlings, planted in plastic cylindrical vials filled with 100 mL autoclaved vermiculite, were pretreated with simulated acid rain (SAR) or distilled water (W) for two months. Acidic solution for SAR was prepared by mixing 0.5 M sulfuric acid and nitric acid at an S : N ratio of 3 : 1, and the solution was adjusted to pH 3 or 2. Seedlings were divided into the following four groups. In the pH 2-T group, only the top of the seedling was sprayed with pH 2 SAR three times a week. In the pH 2-TR and pH 3-TR groups, the top of the seedling was also sprayed with SAR (pH 2 and 3, respectively) twice a week, and the root was also exposed to SAR (pH 2 and 3, respectively) once a week. Control seedlings (W) received distilled water twice a week, and tap water once a week. Seedlings were pretreated with SAR from December 13, 1999 to February 16, 2000 in the first experiment, Exp. 1 (i). In the second experiment, Exp. 1 (ii), SAR treatment began on May 8, 2000, and finished on July 10, 2000. Seedlings were grown under a natural photoperiod during the treatment periods.
Seedlings were inoculated with 500 virulent isolate (S10) of pinewood nematodes February 17, 2000 in Exp. 1(i), or with 500 avirulent (C14-5) isolate July 11, 2000 in Exp. 1(ii). Pinewood nematodes extracted from the entire seedlings 24 hrs after the inoculation were regarded as nematodes that
Proccedings: IUFRO Kanazawa 2003 "Forest Insect Population Dynamics and Host Influences” - 22 -

succeeded in invasion. Additional details of these experiments are described in our previous studies [7][8].
Exp. 2. Nematode invasion test in Petri dishes with 1-year-shoot-segments
Three-year-old Japanese black pine seedlings were used
for this experiment. Twenty seedlings were exposed to diluted sulfuric acid (SAR) at pH 3. Another 20 seedlings were exposed to tap water (TW, pH 6.3) as a control. SAR pretreatment was done from June 15 to December 4, 2000. The details of this experiment are also given in our previous paper [5].
The nematode invasion test was done on December 4, 2000, using 18 randomly sampled seedlings, half of which were pretreated with SAR and the remainder with TW. The inoculum of both the virulent and avirulent nematodes we used was prepared according to Futai [12]. One-year-shoots of the seedlings which had been treated with SAR or TW were cut into 10-mm-long segments after removing their needles, and the effect of acid rain on invasion of the nematodes into these shoot segments was determined as previously described by Futai [10]: four shoot segments, two from the plants treated with SAR and two from those with TW were placed on a 1.5 % plain agar plate in 9 cm diameter Petri dishes. The four shoot segments were placed 3 cm from the center of the Petri dish, so that the segments from different treatments were at right angles to the center and the shoot segments from the same treatment were at opposite sides from the center. Fifteen hundred nematodes of each virulent (S10) and avirulent (C14-5) isolate were inoculated at the center of each of 10 Petri dishes as described above. After 12 hrs incubation at room temperature (ca. 20 °C), the nematodes were extracted separately from a 1.5-mm-thick disk cut from the bottom of each shoot segment (B), the rest of each 8.5-mm-long shoot segment (S), and from a 11-mm-diameter agar disk removed from beneath the shoot segment (A), using the Baermann funnel technique. Here, the sum of B, S, and A was regarded as the number of nematodes that aggregated to the segment, and S as the nematodes that invaded the segment. The invasion rate for the shoot segments was then determined:
Invasion rate = (S / (B + S + A)) x 100 (%)
III. Results and Discussion
In Exp. 1, pretreatment with pH 3-TR significantly decreased the number of virulent nematodes isolated from Japanese black pine seedlings 24 hrs after inoculation compared to those from the control seedlings (Table 1, p = 0.025; Mann-Whitney U test). Pretreatment with SAR at pH 2 (both pH 2-T and pH 2-TR), however, scarcely affected the number of virulent nematodes isolated. The number of avirulent nematodes isolated was not influenced by pretreatment with SAR at any level (Table 1).
Table 1. Number of virulent and avirulent pinewood nematodes isolated from current year growth of Japanese black pine seedlings exposed to distilled water (W), or simulated acid rain (SAR) at pH 3 or 2 (pH 2-T and pH 2-TR treatment), 24 hrs after the inoculation. Seedlings received SAR on only the top part in the T-treatment, and both the top and root parts in the TR-treatment. Inoculum density: 500 nematodes/20 μL. Values are means ± S.E (n =10).
virulent avirulent W(control) 58.1 ± 14.7 49.6 ± 6.0
pH 3-TR 19.5 ± 3.9 46.4 ± 7.5 pH 2-T 70.0 ± 24.5 70.3 ± 11.7
pH 2-TR 68.5 ± 27.1 56.5 ± 6.9
In Exp. 2, pretreatment with SAR at pH 3 did not affect
the numbers of virulent and avirulent nematodes that aggregated to the segments. Fewer virulent nematodes invaded the segments pretreated with SAR at pH 3 compared to the control segments (Table 2), whereas there was little difference in avirulent nematode invasion between the segments pretreated with SAR at pH 3 and the control segments (Table 3). It appeared that fewer avirulent than virulent pinewood nematodes invaded the segments (Table 2, 3). Table 2: Numbers of virulent pinewood nematodes that aggregated to or invaded the segments of Japanese black pine stem pretreated with simulated acid rain (SAR) at pH 3 or tap water (TW). Invasion rate was calculated from numbers of aggregated and invaded nematodes.
No. of
invaded nematodes
No. of aggregated nematodes
Invasion rate (%)
SAR 143 ± 22 746 ± 72 19.2 ± 2.5 TW 208 ± 56 753 ± 112 25.6 ± 3.6
Values are means ± S. E. n = 9.
Table 3: Numbers of avirulent pinewood nematodes that aggregated to or invaded the segments of Japanese black pine stem pretreated with simulated acid rain (SAR) at pH 3 or tap water (TW). Invasion rate was calculated from numbers of aggregated and invaded nematodes.
No. of
invaded nematodes
No. of aggregated nematodes
Invasion rate (%)
SAR 35 ± 13 785 ± 112 4.5 ± 1.5 TW 28 ± 11 727 ± 117 3.6 ± 0.9
Values are means ± S. E. n = 9.
Plant-parasitic nematode aggregation to a plant may reflect host preference. Futai [13] reported that the pinewood nematode preferentially aggregated to P. thunbergii segments than to Quercus phyllylaeoides segments, while
Proccedings: IUFRO Kanazawa 2003 "Forest Insect Population Dynamics and Host Influences” - 23 -
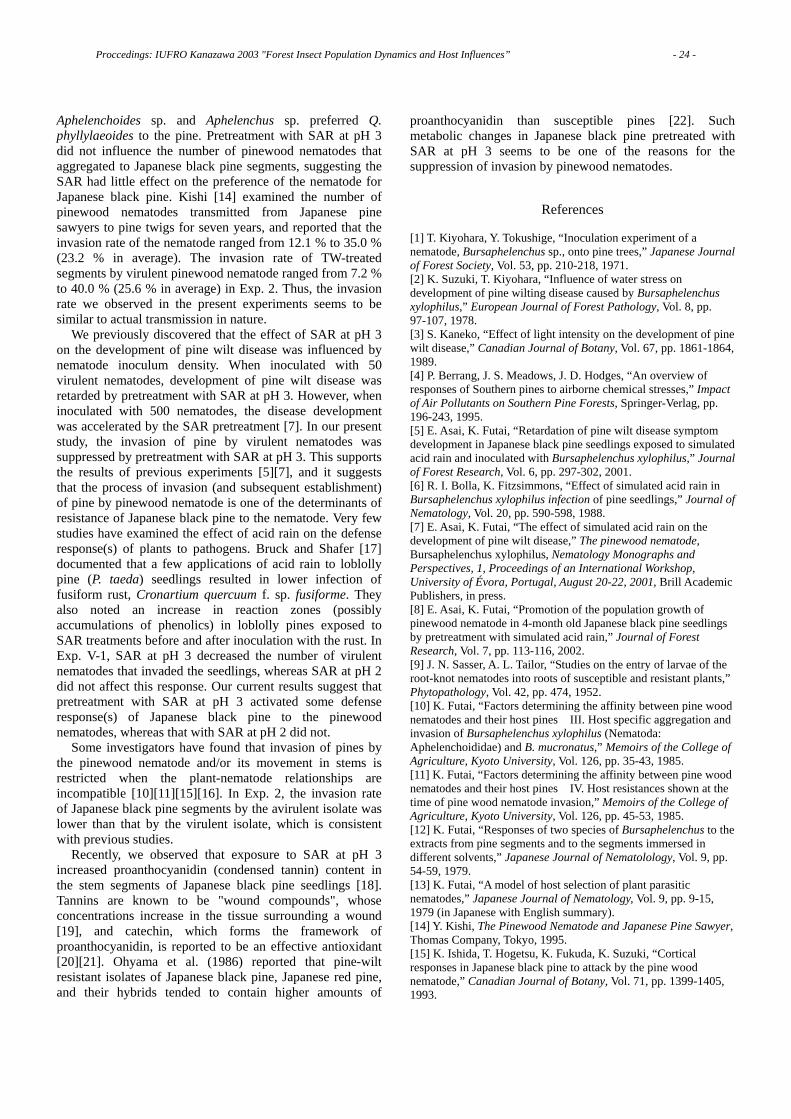
Aphelenchoides sp. and Aphelenchus sp. preferred Q. phyllylaeoides to the pine. Pretreatment with SAR at pH 3 did not influence the number of pinewood nematodes that aggregated to Japanese black pine segments, suggesting the SAR had little effect on the preference of the nematode for Japanese black pine. Kishi [14] examined the number of pinewood nematodes transmitted from Japanese pine sawyers to pine twigs for seven years, and reported that the invasion rate of the nematode ranged from 12.1 % to 35.0 % (23.2 % in average). The invasion rate of TW-treated segments by virulent pinewood nematode ranged from 7.2 % to 40.0 % (25.6 % in average) in Exp. 2. Thus, the invasion rate we observed in the present experiments seems to be similar to actual transmission in nature.
We previously discovered that the effect of SAR at pH 3 on the development of pine wilt disease was influenced by nematode inoculum density. When inoculated with 50 virulent nematodes, development of pine wilt disease was retarded by pretreatment with SAR at pH 3. However, when inoculated with 500 nematodes, the disease development was accelerated by the SAR pretreatment [7]. In our present study, the invasion of pine by virulent nematodes was suppressed by pretreatment with SAR at pH 3. This supports the results of previous experiments [5][7], and it suggests that the process of invasion (and subsequent establishment) of pine by pinewood nematode is one of the determinants of resistance of Japanese black pine to the nematode. Very few studies have examined the effect of acid rain on the defense response(s) of plants to pathogens. Bruck and Shafer [17] documented that a few applications of acid rain to loblolly pine (P. taeda) seedlings resulted in lower infection of fusiform rust, Cronartium quercuum f. sp. fusiforme. They also noted an increase in reaction zones (possibly accumulations of phenolics) in loblolly pines exposed to SAR treatments before and after inoculation with the rust. In Exp. V-1, SAR at pH 3 decreased the number of virulent nematodes that invaded the seedlings, whereas SAR at pH 2 did not affect this response. Our current results suggest that pretreatment with SAR at pH 3 activated some defense response(s) of Japanese black pine to the pinewood nematodes, whereas that with SAR at pH 2 did not.
Some investigators have found that invasion of pines by the pinewood nematode and/or its movement in stems is restricted when the plant-nematode relationships are incompatible [10][11][15][16]. In Exp. 2, the invasion rate of Japanese black pine segments by the avirulent isolate was lower than that by the virulent isolate, which is consistent with previous studies.
Recently, we observed that exposure to SAR at pH 3 increased proanthocyanidin (condensed tannin) content in the stem segments of Japanese black pine seedlings [18]. Tannins are known to be "wound compounds", whose concentrations increase in the tissue surrounding a wound [19], and catechin, which forms the framework of proanthocyanidin, is reported to be an effective antioxidant [20][21]. Ohyama et al. (1986) reported that pine-wilt resistant isolates of Japanese black pine, Japanese red pine, and their hybrids tended to contain higher amounts of
proanthocyanidin than susceptible pines [22]. Such metabolic changes in Japanese black pine pretreated with SAR at pH 3 seems to be one of the reasons for the suppression of invasion by pinewood nematodes.
References [1] T. Kiyohara, Y. Tokushige, “Inoculation experiment of a nematode, Bursaphelenchus sp., onto pine trees,” Japanese Journal of Forest Society, Vol. 53, pp. 210-218, 1971. [2] K. Suzuki, T. Kiyohara, “Influence of water stress on development of pine wilting disease caused by Bursaphelenchus xylophilus,” European Journal of Forest Pathology, Vol. 8, pp. 97-107, 1978. [3] S. Kaneko, “Effect of light intensity on the development of pine wilt disease,” Canadian Journal of Botany, Vol. 67, pp. 1861-1864, 1989. [4] P. Berrang, J. S. Meadows, J. D. Hodges, “An overview of responses of Southern pines to airborne chemical stresses,” Impact of Air Pollutants on Southern Pine Forests, Springer-Verlag, pp. 196-243, 1995. [5] E. Asai, K. Futai, “Retardation of pine wilt disease symptom development in Japanese black pine seedlings exposed to simulated acid rain and inoculated with Bursaphelenchus xylophilus,” Journal of Forest Research, Vol. 6, pp. 297-302, 2001. [6] R. I. Bolla, K. Fitzsimmons, “Effect of simulated acid rain in Bursaphelenchus xylophilus infection of pine seedlings,” Journal of Nematology, Vol. 20, pp. 590-598, 1988. [7] E. Asai, K. Futai, “The effect of simulated acid rain on the development of pine wilt disease,” The pinewood nematode, Bursaphelenchus xylophilus, Nematology Monographs and Perspectives, 1, Proceedings of an International Workshop, University of Évora, Portugal, August 20-22, 2001, Brill Academic Publishers, in press. [8] E. Asai, K. Futai, “Promotion of the population growth of pinewood nematode in 4-month old Japanese black pine seedlings by pretreatment with simulated acid rain,” Journal of Forest Research, Vol. 7, pp. 113-116, 2002. [9] J. N. Sasser, A. L. Tailor, “Studies on the entry of larvae of the root-knot nematodes into roots of susceptible and resistant plants,” Phytopathology, Vol. 42, pp. 474, 1952. [10] K. Futai, “Factors determining the affinity between pine wood nematodes and their host pines III. Host specific aggregation and invasion of Bursaphelenchus xylophilus (Nematoda: Aphelenchoididae) and B. mucronatus,” Memoirs of the College of Agriculture, Kyoto University, Vol. 126, pp. 35-43, 1985. [11] K. Futai, “Factors determining the affinity between pine wood nematodes and their host pines IV. Host resistances shown at the time of pine wood nematode invasion,” Memoirs of the College of Agriculture, Kyoto University, Vol. 126, pp. 45-53, 1985. [12] K. Futai, “Responses of two species of Bursaphelenchus to the extracts from pine segments and to the segments immersed in different solvents,” Japanese Journal of Nematolology, Vol. 9, pp. 54-59, 1979. [13] K. Futai, “A model of host selection of plant parasitic nematodes,” Japanese Journal of Nematology, Vol. 9, pp. 9-15, 1979 (in Japanese with English summary). [14] Y. Kishi, The Pinewood Nematode and Japanese Pine Sawyer, Thomas Company, Tokyo, 1995. [15] K. Ishida, T. Hogetsu, K. Fukuda, K. Suzuki, “Cortical responses in Japanese black pine to attack by the pine wood nematode,” Canadian Journal of Botany, Vol. 71, pp. 1399-1405, 1993.
Proccedings: IUFRO Kanazawa 2003 "Forest Insect Population Dynamics and Host Influences” - 24 -

[16] H. Oku, T. Shiraishi, K. Chikamatsu, “Active defence as a mechanism of resistance in pine against pine wilt disease,” Annals of the Phytopathological Society of Japan, Vol. 55, pp. 603-608, 1989. [17] R. I. Bruck, S. R. Shafer, “Effects of acid precipitation on plant diseases,” Direct and Indirect Effects of Acidic Deposition on Vegetation, Butterworth, pp. 19-32, 1984. [18] E. Asai, N. Hara, K. Futai, “The effects of simulated acid rain on the development of pine wilt disease XI ⎯ Suppression of pinewood-nematode-invasion caused by the treatment with simulated acid rain at pH 3,” The Transactions of the Meeting of the Japanese Forestry Society, Vol. 112, pp. 302, 2001 (in Japanese). [19] A. M. Zobel, “Phenolic compounds in defence against air pollution,” Plant Responses to Air Pollution, John Wiley & Sons, pp. 241-266, 1996. [20] F. L. Booker, S. Anttonen, A. S. Heagle, “Catechin, proanthocyanidin and lignin contents of loblolly pine (Pinus taeda) needles after chronic exposure to ozone,” New Phytologist, Vol. 132, pp. 483-492, 1996. [21] K. Kondo, M. Kurihara, N. Miyata, T. Suzuki, M. Toyoda, “Mechanistic studies of catechins as antioxidants against radical oxidation,” Archives of Biochemistry and Biophysics, Vol. 362, pp. 79-86, 1999. [22] N. Ohyama, S. Shiraishi, T. Takagi, “Characteristics in the graftings of the resistant pine against wood nematode,” Forest Tree Breeding (Rinboku-no Ikushu), Vol. 140, pp. 17-21, 1986 (in Japanese).
Proccedings: IUFRO Kanazawa 2003 "Forest Insect Population Dynamics and Host Influences” - 25 -
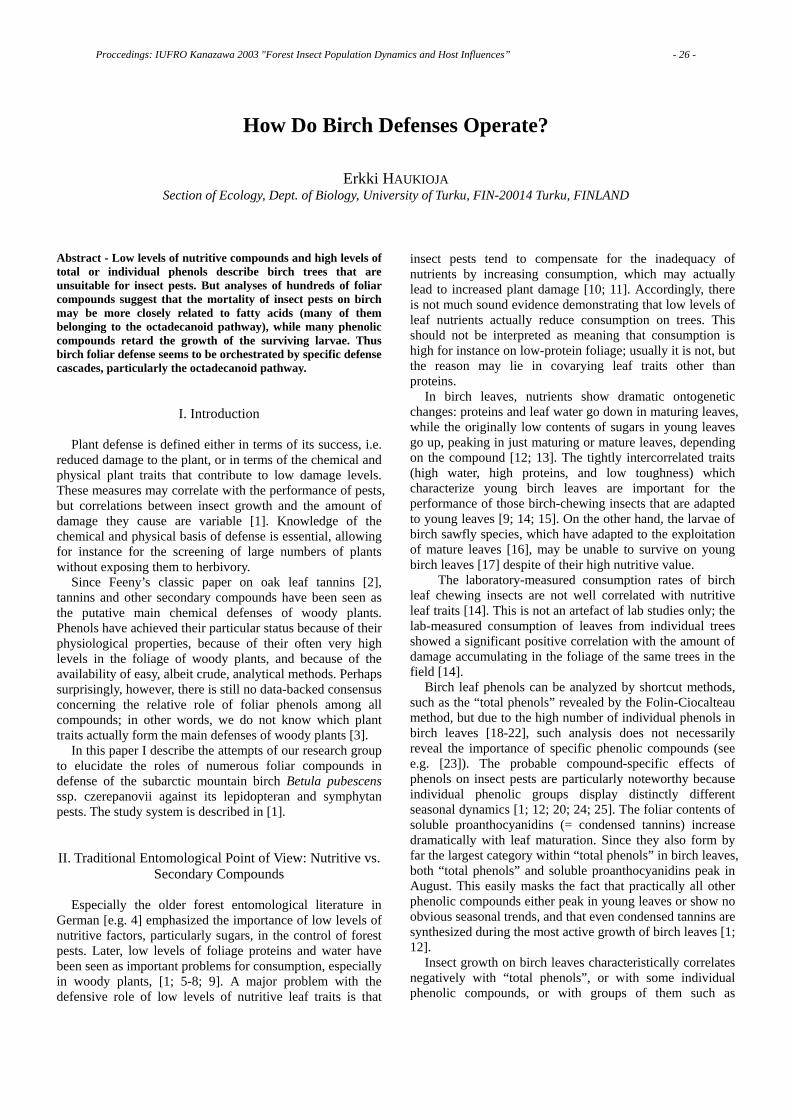
How Do Birch Defenses Operate?
Erkki HAUKIOJA Section of Ecology, Dept. of Biology, University of Turku, FIN-20014 Turku, FINLAND
Abstract - Low levels of nutritive compounds and high levels of total or individual phenols describe birch trees that are unsuitable for insect pests. But analyses of hundreds of foliar compounds suggest that the mortality of insect pests on birch may be more closely related to fatty acids (many of them belonging to the octadecanoid pathway), while many phenolic compounds retard the growth of the surviving larvae. Thus birch foliar defense seems to be orchestrated by specific defense cascades, particularly the octadecanoid pathway.
I. Introduction
Plant defense is defined either in terms of its success, i.e. reduced damage to the plant, or in terms of the chemical and physical plant traits that contribute to low damage levels. These measures may correlate with the performance of pests, but correlations between insect growth and the amount of damage they cause are variable [1]. Knowledge of the chemical and physical basis of defense is essential, allowing for instance for the screening of large numbers of plants without exposing them to herbivory.
Since Feeny’s classic paper on oak leaf tannins [2], tannins and other secondary compounds have been seen as the putative main chemical defenses of woody plants. Phenols have achieved their particular status because of their physiological properties, because of their often very high levels in the foliage of woody plants, and because of the availability of easy, albeit crude, analytical methods. Perhaps surprisingly, however, there is still no data-backed consensus concerning the relative role of foliar phenols among all compounds; in other words, we do not know which plant traits actually form the main defenses of woody plants [3].
In this paper I describe the attempts of our research group to elucidate the roles of numerous foliar compounds in defense of the subarctic mountain birch Betula pubescens ssp. czerepanovii against its lepidopteran and symphytan pests. The study system is described in [1]. II. Traditional Entomological Point of View: Nutritive vs.
Secondary Compounds
Especially the older forest entomological literature in German [e.g. 4] emphasized the importance of low levels of nutritive factors, particularly sugars, in the control of forest pests. Later, low levels of foliage proteins and water have been seen as important problems for consumption, especially in woody plants, [1; 5-8; 9]. A major problem with the defensive role of low levels of nutritive leaf traits is that
insect pests tend to compensate for the inadequacy of nutrients by increasing consumption, which may actually lead to increased plant damage [10; 11]. Accordingly, there is not much sound evidence demonstrating that low levels of leaf nutrients actually reduce consumption on trees. This should not be interpreted as meaning that consumption is high for instance on low-protein foliage; usually it is not, but the reason may lie in covarying leaf traits other than proteins.
In birch leaves, nutrients show dramatic ontogenetic changes: proteins and leaf water go down in maturing leaves, while the originally low contents of sugars in young leaves go up, peaking in just maturing or mature leaves, depending on the compound [12; 13]. The tightly intercorrelated traits (high water, high proteins, and low toughness) which characterize young birch leaves are important for the performance of those birch-chewing insects that are adapted to young leaves [9; 14; 15]. On the other hand, the larvae of birch sawfly species, which have adapted to the exploitation of mature leaves [16], may be unable to survive on young birch leaves [17] despite of their high nutritive value.
The laboratory-measured consumption rates of birch leaf chewing insects are not well correlated with nutritive leaf traits [14]. This is not an artefact of lab studies only; the lab-measured consumption of leaves from individual trees showed a significant positive correlation with the amount of damage accumulating in the foliage of the same trees in the field [14].
Birch leaf phenols can be analyzed by shortcut methods, such as the “total phenols” revealed by the Folin-Ciocalteau method, but due to the high number of individual phenols in birch leaves [18-22], such analysis does not necessarily reveal the importance of specific phenolic compounds (see e.g. [23]). The probable compound-specific effects of phenols on insect pests are particularly noteworthy because individual phenolic groups display distinctly different seasonal dynamics [1; 12; 20; 24; 25]. The foliar contents of soluble proanthocyanidins (= condensed tannins) increase dramatically with leaf maturation. Since they also form by far the largest category within “total phenols” in birch leaves, both “total phenols” and soluble proanthocyanidins peak in August. This easily masks the fact that practically all other phenolic compounds either peak in young leaves or show no obvious seasonal trends, and that even condensed tannins are synthesized during the most active growth of birch leaves [1; 12].
Insect growth on birch leaves characteristically correlates negatively with “total phenols”, or with some individual phenolic compounds, or with groups of them such as
Proccedings: IUFRO Kanazawa 2003 "Forest Insect Population Dynamics and Host Influences” - 26 -
phenolic glycosides. The problem is that the particular compounds which correlate most strongly with insect traits tend to vary from one experiment to another. One possible reason is that the absolute and relative contents of leaf phenols change in the course of leaf maturation, and the compounds showing the best correlations thus change as well. On young as well as shaded leaves, for instance, insect growth tends to correlate negatively with hydrolyzable tannins [9; 15], particularly with galloylglucoses, which peak in early season [20]. In more mature leaves, “total phenols”, proanthocyanidins, flavonoids, or hydrolyzable tannins often show the most negative correlations with insect growth [9; 14; 15; 19; 23; 26]. Variable correlations between insect growth and leaf phenols may also be due to other causes, such as interactive effects between nutritive [9; 11; 14] and other leaf traits (section III), or to the species-specific adaptation of the insect to young or mature leaves [17].
Birch leaf phenols generally display higher negative correlations with insect growth than with consumption, casting some doubt on their defensive role. However, when the interactive effects of phenols, leaf water and leaf toughness were taken into account, phenols explained more of the variance in the consumption than in the larval growth of the geometrid Epirrita autumnata – though generally less than leaf water [14]. We know less about the effects of leaf traits on late season sawflies, but leaf water content and some phenols seem to be involved in their defense as well (Riipi et al., Kapari et al., unpublished data).
To sum up: leaf nutritive traits and leaf phenols are involved in birch defense against lepidopteran and sawfly chewers. The correlations between consumed amounts of foliage and leaf traits are variable, obviously for a number of reasons. However, in a strict sense even recurring negative correlations between phenols and insect growth or performance do not necessarily prove that phenols are the main defenses in birch leaves. Their true defensive role is revealed only by comparing the detrimental effects of phenols to the possibly similar effects of other foliar compounds on herbivory [3]. In the next chapter I introduce our approach to determining the relative importance of phenols and other putative leaf defenses. To my knowledge this approach has not been used earlier to the same extent in studying the defenses of woody plants.
III. Lessons from Pathogen Studies: The Importance of Specific Defense Cascades
Although the possible role of phenolic compounds has
been recognized in the literature on plant defenses against pathogens, this literature – contrary to the mainstream of forest entomological studies – heavily emphasizes specific defense mechanisms [e.g. 27; 28]. During the last ten years it has become increasingly clear that the specific defense mechanisms against pathogens are governed by a few complex defense cascades [e.g. 29; 30]. The same main cascades operate in different plant species, but because they
can switch up and down large numbers of genes, these few main cascades can produce very flexible and specific outcomes. The best known defense cascades are those of the octadecanoid and salicylic acid pathways [e.g. 31], induced e.g. by hormone-like jasmonates, salicylic acid or ethylene. Jasmonic acid derivatives are nowadays widely used to trigger induced plant defenses without damaging the plants. Different defense pathways show complex interactions; they may for instance interfere in other pathways, leading to so called crosstalk between different inducers and pathways [32; 33].
Interestingly, plants seem to utilize the same defense cascades against both biotic pathogens and insects and abiotic challenges, and often in very sophisticated ways. In the entomological literature, much effort is nowadays directed to the capacity of volatile plant compounds, triggered by defense pathways, to lure parasitoids to protect the plants [34-39]. The relative role of such indirect defenses, relative to direct plant defenses (which directly reduce herbivore growth or survivorship) is actually poorly understood, and may be an underestimated major mechanism in plant defense. A particularly interesting finding is that plant volatiles may induce defenses or volatile emissions in other plant individuals [40-43].
The operation and relevance of particular defense cascades can be evaluated in different ways. The activity of the pathways can be studied by microarrays, directly measuring the switching on and off of particular genes [e.g. 44; 45]. Another alternative is to apply known inducers of defense cascades (often jasmonic acid or its methylated form) and to study changes in herbivory [e.g. 35; 36] or in other defenses, such as phenols or quinones. These last approaches have also been applied to woody plants [41; 46]. The third method is to analyze large numbers of individual compounds in plants, and to try to determine their relevance for plant defense from their correlations with insect traits.
Although the first two approaches are superior in elucidating the mechanisms of defense, the third alternative can help in resolving the relative importance of different types of defenses. An obvious problem is the necessarily large amount of analytical work that is needed, but due to recent progress in analytical chemistry in identifying huge numbers of compounds from cells (the metabolomic approach [e.g. 47; 48]) this too has become increasingly possible. These new analytical methods heavily rely on gas chromatography and mass spectrometry. By this means close to 1500 peaks have been detected for instance in birch leaves (Vladimir Ossipov, unpublished data).
Preliminary analyses by Haukioja et al. (ms), using ca 600 birch leaf traits detected by the HPLC and GC-MS methods, suggest that different classes of foliar compounds are important against different insect traits. The survivorship of Epirrita autumnata larvae (varying from 20 to 90 %), bagged on branches of individual mountain birch trees and therefore unaffected by predators or parasitoids, displayed the most negative correlations with several fatty acids, many of them relating to the octadecanoid pathway. The activation of defense cascades often relates to oxidative reactions [49]
Proccedings: IUFRO Kanazawa 2003 "Forest Insect Population Dynamics and Host Influences” - 27 -
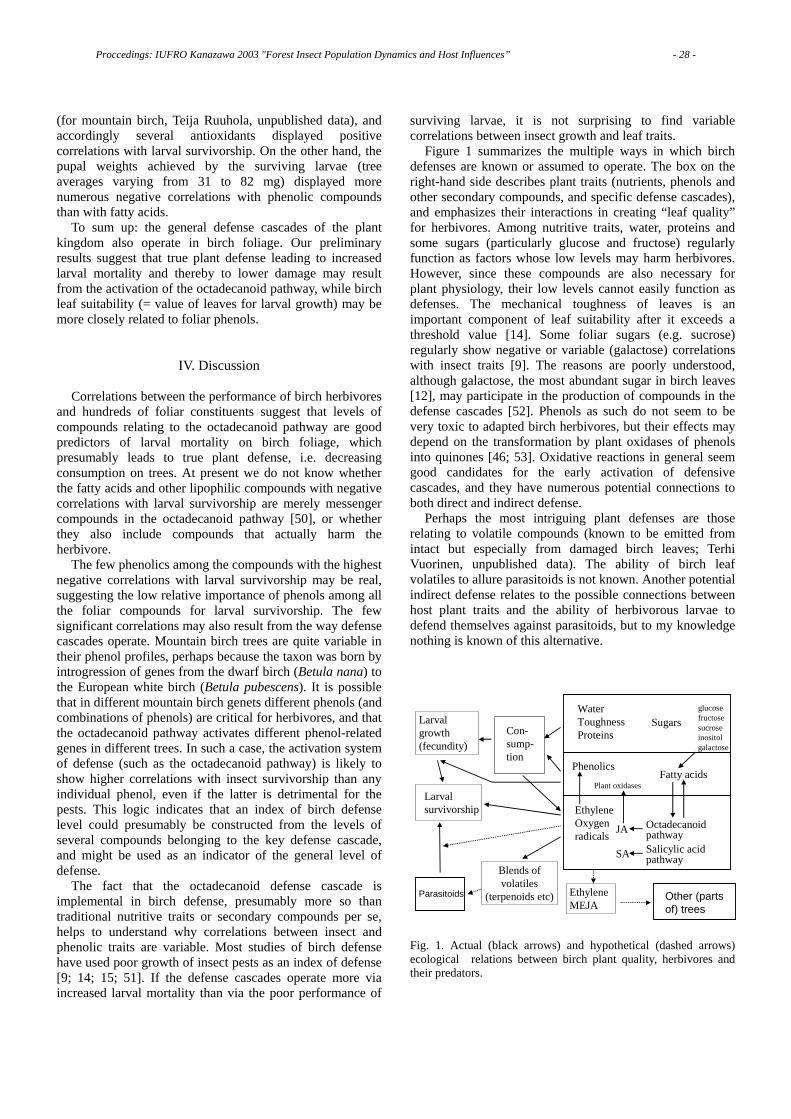
(for mountain birch, Teija Ruuhola, unpublished data), and accordingly several antioxidants displayed positive correlations with larval survivorship. On the other hand, the pupal weights achieved by the surviving larvae (tree averages varying from 31 to 82 mg) displayed more numerous negative correlations with phenolic compounds than with fatty acids.
To sum up: the general defense cascades of the plant kingdom also operate in birch foliage. Our preliminary results suggest that true plant defense leading to increased larval mortality and thereby to lower damage may result from the activation of the octadecanoid pathway, while birch leaf suitability (= value of leaves for larval growth) may be more closely related to foliar phenols.
IV. Discussion
Correlations between the performance of birch herbivores and hundreds of foliar constituents suggest that levels of compounds relating to the octadecanoid pathway are good predictors of larval mortality on birch foliage, which presumably leads to true plant defense, i.e. decreasing consumption on trees. At present we do not know whether the fatty acids and other lipophilic compounds with negative correlations with larval survivorship are merely messenger compounds in the octadecanoid pathway [50], or whether they also include compounds that actually harm the herbivore.
The few phenolics among the compounds with the highest negative correlations with larval survivorship may be real, suggesting the low relative importance of phenols among all the foliar compounds for larval survivorship. The few significant correlations may also result from the way defense cascades operate. Mountain birch trees are quite variable in their phenol profiles, perhaps because the taxon was born by introgression of genes from the dwarf birch (Betula nana) to the European white birch (Betula pubescens). It is possible that in different mountain birch genets different phenols (and combinations of phenols) are critical for herbivores, and that the octadecanoid pathway activates different phenol-related genes in different trees. In such a case, the activation system of defense (such as the octadecanoid pathway) is likely to show higher correlations with insect survivorship than any individual phenol, even if the latter is detrimental for the pests. This logic indicates that an index of birch defense level could presumably be constructed from the levels of several compounds belonging to the key defense cascade, and might be used as an indicator of the general level of defense.
The fact that the octadecanoid defense cascade is implemental in birch defense, presumably more so than traditional nutritive traits or secondary compounds per se, helps to understand why correlations between insect and phenolic traits are variable. Most studies of birch defense have used poor growth of insect pests as an index of defense [9; 14; 15; 51]. If the defense cascades operate more via increased larval mortality than via the poor performance of
surviving larvae, it is not surprising to find variable correlations between insect growth and leaf traits.
Figure 1 summarizes the multiple ways in which birch defenses are known or assumed to operate. The box on the right-hand side describes plant traits (nutrients, phenols and other secondary compounds, and specific defense cascades), and emphasizes their interactions in creating “leaf quality” for herbivores. Among nutritive traits, water, proteins and some sugars (particularly glucose and fructose) regularly function as factors whose low levels may harm herbivores. However, since these compounds are also necessary for plant physiology, their low levels cannot easily function as defenses. The mechanical toughness of leaves is an important component of leaf suitability after it exceeds a threshold value [14]. Some foliar sugars (e.g. sucrose) regularly show negative or variable (galactose) correlations with insect traits [9]. The reasons are poorly understood, although galactose, the most abundant sugar in birch leaves [12], may participate in the production of compounds in the defense cascades [52]. Phenols as such do not seem to be very toxic to adapted birch herbivores, but their effects may depend on the transformation by plant oxidases of phenols into quinones [46; 53]. Oxidative reactions in general seem good candidates for the early activation of defensive cascades, and they have numerous potential connections to both direct and indirect defense.
Perhaps the most intriguing plant defenses are those relating to volatile compounds (known to be emitted from intact but especially from damaged birch leaves; Terhi Vuorinen, unpublished data). The ability of birch leaf volatiles to allure parasitoids is not known. Another potential indirect defense relates to the possible connections between host plant traits and the ability of herbivorous larvae to defend themselves against parasitoids, but to my knowledge nothing is known of this alternative.
Larval growth(fecundity)
WaterToughnessProteins
Sugars
PhenolicsFatty acids
OctadecanoidpathwaySalicylic acidpathway
EthyleneOxygenradicals
Larval survivorship
EthyleneMEJA
SA
JA
Plant oxidases
Blends of volatiles
(terpenoids etc)
glucosefructosesucroseinositolgalactose
Con-sump-tion
Parasitoids Other (parts of) trees
Fig. 1. Actual (black arrows) and hypothetical (dashed arrows) ecological relations between birch plant quality, herbivores and their predators.
Proccedings: IUFRO Kanazawa 2003 "Forest Insect Population Dynamics and Host Influences” - 28 -
To sum up: for several reasons, birch defense is obviously far more complex than is indicated by the ecological literature. It is presumably not organized by any single group of compounds, but is derived from different chemical and physical mechanisms, simultaneously involved in creating the outcome, “defense”. Second, defense seems to result from at least partly different effects on various insect parameters, such as survival and growth or fecundity. Insect mortality may result from plant traits that prevent further consumption by directly killing the herbivore, but another obvious mechanism is recruitment of the third trophic level, i.e. parasitoids, to curtail the numbers of herbivores on the plant. Currently, we do not have a good understanding of the relative roles of direct and indirect defenses in woody or other plants. Elucidating the mechanisms that determine the importance of traditionally measured plant traits (phenols, terpenoids, nutritive traits), demands the use of more sophisticated analytical methods than to date. This is tedious, and so far no short-cut methods are available. Still numerous compounds have to be quantified if we are to understand for instance how birch defenses operate, how they have evolved, and the role of plant nutrition in defense.
References
[1] E. Haukioja, "Putting the insect into the birch-insect interaction". Oecologia, Vol. 136, pp. 161-168, 2003. [2] P. Feeny, "Seasonal changes in oak leaf tannins and nutrients as a cause of spring feeding by winter moth caterpillars". Ecology, Vol. 51, pp. 565-581, 1970. [3] E. Haukioja, "Tree defenses against insects" in Multigenic and Induced Systemic Resistance in Plants, E. Bent and S. Tuzun, Eds, in press. Kluver Academic Publishers, 2004. [4] W. Schwenke, "Neue Hinweise auf eine Abhängigkeit der Vermehrung blatt- und nadelfressender Forstinsekten vom Zuckergehalt ihrer Nahrung". Zeitschrift fur angewanndte Entomologie, Vol. 61, pp. 365-369, 1968. [5] W. J. Mattson, J. M. Scriber, "Nutritional ecology of insect folivores of woody plants: nitrogen, water, fiber, and mineral considerations" in Nutritional Ecology of Insects, Mites, Spiders and Related Invertebrates, F. Slansky, Jr. and J. G. Rodriquez, Eds, pp. 105-146. John Wiley, 1987. [6] J. M. Scriber, P. Feeny, "Growth of herbivorous caterpillars in relation to feeding specialization and to the growth form of their food plants". Ecology, Vol. 60, pp. 829-850, 1979. [7] J. M. Scriber, "Limiting effects of low leaf-water content on the nitrogen utilization, energy budget, and larval growth of Hyalophora cecropia Lepidoptera: Saturniidae". Oecologia, Vol. 28, pp. 269-287, 1977. [8] J. M. Scriber, F. Slansky, Jr., "The nutritional ecology of immature insects". Annual Review of Entomology, Vol. 26, pp. 183-211, 1981. [9] J. Henriksson, E. Haukioja, V. Ossipov, S. Ossipova, S. Sillanpää, L. Kapari, K. Pihlaja, "Effects of host shading on consumption and growth of the geometrid Epirrita autumnata: interactive roles of water, primary and secondary compounds". Oikos, Vol. 103, pp. 3-16, 2003. [10] N. Moran, W. D. Hamilton, "Low nutritive quality as defence against herbivores". J. theor. Biol., Vol. 86, pp. 247-254, 1980.
[11] S. J. Simpson, D. Raubenheimer, "The geometric analysis of nutrient-allelochemical interactions: a case study using locusts". Ecology, Vol. 82, pp. 422-439, 2001. [12] M. Riipi, V. Ossipov, K. Lempa, E. Haukioja, J. Koricheva, S. Ossipova, K. Pihlaja, "Seasonal changes in birch leaf chemistry: are there trade-offs between leaf growth and accumulation of phenolics?". Oecologia, Vol. 130, pp. 380-390, 2002. [13] T. Ruuhola, V. Ossipov, K. Lempa, E. Haukioja, "Amino acids during development of mountain birch leaves". Chemoecology, Vol. 13, pp. 95-101, 2003. [14] E. Haukioja, V. Ossipov, K. Lempa, "Interactive effects of leaf maturation and phenolics on consumption and growth of a geometrid moth". Enomologia. Experimentalis et Applicata, Vol. 104, pp. 125-136, 2002. [15] A. Kause, V. Ossipov, E. Haukioja, K. Lempa, S. Hanhimäki, "Multiplicity of biochemical factors determining quality of growing birch leaves". Oecologia, Vol. 120, pp. 102-112, 1999. [16] A. Kause, I. Saloniemi, J. P. Morin, E. Haukioja, S. Hanhimäki, K. Ruohomäki, "Seasonally varying diet quality and the quantitative genetics of development time and body size in birch feeding insects". Evolution, Vol. 55, pp. 1992-2001, 2001. [17] J. Martel, S. Hanhimäki, A. Kause, E. Haukioja, "Diversity of birch sawfly responses to seasonally atypical diets across a seasonal gradient of larval feeding periods". Enomologia. Experimentalis et Applicata, Vol. 100, pp. 301-309, 2001. [18] V. Ossipov, K. Nurmi, J. Loponen, E. Haukioja, K. Pihlaja, "HPLC separation and identification of phenolic compounds from leaves of Betula pubescens and Betula pendula". Journal of Chromatography, Vol. 721, pp. 59-68, 1996. [19] V. Ossipov, E. Haukioja, S. Hanhimäki, K. Pihlaja, "Phenolic and phenolic-related factors as determinants of suitability of mountain birch leaves to an herbivorous insect". Biochemical Systematics and Ecology., Vol. 29, pp. 223-240, 2001. [20] J.-P. Salminen, V. Ossipov, E. Haukioja, K. Pihlaja, "Seasonal variation in the content of hydrolysable tannins in leaves of Betula pubescens". Phytochemistry, Vol. 57, pp. 15-22, 2001. [21] M. Keinänen, R. Julkunen-Tiitto, P. Mutikainen, M. Walls, J. Ovaska, E. Vapaavuori, "Trade-offs in secondary metabolism: effects of fertilization, defoliation, and genotype on birch leaf phenolics". Ecology, Vol. 80, pp. 1970-1986, 1999. [22] M.-L. Laitinen, R. Julkunen-Tiitto, M. Rousi, "Foliar phenolic composition of European white birch during bud unfolding and leaf development". Physiologia Plantarum, Vol. 114, pp. 450-460, 2002. [23] J.-P. Salminen, K. Lempa, "Effects of hydrolysable tannins on an herbivorous insect: fate of individual tannins in insect digestive tract". Chemoecology, Vol. 12, pp. 203-211, 2002. [24] K. Nurmi, V. Ossipov, E. Haukioja, K. Pihlaja, "Variation of total phenolic content and low-molecular-weight phenolics in foliage of the mountain birch trees Betula pubescens ssp. tortuosa". Journal of Chemical Ecology, Vol. 22, pp. 2033-2050, 1996. [25] M. Riipi, E. Haukioja, K. Lempa, V. Ossipov, S. Ossipova, K. Pihlaja, "Ranking of individual mountain birch trees in terms of leaf chemistry: seasonal and annual variation". Chemoecology , in press, 2004. [26] P. Kaitaniemi, K. Ruohomäki, V. Ossipov, E. Haukioja, K. Pihlaja, "Delayed induced changes in the biochemical composition of host plant leaves during an insect outbreak". Oecologia, Vol. 116, pp. 182-190, 1998. [27] M. C. Heath, "Evolution of resistance to fungal parasitism in natural ecosystems". New Phytologist,ol. 119, pp. 331-343, 1991. [28] M. C. Heath, "Nonhost resistance and nonspecific plant defenses". Current Opinion in Plant Biology, Vol. 3, pp. 315-319, 2000.
Proccedings: IUFRO Kanazawa 2003 "Forest Insect Population Dynamics and Host Influences” - 29 -
[29] B. P. H. J. Thomma, I. A. M. A. Pennickx, W. F. Broekaert, B. P. A. Cammue, "The complexity of disease signaling in Arabidopsis". Current Opinion in Immunology, Vol. 13, pp. 63-6, 2001. [30] B. P. H. J. Thomma, K. Eggermont, B. Mauch-Mani, R. Vogelsang, B. P. A. Cammue, W. F. Broekaert, "Separate jasmonate-dependent and salicylate-dependent defense-response pathways in Arabidopsis are essential for resistance to distinct microbial pathogens". PNAS, Vol. 95, pp. 15107-15111, 1998. [31] P. Reymond, E. E. Farmer, "Jasmonate and salicylate as global signals for defense gene expression". Current Opinion in Plant Biology, Vol. 1, pp. 404-411, 1998. [32] M. D. Hunter, "A breath of fresh air: beyond laboratory studies of plant volatile-natural enemy interactions". Agricultural and Forest Entomology, Vol. 4, pp. 81-86, 2002. [33] B. N. Kunkel, D. M. Brooks, "Cross talk between signaling pathways in pathogen defense". Current Opinion in Plant Biology, Vol. 5, pp. 325-331, 2002. [34] C. M. De Moraes, W. J. Lewis, P. W. Pare, H. T. Alborn, J. H. Tumlinson, "Herbivore-infested plants selectively attract parasitoids". Nature, Vol. 393, pp. 570-573, 1998. [35] J. S. Thaler, "Jasmonate-inducible plant defences cause increased parasitism of herbivores". Nature, Vol. 399, pp. 686-688, 1999. [36] A. Kessler, I. T. Baldwin, "Defensive function of herbivore-Induced plant volatile emissions in nature". Science, Vol. 291, pp. 2141-2144, 2001. [37] R. M. P. van Poecke, M. Dicke, "Induced parasitoid attraction by Arabidopsis thaliana: involvement of the octadecanoid and the salicylic acid pathway". Journal of Experimental Botany, Vol. 53, pp. 1793-1799, 2002. [38] R. M. P. van Poecke, M. Dicke, "Signal transduction downstream of salicylic and jasmonic acid in herbivory-induced parasitoid attraction by Arabidopsis is independent of JAR1 and NPR1". Plant Cell and Environment, Vol. 26, pp. 1541-1548, 2003. [39] E. A. Schmelz, H. T. Alborn, E. Banchio, J. H. Tumlinson, "Quantitative relationships between induced jasmonic acid levels and volatile emission in Zea mays during Spodoptera exigua herbivory". Planta, Vol. 216, pp. 665-673, 2003. [40] R. Dolch, T. Tscharntke, "Defoliation of alders Alnus glutinosa affects herbivory by leaf beetles on undamaged neighbours". Oecologia, Vol. 125, pp. 504-511, 2000. [41] T. Tscharntke, S. Thiessen, R. Dolch, W. Boland, "Herbivory, induced resistance, and interplant signal transfer in Alnus glutinosa". Biochemical and Systematic. Ecology, Vol. 29, pp. 1025-1047, 2001. [42] R. Karban, I. T. Baldwin, K. J. Baxter, G. Laue, G. W. Felton, "Communication between plants: induced resistance in wild tobacco plants following clipping of neighboring sagebrush". Oecologia, Vol. 125, pp. 66-71, 2000. [43] G. Arimura, R. Ozawa, T. Nishioka, W. Boland, T. Koch, F. Kuhnemann, J. Takabayashi, "Herbivore-induced volatiles induce the emission of ethylene in neighboring lima bean plants". Plant Journal, Vol. 29, pp. 87-98, 2002. [44] R. Halitschke, K. Gase, D. Q. Hui, D. D. Schmidt, I. T. Baldwin, "Molecular interactions between the specialist herbivore Manduca sexta Lepidoptera, Sphingidae and its natural host Nicotiana attenuata. VI. Microarray analysis reveals that most herbivore-specific transcriptional changes are mediated by fatty acid-amino acid conjugates". Plant Physiology, Vol. 131, pp. 1894-1902, 2003. [45] D. Q. Hui, J. Iqbal, K. Lehmann, K. Gase, H. P. Saluz, I. T. Baldwin, "Molecular interactions between the specialist herbivore Manduca sexta Lepidoptera, Sphingidae and its natural host Nicotiana attenuata: V. Microarray analysis and further
characterization of large-scale changes in herbivore-induced mRNAs". Plant Physiology, Vol. 131, pp. 1877-1893, 2003. [46] C. P. Constabel, L. Yip, J. J. Patton, M. E. Christopher, "Polyphenol oxidase from hybrid poplar. Cloning and expression in response to wounding and herbivory". Plant Physiology, Vol. 124, pp. 285-295, 2000. [47] O. Fiehn, J. Kopka, P. Dörmann, T. Altmann, R. Trethewey, L. Willmitzer, "Metabolite profiling for functional genomics". Nature Biotechnology, Vol. 18, pp. 1157-1161, 2000. [48] O. Fiehn, S. Kloska, T. Altmann, "Integrated studies on plant biology using multiparallel techniques". Current Opinion in Biotechnology, Vol. 12, pp. 82-86, 2001. [49] R. I. Pellinen, M.-S. Korhonen, A. A. Tauriainen, E. T. Palva, J. Kangasjärvi, "Hydrogen peroxidase activates cell death and defense gene expression in birch". Plant Physiology, Vol. 130, pp. 549-560, 2002. [50] E. E. Farmer, H. Weber, S. Vollenweider, "Fatty acid signaling in Arabidopsis". Planta, Vol. 206, pp. 167-174, 1998. [51] P. Mutikainen, M. Walls, J. Ovaska, M. Keinänen, R. Julkunen-Tiitto, E. Vapaavuori, "Herbivore resistance in Betula pendula: effect of fertilization, defoliation, and plant genotype". Ecology, Vol. 81, pp. 49-65, 2000. [52] E. Blée, "Impact of phyto-oxylipids in plant defense". Trends in Plant Science, Vol. 7, pp. 315-321, 2002. [53] G. W. Felton, K. K. Donato, R. M. Broadway, S. S. Duffey, "Impact of oxidized plant phenolics on the nutritional quality of dietary protein to a noctuid herbivore, Spodoptera exigua". Journal of Insect Physiology, Vol. 38, pp. 277-285, 1992.
Proccedings: IUFRO Kanazawa 2003 "Forest Insect Population Dynamics and Host Influences” - 30 -
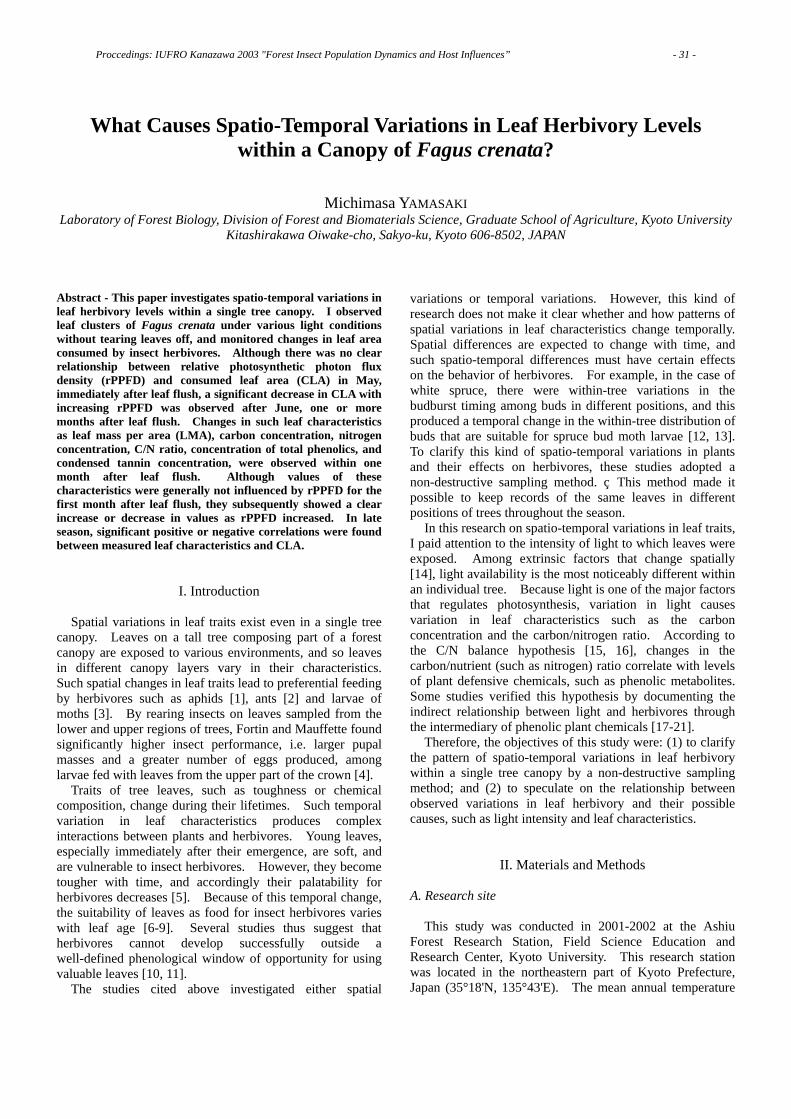
What Causes Spatio-Temporal Variations in Leaf Herbivory Levels within a Canopy of Fagus crenata?
Michimasa YAMASAKI Laboratory of Forest Biology, Division of Forest and Biomaterials Science, Graduate School of Agriculture, Kyoto University
Kitashirakawa Oiwake-cho, Sakyo-ku, Kyoto 606-8502, JAPAN Abstract - This paper investigates spatio-temporal variations in leaf herbivory levels within a single tree canopy. I observed leaf clusters of Fagus crenata under various light conditions without tearing leaves off, and monitored changes in leaf area consumed by insect herbivores. Although there was no clear relationship between relative photosynthetic photon flux density (rPPFD) and consumed leaf area (CLA) in May, immediately after leaf flush, a significant decrease in CLA with increasing rPPFD was observed after June, one or more months after leaf flush. Changes in such leaf characteristics as leaf mass per area (LMA), carbon concentration, nitrogen concentration, C/N ratio, concentration of total phenolics, and condensed tannin concentration, were observed within one month after leaf flush. Although values of these characteristics were generally not influenced by rPPFD for the first month after leaf flush, they subsequently showed a clear increase or decrease in values as rPPFD increased. In late season, significant positive or negative correlations were found between measured leaf characteristics and CLA.
I. Introduction
Spatial variations in leaf traits exist even in a single tree canopy. Leaves on a tall tree composing part of a forest canopy are exposed to various environments, and so leaves in different canopy layers vary in their characteristics. Such spatial changes in leaf traits lead to preferential feeding by herbivores such as aphids [1], ants [2] and larvae of moths [3]. By rearing insects on leaves sampled from the lower and upper regions of trees, Fortin and Mauffette found significantly higher insect performance, i.e. larger pupal masses and a greater number of eggs produced, among larvae fed with leaves from the upper part of the crown [4].
Traits of tree leaves, such as toughness or chemical composition, change during their lifetimes. Such temporal variation in leaf characteristics produces complex interactions between plants and herbivores. Young leaves, especially immediately after their emergence, are soft, and are vulnerable to insect herbivores. However, they become tougher with time, and accordingly their palatability for herbivores decreases [5]. Because of this temporal change, the suitability of leaves as food for insect herbivores varies with leaf age [6-9]. Several studies thus suggest that herbivores cannot develop successfully outside a well-defined phenological window of opportunity for using valuable leaves [10, 11].
The studies cited above investigated either spatial
variations or temporal variations. However, this kind of research does not make it clear whether and how patterns of spatial variations in leaf characteristics change temporally. Spatial differences are expected to change with time, and such spatio-temporal differences must have certain effects on the behavior of herbivores. For example, in the case of white spruce, there were within-tree variations in the budburst timing among buds in different positions, and this produced a temporal change in the within-tree distribution of buds that are suitable for spruce bud moth larvae [12, 13]. To clarify this kind of spatio-temporal variations in plants and their effects on herbivores, these studies adopted a non-destructive sampling method. This method made it possible to keep records of the same leaves in different positions of trees throughout the season.
In this research on spatio-temporal variations in leaf traits, I paid attention to the intensity of light to which leaves were exposed. Among extrinsic factors that change spatially [14], light availability is the most noticeably different within an individual tree. Because light is one of the major factors that regulates photosynthesis, variation in light causes variation in leaf characteristics such as the carbon concentration and the carbon/nitrogen ratio. According to the C/N balance hypothesis [15, 16], changes in the carbon/nutrient (such as nitrogen) ratio correlate with levels of plant defensive chemicals, such as phenolic metabolites. Some studies verified this hypothesis by documenting the indirect relationship between light and herbivores through the intermediary of phenolic plant chemicals [17-21].
Therefore, the objectives of this study were: (1) to clarify the pattern of spatio-temporal variations in leaf herbivory within a single tree canopy by a non-destructive sampling method; and (2) to speculate on the relationship between observed variations in leaf herbivory and their possible causes, such as light intensity and leaf characteristics.
II. Materials and Methods A. Research site
This study was conducted in 2001-2002 at the Ashiu Forest Research Station, Field Science Education and Research Center, Kyoto University. This research station was located in the northeastern part of Kyoto Prefecture, Japan (35°18'N, 135°43'E). The mean annual temperature
Proccedings: IUFRO Kanazawa 2003 "Forest Insect Population Dynamics and Host Influences” - 31 -
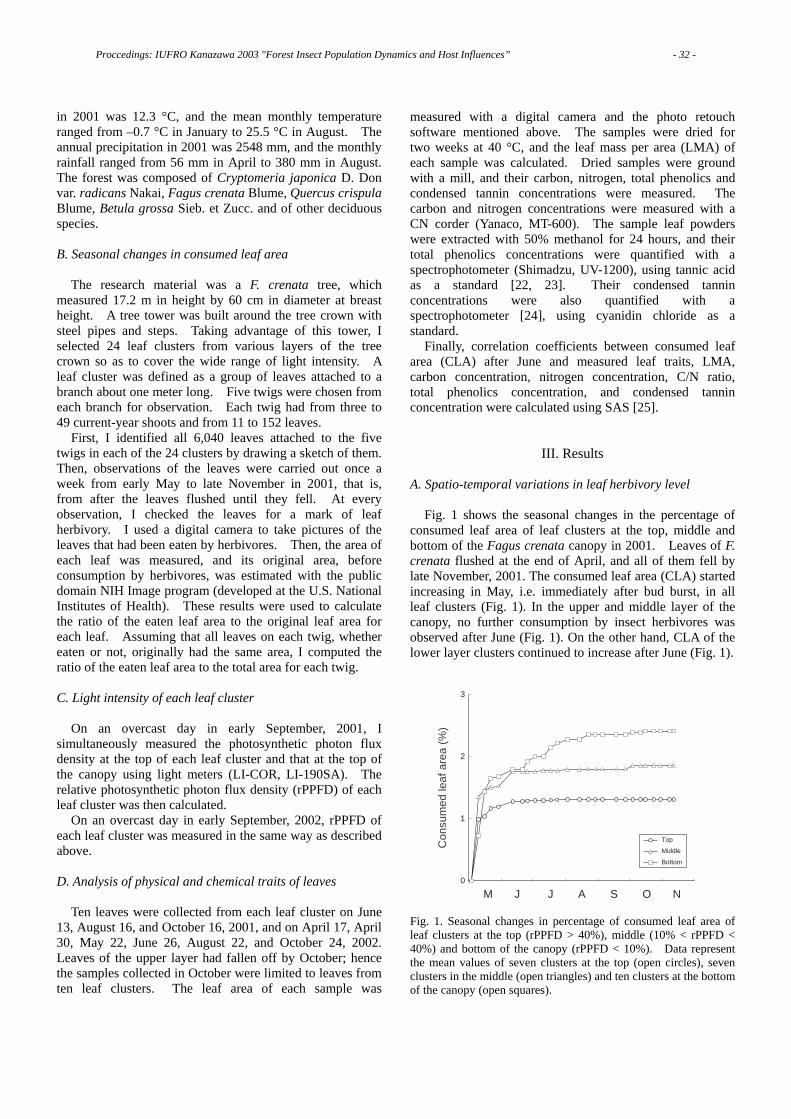
in 2001 was 12.3 °C, and the mean monthly temperature ranged from –0.7 °C in January to 25.5 °C in August. The annual precipitation in 2001 was 2548 mm, and the monthly rainfall ranged from 56 mm in April to 380 mm in August. The forest was composed of Cryptomeria japonica D. Don var. radicans Nakai, Fagus crenata Blume, Quercus crispula Blume, Betula grossa Sieb. et Zucc. and of other deciduous species. B. Seasonal changes in consumed leaf area
The research material was a F. crenata tree, which measured 17.2 m in height by 60 cm in diameter at breast height. A tree tower was built around the tree crown with steel pipes and steps. Taking advantage of this tower, I selected 24 leaf clusters from various layers of the tree crown so as to cover the wide range of light intensity. A leaf cluster was defined as a group of leaves attached to a branch about one meter long. Five twigs were chosen from each branch for observation. Each twig had from three to 49 current-year shoots and from 11 to 152 leaves.
First, I identified all 6,040 leaves attached to the five twigs in each of the 24 clusters by drawing a sketch of them. Then, observations of the leaves were carried out once a week from early May to late November in 2001, that is, from after the leaves flushed until they fell. At every observation, I checked the leaves for a mark of leaf herbivory. I used a digital camera to take pictures of the leaves that had been eaten by herbivores. Then, the area of each leaf was measured, and its original area, before consumption by herbivores, was estimated with the public domain NIH Image program (developed at the U.S. National Institutes of Health). These results were used to calculate the ratio of the eaten leaf area to the original leaf area for each leaf. Assuming that all leaves on each twig, whether eaten or not, originally had the same area, I computed the ratio of the eaten leaf area to the total area for each twig. C. Light intensity of each leaf cluster
On an overcast day in early September, 2001, I simultaneously measured the photosynthetic photon flux density at the top of each leaf cluster and that at the top of the canopy using light meters (LI-COR, LI-190SA). The relative photosynthetic photon flux density (rPPFD) of each leaf cluster was then calculated.
On an overcast day in early September, 2002, rPPFD of each leaf cluster was measured in the same way as described above. D. Analysis of physical and chemical traits of leaves
Ten leaves were collected from each leaf cluster on June 13, August 16, and October 16, 2001, and on April 17, April 30, May 22, June 26, August 22, and October 24, 2002. Leaves of the upper layer had fallen off by October; hence the samples collected in October were limited to leaves from ten leaf clusters. The leaf area of each sample was
measured with a digital camera and the photo retouch software mentioned above. The samples were dried for two weeks at 40 °C, and the leaf mass per area (LMA) of each sample was calculated. Dried samples were ground with a mill, and their carbon, nitrogen, total phenolics and condensed tannin concentrations were measured. The carbon and nitrogen concentrations were measured with a CN corder (Yanaco, MT-600). The sample leaf powders were extracted with 50% methanol for 24 hours, and their total phenolics concentrations were quantified with a spectrophotometer (Shimadzu, UV-1200), using tannic acid as a standard [22, 23]. Their condensed tannin concentrations were also quantified with a spectrophotometer [24], using cyanidin chloride as a standard.
Finally, correlation coefficients between consumed leaf area (CLA) after June and measured leaf traits, LMA, carbon concentration, nitrogen concentration, C/N ratio, total phenolics concentration, and condensed tannin concentration were calculated using SAS [25].
III. Results A. Spatio-temporal variations in leaf herbivory level
Fig. 1 shows the seasonal changes in the percentage of consumed leaf area of leaf clusters at the top, middle and bottom of the Fagus crenata canopy in 2001. Leaves of F. crenata flushed at the end of April, and all of them fell by late November, 2001. The consumed leaf area (CLA) started increasing in May, i.e. immediately after bud burst, in all leaf clusters (Fig. 1). In the upper and middle layer of the canopy, no further consumption by insect herbivores was observed after June (Fig. 1). On the other hand, CLA of the lower layer clusters continued to increase after June (Fig. 1).
0
1
2
3
Con
sum
ed le
af a
rea
(%)
Top
Middle
Bottom
M J J A S O N Fig. 1. Seasonal changes in percentage of consumed leaf area of leaf clusters at the top (rPPFD > 40%), middle (10% < rPPFD < 40%) and bottom of the canopy (rPPFD < 10%). Data represent the mean values of seven clusters at the top (open circles), seven clusters in the middle (open triangles) and ten clusters at the bottom of the canopy (open squares).
Proccedings: IUFRO Kanazawa 2003 "Forest Insect Population Dynamics and Host Influences” - 32 -
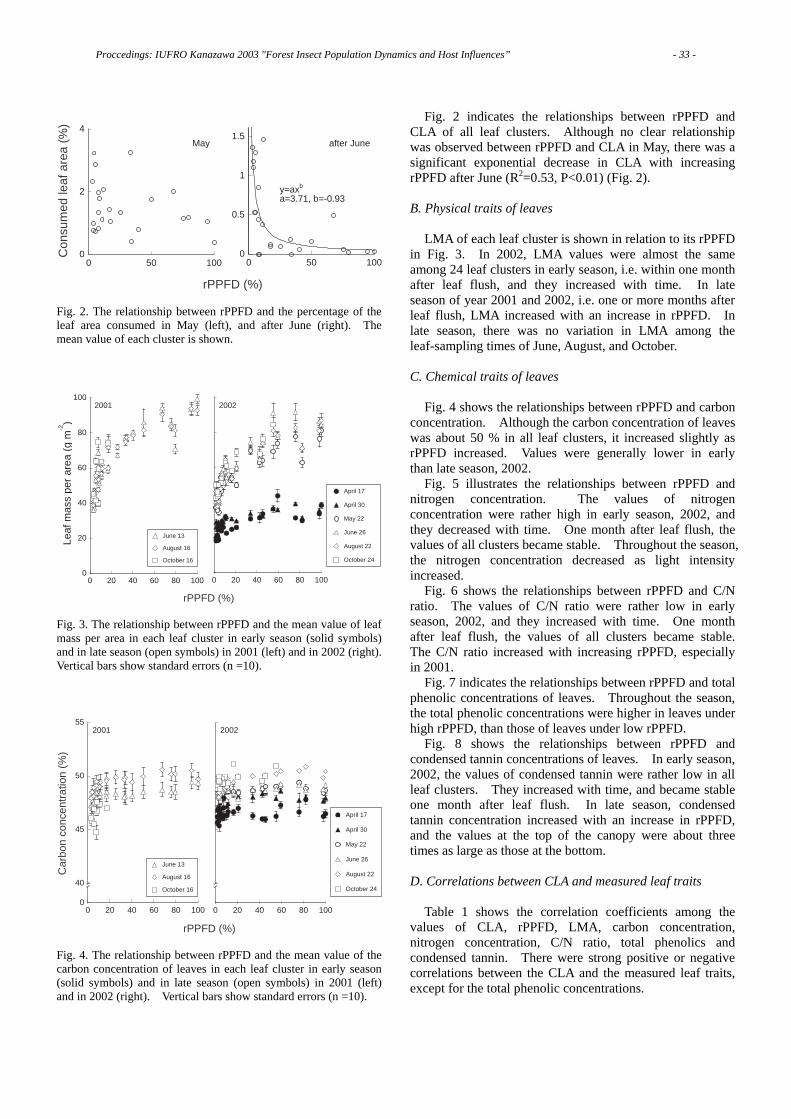
0
2
4
0 50 100
Con
sum
ed le
af a
rea
(%)
rPPFD (%)
0
0.5
1
1.5
0 50 100
May after June
y=axb
a=3.71, b=-0.93
Fig. 2. The relationship between rPPFD and the percentage of the leaf area consumed in May (left), and after June (right). The mean value of each cluster is shown.
0
20
40
60
80
100
0 20 40 60 80 100
rPPFD (%)
June 13
August 16
October 16
Leaf
mas
s pe
r ar
ea (
g m
-2)
0 20 40 60 80 100
April 17
April 30
May 22
June 26
August 22
October 24
2001 2002
Fig. 3. The relationship between rPPFD and the mean value of leaf mass per area in each leaf cluster in early season (solid symbols) and in late season (open symbols) in 2001 (left) and in 2002 (right). Vertical bars show standard errors (n =10).
0
40
45
50
55
0 20 40 60 80 100
Car
bon
conc
entr
atio
n (%
)
rPPFD (%)
June 13
August 16
October 16
0 20 40 60 80 100
April 17
April 30
May 22
June 26
August 22
October 24
2001 2002
Fig. 4. The relationship between rPPFD and the mean value of the carbon concentration of leaves in each leaf cluster in early season (solid symbols) and in late season (open symbols) in 2001 (left) and in 2002 (right). Vertical bars show standard errors (n =10).
Fig. 2 indicates the relationships between rPPFD and CLA of all leaf clusters. Although no clear relationship was observed between rPPFD and CLA in May, there was a significant exponential decrease in CLA with increasing rPPFD after June (R2=0.53, P<0.01) (Fig. 2). B. Physical traits of leaves
LMA of each leaf cluster is shown in relation to its rPPFD in Fig. 3. In 2002, LMA values were almost the same among 24 leaf clusters in early season, i.e. within one month after leaf flush, and they increased with time. In late season of year 2001 and 2002, i.e. one or more months after leaf flush, LMA increased with an increase in rPPFD. In late season, there was no variation in LMA among the leaf-sampling times of June, August, and October. C. Chemical traits of leaves
Fig. 4 shows the relationships between rPPFD and carbon concentration. Although the carbon concentration of leaves was about 50 % in all leaf clusters, it increased slightly as rPPFD increased. Values were generally lower in early than late season, 2002.
Fig. 5 illustrates the relationships between rPPFD and nitrogen concentration. The values of nitrogen concentration were rather high in early season, 2002, and they decreased with time. One month after leaf flush, the values of all clusters became stable. Throughout the season, the nitrogen concentration decreased as light intensity increased.
Fig. 6 shows the relationships between rPPFD and C/N ratio. The values of C/N ratio were rather low in early season, 2002, and they increased with time. One month after leaf flush, the values of all clusters became stable. The C/N ratio increased with increasing rPPFD, especially in 2001.
Fig. 7 indicates the relationships between rPPFD and total phenolic concentrations of leaves. Throughout the season, the total phenolic concentrations were higher in leaves under high rPPFD, than those of leaves under low rPPFD.
Fig. 8 shows the relationships between rPPFD and condensed tannin concentrations of leaves. In early season, 2002, the values of condensed tannin were rather low in all leaf clusters. They increased with time, and became stable one month after leaf flush. In late season, condensed tannin concentration increased with an increase in rPPFD, and the values at the top of the canopy were about three times as large as those at the bottom. D. Correlations between CLA and measured leaf traits
Table 1 shows the correlation coefficients among the values of CLA, rPPFD, LMA, carbon concentration, nitrogen concentration, C/N ratio, total phenolics and condensed tannin. There were strong positive or negative correlations between the CLA and the measured leaf traits, except for the total phenolic concentrations.
Proccedings: IUFRO Kanazawa 2003 "Forest Insect Population Dynamics and Host Influences” - 33 -
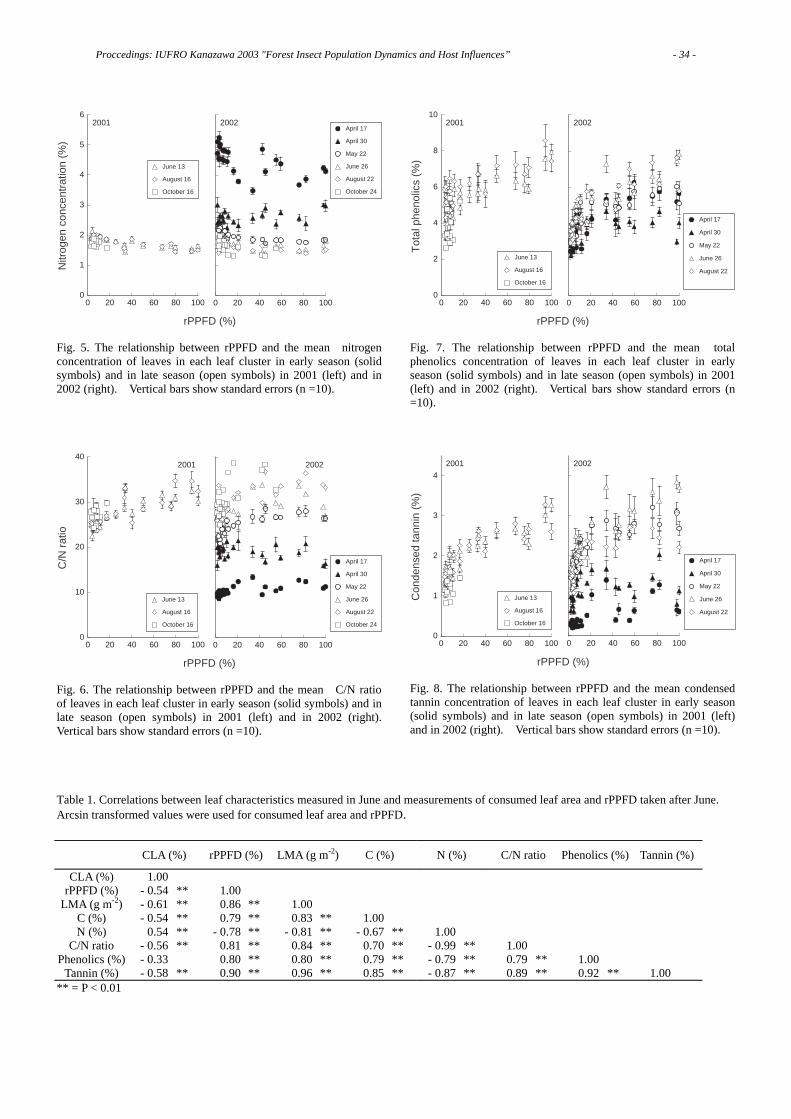
0
1
2
3
4
5
6
0 20 40 60 80 100
Nitr
ogen
con
cent
ratio
n (%
)
rPPFD (%)
June 13
August 16
October 16
0 20 40 60 80 100
April 17
April 30
May 22
June 26
August 22
October 24
2001 2002
Fig. 5. The relationship between rPPFD and the mean nitrogen concentration of leaves in each leaf cluster in early season (solid symbols) and in late season (open symbols) in 2001 (left) and in 2002 (right). Vertical bars show standard errors (n =10).
0
10
20
30
40
0 20 40 60 80 100
C/N
rat
io
rPPFD (%)
June 13
August 16
October 16
0 20 40 60 80 100
April 17
April 30
May 22
June 26
August 22
October 24
2001 2002
Fig. 6. The relationship between rPPFD and the mean C/N ratio of leaves in each leaf cluster in early season (solid symbols) and in late season (open symbols) in 2001 (left) and in 2002 (right). Vertical bars show standard errors (n =10).
0
2
4
6
8
10
0 20 40 60 80 100
Tot
al p
heno
lics
(%)
rPPFD (%)
June 13
August 16
October 16
0 20 40 60 80 100
April 17
April 30
May 22
June 26
August 22
2001 2002
Fig. 7. The relationship between rPPFD and the mean total phenolics concentration of leaves in each leaf cluster in early season (solid symbols) and in late season (open symbols) in 2001 (left) and in 2002 (right). Vertical bars show standard errors (n =10).
0
1
2
3
4
0 20 40 60 80 100
Con
dens
ed ta
nnin
(%
)
rPPFD (%)
June 13
August 16
October 16
0 20 40 60 80 100
April 17
April 30
May 22
June 26
August 22
2001 2002
Fig. 8. The relationship between rPPFD and the mean condensed tannin concentration of leaves in each leaf cluster in early season (solid symbols) and in late season (open symbols) in 2001 (left) and in 2002 (right). Vertical bars show standard errors (n =10).
Table 1. Correlations between leaf characteristics measured in June and measurements of consumed leaf area and rPPFD taken after June. Arcsin transformed values were used for consumed leaf area and rPPFD.
CLA (%) rPPFD (%) LMA (g m-2) C (%) N (%) C/N ratio Phenolics (%) Tannin (%)
CLA (%) 1.00 rPPFD (%) - 0.54 ** 1.00
LMA (g m-2) - 0.61 ** 0.86 ** 1.00 C (%) - 0.54 ** 0.79 ** 0.83 ** 1.00 N (%) 0.54 ** - 0.78 ** - 0.81 ** - 0.67 ** 1.00
C/N ratio - 0.56 ** 0.81 ** 0.84 ** 0.70 ** - 0.99 ** 1.00 Phenolics (%) - 0.33 0.80 ** 0.80 ** 0.79 ** - 0.79 ** 0.79 ** 1.00
Tannin (%) - 0.58 ** 0.90 ** 0.96 ** 0.85 ** - 0.87 ** 0.89 ** 0.92 ** 1.00 ** = P < 0.01
Proccedings: IUFRO Kanazawa 2003 "Forest Insect Population Dynamics and Host Influences” - 34 -

IV. Discussion
Spatio-temporal variations in leaf herbivory level within a canopy of Fagus crenata were studied in this research by repeated observations of leaves in various positions of the canopy. Herbivores started eating F. crenata leaves immediately after leaf flush in all leaf clusters within the canopy (Fig. 1). In early season, within one month after leaf flush, there were no clear variations in consumed leaf area (CLA) among leaf clusters under various light conditions (Fig. 2). CLA continued to increase after June mainly at the bottom of the canopy, where light availability was lower (Fig. 1). Because of this tendency, there was a clear decline in CLA with increasing light intensity in late season, one or more months after leaf flush (Fig. 2).
The analysis of physical and chemical characteristics revealed that spatio-temporal variations also exist in these characteristics. I found that the nitrogen concentration was rather high in early season, just after leaf flush (Fig. 5), while the LMA, carbon concentration, C/N ratio and condensed tannin were rather low in early season (Fig. 3, 4, 6, 8). These values changed with time and became stable one month after leaf flush. In late season, there is a clear gradient of some leaf characteristics as light intensity increased. That is, the LMA and C/N ratio, as well as the concentrations of total phenolics and condensed tannins, increased as light intensity increased (Fig. 3, 6, 7, 8).
I found that the values of the measured leaf characteristics did not change in a large way one or more months after leaf flush (Fig. 3, 4, 5, 6, 7, 8). It can be supposed from this that leaf maturation was finished within one month after leaf flush. Therefore, we can redefine early season as the period before leaf maturation and late season as the period after leaf maturation. Interactions between leaf characteristics and leaf herbivory may differ during these two periods.
In early season, the values of LMA were lower in all clusters than those in late season (Fig. 3). Young leaves in the early season are soft and therefore are supposed to be equally easy to consume for insect herbivores, regardless of their positions in the canopy. In late season, LMA increased with an increase in rPPFD (Fig. 3). Table 1 shows that there was a strong positive correlation between the values of LMA in June and rPPFD. Furthermore, there was a strong negative correlation between CLA and LMA (Table 3). Thus spatio-temporal variations in CLA found in late season can partially be explained by variations in LMA, which were probably caused by the heterogeneity of light [26-28]. These observations give support to the general recognition that leaves are defended against herbivores by toughness [29-31].
In late season, a significant negative correlation was found between rPPFD and nitrogen concentration, while there was a significant positive correlation between nitrogen concentration and CLA (Table 1). It follows from these results that light indirectly influences food availability for herbivores by varying the quantity of nitrogen. The positive correlation between nitrogen and CLA lends support
to Mattson's argument that the lower concentration of nitrogen in leaves means low food value for herbivores [32]. Thus the observed within-tree decrease in leaf nitrogen concentration may partly account for reduced consumption in leaves at the top of the canopy (Fig. 1). In addition, the rather high concentration of nitrogen in leaves in every position of the canopy in early season may partly account for the lack of variation in CLA in this season (Fig. 1).
The condensed tannin content of leaves was lower in all clusters in early than late season (Fig. 8). In late season, the condensed tannin of leaves was negatively correlated with CLA (Table 1). Tannin is considered to work as an inhibitor of digestion for herbivores [33, 34], causing slow growth and high mortality [35-37]. Therefore, the availability of leaves with low tannin concentrations in early season may be equally high for herbivores irrespective of their positions in the canopy. Ayres et al. [36] reported that the growth rate of leaf beetles was 30% lower when fed on leaves painted with condensed tannin solution, which is equivalent to 3% tannin in dry mass, than when fed on leaves without it. At the top of the canopy of F. crenata, the level of condensed tannin in leaves after June was about 3% of dry mass (Fig. 8). If the level of condensed tannin at the top of the canopy was too high for herbivores to consume in the late season, reduced levels of CLA at the top of the canopy in late season may be primarily attributable to this leaf characteristic (Fig. 2).
V. Conclusions
Spatio-temporal variations were observed in leaf herbivory level within a canopy of Fagus crenata. There was no clear variation in CLA among leaf clusters in different positions in early season, immediately after leaf flush, but a negative correlation was observed between rPPFD and CLA in the late season. Since the LMA and condensed tannin concentrations were relatively low, and the nitrogen concentrations were relatively high in early season throughout the canopy, leaves were equally available for insect herbivores irrespective of their positions in the canopy. In contrast, in the late season large spatial variations in leaf characteristics, which were likely caused by the heterogeneity of light, were highly correlated to the spatial variations in CLA.
Acknowledgements
I would like to thank all staff members of the Ashiu Forest Research Station, Field Science Education and Research Center, Kyoto University, for enabling the investigation herein described. I am also grateful to all members of the Laboratory of Forest Biology, Kyoto University, Dr. Michinori Sakimoto of the Field Science Education and Research Center, Kyoto University, and Dr. Shizuo Suzuki of the Institute for Environmental Sciences for their very valuable help, advice, and encouragement
Proccedings: IUFRO Kanazawa 2003 "Forest Insect Population Dynamics and Host Influences” - 35 -
during the work.
References [1] W. V. Zucker, “How aphids choose leaves: The roles of phenolics in host selection by a galling aphid,” Ecology, Vol. 63, pp. 972-981, 1982. [2] J. Howard, “Infidelity of leafcutting ants to host plants: Resource heterogeneity or defense induction?,” Oecologia, Vol. 82, pp. 394-401, 1990. [3] K. F. Wallin, K. F. Raffa, “Association of within-tree jack pine budworm feeding patterns with canopy level and within-needle variation of water, nutrient, and monoterpene concentrations,” Canadian Journal of Forest Research, Vol. 28, pp. 228-233, 1998. [4] M. Fortin, Y. Mauffette, “The suitability of leaves from different canopy layers for a generalist herbivore (Lepidoptera: Lasiocampidae) foraging on sugar maple,” Canadian Journal of Forest Research, Vol. 32, pp. 379-389, 2002. [5] P. Feeny, “Seasonal changes in oak leaf tannins and nutrients as a cause of spring feeding by winter moth caterpillars,” Ecology, Vol. 51, pp. 565-581, 1970. [6] M. P. Ayres, S. F. Maclean, Jr., “Development of birch leaves and the growth energetics of Epirrita autumnata (Geometridae),” Ecology, Vol. 68, pp. 558-568, 1987. [7] H. Damman, “Leaf quality and enemy avoidance by the larvae of a pyralid moth,” Ecology, Vol. 68, pp. 88-97, 1987. [8] C. D. Thomas, “Behavioural determination of diet breadth in insect herbivores: The effect of leaf age on choice of host species by beetles feeding on Passiflora vines,” Oikos, Vol. 48, pp. 211-216, 1987. [9] S. Larsson, C. P. Ohmart, “Leaf age and larval performance of the leaf beetle Paropsis atomaria,” Ecological Entomology, Vol. 13, pp. 19-24, 1988. [10] A. F. Hunter, M. J. Lechowicz, “Foliage quality changes during canopy development of some northern hardwood trees,” Oecologia, Vol. 89, pp. 316-323, 1992. [11] R. K. Lawrence, W. J. Mattson, R. A. Haack, “White spruce and the spruce budworm: Defining the phenological window of susceptibility,” The Canadian Entomologist, Vol. 129, pp. 291-318, 1997. [12] D. T. Quiring, “Influence of intra-tree variation in time of budburst of white spruce on herbivory and the behaviour and survivorship of Zeiraphera canadensis,” Ecological Entomology, Vol. 18, pp. 353-364, 1993. [13] A. L. Carroll, D. T. Quiring, “Intratree variation in foliage development influences the foraging strategy of a caterpillar,” Ecology, Vol. 75, pp. 1978-1990, 1994. [14] C. M. Orians, C. G. Jones, “Plants as resource mosaics: A functional model for predicting patterns of within-plant resource heterogeneity to consumers based on vascular architecture and local environmental variability,” Oikos, Vol. 94, pp. 493-504, 2001. [15] J. P. Bryant, F. S. Chapin, III, D. R. Klein, “Carbon/nutrient balance of boreal plants in relation to vertebrate herbivory,” Oikos, Vol. 40, pp. 357-368, 1983. [16] P. D. Coley, J. P. Bryant, F. S. Chapin, III, “Resource availability and plant antiherbivore defense,” Science, Vol. 230, pp. 895-899, 1985. [17] S. Larsson, A. Wiren, L. Lundgren, T. Ericsson, “Effects of light and nutrient stress on leaf phenolic chemistry in Salix dasyclados and susceptibility to Galerucella lineola (Coleoptera),” Oikos, Vol. 47, pp. 205-210, 1986. [18] R. L. Lindroth, P. B. Reich, M. G. Tjoelker, J. C. Volin, J. Oleksyn, “Light environment alters response to ozone stress in seedlings of Acer saccharum Marsh. and hybrid Populus L. III.
Consequences for performance of gypsy moth,” New Phytologist, Vol. 124, pp. 647-651, 1993. [19] J. F. Dudt, D. J. Shure, “The influence of light and nutrients on foliar phenolics and insect herbivory,” Ecology, Vol. 75, pp. 86-98, 1994. [20] J. Agrell, E. P. McDonald, R. L. Lindroth, “Effects of CO2 and light on tree phytochemistry and insect performance,” Oikos, Vol. 88, pp. 259-272, 2000. [21] E. Nabeshima, M. Murakami, T. Hiura, “Effects of herbivory and light conditions on induced defense in Quercus crispula,” Journal of Plant Research, Vol. 114, pp. 403-409, 2001. [22] M. L. Price, L. G. Butler, “Rapid visual estimation and spectrophotometric determination of tannin content of sorghum grain,” Journal of Agricultural and Food Chemistry, Vol. 25, pp. 1268-1273, 1977. [23] P. G. Waterman, S. Mole, Analysis of phenolic plant metabolites, Blackwell, 1994. [24] L. J. Porter, L. N. Hrstich, B. G. Chan, “The conversion of procyanidins and prodelphinidins to cyanidin and delphinidin,” Phytochemistry, Vol. 25, pp. 223-230, 1986. [25] SAS, SAS user's guide: statistics. Version 5 ed., SAS Institute, 1985. [26] J. C. Schultz, “Habitat selection and foraging tactics of caterpillars in heterogeneous trees,” In Variable plants and herbivores in natural and managed systems, ed. R. F. Denno, M. S. McClure, Academic Press, pp. 61-90, 1983. [27] M. D. Hunter, P. W. Price, “Natural variability in plants and animals,” In Effects of resource distribution on animal-plant interactions, ed. M. D. Hunter, T. Ohgushi, P. W. Price, Academic Press, pp. 1-12, 1992. [28] W. Larcher, Physiological plant ecology, Springer, 2003. [29] P. D. Coley, “Herbivory and defensive characteristics of tree species in a lowland tropical forest,” Ecological Monographs, Vol. 53, pp. 209-233, 1983. [30] P. B. Reich, C. Uhl, M. B. Walters, D. S. Ellsworth, “Leaf lifespan as a determinant of leaf structure and function among 23 amazonian tree species,” Oecologia, Vol. 86, pp. 16-24, 1991. [31] M. F. Choong, “What makes a leaf tough and how this affects the pattern of Castanopsis fissa leaf consumption by caterpillars,” Functional Ecology, Vol. 10, pp. 668-674, 1996. [32] W. J. Mattson, Jr., “Herbivory in relation to plant nitrogen content,” Annual Review of Ecology and Systematics, Vol. 11, pp. 119-161, 1980. [33] D. F. Rhoades, R. G. Cates, “Toward a general theory of plant antiherbivore chemistry,” In Biochemical interactions between plants and insects, ed. J. W. Wallace, R. L. Mansell, Plenum Press, pp. 168-213, 1976. [34] J. C. Schultz, “Tannin-insect interactions,” In Chemistry and significance of condensed tannins, ed. R. W. Hemingway, J. J. Karchesy, Plenum Press, pp. 417-433, 1989. [35] P. Feeny, “Effect of oak leaf tannins on larval growth of the winter moth Operophtera brumata,” Journal of Insect Physiology, Vol. 14, pp. 805-817, 1968. [36] M. P. Ayres, T. P. Clausen, S. F. MacLean, Jr., A. M. Redman, P. B. Reichardt, “Diversity of structure and anti-herbivore activity in condensed tannins,” Ecology, Vol. 78, pp. 1696-1712, 1997. [37] M. Nomura, T. Itioka, “Effects of synthesized tannin on the growth and survival of a generalist herbivorous insect, the common cutworm, Spodoptera litura Fabricius (Lepidoptera: Noctuidae),” Applied Entomology and Zoology, Vol. 37, pp. 285-289, 2002.
Proccedings: IUFRO Kanazawa 2003 "Forest Insect Population Dynamics and Host Influences” - 36 -
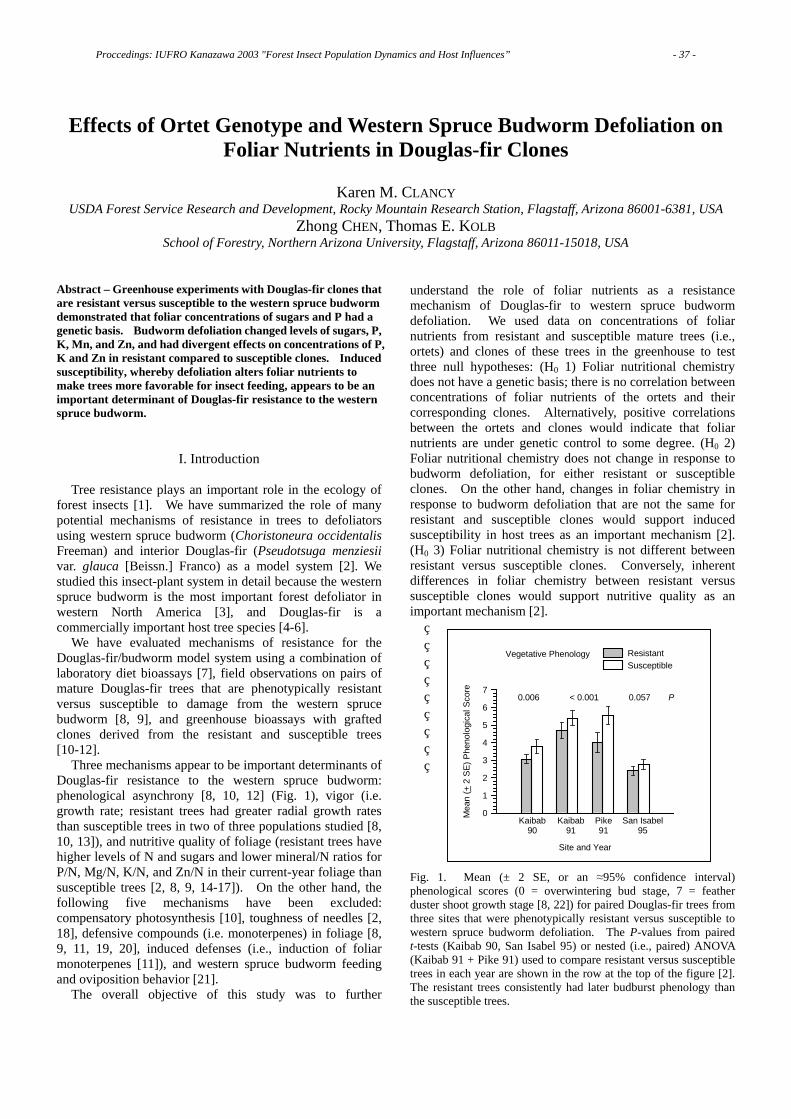
Effects of Ortet Genotype and Western Spruce Budworm Defoliation on Foliar Nutrients in Douglas-fir Clones
Karen M. CLANCY
USDA Forest Service Research and Development, Rocky Mountain Research Station, Flagstaff, Arizona 86001-6381, USA Zhong CHEN, Thomas E. KOLB
School of Forestry, Northern Arizona University, Flagstaff, Arizona 86011-15018, USA Abstract – Greenhouse experiments with Douglas-fir clones that are resistant versus susceptible to the western spruce budworm demonstrated that foliar concentrations of sugars and P had a genetic basis. Budworm defoliation changed levels of sugars, P, K, Mn, and Zn, and had divergent effects on concentrations of P, K and Zn in resistant compared to susceptible clones. Induced susceptibility, whereby defoliation alters foliar nutrients to make trees more favorable for insect feeding, appears to be an important determinant of Douglas-fir resistance to the western spruce budworm.
I. Introduction
Tree resistance plays an important role in the ecology of forest insects [1]. We have summarized the role of many potential mechanisms of resistance in trees to defoliators using western spruce budworm (Choristoneura occidentalis Freeman) and interior Douglas-fir (Pseudotsuga menziesii var. glauca [Beissn.] Franco) as a model system [2]. We studied this insect-plant system in detail because the western spruce budworm is the most important forest defoliator in western North America [3], and Douglas-fir is a commercially important host tree species [4-6].
We have evaluated mechanisms of resistance for the Douglas-fir/budworm model system using a combination of laboratory diet bioassays [7], field observations on pairs of mature Douglas-fir trees that are phenotypically resistant versus susceptible to damage from the western spruce budworm [8, 9], and greenhouse bioassays with grafted clones derived from the resistant and susceptible trees [10-12].
Three mechanisms appear to be important determinants of Douglas-fir resistance to the western spruce budworm: phenological asynchrony [8, 10, 12] (Fig. 1), vigor (i.e. growth rate; resistant trees had greater radial growth rates than susceptible trees in two of three populations studied [8, 10, 13]), and nutritive quality of foliage (resistant trees have higher levels of N and sugars and lower mineral/N ratios for P/N, Mg/N, K/N, and Zn/N in their current-year foliage than susceptible trees [2, 8, 9, 14-17]). On the other hand, the following five mechanisms have been excluded: compensatory photosynthesis [10], toughness of needles [2, 18], defensive compounds (i.e. monoterpenes) in foliage [8, 9, 11, 19, 20], induced defenses (i.e., induction of foliar monoterpenes [11]), and western spruce budworm feeding and oviposition behavior [21].
The overall objective of this study was to further
understand the role of foliar nutrients as a resistance mechanism of Douglas-fir to western spruce budworm defoliation. We used data on concentrations of foliar nutrients from resistant and susceptible mature trees (i.e., ortets) and clones of these trees in the greenhouse to test three null hypotheses: (H0 1) Foliar nutritional chemistry does not have a genetic basis; there is no correlation between concentrations of foliar nutrients of the ortets and their corresponding clones. Alternatively, positive correlations between the ortets and clones would indicate that foliar nutrients are under genetic control to some degree. (H0 2) Foliar nutritional chemistry does not change in response to budworm defoliation, for either resistant or susceptible clones. On the other hand, changes in foliar chemistry in response to budworm defoliation that are not the same for resistant and susceptible clones would support induced susceptibility in host trees as an important mechanism [2]. (H0 3) Foliar nutritional chemistry is not different between resistant versus susceptible clones. Conversely, inherent differences in foliar chemistry between resistant versus susceptible clones would support nutritive quality as an important mechanism [2].
Fig. 1. Mean (± 2 SE, or an ≈95% confidence interval) phenological scores (0 = overwintering bud stage, 7 = feather duster shoot growth stage [8, 22]) for paired Douglas-fir trees from three sites that were phenotypically resistant versus susceptible to western spruce budworm defoliation. The P-values from paired t-tests (Kaibab 90, San Isabel 95) or nested (i.e., paired) ANOVA (Kaibab 91 + Pike 91) used to compare resistant versus susceptible trees in each year are shown in the row at the top of the figure [2]. The resistant trees consistently had later budburst phenology than the susceptible trees.
Vegetative Phenology
Site and Year
Mea
n (+
2 S
E) P
heno
logi
cal S
core
0
1
2
3
4
5
6
7
ResistantSusceptible
Kaibab90
Kaibab91
Pike91
San Isabel95
0.006 < 0.001 0.057 P
Proccedings: IUFRO Kanazawa 2003 "Forest Insect Population Dynamics and Host Influences” - 37 -

II. Materials and Methods
Our experimental plant material consisted of clones derived from mature Douglas-fir trees that differed in western spruce budworm defoliation under field conditions [8]. The mature Douglas-fir trees were from sites in the United States on the Pike National Forest near Deckers, CO and the Kaibab National Forest near Jacob Lake, AZ. At the time the trees were identified (1988 and 1989) most of the trees at the sites had sustained moderate to severe budworm defoliation for at least several years, as determined from their growth form and general condition. We selected seven phenotypically resistant trees at the Pike National Forest site and five phenotypically resistant trees at the Kaibab National Forest site by identifying trees with full crowns and little other evidence of budworm damage. These trees were visually distinct from other trees in the stand that were characterized as phenotypically susceptible based on their defoliated crowns. Each resistant tree was paired with a nearby (within 30 m) susceptible tree of similar size (height and DBH) and microsite (slope and aspect). In other words, the pairs of resistant and susceptible trees were “matched” as closely as possible to minimize any size-, age-, or microsite-related effects that could confound effects associated with different levels of herbivory. We deliberately chose pairs at each site that represented a range of size (i.e., age) classes. Age of the 24 trees ranged between 45 and 123 years (79.3 ± 4.1 years [mean ± SE, here and throughout]); height ranged between 6.4 and 14.9 m (10.4 ± 0.5 m); DBH ranged between 15 and 40 cm (25.3 ± 1.3 cm).
We cloned each of the 24 mature trees by whip-grafting branches collected from the lower third of the crown onto one-year seedling rootstocks in 1991 and 1992. This is a common and widespread technique for reproducing mature tree characteristics in a smaller plant [23, 24]. Such cloning resulted in the fixation of the genotype and tissue developmental stage of mature trees but not tree environment.
The experiment had a completely randomized block design composed of six blocks, each containing 48 clonally propagated trees (i.e. two treatments [budworm defoliation versus control] x two traits [resistant versus susceptible]/pair x 12 pairs). In total, 288 cloned trees were included in the experiment. However, 11 trees died before the experiment started, therefore, there were actually four to six replications of each treatment combination for each of the 12 pairs.
In order to test the role of budburst phenology as an influence on budworm performance, we conducted the budworm defoliation experiment differently in 1998 and 1999 [12]. In 1998, defoliation by budworm larvae was matched to the budbreak phenology of each individual clone. Because budworm larval feeding was purposely matched to the fourth budburst stage of each clone, the effect of genetic variation in budburst phenology among trees on budworm feeding was minimized. However, in 1999 the larvae were placed on all the trees at the same date when approximately 50% of all terminal buds in the population were in the second (i.e. yellow) budburst stage [22]. This schedule of larval
introduction allowed genetic differences in budburst phenology among trees to influence the developmental stage of buds available for budworm feeding, as can occur in Douglas-fir forests [8]. All the trees were fertilized in 1998 and 1999. In 2000, none of the trees were defoliated and the clones were not fertilized so that we could determine if lower levels of soil nutrients had different effects on the foliar chemistry of resistant versus susceptible trees. The budworm larvae used in our study were from our laboratory cultures of diapausing and nondiapausing western spruce budworms, maintained in the Entomology Laboratory at the Rocky Mountain Research Station, Flagstaff, AZ, U. S. A. The nondiapausing colony has growth rates and feeding behavior similar to a wild population [26].
Current-year foliage from the clonal trees in the greenhouse was sampled in 1998 and 1999 when late instars of the budworm were actively feeding on the defoliated trees, and the foliage was at the seventh (or feather duster) developmental stage [22]. Seventh stage foliage was also sampled in 2000. Two clusters of current-year foliage were clipped at random from the upper third of the crown, sealed inside plastic bags, temporarily stored in a freezer, and later transferred to ultralow freezer and stored at –60 oC until analyzed. The foliage sampled from defoliated trees was not directly damaged by budworms.
The needles were pulled off the stems in preparation for the chemical analyses, and a composite subsample of all the current-year needles sampled in each year from the four to six trees from the same clone and treatment (i.e. budworm defoliation versus control) was analyzed (i.e., the samples taken from the four to six trees were pooled prior to chemical analyses). Therefore, no block effect was included in the analysis of the foliar nutrient data. A total of 48 pooled foliage samples were used for chemical analysis for each of the three sample years (i.e. two treatments [defoliated versus control] x two traits [resistant versus susceptible clones] x 12 pairs). We wore disposable gloves when handling the foliage to avoid contamination with minerals from our skin.
Foliage samples were analyzed by the Analytical Services Laboratory at Northern Arizona University for the following: total Kjeldahl nitrogen (N) and phosphorus (P) (colorimetrically); potassium (K), calcium (Ca), magnesium (Mg), manganese (Mn), copper (Cu), iron (Fe) and zinc (Zn) (by flame atomic absorption spectroscopy); and sugars – sucrose, fructose and glucose (by high-performance liquid chromatograph). Nutrient concentrations were based on the dry weight of the foliage.
We used Spearman’s rho (ρ) to examine correlations between the foliar chemistry of the Douglas-fir parent trees and the clones that were derived from them. We used the mean value of all observations for foliar nutrients for each of the 24 ortets (two or three samples/tree [9]), and the 1998, 1999, and 2000 corresponding grafted clone mean values (two samples/clone [defoliated and not defoliated treatments] for each sample year). Rho was determined for each of the 10 nutrients (dry weight foliar concentrations of N, sugars [sucrose + fructose + glucose], P, K, Mg, Ca, Mn, Cu, Fe and Zn); we could expect 1.5 of the 30 rho values to
Proccedings: IUFRO Kanazawa 2003 "Forest Insect Population Dynamics and Host Influences” - 38 -

be significant from random chance at P = 0.05. Repeated measures analysis of variance (ANOVA) tests
were used to investigate the effects of trait (resistant versus susceptible), treatment (defoliated versus not defoliated), and sample year (1998, 1999, and 2000), and their interactions on variations in concentrations of each of the 10 nutrients [25]. The Douglas-fir populations we sampled from the Pike (Colorado) and Kaibab (Arizona) National Forest sites were not genetically differentiated based on an isoenzyme study [27]; consequently, we treated the 12 pairs of trees from these two sites as one population for statistical analysis.
III. Results
A. H0 1: Foliar Nutritional Chemistry Does Not Have a Genetic Basis
We calculated Spearman’s rho (ρ) between the parent
trees and their corresponding grafted clones (n = 24 ortet/clone pairs) to test this null hypothesis. We failed to reject the null hypothesis for foliar concentrations of N, K, Mg, Mn, Cu or Zn; 18 out of the 20 values for Rho were not significant (P > 0.05) [25].
However, significant and positive rank correlations led us to reject the null hypothesis for sugars in all three sample years (Fig. 2A), and for phosphorus in 1999 (Fig. 2B). There were also positive but non-significant rank correlations for P in 1998 (ρ = 0.292, P = 0.166) and 2000 (ρ = 0.219, P = 0.302).
We concluded that foliar concentrations of sugars and possibly P were under some degree of genetic control for Douglas-fir in our study, as evidenced by the robust significant positive correlations between the foliar chemistry of the ortets and their corresponding clones (Fig. 2). On the other hand, foliar concentrations of N, K, Mg, Ca, Mn, Cu, Fe and Zn did not appear to be under strong genetic control; positive correlations between foliar chemistry of the ortets and clones were weak or absent. B. Effect of Sample Year
A noteworthy pattern in the data from the nutritional chemistry of the grafted clones is that the sample year main effect was very strong (P < 0.001) for all nutrients except Ca [25]. There were large increases in the foliar concentrations of N (Fig. 3A), P (Fig. 4A), K (Fig. 4B), Mg (data not shown), Mn (Fig. 3C), Fe (data not shown) and Zn (Fig. 4C) in all clones between 1998 and 1999. This increase is most likely because the grafted trees were transplanted from 1- to 5-gallon (15-liter) pots in 1997, prior to the start of the experiment, to give the roots more room to grow. The root mass area probably increased substantially between the 1998 and 1999 growing seasons, thus allowing the trees to absorb more nutrients from the soil in 1999 compared to 1998.
Fig. 2. Mean values for dry weight concentrations of sugars in 1998, 1999, and 2000 (A) and phosphorus in 1999 (B) in current-year foliage from grafted Douglas-fir clones versus ortets (i.e., parent trees) that are resistant versus susceptible to defoliation by the western spruce budworm (n = 24 for each year). The lines on the graphs were fit with regression analysis. Spearman’s rho (ρ) between the ortet mean values and the corresponding grafted clone mean values are shown at the top of each graph.
The trees were not fertilized in 2000 because we wanted to determine if lower levels of soil nutrients had different effects on the foliar chemistry of resistant versus susceptible trees. There were large decreases in levels of N (Fig. 3A), sugars (Fig. 3B), P (Fig. 4A), K (Fig. 4B), Mg (data not shown), Mn (Fig. 3C), Cu (data not shown), Fe (data not shown) and Zn (Fig. 4C) between 1999 and 2000 that apparently reflected the lower levels of these nutrients in the soil after we stopped fertilizing. Moreover, foliar concentrations of N, sugars, P, K, Cu and Zn were lowest in 2000 among all sample years.
A. Sugars (%)
ρ > 0.675 P < 0.001 n = 24
Mean Sugars in Ortet Foliage
4 5 6 7 8 9 10 11 12
Mea
n S
ugar
s in
Clo
ne F
olia
ge
4
6
8
10
12
14
161998
1999
2000
B. Phosphorus (mg/g)
ρ = 0.609 P = 0.002 n = 24
Mean P in Ortet Foliage
2.0 2.1 2.2 2.3 2.4 2.5 2.6 2.7
Mea
n P
in C
lone
Fol
iage
4.5
5.0
5.5
6.0
6.5
7.0
1999
Proccedings: IUFRO Kanazawa 2003 "Forest Insect Population Dynamics and Host Influences” - 39 -
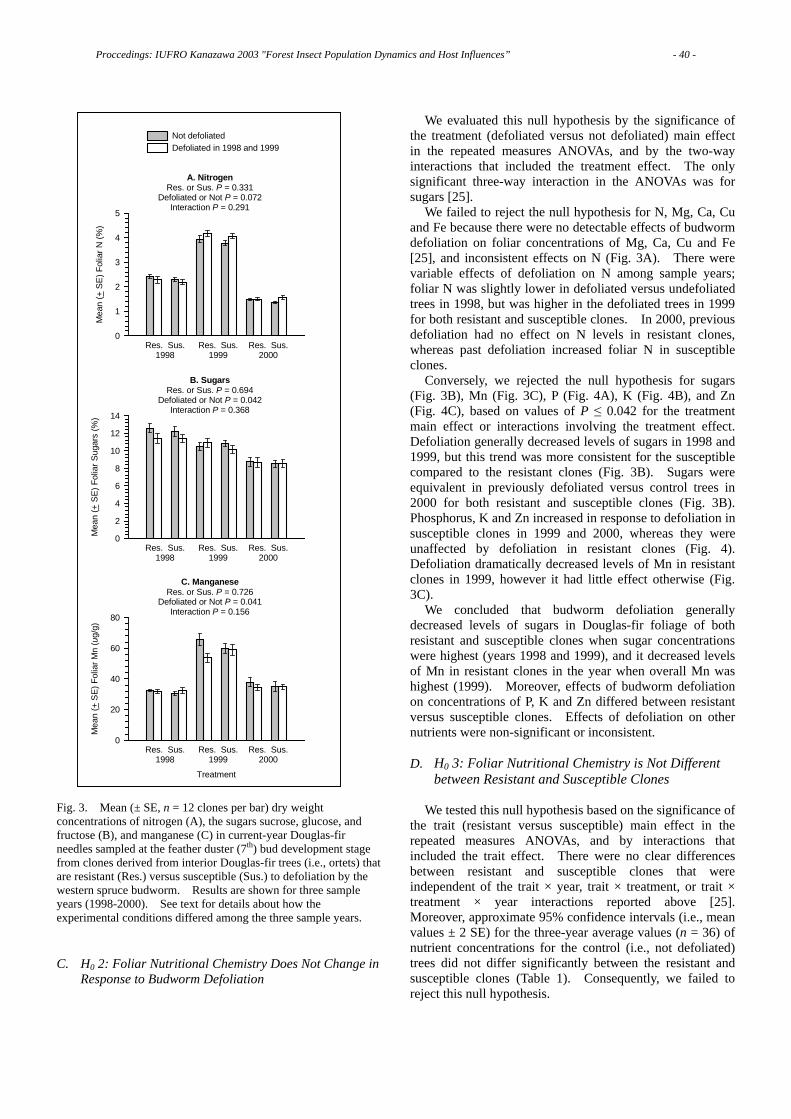
Fig. 3. Mean (± SE, n = 12 clones per bar) dry weight concentrations of nitrogen (A), the sugars sucrose, glucose, and fructose (B), and manganese (C) in current-year Douglas-fir needles sampled at the feather duster (7th) bud development stage from clones derived from interior Douglas-fir trees (i.e., ortets) that are resistant (Res.) versus susceptible (Sus.) to defoliation by the western spruce budworm. Results are shown for three sample years (1998-2000). See text for details about how the experimental conditions differed among the three sample years. C. H0 2: Foliar Nutritional Chemistry Does Not Change in
Response to Budworm Defoliation
We evaluated this null hypothesis by the significance of the treatment (defoliated versus not defoliated) main effect in the repeated measures ANOVAs, and by the two-way interactions that included the treatment effect. The only significant three-way interaction in the ANOVAs was for sugars [25].
We failed to reject the null hypothesis for N, Mg, Ca, Cu and Fe because there were no detectable effects of budworm defoliation on foliar concentrations of Mg, Ca, Cu and Fe [25], and inconsistent effects on N (Fig. 3A). There were variable effects of defoliation on N among sample years; foliar N was slightly lower in defoliated versus undefoliated trees in 1998, but was higher in the defoliated trees in 1999 for both resistant and susceptible clones. In 2000, previous defoliation had no effect on N levels in resistant clones, whereas past defoliation increased foliar N in susceptible clones.
Conversely, we rejected the null hypothesis for sugars (Fig. 3B), Mn (Fig. 3C), P (Fig. 4A), K (Fig. 4B), and Zn (Fig. 4C), based on values of P ≤ 0.042 for the treatment main effect or interactions involving the treatment effect. Defoliation generally decreased levels of sugars in 1998 and 1999, but this trend was more consistent for the susceptible compared to the resistant clones (Fig. 3B). Sugars were equivalent in previously defoliated versus control trees in 2000 for both resistant and susceptible clones (Fig. 3B). Phosphorus, K and Zn increased in response to defoliation in susceptible clones in 1999 and 2000, whereas they were unaffected by defoliation in resistant clones (Fig. 4). Defoliation dramatically decreased levels of Mn in resistant clones in 1999, however it had little effect otherwise (Fig. 3C).
We concluded that budworm defoliation generally decreased levels of sugars in Douglas-fir foliage of both resistant and susceptible clones when sugar concentrations were highest (years 1998 and 1999), and it decreased levels of Mn in resistant clones in the year when overall Mn was highest (1999). Moreover, effects of budworm defoliation on concentrations of P, K and Zn differed between resistant versus susceptible clones. Effects of defoliation on other nutrients were non-significant or inconsistent. D. H0 3: Foliar Nutritional Chemistry is Not Different
between Resistant and Susceptible Clones
We tested this null hypothesis based on the significance of the trait (resistant versus susceptible) main effect in the repeated measures ANOVAs, and by interactions that included the trait effect. There were no clear differences between resistant and susceptible clones that were independent of the trait × year, trait × treatment, or trait × treatment × year interactions reported above [25]. Moreover, approximate 95% confidence intervals (i.e., mean values ± 2 SE) for the three-year average values (n = 36) of nutrient concentrations for the control (i.e., not defoliated) trees did not differ significantly between the resistant and susceptible clones (Table 1). Consequently, we failed to reject this null hypothesis.
C. ManganeseRes. or Sus. P = 0.726
Defoliated or Not P = 0.041Interaction P = 0.156
Treatment
Mea
n (+
SE
) Fol
iar M
n ( u
g/g)
0
20
40
60
80
Res. Sus.1998
Res. Sus.1999
Res. Sus.2000
B. SugarsRes. or Sus. P = 0.694
Defoliated or Not P = 0.042Interaction P = 0.368
Mea
n (+
SE
) Fol
iar S
ugar
s (%
)
0
2
4
6
8
10
12
14
Res. Sus.1998
Res. Sus.1999
Res. Sus.2000
A. NitrogenRes. or Sus. P = 0.331
Defoliated or Not P = 0.072Interaction P = 0.291
Mea
n (+
SE
) Fol
iar N
(%)
0
1
2
3
4
5
Not defoliatedDefoliated in 1998 and 1999
Res. Sus.1998
Res. Sus.1999
Res. Sus.2000
Proccedings: IUFRO Kanazawa 2003 "Forest Insect Population Dynamics and Host Influences” - 40 -
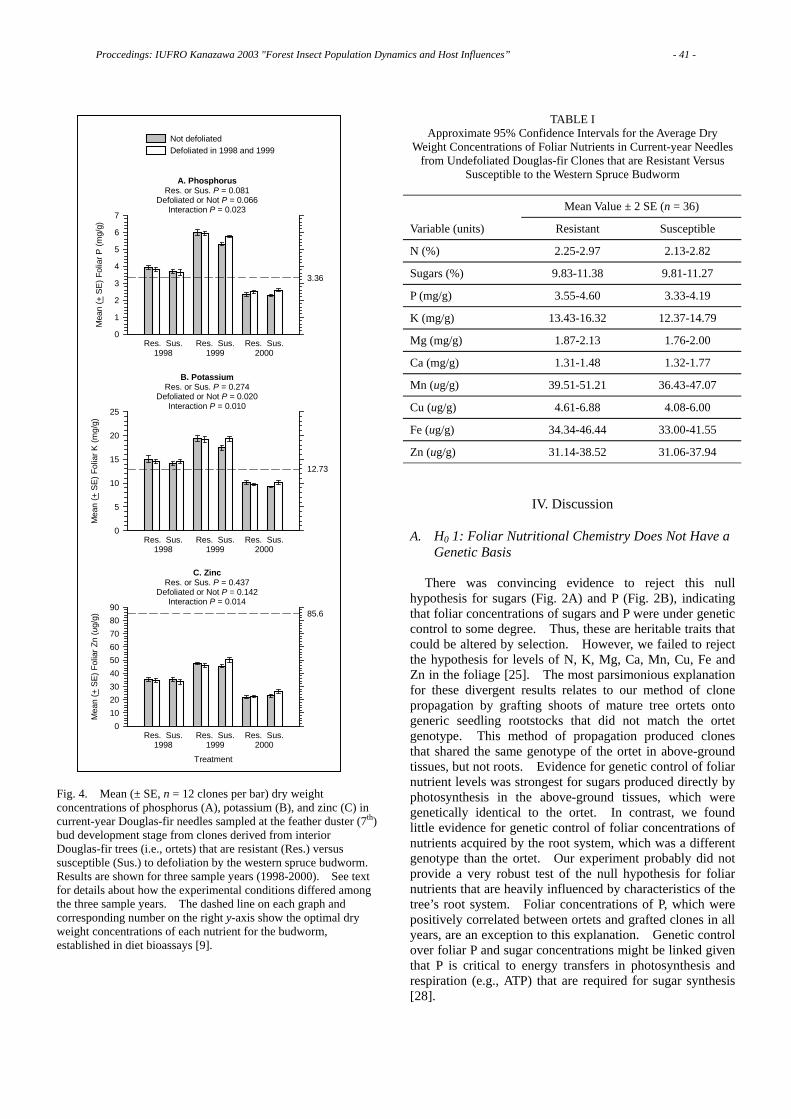
Fig. 4. Mean (± SE, n = 12 clones per bar) dry weight concentrations of phosphorus (A), potassium (B), and zinc (C) in current-year Douglas-fir needles sampled at the feather duster (7th) bud development stage from clones derived from interior Douglas-fir trees (i.e., ortets) that are resistant (Res.) versus susceptible (Sus.) to defoliation by the western spruce budworm. Results are shown for three sample years (1998-2000). See text for details about how the experimental conditions differed among the three sample years. The dashed line on each graph and corresponding number on the right y-axis show the optimal dry weight concentrations of each nutrient for the budworm, established in diet bioassays [9].
TABLE I Approximate 95% Confidence Intervals for the Average Dry
Weight Concentrations of Foliar Nutrients in Current-year Needles from Undefoliated Douglas-fir Clones that are Resistant Versus
Susceptible to the Western Spruce Budworm
Mean Value ± 2 SE (n = 36)
Variable (units) Resistant Susceptible
N (%) 2.25-2.97 2.13-2.82
Sugars (%) 9.83-11.38 9.81-11.27
P (mg/g) 3.55-4.60 3.33-4.19
K (mg/g) 13.43-16.32 12.37-14.79
Mg (mg/g) 1.87-2.13 1.76-2.00
Ca (mg/g) 1.31-1.48 1.32-1.77
Mn (ug/g) 39.51-51.21 36.43-47.07
Cu (ug/g) 4.61-6.88 4.08-6.00
Fe (ug/g) 34.34-46.44 33.00-41.55
Zn (ug/g) 31.14-38.52 31.06-37.94
IV. Discussion A. H0 1: Foliar Nutritional Chemistry Does Not Have a
Genetic Basis
There was convincing evidence to reject this null hypothesis for sugars (Fig. 2A) and P (Fig. 2B), indicating that foliar concentrations of sugars and P were under genetic control to some degree. Thus, these are heritable traits that could be altered by selection. However, we failed to reject the hypothesis for levels of N, K, Mg, Ca, Mn, Cu, Fe and Zn in the foliage [25]. The most parsimonious explanation for these divergent results relates to our method of clone propagation by grafting shoots of mature tree ortets onto generic seedling rootstocks that did not match the ortet genotype. This method of propagation produced clones that shared the same genotype of the ortet in above-ground tissues, but not roots. Evidence for genetic control of foliar nutrient levels was strongest for sugars produced directly by photosynthesis in the above-ground tissues, which were genetically identical to the ortet. In contrast, we found little evidence for genetic control of foliar concentrations of nutrients acquired by the root system, which was a different genotype than the ortet. Our experiment probably did not provide a very robust test of the null hypothesis for foliar nutrients that are heavily influenced by characteristics of the tree’s root system. Foliar concentrations of P, which were positively correlated between ortets and grafted clones in all years, are an exception to this explanation. Genetic control over foliar P and sugar concentrations might be linked given that P is critical to energy transfers in photosynthesis and respiration (e.g., ATP) that are required for sugar synthesis [28].
C. ZincRes. or Sus. P = 0.437
Defoliated or Not P = 0.142Interaction P = 0.014
Treatment
Mea
n (+
SE
) Fol
iar Z
n ( u
g/g)
0102030405060708090
Res. Sus.1998
Res. Sus.1999
Res. Sus.2000
B. PotassiumRes. or Sus. P = 0.274
Defoliated or Not P = 0.020Interaction P = 0.010
Mea
n (+
SE
) Fol
iar K
(mg/
g)
0
5
10
15
20
25
Res. Sus.1998
Res. Sus.1999
Res. Sus.2000
A. PhosphorusRes. or Sus. P = 0.081
Defoliated or Not P = 0.066Interaction P = 0.023
Mea
n (+
SE
) Fol
iar P
(mg/
g)
0
1
2
3
4
5
6
7
Not defoliatedDefoliated in 1998 and 1999
Res. Sus.1998
Res. Sus.1999
Res. Sus.2000
85.6
12.73
3.36
Proccedings: IUFRO Kanazawa 2003 "Forest Insect Population Dynamics and Host Influences” - 41 -

Palermo et al. [29] conducted another test of this hypothesis for nutrients absorbed by roots; they measured concentrations of N, P, Mg and Zn in the current-year foliage of 3-year-old half-sib seedlings grown from open-pollinated seeds collected from 11 pairs of resistant and susceptible Douglas-firs from our study sites. There was variation among the half-sib seedlings from the 11 resistant maternal genotypes in N (P = 0.006), and variation among the seedlings from the 11 susceptible maternal genotypes in N (P = 0.002) and P (P = 0.004). The existence of variation in levels of foliar nutrients among half-sib seedlings from different maternal trees suggests that foliar nutritional chemistry of Douglas-fir can be influenced by the genotype of the tree, although the relationship between this variation and resistance to western spruce budworm defoliation is presently unclear. B. H0 2: Foliar Nutritional Chemistry Does Not Change
in Response to Budworm Defoliation
We rejected this null hypothesis for sugars (Fig. 3B), P (Fig. 4A), K (Fig. 4B), Mn (Fig. 3C) and Zn (Fig. 4C). Defoliation by the western spruce budworm changed concentrations of these foliar nutrients, although it did not have detectable (Mg, Ca, Cu and Fe) [25] or consistent (N) (Fig. 3A) effects on the other nutrients we measured. Kolb et al. [30] also reported that budworm defoliation changed foliar nutrient levels in Douglas-fir; heavy defoliation increased concentrations of N, Ca and Mg in seedlings. Furthermore, Clancy et al. [31] documented several additional examples of how herbivory can change levels of foliar nutrients in coniferous trees.
More importantly, effects of budworm defoliation on foliar levels of P, K and Zn differed between resistant and susceptible clones, based on the significant trait × treatment interactions terms in the ANOVAs (Fig. 4). This result lends support for induced susceptibility as an important mechanism of resistance in the Douglas-fir/western spruce budworm system, as hypothesized by Clancy et al. [8] and Clancy [2] . Clancy et al. [8] emphasized that differences in foliar chemistry between the phenotypically resistant and susceptible Douglas-fir ortets at the Pike and Kaibab National Forest sites could be the result of different budworm defoliation histories rather than the cause of the differences; susceptible trees had lower foliar levels of N and sugar than resistant trees, plus they had mineral/N ratios (for P, K, Ca, Mg, Cu, and Zn) which were closer to the optimum levels for budworms previously established in artificial diet bioassays [2, 9, 14-17]. The authors speculated that the foliar chemistry of susceptible trees is more prone to change in response to defoliation, whereas the resistant trees are less prone to induced changes in chemistry from defoliation. Consequently, susceptible trees may become a better source of food for the larvae with consecutive years of damage, but resistant trees do not. Furthermore, Clancy [2] has shown that small absolute differences in foliar nutrients between resistant and susceptible Douglas-firs could have real biological
significance in affecting population dynamics of the western spruce budworm.
The optimal dry weight concentrations of P, K and Zn for the budworm, established in diet bioassays, are 3.36 mg/g for P, 12.73 mg/g for K, and 85.6 μg/g for Zn [9]. There were no detectable differences between defoliated and non-defoliated trees for either resistant or susceptible clones for any of these minerals in 1998, and the average 1999 levels of P and K far exceeded the optimum concentrations (Fig. 4A, 4B). However, the 2000 data for P (Fig. 4A) and K (Fig. 4B), and the 1999-2000 data for Zn (Fig. 4C) all indicated that the levels of these minerals did not change in response to budworm defoliation in the resistant clones, whereas they increased in the susceptible clones that were defoliated. Furthermore, the increased foliar concentrations of P, K and Zn in the defoliated susceptible clones were closer to the optimum levels for the budworm compared to the lower concentrations in the control susceptible clones. These results suggest that induced susceptibility is a mechanism of resistance influencing interactions between interior Douglas-fir trees and the western spruce budworm. C. H0 3: Foliar Nutritional Chemistry is Not Different
Between Resistant and Susceptible Clones
On the whole, there was no convincing evidence from this experiment to support rejecting the null hypothesis that there are no inherent differences in foliar nutrients between the resistant and susceptible clones (Table 1). This was an unexpected result, given the differences in foliar nutrient concentrations observed between the resistant and susceptible mature tree ortets (plus 54 additional mature Douglas-fir trees sampled) in the forest [2, 8, 9, 14-17]. We believe that these previously reported differences in foliar nutrient levels between the resistant and susceptible mature trees in the forest after budworm outbreaks were caused by prior defoliation as discussed above. In other words, the differences in foliage nutrient levels are probably the result of different defoliation patterns rather than the cause.
V. Summary and Conclusions
We believe that the most important proximate mechanism causing lower levels of budworm defoliation in resistant Douglas-fir trees is mismatched phenology between budburst of the trees and the emergence of second instar budworm larvae in the spring; resistant trees have later budburst compared to susceptible trees [2, 8, 10, 12] (Fig. 1). Accordingly, the susceptible trees in a stand, which have earlier budburst, are defoliated more. However, the susceptible trees also have inherently slower growth rates than the resistant trees [2, 8, 10, 13], resulting in less capacity to tolerate or compensate for lost photosynthetic area (sensu McNaughton [32]). The results from this experiment demonstrate that the foliar nutrients of
Proccedings: IUFRO Kanazawa 2003 "Forest Insect Population Dynamics and Host Influences” - 42 -
susceptible trees appear to be more prone to change in response to budworm defoliation than resistant trees. Consequently, susceptible trees become a better source of food for the larvae with consecutive years of defoliation, but resistant trees do not.
Clancy et al. [8] suggested that budworm defoliation of susceptible Douglas-firs might have a positive feedback for subsequent generations, as in the “resource regulation hypothesis” proposed by Craig et al. [33]. This experiment provides empirical evidence that this is indeed the case for interior Douglas-fir trees. We conclude that induced susceptibility via changes in concentrations of foliar nutrients is a fourth mechanism that appears to be an important determinant of Douglas-fir resistance to the western spruce budworm.
Acknowledgements
We thank Jan Huntsberger and Jerry Snow for their valuable assistance in maintaining the Douglas-fir clones and the western spruce budworm cultures, respectively. Rudy King provided advice on the ANOVA model. Tom Huntsberger conducted the chemical analyses. Our nondiapausing western spruce budworm colony was started with egg masses obtained from the Canadian Forest Service, Forest Pest Management Institute. This research was supported by research joint venture agreement No. 28-JV7-963 between the Rocky Mountain Research Station and Northern Arizona University, and by the Mission Research and McIntire-Stennis Programs, School of Forestry, Northern Arizona University.
References [1] S. Larsson, “Resistance in trees to insects – an overview of mechanisms and interactions,” In M. R. Wagner, K. M. Clancy, F. Lieutier, T. D. Paine (eds.), Mechanisms and Deployment of Resistance in Trees to Insects, Kluwer Academic Publishers, pp. 1-29, 2002. [2] K. M. Clancy, “Mechanisms of resistance in trees to defoliators,” In M. R. Wagner, K. M. Clancy, F. Lieutier, T. D. Paine (eds.), Mechanisms and Deployment of Resistance in Trees to Insects, Kluwer Academic Publishers, pp. 77-101, 2002. [3] M. H. Brookes, J. J. Colbert, R. G. Mitchell, R.W. Stark, R.W. (eds.), Western Spruce Budworm, U.S. Department of Agriculture Forest Service Technical Bulletin 1694, 1987. [4] R. R. Silen, “Genetics of Douglas-fir,” U.S. Deptartment of Agriculture Forest Service Research Paper WO-35, 1978. [5] R. K. Hermann, D. P. Lavender, “Pseudotsuga menziesii (Mirb.) Franco, Douglas-fir,” In R. M. Burns, B. H. Honkala (eds.), Silvics of North America, Agriculture Handbook 654, U. S. Deptartment of Agriculture Forest Service, 1990. [6] J. W. Hardin, D. J. Leopold, F. M. White, Textbook of Dendrology, McGraw-Hill, 2001. [7] K. M. Clancy, “Multiple-generation bioassay for investigating western spruce budworm (Lepidoptera: Tortricidae) nutritional ecology,” Environmental Entomology, Vol. 20, pp. 1363-1374, 1991. [8] K. M Clancy, J. K. Itami, D. P. Huebner, “Douglas-fir nutrients and terpenes: potential resistance factors to western spruce
budworm defoliation,” Forest Science, Vol. 39, pp. 78-94, 1993. [9] K. M. Clancy, “Biochemical characteristics of Douglas-fir trees resistant to damage from the western spruce budworm: patterns from three populations,” In R. I. Alfero et al. (eds.), Protection of World Forests from Insect Pests: Advances in Research, IUFRO World Series Vol. 11, pp. 115-125, 2001. [10] Z. Chen, T. E. Kolb, K. M. Clancy, “Mechanisms of Douglas-fir resistance to western spruce budworm defoliation: bud burst phenology, photosynthetic compensation and growth rate,” Tree Physiology, Vol. 21, pp. 1159-1169, 2001. [11] Z. Chen, T. E. Kolb, K. M. Clancy, “The role of monoterpenes in resistance of Douglas-fir to western spruce budworm defoliation,” Journal of Chemical Ecology, Vol. 28, pp. 898-920, 2002. [12] Z. Chen, K. M. Clancy, T. E. Kolb, “Variation in budburst phenology of Douglas-fir related to western spruce budworm (Lepidoptera: Tortricidae) fitness,” Journal of Economic Entomology, Vol. 96, pp. 377-387, 2003. [13] Z. Chen, T. E. Kolb, K. M. Clancy, “Effects of artificial and western spruce budworm (Lepidoptera: Tortricidae) defoliation on growth and biomass allocation of Douglas-fir seedlings,” Journal of Economic Entomology, Vol. 95, pp. 587-594, 2002. [14] K. M. Clancy, “Douglas-fir nutrients and terpenes as potenital factors influencing western spruce budworm defoliation,” In Y. N. Baranchikov, W. J. Mattson, F. Pain, and T. L. Payne (eds.), Forest Insect Guilds: Patterns of Interaction with Host Trees, USDA Forest Service General Technical Report NE-153, pp. 124-134, 1991. [15] K. M Clancy, “Response of western spruce budworm (Lepidoptera: Tortricidae) to increased nitrogen in artificial diets,” Environmental Entomology, Vol. 21, pp. 331-344, 1992. [16] K. M. Clancy, “The role of sugars in western spruce budworm nutritional ecology,” Ecological Entomology, Vol. 17, pp. 189-197, 1992. [17] K. M. Clancy, R. M. King, “Defining the western spruce budworm’s nutritional niche with response surface methodology,” Ecology, Vol. 74, pp. 442-454, 1993. [18] K. E. Burr, K. M. Clancy, “Douglas-fir needle anatomy in relation to western spruce budworm (Lepidoptera: Tortricidae) herbivory”, Journal of Economic Entomology, Vol. 86, pp. 93-99, 1993. [19] K. M. Clancy, R. D. Foust, T. G. Huntsberger, J. G. Whitaker, D. M. Whitaker, “Technique for using microencapsulated terpenes in lepidopteran artificial diets,” Journal of Chemical Ecology, Vol. 18, pp. 543-560, 1992. [20] K. M. Clancy, “Are terpenes defensive compounds for the western spruce budworm?” Supplement to the Bulletin of the Ecological Society of America, Vol. 74, p. 193, 1993. [21] B. L. Palermo, K. M. Clancy, G. W. Koch, “Feeding and oviposition behavior do not explain Douglas-fir resistance to defoliation by the western spruce budworm (Lepidoptera: Tortricidae),” Environmental Entomology, Vol. 32, pp. 626-632, 2003. [22] R. F. Shepherd, “A technique to study phenological interactions between Douglas-fir and emerging second instar western spruce budworm,” In R.L. Talerico, M. Montgomery (eds.), Proceedings: Forest Defoliator-Host Interactions: A Comparison between Gypsy Moth and Spruce Budworms, U.S. Deptartment of Agriculture Forest Service General Technical Report NE-85, pp.17-20, 1983. [23] H. T. Hartmann, D. E. Kester (eds.), Plant Propagation: Principles and Practices. Prentice-Hall, 1983. [24] B. Zobel, J. Talbert, J. (eds.), Applied Forest Tree Improvement, Waveland Press, 1984. [25] K. M. Clancy, Z. Chen, T. E. Kolb, “Foliar nutrients and induced susceptibility: genetic mechanisms of Douglas-fir
Proccedings: IUFRO Kanazawa 2003 "Forest Insect Population Dynamics and Host Influences” - 43 -
resistance to western spruce budworm defoliation,” Canadian Journal of Forest Research, Vol. 34, pp. 939-949, 2004. [26] K. J. Leyva, K. M. Clancy, P. W. Price, “Performance of wild versus laboratory populations of western spruce budworm (Lepidoptera: Tortricidae) feeding on Douglas-fir foliage,” Environmental Entomology, Vol. 24, pp. 80-87, 1995. [27] Z. Chen, T. E. Kolb, K. M. Clancy, V. D. Hipkins, L. E. DeWald, “Allozyme variation in interior Douglas-fir: association with growth and resistance to western spruce budworm herbivory,” Canadian Journal of Forest Research, Vol. 31, pp. 1691-1700, 2001. [28] T. T. Kozlowski, P. J. Kramer, S. G. Pallardy, The Physiological Ecology of Woody Plants, Academic Press, 1991. [29] B. L. Palermo, K. M. Clancy, G. W. Koch, “The potential role of ectomycorrhizal fungi in determining Douglas-fir resistance to defoliation by the western spruce budworm (Lepidoptera : Tortricidae), ” Journal of Economic Entomology, Vol. 96, pp. 783-791, 2003. [30] T. E. Kolb, K. A. Dodds, K. M. Clancy, “Effect of western spruce budworm defoliation on the physiology and growth of potted Douglas-fir seedlings,” Forest Science, Vol. 45, pp. 280-291, 1999. [31] K. M. Clancy, M. R. Wagner, P. B. Reich, “Ecophysiology and insect herbivory,” In W. K. Smith, T. M. Hinckley (eds.), Ecophysiology of Coniferous Forests. Academic Press, pp. 125-180, 1995. [32] S. J. McNaughton, “Compensatory plant growth as a response to herbivory,” Oikos , Vol. 40, pp. 329-336, 1983. [33] T. P. Craig, P. W. Price, J. K. Itami, “Resource regulation by a stem-galling sawfly on the arroyo willow,” Ecology, Vol. 67, pp. 419-425, 1986.
Proccedings: IUFRO Kanazawa 2003 "Forest Insect Population Dynamics and Host Influences” - 44 -
Intra- and Interspecific Variations in the Balance between Ant and Non-Ant Defenses in Macaranga
Masahiro NOMURA Japan Science and Technology Corporation, Kawaguchi Center Building 12F, 4-1-8, Hon-cho, Kawaguchi, Saitama
332-0012, JAPAN Aya HATADA
Center for Ecological Research, Kyoto University, Kamitanakami Hirano-cho, Otsu, Shiga, 520-2113, JAPAN Takao ITIOKA
Laboratory of Environmental Entomology, Graduate School of Bioagricultural Sciences, Nagoya University, Nagoya 464-8601, JAPAN
Abstract - We measured inter- and intraspecific variations in the balance between ant and non-ant defenses in Macaranga (Euphorbiaceae) species. We found that there were wide inter- and intraspecific variations in the intensities of ant and non-ant defenses, and that there was a negative correlation between the intensities of ant and non-ant defenses. These results suggest that the two modes of defense mechanisms face a trade-off between them under resource limitation.
I. Introduction Plants have evolved various mechanisms for
anti-herbivore defense. Many plant species are known to depend on other organisms for anti-herbivore defense [1 - 4]. Some plant species utilize ants for anti-herbivore defense [3, 5 - 7]. In this type of defense system, plants attract or nourish ants, and in turn get protection from attacks by herbivores. The plants that provide nest sites for ants and have symbiotic relationship with them are called myrmecophytes [8]. Here, anti-herbivore defenses with ants are called ant defenses.
In contrast, it is widely known that plants defend themselves against herbivores by using chemical defenses, such as toxins and repellents, and by physical ones, such as trichomes and thick cell walls [9 - 11]. We call these types of defense mechanisms non-ant defenses, as opposed to ant defenses.
Both ant and non-ant defense mechanisms require metabolic costs. For the maintenance of ant defenses, plants have to provide their symbiont ants with food that contains large amounts of lipids, amino acids and carbohydrates [12 - 16]. For the maintenance of non-ant defenses, plants have to synthesize secondary metabolic compounds, including toxins and fibers [17, 18]. High investment in each anti-herbivore defense mechanism may increase the efficiency of the defense mechanism against herbivores, however, it does not always increase a plant's fitness because limited resources are diverted from other life history aspects, such as growth and reproduction [18, 19 - 21].
How do plants balance the two costly but contradictory
defense mechanisms? Janzen [22] hypothesized that non-ant defenses have been lost in the myrmecophyte, because maintenance of both ant and non-ant defenses places an unnecessary metabolic burden on the plants.
The genus Macaranga consists mainly of pioneer trees and diversified mainly in tropical areas of Southeast Asian [23, 24]. The genus is known for a wide variation in the intensity of mutualistic relationship with ants from non-myrmecophytes to facultative, transitional and obligate myrmecophytes [25-28]. Obligate myrmecophytes provide nest sites and food bodies for their symbiont ants, and in turn, they benefit from protection offered by the ants against herbivores [25 - 32].
Obligate myrmecophytic species without ant colonies suffer serious herbivory damage [31]. Thus, both obligate myrmecophytes and their symbiont ants depend on each other for their survival. However, even obligate myrmecophytic species do not always maintain symbiosis with ants throughout their life cycle. In Macaranga, symbiosis with ants starts in young seedlings when foundress ant queens colonize the seedlings inside the hollow stems. About one month after settlement by ant queens, adult ant workers emerge from the hollow stems and then start defending the host plants. If obligate myrmecophytic Macaranga defend themselves perfectly against their herbivores throughout their life cycle, it is predicted that they defend themselves mainly by non-ant defenses before the beginning of colonization by symbiont ants.
The purpose of this study is to examine whether Janzen's hypothesis [22] of a trade-off between ant and non-ant defenses is applicable to inter- and intraspecific variations in anti-herbivore defense strategies in Macaranga. Our hypotheses are: 1. The intensity of ant defenses is lower in the Macaranga species in which non-ant defense is more intensive. 2. Myrmecophytic Macaranga defend themselves by intensive non-ant defenses before symbiosis with ants, and that the intensity of non-ant defenses decreases after the symbiont ant colonies become established.
Proccedings: IUFRO Kanazawa 2003 "Forest Insect Population Dynamics and Host Influences” - 45 -

II. Study Site This study was conducted in a lowland mixed dipterocarp
forest in Lambir Hills National Park, Miri, Sarawak, Malaysia (4°2’N, 113°50’E, altitude 50 - 150m). The region is situated in the humid tropics with no pronounced dry season and seasonal variation in temperature [33, 34].
III. Macaranga At least 15 species of Macaranga occur at the study site
[35], and at least nine species are myrmecophytes. We focused on ten species, Macaranga winkleri Pax. and Hoffm., M. trachyphylla Airy Shaw, M. bancana (Miq.) Muell. Arg., M. hypoleuca (Reichb. F. and Zoll.) Muell arg., M. beccariana Merr., M. lamellata Whitmore, M. kingii Hook., M. hullettii King ex Hook., M. gigantea (Reichb. F. and Zoll.) Muell. Arg. and M. praestans Airy Shaw. The former eight species are obligate myrmecophytes, and the latter two species are non-myrmecophytes. Myrmecophytic species provide nest sites and food bodies for their symbiont ants. Symbiont ants patrol the leaves of their host plants and protect them from herbivores [25 - 32]. Most of the ant species that are symbionts of Macaranga belong to Crematogaster (Hymenoptera: Formicidae: Myrmicinae) [27, 36]. The partnership between Macaranga myrmecophytes and symbiont ants is highly species-specific [28, 36]. Symbiont ants use food bodies as their main food and they seldom leave their host plants. Obligate myrmecophytes cannot survive without symbiosis with their specific ants, and almost all seedlings 40 cm or more in height of obligate myrmecophytic species harbor symbiotic ant colonies in the field. However, even obligate myrmecophytes do not always maintain symbiosis with ants throughout their life. In Macaranga, symbiosis with ants starts when seedlings reach about 10 - 30 cm in height. At that time, the stems begin to swell and the piths degrade so that foundress ant queens can settle inside the hollow stems. After confining themselves within the stems, the ant queens begin to feed their initial ant workers with regurgitated food. About one month after queen settlement, the initial ant workers emerge from the stems as adults and start defending the host plant. We defined three growth stages of seedlings (saplings) with reference to the time of initiation and establishment of symbiosis with ants. The first stage is the "pre-symbiosis" stage, when seedlings have not yet received ant queens. Seedlings about 10 - 30 cm in height were used to represent plants in this growth stage. The second is the "pre-defense" stage, soon after the initial ant workers emerge but before ant defense has well established. Seedlings about 40 cm in height and with only one exit hole on the stem were used to represent plants in this growth stage. Saplings about 1.5 - 2.2 m in height were used to represent plants in the “ant-defending growth stage, a stage when saplings are defended by many ant workers.
M. gigantea and M. praestans are non-myrmecophytic species. They often attract non-specific ant species with
extrafloral nectar (EFN), which are secreted from leaf surface. Ants that are attracted to EFN also defend the plants from herbivores, although the effectiveness of the defense is remarkably weaker than that in myrmecophytic species [29]. In M. praestans, only newly developing leaves have EFN, which then deteriorate as the leaves mature. To measure the intensities of non-ant defenses, leaves collected from 1.5 - 2.2 m tall saplings of M. praestans and 3 - 8 m tall saplings of M. gigantea were used.
Although there is interspecific variation in habitat preference with reference to light intensity among eight myrmecophytic species [37], their habitats overlap closely each other. Five myrmecophytic species, M. winkleri, M. bancana, M. trachyphylla, M. hypoleuca, M. beccariana, prefer moderate shade-intensity conditions and they are observed at treefall gaps and riversides in the forest. Three myrmecophytic species, M. kingii, M. lamellata and M. hullettii, prefer slightly shadier conditions than do the other myrmecophytic species. Therefore, the former five species are called "shade-intolerant myrmecophytes" and the later three species are called "shade-tolerant myrmecophytes". M. gigantea prefers slightly brighter conditions, although its habitat also overlaps closely with that of the shade-intolerant myrmecophytes. M. praestans prefers much shadier conditions than do the other species, such as the forest floor.
We randomly selected seedlings (saplings) that showed no obvious damage. Only mature apical leaves of each selected seedling (sapling) were used for the measurements of the intensities of non-ant defenses.
IV. Interspecific Variation in the Intensity of Ant Defense Interspecific variation in the intensities of ant defenses in
Macaranga has been partly described [16, 25 - 32, 39]. Itioka et al. [31] and Nomura et al. [38] measured ant aggressiveness to artificial damage on host plants at the ant-defending stage. There were significant differences in all measures of ant aggressive behaviors among eight species of obligate myrmecophytes (Table 1). Ant aggressiveness on the five shade-intolerant myrmecophytes tended to be higher than that on the three shade-tolerant myrmecophytes. There were significant differences in ant aggressive behaviors even within five shade-intolerant myrmecophytes (Kruskal-wallis test, adjusted H = 46.095, 44.409, 37.510 and 44.312 for aggregated ants at leaf tip, climbers, workers on the hand, and biters, respectively; P < 0.0001 for all; Table 1), and three shade-tolerant myrmecophytes (Kruskal-wallis test, adjusted H = 6.825 and 6.300 for climbers and workers on the hand, respectively; P < 0.05; Table 1). To estimate the intensity of ant defense, the sum of the
Proccedings: IUFRO Kanazawa 2003 "Forest Insect Population Dynamics and Host Influences” - 46 -
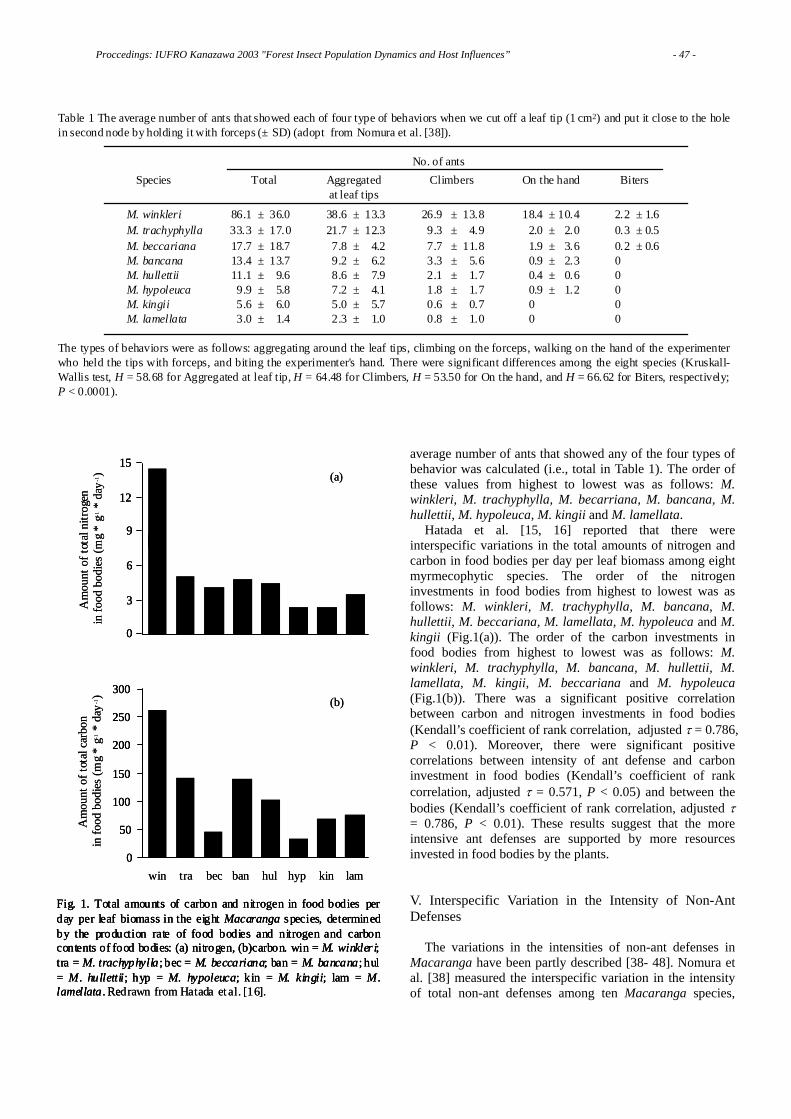
average number of ants that showed any of the four types of behavior was calculated (i.e., total in Table 1). The order of these values from highest to lowest was as follows: M. winkleri, M. trachyphylla, M. becarriana, M. bancana, M. hullettii, M. hypoleuca, M. kingii and M. lamellata.
Hatada et al. [15, 16] reported that there were interspecific variations in the total amounts of nitrogen and carbon in food bodies per day per leaf biomass among eight myrmecophytic species. The order of the nitrogen investments in food bodies from highest to lowest was as follows: M. winkleri, M. trachyphylla, M. bancana, M. hullettii, M. beccariana, M. lamellata, M. hypoleuca and M. kingii (Fig.1(a)). The order of the carbon investments in food bodies from highest to lowest was as follows: M. winkleri, M. trachyphylla, M. bancana, M. hullettii, M. lamellata, M. kingii, M. beccariana and M. hypoleuca (Fig.1(b)). There was a significant positive correlation between carbon and nitrogen investments in food bodies (Kendall’s coefficient of rank correlation, adjusted τ = 0.786, P < 0.01). Moreover, there were significant positive correlations between intensity of ant defense and carbon investment in food bodies (Kendall’s coefficient of rank correlation, adjusted τ = 0.571, P < 0.05) and between the bodies (Kendall’s coefficient of rank correlation, adjusted τ = 0.786, P < 0.01). These results suggest that the more intensive ant defenses are supported by more resources invested in food bodies by the plants.
V. Interspecific Variation in the Intensity of Non-Ant Defenses
The variations in the intensities of non-ant defenses in
Macaranga have been partly described [38- 48]. Nomura et al. [38] measured the interspecific variation in the intensity of total non-ant defenses among ten Macaranga species,
Table 1 The average number of ants that showed each of four type of behaviors when we cut off a leaf tip (1 cm2) and put it close to the hole in second node by holding it with forceps (± SD) (adopt from Nomura et al. [38]). No. of ants
Species Total Aggregated Climbers On the hand Biters at leaf tips
M. winkleri 86.1 ± 36.0 38.6 ± 13.3 26.9 ± 13.8 18.4 ± 10.4 2.2 ± 1.6 M. trachyphylla 33.3 ± 17.0 21.7 ± 12.3 9.3 ± 4.9 2.0 ± 2.0 0.3 ± 0.5 M. beccariana 17.7 ± 18.7 7.8 ± 4.2 7.7 ± 11.8 1.9 ± 3.6 0.2 ± 0.6 M. bancana 13.4 ± 13.7 9.2 ± 6.2 3.3 ± 5.6 0.9 ± 2.3 0 M. hullettii 11.1 ± 9.6 8.6 ± 7.9 2.1 ± 1.7 0.4 ± 0.6 0 M. hypoleuca 9.9 ± 5.8 7.2 ± 4.1 1.8 ± 1.7 0.9 ± 1.2 0 M. kingii 5.6 ± 6.0 5.0 ± 5.7 0.6 ± 0.7 0 0 M. lamellata 3.0 ± 1.4 2.3 ± 1.0 0.8 ± 1.0 0 0 The types of behaviors were as follows: aggregating around the leaf tips, climbing on the forceps, walking on the hand of the experimenter who held the tips with forceps, and biting the experimenter's hand. There were significant differences among the eight species (Kruskall-Wallis test, H = 58.68 for Aggregated at leaf tip, H = 64.48 for Climbers, H = 53.50 for On the hand, and H = 66.62 for Biters, respectively; P < 0.0001).
0
3
6
9
12
15
0
50
100
150
200
250
300
win tra bec ban hul hyp kin lam
(a)
(b)
Fig. 1. Total amounts of carbon and nitrogen in food bodies perday per leaf biomass in the eight Macaranga species, determinedby the production rate of food bodies and nitrogen and carboncontents of food bodies: (a) nitrogen, (b)carbon. win = M. winkler i;tra = M. trachyphylla ; bec = M. beccariana; ban = M. bancana; hul= M. hullettii; hyp = M. hypoleuca; kin = M. kingii; lam = M.lamellata . Redrawn from Hatada et al. [16].
Am
ount
of t
otal
nitr
ogen
in fo
od b
odie
s (m
g *
g-1*
day-1
)A
mou
nt o
f tot
al c
arbo
nin
food
bod
ies
(mg
* g-1
* da
y-1)
0
3
6
9
12
15
0
3
6
9
12
15
0
50
100
150
200
250
300
0
50
100
150
200
250
300
win tra bec ban hul hyp kin lam
(a)
(b)
Fig. 1. Total amounts of carbon and nitrogen in food bodies perday per leaf biomass in the eight Macaranga species, determinedby the production rate of food bodies and nitrogen and carboncontents o
Fig. 1. Total amounts of carbon and nitrogen in food bodies perday per leaf biomass in the eight Macaranga species, determinedby the production rate of food bodies and nitrogen and carboncontents of food bodies: (a) nitrogen, (b)carbon. win = M. winkler i;tra = M. trachyphylla ; bec = M. beccariana; ban = M. bancana; hul= M. hullettii; hyp = M. hypoleuca; kin = M. kingii; lam = M.lamellata . Re
f food bodies: (a) nitrogen, (b)carbon. win = M. winkler i;tra = M. trachyphylla ; bec = M. beccariana; ban = M. bancana; hul= M. hullettii; hyp = M. hypoleuca; kin = M. kingii; lam = M.lamellata . Redrawn from Hatada et al. [16].
Am
ount
of t
otal
nitr
ogen
in fo
od b
odie
s (m
g *
g-1*
day-1
)A
mou
nt o
f tot
al c
arbo
nin
food
bod
ies
(mg
* g-1
* da
y-1)
Proccedings: IUFRO Kanazawa 2003 "Forest Insect Population Dynamics and Host Influences” - 47 -

including eight myrmecophytic species at ant-defending stage by comparing the inhibitory effects on the growth performance on a generalist herbivorous insect, the common cutworm (Spodoptera litura Fabricius (Lepidoptera: Noctuidae)) when larvae fed on fresh leaves of each Macaranga species. Curves of cumulative survival rates of the cutworm larvae were significantly different among ten species (Log rank test, χ2 = 1135.818, P < 0.0001; Fig. 2). The hazard curve of cumulative survival rate was higher for the five shade-intolerant myrmecophytes than for the three shade-tolerant myrmecophytes. Cumulative survival rate of cutworm larvae on M. praestans was lower than that on the other species, except for M. hullettii. The cutworm larvae were able to penetrate leaves of all species with their mandibles, except for M. praestans, on which all larvae died of starvation due to their inability to break the leaf surface. Therefore, harmful influences on cutworm growth were higher in M. praestans than M. hullettii. Cumulative survival rate on M. gigantea was intermediate between those on shade-intolerant and shade-tolerant myrmecophytes. Curves of cumulative survival rates were not significantly different among M. gigantea, M. hypoleuca and M. beccariana. However, some larvae survived until 3rd instar on M. beccariana and M. hypoleuca,whereas all larvae on M. gigantea died as 2nd instars. Therefore, harmful influences on cutworm growth were higher in M. gigantea than in M. beccariana and M. hypoleuca. Curves of cumulative survival rates of cutworm larvae were different even among the five shade-intolerant myrmecophytes and the three
shade-tolerant myrmecophytes (Log rank test, χ2 = 522.281and 89.995, for shade-intolerant and shade-tolerant myrmecophytes, respectively; P < 0.0001; Fig. 2). The order of inhibitory effects of fresh leaves on the growth of the cutworm larvae, from lowest to highest was as follows; M. winkleri, M. trachyphylla, M. bancana, M. beccariana, M. hypoleuca, M. gigantea, M. lamellata, M. kingii, M. hullettii and M. praestans. There was a significant negative correlation between the intensities of ant and non-ant defenses (Kendall’s coefficient of rank correlation, adjusted τ = - 0.629, P < 0.05). This result supports Janzen's hypothesis of a trade-off between ant and non-ant defenses. Moreover, this result suggests that even sympartric species have different defense strategies, with a trade-off between the two modes of defense mechanisms.
Non-ant defense mechanisms can be separated into physical and chemical components. To assess the intensity of physical defense, Nomura et al. [38, 46] measured leaf toughness. Since the leaves that were used in this study are covered with very few trichome and spines, it was assumed that leaf toughness is a good character that determines and indicates the intensity of physical defense of Macaranga species. Leaf toughness differed significantly among the ten species (ANOVA, F = 84.033, P < 0.0001; Fig. 3). Leaf toughness tended to be lower in the five shade-intolerant myrmecophytes than in the three shade-tolerant myrmecophytes and the two non-myrmecophytes. The leaf
0 10 20 300
20
40
60
80
100
Days
Surv
ival
rate
(%)
Fig. 2. Curves of cumulative survival rates of larvae of the common cut worm (Spodoptera litula) fed fresh leaves of ten Macarangaspecies: (■) M. winkleri, (★) M. trachyphylla, (◆) M. bancana, (●) M. beccariana, (▲) M. hypoleuca, (+) M. gigantea, (△) M.lamellate, (□) M. kingii, (○) M. hulletti and (×) M. praestans (adapted from Nomura et al.[38]). Curves of cumulative survival rates ofthe cutworm were significantly different among the ten species (Log rank test, χ2=1135.818, P<0.0001)
Proccedings: IUFRO Kanazawa 2003 "Forest Insect Population Dynamics and Host Influences” - 48 -

toughness of M. praestans was significantly lower than that in the other species (Scheffé F test, P < 0.05; Fig. 3). The leaf toughness in M. gigantea was intermediate between those in shade-intolerant and shade-tolerant myrmecophytes. Leaf toughness differed significantly even among sympartric species (ANOVA, F = 20.088 and 25.700 for shade-intolerant and shade-tolerant myrmecophytes, respectively; P < 0.0001, Fig. 3). The toughness of M. winkleri leaves was significantly lower than that of M. hypoleuca, M. beccariana and M. bancana leaves (Scheffé F test, P < 0.05). The leaf toughness in M. kingii was significantly lower than that in any shade-tolerant myrmecophyte (Scheffé F test, P < 0.05). There was a significant positive correlation between leaf toughness and intensity of total non-ant defense (Kendall’s coefficient of rank correlation, adjusted τ = 0.854, P < 0.001).
To assess the intensity of chemical defense, Nomura et al. [38] measured total phenol and condensed tannin contents in leaves. Total phenol contents differed significantly among ten species (ANOVA, F = 31.164, P < 0.0001; Fig. 4(a)). However, there was no visible tendency in total phenol contents among shade-intolerant myrmecophytes, shade-tolerant myrmecophytes and non-myrmecophytes.
Condensed tannin contents differed significantly among ten species (ANOVA, F = 24.575, P < 0.0001; Fig. 4(b).). However, there was no visible tendency in condensed tannin contents among shade-intolerant myrmecophytes, shade-tolerant myrmecophytes and non-myrmecophytes. There were no significant correlations between the intensity of total non-ant defense and phenol content and between the intensity of total non-ant defense and condensed tannin content. These results suggest that leaf toughness is more important for total non-ant defense than for chemical defense.
VI. Intraspecific Variation in the Intensity of Non-Ant Defenses in Myrmecophytic Macaranga before and after the Initiation of Symbiosis with Ants
Changes in the intensity of total non-ant defense of
seedlings before and after symbiont ants colonized were estimated by measuring the survival rate of the cutworm when larvae were fed on fresh leaves from seedlings (saplings) of the three species at three growth stages [48].
Within each Macaranga species, the curve of the cumulative survival rate of larvae fed pre-symbiosis leaves was significantly lower than that of larvae fed ant-defending leaves (Log rank test, χ2 = 276.231, 427.388 and 38.408, for M. winkleri, M. trachyphylla and M. beccariana, respectively; P < 0.0001 for all; Fig. 5). The curve of the cumulative survival rate of the cutworm larvae on pre-defense leaves was intermediate between those on pre-symbiosis and ant-defending leaves in both M. trachyphylla and M. beccariana. Sufficient seedlings in the pre-defense stage in M. winkleri were not available at the study site.
0
0.2
0.4
0.6
prahulkinlamgighypbecbantrawin
a
bcbcbab
d
c
bc
c
e
Fig. 3. Leaf toughness in the ten Macaranga species. Toughnesswas determined from the weight needed to penetrate a fresh leaf by3 mm-diameter penetrometer column (adopt from Nomura et al.[38]). There were significant differences among ten species(ANOVA, F = 84.033, P < 0.0001). Weight followed by differentletters are significantly different from each other (Scheffé F test:P < 0.05). Abbreviations as in Fig. 1 legend.
Leaf
toug
hnes
s(m
ean
kg ±
SD)
0
0.2
0.4
0.6
0.2
0.4
0.6
prahulkinlamgighypbecbantrawin
a
bcbcbab
d
c
bc
c
e
Fig. 3. Leaf toughness in the ten Macaranga species. Toughnesswas determined from the weight needed to penetrate a fresh leaf by3 mm-diameter penetrometer column (adopt from Nomura et al.[38]). There were significant differences among ten species(ANOVA, F = 84.033, P < 0.0001). Weight followed by differentletters are significantly different from each other (Scheffé F test:P < 0.05). Abbreviations as in Fig. 1 legend.
Fig. 3. Leaf toughness in the ten Macaranga species. Toughnesswas determined from the weight needed to penetrate a fresh leaf by3 mm-diameter penetrometer column (adopt from Nomura et al.[38]). The
Fig. 3. Leaf toughness in the ten Macaranga species. Toughnesswas determined from the weight needed to penetrate a fresh leaf by3 mm-diameter penetrometer column (adopt from Nomura et al.[38]). There were significant differences among ten species(ANOVA, F = 84.033, P < 0.0001). Weight followed by differentletters are significantly different from each other (Scheffé F test:P < 0.05). Abbrevia
re were significant differences among ten species(ANOVA, F = 84.033, P < 0.0001). Weight followed by differentletters are significantly different from each other (Scheffé F test:P < 0.05). Abbreviations as in Fig. 1 legend.
Leaf
toug
hnes
s(m
ean
kg ±
SD)
Fig. 4. Total phenol and condensed tannin contents in the tenMacaranga species: (a) total phenol, (b) condensed tannin (adoptfrom Nomura et al. [38]). There were significant differences intotal phenol and condensed tannin contents among ten species(ANOVA, F = 31.164, 24.575 for total phenol and condensedtannin, respectively; P < 0.0001). Weight followed by differentletters are significantly different from each other (Scheffé F test, P< 0.05). Abbreviations as in Fig. 1 legend.
Tota
l phe
nol c
onte
nt(m
g *
g-1)
t
0
50
100
150
200
250
aa
a
abab ab
cd
e
bcd
abc
(a)
0
5
10
15
20
(b)
aaa
aa a
abab
b
c
prahulkinlamgighypbecbantrawin
Con
dens
ed ta
nnin
con
tent
(mg
* g-1
)
Fig. 4. Total phenol and condensed tannin contents in the tenMacaranga species: (a) total phenol, (b) condensed tannin (adoptfrom Nomura et al. [38]). There were significant differences intotal phenol and condensed tannin contents among ten species(ANOVA, F = 31.164, 24.575 for total phenol and condensedtannin, respectively; P < 0.0001). Weight followed by differentletters are significantly different from each other (Scheffé F test, P< 0.05). Abbreviations as in Fig. 1 legend.
Fig. 4. Total phenol and condensed tannin contents in the tenMacaranga species: (a) total phenol, (b) condensed tannin (adoptfrom Nomura et al. [38]). There were significant differences intotal phe
Fig. 4. Total phenol and condensed tannin contents in the tenMacaranga species: (a) total phenol, (b) condensed tannin (adoptfrom Nomura et al. [38]). There were significant differences intotal phenol and condensed tannin contents among ten species(ANOVA, F = 31.164, 24.575 for total phenol and condensedtannin, respectively; P < 0.0001). Weight followed by differentletters are significantly
nol and condensed tannin contents among ten species(ANOVA, F = 31.164, 24.575 for total phenol and condensedtannin, respectively; P < 0.0001). Weight followed by differentletters are significantly different from each other (Scheffé F test, P< 0.05). Abbreviations as in Fig. 1 legend.
Tota
l phe
nol c
onte
nt(m
g *
g-1)
t
0
50
100
150
200
0
50
100
150
200
250
aa
a
abab ab
cd
e
bcd
abc
(a)
0
5
10
15
20
(b)
aaa
aa a
abab
b
c
prahulkinlamgighypbecbantrawin prahulkinlamgighypbecbantrawin
Con
dens
ed ta
nnin
con
tent
(mg
* g-1
)
Proccedings: IUFRO Kanazawa 2003 "Forest Insect Population Dynamics and Host Influences” - 49 -
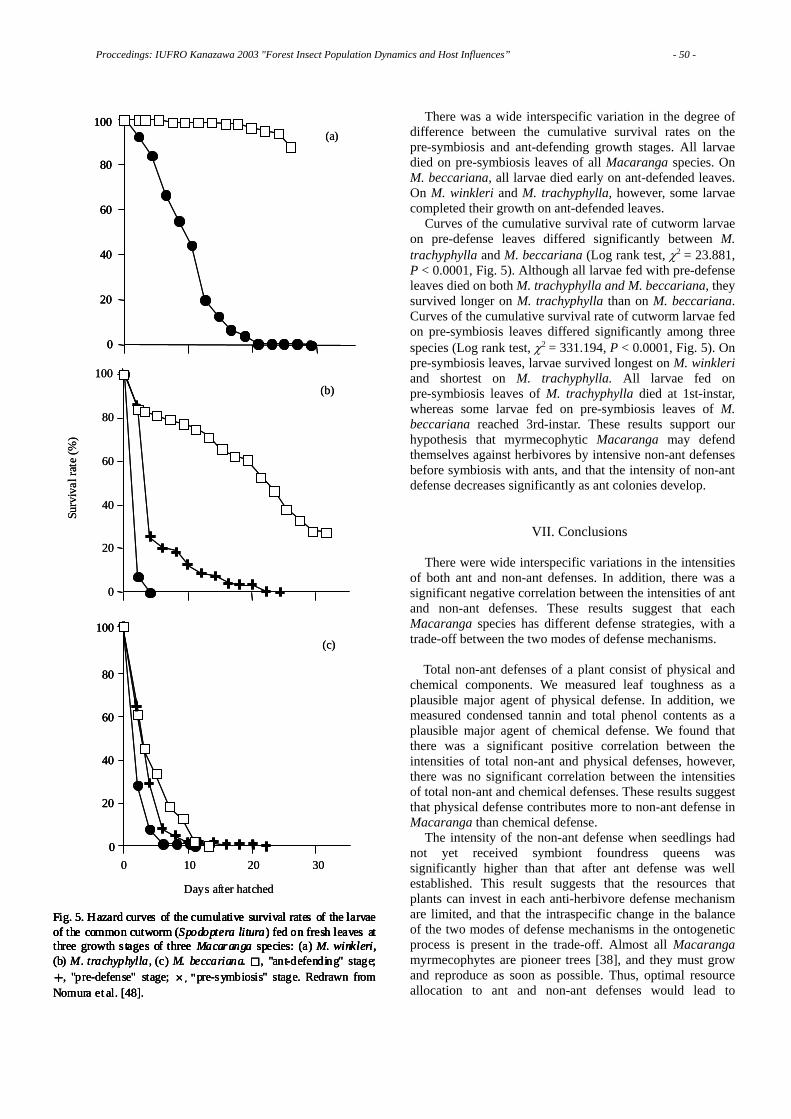
There was a wide interspecific variation in the degree of difference between the cumulative survival rates on the pre-symbiosis and ant-defending growth stages. All larvae died on pre-symbiosis leaves of all Macaranga species. On M. beccariana, all larvae died early on ant-defended leaves. On M. winkleri and M. trachyphylla, however, some larvae completed their growth on ant-defended leaves.
Curves of the cumulative survival rate of cutworm larvae on pre-defense leaves differed significantly between M. trachyphylla and M. beccariana (Log rank test, χ2 = 23.881, P < 0.0001, Fig. 5). Although all larvae fed with pre-defense leaves died on both M. trachyphylla and M. beccariana, they survived longer on M. trachyphylla than on M. beccariana. Curves of the cumulative survival rate of cutworm larvae fed on pre-symbiosis leaves differed significantly among three species (Log rank test, χ2 = 331.194, P < 0.0001, Fig. 5). On pre-symbiosis leaves, larvae survived longest on M. winkleri and shortest on M. trachyphylla. All larvae fed on pre-symbiosis leaves of M. trachyphylla died at 1st-instar, whereas some larvae fed on pre-symbiosis leaves of M. beccariana reached 3rd-instar. These results support our hypothesis that myrmecophytic Macaranga may defend themselves against herbivores by intensive non-ant defenses before symbiosis with ants, and that the intensity of non-ant defense decreases significantly as ant colonies develop.
VII. Conclusions There were wide interspecific variations in the intensities
of both ant and non-ant defenses. In addition, there was a significant negative correlation between the intensities of ant and non-ant defenses. These results suggest that each Macaranga species has different defense strategies, with a trade-off between the two modes of defense mechanisms. Total non-ant defenses of a plant consist of physical and chemical components. We measured leaf toughness as a plausible major agent of physical defense. In addition, we measured condensed tannin and total phenol contents as a plausible major agent of chemical defense. We found that there was a significant positive correlation between the intensities of total non-ant and physical defenses, however, there was no significant correlation between the intensities of total non-ant and chemical defenses. These results suggest that physical defense contributes more to non-ant defense in Macaranga than chemical defense.
The intensity of the non-ant defense when seedlings had not yet received symbiont foundress queens was significantly higher than that after ant defense was well established. This result suggests that the resources that plants can invest in each anti-herbivore defense mechanism are limited, and that the intraspecific change in the balance of the two modes of defense mechanisms in the ontogenetic process is present in the trade-off. Almost all Macaranga myrmecophytes are pioneer trees [38], and they must grow and reproduce as soon as possible. Thus, optimal resource allocation to ant and non-ant defenses would lead to
0
20
40
60
80
100(b)
Surv
ival
rate
(%)
Fig. 5. Hazard curves of the cumulative survival rates of the larvaeof the common cutworm (Spodoptera litura) fed on fresh leaves atthree growth s tages of three Macaranga species: (a) M. winkleri,(b) M. trachyphylla , (c) M. beccariana. □, "ant-defending" stage;+, "pre-defense" stage; ×, "pre-symbiosis" stage. Redrawn fromNomura et al. [48].
Days after hatched
0
20
40
60
80
100
0 10 20 30
(c)
0
20
40
60
80
100(a)
0
20
40
60
80
100(b)
Surv
ival
rate
(%)
Fig. 5. Hazard curves of the cumulative survival rates of the larvaeof the common cutworm (Spodoptera litura) fed on fresh leaves atthree growth s tages of three Macaranga species: (a) M. winkleri,(b) M. trachyphylla , (c) M. beccariana. □, "ant-defending" stage;+, "pre-defense" stage; ×, "pre-symbiosis" stage. Redrawn fromNomura et al. [48].
Fig. 5. Hazard curves of the cumulative survival rates of the larvaeof the common cutworm (Spodoptera litura) fed on fresh leaves atthree growth s tages of three Macaranga species: (a) M. winkleri,(
Fig. 5. Hazard curves of the cumulative survival rates of the larvaeof the common cutworm (Spodoptera litura) fed on fresh leaves atthree growth s tages of three Macaranga species: (a) M. winkleri,(b) M. trachyphylla , (c) M. beccariana. □, "ant-defending" stage;+, "pre-defense" stage; ×, "pre-symbiosis" stage. Redrawn fromNomura et al. [48].
Days after hatched
0
20
40
60
80
100
0
20
40
60
80
100
0 10 20 30
(c)
0
20
40
60
80
100
0
20
40
60
80
100(a)
Proccedings: IUFRO Kanazawa 2003 "Forest Insect Population Dynamics and Host Influences” - 50 -
increased fitness in Macaranga seedlings because they can invest the saved resources in other life history aspects, such as growth and reproduction.
Acknowledgments We thank Dr. Hua Seng Lee and Mr. Abang A. Hamid,
Forest Department of Sarawak, the late Prof. Tamiji Inoue, Kyoto University, and Prof. Kazuhiko Ogino, the University of Shiga Prefecture for providing opportunities for this study. We also thank Profs. Takayuki Ohgushi, Kyoto University, Profs. Tohru Nakashizuka, Research Institute for Humanity and Nature and Assistant Prof. Takao Itino, Shinshu University for their helpful comments on our experimental designs. We also thank Prof. Satoshi Tahara, Hokkaido University for teaching chemical analysis. We also thank Prof. Seiki Yamane, Kagoshima University for valuable comments on ant identification. Thanks are also due to the staff of the Sarawak Forest Department and the people who assisted with the fieldwork. We also thank two anonymous referees who improved the manuscript. This work was partly supported by the Japan Ministry of Education, Science and Culture for International Scientific Research (no. 10041163), Creative Basic Research (no.09NP1501), and by Japan Science and Technology Corporation for CREST (Core Research for Evolutional Science and Technology).
References
[1] R. Buckley, "Ant-Plant-Homopteran interactions," Advances in Ecological Research, Vo1. 6, pp. 53-85, 1987. [2] H. J. Williams, G. W. Elzen, S. B. Vinson, "Parasitoid-host-plant interactions, emphasizing cotton (Gossypium)," in Novel aspects of insect-plant interactions, P. Barbosa, D. K. Letourneau, eds., New York: Wiley, pp. 171-200. 1988. [3] C. R. Huxley, D. F. Cutler, eds., Ant-plant interactions, Oxford: Oxford University Press, 1991. [4] E. E. Farmer, "New fatty acid-based signals: A lesson from the plant world," Science, Vol. 276, pp. 912-913, 1997. [5] W. W. Benson, Amazon ant-plants, in Amazonia, G. T. Prance, T. E. Lovejoy, eds., Oxford: Pergamon Press, pp. 239-266. 1985. [6] D. W. Davidson, W. W. Epstein, "Epiphytic associations with ants." in Vascular plants as epiphytes, U. Lüttge, ed.,. Berlin, Germany: Springer-Verlag, pp. 200-233, 1989. [7] B. Hölldobler, E. O. Wilson, The ants, Cambridge, Massachusetts: Harvard University Press, 1990. [8] R. J. Lincolon, G. A. Boxshall, P. F. Clark, A dictionary of ecology, Cambridge: Cambridge University Press, 1982. [9] G. A. Rosenthal, M. R. Berenbaum, eds., Herbivores-their interactions with secondary plant metabolites, Vol. 1: The chemical participants, New York: Academic Press, 1991. [10] A. J. Pollard, "The importance of deterrence: Responses of grazing animals to plant variation," in Plant resistance to herbivores and pathogens, R. S. Fritz, E. L. Simms, eds., Chicago: The University of Chicago Press, pp.216-239, 1992. [11] J. B. Harborne, Plant secondary metabolism, in Plant ecology, M. J. Crawley, ed., Oxford: Blackwell Scientific Publications, pp. 132-155, 1997. [12] F. R. Ricson, "Developmental anatomy and ultrastructure of
the ant-food bodies (Beccarian bodies) of M. triloba and M. hypoleuca (Euphorbiaceae)," American Journal of Botany, Vol. 67, pp. 285-292, 1980. [13] M. Heil, B. Fiala, G. Zotz, P. Menke, U. Mashiwitz, "Food body production in Macaranga triloba (Euphorbiaceae): A plant investment in antiherbivore defense via symbiotic ant partners," Journal of Ecology Vol. 85, pp. 847-861, 1997. [14] M. Heil, B. Fiala, W. Kaiser, K. E. Linsenmair, "Chemical contents of Macaranga food bodies: Adaptations to their role in ant attraction and nutrition," Functional Ecology, Vol. 12, pp. 117-122, 1998. [15] A. Hatada, T. Itioka, R. Yamaoka, T. Itino, "Carbon and nitrogen contents of food bodies in three myrmecophytic species of Macaranga: implications for anti-herbivore defense mechanisms," Journal of Plant Research, Vol. 115, pp. 179-184, 2002. [16] A. Hatada, T. Itioka, T. Nakashizuka, "Variation of the intensities of ant defense in ten Macaranga species," unpublished. [17] G. M. Barker, "Grass host preference of Listronotus bonariensis (Coleoptera: Curculionidae)," Journal of Economic Entomology, Vol. 82. pp. 1807-1816, 1989. [18] E. L. Simms, "Cost of plant resistance to herbivory," in Plant resistance to herbivores and pathogens, R. S. Fritz, E. L. Simms, eds,. Chicago: The University of Chicago Press, pp. 216-239, 1992. [19] E. L. Simms, M. D. Rausher, "Costs and benefits of the evolution of plant defence against herbivory," American Naturalist, Vol. 130, pp. 570-581, 1987. [20] M. A. Briggs, J. C. Schultz, "Chemical defense production in Lotus corniculatus. II. Trade-offs among growth, reproduction, and defense," Oecologia, Vol. 83, pp. 32-37, 1990. [21] D. A. Herms, W. J. Mattson, "The dilemma of plants: to grow or defend," Quarterly Review of Biology, Vol. 67, pp. 283-335, 1992. [22] D. H. Janzen, "Coevolution of mutualism between ants and acacias in Central America," Evolution, Vol. 20, pp. 249-275, 1966. [23] T. C. Whitmore, "First thoughts on species evolution in Malayan Macaranga (Studies in Macaranga III)," Biological journal of the Linnean Society, Vol. 1, pp. 223-231, 1969. [24] T. C. Whitmore, "Macaranga," in The Euphorbiaceae of Borneo, H. K. Airy Shaw, ed., Kew Bulletin Additional Series 4, London: Kew Gardens, pp. 140-159, 1975. [25] B. Fiala, U. Maschwitz, T. Y. Pong, A. J. Helbig, "Studies of a South East Asian ant-plant association: protection of Macaranga trees by Crematogaster borneensis," Oecologia, Vol. 79, pp. 463-470, 1989. [26] B. Fiala, U. Maschwitz, "Studies on the South East Asian ant-plant association Crematogaster borneensis / Macaranga: adaptations of the ant-partner," Insectes Society, Vol. 37, pp. 212-231, 1990. [27] B. Fiala, H. Grunsky, U. Maschwitz, K. E. Linsenmair, "Diversity of ant-plant interactions: protective efficacy in Macaranga species with different degrees of ant associations," Oecologia, Vol. 97, pp. 186-192, 1994. [28] B. Fala, A. Jakob, U. Maschwitz, K. E. Linsenmair, "Diversity, evolutionary specialisation and geographic distribution of mutualistic ant-plant complex: Macaranga and Crematogaster in South East Asia," Biological Journal of the Linnean Society, Vol. 66, pp. 305-331, 1999. [29] B. Fiala, U. Maschwitz, "Extrafloral nectaries in the genus Macaranga (Euphorbiaceae) in Malaysia: comparative studies of their possible significance as predispositions for myrmecophytism," Biological Journal of the Linnean Society, Vol. 44, pp. 287-305, 1991. [30] B. Fiala, U. Maschwitz, "Food bodies and their significance for obligate ant-association in the tree genus Macaranga (Euphorbiaceae)," Botanical Journal of the Linnean Society, Vol.
Proccedings: IUFRO Kanazawa 2003 "Forest Insect Population Dynamics and Host Influences” - 51 -
110, pp. 61-75, 1992. [31] T. Itioka, M. Nomura, Y. Inui, T. Itino, T. Inoue, "Difference in intensity of ant defense among three species of Macaranga myrmecophytes in a Southeast Asian dipterocarp forest," Biotropica, Vol. 32, pp. 318-326, 2000. [32] M. Heil, B. Fiala, U. Maschwitz, K.E. Linsenmair, "On benefits of indirect defense: short- and long-term studies of antiherbivore protection via mutualistic ants," Oecologia, Vol. 126, pp. 395-403, 2001. [33] T. Inoue, A. A. Hamid, eds., Plant reproductive systems and animal seasonal dynamics: Long-term study of dipterocarp forests in Sarawak, Otsu: Center for Ecological Research, Kyoto University, 1994 [34] M. Kato et al. "Seasonality and vertical structure of light-attracted insect communities in a dipterocarp forest in Sarawak," Reserches on Population Ecology, Vol. 37, pp. 59-79, 1995. [35] H. Nagamasu K. Momose, "Flora of Lambir Hills National Park, Sarawak, with special reference to Canopy Biology Plot," in General flowering of tropical rainforest in Sarawak, T. Inoue, A. A. Hamid, eds., Otsu: Center for Ecological Research, Kyoto University, pp. 20-67, 1997. [36] T. Itino et al, "Cospeciation of ants and plants," Ecological Research, Vol. 16, pp. 787-793, 2001. [37] S. J. Davies, P. A. Palmiotto, P. S. Ashton, H. S. Lee, J. V. Lafrankie, "Comparative ecology of 11 sympatric species of Macaranga in Borneo: Tree distribution in relation to horizontal and vertical resource heterogeneity," Journal of Ecology, Vol. 86, pp. 662-673, 1998. [38] M. Nomura, A. Hatada, T. Itioka, "Effects of leaf turnover on anti-herbivore defense strategies in relation to the balance between ant and non-ant defenses in the South East Asian plant genus Macaranga," unpublished. [49] S. Sultana, M. Ilyas, "Chromenoflavones from Macaranga indica," Phytochemistry, Vol. 25, pp. 953-954, 1986. [40] E. Hnawia, O. Thoison, F. Guéritte-Voegelein, D. Bourret, T. Sévenet, "A geranyl substituted flavonol from Macaranga vedeliana," Phytochemistry, Vol. 29. pp. 2369-2368, 1990. [41] J. H. Lin, G. I. Nonaka, I. Nishioka, "Tannins and related compounds XCIV. Isolation and characterization of seven new hydrolizable tannins from the leaves of Macaranga tanarius (L.) Muell. Et Arg.," Chemical and Pharmaceutical Bulletin (Tokyo), Vol. 38, pp. 1218-1223, 1990. [42] J. H. Lin, M. Ishimatsu, T. Tanaka, G. I. Nonaka, I. Nishioka, "Tannins and related compounds XCIV. Structures of macarangins and macarinins. New hydolyzable tannins possessing macaronyl and tergalloyl ester group from the leaves of M. sinensis Baill. Muell.-Arg.," Chemical and Pharmaceutical Bulletin (Tokyo), Vol. 38, pp. 1844-1851, 1990. [43] J. H. Lin, "Studies on tannins of the bark of M. tanarius (L.) Muell. Et Arg.," Journal of Food Drug Analysis, Vol. 1, pp. 273-280, 1993. [44] J. H. Lin, "Studies on tannins of the bark of M. sinensis (Baill.) Muell.-Arg.," Journal of Food Drug Analysis, Vol. 2, pp. 201-209, 1994. [45] M. Heil, B. Fiala, T. Boller, K. E. Linsenmair, "Reduced chitinase activites in ant-plants of genus Macaranga," Naturwissenschaften, Vol. 86, pp. 146-149, 1999. [46] M. Nomura, T. Itioka, T. Itino, "Variation in abiotic defense within myrmecophytic and non-myrmecophytic species of Macaranga in a Bornean dipterocarp forest," Ecological Research, Vol. 15, pp. 1-11, 2000. [47] G. Eck, B. Fiala, K. E. Linsenmair, R. B. Hashim, P. Proksch, "Trade-off between chemical and biotic antiherbivore defense in the South East Asian plant genus Macaranga," Journal of
Chemical Ecology, Vol. 27, pp. 1979-1996, 2001. [48] M. Nomura, T. Itioka, K. Murase, "Non-ant anti-herbivore defenses before plant-ant colonization in Macaranga myrmecophytes," Population Ecology, Vol. 43, pp. 207-212. 2001.
Proccedings: IUFRO Kanazawa 2003 "Forest Insect Population Dynamics and Host Influences” - 52 -
Leaf Longevity and Defense Characteristics in Trees of Betulaceae
Takayoshi KOIKE Hokkaido University Forests, FSC, Sapporo 060-0809, JAPAN
Sawako MATSUKI, Dongsu CHOI Graduate School of Agriculture, Hokkaido University, Sapporo 060-8589, JAPAN
Takeshi MATSUMOTO Hokkaido University Forests, FSC, Sapporo 060-0809, JAPAN
Present address: Forestry and Forest Products Research Institute (FFPRI), Shikoku Research Center 780-8077, JAPAN Yasuaki SAKAMOTO, Yutaka MARUYAMA
Hokkaido Research Center, FFPRI, Sapporo 062-8516, JAPAN
Abstract- To make baseline data for the maintenance of forest health, net photosynthesis, leaf carbon/nitrogen (C/N) ratio, toughness, existence of trichomes, and chemical defense traits were studied in trees of 18 Betulaceae species. These included five species (Alnus glutinos, A. incana, A. sibirica, Betula pendula, and B. verrucosa) originating from the Eurasian continent. The amount of total phenolics showed a positive correlation with C/N ratio. Leaf longevity correlated negatively with the amount of total phenolics. Except for Betula platyphylla, two Carpinus and Corylus heterophylla, there was a positive correlation between the amount of condensed tannin and leaf longevity. A weak negative correlation was found between leaf lifespan and LMA (leaf mass per area). No relation between the existence of trichomes and leaf longevity was found. Successional traits of 18 Betulaceae species and leaf defense are discussed based on relations of the C/N ratio of leaves and adaptive radiation in the family.
I. Introduction
Betulaceae trees are a common species in secondary forests in northern Japan. These species show several successional traits, i.e. early-, mid- (or gap phase), and late- successional characteristics. Research has been conducted into phylogeny constraints of the pattern of leaf survival and structure of winter buds [1]. There are several studies on the growth characteristics of Betulaceae, although their defense traits have not been researched [2].
Several alders and birches were imported from western Eurasian regions, especially from northern Europe, for breeding [3]. Some of these are resistant to insect herbivores, but others are susceptible. In general, tree species with a short leaf lifespan seem to have a lower defense capacity against insect herbivores while trees with a long leaf lifespan have a higher defense capacity [4].
Based on field observations [5], alder is a typical pioneer and its leaves are grazed annually by leaf beetles (Agelastica coerulea). Leaf grazing, however, rarely kills these trees. In contrast, even though from the same family of Betulaceae, leaves of Ostrya japonica (gap phase species) are hardly grazed by insect herbivores. Why is there a difference in the susceptibility to insect herbivores among tree species of Betulaceae? Is there a relationship between leaf longevity of
Betulaceae trees and their defense characteristics? It is expected that trees with a long leaf lifespan may have a higher defense capacity but a relatively lower photosynthetic rate.
In general, contents of defense chemicals are not only affected by soil fertility, but also by the growth phase of the plant life cycle [6,7]. The defense characteristics of plants change as the seasons progress and with the effect of grazing of herbivores. However, these characteristics are strongly dependent on species-specific traits [8]. Therefore, as baseline data for keeping vital and healthy forests dominated by Betulaceae species in northern Japan, the ecological role of defense characteristics of the representative tree species should be researched.
To achieve this, we examined leaf defense characteristics of 18 successional Betulaceae species in relation to the carbon/ nitrogen (C/N) in leaves and adaptive radiation in the Betulaceae family.
II. Materials and Methods
A. Plant materials All species were young stage trees and ca. 25-years old
(B. davurica was 15-years old as of 2002), grown at the Hitsujigaoka Experimental Forest of FFPRI (Sapporo; 42o58’N, 141o23’E, 146 m a.s.l.). Sample leaves, with a leaf age of 60-80 days, were collected from the sun crown (mid Aug, 2000). Early successional species: Alnus hirsuta, A. inokumae (=A. hirsuta var. microphylla), A. japonica, A. maximowiczii, Betula ermanii, B. obovata (=B. tatewakiana; shrub), and B. platyphylla var. japonica are native to Hokkaido, Japan. Five species (Alnus glutinos, A. incana, A. sibirica, Betula pendula, and B. verrucosa = B. pubescenns) originated from the Eurasian continent (northern Europe). Mid successional species: Betula davurica, B. maximowicziana, Ostrya japonica, Corylus heterophylla var. thunbergii (shrub), and late successional species: Carpinus cordata and C. laxiflora originated in Hokkaido. All Alnus species have symbiotic microorganisms (Frankia sp.) in their roots, which fix nitrogen directly from the air.
Proccedings: IUFRO Kanazawa 2003 "Forest Insect Population Dynamics and Host Influences” - 53 -
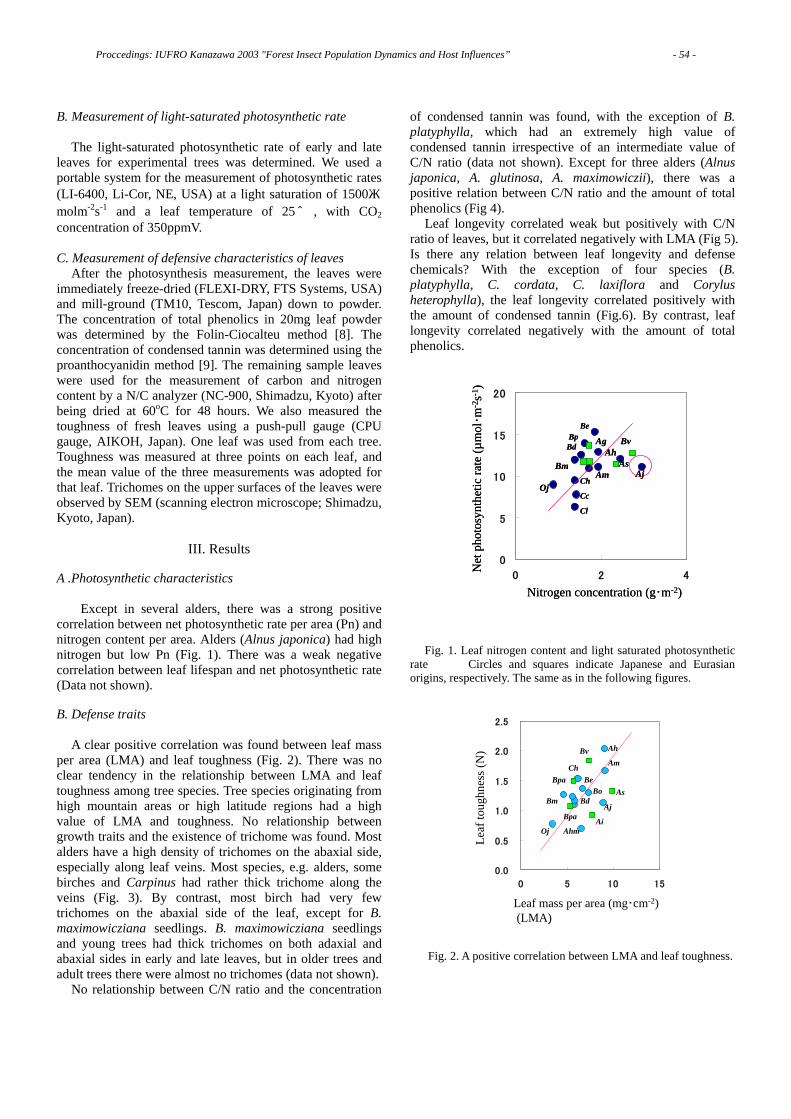
B. Measurement of light-saturated photosynthetic rate The light-saturated photosynthetic rate of early and late
leaves for experimental trees was determined. We used a portable system for the measurement of photosynthetic rates (LI-6400, Li-Cor, NE, USA) at a light saturation of 1500μmolm-2s-1 and a leaf temperature of 25℃ , with CO2 concentration of 350ppmV. C. Measurement of defensive characteristics of leaves
After the photosynthesis measurement, the leaves were immediately freeze-dried (FLEXI-DRY, FTS Systems, USA) and mill-ground (TM10, Tescom, Japan) down to powder. The concentration of total phenolics in 20mg leaf powder was determined by the Folin-Ciocalteu method [8]. The concentration of condensed tannin was determined using the proanthocyanidin method [9]. The remaining sample leaves were used for the measurement of carbon and nitrogen content by a N/C analyzer (NC-900, Shimadzu, Kyoto) after being dried at 60oC for 48 hours. We also measured the toughness of fresh leaves using a push-pull gauge (CPU gauge, AIKOH, Japan). One leaf was used from each tree. Toughness was measured at three points on each leaf, and the mean value of the three measurements was adopted for that leaf. Trichomes on the upper surfaces of the leaves were observed by SEM (scanning electron microscope; Shimadzu, Kyoto, Japan).
III. Results
A .Photosynthetic characteristics
Except in several alders, there was a strong positive
correlation between net photosynthetic rate per area (Pn) and nitrogen content per area. Alders (Alnus japonica) had high nitrogen but low Pn (Fig. 1). There was a weak negative correlation between leaf lifespan and net photosynthetic rate (Data not shown). B. Defense traits
A clear positive correlation was found between leaf mass
per area (LMA) and leaf toughness (Fig. 2). There was no clear tendency in the relationship between LMA and leaf toughness among tree species. Tree species originating from high mountain areas or high latitude regions had a high value of LMA and toughness. No relationship between growth traits and the existence of trichome was found. Most alders have a high density of trichomes on the abaxial side, especially along leaf veins. Most species, e.g. alders, some birches and Carpinus had rather thick trichome along the veins (Fig. 3). By contrast, most birch had very few trichomes on the abaxial side of the leaf, except for B. maximowicziana seedlings. B. maximowicziana seedlings and young trees had thick trichomes on both adaxial and abaxial sides in early and late leaves, but in older trees and adult trees there were almost no trichomes (data not shown).
No relationship between C/N ratio and the concentration
of condensed tannin was found, with the exception of B. platyphylla, which had an extremely high value of condensed tannin irrespective of an intermediate value of C/N ratio (data not shown). Except for three alders (Alnus japonica, A. glutinosa, A. maximowiczii), there was a positive relation between C/N ratio and the amount of total phenolics (Fig 4).
Leaf longevity correlated weak but positively with C/N ratio of leaves, but it correlated negatively with LMA (Fig 5). Is there any relation between leaf longevity and defense chemicals? With the exception of four species (B. platyphylla, C. cordata, C. laxiflora and Corylus heterophylla), the leaf longevity correlated positively with the amount of condensed tannin (Fig.6). By contrast, leaf longevity correlated negatively with the amount of total phenolics.
Fig. 1. Leaf nitrogen content and light saturated photosynthetic
rate Circles and squares indicate Japanese and Eurasian origins, respectively. The same as in the following figures.
Fig. 2. A positive correlation between LMA and leaf toughness.
0.0
0.5
1.0
1.5
2.0
2.5
0 5 10 15
Leaf mass per area (mg・cm-2)(LMA)
Leaf
toug
hnes
s (N
) Ah
Am
As
Aj
Ai
Bm Bd
Bpa
Oj Ahm
Bv
Ch Bpa Be
Bo
0.0
0.5
1.0
1.5
2.0
2.5
0 5 10 15
Leaf mass per area (mg・cm-2)(LMA)
Leaf
toug
hnes
s (N
) Ah
Am
As
Aj
Ai
Bm Bd
Bpa
Oj Ahm
Bv
Ch Bpa Be
Bo
0
5
10
15
20
0 2 4
Aj
Nitrogen concentration (g・m-2)
Net
pho
tosy
nthe
tic ra
te (µ
mol・m
-2s-1
)
Ch
Cc
Cl
Oj
Bm
BeBp
Bd Ag BvAh
AsAm
0
5
10
15
20
0 2 4
Aj
Nitrogen concentration (g・m-2)
Net
pho
tosy
nthe
tic ra
te (µ
mol・m
-2s-1
)
Ch
Cc
Cl
Oj
Bm
BeBp
Bd Ag BvAh
AsAm Aj
Nitrogen concentration (g・m-2)
Net
pho
tosy
nthe
tic ra
te (µ
mol・m
-2s-1
)
Ch
Cc
Cl
Oj
Bm
BeBp
Bd Ag BvAh
AsAm
Proccedings: IUFRO Kanazawa 2003 "Forest Insect Population Dynamics and Host Influences” - 54 -
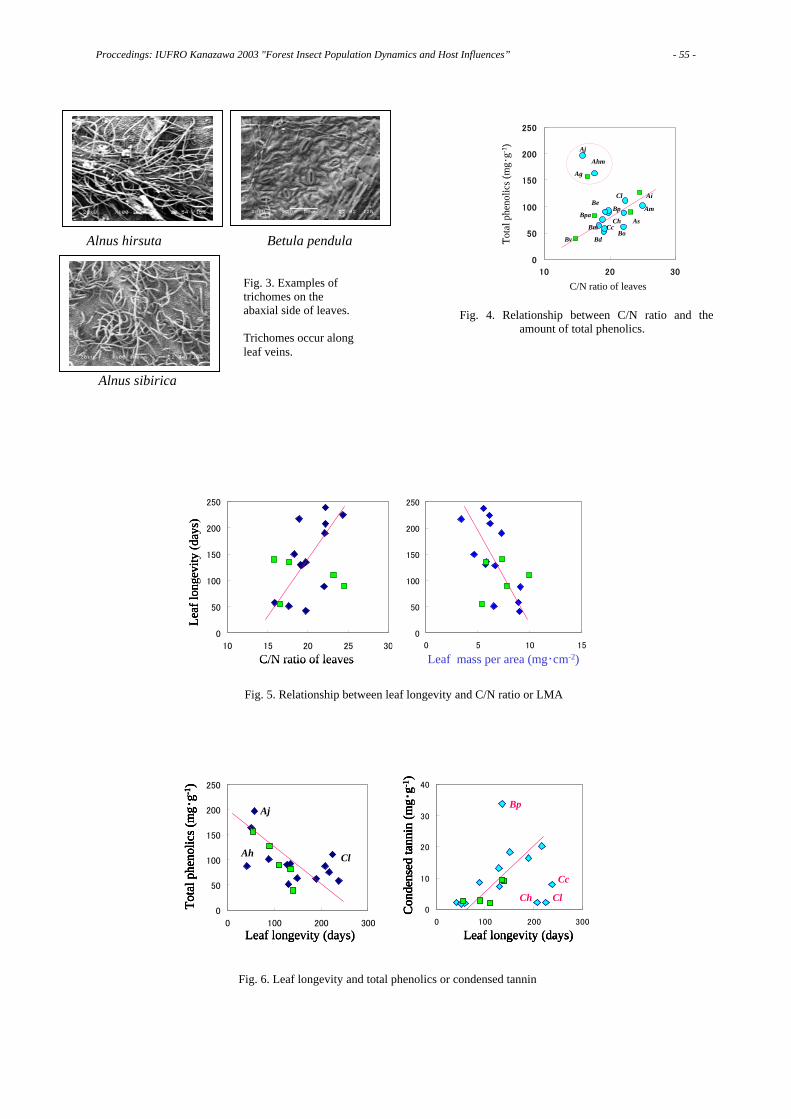
Alnus hirsuta Betula pendula
Alnus sibirica
Fig. 3. Examples of trichomes on the abaxial side of leaves. Trichomes occur along leaf veins.
Fig. 6. Leaf longevity and total phenolics or condensed tannin
0
10
20
30
40
0 100 200 300
Leaf longevity (days)
Con
dens
ed ta
nnin
(mg・
g-1)
Bp
Cc
Ch Cl 0
50
100
150
200
250
0 100 200 300
Leaf longevity (days)
Tota
l phe
noli c
s (m
g ・g-1
)
Ah Cl
Aj
0
10
20
30
40
0 100 200 300
Leaf longevity (days)
Con
dens
ed ta
nnin
(mg・
g-1)
0
10
20
30
40
0 100 200 300
Leaf longevity (days)
Con
dens
ed ta
nnin
(mg・
g-1)
Leaf longevity (days)
Con
dens
ed ta
nnin
(mg・
g-1)
Bp
Cc
Ch Cl 0
50
100
150
200
250
0 100 200 300
Leaf longevity (days)
Tota
l phe
noli c
s (m
g ・g-1
)
Ah Cl
Aj
0
50
100
150
200
250
0 100 200 300
Leaf longevity (days)
Tota
l phe
noli c
s (m
g ・g-1
)
Leaf longevity (days)
Tota
l phe
noli c
s (m
g ・g-1
)
Ah Cl
Aj
Fig. 4. Relationship between C/N ratio and theamount of total phenolics.
0
50
100
150
200
250
10 20 30
C/N ratio of leaves
Tota
l phe
nolic
s (m
g・g-1
) Aj
Ahm
Ag
Cl Ai
Bp Am
Ch As
Bo
Be
Bpa
Bm Cc
Bv Bd
0
50
100
150
200
250
10 20 30
C/N ratio of leaves
Tota
l phe
nolic
s (m
g・g-1
) Aj
Ahm
Ag
Cl Ai
Bp Am
Ch As
Bo
Be
Bpa
Bm Cc
Bv Bd
0
50
100
150
200
250
10 15 20 25 30
C/N ratio of leaves
0
50
100
150
200
250
0 5 10 15
Leaf mass per area (mg・cm-2)
Leaf
lon g
evi ty
(day
s)
0
50
100
150
200
250
10 15 20 25 30
C/N ratio of leaves
0
50
100
150
200
250
0 5 10 15
Leaf mass per area (mg・cm-2)
Leaf
lon g
evi ty
(day
s)
0
50
100
150
200
250
10 15 20 25 30
C/N ratio of leaves
0
50
100
150
200
250
0 5 10 15
Leaf mass per area (mg・cm-2)
0
50
100
150
200
250
0 5 10 15
Leaf mass per area (mg・cm-2)
Leaf
lon g
evi ty
(day
s)
Fig. 5. Relationship between leaf longevity and C/N ratio or LMA
Proccedings: IUFRO Kanazawa 2003 "Forest Insect Population Dynamics and Host Influences” - 55 -
IV. Conclusion
Species with a short leaf lifespan had high N and photosynthetic rate per area with a small amount of condensed tannin. Except for three alders, there was a positive relation between C/N ratio and the amount of total phenolics in leaves. There was a negative correlation between the amount of total phenolics and condensed tannin (Spearman’s rank test). Except for white birch (B. platyphylla), most species with long leaf lifespan have a high value of condensed tannin and generally invade forests. Most alders have a higher amount of total phenolics. By contrast, the concentration of condensed tannin in birches was higher than that of alders.
V. Discussion
In deciduous broad-leaved trees, species with long leaf longevity have a relatively lower photosynthetic rate per area [1, 2]. Most species of deciduous leaf habit with low leaf turnover rate usually have a high defense capacity [11]. Is there any relationship between leaf longevity and defense traits? Leaf mass per area (LMA) represents a physical defense, such as mechanical protection and leaf toughness. Trichomes of leaves act as a physical defense in some birch species [12, 13]. Nevertheless, it is expected that the amount of chemical defense should correlate positively with leaf longevity. However, in Betulaceae, a weak negative correlation was found between LMA and leaf lifespan (Fig. 5). Why was the negative correlation found between LMA and leaf longevity among species of Betulaceae? Throughout the six biomes, species with a high photosynthetic rate usually have a high LMA [11] because the amount of photosynthetic organs per area is large, while their leaf longevity is relatively short. Therefore, a negative correlation was found. Species with a long period of leaf emergence have a short leaf lifespan. Leaf lifespan increases as the number of bud scales increase [1]. How about chemical defense? Except for B. platyphylla, there was a weak positive correlation between the amount of condensed tannin and leaf lifespan. Some exceptions were observed, i.e. B. platyphylla had largest amount of condensed tannin but relatively lower leaf longevity. By contrast, two Carpinus species and C. heterophylla had lower amounts of condensed tannin but longer leaf lifespan.
Except in alders, the amount of total phenolics in leaves increased with increasing C/N ratio. Alders have a symbiotic relationship with nitrogen fixing microorganisms (e.g. Frankia sp.), however, lower C/N in their leaves did not always mean lower leaf toughness and shorter leaf longevity. In alder leaves with low C/N ratio, well-developed mesophyll and the extension of vascular bundle sheaths in leaves may maximize their mechanical protection (Koike unpublished data). The inner structure of a leaf should be analyzed from the viewpoints of function and structure. Moreover, alders may compensate for their grazed leaves by continuously producing new leaves. In this experiment, we
matched the leaf age of ca. 60-80 days, therefore, we may have missed the peak value of photosynthetic rate in alders because of their short leaf lifespan [14]. Except for B. platyphylla, typical early successional species have a higher photosynthetic rate and short leaf lifespan with lower condensed tannin. By contrast, two species (Carpinus and O. japonica) have lower photosynthetic rates and longer leaf lifespan with lower condensed tannin.
In general, the contents of defense chemicals are affected not only by soil fertility, but also by the growth phase of the plant life cycle. These can be understood by applying the GDB (growth/ differentiation balance) and CNB (carbon/ nutrient balance) hypotheses [6, 7]. These hypotheses also predict that the characteristics and quantity of leaves herbivores use as food are strongly affected by environmental changes and species characteristics. The defense characteristics of plants change as the season’s progress and with the stimulation of grazing herbivores. However, these characteristics are strongly dependent on species-specific traits [7, 14].
Based on present results, C/N ratio in leaves is a valuable criterion for explaining the relationships between leaf longevity and total phenolics. However, there are some contradictions, e.g. total phenolics correlated negatively with leaf longevity (Fig. 6). The contents of total phenolics should be analyzed in detail, i.e. what kinds of components are included in total phenolics. To establish baseline data for keeping vital and healthy forests, we should consider the ecological role of defense characteristics of the representative tree species. For this, further analysis of plant protection is needed.
Acknowledgements
We would like to thank Dr. M. Rousi, Dr. M. Kitao, Dr. H. Tobita and Prof. N. Kamata for their constructive advice, Mr. S. Kitaoka for collecting references. Financial support in part by JSPS (to TK) is gratefully appreciated.
References
[1] K. Kikuzawa, “Leaf survival and evolution in Betulaceae”. Annals of Botany, Vol. 50, pp. 345-353, 1982. [2] T. Koike, “Leaf structure and photosynthetic performance as related to the forest succession of deciduous broad-leaved trees,” Plant Species Biology, Vol. 3, 77-87, 1988. [3] M. Somego, “Cytogenetic studies in the subgenus Alnuster of the genus Alnus,” Association of Forest Tree Breeding, Tokyo, pp. 132, 1985. [4] T. Koike, S. Matsuki, T. Matsumoto, K. Yamaji, H. Tobita, M. Kitao and Y. Maruyama, “Bottom-up regulation for protection and conservation of forest ecosystems in northern Japan under changing environment,” Eurasian Journal of Forest Research, Vol. 6, pp. 177-189, 2003. [5] S. Matsuki, “Species biology of defense characteristics of deciduous broad-leaved trees, especially of Betulaceae,” PhD Thesis of the Graduate School of Agriculture, Hokkaido University, Sapporo, pp. 134 (in Japanese), 2003. [6] N. Kamata, “Ecological traits in Siebold beech and interaction between plants and herbivories,” Proceedings of the Population
Proccedings: IUFRO Kanazawa 2003 "Forest Insect Population Dynamics and Host Influences” - 56 -

Ecology Society, Vol. 56, 29-46, (in Japanese), 1999. [7] J. Koricheva, S. Larsson, E. Haukioja, and M. Keinanen, “Regulation of woody plant secondary metabolism by resources availability: hypothesis testing by means of meta-analysis,” Oikos, Vol. 83, pp.212-226, 1998. [8] R. Julkunen-Tiitto, “Phenolic constituents in the leaves of northern willows: methods for the analysis of certain phenolics,” Journal of Agriculture Food and Chemistry, Vol. 33, pp. 213-217, 1985. [9] E. C. Bate-Smith, “Astringent tannins of Acer species,” Phytochemistry, Vol. 16, pp. 1421-1426, 1977. [10] H. A. Mooney and S. L. Gulmon, “Constraints on leaf structure and function in reference to herbivory,” BioScience, Vol. 32, pp. 198-206, 1982. [11] P. B. Reich, D. S. Ellsworth, M. B. Walters, J. M. Vose, C.
Greshan, J. C. Volin and W. D. Bowman, “Generality of leaf trait relationships: A test across six biome,” Ecology, Vol. 80, pp. 1955-1969, 1999. [12] E. Valkama, J. P. Salminen, J. Koricheva and K. Pihlaja, “Comparative analysis of leaf trichome structure and composition of epicuticular flavonoids in Finnish birch species,” Annals of Botany, Vol. 91, pp. 643-655, 2003. [13] S. Matsuki, Y. Sano and T. Koike, “Chemical and physical defense in the early and late leaves in three heterophyllous birch species native to northern Japan,” Annals of Botany, Vol. 72, pp. 141-147, 2004. [14] T. Koike, “Autumn coloring, photosynthetic performance and leaf development of deciduous broad-leaved trees in relation to forest succession,” Tree Physiology Vo. 7, pp. 21-32, 1990.
Proccedings: IUFRO Kanazawa 2003 "Forest Insect Population Dynamics and Host Influences” - 57 -
Three Pistachio Species Evaluated For Resistance to the Common Pistachio Psylla, Agonoscena pistaciae
M.Reza MEHRNEJAD Pistachio Research Institute, P. O. Box 77175.435, Rafsanjan, IRAN
Abstract - Two wild pistachio species and the cultivated pistachio were evaluated for resistance to the common pistachio psylla, a major pest of pistachio trees, in a laboratory trial. The results of this study showed the causes of resistance in tested materials. It was found that the cultivated pistachio, Pistacia vera with high fruit quality, were more favorable to the common pistachio psylla than were wild pistachio species with poor nut quality. Key words: Pistacia, pistachio pest, psylla, resistance
I. Introduction
Pistacia Linnaeus is mainly a subtropical genus comprising some 10 species of dioecious trees and shrubs. Geographically, the largest concentration of Pistacia species is found in West Asia and in the Mediterranean region [23]. Wild species are important in the development of pistachio varieties because they provide rootstocks resistant to biotic and abiotic stresses, and tolerant of drought and poor soil conditions. It is these characteristics that make this crop and its wild relatives suitable for planting in marginal lands [17]. Three Pistacia species occur naturally in Iran, including; Pistacia atlantica Desf., Pistacia khinjuk Stocks and Pistacia vera Linnaeus [19]. Pistacia atlantica is one of the most widely distributed wild species. In addition it is divided into four ecogeographic races: subsP. cabulica (Stocks); subsP. mutica (Fischer & C.A. Meyer); subsP. kurdica (Zohary); and subsP. atlantica. Seeds of P. atlantica can be used for seedling production and extraction of oil. Resin is also considered to be a valuable product of these trees. Pistacia khinjuk is rarely a dominant species in the environments where it occurs. It thrives in dry steppe-forests or steppe formations, mostly in stony places and in rocky mountain terrains [23]. In Iran, due to extensive destruction of trees, this species is now only found in very inaccessible places such as rocky cliffs that are otherwise unsuitable sites for trees. Sheibani [19] reported three varieties of this species including; var. heterophylla Bornm, var. populifolia Boiss, and var. oblonga Bornm. However, in Turkey two categories (large-fruited and small fruited types) of "khinjuk" were identified. Large khinjuks have high oil content and they are thus popularly called "fatty khinjuks" [12]. In Iran, similar to its neighboring countries, both of the above mentioned wild species (i.e. P. atlantica and P. khinjuk) are suffering from the effects of erosion caused by human activities, particularly overgrazing and harvesting for use as firewood or charcoal. In contrast,
P. vera is a very important plant species in Iran, and pistachio nuts are currently the primary agricultural export product. Currently, over 300,000 ha of pistachio orchards comprising about 45 indigenous cultivars are under commercial management. Pistachio growers experience many serious problems; pests and diseases are considered one of the main causes of tree damage and reduced yields.
The common pistachio psylla, Agonoscena pistaciae Burckhardt and Lauterer, is one of the most serious insect pests of cultivated pistachio, P. vera in Iran [13 & 14]. This insect is distributed throughout the country in both pistachio producing regions and wild pistachio growing areas. In addition to A. Pistaciae, two other psyllid species, Agonoscena bimaculata Mathur and Megagonoscena viridis (Baeva), occur in Iran. Agonoscena bimaculata was only found on P. khinjuk but M. viridis attacks all three pistachio species (P. atlantica, P. khinjuk and P. vera) that grow in Iran [5 & 16]. However, these later two psyllid species are considered economically unimportant now [16]. Although several species of predacious arthropods attack common pistachio psyllids, their impacts are insufficient for pest control. Psyllid resistance to insecticides has recently developed rapidly [13 & 15]. Host plant resistance would therefore be a valuable strategy that would significantly reduce production costs. Nevertheless, resistance to the common pistachio psylla has not been studied in Iran and no information is available from other pistachio producing countries.
Laboratory experiments have been widely used to evaluate the susceptibility or resistance of various plants against their key pests. Butt et al. [6] suggested that resistance to psylla can be readily identified in pear genotypes in a 24 h bioassay. They reported that a detached leaf test is useful for following the fate of individual nymphs and for limiting their movement for ease of observation. In addition, the test is useful as a bioassay of field grown material. A leaf-section bioassay was also reported by Wünn et al. [21] and this method was successfully used for evaluating rice stem borer resistance in transgenic rice [22].
It seemed possible that among the various species and cultivars of Pistacia there existed some variation in resistance to psylla. Therefore, laboratory and field screening would be useful for evaluating their attractiveness to oviposition and susceptibility to psyllid population development. The present experiment is the first study using a detached leaf bioassay procedure to screen pistachio species for psylla resistance. This study was undertaken to
Proccedings: IUFRO Kanazawa 2003 "Forest Insect Population Dynamics and Host Influences” - 58 -
evaluate three pistachio species from Iran for resistance to common pistachio psylla. Our intention was to develop a fast, reliable bioassay for screening Pistacia germplasm for pistachio psylla resistance.
II. Materials and Methods The bioassay procedure was modified from techniques
described for Pyrus germplasm in several studies [6, 2 & 1]. All laboratory trials were conducted under controlled conditions (27.5±0.5°C, 55±5% RH and 16:8 L:D). Leaf-disc cages were used in the development and reproduction experiments. A cage was made from a plastic Petri-dish (52 mm in diameter) with a 20 mm diameter hole in the middle of the lid, and covered by a piece of fine net (2 mm mesh) to provide ventilation. Agar media (8g/l) was used as a source of moisture for the plant leaf. Young and fully developed leaves were cut to the same size as the dish and placed, lower side down, on the 3 mm thick agar media covered by filter paper. Eight leaf-disc cages and two small glass jars containing a saturated magnesium nitrate salt solution (for maintaining relative humidity 55±5%) were placed in a plastic box inside an incubator. Lighting in the incubators was provided by white fluorescent lamps with light intensity of about 13 watts/m2 in the cabinet area. Leaves of each pistachio species were collected from bearing pistachio trees, including P. atlantica subspecies cabulica, P. khinjuk variety heterophylla and P. vera cultivar Akbari, in the experimental collection at the Pistachio Research Institute of Iran, located in suburb area of Rafsanjan.
A laboratory colony of pistachio psylla was maintained on potted and grafted pistachio (cultivar Akbari) seedlings. Three adult psyllid pairs (male and female) were collected from pistachio orchards and released on caged seedlings and given the opportunity to reproduce for two generations under laboratory conditions (27±2°C and 16:8 L:D).
Nine pairs of adult psyllids (5-6 days old) were removed from the colony and placed in three leaf-disc cages (separately for each plant species) under controlled conditions and allowed to lay eggs for 24 hours. Leaf-disc cages were changed after the first 12 hours. Leaf-discs containing psyllid eggs were examined three times a day (every 8 hours) to determine the egg incubation period and newly hatched nymphs were removed and individually placed in fresh leaf-disc cages using a fine hair brush. Nymphs were gently prodded until they retracted their mouthparts and began to walk. Experiments to measure the developmental time of psyllid nymphs were started using 150 newly emerged nymphs. The psyllid nymphs were also transferred to fresh leaf-disc cages at two day intervals using a fine camel hair paint brush. The development of the nymphal stages was checked once a day and the duration of each stage was recorded until adult emergence. For each adult, the sex was recorded and the body size (body length
from forehead to the end of wings) was measured using a dissecting microscope equipped with an ocular micrometer. The number of dead and missing nymphs was recorded, though missing nymphs, such as those stuck in agar medium throughout the experiment or those that escaped during the 2nd to 5th instars, were not included in overall data. The entire experiments for egg incubation period and nymphal development were replicated twice.
The daily fecundity of pistachio psylla was determined by pairing newly emerged adult male and female psyllids in pistachio leaf-disc cages (54 mm diameter). At the same time, each day each pair of adult psyllids was carefully transferred to a fresh leaf-disc cage using a small aspirator, and all eggs laid on the old leaf-discs were counted. The male was replaced if it was disabled or dead. The adults examined in this study were reared in the development trials and they were standardized by using similar adult size (body length). In this experiment, the fecundity of female psyllid was determined for first 12 days of its life span.
Data obtained from these development and reproduction experiments (developmental time, mortality, sex ratio and fecundity) were compiled in a life table for the first 12 days of adult life span under controlled conditions. Life table parameters were calculated using a QBASIC program [11]. From this, the parameter “intrinsic rate of natural increase (rm)” [4] was determined.
III. Results and Discussion In all laboratory studies reported here, pistachio psylla
readily developed and reproduced on all three Pistacia species. Although the development time, survival of immature stages, as well as fecundity of adult psyllids were significantly different among the three host plants, none of the three pistachio species appeared to be a resistant host. Nymphs that fed generally remained at one site and fed continuously for the duration of the experiment, while excreting copious amounts of honeydew. However, some nymphs moved about, either leaving the leaf (missing) or dying after feeding. The majority of the nymphs (about 65%) on cultivated pistachio fed on leaves and developed to adults. In comparison, more than 80% of nymphs on wild pistachio leaves either died during the immature stages or moved off the leaves (missing) during the first 24h of 1st instar (Fig. 1). The fate of the missing nymphs could not be determined, although considerable differences were found between the numbers of missing nymphs on the three treated plants. However, the high percentage of missing nymphs on wild pistachio species might indicate that this rejection was caused by feeding inhibitors or the absence of sufficient feeding stimulants.
Proccedings: IUFRO Kanazawa 2003 "Forest Insect Population Dynamics and Host Influences” - 59 -

Table 1 Developmental period, adult body length (mm) and reproduction of Agonoscena pistaciae on three host plant species in controlled conditions (27.5±0.5°C, 55±5% RH and 16:8 L:D).
Developmental period (day±SE)
Adult size (mm±SE) Pistachio species
examined Male Female (Male+female) Male Female
Fecundity(egg±SE)
P. atlantica 17.5±0.61b (9)
18.3±0.66b(10)
17.9 1.42±0.027b 1.59±0.037b 68.9±6.33b(10)
P. khinjuk 20.1±0.8a (11)
20.9±0.65a(13)
20.5 1.38±0.013c 1.44±0.030c 66.6±2.8b(10)
P. vera 13.9±0.41c (31)
14.9±0.49c(29)
14.4 1.51±0.010a 1.66±0.012a 181±6.96a(10)
P value 0.001 0.001 0.001 0.001 0.001 Means in each column followed by the same letter are not significantly different in one way ANOVA, using LSD-tests at P=0.05. The figures in parentheses indicate the number of replicates. Fecundity was examined for the first 12 days of adult life span。
Fig. 1. Total immature psyllid mortality (egg to adult) and missing (not feeding) first instar nymphs (%) on three pistachio species in controlled conditions. 150 first instar psyllid nymphs were used at establishment. Fig. 2. Mortality of psyllid nymphal stages when feeding on three pistachio species in controlled conditions.
Fig. 3. Influence of host plant on the intrinsic rate of natural increase (rm) of the common pistachio psylla in controlled conditions. Psyllid fecundity examined during the first 12 days of adult life span. Bars show standard errors (n=10).
In this regard, Butt et al. [6] found most of the pear
psyllid, Cacopsylla pyricola (Foerster) nymphs on resistant pear genotypes left the host leaves during the first 24 h of their experiment. In addition, the chemical composition of plants has previously been demonstrated to affect their susceptibility to insect pests [8, 6 & 7].
The developmental period of immature psyllids on P. atlantica and P. khinjuk was significantly longer than on P. vera (Table 1). The greatest nymphal mortality of psyllids occurred among first instars on all 3 pistachio germplasms, and it was followed by mortality among 2nd instars (Fig. 2). Although some of this initial mortality may be attributed to the shock of being moved, there is evidence that total mortality of psyllid nymphs was much lower on P. vera than on the other two pistachio species (Fig. 1). Adult psyllids that developed on P. vera were also significantly larger than those on the other two pistachio species (Table, 1).
0
20
40
60
80
100
P. atlantica P. khinjuk P. vera
Host species
% Im
mat
ure
mor
talit
y &
m
issi
ng
Mortality Missing
0
20
40
60
80
100
P. atlantica P. khinjuk P. vera
Host species
Mor
talit
y (%
) 1ST STAGE
2ND STAGE
3RD STAGE
4TH STAGE
5TH STAGE
0.088 0.093
0.163
0
0.04
0.08
0.12
0.16
0.2
0.24
P. atlantica P. khinjuk P. vera
Host species
r m
Proccedings: IUFRO Kanazawa 2003 "Forest Insect Population Dynamics and Host Influences” - 60 -
Pistachio psylla ovipositional response showed that all pistachio plants were attractive but differed significantly among species. Two levels of egg-laying during the 12 days of oviposition could be distinguished (Table 1). Adult psyllids laid the smallest egg masses (67 & 69 eggs) on P. khinjuk and P. atlantica respectively. In comparison 181 eggs were laid on P. vera. The intrinsic rate of natural increase (rm) was used as the measure of psyllid performance on each pistachio species. Among tested plant species, rm values of psyllids on P. vera (0.163) was significantly larger than for psyllid on P. atlantica (0.088) and P. khinjuk (0.093) (Fig. 3). In this regard, Ruggle and Gutierrez [18] conducted life table experiments for the spotted alfalfa aphid, Therioaphis trifolii f. maculate (Buckton) on resistant and susceptible cultivars at different temperatures, and the maculate statistic was used to assess the effects of host plant resistance of different cultivars because results were comparable.
The present study showed that antibiosis resistance and lower preference for oviposition occurred together in wild pistachio species. But, Berrada et al. [3] demonstrated that antibiosis resistance and nonpreference for oviposition did not operate similarly in pear species.
Overall, The extended development time, higher rate of mortality for immature instars and smaller size of adults as well as lower fecundity potential of psyllids on wild pistachio species all indicate the lower suitability of these plants as hosts for the common pistachio psylla. These results are in agreement with my observation in natural conditions, where the density of psyllid eggs and young instar nymphs on P. atlantica and P. khinjuk is relatively high in early spring, but the population usually quickly decreased over two weeks time. Usually the density of psyllids remained low thereafter on these plants. Although, biocontrol agents cause large effects on psyllid population in early spring, plant nutritional qualities might be also responsible for psyllid mortality when feeding on wild pistachios. From the present study it might be concluded that both reduced preference for oviposition and antibiosis contributed to moderate resistance in two wild pistachios tested. Resistance to pear psylla is found mainly in wild Pyrus species, originating from Asia and Europe [20, 9, 10 & 2]. More research should be conducted to demonstrate the correlations between pistachio psylla population growth in the field and antibiosis and oviposition preference measured in laboratory studies. This study indicated that the cultivated pistachio, P. vera, with high fruit quality, was more favorable to the common pistachio psylla than two wild pistachio species with poor nut quality. Mehrnejad (unpublished) found that all high-quality cultivars of P. vera are susceptible, but there are some sources of resistance in cultivars with low nut quality. Therefore, broad examination of cultivated pistachio cultivars is needed to screen these plants for psylla resistance. Sources of resistance within this gene pool might be used more effectively in a breeding program than sources from wild pistachio species because of the similarity in fruit characteristics within P. vera.
Acknowledgements
The author thanks Dr. A. Liebhold for a critical reading of the manuscript and laboratory technicians R. Mirzaei, A. Radjabi and M.A. Hage-Abdollahi for assistance. This research was supported by the Pistachio Research Institute of Iran.
References [1] R. L. Bell, Additional East European Pyrus germplasm with resistance to pear psylla nymphal feeding, HortScience, Vol. 27, pP. 412-413, 1992. [2] R. L. Bell, L. C. Stuart, Resistance in Eastern European Pyrus germplasm to pear psylla nymphal feeding, HortScience, Vol. 25, pP. 789-791, 1990. [3] S. Berrada, T. X. Nguyen, J. Lemoine, J. Vanpoucke, D. Fournier, Thirteen pear species and cultivars evaluated for resistance to Cacopsylla pyri (Homoptera: Psyllidae), Environmental Entomology, Vol. 24, pP. 1604-1607, 1995. [4] L. C. Birch, The intrinsic rate of natural increase of an insect population, Journal of Animal Ecology, Vol. 17, pP. 15–26, 1948. [5] D. Burckhardt, P. Lauterer, The jumping plant-lice of Iran (Homoptera: Psylloidea), Revue Suisse de Zoologie, Vol. 100, pP. 829–898, 1993. [6] B. A. Butt, L. C. Stuart, R. L. Bell, Feeding behaviour of pear psylla (Homoptera: Psyllidae) nymphs on susceptible and resistant Pyrus germplasm, Journal of Economic Entomology, Vol. 81, pP. 1394-1397, 1988. [7] B. A. Butt, L. C. Stuart, R. L. Bell, Feeding, longevity, and development of pear psylla (Homoptera: Psyllidae) nymphs on resistant and susceptible pear genotypes, Journal of Economic Entomology, Vol. 82, pP. 458-461, 1989. [8] J. A. Hardman, P. R. Ellies, Host plant factors influencing the susceptibility of cruciferous crops to cabbage root fly attack, Entomologia Experimentalis et Applicata, Vol. 24, pP. 193-197, 1978. [9] M. K. Harris, Host resistance to the pear psylla in a Pyrus communis × P. ussuriensis hybrid, Environmental Entomology, Vol. 2, pP. 883-887, 1973. [10] M. K. Harris, Greenhouse testing of pears with Pyrus ussuriensis for resistance to Psylla pyricola, Journal of Economic Entomology, Vol. 68, pP. 641-644, 1975. [11] M. A. Jervis, M. J. W. Copland, The life cycle, In: M. Jervis, N. Kidd (eds), Insect Natural Enemies, Chapman and Hall, 1996 [12] N. Kaska, S. Caglar, S. Kafkas, Genetic diversity and germplasm conservation of Pistacia species in Turkey, In: S. Padulosi, T. Caruso, E. Barone (Edits.), Taxonomy, distribution, conservation and uses of Pistacia genetic resources, International Plant Genetic Resources Institute (IPGRI), Rome, 1995. [13] M. R. Mehrnejad, Evaluation of the parasitoid Psyllaephagus Pistaciae (Hymenoptera: Encyrtidae) as a biocontrol agent of the common pistachio psylla Agonoscena pistaciae (Hemiptera: Psylloidea), Ph.D. thesis, the University of London, 1998. [14] M. R. Mehrnejad, The current status of pistachio pests in Iran, Cahiers Options Méditerranéennes, Vol. 56, pP. 315-322, 2001. [15] M. R. Mehrnejad, Bionomics of the common pistachio psylla, Agonoscena pistaciae, in Iran, Acta Horticulturae, Vol. 591, pP. 535-539, 2002. [16] M. R. Mehrnejad, Pistachio Psylla and Other Major Psyllids of Iran, Publication of the Agricultural Research and Education Organization, Tehran, 2003.
Proccedings: IUFRO Kanazawa 2003 "Forest Insect Population Dynamics and Host Influences” - 61 -
[17] S. Padulosi, T. Caruso, E. Barone, Taxonomy, distribution, conservation and uses of Pistacia genetic resources, International Plant Genetic Resources Institute (IPGRI), Rome, 1995. [18] P. Ruggle, A. P. Gutierrez, Use of life tables to assess host plant resistance in alfalfa to Therioaphis trifolii f. maculate (Homoptera: Aphididae): Hypothesis for maintenance of resistance, Environmental Entomology, Vol. 24, pP. 313-325, 1995. [19] A. Sheibani, Distribution, use and conservation of pistachio in Iran, In: S. Padulosi, T. Caruso E. Barone (Edits.), Taxonomy, distribution, conservation and uses of Pistacia genetic resources, International Plant Genetic Resources Institute (IPGRI), Rome, 1995. [20] P. H. Westigard, M. N. Westwood, P. B. Lombard, Host preference and resistance of Pyrus species to the pear psylla, Psylla pyricola Foerster, Journal of American Society of Horticultural Sciences, Vol. 95, pP. 34–36, 1970. [21] J. Wünn, A. klöti, P. K. Burckhardt, G. C. Ghosh Biswas, K. Launis, V. A. Iglesia, I. Potrykus, Transgenic indica rice breeding from Bacillus thuringiensis provides effective insect pest control. Bio Technology, Vol. 14, pP. 171-176, 1996. [22] G. Y. Ye, Q. Y. Shu, H. R Cui, C. Hu, M. W. Gao, Y. W. Xia, X. Cheng, I. Altosaar, A leaf-section bioassay for evaluating rice stems borer resistance in transgenic rice containing a synthetic cry1Ab gene from Bacillus thuringiensis Berliner, Bulletin of Entomological Research, Vol. 90, pP. 179-182, 2000. [23] D. Zohary, The genus Pistacia L. In: S. Padulosi, T. Caruso E. Barone, Taxonomy, distribution, conservation and uses of Pistacia genetic resources, International Plant Genetic Resources Institute (IPGRI), Rome, 1995.
Proccedings: IUFRO Kanazawa 2003 "Forest Insect Population Dynamics and Host Influences” - 62 -
Finding the Area of Origin of the Horse-Chestnut Leaf Miner: a Challenge
M. KENIS, S. GIRARDOZ CABI Bioscience Switzerland Centre, 2800 Delémont, SWITZERLAND
N. AVTZIS Technological Educational Institution of Kavala, 66 100 Drama, GREECE
J. FREISE, W. HEITLAND Institute of Animal Ecology, TU Munich, 85354 Freising, GERMANY
G. GRABENWEGER University of Natural Resources and Applied Life Sciences, Institute of Plant Protection, 1190 Vienna, AUSTRIA
F. LAKATOS University of Sopron Hungary H-9400 Sopron
C. LOPEZ VAAMONDE Institute of Zoology, London, NW1 4RY,United Kingdom
A. SVATOS Institute of Organic Chemistry and Biochemistry, CZ-166 10, Prague 6, Czech Republic
R. TOMOV University of Forestry, 1756 Sofia, Bulgaria
Abstract - The horse-chestnut leaf miner, Cameraria ohridella, is a moth of unknown origin that was first discovered in Macedonia in 1984. Twenty years later, it is found in most European cities, defoliating nearly all horse-chestnut trees. A multidisciplinary program has been set up to find its area of origin. It includes studies of the parasitoid complex of C. ohridella in the Balkans and of other Cameraria spp. in other parts of the world; host tree screening tests; surveys in the Balkans, Asia and North America; and molecular studies on C. ohridella and congeneric species.
I. Introduction
When an invasive alien pest invades a new region, determining the area of origin of the pest is a key step in the development of control strategies, particularly with biological control. In most cases, the species is already known in other parts of the world. However, sometimes the pest is new to science. Then, finding its area of origin may become a real detective story. Among insects, one of the most famous cases is the cassava mealybug, Phenacoccus manihoti Matile-Ferrero, a pest that suddenly appeared in 1972 in Central AfricA. This species posed a serious threat for the subsistence of millions of people for whom cassava is the major food crop. After an intensive collaborative research project involving several national and international organisations, the area of origin of the cassava mealy bug was finally found in 1981, in Paraguay. A parasitoid was selected and introduced to Central Africa, which led to a successful biological control program [13].
A more recent example is the horse-chestnut leafminer, Cameraria ohridella Deschka and Dimic (Lep.: Gracillariidae). This insect was first found in Macedonia in
the early 1980’s [2]. Since then, it has spread over most of Europe, and its distribution now covers an area from England to Ukraine and from Sweden to Spain, Italy and Greece [11]. Its main host, the common horse-chestnut (Aesculus hippocastanum) is a major urban tree in most of Europe. In most regions where the pest occurs, horse-chestnut trees are severely defoliated, year after year. The trees are not killed, but the aesthetic damage is so severe that municipalities are already replacing this highly valuable tree by other species. The horse-chestnut is endemic to the Balkans where the few remaining natural stands are also attacked, causing concern for the survival of this rare tree species. Furthermore, the moth can also attack and develop on maple species (Acer pseudoplatanus and A. pseudoplatanoides) [5, 12] and, considering the pressure on the moth to find new suitable host plants after having totally defoliated horse-chestnut trees, it is likely that the damage sustained by maples will increase in the near future.
For the moment, control methods are limited to the aerial spraying of diflubenzuron, the injection of systemic insecticides, and the removal of dead leaves, in which the moth overwinters [11]. However, these methods are expensive and practically difficult to conduct over large areas. The moth is attacked by a range of native natural enemies, particularly parasitoids, but their impact is very limited, and there is no sign that parasitism rates are going to improve in the near future [4, 7]. The only method that may provide a long-term and sustainable solution to the problem is classical biological control, through the release of natural enemies from the region of origin of the moth. Unfortunately, this region of origin is not yet known. It was first thought that the moth came from the Balkans [2], the region where the moth was first found and from where the European
Proccedings: IUFRO Kanazawa 2003 "Forest Insect Population Dynamics and Host Influences” - 63 -
horse-chestnut originates. Although the Balkans option cannot be ruled out [8, 12], there are several arguments against it [15, 17]. Firstly, if the moth originated in Europe, why does it only spread now, and so rapidly? Secondly, the lepidopteran fauna in the Balkans is quite well known, and the moth had never been observed before causing outbreaks in the early 1980's. Furthermore, Cameraria is not a European genus. Most species occur in North America, and a few are known from East, South and Central Asia. Additionally, only very polyphagous parasitoids have been reared from C. ohridella in Europe, whereas, in their native range, most insects are attacked by some specific or oligophagous parasitoids. However, the best argument in favour of an extra-European origin is that, in the Balkans where C. ohridella was first observed twenty years ago outbreaks have continued unabated (however note that there are indications that outbreaks actually started 30 years ago in Macedonia -See [22]). Such long-lasting outbreaks characterize exotic rather than native species.
Other possible areas of origin include East and Central Asia, and North America, where other Cameraria species occur. These are also the regions where other trees of the genus Aesculus occur but, since C. ohridella can also attack and develop on maple species (Acer spp.) in Europe, it cannot be excluded that the host tree in the area of origin belongs to another genus, e.g. Acer or other trees not occurring in Europe [12].
A combination of various methods are presently used to locate the area of origin of C. ohridella. These include: (1) studies of the parasitoid complex of C. ohridella in the Balkans and of other Cameraria spp. in other parts of the world; (2) host tree screening tests; (3) surveys in the Balkans, Asia and North America; (4) molecular studies on C. ohridella and congeneric species. This paper briefly presents these methods. Investigations are still on-going, and most results have not yet been published. Therefore, only methods and preliminary results are presented herein.
II. Parasitoids of C. Ohridella in the Balkans and Cameraria spp. in North America and Asia
We are working on two hypotheses. Firstly, we assume
that if C. ohridella originates from natural horse-chestnut stands in the Balkans, it must have a larger parasitoid complex in this region, including specific parasitoids, than in the regions where it has been recently introduced. Our second assumption is that, if C. ohridella in the Balkans has a lower parasitism rate and a more restricted parasitoid complex than other Cameraria spp. in their native range, we can suspect that the Balkans are not the area of origin of the moth.
Until now, only very polyphagous parasitoids have been found on C. ohridella, and parasitism rates in Europe are unusually low for a leaf miner (e.g. [7, 12]). This has already been used as an argument against the European origin of C. ohridella (e.g. [17, ]Kenis, 1997, Pschorn-Walcher, 1997). However, until recently, observations on parasitism had been
made exclusively in newly invaded regions in Central Europe. Therefore, it was important to survey the Balkans and the regions where the horse chestnut is endemic. Extensive collections were made in Greece, Macedonia and BulgariA. The first results show that the same polyphagous parasitoids occur in the Balkans and in Central Europe. No specific or oligophagous parasitoid has been found in natural stands in the Balkans (G. Grabenweger, R. Tomov, N. Avtzis, unpublished). The main difference between the Balkans and the rest of Europe is the higher prevalence of Pediobius saulius, a eulophid pupal parasitoid known from many other gracillariid moths. Thanks to P. saulius, parasitism rates are usually higher in the Balkans (typically 5-30%, [4]; G. Grabenweger, R. Tomov, N. Avtzis, unpublished) than in Central Europe, but they remain very low for a leaf miner [10], suggesting that Europe is probably not the area of origin of the moth.
The literature on parasitism of other Cameraria spp. is limited to a few studies on American species, in particular the pecan leaf miner Cameraria caryaefoliella (Clemens) [14] and the oak leaf miners Cameraria hamadryadella (Clemens) and another Cameraria species [1, 3]. These studies suggest higher parasitism rates than in Europe [1, 3] and parasitoid species that appear less polyphagous than those attacking C. ohridella [14]. Collections are presently made of other Cameraria spp. in China and Japan. Preliminary results suggest parasitism rates up to 80% (M. Kenis, unpublished).
III. Host Tree Screening Tests C. ohridella is presently screened on possible host trees. Both no-choice tests in field cages and open-field tests are carried out. Oviposition rates and development successes are observed. Tests naturally started with species of the genus Aesculus [5, 6]. Eleven of the 15-18 world Aesculus species have been screened, in addition to many hybrids and varieties. Although, in no-choice tests, oviposition occurred on all species, C. ohridella could develop on a few species only. The European A. hippocastanum and the Japanese A. turbinata were the most suitable trees. Some successful development was observed on some North American species, A. octandra, A. pavia, A. glabra and A. sylvatica, although, on these trees, few larvae successfully developed to the adult stage. On other North American species (A. californica, A. parviflora) and Asian species (A. indica, A. chinensis, A. assamica), the moth could not develop [5, 6]. Since C. ohridella is also found occasionally on maple (Acer pseudoplatanus and Acer platanoides), screening tests are being conducted on Acer species from various origins. Results are not yet available.
IV. Surveys Surveys are carried out in potential regions of origin using
two methods. Firstly, trees are inspected visually for mines
Proccedings: IUFRO Kanazawa 2003 "Forest Insect Population Dynamics and Host Influences” - 64 -
of Cameraria spp. Larvae and adults are compared to C. ohridella. Secondly, since an efficient and highly specific pheromone of C. ohridella is available [16], pheromone traps are placed in various regions of the world to locate low populations of the moth. Surveys have already been made in the Balkans, Asia, and North America.
In Greece and Bulgaria, all stands of A. hippocastanum are infested, at various levels. Several species of Acer have been inspected at the vicinity of horse chestnut stands, but only a few mines were found on A. pseudoplatanus, as it is occasionally observed in Central Europe. No mines were found on A. obtusatum, A. monospessulanum, A. campestre and A. platanoides. Pheromone traps were placed in various regions of Greece in Acer spp. stands far from A. hippocastanum stands, but no moth was caught. Surveys are continuing on more native Acer species and other tree genera.
In Asia, surveys were made horse-chestnut stands in China (Aesculus chinensis and A. wilsonii), Japan (A. turbinata) and Pakistan (A. indica). An undescribed Cameraria sp., different from C. ohridella has been found in Japan on A. turbinata. Other potential host trees were surveyed, in particular Acer spp., on which other Cameraria spp. were observed (M. Kenis, unpublished). These species were used for molecular studies (see below).
In North America, surveys were carried out less intensively, because the leaf miner fauna is supposed to be better known than in Asia. Indeed, another species, Cameraria aesculisella, occurs on Aesculus spp. in eastern North America [12]. Nevertheless, casual surveys have been made and pheromone traps have been placed in Aesculus spp. stand in various US States, without success.
V. Molecular Studies Molecular studies on Cameraria spp. have two different
objectives. Firstly, a phylogeographic study is carried out with C. ohridella in Europe, to assess the genetic variability of European populations and to evaluate if European populations come from a single introduction. RAPD-PCR and mtDNA sequencing are used. Preliminary results were presented in Kovács et al. [18], who showed very little genetic variability in European populations, suggesting a single introduction. However, these results were based on populations collected in plantations in Central Europe only. Similar tests are presently being carried out with populations from natural horse-chestnut stands in the Balkans.
Secondly, we are carrying out a phylogenetic study of the genus Cameraria. Both the nuclear gene 28S rDNA (D1-D3 expansion regions) and the mitochondrial COI are used to reconstruct a combined molecular phylogeny at species level. The aim is to rebuild the ancestral host use and patterns of host shifts of Cameraria to see how these have changed through evolutionary time. In a similar study, Lopez-Vaamonde et al. [19] studied the evolution of host plant use of Phyllonorycter, the genus most closely-related to Cameraria. The authors showed high levels of
phylogenetic conservatism that is, closely related Phyllonorycter species tend to feed on closely related host plant species. If Cameraria’s host plant use is also phylogenetically conserved, we would expect a molecular phylogeny where Cameraria species would cluster according to their host plant group. Thus, if A. hippocastanum is the original host plant of the latter moth species and not the result of a recent colonization event, we would expect to obtain a clade of Aesculus -feeding Cameraria spp. including Cameraria ohridella.
VI. Conclusion
Finding the area of origin of C. ohridella is a real challenge and is proving more difficult than expected. We cannot totally rule out that C. ohridella comes from the Balkans. However, if this is the case, the dramatic increase in population densities of a previously undetected species still needs to be explained. The persistent outbreaks on A. hippocastanum in the Balkans and the lack of specific natural enemies strongly suggest that A. hippocastanum is not its original host. A sudden host shift has been proposed, e.g. by Hellrigl [12] who suggests an Acer species as a possible host of origin but, until now, this host of origin still has to be found. The adoption of new host plants by herbivores is more common when either the herbivore is introduced in a new region, or native herbivores are in contact with new plant species (e.g. introduced crop species). Among examples in the microlepidoptera; the gracillariid moth Phyllonorycter messaniella (Zeller), attacking Fagaceae, Betulaceae and, occasionally, Rosaceae in Europe; increased its host range to many other families when it was introduced into New Zealand [23]. The Mexican tortricid Platynota sultana (Walsingham) adopted many new hosts when it expanded its range to California [20]. Also in California, the native gracillarid Marmara gulosa Guillén and Davis apparently expanded its host range from native willow to various introduced plants such as citrus, avocado, cotton and oleander [9].
There is an increasing amount of evidences that C. ohridella originates from another continent, from an Aesculus species or another host tree. Most of the worlds Aesculus species have been surveyed for C. ohridella, without success. Furthermore, the majority of them seem to be unsuitable for the development of C. ohridella, and C. ohridella is morphologically much closer to the Japanese Acer-feeding Cameraria niphonica Kumata than to any other species, including the Aesculus-feeding C. aesculisella [12]. Thus, it becomes more and more likely that the moth originates not only from another continent, but also from another host tree, e.g. Acer or another tree genus from the Sapindales that does not occur in Europe. In this case, looking for its area of origin may look like searching for a needle in a haystack. This challenge definitely warrants a multidisciplinary approach involving a combination of bio-ecological and molecular studies, as presented here, ideally with more sampling efforts and funding.
Proccedings: IUFRO Kanazawa 2003 "Forest Insect Population Dynamics and Host Influences” - 65 -
Acknowledgements
We thank many colleagues and students who helped us with the surveys and placement of pheromone traps in various regions of the world and with the collection of infested leaves in Europe. We also thank will Koning for his comments on the manuscript. This study is partly funded by the European Commission and the Swiss Federal Office for Education and Science, as part of the FP5 project CONTROCAM, QLK5-CT-2000-01684.
References [1] E.F. Connor, “Colonization, survival, and causes of mortality of Cameraria hamadryadella (Lepidoptera: Gracillariidae) on four species of host plants,” Ecological Entomology Vol. 16, pp. 315-322, 1991. [2] G. Deschka, N. Dimic, “Cameraria ohridella n. sp. aus Mazedonien, Jugoslawien (Lepidoptera, Lithocelletidae),” Acta Entomologica Jugoslavica Vol. 22, No. 1, pp. 11-23, 1986. [3] S.H. Faeth, “Invertebrate predation of leaf-miners at low densities,” Ecological Entomology Vol. 5, pp. 111-114, 1980. [4] J. Freise, W. Heitland, I. Tosevski, “Parasitism of the horse-chestnut leaf miner, Cameraria ohridella Deschka and Dimic (Lep., Gracillariidae), in Serbia and Macedonia,” Anzeiger für Schädlingskunde Vol. 75, pp. 152-157, 2002. [5] J.F. Freise, W. Heitland, A. Sturm, “Das physiologische Wirtspflanzenspektrum der Rosskastanien-Miniermotte, Cameraria ohridella Deschka & Dimic (Lepidoptera: Gracillariidae),” Nachrichtenblatt des Deutschen Pflanzenschutzdienstes Vol. 55, pp. 209-211, 2003. [6] J.F. Freise, W. Heitland, A. Sturm, “Das Wirtspflanzenspektrum der Roßkastanien-Miniermotte, Cameraria ohridella Deschka & Dimic (Lepidoptera: Gracillariidae), einem Schädling der Roßkastanie, Aesculus hippocastanum,” Mitteilungen der Deutschen Gesellschaft fur Allgemeine und Angewandte-Entomologie. In press, 2004 [7] G. Grabenweger, “Parasitism of different larval stages of Cameraria ohridella,” Biocontrol Vol. 48, pp. 671-684, 2003. [8] G. Grabenweger, R. Grill, “On the place of origin of Cameraria ohridella Deschka & Dimic (Lepidoptera: Gracillariidae),” Beiträge zur Entomofaunistik Vol. 1, pp. 9-17, 2000. [9] M. Guillén, D.R. Davis, J.M. Heraty, “Systematics and biology of a new, polyphagous species of Marmara (Lepidoptera: Gracillariidae) infesting grapefruit in the Southwestern United States,” Proceedings of the Entomological Society of Washington Vol. 103, 636-654, 2001. [10] B.A. Hawkins, Pattern and process in Host-Parasitoid Interactions. Cambridge University Press, 1994. [11] W. Heitland, J.-P. Kopelke, L. Freise, “Die Roßkastanien-Miniermotte - 19 Jahre Forschung und noch keine Lösung in Sicht?” Natur und Museum Vol. 133, pp. 221-231, 2003. [12] K. Hellrigl, “Neue Erkenntnisse und Untersuchungen über die Rosskastanien-Miniermotte Cameraria ohridella Deschka & Dimic, 1986 (Lepidoptera, Gracillariidae),” Gredleriana Vol. 1, pp. 9-81, 2001. [13] H.R. Herren, P. Neueunschwander, “Biological control of cassava pests in Africa,” Annual Review of Entomology Vol. 36, pp.257-283, 1991. [14] R.H. Heyerdahl, J.D. Dutcher, “Hymenopterous parasitoids of Pecan leafminers,” Journal of Entomological Science Vol. 20, pp.
411-421, 1985. [15] C. Holzschuh, “Woher kommt die Roßkastanienminiermotte wirklich?” Forstschutz Aktuell Vol. 21, pp. 11-12, 1997. [16] B. Kalinova, A. Svatos, J. Kindl, O. Hovorka, L. Hrdy, J. Kuldova, M. Hoskovec, “Sex pheromone of horse-chestnut leafminer Cameraria ohridella and its use in a pheromone-based monitoring system,” Journal of Chemical Ecology Vol. 29, pp. 387-404, 2003. [17] M. Kenis, “Möglichkeiten einer biologischen Kontrolle von Cameraria ohridella mit eingeführten natürlichen Feinden,” Forstschutz Aktuell Vol. 21, pp. 27-29, 1997. [18] Z. Kovács, C. Stauffer, F. Lakatos, “Genetic study on the spreading of Cameraria ohridella (Deschka et Dimic 1986, Lep. Lithocolletidae) in Europe,” Növényvédelem Vol. 36, pp. 288-290, 2000 (in Hungarian). [19] C. Lopez-Vaamonde, J.M. Cook, H.C.J. Godfray, “Evolutionary dynamics of host plant utilisation in a genus of leaf-mining moths,” Evolution Vol. 57, pp. 1804-1821, 2003. [20] J.A. Powell, “Expanding geographical and ecological range of Platynota sultana in California (Lepidoptera: Tortricidae),” Pan-Pacific Entomologist Vol. 59, pp. 233-239, 1983. [21] H. Pschorn-Walcher, “Freiland-Biologie der eingeschleppten Roßkastanien-Miniermotte Cameraria ohridella Deschka and Dimic (Lep., Gracillariidae) im Wienerwald,” Linzer biologische Beiträge Vol. 26, pp. 633-642. [22] D. Simova-Tosic, S. Filov, "Contribution to the horsechestnut miner." Zastita Bilja Vol. 36, pp. 235-239, 1985 (in Serbo-Croat). [23] K.A.J. Wise, “Host plants of Lithocolletis messaniella,” New Zealand Journal of Science and Technology (A) Vol. 35, pp. 172-174, 1953.
Proccedings: IUFRO Kanazawa 2003 "Forest Insect Population Dynamics and Host Influences” - 66 -
The Genetic Background of Three Introduced Leaf Miner Moth Species - Parectopa robiniella Clemens 1863, Phyllonorycter robiniella Clemens 1859 and Cameraria ohridella Deschka et
Dimic 1986
Ferenc LAKATOS, Zoltán KOVÁCS Institute of Forest and Wood Protection, West-Hungarian University, Sopron, 9400, HUNGARY
Christian STAUFFER Department of Forest- & Soil Sciences, University of Natural Resources & Applied Life Sciences (BOKU),
Vienna, 1190, AUSTRIA Marc KENIS
CABI Bioscience Centre, Delemont, 2800, SWITZERLAND Rumen TOMOV
Department of Plant Protection, University of Forestry, Sofia, 1756, BULGARIA Donald R. DAVIS
National Museum of Natural History, Washington D.C., 20560-0127, USA
Abstract – North American and European populations of three invasive leaf miner moth species Parectopa robiniella Clemens 1863, Phyllonorycter robiniella Clemens 1859 and Cameraria ohridella Deschka et Dimic 1986 were investigated using mtDNA sequences and PCR-RAPD. Significant variation (0.7%) in the mtDNA was detected among Parectopa robiniella population, allowing differentiation of European from North-American populations In the other two species, Phyllonorycter robiniella and C. ohridella, no substitutions could be detected among the populations. The complementary PCR-RAPD analysis in C. ohridella revealed genetic similarities among populations that reflected historical patterns of spread. However, additional samples from more populations and additional markers would be desirable in the future in order to obtain a more stable dataset.
I. Introduction The introductions of insect species can have dramatic effects on the particular ecosystems. Accordingly, the field of invasion biology is well researched and new publications appear regularly. The alien arrival processes, the steps of the colonisation and the impacts of alien species have been analysed in detail [1]. But investigations on how the introduction process affects the genetic structure of the invasive species are seldom investigated [2]. It is possible to obtain precise data if the details of the introduction (single or multiple introduction), and how the settlement took place (e.g. founder effect) are known. Among forest-dwelling insects, data can be found on the introduction process of the pine shoot beetle (Tomicus piniperda L.) [3] and gypsy moth (Lymantria dispar L.) [4] in North-America. The goal of this investigation was to analyse the genetic structure of three invasive leaf miner moths in order to obtain knowledge on their introduction processes. The three species studied here are: A) Parectopa robiniella Clemens 1863, B)
Phyllonorycter robiniella Clemens 1859 and C) Cameraria ohridella Deschka et Dimic 1986 Taxonomic background All three, invasive, leaf-mining species are members of the Gracillariidae (superfamily Gracillarioidea), a large, cosmopolitan family of over 2000 recognised species, with probably an even greater number of species awaiting discovery. The genus Parectopa is a member of the largest, but far most diverse subfamily, Gracillariinae. The genera Phyllonorycter and Cameraria are the largest groups within the Lithocolletinae, a subfamily currently including approximately 10 genera. A. Parectopa robiniella The genus Parectopa has a holarctic distribution. Eleven species of the genus are known in North America (some not congeneric with P. robiniella) [5], but only P. ononidis (Zeller, 1839) and the introduced P. robiniella currently occur in Europe. Four species have been reported to have been present in Hungary as early as 1956 [6], but according to the latest report only the above two species are currently known to exist there [7]. Parectopa robiniella originated from North America. In Europe it was first found in 1970 in Italy. In Hungary the first specimen was found in 1983 [8]. Its host plant is the black locust (Robinia pseudoacacia L.) and it occurs also on variants of black locust. We found mines on the compound leaves (approximately 15 cm long) of the unifolia variant (R. p. f. monophylla) in the botanical garden of the West-Hungarian University during 2003. B. Phyllonorycter robiniella
Proccedings: IUFRO Kanazawa 2003 "Forest Insect Population Dynamics and Host Influences” - 67 -
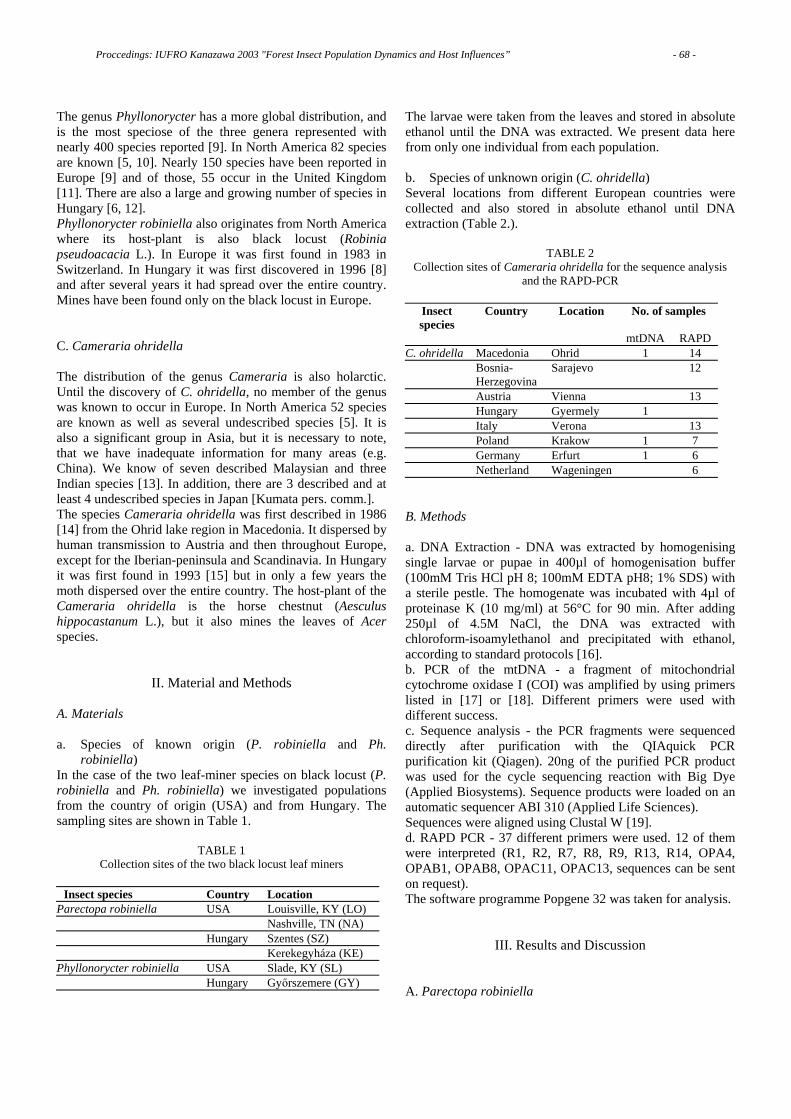
The genus Phyllonorycter has a more global distribution, and is the most speciose of the three genera represented with nearly 400 species reported [9]. In North America 82 species are known [5, 10]. Nearly 150 species have been reported in Europe [9] and of those, 55 occur in the United Kingdom [11]. There are also a large and growing number of species in Hungary [6, 12]. Phyllonorycter robiniella also originates from North America where its host-plant is also black locust (Robinia pseudoacacia L.). In Europe it was first found in 1983 in Switzerland. In Hungary it was first discovered in 1996 [8] and after several years it had spread over the entire country. Mines have been found only on the black locust in Europe. C. Cameraria ohridella The distribution of the genus Cameraria is also holarctic. Until the discovery of C. ohridella, no member of the genus was known to occur in Europe. In North America 52 species are known as well as several undescribed species [5]. It is also a significant group in Asia, but it is necessary to note, that we have inadequate information for many areas (e.g. China). We know of seven described Malaysian and three Indian species [13]. In addition, there are 3 described and at least 4 undescribed species in Japan [Kumata pers. comm.]. The species Cameraria ohridella was first described in 1986 [14] from the Ohrid lake region in Macedonia. It dispersed by human transmission to Austria and then throughout Europe, except for the Iberian-peninsula and Scandinavia. In Hungary it was first found in 1993 [15] but in only a few years the moth dispersed over the entire country. The host-plant of the Cameraria ohridella is the horse chestnut (Aesculus hippocastanum L.), but it also mines the leaves of Acer species.
II. Material and Methods A. Materials a. Species of known origin (P. robiniella and Ph.
robiniella) In the case of the two leaf-miner species on black locust (P. robiniella and Ph. robiniella) we investigated populations from the country of origin (USA) and from Hungary. The sampling sites are shown in Table 1.
TABLE 1 Collection sites of the two black locust leaf miners
Insect species Country Location
Parectopa robiniella USA Louisville, KY (LO) Nashville, TN (NA) Hungary Szentes (SZ) Kerekegyháza (KE) Phyllonorycter robiniella USA Slade, KY (SL) Hungary Győrszemere (GY)
The larvae were taken from the leaves and stored in absolute ethanol until the DNA was extracted. We present data here from only one individual from each population. b. Species of unknown origin (C. ohridella) Several locations from different European countries were collected and also stored in absolute ethanol until DNA extraction (Table 2.).
TABLE 2 Collection sites of Cameraria ohridella for the sequence analysis
and the RAPD-PCR
Insect species
Country Location No. of samples
mtDNA RAPDC. ohridella Macedonia Ohrid 1 14 Bosnia-
HerzegovinaSarajevo 12
Austria Vienna 13 Hungary Gyermely 1 Italy Verona 13 Poland Krakow 1 7 Germany Erfurt 1 6 Netherland Wageningen 6 B. Methods a. DNA Extraction - DNA was extracted by homogenising single larvae or pupae in 400µl of homogenisation buffer (100mM Tris HCl pH 8; 100mM EDTA pH8; 1% SDS) with a sterile pestle. The homogenate was incubated with 4µl of proteinase K (10 mg/ml) at 56°C for 90 min. After adding 250µl of 4.5M NaCl, the DNA was extracted with chloroform-isoamylethanol and precipitated with ethanol, according to standard protocols [16]. b. PCR of the mtDNA - a fragment of mitochondrial cytochrome oxidase I (COI) was amplified by using primers listed in [17] or [18]. Different primers were used with different success. c. Sequence analysis - the PCR fragments were sequenced directly after purification with the QIAquick PCR purification kit (Qiagen). 20ng of the purified PCR product was used for the cycle sequencing reaction with Big Dye (Applied Biosystems). Sequence products were loaded on an automatic sequencer ABI 310 (Applied Life Sciences). Sequences were aligned using Clustal W [19]. d. RAPD PCR - 37 different primers were used. 12 of them were interpreted (R1, R2, R7, R8, R9, R13, R14, OPA4, OPAB1, OPAB8, OPAC11, OPAC13, sequences can be sent on request). The software programme Popgene 32 was taken for analysis.
III. Results and Discussion A. Parectopa robiniella
Proccedings: IUFRO Kanazawa 2003 "Forest Insect Population Dynamics and Host Influences” - 68 -

A 552bp stretch of the mitochondrial COI gene was analysed and four haplotypes were detected (sequences can be sent on demand) (Table 3).
TABLE 3 Haplotypes of P. robiniella found in the Hungarian (HU) and the American (US) populations. Numbers indicate substitution site on
the COI gene.
32 161 341 506 HU_SZ A A C A HU_KE A G C A US_KY A A T A US_TN T A T G
We found distinct differences between the populations from Hungary and North America. American and Hungarian haplotypes showed four mutations and substitution site 341 could be a marker for defining the two populations. Each of the two countries revealed differences although locations were geographically close. This indicates that populations are quite polymorphic and the introduction was certainly by more than one haplotype. The genetic similarities (Kimura) among the populations are shown in the Table 4. Within Hungary 0.18% variation was found whereas within the US variation was 0.36%, indicating that more haplotypes might exist in America. Between the two countries a maximum of 0.72% variation was analysed.
TABLE 4 Similarity matrix (based on Kimura) of P. robiniella
HU_SZ HU_K
E US_K
Y US_TN
HU_SZ - 0.0018 0.0018 0.0054HU_KE - 0.0036 0.0072US_KY - 0.0036US_TN -
A Neighbour Joining tree was calculated taking Kimura 2-parameter Model (Figure 1.). The tree indicates that the Hungarian haplotypes are derived from the American populations. To determine the exact location of origin, further analysis of populations from North America is necessary.
Figure 1. The Neighbour Joining tree based on Kimura 2-distance of the mtCOI gene of P. robiniella populations. As outgroup Phyllonorycter robiniella was taken. (HunI=HU_SZ, HunII=HU_KE, USI=US_KE and USII=US_TN)
The species has significant genetic diversity both in its country of origin and in Hungary. This provides a good opportunity to conduct successful phylogeographical analysis (geographical pattern of genetic differences). What are the causes for such large genetic diversity? In North America it may be explained by the greater geographical distances and by the native characteristics of the species. But, what of the situation in Hungary? Were there multiple introductions? Because of the small distance between the two populations sampled (<100km), this is unlikely. It is possible that within Parectopa there may exist sibling species that are difficult to distinguish morphologically. B. Phyllonorycter robiniella A 536bp stretch of the mitochondrial COI gene was analysed and only one haplotype was detected (sequences can be sent on demand). The populations from Hungary and North-America can be considered genetically similar; however other more polymorphic markers like microsattelites should be developed to clarify historical invasion processes. Because of the low number of populations and individuals surveyed, further research needs to be conducted, taking into account recent studies on the phylogeny of the genus Phyllonorycter [10]. C. Cameraria ohridella a. mitochondrial COI gene A 173bp stretch of the mitochondrial COI gene was analysed (sequences can be sent on demand) and also here only one haplotype was detected. This supports the hypothesis, that either the original population is genetically depauperated or that only one haplotype was introduced into the Ohrid lake district. Although the number of populations examined was greater (4) than in the case of Ph. robiniella, the sequenced DNA section was much shorter. b. RAPD PCR The R14 primer had 4 clear bands and results of the statistical evaluation are shown in Table 5.
TABLE 5 Results of RAPD-PCR of C. ohridella analysing two different
similarity values
Population Nei's D Shannon's I No. of polymorphic
bands Ohrid 0.3436 0.4880 3 Sarajevo 0.3506 0.4948 3 Vienna 0.3083 0.4497 3 Verona 0.2093 0.3034 2 Krakow 0.1244 0.1727 1 Erfurt 0.2071 0.3024 2 Wageningen 0.2428 0.3393 2
HunI
HunII
USI
USII
Outgroup
0.02
Proccedings: IUFRO Kanazawa 2003 "Forest Insect Population Dynamics and Host Influences” - 69 -
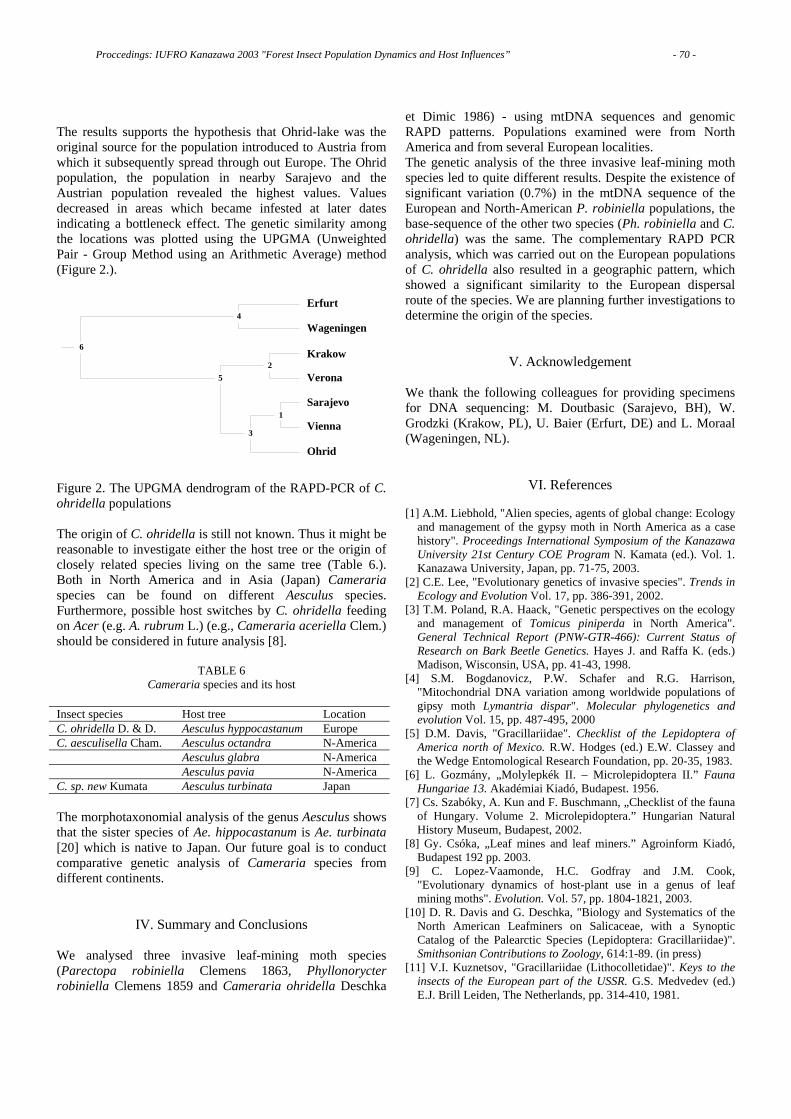
The results supports the hypothesis that Ohrid-lake was the original source for the population introduced to Austria from which it subsequently spread through out Europe. The Ohrid population, the population in nearby Sarajevo and the Austrian population revealed the highest values. Values decreased in areas which became infested at later dates indicating a bottleneck effect. The genetic similarity among the locations was plotted using the UPGMA (Unweighted Pair - Group Method using an Arithmetic Average) method (Figure 2.).
Erfurt
Wageningen
Krakow
Verona
Sarajevo
Vienna
Ohrid
4
6
25
1
3
Figure 2. The UPGMA dendrogram of the RAPD-PCR of C. ohridella populations The origin of C. ohridella is still not known. Thus it might be reasonable to investigate either the host tree or the origin of closely related species living on the same tree (Table 6.). Both in North America and in Asia (Japan) Cameraria species can be found on different Aesculus species. Furthermore, possible host switches by C. ohridella feeding on Acer (e.g. A. rubrum L.) (e.g., Cameraria aceriella Clem.) should be considered in future analysis [8].
TABLE 6 Cameraria species and its host
Insect species Host tree Location C. ohridella D. & D. Aesculus hyppocastanum Europe C. aesculisella Cham. Aesculus octandra N-America Aesculus glabra N-America Aesculus pavia N-America C. sp. new Kumata Aesculus turbinata Japan The morphotaxonomial analysis of the genus Aesculus shows that the sister species of Ae. hippocastanum is Ae. turbinata [20] which is native to Japan. Our future goal is to conduct comparative genetic analysis of Cameraria species from different continents.
IV. Summary and Conclusions We analysed three invasive leaf-mining moth species (Parectopa robiniella Clemens 1863, Phyllonorycter robiniella Clemens 1859 and Cameraria ohridella Deschka
et Dimic 1986) - using mtDNA sequences and genomic RAPD patterns. Populations examined were from North America and from several European localities. The genetic analysis of the three invasive leaf-mining moth species led to quite different results. Despite the existence of significant variation (0.7%) in the mtDNA sequence of the European and North-American P. robiniella populations, the base-sequence of the other two species (Ph. robiniella and C. ohridella) was the same. The complementary RAPD PCR analysis, which was carried out on the European populations of C. ohridella also resulted in a geographic pattern, which showed a significant similarity to the European dispersal route of the species. We are planning further investigations to determine the origin of the species.
V. Acknowledgement We thank the following colleagues for providing specimens for DNA sequencing: M. Doutbasic (Sarajevo, BH), W. Grodzki (Krakow, PL), U. Baier (Erfurt, DE) and L. Moraal (Wageningen, NL).
VI. References [1] A.M. Liebhold, "Alien species, agents of global change: Ecology
and management of the gypsy moth in North America as a case history". Proceedings International Symposium of the Kanazawa University 21st Century COE Program N. Kamata (ed.). Vol. 1. Kanazawa University, Japan, pp. 71-75, 2003.
[2] C.E. Lee, "Evolutionary genetics of invasive species". Trends in Ecology and Evolution Vol. 17, pp. 386-391, 2002.
[3] T.M. Poland, R.A. Haack, "Genetic perspectives on the ecology and management of Tomicus piniperda in North America". General Technical Report (PNW-GTR-466): Current Status of Research on Bark Beetle Genetics. Hayes J. and Raffa K. (eds.) Madison, Wisconsin, USA, pp. 41-43, 1998.
[4] S.M. Bogdanovicz, P.W. Schafer and R.G. Harrison, "Mitochondrial DNA variation among worldwide populations of gipsy moth Lymantria dispar". Molecular phylogenetics and evolution Vol. 15, pp. 487-495, 2000
[5] D.M. Davis, "Gracillariidae". Checklist of the Lepidoptera of America north of Mexico. R.W. Hodges (ed.) E.W. Classey and the Wedge Entomological Research Foundation, pp. 20-35, 1983.
[6] L. Gozmány, „Molylepkék II. – Microlepidoptera II.” Fauna Hungariae 13. Akadémiai Kiadó, Budapest. 1956.
[7] Cs. Szabóky, A. Kun and F. Buschmann, „Checklist of the fauna of Hungary. Volume 2. Microlepidoptera.” Hungarian Natural History Museum, Budapest, 2002.
[8] Gy. Csóka, „Leaf mines and leaf miners.” Agroinform Kiadó, Budapest 192 pp. 2003.
[9] C. Lopez-Vaamonde, H.C. Godfray and J.M. Cook, "Evolutionary dynamics of host-plant use in a genus of leaf mining moths". Evolution. Vol. 57, pp. 1804-1821, 2003.
[10] D. R. Davis and G. Deschka, "Biology and Systematics of the North American Leafminers on Salicaceae, with a Synoptic Catalog of the Palearctic Species (Lepidoptera: Gracillariidae)". Smithsonian Contributions to Zoology, 614:1-89. (in press)
[11] V.I. Kuznetsov, "Gracillariidae (Lithocolletidae)". Keys to the insects of the European part of the USSR. G.S. Medvedev (ed.) E.J. Brill Leiden, The Netherlands, pp. 314-410, 1981.
Proccedings: IUFRO Kanazawa 2003 "Forest Insect Population Dynamics and Host Influences” - 70 -
[12] Cs. Szabóky and Gy. Csóka, "A hárslevél sátorosmoly (Phyllonorycter issikii Kumata, 1963) előfordulása Magyarországon". Növényvédelem Vol. 39, pp. 23-24, 2003.
[13] T. Kumata, "A contribution to the knowledge of the Malaysian Lithocolletinae (Gracillariidae, Lepidoptera) with a revision of indian Cameraria associated with Leguminosae". Insecta Matsumurana, Vol. 48, pp. 85, 1993.
[14] G. Deschka and N. Dimic, "Cameraria ohridella n. sp. aus Mazedonien, Jugoslawien (Lepidoptera, Lithocelletidae)". Acta Ent. Jugosl. Vol. 22/1, pp. 11-23, 1986.
[15] Cs. Szabóky, "A Cameraria ohridella előfordulása Magyarországon". Növényvédelem, Vol. 11, pp. 529-530, 1994.
[16] J. Sambrook J, E.F. Fritsch and T. Maniatis "Molecular cloning: A laboratory manual", 2nd edn. Cold Spring Harbour Laboratory Press, New York, 1989.
[17] C. Simon, F. Frati, A. Beckenbach, B. Crespi, H. Liu and P. Flook, "Evolution, weighting and phylogenetic utility of
mitochondrial gene sequences and a compilation of conserved polymerase chain reaction primers". Annals of the Entomological Society of America, Vol. 87, pp. 651-701, 1994.
[18] D. Lunt, D.X. Zhang, J.M. Szymura and G.M. Hewitt, "The insect COI gene: Evolutionary patterns and conserved primers for phylogenetic studies". Insect Molecular Biology, Vol. 5, pp. 153-165, 1996.
[19] J.D. Thompson, D.G. Higgins and T.J. Gibbson, "Clustal W: Improving the sensitivity of progressive multiple sequence alignment through sequence weighting, position specific gap penalties & weight matrix choice". Nucleic Acids Research, Vol. 22, pp. 4673, 1994.
[20] F. Forest, J.N. Drouin, R. Charest, L. Brouillet and A. Bruneau, "A morphological phylogenetic analysis of Aesculus L. and Billia Peyr. (Sapindaceae)". Can. J. Botan., Vol. 79, pp. 154-169, 2001.
Proccedings: IUFRO Kanazawa 2003 "Forest Insect Population Dynamics and Host Influences” - 71 -
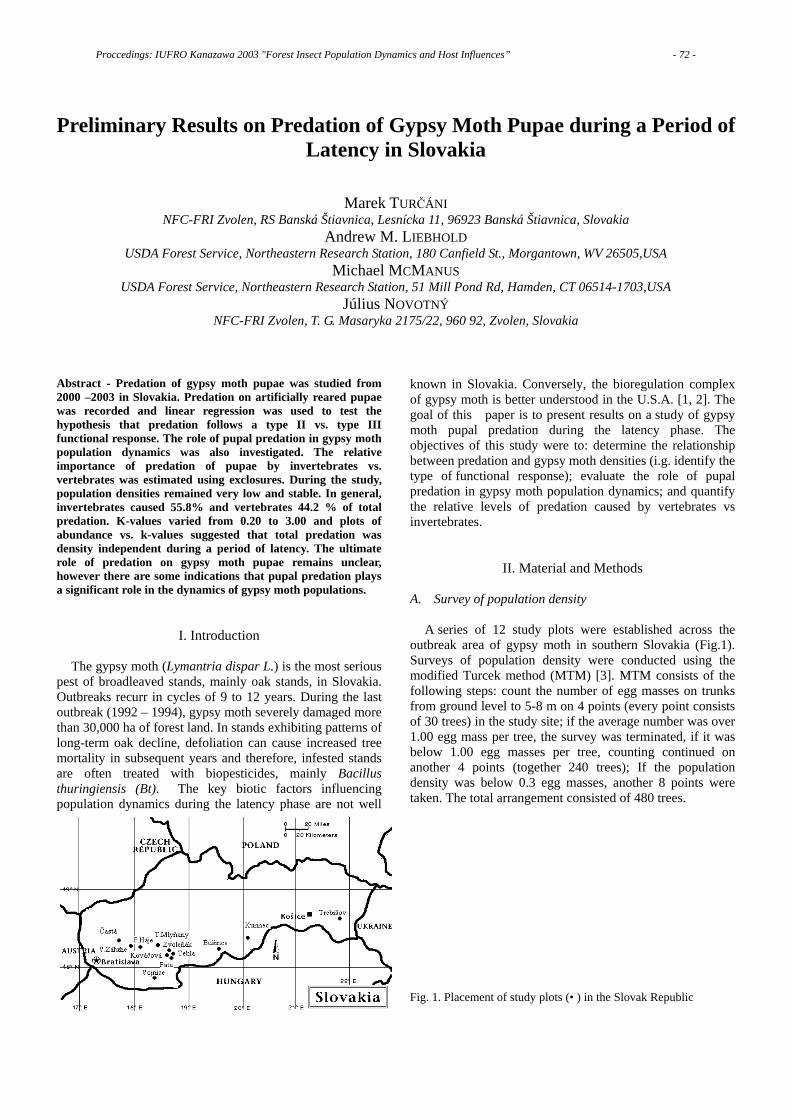
Preliminary Results on Predation of Gypsy Moth Pupae during a Period of Latency in Slovakia
Marek TURČÁNI NFC-FRI Zvolen, RS Banská Štiavnica, Lesnícka 11, 96923 Banská Štiavnica, Slovakia
Andrew M. LIEBHOLD USDA Forest Service, Northeastern Research Station, 180 Canfield St., Morgantown, WV 26505,USA
Michael MCMANUS USDA Forest Service, Northeastern Research Station, 51 Mill Pond Rd, Hamden, CT 06514-1703,USA
Július NOVOTNÝ NFC-FRI Zvolen, T. G. Masaryka 2175/22, 960 92, Zvolen, Slovakia
Abstract - Predation of gypsy moth pupae was studied from 2000 –2003 in Slovakia. Predation on artificially reared pupae was recorded and linear regression was used to test the hypothesis that predation follows a type II vs. type III functional response. The role of pupal predation in gypsy moth population dynamics was also investigated. The relative importance of predation of pupae by invertebrates vs. vertebrates was estimated using exclosures. During the study, population densities remained very low and stable. In general, invertebrates caused 55.8% and vertebrates 44.2 % of total predation. K-values varied from 0.20 to 3.00 and plots of abundance vs. k-values suggested that total predation was density independent during a period of latency. The ultimate role of predation on gypsy moth pupae remains unclear, however there are some indications that pupal predation plays a significant role in the dynamics of gypsy moth populations.
I. Introduction
The gypsy moth (Lymantria dispar L.) is the most serious pest of broadleaved stands, mainly oak stands, in Slovakia. Outbreaks recurr in cycles of 9 to 12 years. During the last outbreak (1992 – 1994), gypsy moth severely damaged more than 30,000 ha of forest land. In stands exhibiting patterns of long-term oak decline, defoliation can cause increased tree mortality in subsequent years and therefore, infested stands are often treated with biopesticides, mainly Bacillus thuringiensis (Bt). The key biotic factors influencing population dynamics during the latency phase are not well
known in Slovakia. Conversely, the bioregulation complex of gypsy moth is better understood in the U.S.A. [1, 2]. The goal of this paper is to present results on a study of gypsy moth pupal predation during the latency phase. The objectives of this study were to: determine the relationship between predation and gypsy moth densities (i.g. identify the type of functional response); evaluate the role of pupal predation in gypsy moth population dynamics; and quantify the relative levels of predation caused by vertebrates vs invertebrates.
II. Material and Methods A. Survey of population density
A series of 12 study plots were established across the outbreak area of gypsy moth in southern Slovakia (Fig.1). Surveys of population density were conducted using the modified Turcek method (MTM) [3]. MTM consists of the following steps: count the number of egg masses on trunks from ground level to 5-8 m on 4 points (every point consists of 30 trees) in the study site; if the average number was over 1.00 egg mass per tree, the survey was terminated, if it was below 1.00 egg masses per tree, counting continued on another 4 points (together 240 trees); If the population density was below 0.3 egg masses, another 8 points were taken. The total arrangement consisted of 480 trees.
Fig. 1. Placement of study plots (• ) in the Slovak Republic
Proccedings: IUFRO Kanazawa 2003 "Forest Insect Population Dynamics and Host Influences” - 72 -

B. Pupal predation
In July 2000-2003, artificially reared pupae were deployed at each site in each year. Predation was recorded by conducting inspections of pupae on three subsequent days following the day of their deployment; the condition of each pupa was recorded and we determined if the pupa was damaged by vertebrates or invertebrates.
The effect of density on predation levels was studied by comparing predation levels at different sites in different years. Predation was expressed as k-values at each site in each year. Density dependence was tested by regressing predation of pupae vs. egg mass density prior to deployment of pupae. Linear regression was used to test the hypothesis that predation follows a type II vs. type III functional response [4].
The impact of pupal predation on population growth was evaluated by plotting egg masses R (Nt+1/Nt) versus k-values from the same year during the entire study period.
The relative contribution of invertebrates vs. vertebrates as agents of predation on pupae was estimated using
exclosures [5]. These experiments were conducted at Kurinec and Kováčová in 2000; Tehla, Kováčová, Zvoleňák and P. Háje in 2001; Trebišov, Bušince, Zvoleňák and Častá in 2002; and Trebišov, Kurinec, Bušince, Zvoleňák, Vojnice, V. Zalužie and Častá in 2003. At each site, 150 laboratory reared pupae were attached to small pieces of burlap using honey bee wax, and then deployed on the ground in study plots. Exclosures were then placed around 75 of these pupae.
Exclosures, which consisted of a ~1.5 cm steel mesh (“hardware cloth”) cage were placed around each pupa. The damage of each pupa was recorded on three subsequent days following the day of deployment. We assumed that the exclosure excluded all vertebrate predators but did not impede predation by invertebrates. The relative contribution of invertebrate predators was thus estimated by the k-values computed from predation of pupae inside exclosures. K-values for predation by vertebrates was estimated as the difference between k-values from predation of pupae without exclosured and k-values from predation of pupae inside exclosures [5].
Fig. 2. Abundance of gypsy moth on 12 study plots expressed by average number of egg masses per tree.
Proccedings: IUFRO Kanazawa 2003 "Forest Insect Population Dynamics and Host Influences” - 73 -
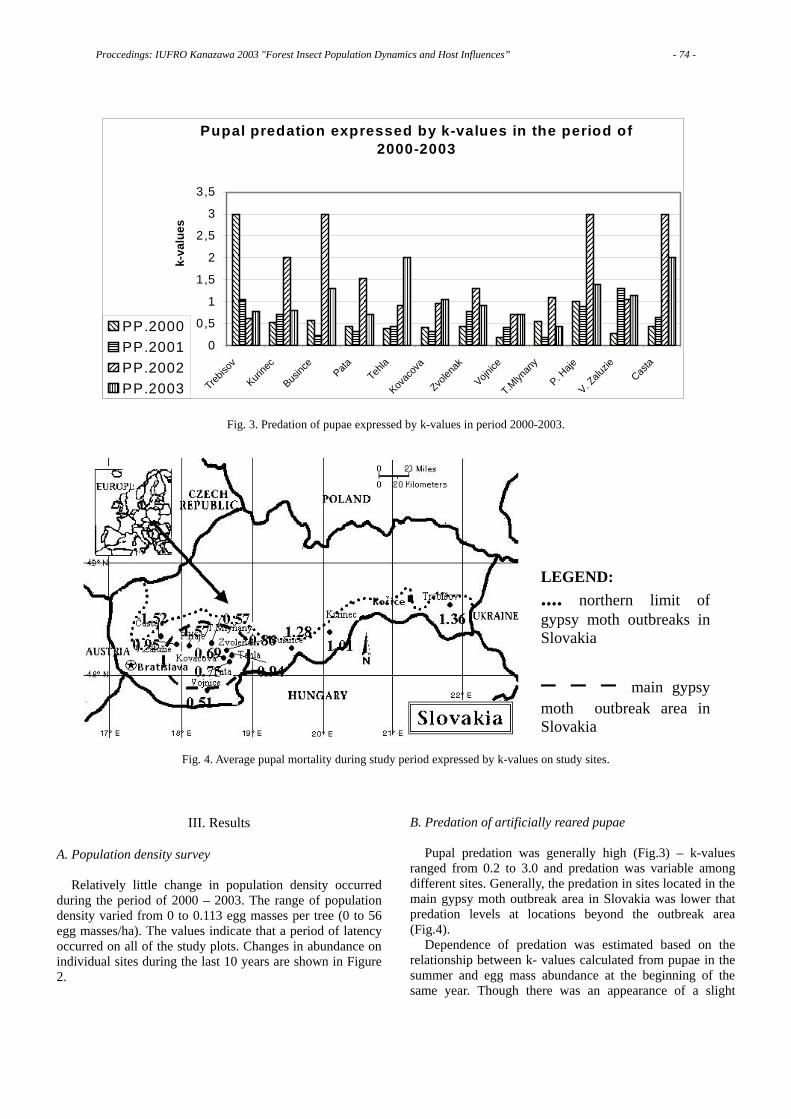
Fig. 3. Predation of pupae expressed by k-values in period 2000-2003.
Fig. 4. Average pupal mortality during study period expressed by k-values on study sites.
III. Results
A. Population density survey
Relatively little change in population density occurred during the period of 2000 – 2003. The range of population density varied from 0 to 0.113 egg masses per tree (0 to 56 egg masses/ha). The values indicate that a period of latency occurred on all of the study plots. Changes in abundance on individual sites during the last 10 years are shown in Figure 2.
B. Predation of artificially reared pupae Pupal predation was generally high (Fig.3) – k-values
ranged from 0.2 to 3.0 and predation was variable among different sites. Generally, the predation in sites located in the main gypsy moth outbreak area in Slovakia was lower that predation levels at locations beyond the outbreak area (Fig.4).
Dependence of predation was estimated based on the relationship between k- values calculated from pupae in the summer and egg mass abundance at the beginning of the same year. Though there was an appearance of a slight
Pupal predation expressed by k-values in the period of 2000-2003
0
0,5
1
1,5
2
2,5
3
3,5
Trebiso
v
Kurine
c
Businc
ePata
Tehla
Kovac
ova
Zvolen
ak
Vojnice
T.Mlyn
any
P. Haje
V. Zalu
zieCas
ta
k-va
lues
PP.2000PP.2001PP.2002PP.2003
LEGEND: .... northern limit ofgypsy moth outbreaks inSlovakia
– – – main gypsymoth outbreak area inSlovakia
Proccedings: IUFRO Kanazawa 2003 "Forest Insect Population Dynamics and Host Influences” - 74 -
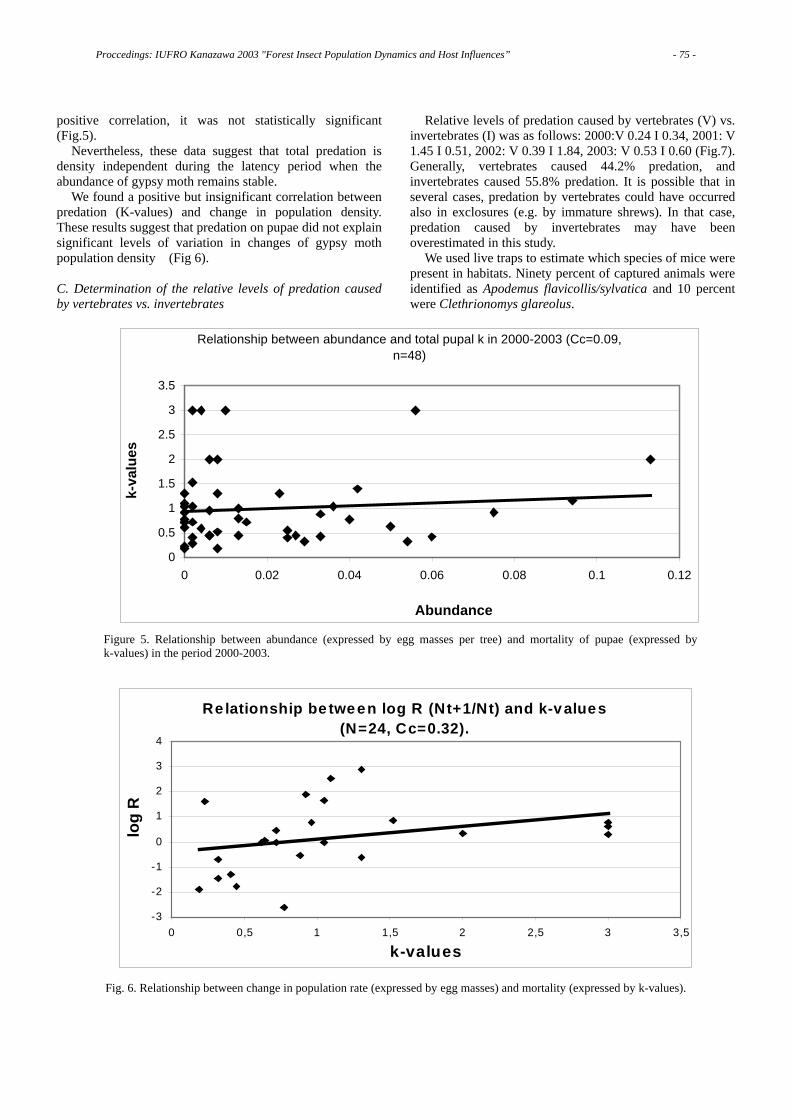
positive correlation, it was not statistically significant (Fig.5).
Nevertheless, these data suggest that total predation is density independent during the latency period when the abundance of gypsy moth remains stable.
We found a positive but insignificant correlation between predation (K-values) and change in population density. These results suggest that predation on pupae did not explain significant levels of variation in changes of gypsy moth population density (Fig 6). C. Determination of the relative levels of predation caused by vertebrates vs. invertebrates
Relative levels of predation caused by vertebrates (V) vs. invertebrates (I) was as follows: 2000:V 0.24 I 0.34, 2001: V 1.45 I 0.51, 2002: V 0.39 I 1.84, 2003: V 0.53 I 0.60 (Fig.7). Generally, vertebrates caused 44.2% predation, and invertebrates caused 55.8% predation. It is possible that in several cases, predation by vertebrates could have occurred also in exclosures (e.g. by immature shrews). In that case, predation caused by invertebrates may have been overestimated in this study.
We used live traps to estimate which species of mice were present in habitats. Ninety percent of captured animals were identified as Apodemus flavicollis/sylvatica and 10 percent were Clethrionomys glareolus.
Figure 5. Relationship between abundance (expressed by egg masses per tree) and mortality of pupae (expressed by k-values) in the period 2000-2003.
Fig. 6. Relationship between change in population rate (expressed by egg masses) and mortality (expressed by k-values).
Relationship be tween log R (Nt+1/Nt) and k-values (N=24, Cc=0.32).
-3
-2
-1
0
1
2
3
4
0 0,5 1 1,5 2 2,5 3 3,5
k-values
log
R
Relationship between abundance and total pupal k in 2000-2003 (Cc=0.09,n=48)
0
0.5
1
1.5
2
2.5
3
3.5
0 0.02 0.04 0.06 0.08 0.1 0.12
Abundance
k-va
lues
Proccedings: IUFRO Kanazawa 2003 "Forest Insect Population Dynamics and Host Influences” - 75 -

Fig. 7. Comparison of predation caused by vertebrates and invertebrates expressed by k-values during the study period.
IV. Discussion
Until now, little was known about pupal predation by vertebrates and invertebrates on gypsy moth populations in the region of Central Europe. In our study, the percentage of damage was high everywhere during the whole period; k-values only rarely did not exceed 0.5.
A similar study was conducted in Austria by Gschwanter et al [6]. Gypsy moth abundance during this study was estimated to be 0.01 egg masses per tree and the average pupal mortality reached about 80%. Predation at one plot was caused by mice 46.3%, Calosoma sycophanta 1.4%, other predators 4.1%; 40.4% of pupae disappeared. Predation on another plot was as follows: mice 36.4%, Calosoma sycophanta 3.7%, other predators 4.1% and 22.8% disappeared. It was determined that Apodemus flavicollis and Clethrionomys glareolus were the most important vertebrate predators in Austria; the same results were confirmed during our study in Slovakia.
Elkinton et al. [7] found that there was a significant relationship between the acorn crop and the abundance of small mammals in North America, however a relationship between gypsy moth abundance and small mammal abundance was not found. The reason for this disparity was that the majority of small mammals and birds are generalist feeders and gypsy moths are only a minor part of their diet. There was an abundance of acorns in Slovakia in 1999, however, since then we have not estimated the acorn crop on our study sites.
During our experiments we were not able to confirm the results of Campbell & Sloan [8], that pupal predation caused by vertebrates was much higher than that caused by invertebrates. Apparently the relative importance of predation is very different in North America than in Europe.
Turček [9] and Randík [10] listed the following species of birds as predators of gypsy moth pupae in Slovakia during outbreaks: Oriolus oriolus, Sitta europaea, Parus maior, Lanius collurio, Dryobates maior and Dryobates minor. We did not make direct observations of birds that predated gypsy moth pupae in our study.
Elkinton & Liebhold [2] consider Calosoma sycophanta as an important predator of larvae and pupae. Weseloh et all. [11] found that C. sycophanta consumed about 75% of pupae on the trunk, but a smaller percentage on leaves and thin branches. The abundance of C. sycophanta remained at low levels during the period of our study.
V. Conclusions
· Population densities were very low and relatively stable during the study period. · K-values varied from 0.20 to 3.00 and total predation was density independent. · The ultimate role of predation on gypsy moth pupae is not clear, however there are some indications that predation of pupae plays some role in gypsy moth populations in Slovakia. · These experiments indicate that invertebrates are more important predators of pupae (causing 55.8% predation) than vertebrates (causing 44.2% predation) in low level gypsy moth populations in Slovakia.
References [1] C. C. Doane, M. L. McManus (eds.), “The gypsy moth: Research toward integrated pest management,” USDA Forest
Comparison of predation caused by Vertebrata andEvertebrata
0
0.5
1
1.5
2
2000 2001 2002 2003
k- v
alue
s
InsectM am m al
Proccedings: IUFRO Kanazawa 2003 "Forest Insect Population Dynamics and Host Influences” - 76 -
Service Science Education Agricultural Technical Bulletin Vol. 1584, Washington DC, p. 757, 1981. [2] J. S. Elkinton, A. M. Liebhold, “Population dynamics of gypsy moth in North America, “ Annual Review of Entomology Vol. 35, pp. 571-596, 1990. [3] M. Turčáni, [Estimation of gypsy moth (Lymantria dispar L.) abundance changes in different parts of outbreak area in Slovakia during the period 1990 - 1997 by using modified Turcek method], Vedecké práce LVÚ Zvolen n. 42, Príroda, pp. 129-155, 1998. [4] C.S. Holling, “The functional response of predators to prey density and its role in mimicry and population regulation,” Mem Entomological Society of Canada Vol. 45, pp. 1-60, 1965. [5] S. T. Grushecky, A. M. Liebhold, R. Greer, R. L. Smith, “Does forest thinning affect predation on gypsy moth (Lepidoptera: Lymantriidae) larvae and pupae?” Environmental Entomology Vol. 27, pp. 268-276, 1998. [6] T. Gschwantner, G. Hoch, A. Schopf, “Mortality of Gypsy Moth Pupae Caused by Predators in Eastern Austria. In: U.S.Department of Agriculture. Interagency Research Forum on Gypsy Moth and other Invasive Species 1999 (S. L. C. Fosbroke, K. W. Gottschalk Eds.) s. 30, 1999. [7] J. S. Elkinton, W. M. Healy, J. P. Buonaccorsi, G. H. Boettner, A. M. Hazzard, H. R. Smith, A. M. Liebhold, Interactions among Gypsy Moths, White-footed Mice, and Acorns,” Ecology, Vol. 77, pp. 2332 – 2342,1996. [8] R. W. Campbell, R. J. Sloan, “Natural regulation of innocuous gypsy moth populations,” Environmental Entomology Vol. 6, pp. 315-322, 1977. [9] J. F. Turček, [About bird populations in deciduous forests during outbreak of gypsy moth] Zprávy Statních výzkumních ustavů lesnických ČSR. pp. 108 – 131, 1949. [10] A. Randík, [Contribution to conservation of birds in areas of occurence of gypsy moth (Lymantria dispar L.) in the southern Slovakia]. In:Práce a štúdie československej ochrany prírody, Bratislava, Vol. 1, n. 2, pp. 1-89, 1967. [11] R. Weseloh, R G. Bernon, L. Butler, R. Fuester, D. McCullough, F. Stehr, “Release of Calosoma sycophanta (Coleoptera: Carabidae) Near the Edge of Gypsy Moth (Lepidoptera: Lymantriidae) Distribution,” Environ. Entomol. Vol. 24, pp. 1713 – 1717, 1995.
Proccedings: IUFRO Kanazawa 2003 "Forest Insect Population Dynamics and Host Influences” - 77 -

Ecosystem Function and the Prediction of Tree Resistance to Defoliators
M.K. (Nod) KAY New Zealand Forest Research Institute, Rotorua, NEW ZEALAND
Stephen D. WRATTEN Division of Soil, Plant and Ecological Sciences, Lincoln Univ., Canterbury, NEW ZEALAND
Abstract - The utilization of natural tree resistance to insect pests is an acceptable strategy for the sustainable management of forests. However, the identification of predictors or patterns in the natural occurrence of resistance has thwarted the exploitation of this strategy. An explanation of ecosystem function is presented which argues that the lower trophic complexity associated with geographically constrained ecosystems results in an allocation of plant resources to bottom-up defenses against herbivores. Within the meta-population of a plant species, small isolated populations should be the most resistant to insect herbivores.
I. Introduction
In the current eco-political environment the options for integrated pest management are declining as the emphasis on sustainable forestry grows. Even the traditional stalwart of biological control of forest pests is increasingly difficult to apply, as risk-averse legislation endeavors to maintain an environmental status quo, supported in part, by the poorly understood concept of biodiversity. The role of biodiversity in ecosystem stability is the great ecological debate of the moment and understanding how ecosystems function will not only enhance conservation programs, but may also generate new paradigms for effective forest pest management.
II. Patterns of Resistance
Natural plant resistance to insect pests offers an acceptable method of pest management for sustainable forestry. However the identification of tree resistance is often fortuitous [1]. Numerous attempts have been made to identify patterns in the distribution of tree resistance to insects but these attempts were thwarted to a large degree by the complexity of ecosystems and the knowledge that the biotic interactions of any particular species vary throughout its range [2][3][4]. However, this geographic variability in itself offers an opportunity to identify patterns.
Plant attributes, such as geographic range, may be regarded as components of ‘apparency’, as defined by Feeny [5]. Plants which are more apparent in time and space than rare species, should be exposed to a greater range of pests and presumably they should be selected to counter or adapt to the losses incurred. This reasoning lead Levin to predict that plant resistance to invertebrate herbivores would best be sort in the center of a plant’s geographic range [6]. He argued that this
would approximate the evolutionary center of the plant and its co-evolved phytophage load and that the exposure to a larger array of herbivores would result in a greater suite of plant defenses. Southwood had shown that the numbers of invertebrate herbivores associated with trees increased with the geographic range of the tree species and Levin’s hypothesis received some support from an assessment of the palatability of a number of European tree species with differing phytophage loads [7][8]. However, the argument ignores the tritrophic element of ecosystem function and the accepted plurality that both top-down and bottom-up processes assist in the regulation of herbivores [9].
III. Recent Research
The gypsy moth, Lymantria dispar (Lepidoptera: Lymantriidae) is a major polyphagous defoliator, principally of Northern Hemisphere oak, Quercus, (Fagales: Fagaceae) forests. The eggs of this moth are continually intercepted at Australasian ports and over the last decade New Zealand has suffered the establishment of a number of invasive polyphagous invertebrate forest defoliators. These insects, principally Lymantriids, are unrepresented in the New Zealand indigenous invertebrate fauna and would be expected to devastate a ‘naive’ insular flora. However, they have failed to establish in the indigenous forest and a risk assessment, using gypsy moth bioassays, of key Australasian forest tree species found that New Zealand forest tree species, including the Nothofagus (Fagales: Nothofagaceae) taxa, were largely unpalatable, or resistant, to this defoliator [10].
Nothofagus species are the climax dominants, of the endemic forests of the Southern Hemisphere and typically occur as monospecific forests. The fragmentation of the Gondwanan Nothofagus community offers an evolutionary view of macroecological dimension. The islands of New Zealand have effectively been isolated for about 65 million years and in that time have themselves undergone fragmentation that, at times, reduced New Zealand to an archipelago of biotic refugia. The South American portion of Gondwana, that is latitudinally equivalent to New Zealand, is considerably larger than New Zealand and has remained in contact with the greater biodiversity of that continent.
An incursion of the painted apple moth, Teia anartoides, a polyphagous Australian Lymantriid, into New Zealand, allowed the reciprocal testing of the Nothofagus genus with a Southern Hemisphere defoliator [11]. The results, using T.
Proccedings: IUFRO Kanazawa 2003 "Forest Insect Population Dynamics and Host Influences” - 78 -

anartoides bioassays, showed the same relative palatabilities of New Zealand species as the bioassays undertaken with L. dispar, but that the Nothofagus species from South America were significantly more palatable than the New Zealand representatives of the genus and in some instances more palatable than the insect’s primary host, Acacia. These results would seem at odds with the accepted paradigm of the vulnerability of island ecosystems to invasion [12]. However, they could be explained through a differential of top-down and bottom-up processes within ecosystems of different spatial magnitude.
IV. An Explanation
The species-area relationship is possibly the strongest empirical generalization in community ecology [13] i.e., biodiversity can be expected to increase with habitat area. A corollary of the species-area effect is that food web complexity will also increase with area. However, habitat fragmentation studies and trophic level patterns in spatially distinct ecosystems, show that the trophic components of invertebrate communities do not change uniformly with area [14][15][16][17][18]. Rather, during habitat fragmentation, the higher trophic levels are lost prematurely or disproportionately, or cannot be maintained in small habitats. These higher trophic levels are the top-down regulators of lower levels and when the lower level comprises the herbivores, they are the key explanation for the maintenance of the ‘green world’ [19]. The contrasting argument that has fuelled the top-down/bottom-up debate, is that not all plant material is, directly or indirectly, available to herbivores. Herbivore populations may well be constrained by a ‘bottom-up’ inaccessibility of resources [20][21][22][23]. The existence of a top-down/bottom-up plurality has been generally accepted, but it is empirically difficult to apply. Although both processes have been individually demonstrated in particular insect/plant systems the empirical evaluation of the relative importance of both in one ecosystem remains rare or non-existent [24][25]. However, despite the paucity of data, the fact that top-down and bottom-up processes are likely to occur in all ecosystems, suggests that when robust top-down regulation of herbivore populations by natural enemies is reduced or absent over evolutionary time, plants should be selected to allocate resources to ‘bottom-up’ defense. If food web complexity equates with ecosystem stability (hotly debated [26][27][28][29][30][31]), then in spatially restricted habitats, which do not support complex food webs, herbivore populations must be relatively more regulated by bottom-up forces, to maintain a ‘green world’ stability.
V. The IRA hypothesis
The Island Resource Allocation (IRA) hypothesis presented
here, offers the thesis that for plant species that do not escape
herbivory by dispersal or precocious seeding etc, the susceptibility of a plant species to invertebrate herbivores is proportional to its geographic range. That is, geographically constrained plant populations will support lower biodiversity, with fewer trophic levels, and be less protected by the top-down regulation of herbivore populations. If top-down regulation of herbivores is weak, because of the lack of trophic complexity, then plants will be selected to allocate resources to a bottom-up defense.
Islands are constantly bombarded by herbivores, which
probably arrive without their associated natural enemies, or have founding populations too small to accommodate their associated natural enemies. To survive island plants must be selected for herbivore defense and the necessity of an innate defense must increase as island area decreases. The high rate of endemism on islands is proof of long-term stability. Presumably the stability of these insular systems is reached by some mechanism other than trophic complexity. How else could such ecosystems possibly persist under a constant threat of extinction from unregulated populations of immigrant herbivores?
VI. Summary and Conclusions
That plants from small geographic areas will be relatively resistant to invertebrate herbivores appears to be counter-intuitive because of the long-held view that islands are inherently invadible - through the availability of empty niches. This paradigm assumes that community simplicity negates a requirement for metabolically-costly defenses because of the low numbers of consumer species in the community. This assumption was implicit in the work of Levin in which he suggested that higher levels of plant defense would be expected in plant species with wide geographical ranges. The opposing view offered here is that plant resistance should be sort in smaller, isolated populations within the meta-population of a plant species. There is supporting evidence for both views and more research would not only benefit foresters but also the aid in the development of reliable ecological predictors.
References
[1] M.K. Kay, “Resistance of Douglas fir to P. suavis”. New Zealand Journal of Forestry Science, Vol. 13(1) pp. 46-52, 1983. [2] Y.N. Baranchikov, W.J. Mattson, , F.P.Hain, T.L Payne, (Eds), " Forest Insect Guilds: Patterns of Interaction with Host Trees " Proc. Joint IUFRO WP Symp., Abakan, Siberia, USSR, August 13-17, 1989. USDA Forest Service, General Technical Report NE-153, pp. 400, 1991. [3] W.J. Mattson, J.Lévieux, C. Bernard-Dagan, (Eds), " Mechanisms of Woody Plant Defenses Against Insects: Search for Pattern ". Proceedings IUFRO WP Symposium, Orléans, France, August 26-29, 1986. Springer, pp. 416, 1988. [4] W.J. Mattson, P. Niemela, M. Rousi (Eds), " Dynamics of Forest Herbivory: Quest for Pattern and Principle ". Proceedings
Proccedings: IUFRO Kanazawa 2003 "Forest Insect Population Dynamics and Host Influences” - 79 -

International Symposium IUFRO S7.01-02 and S7.01-03 Working Parties, Maui, Hawaï, February 2-6, 1994. USDA, Forest Service, Northern Forest Experiment Station, Gen. Tech. Rep. NC-183, 286 pp. 1996. [5] P.P. Feeny, “Plant apparency and chemical defence”. Recent Advances in Phytochemistry, Vol. 10, pp. 1-40, 1976. [6] D.A. Levin, “Pest pressure and recombination systems in plants”. American Naturalist Vol.109, pp. 437-451, 1975. [7] T. R. E. Southwood, “The number of species of insect associated with various trees”. Journal. Animal. Ecology, Vol. 30, pp. 1-8, 1961. [8] S.D. Wratten, P. Goddard, P.J Edwards, “British trees and insects: the role of palatability”. American Naturalist Vol. 118, pp. 916-919, 1981. [9] M. D. Hunter, P. W. Price, “Playing chutes and ladders: heterogenity and the relative roles of bottom-up and top-down forces in natural communities”. Ecology Vol.73(3), pp. 724-732, 1992. [10] M. Matsuki, M. Kay,. J. Serin, R. Floyd, J. K. Scott, “Potential risk of accidental introduction of Asian gypsy moth (Lymantria dispar) to Australasia: effects of climatic conditions and suitability of native plants”. Agricultural and Forest Entomology Vol. 3, pp. 305-320, 2001. [11] M. K. Kay, “Macroecology and the prediction of invasive invertebrate guilds”. – In: Goldson, S.L. and Suckling, D.M. (eds.), Defending the green oasis: New Zealand biosecurity and science. NZ Plant Protection Society Biosecurity Symposium, Rotorua, NZ. pp. 93-100, 2003. [12] M. Williamson, Island Populations. - Oxford University Press. 1981. [13] R. D Holt, J. H. Lawton, G. A. Polis, N. D. Martinez, “Trophic rank and the species-area relationship”. Ecology Vol.80(5), pp. 1495-1504, 1999. [14] T. W. Schoener, “Food webs from the small to the large”. Ecology Vol.70, pp. 1559-89, 1989. [15] A. Kreuss, T. Tscharntke, “Habitat fragmentation, species loss and biological control”. Science Vol. 264, pp. 1581-1584, 1994. [16] J. H. Lawton, “Community ecology in a changing world”. Excellence in Ecology Vol.11, 227pp. 2000. [17] A. Komonen, R. Penttilä, M. Lindgren, I. Hanski, “Forest fragmentation truncates a food chain based on an old-growth forest bracket fungus”. Oikos Vol.90, pp. 119-126, 2000. [18] K. Schoenly, R. A. Beaver, T. A. Heumier, “On the trophic relations of insects: a food-web approach”. American Naturalist Vol.137, pp. 597-638, 1991. [19] N. G. Hairston, F. E. Smith, L. B. Slobodkin, “Community structure, population control and competition”. American Naturalist Vol. 94, pp. 421 – 425, 1960. [20] P. P. Feeny, “Effect of oak leaf tannins on larval growth of the winter moth Operophtera brumata”. Journal of Insect Physiology Vol 14, pp. 805-817, 1968. [21] P. D. Coley, J. P. Bryant, F. S. Chapin, “Resource availability and plant antiherbivore defense”. Science Vol. 230, pp. 895-899, 1985. [22] T. C. R. White “The abundance of invertebrate herbivores in relation to the availability of nitrogen in stressed plants”. Oecologia Vol. 63, pp. 90-105, 1984. [23] S. D. Wratten, “Population regulation in insect herbivores: top-down or bottom-up”. New Zealand Journal of Ecology Vol 16, pp. 145-149, 1992. [24] H. C. Coppel, J. W. Mertins, Biological Insect Pest Suppression. Springer-Verlag, Berlin, 1977. [25] R. S. Fritz, E. L. Simms, Plant Resistance to Herbivores and Pathogens. - University Chicago Press, Chicago. 1992. [26] D. Tilman, “Biodiversity: population versus ecosystem stability”. Ecology Vol. 77, pp. 350-363, 1996. [27] D. Tilman, “The ecological consequences of changes in biodiversity: a search for general principles”. Ecology Vol. 80(5), pp.
1455-1474, 1999. [28] J. P. Grime, “Biodiversity and ecosystem function: the debate deepens”. Science Vol. 277, pp.1260-1261, 1997. [29] G. P. Closs, S. R. Balcombe, M. J. Shirley, “Generalist predators, interaction strength and food web stability”. Advances in Ecological Research Vol. 28, pp. 93-126, 1999. [30] D.A. Wardle, M.A. Huston, J.P. Grime, F. Berendse, E. Garnier, W.K. Lauenroth, H. Setälä, S.D. Wilson, “Biodiversity and ecosystem function: an issue in ecology”. Bulletin of the Ecological Society of America Vol. 81, pp. 235-239, 2000. [31] M. Loreau, S. Naeem, P. Inchausti, J. Bengtsson, J. P. Grime, A. Hector, D. U.Hooper, M. A. Huston, D. Raffaelli, B. Schmid, D. Tilman, D. A. Wardle, “Biodiversity and ecosystem functioning: current knowledge and future challenges”. Science Vol. 294, pp. 804-808, 2001.
Proccedings: IUFRO Kanazawa 2003 "Forest Insect Population Dynamics and Host Influences” - 80 -
Growth Responses and Mortality of Scots Pine (Pinus sylvestris L.) after a Pine Sawfly Outbreak
Päivi LYYTIKÄINEN-SAARENMAA
Department of Applied Biology, University of Helsinki, P.O. Box 27, FIN-00014 University of Helsinki, FINLAND Pekka NIEMELÄ
Faculty of Forestry, University of Joensuu, P.O. Box 111, FIN-80101 Joensuu, FINLAND Erkki ANNILA
Finnish Forest Research Institute, Vantaa Research Centre, P.O. Box 17, FIN-01301 Vantaa, FINLAND Abstract - The focus of this study has been to provide estimates of growth losses and tree mortality after an outbreak by the large pine sawfly Diprion pini (L.) and preliminary estimates of the economic value of losses. The study was carried out in SW Finland. Increment cores were sampled for radial growth measurements from trees subjected to slight, moderate and heavy defoliation. Tree mortality during the recovery period was estimated for three different hierarchy positions of trees; hold-overs, dominants and intermediates.
I. Introduction
The primary effects of diprionid sawflies feeding on Scots pine Pinus sylvestris (L.) are reductions in tree growth and individual tree mortality. Defoliation affects tree growth in different ways according to the timing, defoliation intensity, length of consumption period, and age of foliage. Reduced stand productivity negatively affects monetary values. Generally, there is a positive relationship between the amount of remaining needles and tree volume increment [1, 2]. Comprehensive studies on the increment losses by the large pine sawfly Diprion pini (L.) (Hymenoptera: Diprionidae) are remarkably few in Scandinavia, even if the amount of losses constitute one of the main questions in forest protection [3, 4, 5, 6]. In the Netherlands decreases in radial increment were 57−60% after severe needle damage [7]. According to [5], losses of more than 90% in radial growth can happen if defoliation extends at least two years. Heavy needle damage can in extreme cases result in missing annual rings. Defoliation by D. pini causes higher losses than consumption by early season feeders, e.g. the European pine sawfly Neodiprion sertifer (Geoffr.) [8, 9, 10, 6]. Defoliation early in the season seldom causes tree mortality, whereas the proportion of tree mortality is much higher after late season feeding, particularly if an outbreak continues at least two years. Tree mortality in a stand defoliated by D. pini has been recorded to be approximately 2−3% after a single-year outbreak [7]. However, severe defoliation for two consecutive years can promote mortality for up to 60−75% of trees in stands, depending tree size [5].
D. pini is a common forest pest in northern European coniferous forests, occasionally reaching outbreak levels. Outbreaks are eruptive, following several years of low population densities. Peak densities may typically continue
for 1−3 years in one region until the population crashes [10]. D. pini consumes Scots pine stands of all ages, but prefers mature stands during the early phase of an outbreak [11]. Until the 1990’s, outbreaks typically covered hundreds or thousands of hectares of pine-dominated forests in Finland [3, 10]. During the latest outbreak of D. pini in 1998-2001, approximately 500 000 hectares was defoliated, which is the most widespread insect outbreak ever recorded in Finland. The large scale of the outbreak area is common in Central but not northern Europe. D. pini is a late-season defoliator that feeds both on current and mature needles. This kind of feeding preference causes serious losses and makes D. pini a harmful forest pest and a tree-killer species [2].
Almost nothing is known about the total length of a recovery period after an outbreak by D. pini. Observations of the impact of defoliation on the rotation period of a stand have been published for some other forest pests, e.g. [12]. Consequences for forestry resulting from needle feeding by D. pini are still mostly unknown. The topics of interest of the present study are (i) to provide estimates of the reduced annual increment after defoliation by D. pini, (ii) to estimate tree mortality and (iii) to provide preliminary estimates of the economic impact of increment losses and tree mortality.
II. Materials and Methods
The study was carried out in SW Finland (Harjavalta 61o17’ N, 22o09’ E) in 1990-2002. The randomly selected mature trees were growing on a study site of 5.53 ha on dry sandy soil. Most of the Scots pines in the area were defoliated late in the season in 1989 by D. pini. The population crashed in 1990 after a single-year outbreak. Ten experimental groups consisted of three pines: the first pine tree had slight defoliation with approximately 10 % loss of needle biomass; the second tree had moderate defoliation with approximately 50 % loss of needle biomass; and the third tree had heavy defoliation with more than approximately 90 % loss of needle biomass. The distance between the trees was 2−5 m. The defoliation intensity was visually estimated in May 1990 from four different cardinal directions to an accuracy of 10 %. Increment cores were sampled for radial growth measurements in November 2000 in order to compare tree increment before and after defoliation. Only five trees in each defoliation category could be sampled due to earlier sampling
Proccedings: IUFRO Kanazawa 2003 "Forest Insect Population Dynamics and Host Influences” - 81 -

Fig. 1. Width of annual rings at breast height in Scots pines exposed to slight, moderate and heavy defoliation. Mean annual ring widths of years 1986-1989 were used for the baseline (100 %). Annual ring widths were compared to the mean annual ring width before the outbreak and the ratio expressed as a percentage (±s.e.) Asterisks indicate significant (ANOVA: P<0.001) differences between categories and arrows indicate the years of defoliation. In each defoliation category, n = 5. For defoliation categories, see text. procedures. The width of annual rings was measured from the period of 1986-2000 (Fig. 1). The growth losses after defoliation caused by D. pini (i.e., from 1990 onward) were estimated on the basis of the width of annual rings in the four-year period prior to the defoliation year (i.e., 1986-1989). Means of ring widths for each defoliation category in that period represented a ring width of 100%. The widths of annual rings, following the outbreak year, were then compared with those means. When making these preliminary estimates, it was assumed that the reduction in radial increment and the reduction in volume increment were of the same order of magnitude.
Stand characteristics were measured in 2002 using a circular sample plot survey method with a changing radius, including at least 20 pines (Table 1). In each of five circular plots the diameter at breast height and height of all trees were measured. Trees were classified into three hierarchy positions: hold-overs, dominants and intermediates. For further information on the study site, see [4, 6].
TABLE I Stand characteristics of the study site in Harjavalta. Standard deviations are shown in parenthesis. _______________________________________________________ Age (yr) 70.5 (6.9) Trees ha-1 1406 (727)
Mean diameter at breast height (cm) 15.81 (5.11) Mean height (m) 11.62 (2.67) Mean volume (m3ha-1) 167.26 (67.56) _______________________________________________________
Tree mortality on a study site was estimated using a line
plot survey method, where the width of each line was 10 m. Lines were situated horizontally across the site next to each other. The condition of trees was evaluated in 2002 and killed trees classified into three categories: hold-overs, dominants and intermediates. A similar classification was used in circular survey plots. Mean values for mortality calculations were adopted from those of circular survey plots. Tree mortality was nil in 1990 and most of the mortality had already happened by 1994 (P. Lyytikäinen-Saarenmaa, pers. observation).
Calculations of economic losses were based on the data of plot surveys and current timber prices of the province. Volume of the growing stock was calculated using the Smalian-Amgwerd formula (v = 0.4d2h; where v = volume, d = diameter at breast height, and h = tree height) [13]. Diameters for earlier years were calculated by subtracting the corresponding mean ring widths needed from the diameters measured in 2000. The economic values were calculated using four variables: mean volume (m3ha-1) of Scots pine in three hierarchy categories, average annual volume increment, the intensity of pine sawfly defoliation, and value of timber. The mean volume of Scots pine in the study area was 167.23 m3ha-1, the estimated annual volume increment 5.4 m3ha-1 [13] and the mean timber price €29/m3.
One-way ANOVA was used to test the homogeneity of annual rings between means of defoliation categories prior to defoliation and the effect of defoliation on the width of annual rings, as well as tree mortality, between different hierarchy positions [14]. These tests were followed by Tukey’s test for multiple comparisons.
Proccedings: IUFRO Kanazawa 2003 "Forest Insect Population Dynamics and Host Influences” - 82 -

III. Results
Prior to defoliation by D. pini, there were no statistically significant differences in annual ring widths between the defoliation categories in 1986 (F=1.22, df=2, P=N.S.), 1987 (F=0.08, df=2, P=N.S.), 1988 (F=0.10, df=2, P=N.S.) or 1989 (F=0.61, df=2, P=N.S.) (Fig.1). Ring widths differed significantly between defoliation categories in 1990−1995 and 2000. When comparing the annual rings with those of the four previous years, which did not vary from year to year (F=0.06, df=3, P=N.S.), the growth losses for the different categories in 1990 were 33%, 97% and 98 %, respectively (Fig. 1). The rate of annual growth for the categories was still 31%, 46% and 54% lower, respectively, eight years after the damage (Fig. 1). Growth responses, following the outbreak in 1989, were not possible to estimate after 1998, due to a new outbreak by D. pini. The rough estimate for the amount of a cumulative growth loss until 1998 was 33.11 m3ha-1.
According to our estimates of stand volume, the total cumulative amount of tree mortality was 3.46 m3ha-1 (Table 2). Hold-overs represented most of the mortality (1.27 m3ha-
1). There were no statistically significant differences in tree mortality between hierarchy categories (F=0.05, df=2, P=N.S.) Total tree mortality of the site after a single-year outbreak corresponded to 2.07% of the total volume of the growing stock per hectare.
Average economic values for growth losses in different defoliation categories and tree mortality were estimated for the year 1994, which represents an average year of the recovery period. We can assume that the total mortality happened before that year. Annual volume increment of the stand was estimated to be 5.4 m3ha-1. The average annual amount of growth loss after moderate defoliation was 4.06 m3ha-1 and cumulative mortality 3.46 m3ha-1, totalling 7.52 m3ha-1. Therefore, an amount of annual growth losses can reach €118 ha-1 and cumulative mortality €100 ha-1 after a single year of moderate defoliation. Similarly, it is possible to estimate a value for average growth loss for each year during the recovery period. The estimated total economic loss for a nine-year recovery period, including cumulative growth loss and cumulative tree mortality, is €1060 ha-1.
TABLE II Tree mortality of the study site in Harjavalta. Hierarchy positions of trees are divided into three categories: hold-overs, dominants and intermediates. Standard deviations are shown in parenthesis. _______________________________________________________ Crown position Mortality loss (m3ha-1) _______________________________________________________ Hold-overs 1.27 (2.19) Dominants 1.18 (0.38) Intermediates 1.01 (0.54) Total 3.46 (1.23) _______________________________________________________
IV. Discussion
Defoliation of Scots pine late in the season causes serious reductions in growth, occurring in the following year and later [7, 15]. Needle damage later in the season may produce different kinds of response in carbohydrate dynamics, depending on the needle age class consumed, crown fraction, and timing of defoliation [16, 2], resulting in high losses in radial, volume and height growth. Defoliation late in the season disturbs the most productive sources of carbohydrate, which is reflected in the subsequent stem growth [15]. Impact on radial and volume growth is approximately 2−3 times higher after late season defoliation, compared with early season defoliation [15, 9, 6]. It is evident that the amount of growth losses after needle damage are proportional to the intensity of feeding, as observed in several studies [7, 1, 2].
The present results are in accordance with the earlier findings on the amount of radial growth losses of Scots pine during the first recovery years [5]. Typically, several studies have failed to follow the total recovery period. Trees suffering from only slight defoliation approached normal growth rates after a year, showing the typical V –shaped decline-recovery pattern in radial growth [17]. Responses after moderate and heavy defoliation were almost identical, showing high losses during 7−8 years. Unfortunately, a new outbreak by D. pini started in 1998 and we lost the last part of the recovery period. It may take at least 10-15 years before the radial and volume growth is re-established after moderate or heavy defoliation [8, 9, 10]. Among late season feeders in Europe, D. pini seems to be one of the most disastrous defoliators on Scots pine.
Scots pine withstands even severe defoliation of one year quite well. Two or more years of continuous needle damage may cause substantial mortality [7], partly due to secondary stem-boring insects, such as bark beetles [5]. According to earlier observations, mortality rates are typically 4−24% in Europe [7,18]. Ref. [5] reported exceptionally high mortality (60−75%) after a two-year outbreak. The outbreak in Harjavalta area extended only a year, causing 2% mortality of the stand volume within the following 3-4 years. Mostly large trees suffered from mortality. This indicates the preference of D. pini for mature trees in this phase of an outbreak. The mortality pattern would have been different if the outbreak had continued for at least two consecutive years.
The rough estimates of economic consequences indicated a much higher impact of D. pini than revealed by the few earlier studies in Europe [3, 7, 18]. The feeding intensity by D. pini can quite often be moderate to heavy during peak densities of an outbreak, and the proportion of tree mortality can increase up to 70−80%, with considerable economic consequences. Losses in radial and volume growth mostly corresponded to the total economic loss after a single-year outbreak, but the figure would have been different after a longer-lasting outbreak. The length of a full recovery period still remains a partly open question, but the results of the present study indicate that the recovery period is long. Each of these “recovery” years will add annual increment losses to the total economic losses.
Proccedings: IUFRO Kanazawa 2003 "Forest Insect Population Dynamics and Host Influences” - 83 -

The present study carries some limitations and sources of error. First of all, there was only one study site, without real controls. There should have been several similar sites in different parts of the whole outbreak area, where similar treatments and sampling could have been carried out. Besides, a true experiment would have needed control sites on undefoliated, similar stands in the province. Control sites could have provided trends for normal annual increment. The results of this case study still accorded closely with the observations in other studies [7, 15, 5]. Secondly, information on other mortality factors is missing. There were some signs of pine shoot beetles in the study site, but obviously the population density of bark beetles was not high. Thirdly, the assumption was made that the decrease in radial and volume increment were of the same order of magnitude. Since our aim was to provide approximate, preliminary estimates, this generalisation seems justified. Finally, when calculating estimates of the economic consequences of the outbreak, some average parameters, e.g. annual increment of this kind of stand, were employed to represent the study site. Current mean timber price of the province was applied for the recovery period studied, not annual mean timber prices.
V. Summary and Conclusions
Annual increment losses mostly accounted for the total economic losses after a single-year outbreak by D. pini. Cumulative tree mortality was highest in hold-overs, and total mortality approximately equalled the level of annual volume increment of the stand. Growth losses were still considerable after a nine-year recovery period, particularly in trees with moderate and heavy defoliation. The present study gave results from a single forest area only. This area is characterised by dry soil and is impacted by nearby industries. A similar study on a geographically more dispersed area is needed to develop a more reliable and comprehensive estimate of the impact of defoliation on different kinds of stands. The future aim is to construct a model using site data like this, connected with data of the population dynamics of pine sawflies. This model would predict the trends of insect populations and defoliation intensity, determine risk thresholds on the basis of population prognoses, and estimate the economic consequences of the damage. The model would link methods of integrated pest management and sustainable forest management, providing a highly practical and important tool for forest managers.
Acknowledgements
We wish to thank Mr. Martti Varama, Mr. Juhani Mäkinen and Ms. Anna-Maija Kokkonen for helping in the field, Mr. Mikko Kukkola for helping with increment core data, and Dr. Hannu Saarenmaa for giving constructive comments on the manuscript. The study was financially supported by the Academy of Finland.
References [1] G. Sanchez-Martinez, M.R. Wagner, “Sawfly (Hymenoptera: Diprionidae) and artificial defoliation affects above- and below-ground growth of ponderosa pine seedlings,” Journal of Economic Entomology, Vol. 87, pp. 1038-1045, 1994. [2] P. Lyytikäinen-Saarenmaa, “Growth responses of Scots pine (Pinaceae) to artificial and sawfly (Hymenoptera: Diprionidae) defoliation,” The Canadian Entomologist, Vol. 131, pp. 455-463, 1999. [3] M. Hertz, ”Die Gewöhnliche Kiefernbuschhornblattwespe (Lophyrus pini L.) und ihre Forstwirtschaftliche Bedeutung”. ”Tutkimuksia tavallisesta männynneulaspistiäisestä (Lophyrus pini L.) ja sen metsätaloudellisesta merkityksestä,” Communicationes Instituti Forestalis Fenniae, Vol. 18.6, pp. 1-53, (in Finnish with German summary), 1933. [4] M. Kytö, P. Niemelä, E. Annila, M. Varama, “Effects of forest fertilization on the radial growth and resin exudation of insect-defoliated Scots pines,” Journal of Applied Ecology, Vol. 36, pp. 763-769, 1999. [5] B. Långström, E. Annila, C. Hellqvist, M. Varama, P. Niemelä, ”Tree mortality, needle biomass recovery and growth losses in Scots pine following defoliation by Diprion pini (L.) and subsequent attack by Tomicus piniperda (L.),” Scandinavian Journal of Forest Research, Vol. 16, pp. 342-353, 2001. [6] P. Lyytikäinen-Saarenmaa, E. Tomppo, ”Impact of sawfly defoliation on growth of Scots pine Pinus sylvestris (Pinaceae) and associated economic losses,” Bulletin of Entomological Research, Vol. 92, pp. 137-140, 2002. [7] H. M. Kulman, “Effects of insect defoliation on growth and mortality of trees,” Annual Review of Entomology, Vol. 16, pp. 289-324, 1971. [8] P. Tiihonen, ”Ruskean mäntypistiäisen (N. sertifer Geoffr.) tuhojen vaikutuksesta männiköiden kasvuun Etelä-Pohjanmaalla, Pohjois-Satakunnassa ja Länsi-Uudellamaalla vuosina 1960-1967,” Metsäntutkimuslaitoksen julkaisuja, Vol. 71, pp. 1-21, (in Finnish), 1970. [9] Ø. Austarå, A. Orlund, A. Svendsrud, A. Weidahl, “Growth loss and economic consequences following two year defoliation of Pinus sylvestris by the pine sawfly Neodiprion sertifer in West-Norway,” Scandinavian Journal of Forest Research, Vol. 2, pp. 111-119, 1987. [10] M. Viitasaari, M. Varama, “Sawflies 4. Conifer sawflies (Diprionidae)”. “Sahapistiäiset 4. Havupistiäiset (Diprionidae),” University of Helsinki, Department of Agricultural and Forest Zoology. Reports, Vol. 10, pp. 1-79, (in Finnish with English summary), 1987. [11] B. De Somviele, P. Lyytikäinen-Saarenmaa, P. Niemelä, ”Sawfly (Hym., Diprionidae) outbreaks on Scots pine: effect of stand structure, site quality and relative tree position on defoliation intensity,” Forest Ecology and Management, Vol. 194, pp. 305-317, 2004. [12] N. A. Straw, H. L. Armour, K. R. Day, “The financial costs of defoliation of Scots pine (Pinus sylvestris) by pine looper moth (Bupalus piniaria),” Forestry, Vol. 75, pp. 525-536, 2002. [13] Metsäkeskus Tapio, Data and guidelines on forest resources and management. Tapion Taskukirja, Metsäkeskus Tapio, (in Finnish), 1994. [14] R. R. Sokal, F. J. Rohlf, Biometry, Freeman and Company, 1981. [15] A. Ericsson, S. Larsson, O. Tenow, “Effects of early and late season defoliation on growth and carbohydrate dynamics of Scots pine,” Journal of Applied Ecology, Vol. 17, pp. 747-769, 1980. [16] T. Honkanen, E. Haukioja, J. Suomela, “Effects of simulated defoliation and debudding on needle and shoot growth in Scots pine
Proccedings: IUFRO Kanazawa 2003 "Forest Insect Population Dynamics and Host Influences” - 84 -

(Pinus sylvestris) − implications of plant source sink relationship for plant−herbivore studies,” Functional Ecology, Vol. 8, pp. 631-639, 1994. [17] Ø. Austarå, “Diameter growth and tree mortality of Norway spruce following mass outbreaks by Epinotia nanana,” Norsk institutt for skogforskning, Report, Vol. 10, pp. 1-9, 1984. [18] H. Pschorn-Walcher, “Underordnung Symphyta, Pflanzenwespen,” In W. Schwenke, (ed.), Die Forstschädlinge Europas, 4 Band, Hautflügler und Zweiflügler, Paul Parey, (in German), 1982.
Proccedings: IUFRO Kanazawa 2003 "Forest Insect Population Dynamics and Host Influences” - 85 -
Application of Balsam Fir Sawfly Nucleopolyhedrovirus against its Natural Host Neodiprion abietis (Hymenoptera: Diprionidae)
Christina S. CAMPBELL, Dan T. QUIRING Biology Department, University of New Brunswick, Fredericton, New Brunswick E3B 6C2, CANADA
Edward G. KETTELA, Christopher J. LUCAROTTI1
Natural Resources Canada, Canadian Forest Service – Atlantic Forestry Centre, P.O. Box 4000, Fredericton, New Brunswick E3B 5P7, CANADA
1Corresponding author. Abstract – Fifty-hectare blocks of balsam fir forest, in western Newfoundland Canada, were treated with 1 - 3 x 10⁹ occlusion bodies/hectare of Neodiprion abietis nucleopolyhedrovirus (NeabNPV) in 2.5 L 20% aqueous molasses using Cessna 188 ‘Ag Truck’ airplanes equipped with Micronaire AU 4000 rotary atomizers. In the weeks following application, there was higher balsam fir sawfly larval mortality in the spray blocks than in the control. In the subsequent year, there was lower percentage egg hatch and higher larval mortality in samples collected from the spray blocks compared to those from the control block. Balsam fir sawfly pupae with white as opposed to brown pupal cases were significantly more like to harbour NeabNPV infection. These results suggest that aerial applications of NeabNPV can suppress outbreaking balsam fir sawfly populations.
I. Introduction
Since 1990, outbreak populations of balsam fir sawfly
(Neodiprion abietis Harr.) have affected approximately 260,000 ha of high-value, precommercially-thinned, balsam fir (Abies balsamea (L.) Mill.) forest in western Newfoundland, Canada. These infestations have resulted in extensive defoliation [1] causing up to 80% loss in incremental growth in balsam fir trees and recovery from this defoliation is slow [2].
In Newfoundland, the balsam fir sawfly has one generation per year. Eggs hatch in early June. Larvae are gregarious and feed openly on foliage that is one year old and older [3]. Pupation occurs in July and August followed shortly thereafter by adult emergence. Eggs are laid in current-year foliage where they overwinter [4]. The balsam fir sawfly nucleopolyhedrovirus (NeabNPV: Baculoviridae) was isolated from infected, field-collected balsam fir sawfly larvae from Newfoundland [5]. NeabNPV is being developed as a biological agent for balsam fir sawfly control. Here, we present results from NeabNPV field efficacy trials carried out in 2000 and 2001.
II. Materials and Methods A. Aerial application of NeabNPV
In all aerial applications, NeabNPV, partially purified from infected balsam fir sawfly larvae cadavers, was applied in 2.5 L of 20% aqueous molasses/ha from Cessna 188 ‘Ag Truck’ airplanes equipped with four, underwing Micronaire AU 4000 atomizers. NeabNPV was applied to three 50-ha balsam fir forest blocks (00-T1, 00-T2, 00-T3) located on the north side of Big Gull Pond on July 22 (2045 – 2130) and 23, (0559 – 0610) 2000 at a rate of 3 x 10⁹ occlusion bodies (OBs)/ha. On July 21, 2001 (0615-0650), a 50-ha block (01-T1), located northwest of Stag Lake, was treated at a rate of 1x10⁹ OBs/ha. In 2000, an untreated control block (00-C1) was a balsam fir stand of similar age and structure and was proximal to the 2000 treatment blocks. Treatment and control blocks were all located near Corner Brook, Newfoundland. B. Assessment of Efficacy
To assess NeabNPV efficacy, 45-cm long, mid-crown balsam fir branch tips were taken from 30 trees along transects within each treatment and untreated control block immediately before NeabNPV application and each week for three weeks following the application. Balsam fir sawfly larvae on the treatment and control branches were counted and recorded.
C. Egg hatch and larval survivorship in 2001
Lower mid-crown branches with balsam fir sawfly eggs were collected from the 2000 treatment (00-T3) and untreated control (00-C1) blocks on June 22, 2001. The number of eggs per branch was determined and sufficient branches to yield approximately 300 eggs per block were selected. Needles near the cut end of each branch were removed and the end of each branch was re-cut, at an angle, under water to allow water-flow to the vessel elements of the branch. Immediately upon re-cutting, branches were transferred to either 450-mL Mason jars or 250-mL Erlenmeyer flasks, filled with 0.15% NaOCl-tap water, depending on the size of the branch. NaOCl was added to inhibit fungal and bacterial growth. The vessels containing branches were then placed in a north-facing room, at the Pasadena Field Station (Pasadena, Newfoundland), where
Proccedings: IUFRO Kanazawa 2003 "Forest Insect Population Dynamics and Host Influences” - 86 -
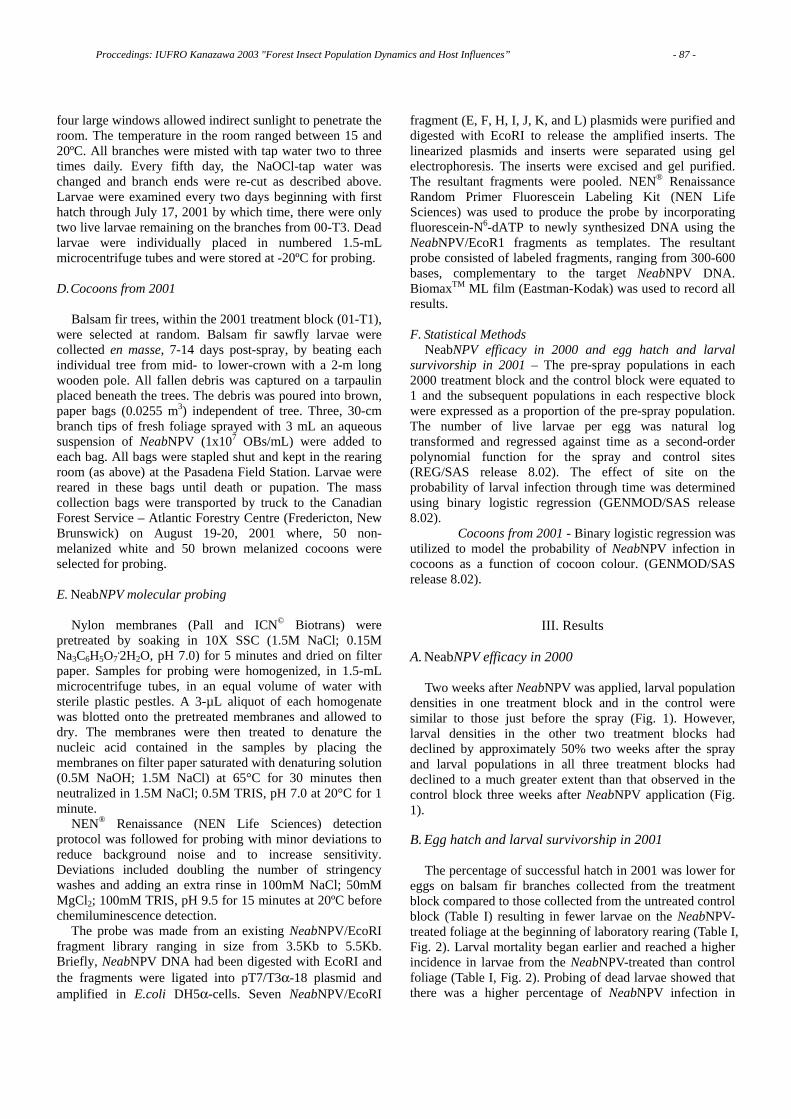
four large windows allowed indirect sunlight to penetrate the room. The temperature in the room ranged between 15 and 20ºC. All branches were misted with tap water two to three times daily. Every fifth day, the NaOCl-tap water was changed and branch ends were re-cut as described above. Larvae were examined every two days beginning with first hatch through July 17, 2001 by which time, there were only two live larvae remaining on the branches from 00-T3. Dead larvae were individually placed in numbered 1.5-mL microcentrifuge tubes and were stored at -20ºC for probing. D. Cocoons from 2001
Balsam fir trees, within the 2001 treatment block (01-T1), were selected at random. Balsam fir sawfly larvae were collected en masse, 7-14 days post-spray, by beating each individual tree from mid- to lower-crown with a 2-m long wooden pole. All fallen debris was captured on a tarpaulin placed beneath the trees. The debris was poured into brown, paper bags (0.0255 m3) independent of tree. Three, 30-cm branch tips of fresh foliage sprayed with 3 mL an aqueous suspension of NeabNPV (1x10⁷ OBs/mL) were added to each bag. All bags were stapled shut and kept in the rearing room (as above) at the Pasadena Field Station. Larvae were reared in these bags until death or pupation. The mass collection bags were transported by truck to the Canadian Forest Service – Atlantic Forestry Centre (Fredericton, New Brunswick) on August 19-20, 2001 where, 50 non-melanized white and 50 brown melanized cocoons were selected for probing. E. NeabNPV molecular probing
Nylon membranes (Pall and ICN© Biotrans) were pretreated by soaking in 10X SSC (1.5M NaCl; 0.15M Na3C6H5O7
.2H2O, pH 7.0) for 5 minutes and dried on filter paper. Samples for probing were homogenized, in 1.5-mL microcentrifuge tubes, in an equal volume of water with sterile plastic pestles. A 3-µL aliquot of each homogenate was blotted onto the pretreated membranes and allowed to dry. The membranes were then treated to denature the nucleic acid contained in the samples by placing the membranes on filter paper saturated with denaturing solution (0.5M NaOH; 1.5M NaCl) at 65°C for 30 minutes then neutralized in 1.5M NaCl; 0.5M TRIS, pH 7.0 at 20°C for 1 minute.
NEN® Renaissance (NEN Life Sciences) detection protocol was followed for probing with minor deviations to reduce background noise and to increase sensitivity. Deviations included doubling the number of stringency washes and adding an extra rinse in 100mM NaCl; 50mM MgCl2; 100mM TRIS, pH 9.5 for 15 minutes at 20ºC before chemiluminescence detection.
The probe was made from an existing NeabNPV/EcoRI fragment library ranging in size from 3.5Kb to 5.5Kb. Briefly, NeabNPV DNA had been digested with EcoRI and the fragments were ligated into pT7/T3α-18 plasmid and amplified in E.coli DH5α-cells. Seven NeabNPV/EcoRI
fragment (E, F, H, I, J, K, and L) plasmids were purified and digested with EcoRI to release the amplified inserts. The linearized plasmids and inserts were separated using gel electrophoresis. The inserts were excised and gel purified. The resultant fragments were pooled. NEN® Renaissance Random Primer Fluorescein Labeling Kit (NEN Life Sciences) was used to produce the probe by incorporating fluorescein-N6-dATP to newly synthesized DNA using the NeabNPV/EcoR1 fragments as templates. The resultant probe consisted of labeled fragments, ranging from 300-600 bases, complementary to the target NeabNPV DNA. BiomaxTM ML film (Eastman-Kodak) was used to record all results. F. Statistical Methods
NeabNPV efficacy in 2000 and egg hatch and larval survivorship in 2001 – The pre-spray populations in each 2000 treatment block and the control block were equated to 1 and the subsequent populations in each respective block were expressed as a proportion of the pre-spray population. The number of live larvae per egg was natural log transformed and regressed against time as a second-order polynomial function for the spray and control sites (REG/SAS release 8.02). The effect of site on the probability of larval infection through time was determined using binary logistic regression (GENMOD/SAS release 8.02).
Cocoons from 2001 - Binary logistic regression was utilized to model the probability of NeabNPV infection in cocoons as a function of cocoon colour. (GENMOD/SAS release 8.02).
III. Results A. NeabNPV efficacy in 2000
Two weeks after NeabNPV was applied, larval population
densities in one treatment block and in the control were similar to those just before the spray (Fig. 1). However, larval densities in the other two treatment blocks had declined by approximately 50% two weeks after the spray and larval populations in all three treatment blocks had declined to a much greater extent than that observed in the control block three weeks after NeabNPV application (Fig. 1). B. Egg hatch and larval survivorship in 2001
The percentage of successful hatch in 2001 was lower for
eggs on balsam fir branches collected from the treatment block compared to those collected from the untreated control block (Table I) resulting in fewer larvae on the NeabNPV-treated foliage at the beginning of laboratory rearing (Table I, Fig. 2). Larval mortality began earlier and reached a higher incidence in larvae from the NeabNPV-treated than control foliage (Table I, Fig. 2). Probing of dead larvae showed that there was a higher percentage of NeabNPV infection in
Proccedings: IUFRO Kanazawa 2003 "Forest Insect Population Dynamics and Host Influences” - 87 -
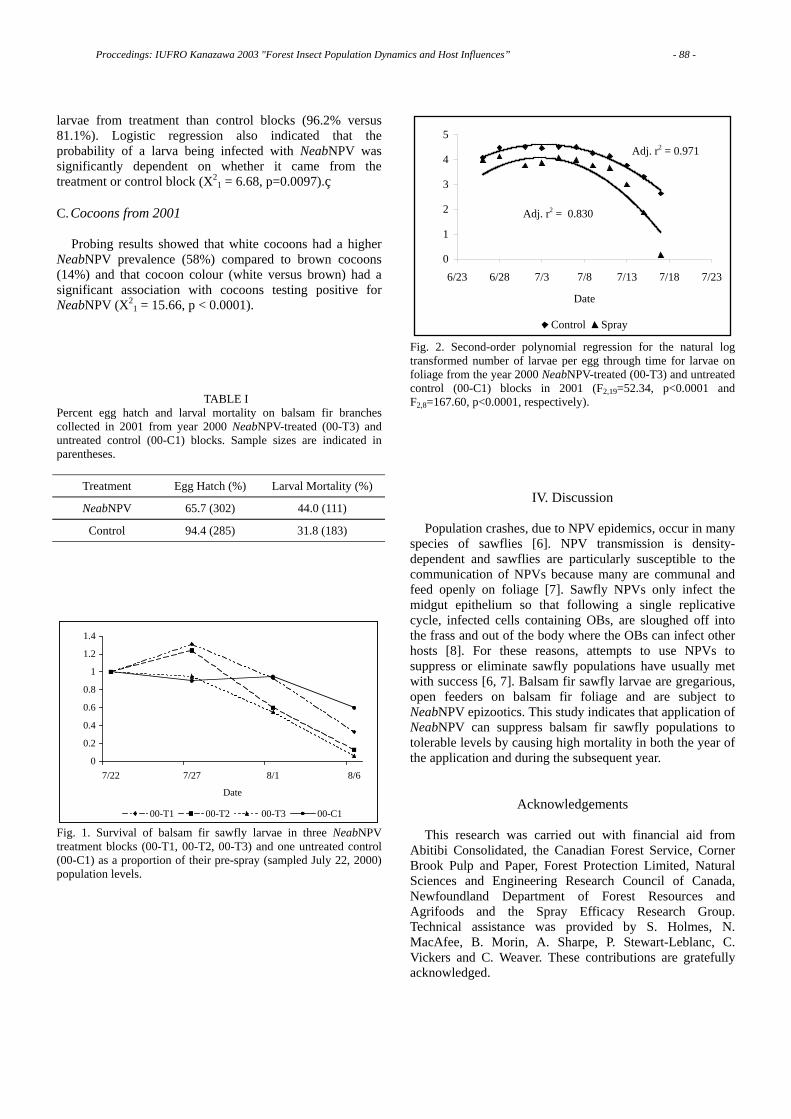
larvae from treatment than control blocks (96.2% versus 81.1%). Logistic regression also indicated that the probability of a larva being infected with NeabNPV was significantly dependent on whether it came from the treatment or control block (X2
1 = 6.68, p=0.0097). C. Cocoons from 2001
Probing results showed that white cocoons had a higher NeabNPV prevalence (58%) compared to brown cocoons (14%) and that cocoon colour (white versus brown) had a significant association with cocoons testing positive for NeabNPV (X2
1 = 15.66, p < 0.0001).
TABLE I Percent egg hatch and larval mortality on balsam fir branches collected in 2001 from year 2000 NeabNPV-treated (00-T3) and untreated control (00-C1) blocks. Sample sizes are indicated in parentheses.
Treatment Egg Hatch (%) Larval Mortality (%)
NeabNPV 65.7 (302) 44.0 (111)
Control 94.4 (285) 31.8 (183)
0
0.2
0.4
0.6
0.8
1
1.2
1.4
7/22 7/27 8/1 8/6
Date
00-T1 00-T2 00-T3 00-C1 Fig. 1. Survival of balsam fir sawfly larvae in three NeabNPV treatment blocks (00-T1, 00-T2, 00-T3) and one untreated control (00-C1) as a proportion of their pre-spray (sampled July 22, 2000) population levels.
0
1
2
3
4
5
6/23 6/28 7/3 7/8 7/13 7/18 7/23
Date
Control Spray
Adj. r2 = 0.971
Adj. r2 = 0.830
Fig. 2. Second-order polynomial regression for the natural log transformed number of larvae per egg through time for larvae on foliage from the year 2000 NeabNPV-treated (00-T3) and untreated control (00-C1) blocks in 2001 (F2,19=52.34, p<0.0001 and F2,8=167.60, p<0.0001, respectively).
IV. Discussion
Population crashes, due to NPV epidemics, occur in many species of sawflies [6]. NPV transmission is density-dependent and sawflies are particularly susceptible to the communication of NPVs because many are communal and feed openly on foliage [7]. Sawfly NPVs only infect the midgut epithelium so that following a single replicative cycle, infected cells containing OBs, are sloughed off into the frass and out of the body where the OBs can infect other hosts [8]. For these reasons, attempts to use NPVs to suppress or eliminate sawfly populations have usually met with success [6, 7]. Balsam fir sawfly larvae are gregarious, open feeders on balsam fir foliage and are subject to NeabNPV epizootics. This study indicates that application of NeabNPV can suppress balsam fir sawfly populations to tolerable levels by causing high mortality in both the year of the application and during the subsequent year.
Acknowledgements
This research was carried out with financial aid from Abitibi Consolidated, the Canadian Forest Service, Corner Brook Pulp and Paper, Forest Protection Limited, Natural Sciences and Engineering Research Council of Canada, Newfoundland Department of Forest Resources and Agrifoods and the Spray Efficacy Research Group. Technical assistance was provided by S. Holmes, N. MacAfee, B. Morin, A. Sharpe, P. Stewart-Leblanc, C. Vickers and C. Weaver. These contributions are gratefully acknowledged.
Proccedings: IUFRO Kanazawa 2003 "Forest Insect Population Dynamics and Host Influences” - 88 -
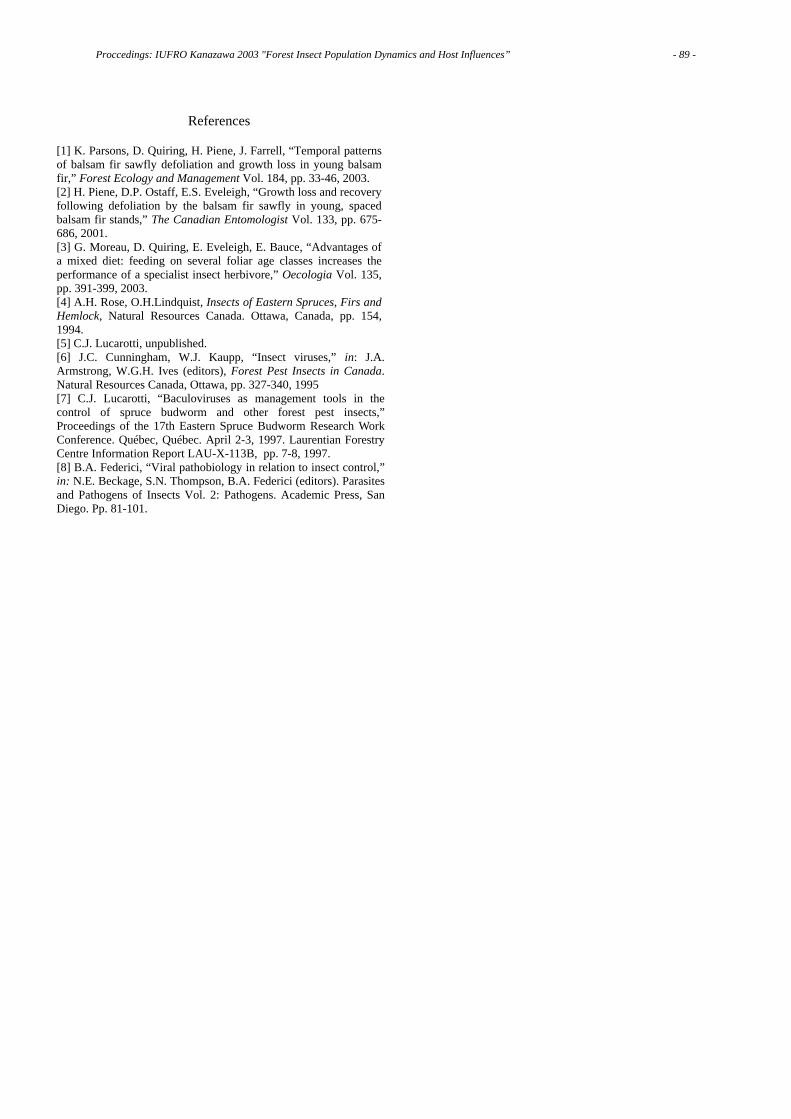
References
[1] K. Parsons, D. Quiring, H. Piene, J. Farrell, “Temporal patterns of balsam fir sawfly defoliation and growth loss in young balsam fir,” Forest Ecology and Management Vol. 184, pp. 33-46, 2003. [2] H. Piene, D.P. Ostaff, E.S. Eveleigh, “Growth loss and recovery following defoliation by the balsam fir sawfly in young, spaced balsam fir stands,” The Canadian Entomologist Vol. 133, pp. 675-686, 2001. [3] G. Moreau, D. Quiring, E. Eveleigh, E. Bauce, “Advantages of a mixed diet: feeding on several foliar age classes increases the performance of a specialist insect herbivore,” Oecologia Vol. 135, pp. 391-399, 2003. [4] A.H. Rose, O.H.Lindquist, Insects of Eastern Spruces, Firs and Hemlock, Natural Resources Canada. Ottawa, Canada, pp. 154, 1994. [5] C.J. Lucarotti, unpublished. [6] J.C. Cunningham, W.J. Kaupp, “Insect viruses,” in: J.A. Armstrong, W.G.H. Ives (editors), Forest Pest Insects in Canada. Natural Resources Canada, Ottawa, pp. 327-340, 1995 [7] C.J. Lucarotti, “Baculoviruses as management tools in the control of spruce budworm and other forest pest insects,” Proceedings of the 17th Eastern Spruce Budworm Research Work Conference. Québec, Québec. April 2-3, 1997. Laurentian Forestry Centre Information Report LAU-X-113B, pp. 7-8, 1997. [8] B.A. Federici, “Viral pathobiology in relation to insect control,” in: N.E. Beckage, S.N. Thompson, B.A. Federici (editors). Parasites and Pathogens of Insects Vol. 2: Pathogens. Academic Press, San Diego. Pp. 81-101.
Proccedings: IUFRO Kanazawa 2003 "Forest Insect Population Dynamics and Host Influences” - 89 -
Seed-Insect Fauna in Pre-Dispersal Acorns of Quercus Variabilis and Q. Serrata and Its Impact on Acorn Production
Hiroshi FUKUMOTO1, Hisashi KAJIMURA Laboratory of Forest Protection, Graduate School of Bioagricultural Sciences, Nagoya University, Nagoya 464-8601, JAPAN
1: Present address: Agricultural Research Division, Mie Prefectural Science and Technology Promotion CenterKawagita 530, Ureshino-cho, Ichishi-gun, Mie 515-2316, JAPAN Abstract - Seed-insect fauna in pre-dispersal acorns of Quercus variabilis Blume and Q. serrata Thunb. ex Murray and impact of the insects on acorn production were investigated in broad-leaved forests of central Japan. In Q. variabilis, Curculio robustus (Roelofs), curculio weevil (unidentified species), Poecilips cardamomi (Schaufuss), blastobasid moth (unidentified species), Pammene nemorosa Kuznetzov, Cydia glandicolana (Danilevsky) and Characoma ruficirra (Hampson) attacked pre-dispersal acorns. These insects damaged more than 50% (site A) and less than 25% (site B) of the initial number of female reproductive organs of plants. By contrast, pre-dispersal acorns of Q. serrata were attacked by seven insect species: Mechoris ursulus (Roelofs), Curculio sikkimensis (Heller), P. cardamomi, cynipid wasp (unidentified species), Cydia danilevskyi (Kuznetzov), C. glandicolana and Cydia amurensis (Danilevsky). These insects damaged less than 10% of the organs (site A and B). Thus, it is clear from our field data that seed-insect fauna was markedly different between Q. variabilis and Q. serrata, and the insects had a more serious effect on acorn production in Q. variabilis than in Q. serrata. A germination test of insect-damaged Q. variabilis acorns was carried out in the laboratory. Germination rate of acorns damaged by curculio weevils was significantly lower than that of the sound acorns, particularly when there was a larger endosperm loss of the damaged acorns. Thus, predation by seed insects would have a negative effect on acorn germination.
I. Introduction
The genus Quercus is a major tree in secondary forests in warm and cool temperate regions in Japan. Quercus acorns are damaged by many herbivorous predators such as insects, birds and mammals before and after dispersal [1, 2, 3]. Of these, insects are considered to be the most important predators. To date, approximately 67 species of phytophagous insects are known to damage acorns of oak trees [4]. They can play a significant role in mortality of pre-dispersal acorns [5, 6]. However, little information is available about seed-insect fauna and effects of insect damage on acorn production and germination in Japan.
The aims of the present study are to investigate 1) seed-insect fauna in two co-occurring oaks, Q.variabilis and Q. serrata, 2) losses attributable to damage by the insects and 3) germination success of insect-damaged acorns in relation to endosperm loss.
II. Materials and methods
A. Study site A series of field experiments were carried out in secondary
forests on the Nagoya University Campus (site A) and Higashiyama Park (site B), Aichi Prefecture, central Japan. The forest consists mainly of deciduous oaks (Q. variabilis and Q. serrata) and Japanese red pine (Pinus densiflora Sieb. et Zucc). The annual precipitation and annual mean temperature at the Nagoya Weather Station are about 1500 mm and 15.1 ℃ , respectively [7]. B. Acorn development of studied tree species
Quercus variabilis and Q. serrata belong to section Cerris and
section Prinus, respectively [8]. The time between flowering and fertilization differs markedly between these two sections. In the Cerris reproductive cycle, which lasts two years, development of female reproductive organ stops in the early summer of the first year shortly after pollination, and fertilization and acorn maturation occur during the second year ("2nd-year acorn"). In this study, pistillate flowers and tiny unfertilized acorns were referred to as "1st-year acorn". By contrast, in the Prinus cycle, pistillate flowers are produced in the spring, and acorns mature in the autumn of the same year. Tiny Q. serrata acorns with a cupule width of less than 2 mm were regarded as pistillate flowers [9]. C. Survey of insects attacking acorns of Q. variabilis and Q. serrata (Experiment 1)
To investigate the seed-insect fauna of pre-dispersal acorns of Q. variabilis and Q. serrata, falling female reproductive organs (pistillate flowers and acorns) were collected using seed traps in 1995 and 1996 in site A. Five trees each of Q. variabilis and Q. serrata, with no canopy overlap of adjacent conspecific oaks, were selected. Two seed traps, each with a projection area of 0.24 ㎡, were set under the canopy of each tree on 1 June 1995. The organs that fall into the traps were collected once a week from June to December in both 1995 and 1996. In the laboratory, 1st-year acorns of Q. variabilis and pistillate flowers of Q. serrata were eliminated. Collected acorns were dissected, and were classified into sound, aborted, insect-damaged and degenerated. The insect species in damaged acorns were identified.
To identify larvae of seed insects in collected acorns, the insects were reared until the adult stage in the field or laboratory. In this study area (site A), five 2nd-year immature acorns of Q. variabilis damaged by moths were sampled from branches of other trees in
Proccedings: IUFRO Kanazawa 2003 "Forest Insect Population Dynamics and Host Influences” - 90 -
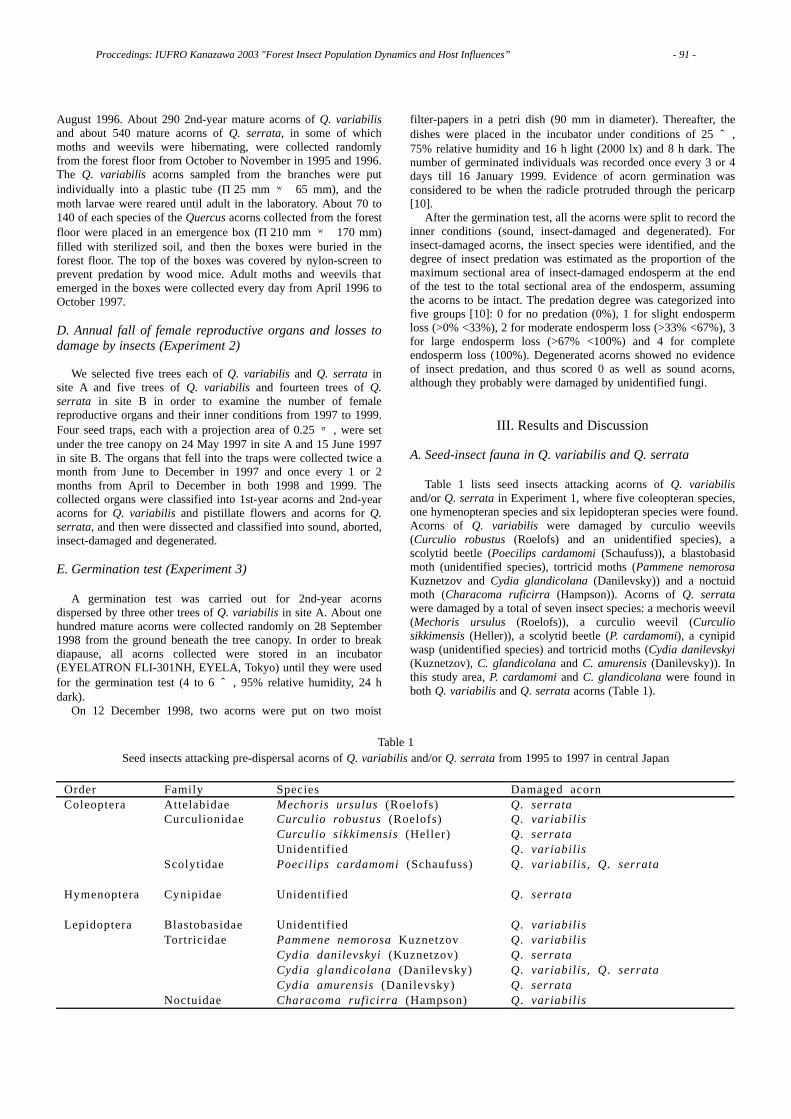
August 1996. About 290 2nd-year mature acorns of Q. variabilis and about 540 mature acorns of Q. serrata, in some of which moths and weevils were hibernating, were collected randomly from the forest floor from October to November in 1995 and 1996. The Q. variabilis acorns sampled from the branches were put individually into a plastic tube (φ25 mm × 65 mm), and the moth larvae were reared until adult in the laboratory. About 70 to 140 of each species of the Quercus acorns collected from the forest floor were placed in an emergence box (φ210 mm × 170 mm) filled with sterilized soil, and then the boxes were buried in the forest floor. The top of the boxes was covered by nylon-screen to prevent predation by wood mice. Adult moths and weevils that emerged in the boxes were collected every day from April 1996 to October 1997. D. Annual fall of female reproductive organs and losses to damage by insects (Experiment 2)
We selected five trees each of Q. variabilis and Q. serrata in site A and five trees of Q. variabilis and fourteen trees of Q. serrata in site B in order to examine the number of female reproductive organs and their inner conditions from 1997 to 1999. Four seed traps, each with a projection area of 0.25 ㎡, were set under the tree canopy on 24 May 1997 in site A and 15 June 1997 in site B. The organs that fell into the traps were collected twice a month from June to December in 1997 and once every 1 or 2 months from April to December in both 1998 and 1999. The collected organs were classified into 1st-year acorns and 2nd-year acorns for Q. variabilis and pistillate flowers and acorns for Q. serrata, and then were dissected and classified into sound, aborted, insect-damaged and degenerated. E. Germination test (Experiment 3)
A germination test was carried out for 2nd-year acorns dispersed by three other trees of Q. variabilis in site A. About one hundred mature acorns were collected randomly on 28 September 1998 from the ground beneath the tree canopy. In order to break diapause, all acorns collected were stored in an incubator (EYELATRON FLI-301NH, EYELA, Tokyo) until they were used for the germination test (4 to 6 ℃, 95% relative humidity, 24 h dark).
On 12 December 1998, two acorns were put on two moist
filter-papers in a petri dish (90 mm in diameter). Thereafter, the dishes were placed in the incubator under conditions of 25 ℃, 75% relative humidity and 16 h light (2000 lx) and 8 h dark. The number of germinated individuals was recorded once every 3 or 4 days till 16 January 1999. Evidence of acorn germination was considered to be when the radicle protruded through the pericarp [10].
After the germination test, all the acorns were split to record the inner conditions (sound, insect-damaged and degenerated). For insect-damaged acorns, the insect species were identified, and the degree of insect predation was estimated as the proportion of the maximum sectional area of insect-damaged endosperm at the end of the test to the total sectional area of the endosperm, assuming the acorns to be intact. The predation degree was categorized into five groups [10]: 0 for no predation (0%), 1 for slight endosperm loss (>0% <33%), 2 for moderate endosperm loss (>33% <67%), 3 for large endosperm loss (>67% <100%) and 4 for complete endosperm loss (100%). Degenerated acorns showed no evidence of insect predation, and thus scored 0 as well as sound acorns, although they probably were damaged by unidentified fungi.
III. Results and Discussion A. Seed-insect fauna in Q. variabilis and Q. serrata
Table 1 lists seed insects attacking acorns of Q. variabilis and/or Q. serrata in Experiment 1, where five coleopteran species, one hymenopteran species and six lepidopteran species were found. Acorns of Q. variabilis were damaged by curculio weevils (Curculio robustus (Roelofs) and an unidentified species), a scolytid beetle (Poecilips cardamomi (Schaufuss)), a blastobasid moth (unidentified species), tortricid moths (Pammene nemorosa Kuznetzov and Cydia glandicolana (Danilevsky)) and a noctuid moth (Characoma ruficirra (Hampson)). Acorns of Q. serrata were damaged by a total of seven insect species: a mechoris weevil (Mechoris ursulus (Roelofs)), a curculio weevil (Curculio sikkimensis (Heller)), a scolytid beetle (P. cardamomi), a cynipid wasp (unidentified species) and tortricid moths (Cydia danilevskyi (Kuznetzov), C. glandicolana and C. amurensis (Danilevsky)). In this study area, P. cardamomi and C. glandicolana were found in both Q. variabilis and Q. serrata acorns (Table 1).
Table 1
Seed insects attacking pre-dispersal acorns of Q. variabilis and/or Q. serrata from 1995 to 1997 in central Japan
Order Family Species Damaged acorn Coleoptera Attelabidae Mechoris ursulus (Roelofs) Q. serrata Curculionidae Curculio robustus (Roelofs) Q. variabilis Curculio sikkimensis (Heller) Q. serrata Unidentified Q. variabilis Scolytidae Poecilips cardamomi (Schaufuss) Q. variabilis, Q. serrata Hymenoptera Cynipidae Unidentified Q. serrata Lepidoptera Blastobasidae Unidentified Q. variabilis Tortricidae Pammene nemorosa Kuznetzov Q. variabilis Cydia danilevskyi (Kuznetzov) Q. serrata Cydia glandicolana (Danilevsky) Q. variabilis, Q. serrata Cydia amurensis (Danilevsky) Q. serrata Noctuidae Characoma ruficirra (Hampson) Q. variabilis
Proccedings: IUFRO Kanazawa 2003 "Forest Insect Population Dynamics and Host Influences” - 91 -

Fig. 1. The number of female reproductive organs with different inner conditions that fell into seed traps.(a) Q. variabilis in site A, (b) Q. variabilis in site B, (c) Q. serrata in site A, (d) Q. serrata in site B.
Fig. 2. The proportion of the number of organs in each inner condition to total number of dropped organs, expressed as a percentage. (a) Q. variabilis in site A, (b) Q. variabilis in site B, (c) Q. serrata in site A, (d) Q. serrata in site B.
Proccedings: IUFRO Kanazawa 2003 "Forest Insect Population Dynamics and Host Influences” - 92 -
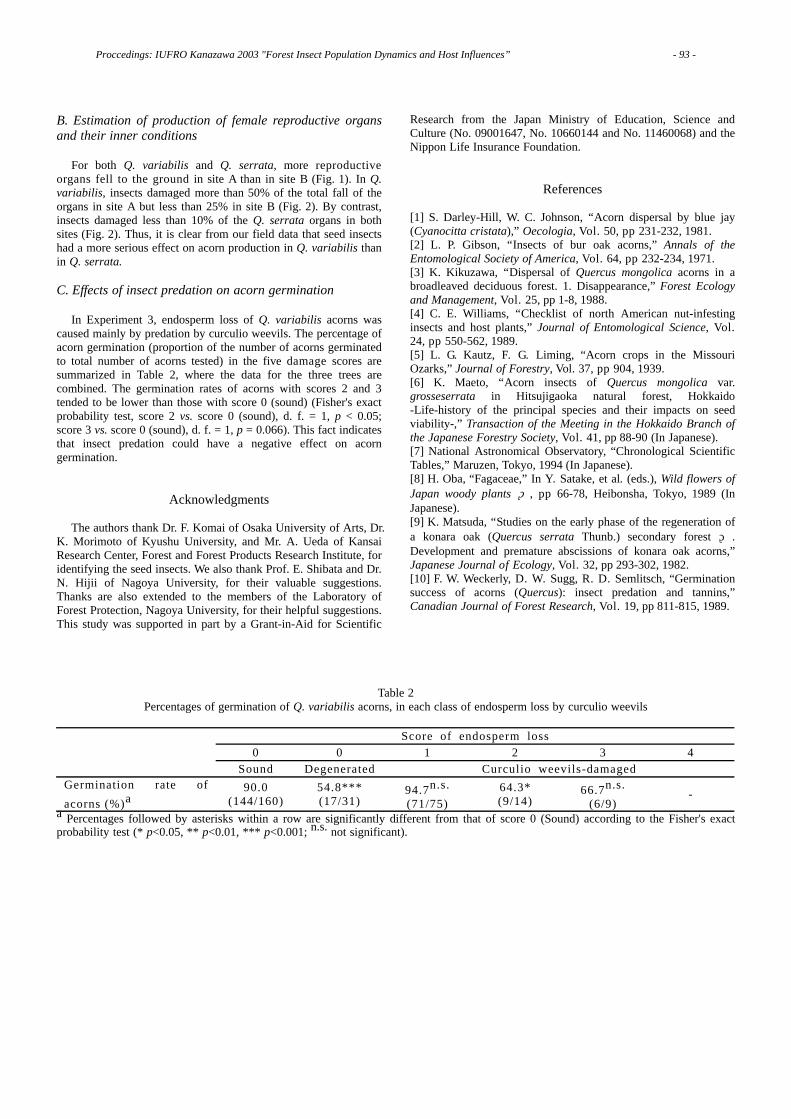
B. Estimation of production of female reproductive organs and their inner conditions
For both Q. variabilis and Q. serrata, more reproductive organs fell to the ground in site A than in site B (Fig. 1). In Q. variabilis, insects damaged more than 50% of the total fall of the organs in site A but less than 25% in site B (Fig. 2). By contrast, insects damaged less than 10% of the Q. serrata organs in both sites (Fig. 2). Thus, it is clear from our field data that seed insects had a more serious effect on acorn production in Q. variabilis than in Q. serrata. C. Effects of insect predation on acorn germination
In Experiment 3, endosperm loss of Q. variabilis acorns was caused mainly by predation by curculio weevils. The percentage of acorn germination (proportion of the number of acorns germinated to total number of acorns tested) in the five damage scores are summarized in Table 2, where the data for the three trees are combined. The germination rates of acorns with scores 2 and 3 tended to be lower than those with score 0 (sound) (Fisher's exact probability test, score 2 vs. score 0 (sound), d. f. = 1, p < 0.05; score 3 vs. score 0 (sound), d. f. = 1, p = 0.066). This fact indicates that insect predation could have a negative effect on acorn germination.
Acknowledgments
The authors thank Dr. F. Komai of Osaka University of Arts, Dr. K. Morimoto of Kyushu University, and Mr. A. Ueda of Kansai Research Center, Forest and Forest Products Research Institute, for identifying the seed insects. We also thank Prof. E. Shibata and Dr. N. Hijii of Nagoya University, for their valuable suggestions. Thanks are also extended to the members of the Laboratory of Forest Protection, Nagoya University, for their helpful suggestions. This study was supported in part by a Grant-in-Aid for Scientific
Research from the Japan Ministry of Education, Science and Culture (No. 09001647, No. 10660144 and No. 11460068) and the Nippon Life Insurance Foundation.
References [1] S. Darley-Hill, W. C. Johnson, “Acorn dispersal by blue jay (Cyanocitta cristata),” Oecologia, Vol. 50, pp 231-232, 1981. [2] L. P. Gibson, “Insects of bur oak acorns,” Annals of the Entomological Society of America, Vol. 64, pp 232-234, 1971. [3] K. Kikuzawa, “Dispersal of Quercus mongolica acorns in a broadleaved deciduous forest. 1. Disappearance,” Forest Ecology and Management, Vol. 25, pp 1-8, 1988. [4] C. E. Williams, “Checklist of north American nut-infesting insects and host plants,” Journal of Entomological Science, Vol. 24, pp 550-562, 1989. [5] L. G. Kautz, F. G. Liming, “Acorn crops in the Missouri Ozarks,” Journal of Forestry, Vol. 37, pp 904, 1939. [6] K. Maeto, “Acorn insects of Quercus mongolica var. grosseserrata in Hitsujigaoka natural forest, Hokkaido -Life-history of the principal species and their impacts on seed viability-,” Transaction of the Meeting in the Hokkaido Branch of the Japanese Forestry Society, Vol. 41, pp 88-90 (In Japanese). [7] National Astronomical Observatory, “Chronological Scientific Tables,” Maruzen, Tokyo, 1994 (In Japanese). [8] H. Oba, “Fagaceae,” In Y. Satake, et al. (eds.), Wild flowers of Japan woody plants Ⅰ, pp 66-78, Heibonsha, Tokyo, 1989 (In Japanese). [9] K. Matsuda, “Studies on the early phase of the regeneration of a konara oak (Quercus serrata Thunb.) secondary forest Ⅰ . Development and premature abscissions of konara oak acorns,” Japanese Journal of Ecology, Vol. 32, pp 293-302, 1982. [10] F. W. Weckerly, D. W. Sugg, R. D. Semlitsch, “Germination success of acorns (Quercus): insect predation and tannins,” Canadian Journal of Forest Research, Vol. 19, pp 811-815, 1989.
Table 2 Percentages of germination of Q. variabilis acorns, in each class of endosperm loss by curculio weevils
Score of endosperm loss 0 0 1 2 3 4 Sound Degenerated Curculio weevils-damaged Germination rate of acorns (%)a
90.0 (144/160)
54.8*** (17/31)
94.7n.s. (71/75)
64.3* (9/14)
66.7n.s. (6/9)
- a Percentages followed by asterisks within a row are significantly different from that of score 0 (Sound) according to the Fisher's exact probability test (* p<0.05, ** p<0.01, *** p<0.001; n.s. not significant).
Proccedings: IUFRO Kanazawa 2003 "Forest Insect Population Dynamics and Host Influences” - 93 -
Characteristics of the Resistance of Pinus armandii var. amamiana, an Endangered Pine Species in Japan, to Pine Wilt Disease
Katsunori NAKAMURA, Mitsuteru AKIBA Kyushu Research Center, Forestry and Forest Products Research Institute, Kumamoto 860-0862, JAPAN
Seiichi KANETANI Forestry and Forest Products Research Institute, Tsukuba 305-8687, JAPAN
Abstract - Pine wilt disease (PWD) was suggested as a mortality factor of Pinus armandii var. amamiana (PAA), an endangered pine species in Japan, from field surveys of the pathogenic nematode, Bursaphelenchus xylophilus, in dying and dead PAA trees and from a field inoculation test with the nematode. Disease development in nematode-inoculated PAA trees was slow and progressed gradually from the inoculated branch to the trunk, thereby demonstrating partial resistance of PAA to PWD.
I. Introduction
Pinus armandii var. amamiana (PAA) is an endangered pine species whose natural habitat is restricted to Yaku-shima and Tanega-shima Islands, southwestern Japan [1, 2, 3]. Pine wilt disease (PWD) might become a contributory factor in extinction of PAA because mass mortality related to needle blight, one of the typical symptoms of PWD, has occurred in its natural habitats [4]. In contrast, some researchers have speculated that PAA may be less susceptible to PWD, based on observations that PAA trees survived after bad epidemics of PWD in co-occurring P. thunbergii trees. Thus it is important to clarify the extent of PAA resistance to PWD in order to prepare a plan for conservation of PAA.
II. Survey of Pine Wilt Disease Infection
PWD is caused by the pinewood nematode, Bursaphelenchus xylophilus [5], which is mainly vectored by the Japanese pine sawyer, Monochamus alternatus [6, 7]. We tried to collect evidence of PWD infection in dying and dead PAA trees in the field. Feeding marks of the insect vector, M. alternatus, were commonly found on the twigs of PAA trees, suggesting that the insect-borne nematodes were frequently provided opportunities to enter PAA trees. We detected B. xylophilus in 5 out of 7 weakened or newly-dead PAA trees in the field [8]. These results suggest that PWD can cause mortality in PAA trees under field conditions.
III. Field Inoculation Test
Field-grown trees of PAA and P. thunbergii planted in the
Experimental Forest of Kyushu Research Center, FFPRI, were selected and then inoculated with B. xylophilus. In the susceptible P. thunbergii trees, disease symptoms occurred simultaneously and developed quickly, which is typical of inoculation tests with B. xylophilus. In PAA trees, however, disease development was considerably different from that in P. thunbergii [9]. In PAA symptoms first occurred at the inoculation points and then slowly spread to the whole tree over a relatively long time period. Cessation of oleoresin flow, that is commonly known to be the first symptom in the development of PWD, occurred in the course of spread of foliage discoloration in PAA trees. These results suggest that PWD development in PAA trees progresses not systemically but gradually; progressing from the infected branches to the trunk and other branches. The occurrence of disease symptoms was delayed when the number of inoculated nematodes was small, but all PAA trees inoculated with nematodes eventually died irrespective of the inoculation density.
IV. Progressive Partial Death in PAA Trees
Some field-grown PAA trees had branches that could be divided into two sections, based on the time since death; sections on the top side that had died some time ago, and newly dead sections on the trunk side. This evidence suggests that the area affected by PWD in PAA trees spreads from the infected site towards the trunk over a period of several years.
V. Conclusions
The level of mortality of PAA trees in the nematode inoculation test was not different from that of susceptible P. thunbergii trees. However, the delayed disease development in PAA trees demonstrated some resistance to PWD. The progressive partial death observed in large PAA trees growing in the field resulted from delayed disease development. Due to this kind of resistance, field-grown PAA trees should have a chance to recover from PWD infection. Consequently, we conclude that PAA is less susceptible to PWD than P. thunbergii. Nevertheless, appropriate protection measures against PWD are still
Proccedings: IUFRO Kanazawa 2003 "Forest Insect Population Dynamics and Host Influences” - 94 -
needed to avoid further loss of field populations of this endangered species.
References [1] S. Hatusima, “Taxonomic study on Pinus armandii Franch. and Pinus amamiana Koidz.” Japanese Journal of Forestry Society, Vol. 20, pp. 392-400, 1938. (In Japanese) [2] T. Yahara, H. Ohba, J. Murata, K. Iwatsuki, “Taxonomic review of vascular plants endemic to Yakushima Island, Japan” Journal of the Faculty of Science, the University of Tokyo, Section III, Vol. 14, pp. 69-119, 1987. [3] The Environment Agency, “New Japanese red list in plants” The Environment Agency, 1997. (In Japanese) [4] S. Hayashi, H. Umata, Y. Takahashi, “Forest genetic studies on Yakutanegoyo (Pinus armandii Franch. var. amamiana Hatusima) for a preventive from its extermination” Bulletin of Kagoshima University Forests, Vol. 12, pp. 67-77, 1984. (In Japanese with English Summary) [5] T. Kiyohara, Y. Tokushige, “Inoculation experiments of a nematode, Bursaphelenchus sp. onto pine trees” Japanese Journal of Forestry Society, Vol. 53, pp. 210-218, 1971. (in Japanese with English summary) [6] K. Morimoto, A. Iwasaki, “Role of Monochamus alternatus (Coleoptera: Cerambycidae) as a vector of Bursaphelenchus lignicolus (Nematoda: Aphelenchoididae)” Japanese Journal of Forestry Society, Vol. 54, pp. 177-183, 1972. (in Japanese with English summary) [7] Y. Mamiya, N. Enda, “Transmission of Bursaphelenchus lignicolus (Nematoda: Aphelenchoididae) by Monochamus alternatus (Coleoptera: Cerambycidae)” Nematologica Vol. 18, pp. 159-162, 1972. [8] K. Nakamura, M. Akiba, S. Kanetani, “Pine wilt disease as promising causal agent of the mass mortality of Pinus armandii var. amamiana (Koidz.) Hatusima in the field” Ecological Research Vol. 16, pp. 795-801, 2001. [9] M. Akiba, K. Nakamura, “Susceptibility of an endangered tree species Pinus armandii var. amamiana to pine wilt diesease in the field ”, Jornal of Forest Research Vol. 10, pp. 3-7, 2005.
Proccedings: IUFRO Kanazawa 2003 "Forest Insect Population Dynamics and Host Influences” - 95 -
Spruce Bark Beetle (Ips typographus L.) Risk Based on Individual Tree Parameters
Paulius ZOLUBAS Department of Plant Protection, Lithuanian University of Agriculture, 4324 Kaunas, LITHUANIA
Abstract – Spruce bark beetle (Ips typographus L.) under nor-mal population conditions prefer to colonize dominant (Kraft class 2), larger (taller, of bigger diameter, with thicker bark) and undamaged (except for root rot) Norway spruce trees (Picea abies Karst.).
I. Introduction
Damage by spruce bark beetle is recorded, on average, on a few thousand ha of spruce forests every year in Lithuania, with heavy outbreaks repeating every 8-10 years. The last large outbreaks were recorded in 1970-73 (with 6000-6500 ha annual damage) and in 1984-85 (5000-5300 ha/year). Heavy wind throws in 1993 (about 3 million m3) and climate anomalies (droughts) provoked the heaviest epidemics of spruce bark beetle (Ips typographus L.) in 380 thousand ha and resulted in the harvesting of 8 million m3 of dead trees. Nearly 20 thousand ha were clear-cut by the end of outbreak in 1997 [1]. It is clearly seen that sporadic (situational) forest protection measures, applied to control pests and diseases, have been insufficient and could not effectively improve forest health in Lithuania. Recent pest and disease management appear to be inadequate, and therefore modern forest health management strategies should be developed, with monitoring and predicting disease/pest occurrence and impact on forest ecosystems the objectives of highest priority. Although the spruce beetle Ips typographus (L.) is the most important secondary pest of Norway spruce (Picea abies Karst.) in Lithuania [2] and in most of Europe, no methods of predicting tree or stand susceptibility and outbreak risk have been developed for this species.
II. Methods
A ”network,” consisting of 106 test plots, scattered all over the country in pure mid-aged (ca 80 years old) spruce stands, was established in 2000-2002. Test plots represented fixed radius 0.02 ha plots, established to enclose at least one bark beetle freshly attacked tree. All spruce trees in the plot, belonging to main store, were sampled for status (live, freshly attacked, damaged by other agents, etc.), height, diameter at breast height, bark thickness, and tree social position in the stand (Kraft class – superior, dominant, co-dominant, intermediate, overtopped). All Ips typographus infested and selected representatives of all tree social classes were sampled with an increment borer for phloem, sapwood thickness and stem rot presence. Significance of differences in measured variables between attacked and healthy trees was evaluated using Student-t, for quantitative data, and chi2
statistics for qualitative variables [3].
III. Results and discussion
Three-hundred-forty-three of 925 spruce trees (37.1%) sampled in 106 test plots, were colonized by Ips typographus. However, distribution by social position class was different among successfully attacked and healthy trees (table 1). Approximately 10% of Ips attacked and healthy trees were categorized as uperior trees (table 1). In contrast, approximately 70% of Ips attacked trees were dominant (Kraft class 2) trees whereas trees in this class comprised only 48.6 ±2.1% of healthy trees. Co-dominant tree (Kraft class 3) accounted for approximately only 18% and 39% of attacked and healthy trees, respectively (table 1). Even though test plots were established on managed forests where there were few intermediate and overtopped spruce trees (Kraft class 4 and 5) , our data suggests that a lower proportion of these trees are attacked by Ips (table 1).
On average,attacked trees were taller, had a larger diameter (DBH) and thicker bark than healthy trees (table 2). Phloem thickness and sapwood areas had no effect on spruce tree preference by Ips typographus. However, trees damaged by root rot were more susceptible to bark beetle attacks; all other damage (broken or dry top, defoliation, etc.) seems to decrease spruce suitability to Ips typographus (table 2).
TABLE 1
Distribution of spruce by tree social position in the stand
Tree status Ips attacked healthy trees superior 35 10,2 ±1,6% 58 10,0±1,2% n.s.dominant 240 70,0 ±2,5% 283 48,6±2,1% ***co-dominant 61 17,8 ±2,1% 225 38,7±2,0% ***intermediate 4 1,2 ±0,6% 16 2,7±0,7% * overtopped 3 0,9 ±0,5% n.s.Total 343 100,0 % 582 100,0% significance of difference: * – chi2
It is universally agreed that endemic spruce bark beetle
populations attack and successfully colonize only weak and/or suppressed trees [4]. Distribution of colonized trees by social position in our research does not support this idea. Although a similar percentage of attacked and healthy trees were in the superior tree class, dominant trees were more frequently attacked, and co-dominant trees were definitely less attractive (or more resistant) to Ips typographus. The trend of lower attractiveness of suppressed trees was also evident.
Proccedings: IUFRO Kanazawa 2003 "Forest Insect Population Dynamics and Host Influences” - 96 -
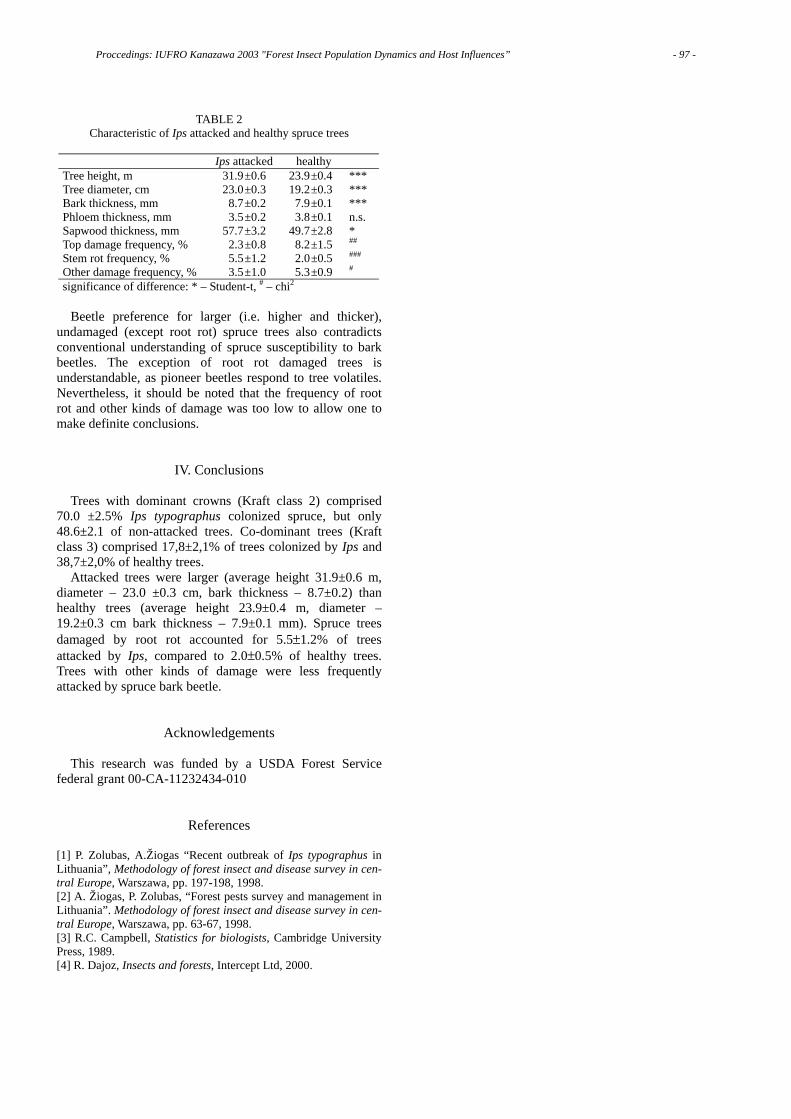
TABLE 2 Characteristic of Ips attacked and healthy spruce trees
Ips attacked healthy
Tree height, m 31.9±0.6 23.9±0.4 ***Tree diameter, cm 23.0±0.3 19.2±0.3 ***Bark thickness, mm 8.7±0.2 7.9±0.1 ***Phloem thickness, mm 3.5±0.2 3.8±0.1 n.s. Sapwood thickness, mm 57.7±3.2 49.7±2.8 * Top damage frequency, % 2.3±0.8 8.2±1.5 ##
Stem rot frequency, % 5.5±1.2 2.0±0.5 ###
Other damage frequency, % 3.5±1.0 5.3±0.9 #
significance of difference: * – Student-t, # – chi2 Beetle preference for larger (i.e. higher and thicker),
undamaged (except root rot) spruce trees also contradicts conventional understanding of spruce susceptibility to bark beetles. The exception of root rot damaged trees is understandable, as pioneer beetles respond to tree volatiles. Nevertheless, it should be noted that the frequency of root rot and other kinds of damage was too low to allow one to make definite conclusions.
IV. Conclusions
Trees with dominant crowns (Kraft class 2) comprised 70.0 ±2.5% Ips typographus colonized spruce, but only 48.6±2.1 of non-attacked trees. Co-dominant trees (Kraft class 3) comprised 17,8±2,1% of trees colonized by Ips and 38,7±2,0% of healthy trees.
Attacked trees were larger (average height 31.9±0.6 m, diameter – 23.0 ±0.3 cm, bark thickness – 8.7±0.2) than healthy trees (average height 23.9±0.4 m, diameter – 19.2±0.3 cm bark thickness – 7.9±0.1 mm). Spruce trees damaged by root rot accounted for 5.5±1.2% of trees attacked by Ips, compared to 2.0±0.5% of healthy trees. Trees with other kinds of damage were less frequently attacked by spruce bark beetle.
Acknowledgements
This research was funded by a USDA Forest Service federal grant 00-CA-11232434-010
References [1] P. Zolubas, A.Žiogas “Recent outbreak of Ips typographus in Lithuania”, Methodology of forest insect and disease survey in cen-tral Europe, Warszawa, pp. 197-198, 1998. [2] A. Žiogas, P. Zolubas, “Forest pests survey and management in Lithuania”. Methodology of forest insect and disease survey in cen-tral Europe, Warszawa, pp. 63-67, 1998. [3] R.C. Campbell, Statistics for biologists, Cambridge University Press, 1989. [4] R. Dajoz, Insects and forests, Intercept Ltd, 2000.
Proccedings: IUFRO Kanazawa 2003 "Forest Insect Population Dynamics and Host Influences” - 97 -
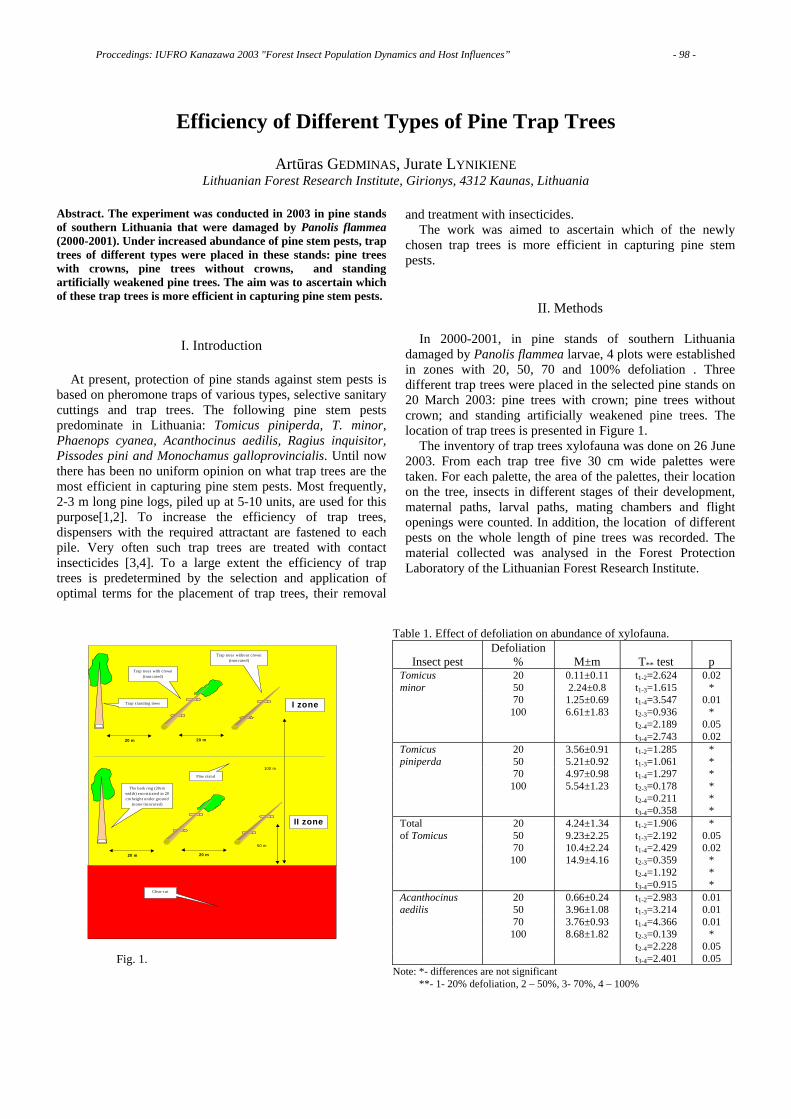
Efficiency of Different Types of Pine Trap Trees
Artūras GEDMINAS, Jurate LYNIKIENE Lithuanian Forest Research Institute, Girionys, 4312 Kaunas, Lithuania
Abstract. The experiment was conducted in 2003 in pine stands of southern Lithuania that were damaged by Panolis flammea (2000-2001). Under increased abundance of pine stem pests, trap trees of different types were placed in these stands: pine trees with crowns, pine trees without crowns, and standing artificially weakened pine trees. The aim was to ascertain which of these trap trees is more efficient in capturing pine stem pests.
I. Introduction
At present, protection of pine stands against stem pests is
based on pheromone traps of various types, selective sanitary cuttings and trap trees. The following pine stem pests predominate in Lithuania: Tomicus piniperda, T. minor, Phaenops cyanea, Acanthocinus aedilis, Ragius inquisitor, Pissodes pini and Monochamus galloprovincialis. Until now there has been no uniform opinion on what trap trees are the most efficient in capturing pine stem pests. Most frequently, 2-3 m long pine logs, piled up at 5-10 units, are used for this purpose[1,2]. To increase the efficiency of trap trees, dispensers with the required attractant are fastened to each pile. Very often such trap trees are treated with contact insecticides [3,4]. To a large extent the efficiency of trap trees is predetermined by the selection and application of optimal terms for the placement of trap trees, their removal
and treatment with insecticides. The work was aimed to ascertain which of the newly
chosen trap trees is more efficient in capturing pine stem pests.
II. Methods
In 2000-2001, in pine stands of southern Lithuania damaged by Panolis flammea larvae, 4 plots were established in zones with 20, 50, 70 and 100% defoliation . Three different trap trees were placed in the selected pine stands on 20 March 2003: pine trees with crown; pine trees without crown; and standing artificially weakened pine trees. The location of trap trees is presented in Figure 1.
The inventory of trap trees xylofauna was done on 26 June 2003. From each trap tree five 30 cm wide palettes were taken. For each palette, the area of the palettes, their location on the tree, insects in different stages of their development, maternal paths, larval paths, mating chambers and flight openings were counted. In addition, the location of different pests on the whole length of pine trees was recorded. The material collected was analysed in the Forest Protection Laboratory of the Lithuanian Forest Research Institute.
Fig. 1.
20 m 20 m
20 m 20 m
Trap trees with crown (truncuted)
Trap trees without crown (truncuted)
Pine s tand
Clear-cut
100 m
50 m
I zone
II zone
The bark ring (20cm width) excorticated in 20 cm height under ground
(none truncuted)
Trap s tanding trees
Table 1. Effect of defoliation on abundance of xylofauna.
Insect pest Defoliation
%
M±m
T** test
p Tomicus 20 0.11±0.11 t1-2=2.624 0.02minor 50 2.24±0.8 t1-3=1.615 * 70 1.25±0.69 t1-4=3.547 0.01 100 6.61±1.83 t2-3=0.936 * t2-4=2.189 0.05 t3-4=2.743 0.02Tomicus 20 3.56±0.91 t1-2=1.285 * piniperda 50 5.21±0.92 t1-3=1.061 * 70 4.97±0.98 t1-4=1.297 * 100 5.54±1.23 t2-3=0.178 * t2-4=0.211 * t3-4=0.358 * Total 20 4.24±1.34 t1-2=1.906 * of Tomicus 50 9.23±2.25 t1-3=2.192 0.05 70 10.4±2.24 t1-4=2.429 0.02 100 14.9±4.16 t2-3=0.359 * t2-4=1.192 * t3-4=0.915 * Acanthocinus 20 0.66±0.24 t1-2=2.983 0.01aedilis 50 3.96±1.08 t1-3=3.214 0.01 70 3.76±0.93 t1-4=4.366 0.01 100 8.68±1.82 t2-3=0.139 * t2-4=2.228 0.05 t3-4=2.401 0.05
Note: *- differences are not significant **- 1- 20% defoliation, 2 – 50%, 3- 70%, 4 – 100%
Proccedings: IUFRO Kanazawa 2003 "Forest Insect Population Dynamics and Host Influences” - 98 -

III. Results and Discussion
The percent composition of the xylofauna recorded during the inventory of trap trees was: Tomicus piniperda 29.9%, Acanthocinus aedilis 25.1%, Pityogenes chalcographus 15.4%, Scolytidae sp. 14.4%, Tomicus minor 12.1%, Thanasimus formicarius 2.5%, Ips sexdentatus 0.6%. This xylofauna composition differed in each variant of the experiment.
The data collected was analysed according to study zones, plots with different levels of crown defoliation and trap tree types. Comparison of the results has revealed that the abundance and diversity of xylofauna in trap trees is independent of how far from the cutting area they were placed in the forest. It can be explained by the fact that the main pine xylophagans accumulate not in cutting residues (stumps, branches), but in the stand itself. On average in 1000 cm² size palettes we found 5.3 Tomicus piniperda; 4.0 T. minor; 9.6 maternal paths of other Scolytidae sp.: 5.8 Acanthocinus aedilis; and 1.3 Thanasimus formicarius 1.3 specimens.
Comparing plots with different levels of damaged pine needles, it was found that the control (20% defoliation) plot reliably differs from other plots with 50%, 70% and 100% defoliation (Table 1).
In plots with higher defoliation, total abundance of xylofauna in trap trees did not differ and was 2.7 times higher than in the control stand.
The abundance of Tomicus piniperda was almost the same in different plots. It can be stated that pine defoliation level had no major significance on the abundance of this beetle. This factor was more important to Acanthocinus aedilis and Tomicus minor (Table 1).
Acanthocinus aedilis prefers strongly weakened pine trees and those already attacked by Tomicus piniperda. Therefore, its abundance in the100% defoliation plot was 2.2 times higher than in 50-70% plots and 13.1 times higher than in the control stand. Changes in the abundance of Tomicus minor in stands with different defoliation levels is similar to that of Acanthocinus aedilis.
The abundance of Tomicus piniperda was similar in all studied types of trap trees (Table 2). Tomicus minor and Acanthocinus aedilis were least abundant in standing trap trees. Acanthocinus aedilis was most abundant (6.27 spec./1000 cm²) in lying trap trees without crowns. This shows once again, that this beetle attacks weakened trees.
Tomicus minor mostly prefers lying trap trees with crowns. It is understandable, since trees with crowns stay viable for a longer time, providing suitable conditions for the development of Tomicus minor.
Xylofauna inventory support the statement found in the literature that Acanthocinus aedilis larvae can additionally feed on Tomicus piniperda larvae and pupae. Under higher abundance of Acanthocinus aedilis and Thanasimus formicarius larvae, the abundance of Tomicus piniperda significantly decreases. Based on the number of maternal paths of Tomicus piniperda, we predict that about 250
offsprings should develop per 1000 cm². During our inventories, Acanthocinum aedilis (5.8 spec./1000 cm²), Thanasimus formicarius (1.3 spec./ 1000 cm²) and diseases killed about 96% of Tomicus piniperda offspring of the new generation.
Tomicus piniperda is efficiently captured by standing artificially weakened trap trees. Such trap trees successfully attract the adults of Tomicus piniperda (8.3 spec./ 1000 cm²). However, high resin content in these trap trees has completely stopped the development of the new generation.
IV. Conclusions 1. According to the amount of attracted xylofauna, the most
efficient were lying trap trees with crowns, followed by lying trap trees without crowns.
2. During the experiment Acanthacinus aedilis (5.8 spec./ 1000 cm²), Thanasimus formicarius (1.3 spec./ 1000 cm²) and diseases killed 96% of Tomicus piniperda offsprings of the new generation.
3. Crown defoliation level did not influence the attraction of Tomicus piniperda and Tomicus minor to trap trees but trapping Acanthocinus aedilis is best in stands with 90-100% crown defoliation.
References [1] Воронцов А.И. 1978. Патология леса. М., C. 266. [2] Воронцов А.И., Мозолевская Е.Т., Соколова Э.С. Технология защиты леса. М. “Экология”, 1991.-304. [3] Žiogas A. 1997. Miško entomologija. Kaunas, 272 p. [4] Miško apsaugos vadovas. 2000. Kaunas, Lututė, 351 p.
Proccedings: IUFRO Kanazawa 2003 "Forest Insect Population Dynamics and Host Influences” - 99 -
Outbreaks of Pine Defoliating Insects and Radial Growth
Artūras GEDMINAS Lithuanian Forest Research Institute, Liepu 1, Girionys, LT-4312 Kaunas reg., LITHUANIA
Abstract. Analysis of radial increments of pines in southern Lithuania suggest that outbreaks of needle-eating pests became more frequent during periods of reduced radial increment of pine trees (every 12-15 years). Reductions in radial increment included: 1.05% of volume increment, (i.e. 3.28 m³/ha) due to damage by Diprion pini L., for 3 years; - 3.46% (10.8 m³/ha) due to Lymantria monacha L. over 5 years;; - 2.58% (8.05 m³/ha ) over 5 years due to Dendrolimus pini L.; and - 2.11%, (6.58 m³/ha) due to damage by Panolis flammea Schiff..
I. Introduction
It is said, that a severe damage of needles is expressed by a 6-fold loss of mean annual increment, and normal functioning of trees can start again only after 10 years. The studies of other authors in III-IV age class pine stands show, that they can withstand a complete loss of needles caused by pine noctuid only once, while 60% loss of needles fails to worsen the state of pine stands [11]. 100% damage of needles means the loss of six mean annual increments [10].
In 1957, under mass outbreak of Acantholyda posticalis Mats. in 60-80-year-old pine stands in the Vitebsk region, the increment of pines decreased 2.5-3.5 times and did not fully recover in ten years [6]. Due to the loss of needles, top branches of trees begin to die, which lead to the reduction in stand height [5].
Until recently, not much attention was paid to stand losses caused by pests and to their economic evaluation. Prof. Vorontsov [4] tried to tackle the problem on a wider scale. Some authors state that diversity in the assessment of losses is independent of the species of insects [9]. It was found that levels of defoliation of up to 80% caused by Diprion pini L., Lymantria monacha L., Dendrolimus pini L., Panolis flammea Schiff. or other needle-eating pests, reduce diameter increment of that year by 12-30%, that of the next year by 40-60%, and that of the subsequent year by 30-60%., i.e. by 80-150% calculating from mean annual increment.
A complete loss of needles only once reduces increment in the current and two subsequent years by 60%, 60-100% and 40-80%, or cumunatively by 160-240%. On average, diameter increment recovers only after 6-8 years, but not in all trees [9].
In general, data in the literature differ even when the influence of only one species of insects is described, and especially in cases of low or average defoliation. Some authors think that 10-30% defoliation has no major impact on the stand, while others state that 10-15% loss of needles requires a recovery period of two years. In most cases this is the consequence of different calculation methods. According to the scientists from Ukraine, pine trees with defoliation
levels up to 25% over all years of their weakened condition lose 0.5, 25-50% - 3, 50-75% - 4, 75-100% - 6 mean annual increments [10].
In practice, very often calculations of losses are based on elimination of other factors, comparing the increment of damaged or control stands [8], or comparing the increment of the same stand in the year of damage and in following years [3,7,12].
Estimation of increment losses is necessary to ascertain the usefulness of counteracting measures. According to the data of V.N.Trofimov and O.V.Trofimova, counteracting measures should be applied under greater than 60% loss of needles [11].
This work was aimed to ascertain the peculiarities of changes in pine radial increment over a 30-year period (1972-2002) as well as to estimate the losses of radial increment in pine stands of southern Lithuania, suffering from permanent outbreaks of needle-eating insects.
II. Methods
The work was carried out in 2002 in the pine stands of southern Lithuania (in forest enterprises of Druskininkai, Veisiejai and in Dzūkija National Park). Based on the data collected by the Station of Forest Sanitary Protection [1] on damage in Lithuanian stands over 30 years, we have chosen needle-eating pests which dominated in this period: Diprion pini L.; Lymantria monacha L.; Dendrolimus pini L.; and Panolis flammea Schiff.
In various damaged pine stands, 13 plots with differing tree damage characteristics were selected. Pine trees in one plot (plot 1) over the studied period were damaged 4 times, in another (plot 2) – 3 times, in six (plots 3-7 and 15) – twice, and in five remaining plots (8, 12, 17-19), only once. Diverse combinations of damage were chosen: by one of all the mentioned needle-eating pest species; repeated damage by the same species; damage by different species, etc. Control plots (9, 11, 13, 14, 16) were selected in pine stands where over the last 30 years no damage was registered. All chosen pine stands were of similar age (on average 85 years), and site type -Na.
In each plot 20 pine trees were randomly selected and in October 2002, one core sample was taken from them with Presler’s borer in a NS direction at 1.3 m height from the ground. All in all, 340 samples were taken. Analysis of the samples was conducted in the laboratory of the Lithuanian Forest Research Institute.
Proccedings: IUFRO Kanazawa 2003 "Forest Insect Population Dynamics and Host Influences” - 100 -
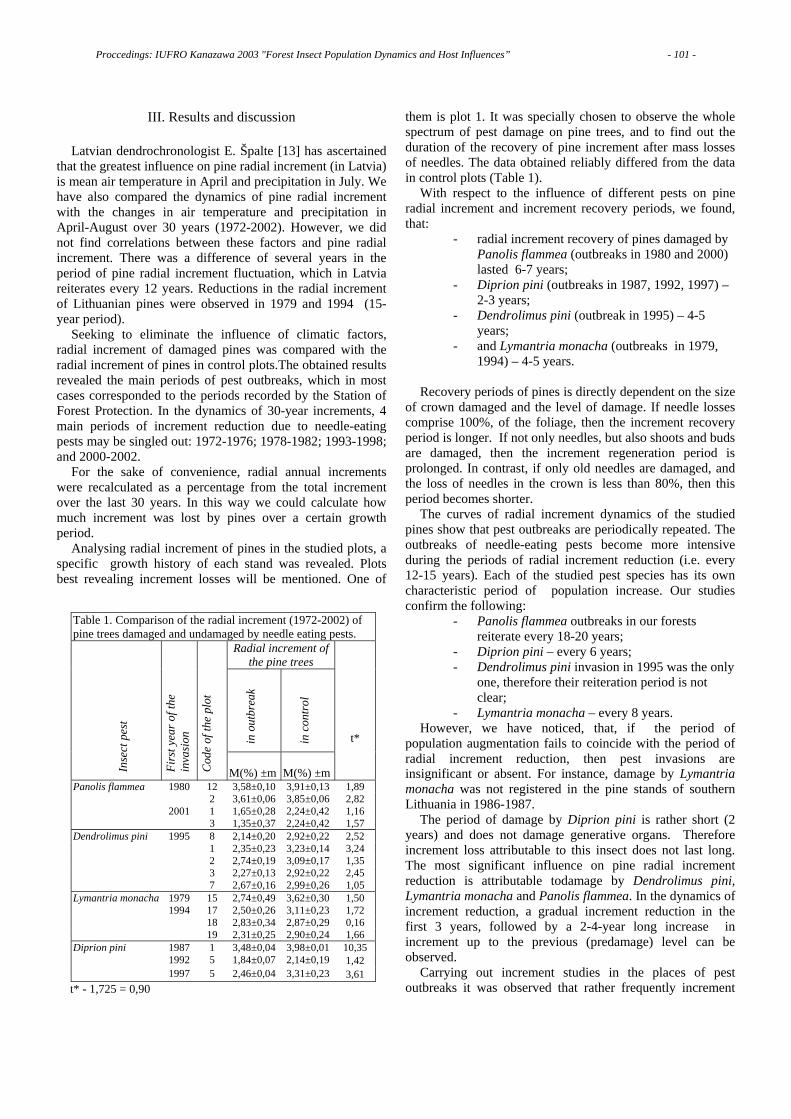
III. Results and discussion
Latvian dendrochronologist E. Špalte [13] has ascertained that the greatest influence on pine radial increment (in Latvia) is mean air temperature in April and precipitation in July. We have also compared the dynamics of pine radial increment with the changes in air temperature and precipitation in April-August over 30 years (1972-2002). However, we did not find correlations between these factors and pine radial increment. There was a difference of several years in the period of pine radial increment fluctuation, which in Latvia reiterates every 12 years. Reductions in the radial increment of Lithuanian pines were observed in 1979 and 1994 (15-year period).
Seeking to eliminate the influence of climatic factors, radial increment of damaged pines was compared with the radial increment of pines in control plots.The obtained results revealed the main periods of pest outbreaks, which in most cases corresponded to the periods recorded by the Station of Forest Protection. In the dynamics of 30-year increments, 4 main periods of increment reduction due to needle-eating pests may be singled out: 1972-1976; 1978-1982; 1993-1998; and 2000-2002.
For the sake of convenience, radial annual increments were recalculated as a percentage from the total increment over the last 30 years. In this way we could calculate how much increment was lost by pines over a certain growth period.
Analysing radial increment of pines in the studied plots, a specific growth history of each stand was revealed. Plots best revealing increment losses will be mentioned. One of
them is plot 1. It was specially chosen to observe the whole spectrum of pest damage on pine trees, and to find out the duration of the recovery of pine increment after mass losses of needles. The data obtained reliably differed from the data in control plots (Table 1).
With respect to the influence of different pests on pine radial increment and increment recovery periods, we found, that:
- radial increment recovery of pines damaged by Panolis flammea (outbreaks in 1980 and 2000) lasted 6-7 years;
- Diprion pini (outbreaks in 1987, 1992, 1997) – 2-3 years;
- Dendrolimus pini (outbreak in 1995) – 4-5 years;
- and Lymantria monacha (outbreaks in 1979, 1994) – 4-5 years.
Recovery periods of pines is directly dependent on the size
of crown damaged and the level of damage. If needle losses comprise 100%, of the foliage, then the increment recovery period is longer. If not only needles, but also shoots and buds are damaged, then the increment regeneration period is prolonged. In contrast, if only old needles are damaged, and the loss of needles in the crown is less than 80%, then this period becomes shorter.
The curves of radial increment dynamics of the studied pines show that pest outbreaks are periodically repeated. The outbreaks of needle-eating pests become more intensive during the periods of radial increment reduction (i.e. every 12-15 years). Each of the studied pest species has its own characteristic period of population increase. Our studies confirm the following:
- Panolis flammea outbreaks in our forests reiterate every 18-20 years;
- Diprion pini – every 6 years; - Dendrolimus pini invasion in 1995 was the only
one, therefore their reiteration period is not clear;
- Lymantria monacha – every 8 years. However, we have noticed, that, if the period of
population augmentation fails to coincide with the period of radial increment reduction, then pest invasions are insignificant or absent. For instance, damage by Lymantria monacha was not registered in the pine stands of southern Lithuania in 1986-1987.
The period of damage by Diprion pini is rather short (2 years) and does not damage generative organs. Therefore increment loss attributable to this insect does not last long. The most significant influence on pine radial increment reduction is attributable todamage by Dendrolimus pini, Lymantria monacha and Panolis flammea. In the dynamics of increment reduction, a gradual increment reduction in the first 3 years, followed by a 2-4-year long increase in increment up to the previous (predamage) level can be observed.
Carrying out increment studies in the places of pest outbreaks it was observed that rather frequently increment
Table 1. Comparison of the radial increment (1972-2002) of pine trees damaged and undamaged by needle eating pests.
Radial increment of the pine trees
in
out
brea
k
in
con
trol
t*
In
sect
pes
t
Firs
t yea
r of t
he
inva
sion
Cod
e of
the
plot
M(%) ±m
M(%) ±m
Panolis flammea 1980 12 3,58±0,10 3,91±0,13 1,89 2 3,61±0,06 3,85±0,06 2,82 2001 1 1,65±0,28 2,24±0,42 1,16 3 1,35±0,37 2,24±0,42 1,57 Dendrolimus pini 1995 8 2,14±0,20 2,92±0,22 2,52 1 2,35±0,23 3,23±0,14 3,24 2 2,74±0,19 3,09±0,17 1,35 3 2,27±0,13 2,92±0,22 2,45 7 2,67±0,16 2,99±0,26 1,05 Lymantria monacha 1979 15 2,74±0,49 3,62±0,30 1,50 1994 17 2,50±0,26 3,11±0,23 1,72 18 2,83±0,34 2,87±0,29 0,16 19 2,31±0,25 2,90±0,24 1,66 Diprion pini 1987 1 3,48±0,04 3,98±0,01 10,35 1992 5 1,84±0,07 2,14±0,19 1,42 1997 5 2,46±0,04 3,31±0,23 3,61 t* - 1,725 = 0,90
Proccedings: IUFRO Kanazawa 2003 "Forest Insect Population Dynamics and Host Influences” - 101 -
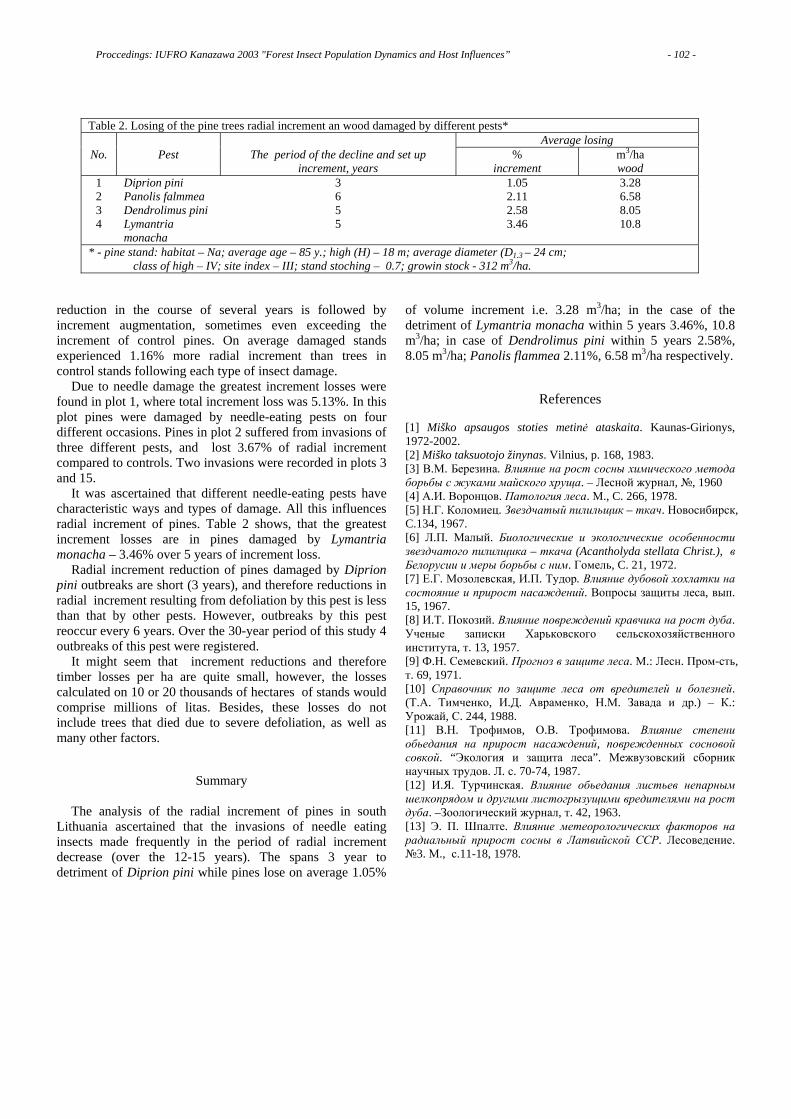
reduction in the course of several years is followed by increment augmentation, sometimes even exceeding the increment of control pines. On average damaged stands experienced 1.16% more radial increment than trees in control stands following each type of insect damage.
Due to needle damage the greatest increment losses were found in plot 1, where total increment loss was 5.13%. In this plot pines were damaged by needle-eating pests on four different occasions. Pines in plot 2 suffered from invasions of three different pests, and lost 3.67% of radial increment compared to controls. Two invasions were recorded in plots 3 and 15.
It was ascertained that different needle-eating pests have characteristic ways and types of damage. All this influences radial increment of pines. Table 2 shows, that the greatest increment losses are in pines damaged by Lymantria monacha – 3.46% over 5 years of increment loss.
Radial increment reduction of pines damaged by Diprion pini outbreaks are short (3 years), and therefore reductions in radial increment resulting from defoliation by this pest is less than that by other pests. However, outbreaks by this pest reoccur every 6 years. Over the 30-year period of this study 4 outbreaks of this pest were registered.
It might seem that increment reductions and therefore timber losses per ha are quite small, however, the losses calculated on 10 or 20 thousands of hectares of stands would comprise millions of litas. Besides, these losses do not include trees that died due to severe defoliation, as well as many other factors.
Summary
The analysis of the radial increment of pines in south Lithuania ascertained that the invasions of needle eating insects made frequently in the period of radial increment decrease (over the 12-15 years). The spans 3 year to detriment of Diprion pini while pines lose on average 1.05%
of volume increment i.e. 3.28 m3/ha; in the case of the detriment of Lymantria monacha within 5 years 3.46%, 10.8 m3/ha; in case of Dendrolimus pini within 5 years 2.58%, 8.05 m3/ha; Panolis flammea 2.11%, 6.58 m3/ha respectively.
References [1] Miško apsaugos stoties metinė ataskaita. Kaunas-Girionys, 1972-2002. [2] Miško taksuotojo žinynas. Vilnius, p. 168, 1983. [3] В.М. Березина. Влияние на рост сосны химического метода борьбы с жуками майcкого хруща. – Лесной журнал, №, 1960 [4] А.И. Воронцов. Патология леса. М., C. 266, 1978. [5] Н.Г. Коломиец. Звездчатый пилильщик – ткач. Новосибирск, C.134, 1967. [6] Л.П. Малый. Биологические и экологические особенности звездчатого пилилщика – ткача (Acantholyda stellata Christ.), в Белорусии и меры борьбы с ним. Гомель, C. 21, 1972. [7] Е.Г. Мозолевская, И.П. Тудор. Влияние дубовой хохлатки на состояние и прирост насаждений. Вопросы защиты леса, вып. 15, 1967. [8] И.Т. Покозий. Влияние повреждений кравчика на рост дуба. Ученые записки Харьковского сельскохозяйственного института, т. 13, 1957. [9] Ф.Н. Семевский. Прогноз в защите леса. М.: Лесн. Пром-сть, т. 69, 1971. [10] Справочник по защите леса от вредителей и болезней. (Т.А. Тимченко, И.Д. Авраменко, Н.М. Завада и др.) – К.: Урожай, С. 244, 1988. [11] В.Н. Трофимов, О.В. Трофимова. Влияние степени обьедания на прирост насаждений, поврежденных сосновой совкой. “Экология и защита леса”. Межвузовский сборник научных трудов. Л. с. 70-74, 1987. [12] И.Я. Турчинская. Влияние обьедания листьев непарным шелкопрядом и другими листогрызущими вредителями на рост дуба. –Зоологический журнал, т. 42, 1963. [13] Э. П. Шпалте. Влияние метеорологических факторов на радиальный прирост сосны в Латвийской ССР. Лесоведение. №3. М., с.11-18, 1978.
Table 2. Losing of the pine trees radial increment an wood damaged by different pests* Average losing
No. Pest The period of the decline and set up increment, years
% increment
m3/ha wood
1 Diprion pini 3 1.05 3.28 2 Panolis falmmea 6 2.11 6.58 3 Dendrolimus pini 5 2.58 8.05 4 Lymantria
monacha 5 3.46 10.8
* - pine stand: habitat – Na; average age – 85 y.; high (H) – 18 m; average diameter (D1.3 – 24 cm; class of high – IV; site index – III; stand stoching – 0.7; growin stock - 312 m3/ha.
Proccedings: IUFRO Kanazawa 2003 "Forest Insect Population Dynamics and Host Influences” - 102 -
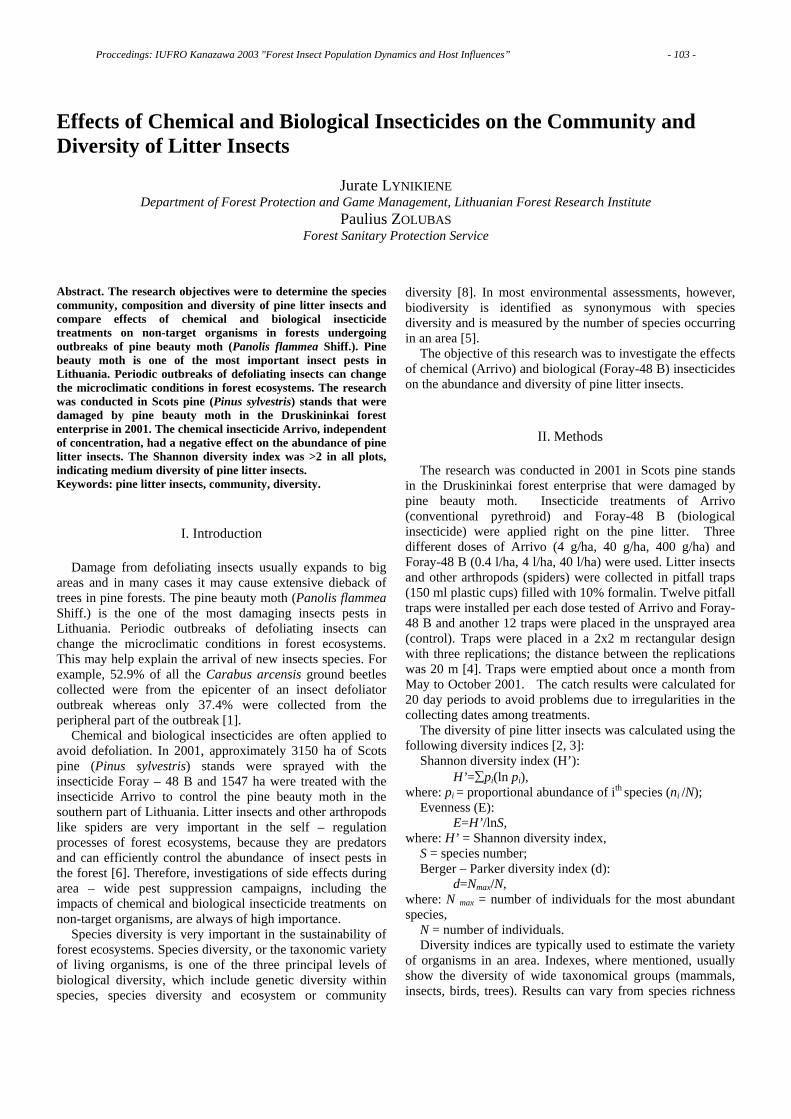
Effects of Chemical and Biological Insecticides on the Community and Diversity of Litter Insects
Jurate LYNIKIENE
Department of Forest Protection and Game Management, Lithuanian Forest Research Institute Paulius ZOLUBAS
Forest Sanitary Protection Service
Abstract. The research objectives were to determine the species community, composition and diversity of pine litter insects and compare effects of chemical and biological insecticide treatments on non-target organisms in forests undergoing outbreaks of pine beauty moth (Panolis flammea Shiff.). Pine beauty moth is one of the most important insect pests in Lithuania. Periodic outbreaks of defoliating insects can change the microclimatic conditions in forest ecosystems. The research was conducted in Scots pine (Pinus sylvestris) stands that were damaged by pine beauty moth in the Druskininkai forest enterprise in 2001. The chemical insecticide Arrivo, independent of concentration, had a negative effect on the abundance of pine litter insects. The Shannon diversity index was >2 in all plots, indicating medium diversity of pine litter insects. Keywords: pine litter insects, community, diversity.
I. Introduction
Damage from defoliating insects usually expands to big areas and in many cases it may cause extensive dieback of trees in pine forests. The pine beauty moth (Panolis flammea Shiff.) is the one of the most damaging insects pests in Lithuania. Periodic outbreaks of defoliating insects can change the microclimatic conditions in forest ecosystems. This may help explain the arrival of new insects species. For example, 52.9% of all the Carabus arcensis ground beetles collected were from the epicenter of an insect defoliator outbreak whereas only 37.4% were collected from the peripheral part of the outbreak [1].
Chemical and biological insecticides are often applied to avoid defoliation. In 2001, approximately 3150 ha of Scots pine (Pinus sylvestris) stands were sprayed with the insecticide Foray – 48 B and 1547 ha were treated with the insecticide Arrivo to control the pine beauty moth in the southern part of Lithuania. Litter insects and other arthropods like spiders are very important in the self – regulation processes of forest ecosystems, because they are predators and can efficiently control the abundance of insect pests in the forest [6]. Therefore, investigations of side effects during area – wide pest suppression campaigns, including the impacts of chemical and biological insecticide treatments on non-target organisms, are always of high importance.
Species diversity is very important in the sustainability of forest ecosystems. Species diversity, or the taxonomic variety of living organisms, is one of the three principal levels of biological diversity, which include genetic diversity within species, species diversity and ecosystem or community
diversity [8]. In most environmental assessments, however, biodiversity is identified as synonymous with species diversity and is measured by the number of species occurring in an area [5].
The objective of this research was to investigate the effects of chemical (Arrivo) and biological (Foray-48 B) insecticides on the abundance and diversity of pine litter insects.
II. Methods The research was conducted in 2001 in Scots pine stands
in the Druskininkai forest enterprise that were damaged by pine beauty moth. Insecticide treatments of Arrivo (conventional pyrethroid) and Foray-48 B (biological insecticide) were applied right on the pine litter. Three different doses of Arrivo (4 g/ha, 40 g/ha, 400 g/ha) and Foray-48 B (0.4 l/ha, 4 l/ha, 40 l/ha) were used. Litter insects and other arthropods (spiders) were collected in pitfall traps (150 ml plastic cups) filled with 10% formalin. Twelve pitfall traps were installed per each dose tested of Arrivo and Foray-48 B and another 12 traps were placed in the unsprayed area (control). Traps were placed in a 2x2 m rectangular design with three replications; the distance between the replications was 20 m [4]. Traps were emptied about once a month from May to October 2001. The catch results were calculated for 20 day periods to avoid problems due to irregularities in the collecting dates among treatments.
The diversity of pine litter insects was calculated using the following diversity indices [2, 3]:
Shannon diversity index (H’): H’=∑pi(ln pi),
where: pi = proportional abundance of ith species (ni /N); Evenness (E):
E=H’/lnS, where: H’ = Shannon diversity index,
S = species number; Berger – Parker diversity index (d):
d=Nmax/N, where: N max = number of individuals for the most abundant species,
N = number of individuals. Diversity indices are typically used to estimate the variety
of organisms in an area. Indexes, where mentioned, usually show the diversity of wide taxonomical groups (mammals, insects, birds, trees). Results can vary from species richness
Proccedings: IUFRO Kanazawa 2003 "Forest Insect Population Dynamics and Host Influences” - 103 -
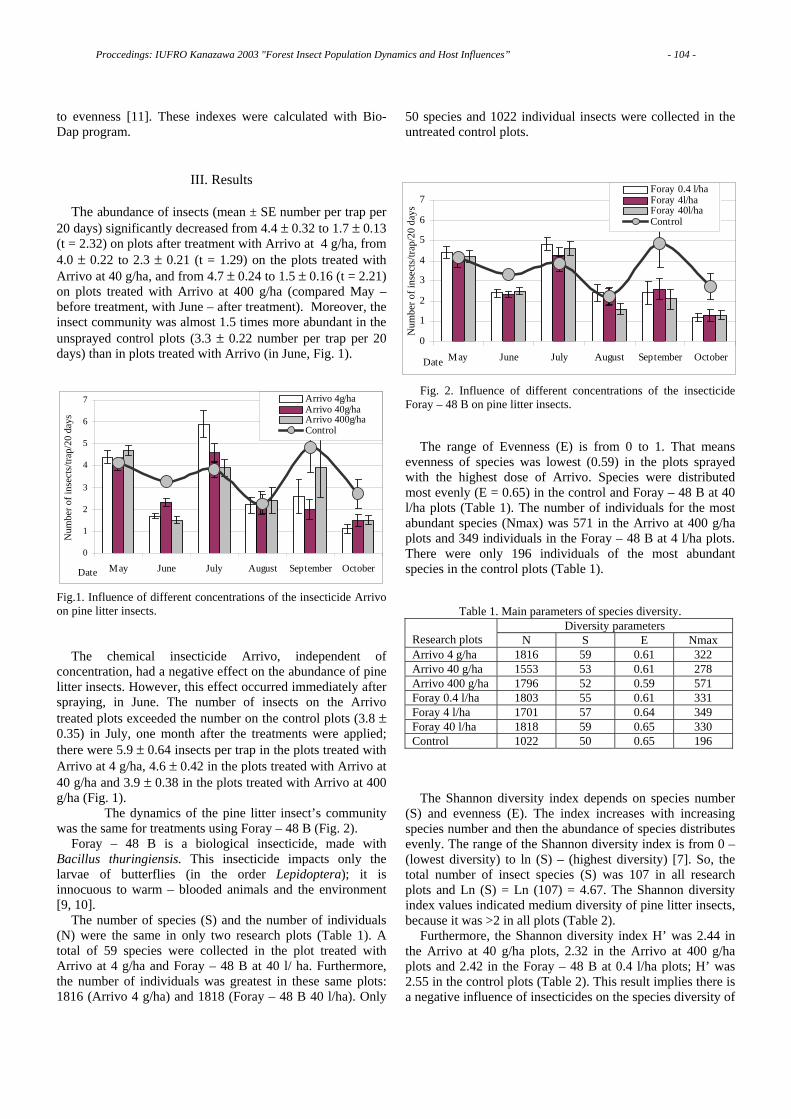
to evenness [11]. These indexes were calculated with Bio-Dap program.
III. Results
The abundance of insects (mean ± SE number per trap per 20 days) significantly decreased from 4.4 ± 0.32 to 1.7 ± 0.13 (t = 2.32) on plots after treatment with Arrivo at 4 g/ha, from 4.0 ± 0.22 to 2.3 ± 0.21 (t = 1.29) on the plots treated with Arrivo at 40 g/ha, and from 4.7 ± 0.24 to 1.5 ± 0.16 (t = 2.21) on plots treated with Arrivo at 400 g/ha (compared May – before treatment, with June – after treatment). Moreover, the insect community was almost 1.5 times more abundant in the unsprayed control plots (3.3 ± 0.22 number per trap per 20 days) than in plots treated with Arrivo (in June, Fig. 1).
Fig.1. Influence of different concentrations of the insecticide Arrivo on pine litter insects.
The chemical insecticide Arrivo, independent of
concentration, had a negative effect on the abundance of pine litter insects. However, this effect occurred immediately after spraying, in June. The number of insects on the Arrivo treated plots exceeded the number on the control plots (3.8 ± 0.35) in July, one month after the treatments were applied; there were 5.9 ± 0.64 insects per trap in the plots treated with Arrivo at 4 g/ha, 4.6 ± 0.42 in the plots treated with Arrivo at 40 g/ha and 3.9 ± 0.38 in the plots treated with Arrivo at 400 g/ha (Fig. 1).
The dynamics of the pine litter insect’s community was the same for treatments using Foray – 48 B (Fig. 2).
Foray – 48 B is a biological insecticide, made with Bacillus thuringiensis. This insecticide impacts only the larvae of butterflies (in the order Lepidoptera); it is innocuous to warm – blooded animals and the environment [9, 10].
The number of species (S) and the number of individuals (N) were the same in only two research plots (Table 1). A total of 59 species were collected in the plot treated with Arrivo at 4 g/ha and Foray – 48 B at 40 l/ ha. Furthermore, the number of individuals was greatest in these same plots: 1816 (Arrivo 4 g/ha) and 1818 (Foray – 48 B 40 l/ha). Only
50 species and 1022 individual insects were collected in the untreated control plots.
Fig. 2. Influence of different concentrations of the insecticide
Foray – 48 B on pine litter insects. The range of Evenness (E) is from 0 to 1. That means
evenness of species was lowest (0.59) in the plots sprayed with the highest dose of Arrivo. Species were distributed most evenly (E = 0.65) in the control and Foray – 48 B at 40 l/ha plots (Table 1). The number of individuals for the most abundant species (Nmax) was 571 in the Arrivo at 400 g/ha plots and 349 individuals in the Foray – 48 B at 4 l/ha plots. There were only 196 individuals of the most abundant species in the control plots (Table 1).
The Shannon diversity index depends on species number
(S) and evenness (E). The index increases with increasing species number and then the abundance of species distributes evenly. The range of the Shannon diversity index is from 0 – (lowest diversity) to ln (S) – (highest diversity) [7]. So, the total number of insect species (S) was 107 in all research plots and Ln (S) = Ln (107) = 4.67. The Shannon diversity index values indicated medium diversity of pine litter insects, because it was >2 in all plots (Table 2).
Furthermore, the Shannon diversity index H’ was 2.44 in the Arrivo at 40 g/ha plots, 2.32 in the Arrivo at 400 g/ha plots and 2.42 in the Foray – 48 B at 0.4 l/ha plots; H’ was 2.55 in the control plots (Table 2). This result implies there is a negative influence of insecticides on the species diversity of
0
1
2
3
4
5
6
7
May June July August September OctoberDate
Num
ber o
f ins
ects
/trap
/20
days
Arrivo 4g/haArrivo 40g/haArrivo 400g/haControl
0
1
2
3
4
5
6
7
May June July August September OctoberDate
Num
ber o
f ins
ects
/trap
/20
days
Foray 0.4 l/haForay 4l/haForay 40l/haControl
Table 1. Main parameters of species diversity. Diversity parameters
Research plots N S E Nmax Arrivo 4 g/ha 1816 59 0.61 322 Arrivo 40 g/ha 1553 53 0.61 278 Arrivo 400 g/ha 1796 52 0.59 571 Foray 0.4 l/ha 1803 55 0.61 331 Foray 4 l/ha 1701 57 0.64 349 Foray 40 l/ha 1818 59 0.65 330 Control 1022 50 0.65 196
Proccedings: IUFRO Kanazawa 2003 "Forest Insect Population Dynamics and Host Influences” - 104 -
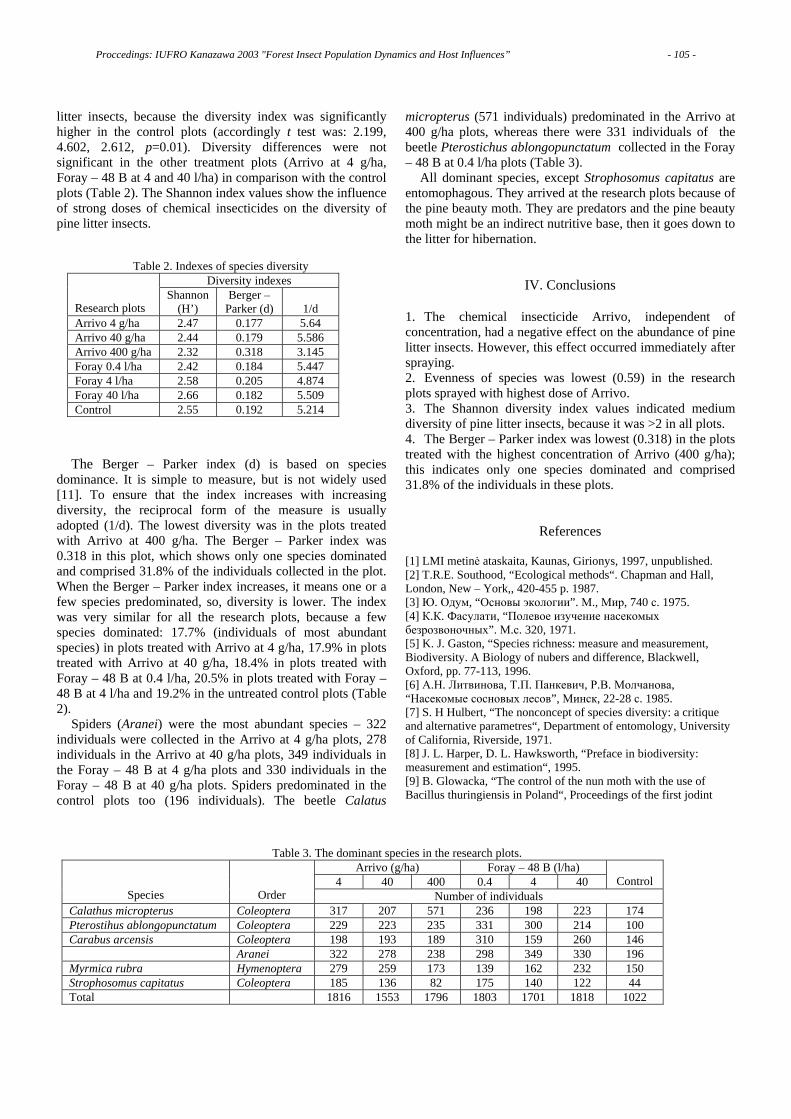
litter insects, because the diversity index was significantly higher in the control plots (accordingly t test was: 2.199, 4.602, 2.612, p=0.01). Diversity differences were not significant in the other treatment plots (Arrivo at 4 g/ha, Foray – 48 B at 4 and 40 l/ha) in comparison with the control plots (Table 2). The Shannon index values show the influence of strong doses of chemical insecticides on the diversity of pine litter insects.
The Berger – Parker index (d) is based on species
dominance. It is simple to measure, but is not widely used [11]. To ensure that the index increases with increasing diversity, the reciprocal form of the measure is usually adopted (1/d). The lowest diversity was in the plots treated with Arrivo at 400 g/ha. The Berger – Parker index was 0.318 in this plot, which shows only one species dominated and comprised 31.8% of the individuals collected in the plot. When the Berger – Parker index increases, it means one or a few species predominated, so, diversity is lower. The index was very similar for all the research plots, because a few species dominated: 17.7% (individuals of most abundant species) in plots treated with Arrivo at 4 g/ha, 17.9% in plots treated with Arrivo at 40 g/ha, 18.4% in plots treated with Foray – 48 B at 0.4 l/ha, 20.5% in plots treated with Foray – 48 B at 4 l/ha and 19.2% in the untreated control plots (Table 2).
Spiders (Aranei) were the most abundant species – 322 individuals were collected in the Arrivo at 4 g/ha plots, 278 individuals in the Arrivo at 40 g/ha plots, 349 individuals in the Foray – 48 B at 4 g/ha plots and 330 individuals in the Foray – 48 B at 40 g/ha plots. Spiders predominated in the control plots too (196 individuals). The beetle Calatus
micropterus (571 individuals) predominated in the Arrivo at 400 g/ha plots, whereas there were 331 individuals of the beetle Pterostichus ablongopunctatum collected in the Foray – 48 B at 0.4 l/ha plots (Table 3).
All dominant species, except Strophosomus capitatus are entomophagous. They arrived at the research plots because of the pine beauty moth. They are predators and the pine beauty moth might be an indirect nutritive base, then it goes down to the litter for hibernation.
IV. Conclusions
1. The chemical insecticide Arrivo, independent of concentration, had a negative effect on the abundance of pine litter insects. However, this effect occurred immediately after spraying. 2. Evenness of species was lowest (0.59) in the research plots sprayed with highest dose of Arrivo. 3. The Shannon diversity index values indicated medium diversity of pine litter insects, because it was >2 in all plots. 4. The Berger – Parker index was lowest (0.318) in the plots treated with the highest concentration of Arrivo (400 g/ha); this indicates only one species dominated and comprised 31.8% of the individuals in these plots.
References [1] LMI metinė ataskaita, Kaunas, Girionys, 1997, unpublished. [2] T.R.E. Southood, “Ecological methods“. Chapman and Hall, London, New – York,, 420-455 p. 1987. [3] Ю. Одум, “Основы экологии”. М., Мир, 740 с. 1975. [4] К.К. Фасулати, “Полевое изучение насекомых безрозвоночных”. М.с. 320, 1971. [5] K. J. Gaston, “Species richness: measure and measurement, Biodiversity. A Biology of nubers and difference, Blackwell, Oxford, pp. 77-113, 1996. [6] А.Н. Литвинова, Т.П. Панкевич, Р.В. Молчанова, “Насекомые сосновых лесов”, Минск, 22-28 с. 1985. [7] S. H Hulbert, “The nonconcept of species diversity: a critique and alternative parametres“, Department of entomology, University of California, Riverside, 1971. [8] J. L. Harper, D. L. Hawksworth, “Preface in biodiversity: measurement and estimation“, 1995. [9] B. Glowacka, “The control of the nun moth with the use of Bacillus thuringiensis in Poland“, Proceedings of the first jodint
Table 2. Indexes of species diversity Diversity indexes
Research plots
Shannon (H’)
Berger – Parker (d)
1/d
Arrivo 4 g/ha 2.47 0.177 5.64 Arrivo 40 g/ha 2.44 0.179 5.586 Arrivo 400 g/ha 2.32 0.318 3.145 Foray 0.4 l/ha 2.42 0.184 5.447 Foray 4 l/ha 2.58 0.205 4.874 Foray 40 l/ha 2.66 0.182 5.509 Control 2.55 0.192 5.214
Table 3. The dominant species in the research plots. Arrivo (g/ha) Foray – 48 B (l/ha)
4 40 400 0.4 4 40
Control
Species
Order Number of individuals Calathus micropterus Coleoptera 317 207 571 236 198 223 174 Pterostihus ablongopunctatum Coleoptera 229 223 235 331 300 214 100 Carabus arcensis Coleoptera 198 193 189 310 159 260 146 Aranei 322 278 238 298 349 330 196 Myrmica rubra Hymenoptera 279 259 173 139 162 232 150 Strophosomus capitatus Coleoptera 185 136 82 175 140 122 44 Total 1816 1553 1796 1803 1701 1818 1022
Proccedings: IUFRO Kanazawa 2003 "Forest Insect Population Dynamics and Host Influences” - 105 -

meeting. Bulletin, OILB – SROP, 57-60 p. 1996. [10] A. Lindelow, “Outbreak of pine looper moth in Sweden“, Tallmataruroft pa Uokensas, Vaxtsyddsnostirr, 5 ref, 100-103 p. 1997. [11] A. E. Maguran, “Ecological diversity and its measurement“, Princeton Univ. Press, Princeton, N.Y, 179 p., 1988.
Proccedings: IUFRO Kanazawa 2003 "Forest Insect Population Dynamics and Host Influences” - 106 -

Comparison of Foliar Defense by Chemical Analysis and Bioassay in Betulaceae Seedlings
Sawako MATSUKI Graduate School of Agriculture, Hokkaido University, Sapporo 060-8589, JAPAN
Hirohumi HARA Center for Ecological Research, Kyoto University, Otsu 520-2113, JAPAN
Takayoshi KOIKE Hokkaido University Forest, FSC, Sapporo 060-0809, JAPAN
Abstract – Chemical analysis and bioassay test were carried out to clarify the specific differences in leaf quality and in growth of the gypsy moth on six Betulaceae species. We found significant differences in leaf quality and in pupal mass across species. However, the difference in growth was not explained by levels of defensive compounds or by the water and nitrogen content of leaves. Long and thick hairs on leaf surface were observed in non-palatable species.
I. Introduction
The gypsy moth (Lymantria dispar) is a typical polyphagous feeder on deciduous trees and exhibits cyclical outbreaks over extensive regions of Japan [1, 2]. From 2000 to 2003 we found an outbreak of the gypsy moth in the Nakagawa Experimental Forest (in the northern part of Hokkaido island). In this forest, variation in the intensity of feeding by the gypsy moth was observed. Although it was reported that the gypsy moth preferred larch and birch species [3], its order of preference of various Betulaceae species is still unknown. The Betulaceae species distributed in Hokkaido thrive at different stages of forest establishment. Alnus hirsuta and Betula sp. are typical pioneer species, showing high growth and photosynthetic rate under high light condition, indeterminant growth pattern and a short leaf lifespan. In contrast, Carpinus cordata thrives at the relatively shady forest floor, showing determinant growth pattern and a long leaf lifespan. Ostrya japonica shows an intermediate pattern of growth between these extremes. The growth / differentiation hypothesis [4] and the cost-benefit hypothesis [5] suggest that fast growing species should be more palatable to herbivores than slow growing species, because defense is costly and competes with productivity. Phenolic compounds (e.g. total phenolics and condensed tannin) are typical defensive compounds against herbivores. Toughness and hairs (non-glandular trichome) are also effective at preventing feeding by herbivores. High water and nitrogen content in leaves have a positive effect on the growth of herbivores. Larvae of the gypsy moth were grown with leaves of six Betulaceae species, and defensive parameters, together with water and nitrogen content of the leaves, were analyzed.
II. Materials and Methods
Gypsy moths (Lymantria dispar) were grown from eggs to pupae with leaves of six 3-year-old Betulaceae seedlings (Alnus hirsuta=Ah, Betula platyphylla var. japonica=Bp, B. ermanii=Be, B. maximowicziana=Bm, Ostrya japonica=Oj and Carpinus cordata=Cc). This took from mid May to mid June in 2002. The fresh masses of pupae were measured. Egg mass was sampled from the Nakagawa Experimental Forest in spring 2002. The seedlings were grown at the nursery of the Sapporo Experimental Forest from spring 2001. A total of 15 larvae were grown on each species. Total phenolics [6, 7], condensed tannin [8], toughness, and water and nitrogen content of leaves as sampled in 29 May were all measured. Hairs on leaf surfaces were observed via scanning electron microscopy (SEM). The mass of each pupa was measured in mid July.
III. Results A. Bioassay test Most gypsy moth larvae successfully reached the pupal stage with the leaves of the six Betulacea species (2, 3, 1 and 3 larvae died on Ah, Bp, Bm and Cc respectively). A difference was found in the mass of pupae (Fig. 1) across the species. Masses of pupae grown on Ah and Bp, which are fast growing species, were relatively high. Masses of pupae grown on Oj and Cc, which are slow growing species, were relatively low. Masses of pupae grown on Bm were the lowest.
Fig. 1 Pupa mass on each species
Pupa
mas
s (m
g)
0
200
400
600
800
1000
1200
BpAh Be Bm Oj Cc
a
bb
abab
ab
Pupa
mas
s (m
g)
0
200
400
600
800
1000
1200
BpAh Be Bm Oj Cc
a
bb
abab
ab
0
200
400
600
800
1000
1200
BpAh Be Bm Oj Cc
a
bb
abab
ab
Proccedings: IUFRO Kanazawa 2003 "Forest Insect Population Dynamics and Host Influences” - 107 -
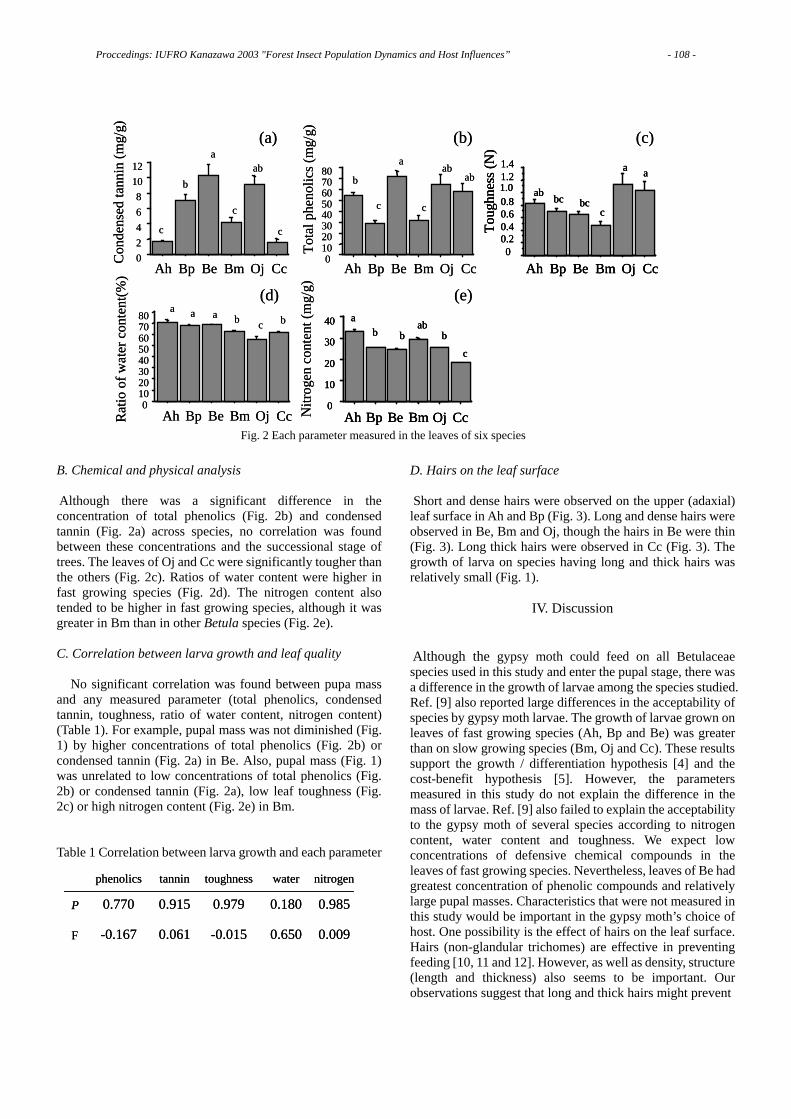
B. Chemical and physical analysis Although there was a significant difference in the concentration of total phenolics (Fig. 2b) and condensed tannin (Fig. 2a) across species, no correlation was found between these concentrations and the successional stage of trees. The leaves of Oj and Cc were significantly tougher than the others (Fig. 2c). Ratios of water content were higher in fast growing species (Fig. 2d). The nitrogen content also tended to be higher in fast growing species, although it was greater in Bm than in other Betula species (Fig. 2e). C. Correlation between larva growth and leaf quality
No significant correlation was found between pupa mass and any measured parameter (total phenolics, condensed tannin, toughness, ratio of water content, nitrogen content) (Table 1). For example, pupal mass was not diminished (Fig. 1) by higher concentrations of total phenolics (Fig. 2b) or condensed tannin (Fig. 2a) in Be. Also, pupal mass (Fig. 1) was unrelated to low concentrations of total phenolics (Fig. 2b) or condensed tannin (Fig. 2a), low leaf toughness (Fig. 2c) or high nitrogen content (Fig. 2e) in Bm.
Table 1 Correlation between larva growth and each parameter
D. Hairs on the leaf surface Short and dense hairs were observed on the upper (adaxial) leaf surface in Ah and Bp (Fig. 3). Long and dense hairs were observed in Be, Bm and Oj, though the hairs in Be were thin (Fig. 3). Long thick hairs were observed in Cc (Fig. 3). The growth of larva on species having long and thick hairs was relatively small (Fig. 1).
IV. Discussion Although the gypsy moth could feed on all Betulaceae species used in this study and enter the pupal stage, there was a difference in the growth of larvae among the species studied. Ref. [9] also reported large differences in the acceptability of species by gypsy moth larvae. The growth of larvae grown on leaves of fast growing species (Ah, Bp and Be) was greater than on slow growing species (Bm, Oj and Cc). These results support the growth / differentiation hypothesis [4] and the cost-benefit hypothesis [5]. However, the parameters measured in this study do not explain the difference in the mass of larvae. Ref. [9] also failed to explain the acceptability to the gypsy moth of several species according to nitrogen content, water content and toughness. We expect low concentrations of defensive chemical compounds in the leaves of fast growing species. Nevertheless, leaves of Be had greatest concentration of phenolic compounds and relatively large pupal masses. Characteristics that were not measured in this study would be important in the gypsy moth’s choice of host. One possibility is the effect of hairs on the leaf surface. Hairs (non-glandular trichomes) are effective in preventing feeding [10, 11 and 12]. However, as well as density, structure (length and thickness) also seems to be important. Our observations suggest that long and thick hairs might prevent
Fig. 2 Each parameter measured in the leaves of six species
02468
1012
Con
dens
ed ta
nnin
(mg/
g)
BpAh Be Bm Oj Cc
aab
b
c
c
c
01020304050607080
Tota
l phe
nolic
s(m
g/g)
aab
abb
c c
BpAh Be Bm Oj Cc
Toug
hnes
s (N
)
00.20.40.60.81.01.21.4 a a
ab bc bcc
BpAh Be Bm Oj Cc
(a) (b) (c)R
atio
of w
ater
con
tent
(%)
01020304050607080
BpAh Be Bm Oj Cc
a a a b bc
Nitr
ogen
con
tent
(mg/
g)
0
10
20
30
40
BpAh Be Bm Oj Cc
a
c
b bab
b
(d) (e)
02468
1012
Con
dens
ed ta
nnin
(mg/
g)
BpAh Be Bm Oj Cc
aab
b
c
c
c
01020304050607080
Tota
l phe
nolic
s(m
g/g)
aab
abb
c c
BpAh Be Bm Oj Cc
Toug
hnes
s (N
)
00.20.40.60.81.01.21.4 a a
ab bc bcc
BpAh Be Bm Oj Cc
Toug
hnes
s (N
)
00.20.40.60.81.01.21.4 a a
ab bc bcc
BpAh Be Bm Oj Cc
(a) (b) (c)R
atio
of w
ater
con
tent
(%)
01020304050607080
BpAh Be Bm Oj Cc
a a a b bc
Nitr
ogen
con
tent
(mg/
g)
0
10
20
30
40
BpAh Be Bm Oj Cc
a
c
b bab
b
0
10
20
30
40
BpAh Be Bm Oj Cc
a
c
b bab
b
(d) (e)
phenolics tannin toughness water nitrogen
P
F
0.770 0.915 0.979 0.180
-0.167 0.061 -0.015 0.650
0.985
0.009
phenolics tannin toughness water nitrogen
P
F
0.770 0.915 0.979 0.180
-0.167 0.061 -0.015 0.650
0.985
0.009
Proccedings: IUFRO Kanazawa 2003 "Forest Insect Population Dynamics and Host Influences” - 108 -

feeding by the gypsy moth. In order to clarify these issues, further study is needed.
Acknowledgements
We are particularly grateful to Mr. T. Abe and Mr. T. Shibata for help with the bioassay and chemical analysis. We thank Dr. Y. Sano and Mr. T. Ito for technical assistance with SEM. We greatly appreciate the comments of all the scientists who attended the IUFRO meeting at Kanazawa. Partial financial support by the RR2002 of MEXT Japan is acknowledged with gratitude.
References [1] Y. Higashiura, “Pest control in natural and man-made forests in northern Japan,” Forest Ecology and Management, Vol. 39, pp. 55-64, 1991. [2] A. Liebhold, Y. Higashiura and A. Unno, “Forest type affects predation on gypsy moth (Lepidoptera: Lymantriidae) pupae in Japan,” Population Ecology, Vol. 27, pp. 858-862, 1998. [3] H. Hara, “Major insects injurious to the trees of Betula spp. and Fraxinus mandschurica var. japonica in Hokkaido and their management,” Bulletin of the Hokkaido Forestry Research Institute, Vol. 37, pp. 67-74, 2001 (In Japanese). [4] H. A. Mooney and S. L. Gulmon, “Constraints on leaf structure and function in reference to herbivory,” BioScience, Vol. 32, pp. 198-206, 1982. [5] K. Kikuzawa, “Cost-Benefit analysis of leaf habit and leaf longevity of trees and their geographical pattern,” American Naturalist, Vol. 138, pp. 1250-1263, 1991 [6] O. Folin and V. Ciocalteu, “On tyrosine in proteins as determination in proteins,” Journal of Biological Chemistry, Vol. 27, pp. 627-650,1927. [7] R. Julkunen-Tiitto, “Phenolic constituents in the leaves of northern willows: methods for the analysis of certain phenolics,” Journal of Agriculture Food and Chemistry, Vol. 33, pp. 213-217, 1985. [8] E. C. Bate-Smith, “Astringent tannins of Acer species,” Phytochemistry, Vol. 16, pp. 1421-1426, 1977. [9] A. F. Hunter and M. J. Lechowicz, “Foliage quality change during canopy development of some northern hardwood trees,” Oecologia, Vol. 89, pp. 316-323, 1992. [10] M. B. Traw and T. E. Dawson, “Differential induction of trichomes by three herbivores of black mustard” Oecologia, Vol. 131, pp. 526-532, 2002 [11] E. Valkama, J. P. Salminen, J. Koricheva and K. Pihlaja,
“Comparative analysis of leaf trichome structure and composition of epicuticular flavonoids in Finnish birch species,” Annals of Botany, Vol. 91, pp. 643-655, 2003. [12] S. Matsuki, Y. Sano and T. Koike, “Chemical and physical defense in the early and late leaves in three heterophyllous birch species native to northern Japan,” Annals of Botany, in press.
Fig.3 Photograph of hairs on the leaf adaxial surface
Bp Ah Be Bm Oj Cc
Short, dense Long, thin Long, thick, dense Long, thick
Proccedings: IUFRO Kanazawa 2003 "Forest Insect Population Dynamics and Host Influences” - 109 -

Population Fluctuation of the Stink Bug, Plautia crossota stali, as Affected by Cone Production of Japanese Cedar
Masahiko MORISHITA Laboratory of Persimmon and Peach, Fruit Tree Experiment Station, Wakayama Research Center of Agriculture,
Forestry and Fisheries, Kokawa 3336, Kokawa, Wakayama 649-6531, Japan Abstract – There was a highly positive correlation between the overwintering density of the bug, Plautia crossota stali, and the amount of airborne pollen produced by Japanese cedar, which is closely related to cone production. This suggests that bug density is regulated primarily by food availability. The amount of airborne Japanese cedar pollen is a useful index for forecasting bug population density.
I. Introduction The brown-winged green stink bug, Plautia crossota stali Scott, is one of the most devastating pests of fruit crops in Japan [2, 8]. It mainly reproduces on the cones of two conifers, Japanese cedar (Cryptomeria japonica D. Don) and Japanese cypress (Chamaecyparis obtusa Endl.) which were widely planted for timber in Japan after World War Ⅱ [2, 9]. As a result infestation levels on fruit crops have been increasing remarkably since the 1990's. It is, however, not easy to estimate cone production in these conifers. Hospital research into hay fever has produced considerable amounts of data on airborne pollen density of Japanese cedar in Japan [1], while there has been little data on Japanese cypress. I have used the airborne pollen count of Japanese cedar related to cone production in order to forecast the bug density in Wakayama Prefecture, western Japan.
II. Materials and Methods A. Airborne pollen density A survey on airborne pollen density of Japanese cedar was carried out at three districts (Wakayama, Hashimoto and Goboh) in 1986-2002. A slide grass(6×6cm) with a sticky substance placed in a Darham sampler was on the roof of a hospital building and was replaced every day during the dispersal season from February to April. Pollen grains were counted under a microscope. B. Light trap catches Adults of P. crossota stali were caught by a light trap (100W mercury lamp) in our laboratory located in Kokawa in Wakayama Prefecture during April and October. C. Density of overwintering adults Adults overwinter in fallen leaves on the deciduous forest floor. A total of 50 liters of fallen leaves was collected using plastic containers and the adults were sorted in February. This survey was conducted at 60 sites.
0
2000
4000
6000
8000
1985 1990 1995 2000
Hashimoto
Wakayama
Goboh
Fig. 1. Annual changes in the number of airborne pollen of Japanese cedar at three sites in Wakayama Prefecture.
0
5
10
15B
0
2000
4000
6000A
0
2000
4000
6000C
0
1
2
1985 1990 1995 2000
D
peachapricot
Fig. 2. Annual changes in the amount of airborne pollen of Japanese cedar (mean value of three sites: A), density of P. crossota stali in fallen leaves in winter (mean value: B), and light trap catches of P. crossota stali in April-July (C), and the percentage of damaged fruit of peach and Japanese apricot which ripen in June-July (D) in commercial orchards.
III. Results
The amount of airborne pollen grains of Japanese cedar fluctuated synchronously at the different sites, although there were differences in the peak number among three sites (Fig. 1). The largest peak was in 1995.
Proccedings: IUFRO Kanazawa 2003 "Forest Insect Population Dynamics and Host Influences” - 110 -

Figure 2 shows that the increases in pollen counts were followed by increases in the density of overwintering adults and light trap catches in the following year. The largest peak of the overwintering density was observed in the winter of 1995/1996 and the largest peak of the light trap catches in 1996. Outbreak of the bug in 1996 was responsible for heavy damage of summer fruit crops such as peach and Japanese apricot in that year. A highly positive correlation was found between the overwintering density of P. crossota stali and the amount of airborne pollen of Japanese cedar which is closely related to the cone production (Fig. 3). There also was a highly positive correlation between the amount of airborne pollen and the number of P. crossota stali caught in light trap during April-July of the following year. These results suggest that the amount of airborne Japanese cedar pollen is a helpful index for forecasting the bug population density in the following spring-summer season.
0.01
0.1
1
10
100
10
100
1000
10000
100 1000 10000No. pollen/cm2
A
B
Fig. 3. Relationships between the amount of airborne pollen of Japanese cedar (mean value of three sites) and overwintering adult bug densities (A), and light trap catches of P. crossota stali in April-July (B). A, Y1 = 0.000004898 X 1.621 (R2= 0.7912), B, Y2 = 0.09931X 1.201 (R2=0.5463), where X is the amount of airborne pollen, Y1 is the overwintering adult density and Y2 is light trap catches in April-June of the following year.
IV. Discussion Dispersal of Japanese cedar pollen occurs from February to April with a peak in March and seeds begin growing from July and fully ripen from August [6]. P. crossota stali appear two generations every year [4, 7]. It overwinters as adult and then disperses to feeding sites such as orchards and seed-bearing trees in spring [8]. They begin flying to groves of Japanese cedar and Japanese cypress to reproduce when their seeds reached maturity. Oviposition on cones occurs from June to August and nymphs are most common from August to September [5]. Japanese cedar has been through out Japan whereas Japanese cypress is more common in western Japan [6]. Airborne pollen counts of both conifers have fluctuated in a similar manner in recent years [Inamori, unpublished]
suggesting that both conifers contribute to reproduction of two stink bugs in a similar manner. There was a highly positive correlation between the overwintering bug density and the amount of airborne Japanese cedar pollen (Fig. 3). This suggests that bug population dynamics are dominated by bottom-up regulation as a result of strong fluctuation in seed abundance, although mortality from natural enemies and cold in winter temperatures is currently unknown. Further research is needed on the ecological process that link bug densities to the amount of cones [3]. Forecasts of damage to autumn fruit (e.g., persimmon and pear) by the bug cannot be directly predicted from damage to summer fruit (peach and Japanese apricot), because the dispersal of bugs from groves of Japanese cedar to orchards depends on Japanese cedar cone abundance . Therefore, additional work is needed to determine when and how many bugs migrate into fruit orchards in the autumn.
Acknowledgements
I thank Dr. T. Enomoto for providing unpublished data on airborne pollen of Japanese cedar.
References [1] T. Enomoto et al., “Fourteen Years Survey of Japanese cedar (Cryptomeria japonica) airborne pollen in Wakayama Prefecture.” Med. J. Jpn. Red Cross Soc. Wakayama Med. Cent. Vol. 16, pp. 101-111, 1998. [2] H. Hasegawa, K. Umeya,. [Outbreak of stink bugs in fruit trees.] Plant Protection Vol. 28, pp. 279-286, 1974. [3] M. Morishita, “Forecasting of population density of two stink bugs, Plautia crossota stali Scott and Glaucias subpunctatus (Walker) (Heteroptera: Pentatomidae), by using airborne pollen counts of sugi (Cryptomeria japonica),” Jpn. J. Appl. Entomol. Zool. Vol. 45, pp. 143-148, 2001. [4] S. Moriya, “Ecological studies on the brown-winged green stink bug, Plautia stali Scott, with special reference to its occurrence and adult movement,” Bull. Okinawa. Pref. Agri. Expt. Sta. Suppl. Vol. 5, pp. 1-135, 1995. [5] M. Oda, M. T. Sugiura, Y. Nakanishi, E. Sibata, Y. Uesumi, “Ecological studies of stink bugs attacking the fruit trees. II. The ecology on the occurrence of Japanese cedar and Japanese cypress of the brown-winged green bug, Plautia stali Scott and the brown-marmorated stink bug, Halyomorpha mista Uhler,” Bull. Nara Agri. Expt. Sta. Vol. 12, pp. 120-130, 1981. [6] N. Sahashi, Y. Takahashi, K. Murayama, “Pollen of Japanese cedar.” Medical Journal Corporation. 17p., 1995. [7] K. Tanaka, “Life history of Plautia crossata stali Scott in the middle part of Mie Prefecture,” Proc. Kansai Pl. Prot. Soc. Vol. 21, pp. 3-7, 1979. [8] K. Yamada, M. Miyahara, “Studies on the ecology and control of some stink bugs infesting fruits. III. On the host plants of the brown winged green bug and the polished green bug,” Bull. Fukuoka Hort. Expt. Sta. Vol. 18, pp. 54-61, 1980. [9] K. Yamada, M. Noda, “Studies on the forecasting of the occurrence for stink bugs infesting fruits,” Bull. Fukuoka Agric. Res. Cent. B-4, pp. 17-24, 1985.
Proccedings: IUFRO Kanazawa 2003 "Forest Insect Population Dynamics and Host Influences” - 111 -

Ontogenetic Resistance in Pinus ponderosa to Rhyacionia neomexicana (Lepidoptera: Tortricidae): Role of Anatomical Features
Michael R. WAGNER, Zhong CHEN School of Forestry, Northern Arizona University, Flagstaff, AZ 86011-5018, USA
Abstract- The anatomical features of 10-year old saplings derived from rooted cuttings (stecklings) from sexually mature (19-33 years old) ponderosa pine (Pinus ponderosa) trees (ontogenetically mature), and 10-year old saplings from seedlings (ontogenetically immature) were compared to test if ontogenetic maturity was associated with resistance to southwestern pine tip moths (Rhyacionia neomexicana (Dyar)). Southwestern pine tip moth preferred to attack ontogenetically immature trees and differences in one-year old needle length and toughness may contribute to with this pattern
I. Introduction
The resistance of host trees to insect herbivores is often ontogenetic or age dependent. Many insect herbivores seem to be associated with host plants of particular ages or sizes [1, 2]. Some insect guilds attack host plants only at certain ontogenetic stages or ages. For example, Rhyacionia (Lepidoptera: Tortricidae) tip/shoot moths are well known to attack juvenile (usually less than 20 years old) [3, 4] but not mature pines; whereas the Dendroctonus (Coleoptera: Scolytidae) bark beetles primarily attack mature [5, 6, 7] but not young pines. More interestingly, host trees of different ages or sizes also may create a selection pressure for those insect herbivores that have similar feeding behaviors on host trees such as pine sawflies (Neodiprion spp.). For example, three reported sawfly species in Arizona: N. gillettei, N. autumnalis, and N. fulviceps prefer needles on seedlings, sapling to mature trees, and mature trees of ponderosa pines, respectively [8].
The success of insect herbivores on host plants depends on numerous factors such as the availability of suitable nutrients, effectiveness of physical and biochemical defenses of host plants, inter- and intra-species association (e.g. competition and symbiosis), and predation pressure. Among them, the availability of suitable nutrients (e.g. nitrogen), effectiveness of physical and biochemical defenses (e.g. toughness, phenolics, fiber, and terpenes) of host plants often determine the foliage resource quality and are directly associated with plant ontogenetic stages or ages. Clancy [9] summarized 10 common mechanisms of conifer tree resistance to insect defoliators; at least three of them (e.g. toughness of needles, nutrient quality, and defensive compounds) are closely related to host ontogenetic changes or ages and also should be applicable for other insect guilds such as pine tip/shoot moths. Although there is an intrinsic relationship between tree physiology and forest insect pests
[10], few studies actually demonstrated how these ontogenetic or age related changes influence the success of insect herbivores.
Southwestern pine tip moth (Rhyacionia neomexicana (Dyar)) is a native insect pest that occurs in ponderosa pine (Pinus ponderosa Dougl. ex Laws) dominated conifer forest ecosystems in the western United States. It typically attacks juvenile ponderosa pines but occasionally also other pine species including Scotch pine (P. sylverstris L.), jack pine (P. banksiana Lamb), and Austrian pine (P. nigra Arnold) [4,11]. The southwestern pine tip moth has one generation per year, and its larvae go through 5 instars. The early instars mine inside needles, and the later instars bore into shoots and feed on the inside tender tissues. Because pine tip moth primarily attacks the new growth of shoots and buds, it directly disrupts the normal growth pattern of pines and causes the deformation of trees including crooks, forks, multiple stems, and spike tops (dead leaders) [4].
Spiegel and Price [12] investigated the distribution of southwestern pine tip moths among ponderosa pine trees of different age classes around Flagstaff, Arizona and found that tip moth attacks did not occur on trees that were greater than 20 years of age or taller than 4 m, which agreed with the conventional wisdom regarding tip moth attack behavior [12]. However, mechanisms of ontogenetic resistance in ponderosa pine to southwestern pine tip moth have not been tested. In this study, we will address two major research questions: 1) Is there an ontogenetic basis for tip moth preference of certain aged trees? and 2) What host plant morphological and anatomical traits (e.g. shoot and needle length, and needle toughness) may explain this pattern? We postulated that cuttings generated by stem cuttings (an asexual propagation method to produce clones) would have similar height growth as seedlings (so to remove the influence of size) but have advanced ontogenetic characteristics. We hypothesized that 1) tip moths would attack new growth of needles and shoots more on saplings from seedling origin (ontogenetically immature) than on saplings from rooted cuttings (ontogenetically mature); and 2) saplings from rooted cuttings would have shorter shoots and needles but greater toughness of needles than saplings from seedlings.
II. Materials and Methods A. Tree materials
Proccedings: IUFRO Kanazawa 2003 "Forest Insect Population Dynamics and Host Influences” - 112 -
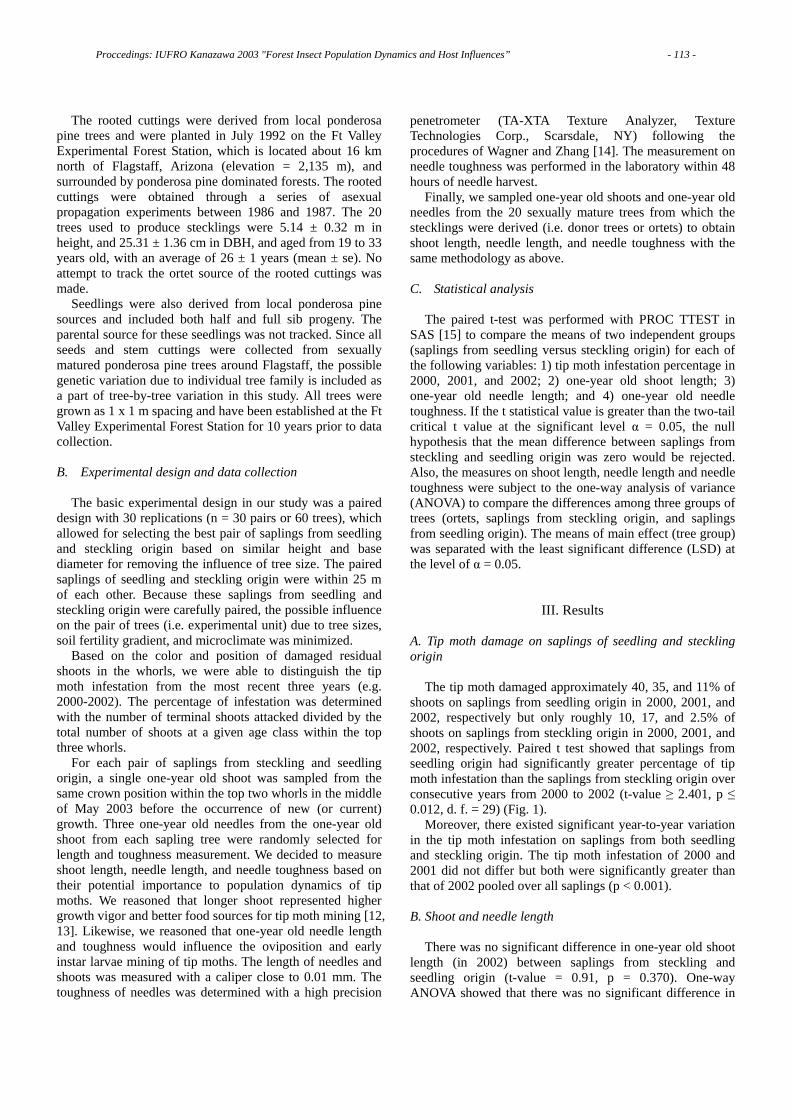
The rooted cuttings were derived from local ponderosa pine trees and were planted in July 1992 on the Ft Valley Experimental Forest Station, which is located about 16 km north of Flagstaff, Arizona (elevation = 2,135 m), and surrounded by ponderosa pine dominated forests. The rooted cuttings were obtained through a series of asexual propagation experiments between 1986 and 1987. The 20 trees used to produce stecklings were 5.14 ± 0.32 m in height, and 25.31 ± 1.36 cm in DBH, and aged from 19 to 33 years old, with an average of 26 ± 1 years (mean ± se). No attempt to track the ortet source of the rooted cuttings was made.
Seedlings were also derived from local ponderosa pine sources and included both half and full sib progeny. The parental source for these seedlings was not tracked. Since all seeds and stem cuttings were collected from sexually matured ponderosa pine trees around Flagstaff, the possible genetic variation due to individual tree family is included as a part of tree-by-tree variation in this study. All trees were grown as 1 x 1 m spacing and have been established at the Ft Valley Experimental Forest Station for 10 years prior to data collection. B. Experimental design and data collection
The basic experimental design in our study was a paired design with 30 replications (n = 30 pairs or 60 trees), which allowed for selecting the best pair of saplings from seedling and steckling origin based on similar height and base diameter for removing the influence of tree size. The paired saplings of seedling and steckling origin were within 25 m of each other. Because these saplings from seedling and steckling origin were carefully paired, the possible influence on the pair of trees (i.e. experimental unit) due to tree sizes, soil fertility gradient, and microclimate was minimized.
Based on the color and position of damaged residual shoots in the whorls, we were able to distinguish the tip moth infestation from the most recent three years (e.g. 2000-2002). The percentage of infestation was determined with the number of terminal shoots attacked divided by the total number of shoots at a given age class within the top three whorls.
For each pair of saplings from steckling and seedling origin, a single one-year old shoot was sampled from the same crown position within the top two whorls in the middle of May 2003 before the occurrence of new (or current) growth. Three one-year old needles from the one-year old shoot from each sapling tree were randomly selected for length and toughness measurement. We decided to measure shoot length, needle length, and needle toughness based on their potential importance to population dynamics of tip moths. We reasoned that longer shoot represented higher growth vigor and better food sources for tip moth mining [12, 13]. Likewise, we reasoned that one-year old needle length and toughness would influence the oviposition and early instar larvae mining of tip moths. The length of needles and shoots was measured with a caliper close to 0.01 mm. The toughness of needles was determined with a high precision
penetrometer (TA-XTA Texture Analyzer, Texture Technologies Corp., Scarsdale, NY) following the procedures of Wagner and Zhang [14]. The measurement on needle toughness was performed in the laboratory within 48 hours of needle harvest.
Finally, we sampled one-year old shoots and one-year old needles from the 20 sexually mature trees from which the stecklings were derived (i.e. donor trees or ortets) to obtain shoot length, needle length, and needle toughness with the same methodology as above. C. Statistical analysis
The paired t-test was performed with PROC TTEST in SAS [15] to compare the means of two independent groups (saplings from seedling versus steckling origin) for each of the following variables: 1) tip moth infestation percentage in 2000, 2001, and 2002; 2) one-year old shoot length; 3) one-year old needle length; and 4) one-year old needle toughness. If the t statistical value is greater than the two-tail critical t value at the significant level α = 0.05, the null hypothesis that the mean difference between saplings from steckling and seedling origin was zero would be rejected. Also, the measures on shoot length, needle length and needle toughness were subject to the one-way analysis of variance (ANOVA) to compare the differences among three groups of trees (ortets, saplings from steckling origin, and saplings from seedling origin). The means of main effect (tree group) was separated with the least significant difference (LSD) at the level of α = 0.05.
III. Results A. Tip moth damage on saplings of seedling and steckling origin
The tip moth damaged approximately 40, 35, and 11% of shoots on saplings from seedling origin in 2000, 2001, and 2002, respectively but only roughly 10, 17, and 2.5% of shoots on saplings from steckling origin in 2000, 2001, and 2002, respectively. Paired t test showed that saplings from seedling origin had significantly greater percentage of tip moth infestation than the saplings from steckling origin over consecutive years from 2000 to 2002 (t-value ≥ 2.401, p ≤ 0.012, d. f. = 29) (Fig. 1).
Moreover, there existed significant year-to-year variation in the tip moth infestation on saplings from both seedling and steckling origin. The tip moth infestation of 2000 and 2001 did not differ but both were significantly greater than that of 2002 pooled over all saplings (p < 0.001). B. Shoot and needle length
There was no significant difference in one-year old shoot length (in 2002) between saplings from steckling and seedling origin (t-value = 0.91, p = 0.370). One-way ANOVA showed that there was no significant difference in
Proccedings: IUFRO Kanazawa 2003 "Forest Insect Population Dynamics and Host Influences” - 113 -
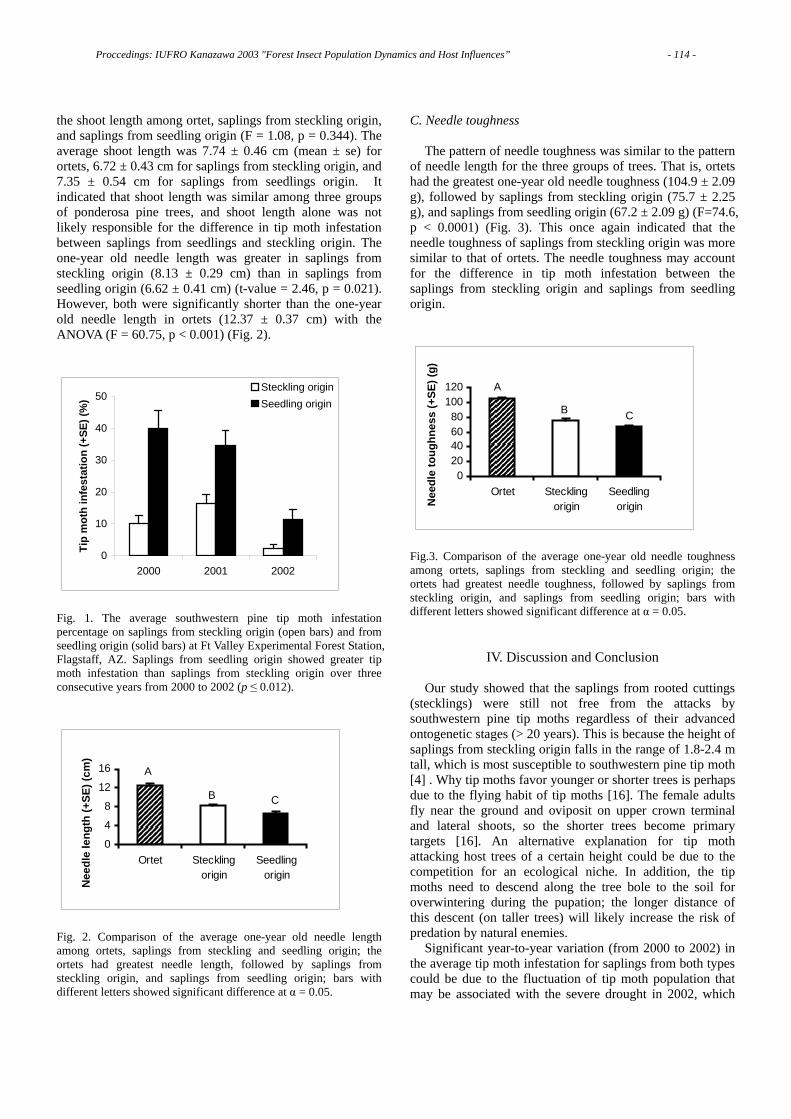
the shoot length among ortet, saplings from steckling origin, and saplings from seedling origin (F = 1.08, p = 0.344). The average shoot length was 7.74 ± 0.46 cm (mean ± se) for ortets, 6.72 ± 0.43 cm for saplings from steckling origin, and 7.35 ± 0.54 cm for saplings from seedlings origin. It indicated that shoot length was similar among three groups of ponderosa pine trees, and shoot length alone was not likely responsible for the difference in tip moth infestation between saplings from seedlings and steckling origin. The one-year old needle length was greater in saplings from steckling origin (8.13 ± 0.29 cm) than in saplings from seedling origin (6.62 ± 0.41 cm) (t-value = 2.46, p = 0.021). However, both were significantly shorter than the one-year old needle length in ortets (12.37 ± 0.37 cm) with the ANOVA (F = 60.75, p < 0.001) (Fig. 2).
0
10
20
30
40
50
2000 2001 2002
Tip
mot
h in
fest
atio
n (+
SE) (
%)
Steckling originSeedling origin
Fig. 1. The average southwestern pine tip moth infestation percentage on saplings from steckling origin (open bars) and from seedling origin (solid bars) at Ft Valley Experimental Forest Station, Flagstaff, AZ. Saplings from seedling origin showed greater tip moth infestation than saplings from steckling origin over three consecutive years from 2000 to 2002 (p ≤ 0.012).
0
4
8
12
16
Ortet Stecklingorigin
Seedlingorigin
Nee
dle
leng
th (+
SE) (
cm)
A
B C
Fig. 2. Comparison of the average one-year old needle length among ortets, saplings from steckling and seedling origin; the ortets had greatest needle length, followed by saplings from steckling origin, and saplings from seedling origin; bars with different letters showed significant difference at α = 0.05.
C. Needle toughness
The pattern of needle toughness was similar to the pattern of needle length for the three groups of trees. That is, ortets had the greatest one-year old needle toughness (104.9 ± 2.09 g), followed by saplings from steckling origin (75.7 ± 2.25 g), and saplings from seedling origin (67.2 ± 2.09 g) (F=74.6, p < 0.0001) (Fig. 3). This once again indicated that the needle toughness of saplings from steckling origin was more similar to that of ortets. The needle toughness may account for the difference in tip moth infestation between the saplings from steckling origin and saplings from seedling origin.
020406080
100120
Ortet Stecklingorigin
SeedlingoriginNee
dle
toug
hnes
s (+
SE) (
g)
A
B C
Fig.3. Comparison of the average one-year old needle toughness among ortets, saplings from steckling and seedling origin; the ortets had greatest needle toughness, followed by saplings from steckling origin, and saplings from seedling origin; bars with different letters showed significant difference at α = 0.05.
IV. Discussion and Conclusion
Our study showed that the saplings from rooted cuttings (stecklings) were still not free from the attacks by southwestern pine tip moths regardless of their advanced ontogenetic stages (> 20 years). This is because the height of saplings from steckling origin falls in the range of 1.8-2.4 m tall, which is most susceptible to southwestern pine tip moth [4] . Why tip moths favor younger or shorter trees is perhaps due to the flying habit of tip moths [16]. The female adults fly near the ground and oviposit on upper crown terminal and lateral shoots, so the shorter trees become primary targets [16]. An alternative explanation for tip moth attacking host trees of a certain height could be due to the competition for an ecological niche. In addition, the tip moths need to descend along the tree bole to the soil for overwintering during the pupation; the longer distance of this descent (on taller trees) will likely increase the risk of predation by natural enemies.
Significant year-to-year variation (from 2000 to 2002) in the average tip moth infestation for saplings from both types could be due to the fluctuation of tip moth population that may be associated with the severe drought in 2002, which
Proccedings: IUFRO Kanazawa 2003 "Forest Insect Population Dynamics and Host Influences” - 114 -
was the most severe drought as defined by the Plamer Drought Severity Index (PDSI) in recorded history. The shoot length was similar for ortets, and saplings from steckling and seedling origin and thus seemed not responsible for the difference of tip moth infestation between saplings of stecking and seedling origin. The southwestern pine tip moth lays eggs on one-year old needles and the first two instars of larvae primarily mine the one-year old needles [4]. Therefore, both the one-year old needle length and toughness very likely influences the initial success of early instar larvae on host trees.
Conclusively, the southwestern pine tip moths showed a preference to attack saplings from seedling origin over saplings from steckling origin in spite of their similar size; and this pattern was consistent over three consecutive years. Our field experimental results further verified the conventional wisdom that the tip moths primarily attack juvenile pines. The one-year needle length and toughness better explain this pattern than one-year shoot length.
References [1] M.J.C. Kearsley, T.G. Whitham, “Developmental changes in resistance to herbivory: implication for individuals and populations,” Ecology Vol. 70, pp. 422-434, 1989. [2] J.D. McMillin, M.R. Wagner, “Influence of stand characteristics and site quality on sawfly population dynamics.” In: (M. R. Wagner and K.F. Raffa eds.) Sawfly life history adaptations to woody plants. Academic press, Orlando, pp 157-172, 1993. [3] H.O. Yates III, N.A. Overgaard, T.W. Koerber, “Nantucket pine tip moth.” USDA Forest Service, Forest Insect and Disease Leaflet 70, 7p., 1981. [4] D.T. Jennings, R.E. Stevens, “Southwestern pine tip moth.” USDA Forest Service, Forest Insect and Disease Leaflet 58, 7p., 1982. [5] J.M. Schmidt, R.H. Frye, “Spruce beetle in the Rockies.” USDA GTR RM-49, 1977. [6] J.S. Hard, “Spruce beetles attack slowly growing spruce. Forest Science Vol. 31, pp. 839-850, 1985. [7] R.G. Mitchell, H.K. Preisler, “Analysis of spatial patterns of lodgepole pine attacked by outbreak populations of mountain pine beetle,” Forest Science Vol. 37: pp. 1390-1408. [8] C.D. Dunbar, M.R. Wagner, “Distribution of ponderosa pine (Pinus ponderosa) feeding sawflies (Hymenoptera: Diprionidae) in the United States and Canada,” Entomological News Vol. 101, pp. 226-272, 1990. [9] K.M. Clancy, “Mechanisms of resistance in trees to defoliators.” In M. R. Wagner et al. (eds.), Mechanisms and Deployment of Resistance in Trees to Insects, pp. 79-103. Kluwer Academic Publishers, The Netherlands, 2002. [10] T. T. Kozlowski, “Tree physiology and forest pests. Journal of Forestry Vol. 67, pp. 118-123, 1969. [11] D.T. Jennings, “Life history of the southwestern pine tip moth, Rhyacionia neomexicana (Dyar) (Lepidoptera:
Olethreutidae),” Annals of Entomological Society of America Vol. 68, pp. 597-606, 1975. [12] L.H. Spiegel, P.W. Price, “Plant aging and the distribution of Rhyacionia neomexicana (Lepidoptera: Tortricidae),” Environmental Entomology Vol. 25, pp. 359-365, 1996. [13] P.W. Price, “The plant vigor hypothesis and herbivore attack,” Oikos 62: 244-251, 1991. [14] M.R. Wagner, Z. Zhang, Host plant traits associated with resistance of ponderosa pine to the sawflies. Oecologia Vol. 83, pp. 452-457, 1993. [15] SAS Institute, “SAS/STAT User’s Guide”, version 6. SAS Institute Inc., Cary, NC, 1990. [16] D.W. Long, M.R. Wagner, “Effects of southwestern pine tip moth and vegetation competition on ponderosa pine growth,” Forest Science Vol. 38, pp. 173-186, 1992.
Proccedings: IUFRO Kanazawa 2003 "Forest Insect Population Dynamics and Host Influences” - 115 -

Stand-Level Defoliation Ratio by Herbivorous Insects along Altitudes, between Geological Features, and between Topography on Mt. Kinabalu,
Borneo
Shizuo SUZUKI Graduate School of Agriculture, Laboratory of Forest Biology, Kyoto University, Kyoto 606-8502, JAPAN
(Present address: Institute for Environmental Sciences, Rokkasho, Aomori 039-3212, JAPAN) Kanehiro KITAYAMA
Center for Ecological Research, Kyoto University, Ohtsu 520-2113, JAPAN Shin-ichiro AIBA
Faculty of Science, Kagoshima University, Kagoshima 890-0065, JAPAN Masaaki TAKYU
Faculty of Regional Environmental Science, Tokyo University of Agriculture, Tokyo 156-8502, JAPAN Kihachiro KIKUZAWA
Graduate School of Agriculture, Laboratory of Forest Biology, Kyoto University, Kyoto 606-8502, JAPAN Abstract - Stand-level defoliation ratio by herbivorous insects (the ratio of consumed leaf mass to available leaf mass as food for herbivorous insects) was investigated by using litter leaves collected in litter traps to evaluate the variation of herbivory according to environmental conditions. Twelve plots have been set up at four elevations, on three geological substrates, and in two topographical units in Mt. Kinabalu, Borneo. The stand-level defoliation ratio 1) decreased with increasing altitude, 2) was lower at ultrabasic than Tertiary sedimentary sites at each altitude, and 3) was lower at ridge than lower slope sites at each geological substrate. These results indicate that the stand-level defoliation ratio increases with increasing forest productivity.
I. Introduction Many workers have investigated percentage consumption by herbivorous insects. Defoliation ratio by herbivorous insects (the ratio of consumed leaf mass to available leaf mass as food for herbivores) ranged from 5-15% and 3-20% in tropical forests, respectively [1, 2]. These observations were limited to particular life stages such as seedlings and saplings, selected species, and specific habitats such as understory and gaps [3, 4, 5, 6, 7]. This may be because tropical forests have high species diversity and large tree height and it was very difficult to evaluate herbivory at the forest stand level.
Leaf characteristics are expected to affect the degree of herbivory. They represent the concentration of nutrients and defensive substances. Leaf N concentration generally has positive influences on the growth, fecundity, and survivorship of herbivores [8, 9]; on the other hand, defensive substances negatively influence them [10]. Concentrations of leaf N and defensive substances are associated with environmental conditions of the plant's habitat. For example, leaf N concentration rose with nutrient
availability in soil [19]. Carbon-based defensive substances such as total phenolics and condensed tannin in leaves increased under poor soil nutrient conditions [12, 13] and under water deficits [12]. Herbivorous insect’s activity itself as well as leaf characteristics as a food resource are important factors that influence the degree of herbivory and the activity depends on environmental conditions, especially air temperature [14]. Thus we expect that the degree of herbivory changes according to the environmental conditions of the habitat.
On Mt. Kinabalu 12 plots have been set up by using gradients of altitude, geological substrate and topography [11, 15, 16]. By using these plots, the herbivory in tropical rain forests can be evaluated systematically according to environmental conditions of the habitat. The objectives of this study are 1) to quantify the stand-level defoliation ratio by herbivorous insects and 2) to describe the pattern of the herbivory in relation to altitude, geological substrate, and topography.
II. Methods A. Study site Mt. Kinabalu is located at N6º latitude on Borneo Island, Malaysia and the elevation of the summit is 4095 m above sea level (a.s.l.). Primary forests are preserved very well in the Kinabalu Park. There are 12 plots in the Park according to three gradients [11, 15, 16].
As regards altitude, there are four elevations: 700, 1700, 2700, and 3100 m a.s.l. Average air temperature decreased with increasing altitude at a rate of 0.55˚C per 100 m [17]. Air temperature varied 13.3˚C between the sites with the highest and the lowest altitude (Table I). As regards geological substrate, there are three parent rocks: ultrabasic
Proccedings: IUFRO Kanazawa 2003 "Forest Insect Population Dynamics and Host Influences” - 116 -

rock, Tertiary sedimentary rock, and Quaternary sediment. Soils on ultrabasic rock have relatively lower N and P contents and those on Quaternary sediment have relatively higher N and P contents than those on Tertiary sedimentary rock [11, 15]. Ultrabasic and Tertiary sedimentary rocks occur on each of the four elevations (Table I).
Ridge and lower slope topographical units were selected on each of the three geological substrates at the approximately 1700 m a.s.l. elevation [16, Table I]. Soil nutrient content was higher at the lower slope than the ridge site.
TABLE I Environment and vegetation of the 12 sites on Mount Kinabalu.
Site Exact
altitude (m)
Mean annual temperature (degree C)a
Vegetation zone
07T 650 23.9 lowland 07U 700 23.7 lowland 17Q 1860 17.3 lower montane 17T 1560 18.9 lower montane 17U 1860 17.3 lower montane 17Q-R 1860 17.3 lower montane 17T-R 1560 18.9 lower montane 17U-R 1860 17.3 lower montane 27T 2590 13.3 upper montane 27U 2700 12.7 upper montane 31T 3080 10.6 subalpine 31U 3050 10.7 subalpine
These plots and data correspond to [15] and [16]. Q: Quaternary sedimentary rock, T: Tertiary sedimentary rock, U: ultrabasic rock, -R: ridge a: Mean annual temperature estimated from mean lapse rate obtained by [17]. B. Estimation of herbivory Plot size ranged from 0.05 to 1.00 ha according to altitude and topography. There were 10 or 20 litter traps in each plot and they were placed at regular intervals at a height of 1 m above the ground (Table II). The size of the litter trap opening was 0.5 m2. Trapped litter was collected every two weeks, dried at 70°C for 3 days, and sorted into leaves, reproductive organs, twigs, epiphytes, palms and bamboos, frass from herbivorous insects, and dust. Stand-level defoliation ratio by herbivorous insects was measured by using a subsample of bulk litter (ranging from 20-62%) collected for one year from 15 June 1998 to 31 May 1999 (Table II). All physically broken leaves were excluded from the investigation.
Each litter leaf was weighed using an electronic balance, then it was soaked in water, flattened and digitized using a scanner (CanoScan N1220U, Canon, Tokyo). The shape and area of the damaged and original-form were measured by computer (NIH Image ver. 1.58 software) as follows. Most broad leaves were eaten on the inside and the edge. If the
TABLE II Description of data used to investigate herbivory. Leaf litter mass
was measured from June 1998 to May 1999 at the 12 sites. Symbols for the site names are described in Table I.
Site Area
(ha) Number of litter traps
Sub-sampled fractiona
07T 1.00 20 0.2007U 1.00 20 0.2317Q 1.00 20 0.2017T 0.50 20 0.2117U 0.20 10 0.4417Q-R 0.05 10 0.6217T-R 0.05 10 0.6117U-R 0.05 10 0.6027T 0.25 10 0.2227U 0.20 10 0.2131T 0.20 10 0.2231U 0.06 10 0.41
a: The ratio of used litter leaf mass for investigation to collected litter leaf mass within a plot.
Fig. I Illustration of recovering the original-form for broad leaves. middle edge of a leaf blade was eaten (Fig. I-a), the original area was estimated by connecting the two outer edges of the missing portion with a straight line. If the tip of a leaf blade was missing (Fig. I-b), a center line was projected from the midrib and two tangential lines were projected to intercept the center line. When the two tangential lines did not meet at the same point, the point closest to the leaf blade was selected to represent the tip of the original leaf. In the rare case where one of the two tangential lines at the point T did not intersect the center line (Fig. I-c), only one side of the leaf blade was used and the original area was estimated by doubling, with the assumption that the leaf was symmetric. For conifer shoots, we measured shoot length, the length of the eaten parts, the weight of the shoot, and the ratio of the eaten parts on the cross-section. We then calculated the weights of the missing parts consumed by herbivorous
Proccedings: IUFRO Kanazawa 2003 "Forest Insect Population Dynamics and Host Influences” - 117 -
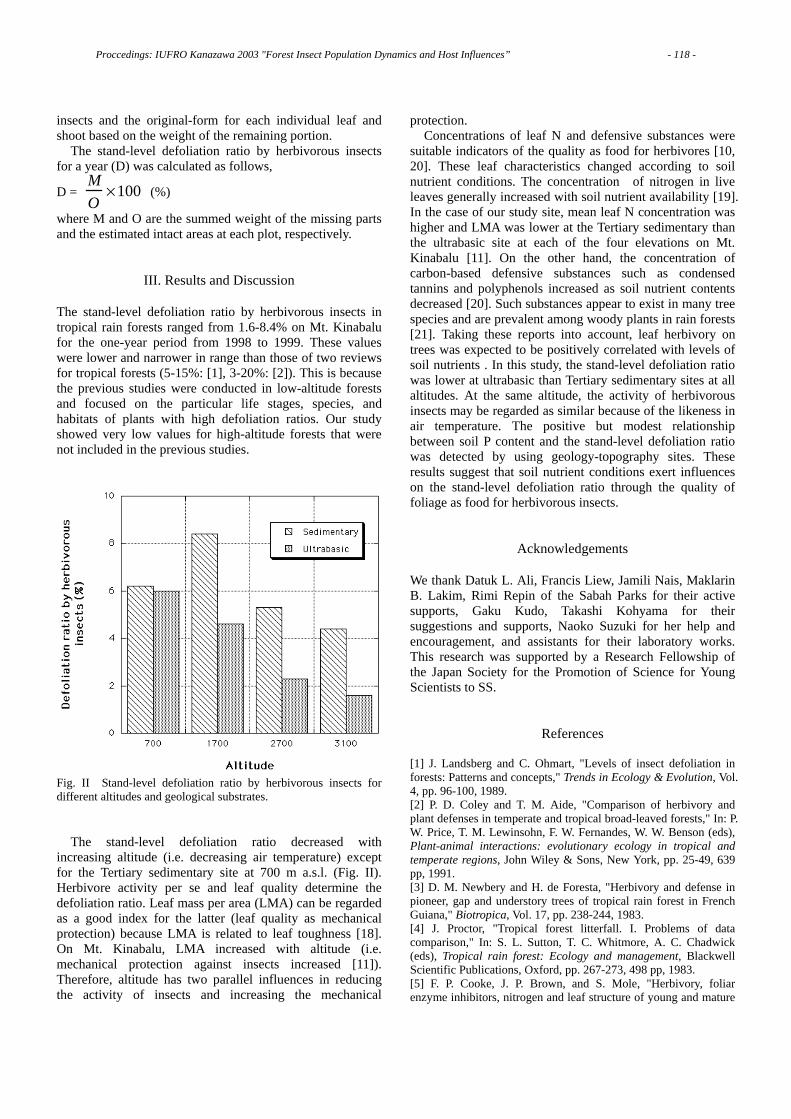
insects and the original-form for each individual leaf and shoot based on the weight of the remaining portion.
The stand-level defoliation ratio by herbivorous insects for a year (D) was calculated as follows,
D = MO
×100 (%)
where M and O are the summed weight of the missing parts and the estimated intact areas at each plot, respectively.
III. Results and Discussion
The stand-level defoliation ratio by herbivorous insects in tropical rain forests ranged from 1.6-8.4% on Mt. Kinabalu for the one-year period from 1998 to 1999. These values were lower and narrower in range than those of two reviews for tropical forests (5-15%: [1], 3-20%: [2]). This is because the previous studies were conducted in low-altitude forests and focused on the particular life stages, species, and habitats of plants with high defoliation ratios. Our study showed very low values for high-altitude forests that were not included in the previous studies.
Fig. II Stand-level defoliation ratio by herbivorous insects for different altitudes and geological substrates.
The stand-level defoliation ratio decreased with increasing altitude (i.e. decreasing air temperature) except for the Tertiary sedimentary site at 700 m a.s.l. (Fig. II). Herbivore activity per se and leaf quality determine the defoliation ratio. Leaf mass per area (LMA) can be regarded as a good index for the latter (leaf quality as mechanical protection) because LMA is related to leaf toughness [18]. On Mt. Kinabalu, LMA increased with altitude (i.e. mechanical protection against insects increased [11]). Therefore, altitude has two parallel influences in reducing the activity of insects and increasing the mechanical
protection. Concentrations of leaf N and defensive substances were
suitable indicators of the quality as food for herbivores [10, 20]. These leaf characteristics changed according to soil nutrient conditions. The concentration of nitrogen in live leaves generally increased with soil nutrient availability [19]. In the case of our study site, mean leaf N concentration was higher and LMA was lower at the Tertiary sedimentary than the ultrabasic site at each of the four elevations on Mt. Kinabalu [11]. On the other hand, the concentration of carbon-based defensive substances such as condensed tannins and polyphenols increased as soil nutrient contents decreased [20]. Such substances appear to exist in many tree species and are prevalent among woody plants in rain forests [21]. Taking these reports into account, leaf herbivory on trees was expected to be positively correlated with levels of soil nutrients . In this study, the stand-level defoliation ratio was lower at ultrabasic than Tertiary sedimentary sites at all altitudes. At the same altitude, the activity of herbivorous insects may be regarded as similar because of the likeness in air temperature. The positive but modest relationship between soil P content and the stand-level defoliation ratio was detected by using geology-topography sites. These results suggest that soil nutrient conditions exert influences on the stand-level defoliation ratio through the quality of foliage as food for herbivorous insects.
Acknowledgements
We thank Datuk L. Ali, Francis Liew, Jamili Nais, Maklarin B. Lakim, Rimi Repin of the Sabah Parks for their active supports, Gaku Kudo, Takashi Kohyama for their suggestions and supports, Naoko Suzuki for her help and encouragement, and assistants for their laboratory works. This research was supported by a Research Fellowship of the Japan Society for the Promotion of Science for Young Scientists to SS.
References [1] J. Landsberg and C. Ohmart, "Levels of insect defoliation in forests: Patterns and concepts," Trends in Ecology & Evolution, Vol. 4, pp. 96-100, 1989. [2] P. D. Coley and T. M. Aide, "Comparison of herbivory and plant defenses in temperate and tropical broad-leaved forests," In: P. W. Price, T. M. Lewinsohn, F. W. Fernandes, W. W. Benson (eds), Plant-animal interactions: evolutionary ecology in tropical and temperate regions, John Wiley & Sons, New York, pp. 25-49, 639 pp, 1991. [3] D. M. Newbery and H. de Foresta, "Herbivory and defense in pioneer, gap and understory trees of tropical rain forest in French Guiana," Biotropica, Vol. 17, pp. 238-244, 1983. [4] J. Proctor, "Tropical forest litterfall. I. Problems of data comparison," In: S. L. Sutton, T. C. Whitmore, A. C. Chadwick (eds), Tropical rain forest: Ecology and management, Blackwell Scientific Publications, Oxford, pp. 267-273, 498 pp, 1983. [5] F. P. Cooke, J. P. Brown, and S. Mole, "Herbivory, foliar enzyme inhibitors, nitrogen and leaf structure of young and mature
Proccedings: IUFRO Kanazawa 2003 "Forest Insect Population Dynamics and Host Influences” - 118 -
leaves in a tropical forest," Biotropica, Vol. 16, pp. 257-263, 1984. [6] M. de la Cruz and R. Dirzo, "A survey of the standing levels of herbivory in seedlings from a Mexican rain forest," Biotropica, Vol. 19, pp. 98-106, 1987. [7] P. D. Coley, "Rates of Herbivory on different tropical trees," In: E. G. Leigh Jr., A. S. Rand, D. M. Windsor (eds), The ecology of a tropical forest: seasonal rhythms and long-term changes, 2nd edition Smithsonian Institution Press, Washinton, D. C., pp. 123-132, 468 pp, 1996. [8] W. J. Mattson Jr., "Herbivory in relation to plant nitrogen content," Annu. Rev. Ecol. Syst., Vol. 11, pp. 119-161, 1980. [9] S. Suzuki, "Leaf phenology, seasonal changes in leaf quality and herbivory pattern of Sanguisorba tenuifolia at different altitudes," Oecologia, Vol. 117, pp. 169-176, 1998. [10] P. G. Waterman and S. Mole, Analysis of Phenolic Plant Metabolites, Blackwell Scientific Pablications, Oxford, 1994. [11] K. Kitayama and S. Aiba, "Ecosystem structure and productivity of tropical rain forests along altitudinal gradients with contrasting soil phosphorus pools on Mount Kinabalu, Borneo," J. Ecol., Vol. 90, pp. 37-51, 2002. [12] D. W. Ross and C. W. Berisford, "Nantucket pine tip moth (Lepidoptera: Tortricidae) response to water and nutrient status of loblolly pine," Forest Science, Vol. 36, pp. 719-733, 1990. [13] J. F. Dudt and D. J. Shure, "The influence of light and nutrients on foliar phenolics and insect herbivory," Ecology, Vol. 75, pp. 86-98, 1994. [14] T. D. Schowalter, W. W. Hargrove, and D. A. Crossley Jr., "Herbivory in forested ecosystems," Annu. Rev. Entomol., Vol. 31, pp. 177-196, 1986. [15] S. Aiba and K. Kitayama, "Structure, composition and species diversity in an altitude-substrate matrix of rain forest tree communities on Mount Kinabalu, Borneo," Plant Ecol., Vol. 140, pp. 139-157, 1999. [16] M. Takyu, S. Aiba, and K. Kitayama, "Effects of topography on tropical lower montane forests under different geological conditions on Mount Kinabalu, Borneo," Plant Ecol., Vol. 159, pp. 35-49, 2002. [17] K. Kitayama, "An altitudinal transect study of the vegetation on Mount Kinabalu, Borneo," Vegetatio, Vol. 102, pp. 149-171, 1992. [18] P. D. Coley, "Herbivory and defensive characteristics of tree species in a lowland tropical forest," Ecol. Monogr., Vol. 53, pp. 209-233, 1983. [19] F. S. III. Chapin, "Effects of multiple environmental stresses on nutrient availability and use," In: H. A. Mooney, W. E. Winner, E. J. Pell, E. Chu (eds), Response of Plants to Multiple Stresses, Academic Press, San Diego, pp. 67-88, 1991. [20] S. A. Cunningham, B. Summerhayes, and M. Westoby, "Evolutionary divergences in leaf structure and chemistry, comparing rainfall and soil nutrient gradients," Ecol. Monogr., Vol. 69, pp. 569-588, 1999. [21] J. S. Gartlan, D. B. McKey, P. G. Waterman, C. N. Mbi, and T. T. Struhsaker, "A Comparative study of the phytochemistry of two African rain forests," Biochemical Systematics and Ecology, Vol. 8, pp. 401-422, 1980.
Proccedings: IUFRO Kanazawa 2003 "Forest Insect Population Dynamics and Host Influences” - 119 -

Do Ectomycorrhizal Mutualists Influence Douglas-fir Resistance to Defoliation by the Western Spruce Budworm?
Karen M. CLANCY USDA Forest Service Research and Development, Rocky Mountain Research Station, Flagstaff, Arizona 86001-6381, USA
Barbara L. PALERMO, George W. KOCH Department of Biological Sciences, Northern Arizona University, Flagstaff, Arizona 86011-5640, USA
Abstract - Douglas-fir seedlings derived from parent trees that are resistant versus susceptible to western spruce budworm defoliation were inoculated with Laccaria bicolor ectomycorrhizal fungi or untreated. Inoculated resistant seedlings had more infested root tips than susceptible seedlings. L. bicolor increased foliar concentrations of phosphorus and magnesium in resistant seedlings, and it increased the growth rate of susceptible seedlings. These divergent responses to L. bicolor treatment suggest that ecotmycorrhizae might play a role in Douglas-fir resistance to damage from the budworm.
I. Introduction
Mycorrhizae are symbiotic, mutually beneficial associations between the roots of trees and specialized soil fungi [1]. All forest trees form mycorrhizae in natural soils. These fungus-root organs provide many benefits to the seedling and adult tree, especially enhancing water and nutrient uptake [1]. Thus, mycorrhizal associations may affect plant resistance to herbivory by way of their influence on mineral nutrients, host plant vigor, etc. [2, 3]. There are >2,000 mycorrhizal species associated with Douglas-fir (Pseudotsuga menziesii [Mirb.] Franco) trees [4, 5].
Because mycorrhizae have important influences on plant growth and nutrient levels in plant tissues, they might affect plant resistance to herbivores such as the western spruce budworm (Choristoneura occidentalis Freeman). For example, interior Douglas-fir (P. menziesii var. glauca [Beissn.] Franco) trees that are phenotypically resistant to damage from C. occidentalis had higher levels of nitrogen (N) and sugars, plus lower mineral/N ratios for phosphorus/N, magnesium/N, potassium/N, and zinc/N, in their foliage than susceptible trees [6]. Resistant trees also had greater radial growth rates compared to susceptible trees in two of three populations studied [7].
Four mechanisms of interior Douglas-fir resistance to damage from the western spruce budworm have been documented [7, 8]; three of the mechanisms could be linked with potential mycorrhizal mediation of herbivore resistance. First, phenological asynchronony [7, 9-11] resulting from delayed bud burst enables resistant trees to reduce the exposure of vulnerable developing tissues to western spruce budworm larvae when they emerge to feed on swollen buds in the spring; this seems unlikely to be influenced by mycorrhizae. Second, foliar nutritive quality influences
budworm larval performance, with intermediate levels of sugars and key elements including P, Mg, and K (plus mineral/N ratios) being optimal and lower and higher tissue concentrations reducing larval performance [6, 7, 12-14]. Variation among trees in foliar nutrients could be associated with mycorrhizae. Third, shoot vigor, measured as growth rate, is positively related to western spruce budworm resistance [9, 10, 15], and tree growth rates could also be affected by mycorrhizae. The fourth mechanism is induced susceptibility, whereby defoliation alters foliar nutrients to make trees more favorable for insect feeding [8]. Differences in mycorrhizae might help explain why susceptible trees appear to be more prone to changes in foliar nutritional chemistry in response to western spruce budworm defoliation than resistant trees. The objective of this study was to investigate the
potential role of ectomycorrhizal fungi in determining Douglas-fir resistance to defoliation by the western spruce budworm [3]. We used half-sib seedlings grown from open-pollinated cones collected from resistant and susceptible Douglas-firs [10] to address the following questions: 1) Do ectomycorrhizal fungi change the chemical composition of Douglas-fir foliage, or the growth rate of seedlings? 2) Could ectomycorrhizae help determine Douglas-fir resistance to defoliation by the budworm?
II. Materials and Methods
We used 30–90 cm, 3-year-old Douglas-fir half-sib seedlings. The seedlings were grown from open-pollinated seeds collected from eight pairs of trees that are phenotypically susceptible (showing obvious signs of a history of defoliation) or resistant (healthy-looking) to the budworm on the Pike National Forest near Deckers, CO and from three pairs of trees on the San Isabel National Forest near Buena Vista, CO [6, 9, 16]. The resistant and susceptible parent trees were paired in the field (within 60 m of one another) based on similarities in age, height, and microsite. Seeds were collected from the 11 pairs of mature Douglas-fir trees (11 resistant trees plus 11 susceptible trees, for a total of 22 parent tree genotypes) to produce the half-sib seedlings, which were grown in the Rocky Mountain Research Station greenhouses in Flagstaff, AZ [10]. We matched half-sib seedlings derived from the
Proccedings: IUFRO Kanazawa 2003 "Forest Insect Population Dynamics and Host Influences” - 120 -
original pairs of resistant and susceptible parent trees throughout the experiments in order to control for variation among the 11 pairs. The seedlings were raised in a nutrient-poor peat moss-vermiculite growing medium and had not been fertilized for the previous 2 years.
The seedlings were subjected to one of two treatments: 36 were inoculated with ectomycorrhizal fungi, and 54 served as untreated controls. Seedlings from both groups were removed from their small plastic pots (15 cm diameter × 20 cm in height) and transplanted into larger pots (30 cm in diameter × 27 cm in height). All of the seedlings were irrigated with pH-adjusted water to promote fungal growth. Soil pH was checked regularly for all treatments to ensure that it remained between 5.0 and 6.0. Most species of mycorrhizal fungi prefer slightly acidic soils; pH levels that are too high or too low can kill the fungus and inhibit the uptake of nutrients [4, 17].
At the time of transplant, 36 seedlings (18 resistant and 18 susceptible) were artificially inoculated with Laccaria bicolor, an ectomycorrhizal fungus associated with Douglas-fir trees and commonly used in nurseries [18]. Root samples (20 cm in length) were cut from 10 randomly selected trees (five resistant and five susceptible) and inspected under a microscope to calculate the percentage of short roots infected with the fungus prior to inoculation (number of infected root tips ÷ the total number of root tips). This is the same procedure used by Gehring and Whitham [19] to compare the proportion of ectomycorrhizal colonization on resistant versus susceptible pinyon pine (Pinus edulis Engelmann) trees. Pre-treatment inspection of the roots revealed the presence of little or no mycorrhizae (0 – 6%), most likely because of the highly alkaline water used for irrigation. The proportion of short roots that were infected with the fungus averaged 2 ± 0.6% (± SE, here and throughout) on both resistant and susceptible genotypes. The seedlings were root-dipped into a hydrogel containing L. bicolor inoculant (vegetative mycelium) grown in sterile culture on a vermiculite carrier. The inoculant (MycorTreeTM Laccaria) was purchased from Plant Health Care, Inc., in Pittsburgh, PA. An absorptive compound (Terra-SorbTM Fine, Plant Health Care, Inc., Pittsburgh, PA) was added to the mixture to ensure adhesion to the roots.
The remaining 108 seedlings (54 resistant and 54 susceptible) were untreated. The large number of controls was necessary to ensure enough were available for three sets of budworm-feeding comparisons.
All seedlings were maintained in a greenhouse where temperatures were controlled by a computer to simulate early spring conditions in a high elevation Douglas-fir habitat (12 h at 4oC and 12 h at 10oC). The cooler temperatures were necessary to delay flushing and provide sufficient time for the inoculation treatment to have an effect. Once individual trees began to flush, greenhouse temperatures were increased (12 h at 10oC and 12 h at 25oC) to promote flushing of the remaining trees.
We used three paired treatment comparisons (i.e., three paired t-tests) to evaluate the effects of parent tree category (resistant versus susceptible) and ectomycorrhizae
(inoculated versus not inoculated) on foliar nutritional chemistry and seedling growth. Resistant versus susceptible half-sib seedlings were matched according to physical similarities (i.e., height, foliage density, and general architecture) to minimize potential budworm feeding preferences based on differences in host plant morphology. Originally, there were 18 pairs of resistant versus susceptible half-sib seedlings in each of the three paired t-tests, totaling 54 pairs (108 seedlings). However, 9 pairs had to be eliminated because one or both seedlings within the pair died during the experiment, leaving a total of 45 pairs (90 seedlings).
We compared: 1) Twelve pairs of resistant versus susceptible control seedlings to find out if there were inherent differences in responses (i.e., foliar nutritional chemistry and seedling growth) between seedlings from the two parent tree categories; 2) Sixteen pairs of resistant control versus inoculated susceptible seedlings to determine if ecotmycorrhizae changed responses for susceptible seedlings; and 3) Seventeen pairs of resistant inoculated versus susceptible control seedlings to decide if ecotmycorrhizae changed responses for resistant seedlings. Pairs of resistant versus susceptible seedlings from the 11 different maternal tree pairs were distributed in approximately even proportions among the three treatment comparisons to avoid any bias.
Three or four newly flushed shoots were sampled from each seedling. The Analytical Services Laboratory at Northern Arizona University analyzed foliage samples for total Kjeldahl N and P (colorimetrically), plus Mg and Zn (by flame atomic absorption spectroscopy). These four key nutrients are known to affect budworm performance [6, 7, 12-14]. Only the current-year shoots were sampled because nutrients accumulate in the youngest needles and because they are the preferred food source of the budworm [20]. Results from the analyses were used to compare foliar nutritional quality among inoculated and untreated seedlings. Trees were sampled as soon as they began to flush to preserve the chemical composition of the expanding needles. The samples were temporarily stored in zip-lock bags and frozen at 0oC until all of the trees had flushed.
We measured seedling height and basal diameter when the trees were transplanted into larger pots and again when the foliage was sampled for chemical analysis. Stem height and basal diameter were combined to calculate an overall growth ratio ([post-treatment height • (diameter)2] ÷ [pre-treatment height • (diameter)2]) to determine seedling growth due to treatment.
We used paired t-tests to contrast the seedling (foliar concentrations of N, P, Mg, and Zn, and growth) responses between the paired resistant and susceptible seedlings used in each of the three treatment comparisons. Because we used the same experimental units to measure multiple dependent variables, we could expect to detect differences for about 0.3 of the five response variables from random chance (P = 0.05).
Proccedings: IUFRO Kanazawa 2003 "Forest Insect Population Dynamics and Host Influences” - 121 -

III. Results
A. Inoculation with Ectomycorrhizal Fungi
Post-treatment inspection of 10 randomly selected seedlings that were inoculated (five resistant and five susceptible) revealed higher levels of ectomycorrhizae (8 – 14%) compared to the pre-treatment inspection (0 – 6%). Prior to inoculation with L. bicolor, both resistant and susceptible seedlings averaged 2 % fungal colonization on their roots. After treatment, the average proportion of infected roots on inoculated resistant seedlings was significantly higher than the average proportion of infected roots on susceptible seedlings that were inoculated (Fig. 1).
B. Effects of Mycorrhizal Fungi on the Chemical
Composition of Douglas-fir foliage
There were no significant differences in foliar concentrations of N (data not shown), P (Fig. 2A), Mg (Fig. 2B), or Zn (data not shown) between the resistant versus susceptible control seedlings (P ≥ 0.453 [3]). This suggested that there were no inherent differences in foliar chemistry between the resistant versus susceptible seedlings.
The ectomycorrhizal inoculation did not change the foliar chemistry of the susceptible seedlings (Figs. 2A, B; [3]). However, it significantly increased foliar concentrations of P and Mg in the resistant seedlings (Figs. 2A, B), although there was no effect on levels of N or Zn [3].
C. Effect of Mycorrhizal Fungi on Seedling Growth
Seedling growth rates were equivalent for the resistant versus susceptible control seedlings (Fig. 2C), indicating there were no inherent differences in growth rates between the resistant and susceptible seedlings. The ectomycorrhizal inoculation caused a slight but significant increase in the growth rate of the susceptible seedlings, but it had no detectable effect on growth of the resistant seedlings (Fig. 2C).
Fig. 1. Douglas-fir seedlings from resistant parent trees had more root tips infested with ectomycorrhizal fungi after inoculation with L. bicolor than susceptible seedlings did (t = -17.36, P < 0.001, n = 10).
Fig. 2. Dry weight concentrations of P (A) and Mg (B) in the new (i.e., current-year) foliage, and seedling growth rates (C) of half-sib seedlings grown from open-pollinated seeds collected from interior Douglas-fir trees that are resistant versus susceptible to defoliation by the western spruce budworm. Results are shown for three treatment pairs, from left to right: 1) C C, resistant control (i.e., untreated) versus susceptible control seedlings; 2) C EM, resistant control versus susceptible seedlings treated with Laccaria bicolor ectomycorrhizal fungi; and 3) EM C, resistant ectomycorrhizal-treated versus susceptible control seedlings. The P-values from paired t-tests (n = 12-17) used to compare the seedlings’ responses to the two treatments in each pair are shown in the first row at the top of the figure.
IV. Summary and Conclusions
L. bicolor increased foliar concentrations of P (Fig. 2A) and Mg (Fig. 2B) in resistant seedlings, and increased the growth of susceptible seedlings (Fig. 2C), despite the short treatment period. The effects of mycorrhizal fungi on half-sib Douglas-fir seedlings in this experiment were limited to just 48 days, on average. Yet, post-treatment inspection of roots from randomly selected seedlings revealed higher levels of fungal colonization (8 – 14%) compared to the pre-treatment inspection (0 – 6%) (Fig. 1). Unusually sunny weather during the experiment caused
Inoculation with L. bicolor
Mea
n (+
SE
) % F
unga
l Col
oniz
atio
nof
See
dlin
g R
oots
0
2
4
6
8
10
12
14
Resistant SeedlingsSusceptible Seedlings
Before After
P < 0.001n = 10
Folia
r P (m
g/g
dry
wt.)
0.0
0.5
1.0
1.5
2.0
2.5
3.0
3.5
Resistant SeedlingsSusceptible Seedlings
C C C EM EM C
A. Phosphorus
0.829 0.084 0.031 P
Folia
r Mg
(mg/
g dr
y w
t.)
0.0
0.5
1.0
1.5
2.0
2.5
3.0
C C C EM EM C
B. Magnesium
0.806 0.193 0.047 P
Treatment Pairs
See
dlin
g G
row
th (%
)
0.00.20.40.60.81.01.21.41.61.8
C C C EM EM C
C. Seedling Growth
0.186 0.007 0.307 P
Mea
n (+
95%
Con
fiden
ce In
terv
al):
Proccedings: IUFRO Kanazawa 2003 "Forest Insect Population Dynamics and Host Influences” - 122 -
greenhouse conditions to fluctuate, oftentimes exceeding the intended maximum temperature. As a result, the trees flushed earlier than we expected and collection of foliage samples for chemical analysis had to be conducted earlier than planned. Nonetheless, there were detectable differences from the ectomycorrhizal inoculations on seedling growth rates and on foliar P and Mg. The fungus had no detectable effect on N or Zn [3].
The inoculated half-sib seedlings from resistant parent trees had significantly more infected root tips than the inoculated seedlings from susceptible parent trees did (Fig. 1). The ectomycorrhizal inoculation also had different effects on the resistant versus susceptible seedlings for levels of P and Mg in the foliage (Figs. 2A, B) and for seedling growth rates (Fig. 2C). Overall, these results suggest that ectomycorrhizae might play a role in Douglas-fir resistance to damage from the western spruce budworm.
Muzika and Liebhold [21] stated that despite considerable research, the effect of foliage quality on population dynamics of defoliators is not well understood. Nonetheless, previous research has shown that budworm defoliation may alter foliar nutrients [8, 22], and reduce ectomycorrhizal colonization [23]. There may also be genetically based differences in the way resistant and susceptible trees respond to mycorrhizal fungi. We must consider the results presented here as preliminary, given the short treatment period and the relatively small sample sizes. Nonetheless, they suggest that mycorrhizal fungi may affect the differences in growth and foliar chemistry observed between the resistant versus susceptible parent trees in the field.
References [1] M. A. Castellano, R. Molina, “Mycorrhizae,” In T. D. Landis, R. W. Tinus, S. E. McDonald, J. P. Barnett, The Container Tree Nursery Manual, Volume 5, Agriculture Handbook 674, U. S. Department of Agriculture, Forest Service, pp. 101-167, 1989. [2] C. A. Gehring., N. S. Cobb, T. G. Whitham, “Three-way interactions among ectomycorrhizal mutualists, scale insects, and resistant and susceptible pinyon pines,” American Naturalist, Vol. 149, pp. 824-841, 1997. [3] B. L. Palermo, K. M. Clancy, G. W. Koch, “The potential role of ectomycorrhizal fungi in determining Douglas-fir resistance to defoliation by the western spruce budworm (Lepidoptera : Tortricidae), ” Journal of Economic Entomology, Vol. 96, pp. 783-791, 2003. [4] R. L Edmonds, J. K. Agee, R. I. Gara, Forest Health and Protection, McGraw-Hill, 2000. [5] T. S. Grove, N. Malajczuk, “The potential for management of ectomycorrhiza in forestry,” In A.D. Robson, K.K. Abbott (eds.), Management of Mycorrhizas in Agriculture, Horticulture and Forestry, Kluwer Academic Publishers, pp. 201-210, 1994. [6] K. M. Clancy, “Biochemical characteristics of Douglas-fir trees resistant to damage from the western spruce budworm: patterns from three populations,” In R. I. Alfero et al. (eds.), Protection of World Forests from Insect Pests: Advances in Research, IUFRO World Series Vol. 11, pp. 115-125, 2001. [7] K. M. Clancy, “Mechanisms of resistance in trees to defoliators,” In M. R. Wagner, K. M. Clancy, F. Lieutier, and T. D.
Paine (eds.), Mechanisms and Deployment of Resistance in Trees to Insects, Kluwer Academic Publishers, pp. 77-101, 2002. [8] K. M. Clancy, Z. Chen, T. E. Kolb, “Foliar nutrients and induced susceptibility: genetic mechanisms of Douglas-fir resistance to western spruce budworm defoliation,” Canadian Journal of Forest Research, Vol. 34, pp. 939-949, 2004. [9] K. M Clancy, J. K. Itami, D. P. Huebner, “Douglas-fir nutrients and terpenes: potential resistance factors to western spruce budworm defoliation,” Forest Science, Vol. 39, pp. 78-94, 1993. [10] Z. Chen, T. E. Kolb, K. M. Clancy, “Mechanisms of Douglas-fir resistance to western spruce budworm defoliation: bud burst phenology, photosynthetic compensation and growth rate,” Tree Physiology, Vol. 21, pp. 1159-1169, 2001. [11] Z. Chen, K. M. Clancy, T. E. Kolb, “Variation in budburst phenology of Douglas-fir related to western spruce budworm (Lepidoptera: Tortricidae) fitness,” Journal of Economic Entomology, Vol. 96, pp. 377-387, 2003. [12] K. M Clancy, “Response of western spruce budworm (Lepidoptera: Tortricidae) to increased nitrogen in artificial diets,” Environmental Entomology, Vol. 21, pp. 331-344, 1992. [13] K. M. Clancy, “The role of sugars in western spruce budworm nutritional ecology,” Ecological Entomology, Vol. 17, pp. 189-197, 1992 [14] K. M. Clancy, R. M. King, “Defining the western spruce budworm’s nutritional niche with response surface methodology,” Ecology, Vol. 74, pp. 442-454, 1993. [15] Z. Chen, T. E. Kolb, K. M. Clancy, “Effects of artificial and western spruce budworm (Lepidoptera: Tortricidae) defoliation on growth and biomass allocation of Douglas-fir seedlings,” Journal of Economic Entomology, Vol. 95, pp. 587-594, 2002. [16] K. M. Clancy, “Douglas-fir nutrients and terpenes as potenital factors influencing western spruce budworm defoliation,” In Y. N. Baranchikov, W. J. Mattson, F. Pain, and T. L. Payne (eds.), Forest Insect Guilds: Patterns of Interaction with Host Trees, USDA Forest Service General Technical Report NE-153, pp. 124-134, 1991. [17] H. Marschner, B. Dell, “Nutrient uptake in mycorrhizal symbiosis,” Plant and Soil, Vol. 159, pp. 89-102, 1994. [18] M. A. Castellano, J. M. Trappe, “Ectomycorrhial formation and plantation performance of Douglas-fir nursery stock inoculated with Rhizopogon spores,” Canadian Journal of Forest Research, Vol. 15, pp. 613-617, 1985. [19] C. A. Gehring, T. G. Whitham, “Comparisons of ectomycorhizae on pinyon pines (Pinus edulis; Pinaceae) across extremes of soil type and herbivory,” American Journal of Botany, Vol. 81, pp. 1509-1516, 1994. [20] D. G. Fellin, J. E. Dewey, “Western spruce budworm”, USDA Forest Service Forest Insect & Disease Leaflet, No. 53, 1986. [21] R. M. Muzika, A. M. Liebhold, “A critique of silvicultural approaches to managing defoliating insects in North America,” Agricultural and Forest Entomology, Vol. 2, pp. 97-105, 2000. [22] G. A. Van Sickle, “Host responses,” In M. H Brookes, R. W. Campbell, J. J. Colbert, R. G. Mitchell, R. W. Stark (eds.), Western Spruce Budworm, USDA Forest Service Technical Bulletin 1694, pp. 57-70, 1987. [23] T. E. Kolb, K. A. Dodds, K. M. Clancy, “Effect of western spruce budworm defoliation on the physiology and growth of potted Douglas-fir seedlings,” Forest Science, Vol. 45, pp. 280-291, 1999.
Proccedings: IUFRO Kanazawa 2003 "Forest Insect Population Dynamics and Host Influences” - 123 -
Effects of Simulated Partial Cotyledon Herbivory on Seedling Growth in Quercus crispula Acorns
Naoya WADA Center for Far Eastern Studies, University of Toyama, Toyama, Toyama 930-8555, JAPAN
Naoto KAMATA Graduate School of Natural Science and Technology, Kanazawa University, Kanazawa, Ishikawa 920-1192, JAPAN
Abstract - We examined the effects of partial cotyledon herbivory on developmental growth of seedlings from Quercus crispula acorns by simulated cotyledon removal. Although the size was smaller, seedlings developed from partially cotyledon-removed acorns showed higher RGRs with lower cotyledon reserves than those from intact ones. This suggests the existence of compensatory responses to herbivory involving enhanced utilization of cotyledon reserves in acorns.
I. Introduction
Quercus acorns contain a large amount of resources in their cotyledons [1, 2], and as a result they are highly attractive to many kinds of predators [3-6]. Although acorns are frequently attacked by seed predators and suffer from cotyledon herbivory, it has been reported that consumed acorns can germinate and develop into seedlings if the embryo is not damaged [7, 8], suggesting one of the adaptive function of oak acorns to partial cotyledon herbivory. However, there are few studies to clarify quantitatively how strongly relative growth rates (RGRs) of oak seedlings are influenced by partial cotyledon herbivory before acorns germinate.
The initial growth of oak seedlings appears to depend largely on cotyledon reserves in acorns [9-11]. Branco et al. [8] found that germination (i.e., root elongation) speeds tended to increase with greater degrees of cotyledon herbivory in Quercus suber acorns. This suggests the occurrence of rapid resource translocation from cotyledon reserves into roots and/or hypocotyl, resulting in a higher RGR of seedlings developed from partially cotyledon-consumed acorns as compared with those from intact ones. The aim of this study tests the above prediction in Quercus crispula acorns.
II. Plant materials
Quercus crispula Blume (syn. Q. mongolica var. grosseserrata (Blume) Rehd. et Wils.)(Fagaceae) is, a shade-tolerant climax species [12], which is predominantly deciduous and is found throughout the cool-temperate forests of Japan. Acorns of this species at the pre-dispersal stage were infested and eaten by insect larvae, Curculio spp. (Curculionidae), Cydia glandicolana and C. danilevskyi (Torticidae)[6]. At the post-dispersal stage, the main seed
predators are small rodents, mice and voles [13-16]. Although these small rodents can eat acorns completely, partial consumption (cotyledons) was also frequently observed in laboratory experiments [17, 18], suggesting that the occurrence of acorns that are partially consumed by predators but still have sound embryos may not be rare in nature, as reported in oaks in north America [7].
We randomly collected acorns that had recently fallen to the forest floor (having been deposited on the fresh leaf litters) under the canopy of a mature tree (ca. 50 cm in diameter at the breast height), in a cool-temperate deciduous forest of Arimine (ca. 1000 m a.s.l.), which is located in Toyama Prefecture, central Japan.
III. Methods A. Root developmental stage
We selected sixty sound acorns collected in early October of 1999; 50% of the cotyledons were immediately cut off of twenty acorns , on another twenty acorns 75% of the cotyledons were cut off using a sharp knife, and the remaining twenty acorns were untreated as controls. Thus, we simulated herbivory as 50% or 75% of the cotyledon but embryos were left intact. All samples were weighed (fresh weight).
We filled a plastic box (35 (L) x 25 (W) x 15 (D) cm) with soil (garden soil, S. K. Agri. Co. Ltd., Gunma, Japan), moistened it thoroughly and sowed the samples 1 cm below the surface in a 5 × 6 grid (n = 30: 10, 50% cotyledon-removed acorns; 10, 75% cotyledon-removed acorns; 10, controls). The surface of the soil was covered with moistened vermiculite. The plastic box was covered with a lid that had small perforations to retain the moisture and prevent drying out. The remaining 30 samples were treated in the same manner. We held the two plastic boxes with samples in an incubator at 5℃ during two months. At the end of this period, each sample was harvested, washed thourougly, and divided into root, hypocotyl, cotyledon and shell. Then they were dried at 80℃ for 48 hrs, and weighed. The RGR was calculated using the following formula:
RGR = (log W2 – log W1) / (t2 – t1), where W1 (mg) and W2 (mg) were dry weight at the time t1 (wk) and t2 (wk), respectively. Values for W2 were total dry
Proccedings: IUFRO Kanazawa 2003 "Forest Insect Population Dynamics and Host Influences” - 124 -

weight with the exception of the shell at time t2, i.e., root, hypocotyl, and cotyledon. Values for W1 were the initial dry weight of cotyledon and hypocotl including embryo, estimated using the relationship between fresh and dry weights of acorns (n = 10 samples for each treatment) using the following equations; Y = 0.46 X + 0.08 (r2 = 0.89, P < 0.01, for intact acorns), Y = 0.45 X + 0.04 (r2 = 0.89, P < 0.01, for 50% removed), Y = 0.52 X – 0.05 (r2 = 0.90, P < 0.01, for 75% removed), where X (g) was the fresh weight of acorns and Y (g) was the dry weight of cotyledons and hypocotyls excluding shells. The decreased rate of cotyledon dry mass from t1 to t2 was also calculated for each sample. B. Seedling emergence stage
We selected sixty sound acorns collected in early October of 2001, and simulated herbivory as the same manner as mentioned above under section A. We incubated samples at 5℃ over 6.5 months. After that, each sample was individually transplanted into a pot (12 cm in diameter and 12 cm in depth), and was grown in a sunny location in Toyama University over a 1.5 month period. Then, height and basal diameter were measured for each emerged seedling. Each sample was harvested, washed thoroughly, and divided into leaf, stem, root, cotyledon and shell. They were then dried at 80℃ for 48 hrs, and were weighed. The RGR was calculated as the formula described in section A. In the formula, W2 was the actual total dry weight with the exception of the shell at time t2. Values of W1 represented the initial dry weight of cotyledons and hypocotls including embryo, and were calculated using the relationship between fresh and dry weight of acorns (n = 25 samples for partially cotyledon-removed acorns, and n = 50 for intact acorns) using the following equations; Y = 0.47 X – 0.13 (r2 = 0.96, P < 0.01, for intact acorns), Y = 0.43 X – 0.03 (r2 = 0.98, P < 0.01, for 50% removed), Y = 0.44 X – 0.05 (r2 = 0.91, P < 0.01, for 75% removed), where X (g) was the fresh weight of the acorn and Y (g) was dry weight of the seedling excluding the shell. The decrease in cotyledon dry mass from t1 to t2 was also calculated for each sample.
IV. Results
Acorns germinate and develop the root from fall to spring in nature. At this stage, the root grows using resources only in cotyledon. Therefore, lower (negative) RGR and greater rates of cotyledon mass decrease leads to more rapidegrowth of roots. Acorns with more heavily damaged cotyledons, 75% removed, exhibited lower RGRs and higher rates of cotyledon mass decrease compared with acorns with 50% removal and controls (Fig. 1, left figures). This suggests rapid translocation of resources stored in cotyledons to roots
in heavily cotyledon-damaged acorns. Half of cotyledon-removed acorns showed no significant difference in RGRs and rates of cotyledon mass decrease compared with controls at the root development stage.
Fig. 1. The relative growth rate (RGR) and decrease rate of cotyledon mass (%) (mean + 1SE) for individuals at root developmental stage (A) and at seedling emergence stage (B). Different letters show significant differences among treatments at P < 0.05 level (Kruskal Walis test and Mann-Whitney U test).
In contrast to individuals (acorns) at the root development stage, high (positive) RGR is expected for individuals at the seedling emergence stage if newly emerged leaves produce hydrocarbons by photosynthesis at rates that exceed seedling-constructive costs. Our results showed positive RGRs at the seedling emergence stage regardless of cotyledon-removal treatments (Fig. 1, right-top figure). Significantly higher RGRs and higher rates of cotyledon mass decrease (Fig. 1, right-bottom figure) were observed in individuals that developed from cotyledon-removed acorns than in controls. This suggests that acorns, with partially consumed cotyledons, can develop into seedlings more rapidly and with higher utilization of cotyledon-reserves compared with intact acorns. The height and basal diameter of seedlings were not significantly different between individuals with half of cotyledons removed and controls (Fig. 2). However, acorns with heavily -removed cotyledons (75% removal) grew into smaller seedlings.
Fig. 2. The height and basal stem diameter (mean + 1SE) of seedlings. Different letters indicate significant differences among treatments at P < 0.05 level (Kruskal Walis test and Mann-Whitney U test).
Proccedings: IUFRO Kanazawa 2003 "Forest Insect Population Dynamics and Host Influences” - 125 -
V. Discussion
Juveniles developed from acorns with 75% cotyledon-removal grew more rapidly during the root development stage as shown in Fig. 1A. Furthermore, we observed no large difference in root elongation (ca. 10 mm on average) at this stage between juveniles of cotyledon-removed acorns and those from intact acorns. Several studies have reported higher germination speeds in insect-damaged acorns than in intact acorns of Quercus spp. [8, 19]. Our results demonstrated higher utilization of cotyledon-reserves in acorns with heavy cotyledon removal than in intact acorns (Fig. 1A, left-bottom figure). Thus rapid resource-translocation from cotyledon to root and/or hycopotyl during the root development stage seems to enable acorns with partial cotyledon-removal to develop into seedlings with high RGRs as shown in Figs. 1B and 2. We observed faster leaf emergence in juveniles developed from acorns with partial cotyledon removal than in those from intact acorns. More rapider germination and translocation of cotyledon reserves to root and shoot may lead seedlings to emerge faster above the ground, and to produce hydrocarbons by photosynthesis in earlier season, suggesting one of the compensatory responses to partial cotyledon herbivory.
In our study, however, we did not specifically determine the reason why acorns with partial removed cotyledons germinated and grew more quickly compared with intact acorns, because a likely cause for this relationship may be that acorns with partial cotyledon removal would be able to uptake water faster from a section made by cut-off treatments in our experiments. Kikuzawa and Koyama [20] demonstrated that smaller-sized seeds had higher efficiencies of water absorption required to germinate because of higher ratios of surface area relative to volume. Thus mechanism may act on acorns with partially removed cotyledons- and/or acorns naturally damaged by insects [8, 19]. In addition, acorns might have surplus resources required for seedling establishment. Further studies are necessary to clarify ecological and evolutionarily meanings of surplus cotyledon-reserves in Quercus seeds [7, 10, 21].
Acknowledgements
We thank Ms Mika Masuda for her assistance on this study. This work was supported in part by a Grant-in-Aid for Scientific Research from the Ministry of Education, Culture, Sports, Science and Technology (No. 12440216).
References [1] H. L. Short, “Composition and squirrel use of acorns of black and white oak groups,” Journal of Wildlife Management, Vol. 40, pp. 479-483, 1976. [2] F. A. Servello, R. L. Kirkpatrick, “Regional variation in the nutritional ecology of ruffed grouse,” Journal of Wildlife Management, Vol. 51, pp. 749-770, 1987.
[3] K. Mellanby, “The effects of some mammals and birds on regeneration of oak,” Journal of Applied Ecology, Vol. 5, pp. 359-366, 1968. [4] M. W. Shaw, “Factors affecting the natural regeneration of sessile oak (Quercus petraea) in North Wales. I. A preliminary study of acorn production, viability and losses,” Journal of Ecology, Vol. 56, pp. 565-583, 1968. [5] M. I. Borchert, F. W. Davis, J. Michaelsen, L. D. Oyler, “Interactions of factors affecting seedling recruitment of blue oak (Quercus douglasii) in California,” Ecology, Vol. 70, pp. 389-404, 1989. [6] K. Maetô, “Relationships between size and mortality of Quercus mongolica var. grosseserrata acorns due to pre-dispersal infestation by frugivorous insects,” Journal of Japanese Forest Society, Vol. 77, pp. 213-219, 1995. [7] M. A. Steele, T. Knowles, K. Bridle, E. L. Simms, “Tannins and partial consumption of acorns: implications for dispersal of oaks by predators,” American Midland Naturalist, Vol. 130, pp. 229-238, 1993. [8] M. Branco, C. Branco, H. Merouani, M. H. Almedia, “Germination success, survival and seedling vigour of Quercus suber acorns in relation to insect damage,” Forest Ecology and Management, Vol. 166, pp. 159-164, 2002. [9] P. G. Javris, “The effects of acorn size and provenance on the growth of seedlings of sessile oak,” Quarterly Journal of Forestry, Vol. 57, pp. 11-19, 1963. [10] C. Bonfil, “The effects of seed size, cotyledon reserves and herbivory on seedling survival and growth in Quercus rugosa and Q. laurina (Fagaceae),” American Journal of Botany, Vol. 85, pp. 79-87, 1998. [11] K. Guo, M. J. A. Werger, “Different responses to shade of evergreen and deciduous oak seedlings and the effect of acorn size,” Acta Oecologica, Vol. 20, pp. 579-586, 1999. [12] T. Koike, “Leaf structure and photosynthetic performance as related to the forest succession of deciduous broad-leaves trees,” Plant Species Biology, Vol. 3, pp. 77-89, 1988. [13] K. Kikuzawa, “Dispersal of Quercus mongolica acorns in a broadleaved deciduous forest 1. Disappearance,” Forest Ecology and Management, Vol. 25, pp. 1-8, 1988. [14] M. Miyaki, K. Kikuzawa, “Dispersal of Quercus mongolica acorns in a broadleaved deciduous forest 2. Scatterhoarding by mice,” Forest Ecology and Management, Vol. 25, pp. 9-16, 1988. [15] N. Wada, “Dwarf bamboos affect the regeneration of zoochorous trees by providing habitats to acorn-feeding rodents,” Oecologia, Vol. 94, pp. 403-407, 1993. [16] A. Ueda, “Pre- and post-despersal damage to the acorns of two oak species (Quercus serrata Thumb. and Q. mongolica Fischer) in a species-rich deciduous forest,” Journal of Forest Research, Vol. 5, pp. 169-174, 2000. [17] A. Nakatsu, “Studies on the taste of wild murid rodents for the normal and warm-eaten acorns in the laboratory,” Trasactions of the meeting in Hokkaido branch of the Japanese forest society, Vol. 37, pp. 109-112, 1989 (in Japanese). [18] A. Nakatsu, N. Kawaji, K. Fukuyama, K. Maetô, “Preference tests of the small Japanese field-mouse, Apodemus argenteus, for normal and worm-eatern acorns, Quercus mongolica var. grosseserrata, in the laboratory,” Trasactions of the meeting in Hokkaido branch of the Japanese forest society, Vol. 41, pp. 91-94, 1993 (in Japanese). [19] H. Fukimoto, H. Kajimura, “Effects of insect predation on hypocotyl survival and germination success of mature Quercus variabilis acorns,” Journal of Forest Research, Vol. 5, pp. 31-34, 2000. [20] K. Kikuzawa, H. Koyama, “Scaling of soil water absorption by seeds: an experiment using seed analogues,” Seed Science
Proccedings: IUFRO Kanazawa 2003 "Forest Insect Population Dynamics and Host Influences” - 126 -

Research, Vol. 9, pp. 171-178, 1999. [21] L. K. Sonesson, “Growth and survival after cotyledon removal in Quercus robur seedlings, grown in different soil types,” Oikos, Vol. 69, pp. 65-70, 1994.
Proccedings: IUFRO Kanazawa 2003 "Forest Insect Population Dynamics and Host Influences” - 127 -
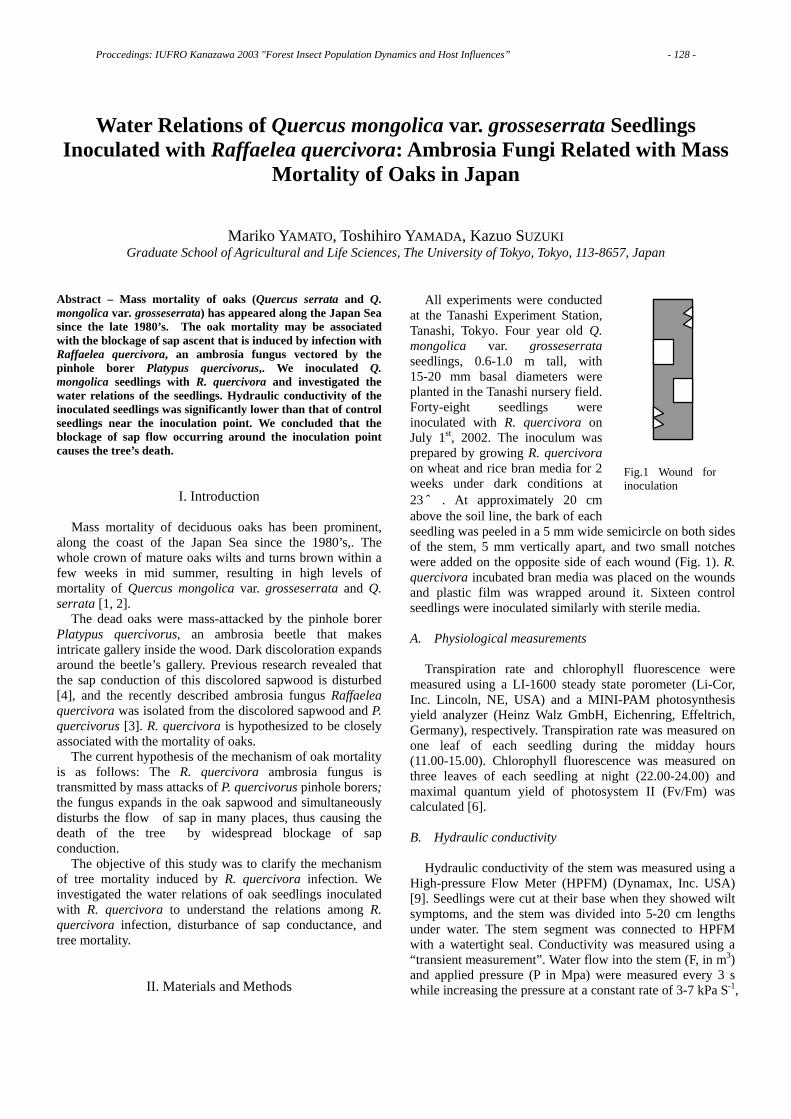
Water Relations of Quercus mongolica var. grosseserrata Seedlings Inoculated with Raffaelea quercivora: Ambrosia Fungi Related with Mass
Mortality of Oaks in Japan
Mariko YAMATO, Toshihiro YAMADA, Kazuo SUZUKI
Graduate School of Agricultural and Life Sciences, The University of Tokyo, Tokyo, 113-8657, Japan Abstract – Mass mortality of oaks (Quercus serrata and Q. mongolica var. grosseserrata) has appeared along the Japan Sea since the late 1980’s. The oak mortality may be associated with the blockage of sap ascent that is induced by infection with Raffaelea quercivora, an ambrosia fungus vectored by the pinhole borer Platypus quercivorus,. We inoculated Q. mongolica seedlings with R. quercivora and investigated the water relations of the seedlings. Hydraulic conductivity of the inoculated seedlings was significantly lower than that of control seedlings near the inoculation point. We concluded that the blockage of sap flow occurring around the inoculation point causes the tree’s death.
I. Introduction
Mass mortality of deciduous oaks has been prominent, along the coast of the Japan Sea since the 1980’s,. The whole crown of mature oaks wilts and turns brown within a few weeks in mid summer, resulting in high levels of mortality of Quercus mongolica var. grosseserrata and Q. serrata [1, 2].
The dead oaks were mass-attacked by the pinhole borer Platypus quercivorus, an ambrosia beetle that makes intricate gallery inside the wood. Dark discoloration expands around the beetle’s gallery. Previous research revealed that the sap conduction of this discolored sapwood is disturbed [4], and the recently described ambrosia fungus Raffaelea quercivora was isolated from the discolored sapwood and P. quercivorus [3]. R. quercivora is hypothesized to be closely associated with the mortality of oaks.
The current hypothesis of the mechanism of oak mortality is as follows: The R. quercivora ambrosia fungus is transmitted by mass attacks of P. quercivorus pinhole borers; the fungus expands in the oak sapwood and simultaneously disturbs the flow of sap in many places, thus causing the death of the tree by widespread blockage of sap conduction.
The objective of this study was to clarify the mechanism of tree mortality induced by R. quercivora infection. We investigated the water relations of oak seedlings inoculated with R. quercivora to understand the relations among R. quercivora infection, disturbance of sap conductance, and tree mortality.
II. Materials and Methods
All experiments were conducted at the Tanashi Experiment Station, Tanashi, Tokyo. Four year old Q. mongolica var. grosseserrata seedlings, 0.6-1.0 m tall, with 15-20 mm basal diameters were planted in the Tanashi nursery field. Forty-eight seedlings were inoculated with R. quercivora on July 1st, 2002. The inoculum was prepared by growing R. quercivora on wheat and rice bran media for 2 weeks under dark conditions at 23℃ . At approximately 20 cm above the soil line, the bark of each seedling was peeled in a 5 mm wide semicircle on both sides of the stem, 5 mm vertically apart, and two small notches were added on the opposite side of each wound (Fig. 1). R. quercivora incubated bran media was placed on the wounds and plastic film was wrapped around it. Sixteen control seedlings were inoculated similarly with sterile media.
A. Physiological measurements
Transpiration rate and chlorophyll fluorescence were measured using a LI-1600 steady state porometer (Li-Cor, Inc. Lincoln, NE, USA) and a MINI-PAM photosynthesis yield analyzer (Heinz Walz GmbH, Eichenring, Effeltrich, Germany), respectively. Transpiration rate was measured on one leaf of each seedling during the midday hours (11.00-15.00). Chlorophyll fluorescence was measured on three leaves of each seedling at night (22.00-24.00) and maximal quantum yield of photosystem II (Fv/Fm) was calculated [6]. B. Hydraulic conductivity
Hydraulic conductivity of the stem was measured using a High-pressure Flow Meter (HPFM) (Dynamax, Inc. USA) [9]. Seedlings were cut at their base when they showed wilt symptoms, and the stem was divided into 5-20 cm lengths under water. The stem segment was connected to HPFM with a watertight seal. Conductivity was measured using a “transient measurement”. Water flow into the stem (F, in m3) and applied pressure (P in Mpa) were measured every 3 s while increasing the pressure at a constant rate of 3-7 kPa S-1,
Fig.1 Wound forinoculation
Proccedings: IUFRO Kanazawa 2003 "Forest Insect Population Dynamics and Host Influences” - 128 -
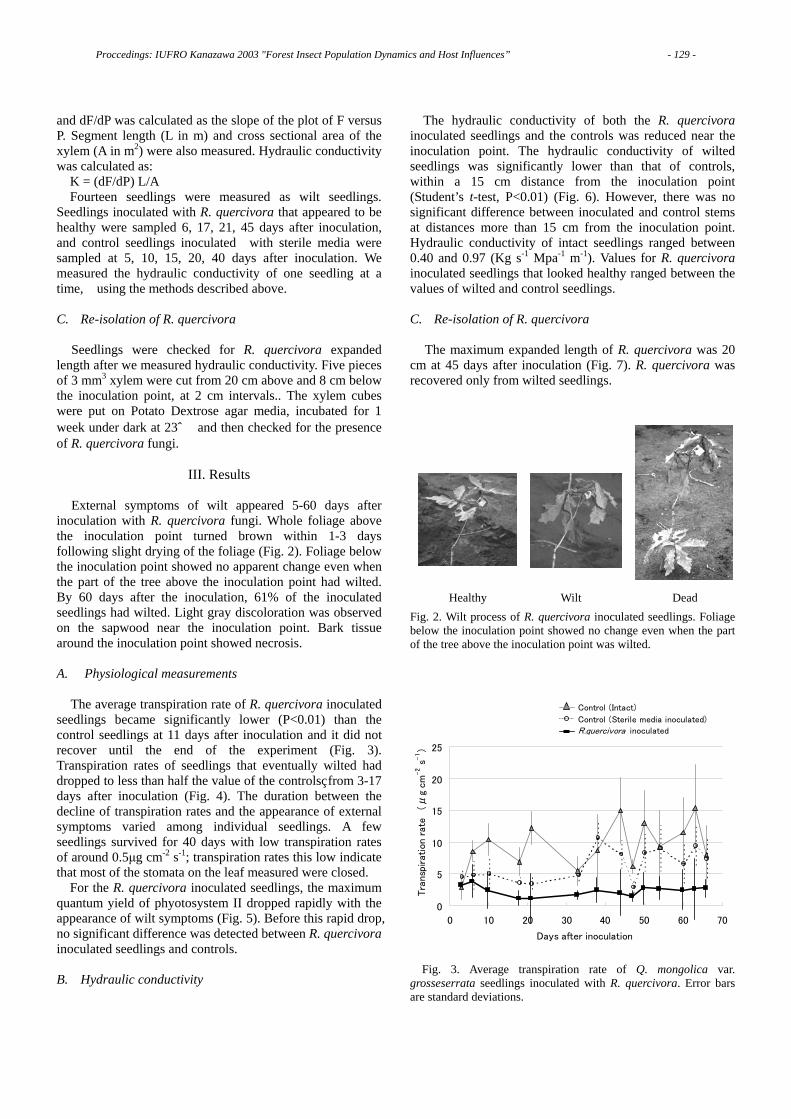
Healthy Wilt Dead
and dF/dP was calculated as the slope of the plot of F versus P. Segment length (L in m) and cross sectional area of the xylem (A in m2) were also measured. Hydraulic conductivity was calculated as:
K = (dF/dP) L/A Fourteen seedlings were measured as wilt seedlings.
Seedlings inoculated with R. quercivora that appeared to be healthy were sampled 6, 17, 21, 45 days after inoculation, and control seedlings inoculated with sterile media were sampled at 5, 10, 15, 20, 40 days after inoculation. We measured the hydraulic conductivity of one seedling at a time, using the methods described above. C. Re-isolation of R. quercivora
Seedlings were checked for R. quercivora expanded length after we measured hydraulic conductivity. Five pieces of 3 mm3 xylem were cut from 20 cm above and 8 cm below the inoculation point, at 2 cm intervals.. The xylem cubes were put on Potato Dextrose agar media, incubated for 1 week under dark at 23℃ and then checked for the presence of R. quercivora fungi.
III. Results
External symptoms of wilt appeared 5-60 days after
inoculation with R. quercivora fungi. Whole foliage above the inoculation point turned brown within 1-3 days following slight drying of the foliage (Fig. 2). Foliage below the inoculation point showed no apparent change even when the part of the tree above the inoculation point had wilted. By 60 days after the inoculation, 61% of the inoculated seedlings had wilted. Light gray discoloration was observed on the sapwood near the inoculation point. Bark tissue around the inoculation point showed necrosis. A. Physiological measurements
The average transpiration rate of R. quercivora inoculated
seedlings became significantly lower (P<0.01) than the control seedlings at 11 days after inoculation and it did not recover until the end of the experiment (Fig. 3). Transpiration rates of seedlings that eventually wilted had dropped to less than half the value of the controls from 3-17 days after inoculation (Fig. 4). The duration between the decline of transpiration rates and the appearance of external symptoms varied among individual seedlings. A few seedlings survived for 40 days with low transpiration rates of around 0.5μg cm-2 s-1; transpiration rates this low indicate that most of the stomata on the leaf measured were closed.
For the R. quercivora inoculated seedlings, the maximum quantum yield of phyotosystem ІІ dropped rapidly with the appearance of wilt symptoms (Fig. 5). Before this rapid drop, no significant difference was detected between R. quercivora inoculated seedlings and controls.
B. Hydraulic conductivity
The hydraulic conductivity of both the R. quercivora inoculated seedlings and the controls was reduced near the inoculation point. The hydraulic conductivity of wilted seedlings was significantly lower than that of controls, within a 15 cm distance from the inoculation point (Student’s t-test, P<0.01) (Fig. 6). However, there was no significant difference between inoculated and control stems at distances more than 15 cm from the inoculation point. Hydraulic conductivity of intact seedlings ranged between 0.40 and 0.97 (Kg s-1 Mpa-1 m-1). Values for R. quercivora inoculated seedlings that looked healthy ranged between the values of wilted and control seedlings. C. Re-isolation of R. quercivora
The maximum expanded length of R. quercivora was 20 cm at 45 days after inoculation (Fig. 7). R. quercivora was recovered only from wilted seedlings.
Fig. 2. Wilt process of R. quercivora inoculated seedlings. Foliage below the inoculation point showed no change even when the part of the tree above the inoculation point was wilted.
Fig. 3. Average transpiration rate of Q. mongolica var.
grosseserrata seedlings inoculated with R. quercivora. Error bars are standard deviations.
0
5
10
15
20
25
0 10 20 30 40 50 60 70
Days after inoculation
Tra
nspirat
ion
rate
(μ
g cm
-2 s
-1)
Control (Sterile media inoculated)
R.quercivora inoculated
Control (Intact)
Proccedings: IUFRO Kanazawa 2003 "Forest Insect Population Dynamics and Host Influences” - 129 -
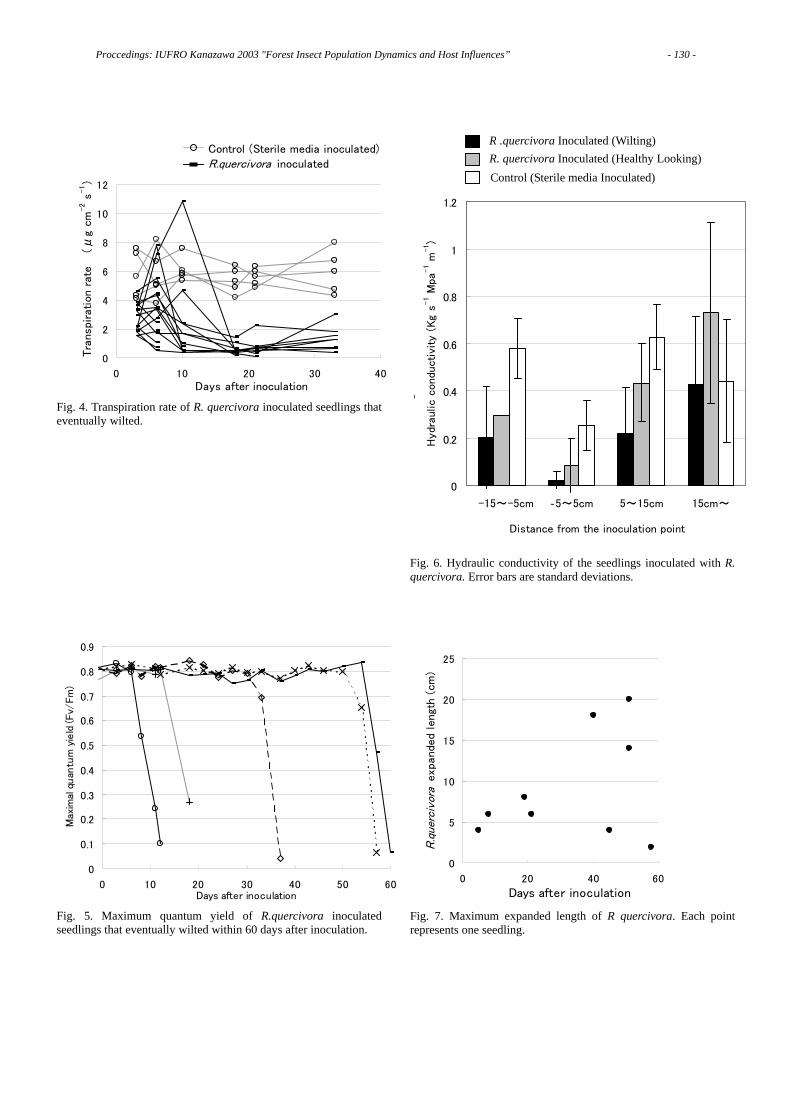
0
2
4
6
8
10
12
0 10 20 30 40Days after inoculation
Tra
nspiration r
ate
(μ
g c
m-2 s
-1)
Control (Sterile media inoculated)
R.quercivora inoculated
Fig. 4. Transpiration rate of R. quercivora inoculated seedlings that eventually wilted.
0
0.1
0.2
0.3
0.4
0.5
0.6
0.7
0.8
0.9
0 10 20 30 40 50 60Days after inoculation
Max
imal
quan
tum
yie
ld (Fv/
Fm
)
Fig. 5. Maximum quantum yield of R.quercivora inoculated seedlings that eventually wilted within 60 days after inoculation.
0
0.2
0.4
0.6
0.8
1
1.2
-15~-5cm ‐5~5cm 5~15cm 15cm~
Distance from the inoculation point
Hyd
raul
ic c
ond
uct
ivity
(Kg s
-1 M
pa-1 m
-1)
Fig. 6. Hydraulic conductivity of the seedlings inoculated with R. quercivora. Error bars are standard deviations.
0
5
10
15
20
25
0 20 40 60
Days after inoculation
R.q
uerc
ivor
a e
xpanded length
(cm
)
Fig. 7. Maximum expanded length of R quercivora. Each point represents one seedling.
R .quercivora Inoculated (Wilting) R. quercivora Inoculated (Healthy Looking) Control (Sterile media Inoculated)
Proccedings: IUFRO Kanazawa 2003 "Forest Insect Population Dynamics and Host Influences” - 130 -
IV. Discussion
Hydraulic conductivity was significantly reduced within a 15 cm distance from the inoculation point, which was similar to the maximum expanded length of R. quercivora. This demonstrates that R. quercivora distributes locally around the inoculation point and affects the hydraulic pathway around the infected xylem. Hydraulic conductivity can change as a result of interruption of the water column in the vessels. The possible causes of interruptions are vapor blockage (cavitaion) [5], high molecular substances that clog the pit membrane, and occluding components such as fungal hyphae, tyloses, and gums. There are reports that tyloses and gums are abundant around the xylem infected with R. quercivora. Further research is necessary to clarify what factors are responsible for the reduction of hydraulic conductivity.
Transpiration rates dropped and remained low for R. quercivora inoculated seedlings. This suggests that stomata closed in order to maintain turgor pressure under reduced hydraulic conductivity [8]. Even with closed stomata, evaporation from the cuticle and bark would have continued. With severe reduction of hydraulic conductivity, this evaporation would be enough to cause the seedlings to wilt .
Maximum quantum yield of phyotosystem ІІ (Fv/Fm) dropped rapidly with the appearance of wilt symptoms. According to previous research, this rapid drop was delayed by supplying water to the wilting part of the tree [10]. This suggests that the change of Fv/Fm was caused by water deficits.
R. quercivora distributes locally around the inoculation point, causing significant reduction of hydraulic conductivity. We conclude that this blockage of sap flow is the cause of tree death. The unique part of this wilt mechanism is the localization of the pathogen. With other wilt diseases such as Oak wilt or Dutch elm disease, the pathogen induces leaf wilt after it invades the whole tree [7]. Further research is necessary to confirm whether blockage of sap flow alone is sufficient to induce wilt.
References [1] S. Ito, T. Yamada, “Distribution and spread of the mass mortality of oak trees,” Journal of Japanese Forestry Society, Vol. 80, pp. 229-232, 1998. (In Japanese) [2] S. Ito, T. Kubono, N. Sahashi, T. Yamada, “Associated fungi with the mass mortality of oak trees,” Journal of Japanese Forestry Society, Vol. 5, pp. 170-175, 1998. (In Japanese with English summary) [3] T. Kubono, S. Ito, “Raffaelea quercivora sp. nov. associated with mass mortality of Japanese oak, and the ambrosia beetle (Platypus quercivorus), “ Mycoscience, Vol. 43, pp. 255-260, 2002. [4] K. Kuroda, T. Yamada, “Discoloration of sapwood and blockage of xylem sap ascent in the trunks of wilting Quercus spp. Following attack by Platypus quercivorus,” Journal of Japanese Forestry Society, Vol. 78, pp. 84-88, 1996. (in Japanese with English summary) [5] D. Newbanks, A. Bosch, M. H. Zimmermann, “Evidence for xylem dysfunction by embolization in Dutch elm disease,”
Phytopathology, Vol. 73, pp. 1060-1063, 1983. [6] K. Rohacek, M. Batak, “Technique of the modulated chlorophyll fluorescence: basic concepts, useful parameters, and some applications. Phyotosynthetica, Vol. 37, pp. 339-363. [7] W. Sinclair, H. H. Lyon, W. T. Johnson, Disease of Trees and Shrubs, Cornell University Press, 1987. [8] J. S. Sperry, N. N. Alder, S. E. Eastlack, “The effect of reduced hydraulic conductance and xylem cavitation,” Journal of Experimental Botany, Vol. 44, pp. 1075-1082, 1993. [9] M. T. Tyree, S. Patino, J. Bennink, J. Alexander, “Dynamic measurements of root hydraulic conductance using a high-pressure flowmeter in the laboratory and field,” Journal of Experimental Botany, Vol. 46, pp. 83-94, 1995. [10] M. Yamato, T. Yamada, K. Suzuki, “Wilt of oaks – blockage of xylem sap ascent,” Bulletin of the Tokyo University Forests, Vol. 106, pp. 69-76, 2002. (in Japanese with English summary)
Proccedings: IUFRO Kanazawa 2003 "Forest Insect Population Dynamics and Host Influences” - 131 -
Defense Responses of Oak Trees against the Fungus Raffaelea quercivora Vectored by the Ambrosia Beetle Platypus quercivorus
Toshihiro YAMADA Experimental Station at Tanashi, University Forests, The University of Tokyo, Nishitokyo, Tokyo 188-0002, JAPAN
Yu ICHIHARA Tohoku Research Center, Forestry and Forest Products Research Institute, Morioka, Iwate 020-0123, JAPAN
Keko HORI Graduate School of Agricultural and Life Sciences, The University of Tokyo, Bunkyo-ku, Tokyo 113-8657, JAPAN
Abstract – Japanese oak wilt caused by Raffaelea quercivora has continually appeared in Japan since the 1980's. We investigated defensive responses of oak sapwood, i.e. the formation of reaction zone barriers. We observed tyloses suberization, but parenchyma was not suberized conspicuously. Insoluble deposits occluded fibre tracheids and small vessels. Staining tests showed that they consisted of lignin-like compounds, pectin, phenolics, quinones, and lipids. Wood fibre occlusion with deposits preceded tyloses and accumulation of parenchyma phenolics. Accumulation of condensed lignin suggested that the deposits consisted mainly of condensed lignin.
I. Introduction
Mass mortality of oak trees (mainly Quercus serrata and Q. crispula) has continually appeared in Japan since the 1980's [1]. The newly identified causal fungus Raffaelea quercivora is vectored by an ambrosia beetle Platypus quercivorus [2-5]. Blockage of xylem sap ascent induced by R. quercivora infection has been hypothesized to cause this mortality [6, 7]. Clarifying defense responses against the pathogen is necessary to understand interactions between the host trees and the pathogenic fungus, including wilt mechanisms. We are investigating the defense responses of oak sapwood against the pathogen, because it is the most important factor in the spread of both wood discoloration and the pathogen in sapwood.
II. Materials and Methods A. Materials
We investigated the sapwood-discolored wood boundary, i.e., the reaction zone barrier (RZB), by measuring primarily histochemical responses on the following materials. Chemical analyses and bioassays with the fungus were also conducted on several materials. 1. Mature Q. crispula trees surviving natural attack by P. quercivorus / R. quercivora of various damage classes were harvested in Yamagata Prefecture in September. A mature Q.
serrata tree surviving natural attack but without symptoms was also harvested in Kyoto Prefecture in October. 2. Sapwood of wounded Q. serrata branches planted at the Forestry and Forest Products Research Institute (FFPRI), Ibaraki Prefecture were wounded with a drill in July to elucidate the time-course of defense events. 3. Sapwood of fungal-inoculated Q. crispula trees
Young Q. crispula trees were wound inoculated with R. quercivora at Tohoku Res. Ctr., FFPRI in July [2], and were harvested 3 months after the inoculation. B. Histochemical tests
Wood blocks were sectioned with a sliding microtome 20-30 μm thick and examined histochemically [8, 9].
Lignin was stained with phloroglucinol – hydrochloric acid (PG-HCl), Schiff’s reagent or observed under UV illumination (U-mode). After quenching with PG-HCl, suberin was observed under UV illumination. Phenolic substances were stained using nitroso-phenol methods. Quinone was stained with o-tolidine. Lipid was stained with Nile blue or Sudan black B. Ruthenium red was used for pectin staining. Safranin O – Fast Green FCF double staining was also used. Then, sections were observed under the microscope. Staining for NAD diaphorase activity was conducted to assess the parenchyma cells activity.
Microtome sections were immersed in ethanol-benzene (1:2) and incubated at 25ºC for 24 hr to check the solubility of the deposits.
Branches were investigated macroscopically under UV (360 nm) illumination 3 months after the wounding . C. Chemical analysis of lignin
Wood slices for lignin analysis were obtained from fungus inoculated young trees, and occlusion of fibre-tracheids in RZB was confirmed. Lignin content was determined by the acetyl bromide method. Chemical structure of lignin was determined by alkaline nitrobenzene oxidation.
Proccedings: IUFRO Kanazawa 2003 "Forest Insect Population Dynamics and Host Influences” - 132 -
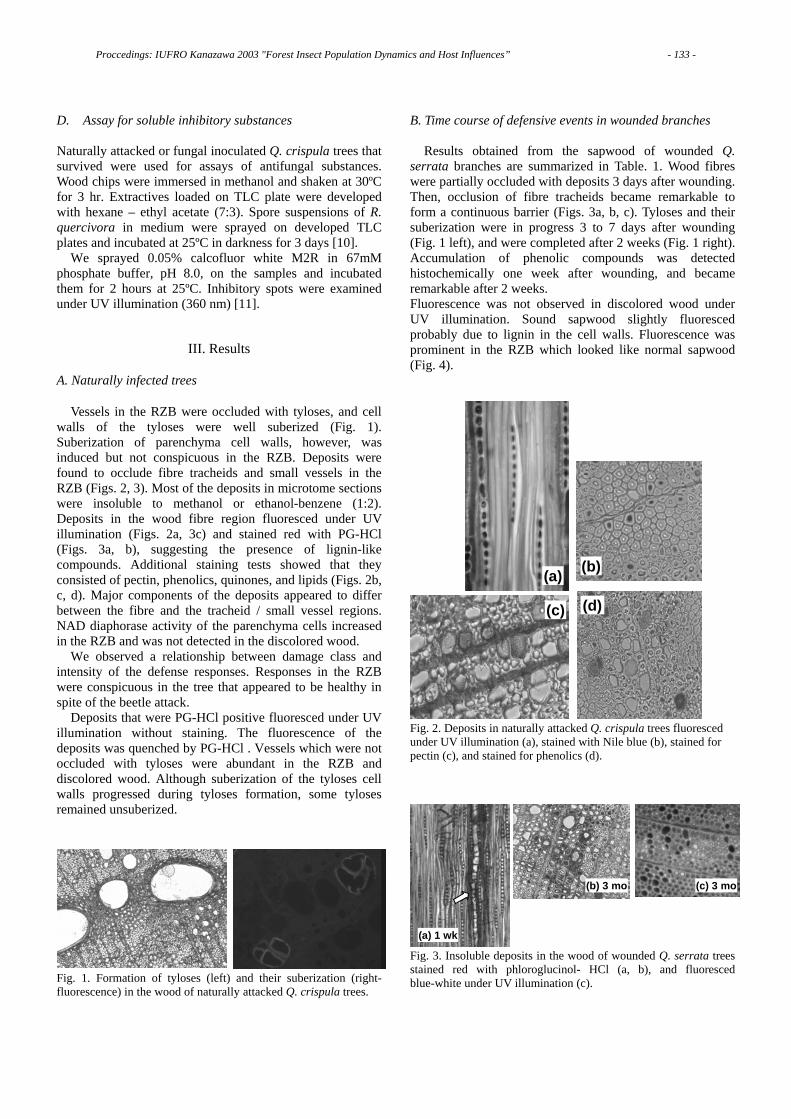
D. Assay for soluble inhibitory substances Naturally attacked or fungal inoculated Q. crispula trees that survived were used for assays of antifungal substances. Wood chips were immersed in methanol and shaken at 30ºC for 3 hr. Extractives loaded on TLC plate were developed with hexane – ethyl acetate (7:3). Spore suspensions of R. quercivora in medium were sprayed on developed TLC plates and incubated at 25ºC in darkness for 3 days [10].
We sprayed 0.05% calcofluor white M2R in 67mM phosphate buffer, pH 8.0, on the samples and incubated them for 2 hours at 25ºC. Inhibitory spots were examined under UV illumination (360 nm) [11].
III. Results
A. Naturally infected trees
Vessels in the RZB were occluded with tyloses, and cell walls of the tyloses were well suberized (Fig. 1). Suberization of parenchyma cell walls, however, was induced but not conspicuous in the RZB. Deposits were found to occlude fibre tracheids and small vessels in the RZB (Figs. 2, 3). Most of the deposits in microtome sections were insoluble to methanol or ethanol-benzene (1:2). Deposits in the wood fibre region fluoresced under UV illumination (Figs. 2a, 3c) and stained red with PG-HCl (Figs. 3a, b), suggesting the presence of lignin-like compounds. Additional staining tests showed that they consisted of pectin, phenolics, quinones, and lipids (Figs. 2b, c, d). Major components of the deposits appeared to differ between the fibre and the tracheid / small vessel regions. NAD diaphorase activity of the parenchyma cells increased in the RZB and was not detected in the discolored wood.
We observed a relationship between damage class and intensity of the defense responses. Responses in the RZB were conspicuous in the tree that appeared to be healthy in spite of the beetle attack.
Deposits that were PG-HCl positive fluoresced under UV illumination without staining. The fluorescence of the deposits was quenched by PG-HCl . Vessels which were not occluded with tyloses were abundant in the RZB and discolored wood. Although suberization of the tyloses cell walls progressed during tyloses formation, some tyloses remained unsuberized.
Fig. 1. Formation of tyloses (left) and their suberization (right- fluorescence) in the wood of naturally attacked Q. crispula trees.
B. Time course of defensive events in wounded branches
Results obtained from the sapwood of wounded Q. serrata branches are summarized in Table. 1. Wood fibres were partially occluded with deposits 3 days after wounding. Then, occlusion of fibre tracheids became remarkable to form a continuous barrier (Figs. 3a, b, c). Tyloses and their suberization were in progress 3 to 7 days after wounding (Fig. 1 left), and were completed after 2 weeks (Fig. 1 right). Accumulation of phenolic compounds was detected histochemically one week after wounding, and became remarkable after 2 weeks. Fluorescence was not observed in discolored wood under UV illumination. Sound sapwood slightly fluoresced probably due to lignin in the cell walls. Fluorescence was prominent in the RZB which looked like normal sapwood (Fig. 4).
(a) (b)
(c) (d)
(a) (b)
(c) (d)
Fig. 2. Deposits in naturally attacked Q. crispula trees fluoresced under UV illumination (a), stained with Nile blue (b), stained for pectin (c), and stained for phenolics (d).
(a) 1 wk
(b) 3 mo (c) 3 mo
(a) 1 wk
(b) 3 mo (c) 3 mo
(a) 1 wk(a) 1 wk
(b) 3 mo(b) 3 mo (c) 3 mo(c) 3 mo
Fig. 3. Insoluble deposits in the wood of wounded Q. serrata trees stained red with phloroglucinol- HCl (a, b), and fluoresced blue-white under UV illumination (c).
Proccedings: IUFRO Kanazawa 2003 "Forest Insect Population Dynamics and Host Influences” - 133 -
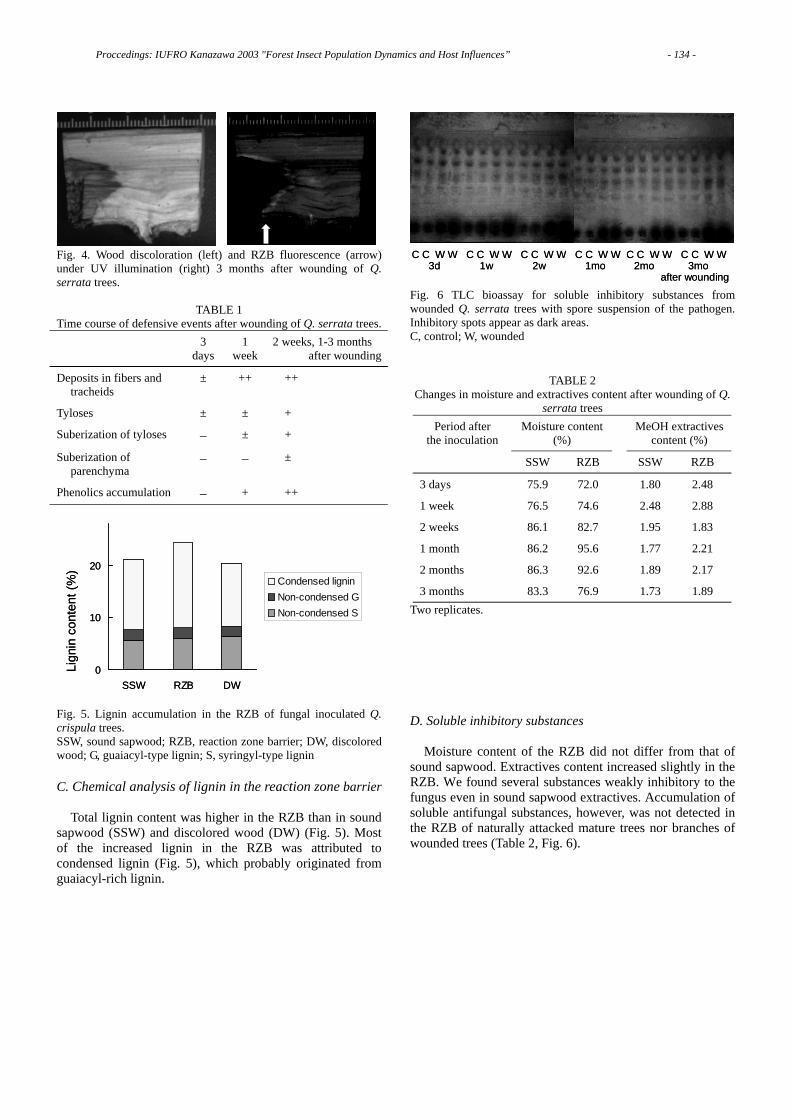
Fig. 4. Wood discoloration (left) and RZB fluorescence (arrow) under UV illumination (right) 3 months after wounding of Q. serrata trees.
TABLE 1
Time course of defensive events after wounding of Q. serrata trees. 3
days 1
week 2 weeks, 1-3 months after wounding
Deposits in fibers and tracheids
± ++ ++
Tyloses ± ± +
Suberization of tyloses – ± +
Suberization of parenchyma
– – ±
Phenolics accumulation – + ++
Lign
in c
onte
nt (%
)
0
10
20
SSW RZB DW
Condensed ligninNon-condensed GNon-condensed S
Lign
in c
onte
nt (%
)
0
10
20
SSW RZB DW
Condensed ligninNon-condensed GNon-condensed S
Fig. 5. Lignin accumulation in the RZB of fungal inoculated Q. crispula trees. SSW, sound sapwood; RZB, reaction zone barrier; DW, discolored wood; G, guaiacyl-type lignin; S, syringyl-type lignin C. Chemical analysis of lignin in the reaction zone barrier
Total lignin content was higher in the RZB than in sound sapwood (SSW) and discolored wood (DW) (Fig. 5). Most of the increased lignin in the RZB was attributed to condensed lignin (Fig. 5), which probably originated from guaiacyl-rich lignin.
C C W W C C W W C C W W C C W W C C W W C C W W3d 1w 2w 1mo 2mo 3mo
after wounding
C C W W C C W W C C W W C C W W C C W W C C W W3d 1w 2w 1mo 2mo 3mo
after wounding Fig. 6 TLC bioassay for soluble inhibitory substances from wounded Q. serrata trees with spore suspension of the pathogen. Inhibitory spots appear as dark areas. C, control; W, wounded
TABLE 2 Changes in moisture and extractives content after wounding of Q.
serrata trees Period after
the inoculation Moisture content
(%) MeOH extractives
content (%)
SSW RZB SSW RZB
3 days 75.9 72.0 1.80 2.48
1 week 76.5 74.6 2.48 2.88
2 weeks 86.1 82.7 1.95 1.83
1 month 86.2 95.6 1.77 2.21
2 months 86.3 92.6 1.89 2.17
3 months 83.3 76.9 1.73 1.89 Two replicates. D. Soluble inhibitory substances
Moisture content of the RZB did not differ from that of sound sapwood. Extractives content increased slightly in the RZB. We found several substances weakly inhibitory to the fungus even in sound sapwood extractives. Accumulation of soluble antifungal substances, however, was not detected in the RZB of naturally attacked mature trees nor branches of wounded trees (Table 2, Fig. 6).
Proccedings: IUFRO Kanazawa 2003 "Forest Insect Population Dynamics and Host Influences” - 134 -
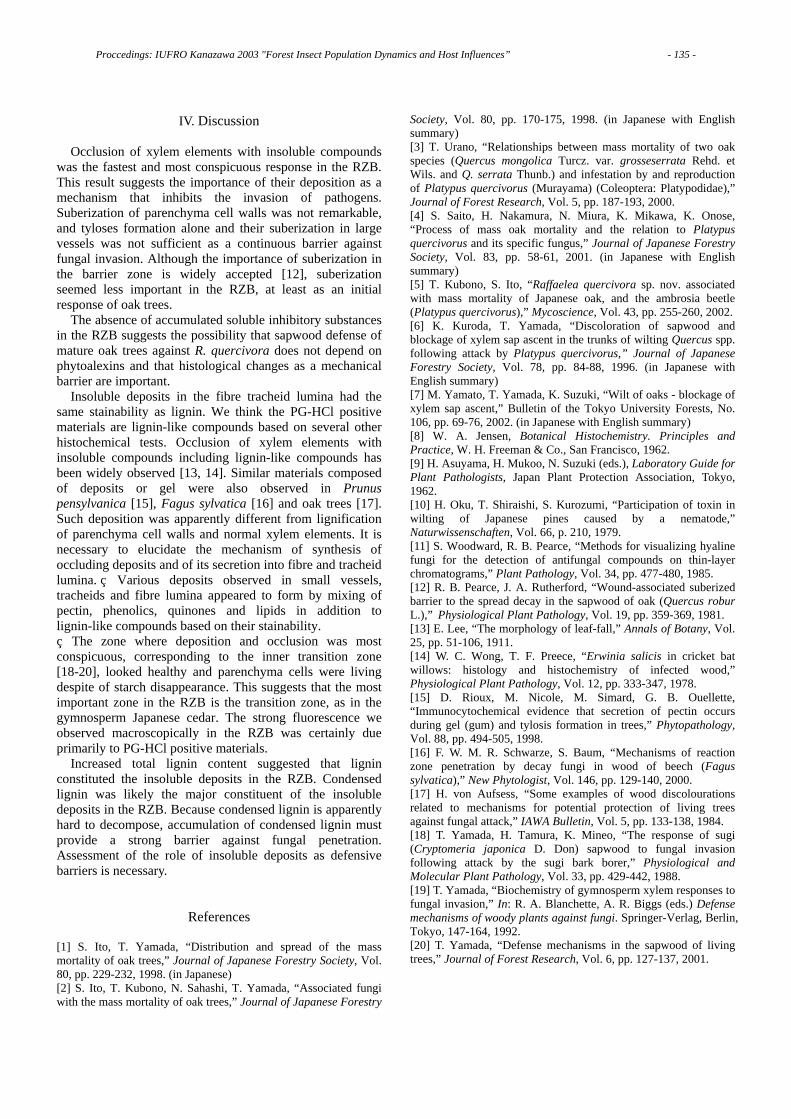
IV. Discussion
Occlusion of xylem elements with insoluble compounds was the fastest and most conspicuous response in the RZB. This result suggests the importance of their deposition as a mechanism that inhibits the invasion of pathogens. Suberization of parenchyma cell walls was not remarkable, and tyloses formation alone and their suberization in large vessels was not sufficient as a continuous barrier against fungal invasion. Although the importance of suberization in the barrier zone is widely accepted [12], suberization seemed less important in the RZB, at least as an initial response of oak trees.
The absence of accumulated soluble inhibitory substances in the RZB suggests the possibility that sapwood defense of mature oak trees against R. quercivora does not depend on phytoalexins and that histological changes as a mechanical barrier are important.
Insoluble deposits in the fibre tracheid lumina had the same stainability as lignin. We think the PG-HCl positive materials are lignin-like compounds based on several other histochemical tests. Occlusion of xylem elements with insoluble compounds including lignin-like compounds has been widely observed [13, 14]. Similar materials composed of deposits or gel were also observed in Prunus pensylvanica [15], Fagus sylvatica [16] and oak trees [17]. Such deposition was apparently different from lignification of parenchyma cell walls and normal xylem elements. It is necessary to elucidate the mechanism of synthesis of occluding deposits and of its secretion into fibre and tracheid lumina. Various deposits observed in small vessels, tracheids and fibre lumina appeared to form by mixing of pectin, phenolics, quinones and lipids in addition to lignin-like compounds based on their stainability. The zone where deposition and occlusion was most conspicuous, corresponding to the inner transition zone [18-20], looked healthy and parenchyma cells were living despite of starch disappearance. This suggests that the most important zone in the RZB is the transition zone, as in the gymnosperm Japanese cedar. The strong fluorescence we observed macroscopically in the RZB was certainly due primarily to PG-HCl positive materials.
Increased total lignin content suggested that lignin constituted the insoluble deposits in the RZB. Condensed lignin was likely the major constituent of the insoluble deposits in the RZB. Because condensed lignin is apparently hard to decompose, accumulation of condensed lignin must provide a strong barrier against fungal penetration. Assessment of the role of insoluble deposits as defensive barriers is necessary.
References [1] S. Ito, T. Yamada, “Distribution and spread of the mass mortality of oak trees,” Journal of Japanese Forestry Society, Vol. 80, pp. 229-232, 1998. (in Japanese) [2] S. Ito, T. Kubono, N. Sahashi, T. Yamada, “Associated fungi with the mass mortality of oak trees,” Journal of Japanese Forestry
Society, Vol. 80, pp. 170-175, 1998. (in Japanese with English summary) [3] T. Urano, “Relationships between mass mortality of two oak species (Quercus mongolica Turcz. var. grosseserrata Rehd. et Wils. and Q. serrata Thunb.) and infestation by and reproduction of Platypus quercivorus (Murayama) (Coleoptera: Platypodidae),” Journal of Forest Research, Vol. 5, pp. 187-193, 2000. [4] S. Saito, H. Nakamura, N. Miura, K. Mikawa, K. Onose, “Process of mass oak mortality and the relation to Platypus quercivorus and its specific fungus,” Journal of Japanese Forestry Society, Vol. 83, pp. 58-61, 2001. (in Japanese with English summary) [5] T. Kubono, S. Ito, “Raffaelea quercivora sp. nov. associated with mass mortality of Japanese oak, and the ambrosia beetle (Platypus quercivorus),” Mycoscience, Vol. 43, pp. 255-260, 2002. [6] K. Kuroda, T. Yamada, “Discoloration of sapwood and blockage of xylem sap ascent in the trunks of wilting Quercus spp. following attack by Platypus quercivorus,” Journal of Japanese Forestry Society, Vol. 78, pp. 84-88, 1996. (in Japanese with English summary) [7] M. Yamato, T. Yamada, K. Suzuki, “Wilt of oaks - blockage of xylem sap ascent,” Bulletin of the Tokyo University Forests, No. 106, pp. 69-76, 2002. (in Japanese with English summary) [8] W. A. Jensen, Botanical Histochemistry. Principles and Practice, W. H. Freeman & Co., San Francisco, 1962. [9] H. Asuyama, H. Mukoo, N. Suzuki (eds.), Laboratory Guide for Plant Pathologists, Japan Plant Protection Association, Tokyo, 1962. [10] H. Oku, T. Shiraishi, S. Kurozumi, “Participation of toxin in wilting of Japanese pines caused by a nematode,” Naturwissenschaften, Vol. 66, p. 210, 1979. [11] S. Woodward, R. B. Pearce, “Methods for visualizing hyaline fungi for the detection of antifungal compounds on thin-layer chromatograms,” Plant Pathology, Vol. 34, pp. 477-480, 1985. [12] R. B. Pearce, J. A. Rutherford, “Wound-associated suberized barrier to the spread decay in the sapwood of oak (Quercus robur L.),” Physiological Plant Pathology, Vol. 19, pp. 359-369, 1981. [13] E. Lee, “The morphology of leaf-fall,” Annals of Botany, Vol. 25, pp. 51-106, 1911. [14] W. C. Wong, T. F. Preece, “Erwinia salicis in cricket bat willows: histology and histochemistry of infected wood,” Physiological Plant Pathology, Vol. 12, pp. 333-347, 1978. [15] D. Rioux, M. Nicole, M. Simard, G. B. Ouellette, “Immunocytochemical evidence that secretion of pectin occurs during gel (gum) and tylosis formation in trees,” Phytopathology, Vol. 88, pp. 494-505, 1998. [16] F. W. M. R. Schwarze, S. Baum, “Mechanisms of reaction zone penetration by decay fungi in wood of beech (Fagus sylvatica),” New Phytologist, Vol. 146, pp. 129-140, 2000. [17] H. von Aufsess, “Some examples of wood discolourations related to mechanisms for potential protection of living trees against fungal attack,” IAWA Bulletin, Vol. 5, pp. 133-138, 1984. [18] T. Yamada, H. Tamura, K. Mineo, “The response of sugi (Cryptomeria japonica D. Don) sapwood to fungal invasion following attack by the sugi bark borer,” Physiological and Molecular Plant Pathology, Vol. 33, pp. 429-442, 1988. [19] T. Yamada, “Biochemistry of gymnosperm xylem responses to fungal invasion,” In: R. A. Blanchette, A. R. Biggs (eds.) Defense mechanisms of woody plants against fungi. Springer-Verlag, Berlin, Tokyo, 147-164, 1992. [20] T. Yamada, “Defense mechanisms in the sapwood of living trees,” Journal of Forest Research, Vol. 6, pp. 127-137, 2001.
Proccedings: IUFRO Kanazawa 2003 "Forest Insect Population Dynamics and Host Influences” - 135 -
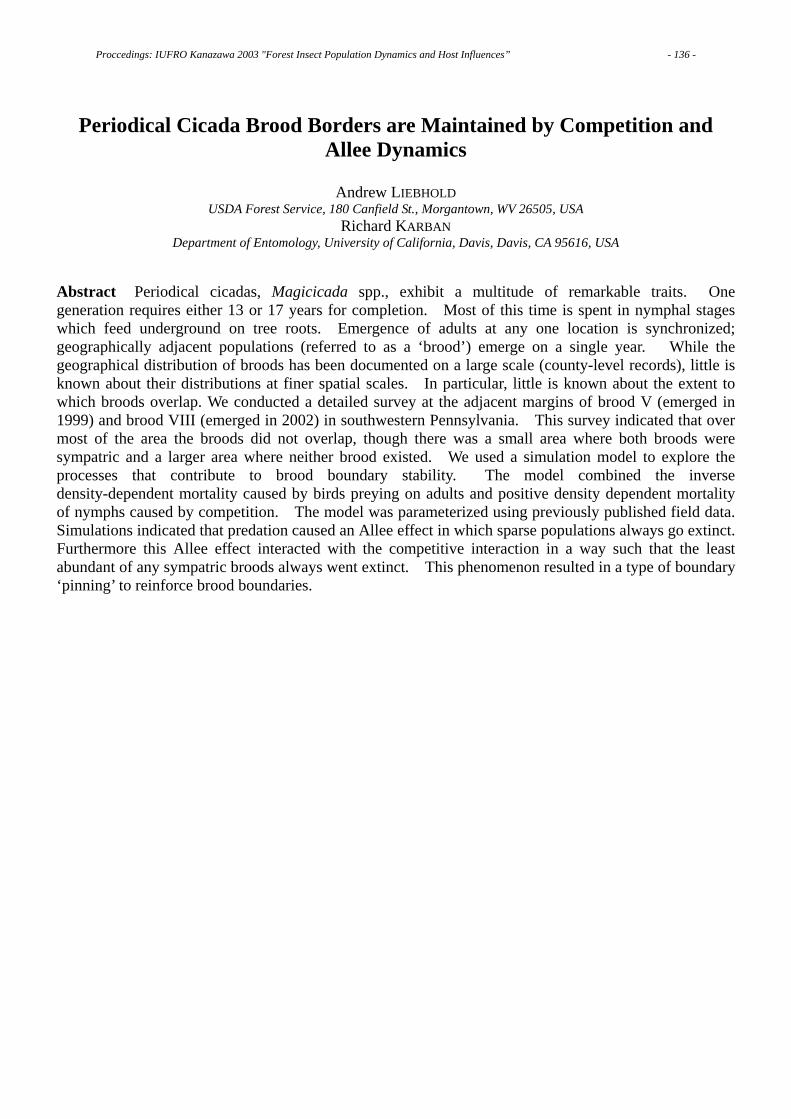
Periodical Cicada Brood Borders are Maintained by Competition and Allee Dynamics
Andrew LIEBHOLD
USDA Forest Service, 180 Canfield St., Morgantown, WV 26505, USA Richard KARBAN
Department of Entomology, University of California, Davis, Davis, CA 95616, USA Abstract Periodical cicadas, Magicicada spp., exhibit a multitude of remarkable traits. One generation requires either 13 or 17 years for completion. Most of this time is spent in nymphal stages which feed underground on tree roots. Emergence of adults at any one location is synchronized; geographically adjacent populations (referred to as a ‘brood’) emerge on a single year. While the geographical distribution of broods has been documented on a large scale (county-level records), little is known about their distributions at finer spatial scales. In particular, little is known about the extent to which broods overlap. We conducted a detailed survey at the adjacent margins of brood V (emerged in 1999) and brood VIII (emerged in 2002) in southwestern Pennsylvania. This survey indicated that over most of the area the broods did not overlap, though there was a small area where both broods were sympatric and a larger area where neither brood existed. We used a simulation model to explore the processes that contribute to brood boundary stability. The model combined the inverse density-dependent mortality caused by birds preying on adults and positive density dependent mortality of nymphs caused by competition. The model was parameterized using previously published field data. Simulations indicated that predation caused an Allee effect in which sparse populations always go extinct. Furthermore this Allee effect interacted with the competitive interaction in a way such that the least abundant of any sympatric broods always went extinct. This phenomenon resulted in a type of boundary ‘pinning’ to reinforce brood boundaries.
Proccedings: IUFRO Kanazawa 2003 "Forest Insect Population Dynamics and Host Influences” - 136 -
Induced Response of Oak Trees to Raffaelea quercivora as a Possible Defense against Japanese Oak Wilt Caused by the Ambrosia Fungus
Carried by an Ambrosia Beetle
Kenryu KATO, Hisahito OANA, Nobuko KAKIUCHI, Masayuki MIKAGE, Naoto KAMATA Graduate School of Natural Science and Technology, Kanazawa University, Kanazawa, Ishikawa 920-1192, JAPAN
Kojiro ESAKI Ishikawa Forest Experiment Station, Hakusan, Ishikawa 920-2114, JAPAN
Tohru MITSUNAGA, Shin-ichiro ITO Faculty of Bioresources, Mie University, Kamihama 1515, Tsu, Mie, 514-8507, JAPAN
Abstract Japanese oak wilt (JOW) has been recognized in Japan since the 1930s, but in the last fifteen years epidemics of this disease have intensified and spread to western coastal areas. The symbiotic ambrosia fungus Raffaelea quercivora is the causal agent of oak dieback, and is vectored by Platypus quercivorus (Murayama). This is the first example of an ambrosia beetle fungus that kills vigorous trees. Mortality of Quercus crispula Blume was approximately 40%. Necrosis has been observed around the gallery systems in sapwood, and has been attributed to R. quercivora. The necrosis stops water conductance, and a tree dies when necrosis completely blocks any cross-section of the tree. We found that many P. quercivorus males avoided such necrosis when they tunneled into trees that had attacked in the previous year. Gallic acid was newly produced in necrotic tissue and concentrations of ellagic acid were doubled. A laboratory experiment proved that P. quercivorus adults avoided the sapwood with high concentrations of gallic acid or ellagic acid. It is estimated that 0.0456% of gallic acid and 0.0260% of ellagic acid completely prevent insect tunneling. These tannic acids thus have some potential as control tools against Japanese oak wilt caused by the ambrosia fungus.
Proccedings: IUFRO Kanazawa 2003 "Forest Insect Population Dynamics and Host Influences” - 137 -
Study of Quercus crispula Wood Extractives Damaged from Platypus quercivorous Attack
Miwa KASAI, Shin-ichiro ITO, Tohru MITSUNAGA Faculty of Bioresources, Mie University, Kamihama 1515, Tsu, Mie, 514-8507, JAPAN
Naoto KAMATA Graduate School of Natural Science and Technology, Kanazawa University, Kanazawa, Ishikawa 920-1192, JAPAN
Abstract Discoloration of Quercus crispula sapwood resulting from colonization by the ambrosia beetle Platypus quercivorus was examined. Polyphenol analyses showed that hydrolyzable tannin was contained in healthy sapwood but diseased sapwood contained large quantities of ellagic acid and lesser amounts of gallic acid. Tannase and laccase activities were identified from Raffaelea quercivora, a symbiotic fungus associated with P. quercivorus. Purprogallincarboxylic acid bio-converted with laccase from gallic acid was contained in diseased sapwood. We conclude that the discoloration of sapwood is caused by the biological oxidation of wood extractives, especially polyphenolic compounds.
Proccedings: IUFRO Kanazawa 2003 "Forest Insect Population Dynamics and Host Influences” - 138 -

Sensory Cues for Shelter Use
Niklas BJÖRKLUND Department of Entomology, Swedish University of Agricultural Sciences, P.O. Box 7044, SE-750 07 Uppsala, SWEDEN
Abstract Many insects spend a large proportion of their life inactive, hiding in shelters. Therefore, the presence of shelters may influence where the insects feed. I examined stimuli affecting the use of shelters by adults of the pine weevil, Hylobius abietis (L.), which is an economically important forest pest in Europe since the adults feed on the stem bark of newly planted conifer seedlings. When there are hiding or burrowing places present in close vicinity of a seedling, pine weevils may hide there and repeatedly return to feed on the same seedling. Experiments were conducted in a laboratory arena with above- or below-ground shelters and in the presence or absence of wind. Pine weevils were highly attracted to both above- and below-ground shelters and weevils in shelters were often observed placing themselves in a characteristic “resting” posture. Experiments with opaque and transparent shelters showed that visual stimuli are used in the orientation towards shelters and also increase the probability of remaining for a long period behind a shelter. The presence of wind increased the propensity to use both above- and below ground shelters.
Proccedings: IUFRO Kanazawa 2003 "Forest Insect Population Dynamics and Host Influences” - 139 -
Population Dynamics of Willow Leaf Beetles in Managed and Natural Willow Stands
Peter DALIN
Department of Entomology, Swedish University of Agricultural Sciences, P.O. Box 7044, SE-750 07 Uppsala, SWEDEN Abstract It is generally believed that diversity leads to stability in ecosystems. One consequence would be that insect populations should fluctuate less in density over time in natural and diverse systems compared with managed systems. In this study, we measured densities of leaf beetles (Coleoptera: Chrysomelidae) over five years in 20 managed willow (Salix viminalis) plantations and in 22 natural willow (S. cinerea) stands. We found no significant difference in temporal variability (coefficient of variation) of leaf beetle density between managed and natural willow stands. However, outbreaks (i.e. drastic increases in leaf beetle density) tended to be more frequent in the willow plantations. In addition, leaf beetle populations showed strong negative density dependent growth in natural willow stands. No such patterns were observed in the managed willow stands. Although feedback effects were observed in the natural willow stands, this did not lead to a significantly greater stability of leaf beetle populations compared with willow plantations.
Proccedings: IUFRO Kanazawa 2003 "Forest Insect Population Dynamics and Host Influences” - 140 -

Harvesting Disrupts Biological Control of Leaf Beetles in Short-Rotation Coppice Willows
Christer BJÖRKMAN
Department of Entomology, Swedish University of Agricultural Sciences, P.O. Box 7044, SE-750 07 Uppsala, SWEDEN Abstract Disturbances such as harvesting may interfere with the ecological processes that lead to biological control of insect pests. For willows, which are grown as short rotation coppice crops harvested every 3rd to 5th year, it has been suggested that high plant quality in the re-sprouting shoots after harvesting may explain observed high densities of herbivorous insects, especially leaf beetles (Coleoptera: Chrysomelidae), in the plantations. Here we show that generalist predators may be important as regulators of leaf beetle populations. All the three leaf beetle species, studied for five years in twelve plantations showed a negative correlation between the population growth rate from spring to fall and the abundance of the most common generalist predator Orthotylus marginalis (Heteroptera: Miridae). For the most abundant leaf beetle, Phratora vulgatissima, it was also found a significant positive correlation between its population growth rate and egg survival indicating an overall effect of predation on herbivore population growth. Harvesting, taking place during the winter had a negative effect on the abundance of leaf beetles and predators. However, the first year after harvesting, all three leaf beetle species regained this loss with a high population growth rate. A reason for the better ability of the herbivores to recover from the disturbance may be that they, unlike the predators, mainly overwinter outside the plantations. All three leaf beetle species peaked in density three years after harvesting whereas the density of generalist natural enemies increased or levelled off during the five year period after harvesting. It is concluded that predation by generalist predators is potentially important for population control of leaf beetles in willow coppice, but that the intermediate disturbance regime of around 5 years between harvests, appears to be too short to avoid disruption of biological control. Alternative harvesting regimes resulting in more efficient biological control in short rotation coppice systems may be a longer period between harvests that enables the predators to fully respond numerically, to leave natural enemies refuges at harvest, or to harvest adjacent plantations asynchronously.
Proccedings: IUFRO Kanazawa 2003 "Forest Insect Population Dynamics and Host Influences” - 141 -

Reproductive Success of the Spruce Bark Beetle Ips typographus and Impact of Natural Enemies in Five Years Following a Storm-Felling
Martin SCHROEDER, Åke LINDELÖW
Department of Entomology, Swedish University of Agricultural Sciences, P.O. Box 7044, SE-750 07 Uppsala, SWEDEN Abstract After a large storm-felling in Sweden in November 1995 the reproductive success of the bark beetle Ips typographus and the densities of natural enemies were studied by sampling of bark from colonised trees. The study was conducted in two reserves where all storm-felled trees were left. In the first summer I. typographus only colonised storm-felled trees. In the second summer both storm-felled and standing living trees were colonised, while in the third to fifth summers only living trees were attacked. After the fifth summer no more trees were killed by the bark beetle. The reproductive success of I. typographus was highest in the storm-felled trees and decreased over the five-year period while the density of enemies increased over the same time. More than 50 % of the variation in the reproductive success of I. typographus could be explained by the egg gallery density of I. typographus. The densities of enemies did not contribute to explaining the remaining variation in reproductive success of I. typographus. Thus, this study indicates that intraspecific competition is an important factor contributing to terminating outbreaks of I. typographus.
Proccedings: IUFRO Kanazawa 2003 "Forest Insect Population Dynamics and Host Influences” - 142 -
Temporal Patterns in Epirrita autumnata Dynamics: Parasitoids and Other Possible Factors
Helena BYLUND, Olle TENOW Department of Entomology, Swedish University of Agricultural Sciences, P.O. Box 7044, SE-750 07 Uppsala, Sweden
Abstract Larvae of the autumnal moth Epirrita autumnata (Geometridae), are defoliating different parts of the mountain birch forests in northern Fennoscandia every 9-10 years. Larval densities of E. atumnata were monitored during two periods, 1955-1967 and 1984-2003, at Abisko, northern Sweden. Time series analyses of density data indicated that different factors were important in the two periods. The generation rate of change in moth density was fitted in multiple regressions with the population density of the previous year and parasitism rate, as well as other factors, for each period separately and for all years together. Parasitism explained most of the variability in the second monitoring period while winter temperatures were important in the first period. First-order effects and parasitism explained 74% of the variability for all years.
Proccedings: IUFRO Kanazawa 2003 "Forest Insect Population Dynamics and Host Influences” - 143 -

Is the Parasitoid Perilitus areolaris a Significant Mortality Factor for Adult Pine Weevils?
Helena BYLUND, Henrik NORDENHEM and Göran NORDLANDER Department of Entomology, Swedish University of Agricultural Sciences, P.O. Box 7044, SE-750 07 Uppsala, Sweden
Abstract Perilitus areolaris (Braconidae) parasitizes adult pine weevils (Hylobius abietis; Curculionidae). Little is known about the biology of this parasitoid and how it affects the population dynamics of the pine weevil. We collected several thousand pine weevils from spring to autumn over 3 years at 6 clear-cuttings in the southern part of Sweden. The weevils were dissected and we recorded the reproductive phase, the presence/absence of flight muscles and the presence/absence of parasitoid eggs and larvae. Preliminary analyses of the data showed that about 20% of the pre-reproductive, young weevils were parasitized at the weevil regeneration sites (1 and 2 year-old clear-cuttings). We concluded that P. areolaris is a significant mortality factor that decreases the production of weevils at the study sites.
Proccedings: IUFRO Kanazawa 2003 "Forest Insect Population Dynamics and Host Influences” - 144 -
Relationships between Defensive Characteristics of Fagus crenata Galls and the Timing of Gall Fall
Kenji TOKUNAGA, Naoto KAMATA
Graduate School of Natural Science and Technology, Kanazawa University, Kanazawa, Ishikawa 920-1192, JAPAN Abstract Plant galls usually contain defensive chemicals, such as tannins. We measured levels of physical and chemical defenses of galls and of galled leaves of Fagus crenata, which were induced by six species of gall midges. Relationships between these defensive features and the timing of the fall of galls from host plants were determined. Ecological significance of defensive features of galls and galled leaves were discussed with respect to manipulation by gall inducers. We collected galled and ungalled leaves with six species of gall midges from current year shoots, in which leaves had received no damage from folivores. Dry leaf mass per area (LMA) was used as a measureof physical defense. The concentration of total phenolics and that of condensed tannins were also determined for galls and leaves. The timing of gall drop was determined from litter samples collected every month using litter traps. The LMA of galled leaves were generally greater than those of ungalled leaves. In contrast, levels of chemical defenses in galls varied greatly among gall midge species. However, levels of chemical defenses evel tended to be higher in galls that fell later in a season. These results suggest that higher levels of chemical defenses were related to longer periods of exposure to folivores.Results also appear to support the hypothesis of manipulation by gall-inducers, in which a gall-inducer manipulates the defensive traits of its gall or galled leaf to reduce the risk of mortality caused by folivores.
Proccedings: IUFRO Kanazawa 2003 "Forest Insect Population Dynamics and Host Influences” - 145 -
Linking Ecosystem Ecology to Insect Population Ecology: Nitrogen Cycling, Foliage Properties, and Insect Outbreaks
Naoto KAMATA, Yuki KUNIHISA, Lina KOYAMA Graduate School of Natural Science and Technology, Kanazawa University, Kanazawa, Ishikawa 920-1192, JAPAN
Naoya WADA Center for Far Eastern Studies, Toyama University, Toyama, Toyama 930-8555, JAPAN
Abstract The beech caterpillar, Syntypistis punctatella (Motschulsky) (Lepidoptera: Notodontidae), often causes extensive defoliation of beech forests in Japan. Outbreaks often occur synchronously among different areas at intervals of 8 – 11 years. Defoliation by this insect tends to occur at a specific range of elevations. This range of elevation varies among regions, but the outbreak zone tends to be lower at higher latitudes; e.g. 300–500 m ASL in southern Hokkaido (42°N), 600–800 m ASL in Hakkohda (40°40´N), 900–1100 m ASL in Hachimantai (40°N), and 1100–1300 m ASL in Hakusan (36°N). As a result, defoliated areas spread horizontally in altitudinal belts. Many hypotheses have been presented to explain elevation-dependent population outbreaks. In Hachimantai, five study plots were established along elevational gradients running through each plot. In each plot, beech saplings (3–5 m at height) were manually defoliated to investigate foliage quality and delayed induced response after insect defoliation. Soil nitrogen availability was determined by measuring NH4
+ and NO3- concentration in soil
extracts. Soil nitrogen availability and foliage quality was highest in the plot where the beech caterpillar reached outbreak levels. A positive feedback among soil nitrogen availability, foliage quality, and insect population increase were identified in the system. We hypothesized that the rate of nitrogen cycling relative to altitude is key to determining these three factors.
Proccedings: IUFRO Kanazawa 2003 "Forest Insect Population Dynamics and Host Influences” - 146 -

Semiochemical Diversity and Niche Partitioning among Scolytids and the Generalist Bark-Beetle Predator,
Thanasimus formicarius (Coleoptera: Cleridae)
Nathalie WARZEE, Jean-Claude GREGOIRE Lutte biologique et Ecologie spatiale, CP 160/12, Université Libre de Bruxelles, 50 avenue F.D. Roosevelt, B-1050 Brussels,
BELGIUM Hervé JACTEL, Pierre MENASSIEU
Laboratory of Forest Entomology & Biodiversity, INRA, BP45, F-33612 Cestas Cedex, FRANCE Christian MALOSSE
Laboratory of Phytopharmacy, INRA, Route de Saint-Cyr, F-78026 Versailles Cedex, FRANCE Abstract In southwestern France, two conspecific scolytids, Ips sexdentatus (Boern.) and Orthotomicus erosus (Woll.), share several pheromone compounds, to which their common predator, Thanasimus formicarius (L.), responds. This raises questions regarding the role of pheromones in niche competition between the bark beetles and in prey recognition by the predator.
In spring 2003, in a pure stand of maritime pine (25 years old) located in the Forest Research Centre of INRA (Cestas, France), four attractants of bark beetles and T. formicarius, (i.e.: racemic ipsdienol (I);exo-brevicomin (E); Pheroprax® the commercial pheromone of Ips typographus, a blend of 2-methyl-3-buten-2-ol and cis-verbenol (P); and Stenoprax® the commercial pheromone of Ips sexdentatus, a blend of ipsdienol and 2-methyl-3-buten-2-ol (S)), were tested in six different combinations: S, I, PI, SE, IE and PIE. Each mixture was replicated five times and the control (no attractant) was repeated twice. The 32 small “bottle-traps” (30x15 cm) were randomly set-up on a 8x4 grid and were inspected weekly from 5 May to 12 June 2003. Traps were permutated at each inspection. Differences between mean relative catches/trap/day were tested with the GLM procedure and a post-hoc Scheffe’s test.
Catches of I. sexdentatus were significantly (P < 0.001) higher in pheromone traps loaded with S and SE blends, whereas Orthotomicus spp. was significantly (P < 0.001) more attracted by pheromone traps loaded with S, SE, PI and PIE mixtures. All the six kairomone mixtures induced higher attraction of T. formicarius than the control, although S was the only blend that induced significantly (p < 0.001) higher catches than the control trap.
Orthotomicus spp. responds to all the pheromone blends attractive to Ips sexdentatus but the reciprocal is not true. These bark beetles share the same habitat of pine forest but they have different ecological niches. The small species Orthotomicus lives in thin bark of pine trees and the large species I. sexdentatus needs thick bark to develop. For Orthotomicus spp., it is therefore an advantage to be able to respond to the pheromone of I. sexdentatus because trees attacked by the large species are likely to provide the smaller species with suitable conditions of development. The reverse is not true as the presence of Orthotomicus spp. does not necessarily indicate the availability of thick bark : it is then also an advantage for I. sexdentatus not to respond to the pheromone of the small scolytid species. T. formicarius is able to recognize and respond to any combination of the semiochemicals that compose the active pheromone of the bark beetles (Ips and Orthotomicus spp.). As a generalist predator, it is probably in its interest to respond to the pheromone of different prey, thereby enhancing the probability of finding food, a sexual partner and eventually a suitable habitat for breeding. The results have also practical implications. Fortunately, Stenoprax® lures can be used to monitor Ips sexdentatus, Orthotomicus spp. and Thanasimus formicarius populations with the same pheromone traps. Unfortunately, any pheromone mass trapping of the pests (bark beetles) may adversely affect the natural enemies (Thanasimus).
Proccedings: IUFRO Kanazawa 2003 "Forest Insect Population Dynamics and Host Influences” - 147 -
Utilization of the Symbiotic Fungus Propagated in Host-Tree before Oviposition by a Woodwasp, Urocerus japonicus (Hymenoptera: Siricidae)
Hideshi FUKUDA
1Depertment of Human Environment and Information Technology, Faculty of Social and Informational Sciences, Nihon Fukushi University, Higashiehaemi-cho, Handa, Aichi 475-0012, JAPAN
Akira SANO Mie Prefectural Science and Technology Promotion Center., Hakusan-cho, Mie 515-2602, JAPAN
Abstract Most woodwasps (Siricidae) are symbiotically associated with the specific fungus, Amylostereum spp. Female adults inoculate the fungus during their oviposition in the sapwood of host trees. Woodwasp larvae can digest sapwood with low nutritional quality with the aid of symbionts. In an earlier study, we clarified that a woodwasp with no fungal symbionts, Xeris spectrum can utilize the fungal symbionts of other woodwasp species without possessing any symbiotic fungi of its own. Moreover, the larvae of fungus-carrying woodwasp species cannot develop on living trees. The female adults oviposit selectively on freshly killed trees that are presumed to be suitable for fungus propagation, because the conditions of the wood at the time of oviposition affect propagation of the fungus. Whether fungus-carrying woodwasps can develop using no maternal symbiotic fungus or not has never been studied. Thus, we conducted fungus-isolation and oviposition experiments to evaluate the preference and performance of U. japonicus on fungus-inoculated trees. Experiments were conducted from 1999 to 2001. In July 1999, the first year, new female adults of U. japonicus were allowed to oviposit on living trees of Cryptomeria japonica (oviposited trees). In October, the symbiotic fungus of U. japonicus was artificially inoculated on living trees of C. japonica (inoculated trees). In November, oviposited trees, inoculated trees and control (not oviposited and not inoculated) trees were felled and a portion of the inoculated trees were bucked to 2 m lengths. In July 2000, the second year, new female adults were allowed to oviposit on each tree. At the same time, fungi were isolated from both oviposited and inoculated trees. In 2001, the third year, we counted the number of new adults that emerged from each tree where oviposition occurred in the 2nd year, and we also counted oviposition holes on each tree. The inoculated symbiotic fungus propagated on both oviposited trees and inoculated trees 8 months after tree-felling, during the oviposition period of the next year. Moreover, the symbiotic fungus was distributed widely in the wood of inoculated trees, especially on bucked trees. Oviposition by U. japonicus was higher on oviposited and inoculated trees than on control trees; moreover, oviposition was higher on inoculated than on oviposited trees. On inoculated trees, many oviposition holes were observed near vertical lines from inoculated positions, where the symbiotic fungus had propagated vigorously. Next generation adults emerged from inoculated trees, whereas no adults emerged from oviposited and control trees. The number of emerged adults was especially high on bucked trees. From these results, we demonstrated that a fungus-carrying woodwasp species, U. japonicus, can reproduce using no maternal symbiotic fungus. Combined with results from a previous study, these results indicate that both X. spectrum, a woodwasp species that has no maternal symbiont, and U. japonicus a fungus-carrying woodwasp species, can utilize the Amylostereum fungi which had already propagated in the wood. This information is important for clarifying the coevolution between woodwasps and Amylostereum fungi. KEY WORDS: Amylostereum fungus, fungus-isolation, oviposition preference, survival rate, Urocerus japonicus
Proccedings: IUFRO Kanazawa 2003 "Forest Insect Population Dynamics and Host Influences” - 148 -
Reaction of the Ambrosia Beetle Platypus quercivorus to Gallic Acid and Ellagic Acid in Oak Sapwood
Hisahito OANA, Nobuko KAKIUCHI, Masayuki MIKAGE, Naoto KAMATA Graduate School of Natural Science and Technology, Kanazawa University, Kanazawa, Ishikawa 920-1192, JAPAN
Kojiro ESAKI Ishikawa Forest Experiment Station, Hakusan, Ishikawa 920-2114, JAPAN
Tohru MITSUNAGA, Shin-ichiro ITO Faculty of Bioresources, Mie University, Kamihama 1515, Tsu, Mie, 514-8507, JAPAN
Abstract The ambrosia beetle, Platypus quercivorus (Coleoptera: Platypoididae) (Maruyama), is a critical vector of the fungus, Raffaelea quercivora. Inoculation of R. quercivora, causes necrosis in sapwood, stops water conductance, and kills host trees. Platypus quercivorus constructs galleries in oak sapwood, avoiding necrosis formed by attacks of the same species in the previous year. Reproductive success of P. quercivorus was greatly decreased on host trees that were attacked in the previous year because there was less space for galleries in the second year. In most cases, P. quercivorus could not reproduce at all on trees with a previous infestation history. If P. quercivorus avoid necrosis in response to chemical substances, then these chemicals may be useful tools for preventing P. quercivorus attacks. Gallic acid is not detected from healthy sapwood but is detected (0.001% wet weight) in necrotic tissue. Concentration of ellagic acid is higher (0.050% wet weight) in necrotic tissue than in healthy sapwood. To test the effect of gallic acid and/or ellagic acid on behavior of gallery construction by P. quercivorus, male beetles were introduced to oak xylem in which gallic acid and/or ellagic acid concentrations were experimentally elevated. Results indicated that P. quercivorus avoided high concentrations of gallic acid and ellagic acid. These results coincided with previous reports obtained by field observations and by inoculation experiments indicating that P. quercivorus avoiding necrosis when constructing galleries. Gallic acid did not disturb gallery construction of P. quercivorus at the same low concentration found in necrosis. In contrast, ellagic was capable of terminating gallery construction completely. These results suggest that ellagic acid plays a critical role in the avoidance of necrosis during P. quercivorus gallery construction.
Proccedings: IUFRO Kanazawa 2003 "Forest Insect Population Dynamics and Host Influences” - 149 -

Volatile Compounds Related to Attractant of Platypus quercivorus (Murayama) from Quercus crispula
Hiroyuki TAKEMOTO, Shin-ichiro ITO, Tohru MITSUNAGA Faculty of Bioresources, Mie University, Kamihama 1515, Tsu, Mie, 514-8507, JAPAN
Naoto KAMATA Graduate School of Natural Science and Technology, Kanazawa University, Kanazawa, Ishikawa 920-1192, JAPAN
Masahide KOBAYASHI Kyoto Prefectural Forestry Experimental Station, Honjo, Tanba, Funai,Kyoto 621-1121, JAPAN
Abstract The mass mortality of oak trees in Japan is expanding due to the vector, Platypus quercivorus (Murayama), which bores into the trunks of oaks and other angiosperm trees. We analyzed the volatile compounds emitted from the tissues of the most frequently attacked host tree, Quercus crispula. We also investigated relationships between several compounds identified and the attractive responses of the beetle. Results from the bioassays showed that toluene, 3-octanone, anisole and 1-hexadecanal are probably attractant compounds for P. quercivorus.
Proccedings: IUFRO Kanazawa 2003 "Forest Insect Population Dynamics and Host Influences” - 150 -
Stand-Level Distribution and Movement of Platypus quercivorus Adults and Spatial Patterns of Attacks
Kojiro ESAKI Ishikawa Forest Experiment Station, Hakusan, Ishikawa 920-2114, JAPAN
Kenryu KATO, Naoto KAMATA
Graduate School of Natural Science and Technology, Kanazawa University, Kanazawa, Ishikawa 920-1192, JAPAN Abstract Flying populations of an ambrosia beetle, Platypus quercivorus (Murayama), a vector of the ambrosia fungus Raffaelea quercivora, which causes Japanese oak wilt in Japan, were sampled using sticky screen traps. Platypus quercivorus beetles tend to move upwards along slopes. The highest concentrations of flying beetles usually occur at the upper forest margins. During the period when numbers of flying beetles were increasing, the incidence of newly infested trees spread from the epicenter into the forest. During the period when number of flying beetles is decreased, the epicenter shrank into the upper forest edge. Newly infested trees did not occur in this period because most trees had already been infested. Near the upper forest edge, where many beetles were highly concentrated throughout the season, the number of new entry holes decreased considerably after the initial attack, early in the season, though many adults were present throughout the entire period.
Proccedings: IUFRO Kanazawa 2003 "Forest Insect Population Dynamics and Host Influences” - 151 -
Influence of Light Condition on the Spatial Distribution of an Ambrosia Beetle Platypus quercivorus (Murayama) (Coleoptera: Platypodidae)
Flying in a Natural Secondary Broad-Leafed Forest
Yutaka IGETA, Kenryu KATO, Naoto KAMATA Graduate School of Natural Science and Technology, Kanazawa University, Kanazawa, Ishikawa 920-1192, JAPAN
Kojiro ESAKI Ishikawa Forest Experiment Station, Hakusan, Ishikawa 920-2114, JAPAN
Abstract Platypus quercivorus (MURAYAMA) is known to be the primary vector of Raffaelea quercivora that causes oak mortality in Japan. Differing from many Scolytid and Platypodid species, P. quercivorus attacks healthy host trees and sometimes kills them. In this study we examined adult phototaxis in a laboratory experiment, we investigated the spatial distribution of adults flying in and around forest gaps and we investigated light conditions relative to the distribution of adults in the field. Results of the phototaxis experiments indicate that newly emerged adults of P. quercivorus are positively phototactic. The distribution of P. quercivorus at the stand level was influenced by light conditions. The behavioral response of P. quercivorus to light may therefore explain their tendency to invade trees around roads and forest gaps.
Proccedings: IUFRO Kanazawa 2003 "Forest Insect Population Dynamics and Host Influences” - 152 -
Analysis of Japanese Oak Wilt Spread Using Aerial Photography and GIS
Ryotaro KOMURA, Naoto KAMATA, Ken-ichiro MURAMOTO Graduate School of Natural Science and Technology, Kanazawa University, Kakuma, Kanazawa, Ishikawa 920-1192, JAPAN
Andrew LIEBHOLD Northeastern Research Station, USDA Forest Service, 180 Canfield St, Morgantown, WV 26505 USA
Koujiro ESAKI Ishikawa Forest Experiment Station, Hakusan, Ishikawa 920-2114, JAPAN
Abstract In Japan, Japanese oak wilt (JOW) has been known since the 1930s. In the decades directly following its initial discovery, JOW epidepmics were only a few years in duration and were confined to only a few areas on the Japan Sea (western) coast of Japan. However, in the last ten years epidemics have intensified and spread to the island's western coastal areas. The symbiotic ambrosia fungus Raffaelea quercivora is the causal agent of oak dieback, and is vectored by Platypus quercivorus (Murayama). This is the first example of an ambrosia beetle fungus that kills vigorous trees. We provide here an analysis of the historical distribution and spread of JOW previously recorded at the regional scale . Additionally of mortality caused by JOW at the stand scale level was investigated using aerial photographs. In this study, statistical analysis of spread of the oak diebacks was done conducted using a geographical information system (GIS) and rates of JOW spread were among different spatial scales. Results suggest that spread is the result of long, middle and short distance movement by adult beetles.
Proccedings: IUFRO Kanazawa 2003 "Forest Insect Population Dynamics and Host Influences” - 153 -
MISSING ORAL PAPERS
Japanese oak wilt caused by Raffaelea quercivora carried by an ambrosia beetle Shin-ichiro ITO, Mie University Comparison of tree resistance, climate and natural enemies of Adelges tsugae in Asia and North America Michael MONTGOMERY Enhanced predation pressure but not predation itself regulates population dynamics of the seed bug, Melamphaus faber Takayoshi NISHIDA Influences of the host spruce on the population dynamics of the white pine weevil Rene ALFARO Spread of an introduced tree pest organism, the pinewood nematode, in Japan Katsumi TOGASHI Is Bursaphelenchus mucronatus replaced by B. xylophilus?: Yearly fluctuation in distributions of the two nematode species and their vector beetles at the front of range expansion of pine wilt disease Shota JIKUMARU Effects of host plant quality on the population dynamics of the leaf beetle Chrysomela lapponica Elena ZVEREVA Indirect effect of a lace bug on a chrysomelid beetle via host willow quality Michihiro ISHIHARA Field validation of phenolic content as a predictor of resistance of Norway spruce to Ips typographus attacks, during an outbreak Francois LIEUTIER Integrated management of spruce bark beetle population in mountain forests Julius NOVOTONY The effect of defoliation by Panolis flammea (Lepidoptera, Noctuidae) on secondary metabolites in Scots pine needles Lidia SUKOVATA Novel defense systems of the privet tree and the papaya tree and counteradaptations of herbivorous insects Kotaro KONNO New approach in protection of the Scots pine plantations against the pine shoot moth, Rhyacionia buoliana Andrzej KOLK
Proccedings: IUFRO Kanazawa 2003 "Forest Insect Population Dynamics and Host Influences” - 154 -

Responses to exotic forest pest in New Zealand: fall webworm, gypsy moth, painted apple moth Davor BEJAKOVICH Are mixed forest stands less susceptible to insect herbivore attacks as compared to pure stands? Julia KORICHEVA Influence of the host plant and natural enemies on balsam fir sawfly populations Dan T. QUIRING
Proccedings: IUFRO Kanazawa 2003 "Forest Insect Population Dynamics and Host Influences” - 155 -
MISSING POSTER PAPERS Allochronic reproductive isolation between populations of the gall midge Asteralobia sasakii inhabiting two holly trees Ken TABUCHI Comparing tree resistance against the gall-forming adelgid, Adelges abietis (Homoptera: Adelgidae), in ancestal and novel host plants Matti ROUSI & Pekka NIEMELA Response of gall wasp community to genetic variation in the host plant, Quercus crispula Masato ITO Genetically-based resistance of black spruce, Picea mariana, to the yellow-headed spruce sawfly Pikonema alaskensis Dan T. QUIRING Genetically-based resistance of jack pine, Pinus banksiana, to the white pine weevil, Pissodes strobi Dan T. QUIRING Mortality of silver birch seedlings after insect and vole feeding: genotypic variation and herbivore effects Heikki ROININEN The potential role of ectomycorrhizal mutualists in determining Douglas-fir resistance to defoliation by the western spruce budworm Karen CLANCY Host traits associated with susceptibility of elms (Ulmus spp) to the elm leaf beetle (Pyrrhalta luteola) Michael WAGNER Macroecology: a reconciliation of top-down/bottom-up processes Nod KAY Conservation of biodiversity in managed forests Martin SCHROEDER Colonization and reproduction of bark beetles on wind felled Norway spruces in southern Finland Miikka ERIKSSON Community of insects attracted to fermented tree sap Jiichiro YOSHIMOTO Pine Weevil: Host plant acceptance on mineral soil and humus Niklas BJÖRKLUND
Proccedings: IUFRO Kanazawa 2003 "Forest Insect Population Dynamics and Host Influences” - 156 -
IUFRO Kanazawa 2003
PROGRAM
INTERNATONAL SYMPOSIUM “Forest Insect Population Dynamics and Host Influences”
Joint meeting of IUFRO working groups:
7.01.02 Tree Resistance to Insects 7.03.06 Integrated management of forest defoliating insects
7.03.07 Population dynamics of forest insects
Kanazawa Citymonde Hotel, Kanazawa, Japan 14-19 September 2003
Sponsored by IUFRO-J
Ishikawa Prefecture
Kanazawa City
21st-COE Program of Kanazawa University
Symposium Conveners Dr Naoto Kamata, Kanazawa University, Japan
Dr Katsumi Togashi, Hiroshima University, Japan
Proccedings: IUFRO Kanazawa 2003 "Forest Insect Population Dynamics and Host Influences” - 157 -

PROGRAM OVERVIEW 14-Sep
SUN 15-Sep MON
16-Sep TUE
17-Sep WED
18-Sep THU
19-Sep FRI
20-Sep SAT
21-Sep SUN
AM Oral session (1F: Citymonde Hall)
Oral session
Lunch Buffet lunch (2F: Room “Yu-zen”)
Buffet lunch (2F: “Yu-zen”)
Oral session Oral session Oral session PM 17:00-19:00
Reception
Poster Session (2F:
“Yu-zen”)
FREE Sight
seeing & Shopping
Poster Session (2F:
“Yu-zen”)
8:00 Dep .
In-congress tour
20:00 Arr. Poster session
(13F: “Kenroku”)
8:00 Departure
Post-congress overnight tour (OP)
(Shirakawago, Mt. Norikura, Kamikochi)
20:00 Arrival
Evening 19:00-21:00 Welcome Party (2F: Room “Yu-zen”)
Dinner (on your own) 17:45-20:00 Farewell Party
(Japanese Restaurant: “Kin-jo-ro”)
Dinner (on your own)
FLOOR PLAN
Proccedings: IUFRO Kanazawa 2003 "Forest Insect Population Dynamics and Host Influences” - 158 -

PROGRAM 14-Sep-03 17:00 Reception (1st or 2nd Floor of Kanazawa Citymonde Hotel) 19:00 Welcome Party (Room: Yu-zen, 2F) Guest Speech Kazuo SUZUKI, Coordinator of Division 7, IUFRO (Tokyo University) Yujiro HAYASHI, President of Kanazawa University 21:30 Close 15-Sep-03 7:45 Reception (Citymnonde Hall, 1F) 8:15 Opening (Room: Citymonde Hall, 1F) Guest Speech
Kazuo SUZUKI, Cordinator of Division 7, IUFRO (Tokyo University) Shunichi MITSUHASHI, Deputy Director General, Department of Agriculture, Forestry and
Fishery (Ishikawa Prefectural Government) Kazuichi HAYAKAWA, Project Leader of 21st-Century COE Program (Kanazawa University)
Moderator: Naoto KAMATA 8:30 Invited lecture: “Pine wilt disease caused by pinewood nematode” (Kazuyoshi FUTAI) 9:10 Invited lecture: “Japanese oak wilt caused by Raffaelea quercivora carried by an ambrosia beetle” (Shin-ichiro ITO) 9:50 Coffee Break Moderator: Heikki ROININEN 10:05 Andrew LIEBHOLD “Spatial dynamics of Periodical Cicada Populations in North America” 10:30 Michael MONTGOMERY “Comparison of tree resistance, climate and natural enemies of Adelges
tsugae in Asia and North America” 10:55 Takayoshi NISHIDA “Enhanced predation pressure but not predation itself regulates population
dynamics of the seed bug, Melamphaus faber” 11:20 Nathalie WARZEE “Thanasimus formicarius : a good indicator for assessing the impact of forest
biodiversity on forest pests ?” 11:45 Lunch (Buffet lunch will be held in the room "Yu-zen", 2F) Moderator: Toshihiro YAMADA 13:00 Naoto KAMATA “Induced response of oak trees to Raffaelea quercivora as a possible control tool
against Japanese oak wilt caused by the ambrosia fungus carried by an ambrosia beetle” 13:25 Miwa KASAI “Study of Quercus mongolica wood extractives damaged from Platypus quercivorous attack” Moderator: Francois LIEUTIER 13:50 Manuela Rodrigues BRANCO “Host preference of Tomicus piniperda and T. destruens for three pine
species”
Proccedings: IUFRO Kanazawa 2003 "Forest Insect Population Dynamics and Host Influences” - 159 -
14:15 Niklas BJORKLUND “The significance of odour and visual stimuli in orientation too seedlings for the pine weevil Hylobius abietis (L.)”
14:40 Rene ALFARO “Influences of the host spruce on the population dynamics of the white pine weevil”
15:05 Coffee Break Moderator: Ei'ichi SHIBATA 15:20 Katsumi TOGASHI “Spread of an introduced tree pest organism, the pinewood nematode, in Japan” 15:45 Ei-ichiro ASAI “The effect of simulated acid rain on the resistance of pine trees to the invasion by
pinewood nematode” 16:10 Shota JIKUMARU “Is Bursaphelenchus mucronatus replaced by B. xylophilus?: Yearly fluctuation in
distributions of the two nematode species and their vector beetles at the front of range expansion of pine wilt disease”
16:35 House Keeping & Coffee Break 17:00 Poster session (Room: “Yu-zen”, 2F) 18:30 Close Dinner (on your own) 16-Sep-03 Moderator: Katsumi TOGASHI 8:15 Elena ZVEREVA “Effects of host plant quality on the population dynamics of the leaf beetle
Chrysomela lapponica” 8:40 Michihiro ISHIHARA “Indirect effect of a lace bug on a chrysomelid beetle via host willow quality” 9:05 Peter DALIN “Population dynamics of leaf beetles in managed and natural willow systems” 9:30 Christer BJORKMAN “Harvest disrupts biological control in a short rotation coppice system” 9:55 Coffee Break Moderator: Rene ALFARO 10:10 Francois LIEUTIER “Field validation of phenolic content as a predictor of resistance of Norway spruce
to Ips typographus attacks, during an outbreak” 10:35 Martin SCHROEDER “Reproductive success of the bark beetle Ips typographus and impact of natural
enemies in a five year period following a large scale storm-felling” 11:00 Julius NOVOTONY “Integrated management of spruce bark beetle population in mountain forests” 11:25 House keeping 11:40 Lunch (Buffet lunch will be held in the room "Yu-zen", 2F) Afternoon Free Time: Sightseeing and Shopping Dinner (on your own)
Proccedings: IUFRO Kanazawa 2003 "Forest Insect Population Dynamics and Host Influences” - 160 -
17-Sep-03 Moderator: Naoto KAMATA 8:15 Invited lecture: “Invasive alien species issues” (Keizi KIRITANI) 8:55 Invited lecture: “Rich biota in the forests of Yanbaru, Northern montane part of Okinawa Island, and
imminent extinction crisis of the endangered species” (Yosiaki ITÔ) 9:35 Coffee Break Moderator: Michael Wagner 9:50 Erkki HAUKIOJA “How does birch defense against defoliators operate?” 10:15 Michimasa YAMASAKI “What causes spatio-temporal variations in leaf herbivory level within a canopy of
Fagus crenata?” 10:40 Karen CLANCY “Effects of ortet genotype, western spruce budworm defoliation, and fertilization
on foliar nutrients in Douglas-fir clones” 11:05 Masahiro NOMURA “Intra- and Interspecific variation in the balance between ant and non-ant defenses
in Macaranga” 11:30 Lunch (Buffet lunch will be held in the room "Yu-zen", 2F) Moderator: Karen CLANCY 13:00 Takayoshi KOIKE “Growth and defense characteristics in leaves of Betulaceae” 13:25 Lidia SUKOVATA “The effect of defoliation by Panolis flammea (Lepidoptera, Noctuidae) on
secondary metabolites in Scots pine needles” 13:50 Kotaro KONNO “Novel defense systems of the privet tree and the papaya tree and
counteradaptations of herbivorous insects” 14:15 Coffee Break Moderator: Julius NOVOTNY 14:30 Andrzej KOLK “New approach in protection of the Scots pine plantations against the pine shoot
moth, Rhyacionia buoliana” 14:55 Reza MEHRNEJAD “Three pistachio species evaluated for resistance to the common pistachio psylla,
Agonoscena pistaciae” 15:20 House Keeping & Coffee Break 16:00 Poster session (Room: “Yu-zen”, 2F)
Remove your poster(s) once by 18:30 of 17 SEP. 18:00 Close Dinner (on your own)
18-Sep-03 7:50 Meet in front of the reception desk on the 1st floor. We will use three busses. For foreigners, we do not
recommend to get on the No. 3 bus. There will be no English guide in the No. 3 bus. 8:00 Departure In-Congress Field Trip
Proccedings: IUFRO Kanazawa 2003 "Forest Insect Population Dynamics and Host Influences” - 161 -
18:30 Arrival Dinner (on your own) 19-Sep-03 Moderator: Dan QURING
8:30 Davor BEJAKOVICH “Responses to exotic forest pest in New Zealand: fall webworm, gypsy moth, painted apple moth”
8:55 Marc KENIS “Mortality factors affecting an invasive alien species in Europe, Cameraria ohridella”
9:20 Ferenc LAKATOS “The genetic background of three introduced leaf miner moth” 9:45 Coffee Break Moderator: Andrew LIEBHOLD 10:00 Marek TURČÁNI “The results of study of predation of gypsy moth pupae in Slovakia
during a period of latency” 10:25 Helena BYLUND “Multiple factors affecting population dynamics of the autumnal moth (Epirrita
autumnata)” 10:50 Julia KORICHEVA “Are mixed forest stands less susceptible to insect herbivore attacks as compared
to pure stands?” 11:15 Nod KAY “Ecosystem function and the prediction of tree defoliator resistance” 1:40 Lunch (Buffet lunch will be held in the room "Yu-zen", 2F) Moderator: Nod KAY 13:30 Paivi LYYTIKAINEN-SAARENMAA “Growth responses and mortality of Scots pines after a pine
sawfly outbreak” 13:55 Dan QUIRING “Influence of the host plant and natural enemies on balsam fir sawfly populations” 14:20 Christopher LUCAROTTI “Field trials of the balsam fir sawfly nucleopolyhedrovirus to control
its natural host, Neodiprion abietis (Hymenoptera: Diprionidae)” 14:45 Coffee Break 15:00 Business Meeting & House Keeping 16:00 Poster sessions & Mixer (Room: Kenroku, 13F) Please remove your poster by 17:30 18:00 Farewell Party (Meet in front of the reception desk on the 1st floor at 17:45 and move together to a Japanese restaurant “Kin-jo-ro”) 21:00 Close 20-Sep-03 Post-Congress Field Trip (Optional) 7:50 Meet in front of the reception desk on the 1st floor at 7:45 21-Sep-03 Post-Congress Field Trip (Optional) 20:00 Arrival at Kanazawa Citymonde Hotel
Proccedings: IUFRO Kanazawa 2003 "Forest Insect Population Dynamics and Host Influences” - 162 -

POSTER PAPERS
For poster presenter, 1. A room for poster display will be a room “Yu-zen” at the 2nd floor during 15-17 SEP and a room “Kenroku” at the 13th floor on 19 SEP. 2. Mount your poster(s) on a poster boards in a Room “Yu-zen (2F)” in the afternoon of 15 SEP. 3. Remove your poster(s) once by 18:30 of 17 SEP. 4. Mount your poster again on a poster boards in a Room “Kenroku (13F)” in the afternoon of 19 SEP. 5. Remove your poster(s) by 17:30 of 19 SEP.
1. Hiroshi FUKUMOTO “Seed-insect fauna in pre-dispersal acorns of Quercus variabilis and Q. serrata and its impact on acorn production” 2. Helena BYLUND “Is the parasitoid Perelitus areolaris an important mortality factor in pine weevil populations?” 3. Katsunori NAKAMURA “Characteristic of the Resistance of Pinus armandii var. amamiana, an Endangered Pine Species in Japan, to Pine Wilt Disease” 4. Arturas GEDMINAS “Efficiency of pine trap trees” 5. Arturas GEDMINAS “Impact of defoliating insects upon pine radial growth” 6. Ken TABUCHI “Allochronic reproductive isolation between populations of the gall midge Asteralobia sasakii inhabiting two holly trees” 7. Matti ROUSI & Pekka NIEMELA “Comparing tree resistance against the gall-forming adelgid, Adelges abietis (Homoptera: Adelgidae), in ancestal and novel host plants” 8. Kenji TOKUNAGA “Comparison of physical and chemical properties between galled leaves and ungalled leaves” 9. Masato ITO “Response of gall wasp community to genetic variation in the host plant, Quercus crispula” 10. VACANT 11. Dan QUIRING “Genetically-based resistance of black spruce, Picea mariana, to the yellow-headed spruce sawfly Pikonema alaskensis” 12. Dan QUIRING “Genetically-based resistance of jack pine, Pinus banksiana, to the white pine weevil, Pissodes strobi” 13. Heikki ROININEN “Mortality of silver birch seedlings after insect and vole feeding: genotypic variation and herbivore effects” 14. Karen CLANCY “The potential role of ectomycorrhizal mutualists in determining Douglas-fir resistance to defoliation by the western spruce budworm” 15. Sawako MATSUKI “Comparison of foliar defense by chemical analysis and bioassay in Betulaceae seedlings” 16. Masahiko MORISHITA “Forecasting of population density of two stink bugs by using airborne sugi pollen counts” 17. Michael WAGNER “Ontogenetic resistance in Pinus ponderosa to Rhayacionia neomexicana: role of anatomical factors” 18. Michael WAGNER “Host traits associated with susceptibility of elms (Ulmus spp) to the elm leaf beetle (Pyrrhalta luteola)” 19. Shizuo SUZUKI “Defoliation ratio by herbivorous insects at forest stand level along altitudes, between geological substrates, and between topography on Mt. Kinabalu, Borneo” 20. Naoto KAMATA “Linking ecosystem ecology to insect population ecology: nitrogen cycling, foliage properties,
Proccedings: IUFRO Kanazawa 2003 "Forest Insect Population Dynamics and Host Influences” - 163 -

and insect population outbreaks” 21. Naoya WADA “Effects of simulated partial cotyledon herbivory on seedling growth in a Japanese oak Quercus crispula” 22. Nod KAY “Macroecology: a reconciliation of top-down/bottom-up processes” 23. Martin SCHROEDER “Conservation of biodiversity in managed forests” 24. Nathalie WARZEE “Semiochemical diversity and niche partitioning among scolytids and the generalist bark-beetles predator, Thanasimus formicarius” 25. Miikka ERIKSSON “Colonization and reproduction of bark beetles on wind felled Norway spruces in southern Finland” 26. Jiichiro YOSHIMOTO “Community of insects attracted to fermented tree sap” 27. Hideshi FUKUDA “Utilization of the symbiotic fungus propagated in host-tree before oviposition by a woodwasp, Urocerus japonicus (Hymenoptera: Siricidae)” 28. VACANT 29. Mariko YAMATO “Water relations of oak seedlings infected with Raffaelea quercivora vectored by Platypus quercivorus” 30. Toshihiro YAMADA “Defense responses of oak trees against the fungus Raffaelea quercivora vectored by the ambrosia beetle Platypus quercivorus” 31. Hisahito OANA “Reaction of an ambrosia beetle Platypus quercivorus to gallic acid and ellagic acid in sapwood of oak infested by Raffaelea quercivora” 32. Hiroyuki TAKEMOTO “Volatile Compounds Related to Attractant of Platypus quercivorous from Quercus mongolica” 33. VACANT 34. Kojiro ESAKI “Stand-level distribution and movement of Platypus quercivorus adults and patterns of incidence of new infestation” 35. Yutaka IGETA “Influence of light condition on the spatial distribution of an ambrosia beetle Platypus quercivorus (Murayama) (Coleoptera: Platypodidae) flying in a secondary natural broad-leafed forest” 36. Ryotaro KOMURA “Analysis of Japanese oak wilt spread using aerial photography and GIS” 37. VACANT 38. VACANT 39. VACANT 40. Teresa Vasconcelos 41. Niklas BJÖRKLUND ”PINE WEEVIL: Host plant acceptance on mineral soil and humus” 42. Kensuke IMAI 43. VACANT 44. VACANT
POSTER ARRANGEMENT
Proccedings: IUFRO Kanazawa 2003 "Forest Insect Population Dynamics and Host Influences” - 164 -
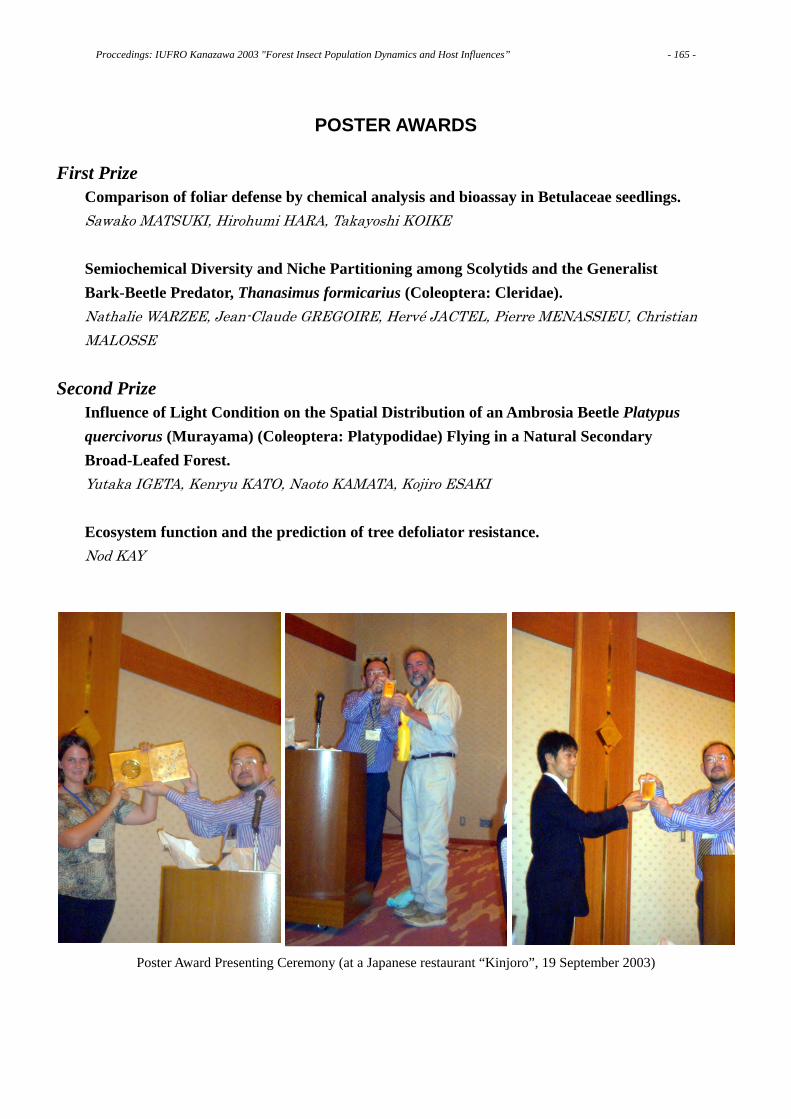
POSTER AWARDS First Prize
Comparison of foliar defense by chemical analysis and bioassay in Betulaceae seedlings. Sawako MATSUKI, Hirohumi HARA, Takayoshi KOIKE Semiochemical Diversity and Niche Partitioning among Scolytids and the Generalist Bark-Beetle Predator, Thanasimus formicarius (Coleoptera: Cleridae). Nathalie WARZEE, Jean-Claude GREGOIRE, Hervé JACTEL, Pierre MENASSIEU, Christian MALOSSE
Second Prize
Influence of Light Condition on the Spatial Distribution of an Ambrosia Beetle Platypus quercivorus (Murayama) (Coleoptera: Platypodidae) Flying in a Natural Secondary Broad-Leafed Forest. Yutaka IGETA, Kenryu KATO, Naoto KAMATA, Kojiro ESAKI Ecosystem function and the prediction of tree defoliator resistance. Nod KAY
Poster Award Presenting Ceremony (at a Japanese restaurant “Kinjoro”, 19 September 2003)
Proccedings: IUFRO Kanazawa 2003 "Forest Insect Population Dynamics and Host Influences” - 165 -
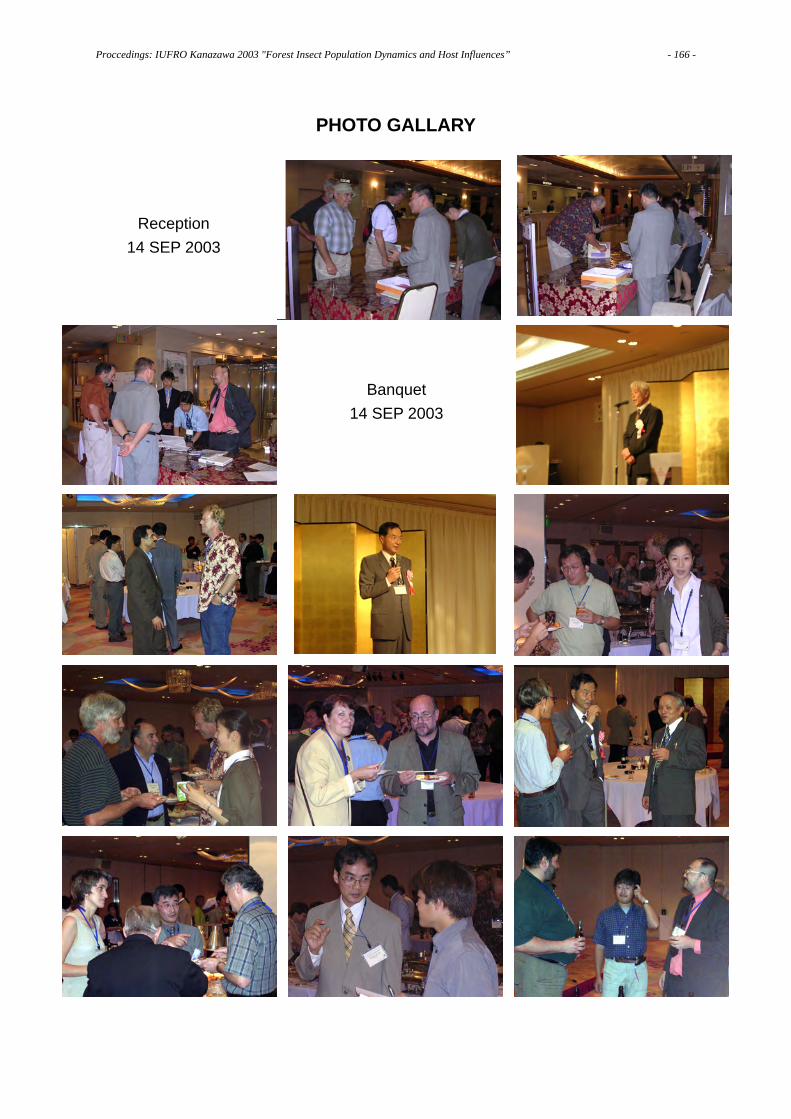
PHOTO GALLARY
Reception 14 SEP 2003
Banquet 14 SEP 2003
Proccedings: IUFRO Kanazawa 2003 "Forest Insect Population Dynamics and Host Influences” - 166 -

Proccedings: IUFRO Kanazawa 2003 "Forest Insect Population Dynamics and Host Influences” - 167 -
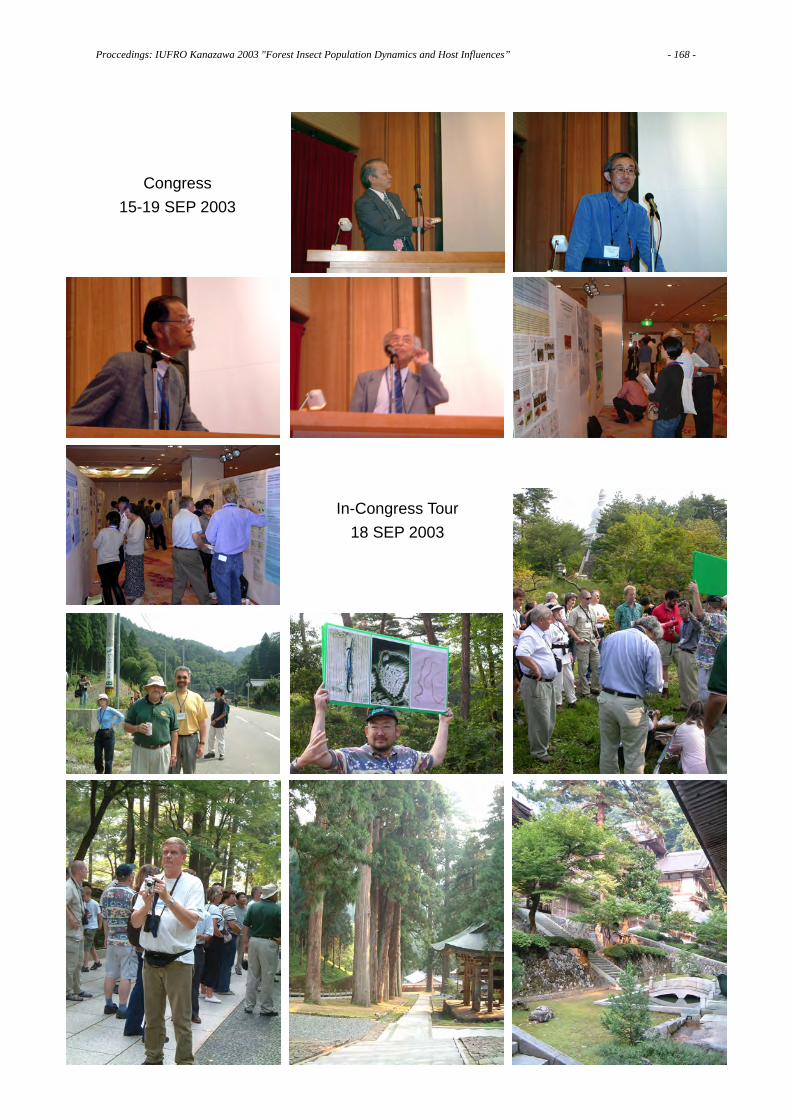
In-Congress Tour 18 SEP 2003
Congress 15-19 SEP 2003
Proccedings: IUFRO Kanazawa 2003 "Forest Insect Population Dynamics and Host Influences” - 168 -
Farewell Party 19 SEP 2003
Proccedings: IUFRO Kanazawa 2003 "Forest Insect Population Dynamics and Host Influences” - 169 -
Proccedings: IUFRO Kanazawa 2003 "Forest Insect Population Dynamics and Host Influences” - 170 -

Post-Congress Tour 20-21 SEP 2003
Proccedings: IUFRO Kanazawa 2003 "Forest Insect Population Dynamics and Host Influences” - 171 -
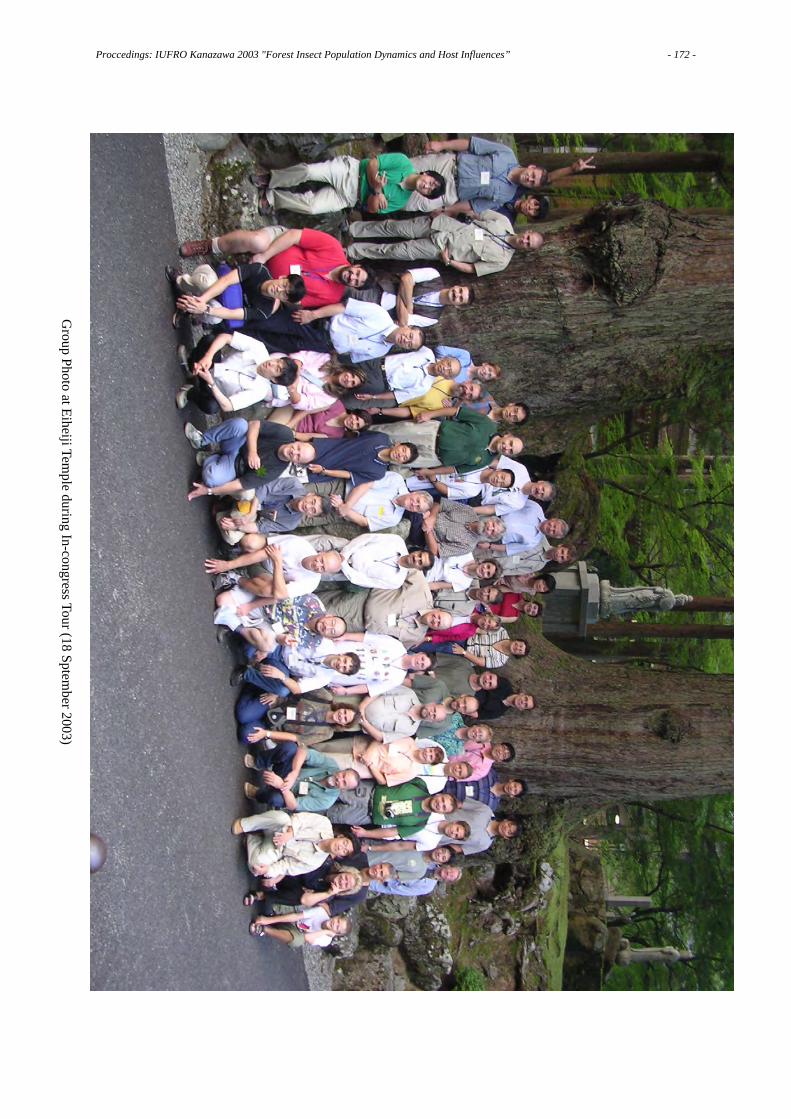
Group Photo at Eiheiji Tem
ple during In-congress Tour (18 Sptember 2003)
Proccedings: IUFRO Kanazawa 2003 "Forest Insect Population Dynamics and Host Influences” - 172 -

List of Participants IUFRO Kanazawa 2003LAST NAME First Name Institution COUNTRY E-mail address
ALFARO Rene ParticipantCanadian ForestService CANADA [email protected]
ASAI Ei-ichiro Participant Kyoto University JAPAN [email protected]
BEJAKOVICH Davor Participant
Ministry ofAgriculture andForestry
NEWZEALAND [email protected]
BJORKLUND Niklas Participant
SwedishUniversity ofAgriculture SWEDEN [email protected]
BJORKMAN Christer Participant
SwedishUniversity ofAgriculture SWEDEN [email protected]
BRANCO Manuela Participant
InstitutoSuperior deAgronomia PORTUGAL [email protected]
BYLUND Helena Participant
SwedishUniversity ofAgricultural SWEDEN [email protected]
CLANCY Karen ParticipantUSDA ForestService USA [email protected]
DALIN Peter Participant
SwedishUniversity ofAgriculture SWEDEN [email protected]
ERIKSSON Miikka Participant
Finnish ForestResearchInstitute FINLAND [email protected]
ESAKI Kojiro Participant
IshikawaPrefecturalForest ResearchInstitute JAPAN [email protected]
FUKUDA Hideshi ParticipantNihon FukushiUniversity JAPAN [email protected]
FUKUMOTO Hiroshi Participant
Mie PrefecturalScience andTechnologyPromotion JAPAN [email protected]
FUTAI Kazuyoshi Invited Speaker Kyoto University JAPAN [email protected]
GEDMINAS Arturas ParticipantLitheuanianForest Institute LITHUANIA [email protected]
HAUKIOJA Erkki ParticipantUniversity ofTurku FINLAND [email protected]
HAYAKAWA KazuichiGuest (Leader,21st-COE Project)
KanazawaUniversity JAPAN
HAYASHI Yujiro
Guest (President,KanazawaUniversity)
KanazawaUniversity JAPAN
IGETA Yutaka StudentKanazawaUniversity JAPAN [email protected]
IMAI Kensuke Student Kyoto University JAPAN [email protected]
ISHIHARA Michihiro Participant
OsakaPrefectureUniversity JAPAN [email protected]
ITO Yosiaki Invited Speaker JAPAN [email protected] Shin-ichiro Invited Speaker Mie University JAPAN [email protected]
ITO Masato StudentNagoyaUniversity JAPAN [email protected]
JABLONSKI Tomasz ParticipantForest ResearchInstitute POLAND [email protected]
Proccedings: IUFRO Kanazawa 2003 "Forest Insect Population Dynamics and Host Influences” - 173 -

JIKUMARU Shota Participant
HiroshimaPrefecturalForestryResearch JAPAN [email protected]
KAMATA Naoto ParticipantKanazawaUniversity JAPAN [email protected]
KASAI Miwa Participant Mie University JAPAN [email protected]
KAWANISHI Takuya ParticipantKanazawaUniversity JAPAN [email protected]
KAY Nod Participant
NZ ForestResearchInstitute
NEWZEALAND [email protected]
KENIS Marc Participant
CABIBioscienceSwitzerland
SWITZERLAND [email protected]
KIMOTO Troy Participant
Canadian FoodInspectionAgency CANADA [email protected]
KIRITANI Kenji Invited Speaker JAPAN [email protected]
KOIKE Takayoshi ParticipantHokkaidoUniversity JAPAN [email protected]
KOLK Andrzej ParticipantForest ResearchInstitute POLAND [email protected]
KOMURA Ryotaro StudentKanazawaUniversity JAPAN [email protected]
KONNO Kotaro Participant
NationalInstitute ofAgrobiologicalSciences JAPAN [email protected]
KORICHEVA Julia ParticipantUniversity ofTurku FINLAND [email protected]
KOYAMA Lina StaffKanazawaUniversity JAPAN
KUBO Mamoru ParticipantKanazawaUniversity JAPAN [email protected]
LAKATOS Ferenc ParticipantUniversity ofWest Hungary HUNGARY [email protected]
LIEBHOLD Andrew ParticipantUSDA ForestService USA [email protected]
LIEUTIER Francois ParticipantUniversity ofOrleans FRANCE [email protected]
LUCAROTTI Christopher ParticipantCanadian ForestService CANADA [email protected]
LYYTIKAINEN-SAARENMAA Paivi Participant
University ofHelsinki FINLAND [email protected]
MATSUKI Sawako StudentHokkaidoUniversity JAPAN [email protected]
MATSUOKA Michiko StudentOsaka Women'sUniversity JAPAN [email protected]
MEHRNEJAD Reza Participant
PistachioResearchInstitute IRAN [email protected]
MITSUHASHI Shunichi
Guest (DeputyDirector General,Dep. of Agr., For.& Fish.)
IshikawaPrefecturalGovernment JAPAN
MITSUNAGA Toru Participant Mie University JAPAN [email protected]
MONTGOMERY Michael ParticipantUSDA ForestService USA [email protected]
MORISHITA Masahiko Participant
WakayamaResearchCenter ofAgriculture,Forestry and JAPAN [email protected]
MURAMOTO Ken-ichiro ParticipantKanazawaUniversity JAPAN [email protected]
NAKAMURA Katsunori ParticipantFFPRI, KyushuResearch JAPAN [email protected]
Proccedings: IUFRO Kanazawa 2003 "Forest Insect Population Dynamics and Host Influences” - 174 -
NAKAMURA Koji ParticipantKanazawaUniversity JAPAN [email protected]
NAMURA Kengo StaffKanazawaUniversity JAPAN
NIEMELA Pekka ParticipantUniversity ofJoensuu FINLAND [email protected]
NISHIDA Takayoshi Participant Kyoto University JAPAN [email protected]
NODA Hideki StaffKanazawaUniversity JAPAN
NOMURA Masahiro Participant Kyoto University JAPAN [email protected]
NOVOTNY Julius ParticipantForest ResearchInstitute Zvolen SLOVAKIA [email protected]
OANA Hisahito StudentKanazawaUniversity JAPAN [email protected]
OHGUSHI Takayuki Participant Kyoto University JAPAN [email protected]
QUIRING Dan ParticipantUniversity ofNew Brunswick CANADA [email protected]
ROININEN Heikki Participant
Finnish ForestResearchInstitute FINLAND [email protected]
ROUSI Matti Participant
Finnish ForestResearchInstitute FINLAND [email protected]
SAKATA Hana StudentThe Universityof Tokyo JAPAN [email protected]
SCHROEDER Martin Participant
SwedishUnivercity ofAguriculturalSciences SWEDEN [email protected]
SETOYAMA Masato StudentThe Universityof Tokyo JAPAN [email protected]
SHIBATA Eiichi ParticipantNaogyaUniversity JAPAN [email protected]
SUKOVATA Lidia ParticipantForest ResearchInstitute POLAND [email protected]
SUZUKI Kazuo
Guest (DivisionCoordinator,IUFRO D7)
The Universityof Tokyo JAPAN [email protected]
SUZUKI Shizuo Participant
Institute forEnvironmentalSciences JAPAN [email protected]
TABUCHI Ken Student Chiba University JAPAN [email protected] Hiroyuki Student Mie University JAPAN [email protected]
KOMURA Akiko StaffKanazawaUniversity JAPAN
TOGASHI Katsumi ParticipantHiroshimaUniversity JAPAN [email protected]
TOKUNAGA Kenji StudentKanazawaUniversity JAPAN [email protected]
TOSAKA Yasuhiko Student Kyoto University JAPAN [email protected]
TURČÁNI Marek ParticipantForest ResearchInstitute Zvolen SLOVAKIA [email protected]
VASCONCELOS Teresa Participant
Escola SuperiorAgraria deCoimbra PORTUGAL [email protected]
WADA Naoya ParticipantToyamaUniversity JAPAN [email protected]
WAGNER Michael ParticipantNorthernArizona USA [email protected]
WAKAI Kiichi StaffKanazawaUniversity JAPAN
WARZEE Nathalie Participant
FREEUNIVERSITYOF BRUSSELS BELGIUM [email protected]
YAMADA Toshihiro ParticipantThe Universityof Tokyo JAPAN [email protected]
YAMASAKI Michimasa Participant Kyoto University JAPAN [email protected]
YAMASHITA Hanae StudentThe Universityof Tokyo JAPAN [email protected]
Proccedings: IUFRO Kanazawa 2003 "Forest Insect Population Dynamics and Host Influences” - 175 -

YAMATO Mariko StudentThe Universityof Tokyo JAPAN [email protected]
YOSHIMOTO Jiichiro Student Kyoto University JAPAN [email protected]
ZOLUBAS Paulius Participant
LithuanianUniversity ofAgriculture Lithuania [email protected]
ZVEREVA Elena ParticipantUniversity ofTurku FINLAND [email protected]
Proccedings: IUFRO Kanazawa 2003 "Forest Insect Population Dynamics and Host Influences” - 176 -


![[Acronym] Proceedings - UFG](https://static.fdokumen.com/doc/165x107/631430486ebca169bd0abf4b/acronym-proceedings-ufg.jpg)