
Proceedings - International Union of Speleology
504
Proceedings VOLUME 3 Edited by Michal Filippi Pavel Bosák 16 th INTERNATIONAL CONGRESS OF SPELEOLOGY
-
Upload
khangminh22 -
Category
Documents
-
view
1 -
download
0
Transcript of Proceedings - International Union of Speleology
ProceedingsVOLUME 3
Edited by
Michal FilippiPavel Bosák
16th INTERNATIONAL CONGRESS OF SPELEOLOGY

Czech Republic, BrnoJuly 21 –28, 2013
2013
16th INTERNATIONAL CONGRESS OF SPELEOLOGY
ProceedingsVOLUME 3
Edited by
Michal FilippiPavel Bosák
16th INTERNATIONAL CONGRESS OF SPELEOLOGYCzech Republic, BrnoJuly 21 –28, 2013
Cover photos (some photos were adjusted/cropped)Top left – Specific carbonate speleothem decorations in the Ghost Chamber, Sima de la Higuera Cave. Photo by V. Ferrer.For details see the paper by F. Gázquez and J.-M. Calaforra.Top right – A challenging exploration in the Cueva de los Cristales. Mexico. Photo by La Venta Exploring Team andSpeleoresearch & Films. For details see the paper by F. Gázquez et al.Bottom left – An example of a microcrystalline grained halite speleothem, the Octopus formation in the 3N Cave, QeshmIsland, Iran. Photo by NAMAK team. For details see the paper by Filippi et al.Bottom right – Internal skeleton structure of cryogenic gypsum crystals caused by the presence of partitions oriented parallelto the faces. For details see the paper by Kadebskaya and Tchaikovsky.
Produced by the Organizing Committee of the 16th International Congress of Speleology. Published by the Czech Speleological Society and the SPELEO2013 and in the co-operation with the International Union ofSpeleology.Design by M. Filippi and SAVIO, s. r. o.Layout by SAVIO, s. r. o.Printed in the Czech Republic by H.R.G. spol. s r. o.
The contributions were not corrected from language point of view. Contributions express author(s) opinion.
Recommended form of citation for this volume:Filippi M., Bosák P. (Eds), 2013. Proceedings of the 16th International Congress of Speleology, July 21–28, Brno. Volume 3,p. 499. Czech Speleological Society. Praha.
VOLUME 3Proceedings
ISBN 978-80-87857-09-0
© 2013 Czech Speleological Society, Praha, Czech Republic.
Individual authors retain their copyrights. All rights reserved.No part of this work may be reproduced or transmitted in anyform or by any means, electronic or mechanical, includingphotocopying, recording, or any data storage or retrievalsystem without the express written permission of thecopyright owner. All drawings and maps are used withpermission of the authors. Unauthorized use is strictlyprohibited.
KATALOGIZACE V KNIZE - NÁRODNÍ KNIHOVNA ČR
International Congress of Speleology (16. : Brno, Česko)16th International Congress of Speleology : Czech Republic,
Brno July 21–28,2013 : proceedings. Volume 3 / edited by MichalFilippi, Pavel Bosák. -- [Prague] : Czech Speleological Society andthe SPELEO2013 and in the co-operation with the InternationalUnion of Speleology, 2013 ISBN 978-80-87857-09-0 (brož.)
551.44 * 551.435.8 * 551.435.88-021.252 * 549- speleology- karstology- karst- pseudokarst- mineralogy- proceedings of conferences- speleologie- karsologie- kras- pseudokras- mineralogie- sborníky konferencí
551 - Geology, meteorology [7]551 - Geologie. Meteorologie. Klimatologie [7]

Scientific Committee
ChairmanPavel Bosák (Czech Republic) – Karst and Pseudokarst
Vice-ChairmanMichal Filippi (Czech Republic) – Karst and Pseudokarst
Members Jiří Adamovič (Czech Republic) – PseudokarstPhilippe Audra (France) – SpeleogenesisJean-Pierre Bartholeyns (France) – Management and ProtectionAaron Bird (USA) – ExplorationDidier Cailhol (France) – Speleogenesis Matt Covington (USA) – Modelling in Karst and Caves Robert Eavis (USA) – ExplorationAnette S. Engel (USA) – GeomicrobiologyLukáš Faltejsek (Czech Republic) – Biospeleology Derek Ford (Canada) – Climate and PaleoclimateFranci Gabrovšek (Slovenia) – Modelling Mladen Garašič (Croatia) – Survey, Mapping and Data ProcessingMartin Golec (Czech Republic) – Archeology and PaleontologyChristiane Grebe (Germany) – Management and ProtectionNadja Zupan Hajna (Slovenia) – Extraterrestrial KarstIvan Horáček (Czech Republic) – BiospeleologyStephan Kempe (Germany) – HistoryAleksander A. Klimchouk (Ukraine) – SpeleogenesisJiří Kyselák (Czech Republic) – ExplorationPeter Matthews (Australia) – Survey, Mapping and Data Processing Iona Meleg (France) – Management and ProtectionMario Parise (Italy) – Artificial Underground Bohdan P. Onac (USA) – MineralogyYavor Shopov (Bulgaria) – Climate and Paleoclimate
The names of the Committee members are given along with their home countriesand fields of research they represented as convenors.


Contents
Preface 10
Session: Karst and Caves in Carbonate Rocks, Salt and Gypsum 13–213
KARST HYDROGEOLOGY OF THE HANEY LIMESTONE, SOUTH-CENTRAL KENTUCKYSarah M. Arpin, Christopher G. Groves ..........................................................................................................................................................15
AN INTRODUCTION TO KALAHROUD CAVE, NORTH OF ESFAHAN, IRANShirin Bahadorinia, Sayed Hassen Hejazi, Alireza Nadimi, Derek C. Ford ......................................................................................16
CAVE SYSTEM OF KITA GAĆEŠINA – DRAŽENOVA PUHALJKA. THE LONGEST CAVE IN THE DINARIC KARSTTeo Barišić, Darko Bakšić, Dalibor Paar ........................................................................................................................................................17
CAVES OF EL PEÑON, CORDILLERA ORIENTAL, COLOMBIA Martin Bochud, Roman Hapka, Jean-Marc Jutzet ..........21
RECENT SURVEY AND EXPLORATION IN LECHUGUILLA CAVE, NEW MEXICO, USA Peter Bosted, John Lyles ............27
PLEISTOCENE SEA LEVEL CHANGES AS REVEALED BY FLANK MARGIN CAVES IN TELOGENETIC LIMESTONESIN SICILY AND SARDINIA (ITALY) Ilenia Maria D’Angeli, Jo De Waele, Rosario Ruggieri, Laura Sanna ............................29
SOME SCIENTIFIC FEATURES OF THE PUERTO PRINCESA UNDERGROUND RIVER:ONE OF THE NEW 7 WONDERS OF NATURE (PALAWAN, PHILIPPINES)Antonio De Vivo, Leonardo Piccini, Paolo Forti, Giovanni Badino......................................................................................................35
SUBTERRANEAN GLACIAL SPILLWAYS: AN EXAMPLE FROM THE KARST OF SOUTH WALES, U.K.Andrew R. Farrant, Michael J. Simms, Steven R. Noble ..........................................................................................................................42
PROJECT NAMAK: SOME OF THE MOST SPECTACULAR FINDINGS IN THE IRANIAN SALT KARSTMichal Filippi, Jiří Bruthans, Ondřej Jager, Mohammad Zare, Naser Asadí ....................................................................................48
KARST DEVELOPMENT IN THE GLACIATED AND PERMAFROST REGIONS OF THE NORTHWEST TERRITORIES,CANADA Derek C. Ford ........................................................................................................................................................................................54
LITTLE LIMESTONE LAKE: A BEAUTIFUL MARL LAKE IN MANITOBA, CANADA Derek Ford ..................................................55
CAVES AND KARST HYDROGEOLOGY OF JERUSALEM, ISRAEL Amos Frumkin ..........................................................................60
CAVES UNDER DUBROVNIK AIRPORT IN CROATIA Mladen Garašić ..............................................................................................66
SOME INFORMATION ABOUT THE DEEPEST CAVES KNOWN IN CROATIAN KARST AREAMladen Garašić, Davor Garašić ........................................................................................................................................................................72
HYPOGENE SPELEOGENESIS AND SPELEOTHEMS OF SIMA DE LA HIGUERA CAVE(MURCIA, SOUTH-EASTERN SPAIN) Fernando Gázquez, José-María Calaforra ..........................................................................78
THE APPLICATION OF GIS METHODS IN MORPHOMETRICAL ANALYSIS OF DOLINES ON LIMESTONE ANDDOLOMITE BEDROCK Petra Gostinčar ..........................................................................................................................................................84
ORIGIN OF ATYPICAL CALCITE SPELEOTHEMS FILLING FISSURES IN SANDSTONESMichał Gradziński, Marek Duliński, Helena Hercman, Andrzej Górny, Stanisław Przybyszowski ......................................89
UPLIFT EVIDENCE FROM KARST MORPHOLOGY: PRELIMINARY EVIDENCE FROM BLAMBANGAN PENINSULAKARST, INDONESIA Eko Haryono......................................................................................................................................................................90
VALLEY INCISION IN THE NÍZKE TATRY MTS. (SLOVAKIA) ESTIMATED BASEDON PALEOMAGNETIC AND RADIOMETRIC CAVE SEDIMENT DATINGSJaroslav Kadlec, Pavol Bella, Kristýna Čížková, Darryl E. Granger, Helena Hercman, Peter Holúbek,Martin Chadima, Monika Orvošová, Petr Pruner, Petr Schnabl, Stanislav Šlechta ....................................................................94
MAGNETIC FABRIC AND MINERALOGY OF CAVE DEPOSITS IN BOTOVSKAYA CAVE (EASTERN SIBERIA,RUSSIAN FEDERATION) Jaroslav Kadlec, Helena Herman, Martin Chadima, Lenka Lisá, Hedi Oberhänsli,Alexandr Osintsev ....................................................................................................................................................................................................96
CASE STUDIES OF FLUORESCENT GROUNDWATER TRACING IN RECENT CAVE RESEARCHBenjamin V. Miller, Chris Groves, Jason S. Polk, Robert N. Lerch ......................................................................................................99
THE JAJ PLATEAU (LEBANON): TYPICAL HIGH ALTITUDE MEDITERRANEAN KARSTFadi H. Nader, Hughes Badaoui, Marc Metni, Chadi Chaker, Habib Helou, Johnny Tawk ....................................................105
A CONCEPTUAL MODEL OF SPELEOGENESIS IN GREECE Christos Pennos, Stein-Erik Lauritzen ..................................107
2013 ICS Proceedings

COMPLEX EPIKARST HYDROLOGEOLOGY AND CONTAMINANT TRANSPORT IN A SOUTH-CENTRALKENTUCKY KARST LANDSCAPE Jason S. Polk, Sean Vanderhoff, Chris Groves, Benjamin Miller, Carl Bolster ........110
KARST HYDROGEOLOGICAL OBSERVATIONS IN CAO BANG PROVINCE (VIETNAM): THE TRA LINH-THANGHEN LAKE AREA Gheorghe M. Ponta, Bogdan P. Onac, Nyguen Xuan Nam ................................................................................116
INCIDENCES OF THE TECTONICS IN THE KARSTIFICATION OF CHALK LIMESTONES IN THE WESTERNPARIS BASIN: EXAMPLE FROM THE PETITES DALES CAVE (SAINT MARTIN AUX BUNEAUX, FRANCE)Joël Rodet, Kun Ma, Jean-Pierre Viard ..........................................................................................................................................................121
CEILING CHANNEL AND INPUT KARST. EXAMPLE OF THE PETITES DALES CAVE, NORMANDY, FRANCEJoël Rodet, Laurent Magne, Jean-Pierre Viard ..........................................................................................................................................126
GULLS, GULL-CAVES AND CAMBERING IN THE SOUTHERN COTSWOLD HILLS, ENGLANDCharles Self, Andrew Farrant............................................................................................................................................................................132
THE ROLE OF FOLD-AND-THRUST STRUCTURE IN THE LARGE SHAFTS AND CHAMBERS DEVELOPMENT:CASE STUDY OF THE POLISH TATRA MTS. Jacek Szczygieł ..............................................................................................................137
HYPOGENIC CAVES OF SICILY (SOUTHERN ITALY) Marco Vattano, Philippe Audra, Fabrizio Benvenuto,Jean-Yves Bigot, Jo De Waele, Ermanno Galli, Giuliana Madonia, Jean-Claude Nobécourt ..................................................144
SEDIMENTS AT THE MÜNNICH PASSAGE IN THE BARADLA CAVE (HUNGARY): MINERALOGICAL ANDPETROLOGICAL STUDY Gábor Vid, István Berényi Üveges, Orsolya Viktorik, Tibor Németh, Zsolt Bendő,Sándor Józsa, Judit Berényi Üveges ..............................................................................................................................................................150
ENDOKARSTS AND CRYPTOKARSTS IN CRETACEOUS COARSE AND HIGHLY POROUS CHALK AT THEBELGIAN-DUTCH BORDER Luc Willems, Joël Rodet..............................................................................................................................154
THE TUPPER GLACIER SINK – RASPBERRY RISING CAVE SYSTEM, GLACIER NATIONAL PARK, CANADA:A REMARKABLE EXAMPLE IN STRIPE KARST Charles Yonge, Nicholaus Vieira, Adam Walker ........................................158
CAVE AND KARST PROSPECTION IN RAS AL-KHAIMAH MOUNTAINS, NORTHERN UNITED ARAB EMIRATENadja Zupan Hajna, Asma Al Farraj Al Ketbi, Franci Gabrovšek, Metka Petrič, Tadej Slabe, Martin Knez,Janez Mulec ..............................................................................................................................................................................................................164
INFLUENCE OF THE PLEISTOCENE GLACIATIONS ON KARST DEVELOPMENT IN THE DINARIDES – EXAMPLESFROM VELEBIT MT. (CROATIA) Neven Bočić, Sanja Faivre, Marijan Kovačić, Nada Horvatinčić ......................................170
CONTRIBUTION OF THE KARSTIC ENVIRONMENT ON THE ORIGIN OF THE COLLOPHANITES OF ITATAIAURANIUM-PHOSPHORUS DEPOSIT, BORBOREMA PROVINCE, BRAZIL José Adilson Dias Cavalcanti,Cesar Ulisses Vieira Veríssimo, Maria Dulcinea M.R. Bessa, Clovis Vaz Parente ....................................................................173
NA JAVORCE CAVE – A NEW DISCOVERY IN THE BOHEMIAN KARST (CZECH REPUBLIC):UNIQUE EXAMPLE OF RELATIONSHIPS BETWEEN HYDROTHERMAL AND COMMON KARSTIFICATIONJiří Dragoun, Karel Žák, Jiří Vejlupek, Michal Filippi, Jiří Novotný, Petr Dobeš............................................................................179
FIELD MEASUREMENTS OF GYPSUM DENUDATION RATE IN KULOGORSKAYA CAVE SYSTEMNikolay Franz, Sergey Sorokin, Alexandra Alexeeva, Irina Inshina, Olga Novysh, Anton Kazak ........................................185
GEOLOGY AND STRUCTURE OF PARIAN CAVE, ISFAHAN, IRAN Ghassem Ghaderi, Leila Karimi ....................................190
PRELIMINARY STUDIES ON CORROSIVE FORMS AND CLASTIC DEPOSITS IN THE ŚNIEŻNA CAVE(THE TATRA MTS., POLAND) Ditta Kicińska ..............................................................................................................................................194
GEOCHEMICAL AND STABLE ISOTOPE CHARACTERIZATION OF DRIP WATER FROM THE POSTOJNA CAVE,SLOVENIA Magda Mandić, Andrej Mihevc, Albrecht Leis, Ines Krajcar Bronić ........................................................................196
THE SKALISTÝ POTOK CAVE IN THE RELATIONSHIP TO THE RELIEF OF THE SOUTH PART OF JASOVSKÁPLATEAU (SLOVAK KARST) AFTER 25 YEARS OF RESEARCH Alena Petrvalská, Zdenko Hochmuth ..............................201
CAN CONDUIT VOLUMES OBTAINED FROM ARTIFICIAL TRACER TESTS BE TRUSTED?Anna Vojtěchová, Jiří Bruthans, Ondřej Jäger, František Krejča ........................................................................................................206
THE TECTONIC CONTROL OF AN UNDERGROUND RIVER NETWORK, AGIA TRIADA CAVE (KARYSTOS, GREECE)Emmanuel Vassilakis, Kyriaki Papadopoulou-Vrynioti ..........................................................................................................................208
Session: Karst and Caves in Other Rocks, Pseudokarst 215–331
CAVE FORMATION INITIATED BY DISSOLUTION OF CARBONATE CEMENT IN QUARTZOSE SANDSTONESJiří Adamovič, Radek Mikuláš, Tomáš Navrátil, Jan Mertlík ................................................................................................................217
2013 ICS Proceedings
ARENITIC CAVES IN VENEZUELAN TEPUIS: WHAT DO THEY SAY ABOUT TEPUIS THEMSELVES?Roman Aubrecht, Tomáš Lánczos, Ján Schlögl, Lukáš Vlček, Branislav Šmída..........................................................................221
INFRARED THERMOGRAPHIC SURVEY OF PSEUDOKARST SITES IN THE FYSCH BELT OF OUTER WESTCARPATHIANS (CZECH REPUBLIC) Ivo Baroň, David Bečkovský, Lumír Míča ..........................................................................227
KAHUENAHA NUI (HAWAII): A CAVE DEVELOPED IN FOUR DIFFERENT LAVA FLOWSIngo Bauer, Stephan Kempe, Peter Bosted ................................................................................................................................................231
GENETIC TYPES OF NON-SOLUTION CAVES Pavel Bella, Ludovít Gaál........................................................................................237
THE KEOKEO LAVA TUBE SYSTEM IN HAWAIIPeter Bosted, Tomislav Gracanin, Veda Hackell, Ann Bosted, Ingo Bauer, Stephan Kempe ..............................................243
ORIGIN OF “ROCK CITIES”, PILLARS AND CLEFT-CONDUITS IN KAOLINITE-BONDED SANDSTONE:NEW INSIGHT FROM STUDY IN SANDSTONE QUARRY WHERE LANDFORMS RECENTLY EVOLVEJiří Bruthans, Jan Soukup, Jana Schweigstillová, Jana Vaculíková, Daniel Smutek, Alan L. Mayo, Lukáš Falteisek ..........247
ORIGINS OF THE KARSTIC SEDIMENT FILLING OF THE NORTHWESTERN PARIS BASIN CAVESS. Chédeville, J. Rodet, B. Laignel, D. Todisco, E. Dupuis, G. Girot, G. Hanin ............................................................................253
SANDSTONE CAVES IN THE SYDNEY BASIN: A REVIEW OF THEIR CULTURAL AND NATURAL HERITAGEJohn R Dunkley........................................................................................................................................................................................................259
KARST EVOLUTION IN SANDSTONE: THE CHAPADA DOS GUIMARÃES SITE, BRAZILRubens Hardt, Joël Rodet, Sergio dos Anjos Ferreira Pinto ..............................................................................................................264
THREE TYPES OF CREVICE-TYPE CAVES IN THE AREA OF CZECH FLYSCH CARPATHIANSJan Lenart, Tomáš Pánek ....................................................................................................................................................................................268
EXHUMATION OF PALAEOKARST BY VADOSE WEATHERING: A TELLING EXAMPLE FROM EASTERN AUSTRALIAR. Armstrong L. Osborne ....................................................................................................................................................................................275
AN INTRODUCTION TO SRI LANKAN GNEISS AND GRANITE CAVESR. Armstrong L. Osborne, Pathmakumara Jayasingha, Wasantha S. Weliange ........................................................................280
ENDO- AND EXO-KARSTIC FEATURES IN BANDED IRON FORMATION AND CANGA, SERRA DA PIEDADE,QUADRILÁTERO FERRÍFERO (BRAZIL)Manuela Corrêa Pereira, Joel Georges Marie Andre Rodet, André Augustos Rodrigues Salgado ....................................286
ENGLACIAL CAVES OF GLACIAR PERITO MORENO AND GLACIAR AMEGHINO, PATAGONIA (ARGENTINA)Leonardo Puccini, Marco Mecchia ................................................................................................................................................................292
SPELEOGENESIS AND SPELEOTHEMS OF THE GUACAMAYA CAVE, AUYAN TEPUI, VENEZUELAFrancesco Sauro, Joyce Lundberg, Jo De Waele, Nicola Tisato. Ermanno Galli ........................................................................298
GOBHOLO CAVE: A LONG GRANITE CAVE IN SWAZILAND (SOUTHERN AFRICA)Manuela Scheuerer, Johannes E. K. Lundberg, Rabbe Sjöberg ........................................................................................................305
SOME SIGNIFICANT CAVES FOUND IN THE NON-KARSTIC ROCKS OF HUNGARYIstván Eszterhás, George Szentes ..................................................................................................................................................................308
TYPES OF NON-KARST CAVES IN POLISH OUTER CARPATHIANS – HISTORICAL REVIEW AND PERSPECTIVESJan Urban, Włodzimierz Margielewski ..........................................................................................................................................................314
CAVES IN SANDSTONE DEPOSITS OF THE SOUTHERN ITALIAN APENNINESGianni Campanella, Mario Parise, Angela Rizzi, Mariangela Sammarco, Antonio Trocino ..................................................320
KARST DEVELOPED IN SILICICLASTIC ROCKS AT SERRA DO ESPINHAÇO MERIDIONAL, MINAS GERAIS (BRAZIL)Alessandra Mendes Carvalho Vasconcelos, Fernanda Cristina Rodrigues de Souza, Joel Rodet, CristianeValéria de Oliveira, André Augusto Rodrigues Salgado........................................................................................................................326
Session: Speleogenesis 333–421
LAG AND TRANSFER TIME INFERRED FROM MELTING CYCLES RECORD IN THE COULOMP KARST SPRING(ALPES DE HAUTEPROVENCE, FRANCE) Philippe Audra, Jean-Claude Nobécourt..................................................................335
DISSOLUTION RATES, CARBON DIOXIDE DYNAMICS, AND GEOMORPHOLOGICAL FEEDBACKS IN OPENCHANNEL CAVE STREAMS Matthew D. Covington, Mitja Prelovšek, Franci Gabrovšek ......................................................340
A METHODOLOGY TO ESTIMATE THE AGE OF CAVES IN NORTHERN LATITUDES, USING TOERFJELLHOLAIN NORWAY AS AN EXAMPLE Trevor Faulkner ........................................................................................................................................342
2013 ICS Proceedings

HOW DO APERTURE SIZES IN LIMESTONE VARY FOR THE ONSETS OF TURBULENT FLOW AND FIRST-ORDERDISSOLUTION KINETICS? Trevor Faulkner ................................................................................................................................................349
INVESTIGATIONS INTO THE POTENTIAL FOR HYPOGENE SPELEOGENESIS IN THE CUMBERLAND PLATEAUOF SOUTHEAST KENTUCKY, U.S.A. Lee J. Florea ....................................................................................................................................356
THE ROLE OF BASE LEVEL INCISION AND TRANSIENT RECHARGE IN VERTICAL ORGANISATION OF KARSTNETWORK Franci Gabrovšek, Philipp Häuselmann, Philippe Audra ..............................................................................................362
HYPOGENIC SPELEOGENESIS IN THE CRIMEAN FORE-MOUNTAINS (THE BLACK SEA REGION, SOUTH UKRAINE)AND ITS ROLE IN THE REGIONAL GEOMORPHOLOGY Alexander B. Klimchouk, Gennadiy N. Amelichev,Elizaveta I. Tymokhina, Sergiy V. Tokarev ..................................................................................................................................................364
PARAGENESIS: THE “ROYAL MARK” OF SUBGLACIAL SPELEOGENESIS Stein-Erik Lauritzen ............................................366
GLACIER ICE-CONTACT SPELEOGENESIS Stein-Erik Lauritzen, Rannveig Øvrevik Skoglund ............................................368
GROUNDWATER / SURFACE WATER MIXING IN THE UNDERGROUNDHYDROLOGIC SYSTEM OF THE DEMÄNOVSKÁ DOLINA VALLEY (SLOVAKIA)Peter Malík, Dagmar Haviarová, Jaromír Švasta, Miloš Gregor, Anton Auxt ..............................................................................370
KARST PROCESSES AND CARBON FLUX IN THE FRASASSI CAVES ITALY Marco Menichetti............................................376
MIOCENE - PLIOCENE AGE OF CAVE SNEŽNA JAMA NA RADUHI, SOUTHERN ALPS, SLOVENIAAndrej Mihevc, Ivan Horáček, Petr Pruner, Nadja Zupan Hajna, Stanislav Čermák, Jan Wagner, Pavel Bosák ..........379
SEDIMENTARY STUDY AND U-TH DATATIONS CONTRIBUTION TO THE MORPHODYNAMIC RECONSTITUTIONOF THE JUNCTION CHAMBER (KASSARAT CAVE, NABAY, LEBANON): A GEOMORPHOLOGICAL APPROACH FORPALAEOHYDROLOGICAL RECORDS ANALYSISC. Nehme, J.-J. Delannoy, S. Jaillet, J. Adjizian-Gerard, John Hellstrom, T. Comaty, M. Arzouni, P. Matta......................384
A GENETIC CLASSIFICATION OF CAVES IN LOWER AUSTRIA Pauline Oberender, Lukas Plan ........................................390
EFFECTS OF CO2-DEPLETED VADOSE SEEPAGE IN KARST Arthur N. Palmer, Margaret V. Palmer ................................393
DETAILED MORPHOLOGIC ANALYSIS OF PALAEOTRAUN GALLERY USING A TERRESTRIAL LASER SCAN(DACHSTEIN-MAMMUTHÖHLE, UPPER AUSTRIA) Lukas Plan, Andreas Roncat, Gregor Marx ........................................399
INFLUENCE OF THE PLIO-PLEISTOCENE TECTONICS ON THE EVOLUTION OF THE PURGATORIO POLJE(NORTH-WESTERN SICILY) Rosario Ruggieri, Giuseppe Napoli , Pietro Renda ........................................................................402
SPELEOGENESIS OF A 3D-MAZE CAVE (HERMANNSHÖHLE, LOWER AUSTRIA)Andrea Schober, Lukas Plan, Denis Scholz, Christoph Spötl ............................................................................................................408
EVOLUTION OF CAVE PROVALATA: REMARKABLE EXAMPLE OF HYPOGENIC THERMAL CARBONIC ANDSULFURIC ACID SPELEOGENESIS Marjan Temovski, Philippe Audra ............................................................................................412
FLANK MARGIN CAVES ON A PASSIVE CONTINENTAL MARGIN: NARACOORTE AND OTHER SOUTHERNAUSTRALIAN EXAMPLES Susan White ........................................................................................................................................................418
TRITIUM AND H, O AND C STABLE ISOTOPES AS A TOOL FOR TRACKING OF WATER CIRCULATIONIN THE NIEDŹWIEDZIA CAVE SYSTEM (SUDETES, POLAND) Michał Gąsiorowski, Helena Hercman ............................421
Session: Cave Mineralogy 423–495
HYPOGENE SULFURIC ACID SPELEOGENESIS AND RARE SULFATE MINERALS (FIBROFERRITE, JAROSITESUBGROUP) BAUME GALINIERE CAVE (ALPES-DE-HAUTE-PROVENCE, FRANCE)Philippe Audra, Fernando Gázquez, Fernando Rull, Jean-Yves Bigot, Hubert Camus ............................................................425
RARE SULFATES (MIRABILITE, EUGSTERITE) IN THE DRY MICROCLIMATE OF CHAMOIS CAVE(ALPES-DE-HAUTE-PROVENCE, FRANCE) Philippe Audra, Jean-Claude Nobécourt................................................................432
MINERALOGY AND SPELEOGENESIS OF THE CORONA ‘E SA CRABA QUARTZITE CAVE(SOUTHWEST SARDINIA) Eleonora Baldoni, Jo De Waele, Ermanno Galli, Mauro Messina, Bogdan P. Onac,Laura Sanna, Francesco Sauro, Mauro Villani ..........................................................................................................................................437
GENESIS AND EVOLUTION OF CALCITE BUBBLES IN GYPSUM CAVESMassimo Ercolani, Katia Poletti, Paolo Forti ............................................................................................................................................443
STRONTIANITE FROM SERIZJAN CAVE (IRAN): A NEW OCCURRENCE OF THIS RARE CAVE MINERAL WITHA DISCUSION ON ITS GENESIS José Maria Calaforra, Jo De Waele, Paolo Forti, Ermanno Galli, Masoud Ebadi ......449
SKELETON CRYSTALS OF CRYOGENIC GYPSUM FROM KUNGUR ICE CAVE, URAL MOUNTAINS, RUSSIAOlga Kadebskaya, Ilya Tchaikovsky ..............................................................................................................................................................454
2013 ICS Proceedings

ALLOPHANE MOONMILK FROM A GRANITE-GNEISS CAVE IN NORWAY: A BIOGENIC INTERMEDIATE IN DEEPWEATEHRING? Stein-Erik Lauritzen ..............................................................................................................................................................459
CALCITE SPELEOTHEMS IN PSEUDOKARST TJUV-ANTES GROTTA, NORTHERN SWEDENJohannes E. K. Lundberg, Magnus Ivarsson, Therese Sallstedt, Rabbe Sjöberg, Juan Ramón Vidal Romaní,Love Dalén, Stina Höglund ................................................................................................................................................................................461
DATING DIAGENISED ARAGONITE SPELEOTHEMS Rebeca Martín-García, Ana M. Alonso-Zarza, Silvia Frisia ........465
THE HYPOGENE ORIGIN OF DIANA CAVE (ROMANIA) AND ITS SULFURIC ACID WEATHERING ENVIRONMENTBogdan P. Onac, Cristina M. Pușcaș, Herta S. Effenberger, Ioan Povară, Jonathan G. Wynn ............................................470
THE LIFE CYCLE OF SPELEOTHEMS, WITH POSSIBLE IMPLICATIONS FOR RADIOMETRIC DATING Charles Self ........474
SPELEOTHEMS IN CAVITIES DEVELOPED IN MAGMATIC ROCKSJuan Ramón Vidal-Romaní, Jorge Sanjurjo-Sánchez, Marcos Vaqueiro-Rodríguez, Laura González-López,María José López-Galindo ..................................................................................................................................................................................479
EVOLUTION OF GUANO UNDER DIFFERENT ENVIRONMENTAL CONDITIONS: A MINERALOGICAL APPROACHAlexandra M. Giurgiu, Bogdan P. Onac, Tudor Tămaş, Joan J. Fornós ............................................................................................483
A CONTRIBUTION TO THE MINERALOGY OF MONTE GUISI CAVE (SW SARDINIA, ITALY)Cristian Moldovan, Monica I. Călugăr, Bogdan P. Onac, Jo de Waele, Angelo Naseddu, Joan J. Fornós ........................486
NEW LOCALITIES OF COARSELY CRYSTALLINE CRYOGENIC CAVE CARBONATES IN SLOVAKIAMonika Orvošová, Lukáš Vlček, Karel Žák ................................................................................................................................................490
Partners, Sponsors 496
Authors Index 498
2013 ICS Proceedings
Dear readers, the Proceedings volumes you are holding inyour hands were issued within the 16th International Congressof Speleology (hereafter 16thICS) on July 21–28, 2013 inBrno, Czech Republic. Let us welcome you to its reading.In total, over 320 contributions (over 250 oral presentationsand over 70 posters) by more than 750 authors have beenreceived to be included within the Congress Proceedings.This represents over 2,300 received e-mails and a similarnumber of responses during the last 6 months, approximately4,300 electronic files and over 1,450 printed pages of thetext. To put it simply, “really, really much interesting stuffconcerned with cave and karst subject”. The author’sguidelines stipulated that the particular contributions shouldnot exceed 6 pages of text and we were delighted to find thatmost authors prepared contributions close to this upper limit.Only very few contributions did not exceed one page of text.This illustrates a clear willingness of the cavers and karstscientist to share their discoveries and research conclusions.
The presented contributions (abstracts/papers) stand for bothoral and poster presentations as indicated in the headings.Contributions in each session are arranged alphabetically bythe last name of the first author. All contributions werereviewed from the viewpoint of technical quality and scientificcontent by members of the scientific committee and invitedreviewers. The authors had the opportunity to revise theirpapers in response to reviewer’s comments and we werepleased to see that the reviews have improved the clarity andreadability of the contributions. However, profoundimprovement of the English language could not be arrangeddue to the shortage of time and insufficient human resources;the authors themselves are therefore responsible for thelinguistic level of their contributions.
Thirteen thematically different sessions and six specialsessions were scheduled within the call for your contributionsto cover the whole range of subjects to be discussed withinthe wide scope of the 16thICS. The low number ofcontributions for some of these “detailed” sessionsnecessitated their merging with others. As a result, elevenoriginal and three joint sessions are presented within theProceedings. The contributions were grouped into threeseparate volumes. The purpose of this arrangement was thateach particular Volume is filled with a certain logical hierarchyof topics, and that related topics are presented together. Itwas also the intention that the content of each Volume istopically balanced and contains both generally interesting(popular) topics with rich photographic documentation andhardcore scientific topics dominated by tables and plots.
Volume I starts with three plenary lectures representingthree global topics related to 16thICS subject. Further itcontains papers concerned with history of research (session“History of Speleology and Karst Research”), archeology andpaleontology (sessions “Archaeology and Paleontology inCaves”), topics focused on management and preservation ofcaves and karst areas and other social-related aspects(sessions “Protection and Management of Karst, Education”;“Karst and Caves: Social Aspects and Other Topics”). In the
last mentioned session you can also find a small part devotedto extraterrestrial karst. Volume I is ended by a relatively largeportion of biology-oriented papers placed within the session“Biospeleology, Geomicrobiology and Ecology”.
Volume II contains the traditionally heavily attended session“Exploration and Cave Techniques” and by the relatedsession “Speleological Research and Activities in ArtificialUnderground”. These exploration topics are, we believe,logically supplemented with contributions from the field of“Karst and Cave Survey, Mapping and Data Processing”. Thecontent of the second Volume is completed with a somewhatmore specialized session “Modelling in Karst and CaveEnvironments” and with session “Cave Climate andPaleoclimate Record”. The last mentioned session probablybetter fits to the end of Volume III, but it was placed intoVolume II in order to reach balance in the extent of theindividual volumes.
Volume III also starts with traditional, heavily attended topicsorganized in two sessions: “Karst and Caves in CarbonateRocks, Salt and Gypsum” and “Karst and Caves in OtherRocks, Pseudokarst”. These topics are supplemented by therelated session “Speleogenesis”. This last volume of theProceedings is ended by the study of cave minerals, includedin a specific session “Cave Minerals”.
It is clear already from the previous ICS meetings that therange of the published topics becomes wider and wider,including localities in the whole world but also – owing to theaccess to high-quality spacecraft images – from otherplanets. The range of the instrumental, analytical andsoftware methods employed in cave and karst research isremarkable and shows that the topic of “cave & karstexploration“ attracts an ever increasing number ofresearchers even from already established scientificdisciplines.
Let us also say a few words about the selection of the coverphotos for the Proceedings volumes. The idea was to selectsuch photos which would best represent all topics (especiallythose enjoying the highest interest) in each particular volumeand be of high technical quality. Since we believe the coverpage is a place for a serious presentation of the inner content,we made our selection from photos used in the presentedpapers. In one case the additional photo was requested toget a better representation of the topic. For our purpose, wedecided to place several photos on the cover page of eachvolume. We hope that you enjoy them.
We wish to take this opportunity to apologize for the allmistakes which might have possibly originated within theoperations with different versions of the manuscripts andother related files and e-mails which passed through ourcomputers. We believe that everybody find their interestingreading in the Proceedings and we wish that the wholepublication (Volumes I–III) becomes a valuable record of the16th meeting of enthusiasts addicted to the fascination of theunderground world.
Preface
10
2013 ICS Proceedings

Finally we wish to thank all the authors for their contributions.Enormous thanks belong to the reviewers and especiallyconvenors (members of the scientific committee) of theparticular sessions for their time and effort in theimprovement of the overall message of the texts. We alsowish to thank Michal Molhanec who significantly helped withthe on-line form for the contribution submission, to JiříAdamovič who repeatedly helped us with the improvementof our English, and to Jan Spružina, Zdeněk Motyčka, JanaHolubcová, and Renata Filippi who contributed to thepreparation of the Proceedings.
After the few introductory words, let’s now enjoy the papersfrom localities all over the world, presenting all forms ofactivities in karst, caves and other related surface andsubsurface environments!
Michal Filippi and Pavel BosákProceedings editors
11
2013 ICS Proceedings

12
Karst and Caves in CarbonateRocks, Salt and Gypsum
Session:
2013 ICS Proceedings
13

14
KARST HYDROGEOLOGY OF THE HANEY LIMESTONE,SOUTH-CENTRAL KENTUCKY
Sarah M. Arpin, Christopher G. GrovesHoffman Environmental Research Institute, Department of Geography and Geology, Western KentuckyUniversity, Bowling Green, KY 42101, USA, [email protected], [email protected]
South-central Kentucky has one of the world’s most intensively studied karst areas, with most work focusing on theMammoth Cave System and its aquifers. However, slightly higher in the stratigraphic section than Mammoth Cave, theHaney Limestone is an important but less well studied carbonate aquifer. This research provides the first comprehensivehydrogeologic description of the Haney Limestone, synthesizing patterns of the cave and karst features developed within.Joints are the most dominant control on passage development in the Haney Limestone within the study area; whenconsidered together the orientation of these joints is consistent with the orientation of regional joint sets. There is evidencethat the spaces along these joints in some cases may have been were enlarged by stress release fracturing. Bedding planesand the presence of insoluble rock at the base of the Haney also exert significant control on conduit development in theHaney Limestone. The strong influence of joints on conduit development in the Haney Limestone contrasts with the majorcaves of the St. Louis, Ste. Genevieve, and Girkin Limestones below, in which bedding planes are a dominant influence.
Most of the caves of the study area developed in the Haney Limestone are single-conduit caves that receive water throughdirect, allogenic sources. Cave entrances are frequently perennial spring resurgences; whereas the presence of activestreams suggests that the caves are a function of the current landscape, acting as drains for localized recharge areas. Thehydrology of the Haney Limestone plays an important, if localized, role in the regional hydrology of south-centralKentucky; integrated into the current system of surface and subsurface drainage of the regional karst landscape. Evidencesupports the idea that caves of the Haney Limestone are, geologically, relatively recent phenomena. A majority of thecaves in the study area are hydrologically active, the water resurging from the sampled springs is undersaturated withrespect to limestone, and the caves are developed along potential stress release fractures associated with small, relativelyyoung valleys. This suggests that caves in the Haney Limestone were not directly influenced by the incision of the GreenRiver, like Mammoth Cave, but that cave development is a much more recent process.
Karst and Caves in Carbonate Rocks, Salt and Gypsum – oral 2013 ICS Proceedings
15
AN INTRODUCTION TO KALAHROUD CAVE,NORTH OF ESFAHAN, IRAN
Shirin Bahadorinia1, Sayed Hassen Hejazi1, Alireza Nadimi2, Derek Ford3
1Department of Geology, Islamic Azad University, Khorasgan Branch, Esfahan, Iran, [email protected] of Geology, Isfahan University, Esfahan, Iran
3School of Geography and Earth Sciences, McMaster University, Canada
Kalahroud Cave (Lat. 33° 22’ 21” N, Long. 51° 34’ 35” W, at 2,300 m a.s.l. near the village of Kalahroud, Esfahan Province,Iran) is an interesting and complex cave formed in Cretaceous limestones. It is located on the southwestern boundary ofhigh mountains of the Urmiyeh-Dokhtar magmatic belt of Iran, which is a dramatically faulted, active tectonic area. Thecave has formed in the foot wall of the Kalahroud Thrust. The limestones are thick to massively bedded but contain thinnershales, are locally tectonized, and are overlain (capped) by insoluble strata. Stratal dip is approximately 15°. The caveentrance is in cliffs ~25 m above the floor of a strike-aligned river valley with a channel active only in rare storms. Theregion is semi-arid, with only 51.8 mm average annual precipitation and a mean temperature of 22.1 °C.
The explored cave is ~200 m in length and has three morphologically distinct parts. From the entrance a steep breakdownpassage extends broadly down dip to a depth of ~50 m. There the form changes to two large solution notch chambersbeveling the dipping strata, with multiple notches, solution pockets and pendants, tapering ramiform extensions upwardsand laterally, and blind pits in the floors. Two constricted joint-guided tributaries enter at the notching level that displayirregular phreatic form, including slow flow scalloping, and terminations in blind pits. There were a-periodic pools manymetres in diameter in the main chambers, indicated by stranded calcite raft debris and many conulites built up to precisepaleo-water surfaces. On a visit shortly after rains in April 2012 one small pool with some raft accretion was found.
There is a variety of chemical and clastic sediments in the cave. Precipitates include the calcite rafts, widespread popcornand cave coral on walls and pits, anthodites, frostwork associated with ferruginous shale bands, and dogtooth spar. Verysignificantly, cemented rinds of highly weathered bedrock overlain by dense layered calcite are the oldest chemical deposits,reminiscent of those in Wind Cave, South Dakota, USA. ICPMS U-Series dating (courtesy of the Department of EarthSciences, Oxford University, UK) shows that the oldest rafts in the largest pool are ~ 9,000 y B.P. in age, and the uppermostare modern. Clastic sediments are limited to breakdown and colluvial debris flows in the entrance passage, abundant clayfines in the notch chambers and tributaries. There do not appear to be any vadose stream deposits.
From field observations, two main factors in cave development were tectonic uplift and deformation facilitatinggroundwater circulation, and dissolution with prominent rest levels (notching). Surface river entrenchment has drainedand truncated the upper cave and there is only net deposition in the notch chambers. It appears that Kalahroud Cave is ahypogene cave, but further studies are required to prove this.
Karst and Caves in Carbonate Rocks, Salt and Gypsum – oral 2013 ICS Proceedings
16
CAVE SYSTEM OF KITA GAĆEŠINA – DRAŽENOVA PUHALJKATHE LONGEST CAVE IN THE DINARIC KARST
Teo Barišić, Darko Bakšić, Dalibor PaarThe Speleological Committee of the Croatian Mountaineering Association, Kozarčeva 22, Zagreb, Croatia
[email protected], [email protected], [email protected]
The Croatian cavers have continued to explore the Crnopac Massif, the most northern, the highest and the most karstifiedpart of the south-eastern Velebit mountain ridge known thanks to its underground karst phenomena. In more than 8 yearsof intensive research Cave system of Kita Gaćešina – Drazenova puhaljka reached the length of 23,334 m, depth of 737 m and became the Croatian and Dinaric karst longest cave. Speleologists have done some geomorphological research,microclimatic and radon concentracion measurements, collecting and analysing some animal species. The whole areashows enormous speleological and tourism potential.
1. IntroductionThe Dinaric karst form a mountain chain in the SouthernEurope, spanning areas of Slovenia, Croatia, Bosnia andHerzegovina, Serbia, Albania and Montenegro. They extendfor 645 km along the coast of the Adriatic Sea (northwest-southeast), from the Julian Alps in the northwest down tothe Šar-Korab Massif. The highest mountain of the DinaricKarst is Mount Prokletije, located on the border of easternMontenegro and northern Albania (2,692 m a.s.l.).
The Dinaric Karst is the fifth most rugged and extensivelymountainous area of Europe after the Caucasus Mountains,Alps, Pyrenees and Scandinavian Mountains.
The Dinarides are known as a place of origin of term karst,the German name for Kras, a region in Slovenia partiallyextending into Italy, where the first scientific research ofkarst topography was made. This includes use of Croatiankarst phenomena terms such as ponor, dolina, polje, jama,etc., in international geological vocabulary.
Dinaric karst is also the top of hotspots of world’ssubterranean biodiversity. The Postojnska Cave, describedfor the first time in 17th century is one of the famous andoldest tourist caves in the World. Since that time it was alsoknown as the longest Dinaric cave.
In last few decades, number of speleological explorationsin whole area grows. Hundreds of cavers in each countryhave found new caving attractive zones with deep and longcaves.
The Crnopac Massif in Croatia is the most northern, thehighest and the most karstified part of the south-easternVelebit mountain ridge (part of Dinaric coastal mountainouskarst). Numerous surface and underground karstphenomena are characteristic, including Cave system ofKita Gaćešina – Draženova puhaljka, since 2011 – theDinaric longest cave.
2. Crnopac MassifThe Crnopac Massif is situated between higher terrain ofthe Gračac Polje on the north and Zrmanja and Krupa rivervalleys on the South and East. The massif is built of thickupper Triassic, Jurassic and Cretaceous carbonate deposits.
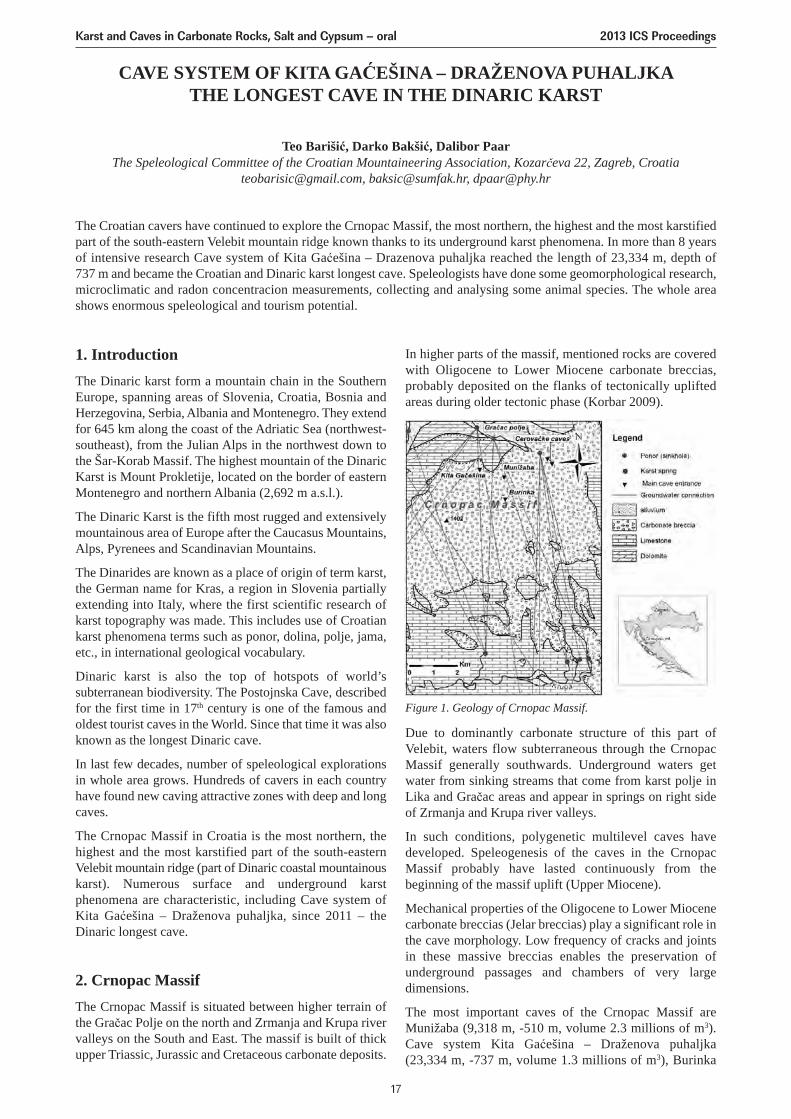
Due to dominantly carbonate structure of this part ofVelebit, waters flow subterraneous through the CrnopacMassif generally southwards. Underground waters getwater from sinking streams that come from karst polje inLika and Gračac areas and appear in springs on right sideof Zrmanja and Krupa river valleys.
In such conditions, polygenetic multilevel caves havedeveloped. Speleogenesis of the caves in the CrnopacMassif probably have lasted continuously from thebeginning of the massif uplift (Upper Miocene).
Mechanical properties of the Oligocene to Lower Miocenecarbonate breccias (Jelar breccias) play a significant role inthe cave morphology. Low frequency of cracks and jointsin these massive breccias enables the preservation ofunderground passages and chambers of very largedimensions.
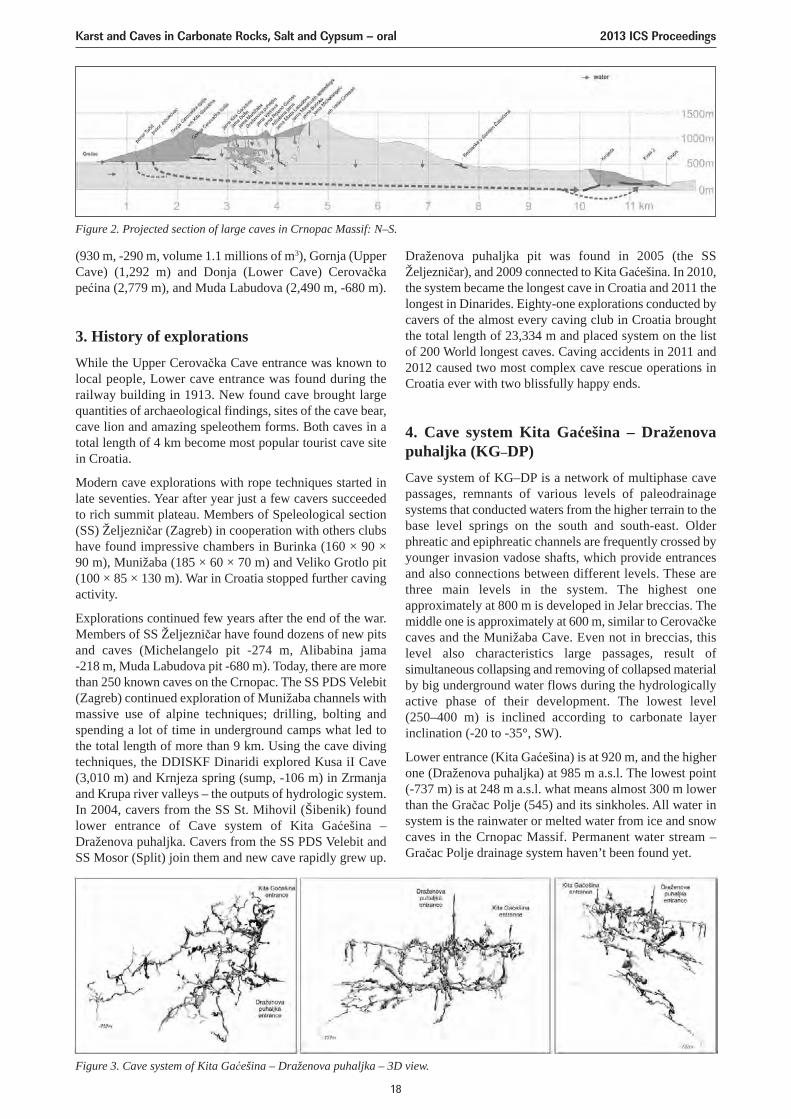
The most important caves of the Crnopac Massif areMunižaba (9,318 m, -510 m, volume 2.3 millions of m3).Cave system Kita Gaćešina – Draženova puhaljka (23,334 m, -737 m, volume 1.3 millions of m3), Burinka
In higher parts of the massif, mentioned rocks are coveredwith Oligocene to Lower Miocene carbonate breccias,probably deposited on the flanks of tectonically upliftedareas during older tectonic phase (Korbar 2009).
Karst and Caves in Carbonate Rocks, Salt and Gypsum – oral 2013 ICS Proceedings
17
Figure 1. Geology of Crnopac Massif.
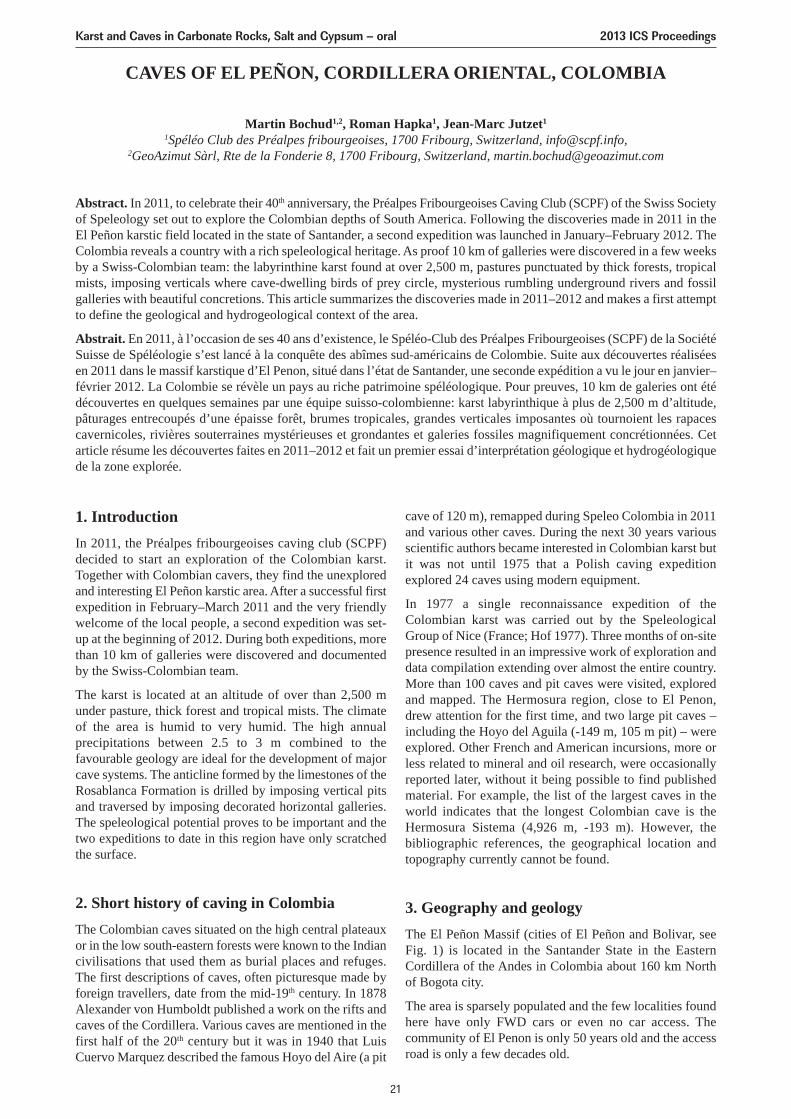
Draženova puhaljka pit was found in 2005 (the SSŽeljezničar), and 2009 connected to Kita Gaćešina. In 2010,the system became the longest cave in Croatia and 2011 thelongest in Dinarides. Eighty-one explorations conducted bycavers of the almost every caving club in Croatia broughtthe total length of 23,334 m and placed system on the listof 200 World longest caves. Caving accidents in 2011 and2012 caused two most complex cave rescue operations inCroatia ever with two blissfully happy ends.
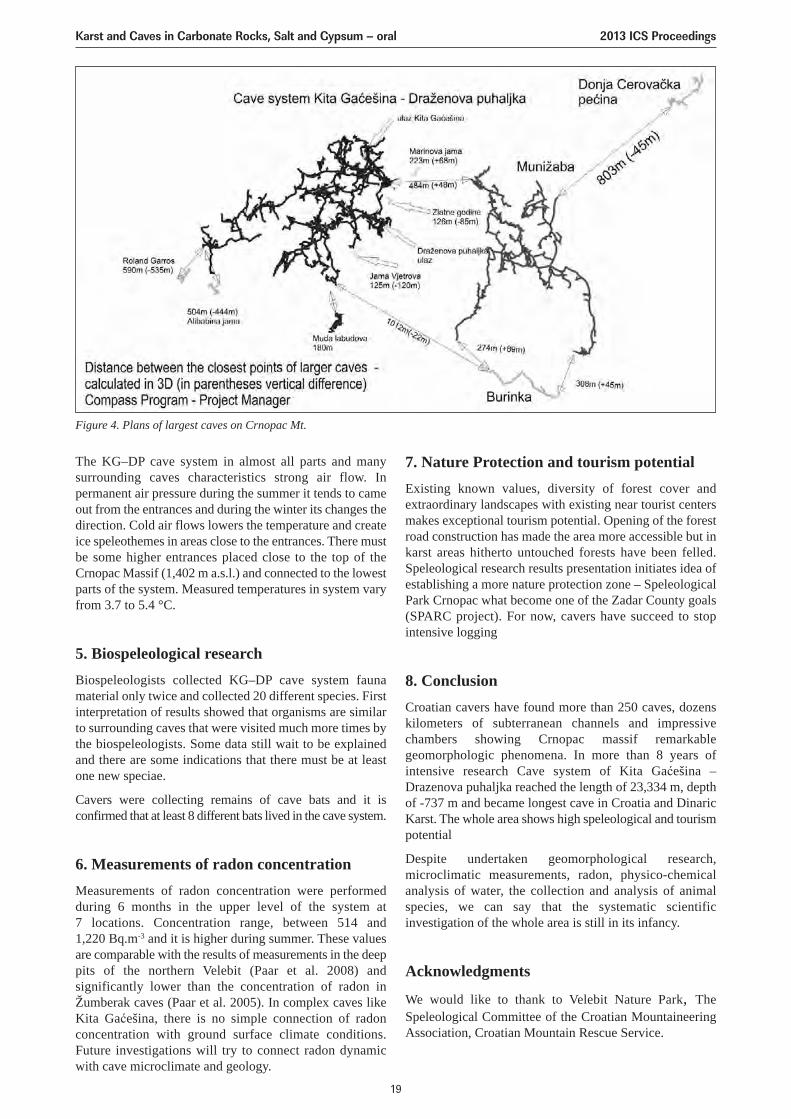
4. Cave system Kita Gaćešina – Draženovapuhaljka (KG–DP)Cave system of KG–DP is a network of multiphase cavepassages, remnants of various levels of paleodrainagesystems that conducted waters from the higher terrain to thebase level springs on the south and south-east. Olderphreatic and epiphreatic channels are frequently crossed byyounger invasion vadose shafts, which provide entrancesand also connections between different levels. These arethree main levels in the system. The highest oneapproximately at 800 m is developed in Jelar breccias. Themiddle one is approximately at 600 m, similar to Cerovačkecaves and the Munižaba Cave. Even not in breccias, thislevel also characteristics large passages, result ofsimultaneous collapsing and removing of collapsed materialby big underground water flows during the hydrologicallyactive phase of their development. The lowest level (250–400 m) is inclined according to carbonate layerinclination (-20 to -35°, SW).
Lower entrance (Kita Gaćešina) is at 920 m, and the higherone (Draženova puhaljka) at 985 m a.s.l. The lowest point(-737 m) is at 248 m a.s.l. what means almost 300 m lowerthan the Gračac Polje (545) and its sinkholes. All water insystem is the rainwater or melted water from ice and snowcaves in the Crnopac Massif. Permanent water stream –Gračac Polje drainage system haven’t been found yet.
(930 m, -290 m, volume 1.1 millions of m3), Gornja (UpperCave) (1,292 m) and Donja (Lower Cave) Cerovačkapećina (2,779 m), and Muda Labudova (2,490 m, -680 m).
3. History of explorationsWhile the Upper Cerovačka Cave entrance was known tolocal people, Lower cave entrance was found during therailway building in 1913. New found cave brought largequantities of archaeological findings, sites of the cave bear,cave lion and amazing speleothem forms. Both caves in atotal length of 4 km become most popular tourist cave sitein Croatia.
Modern cave explorations with rope techniques started inlate seventies. Year after year just a few cavers succeededto rich summit plateau. Members of Speleological section(SS) Željezničar (Zagreb) in cooperation with others clubshave found impressive chambers in Burinka (160 × 90 × 90 m), Munižaba (185 × 60 × 70 m) and Veliko Grotlo pit(100 × 85 × 130 m). War in Croatia stopped further cavingactivity.
Explorations continued few years after the end of the war.Members of SS Željezničar have found dozens of new pitsand caves (Michelangelo pit -274 m, Alibabina jama -218 m, Muda Labudova pit -680 m). Today, there are morethan 250 known caves on the Crnopac. The SS PDS Velebit(Zagreb) continued exploration of Munižaba channels withmassive use of alpine techniques; drilling, bolting andspending a lot of time in underground camps what led tothe total length of more than 9 km. Using the cave divingtechniques, the DDISKF Dinaridi explored Kusa iI Cave(3,010 m) and Krnjeza spring (sump, -106 m) in Zrmanjaand Krupa river valleys – the outputs of hydrologic system.In 2004, cavers from the SS St. Mihovil (Šibenik) foundlower entrance of Cave system of Kita Gaćešina –Draženova puhaljka. Cavers from the SS PDS Velebit andSS Mosor (Split) join them and new cave rapidly grew up.
Figure 2. Projected section of large caves in Crnopac Massif: N–S.
Figure 3. Cave system of Kita Gaćešina – Draženova puhaljka – 3D view.
Karst and Caves in Carbonate Rocks, Salt and Gypsum – oral 2013 ICS Proceedings
18
The KG–DP cave system in almost all parts and manysurrounding caves characteristics strong air flow. Inpermanent air pressure during the summer it tends to cameout from the entrances and during the winter its changes thedirection. Cold air flows lowers the temperature and createice speleothemes in areas close to the entrances. There mustbe some higher entrances placed close to the top of theCrnopac Massif (1,402 m a.s.l.) and connected to the lowestparts of the system. Measured temperatures in system varyfrom 3.7 to 5.4 °C.
5. Biospeleological researchBiospeleologists collected KG–DP cave system faunamaterial only twice and collected 20 different species. Firstinterpretation of results showed that organisms are similarto surrounding caves that were visited much more times bythe biospeleologists. Some data still wait to be explainedand there are some indications that there must be at leastone new speciae.
Cavers were collecting remains of cave bats and it isconfirmed that at least 8 different bats lived in the cave system.
6. Measurements of radon concentrationMeasurements of radon concentration were performedduring 6 months in the upper level of the system at 7 locations. Concentration range, between 514 and 1,220 Bq.m-3 and it is higher during summer. These values are comparable with the results of measurements in the deeppits of the northern Velebit (Paar et al. 2008) andsignificantly lower than the concentration of radon inŽumberak caves (Paar et al. 2005). In complex caves likeKita Gaćešina, there is no simple connection of radonconcentration with ground surface climate conditions.Future investigations will try to connect radon dynamicwith cave microclimate and geology.
Figure 4. Plans of largest caves on Crnopac Mt.
7. Nature Protection and tourism potentialExisting known values, diversity of forest cover andextraordinary landscapes with existing near tourist centersmakes exceptional tourism potential. Opening of the forestroad construction has made the area more accessible but inkarst areas hitherto untouched forests have been felled.Speleological research results presentation initiates idea ofestablishing a more nature protection zone – SpeleologicalPark Crnopac what become one of the Zadar County goals(SPARC project). For now, cavers have succeed to stopintensive logging
8. ConclusionCroatian cavers have found more than 250 caves, dozenskilometers of subterranean channels and impressivechambers showing Crnopac massif remarkablegeomorphologic phenomena. In more than 8 years ofintensive research Cave system of Kita Gaćešina –Drazenova puhaljka reached the length of 23,334 m, depthof -737 m and became longest cave in Croatia and DinaricKarst. The whole area shows high speleological and tourismpotential
Despite undertaken geomorphological research,microclimatic measurements, radon, physico-chemicalanalysis of water, the collection and analysis of animalspecies, we can say that the systematic scientificinvestigation of the whole area is still in its infancy.
Acknowledgments
We would like to thank to Velebit Nature Park, TheSpeleological Committee of the Croatian MountaineeringAssociation, Croatian Mountain Rescue Service.
Karst and Caves in Carbonate Rocks, Salt and Gypsum – oral 2013 ICS Proceedings
19

ReferencesBarišić T, Bakšić D, Paar D, Rnjak G, 2010. Kita Gaćešina –
Draženova puhaljka Speleological Explorations 2004–2010and Some Characteristics of Cave System, 1. Croatianspeleological Congress, Poreč.
Bočić N, 2009. Cerovačke caves and other karst phenomena ofthe Crnopac Massif. International Interdisciplinary ScientificConference “Sustainability of the Karst Environment – Dinarickarst and other karst regions”, Plitvička jezera.
Kovač-Konrad P, Jalžić V, 2006. Prvi sifon špilje Kusa 1.Speleolog, Vol 54., 20–23, Zagreb (in Croatian).
Kovačević A, 2008. Kusa nad Manastirskim lukama – Kusa 2.Speleolog, Vol. 56, 61–65, Zagreb (in Croatian).
Kuhta M, Stroj A, 2005. The Speleogenesis of the caves inCrnopac Mt. Area. Proceedings of the 14th InternationalCongress of Speleology, 46–48, Hellenic SpeleologicalSociety, Athens.
Kuhta M, Borovec M, Bosner N, 2002. Speleološka istraživanjaCrnopca u 2002. i 2003. godini. Speleolog, Vol. 50–51, 48–55,Zagreb (in Croatian).
Lukić O, 1988. Speleološka istraživanja Crnopca na Velebitu.Speleolog, Vol. 36–37, 14–26, Zagreb (in Croatian).
Paar D, Ujević M, Bakšić D, Lacković D, Čop A., Radolić V,2008. Physical and Chemical Research in Velebita pit (Croatia),Acta Carsologica 37/2–3, 273–278.
Karst and Caves in Carbonate Rocks, Salt and Gypsum – oral 2013 ICS Proceedings
20
CAVES OF EL PEÑON, CORDILLERA ORIENTAL, COLOMBIA
Martin Bochud1,2, Roman Hapka1, Jean-Marc Jutzet1
1Spéléo Club des Préalpes fribourgeoises, 1700 Fribourg, Switzerland, [email protected],2GeoAzimut Sàrl, Rte de la Fonderie 8, 1700 Fribourg, Switzerland, [email protected]
Abstract. In 2011, to celebrate their 40th anniversary, the Préalpes Fribourgeoises Caving Club (SCPF) of the Swiss Societyof Speleology set out to explore the Colombian depths of South America. Following the discoveries made in 2011 in theEl Peñon karstic field located in the state of Santander, a second expedition was launched in January–February 2012. TheColombia reveals a country with a rich speleological heritage. As proof 10 km of galleries were discovered in a few weeksby a Swiss-Colombian team: the labyrinthine karst found at over 2,500 m, pastures punctuated by thick forests, tropicalmists, imposing verticals where cave-dwelling birds of prey circle, mysterious rumbling underground rivers and fossilgalleries with beautiful concretions. This article summarizes the discoveries made in 2011–2012 and makes a first attemptto define the geological and hydrogeological context of the area.
Abstrait. En 2011, à l’occasion de ses 40 ans d’existence, le Spéléo-Club des Préalpes Fribourgeoises (SCPF) de la SociétéSuisse de Spéléologie s’est lancé à la conquête des abîmes sud-américains de Colombie. Suite aux découvertes réaliséesen 2011 dans le massif karstique d’El Penon, situé dans l’état de Santander, une seconde expédition a vu le jour en janvier–février 2012. La Colombie se révèle un pays au riche patrimoine spéléologique. Pour preuves, 10 km de galeries ont étédécouvertes en quelques semaines par une équipe suisso-colombienne: karst labyrinthique à plus de 2,500 m d’altitude,pâturages entrecoupés d’une épaisse forêt, brumes tropicales, grandes verticales imposantes où tournoient les rapacescavernicoles, rivières souterraines mystérieuses et grondantes et galeries fossiles magnifiquement concrétionnées. Cetarticle résume les découvertes faites en 2011–2012 et fait un premier essai d’interprétation géologique et hydrogéologiquede la zone explorée.
1. IntroductionIn 2011, the Préalpes fribourgeoises caving club (SCPF)decided to start an exploration of the Colombian karst.Together with Colombian cavers, they find the unexploredand interesting El Peñon karstic area. After a successful firstexpedition in February–March 2011 and the very friendlywelcome of the local people, a second expedition was set-up at the beginning of 2012. During both expeditions, morethan 10 km of galleries were discovered and documentedby the Swiss-Colombian team.
The karst is located at an altitude of over than 2,500 munder pasture, thick forest and tropical mists. The climateof the area is humid to very humid. The high annualprecipitations between 2.5 to 3 m combined to thefavourable geology are ideal for the development of majorcave systems. The anticline formed by the limestones of theRosablanca Formation is drilled by imposing vertical pitsand traversed by imposing decorated horizontal galleries.The speleological potential proves to be important and thetwo expeditions to date in this region have only scratchedthe surface.
2. Short history of caving in ColombiaThe Colombian caves situated on the high central plateauxor in the low south-eastern forests were known to the Indiancivilisations that used them as burial places and refuges.The first descriptions of caves, often picturesque made byforeign travellers, date from the mid-19th century. In 1878Alexander von Humboldt published a work on the rifts andcaves of the Cordillera. Various caves are mentioned in thefirst half of the 20th century but it was in 1940 that LuisCuervo Marquez described the famous Hoyo del Aire (a pit
cave of 120 m), remapped during Speleo Colombia in 2011and various other caves. During the next 30 years variousscientific authors became interested in Colombian karst butit was not until 1975 that a Polish caving expeditionexplored 24 caves using modern equipment.
In 1977 a single reconnaissance expedition of theColombian karst was carried out by the SpeleologicalGroup of Nice (France; Hof 1977). Three months of on-sitepresence resulted in an impressive work of exploration anddata compilation extending over almost the entire country.More than 100 caves and pit caves were visited, exploredand mapped. The Hermosura region, close to El Penon,drew attention for the first time, and two large pit caves –including the Hoyo del Aguila (-149 m, 105 m pit) – wereexplored. Other French and American incursions, more orless related to mineral and oil research, were occasionallyreported later, without it being possible to find publishedmaterial. For example, the list of the largest caves in theworld indicates that the longest Colombian cave is theHermosura Sistema (4,926 m, -193 m). However, thebibliographic references, the geographical location andtopography currently cannot be found.
3. Geography and geologyThe El Peñon Massif (cities of El Peñon and Bolivar, seeFig. 1) is located in the Santander State in the EasternCordillera of the Andes in Colombia about 160 km Northof Bogota city.
The area is sparsely populated and the few localities foundhere have only FWD cars or even no car access. Thecommunity of El Penon is only 50 years old and the accessroad is only a few decades old.
Karst and Caves in Carbonate Rocks, Salt and Gypsum – oral 2013 ICS Proceedings
21
Structurally, the El Peñon area is located on a main anticlinestructure with secondary folds forming the plateau wherethe caves are located. The main fold axis is dipping slightlyto the NNE. As described by Coletta et al. (1990). TheVelez–El Peñon area is a large pop-up structure borderedby two opposite verging thrust fault involving Jurrassic andpre-Jurassic structure. The west verging thrusts are locatedto the West of the El Peñon Area. The Cretaceous-Jurassicdeposits thrust over Tertiary deposits.
Geographical, hydrological and geological settings pointson a speleological potential of more than 2,500 m. Indeed,the highest altitude in the SE of El Peñon is about 3,000 mand the limestone deposits almost reach the altitude of 385 m where the two rivers draining most of the massif joinin the west of the massif.
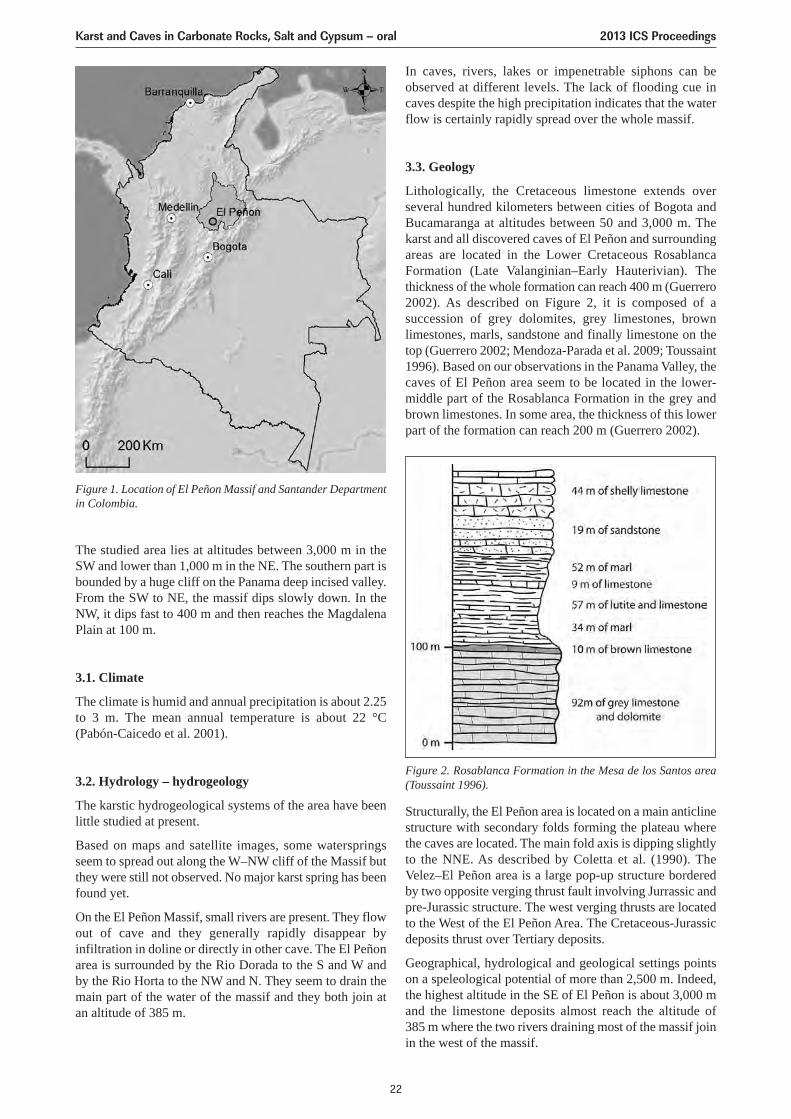
The studied area lies at altitudes between 3,000 m in theSW and lower than 1,000 m in the NE. The southern part isbounded by a huge cliff on the Panama deep incised valley.From the SW to NE, the massif dips slowly down. In theNW, it dips fast to 400 m and then reaches the MagdalenaPlain at 100 m.
3.1. Climate
The climate is humid and annual precipitation is about 2.25to 3 m. The mean annual temperature is about 22 °C(Pabón-Caicedo et al. 2001).
3.2. Hydrology – hydrogeology
The karstic hydrogeological systems of the area have beenlittle studied at present.
Based on maps and satellite images, some waterspringsseem to spread out along the W–NW cliff of the Massif butthey were still not observed. No major karst spring has beenfound yet.
On the El Peñon Massif, small rivers are present. They flowout of cave and they generally rapidly disappear byinfiltration in doline or directly in other cave. The El Peñonarea is surrounded by the Rio Dorada to the S and W andby the Rio Horta to the NW and N. They seem to drain themain part of the water of the massif and they both join atan altitude of 385 m.
In caves, rivers, lakes or impenetrable siphons can beobserved at different levels. The lack of flooding cue incaves despite the high precipitation indicates that the waterflow is certainly rapidly spread over the whole massif.
3.3. Geology
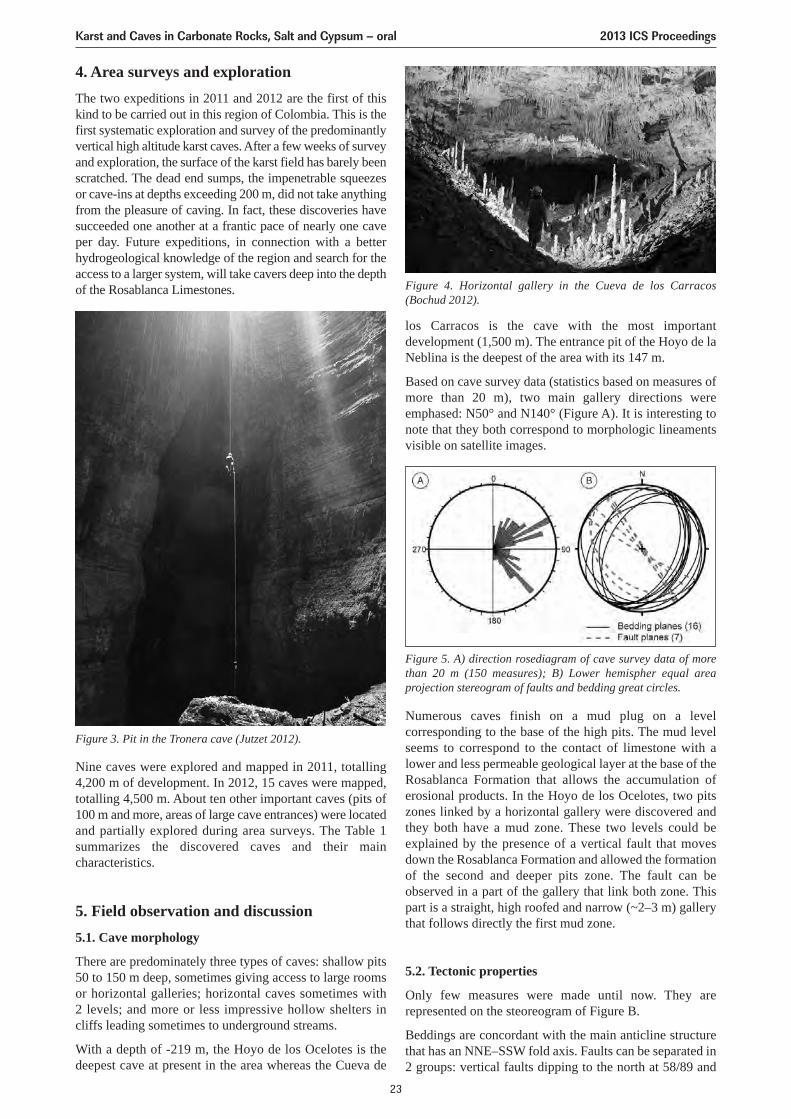
Lithologically, the Cretaceous limestone extends overseveral hundred kilometers between cities of Bogota andBucamaranga at altitudes between 50 and 3,000 m. Thekarst and all discovered caves of El Peñon and surroundingareas are located in the Lower Cretaceous RosablancaFormation (Late Valanginian–Early Hauterivian). Thethickness of the whole formation can reach 400 m (Guerrero2002). As described on Figure 2, it is composed of asuccession of grey dolomites, grey limestones, brownlimestones, marls, sandstone and finally limestone on thetop (Guerrero 2002; Mendoza-Parada et al. 2009; Toussaint1996). Based on our observations in the Panama Valley, thecaves of El Peñon area seem to be located in the lower-middle part of the Rosablanca Formation in the grey andbrown limestones. In some area, the thickness of this lowerpart of the formation can reach 200 m (Guerrero 2002).
Figure 1. Location of El Peñon Massif and Santander Departmentin Colombia.
Figure 2. Rosablanca Formation in the Mesa de los Santos area(Toussaint 1996).
Karst and Caves in Carbonate Rocks, Salt and Gypsum – oral 2013 ICS Proceedings
22
4. Area surveys and explorationThe two expeditions in 2011 and 2012 are the first of thiskind to be carried out in this region of Colombia. This is thefirst systematic exploration and survey of the predominantlyvertical high altitude karst caves. After a few weeks of surveyand exploration, the surface of the karst field has barely beenscratched. The dead end sumps, the impenetrable squeezesor cave-ins at depths exceeding 200 m, did not take anythingfrom the pleasure of caving. In fact, these discoveries havesucceeded one another at a frantic pace of nearly one caveper day. Future expeditions, in connection with a betterhydrogeological knowledge of the region and search for theaccess to a larger system, will take cavers deep into the depthof the Rosablanca Limestones.
Nine caves were explored and mapped in 2011, totalling4,200 m of development. In 2012, 15 caves were mapped,totalling 4,500 m. About ten other important caves (pits of100 m and more, areas of large cave entrances) were locatedand partially explored during area surveys. The Table 1summarizes the discovered caves and their maincharacteristics.
5. Field observation and discussion5.1. Cave morphology
There are predominately three types of caves: shallow pits50 to 150 m deep, sometimes giving access to large roomsor horizontal galleries; horizontal caves sometimes with 2 levels; and more or less impressive hollow shelters incliffs leading sometimes to underground streams.
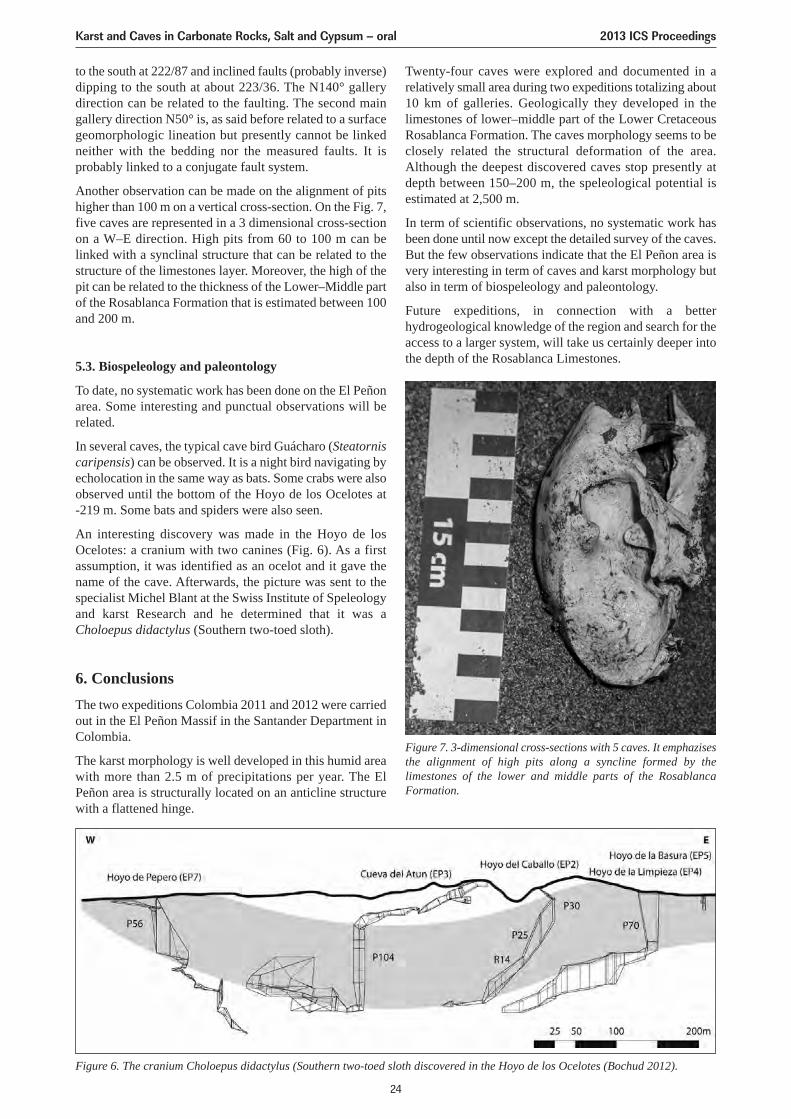
With a depth of -219 m, the Hoyo de los Ocelotes is thedeepest cave at present in the area whereas the Cueva de
los Carracos is the cave with the most importantdevelopment (1,500 m). The entrance pit of the Hoyo de laNeblina is the deepest of the area with its 147 m.
Based on cave survey data (statistics based on measures ofmore than 20 m), two main gallery directions wereemphased: N50° and N140° (Figure A). It is interesting tonote that they both correspond to morphologic lineamentsvisible on satellite images.
Numerous caves finish on a mud plug on a levelcorresponding to the base of the high pits. The mud levelseems to correspond to the contact of limestone with alower and less permeable geological layer at the base of theRosablanca Formation that allows the accumulation oferosional products. In the Hoyo de los Ocelotes, two pitszones linked by a horizontal gallery were discovered andthey both have a mud zone. These two levels could beexplained by the presence of a vertical fault that movesdown the Rosablanca Formation and allowed the formationof the second and deeper pits zone. The fault can beobserved in a part of the gallery that link both zone. Thispart is a straight, high roofed and narrow (~2–3 m) gallerythat follows directly the first mud zone.
5.2. Tectonic properties
Only few measures were made until now. They arerepresented on the steoreogram of Figure B.
Beddings are concordant with the main anticline structurethat has an NNE–SSW fold axis. Faults can be separated in2 groups: vertical faults dipping to the north at 58/89 and
Figure 3. Pit in the Tronera cave (Jutzet 2012).
Figure 4. Horizontal gallery in the Cueva de los Carracos(Bochud 2012).
Figure 5. A) direction rosediagram of cave survey data of morethan 20 m (150 measures); B) Lower hemispher equal areaprojection stereogram of faults and bedding great circles.
Karst and Caves in Carbonate Rocks, Salt and Gypsum – oral 2013 ICS Proceedings
23
to the south at 222/87 and inclined faults (probably inverse)dipping to the south at about 223/36. The N140° gallerydirection can be related to the faulting. The second maingallery direction N50° is, as said before related to a surfacegeomorphologic lineation but presently cannot be linkedneither with the bedding nor the measured faults. It isprobably linked to a conjugate fault system.
Another observation can be made on the alignment of pitshigher than 100 m on a vertical cross-section. On the Fig. 7,five caves are represented in a 3 dimensional cross-sectionon a W–E direction. High pits from 60 to 100 m can belinked with a synclinal structure that can be related to thestructure of the limestones layer. Moreover, the high of thepit can be related to the thickness of the Lower–Middle partof the Rosablanca Formation that is estimated between 100and 200 m.
5.3. Biospeleology and paleontology
To date, no systematic work has been done on the El Peñonarea. Some interesting and punctual observations will berelated.
In several caves, the typical cave bird Guácharo (Steatorniscaripensis) can be observed. It is a night bird navigating byecholocation in the same way as bats. Some crabs were alsoobserved until the bottom of the Hoyo de los Ocelotes at-219 m. Some bats and spiders were also seen.
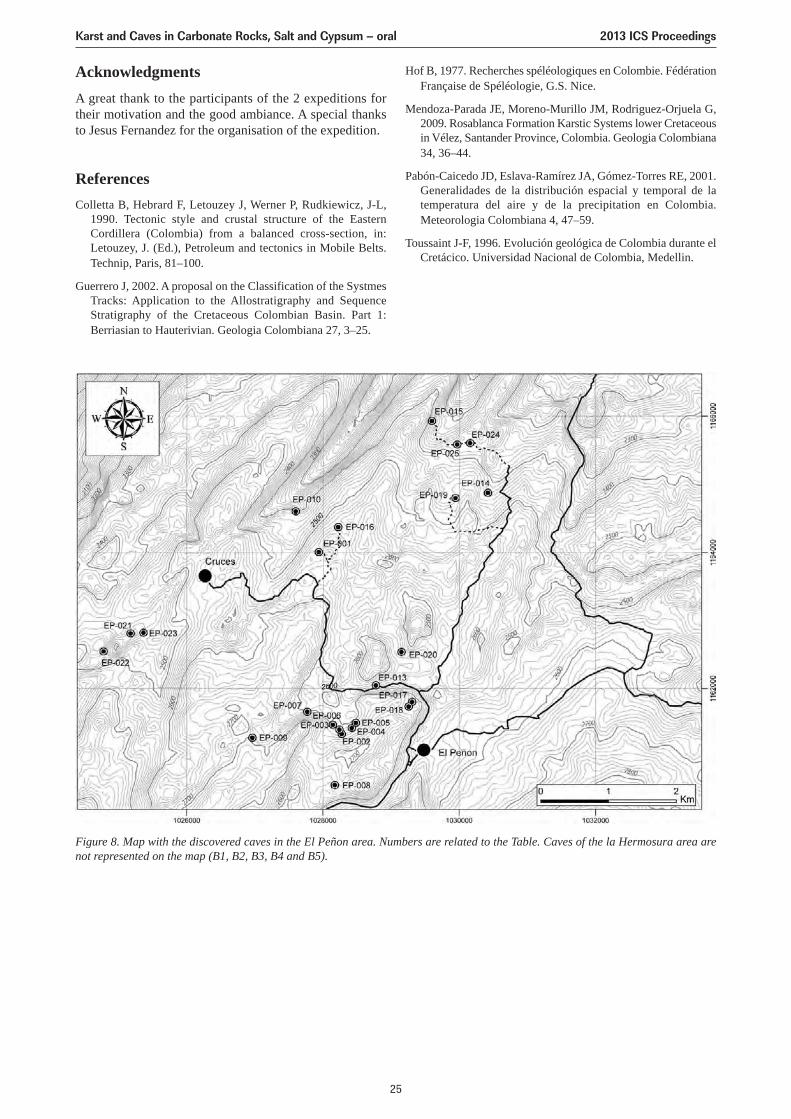
An interesting discovery was made in the Hoyo de losOcelotes: a cranium with two canines (Fig. 6). As a firstassumption, it was identified as an ocelot and it gave thename of the cave. Afterwards, the picture was sent to thespecialist Michel Blant at the Swiss Institute of Speleologyand karst Research and he determined that it was aCholoepus didactylus (Southern two-toed sloth).
6. ConclusionsThe two expeditions Colombia 2011 and 2012 were carriedout in the El Peñon Massif in the Santander Department inColombia.
The karst morphology is well developed in this humid areawith more than 2.5 m of precipitations per year. The ElPeñon area is structurally located on an anticline structurewith a flattened hinge.
Twenty-four caves were explored and documented in arelatively small area during two expeditions totalizing about10 km of galleries. Geologically they developed in thelimestones of lower–middle part of the Lower CretaceousRosablanca Formation. The caves morphology seems to beclosely related the structural deformation of the area.Although the deepest discovered caves stop presently atdepth between 150–200 m, the speleological potential isestimated at 2,500 m.
In term of scientific observations, no systematic work hasbeen done until now except the detailed survey of the caves.But the few observations indicate that the El Peñon area isvery interesting in term of caves and karst morphology butalso in term of biospeleology and paleontology.
Future expeditions, in connection with a betterhydrogeological knowledge of the region and search for theaccess to a larger system, will take us certainly deeper intothe depth of the Rosablanca Limestones.
Figure 6. The cranium Choloepus didactylus (Southern two-toed sloth discovered in the Hoyo de los Ocelotes (Bochud 2012).
Figure 7. 3-dimensional cross-sections with 5 caves. It emphazisesthe alignment of high pits along a syncline formed by thelimestones of the lower and middle parts of the RosablancaFormation.
Karst and Caves in Carbonate Rocks, Salt and Gypsum – oral 2013 ICS Proceedings
24
AcknowledgmentsA great thank to the participants of the 2 expeditions fortheir motivation and the good ambiance. A special thanksto Jesus Fernandez for the organisation of the expedition.
ReferencesColletta B, Hebrard F, Letouzey J, Werner P, Rudkiewicz, J-L,
1990. Tectonic style and crustal structure of the EasternCordillera (Colombia) from a balanced cross-section, in:Letouzey, J. (Ed.), Petroleum and tectonics in Mobile Belts.Technip, Paris, 81–100.
Guerrero J, 2002. A proposal on the Classification of the SystmesTracks: Application to the Allostratigraphy and SequenceStratigraphy of the Cretaceous Colombian Basin. Part 1:Berriasian to Hauterivian. Geologia Colombiana 27, 3–25.
Hof B, 1977. Recherches spéléologiques en Colombie. FédérationFrançaise de Spéléologie, G.S. Nice.
Mendoza-Parada JE, Moreno-Murillo JM, Rodriguez-Orjuela G,2009. Rosablanca Formation Karstic Systems lower Cretaceousin Vélez, Santander Province, Colombia. Geologia Colombiana34, 36–44.
Pabón-Caicedo JD, Eslava-Ramírez JA, Gómez-Torres RE, 2001.Generalidades de la distribución espacial y temporal de latemperatura del aire y de la precipitation en Colombia.Meteorologia Colombiana 4, 47–59.
Toussaint J-F, 1996. Evolución geológica de Colombia durante elCretácico. Universidad Nacional de Colombia, Medellin.
Figure 8. Map with the discovered caves in the El Peñon area. Numbers are related to the Table. Caves of the la Hermosura area arenot represented on the map (B1, B2, B3, B4 and B5).
Karst and Caves in Carbonate Rocks, Salt and Gypsum – oral 2013 ICS Proceedings
25
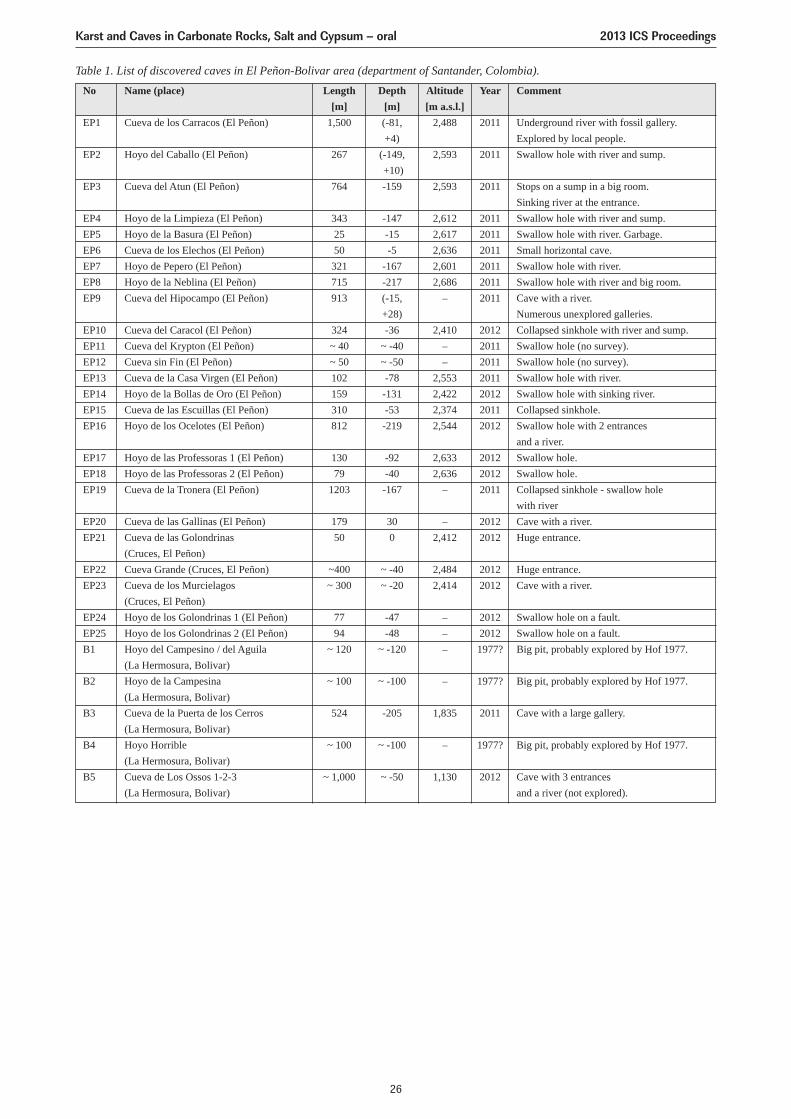
No Name (place) Length Depth Altitude Year Comment[m] [m] [m a.s.l.]
EP1 Cueva de los Carracos (El Peñon) 1,500 (-81, 2,488 2011 Underground river with fossil gallery. +4) Explored by local people.
EP2 Hoyo del Caballo (El Peñon) 267 (-149, 2,593 2011 Swallow hole with river and sump.+10)
EP3 Cueva del Atun (El Peñon) 764 -159 2,593 2011 Stops on a sump in a big room.Sinking river at the entrance.
EP4 Hoyo de la Limpieza (El Peñon) 343 -147 2,612 2011 Swallow hole with river and sump.EP5 Hoyo de la Basura (El Peñon) 25 -15 2,617 2011 Swallow hole with river. Garbage.EP6 Cueva de los Elechos (El Peñon) 50 -5 2,636 2011 Small horizontal cave.EP7 Hoyo de Pepero (El Peñon) 321 -167 2,601 2011 Swallow hole with river.EP8 Hoyo de la Neblina (El Peñon) 715 -217 2,686 2011 Swallow hole with river and big room.EP9 Cueva del Hipocampo (El Peñon) 913 (-15, – 2011 Cave with a river.
+28) Numerous unexplored galleries.EP10 Cueva del Caracol (El Peñon) 324 -36 2,410 2012 Collapsed sinkhole with river and sump.EP11 Cueva del Krypton (El Peñon) ~ 40 ~ -40 – 2011 Swallow hole (no survey).EP12 Cueva sin Fin (El Peñon) ~ 50 ~ -50 – 2011 Swallow hole (no survey).EP13 Cueva de la Casa Virgen (El Peñon) 102 -78 2,553 2011 Swallow hole with river.EP14 Hoyo de la Bollas de Oro (El Peñon) 159 -131 2,422 2012 Swallow hole with sinking river.EP15 Cueva de las Escuillas (El Peñon) 310 -53 2,374 2011 Collapsed sinkhole.EP16 Hoyo de los Ocelotes (El Peñon) 812 -219 2,544 2012 Swallow hole with 2 entrances
and a river.EP17 Hoyo de las Professoras 1 (El Peñon) 130 -92 2,633 2012 Swallow hole.EP18 Hoyo de las Professoras 2 (El Peñon) 79 -40 2,636 2012 Swallow hole.EP19 Cueva de la Tronera (El Peñon) 1203 -167 – 2011 Collapsed sinkhole - swallow hole
with riverEP20 Cueva de las Gallinas (El Peñon) 179 30 – 2012 Cave with a river.EP21 Cueva de las Golondrinas 50 0 2,412 2012 Huge entrance.
(Cruces, El Peñon)EP22 Cueva Grande (Cruces, El Peñon) ~400 ~ -40 2,484 2012 Huge entrance.EP23 Cueva de los Murcielagos ~ 300 ~ -20 2,414 2012 Cave with a river.
(Cruces, El Peñon)EP24 Hoyo de los Golondrinas 1 (El Peñon) 77 -47 – 2012 Swallow hole on a fault.EP25 Hoyo de los Golondrinas 2 (El Peñon) 94 -48 – 2012 Swallow hole on a fault.B1 Hoyo del Campesino / del Aguila ~ 120 ~ -120 – 1977? Big pit, probably explored by Hof 1977.
(La Hermosura, Bolivar)B2 Hoyo de la Campesina ~ 100 ~ -100 – 1977? Big pit, probably explored by Hof 1977.
(La Hermosura, Bolivar)B3 Cueva de la Puerta de los Cerros 524 -205 1,835 2011 Cave with a large gallery.
(La Hermosura, Bolivar)B4 Hoyo Horrible ~ 100 ~ -100 – 1977? Big pit, probably explored by Hof 1977.
(La Hermosura, Bolivar)B5 Cueva de Los Ossos 1-2-3 ~ 1,000 ~ -50 1,130 2012 Cave with 3 entrances
(La Hermosura, Bolivar) and a river (not explored).
Table 1. List of discovered caves in El Peñon-Bolivar area (department of Santander, Colombia).
Karst and Caves in Carbonate Rocks, Salt and Gypsum – oral 2013 ICS Proceedings
26
RECENT SURVEY AND EXPLORATION IN LECHUGUILLA CAVE,NEW MEXICO, USA
Peter Bosted1, John Lyles2
1PO Box 6254, Ocean View HI 96737 USA, [email protected] Box 95, Los Alamos NM 87644 USA, [email protected]
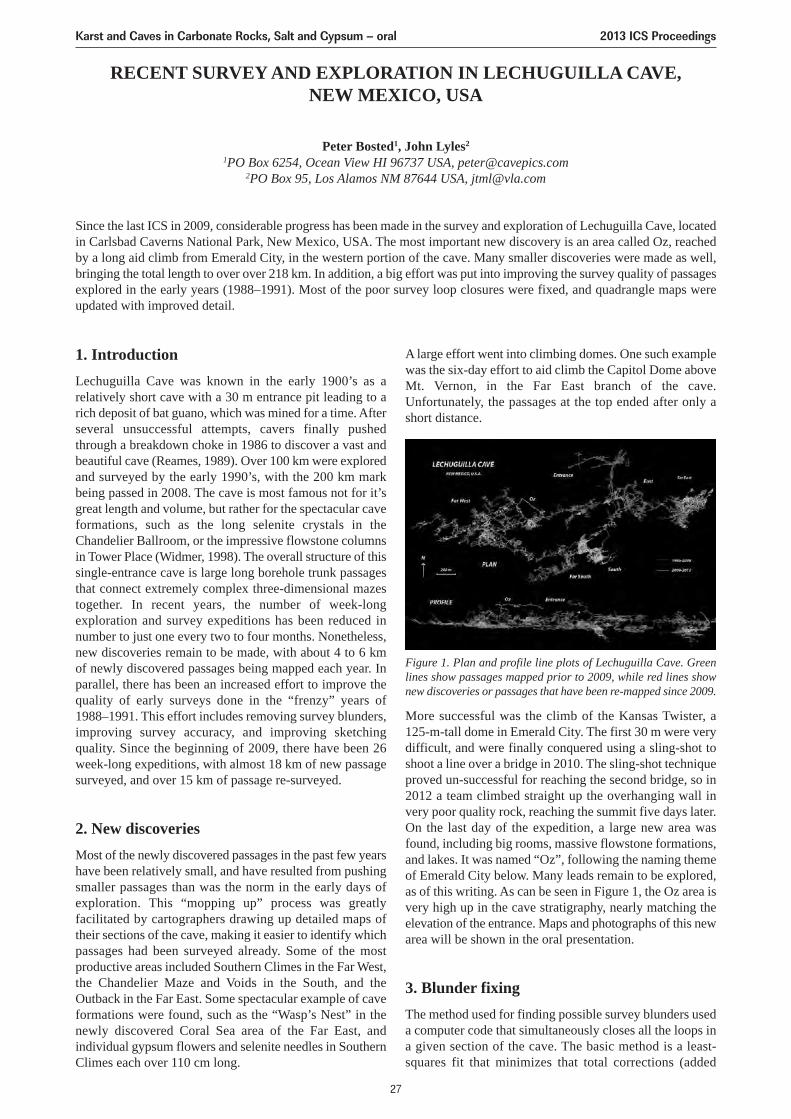
Since the last ICS in 2009, considerable progress has been made in the survey and exploration of Lechuguilla Cave, locatedin Carlsbad Caverns National Park, New Mexico, USA. The most important new discovery is an area called Oz, reachedby a long aid climb from Emerald City, in the western portion of the cave. Many smaller discoveries were made as well,bringing the total length to over over 218 km. In addition, a big effort was put into improving the survey quality of passagesexplored in the early years (1988–1991). Most of the poor survey loop closures were fixed, and quadrangle maps wereupdated with improved detail.
1. IntroductionLechuguilla Cave was known in the early 1900’s as arelatively short cave with a 30 m entrance pit leading to arich deposit of bat guano, which was mined for a time. Afterseveral unsuccessful attempts, cavers finally pushedthrough a breakdown choke in 1986 to discover a vast andbeautiful cave (Reames, 1989). Over 100 km were exploredand surveyed by the early 1990’s, with the 200 km markbeing passed in 2008. The cave is most famous not for it’sgreat length and volume, but rather for the spectacular caveformations, such as the long selenite crystals in theChandelier Ballroom, or the impressive flowstone columnsin Tower Place (Widmer, 1998). The overall structure of thissingle-entrance cave is large long borehole trunk passagesthat connect extremely complex three-dimensional mazestogether. In recent years, the number of week-longexploration and survey expeditions has been reduced innumber to just one every two to four months. Nonetheless,new discoveries remain to be made, with about 4 to 6 kmof newly discovered passages being mapped each year. Inparallel, there has been an increased effort to improve thequality of early surveys done in the “frenzy” years of1988–1991. This effort includes removing survey blunders,improving survey accuracy, and improving sketchingquality. Since the beginning of 2009, there have been 26week-long expeditions, with almost 18 km of new passagesurveyed, and over 15 km of passage re-surveyed.
2. New discoveriesMost of the newly discovered passages in the past few yearshave been relatively small, and have resulted from pushingsmaller passages than was the norm in the early days ofexploration. This “mopping up” process was greatlyfacilitated by cartographers drawing up detailed maps oftheir sections of the cave, making it easier to identify whichpassages had been surveyed already. Some of the mostproductive areas included Southern Climes in the Far West,the Chandelier Maze and Voids in the South, and theOutback in the Far East. Some spectacular example of caveformations were found, such as the “Wasp’s Nest” in thenewly discovered Coral Sea area of the Far East, andindividual gypsum flowers and selenite needles in SouthernClimes each over 110 cm long.
A large effort went into climbing domes. One such examplewas the six-day effort to aid climb the Capitol Dome aboveMt. Vernon, in the Far East branch of the cave.Unfortunately, the passages at the top ended after only ashort distance.
Figure 1. Plan and profile line plots of Lechuguilla Cave. Greenlines show passages mapped prior to 2009, while red lines shownew discoveries or passages that have been re-mapped since 2009.
More successful was the climb of the Kansas Twister, a 125-m-tall dome in Emerald City. The first 30 m were verydifficult, and were finally conquered using a sling-shot toshoot a line over a bridge in 2010. The sling-shot techniqueproved un-successful for reaching the second bridge, so in2012 a team climbed straight up the overhanging wall invery poor quality rock, reaching the summit five days later.On the last day of the expedition, a large new area wasfound, including big rooms, massive flowstone formations,and lakes. It was named “Oz”, following the naming themeof Emerald City below. Many leads remain to be explored,as of this writing. As can be seen in Figure 1, the Oz area isvery high up in the cave stratigraphy, nearly matching theelevation of the entrance. Maps and photographs of this newarea will be shown in the oral presentation.
3. Blunder fixingThe method used for finding possible survey blunders useda computer code that simultaneously closes all the loops ina given section of the cave. The basic method is a least-squares fit that minimizes that total corrections (added
Karst and Caves in Carbonate Rocks, Salt and Gypsum – oral 2013 ICS Proceedings
27
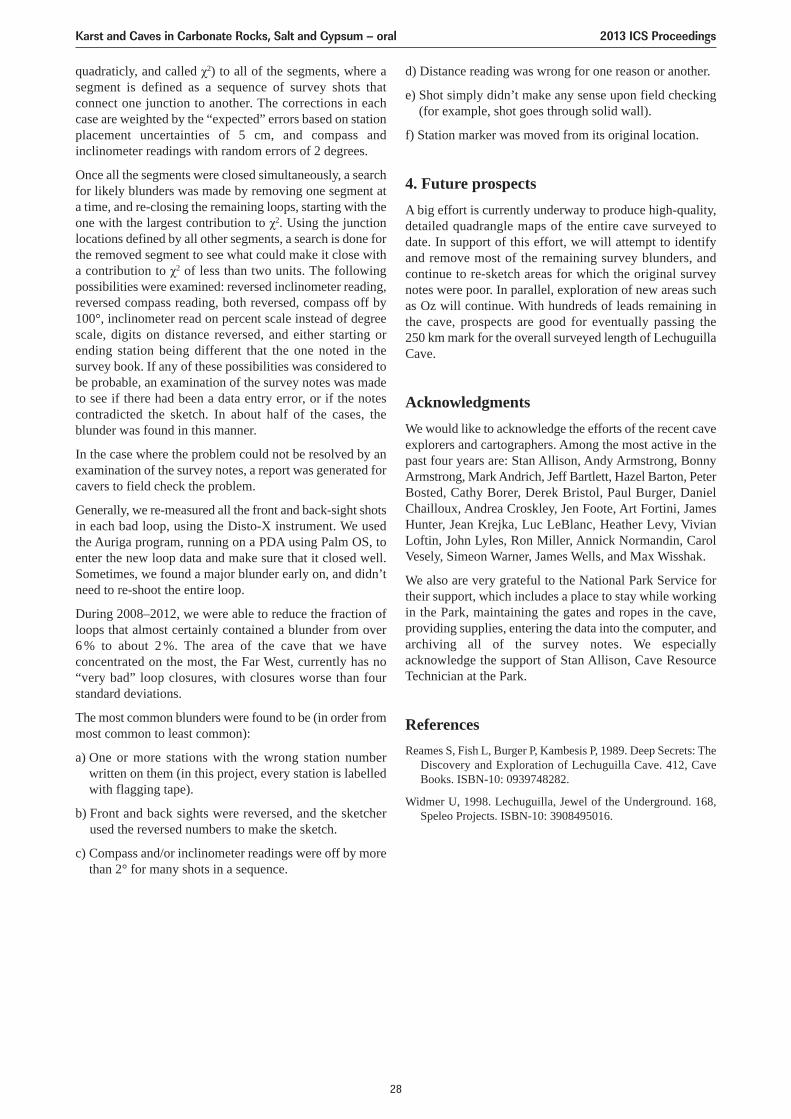
quadraticly, and called χ2) to all of the segments, where asegment is defined as a sequence of survey shots thatconnect one junction to another. The corrections in eachcase are weighted by the “expected” errors based on stationplacement uncertainties of 5 cm, and compass andinclinometer readings with random errors of 2 degrees.
Once all the segments were closed simultaneously, a searchfor likely blunders was made by removing one segment ata time, and re-closing the remaining loops, starting with theone with the largest contribution to χ2. Using the junctionlocations defined by all other segments, a search is done forthe removed segment to see what could make it close witha contribution to χ2 of less than two units. The followingpossibilities were examined: reversed inclinometer reading,reversed compass reading, both reversed, compass off by100°, inclinometer read on percent scale instead of degreescale, digits on distance reversed, and either starting orending station being different that the one noted in thesurvey book. If any of these possibilities was considered tobe probable, an examination of the survey notes was madeto see if there had been a data entry error, or if the notescontradicted the sketch. In about half of the cases, theblunder was found in this manner.
In the case where the problem could not be resolved by anexamination of the survey notes, a report was generated forcavers to field check the problem.
Generally, we re-measured all the front and back-sight shotsin each bad loop, using the Disto-X instrument. We usedthe Auriga program, running on a PDA using Palm OS, toenter the new loop data and make sure that it closed well.Sometimes, we found a major blunder early on, and didn’tneed to re-shoot the entire loop.
During 2008–2012, we were able to reduce the fraction ofloops that almost certainly contained a blunder from over 6 % to about 2 %. The area of the cave that we haveconcentrated on the most, the Far West, currently has no“very bad” loop closures, with closures worse than fourstandard deviations.
The most common blunders were found to be (in order frommost common to least common):
a) One or more stations with the wrong station numberwritten on them (in this project, every station is labelledwith flagging tape).
b) Front and back sights were reversed, and the sketcherused the reversed numbers to make the sketch.
c) Compass and/or inclinometer readings were off by morethan 2° for many shots in a sequence.
d) Distance reading was wrong for one reason or another.
e) Shot simply didn’t make any sense upon field checking(for example, shot goes through solid wall).
f) Station marker was moved from its original location.
4. Future prospectsA big effort is currently underway to produce high-quality,detailed quadrangle maps of the entire cave surveyed todate. In support of this effort, we will attempt to identifyand remove most of the remaining survey blunders, andcontinue to re-sketch areas for which the original surveynotes were poor. In parallel, exploration of new areas suchas Oz will continue. With hundreds of leads remaining inthe cave, prospects are good for eventually passing the 250 km mark for the overall surveyed length of LechuguillaCave.
AcknowledgmentsWe would like to acknowledge the efforts of the recent caveexplorers and cartographers. Among the most active in thepast four years are: Stan Allison, Andy Armstrong, BonnyArmstrong, Mark Andrich, Jeff Bartlett, Hazel Barton, PeterBosted, Cathy Borer, Derek Bristol, Paul Burger, DanielChailloux, Andrea Croskley, Jen Foote, Art Fortini, JamesHunter, Jean Krejka, Luc LeBlanc, Heather Levy, VivianLoftin, John Lyles, Ron Miller, Annick Normandin, CarolVesely, Simeon Warner, James Wells, and Max Wisshak.
We also are very grateful to the National Park Service fortheir support, which includes a place to stay while workingin the Park, maintaining the gates and ropes in the cave,providing supplies, entering the data into the computer, andarchiving all of the survey notes. We especiallyacknowledge the support of Stan Allison, Cave ResourceTechnician at the Park.
ReferencesReames S, Fish L, Burger P, Kambesis P, 1989. Deep Secrets: The
Discovery and Exploration of Lechuguilla Cave. 412, CaveBooks. ISBN-10: 0939748282.
Widmer U, 1998. Lechuguilla, Jewel of the Underground. 168,Speleo Projects. ISBN-10: 3908495016.
Karst and Caves in Carbonate Rocks, Salt and Gypsum – oral 2013 ICS Proceedings
28
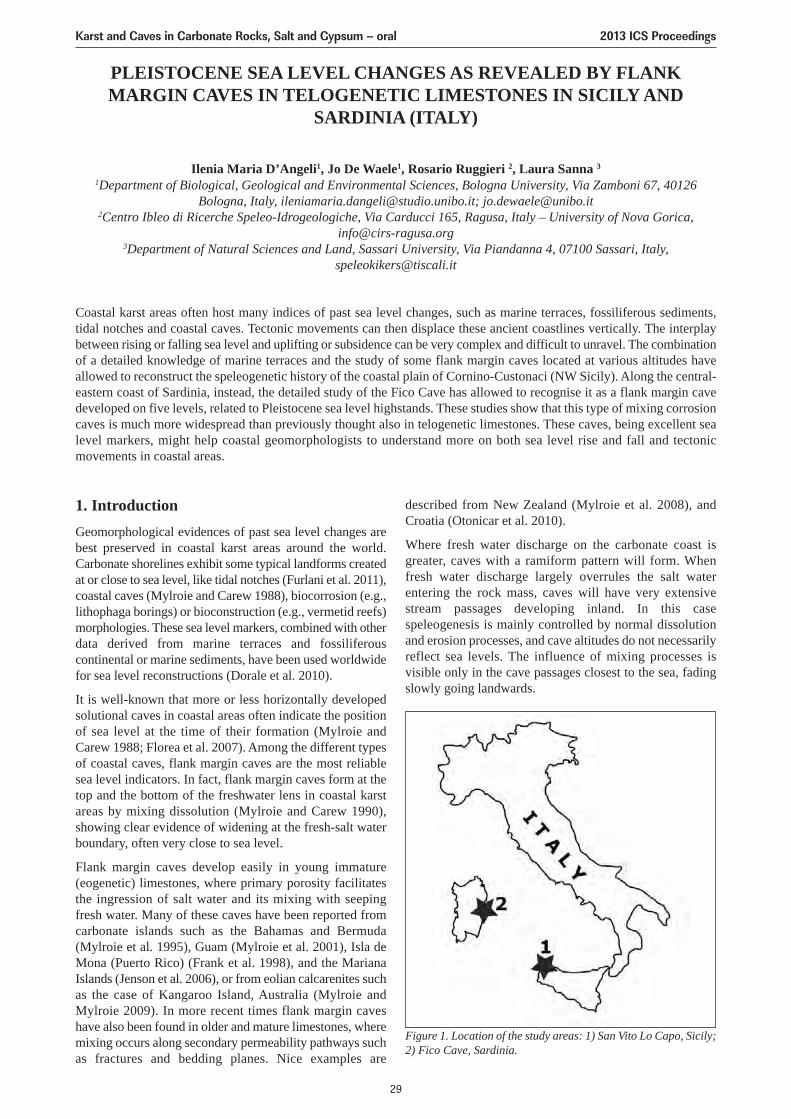
PLEISTOCENE SEA LEVEL CHANGES AS REVEALED BY FLANKMARGIN CAVES IN TELOGENETIC LIMESTONES IN SICILY AND
SARDINIA (ITALY)
Ilenia Maria D’Angeli1, Jo De Waele1, Rosario Ruggieri 2, Laura Sanna 3
1Department of Biological, Geological and Environmental Sciences, Bologna University, Via Zamboni 67, 40126Bologna, Italy, [email protected]; [email protected]
2Centro Ibleo di Ricerche Speleo-Idrogeologiche, Via Carducci 165, Ragusa, Italy – University of Nova Gorica,[email protected]
3Department of Natural Sciences and Land, Sassari University, Via Piandanna 4, 07100 Sassari, Italy,[email protected]
Coastal karst areas often host many indices of past sea level changes, such as marine terraces, fossiliferous sediments,tidal notches and coastal caves. Tectonic movements can then displace these ancient coastlines vertically. The interplaybetween rising or falling sea level and uplifting or subsidence can be very complex and difficult to unravel. The combinationof a detailed knowledge of marine terraces and the study of some flank margin caves located at various altitudes haveallowed to reconstruct the speleogenetic history of the coastal plain of Cornino-Custonaci (NW Sicily). Along the central-eastern coast of Sardinia, instead, the detailed study of the Fico Cave has allowed to recognise it as a flank margin cavedeveloped on five levels, related to Pleistocene sea level highstands. These studies show that this type of mixing corrosioncaves is much more widespread than previously thought also in telogenetic limestones. These caves, being excellent sealevel markers, might help coastal geomorphologists to understand more on both sea level rise and fall and tectonicmovements in coastal areas.
1. IntroductionGeomorphological evidences of past sea level changes arebest preserved in coastal karst areas around the world.Carbonate shorelines exhibit some typical landforms createdat or close to sea level, like tidal notches (Furlani et al. 2011),coastal caves (Mylroie and Carew 1988), biocorrosion (e.g.,lithophaga borings) or bioconstruction (e.g., vermetid reefs)morphologies. These sea level markers, combined with otherdata derived from marine terraces and fossiliferouscontinental or marine sediments, have been used worldwidefor sea level reconstructions (Dorale et al. 2010).
It is well-known that more or less horizontally developedsolutional caves in coastal areas often indicate the positionof sea level at the time of their formation (Mylroie andCarew 1988; Florea et al. 2007). Among the different typesof coastal caves, flank margin caves are the most reliablesea level indicators. In fact, flank margin caves form at thetop and the bottom of the freshwater lens in coastal karstareas by mixing dissolution (Mylroie and Carew 1990),showing clear evidence of widening at the fresh-salt waterboundary, often very close to sea level.
Flank margin caves develop easily in young immature(eogenetic) limestones, where primary porosity facilitatesthe ingression of salt water and its mixing with seepingfresh water. Many of these caves have been reported fromcarbonate islands such as the Bahamas and Bermuda(Mylroie et al. 1995), Guam (Mylroie et al. 2001), Isla deMona (Puerto Rico) (Frank et al. 1998), and the MarianaIslands (Jenson et al. 2006), or from eolian calcarenites suchas the case of Kangaroo Island, Australia (Mylroie andMylroie 2009). In more recent times flank margin caveshave also been found in older and mature limestones, wheremixing occurs along secondary permeability pathways suchas fractures and bedding planes. Nice examples are
described from New Zealand (Mylroie et al. 2008), andCroatia (Otonicar et al. 2010).
Where fresh water discharge on the carbonate coast isgreater, caves with a ramiform pattern will form. Whenfresh water discharge largely overrules the salt waterentering the rock mass, caves will have very extensivestream passages developing inland. In this casespeleogenesis is mainly controlled by normal dissolutionand erosion processes, and cave altitudes do not necessarilyreflect sea levels. The influence of mixing processes isvisible only in the cave passages closest to the sea, fadingslowly going landwards.
Figure 1. Location of the study areas: 1) San Vito Lo Capo, Sicily;2) Fico Cave, Sardinia.
Karst and Caves in Carbonate Rocks, Salt and Gypsum – oral 2013 ICS Proceedings
29
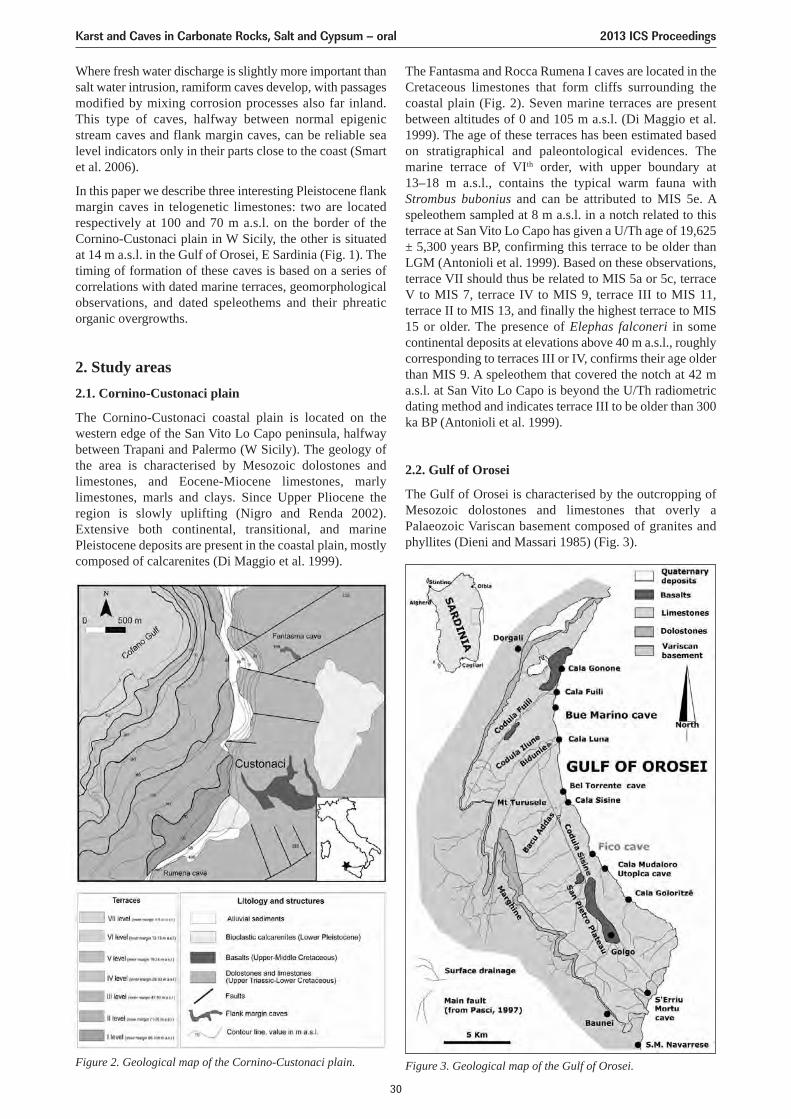
Where fresh water discharge is slightly more important thansalt water intrusion, ramiform caves develop, with passagesmodified by mixing corrosion processes also far inland.This type of caves, halfway between normal epigenicstream caves and flank margin caves, can be reliable sealevel indicators only in their parts close to the coast (Smartet al. 2006).
In this paper we describe three interesting Pleistocene flankmargin caves in telogenetic limestones: two are locatedrespectively at 100 and 70 m a.s.l. on the border of theCornino-Custonaci plain in W Sicily, the other is situatedat 14 m a.s.l. in the Gulf of Orosei, E Sardinia (Fig. 1). Thetiming of formation of these caves is based on a series ofcorrelations with dated marine terraces, geomorphologicalobservations, and dated speleothems and their phreaticorganic overgrowths.
2. Study areas2.1. Cornino-Custonaci plain
The Cornino-Custonaci coastal plain is located on thewestern edge of the San Vito Lo Capo peninsula, halfwaybetween Trapani and Palermo (W Sicily). The geology ofthe area is characterised by Mesozoic dolostones andlimestones, and Eocene-Miocene limestones, marlylimestones, marls and clays. Since Upper Pliocene theregion is slowly uplifting (Nigro and Renda 2002).Extensive both continental, transitional, and marinePleistocene deposits are present in the coastal plain, mostlycomposed of calcarenites (Di Maggio et al. 1999).
The Fantasma and Rocca Rumena I caves are located in theCretaceous limestones that form cliffs surrounding thecoastal plain (Fig. 2). Seven marine terraces are presentbetween altitudes of 0 and 105 m a.s.l. (Di Maggio et al.1999). The age of these terraces has been estimated basedon stratigraphical and paleontological evidences. Themarine terrace of VIth order, with upper boundary at 13–18 m a.s.l., contains the typical warm fauna withStrombus bubonius and can be attributed to MIS 5e. Aspeleothem sampled at 8 m a.s.l. in a notch related to thisterrace at San Vito Lo Capo has given a U/Th age of 19,625± 5,300 years BP, confirming this terrace to be older thanLGM (Antonioli et al. 1999). Based on these observations,terrace VII should thus be related to MIS 5a or 5c, terraceV to MIS 7, terrace IV to MIS 9, terrace III to MIS 11,terrace II to MIS 13, and finally the highest terrace to MIS15 or older. The presence of Elephas falconeri in somecontinental deposits at elevations above 40 m a.s.l., roughlycorresponding to terraces III or IV, confirms their age olderthan MIS 9. A speleothem that covered the notch at 42 ma.s.l. at San Vito Lo Capo is beyond the U/Th radiometricdating method and indicates terrace III to be older than 300ka BP (Antonioli et al. 1999).
2.2. Gulf of Orosei
The Gulf of Orosei is characterised by the outcropping ofMesozoic dolostones and limestones that overly aPalaeozoic Variscan basement composed of granites andphyllites (Dieni and Massari 1985) (Fig. 3).
Figure 2. Geological map of the Cornino-Custonaci plain. Figure 3. Geological map of the Gulf of Orosei.
Karst and Caves in Carbonate Rocks, Salt and Gypsum – oral 2013 ICS Proceedings
30
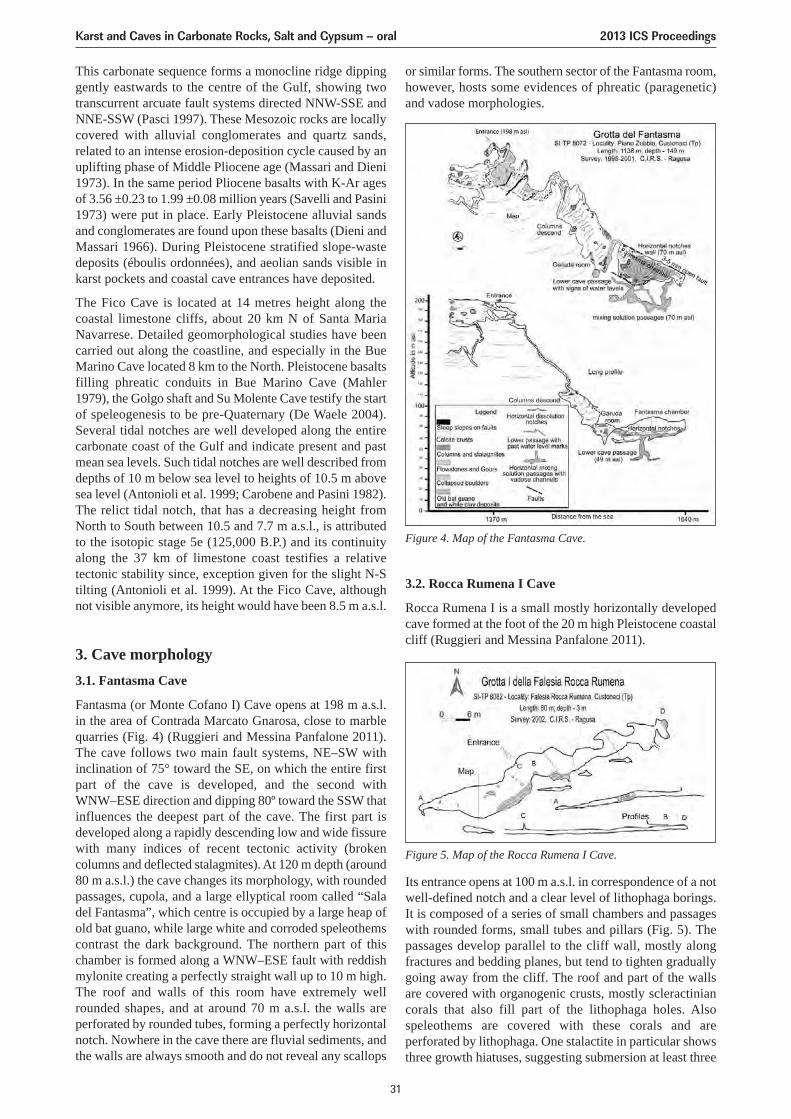
This carbonate sequence forms a monocline ridge dippinggently eastwards to the centre of the Gulf, showing twotranscurrent arcuate fault systems directed NNW-SSE andNNE-SSW (Pasci 1997). These Mesozoic rocks are locallycovered with alluvial conglomerates and quartz sands,related to an intense erosion-deposition cycle caused by anuplifting phase of Middle Pliocene age (Massari and Dieni1973). In the same period Pliocene basalts with K-Ar agesof 3.56 ±0.23 to 1.99 ±0.08 million years (Savelli and Pasini1973) were put in place. Early Pleistocene alluvial sandsand conglomerates are found upon these basalts (Dieni andMassari 1966). During Pleistocene stratified slope-wastedeposits (éboulis ordonnées), and aeolian sands visible inkarst pockets and coastal cave entrances have deposited.
The Fico Cave is located at 14 metres height along thecoastal limestone cliffs, about 20 km N of Santa MariaNavarrese. Detailed geomorphological studies have beencarried out along the coastline, and especially in the BueMarino Cave located 8 km to the North. Pleistocene basaltsfilling phreatic conduits in Bue Marino Cave (Mahler1979), the Golgo shaft and Su Molente Cave testify the startof speleogenesis to be pre-Quaternary (De Waele 2004).Several tidal notches are well developed along the entirecarbonate coast of the Gulf and indicate present and pastmean sea levels. Such tidal notches are well described fromdepths of 10 m below sea level to heights of 10.5 m abovesea level (Antonioli et al. 1999; Carobene and Pasini 1982).The relict tidal notch, that has a decreasing height fromNorth to South between 10.5 and 7.7 m a.s.l., is attributedto the isotopic stage 5e (125,000 B.P.) and its continuityalong the 37 km of limestone coast testifies a relativetectonic stability since, exception given for the slight N-Stilting (Antonioli et al. 1999). At the Fico Cave, althoughnot visible anymore, its height would have been 8.5 m a.s.l.
3. Cave morphology3.1. Fantasma Cave
Fantasma (or Monte Cofano I) Cave opens at 198 m a.s.l.in the area of Contrada Marcato Gnarosa, close to marblequarries (Fig. 4) (Ruggieri and Messina Panfalone 2011).The cave follows two main fault systems, NE–SW withinclination of 75° toward the SE, on which the entire firstpart of the cave is developed, and the second withWNW–ESE direction and dipping 80º toward the SSW thatinfluences the deepest part of the cave. The first part isdeveloped along a rapidly descending low and wide fissurewith many indices of recent tectonic activity (brokencolumns and deflected stalagmites). At 120 m depth (around80 m a.s.l.) the cave changes its morphology, with roundedpassages, cupola, and a large ellyptical room called “Saladel Fantasma”, which centre is occupied by a large heap ofold bat guano, while large white and corroded speleothemscontrast the dark background. The northern part of thischamber is formed along a WNW–ESE fault with reddishmylonite creating a perfectly straight wall up to 10 m high.The roof and walls of this room have extremely wellrounded shapes, and at around 70 m a.s.l. the walls areperforated by rounded tubes, forming a perfectly horizontalnotch. Nowhere in the cave there are fluvial sediments, andthe walls are always smooth and do not reveal any scallops
or similar forms. The southern sector of the Fantasma room,however, hosts some evidences of phreatic (paragenetic)and vadose morphologies.
3.2. Rocca Rumena I Cave
Rocca Rumena I is a small mostly horizontally developedcave formed at the foot of the 20 m high Pleistocene coastalcliff (Ruggieri and Messina Panfalone 2011).
Its entrance opens at 100 m a.s.l. in correspondence of a notwell-defined notch and a clear level of lithophaga borings.It is composed of a series of small chambers and passageswith rounded forms, small tubes and pillars (Fig. 5). Thepassages develop parallel to the cliff wall, mostly alongfractures and bedding planes, but tend to tighten graduallygoing away from the cliff. The roof and part of the wallsare covered with organogenic crusts, mostly scleractiniancorals that also fill part of the lithophaga holes. Alsospeleothems are covered with these corals and areperforated by lithophaga. One stalactite in particular showsthree growth hiatuses, suggesting submersion at least three
Figure 4. Map of the Fantasma Cave.
Figure 5. Map of the Rocca Rumena I Cave.
Karst and Caves in Carbonate Rocks, Salt and Gypsum – oral 2013 ICS Proceedings
31
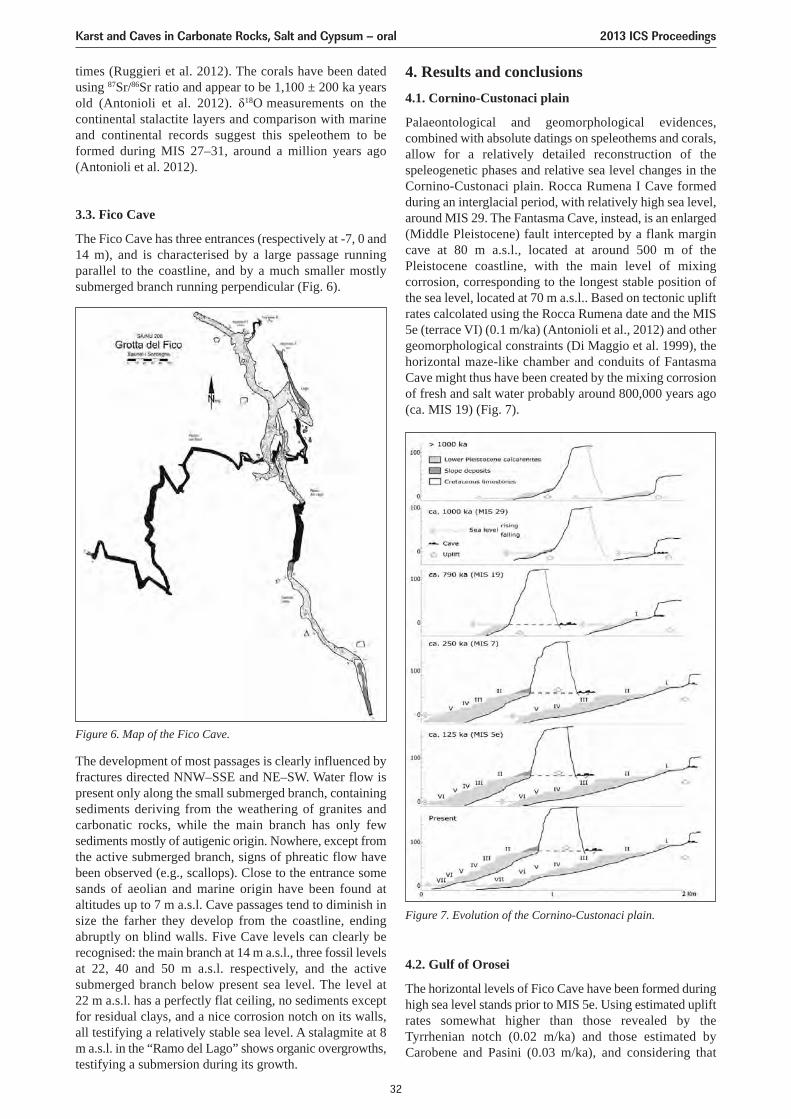
times (Ruggieri et al. 2012). The corals have been datedusing 87Sr/86Sr ratio and appear to be 1,100 ± 200 ka yearsold (Antonioli et al. 2012). δ18O measurements on thecontinental stalactite layers and comparison with marineand continental records suggest this speleothem to beformed during MIS 27–31, around a million years ago(Antonioli et al. 2012).
3.3. Fico Cave
The Fico Cave has three entrances (respectively at -7, 0 and14 m), and is characterised by a large passage runningparallel to the coastline, and by a much smaller mostlysubmerged branch running perpendicular (Fig. 6).
The development of most passages is clearly influenced byfractures directed NNW–SSE and NE–SW. Water flow ispresent only along the small submerged branch, containingsediments deriving from the weathering of granites andcarbonatic rocks, while the main branch has only fewsediments mostly of autigenic origin. Nowhere, except fromthe active submerged branch, signs of phreatic flow havebeen observed (e.g., scallops). Close to the entrance somesands of aeolian and marine origin have been found ataltitudes up to 7 m a.s.l. Cave passages tend to diminish insize the farher they develop from the coastline, endingabruptly on blind walls. Five Cave levels can clearly berecognised: the main branch at 14 m a.s.l., three fossil levelsat 22, 40 and 50 m a.s.l. respectively, and the activesubmerged branch below present sea level. The level at 22 m a.s.l. has a perfectly flat ceiling, no sediments exceptfor residual clays, and a nice corrosion notch on its walls,all testifying a relatively stable sea level. A stalagmite at 8m a.s.l. in the “Ramo del Lago” shows organic overgrowths,testifying a submersion during its growth.
Figure 6. Map of the Fico Cave.
4. Results and conclusions4.1. Cornino-Custonaci plain
Palaeontological and geomorphological evidences,combined with absolute datings on speleothems and corals,allow for a relatively detailed reconstruction of thespeleogenetic phases and relative sea level changes in theCornino-Custonaci plain. Rocca Rumena I Cave formedduring an interglacial period, with relatively high sea level,around MIS 29. The Fantasma Cave, instead, is an enlarged(Middle Pleistocene) fault intercepted by a flank margincave at 80 m a.s.l., located at around 500 m of thePleistocene coastline, with the main level of mixingcorrosion, corresponding to the longest stable position ofthe sea level, located at 70 m a.s.l.. Based on tectonic upliftrates calcolated using the Rocca Rumena date and the MIS5e (terrace VI) (0.1 m/ka) (Antonioli et al., 2012) and othergeomorphological constraints (Di Maggio et al. 1999), thehorizontal maze-like chamber and conduits of FantasmaCave might thus have been created by the mixing corrosionof fresh and salt water probably around 800,000 years ago(ca. MIS 19) (Fig. 7).
4.2. Gulf of Orosei
The horizontal levels of Fico Cave have been formed duringhigh sea level stands prior to MIS 5e. Using estimated upliftrates somewhat higher than those revealed by theTyrrhenian notch (0.02 m/ka) and those estimated byCarobene and Pasini (0.03 m/ka), and considering that
Figure 7. Evolution of the Cornino-Custonaci plain.
Karst and Caves in Carbonate Rocks, Salt and Gypsum – oral 2013 ICS Proceedings
32
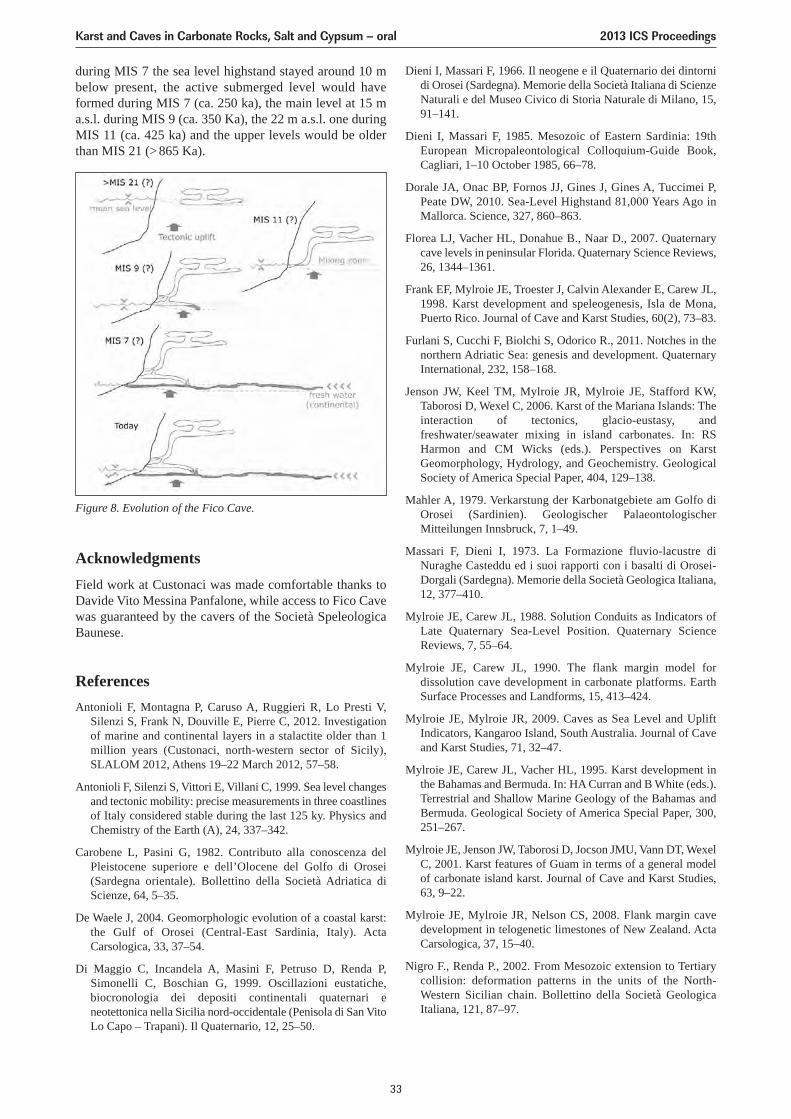
during MIS 7 the sea level highstand stayed around 10 mbelow present, the active submerged level would haveformed during MIS 7 (ca. 250 ka), the main level at 15 ma.s.l. during MIS 9 (ca. 350 Ka), the 22 m a.s.l. one duringMIS 11 (ca. 425 ka) and the upper levels would be olderthan MIS 21 (>865 Ka).
AcknowledgmentsField work at Custonaci was made comfortable thanks toDavide Vito Messina Panfalone, while access to Fico Cavewas guaranteed by the cavers of the Società SpeleologicaBaunese.
ReferencesAntonioli F, Montagna P, Caruso A, Ruggieri R, Lo Presti V,
Silenzi S, Frank N, Douville E, Pierre C, 2012. Investigationof marine and continental layers in a stalactite older than 1million years (Custonaci, north-western sector of Sicily),SLALOM 2012, Athens 19–22 March 2012, 57–58.
Antonioli F, Silenzi S, Vittori E, Villani C, 1999. Sea level changesand tectonic mobility: precise measurements in three coastlinesof Italy considered stable during the last 125 ky. Physics andChemistry of the Earth (A), 24, 337–342.
Carobene L, Pasini G, 1982. Contributo alla conoscenza delPleistocene superiore e dell’Olocene del Golfo di Orosei(Sardegna orientale). Bollettino della Società Adriatica diScienze, 64, 5–35.
De Waele J, 2004. Geomorphologic evolution of a coastal karst:the Gulf of Orosei (Central-East Sardinia, Italy). ActaCarsologica, 33, 37–54.
Di Maggio C, Incandela A, Masini F, Petruso D, Renda P,Simonelli C, Boschian G, 1999. Oscillazioni eustatiche,biocronologia dei depositi continentali quaternari eneotettonica nella Sicilia nord-occidentale (Penisola di San VitoLo Capo – Trapani). Il Quaternario, 12, 25–50.
Dieni I, Massari F, 1966. Il neogene e il Quaternario dei dintornidi Orosei (Sardegna). Memorie della Società Italiana di ScienzeNaturali e del Museo Civico di Storia Naturale di Milano, 15,91–141.
Dieni I, Massari F, 1985. Mesozoic of Eastern Sardinia: 19thEuropean Micropaleontological Colloquium-Guide Book,Cagliari, 1–10 October 1985, 66–78.
Dorale JA, Onac BP, Fornos JJ, Gines J, Gines A, Tuccimei P,Peate DW, 2010. Sea-Level Highstand 81,000 Years Ago inMallorca. Science, 327, 860–863.
Florea LJ, Vacher HL, Donahue B., Naar D., 2007. Quaternarycave levels in peninsular Florida. Quaternary Science Reviews,26, 1344–1361.
Frank EF, Mylroie JE, Troester J, Calvin Alexander E, Carew JL,1998. Karst development and speleogenesis, Isla de Mona,Puerto Rico. Journal of Cave and Karst Studies, 60(2), 73–83.
Furlani S, Cucchi F, Biolchi S, Odorico R., 2011. Notches in thenorthern Adriatic Sea: genesis and development. QuaternaryInternational, 232, 158–168.
Jenson JW, Keel TM, Mylroie JR, Mylroie JE, Stafford KW,Taborosi D, Wexel C, 2006. Karst of the Mariana Islands: Theinteraction of tectonics, glacio-eustasy, andfreshwater/seawater mixing in island carbonates. In: RSHarmon and CM Wicks (eds.). Perspectives on KarstGeomorphology, Hydrology, and Geochemistry. GeologicalSociety of America Special Paper, 404, 129–138.
Mahler A, 1979. Verkarstung der Karbonatgebiete am Golfo diOrosei (Sardinien). Geologischer PalaeontologischerMitteilungen Innsbruck, 7, 1–49.
Massari F, Dieni I, 1973. La Formazione fluvio-lacustre diNuraghe Casteddu ed i suoi rapporti con i basalti di Orosei-Dorgali (Sardegna). Memorie della Società Geologica Italiana,12, 377–410.
Mylroie JE, Carew JL, 1988. Solution Conduits as Indicators ofLate Quaternary Sea-Level Position. Quaternary ScienceReviews, 7, 55–64.
Mylroie JE, Carew JL, 1990. The flank margin model fordissolution cave development in carbonate platforms. EarthSurface Processes and Landforms, 15, 413–424.
Mylroie JE, Mylroie JR, 2009. Caves as Sea Level and UpliftIndicators, Kangaroo Island, South Australia. Journal of Caveand Karst Studies, 71, 32–47.
Mylroie JE, Carew JL, Vacher HL, 1995. Karst development inthe Bahamas and Bermuda. In: HA Curran and B White (eds.).Terrestrial and Shallow Marine Geology of the Bahamas andBermuda. Geological Society of America Special Paper, 300,251–267.
Mylroie JE, Jenson JW, Taborosi D, Jocson JMU, Vann DT, WexelC, 2001. Karst features of Guam in terms of a general modelof carbonate island karst. Journal of Cave and Karst Studies,63, 9–22.
Mylroie JE, Mylroie JR, Nelson CS, 2008. Flank margin cavedevelopment in telogenetic limestones of New Zealand. ActaCarsologica, 37, 15–40.
Nigro F., Renda P., 2002. From Mesozoic extension to Tertiarycollision: deformation patterns in the units of the North-Western Sicilian chain. Bollettino della Società GeologicaItaliana, 121, 87–97.
Figure 8. Evolution of the Fico Cave.
Karst and Caves in Carbonate Rocks, Salt and Gypsum – oral 2013 ICS Proceedings
33

Pasci S, 1997. Tertiary transcurrent tectonics of North-CentralSardinia. Bulletin de la Société Géologique de France, 168,301–312.
Ruggieri R, Messina Panfalone D, 2011. Dentro e fuori lamontagna. Priulla, Palermo 2011, 182.
Ruggieri R, Messina Panfalone D, Antonioli F, Rosso A, San
Filippo R, Maniscalco R, 2012. The Rumena Flank Margin caveand its implications in support of paleogeographic evolution ofthe Monti di Capo San Vito (north western Sicily). RendicontiOnline Società Geologica Italiana, 21, 632–633.
Savelli C, Pasini G, 1973. Preliminary results of K-Ar dating ofbasalts from Eastern Sardinia and the Gulf of Orosei. Giornaledi Geologia, 39, 303–312.
Smart PL, Beddows PA, Coke J, Doerr S, Smith S, Whitaker FF,2006. Cave development on the Caribbean coast of the YucatanPeninsula, Quintana Roo, Mexico. In: RS Harmon and CMWicks (eds.). Perspectives on Karst Geomorphology,Hydrology, and Geochemistry. Geological Society of AmericaSpecial Paper, 404, 105–128.
Karst and Caves in Carbonate Rocks, Salt and Gypsum – oral 2013 ICS Proceedings
34
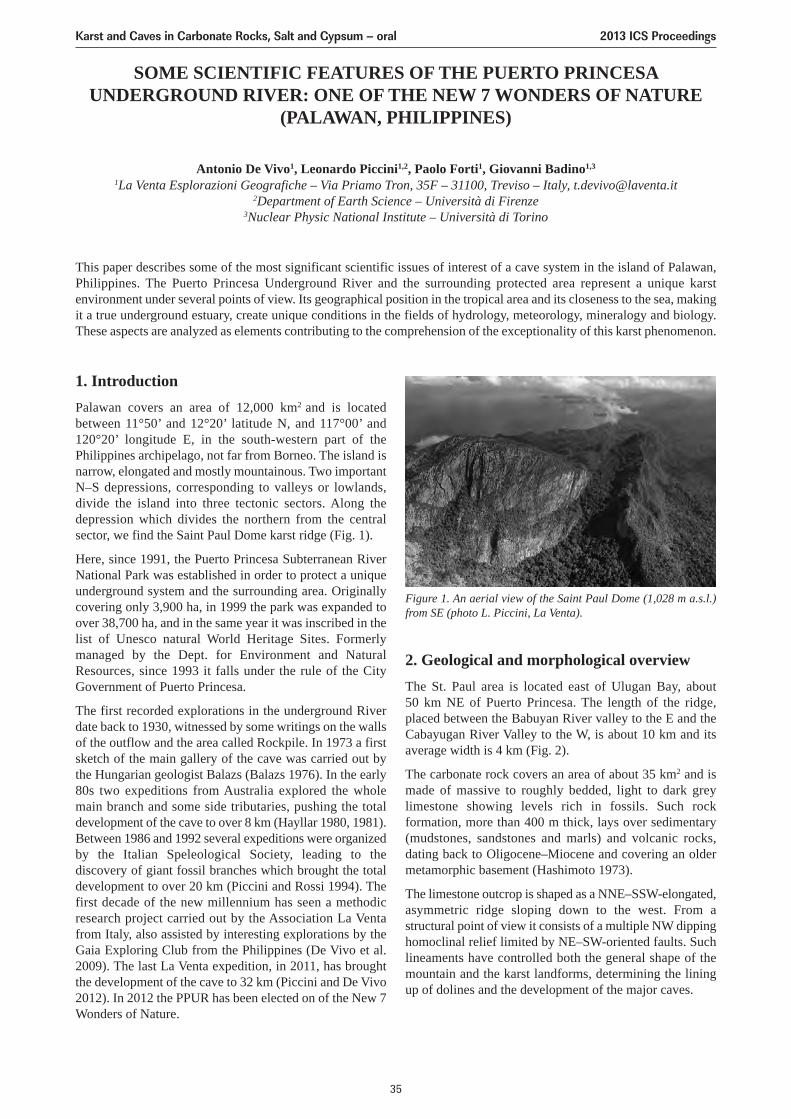
SOME SCIENTIFIC FEATURES OF THE PUERTO PRINCESAUNDERGROUND RIVER: ONE OF THE NEW 7 WONDERS OF NATURE
(PALAWAN, PHILIPPINES)
Antonio De Vivo1, Leonardo Piccini1,2, Paolo Forti1, Giovanni Badino1,3
1La Venta Esplorazioni Geografiche – Via Priamo Tron, 35F – 31100, Treviso – Italy, [email protected] of Earth Science – Università di Firenze
3Nuclear Physic National Institute – Università di Torino
This paper describes some of the most significant scientific issues of interest of a cave system in the island of Palawan,Philippines. The Puerto Princesa Underground River and the surrounding protected area represent a unique karstenvironment under several points of view. Its geographical position in the tropical area and its closeness to the sea, makingit a true underground estuary, create unique conditions in the fields of hydrology, meteorology, mineralogy and biology.These aspects are analyzed as elements contributing to the comprehension of the exceptionality of this karst phenomenon.
1. IntroductionPalawan covers an area of 12,000 km2 and is locatedbetween 11°50’ and 12°20’ latitude N, and 117°00’ and120°20’ longitude E, in the south-western part of thePhilippines archipelago, not far from Borneo. The island isnarrow, elongated and mostly mountainous. Two importantN–S depressions, corresponding to valleys or lowlands,divide the island into three tectonic sectors. Along thedepression which divides the northern from the centralsector, we find the Saint Paul Dome karst ridge (Fig. 1).
Here, since 1991, the Puerto Princesa Subterranean RiverNational Park was established in order to protect a uniqueunderground system and the surrounding area. Originallycovering only 3,900 ha, in 1999 the park was expanded toover 38,700 ha, and in the same year it was inscribed in thelist of Unesco natural World Heritage Sites. Formerlymanaged by the Dept. for Environment and NaturalResources, since 1993 it falls under the rule of the CityGovernment of Puerto Princesa.
The first recorded explorations in the underground Riverdate back to 1930, witnessed by some writings on the wallsof the outflow and the area called Rockpile. In 1973 a firstsketch of the main gallery of the cave was carried out bythe Hungarian geologist Balazs (Balazs 1976). In the early80s two expeditions from Australia explored the wholemain branch and some side tributaries, pushing the totaldevelopment of the cave to over 8 km (Hayllar 1980, 1981).Between 1986 and 1992 several expeditions were organizedby the Italian Speleological Society, leading to thediscovery of giant fossil branches which brought the totaldevelopment to over 20 km (Piccini and Rossi 1994). Thefirst decade of the new millennium has seen a methodicresearch project carried out by the Association La Ventafrom Italy, also assisted by interesting explorations by theGaia Exploring Club from the Philippines (De Vivo et al.2009). The last La Venta expedition, in 2011, has broughtthe development of the cave to 32 km (Piccini and De Vivo2012). In 2012 the PPUR has been elected on of the New 7Wonders of Nature.
2. Geological and morphological overviewThe St. Paul area is located east of Ulugan Bay, about 50 km NE of Puerto Princesa. The length of the ridge,placed between the Babuyan River valley to the E and theCabayugan River Valley to the W, is about 10 km and itsaverage width is 4 km (Fig. 2).
The carbonate rock covers an area of about 35 km2 and ismade of massive to roughly bedded, light to dark greylimestone showing levels rich in fossils. Such rockformation, more than 400 m thick, lays over sedimentary(mudstones, sandstones and marls) and volcanic rocks,dating back to Oligocene–Miocene and covering an oldermetamorphic basement (Hashimoto 1973).
The limestone outcrop is shaped as a NNE–SSW-elongated,asymmetric ridge sloping down to the west. From astructural point of view it consists of a multiple NW dippinghomoclinal relief limited by NE–SW-oriented faults. Suchlineaments have controlled both the general shape of themountain and the karst landforms, determining the liningup of dolines and the development of the major caves.
Figure 1. An aerial view of the Saint Paul Dome (1,028 m a.s.l.)from SE (photo L. Piccini, La Venta).
Karst and Caves in Carbonate Rocks, Salt and Gypsum – oral 2013 ICS Proceedings
35
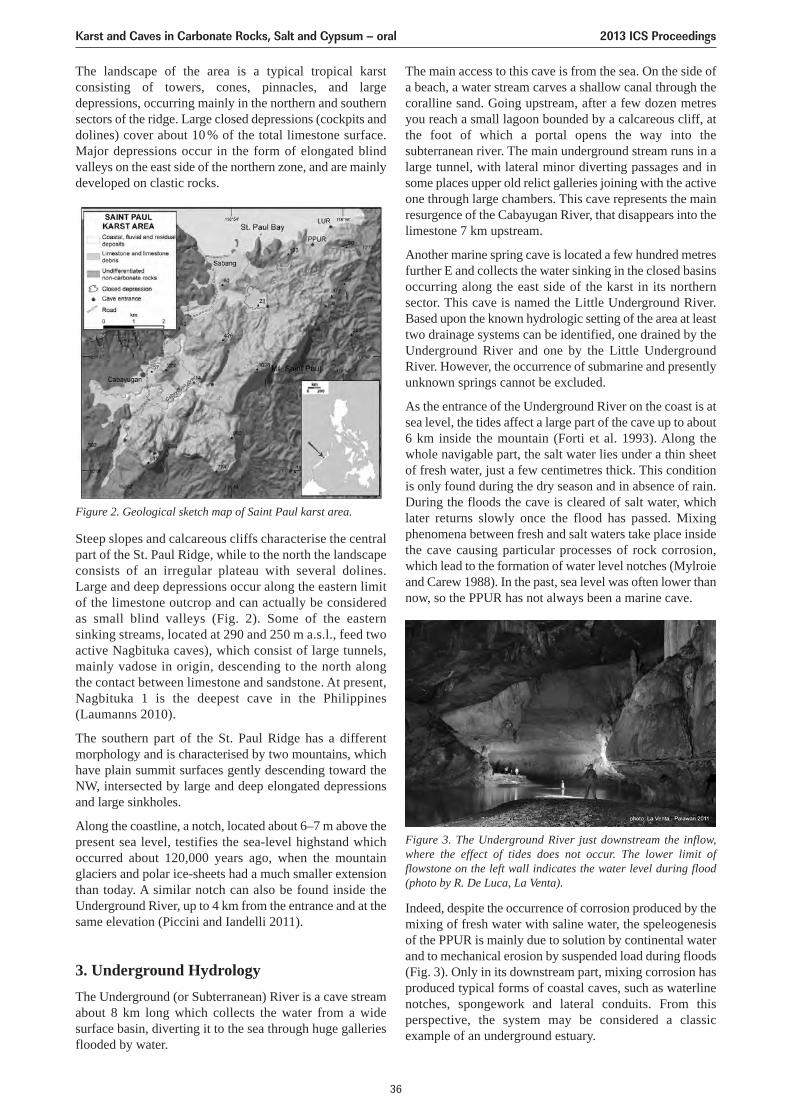
The main access to this cave is from the sea. On the side ofa beach, a water stream carves a shallow canal through thecoralline sand. Going upstream, after a few dozen metresyou reach a small lagoon bounded by a calcareous cliff, atthe foot of which a portal opens the way into thesubterranean river. The main underground stream runs in alarge tunnel, with lateral minor diverting passages and insome places upper old relict galleries joining with the activeone through large chambers. This cave represents the mainresurgence of the Cabayugan River, that disappears into thelimestone 7 km upstream.
Another marine spring cave is located a few hundred metresfurther E and collects the water sinking in the closed basinsoccurring along the east side of the karst in its northernsector. This cave is named the Little Underground River.Based upon the known hydrologic setting of the area at leasttwo drainage systems can be identified, one drained by theUnderground River and one by the Little UndergroundRiver. However, the occurrence of submarine and presentlyunknown springs cannot be excluded.
As the entrance of the Underground River on the coast is atsea level, the tides affect a large part of the cave up to about6 km inside the mountain (Forti et al. 1993). Along thewhole navigable part, the salt water lies under a thin sheetof fresh water, just a few centimetres thick. This conditionis only found during the dry season and in absence of rain.During the floods the cave is cleared of salt water, whichlater returns slowly once the flood has passed. Mixingphenomena between fresh and salt waters take place insidethe cave causing particular processes of rock corrosion,which lead to the formation of water level notches (Mylroieand Carew 1988). In the past, sea level was often lower thannow, so the PPUR has not always been a marine cave.
Indeed, despite the occurrence of corrosion produced by themixing of fresh water with saline water, the speleogenesisof the PPUR is mainly due to solution by continental waterand to mechanical erosion by suspended load during floods(Fig. 3). Only in its downstream part, mixing corrosion hasproduced typical forms of coastal caves, such as waterlinenotches, spongework and lateral conduits. From thisperspective, the system may be considered a classicexample of an underground estuary.
The landscape of the area is a typical tropical karstconsisting of towers, cones, pinnacles, and largedepressions, occurring mainly in the northern and southernsectors of the ridge. Large closed depressions (cockpits anddolines) cover about 10 % of the total limestone surface.Major depressions occur in the form of elongated blindvalleys on the east side of the northern zone, and are mainlydeveloped on clastic rocks.
Steep slopes and calcareous cliffs characterise the centralpart of the St. Paul Ridge, while to the north the landscapeconsists of an irregular plateau with several dolines.Large and deep depressions occur along the eastern limitof the limestone outcrop and can actually be consideredas small blind valleys (Fig. 2). Some of the easternsinking streams, located at 290 and 250 m a.s.l., feed twoactive Nagbituka caves), which consist of large tunnels,mainly vadose in origin, descending to the north alongthe contact between limestone and sandstone. At present,Nagbituka 1 is the deepest cave in the Philippines(Laumanns 2010).
The southern part of the St. Paul Ridge has a differentmorphology and is characterised by two mountains, whichhave plain summit surfaces gently descending toward theNW, intersected by large and deep elongated depressionsand large sinkholes.
Along the coastline, a notch, located about 6–7 m above thepresent sea level, testifies the sea-level highstand whichoccurred about 120,000 years ago, when the mountainglaciers and polar ice-sheets had a much smaller extensionthan today. A similar notch can also be found inside theUnderground River, up to 4 km from the entrance and at thesame elevation (Piccini and Iandelli 2011).
3. Underground HydrologyThe Underground (or Subterranean) River is a cave streamabout 8 km long which collects the water from a widesurface basin, diverting it to the sea through huge galleriesflooded by water.
Figure 2. Geological sketch map of Saint Paul karst area.
Figure 3. The Underground River just downstream the inflow,where the effect of tides does not occur. The lower limit offlowstone on the left wall indicates the water level during flood(photo by R. De Luca, La Venta).
Karst and Caves in Carbonate Rocks, Salt and Gypsum – oral 2013 ICS Proceedings
36
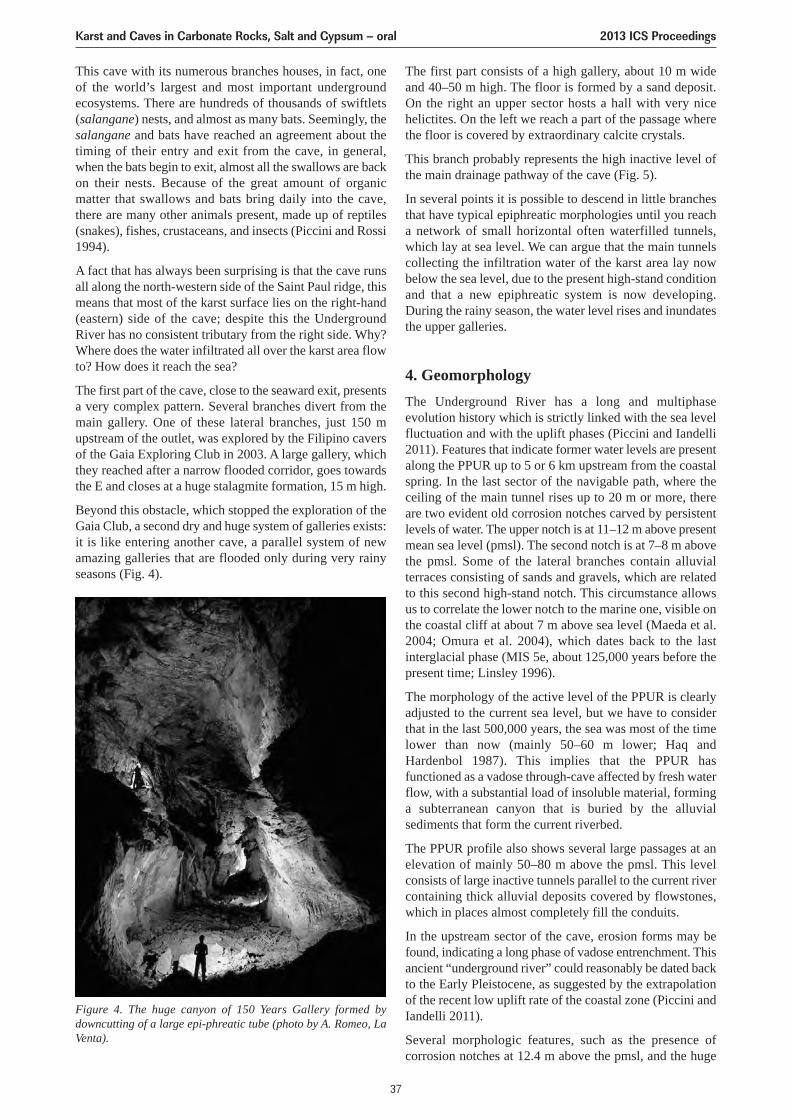
This cave with its numerous branches houses, in fact, oneof the world’s largest and most important undergroundecosystems. There are hundreds of thousands of swiftlets(salangane) nests, and almost as many bats. Seemingly, thesalangane and bats have reached an agreement about thetiming of their entry and exit from the cave, in general,when the bats begin to exit, almost all the swallows are backon their nests. Because of the great amount of organicmatter that swallows and bats bring daily into the cave,there are many other animals present, made up of reptiles(snakes), fishes, crustaceans, and insects (Piccini and Rossi1994).
A fact that has always been surprising is that the cave runsall along the north-western side of the Saint Paul ridge, thismeans that most of the karst surface lies on the right-hand(eastern) side of the cave; despite this the UndergroundRiver has no consistent tributary from the right side. Why?Where does the water infiltrated all over the karst area flowto? How does it reach the sea?
The first part of the cave, close to the seaward exit, presentsa very complex pattern. Several branches divert from themain gallery. One of these lateral branches, just 150 mupstream of the outlet, was explored by the Filipino caversof the Gaia Exploring Club in 2003. A large gallery, whichthey reached after a narrow flooded corridor, goes towardsthe E and closes at a huge stalagmite formation, 15 m high.
Beyond this obstacle, which stopped the exploration of theGaia Club, a second dry and huge system of galleries exists:it is like entering another cave, a parallel system of newamazing galleries that are flooded only during very rainyseasons (Fig. 4).
The first part consists of a high gallery, about 10 m wideand 40–50 m high. The floor is formed by a sand deposit.On the right an upper sector hosts a hall with very nicehelictites. On the left we reach a part of the passage wherethe floor is covered by extraordinary calcite crystals.
This branch probably represents the high inactive level ofthe main drainage pathway of the cave (Fig. 5).
In several points it is possible to descend in little branchesthat have typical epiphreatic morphologies until you reacha network of small horizontal often waterfilled tunnels,which lay at sea level. We can argue that the main tunnelscollecting the infiltration water of the karst area lay nowbelow the sea level, due to the present high-stand conditionand that a new epiphreatic system is now developing.During the rainy season, the water level rises and inundatesthe upper galleries.
4. GeomorphologyThe Underground River has a long and multiphaseevolution history which is strictly linked with the sea levelfluctuation and with the uplift phases (Piccini and Iandelli2011). Features that indicate former water levels are presentalong the PPUR up to 5 or 6 km upstream from the coastalspring. In the last sector of the navigable path, where theceiling of the main tunnel rises up to 20 m or more, thereare two evident old corrosion notches carved by persistentlevels of water. The upper notch is at 11–12 m above presentmean sea level (pmsl). The second notch is at 7–8 m abovethe pmsl. Some of the lateral branches contain alluvialterraces consisting of sands and gravels, which are relatedto this second high-stand notch. This circumstance allowsus to correlate the lower notch to the marine one, visible onthe coastal cliff at about 7 m above sea level (Maeda et al.2004; Omura et al. 2004), which dates back to the lastinterglacial phase (MIS 5e, about 125,000 years before thepresent time; Linsley 1996).
The morphology of the active level of the PPUR is clearlyadjusted to the current sea level, but we have to considerthat in the last 500,000 years, the sea was most of the timelower than now (mainly 50–60 m lower; Haq andHardenbol 1987). This implies that the PPUR hasfunctioned as a vadose through-cave affected by fresh waterflow, with a substantial load of insoluble material, forminga subterranean canyon that is buried by the alluvialsediments that form the current riverbed.
The PPUR profile also shows several large passages at anelevation of mainly 50–80 m above the pmsl. This levelconsists of large inactive tunnels parallel to the current rivercontaining thick alluvial deposits covered by flowstones,which in places almost completely fill the conduits.
In the upstream sector of the cave, erosion forms may befound, indicating a long phase of vadose entrenchment. Thisancient “underground river” could reasonably be dated backto the Early Pleistocene, as suggested by the extrapolationof the recent low uplift rate of the coastal zone (Piccini andIandelli 2011).
Several morphologic features, such as the presence ofcorrosion notches at 12.4 m above the pmsl, and the huge
Figure 4. The huge canyon of 150 Years Gallery formed bydowncutting of a large epi-phreatic tube (photo by A. Romeo, LaVenta).
Karst and Caves in Carbonate Rocks, Salt and Gypsum – oral 2013 ICS Proceedings
37
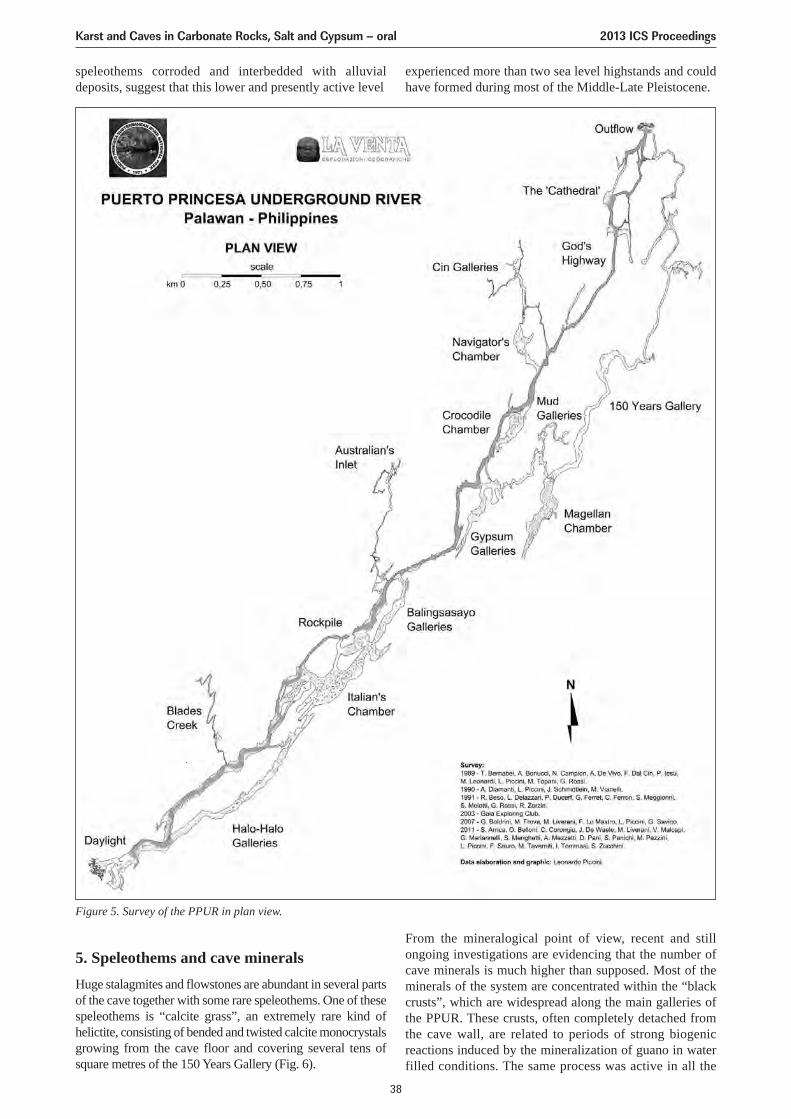
speleothems corroded and interbedded with alluvialdeposits, suggest that this lower and presently active level
experienced more than two sea level highstands and couldhave formed during most of the Middle-Late Pleistocene.
5. Speleothems and cave mineralsHuge stalagmites and flowstones are abundant in several partsof the cave together with some rare speleothems. One of thesespeleothems is “calcite grass”, an extremely rare kind ofhelictite, consisting of bended and twisted calcite monocrystalsgrowing from the cave floor and covering several tens ofsquare metres of the 150 Years Gallery (Fig. 6).
From the mineralogical point of view, recent and stillongoing investigations are evidencing that the number ofcave minerals is much higher than supposed. Most of theminerals of the system are concentrated within the “blackcrusts”, which are widespread along the main galleries ofthe PPUR. These crusts, often completely detached fromthe cave wall, are related to periods of strong biogenicreactions induced by the mineralization of guano in waterfilled conditions. The same process was active in all the
Figure 5. Survey of the PPUR in plan view.
Karst and Caves in Carbonate Rocks, Salt and Gypsum – oral 2013 ICS Proceedings
38
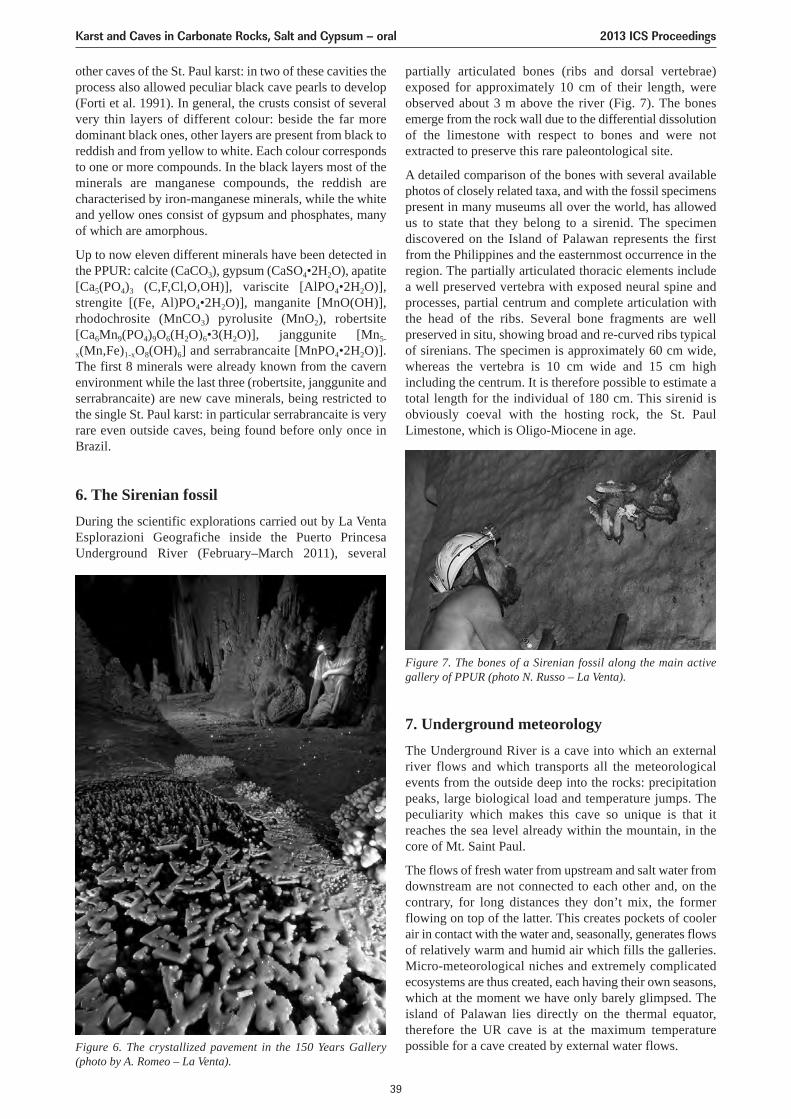
other caves of the St. Paul karst: in two of these cavities theprocess also allowed peculiar black cave pearls to develop(Forti et al. 1991). In general, the crusts consist of severalvery thin layers of different colour: beside the far moredominant black ones, other layers are present from black toreddish and from yellow to white. Each colour correspondsto one or more compounds. In the black layers most of theminerals are manganese compounds, the reddish arecharacterised by iron-manganese minerals, while the whiteand yellow ones consist of gypsum and phosphates, manyof which are amorphous.
Up to now eleven different minerals have been detected inthe PPUR: calcite (CaCO3), gypsum (CaSO4•2H2O), apatite[Ca5(PO4)3 (C,F,Cl,O,OH)], variscite [AlPO4•2H2O)],strengite [(Fe, Al)PO4•2H2O)], manganite [MnO(OH)],rhodochrosite (MnCO3) pyrolusite (MnO2), robertsite[Ca6Mn9(PO4)9O6(H2O)6•3(H2O)], janggunite [Mn5-
x(Mn,Fe)1-xO8(OH)6] and serrabrancaite [MnPO4•2H2O)].The first 8 minerals were already known from the cavernenvironment while the last three (robertsite, janggunite andserrabrancaite) are new cave minerals, being restricted tothe single St. Paul karst: in particular serrabrancaite is veryrare even outside caves, being found before only once inBrazil.
6. The Sirenian fossilDuring the scientific explorations carried out by La VentaEsplorazioni Geografiche inside the Puerto PrincesaUnderground River (February–March 2011), several
partially articulated bones (ribs and dorsal vertebrae)exposed for approximately 10 cm of their length, wereobserved about 3 m above the river (Fig. 7). The bonesemerge from the rock wall due to the differential dissolutionof the limestone with respect to bones and were notextracted to preserve this rare paleontological site.
A detailed comparison of the bones with several availablephotos of closely related taxa, and with the fossil specimenspresent in many museums all over the world, has allowedus to state that they belong to a sirenid. The specimendiscovered on the Island of Palawan represents the firstfrom the Philippines and the easternmost occurrence in theregion. The partially articulated thoracic elements includea well preserved vertebra with exposed neural spine andprocesses, partial centrum and complete articulation withthe head of the ribs. Several bone fragments are wellpreserved in situ, showing broad and re-curved ribs typicalof sirenians. The specimen is approximately 60 cm wide,whereas the vertebra is 10 cm wide and 15 cm highincluding the centrum. It is therefore possible to estimate atotal length for the individual of 180 cm. This sirenid isobviously coeval with the hosting rock, the St. PaulLimestone, which is Oligo-Miocene in age.
7. Underground meteorologyThe Underground River is a cave into which an externalriver flows and which transports all the meteorologicalevents from the outside deep into the rocks: precipitationpeaks, large biological load and temperature jumps. Thepeculiarity which makes this cave so unique is that itreaches the sea level already within the mountain, in thecore of Mt. Saint Paul.
The flows of fresh water from upstream and salt water fromdownstream are not connected to each other and, on thecontrary, for long distances they don’t mix, the formerflowing on top of the latter. This creates pockets of coolerair in contact with the water and, seasonally, generates flowsof relatively warm and humid air which fills the galleries.Micro-meteorological niches and extremely complicatedecosystems are thus created, each having their own seasons,which at the moment we have only barely glimpsed. Theisland of Palawan lies directly on the thermal equator,therefore the UR cave is at the maximum temperaturepossible for a cave created by external water flows.Figure 6. The crystallized pavement in the 150 Years Gallery
(photo by A. Romeo – La Venta).
Figure 7. The bones of a Sirenian fossil along the main activegallery of PPUR (photo N. Russo – La Venta).
Karst and Caves in Carbonate Rocks, Salt and Gypsum – oral 2013 ICS Proceedings
39
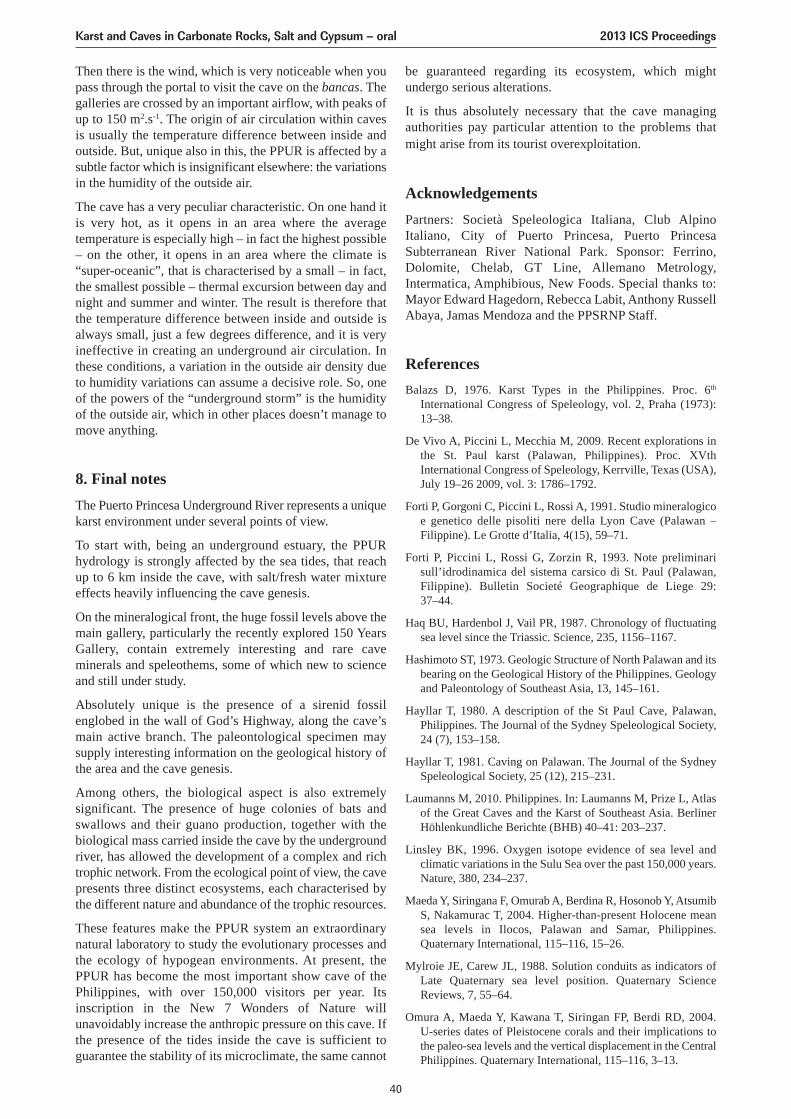
Then there is the wind, which is very noticeable when youpass through the portal to visit the cave on the bancas. Thegalleries are crossed by an important airflow, with peaks ofup to 150 m2.s-1. The origin of air circulation within cavesis usually the temperature difference between inside andoutside. But, unique also in this, the PPUR is affected by asubtle factor which is insignificant elsewhere: the variationsin the humidity of the outside air.
The cave has a very peculiar characteristic. On one hand itis very hot, as it opens in an area where the averagetemperature is especially high – in fact the highest possible– on the other, it opens in an area where the climate is“super-oceanic”, that is characterised by a small – in fact,the smallest possible – thermal excursion between day andnight and summer and winter. The result is therefore thatthe temperature difference between inside and outside isalways small, just a few degrees difference, and it is veryineffective in creating an underground air circulation. Inthese conditions, a variation in the outside air density dueto humidity variations can assume a decisive role. So, oneof the powers of the “underground storm” is the humidityof the outside air, which in other places doesn’t manage tomove anything.
8. Final notesThe Puerto Princesa Underground River represents a uniquekarst environment under several points of view.
To start with, being an underground estuary, the PPURhydrology is strongly affected by the sea tides, that reachup to 6 km inside the cave, with salt/fresh water mixtureeffects heavily influencing the cave genesis.
On the mineralogical front, the huge fossil levels above themain gallery, particularly the recently explored 150 YearsGallery, contain extremely interesting and rare caveminerals and speleothems, some of which new to scienceand still under study.
Absolutely unique is the presence of a sirenid fossilenglobed in the wall of God’s Highway, along the cave’smain active branch. The paleontological specimen maysupply interesting information on the geological history ofthe area and the cave genesis.
Among others, the biological aspect is also extremelysignificant. The presence of huge colonies of bats andswallows and their guano production, together with thebiological mass carried inside the cave by the undergroundriver, has allowed the development of a complex and richtrophic network. From the ecological point of view, the cavepresents three distinct ecosystems, each characterised bythe different nature and abundance of the trophic resources.
These features make the PPUR system an extraordinarynatural laboratory to study the evolutionary processes andthe ecology of hypogean environments. At present, thePPUR has become the most important show cave of thePhilippines, with over 150,000 visitors per year. Itsinscription in the New 7 Wonders of Nature willunavoidably increase the anthropic pressure on this cave. Ifthe presence of the tides inside the cave is sufficient toguarantee the stability of its microclimate, the same cannot
be guaranteed regarding its ecosystem, which mightundergo serious alterations.
It is thus absolutely necessary that the cave managingauthorities pay particular attention to the problems thatmight arise from its tourist overexploitation.
AcknowledgementsPartners: Società Speleologica Italiana, Club AlpinoItaliano, City of Puerto Princesa, Puerto PrincesaSubterranean River National Park. Sponsor: Ferrino,Dolomite, Chelab, GT Line, Allemano Metrology,Intermatica, Amphibious, New Foods. Special thanks to:Mayor Edward Hagedorn, Rebecca Labit, Anthony RussellAbaya, Jamas Mendoza and the PPSRNP Staff.
ReferencesBalazs D, 1976. Karst Types in the Philippines. Proc. 6th
International Congress of Speleology, vol. 2, Praha (1973):13–38.
De Vivo A, Piccini L, Mecchia M, 2009. Recent explorations inthe St. Paul karst (Palawan, Philippines). Proc. XVthInternational Congress of Speleology, Kerrville, Texas (USA),July 19–26 2009, vol. 3: 1786–1792.
Forti P, Gorgoni C, Piccini L, Rossi A, 1991. Studio mineralogicoe genetico delle pisoliti nere della Lyon Cave (Palawan –Filippine). Le Grotte d’Italia, 4(15), 59–71.
Forti P, Piccini L, Rossi G, Zorzin R, 1993. Note preliminarisull’idrodinamica del sistema carsico di St. Paul (Palawan,Filippine). Bulletin Societé Geographique de Liege 29: 37–44.
Haq BU, Hardenbol J, Vail PR, 1987. Chronology of fluctuatingsea level since the Triassic. Science, 235, 1156–1167.
Hashimoto ST, 1973. Geologic Structure of North Palawan and itsbearing on the Geological History of the Philippines. Geologyand Paleontology of Southeast Asia, 13, 145–161.
Hayllar T, 1980. A description of the St Paul Cave, Palawan,Philippines. The Journal of the Sydney Speleological Society,24 (7), 153–158.
Hayllar T, 1981. Caving on Palawan. The Journal of the SydneySpeleological Society, 25 (12), 215–231.
Laumanns M, 2010. Philippines. In: Laumanns M, Prize L, Atlasof the Great Caves and the Karst of Southeast Asia. BerlinerHöhlenkundliche Berichte (BHB) 40–41: 203–237.
Linsley BK, 1996. Oxygen isotope evidence of sea level andclimatic variations in the Sulu Sea over the past 150,000 years.Nature, 380, 234–237.
Maeda Y, Siringana F, Omurab A, Berdina R, Hosonob Y, AtsumibS, Nakamurac T, 2004. Higher-than-present Holocene meansea levels in Ilocos, Palawan and Samar, Philippines.Quaternary International, 115–116, 15–26.
Mylroie JE, Carew JL, 1988. Solution conduits as indicators ofLate Quaternary sea level position. Quaternary ScienceReviews, 7, 55–64.
Omura A, Maeda Y, Kawana T, Siringan FP, Berdi RD, 2004.U-series dates of Pleistocene corals and their implications tothe paleo-sea levels and the vertical displacement in the CentralPhilippines. Quaternary International, 115–116, 3–13.
Karst and Caves in Carbonate Rocks, Salt and Gypsum – oral 2013 ICS Proceedings
40

Piccini L, Rossi G, (Eds.), 1994. Le esplorazioni speleologicheitaliane nell’Isola di Palawan, Filippine – Italian cavingexploration in the island of Palawan, Philippines. Speleologia,31, 5–61 (Italian–English).
Piccini L, De Vivo A, 2012. Il carso del Monte Saint Paul(Palawan – Filippine). Speleologia, 66, 46–59.
Piccini L, Iandelli N, 2011. Tectonic uplift, sea level changes andevolution of a coastal karst: the Saint Paul Mountan (Palawan,Philippines). Earth Surface Processes and Landforms, 36, 594–609.
Karst and Caves in Carbonate Rocks, Salt and Gypsum – oral 2013 ICS Proceedings
41
SUBTERRANEAN GLACIAL SPILLWAYS: AN EXAMPLE FROM THEKARST OF SOUTH WALES, UK
Andrew R Farrant1, Michael J Simms2, Steven R Noble1
1British Geological Survey, Keyworth, Nottingham, NG12 5GG, UK, [email protected] of Geology, National Museums Northern Ireland, Cultra, Holywood, Co. Down, BT18 0EU, Northern
Ireland, [email protected]
Many karst areas in the UK have been glaciated one or more times during the last 0.5 Ma, yet there are few documentedexamples of caves in these regions being affected by glacial processes other than erosion. The karst of South Wales is onearea where sub or pro-glacial modification of pre-existing caves is thought to occur. Evidence from the Ogof Draenencave system suggests that caves can sometimes act as subterranean glacial “underspill” channels for melt-water. This cave,one of the longest in Britain with a surveyed length of over 70 km, underlies the interfluve between two glaciated valleys.Sediment fills and speleo-morphological observations indicate that melt-water from a high level glacier in the Afon Lwydvalley (>340 m a.s.l.) filled part of the cave and over-spilled into the neighbouring Usk valley, temporarily reversing non-glacial groundwater flow directions in the cave. It is suggested that this may have occurred during a Middle Pleistoceneglaciation.
(Note: Welsh terms used in this paper: Ogof = Cave, Afon = River, Cwm = Valley, Mynydd = Mountain).
1. IntroductionMost of the upland karst areas in the north and west of theUK have been glaciated several times during the past 0.5 Ma, particularly during the Marine Isotope Stage (MIS)12 Anglian glaciation (equivalent to the Elsterian ofnorthwest Europe) and the MIS 2-4 Devensian glaciation(equivalent to the Weichselian), but also during MiddlePleistocene glaciations. Glaciations can have profound andcomplex effects upon karst landforms and their underlyingaquifers, and may destroy, inhibit, preserve, or stimulatekarst development (Ford 1987). Sub-glacial water flow canbe considerable, especially in active, warm based glaciers,and at the margins of glaciers and ice sheets. Where theseare in contact with karstified aquifers, there is scope forsignificant input of allogenic melt water into pre-existingcave systems (Lauritzen 1984, 1986).
The impact of glaciations on caves in the UK is poorlyunderstood, with few documented examples of caves beingaffected by glacial activity except through valley incisionand erosion. One example of a cave system being affectedby glacial activity is Dale Barn Cave in the Yorkshire Daleskarst of northwest England, which is thought to have beenreactivated by sub glacial melt waters (Murphy et al. 2001).This largely phreatic system connects two adjacent glacialvalleys, Chapel-le-Dale and Kingsdale near Ingleton,Yorkshire. Speleothems dated to 343.4 (+86.0/-47.7) kawithin the Illusion Pot section of the cave suggest that theconduit was drained during or prior to Marine IsotopeStage 10. However, scalloping on these speleothems suggestit underwent a second, later phreatic episode, with waterforced uphill from Chapel-le-Dale to Kingsdale, a distanceof approximately 1.5 km. Sediments preserved within theconduit contain distinctive lithologies derived from theChapel-le-Dale end of the cave, and resemble thosedescribed from sub-glacial eskers. The reactivation of theconduit is most plausibly explained by sub-glacial drainagenear the snout of the Chapel-le-Dale glacier flowing throughto the higher, but unglaciated Kingsdale valley.
In the karst of South Wales, there is further evidence forglacial modification of pre-existing cave systems throughmelt water recharge. Copious amounts of sediment havebeen introduced into some caves by glacial melt-water,notably those under Mynydd Llangattock (Smart andGardner 1988). This has led to ponding and localizedparagenesis; blocking some passages, reactivating othersand in some cases, facilitating the development of newconduits (Farrant and Smart 2011). In Ogof Agen Allwedd,Simms and Hunt (2007) provide evidence of sedimentinflux, glacial flooding and impoundment and suggest thatglacial damming and recharge from melt-water might havebeen a significant factor in its development. The discoveryof a major new cave system Ogof Draenen in 1994 (Farrantand Simms 2011) a few kilometers to the southeast ofMynydd Llangattock has provided additional evidence forthe utilization of caves by glacial melt water.
2. Ogof DraenenOgof Draenen [National Grid Reference SO 24631 1179]is a complex multiphase intrastratal cave system located sixkilometres south-west of Abergavenny, South Wales(Figure 1). It is currently one of the longest cave systemsin the UK at more than 70 km in length and spanning over150 m in elevation (Chelsea Speleological Society andStevens 1997; Waltham et al. 1997). The cave is developedwithin Lower Carboniferous limestones on the north-eastern margin of the South Wales coalfield. The limestonesare overlain by Upper Carboniferous siliciclastics includingthe Twrch Sandstone Formation (“Millstone Grit”) and the“Coal Measures”, a cyclical sequence of sandstones andmudstones with some coal seams (Barclay 1989). Thegeological structure is relatively simple, with dips to thesouth-west at between 5° and 20°. Ogof Draenen underliesthe interfluve between the deeply incised Usk valley and itstributaries to the north and east, and the smaller Afon Lwydvalley to the west.
Karst and Caves in Carbonate Rocks, Salt and Gypsum – oral 2013 ICS Proceedings
42
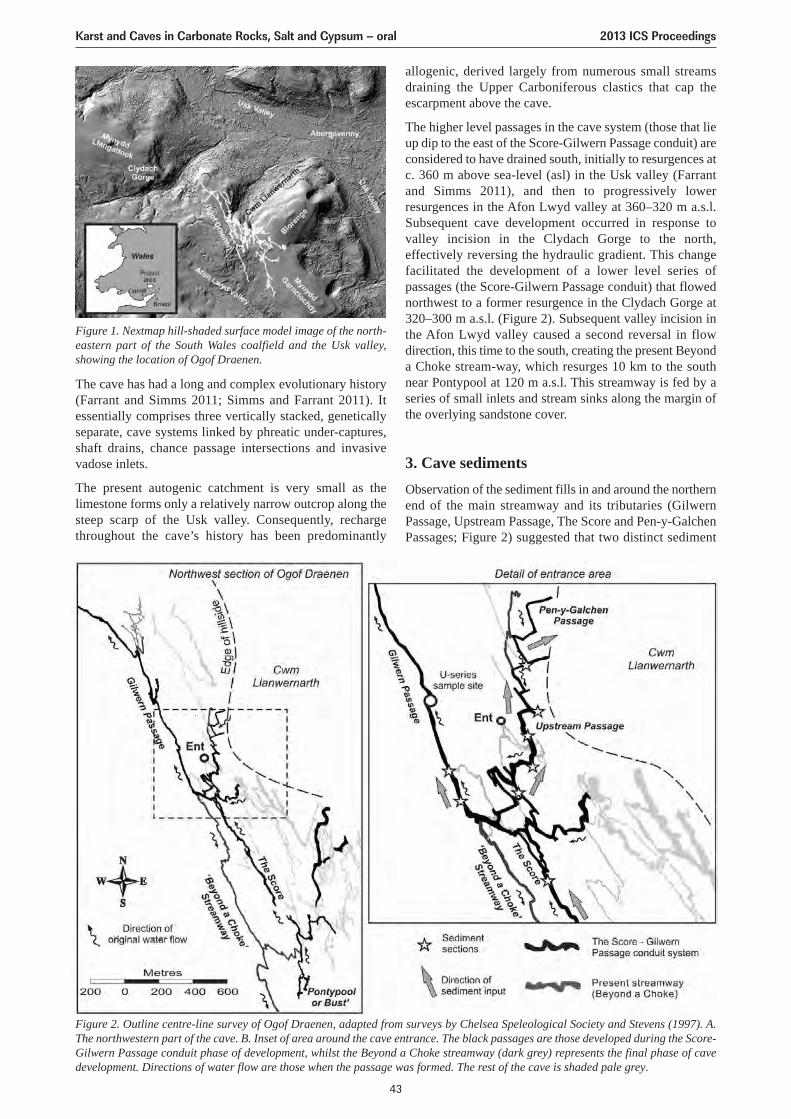
The cave has had a long and complex evolutionary history(Farrant and Simms 2011; Simms and Farrant 2011). Itessentially comprises three vertically stacked, geneticallyseparate, cave systems linked by phreatic under-captures,shaft drains, chance passage intersections and invasivevadose inlets.
The present autogenic catchment is very small as thelimestone forms only a relatively narrow outcrop along thesteep scarp of the Usk valley. Consequently, rechargethroughout the cave’s history has been predominantly
allogenic, derived largely from numerous small streamsdraining the Upper Carboniferous clastics that cap theescarpment above the cave.
The higher level passages in the cave system (those that lieup dip to the east of the Score-Gilwern Passage conduit) areconsidered to have drained south, initially to resurgences atc. 360 m above sea-level (asl) in the Usk valley (Farrantand Simms 2011), and then to progressively lowerresurgences in the Afon Lwyd valley at 360–320 m a.s.l.Subsequent cave development occurred in response tovalley incision in the Clydach Gorge to the north,effectively reversing the hydraulic gradient. This changefacilitated the development of a lower level series ofpassages (the Score-Gilwern Passage conduit) that flowednorthwest to a former resurgence in the Clydach Gorge at320–300 m a.s.l. (Figure 2). Subsequent valley incision inthe Afon Lwyd valley caused a second reversal in flowdirection, this time to the south, creating the present Beyonda Choke stream-way, which resurges 10 km to the southnear Pontypool at 120 m a.s.l. This streamway is fed by aseries of small inlets and stream sinks along the margin ofthe overlying sandstone cover.
3. Cave sedimentsObservation of the sediment fills in and around the northernend of the main streamway and its tributaries (GilwernPassage, Upstream Passage, The Score and Pen-y-GalchenPassages; Figure 2) suggested that two distinct sediment
Figure 1. Nextmap hill-shaded surface model image of the north-eastern part of the South Wales coalfield and the Usk valley,showing the location of Ogof Draenen.
Figure 2. Outline centre-line survey of Ogof Draenen, adapted from surveys by Chelsea Speleological Society and Stevens (1997). A.The northwestern part of the cave. B. Inset of area around the cave entrance. The black passages are those developed during the Score-Gilwern Passage conduit phase of development, whilst the Beyond a Choke streamway (dark grey) represents the final phase of cavedevelopment. Directions of water flow are those when the passage was formed. The rest of the cave is shaded pale grey.
Karst and Caves in Carbonate Rocks, Salt and Gypsum – oral 2013 ICS Proceedings
43
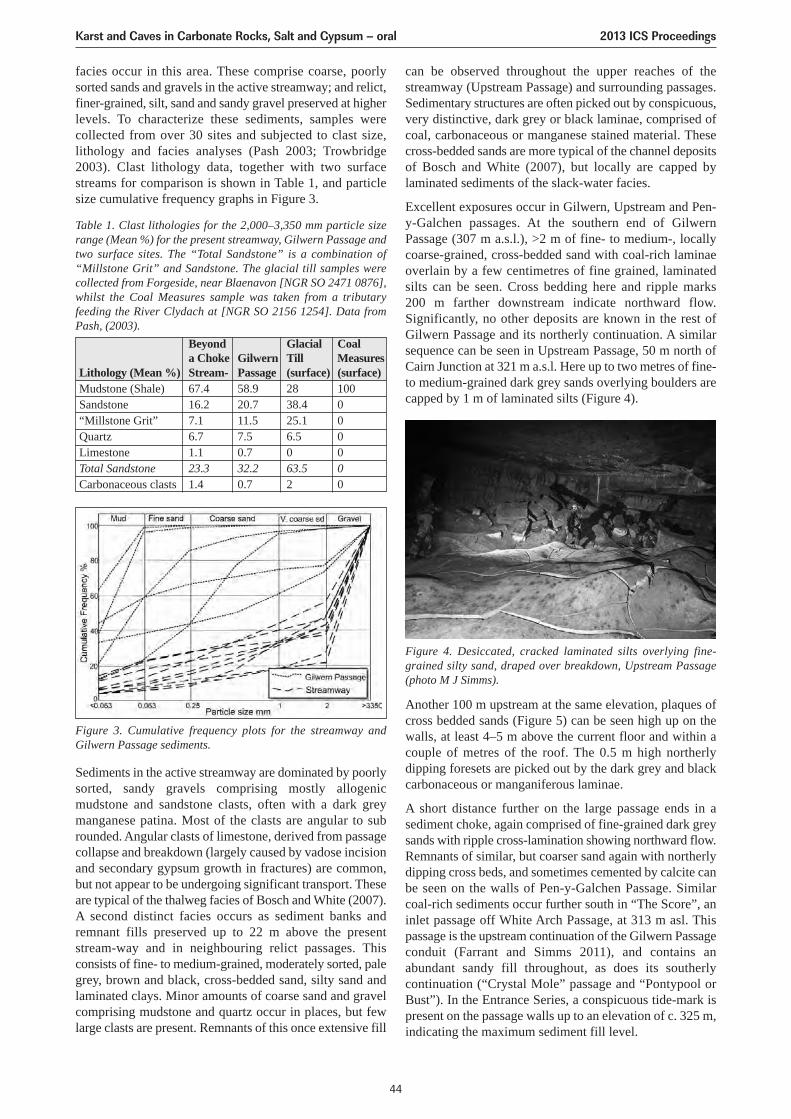
can be observed throughout the upper reaches of thestreamway (Upstream Passage) and surrounding passages.Sedimentary structures are often picked out by conspicuous,very distinctive, dark grey or black laminae, comprised ofcoal, carbonaceous or manganese stained material. Thesecross-bedded sands are more typical of the channel depositsof Bosch and White (2007), but locally are capped bylaminated sediments of the slack-water facies.
Excellent exposures occur in Gilwern, Upstream and Pen-y-Galchen passages. At the southern end of GilwernPassage (307 m a.s.l.), >2 m of fine- to medium-, locallycoarse-grained, cross-bedded sand with coal-rich laminaeoverlain by a few centimetres of fine grained, laminatedsilts can be seen. Cross bedding here and ripple marks200 m farther downstream indicate northward flow.Significantly, no other deposits are known in the rest ofGilwern Passage and its northerly continuation. A similarsequence can be seen in Upstream Passage, 50 m north ofCairn Junction at 321 m a.s.l. Here up to two metres of fine-to medium-grained dark grey sands overlying boulders arecapped by 1 m of laminated silts (Figure 4).
Another 100 m upstream at the same elevation, plaques ofcross bedded sands (Figure 5) can be seen high up on thewalls, at least 4–5 m above the current floor and within acouple of metres of the roof. The 0.5 m high northerlydipping foresets are picked out by the dark grey and blackcarbonaceous or manganiferous laminae.
A short distance further on the large passage ends in asediment choke, again comprised of fine-grained dark greysands with ripple cross-lamination showing northward flow.Remnants of similar, but coarser sand again with northerlydipping cross beds, and sometimes cemented by calcite canbe seen on the walls of Pen-y-Galchen Passage. Similarcoal-rich sediments occur further south in “The Score”, aninlet passage off White Arch Passage, at 313 m asl. Thispassage is the upstream continuation of the Gilwern Passageconduit (Farrant and Simms 2011), and contains anabundant sandy fill throughout, as does its southerlycontinuation (“Crystal Mole” passage and “Pontypool orBust”). In the Entrance Series, a conspicuous tide-mark ispresent on the passage walls up to an elevation of c. 325 m,indicating the maximum sediment fill level.
facies occur in this area. These comprise coarse, poorlysorted sands and gravels in the active streamway; and relict,finer-grained, silt, sand and sandy gravel preserved at higherlevels. To characterize these sediments, samples werecollected from over 30 sites and subjected to clast size,lithology and facies analyses (Pash 2003; Trowbridge2003). Clast lithology data, together with two surfacestreams for comparison is shown in Table 1, and particlesize cumulative frequency graphs in Figure 3.
Sediments in the active streamway are dominated by poorlysorted, sandy gravels comprising mostly allogenicmudstone and sandstone clasts, often with a dark greymanganese patina. Most of the clasts are angular to subrounded. Angular clasts of limestone, derived from passagecollapse and breakdown (largely caused by vadose incisionand secondary gypsum growth in fractures) are common,but not appear to be undergoing significant transport. Theseare typical of the thalweg facies of Bosch and White (2007).A second distinct facies occurs as sediment banks andremnant fills preserved up to 22 m above the presentstream-way and in neighbouring relict passages. Thisconsists of fine- to medium-grained, moderately sorted, palegrey, brown and black, cross-bedded sand, silty sand andlaminated clays. Minor amounts of coarse sand and gravelcomprising mudstone and quartz occur in places, but fewlarge clasts are present. Remnants of this once extensive fill
Table 1. Clast lithologies for the 2,000–3,350 mm particle sizerange (Mean %) for the present streamway, Gilwern Passage andtwo surface sites. The “Total Sandstone” is a combination of“Millstone Grit” and Sandstone. The glacial till samples werecollected from Forgeside, near Blaenavon [NGR SO 2471 0876],whilst the Coal Measures sample was taken from a tributaryfeeding the River Clydach at [NGR SO 2156 1254]. Data fromPash, (2003).
Beyond Glacial Coala Choke Gilwern Till Measures
Lithology (Mean %) Stream- Passage (surface) (surface)Mudstone (Shale) 67.4 58.9 28 100Sandstone 16.2 20.7 38.4 0“Millstone Grit” 7.1 11.5 25.1 0Quartz 6.7 7.5 6.5 0Limestone 1.1 0.7 0 0Total Sandstone 23.3 32.2 63.5 0Carbonaceous clasts 1.4 0.7 2 0
Figure 3. Cumulative frequency plots for the streamway andGilwern Passage sediments.
Figure 4. Desiccated, cracked laminated silts overlying fine-grained silty sand, draped over breakdown, Upstream Passage(photo M J Simms).
Karst and Caves in Carbonate Rocks, Salt and Gypsum – oral 2013 ICS Proceedings
44
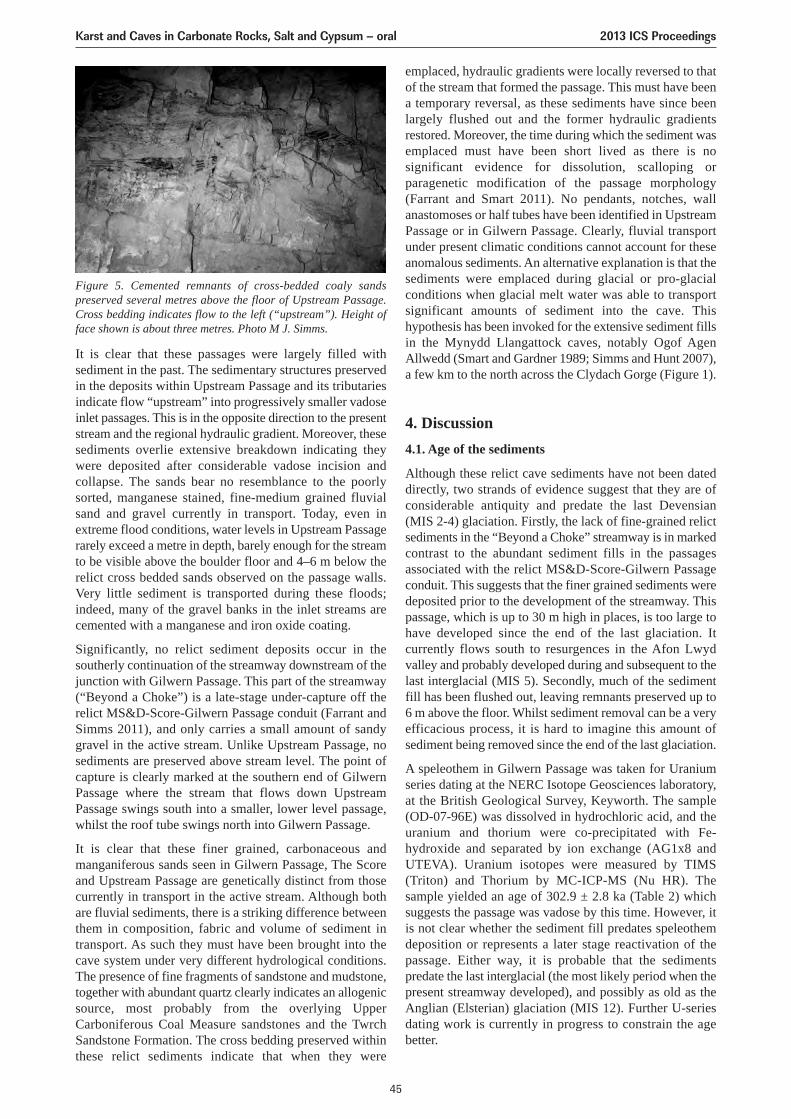
Figure 5. Cemented remnants of cross-bedded coaly sandspreserved several metres above the floor of Upstream Passage.Cross bedding indicates flow to the left (“upstream”). Height offace shown is about three metres. Photo M J. Simms.
It is clear that these passages were largely filled withsediment in the past. The sedimentary structures preservedin the deposits within Upstream Passage and its tributariesindicate flow “upstream” into progressively smaller vadoseinlet passages. This is in the opposite direction to the presentstream and the regional hydraulic gradient. Moreover, thesesediments overlie extensive breakdown indicating theywere deposited after considerable vadose incision andcollapse. The sands bear no resemblance to the poorlysorted, manganese stained, fine-medium grained fluvialsand and gravel currently in transport. Today, even inextreme flood conditions, water levels in Upstream Passagerarely exceed a metre in depth, barely enough for the streamto be visible above the boulder floor and 4–6 m below therelict cross bedded sands observed on the passage walls.Very little sediment is transported during these floods;indeed, many of the gravel banks in the inlet streams arecemented with a manganese and iron oxide coating.
Significantly, no relict sediment deposits occur in thesoutherly continuation of the streamway downstream of thejunction with Gilwern Passage. This part of the streamway(“Beyond a Choke”) is a late-stage under-capture off therelict MS&D-Score-Gilwern Passage conduit (Farrant andSimms 2011), and only carries a small amount of sandygravel in the active stream. Unlike Upstream Passage, nosediments are preserved above stream level. The point ofcapture is clearly marked at the southern end of GilwernPassage where the stream that flows down UpstreamPassage swings south into a smaller, lower level passage,whilst the roof tube swings north into Gilwern Passage.
It is clear that these finer grained, carbonaceous andmanganiferous sands seen in Gilwern Passage, The Scoreand Upstream Passage are genetically distinct from thosecurrently in transport in the active stream. Although bothare fluvial sediments, there is a striking difference betweenthem in composition, fabric and volume of sediment intransport. As such they must have been brought into thecave system under very different hydrological conditions.The presence of fine fragments of sandstone and mudstone,together with abundant quartz clearly indicates an allogenicsource, most probably from the overlying UpperCarboniferous Coal Measure sandstones and the TwrchSandstone Formation. The cross bedding preserved withinthese relict sediments indicate that when they were
emplaced, hydraulic gradients were locally reversed to thatof the stream that formed the passage. This must have beena temporary reversal, as these sediments have since beenlargely flushed out and the former hydraulic gradientsrestored. Moreover, the time during which the sediment wasemplaced must have been short lived as there is nosignificant evidence for dissolution, scalloping orparagenetic modification of the passage morphology(Farrant and Smart 2011). No pendants, notches, wallanastomoses or half tubes have been identified in UpstreamPassage or in Gilwern Passage. Clearly, fluvial transportunder present climatic conditions cannot account for theseanomalous sediments. An alternative explanation is that thesediments were emplaced during glacial or pro-glacialconditions when glacial melt water was able to transportsignificant amounts of sediment into the cave. Thishypothesis has been invoked for the extensive sediment fillsin the Mynydd Llangattock caves, notably Ogof AgenAllwedd (Smart and Gardner 1989; Simms and Hunt 2007),a few km to the north across the Clydach Gorge (Figure 1).
4. Discussion4.1. Age of the sediments
Although these relict cave sediments have not been dateddirectly, two strands of evidence suggest that they are ofconsiderable antiquity and predate the last Devensian(MIS 2-4) glaciation. Firstly, the lack of fine-grained relictsediments in the “Beyond a Choke” streamway is in markedcontrast to the abundant sediment fills in the passagesassociated with the relict MS&D-Score-Gilwern Passageconduit. This suggests that the finer grained sediments weredeposited prior to the development of the streamway. Thispassage, which is up to 30 m high in places, is too large tohave developed since the end of the last glaciation. Itcurrently flows south to resurgences in the Afon Lwydvalley and probably developed during and subsequent to thelast interglacial (MIS 5). Secondly, much of the sedimentfill has been flushed out, leaving remnants preserved up to6 m above the floor. Whilst sediment removal can be a veryefficacious process, it is hard to imagine this amount ofsediment being removed since the end of the last glaciation.
A speleothem in Gilwern Passage was taken for Uraniumseries dating at the NERC Isotope Geosciences laboratory,at the British Geological Survey, Keyworth. The sample(OD-07-96E) was dissolved in hydrochloric acid, and theuranium and thorium were co-precipitated with Fe-hydroxide and separated by ion exchange (AG1x8 andUTEVA). Uranium isotopes were measured by TIMS(Triton) and Thorium by MC-ICP-MS (Nu HR). Thesample yielded an age of 302.9 ± 2.8 ka (Table 2) whichsuggests the passage was vadose by this time. However, itis not clear whether the sediment fill predates speleothemdeposition or represents a later stage reactivation of thepassage. Either way, it is probable that the sedimentspredate the last interglacial (the most likely period when thepresent streamway developed), and possibly as old as theAnglian (Elsterian) glaciation (MIS 12). Further U-seriesdating work is currently in progress to constrain the agebetter.
Karst and Caves in Carbonate Rocks, Salt and Gypsum – oral 2013 ICS Proceedings
45
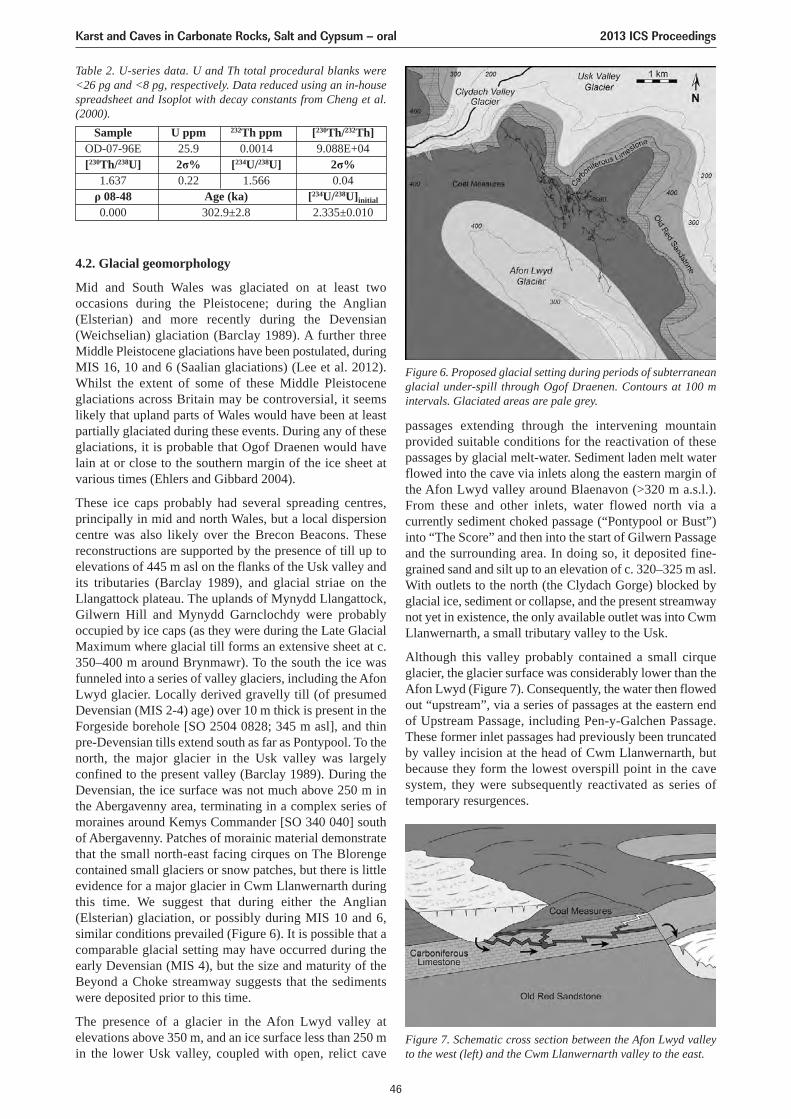
4.2. Glacial geomorphology
Mid and South Wales was glaciated on at least twooccasions during the Pleistocene; during the Anglian(Elsterian) and more recently during the Devensian(Weichselian) glaciation (Barclay 1989). A further threeMiddle Pleistocene glaciations have been postulated, duringMIS 16, 10 and 6 (Saalian glaciations) (Lee et al. 2012).Whilst the extent of some of these Middle Pleistoceneglaciations across Britain may be controversial, it seemslikely that upland parts of Wales would have been at leastpartially glaciated during these events. During any of theseglaciations, it is probable that Ogof Draenen would havelain at or close to the southern margin of the ice sheet atvarious times (Ehlers and Gibbard 2004).
These ice caps probably had several spreading centres,principally in mid and north Wales, but a local dispersioncentre was also likely over the Brecon Beacons. Thesereconstructions are supported by the presence of till up toelevations of 445 m asl on the flanks of the Usk valley andits tributaries (Barclay 1989), and glacial striae on theLlangattock plateau. The uplands of Mynydd Llangattock,Gilwern Hill and Mynydd Garnclochdy were probablyoccupied by ice caps (as they were during the Late GlacialMaximum where glacial till forms an extensive sheet at c.350–400 m around Brynmawr). To the south the ice wasfunneled into a series of valley glaciers, including the AfonLwyd glacier. Locally derived gravelly till (of presumedDevensian (MIS 2-4) age) over 10 m thick is present in theForgeside borehole [SO 2504 0828; 345 m asl], and thinpre-Devensian tills extend south as far as Pontypool. To thenorth, the major glacier in the Usk valley was largelyconfined to the present valley (Barclay 1989). During theDevensian, the ice surface was not much above 250 m inthe Abergavenny area, terminating in a complex series ofmoraines around Kemys Commander [SO 340 040] southof Abergavenny. Patches of morainic material demonstratethat the small north-east facing cirques on The Blorengecontained small glaciers or snow patches, but there is littleevidence for a major glacier in Cwm Llanwernarth duringthis time. We suggest that during either the Anglian(Elsterian) glaciation, or possibly during MIS 10 and 6,similar conditions prevailed (Figure 6). It is possible that acomparable glacial setting may have occurred during theearly Devensian (MIS 4), but the size and maturity of theBeyond a Choke streamway suggests that the sedimentswere deposited prior to this time.
The presence of a glacier in the Afon Lwyd valley atelevations above 350 m, and an ice surface less than 250 min the lower Usk valley, coupled with open, relict cave
passages extending through the intervening mountainprovided suitable conditions for the reactivation of thesepassages by glacial melt-water. Sediment laden melt waterflowed into the cave via inlets along the eastern margin ofthe Afon Lwyd valley around Blaenavon (>320 m a.s.l.).From these and other inlets, water flowed north via acurrently sediment choked passage (“Pontypool or Bust”)into “The Score” and then into the start of Gilwern Passageand the surrounding area. In doing so, it deposited fine-grained sand and silt up to an elevation of c. 320–325 m asl.With outlets to the north (the Clydach Gorge) blocked byglacial ice, sediment or collapse, and the present streamwaynot yet in existence, the only available outlet was into CwmLlanwernarth, a small tributary valley to the Usk.
Although this valley probably contained a small cirqueglacier, the glacier surface was considerably lower than theAfon Lwyd (Figure 7). Consequently, the water then flowedout “upstream”, via a series of passages at the eastern endof Upstream Passage, including Pen-y-Galchen Passage.These former inlet passages had previously been truncatedby valley incision at the head of Cwm Llanwernarth, butbecause they form the lowest overspill point in the cavesystem, they were subsequently reactivated as series oftemporary resurgences.
Table 2. U-series data. U and Th total procedural blanks were<26 pg and <8 pg, respectively. Data reduced using an in-housespreadsheet and Isoplot with decay constants from Cheng et al.(2000).
Sample U ppm 232Th ppm [230Th/232Th]OD-07-96E 25.9 0.0014 9.088E+04[230Th/238U] 2σ% [234U/238U] 2σ%
1.637 0.22 1.566 0.04ρ 08-48 Age (ka) [234U/238U]initial
0.000 302.9±2.8 2.335±0.010
Figure 6. Proposed glacial setting during periods of subterraneanglacial under-spill through Ogof Draenen. Contours at 100 mintervals. Glaciated areas are pale grey.
Figure 7. Schematic cross section between the Afon Lwyd valleyto the west (left) and the Cwm Llanwernarth valley to the east.
Karst and Caves in Carbonate Rocks, Salt and Gypsum – oral 2013 ICS Proceedings
46
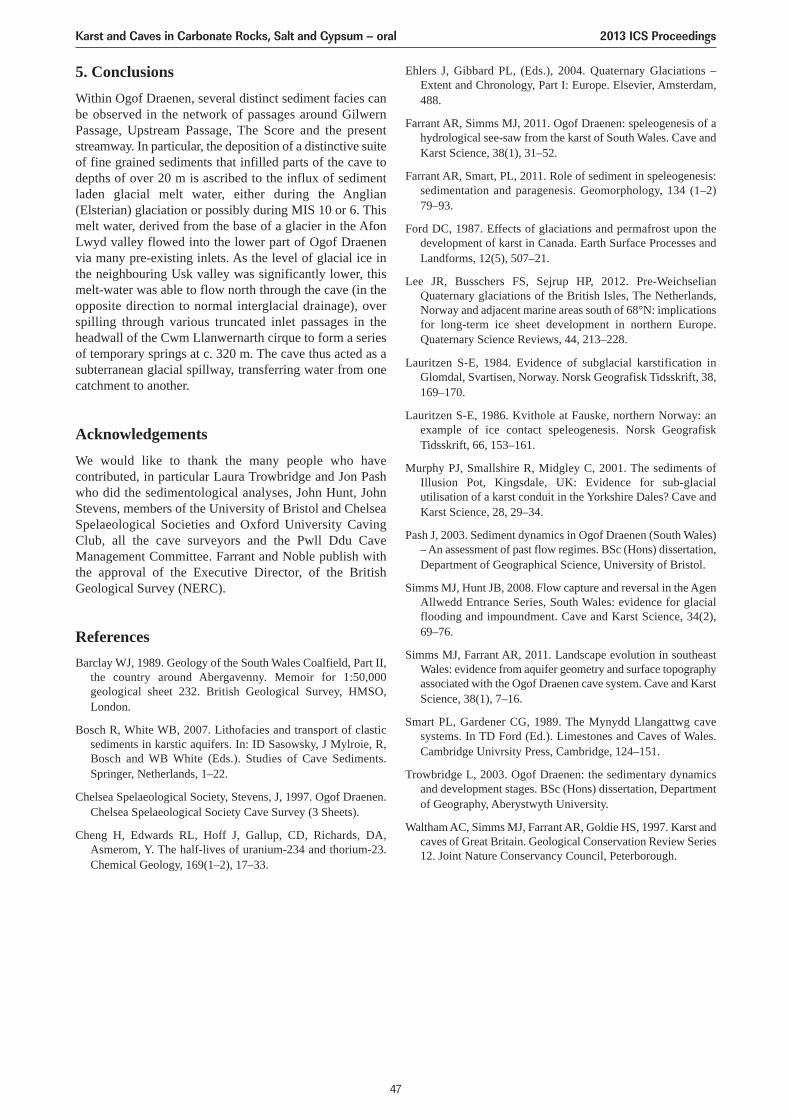
5. ConclusionsWithin Ogof Draenen, several distinct sediment facies canbe observed in the network of passages around GilwernPassage, Upstream Passage, The Score and the presentstreamway. In particular, the deposition of a distinctive suiteof fine grained sediments that infilled parts of the cave todepths of over 20 m is ascribed to the influx of sedimentladen glacial melt water, either during the Anglian(Elsterian) glaciation or possibly during MIS 10 or 6. Thismelt water, derived from the base of a glacier in the AfonLwyd valley flowed into the lower part of Ogof Draenenvia many pre-existing inlets. As the level of glacial ice inthe neighbouring Usk valley was significantly lower, thismelt-water was able to flow north through the cave (in theopposite direction to normal interglacial drainage), overspilling through various truncated inlet passages in theheadwall of the Cwm Llanwernarth cirque to form a seriesof temporary springs at c. 320 m. The cave thus acted as asubterranean glacial spillway, transferring water from onecatchment to another.
AcknowledgementsWe would like to thank the many people who havecontributed, in particular Laura Trowbridge and Jon Pashwho did the sedimentological analyses, John Hunt, JohnStevens, members of the University of Bristol and ChelseaSpelaeological Societies and Oxford University CavingClub, all the cave surveyors and the Pwll Ddu CaveManagement Committee. Farrant and Noble publish withthe approval of the Executive Director, of the BritishGeological Survey (NERC).
ReferencesBarclay WJ, 1989. Geology of the South Wales Coalfield, Part II,
the country around Abergavenny. Memoir for 1:50,000geological sheet 232. British Geological Survey, HMSO,London.
Bosch R, White WB, 2007. Lithofacies and transport of clasticsediments in karstic aquifers. In: ID Sasowsky, J Mylroie, R,Bosch and WB White (Eds.). Studies of Cave Sediments.Springer, Netherlands, 1–22.
Chelsea Spelaeological Society, Stevens, J, 1997. Ogof Draenen.Chelsea Spelaeological Society Cave Survey (3 Sheets).
Cheng H, Edwards RL, Hoff J, Gallup, CD, Richards, DA,Asmerom, Y. The half-lives of uranium-234 and thorium-23.Chemical Geology, 169(1–2), 17–33.
Ehlers J, Gibbard PL, (Eds.), 2004. Quaternary Glaciations –Extent and Chronology, Part I: Europe. Elsevier, Amsterdam,488.
Farrant AR, Simms MJ, 2011. Ogof Draenen: speleogenesis of ahydrological see-saw from the karst of South Wales. Cave andKarst Science, 38(1), 31–52.
Farrant AR, Smart, PL, 2011. Role of sediment in speleogenesis:sedimentation and paragenesis. Geomorphology, 134 (1–2) 79–93.
Ford DC, 1987. Effects of glaciations and permafrost upon thedevelopment of karst in Canada. Earth Surface Processes andLandforms, 12(5), 507–21.
Lee JR, Busschers FS, Sejrup HP, 2012. Pre-WeichselianQuaternary glaciations of the British Isles, The Netherlands,Norway and adjacent marine areas south of 68°N: implicationsfor long-term ice sheet development in northern Europe.Quaternary Science Reviews, 44, 213–228.
Lauritzen S-E, 1984. Evidence of subglacial karstification inGlomdal, Svartisen, Norway. Norsk Geografisk Tidsskrift, 38,169–170.
Lauritzen S-E, 1986. Kvithole at Fauske, northern Norway: anexample of ice contact speleogenesis. Norsk GeografiskTidsskrift, 66, 153–161.
Murphy PJ, Smallshire R, Midgley C, 2001. The sediments ofIllusion Pot, Kingsdale, UK: Evidence for sub-glacialutilisation of a karst conduit in the Yorkshire Dales? Cave andKarst Science, 28, 29–34.
Pash J, 2003. Sediment dynamics in Ogof Draenen (South Wales)– An assessment of past flow regimes. BSc (Hons) dissertation,Department of Geographical Science, University of Bristol.
Simms MJ, Hunt JB, 2008. Flow capture and reversal in the AgenAllwedd Entrance Series, South Wales: evidence for glacialflooding and impoundment. Cave and Karst Science, 34(2),69–76.
Simms MJ, Farrant AR, 2011. Landscape evolution in southeastWales: evidence from aquifer geometry and surface topographyassociated with the Ogof Draenen cave system. Cave and KarstScience, 38(1), 7–16.
Smart PL, Gardener CG, 1989. The Mynydd Llangattwg cavesystems. In TD Ford (Ed.). Limestones and Caves of Wales.Cambridge Univrsity Press, Cambridge, 124–151.
Trowbridge L, 2003. Ogof Draenen: the sedimentary dynamicsand development stages. BSc (Hons) dissertation, Departmentof Geography, Aberystwyth University.
Waltham AC, Simms MJ, Farrant AR, Goldie HS, 1997. Karst andcaves of Great Britain. Geological Conservation Review Series12. Joint Nature Conservancy Council, Peterborough.
Karst and Caves in Carbonate Rocks, Salt and Gypsum – oral 2013 ICS Proceedings
47
PROJECT NAMAK: SOME OF THE MOST SPECTACULAR FINDINGS INTHE IRANIAN SALT KARST
Michal Filippi1, Jiří Bruthans2, Ondřej Jager3, Mohammad Zare4, Naser Asadí5
1Institute of Geology ASCR, v. v. i., Rozvojová 269, 165 00 Prague 6, Czech Republic, [email protected] University in Prague, Albertov 6, 128 43 Prague, Czech Republic, [email protected]
3AQH s. r. o., Frýdlanstká 1310/23, 182 00 Prague, Czech Republic4Departmnet of Earth Sciences, Shiraz University, Shiraz, Iran
5Department of Geology, Faculty of Science, Sistan and Baluchestan University, Zahedan, Iran
NAMAK Project (“namak” means salt in Persian language) is an informal association of geologists and speleologists whocooperate on exploration and scientific research of the salt karst in southern and southwestern Iran. During the Project(from 1998 until 2013) about 16 salt diapirs were visited and more than 60 caves were discovered, 30 of which weremapped. The most exciting scientific and speleological discoveries were made in the Namakdan, Hormoz and Jahani saltdiapirs; however, many other remarkable discoveries have been made on other several Iranian salt diapirs. This contributionsummarizes the most interesting findings achieved during the ten expeditions carried out by the NAMAK team.
1. IntroductionThe NAMAK team studies Iranian salt karst since 1998. Upto now the 10 full-scale expeditions and several shorter tripswere carried out between 1998 and 2010. Members of theNAMAK team assisted during film documentaries made bythe BBC, Iranian TV and the Czech TV. The discovery anddocumentation of the 3N Cave by the NAMAK teampositively influenced declaring a part of Qeshm Island as aNational Geopark, which was also recognized as part of theUNESCO Network of Geoparks in the year 2006.
The southern and southwestern part of the Zagros Mts. inIslamic Republic of Iran (provinces Hormozgan, Fars andBushehr) represents an area with the largest number ofpiercing salt diapirs in the world. Numerous diapirs teemwith a variability of well-developed karst phenomena,including countless salt caves with brine springs and richsecondary halite deposits. However, the area was notpreviously subjected to some systematic geologicalresearch, except the tectonic and structural studies (seereferences in Talbot and Alavi, 1996). New knowledge fromother geological fields has been obtained within the lastcirca 10 years. Characterization of the karst phenomena andnotes to the speleogenesis in this area were presented byBosák et al. (2002). Evolution of the surface morphologyin relation to the karstification on some coastal salt diapirswas described by Bruthans et al. (2008, 2009, 2010).Overview of the various types of secondary cave depositswas presented by Filippi et al. (2011). Also the speleologicalfindings will be summarized in detail soon (Filippi et al. inprep.). The presented contribution extracts some of the mostspectacular findings made by the NAMAK team.
2. Geography and geology of the areaFour salt diapirs were studied in detail during the NAMAKexpeditions: Hormoz and Namakdan diapirs on islands inthe Persian Gulf (Hormozgan Province), Kuh-e Jahanidiapir near Firuzabad (Fars Province) and Namak diapir(Busher Province) in the Zagros Range. However someother salt diapirs (e.g., Namak, Gach, Saadad Abad,
Mesijune have been visited (for location see the Fig. 1 inBruthans et al. 2009). The climate in the visited areas is aridor semi-arid. Main precipitation occurs from November–April. The annual average temperature is 27 °C in thePersian Gulf region and 20 °C at mountainous diapirs.Temperature can reach 50 °C in the summer. During ourexpeditions (usually in the period from January to May),temperatures varied between 15 and 40 °C. The humidityon the surface varied from 50 % to 98 %. Strongprecipitation events occur sporadically every several years,usually during the winter season.
Geologically salt karst areas are situated in the eastern partof the Zagros Mountain Range and the Persian GulfPlatform, which is composed of elongated whaleback orbox-shaped anticlinal mountains, generally NW–SE-trending (Bosák et al. 1998). The relief is young; theprincipal folding started only in Middle Pliocene. Rock saltcomposing the diapirs belongs to the Hormoz Complex,which was deposited during Upper Precambrian to MiddleCambrian times, i.e. more than half a billion years ago(Bosák et al. 1998). The salt deposits have been covered byother sedimentary rocks, which attained a thickness ofseveral kilometers. Due to high pressure in such depths,tectonic factors, and due to the high plasticity and lowdensity of salt, the deposits started to rise towards thesurface in form of salt diapirs (plugs, domes).
Salt diapirs in Iran are represented by more or less circular,cylindrical, etc. bodies with diameter between ca. 1 to 18 km. The rock salt is folded into tight to isoclinal folds,with alternating white to grayish and reddish salt withvaricolored carbonate, siliciclastic, iron oxides and volcano-sedimentary rocks and rarely anhydrite and gypsum. Blocksof exotic (igneous and sedimentary rocks) transported byhalokinesis from depth reach diameters up to 2 km acrossin many diapirs.
3. MethodsTopographical maps (1:25,000 and 1:50,000), satelliteimages (presented by the Google Earth utility), and aerial
Karst and Caves in Carbonate Rocks, Salt and Gypsum – oral 2013 ICS Proceedings
48
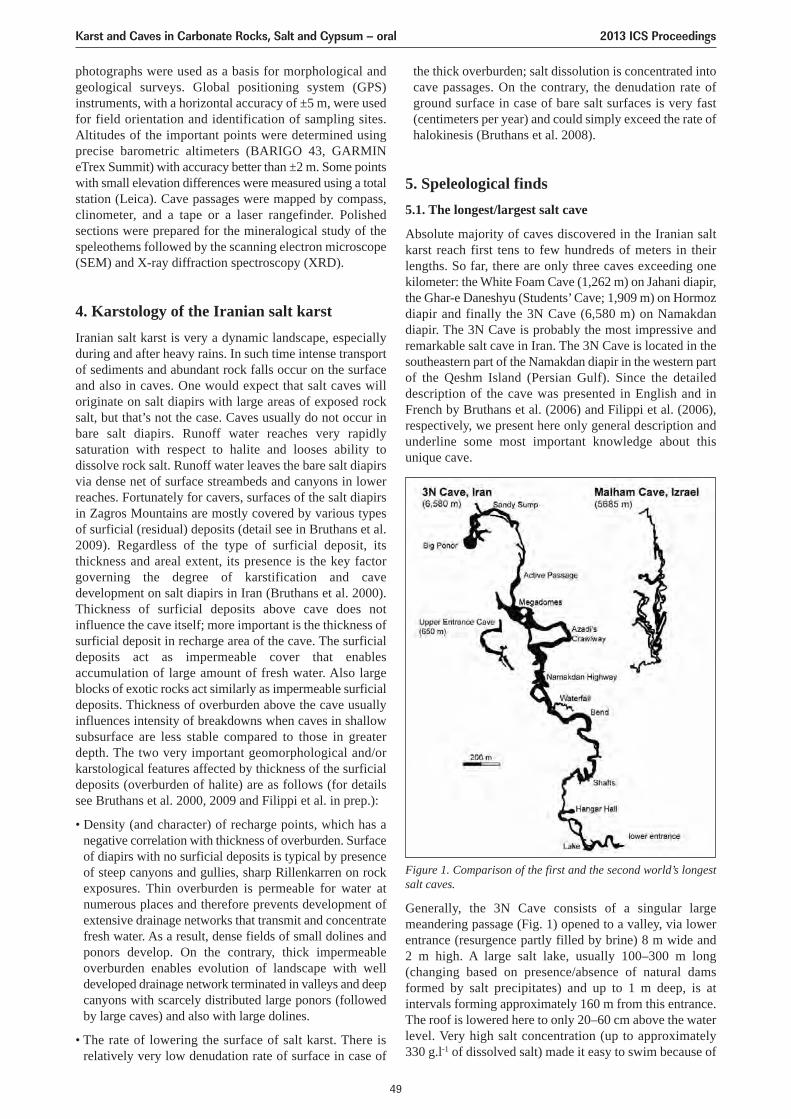
photographs were used as a basis for morphological andgeological surveys. Global positioning system (GPS)instruments, with a horizontal accuracy of ±5 m, were usedfor field orientation and identification of sampling sites.Altitudes of the important points were determined usingprecise barometric altimeters (BARIGO 43, GARMINeTrex Summit) with accuracy better than ±2 m. Some pointswith small elevation differences were measured using a totalstation (Leica). Cave passages were mapped by compass,clinometer, and a tape or a laser rangefinder. Polishedsections were prepared for the mineralogical study of thespeleothems followed by the scanning electron microscope(SEM) and X-ray diffraction spectroscopy (XRD).
4. Karstology of the Iranian salt karstIranian salt karst is very a dynamic landscape, especiallyduring and after heavy rains. In such time intense transportof sediments and abundant rock falls occur on the surfaceand also in caves. One would expect that salt caves willoriginate on salt diapirs with large areas of exposed rocksalt, but that’s not the case. Caves usually do not occur inbare salt diapirs. Runoff water reaches very rapidlysaturation with respect to halite and looses ability todissolve rock salt. Runoff water leaves the bare salt diapirsvia dense net of surface streambeds and canyons in lowerreaches. Fortunately for cavers, surfaces of the salt diapirsin Zagros Mountains are mostly covered by various typesof surficial (residual) deposits (detail see in Bruthans et al.2009). Regardless of the type of surficial deposit, itsthickness and areal extent, its presence is the key factorgoverning the degree of karstification and cavedevelopment on salt diapirs in Iran (Bruthans et al. 2000).Thickness of surficial deposits above cave does notinfluence the cave itself; more important is the thickness ofsurficial deposit in recharge area of the cave. The surficialdeposits act as impermeable cover that enablesaccumulation of large amount of fresh water. Also largeblocks of exotic rocks act similarly as impermeable surficialdeposits. Thickness of overburden above the cave usuallyinfluences intensity of breakdowns when caves in shallowsubsurface are less stable compared to those in greaterdepth. The two very important geomorphological and/orkarstological features affected by thickness of the surficialdeposits (overburden of halite) are as follows (for detailssee Bruthans et al. 2000, 2009 and Filippi et al. in prep.):
• Density (and character) of recharge points, which has anegative correlation with thickness of overburden. Surfaceof diapirs with no surficial deposits is typical by presenceof steep canyons and gullies, sharp Rillenkarren on rockexposures. Thin overburden is permeable for water atnumerous places and therefore prevents development ofextensive drainage networks that transmit and concentratefresh water. As a result, dense fields of small dolines andponors develop. On the contrary, thick impermeableoverburden enables evolution of landscape with welldeveloped drainage network terminated in valleys and deepcanyons with scarcely distributed large ponors (followedby large caves) and also with large dolines.
• The rate of lowering the surface of salt karst. There isrelatively very low denudation rate of surface in case of
the thick overburden; salt dissolution is concentrated intocave passages. On the contrary, the denudation rate ofground surface in case of bare salt surfaces is very fast(centimeters per year) and could simply exceed the rate ofhalokinesis (Bruthans et al. 2008).
5. Speleological finds5.1. The longest/largest salt cave
Absolute majority of caves discovered in the Iranian saltkarst reach first tens to few hundreds of meters in theirlengths. So far, there are only three caves exceeding onekilometer: the White Foam Cave (1,262 m) on Jahani diapir,the Ghar-e Daneshyu (Students’ Cave; 1,909 m) on Hormozdiapir and finally the 3N Cave (6,580 m) on Namakdandiapir. The 3N Cave is probably the most impressive andremarkable salt cave in Iran. The 3N Cave is located in thesoutheastern part of the Namakdan diapir in the western partof the Qeshm Island (Persian Gulf). Since the detaileddescription of the cave was presented in English and inFrench by Bruthans et al. (2006) and Filippi et al. (2006),respectively, we present here only general description andunderline some most important knowledge about thisunique cave.
Figure 1. Comparison of the first and the second world’s longestsalt caves.
Generally, the 3N Cave consists of a singular largemeandering passage (Fig. 1) opened to a valley, via lowerentrance (resurgence partly filled by brine) 8 m wide and 2 m high. A large salt lake, usually 100–300 m long(changing based on presence/absence of natural damsformed by salt precipitates) and up to 1 m deep, is atintervals forming approximately 160 m from this entrance.The roof is lowered here to only 20–60 cm above the waterlevel. Very high salt concentration (up to approximately 330 g.l-1 of dissolved salt) made it easy to swim because of
Karst and Caves in Carbonate Rocks, Salt and Gypsum – oral 2013 ICS Proceedings
49
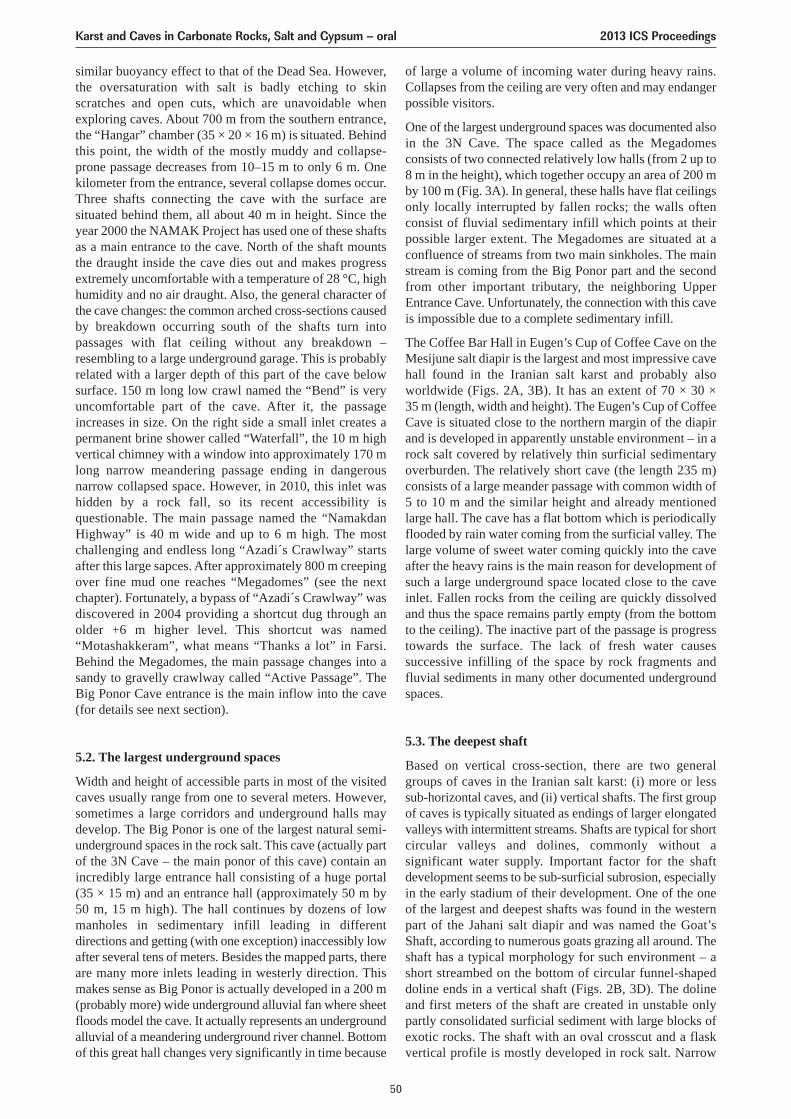
of large a volume of incoming water during heavy rains.Collapses from the ceiling are very often and may endangerpossible visitors.
One of the largest underground spaces was documented alsoin the 3N Cave. The space called as the Megadomesconsists of two connected relatively low halls (from 2 up to8 m in the height), which together occupy an area of 200 mby 100 m (Fig. 3A). In general, these halls have flat ceilingsonly locally interrupted by fallen rocks; the walls oftenconsist of fluvial sedimentary infill which points at theirpossible larger extent. The Megadomes are situated at aconfluence of streams from two main sinkholes. The mainstream is coming from the Big Ponor part and the secondfrom other important tributary, the neighboring UpperEntrance Cave. Unfortunately, the connection with this caveis impossible due to a complete sedimentary infill.
The Coffee Bar Hall in Eugen’s Cup of Coffee Cave on theMesijune salt diapir is the largest and most impressive cavehall found in the Iranian salt karst and probably alsoworldwide (Figs. 2A, 3B). It has an extent of 70 × 30 × 35 m (length, width and height). The Eugen’s Cup of CoffeeCave is situated close to the northern margin of the diapirand is developed in apparently unstable environment – in arock salt covered by relatively thin surficial sedimentaryoverburden. The relatively short cave (the length 235 m)consists of a large meander passage with common width of5 to 10 m and the similar height and already mentionedlarge hall. The cave has a flat bottom which is periodicallyflooded by rain water coming from the surficial valley. Thelarge volume of sweet water coming quickly into the caveafter the heavy rains is the main reason for development ofsuch a large underground space located close to the caveinlet. Fallen rocks from the ceiling are quickly dissolvedand thus the space remains partly empty (from the bottomto the ceiling). The inactive part of the passage is progresstowards the surface. The lack of fresh water causessuccessive infilling of the space by rock fragments andfluvial sediments in many other documented undergroundspaces.
5.3. The deepest shaft
Based on vertical cross-section, there are two generalgroups of caves in the Iranian salt karst: (i) more or lesssub-horizontal caves, and (ii) vertical shafts. The first groupof caves is typically situated as endings of larger elongatedvalleys with intermittent streams. Shafts are typical for shortcircular valleys and dolines, commonly without asignificant water supply. Important factor for the shaftdevelopment seems to be sub-surficial subrosion, especiallyin the early stadium of their development. One of the oneof the largest and deepest shafts was found in the westernpart of the Jahani salt diapir and was named the Goat’sShaft, according to numerous goats grazing all around. Theshaft has a typical morphology for such environment – ashort streambed on the bottom of circular funnel-shapeddoline ends in a vertical shaft (Figs. 2B, 3D). The dolineand first meters of the shaft are created in unstable onlypartly consolidated surficial sediment with large blocks ofexotic rocks. The shaft with an oval crosscut and a flaskvertical profile is mostly developed in rock salt. Narrow
similar buoyancy effect to that of the Dead Sea. However,the oversaturation with salt is badly etching to skinscratches and open cuts, which are unavoidable whenexploring caves. About 700 m from the southern entrance,the “Hangar” chamber (35 × 20 × 16 m) is situated. Behindthis point, the width of the mostly muddy and collapse-prone passage decreases from 10–15 m to only 6 m. Onekilometer from the entrance, several collapse domes occur.Three shafts connecting the cave with the surface aresituated behind them, all about 40 m in height. Since theyear 2000 the NAMAK Project has used one of these shaftsas a main entrance to the cave. North of the shaft mountsthe draught inside the cave dies out and makes progressextremely uncomfortable with a temperature of 28 ° C, highhumidity and no air draught. Also, the general character ofthe cave changes: the common arched cross-sections causedby breakdown occurring south of the shafts turn intopassages with flat ceiling without any breakdown –resembling to a large underground garage. This is probablyrelated with a larger depth of this part of the cave belowsurface. 150 m long low crawl named the “Bend” is veryuncomfortable part of the cave. After it, the passageincreases in size. On the right side a small inlet creates apermanent brine shower called “Waterfall”, the 10 m highvertical chimney with a window into approximately 170 mlong narrow meandering passage ending in dangerousnarrow collapsed space. However, in 2010, this inlet washidden by a rock fall, so its recent accessibility isquestionable. The main passage named the “NamakdanHighway” is 40 m wide and up to 6 m high. The mostchallenging and endless long “Azadi´s Crawlway” startsafter this large sapces. After approximately 800 m creepingover fine mud one reaches “Megadomes” (see the nextchapter). Fortunately, a bypass of “Azadi´s Crawlway” wasdiscovered in 2004 providing a shortcut dug through anolder +6 m higher level. This shortcut was named“Motashakkeram”, what means “Thanks a lot” in Farsi.Behind the Megadomes, the main passage changes into asandy to gravelly crawlway called “Active Passage”. TheBig Ponor Cave entrance is the main inflow into the cave(for details see next section).
5.2. The largest underground spaces
Width and height of accessible parts in most of the visitedcaves usually range from one to several meters. However,sometimes a large corridors and underground halls maydevelop. The Big Ponor is one of the largest natural semi-underground spaces in the rock salt. This cave (actually partof the 3N Cave – the main ponor of this cave) contain anincredibly large entrance hall consisting of a huge portal(35 × 15 m) and an entrance hall (approximately 50 m by50 m, 15 m high). The hall continues by dozens of lowmanholes in sedimentary infill leading in differentdirections and getting (with one exception) inaccessibly lowafter several tens of meters. Besides the mapped parts, thereare many more inlets leading in westerly direction. Thismakes sense as Big Ponor is actually developed in a 200 m(probably more) wide underground alluvial fan where sheetfloods model the cave. It actually represents an undergroundalluvial of a meandering underground river channel. Bottomof this great hall changes very significantly in time because
Karst and Caves in Carbonate Rocks, Salt and Gypsum – oral 2013 ICS Proceedings
50
terrace composed of large blocks of rocks that are cementedby halite and gypsum occur 30 meters below the shaftmouth. Shaft bottom covered by rock boulders can bereached after another 40 m. The shaft continued by asloping cave starting with relatively extensive dome withan unstable ceiling. After approximately 120 m the caveterminates in inaccessible riverbeds in sediment and debris.
5.4. Caves formed in two different rocks
Rare examples of caves may develop in areas where saltglaciers (overflow) cover the surroundings country rocks(mostly limestone). Bottoms of such caves and partly alsowalls are formed in limestone and ceilings consist of rocksalt. Cave of Deliverance in western part of the Khurgu saltdiapir (about 2 km SEE from the south portal of the roadtunnel situated on the main road from Bandar-e Abbas toYazd) is one of the best developed examples of such caves(for cave map see Bosák et al. 2002). The cave drains a hugeblind canyon, which is developed on the border of saltdiapir and a limestone anticline. The small southern cavebranch drains a funnel-shaped doline developed on contactbetween limestone and salt. Originally, the cave wasexclusively developed in salt on the contact with limestonebedrock. After having been enlarged enough to enable thetransport of a clastic load, the vadose canyon entrenchedinto the limestone. An inclined (35°) contact between saltand limestone is visible in the small southern branch ofcave.
5.5. The most remarkable doline/canyon
Iranian salt karst is rich in various types of blind valleys,shafts, abysses and dolines. Mostly they are represented byfunnel-shaped depression with gentle slopes. Sometimesthese depressions are followed by vertical shafts continuedby relatively short steeply inclined inlet cave. For unusualmorphology and complex genesis, the Puzzle Canyon onthe Jahani salt diapir is quite different and unique. Thebranched labyrinth-type canyon with up to 13 m high, butonly 0.5–1.5 m wide walls is situated on a flat bottom ofthe doline 100 × 200 m wide (Fig. 3C). The bottom of thedoline is formed by fine deposits which settled there bynumerous floods after heavy rains before the swallow holein the bottom of doline was activated. The canyondeveloped due to headword erosion of sediment duringheavy rains when streams enter the doline from severalsides and rapidly carve several canyon branches and sinkinto the Puzzle Canyon Cave (Fig. 2C). The cave starts witha 15 m deep vertical step followed by relatively high andapparently unstable underground space formed in sediment.Fallen blocks of the sediments and rock fragments arecommon there. Gradually decreasing height of passagesends the passability of the cave on a distance 128 m fromthe entrance.
5.6. The highest “waterfall”
Majority of the visited caves are more or less sub-horizontal. However, few caves located on margins of saltdiapirs with significant positive morphology are
Figure 2. Maps of the selected speleological objects.
Karst and Caves in Carbonate Rocks, Salt and Gypsum – oral 2013 ICS Proceedings
51
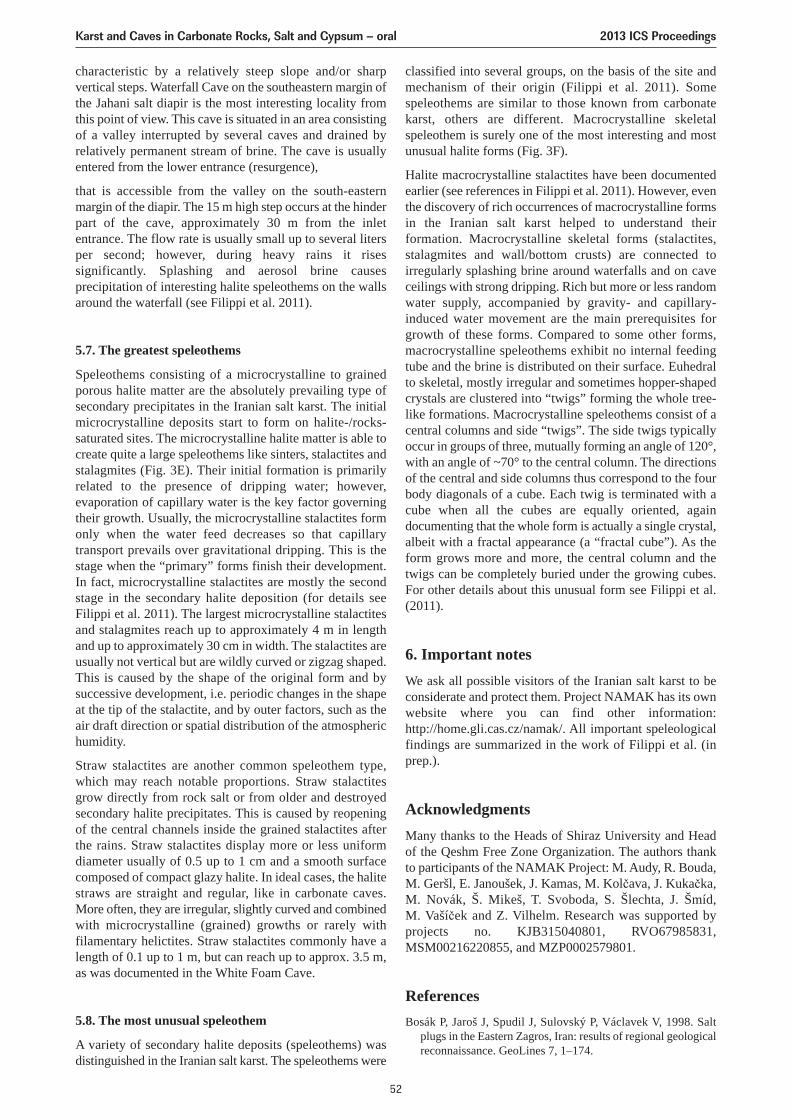
characteristic by a relatively steep slope and/or sharpvertical steps. Waterfall Cave on the southeastern margin ofthe Jahani salt diapir is the most interesting locality fromthis point of view. This cave is situated in an area consistingof a valley interrupted by several caves and drained byrelatively permanent stream of brine. The cave is usuallyentered from the lower entrance (resurgence),
that is accessible from the valley on the south-easternmargin of the diapir. The 15 m high step occurs at the hinderpart of the cave, approximately 30 m from the inletentrance. The flow rate is usually small up to several litersper second; however, during heavy rains it risessignificantly. Splashing and aerosol brine causesprecipitation of interesting halite speleothems on the wallsaround the waterfall (see Filippi et al. 2011).
5.7. The greatest speleothems
Speleothems consisting of a microcrystalline to grainedporous halite matter are the absolutely prevailing type ofsecondary precipitates in the Iranian salt karst. The initialmicrocrystalline deposits start to form on halite-/rocks-saturated sites. The microcrystalline halite matter is able tocreate quite a large speleothems like sinters, stalactites andstalagmites (Fig. 3E). Their initial formation is primarilyrelated to the presence of dripping water; however,evaporation of capillary water is the key factor governingtheir growth. Usually, the microcrystalline stalactites formonly when the water feed decreases so that capillarytransport prevails over gravitational dripping. This is thestage when the “primary” forms finish their development.In fact, microcrystalline stalactites are mostly the secondstage in the secondary halite deposition (for details seeFilippi et al. 2011). The largest microcrystalline stalactitesand stalagmites reach up to approximately 4 m in lengthand up to approximately 30 cm in width. The stalactites areusually not vertical but are wildly curved or zigzag shaped.This is caused by the shape of the original form and bysuccessive development, i.e. periodic changes in the shapeat the tip of the stalactite, and by outer factors, such as theair draft direction or spatial distribution of the atmospherichumidity.
Straw stalactites are another common speleothem type,which may reach notable proportions. Straw stalactitesgrow directly from rock salt or from older and destroyedsecondary halite precipitates. This is caused by reopeningof the central channels inside the grained stalactites afterthe rains. Straw stalactites display more or less uniformdiameter usually of 0.5 up to 1 cm and a smooth surfacecomposed of compact glazy halite. In ideal cases, the halitestraws are straight and regular, like in carbonate caves.More often, they are irregular, slightly curved and combinedwith microcrystalline (grained) growths or rarely withfilamentary helictites. Straw stalactites commonly have alength of 0.1 up to 1 m, but can reach up to approx. 3.5 m,as was documented in the White Foam Cave.
5.8. The most unusual speleothem
A variety of secondary halite deposits (speleothems) wasdistinguished in the Iranian salt karst. The speleothems were
classified into several groups, on the basis of the site andmechanism of their origin (Filippi et al. 2011). Somespeleothems are similar to those known from carbonatekarst, others are different. Macrocrystalline skeletalspeleothem is surely one of the most interesting and mostunusual halite forms (Fig. 3F).
Halite macrocrystalline stalactites have been documentedearlier (see references in Filippi et al. 2011). However, eventhe discovery of rich occurrences of macrocrystalline formsin the Iranian salt karst helped to understand theirformation. Macrocrystalline skeletal forms (stalactites,stalagmites and wall/bottom crusts) are connected toirregularly splashing brine around waterfalls and on caveceilings with strong dripping. Rich but more or less randomwater supply, accompanied by gravity- and capillary-induced water movement are the main prerequisites forgrowth of these forms. Compared to some other forms,macrocrystalline speleothems exhibit no internal feedingtube and the brine is distributed on their surface. Euhedralto skeletal, mostly irregular and sometimes hopper-shapedcrystals are clustered into “twigs” forming the whole tree-like formations. Macrocrystalline speleothems consist of acentral columns and side “twigs”. The side twigs typicallyoccur in groups of three, mutually forming an angle of 120°,with an angle of ~70° to the central column. The directionsof the central and side columns thus correspond to the fourbody diagonals of a cube. Each twig is terminated with acube when all the cubes are equally oriented, againdocumenting that the whole form is actually a single crystal,albeit with a fractal appearance (a “fractal cube”). As theform grows more and more, the central column and thetwigs can be completely buried under the growing cubes.For other details about this unusual form see Filippi et al.(2011).
6. Important notesWe ask all possible visitors of the Iranian salt karst to beconsiderate and protect them. Project NAMAK has its ownwebsite where you can find other information:http://home.gli.cas.cz/namak/. All important speleologicalfindings are summarized in the work of Filippi et al. (inprep.).
AcknowledgmentsMany thanks to the Heads of Shiraz University and Headof the Qeshm Free Zone Organization. The authors thankto participants of the NAMAK Project: M. Audy, R. Bouda,M. Geršl, E. Janoušek, J. Kamas, M. Kolčava, J. Kukačka,M. Novák, Š. Mikeš, T. Svoboda, S. Šlechta, J. Šmíd, M. Vašíček and Z. Vilhelm. Research was supported byprojects no. KJB315040801, RVO67985831,MSM00216220855, and MZP0002579801.
ReferencesBosák P, Jaroš J, Spudil J, Sulovský P, Václavek V, 1998. Salt
plugs in the Eastern Zagros, Iran: results of regional geologicalreconnaissance. GeoLines 7, 1–174.
Karst and Caves in Carbonate Rocks, Salt and Gypsum – oral 2013 ICS Proceedings
52
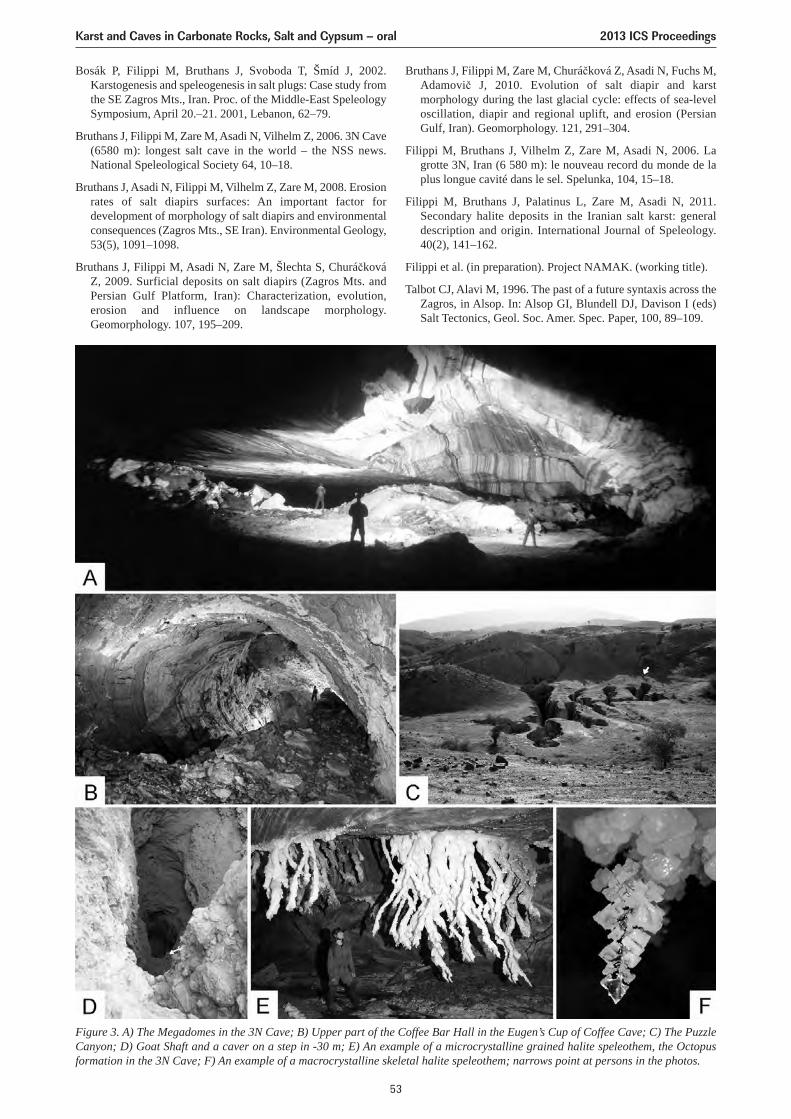
Bosák P, Filippi M, Bruthans J, Svoboda T, Šmíd J, 2002.Karstogenesis and speleogenesis in salt plugs: Case study fromthe SE Zagros Mts., Iran. Proc. of the Middle-East SpeleologySymposium, April 20.–21. 2001, Lebanon, 62–79.
Bruthans J, Filippi M, Zare M, Asadi N, Vilhelm Z, 2006. 3N Cave(6580 m): longest salt cave in the world – the NSS news.National Speleological Society 64, 10–18.
Bruthans J, Asadi N, Filippi M, Vilhelm Z, Zare M, 2008. Erosionrates of salt diapirs surfaces: An important factor fordevelopment of morphology of salt diapirs and environmentalconsequences (Zagros Mts., SE Iran). Environmental Geology,53(5), 1091–1098.
Bruthans J, Filippi M, Asadi N, Zare M, Šlechta S, ChuráčkováZ, 2009. Surficial deposits on salt diapirs (Zagros Mts. andPersian Gulf Platform, Iran): Characterization, evolution,erosion and influence on landscape morphology.Geomorphology. 107, 195–209.
Bruthans J, Filippi M, Zare M, Churáčková Z, Asadi N, Fuchs M,Adamovič J, 2010. Evolution of salt diapir and karstmorphology during the last glacial cycle: effects of sea-leveloscillation, diapir and regional uplift, and erosion (PersianGulf, Iran). Geomorphology. 121, 291–304.
Filippi M, Bruthans J, Vilhelm Z, Zare M, Asadi N, 2006. Lagrotte 3N, Iran (6 580 m): le nouveau record du monde de laplus longue cavité dans le sel. Spelunka, 104, 15–18.
Filippi M, Bruthans J, Palatinus L, Zare M, Asadi N, 2011.Secondary halite deposits in the Iranian salt karst: generaldescription and origin. International Journal of Speleology.40(2), 141–162.
Filippi et al. (in preparation). Project NAMAK. (working title).
Talbot CJ, Alavi M, 1996. The past of a future syntaxis across theZagros, in Alsop. In: Alsop GI, Blundell DJ, Davison I (eds)Salt Tectonics, Geol. Soc. Amer. Spec. Paper, 100, 89–109.
Figure 3. A) The Megadomes in the 3N Cave; B) Upper part of the Coffee Bar Hall in the Eugen’s Cup of Coffee Cave; C) The PuzzleCanyon; D) Goat Shaft and a caver on a step in -30 m; E) An example of a microcrystalline grained halite speleothem, the Octopusformation in the 3N Cave; F) An example of a macrocrystalline skeletal halite speleothem; narrows point at persons in the photos.
Karst and Caves in Carbonate Rocks, Salt and Gypsum – oral 2013 ICS Proceedings
53
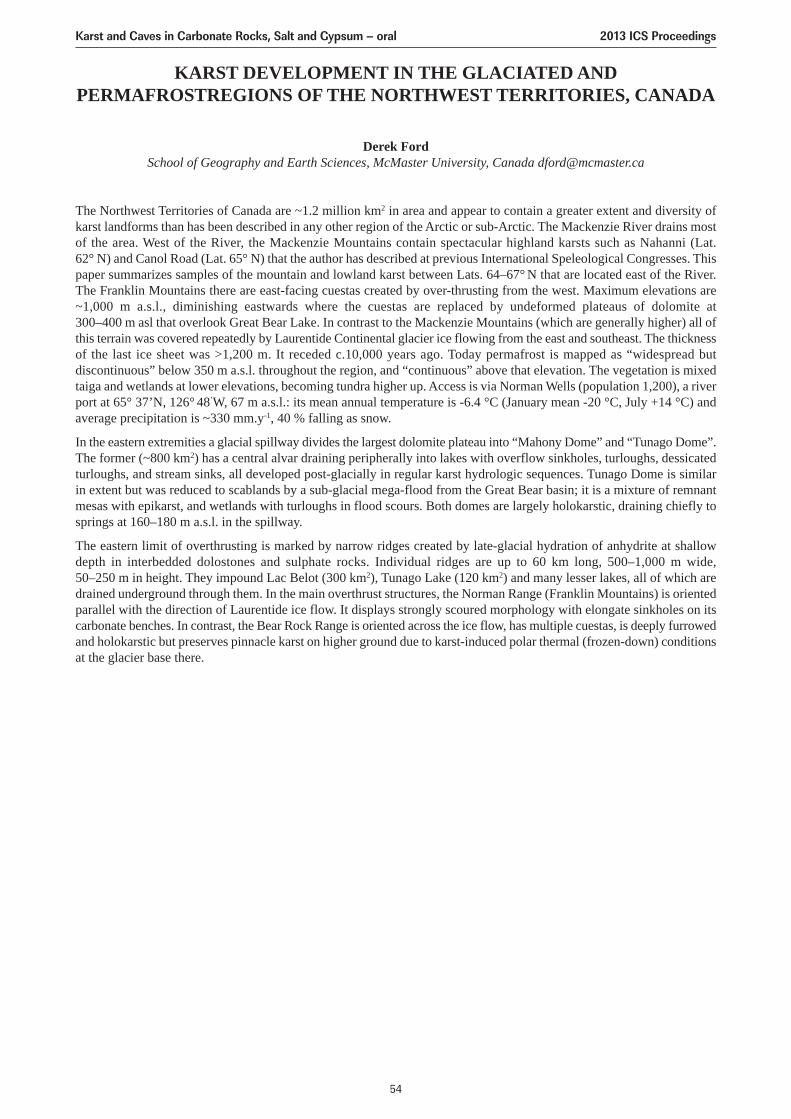
KARST DEVELOPMENT IN THE GLACIATED ANDPERMAFROSTREGIONS OF THE NORTHWEST TERRITORIES, CANADA
Derek FordSchool of Geography and Earth Sciences, McMaster University, Canada [email protected]
The Northwest Territories of Canada are ~1.2 million km2 in area and appear to contain a greater extent and diversity ofkarst landforms than has been described in any other region of the Arctic or sub-Arctic. The Mackenzie River drains mostof the area. West of the River, the Mackenzie Mountains contain spectacular highland karsts such as Nahanni (Lat. 62° N) and Canol Road (Lat. 65° N) that the author has described at previous International Speleological Congresses. Thispaper summarizes samples of the mountain and lowland karst between Lats. 64–67° N that are located east of the River.The Franklin Mountains there are east-facing cuestas created by over-thrusting from the west. Maximum elevations are~1,000 m a.s.l., diminishing eastwards where the cuestas are replaced by undeformed plateaus of dolomite at 300–400 m asl that overlook Great Bear Lake. In contrast to the Mackenzie Mountains (which are generally higher) all ofthis terrain was covered repeatedly by Laurentide Continental glacier ice flowing from the east and southeast. The thicknessof the last ice sheet was >1,200 m. It receded c.10,000 years ago. Today permafrost is mapped as “widespread butdiscontinuous” below 350 m a.s.l. throughout the region, and “continuous” above that elevation. The vegetation is mixedtaiga and wetlands at lower elevations, becoming tundra higher up. Access is via Norman Wells (population 1,200), a riverport at 65° 37’N, 126° 48’W, 67 m a.s.l.: its mean annual temperature is -6.4 °C (January mean -20 °C, July +14 °C) andaverage precipitation is ~330 mm.y-1, 40 % falling as snow.
In the eastern extremities a glacial spillway divides the largest dolomite plateau into “Mahony Dome” and “Tunago Dome”.The former (~800 km2) has a central alvar draining peripherally into lakes with overflow sinkholes, turloughs, dessicatedturloughs, and stream sinks, all developed post-glacially in regular karst hydrologic sequences. Tunago Dome is similarin extent but was reduced to scablands by a sub-glacial mega-flood from the Great Bear basin; it is a mixture of remnantmesas with epikarst, and wetlands with turloughs in flood scours. Both domes are largely holokarstic, draining chiefly tosprings at 160–180 m a.s.l. in the spillway.
The eastern limit of overthrusting is marked by narrow ridges created by late-glacial hydration of anhydrite at shallowdepth in interbedded dolostones and sulphate rocks. Individual ridges are up to 60 km long, 500–1,000 m wide, 50–250 m in height. They impound Lac Belot (300 km2), Tunago Lake (120 km2) and many lesser lakes, all of which aredrained underground through them. In the main overthrust structures, the Norman Range (Franklin Mountains) is orientedparallel with the direction of Laurentide ice flow. It displays strongly scoured morphology with elongate sinkholes on itscarbonate benches. In contrast, the Bear Rock Range is oriented across the ice flow, has multiple cuestas, is deeply furrowedand holokarstic but preserves pinnacle karst on higher ground due to karst-induced polar thermal (frozen-down) conditionsat the glacier base there.
Karst and Caves in Carbonate Rocks, Salt and Gypsum – oral 2013 ICS Proceedings
54
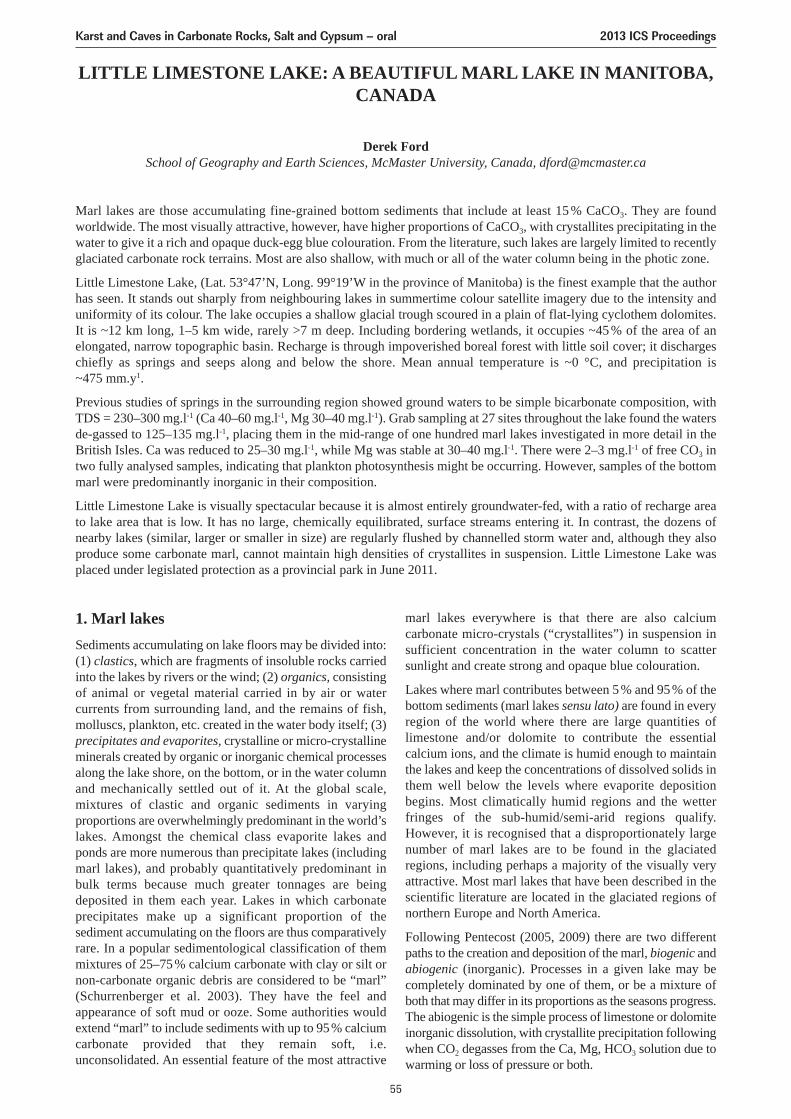
LITTLE LIMESTONE LAKE: A BEAUTIFUL MARL LAKE IN MANITOBA,CANADA
Derek FordSchool of Geography and Earth Sciences, McMaster University, Canada, [email protected]
Marl lakes are those accumulating fine-grained bottom sediments that include at least 15 % CaCO3. They are foundworldwide. The most visually attractive, however, have higher proportions of CaCO3, with crystallites precipitating in thewater to give it a rich and opaque duck-egg blue colouration. From the literature, such lakes are largely limited to recentlyglaciated carbonate rock terrains. Most are also shallow, with much or all of the water column being in the photic zone.
Little Limestone Lake, (Lat. 53°47’N, Long. 99°19’W in the province of Manitoba) is the finest example that the authorhas seen. It stands out sharply from neighbouring lakes in summertime colour satellite imagery due to the intensity anduniformity of its colour. The lake occupies a shallow glacial trough scoured in a plain of flat-lying cyclothem dolomites.It is ~12 km long, 1–5 km wide, rarely >7 m deep. Including bordering wetlands, it occupies ~45 % of the area of anelongated, narrow topographic basin. Recharge is through impoverished boreal forest with little soil cover; it dischargeschiefly as springs and seeps along and below the shore. Mean annual temperature is ~0 °C, and precipitation is ~475 mm.y1.
Previous studies of springs in the surrounding region showed ground waters to be simple bicarbonate composition, withTDS = 230–300 mg.l-1 (Ca 40–60 mg.l-1, Mg 30–40 mg.l-1). Grab sampling at 27 sites throughout the lake found the watersde-gassed to 125–135 mg.l-1, placing them in the mid-range of one hundred marl lakes investigated in more detail in theBritish Isles. Ca was reduced to 25–30 mg.l-1, while Mg was stable at 30–40 mg.l-1. There were 2–3 mg.l-1 of free CO3 intwo fully analysed samples, indicating that plankton photosynthesis might be occurring. However, samples of the bottommarl were predominantly inorganic in their composition.
Little Limestone Lake is visually spectacular because it is almost entirely groundwater-fed, with a ratio of recharge areato lake area that is low. It has no large, chemically equilibrated, surface streams entering it. In contrast, the dozens ofnearby lakes (similar, larger or smaller in size) are regularly flushed by channelled storm water and, although they alsoproduce some carbonate marl, cannot maintain high densities of crystallites in suspension. Little Limestone Lake wasplaced under legislated protection as a provincial park in June 2011.
1. Marl lakesSediments accumulating on lake floors may be divided into:(1) clastics, which are fragments of insoluble rocks carriedinto the lakes by rivers or the wind; (2) organics, consistingof animal or vegetal material carried in by air or watercurrents from surrounding land, and the remains of fish,molluscs, plankton, etc. created in the water body itself; (3)precipitates and evaporites, crystalline or micro-crystallineminerals created by organic or inorganic chemical processesalong the lake shore, on the bottom, or in the water columnand mechanically settled out of it. At the global scale,mixtures of clastic and organic sediments in varyingproportions are overwhelmingly predominant in the world’slakes. Amongst the chemical class evaporite lakes andponds are more numerous than precipitate lakes (includingmarl lakes), and probably quantitatively predominant inbulk terms because much greater tonnages are beingdeposited in them each year. Lakes in which carbonateprecipitates make up a significant proportion of thesediment accumulating on the floors are thus comparativelyrare. In a popular sedimentological classification of themmixtures of 25–75% calcium carbonate with clay or silt ornon-carbonate organic debris are considered to be “marl”(Schurrenberger et al. 2003). They have the feel andappearance of soft mud or ooze. Some authorities wouldextend “marl” to include sediments with up to 95% calciumcarbonate provided that they remain soft, i.e.unconsolidated. An essential feature of the most attractive
marl lakes everywhere is that there are also calciumcarbonate micro-crystals (“crystallites”) in suspension insufficient concentration in the water column to scattersunlight and create strong and opaque blue colouration.
Lakes where marl contributes between 5% and 95% of thebottom sediments (marl lakes sensu lato) are found in everyregion of the world where there are large quantities oflimestone and/or dolomite to contribute the essentialcalcium ions, and the climate is humid enough to maintainthe lakes and keep the concentrations of dissolved solids inthem well below the levels where evaporite depositionbegins. Most climatically humid regions and the wetterfringes of the sub-humid/semi-arid regions qualify.However, it is recognised that a disproportionately largenumber of marl lakes are to be found in the glaciatedregions, including perhaps a majority of the visually veryattractive. Most marl lakes that have been described in thescientific literature are located in the glaciated regions ofnorthern Europe and North America.
Following Pentecost (2005, 2009) there are two differentpaths to the creation and deposition of the marl, biogenic andabiogenic (inorganic). Processes in a given lake may becompletely dominated by one of them, or be a mixture ofboth that may differ in its proportions as the seasons progress.The abiogenic is the simple process of limestone or dolomiteinorganic dissolution, with crystallite precipitation followingwhen CO2 degasses from the Ca, Mg, HCO3 solution due towarming or loss of pressure or both.
Karst and Caves in Carbonate Rocks, Salt and Gypsum – oral 2013 ICS Proceedings
55
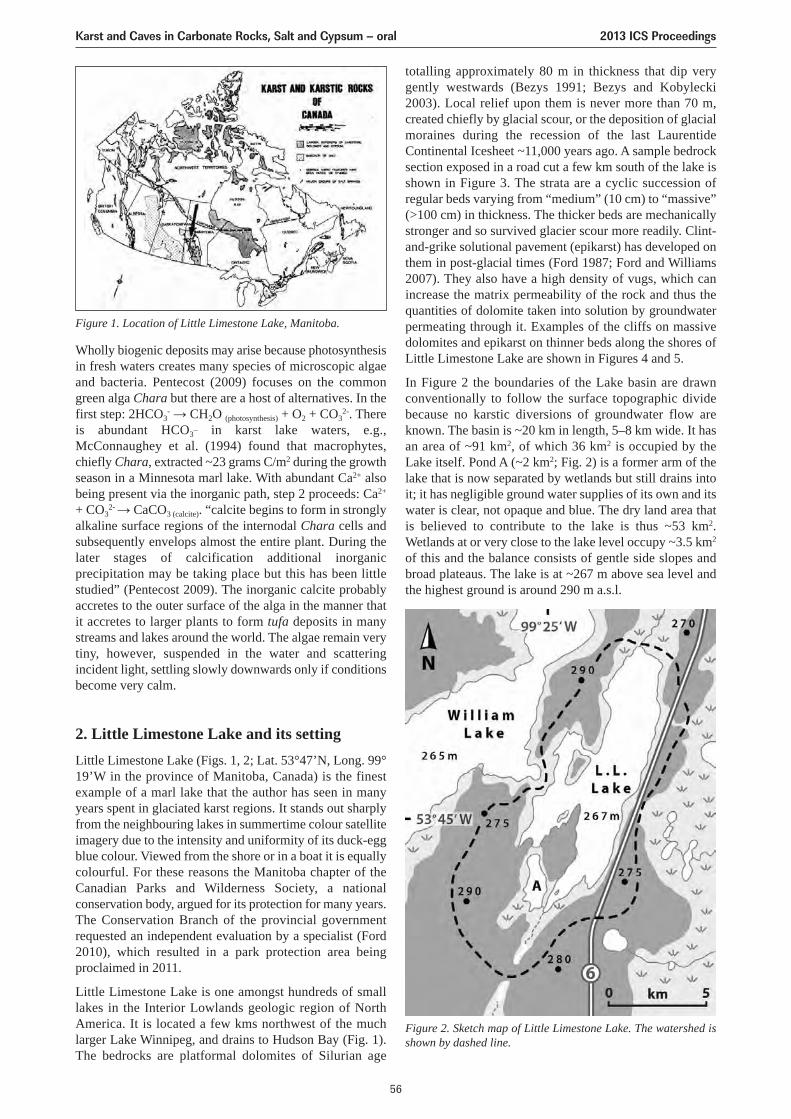
Wholly biogenic deposits may arise because photosynthesisin fresh waters creates many species of microscopic algaeand bacteria. Pentecost (2009) focuses on the commongreen alga Chara but there are a host of alternatives. In thefirst step: 2HCO3
- → CH2O (photosynthesis) + O2 + CO32-. There
is abundant HCO3_ in karst lake waters, e.g.,
McConnaughey et al. (1994) found that macrophytes,chiefly Chara, extracted ~23 grams C/m2 during the growthseason in a Minnesota marl lake. With abundant Ca2+ alsobeing present via the inorganic path, step 2 proceeds: Ca2+
+ CO32- → CaCO3 (calcite). “calcite begins to form in strongly
alkaline surface regions of the internodal Chara cells andsubsequently envelops almost the entire plant. During thelater stages of calcification additional inorganicprecipitation may be taking place but this has been littlestudied” (Pentecost 2009). The inorganic calcite probablyaccretes to the outer surface of the alga in the manner thatit accretes to larger plants to form tufa deposits in manystreams and lakes around the world. The algae remain verytiny, however, suspended in the water and scatteringincident light, settling slowly downwards only if conditionsbecome very calm.
2. Little Limestone Lake and its settingLittle Limestone Lake (Figs. 1, 2; Lat. 53°47’N, Long. 99°19’W in the province of Manitoba, Canada) is the finestexample of a marl lake that the author has seen in manyyears spent in glaciated karst regions. It stands out sharplyfrom the neighbouring lakes in summertime colour satelliteimagery due to the intensity and uniformity of its duck-eggblue colour. Viewed from the shore or in a boat it is equallycolourful. For these reasons the Manitoba chapter of theCanadian Parks and Wilderness Society, a nationalconservation body, argued for its protection for many years.The Conservation Branch of the provincial governmentrequested an independent evaluation by a specialist (Ford2010), which resulted in a park protection area beingproclaimed in 2011.
Little Limestone Lake is one amongst hundreds of smalllakes in the Interior Lowlands geologic region of NorthAmerica. It is located a few kms northwest of the muchlarger Lake Winnipeg, and drains to Hudson Bay (Fig. 1).The bedrocks are platformal dolomites of Silurian age
totalling approximately 80 m in thickness that dip verygently westwards (Bezys 1991; Bezys and Kobylecki2003). Local relief upon them is never more than 70 m,created chiefly by glacial scour, or the deposition of glacialmoraines during the recession of the last LaurentideContinental Icesheet ~11,000 years ago. A sample bedrocksection exposed in a road cut a few km south of the lake isshown in Figure 3. The strata are a cyclic succession ofregular beds varying from “medium” (10 cm) to “massive”(>100 cm) in thickness. The thicker beds are mechanicallystronger and so survived glacier scour more readily. Clint-and-grike solutional pavement (epikarst) has developed onthem in post-glacial times (Ford 1987; Ford and Williams2007). They also have a high density of vugs, which canincrease the matrix permeability of the rock and thus thequantities of dolomite taken into solution by groundwaterpermeating through it. Examples of the cliffs on massivedolomites and epikarst on thinner beds along the shores ofLittle Limestone Lake are shown in Figures 4 and 5.
In Figure 2 the boundaries of the Lake basin are drawnconventionally to follow the surface topographic dividebecause no karstic diversions of groundwater flow areknown. The basin is ~20 km in length, 5–8 km wide. It hasan area of ~91 km2, of which 36 km2 is occupied by theLake itself. Pond A (~2 km2; Fig. 2) is a former arm of thelake that is now separated by wetlands but still drains intoit; it has negligible ground water supplies of its own and itswater is clear, not opaque and blue. The dry land area thatis believed to contribute to the lake is thus ~53 km2.Wetlands at or very close to the lake level occupy ~3.5 km2
of this and the balance consists of gentle side slopes andbroad plateaus. The lake is at ~267 m above sea level andthe highest ground is around 290 m a.s.l.
Figure 1. Location of Little Limestone Lake, Manitoba.
Figure 2. Sketch map of Little Limestone Lake. The watershed isshown by dashed line.
Karst and Caves in Carbonate Rocks, Salt and Gypsum – oral 2013 ICS Proceedings
56
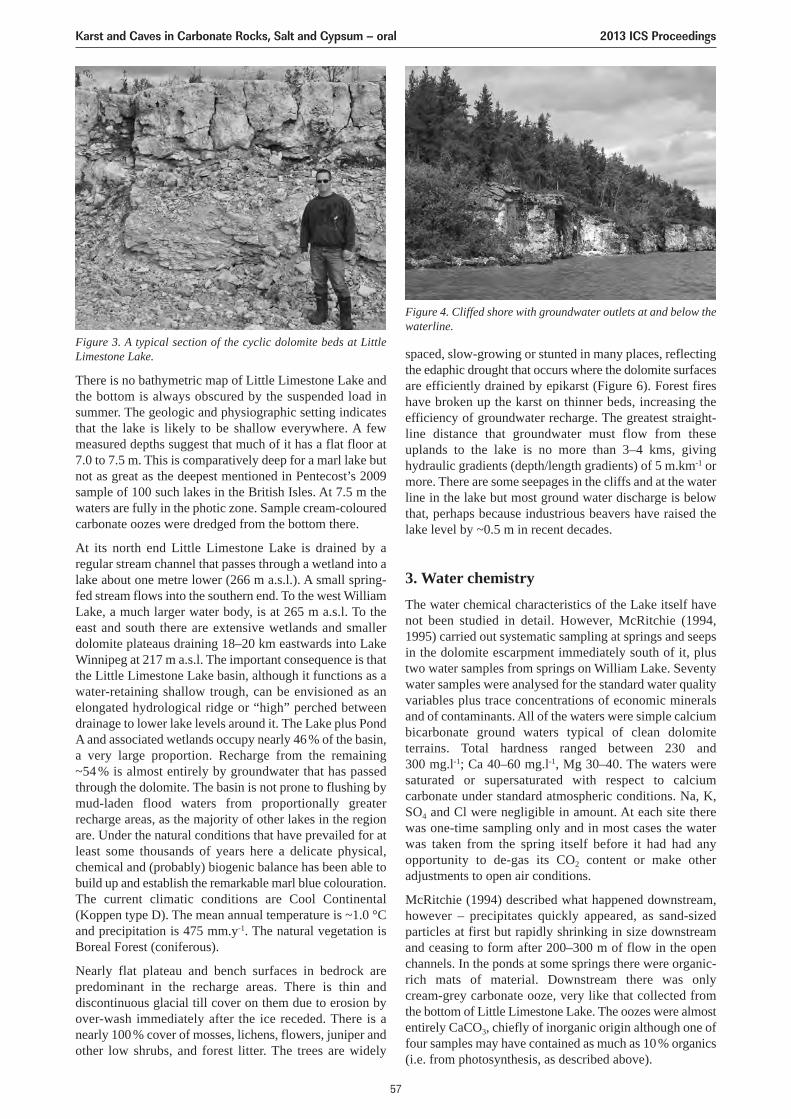
There is no bathymetric map of Little Limestone Lake andthe bottom is always obscured by the suspended load insummer. The geologic and physiographic setting indicatesthat the lake is likely to be shallow everywhere. A fewmeasured depths suggest that much of it has a flat floor at7.0 to 7.5 m. This is comparatively deep for a marl lake butnot as great as the deepest mentioned in Pentecost’s 2009sample of 100 such lakes in the British Isles. At 7.5 m thewaters are fully in the photic zone. Sample cream-colouredcarbonate oozes were dredged from the bottom there.
At its north end Little Limestone Lake is drained by aregular stream channel that passes through a wetland into alake about one metre lower (266 m a.s.l.). A small spring-fed stream flows into the southern end. To the west WilliamLake, a much larger water body, is at 265 m a.s.l. To theeast and south there are extensive wetlands and smallerdolomite plateaus draining 18–20 km eastwards into LakeWinnipeg at 217 m a.s.l. The important consequence is thatthe Little Limestone Lake basin, although it functions as awater-retaining shallow trough, can be envisioned as anelongated hydrological ridge or “high” perched betweendrainage to lower lake levels around it. The Lake plus PondA and associated wetlands occupy nearly 46% of the basin,a very large proportion. Recharge from the remaining ~54 % is almost entirely by groundwater that has passedthrough the dolomite. The basin is not prone to flushing bymud-laden flood waters from proportionally greaterrecharge areas, as the majority of other lakes in the regionare. Under the natural conditions that have prevailed for atleast some thousands of years here a delicate physical,chemical and (probably) biogenic balance has been able tobuild up and establish the remarkable marl blue colouration.The current climatic conditions are Cool Continental(Koppen type D). The mean annual temperature is ~1.0 ° Cand precipitation is 475 mm.y-1. The natural vegetation isBoreal Forest (coniferous).
Nearly flat plateau and bench surfaces in bedrock arepredominant in the recharge areas. There is thin anddiscontinuous glacial till cover on them due to erosion byover-wash immediately after the ice receded. There is anearly 100% cover of mosses, lichens, flowers, juniper andother low shrubs, and forest litter. The trees are widely
spaced, slow-growing or stunted in many places, reflectingthe edaphic drought that occurs where the dolomite surfacesare efficiently drained by epikarst (Figure 6). Forest fireshave broken up the karst on thinner beds, increasing theefficiency of groundwater recharge. The greatest straight-line distance that groundwater must flow from theseuplands to the lake is no more than 3–4 kms, givinghydraulic gradients (depth/length gradients) of 5 m.km-1 ormore. There are some seepages in the cliffs and at the waterline in the lake but most ground water discharge is belowthat, perhaps because industrious beavers have raised thelake level by ~0.5 m in recent decades.
3. Water chemistryThe water chemical characteristics of the Lake itself havenot been studied in detail. However, McRitchie (1994,1995) carried out systematic sampling at springs and seepsin the dolomite escarpment immediately south of it, plustwo water samples from springs on William Lake. Seventywater samples were analysed for the standard water qualityvariables plus trace concentrations of economic mineralsand of contaminants. All of the waters were simple calciumbicarbonate ground waters typical of clean dolomiteterrains. Total hardness ranged between 230 and 300 mg.l-1; Ca 40–60 mg.l-1, Mg 30–40. The waters weresaturated or supersaturated with respect to calciumcarbonate under standard atmospheric conditions. Na, K,SO4 and Cl were negligible in amount. At each site therewas one-time sampling only and in most cases the waterwas taken from the spring itself before it had had anyopportunity to de-gas its CO2 content or make otheradjustments to open air conditions.
McRitchie (1994) described what happened downstream,however – precipitates quickly appeared, as sand-sizedparticles at first but rapidly shrinking in size downstreamand ceasing to form after 200–300 m of flow in the openchannels. In the ponds at some springs there were organic-rich mats of material. Downstream there was onlycream-grey carbonate ooze, very like that collected fromthe bottom of Little Limestone Lake. The oozes were almostentirely CaCO3, chiefly of inorganic origin although one offour samples may have contained as much as 10% organics(i.e. from photosynthesis, as described above).
Figure 3. A typical section of the cyclic dolomite beds at LittleLimestone Lake.
Figure 4. Cliffed shore with groundwater outlets at and below thewaterline.
Karst and Caves in Carbonate Rocks, Salt and Gypsum – oral 2013 ICS Proceedings
57
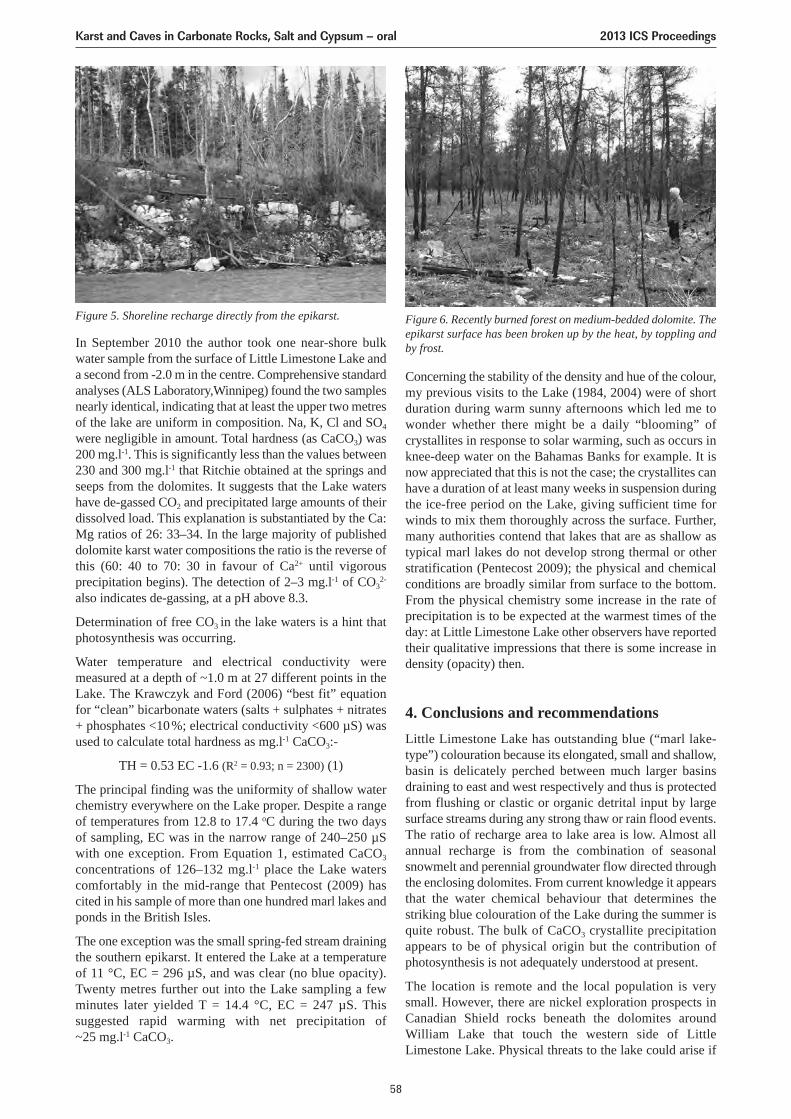
In September 2010 the author took one near-shore bulkwater sample from the surface of Little Limestone Lake anda second from -2.0 m in the centre. Comprehensive standardanalyses (ALS Laboratory,Winnipeg) found the two samplesnearly identical, indicating that at least the upper two metresof the lake are uniform in composition. Na, K, Cl and SO4
were negligible in amount. Total hardness (as CaCO3) was200 mg.l-1. This is significantly less than the values between230 and 300 mg.l-1 that Ritchie obtained at the springs andseeps from the dolomites. It suggests that the Lake watershave de-gassed CO2 and precipitated large amounts of theirdissolved load. This explanation is substantiated by the Ca:Mg ratios of 26: 33–34. In the large majority of publisheddolomite karst water compositions the ratio is the reverse ofthis (60: 40 to 70: 30 in favour of Ca2+ until vigorousprecipitation begins). The detection of 2–3 mg.l-1 of CO3
2-
also indicates de-gassing, at a pH above 8.3.
Determination of free CO3 in the lake waters is a hint thatphotosynthesis was occurring.
Water temperature and electrical conductivity weremeasured at a depth of ~1.0 m at 27 different points in theLake. The Krawczyk and Ford (2006) “best fit” equationfor “clean” bicarbonate waters (salts + sulphates + nitrates+ phosphates <10%; electrical conductivity <600 µS) wasused to calculate total hardness as mg.l-1 CaCO3:-
TH = 0.53 EC -1.6 (R2 = 0.93; n = 2300) (1)
The principal finding was the uniformity of shallow waterchemistry everywhere on the Lake proper. Despite a rangeof temperatures from 12.8 to 17.4 oC during the two daysof sampling, EC was in the narrow range of 240–250 µSwith one exception. From Equation 1, estimated CaCO3
concentrations of 126–132 mg.l-1 place the Lake waterscomfortably in the mid-range that Pentecost (2009) hascited in his sample of more than one hundred marl lakes andponds in the British Isles.
The one exception was the small spring-fed stream drainingthe southern epikarst. It entered the Lake at a temperatureof 11 °C, EC = 296 µS, and was clear (no blue opacity).Twenty metres further out into the Lake sampling a fewminutes later yielded T = 14.4 °C, EC = 247 µS. Thissuggested rapid warming with net precipitation of ~25 mg.l-1 CaCO3.
Concerning the stability of the density and hue of the colour,my previous visits to the Lake (1984, 2004) were of shortduration during warm sunny afternoons which led me towonder whether there might be a daily “blooming” ofcrystallites in response to solar warming, such as occurs inknee-deep water on the Bahamas Banks for example. It isnow appreciated that this is not the case; the crystallites canhave a duration of at least many weeks in suspension duringthe ice-free period on the Lake, giving sufficient time forwinds to mix them thoroughly across the surface. Further,many authorities contend that lakes that are as shallow astypical marl lakes do not develop strong thermal or otherstratification (Pentecost 2009); the physical and chemicalconditions are broadly similar from surface to the bottom.From the physical chemistry some increase in the rate ofprecipitation is to be expected at the warmest times of theday: at Little Limestone Lake other observers have reportedtheir qualitative impressions that there is some increase indensity (opacity) then.
4. Conclusions and recommendationsLittle Limestone Lake has outstanding blue (“marl lake-type”) colouration because its elongated, small and shallow,basin is delicately perched between much larger basinsdraining to east and west respectively and thus is protectedfrom flushing or clastic or organic detrital input by largesurface streams during any strong thaw or rain flood events.The ratio of recharge area to lake area is low. Almost allannual recharge is from the combination of seasonalsnowmelt and perennial groundwater flow directed throughthe enclosing dolomites. From current knowledge it appearsthat the water chemical behaviour that determines thestriking blue colouration of the Lake during the summer isquite robust. The bulk of CaCO3 crystallite precipitationappears to be of physical origin but the contribution ofphotosynthesis is not adequately understood at present.
The location is remote and the local population is verysmall. However, there are nickel exploration prospects inCanadian Shield rocks beneath the dolomites aroundWilliam Lake that touch the western side of LittleLimestone Lake. Physical threats to the lake could arise if
Figure 5. Shoreline recharge directly from the epikarst. Figure 6. Recently burned forest on medium-bedded dolomite. Theepikarst surface has been broken up by the heat, by toppling andby frost.
Karst and Caves in Carbonate Rocks, Salt and Gypsum – oral 2013 ICS Proceedings
58
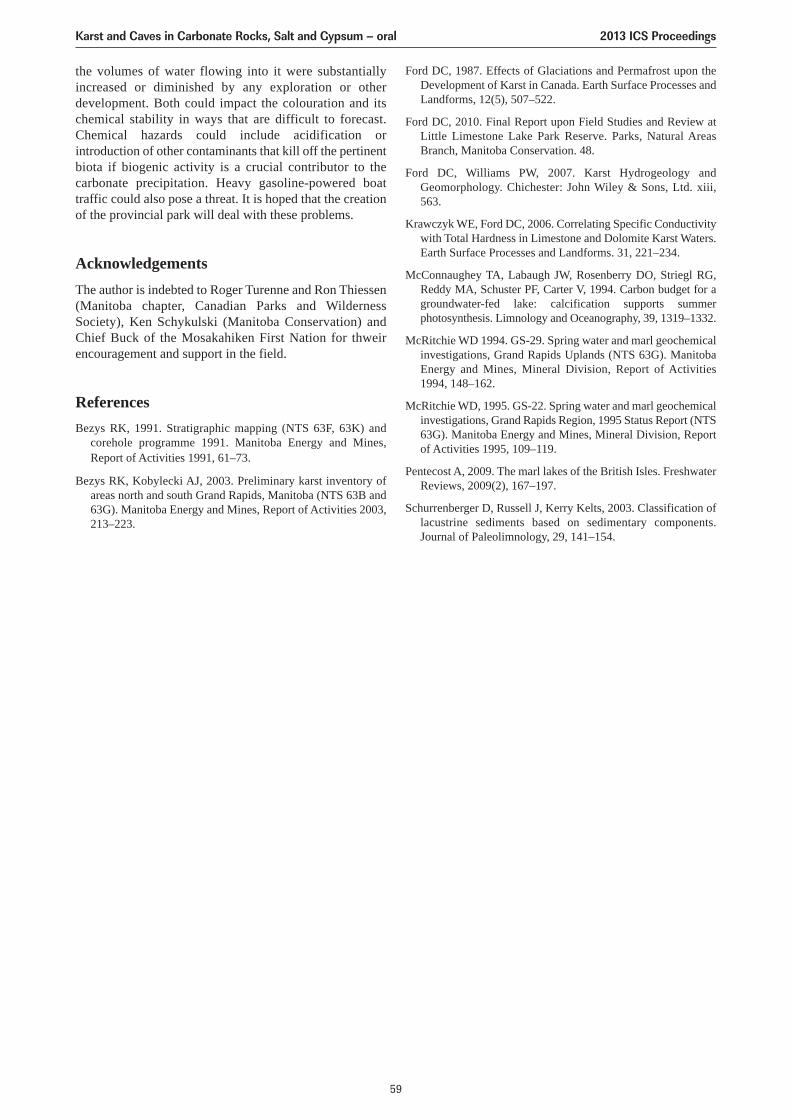
the volumes of water flowing into it were substantiallyincreased or diminished by any exploration or otherdevelopment. Both could impact the colouration and itschemical stability in ways that are difficult to forecast.Chemical hazards could include acidification orintroduction of other contaminants that kill off the pertinentbiota if biogenic activity is a crucial contributor to thecarbonate precipitation. Heavy gasoline-powered boattraffic could also pose a threat. It is hoped that the creationof the provincial park will deal with these problems.
AcknowledgementsThe author is indebted to Roger Turenne and Ron Thiessen(Manitoba chapter, Canadian Parks and WildernessSociety), Ken Schykulski (Manitoba Conservation) andChief Buck of the Mosakahiken First Nation for thweirencouragement and support in the field.
ReferencesBezys RK, 1991. Stratigraphic mapping (NTS 63F, 63K) and
corehole programme 1991. Manitoba Energy and Mines,Report of Activities 1991, 61–73.
Bezys RK, Kobylecki AJ, 2003. Preliminary karst inventory ofareas north and south Grand Rapids, Manitoba (NTS 63B and63G). Manitoba Energy and Mines, Report of Activities 2003,213–223.
Ford DC, 1987. Effects of Glaciations and Permafrost upon theDevelopment of Karst in Canada. Earth Surface Processes andLandforms, 12(5), 507–522.
Ford DC, 2010. Final Report upon Field Studies and Review atLittle Limestone Lake Park Reserve. Parks, Natural AreasBranch, Manitoba Conservation. 48.
Ford DC, Williams PW, 2007. Karst Hydrogeology andGeomorphology. Chichester: John Wiley & Sons, Ltd. xiii, 563.
Krawczyk WE, Ford DC, 2006. Correlating Specific Conductivitywith Total Hardness in Limestone and Dolomite Karst Waters.Earth Surface Processes and Landforms. 31, 221–234.
McConnaughey TA, Labaugh JW, Rosenberry DO, Striegl RG,Reddy MA, Schuster PF, Carter V, 1994. Carbon budget for agroundwater-fed lake: calcification supports summerphotosynthesis. Limnology and Oceanography, 39, 1319–1332.
McRitchie WD 1994. GS-29. Spring water and marl geochemicalinvestigations, Grand Rapids Uplands (NTS 63G). ManitobaEnergy and Mines, Mineral Division, Report of Activities1994, 148–162.
McRitchie WD, 1995. GS-22. Spring water and marl geochemicalinvestigations, Grand Rapids Region, 1995 Status Report (NTS63G). Manitoba Energy and Mines, Mineral Division, Reportof Activities 1995, 109–119.
Pentecost A, 2009. The marl lakes of the British Isles. FreshwaterReviews, 2009(2), 167–197.
Schurrenberger D, Russell J, Kerry Kelts, 2003. Classification oflacustrine sediments based on sedimentary components.Journal of Paleolimnology, 29, 141–154.
Karst and Caves in Carbonate Rocks, Salt and Gypsum – oral 2013 ICS Proceedings
59
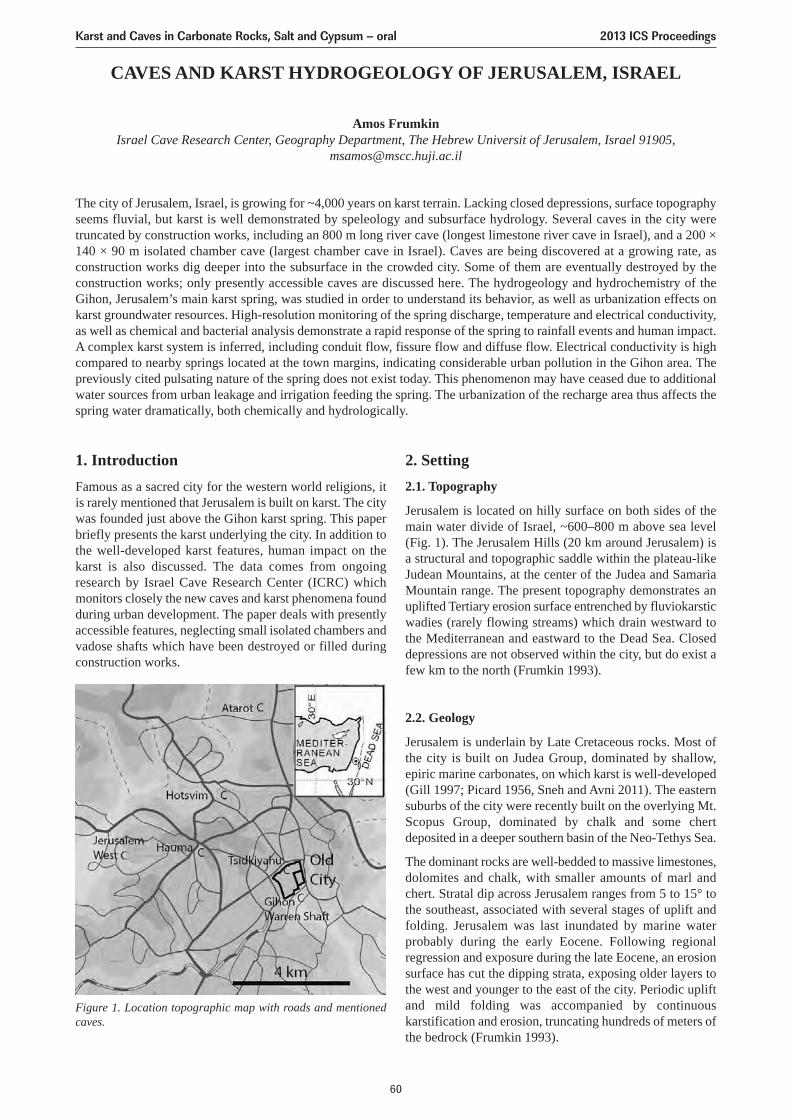
CAVES AND KARST HYDROGEOLOGY OF JERUSALEM, ISRAEL
Amos FrumkinIsrael Cave Research Center, Geography Department, The Hebrew Universit of Jerusalem, Israel 91905,
The city of Jerusalem, Israel, is growing for ~4,000 years on karst terrain. Lacking closed depressions, surface topographyseems fluvial, but karst is well demonstrated by speleology and subsurface hydrology. Several caves in the city weretruncated by construction works, including an 800 m long river cave (longest limestone river cave in Israel), and a 200 ×140 × 90 m isolated chamber cave (largest chamber cave in Israel). Caves are being discovered at a growing rate, asconstruction works dig deeper into the subsurface in the crowded city. Some of them are eventually destroyed by theconstruction works; only presently accessible caves are discussed here. The hydrogeology and hydrochemistry of theGihon, Jerusalem’s main karst spring, was studied in order to understand its behavior, as well as urbanization effects onkarst groundwater resources. High-resolution monitoring of the spring discharge, temperature and electrical conductivity,as well as chemical and bacterial analysis demonstrate a rapid response of the spring to rainfall events and human impact.A complex karst system is inferred, including conduit flow, fissure flow and diffuse flow. Electrical conductivity is highcompared to nearby springs located at the town margins, indicating considerable urban pollution in the Gihon area. Thepreviously cited pulsating nature of the spring does not exist today. This phenomenon may have ceased due to additionalwater sources from urban leakage and irrigation feeding the spring. The urbanization of the recharge area thus affects thespring water dramatically, both chemically and hydrologically.
1. IntroductionFamous as a sacred city for the western world religions, itis rarely mentioned that Jerusalem is built on karst. The citywas founded just above the Gihon karst spring. This paperbriefly presents the karst underlying the city. In addition tothe well-developed karst features, human impact on thekarst is also discussed. The data comes from ongoingresearch by Israel Cave Research Center (ICRC) whichmonitors closely the new caves and karst phenomena foundduring urban development. The paper deals with presentlyaccessible features, neglecting small isolated chambers andvadose shafts which have been destroyed or filled duringconstruction works.
2. Setting2.1. Topography
Jerusalem is located on hilly surface on both sides of themain water divide of Israel, ~600–800 m above sea level(Fig. 1). The Jerusalem Hills (20 km around Jerusalem) isa structural and topographic saddle within the plateau-likeJudean Mountains, at the center of the Judea and SamariaMountain range. The present topography demonstrates anuplifted Tertiary erosion surface entrenched by fluviokarsticwadies (rarely flowing streams) which drain westward tothe Mediterranean and eastward to the Dead Sea. Closeddepressions are not observed within the city, but do exist afew km to the north (Frumkin 1993).
2.2. Geology
Jerusalem is underlain by Late Cretaceous rocks. Most ofthe city is built on Judea Group, dominated by shallow,epiric marine carbonates, on which karst is well-developed(Gill 1997; Picard 1956, Sneh and Avni 2011). The easternsuburbs of the city were recently built on the overlying Mt.Scopus Group, dominated by chalk and some chertdeposited in a deeper southern basin of the Neo-Tethys Sea.
The dominant rocks are well-bedded to massive limestones,dolomites and chalk, with smaller amounts of marl andchert. Stratal dip across Jerusalem ranges from 5 to 15° tothe southeast, associated with several stages of uplift andfolding. Jerusalem was last inundated by marine waterprobably during the early Eocene. Following regionalregression and exposure during the late Eocene, an erosionsurface has cut the dipping strata, exposing older layers tothe west and younger to the east of the city. Periodic upliftand mild folding was accompanied by continuouskarstification and erosion, truncating hundreds of meters ofthe bedrock (Frumkin 1993).
Figure 1. Location topographic map with roads and mentionedcaves.
Karst and Caves in Carbonate Rocks, Salt and Gypsum – oral 2013 ICS Proceedings
60
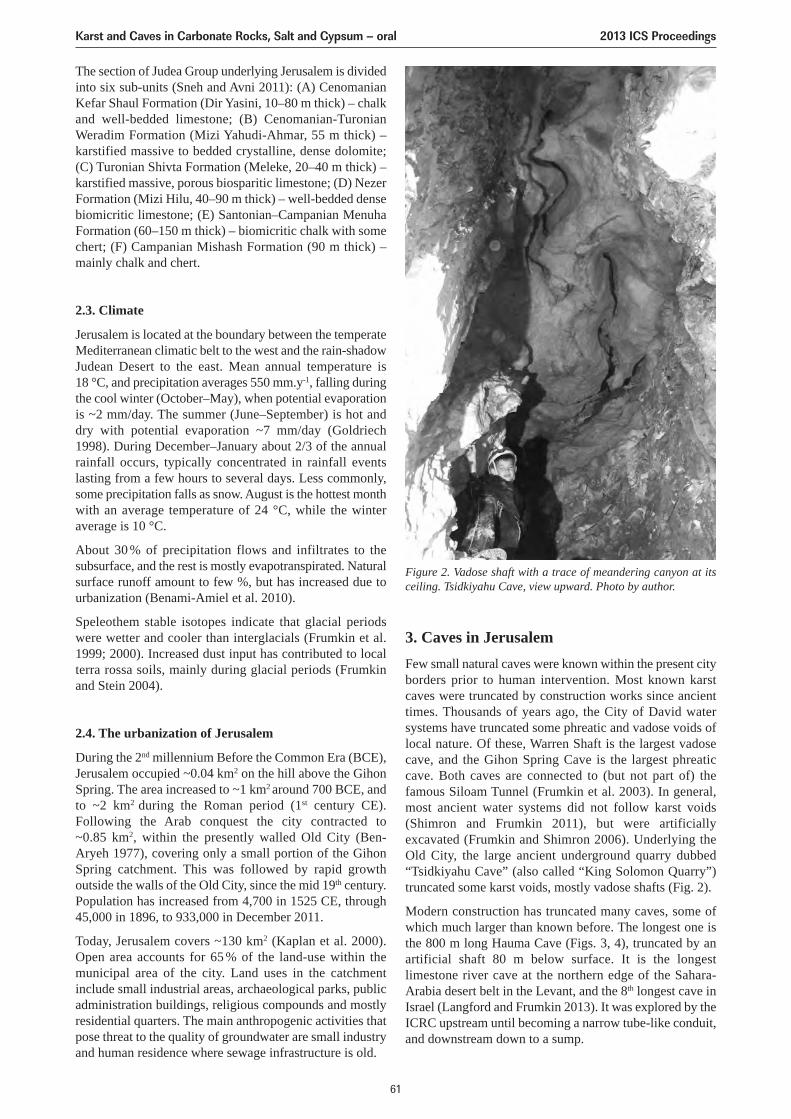
The section of Judea Group underlying Jerusalem is dividedinto six sub-units (Sneh and Avni 2011): (A) CenomanianKefar Shaul Formation (Dir Yasini, 10–80 m thick) – chalkand well-bedded limestone; (B) Cenomanian-TuronianWeradim Formation (Mizi Yahudi-Ahmar, 55 m thick) –karstified massive to bedded crystalline, dense dolomite;(C) Turonian Shivta Formation (Meleke, 20–40 m thick) –karstified massive, porous biosparitic limestone; (D) NezerFormation (Mizi Hilu, 40–90 m thick) – well-bedded densebiomicritic limestone; (E) Santonian–Campanian MenuhaFormation (60–150 m thick) – biomicritic chalk with somechert; (F) Campanian Mishash Formation (90 m thick) –mainly chalk and chert.
2.3. Climate
Jerusalem is located at the boundary between the temperateMediterranean climatic belt to the west and the rain-shadowJudean Desert to the east. Mean annual temperature is 18 °C, and precipitation averages 550 mm.y-1, falling duringthe cool winter (October–May), when potential evaporationis ~2 mm/day. The summer (June–September) is hot anddry with potential evaporation ~7 mm/day (Goldriech1998). During December–January about 2/3 of the annualrainfall occurs, typically concentrated in rainfall eventslasting from a few hours to several days. Less commonly,some precipitation falls as snow. August is the hottest monthwith an average temperature of 24 °C, while the winteraverage is 10 °C.
About 30 % of precipitation flows and infiltrates to thesubsurface, and the rest is mostly evapotranspirated. Naturalsurface runoff amount to few %, but has increased due tourbanization (Benami-Amiel et al. 2010).
Speleothem stable isotopes indicate that glacial periodswere wetter and cooler than interglacials (Frumkin et al.1999; 2000). Increased dust input has contributed to localterra rossa soils, mainly during glacial periods (Frumkinand Stein 2004).
2.4. The urbanization of Jerusalem
During the 2nd millennium Before the Common Era (BCE),Jerusalem occupied ~0.04 km2 on the hill above the GihonSpring. The area increased to ~1 km2 around 700 BCE, andto ~2 km2 during the Roman period (1st century CE).Following the Arab conquest the city contracted to~0.85 km2, within the presently walled Old City (Ben-Aryeh 1977), covering only a small portion of the GihonSpring catchment. This was followed by rapid growthoutside the walls of the Old City, since the mid 19th century.Population has increased from 4,700 in 1525 CE, through45,000 in 1896, to 933,000 in December 2011.
Today, Jerusalem covers ~130 km2 (Kaplan et al. 2000).Open area accounts for 65 % of the land-use within themunicipal area of the city. Land uses in the catchmentinclude small industrial areas, archaeological parks, publicadministration buildings, religious compounds and mostlyresidential quarters. The main anthropogenic activities thatpose threat to the quality of groundwater are small industryand human residence where sewage infrastructure is old.
3. Caves in JerusalemFew small natural caves were known within the present cityborders prior to human intervention. Most known karstcaves were truncated by construction works since ancienttimes. Thousands of years ago, the City of David watersystems have truncated some phreatic and vadose voids oflocal nature. Of these, Warren Shaft is the largest vadosecave, and the Gihon Spring Cave is the largest phreaticcave. Both caves are connected to (but not part of) thefamous Siloam Tunnel (Frumkin et al. 2003). In general,most ancient water systems did not follow karst voids(Shimron and Frumkin 2011), but were artificiallyexcavated (Frumkin and Shimron 2006). Underlying theOld City, the large ancient underground quarry dubbed“Tsidkiyahu Cave” (also called “King Solomon Quarry”)truncated some karst voids, mostly vadose shafts (Fig. 2).
Modern construction has truncated many caves, some ofwhich much larger than known before. The longest one isthe 800 m long Hauma Cave (Figs. 3, 4), truncated by anartificial shaft 80 m below surface. It is the longestlimestone river cave at the northern edge of the Sahara-Arabia desert belt in the Levant, and the 8th longest cave inIsrael (Langford and Frumkin 2013). It was explored by theICRC upstream until becoming a narrow tube-like conduit,and downstream down to a sump.
Figure 2. Vadose shaft with a trace of meandering canyon at itsceiling. Tsidkiyahu Cave, view upward. Photo by author.
Karst and Caves in Carbonate Rocks, Salt and Gypsum – oral 2013 ICS Proceedings
61
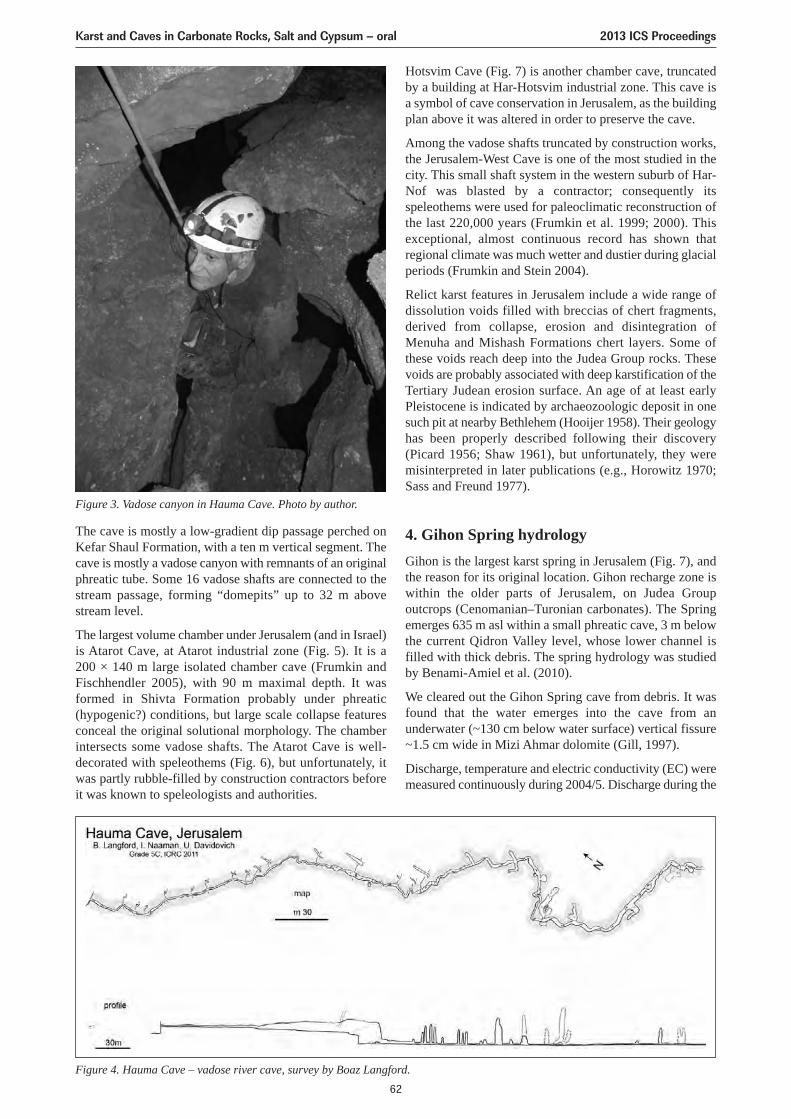
The cave is mostly a low-gradient dip passage perched onKefar Shaul Formation, with a ten m vertical segment. Thecave is mostly a vadose canyon with remnants of an originalphreatic tube. Some 16 vadose shafts are connected to thestream passage, forming “domepits” up to 32 m abovestream level.
The largest volume chamber under Jerusalem (and in Israel)is Atarot Cave, at Atarot industrial zone (Fig. 5). It is a200 × 140 m large isolated chamber cave (Frumkin andFischhendler 2005), with 90 m maximal depth. It wasformed in Shivta Formation probably under phreatic(hypogenic?) conditions, but large scale collapse featuresconceal the original solutional morphology. The chamberintersects some vadose shafts. The Atarot Cave is well-decorated with speleothems (Fig. 6), but unfortunately, itwas partly rubble-filled by construction contractors beforeit was known to speleologists and authorities.
Hotsvim Cave (Fig. 7) is another chamber cave, truncatedby a building at Har-Hotsvim industrial zone. This cave isa symbol of cave conservation in Jerusalem, as the buildingplan above it was altered in order to preserve the cave.
Among the vadose shafts truncated by construction works,the Jerusalem-West Cave is one of the most studied in thecity. This small shaft system in the western suburb of Har-Nof was blasted by a contractor; consequently itsspeleothems were used for paleoclimatic reconstruction ofthe last 220,000 years (Frumkin et al. 1999; 2000). Thisexceptional, almost continuous record has shown thatregional climate was much wetter and dustier during glacialperiods (Frumkin and Stein 2004).
Relict karst features in Jerusalem include a wide range ofdissolution voids filled with breccias of chert fragments,derived from collapse, erosion and disintegration ofMenuha and Mishash Formations chert layers. Some ofthese voids reach deep into the Judea Group rocks. Thesevoids are probably associated with deep karstification of theTertiary Judean erosion surface. An age of at least earlyPleistocene is indicated by archaeozoologic deposit in onesuch pit at nearby Bethlehem (Hooijer 1958). Their geologyhas been properly described following their discovery(Picard 1956; Shaw 1961), but unfortunately, they weremisinterpreted in later publications (e.g., Horowitz 1970;Sass and Freund 1977).
4. Gihon Spring hydrologyGihon is the largest karst spring in Jerusalem (Fig. 7), andthe reason for its original location. Gihon recharge zone iswithin the older parts of Jerusalem, on Judea Groupoutcrops (Cenomanian–Turonian carbonates). The Springemerges 635 m asl within a small phreatic cave, 3 m belowthe current Qidron Valley level, whose lower channel isfilled with thick debris. The spring hydrology was studiedby Benami-Amiel et al. (2010).
We cleared out the Gihon Spring cave from debris. It wasfound that the water emerges into the cave from anunderwater (~130 cm below water surface) vertical fissure~1.5 cm wide in Mizi Ahmar dolomite (Gill, 1997).
Discharge, temperature and electric conductivity (EC) weremeasured continuously during 2004/5. Discharge during the
Figure 3. Vadose canyon in Hauma Cave. Photo by author.
Figure 4. Hauma Cave – vadose river cave, survey by Boaz Langford.
Karst and Caves in Carbonate Rocks, Salt and Gypsum – oral 2013 ICS Proceedings
62
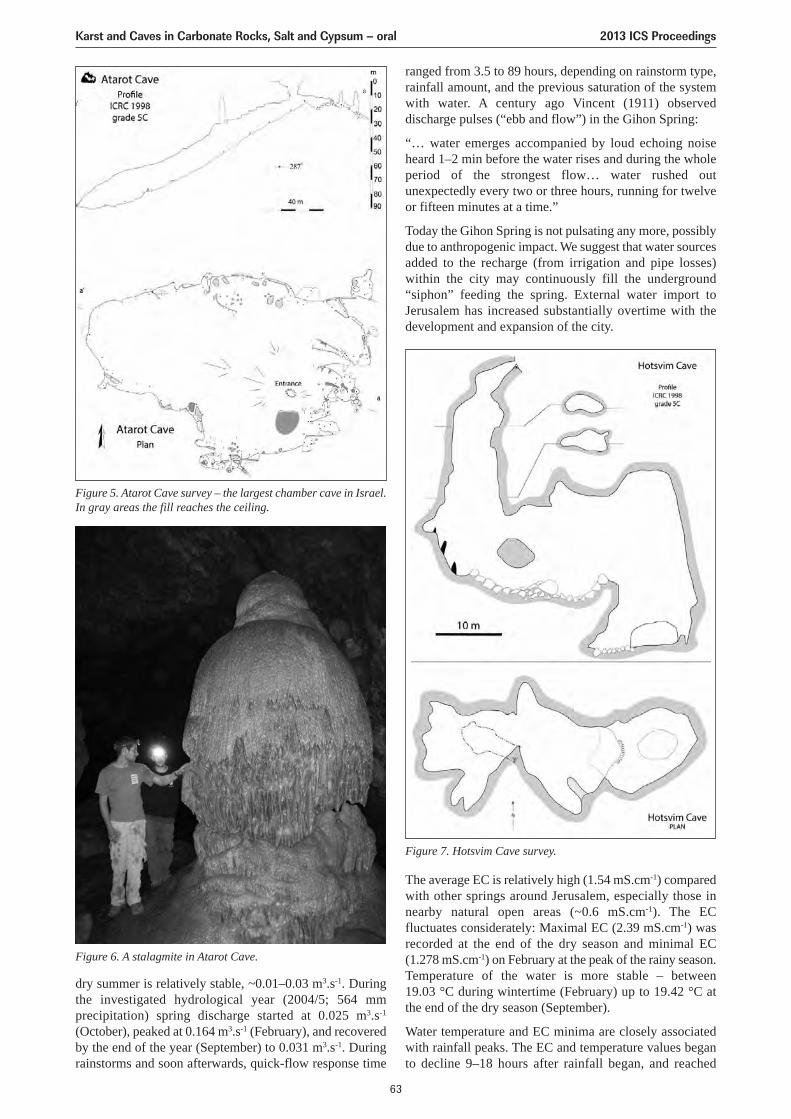
dry summer is relatively stable, ~0.01–0.03 m3.s-1. Duringthe investigated hydrological year (2004/5; 564 mmprecipitation) spring discharge started at 0.025 m3.s-1
(October), peaked at 0.164 m3.s-1 (February), and recoveredby the end of the year (September) to 0.031 m3.s-1. Duringrainstorms and soon afterwards, quick-flow response time
Figure 5. Atarot Cave survey – the largest chamber cave in Israel.In gray areas the fill reaches the ceiling.
Figure 6. A stalagmite in Atarot Cave.
Figure 7. Hotsvim Cave survey.
The average EC is relatively high (1.54 mS.cm-1) comparedwith other springs around Jerusalem, especially those innearby natural open areas (~0.6 mS.cm-1). The ECfluctuates considerately: Maximal EC (2.39 mS.cm-1) wasrecorded at the end of the dry season and minimal EC(1.278 mS.cm-1) on February at the peak of the rainy season.Temperature of the water is more stable – between 19.03 °C during wintertime (February) up to 19.42 °C atthe end of the dry season (September).
Water temperature and EC minima are closely associatedwith rainfall peaks. The EC and temperature values beganto decline 9–18 hours after rainfall began, and reached
ranged from 3.5 to 89 hours, depending on rainstorm type,rainfall amount, and the previous saturation of the systemwith water. A century ago Vincent (1911) observeddischarge pulses (“ebb and flow”) in the Gihon Spring:
“… water emerges accompanied by loud echoing noiseheard 1–2 min before the water rises and during the wholeperiod of the strongest flow… water rushed outunexpectedly every two or three hours, running for twelveor fifteen minutes at a time.”
Today the Gihon Spring is not pulsating any more, possiblydue to anthropogenic impact. We suggest that water sourcesadded to the recharge (from irrigation and pipe losses)within the city may continuously fill the underground“siphon” feeding the spring. External water import toJerusalem has increased substantially overtime with thedevelopment and expansion of the city.
Karst and Caves in Carbonate Rocks, Salt and Gypsum – oral 2013 ICS Proceedings
63
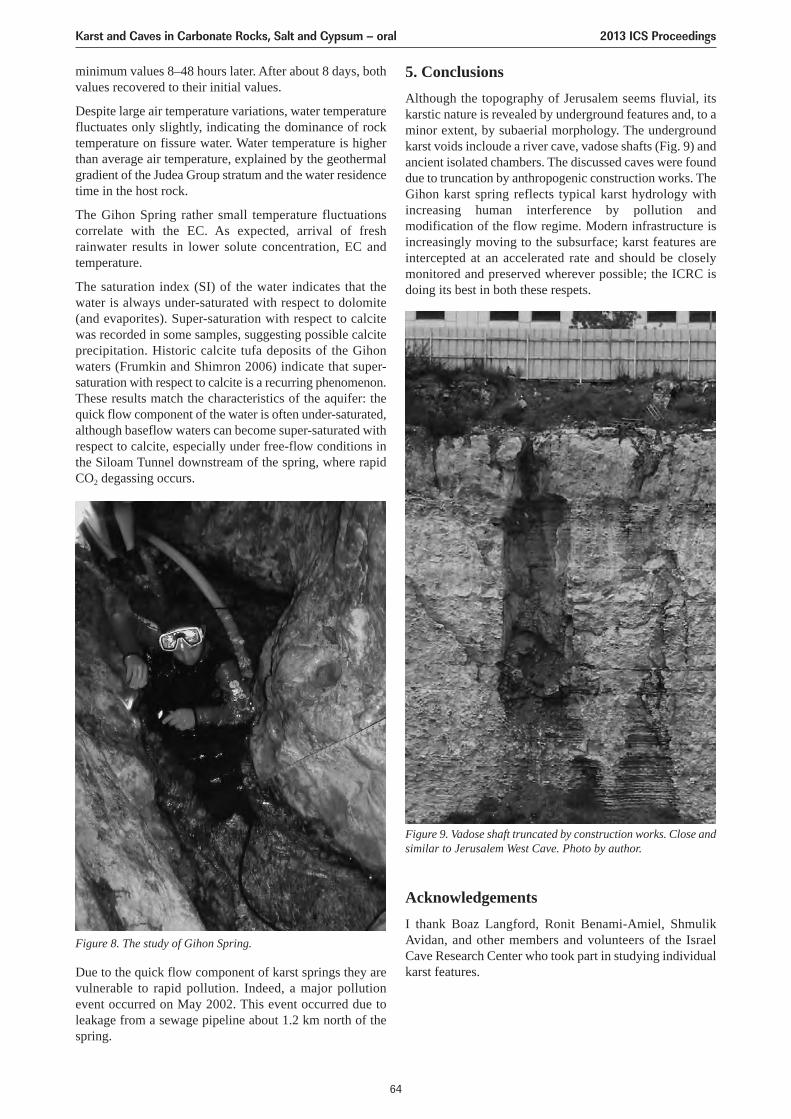
Due to the quick flow component of karst springs they arevulnerable to rapid pollution. Indeed, a major pollutionevent occurred on May 2002. This event occurred due toleakage from a sewage pipeline about 1.2 km north of thespring.
5. ConclusionsAlthough the topography of Jerusalem seems fluvial, itskarstic nature is revealed by underground features and, to aminor extent, by subaerial morphology. The undergroundkarst voids incloude a river cave, vadose shafts (Fig. 9) andancient isolated chambers. The discussed caves were founddue to truncation by anthropogenic construction works. TheGihon karst spring reflects typical karst hydrology withincreasing human interference by pollution andmodification of the flow regime. Modern infrastructure isincreasingly moving to the subsurface; karst features areintercepted at an accelerated rate and should be closelymonitored and preserved wherever possible; the ICRC isdoing its best in both these respets.
minimum values 8–48 hours later. After about 8 days, bothvalues recovered to their initial values.
Despite large air temperature variations, water temperaturefluctuates only slightly, indicating the dominance of rocktemperature on fissure water. Water temperature is higherthan average air temperature, explained by the geothermalgradient of the Judea Group stratum and the water residencetime in the host rock.
The Gihon Spring rather small temperature fluctuationscorrelate with the EC. As expected, arrival of freshrainwater results in lower solute concentration, EC andtemperature.
The saturation index (SI) of the water indicates that thewater is always under-saturated with respect to dolomite(and evaporites). Super-saturation with respect to calcitewas recorded in some samples, suggesting possible calciteprecipitation. Historic calcite tufa deposits of the Gihonwaters (Frumkin and Shimron 2006) indicate that super-saturation with respect to calcite is a recurring phenomenon.These results match the characteristics of the aquifer: thequick flow component of the water is often under-saturated,although baseflow waters can become super-saturated withrespect to calcite, especially under free-flow conditions inthe Siloam Tunnel downstream of the spring, where rapidCO2 degassing occurs.
Figure 8. The study of Gihon Spring.
Figure 9. Vadose shaft truncated by construction works. Close andsimilar to Jerusalem West Cave. Photo by author.
AcknowledgementsI thank Boaz Langford, Ronit Benami-Amiel, ShmulikAvidan, and other members and volunteers of the IsraelCave Research Center who took part in studying individualkarst features.
Karst and Caves in Carbonate Rocks, Salt and Gypsum – oral 2013 ICS Proceedings
64
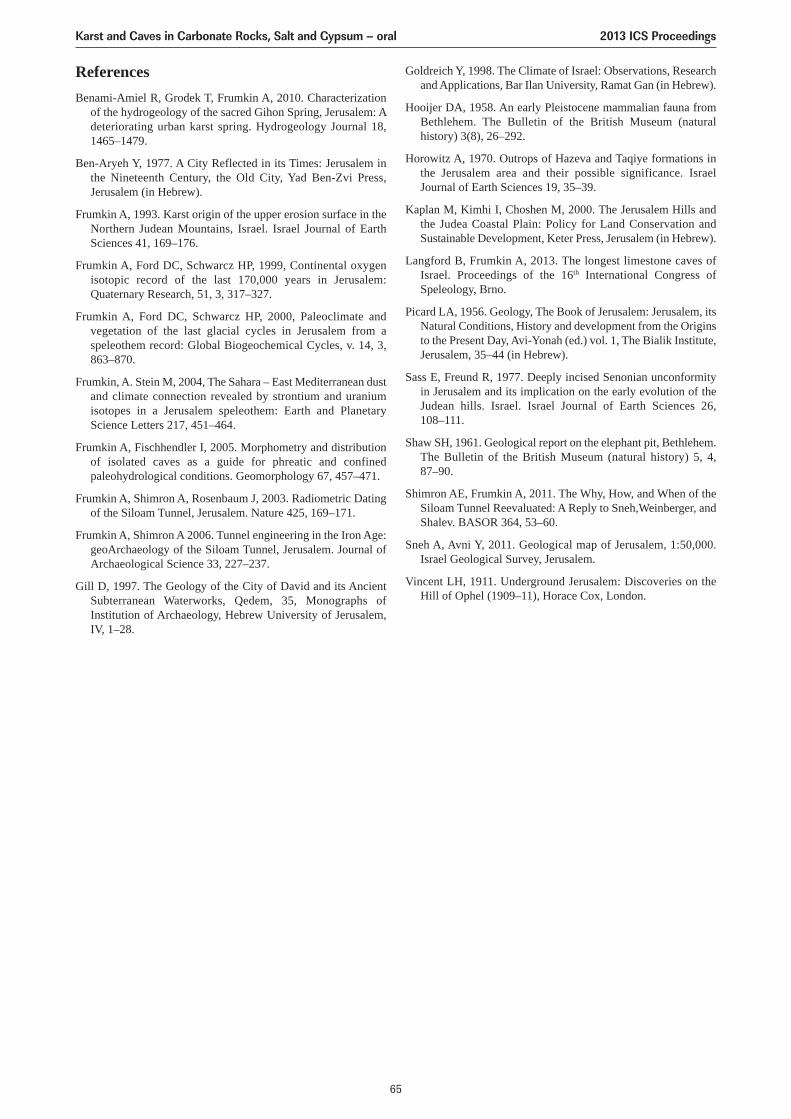
ReferencesBenami-Amiel R, Grodek T, Frumkin A, 2010. Characterization
of the hydrogeology of the sacred Gihon Spring, Jerusalem: Adeteriorating urban karst spring. Hydrogeology Journal 18,1465–1479.
Ben-Aryeh Y, 1977. A City Reflected in its Times: Jerusalem inthe Nineteenth Century, the Old City, Yad Ben-Zvi Press,Jerusalem (in Hebrew).
Frumkin A, 1993. Karst origin of the upper erosion surface in theNorthern Judean Mountains, Israel. Israel Journal of EarthSciences 41, 169–176.
Frumkin A, Ford DC, Schwarcz HP, 1999, Continental oxygenisotopic record of the last 170,000 years in Jerusalem:Quaternary Research, 51, 3, 317–327.
Frumkin A, Ford DC, Schwarcz HP, 2000, Paleoclimate andvegetation of the last glacial cycles in Jerusalem from aspeleothem record: Global Biogeochemical Cycles, v. 14, 3,863–870.
Frumkin, A. Stein M, 2004, The Sahara – East Mediterranean dustand climate connection revealed by strontium and uraniumisotopes in a Jerusalem speleothem: Earth and PlanetaryScience Letters 217, 451–464.
Frumkin A, Fischhendler I, 2005. Morphometry and distributionof isolated caves as a guide for phreatic and confinedpaleohydrological conditions. Geomorphology 67, 457–471.
Frumkin A, Shimron A, Rosenbaum J, 2003. Radiometric Datingof the Siloam Tunnel, Jerusalem. Nature 425, 169–171.
Frumkin A, Shimron A 2006. Tunnel engineering in the Iron Age:geoArchaeology of the Siloam Tunnel, Jerusalem. Journal ofArchaeological Science 33, 227–237.
Gill D, 1997. The Geology of the City of David and its AncientSubterranean Waterworks, Qedem, 35, Monographs ofInstitution of Archaeology, Hebrew University of Jerusalem,IV, 1–28.
Goldreich Y, 1998. The Climate of Israel: Observations, Researchand Applications, Bar Ilan University, Ramat Gan (in Hebrew).
Hooijer DA, 1958. An early Pleistocene mammalian fauna fromBethlehem. The Bulletin of the British Museum (naturalhistory) 3(8), 26–292.
Horowitz A, 1970. Outrops of Hazeva and Taqiye formations inthe Jerusalem area and their possible significance. IsraelJournal of Earth Sciences 19, 35–39.
Kaplan M, Kimhi I, Choshen M, 2000. The Jerusalem Hills andthe Judea Coastal Plain: Policy for Land Conservation andSustainable Development, Keter Press, Jerusalem (in Hebrew).
Langford B, Frumkin A, 2013. The longest limestone caves ofIsrael. Proceedings of the 16th International Congress ofSpeleology, Brno.
Picard LA, 1956. Geology, The Book of Jerusalem: Jerusalem, itsNatural Conditions, History and development from the Originsto the Present Day, Avi-Yonah (ed.) vol. 1, The Bialik Institute,Jerusalem, 35–44 (in Hebrew).
Sass E, Freund R, 1977. Deeply incised Senonian unconformityin Jerusalem and its implication on the early evolution of theJudean hills. Israel. Israel Journal of Earth Sciences 26, 108–111.
Shaw SH, 1961. Geological report on the elephant pit, Bethlehem.The Bulletin of the British Museum (natural history) 5, 4, 87–90.
Shimron AE, Frumkin A, 2011. The Why, How, and When of theSiloam Tunnel Reevaluated: A Reply to Sneh,Weinberger, andShalev. BASOR 364, 53–60.
Sneh A, Avni Y, 2011. Geological map of Jerusalem, 1:50,000.Israel Geological Survey, Jerusalem.
Vincent LH, 1911. Underground Jerusalem: Discoveries on theHill of Ophel (1909–11), Horace Cox, London.
Karst and Caves in Carbonate Rocks, Salt and Gypsum – oral 2013 ICS Proceedings
65
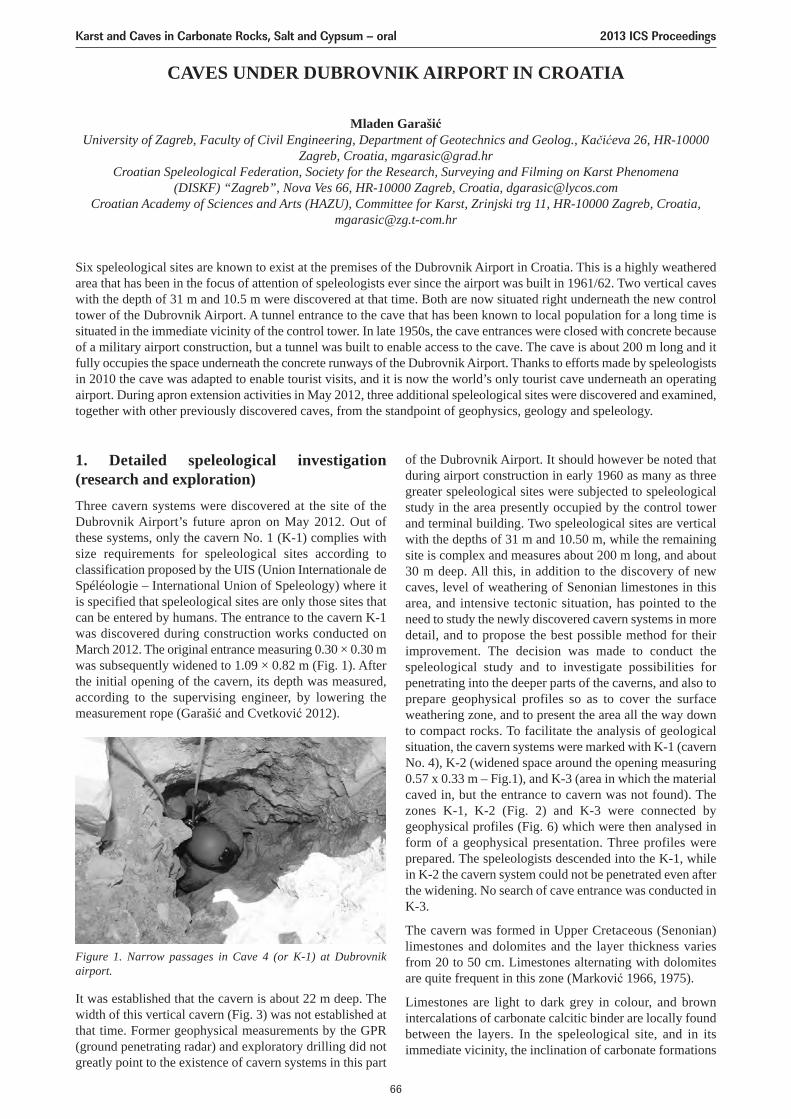
of the Dubrovnik Airport. It should however be noted thatduring airport construction in early 1960 as many as threegreater speleological sites were subjected to speleologicalstudy in the area presently occupied by the control towerand terminal building. Two speleological sites are verticalwith the depths of 31 m and 10.50 m, while the remainingsite is complex and measures about 200 m long, and about30 m deep. All this, in addition to the discovery of newcaves, level of weathering of Senonian limestones in thisarea, and intensive tectonic situation, has pointed to theneed to study the newly discovered cavern systems in moredetail, and to propose the best possible method for theirimprovement. The decision was made to conduct thespeleological study and to investigate possibilities forpenetrating into the deeper parts of the caverns, and also toprepare geophysical profiles so as to cover the surfaceweathering zone, and to present the area all the way downto compact rocks. To facilitate the analysis of geologicalsituation, the cavern systems were marked with K-1 (cavernNo. 4), K-2 (widened space around the opening measuring0.57 x 0.33 m – Fig.1), and K-3 (area in which the materialcaved in, but the entrance to cavern was not found). Thezones K-1, K-2 (Fig. 2) and K-3 were connected bygeophysical profiles (Fig. 6) which were then analysed inform of a geophysical presentation. Three profiles wereprepared. The speleologists descended into the K-1, whilein K-2 the cavern system could not be penetrated even afterthe widening. No search of cave entrance was conducted inK-3.
The cavern was formed in Upper Cretaceous (Senonian)limestones and dolomites and the layer thickness variesfrom 20 to 50 cm. Limestones alternating with dolomitesare quite frequent in this zone (Marković 1966, 1975).
Limestones are light to dark grey in colour, and brownintercalations of carbonate calcitic binder are locally foundbetween the layers. In the speleological site, and in itsimmediate vicinity, the inclination of carbonate formations
CAVES UNDER DUBROVNIK AIRPORT IN CROATIA
Mladen GarašićUniversity of Zagreb, Faculty of Civil Engineering, Department of Geotechnics and Geolog., Kačićeva 26, HR-10000
Zagreb, Croatia, [email protected] Speleological Federation, Society for the Research, Surveying and Filming on Karst Phenomena
(DISKF) “Zagreb”, Nova Ves 66, HR-10000 Zagreb, Croatia, [email protected] Academy of Sciences and Arts (HAZU), Committee for Karst, Zrinjski trg 11, HR-10000 Zagreb, Croatia,
Six speleological sites are known to exist at the premises of the Dubrovnik Airport in Croatia. This is a highly weatheredarea that has been in the focus of attention of speleologists ever since the airport was built in 1961/62. Two vertical caveswith the depth of 31 m and 10.5 m were discovered at that time. Both are now situated right underneath the new controltower of the Dubrovnik Airport. A tunnel entrance to the cave that has been known to local population for a long time issituated in the immediate vicinity of the control tower. In late 1950s, the cave entrances were closed with concrete becauseof a military airport construction, but a tunnel was built to enable access to the cave. The cave is about 200 m long and itfully occupies the space underneath the concrete runways of the Dubrovnik Airport. Thanks to efforts made by speleologistsin 2010 the cave was adapted to enable tourist visits, and it is now the world’s only tourist cave underneath an operatingairport. During apron extension activities in May 2012, three additional speleological sites were discovered and examined,together with other previously discovered caves, from the standpoint of geophysics, geology and speleology.
1. Detailed speleological investigation(research and exploration)Three cavern systems were discovered at the site of theDubrovnik Airport’s future apron on May 2012. Out ofthese systems, only the cavern No. 1 (K-1) complies withsize requirements for speleological sites according toclassification proposed by the UIS (Union Internationale deSpéléologie – International Union of Speleology) where itis specified that speleological sites are only those sites thatcan be entered by humans. The entrance to the cavern K-1was discovered during construction works conducted onMarch 2012. The original entrance measuring 0.30 × 0.30 mwas subsequently widened to 1.09 × 0.82 m (Fig. 1). Afterthe initial opening of the cavern, its depth was measured,according to the supervising engineer, by lowering themeasurement rope (Garašić and Cvetković 2012).
It was established that the cavern is about 22 m deep. Thewidth of this vertical cavern (Fig. 3) was not established atthat time. Former geophysical measurements by the GPR(ground penetrating radar) and exploratory drilling did notgreatly point to the existence of cavern systems in this part
Figure 1. Narrow passages in Cave 4 (or K-1) at Dubrovnikairport.
Karst and Caves in Carbonate Rocks, Salt and Gypsum – oral 2013 ICS Proceedings
66
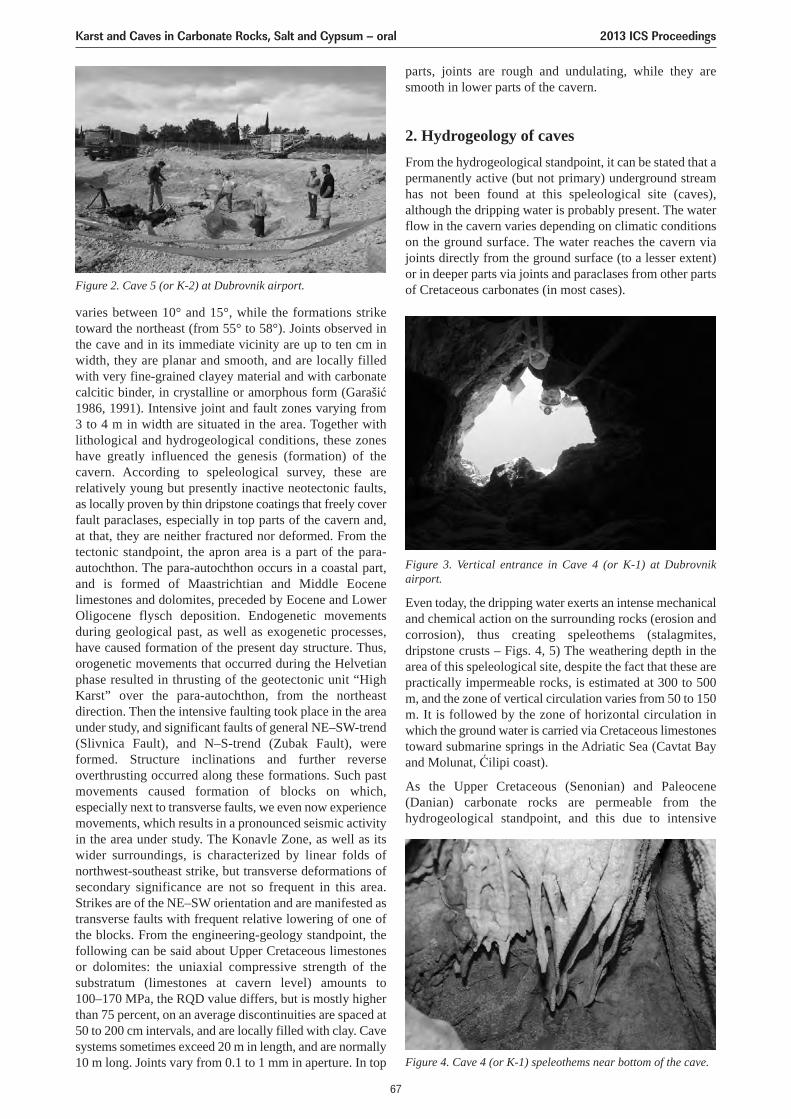
varies between 10° and 15°, while the formations striketoward the northeast (from 55° to 58°). Joints observed inthe cave and in its immediate vicinity are up to ten cm inwidth, they are planar and smooth, and are locally filledwith very fine-grained clayey material and with carbonatecalcitic binder, in crystalline or amorphous form (Garašić1986, 1991). Intensive joint and fault zones varying from 3 to 4 m in width are situated in the area. Together withlithological and hydrogeological conditions, these zoneshave greatly influenced the genesis (formation) of thecavern. According to speleological survey, these arerelatively young but presently inactive neotectonic faults,as locally proven by thin dripstone coatings that freely coverfault paraclases, especially in top parts of the cavern and,at that, they are neither fractured nor deformed. From thetectonic standpoint, the apron area is a part of the para-autochthon. The para-autochthon occurs in a coastal part,and is formed of Maastrichtian and Middle Eocenelimestones and dolomites, preceded by Eocene and LowerOligocene flysch deposition. Endogenetic movementsduring geological past, as well as exogenetic processes,have caused formation of the present day structure. Thus,orogenetic movements that occurred during the Helvetianphase resulted in thrusting of the geotectonic unit “HighKarst” over the para-autochthon, from the northeastdirection. Then the intensive faulting took place in the areaunder study, and significant faults of general NE–SW-trend(Slivnica Fault), and N–S-trend (Zubak Fault), wereformed. Structure inclinations and further reverseoverthrusting occurred along these formations. Such pastmovements caused formation of blocks on which,especially next to transverse faults, we even now experiencemovements, which results in a pronounced seismic activityin the area under study. The Konavle Zone, as well as itswider surroundings, is characterized by linear folds ofnorthwest-southeast strike, but transverse deformations ofsecondary significance are not so frequent in this area.Strikes are of the NE–SW orientation and are manifested astransverse faults with frequent relative lowering of one ofthe blocks. From the engineering-geology standpoint, thefollowing can be said about Upper Cretaceous limestonesor dolomites: the uniaxial compressive strength of thesubstratum (limestones at cavern level) amounts to 100–170 MPa, the RQD value differs, but is mostly higherthan 75 percent, on an average discontinuities are spaced at50 to 200 cm intervals, and are locally filled with clay. Cavesystems sometimes exceed 20 m in length, and are normally10 m long. Joints vary from 0.1 to 1 mm in aperture. In top
parts, joints are rough and undulating, while they aresmooth in lower parts of the cavern.
2. Hydrogeology of cavesFrom the hydrogeological standpoint, it can be stated that apermanently active (but not primary) underground streamhas not been found at this speleological site (caves),although the dripping water is probably present. The waterflow in the cavern varies depending on climatic conditionson the ground surface. The water reaches the cavern viajoints directly from the ground surface (to a lesser extent)or in deeper parts via joints and paraclases from other partsof Cretaceous carbonates (in most cases).Figure 2. Cave 5 (or K-2) at Dubrovnik airport.
Figure 3. Vertical entrance in Cave 4 (or K-1) at Dubrovnikairport.
Figure 4. Cave 4 (or K-1) speleothems near bottom of the cave.
Even today, the dripping water exerts an intense mechanicaland chemical action on the surrounding rocks (erosion andcorrosion), thus creating speleothems (stalagmites,dripstone crusts – Figs. 4, 5) The weathering depth in thearea of this speleological site, despite the fact that these arepractically impermeable rocks, is estimated at 300 to 500m, and the zone of vertical circulation varies from 50 to 150m. It is followed by the zone of horizontal circulation inwhich the ground water is carried via Cretaceous limestonestoward submarine springs in the Adriatic Sea (Cavtat Bayand Molunat, Ćilipi coast).
As the Upper Cretaceous (Senonian) and Paleocene(Danian) carbonate rocks are permeable from thehydrogeological standpoint, and this due to intensive
Karst and Caves in Carbonate Rocks, Salt and Gypsum – oral 2013 ICS Proceedings
67
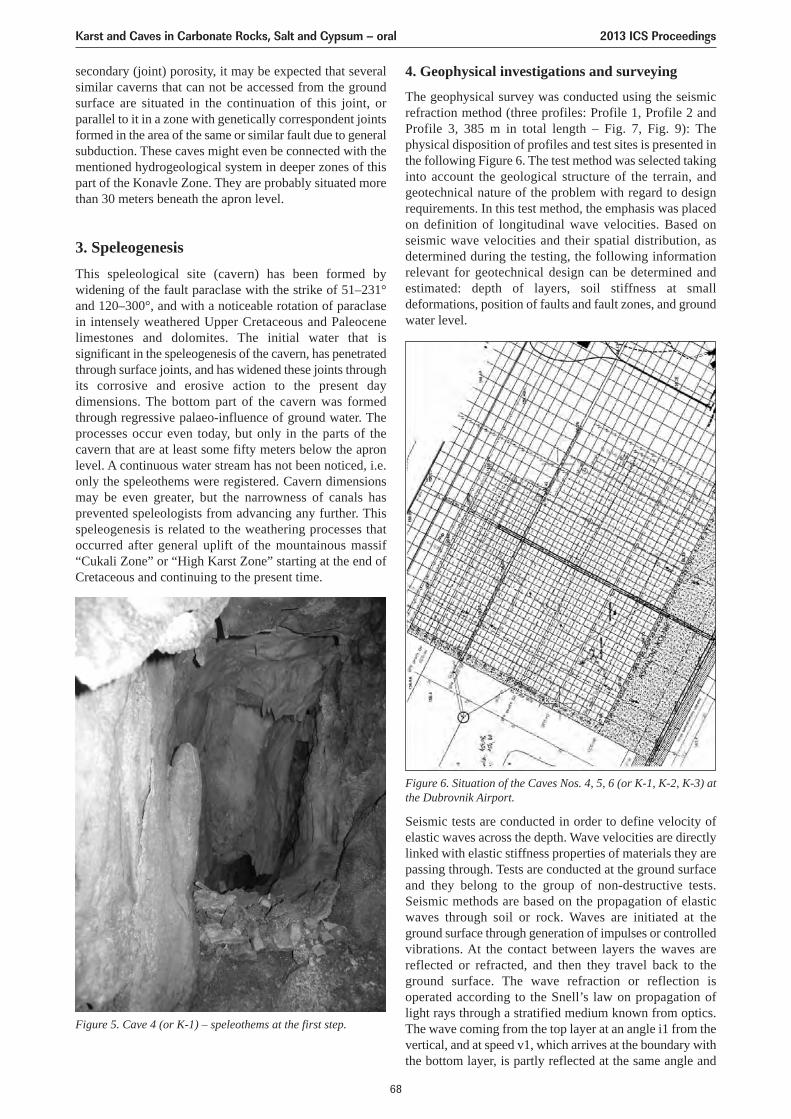
secondary (joint) porosity, it may be expected that severalsimilar caverns that can not be accessed from the groundsurface are situated in the continuation of this joint, orparallel to it in a zone with genetically correspondent jointsformed in the area of the same or similar fault due to generalsubduction. These caves might even be connected with thementioned hydrogeological system in deeper zones of thispart of the Konavle Zone. They are probably situated morethan 30 meters beneath the apron level.
3. SpeleogenesisThis speleological site (cavern) has been formed bywidening of the fault paraclase with the strike of 51–231°and 120–300°, and with a noticeable rotation of paraclasein intensely weathered Upper Cretaceous and Paleocenelimestones and dolomites. The initial water that issignificant in the speleogenesis of the cavern, has penetratedthrough surface joints, and has widened these joints throughits corrosive and erosive action to the present daydimensions. The bottom part of the cavern was formedthrough regressive palaeo-influence of ground water. Theprocesses occur even today, but only in the parts of thecavern that are at least some fifty meters below the apronlevel. A continuous water stream has not been noticed, i.e.only the speleothems were registered. Cavern dimensionsmay be even greater, but the narrowness of canals hasprevented speleologists from advancing any further. Thisspeleogenesis is related to the weathering processes thatoccurred after general uplift of the mountainous massif“Cukali Zone” or “High Karst Zone” starting at the end ofCretaceous and continuing to the present time.
4. Geophysical investigations and surveying
The geophysical survey was conducted using the seismicrefraction method (three profiles: Profile 1, Profile 2 andProfile 3, 385 m in total length – Fig. 7, Fig. 9): Thephysical disposition of profiles and test sites is presented inthe following Figure 6. The test method was selected takinginto account the geological structure of the terrain, andgeotechnical nature of the problem with regard to designrequirements. In this test method, the emphasis was placedon definition of longitudinal wave velocities. Based onseismic wave velocities and their spatial distribution, asdetermined during the testing, the following informationrelevant for geotechnical design can be determined andestimated: depth of layers, soil stiffness at smalldeformations, position of faults and fault zones, and groundwater level.
Seismic tests are conducted in order to define velocity ofelastic waves across the depth. Wave velocities are directlylinked with elastic stiffness properties of materials they arepassing through. Tests are conducted at the ground surfaceand they belong to the group of non-destructive tests.Seismic methods are based on the propagation of elasticwaves through soil or rock. Waves are initiated at theground surface through generation of impulses or controlledvibrations. At the contact between layers the waves arereflected or refracted, and then they travel back to theground surface. The wave refraction or reflection isoperated according to the Snell’s law on propagation oflight rays through a stratified medium known from optics.The wave coming from the top layer at an angle i1 from thevertical, and at speed v1, which arrives at the boundary withthe bottom layer, is partly reflected at the same angle and
Figure 5. Cave 4 (or K-1) – speleothems at the first step.
Figure 6. Situation of the Caves Nos. 4, 5, 6 (or K-1, K-2, K-3) atthe Dubrovnik Airport.
Karst and Caves in Carbonate Rocks, Salt and Gypsum – oral 2013 ICS Proceedings
68
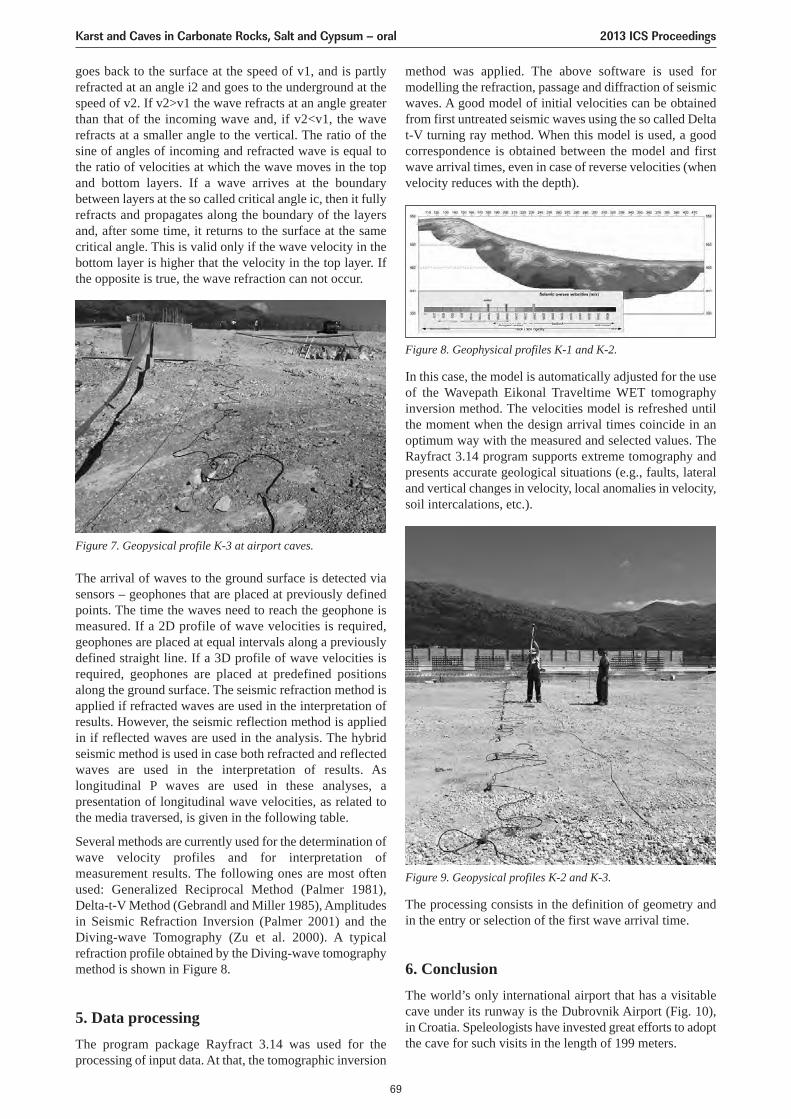
goes back to the surface at the speed of v1, and is partlyrefracted at an angle i2 and goes to the underground at thespeed of v2. If v2>v1 the wave refracts at an angle greaterthan that of the incoming wave and, if v2<v1, the waverefracts at a smaller angle to the vertical. The ratio of thesine of angles of incoming and refracted wave is equal tothe ratio of velocities at which the wave moves in the topand bottom layers. If a wave arrives at the boundarybetween layers at the so called critical angle ic, then it fullyrefracts and propagates along the boundary of the layersand, after some time, it returns to the surface at the samecritical angle. This is valid only if the wave velocity in thebottom layer is higher that the velocity in the top layer. Ifthe opposite is true, the wave refraction can not occur.
Figure 7. Geopysical profile K-3 at airport caves.
The arrival of waves to the ground surface is detected viasensors – geophones that are placed at previously definedpoints. The time the waves need to reach the geophone ismeasured. If a 2D profile of wave velocities is required,geophones are placed at equal intervals along a previouslydefined straight line. If a 3D profile of wave velocities isrequired, geophones are placed at predefined positionsalong the ground surface. The seismic refraction method isapplied if refracted waves are used in the interpretation ofresults. However, the seismic reflection method is appliedin if reflected waves are used in the analysis. The hybridseismic method is used in case both refracted and reflectedwaves are used in the interpretation of results. Aslongitudinal P waves are used in these analyses, apresentation of longitudinal wave velocities, as related tothe media traversed, is given in the following table.
Several methods are currently used for the determination ofwave velocity profiles and for interpretation ofmeasurement results. The following ones are most oftenused: Generalized Reciprocal Method (Palmer 1981),Delta-t-V Method (Gebrandl and Miller 1985), Amplitudesin Seismic Refraction Inversion (Palmer 2001) and theDiving-wave Tomography (Zu et al. 2000). A typicalrefraction profile obtained by the Diving-wave tomographymethod is shown in Figure 8.
5. Data processingThe program package Rayfract 3.14 was used for theprocessing of input data. At that, the tomographic inversion
method was applied. The above software is used formodelling the refraction, passage and diffraction of seismicwaves. A good model of initial velocities can be obtainedfrom first untreated seismic waves using the so called Deltat-V turning ray method. When this model is used, a goodcorrespondence is obtained between the model and firstwave arrival times, even in case of reverse velocities (whenvelocity reduces with the depth).
Figure 8. Geophysical profiles K-1 and K-2.
In this case, the model is automatically adjusted for the useof the Wavepath Eikonal Traveltime WET tomographyinversion method. The velocities model is refreshed untilthe moment when the design arrival times coincide in anoptimum way with the measured and selected values. TheRayfract 3.14 program supports extreme tomography andpresents accurate geological situations (e.g., faults, lateraland vertical changes in velocity, local anomalies in velocity,soil intercalations, etc.).
Figure 9. Geopysical profiles K-2 and K-3.
The processing consists in the definition of geometry andin the entry or selection of the first wave arrival time.
6. ConclusionThe world’s only international airport that has a visitablecave under its runway is the Dubrovnik Airport (Fig. 10),in Croatia. Speleologists have invested great efforts to adoptthe cave for such visits in the length of 199 meters.
Karst and Caves in Carbonate Rocks, Salt and Gypsum – oral 2013 ICS Proceedings
69
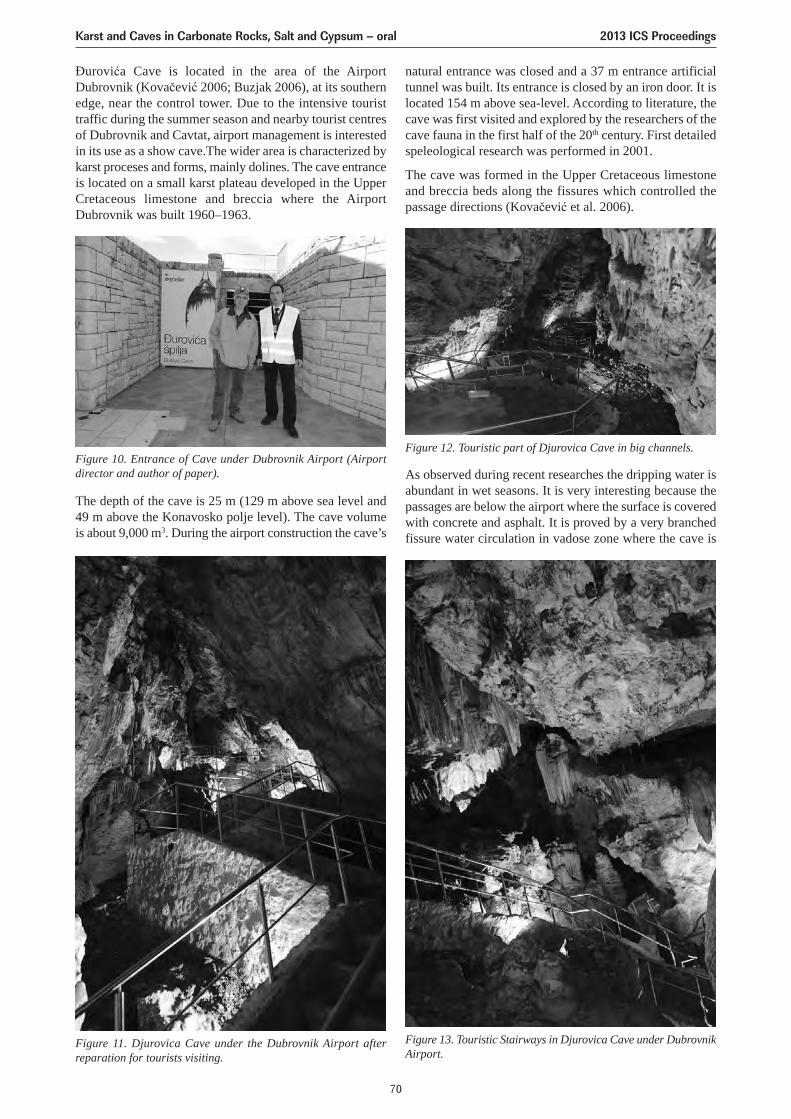
Đurovića Cave is located in the area of the AirportDubrovnik (Kovačević 2006; Buzjak 2006), at its southernedge, near the control tower. Due to the intensive touristtraffic during the summer season and nearby tourist centresof Dubrovnik and Cavtat, airport management is interestedin its use as a show cave.The wider area is characterized bykarst proceses and forms, mainly dolines. The cave entranceis located on a small karst plateau developed in the UpperCretaceous limestone and breccia where the AirportDubrovnik was built 1960–1963.
The depth of the cave is 25 m (129 m above sea level and49 m above the Konavosko polje level). The cave volumeis about 9,000 m3. During the airport construction the cave’s
natural entrance was closed and a 37 m entrance artificialtunnel was built. Its entrance is closed by an iron door. It islocated 154 m above sea-level. According to literature, thecave was first visited and explored by the researchers of thecave fauna in the first half of the 20th century. First detailedspeleological research was performed in 2001.
The cave was formed in the Upper Cretaceous limestoneand breccia beds along the fissures which controlled thepassage directions (Kovačević et al. 2006).
As observed during recent researches the dripping water isabundant in wet seasons. It is very interesting because thepassages are below the airport where the surface is coveredwith concrete and asphalt. It is proved by a very branchedfissure water circulation in vadose zone where the cave is
Figure 10. Entrance of Cave under Dubrovnik Airport (Airportdirector and author of paper).
Figure 11. Djurovica Cave under the Dubrovnik Airport afterreparation for tourists visiting.
Figure 12. Touristic part of Djurovica Cave in big channels.
Figure 13. Touristic Stairways in Djurovica Cave under DubrovnikAirport.
Karst and Caves in Carbonate Rocks, Salt and Gypsum – oral 2013 ICS Proceedings
70
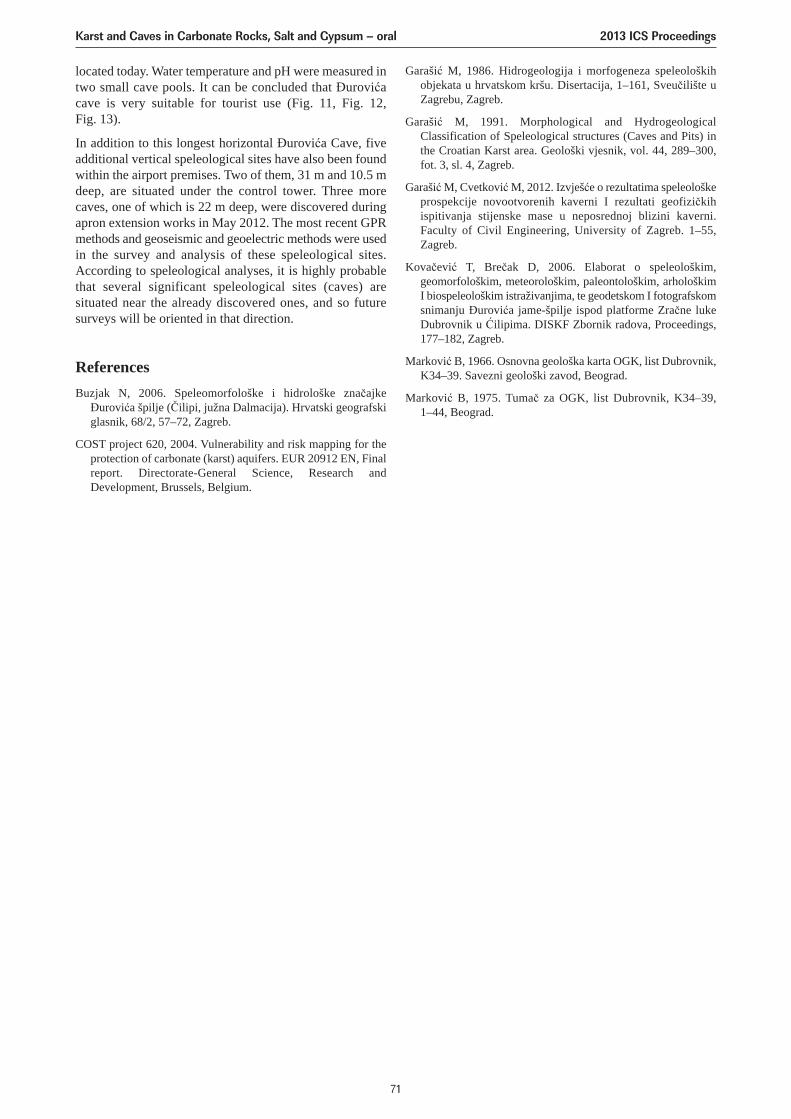
located today. Water temperature and pH were measured intwo small cave pools. It can be concluded that Đurovićacave is very suitable for tourist use (Fig. 11, Fig. 12, Fig. 13).
In addition to this longest horizontal Đurovića Cave, fiveadditional vertical speleological sites have also been foundwithin the airport premises. Two of them, 31 m and 10.5 mdeep, are situated under the control tower. Three morecaves, one of which is 22 m deep, were discovered duringapron extension works in May 2012. The most recent GPRmethods and geoseismic and geoelectric methods were usedin the survey and analysis of these speleological sites.According to speleological analyses, it is highly probablethat several significant speleological sites (caves) aresituated near the already discovered ones, and so futuresurveys will be oriented in that direction.
ReferencesBuzjak N, 2006. Speleomorfološke i hidrološke značajke
Đurovića špilje (Čilipi, južna Dalmacija). Hrvatski geografskiglasnik, 68/2, 57–72, Zagreb.
COST project 620, 2004. Vulnerability and risk mapping for theprotection of carbonate (karst) aquifers. EUR 20912 EN, Finalreport. Directorate-General Science, Research andDevelopment, Brussels, Belgium.
Garašić M, 1986. Hidrogeologija i morfogeneza speleološkihobjekata u hrvatskom kršu. Disertacija, 1–161, Sveučilište uZagrebu, Zagreb.
Garašić M, 1991. Morphological and HydrogeologicalClassification of Speleological structures (Caves and Pits) inthe Croatian Karst area. Geološki vjesnik, vol. 44, 289–300,fot. 3, sl. 4, Zagreb.
Garašić M, Cvetković M, 2012. Izvješće o rezultatima speleološkeprospekcije novootvorenih kaverni I rezultati geofizičkihispitivanja stijenske mase u neposrednoj blizini kaverni.Faculty of Civil Engineering, University of Zagreb. 1–55,Zagreb.
Kovačević T, Brečak D, 2006. Elaborat o speleološkim,geomorfološkim, meteorološkim, paleontološkim, arhološkimI biospeleološkim istraživanjima, te geodetskom I fotografskomsnimanju Đurovića jame-špilje ispod platforme Zračne lukeDubrovnik u Ćilipima. DISKF Zbornik radova, Proceedings,177–182, Zagreb.
Marković B, 1966. Osnovna geološka karta OGK, list Dubrovnik,K34–39. Savezni geološki zavod, Beograd.
Marković B, 1975. Tumač za OGK, list Dubrovnik, K34–39,1–44, Beograd.
Karst and Caves in Carbonate Rocks, Salt and Gypsum – oral 2013 ICS Proceedings
71
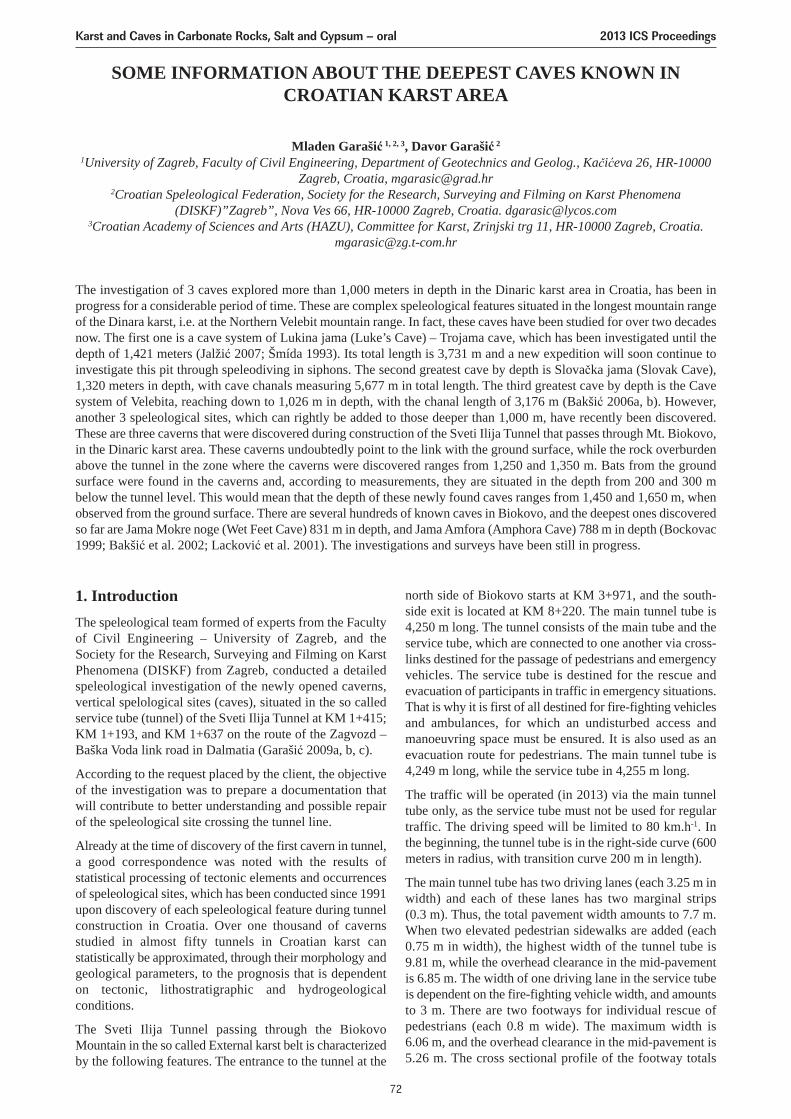
SOME INFORMATION ABOUT THE DEEPEST CAVES KNOWN INCROATIAN KARST AREA
Mladen Garašić 1, 2, 3, Davor Garašić 2
1University of Zagreb, Faculty of Civil Engineering, Department of Geotechnics and Geolog., Kačićeva 26, HR-10000Zagreb, Croatia, [email protected]
2Croatian Speleological Federation, Society for the Research, Surveying and Filming on Karst Phenomena(DISKF)”Zagreb”, Nova Ves 66, HR-10000 Zagreb, Croatia. [email protected]
3Croatian Academy of Sciences and Arts (HAZU), Committee for Karst, Zrinjski trg 11, HR-10000 Zagreb, [email protected]
The investigation of 3 caves explored more than 1,000 meters in depth in the Dinaric karst area in Croatia, has been inprogress for a considerable period of time. These are complex speleological features situated in the longest mountain rangeof the Dinara karst, i.e. at the Northern Velebit mountain range. In fact, these caves have been studied for over two decadesnow. The first one is a cave system of Lukina jama (Luke’s Cave) – Trojama cave, which has been investigated until thedepth of 1,421 meters (Jalžić 2007; Šmída 1993). Its total length is 3,731 m and a new expedition will soon continue toinvestigate this pit through speleodiving in siphons. The second greatest cave by depth is Slovačka jama (Slovak Cave),1,320 meters in depth, with cave chanals measuring 5,677 m in total length. The third greatest cave by depth is the Cavesystem of Velebita, reaching down to 1,026 m in depth, with the chanal length of 3,176 m (Bakšić 2006a, b). However,another 3 speleological sites, which can rightly be added to those deeper than 1,000 m, have recently been discovered.These are three caverns that were discovered during construction of the Sveti Ilija Tunnel that passes through Mt. Biokovo,in the Dinaric karst area. These caverns undoubtedly point to the link with the ground surface, while the rock overburdenabove the tunnel in the zone where the caverns were discovered ranges from 1,250 and 1,350 m. Bats from the groundsurface were found in the caverns and, according to measurements, they are situated in the depth from 200 and 300 mbelow the tunnel level. This would mean that the depth of these newly found caves ranges from 1,450 and 1,650 m, whenobserved from the ground surface. There are several hundreds of known caves in Biokovo, and the deepest ones discoveredso far are Jama Mokre noge (Wet Feet Cave) 831 m in depth, and Jama Amfora (Amphora Cave) 788 m in depth (Bockovac1999; Bakšić et al. 2002; Lacković et al. 2001). The investigations and surveys have been still in progress.
1. IntroductionThe speleological team formed of experts from the Facultyof Civil Engineering – University of Zagreb, and theSociety for the Research, Surveying and Filming on KarstPhenomena (DISKF) from Zagreb, conducted a detailedspeleological investigation of the newly opened caverns,vertical spelological sites (caves), situated in the so calledservice tube (tunnel) of the Sveti Ilija Tunnel at KM 1+415;KM 1+193, and KM 1+637 on the route of the Zagvozd –Baška Voda link road in Dalmatia (Garašić 2009a, b, c).
According to the request placed by the client, the objectiveof the investigation was to prepare a documentation thatwill contribute to better understanding and possible repairof the speleological site crossing the tunnel line.
Already at the time of discovery of the first cavern in tunnel,a good correspondence was noted with the results ofstatistical processing of tectonic elements and occurrencesof speleological sites, which has been conducted since 1991upon discovery of each speleological feature during tunnelconstruction in Croatia. Over one thousand of cavernsstudied in almost fifty tunnels in Croatian karst canstatistically be approximated, through their morphology andgeological parameters, to the prognosis that is dependenton tectonic, lithostratigraphic and hydrogeologicalconditions.
The Sveti Ilija Tunnel passing through the BiokovoMountain in the so called External karst belt is characterizedby the following features. The entrance to the tunnel at the
north side of Biokovo starts at KM 3+971, and the south-side exit is located at KM 8+220. The main tunnel tube is4,250 m long. The tunnel consists of the main tube and theservice tube, which are connected to one another via cross-links destined for the passage of pedestrians and emergencyvehicles. The service tube is destined for the rescue andevacuation of participants in traffic in emergency situations.That is why it is first of all destined for fire-fighting vehiclesand ambulances, for which an undisturbed access andmanoeuvring space must be ensured. It is also used as anevacuation route for pedestrians. The main tunnel tube is4,249 m long, while the service tube in 4,255 m long.
The traffic will be operated (in 2013) via the main tunneltube only, as the service tube must not be used for regulartraffic. The driving speed will be limited to 80 km.h-1. Inthe beginning, the tunnel tube is in the right-side curve (600meters in radius, with transition curve 200 m in length).
The main tunnel tube has two driving lanes (each 3.25 m inwidth) and each of these lanes has two marginal strips (0.3 m). Thus, the total pavement width amounts to 7.7 m.When two elevated pedestrian sidewalks are added (each0.75 m in width), the highest width of the tunnel tube is 9.81 m, while the overhead clearance in the mid-pavementis 6.85 m. The width of one driving lane in the service tubeis dependent on the fire-fighting vehicle width, and amountsto 3 m. There are two footways for individual rescue ofpedestrians (each 0.8 m wide). The maximum width is 6.06 m, and the overhead clearance in the mid-pavement is5.26 m. The cross sectional profile of the footway totals
Karst and Caves in Carbonate Rocks, Salt and Gypsum – oral 2013 ICS Proceedings
72
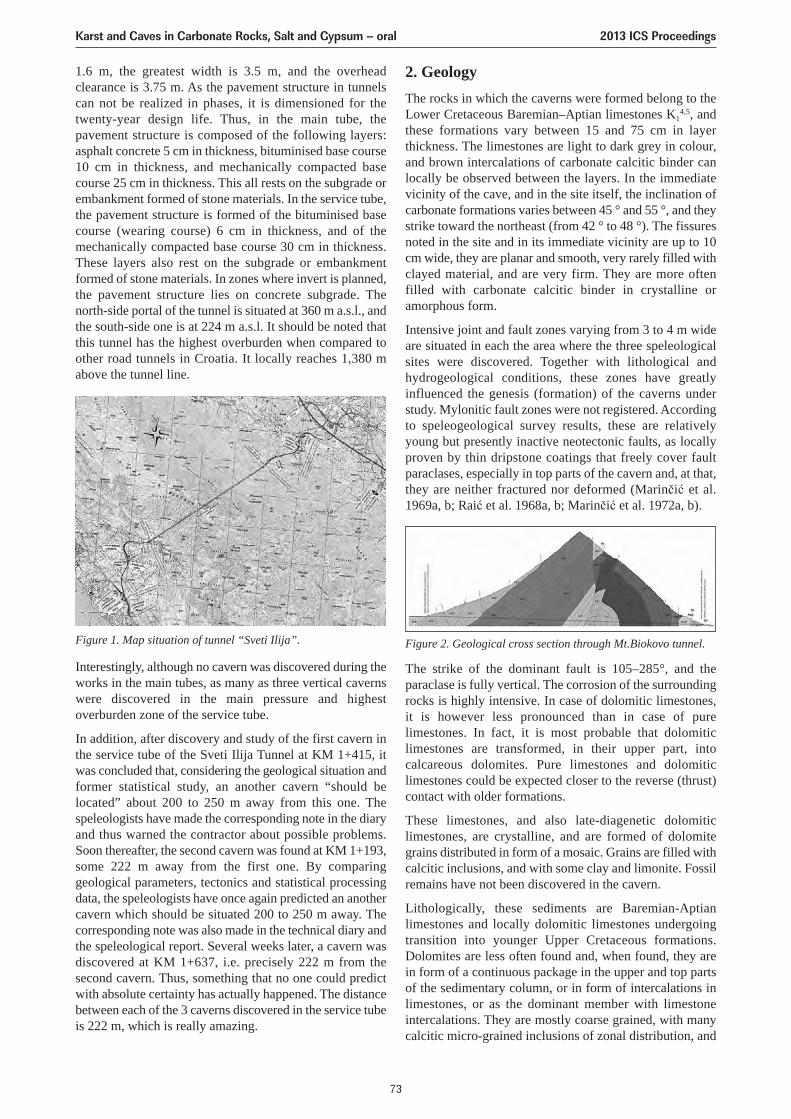
1.6 m, the greatest width is 3.5 m, and the overheadclearance is 3.75 m. As the pavement structure in tunnelscan not be realized in phases, it is dimensioned for thetwenty-year design life. Thus, in the main tube, thepavement structure is composed of the following layers:asphalt concrete 5 cm in thickness, bituminised base course10 cm in thickness, and mechanically compacted basecourse 25 cm in thickness. This all rests on the subgrade orembankment formed of stone materials. In the service tube,the pavement structure is formed of the bituminised basecourse (wearing course) 6 cm in thickness, and of themechanically compacted base course 30 cm in thickness.These layers also rest on the subgrade or embankmentformed of stone materials. In zones where invert is planned,the pavement structure lies on concrete subgrade. Thenorth-side portal of the tunnel is situated at 360 m a.s.l., andthe south-side one is at 224 m a.s.l. It should be noted thatthis tunnel has the highest overburden when compared toother road tunnels in Croatia. It locally reaches 1,380 mabove the tunnel line.
Interestingly, although no cavern was discovered during theworks in the main tubes, as many as three vertical cavernswere discovered in the main pressure and highestoverburden zone of the service tube.
In addition, after discovery and study of the first cavern inthe service tube of the Sveti Ilija Tunnel at KM 1+415, itwas concluded that, considering the geological situation andformer statistical study, an another cavern “should belocated” about 200 to 250 m away from this one. Thespeleologists have made the corresponding note in the diaryand thus warned the contractor about possible problems.Soon thereafter, the second cavern was found at KM 1+193,some 222 m away from the first one. By comparinggeological parameters, tectonics and statistical processingdata, the speleologists have once again predicted an anothercavern which should be situated 200 to 250 m away. Thecorresponding note was also made in the technical diary andthe speleological report. Several weeks later, a cavern wasdiscovered at KM 1+637, i.e. precisely 222 m from thesecond cavern. Thus, something that no one could predictwith absolute certainty has actually happened. The distancebetween each of the 3 caverns discovered in the service tubeis 222 m, which is really amazing.
2. GeologyThe rocks in which the caverns were formed belong to theLower Cretaceous Baremian–Aptian limestones K1
4,5, andthese formations vary between 15 and 75 cm in layerthickness. The limestones are light to dark grey in colour,and brown intercalations of carbonate calcitic binder canlocally be observed between the layers. In the immediatevicinity of the cave, and in the site itself, the inclination ofcarbonate formations varies between 45 ° and 55 °, and theystrike toward the northeast (from 42 ° to 48 °). The fissuresnoted in the site and in its immediate vicinity are up to 10cm wide, they are planar and smooth, very rarely filled withclayed material, and are very firm. They are more oftenfilled with carbonate calcitic binder in crystalline oramorphous form.
Intensive joint and fault zones varying from 3 to 4 m wideare situated in each the area where the three speleologicalsites were discovered. Together with lithological andhydrogeological conditions, these zones have greatlyinfluenced the genesis (formation) of the caverns understudy. Mylonitic fault zones were not registered. Accordingto speleogeological survey results, these are relativelyyoung but presently inactive neotectonic faults, as locallyproven by thin dripstone coatings that freely cover faultparaclases, especially in top parts of the cavern and, at that,they are neither fractured nor deformed (Marinčić et al.1969a, b; Raić et al. 1968a, b; Marinčić et al. 1972a, b).
The strike of the dominant fault is 105–285°, and theparaclase is fully vertical. The corrosion of the surroundingrocks is highly intensive. In case of dolomitic limestones,it is however less pronounced than in case of purelimestones. In fact, it is most probable that dolomiticlimestones are transformed, in their upper part, intocalcareous dolomites. Pure limestones and dolomiticlimestones could be expected closer to the reverse (thrust)contact with older formations.
These limestones, and also late-diagenetic dolomiticlimestones, are crystalline, and are formed of dolomitegrains distributed in form of a mosaic. Grains are filled withcalcitic inclusions, and with some clay and limonite. Fossilremains have not been discovered in the cavern.
Lithologically, these sediments are Baremian-Aptianlimestones and locally dolomitic limestones undergoingtransition into younger Upper Cretaceous formations.Dolomites are less often found and, when found, they arein form of a continuous package in the upper and top partsof the sedimentary column, or in form of intercalations inlimestones, or as the dominant member with limestoneintercalations. They are mostly coarse grained, with manycalcitic micro-grained inclusions of zonal distribution, and
Figure 1. Map situation of tunnel “Sveti Ilija”. Figure 2. Geological cross section through Mt.Biokovo tunnel.
Karst and Caves in Carbonate Rocks, Salt and Gypsum – oral 2013 ICS Proceedings
73
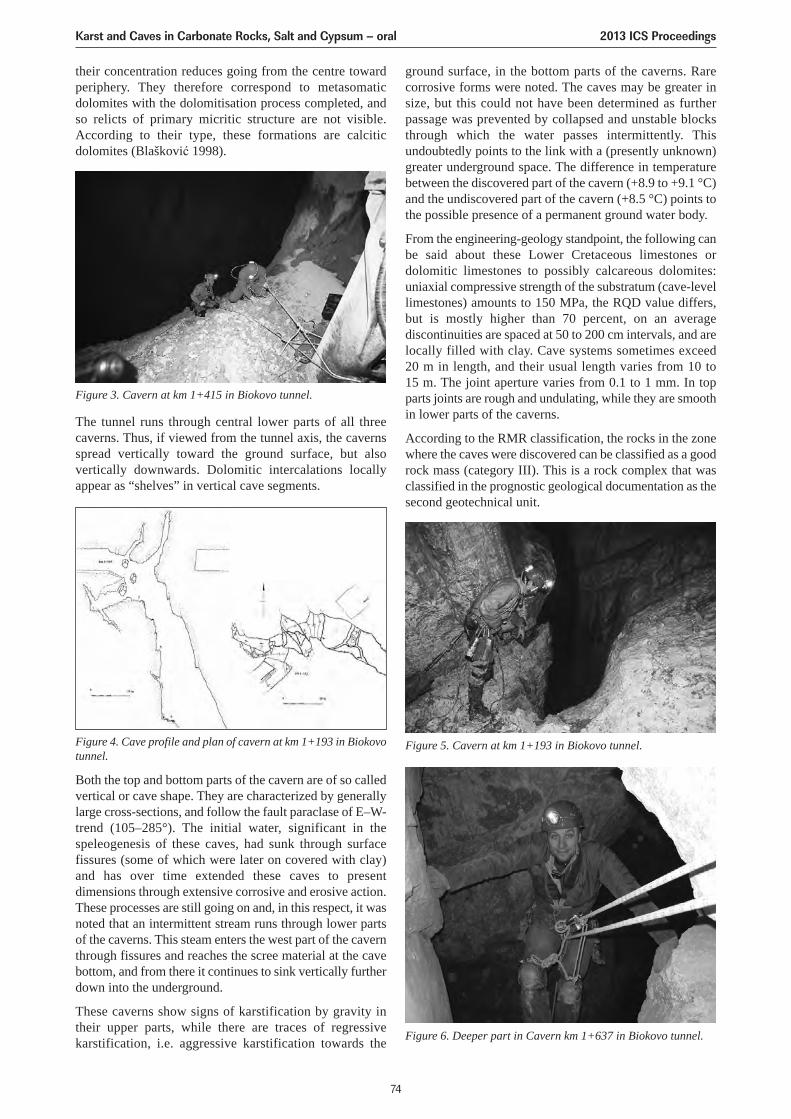
their concentration reduces going from the centre towardperiphery. They therefore correspond to metasomaticdolomites with the dolomitisation process completed, andso relicts of primary micritic structure are not visible.According to their type, these formations are calciticdolomites (Blašković 1998).
The tunnel runs through central lower parts of all threecaverns. Thus, if viewed from the tunnel axis, the cavernsspread vertically toward the ground surface, but alsovertically downwards. Dolomitic intercalations locallyappear as “shelves” in vertical cave segments.
Both the top and bottom parts of the cavern are of so calledvertical or cave shape. They are characterized by generallylarge cross-sections, and follow the fault paraclase of E–W-trend (105–285°). The initial water, significant in thespeleogenesis of these caves, had sunk through surfacefissures (some of which were later on covered with clay)and has over time extended these caves to presentdimensions through extensive corrosive and erosive action.These processes are still going on and, in this respect, it wasnoted that an intermittent stream runs through lower partsof the caverns. This steam enters the west part of the cavernthrough fissures and reaches the scree material at the cavebottom, and from there it continues to sink vertically furtherdown into the underground.
These caverns show signs of karstification by gravity intheir upper parts, while there are traces of regressivekarstification, i.e. aggressive karstification towards the
ground surface, in the bottom parts of the caverns. Rarecorrosive forms were noted. The caves may be greater insize, but this could not have been determined as furtherpassage was prevented by collapsed and unstable blocksthrough which the water passes intermittently. Thisundoubtedly points to the link with a (presently unknown)greater underground space. The difference in temperaturebetween the discovered part of the cavern (+8.9 to +9.1 °C)and the undiscovered part of the cavern (+8.5 °C) points tothe possible presence of a permanent ground water body.
From the engineering-geology standpoint, the following canbe said about these Lower Cretaceous limestones ordolomitic limestones to possibly calcareous dolomites:uniaxial compressive strength of the substratum (cave-levellimestones) amounts to 150 MPa, the RQD value differs,but is mostly higher than 70 percent, on an averagediscontinuities are spaced at 50 to 200 cm intervals, and arelocally filled with clay. Cave systems sometimes exceed 20 m in length, and their usual length varies from 10 to 15 m. The joint aperture varies from 0.1 to 1 mm. In topparts joints are rough and undulating, while they are smoothin lower parts of the caverns.
According to the RMR classification, the rocks in the zonewhere the caves were discovered can be classified as a goodrock mass (category III). This is a rock complex that wasclassified in the prognostic geological documentation as thesecond geotechnical unit.
Figure 3. Cavern at km 1+415 in Biokovo tunnel.
Figure 4. Cave profile and plan of cavern at km 1+193 in Biokovotunnel.
Figure 5. Cavern at km 1+193 in Biokovo tunnel.
Figure 6. Deeper part in Cavern km 1+637 in Biokovo tunnel.
Karst and Caves in Carbonate Rocks, Salt and Gypsum – oral 2013 ICS Proceedings
74
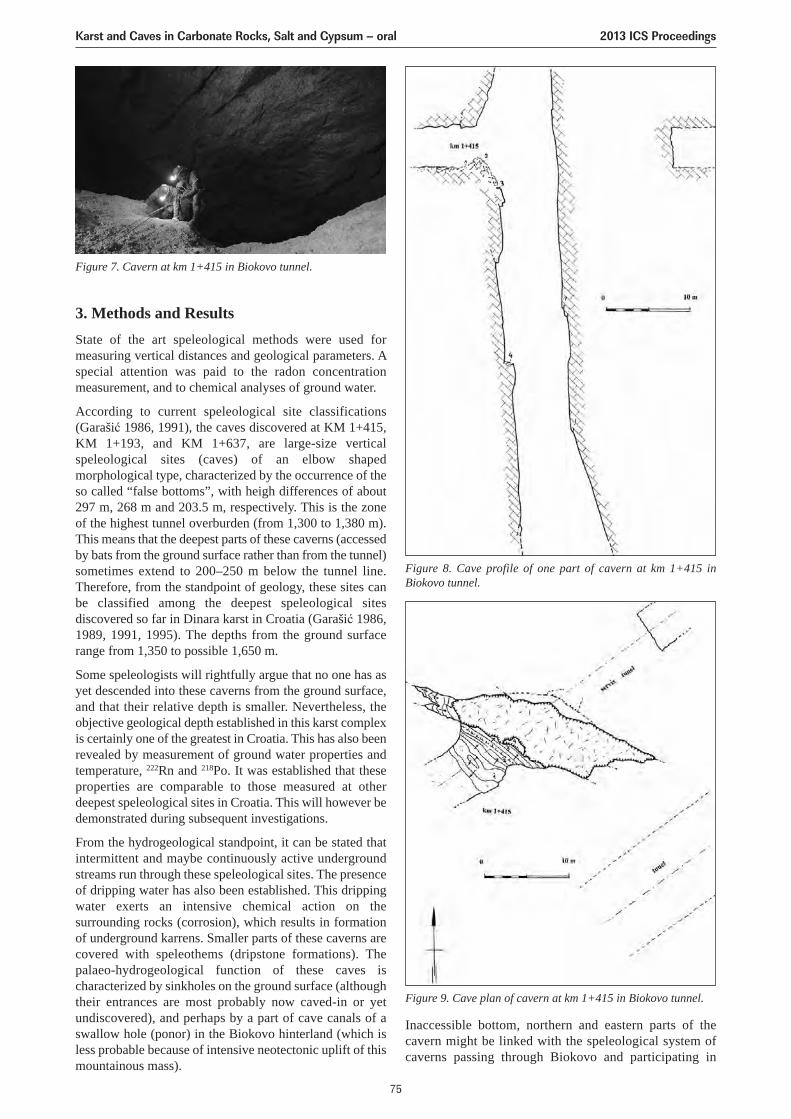
3. Methods and ResultsState of the art speleological methods were used formeasuring vertical distances and geological parameters. Aspecial attention was paid to the radon concentrationmeasurement, and to chemical analyses of ground water.
According to current speleological site classifications(Garašić 1986, 1991), the caves discovered at KM 1+415,KM 1+193, and KM 1+637, are large-size verticalspeleological sites (caves) of an elbow shapedmorphological type, characterized by the occurrence of theso called “false bottoms”, with heigh differences of about297 m, 268 m and 203.5 m, respectively. This is the zoneof the highest tunnel overburden (from 1,300 to 1,380 m).This means that the deepest parts of these caverns (accessedby bats from the ground surface rather than from the tunnel)sometimes extend to 200–250 m below the tunnel line.Therefore, from the standpoint of geology, these sites canbe classified among the deepest speleological sitesdiscovered so far in Dinara karst in Croatia (Garašić 1986,1989, 1991, 1995). The depths from the ground surfacerange from 1,350 to possible 1,650 m.
Some speleologists will rightfully argue that no one has asyet descended into these caverns from the ground surface,and that their relative depth is smaller. Nevertheless, theobjective geological depth established in this karst complexis certainly one of the greatest in Croatia. This has also beenrevealed by measurement of ground water properties andtemperature, 222Rn and 218Po. It was established that theseproperties are comparable to those measured at otherdeepest speleological sites in Croatia. This will however bedemonstrated during subsequent investigations.
From the hydrogeological standpoint, it can be stated thatintermittent and maybe continuously active undergroundstreams run through these speleological sites. The presenceof dripping water has also been established. This drippingwater exerts an intensive chemical action on thesurrounding rocks (corrosion), which results in formationof underground karrens. Smaller parts of these caverns arecovered with speleothems (dripstone formations). Thepalaeo-hydrogeological function of these caves ischaracterized by sinkholes on the ground surface (althoughtheir entrances are most probably now caved-in or yetundiscovered), and perhaps by a part of cave canals of aswallow hole (ponor) in the Biokovo hinterland (which isless probable because of intensive neotectonic uplift of thismountainous mass).
Inaccessible bottom, northern and eastern parts of thecavern might be linked with the speleological system ofcaverns passing through Biokovo and participating in
Figure 7. Cavern at km 1+415 in Biokovo tunnel.
Figure 8. Cave profile of one part of cavern at km 1+415 inBiokovo tunnel.
Figure 9. Cave plan of cavern at km 1+415 in Biokovo tunnel.
Karst and Caves in Carbonate Rocks, Salt and Gypsum – oral 2013 ICS Proceedings
75
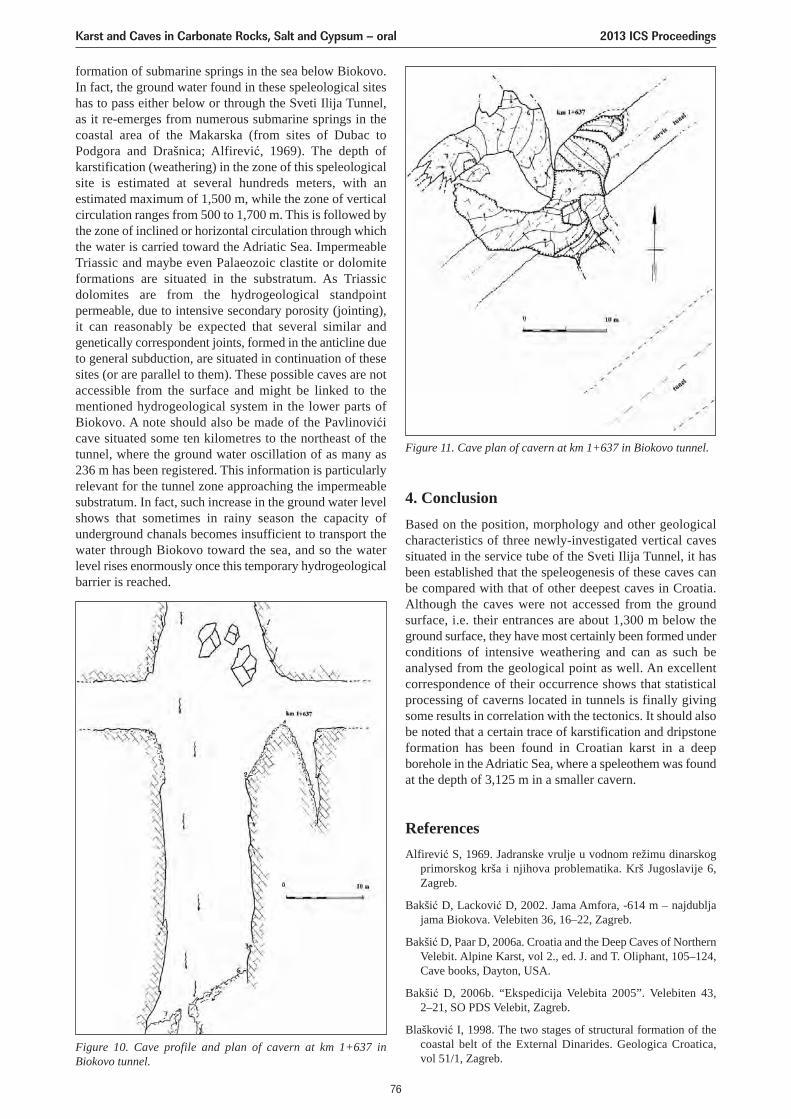
formation of submarine springs in the sea below Biokovo.In fact, the ground water found in these speleological siteshas to pass either below or through the Sveti Ilija Tunnel,as it re-emerges from numerous submarine springs in thecoastal area of the Makarska (from sites of Dubac toPodgora and Drašnica; Alfirević, 1969). The depth ofkarstification (weathering) in the zone of this speleologicalsite is estimated at several hundreds meters, with anestimated maximum of 1,500 m, while the zone of verticalcirculation ranges from 500 to 1,700 m. This is followed bythe zone of inclined or horizontal circulation through whichthe water is carried toward the Adriatic Sea. ImpermeableTriassic and maybe even Palaeozoic clastite or dolomiteformations are situated in the substratum. As Triassicdolomites are from the hydrogeological standpointpermeable, due to intensive secondary porosity (jointing),it can reasonably be expected that several similar andgenetically correspondent joints, formed in the anticline dueto general subduction, are situated in continuation of thesesites (or are parallel to them). These possible caves are notaccessible from the surface and might be linked to thementioned hydrogeological system in the lower parts ofBiokovo. A note should also be made of the Pavlinovićicave situated some ten kilometres to the northeast of thetunnel, where the ground water oscillation of as many as236 m has been registered. This information is particularlyrelevant for the tunnel zone approaching the impermeablesubstratum. In fact, such increase in the ground water levelshows that sometimes in rainy season the capacity ofunderground chanals becomes insufficient to transport thewater through Biokovo toward the sea, and so the waterlevel rises enormously once this temporary hydrogeologicalbarrier is reached.
4. ConclusionBased on the position, morphology and other geologicalcharacteristics of three newly-investigated vertical cavessituated in the service tube of the Sveti Ilija Tunnel, it hasbeen established that the speleogenesis of these caves canbe compared with that of other deepest caves in Croatia.Although the caves were not accessed from the groundsurface, i.e. their entrances are about 1,300 m below theground surface, they have most certainly been formed underconditions of intensive weathering and can as such beanalysed from the geological point as well. An excellentcorrespondence of their occurrence shows that statisticalprocessing of caverns located in tunnels is finally givingsome results in correlation with the tectonics. It should alsobe noted that a certain trace of karstification and dripstoneformation has been found in Croatian karst in a deepborehole in the Adriatic Sea, where a speleothem was foundat the depth of 3,125 m in a smaller cavern.
ReferencesAlfirević S, 1969. Jadranske vrulje u vodnom režimu dinarskog
primorskog krša i njihova problematika. Krš Jugoslavije 6,Zagreb.
Bakšić D, Lacković D, 2002. Jama Amfora, -614 m – najdubljajama Biokova. Velebiten 36, 16–22, Zagreb.
Bakšić D, Paar D, 2006a. Croatia and the Deep Caves of NorthernVelebit. Alpine Karst, vol 2., ed. J. and T. Oliphant, 105–124,Cave books, Dayton, USA.
Bakšić D, 2006b. “Ekspedicija Velebita 2005”. Velebiten 43,2–21, SO PDS Velebit, Zagreb.
Blašković I, 1998. The two stages of structural formation of thecoastal belt of the External Dinarides. Geologica Croatica,vol 51/1, Zagreb.
Figure 10. Cave profile and plan of cavern at km 1+637 inBiokovo tunnel.
Figure 11. Cave plan of cavern at km 1+637 in Biokovo tunnel.
Karst and Caves in Carbonate Rocks, Salt and Gypsum – oral 2013 ICS Proceedings
76
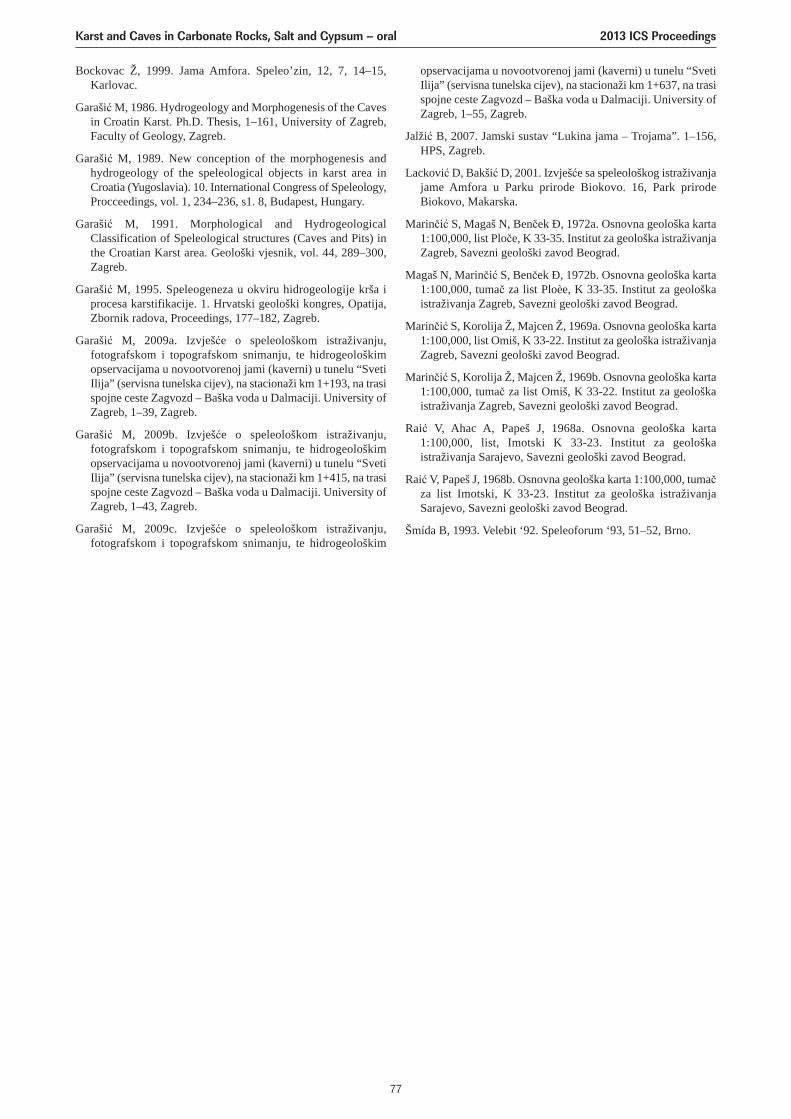
Bockovac Ž, 1999. Jama Amfora. Speleo’zin, 12, 7, 14–15,Karlovac.
Garašić M, 1986. Hydrogeology and Morphogenesis of the Cavesin Croatin Karst. Ph.D. Thesis, 1–161, University of Zagreb,Faculty of Geology, Zagreb.
Garašić M, 1989. New conception of the morphogenesis andhydrogeology of the speleological objects in karst area inCroatia (Yugoslavia). 10. International Congress of Speleology,Procceedings, vol. 1, 234–236, s1. 8, Budapest, Hungary.
Garašić M, 1991. Morphological and HydrogeologicalClassification of Speleological structures (Caves and Pits) inthe Croatian Karst area. Geološki vjesnik, vol. 44, 289–300,Zagreb.
Garašić M, 1995. Speleogeneza u okviru hidrogeologije krša iprocesa karstifikacije. 1. Hrvatski geološki kongres, Opatija,Zbornik radova, Proceedings, 177–182, Zagreb.
Garašić M, 2009a. Izvješće o speleološkom istraživanju,fotografskom i topografskom snimanju, te hidrogeološkimopservacijama u novootvorenoj jami (kaverni) u tunelu “SvetiIlija” (servisna tunelska cijev), na stacionaži km 1+193, na trasispojne ceste Zagvozd – Baška voda u Dalmaciji. University ofZagreb, 1–39, Zagreb.
Garašić M, 2009b. Izvješće o speleološkom istraživanju,fotografskom i topografskom snimanju, te hidrogeološkimopservacijama u novootvorenoj jami (kaverni) u tunelu “SvetiIlija” (servisna tunelska cijev), na stacionaži km 1+415, na trasispojne ceste Zagvozd – Baška voda u Dalmaciji. University ofZagreb, 1–43, Zagreb.
Garašić M, 2009c. Izvješće o speleološkom istraživanju,fotografskom i topografskom snimanju, te hidrogeološkim
opservacijama u novootvorenoj jami (kaverni) u tunelu “SvetiIlija” (servisna tunelska cijev), na stacionaži km 1+637, na trasispojne ceste Zagvozd – Baška voda u Dalmaciji. University ofZagreb, 1–55, Zagreb.
Jalžić B, 2007. Jamski sustav “Lukina jama – Trojama”. 1–156,HPS, Zagreb.
Lacković D, Bakšić D, 2001. Izvješće sa speleološkog istraživanjajame Amfora u Parku prirode Biokovo. 16, Park prirodeBiokovo, Makarska.
Marinčić S, Magaš N, Benček Ð, 1972a. Osnovna geološka karta1:100,000, list Ploče, K 33-35. Institut za geološka istraživanjaZagreb, Savezni geološki zavod Beograd.
Magaš N, Marinčić S, Benček Ð, 1972b. Osnovna geološka karta1:100,000, tumač za list Ploèe, K 33-35. Institut za geološkaistraživanja Zagreb, Savezni geološki zavod Beograd.
Marinčić S, Korolija Ž, Majcen Ž, 1969a. Osnovna geološka karta1:100,000, list Omiš, K 33-22. Institut za geološka istraživanjaZagreb, Savezni geološki zavod Beograd.
Marinčić S, Korolija Ž, Majcen Ž, 1969b. Osnovna geološka karta1:100,000, tumač za list Omiš, K 33-22. Institut za geološkaistraživanja Zagreb, Savezni geološki zavod Beograd.
Raić V, Ahac A, Papeš J, 1968a. Osnovna geološka karta1:100,000, list, Imotski K 33-23. Institut za geološkaistraživanja Sarajevo, Savezni geološki zavod Beograd.
Raić V, Papeš J, 1968b. Osnovna geološka karta 1:100,000, tumačza list Imotski, K 33-23. Institut za geološka istraživanjaSarajevo, Savezni geološki zavod Beograd.
Šmída B, 1993. Velebit ‘92. Speleoforum ‘93, 51–52, Brno.
Karst and Caves in Carbonate Rocks, Salt and Gypsum – oral 2013 ICS Proceedings
77
HYPOGENE SPELEOGENESIS AND SPELEOTHEMS OF SIMA DE LAHIGUERA CAVE (MURCIA, SOUTH-EASTERN SPAIN)
Fernando Gázquez1,2, José-María Calaforra1
1Water Resources and Environmental Geology Research Group, Dept. of Hydrogeology and Analytical Chemistry –University of Almería, Crta.Sacramento s/n, 04120 La Cañada de San Urbano, Almería, Spain, [email protected],
[email protected] Asociada UVA-CSIC al Centro de Astrobiología, University of Valladolid, Parque Tecnológico Boecillo,
47151, Valladolid (Spain)
Sima de la Higuera Cave (Pliego, south-eastern Spain) has been recently adapted for speleological use. Nevertheless,knowledge of the hypogenic origin of this cavity is still quite limited. The peculiar genetic mechanisms could provideadded value if the cave is exploited for speleotourism. By studying geomorphological features and speleothemcharacteristics, it has been possible to deduce the predominant speleogenetic mechanism (whether hypogenic or epigenic)that controlled the evolution of this cave. The hypogenic mechanism that gave rise to this cavity was associated withupflow of CO2-rich hydrothermal fluid from depth, and was unconnected to meteoric water seepage. In this paper wedescribe some of the geomorphological evidence and unusual speleothems in Sima de la Higuera Cave. Large scallopsare found on the upper level (-74 m); these are related to the mechanism of hypogenic speleogenesis and generally indicatethe direction of ascending flow. There are also corrosion crusts made of micritic calcite. In addition, bubble trails relatedto bubbles of rising CO2 have been identified. Centimetric calcite spar speleothems frequently fill fractures in the hostrock. Other typical hypogenic speleothems occur in this cave, including calcite raft cones, folia, cave clouds, tower coraland calcite raft deposits, all suggesting the influence of thermal water during the cave’s formation. Furthermore, the firstreported occurrence of calcite raft double-tower cones has been described in this cave; their origin is linked to water tableoscillations in Paradise Chamber (-82 m). At the deepest level (-110 m), Mn-Fe oxyhydroxides occur as a black coatingtotally covering the cave walls, usually over subaerial “boxwork” formations. The wide variety of speleothems unconnectedto meteoric water seepage make Sima de la Higuera Cave one of the most unusual hypogenic caves in Spain.
1. IntroductionSeepage of meteoric water in karstic terrains is the mostcommon mechanism for cave development. However,besides this kind of cavity (epigenic caves), there is anothertype of genesis linked to rising hydrothermal fluids, usuallyrich in dissolved CO2 and/or H2S. These hypogenic cavesform as a result of circulation of thermal water, usually fromdepth, and are unconnected with superficial flow (Palmer2011). The term “hypogenic” does not refer specifically toextremely deep caves but rather to the origin of the fluidsresponsible for these caves’ development (Klimchouk 2009).This kind of system is represented by around 5–10% of thecavities worldwide (Forti 1996; Forti et al. 2002).
Geomorphological features and specific speleothems arethe most useful tools for identifying whether the origin of acave was hypogenic or epigenic (Audra et al. 2002). Themorphologies generated by hypogene mechanisms dependon the characteristics of the host rock, the temperature atwhich dissolution occurs, and the nature of the gases insolution. For instance, H2S-rich thermal water gives rise toacid attack that is more efficient than corrosion producedexclusively by CO2 (Forti et al. 2002). Furthermore, in H2S-rich systems, the water-rock interaction frequently resultsin gypsum precipitation (Palmer and Palmer, 2012).
Other morphological features typical of hypogenicconditions are bubble trails, bell-shaped condensation-corrosion domes, scallops and widespread corrosionpockets (Forti 1996).
On the other hand, the speleothems and cave mineralsformed under subaqueous conditions from a solution highly
saturated in calcium carbonate can provide the evidence tosupport a hypogenic origin of caves. For example,speleothems such as large bisphenoidal calcite crystals(Lundberg et al. 2000), calcite raft cones (Audra et al.2002), cave clouds and folia (Audra et al. 2009; Davis2012), tower coral and calcite raft deposits (Hill and Forti1997) all commonly occur in hypogenic caves.
In the current paper, we describe and examine thehypogenic geomorphological features of Sima de la HigueraCave (Murcia, South-eastern Spain), which has beenrecently adapted for speleological use. Together with themineralogical and geochemical characteristics of some ofits speleothems, these have enabled a preliminary model ofthe evolution of this cave to be established.
2. Geological settingSima de la Higuera (Fig Tree Cave) is located in the Sierrade Espuña, in the municipal district of Pliego (MurciaRegion). Its entrance lies 485 m a.s.l. and its mouth iscrowned by a large fig tree that gives the cave its name.Speleological exploration of the cave began in 1997,although there is evidence that it was discovered earlier thanthis date (Club Cuatro Picos and Club Pliego Espuña 2001;Ferrer 2010). Its surveyed length is 5,500 m and its deepestpart is 156 m below the cave entrance (82 m below the baseof the entrance sinkhole) (Fig. 1B).
The cave lies in Oligo-Miocene detrital and marly limestone(Fig. 1A). The carbonate sequence is quite fractured due toNW-SE pressure that has given rise to a series of joints and
Karst and Caves in Carbonate Rocks, Salt and Gypsum – oral 2013 ICS Proceedings
78
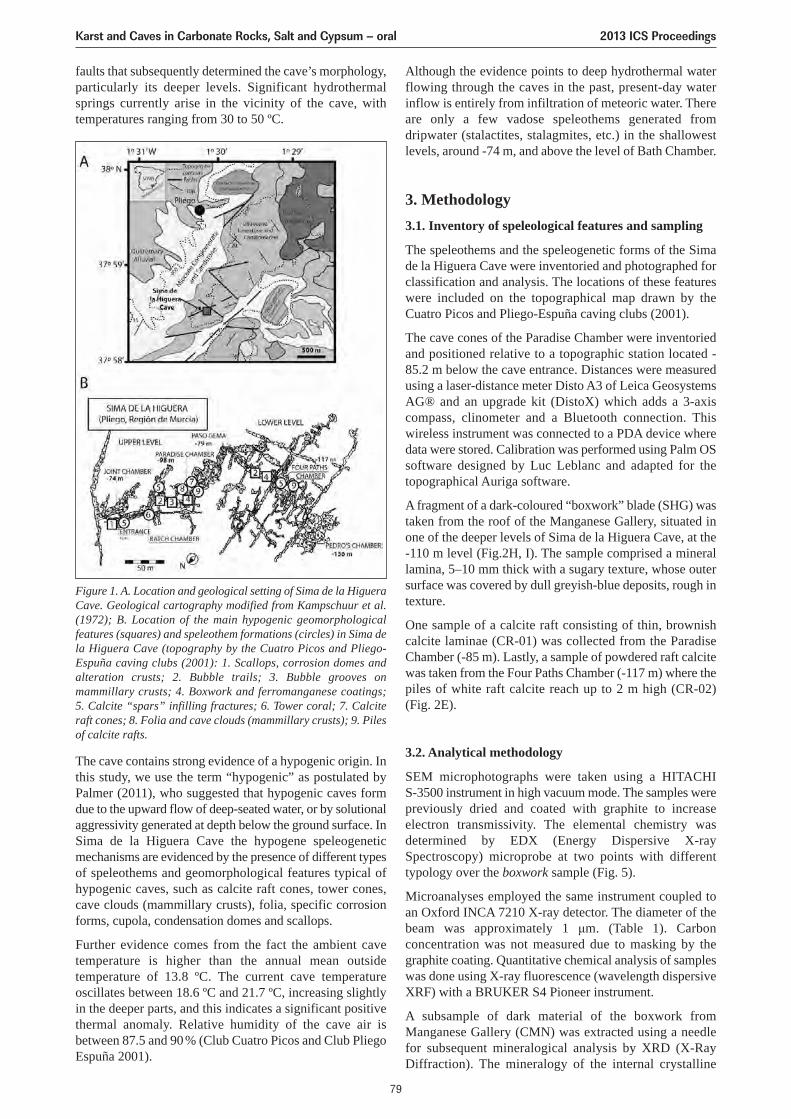
faults that subsequently determined the cave’s morphology,particularly its deeper levels. Significant hydrothermalsprings currently arise in the vicinity of the cave, withtemperatures ranging from 30 to 50 ºC.
The cave contains strong evidence of a hypogenic origin. Inthis study, we use the term “hypogenic” as postulated byPalmer (2011), who suggested that hypogenic caves formdue to the upward flow of deep-seated water, or by solutionalaggressivity generated at depth below the ground surface. InSima de la Higuera Cave the hypogene speleogeneticmechanisms are evidenced by the presence of different typesof speleothems and geomorphological features typical ofhypogenic caves, such as calcite raft cones, tower cones,cave clouds (mammillary crusts), folia, specific corrosionforms, cupola, condensation domes and scallops.
Further evidence comes from the fact the ambient cavetemperature is higher than the annual mean outsidetemperature of 13.8 ºC. The current cave temperatureoscillates between 18.6 ºC and 21.7 ºC, increasing slightlyin the deeper parts, and this indicates a significant positivethermal anomaly. Relative humidity of the cave air isbetween 87.5 and 90% (Club Cuatro Picos and Club PliegoEspuña 2001).
Figure 1. A. Location and geological setting of Sima de la HigueraCave. Geological cartography modified from Kampschuur et al.(1972); B. Location of the main hypogenic geomorphologicalfeatures (squares) and speleothem formations (circles) in Sima dela Higuera Cave (topography by the Cuatro Picos and Pliego-Espuña caving clubs (2001): 1. Scallops, corrosion domes andalteration crusts; 2. Bubble trails; 3. Bubble grooves onmammillary crusts; 4. Boxwork and ferromanganese coatings;5. Calcite “spars” infilling fractures; 6. Tower coral; 7. Calciteraft cones; 8. Folia and cave clouds (mammillary crusts); 9. Pilesof calcite rafts.
Although the evidence points to deep hydrothermal waterflowing through the caves in the past, present-day waterinflow is entirely from infiltration of meteoric water. Thereare only a few vadose speleothems generated fromdripwater (stalactites, stalagmites, etc.) in the shallowestlevels, around -74 m, and above the level of Bath Chamber.
3. Methodology3.1. Inventory of speleological features and sampling
The speleothems and the speleogenetic forms of the Simade la Higuera Cave were inventoried and photographed forclassification and analysis. The locations of these featureswere included on the topographical map drawn by theCuatro Picos and Pliego-Espuña caving clubs (2001).
The cave cones of the Paradise Chamber were inventoriedand positioned relative to a topographic station located -85.2 m below the cave entrance. Distances were measuredusing a laser-distance meter Disto A3 of Leica GeosystemsAG® and an upgrade kit (DistoX) which adds a 3-axiscompass, clinometer and a Bluetooth connection. Thiswireless instrument was connected to a PDA device wheredata were stored. Calibration was performed using Palm OSsoftware designed by Luc Leblanc and adapted for thetopographical Auriga software.
A fragment of a dark-coloured “boxwork” blade (SHG) wastaken from the roof of the Manganese Gallery, situated inone of the deeper levels of Sima de la Higuera Cave, at the-110 m level (Fig.2H, I). The sample comprised a minerallamina, 5–10 mm thick with a sugary texture, whose outersurface was covered by dull greyish-blue deposits, rough intexture.
One sample of a calcite raft consisting of thin, brownishcalcite laminae (CR-01) was collected from the ParadiseChamber (-85 m). Lastly, a sample of powdered raft calcitewas taken from the Four Paths Chamber (-117 m) where thepiles of white raft calcite reach up to 2 m high (CR-02) (Fig. 2E).
3.2. Analytical methodology
SEM microphotographs were taken using a HITACHIS-3500 instrument in high vacuum mode. The samples werepreviously dried and coated with graphite to increaseelectron transmissivity. The elemental chemistry wasdetermined by EDX (Energy Dispersive X-raySpectroscopy) microprobe at two points with differenttypology over the boxwork sample (Fig. 5).
Microanalyses employed the same instrument coupled toan Oxford INCA 7210 X-ray detector. The diameter of thebeam was approximately 1 μm. (Table 1). Carbonconcentration was not measured due to masking by thegraphite coating. Quantitative chemical analysis of sampleswas done using X-ray fluorescence (wavelength dispersiveXRF) with a BRUKER S4 Pioneer instrument.
A subsample of dark material of the boxwork fromManganese Gallery (CMN) was extracted using a needlefor subsequent mineralogical analysis by XRD (X-RayDiffraction). The mineralogy of the internal crystalline
Karst and Caves in Carbonate Rocks, Salt and Gypsum – oral 2013 ICS Proceedings
79
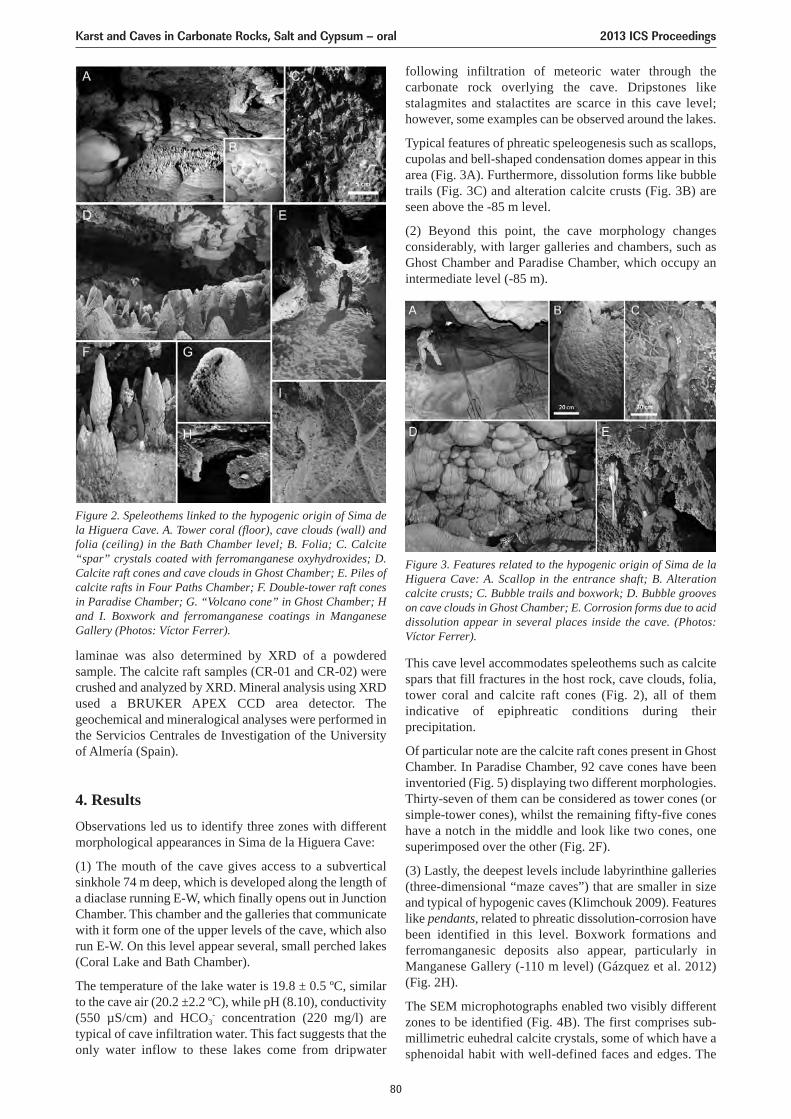
following infiltration of meteoric water through thecarbonate rock overlying the cave. Dripstones likestalagmites and stalactites are scarce in this cave level;however, some examples can be observed around the lakes.
Typical features of phreatic speleogenesis such as scallops,cupolas and bell-shaped condensation domes appear in thisarea (Fig. 3A). Furthermore, dissolution forms like bubbletrails (Fig. 3C) and alteration calcite crusts (Fig. 3B) areseen above the -85 m level.
(2) Beyond this point, the cave morphology changesconsiderably, with larger galleries and chambers, such asGhost Chamber and Paradise Chamber, which occupy anintermediate level (-85 m).
This cave level accommodates speleothems such as calcitespars that fill fractures in the host rock, cave clouds, folia,tower coral and calcite raft cones (Fig. 2), all of themindicative of epiphreatic conditions during theirprecipitation.
Of particular note are the calcite raft cones present in GhostChamber. In Paradise Chamber, 92 cave cones have beeninventoried (Fig. 5) displaying two different morphologies.Thirty-seven of them can be considered as tower cones (orsimple-tower cones), whilst the remaining fifty-five coneshave a notch in the middle and look like two cones, onesuperimposed over the other (Fig. 2F).
(3) Lastly, the deepest levels include labyrinthine galleries(three-dimensional “maze caves”) that are smaller in sizeand typical of hypogenic caves (Klimchouk 2009). Featureslike pendants, related to phreatic dissolution-corrosion havebeen identified in this level. Boxwork formations andferromanganesic deposits also appear, particularly inManganese Gallery (-110 m level) (Gázquez et al. 2012)(Fig. 2H).
The SEM microphotographs enabled two visibly differentzones to be identified (Fig. 4B). The first comprises sub-millimetric euhedral calcite crystals, some of which have asphenoidal habit with well-defined faces and edges. The
laminae was also determined by XRD of a powderedsample. The calcite raft samples (CR-01 and CR-02) werecrushed and analyzed by XRD. Mineral analysis using XRDused a BRUKER APEX CCD area detector. Thegeochemical and mineralogical analyses were performed inthe Servicios Centrales de Investigation of the Universityof Almería (Spain).
4. ResultsObservations led us to identify three zones with differentmorphological appearances in Sima de la Higuera Cave:
(1) The mouth of the cave gives access to a subverticalsinkhole 74 m deep, which is developed along the length ofa diaclase running E-W, which finally opens out in JunctionChamber. This chamber and the galleries that communicatewith it form one of the upper levels of the cave, which alsorun E-W. On this level appear several, small perched lakes(Coral Lake and Bath Chamber).
The temperature of the lake water is 19.8 ± 0.5 ºC, similarto the cave air (20.2 ±2.2 ºC), while pH (8.10), conductivity(550 µS/cm) and HCO3
- concentration (220 mg/l) aretypical of cave infiltration water. This fact suggests that theonly water inflow to these lakes come from dripwater
Figure 2. Speleothems linked to the hypogenic origin of Sima dela Higuera Cave. A. Tower coral (floor), cave clouds (wall) andfolia (ceiling) in the Bath Chamber level; B. Folia; C. Calcite“spar” crystals coated with ferromanganese oxyhydroxides; D.Calcite raft cones and cave clouds in Ghost Chamber; E. Piles ofcalcite rafts in Four Paths Chamber; F. Double-tower raft conesin Paradise Chamber; G. “Volcano cone” in Ghost Chamber; Hand I. Boxwork and ferromanganese coatings in ManganeseGallery (Photos: Víctor Ferrer).
Figure 3. Features related to the hypogenic origin of Sima de laHiguera Cave: A. Scallop in the entrance shaft; B. Alterationcalcite crusts; C. Bubble trails and boxwork; D. Bubble grooveson cave clouds in Ghost Chamber; E. Corrosion forms due to aciddissolution appear in several places inside the cave. (Photos:Víctor Ferrer).
Karst and Caves in Carbonate Rocks, Salt and Gypsum – oral 2013 ICS Proceedings
80
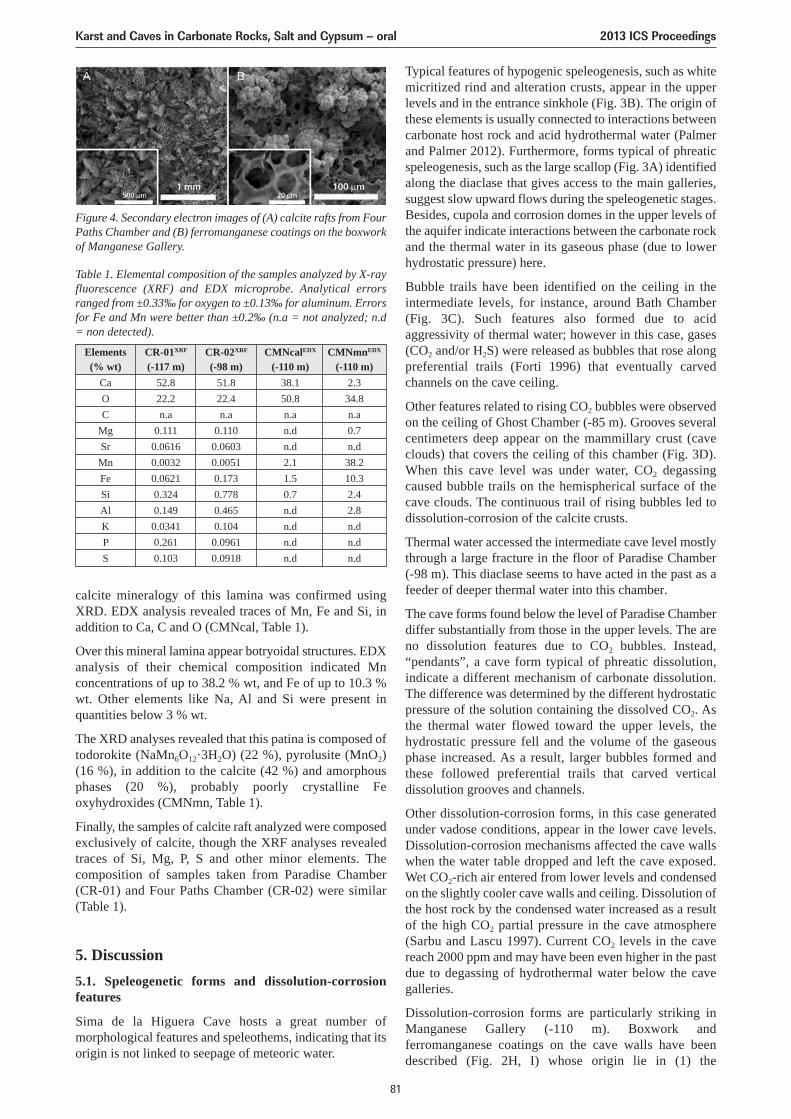
calcite mineralogy of this lamina was confirmed usingXRD. EDX analysis revealed traces of Mn, Fe and Si, inaddition to Ca, C and O (CMNcal, Table 1).
Over this mineral lamina appear botryoidal structures. EDXanalysis of their chemical composition indicated Mnconcentrations of up to 38.2 % wt, and Fe of up to 10.3 %wt. Other elements like Na, Al and Si were present inquantities below 3 % wt.
The XRD analyses revealed that this patina is composed oftodorokite (NaMn6O12·3H2O) (22 %), pyrolusite (MnO2)(16 %), in addition to the calcite (42 %) and amorphousphases (20 %), probably poorly crystalline Feoxyhydroxides (CMNmn, Table 1).
Finally, the samples of calcite raft analyzed were composedexclusively of calcite, though the XRF analyses revealedtraces of Si, Mg, P, S and other minor elements. Thecomposition of samples taken from Paradise Chamber (CR-01) and Four Paths Chamber (CR-02) were similar (Table 1).
5. Discussion5.1. Speleogenetic forms and dissolution-corrosionfeatures
Sima de la Higuera Cave hosts a great number ofmorphological features and speleothems, indicating that itsorigin is not linked to seepage of meteoric water.
Typical features of hypogenic speleogenesis, such as whitemicritized rind and alteration crusts, appear in the upperlevels and in the entrance sinkhole (Fig. 3B). The origin ofthese elements is usually connected to interactions betweencarbonate host rock and acid hydrothermal water (Palmerand Palmer 2012). Furthermore, forms typical of phreaticspeleogenesis, such as the large scallop (Fig. 3A) identifiedalong the diaclase that gives access to the main galleries,suggest slow upward flows during the speleogenetic stages.Besides, cupola and corrosion domes in the upper levels ofthe aquifer indicate interactions between the carbonate rockand the thermal water in its gaseous phase (due to lowerhydrostatic pressure) here.
Bubble trails have been identified on the ceiling in theintermediate levels, for instance, around Bath Chamber(Fig. 3C). Such features also formed due to acidaggressivity of thermal water; however in this case, gases(CO2 and/or H2S) were released as bubbles that rose alongpreferential trails (Forti 1996) that eventually carvedchannels on the cave ceiling.
Other features related to rising CO2 bubbles were observedon the ceiling of Ghost Chamber (-85 m). Grooves severalcentimeters deep appear on the mammillary crust (caveclouds) that covers the ceiling of this chamber (Fig. 3D).When this cave level was under water, CO2 degassingcaused bubble trails on the hemispherical surface of thecave clouds. The continuous trail of rising bubbles led todissolution-corrosion of the calcite crusts.
Thermal water accessed the intermediate cave level mostlythrough a large fracture in the floor of Paradise Chamber (-98 m). This diaclase seems to have acted in the past as afeeder of deeper thermal water into this chamber.
The cave forms found below the level of Paradise Chamberdiffer substantially from those in the upper levels. The areno dissolution features due to CO2 bubbles. Instead,“pendants”, a cave form typical of phreatic dissolution,indicate a different mechanism of carbonate dissolution.The difference was determined by the different hydrostaticpressure of the solution containing the dissolved CO2. Asthe thermal water flowed toward the upper levels, thehydrostatic pressure fell and the volume of the gaseousphase increased. As a result, larger bubbles formed andthese followed preferential trails that carved verticaldissolution grooves and channels.
Other dissolution-corrosion forms, in this case generatedunder vadose conditions, appear in the lower cave levels.Dissolution-corrosion mechanisms affected the cave wallswhen the water table dropped and left the cave exposed.Wet CO2-rich air entered from lower levels and condensedon the slightly cooler cave walls and ceiling. Dissolution ofthe host rock by the condensed water increased as a resultof the high CO2 partial pressure in the cave atmosphere(Sarbu and Lascu 1997). Current CO2 levels in the cavereach 2000 ppm and may have been even higher in the pastdue to degassing of hydrothermal water below the cavegalleries.
Dissolution-corrosion forms are particularly striking inManganese Gallery (-110 m). Boxwork andferromanganese coatings on the cave walls have beendescribed (Fig. 2H, I) whose origin lie in (1) the
Figure 4. Secondary electron images of (A) calcite rafts from FourPaths Chamber and (B) ferromanganese coatings on the boxworkof Manganese Gallery.
Elements CR-01XRF CR-02XRF CMNcalEDX CMNmnEDX
(% wt) (-117 m) (-98 m) (-110 m) (-110 m)Ca 52.8 51.8 38.1 2.3O 22.2 22.4 50.8 34.8C n.a n.a n.a n.a
Mg 0.111 0.110 n.d 0.7Sr 0.0616 0.0603 n.d n.dMn 0.0032 0.0051 2.1 38.2Fe 0.0621 0.173 1.5 10.3Si 0.324 0.778 0.7 2.4Al 0.149 0.465 n.d 2.8K 0.0341 0.104 n.d n.dP 0.261 0.0961 n.d n.dS 0.103 0.0918 n.d n.d
Table 1. Elemental composition of the samples analyzed by X-rayfluorescence (XRF) and EDX microprobe. Analytical errorsranged from ±0.33‰ for oxygen to ±0.13‰ for aluminum. Errorsfor Fe and Mn were better than ±0.2‰ (n.a = not analyzed; n.d= non detected).
Karst and Caves in Carbonate Rocks, Salt and Gypsum – oral 2013 ICS Proceedings
81
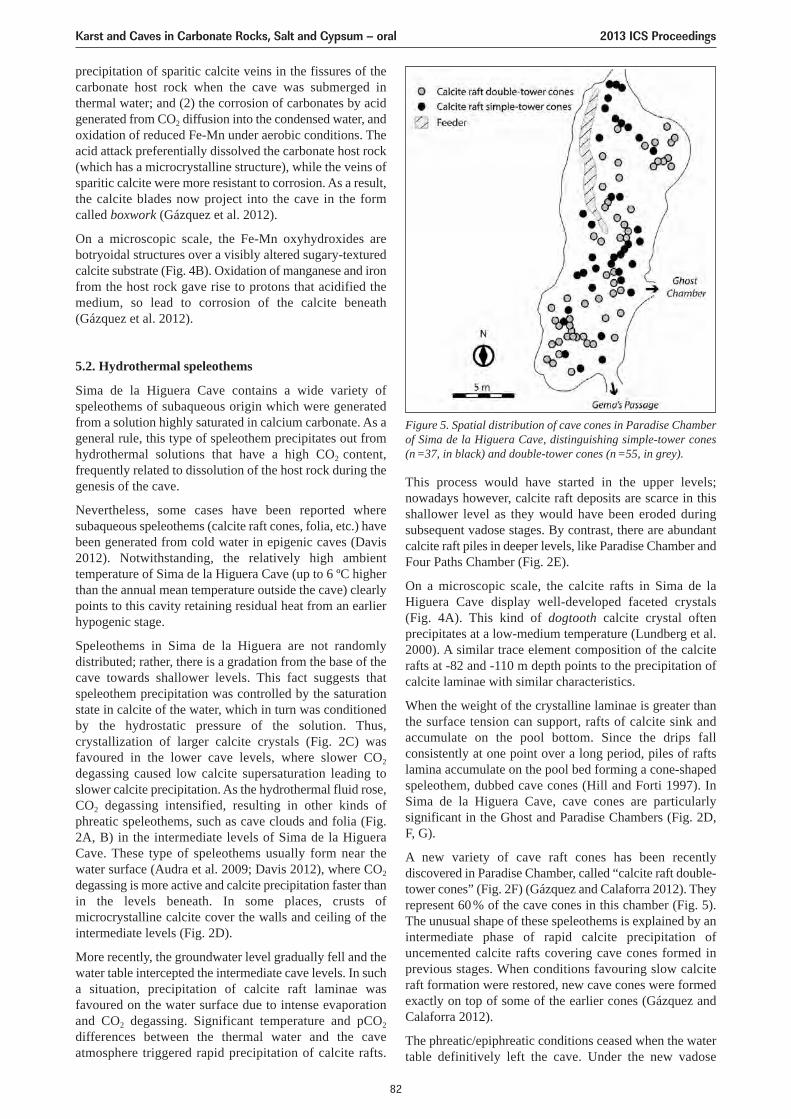
precipitation of sparitic calcite veins in the fissures of thecarbonate host rock when the cave was submerged inthermal water; and (2) the corrosion of carbonates by acidgenerated from CO2 diffusion into the condensed water, andoxidation of reduced Fe-Mn under aerobic conditions. Theacid attack preferentially dissolved the carbonate host rock(which has a microcrystalline structure), while the veins ofsparitic calcite were more resistant to corrosion. As a result,the calcite blades now project into the cave in the formcalled boxwork (Gázquez et al. 2012).
On a microscopic scale, the Fe-Mn oxyhydroxides arebotryoidal structures over a visibly altered sugary-texturedcalcite substrate (Fig. 4B). Oxidation of manganese and ironfrom the host rock gave rise to protons that acidified themedium, so lead to corrosion of the calcite beneath(Gázquez et al. 2012).
5.2. Hydrothermal speleothems
Sima de la Higuera Cave contains a wide variety ofspeleothems of subaqueous origin which were generatedfrom a solution highly saturated in calcium carbonate. As ageneral rule, this type of speleothem precipitates out fromhydrothermal solutions that have a high CO2 content,frequently related to dissolution of the host rock during thegenesis of the cave.
Nevertheless, some cases have been reported wheresubaqueous speleothems (calcite raft cones, folia, etc.) havebeen generated from cold water in epigenic caves (Davis2012). Notwithstanding, the relatively high ambienttemperature of Sima de la Higuera Cave (up to 6 ºC higherthan the annual mean temperature outside the cave) clearlypoints to this cavity retaining residual heat from an earlierhypogenic stage.
Speleothems in Sima de la Higuera are not randomlydistributed; rather, there is a gradation from the base of thecave towards shallower levels. This fact suggests thatspeleothem precipitation was controlled by the saturationstate in calcite of the water, which in turn was conditionedby the hydrostatic pressure of the solution. Thus,crystallization of larger calcite crystals (Fig. 2C) wasfavoured in the lower cave levels, where slower CO2
degassing caused low calcite supersaturation leading toslower calcite precipitation. As the hydrothermal fluid rose,CO2 degassing intensified, resulting in other kinds ofphreatic speleothems, such as cave clouds and folia (Fig.2A, B) in the intermediate levels of Sima de la HigueraCave. These type of speleothems usually form near thewater surface (Audra et al. 2009; Davis 2012), where CO2
degassing is more active and calcite precipitation faster thanin the levels beneath. In some places, crusts ofmicrocrystalline calcite cover the walls and ceiling of theintermediate levels (Fig. 2D).
More recently, the groundwater level gradually fell and thewater table intercepted the intermediate cave levels. In sucha situation, precipitation of calcite raft laminae wasfavoured on the water surface due to intense evaporationand CO2 degassing. Significant temperature and pCO2
differences between the thermal water and the caveatmosphere triggered rapid precipitation of calcite rafts.
This process would have started in the upper levels;nowadays however, calcite raft deposits are scarce in thisshallower level as they would have been eroded duringsubsequent vadose stages. By contrast, there are abundantcalcite raft piles in deeper levels, like Paradise Chamber andFour Paths Chamber (Fig. 2E).
On a microscopic scale, the calcite rafts in Sima de laHiguera Cave display well-developed faceted crystals (Fig. 4A). This kind of dogtooth calcite crystal oftenprecipitates at a low-medium temperature (Lundberg et al.2000). A similar trace element composition of the calciterafts at -82 and -110 m depth points to the precipitation ofcalcite laminae with similar characteristics.
When the weight of the crystalline laminae is greater thanthe surface tension can support, rafts of calcite sink andaccumulate on the pool bottom. Since the drips fallconsistently at one point over a long period, piles of raftslamina accumulate on the pool bed forming a cone-shapedspeleothem, dubbed cave cones (Hill and Forti 1997). InSima de la Higuera Cave, cave cones are particularlysignificant in the Ghost and Paradise Chambers (Fig. 2D,F, G).
A new variety of cave raft cones has been recentlydiscovered in Paradise Chamber, called “calcite raft double-tower cones” (Fig. 2F) (Gázquez and Calaforra 2012). Theyrepresent 60% of the cave cones in this chamber (Fig. 5).The unusual shape of these speleothems is explained by anintermediate phase of rapid calcite precipitation ofuncemented calcite rafts covering cave cones formed inprevious stages. When conditions favouring slow calciteraft formation were restored, new cave cones were formedexactly on top of some of the earlier cones (Gázquez andCalaforra 2012).
The phreatic/epiphreatic conditions ceased when the watertable definitively left the cave. Under the new vadose
Figure 5. Spatial distribution of cave cones in Paradise Chamberof Sima de la Higuera Cave, distinguishing simple-tower cones(n=37, in black) and double-tower cones (n=55, in grey).
Karst and Caves in Carbonate Rocks, Salt and Gypsum – oral 2013 ICS Proceedings
82
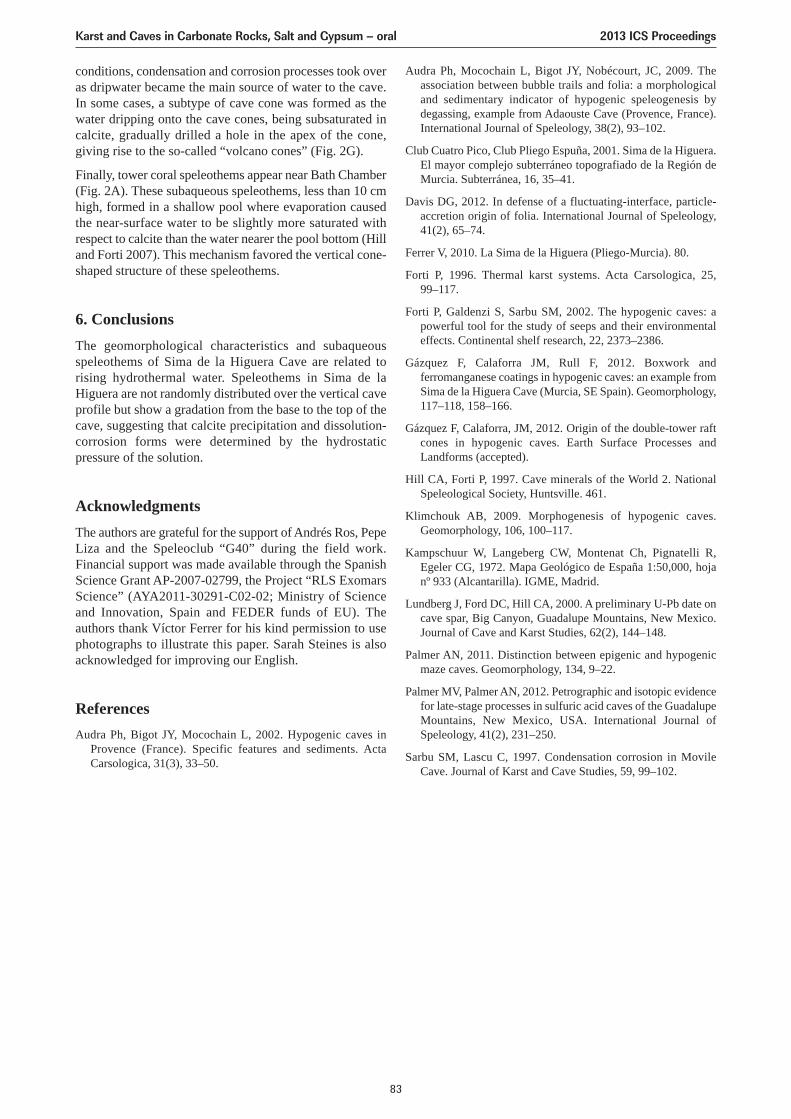
conditions, condensation and corrosion processes took overas dripwater became the main source of water to the cave.In some cases, a subtype of cave cone was formed as thewater dripping onto the cave cones, being subsaturated incalcite, gradually drilled a hole in the apex of the cone,giving rise to the so-called “volcano cones” (Fig. 2G).
Finally, tower coral speleothems appear near Bath Chamber(Fig. 2A). These subaqueous speleothems, less than 10 cmhigh, formed in a shallow pool where evaporation causedthe near-surface water to be slightly more saturated withrespect to calcite than the water nearer the pool bottom (Hilland Forti 2007). This mechanism favored the vertical cone-shaped structure of these speleothems.
6. ConclusionsThe geomorphological characteristics and subaqueousspeleothems of Sima de la Higuera Cave are related torising hydrothermal water. Speleothems in Sima de laHiguera are not randomly distributed over the vertical caveprofile but show a gradation from the base to the top of thecave, suggesting that calcite precipitation and dissolution-corrosion forms were determined by the hydrostaticpressure of the solution.
AcknowledgmentsThe authors are grateful for the support of Andrés Ros, PepeLiza and the Speleoclub “G40” during the field work.Financial support was made available through the SpanishScience Grant AP-2007-02799, the Project “RLS ExomarsScience” (AYA2011-30291-C02-02; Ministry of Scienceand Innovation, Spain and FEDER funds of EU). Theauthors thank Víctor Ferrer for his kind permission to usephotographs to illustrate this paper. Sarah Steines is alsoacknowledged for improving our English.
ReferencesAudra Ph, Bigot JY, Mocochain L, 2002. Hypogenic caves in
Provence (France). Specific features and sediments. ActaCarsologica, 31(3), 33–50.
Audra Ph, Mocochain L, Bigot JY, Nobécourt, JC, 2009. Theassociation between bubble trails and folia: a morphologicaland sedimentary indicator of hypogenic speleogenesis bydegassing, example from Adaouste Cave (Provence, France).International Journal of Speleology, 38(2), 93–102.
Club Cuatro Pico, Club Pliego Espuña, 2001. Sima de la Higuera.El mayor complejo subterráneo topografiado de la Región deMurcia. Subterránea, 16, 35–41.
Davis DG, 2012. In defense of a fluctuating-interface, particle-accretion origin of folia. International Journal of Speleology,41(2), 65–74.
Ferrer V, 2010. La Sima de la Higuera (Pliego-Murcia). 80.
Forti P, 1996. Thermal karst systems. Acta Carsologica, 25, 99–117.
Forti P, Galdenzi S, Sarbu SM, 2002. The hypogenic caves: apowerful tool for the study of seeps and their environmentaleffects. Continental shelf research, 22, 2373–2386.
Gázquez F, Calaforra JM, Rull F, 2012. Boxwork andferromanganese coatings in hypogenic caves: an example fromSima de la Higuera Cave (Murcia, SE Spain). Geomorphology,117–118, 158–166.
Gázquez F, Calaforra, JM, 2012. Origin of the double-tower raftcones in hypogenic caves. Earth Surface Processes andLandforms (accepted).
Hill CA, Forti P, 1997. Cave minerals of the World 2. NationalSpeleological Society, Huntsville. 461.
Klimchouk AB, 2009. Morphogenesis of hypogenic caves.Geomorphology, 106, 100–117.
Kampschuur W, Langeberg CW, Montenat Ch, Pignatelli R,Egeler CG, 1972. Mapa Geológico de España 1:50,000, hojanº 933 (Alcantarilla). IGME, Madrid.
Lundberg J, Ford DC, Hill CA, 2000. A preliminary U-Pb date oncave spar, Big Canyon, Guadalupe Mountains, New Mexico.Journal of Cave and Karst Studies, 62(2), 144–148.
Palmer AN, 2011. Distinction between epigenic and hypogenicmaze caves. Geomorphology, 134, 9–22.
Palmer MV, Palmer AN, 2012. Petrographic and isotopic evidencefor late-stage processes in sulfuric acid caves of the GuadalupeMountains, New Mexico, USA. International Journal ofSpeleology, 41(2), 231–250.
Sarbu SM, Lascu C, 1997. Condensation corrosion in MovileCave. Journal of Karst and Cave Studies, 59, 99–102.
Karst and Caves in Carbonate Rocks, Salt and Gypsum – oral 2013 ICS Proceedings
83
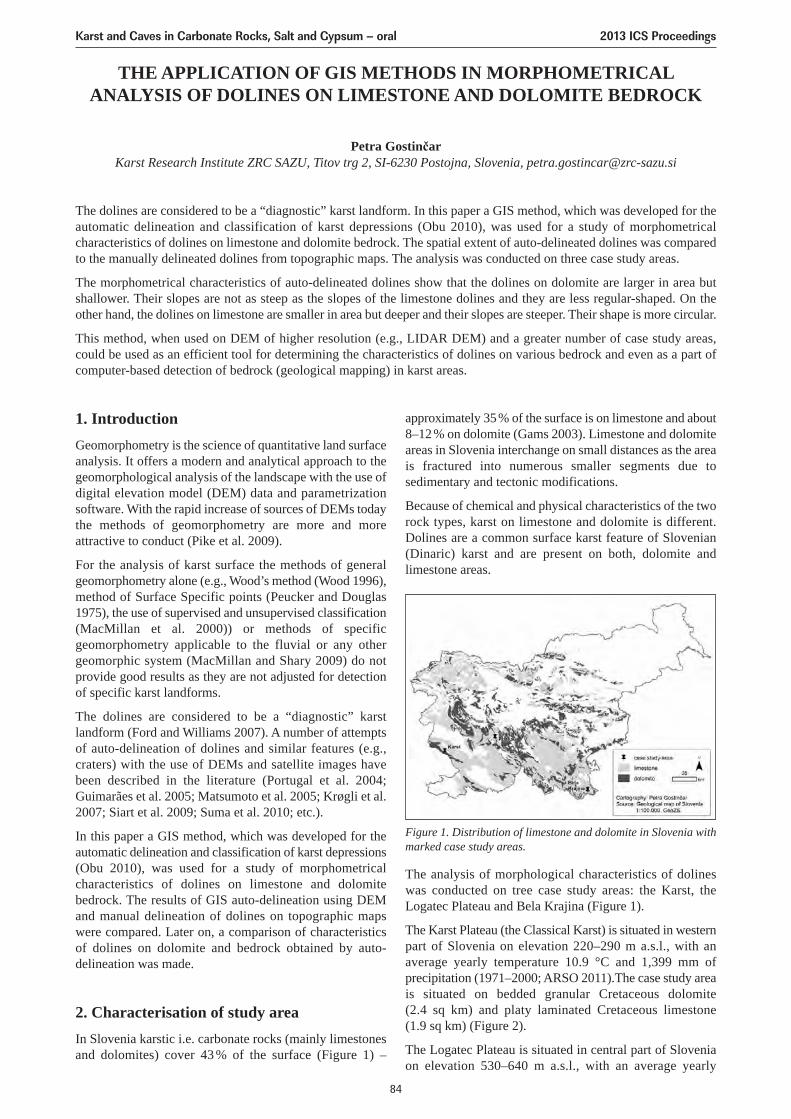
The analysis of morphological characteristics of dolineswas conducted on tree case study areas: the Karst, theLogatec Plateau and Bela Krajina (Figure 1).
The Karst Plateau (the Classical Karst) is situated in westernpart of Slovenia on elevation 220–290 m a.s.l., with anaverage yearly temperature 10.9 °C and 1,399 mm ofprecipitation (1971–2000; ARSO 2011).The case study areais situated on bedded granular Cretaceous dolomite (2.4 sq km) and platy laminated Cretaceous limestone (1.9 sq km) (Figure 2).
The Logatec Plateau is situated in central part of Sloveniaon elevation 530–640 m a.s.l., with an average yearly
THE APPLICATION OF GIS METHODS IN MORPHOMETRICALANALYSIS OF DOLINES ON LIMESTONE AND DOLOMITE BEDROCK
Petra GostinčarKarst Research Institute ZRC SAZU, Titov trg 2, SI-6230 Postojna, Slovenia, [email protected]
The dolines are considered to be a “diagnostic” karst landform. In this paper a GIS method, which was developed for theautomatic delineation and classification of karst depressions (Obu 2010), was used for a study of morphometricalcharacteristics of dolines on limestone and dolomite bedrock. The spatial extent of auto-delineated dolines was comparedto the manually delineated dolines from topographic maps. The analysis was conducted on three case study areas.
The morphometrical characteristics of auto-delineated dolines show that the dolines on dolomite are larger in area butshallower. Their slopes are not as steep as the slopes of the limestone dolines and they are less regular-shaped. On theother hand, the dolines on limestone are smaller in area but deeper and their slopes are steeper. Their shape is more circular.
This method, when used on DEM of higher resolution (e.g., LIDAR DEM) and a greater number of case study areas,could be used as an efficient tool for determining the characteristics of dolines on various bedrock and even as a part ofcomputer-based detection of bedrock (geological mapping) in karst areas.
1. IntroductionGeomorphometry is the science of quantitative land surfaceanalysis. It offers a modern and analytical approach to thegeomorphological analysis of the landscape with the use ofdigital elevation model (DEM) data and parametrizationsoftware. With the rapid increase of sources of DEMs todaythe methods of geomorphometry are more and moreattractive to conduct (Pike et al. 2009).
For the analysis of karst surface the methods of generalgeomorphometry alone (e.g., Wood’s method (Wood 1996),method of Surface Specific points (Peucker and Douglas1975), the use of supervised and unsupervised classification(MacMillan et al. 2000)) or methods of specificgeomorphometry applicable to the fluvial or any othergeomorphic system (MacMillan and Shary 2009) do notprovide good results as they are not adjusted for detectionof specific karst landforms.
The dolines are considered to be a “diagnostic” karstlandform (Ford and Williams 2007). A number of attemptsof auto-delineation of dolines and similar features (e.g.,craters) with the use of DEMs and satellite images havebeen described in the literature (Portugal et al. 2004;Guimarães et al. 2005; Matsumoto et al. 2005; Krøgli et al.2007; Siart et al. 2009; Suma et al. 2010; etc.).
In this paper a GIS method, which was developed for theautomatic delineation and classification of karst depressions(Obu 2010), was used for a study of morphometricalcharacteristics of dolines on limestone and dolomitebedrock. The results of GIS auto-delineation using DEMand manual delineation of dolines on topographic mapswere compared. Later on, a comparison of characteristicsof dolines on dolomite and bedrock obtained by auto-delineation was made.
2. Characterisation of study areaIn Slovenia karstic i.e. carbonate rocks (mainly limestonesand dolomites) cover 43 % of the surface (Figure 1) –
approximately 35% of the surface is on limestone and about8–12% on dolomite (Gams 2003). Limestone and dolomiteareas in Slovenia interchange on small distances as the areais fractured into numerous smaller segments due tosedimentary and tectonic modifications.
Because of chemical and physical characteristics of the tworock types, karst on limestone and dolomite is different.Dolines are a common surface karst feature of Slovenian(Dinaric) karst and are present on both, dolomite andlimestone areas.
Figure 1. Distribution of limestone and dolomite in Slovenia withmarked case study areas.
Karst and Caves in Carbonate Rocks, Salt and Gypsum – oral 2013 ICS Proceedings
84
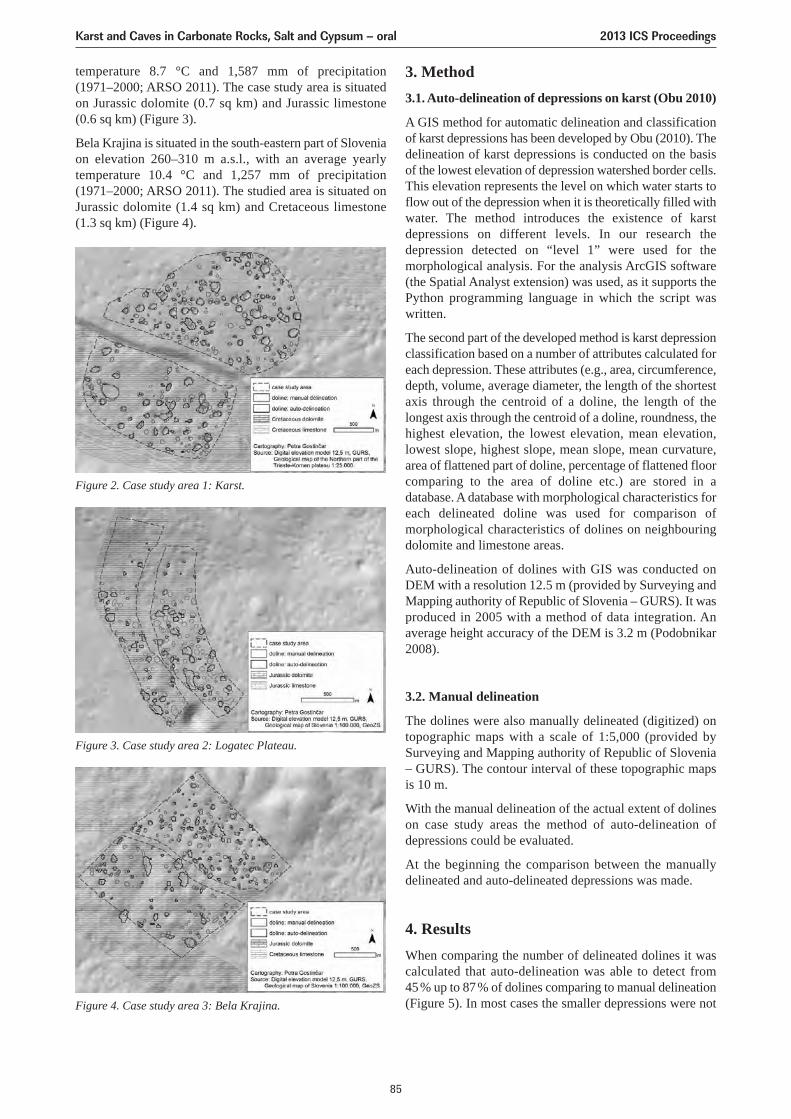
temperature 8.7 °C and 1,587 mm of precipitation (1971–2000; ARSO 2011). The case study area is situatedon Jurassic dolomite (0.7 sq km) and Jurassic limestone (0.6 sq km) (Figure 3).
Bela Krajina is situated in the south-eastern part of Sloveniaon elevation 260–310 m a.s.l., with an average yearlytemperature 10.4 °C and 1,257 mm of precipitation (1971–2000; ARSO 2011). The studied area is situated onJurassic dolomite (1.4 sq km) and Cretaceous limestone (1.3 sq km) (Figure 4).
Figure 2. Case study area 1: Karst.
Figure 3. Case study area 2: Logatec Plateau.
Figure 4. Case study area 3: Bela Krajina.
3. Method3.1. Auto-delineation of depressions on karst (Obu 2010)
A GIS method for automatic delineation and classificationof karst depressions has been developed by Obu (2010). Thedelineation of karst depressions is conducted on the basisof the lowest elevation of depression watershed border cells.This elevation represents the level on which water starts toflow out of the depression when it is theoretically filled withwater. The method introduces the existence of karstdepressions on different levels. In our research thedepression detected on “level 1” were used for themorphological analysis. For the analysis ArcGIS software(the Spatial Analyst extension) was used, as it supports thePython programming language in which the script waswritten.
The second part of the developed method is karst depressionclassification based on a number of attributes calculated foreach depression. These attributes (e.g., area, circumference,depth, volume, average diameter, the length of the shortestaxis through the centroid of a doline, the length of thelongest axis through the centroid of a doline, roundness, thehighest elevation, the lowest elevation, mean elevation,lowest slope, highest slope, mean slope, mean curvature,area of flattened part of doline, percentage of flattened floorcomparing to the area of doline etc.) are stored in adatabase. A database with morphological characteristics foreach delineated doline was used for comparison ofmorphological characteristics of dolines on neighbouringdolomite and limestone areas.
Auto-delineation of dolines with GIS was conducted onDEM with a resolution 12.5 m (provided by Surveying andMapping authority of Republic of Slovenia – GURS). It wasproduced in 2005 with a method of data integration. Anaverage height accuracy of the DEM is 3.2 m (Podobnikar2008).
3.2. Manual delineation
The dolines were also manually delineated (digitized) ontopographic maps with a scale of 1:5,000 (provided bySurveying and Mapping authority of Republic of Slovenia– GURS). The contour interval of these topographic mapsis 10 m.
With the manual delineation of the actual extent of dolineson case study areas the method of auto-delineation ofdepressions could be evaluated.
At the beginning the comparison between the manuallydelineated and auto-delineated depressions was made.
4. ResultsWhen comparing the number of delineated dolines it wascalculated that auto-delineation was able to detect from 45% up to 87% of dolines comparing to manual delineation(Figure 5). In most cases the smaller depressions were not
Karst and Caves in Carbonate Rocks, Salt and Gypsum – oral 2013 ICS Proceedings
85
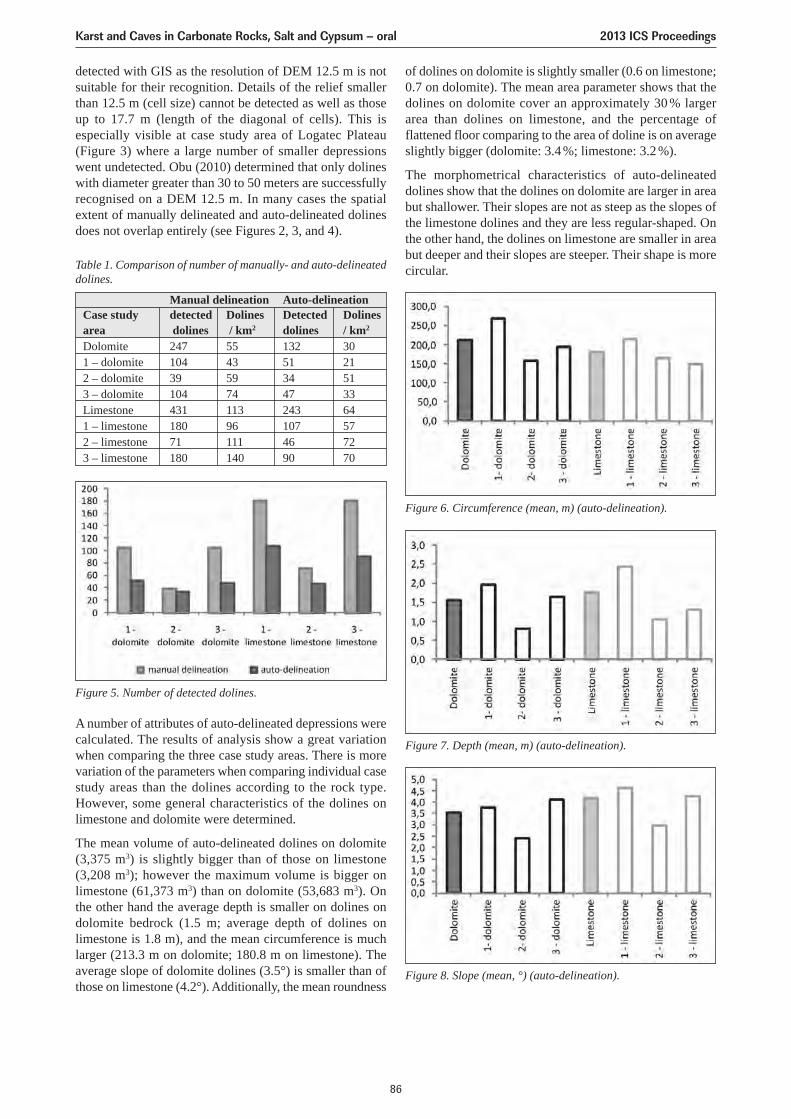
detected with GIS as the resolution of DEM 12.5 m is notsuitable for their recognition. Details of the relief smallerthan 12.5 m (cell size) cannot be detected as well as thoseup to 17.7 m (length of the diagonal of cells). This isespecially visible at case study area of Logatec Plateau(Figure 3) where a large number of smaller depressionswent undetected. Obu (2010) determined that only dolineswith diameter greater than 30 to 50 meters are successfullyrecognised on a DEM 12.5 m. In many cases the spatialextent of manually delineated and auto-delineated dolinesdoes not overlap entirely (see Figures 2, 3, and 4).
Table 1. Comparison of number of manually- and auto-delineateddolines.
of dolines on dolomite is slightly smaller (0.6 on limestone;0.7 on dolomite). The mean area parameter shows that thedolines on dolomite cover an approximately 30 % largerarea than dolines on limestone, and the percentage offlattened floor comparing to the area of doline is on averageslightly bigger (dolomite: 3.4%; limestone: 3.2%).
The morphometrical characteristics of auto-delineateddolines show that the dolines on dolomite are larger in areabut shallower. Their slopes are not as steep as the slopes ofthe limestone dolines and they are less regular-shaped. Onthe other hand, the dolines on limestone are smaller in areabut deeper and their slopes are steeper. Their shape is morecircular.
Figure 6. Circumference (mean, m) (auto-delineation).
Figure 7. Depth (mean, m) (auto-delineation).
Figure 8. Slope (mean, °) (auto-delineation).
Manual delineation Auto-delineationCase study detected Dolines Detected Dolinesarea dolines / km2 dolines / km2
Dolomite 247 55 132 301 – dolomite 104 43 51 212 – dolomite 39 59 34 513 – dolomite 104 74 47 33Limestone 431 113 243 641 – limestone 180 96 107 572 – limestone 71 111 46 723 – limestone 180 140 90 70
A number of attributes of auto-delineated depressions werecalculated. The results of analysis show a great variationwhen comparing the three case study areas. There is morevariation of the parameters when comparing individual casestudy areas than the dolines according to the rock type.However, some general characteristics of the dolines onlimestone and dolomite were determined.
The mean volume of auto-delineated dolines on dolomite(3,375 m3) is slightly bigger than of those on limestone(3,208 m3); however the maximum volume is bigger onlimestone (61,373 m3) than on dolomite (53,683 m3). Onthe other hand the average depth is smaller on dolines ondolomite bedrock (1.5 m; average depth of dolines onlimestone is 1.8 m), and the mean circumference is muchlarger (213.3 m on dolomite; 180.8 m on limestone). Theaverage slope of dolomite dolines (3.5°) is smaller than ofthose on limestone (4.2°). Additionally, the mean roundness
Figure 5. Number of detected dolines.
Karst and Caves in Carbonate Rocks, Salt and Gypsum – oral 2013 ICS Proceedings
86
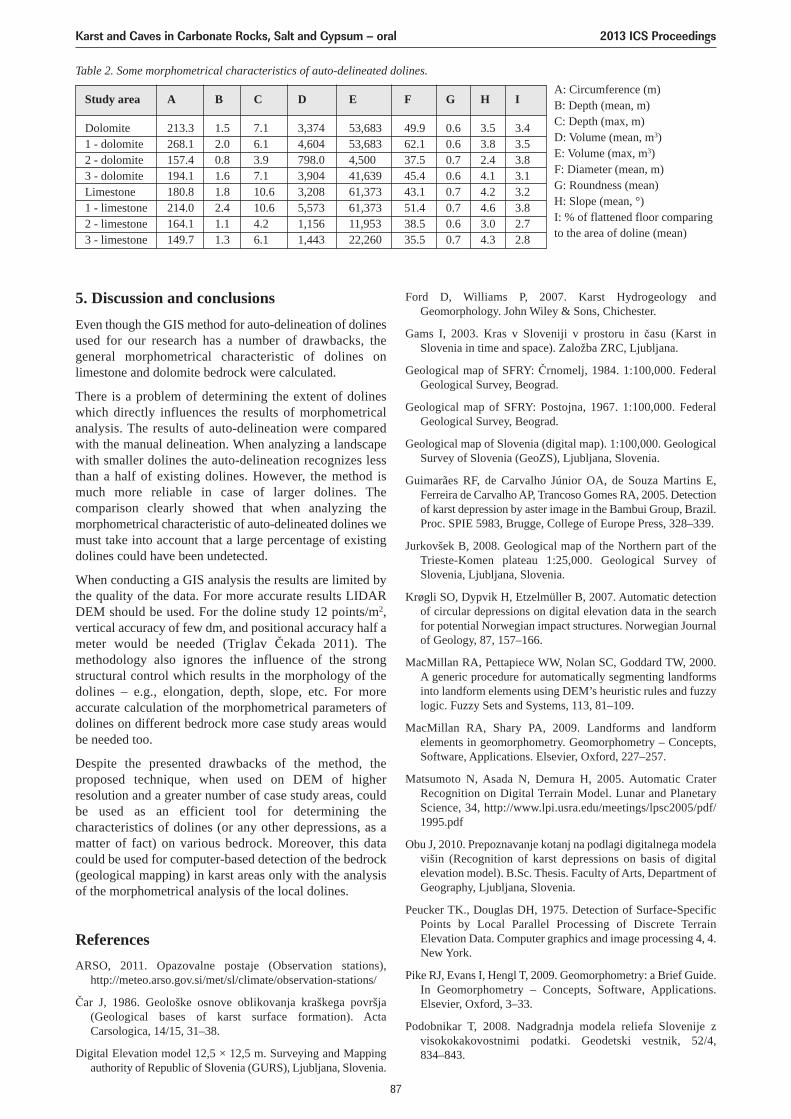
Table 2. Some morphometrical characteristics of auto-delineated dolines.
Study area A B C D E F G H I
Dolomite 213.3 1.5 7.1 3,374 53,683 49.9 0.6 3.5 3.4 1 - dolomite 268.1 2.0 6.1 4,604 53,683 62.1 0.6 3.8 3.5 2 - dolomite 157.4 0.8 3.9 798.0 4,500 37.5 0.7 2.4 3.8 3 - dolomite 194.1 1.6 7.1 3,904 41,639 45.4 0.6 4.1 3.1 Limestone 180.8 1.8 10.6 3,208 61,373 43.1 0.7 4.2 3.2 1 - limestone 214.0 2.4 10.6 5,573 61,373 51.4 0.7 4.6 3.8 2 - limestone 164.1 1.1 4.2 1,156 11,953 38.5 0.6 3.0 2.7 3 - limestone 149.7 1.3 6.1 1,443 22,260 35.5 0.7 4.3 2.8
A: Circumference (m)B: Depth (mean, m) C: Depth (max, m) D: Volume (mean, m3) E: Volume (max, m3) F: Diameter (mean, m) G: Roundness (mean) H: Slope (mean, °) I: % of flattened floor comparingto the area of doline (mean)
5. Discussion and conclusionsEven though the GIS method for auto-delineation of dolinesused for our research has a number of drawbacks, thegeneral morphometrical characteristic of dolines onlimestone and dolomite bedrock were calculated.
There is a problem of determining the extent of dolineswhich directly influences the results of morphometricalanalysis. The results of auto-delineation were comparedwith the manual delineation. When analyzing a landscapewith smaller dolines the auto-delineation recognizes lessthan a half of existing dolines. However, the method ismuch more reliable in case of larger dolines. Thecomparison clearly showed that when analyzing themorphometrical characteristic of auto-delineated dolines wemust take into account that a large percentage of existingdolines could have been undetected.
When conducting a GIS analysis the results are limited bythe quality of the data. For more accurate results LIDARDEM should be used. For the doline study 12 points/m2,vertical accuracy of few dm, and positional accuracy half ameter would be needed (Triglav Čekada 2011). Themethodology also ignores the influence of the strongstructural control which results in the morphology of thedolines – e.g., elongation, depth, slope, etc. For moreaccurate calculation of the morphometrical parameters ofdolines on different bedrock more case study areas wouldbe needed too.
Despite the presented drawbacks of the method, theproposed technique, when used on DEM of higherresolution and a greater number of case study areas, couldbe used as an efficient tool for determining thecharacteristics of dolines (or any other depressions, as amatter of fact) on various bedrock. Moreover, this datacould be used for computer-based detection of the bedrock(geological mapping) in karst areas only with the analysisof the morphometrical analysis of the local dolines.
ReferencesARSO, 2011. Opazovalne postaje (Observation stations),
http://meteo.arso.gov.si/met/sl/climate/observation-stations/
Čar J, 1986. Geološke osnove oblikovanja kraškega površja(Geological bases of karst surface formation). ActaCarsologica, 14/15, 31–38.
Digital Elevation model 12,5 × 12,5 m. Surveying and Mappingauthority of Republic of Slovenia (GURS), Ljubljana, Slovenia.
Ford D, Williams P, 2007. Karst Hydrogeology andGeomorphology. John Wiley & Sons, Chichester.
Gams I, 2003. Kras v Sloveniji v prostoru in času (Karst inSlovenia in time and space). Založba ZRC, Ljubljana.
Geological map of SFRY: Črnomelj, 1984. 1:100,000. FederalGeological Survey, Beograd.
Geological map of SFRY: Postojna, 1967. 1:100,000. FederalGeological Survey, Beograd.
Geological map of Slovenia (digital map). 1:100,000. GeologicalSurvey of Slovenia (GeoZS), Ljubljana, Slovenia.
Guimarães RF, de Carvalho Júnior OA, de Souza Martins E,Ferreira de Carvalho AP, Trancoso Gomes RA, 2005. Detectionof karst depression by aster image in the Bambui Group, Brazil.Proc. SPIE 5983, Brugge, College of Europe Press, 328–339.
Jurkovšek B, 2008. Geological map of the Northern part of theTrieste-Komen plateau 1:25,000. Geological Survey ofSlovenia, Ljubljana, Slovenia.
Krøgli SO, Dypvik H, Etzelmüller B, 2007. Automatic detectionof circular depressions on digital elevation data in the searchfor potential Norwegian impact structures. Norwegian Journalof Geology, 87, 157–166.
MacMillan RA, Pettapiece WW, Nolan SC, Goddard TW, 2000.A generic procedure for automatically segmenting landformsinto landform elements using DEM’s heuristic rules and fuzzylogic. Fuzzy Sets and Systems, 113, 81–109.
MacMillan RA, Shary PA, 2009. Landforms and landformelements in geomorphometry. Geomorphometry – Concepts,Software, Applications. Elsevier, Oxford, 227–257.
Matsumoto N, Asada N, Demura H, 2005. Automatic CraterRecognition on Digital Terrain Model. Lunar and PlanetaryScience, 34, http://www.lpi.usra.edu/meetings/lpsc2005/pdf/1995.pdf
Obu J, 2010. Prepoznavanje kotanj na podlagi digitalnega modelavišin (Recognition of karst depressions on basis of digitalelevation model). B.Sc. Thesis. Faculty of Arts, Department ofGeography, Ljubljana, Slovenia.
Peucker TK., Douglas DH, 1975. Detection of Surface-SpecificPoints by Local Parallel Processing of Discrete TerrainElevation Data. Computer graphics and image processing 4, 4.New York.
Pike RJ, Evans I, Hengl T, 2009. Geomorphometry: a Brief Guide.In Geomorphometry – Concepts, Software, Applications.Elsevier, Oxford, 3–33.
Podobnikar T, 2008. Nadgradnja modela reliefa Slovenije zvisokokakovostnimi podatki. Geodetski vestnik, 52/4, 834–843.
Karst and Caves in Carbonate Rocks, Salt and Gypsum – oral 2013 ICS Proceedings
87

Portugal RS, De Souza Filho CR, Bland PA, 2004. AutomaticCrater Detection Using DEM and Circular Coherency Analysis– A Case Study on South American Craters. 67th AnnualMeteorological Society Meeting, www.lpi.usra.edu/meetings/metsoc2004/pdf/5096.pdf
Siart C, Bubenzer O, Eitel B, 2009. Combining digital elevationdata (SRTM/ASTER), high resolution satellite imagery(Quicbird) and GIS for geomorphological mapping. A multi-component case study on Mediterranean karst in Central Crete.Geomorphology, 112, 1–2, 106–121.
Suma A, Prieto FJG, de Cosmo PD, 2010. Detection and mappingof karst depressions through remote sensing approach: anexample from Sierra de Libar. “Classical karst”s, 18th
karstological school, Postojna, Slovenia.
Triglav Čekada M., 2011. Možnost uporabe zračnega laserskegaskeniranja (LIDAR) za geomorfološke študije (Possibilities ofaerial laser scanning (LIDAR) usage for geomorphic studies).Geografski vestnik, 83/2, 81–93.
Wood JD, 1996. The Geomorphological Characterisation ofDitigal Elevation models: Ph.D. Thesis, University ofLeicester, London, United Kingdom.
Karst and Caves in Carbonate Rocks, Salt and Gypsum – oral 2013 ICS Proceedings
88
ORIGIN OF ATYPICAL CALCITE SPELEOTHEMS FILLING FISSURES INSANDSTONES
Michał Gradziński1, Marek Duliński2, Helena Hercman3, Andrzej Górny4, Stanisław Przybyszowski5
1Institute of Geological Sciences, Jagiellonian University, Oleandry 2a, 30-063 Kraków, Poland,[email protected]
2Faculty of Physics and Applied Computer Science, AGH – University of Science and Technology, al. Mickiewicza 30,30-059 Krakow, [email protected]
3Institute of Geological Sciences, Polish Academy of Sciences, Twarda 51/55, 00-818 Warszawa, Poland,[email protected]
4Andrzej Górny, Geological Museum, Faculty of Geology, Geophysics and Environment Protection,AGH Academy of Science and Technology, Aleja Mickiewicza 30, 30-059 Kraków, Poland, [email protected]
5Stanisław Przybyszowski, Kleczany Stone Resources Company Ltd, 33-394 Kleczany 176, Poland
Atypical calcite speleothems developed in fissures in the Cergowa sandstones were found in the Kleczany Quarry (PolishWestern Carpathians). They represent flowstone and stalactites, rafts and various sparry crusts. Such speleothems,especially phreatic ones, are uncommon in the Outer Carpathians composed mainly of siliciclastic rocks of flysch type,with only limited content of calcium carbonate.
The analyzed speleothems grew in vadose and phreatic conditions as well as at the air-water interface. Phreatic speleothemsand thin rafts comprise calcite crystals of eccentric morphology, as for example gothic-arch crystals, macrotrilate crystals,single- and multi-stepped crystals. They were formed due to disequilibrium conditions probably resulting from the presenceof foreign ions in parent water. Flowstones were fed with thin film of seepage water flowing down the fissure walls. Basedon their stable isotope composition, the majority of speleothems form two clusters. The first of them is characterized byδ 18O values between -9.8 and -8.5‰ and of δ 13C values between -5.7 and -0.6‰. The second cluster of samples yieldsδ 18O values between -9.4 and -7.3‰ and values of δ13C from -11.5 to -9.7‰.
The speleothems originated between 230 +14, -13 ka and Holocene, mainly during warm periods. Phreatic speleothems,including massive rafts, precipitated from ascending water of deep circulation whereas vadose and water-table speleothemscrystallized from local infiltration water charged with soil CO2. Mixing of both waters in a shallow phreatic zone is plausiblenear the water-table. It affected the morphology of crystal composing the thin-rafts.
Karst and Caves in Carbonate Rocks, Salt and Gypsum – oral 2013 ICS Proceedings
89
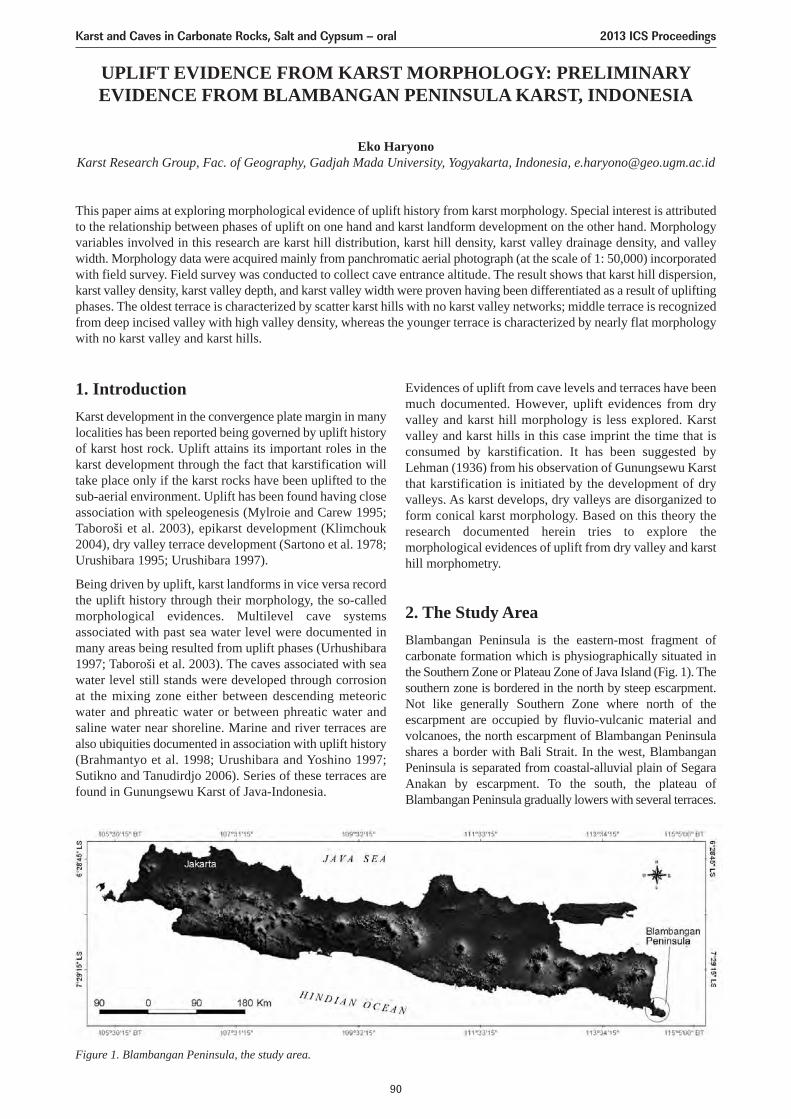
UPLIFT EVIDENCE FROM KARST MORPHOLOGY: PRELIMINARYEVIDENCE FROM BLAMBANGAN PENINSULA KARST, INDONESIA
Eko HaryonoKarst Research Group, Fac. of Geography, Gadjah Mada University, Yogyakarta, Indonesia, [email protected]
This paper aims at exploring morphological evidence of uplift history from karst morphology. Special interest is attributedto the relationship between phases of uplift on one hand and karst landform development on the other hand. Morphologyvariables involved in this research are karst hill distribution, karst hill density, karst valley drainage density, and valleywidth. Morphology data were acquired mainly from panchromatic aerial photograph (at the scale of 1: 50,000) incorporatedwith field survey. Field survey was conducted to collect cave entrance altitude. The result shows that karst hill dispersion,karst valley density, karst valley depth, and karst valley width were proven having been differentiated as a result of upliftingphases. The oldest terrace is characterized by scatter karst hills with no karst valley networks; middle terrace is recognizedfrom deep incised valley with high valley density, whereas the younger terrace is characterized by nearly flat morphologywith no karst valley and karst hills.
Karst and Caves in Carbonate Rocks, Salt and Gypsum – oral 2013 ICS Proceedings
90
1. IntroductionKarst development in the convergence plate margin in manylocalities has been reported being governed by uplift historyof karst host rock. Uplift attains its important roles in thekarst development through the fact that karstification willtake place only if the karst rocks have been uplifted to thesub-aerial environment. Uplift has been found having closeassociation with speleogenesis (Mylroie and Carew 1995;Taboroši et al. 2003), epikarst development (Klimchouk2004), dry valley terrace development (Sartono et al. 1978;Urushibara 1995; Urushibara 1997).
Being driven by uplift, karst landforms in vice versa recordthe uplift history through their morphology, the so-calledmorphological evidences. Multilevel cave systemsassociated with past sea water level were documented inmany areas being resulted from uplift phases (Urhushibara1997; Taboroši et al. 2003). The caves associated with seawater level still stands were developed through corrosionat the mixing zone either between descending meteoricwater and phreatic water or between phreatic water andsaline water near shoreline. Marine and river terraces arealso ubiquities documented in association with uplift history(Brahmantyo et al. 1998; Urushibara and Yoshino 1997;Sutikno and Tanudirdjo 2006). Series of these terraces arefound in Gunungsewu Karst of Java-Indonesia.
Evidences of uplift from cave levels and terraces have beenmuch documented. However, uplift evidences from dryvalley and karst hill morphology is less explored. Karstvalley and karst hills in this case imprint the time that isconsumed by karstification. It has been suggested byLehman (1936) from his observation of Gunungsewu Karstthat karstification is initiated by the development of dryvalleys. As karst develops, dry valleys are disorganized toform conical karst morphology. Based on this theory theresearch documented herein tries to explore themorphological evidences of uplift from dry valley and karsthill morphometry.
2. The Study AreaBlambangan Peninsula is the eastern-most fragment ofcarbonate formation which is physiographically situated inthe Southern Zone or Plateau Zone of Java Island (Fig. 1). Thesouthern zone is bordered in the north by steep escarpment.Not like generally Southern Zone where north of theescarpment are occupied by fluvio-vulcanic material andvolcanoes, the north escarpment of Blambangan Peninsulashares a border with Bali Strait. In the west, BlambanganPeninsula is separated from coastal-alluvial plain of SegaraAnakan by escarpment. To the south, the plateau ofBlambangan Peninsula gradually lowers with several terraces.
Figure 1. Blambangan Peninsula, the study area.
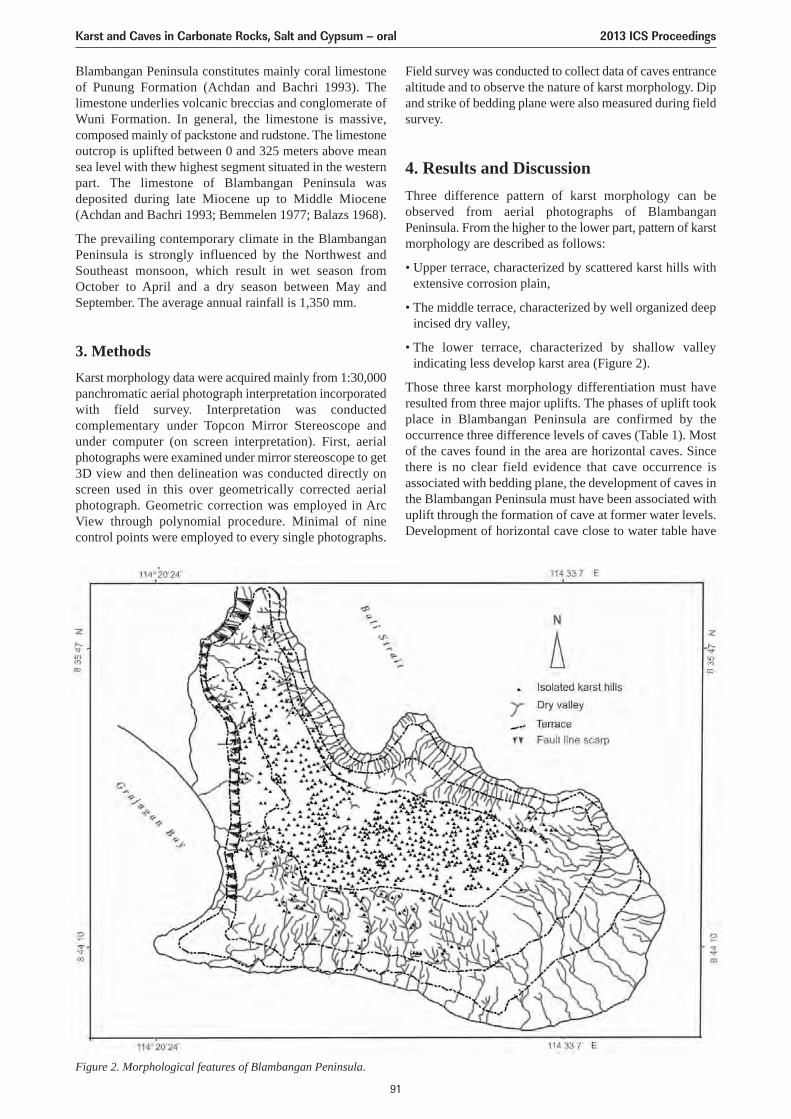
Blambangan Peninsula constitutes mainly coral limestoneof Punung Formation (Achdan and Bachri 1993). Thelimestone underlies volcanic breccias and conglomerate ofWuni Formation. In general, the limestone is massive,composed mainly of packstone and rudstone. The limestoneoutcrop is uplifted between 0 and 325 meters above meansea level with thew highest segment situated in the westernpart. The limestone of Blambangan Peninsula wasdeposited during late Miocene up to Middle Miocene(Achdan and Bachri 1993; Bemmelen 1977; Balazs 1968).
The prevailing contemporary climate in the BlambanganPeninsula is strongly influenced by the Northwest andSoutheast monsoon, which result in wet season fromOctober to April and a dry season between May andSeptember. The average annual rainfall is 1,350 mm.
3. MethodsKarst morphology data were acquired mainly from 1:30,000panchromatic aerial photograph interpretation incorporatedwith field survey. Interpretation was conductedcomplementary under Topcon Mirror Stereoscope andunder computer (on screen interpretation). First, aerialphotographs were examined under mirror stereoscope to get3D view and then delineation was conducted directly onscreen used in this over geometrically corrected aerialphotograph. Geometric correction was employed in ArcView through polynomial procedure. Minimal of ninecontrol points were employed to every single photographs.
Field survey was conducted to collect data of caves entrancealtitude and to observe the nature of karst morphology. Dipand strike of bedding plane were also measured during fieldsurvey.
4. Results and DiscussionThree difference pattern of karst morphology can beobserved from aerial photographs of BlambanganPeninsula. From the higher to the lower part, pattern of karstmorphology are described as follows:
• Upper terrace, characterized by scattered karst hills withextensive corrosion plain,
• The middle terrace, characterized by well organized deepincised dry valley,
• The lower terrace, characterized by shallow valleyindicating less develop karst area (Figure 2).
Those three karst morphology differentiation must haveresulted from three major uplifts. The phases of uplift tookplace in Blambangan Peninsula are confirmed by theoccurrence three difference levels of caves (Table 1). Mostof the caves found in the area are horizontal caves. Sincethere is no clear field evidence that cave occurrence isassociated with bedding plane, the development of caves inthe Blambangan Peninsula must have been associated withuplift through the formation of cave at former water levels.Development of horizontal cave close to water table have
Karst and Caves in Carbonate Rocks, Salt and Gypsum – oral 2013 ICS Proceedings
91
Figure 2. Morphological features of Blambangan Peninsula.
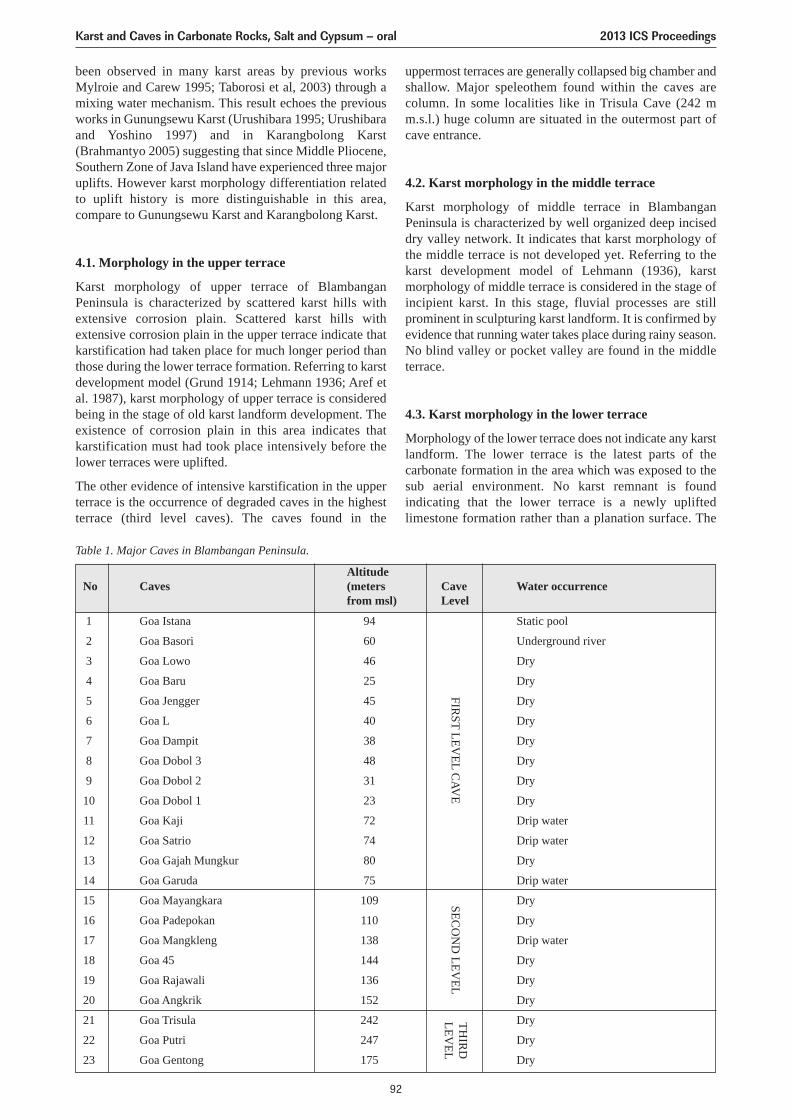
been observed in many karst areas by previous worksMylroie and Carew 1995; Taborosi et al, 2003) through amixing water mechanism. This result echoes the previousworks in Gunungsewu Karst (Urushibara 1995; Urushibaraand Yoshino 1997) and in Karangbolong Karst(Brahmantyo 2005) suggesting that since Middle Pliocene,Southern Zone of Java Island have experienced three majoruplifts. However karst morphology differentiation relatedto uplift history is more distinguishable in this area,compare to Gunungsewu Karst and Karangbolong Karst.
4.1. Morphology in the upper terrace
Karst morphology of upper terrace of BlambanganPeninsula is characterized by scattered karst hills withextensive corrosion plain. Scattered karst hills withextensive corrosion plain in the upper terrace indicate thatkarstification had taken place for much longer period thanthose during the lower terrace formation. Referring to karstdevelopment model (Grund 1914; Lehmann 1936; Aref etal. 1987), karst morphology of upper terrace is consideredbeing in the stage of old karst landform development. Theexistence of corrosion plain in this area indicates thatkarstification must had took place intensively before thelower terraces were uplifted.
The other evidence of intensive karstification in the upperterrace is the occurrence of degraded caves in the highestterrace (third level caves). The caves found in the
uppermost terraces are generally collapsed big chamber andshallow. Major speleothem found within the caves arecolumn. In some localities like in Trisula Cave (242 mm.s.l.) huge column are situated in the outermost part ofcave entrance.
4.2. Karst morphology in the middle terrace
Karst morphology of middle terrace in BlambanganPeninsula is characterized by well organized deep inciseddry valley network. It indicates that karst morphology ofthe middle terrace is not developed yet. Referring to thekarst development model of Lehmann (1936), karstmorphology of middle terrace is considered in the stage ofincipient karst. In this stage, fluvial processes are stillprominent in sculpturing karst landform. It is confirmed byevidence that running water takes place during rainy season.No blind valley or pocket valley are found in the middleterrace.
4.3. Karst morphology in the lower terrace
Morphology of the lower terrace does not indicate any karstlandform. The lower terrace is the latest parts of thecarbonate formation in the area which was exposed to thesub aerial environment. No karst remnant is foundindicating that the lower terrace is a newly upliftedlimestone formation rather than a planation surface. The
1 Goa Istana 94
2 Goa Basori 60
3 Goa Lowo 46
4 Goa Baru 25
5 Goa Jengger 45
6 Goa L 40
7 Goa Dampit 38
8 Goa Dobol 3 48
9 Goa Dobol 2 31
10 Goa Dobol 1 23
11 Goa Kaji 72
12 Goa Satrio 74
13 Goa Gajah Mungkur 80
14 Goa Garuda 75
15 Goa Mayangkara 109
16 Goa Padepokan 110
17 Goa Mangkleng 138
18 Goa 45 144
19 Goa Rajawali 136
20 Goa Angkrik 152
21 Goa Trisula 242
22 Goa Putri 247
23 Goa Gentong 175
FIRST LEV
EL CAV
ESEC
ON
D LEV
ELTH
IRD
LEVEL
Static pool
Underground river
Dry
Dry
Dry
Dry
Dry
Dry
Dry
Dry
Drip water
Drip water
Dry
Drip water
Dry
Dry
Drip water
Dry
Dry
Dry
Dry
Dry
Dry
AltitudeNo Caves (meters Cave Water occurrence
from msl) Level
Table 1. Major Caves in Blambangan Peninsula.
Karst and Caves in Carbonate Rocks, Salt and Gypsum – oral 2013 ICS Proceedings
92
lower terrace is separated from the middle terrace by east-west direction structural terrace.
5. Concluding remarksUplift history of Java Island was documented very well inBlambangan Peninsula, either from morphological evidenceas discuss here or structural evidence. Three major upliftsas describe from different part of the island are clearlydocumented in this area. Different evidence from cavesediment seems also very interesting topic for furtherresearch, especially for dating purpose, neo-tectonic, orpaleo-climate reconstruction.
ReferencesAref El MM, Kadrah AMA, Lotfy ZH, 1987. Karst topography
and karstification processes in the Eocene limestone plateau ofEl Bahariya, Z. Geomorphologie N.F, (31)1, 45–64.
Achdan A, Bachri S, 1993. Geologic Map of The BlambanganQuadrangle-East Java, Centre for Geological Research andDevelopment, Bandung.
Balazs D, 1968. Karst Regions in Indonesia, Karszt esBarlangkutatas, Volume 5, Budapest.
Bemmelen RWVan, 1970. The Geology of Indonesia, Vol IA,Second edition, Martinus Nijhoff, The Hgue.
Brahmantyo B, Puradimaja DJ, Bandono, Sadisun IA, 1998.Interpretasi kelurusan dari citra SPOT dan hubungannyadengan pola pengaliran bawah tanah pada Perbukitan KarstGunung Sewu, Jawa Tengah bagian selatan, Buletin Geologi,28 (1), 37–49.
Brahmantyo B, 2005. Perkembangan bentangalam karst GombongSelatan, dengan geologi sebagai faktor kendali, Disertasi, Tidakdipublikasikan, ITB, Bandung.
Gillieson D, 1996, Caves: Processes, Development, andManagement, Blackwell, Oxford.
Grund A, 1914. Der geographische Zyklus im Karst, Z. GesErdkunde, 52, 621–40.
Mylroie JE, Carew JL, 1995. Karst Development on carbonateIslands, in Budd, D.A. Sallet A.H. dan Harris, P.A. (eds),Unvconfromity in Carbonat strata-Their Reconition and thesignificance of Associated Porosity, AAPG Meomoir, 63, 55–76.
Pannekoek AJ, 1949. Outline of The Geomorphology of Java,Leiden.
Taboroši D, Jenson JW, Mylroie JE, 2003. Zones of enhanceddissolution and associated cave morphology in an upliftedcarbonate island karst aquifer, northern Guam, Mariana Islands,Speleogenesis and Evolution of Karst Aquifers. 1 (4),December 2003, 16.
Klimchouk A, 2004. Towards defining, delimiting and classifyingepikarst: Its origin, processes and variants of geomorphicevolution, in Jones, WK, Culver, D.C. and Herman, J. (Eds.).2004. Epikarst. Karst Water Institute special publication, 9, 23–35.
Lehmann H, 1936. Morphologiche Studien auf Java, Gogr, Abh,3, Stutgart.
Sartono S, Hidayat S, Zaim J, Nababan UP, Djubiantono T, 1878.Undak Sungai Baksoko Berdasarkan Analisis Foto Udara,Proyek Pendendalian dan Penggalian Purbakala, Dep P dan K.
Sutikno, Tanudirdjo D, 2006. Kajian Georkeologi KawasanGunungsewu sebagai Dasar Model Pelestarian LingkunganKarst, Laporan Penelitian, UGM, Yogyakarta.
Urushibara-Yoshino K, 1995. Environmental change in the karstareas on the Island of Java, Proceedings of The InternationalSymposium on Paleoenvironmental Change in Tropical-Subtropical Monsoon Asia, Research Centre for Regioanalgeography, Hiroshima University. Hiroshima.
Urushibara-Yoshino K, dan Yoshino M, 1997.Palaeoenvironmental change in Java Island and its suroundingareas, Journal of Quarternary Science, 12 (5), 435–442.
Karst and Caves in Carbonate Rocks, Salt and Gypsum – oral 2013 ICS Proceedings
93
VALLEY INCISION IN THE NÍZKE TATRY MTS. (SLOVAKIA)ESTIMATED BASED ON PALEOMAGNETIC AND RADIOMETRIC CAVE
SEDIMENT DATINGS
Jaroslav Kadlec1, Pavol Bella2, Kristýna Čížková1, Darryl E. Granger3, Helena Hercman4, Peter Holúbek5,Martin Chadima1,6, Monika Orvošová5, Petr Pruner1, Petr Schnabl1, Stanislav Šlechta1
1Institute of Geology AS CR, v.v.i., Rozvojová 269, 165 00 Praha 6, [email protected]áva slovenských jaskýň, Hodžova 11, 031 01 Liptovský Mikuláš
3Earth and Atmospheric Sciences, Purdue University, West Lafayette, Indiana 479074Institute of Geological Sciences PAS, Twarda 51/55, 00-818, Warsaw
5Slovenské múzeum ochrany prírody a jaskyniarstva, Školská 4, 031 01 Liptovský Mikuláš6Agico spol. s r.o., Ječná 29a, 621 00 Brno
Up to eleven horizontal cave levels occur at different altitudes in Jánska, Demänovská and Mošnická karst valleys in theNízke Tatry Mts. Most of the caves are filled with allochthonous sediments transported from the area formed mostly bygranite. The cave levels were filled with fluvial sediments in dependence on the valleys incision caused by Neogene andPleistocene uplift of the mountain range. The fluvial sediments are intercalated with, or capped, by flowstone layers in thecaves. The paleomagnetic polarities measured both in clastic and chemogenic sediments indicate the age of deposition.Based on obtained polarity data we are able to distinguish cave sediments deposited during the Brunhes, Matuyama andGauss chrons. The paleomagnetic interpretation was partly verified by U-series datings of flowstones preserved in thesedimentary sections. Except for the horizontal cave levels located in the karst valleys, additional large cave systems werefound at extremely high altitudes in the Nízke Tatry Mts. 600–700 m above the lowest horizontal cave level.
1. IntroductionAn estimation of deposition time of inner cave sedimentsis possible based on measurement of paleomagnetic polarityrecord preserved in fine clastic and chemogene deposits.The paleomagnetic interpretation can be verified by U-series dating of speleothems intercalated into thesedimentary sections (e.g., Bosák and Pruner 2011).
2. Geography and geologyTriassic carbonate rocks forming the northern slopes of theNízke Tatry Mts. in Slovakia are hosting cave systemsdeveloped in eleven levels (Droppa 1966). Cave passageslocated in different altitudes were filled with fluvial, floodand chemogenic deposits during the Demänovská andJanská karst valleys incision. Except for the horizontal cavelevels located in these karst valleys, additional cave systemswere developed at high altitudes in the Nízke Tatry Mts. inKrakova Hoľa, Kozie Chrbty, and Ohniště Plateau.
3. MethodsPaleomagnetic polarities recorded in both fine clastic andchemogenic cave deposits were acquired by thermal oralternating field demagnetization. Directions ofmagnetization vector were measured using both spinner andsuperconducting rock magnetometers. Magnetostratigraphicinter-pretations were verified by U-series (230Th/234U and234U/238U) dating of speleothems deposited in thesedimentary sections. The paleomagnetic age of sedimentspreserved in the high altitude cave systems was verifiedbased on cosmogenic isotope activity (10Be and 27Al)measured in quartz pebbles.
4. Results and discussionBased on obtained magnetostratigraphic pattern we are ableto distinguish cave sediments deposited during the Gauss(2.588–3.58 Ma), Matuyama (0.781–2.588 Ma), andBrunhes (<0.781 Ma) paleomagnetic chrons. Thepaleomagnetic record extracted from the high altitude cavesystems indicates deposition between 3.1 and 1.75 Ma ago.The sediments had to be deposited during a period oftectonic stability when only shallow valleys were developedon both sites of the mountain range. The tectonic uplift inthis area was accelerated since 1.7 Ma. The valley incisionrate can be estimated based on paleomagnetic polarity andelevation data as follows: 6 cm.ka-1 during 1.7–1.1 Ma; 32 cm.ka-1 during 1.1–0.78 Ma; and 4 cm.ka-1 since 0.78 Ma. The remarkable increase of the valley incisionduring the latest Early Pleistocene corresponds with resultsof valley incision study performed in the Swiss Alpsreaching twice to four times faster rate in comparison withther Nizke Tatry Mts. (Haeuselmann et al. 2007). Theperiods of alluvial agradation in the caves were alsocorrelated with terraces deposited by the Váh River running10 km North from the karst area. Paleomagnetic polarity ofthe fluvial deposits filling the largest 4th cave level show theage of sediments younger than 0.78 Ma which is inagreement with stratigraphic conclusion of the mostextensive Váh River terrace to the early Mid-Pleistocene(Droppa 1966).
5. ConclusionsThe cave levels in the Nízke Tatry Mts. were filled withfluvial sediments in dependence of Neogene andPleistocene uplift of the mountain range. Sedimentspreserved in the large cave systems developed in extremely
Karst and Caves in Carbonate Rocks, Salt and Gypsum – oral 2013 ICS Proceedings
94
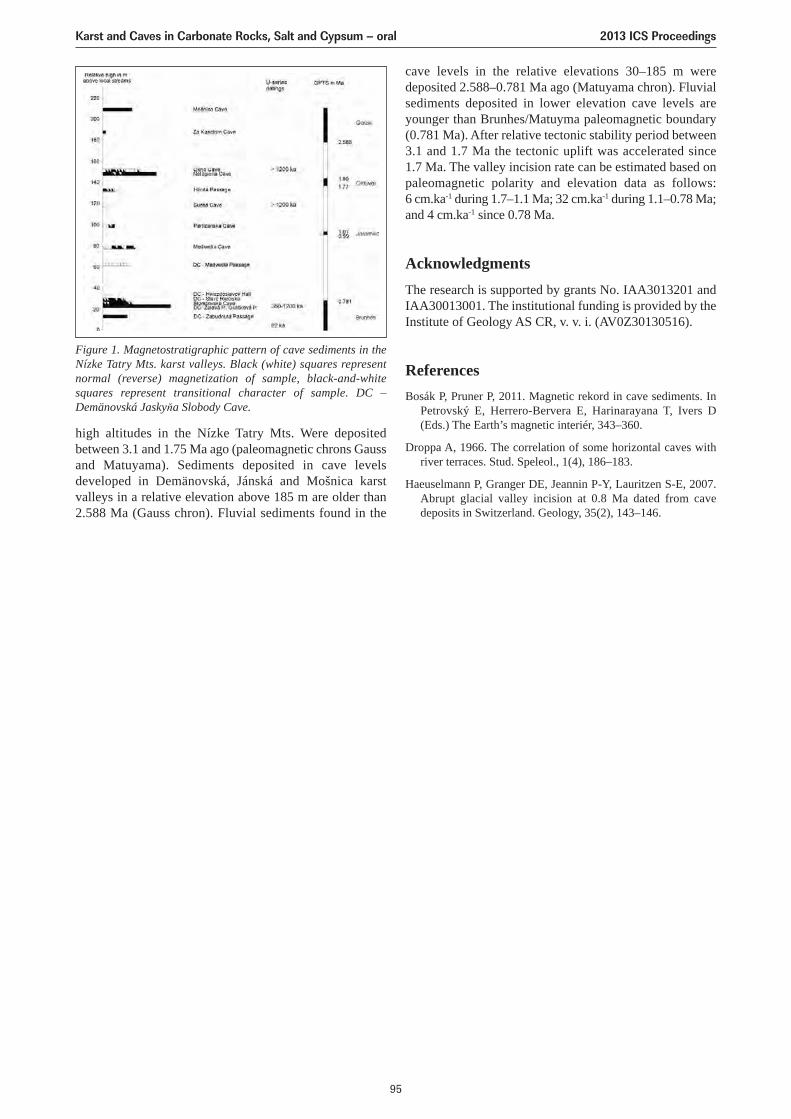
high altitudes in the Nízke Tatry Mts. Were depositedbetween 3.1 and 1.75 Ma ago (paleomagnetic chrons Gaussand Matuyama). Sediments deposited in cave levelsdeveloped in Demänovská, Jánská and Mošnica karstvalleys in a relative elevation above 185 m are older than2.588 Ma (Gauss chron). Fluvial sediments found in the
Figure 1. Magnetostratigraphic pattern of cave sediments in theNízke Tatry Mts. karst valleys. Black (white) squares representnormal (reverse) magnetization of sample, black-and-whitesquares represent transitional character of sample. DC –Demänovská Jaskyňa Slobody Cave.
cave levels in the relative elevations 30–185 m weredeposited 2.588–0.781 Ma ago (Matuyama chron). Fluvialsediments deposited in lower elevation cave levels areyounger than Brunhes/Matuyma paleomagnetic boundary(0.781 Ma). After relative tectonic stability period between3.1 and 1.7 Ma the tectonic uplift was accelerated since 1.7 Ma. The valley incision rate can be estimated based onpaleomagnetic polarity and elevation data as follows: 6 cm.ka-1 during 1.7–1.1 Ma; 32 cm.ka-1 during 1.1–0.78 Ma;and 4 cm.ka-1 since 0.78 Ma.
AcknowledgmentsThe research is supported by grants No. IAA3013201 andIAA30013001. The institutional funding is provided by theInstitute of Geology AS CR, v. v. i. (AV0Z30130516).
ReferencesBosák P, Pruner P, 2011. Magnetic rekord in cave sediments. In
Petrovský E, Herrero-Bervera E, Harinarayana T, Ivers D(Eds.) The Earth’s magnetic interiér, 343–360.
Droppa A, 1966. The correlation of some horizontal caves withriver terraces. Stud. Speleol., 1(4), 186–183.
Haeuselmann P, Granger DE, Jeannin P-Y, Lauritzen S-E, 2007.Abrupt glacial valley incision at 0.8 Ma dated from cavedeposits in Switzerland. Geology, 35(2), 143–146.
Karst and Caves in Carbonate Rocks, Salt and Gypsum – oral 2013 ICS Proceedings
95
MAGNETIC FABRIC AND MINERALOGY OF CAVE DEPOSITS INBOTOVSKAYA CAVE (EASTERN SIBERIA, RUSSIAN FEDERATION)
Jaroslav Kadlec1, Helena Herman2, Martin Chadima1,3, Lenka Lisá1, Hedi Oberhänsli4, Alexandr Osintsev5
1Institute of Geology AS CR, v.v.i., Rozvojova 269, CZ-165 00 Praha 6, Czech Republic, [email protected] of Geological Sciences, PAN, Warszawa, Poland
3Agico spol. s r.o., Ječná 29a, 621 00 Brno4GeoForschungsZentrum Potsdam, Germany
5Speleoclub Arabica, Irkutsk, Russia
The Botovskaya Cave is a typical example of a two-dimensional maze with a total length of explored passages exceeding60 km, which represents the longest limestone cave system in the Russian Federation. The clastic cave sediments fillingthe cave passages differ in both mineral and mineral magnetic properties and were deposited under different hydrologicalconditions. The older portion of the clastic cave fills was derived from overlying sandstones, whereas the properties ofyounger cave sediments show closer affinity to the soils and weathering products originating on the sandstone plateauabove the cave. The cave sediments underwent repeated periods of deposition and erosion during the Tertiary andPleistocene.
1. IntroductionThe aim of this project is an examination of the BotovskayaCave deposits using methods operating with magnetic andheavy minerals and with quartz grain exoscopy. Obtainedmineral characteristics were used for correlations from thepoint of view of sediment source and mode of transportationinto the cave passages. Radiometric and paleomagneticdatings of the cave carbonate bed allowed us to estimate theage of both depositional and post-depositional processes.
2. Geography and geologyThe Botovskaya Cave is located on the Angarsko-LenskyPlateau of the southern Siberian Craton about 500 km northof Irkutsk City. The area reaches altitudes of 1,100 m a.s.l.,and belongs to the Zhigalovo District of the Irkutsk Area.The plateau is dissected by river valleys up to 400 m deep.Cave entrances lie at a relative elevation of 310 m abovethe Lena River level, in a valley of the Garevogo Creek, theleft tributary of the Boty River, which joins the Lena River.The cave system, dipping gently to the north, has developedin an Early Ordovician limestone formation with a thicknessof 6 to 12 m. The limestone bed is underlain by Middle andLate Cambrian sandstone, siltstone, marl and gypsum andoverlain by Middle Ordovician sandstone, limestone andargillite. The cave system developed under confined(artesian karst) settings (Klimchouk 2000, 2003). Thespeleogenesis of the Botovskaya Cave system wasinterpreted by Filippov (2000) and is due to two differentprocesses: (i) corrosion involving meteoric water, and (ii)ascending deep circulating artesian water (belowgroundwater level) spanning the time period between LateMesozoic and Early Neogene.
3. MethodsThe studied sections of the cave deposits were documentedwith special reference to lithology, sedimentary structures
and aggradation and erosion event records. Mineralmagnetic characteristics such as low field bulk magneticsusceptibility (MS) and anhysteretic remanent magnetization(ARM) together with anisotropy of magnetic susceptibility(AMS) help to find the source of the cave fills and estimatea mode of sediment transport to the cave passages. Thecharacter of quartz grain surfaces indicates transportationand post-depositional history of clastic sediments.Exoscopic observations were performed on quartz grainslarger than 0.25 mm separated from either clastic cavedeposits or from the Ordovician sandstone bedrock afterwet sieving and boiling in HCl. Heavy minerals wereseparated after wet sieving from the grain-size fraction of0.25–0.063 mm using tetrabromethane and observed inCanadian balsam. At least 300 grains of transparent heavyminerals were determined in each sample. The flowstonebed used for the paleomagnetic polarity measurements wasalso dated by the 230Th/234U radiometric method.
4. Results4.1. Magnetic fabric and mineral magneticcharacteristics
The MS values slightly increase from bottom sand sedimentbeds to the above lying clay dominating sediments (see Fig. 2). The highest MS values were measured in themodern topsoil collected above the Medeo Entrance. TheARM values show steep increase in the top beds. The AMSparameter is sensitive to presence of very finesuperparamagnetic minerals originating during pedogenesisor forest fires. The magnetic fabric of the sediments ismostly oblate. The magnetic lineation directions in the topsedimentary beds show concentration in NW to SWdirections with the mean direction tending to the WSW. Thepoles to magnetic foliation are usually concentrated aroundthe center of the projection. The magnetic lineationdirections measured in the bottom sedimentary beds showalmost random distribution accompanied by largedispersion of poles to magnetic foliation.
Karst and Caves in Carbonate Rocks, Salt and Gypsum – oral 2013 ICS Proceedings
96
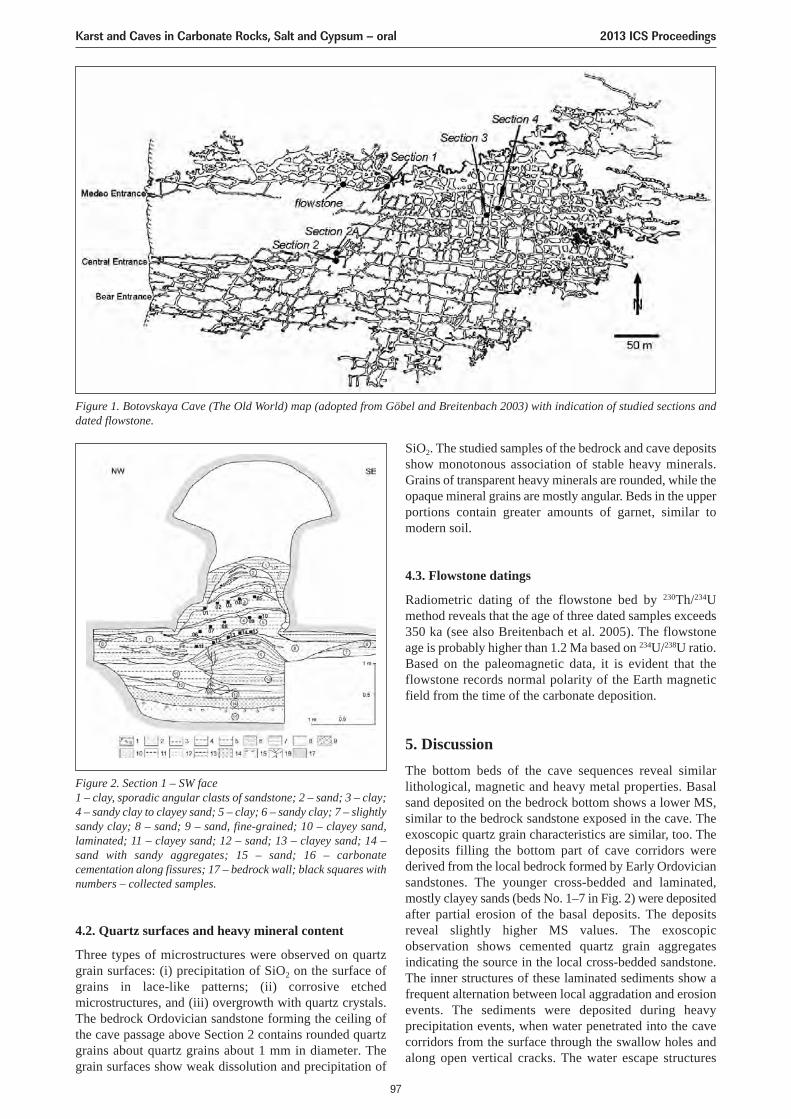
4.2. Quartz surfaces and heavy mineral content
Three types of microstructures were observed on quartzgrain surfaces: (i) precipitation of SiO2 on the surface ofgrains in lace-like patterns; (ii) corrosive etchedmicrostructures, and (iii) overgrowth with quartz crystals.The bedrock Ordovician sandstone forming the ceiling ofthe cave passage above Section 2 contains rounded quartzgrains about quartz grains about 1 mm in diameter. Thegrain surfaces show weak dissolution and precipitation of
SiO2. The studied samples of the bedrock and cave depositsshow monotonous association of stable heavy minerals.Grains of transparent heavy minerals are rounded, while theopaque mineral grains are mostly angular. Beds in the upperportions contain greater amounts of garnet, similar tomodern soil.
4.3. Flowstone datings
Radiometric dating of the flowstone bed by 230Th/234Umethod reveals that the age of three dated samples exceeds350 ka (see also Breitenbach et al. 2005). The flowstoneage is probably higher than 1.2 Ma based on 234U/238U ratio.Based on the paleomagnetic data, it is evident that theflowstone records normal polarity of the Earth magneticfield from the time of the carbonate deposition.
5. DiscussionThe bottom beds of the cave sequences reveal similarlithological, magnetic and heavy metal properties. Basalsand deposited on the bedrock bottom shows a lower MS,similar to the bedrock sandstone exposed in the cave. Theexoscopic quartz grain characteristics are similar, too. Thedeposits filling the bottom part of cave corridors werederived from the local bedrock formed by Early Ordoviciansandstones. The younger cross-bedded and laminated,mostly clayey sands (beds No. 1–7 in Fig. 2) were depositedafter partial erosion of the basal deposits. The depositsreveal slightly higher MS values. The exoscopicobservation shows cemented quartz grain aggregatesindicating the source in the local cross-bedded sandstone.The inner structures of these laminated sediments show afrequent alternation between local aggradation and erosionevents. The sediments were deposited during heavyprecipitation events, when water penetrated into the cavecorridors from the surface through the swallow holes andalong open vertical cracks. The water escape structures
Figure 1. Botovskaya Cave (The Old World) map (adopted from Göbel and Breitenbach 2003) with indication of studied sections anddated flowstone.
Figure 2. Section 1 – SW face1 – clay, sporadic angular clasts of sandstone; 2 – sand; 3 – clay;4 – sandy clay to clayey sand; 5 – clay; 6 – sandy clay; 7 – slightlysandy clay; 8 – sand; 9 – sand, fine-grained; 10 – clayey sand,laminated; 11 – clayey sand; 12 – sand; 13 – clayey sand; 14 –sand with sandy aggregates; 15 – sand; 16 – carbonatecementation along fissures; 17 – bedrock wall; black squares withnumbers – collected samples.
Karst and Caves in Carbonate Rocks, Salt and Gypsum – oral 2013 ICS Proceedings
97
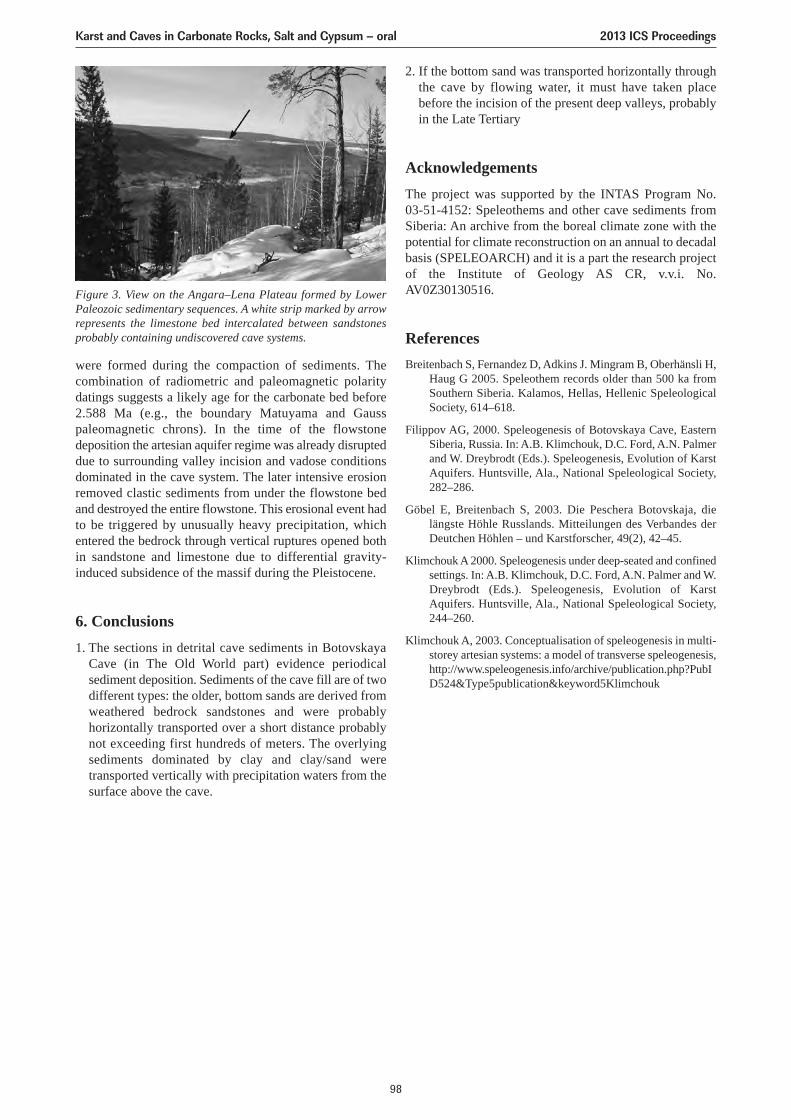
were formed during the compaction of sediments. Thecombination of radiometric and paleomagnetic polaritydatings suggests a likely age for the carbonate bed before2.588 Ma (e.g., the boundary Matuyama and Gausspaleomagnetic chrons). In the time of the flowstonedeposition the artesian aquifer regime was already disrupteddue to surrounding valley incision and vadose conditionsdominated in the cave system. The later intensive erosionremoved clastic sediments from under the flowstone bedand destroyed the entire flowstone. This erosional event hadto be triggered by unusually heavy precipitation, whichentered the bedrock through vertical ruptures opened bothin sandstone and limestone due to differential gravity-induced subsidence of the massif during the Pleistocene.
6. Conclusions1. The sections in detrital cave sediments in Botovskaya
Cave (in The Old World part) evidence periodicalsediment deposition. Sediments of the cave fill are of twodifferent types: the older, bottom sands are derived fromweathered bedrock sandstones and were probablyhorizontally transported over a short distance probablynot exceeding first hundreds of meters. The overlyingsediments dominated by clay and clay/sand weretransported vertically with precipitation waters from thesurface above the cave.
2. If the bottom sand was transported horizontally throughthe cave by flowing water, it must have taken placebefore the incision of the present deep valleys, probablyin the Late Tertiary
AcknowledgementsThe project was supported by the INTAS Program No. 03-51-4152: Speleothems and other cave sediments fromSiberia: An archive from the boreal climate zone with thepotential for climate reconstruction on an annual to decadalbasis (SPELEOARCH) and it is a part the research projectof the Institute of Geology AS CR, v.v.i. No.AV0Z30130516.
ReferencesBreitenbach S, Fernandez D, Adkins J. Mingram B, Oberhänsli H,
Haug G 2005. Speleothem records older than 500 ka fromSouthern Siberia. Kalamos, Hellas, Hellenic SpeleologicalSociety, 614–618.
Filippov AG, 2000. Speleogenesis of Botovskaya Cave, EasternSiberia, Russia. In: A.B. Klimchouk, D.C. Ford, A.N. Palmerand W. Dreybrodt (Eds.). Speleogenesis, Evolution of KarstAquifers. Huntsville, Ala., National Speleological Society,282–286.
Göbel E, Breitenbach S, 2003. Die Peschera Botovskaja, dielängste Höhle Russlands. Mitteilungen des Verbandes derDeutchen Höhlen – und Karstforscher, 49(2), 42–45.
Klimchouk A 2000. Speleogenesis under deep-seated and confinedsettings. In: A.B. Klimchouk, D.C. Ford, A.N. Palmer and W.Dreybrodt (Eds.). Speleogenesis, Evolution of KarstAquifers. Huntsville, Ala., National Speleological Society,244–260.
Klimchouk A, 2003. Conceptualisation of speleogenesis in multi-storey artesian systems: a model of transverse speleogenesis,http://www.speleogenesis.info/archive/publication.php?PubID524&Type5publication&keyword5Klimchouk
Figure 3. View on the Angara–Lena Plateau formed by LowerPaleozoic sedimentary sequences. A white strip marked by arrowrepresents the limestone bed intercalated between sand stonesprobably containing undiscovered cave systems.
Karst and Caves in Carbonate Rocks, Salt and Gypsum – oral 2013 ICS Proceedings
98
CASE STUDIES OF FLUORESCENT GROUNDWATER TRACINGIN RECENT CAVE RESEARCH
Benjamin V. Miller1, Chris Groves1, Jason S. Polk1, Robert N. Lerch2
1Western Kentucky University, Department of Geography and Geology, 1906 College Heights Blvd., Bowling Green,KY 42101, United States, [email protected]
2USDA-Agricultural Research Service, Cropping Systems & Water Quality Research Unit, Agricultural EngineeringBuilding, University of Missouri, Columbia, MO 65211, United States
Groundwater studies have utilized fluorescent dyes in order to map groundwater flow paths and confirm hydrologicconnections amongst karst features. These techniques are now well established so that common dyes and commonmonitoring techniques can be used to apply these methods to a wide range of applications and in a variety of locations.This paper examines four case studies where groundwater tracing with fluorescent dyes to better understanding thehydrologic characterization of cave and karst systems. A five-year project delineated recharge areas for two significantcave systems; Onondaga Cave and Cathedral Cave; which are publicly owned and manage cave systems. Dye tracing wasused to delineate recharge areas for streams located in Carroll Cave, a hydrologically complex and biologically significantcave system in central Missouri. P-Bar Cave, located in the Bighorn Mountains of Wyoming, is a large stream swalletdraining approximately 104 km2 into the main cave entrance. Groundwater tracing techniques were applied at P-Bar Caveto determine resurgences for the stream at springs located 9.6 kilometers down canyon. Crumps Cave, a large cave locatedon the Pennyroyal Sinkhole Plain of south-central Kentucky is a site where epikarstic research on contaminant transportis taking place. Tracing with fluorescent dyes has examined the extreme variances in travel times between flow from thesurface into the epikarstic aquifer and travel from in-cave perennial waterfalls to the resurgence for the cave stream 35 kilometers away. Groundwater tracing continues to be a useful tool in understanding the complex flow systems foundin karst areas and provides useful information for both researchers and agency land managers.
1. Common groundwater tracing methodsFluorescent dyes have been used in groundwater tracing todelineate groundwater basins and to compliment hydrologicresearch in cave and karst regions. In conductinggroundwater tracing in a karst area one of the initial tasksis to identify all recharge and discharge features during aKarst Hydrologic Inventory (KHI). This KHI helps toidentify potential monitoring locations, at features drainingthe aquifer or in local surface streams, and potential dyeinjection locations, at features recharging the aquifer(Crawford Hydrology Lab 2010).
Once discharge features are identified, a monitoring methodis chosen depending on given objectives for the trace.Charcoal receptors are the most common method formonitoring groundwater features and consist of a meshpacket containing 3–5 grams of crushed coconut charcoal(Crawford Hydrology Lab, 2010). These are attached towire or nylon string and are placed directly in the flow ofdischarge features. Regular changing of these receptors atgiven time intervals aids in determining travel frominjection location to recovery site. Grab samples can alsobe collected in glass vials for analysis of currentconcentrations of dye. Autosamplers can be used for thecollection of these grab samples at specific time intervalsand when combined with discharge data quantitative tracingcan be used to examine the amount of dye recovered versusthe amount of dye injected. Technological advances havealso made portable field fluorometers, which can analyzeconcentrations of specific dyes and record this data to amemory device for later download (Meus et al. 2006).
Tracers used in groundwater tracing commonly use fivecommon dyes; fluorescein, eosine oj, rhodamine wt,
sulphorhodamine b, and tinopal ob (Aley and Fletcher1976; Jones 1984). Picking a specific dye for trace must bedetermined by background levels in a study area and thetype of features tracers are injected into. Injection methodsalso vary depending on the hydrologic conditions presentat a given location. Dry streambeds or sinkholes mayrequire the use of a dry-set where powdered dye is placedinside of a PVC pipe and then staked to the base of a streamchannel to await injection of the tracer following a stormevent. If road access is available fire tanker trucks may alsobe used to create a temporary stream into which dye can beinjected. Finally if flowing streams are located at aninjection site then the dye can be directly poured into thestream for an injection. However, in all cases extreme caremust be taken to prevent any contamination of dyesamongst injection locations and specifically amongstmonitoring sites.
Several examples of case studies from groundwater tracesin various locations in the continental United States (Fig. 1) are presented below. Each of these examplesutilized groundwater tracing to achieve different objectivesand used different methods.
2. Case Studies of Groundwater Tracing inCave Studies2.1. Onondaga Cave and Cathedral Cave, Missouri,USA
Onondaga Cave and Cathedral Cave are two large cavesystems located in central Missouri in the Ozarks ecoregion.Both caves are preserved by the Missouri Division of StateParks and are the centerpieces of Onondaga Cave State Park
Karst and Caves in Carbonate Rocks, Salt and Gypsum – oral 2013 ICS Proceedings
99
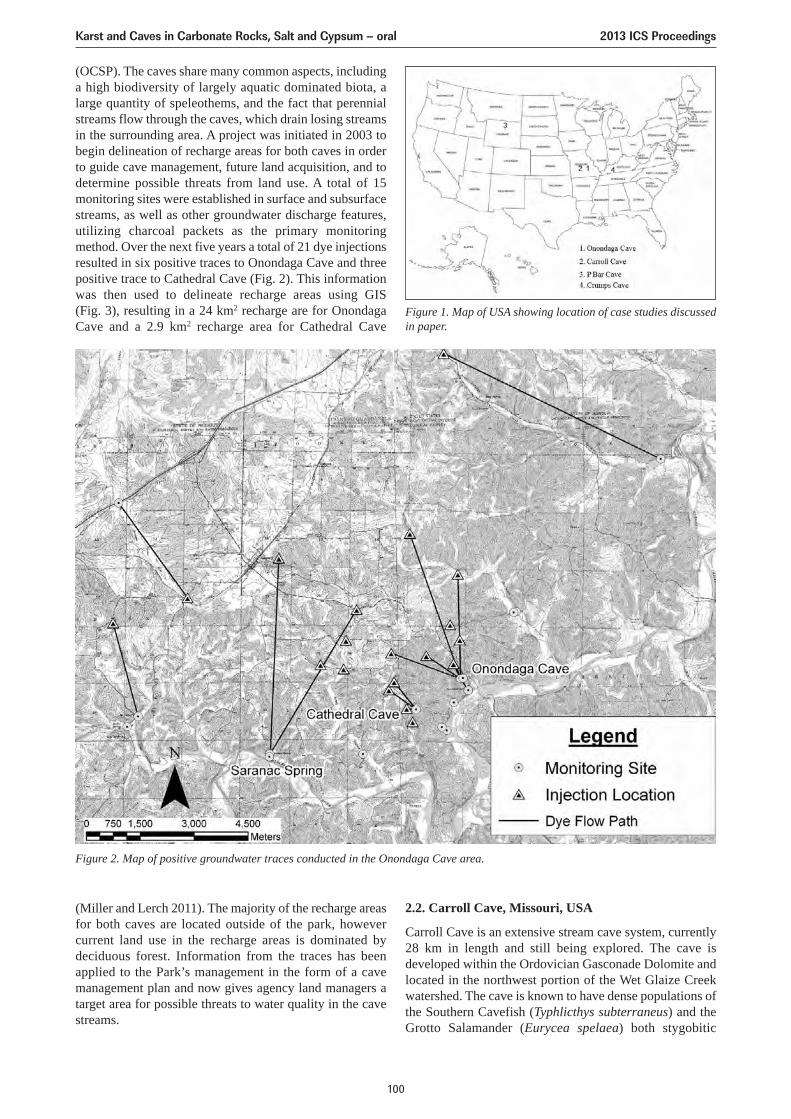
2.2. Carroll Cave, Missouri, USA
Carroll Cave is an extensive stream cave system, currently28 km in length and still being explored. The cave isdeveloped within the Ordovician Gasconade Dolomite andlocated in the northwest portion of the Wet Glaize Creekwatershed. The cave is known to have dense populations ofthe Southern Cavefish (Typhlicthys subterraneus) and theGrotto Salamander (Eurycea spelaea) both stygobitic
(OCSP). The caves share many common aspects, includinga high biodiversity of largely aquatic dominated biota, alarge quantity of speleothems, and the fact that perennialstreams flow through the caves, which drain losing streamsin the surrounding area. A project was initiated in 2003 tobegin delineation of recharge areas for both caves in orderto guide cave management, future land acquisition, and todetermine possible threats from land use. A total of 15monitoring sites were established in surface and subsurfacestreams, as well as other groundwater discharge features,utilizing charcoal packets as the primary monitoringmethod. Over the next five years a total of 21 dye injectionsresulted in six positive traces to Onondaga Cave and threepositive trace to Cathedral Cave (Fig. 2). This informationwas then used to delineate recharge areas using GIS (Fig. 3), resulting in a 24 km2 recharge are for OnondagaCave and a 2.9 km2 recharge area for Cathedral Cave
(Miller and Lerch 2011). The majority of the recharge areasfor both caves are located outside of the park, howevercurrent land use in the recharge areas is dominated bydeciduous forest. Information from the traces has beenapplied to the Park’s management in the form of a cavemanagement plan and now gives agency land managers atarget area for possible threats to water quality in the cavestreams.
Figure 1. Map of USA showing location of case studies discussedin paper.
Figure 2. Map of positive groundwater traces conducted in the Onondaga Cave area.
Karst and Caves in Carbonate Rocks, Salt and Gypsum – oral 2013 ICS Proceedings
100
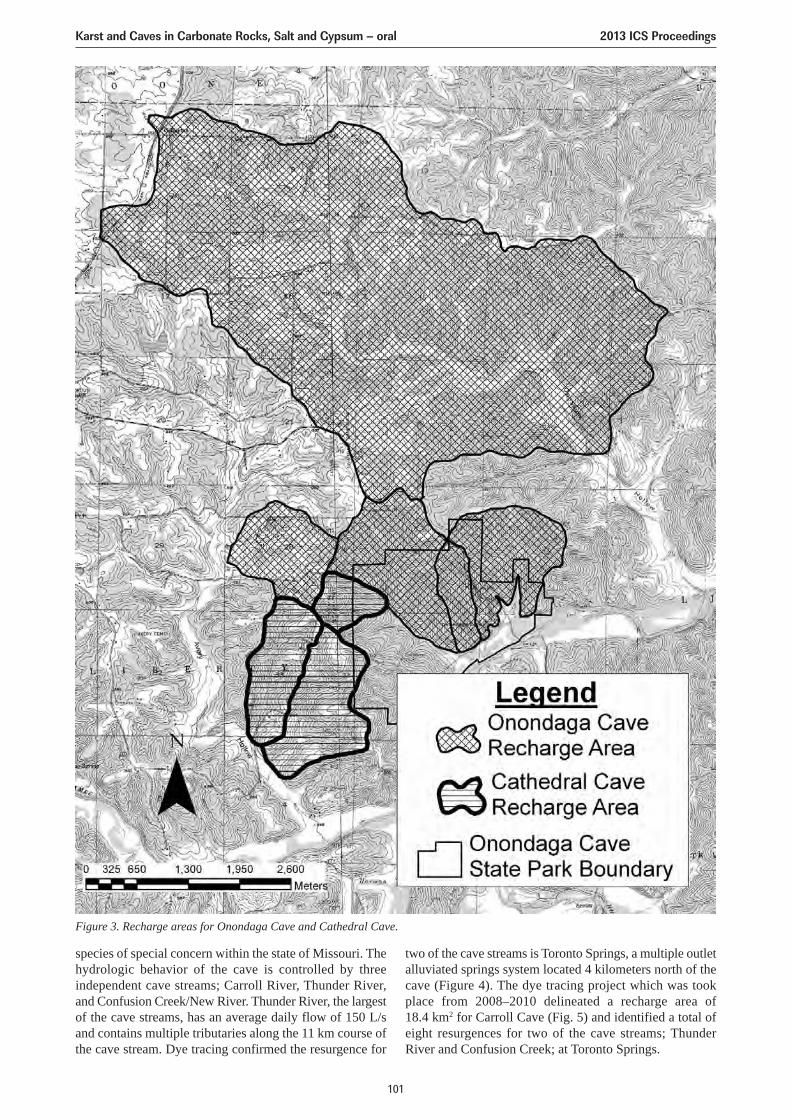
species of special concern within the state of Missouri. Thehydrologic behavior of the cave is controlled by threeindependent cave streams; Carroll River, Thunder River,and Confusion Creek/New River. Thunder River, the largestof the cave streams, has an average daily flow of 150 L/sand contains multiple tributaries along the 11 km course ofthe cave stream. Dye tracing confirmed the resurgence for
two of the cave streams is Toronto Springs, a multiple outletalluviated springs system located 4 kilometers north of thecave (Figure 4). The dye tracing project which was tookplace from 2008–2010 delineated a recharge area of 18.4 km2 for Carroll Cave (Fig. 5) and identified a total ofeight resurgences for two of the cave streams; ThunderRiver and Confusion Creek; at Toronto Springs.
Figure 3. Recharge areas for Onondaga Cave and Cathedral Cave.
Karst and Caves in Carbonate Rocks, Salt and Gypsum – oral 2013 ICS Proceedings
101
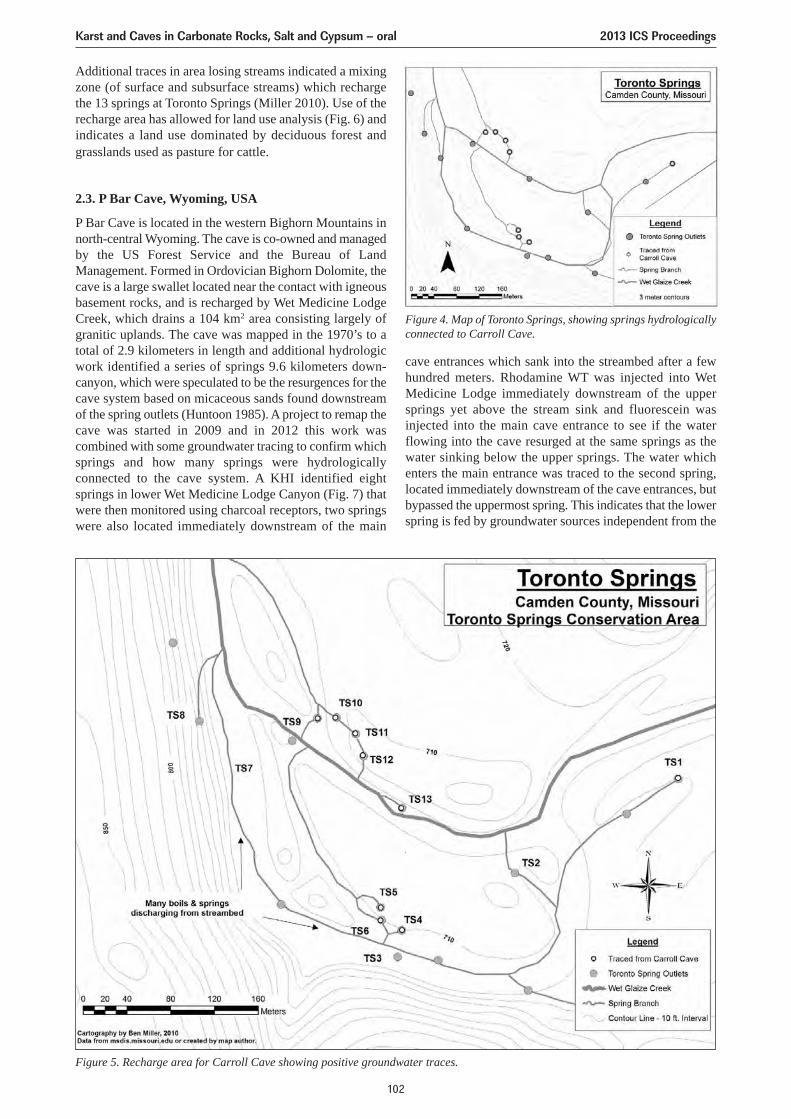
Additional traces in area losing streams indicated a mixingzone (of surface and subsurface streams) which rechargethe 13 springs at Toronto Springs (Miller 2010). Use of therecharge area has allowed for land use analysis (Fig. 6) andindicates a land use dominated by deciduous forest andgrasslands used as pasture for cattle.
2.3. P Bar Cave, Wyoming, USA
P Bar Cave is located in the western Bighorn Mountains innorth-central Wyoming. The cave is co-owned and managedby the US Forest Service and the Bureau of LandManagement. Formed in Ordovician Bighorn Dolomite, thecave is a large swallet located near the contact with igneousbasement rocks, and is recharged by Wet Medicine LodgeCreek, which drains a 104 km2 area consisting largely ofgranitic uplands. The cave was mapped in the 1970’s to atotal of 2.9 kilometers in length and additional hydrologicwork identified a series of springs 9.6 kilometers down-canyon, which were speculated to be the resurgences for thecave system based on micaceous sands found downstreamof the spring outlets (Huntoon 1985). A project to remap thecave was started in 2009 and in 2012 this work wascombined with some groundwater tracing to confirm whichsprings and how many springs were hydrologicallyconnected to the cave system. A KHI identified eightsprings in lower Wet Medicine Lodge Canyon (Fig. 7) thatwere then monitored using charcoal receptors, two springswere also located immediately downstream of the main
cave entrances which sank into the streambed after a fewhundred meters. Rhodamine WT was injected into WetMedicine Lodge immediately downstream of the uppersprings yet above the stream sink and fluorescein wasinjected into the main cave entrance to see if the waterflowing into the cave resurged at the same springs as thewater sinking below the upper springs. The water whichenters the main entrance was traced to the second spring,located immediately downstream of the cave entrances, butbypassed the uppermost spring. This indicates that the lowerspring is fed by groundwater sources independent from the
Figure 5. Recharge area for Carroll Cave showing positive groundwater traces.
Figure 4. Map of Toronto Springs, showing springs hydrologicallyconnected to Carroll Cave.
Karst and Caves in Carbonate Rocks, Salt and Gypsum – oral 2013 ICS Proceedings
102
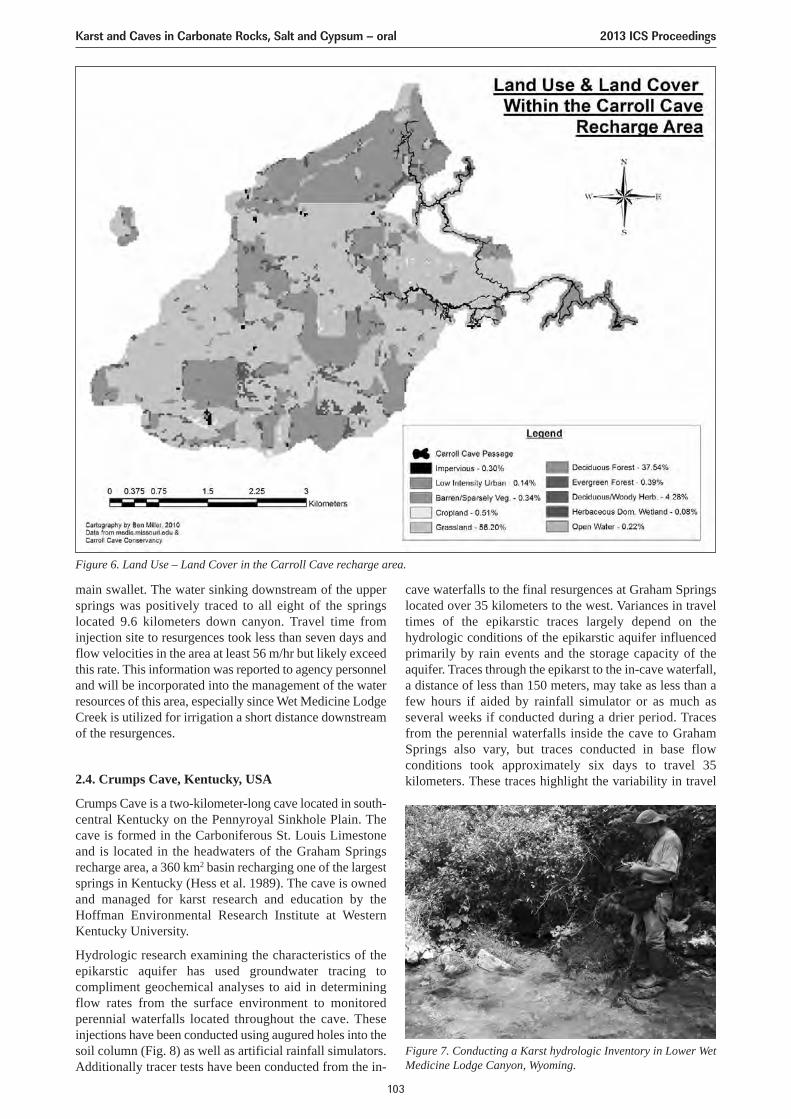
cave waterfalls to the final resurgences at Graham Springslocated over 35 kilometers to the west. Variances in traveltimes of the epikarstic traces largely depend on thehydrologic conditions of the epikarstic aquifer influencedprimarily by rain events and the storage capacity of theaquifer. Traces through the epikarst to the in-cave waterfall,a distance of less than 150 meters, may take as less than afew hours if aided by rainfall simulator or as much asseveral weeks if conducted during a drier period. Tracesfrom the perennial waterfalls inside the cave to GrahamSprings also vary, but traces conducted in base flowconditions took approximately six days to travel 35kilometers. These traces highlight the variability in travel
main swallet. The water sinking downstream of the uppersprings was positively traced to all eight of the springslocated 9.6 kilometers down canyon. Travel time frominjection site to resurgences took less than seven days andflow velocities in the area at least 56 m/hr but likely exceedthis rate. This information was reported to agency personneland will be incorporated into the management of the waterresources of this area, especially since Wet Medicine LodgeCreek is utilized for irrigation a short distance downstreamof the resurgences.
2.4. Crumps Cave, Kentucky, USA
Crumps Cave is a two-kilometer-long cave located in south-central Kentucky on the Pennyroyal Sinkhole Plain. Thecave is formed in the Carboniferous St. Louis Limestoneand is located in the headwaters of the Graham Springsrecharge area, a 360 km2 basin recharging one of the largestsprings in Kentucky (Hess et al. 1989). The cave is ownedand managed for karst research and education by theHoffman Environmental Research Institute at WesternKentucky University.
Hydrologic research examining the characteristics of theepikarstic aquifer has used groundwater tracing tocompliment geochemical analyses to aid in determiningflow rates from the surface environment to monitoredperennial waterfalls located throughout the cave. Theseinjections have been conducted using augured holes into thesoil column (Fig. 8) as well as artificial rainfall simulators.Additionally tracer tests have been conducted from the in-
Figure 6. Land Use – Land Cover in the Carroll Cave recharge area.
Figure 7. Conducting a Karst hydrologic Inventory in Lower WetMedicine Lodge Canyon, Wyoming.
Karst and Caves in Carbonate Rocks, Salt and Gypsum – oral 2013 ICS Proceedings
103
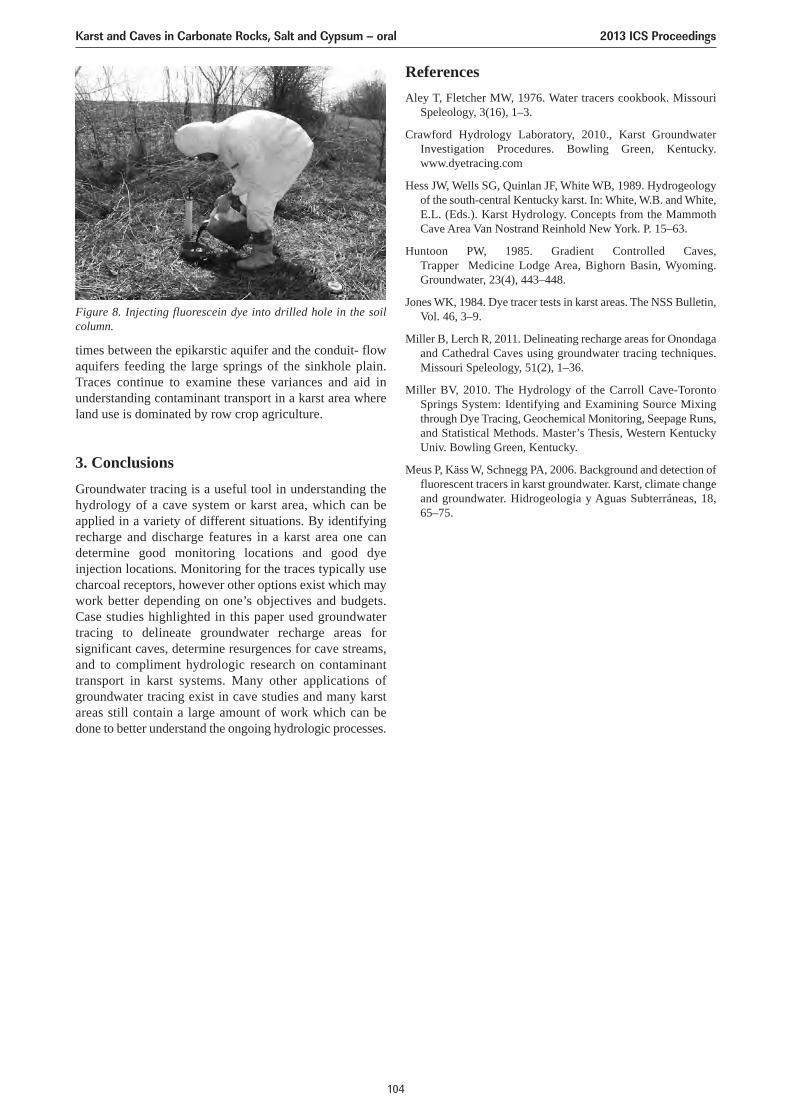
times between the epikarstic aquifer and the conduit- flowaquifers feeding the large springs of the sinkhole plain.Traces continue to examine these variances and aid inunderstanding contaminant transport in a karst area whereland use is dominated by row crop agriculture.
3. ConclusionsGroundwater tracing is a useful tool in understanding thehydrology of a cave system or karst area, which can beapplied in a variety of different situations. By identifyingrecharge and discharge features in a karst area one candetermine good monitoring locations and good dyeinjection locations. Monitoring for the traces typically usecharcoal receptors, however other options exist which maywork better depending on one’s objectives and budgets.Case studies highlighted in this paper used groundwatertracing to delineate groundwater recharge areas forsignificant caves, determine resurgences for cave streams,and to compliment hydrologic research on contaminanttransport in karst systems. Many other applications ofgroundwater tracing exist in cave studies and many karstareas still contain a large amount of work which can bedone to better understand the ongoing hydrologic processes.
ReferencesAley T, Fletcher MW, 1976. Water tracers cookbook. Missouri
Speleology, 3(16), 1–3.
Crawford Hydrology Laboratory, 2010., Karst GroundwaterInvestigation Procedures. Bowling Green, Kentucky.www.dyetracing.com
Hess JW, Wells SG, Quinlan JF, White WB, 1989. Hydrogeologyof the south-central Kentucky karst. In: White, W.B. and White,E.L. (Eds.). Karst Hydrology. Concepts from the MammothCave Area Van Nostrand Reinhold New York. P. 15–63.
Huntoon PW, 1985. Gradient Controlled Caves,Trapper�Medicine Lodge Area, Bighorn Basin, Wyoming.Groundwater, 23(4), 443–448.
Jones WK, 1984. Dye tracer tests in karst areas. The NSS Bulletin,Vol. 46, 3–9.
Miller B, Lerch R, 2011. Delineating recharge areas for Onondagaand Cathedral Caves using groundwater tracing techniques.Missouri Speleology, 51(2), 1–36.
Miller BV, 2010. The Hydrology of the Carroll Cave-TorontoSprings System: Identifying and Examining Source Mixingthrough Dye Tracing, Geochemical Monitoring, Seepage Runs,and Statistical Methods. Master’s Thesis, Western KentuckyUniv. Bowling Green, Kentucky.
Meus P, Käss W, Schnegg PA, 2006. Background and detection offluorescent tracers in karst groundwater. Karst, climate changeand groundwater. Hidrogeologia y Aguas Subterráneas, 18, 65–75.
Figure 8. Injecting fluorescein dye into drilled hole in the soilcolumn.
Karst and Caves in Carbonate Rocks, Salt and Gypsum – oral 2013 ICS Proceedings
104
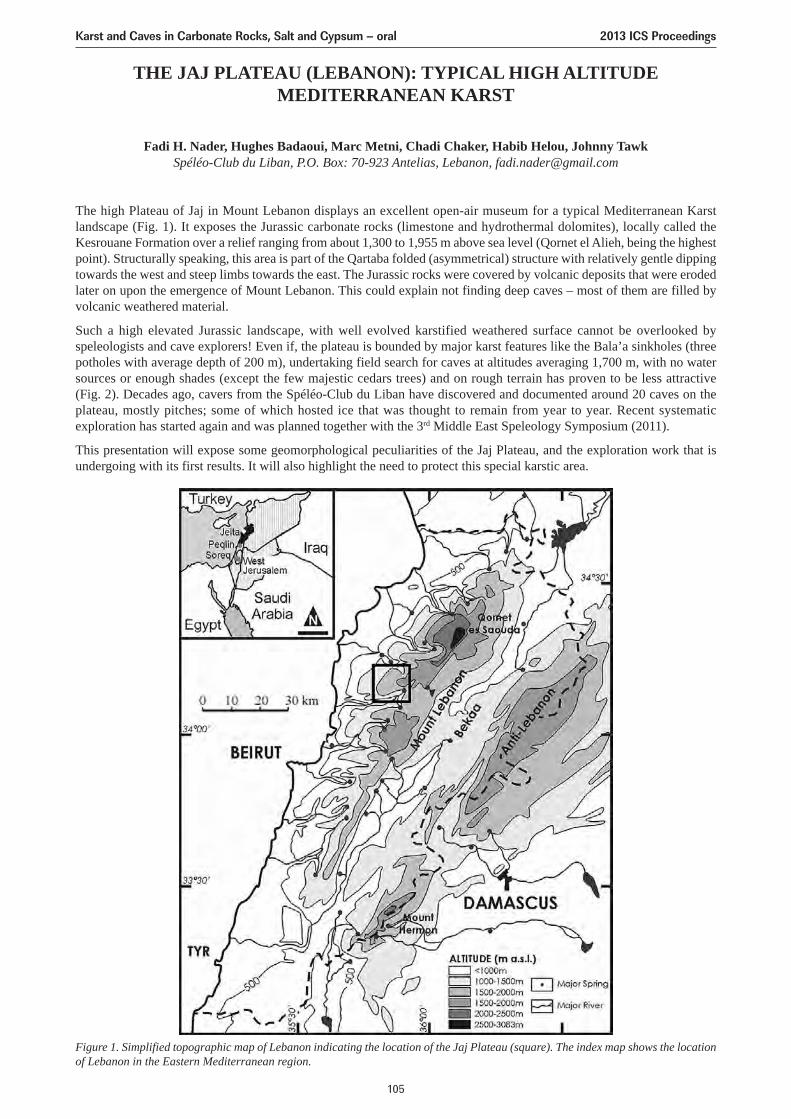
THE JAJ PLATEAU (LEBANON): TYPICAL HIGH ALTITUDEMEDITERRANEAN KARST
Fadi H. Nader, Hughes Badaoui, Marc Metni, Chadi Chaker, Habib Helou, Johnny TawkSpéléo-Club du Liban, P.O. Box: 70-923 Antelias, Lebanon, [email protected]
The high Plateau of Jaj in Mount Lebanon displays an excellent open-air museum for a typical Mediterranean Karstlandscape (Fig. 1). It exposes the Jurassic carbonate rocks (limestone and hydrothermal dolomites), locally called theKesrouane Formation over a relief ranging from about 1,300 to 1,955 m above sea level (Qornet el Alieh, being the highestpoint). Structurally speaking, this area is part of the Qartaba folded (asymmetrical) structure with relatively gentle dippingtowards the west and steep limbs towards the east. The Jurassic rocks were covered by volcanic deposits that were erodedlater on upon the emergence of Mount Lebanon. This could explain not finding deep caves – most of them are filled byvolcanic weathered material.
Such a high elevated Jurassic landscape, with well evolved karstified weathered surface cannot be overlooked byspeleologists and cave explorers! Even if, the plateau is bounded by major karst features like the Bala’a sinkholes (threepotholes with average depth of 200 m), undertaking field search for caves at altitudes averaging 1,700 m, with no watersources or enough shades (except the few majestic cedars trees) and on rough terrain has proven to be less attractive (Fig. 2). Decades ago, cavers from the Spéléo-Club du Liban have discovered and documented around 20 caves on theplateau, mostly pitches; some of which hosted ice that was thought to remain from year to year. Recent systematicexploration has started again and was planned together with the 3rd Middle East Speleology Symposium (2011).
This presentation will expose some geomorphological peculiarities of the Jaj Plateau, and the exploration work that isundergoing with its first results. It will also highlight the need to protect this special karstic area.
Figure 1. Simplified topographic map of Lebanon indicating the location of the Jaj Plateau (square). The index map shows the locationof Lebanon in the Eastern Mediterranean region.
Karst and Caves in Carbonate Rocks, Salt and Gypsum – oral 2013 ICS Proceedings
105
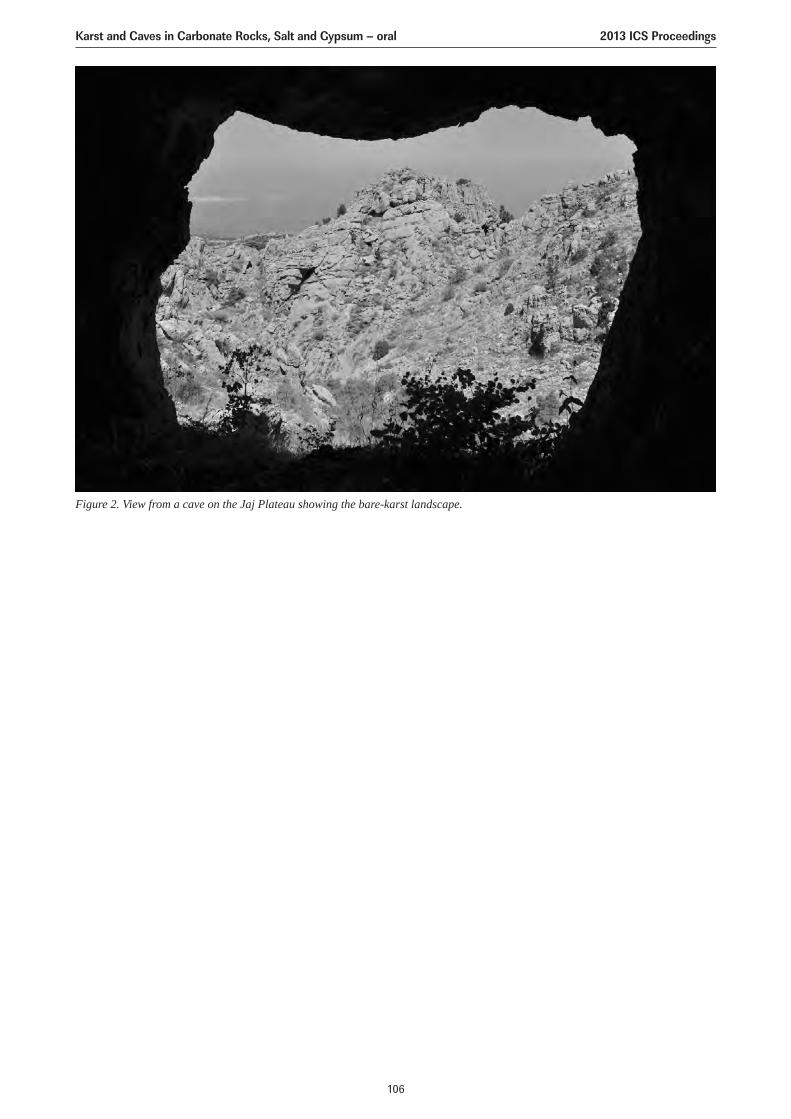
Figure 2. View from a cave on the Jaj Plateau showing the bare-karst landscape.
Karst and Caves in Carbonate Rocks, Salt and Gypsum – oral 2013 ICS Proceedings
106
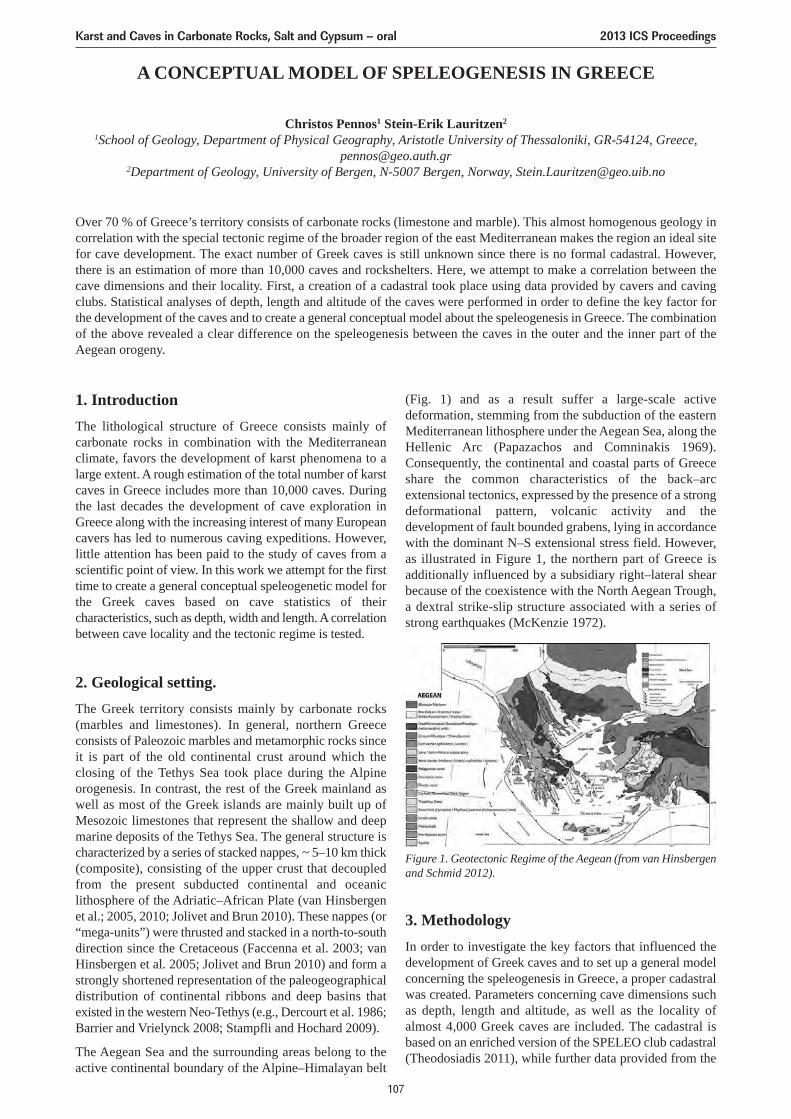
A CONCEPTUAL MODEL OF SPELEOGENESIS IN GREECE
Christos Pennos1 Stein-Erik Lauritzen2
1School of Geology, Department of Physical Geography, Aristotle University of Thessaloniki, GR-54124, Greece,[email protected]
2Department of Geology, University of Bergen, N-5007 Bergen, Norway, [email protected]
Over 70 % of Greece’s territory consists of carbonate rocks (limestone and marble). This almost homogenous geology incorrelation with the special tectonic regime of the broader region of the east Mediterranean makes the region an ideal sitefor cave development. The exact number of Greek caves is still unknown since there is no formal cadastral. However,there is an estimation of more than 10,000 caves and rockshelters. Here, we attempt to make a correlation between thecave dimensions and their locality. First, a creation of a cadastral took place using data provided by cavers and cavingclubs. Statistical analyses of depth, length and altitude of the caves were performed in order to define the key factor forthe development of the caves and to create a general conceptual model about the speleogenesis in Greece. The combinationof the above revealed a clear difference on the speleogenesis between the caves in the outer and the inner part of theAegean orogeny.
1. IntroductionThe lithological structure of Greece consists mainly ofcarbonate rocks in combination with the Mediterraneanclimate, favors the development of karst phenomena to alarge extent. A rough estimation of the total number of karstcaves in Greece includes more than 10,000 caves. Duringthe last decades the development of cave exploration inGreece along with the increasing interest of many Europeancavers has led to numerous caving expeditions. However,little attention has been paid to the study of caves from ascientific point of view. In this work we attempt for the firsttime to create a general conceptual speleogenetic model forthe Greek caves based on cave statistics of theircharacteristics, such as depth, width and length. A correlationbetween cave locality and the tectonic regime is tested.
2. Geological setting.The Greek territory consists mainly by carbonate rocks(marbles and limestones). In general, northern Greececonsists of Paleozoic marbles and metamorphic rocks sinceit is part of the old continental crust around which theclosing of the Tethys Sea took place during the Alpineorogenesis. In contrast, the rest of the Greek mainland aswell as most of the Greek islands are mainly built up ofMesozoic limestones that represent the shallow and deepmarine deposits of the Tethys Sea. The general structure ischaracterized by a series of stacked nappes, ~ 5–10 km thick(composite), consisting of the upper crust that decoupledfrom the present subducted continental and oceaniclithosphere of the Adriatic–African Plate (van Hinsbergenet al.; 2005, 2010; Jolivet and Brun 2010). These nappes (or“mega-units”) were thrusted and stacked in a north-to-southdirection since the Cretaceous (Faccenna et al. 2003; vanHinsbergen et al. 2005; Jolivet and Brun 2010) and form astrongly shortened representation of the paleogeographicaldistribution of continental ribbons and deep basins thatexisted in the western Neo-Tethys (e.g., Dercourt et al. 1986;Barrier and Vrielynck 2008; Stampfli and Hochard 2009).
The Aegean Sea and the surrounding areas belong to theactive continental boundary of the Alpine–Himalayan belt
(Fig. 1) and as a result suffer a large-scale activedeformation, stemming from the subduction of the easternMediterranean lithosphere under the Aegean Sea, along theHellenic Arc (Papazachos and Comninakis 1969).Consequently, the continental and coastal parts of Greeceshare the common characteristics of the back–arcextensional tectonics, expressed by the presence of a strongdeformational pattern, volcanic activity and thedevelopment of fault bounded grabens, lying in accordancewith the dominant N–S extensional stress field. However,as illustrated in Figure 1, the northern part of Greece isadditionally influenced by a subsidiary right–lateral shearbecause of the coexistence with the North Aegean Trough,a dextral strike-slip structure associated with a series ofstrong earthquakes (McKenzie 1972).
Karst and Caves in Carbonate Rocks, Salt and Gypsum – oral 2013 ICS Proceedings
107
3. MethodologyIn order to investigate the key factors that influenced thedevelopment of Greek caves and to set up a general modelconcerning the speleogenesis in Greece, a proper cadastralwas created. Parameters concerning cave dimensions suchas depth, length and altitude, as well as the locality ofalmost 4,000 Greek caves are included. The cadastral isbased on an enriched version of the SPELEO club cadastral(Theodosiadis 2011), while further data provided from the
Figure 1. Geotectonic Regime of the Aegean (from van Hinsbergenand Schmid 2012).
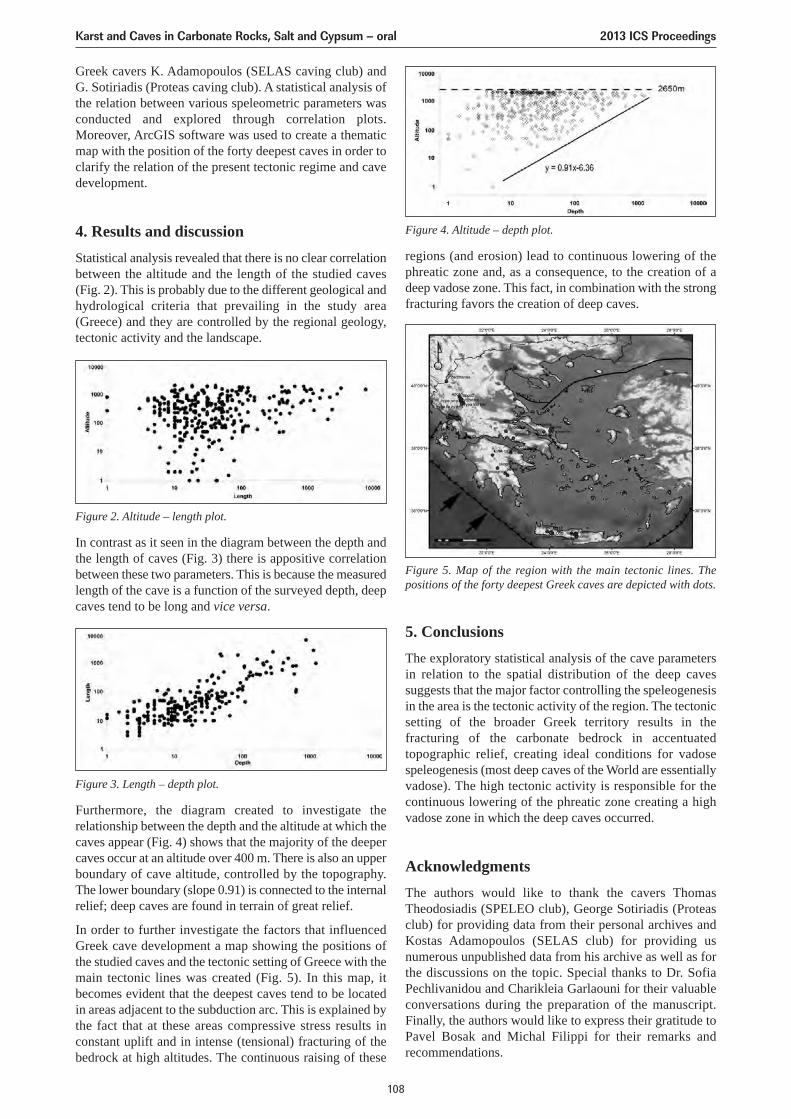
In contrast as it seen in the diagram between the depth andthe length of caves (Fig. 3) there is appositive correlationbetween these two parameters. This is because the measuredlength of the cave is a function of the surveyed depth, deepcaves tend to be long and vice versa.
Furthermore, the diagram created to investigate therelationship between the depth and the altitude at which thecaves appear (Fig. 4) shows that the majority of the deepercaves occur at an altitude over 400 m. There is also an upperboundary of cave altitude, controlled by the topography.The lower boundary (slope 0.91) is connected to the internalrelief; deep caves are found in terrain of great relief.
In order to further investigate the factors that influencedGreek cave development a map showing the positions ofthe studied caves and the tectonic setting of Greece with themain tectonic lines was created (Fig. 5). In this map, itbecomes evident that the deepest caves tend to be locatedin areas adjacent to the subduction arc. This is explained bythe fact that at these areas compressive stress results inconstant uplift and in intense (tensional) fracturing of thebedrock at high altitudes. The continuous raising of these
Greek cavers K. Adamopoulos (SELAS caving club) andG. Sotiriadis (Proteas caving club). A statistical analysis ofthe relation between various speleometric parameters wasconducted and explored through correlation plots.Moreover, ArcGIS software was used to create a thematicmap with the position of the forty deepest caves in order toclarify the relation of the present tectonic regime and cavedevelopment.
4. Results and discussionStatistical analysis revealed that there is no clear correlationbetween the altitude and the length of the studied caves(Fig. 2). This is probably due to the different geological andhydrological criteria that prevailing in the study area(Greece) and they are controlled by the regional geology,tectonic activity and the landscape.
regions (and erosion) lead to continuous lowering of thephreatic zone and, as a consequence, to the creation of adeep vadose zone. This fact, in combination with the strongfracturing favors the creation of deep caves.
5. ConclusionsThe exploratory statistical analysis of the cave parametersin relation to the spatial distribution of the deep cavessuggests that the major factor controlling the speleogenesisin the area is the tectonic activity of the region. The tectonicsetting of the broader Greek territory results in thefracturing of the carbonate bedrock in accentuatedtopographic relief, creating ideal conditions for vadosespeleogenesis (most deep caves of the World are essentiallyvadose). The high tectonic activity is responsible for thecontinuous lowering of the phreatic zone creating a highvadose zone in which the deep caves occurred.
AcknowledgmentsThe authors would like to thank the cavers ThomasTheodosiadis (SPELEO club), George Sotiriadis (Proteasclub) for providing data from their personal archives andKostas Adamopoulos (SELAS club) for providing usnumerous unpublished data from his archive as well as forthe discussions on the topic. Special thanks to Dr. SofiaPechlivanidou and Charikleia Garlaouni for their valuableconversations during the preparation of the manuscript.Finally, the authors would like to express their gratitude toPavel Bosak and Michal Filippi for their remarks andrecommendations.
Figure 2. Altitude – length plot.
Figure 3. Length – depth plot.
Figure 4. Altitude – depth plot.
Figure 5. Map of the region with the main tectonic lines. Thepositions of the forty deepest Greek caves are depicted with dots.
Karst and Caves in Carbonate Rocks, Salt and Gypsum – oral 2013 ICS Proceedings
108
ReferencesAdamopoulos K, 2005. The deepest and the longest caves in Greece,
Proceedings of 14th International Congress of Speleology, 21–28August, 2005, Athens, Kalamos, Greece.
Adamopoulos K, 2011. Lefka Ori, The biggest Greek caves in Creteisland (in Greek). Proceedings of the 14th Panhellenic speleologicalmeeting, Chania, Crete.
Barrier E, Vrielynck B, 2008. MEBE Atlas of Paleotectonic maps ofthe Middle East, Commission for the Geological Map of theWorld.
Dercourt J, Zonenshain LP, Ricou L-E, Kazmin VG, Le Pichon X,Knipper AL, Grandjacquet C, Sbortshikov IM, Geyssant J,Lepvrier C, Pechersky DH, Boulin J, Sibuet J-C, Savostin LA,Sorokhtin O, Westphal M, Bazhenov ML, Lauer JP, Biju-DuvalB, 1986. Geological evolution of the tethys belt from the atlanticto the pamirs since the LIAS, Tectonophysics, Volume 123, Issues1–4, Pages 241–315, ISSN 0040-1951, 10.1016/0040-1951(86)90199-X.
Faccenna C, Jolivet L, PiromalloC, Morelli A, 2003. Subduction andthe depth of convection of the Mediterranean mantle, Journal ofGeophysical Research, 108(B2), 2099.
Jolivet L, Brun J-P, 2010. Cenozoic geodynamic evolution of theAegean, International Journal of Earth Sciences, 99, 109–138.
McKenzie D, 1972. Active Tectonics of the Mediterranean Region.Geophysical Journal of the Royal Astronomical Society, 30: 109–185. doi: 10.1111/j.1365-246X.1972.tb02351.x.
Papazachos B, Comninakis P, 1970. Geophysical features of theGreek island arc and eastern Mediterranean ridge, Com. Ren. DesSceances de la Conference Reunie a Madrid, 1969, Vol. 16, 74–75.
Stampfli G, Hochard MC, 2009. Plate tectonics of the Alpine realm,in Ancient orogens and modern analogues. Geological Society,London, Special Publications, edited by J. B. Murphy, et al., 89–111.
Theodosiadis T, 2011. SPELEO cave cadastral, SPELEO club,Athens, Greece. http://arxeio.speleo.gr
van Hinsbergen, DJJ, Hafkenscheid E, Spakman W, MeulenkampJE, Wortel MJR, 2005. Nappe stacking resulting from subductionof oceanic and continental lithosphere below Greece, Geology,33(4), 325–328.
van Hinsbergen, DJJ, Kaymakci N, Spakman W, Torsvik TH, 2010.Reconciling the geological history of western Turkey with platecircuits and mantle tomography, Earth and Planetary ScienceLetters, 297, 674–686.
van Hinsbergen, DJJ, Schmid SM, 2012. Map view restoration ofAegean–West Anatolian accretion and extension since theEocene, Tectonics, 31, TC5005, doi:10.1029/2012TC003132.
Karst and Caves in Carbonate Rocks, Salt and Gypsum – oral 2013 ICS Proceedings
109
COMPLEX EPIKARST HYDROLOGEOLOGY AND CONTAMINANTTRANSPORT IN A SOUTH-CENTRAL KENTUCKY KARST LANDSCAPE
Jason S. Polk1, Sean Vanderhoff1, Chris Groves1, Benjamin Miller1, and Carl Bolster2
1Hoffman Environmental Research Institute, Western Kentucky University, Bowling Green, KY 42101 United States,[email protected]
2USDA-Agricultural Research Service, Bowling Green, KY, 42101 United States
The movement of autogenic recharge through the shallow epikarstic zone in soil-mantled karst aquifers is important inunderstanding recharge areas and rates, storage, and contaminant transport processes. The groundwater in agriculturalkarst areas, such as Kentucky’s Pennyroyal Plateau, which is characterized by shallow epikarst and deeper conduits flow,is susceptible to contamination from organic soil amendments and pesticides. To understand the storage and flow ofautogenic recharge and its effects on contaminant transport on water flowing to a single epikarst drain in Crump’s Caveon Kentucky’s Mississippian Plateau, we employed several techniques to characterize the nature and hydrogeology of thesystem. During 2010–2012, water samples and geochemical data were collected every four hours before, during, andbetween storm events from a waterfall in Crumps Cave to track the transport and residence time of epikarst water andorganic soil amendments during variable flow conditions. Geochemical data consisting of pH, specific conductivity,temperature, and discharge were collected continuously at 10-minute intervals, along with rainfall amounts. In addition,stable isotope data from rainfall, soil water, and epikarst water were collected weekly and during storm events to examinestorage and recharge behavior of the system. The changes in geochemistry indicate simultaneous storage and transport ofmeteoric water through epikarst pathways into the cave, with rapid transport of bacteria occurring through the conduitsthat bypass storage. The isotopic data indicate that recharge is rapidly homogenized in the epikarst, with storage varyingthroughout the year based on meteorological conditions. Results indicate current best management practices in agriculturalkarst areas need to be revisited to incorporate areas that do not have surface runoff, but where contaminants are transportedby seepage into local aquifers.
1. IntroductionKentucky’s subtropical climate and fertile soil provideextensive agricultural lands for row crops. A commonagricultural practice in the area is to apply animal waste asan organic soil amendment for soil nutrient enhancement.If these amendments are not completely exhausted throughcrop utilization, they can become pollutants and enter thegroundwater system. In Kentucky, 55% of the land area ischaracterized by highly soluble carbonate rocks withinwhich karst landscapes form (Currens 2002). The resultingkarst landscape/aquifer systems, typically with highpermeability, are characterized by the development offeatures such as sinkholes, caves, and large springs.Because much of the recharge entering these systems movesrapidly under turbulent flow, and in many cases as sinkingstreams with little physical filtration, groundwater in thesekarst aquifers is often highly susceptible to contaminationfrom agricultural practices, among other sources ofpollution (White 1988; Drew and Holtzl 1999).
This research was designed to better understand the fate andtransport of agricultural contaminants in the well-developedkarst aquifer/landscape systems of south-central Kentuckyby conducting field experiments associated with actualfield-scale agriculture at the Crumps Cave EducationalPreserve, and aimed to answer the following researchquestions: (1) if aquifer recharge influences manuretransport at this representative site, is there significantretardation of flow and storage of water and/or fecalbacteria in the soil/epikarst zone before it enters the mainpart of the aquifer?; and, if so 2) what is the timing of flowthrough this shallow part of the epikarst flow system?; 3)how does that effect the introduction of fecal bacteria into
the main part of the aquifer?; and 4) where is the primarystorage for contaminants and bacteria in the soil-epikarstsetting?
2. Study AreaCrumps Cave is located beneath a portion of the extensivesinkhole plain of the Pennyroyal Plateau within theMississippian Plateaus Section of the Interior Low PlateausPhysiographic Province in Waren County, KY, USA (Figure 1) (Groves et al. 2005). There is about two km ofhorizontal cave passages beneath several agricultural fields,with the cave floor averaging 25 m below the surface. Therecharge area lays within the Graham Springs groundwaterbasin (Ray and Currens 1998, 2000) which discharges atWilkins Bluehole on the Barren River, 18 km southwest. Itis the second largest spring in Kentucky (Ray and Blair2005). The site is underlain by Crider silt loam, Pembrokesilt loam and Baxter gravelly silt loam soils (Soil SurveyStaff NRCS 2011). These soils are moderately permeable,well-drained soils, reddish in color with chert fragments intheir lower portions. The thickness of the soils variesthroughout the study area. Auger hole tests show thethickness before encountering chert fragments ranges from0.3–4 meters.
The entrance to Crumps Cave is a collapse sinkhole that haspartially collapsed. The cave passages have formed withinthe highest part of the Mississippian-aged St. Louislimestone, with a local dip of 1–2° to the west (Richards1964). The bedded Lost River Chert lies between theground surface and the cave below, and locally appears tooperate as a leaky perching layer. Water tends to reach the
Karst and Caves in Carbonate Rocks, Salt and Gypsum – oral 2013 ICS Proceedings
110
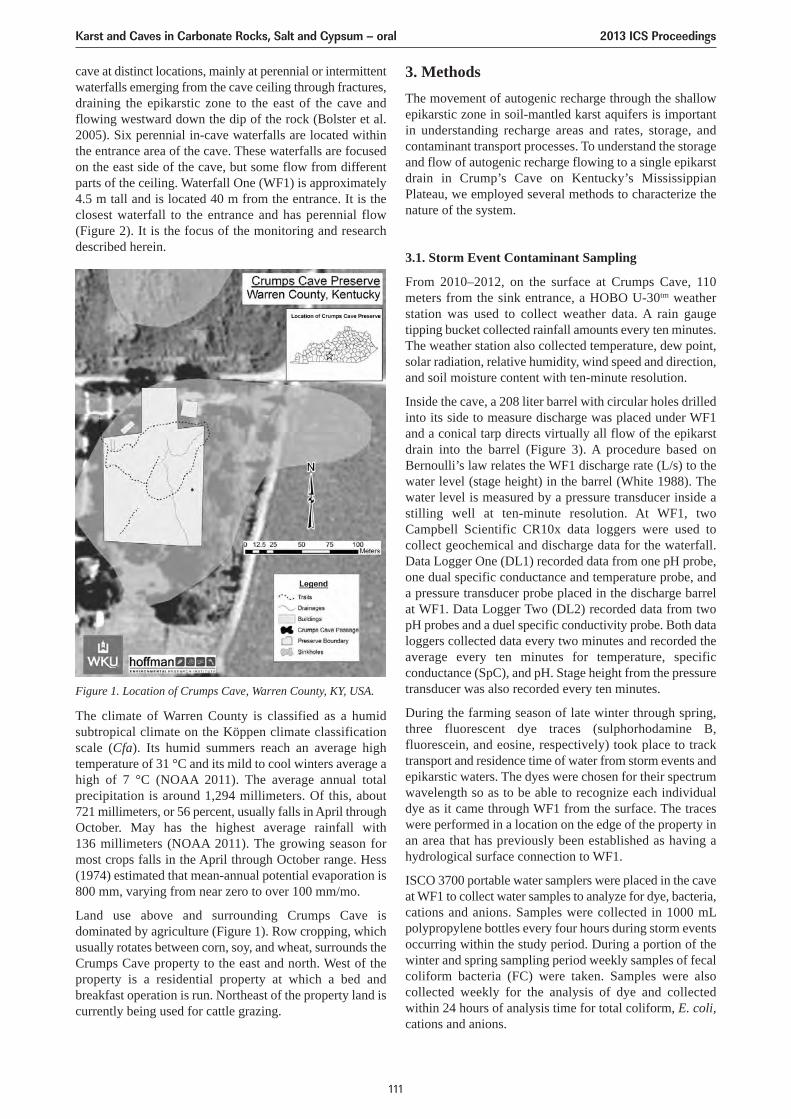
3. MethodsThe movement of autogenic recharge through the shallowepikarstic zone in soil-mantled karst aquifers is importantin understanding recharge areas and rates, storage, andcontaminant transport processes. To understand the storageand flow of autogenic recharge flowing to a single epikarstdrain in Crump’s Cave on Kentucky’s MississippianPlateau, we employed several methods to characterize thenature of the system.
3.1. Storm Event Contaminant Sampling
From 2010–2012, on the surface at Crumps Cave, 110meters from the sink entrance, a HOBO U-30tm weatherstation was used to collect weather data. A rain gaugetipping bucket collected rainfall amounts every ten minutes.The weather station also collected temperature, dew point,solar radiation, relative humidity, wind speed and direction,and soil moisture content with ten-minute resolution.
Inside the cave, a 208 liter barrel with circular holes drilledinto its side to measure discharge was placed under WF1and a conical tarp directs virtually all flow of the epikarstdrain into the barrel (Figure 3). A procedure based onBernoulli’s law relates the WF1 discharge rate (L/s) to thewater level (stage height) in the barrel (White 1988). Thewater level is measured by a pressure transducer inside astilling well at ten-minute resolution. At WF1, twoCampbell Scientific CR10x data loggers were used tocollect geochemical and discharge data for the waterfall.Data Logger One (DL1) recorded data from one pH probe,one dual specific conductance and temperature probe, anda pressure transducer probe placed in the discharge barrelat WF1. Data Logger Two (DL2) recorded data from twopH probes and a duel specific conductivity probe. Both dataloggers collected data every two minutes and recorded theaverage every ten minutes for temperature, specificconductance (SpC), and pH. Stage height from the pressuretransducer was also recorded every ten minutes.
During the farming season of late winter through spring,three fluorescent dye traces (sulphorhodamine B,fluorescein, and eosine, respectively) took place to tracktransport and residence time of water from storm events andepikarstic waters. The dyes were chosen for their spectrumwavelength so as to be able to recognize each individualdye as it came through WF1 from the surface. The traceswere performed in a location on the edge of the property inan area that has previously been established as having ahydrological surface connection to WF1.
ISCO 3700 portable water samplers were placed in the caveat WF1 to collect water samples to analyze for dye, bacteria,cations and anions. Samples were collected in 1000 mLpolypropylene bottles every four hours during storm eventsoccurring within the study period. During a portion of thewinter and spring sampling period weekly samples of fecalcoliform bacteria (FC) were taken. Samples were alsocollected weekly for the analysis of dye and collectedwithin 24 hours of analysis time for total coliform, E. coli,cations and anions.
cave at distinct locations, mainly at perennial or intermittentwaterfalls emerging from the cave ceiling through fractures,draining the epikarstic zone to the east of the cave andflowing westward down the dip of the rock (Bolster et al.2005). Six perennial in-cave waterfalls are located withinthe entrance area of the cave. These waterfalls are focusedon the east side of the cave, but some flow from differentparts of the ceiling. Waterfall One (WF1) is approximately4.5 m tall and is located 40 m from the entrance. It is theclosest waterfall to the entrance and has perennial flow(Figure 2). It is the focus of the monitoring and researchdescribed herein.
The climate of Warren County is classified as a humidsubtropical climate on the Köppen climate classificationscale (Cfa). Its humid summers reach an average hightemperature of 31 °C and its mild to cool winters average ahigh of 7 °C (NOAA 2011). The average annual totalprecipitation is around 1,294 millimeters. Of this, about 721 millimeters, or 56 percent, usually falls in April throughOctober. May has the highest average rainfall with 136 millimeters (NOAA 2011). The growing season formost crops falls in the April through October range. Hess(1974) estimated that mean-annual potential evaporation is800 mm, varying from near zero to over 100 mm/mo.
Land use above and surrounding Crumps Cave isdominated by agriculture (Figure 1). Row cropping, whichusually rotates between corn, soy, and wheat, surrounds theCrumps Cave property to the east and north. West of theproperty is a residential property at which a bed andbreakfast operation is run. Northeast of the property land iscurrently being used for cattle grazing.
Figure 1. Location of Crumps Cave, Warren County, KY, USA.
Karst and Caves in Carbonate Rocks, Salt and Gypsum – oral 2013 ICS Proceedings
111
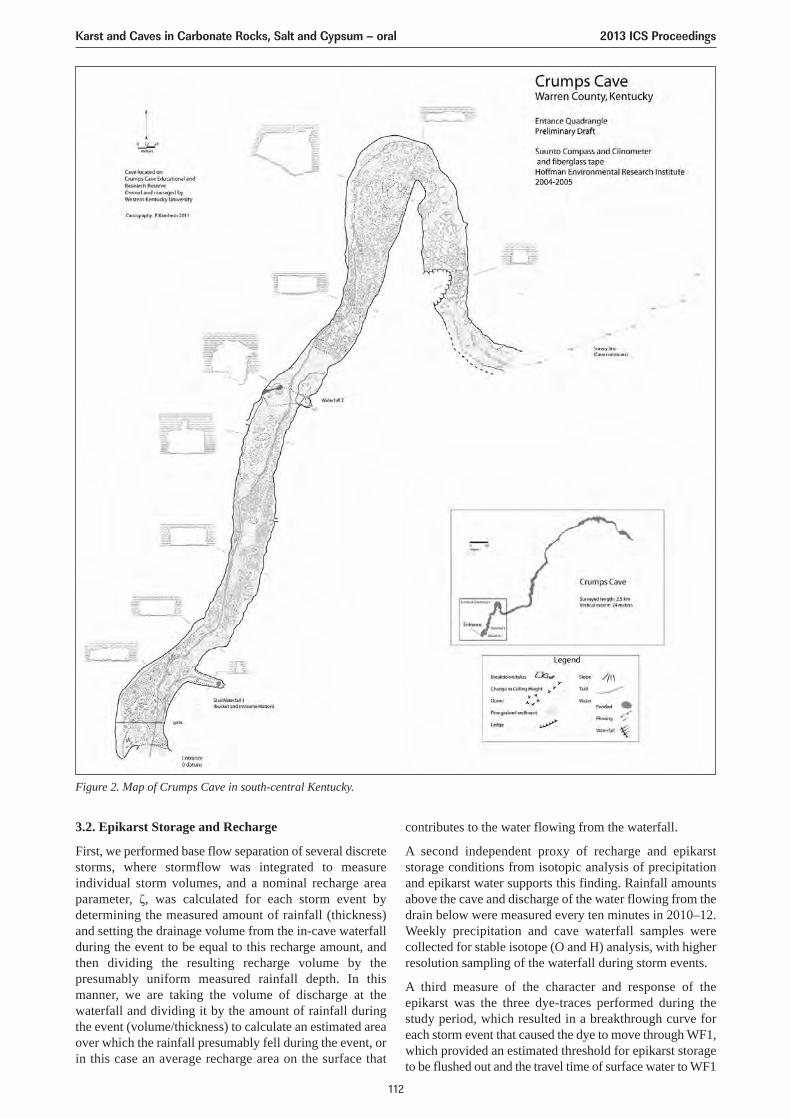
3.2. Epikarst Storage and Recharge
First, we performed base flow separation of several discretestorms, where stormflow was integrated to measureindividual storm volumes, and a nominal recharge areaparameter, ζ, was calculated for each storm event bydetermining the measured amount of rainfall (thickness)and setting the drainage volume from the in-cave waterfallduring the event to be equal to this recharge amount, andthen dividing the resulting recharge volume by thepresumably uniform measured rainfall depth. In thismanner, we are taking the volume of discharge at thewaterfall and dividing it by the amount of rainfall duringthe event (volume/thickness) to calculate an estimated areaover which the rainfall presumably fell during the event, orin this case an average recharge area on the surface that
Figure 2. Map of Crumps Cave in south-central Kentucky.
contributes to the water flowing from the waterfall.
A second independent proxy of recharge and epikarststorage conditions from isotopic analysis of precipitationand epikarst water supports this finding. Rainfall amountsabove the cave and discharge of the water flowing from thedrain below were measured every ten minutes in 2010–12.Weekly precipitation and cave waterfall samples werecollected for stable isotope (O and H) analysis, with higherresolution sampling of the waterfall during storm events.
A third measure of the character and response of theepikarst was the three dye-traces performed during thestudy period, which resulted in a breakthrough curve foreach storm event that caused the dye to move through WF1,which provided an estimated threshold for epikarst storageto be flushed out and the travel time of surface water to WF1
Karst and Caves in Carbonate Rocks, Salt and Gypsum – oral 2013 ICS Proceedings
112
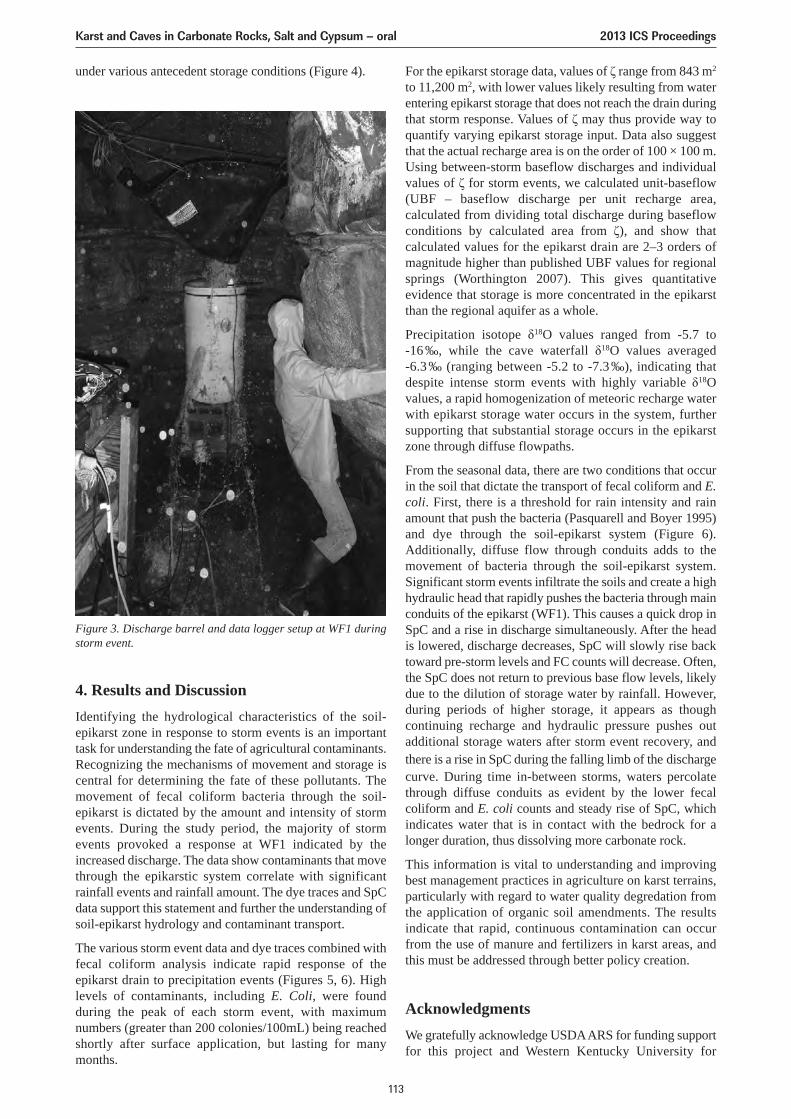
4. Results and DiscussionIdentifying the hydrological characteristics of the soil-epikarst zone in response to storm events is an importanttask for understanding the fate of agricultural contaminants.Recognizing the mechanisms of movement and storage iscentral for determining the fate of these pollutants. Themovement of fecal coliform bacteria through the soil-epikarst is dictated by the amount and intensity of stormevents. During the study period, the majority of stormevents provoked a response at WF1 indicated by theincreased discharge. The data show contaminants that movethrough the epikarstic system correlate with significantrainfall events and rainfall amount. The dye traces and SpCdata support this statement and further the understanding ofsoil-epikarst hydrology and contaminant transport.
The various storm event data and dye traces combined withfecal coliform analysis indicate rapid response of theepikarst drain to precipitation events (Figures 5, 6). Highlevels of contaminants, including E. Coli, were foundduring the peak of each storm event, with maximumnumbers (greater than 200 colonies/100mL) being reachedshortly after surface application, but lasting for manymonths.
under various antecedent storage conditions (Figure 4).
Figure 3. Discharge barrel and data logger setup at WF1 duringstorm event.
For the epikarst storage data, values of ζ range from 843 m2
to 11,200 m2, with lower values likely resulting from waterentering epikarst storage that does not reach the drain duringthat storm response. Values of ζ may thus provide way toquantify varying epikarst storage input. Data also suggestthat the actual recharge area is on the order of 100 × 100 m.Using between-storm baseflow discharges and individualvalues of ζ for storm events, we calculated unit-baseflow(UBF – baseflow discharge per unit recharge area,calculated from dividing total discharge during baseflowconditions by calculated area from ζ), and show thatcalculated values for the epikarst drain are 2–3 orders ofmagnitude higher than published UBF values for regionalsprings (Worthington 2007). This gives quantitativeevidence that storage is more concentrated in the epikarstthan the regional aquifer as a whole.
Precipitation isotope δ18O values ranged from -5.7 to -16 ‰, while the cave waterfall δ18O values averaged -6.3 ‰ (ranging between -5.2 to -7.3 ‰), indicating thatdespite intense storm events with highly variable δ18Ovalues, a rapid homogenization of meteoric recharge waterwith epikarst storage water occurs in the system, furthersupporting that substantial storage occurs in the epikarstzone through diffuse flowpaths.
From the seasonal data, there are two conditions that occurin the soil that dictate the transport of fecal coliform and E.coli. First, there is a threshold for rain intensity and rainamount that push the bacteria (Pasquarell and Boyer 1995)and dye through the soil-epikarst system (Figure 6).Additionally, diffuse flow through conduits adds to themovement of bacteria through the soil-epikarst system.Significant storm events infiltrate the soils and create a highhydraulic head that rapidly pushes the bacteria through mainconduits of the epikarst (WF1). This causes a quick drop inSpC and a rise in discharge simultaneously. After the headis lowered, discharge decreases, SpC will slowly rise backtoward pre-storm levels and FC counts will decrease. Often,the SpC does not return to previous base flow levels, likelydue to the dilution of storage water by rainfall. However,during periods of higher storage, it appears as thoughcontinuing recharge and hydraulic pressure pushes outadditional storage waters after storm event recovery, andthere is a rise in SpC during the falling limb of the dischargecurve. During time in-between storms, waters percolatethrough diffuse conduits as evident by the lower fecalcoliform and E. coli counts and steady rise of SpC, whichindicates water that is in contact with the bedrock for alonger duration, thus dissolving more carbonate rock.
This information is vital to understanding and improvingbest management practices in agriculture on karst terrains,particularly with regard to water quality degredation fromthe application of organic soil amendments. The resultsindicate that rapid, continuous contamination can occurfrom the use of manure and fertilizers in karst areas, andthis must be addressed through better policy creation.
AcknowledgmentsWe gratefully acknowledge USDA ARS for funding supportfor this project and Western Kentucky University for
Karst and Caves in Carbonate Rocks, Salt and Gypsum – oral 2013 ICS Proceedings
113
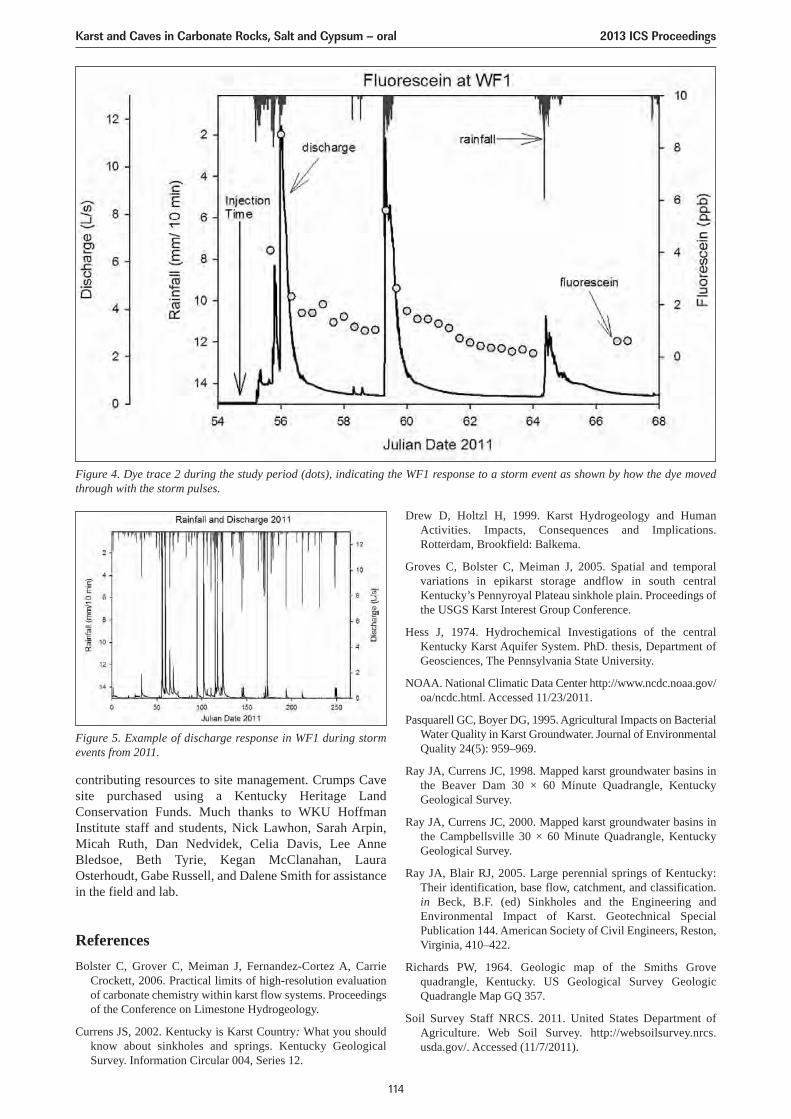
Figure 4. Dye trace 2 during the study period (dots), indicating the WF1 response to a storm event as shown by how the dye movedthrough with the storm pulses.
Figure 5. Example of discharge response in WF1 during stormevents from 2011.
contributing resources to site management. Crumps Cavesite purchased using a Kentucky Heritage LandConservation Funds. Much thanks to WKU HoffmanInstitute staff and students, Nick Lawhon, Sarah Arpin,Micah Ruth, Dan Nedvidek, Celia Davis, Lee AnneBledsoe, Beth Tyrie, Kegan McClanahan, LauraOsterhoudt, Gabe Russell, and Dalene Smith for assistancein the field and lab.
ReferencesBolster C, Grover C, Meiman J, Fernandez-Cortez A, Carrie
Crockett, 2006. Practical limits of high-resolution evaluationof carbonate chemistry within karst flow systems. Proceedingsof the Conference on Limestone Hydrogeology.
Currens JS, 2002. Kentucky is Karst Country: What you shouldknow about sinkholes and springs. Kentucky GeologicalSurvey. Information Circular 004, Series 12.
Drew D, Holtzl H, 1999. Karst Hydrogeology and HumanActivities. Impacts, Consequences and Implications.Rotterdam, Brookfield: Balkema.
Groves C, Bolster C, Meiman J, 2005. Spatial and temporalvariations in epikarst storage andflow in south centralKentucky’s Pennyroyal Plateau sinkhole plain. Proceedings ofthe USGS Karst Interest Group Conference.
Hess J, 1974. Hydrochemical Investigations of the centralKentucky Karst Aquifer System. PhD. thesis, Department ofGeosciences, The Pennsylvania State University.
NOAA. National Climatic Data Center http://www.ncdc.noaa.gov/oa/ncdc.html. Accessed 11/23/2011.
Pasquarell GC, Boyer DG, 1995. Agricultural Impacts on BacterialWater Quality in Karst Groundwater. Journal of EnvironmentalQuality 24(5): 959–969.
Ray JA, Currens JC, 1998. Mapped karst groundwater basins inthe Beaver Dam 30 × 60 Minute Quadrangle, KentuckyGeological Survey.
Ray JA, Currens JC, 2000. Mapped karst groundwater basins inthe Campbellsville 30 × 60 Minute Quadrangle, KentuckyGeological Survey.
Ray JA, Blair RJ, 2005. Large perennial springs of Kentucky:Their identification, base flow, catchment, and classification.in Beck, B.F. (ed) Sinkholes and the Engineering andEnvironmental Impact of Karst. Geotechnical SpecialPublication 144. American Society of Civil Engineers, Reston,Virginia, 410–422.
Richards PW, 1964. Geologic map of the Smiths Grovequadrangle, Kentucky. US Geological Survey GeologicQuadrangle Map GQ 357.
Soil Survey Staff NRCS. 2011. United States Department ofAgriculture. Web Soil Survey. http://websoilsurvey.nrcs.usda.gov/. Accessed (11/7/2011).
Karst and Caves in Carbonate Rocks, Salt and Gypsum – oral 2013 ICS Proceedings
114
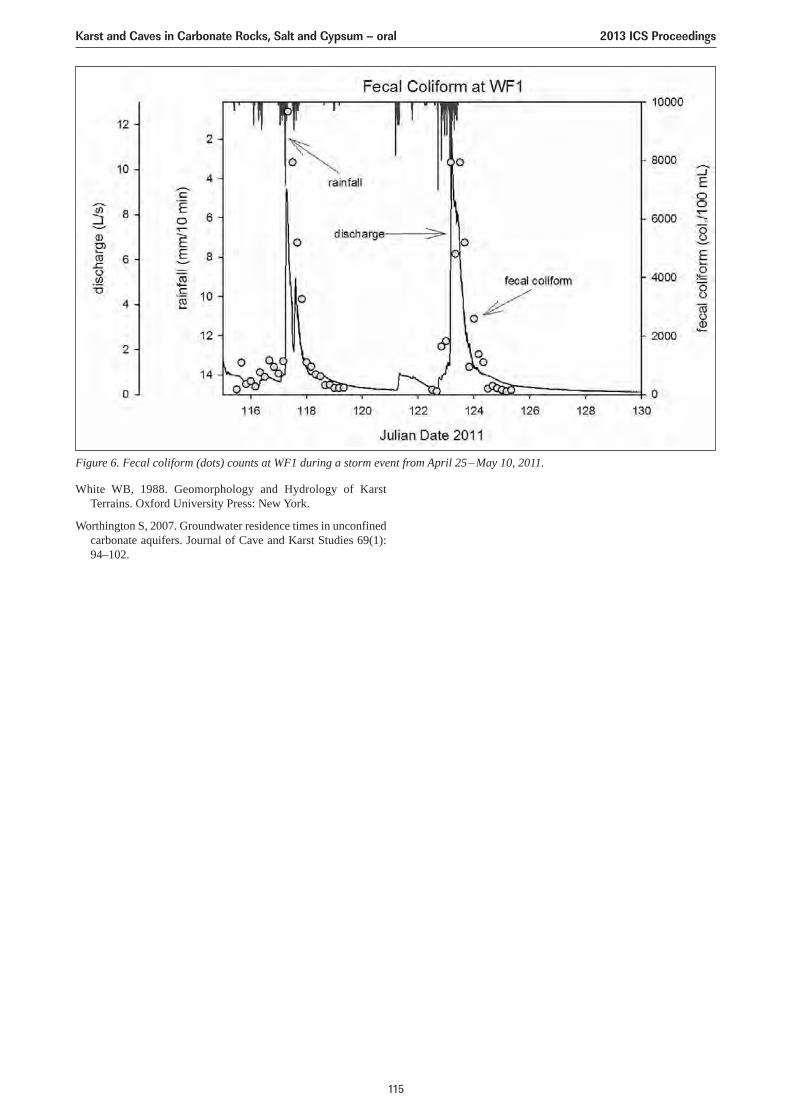
Figure 6. Fecal coliform (dots) counts at WF1 during a storm event from April 25– May 10, 2011.
White WB, 1988. Geomorphology and Hydrology of KarstTerrains. Oxford University Press: New York.
Worthington S, 2007. Groundwater residence times in unconfinedcarbonate aquifers. Journal of Cave and Karst Studies 69(1):94–102.
Karst and Caves in Carbonate Rocks, Salt and Gypsum – oral 2013 ICS Proceedings
115
KARST HYDROGEOLOGICAL OBSERVATIONS IN CAO BANGPROVINCE (VIETNAM): THE TRA LINH-THANG HEN LAKE AREA
Gheorghe M. Ponta1, Bogdan P. Onac2, Nyguen Xuan Nam3
1PELA GeoEnvironmental, 1009 23rd Avenue, Tuscaloosa, AL 35401, USA, [email protected] of Geology, University of South Florida, 4202 E. Fowler Ave., SCA 528, Tampa, FL 33620 USA,
[email protected] Institute of Geoscience and Mineral Resource, [email protected]
In March 2012, the “Geokarst Adventure” Association under the auspices of the French Speleological Federation and theRomanian Speleological Federation along with the Vietnam Institute of Geoscience and Mineral Resource organized anexpedition to explore the karst systems located in the Cao Bang Province, Northeastern Vietnam. The results include karstgeological and hydrogeological observations and preliminary geochemical data based on 14 water samples. The valuesmeasured for the specific conductance are typical for caves waters (between 232.6 and 371 μS/cm). Total alkalinity asCaCO3 ranges between 92.5 and 186 mg/l (gour 68), and the total hardness as CaCO3 varies between 85 and 326 mg/l.The highest pH value (8.29), specific conductance (371 μS/cm) and concentration of calcium (97.93 mg/l) were recordedat Thang Hen Lake. The lowest temperature of 16.4 ºC, specific conductivity of 166.9 μS/cm, and total alkalinity as CaCO3
of 68 mg/l were recorded in the water sample collected in the gour of Bang Ga T09 cave. The waters are calciumbicarbonate type. The local meteoric water line (LMWL) for the investigated region is δD = 7.83δ18O + 14.694 and showsa higher intercept and slope value than the global meteoric water line (GMWL), suggesting major changes in the originof precipitation during the seasonal rain cycles.
1. Geographical SettingsThe Socialist Republic of Vietnam is situated in theeasternmost part of the Indochinese Peninsula (Fig. 1a).It covers a total area of 331,210 km2 of which 40 % isrepresented by mountains, mostly forested. Carbonate rocksare exposed over 60,000 km2, representing 18.12 % ofcountries’ surface (Clements 2006).
The Province of Cao Bằng is located in the northeasternVietnam, 270 kilometers from Hanoi, on the border withChina. It has a surface of 6,724.6 km2 and a population of632,450 (Fig. 1a). The topography of the region ischaracterized by mountain ranges with elevation over 900 m above sea level (a.s.l.), and karstic plateausdeveloped between 500 and 700 m a.s.l. Tropical climate ischaracteristic to the area. The temperature varies from 5 °Cin December and January to 37 °C in July and August.
The karst of northern Vietnam was extensively exploredover the last 15 years and several cave exploration reports,karst geology and hydrology papers are available:Brouquisse (1998/1999), Holroyd and his team (2003,2005, 2010), Limbert and his team (1999, 2007), NyuyenThi Thuy (2007) and Italian-French-Vietnamese CavingProject (2007).
2. GeologyThe Cao Bang province is underlain by a variety of rocksranging in age from Cambrian to Quaternary. The majorityof the karst features identified in the field and water samplescollected in March 2012 are hosted in the Bắc Sơnformation of Carboniferous–Permian age (C-P bs) whichconsists of siliceous shales, shaly limestones, andlimestones. The limestone unit is up to 800 m thick. TheBac Son limestone is finely crystalline, light gray to dark
gray. Bedding is generally 30 to 50 cm thick, oriented NW–SE, dipping 19º to 25º. Groundwater movement occursalong solutionally enlarged fractures, cavities, joints, andbedding planes. The area underlain by limestones isextensive. The topography consists of large poljes,surrounded by prominent limestones pinnacles and towerkarst.
3. Karst hydrogeological observations in theTra Linh – Thang Hen lake areaThe Tra Linh – Thang Hen Lake area is formed by asequence of poljes and karst windows developed along theTran Linh River (Q ~400 l/s in March 2012). The limestonemassifs are traverse by caves that carry rivers from onepolje to the next. In some areas two levels of cave passagesare developed, one as a stream passage at the present floodplain level, and a fossil one at 50 m relative altitude,marking a former flood plain level.
The Tra Linh River is collecting its waters a few kilometersnorth of the border with China. Fourteen km downstream,the river is disappearing underground at the base of alimestone massif, reappearing 500 m downstream in anunderwater cave, which ends with a large spring. Hundredmeters downstream from the cave entrance an 8 m highwaterfall is formed. Downstream, the Tra Linh River ismeandering through a large polje, covered with alluvialdeposits, sinking for the second time in a cave/swallet,which is penetrable for about 100 m (Fig. 2). The end sumpis clogged with alluvial deposits, trash and tree branches.The sump was not explored due concerns that flash floodwaters moved unexploded ordinances from the VietnamWar era into the cave. One km north from the cave, a streamwith a flow of about 10 l/s is disappearing undergroundthrough an impenetrable swallet.
Karst and Caves in Carbonate Rocks, Salt and Gypsum – oral 2013 ICS Proceedings
116
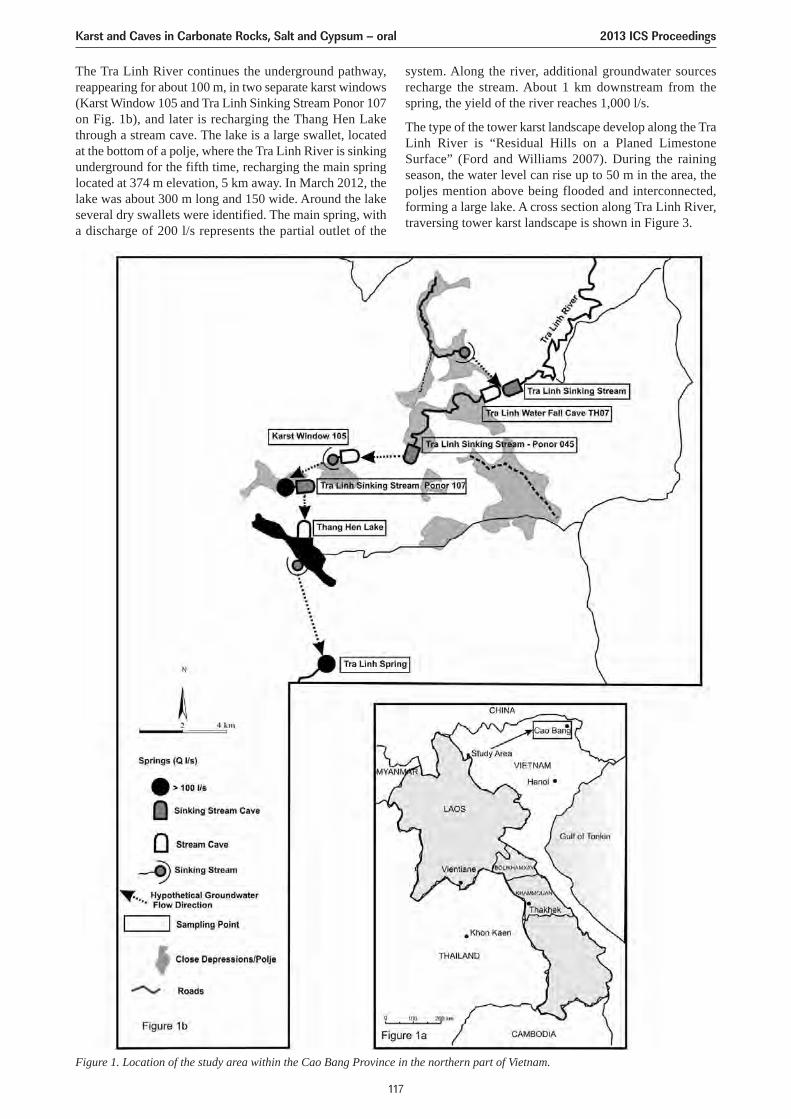
The Tra Linh River continues the underground pathway,reappearing for about 100 m, in two separate karst windows(Karst Window 105 and Tra Linh Sinking Stream Ponor 107on Fig. 1b), and later is recharging the Thang Hen Lakethrough a stream cave. The lake is a large swallet, locatedat the bottom of a polje, where the Tra Linh River is sinkingunderground for the fifth time, recharging the main springlocated at 374 m elevation, 5 km away. In March 2012, thelake was about 300 m long and 150 wide. Around the lakeseveral dry swallets were identified. The main spring, witha discharge of 200 l/s represents the partial outlet of the
system. Along the river, additional groundwater sourcesrecharge the stream. About 1 km downstream from thespring, the yield of the river reaches 1,000 l/s.
The type of the tower karst landscape develop along the TraLinh River is “Residual Hills on a Planed LimestoneSurface” (Ford and Williams 2007). During the rainingseason, the water level can rise up to 50 m in the area, thepoljes mention above being flooded and interconnected,forming a large lake. A cross section along Tra Linh River,traversing tower karst landscape is shown in Figure 3.
Figure 1. Location of the study area within the Cao Bang Province in the northern part of Vietnam.
Karst and Caves in Carbonate Rocks, Salt and Gypsum – oral 2013 ICS Proceedings
117
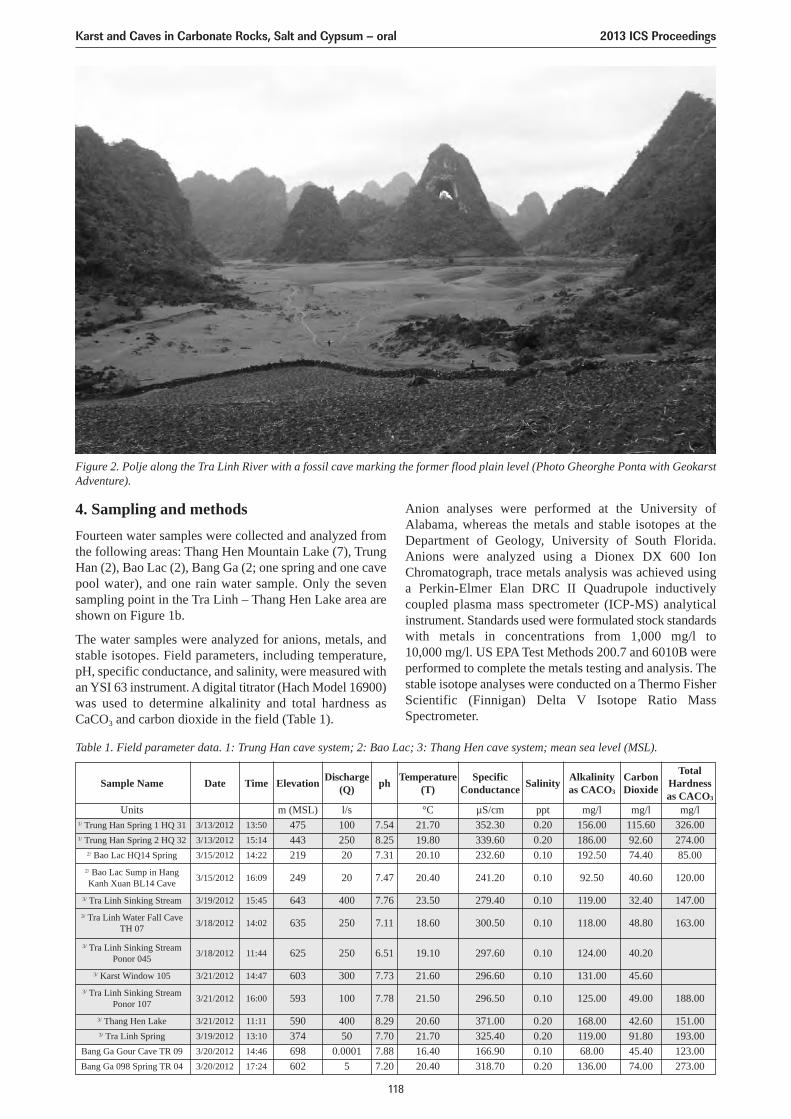
4. Sampling and methodsFourteen water samples were collected and analyzed fromthe following areas: Thang Hen Mountain Lake (7), TrungHan (2), Bao Lac (2), Bang Ga (2; one spring and one cavepool water), and one rain water sample. Only the sevensampling point in the Tra Linh – Thang Hen Lake area areshown on Figure 1b.
The water samples were analyzed for anions, metals, andstable isotopes. Field parameters, including temperature,pH, specific conductance, and salinity, were measured withan YSI 63 instrument. A digital titrator (Hach Model 16900)was used to determine alkalinity and total hardness asCaCO3 and carbon dioxide in the field (Table 1).
Anion analyses were performed at the University ofAlabama, whereas the metals and stable isotopes at theDepartment of Geology, University of South Florida.Anions were analyzed using a Dionex DX 600 IonChromatograph, trace metals analysis was achieved usinga Perkin-Elmer Elan DRC II Quadrupole inductivelycoupled plasma mass spectrometer (ICP-MS) analyticalinstrument. Standards used were formulated stock standardswith metals in concentrations from 1,000 mg/l to10,000 mg/l. US EPA Test Methods 200.7 and 6010B wereperformed to complete the metals testing and analysis. Thestable isotope analyses were conducted on a Thermo FisherScientific (Finnigan) Delta V Isotope Ratio MassSpectrometer.
Figure 2. Polje along the Tra Linh River with a fossil cave marking the former flood plain level (Photo Gheorghe Ponta with GeokarstAdventure).
Table 1. Field parameter data. 1: Trung Han cave system; 2: Bao Lac; 3: Thang Hen cave system; mean sea level (MSL).
Sample Name
Units1/ Trung Han Spring 1 HQ 31 3/13/2012 13:50
Date Time Elevation
m (MSL)475
Discharge(Q)
l/s100 7.54
ph Temperature(T)
°C21.70
SpecificConductance
µS/cm352.30
Salinity
ppt0.20
Alkalinityas CACO3
mg/l156.00
CarbonDioxide
mg/l115.60
TotalHardnessas CACO3
mg/l326.00
1/ Trung Han Spring 2 HQ 32 3/13/2012 15:14 443 250 8.25 19.80 339.60 0.20 186.00 92.60 274.002/ Bao Lac HQ14 Spring 3/15/2012 14:22 219 20 7.31 20.10 232.60 0.10 192.50 74.40 85.00
2/ Bao Lac Sump in HangKanh Xuan BL14 Cave 3/15/2012 16:09 249 20 7.47 20.40 241.20 0.10 92.50 40.60 120.00
3/ Tra Linh Sinking Stream 3/19/2012 15:45 643 400 7.76 23.50 279.40 0.10 119.00 32.40 147.003/ Tra Linh Water Fall Cave
TH 07 3/18/2012 14:02 635 250 7.11 18.60 300.50 0.10 118.00 48.80 163.00
3/ Tra Linh Sinking StreamPonor 045 3/18/2012 11:44 625 250 6.51 19.10 297.60 0.10 124.00 40.20
3/ Karst Window 105 3/21/2012 14:47 603 300 7.73 21.60 296.60 0.10 131.00 45.603/ Tra Linh Sinking Stream
Ponor 107 3/21/2012 16:00 593 100 7.78 21.50 296.50 0.10 125.00 49.00 188.00
3/ Thang Hen Lake 3/21/2012 11:11 590 400 8.29 20.60 371.00 0.20 168.00 42.60 151.003/ Tra Linh Spring 3/19/2012 13:10 374 50 7.70 21.70 325.40 0.20 119.00 91.80 193.00
Bang Ga Gour Cave TR 09 3/20/2012 14:46 698 0.0001 7.88 16.40 166.90 0.10 68.00 45.40 123.00Bang Ga 098 Spring TR 04 3/20/2012 17:24 602 5 7.20 20.40 318.70 0.20 136.00 74.00 273.00
Karst and Caves in Carbonate Rocks, Salt and Gypsum – oral 2013 ICS Proceedings
118
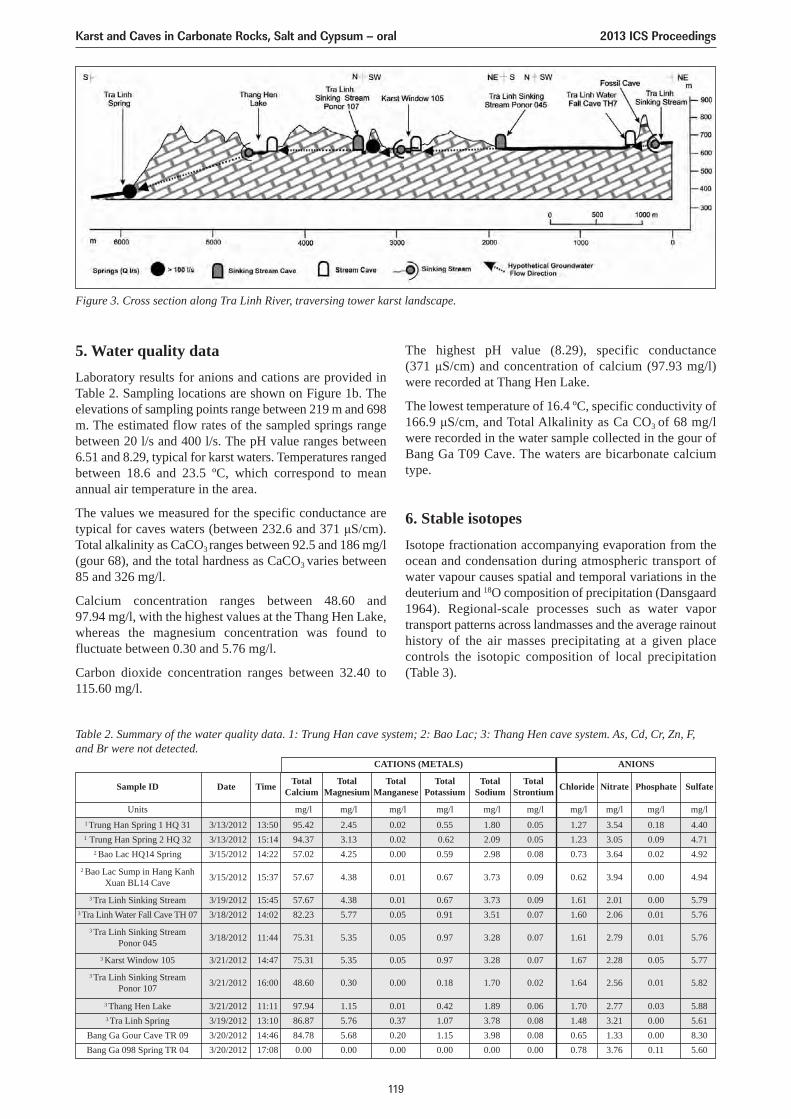
5. Water quality dataLaboratory results for anions and cations are provided inTable 2. Sampling locations are shown on Figure 1b. Theelevations of sampling points range between 219 m and 698m. The estimated flow rates of the sampled springs rangebetween 20 l/s and 400 l/s. The pH value ranges between6.51 and 8.29, typical for karst waters. Temperatures rangedbetween 18.6 and 23.5 ºC, which correspond to meanannual air temperature in the area.
The values we measured for the specific conductance aretypical for caves waters (between 232.6 and 371 μS/cm).Total alkalinity as CaCO3 ranges between 92.5 and 186 mg/l(gour 68), and the total hardness as CaCO3 varies between85 and 326 mg/l.
Calcium concentration ranges between 48.60 and 97.94 mg/l, with the highest values at the Thang Hen Lake,whereas the magnesium concentration was found tofluctuate between 0.30 and 5.76 mg/l.
Carbon dioxide concentration ranges between 32.40 to115.60 mg/l.
The highest pH value (8.29), specific conductance (371 μS/cm) and concentration of calcium (97.93 mg/l)were recorded at Thang Hen Lake.
The lowest temperature of 16.4 ºC, specific conductivity of166.9 μS/cm, and Total Alkalinity as Ca CO3 of 68 mg/lwere recorded in the water sample collected in the gour ofBang Ga T09 Cave. The waters are bicarbonate calciumtype.
6. Stable isotopesIsotope fractionation accompanying evaporation from theocean and condensation during atmospheric transport ofwater vapour causes spatial and temporal variations in thedeuterium and 18O composition of precipitation (Dansgaard1964). Regional-scale processes such as water vaportransport patterns across landmasses and the average rainouthistory of the air masses precipitating at a given placecontrols the isotopic composition of local precipitation(Table 3).
Figure 3. Cross section along Tra Linh River, traversing tower karst landscape.
Sample ID Date Time TotalCalcium
TotalMagnesium
TotalManganese
TotalPotassium
TotalSodium
TotalStrontium Chloride Nitrate Phosphate Sulfate
Table 2. Summary of the water quality data. 1: Trung Han cave system; 2: Bao Lac; 3: Thang Hen cave system. As, Cd, Cr, Zn, F, and Br were not detected.
CATIONS (METALS) ANIONS
Units mg/l mg/l mg/l mg/l mg/l mg/l mg/l mg/l mg/l mg/l1 Trung Han Spring 1 HQ 31 3/13/2012 13:50 95.42 2.45 0.02 0.55 1.80 0.05 1.27 3.54 0.18 4.40 1 Trung Han Spring 2 HQ 32 3/13/2012 15:14 94.37 3.13 0.02 0.62 2.09 0.05 1.23 3.05 0.09 4.71
2 Bao Lac HQ14 Spring 3/15/2012 14:22 57.02 4.25 0.00 0.59 2.98 0.08 0.73 3.64 0.02 4.92
3 Thang Hen Lake 3/21/2012 11:11 97.94 1.15 0.01 0.42 1.89 0.06 1.70 2.77 0.03 5.88 3 Tra Linh Spring 3/19/2012 13:10 86.87 5.76 0.37 1.07 3.78 0.08 1.48 3.21 0.00 5.61
Bang Ga Gour Cave TR 09 3/20/2012 14:46 84.78 5.68 0.20 1.15 3.98 0.08 0.65 1.33 0.00 8.30 Bang Ga 098 Spring TR 04 3/20/2012 17:08 0.00 0.00 0.00 0.00 0.00 0.00 0.78 3.76 0.11 5.60
3/15/2012 15:37 57.67 4.38 0.01 0.67 3.73 0.09 0.62 3.94 0.00 4.942 Bao Lac Sump in Hang Kanh
Xuan BL14 Cave3 Tra Linh Sinking Stream 3/19/2012 15:45 57.67 4.38 0.01 0.67 3.73 0.09 1.61 2.01 0.00 5.79
3 Tra Linh Water Fall Cave TH 07 3/18/2012 14:02 82.23 5.77 0.05 0.91 3.51 0.07 1.60 2.06 0.01 5.76
3/18/2012 11:44 75.31 5.35 0.05 0.97 3.28 0.07 1.61 2.79 0.01 5.763 Tra Linh Sinking Stream
Ponor 0453 Karst Window 105 3/21/2012 14:47 75.31 5.35 0.05 0.97 3.28 0.07 1.67 2.28 0.05 5.77
3/21/2012 16:00 48.60 0.30 0.00 0.18 1.70 0.02 1.64 2.56 0.01 5.823 Tra Linh Sinking Stream
Ponor 107
Karst and Caves in Carbonate Rocks, Salt and Gypsum – oral 2013 ICS Proceedings
119
The δ18O values of the water samples collected over 8 daysranged from -9 to -7.62‰. The δD values in the cave waters,springs, and rivers ranged from -55 to -42‰. The onlyrainfall sample collected on March 13, 2012 stands out withits very positive values for both δ18O and δD (see Table 3).
The relationship between 18O and 2H in world’s freshsurface / cave waters is predicted by the GMWL defined byCraig (1961) as:
δD = 8δ18O + 10 (‰).
The local meteoric water line (LMWL) for the investigatedregion is δD = 7.8359x + 14.694 and shows a higherintercept and slope value than the GMWL, suggestingmajor changes in the origin of precipitation during theseasonal rain cycles. Although we called LMWL, we arefully aware that the isotopic compositions undergoesvariations on event-based and therefore, our LMWL solelyreflects the conditions during those 8 days of sampling,therefore, the results need to be considered as preliminaryand used with caution if comparisons with other regions ordata sets are sought.
Table 3. Summary of the stable isotope data. 1: Trung Han cavesystem; 2: Bao Lac; 3: Thang Hen cave system.
Sample δ18O δD d-excess(‰) (‰) (‰)
1Trung Han Spring1HQ 31 -7.86 -49.12 13.741Trung Han Spring2HQ 32 -7.78 -46.19 16.062Bao Lac Spring -8.93 -55.23 16.222Bao Lac Sump inHang Kanh XuanCave -9.00 -52.54 19.493Tra Linh sinkingstream -7.76 -45.34 16.733Tra Linh Water FallCave TH 07 -7.63 -42.35 18.663Tra Linh SinkingStream Ponor 045 -7.98 -44.29 19.523Karst Window 105 -7.66 -53.96 7.313Tra Linh SinkingStream Ponor 107 -7.62 -54.15 6.853Thang Hen Lake -7.71 -48.51 13.163Tra Linh Spring -8.08 -45.27 19.37Bang Ga gour -8.39 -42.49 24.60Bang Ga Spring T4 -8.24 -50.79 15.10Rain Water 1.37 26.80 15.85
More samples of precipitation and fresh groundwater areneeded to construct a real LMWL for this region, and tocalculate the deuterium excess value, defined as:
d = δD - 8δ18O (‰).
This parameter is a valuable indicator of the source area ofthe water vapor. Values around +10‰ are typical for mostcontinental meteoric waters, whereas values well above+10‰ suggest more evaporated moisture being added tothe atmosphere (Rozanski et al. 1992).
AcknowledgmentsWe are grateful to the following organizations that providedus with the hydrogeological analyses: Institute ofGeosciences and Mineral Resources and PELAGeoEnvironmental and to members of the GeokarstAdventure for their help during the fieldwork.
ReferencesBrouquisse F, 1998/1999. Données physico-chimiques, Federation
Francaise de Speleologie, Societa Speleologica Italiana(Unpublished report).
Cao Bang 2007, Italo-french-vietnamese caving project inVietnam (Unpublished report).
Clements R, Sodhi NS, Schilthuizen M, Ng KLP, 2006. Limestonekarsts of Southeast Asia: imperiled arks of biodiversity.BioScience, 56(9), 733–742.
Craig H, 1961. Isotopic variations in meteoric waters. Science,133, 1702–1703.
Dansgaard W, 1964. Stable isotopes in precipitation. Tellus, XVI(4), 436–468.
Ford DC, Williams PW, 2007. Karst Hydrogeology andGeomorphology. John Wiley & Sons, London, 562.
Holroyd M. and team, 2003, 2005, 2010. Vietnam Expedition(Unpublished reports).
Limbert H. and team, 1999, 2007, 2009. Vietnam CavingExpedition. http://www.vietnamcaves.com/report-2009
Nguyen Thi Thuy, 2007. Application of stable isotopegeochemistry in a study of paleoclimate and environment. Casestudy in Son La, Vietnam. Master Dissertation, UniversiteitGent, Vrije Universitei Brussels, Belgium.
Rozanski K, Araguás-Araguás L, Gonfiantini R, 1992. Relationbetween long-term trends of oxygen-18 isotope compositionof precipitation and climate. Science, 258, 981–985.
Topographic map of Na Khoang, 1:50,000.
Topographic map of Cao Bang, 1:50,000.
Karst and Caves in Carbonate Rocks, Salt and Gypsum – oral 2013 ICS Proceedings
120
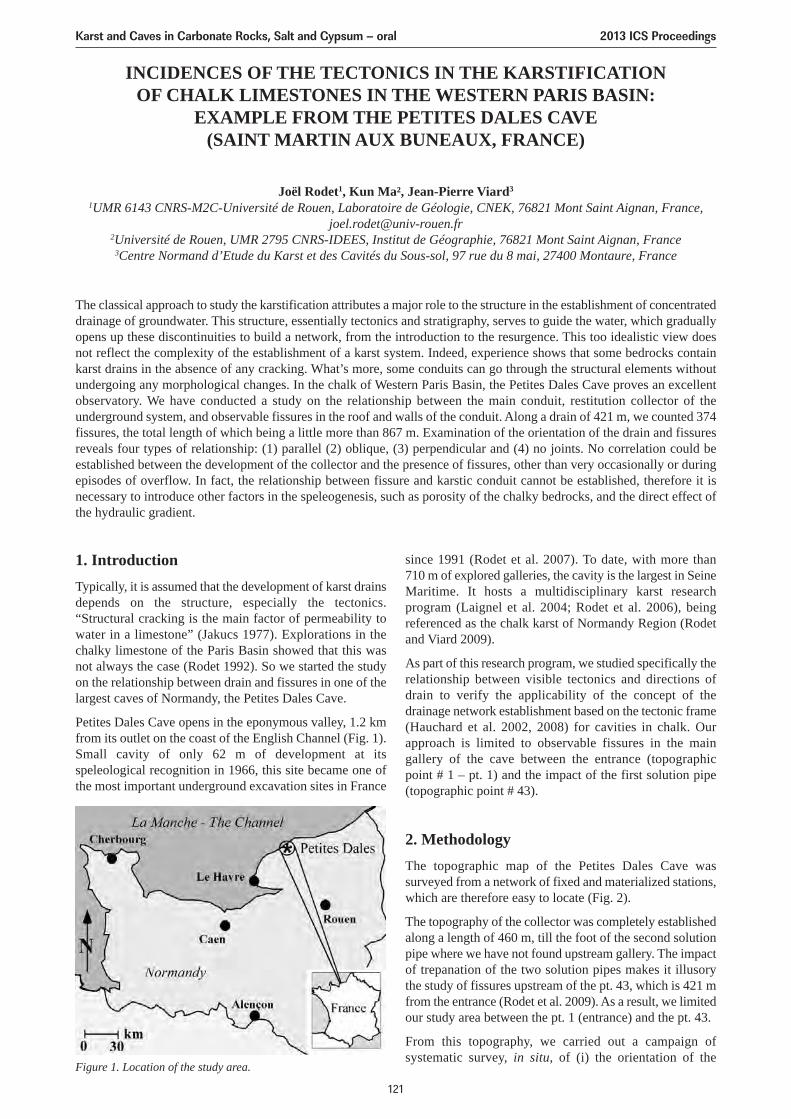
INCIDENCES OF THE TECTONICS IN THE KARSTIFICATIONOF CHALK LIMESTONES IN THE WESTERN PARIS BASIN:
EXAMPLE FROM THE PETITES DALES CAVE(SAINT MARTIN AUX BUNEAUX, FRANCE)
Joël Rodet1, Kun Ma², Jean-Pierre Viard3
1UMR 6143 CNRS-M2C-Université de Rouen, Laboratoire de Géologie, CNEK, 76821 Mont Saint Aignan, France,[email protected]
2Université de Rouen, UMR 2795 CNRS-IDEES, Institut de Géographie, 76821 Mont Saint Aignan, France3Centre Normand d’Etude du Karst et des Cavités du Sous-sol, 97 rue du 8 mai, 27400 Montaure, France
The classical approach to study the karstification attributes a major role to the structure in the establishment of concentrateddrainage of groundwater. This structure, essentially tectonics and stratigraphy, serves to guide the water, which graduallyopens up these discontinuities to build a network, from the introduction to the resurgence. This too idealistic view doesnot reflect the complexity of the establishment of a karst system. Indeed, experience shows that some bedrocks containkarst drains in the absence of any cracking. What’s more, some conduits can go through the structural elements withoutundergoing any morphological changes. In the chalk of Western Paris Basin, the Petites Dales Cave proves an excellentobservatory. We have conducted a study on the relationship between the main conduit, restitution collector of theunderground system, and observable fissures in the roof and walls of the conduit. Along a drain of 421 m, we counted 374fissures, the total length of which being a little more than 867 m. Examination of the orientation of the drain and fissuresreveals four types of relationship: (1) parallel (2) oblique, (3) perpendicular and (4) no joints. No correlation could beestablished between the development of the collector and the presence of fissures, other than very occasionally or duringepisodes of overflow. In fact, the relationship between fissure and karstic conduit cannot be established, therefore it isnecessary to introduce other factors in the speleogenesis, such as porosity of the chalky bedrocks, and the direct effect ofthe hydraulic gradient.
1. IntroductionTypically, it is assumed that the development of karst drainsdepends on the structure, especially the tectonics.“Structural cracking is the main factor of permeability towater in a limestone” (Jakucs 1977). Explorations in thechalky limestone of the Paris Basin showed that this wasnot always the case (Rodet 1992). So we started the studyon the relationship between drain and fissures in one of thelargest caves of Normandy, the Petites Dales Cave.
Petites Dales Cave opens in the eponymous valley, 1.2 kmfrom its outlet on the coast of the English Channel (Fig. 1).Small cavity of only 62 m of development at itsspeleological recognition in 1966, this site became one ofthe most important underground excavation sites in France
since 1991 (Rodet et al. 2007). To date, with more than 710 m of explored galleries, the cavity is the largest in SeineMaritime. It hosts a multidisciplinary karst researchprogram (Laignel et al. 2004; Rodet et al. 2006), beingreferenced as the chalk karst of Normandy Region (Rodetand Viard 2009).
As part of this research program, we studied specifically therelationship between visible tectonics and directions ofdrain to verify the applicability of the concept of thedrainage network establishment based on the tectonic frame(Hauchard et al. 2002, 2008) for cavities in chalk. Ourapproach is limited to observable fissures in the maingallery of the cave between the entrance (topographicpoint # 1 – pt. 1) and the impact of the first solution pipe(topographic point # 43).
2. MethodologyThe topographic map of the Petites Dales Cave wassurveyed from a network of fixed and materialized stations,which are therefore easy to locate (Fig. 2).
The topography of the collector was completely establishedalong a length of 460 m, till the foot of the second solutionpipe where we have not found upstream gallery. The impactof trepanation of the two solution pipes makes it illusorythe study of fissures upstream of the pt. 43, which is 421 mfrom the entrance (Rodet et al. 2009). As a result, we limitedour study area between the pt. 1 (entrance) and the pt. 43.
From this topography, we carried out a campaign ofsystematic survey, in situ, of (i) the orientation of the
Figure 1. Location of the study area.
Karst and Caves in Carbonate Rocks, Salt and Gypsum – oral 2013 ICS Proceedings
121
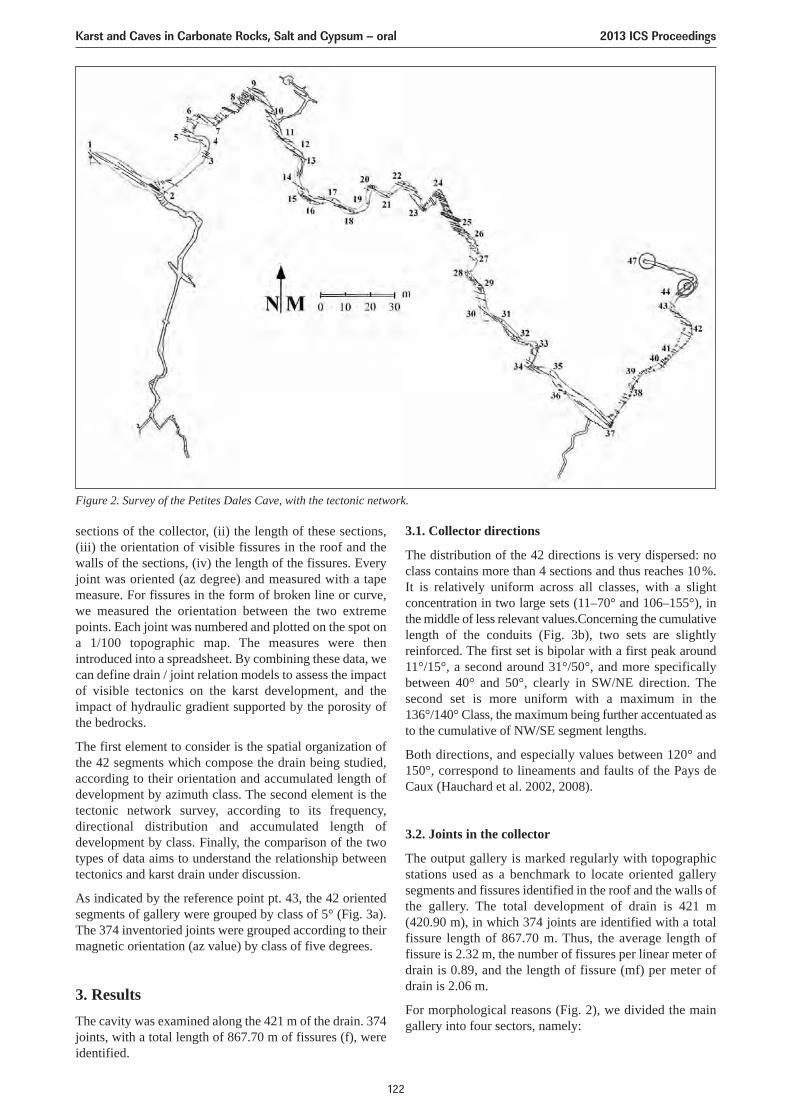
Figure 2. Survey of the Petites Dales Cave, with the tectonic network.
Karst and Caves in Carbonate Rocks, Salt and Gypsum – oral 2013 ICS Proceedings
122
sections of the collector, (ii) the length of these sections,(iii) the orientation of visible fissures in the roof and thewalls of the sections, (iv) the length of the fissures. Everyjoint was oriented (az degree) and measured with a tapemeasure. For fissures in the form of broken line or curve,we measured the orientation between the two extremepoints. Each joint was numbered and plotted on the spot ona 1/100 topographic map. The measures were thenintroduced into a spreadsheet. By combining these data, wecan define drain / joint relation models to assess the impactof visible tectonics on the karst development, and theimpact of hydraulic gradient supported by the porosity ofthe bedrocks.
The first element to consider is the spatial organization ofthe 42 segments which compose the drain being studied,according to their orientation and accumulated length ofdevelopment by azimuth class. The second element is thetectonic network survey, according to its frequency,directional distribution and accumulated length ofdevelopment by class. Finally, the comparison of the twotypes of data aims to understand the relationship betweentectonics and karst drain under discussion.
As indicated by the reference point pt. 43, the 42 orientedsegments of gallery were grouped by class of 5° (Fig. 3a).The 374 inventoried joints were grouped according to theirmagnetic orientation (az value) by class of five degrees.
3. ResultsThe cavity was examined along the 421 m of the drain. 374joints, with a total length of 867.70 m of fissures (f), wereidentified.
3.1. Collector directions
The distribution of the 42 directions is very dispersed: noclass contains more than 4 sections and thus reaches 10%.It is relatively uniform across all classes, with a slightconcentration in two large sets (11–70° and 106–155°), inthe middle of less relevant values.Concerning the cumulativelength of the conduits (Fig. 3b), two sets are slightlyreinforced. The first set is bipolar with a first peak around11°/15°, a second around 31°/50°, and more specificallybetween 40° and 50°, clearly in SW/NE direction. Thesecond set is more uniform with a maximum in the136°/140° Class, the maximum being further accentuated asto the cumulative of NW/SE segment lengths.
Both directions, and especially values between 120° and150°, correspond to lineaments and faults of the Pays deCaux (Hauchard et al. 2002, 2008).
3.2. Joints in the collector
The output gallery is marked regularly with topographicstations used as a benchmark to locate oriented gallerysegments and fissures identified in the roof and the walls ofthe gallery. The total development of drain is 421 m (420.90 m), in which 374 joints are identified with a totalfissure length of 867.70 m. Thus, the average length offissure is 2.32 m, the number of fissures per linear meter ofdrain is 0.89, and the length of fissure (mf) per meter ofdrain is 2.06 m.
For morphological reasons (Fig. 2), we divided the maingallery into four sectors, namely:
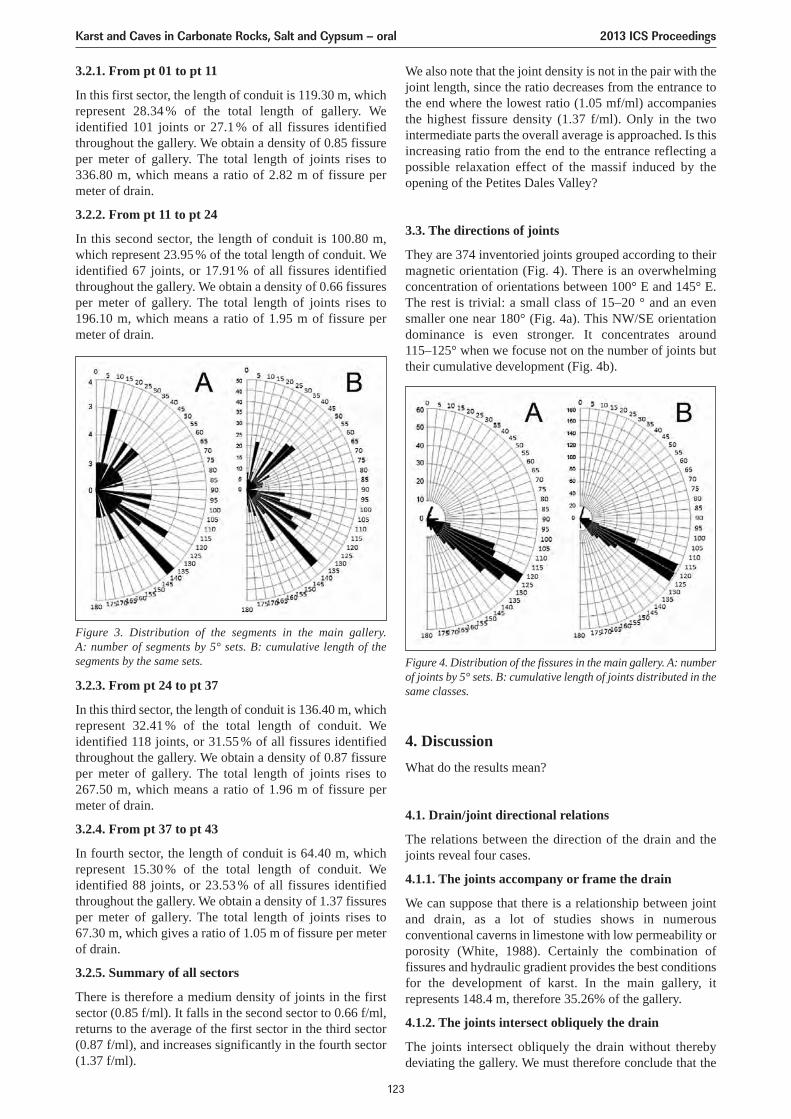
3.2.3. From pt 24 to pt 37
In this third sector, the length of conduit is 136.40 m, whichrepresent 32.41 % of the total length of conduit. Weidentified 118 joints, or 31.55 % of all fissures identifiedthroughout the gallery. We obtain a density of 0.87 fissureper meter of gallery. The total length of joints rises to267.50 m, which means a ratio of 1.96 m of fissure permeter of drain.
3.2.4. From pt 37 to pt 43
In fourth sector, the length of conduit is 64.40 m, whichrepresent 15.30 % of the total length of conduit. Weidentified 88 joints, or 23.53 % of all fissures identifiedthroughout the gallery. We obtain a density of 1.37 fissuresper meter of gallery. The total length of joints rises to67.30 m, which gives a ratio of 1.05 m of fissure per meterof drain.
3.2.5. Summary of all sectors
There is therefore a medium density of joints in the firstsector (0.85 f/ml). It falls in the second sector to 0.66 f/ml,returns to the average of the first sector in the third sector(0.87 f/ml), and increases significantly in the fourth sector(1.37 f/ml).
We also note that the joint density is not in the pair with thejoint length, since the ratio decreases from the entrance tothe end where the lowest ratio (1.05 mf/ml) accompaniesthe highest fissure density (1.37 f/ml). Only in the twointermediate parts the overall average is approached. Is thisincreasing ratio from the end to the entrance reflecting apossible relaxation effect of the massif induced by theopening of the Petites Dales Valley?
3.3. The directions of joints
They are 374 inventoried joints grouped according to theirmagnetic orientation (Fig. 4). There is an overwhelmingconcentration of orientations between 100° E and 145° E.The rest is trivial: a small class of 15–20 ° and an evensmaller one near 180° (Fig. 4a). This NW/SE orientationdominance is even stronger. It concentrates around 115–125° when we focuse not on the number of joints buttheir cumulative development (Fig. 4b).
4. DiscussionWhat do the results mean?
4.1. Drain/joint directional relations
The relations between the direction of the drain and thejoints reveal four cases.
4.1.1. The joints accompany or frame the drain
We can suppose that there is a relationship between jointand drain, as a lot of studies shows in numerousconventional caverns in limestone with low permeability orporosity (White, 1988). Certainly the combination offissures and hydraulic gradient provides the best conditionsfor the development of karst. In the main gallery, itrepresents 148.4 m, therefore 35.26% of the gallery.
4.1.2. The joints intersect obliquely the drain
The joints intersect obliquely the drain without therebydeviating the gallery. We must therefore conclude that the
3.2.1. From pt 01 to pt 11
In this first sector, the length of conduit is 119.30 m, whichrepresent 28.34 % of the total length of gallery. Weidentified 101 joints or 27.1 % of all fissures identifiedthroughout the gallery. We obtain a density of 0.85 fissureper meter of gallery. The total length of joints rises to336.80 m, which means a ratio of 2.82 m of fissure permeter of drain.
3.2.2. From pt 11 to pt 24
In this second sector, the length of conduit is 100.80 m,which represent 23.95% of the total length of conduit. Weidentified 67 joints, or 17.91 % of all fissures identifiedthroughout the gallery. We obtain a density of 0.66 fissuresper meter of gallery. The total length of joints rises to196.10 m, which means a ratio of 1.95 m of fissure permeter of drain.
Figure 3. Distribution of the segments in the main gallery.A: number of segments by 5° sets. B: cumulative length of thesegments by the same sets. Figure 4. Distribution of the fissures in the main gallery. A: number
of joints by 5° sets. B: cumulative length of joints distributed in thesame classes.
Karst and Caves in Carbonate Rocks, Salt and Gypsum – oral 2013 ICS Proceedings
123
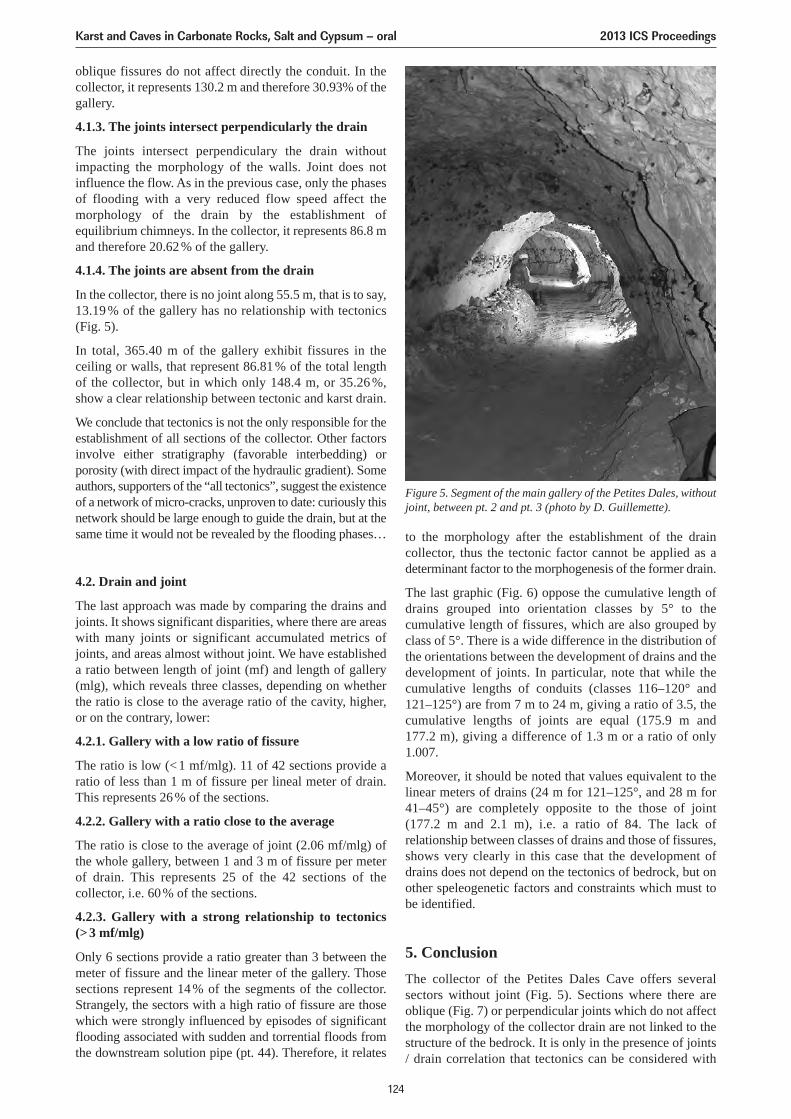
oblique fissures do not affect directly the conduit. In thecollector, it represents 130.2 m and therefore 30.93% of thegallery.
4.1.3. The joints intersect perpendicularly the drain
The joints intersect perpendiculary the drain withoutimpacting the morphology of the walls. Joint does notinfluence the flow. As in the previous case, only the phasesof flooding with a very reduced flow speed affect themorphology of the drain by the establishment ofequilibrium chimneys. In the collector, it represents 86.8 mand therefore 20.62% of the gallery.
4.1.4. The joints are absent from the drain
In the collector, there is no joint along 55.5 m, that is to say,13.19 % of the gallery has no relationship with tectonics(Fig. 5).
In total, 365.40 m of the gallery exhibit fissures in theceiling or walls, that represent 86.81% of the total lengthof the collector, but in which only 148.4 m, or 35.26 %,show a clear relationship between tectonic and karst drain.
We conclude that tectonics is not the only responsible for theestablishment of all sections of the collector. Other factorsinvolve either stratigraphy (favorable interbedding) orporosity (with direct impact of the hydraulic gradient). Someauthors, supporters of the “all tectonics”, suggest the existenceof a network of micro-cracks, unproven to date: curiously thisnetwork should be large enough to guide the drain, but at thesame time it would not be revealed by the flooding phases…
4.2. Drain and joint
The last approach was made by comparing the drains andjoints. It shows significant disparities, where there are areaswith many joints or significant accumulated metrics ofjoints, and areas almost without joint. We have establisheda ratio between length of joint (mf) and length of gallery(mlg), which reveals three classes, depending on whetherthe ratio is close to the average ratio of the cavity, higher,or on the contrary, lower:
4.2.1. Gallery with a low ratio of fissure
The ratio is low (<1 mf/mlg). 11 of 42 sections provide aratio of less than 1 m of fissure per lineal meter of drain.This represents 26% of the sections.
4.2.2. Gallery with a ratio close to the average
The ratio is close to the average of joint (2.06 mf/mlg) ofthe whole gallery, between 1 and 3 m of fissure per meterof drain. This represents 25 of the 42 sections of thecollector, i.e. 60% of the sections.
4.2.3. Gallery with a strong relationship to tectonics(>3 mf/mlg)
Only 6 sections provide a ratio greater than 3 between themeter of fissure and the linear meter of the gallery. Thosesections represent 14% of the segments of the collector.Strangely, the sectors with a high ratio of fissure are thosewhich were strongly influenced by episodes of significantflooding associated with sudden and torrential floods fromthe downstream solution pipe (pt. 44). Therefore, it relates
Karst and Caves in Carbonate Rocks, Salt and Gypsum – oral 2013 ICS Proceedings
124
to the morphology after the establishment of the draincollector, thus the tectonic factor cannot be applied as adeterminant factor to the morphogenesis of the former drain.
The last graphic (Fig. 6) oppose the cumulative length ofdrains grouped into orientation classes by 5° to thecumulative length of fissures, which are also grouped byclass of 5°. There is a wide difference in the distribution ofthe orientations between the development of drains and thedevelopment of joints. In particular, note that while thecumulative lengths of conduits (classes 116–120° and 121–125°) are from 7 m to 24 m, giving a ratio of 3.5, thecumulative lengths of joints are equal (175.9 m and 177.2 m), giving a difference of 1.3 m or a ratio of only1.007.
Moreover, it should be noted that values equivalent to thelinear meters of drains (24 m for 121–125°, and 28 m for41–45°) are completely opposite to the those of joint (177.2 m and 2.1 m), i.e. a ratio of 84. The lack ofrelationship between classes of drains and those of fissures,shows very clearly in this case that the development ofdrains does not depend on the tectonics of bedrock, but onother speleogenetic factors and constraints which must tobe identified.
5. ConclusionThe collector of the Petites Dales Cave offers severalsectors without joint (Fig. 5). Sections where there areoblique (Fig. 7) or perpendicular joints which do not affectthe morphology of the collector drain are not linked to thestructure of the bedrock. It is only in the presence of joints/ drain correlation that tectonics can be considered with
Figure 5. Segment of the main gallery of the Petites Dales, withoutjoint, between pt. 2 and pt. 3 (photo by D. Guillemette).
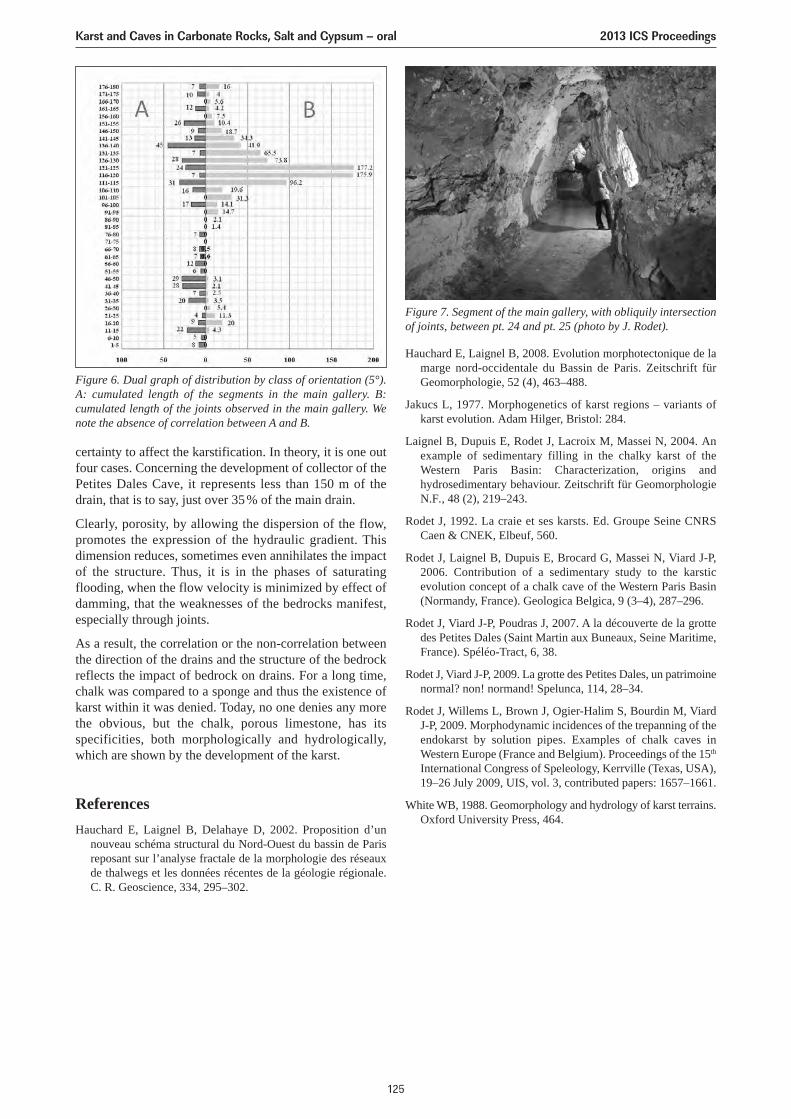
certainty to affect the karstification. In theory, it is one outfour cases. Concerning the development of collector of thePetites Dales Cave, it represents less than 150 m of thedrain, that is to say, just over 35% of the main drain.
Clearly, porosity, by allowing the dispersion of the flow,promotes the expression of the hydraulic gradient. Thisdimension reduces, sometimes even annihilates the impactof the structure. Thus, it is in the phases of saturatingflooding, when the flow velocity is minimized by effect ofdamming, that the weaknesses of the bedrocks manifest,especially through joints.
As a result, the correlation or the non-correlation betweenthe direction of the drains and the structure of the bedrockreflects the impact of bedrock on drains. For a long time,chalk was compared to a sponge and thus the existence ofkarst within it was denied. Today, no one denies any morethe obvious, but the chalk, porous limestone, has itsspecificities, both morphologically and hydrologically,which are shown by the development of the karst.
ReferencesHauchard E, Laignel B, Delahaye D, 2002. Proposition d’un
nouveau schéma structural du Nord-Ouest du bassin de Parisreposant sur l’analyse fractale de la morphologie des réseauxde thalwegs et les données récentes de la géologie régionale.C. R. Geoscience, 334, 295–302.
Figure 6. Dual graph of distribution by class of orientation (5°).A: cumulated length of the segments in the main gallery. B:cumulated length of the joints observed in the main gallery. Wenote the absence of correlation between A and B.
Figure 7. Segment of the main gallery, with obliquily intersectionof joints, between pt. 24 and pt. 25 (photo by J. Rodet).
Hauchard E, Laignel B, 2008. Evolution morphotectonique de lamarge nord-occidentale du Bassin de Paris. Zeitschrift fürGeomorphologie, 52 (4), 463–488.
Jakucs L, 1977. Morphogenetics of karst regions – variants ofkarst evolution. Adam Hilger, Bristol: 284.
Laignel B, Dupuis E, Rodet J, Lacroix M, Massei N, 2004. Anexample of sedimentary filling in the chalky karst of theWestern Paris Basin: Characterization, origins andhydrosedimentary behaviour. Zeitschrift für GeomorphologieN.F., 48 (2), 219–243.
Rodet J, 1992. La craie et ses karsts. Ed. Groupe Seine CNRSCaen & CNEK, Elbeuf, 560.
Rodet J, Laignel B, Dupuis E, Brocard G, Massei N, Viard J-P,2006. Contribution of a sedimentary study to the karsticevolution concept of a chalk cave of the Western Paris Basin(Normandy, France). Geologica Belgica, 9 (3–4), 287–296.
Rodet J, Viard J-P, Poudras J, 2007. A la découverte de la grottedes Petites Dales (Saint Martin aux Buneaux, Seine Maritime,France). Spéléo-Tract, 6, 38.
Rodet J, Viard J-P, 2009. La grotte des Petites Dales, un patrimoinenormal? non! normand! Spelunca, 114, 28–34.
Rodet J, Willems L, Brown J, Ogier-Halim S, Bourdin M, ViardJ-P, 2009. Morphodynamic incidences of the trepanning of theendokarst by solution pipes. Examples of chalk caves inWestern Europe (France and Belgium). Proceedings of the 15th
International Congress of Speleology, Kerrville (Texas, USA),19–26 July 2009, UIS, vol. 3, contributed papers: 1657–1661.
White WB, 1988. Geomorphology and hydrology of karst terrains.Oxford University Press, 464.
Karst and Caves in Carbonate Rocks, Salt and Gypsum – oral 2013 ICS Proceedings
125
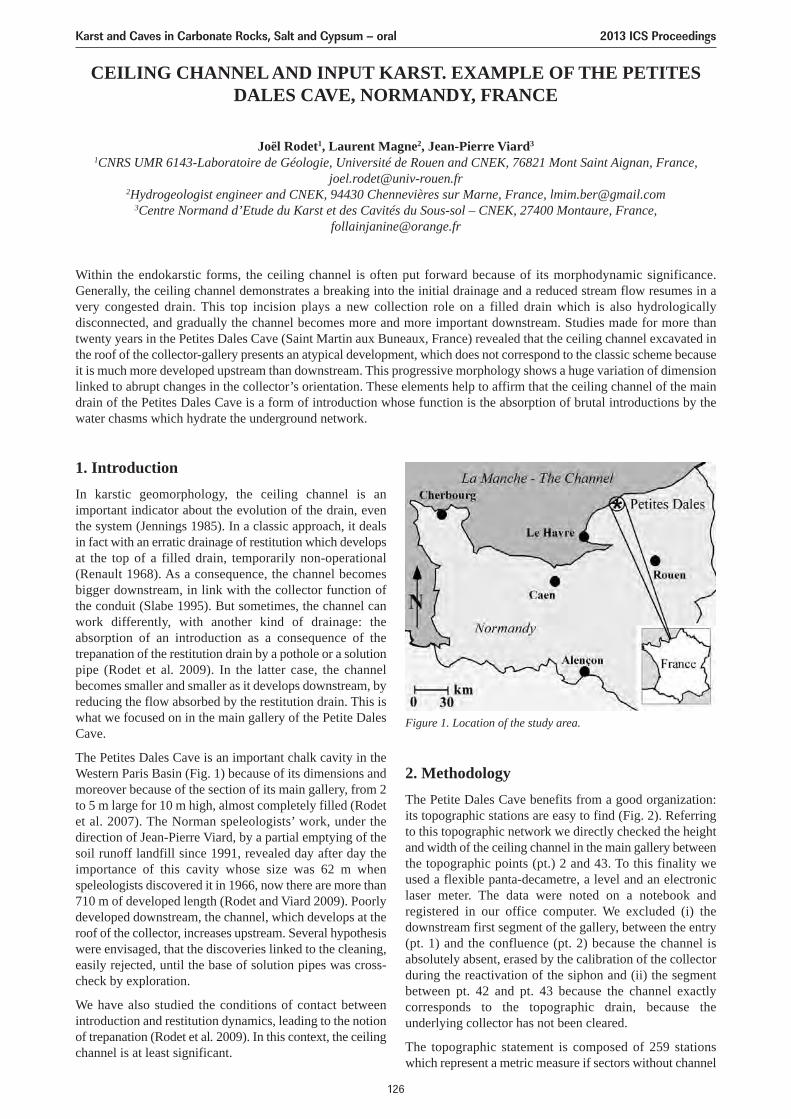
CEILING CHANNEL AND INPUT KARST. EXAMPLE OF THE PETITESDALES CAVE, NORMANDY, FRANCE
Joël Rodet1, Laurent Magne2, Jean-Pierre Viard3
1CNRS UMR 6143-Laboratoire de Géologie, Université de Rouen and CNEK, 76821 Mont Saint Aignan, France,[email protected]
2Hydrogeologist engineer and CNEK, 94430 Chennevières sur Marne, France, [email protected] Normand d’Etude du Karst et des Cavités du Sous-sol – CNEK, 27400 Montaure, France,
Within the endokarstic forms, the ceiling channel is often put forward because of its morphodynamic significance.Generally, the ceiling channel demonstrates a breaking into the initial drainage and a reduced stream flow resumes in avery congested drain. This top incision plays a new collection role on a filled drain which is also hydrologicallydisconnected, and gradually the channel becomes more and more important downstream. Studies made for more thantwenty years in the Petites Dales Cave (Saint Martin aux Buneaux, France) revealed that the ceiling channel excavated inthe roof of the collector-gallery presents an atypical development, which does not correspond to the classic scheme becauseit is much more developed upstream than downstream. This progressive morphology shows a huge variation of dimensionlinked to abrupt changes in the collector’s orientation. These elements help to affirm that the ceiling channel of the maindrain of the Petites Dales Cave is a form of introduction whose function is the absorption of brutal introductions by thewater chasms which hydrate the underground network.
1. IntroductionIn karstic geomorphology, the ceiling channel is animportant indicator about the evolution of the drain, eventhe system (Jennings 1985). In a classic approach, it dealsin fact with an erratic drainage of restitution which developsat the top of a filled drain, temporarily non-operational(Renault 1968). As a consequence, the channel becomesbigger downstream, in link with the collector function ofthe conduit (Slabe 1995). But sometimes, the channel canwork differently, with another kind of drainage: theabsorption of an introduction as a consequence of thetrepanation of the restitution drain by a pothole or a solutionpipe (Rodet et al. 2009). In the latter case, the channelbecomes smaller and smaller as it develops downstream, byreducing the flow absorbed by the restitution drain. This iswhat we focused on in the main gallery of the Petite DalesCave.
The Petites Dales Cave is an important chalk cavity in theWestern Paris Basin (Fig. 1) because of its dimensions andmoreover because of the section of its main gallery, from 2to 5 m large for 10 m high, almost completely filled (Rodetet al. 2007). The Norman speleologists’ work, under thedirection of Jean-Pierre Viard, by a partial emptying of thesoil runoff landfill since 1991, revealed day after day theimportance of this cavity whose size was 62 m whenspeleologists discovered it in 1966, now there are more than710 m of developed length (Rodet and Viard 2009). Poorlydeveloped downstream, the channel, which develops at theroof of the collector, increases upstream. Several hypothesiswere envisaged, that the discoveries linked to the cleaning,easily rejected, until the base of solution pipes was cross-check by exploration.
We have also studied the conditions of contact betweenintroduction and restitution dynamics, leading to the notionof trepanation (Rodet et al. 2009). In this context, the ceilingchannel is at least significant.
2. MethodologyThe Petite Dales Cave benefits from a good organization:its topographic stations are easy to find (Fig. 2). Referringto this topographic network we directly checked the heightand width of the ceiling channel in the main gallery betweenthe topographic points (pt.) 2 and 43. To this finality weused a flexible panta-decametre, a level and an electroniclaser meter. The data were noted on a notebook andregistered in our office computer. We excluded (i) thedownstream first segment of the gallery, between the entry(pt. 1) and the confluence (pt. 2) because the channel isabsolutely absent, erased by the calibration of the collectorduring the reactivation of the siphon and (ii) the segmentbetween pt. 42 and pt. 43 because the channel exactlycorresponds to the topographic drain, because theunderlying collector has not been cleared.
The topographic statement is composed of 259 stationswhich represent a metric measure if sectors without channel
Figure 1. Location of the study area.
Karst and Caves in Carbonate Rocks, Salt and Gypsum – oral 2013 ICS Proceedings
126
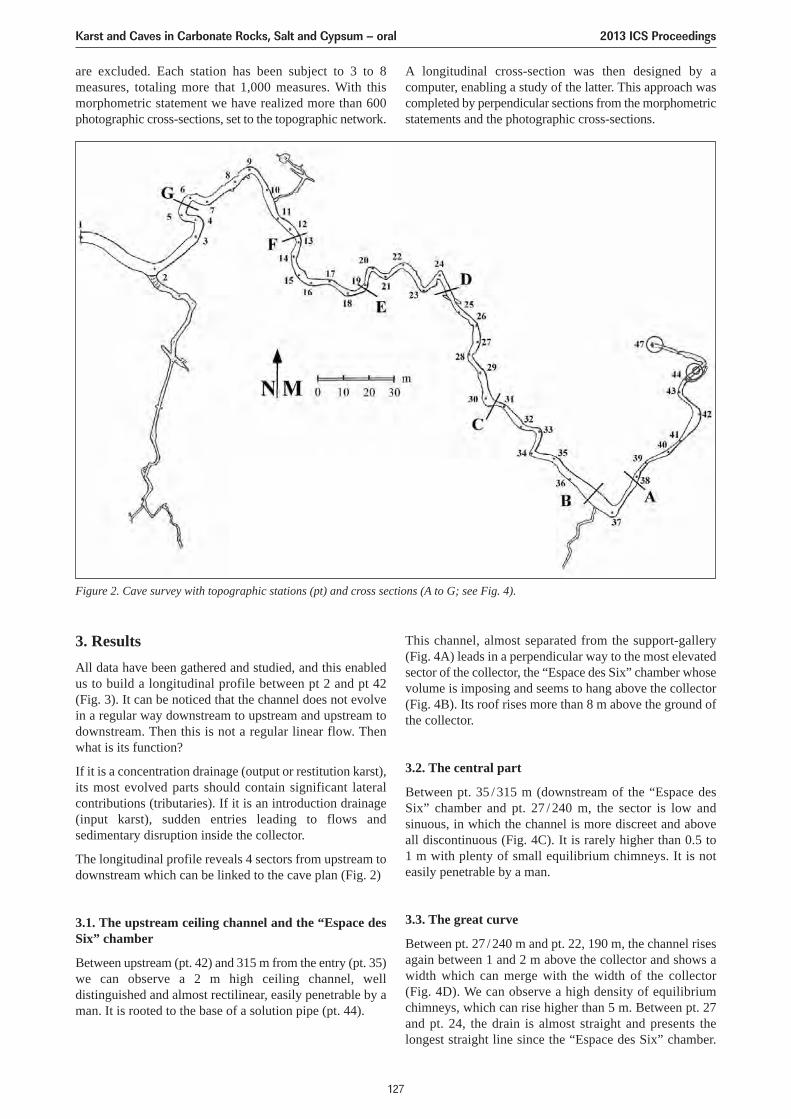
are excluded. Each station has been subject to 3 to 8measures, totaling more that 1,000 measures. With thismorphometric statement we have realized more than 600photographic cross-sections, set to the topographic network.
A longitudinal cross-section was then designed by acomputer, enabling a study of the latter. This approach wascompleted by perpendicular sections from the morphometricstatements and the photographic cross-sections.
Figure 2. Cave survey with topographic stations (pt) and cross sections (A to G; see Fig. 4).
3. ResultsAll data have been gathered and studied, and this enabledus to build a longitudinal profile between pt 2 and pt 42(Fig. 3). It can be noticed that the channel does not evolvein a regular way downstream to upstream and upstream todownstream. Then this is not a regular linear flow. Thenwhat is its function?
If it is a concentration drainage (output or restitution karst),its most evolved parts should contain significant lateralcontributions (tributaries). If it is an introduction drainage(input karst), sudden entries leading to flows andsedimentary disruption inside the collector.
The longitudinal profile reveals 4 sectors from upstream todownstream which can be linked to the cave plan (Fig. 2)
3.1. The upstream ceiling channel and the “Espace desSix” chamber
Between upstream (pt. 42) and 315 m from the entry (pt. 35)we can observe a 2 m high ceiling channel, welldistinguished and almost rectilinear, easily penetrable by aman. It is rooted to the base of a solution pipe (pt. 44).
This channel, almost separated from the support-gallery(Fig. 4A) leads in a perpendicular way to the most elevatedsector of the collector, the “Espace des Six” chamber whosevolume is imposing and seems to hang above the collector(Fig. 4B). Its roof rises more than 8 m above the ground ofthe collector.
3.2. The central part
Between pt. 35 / 315 m (downstream of the “Espace desSix” chamber and pt. 27 / 240 m, the sector is low andsinuous, in which the channel is more discreet and aboveall discontinuous (Fig. 4C). It is rarely higher than 0.5 to 1 m with plenty of small equilibrium chimneys. It is noteasily penetrable by a man.
3.3. The great curve
Between pt. 27 /240 m and pt. 22, 190 m, the channel risesagain between 1 and 2 m above the collector and shows awidth which can merge with the width of the collector (Fig. 4D). We can observe a high density of equilibriumchimneys, which can rise higher than 5 m. Between pt. 27and pt. 24, the drain is almost straight and presents thelongest straight line since the “Espace des Six” chamber.
Karst and Caves in Carbonate Rocks, Salt and Gypsum – oral 2013 ICS Proceedings
127
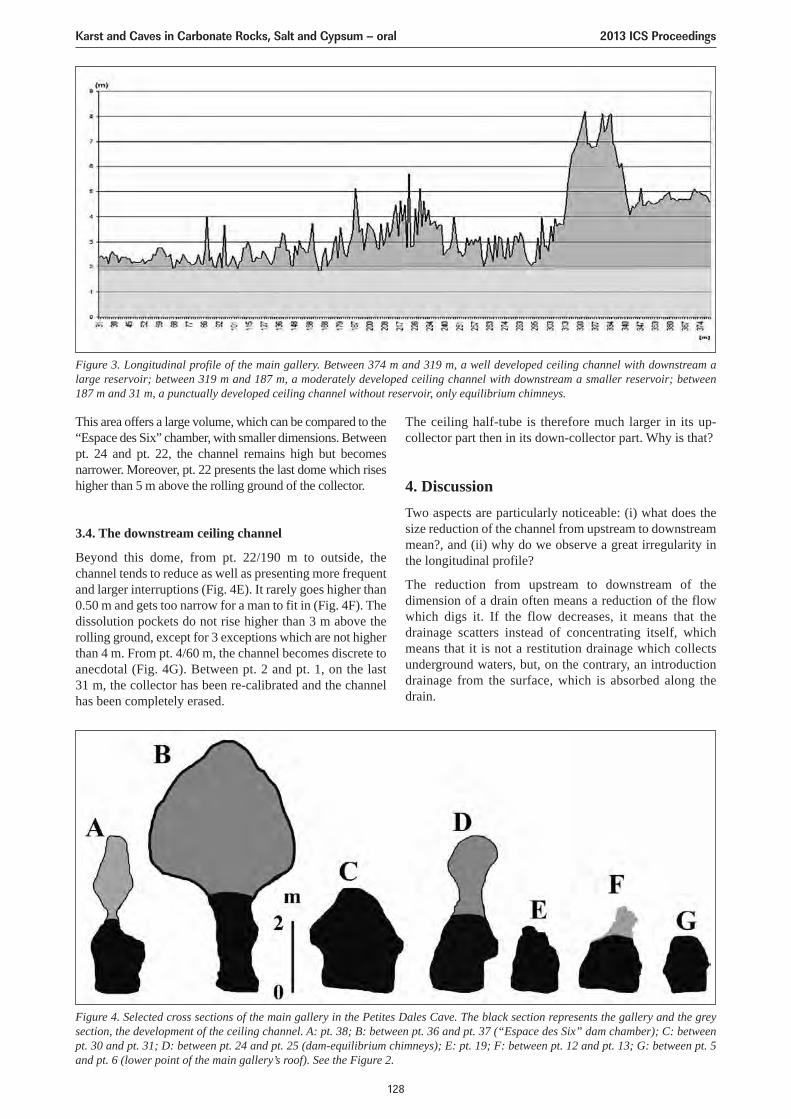
This area offers a large volume, which can be compared to the“Espace des Six” chamber, with smaller dimensions. Betweenpt. 24 and pt. 22, the channel remains high but becomesnarrower. Moreover, pt. 22 presents the last dome which riseshigher than 5 m above the rolling ground of the collector.
3.4. The downstream ceiling channel
Beyond this dome, from pt. 22/190 m to outside, thechannel tends to reduce as well as presenting more frequentand larger interruptions (Fig. 4E). It rarely goes higher than0.50 m and gets too narrow for a man to fit in (Fig. 4F). Thedissolution pockets do not rise higher than 3 m above therolling ground, except for 3 exceptions which are not higherthan 4 m. From pt. 4/60 m, the channel becomes discrete toanecdotal (Fig. 4G). Between pt. 2 and pt. 1, on the last 31 m, the collector has been re-calibrated and the channelhas been completely erased.
The ceiling half-tube is therefore much larger in its up-collector part then in its down-collector part. Why is that?
4. DiscussionTwo aspects are particularly noticeable: (i) what does thesize reduction of the channel from upstream to downstreammean?, and (ii) why do we observe a great irregularity inthe longitudinal profile?
The reduction from upstream to downstream of thedimension of a drain often means a reduction of the flowwhich digs it. If the flow decreases, it means that thedrainage scatters instead of concentrating itself, whichmeans that it is not a restitution drainage which collectsunderground waters, but, on the contrary, an introductiondrainage from the surface, which is absorbed along thedrain.
Figure 3. Longitudinal profile of the main gallery. Between 374 m and 319 m, a well developed ceiling channel with downstream alarge reservoir; between 319 m and 187 m, a moderately developed ceiling channel with downstream a smaller reservoir; between187 m and 31 m, a punctually developed ceiling channel without reservoir, only equilibrium chimneys.
Figure 4. Selected cross sections of the main gallery in the Petites Dales Cave. The black section represents the gallery and the greysection, the development of the ceiling channel. A: pt. 38; B: between pt. 36 and pt. 37 (“Espace des Six” dam chamber); C: betweenpt. 30 and pt. 31; D: between pt. 24 and pt. 25 (dam-equilibrium chimneys); E: pt. 19; F: between pt. 12 and pt. 13; G: between pt. 5and pt. 6 (lower point of the main gallery’s roof). See the Figure 2.
Karst and Caves in Carbonate Rocks, Salt and Gypsum – oral 2013 ICS Proceedings
128
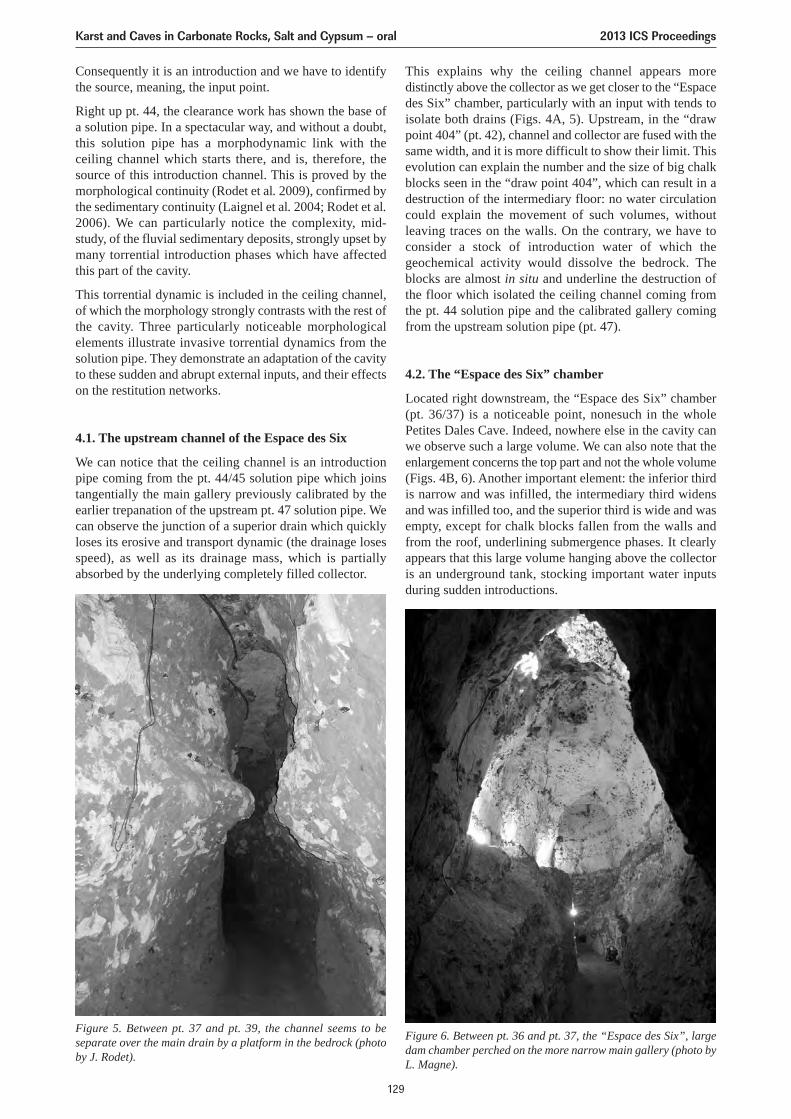
Consequently it is an introduction and we have to identifythe source, meaning, the input point.
Right up pt. 44, the clearance work has shown the base ofa solution pipe. In a spectacular way, and without a doubt,this solution pipe has a morphodynamic link with theceiling channel which starts there, and is, therefore, thesource of this introduction channel. This is proved by themorphological continuity (Rodet et al. 2009), confirmed bythe sedimentary continuity (Laignel et al. 2004; Rodet et al.2006). We can particularly notice the complexity, mid-study, of the fluvial sedimentary deposits, strongly upset bymany torrential introduction phases which have affectedthis part of the cavity.
This torrential dynamic is included in the ceiling channel,of which the morphology strongly contrasts with the rest ofthe cavity. Three particularly noticeable morphologicalelements illustrate invasive torrential dynamics from thesolution pipe. They demonstrate an adaptation of the cavityto these sudden and abrupt external inputs, and their effectson the restitution networks.
4.1. The upstream channel of the Espace des Six
We can notice that the ceiling channel is an introductionpipe coming from the pt. 44/45 solution pipe which joinstangentially the main gallery previously calibrated by theearlier trepanation of the upstream pt. 47 solution pipe. Wecan observe the junction of a superior drain which quicklyloses its erosive and transport dynamic (the drainage losesspeed), as well as its drainage mass, which is partiallyabsorbed by the underlying completely filled collector.
This explains why the ceiling channel appears moredistinctly above the collector as we get closer to the “Espacedes Six” chamber, particularly with an input with tends toisolate both drains (Figs. 4A, 5). Upstream, in the “drawpoint 404” (pt. 42), channel and collector are fused with thesame width, and it is more difficult to show their limit. Thisevolution can explain the number and the size of big chalkblocks seen in the “draw point 404”, which can result in adestruction of the intermediary floor: no water circulationcould explain the movement of such volumes, withoutleaving traces on the walls. On the contrary, we have toconsider a stock of introduction water of which thegeochemical activity would dissolve the bedrock. Theblocks are almost in situ and underline the destruction ofthe floor which isolated the ceiling channel coming fromthe pt. 44 solution pipe and the calibrated gallery comingfrom the upstream solution pipe (pt. 47).
4.2. The “Espace des Six” chamber
Located right downstream, the “Espace des Six” chamber(pt. 36/37) is a noticeable point, nonesuch in the wholePetites Dales Cave. Indeed, nowhere else in the cavity canwe observe such a large volume. We can also note that theenlargement concerns the top part and not the whole volume(Figs. 4B, 6). Another important element: the inferior thirdis narrow and was infilled, the intermediary third widensand was infilled too, and the superior third is wide and wasempty, except for chalk blocks fallen from the walls andfrom the roof, underlining submergence phases. It clearlyappears that this large volume hanging above the collectoris an underground tank, stocking important water inputsduring sudden introductions.
Figure 5. Between pt. 37 and pt. 39, the channel seems to beseparate over the main drain by a platform in the bedrock (photoby J. Rodet).
Figure 6. Between pt. 36 and pt. 37, the “Espace des Six”, largedam chamber perched on the more narrow main gallery (photo byL. Magne).
Karst and Caves in Carbonate Rocks, Salt and Gypsum – oral 2013 ICS Proceedings
129
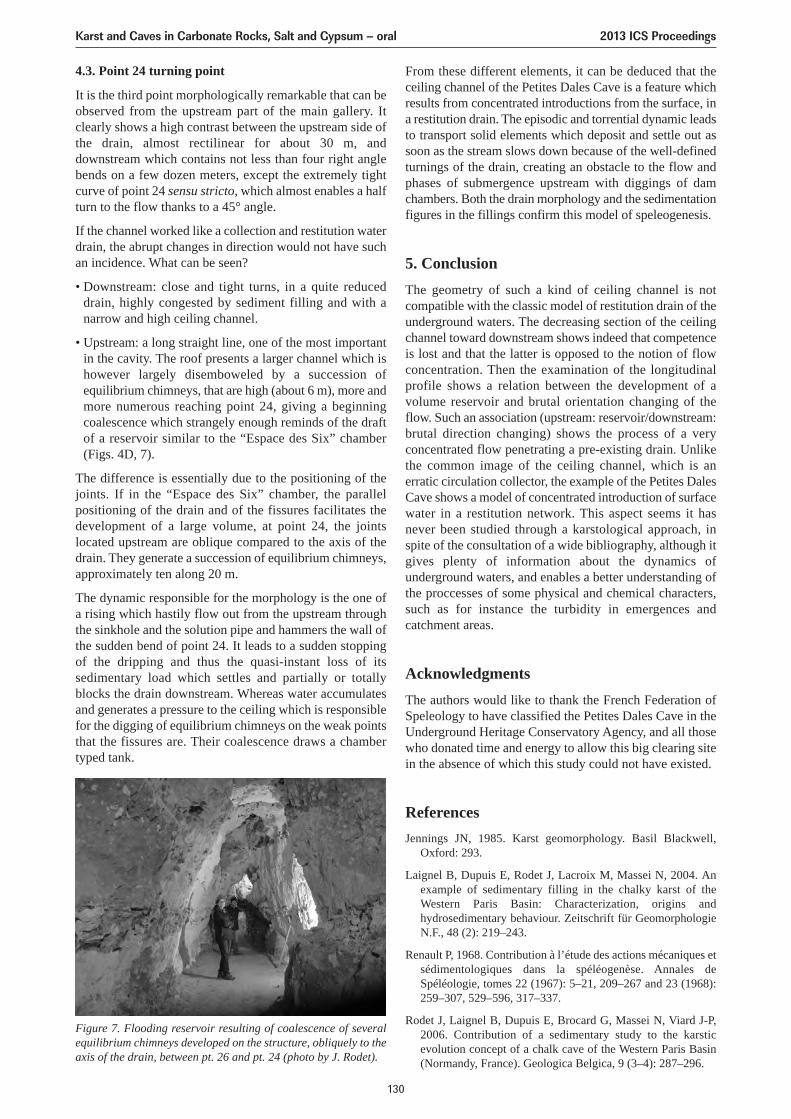
4.3. Point 24 turning point
It is the third point morphologically remarkable that can beobserved from the upstream part of the main gallery. Itclearly shows a high contrast between the upstream side ofthe drain, almost rectilinear for about 30 m, anddownstream which contains not less than four right anglebends on a few dozen meters, except the extremely tightcurve of point 24 sensu stricto, which almost enables a halfturn to the flow thanks to a 45° angle.
If the channel worked like a collection and restitution waterdrain, the abrupt changes in direction would not have suchan incidence. What can be seen?
• Downstream: close and tight turns, in a quite reduceddrain, highly congested by sediment filling and with anarrow and high ceiling channel.
• Upstream: a long straight line, one of the most importantin the cavity. The roof presents a larger channel which ishowever largely disemboweled by a succession ofequilibrium chimneys, that are high (about 6 m), more andmore numerous reaching point 24, giving a beginningcoalescence which strangely enough reminds of the draftof a reservoir similar to the “Espace des Six” chamber(Figs. 4D, 7).
The difference is essentially due to the positioning of thejoints. If in the “Espace des Six” chamber, the parallelpositioning of the drain and of the fissures facilitates thedevelopment of a large volume, at point 24, the jointslocated upstream are oblique compared to the axis of thedrain. They generate a succession of equilibrium chimneys,approximately ten along 20 m.
The dynamic responsible for the morphology is the one ofa rising which hastily flow out from the upstream throughthe sinkhole and the solution pipe and hammers the wall ofthe sudden bend of point 24. It leads to a sudden stoppingof the dripping and thus the quasi-instant loss of itssedimentary load which settles and partially or totallyblocks the drain downstream. Whereas water accumulatesand generates a pressure to the ceiling which is responsiblefor the digging of equilibrium chimneys on the weak pointsthat the fissures are. Their coalescence draws a chambertyped tank.
From these different elements, it can be deduced that theceiling channel of the Petites Dales Cave is a feature whichresults from concentrated introductions from the surface, ina restitution drain. The episodic and torrential dynamic leadsto transport solid elements which deposit and settle out assoon as the stream slows down because of the well-definedturnings of the drain, creating an obstacle to the flow andphases of submergence upstream with diggings of damchambers. Both the drain morphology and the sedimentationfigures in the fillings confirm this model of speleogenesis.
5. ConclusionThe geometry of such a kind of ceiling channel is notcompatible with the classic model of restitution drain of theunderground waters. The decreasing section of the ceilingchannel toward downstream shows indeed that competenceis lost and that the latter is opposed to the notion of flowconcentration. Then the examination of the longitudinalprofile shows a relation between the development of avolume reservoir and brutal orientation changing of theflow. Such an association (upstream: reservoir/downstream:brutal direction changing) shows the process of a veryconcentrated flow penetrating a pre-existing drain. Unlikethe common image of the ceiling channel, which is anerratic circulation collector, the example of the Petites DalesCave shows a model of concentrated introduction of surfacewater in a restitution network. This aspect seems it hasnever been studied through a karstological approach, inspite of the consultation of a wide bibliography, although itgives plenty of information about the dynamics ofunderground waters, and enables a better understanding ofthe proccesses of some physical and chemical characters,such as for instance the turbidity in emergences andcatchment areas.
AcknowledgmentsThe authors would like to thank the French Federation ofSpeleology to have classified the Petites Dales Cave in theUnderground Heritage Conservatory Agency, and all thosewho donated time and energy to allow this big clearing sitein the absence of which this study could not have existed.
ReferencesJennings JN, 1985. Karst geomorphology. Basil Blackwell,
Oxford: 293.
Laignel B, Dupuis E, Rodet J, Lacroix M, Massei N, 2004. Anexample of sedimentary filling in the chalky karst of theWestern Paris Basin: Characterization, origins andhydrosedimentary behaviour. Zeitschrift für GeomorphologieN.F., 48 (2): 219–243.
Renault P, 1968. Contribution à l’étude des actions mécaniques etsédimentologiques dans la spéléogenèse. Annales deSpéléologie, tomes 22 (1967): 5–21, 209–267 and 23 (1968):259–307, 529–596, 317–337.
Rodet J, Laignel B, Dupuis E, Brocard G, Massei N, Viard J-P,2006. Contribution of a sedimentary study to the karsticevolution concept of a chalk cave of the Western Paris Basin(Normandy, France). Geologica Belgica, 9 (3–4): 287–296.
Figure 7. Flooding reservoir resulting of coalescence of severalequilibrium chimneys developed on the structure, obliquely to theaxis of the drain, between pt. 26 and pt. 24 (photo by J. Rodet).
Karst and Caves in Carbonate Rocks, Salt and Gypsum – oral 2013 ICS Proceedings
130

Rodet J, Machado MMM, Ruchkys de Avezedo Ú, 2012. Thoughtsabout the karstic heritage management and its enhancement:examples from Normandy and Brazil. Proceedings of the 13th
National Congress of Speleology, Muotathal (CH), 29 sept.–01 oct. 2012: 305–306, abstract, PPT.
Rodet J and Viard J-P, 2009. La grotte des Petites Dales, unpatrimoine normal? non! normand!. Spelunca, 114: 28–34.
Rodet J, Viard J-P, Poudras J, 2007. A la découverte de la grottedes Petites Dales (Saint Martin aux Buneaux, Seine Maritime,France). Spéléo-Tract, 6: 38.
Rodet J, Willems L, Brown J, Ogier-Halim S, Bourdin M, ViardJ-P, 2009. Morphodynamic incidences of the trepanning of theendokarst by solution pipes. Examples of chalk caves inWestern Europe (France and Belgium). Proceedings of the 15th
International Congress of Speleology, Kerrville (Texas, USA),19–26 July 2009, UIS, vol. 3, contributed papers: 1657–1661.
Slabe T, 1995. Cave rocky relief and its speleogeneticalsignificance. Znanstvenoraziskovalni Center SAZU, 128.
Karst and Caves in Carbonate Rocks, Salt and Gypsum – oral 2013 ICS Proceedings
131
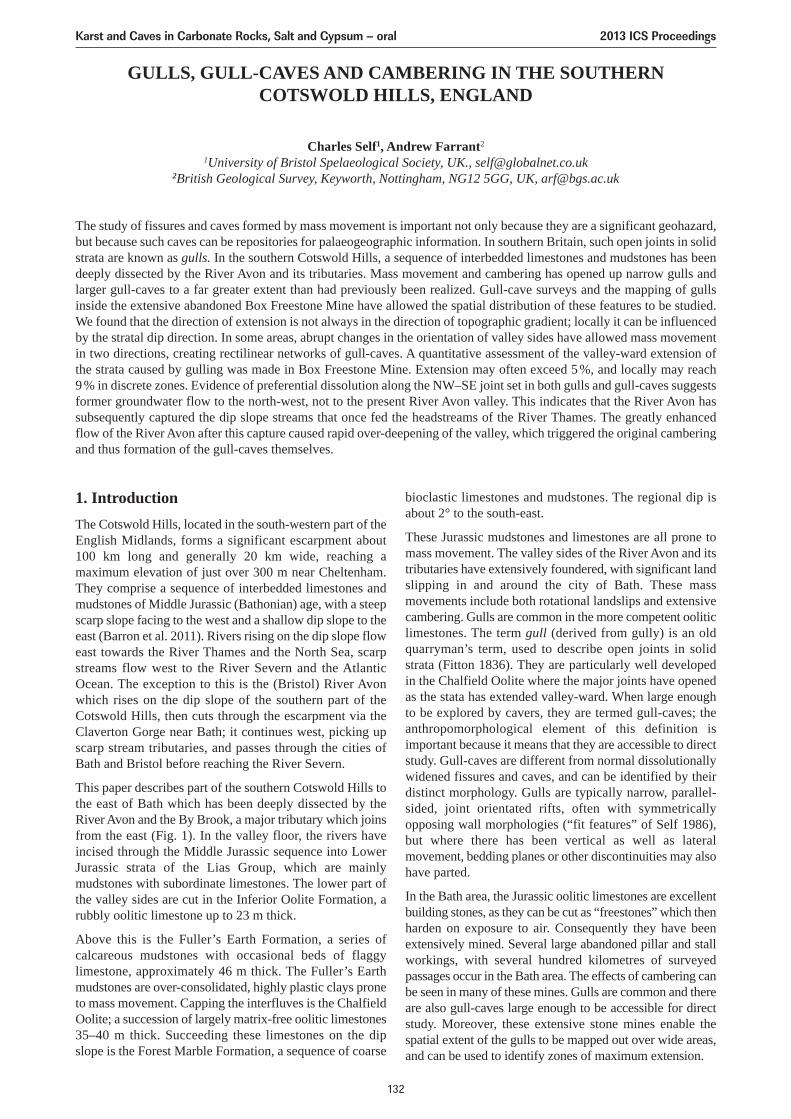
GULLS, GULL-CAVES AND CAMBERING IN THE SOUTHERNCOTSWOLD HILLS, ENGLAND
Charles Self1, Andrew Farrant2
1University of Bristol Spelaeological Society, UK., [email protected] Geological Survey, Keyworth, Nottingham, NG12 5GG, UK, [email protected]
The study of fissures and caves formed by mass movement is important not only because they are a significant geohazard,but because such caves can be repositories for palaeogeographic information. In southern Britain, such open joints in solidstrata are known as gulls. In the southern Cotswold Hills, a sequence of interbedded limestones and mudstones has beendeeply dissected by the River Avon and its tributaries. Mass movement and cambering has opened up narrow gulls andlarger gull-caves to a far greater extent than had previously been realized. Gull-cave surveys and the mapping of gullsinside the extensive abandoned Box Freestone Mine have allowed the spatial distribution of these features to be studied.We found that the direction of extension is not always in the direction of topographic gradient; locally it can be influencedby the stratal dip direction. In some areas, abrupt changes in the orientation of valley sides have allowed mass movementin two directions, creating rectilinear networks of gull-caves. A quantitative assessment of the valley-ward extension ofthe strata caused by gulling was made in Box Freestone Mine. Extension may often exceed 5%, and locally may reach 9% in discrete zones. Evidence of preferential dissolution along the NW–SE joint set in both gulls and gull-caves suggestsformer groundwater flow to the north-west, not to the present River Avon valley. This indicates that the River Avon hassubsequently captured the dip slope streams that once fed the headstreams of the River Thames. The greatly enhancedflow of the River Avon after this capture caused rapid over-deepening of the valley, which triggered the original camberingand thus formation of the gull-caves themselves.
1. IntroductionThe Cotswold Hills, located in the south-western part of theEnglish Midlands, forms a significant escarpment about 100 km long and generally 20 km wide, reaching amaximum elevation of just over 300 m near Cheltenham.They comprise a sequence of interbedded limestones andmudstones of Middle Jurassic (Bathonian) age, with a steepscarp slope facing to the west and a shallow dip slope to theeast (Barron et al. 2011). Rivers rising on the dip slope floweast towards the River Thames and the North Sea, scarpstreams flow west to the River Severn and the AtlanticOcean. The exception to this is the (Bristol) River Avonwhich rises on the dip slope of the southern part of theCotswold Hills, then cuts through the escarpment via theClaverton Gorge near Bath; it continues west, picking upscarp stream tributaries, and passes through the cities ofBath and Bristol before reaching the River Severn.
This paper describes part of the southern Cotswold Hills tothe east of Bath which has been deeply dissected by theRiver Avon and the By Brook, a major tributary which joinsfrom the east (Fig. 1). In the valley floor, the rivers haveincised through the Middle Jurassic sequence into LowerJurassic strata of the Lias Group, which are mainlymudstones with subordinate limestones. The lower part ofthe valley sides are cut in the Inferior Oolite Formation, arubbly oolitic limestone up to 23 m thick.
Above this is the Fuller’s Earth Formation, a series ofcalcareous mudstones with occasional beds of flaggylimestone, approximately 46 m thick. The Fuller’s Earthmudstones are over-consolidated, highly plastic clays proneto mass movement. Capping the interfluves is the ChalfieldOolite; a succession of largely matrix-free oolitic limestones35–40 m thick. Succeeding these limestones on the dipslope is the Forest Marble Formation, a sequence of coarse
bioclastic limestones and mudstones. The regional dip isabout 2° to the south-east.
These Jurassic mudstones and limestones are all prone tomass movement. The valley sides of the River Avon and itstributaries have extensively foundered, with significant landslipping in and around the city of Bath. These massmovements include both rotational landslips and extensivecambering. Gulls are common in the more competent ooliticlimestones. The term gull (derived from gully) is an oldquarryman’s term, used to describe open joints in solidstrata (Fitton 1836). They are particularly well developedin the Chalfield Oolite where the major joints have openedas the stata has extended valley-ward. When large enoughto be explored by cavers, they are termed gull-caves; theanthropomorphological element of this definition isimportant because it means that they are accessible to directstudy. Gull-caves are different from normal dissolutionallywidened fissures and caves, and can be identified by theirdistinct morphology. Gulls are typically narrow, parallel-sided, joint orientated rifts, often with symmetricallyopposing wall morphologies (“fit features” of Self 1986),but where there has been vertical as well as lateralmovement, bedding planes or other discontinuities may alsohave parted.
In the Bath area, the Jurassic oolitic limestones are excellentbuilding stones, as they can be cut as “freestones” which thenharden on exposure to air. Consequently they have beenextensively mined. Several large abandoned pillar and stallworkings, with several hundred kilometres of surveyedpassages occur in the Bath area. The effects of cambering canbe seen in many of these mines. Gulls are common and thereare also gull-caves large enough to be accessible for directstudy. Moreover, these extensive stone mines enable thespatial extent of the gulls to be mapped out over wide areas,and can be used to identify zones of maximum extension.
Karst and Caves in Carbonate Rocks, Salt and Gypsum – oral 2013 ICS Proceedings
132
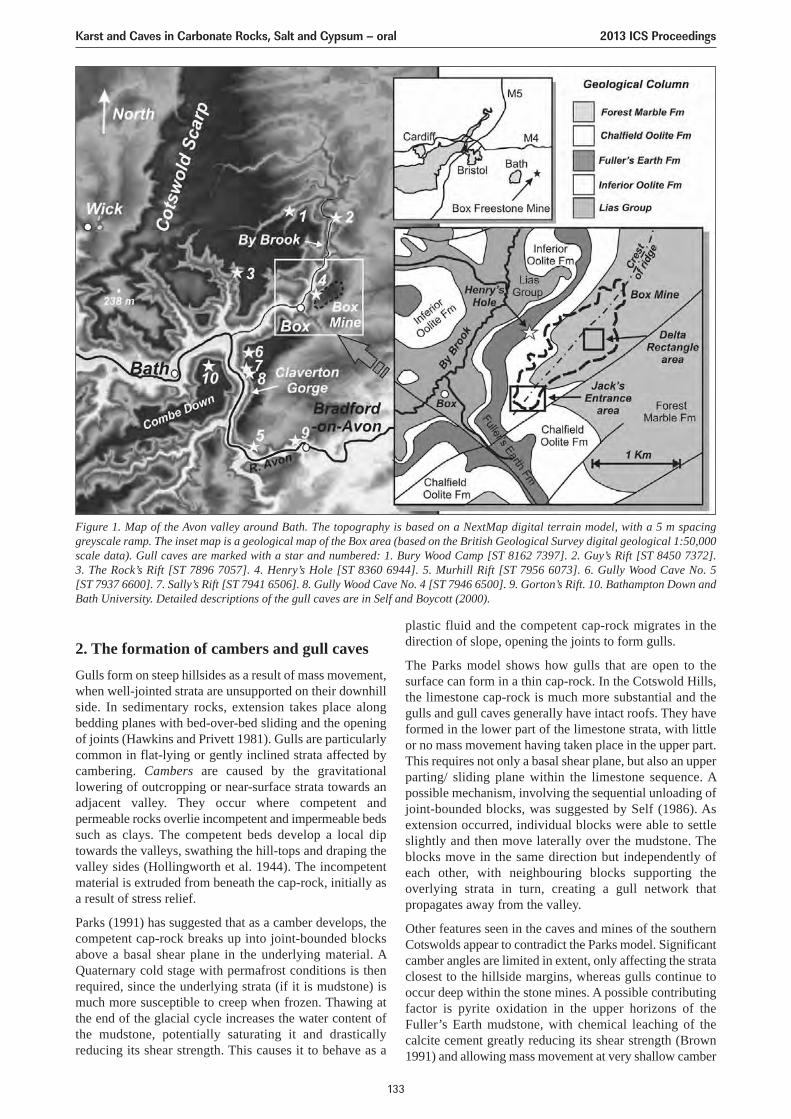
2. The formation of cambers and gull cavesGulls form on steep hillsides as a result of mass movement,when well-jointed strata are unsupported on their downhillside. In sedimentary rocks, extension takes place alongbedding planes with bed-over-bed sliding and the openingof joints (Hawkins and Privett 1981). Gulls are particularlycommon in flat-lying or gently inclined strata affected bycambering. Cambers are caused by the gravitationallowering of outcropping or near-surface strata towards anadjacent valley. They occur where competent andpermeable rocks overlie incompetent and impermeable bedssuch as clays. The competent beds develop a local diptowards the valleys, swathing the hill-tops and draping thevalley sides (Hollingworth et al. 1944). The incompetentmaterial is extruded from beneath the cap-rock, initially asa result of stress relief.
Parks (1991) has suggested that as a camber develops, thecompetent cap-rock breaks up into joint-bounded blocksabove a basal shear plane in the underlying material. AQuaternary cold stage with permafrost conditions is thenrequired, since the underlying strata (if it is mudstone) ismuch more susceptible to creep when frozen. Thawing atthe end of the glacial cycle increases the water content ofthe mudstone, potentially saturating it and drasticallyreducing its shear strength. This causes it to behave as a
plastic fluid and the competent cap-rock migrates in thedirection of slope, opening the joints to form gulls.
The Parks model shows how gulls that are open to thesurface can form in a thin cap-rock. In the Cotswold Hills,the limestone cap-rock is much more substantial and thegulls and gull caves generally have intact roofs. They haveformed in the lower part of the limestone strata, with littleor no mass movement having taken place in the upper part.This requires not only a basal shear plane, but also an upperparting/ sliding plane within the limestone sequence. Apossible mechanism, involving the sequential unloading ofjoint-bounded blocks, was suggested by Self (1986). Asextension occurred, individual blocks were able to settleslightly and then move laterally over the mudstone. Theblocks move in the same direction but independently ofeach other, with neighbouring blocks supporting theoverlying strata in turn, creating a gull network thatpropagates away from the valley.
Other features seen in the caves and mines of the southernCotswolds appear to contradict the Parks model. Significantcamber angles are limited in extent, only affecting the strataclosest to the hillside margins, whereas gulls continue tooccur deep within the stone mines. A possible contributingfactor is pyrite oxidation in the upper horizons of theFuller’s Earth mudstone, with chemical leaching of thecalcite cement greatly reducing its shear strength (Brown1991) and allowing mass movement at very shallow camber
Figure 1. Map of the Avon valley around Bath. The topography is based on a NextMap digital terrain model, with a 5 m spacinggreyscale ramp. The inset map is a geological map of the Box area (based on the British Geological Survey digital geological 1:50,000scale data). Gull caves are marked with a star and numbered: 1. Bury Wood Camp [ST 8162 7397]. 2. Guy’s Rift [ST 8450 7372]. 3. The Rock’s Rift [ST 7896 7057]. 4. Henry’s Hole [ST 8360 6944]. 5. Murhill Rift [ST 7956 6073]. 6. Gully Wood Cave No. 5 [ST 7937 6600]. 7. Sally’s Rift [ST 7941 6506]. 8. Gully Wood Cave No. 4 [ST 7946 6500]. 9. Gorton’s Rift. 10. Bathampton Down andBath University. Detailed descriptions of the gull caves are in Self and Boycott (2000).
Karst and Caves in Carbonate Rocks, Salt and Gypsum – oral 2013 ICS Proceedings
133
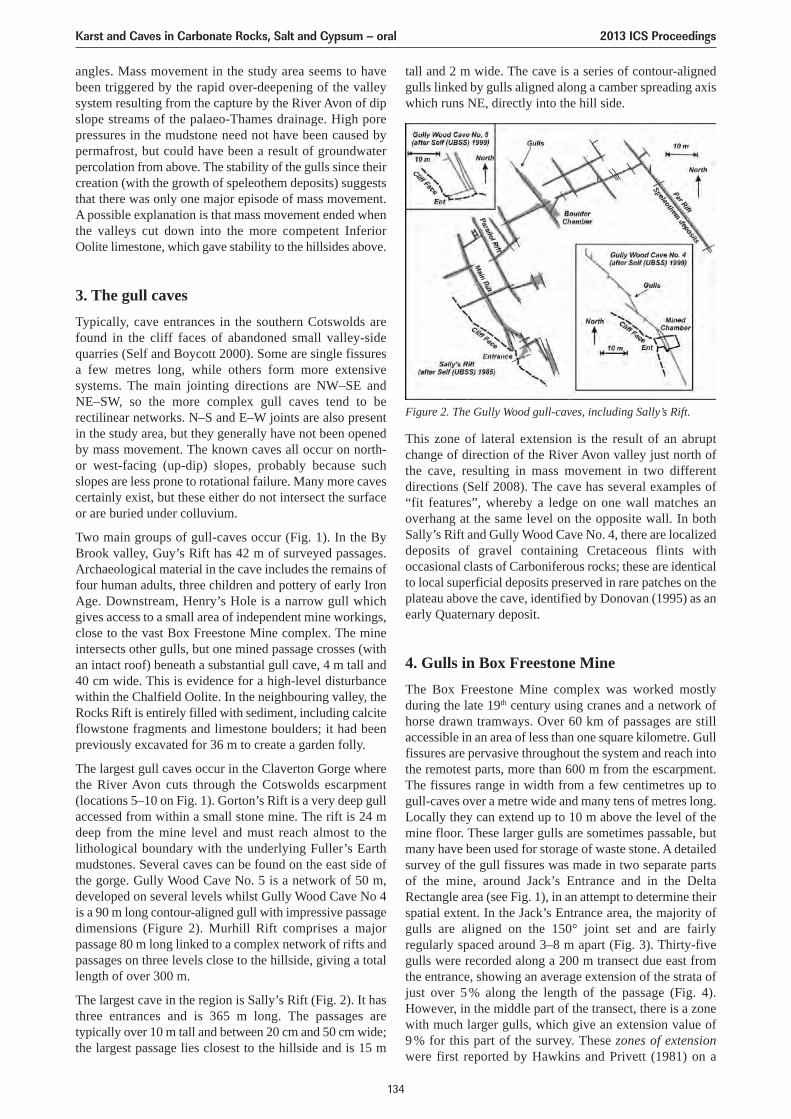
This zone of lateral extension is the result of an abruptchange of direction of the River Avon valley just north ofthe cave, resulting in mass movement in two differentdirections (Self 2008). The cave has several examples of“fit features”, whereby a ledge on one wall matches anoverhang at the same level on the opposite wall. In bothSally’s Rift and Gully Wood Cave No. 4, there are localizeddeposits of gravel containing Cretaceous flints withoccasional clasts of Carboniferous rocks; these are identicalto local superficial deposits preserved in rare patches on theplateau above the cave, identified by Donovan (1995) as anearly Quaternary deposit.
4. Gulls in Box Freestone MineThe Box Freestone Mine complex was worked mostlyduring the late 19th century using cranes and a network ofhorse drawn tramways. Over 60 km of passages are stillaccessible in an area of less than one square kilometre. Gullfissures are pervasive throughout the system and reach intothe remotest parts, more than 600 m from the escarpment.The fissures range in width from a few centimetres up togull-caves over a metre wide and many tens of metres long.Locally they can extend up to 10 m above the level of themine floor. These larger gulls are sometimes passable, butmany have been used for storage of waste stone. A detailedsurvey of the gull fissures was made in two separate partsof the mine, around Jack’s Entrance and in the DeltaRectangle area (see Fig. 1), in an attempt to determine theirspatial extent. In the Jack’s Entrance area, the majority ofgulls are aligned on the 150° joint set and are fairlyregularly spaced around 3–8 m apart (Fig. 3). Thirty-fivegulls were recorded along a 200 m transect due east fromthe entrance, showing an average extension of the strata ofjust over 5 % along the length of the passage (Fig. 4).However, in the middle part of the transect, there is a zonewith much larger gulls, which give an extension value of 9 % for this part of the survey. These zones of extensionwere first reported by Hawkins and Privett (1981) on a
angles. Mass movement in the study area seems to havebeen triggered by the rapid over-deepening of the valleysystem resulting from the capture by the River Avon of dipslope streams of the palaeo-Thames drainage. High porepressures in the mudstone need not have been caused bypermafrost, but could have been a result of groundwaterpercolation from above. The stability of the gulls since theircreation (with the growth of speleothem deposits) suggeststhat there was only one major episode of mass movement.A possible explanation is that mass movement ended whenthe valleys cut down into the more competent InferiorOolite limestone, which gave stability to the hillsides above.
3. The gull cavesTypically, cave entrances in the southern Cotswolds arefound in the cliff faces of abandoned small valley-sidequarries (Self and Boycott 2000). Some are single fissuresa few metres long, while others form more extensivesystems. The main jointing directions are NW–SE andNE–SW, so the more complex gull caves tend to berectilinear networks. N–S and E–W joints are also presentin the study area, but they generally have not been openedby mass movement. The known caves all occur on north-or west-facing (up-dip) slopes, probably because suchslopes are less prone to rotational failure. Many more cavescertainly exist, but these either do not intersect the surfaceor are buried under colluvium.
Two main groups of gull-caves occur (Fig. 1). In the ByBrook valley, Guy’s Rift has 42 m of surveyed passages.Archaeological material in the cave includes the remains offour human adults, three children and pottery of early IronAge. Downstream, Henry’s Hole is a narrow gull whichgives access to a small area of independent mine workings,close to the vast Box Freestone Mine complex. The mineintersects other gulls, but one mined passage crosses (withan intact roof) beneath a substantial gull cave, 4 m tall and40 cm wide. This is evidence for a high-level disturbancewithin the Chalfield Oolite. In the neighbouring valley, theRocks Rift is entirely filled with sediment, including calciteflowstone fragments and limestone boulders; it had beenpreviously excavated for 36 m to create a garden folly.
The largest gull caves occur in the Claverton Gorge wherethe River Avon cuts through the Cotswolds escarpment(locations 5–10 on Fig. 1). Gorton’s Rift is a very deep gullaccessed from within a small stone mine. The rift is 24 mdeep from the mine level and must reach almost to thelithological boundary with the underlying Fuller’s Earthmudstones. Several caves can be found on the east side ofthe gorge. Gully Wood Cave No. 5 is a network of 50 m,developed on several levels whilst Gully Wood Cave No 4is a 90 m long contour-aligned gull with impressive passagedimensions (Figure 2). Murhill Rift comprises a majorpassage 80 m long linked to a complex network of rifts andpassages on three levels close to the hillside, giving a totallength of over 300 m.
The largest cave in the region is Sally’s Rift (Fig. 2). It hasthree entrances and is 365 m long. The passages aretypically over 10 m tall and between 20 cm and 50 cm wide;the largest passage lies closest to the hillside and is 15 m
tall and 2 m wide. The cave is a series of contour-alignedgulls linked by gulls aligned along a camber spreading axiswhich runs NE, directly into the hill side.
Figure 2. The Gully Wood gull-caves, including Sally’s Rift.
Karst and Caves in Carbonate Rocks, Salt and Gypsum – oral 2013 ICS Proceedings
134
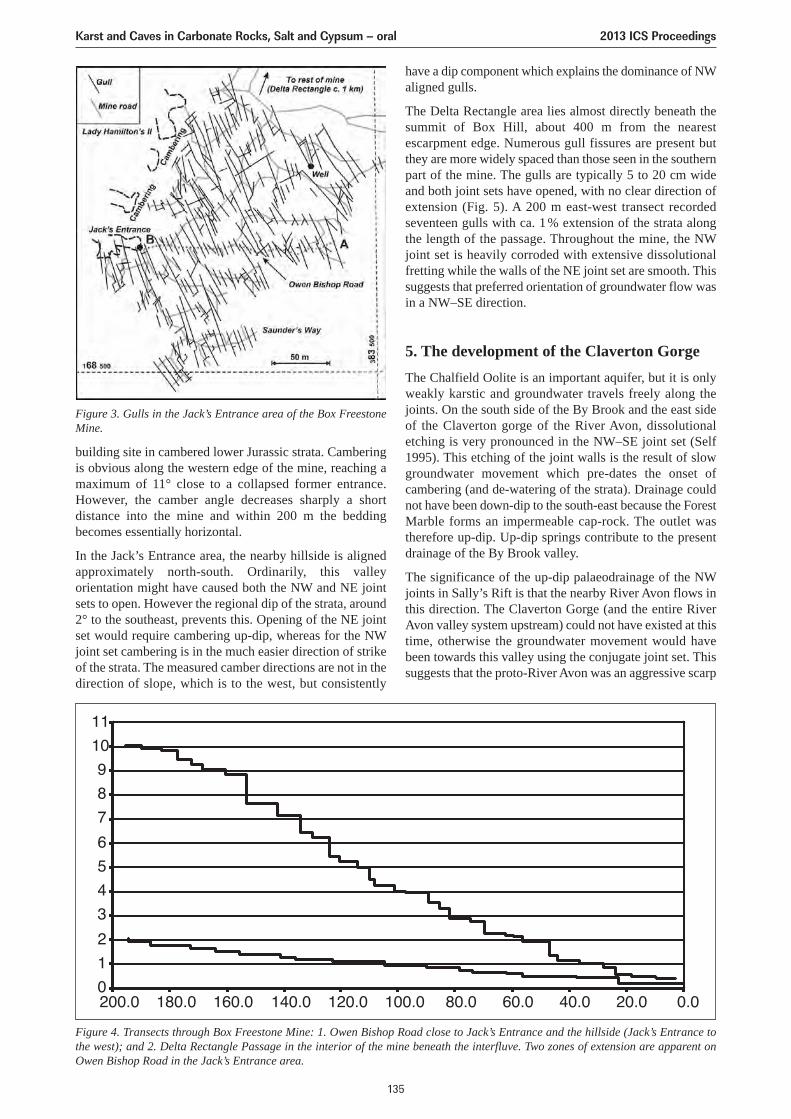
building site in cambered lower Jurassic strata. Camberingis obvious along the western edge of the mine, reaching amaximum of 11° close to a collapsed former entrance.However, the camber angle decreases sharply a shortdistance into the mine and within 200 m the beddingbecomes essentially horizontal.
In the Jack’s Entrance area, the nearby hillside is alignedapproximately north-south. Ordinarily, this valleyorientation might have caused both the NW and NE jointsets to open. However the regional dip of the strata, around2° to the southeast, prevents this. Opening of the NE jointset would require cambering up-dip, whereas for the NWjoint set cambering is in the much easier direction of strikeof the strata. The measured camber directions are not in thedirection of slope, which is to the west, but consistently
have a dip component which explains the dominance of NWaligned gulls.
The Delta Rectangle area lies almost directly beneath thesummit of Box Hill, about 400 m from the nearestescarpment edge. Numerous gull fissures are present butthey are more widely spaced than those seen in the southernpart of the mine. The gulls are typically 5 to 20 cm wideand both joint sets have opened, with no clear direction ofextension (Fig. 5). A 200 m east-west transect recordedseventeen gulls with ca. 1 % extension of the strata alongthe length of the passage. Throughout the mine, the NWjoint set is heavily corroded with extensive dissolutionalfretting while the walls of the NE joint set are smooth. Thissuggests that preferred orientation of groundwater flow wasin a NW–SE direction.
5. The development of the Claverton GorgeThe Chalfield Oolite is an important aquifer, but it is onlyweakly karstic and groundwater travels freely along thejoints. On the south side of the By Brook and the east sideof the Claverton gorge of the River Avon, dissolutionaletching is very pronounced in the NW–SE joint set (Self1995). This etching of the joint walls is the result of slowgroundwater movement which pre-dates the onset ofcambering (and de-watering of the strata). Drainage couldnot have been down-dip to the south-east because the ForestMarble forms an impermeable cap-rock. The outlet wastherefore up-dip. Up-dip springs contribute to the presentdrainage of the By Brook valley.
The significance of the up-dip palaeodrainage of the NWjoints in Sally’s Rift is that the nearby River Avon flows inthis direction. The Claverton Gorge (and the entire RiverAvon valley system upstream) could not have existed at thistime, otherwise the groundwater movement would havebeen towards this valley using the conjugate joint set. Thissuggests that the proto-River Avon was an aggressive scarp
Figure 3. Gulls in the Jack’s Entrance area of the Box FreestoneMine.
Figure 4. Transects through Box Freestone Mine: 1. Owen Bishop Road close to Jack’s Entrance and the hillside (Jack’s Entrance tothe west); and 2. Delta Rectangle Passage in the interior of the mine beneath the interfluve. Two zones of extension are apparent onOwen Bishop Road in the Jack’s Entrance area.
Karst and Caves in Carbonate Rocks, Salt and Gypsum – oral 2013 ICS Proceedings
135
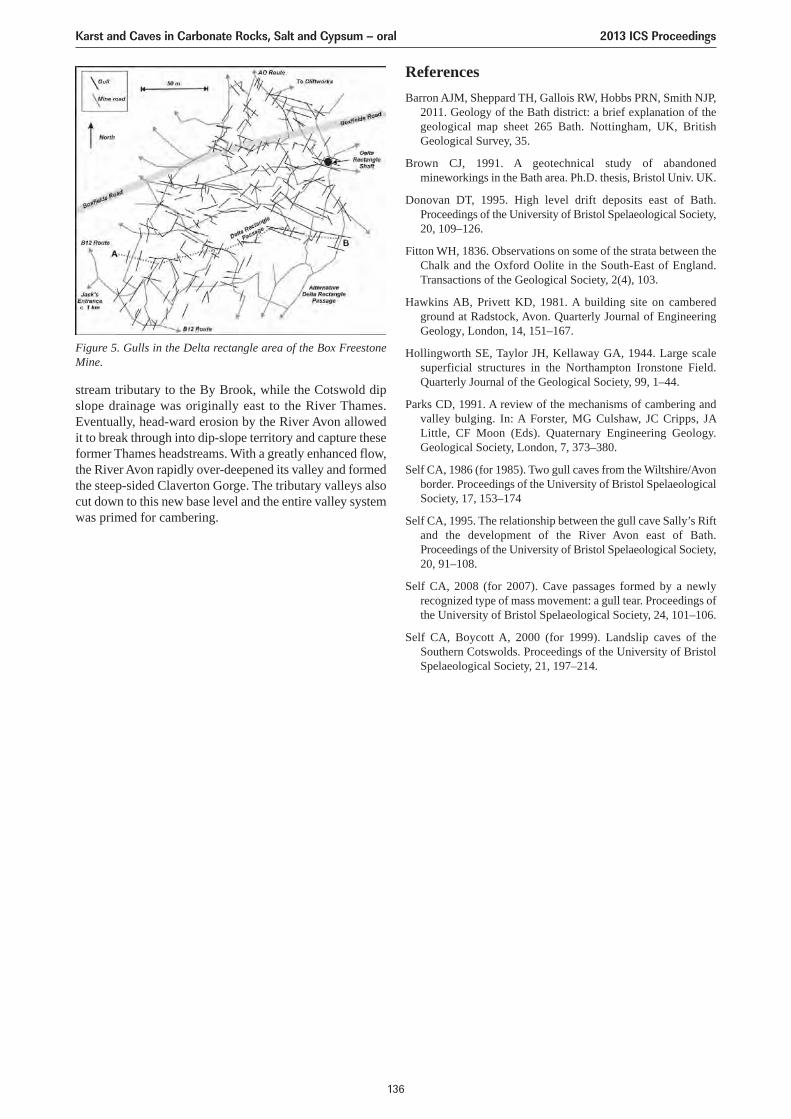
Figure 5. Gulls in the Delta rectangle area of the Box FreestoneMine.
stream tributary to the By Brook, while the Cotswold dipslope drainage was originally east to the River Thames.Eventually, head-ward erosion by the River Avon allowedit to break through into dip-slope territory and capture theseformer Thames headstreams. With a greatly enhanced flow,the River Avon rapidly over-deepened its valley and formedthe steep-sided Claverton Gorge. The tributary valleys alsocut down to this new base level and the entire valley systemwas primed for cambering.
ReferencesBarron AJM, Sheppard TH, Gallois RW, Hobbs PRN, Smith NJP,
2011. Geology of the Bath district: a brief explanation of thegeological map sheet 265 Bath. Nottingham, UK, BritishGeological Survey, 35.
Brown CJ, 1991. A geotechnical study of abandonedmineworkings in the Bath area. Ph.D. thesis, Bristol Univ. UK.
Donovan DT, 1995. High level drift deposits east of Bath.Proceedings of the University of Bristol Spelaeological Society,20, 109–126.
Fitton WH, 1836. Observations on some of the strata between theChalk and the Oxford Oolite in the South-East of England.Transactions of the Geological Society, 2(4), 103.
Hawkins AB, Privett KD, 1981. A building site on camberedground at Radstock, Avon. Quarterly Journal of EngineeringGeology, London, 14, 151–167.
Hollingworth SE, Taylor JH, Kellaway GA, 1944. Large scalesuperficial structures in the Northampton Ironstone Field.Quarterly Journal of the Geological Society, 99, 1–44.
Parks CD, 1991. A review of the mechanisms of cambering andvalley bulging. In: A Forster, MG Culshaw, JC Cripps, JALittle, CF Moon (Eds). Quaternary Engineering Geology.Geological Society, London, 7, 373–380.
Self CA, 1986 (for 1985). Two gull caves from the Wiltshire/Avonborder. Proceedings of the University of Bristol SpelaeologicalSociety, 17, 153–174
Self CA, 1995. The relationship between the gull cave Sally’s Riftand the development of the River Avon east of Bath.Proceedings of the University of Bristol Spelaeological Society,20, 91–108.
Self CA, 2008 (for 2007). Cave passages formed by a newlyrecognized type of mass movement: a gull tear. Proceedings ofthe University of Bristol Spelaeological Society, 24, 101–106.
Self CA, Boycott A, 2000 (for 1999). Landslip caves of theSouthern Cotswolds. Proceedings of the University of BristolSpelaeological Society, 21, 197–214.
Karst and Caves in Carbonate Rocks, Salt and Gypsum – oral 2013 ICS Proceedings
136
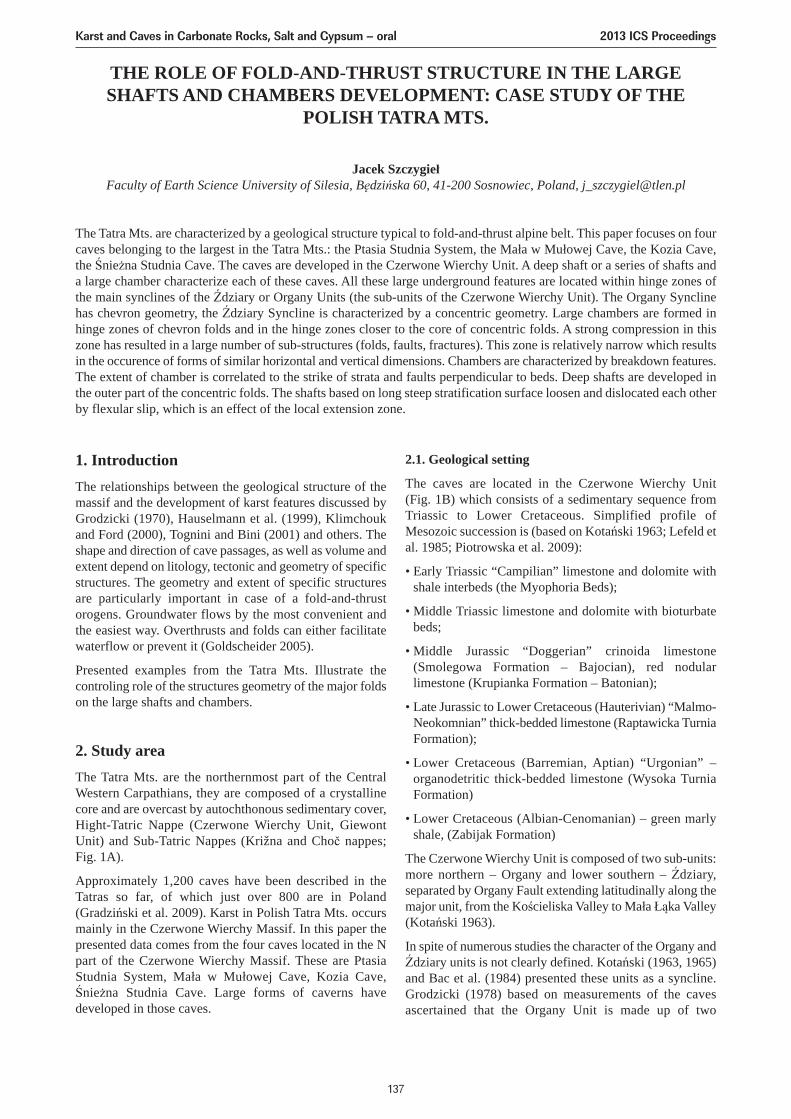
THE ROLE OF FOLD-AND-THRUST STRUCTURE IN THE LARGESHAFTS AND CHAMBERS DEVELOPMENT: CASE STUDY OF THE
POLISH TATRA MTS.
Jacek SzczygiełFaculty of Earth Science University of Silesia, Będzińska 60, 41-200 Sosnowiec, Poland, [email protected]
The Tatra Mts. are characterized by a geological structure typical to fold-and-thrust alpine belt. This paper focuses on fourcaves belonging to the largest in the Tatra Mts.: the Ptasia Studnia System, the Mała w Mułowej Cave, the Kozia Cave,the Śnieżna Studnia Cave. The caves are developed in the Czerwone Wierchy Unit. A deep shaft or a series of shafts anda large chamber characterize each of these caves. All these large underground features are located within hinge zones ofthe main synclines of the Ździary or Organy Units (the sub-units of the Czerwone Wierchy Unit). The Organy Synclinehas chevron geometry, the Ździary Syncline is characterized by a concentric geometry. Large chambers are formed inhinge zones of chevron folds and in the hinge zones closer to the core of concentric folds. A strong compression in thiszone has resulted in a large number of sub-structures (folds, faults, fractures). This zone is relatively narrow which resultsin the occurence of forms of similar horizontal and vertical dimensions. Chambers are characterized by breakdown features.The extent of chamber is correlated to the strike of strata and faults perpendicular to beds. Deep shafts are developed inthe outer part of the concentric folds. The shafts based on long steep stratification surface loosen and dislocated each otherby flexular slip, which is an effect of the local extension zone.
1. IntroductionThe relationships between the geological structure of themassif and the development of karst features discussed byGrodzicki (1970), Hauselmann et al. (1999), Klimchoukand Ford (2000), Tognini and Bini (2001) and others. Theshape and direction of cave passages, as well as volume andextent depend on litology, tectonic and geometry of specificstructures. The geometry and extent of specific structuresare particularly important in case of a fold-and-thrustorogens. Groundwater flows by the most convenient andthe easiest way. Overthrusts and folds can either facilitatewaterflow or prevent it (Goldscheider 2005).
Presented examples from the Tatra Mts. Illustrate thecontroling role of the structures geometry of the major foldson the large shafts and chambers.
2. Study areaThe Tatra Mts. are the northernmost part of the CentralWestern Carpathians, they are composed of a crystallinecore and are overcast by autochthonous sedimentary cover,Hight-Tatric Nappe (Czerwone Wierchy Unit, GiewontUnit) and Sub-Tatric Nappes (Križna and Choč nappes; Fig. 1A).
Approximately 1,200 caves have been described in theTatras so far, of which just over 800 are in Poland(Gradziński et al. 2009). Karst in Polish Tatra Mts. occursmainly in the Czerwone Wierchy Massif. In this paper thepresented data comes from the four caves located in the Npart of the Czerwone Wierchy Massif. These are PtasiaStudnia System, Mała w Mułowej Cave, Kozia Cave,Śnieżna Studnia Cave. Large forms of caverns havedeveloped in those caves.
2.1. Geological setting
The caves are located in the Czerwone Wierchy Unit (Fig. 1B) which consists of a sedimentary sequence fromTriassic to Lower Cretaceous. Simplified profile ofMesozoic succession is (based on Kotański 1963; Lefeld etal. 1985; Piotrowska et al. 2009):
• Early Triassic “Campilian” limestone and dolomite withshale interbeds (the Myophoria Beds);
• Middle Triassic limestone and dolomite with bioturbatebeds;
• Middle Jurassic “Doggerian” crinoida limestone(Smolegowa Formation – Bajocian), red nodularlimestone (Krupianka Formation – Batonian);
• Late Jurassic to Lower Cretaceous (Hauterivian) “Malmo-Neokomnian” thick-bedded limestone (Raptawicka TurniaFormation);
• Lower Cretaceous (Barremian, Aptian) “Urgonian” –organodetritic thick-bedded limestone (Wysoka TurniaFormation)
• Lower Cretaceous (Albian-Cenomanian) – green marlyshale, (Zabijak Formation)
The Czerwone Wierchy Unit is composed of two sub-units:more northern – Organy and lower southern – Ździary,separated by Organy Fault extending latitudinally along themajor unit, from the Kościeliska Valley to Mała Łąka Valley(Kotański 1963).
In spite of numerous studies the character of the Organy andŹdziary units is not clearly defined. Kotański (1963, 1965)and Bac et al. (1984) presented these units as a syncline.Grodzicki (1978) based on measurements of the cavesascertained that the Organy Unit is made up of two
Karst and Caves in Carbonate Rocks, Salt and Gypsum – oral 2013 ICS Proceedings
137
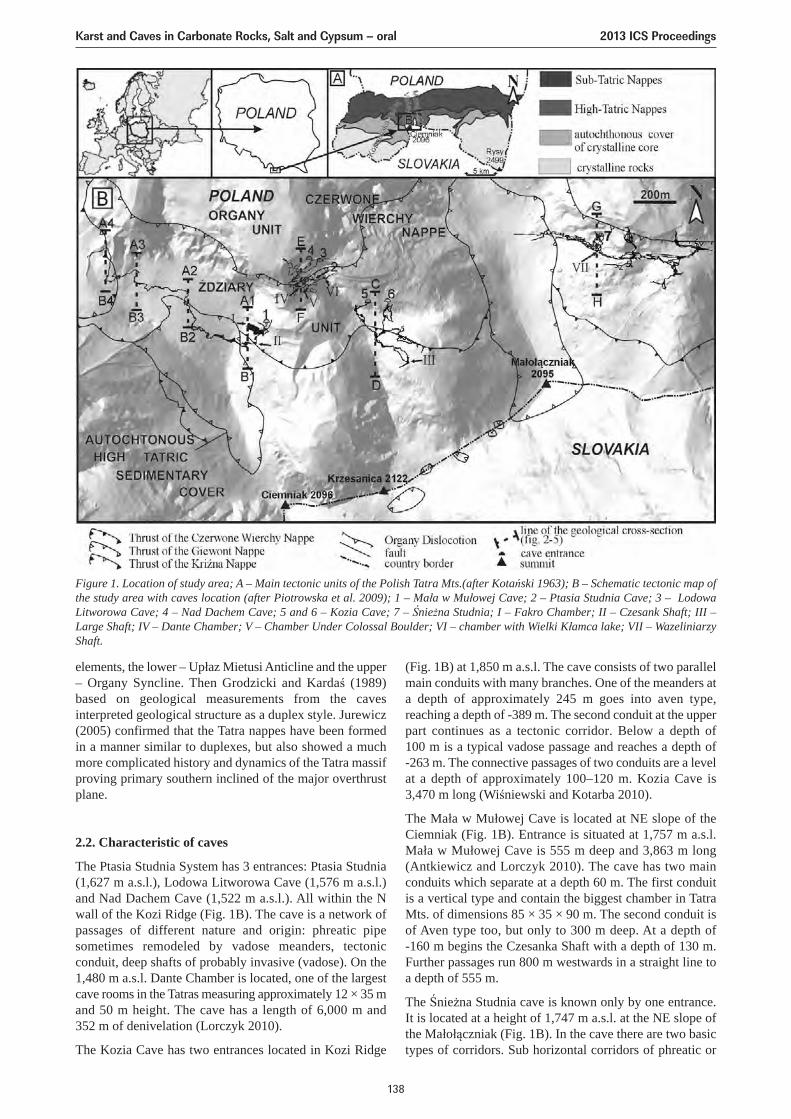
elements, the lower – Upłaz Mietusi Anticline and the upper– Organy Syncline. Then Grodzicki and Kardaś (1989)based on geological measurements from the cavesinterpreted geological structure as a duplex style. Jurewicz(2005) confirmed that the Tatra nappes have been formedin a manner similar to duplexes, but also showed a muchmore complicated history and dynamics of the Tatra massifproving primary southern inclined of the major overthrustplane.
2.2. Characteristic of caves
The Ptasia Studnia System has 3 entrances: Ptasia Studnia(1,627 m a.s.l.), Lodowa Litworowa Cave (1,576 m a.s.l.)and Nad Dachem Cave (1,522 m a.s.l.). All within the Nwall of the Kozi Ridge (Fig. 1B). The cave is a network ofpassages of different nature and origin: phreatic pipesometimes remodeled by vadose meanders, tectonicconduit, deep shafts of probably invasive (vadose). On the1,480 m a.s.l. Dante Chamber is located, one of the largestcave rooms in the Tatras measuring approximately 12 × 35 mand 50 m height. The cave has a length of 6,000 m and352 m of denivelation (Lorczyk 2010).
The Kozia Cave has two entrances located in Kozi Ridge
(Fig. 1B) at 1,850 m a.s.l. The cave consists of two parallelmain conduits with many branches. One of the meanders ata depth of approximately 245 m goes into aven type,reaching a depth of -389 m. The second conduit at the upperpart continues as a tectonic corridor. Below a depth of 100 m is a typical vadose passage and reaches a depth of-263 m. The connective passages of two conduits are a levelat a depth of approximately 100–120 m. Kozia Cave is3,470 m long (Wiśniewski and Kotarba 2010).
The Mała w Mułowej Cave is located at NE slope of theCiemniak (Fig. 1B). Entrance is situated at 1,757 m a.s.l.Mała w Mułowej Cave is 555 m deep and 3,863 m long(Antkiewicz and Lorczyk 2010). The cave has two mainconduits which separate at a depth 60 m. The first conduitis a vertical type and contain the biggest chamber in TatraMts. of dimensions 85 × 35 × 90 m. The second conduit isof Aven type too, but only to 300 m deep. At a depth of-160 m begins the Czesanka Shaft with a depth of 130 m.Further passages run 800 m westwards in a straight line toa depth of 555 m.
The Śnieżna Studnia cave is known only by one entrance.It is located at a height of 1,747 m a.s.l. at the NE slope ofthe Małołączniak (Fig. 1B). In the cave there are two basictypes of corridors. Sub horizontal corridors of phreatic or
Figure 1. Location of study area; A – Main tectonic units of the Polish Tatra Mts.(after Kotański 1963); B – Schematic tectonic map ofthe study area with caves location (after Piotrowska et al. 2009); 1 – Mała w Mułowej Cave; 2 – Ptasia Studnia Cave; 3 – LodowaLitworowa Cave; 4 – Nad Dachem Cave; 5 and 6 – Kozia Cave; 7 – Śnieżna Studnia; I – Fakro Chamber; II – Czesank Shaft; III –Large Shaft; IV – Dante Chamber; V – Chamber Under Colossal Boulder; VI – chamber with Wielki Kłamca lake; VII – WazeliniarzyShaft.
Karst and Caves in Carbonate Rocks, Salt and Gypsum – oral 2013 ICS Proceedings
138
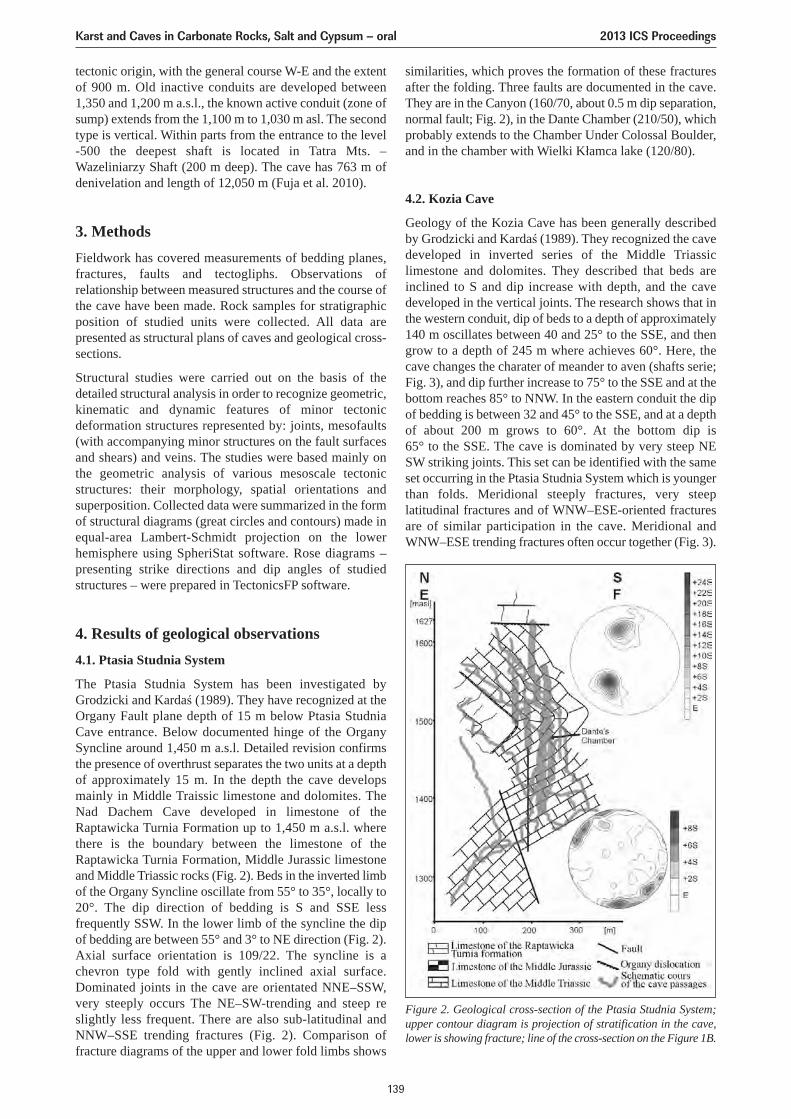
tectonic origin, with the general course W-E and the extentof 900 m. Old inactive conduits are developed between1,350 and 1,200 m a.s.l., the known active conduit (zone ofsump) extends from the 1,100 m to 1,030 m asl. The secondtype is vertical. Within parts from the entrance to the level-500 the deepest shaft is located in Tatra Mts. –Wazeliniarzy Shaft (200 m deep). The cave has 763 m ofdenivelation and length of 12,050 m (Fuja et al. 2010).
3. MethodsFieldwork has covered measurements of bedding planes,fractures, faults and tectogliphs. Observations ofrelationship between measured structures and the course ofthe cave have been made. Rock samples for stratigraphicposition of studied units were collected. All data arepresented as structural plans of caves and geological cross-sections.
Structural studies were carried out on the basis of thedetailed structural analysis in order to recognize geometric,kinematic and dynamic features of minor tectonicdeformation structures represented by: joints, mesofaults(with accompanying minor structures on the fault surfacesand shears) and veins. The studies were based mainly onthe geometric analysis of various mesoscale tectonicstructures: their morphology, spatial orientations andsuperposition. Collected data were summarized in the formof structural diagrams (great circles and contours) made inequal-area Lambert-Schmidt projection on the lowerhemisphere using SpheriStat software. Rose diagrams –presenting strike directions and dip angles of studiedstructures – were prepared in TectonicsFP software.
4. Results of geological observations4.1. Ptasia Studnia System
The Ptasia Studnia System has been investigated byGrodzicki and Kardaś (1989). They have recognized at theOrgany Fault plane depth of 15 m below Ptasia StudniaCave entrance. Below documented hinge of the OrganySyncline around 1,450 m a.s.l. Detailed revision confirmsthe presence of overthrust separates the two units at a depthof approximately 15 m. In the depth the cave developsmainly in Middle Traissic limestone and dolomites. TheNad Dachem Cave developed in limestone of theRaptawicka Turnia Formation up to 1,450 m a.s.l. wherethere is the boundary between the limestone of theRaptawicka Turnia Formation, Middle Jurassic limestoneand Middle Triassic rocks (Fig. 2). Beds in the inverted limbof the Organy Syncline oscillate from 55° to 35°, locally to20°. The dip direction of bedding is S and SSE lessfrequently SSW. In the lower limb of the syncline the dipof bedding are between 55° and 3° to NE direction (Fig. 2).Axial surface orientation is 109/22. The syncline is achevron type fold with gently inclined axial surface.Dominated joints in the cave are orientated NNE–SSW,very steeply occurs The NE–SW-trending and steep reslightly less frequent. There are also sub-latitudinal andNNW–SSE trending fractures (Fig. 2). Comparison offracture diagrams of the upper and lower fold limbs shows
similarities, which proves the formation of these fracturesafter the folding. Three faults are documented in the cave.They are in the Canyon (160/70, about 0.5 m dip separation,normal fault; Fig. 2), in the Dante Chamber (210/50), whichprobably extends to the Chamber Under Colossal Boulder,and in the chamber with Wielki Kłamca lake (120/80).
4.2. Kozia Cave
Geology of the Kozia Cave has been generally describedby Grodzicki and Kardaś (1989). They recognized the cavedeveloped in inverted series of the Middle Triassiclimestone and dolomites. They described that beds areinclined to S and dip increase with depth, and the cavedeveloped in the vertical joints. The research shows that inthe western conduit, dip of beds to a depth of approximately140 m oscillates between 40 and 25° to the SSE, and thengrow to a depth of 245 m where achieves 60°. Here, thecave changes the charater of meander to aven (shafts serie;Fig. 3), and dip further increase to 75° to the SSE and at thebottom reaches 85° to NNW. In the eastern conduit the dipof bedding is between 32 and 45° to the SSE, and at a depthof about 200 m grows to 60°. At the bottom dip is 65° to the SSE. The cave is dominated by very steep NESW striking joints. This set can be identified with the sameset occurring in the Ptasia Studnia System which is youngerthan folds. Meridional steeply fractures, very steeplatitudinal fractures and of WNW–ESE-oriented fracturesare of similar participation in the cave. Meridional andWNW–ESE trending fractures often occur together (Fig. 3).
Figure 2. Geological cross-section of the Ptasia Studnia System;upper contour diagram is projection of stratification in the cave,lower is showing fracture; line of the cross-section on the Figure 1B.
Karst and Caves in Carbonate Rocks, Salt and Gypsum – oral 2013 ICS Proceedings
139
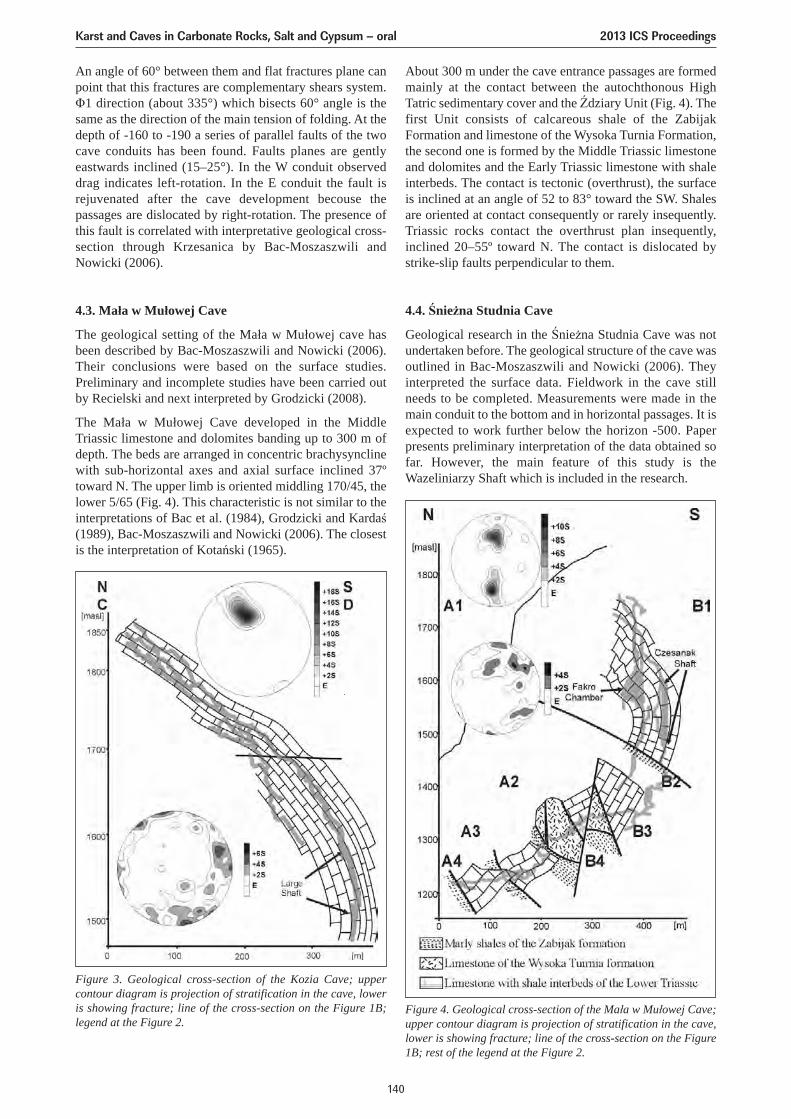
An angle of 60° between them and flat fractures plane canpoint that this fractures are complementary shears system.Φ1 direction (about 335°) which bisects 60° angle is thesame as the direction of the main tension of folding. At thedepth of -160 to -190 a series of parallel faults of the twocave conduits has been found. Faults planes are gentlyeastwards inclined (15–25°). In the W conduit observeddrag indicates left-rotation. In the E conduit the fault isrejuvenated after the cave development becouse thepassages are dislocated by right-rotation. The presence ofthis fault is correlated with interpretative geological cross-section through Krzesanica by Bac-Moszaszwili andNowicki (2006).
4.3. Mała w Mułowej Cave
The geological setting of the Mała w Mułowej cave hasbeen described by Bac-Moszaszwili and Nowicki (2006).Their conclusions were based on the surface studies.Preliminary and incomplete studies have been carried outby Recielski and next interpreted by Grodzicki (2008).
The Mała w Mułowej Cave developed in the MiddleTriassic limestone and dolomites banding up to 300 m ofdepth. The beds are arranged in concentric brachysynclinewith sub-horizontal axes and axial surface inclined 37ºtoward N. The upper limb is oriented middling 170/45, thelower 5/65 (Fig. 4). This characteristic is not similar to theinterpretations of Bac et al. (1984), Grodzicki and Kardaś(1989), Bac-Moszaszwili and Nowicki (2006). The closestis the interpretation of Kotański (1965).
About 300 m under the cave entrance passages are formedmainly at the contact between the autochthonous HighTatric sedimentary cover and the Ździary Unit (Fig. 4). Thefirst Unit consists of calcareous shale of the ZabijakFormation and limestone of the Wysoka Turnia Formation,the second one is formed by the Middle Triassic limestoneand dolomites and the Early Triassic limestone with shaleinterbeds. The contact is tectonic (overthrust), the surfaceis inclined at an angle of 52 to 83° toward the SW. Shalesare oriented at contact consequently or rarely insequently.Triassic rocks contact the overthrust plan insequently,inclined 20–55º toward N. The contact is dislocated bystrike-slip faults perpendicular to them.
4.4. Śnieżna Studnia Cave
Geological research in the Śnieżna Studnia Cave was notundertaken before. The geological structure of the cave wasoutlined in Bac-Moszaszwili and Nowicki (2006). Theyinterpreted the surface data. Fieldwork in the cave stillneeds to be completed. Measurements were made in themain conduit to the bottom and in horizontal passages. It isexpected to work further below the horizon -500. Paperpresents preliminary interpretation of the data obtained sofar. However, the main feature of this study is theWazeliniarzy Shaft which is included in the research.
Figure 3. Geological cross-section of the Kozia Cave; uppercontour diagram is projection of stratification in the cave, loweris showing fracture; line of the cross-section on the Figure 1B;legend at the Figure 2.
Figure 4. Geological cross-section of the Mała w Mułowej Cave;upper contour diagram is projection of stratification in the cave,lower is showing fracture; line of the cross-section on the Figure1B; rest of the legend at the Figure 2.
Karst and Caves in Carbonate Rocks, Salt and Gypsum – oral 2013 ICS Proceedings
140
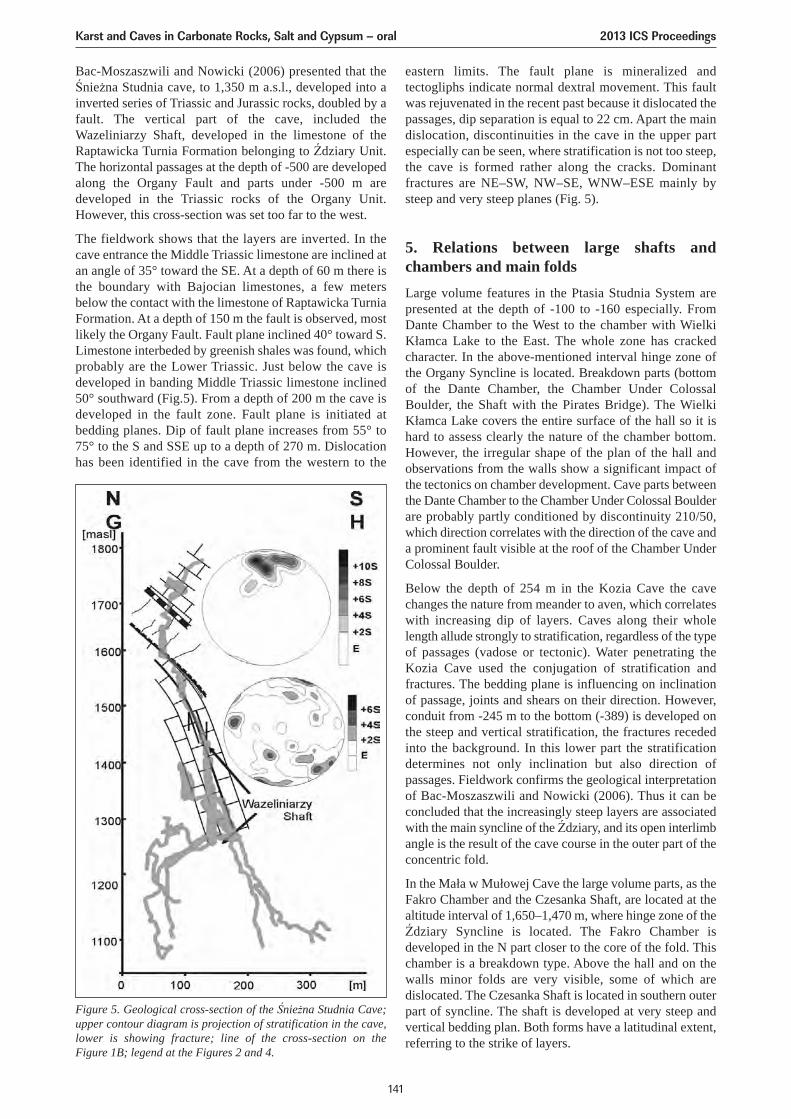
Bac-Moszaszwili and Nowicki (2006) presented that theŚnieżna Studnia cave, to 1,350 m a.s.l., developed into ainverted series of Triassic and Jurassic rocks, doubled by afault. The vertical part of the cave, included theWazeliniarzy Shaft, developed in the limestone of theRaptawicka Turnia Formation belonging to Ździary Unit.The horizontal passages at the depth of -500 are developedalong the Organy Fault and parts under -500 m aredeveloped in the Triassic rocks of the Organy Unit.However, this cross-section was set too far to the west.
The fieldwork shows that the layers are inverted. In thecave entrance the Middle Triassic limestone are inclined atan angle of 35° toward the SE. At a depth of 60 m there isthe boundary with Bajocian limestones, a few metersbelow the contact with the limestone of Raptawicka TurniaFormation. At a depth of 150 m the fault is observed, mostlikely the Organy Fault. Fault plane inclined 40° toward S.Limestone interbeded by greenish shales was found, whichprobably are the Lower Triassic. Just below the cave isdeveloped in banding Middle Triassic limestone inclined50° southward (Fig.5). From a depth of 200 m the cave isdeveloped in the fault zone. Fault plane is initiated atbedding planes. Dip of fault plane increases from 55° to75° to the S and SSE up to a depth of 270 m. Dislocationhas been identified in the cave from the western to the
eastern limits. The fault plane is mineralized andtectogliphs indicate normal dextral movement. This faultwas rejuvenated in the recent past because it dislocated thepassages, dip separation is equal to 22 cm. Apart the maindislocation, discontinuities in the cave in the upper partespecially can be seen, where stratification is not too steep,the cave is formed rather along the cracks. Dominantfractures are NE–SW, NW–SE, WNW–ESE mainly bysteep and very steep planes (Fig. 5).
5. Relations between large shafts andchambers and main foldsLarge volume features in the Ptasia Studnia System arepresented at the depth of -100 to -160 especially. FromDante Chamber to the West to the chamber with WielkiKłamca Lake to the East. The whole zone has crackedcharacter. In the above-mentioned interval hinge zone ofthe Organy Syncline is located. Breakdown parts (bottomof the Dante Chamber, the Chamber Under ColossalBoulder, the Shaft with the Pirates Bridge). The WielkiKłamca Lake covers the entire surface of the hall so it ishard to assess clearly the nature of the chamber bottom.However, the irregular shape of the plan of the hall andobservations from the walls show a significant impact ofthe tectonics on chamber development. Cave parts betweenthe Dante Chamber to the Chamber Under Colossal Boulderare probably partly conditioned by discontinuity 210/50,which direction correlates with the direction of the cave anda prominent fault visible at the roof of the Chamber UnderColossal Boulder.
Below the depth of 254 m in the Kozia Cave the cavechanges the nature from meander to aven, which correlateswith increasing dip of layers. Caves along their wholelength allude strongly to stratification, regardless of the typeof passages (vadose or tectonic). Water penetrating theKozia Cave used the conjugation of stratification andfractures. The bedding plane is influencing on inclinationof passage, joints and shears on their direction. However,conduit from -245 m to the bottom (-389) is developed onthe steep and vertical stratification, the fractures recededinto the background. In this lower part the stratificationdetermines not only inclination but also direction ofpassages. Fieldwork confirms the geological interpretationof Bac-Moszaszwili and Nowicki (2006). Thus it can beconcluded that the increasingly steep layers are associatedwith the main syncline of the Ździary, and its open interlimbangle is the result of the cave course in the outer part of theconcentric fold.
In the Mała w Mułowej Cave the large volume parts, as theFakro Chamber and the Czesanka Shaft, are located at thealtitude interval of 1,650–1,470 m, where hinge zone of theŹdziary Syncline is located. The Fakro Chamber isdeveloped in the N part closer to the core of the fold. Thischamber is a breakdown type. Above the hall and on thewalls minor folds are very visible, some of which aredislocated. The Czesanka Shaft is located in southern outerpart of syncline. The shaft is developed at very steep andvertical bedding plan. Both forms have a latitudinal extent,referring to the strike of layers.
Figure 5. Geological cross-section of the Śnieżna Studnia Cave;upper contour diagram is projection of stratification in the cave,lower is showing fracture; line of the cross-section on theFigure 1B; legend at the Figures 2 and 4.
Karst and Caves in Carbonate Rocks, Salt and Gypsum – oral 2013 ICS Proceedings
141
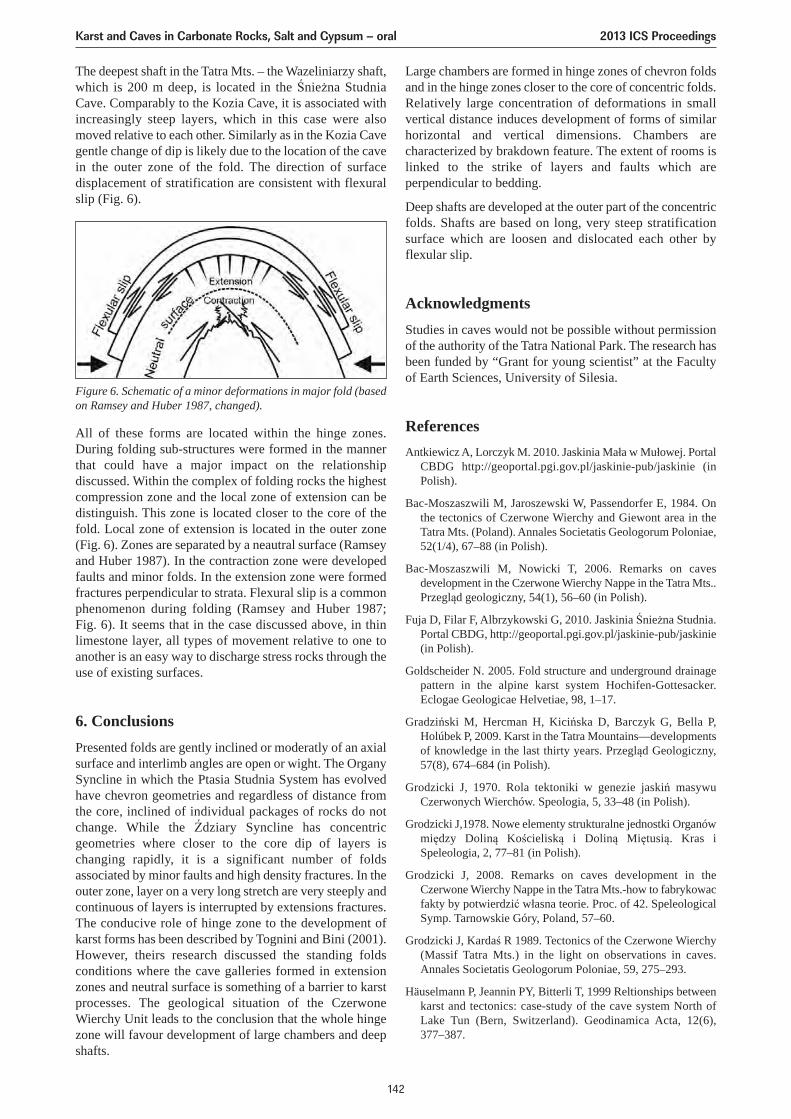
The deepest shaft in the Tatra Mts. – the Wazeliniarzy shaft,which is 200 m deep, is located in the Śnieżna StudniaCave. Comparably to the Kozia Cave, it is associated withincreasingly steep layers, which in this case were alsomoved relative to each other. Similarly as in the Kozia Cavegentle change of dip is likely due to the location of the cavein the outer zone of the fold. The direction of surfacedisplacement of stratification are consistent with flexuralslip (Fig. 6).
All of these forms are located within the hinge zones.During folding sub-structures were formed in the mannerthat could have a major impact on the relationshipdiscussed. Within the complex of folding rocks the highestcompression zone and the local zone of extension can bedistinguish. This zone is located closer to the core of thefold. Local zone of extension is located in the outer zone(Fig. 6). Zones are separated by a neautral surface (Ramseyand Huber 1987). In the contraction zone were developedfaults and minor folds. In the extension zone were formedfractures perpendicular to strata. Flexural slip is a commonphenomenon during folding (Ramsey and Huber 1987;Fig. 6). It seems that in the case discussed above, in thinlimestone layer, all types of movement relative to one toanother is an easy way to discharge stress rocks through theuse of existing surfaces.
6. ConclusionsPresented folds are gently inclined or moderatly of an axialsurface and interlimb angles are open or wight. The OrganySyncline in which the Ptasia Studnia System has evolvedhave chevron geometries and regardless of distance fromthe core, inclined of individual packages of rocks do notchange. While the Ździary Syncline has concentricgeometries where closer to the core dip of layers ischanging rapidly, it is a significant number of foldsassociated by minor faults and high density fractures. In theouter zone, layer on a very long stretch are very steeply andcontinuous of layers is interrupted by extensions fractures.The conducive role of hinge zone to the development ofkarst forms has been described by Tognini and Bini (2001).However, theirs research discussed the standing foldsconditions where the cave galleries formed in extensionzones and neutral surface is something of a barrier to karstprocesses. The geological situation of the CzerwoneWierchy Unit leads to the conclusion that the whole hingezone will favour development of large chambers and deepshafts.
Figure 6. Schematic of a minor deformations in major fold (basedon Ramsey and Huber 1987, changed).
Large chambers are formed in hinge zones of chevron foldsand in the hinge zones closer to the core of concentric folds.Relatively large concentration of deformations in smallvertical distance induces development of forms of similarhorizontal and vertical dimensions. Chambers arecharacterized by brakdown feature. The extent of rooms islinked to the strike of layers and faults which areperpendicular to bedding.
Deep shafts are developed at the outer part of the concentricfolds. Shafts are based on long, very steep stratificationsurface which are loosen and dislocated each other byflexular slip.
AcknowledgmentsStudies in caves would not be possible without permissionof the authority of the Tatra National Park. The research hasbeen funded by “Grant for young scientist” at the Facultyof Earth Sciences, University of Silesia.
ReferencesAntkiewicz A, Lorczyk M. 2010. Jaskinia Mała w Mułowej. Portal
CBDG http://geoportal.pgi.gov.pl/jaskinie-pub/jaskinie (inPolish).
Bac-Moszaszwili M, Jaroszewski W, Passendorfer E, 1984. Onthe tectonics of Czerwone Wierchy and Giewont area in theTatra Mts. (Poland). Annales Societatis Geologorum Poloniae,52(1/4), 67–88 (in Polish).
Bac-Moszaszwili M, Nowicki T, 2006. Remarks on cavesdevelopment in the Czerwone Wierchy Nappe in the Tatra Mts..Przegląd geologiczny, 54(1), 56–60 (in Polish).
Fuja D, Filar F, Albrzykowski G, 2010. Jaskinia Śnieżna Studnia.Portal CBDG, http://geoportal.pgi.gov.pl/jaskinie-pub/jaskinie(in Polish).
Goldscheider N. 2005. Fold structure and underground drainagepattern in the alpine karst system Hochifen-Gottesacker.Eclogae Geologicae Helvetiae, 98, 1–17.
Gradziński M, Hercman H, Kicińska D, Barczyk G, Bella P,Holúbek P, 2009. Karst in the Tatra Mountains—developmentsof knowledge in the last thirty years. Przegląd Geologiczny,57(8), 674–684 (in Polish).
Grodzicki J, 1970. Rola tektoniki w genezie jaskiń masywuCzerwonych Wierchów. Speologia, 5, 33–48 (in Polish).
Grodzicki J,1978. Nowe elementy strukturalne jednostki Organówmiędzy Doliną Kościeliską i Doliną Miętusią. Kras iSpeleologia, 2, 77–81 (in Polish).
Grodzicki J, 2008. Remarks on caves development in theCzerwone Wierchy Nappe in the Tatra Mts.-how to fabrykowacfakty by potwierdzić własna teorie. Proc. of 42. SpeleologicalSymp. Tarnowskie Góry, Poland, 57–60.
Grodzicki J, Kardaś R 1989. Tectonics of the Czerwone Wierchy(Massif Tatra Mts.) in the light on observations in caves.Annales Societatis Geologorum Poloniae, 59, 275–293.
Häuselmann P, Jeannin PY, Bitterli T, 1999 Reltionships betweenkarst and tectonics: case-study of the cave system North ofLake Tun (Bern, Switzerland). Geodinamica Acta, 12(6), 377–387.
Karst and Caves in Carbonate Rocks, Salt and Gypsum – oral 2013 ICS Proceedings
142

Jurewicz E, 2005. Geodynamic evolution of the Tatra Mts. and thePieniny Klippen Belt (Western Carpathians): problems andcomments. Acta Geologica Polonica, 55, 295–338.
Klimchouk A, Ford D, 2000. Lithologic and structural controls ofdissolutional cave development. In: AB Klimchouk, DC Ford,AN Palmer, W Dreybrodt (Eds.). Speleogenesis. Evolution ofKarst Aquifers. National Speleological Society, Huntsville,Alabama, 54–64.
Kotański Z, 1963. Nowe elementy budowy masywu CzerwonychWierchów. Acta Geologica Polonica, 13, 149–181 (in Polish).
Lefeld J, Gaździcki A, Iwanow A, Krajewski K, Wójcik K, 1985.Jurassic and Cretaceous lithostratigraphic units of the TatraMountains. Studia Geologica Polonica, 84, 1–93.
Lorczyk M. 2010. Ptasia Studnia-Jaskinia Lodowa Litworowa-Jaskinia Nad Dachem. Portal CBDG;http://geoportal.pgi.gov.pl/jaskinie-pub/jaskinie (in Polish).
Piotrowska K, Cymerman Z, Rączkowski W, 2009. Detailedgeological map of the Tatra Mts. in scale 1:10,000 – sheetCzerwone. National Geological Institut-Polish Reserch Institut.Warszawa.
Ramsay JG, Huber MI, 1987. The technigues of modern structuralgeology. Vol. 2:Folds and Fractures. Academic Press. London.
Tognini P, Bini A, 2001. Efects of structural setting endokarstsystem geometry in the Valle del Nose (Como Lake, NorthernItaly). Geologica Belgica, 4(3/4), 197–211.
Wiśniewski WW, Kotarba S, 2010. Jaskinia Kozia. Portal CBDG,http://geoportal.pgi.gov.pl/jaskinie-pub/jaskinie (in Polish).
Karst and Caves in Carbonate Rocks, Salt and Gypsum – oral 2013 ICS Proceedings
143
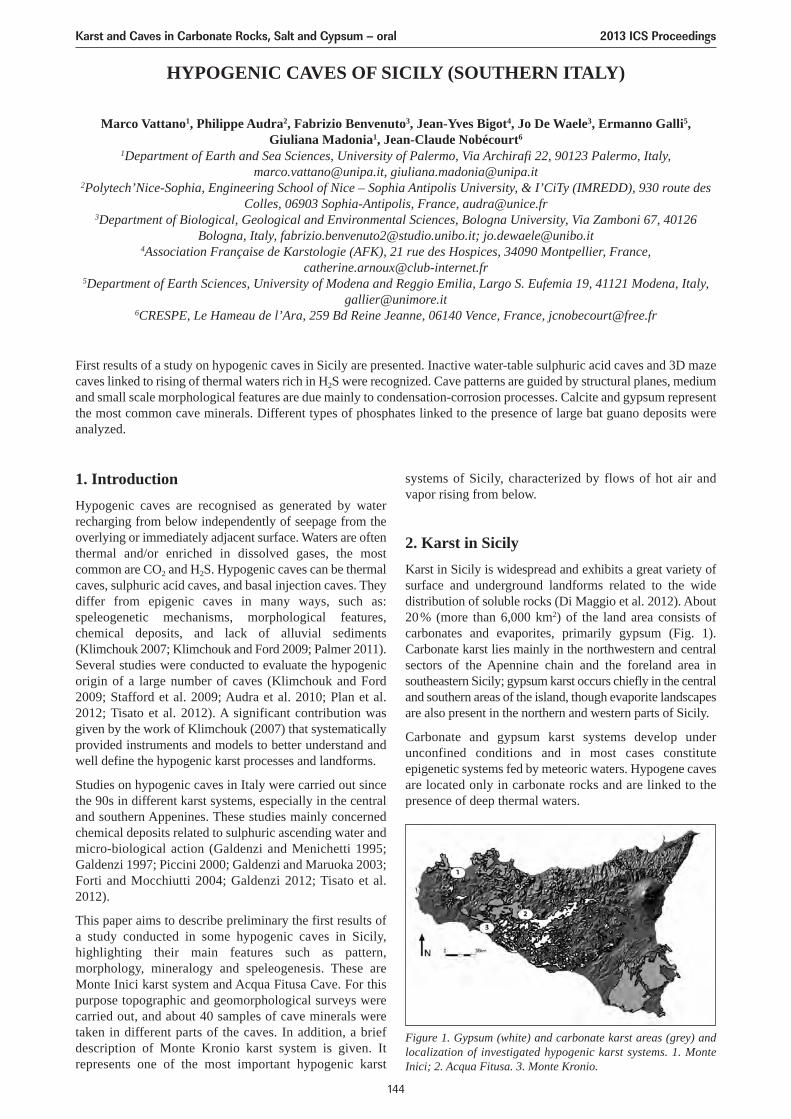
HYPOGENIC CAVES OF SICILY (SOUTHERN ITALY)
Marco Vattano1, Philippe Audra2, Fabrizio Benvenuto3, Jean-Yves Bigot4, Jo De Waele3, Ermanno Galli5,Giuliana Madonia1, Jean-Claude Nobécourt6
1Department of Earth and Sea Sciences, University of Palermo, Via Archirafi 22, 90123 Palermo, Italy,[email protected], [email protected]
2Polytech’Nice-Sophia, Engineering School of Nice – Sophia Antipolis University, & I’CiTy (IMREDD), 930 route desColles, 06903 Sophia-Antipolis, France, [email protected]
3Department of Biological, Geological and Environmental Sciences, Bologna University, Via Zamboni 67, 40126Bologna, Italy, [email protected]; [email protected]
4Association Française de Karstologie (AFK), 21 rue des Hospices, 34090 Montpellier, France,[email protected]
5Department of Earth Sciences, University of Modena and Reggio Emilia, Largo S. Eufemia 19, 41121 Modena, Italy,[email protected]
6CRESPE, Le Hameau de l’Ara, 259 Bd Reine Jeanne, 06140 Vence, France, [email protected]
First results of a study on hypogenic caves in Sicily are presented. Inactive water-table sulphuric acid caves and 3D mazecaves linked to rising of thermal waters rich in H2S were recognized. Cave patterns are guided by structural planes, mediumand small scale morphological features are due mainly to condensation-corrosion processes. Calcite and gypsum representthe most common cave minerals. Different types of phosphates linked to the presence of large bat guano deposits wereanalyzed.
1. IntroductionHypogenic caves are recognised as generated by waterrecharging from below independently of seepage from theoverlying or immediately adjacent surface. Waters are oftenthermal and/or enriched in dissolved gases, the mostcommon are CO2 and H2S. Hypogenic caves can be thermalcaves, sulphuric acid caves, and basal injection caves. Theydiffer from epigenic caves in many ways, such as:speleogenetic mechanisms, morphological features,chemical deposits, and lack of alluvial sediments(Klimchouk 2007; Klimchouk and Ford 2009; Palmer 2011).Several studies were conducted to evaluate the hypogenicorigin of a large number of caves (Klimchouk and Ford2009; Stafford et al. 2009; Audra et al. 2010; Plan et al.2012; Tisato et al. 2012). A significant contribution wasgiven by the work of Klimchouk (2007) that systematicallyprovided instruments and models to better understand andwell define the hypogenic karst processes and landforms.
Studies on hypogenic caves in Italy were carried out sincethe 90s in different karst systems, especially in the centraland southern Appenines. These studies mainly concernedchemical deposits related to sulphuric ascending water andmicro-biological action (Galdenzi and Menichetti 1995;Galdenzi 1997; Piccini 2000; Galdenzi and Maruoka 2003;Forti and Mocchiutti 2004; Galdenzi 2012; Tisato et al.2012).
This paper aims to describe preliminary the first results ofa study conducted in some hypogenic caves in Sicily,highlighting their main features such as pattern,morphology, mineralogy and speleogenesis. These areMonte Inici karst system and Acqua Fitusa Cave. For thispurpose topographic and geomorphological surveys werecarried out, and about 40 samples of cave minerals weretaken in different parts of the caves. In addition, a briefdescription of Monte Kronio karst system is given. Itrepresents one of the most important hypogenic karst
systems of Sicily, characterized by flows of hot air andvapor rising from below.
2. Karst in SicilyKarst in Sicily is widespread and exhibits a great variety ofsurface and underground landforms related to the widedistribution of soluble rocks (Di Maggio et al. 2012). About20% (more than 6,000 km2) of the land area consists ofcarbonates and evaporites, primarily gypsum (Fig. 1).Carbonate karst lies mainly in the northwestern and centralsectors of the Apennine chain and the foreland area insoutheastern Sicily; gypsum karst occurs chiefly in the centraland southern areas of the island, though evaporite landscapesare also present in the northern and western parts of Sicily.
Carbonate and gypsum karst systems develop underunconfined conditions and in most cases constituteepigenetic systems fed by meteoric waters. Hypogene cavesare located only in carbonate rocks and are linked to thepresence of deep thermal waters.
Figure 1. Gypsum (white) and carbonate karst areas (grey) andlocalization of investigated hypogenic karst systems. 1. MonteInici; 2. Acqua Fitusa. 3. Monte Kronio.
Karst and Caves in Carbonate Rocks, Salt and Gypsum – oral 2013 ICS Proceedings
144
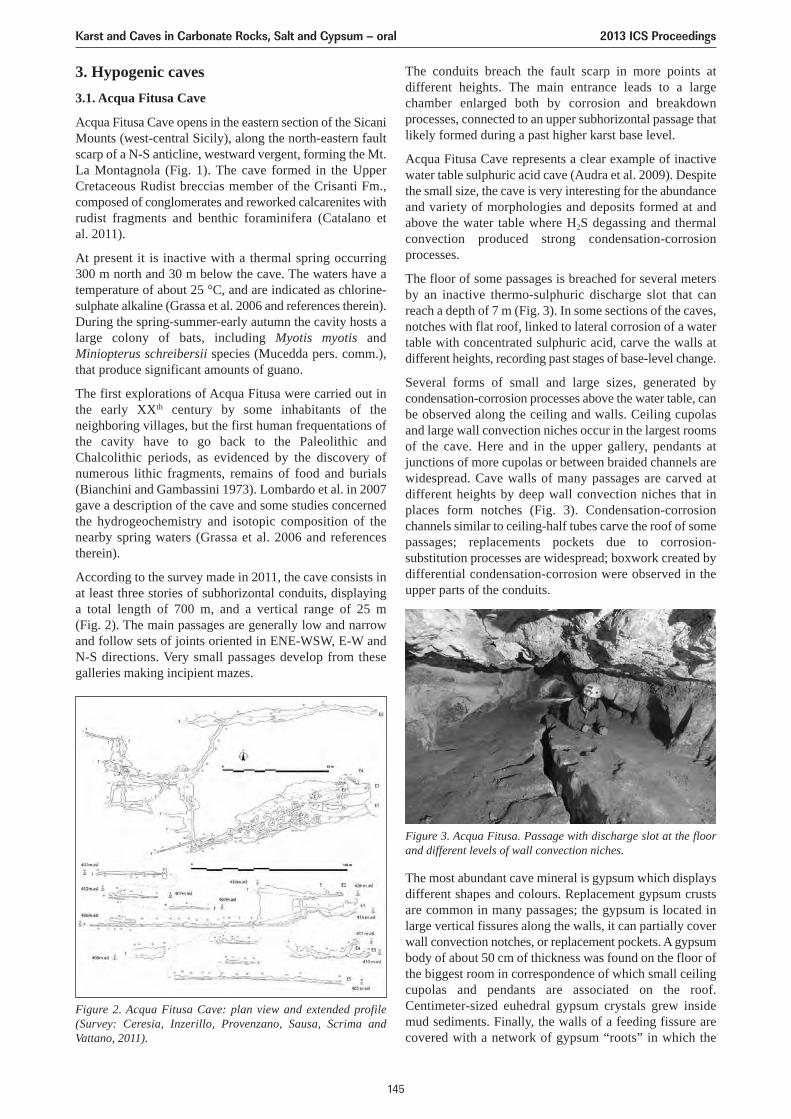
3. Hypogenic caves3.1. Acqua Fitusa Cave
Acqua Fitusa Cave opens in the eastern section of the SicaniMounts (west-central Sicily), along the north-eastern faultscarp of a N-S anticline, westward vergent, forming the Mt.La Montagnola (Fig. 1). The cave formed in the UpperCretaceous Rudist breccias member of the Crisanti Fm.,composed of conglomerates and reworked calcarenites withrudist fragments and benthic foraminifera (Catalano et al. 2011).
At present it is inactive with a thermal spring occurring 300 m north and 30 m below the cave. The waters have atemperature of about 25 °C, and are indicated as chlorine-sulphate alkaline (Grassa et al. 2006 and references therein).During the spring-summer-early autumn the cavity hosts alarge colony of bats, including Myotis myotis andMiniopterus schreibersii species (Mucedda pers. comm.),that produce significant amounts of guano.
The first explorations of Acqua Fitusa were carried out inthe early XXth century by some inhabitants of theneighboring villages, but the first human frequentations ofthe cavity have to go back to the Paleolithic andChalcolithic periods, as evidenced by the discovery ofnumerous lithic fragments, remains of food and burials(Bianchini and Gambassini 1973). Lombardo et al. in 2007gave a description of the cave and some studies concernedthe hydrogeochemistry and isotopic composition of thenearby spring waters (Grassa et al. 2006 and referencestherein).
According to the survey made in 2011, the cave consists inat least three stories of subhorizontal conduits, displayinga total length of 700 m, and a vertical range of 25 m (Fig. 2). The main passages are generally low and narrowand follow sets of joints oriented in ENE-WSW, E-W andN-S directions. Very small passages develop from thesegalleries making incipient mazes.
The conduits breach the fault scarp in more points atdifferent heights. The main entrance leads to a largechamber enlarged both by corrosion and breakdownprocesses, connected to an upper subhorizontal passage thatlikely formed during a past higher karst base level.
Acqua Fitusa Cave represents a clear example of inactivewater table sulphuric acid cave (Audra et al. 2009). Despitethe small size, the cave is very interesting for the abundanceand variety of morphologies and deposits formed at andabove the water table where H2S degassing and thermalconvection produced strong condensation-corrosionprocesses.
The floor of some passages is breached for several metersby an inactive thermo-sulphuric discharge slot that canreach a depth of 7 m (Fig. 3). In some sections of the caves,notches with flat roof, linked to lateral corrosion of a watertable with concentrated sulphuric acid, carve the walls atdifferent heights, recording past stages of base-level change.
Several forms of small and large sizes, generated bycondensation-corrosion processes above the water table, canbe observed along the ceiling and walls. Ceiling cupolasand large wall convection niches occur in the largest roomsof the cave. Here and in the upper gallery, pendants atjunctions of more cupolas or between braided channels arewidespread. Cave walls of many passages are carved atdifferent heights by deep wall convection niches that inplaces form notches (Fig. 3). Condensation-corrosionchannels similar to ceiling-half tubes carve the roof of somepassages; replacements pockets due to corrosion-substitution processes are widespread; boxwork created bydifferential condensation-corrosion were observed in theupper parts of the conduits.
Figure 2. Acqua Fitusa Cave: plan view and extended profile(Survey: Ceresia, Inzerillo, Provenzano, Sausa, Scrima andVattano, 2011).
Figure 3. Acqua Fitusa. Passage with discharge slot at the floorand different levels of wall convection niches.
The most abundant cave mineral is gypsum which displaysdifferent shapes and colours. Replacement gypsum crustsare common in many passages; the gypsum is located inlarge vertical fissures along the walls, it can partially coverwall convection notches, or replacement pockets. A gypsumbody of about 50 cm of thickness was found on the floor ofthe biggest room in correspondence of which small ceilingcupolas and pendants are associated on the roof.Centimeter-sized euhedral gypsum crystals grew insidemud sediments. Finally, the walls of a feeding fissure arecovered with a network of gypsum “roots” in which the
Karst and Caves in Carbonate Rocks, Salt and Gypsum – oral 2013 ICS Proceedings
145
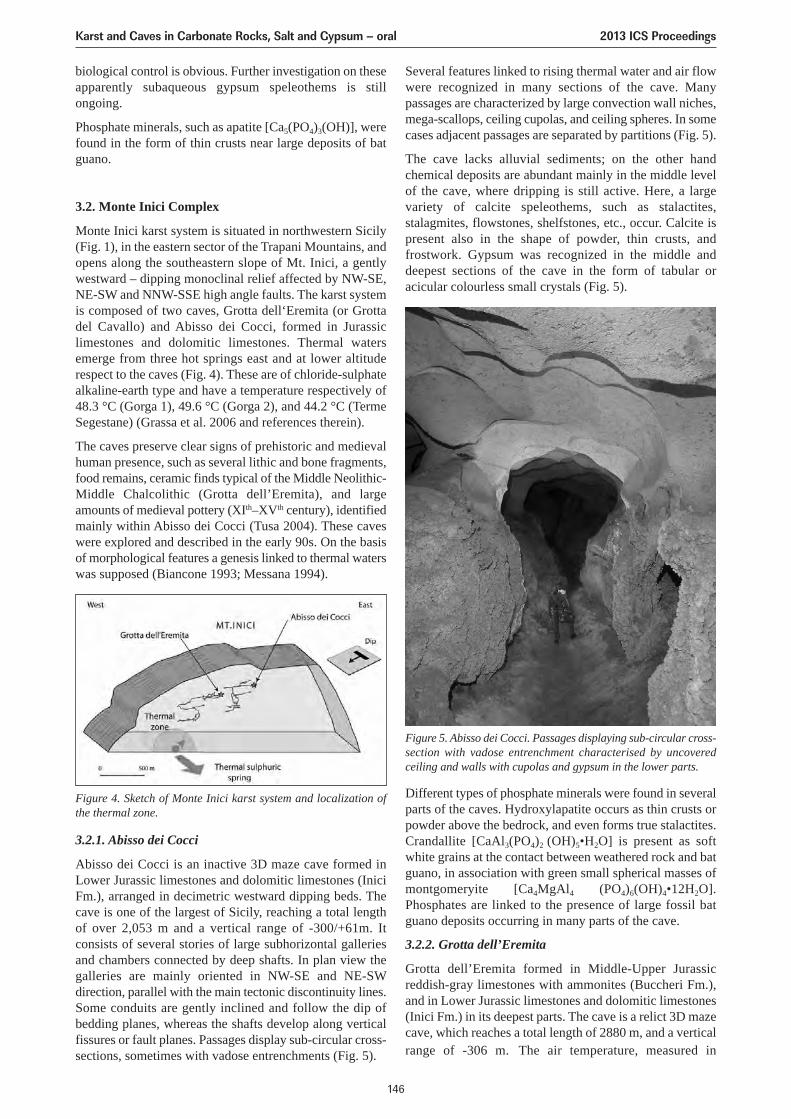
3.2.1. Abisso dei Cocci
Abisso dei Cocci is an inactive 3D maze cave formed inLower Jurassic limestones and dolomitic limestones (IniciFm.), arranged in decimetric westward dipping beds. Thecave is one of the largest of Sicily, reaching a total lengthof over 2,053 m and a vertical range of -300/+61m. Itconsists of several stories of large subhorizontal galleriesand chambers connected by deep shafts. In plan view thegalleries are mainly oriented in NW-SE and NE-SWdirection, parallel with the main tectonic discontinuity lines.Some conduits are gently inclined and follow the dip ofbedding planes, whereas the shafts develop along verticalfissures or fault planes. Passages display sub-circular cross-sections, sometimes with vadose entrenchments (Fig. 5).
Several features linked to rising thermal water and air flowwere recognized in many sections of the cave. Manypassages are characterized by large convection wall niches,mega-scallops, ceiling cupolas, and ceiling spheres. In somecases adjacent passages are separated by partitions (Fig. 5).
The cave lacks alluvial sediments; on the other handchemical deposits are abundant mainly in the middle levelof the cave, where dripping is still active. Here, a largevariety of calcite speleothems, such as stalactites,stalagmites, flowstones, shelfstones, etc., occur. Calcite ispresent also in the shape of powder, thin crusts, andfrostwork. Gypsum was recognized in the middle anddeepest sections of the cave in the form of tabular oracicular colourless small crystals (Fig. 5).
biological control is obvious. Further investigation on theseapparently subaqueous gypsum speleothems is stillongoing.
Phosphate minerals, such as apatite [Ca5(PO4)3(OH)], werefound in the form of thin crusts near large deposits of batguano.
3.2. Monte Inici Complex
Monte Inici karst system is situated in northwestern Sicily(Fig. 1), in the eastern sector of the Trapani Mountains, andopens along the southeastern slope of Mt. Inici, a gentlywestward – dipping monoclinal relief affected by NW-SE,NE-SW and NNW-SSE high angle faults. The karst systemis composed of two caves, Grotta dell‘Eremita (or Grottadel Cavallo) and Abisso dei Cocci, formed in Jurassiclimestones and dolomitic limestones. Thermal watersemerge from three hot springs east and at lower altituderespect to the caves (Fig. 4). These are of chloride-sulphatealkaline-earth type and have a temperature respectively of48.3 °C (Gorga 1), 49.6 °C (Gorga 2), and 44.2 °C (TermeSegestane) (Grassa et al. 2006 and references therein).
The caves preserve clear signs of prehistoric and medievalhuman presence, such as several lithic and bone fragments,food remains, ceramic finds typical of the Middle Neolithic-Middle Chalcolithic (Grotta dell’Eremita), and largeamounts of medieval pottery (XIth–XVth century), identifiedmainly within Abisso dei Cocci (Tusa 2004). These caveswere explored and described in the early 90s. On the basisof morphological features a genesis linked to thermal waterswas supposed (Biancone 1993; Messana 1994).
Figure 4. Sketch of Monte Inici karst system and localization ofthe thermal zone.
Figure 5. Abisso dei Cocci. Passages displaying sub-circular cross-section with vadose entrenchment characterised by uncoveredceiling and walls with cupolas and gypsum in the lower parts.
Different types of phosphate minerals were found in severalparts of the caves. Hydroxylapatite occurs as thin crusts orpowder above the bedrock, and even forms true stalactites.Crandallite [CaAl3(PO4)2 (OH)5•H2O] is present as softwhite grains at the contact between weathered rock and batguano, in association with green small spherical masses ofmontgomeryite [Ca4MgAl4 (PO4)6(OH)4•12H2O].Phosphates are linked to the presence of large fossil batguano deposits occurring in many parts of the cave.
3.2.2. Grotta dell’Eremita
Grotta dell’Eremita formed in Middle-Upper Jurassicreddish-gray limestones with ammonites (Buccheri Fm.),and in Lower Jurassic limestones and dolomitic limestones(Inici Fm.) in its deepest parts. The cave is a relict 3D mazecave, which reaches a total length of 2880 m, and a verticalrange of -306 m. The air temperature, measured in
Karst and Caves in Carbonate Rocks, Salt and Gypsum – oral 2013 ICS Proceedings
146
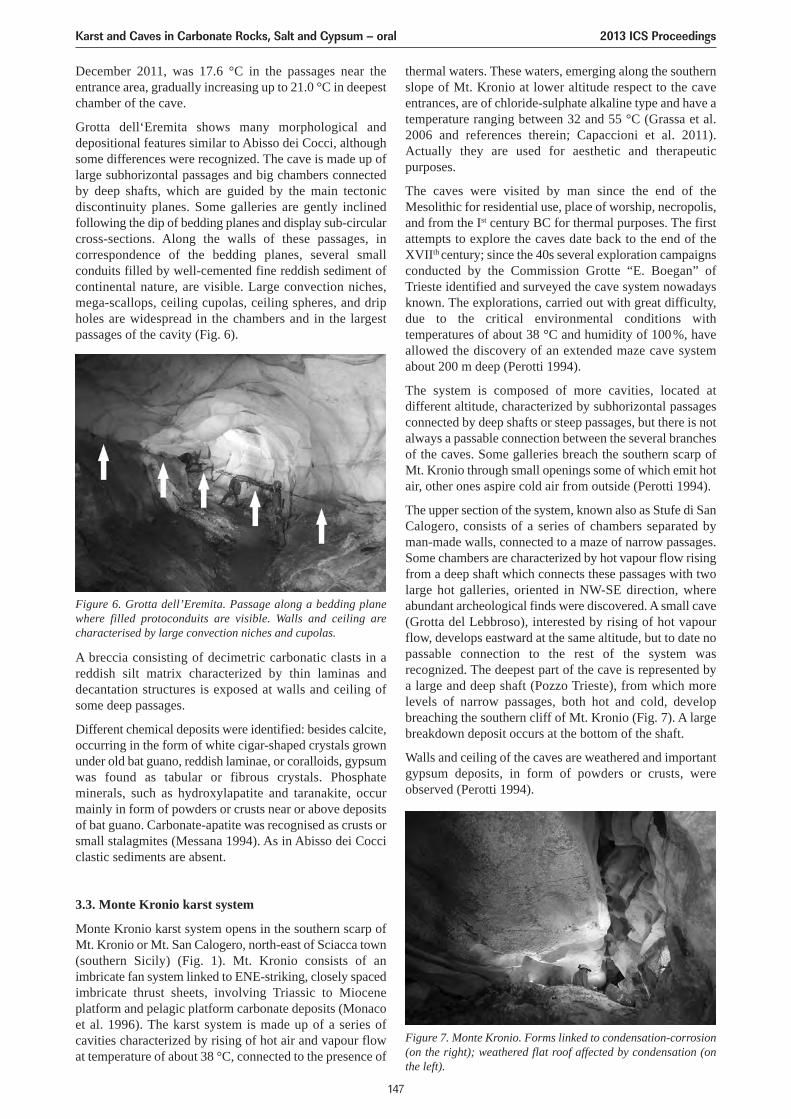
December 2011, was 17.6 °C in the passages near theentrance area, gradually increasing up to 21.0 °C in deepestchamber of the cave.
Grotta dell‘Eremita shows many morphological anddepositional features similar to Abisso dei Cocci, althoughsome differences were recognized. The cave is made up oflarge subhorizontal passages and big chambers connectedby deep shafts, which are guided by the main tectonicdiscontinuity planes. Some galleries are gently inclinedfollowing the dip of bedding planes and display sub-circularcross-sections. Along the walls of these passages, incorrespondence of the bedding planes, several smallconduits filled by well-cemented fine reddish sediment ofcontinental nature, are visible. Large convection niches,mega-scallops, ceiling cupolas, ceiling spheres, and dripholes are widespread in the chambers and in the largestpassages of the cavity (Fig. 6).
A breccia consisting of decimetric carbonatic clasts in areddish silt matrix characterized by thin laminas anddecantation structures is exposed at walls and ceiling ofsome deep passages.
Different chemical deposits were identified: besides calcite,occurring in the form of white cigar-shaped crystals grownunder old bat guano, reddish laminae, or coralloids, gypsumwas found as tabular or fibrous crystals. Phosphateminerals, such as hydroxylapatite and taranakite, occurmainly in form of powders or crusts near or above depositsof bat guano. Carbonate-apatite was recognised as crusts orsmall stalagmites (Messana 1994). As in Abisso dei Cocciclastic sediments are absent.
3.3. Monte Kronio karst system
Monte Kronio karst system opens in the southern scarp ofMt. Kronio or Mt. San Calogero, north-east of Sciacca town(southern Sicily) (Fig. 1). Mt. Kronio consists of animbricate fan system linked to ENE-striking, closely spacedimbricate thrust sheets, involving Triassic to Mioceneplatform and pelagic platform carbonate deposits (Monacoet al. 1996). The karst system is made up of a series ofcavities characterized by rising of hot air and vapour flowat temperature of about 38 °C, connected to the presence of
thermal waters. These waters, emerging along the southernslope of Mt. Kronio at lower altitude respect to the caveentrances, are of chloride-sulphate alkaline type and have atemperature ranging between 32 and 55 °C (Grassa et al.2006 and references therein; Capaccioni et al. 2011).Actually they are used for aesthetic and therapeuticpurposes.
The caves were visited by man since the end of theMesolithic for residential use, place of worship, necropolis,and from the Ist century BC for thermal purposes. The firstattempts to explore the caves date back to the end of theXVIIth century; since the 40s several exploration campaignsconducted by the Commission Grotte “E. Boegan” ofTrieste identified and surveyed the cave system nowadaysknown. The explorations, carried out with great difficulty,due to the critical environmental conditions withtemperatures of about 38 °C and humidity of 100%, haveallowed the discovery of an extended maze cave systemabout 200 m deep (Perotti 1994).
The system is composed of more cavities, located atdifferent altitude, characterized by subhorizontal passagesconnected by deep shafts or steep passages, but there is notalways a passable connection between the several branchesof the caves. Some galleries breach the southern scarp ofMt. Kronio through small openings some of which emit hotair, other ones aspire cold air from outside (Perotti 1994).
The upper section of the system, known also as Stufe di SanCalogero, consists of a series of chambers separated byman-made walls, connected to a maze of narrow passages.Some chambers are characterized by hot vapour flow risingfrom a deep shaft which connects these passages with twolarge hot galleries, oriented in NW-SE direction, whereabundant archeological finds were discovered. A small cave(Grotta del Lebbroso), interested by rising of hot vapourflow, develops eastward at the same altitude, but to date nopassable connection to the rest of the system wasrecognized. The deepest part of the cave is represented bya large and deep shaft (Pozzo Trieste), from which morelevels of narrow passages, both hot and cold, developbreaching the southern cliff of Mt. Kronio (Fig. 7). A largebreakdown deposit occurs at the bottom of the shaft.
Walls and ceiling of the caves are weathered and importantgypsum deposits, in form of powders or crusts, wereobserved (Perotti 1994).
Figure 6. Grotta dell’Eremita. Passage along a bedding planewhere filled protoconduits are visible. Walls and ceiling arecharacterised by large convection niches and cupolas.
Figure 7. Monte Kronio. Forms linked to condensation-corrosion(on the right); weathered flat roof affected by condensation (onthe left).
Karst and Caves in Carbonate Rocks, Salt and Gypsum – oral 2013 ICS Proceedings
147
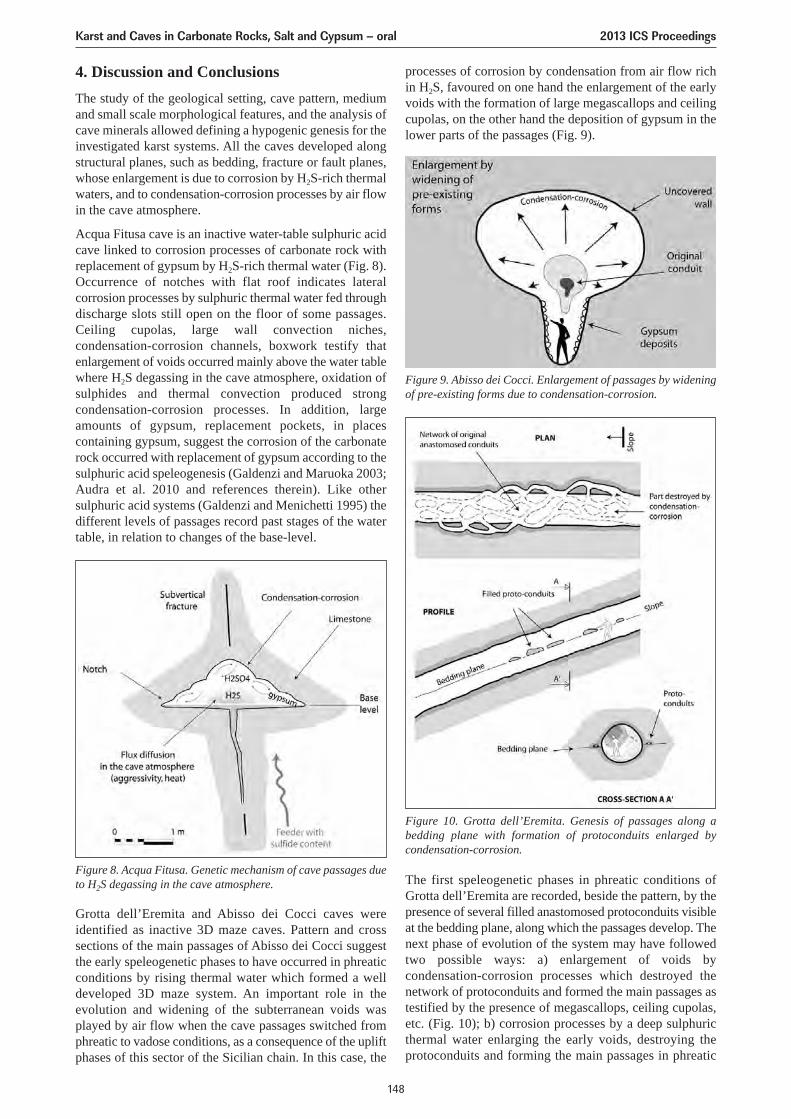
4. Discussion and ConclusionsThe study of the geological setting, cave pattern, mediumand small scale morphological features, and the analysis ofcave minerals allowed defining a hypogenic genesis for theinvestigated karst systems. All the caves developed alongstructural planes, such as bedding, fracture or fault planes,whose enlargement is due to corrosion by H2S-rich thermalwaters, and to condensation-corrosion processes by air flowin the cave atmosphere.
Acqua Fitusa cave is an inactive water-table sulphuric acidcave linked to corrosion processes of carbonate rock withreplacement of gypsum by H2S-rich thermal water (Fig. 8).Occurrence of notches with flat roof indicates lateralcorrosion processes by sulphuric thermal water fed throughdischarge slots still open on the floor of some passages.Ceiling cupolas, large wall convection niches,condensation-corrosion channels, boxwork testify thatenlargement of voids occurred mainly above the water tablewhere H2S degassing in the cave atmosphere, oxidation ofsulphides and thermal convection produced strongcondensation-corrosion processes. In addition, largeamounts of gypsum, replacement pockets, in placescontaining gypsum, suggest the corrosion of the carbonaterock occurred with replacement of gypsum according to thesulphuric acid speleogenesis (Galdenzi and Maruoka 2003;Audra et al. 2010 and references therein). Like othersulphuric acid systems (Galdenzi and Menichetti 1995) thedifferent levels of passages record past stages of the watertable, in relation to changes of the base-level.
Grotta dell’Eremita and Abisso dei Cocci caves wereidentified as inactive 3D maze caves. Pattern and crosssections of the main passages of Abisso dei Cocci suggestthe early speleogenetic phases to have occurred in phreaticconditions by rising thermal water which formed a welldeveloped 3D maze system. An important role in theevolution and widening of the subterranean voids wasplayed by air flow when the cave passages switched fromphreatic to vadose conditions, as a consequence of the upliftphases of this sector of the Sicilian chain. In this case, the
processes of corrosion by condensation from air flow richin H2S, favoured on one hand the enlargement of the earlyvoids with the formation of large megascallops and ceilingcupolas, on the other hand the deposition of gypsum in thelower parts of the passages (Fig. 9).
The first speleogenetic phases in phreatic conditions ofGrotta dell’Eremita are recorded, beside the pattern, by thepresence of several filled anastomosed protoconduits visibleat the bedding plane, along which the passages develop. Thenext phase of evolution of the system may have followedtwo possible ways: a) enlargement of voids bycondensation-corrosion processes which destroyed thenetwork of protoconduits and formed the main passages astestified by the presence of megascallops, ceiling cupolas,etc. (Fig. 10); b) corrosion processes by a deep sulphuricthermal water enlarging the early voids, destroying theprotoconduits and forming the main passages in phreatic
Figure 8. Acqua Fitusa. Genetic mechanism of cave passages dueto H2S degassing in the cave atmosphere.
Figure 9. Abisso dei Cocci. Enlargement of passages by wideningof pre-existing forms due to condensation-corrosion.
Figure 10. Grotta dell’Eremita. Genesis of passages along abedding plane with formation of protoconduits enlarged bycondensation-corrosion.
Karst and Caves in Carbonate Rocks, Salt and Gypsum – oral 2013 ICS Proceedings
148
conditions. Successively, condensation-corrosion processesby acid sulphuric air flow enlarged the early phreatic voidswith the formation of megascallops, ceiling cupolas etc.,and deposition of gypsum. The question is open, futurestudies will clarify the issue.
Finally, in all the investigated caves the presence ofdifferent types of phosphate minerals is linked to the largedeposits of bat guano (Hill and Forti 1997).
Monte Kronio system is an active hypogenic karst systemand is unique in Sicily and probably in the world. It owesits peculiarity to the rising of hot air and vapour flow, linkedto a deep thermal aquifer, still not identified within thesystem. Although this system is known since prehistorictimes, yet little is known about its real development andspeleogenetic mechanisms due to the harsh environmentalconditions that make exploration extremely difficult.Multidisplinary studies are currently in progress.
AcknowledgementsG. Ceresia, S. Inzerillo, A. Provenzano, L. Sausa, A. Scrimacontributed to resurvey Acqua Fitusa cave. G. Ceresia, A.Provenzano, P. Tordjman and G. Valdese helped sampling.Mr. Mancuso helped visiting to Monte Inici karst system.Commissione E. Boegan and La Venta for facilitating thefield activities in the Monte Kronio caves. Michal Philippiand Jiří Bruthans for the review of this paper.
ReferencesAudra P, D’Antoni-Nobecourt J-C, Bigot J-Y, 2010. Hypogenic
caves in France. Speleogenesis and morphology of the cavesystems. Bulletin de la Société Géologique de France, 181 (4),327–335.
Audra P, Mocochain L, Bigot J-Y, Nobécourt J-C, 2009. Thepattern of hypogenic caves. Proceedings of the 15thInternational Congress of Speleology, Kerrville (TX), 2, 795–800.
Bianchini G, Gambassini P, 1973. Le Grotte dell’Acqua Fitusa(Agrigento) I – Gli scavi e l’industria litica. Rivista di ScienzePreistoriche, 28 (1), 1–55.
Biancone V, 1993. Monte Inici. Una sorpresa tutta siciliana!Speleologia, 29, 72–77.
Capaccioni B, Vaselli O, Tassi F, Santo AP, Huertas AD, 2011.Hydrogeochemistry of the thermal waters from the SciaccaGeothermal Field (Sicily, southern Italy). Journal of Hydrology,396, 292–301.
Catalano R, Agate M, Avellone G, Basilone L, Gasparo MorticelliM, Gugliotta C, Sulli A, Valenti V, Gibilaro C, Pierini S, 2011.Walking along a crustal profile across the Sicily Fold andThrust Belt. AAPG International Conference & Exhibition,Post conference field trip 4, 27–29 October 2011.
Di Maggio C, Madonia G, Parise M, Vattano M, 2012. Karst inSicily and its conservation. Journal of Cave and Karst Studies,74(2), 157–172.
Forti P, Mocchiutti A, 2004. Le condizioni ambientali chepermettono l’evoluzione di speleotemi di zolfo in cavitàipogeniche: nuovi dati dalle grotte di Capo Palinuro (Salerno,Italia). Le Grotte d’Italia, 4 (5), 39–48.
Galdenzi S, 1997. Initial geological observations in cavesbordering the Sibari plain (southern Italy). Journal of Cave andKarst Studies, 59 (2), 81–86.
Galdenzi S, 2012. Corrosion of limestone tablets in sulfidicground-water: measurements and speleogenetic implications.International Journal of Speleology, 41 (2), 149–159.
Galdenzi S, Maruoka T, 2003. Gypsum deposits in the FrasassiCaves, central Italy. Journal of Cave and Karst Studies, 65,111–125.
Galdenzi S, Menichetti M, 1995. Occurrence of hypogenic cavesin a karst region: examples from central Italy. EnvironmentalGeology, 26, 39–47.
Grassa F, Capasso G, Favara R, Inguaggiato S, 2006. Chemicaland isotopic composition of waters and dissolved gases in somethermal springs of Sicily and adjacent volcanic islands, Italy.Pure and applied geophysics, 163, 781–807.
Hill C, Forti P, 1997. Cave mineral of the world. NationalSpeleological Society, Huntsville, 463.
Klimchouk AB, 2007. Hypogene Speleogenesis: hydrogeologicaland morphogenetic perspective. National Cave and KarstResearch Institute, Special Papers, 1, Carlsbad, NM, 106.
Klimchouk AB, Ford DC (Eds) 2009. Hypogene Speleogenesisand Karst Hydrogeology of Artesian Basins. Ukrainian Instituteof Speleology and Karstology, Special Paper, 1, Simferopol,280.
Lombardo G, Sciumè A, Sollano G, Vecchio E, 2007. La Grottadell’Acqua Fitusa e l’area della Montagnola nel territorio diSan Giovanni Gemini (Ag). Speleologia Iblea, 12, 125–132.
Messana E, 1994. Il sistema carsico del gruppo montuoso di M.Inici (Castellammare del Golfo, TP). Bollettinodell’Accademia Gioenia Scienze Naturali, 27 (348), 547–562.
Monaco C, Mazzoli S, Tortorici L, 1996. Active thrust tectonicsin western Sicily (southern Italy): the 1968 Belice earthquakesequence. Terra Nova, 8, 372–381.
Palmer AN, 2011. Distinction between epigenic and hypogenicmaze caves. Geomorphology, 134, 9–22.
Perotti G., 1994. Kronio. – Le stufe di San Calogero e il loro flussovaporoso. Bollettino dell’Accademia Gioenia Scienze Naturali,27 (348), 435–475.
Piccini L, 2000. Il carsismo di origine idrotermale del Colle diMonsummano (Pistoia – Toscana). Le Grotte d’Italia, 1 (5),33–43.
Plan L, Tschegg C, De Waele J, Spötl C, 2012. Corrosionmorphology and cave wall alteration in an Alpine sulfuric acidcave (Kraushöhle, Austria). Geomorphology, 169–170, 45–54.
Stafford KW, Land L, Veni G (Eds.) 2009. Advances in HypogeneKarst Studies. National Cave and Karst Research InstituteSymposium, 1, 182.
Tisato N, Sauro F, Bernasconi SM, Bruijn R, De Waele J, 2012.Hypogenic contribution to speleogenesis in a predominantepigenic karst system: A case study from the Venetian Alps,Italy. Geomorphology, 151–152, 156–163.
Tusa S, 2004. Grotta del Cavallo e la preistoria del comprensoriodi Inici. In: CAI Palermo (Ed.). I Tesori di Monte Inici, 85–95.
Karst and Caves in Carbonate Rocks, Salt and Gypsum – oral 2013 ICS Proceedings
149
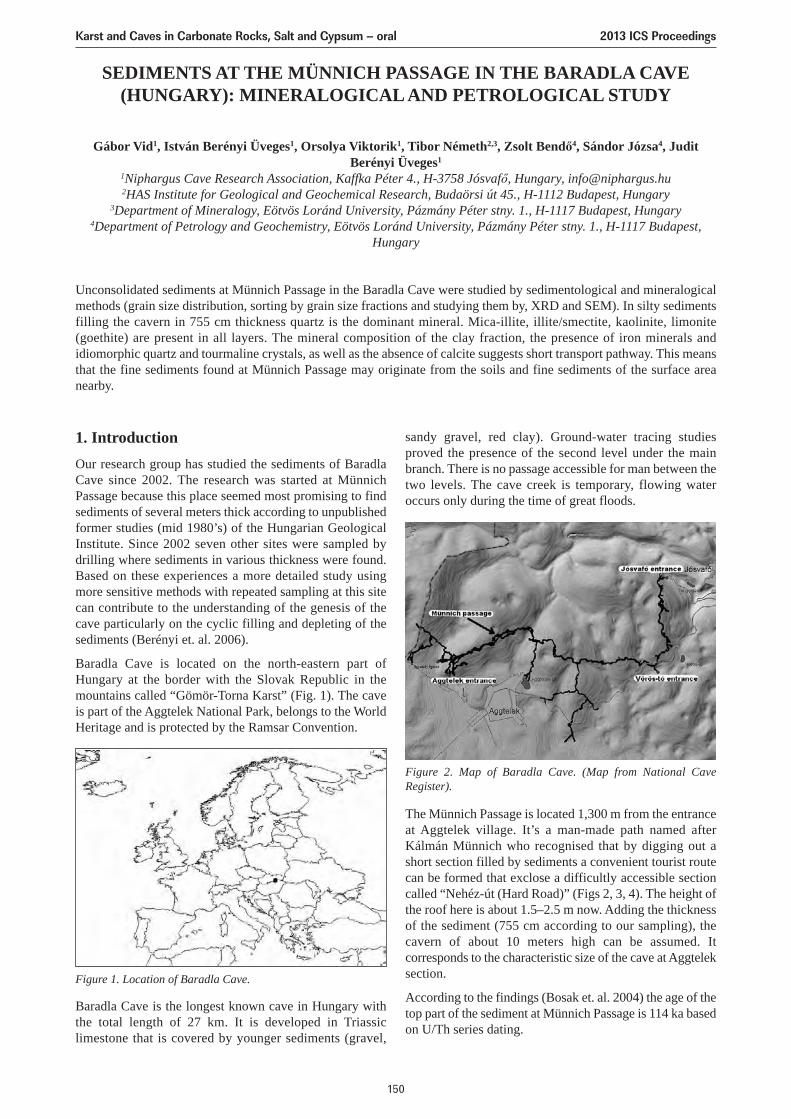
sandy gravel, red clay). Ground-water tracing studiesproved the presence of the second level under the mainbranch. There is no passage accessible for man between thetwo levels. The cave creek is temporary, flowing wateroccurs only during the time of great floods.
The Münnich Passage is located 1,300 m from the entranceat Aggtelek village. It’s a man-made path named afterKálmán Münnich who recognised that by digging out ashort section filled by sediments a convenient tourist routecan be formed that exclose a difficultly accessible sectioncalled “Nehéz-út (Hard Road)” (Figs 2, 3, 4). The height ofthe roof here is about 1.5–2.5 m now. Adding the thicknessof the sediment (755 cm according to our sampling), thecavern of about 10 meters high can be assumed. Itcorresponds to the characteristic size of the cave at Aggteleksection.
According to the findings (Bosak et. al. 2004) the age of thetop part of the sediment at Münnich Passage is 114 ka basedon U/Th series dating.
SEDIMENTS AT THE MÜNNICH PASSAGE IN THE BARADLA CAVE(HUNGARY): MINERALOGICAL AND PETROLOGICAL STUDY
Gábor Vid1, István Berényi Üveges1, Orsolya Viktorik1, Tibor Németh2,3, Zsolt Bendő4, Sándor Józsa4, JuditBerényi Üveges1
1Niphargus Cave Research Association, Kaffka Péter 4., H-3758 Jósvafő, Hungary, [email protected] Institute for Geological and Geochemical Research, Budaörsi út 45., H-1112 Budapest, Hungary
3Department of Mineralogy, Eötvös Loránd University, Pázmány Péter stny. 1., H-1117 Budapest, Hungary4Department of Petrology and Geochemistry, Eötvös Loránd University, Pázmány Péter stny. 1., H-1117 Budapest,
Hungary
Unconsolidated sediments at Münnich Passage in the Baradla Cave were studied by sedimentological and mineralogicalmethods (grain size distribution, sorting by grain size fractions and studying them by, XRD and SEM). In silty sedimentsfilling the cavern in 755 cm thickness quartz is the dominant mineral. Mica-illite, illite/smectite, kaolinite, limonite(goethite) are present in all layers. The mineral composition of the clay fraction, the presence of iron minerals andidiomorphic quartz and tourmaline crystals, as well as the absence of calcite suggests short transport pathway. This meansthat the fine sediments found at Münnich Passage may originate from the soils and fine sediments of the surface areanearby.
1. IntroductionOur research group has studied the sediments of BaradlaCave since 2002. The research was started at MünnichPassage because this place seemed most promising to findsediments of several meters thick according to unpublishedformer studies (mid 1980’s) of the Hungarian GeologicalInstitute. Since 2002 seven other sites were sampled bydrilling where sediments in various thickness were found.Based on these experiences a more detailed study usingmore sensitive methods with repeated sampling at this sitecan contribute to the understanding of the genesis of thecave particularly on the cyclic filling and depleting of thesediments (Berényi et. al. 2006).
Baradla Cave is located on the north-eastern part ofHungary at the border with the Slovak Republic in themountains called “Gömör-Torna Karst” (Fig. 1). The caveis part of the Aggtelek National Park, belongs to the WorldHeritage and is protected by the Ramsar Convention.
Baradla Cave is the longest known cave in Hungary withthe total length of 27 km. It is developed in Triassiclimestone that is covered by younger sediments (gravel,
Figure 1. Location of Baradla Cave.
Figure 2. Map of Baradla Cave. (Map from National CaveRegister).
Karst and Caves in Carbonate Rocks, Salt and Gypsum – oral 2013 ICS Proceedings
150
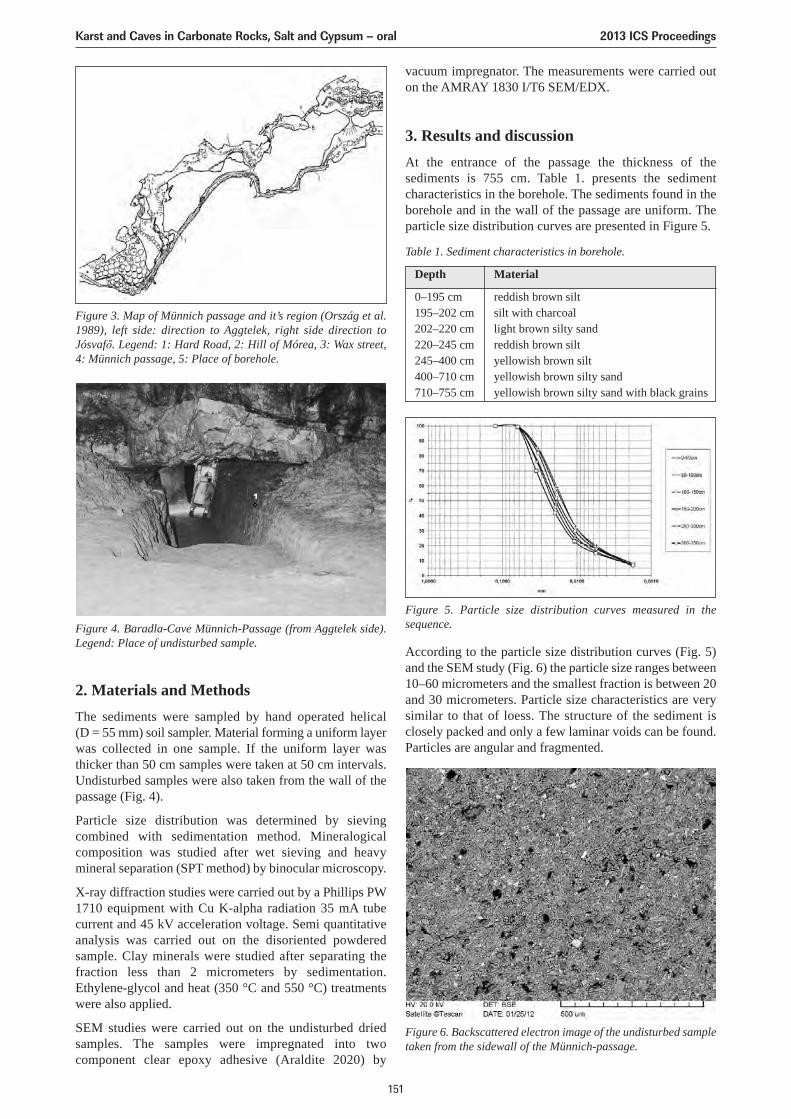
2. Materials and MethodsThe sediments were sampled by hand operated helical(D = 55 mm) soil sampler. Material forming a uniform layerwas collected in one sample. If the uniform layer wasthicker than 50 cm samples were taken at 50 cm intervals.Undisturbed samples were also taken from the wall of thepassage (Fig. 4).
Particle size distribution was determined by sievingcombined with sedimentation method. Mineralogicalcomposition was studied after wet sieving and heavymineral separation (SPT method) by binocular microscopy.
X-ray diffraction studies were carried out by a Phillips PW1710 equipment with Cu K-alpha radiation 35 mA tubecurrent and 45 kV acceleration voltage. Semi quantitativeanalysis was carried out on the disoriented powderedsample. Clay minerals were studied after separating thefraction less than 2 micrometers by sedimentation.Ethylene-glycol and heat (350 °C and 550 °C) treatmentswere also applied.
SEM studies were carried out on the undisturbed driedsamples. The samples were impregnated into twocomponent clear epoxy adhesive (Araldite 2020) by
vacuum impregnator. The measurements were carried outon the AMRAY 1830 I/T6 SEM/EDX.
3. Results and discussionAt the entrance of the passage the thickness of thesediments is 755 cm. Table 1. presents the sedimentcharacteristics in the borehole. The sediments found in theborehole and in the wall of the passage are uniform. Theparticle size distribution curves are presented in Figure 5.
Figure 3. Map of Münnich passage and it’s region (Ország et al.1989), left side: direction to Aggtelek, right side direction toJósvafő. Legend: 1: Hard Road, 2: Hill of Mórea, 3: Wax street,4: Münnich passage, 5: Place of borehole.
Figure 4. Baradla-Cave Münnich-Passage (from Aggtelek side).Legend: Place of undisturbed sample.
Depth Material
0–195 cm reddish brown silt195–202 cm silt with charcoal202–220 cm light brown silty sand220–245 cm reddish brown silt245–400 cm yellowish brown silt400–710 cm yellowish brown silty sand710–755 cm yellowish brown silty sand with black grains
Table 1. Sediment characteristics in borehole.
Figure 5. Particle size distribution curves measured in thesequence.
According to the particle size distribution curves (Fig. 5)and the SEM study (Fig. 6) the particle size ranges between10–60 micrometers and the smallest fraction is between 20and 30 micrometers. Particle size characteristics are verysimilar to that of loess. The structure of the sediment isclosely packed and only a few laminar voids can be found.Particles are angular and fragmented.
Figure 6. Backscattered electron image of the undisturbed sampletaken from the sidewall of the Münnich-passage.
Karst and Caves in Carbonate Rocks, Salt and Gypsum – oral 2013 ICS Proceedings
151
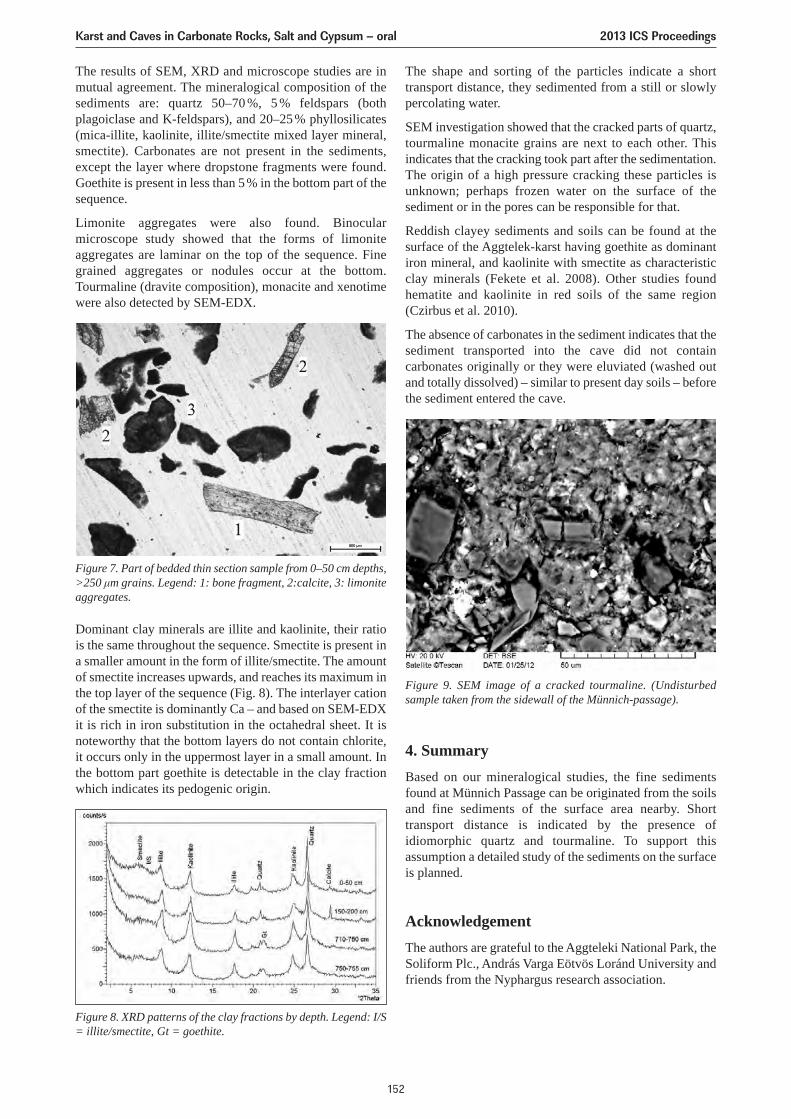
The results of SEM, XRD and microscope studies are inmutual agreement. The mineralogical composition of thesediments are: quartz 50–70 %, 5 % feldspars (bothplagoiclase and K-feldspars), and 20–25% phyllosilicates(mica-illite, kaolinite, illite/smectite mixed layer mineral,smectite). Carbonates are not present in the sediments,except the layer where dropstone fragments were found.Goethite is present in less than 5% in the bottom part of thesequence.
Limonite aggregates were also found. Binocularmicroscope study showed that the forms of limoniteaggregates are laminar on the top of the sequence. Finegrained aggregates or nodules occur at the bottom.Tourmaline (dravite composition), monacite and xenotimewere also detected by SEM-EDX.
Figure 7. Part of bedded thin section sample from 0–50 cm depths,>250 μm grains. Legend: 1: bone fragment, 2:calcite, 3: limoniteaggregates.
Dominant clay minerals are illite and kaolinite, their ratiois the same throughout the sequence. Smectite is present ina smaller amount in the form of illite/smectite. The amountof smectite increases upwards, and reaches its maximum inthe top layer of the sequence (Fig. 8). The interlayer cationof the smectite is dominantly Ca – and based on SEM-EDXit is rich in iron substitution in the octahedral sheet. It isnoteworthy that the bottom layers do not contain chlorite,it occurs only in the uppermost layer in a small amount. Inthe bottom part goethite is detectable in the clay fractionwhich indicates its pedogenic origin.
The shape and sorting of the particles indicate a shorttransport distance, they sedimented from a still or slowlypercolating water.
SEM investigation showed that the cracked parts of quartz,tourmaline monacite grains are next to each other. Thisindicates that the cracking took part after the sedimentation.The origin of a high pressure cracking these particles isunknown; perhaps frozen water on the surface of thesediment or in the pores can be responsible for that.
Reddish clayey sediments and soils can be found at thesurface of the Aggtelek-karst having goethite as dominantiron mineral, and kaolinite with smectite as characteristicclay minerals (Fekete et al. 2008). Other studies foundhematite and kaolinite in red soils of the same region(Czirbus et al. 2010).
The absence of carbonates in the sediment indicates that thesediment transported into the cave did not containcarbonates originally or they were eluviated (washed outand totally dissolved) – similar to present day soils – beforethe sediment entered the cave.
4. SummaryBased on our mineralogical studies, the fine sedimentsfound at Münnich Passage can be originated from the soilsand fine sediments of the surface area nearby. Shorttransport distance is indicated by the presence ofidiomorphic quartz and tourmaline. To support thisassumption a detailed study of the sediments on the surfaceis planned.
AcknowledgementThe authors are grateful to the Aggteleki National Park, theSoliform Plc., András Varga Eötvös Loránd University andfriends from the Nyphargus research association.
Figure 8. XRD patterns of the clay fractions by depth. Legend: I/S= illite/smectite, Gt = goethite.
Figure 9. SEM image of a cracked tourmaline. (Undisturbedsample taken from the sidewall of the Münnich-passage).
Karst and Caves in Carbonate Rocks, Salt and Gypsum – oral 2013 ICS Proceedings
152

ReferencesBerényi Ü. I., Berényi Ü. J., Vid Gábor, 2006: Adalékok a Baradla-
barlang fejlődésének elméletéhez üledékvizsgálatok alapján.Karszt és Barlang 2006 I–II (in Hungarian).
Bosák P., Hercman H, Kadlec J, Móga J, Pruner P, 2004:Paleomagnetic and U-series dating of cave sediments inBaradla cave, Hungary. Acta Carsologica, 33(2), 219–238.
Czirbus N, Nyilas T, Bozsó G, Hetényi M, 2010: Az aggteleki-karsztról származó vörösagyagos rendzina talaj szervesanyagának geokémiai jellemzése Rock-Eval pirolízissel.Kárpát-medencei Doktoranduszok Nemzetközi Konferenciája,Konferencia Kötet, 46–54 (in Hungarian).
Fekete J, Csibi M, Stefanovits P, 2008: Magyarországivörösagyagok jelentősége, fontosabb talajtani jellemzőik.Talajvédelem különszám 585–594 (in Hungarian).
National Cave Register, http://www.termeszetvedelem.hu/index.php?pg=cave_5430-1
Ország Gy, Vid Ö, Szilágyi F, Végh Zs, Gyuricza Gy, Frunyó E,Tóth Zs, 1989: Baradla-barlang 1:1,000, Magyarországbarlangtérkepei 7. kötet (in Hungarian).
Karst and Caves in Carbonate Rocks, Salt and Gypsum – oral 2013 ICS Proceedings
153
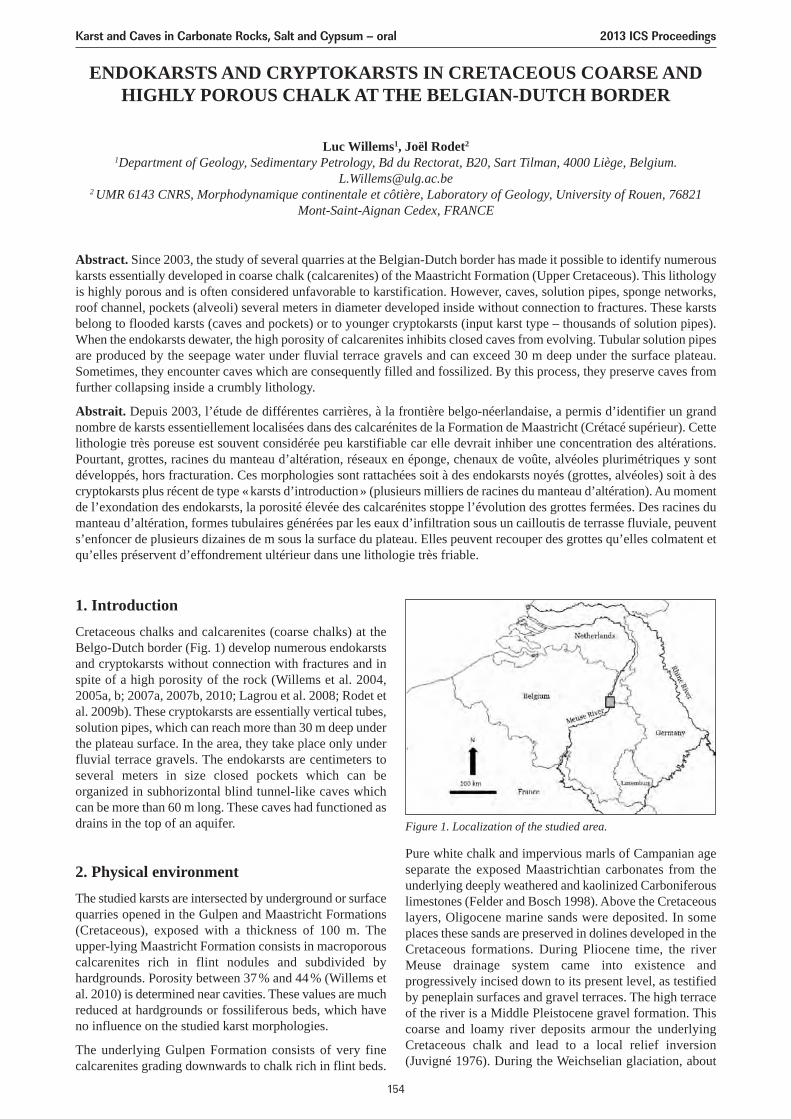
Pure white chalk and impervious marls of Campanian ageseparate the exposed Maastrichtian carbonates from theunderlying deeply weathered and kaolinized Carboniferouslimestones (Felder and Bosch 1998). Above the Cretaceouslayers, Oligocene marine sands were deposited. In someplaces these sands are preserved in dolines developed in theCretaceous formations. During Pliocene time, the riverMeuse drainage system came into existence andprogressively incised down to its present level, as testifiedby peneplain surfaces and gravel terraces. The high terraceof the river is a Middle Pleistocene gravel formation. Thiscoarse and loamy river deposits armour the underlyingCretaceous chalk and lead to a local relief inversion(Juvigné 1976). During the Weichselian glaciation, about
ENDOKARSTS AND CRYPTOKARSTS IN CRETACEOUS COARSE ANDHIGHLY POROUS CHALK AT THE BELGIAN-DUTCH BORDER
Luc Willems1, Joël Rodet2
1Department of Geology, Sedimentary Petrology, Bd du Rectorat, B20, Sart Tilman, 4000 Liège, [email protected]
2 UMR 6143 CNRS, Morphodynamique continentale et côtière, Laboratory of Geology, University of Rouen, 76821Mont-Saint-Aignan Cedex, FRANCE
Abstract. Since 2003, the study of several quarries at the Belgian-Dutch border has made it possible to identify numerouskarsts essentially developed in coarse chalk (calcarenites) of the Maastricht Formation (Upper Cretaceous). This lithologyis highly porous and is often considered unfavorable to karstification. However, caves, solution pipes, sponge networks,roof channel, pockets (alveoli) several meters in diameter developed inside without connection to fractures. These karstsbelong to flooded karsts (caves and pockets) or to younger cryptokarsts (input karst type – thousands of solution pipes).When the endokarsts dewater, the high porosity of calcarenites inhibits closed caves from evolving. Tubular solution pipesare produced by the seepage water under fluvial terrace gravels and can exceed 30 m deep under the surface plateau.Sometimes, they encounter caves which are consequently filled and fossilized. By this process, they preserve caves fromfurther collapsing inside a crumbly lithology.
Abstrait. Depuis 2003, l’étude de différentes carrières, à la frontière belgo-néerlandaise, a permis d’identifier un grandnombre de karsts essentiellement localisées dans des calcarénites de la Formation de Maastricht (Crétacé supérieur). Cettelithologie très poreuse est souvent considérée peu karstifiable car elle devrait inhiber une concentration des altérations.Pourtant, grottes, racines du manteau d’altération, réseaux en éponge, chenaux de voûte, alvéoles plurimétriques y sontdéveloppés, hors fracturation. Ces morphologies sont rattachées soit à des endokarsts noyés (grottes, alvéoles) soit à descryptokarsts plus récent de type «karsts d’introduction» (plusieurs milliers de racines du manteau d’altération). Au momentde l’exondation des endokarsts, la porosité élevée des calcarénites stoppe l’évolution des grottes fermées. Des racines dumanteau d’altération, formes tubulaires générées par les eaux d’infiltration sous un cailloutis de terrasse fluviale, peuvents’enfoncer de plusieurs dizaines de m sous la surface du plateau. Elles peuvent recouper des grottes qu’elles colmatent etqu’elles préservent d’effondrement ultérieur dans une lithologie très friable.
1. IntroductionCretaceous chalks and calcarenites (coarse chalks) at theBelgo-Dutch border (Fig. 1) develop numerous endokarstsand cryptokarsts without connection with fractures and inspite of a high porosity of the rock (Willems et al. 2004,2005a, b; 2007a, 2007b, 2010; Lagrou et al. 2008; Rodet etal. 2009b). These cryptokarsts are essentially vertical tubes,solution pipes, which can reach more than 30 m deep underthe plateau surface. In the area, they take place only underfluvial terrace gravels. The endokarsts are centimeters toseveral meters in size closed pockets which can beorganized in subhorizontal blind tunnel-like caves whichcan be more than 60 m long. These caves had functioned asdrains in the top of an aquifer.
2. Physical environmentThe studied karsts are intersected by underground or surfacequarries opened in the Gulpen and Maastricht Formations(Cretaceous), exposed with a thickness of 100 m. Theupper-lying Maastricht Formation consists in macroporouscalcarenites rich in flint nodules and subdivided byhardgrounds. Porosity between 37% and 44% (Willems etal. 2010) is determined near cavities. These values are muchreduced at hardgrounds or fossiliferous beds, which haveno influence on the studied karst morphologies.
The underlying Gulpen Formation consists of very finecalcarenites grading downwards to chalk rich in flint beds.
Figure 1. Localization of the studied area.
Karst and Caves in Carbonate Rocks, Salt and Gypsum – oral 2013 ICS Proceedings
154
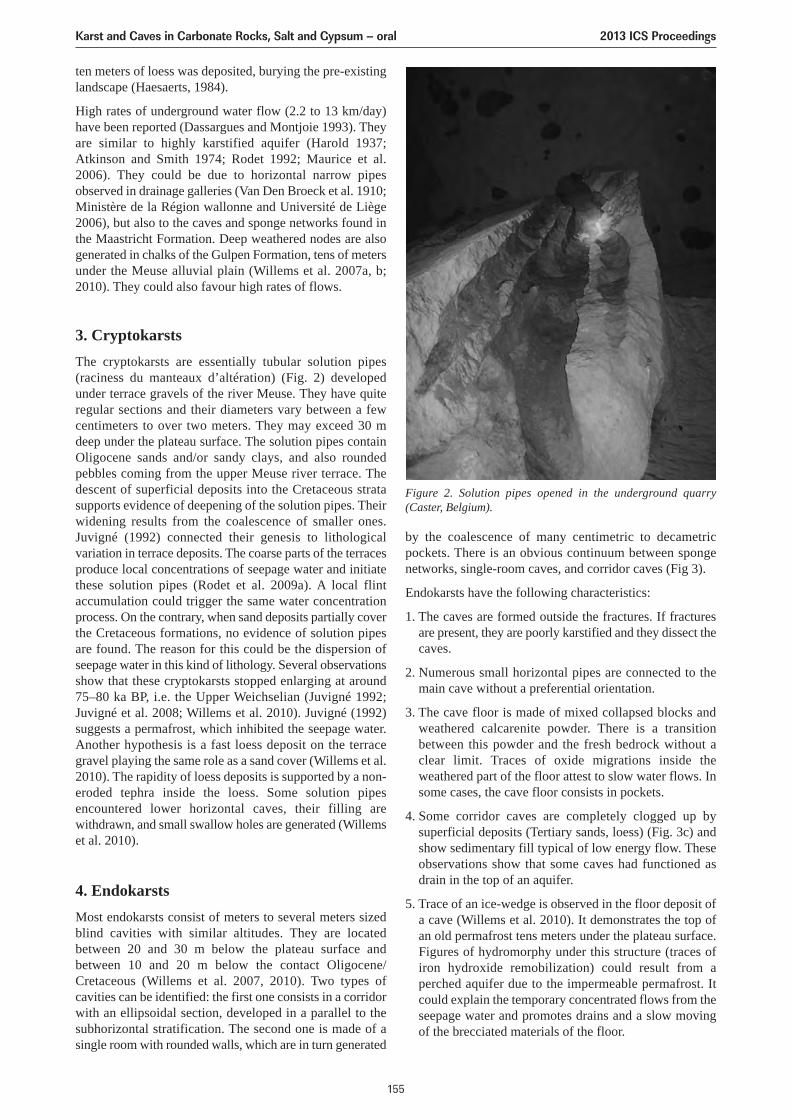
ten meters of loess was deposited, burying the pre-existinglandscape (Haesaerts, 1984).
High rates of underground water flow (2.2 to 13 km/day)have been reported (Dassargues and Montjoie 1993). Theyare similar to highly karstified aquifer (Harold 1937;Atkinson and Smith 1974; Rodet 1992; Maurice et al.2006). They could be due to horizontal narrow pipesobserved in drainage galleries (Van Den Broeck et al. 1910;Ministère de la Région wallonne and Université de Liège2006), but also to the caves and sponge networks found inthe Maastricht Formation. Deep weathered nodes are alsogenerated in chalks of the Gulpen Formation, tens of metersunder the Meuse alluvial plain (Willems et al. 2007a, b;2010). They could also favour high rates of flows.
3. CryptokarstsThe cryptokarsts are essentially tubular solution pipes(raciness du manteaux d’altération) (Fig. 2) developedunder terrace gravels of the river Meuse. They have quiteregular sections and their diameters vary between a fewcentimeters to over two meters. They may exceed 30 mdeep under the plateau surface. The solution pipes containOligocene sands and/or sandy clays, and also roundedpebbles coming from the upper Meuse river terrace. Thedescent of superficial deposits into the Cretaceous stratasupports evidence of deepening of the solution pipes. Theirwidening results from the coalescence of smaller ones.Juvigné (1992) connected their genesis to lithologicalvariation in terrace deposits. The coarse parts of the terracesproduce local concentrations of seepage water and initiatethese solution pipes (Rodet et al. 2009a). A local flintaccumulation could trigger the same water concentrationprocess. On the contrary, when sand deposits partially coverthe Cretaceous formations, no evidence of solution pipesare found. The reason for this could be the dispersion ofseepage water in this kind of lithology. Several observationsshow that these cryptokarsts stopped enlarging at around75–80 ka BP, i.e. the Upper Weichselian (Juvigné 1992;Juvigné et al. 2008; Willems et al. 2010). Juvigné (1992)suggests a permafrost, which inhibited the seepage water.Another hypothesis is a fast loess deposit on the terracegravel playing the same role as a sand cover (Willems et al.2010). The rapidity of loess deposits is supported by a non-eroded tephra inside the loess. Some solution pipesencountered lower horizontal caves, their filling arewithdrawn, and small swallow holes are generated (Willemset al. 2010).
4. EndokarstsMost endokarsts consist of meters to several meters sizedblind cavities with similar altitudes. They are locatedbetween 20 and 30 m below the plateau surface andbetween 10 and 20 m below the contact Oligocene/Cretaceous (Willems et al. 2007, 2010). Two types ofcavities can be identified: the first one consists in a corridorwith an ellipsoidal section, developed in a parallel to thesubhorizontal stratification. The second one is made of asingle room with rounded walls, which are in turn generated
by the coalescence of many centimetric to decametricpockets. There is an obvious continuum between spongenetworks, single-room caves, and corridor caves (Fig 3).
Endokarsts have the following characteristics:
1. The caves are formed outside the fractures. If fracturesare present, they are poorly karstified and they dissect thecaves.
2. Numerous small horizontal pipes are connected to themain cave without a preferential orientation.
3. The cave floor is made of mixed collapsed blocks andweathered calcarenite powder. There is a transitionbetween this powder and the fresh bedrock without aclear limit. Traces of oxide migrations inside theweathered part of the floor attest to slow water flows. Insome cases, the cave floor consists in pockets.
4. Some corridor caves are completely clogged up bysuperficial deposits (Tertiary sands, loess) (Fig. 3c) andshow sedimentary fill typical of low energy flow. Theseobservations show that some caves had functioned asdrain in the top of an aquifer.
5. Trace of an ice-wedge is observed in the floor deposit ofa cave (Willems et al. 2010). It demonstrates the top ofan old permafrost tens meters under the plateau surface.Figures of hydromorphy under this structure (traces ofiron hydroxide remobilization) could result from aperched aquifer due to the impermeable permafrost. Itcould explain the temporary concentrated flows from theseepage water and promotes drains and a slow movingof the brecciated materials of the floor.
Figure 2. Solution pipes opened in the underground quarry(Caster, Belgium).
Karst and Caves in Carbonate Rocks, Salt and Gypsum – oral 2013 ICS Proceedings
155
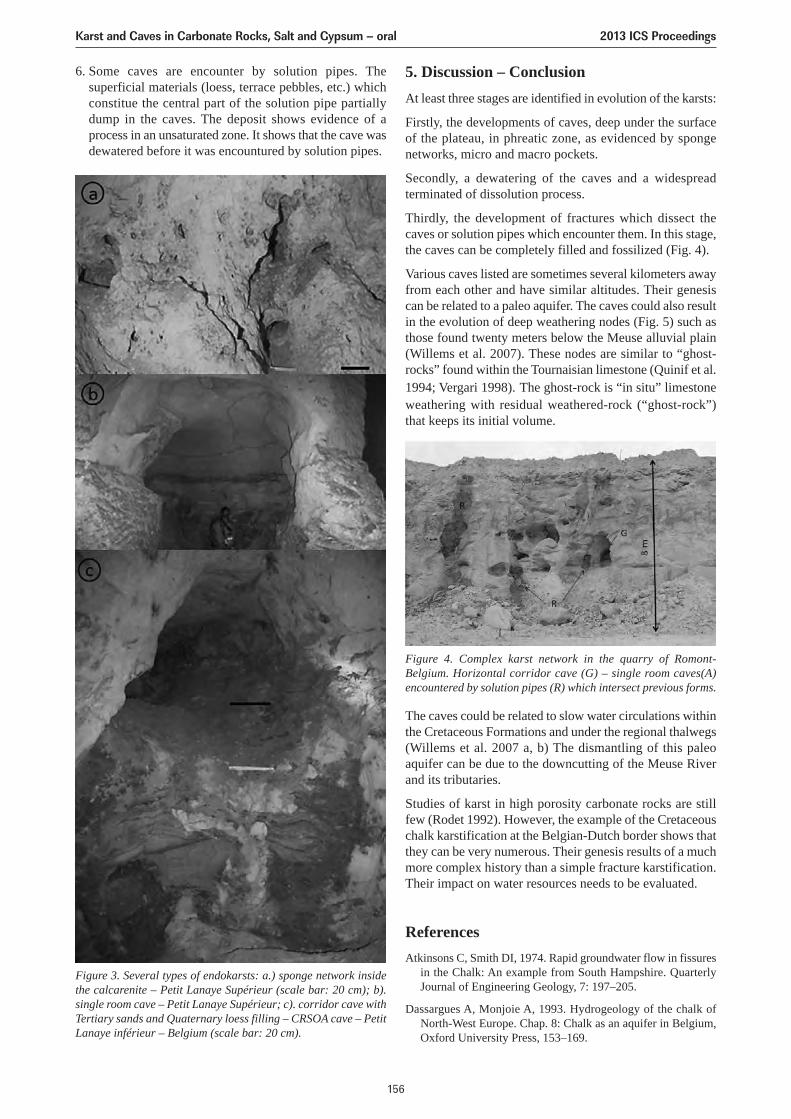
5. Discussion – ConclusionAt least three stages are identified in evolution of the karsts:
Firstly, the developments of caves, deep under the surfaceof the plateau, in phreatic zone, as evidenced by spongenetworks, micro and macro pockets.
Secondly, a dewatering of the caves and a widespreadterminated of dissolution process.
Thirdly, the development of fractures which dissect thecaves or solution pipes which encounter them. In this stage,the caves can be completely filled and fossilized (Fig. 4).
Various caves listed are sometimes several kilometers awayfrom each other and have similar altitudes. Their genesiscan be related to a paleo aquifer. The caves could also resultin the evolution of deep weathering nodes (Fig. 5) such asthose found twenty meters below the Meuse alluvial plain(Willems et al. 2007). These nodes are similar to “ghost-rocks” found within the Tournaisian limestone (Quinif et al.1994; Vergari 1998). The ghost-rock is “in situ” limestoneweathering with residual weathered-rock (“ghost-rock”)that keeps its initial volume.
The caves could be related to slow water circulations withinthe Cretaceous Formations and under the regional thalwegs(Willems et al. 2007 a, b) The dismantling of this paleoaquifer can be due to the downcutting of the Meuse Riverand its tributaries.
Studies of karst in high porosity carbonate rocks are stillfew (Rodet 1992). However, the example of the Cretaceouschalk karstification at the Belgian-Dutch border shows thatthey can be very numerous. Their genesis results of a muchmore complex history than a simple fracture karstification.Their impact on water resources needs to be evaluated.
ReferencesAtkinsons C, Smith DI, 1974. Rapid groundwater flow in fissures
in the Chalk: An example from South Hampshire. QuarterlyJournal of Engineering Geology, 7: 197–205.
Dassargues A, Monjoie A, 1993. Hydrogeology of the chalk ofNorth-West Europe. Chap. 8: Chalk as an aquifer in Belgium,Oxford University Press, 153–169.
6. Some caves are encounter by solution pipes. Thesuperficial materials (loess, terrace pebbles, etc.) whichconstitue the central part of the solution pipe partiallydump in the caves. The deposit shows evidence of aprocess in an unsaturated zone. It shows that the cave wasdewatered before it was encountured by solution pipes.
Figure 3. Several types of endokarsts: a.) sponge network insidethe calcarenite – Petit Lanaye Supérieur (scale bar: 20 cm); b).single room cave – Petit Lanaye Supérieur; c). corridor cave withTertiary sands and Quaternary loess filling – CRSOA cave – PetitLanaye inférieur – Belgium (scale bar: 20 cm).
Figure 4. Complex karst network in the quarry of Romont-Belgium. Horizontal corridor cave (G) – single room caves(A)encountered by solution pipes (R) which intersect previous forms.
Karst and Caves in Carbonate Rocks, Salt and Gypsum – oral 2013 ICS Proceedings
156
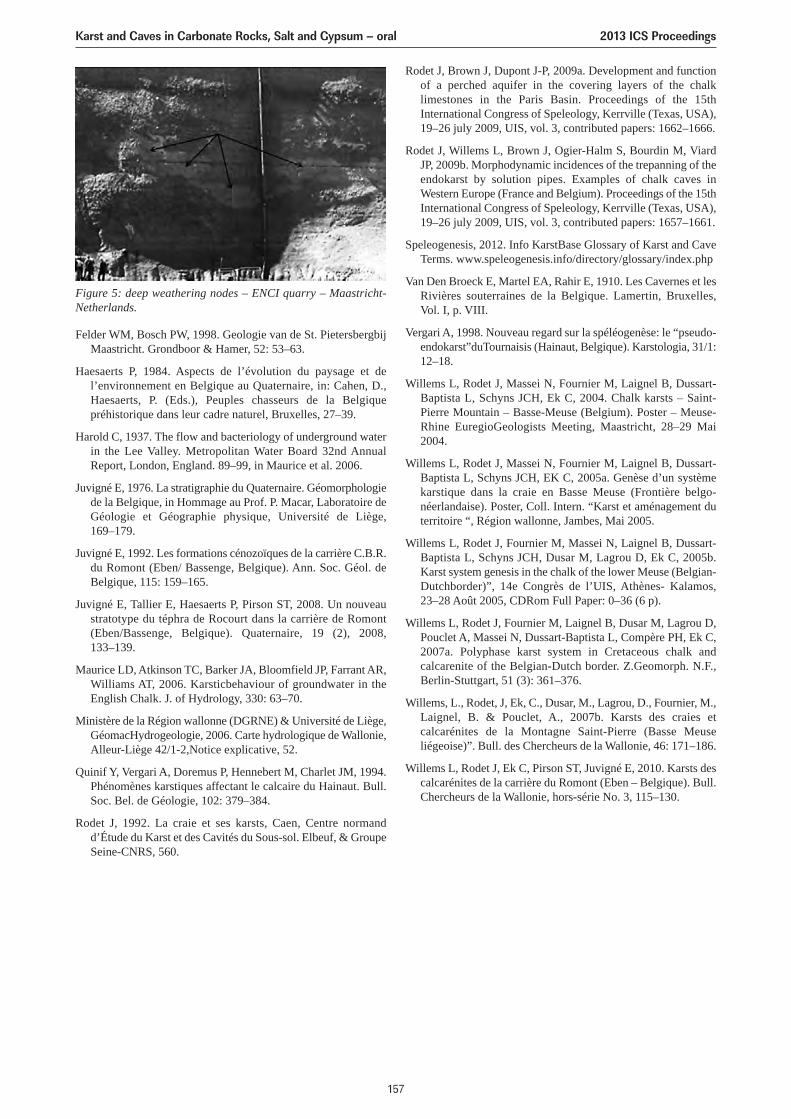
Felder WM, Bosch PW, 1998. Geologie van de St. PietersbergbijMaastricht. Grondboor & Hamer, 52: 53–63.
Haesaerts P, 1984. Aspects de l’évolution du paysage et del’environnement en Belgique au Quaternaire, in: Cahen, D.,Haesaerts, P. (Eds.), Peuples chasseurs de la Belgiquepréhistorique dans leur cadre naturel, Bruxelles, 27–39.
Harold C, 1937. The flow and bacteriology of underground waterin the Lee Valley. Metropolitan Water Board 32nd AnnualReport, London, England. 89–99, in Maurice et al. 2006.
Juvigné E, 1976. La stratigraphie du Quaternaire. Géomorphologiede la Belgique, in Hommage au Prof. P. Macar, Laboratoire deGéologie et Géographie physique, Université de Liège, 169–179.
Juvigné E, 1992. Les formations cénozoïques de la carrière C.B.R.du Romont (Eben/ Bassenge, Belgique). Ann. Soc. Géol. deBelgique, 115: 159–165.
Juvigné E, Tallier E, Haesaerts P, Pirson ST, 2008. Un nouveaustratotype du téphra de Rocourt dans la carrière de Romont(Eben/Bassenge, Belgique). Quaternaire, 19 (2), 2008, 133–139.
Maurice LD, Atkinson TC, Barker JA, Bloomfield JP, Farrant AR,Williams AT, 2006. Karsticbehaviour of groundwater in theEnglish Chalk. J. of Hydrology, 330: 63–70.
Ministère de la Région wallonne (DGRNE) & Université de Liège,GéomacHydrogeologie, 2006. Carte hydrologique de Wallonie,Alleur-Liège 42/1-2,Notice explicative, 52.
Quinif Y, Vergari A, Doremus P, Hennebert M, Charlet JM, 1994.Phénomènes karstiques affectant le calcaire du Hainaut. Bull.Soc. Bel. de Géologie, 102: 379–384.
Rodet J, 1992. La craie et ses karsts, Caen, Centre normandd’Étude du Karst et des Cavités du Sous-sol. Elbeuf, & GroupeSeine-CNRS, 560.
Rodet J, Brown J, Dupont J-P, 2009a. Development and functionof a perched aquifer in the covering layers of the chalklimestones in the Paris Basin. Proceedings of the 15thInternational Congress of Speleology, Kerrville (Texas, USA),19–26 july 2009, UIS, vol. 3, contributed papers: 1662–1666.
Rodet J, Willems L, Brown J, Ogier-Halm S, Bourdin M, ViardJP, 2009b. Morphodynamic incidences of the trepanning of theendokarst by solution pipes. Examples of chalk caves inWestern Europe (France and Belgium). Proceedings of the 15thInternational Congress of Speleology, Kerrville (Texas, USA),19–26 july 2009, UIS, vol. 3, contributed papers: 1657–1661.
Speleogenesis, 2012. Info KarstBase Glossary of Karst and CaveTerms. www.speleogenesis.info/directory/glossary/index.php
Van Den Broeck E, Martel EA, Rahir E, 1910. Les Cavernes et lesRivières souterraines de la Belgique. Lamertin, Bruxelles,Vol. I, p. VIII.
Vergari A, 1998. Nouveau regard sur la spéléogenèse: le “pseudo-endokarst”duTournaisis (Hainaut, Belgique). Karstologia, 31/1:12–18.
Willems L, Rodet J, Massei N, Fournier M, Laignel B, Dussart-Baptista L, Schyns JCH, Ek C, 2004. Chalk karsts – Saint-Pierre Mountain – Basse-Meuse (Belgium). Poster – Meuse-Rhine EuregioGeologists Meeting, Maastricht, 28–29 Mai2004.
Willems L, Rodet J, Massei N, Fournier M, Laignel B, Dussart-Baptista L, Schyns JCH, EK C, 2005a. Genèse d’un systèmekarstique dans la craie en Basse Meuse (Frontière belgo-néerlandaise). Poster, Coll. Intern. “Karst et aménagement duterritoire “, Région wallonne, Jambes, Mai 2005.
Willems L, Rodet J, Fournier M, Massei N, Laignel B, Dussart-Baptista L, Schyns JCH, Dusar M, Lagrou D, Ek C, 2005b.Karst system genesis in the chalk of the lower Meuse (Belgian-Dutchborder)”, 14e Congrès de l’UIS, Athènes- Kalamos,23–28 Août 2005, CDRom Full Paper: 0–36 (6 p).
Willems L, Rodet J, Fournier M, Laignel B, Dusar M, Lagrou D,Pouclet A, Massei N, Dussart-Baptista L, Compère PH, Ek C,2007a. Polyphase karst system in Cretaceous chalk andcalcarenite of the Belgian-Dutch border. Z.Geomorph. N.F.,Berlin-Stuttgart, 51 (3): 361–376.
Willems, L., Rodet, J, Ek, C., Dusar, M., Lagrou, D., Fournier, M.,Laignel, B. & Pouclet, A., 2007b. Karsts des craies etcalcarénites de la Montagne Saint-Pierre (Basse Meuseliégeoise)”. Bull. des Chercheurs de la Wallonie, 46: 171–186.
Willems L, Rodet J, Ek C, Pirson ST, Juvigné E, 2010. Karsts descalcarénites de la carrière du Romont (Eben – Belgique). Bull.Chercheurs de la Wallonie, hors-série No. 3, 115–130.
Figure 5: deep weathering nodes – ENCI quarry – Maastricht-Netherlands.
Karst and Caves in Carbonate Rocks, Salt and Gypsum – oral 2013 ICS Proceedings
157
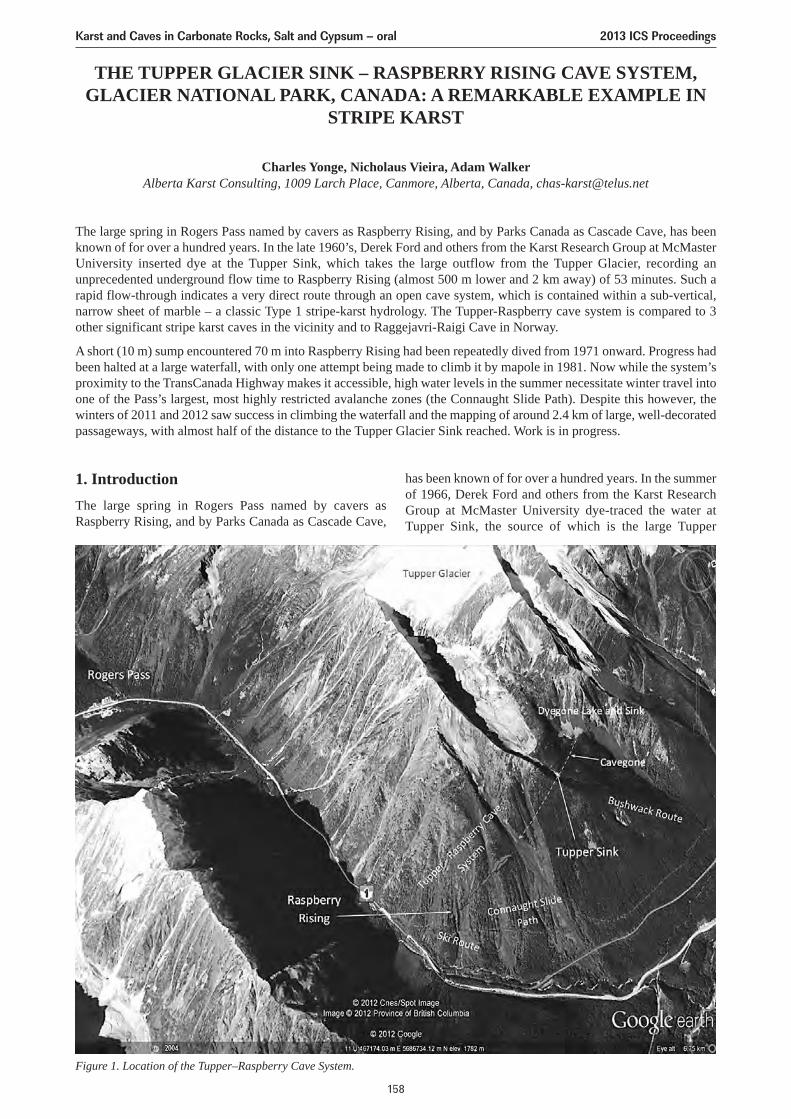
THE TUPPER GLACIER SINK – RASPBERRY RISING CAVE SYSTEM,GLACIER NATIONAL PARK, CANADA: A REMARKABLE EXAMPLE IN
STRIPE KARST
Charles Yonge, Nicholaus Vieira, Adam WalkerAlberta Karst Consulting, 1009 Larch Place, Canmore, Alberta, Canada, [email protected]
The large spring in Rogers Pass named by cavers as Raspberry Rising, and by Parks Canada as Cascade Cave, has beenknown of for over a hundred years. In the late 1960’s, Derek Ford and others from the Karst Research Group at McMasterUniversity inserted dye at the Tupper Sink, which takes the large outflow from the Tupper Glacier, recording anunprecedented underground flow time to Raspberry Rising (almost 500 m lower and 2 km away) of 53 minutes. Such arapid flow-through indicates a very direct route through an open cave system, which is contained within a sub-vertical,narrow sheet of marble – a classic Type 1 stripe-karst hydrology. The Tupper-Raspberry cave system is compared to 3other significant stripe karst caves in the vicinity and to Raggejavri-Raigi Cave in Norway.
A short (10 m) sump encountered 70 m into Raspberry Rising had been repeatedly dived from 1971 onward. Progress hadbeen halted at a large waterfall, with only one attempt being made to climb it by mapole in 1981. Now while the system’sproximity to the TransCanada Highway makes it accessible, high water levels in the summer necessitate winter travel intoone of the Pass’s largest, most highly restricted avalanche zones (the Connaught Slide Path). Despite this however, thewinters of 2011 and 2012 saw success in climbing the waterfall and the mapping of around 2.4 km of large, well-decoratedpassageways, with almost half of the distance to the Tupper Glacier Sink reached. Work is in progress.
1. IntroductionThe large spring in Rogers Pass named by cavers asRaspberry Rising, and by Parks Canada as Cascade Cave,
has been known of for over a hundred years. In the summerof 1966, Derek Ford and others from the Karst ResearchGroup at McMaster University dye-traced the water atTupper Sink, the source of which is the large Tupper
Figure 1. Location of the Tupper–Raspberry Cave System.
Karst and Caves in Carbonate Rocks, Salt and Gypsum – oral 2013 ICS Proceedings
158
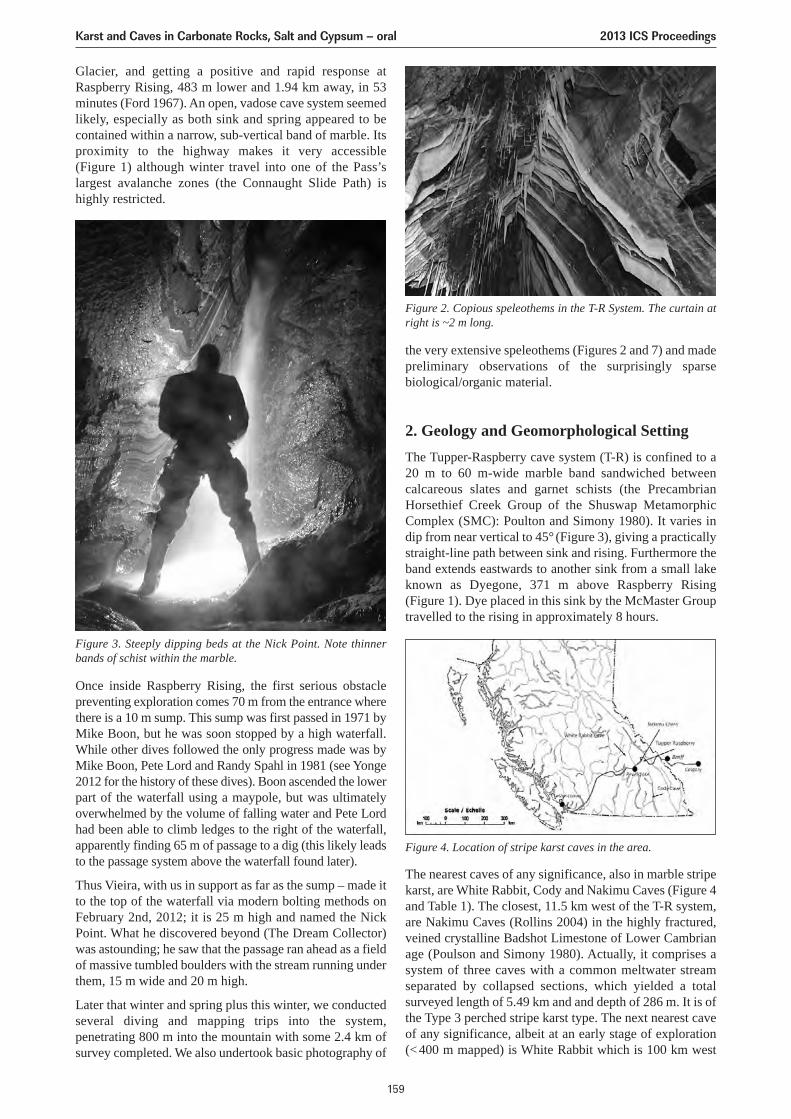
Glacier, and getting a positive and rapid response atRaspberry Rising, 483 m lower and 1.94 km away, in 53minutes (Ford 1967). An open, vadose cave system seemedlikely, especially as both sink and spring appeared to becontained within a narrow, sub-vertical band of marble. Itsproximity to the highway makes it very accessible(Figure 1) although winter travel into one of the Pass’slargest avalanche zones (the Connaught Slide Path) ishighly restricted.
Once inside Raspberry Rising, the first serious obstaclepreventing exploration comes 70 m from the entrance wherethere is a 10 m sump. This sump was first passed in 1971 byMike Boon, but he was soon stopped by a high waterfall.While other dives followed the only progress made was byMike Boon, Pete Lord and Randy Spahl in 1981 (see Yonge2012 for the history of these dives). Boon ascended the lowerpart of the waterfall using a maypole, but was ultimatelyoverwhelmed by the volume of falling water and Pete Lordhad been able to climb ledges to the right of the waterfall,apparently finding 65 m of passage to a dig (this likely leadsto the passage system above the waterfall found later).
Thus Vieira, with us in support as far as the sump – made itto the top of the waterfall via modern bolting methods onFebruary 2nd, 2012; it is 25 m high and named the NickPoint. What he discovered beyond (The Dream Collector)was astounding; he saw that the passage ran ahead as a fieldof massive tumbled boulders with the stream running underthem, 15 m wide and 20 m high.
Later that winter and spring plus this winter, we conductedseveral diving and mapping trips into the system,penetrating 800 m into the mountain with some 2.4 km ofsurvey completed. We also undertook basic photography of
Figure 3. Steeply dipping beds at the Nick Point. Note thinnerbands of schist within the marble.
Figure 2. Copious speleothems in the T-R System. The curtain atright is ~2 m long.
Figure 4. Location of stripe karst caves in the area.
the very extensive speleothems (Figures 2 and 7) and madepreliminary observations of the surprisingly sparsebiological/organic material.
2. Geology and Geomorphological SettingThe Tupper-Raspberry cave system (T-R) is confined to a20 m to 60 m-wide marble band sandwiched betweencalcareous slates and garnet schists (the PrecambrianHorsethief Creek Group of the Shuswap MetamorphicComplex (SMC): Poulton and Simony 1980). It varies indip from near vertical to 45° (Figure 3), giving a practicallystraight-line path between sink and rising. Furthermore theband extends eastwards to another sink from a small lakeknown as Dyegone, 371 m above Raspberry Rising(Figure 1). Dye placed in this sink by the McMaster Grouptravelled to the rising in approximately 8 hours.
The nearest caves of any significance, also in marble stripekarst, are White Rabbit, Cody and Nakimu Caves (Figure 4and Table 1). The closest, 11.5 km west of the T-R system,are Nakimu Caves (Rollins 2004) in the highly fractured,veined crystalline Badshot Limestone of Lower Cambrianage (Poulson and Simony 1980). Actually, it comprises asystem of three caves with a common meltwater streamseparated by collapsed sections, which yielded a totalsurveyed length of 5.49 km and and depth of 286 m. It is ofthe Type 3 perched stripe karst type. The next nearest caveof any significance, albeit at an early stage of exploration(<400 m mapped) is White Rabbit which is 100 km west
Karst and Caves in Carbonate Rocks, Salt and Gypsum – oral 2013 ICS Proceedings
159
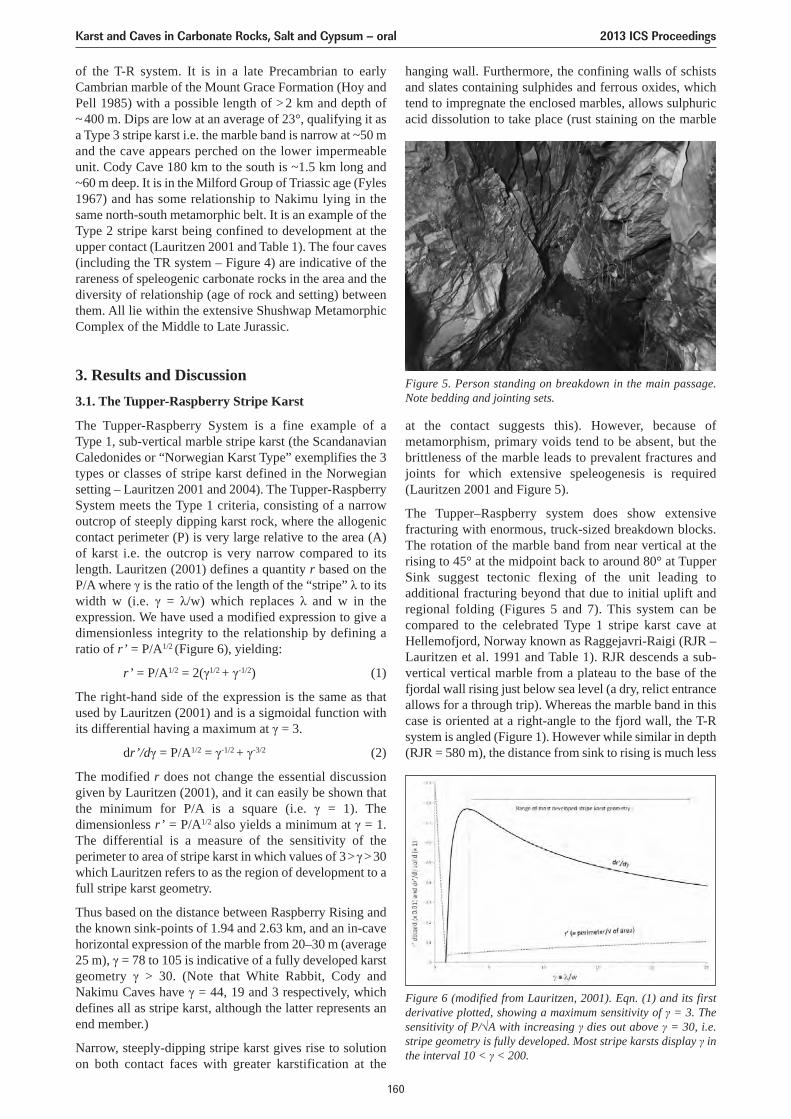
of the T-R system. It is in a late Precambrian to earlyCambrian marble of the Mount Grace Formation (Hoy andPell 1985) with a possible length of > 2 km and depth of~400 m. Dips are low at an average of 23°, qualifying it asa Type 3 stripe karst i.e. the marble band is narrow at ~50 mand the cave appears perched on the lower impermeableunit. Cody Cave 180 km to the south is ~1.5 km long and~60 m deep. It is in the Milford Group of Triassic age (Fyles1967) and has some relationship to Nakimu lying in thesame north-south metamorphic belt. It is an example of theType 2 stripe karst being confined to development at theupper contact (Lauritzen 2001 and Table 1). The four caves(including the TR system – Figure 4) are indicative of therareness of speleogenic carbonate rocks in the area and thediversity of relationship (age of rock and setting) betweenthem. All lie within the extensive Shushwap MetamorphicComplex of the Middle to Late Jurassic.
3. Results and Discussion3.1. The Tupper-Raspberry Stripe Karst
The Tupper-Raspberry System is a fine example of aType 1, sub-vertical marble stripe karst (the ScandanavianCaledonides or “Norwegian Karst Type” exemplifies the 3types or classes of stripe karst defined in the Norwegiansetting – Lauritzen 2001 and 2004). The Tupper-RaspberrySystem meets the Type 1 criteria, consisting of a narrowoutcrop of steeply dipping karst rock, where the allogeniccontact perimeter (P) is very large relative to the area (A)of karst i.e. the outcrop is very narrow compared to itslength. Lauritzen (2001) defines a quantity r based on theP/A where γ is the ratio of the length of the “stripe” λ to itswidth w (i.e. γ = λ/w) which replaces λ and w in theexpression. We have used a modified expression to give adimensionless integrity to the relationship by defining aratio of r’ = P/A1/2 (Figure 6), yielding:
r’ = P/A1/2 = 2(γ1/2 + γ-1/2) (1)
The right-hand side of the expression is the same as thatused by Lauritzen (2001) and is a sigmoidal function withits differential having a maximum at γ = 3.
dr’/dγ = P/A1/2 = γ-1/2 + γ-3/2 (2)
The modified r does not change the essential discussiongiven by Lauritzen (2001), and it can easily be shown thatthe minimum for P/A is a square (i.e. γ = 1). Thedimensionless r’ = P/A1/2 also yields a minimum at γ = 1.The differential is a measure of the sensitivity of theperimeter to area of stripe karst in which values of 3>γ>30which Lauritzen refers to as the region of development to afull stripe karst geometry.
Thus based on the distance between Raspberry Rising andthe known sink-points of 1.94 and 2.63 km, and an in-cavehorizontal expression of the marble from 20–30 m (average25 m), γ = 78 to 105 is indicative of a fully developed karstgeometry γ > 30. (Note that White Rabbit, Cody andNakimu Caves have γ = 44, 19 and 3 respectively, whichdefines all as stripe karst, although the latter represents anend member.)
Narrow, steeply-dipping stripe karst gives rise to solutionon both contact faces with greater karstification at the
hanging wall. Furthermore, the confining walls of schistsand slates containing sulphides and ferrous oxides, whichtend to impregnate the enclosed marbles, allows sulphuricacid dissolution to take place (rust staining on the marble
at the contact suggests this). However, because ofmetamorphism, primary voids tend to be absent, but thebrittleness of the marble leads to prevalent fractures andjoints for which extensive speleogenesis is required(Lauritzen 2001 and Figure 5).
The Tupper–Raspberry system does show extensivefracturing with enormous, truck-sized breakdown blocks.The rotation of the marble band from near vertical at therising to 45° at the midpoint back to around 80° at TupperSink suggest tectonic flexing of the unit leading toadditional fracturing beyond that due to initial uplift andregional folding (Figures 5 and 7). This system can becompared to the celebrated Type 1 stripe karst cave atHellemofjord, Norway known as Raggejavri-Raigi (RJR –Lauritzen et al. 1991 and Table 1). RJR descends a sub-vertical vertical marble from a plateau to the base of thefjordal wall rising just below sea level (a dry, relict entranceallows for a through trip). Whereas the marble band in thiscase is oriented at a right-angle to the fjord wall, the T-Rsystem is angled (Figure 1). However while similar in depth(RJR = 580 m), the distance from sink to rising is much less
Figure 5. Person standing on breakdown in the main passage.Note bedding and jointing sets.
Figure 6 (modified from Lauritzen, 2001). Eqn. (1) and its firstderivative plotted, showing a maximum sensitivity of γ = 3. Thesensitivity of P/√A with increasing γ dies out above γ = 30, i.e.stripe geometry is fully developed. Most stripe karsts display γ inthe interval 10 < γ < 200.
Karst and Caves in Carbonate Rocks, Salt and Gypsum – oral 2013 ICS Proceedings
160
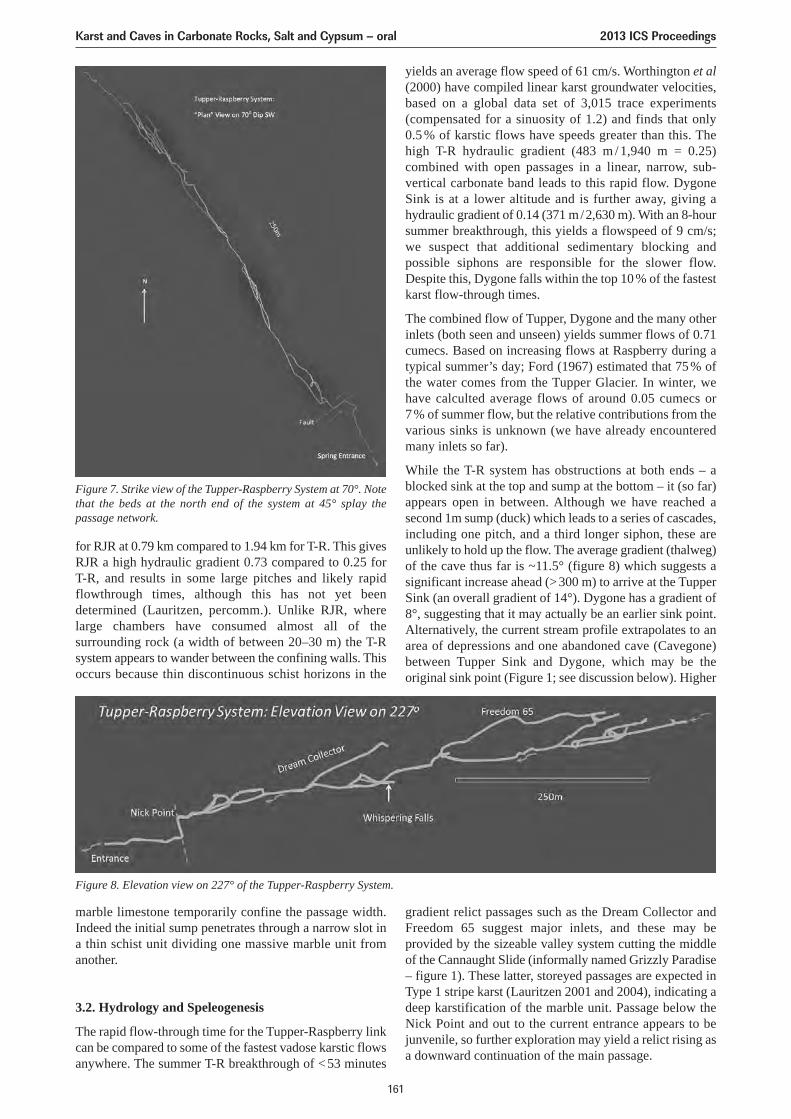
for RJR at 0.79 km compared to 1.94 km for T-R. This givesRJR a high hydraulic gradient 0.73 compared to 0.25 forT-R, and results in some large pitches and likely rapidflowthrough times, although this has not yet beendetermined (Lauritzen, percomm.). Unlike RJR, wherelarge chambers have consumed almost all of thesurrounding rock (a width of between 20–30 m) the T-Rsystem appears to wander between the confining walls. Thisoccurs because thin discontinuous schist horizons in the
marble limestone temporarily confine the passage width.Indeed the initial sump penetrates through a narrow slot ina thin schist unit dividing one massive marble unit fromanother.
3.2. Hydrology and Speleogenesis
The rapid flow-through time for the Tupper-Raspberry linkcan be compared to some of the fastest vadose karstic flowsanywhere. The summer T-R breakthrough of <53 minutes
yields an average flow speed of 61 cm/s. Worthington et al(2000) have compiled linear karst groundwater velocities,based on a global data set of 3,015 trace experiments(compensated for a sinuosity of 1.2) and finds that only 0.5 % of karstic flows have speeds greater than this. Thehigh T-R hydraulic gradient (483 m / 1,940 m = 0.25)combined with open passages in a linear, narrow, sub-vertical carbonate band leads to this rapid flow. DygoneSink is at a lower altitude and is further away, giving ahydraulic gradient of 0.14 (371 m/2,630 m). With an 8-hoursummer breakthrough, this yields a flowspeed of 9 cm/s;we suspect that additional sedimentary blocking andpossible siphons are responsible for the slower flow.Despite this, Dygone falls within the top 10% of the fastestkarst flow-through times.
The combined flow of Tupper, Dygone and the many otherinlets (both seen and unseen) yields summer flows of 0.71cumecs. Based on increasing flows at Raspberry during atypical summer’s day; Ford (1967) estimated that 75% ofthe water comes from the Tupper Glacier. In winter, wehave calculted average flows of around 0.05 cumecs or 7% of summer flow, but the relative contributions from thevarious sinks is unknown (we have already encounteredmany inlets so far).
While the T-R system has obstructions at both ends – ablocked sink at the top and sump at the bottom – it (so far)appears open in between. Although we have reached asecond 1m sump (duck) which leads to a series of cascades,including one pitch, and a third longer siphon, these areunlikely to hold up the flow. The average gradient (thalweg)of the cave thus far is ~11.5° (figure 8) which suggests asignificant increase ahead (>300 m) to arrive at the TupperSink (an overall gradient of 14°). Dygone has a gradient of8°, suggesting that it may actually be an earlier sink point.Alternatively, the current stream profile extrapolates to anarea of depressions and one abandoned cave (Cavegone)between Tupper Sink and Dygone, which may be theoriginal sink point (Figure 1; see discussion below). Higher
gradient relict passages such as the Dream Collector andFreedom 65 suggest major inlets, and these may beprovided by the sizeable valley system cutting the middleof the Cannaught Slide (informally named Grizzly Paradise– figure 1). These latter, storeyed passages are expected inType 1 stripe karst (Lauritzen 2001 and 2004), indicating adeep karstification of the marble unit. Passage below theNick Point and out to the current entrance appears to bejunvenile, so further exploration may yield a relict rising asa downward continuation of the main passage.
Figure 7. Strike view of the Tupper-Raspberry System at 70° . Notethat the beds at the north end of the system at 45° splay thepassage network.
Figure 8. Elevation view on 227° of the Tupper-Raspberry System.
Karst and Caves in Carbonate Rocks, Salt and Gypsum – oral 2013 ICS Proceedings
161
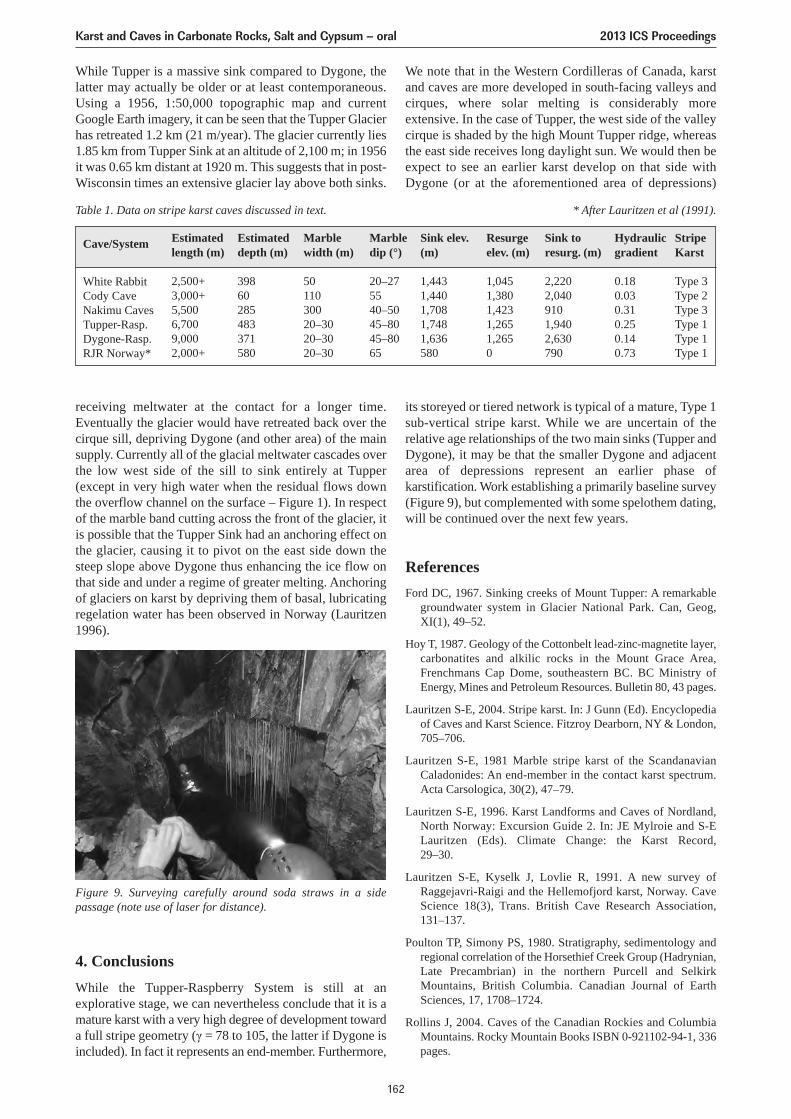
While Tupper is a massive sink compared to Dygone, thelatter may actually be older or at least contemporaneous.Using a 1956, 1:50,000 topographic map and currentGoogle Earth imagery, it can be seen that the Tupper Glacierhas retreated 1.2 km (21 m/year). The glacier currently lies1.85 km from Tupper Sink at an altitude of 2,100 m; in 1956it was 0.65 km distant at 1920 m. This suggests that in post-Wisconsin times an extensive glacier lay above both sinks.
We note that in the Western Cordilleras of Canada, karstand caves are more developed in south-facing valleys andcirques, where solar melting is considerably moreextensive. In the case of Tupper, the west side of the valleycirque is shaded by the high Mount Tupper ridge, whereasthe east side receives long daylight sun. We would then beexpect to see an earlier karst develop on that side withDygone (or at the aforementioned area of depressions)
receiving meltwater at the contact for a longer time.Eventually the glacier would have retreated back over thecirque sill, depriving Dygone (and other area) of the mainsupply. Currently all of the glacial meltwater cascades overthe low west side of the sill to sink entirely at Tupper(except in very high water when the residual flows downthe overflow channel on the surface – Figure 1). In respectof the marble band cutting across the front of the glacier, itis possible that the Tupper Sink had an anchoring effect onthe glacier, causing it to pivot on the east side down thesteep slope above Dygone thus enhancing the ice flow onthat side and under a regime of greater melting. Anchoringof glaciers on karst by depriving them of basal, lubricatingregelation water has been observed in Norway (Lauritzen1996).
4. ConclusionsWhile the Tupper-Raspberry System is still at anexplorative stage, we can nevertheless conclude that it is amature karst with a very high degree of development towarda full stripe geometry (γ = 78 to 105, the latter if Dygone isincluded). In fact it represents an end-member. Furthermore,
its storeyed or tiered network is typical of a mature, Type 1sub-vertical stripe karst. While we are uncertain of therelative age relationships of the two main sinks (Tupper andDygone), it may be that the smaller Dygone and adjacentarea of depressions represent an earlier phase ofkarstification. Work establishing a primarily baseline survey(Figure 9), but complemented with some spelothem dating,will be continued over the next few years.
ReferencesFord DC, 1967. Sinking creeks of Mount Tupper: A remarkable
groundwater system in Glacier National Park. Can, Geog,XI(1), 49–52.
Hoy T, 1987. Geology of the Cottonbelt lead-zinc-magnetite layer,carbonatites and alkilic rocks in the Mount Grace Area,Frenchmans Cap Dome, southeastern BC. BC Ministry ofEnergy, Mines and Petroleum Resources. Bulletin 80, 43 pages.
Lauritzen S-E, 2004. Stripe karst. In: J Gunn (Ed). Encyclopediaof Caves and Karst Science. Fitzroy Dearborn, NY & London,705–706.
Lauritzen S-E, 1981 Marble stripe karst of the ScandanavianCaladonides: An end-member in the contact karst spectrum.Acta Carsologica, 30(2), 47–79.
Lauritzen S-E, 1996. Karst Landforms and Caves of Nordland,North Norway: Excursion Guide 2. In: JE Mylroie and S-ELauritzen (Eds). Climate Change: the Karst Record, 29–30.
Lauritzen S-E, Kyselk J, Lovlie R, 1991. A new survey ofRaggejavri-Raigi and the Hellemofjord karst, Norway. CaveScience 18(3), Trans. British Cave Research Association,131–137.
Poulton TP, Simony PS, 1980. Stratigraphy, sedimentology andregional correlation of the Horsethief Creek Group (Hadrynian,Late Precambrian) in the northern Purcell and SelkirkMountains, British Columbia. Canadian Journal of EarthSciences, 17, 1708–1724.
Rollins J, 2004. Caves of the Canadian Rockies and ColumbiaMountains. Rocky Mountain Books ISBN 0-921102-94-1, 336pages.
Table 1. Data on stripe karst caves discussed in text. * After Lauritzen et al (1991).
Estimatedlength (m)
2,500+3,000+5,5006,7009,0002,000+
Estimateddepth (m)
39860285483371580
Marblewidth (m)
5011030020–3020–3020–30
Marbledip (°)
20–275540–5045–8045–8065
Sink elev.(m)
1,4431,4401,7081,7481,636580
Resurgeelev. (m)
1,0451,3801,4231,2651,2650
Sink toresurg. (m)
2,2202,0409101,9402,630790
Hydraulicgradient
0.180.030.310.250.140.73
StripeKarst
Type 3Type 2Type 3Type 1Type 1Type 1
White RabbitCody CaveNakimu CavesTupper-Rasp.Dygone-Rasp.RJR Norway*
Cave/System
Figure 9. Surveying carefully around soda straws in a sidepassage (note use of laser for distance).
Karst and Caves in Carbonate Rocks, Salt and Gypsum – oral 2013 ICS Proceedings
162

Safford K, 2010. Following the White Rabbit. BC Caver, vol.24(4), 18–20.
Rogers JP, Coates D, 1980. Cody Cave survey. Vancouver IslandCave Exploration Group 10(8).
Thompson P, 1976. Cave exploration in Canada. A special issueof the Canadian Caver, 183 pages.
Worthington SRH, Ford DC, Beddows PA, 2000.Porosity andpermeability enhancement in unconfined carbonate aquifers asa result of solution. In: A Klimchouk, DC Ford, AN Palmer, WDreybrodt (Eds.). Speleogenesis: Evolution of Karst Aquifers.NationalSpeleological Society, Huntsville, AL, USA, 463–472.
Yonge CJ, 2013. Exploration of the Tupper Sink–Raspberry RisingCave System. Canadian Caver #77. In press.
Karst and Caves in Carbonate Rocks, Salt and Gypsum – oral 2013 ICS Proceedings
163
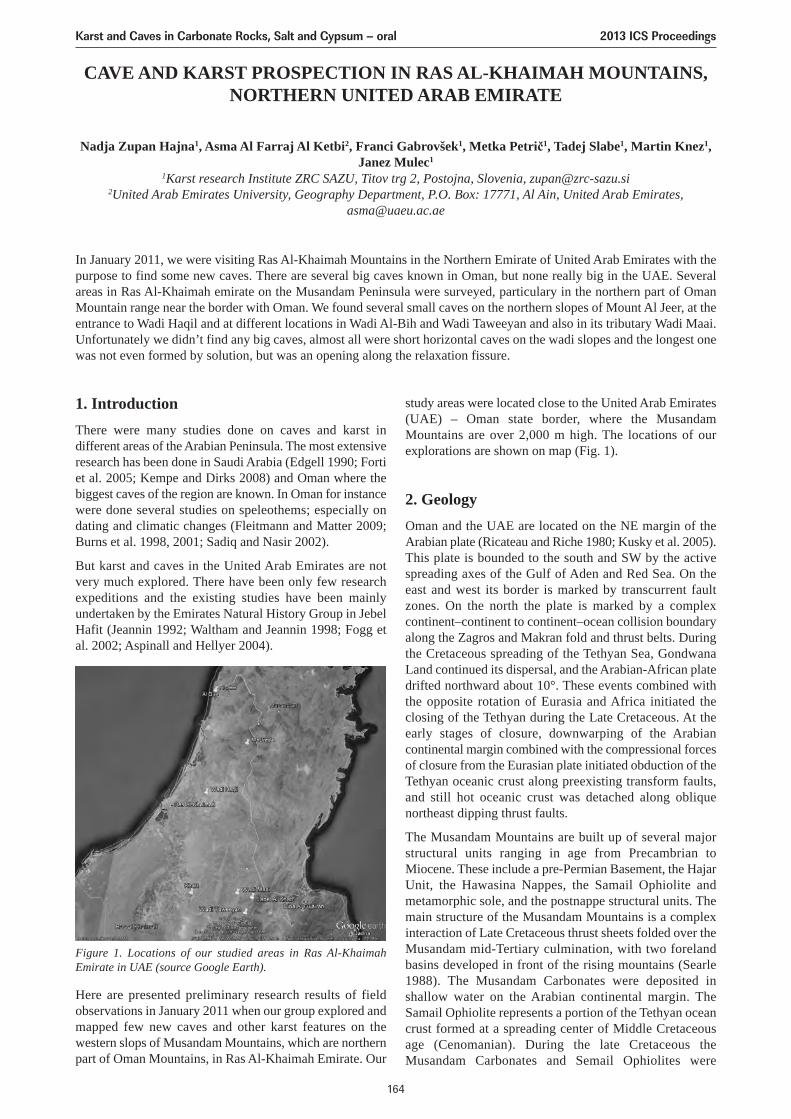
study areas were located close to the United Arab Emirates(UAE) – Oman state border, where the MusandamMountains are over 2,000 m high. The locations of ourexplorations are shown on map (Fig. 1).
2. GeologyOman and the UAE are located on the NE margin of theArabian plate (Ricateau and Riche 1980; Kusky et al. 2005).This plate is bounded to the south and SW by the activespreading axes of the Gulf of Aden and Red Sea. On theeast and west its border is marked by transcurrent faultzones. On the north the plate is marked by a complexcontinent–continent to continent–ocean collision boundaryalong the Zagros and Makran fold and thrust belts. Duringthe Cretaceous spreading of the Tethyan Sea, GondwanaLand continued its dispersal, and the Arabian-African platedrifted northward about 10°. These events combined withthe opposite rotation of Eurasia and Africa initiated theclosing of the Tethyan during the Late Cretaceous. At theearly stages of closure, downwarping of the Arabiancontinental margin combined with the compressional forcesof closure from the Eurasian plate initiated obduction of theTethyan oceanic crust along preexisting transform faults,and still hot oceanic crust was detached along obliquenortheast dipping thrust faults.
The Musandam Mountains are built up of several majorstructural units ranging in age from Precambrian toMiocene. These include a pre-Permian Basement, the HajarUnit, the Hawasina Nappes, the Samail Ophiolite andmetamorphic sole, and the postnappe structural units. Themain structure of the Musandam Mountains is a complexinteraction of Late Cretaceous thrust sheets folded over theMusandam mid-Tertiary culmination, with two forelandbasins developed in front of the rising mountains (Searle1988). The Musandam Carbonates were deposited inshallow water on the Arabian continental margin. TheSamail Ophiolite represents a portion of the Tethyan oceancrust formed at a spreading center of Middle Cretaceousage (Cenomanian). During the late Cretaceous theMusandam Carbonates and Semail Ophiolites were
CAVE AND KARST PROSPECTION IN RAS AL-KHAIMAH MOUNTAINS,NORTHERN UNITED ARAB EMIRATE
Nadja Zupan Hajna1, Asma Al Farraj Al Ketbi2, Franci Gabrovšek1, Metka Petrič1, Tadej Slabe1, Martin Knez1,Janez Mulec1
1Karst research Institute ZRC SAZU, Titov trg 2, Postojna, Slovenia, [email protected] Arab Emirates University, Geography Department, P.O. Box: 17771, Al Ain, United Arab Emirates,
In January 2011, we were visiting Ras Al-Khaimah Mountains in the Northern Emirate of United Arab Emirates with thepurpose to find some new caves. There are several big caves known in Oman, but none really big in the UAE. Severalareas in Ras Al-Khaimah emirate on the Musandam Peninsula were surveyed, particulary in the northern part of OmanMountain range near the border with Oman. We found several small caves on the northern slopes of Mount Al Jeer, at theentrance to Wadi Haqil and at different locations in Wadi Al-Bih and Wadi Taweeyan and also in its tributary Wadi Maai.Unfortunately we didn’t find any big caves, almost all were short horizontal caves on the wadi slopes and the longest onewas not even formed by solution, but was an opening along the relaxation fissure.
1. IntroductionThere were many studies done on caves and karst indifferent areas of the Arabian Peninsula. The most extensiveresearch has been done in Saudi Arabia (Edgell 1990; Fortiet al. 2005; Kempe and Dirks 2008) and Oman where thebiggest caves of the region are known. In Oman for instancewere done several studies on speleothems; especially ondating and climatic changes (Fleitmann and Matter 2009;Burns et al. 1998, 2001; Sadiq and Nasir 2002).
But karst and caves in the United Arab Emirates are notvery much explored. There have been only few researchexpeditions and the existing studies have been mainlyundertaken by the Emirates Natural History Group in JebelHafit (Jeannin 1992; Waltham and Jeannin 1998; Fogg etal. 2002; Aspinall and Hellyer 2004).
Here are presented preliminary research results of fieldobservations in January 2011 when our group explored andmapped few new caves and other karst features on thewestern slops of Musandam Mountains, which are northernpart of Oman Mountains, in Ras Al-Khaimah Emirate. Our
Figure 1. Locations of our studied areas in Ras Al-KhaimahEmirate in UAE (source Google Earth).
Karst and Caves in Carbonate Rocks, Salt and Gypsum – oral 2013 ICS Proceedings
164
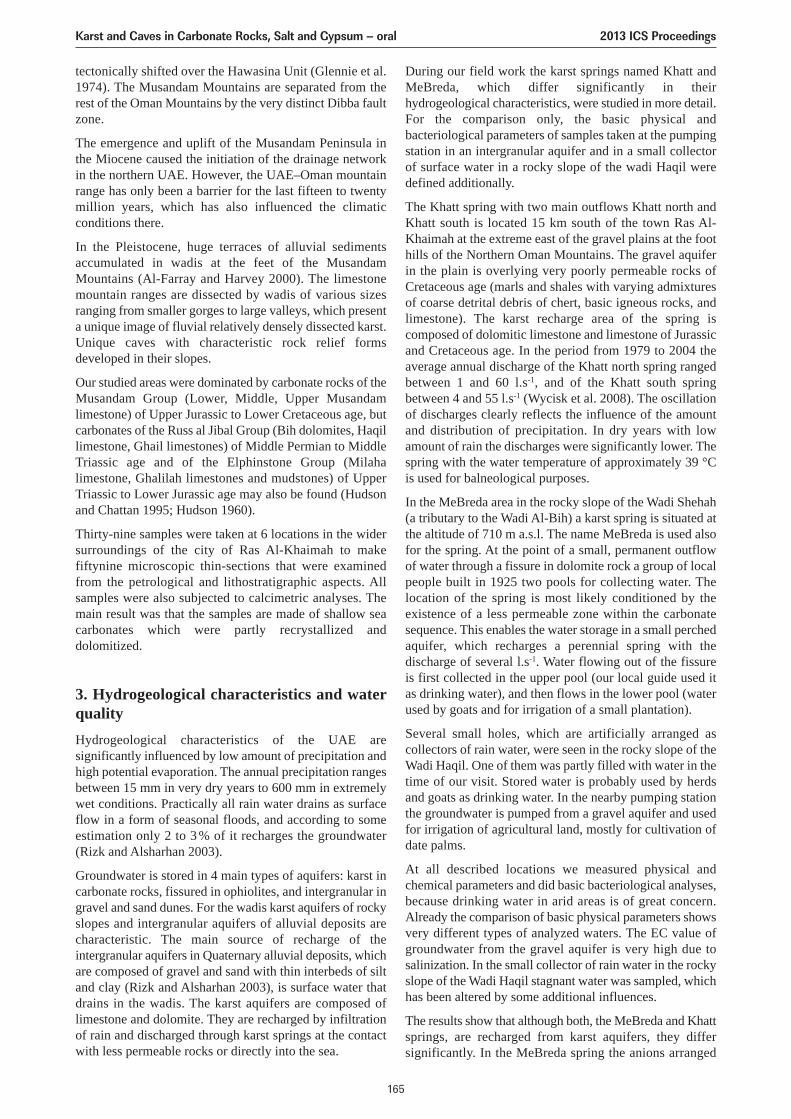
tectonically shifted over the Hawasina Unit (Glennie et al.1974). The Musandam Mountains are separated from therest of the Oman Mountains by the very distinct Dibba faultzone.
The emergence and uplift of the Musandam Peninsula inthe Miocene caused the initiation of the drainage networkin the northern UAE. However, the UAE–Oman mountainrange has only been a barrier for the last fifteen to twentymillion years, which has also influenced the climaticconditions there.
In the Pleistocene, huge terraces of alluvial sedimentsaccumulated in wadis at the feet of the MusandamMountains (Al-Farray and Harvey 2000). The limestonemountain ranges are dissected by wadis of various sizesranging from smaller gorges to large valleys, which presenta unique image of fluvial relatively densely dissected karst.Unique caves with characteristic rock relief formsdeveloped in their slopes.
Our studied areas were dominated by carbonate rocks of theMusandam Group (Lower, Middle, Upper Musandamlimestone) of Upper Jurassic to Lower Cretaceous age, butcarbonates of the Russ al Jibal Group (Bih dolomites, Haqillimestone, Ghail limestones) of Middle Permian to MiddleTriassic age and of the Elphinstone Group (Milahalimestone, Ghalilah limestones and mudstones) of UpperTriassic to Lower Jurassic age may also be found (Hudsonand Chattan 1995; Hudson 1960).
Thirty-nine samples were taken at 6 locations in the widersurroundings of the city of Ras Al-Khaimah to makefiftynine microscopic thin-sections that were examinedfrom the petrological and lithostratigraphic aspects. Allsamples were also subjected to calcimetric analyses. Themain result was that the samples are made of shallow seacarbonates which were partly recrystallized anddolomitized.
3. Hydrogeological characteristics and waterqualityHydrogeological characteristics of the UAE aresignificantly influenced by low amount of precipitation andhigh potential evaporation. The annual precipitation rangesbetween 15 mm in very dry years to 600 mm in extremelywet conditions. Practically all rain water drains as surfaceflow in a form of seasonal floods, and according to someestimation only 2 to 3 % of it recharges the groundwater(Rizk and Alsharhan 2003).
Groundwater is stored in 4 main types of aquifers: karst incarbonate rocks, fissured in ophiolites, and intergranular ingravel and sand dunes. For the wadis karst aquifers of rockyslopes and intergranular aquifers of alluvial deposits arecharacteristic. The main source of recharge of theintergranular aquifers in Quaternary alluvial deposits, whichare composed of gravel and sand with thin interbeds of siltand clay (Rizk and Alsharhan 2003), is surface water thatdrains in the wadis. The karst aquifers are composed oflimestone and dolomite. They are recharged by infiltrationof rain and discharged through karst springs at the contactwith less permeable rocks or directly into the sea.
During our field work the karst springs named Khatt andMeBreda, which differ significantly in theirhydrogeological characteristics, were studied in more detail.For the comparison only, the basic physical andbacteriological parameters of samples taken at the pumpingstation in an intergranular aquifer and in a small collectorof surface water in a rocky slope of the wadi Haqil weredefined additionally.
The Khatt spring with two main outflows Khatt north andKhatt south is located 15 km south of the town Ras Al-Khaimah at the extreme east of the gravel plains at the foothills of the Northern Oman Mountains. The gravel aquiferin the plain is overlying very poorly permeable rocks ofCretaceous age (marls and shales with varying admixturesof coarse detrital debris of chert, basic igneous rocks, andlimestone). The karst recharge area of the spring iscomposed of dolomitic limestone and limestone of Jurassicand Cretaceous age. In the period from 1979 to 2004 theaverage annual discharge of the Khatt north spring rangedbetween 1 and 60 l.s-1, and of the Khatt south springbetween 4 and 55 l.s-1 (Wycisk et al. 2008). The oscillationof discharges clearly reflects the influence of the amountand distribution of precipitation. In dry years with lowamount of rain the discharges were significantly lower. Thespring with the water temperature of approximately 39 °Cis used for balneological purposes.
In the MeBreda area in the rocky slope of the Wadi Shehah(a tributary to the Wadi Al-Bih) a karst spring is situated atthe altitude of 710 m a.s.l. The name MeBreda is used alsofor the spring. At the point of a small, permanent outflowof water through a fissure in dolomite rock a group of localpeople built in 1925 two pools for collecting water. Thelocation of the spring is most likely conditioned by theexistence of a less permeable zone within the carbonatesequence. This enables the water storage in a small perchedaquifer, which recharges a perennial spring with thedischarge of several l.s-1. Water flowing out of the fissureis first collected in the upper pool (our local guide used itas drinking water), and then flows in the lower pool (waterused by goats and for irrigation of a small plantation).
Several small holes, which are artificially arranged ascollectors of rain water, were seen in the rocky slope of theWadi Haqil. One of them was partly filled with water in thetime of our visit. Stored water is probably used by herdsand goats as drinking water. In the nearby pumping stationthe groundwater is pumped from a gravel aquifer and usedfor irrigation of agricultural land, mostly for cultivation ofdate palms.
At all described locations we measured physical andchemical parameters and did basic bacteriological analyses,because drinking water in arid areas is of great concern.Already the comparison of basic physical parameters showsvery different types of analyzed waters. The EC value ofgroundwater from the gravel aquifer is very high due tosalinization. In the small collector of rain water in the rockyslope of the Wadi Haqil stagnant water was sampled, whichhas been altered by some additional influences.
The results show that although both, the MeBreda and Khattsprings, are recharged from karst aquifers, they differsignificantly. In the MeBreda spring the anions arranged
Karst and Caves in Carbonate Rocks, Salt and Gypsum – oral 2013 ICS Proceedings
165
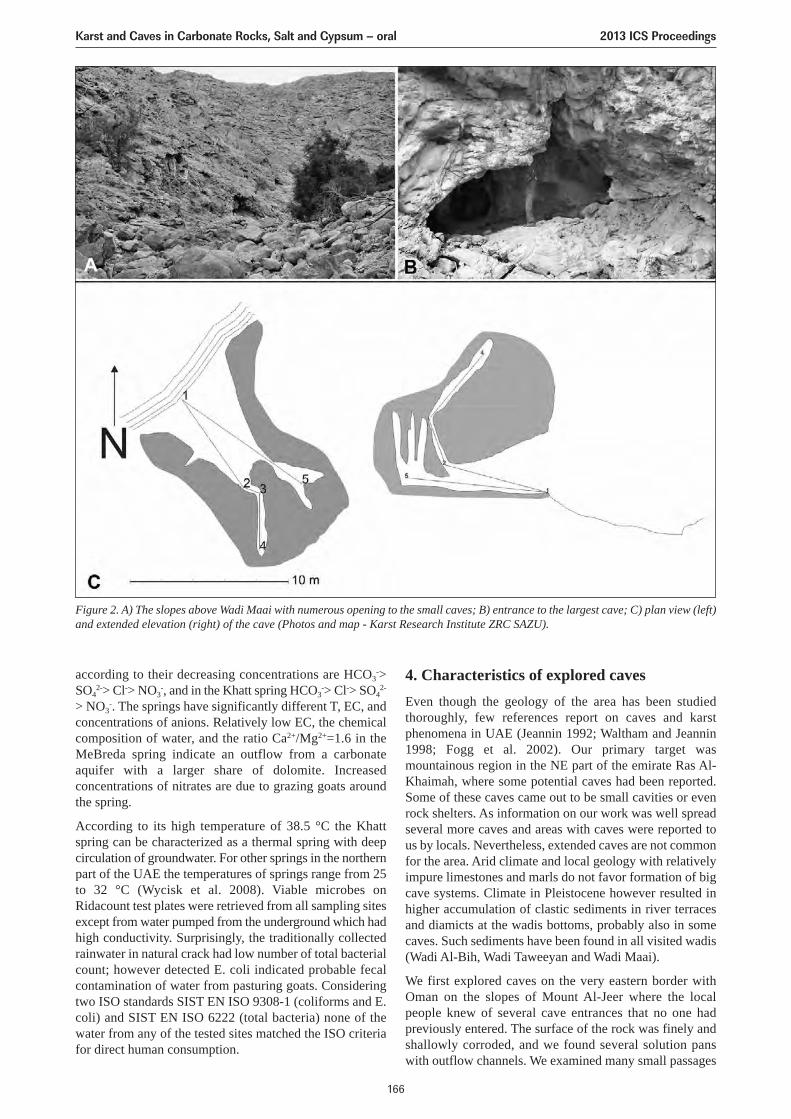
4. Characteristics of explored cavesEven though the geology of the area has been studiedthoroughly, few references report on caves and karstphenomena in UAE (Jeannin 1992; Waltham and Jeannin1998; Fogg et al. 2002). Our primary target wasmountainous region in the NE part of the emirate Ras Al-Khaimah, where some potential caves had been reported.Some of these caves came out to be small cavities or evenrock shelters. As information on our work was well spreadseveral more caves and areas with caves were reported tous by locals. Nevertheless, extended caves are not commonfor the area. Arid climate and local geology with relativelyimpure limestones and marls do not favor formation of bigcave systems. Climate in Pleistocene however resulted inhigher accumulation of clastic sediments in river terracesand diamicts at the wadis bottoms, probably also in somecaves. Such sediments have been found in all visited wadis(Wadi Al-Bih, Wadi Taweeyan and Wadi Maai).
We first explored caves on the very eastern border withOman on the slopes of Mount Al-Jeer where the localpeople knew of several cave entrances that no one hadpreviously entered. The surface of the rock was finely andshallowly corroded, and we found several solution panswith outflow channels. We examined many small passages
according to their decreasing concentrations are HCO3->
SO42-> Cl-> NO3
-, and in the Khatt spring HCO3-> Cl-> SO4
2-
> NO3-. The springs have significantly different T, EC, and
concentrations of anions. Relatively low EC, the chemicalcomposition of water, and the ratio Ca2+/Mg2+=1.6 in theMeBreda spring indicate an outflow from a carbonateaquifer with a larger share of dolomite. Increasedconcentrations of nitrates are due to grazing goats aroundthe spring.
According to its high temperature of 38.5 °C the Khattspring can be characterized as a thermal spring with deepcirculation of groundwater. For other springs in the northernpart of the UAE the temperatures of springs range from 25to 32 °C (Wycisk et al. 2008). Viable microbes onRidacount test plates were retrieved from all sampling sitesexcept from water pumped from the underground which hadhigh conductivity. Surprisingly, the traditionally collectedrainwater in natural crack had low number of total bacterialcount; however detected E. coli indicated probable fecalcontamination of water from pasturing goats. Consideringtwo ISO standards SIST EN ISO 9308-1 (coliforms and E.coli) and SIST EN ISO 6222 (total bacteria) none of thewater from any of the tested sites matched the ISO criteriafor direct human consumption.
Figure 2. A) The slopes above Wadi Maai with numerous opening to the small caves; B) entrance to the largest cave; C) plan view (left)and extended elevation (right) of the cave (Photos and map - Karst Research Institute ZRC SAZU).
Karst and Caves in Carbonate Rocks, Salt and Gypsum – oral 2013 ICS Proceedings
166
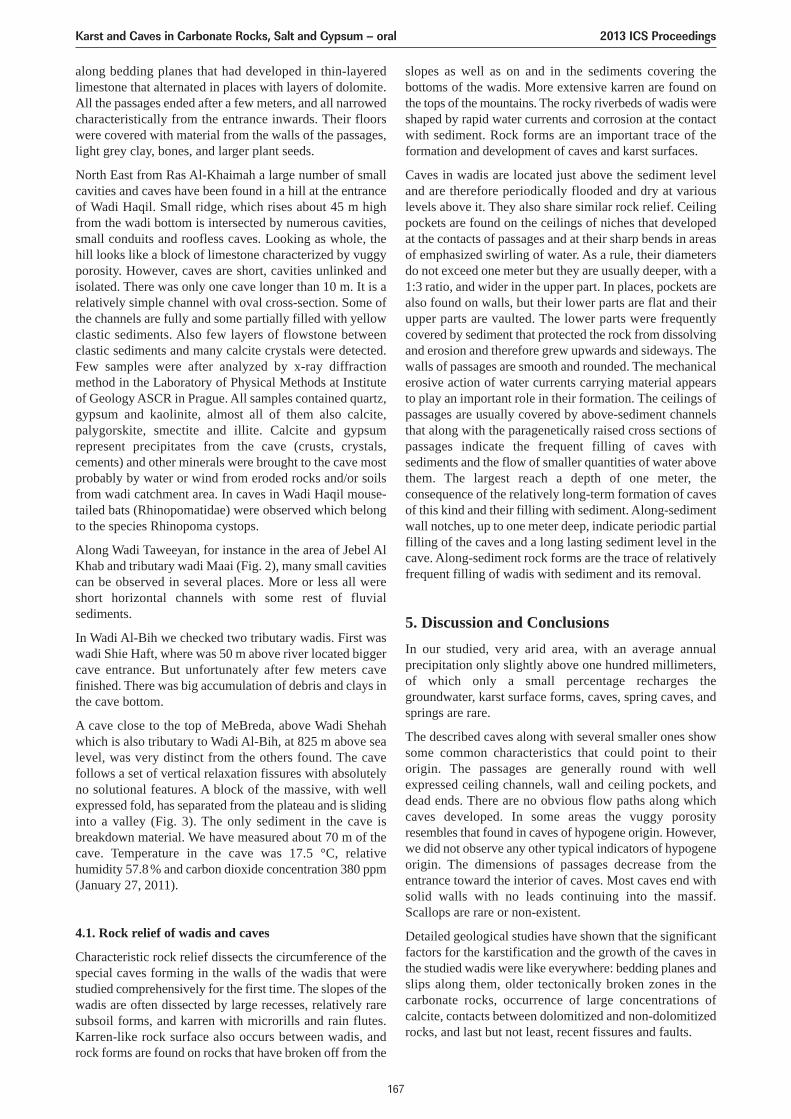
along bedding planes that had developed in thin-layeredlimestone that alternated in places with layers of dolomite.All the passages ended after a few meters, and all narrowedcharacteristically from the entrance inwards. Their floorswere covered with material from the walls of the passages,light grey clay, bones, and larger plant seeds.
North East from Ras Al-Khaimah a large number of smallcavities and caves have been found in a hill at the entranceof Wadi Haqil. Small ridge, which rises about 45 m highfrom the wadi bottom is intersected by numerous cavities,small conduits and roofless caves. Looking as whole, thehill looks like a block of limestone characterized by vuggyporosity. However, caves are short, cavities unlinked andisolated. There was only one cave longer than 10 m. It is arelatively simple channel with oval cross-section. Some ofthe channels are fully and some partially filled with yellowclastic sediments. Also few layers of flowstone betweenclastic sediments and many calcite crystals were detected.Few samples were after analyzed by x-ray diffractionmethod in the Laboratory of Physical Methods at Instituteof Geology ASCR in Prague. All samples contained quartz,gypsum and kaolinite, almost all of them also calcite,palygorskite, smectite and illite. Calcite and gypsumrepresent precipitates from the cave (crusts, crystals,cements) and other minerals were brought to the cave mostprobably by water or wind from eroded rocks and/or soilsfrom wadi catchment area. In caves in Wadi Haqil mouse-tailed bats (Rhinopomatidae) were observed which belongto the species Rhinopoma cystops.
Along Wadi Taweeyan, for instance in the area of Jebel AlKhab and tributary wadi Maai (Fig. 2), many small cavitiescan be observed in several places. More or less all wereshort horizontal channels with some rest of fluvialsediments.
In Wadi Al-Bih we checked two tributary wadis. First waswadi Shie Haft, where was 50 m above river located biggercave entrance. But unfortunately after few meters cavefinished. There was big accumulation of debris and clays inthe cave bottom.
A cave close to the top of MeBreda, above Wadi Shehahwhich is also tributary to Wadi Al-Bih, at 825 m above sealevel, was very distinct from the others found. The cavefollows a set of vertical relaxation fissures with absolutelyno solutional features. A block of the massive, with wellexpressed fold, has separated from the plateau and is slidinginto a valley (Fig. 3). The only sediment in the cave isbreakdown material. We have measured about 70 m of thecave. Temperature in the cave was 17.5 °C, relativehumidity 57.8% and carbon dioxide concentration 380 ppm(January 27, 2011).
4.1. Rock relief of wadis and caves
Characteristic rock relief dissects the circumference of thespecial caves forming in the walls of the wadis that werestudied comprehensively for the first time. The slopes of thewadis are often dissected by large recesses, relatively raresubsoil forms, and karren with microrills and rain flutes.Karren-like rock surface also occurs between wadis, androck forms are found on rocks that have broken off from the
slopes as well as on and in the sediments covering thebottoms of the wadis. More extensive karren are found onthe tops of the mountains. The rocky riverbeds of wadis wereshaped by rapid water currents and corrosion at the contactwith sediment. Rock forms are an important trace of theformation and development of caves and karst surfaces.
Caves in wadis are located just above the sediment leveland are therefore periodically flooded and dry at variouslevels above it. They also share similar rock relief. Ceilingpockets are found on the ceilings of niches that developedat the contacts of passages and at their sharp bends in areasof emphasized swirling of water. As a rule, their diametersdo not exceed one meter but they are usually deeper, with a1:3 ratio, and wider in the upper part. In places, pockets arealso found on walls, but their lower parts are flat and theirupper parts are vaulted. The lower parts were frequentlycovered by sediment that protected the rock from dissolvingand erosion and therefore grew upwards and sideways. Thewalls of passages are smooth and rounded. The mechanicalerosive action of water currents carrying material appearsto play an important role in their formation. The ceilings ofpassages are usually covered by above-sediment channelsthat along with the paragenetically raised cross sections ofpassages indicate the frequent filling of caves withsediments and the flow of smaller quantities of water abovethem. The largest reach a depth of one meter, theconsequence of the relatively long-term formation of cavesof this kind and their filling with sediment. Along-sedimentwall notches, up to one meter deep, indicate periodic partialfilling of the caves and a long lasting sediment level in thecave. Along-sediment rock forms are the trace of relativelyfrequent filling of wadis with sediment and its removal.
5. Discussion and ConclusionsIn our studied, very arid area, with an average annualprecipitation only slightly above one hundred millimeters,of which only a small percentage recharges thegroundwater, karst surface forms, caves, spring caves, andsprings are rare.
The described caves along with several smaller ones showsome common characteristics that could point to theirorigin. The passages are generally round with wellexpressed ceiling channels, wall and ceiling pockets, anddead ends. There are no obvious flow paths along whichcaves developed. In some areas the vuggy porosityresembles that found in caves of hypogene origin. However,we did not observe any other typical indicators of hypogeneorigin. The dimensions of passages decrease from theentrance toward the interior of caves. Most caves end withsolid walls with no leads continuing into the massif.Scallops are rare or non-existent.
Detailed geological studies have shown that the significantfactors for the karstification and the growth of the caves inthe studied wadis were like everywhere: bedding planes andslips along them, older tectonically broken zones in thecarbonate rocks, occurrence of large concentrations ofcalcite, contacts between dolomitized and non-dolomitizedrocks, and last but not least, recent fissures and faults.
Karst and Caves in Carbonate Rocks, Salt and Gypsum – oral 2013 ICS Proceedings
167
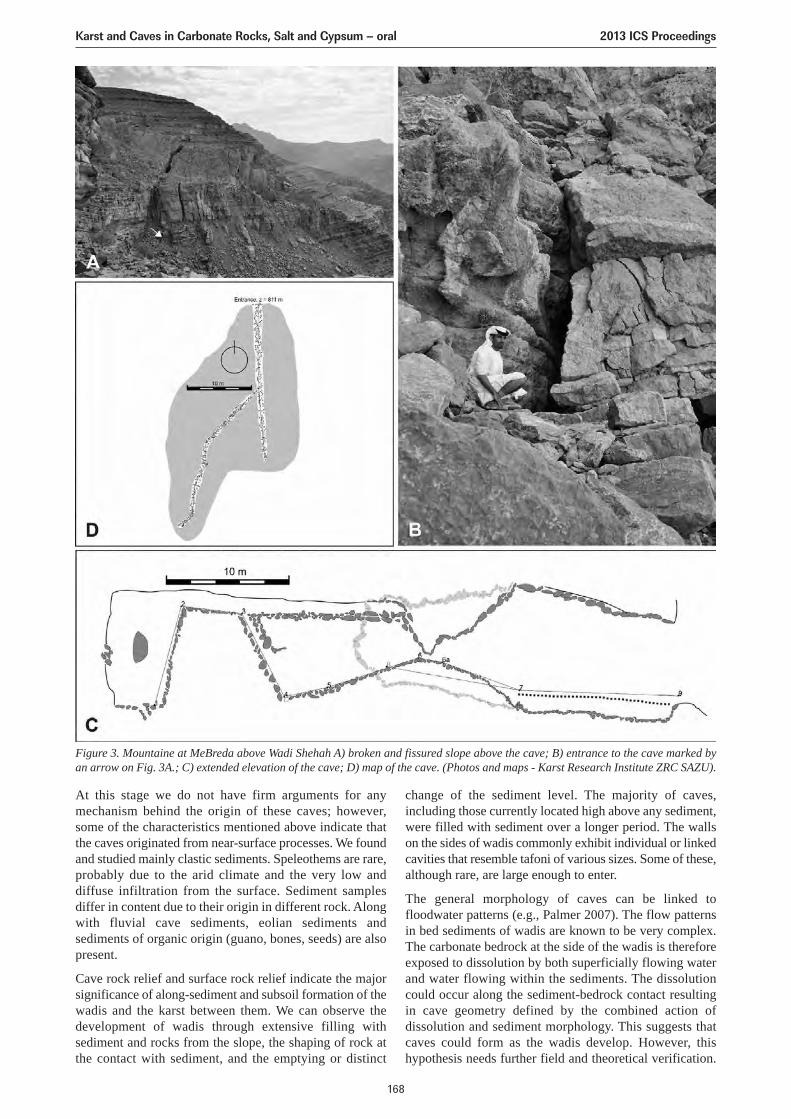
change of the sediment level. The majority of caves,including those currently located high above any sediment,were filled with sediment over a longer period. The wallson the sides of wadis commonly exhibit individual or linkedcavities that resemble tafoni of various sizes. Some of these,although rare, are large enough to enter.
The general morphology of caves can be linked tofloodwater patterns (e.g., Palmer 2007). The flow patternsin bed sediments of wadis are known to be very complex.The carbonate bedrock at the side of the wadis is thereforeexposed to dissolution by both superficially flowing waterand water flowing within the sediments. The dissolutioncould occur along the sediment-bedrock contact resultingin cave geometry defined by the combined action ofdissolution and sediment morphology. This suggests thatcaves could form as the wadis develop. However, thishypothesis needs further field and theoretical verification.
At this stage we do not have firm arguments for anymechanism behind the origin of these caves; however,some of the characteristics mentioned above indicate thatthe caves originated from near-surface processes. We foundand studied mainly clastic sediments. Speleothems are rare,probably due to the arid climate and the very low anddiffuse infiltration from the surface. Sediment samplesdiffer in content due to their origin in different rock. Alongwith fluvial cave sediments, eolian sediments andsediments of organic origin (guano, bones, seeds) are alsopresent.
Cave rock relief and surface rock relief indicate the majorsignificance of along-sediment and subsoil formation of thewadis and the karst between them. We can observe thedevelopment of wadis through extensive filling withsediment and rocks from the slope, the shaping of rock atthe contact with sediment, and the emptying or distinct
Figure 3. Mountaine at MeBreda above Wadi Shehah A) broken and fissured slope above the cave; B) entrance to the cave marked byan arrow on Fig. 3A.; C) extended elevation of the cave; D) map of the cave. (Photos and maps - Karst Research Institute ZRC SAZU).
Karst and Caves in Carbonate Rocks, Salt and Gypsum – oral 2013 ICS Proceedings
168
The lack of fluvial sediments in the caves surely raisesdoubts about the genesis.
One possible explanation of why there are not many cavesin the studied area of Ras Al-Khaimah is that little waterpenetrates the steep karst slopes of wadis, which does notcreate ideal conditions for the development of caves,especially in recent climate conditions. The annualprecipitation values here are very low and most of theprecipitation falls in the form of downpours causing majorsurface runoff in the mountainous areas due to largeinclination of slopes and the thin-layered impure limestonewith intermediate marl layers.
AcknowledgmentsIn January 2011, at the invitation of Prof. Dr. Asma Al-Farraj, a team from the Karst Research Institute at theResearch Centre of the Slovenian Academy of Sciences andArts went to study the karst and caves in the mountainousregions of the northeastern Emirate of Ras Al-Khaimah inthe United Arab Emirates. The research was also supportedby Saud bin Saqr Al Qasimi, Sheikh of the RAK Emirate.The research was supported also by the research programKarst research financed by Slovenian Research Agency.
ReferencesAl-Farraj A, Harvey AM, 2000. Desert pavement characteristics
on wadi terrace and alluvial fan surfacesWadi Al-Bih UAE andOman. Geomorphology, 35 (2000), 279–297.
Aspinall S, Hellyer P, 2004. Jebel Hafit, A Natural History. AbuDhabi.
Burns SJ, Fleitmann D, Matter A, Neff U, Mangini A, 2001.Speleothem evidence from Oman for continental pluvial eventsduring interglacial periods, Geology, 29, 623–626.
Burns SJ, Matter A, Frank N, Mangini A, 1998. Speleothem-basedpaleoclimate record from northern Oman. Geology, 26, 499–502.
Clesceri LS, Greenberg AE, Eaton AD, 1998. Standard methodsfor the examination of water and wastewater. 20th Edition,American Public Health Association, Washington.
Edgell HS, 1990. Karst in Northeastern Saudi Arabia. J.K.S.A.U,Earth Science, Special issue: 1st Saudi symposium on EarthScience, Jeddah, 3, 81–94.
Fleitmann D, Matter A, 2009. External geophysics, climate andenvironment, The speleothem record of climate variability inSouthern Arabia. C. R. Geoscience 341, 633–642.
Fogg T, Fogg P, Waltham T, 2002. Magharet Jebel Hafit – asignificant cave in the United Arab Emirates. Tribulus Journalof the Emirates Natural History Group. 12, 1, 5–14.
Forti P, Galli E, Rossi A, Pint J, Pint S, 2005. Cave Minerals OfSome Limestone Caves Of Saudi Arabia. HellenicSpeleological Society. Research made within the MIUR 2002Project “Morphological and Mineralogical Study ofspeleothems to reconstruct peculiar karst environments” Resp.21–28 August 2005, Kalamos, Hellas.
Glennie KW, Boeuff MGA, Hughes-Clarke MW, Moody-StuartM, Pilaar WHF, Reinhart BM, 1974. Geology of the OmanMountains. Kon. Ned. Geol. Minnhoukundia Genoot. Vern.,33, 423.
Hudson RGS, Chattan M, 1959. The Musandam Limestone(Jurassic to lower Cretaceous) of Oman Arabia. NotesMemoirs. Moyen-Orient., 3, 69–93.
Hudson RGS, 1960. The Permian and Trias of the Omanpeninsula, Arabia. GeologicaMagazine, 97, 299–308.
Jeannin P-Y, 1992. Expedition suisse aux Emirats Arabes Unis.Stalactite (Switzerland), 42(1), 47–55.
Kempe K, Dirks H, 2008. Layla Lakes, Saudi Arabia: The World-wide largest lacustrine Gypsum Tufa. Acta Carsologica, 37(1),7–14.
Kusky T, Cordula Robinson C, El-Baz F, 2005. Tertiary–Quaternary faulting and uplift in the northern Oman HajarMountains. Journal of the Geological Society, 162, 871–888.
Palmer AN, 2007. Cave Geology. Cave Books, Dayton, OH.
Ricateau A, Riche PH, 1980. Geology of the Musandam peninsula(Sultanate of Oman) and its surroundings. Journal of petroleumgeology, 2(3), 139–152.
Rizk ZS, Alsharhan AS, 2003. Water resources in the United ArabEmirates. In: Alsharhan AS, Wood WW (Eds.) Water ResourcesPerspectives: Evaluation, Management and Policy, Elsevier,245–264.
Sadiq AM, Nasir SJ, 2002. Middle Pleistocene karst evolution inthe State of Qatar, Arabian Gulf. Journal of Cave and KarstStudies, 64(2), 132–139.
Searle MP, James NP, Calon TJ, Smewing JD, 1983.Sedimentological and Structural evolution of the Arabiancontinental margin in Musandam Mountains and Dibba zone,U.A.E. Geological Society of America, Bulletin, 94, 1381–400.
Waltham AC, Jeannin PY, 1998. Forum: Caves in the United ArabEmirates. Journal Cave and Karst Science, 25(3), 149.
Wycisk P, Al Assam M, Akram S, Al Mulla M, Schlesier D,Sefelnasr A, Al Suwaidi NB, Al Mehrizi MS, Ebraheem A,2008. Three-dimensional geological and groundwater flowmodelling of drought impact and recharge potentiality in Khattsprings area, Ras Al Khaimah Emirate, UAE. In: WASTA 8thGulf Water Conf., Bahrain, Proceedings, 1–14.
Karst and Caves in Carbonate Rocks, Salt and Gypsum – oral 2013 ICS Proceedings
169
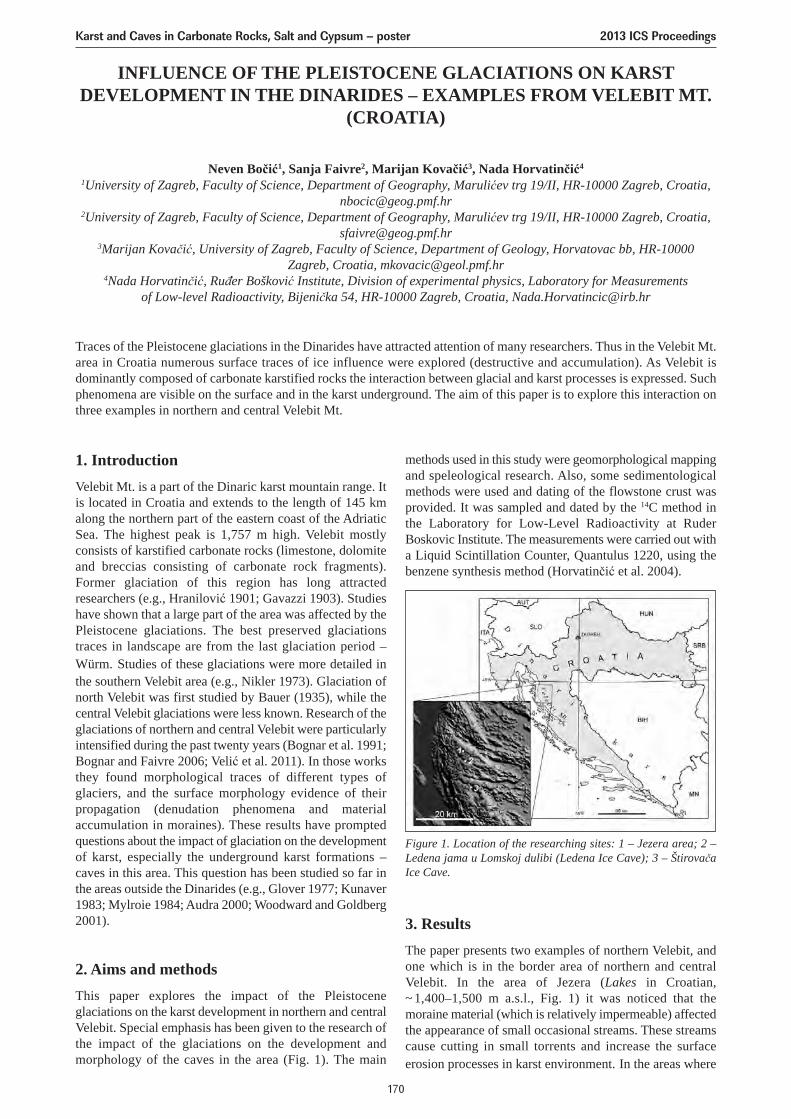
3. ResultsThe paper presents two examples of northern Velebit, andone which is in the border area of northern and centralVelebit. In the area of Jezera (Lakes in Croatian,~ 1,400–1,500 m a.s.l., Fig. 1) it was noticed that themoraine material (which is relatively impermeable) affectedthe appearance of small occasional streams. These streamscause cutting in small torrents and increase the surfaceerosion processes in karst environment. In the areas where
INFLUENCE OF THE PLEISTOCENE GLACIATIONS ON KARSTDEVELOPMENT IN THE DINARIDES – EXAMPLES FROM VELEBIT MT.
(CROATIA)
Neven Bočić1, Sanja Faivre2, Marijan Kovačić3, Nada Horvatinčić4
1University of Zagreb, Faculty of Science, Department of Geography, Marulićev trg 19/II, HR-10000 Zagreb, Croatia,[email protected]
2University of Zagreb, Faculty of Science, Department of Geography, Marulićev trg 19/II, HR-10000 Zagreb, Croatia,[email protected]
3Marijan Kovačić, University of Zagreb, Faculty of Science, Department of Geology, Horvatovac bb, HR-10000Zagreb, Croatia, [email protected]
4Nada Horvatinčić, Ruđer Bošković Institute, Division of experimental physics, Laboratory for Measurementsof Low-level Radioactivity, Bijenička 54, HR-10000 Zagreb, Croatia, [email protected]
Traces of the Pleistocene glaciations in the Dinarides have attracted attention of many researchers. Thus in the Velebit Mt.area in Croatia numerous surface traces of ice influence were explored (destructive and accumulation). As Velebit isdominantly composed of carbonate karstified rocks the interaction between glacial and karst processes is expressed. Suchphenomena are visible on the surface and in the karst underground. The aim of this paper is to explore this interaction onthree examples in northern and central Velebit Mt.
1. IntroductionVelebit Mt. is a part of the Dinaric karst mountain range. Itis located in Croatia and extends to the length of 145 kmalong the northern part of the eastern coast of the AdriaticSea. The highest peak is 1,757 m high. Velebit mostlyconsists of karstified carbonate rocks (limestone, dolomiteand breccias consisting of carbonate rock fragments).Former glaciation of this region has long attractedresearchers (e.g., Hranilović 1901; Gavazzi 1903). Studieshave shown that a large part of the area was affected by thePleistocene glaciations. The best preserved glaciationstraces in landscape are from the last glaciation period –Würm. Studies of these glaciations were more detailed inthe southern Velebit area (e.g., Nikler 1973). Glaciation ofnorth Velebit was first studied by Bauer (1935), while thecentral Velebit glaciations were less known. Research of theglaciations of northern and central Velebit were particularlyintensified during the past twenty years (Bognar et al. 1991;Bognar and Faivre 2006; Velić et al. 2011). In those worksthey found morphological traces of different types ofglaciers, and the surface morphology evidence of theirpropagation (denudation phenomena and materialaccumulation in moraines). These results have promptedquestions about the impact of glaciation on the developmentof karst, especially the underground karst formations –caves in this area. This question has been studied so far inthe areas outside the Dinarides (e.g., Glover 1977; Kunaver1983; Mylroie 1984; Audra 2000; Woodward and Goldberg2001).
2. Aims and methodsThis paper explores the impact of the Pleistoceneglaciations on the karst development in northern and centralVelebit. Special emphasis has been given to the research ofthe impact of the glaciations on the development andmorphology of the caves in the area (Fig. 1). The main
methods used in this study were geomorphological mappingand speleological research. Also, some sedimentologicalmethods were used and dating of the flowstone crust wasprovided. It was sampled and dated by the 14C method inthe Laboratory for Low-Level Radioactivity at RuderBoskovic Institute. The measurements were carried out witha Liquid Scintillation Counter, Quantulus 1220, using thebenzene synthesis method (Horvatinčić et al. 2004).
Figure 1. Location of the researching sites: 1 – Jezera area; 2 –Ledena jama u Lomskoj dulibi (Ledena Ice Cave); 3 – ŠtirovačaIce Cave.
Karst and Caves in Carbonate Rocks, Salt and Gypsum – poster 2013 ICS Proceedings
170
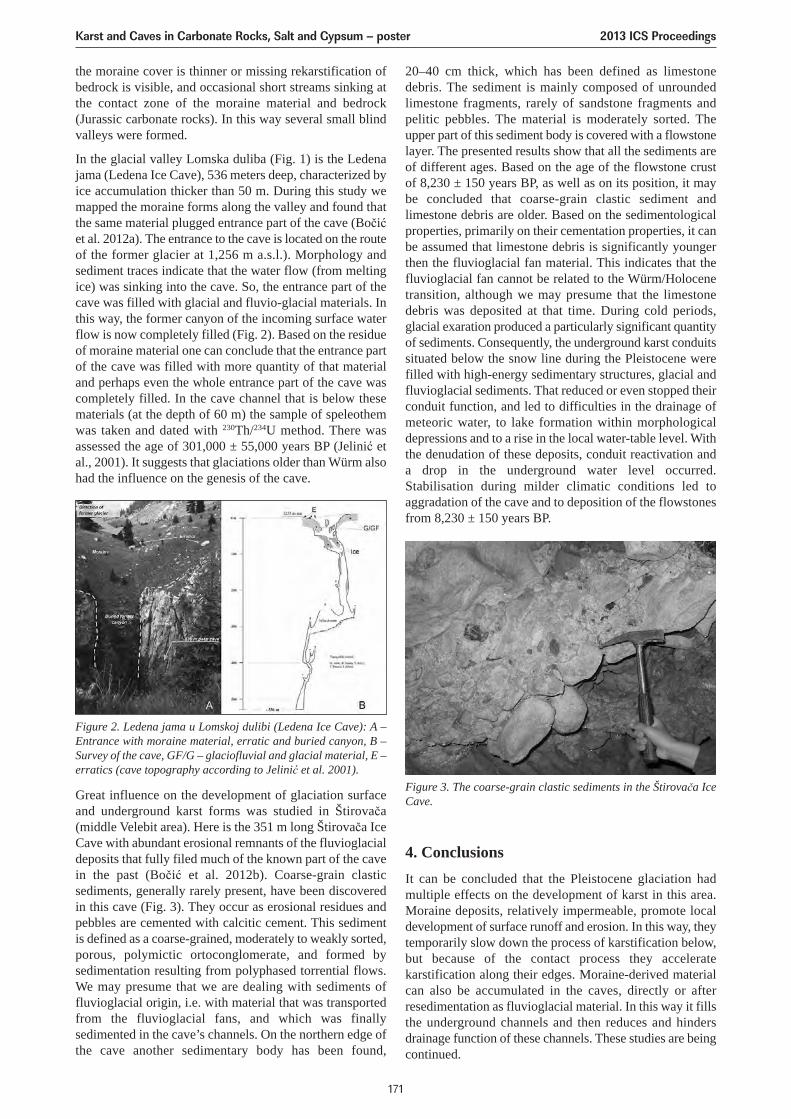
the moraine cover is thinner or missing rekarstification ofbedrock is visible, and occasional short streams sinking atthe contact zone of the moraine material and bedrock(Jurassic carbonate rocks). In this way several small blindvalleys were formed.
In the glacial valley Lomska duliba (Fig. 1) is the Ledenajama (Ledena Ice Cave), 536 meters deep, characterized byice accumulation thicker than 50 m. During this study wemapped the moraine forms along the valley and found thatthe same material plugged entrance part of the cave (Bočićet al. 2012a). The entrance to the cave is located on the routeof the former glacier at 1,256 m a.s.l.). Morphology andsediment traces indicate that the water flow (from meltingice) was sinking into the cave. So, the entrance part of thecave was filled with glacial and fluvio-glacial materials. Inthis way, the former canyon of the incoming surface waterflow is now completely filled (Fig. 2). Based on the residueof moraine material one can conclude that the entrance partof the cave was filled with more quantity of that materialand perhaps even the whole entrance part of the cave wascompletely filled. In the cave channel that is below thesematerials (at the depth of 60 m) the sample of speleothemwas taken and dated with 230Th/234U method. There wasassessed the age of 301,000 ± 55,000 years BP (Jelinić etal., 2001). It suggests that glaciations older than Würm alsohad the influence on the genesis of the cave.
Figure 2. Ledena jama u Lomskoj dulibi (Ledena Ice Cave): A –Entrance with moraine material, erratic and buried canyon, B –Survey of the cave, GF/G – glaciofluvial and glacial material, E –erratics (cave topography according to Jelinić et al. 2001).
Great influence on the development of glaciation surfaceand underground karst forms was studied in Štirovača(middle Velebit area). Here is the 351 m long Štirovača IceCave with abundant erosional remnants of the fluvioglacialdeposits that fully filed much of the known part of the cavein the past (Bočić et al. 2012b). Coarse-grain clasticsediments, generally rarely present, have been discoveredin this cave (Fig. 3). They occur as erosional residues andpebbles are cemented with calcitic cement. This sedimentis defined as a coarse-grained, moderately to weakly sorted,porous, polymictic ortoconglomerate, and formed bysedimentation resulting from polyphased torrential flows.We may presume that we are dealing with sediments offluvioglacial origin, i.e. with material that was transportedfrom the fluvioglacial fans, and which was finallysedimented in the cave’s channels. On the northern edge ofthe cave another sedimentary body has been found,
20–40 cm thick, which has been defined as limestonedebris. The sediment is mainly composed of unroundedlimestone fragments, rarely of sandstone fragments andpelitic pebbles. The material is moderately sorted. Theupper part of this sediment body is covered with a flowstonelayer. The presented results show that all the sediments areof different ages. Based on the age of the flowstone crustof 8,230 ± 150 years BP, as well as on its position, it maybe concluded that coarse-grain clastic sediment andlimestone debris are older. Based on the sedimentologicalproperties, primarily on their cementation properties, it canbe assumed that limestone debris is significantly youngerthen the fluvioglacial fan material. This indicates that thefluvioglacial fan cannot be related to the Würm/Holocenetransition, although we may presume that the limestonedebris was deposited at that time. During cold periods,glacial exaration produced a particularly significant quantityof sediments. Consequently, the underground karst conduitssituated below the snow line during the Pleistocene werefilled with high-energy sedimentary structures, glacial andfluvioglacial sediments. That reduced or even stopped theirconduit function, and led to difficulties in the drainage ofmeteoric water, to lake formation within morphologicaldepressions and to a rise in the local water-table level. Withthe denudation of these deposits, conduit reactivation anda drop in the underground water level occurred.Stabilisation during milder climatic conditions led toaggradation of the cave and to deposition of the flowstonesfrom 8,230 ± 150 years BP.
Figure 3. The coarse-grain clastic sediments in the Štirovača IceCave.
4. ConclusionsIt can be concluded that the Pleistocene glaciation hadmultiple effects on the development of karst in this area.Moraine deposits, relatively impermeable, promote localdevelopment of surface runoff and erosion. In this way, theytemporarily slow down the process of karstification below,but because of the contact process they acceleratekarstification along their edges. Moraine-derived materialcan also be accumulated in the caves, directly or afterresedimentation as fluvioglacial material. In this way it fillsthe underground channels and then reduces and hindersdrainage function of these channels. These studies are beingcontinued.
Karst and Caves in Carbonate Rocks, Salt and Gypsum – poster 2013 ICS Proceedings
171
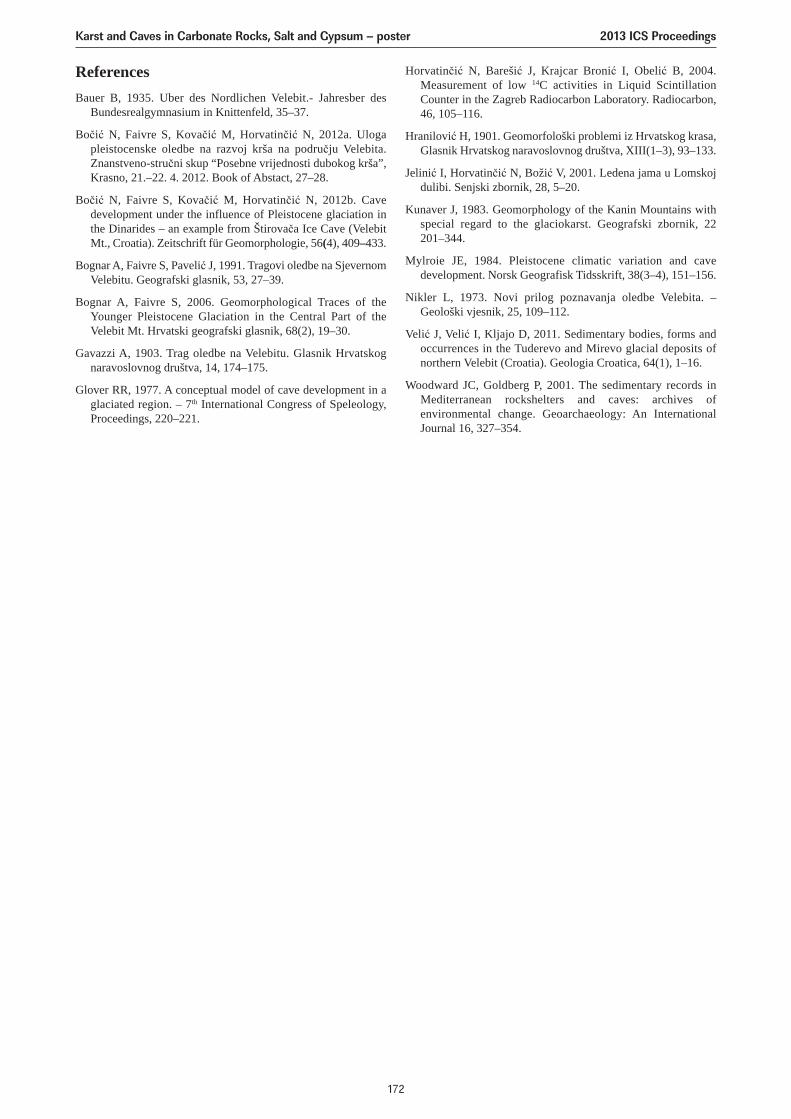
ReferencesBauer B, 1935. Uber des Nordlichen Velebit.- Jahresber des
Bundesrealgymnasium in Knittenfeld, 35–37.
Bočić N, Faivre S, Kovačić M, Horvatinčić N, 2012a. Ulogapleistocenske oledbe na razvoj krša na području Velebita.Znanstveno-stručni skup “Posebne vrijednosti dubokog krša”,Krasno, 21.–22. 4. 2012. Book of Abstact, 27–28.
Bočić N, Faivre S, Kovačić M, Horvatinčić N, 2012b. Cavedevelopment under the influence of Pleistocene glaciation inthe Dinarides – an example from Štirovača Ice Cave (VelebitMt., Croatia). Zeitschrift für Geomorphologie, 56(4), 409–433.
Bognar A, Faivre S, Pavelić J, 1991. Tragovi oledbe na SjevernomVelebitu. Geografski glasnik, 53, 27–39.
Bognar A, Faivre S, 2006. Geomorphological Traces of theYounger Pleistocene Glaciation in the Central Part of theVelebit Mt. Hrvatski geografski glasnik, 68(2), 19–30.
Gavazzi A, 1903. Trag oledbe na Velebitu. Glasnik Hrvatskognaravoslovnog društva, 14, 174–175.
Glover RR, 1977. A conceptual model of cave development in aglaciated region. – 7th International Congress of Speleology,Proceedings, 220–221.
Horvatinčić N, Barešić J, Krajcar Bronić I, Obelić B, 2004.Measurement of low 14C activities in Liquid ScintillationCounter in the Zagreb Radiocarbon Laboratory. Radiocarbon,46, 105–116.
Hranilović H, 1901. Geomorfološki problemi iz Hrvatskog krasa,Glasnik Hrvatskog naravoslovnog društva, XIII(1–3), 93–133.
Jelinić I, Horvatinčić N, Božić V, 2001. Ledena jama u Lomskojdulibi. Senjski zbornik, 28, 5–20.
Kunaver J, 1983. Geomorphology of the Kanin Mountains withspecial regard to the glaciokarst. Geografski zbornik, 22 201–344.
Mylroie JE, 1984. Pleistocene climatic variation and cavedevelopment. Norsk Geografisk Tidsskrift, 38(3–4), 151–156.
Nikler L, 1973. Novi prilog poznavanja oledbe Velebita. –Geološki vjesnik, 25, 109–112.
Velić J, Velić I, Kljajo D, 2011. Sedimentary bodies, forms andoccurrences in the Tuderevo and Mirevo glacial deposits ofnorthern Velebit (Croatia). Geologia Croatica, 64(1), 1–16.
Woodward JC, Goldberg P, 2001. The sedimentary records inMediterranean rockshelters and caves: archives ofenvironmental change. Geoarchaeology: An InternationalJournal 16, 327–354.
Karst and Caves in Carbonate Rocks, Salt and Gypsum – poster 2013 ICS Proceedings
172
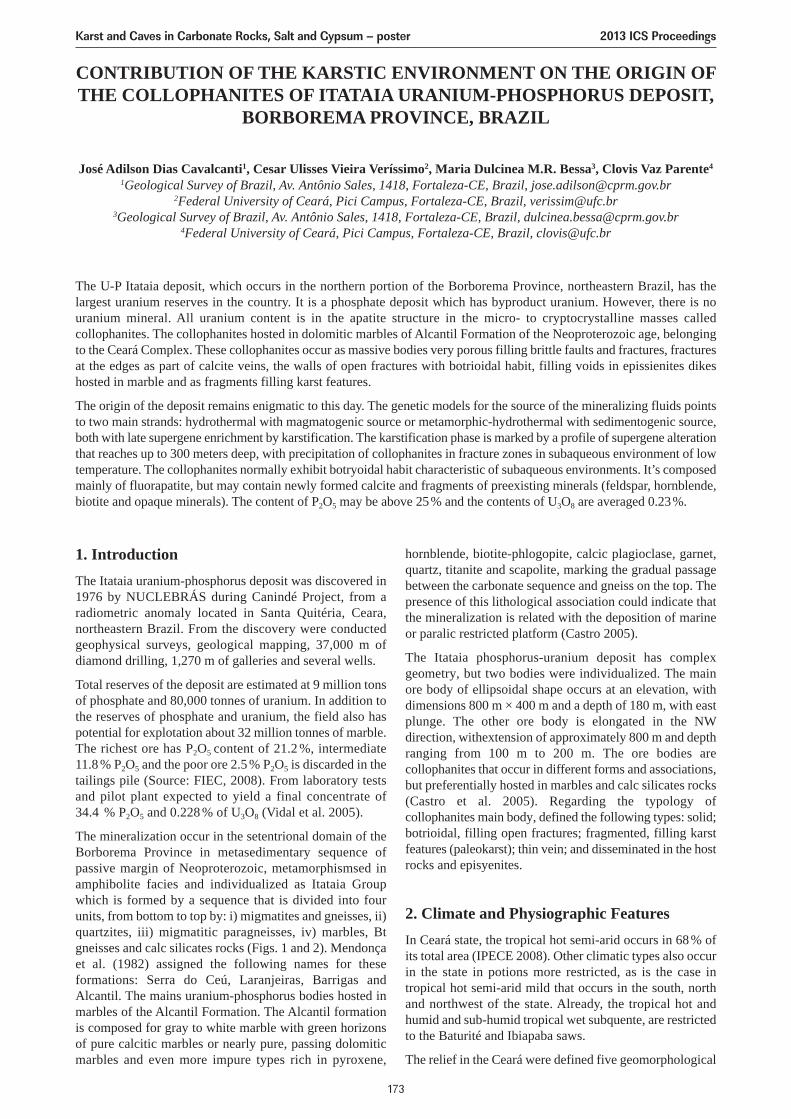
CONTRIBUTION OF THE KARSTIC ENVIRONMENT ON THE ORIGIN OFTHE COLLOPHANITES OF ITATAIA URANIUM-PHOSPHORUS DEPOSIT,
BORBOREMA PROVINCE, BRAZIL
José Adilson Dias Cavalcanti1, Cesar Ulisses Vieira Veríssimo2, Maria Dulcinea M.R. Bessa3, Clovis Vaz Parente4
1Geological Survey of Brazil, Av. Antônio Sales, 1418, Fortaleza-CE, Brazil, [email protected] University of Ceará, Pici Campus, Fortaleza-CE, Brazil, [email protected]
3Geological Survey of Brazil, Av. Antônio Sales, 1418, Fortaleza-CE, Brazil, [email protected] University of Ceará, Pici Campus, Fortaleza-CE, Brazil, [email protected]
The U-P Itataia deposit, which occurs in the northern portion of the Borborema Province, northeastern Brazil, has thelargest uranium reserves in the country. It is a phosphate deposit which has byproduct uranium. However, there is nouranium mineral. All uranium content is in the apatite structure in the micro- to cryptocrystalline masses calledcollophanites. The collophanites hosted in dolomitic marbles of Alcantil Formation of the Neoproterozoic age, belongingto the Ceará Complex. These collophanites occur as massive bodies very porous filling brittle faults and fractures, fracturesat the edges as part of calcite veins, the walls of open fractures with botrioidal habit, filling voids in epissienites dikeshosted in marble and as fragments filling karst features.
The origin of the deposit remains enigmatic to this day. The genetic models for the source of the mineralizing fluids pointsto two main strands: hydrothermal with magmatogenic source or metamorphic-hydrothermal with sedimentogenic source,both with late supergene enrichment by karstification. The karstification phase is marked by a profile of supergene alterationthat reaches up to 300 meters deep, with precipitation of collophanites in fracture zones in subaqueous environment of lowtemperature. The collophanites normally exhibit botryoidal habit characteristic of subaqueous environments. It’s composedmainly of fluorapatite, but may contain newly formed calcite and fragments of preexisting minerals (feldspar, hornblende,biotite and opaque minerals). The content of P2O5 may be above 25% and the contents of U3O8 are averaged 0.23%.
1. IntroductionThe Itataia uranium-phosphorus deposit was discovered in1976 by NUCLEBRÁS during Canindé Project, from aradiometric anomaly located in Santa Quitéria, Ceara,northeastern Brazil. From the discovery were conductedgeophysical surveys, geological mapping, 37,000 m ofdiamond drilling, 1,270 m of galleries and several wells.
Total reserves of the deposit are estimated at 9 million tonsof phosphate and 80,000 tonnes of uranium. In addition tothe reserves of phosphate and uranium, the field also haspotential for explotation about 32 million tonnes of marble.The richest ore has P2O5 content of 21.2 %, intermediate11.8 % P2O5 and the poor ore 2.5 % P2O5 is discarded in thetailings pile (Source: FIEC, 2008). From laboratory testsand pilot plant expected to yield a final concentrate of34.4 % P2O5 and 0.228 % of U3O8 (Vidal et al. 2005).
The mineralization occur in the setentrional domain of theBorborema Province in metasedimentary sequence ofpassive margin of Neoproterozoic, metamorphismsed inamphibolite facies and individualized as Itataia Groupwhich is formed by a sequence that is divided into fourunits, from bottom to top by: i) migmatites and gneisses, ii)quartzites, iii) migmatitic paragneisses, iv) marbles, Btgneisses and calc silicates rocks (Figs. 1 and 2). Mendonçaet al. (1982) assigned the following names for theseformations: Serra do Ceú, Laranjeiras, Barrigas andAlcantil. The mains uranium-phosphorus bodies hosted inmarbles of the Alcantil Formation. The Alcantil formationis composed for gray to white marble with green horizonsof pure calcitic marbles or nearly pure, passing dolomiticmarbles and even more impure types rich in pyroxene,
hornblende, biotite-phlogopite, calcic plagioclase, garnet,quartz, titanite and scapolite, marking the gradual passagebetween the carbonate sequence and gneiss on the top. Thepresence of this lithological association could indicate thatthe mineralization is related with the deposition of marineor paralic restricted platform (Castro 2005).
The Itataia phosphorus-uranium deposit has complexgeometry, but two bodies were individualized. The mainore body of ellipsoidal shape occurs at an elevation, withdimensions 800 m × 400 m and a depth of 180 m, with eastplunge. The other ore body is elongated in the NWdirection, withextension of approximately 800 m and depthranging from 100 m to 200 m. The ore bodies arecollophanites that occur in different forms and associations,but preferentially hosted in marbles and calc silicates rocks(Castro et al. 2005). Regarding the typology ofcollophanites main body, defined the following types: solid;botrioidal, filling open fractures; fragmented, filling karstfeatures (paleokarst); thin vein; and disseminated in the hostrocks and episyenites.
2. Climate and Physiographic FeaturesIn Ceará state, the tropical hot semi-arid occurs in 68% ofits total area (IPECE 2008). Other climatic types also occurin the state in potions more restricted, as is the case intropical hot semi-arid mild that occurs in the south, northand northwest of the state. Already, the tropical hot andhumid and sub-humid tropical wet subquente, are restrictedto the Baturité and Ibiapaba saws.
The relief in the Ceará were defined five geomorphological
Karst and Caves in Carbonate Rocks, Salt and Gypsum – poster 2013 ICS Proceedings
173
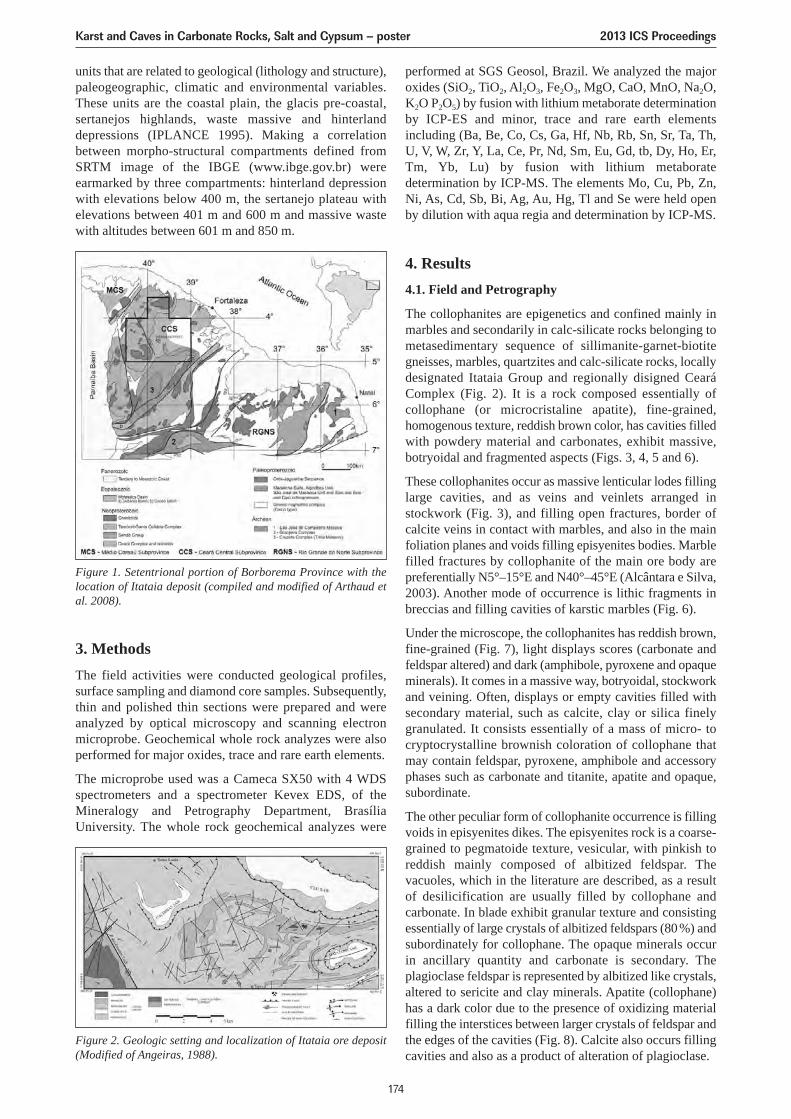
performed at SGS Geosol, Brazil. We analyzed the majoroxides (SiO2, TiO2, Al2O3, Fe2O3, MgO, CaO, MnO, Na2O,K2O P2O5) by fusion with lithium metaborate determinationby ICP-ES and minor, trace and rare earth elementsincluding (Ba, Be, Co, Cs, Ga, Hf, Nb, Rb, Sn, Sr, Ta, Th,U, V, W, Zr, Y, La, Ce, Pr, Nd, Sm, Eu, Gd, tb, Dy, Ho, Er,Tm, Yb, Lu) by fusion with lithium metaboratedetermination by ICP-MS. The elements Mo, Cu, Pb, Zn,Ni, As, Cd, Sb, Bi, Ag, Au, Hg, Tl and Se were held openby dilution with aqua regia and determination by ICP-MS.
4. Results4.1. Field and Petrography
The collophanites are epigenetics and confined mainly inmarbles and secondarily in calc-silicate rocks belonging tometasedimentary sequence of sillimanite-garnet-biotitegneisses, marbles, quartzites and calc-silicate rocks, locallydesignated Itataia Group and regionally disigned CearáComplex (Fig. 2). It is a rock composed essentially ofcollophane (or microcristaline apatite), fine-grained,homogenous texture, reddish brown color, has cavities filledwith powdery material and carbonates, exhibit massive,botryoidal and fragmented aspects (Figs. 3, 4, 5 and 6).
These collophanites occur as massive lenticular lodes fillinglarge cavities, and as veins and veinlets arranged instockwork (Fig. 3), and filling open fractures, border ofcalcite veins in contact with marbles, and also in the mainfoliation planes and voids filling episyenites bodies. Marblefilled fractures by collophanite of the main ore body arepreferentially N5°–15°E and N40°–45°E (Alcântara e Silva,2003). Another mode of occurrence is lithic fragments inbreccias and filling cavities of karstic marbles (Fig. 6).
Under the microscope, the collophanites has reddish brown,fine-grained (Fig. 7), light displays scores (carbonate andfeldspar altered) and dark (amphibole, pyroxene and opaqueminerals). It comes in a massive way, botryoidal, stockworkand veining. Often, displays or empty cavities filled withsecondary material, such as calcite, clay or silica finelygranulated. It consists essentially of a mass of micro- tocryptocrystalline brownish coloration of collophane thatmay contain feldspar, pyroxene, amphibole and accessoryphases such as carbonate and titanite, apatite and opaque,subordinate.
The other peculiar form of collophanite occurrence is fillingvoids in episyenites dikes. The episyenites rock is a coarse-grained to pegmatoide texture, vesicular, with pinkish toreddish mainly composed of albitized feldspar. Thevacuoles, which in the literature are described, as a resultof desilicification are usually filled by collophane andcarbonate. In blade exhibit granular texture and consistingessentially of large crystals of albitized feldspars (80%) andsubordinately for collophane. The opaque minerals occurin ancillary quantity and carbonate is secondary. Theplagioclase feldspar is represented by albitized like crystals,altered to sericite and clay minerals. Apatite (collophane)has a dark color due to the presence of oxidizing materialfilling the interstices between larger crystals of feldspar andthe edges of the cavities (Fig. 8). Calcite also occurs fillingcavities and also as a product of alteration of plagioclase.
units that are related to geological (lithology and structure),paleogeographic, climatic and environmental variables.These units are the coastal plain, the glacis pre-coastal,sertanejos highlands, waste massive and hinterlanddepressions (IPLANCE 1995). Making a correlationbetween morpho-structural compartments defined fromSRTM image of the IBGE (www.ibge.gov.br) wereearmarked by three compartments: hinterland depressionwith elevations below 400 m, the sertanejo plateau withelevations between 401 m and 600 m and massive wastewith altitudes between 601 m and 850 m.
3. MethodsThe field activities were conducted geological profiles,surface sampling and diamond core samples. Subsequently,thin and polished thin sections were prepared and wereanalyzed by optical microscopy and scanning electronmicroprobe. Geochemical whole rock analyzes were alsoperformed for major oxides, trace and rare earth elements.
The microprobe used was a Cameca SX50 with 4 WDSspectrometers and a spectrometer Kevex EDS, of theMineralogy and Petrography Department, BrasíliaUniversity. The whole rock geochemical analyzes were
Figure 1. Setentrional portion of Borborema Province with thelocation of Itataia deposit (compiled and modified of Arthaud etal. 2008).
Figure 2. Geologic setting and localization of Itataia ore deposit(Modified of Angeiras, 1988).
Karst and Caves in Carbonate Rocks, Salt and Gypsum – poster 2013 ICS Proceedings
174
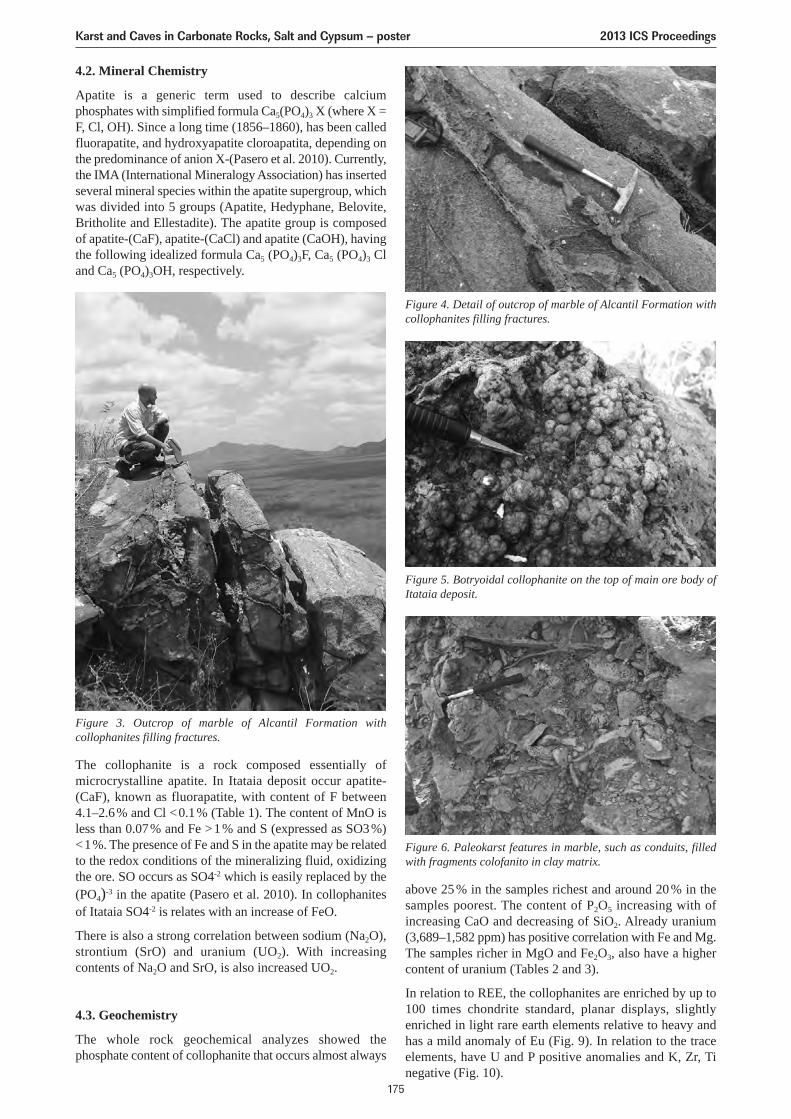
4.2. Mineral Chemistry
Apatite is a generic term used to describe calciumphosphates with simplified formula Ca5(PO4)3 X (where X =F, Cl, OH). Since a long time (1856–1860), has been calledfluorapatite, and hydroxyapatite cloroapatita, depending onthe predominance of anion X-(Pasero et al. 2010). Currently,the IMA (International Mineralogy Association) has insertedseveral mineral species within the apatite supergroup, whichwas divided into 5 groups (Apatite, Hedyphane, Belovite,Britholite and Ellestadite). The apatite group is composedof apatite-(CaF), apatite-(CaCl) and apatite (CaOH), havingthe following idealized formula Ca5 (PO4)3F, Ca5 (PO4)3 Cland Ca5 (PO4)3OH, respectively.
The collophanite is a rock composed essentially ofmicrocrystalline apatite. In Itataia deposit occur apatite-(CaF), known as fluorapatite, with content of F between4.1–2.6% and Cl <0.1% (Table 1). The content of MnO isless than 0.07% and Fe >1% and S (expressed as SO3%)<1%. The presence of Fe and S in the apatite may be relatedto the redox conditions of the mineralizing fluid, oxidizingthe ore. SO occurs as SO4-2 which is easily replaced by the(PO4)-3 in the apatite (Pasero et al. 2010). In collophanitesof Itataia SO4-2 is relates with an increase of FeO.
There is also a strong correlation between sodium (Na2O),strontium (SrO) and uranium (UO2). With increasingcontents of Na2O and SrO, is also increased UO2.
4.3. Geochemistry
The whole rock geochemical analyzes showed thephosphate content of collophanite that occurs almost always
Figure 4. Detail of outcrop of marble of Alcantil Formation withcollophanites filling fractures.
Figure 5. Botryoidal collophanite on the top of main ore body ofItataia deposit.
Figure 6. Paleokarst features in marble, such as conduits, filledwith fragments colofanito in clay matrix.
above 25% in the samples richest and around 20% in thesamples poorest. The content of P2O5 increasing with ofincreasing CaO and decreasing of SiO2. Already uranium(3,689–1,582 ppm) has positive correlation with Fe and Mg.The samples richer in MgO and Fe2O3, also have a highercontent of uranium (Tables 2 and 3).
In relation to REE, the collophanites are enriched by up to100 times chondrite standard, planar displays, slightlyenriched in light rare earth elements relative to heavy andhas a mild anomaly of Eu (Fig. 9). In relation to the traceelements, have U and P positive anomalies and K, Zr, Tinegative (Fig. 10).
Figure 3. Outcrop of marble of Alcantil Formation withcollophanites filling fractures.
Karst and Caves in Carbonate Rocks, Salt and Gypsum – poster 2013 ICS Proceedings
175
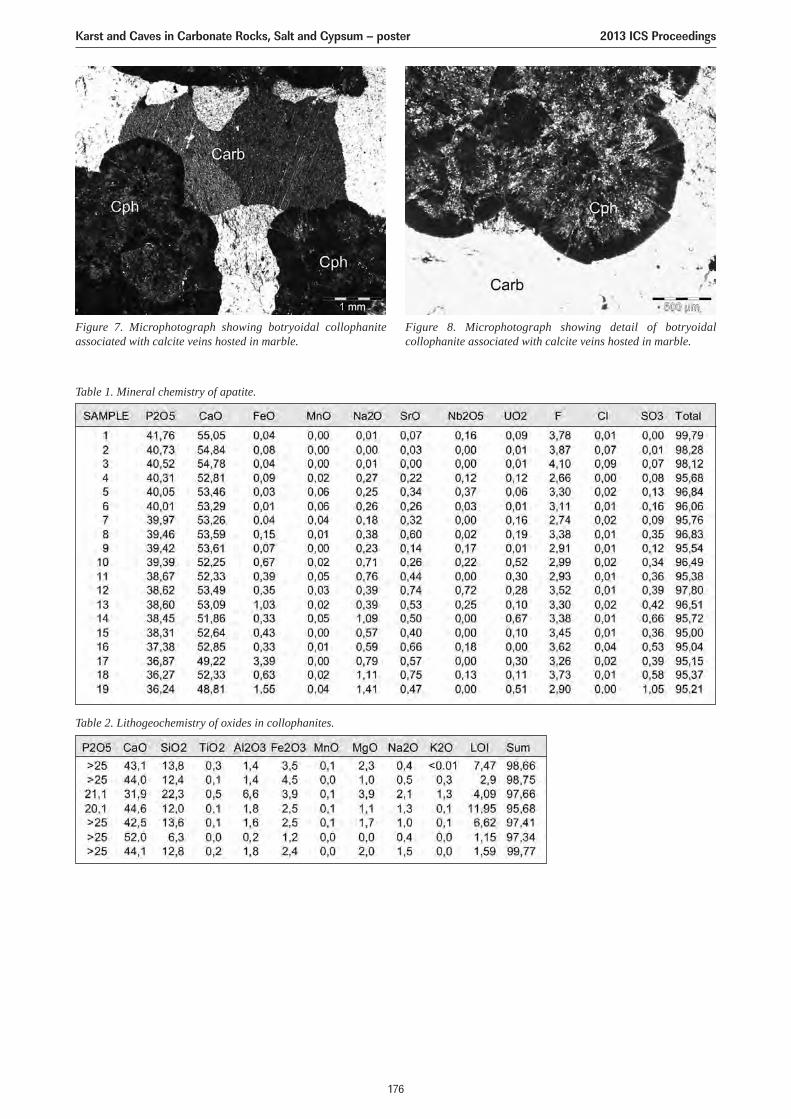
Figure 7. Microphotograph showing botryoidal collophaniteassociated with calcite veins hosted in marble.
Figure 8. Microphotograph showing detail of botryoidalcollophanite associated with calcite veins hosted in marble.
Table 1. Mineral chemistry of apatite.
Table 2. Lithogeochemistry of oxides in collophanites.
Karst and Caves in Carbonate Rocks, Salt and Gypsum – poster 2013 ICS Proceedings
176
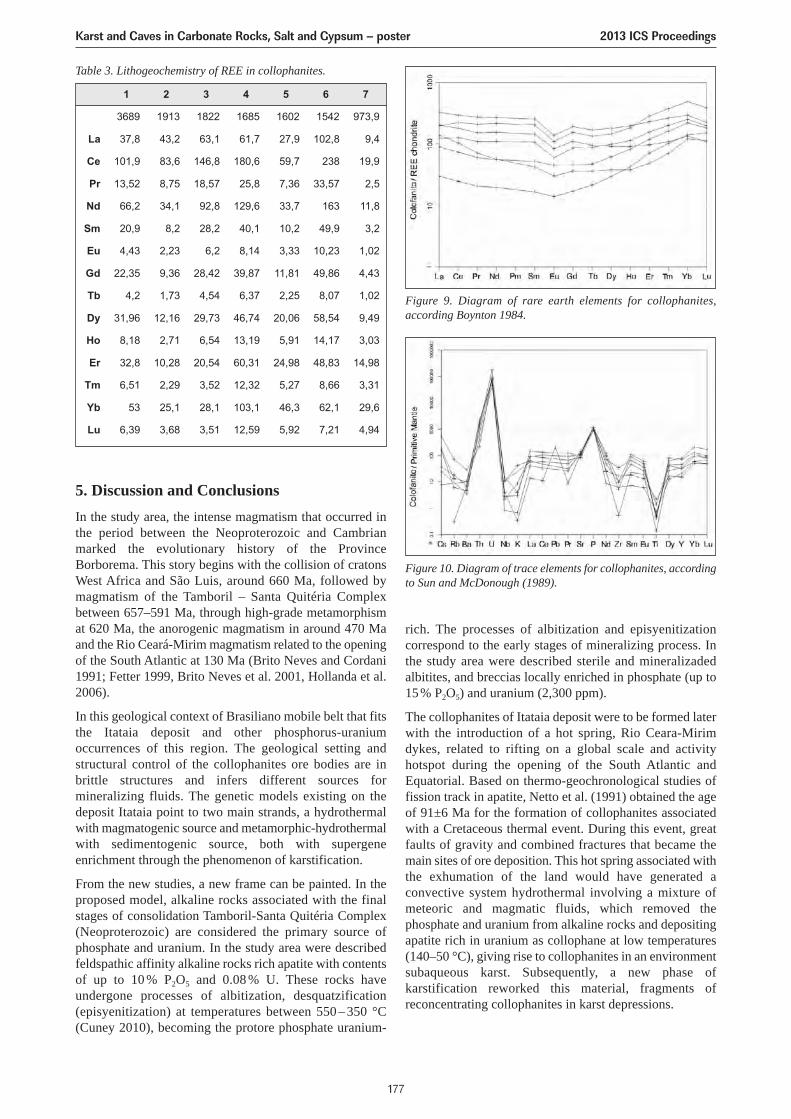
5. Discussion and ConclusionsIn the study area, the intense magmatism that occurred inthe period between the Neoproterozoic and Cambrianmarked the evolutionary history of the ProvinceBorborema. This story begins with the collision of cratonsWest Africa and São Luis, around 660 Ma, followed bymagmatism of the Tamboril – Santa Quitéria Complexbetween 657–591 Ma, through high-grade metamorphismat 620 Ma, the anorogenic magmatism in around 470 Maand the Rio Ceará-Mirim magmatism related to the openingof the South Atlantic at 130 Ma (Brito Neves and Cordani1991; Fetter 1999, Brito Neves et al. 2001, Hollanda et al.2006).
In this geological context of Brasiliano mobile belt that fitsthe Itataia deposit and other phosphorus-uraniumoccurrences of this region. The geological setting andstructural control of the collophanites ore bodies are inbrittle structures and infers different sources formineralizing fluids. The genetic models existing on thedeposit Itataia point to two main strands, a hydrothermalwith magmatogenic source and metamorphic-hydrothermalwith sedimentogenic source, both with supergeneenrichment through the phenomenon of karstification.
From the new studies, a new frame can be painted. In theproposed model, alkaline rocks associated with the finalstages of consolidation Tamboril-Santa Quitéria Complex(Neoproterozoic) are considered the primary source ofphosphate and uranium. In the study area were describedfeldspathic affinity alkaline rocks rich apatite with contentsof up to 10 % P2O5 and 0.08 % U. These rocks haveundergone processes of albitization, desquatzification(episyenitization) at temperatures between 550 – 350 °C(Cuney 2010), becoming the protore phosphate uranium-
Table 3. Lithogeochemistry of REE in collophanites.
rich. The processes of albitization and episyenitizationcorrespond to the early stages of mineralizing process. Inthe study area were described sterile and mineralizadedalbitites, and breccias locally enriched in phosphate (up to15% P2O5) and uranium (2,300 ppm).
The collophanites of Itataia deposit were to be formed laterwith the introduction of a hot spring, Rio Ceara-Mirimdykes, related to rifting on a global scale and activityhotspot during the opening of the South Atlantic andEquatorial. Based on thermo-geochronological studies offission track in apatite, Netto et al. (1991) obtained the ageof 91±6 Ma for the formation of collophanites associatedwith a Cretaceous thermal event. During this event, greatfaults of gravity and combined fractures that became themain sites of ore deposition. This hot spring associated withthe exhumation of the land would have generated aconvective system hydrothermal involving a mixture ofmeteoric and magmatic fluids, which removed thephosphate and uranium from alkaline rocks and depositingapatite rich in uranium as collophane at low temperatures(140–50 °C), giving rise to collophanites in an environmentsubaqueous karst. Subsequently, a new phase ofkarstification reworked this material, fragments ofreconcentrating collophanites in karst depressions.
Figure 9. Diagram of rare earth elements for collophanites,according Boynton 1984.
Figure 10. Diagram of trace elements for collophanites, accordingto Sun and McDonough (1989).
Karst and Caves in Carbonate Rocks, Salt and Gypsum – poster 2013 ICS Proceedings
177
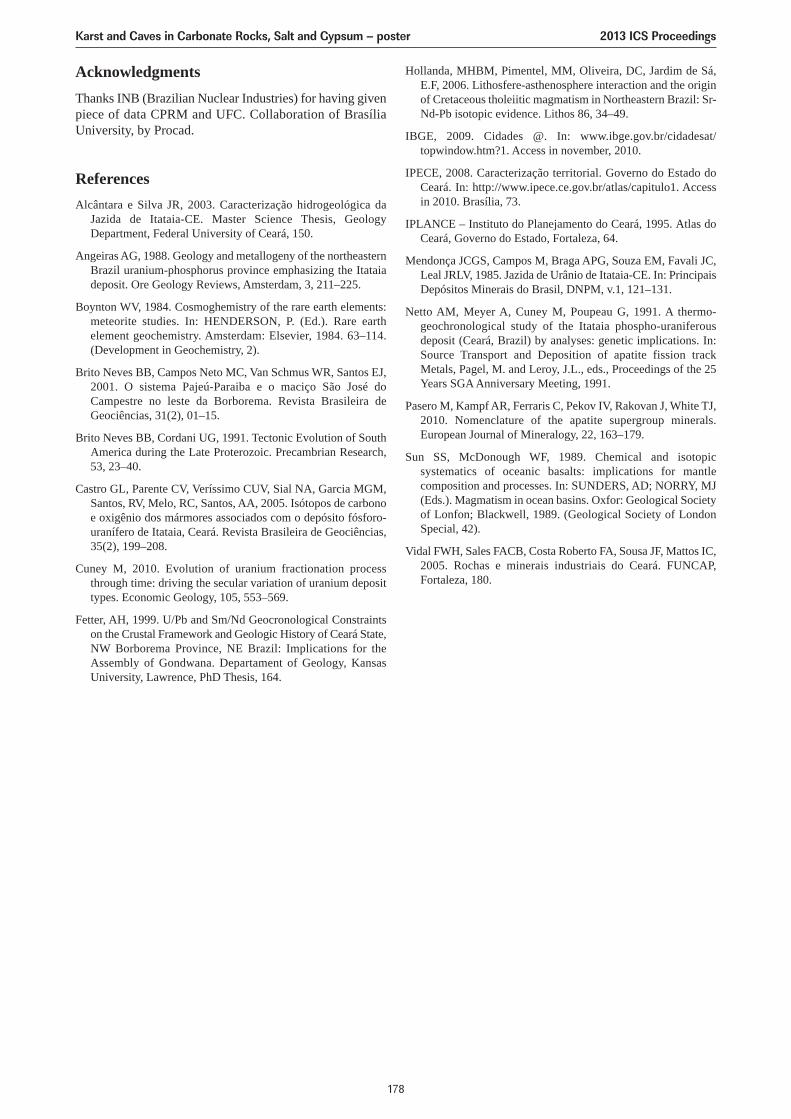
AcknowledgmentsThanks INB (Brazilian Nuclear Industries) for having givenpiece of data CPRM and UFC. Collaboration of BrasíliaUniversity, by Procad.
ReferencesAlcântara e Silva JR, 2003. Caracterização hidrogeológica da
Jazida de Itataia-CE. Master Science Thesis, GeologyDepartment, Federal University of Ceará, 150.
Angeiras AG, 1988. Geology and metallogeny of the northeasternBrazil uranium-phosphorus province emphasizing the Itataiadeposit. Ore Geology Reviews, Amsterdam, 3, 211–225.
Boynton WV, 1984. Cosmoghemistry of the rare earth elements:meteorite studies. In: HENDERSON, P. (Ed.). Rare earthelement geochemistry. Amsterdam: Elsevier, 1984. 63–114.(Development in Geochemistry, 2).
Brito Neves BB, Campos Neto MC, Van Schmus WR, Santos EJ,2001. O sistema Pajeú-Paraiba e o maciço São José doCampestre no leste da Borborema. Revista Brasileira deGeociências, 31(2), 01–15.
Brito Neves BB, Cordani UG, 1991. Tectonic Evolution of SouthAmerica during the Late Proterozoic. Precambrian Research,53, 23–40.
Castro GL, Parente CV, Veríssimo CUV, Sial NA, Garcia MGM,Santos, RV, Melo, RC, Santos, AA, 2005. Isótopos de carbonoe oxigênio dos mármores associados com o depósito fósforo-uranífero de Itataia, Ceará. Revista Brasileira de Geociências,35(2), 199–208.
Cuney M, 2010. Evolution of uranium fractionation processthrough time: driving the secular variation of uranium deposittypes. Economic Geology, 105, 553–569.
Fetter, AH, 1999. U/Pb and Sm/Nd Geocronological Constraintson the Crustal Framework and Geologic History of Ceará State,NW Borborema Province, NE Brazil: Implications for theAssembly of Gondwana. Departament of Geology, KansasUniversity, Lawrence, PhD Thesis, 164.
Hollanda, MHBM, Pimentel, MM, Oliveira, DC, Jardim de Sá,E.F, 2006. Lithosfere-asthenosphere interaction and the originof Cretaceous tholeiitic magmatism in Northeastern Brazil: Sr-Nd-Pb isotopic evidence. Lithos 86, 34–49.
IBGE, 2009. Cidades @. In: www.ibge.gov.br/cidadesat/topwindow.htm?1. Access in november, 2010.
IPECE, 2008. Caracterização territorial. Governo do Estado doCeará. In: http://www.ipece.ce.gov.br/atlas/capitulo1. Accessin 2010. Brasília, 73.
IPLANCE – Instituto do Planejamento do Ceará, 1995. Atlas doCeará, Governo do Estado, Fortaleza, 64.
Mendonça JCGS, Campos M, Braga APG, Souza EM, Favali JC,Leal JRLV, 1985. Jazida de Urânio de Itataia-CE. In: PrincipaisDepósitos Minerais do Brasil, DNPM, v.1, 121–131.
Netto AM, Meyer A, Cuney M, Poupeau G, 1991. A thermo-geochronological study of the Itataia phospho-uraniferousdeposit (Ceará, Brazil) by analyses: genetic implications. In:Source Transport and Deposition of apatite fission trackMetals, Pagel, M. and Leroy, J.L., eds., Proceedings of the 25Years SGA Anniversary Meeting, 1991.
Pasero M, Kampf AR, Ferraris C, Pekov IV, Rakovan J, White TJ,2010. Nomenclature of the apatite supergroup minerals.European Journal of Mineralogy, 22, 163–179.
Sun SS, McDonough WF, 1989. Chemical and isotopicsystematics of oceanic basalts: implications for mantlecomposition and processes. In: SUNDERS, AD; NORRY, MJ(Eds.). Magmatism in ocean basins. Oxfor: Geological Societyof Lonfon; Blackwell, 1989. (Geological Society of LondonSpecial, 42).
Vidal FWH, Sales FACB, Costa Roberto FA, Sousa JF, Mattos IC,2005. Rochas e minerais industriais do Ceará. FUNCAP,Fortaleza, 180.
Karst and Caves in Carbonate Rocks, Salt and Gypsum – poster 2013 ICS Proceedings
178
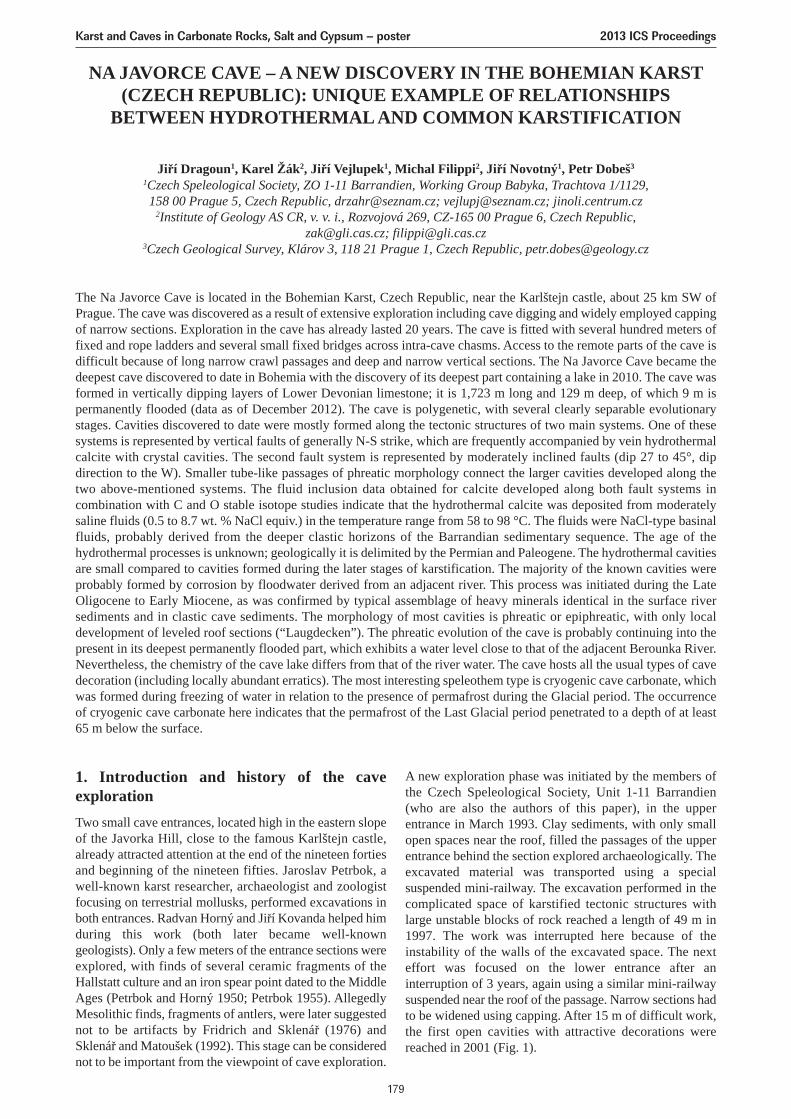
NA JAVORCE CAVE – A NEW DISCOVERY IN THE BOHEMIAN KARST(CZECH REPUBLIC): UNIQUE EXAMPLE OF RELATIONSHIPS
BETWEEN HYDROTHERMAL AND COMMON KARSTIFICATION
Jiří Dragoun1, Karel Žák2, Jiří Vejlupek1, Michal Filippi2, Jiří Novotný1, Petr Dobeš3
1Czech Speleological Society, ZO 1-11 Barrandien, Working Group Babyka, Trachtova 1/1129,158 00 Prague 5, Czech Republic, [email protected]; [email protected]; jinoli.centrum.cz
2Institute of Geology AS CR, v. v. i., Rozvojová 269, CZ-165 00 Prague 6, Czech Republic,[email protected]; [email protected]
3Czech Geological Survey, Klárov 3, 118 21 Prague 1, Czech Republic, [email protected]
The Na Javorce Cave is located in the Bohemian Karst, Czech Republic, near the Karlštejn castle, about 25 km SW ofPrague. The cave was discovered as a result of extensive exploration including cave digging and widely employed cappingof narrow sections. Exploration in the cave has already lasted 20 years. The cave is fitted with several hundred meters offixed and rope ladders and several small fixed bridges across intra-cave chasms. Access to the remote parts of the cave isdifficult because of long narrow crawl passages and deep and narrow vertical sections. The Na Javorce Cave became thedeepest cave discovered to date in Bohemia with the discovery of its deepest part containing a lake in 2010. The cave wasformed in vertically dipping layers of Lower Devonian limestone; it is 1,723 m long and 129 m deep, of which 9 m ispermanently flooded (data as of December 2012). The cave is polygenetic, with several clearly separable evolutionarystages. Cavities discovered to date were mostly formed along the tectonic structures of two main systems. One of thesesystems is represented by vertical faults of generally N-S strike, which are frequently accompanied by vein hydrothermalcalcite with crystal cavities. The second fault system is represented by moderately inclined faults (dip 27 to 45°, dipdirection to the W). Smaller tube-like passages of phreatic morphology connect the larger cavities developed along thetwo above-mentioned systems. The fluid inclusion data obtained for calcite developed along both fault systems incombination with C and O stable isotope studies indicate that the hydrothermal calcite was deposited from moderatelysaline fluids (0.5 to 8.7 wt. % NaCl equiv.) in the temperature range from 58 to 98 °C. The fluids were NaCl-type basinalfluids, probably derived from the deeper clastic horizons of the Barrandian sedimentary sequence. The age of thehydrothermal processes is unknown; geologically it is delimited by the Permian and Paleogene. The hydrothermal cavitiesare small compared to cavities formed during the later stages of karstification. The majority of the known cavities wereprobably formed by corrosion by floodwater derived from an adjacent river. This process was initiated during the LateOligocene to Early Miocene, as was confirmed by typical assemblage of heavy minerals identical in the surface riversediments and in clastic cave sediments. The morphology of most cavities is phreatic or epiphreatic, with only localdevelopment of leveled roof sections (“Laugdecken”). The phreatic evolution of the cave is probably continuing into thepresent in its deepest permanently flooded part, which exhibits a water level close to that of the adjacent Berounka River.Nevertheless, the chemistry of the cave lake differs from that of the river water. The cave hosts all the usual types of cavedecoration (including locally abundant erratics). The most interesting speleothem type is cryogenic cave carbonate, whichwas formed during freezing of water in relation to the presence of permafrost during the Glacial period. The occurrenceof cryogenic cave carbonate here indicates that the permafrost of the Last Glacial period penetrated to a depth of at least65 m below the surface.
1. Introduction and history of the caveexplorationTwo small cave entrances, located high in the eastern slopeof the Javorka Hill, close to the famous Karlštejn castle,already attracted attention at the end of the nineteen fortiesand beginning of the nineteen fifties. Jaroslav Petrbok, awell-known karst researcher, archaeologist and zoologistfocusing on terrestrial mollusks, performed excavations inboth entrances. Radvan Horný and Jiří Kovanda helped himduring this work (both later became well-knowngeologists). Only a few meters of the entrance sections wereexplored, with finds of several ceramic fragments of theHallstatt culture and an iron spear point dated to the MiddleAges (Petrbok and Horný 1950; Petrbok 1955). AllegedlyMesolithic finds, fragments of antlers, were later suggestednot to be artifacts by Fridrich and Sklenář (1976) andSklenář and Matoušek (1992). This stage can be considerednot to be important from the viewpoint of cave exploration.
A new exploration phase was initiated by the members ofthe Czech Speleological Society, Unit 1-11 Barrandien(who are also the authors of this paper), in the upperentrance in March 1993. Clay sediments, with only smallopen spaces near the roof, filled the passages of the upperentrance behind the section explored archaeologically. Theexcavated material was transported using a specialsuspended mini-railway. The excavation performed in thecomplicated space of karstified tectonic structures withlarge unstable blocks of rock reached a length of 49 m in1997. The work was interrupted here because of theinstability of the walls of the excavated space. The nexteffort was focused on the lower entrance after aninterruption of 3 years, again using a similar mini-railwaysuspended near the roof of the passage. Narrow sections hadto be widened using capping. After 15 m of difficult work,the first open cavities with attractive decorations werereached in 2001 (Fig. 1).
Karst and Caves in Carbonate Rocks, Salt and Gypsum – poster 2013 ICS Proceedings
179
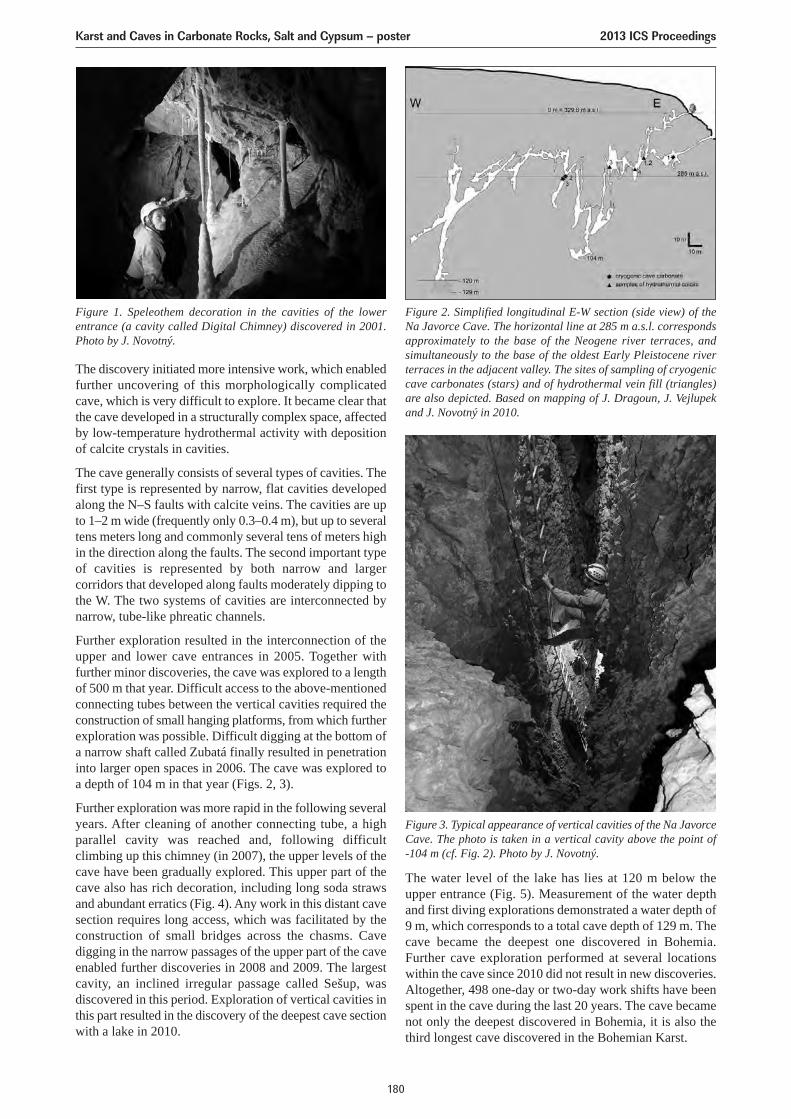
The discovery initiated more intensive work, which enabledfurther uncovering of this morphologically complicatedcave, which is very difficult to explore. It became clear thatthe cave developed in a structurally complex space, affectedby low-temperature hydrothermal activity with depositionof calcite crystals in cavities.
The cave generally consists of several types of cavities. Thefirst type is represented by narrow, flat cavities developedalong the N–S faults with calcite veins. The cavities are upto 1–2 m wide (frequently only 0.3–0.4 m), but up to severaltens meters long and commonly several tens of meters highin the direction along the faults. The second important typeof cavities is represented by both narrow and largercorridors that developed along faults moderately dipping tothe W. The two systems of cavities are interconnected bynarrow, tube-like phreatic channels.
Further exploration resulted in the interconnection of theupper and lower cave entrances in 2005. Together withfurther minor discoveries, the cave was explored to a lengthof 500 m that year. Difficult access to the above-mentionedconnecting tubes between the vertical cavities required theconstruction of small hanging platforms, from which furtherexploration was possible. Difficult digging at the bottom ofa narrow shaft called Zubatá finally resulted in penetrationinto larger open spaces in 2006. The cave was explored toa depth of 104 m in that year (Figs. 2, 3).
Further exploration was more rapid in the following severalyears. After cleaning of another connecting tube, a highparallel cavity was reached and, following difficultclimbing up this chimney (in 2007), the upper levels of thecave have been gradually explored. This upper part of thecave also has rich decoration, including long soda strawsand abundant erratics (Fig. 4). Any work in this distant cavesection requires long access, which was facilitated by theconstruction of small bridges across the chasms. Cavedigging in the narrow passages of the upper part of the caveenabled further discoveries in 2008 and 2009. The largestcavity, an inclined irregular passage called Sešup, wasdiscovered in this period. Exploration of vertical cavities inthis part resulted in the discovery of the deepest cave sectionwith a lake in 2010.
The water level of the lake has lies at 120 m below theupper entrance (Fig. 5). Measurement of the water depthand first diving explorations demonstrated a water depth of9 m, which corresponds to a total cave depth of 129 m. Thecave became the deepest one discovered in Bohemia.Further cave exploration performed at several locationswithin the cave since 2010 did not result in new discoveries.Altogether, 498 one-day or two-day work shifts have beenspent in the cave during the last 20 years. The cave becamenot only the deepest discovered in Bohemia, it is also thethird longest cave discovered in the Bohemian Karst.
Figure 1. Speleothem decoration in the cavities of the lowerentrance (a cavity called Digital Chimney) discovered in 2001.Photo by J. Novotný.
Figure 2. Simplified longitudinal E-W section (side view) of theNa Javorce Cave. The horizontal line at 285 m a.s.l. correspondsapproximately to the base of the Neogene river terraces, andsimultaneously to the base of the oldest Early Pleistocene riverterraces in the adjacent valley. The sites of sampling of cryogeniccave carbonates (stars) and of hydrothermal vein fill (triangles)are also depicted. Based on mapping of J. Dragoun, J. Vejlupekand J. Novotný in 2010.
Figure 3. Typical appearance of vertical cavities of the Na JavorceCave. The photo is taken in a vertical cavity above the point of-104 m (cf. Fig. 2). Photo by J. Novotný.
Karst and Caves in Carbonate Rocks, Salt and Gypsum – poster 2013 ICS Proceedings
180
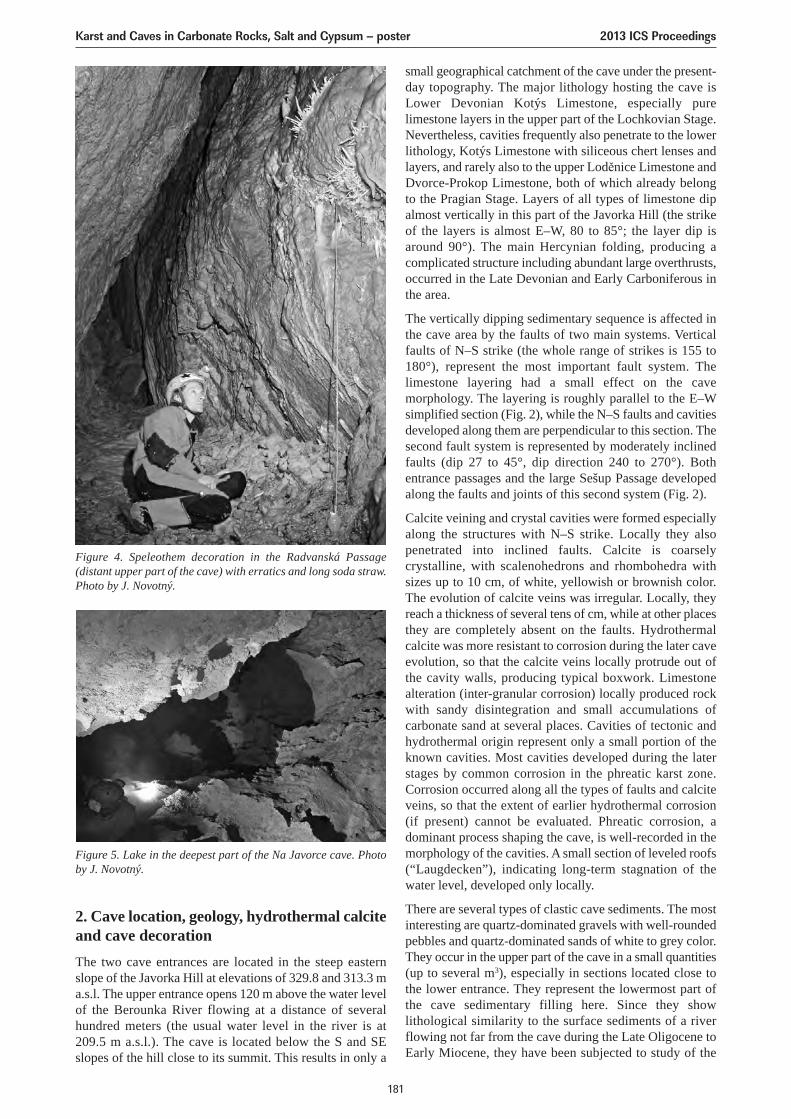
2. Cave location, geology, hydrothermal calciteand cave decorationThe two cave entrances are located in the steep easternslope of the Javorka Hill at elevations of 329.8 and 313.3 ma.s.l. The upper entrance opens 120 m above the water levelof the Berounka River flowing at a distance of severalhundred meters (the usual water level in the river is at209.5 m a.s.l.). The cave is located below the S and SEslopes of the hill close to its summit. This results in only a
small geographical catchment of the cave under the present-day topography. The major lithology hosting the cave isLower Devonian Kotýs Limestone, especially purelimestone layers in the upper part of the Lochkovian Stage.Nevertheless, cavities frequently also penetrate to the lowerlithology, Kotýs Limestone with siliceous chert lenses andlayers, and rarely also to the upper Loděnice Limestone andDvorce-Prokop Limestone, both of which already belongto the Pragian Stage. Layers of all types of limestone dipalmost vertically in this part of the Javorka Hill (the strikeof the layers is almost E–W, 80 to 85°; the layer dip isaround 90°). The main Hercynian folding, producing acomplicated structure including abundant large overthrusts,occurred in the Late Devonian and Early Carboniferous inthe area.
The vertically dipping sedimentary sequence is affected inthe cave area by the faults of two main systems. Verticalfaults of N–S strike (the whole range of strikes is 155 to 180°), represent the most important fault system. Thelimestone layering had a small effect on the cavemorphology. The layering is roughly parallel to the E–Wsimplified section (Fig. 2), while the N–S faults and cavitiesdeveloped along them are perpendicular to this section. Thesecond fault system is represented by moderately inclinedfaults (dip 27 to 45°, dip direction 240 to 270°). Bothentrance passages and the large Sešup Passage developedalong the faults and joints of this second system (Fig. 2).
Calcite veining and crystal cavities were formed especiallyalong the structures with N–S strike. Locally they alsopenetrated into inclined faults. Calcite is coarselycrystalline, with scalenohedrons and rhombohedra withsizes up to 10 cm, of white, yellowish or brownish color.The evolution of calcite veins was irregular. Locally, theyreach a thickness of several tens of cm, while at other placesthey are completely absent on the faults. Hydrothermalcalcite was more resistant to corrosion during the later caveevolution, so that the calcite veins locally protrude out ofthe cavity walls, producing typical boxwork. Limestonealteration (inter-granular corrosion) locally produced rockwith sandy disintegration and small accumulations ofcarbonate sand at several places. Cavities of tectonic andhydrothermal origin represent only a small portion of theknown cavities. Most cavities developed during the laterstages by common corrosion in the phreatic karst zone.Corrosion occurred along all the types of faults and calciteveins, so that the extent of earlier hydrothermal corrosion(if present) cannot be evaluated. Phreatic corrosion, adominant process shaping the cave, is well-recorded in themorphology of the cavities. A small section of leveled roofs(“Laugdecken”), indicating long-term stagnation of thewater level, developed only locally.
There are several types of clastic cave sediments. The mostinteresting are quartz-dominated gravels with well-roundedpebbles and quartz-dominated sands of white to grey color.They occur in the upper part of the cave in a small quantities(up to several m3), especially in sections located close tothe lower entrance. They represent the lowermost part ofthe cave sedimentary filling here. Since they showlithological similarity to the surface sediments of a riverflowing not far from the cave during the Late Oligocene toEarly Miocene, they have been subjected to study of the
Figure 4. Speleothem decoration in the Radvanská Passage(distant upper part of the cave) with erratics and long soda straw.Photo by J. Novotný.
Figure 5. Lake in the deepest part of the Na Javorce cave. Photoby J. Novotný.
Karst and Caves in Carbonate Rocks, Salt and Gypsum – poster 2013 ICS Proceedings
181
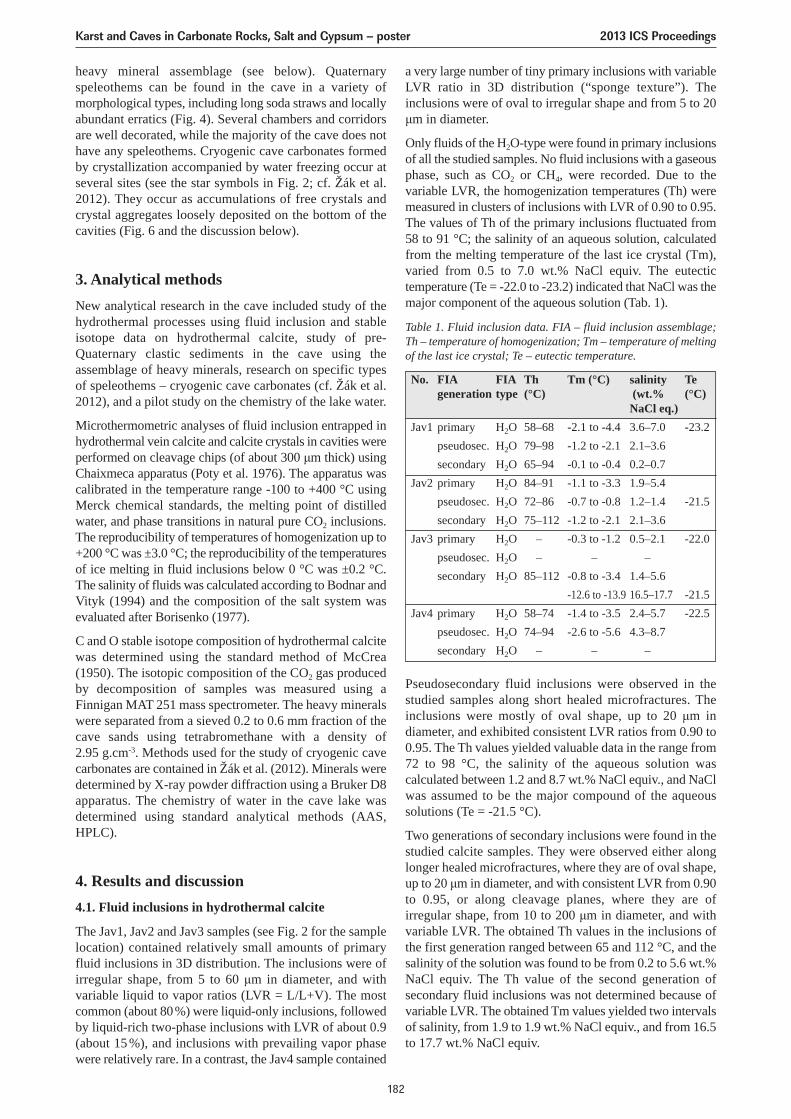
Pseudosecondary fluid inclusions were observed in thestudied samples along short healed microfractures. Theinclusions were mostly of oval shape, up to 20 μm indiameter, and exhibited consistent LVR ratios from 0.90 to0.95. The Th values yielded valuable data in the range from72 to 98 °C, the salinity of the aqueous solution wascalculated between 1.2 and 8.7 wt.% NaCl equiv., and NaClwas assumed to be the major compound of the aqueoussolutions (Te = -21.5 °C).
Two generations of secondary inclusions were found in thestudied calcite samples. They were observed either alonglonger healed microfractures, where they are of oval shape,up to 20 μm in diameter, and with consistent LVR from 0.90to 0.95, or along cleavage planes, where they are ofirregular shape, from 10 to 200 μm in diameter, and withvariable LVR. The obtained Th values in the inclusions ofthe first generation ranged between 65 and 112 °C, and thesalinity of the solution was found to be from 0.2 to 5.6 wt.%NaCl equiv. The Th value of the second generation ofsecondary fluid inclusions was not determined because ofvariable LVR. The obtained Tm values yielded two intervalsof salinity, from 1.9 to 1.9 wt.% NaCl equiv., and from 16.5to 17.7 wt.% NaCl equiv.
heavy mineral assemblage (see below). Quaternaryspeleothems can be found in the cave in a variety ofmorphological types, including long soda straws and locallyabundant erratics (Fig. 4). Several chambers and corridorsare well decorated, while the majority of the cave does nothave any speleothems. Cryogenic cave carbonates formedby crystallization accompanied by water freezing occur atseveral sites (see the star symbols in Fig. 2; cf. Žák et al.2012). They occur as accumulations of free crystals andcrystal aggregates loosely deposited on the bottom of thecavities (Fig. 6 and the discussion below).
3. Analytical methodsNew analytical research in the cave included study of thehydrothermal processes using fluid inclusion and stableisotope data on hydrothermal calcite, study of pre-Quaternary clastic sediments in the cave using theassemblage of heavy minerals, research on specific typesof speleothems – cryogenic cave carbonates (cf. Žák et al.2012), and a pilot study on the chemistry of the lake water.
Microthermometric analyses of fluid inclusion entrapped inhydrothermal vein calcite and calcite crystals in cavities wereperformed on cleavage chips (of about 300 μm thick) usingChaixmeca apparatus (Poty et al. 1976). The apparatus wascalibrated in the temperature range -100 to +400 °C usingMerck chemical standards, the melting point of distilledwater, and phase transitions in natural pure CO2 inclusions.The reproducibility of temperatures of homogenization up to+200 °C was ±3.0 °C; the reproducibility of the temperaturesof ice melting in fluid inclusions below 0 °C was ±0.2 °C.The salinity of fluids was calculated according to Bodnar andVityk (1994) and the composition of the salt system wasevaluated after Borisenko (1977).
C and O stable isotope composition of hydrothermal calcitewas determined using the standard method of McCrea(1950). The isotopic composition of the CO2 gas producedby decomposition of samples was measured using aFinnigan MAT 251 mass spectrometer. The heavy mineralswere separated from a sieved 0.2 to 0.6 mm fraction of thecave sands using tetrabromethane with a density of2.95 g.cm-3. Methods used for the study of cryogenic cavecarbonates are contained in Žák et al. (2012). Minerals weredetermined by X-ray powder diffraction using a Bruker D8apparatus. The chemistry of water in the cave lake wasdetermined using standard analytical methods (AAS,HPLC).
4. Results and discussion4.1. Fluid inclusions in hydrothermal calcite
The Jav1, Jav2 and Jav3 samples (see Fig. 2 for the samplelocation) contained relatively small amounts of primaryfluid inclusions in 3D distribution. The inclusions were ofirregular shape, from 5 to 60 μm in diameter, and withvariable liquid to vapor ratios (LVR = L/L+V). The mostcommon (about 80%) were liquid-only inclusions, followedby liquid-rich two-phase inclusions with LVR of about 0.9(about 15 %), and inclusions with prevailing vapor phasewere relatively rare. In a contrast, the Jav4 sample contained
a very large number of tiny primary inclusions with variableLVR ratio in 3D distribution (“sponge texture”). Theinclusions were of oval to irregular shape and from 5 to 20μm in diameter.
Only fluids of the H2O-type were found in primary inclusionsof all the studied samples. No fluid inclusions with a gaseousphase, such as CO2 or CH4, were recorded. Due to thevariable LVR, the homogenization temperatures (Th) weremeasured in clusters of inclusions with LVR of 0.90 to 0.95.The values of Th of the primary inclusions fluctuated from58 to 91 °C; the salinity of an aqueous solution, calculatedfrom the melting temperature of the last ice crystal (Tm),varied from 0.5 to 7.0 wt.% NaCl equiv. The eutectictemperature (Te = -22.0 to -23.2) indicated that NaCl was themajor component of the aqueous solution (Tab. 1).
Table 1. Fluid inclusion data. FIA – fluid inclusion assemblage;Th – temperature of homogenization; Tm – temperature of meltingof the last ice crystal; Te – eutectic temperature.
No. FIA FIA Th Tm (°C) salinity Tegeneration type (°C) (wt.% (°C)
NaCl eq.)Jav1 primary H2O 58–68 -2.1 to -4.4 3.6–7.0 -23.2
pseudosec. H2O 79–98 -1.2 to -2.1 2.1–3.6secondary H2O 65–94 -0.1 to -0.4 0.2–0.7
Jav2 primary H2O 84–91 -1.1 to -3.3 1.9–5.4pseudosec. H2O 72–86 -0.7 to -0.8 1.2–1.4 -21.5secondary H2O 75–112 -1.2 to -2.1 2.1–3.6
Jav3 primary H2O – -0.3 to -1.2 0.5–2.1 -22.0pseudosec. H2O – – –secondary H2O 85–112 -0.8 to -3.4 1.4–5.6
-12.6 to -13.9 16.5–17.7 -21.5Jav4 primary H2O 58–74 -1.4 to -3.5 2.4–5.7 -22.5
pseudosec. H2O 74–94 -2.6 to -5.6 4.3–8.7secondary H2O – – –
Karst and Caves in Carbonate Rocks, Salt and Gypsum – poster 2013 ICS Proceedings
182
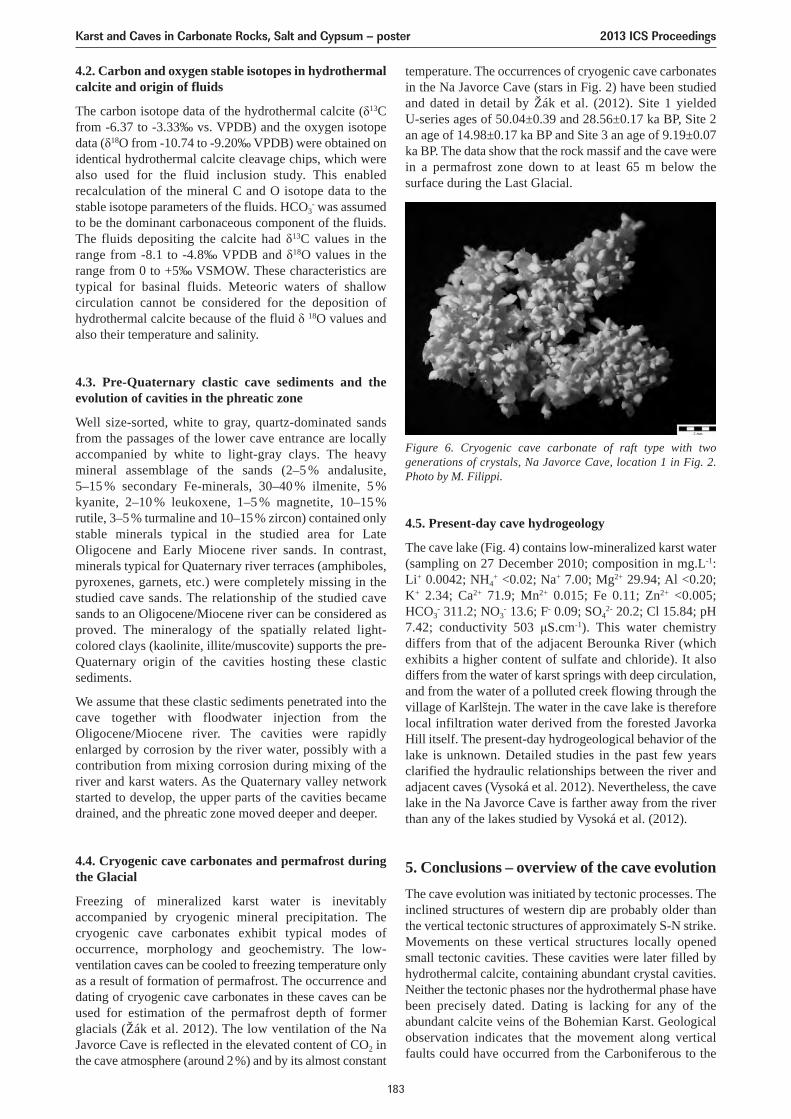
4.2. Carbon and oxygen stable isotopes in hydrothermalcalcite and origin of fluids
The carbon isotope data of the hydrothermal calcite (δ13Cfrom -6.37 to -3.33‰ vs. VPDB) and the oxygen isotopedata (δ18O from -10.74 to -9.20‰ VPDB) were obtained onidentical hydrothermal calcite cleavage chips, which werealso used for the fluid inclusion study. This enabledrecalculation of the mineral C and O isotope data to thestable isotope parameters of the fluids. HCO3
- was assumedto be the dominant carbonaceous component of the fluids.The fluids depositing the calcite had δ13C values in therange from -8.1 to -4.8‰ VPDB and δ18O values in therange from 0 to +5‰ VSMOW. These characteristics aretypical for basinal fluids. Meteoric waters of shallowcirculation cannot be considered for the deposition ofhydrothermal calcite because of the fluid δ 18O values andalso their temperature and salinity.
4.3. Pre-Quaternary clastic cave sediments and theevolution of cavities in the phreatic zone
Well size-sorted, white to gray, quartz-dominated sandsfrom the passages of the lower cave entrance are locallyaccompanied by white to light-gray clays. The heavymineral assemblage of the sands (2–5 % andalusite, 5–15 % secondary Fe-minerals, 30–40 % ilmenite, 5 %kyanite, 2–10 % leukoxene, 1–5 % magnetite, 10–15 %rutile, 3–5% turmaline and 10–15% zircon) contained onlystable minerals typical in the studied area for LateOligocene and Early Miocene river sands. In contrast,minerals typical for Quaternary river terraces (amphiboles,pyroxenes, garnets, etc.) were completely missing in thestudied cave sands. The relationship of the studied cavesands to an Oligocene/Miocene river can be considered asproved. The mineralogy of the spatially related light-colored clays (kaolinite, illite/muscovite) supports the pre-Quaternary origin of the cavities hosting these clasticsediments.
We assume that these clastic sediments penetrated into thecave together with floodwater injection from theOligocene/Miocene river. The cavities were rapidlyenlarged by corrosion by the river water, possibly with acontribution from mixing corrosion during mixing of theriver and karst waters. As the Quaternary valley networkstarted to develop, the upper parts of the cavities becamedrained, and the phreatic zone moved deeper and deeper.
4.4. Cryogenic cave carbonates and permafrost duringthe Glacial
Freezing of mineralized karst water is inevitablyaccompanied by cryogenic mineral precipitation. Thecryogenic cave carbonates exhibit typical modes ofoccurrence, morphology and geochemistry. The low-ventilation caves can be cooled to freezing temperature onlyas a result of formation of permafrost. The occurrence anddating of cryogenic cave carbonates in these caves can beused for estimation of the permafrost depth of formerglacials (Žák et al. 2012). The low ventilation of the NaJavorce Cave is reflected in the elevated content of CO2 inthe cave atmosphere (around 2%) and by its almost constant
temperature. The occurrences of cryogenic cave carbonatesin the Na Javorce Cave (stars in Fig. 2) have been studiedand dated in detail by Žák et al. (2012). Site 1 yieldedU-series ages of 50.04±0.39 and 28.56±0.17 ka BP, Site 2an age of 14.98±0.17 ka BP and Site 3 an age of 9.19±0.07ka BP. The data show that the rock massif and the cave werein a permafrost zone down to at least 65 m below thesurface during the Last Glacial.
4.5. Present-day cave hydrogeology
The cave lake (Fig. 4) contains low-mineralized karst water(sampling on 27 December 2010; composition in mg.L-1:Li+ 0.0042; NH4
+ <0.02; Na+ 7.00; Mg2+ 29.94; Al <0.20;K+ 2.34; Ca2+ 71.9; Mn2+ 0.015; Fe 0.11; Zn2+ <0.005;HCO3
- 311.2; NO3- 13.6; F- 0.09; SO4
2- 20.2; Cl 15.84; pH7.42; conductivity 503 μS.cm-1). This water chemistrydiffers from that of the adjacent Berounka River (whichexhibits a higher content of sulfate and chloride). It alsodiffers from the water of karst springs with deep circulation,and from the water of a polluted creek flowing through thevillage of Karlštejn. The water in the cave lake is thereforelocal infiltration water derived from the forested JavorkaHill itself. The present-day hydrogeological behavior of thelake is unknown. Detailed studies in the past few yearsclarified the hydraulic relationships between the river andadjacent caves (Vysoká et al. 2012). Nevertheless, the cavelake in the Na Javorce Cave is farther away from the riverthan any of the lakes studied by Vysoká et al. (2012).
5. Conclusions – overview of the cave evolutionThe cave evolution was initiated by tectonic processes. Theinclined structures of western dip are probably older thanthe vertical tectonic structures of approximately S-N strike.Movements on these vertical structures locally openedsmall tectonic cavities. These cavities were later filled byhydrothermal calcite, containing abundant crystal cavities.Neither the tectonic phases nor the hydrothermal phase havebeen precisely dated. Dating is lacking for any of theabundant calcite veins of the Bohemian Karst. Geologicalobservation indicates that the movement along verticalfaults could have occurred from the Carboniferous to the
Figure 6. Cryogenic cave carbonate of raft type with twogenerations of crystals, Na Javorce Cave, location 1 in Fig. 2.Photo by M. Filippi.
Karst and Caves in Carbonate Rocks, Salt and Gypsum – poster 2013 ICS Proceedings
183
Cretaceous, and the hydrothermal phase could haveoccurred at any time between the Permian and thePaleogene. Movements along faults after the formation ofhydrothermal calcite were either absent or only of smallamplitude. The hydrothermal phase occurred attemperatures between 58 and 98 °C. Moderately saline fluid(0.5 to 8.7 wt.% NaCl equiv.) with δ18O in the rangebetween 0 and +5‰ VSMOW and δ13C in the rangebetween -8.1 to -4.8‰ VPDB was most probably some kindof basinal water derived from a deeper part of thesedimentary sequence. The extent of hydrothermalcorrosion is difficult to evaluate, since later karst corrosionin the phreatic zone overlaps the earlier hydrothermalcorrosion.
The upper parts of the Na Javorce Cave (aboveapproximately 285 m a.s.l., which is the upper limit of theQuaternary river terraces) were formed by phreaticcorrosion in the pre-Quaternary period, most probablyduring the Late Oligocene and Early Miocene. Therelationship between the river of this age and the cave isreflected in the presence of quartz-dominated sands in thecave, which contain identical heavy mineral assemblagelike the surface sediments. The surface fluvial sediments ata site located 2 km away from the cave are dated bypaleontology (Žák et al. 2003). The principal processes ofcave formation were probably floodwater injection andmixing corrosion. These processes resulted in irregularmorphology of the cavities. The cavities below a level of285 m a.s.l. could also have been formed (or their formationinitiated) during the Oligocene or Miocene. In relation tothe deep incision of the river during the Quaternary, theupper parts of the cave became drained and the phreaticevolution could continue only in deeper part of the cave.The present-day hydraulic relationship between the cavephreatic zone and the 400 m distant river is unknown (thecave lake was discovered in 2010 and has very difficultaccess). The water level in the cave lake and in the river areapproximately equal (within the measuring error). It is clearthat the cave was “trapped” in the Javorka Hill during theQuaternary. It has very limited geographic catchment area.The cave-lake water chemistry is different from those of theriver and of a creek flowing through the town of Karlštejn.The water chemistry probably reflects infiltration in theforested area of Javorka Hill itself. Water flow along the N-S faults from a more northern area is another possibility.
The Quaternary evolution of the cave is poorly understood.Sections with vadose morphology are generally rare in thecave (corrosion by drip-water is locally present) and thespeleothems have not been dated yet, except the cryogeniccave carbonates of the Last Glacial. These cryogenic cavecarbonates indicate that, during the Glacial, especiallyduring the Last Glacial Maximum (between ca. 26.5 and19.0 ka BP), the permafrost extended to a depth of at least65 m below the surface. Cryogenic cave carbonates werefound at several sites within the cave (Fig. 2) and weredated and studied in detail by Žák et al. (2012). Theyoungest age of the cryogenic cave carbonate of 9.19±0.07ka BP was obtained for the sample with the deepest locationwithin the cave. This possibly indicates that the relicpermafrost lenses could have survived until the EarlyHolocene. Late Glacial and Early Holocene age have also
been attributed to the bone finds in the entrance cavesections, transported into the cave by predators. Thepresence of animals and prehistoric humans was restrictedto only a few meters behind both entrances, because of thesediment fill of the passages.
Exploration work done in the cave since 1993 (intensivesince 2001) resulted in the discovery of this interestingcave, which became the deepest cave of Bohemia in 2010.It is clear that the Na Javorce Cave has not yet revealed allits secrets.
AcknowledgmentsThe research in the cave was performed within projectP210/10/1760 of the Czech Science Foundation. Theauthors would like to thank Z. Táborský for heavy mineralseparation and determination, R. Skála for XRD mineralidentification and I. Jačková and B. Čejková for the C andO stable isotope determinations.
ReferencesBodnar RJ, Vityk MO, 1995. Interpretation of microthermometric
data for H2O-NaCl fluid inclusions. In: Fluid Inclusions inMinerals, Methods and Applications, B De Vivo and MLFrezzotti (Eds.). Virginia Tech, Blacksburg, VA, 117–130.
Borisenko AS, 1977. Izutchenye solevogo sostava rastvorovgazovozhidkych vklyutcheniy v mineralach metodom kriometrii.Geologia i Geofyzika, 8, 16–28. Moscow (in Russian).
Fridrich J, Sklenář K, 1976. Die paläolitische und mesolitischeHöhlenbesiedlung des Böhmischen Karstes. FontesArchaeologici Pragenses, 16, 1–122. Prague.
McCrea JM, 1950. On the isotopic chemistry of carbonates and apaleotemperature scale. Journal of Chemical Physics, 18, 849–857.
Poty B, Leroy J, Jachimowicz L, 1976. Measuring temperatureunder microscope – Chaixmeca micro-thermometry apparatus.Bulletin de la Societe Francaise Mineralogie et deCristallographie, 99(2–3), 182–186.
Sklenář K, Matoušek V, 1994. Die Höhlenbesiedlung desBöhmischen Karstes vom Neolithikum bis zum Mittelalter.Fontes Archaeologici Pragenses, 20, 1–212. Prague.
Vysoká H, Bruthans J, Žák K, Mls J, 2012. Response of the karstphreatic zone to flood events in a major river (Bohemian Karst,Czech Republic) and its implication for the cave genesis.Journal of Cave and Karst Studies, 74(1), 65–81.
Žák K, Táborský Z, Lachmanová M, Pudilová M, 2001. Heavymineral assemblages in allochthonous clastic cave sedimentsof the Bohemian Karst: A pilot study. Český kras, XXVI, 5–14. Beroun (in Czech with abstract in English).
Žák K, Teodoridis V, Sakala J, 2003. Find of flora in Tertiarysediments near Karlštejn. Geoscience Research Reports for2002, 47–49. Prague (in Czech with abstract in English).
Žák K, Richter DK, Filippi M, Živor R, Deininger M, Mangini A,Scholz D, 2012. Coarsely crystalline cryogenic cave carbonate– a new archive to estimate the Last Glacial minimumpermafrost depth in Central Europe. Climate of the Past, 8,1821–1837.
Karst and Caves in Carbonate Rocks, Salt and Gypsum – poster 2013 ICS Proceedings
184
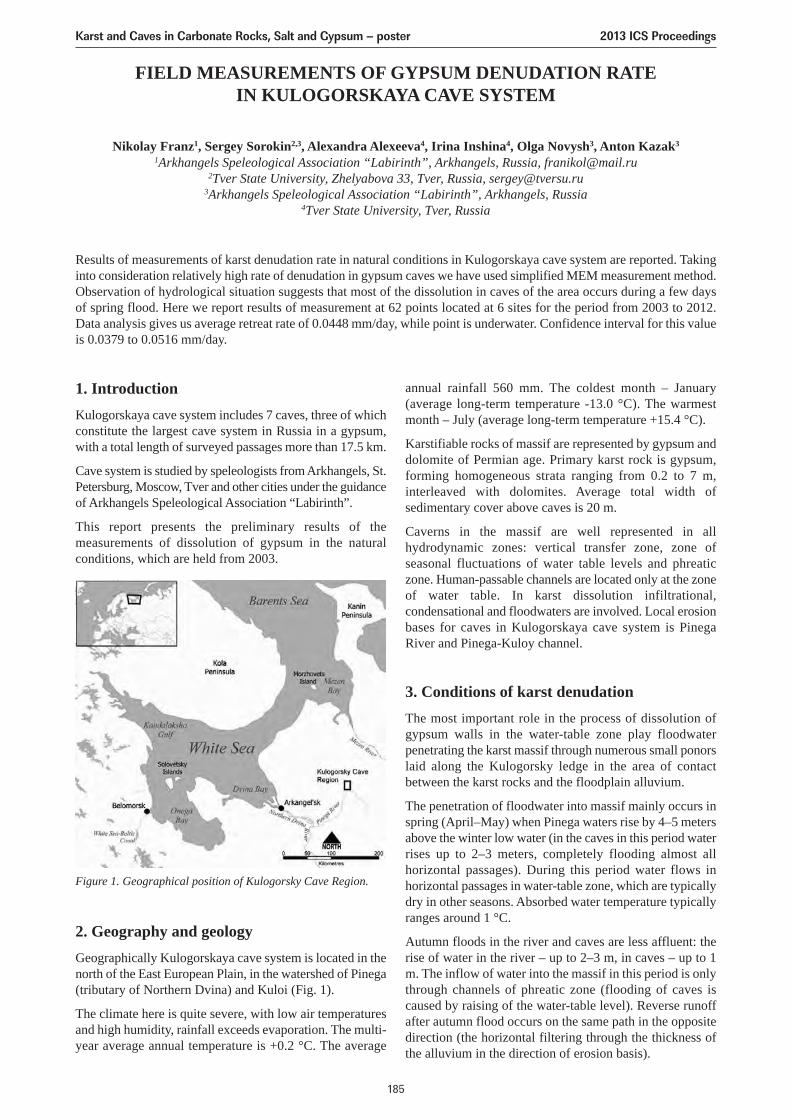
FIELD MEASUREMENTS OF GYPSUM DENUDATION RATEIN KULOGORSKAYA CAVE SYSTEM
Nikolay Franz1, Sergey Sorokin2,3, Alexandra Alexeeva4, Irina Inshina4, Olga Novysh3, Anton Kazak3
1Arkhangels Speleological Association “Labirinth”, Arkhangels, Russia, [email protected] State University, Zhelyabova 33, Tver, Russia, [email protected]
3Arkhangels Speleological Association “Labirinth”, Arkhangels, Russia4Tver State University, Tver, Russia
Results of measurements of karst denudation rate in natural conditions in Kulogorskaya cave system are reported. Takinginto consideration relatively high rate of denudation in gypsum caves we have used simplified MEM measurement method.Observation of hydrological situation suggests that most of the dissolution in caves of the area occurs during a few daysof spring flood. Here we report results of measurement at 62 points located at 6 sites for the period from 2003 to 2012.Data analysis gives us average retreat rate of 0.0448 mm/day, while point is underwater. Confidence interval for this valueis 0.0379 to 0.0516 mm/day.
1. IntroductionKulogorskaya cave system includes 7 caves, three of whichconstitute the largest cave system in Russia in a gypsum,with a total length of surveyed passages more than 17.5 km.
Cave system is studied by speleologists from Arkhangels, St.Petersburg, Moscow, Tver and other cities under the guidanceof Arkhangels Speleological Association “Labirinth”.
This report presents the preliminary results of themeasurements of dissolution of gypsum in the naturalconditions, which are held from 2003.
2. Geography and geologyGeographically Kulogorskaya cave system is located in thenorth of the East European Plain, in the watershed of Pinega(tributary of Northern Dvina) and Kuloi (Fig. 1).
The climate here is quite severe, with low air temperaturesand high humidity, rainfall exceeds evaporation. The multi-year average annual temperature is +0.2 °C. The average
Figure 1. Geographical position of Kulogorsky Cave Region.
annual rainfall 560 mm. The coldest month – January(average long-term temperature -13.0 °C). The warmestmonth – July (average long-term temperature +15.4 °C).
Karstifiable rocks of massif are represented by gypsum anddolomite of Permian age. Primary karst rock is gypsum,forming homogeneous strata ranging from 0.2 to 7 m,interleaved with dolomites. Average total width ofsedimentary cover above caves is 20 m.
Caverns in the massif are well represented in allhydrodynamic zones: vertical transfer zone, zone ofseasonal fluctuations of water table levels and phreaticzone. Human-passable channels are located only at the zoneof water table. In karst dissolution infiltrational,condensational and floodwaters are involved. Local erosionbases for caves in Kulogorskaya cave system is PinegaRiver and Pinega-Kuloy channel.
3. Conditions of karst denudationThe most important role in the process of dissolution ofgypsum walls in the water-table zone play floodwaterpenetrating the karst massif through numerous small ponorslaid along the Kulogorsky ledge in the area of contactbetween the karst rocks and the floodplain alluvium.
The penetration of floodwater into massif mainly occurs inspring (April–May) when Pinega waters rise by 4–5 metersabove the winter low water (in the caves in this period waterrises up to 2–3 meters, completely flooding almost allhorizontal passages). During this period water flows inhorizontal passages in water-table zone, which are typicallydry in other seasons. Absorbed water temperature typicallyranges around 1 °C.
Autumn floods in the river and caves are less affluent: therise of water in the river – up to 2–3 m, in caves – up to 1m. The inflow of water into the massif in this period is onlythrough channels of phreatic zone (flooding of caves iscaused by raising of the water-table level). Reverse runoffafter autumn flood occurs on the same path in the oppositedirection (the horizontal filtering through the thickness ofthe alluvium in the direction of erosion basis).
Karst and Caves in Carbonate Rocks, Salt and Gypsum – poster 2013 ICS Proceedings
185
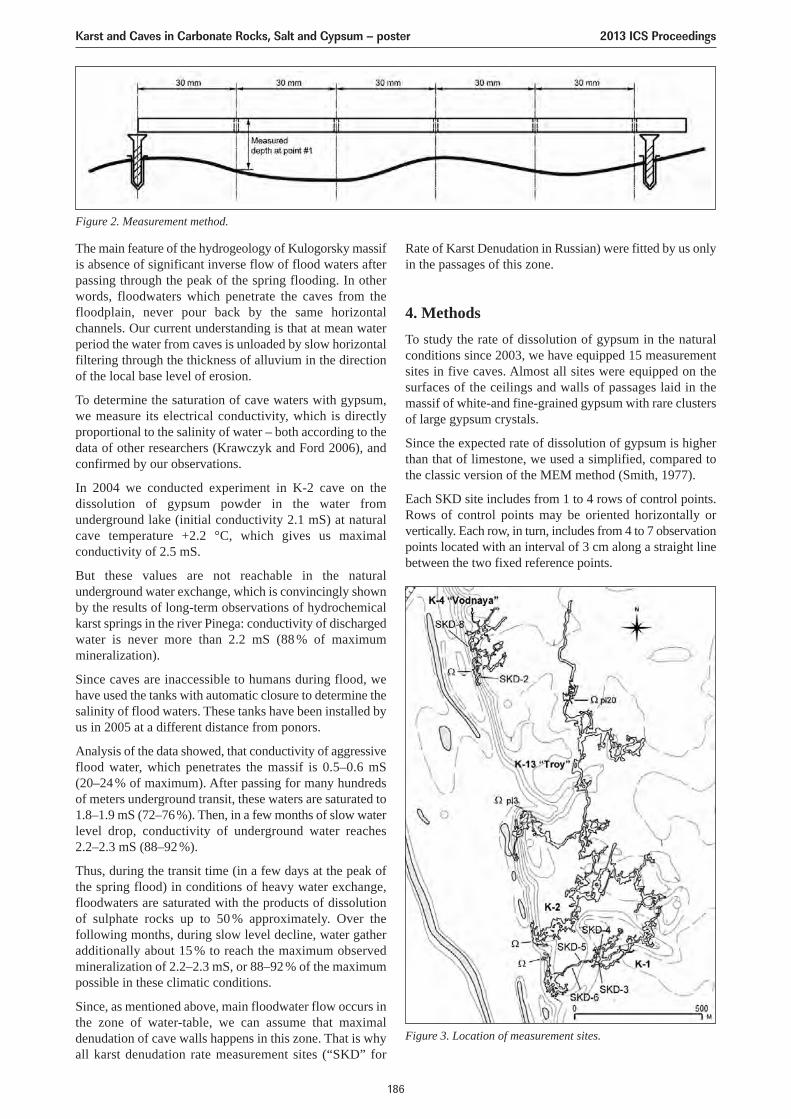
Rate of Karst Denudation in Russian) were fitted by us onlyin the passages of this zone.
4. MethodsTo study the rate of dissolution of gypsum in the naturalconditions since 2003, we have equipped 15 measurementsites in five caves. Almost all sites were equipped on thesurfaces of the ceilings and walls of passages laid in themassif of white-and fine-grained gypsum with rare clustersof large gypsum crystals.
Since the expected rate of dissolution of gypsum is higherthan that of limestone, we used a simplified, compared tothe classic version of the MEM method (Smith, 1977).
Each SKD site includes from 1 to 4 rows of control points.Rows of control points may be oriented horizontally orvertically. Each row, in turn, includes from 4 to 7 observationpoints located with an interval of 3 cm along a straight linebetween the two fixed reference points.
The main feature of the hydrogeology of Kulogorsky massifis absence of significant inverse flow of flood waters afterpassing through the peak of the spring flooding. In otherwords, floodwaters which penetrate the caves from thefloodplain, never pour back by the same horizontalchannels. Our current understanding is that at mean waterperiod the water from caves is unloaded by slow horizontalfiltering through the thickness of alluvium in the directionof the local base level of erosion.
To determine the saturation of cave waters with gypsum,we measure its electrical conductivity, which is directlyproportional to the salinity of water – both according to thedata of other researchers (Krawczyk and Ford 2006), andconfirmed by our observations.
In 2004 we conducted experiment in K-2 cave on thedissolution of gypsum powder in the water fromunderground lake (initial conductivity 2.1 mS) at naturalcave temperature +2.2 °C, which gives us maximalconductivity of 2.5 mS.
But these values are not reachable in the naturalunderground water exchange, which is convincingly shownby the results of long-term observations of hydrochemicalkarst springs in the river Pinega: conductivity of dischargedwater is never more than 2.2 mS (88 % of maximummineralization).
Since caves are inaccessible to humans during flood, wehave used the tanks with automatic closure to determine thesalinity of flood waters. These tanks have been installed byus in 2005 at a different distance from ponors.
Analysis of the data showed, that conductivity of aggressiveflood water, which penetrates the massif is 0.5–0.6 mS (20–24% of maximum). After passing for many hundredsof meters underground transit, these waters are saturated to1.8–1.9 mS (72–76%). Then, in a few months of slow waterlevel drop, conductivity of underground water reaches 2.2–2.3 mS (88–92%).
Thus, during the transit time (in a few days at the peak ofthe spring flood) in conditions of heavy water exchange,floodwaters are saturated with the products of dissolutionof sulphate rocks up to 50 % approximately. Over thefollowing months, during slow level decline, water gatheradditionally about 15 % to reach the maximum observedmineralization of 2.2–2.3 mS, or 88–92% of the maximumpossible in these climatic conditions.
Since, as mentioned above, main floodwater flow occurs inthe zone of water-table, we can assume that maximaldenudation of cave walls happens in this zone. That is whyall karst denudation rate measurement sites (“SKD” for
Figure 2. Measurement method.
Figure 3. Location of measurement sites.
Karst and Caves in Carbonate Rocks, Salt and Gypsum – poster 2013 ICS Proceedings
186
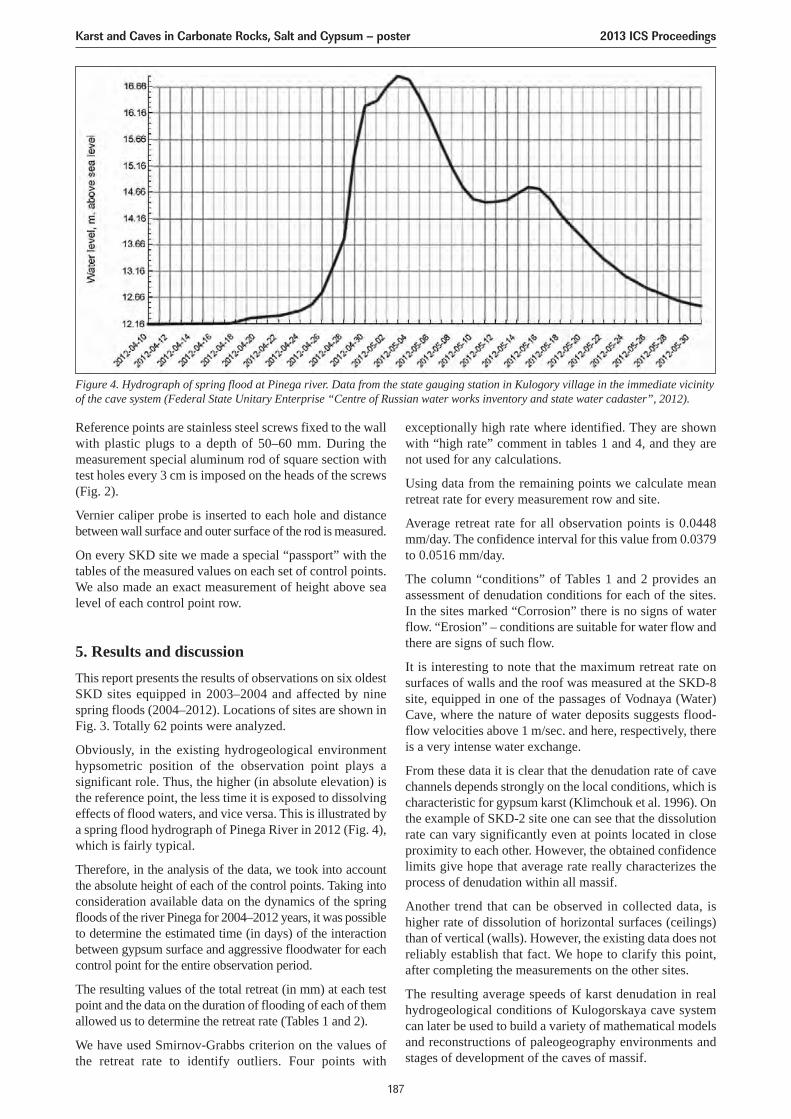
Reference points are stainless steel screws fixed to the wallwith plastic plugs to a depth of 50–60 mm. During themeasurement special aluminum rod of square section withtest holes every 3 cm is imposed on the heads of the screws(Fig. 2).
Vernier caliper probe is inserted to each hole and distancebetween wall surface and outer surface of the rod is measured.
On every SKD site we made a special “passport” with thetables of the measured values on each set of control points.We also made an exact measurement of height above sealevel of each control point row.
5. Results and discussionThis report presents the results of observations on six oldestSKD sites equipped in 2003–2004 and affected by ninespring floods (2004–2012). Locations of sites are shown inFig. 3. Totally 62 points were analyzed.
Obviously, in the existing hydrogeological environmenthypsometric position of the observation point plays asignificant role. Thus, the higher (in absolute elevation) isthe reference point, the less time it is exposed to dissolvingeffects of flood waters, and vice versa. This is illustrated bya spring flood hydrograph of Pinega River in 2012 (Fig. 4),which is fairly typical.
Therefore, in the analysis of the data, we took into accountthe absolute height of each of the control points. Taking intoconsideration available data on the dynamics of the springfloods of the river Pinega for 2004–2012 years, it was possibleto determine the estimated time (in days) of the interactionbetween gypsum surface and aggressive floodwater for eachcontrol point for the entire observation period.
The resulting values of the total retreat (in mm) at each testpoint and the data on the duration of flooding of each of themallowed us to determine the retreat rate (Tables 1 and 2).
We have used Smirnov-Grabbs criterion on the values ofthe retreat rate to identify outliers. Four points with
exceptionally high rate where identified. They are shownwith “high rate” comment in tables 1 and 4, and they arenot used for any calculations.
Using data from the remaining points we calculate meanretreat rate for every measurement row and site.
Average retreat rate for all observation points is 0.0448mm/day. The confidence interval for this value from 0.0379to 0.0516 mm/day.
The column “conditions” of Tables 1 and 2 provides anassessment of denudation conditions for each of the sites.In the sites marked “Corrosion” there is no signs of waterflow. “Erosion” – conditions are suitable for water flow andthere are signs of such flow.
It is interesting to note that the maximum retreat rate onsurfaces of walls and the roof was measured at the SKD-8site, equipped in one of the passages of Vodnaya (Water)Cave, where the nature of water deposits suggests flood-flow velocities above 1 m/sec. and here, respectively, thereis a very intense water exchange.
From these data it is clear that the denudation rate of cavechannels depends strongly on the local conditions, which ischaracteristic for gypsum karst (Klimchouk et al. 1996). Onthe example of SKD-2 site one can see that the dissolutionrate can vary significantly even at points located in closeproximity to each other. However, the obtained confidencelimits give hope that average rate really characterizes theprocess of denudation within all massif.
Another trend that can be observed in collected data, ishigher rate of dissolution of horizontal surfaces (ceilings)than of vertical (walls). However, the existing data does notreliably establish that fact. We hope to clarify this point,after completing the measurements on the other sites.
The resulting average speeds of karst denudation in realhydrogeological conditions of Kulogorskaya cave systemcan later be used to build a variety of mathematical modelsand reconstructions of paleogeography environments andstages of development of the caves of massif.
Figure 4. Hydrograph of spring flood at Pinega river. Data from the state gauging station in Kulogory village in the immediate vicinityof the cave system (Federal State Unitary Enterprise “Centre of Russian water works inventory and state water cadaster”, 2012).
Karst and Caves in Carbonate Rocks, Salt and Gypsum – poster 2013 ICS Proceedings
187
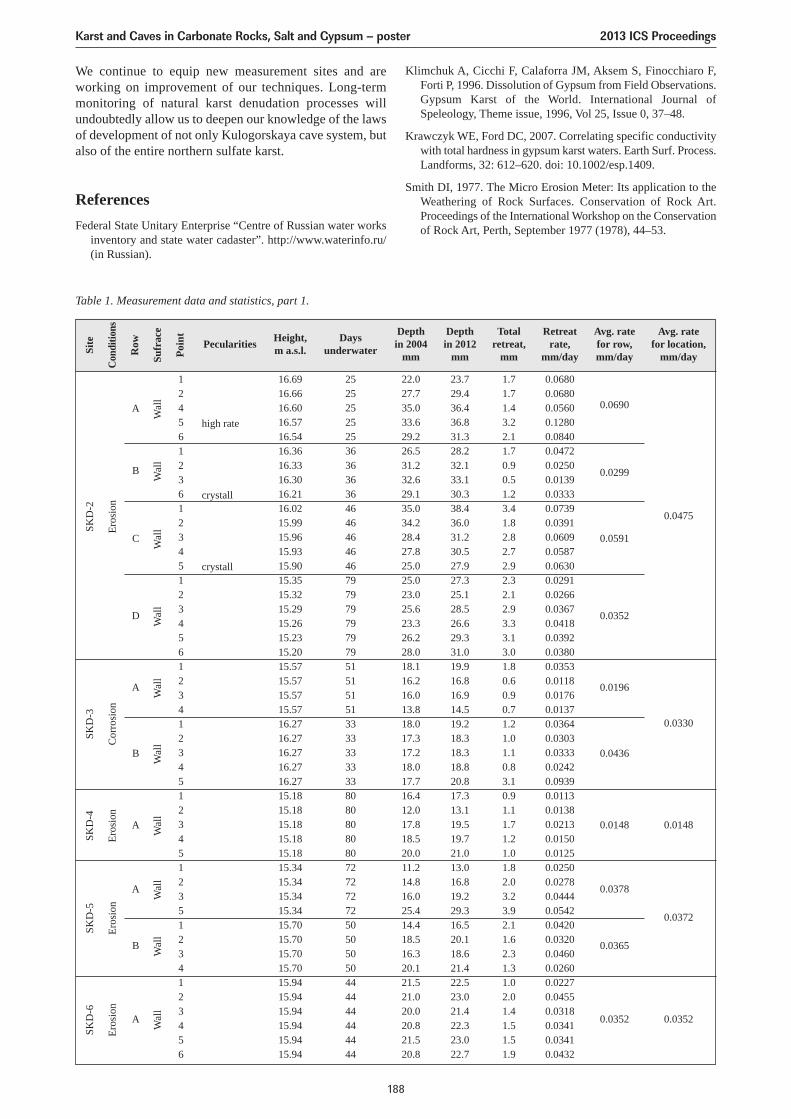
Klimchuk A, Cicchi F, Calaforra JM, Aksem S, Finocchiaro F,Forti P, 1996. Dissolution of Gypsum from Field Observations.Gypsum Karst of the World. International Journal ofSpeleology, Theme issue, 1996, Vol 25, Issue 0, 37–48.
Krawczyk WE, Ford DC, 2007. Correlating specific conductivitywith total hardness in gypsum karst waters. Earth Surf. Process.Landforms, 32: 612–620. doi: 10.1002/esp.1409.
Smith DI, 1977. The Micro Erosion Meter: Its application to theWeathering of Rock Surfaces. Conservation of Rock Art.Proceedings of the International Workshop on the Conservationof Rock Art, Perth, September 1977 (1978), 44–53.
We continue to equip new measurement sites and areworking on improvement of our techniques. Long-termmonitoring of natural karst denudation processes willundoubtedly allow us to deepen our knowledge of the lawsof development of not only Kulogorskaya cave system, butalso of the entire northern sulfate karst.
ReferencesFederal State Unitary Enterprise “Centre of Russian water works
inventory and state water cadaster”. http://www.waterinfo.ru/(in Russian).
Table 1. Measurement data and statistics, part 1.
Site
Con
ditio
nsEr
osio
n
SKD
-2
Cor
rosi
on
SKD
-3
Eros
ion
SKD
-4
Eros
ion
SKD
-5
Eros
ion
SKD
-6
Row
Sufr
ace
Wal
lW
all
Wal
lW
all
Wal
lW
all
Wal
lW
all
Wal
lW
all
Poin
t
Pecularities
high rate
crystall
crystall
Height,m a.s.l.
16.6916.6616.6016.5716.5416.3616.3316.3016.2116.0215.9915.9615.9315.9015.3515.3215.2915.2615.2315.2015.5715.5715.5715.5716.2716.2716.2716.2716.2715.1815.1815.1815.1815.1815.3415.3415.3415.3415.7015.7015.7015.7015.9415.9415.9415.9415.9415.94
124561236123451234561234123451234512351234123456
Daysunderwater
252525252536363636464646464679797979797951515151333333333380808080807272727250505050444444444444
Depthin 2004
mm
22.027.735.033.629.226.531.232.629.135.034.228.427.825.025.023.025.623.326.228.018.116.216.013.818.017.317.218.017.716.412.017.818.520.011.214.816.025.414.418.516.320.121.521.020.020.821.520.8
Depthin 2012
mm
23.729.436.436.831.328.232.133.130.338.436.031.230.527.927.325.128.526.629.331.019.916.816.914.519.218.318.318.820.817.313.119.519.721.013.016.819.229.316.520.118.621.422.523.021.422.323.022.7
Totalretreat,
mm
1.71.71.43.22.11.70.90.51.23.41.82.82.72.92.32.12.93.33.13.01.80.60.90.71.21.01.10.83.10.91.11.71.21.01.82.03.23.92.11.62.31.31.02.01.41.51.51.9
Retreatrate,
mm/day
0.06800.06800.05600.12800.08400.04720.02500.01390.03330.07390.03910.06090.05870.06300.02910.02660.03670.04180.03920.03800.03530.01180.01760.01370.03640.03030.03330.02420.09390.01130.01380.02130.01500.01250.02500.02780.04440.05420.04200.03200.04600.02600.02270.04550.03180.03410.03410.0432
Avg. ratefor row,mm/day
0.0690
0.0475
0.0299
0.0591
0.0352
0.0196
0.0330
0.0436
0.0148 0.0148
0.0378
0.0372
0.0365
0.0352 0.0352
Avg. ratefor location,
mm/day
A
B
C
D
A
B
A
A
B
A
Karst and Caves in Carbonate Rocks, Salt and Gypsum – poster 2013 ICS Proceedings
188

Table 2. Measurement data and statistics, part 2. Si
te
Con
ditio
nsEr
osio
n, h
igh-
spee
d cu
rren
ts
SKD
-8
Row
Sufr
ace
Cel
ling
Wal
lW
all
Poin
t
Pecularities
high rate
high rate
high rate
Height,m a.s.l.
15.9015.9015.9015.9015.9015.6015.6015.6015.6015.6015.3015.3015.3015.30
12345123451234
Daysunderwater
4545454545525252525273737373
Depthin 2004
mm
14.215.215.214.215.014.315.521.022.619.620.116.113.216.0
Depthin 2012
mm
21.920.323.518.616.918.219.824.126.323.425.521.423.219.9
Totalretreat,
mm
7.75.18.34.41.93.94.33.13.73.85.45.310.03.9
Retreatrate,
mm/day
0.17110.11330.18440.09780.04220.07500.08270.05960.07120.07310.07400.07260.13700.0534
Avg. ratefor row,mm/day
0.0844
0.0740.0723
0.0667
Avg. ratefor location,
mm/day
A
B
C
Karst and Caves in Carbonate Rocks, Salt and Gypsum – poster 2013 ICS Proceedings
189
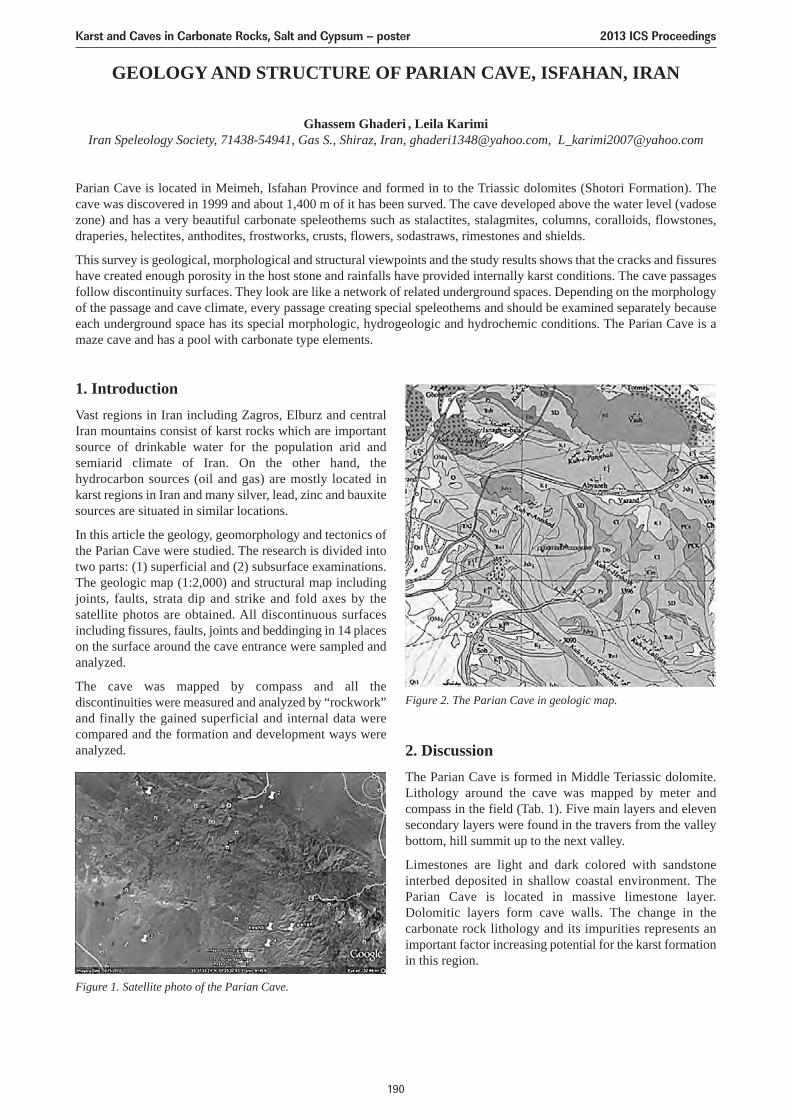
GEOLOGY AND STRUCTURE OF PARIAN CAVE, ISFAHAN, IRAN
Ghassem Ghaderi , Leila KarimiIran Speleology Society, 71438-54941, Gas S., Shiraz, Iran, [email protected], [email protected]
Parian Cave is located in Meimeh, Isfahan Province and formed in to the Triassic dolomites (Shotori Formation). Thecave was discovered in 1999 and about 1,400 m of it has been surved. The cave developed above the water level (vadosezone) and has a very beautiful carbonate speleothems such as stalactites, stalagmites, columns, coralloids, flowstones,draperies, helectites, anthodites, frostworks, crusts, flowers, sodastraws, rimestones and shields.
This survey is geological, morphological and structural viewpoints and the study results shows that the cracks and fissureshave created enough porosity in the host stone and rainfalls have provided internally karst conditions. The cave passagesfollow discontinuity surfaces. They look are like a network of related underground spaces. Depending on the morphologyof the passage and cave climate, every passage creating special speleothems and should be examined separately becauseeach underground space has its special morphologic, hydrogeologic and hydrochemic conditions. The Parian Cave is amaze cave and has a pool with carbonate type elements.
1. IntroductionVast regions in Iran including Zagros, Elburz and centralIran mountains consist of karst rocks which are importantsource of drinkable water for the population arid andsemiarid climate of Iran. On the other hand, thehydrocarbon sources (oil and gas) are mostly located inkarst regions in Iran and many silver, lead, zinc and bauxitesources are situated in similar locations.
In this article the geology, geomorphology and tectonics ofthe Parian Cave were studied. The research is divided intotwo parts: (1) superficial and (2) subsurface examinations.The geologic map (1:2,000) and structural map includingjoints, faults, strata dip and strike and fold axes by thesatellite photos are obtained. All discontinuous surfacesincluding fissures, faults, joints and beddinging in 14 placeson the surface around the cave entrance were sampled andanalyzed.
The cave was mapped by compass and all thediscontinuities were measured and analyzed by “rockwork”and finally the gained superficial and internal data werecompared and the formation and development ways wereanalyzed. 2. Discussion
The Parian Cave is formed in Middle Teriassic dolomite.Lithology around the cave was mapped by meter andcompass in the field (Tab. 1). Five main layers and elevensecondary layers were found in the travers from the valleybottom, hill summit up to the next valley.
Limestones are light and dark colored with sandstoneinterbed deposited in shallow coastal environment. TheParian Cave is located in massive limestone layer.Dolomitic layers form cave walls. The change in thecarbonate rock lithology and its impurities represents animportant factor increasing potential for the karst formationin this region.
Figure 1. Satellite photo of the Parian Cave.
Figure 2. The Parian Cave in geologic map.
Karst and Caves in Carbonate Rocks, Salt and Gypsum – poster 2013 ICS Proceedings
190
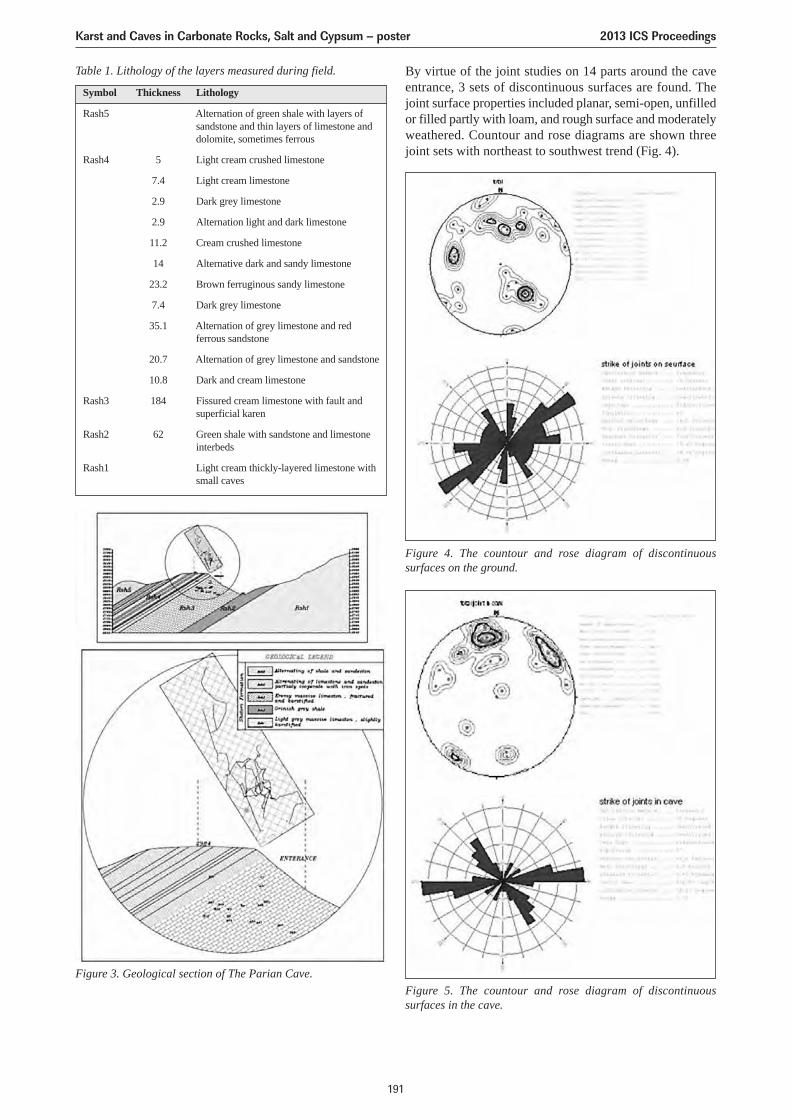
By virtue of the joint studies on 14 parts around the caveentrance, 3 sets of discontinuous surfaces are found. Thejoint surface properties included planar, semi-open, unfilledor filled partly with loam, and rough surface and moderatelyweathered. Countour and rose diagrams are shown threejoint sets with northeast to southwest trend (Fig. 4).
Table 1. Lithology of the layers measured during field.
Figure 3. Geological section of The Parian Cave.
Figure 4. The countour and rose diagram of discontinuoussurfaces on the ground.
Figure 5. The countour and rose diagram of discontinuoussurfaces in the cave.
Symbol Thickness Lithology
Rash5 Alternation of green shale with layers ofsandstone and thin layers of limestone anddolomite, sometimes ferrous
Rash4 5 Light cream crushed limestone
7.4 Light cream limestone
2.9 Dark grey limestone
2.9 Alternation light and dark limestone
11.2 Cream crushed limestone
14 Alternative dark and sandy limestone
23.2 Brown ferruginous sandy limestone
7.4 Dark grey limestone
35.1 Alternation of grey limestone and redferrous sandstone
20.7 Alternation of grey limestone and sandstone
10.8 Dark and cream limestone
Rash3 184 Fissured cream limestone with fault andsuperficial karen
Rash2 62 Green shale with sandstone and limestoneinterbeds
Rash1 Light cream thickly-layered limestone withsmall caves
Karst and Caves in Carbonate Rocks, Salt and Gypsum – poster 2013 ICS Proceedings
191
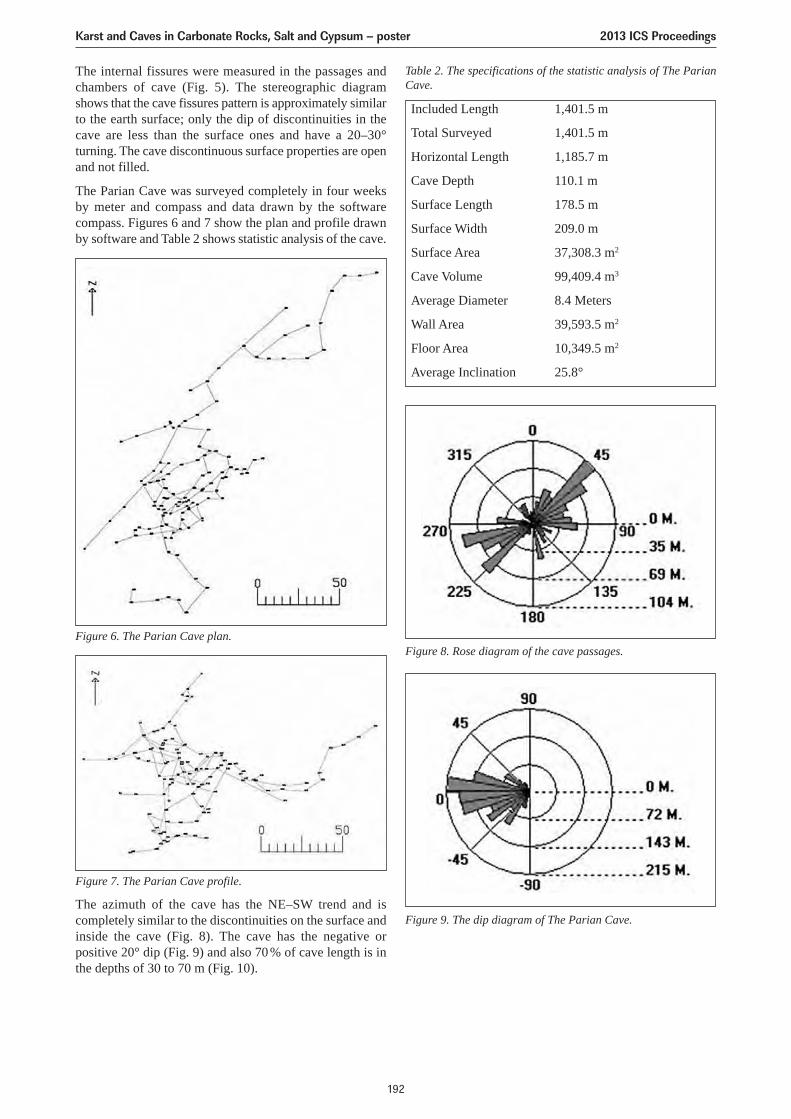
The azimuth of the cave has the NE–SW trend and iscompletely similar to the discontinuities on the surface andinside the cave (Fig. 8). The cave has the negative orpositive 20° dip (Fig. 9) and also 70% of cave length is inthe depths of 30 to 70 m (Fig. 10).
The internal fissures were measured in the passages andchambers of cave (Fig. 5). The stereographic diagramshows that the cave fissures pattern is approximately similarto the earth surface; only the dip of discontinuities in thecave are less than the surface ones and have a 20–30°turning. The cave discontinuous surface properties are openand not filled.
The Parian Cave was surveyed completely in four weeksby meter and compass and data drawn by the softwarecompass. Figures 6 and 7 show the plan and profile drawnby software and Table 2 shows statistic analysis of the cave.
Figure 6. The Parian Cave plan.
Figure 7. The Parian Cave profile.
Table 2. The specifications of the statistic analysis of The ParianCave.
Included Length 1,401.5 m
Total Surveyed 1,401.5 m
Horizontal Length 1,185.7 m
Cave Depth 110.1 m
Surface Length 178.5 m
Surface Width 209.0 m
Surface Area 37,308.3 m2
Cave Volume 99,409.4 m3
Average Diameter 8.4 Meters
Wall Area 39,593.5 m2
Floor Area 10,349.5 m2
Average Inclination 25.8°
Figure 8. Rose diagram of the cave passages.
Figure 9. The dip diagram of The Parian Cave.
Karst and Caves in Carbonate Rocks, Salt and Gypsum – poster 2013 ICS Proceedings
192
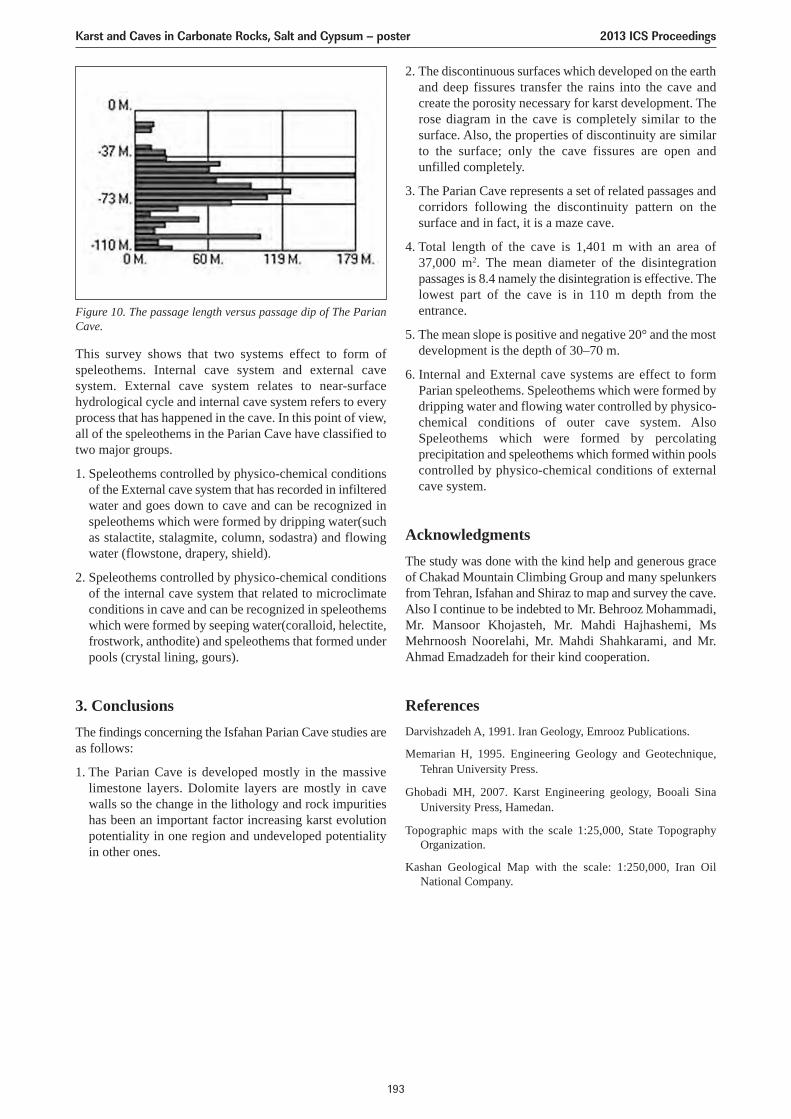
2. The discontinuous surfaces which developed on the earthand deep fissures transfer the rains into the cave andcreate the porosity necessary for karst development. Therose diagram in the cave is completely similar to thesurface. Also, the properties of discontinuity are similarto the surface; only the cave fissures are open andunfilled completely.
3. The Parian Cave represents a set of related passages andcorridors following the discontinuity pattern on thesurface and in fact, it is a maze cave.
4. Total length of the cave is 1,401 m with an area of37,000 m2. The mean diameter of the disintegrationpassages is 8.4 namely the disintegration is effective. Thelowest part of the cave is in 110 m depth from theentrance.
5. The mean slope is positive and negative 20° and the mostdevelopment is the depth of 30–70 m.
6. Internal and External cave systems are effect to formParian speleothems. Speleothems which were formed bydripping water and flowing water controlled by physico-chemical conditions of outer cave system. AlsoSpeleothems which were formed by percolatingprecipitation and speleothems which formed within poolscontrolled by physico-chemical conditions of externalcave system.
AcknowledgmentsThe study was done with the kind help and generous graceof Chakad Mountain Climbing Group and many spelunkersfrom Tehran, Isfahan and Shiraz to map and survey the cave.Also I continue to be indebted to Mr. Behrooz Mohammadi,Mr. Mansoor Khojasteh, Mr. Mahdi Hajhashemi, MsMehrnoosh Noorelahi, Mr. Mahdi Shahkarami, and Mr.Ahmad Emadzadeh for their kind cooperation.
ReferencesDarvishzadeh A, 1991. Iran Geology, Emrooz Publications.
Memarian H, 1995. Engineering Geology and Geotechnique,Tehran University Press.
Ghobadi MH, 2007. Karst Engineering geology, Booali SinaUniversity Press, Hamedan.
Topographic maps with the scale 1:25,000, State TopographyOrganization.
Kashan Geological Map with the scale: 1:250,000, Iran OilNational Company.
This survey shows that two systems effect to form ofspeleothems. Internal cave system and external cavesystem. External cave system relates to near-surfacehydrological cycle and internal cave system refers to everyprocess that has happened in the cave. In this point of view,all of the speleothems in the Parian Cave have classified totwo major groups.
1. Speleothems controlled by physico-chemical conditionsof the External cave system that has recorded in infilteredwater and goes down to cave and can be recognized inspeleothems which were formed by dripping water(suchas stalactite, stalagmite, column, sodastra) and flowingwater (flowstone, drapery, shield).
2. Speleothems controlled by physico-chemical conditionsof the internal cave system that related to microclimateconditions in cave and can be recognized in speleothemswhich were formed by seeping water(coralloid, helectite,frostwork, anthodite) and speleothems that formed underpools (crystal lining, gours).
3. ConclusionsThe findings concerning the Isfahan Parian Cave studies areas follows:
1. The Parian Cave is developed mostly in the massivelimestone layers. Dolomite layers are mostly in cavewalls so the change in the lithology and rock impuritieshas been an important factor increasing karst evolutionpotentiality in one region and undeveloped potentialityin other ones.
Figure 10. The passage length versus passage dip of The ParianCave.
Karst and Caves in Carbonate Rocks, Salt and Gypsum – poster 2013 ICS Proceedings
193
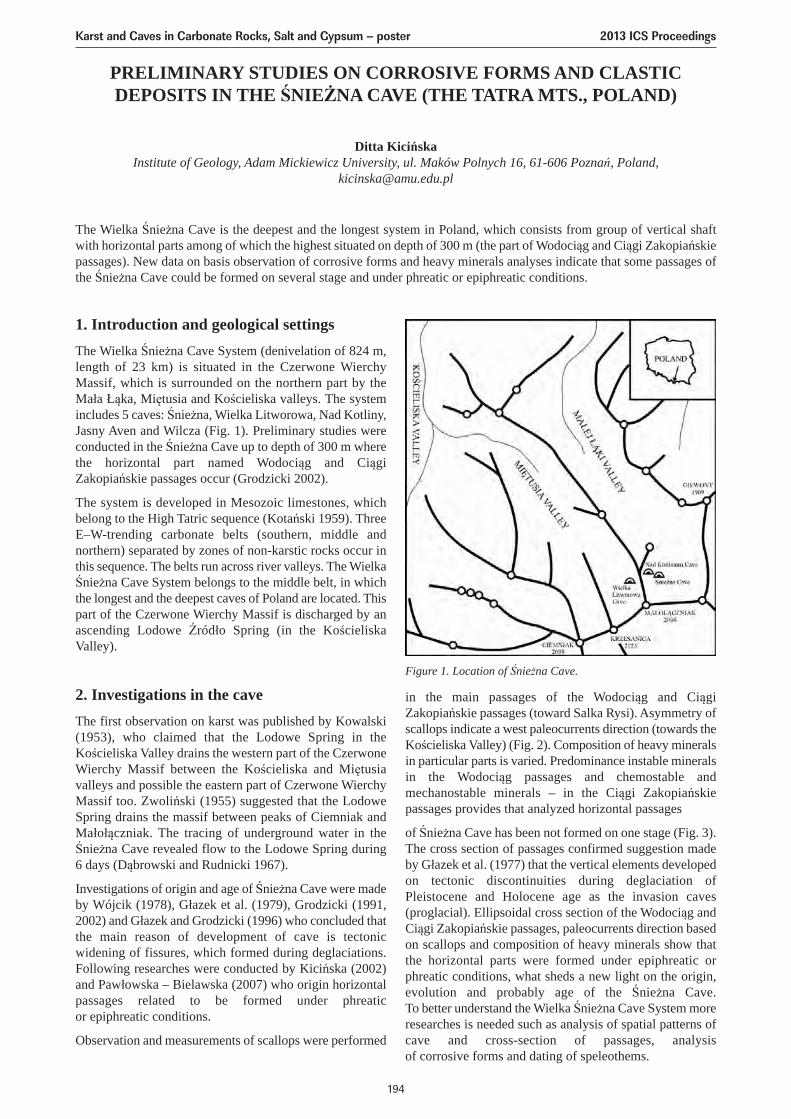
PRELIMINARY STUDIES ON CORROSIVE FORMS AND CLASTICDEPOSITS IN THE ŚNIEŻNA CAVE (THE TATRA MTS., POLAND)
Ditta KicińskaInstitute of Geology, Adam Mickiewicz University, ul. Maków Polnych 16, 61-606 Poznań, Poland,
The Wielka Śnieżna Cave is the deepest and the longest system in Poland, which consists from group of vertical shaftwith horizontal parts among of which the highest situated on depth of 300 m (the part of Wodociąg and Ciągi Zakopiańskiepassages). New data on basis observation of corrosive forms and heavy minerals analyses indicate that some passages ofthe Śnieżna Cave could be formed on several stage and under phreatic or epiphreatic conditions.
1. Introduction and geological settingsThe Wielka Śnieżna Cave System (denivelation of 824 m,length of 23 km) is situated in the Czerwone WierchyMassif, which is surrounded on the northern part by theMała Łąka, Miętusia and Kościeliska valleys. The systemincludes 5 caves: Śnieżna, Wielka Litworowa, Nad Kotliny,Jasny Aven and Wilcza (Fig. 1). Preliminary studies wereconducted in the Śnieżna Cave up to depth of 300 m wherethe horizontal part named Wodociąg and CiągiZakopiańskie passages occur (Grodzicki 2002).
The system is developed in Mesozoic limestones, whichbelong to the High Tatric sequence (Kotański 1959). ThreeE–W-trending carbonate belts (southern, middle andnorthern) separated by zones of non-karstic rocks occur inthis sequence. The belts run across river valleys. The WielkaŚnieżna Cave System belongs to the middle belt, in whichthe longest and the deepest caves of Poland are located. Thispart of the Czerwone Wierchy Massif is discharged by anascending Lodowe Źródło Spring (in the KościeliskaValley).
2. Investigations in the caveThe first observation on karst was published by Kowalski(1953), who claimed that the Lodowe Spring in theKościeliska Valley drains the western part of the CzerwoneWierchy Massif between the Kościeliska and Miętusiavalleys and possible the eastern part of Czerwone WierchyMassif too. Zwoliński (1955) suggested that the LodoweSpring drains the massif between peaks of Ciemniak andMałołączniak. The tracing of underground water in theŚnieżna Cave revealed flow to the Lodowe Spring during6 days (Dąbrowski and Rudnicki 1967).
Investigations of origin and age of Śnieżna Cave were madeby Wójcik (1978), Głazek et al. (1979), Grodzicki (1991,2002) and Głazek and Grodzicki (1996) who concluded thatthe main reason of development of cave is tectonicwidening of fissures, which formed during deglaciations.Following researches were conducted by Kicińska (2002)and Pawłowska – Bielawska (2007) who origin horizontalpassages related to be formed under phreaticor epiphreatic conditions.
Observation and measurements of scallops were performed
in the main passages of the Wodociąg and CiągiZakopiańskie passages (toward Salka Rysi). Asymmetry ofscallops indicate a west paleocurrents direction (towards theKościeliska Valley) (Fig. 2). Composition of heavy mineralsin particular parts is varied. Predominance instable mineralsin the Wodociąg passages and chemostable andmechanostable minerals – in the Ciągi Zakopiańskiepassages provides that analyzed horizontal passages
of Śnieżna Cave has been not formed on one stage (Fig. 3).The cross section of passages confirmed suggestion madeby Głazek et al. (1977) that the vertical elements developedon tectonic discontinuities during deglaciation ofPleistocene and Holocene age as the invasion caves(proglacial). Ellipsoidal cross section of the Wodociąg andCiągi Zakopiańskie passages, paleocurrents direction basedon scallops and composition of heavy minerals show thatthe horizontal parts were formed under epiphreatic orphreatic conditions, what sheds a new light on the origin,evolution and probably age of the Śnieżna Cave.To better understand the Wielka Śnieżna Cave System moreresearches is needed such as analysis of spatial patterns ofcave and cross-section of passages, analysisof corrosive forms and dating of speleothems.
Figure 1. Location of Śnieżna Cave.
Karst and Caves in Carbonate Rocks, Salt and Gypsum – poster 2013 ICS Proceedings
194
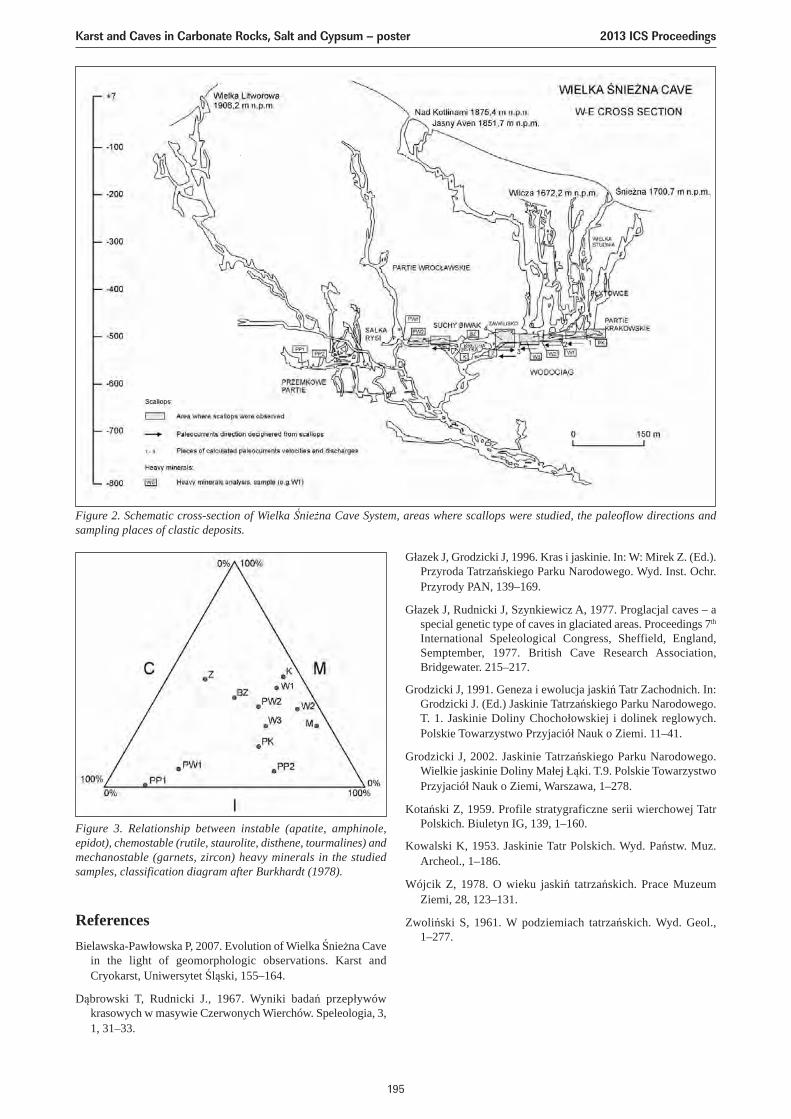
ReferencesBielawska-Pawłowska P, 2007. Evolution of Wielka Śnieżna Cave
in the light of geomorphologic observations. Karst andCryokarst, Uniwersytet Śląski, 155–164.
Dąbrowski T, Rudnicki J., 1967. Wyniki badań przepływówkrasowych w masywie Czerwonych Wierchów. Speleologia, 3,1, 31–33.
Figure 2. Schematic cross-section of Wielka Śnieżna Cave System, areas where scallops were studied, the paleoflow directions andsampling places of clastic deposits.
Figure 3. Relationship between instable (apatite, amphinole,epidot), chemostable (rutile, staurolite, disthene, tourmalines) andmechanostable (garnets, zircon) heavy minerals in the studiedsamples, classification diagram after Burkhardt (1978).
Głazek J, Grodzicki J, 1996. Kras i jaskinie. In: W: Mirek Z. (Ed.).Przyroda Tatrzańskiego Parku Narodowego. Wyd. Inst. Ochr.Przyrody PAN, 139–169.
Głazek J, Rudnicki J, Szynkiewicz A, 1977. Proglacjal caves – aspecial genetic type of caves in glaciated areas. Proceedings 7th
International Speleological Congress, Sheffield, England,Semptember, 1977. British Cave Research Association,Bridgewater. 215–217.
Grodzicki J, 1991. Geneza i ewolucja jaskiń Tatr Zachodnich. In:Grodzicki J. (Ed.) Jaskinie Tatrzańskiego Parku Narodowego.T. 1. Jaskinie Doliny Chochołowskiej i dolinek reglowych.Polskie Towarzystwo Przyjaciół Nauk o Ziemi. 11–41.
Grodzicki J, 2002. Jaskinie Tatrzańskiego Parku Narodowego.Wielkie jaskinie Doliny Małej Łąki. T.9. Polskie TowarzystwoPrzyjaciół Nauk o Ziemi, Warszawa, 1–278.
Kotański Z, 1959. Profile stratygraficzne serii wierchowej TatrPolskich. Biuletyn IG, 139, 1–160.
Kowalski K, 1953. Jaskinie Tatr Polskich. Wyd. Państw. Muz.Archeol., 1–186.
Wójcik Z, 1978. O wieku jaskiń tatrzańskich. Prace MuzeumZiemi, 28, 123–131.
Zwoliński S, 1961. W podziemiach tatrzańskich. Wyd. Geol.,1–277.
Karst and Caves in Carbonate Rocks, Salt and Gypsum – poster 2013 ICS Proceedings
195
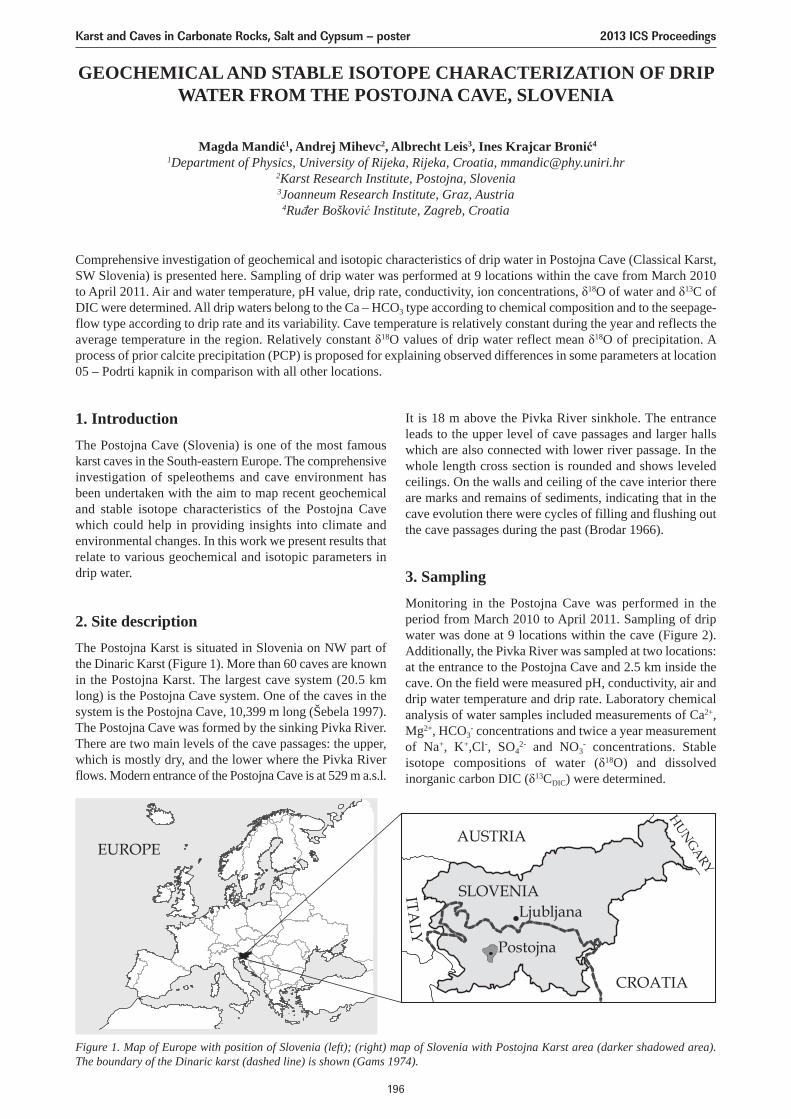
GEOCHEMICAL AND STABLE ISOTOPE CHARACTERIZATION OF DRIPWATER FROM THE POSTOJNA CAVE, SLOVENIA
Magda Mandić1, Andrej Mihevc2, Albrecht Leis3, Ines Krajcar Bronić4
1Department of Physics, University of Rijeka, Rijeka, Croatia, [email protected] Research Institute, Postojna, Slovenia3Joanneum Research Institute, Graz, Austria
4Ruđer Bošković Institute, Zagreb, Croatia
Comprehensive investigation of geochemical and isotopic characteristics of drip water in Postojna Cave (Classical Karst,SW Slovenia) is presented here. Sampling of drip water was performed at 9 locations within the cave from March 2010to April 2011. Air and water temperature, pH value, drip rate, conductivity, ion concentrations, δ18O of water and δ13C ofDIC were determined. All drip waters belong to the Ca – HCO3 type according to chemical composition and to the seepage-flow type according to drip rate and its variability. Cave temperature is relatively constant during the year and reflects theaverage temperature in the region. Relatively constant δ18O values of drip water reflect mean δ18O of precipitation. Aprocess of prior calcite precipitation (PCP) is proposed for explaining observed differences in some parameters at location05 – Podrti kapnik in comparison with all other locations.
1. IntroductionThe Postojna Cave (Slovenia) is one of the most famouskarst caves in the South-eastern Europe. The comprehensiveinvestigation of speleothems and cave environment hasbeen undertaken with the aim to map recent geochemicaland stable isotope characteristics of the Postojna Cavewhich could help in providing insights into climate andenvironmental changes. In this work we present results thatrelate to various geochemical and isotopic parameters indrip water.
2. Site descriptionThe Postojna Karst is situated in Slovenia on NW part ofthe Dinaric Karst (Figure 1). More than 60 caves are knownin the Postojna Karst. The largest cave system (20.5 kmlong) is the Postojna Cave system. One of the caves in thesystem is the Postojna Cave, 10,399 m long (Šebela 1997).The Postojna Cave was formed by the sinking Pivka River.There are two main levels of the cave passages: the upper,which is mostly dry, and the lower where the Pivka Riverflows. Modern entrance of the Postojna Cave is at 529 m a.s.l.
It is 18 m above the Pivka River sinkhole. The entranceleads to the upper level of cave passages and larger hallswhich are also connected with lower river passage. In thewhole length cross section is rounded and shows leveledceilings. On the walls and ceiling of the cave interior thereare marks and remains of sediments, indicating that in thecave evolution there were cycles of filling and flushing outthe cave passages during the past (Brodar 1966).
3. SamplingMonitoring in the Postojna Cave was performed in theperiod from March 2010 to April 2011. Sampling of dripwater was done at 9 locations within the cave (Figure 2).Additionally, the Pivka River was sampled at two locations:at the entrance to the Postojna Cave and 2.5 km inside thecave. On the field were measured pH, conductivity, air anddrip water temperature and drip rate. Laboratory chemicalanalysis of water samples included measurements of Ca2+,Mg2+, HCO3
- concentrations and twice a year measurementof Na+, K+,Cl-, SO4
2- and NO3- concentrations. Stable
isotope compositions of water (δ18O) and dissolvedinorganic carbon DIC (δ13CDIC) were determined.
Figure 1. Map of Europe with position of Slovenia (left); (right) map of Slovenia with Postojna Karst area (darker shadowed area).The boundary of the Dinaric karst (dashed line) is shown (Gams 1974).
Karst and Caves in Carbonate Rocks, Salt and Gypsum – poster 2013 ICS Proceedings
196
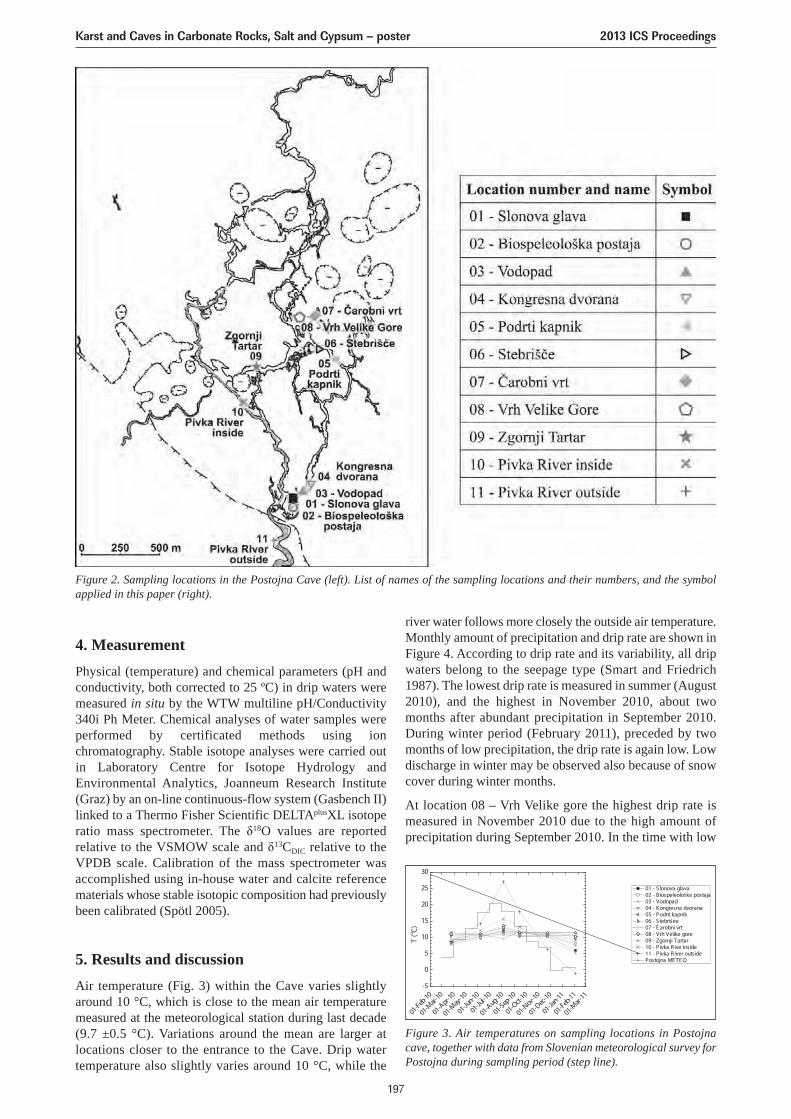
4. MeasurementPhysical (temperature) and chemical parameters (pH andconductivity, both corrected to 25 ºC) in drip waters weremeasured in situ by the WTW multiline pH/Conductivity340i Ph Meter. Chemical analyses of water samples wereperformed by certificated methods using ionchromatography. Stable isotope analyses were carried outin Laboratory Centre for Isotope Hydrology andEnvironmental Analytics, Joanneum Research Institute(Graz) by an on-line continuous-flow system (Gasbench II)linked to a Thermo Fisher Scientific DELTAplusXL isotoperatio mass spectrometer. The δ18O values are reportedrelative to the VSMOW scale and δ13CDIC relative to theVPDB scale. Calibration of the mass spectrometer wasaccomplished using in-house water and calcite referencematerials whose stable isotopic composition had previouslybeen calibrated (Spötl 2005).
5. Results and discussionAir temperature (Fig. 3) within the Cave varies slightlyaround 10 °C, which is close to the mean air temperaturemeasured at the meteorological station during last decade(9.7 ±0.5 °C). Variations around the mean are larger atlocations closer to the entrance to the Cave. Drip watertemperature also slightly varies around 10 °C, while the
river water follows more closely the outside air temperature.Monthly amount of precipitation and drip rate are shown inFigure 4. According to drip rate and its variability, all dripwaters belong to the seepage type (Smart and Friedrich1987). The lowest drip rate is measured in summer (August2010), and the highest in November 2010, about twomonths after abundant precipitation in September 2010.During winter period (February 2011), preceded by twomonths of low precipitation, the drip rate is again low. Lowdischarge in winter may be observed also because of snowcover during winter months.
At location 08 – Vrh Velike gore the highest drip rate ismeasured in November 2010 due to the high amount ofprecipitation during September 2010. In the time with low
01-Feb-
10
01-M
ar-10
01-A
pr-10
01-M
ay-10
01-Ju
n-10
01-Ju
l-10
01-A
ug-10
01-Sep-
10
01-O
ct-10
01-N
ov-10
01-D
ec-10
01-Ja
n-11
01-Feb-
11
01-M
ar-11
-5
0
5
10
15
20
25
30
T (o C)
01 - S lonova glava 02 - Biospeleološka postaja 03 - Vodopad 04 - Kongresna dvorana 05 - Podrti kapnik 06 - S tebrišèe 07 - È arobni vrt 08 - Vrh Velike gore 09 - Zgornji Tartar 10 - Pivka R ive inside 11 - Pivka R iver outside Postojna ME TE O
Figure 3. Air temperatures on sampling locations in Postojnacave, together with data from Slovenian meteorological survey forPostojna during sampling period (step line).
Karst and Caves in Carbonate Rocks, Salt and Gypsum – poster 2013 ICS Proceedings
197
Figure 2. Sampling locations in the Postojna Cave (left). List of names of the sampling locations and their numbers, and the symbolapplied in this paper (right).
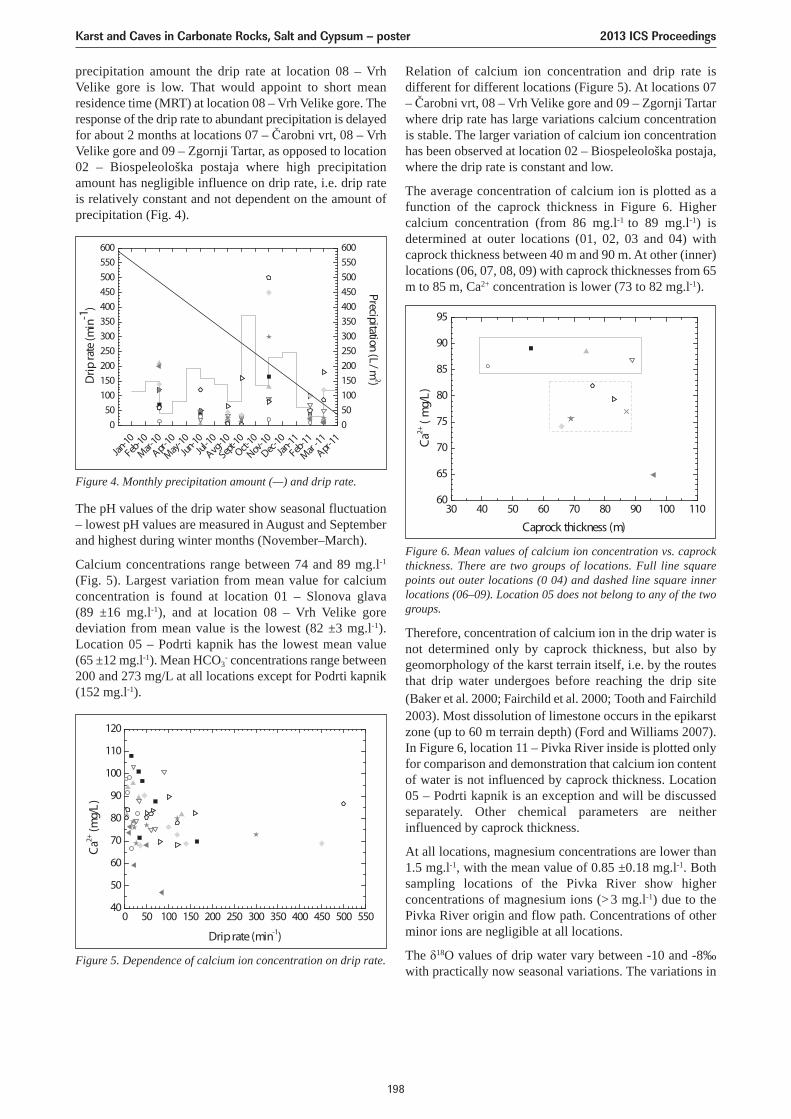
Relation of calcium ion concentration and drip rate isdifferent for different locations (Figure 5). At locations 07– Čarobni vrt, 08 – Vrh Velike gore and 09 – Zgornji Tartarwhere drip rate has large variations calcium concentrationis stable. The larger variation of calcium ion concentrationhas been observed at location 02 – Biospeleološka postaja,where the drip rate is constant and low.
The average concentration of calcium ion is plotted as afunction of the caprock thickness in Figure 6. Highercalcium concentration (from 86 mg.l-1 to 89 mg.l-1) isdetermined at outer locations (01, 02, 03 and 04) withcaprock thickness between 40 m and 90 m. At other (inner)locations (06, 07, 08, 09) with caprock thicknesses from 65m to 85 m, Ca2+ concentration is lower (73 to 82 mg.l-1).
Therefore, concentration of calcium ion in the drip water isnot determined only by caprock thickness, but also bygeomorphology of the karst terrain itself, i.e. by the routesthat drip water undergoes before reaching the drip site(Baker et al. 2000; Fairchild et al. 2000; Tooth and Fairchild2003). Most dissolution of limestone occurs in the epikarstzone (up to 60 m terrain depth) (Ford and Williams 2007).In Figure 6, location 11 – Pivka River inside is plotted onlyfor comparison and demonstration that calcium ion contentof water is not influenced by caprock thickness. Location05 – Podrti kapnik is an exception and will be discussedseparately. Other chemical parameters are neitherinfluenced by caprock thickness.
At all locations, magnesium concentrations are lower than1.5 mg.l-1, with the mean value of 0.85 ±0.18 mg.l-1. Bothsampling locations of the Pivka River show higherconcentrations of magnesium ions (> 3 mg.l-1) due to thePivka River origin and flow path. Concentrations of otherminor ions are negligible at all locations.
The δ18O values of drip water vary between -10 and -8‰with practically now seasonal variations. The variations in
precipitation amount the drip rate at location 08 – VrhVelike gore is low. That would appoint to short meanresidence time (MRT) at location 08 – Vrh Velike gore. Theresponse of the drip rate to abundant precipitation is delayedfor about 2 months at locations 07 – Čarobni vrt, 08 – VrhVelike gore and 09 – Zgornji Tartar, as opposed to location02 – Biospeleološka postaja where high precipitationamount has negligible influence on drip rate, i.e. drip rateis relatively constant and not dependent on the amount ofprecipitation (Fig. 4).
The pH values of the drip water show seasonal fluctuation– lowest pH values are measured in August and Septemberand highest during winter months (November–March).
Calcium concentrations range between 74 and 89 mg.l-1
(Fig. 5). Largest variation from mean value for calciumconcentration is found at location 01 – Slonova glava (89 ±16 mg.l-1), and at location 08 – Vrh Velike goredeviation from mean value is the lowest (82 ±3 mg.l-1).Location 05 – Podrti kapnik has the lowest mean value (65 ±12 mg.l-1). Mean HCO3
- concentrations range between200 and 273 mg/L at all locations except for Podrti kapnik(152 mg.l-1).
Jan-10Feb-
10
Mar-10
Apr-10
May-10Jun
-10Jul
-10
Avg-10
Sept-10Oct-
10
Nov-10
Dec-10Jan
-11Feb-
11
Mar -11
Apr-11
050
100150200250300350400450500550600
Precipitation (L/ m2)D
rip ra
te (m
in-1
)
050100150200250300350400450500550600
Figure 4. Monthly precipitation amount (—) and drip rate.
30 40 50 60 70 80 90 100 11060
65
70
75
80
85
90
95
Ca2+
( m
g/L)
Caprock thickness (m)
Figure 6. Mean values of calcium ion concentration vs. caprockthickness. There are two groups of locations. Full line squarepoints out outer locations (0 04) and dashed line square innerlocations (06–09). Location 05 does not belong to any of the twogroups.
0 50 100 150 200 250 300 350 400 450 500 55040
50
60
70
80
90
100
110
120
Ca2+
(mg/
L)
Drip rate (min-1)
Figure 5. Dependence of calcium ion concentration on drip rate.
Karst and Caves in Carbonate Rocks, Salt and Gypsum – poster 2013 ICS Proceedings
198
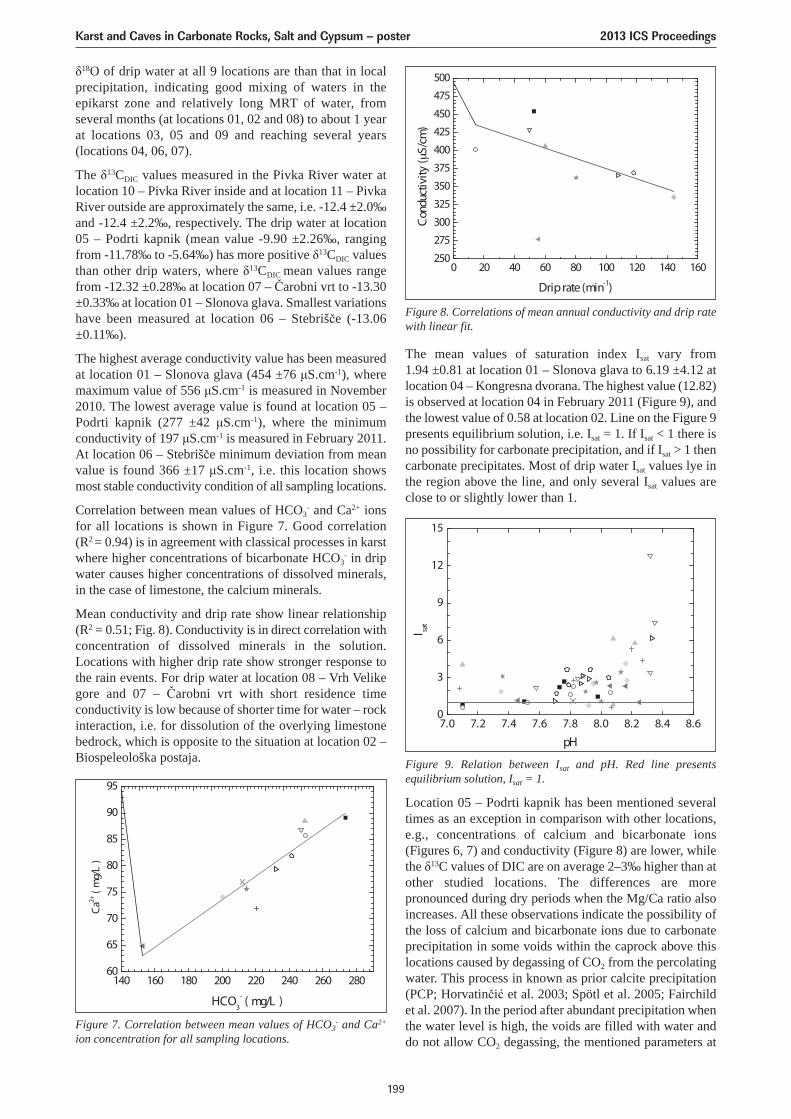
δ18O of drip water at all 9 locations are than that in localprecipitation, indicating good mixing of waters in theepikarst zone and relatively long MRT of water, fromseveral months (at locations 01, 02 and 08) to about 1 yearat locations 03, 05 and 09 and reaching several years(locations 04, 06, 07).
The δ13CDIC values measured in the Pivka River water atlocation 10 – Pivka River inside and at location 11 – PivkaRiver outside are approximately the same, i.e. -12.4 ±2.0‰and -12.4 ±2.2‰, respectively. The drip water at location05 – Podrti kapnik (mean value -9.90 ±2.26‰, rangingfrom -11.78‰ to -5.64‰) has more positive δ13CDIC valuesthan other drip waters, where δ13CDIC mean values rangefrom -12.32 ±0.28‰ at location 07 – Čarobni vrt to -13.30±0.33‰ at location 01 – Slonova glava. Smallest variationshave been measured at location 06 – Stebrišče (-13.06±0.11‰).
The highest average conductivity value has been measuredat location 01 – Slonova glava (454 ±76 μS.cm-1), wheremaximum value of 556 μS.cm-1 is measured in November2010. The lowest average value is found at location 05 –Podrti kapnik (277 ±42 μS.cm-1), where the minimumconductivity of 197 μS.cm-1 is measured in February 2011.At location 06 – Stebrišče minimum deviation from meanvalue is found 366 ±17 μS.cm-1, i.e. this location showsmost stable conductivity condition of all sampling locations.
Correlation between mean values of HCO3- and Ca2+ ions
for all locations is shown in Figure 7. Good correlation(R2 = 0.94) is in agreement with classical processes in karstwhere higher concentrations of bicarbonate HCO3
- in dripwater causes higher concentrations of dissolved minerals,in the case of limestone, the calcium minerals.
Mean conductivity and drip rate show linear relationship(R2 = 0.51; Fig. 8). Conductivity is in direct correlation withconcentration of dissolved minerals in the solution.Locations with higher drip rate show stronger response tothe rain events. For drip water at location 08 – Vrh Velikegore and 07 – Čarobni vrt with short residence timeconductivity is low because of shorter time for water – rockinteraction, i.e. for dissolution of the overlying limestonebedrock, which is opposite to the situation at location 02 –Biospeleološka postaja.
The mean values of saturation index Isat vary from 1.94 ±0.81 at location 01 – Slonova glava to 6.19 ±4.12 atlocation 04 – Kongresna dvorana. The highest value (12.82)is observed at location 04 in February 2011 (Figure 9), andthe lowest value of 0.58 at location 02. Line on the Figure 9presents equilibrium solution, i.e. Isat = 1. If Isat < 1 there isno possibility for carbonate precipitation, and if Isat > 1 thencarbonate precipitates. Most of drip water Isat values lye inthe region above the line, and only several Isat values areclose to or slightly lower than 1.
140 160 180 200 220 240 260 28060
65
70
75
80
85
90
95
Ca2+
( m
g/L
)
HCO3- ( mg/L )
Figure 7. Correlation between mean values of HCO3- and Ca2+
ion concentration for all sampling locations.
0 20 40 60 80 100 120 140 160250
275
300
325
350
375
400
425
450
475
500
Con
duct
ivity
(μS/
cm)
Drip rate (min-1)
Figure 8. Correlations of mean annual conductivity and drip ratewith linear fit.
7.0 7.2 7.4 7.6 7.8 8.0 8.2 8.4 8.60
3
6
9
12
15
I sat
pH
Figure 9. Relation between Isat and pH. Red line presentsequilibrium solution, Isat = 1.
Location 05 – Podrti kapnik has been mentioned severaltimes as an exception in comparison with other locations,e.g., concentrations of calcium and bicarbonate ions(Figures 6, 7) and conductivity (Figure 8) are lower, whilethe δ13C values of DIC are on average 2–3‰ higher than atother studied locations. The differences are morepronounced during dry periods when the Mg/Ca ratio alsoincreases. All these observations indicate the possibility ofthe loss of calcium and bicarbonate ions due to carbonateprecipitation in some voids within the caprock above thislocations caused by degassing of CO2 from the percolatingwater. This process in known as prior calcite precipitation(PCP; Horvatinčić et al. 2003; Spötl et al. 2005; Fairchildet al. 2007). In the period after abundant precipitation whenthe water level is high, the voids are filled with water anddo not allow CO2 degassing, the mentioned parameters at
Karst and Caves in Carbonate Rocks, Salt and Gypsum – poster 2013 ICS Proceedings
199
location 05 do not show different values compared to otherlocations, justifying our assumption of PCP.
6. ConclusionThe one-year monitoring of various chemical and isotopicparameters in drip waters of the Postojna Cave leads to thefollowing conclusions. Air temperature and drip watertemperature reflect the mean annual temperature of the area,but the seasonal variations in the cave are much smaller.Similarly, the mean δ18O values of drip waters reflect theδ18O of the local precipitation, but without pronouncedseasonal variations. According to its chemical composition,all drip waters belong to the same type (Ca – HCO3
-).According to drip rate and its variability, all drip watersbelong to the seepage type, although some differences inthe drip rate response to the precipitation amount areobserved among the studied locations. Location 05 – Podrtikapnik is often an exception when compared to all othermonitored locations by its lower Ca2+ and HCO3
-
concentrations, lower conductivity, higher Mg/Ca ratio, andhigher δ13CDIC values. All these characteristics indicate thepossibility of prior calcite precipitation on the way of thedrip water from the epikarst zone to the cave.
ReferencesBaker A, Genty D, and Fairchild I, 2000. Hydrological
characterization of stalagmite drip waters at Grotte de Villars,Dordogne, by the analysis of inorganic species and luminescentorganic matter. Hydrology and Earth System SciencesDiscussions, 4(3), 439–449.
Brodar S, 1966. Pleistocenski sedimenti in paleolitska najdišča vPostojnski jami. Acta carsologica, 4, 57–138.
Fairchild I, Borsato A, Tooth A, Frisia S, Hawkesworth C andHuang Y, 2000. Controls on trace element (Sr-Mg)compositions of carbonate cave waters: Implications forspeleothem climatic records. Chemical Geology 166, 255–269.
Fairchild I, Frisia S, Borsato A and Tooth A, 2007. Speleothems.In Nash, D. and McLaren, S., eds., Geochemical Sediments andLandscapes. Wiley-Blackwell, Oxford.
Ford D, and Williams F, 2007. Karst hydrogeology andgeomorphology. John Wiley and Sons, West Sussex.
Gams I, 1974. Kras – zgodovinski, naravoslovni in geografski oris.– Slovenska matica, Ljubljana, 359.
Horvatinčić N, Krajcar Bronić I, and Obelić B, 2003. Differencesin the 14C age, δ13C and δ18O of Holocene tufa and speleothemin the Dinaric Karst. Palaeogeography, Palaeoclimatology,Palaeoecology 193(1), 139–157.
Smart P, and Friedrich H, 1987. Water movement and storage inthe unsaturated zone of a naturally karstified aquiferunsaturated zone of a maturaly karstified aquifer, MendipHills,England. In Zeitschrift fur Geomorphologie / Proceedingsof Conference on Environmental Problems in Karst Terrainsand their Solutions, volume 59–87. National Water WellAssociation, Bowling Green, Kentucky.
Spötl C, 2005. A robust and fast method of sampling and analysisof δ13C of dissolved inorganic carbon in ground waters.Isotopes in Environmental and Health Studies 41(3), 217–221.
Spötl C, Fairchild I, and Tooth AF, 2005. Cave air control ondripwater geochemistry, Obir Caves (Austria): Implications forspeleothem deposition in dynamically ventilated caves.Geochimica et Cosmochimica Acta 69, 2451–2468.
Šebela S, 1998. Tectonic structure of Postojnska jama CaveSystem. ZRC SAZU, Postojna.
Tooth AF, and Fairchild IJ, 2003. Soil and karst aquiferhydrological controls on the geochemical evolution ofspeleothem-forming drip waters, Crag Cave, southwest Ireland.Journal of Hydrology 273, 51–68.
Karst and Caves in Carbonate Rocks, Salt and Gypsum – poster 2013 ICS Proceedings
200
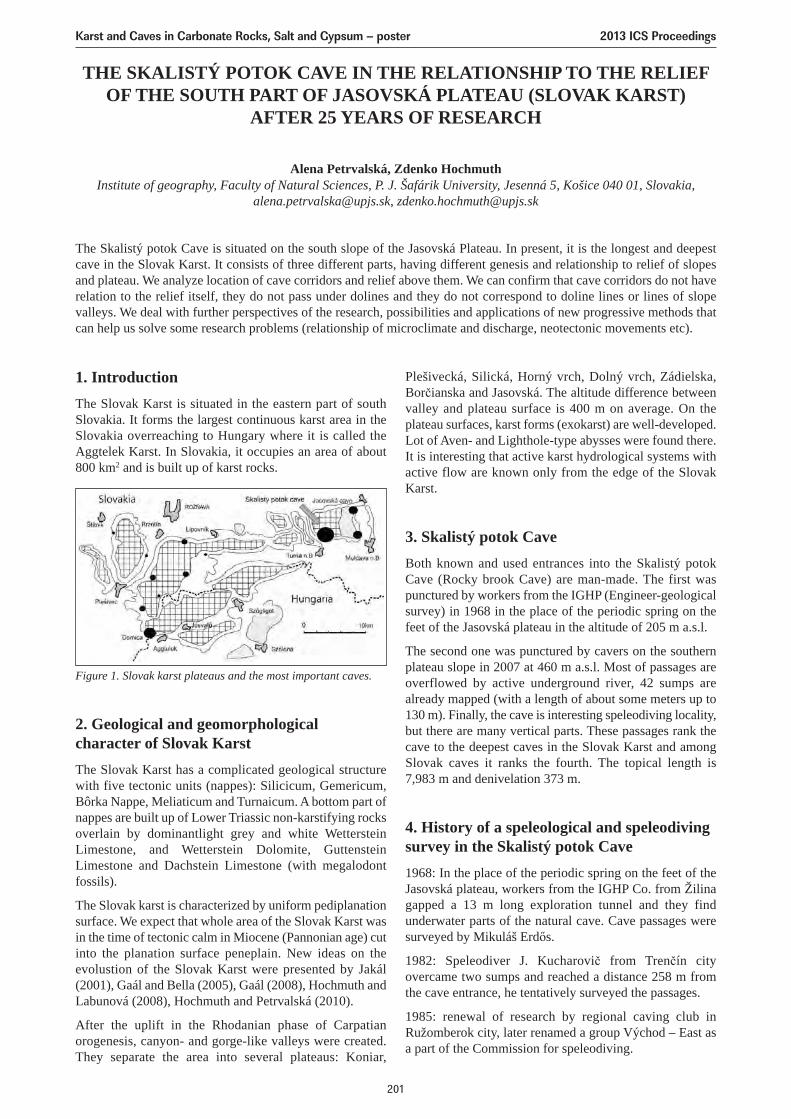
Plešivecká, Silická, Horný vrch, Dolný vrch, Zádielska,Borčianska and Jasovská. The altitude difference betweenvalley and plateau surface is 400 m on average. On theplateau surfaces, karst forms (exokarst) are well-developed.Lot of Aven- and Lighthole-type abysses were found there.It is interesting that active karst hydrological systems withactive flow are known only from the edge of the SlovakKarst.
3. Skalistý potok CaveBoth known and used entrances into the Skalistý potokCave (Rocky brook Cave) are man-made. The first waspunctured by workers from the IGHP (Engineer-geologicalsurvey) in 1968 in the place of the periodic spring on thefeet of the Jasovská plateau in the altitude of 205 m a.s.l.
The second one was punctured by cavers on the southernplateau slope in 2007 at 460 m a.s.l. Most of passages areoverflowed by active underground river, 42 sumps arealready mapped (with a length of about some meters up to130 m). Finally, the cave is interesting speleodiving locality,but there are many vertical parts. These passages rank thecave to the deepest caves in the Slovak Karst and amongSlovak caves it ranks the fourth. The topical length is7,983 m and denivelation 373 m.
4. History of a speleological and speleodivingsurvey in the Skalistý potok Cave1968: In the place of the periodic spring on the feet of theJasovská plateau, workers from the IGHP Co. from Žilinagapped a 13 m long exploration tunnel and they findunderwater parts of the natural cave. Cave passages weresurveyed by Mikuláš Erdős.
1982: Speleodiver J. Kucharovič from Trenčín cityovercame two sumps and reached a distance 258 m fromthe cave entrance, he tentatively surveyed the passages.
1985: renewal of research by regional caving club inRužomberok city, later renamed a group Východ – East asa part of the Commission for speleodiving.
THE SKALISTÝ POTOK CAVE IN THE RELATIONSHIP TO THE RELIEFOF THE SOUTH PART OF JASOVSKÁ PLATEAU (SLOVAK KARST)
AFTER 25 YEARS OF RESEARCH
Alena Petrvalská, Zdenko HochmuthInstitute of geography, Faculty of Natural Sciences, P. J. Šafárik University, Jesenná 5, Košice 040 01, Slovakia,
[email protected], [email protected]
The Skalistý potok Cave is situated on the south slope of the Jasovská Plateau. In present, it is the longest and deepestcave in the Slovak Karst. It consists of three different parts, having different genesis and relationship to relief of slopesand plateau. We analyze location of cave corridors and relief above them. We can confirm that cave corridors do not haverelation to the relief itself, they do not pass under dolines and they do not correspond to doline lines or lines of slopevalleys. We deal with further perspectives of the research, possibilities and applications of new progressive methods thatcan help us solve some research problems (relationship of microclimate and discharge, neotectonic movements etc).
1. IntroductionThe Slovak Karst is situated in the eastern part of southSlovakia. It forms the largest continuous karst area in theSlovakia overreaching to Hungary where it is called theAggtelek Karst. In Slovakia, it occupies an area of about800 km2 and is built up of karst rocks.
2. Geological and geomorphologicalcharacter of Slovak KarstThe Slovak Karst has a complicated geological structurewith five tectonic units (nappes): Silicicum, Gemericum,Bôrka Nappe, Meliaticum and Turnaicum. A bottom part ofnappes are built up of Lower Triassic non-karstifying rocksoverlain by dominantlight grey and white WettersteinLimestone, and Wetterstein Dolomite, GuttensteinLimestone and Dachstein Limestone (with megalodontfossils).
The Slovak karst is characterized by uniform pediplanationsurface. We expect that whole area of the Slovak Karst wasin the time of tectonic calm in Miocene (Pannonian age) cutinto the planation surface peneplain. New ideas on theevolustion of the Slovak Karst were presented by Jakál(2001), Gaál and Bella (2005), Gaál (2008), Hochmuth andLabunová (2008), Hochmuth and Petrvalská (2010).
After the uplift in the Rhodanian phase of Carpatianorogenesis, canyon- and gorge-like valleys were created.They separate the area into several plateaus: Koniar,
Figure 1. Slovak karst plateaus and the most important caves.
Karst and Caves in Carbonate Rocks, Salt and Gypsum – poster 2013 ICS Proceedings
201
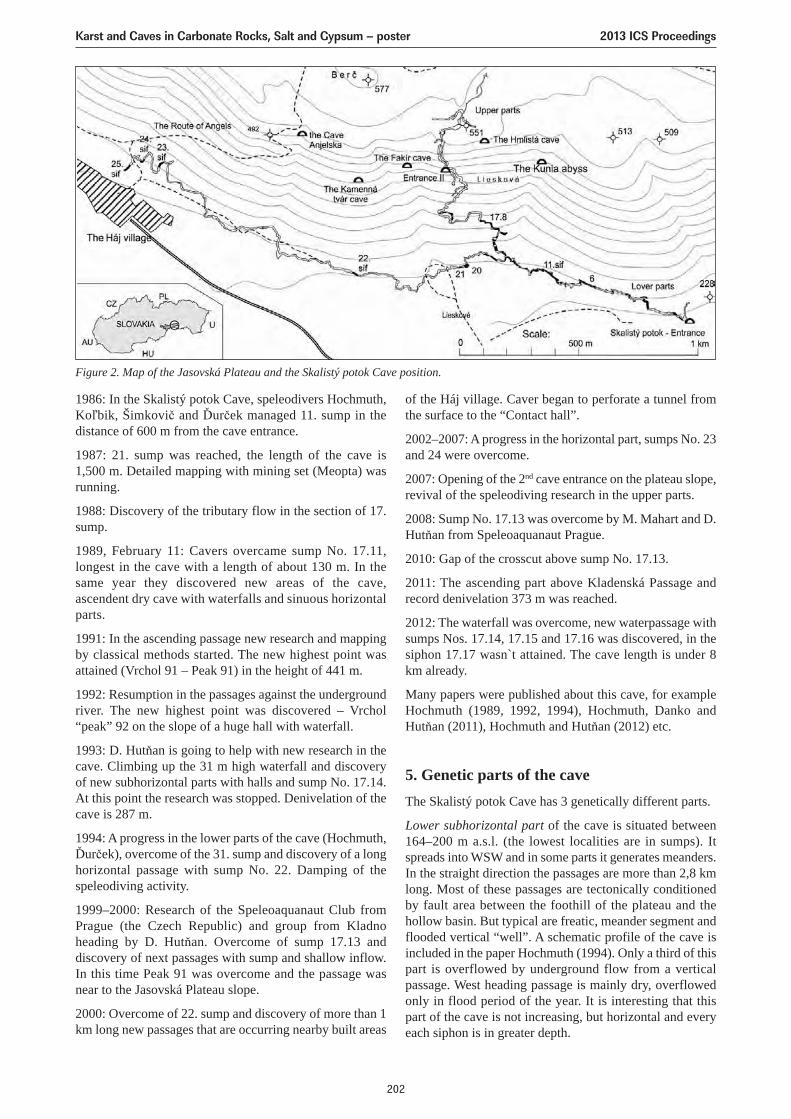
1986: In the Skalistý potok Cave, speleodivers Hochmuth,Koľbik, Šimkovič and Ďurček managed 11. sump in thedistance of 600 m from the cave entrance.
1987: 21. sump was reached, the length of the cave is1,500 m. Detailed mapping with mining set (Meopta) wasrunning.
1988: Discovery of the tributary flow in the section of 17.sump.
1989, February 11: Cavers overcame sump No. 17.11,longest in the cave with a length of about 130 m. In thesame year they discovered new areas of the cave,ascendent dry cave with waterfalls and sinuous horizontalparts.
1991: In the ascending passage new research and mappingby classical methods started. The new highest point wasattained (Vrchol 91 – Peak 91) in the height of 441 m.
1992: Resumption in the passages against the undergroundriver. The new highest point was discovered – Vrchol“peak” 92 on the slope of a huge hall with waterfall.
1993: D. Hutňan is going to help with new research in thecave. Climbing up the 31 m high waterfall and discoveryof new subhorizontal parts with halls and sump No. 17.14.At this point the research was stopped. Denivelation of thecave is 287 m.
1994: A progress in the lower parts of the cave (Hochmuth,Ďurček), overcome of the 31. sump and discovery of a longhorizontal passage with sump No. 22. Damping of thespeleodiving activity.
1999–2000: Research of the Speleoaquanaut Club fromPrague (the Czech Republic) and group from Kladnoheading by D. Hutňan. Overcome of sump 17.13 anddiscovery of next passages with sump and shallow inflow.In this time Peak 91 was overcome and the passage wasnear to the Jasovská Plateau slope.
2000: Overcome of 22. sump and discovery of more than 1km long new passages that are occurring nearby built areas
of the Háj village. Caver began to perforate a tunnel fromthe surface to the “Contact hall”.
2002–2007: A progress in the horizontal part, sumps No. 23and 24 were overcome.
2007: Opening of the 2nd cave entrance on the plateau slope,revival of the speleodiving research in the upper parts.
2008: Sump No. 17.13 was overcome by M. Mahart and D.Hutňan from Speleoaquanaut Prague.
2010: Gap of the crosscut above sump No. 17.13.
2011: The ascending part above Kladenská Passage andrecord denivelation 373 m was reached.
2012: The waterfall was overcome, new waterpassage withsumps Nos. 17.14, 17.15 and 17.16 was discovered, in thesiphon 17.17 wasn`t attained. The cave length is under 8km already.
Many papers were published about this cave, for exampleHochmuth (1989, 1992, 1994), Hochmuth, Danko andHutňan (2011), Hochmuth and Hutňan (2012) etc.
5. Genetic parts of the caveThe Skalistý potok Cave has 3 genetically different parts.
Lower subhorizontal part of the cave is situated between164–200 m a.s.l. (the lowest localities are in sumps). Itspreads into WSW and in some parts it generates meanders.In the straight direction the passages are more than 2,8 kmlong. Most of these passages are tectonically conditionedby fault area between the foothill of the plateau and thehollow basin. But typical are freatic, meander segment andflooded vertical “well”. A schematic profile of the cave isincluded in the paper Hochmuth (1994). Only a third of thispart is overflowed by underground flow from a verticalpassage. West heading passage is mainly dry, overflowedonly in flood period of the year. It is interesting that thispart of the cave is not increasing, but horizontal and everyeach siphon is in greater depth.
Figure 2. Map of the Jasovská Plateau and the Skalistý potok Cave position.
Karst and Caves in Carbonate Rocks, Salt and Gypsum – poster 2013 ICS Proceedings
202
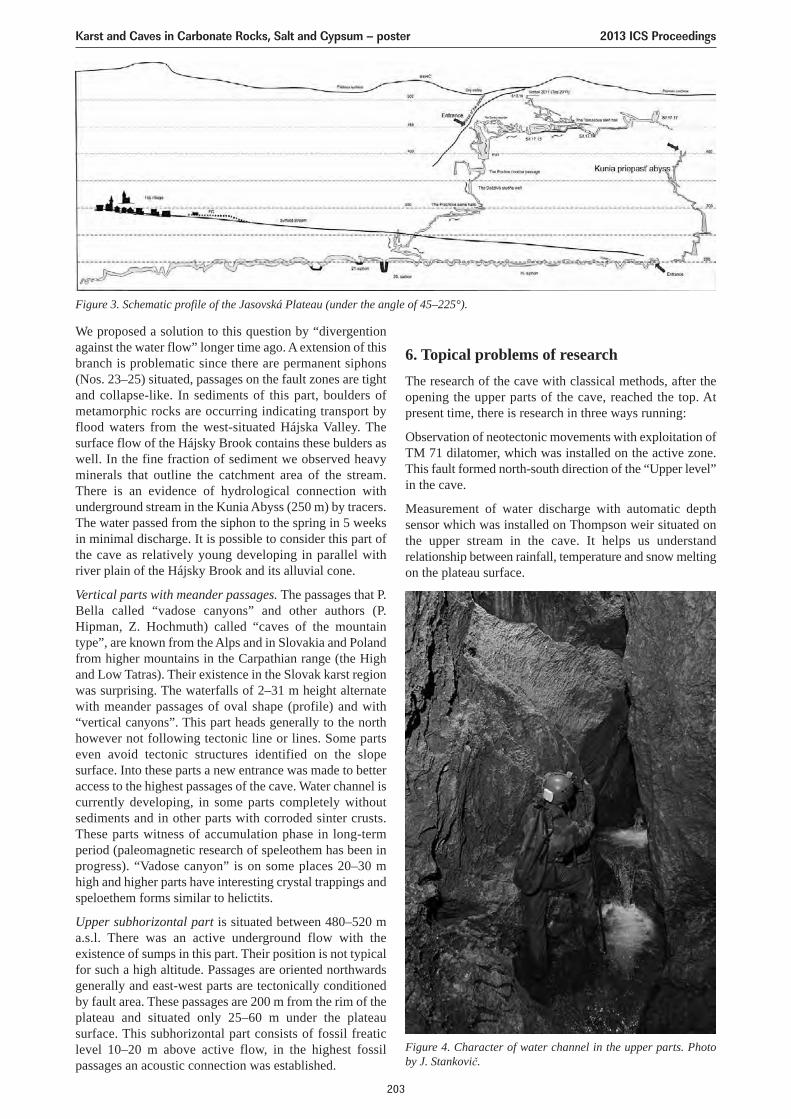
6. Topical problems of researchThe research of the cave with classical methods, after theopening the upper parts of the cave, reached the top. Atpresent time, there is research in three ways running:
Observation of neotectonic movements with exploitation ofTM 71 dilatomer, which was installed on the active zone.This fault formed north-south direction of the “Upper level”in the cave.
Measurement of water discharge with automatic depthsensor which was installed on Thompson weir situated onthe upper stream in the cave. It helps us understandrelationship between rainfall, temperature and snow meltingon the plateau surface.
We proposed a solution to this question by “divergentionagainst the water flow” longer time ago. A extension of thisbranch is problematic since there are permanent siphons(Nos. 23–25) situated, passages on the fault zones are tightand collapse-like. In sediments of this part, boulders ofmetamorphic rocks are occurring indicating transport byflood waters from the west-situated Hájska Valley. Thesurface flow of the Hájsky Brook contains these bulders aswell. In the fine fraction of sediment we observed heavyminerals that outline the catchment area of the stream.There is an evidence of hydrological connection withunderground stream in the Kunia Abyss (250 m) by tracers.The water passed from the siphon to the spring in 5 weeksin minimal discharge. It is possible to consider this part ofthe cave as relatively young developing in parallel withriver plain of the Hájsky Brook and its alluvial cone.
Vertical parts with meander passages. The passages that P.Bella called “vadose canyons” and other authors (P.Hipman, Z. Hochmuth) called “caves of the mountaintype”, are known from the Alps and in Slovakia and Polandfrom higher mountains in the Carpathian range (the Highand Low Tatras). Their existence in the Slovak karst regionwas surprising. The waterfalls of 2–31 m height alternatewith meander passages of oval shape (profile) and with“vertical canyons”. This part heads generally to the northhowever not following tectonic line or lines. Some partseven avoid tectonic structures identified on the slopesurface. Into these parts a new entrance was made to betteraccess to the highest passages of the cave. Water channel iscurrently developing, in some parts completely withoutsediments and in other parts with corroded sinter crusts.These parts witness of accumulation phase in long-termperiod (paleomagnetic research of speleothem has been inprogress). “Vadose canyon” is on some places 20–30 mhigh and higher parts have interesting crystal trappings andspeloethem forms similar to helictits.
Upper subhorizontal part is situated between 480–520 ma.s.l. There was an active underground flow with theexistence of sumps in this part. Their position is not typicalfor such a high altitude. Passages are oriented northwardsgenerally and east-west parts are tectonically conditionedby fault area. These passages are 200 m from the rim of theplateau and situated only 25–60 m under the plateausurface. This subhorizontal part consists of fossil freaticlevel 10–20 m above active flow, in the highest fossilpassages an acoustic connection was established.
Figure 4. Character of water channel in the upper parts. Photoby J. Stankovič.
Figure 3. Schematic profile of the Jasovská Plateau (under the angle of 45–225°).
Karst and Caves in Carbonate Rocks, Salt and Gypsum – poster 2013 ICS Proceedings
203
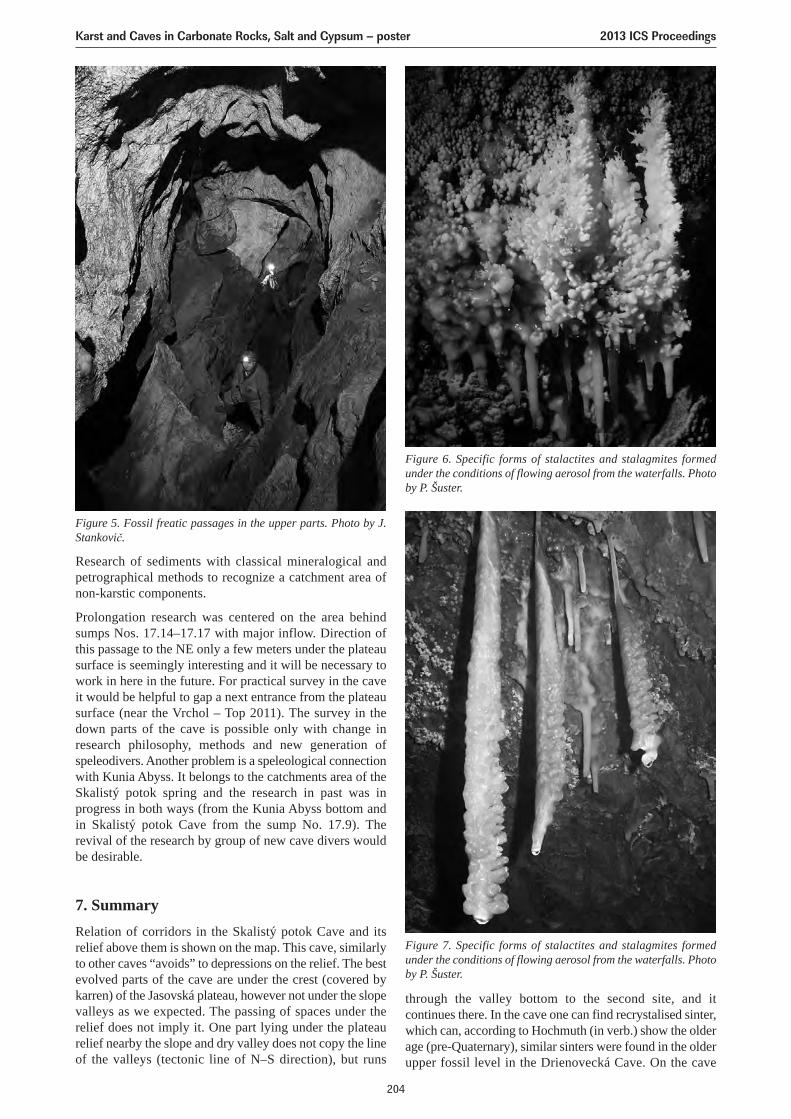
Research of sediments with classical mineralogical andpetrographical methods to recognize a catchment area ofnon-karstic components.
Prolongation research was centered on the area behindsumps Nos. 17.14–17.17 with major inflow. Direction ofthis passage to the NE only a few meters under the plateausurface is seemingly interesting and it will be necessary towork in here in the future. For practical survey in the caveit would be helpful to gap a next entrance from the plateausurface (near the Vrchol – Top 2011). The survey in thedown parts of the cave is possible only with change inresearch philosophy, methods and new generation ofspeleodivers. Another problem is a speleological connectionwith Kunia Abyss. It belongs to the catchments area of theSkalistý potok spring and the research in past was inprogress in both ways (from the Kunia Abyss bottom andin Skalistý potok Cave from the sump No. 17.9). Therevival of the research by group of new cave divers wouldbe desirable.
7. SummaryRelation of corridors in the Skalistý potok Cave and itsrelief above them is shown on the map. This cave, similarlyto other caves “avoids” to depressions on the relief. The bestevolved parts of the cave are under the crest (covered bykarren) of the Jasovská plateau, however not under the slopevalleys as we expected. The passing of spaces under therelief does not imply it. One part lying under the plateaurelief nearby the slope and dry valley does not copy the lineof the valleys (tectonic line of N–S direction), but runs
Figure 5. Fossil freatic passages in the upper parts. Photo by J.Stankovič.
Figure 6. Specific forms of stalactites and stalagmites formedunder the conditions of flowing aerosol from the waterfalls. Photoby P. Šuster.
Figure 7. Specific forms of stalactites and stalagmites formedunder the conditions of flowing aerosol from the waterfalls. Photoby P. Šuster.
through the valley bottom to the second site, and itcontinues there. In the cave one can find recrystalised sinter,which can, according to Hochmuth (in verb.) show the olderage (pre-Quaternary), similar sinters were found in the olderupper fossil level in the Drienovecká Cave. On the cave
Karst and Caves in Carbonate Rocks, Salt and Gypsum – poster 2013 ICS Proceedings
204
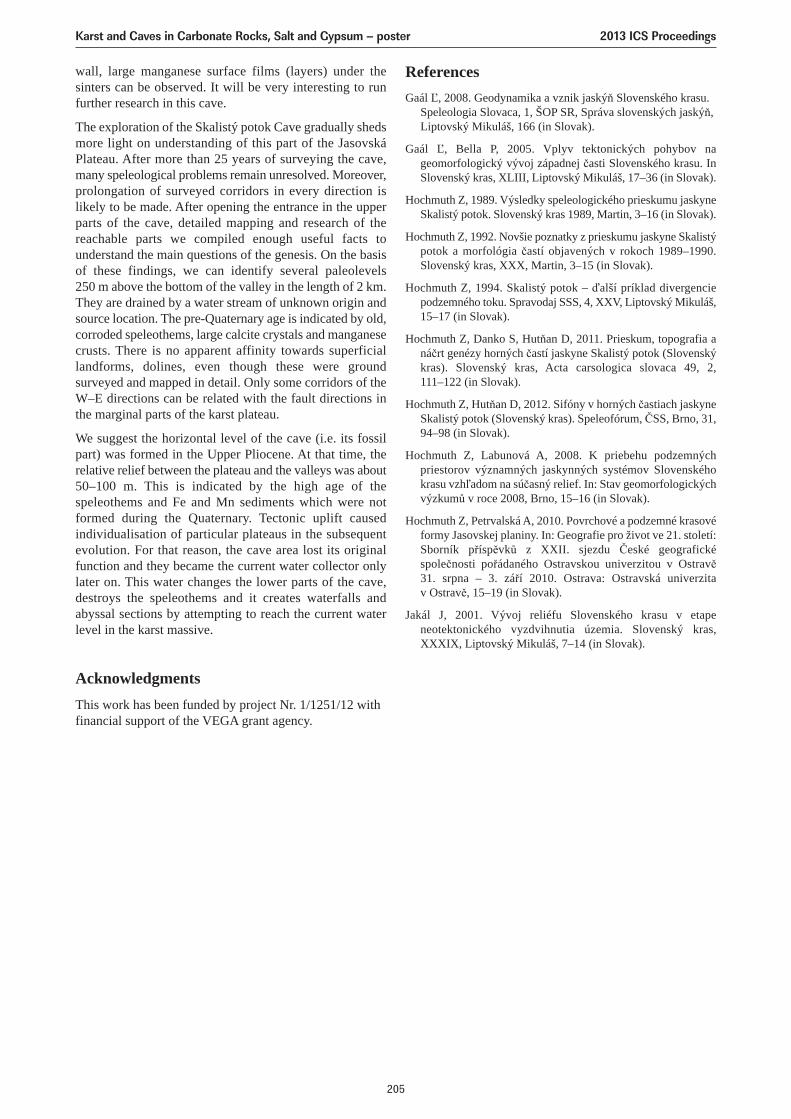
wall, large manganese surface films (layers) under thesinters can be observed. It will be very interesting to runfurther research in this cave.
The exploration of the Skalistý potok Cave gradually shedsmore light on understanding of this part of the JasovskáPlateau. After more than 25 years of surveying the cave,many speleological problems remain unresolved. Moreover,prolongation of surveyed corridors in every direction islikely to be made. After opening the entrance in the upperparts of the cave, detailed mapping and research of thereachable parts we compiled enough useful facts tounderstand the main questions of the genesis. On the basisof these findings, we can identify several paleolevels 250 m above the bottom of the valley in the length of 2 km.They are drained by a water stream of unknown origin andsource location. The pre-Quaternary age is indicated by old,corroded speleothems, large calcite crystals and manganesecrusts. There is no apparent affinity towards superficiallandforms, dolines, even though these were groundsurveyed and mapped in detail. Only some corridors of theW–E directions can be related with the fault directions inthe marginal parts of the karst plateau.
We suggest the horizontal level of the cave (i.e. its fossilpart) was formed in the Upper Pliocene. At that time, therelative relief between the plateau and the valleys was about50–100 m. This is indicated by the high age of thespeleothems and Fe and Mn sediments which were notformed during the Quaternary. Tectonic uplift causedindividualisation of particular plateaus in the subsequentevolution. For that reason, the cave area lost its originalfunction and they became the current water collector onlylater on. This water changes the lower parts of the cave,destroys the speleothems and it creates waterfalls andabyssal sections by attempting to reach the current waterlevel in the karst massive.
AcknowledgmentsThis work has been funded by project Nr. 1/1251/12 withfinancial support of the VEGA grant agency.
ReferencesGaál Ľ, 2008. Geodynamika a vznik jaskýň Slovenského krasu.
Speleologia Slovaca, 1, ŠOP SR, Správa slovenských jaskýň,Liptovský Mikuláš, 166 (in Slovak).
Gaál Ľ, Bella P, 2005. Vplyv tektonických pohybov nageomorfologický vývoj západnej časti Slovenského krasu. InSlovenský kras, XLIII, Liptovský Mikuláš, 17–36 (in Slovak).
Hochmuth Z, 1989. Výsledky speleologického prieskumu jaskyneSkalistý potok. Slovenský kras 1989, Martin, 3–16 (in Slovak).
Hochmuth Z, 1992. Novšie poznatky z prieskumu jaskyne Skalistýpotok a morfológia častí objavených v rokoch 1989–1990.Slovenský kras, XXX, Martin, 3–15 (in Slovak).
Hochmuth Z, 1994. Skalistý potok – ďalší príklad divergenciepodzemného toku. Spravodaj SSS, 4, XXV, Liptovský Mikuláš,15–17 (in Slovak).
Hochmuth Z, Danko S, Hutňan D, 2011. Prieskum, topografia anáčrt genézy horných častí jaskyne Skalistý potok (Slovenskýkras). Slovenský kras, Acta carsologica slovaca 49, 2, 111–122 (in Slovak).
Hochmuth Z, Hutňan D, 2012. Sifóny v horných častiach jaskyneSkalistý potok (Slovenský kras). Speleofórum, ČSS, Brno, 31,94–98 (in Slovak).
Hochmuth Z, Labunová A, 2008. K priebehu podzemnýchpriestorov významných jaskynných systémov Slovenskéhokrasu vzhľadom na súčasný relief. In: Stav geomorfologickýchvýzkumů v roce 2008, Brno, 15–16 (in Slovak).
Hochmuth Z, Petrvalská A, 2010. Povrchové a podzemné krasovéformy Jasovskej planiny. In: Geografie pro život ve 21. století:Sborník příspěvků z XXII. sjezdu České geografickéspolečnosti pořádaného Ostravskou univerzitou v Ostravě31. srpna – 3. září 2010. Ostrava: Ostravská univerzitav Ostravě, 15–19 (in Slovak).
Jakál J, 2001. Vývoj reliéfu Slovenského krasu v etapeneotektonického vyzdvihnutia územia. Slovenský kras,XXXIX, Liptovský Mikuláš, 7–14 (in Slovak).
Karst and Caves in Carbonate Rocks, Salt and Gypsum – poster 2013 ICS Proceedings
205
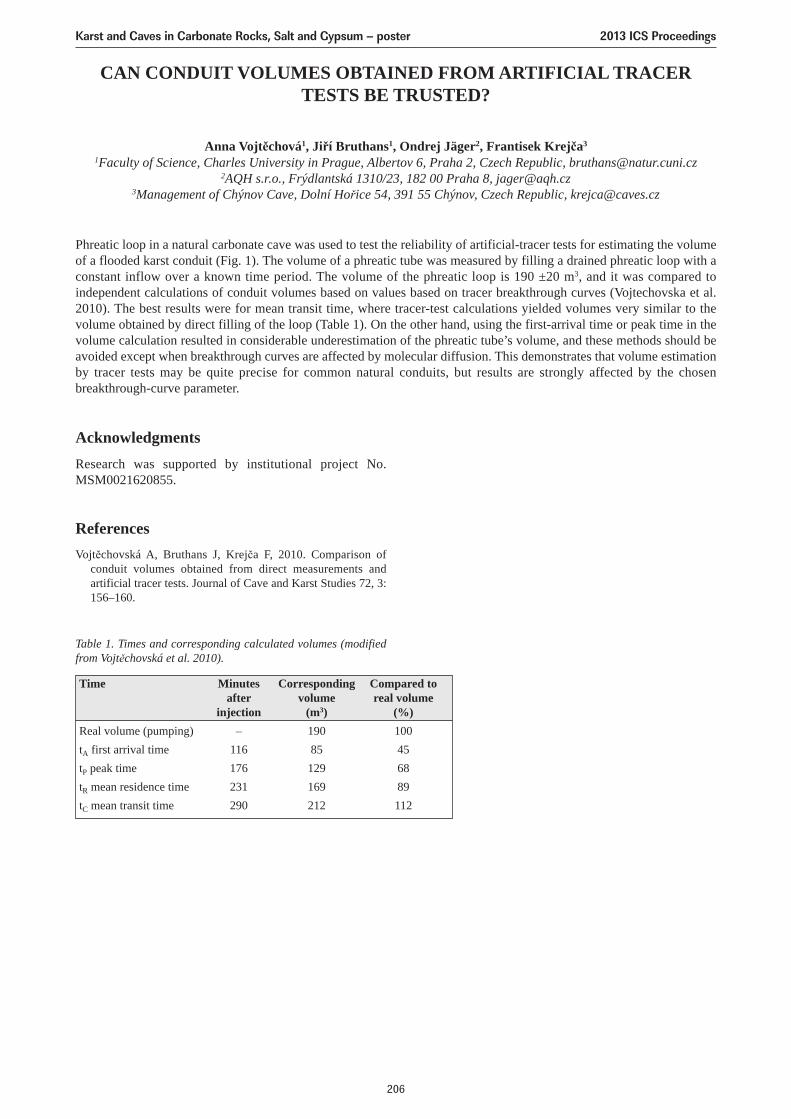
CAN CONDUIT VOLUMES OBTAINED FROM ARTIFICIAL TRACERTESTS BE TRUSTED?
Anna Vojtěchová1, Jiří Bruthans1, Ondrej Jäger2, Frantisek Krejča3
1Faculty of Science, Charles University in Prague, Albertov 6, Praha 2, Czech Republic, [email protected] s.r.o., Frýdlantská 1310/23, 182 00 Praha 8, [email protected]
3Management of Chýnov Cave, Dolní Hořice 54, 391 55 Chýnov, Czech Republic, [email protected]
Phreatic loop in a natural carbonate cave was used to test the reliability of artificial-tracer tests for estimating the volumeof a flooded karst conduit (Fig. 1). The volume of a phreatic tube was measured by filling a drained phreatic loop with aconstant inflow over a known time period. The volume of the phreatic loop is 190 ±20 m3, and it was compared toindependent calculations of conduit volumes based on values based on tracer breakthrough curves (Vojtechovska et al.2010). The best results were for mean transit time, where tracer-test calculations yielded volumes very similar to thevolume obtained by direct filling of the loop (Table 1). On the other hand, using the first-arrival time or peak time in thevolume calculation resulted in considerable underestimation of the phreatic tube’s volume, and these methods should beavoided except when breakthrough curves are affected by molecular diffusion. This demonstrates that volume estimationby tracer tests may be quite precise for common natural conduits, but results are strongly affected by the chosenbreakthrough-curve parameter.
AcknowledgmentsResearch was supported by institutional project No.MSM0021620855.
ReferencesVojtěchovská A, Bruthans J, Krejča F, 2010. Comparison of
conduit volumes obtained from direct measurements andartificial tracer tests. Journal of Cave and Karst Studies 72, 3:156–160.
Table 1. Times and corresponding calculated volumes (modifiedfrom Vojtěchovská et al. 2010).
Time Minutes Corresponding Compared toafter volume real volume
injection (m3) (%)Real volume (pumping) – 190 100tA first arrival time 116 85 45tP peak time 176 129 68tR mean residence time 231 169 89tC mean transit time 290 212 112
Karst and Caves in Carbonate Rocks, Salt and Gypsum – poster 2013 ICS Proceedings
206
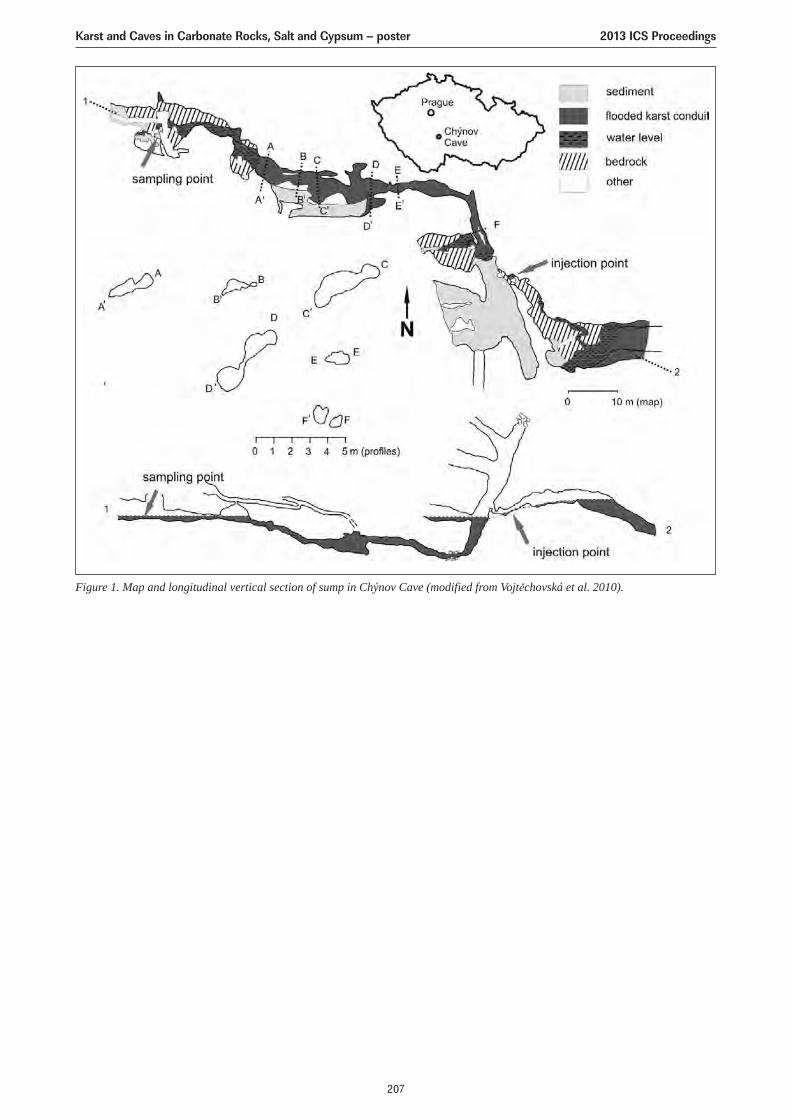
Figure 1. Map and longitudinal vertical section of sump in Chýnov Cave (modified from Vojtěchovská et al. 2010).
Karst and Caves in Carbonate Rocks, Salt and Gypsum – poster 2013 ICS Proceedings
207
THE TECTONIC CONTROL OF AN UNDERGROUND RIVER NETWORK,AGIA TRIADA CAVE (KARYSTOS, GREECE)
Emmanuel Vassilakis1, Kyriaki Papadopoulou-Vrynioti2
1National and Kapodistrian University of Athens, Department of Dynamics, Tectonics and Applied Geology,Panepistimioupolis Zographou, 15784 Athens, Greece, [email protected]
2National and Kapodistrian University of Athens, Department of Geography & Climatology, PanepistimioupolisZographou, 15784 Athens, Greece, [email protected]
The water pathways of the underground river of Agia Triada (Karystos, Greece) and their generation are examined in thisstudy. One of the longest caves explored in Greece is formed at heavily deformed metamorphic rocks and the suggestedcombined methodology, which includes traditional geological mapping, speleological exploration and remote sensingimage interpretation, led us to the conclusion that the water flows along the hinge of a NE–SW-trending mega-fold. Anumber of faults that have been activated after the generation of the underground river, have altered its pathway by creating“knick-points” which host impressive subsurface waterfalls, the largest of which is about 20 m high. The extraction ofmorpho-lineaments from ortho-rectified satellite images revealed the importance of structures that were identified on theopen surface mainly by high-resolution remote sensing data interpretation and are related to the cave development. Thiswas made feasible with the use of the Geographic Information Systems as all the collected data were converted into layersfor further interpretation. It proved to be very useful as the projection of the cave trace on the ortho-rectified data revealedthe underground linkage between two adjacent hydrological basins. This explained the unusual large quantities of waterdischarged by the Agia Triada spring.
1. IntroductionIt is quite often to study an underground karstic landformonly regionally, since the major subject is the generationand operation of a cave. Especially in caves that act asunderground river flows, the main question that arises iswhether this subsurface network should be part of thesurface drainage or not (Papadopoulou-Vrynioti 2002;Papadopoulou-Vrynioti and Kampolis 2011). In this paperwe investigate the role of the tectonic structures at the localkarstification and the influence of several tectonic structuresat the underground connection between two separate sub-basins at the area of Karystos (southern Evia, Greece),where the Agia Triada Cave has been found. It is classifiedas one of the longest caves in Greece (Petrochilou 1981).The existence of an impressive underground waterfall,among lakes and other unique speleological featuresattracted a great number of expeditions for investigating thecave since 1932 (Zervoudakis 1959; Avagianos 1981).
The first fieldwork was carried out during 1994 by doing aspeleological expedition as well as geological mapping atthe open surface around the cave trace (Vassilakis andVlachou 1995). Remote sensing techniques were alsoapplied on an ortho-rectified multi spectral IKONOSsatellite image and panchromatic aerial photographs byusing a 25 m Digital Elevation Model, for increasing themapping accuracy of the area around the Agia Triada springwhich discharges the underground river. Moreover digitaland fieldwork data were imported, combined andinterpreted extensively in a Geographic InformationSystem. The orientation of the cave mapping (by SPELEOClub speleologists) as well as the projection of the cavetrace on the surface and combined with all kinds of theavailable data, proved to be very helpful as it was reallyimportant to relate the fieldwork results (geological andspeleological) with the remote sensing data interpretation.
The applied methodology seems to be ideal for cases likethis one as underground rivers are more often related totectonic structures that might have surface expression. Insuch cases remotely sensed datasets with properinterpretation can lead to the structures that wereresponsible for the cave generation.
2. Geomorphological and geological settingThe discharge of the studied underground river is done bya karstic spring, which is located at an elevation of 250 m,next to the Agia Triada chapel just north of the coastal townof Karystos, at southern Evia, in Greece. The cave extendsNE beneath the mountain of Ochi and great amount ofprecipitation water that is infiltrated through its permeablerocks cropping out on the surface, flows along a naturallyconstructed tunnel. The quantity of the water discharge islarge enough for providing Karystos and the surroundingvillages, domestic, potable water throughout the durationof the year.
The cave is located in a hydrological basin which covers anarea of about 20 km2 discharging most of the WSW slopesof Ochi Mt. since its watershed reaches the highest peak ofthe mountain at nearly 1,400 m of elevation (Fig. 1). Thehydrographic network reaches the 5th order of Strahlerclassification (Strahler 1957). It comprises of two 4th orderbranches, which divide the triangular shaped basin into twoasymmetrically developed sub-basins. The westernmostmain branch flows almost parallel and in a relatively smalldistance from the watershed margin, as well as theeasternmost branch flows next to the eastern margin of thebasin.
The cave entrance is located almost at the central area ofthe basin and in the westernmost sub-basin. The projectionof the underground river, which was mapped by SPELEO
Karst and Caves in Carbonate Rocks, Salt and Gypsum – poster 2013 ICS Proceedings
208
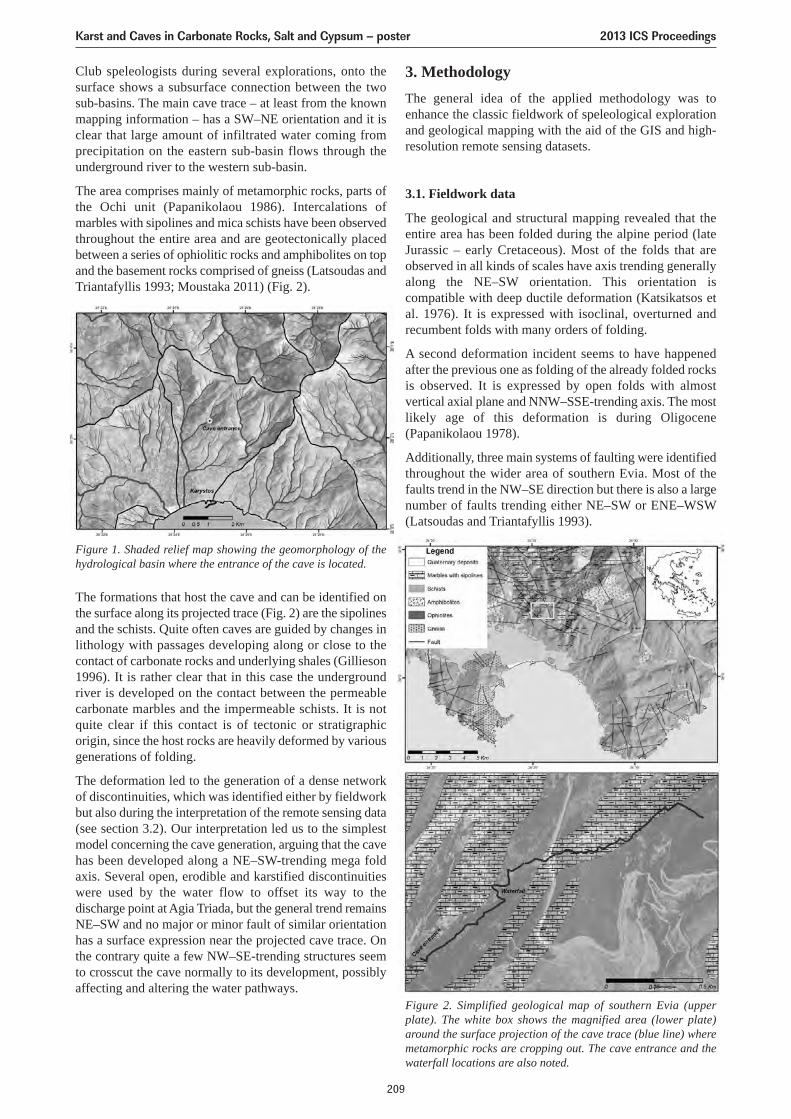
Figure 2. Simplified geological map of southern Evia (upperplate). The white box shows the magnified area (lower plate)around the surface projection of the cave trace (blue line) wheremetamorphic rocks are cropping out. The cave entrance and thewaterfall locations are also noted.
3. MethodologyThe general idea of the applied methodology was toenhance the classic fieldwork of speleological explorationand geological mapping with the aid of the GIS and high-resolution remote sensing datasets.
3.1. Fieldwork data
The geological and structural mapping revealed that theentire area has been folded during the alpine period (lateJurassic – early Cretaceous). Most of the folds that areobserved in all kinds of scales have axis trending generallyalong the NE–SW orientation. This orientation iscompatible with deep ductile deformation (Katsikatsos etal. 1976). It is expressed with isoclinal, overturned andrecumbent folds with many orders of folding.
A second deformation incident seems to have happenedafter the previous one as folding of the already folded rocksis observed. It is expressed by open folds with almostvertical axial plane and NNW–SSE-trending axis. The mostlikely age of this deformation is during Oligocene(Papanikolaou 1978).
Additionally, three main systems of faulting were identifiedthroughout the wider area of southern Evia. Most of thefaults trend in the NW–SE direction but there is also a largenumber of faults trending either NE–SW or ENE–WSW(Latsoudas and Triantafyllis 1993).
Club speleologists during several explorations, onto thesurface shows a subsurface connection between the twosub-basins. The main cave trace – at least from the knownmapping information – has a SW–NE orientation and it isclear that large amount of infiltrated water coming fromprecipitation on the eastern sub-basin flows through theunderground river to the western sub-basin.
The area comprises mainly of metamorphic rocks, parts ofthe Ochi unit (Papanikolaou 1986). Intercalations ofmarbles with sipolines and mica schists have been observedthroughout the entire area and are geotectonically placedbetween a series of ophiolitic rocks and amphibolites on topand the basement rocks comprised of gneiss (Latsoudas andTriantafyllis 1993; Moustaka 2011) (Fig. 2).
The formations that host the cave and can be identified onthe surface along its projected trace (Fig. 2) are the sipolinesand the schists. Quite often caves are guided by changes inlithology with passages developing along or close to thecontact of carbonate rocks and underlying shales (Gillieson1996). It is rather clear that in this case the undergroundriver is developed on the contact between the permeablecarbonate marbles and the impermeable schists. It is notquite clear if this contact is of tectonic or stratigraphicorigin, since the host rocks are heavily deformed by variousgenerations of folding.
The deformation led to the generation of a dense networkof discontinuities, which was identified either by fieldworkbut also during the interpretation of the remote sensing data(see section 3.2). Our interpretation led us to the simplestmodel concerning the cave generation, arguing that the cavehas been developed along a NE–SW-trending mega foldaxis. Several open, erodible and karstified discontinuitieswere used by the water flow to offset its way to thedischarge point at Agia Triada, but the general trend remainsNE–SW and no major or minor fault of similar orientationhas a surface expression near the projected cave trace. Onthe contrary quite a few NW–SE-trending structures seemto crosscut the cave normally to its development, possiblyaffecting and altering the water pathways.
Figure 1. Shaded relief map showing the geomorphology of thehydrological basin where the entrance of the cave is located.
Karst and Caves in Carbonate Rocks, Salt and Gypsum – poster 2013 ICS Proceedings
209
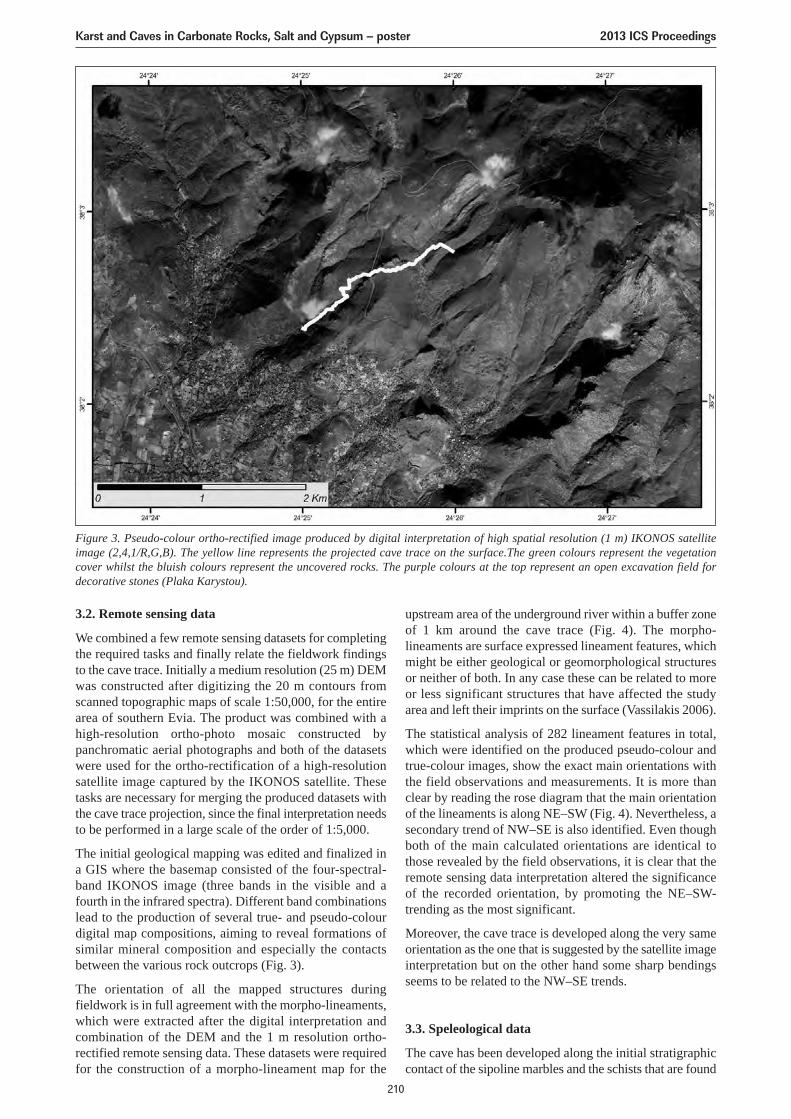
3.2. Remote sensing data
We combined a few remote sensing datasets for completingthe required tasks and finally relate the fieldwork findingsto the cave trace. Initially a medium resolution (25 m) DEMwas constructed after digitizing the 20 m contours fromscanned topographic maps of scale 1:50,000, for the entirearea of southern Evia. The product was combined with ahigh-resolution ortho-photo mosaic constructed bypanchromatic aerial photographs and both of the datasetswere used for the ortho-rectification of a high-resolutionsatellite image captured by the IKONOS satellite. Thesetasks are necessary for merging the produced datasets withthe cave trace projection, since the final interpretation needsto be performed in a large scale of the order of 1:5,000.
The initial geological mapping was edited and finalized ina GIS where the basemap consisted of the four-spectral-band IKONOS image (three bands in the visible and afourth in the infrared spectra). Different band combinationslead to the production of several true- and pseudo-colourdigital map compositions, aiming to reveal formations ofsimilar mineral composition and especially the contactsbetween the various rock outcrops (Fig. 3).
The orientation of all the mapped structures duringfieldwork is in full agreement with the morpho-lineaments,which were extracted after the digital interpretation andcombination of the DEM and the 1 m resolution ortho-rectified remote sensing data. These datasets were requiredfor the construction of a morpho-lineament map for the
upstream area of the underground river within a buffer zoneof 1 km around the cave trace (Fig. 4). The morpho-lineaments are surface expressed lineament features, whichmight be either geological or geomorphological structuresor neither of both. In any case these can be related to moreor less significant structures that have affected the studyarea and left their imprints on the surface (Vassilakis 2006).
The statistical analysis of 282 lineament features in total,which were identified on the produced pseudo-colour andtrue-colour images, show the exact main orientations withthe field observations and measurements. It is more thanclear by reading the rose diagram that the main orientationof the lineaments is along NE–SW (Fig. 4). Nevertheless, asecondary trend of NW–SE is also identified. Even thoughboth of the main calculated orientations are identical tothose revealed by the field observations, it is clear that theremote sensing data interpretation altered the significanceof the recorded orientation, by promoting the NE–SW-trending as the most significant.
Moreover, the cave trace is developed along the very sameorientation as the one that is suggested by the satellite imageinterpretation but on the other hand some sharp bendingsseems to be related to the NW–SE trends.
3.3. Speleological data
The cave has been developed along the initial stratigraphiccontact of the sipoline marbles and the schists that are found
Figure 3. Pseudo-colour ortho-rectified image produced by digital interpretation of high spatial resolution (1 m) IKONOS satelliteimage (2,4,1/R,G,B). The yellow line represents the projected cave trace on the surface.The green colours represent the vegetationcover whilst the bluish colours represent the uncovered rocks. The purple colours at the top represent an open excavation field fordecorative stones (Plaka Karystou).
Karst and Caves in Carbonate Rocks, Salt and Gypsum – poster 2013 ICS Proceedings
210
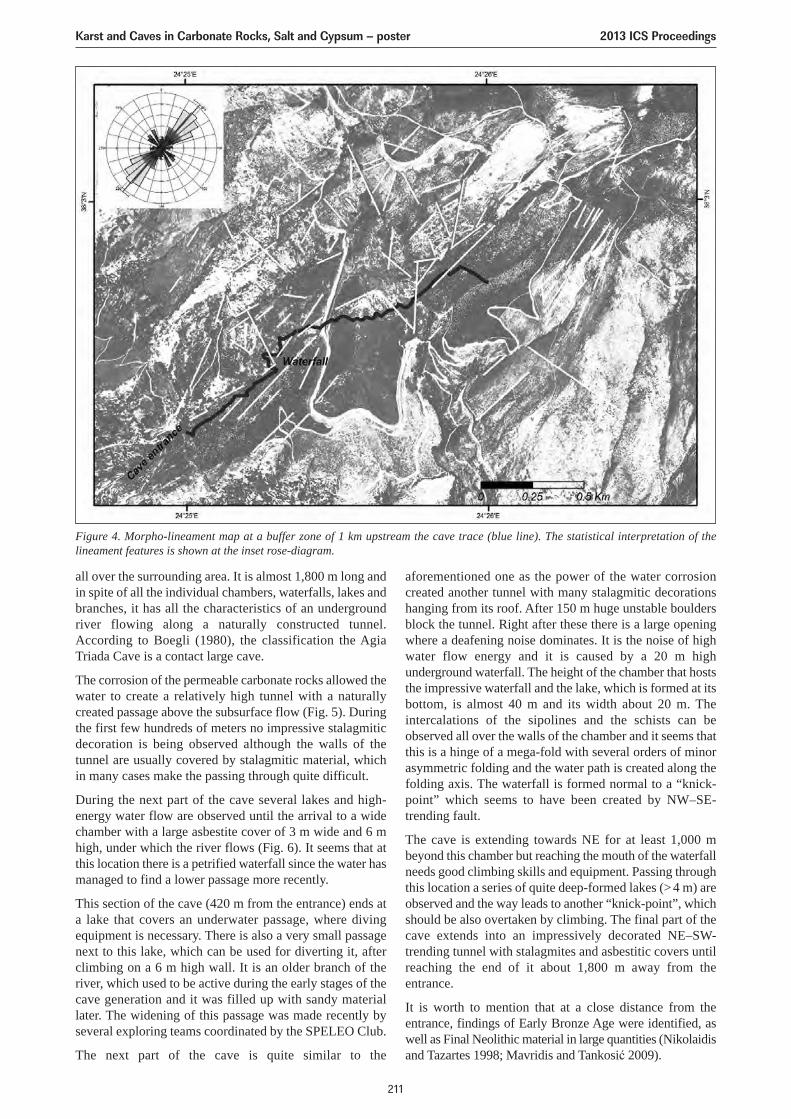
all over the surrounding area. It is almost 1,800 m long andin spite of all the individual chambers, waterfalls, lakes andbranches, it has all the characteristics of an undergroundriver flowing along a naturally constructed tunnel.According to Boegli (1980), the classification the AgiaTriada Cave is a contact large cave.
The corrosion of the permeable carbonate rocks allowed thewater to create a relatively high tunnel with a naturallycreated passage above the subsurface flow (Fig. 5). Duringthe first few hundreds of meters no impressive stalagmiticdecoration is being observed although the walls of thetunnel are usually covered by stalagmitic material, whichin many cases make the passing through quite difficult.
During the next part of the cave several lakes and high-energy water flow are observed until the arrival to a widechamber with a large asbestite cover of 3 m wide and 6 mhigh, under which the river flows (Fig. 6). It seems that atthis location there is a petrified waterfall since the water hasmanaged to find a lower passage more recently.
This section of the cave (420 m from the entrance) ends ata lake that covers an underwater passage, where divingequipment is necessary. There is also a very small passagenext to this lake, which can be used for diverting it, afterclimbing on a 6 m high wall. It is an older branch of theriver, which used to be active during the early stages of thecave generation and it was filled up with sandy materiallater. The widening of this passage was made recently byseveral exploring teams coordinated by the SPELEO Club.
The next part of the cave is quite similar to the
aforementioned one as the power of the water corrosioncreated another tunnel with many stalagmitic decorationshanging from its roof. After 150 m huge unstable bouldersblock the tunnel. Right after these there is a large openingwhere a deafening noise dominates. It is the noise of highwater flow energy and it is caused by a 20 m highunderground waterfall. The height of the chamber that hoststhe impressive waterfall and the lake, which is formed at itsbottom, is almost 40 m and its width about 20 m. Theintercalations of the sipolines and the schists can beobserved all over the walls of the chamber and it seems thatthis is a hinge of a mega-fold with several orders of minorasymmetric folding and the water path is created along thefolding axis. The waterfall is formed normal to a “knick-point” which seems to have been created by NW–SE-trending fault.
The cave is extending towards NE for at least 1,000 mbeyond this chamber but reaching the mouth of the waterfallneeds good climbing skills and equipment. Passing throughthis location a series of quite deep-formed lakes (>4 m) areobserved and the way leads to another “knick-point”, whichshould be also overtaken by climbing. The final part of thecave extends into an impressively decorated NE–SW-trending tunnel with stalagmites and asbestitic covers untilreaching the end of it about 1,800 m away from theentrance.
It is worth to mention that at a close distance from theentrance, findings of Early Bronze Age were identified, aswell as Final Neolithic material in large quantities (Nikolaidisand Tazartes 1998; Mavridis and Tankosić 2009).
Figure 4. Morpho-lineament map at a buffer zone of 1 km upstream the cave trace (blue line). The statistical interpretation of thelineament features is shown at the inset rose-diagram.
Karst and Caves in Carbonate Rocks, Salt and Gypsum – poster 2013 ICS Proceedings
211
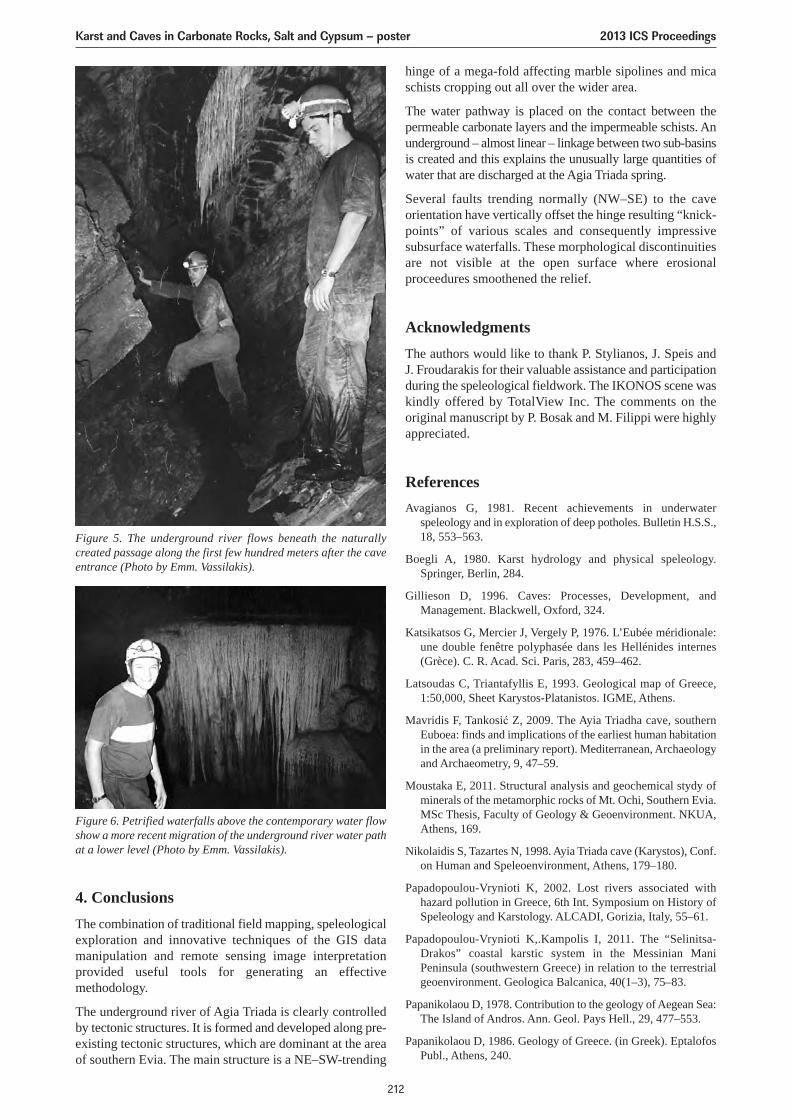
Figure 5. The underground river flows beneath the naturallycreated passage along the first few hundred meters after the caveentrance (Photo by Emm. Vassilakis).
Figure 6. Petrified waterfalls above the contemporary water flowshow a more recent migration of the underground river water pathat a lower level (Photo by Emm. Vassilakis).
4. ConclusionsThe combination of traditional field mapping, speleologicalexploration and innovative techniques of the GIS datamanipulation and remote sensing image interpretationprovided useful tools for generating an effectivemethodology.
The underground river of Agia Triada is clearly controlledby tectonic structures. It is formed and developed along pre-existing tectonic structures, which are dominant at the areaof southern Evia. The main structure is a NE–SW-trending
hinge of a mega-fold affecting marble sipolines and micaschists cropping out all over the wider area.
The water pathway is placed on the contact between thepermeable carbonate layers and the impermeable schists. Anunderground – almost linear – linkage between two sub-basinsis created and this explains the unusually large quantities ofwater that are discharged at the Agia Triada spring.
Several faults trending normally (NW–SE) to the caveorientation have vertically offset the hinge resulting “knick-points” of various scales and consequently impressivesubsurface waterfalls. These morphological discontinuitiesare not visible at the open surface where erosionalproceedures smoothened the relief.
AcknowledgmentsThe authors would like to thank P. Stylianos, J. Speis andJ. Froudarakis for their valuable assistance and participationduring the speleological fieldwork. The IKONOS scene waskindly offered by TotalView Inc. The comments on theoriginal manuscript by P. Bosak and M. Filippi were highlyappreciated.
ReferencesAvagianos G, 1981. Recent achievements in underwater
speleology and in exploration of deep potholes. Bulletin H.S.S.,18, 553–563.
Boegli A, 1980. Karst hydrology and physical speleology.Springer, Berlin, 284.
Gillieson D, 1996. Caves: Processes, Development, andManagement. Blackwell, Oxford, 324.
Katsikatsos G, Mercier J, Vergely P, 1976. L’Eubée méridionale:une double fenêtre polyphasée dans les Hellénides internes(Grèce). C. R. Acad. Sci. Paris, 283, 459–462.
Latsoudas C, Triantafyllis E, 1993. Geological map of Greece,1:50,000, Sheet Karystos-Platanistos. IGME, Athens.
Mavridis F, Tankosić Z, 2009. The Ayia Triadha cave, southernEuboea: finds and implications of the earliest human habitationin the area (a preliminary report). Mediterranean, Archaeologyand Archaeometry, 9, 47–59.
Moustaka E, 2011. Structural analysis and geochemical stydy ofminerals of the metamorphic rocks of Mt. Ochi, Southern Evia.MSc Thesis, Faculty of Geology & Geoenvironment. NKUA,Athens, 169.
Nikolaidis S, Tazartes N, 1998. Ayia Triada cave (Karystos), Conf.on Human and Speleoenvironment, Athens, 179–180.
Papadopoulou-Vrynioti K, 2002. Lost rivers associated withhazard pollution in Greece, 6th Int. Symposium on History ofSpeleology and Karstology. ALCADI, Gorizia, Italy, 55–61.
Papadopoulou-Vrynioti K,.Kampolis I, 2011. The “Selinitsa-Drakos” coastal karstic system in the Messinian ManiPeninsula (southwestern Greece) in relation to the terrestrialgeoenvironment. Geologica Balcanica, 40(1–3), 75–83.
Papanikolaou D, 1978. Contribution to the geology of Aegean Sea:The Island of Andros. Ann. Geol. Pays Hell., 29, 477–553.
Papanikolaou D, 1986. Geology of Greece. (in Greek). EptalofosPubl., Athens, 240.
Karst and Caves in Carbonate Rocks, Salt and Gypsum – poster 2013 ICS Proceedings
212

Petrochilou A, 1981. The deepest and longest caves of the worldand Greece. Bulletin H.S.S., 18, 375–389.
Strahler AN, 1957. Quantitative analysis of watershedgeomorphology. Trans. Amer. Geophys. Union, 38(6), 913–920.
Vassilakis E, 2006. Study of the tectonic structure of Messarabasin, central Crete, with the aid of remote sensing techniquesand G.I.S. Ph.D. Thesis, NKUA, Athens, 546.
Vassilakis E, Vlachou S, 1995. Operation mechanisms of southernEvia springs. BSc Thesis, Faculty of Geology. NKUA, Athens,125.
Zervoudakis I, 1959. Agia Triada cave, no 115. Bulletin H.S.S., 5,76–89.
Karst and Caves in Carbonate Rocks, Salt and Gypsum – poster 2013 ICS Proceedings
213

214
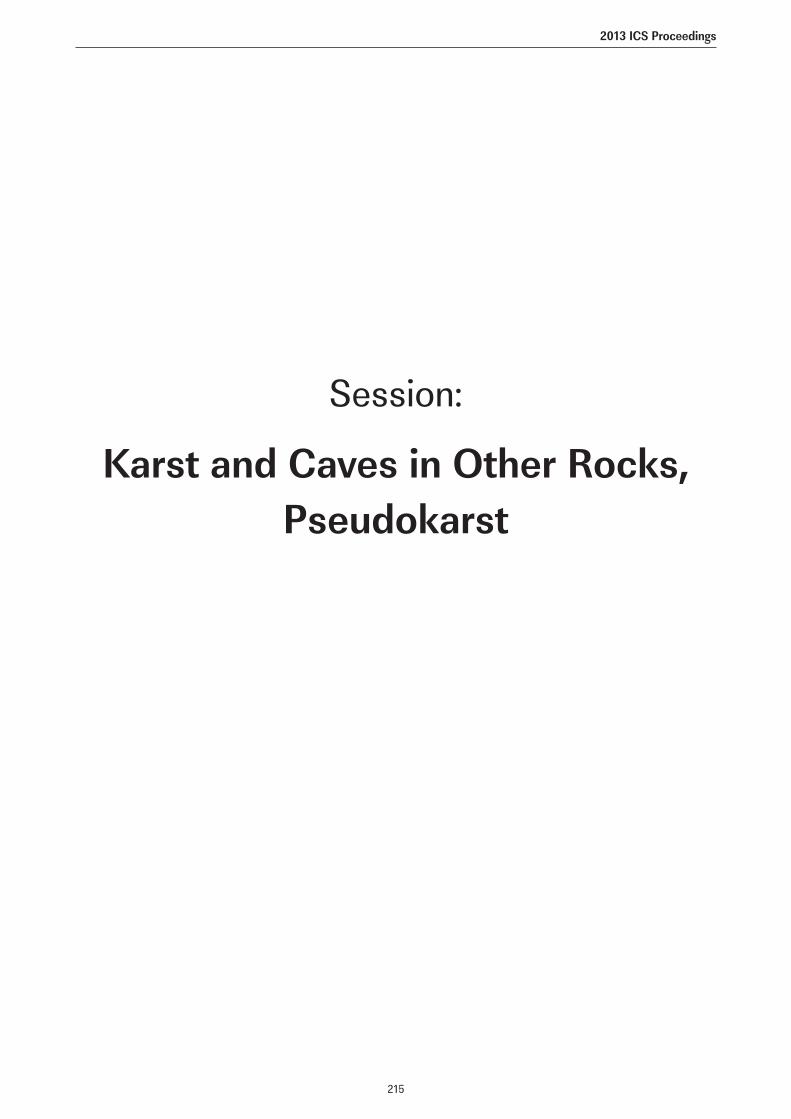
215
2013 ICS Proceedings
Karst and Caves in Other Rocks,Pseudokarst
Session:

216
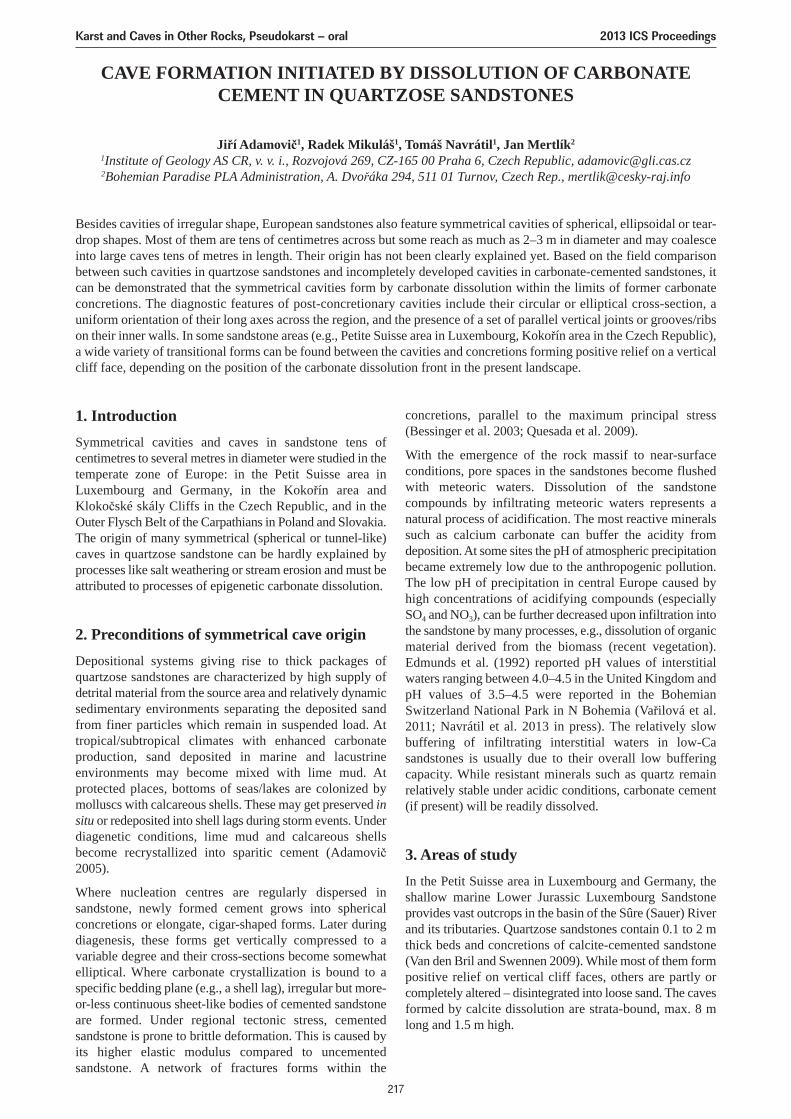
CAVE FORMATION INITIATED BY DISSOLUTION OF CARBONATECEMENT IN QUARTZOSE SANDSTONES
Jiří Adamovič1, Radek Mikuláš1, Tomáš Navrátil1, Jan Mertlík2
1Institute of Geology AS CR, v. v. i., Rozvojová 269, CZ-165 00 Praha 6, Czech Republic, [email protected] Paradise PLA Administration, A. Dvořáka 294, 511 01 Turnov, Czech Rep., [email protected]
Besides cavities of irregular shape, European sandstones also feature symmetrical cavities of spherical, ellipsoidal or tear-drop shapes. Most of them are tens of centimetres across but some reach as much as 2–3 m in diameter and may coalesceinto large caves tens of metres in length. Their origin has not been clearly explained yet. Based on the field comparisonbetween such cavities in quartzose sandstones and incompletely developed cavities in carbonate-cemented sandstones, itcan be demonstrated that the symmetrical cavities form by carbonate dissolution within the limits of former carbonateconcretions. The diagnostic features of post-concretionary cavities include their circular or elliptical cross-section, auniform orientation of their long axes across the region, and the presence of a set of parallel vertical joints or grooves/ribson their inner walls. In some sandstone areas (e.g., Petite Suisse area in Luxembourg, Kokořín area in the Czech Republic),a wide variety of transitional forms can be found between the cavities and concretions forming positive relief on a verticalcliff face, depending on the position of the carbonate dissolution front in the present landscape.
1. IntroductionSymmetrical cavities and caves in sandstone tens ofcentimetres to several metres in diameter were studied in thetemperate zone of Europe: in the Petit Suisse area inLuxembourg and Germany, in the Kokořín area andKlokočské skály Cliffs in the Czech Republic, and in theOuter Flysch Belt of the Carpathians in Poland and Slovakia.The origin of many symmetrical (spherical or tunnel-like)caves in quartzose sandstone can be hardly explained byprocesses like salt weathering or stream erosion and must beattributed to processes of epigenetic carbonate dissolution.
2. Preconditions of symmetrical cave originDepositional systems giving rise to thick packages ofquartzose sandstones are characterized by high supply ofdetrital material from the source area and relatively dynamicsedimentary environments separating the deposited sandfrom finer particles which remain in suspended load. Attropical/subtropical climates with enhanced carbonateproduction, sand deposited in marine and lacustrineenvironments may become mixed with lime mud. Atprotected places, bottoms of seas/lakes are colonized bymolluscs with calcareous shells. These may get preserved insitu or redeposited into shell lags during storm events. Underdiagenetic conditions, lime mud and calcareous shellsbecome recrystallized into sparitic cement (Adamovič2005).
Where nucleation centres are regularly dispersed insandstone, newly formed cement grows into sphericalconcretions or elongate, cigar-shaped forms. Later duringdiagenesis, these forms get vertically compressed to avariable degree and their cross-sections become somewhatelliptical. Where carbonate crystallization is bound to aspecific bedding plane (e.g., a shell lag), irregular but more-or-less continuous sheet-like bodies of cemented sandstoneare formed. Under regional tectonic stress, cementedsandstone is prone to brittle deformation. This is caused byits higher elastic modulus compared to uncementedsandstone. A network of fractures forms within the
concretions, parallel to the maximum principal stress(Bessinger et al. 2003; Quesada et al. 2009).
With the emergence of the rock massif to near-surfaceconditions, pore spaces in the sandstones become flushedwith meteoric waters. Dissolution of the sandstonecompounds by infiltrating meteoric waters represents anatural process of acidification. The most reactive mineralssuch as calcium carbonate can buffer the acidity fromdeposition. At some sites the pH of atmospheric precipitationbecame extremely low due to the anthropogenic pollution.The low pH of precipitation in central Europe caused byhigh concentrations of acidifying compounds (especiallySO4 and NO3), can be further decreased upon infiltration intothe sandstone by many processes, e.g., dissolution of organicmaterial derived from the biomass (recent vegetation).Edmunds et al. (1992) reported pH values of interstitialwaters ranging between 4.0–4.5 in the United Kingdom andpH values of 3.5–4.5 were reported in the BohemianSwitzerland National Park in N Bohemia (Vařilová et al.2011; Navrátil et al. 2013 in press). The relatively slowbuffering of infiltrating interstitial waters in low-Casandstones is usually due to their overall low bufferingcapacity. While resistant minerals such as quartz remainrelatively stable under acidic conditions, carbonate cement(if present) will be readily dissolved.
3. Areas of studyIn the Petit Suisse area in Luxembourg and Germany, theshallow marine Lower Jurassic Luxembourg Sandstoneprovides vast outcrops in the basin of the Sûre (Sauer) Riverand its tributaries. Quartzose sandstones contain 0.1 to 2 mthick beds and concretions of calcite-cemented sandstone(Van den Bril and Swennen 2009). While most of them formpositive relief on vertical cliff faces, others are partly orcompletely altered – disintegrated into loose sand. The cavesformed by calcite dissolution are strata-bound, max. 8 mlong and 1.5 m high.
Karst and Caves in Other Rocks, Pseudokarst – oral 2013 ICS Proceedings
217
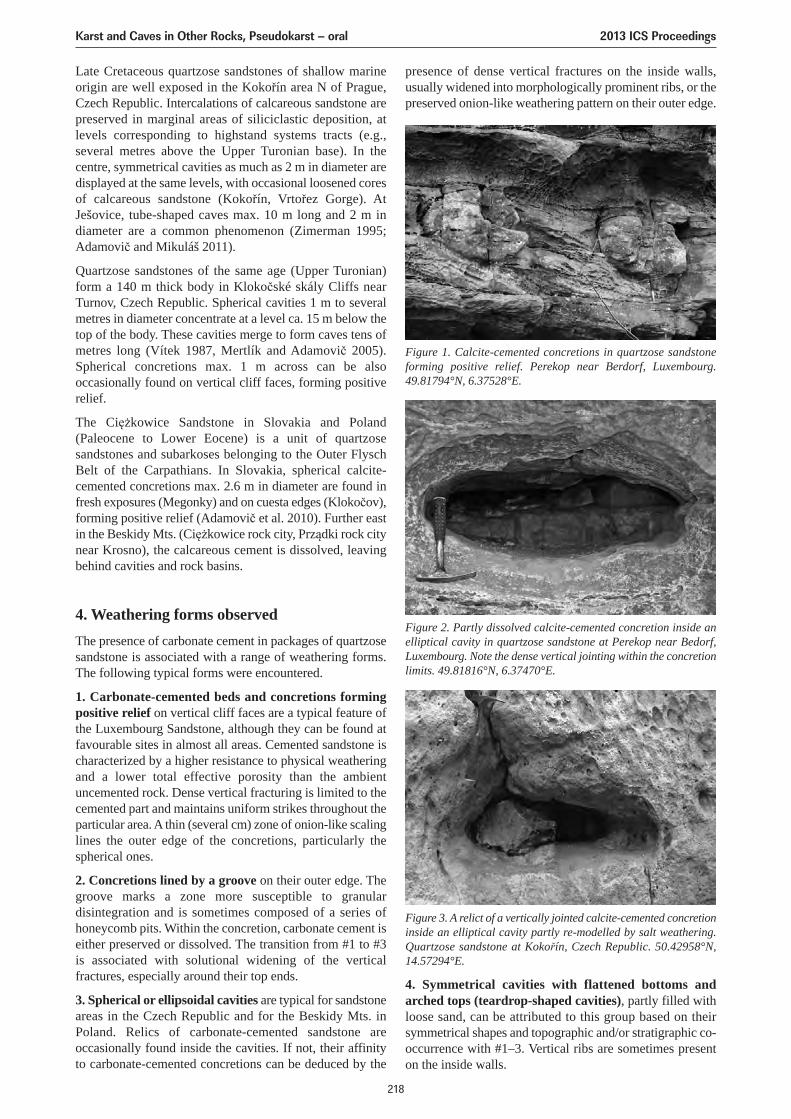
Late Cretaceous quartzose sandstones of shallow marineorigin are well exposed in the Kokořín area N of Prague,Czech Republic. Intercalations of calcareous sandstone arepreserved in marginal areas of siliciclastic deposition, atlevels corresponding to highstand systems tracts (e.g.,several metres above the Upper Turonian base). In thecentre, symmetrical cavities as much as 2 m in diameter aredisplayed at the same levels, with occasional loosened coresof calcareous sandstone (Kokořín, Vrtořez Gorge). AtJešovice, tube-shaped caves max. 10 m long and 2 m indiameter are a common phenomenon (Zimerman 1995;Adamovič and Mikuláš 2011).
Quartzose sandstones of the same age (Upper Turonian)form a 140 m thick body in Klokočské skály Cliffs nearTurnov, Czech Republic. Spherical cavities 1 m to severalmetres in diameter concentrate at a level ca. 15 m below thetop of the body. These cavities merge to form caves tens ofmetres long (Vítek 1987, Mertlík and Adamovič 2005).Spherical concretions max. 1 m across can be alsooccasionally found on vertical cliff faces, forming positiverelief.
The Ciężkowice Sandstone in Slovakia and Poland(Paleocene to Lower Eocene) is a unit of quartzosesandstones and subarkoses belonging to the Outer FlyschBelt of the Carpathians. In Slovakia, spherical calcite-cemented concretions max. 2.6 m in diameter are found infresh exposures (Megonky) and on cuesta edges (Klokočov),forming positive relief (Adamovič et al. 2010). Further eastin the Beskidy Mts. (Ciężkowice rock city, Prządki rock citynear Krosno), the calcareous cement is dissolved, leavingbehind cavities and rock basins.
4. Weathering forms observedThe presence of carbonate cement in packages of quartzosesandstone is associated with a range of weathering forms.The following typical forms were encountered.
1. Carbonate-cemented beds and concretions formingpositive relief on vertical cliff faces are a typical feature ofthe Luxembourg Sandstone, although they can be found atfavourable sites in almost all areas. Cemented sandstone ischaracterized by a higher resistance to physical weatheringand a lower total effective porosity than the ambientuncemented rock. Dense vertical fracturing is limited to thecemented part and maintains uniform strikes throughout theparticular area. A thin (several cm) zone of onion-like scalinglines the outer edge of the concretions, particularly thespherical ones.
2. Concretions lined by a groove on their outer edge. Thegroove marks a zone more susceptible to granulardisintegration and is sometimes composed of a series ofhoneycomb pits. Within the concretion, carbonate cement iseither preserved or dissolved. The transition from #1 to #3is associated with solutional widening of the verticalfractures, especially around their top ends.
3. Spherical or ellipsoidal cavities are typical for sandstoneareas in the Czech Republic and for the Beskidy Mts. inPoland. Relics of carbonate-cemented sandstone areoccasionally found inside the cavities. If not, their affinityto carbonate-cemented concretions can be deduced by the
presence of dense vertical fractures on the inside walls,usually widened into morphologically prominent ribs, or thepreserved onion-like weathering pattern on their outer edge.
Figure 1. Calcite-cemented concretions in quartzose sandstoneforming positive relief. Perekop near Berdorf, Luxembourg.49.81794°N, 6.37528°E.
Figure 2. Partly dissolved calcite-cemented concretion inside anelliptical cavity in quartzose sandstone at Perekop near Bedorf,Luxembourg. Note the dense vertical jointing within the concretionlimits. 49.81816°N, 6.37470°E.
Figure 3. A relict of a vertically jointed calcite-cemented concretioninside an elliptical cavity partly re-modelled by salt weathering.Quartzose sandstone at Kokořín, Czech Republic. 50.42958°N,14.57294°E.
4. Symmetrical cavities with flattened bottoms andarched tops (teardrop-shaped cavities), partly filled withloose sand, can be attributed to this group based on theirsymmetrical shapes and topographic and/or stratigraphic co-occurrence with #1–3. Vertical ribs are sometimes presenton the inside walls.
Karst and Caves in Other Rocks, Pseudokarst – oral 2013 ICS Proceedings
218
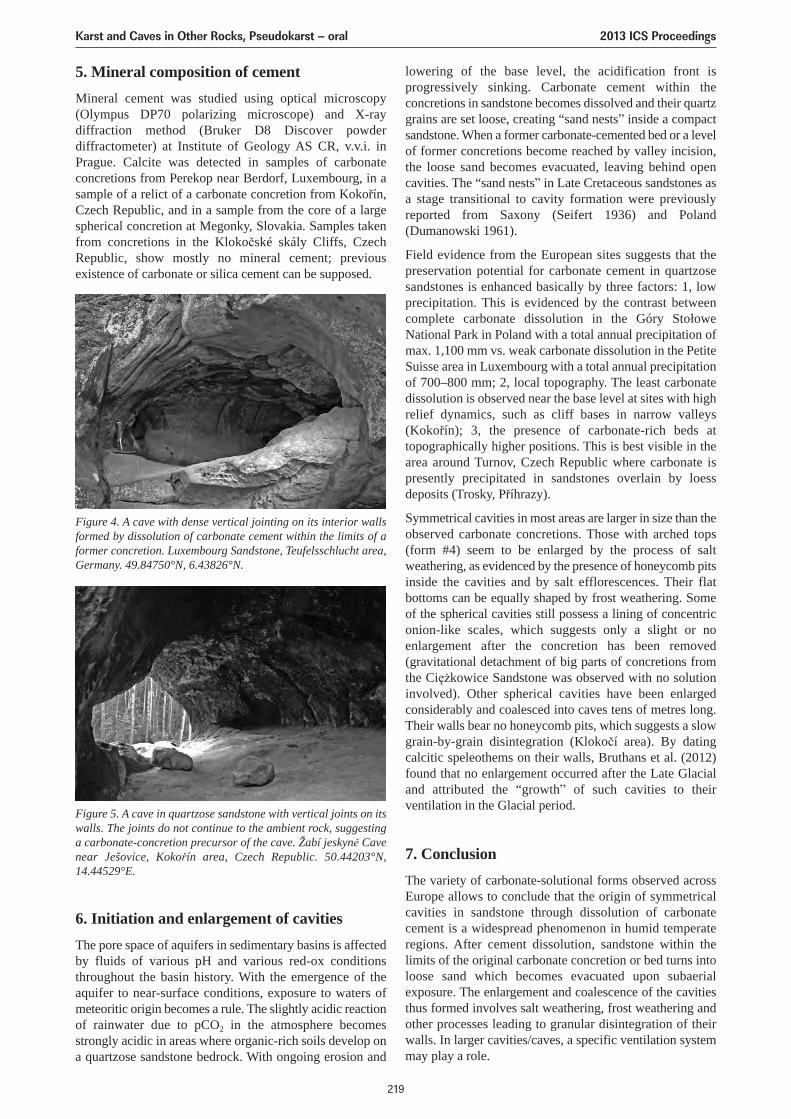
5. Mineral composition of cementMineral cement was studied using optical microscopy(Olympus DP70 polarizing microscope) and X-raydiffraction method (Bruker D8 Discover powderdiffractometer) at Institute of Geology AS CR, v.v.i. inPrague. Calcite was detected in samples of carbonateconcretions from Perekop near Berdorf, Luxembourg, in asample of a relict of a carbonate concretion from Kokořín,Czech Republic, and in a sample from the core of a largespherical concretion at Megonky, Slovakia. Samples takenfrom concretions in the Klokočské skály Cliffs, CzechRepublic, show mostly no mineral cement; previousexistence of carbonate or silica cement can be supposed.
lowering of the base level, the acidification front isprogressively sinking. Carbonate cement within theconcretions in sandstone becomes dissolved and their quartzgrains are set loose, creating “sand nestsˮ inside a compactsandstone. When a former carbonate-cemented bed or a levelof former concretions become reached by valley incision,the loose sand becomes evacuated, leaving behind opencavities. The “sand nestsˮ in Late Cretaceous sandstones asa stage transitional to cavity formation were previouslyreported from Saxony (Seifert 1936) and Poland(Dumanowski 1961).
Field evidence from the European sites suggests that thepreservation potential for carbonate cement in quartzosesandstones is enhanced basically by three factors: 1, lowprecipitation. This is evidenced by the contrast betweencomplete carbonate dissolution in the Góry StołoweNational Park in Poland with a total annual precipitation ofmax. 1,100 mm vs. weak carbonate dissolution in the PetiteSuisse area in Luxembourg with a total annual precipitationof 700–800 mm; 2, local topography. The least carbonatedissolution is observed near the base level at sites with highrelief dynamics, such as cliff bases in narrow valleys(Kokořín); 3, the presence of carbonate-rich beds attopographically higher positions. This is best visible in thearea around Turnov, Czech Republic where carbonate ispresently precipitated in sandstones overlain by loessdeposits (Trosky, Příhrazy).
Symmetrical cavities in most areas are larger in size than theobserved carbonate concretions. Those with arched tops(form #4) seem to be enlarged by the process of saltweathering, as evidenced by the presence of honeycomb pitsinside the cavities and by salt efflorescences. Their flatbottoms can be equally shaped by frost weathering. Someof the spherical cavities still possess a lining of concentriconion-like scales, which suggests only a slight or noenlargement after the concretion has been removed(gravitational detachment of big parts of concretions fromthe Ciężkowice Sandstone was observed with no solutioninvolved). Other spherical cavities have been enlargedconsiderably and coalesced into caves tens of metres long.Their walls bear no honeycomb pits, which suggests a slowgrain-by-grain disintegration (Klokočí area). By datingcalcitic speleothems on their walls, Bruthans et al. (2012)found that no enlargement occurred after the Late Glacialand attributed the “growthˮ of such cavities to theirventilation in the Glacial period.
7. ConclusionThe variety of carbonate-solutional forms observed acrossEurope allows to conclude that the origin of symmetricalcavities in sandstone through dissolution of carbonatecement is a widespread phenomenon in humid temperateregions. After cement dissolution, sandstone within thelimits of the original carbonate concretion or bed turns intoloose sand which becomes evacuated upon subaerialexposure. The enlargement and coalescence of the cavitiesthus formed involves salt weathering, frost weathering andother processes leading to granular disintegration of theirwalls. In larger cavities/caves, a specific ventilation systemmay play a role.
Figure 4. A cave with dense vertical jointing on its interior wallsformed by dissolution of carbonate cement within the limits of aformer concretion. Luxembourg Sandstone, Teufelsschlucht area,Germany. 49.84750°N, 6.43826°N.
Figure 5. A cave in quartzose sandstone with vertical joints on itswalls. The joints do not continue to the ambient rock, suggestinga carbonate-concretion precursor of the cave. Žabí jeskyně Cavenear Ješovice, Kokořín area, Czech Republic. 50.44203°N,14.44529°E.
6. Initiation and enlargement of cavitiesThe pore space of aquifers in sedimentary basins is affectedby fluids of various pH and various red-ox conditionsthroughout the basin history. With the emergence of theaquifer to near-surface conditions, exposure to waters ofmeteoritic origin becomes a rule. The slightly acidic reactionof rainwater due to pCO2 in the atmosphere becomesstrongly acidic in areas where organic-rich soils develop ona quartzose sandstone bedrock. With ongoing erosion and
Karst and Caves in Other Rocks, Pseudokarst – oral 2013 ICS Proceedings
219
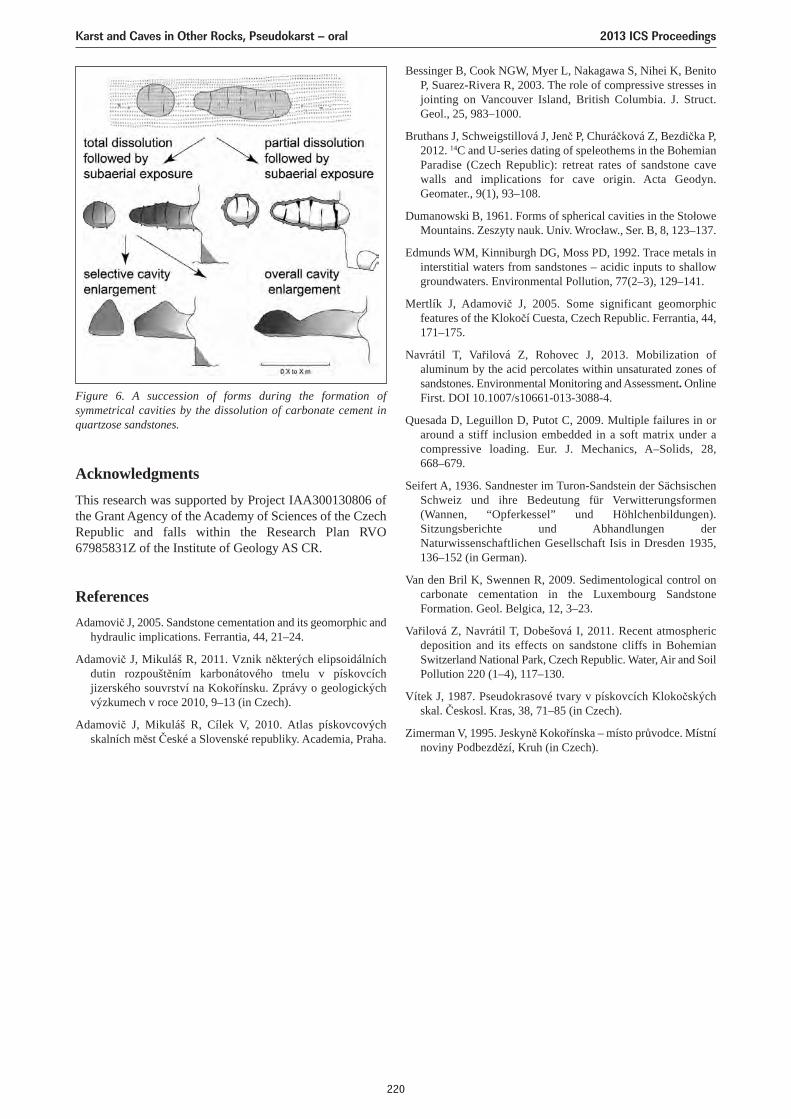
Bessinger B, Cook NGW, Myer L, Nakagawa S, Nihei K, BenitoP, Suarez-Rivera R, 2003. The role of compressive stresses injointing on Vancouver Island, British Columbia. J. Struct.Geol., 25, 983–1000.
Bruthans J, Schweigstillová J, Jenč P, Churáčková Z, Bezdička P,2012. 14C and U-series dating of speleothems in the BohemianParadise (Czech Republic): retreat rates of sandstone cavewalls and implications for cave origin. Acta Geodyn.Geomater., 9(1), 93–108.
Dumanowski B, 1961. Forms of spherical cavities in the StołoweMountains. Zeszyty nauk. Univ. Wrocław., Ser. B, 8, 123–137.
Edmunds WM, Kinniburgh DG, Moss PD, 1992. Trace metals ininterstitial waters from sandstones – acidic inputs to shallowgroundwaters. Environmental Pollution, 77(2–3), 129–141.
Mertlík J, Adamovič J, 2005. Some significant geomorphicfeatures of the Klokočí Cuesta, Czech Republic. Ferrantia, 44,171–175.
Navrátil T, Vařilová Z, Rohovec J, 2013. Mobilization ofaluminum by the acid percolates within unsaturated zones ofsandstones. Environmental Monitoring and Assessment. OnlineFirst. DOI 10.1007/s10661-013-3088-4.
Quesada D, Leguillon D, Putot C, 2009. Multiple failures in oraround a stiff inclusion embedded in a soft matrix under acompressive loading. Eur. J. Mechanics, A–Solids, 28,668–679.
Seifert A, 1936. Sandnester im Turon-Sandstein der SächsischenSchweiz und ihre Bedeutung für Verwitterungsformen(Wannen, “Opferkessel” und Höhlchenbildungen).Sitzungsberichte und Abhandlungen derNaturwissenschaftlichen Gesellschaft Isis in Dresden 1935,136–152 (in German).
Van den Bril K, Swennen R, 2009. Sedimentological control oncarbonate cementation in the Luxembourg SandstoneFormation. Geol. Belgica, 12, 3–23.
Vařilová Z, Navrátil T, Dobešová I, 2011. Recent atmosphericdeposition and its effects on sandstone cliffs in BohemianSwitzerland National Park, Czech Republic. Water, Air and SoilPollution 220 (1–4), 117–130.
Vítek J, 1987. Pseudokrasové tvary v pískovcích Klokočskýchskal. Českosl. Kras, 38, 71–85 (in Czech).
Zimerman V, 1995. Jeskyně Kokořínska – místo průvodce. Místnínoviny Podbezdězí, Kruh (in Czech).
Figure 6. A succession of forms during the formation ofsymmetrical cavities by the dissolution of carbonate cement inquartzose sandstones.
AcknowledgmentsThis research was supported by Project IAA300130806 ofthe Grant Agency of the Academy of Sciences of the CzechRepublic and falls within the Research Plan RVO67985831Z of the Institute of Geology AS CR.
ReferencesAdamovič J, 2005. Sandstone cementation and its geomorphic and
hydraulic implications. Ferrantia, 44, 21–24.
Adamovič J, Mikuláš R, 2011. Vznik některých elipsoidálníchdutin rozpouštěním karbonátového tmelu v pískovcíchjizerského souvrství na Kokořínsku. Zprávy o geologickýchvýzkumech v roce 2010, 9–13 (in Czech).
Adamovič J, Mikuláš R, Cílek V, 2010. Atlas pískovcovýchskalních měst České a Slovenské republiky. Academia, Praha.
Karst and Caves in Other Rocks, Pseudokarst – oral 2013 ICS Proceedings
220
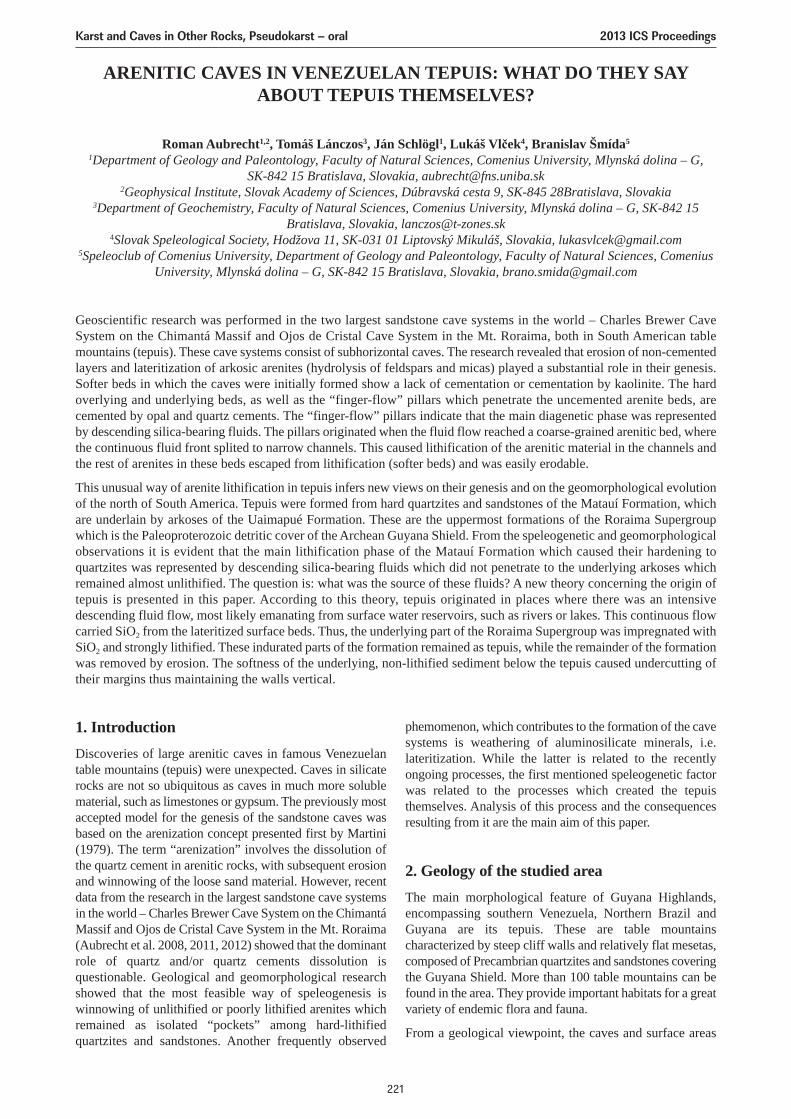
ARENITIC CAVES IN VENEZUELAN TEPUIS: WHAT DO THEY SAYABOUT TEPUIS THEMSELVES?
Roman Aubrecht1,2, Tomáš Lánczos3, Ján Schlögl1, Lukáš Vlček4, Branislav Šmída5
1Department of Geology and Paleontology, Faculty of Natural Sciences, Comenius University, Mlynská dolina – G,SK-842 15 Bratislava, Slovakia, [email protected]
2Geophysical Institute, Slovak Academy of Sciences, Dúbravská cesta 9, SK-845 28Bratislava, Slovakia3Department of Geochemistry, Faculty of Natural Sciences, Comenius University, Mlynská dolina – G, SK-842 15
Bratislava, Slovakia, [email protected] Spe leological Society, Hodžova 11, SK-031 01 Liptovský Mikuláš, Slovakia, [email protected]
5Speleoclub of Comenius University, Department of Geology and Paleontology, Faculty of Natural Sciences, ComeniusUniversity, Mlynská dolina – G, SK-842 15 Bratislava, Slovakia, [email protected]
Geoscientific research was performed in the two largest sandstone cave systems in the world – Charles Brewer CaveSystem on the Chimantá Massif and Ojos de Cristal Cave System in the Mt. Roraima, both in South American tablemountains (tepuis). These cave systems consist of subhorizontal caves. The research revealed that erosion of non-cementedlayers and lateritization of arkosic arenites (hydrolysis of feldspars and micas) played a substantial role in their genesis.Softer beds in which the caves were initially formed show a lack of cementation or cementation by kaolinite. The hardoverlying and underlying beds, as well as the “finger-flow” pillars which penetrate the uncemented arenite beds, arecemented by opal and quartz cements. The “finger-flow” pillars indicate that the main diagenetic phase was representedby descending silica-bearing fluids. The pillars originated when the fluid flow reached a coarse-grained arenitic bed, wherethe continuous fluid front splited to narrow channels. This caused lithification of the arenitic material in the channels andthe rest of arenites in these beds escaped from lithification (softer beds) and was easily erodable.
This unusual way of arenite lithification in tepuis infers new views on their genesis and on the geomorphological evolutionof the north of South America. Tepuis were formed from hard quartzites and sandstones of the Matauí Formation, whichare underlain by arkoses of the Uaimapué Formation. These are the uppermost formations of the Roraima Supergroupwhich is the Paleoproterozoic detritic cover of the Archean Guyana Shield. From the speleogenetic and geomorphologicalobservations it is evident that the main lithification phase of the Matauí Formation which caused their hardening toquartzites was represented by descending silica-bearing fluids which did not penetrate to the underlying arkoses whichremained almost unlithified. The question is: what was the source of these fluids? A new theory concerning the origin oftepuis is presented in this paper. According to this theory, tepuis originated in places where there was an intensivedescending fluid flow, most likely emanating from surface water reservoirs, such as rivers or lakes. This continuous flowcarried SiO2 from the lateritized surface beds. Thus, the underlying part of the Roraima Supergroup was impregnated withSiO2 and strongly lithified. These indurated parts of the formation remained as tepuis, while the remainder of the formationwas removed by erosion. The softness of the underlying, non-lithified sediment below the tepuis caused undercutting oftheir margins thus maintaining the walls vertical.
1. IntroductionDiscoveries of large arenitic caves in famous Venezuelantable mountains (tepuis) were unexpected. Caves in silicaterocks are not so ubiquitous as caves in much more solublematerial, such as limestones or gypsum. The previously mostaccepted model for the genesis of the sandstone caves wasbased on the arenization concept presented first by Martini(1979). The term “arenization” involves the dissolution ofthe quartz cement in arenitic rocks, with subsequent erosionand winnowing of the loose sand material. However, recentdata from the research in the largest sandstone cave systemsin the world – Charles Brewer Cave System on the ChimantáMassif and Ojos de Cristal Cave System in the Mt. Roraima(Aubrecht et al. 2008, 2011, 2012) showed that the dominantrole of quartz and/or quartz cements dissolution isquestionable. Geological and geomorphological researchshowed that the most feasible way of speleogenesis iswinnowing of unlithified or poorly lithified arenites whichremained as isolated “pockets” among hard-lithifiedquartzites and sandstones. Another frequently observed
phemomenon, which contributes to the formation of the cavesystems is weathering of aluminosilicate minerals, i.e.lateritization. While the latter is related to the recentlyongoing processes, the first mentioned speleogenetic factorwas related to the processes which created the tepuisthemselves. Analysis of this process and the consequencesresulting from it are the main aim of this paper.
2. Geology of the studied areaThe main morphological feature of Guyana Highlands,encompassing southern Venezuela, Northern Brazil andGuyana are its tepuis. These are table mountainscharacterized by steep cliff walls and relatively flat mesetas,composed of Precambrian quartzites and sandstones coveringthe Guyana Shield. More than 100 table mountains can befound in the area. They provide important habitats for a greatvariety of endemic flora and fauna.
From a geological viewpoint, the caves and surface areas
Karst and Caves in Other Rocks, Pseudokarst – oral 2013 ICS Proceedings
221
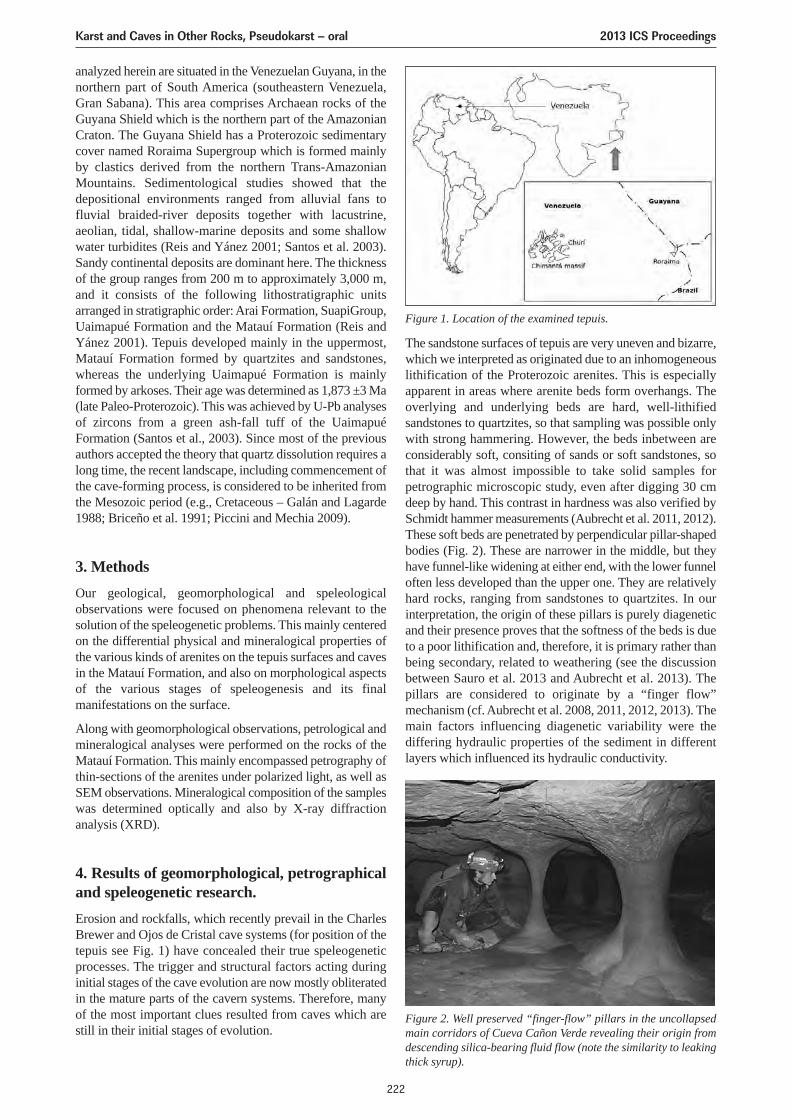
analyzed herein are situated in the Venezuelan Guyana, in thenorthern part of South America (southeastern Venezuela,Gran Sabana). This area comprises Archaean rocks of theGuyana Shield which is the northern part of the AmazonianCraton. The Guyana Shield has a Proterozoic sedimentarycover named Roraima Supergroup which is formed mainlyby clastics derived from the northern Trans-AmazonianMountains. Sedimentological studies showed that thedepositional environments ranged from alluvial fans tofluvial braided-river deposits together with lacustrine,aeolian, tidal, shallow-marine deposits and some shallowwater turbidites (Reis and Yánez 2001; Santos et al. 2003).Sandy continental deposits are dominant here. The thicknessof the group ranges from 200 m to approximately 3,000 m,and it consists of the following lithostratigraphic unitsarranged in stratigraphic order: Arai Formation, SuapiGroup,Uaimapué Formation and the Matauí Formation (Reis andYánez 2001). Tepuis developed mainly in the uppermost,Matauí Formation formed by quartzites and sandstones,whereas the underlying Uaimapué Formation is mainlyformed by arkoses. Their age was determined as 1,873 ±3 Ma(late Paleo-Proterozoic). This was achieved by U-Pb analysesof zircons from a green ash-fall tuff of the UaimapuéFormation (Santos et al., 2003). Since most of the previousauthors accepted the theory that quartz dissolution requires along time, the recent landscape, including commencement ofthe cave-forming process, is considered to be inherited fromthe Mesozoic period (e.g., Cretaceous – Galán and Lagarde1988; Briceño et al. 1991; Piccini and Mechia 2009).
3. MethodsOur geological, geomorphological and speleologicalobservations were focused on phenomena relevant to thesolution of the speleogenetic problems. This mainly centeredon the differential physical and mineralogical properties ofthe various kinds of arenites on the tepuis surfaces and cavesin the Matauí Formation, and also on morphological aspectsof the various stages of speleogenesis and its finalmanifestations on the surface.
Along with geomorphological observations, petrological andmineralogical analyses were performed on the rocks of theMatauí Formation. This mainly encompassed petrography ofthin-sections of the arenites under polarized light, as well asSEM observations. Mineralogical composition of the sampleswas determined optically and also by X-ray diffractionanalysis (XRD).
4. Results of geomorphological, petrographicaland speleogenetic research.Erosion and rockfalls, which recently prevail in the CharlesBrewer and Ojos de Cristal cave systems (for position of thetepuis see Fig. 1) have concealed their true speleogeneticprocesses. The trigger and structural factors acting duringinitial stages of the cave evolution are now mostly obliteratedin the mature parts of the cavern systems. Therefore, manyof the most important clues resulted from caves which arestill in their initial stages of evolution.
The sandstone surfaces of tepuis are very uneven and bizarre,which we interpreted as originated due to an inhomogeneouslithification of the Proterozoic arenites. This is especiallyapparent in areas where arenite beds form overhangs. Theoverlying and underlying beds are hard, well-lithifiedsandstones to quartzites, so that sampling was possible onlywith strong hammering. However, the beds inbetween areconsiderably soft, consiting of sands or soft sandstones, sothat it was almost impossible to take solid samples forpetrographic microscopic study, even after digging 30 cmdeep by hand. This contrast in hardness was also verified bySchmidt hammer measurements (Aubrecht et al. 2011, 2012).These soft beds are penetrated by perpendicular pillar-shapedbodies (Fig. 2). These are narrower in the middle, but theyhave funnel-like widening at either end, with the lower funneloften less developed than the upper one. They are relativelyhard rocks, ranging from sandstones to quartzites. In ourinterpretation, the origin of these pillars is purely diageneticand their presence proves that the softness of the beds is dueto a poor lithification and, therefore, it is primary rather thanbeing secondary, related to weathering (see the discussionbetween Sauro et al. 2013 and Aubrecht et al. 2013). Thepillars are considered to originate by a “finger flow”mechanism (cf. Aubrecht et al. 2008, 2011, 2012, 2013). Themain factors influencing diagenetic variability were thediffering hydraulic properties of the sediment in differentlayers which influenced its hydraulic conductivity.
Figure 1. Location of the examined tepuis.
Figure 2. Well preserved “finger-flow” pillars in the uncollapsedmain corridors of Cueva Cañon Verde revealing their origin fromdescending silica-bearing fluid flow (note the similarity to leakingthick syrup).
Karst and Caves in Other Rocks, Pseudokarst – oral 2013 ICS Proceedings
222
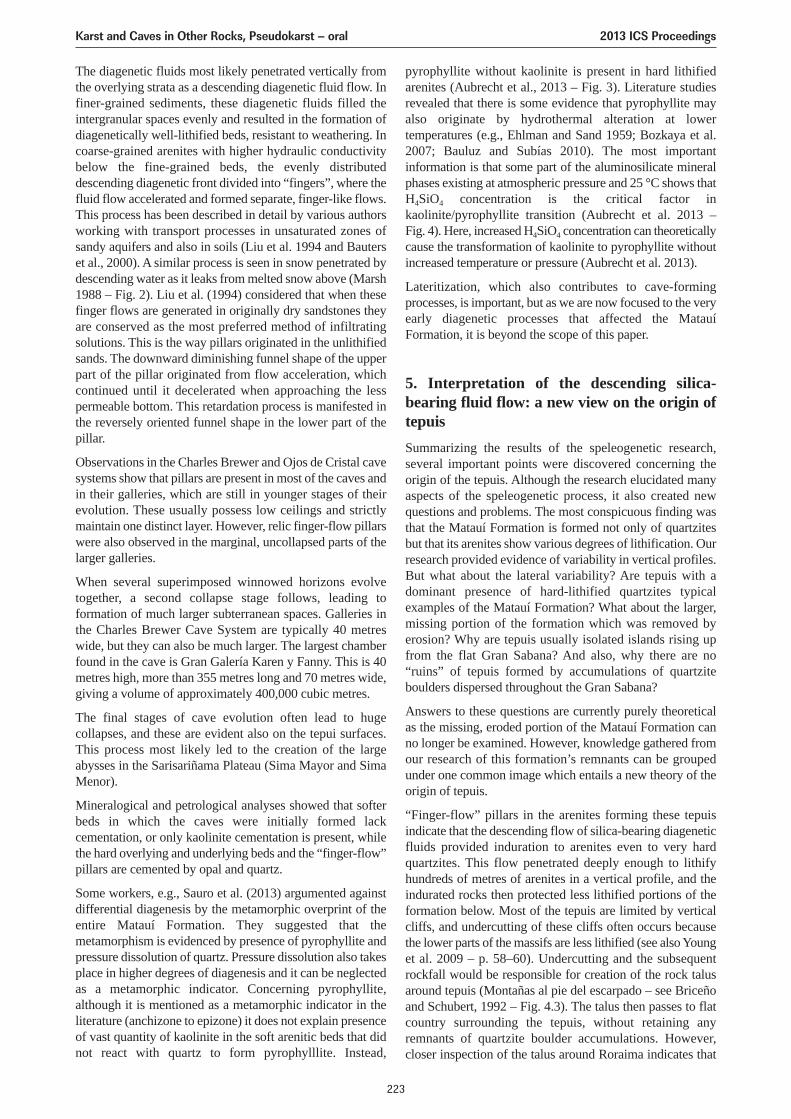
The diagenetic fluids most likely penetrated vertically fromthe overlying strata as a descending diagenetic fluid flow. Infiner-grained sediments, these diagenetic fluids filled theintergranular spaces evenly and resulted in the formation ofdiagenetically well-lithified beds, resistant to weathering. Incoarse-grained arenites with higher hydraulic conductivitybelow the fine-grained beds, the evenly distributeddescending diagenetic front divided into “fingers”, where thefluid flow accelerated and formed separate, finger-like flows.This process has been described in detail by various authorsworking with transport processes in unsaturated zones ofsandy aquifers and also in soils (Liu et al. 1994 and Bauterset al., 2000). A similar process is seen in snow penetrated bydescending water as it leaks from melted snow above (Marsh1988 – Fig. 2). Liu et al. (1994) considered that when thesefinger flows are generated in originally dry sandstones theyare conserved as the most preferred method of infiltratingsolutions. This is the way pillars originated in the unlithifiedsands. The downward diminishing funnel shape of the upperpart of the pillar originated from flow acceleration, whichcontinued until it decelerated when approaching the lesspermeable bottom. This retardation process is manifested inthe reversely oriented funnel shape in the lower part of thepillar.
Observations in the Charles Brewer and Ojos de Cristal cavesystems show that pillars are present in most of the caves andin their galleries, which are still in younger stages of theirevolution. These usually possess low ceilings and strictlymaintain one distinct layer. However, relic finger-flow pillarswere also observed in the marginal, uncollapsed parts of thelarger galleries.
When several superimposed winnowed horizons evolvetogether, a second collapse stage follows, leading toformation of much larger subterranean spaces. Galleries inthe Charles Brewer Cave System are typically 40 metreswide, but they can also be much larger. The largest chamberfound in the cave is Gran Galería Karen y Fanny. This is 40metres high, more than 355 metres long and 70 metres wide,giving a volume of approximately 400,000 cubic metres.
The final stages of cave evolution often lead to hugecollapses, and these are evident also on the tepui surfaces.This process most likely led to the creation of the largeabysses in the Sarisariñama Plateau (Sima Mayor and SimaMenor).
Mineralogical and petrological analyses showed that softerbeds in which the caves were initially formed lackcementation, or only kaolinite cementation is present, whilethe hard overlying and underlying beds and the “finger-flow”pillars are cemented by opal and quartz.
Some workers, e.g., Sauro et al. (2013) argumented againstdifferential diagenesis by the metamorphic overprint of theentire Matauí Formation. They suggested that themetamorphism is evidenced by presence of pyrophyllite andpressure dissolution of quartz. Pressure dissolution also takesplace in higher degrees of diagenesis and it can be neglectedas a metamorphic indicator. Concerning pyrophyllite,although it is mentioned as a metamorphic indicator in theliterature (anchizone to epizone) it does not explain presenceof vast quantity of kaolinite in the soft arenitic beds that didnot react with quartz to form pyrophylllite. Instead,
pyrophyllite without kaolinite is present in hard lithifiedarenites (Aubrecht et al., 2013 – Fig. 3). Literature studiesrevealed that there is some evidence that pyrophyllite mayalso originate by hydrothermal alteration at lowertemperatures (e.g., Ehlman and Sand 1959; Bozkaya et al.2007; Bauluz and Subías 2010). The most importantinformation is that some part of the aluminosilicate mineralphases existing at atmospheric pressure and 25 °C shows thatH4SiO4 concentration is the critical factor inkaolinite/pyrophyllite transition (Aubrecht et al. 2013 –Fig. 4). Here, increased H4SiO4 concentration can theoreticallycause the transformation of kaolinite to pyrophyllite withoutincreased temperature or pressure (Aubrecht et al. 2013).
Lateritization, which also contributes to cave-formingprocesses, is important, but as we are now focused to the veryearly diagenetic processes that affected the MatauíFormation, it is beyond the scope of this paper.
5. Interpretation of the descending silica-bearing fluid flow: a new view on the origin oftepuisSummarizing the results of the speleogenetic research,several important points were discovered concerning theorigin of the tepuis. Although the research elucidated manyaspects of the speleogenetic process, it also created newquestions and problems. The most conspicuous finding wasthat the Matauí Formation is formed not only of quartzitesbut that its arenites show various degrees of lithification. Ourresearch provided evidence of variability in vertical profiles.But what about the lateral variability? Are tepuis with adominant presence of hard-lithified quartzites typicalexamples of the Matauí Formation? What about the larger,missing portion of the formation which was removed byerosion? Why are tepuis usually isolated islands rising upfrom the flat Gran Sabana? And also, why there are no“ruins” of tepuis formed by accumulations of quartziteboulders dispersed throughout the Gran Sabana?
Answers to these questions are currently purely theoreticalas the missing, eroded portion of the Matauí Formation canno longer be examined. However, knowledge gathered fromour research of this formation’s remnants can be groupedunder one common image which entails a new theory of theorigin of tepuis.
“Finger-flow” pillars in the arenites forming these tepuisindicate that the descending flow of silica-bearing diageneticfluids provided induration to arenites even to very hardquartzites. This flow penetrated deeply enough to lithifyhundreds of metres of arenites in a vertical profile, and theindurated rocks then protected less lithified portions of theformation below. Most of the tepuis are limited by verticalcliffs, and undercutting of these cliffs often occurs becausethe lower parts of the massifs are less lithified (see also Younget al. 2009 – p. 58–60). Undercutting and the subsequentrockfall would be responsible for creation of the rock talusaround tepuis (Montañas al pie del escarpado – see Briceñoand Schubert, 1992 – Fig. 4.3). The talus then passes to flatcountry surrounding the tepuis, without retaining anyremnants of quartzite boulder accumulations. However,closer inspection of the talus around Roraima indicates that
Karst and Caves in Other Rocks, Pseudokarst – oral 2013 ICS Proceedings
223
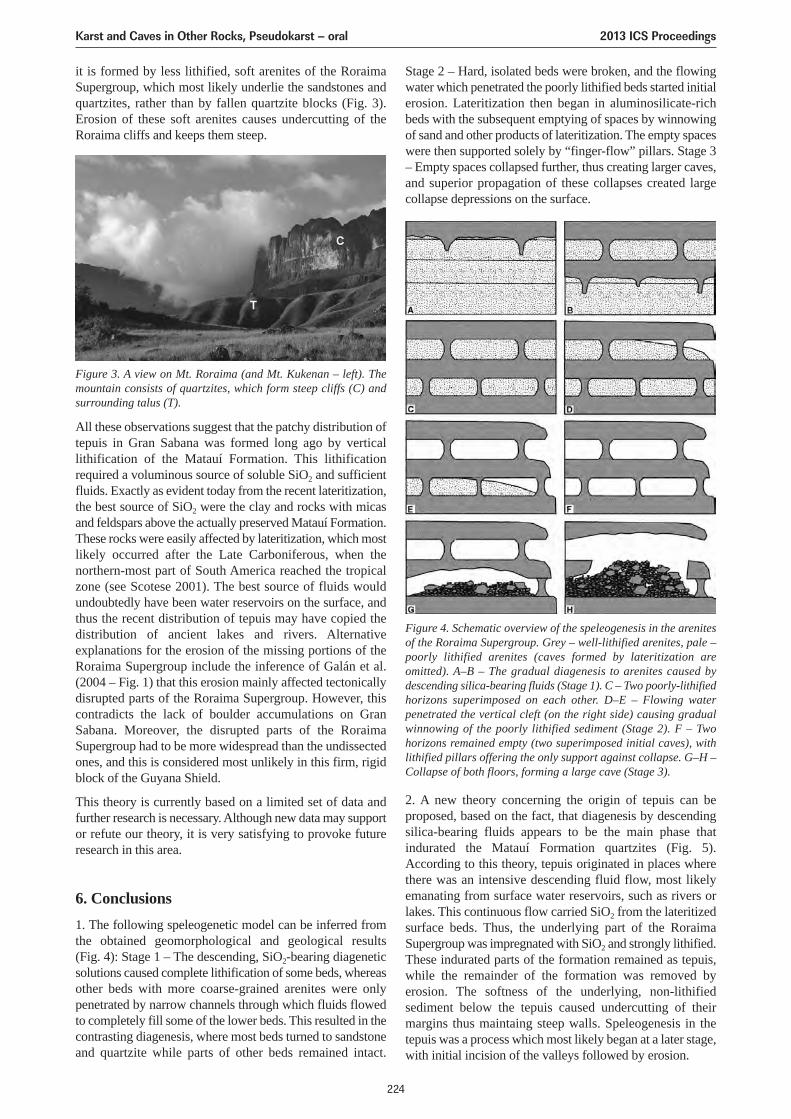
it is formed by less lithified, soft arenites of the RoraimaSupergroup, which most likely underlie the sandstones andquartzites, rather than by fallen quartzite blocks (Fig. 3).Erosion of these soft arenites causes undercutting of theRoraima cliffs and keeps them steep.
Stage 2 – Hard, isolated beds were broken, and the flowingwater which penetrated the poorly lithified beds started initialerosion. Lateritization then began in aluminosilicate-richbeds with the subsequent emptying of spaces by winnowingof sand and other products of lateritization. The empty spaceswere then supported solely by “finger-flow” pillars. Stage 3– Empty spaces collapsed further, thus creating larger caves,and superior propagation of these collapses created largecollapse depressions on the surface.
Figure 3. A view on Mt. Roraima (and Mt. Kukenan – left). Themountain consists of quartzites, which form steep cliffs (C) andsurrounding talus (T).
Figure 4. Schematic overview of the speleogenesis in the arenitesof the Roraima Supergroup. Grey – well-lithified arenites, pale –poorly lithified arenites (caves formed by lateritization areomitted). A–B – The gradual diagenesis to arenites caused bydescending silica-bearing fluids (Stage 1). C – Two poorly-lithifiedhorizons superimposed on each other. D–E – Flowing waterpenetrated the vertical cleft (on the right side) causing gradualwinnowing of the poorly lithified sediment (Stage 2). F – Twohorizons remained empty (two superimposed initial caves), withlithified pillars offering the only support against collapse. G–H –Collapse of both floors, forming a large cave (Stage 3).
All these observations suggest that the patchy distribution oftepuis in Gran Sabana was formed long ago by verticallithification of the Matauí Formation. This lithificationrequired a voluminous source of soluble SiO2 and sufficientfluids. Exactly as evident today from the recent lateritization,the best source of SiO2 were the clay and rocks with micasand feldspars above the actually preserved Matauí Formation.These rocks were easily affected by lateritization, which mostlikely occurred after the Late Carboniferous, when thenorthern-most part of South America reached the tropicalzone (see Scotese 2001). The best source of fluids wouldundoubtedly have been water reservoirs on the surface, andthus the recent distribution of tepuis may have copied thedistribution of ancient lakes and rivers. Alternativeexplanations for the erosion of the missing portions of theRoraima Supergroup include the inference of Galán et al.(2004 – Fig. 1) that this erosion mainly affected tectonicallydisrupted parts of the Roraima Supergroup. However, thiscontradicts the lack of boulder accumulations on GranSabana. Moreover, the disrupted parts of the RoraimaSupergroup had to be more widespread than the undissectedones, and this is considered most unlikely in this firm, rigidblock of the Guyana Shield.
This theory is currently based on a limited set of data andfurther research is necessary. Although new data may supportor refute our theory, it is very satisfying to provoke futureresearch in this area.
6. Conclusions1. The following speleogenetic model can be inferred fromthe obtained geomorphological and geological results(Fig. 4): Stage 1 – The descending, SiO2-bearing diageneticsolutions caused complete lithification of some beds, whereasother beds with more coarse-grained arenites were onlypenetrated by narrow channels through which fluids flowedto completely fill some of the lower beds. This resulted in thecontrasting diagenesis, where most beds turned to sandstoneand quartzite while parts of other beds remained intact.
2. A new theory concerning the origin of tepuis can beproposed, based on the fact, that diagenesis by descendingsilica-bearing fluids appears to be the main phase thatindurated the Matauí Formation quartzites (Fig. 5).According to this theory, tepuis originated in places wherethere was an intensive descending fluid flow, most likelyemanating from surface water reservoirs, such as rivers orlakes. This continuous flow carried SiO2 from the lateritizedsurface beds. Thus, the underlying part of the RoraimaSupergroup was impregnated with SiO2 and strongly lithified.These indurated parts of the formation remained as tepuis,while the remainder of the formation was removed byerosion. The softness of the underlying, non-lithifiedsediment below the tepuis caused undercutting of theirmargins thus maintaing steep walls. Speleogenesis in thetepuis was a process which most likely began at a later stage,with initial incision of the valleys followed by erosion.
Karst and Caves in Other Rocks, Pseudokarst – oral 2013 ICS Proceedings
224
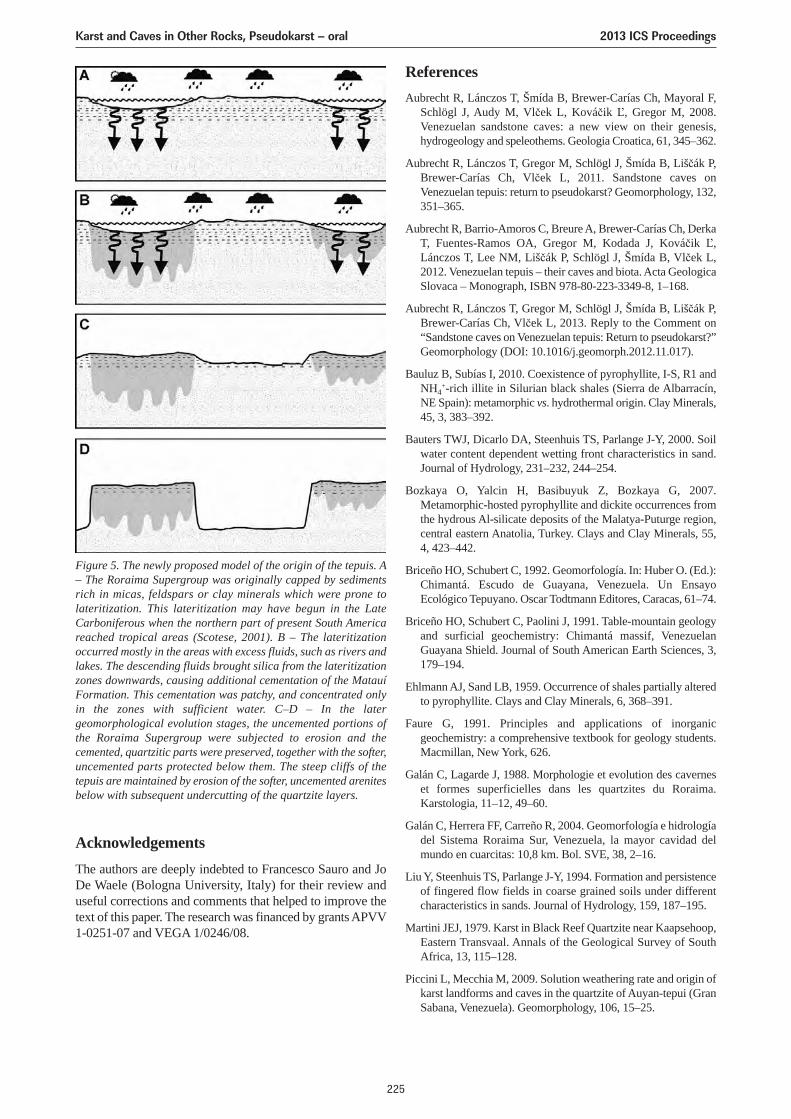
AcknowledgementsThe authors are deeply indebted to Francesco Sauro and JoDe Waele (Bologna University, Italy) for their review anduseful corrections and comments that helped to improve thetext of this paper. The research was financed by grants APVV1-0251-07 and VEGA 1/0246/08.
ReferencesAubrecht R, Lánczos T, Šmída B, Brewer-Carías Ch, Mayoral F,
Schlögl J, Audy M, Vlček L, Kováčik Ľ, Gregor M, 2008.Venezuelan sandstone caves: a new view on their genesis,hydrogeology and speleothems. Geologia Croatica, 61, 345–362.
Aubrecht R, Lánczos T, Gregor M, Schlögl J, Šmída B, Liščák P,Brewer-Carías Ch, Vlček L, 2011. Sandstone caves onVenezuelan tepuis: return to pseudokarst? Geomorphology, 132,351–365.
Aubrecht R, Barrio-Amoros C, Breure A, Brewer-Carías Ch, DerkaT, Fuentes-Ramos OA, Gregor M, Kodada J, Kováčik Ľ,Lánczos T, Lee NM, Liščák P, Schlögl J, Šmída B, Vlček L,2012. Venezuelan tepuis – their caves and biota. Acta GeologicaSlovaca – Monograph, ISBN 978-80-223-3349-8, 1–168.
Aubrecht R, Lánczos T, Gregor M, Schlögl J, Šmída B, Liščák P,Brewer-Carías Ch, Vlček L, 2013. Reply to the Comment on“Sandstone caves on Venezuelan tepuis: Return to pseudokarst?”Geomorphology (DOI: 10.1016/j.geomorph.2012.11.017).
Bauluz B, Subías I, 2010. Coexistence of pyrophyllite, I-S, R1 andNH4
+-rich illite in Silurian black shales (Sierra de Albarracín,NE Spain): metamorphic vs. hydrothermal origin. Clay Minerals,45, 3, 383–392.
Bauters TWJ, Dicarlo DA, Steenhuis TS, Parlange J-Y, 2000. Soilwater content dependent wetting front characteristics in sand.Journal of Hydrology, 231–232, 244–254.
Bozkaya O, Yalcin H, Basibuyuk Z, Bozkaya G, 2007.Metamorphic-hosted pyrophyllite and dickite occurrences fromthe hydrous Al-silicate deposits of the Malatya-Puturge region,central eastern Anatolia, Turkey. Clays and Clay Minerals, 55,4, 423–442.
Briceño HO, Schubert C, 1992. Geomorfología. In: Huber O. (Ed.):Chimantá. Escudo de Guayana, Venezuela. Un EnsayoEcológico Tepuyano. Oscar Todtmann Editores, Caracas, 61–74.
Briceño HO, Schubert C, Paolini J, 1991. Table-mountain geologyand surficial geochemistry: Chimantá massif, VenezuelanGuayana Shield. Journal of South American Earth Sciences, 3,179–194.
Ehlmann AJ, Sand LB, 1959. Occurrence of shales partially alteredto pyrophyllite. Clays and Clay Minerals, 6, 368–391.
Faure G, 1991. Principles and applications of inorganicgeochemistry: a comprehensive textbook for geology students.Macmillan, New York, 626.
Galán C, Lagarde J, 1988. Morphologie et evolution des caverneset formes superficielles dans les quartzites du Roraima.Karstologia, 11–12, 49–60.
Galán C, Herrera FF, Carreño R, 2004. Geomorfología e hidrologíadel Sistema Roraima Sur, Venezuela, la mayor cavidad delmundo en cuarcitas: 10,8 km. Bol. SVE, 38, 2–16.
Liu Y, Steenhuis TS, Parlange J-Y, 1994. Formation and persistenceof fingered flow fields in coarse grained soils under differentcharacteristics in sands. Journal of Hydrology, 159, 187–195.
Martini JEJ, 1979. Karst in Black Reef Quartzite near Kaapsehoop,Eastern Transvaal. Annals of the Geological Survey of SouthAfrica, 13, 115–128.
Piccini L, Mecchia M, 2009. Solution weathering rate and origin ofkarst landforms and caves in the quartzite of Auyan-tepui (GranSabana, Venezuela). Geomorphology, 106, 15–25.
Figure 5. The newly proposed model of the origin of the tepuis. A– The Roraima Supergroup was originally capped by sedimentsrich in micas, feldspars or clay minerals which were prone tolateritization. This lateritization may have begun in the LateCarboniferous when the northern part of present South Americareached tropical areas (Scotese, 2001). B – The lateritizationoccurred mostly in the areas with excess fluids, such as rivers andlakes. The descending fluids brought silica from the lateritizationzones downwards, causing additional cementation of the MatauíFormation. This cementation was patchy, and concentrated onlyin the zones with sufficient water. C–D – In the latergeomorphological evolution stages, the uncemented portions ofthe Roraima Supergroup were subjected to erosion and thecemented, quartzitic parts were preserved, together with the softer,uncemented parts protected below them. The steep cliffs of thetepuis are maintained by erosion of the softer, uncemented arenitesbelow with subsequent undercutting of the quartzite layers.
Karst and Caves in Other Rocks, Pseudokarst – oral 2013 ICS Proceedings
225

Reis NJ, Yánez G, 2001. O Supergrupo Roraima ao longo da faixafronteirica entre Brazil-Venezuela (Santa Elena del Uairen-Roraima Mountain). In Reis N.J. & Monteiro M.A.S. (Eds.):Contribuicao a geologia da Amazonia, Vol. 2: Manaus, Brazil,Soc. Brasil. Geol. 113–145.
Santos JOS, Potter PE, Reis NJ, Hartmann LA, Fletcher IR,McNaughton NJ, 2003. Age, source, and regional stratigraphyof the Roraima Supergroup and Roraima-like outliers in northernSouth America based on U-Pb geochronology. GeologicalSociety of America Bulletin, 115, 331–348.
Sauro F, Piccini L, Mecchia M, De Waele J, 2012. Comment on“Sandstone caves on Venezuelan tepuis: Return to pseudokarst?”by R. Aubrecht, T. Lánczos, M. Gregor, J. Schlögl, B. Smída, P.Liscák, Ch. Brewer-Carías, L. Vlcek. Geomorphology 132,351–365. Geomorphology.
Scotese CR, 2001. Atlas of Earth History. PALEOMAP Project,Arlington, Texas, 1–52.
Young RW, Wray RAL, Young ARM, 2009. Sandstone landforms.Cambridge University Press, 1–304.
Karst and Caves in Other Rocks, Pseudokarst – oral 2013 ICS Proceedings
226
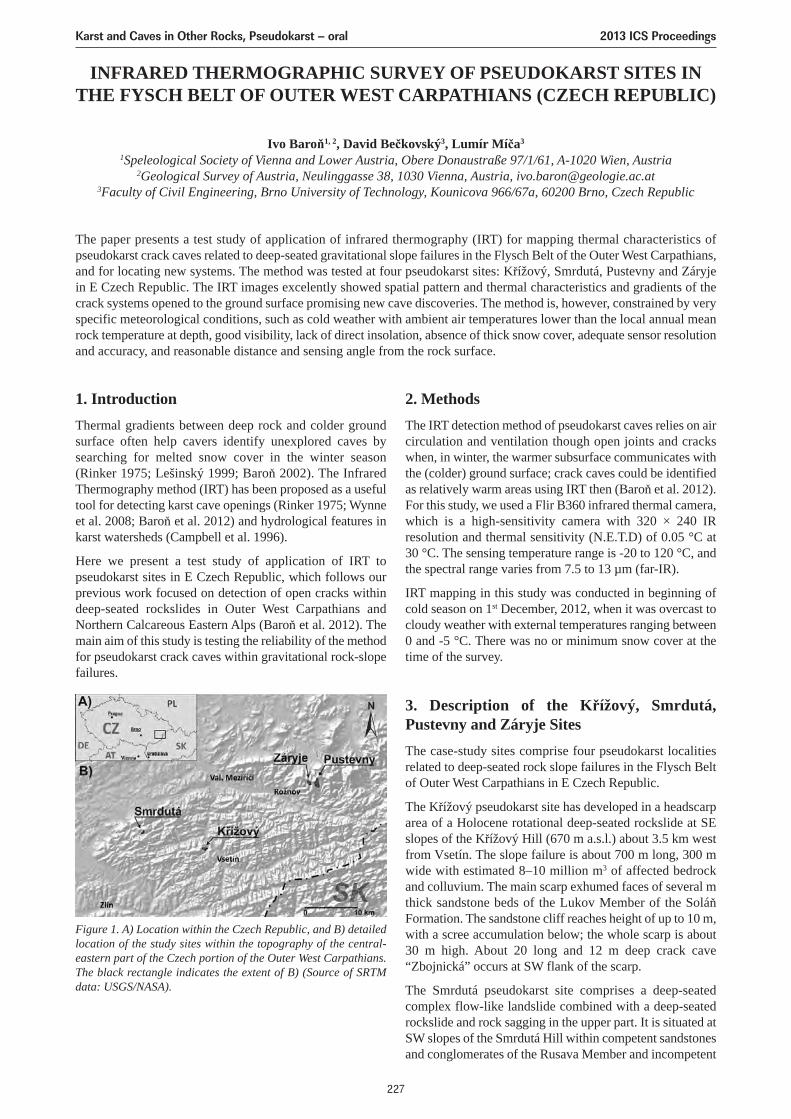
INFRARED THERMOGRAPHIC SURVEY OF PSEUDOKARST SITES INTHE FYSCH BELT OF OUTER WEST CARPATHIANS (CZECH REPUBLIC)
Ivo Baroň1, 2, David Bečkovský3, Lumír Míča3
1Speleological Society of Vienna and Lower Austria, Obere Donaustraße 97/1/61, A-1020 Wien, Austria2Geological Survey of Austria, Neulinggasse 38, 1030 Vienna, Austria, [email protected]
3Faculty of Civil Engineering, Brno University of Technology, Kounicova 966/67a, 60200 Brno, Czech Republic
The paper presents a test study of application of infrared thermography (IRT) for mapping thermal characteristics ofpseudokarst crack caves related to deep-seated gravitational slope failures in the Flysch Belt of the Outer West Carpathians,and for locating new systems. The method was tested at four pseudokarst sites: Křížový, Smrdutá, Pustevny and Záryjein E Czech Republic. The IRT images excelently showed spatial pattern and thermal characteristics and gradients of thecrack systems opened to the ground surface promising new cave discoveries. The method is, however, constrained by veryspecific meteorological conditions, such as cold weather with ambient air temperatures lower than the local annual meanrock temperature at depth, good visibility, lack of direct insolation, absence of thick snow cover, adequate sensor resolutionand accuracy, and reasonable distance and sensing angle from the rock surface.
1. IntroductionThermal gradients between deep rock and colder groundsurface often help cavers identify unexplored caves bysearching for melted snow cover in the winter season(Rinker 1975; Lešinský 1999; Baroň 2002). The InfraredThermography method (IRT) has been proposed as a usefultool for detecting karst cave openings (Rinker 1975; Wynneet al. 2008; Baroň et al. 2012) and hydrological features inkarst watersheds (Campbell et al. 1996).
Here we present a test study of application of IRT topseudokarst sites in E Czech Republic, which follows ourprevious work focused on detection of open cracks withindeep-seated rockslides in Outer West Carpathians andNorthern Calcareous Eastern Alps (Baroň et al. 2012). Themain aim of this study is testing the reliability of the methodfor pseudokarst crack caves within gravitational rock-slopefailures.
2. MethodsThe IRT detection method of pseudokarst caves relies on aircirculation and ventilation though open joints and crackswhen, in winter, the warmer subsurface communicates withthe (colder) ground surface; crack caves could be identifiedas relatively warm areas using IRT then (Baroň et al. 2012).For this study, we used a Flir B360 infrared thermal camera,which is a high-sensitivity camera with 320 × 240 IRresolution and thermal sensitivity (N.E.T.D) of 0.05 °C at30 °C. The sensing temperature range is -20 to 120 °C, andthe spectral range varies from 7.5 to 13 µm (far-IR).
IRT mapping in this study was conducted in beginning ofcold season on 1st December, 2012, when it was overcast tocloudy weather with external temperatures ranging between0 and -5 °C. There was no or minimum snow cover at thetime of the survey.
3. Description of the Křížový, Smrdutá,Pustevny and Záryje SitesThe case-study sites comprise four pseudokarst localitiesrelated to deep-seated rock slope failures in the Flysch Beltof Outer West Carpathians in E Czech Republic.
The Křížový pseudokarst site has developed in a headscarparea of a Holocene rotational deep-seated rockslide at SEslopes of the Křížový Hill (670 m a.s.l.) about 3.5 km westfrom Vsetín. The slope failure is about 700 m long, 300 mwide with estimated 8–10 million m3 of affected bedrockand colluvium. The main scarp exhumed faces of several mthick sandstone beds of the Lukov Member of the SoláňFormation. The sandstone cliff reaches height of up to 10 m,with a scree accumulation below; the whole scarp is about30 m high. About 20 long and 12 m deep crack cave“Zbojnická” occurs at SW flank of the scarp.
The Smrdutá pseudokarst site comprises a deep-seatedcomplex flow-like landslide combined with a deep-seatedrockslide and rock sagging in the upper part. It is situated atSW slopes of the Smrdutá Hill within competent sandstonesand conglomerates of the Rusava Member and incompetent
Figure 1. A) Location within the Czech Republic, and B) detailedlocation of the study sites within the topography of the central-eastern part of the Czech portion of the Outer West Carpathians.The black rectangle indicates the extent of B) (Source of SRTMdata: USGS/NASA).
Karst and Caves in Other Rocks, Pseudokarst – oral 2013 ICS Proceedings
227
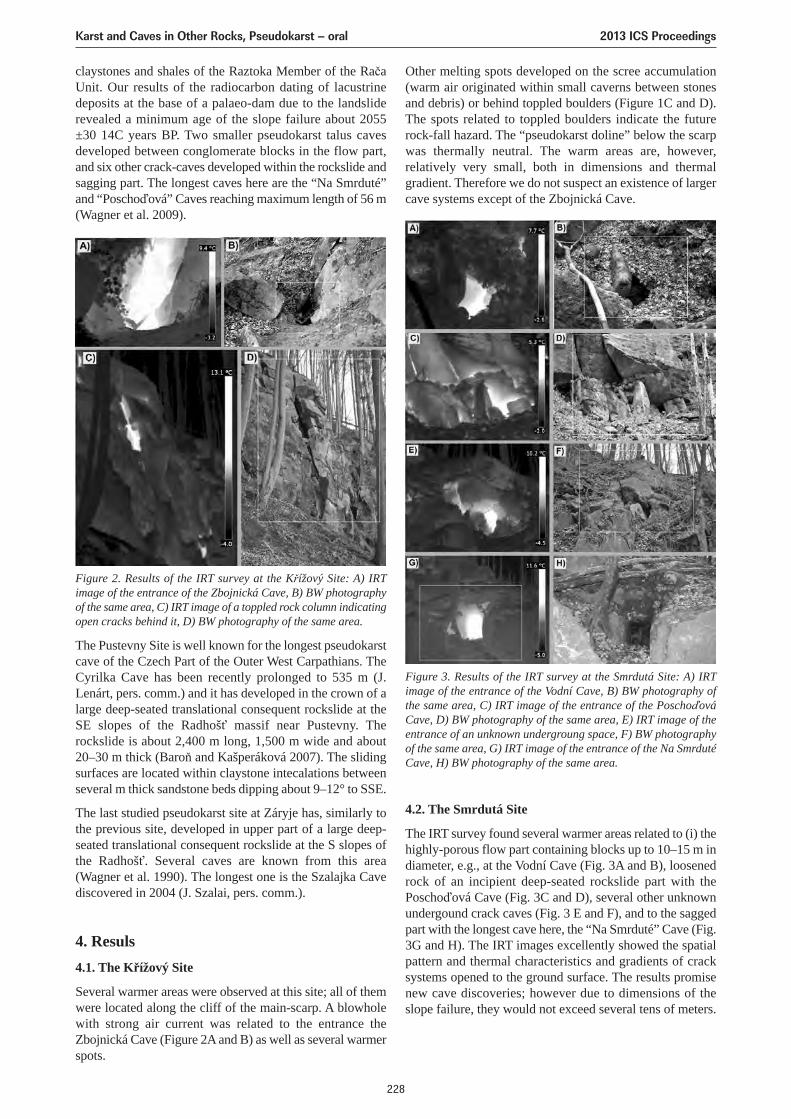
claystones and shales of the Raztoka Member of the RačaUnit. Our results of the radiocarbon dating of lacustrinedeposits at the base of a palaeo-dam due to the landsliderevealed a minimum age of the slope failure about 2055±30 14C years BP. Two smaller pseudokarst talus cavesdeveloped between conglomerate blocks in the flow part,and six other crack-caves developed within the rockslide andsagging part. The longest caves here are the “Na Smrduté”and “Poschoďová” Caves reaching maximum length of 56 m(Wagner et al. 2009).
Other melting spots developed on the scree accumulation(warm air originated within small caverns between stonesand debris) or behind toppled boulders (Figure 1C and D).The spots related to toppled boulders indicate the futurerock-fall hazard. The “pseudokarst doline” below the scarpwas thermally neutral. The warm areas are, however,relatively very small, both in dimensions and thermalgradient. Therefore we do not suspect an existence of largercave systems except of the Zbojnická Cave.
Figure 2. Results of the IRT survey at the Křížový Site: A) IRTimage of the entrance of the Zbojnická Cave, B) BW photographyof the same area, C) IRT image of a toppled rock column indicatingopen cracks behind it, D) BW photography of the same area.
Figure 3. Results of the IRT survey at the Smrdutá Site: A) IRTimage of the entrance of the Vodní Cave, B) BW photography ofthe same area, C) IRT image of the entrance of the PoschoďováCave, D) BW photography of the same area, E) IRT image of theentrance of an unknown undergroung space, F) BW photographyof the same area, G) IRT image of the entrance of the Na SmrdutéCave, H) BW photography of the same area.
The Pustevny Site is well known for the longest pseudokarstcave of the Czech Part of the Outer West Carpathians. TheCyrilka Cave has been recently prolonged to 535 m (J.Lenárt, pers. comm.) and it has developed in the crown of alarge deep-seated translational consequent rockslide at theSE slopes of the Radhošť massif near Pustevny. Therockslide is about 2,400 m long, 1,500 m wide and about20–30 m thick (Baroň and Kašperáková 2007). The slidingsurfaces are located within claystone intecalations betweenseveral m thick sandstone beds dipping about 9–12° to SSE.
The last studied pseudokarst site at Záryje has, similarly tothe previous site, developed in upper part of a large deep-seated translational consequent rockslide at the S slopes ofthe Radhošť. Several caves are known from this area(Wagner et al. 1990). The longest one is the Szalajka Cavediscovered in 2004 (J. Szalai, pers. comm.).
4. Resuls4.1. The Křížový Site
Several warmer areas were observed at this site; all of themwere located along the cliff of the main-scarp. A blowholewith strong air current was related to the entrance theZbojnická Cave (Figure 2A and B) as well as several warmerspots.
4.2. The Smrdutá Site
The IRT survey found several warmer areas related to (i) thehighly-porous flow part containing blocks up to 10–15 m indiameter, e.g., at the Vodní Cave (Fig. 3A and B), loosenedrock of an incipient deep-seated rockslide part with thePoschoďová Cave (Fig. 3C and D), several other unknownundergound crack caves (Fig. 3 E and F), and to the saggedpart with the longest cave here, the “Na Smrduté” Cave (Fig.3G and H). The IRT images excellently showed the spatialpattern and thermal characteristics and gradients of cracksystems opened to the ground surface. The results promisenew cave discoveries; however due to dimensions of theslope failure, they would not exceed several tens of meters.
Karst and Caves in Other Rocks, Pseudokarst – oral 2013 ICS Proceedings
228
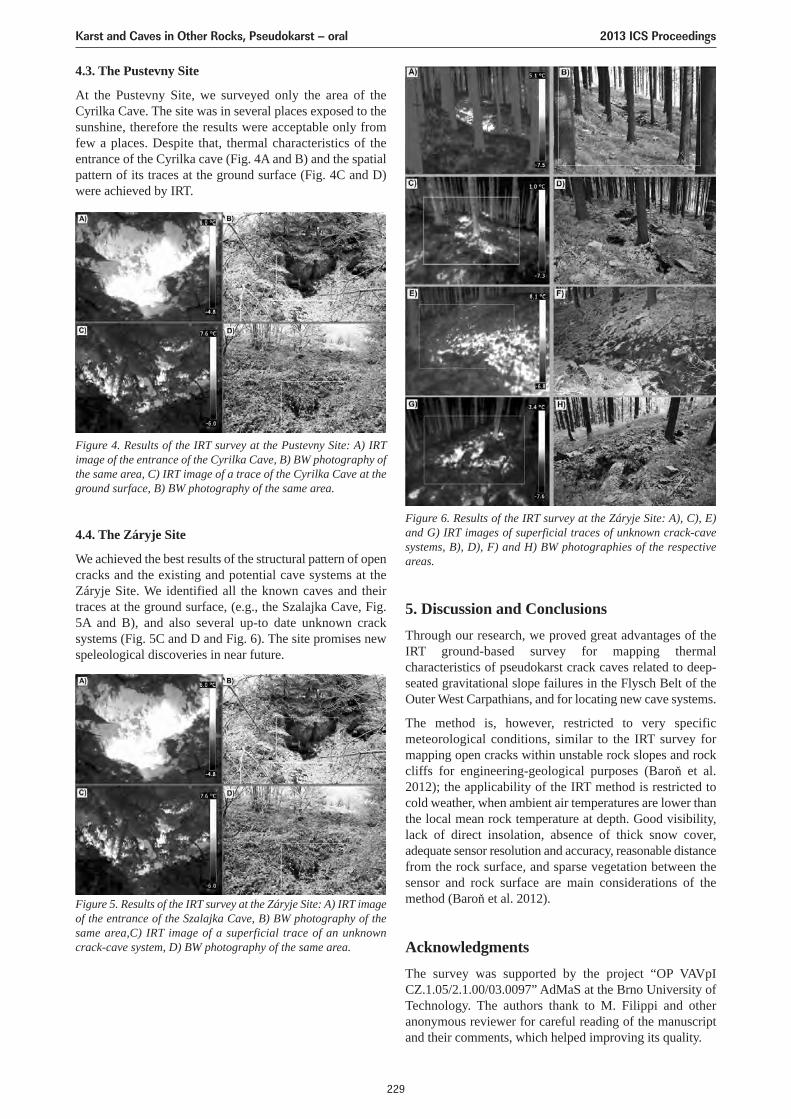
4.3. The Pustevny Site
At the Pustevny Site, we surveyed only the area of theCyrilka Cave. The site was in several places exposed to thesunshine, therefore the results were acceptable only fromfew a places. Despite that, thermal characteristics of theentrance of the Cyrilka cave (Fig. 4A and B) and the spatialpattern of its traces at the ground surface (Fig. 4C and D)were achieved by IRT.
5. Discussion and ConclusionsThrough our research, we proved great advantages of theIRT ground-based survey for mapping thermalcharacteristics of pseudokarst crack caves related to deep-seated gravitational slope failures in the Flysch Belt of theOuter West Carpathians, and for locating new cave systems.
The method is, however, restricted to very specificmeteorological conditions, similar to the IRT survey formapping open cracks within unstable rock slopes and rockcliffs for engineering-geological purposes (Baroň et al.2012); the applicability of the IRT method is restricted tocold weather, when ambient air temperatures are lower thanthe local mean rock temperature at depth. Good visibility,lack of direct insolation, absence of thick snow cover,adequate sensor resolution and accuracy, reasonable distancefrom the rock surface, and sparse vegetation between thesensor and rock surface are main considerations of themethod (Baroň et al. 2012).
AcknowledgmentsThe survey was supported by the project “OP VAVpICZ.1.05/2.1.00/03.0097” AdMaS at the Brno University ofTechnology. The authors thank to M. Filippi and otheranonymous reviewer for careful reading of the manuscriptand their comments, which helped improving its quality.
Figure 4. Results of the IRT survey at the Pustevny Site: A) IRTimage of the entrance of the Cyrilka Cave, B) BW photography ofthe same area, C) IRT image of a trace of the Cyrilka Cave at theground surface, B) BW photography of the same area.
Figure 5. Results of the IRT survey at the Záryje Site: A) IRT imageof the entrance of the Szalajka Cave, B) BW photography of thesame area,C) IRT image of a superficial trace of an unknowncrack-cave system, D) BW photography of the same area.
Figure 6. Results of the IRT survey at the Záryje Site: A), C), E)and G) IRT images of superficial traces of unknown crack-cavesystems, B), D), F) and H) BW photographies of the respectiveareas.
4.4. The Záryje Site
We achieved the best results of the structural pattern of opencracks and the existing and potential cave systems at theZáryje Site. We identified all the known caves and theirtraces at the ground surface, (e.g., the Szalajka Cave, Fig.5A and B), and also several up-to date unknown cracksystems (Fig. 5C and D and Fig. 6). The site promises newspeleological discoveries in near future.
Karst and Caves in Other Rocks, Pseudokarst – oral 2013 ICS Proceedings
229

ReferencesBaroň I, 2002. Location of underground spaces in selected slope
deformations by observations of melted snow and ventaroles(in Czech). Speleofórum 21, 64–66.
Baroň I, Bečkovský D, Míča L, 2012. Application of infraredthermography for mapping open fractures in deep-seatedrockslides and unstable cliffs. Landslides, Springer Verlag. DOI10.1007/s10346-012-0367-z.
Baroň I, Kašperáková D, 2007. Numerical analysis of SilesianNappe gravitational disintegration by means of FDM (Casestudy: Radhošť-Pustevny). Zprávy o geologických výzkumechv roce 2006, 49–52, Czech Geological Survey, Prague (inCzech).
Campbell CW, Abd El Latif M, Foster JW, 1996. Application ofThermography to Karst Hydrology. Journal of Cave and KarstStudies 58(3), 163–167.
Lešinský G, 1999. Comments to caving in winter season withfocus on observing melted spots and ventaroles. Spravodaj SSS1999 (4), 32–33. Liptovský Mikuláš (in Slovak).
Rinker JN, 1975. Airborne infrared thermal detection of caves andcrevasses. Photogrammetric engineering and remote sensing41, 1391–1400.
Wagner J, Demek J, Stráník Z, 1990. Caves of the Moravian-Silesian Beskids and Surrounding. Knihovna ČSS 17: 1–130.Praha.
Wagner J, Baroň I, Bezděčka P, 2009. Pseudokarst caves of theflysch belt of the Outer West Carpathians. In Hromas J. et al.(Eds.), Protected Areas of the Czech Republic, Volume XIV:Caves, Praha – Brno, 536–546 (in Czech).
Wynne JJ, Titus TN, Diaz GCh, 2008. On developing thermal cavedetection techniques for earth, the moon and mars. Earth andPlanetary Science Letters 272, 240–250.
Karst and Caves in Other Rocks, Pseudokarst – oral 2013 ICS Proceedings
230
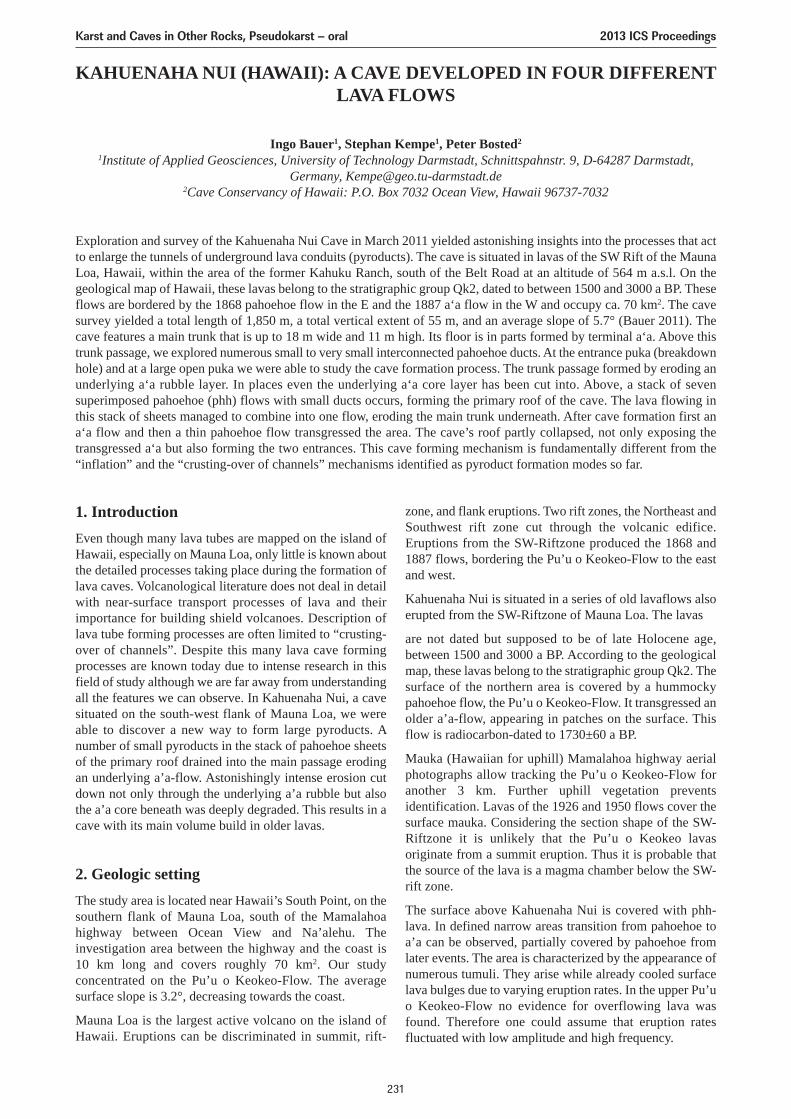
KAHUENAHA NUI (HAWAII): A CAVE DEVELOPED IN FOUR DIFFERENTLAVA FLOWS
Ingo Bauer1, Stephan Kempe1, Peter Bosted2
1Institute of Applied Geosciences, University of Technology Darmstadt, Schnittspahnstr. 9, D-64287 Darmstadt,Germany, [email protected]
2Cave Conservancy of Hawaii: P.O. Box 7032 Ocean View, Hawaii 96737-7032
Exploration and survey of the Kahuenaha Nui Cave in March 2011 yielded astonishing insights into the processes that actto enlarge the tunnels of underground lava conduits (pyroducts). The cave is situated in lavas of the SW Rift of the MaunaLoa, Hawaii, within the area of the former Kahuku Ranch, south of the Belt Road at an altitude of 564 m a.s.l. On thegeological map of Hawaii, these lavas belong to the stratigraphic group Qk2, dated to between 1500 and 3000 a BP. Theseflows are bordered by the 1868 pahoehoe flow in the E and the 1887 a‘a flow in the W and occupy ca. 70 km2. The cavesurvey yielded a total length of 1,850 m, a total vertical extent of 55 m, and an average slope of 5.7° (Bauer 2011). Thecave features a main trunk that is up to 18 m wide and 11 m high. Its floor is in parts formed by terminal a‘a. Above thistrunk passage, we explored numerous small to very small interconnected pahoehoe ducts. At the entrance puka (breakdownhole) and at a large open puka we were able to study the cave formation process. The trunk passage formed by eroding anunderlying a‘a rubble layer. In places even the underlying a‘a core layer has been cut into. Above, a stack of sevensuperimposed pahoehoe (phh) flows with small ducts occurs, forming the primary roof of the cave. The lava flowing inthis stack of sheets managed to combine into one flow, eroding the main trunk underneath. After cave formation first ana‘a flow and then a thin pahoehoe flow transgressed the area. The cave’s roof partly collapsed, not only exposing thetransgressed a‘a but also forming the two entrances. This cave forming mechanism is fundamentally different from the“inflation” and the “crusting-over of channels” mechanisms identified as pyroduct formation modes so far.
1. IntroductionEven though many lava tubes are mapped on the island ofHawaii, especially on Mauna Loa, only little is known aboutthe detailed processes taking place during the formation oflava caves. Volcanological literature does not deal in detailwith near-surface transport processes of lava and theirimportance for building shield volcanoes. Description oflava tube forming processes are often limited to “crusting-over of channels”. Despite this many lava cave formingprocesses are known today due to intense research in thisfield of study although we are far away from understandingall the features we can observe. In Kahuenaha Nui, a cavesituated on the south-west flank of Mauna Loa, we wereable to discover a new way to form large pyroducts. Anumber of small pyroducts in the stack of pahoehoe sheetsof the primary roof drained into the main passage erodingan underlying a’a-flow. Astonishingly intense erosion cutdown not only through the underlying a’a rubble but alsothe a’a core beneath was deeply degraded. This results in acave with its main volume build in older lavas.
2. Geologic settingThe study area is located near Hawaii’s South Point, on thesouthern flank of Mauna Loa, south of the Mamalahoahighway between Ocean View and Na’alehu. Theinvestigation area between the highway and the coast is10 km long and covers roughly 70 km2. Our studyconcentrated on the Pu’u o Keokeo-Flow. The averagesurface slope is 3.2°, decreasing towards the coast.
Mauna Loa is the largest active volcano on the island ofHawaii. Eruptions can be discriminated in summit, rift-
zone, and flank eruptions. Two rift zones, the Northeast andSouthwest rift zone cut through the volcanic edifice.Eruptions from the SW-Riftzone produced the 1868 and1887 flows, bordering the Pu’u o Keokeo-Flow to the eastand west.
Kahuenaha Nui is situated in a series of old lavaflows alsoerupted from the SW-Riftzone of Mauna Loa. The lavas
are not dated but supposed to be of late Holocene age,between 1500 and 3000 a BP. According to the geologicalmap, these lavas belong to the stratigraphic group Qk2. Thesurface of the northern area is covered by a hummockypahoehoe flow, the Pu’u o Keokeo-Flow. It transgressed anolder a’a-flow, appearing in patches on the surface. Thisflow is radiocarbon-dated to 1730±60 a BP.
Mauka (Hawaiian for uphill) Mamalahoa highway aerialphotographs allow tracking the Pu’u o Keokeo-Flow foranother 3 km. Further uphill vegetation preventsidentification. Lavas of the 1926 and 1950 flows cover thesurface mauka. Considering the section shape of the SW-Riftzone it is unlikely that the Pu’u o Keokeo lavasoriginate from a summit eruption. Thus it is probable thatthe source of the lava is a magma chamber below the SW-rift zone.
The surface above Kahuenaha Nui is covered with phh-lava. In defined narrow areas transition from pahoehoe toa’a can be observed, partially covered by pahoehoe fromlater events. The area is characterized by the appearance ofnumerous tumuli. They arise while already cooled surfacelava bulges due to varying eruption rates. In the upper Pu’uo Keokeo-Flow no evidence for overflowing lava wasfound. Therefore one could assume that eruption ratesfluctuated with low amplitude and high frequency.
Karst and Caves in Other Rocks, Pseudokarst – oral 2013 ICS Proceedings
231
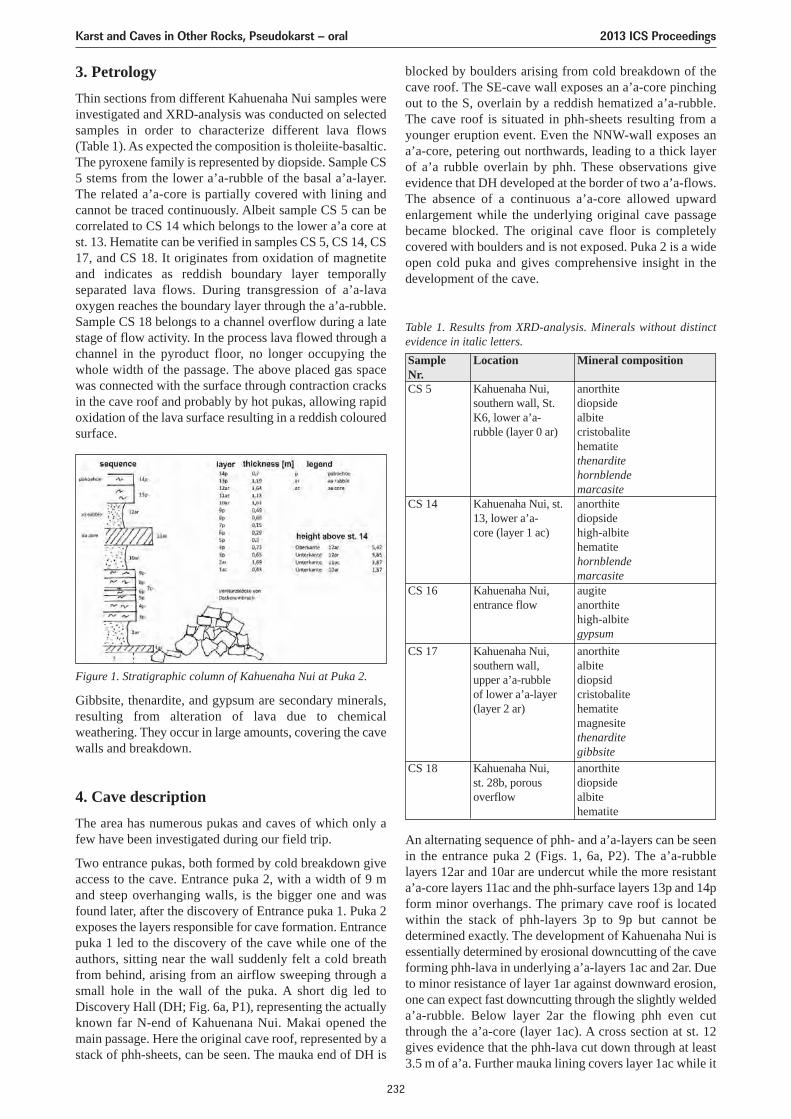
3. PetrologyThin sections from different Kahuenaha Nui samples wereinvestigated and XRD-analysis was conducted on selectedsamples in order to characterize different lava flows(Table 1). As expected the composition is tholeiite-basaltic.The pyroxene family is represented by diopside. Sample CS5 stems from the lower a’a-rubble of the basal a’a-layer.The related a’a-core is partially covered with lining andcannot be traced continuously. Albeit sample CS 5 can becorrelated to CS 14 which belongs to the lower a’a core atst. 13. Hematite can be verified in samples CS 5, CS 14, CS17, and CS 18. It originates from oxidation of magnetiteand indicates as reddish boundary layer temporallyseparated lava flows. During transgression of a’a-lavaoxygen reaches the boundary layer through the a’a-rubble.Sample CS 18 belongs to a channel overflow during a latestage of flow activity. In the process lava flowed through achannel in the pyroduct floor, no longer occupying thewhole width of the passage. The above placed gas spacewas connected with the surface through contraction cracksin the cave roof and probably by hot pukas, allowing rapidoxidation of the lava surface resulting in a reddish colouredsurface.
blocked by boulders arising from cold breakdown of thecave roof. The SE-cave wall exposes an a’a-core pinchingout to the S, overlain by a reddish hematized a’a-rubble.The cave roof is situated in phh-sheets resulting from ayounger eruption event. Even the NNW-wall exposes ana’a-core, petering out northwards, leading to a thick layerof a’a rubble overlain by phh. These observations giveevidence that DH developed at the border of two a’a-flows.The absence of a continuous a’a-core allowed upwardenlargement while the underlying original cave passagebecame blocked. The original cave floor is completelycovered with boulders and is not exposed. Puka 2 is a wideopen cold puka and gives comprehensive insight in thedevelopment of the cave.
Figure 1. Stratigraphic column of Kahuenaha Nui at Puka 2.
Gibbsite, thenardite, and gypsum are secondary minerals,resulting from alteration of lava due to chemicalweathering. They occur in large amounts, covering the cavewalls and breakdown.
4. Cave descriptionThe area has numerous pukas and caves of which only afew have been investigated during our field trip.
Two entrance pukas, both formed by cold breakdown giveaccess to the cave. Entrance puka 2, with a width of 9 mand steep overhanging walls, is the bigger one and wasfound later, after the discovery of Entrance puka 1. Puka 2exposes the layers responsible for cave formation. Entrancepuka 1 led to the discovery of the cave while one of theauthors, sitting near the wall suddenly felt a cold breathfrom behind, arising from an airflow sweeping through asmall hole in the wall of the puka. A short dig led toDiscovery Hall (DH; Fig. 6a, P1), representing the actuallyknown far N-end of Kahuenana Nui. Makai opened themain passage. Here the original cave roof, represented by astack of phh-sheets, can be seen. The mauka end of DH is
Table 1. Results from XRD-analysis. Minerals without distinctevidence in italic letters.Sample Nr.
Location Mineral composition
CS 5 Kahuenaha Nui,southern wall, St.K6, lower a’a-rubble (layer 0 ar)
anorthitediopsidealbitecristobalitehematitethenarditehornblendemarcasite
CS 14 Kahuenaha Nui, st.13, lower a’a-core (layer 1 ac)
anorthitediopsidehigh-albitehematitehornblendemarcasite
CS 16 Kahuenaha Nui,entrance flow
augiteanorthitehigh-albitegypsum
CS 17 Kahuenaha Nui,southern wall,upper a’a-rubbleof lower a’a-layer(layer 2 ar)
anorthitealbitediopsidcristobalitehematitemagnesitethenarditegibbsite
CS 18 Kahuenaha Nui,st. 28b, porousoverflow
anorthitediopsidealbitehematite
An alternating sequence of phh- and a’a-layers can be seenin the entrance puka 2 (Figs. 1, 6a, P2). The a’a-rubblelayers 12ar and 10ar are undercut while the more resistanta’a-core layers 11ac and the phh-surface layers 13p and 14pform minor overhangs. The primary cave roof is locatedwithin the stack of phh-layers 3p to 9p but cannot bedetermined exactly. The development of Kahuenaha Nui isessentially determined by erosional downcutting of the caveforming phh-lava in underlying a’a-layers 1ac and 2ar. Dueto minor resistance of layer 1ar against downward erosion,one can expect fast downcutting through the slightly weldeda’a-rubble. Below layer 2ar the flowing phh even cutthrough the a’a-core (layer 1ac). A cross section at st. 12gives evidence that the phh-lava cut down through at least3.5 m of a’a. Further mauka lining covers layer 1ac while it
Karst and Caves in Other Rocks, Pseudokarst – oral 2013 ICS Proceedings
232
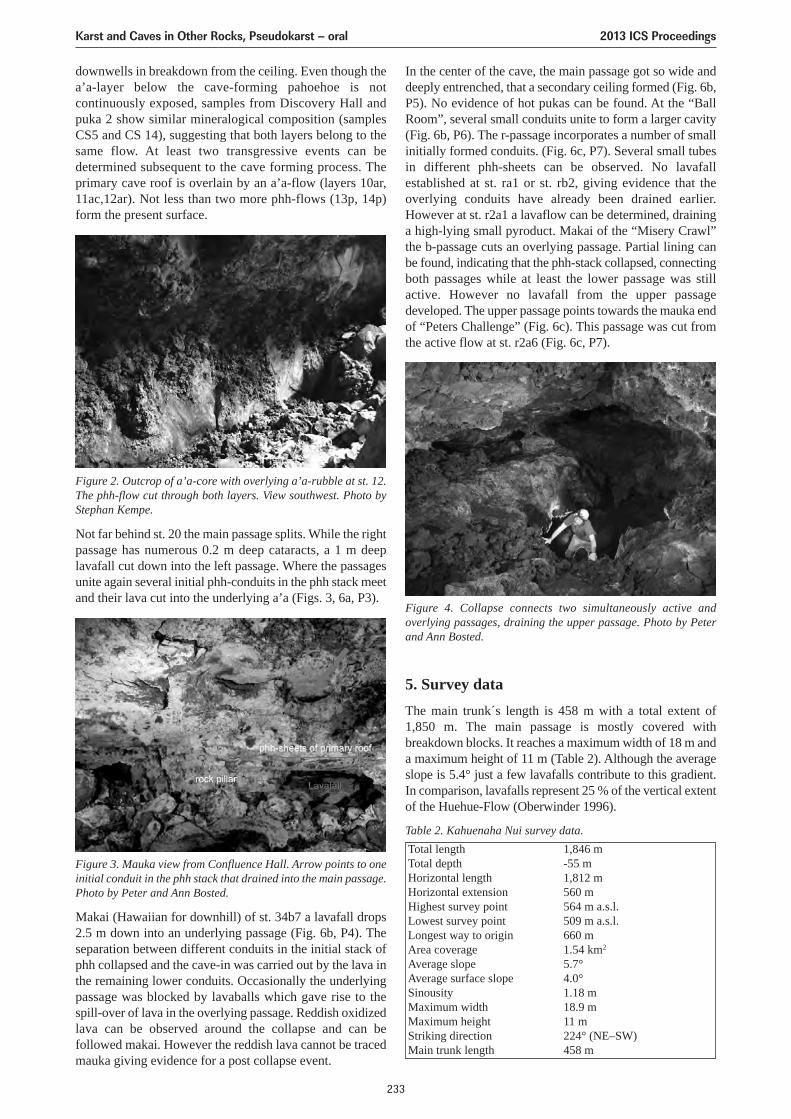
downwells in breakdown from the ceiling. Even though thea’a-layer below the cave-forming pahoehoe is notcontinuously exposed, samples from Discovery Hall andpuka 2 show similar mineralogical composition (samplesCS5 and CS 14), suggesting that both layers belong to thesame flow. At least two transgressive events can bedetermined subsequent to the cave forming process. Theprimary cave roof is overlain by an a’a-flow (layers 10ar,11ac,12ar). Not less than two more phh-flows (13p, 14p)form the present surface.
In the center of the cave, the main passage got so wide anddeeply entrenched, that a secondary ceiling formed (Fig. 6b,P5). No evidence of hot pukas can be found. At the “BallRoom”, several small conduits unite to form a larger cavity(Fig. 6b, P6). The r-passage incorporates a number of smallinitially formed conduits. (Fig. 6c, P7). Several small tubesin different phh-sheets can be observed. No lavafallestablished at st. ra1 or st. rb2, giving evidence that theoverlying conduits have already been drained earlier.However at st. r2a1 a lavaflow can be determined, draininga high-lying small pyroduct. Makai of the “Misery Crawl”the b-passage cuts an overlying passage. Partial lining canbe found, indicating that the phh-stack collapsed, connectingboth passages while at least the lower passage was stillactive. However no lavafall from the upper passagedeveloped. The upper passage points towards the mauka endof “Peters Challenge” (Fig. 6c). This passage was cut fromthe active flow at st. r2a6 (Fig. 6c, P7).
Figure 2. Outcrop of a’a-core with overlying a’a-rubble at st. 12.The phh-flow cut through both layers. View southwest. Photo byStephan Kempe.
Figure 3. Mauka view from Confluence Hall. Arrow points to oneinitial conduit in the phh stack that drained into the main passage.Photo by Peter and Ann Bosted.
Figure 4. Collapse connects two simultaneously active andoverlying passages, draining the upper passage. Photo by Peterand Ann Bosted.
Not far behind st. 20 the main passage splits. While the rightpassage has numerous 0.2 m deep cataracts, a 1 m deeplavafall cut down into the left passage. Where the passagesunite again several initial phh-conduits in the phh stack meetand their lava cut into the underlying a’a (Figs. 3, 6a, P3).
Makai (Hawaiian for downhill) of st. 34b7 a lavafall drops2.5 m down into an underlying passage (Fig. 6b, P4). Theseparation between different conduits in the initial stack ofphh collapsed and the cave-in was carried out by the lava inthe remaining lower conduits. Occasionally the underlyingpassage was blocked by lavaballs which gave rise to thespill-over of lava in the overlying passage. Reddish oxidizedlava can be observed around the collapse and can befollowed makai. However the reddish lava cannot be tracedmauka giving evidence for a post collapse event.
5. Survey dataThe main trunk´s length is 458 m with a total extent of1,850 m. The main passage is mostly covered withbreakdown blocks. It reaches a maximum width of 18 m anda maximum height of 11 m (Table 2). Although the averageslope is 5.4° just a few lavafalls contribute to this gradient.In comparison, lavafalls represent 25 % of the vertical extentof the Huehue-Flow (Oberwinder 1996).
Total lengthTotal depthHorizontal lengthHorizontal extensionHighest survey pointLowest survey pointLongest way to originArea coverageAverage slopeAverage surface slopeSinousityMaximum widthMaximum heightStriking directionMain trunk length
1,846 m-55 m1,812 m560 m564 m a.s.l.509 m a.s.l.660 m1.54 km2
5.7°4.0°1.18 m18.9 m11 m224° (NE–SW)458 m
Table 2. Kahuenaha Nui survey data.
Karst and Caves in Other Rocks, Pseudokarst – oral 2013 ICS Proceedings
233
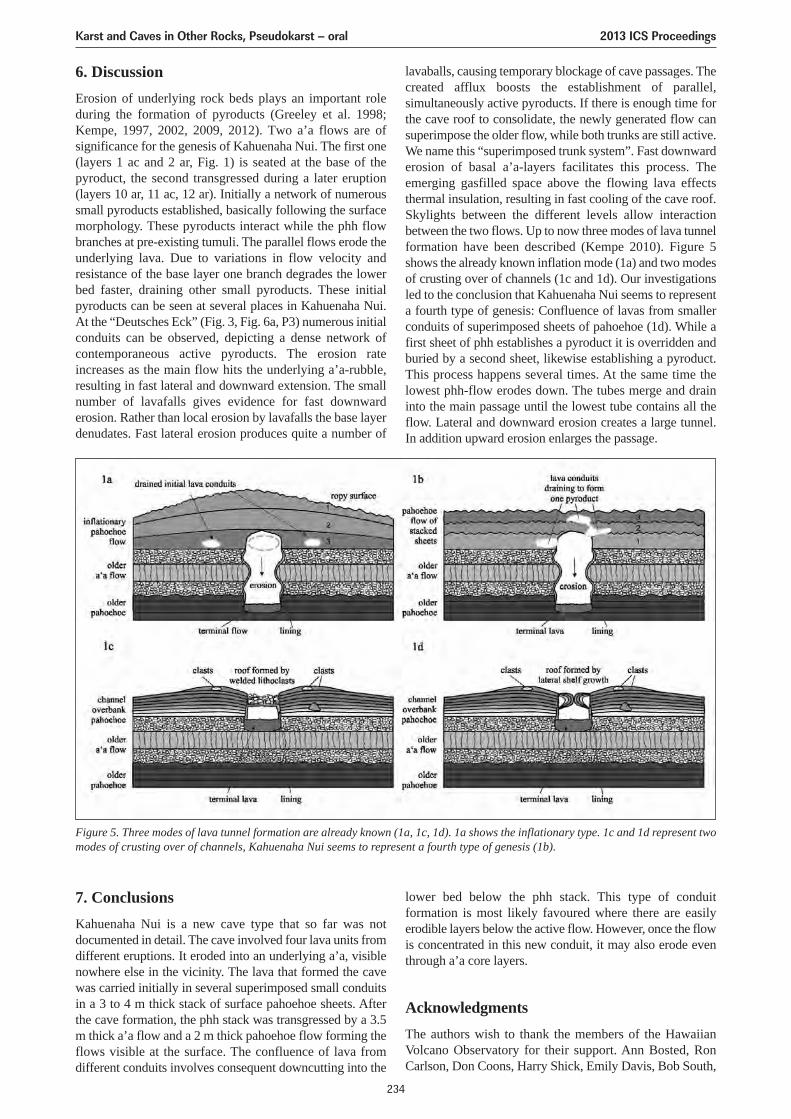
7. ConclusionsKahuenaha Nui is a new cave type that so far was notdocumented in detail. The cave involved four lava units fromdifferent eruptions. It eroded into an underlying a’a, visiblenowhere else in the vicinity. The lava that formed the cavewas carried initially in several superimposed small conduitsin a 3 to 4 m thick stack of surface pahoehoe sheets. Afterthe cave formation, the phh stack was transgressed by a 3.5m thick a’a flow and a 2 m thick pahoehoe flow forming theflows visible at the surface. The confluence of lava fromdifferent conduits involves consequent downcutting into the
lower bed below the phh stack. This type of conduitformation is most likely favoured where there are easilyerodible layers below the active flow. However, once the flowis concentrated in this new conduit, it may also erode eventhrough a’a core layers.
AcknowledgmentsThe authors wish to thank the members of the HawaiianVolcano Observatory for their support. Ann Bosted, RonCarlson, Don Coons, Harry Shick, Emily Davis, Bob South,
6. DiscussionErosion of underlying rock beds plays an important roleduring the formation of pyroducts (Greeley et al. 1998;Kempe, 1997, 2002, 2009, 2012). Two a’a flows are ofsignificance for the genesis of Kahuenaha Nui. The first one(layers 1 ac and 2 ar, Fig. 1) is seated at the base of thepyroduct, the second transgressed during a later eruption(layers 10 ar, 11 ac, 12 ar). Initially a network of numeroussmall pyroducts established, basically following the surfacemorphology. These pyroducts interact while the phh flowbranches at pre-existing tumuli. The parallel flows erode theunderlying lava. Due to variations in flow velocity andresistance of the base layer one branch degrades the lowerbed faster, draining other small pyroducts. These initialpyroducts can be seen at several places in Kahuenaha Nui.At the “Deutsches Eck” (Fig. 3, Fig. 6a, P3) numerous initialconduits can be observed, depicting a dense network ofcontemporaneous active pyroducts. The erosion rateincreases as the main flow hits the underlying a’a-rubble,resulting in fast lateral and downward extension. The smallnumber of lavafalls gives evidence for fast downwarderosion. Rather than local erosion by lavafalls the base layerdenudates. Fast lateral erosion produces quite a number of
lavaballs, causing temporary blockage of cave passages. Thecreated afflux boosts the establishment of parallel,simultaneously active pyroducts. If there is enough time forthe cave roof to consolidate, the newly generated flow cansuperimpose the older flow, while both trunks are still active.We name this “superimposed trunk system”. Fast downwarderosion of basal a’a-layers facilitates this process. Theemerging gasfilled space above the flowing lava effectsthermal insulation, resulting in fast cooling of the cave roof.Skylights between the different levels allow interactionbetween the two flows. Up to now three modes of lava tunnelformation have been described (Kempe 2010). Figure 5shows the already known inflation mode (1a) and two modesof crusting over of channels (1c and 1d). Our investigationsled to the conclusion that Kahuenaha Nui seems to representa fourth type of genesis: Confluence of lavas from smallerconduits of superimposed sheets of pahoehoe (1d). While afirst sheet of phh establishes a pyroduct it is overridden andburied by a second sheet, likewise establishing a pyroduct.This process happens several times. At the same time thelowest phh-flow erodes down. The tubes merge and draininto the main passage until the lowest tube contains all theflow. Lateral and downward erosion creates a large tunnel.In addition upward erosion enlarges the passage.
Figure 5. Three modes of lava tunnel formation are already known (1a, 1c, 1d). 1a shows the inflationary type. 1c and 1d represent twomodes of crusting over of channels, Kahuenaha Nui seems to represent a fourth type of genesis (1b).
Karst and Caves in Other Rocks, Pseudokarst – oral 2013 ICS Proceedings
234
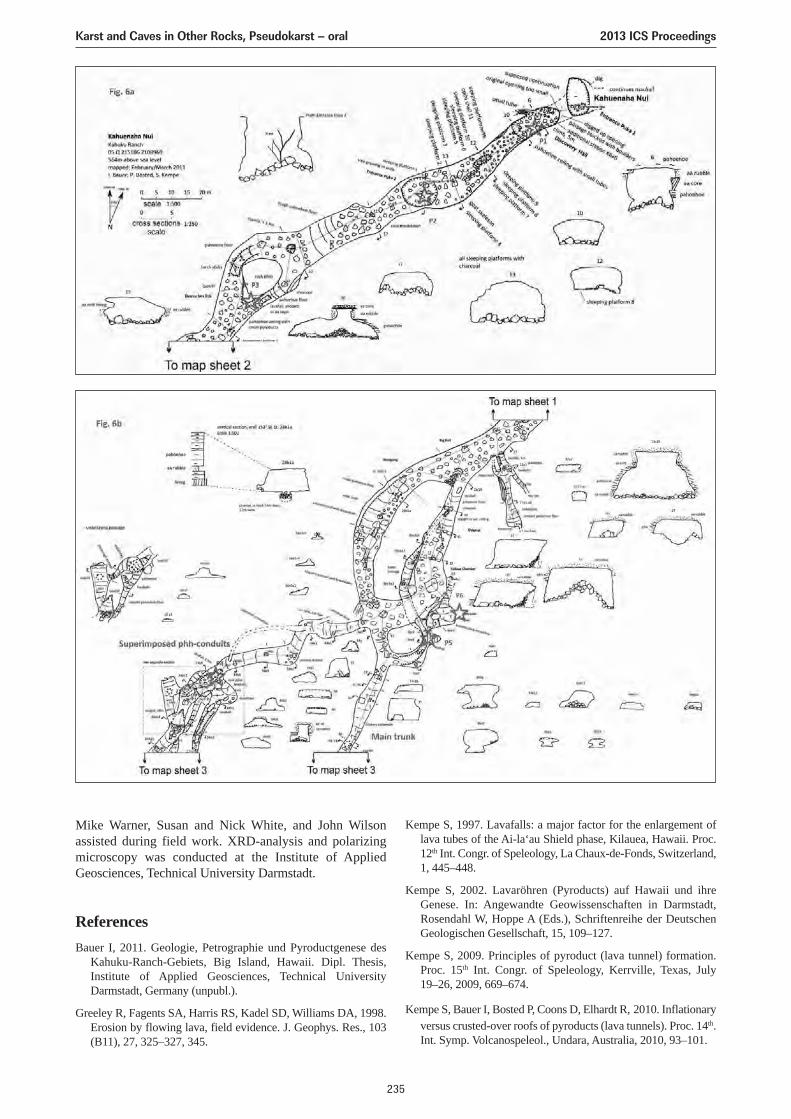
Mike Warner, Susan and Nick White, and John Wilsonassisted during field work. XRD-analysis and polarizingmicroscopy was conducted at the Institute of AppliedGeosciences, Technical University Darmstadt.
ReferencesBauer I, 2011. Geologie, Petrographie und Pyroductgenese des
Kahuku-Ranch-Gebiets, Big Island, Hawaii. Dipl. Thesis,Institute of Applied Geosciences, Technical UniversityDarmstadt, Germany (unpubl.).
Greeley R, Fagents SA, Harris RS, Kadel SD, Williams DA, 1998.Erosion by flowing lava, field evidence. J. Geophys. Res., 103(B11), 27, 325–327, 345.
Kempe S, 1997. Lavafalls: a major factor for the enlargement oflava tubes of the Ai-la‘au Shield phase, Kilauea, Hawaii. Proc.12th Int. Congr. of Speleology, La Chaux-de-Fonds, Switzerland,1, 445–448.
Kempe S, 2002. Lavaröhren (Pyroducts) auf Hawaii und ihreGenese. In: Angewandte Geowissenschaften in Darmstadt,Rosendahl W, Hoppe A (Eds.), Schriftenreihe der DeutschenGeologischen Gesellschaft, 15, 109–127.
Kempe S, 2009. Principles of pyroduct (lava tunnel) formation.Proc. 15th Int. Congr. of Speleology, Kerrville, Texas, July19–26, 2009, 669–674.
Kempe S, Bauer I, Bosted P, Coons D, Elhardt R, 2010. Inflationaryversus crusted-over roofs of pyroducts (lava tunnels). Proc. 14th.Int. Symp. Volcanospeleol., Undara, Australia, 2010, 93–101.
Karst and Caves in Other Rocks, Pseudokarst – oral 2013 ICS Proceedings
235
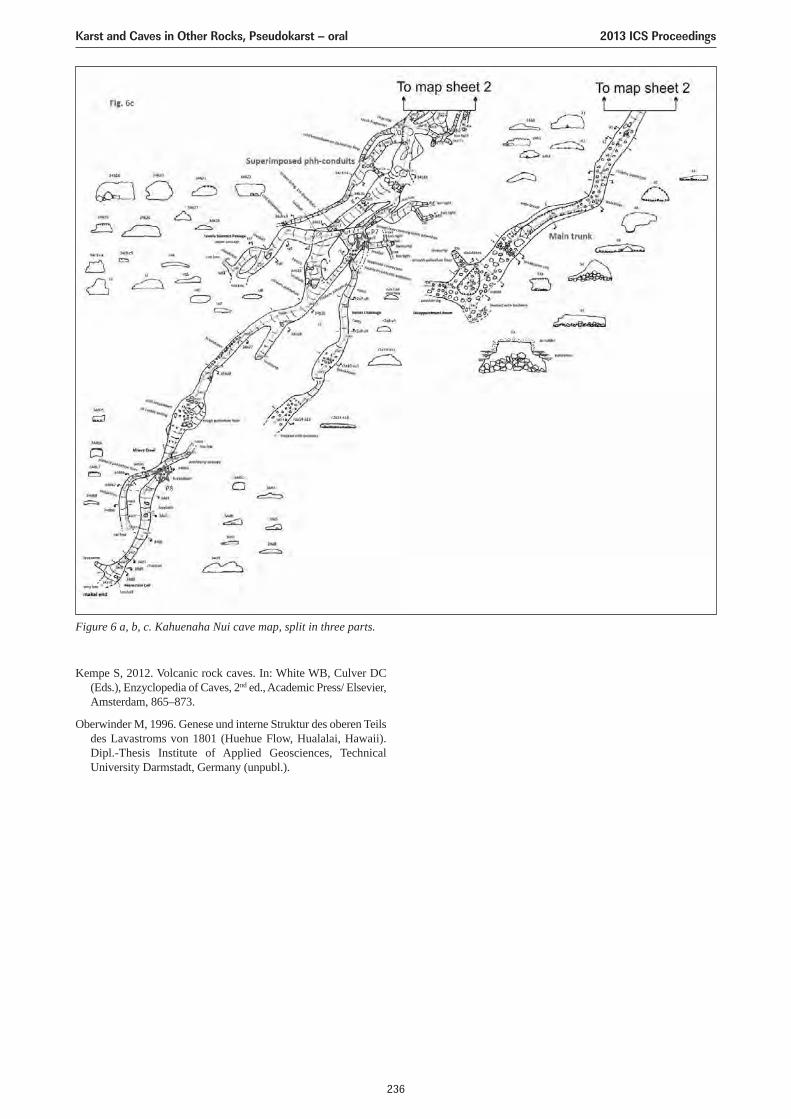
Kempe S, 2012. Volcanic rock caves. In: White WB, Culver DC(Eds.), Enzyclopedia of Caves, 2nd ed., Academic Press/ Elsevier,Amsterdam, 865–873.
Oberwinder M, 1996. Genese und interne Struktur des oberen Teilsdes Lavastroms von 1801 (Huehue Flow, Hualalai, Hawaii).Dipl.-Thesis Institute of Applied Geosciences, TechnicalUniversity Darmstadt, Germany (unpubl.).
Figure 6 a, b, c. Kahuenaha Nui cave map, split in three parts.
Karst and Caves in Other Rocks, Pseudokarst – oral 2013 ICS Proceedings
236
GENETIC TYPES OF NON-SOLUTION CAVES
Pavel Bella1,2, Ludovít Gaál1
1State Nature Conservancy of the Slovak Republic, Slovak Caves Administration, Hodžova 11,031 01 Liptovský Mikuláš, Slovakia, [email protected], [email protected]
2Department of Geography, Pedagogical Faculty, Catholic University, Hrabovská cesta 1, 034 01 Ružomberok,Slovakia, [email protected]
Many caves were originated by various mechanical processes in both non-soluble and soluble rocks. The geneticclassification of the specific group of caves presents one of important and actual speleogenetic problematics. The papergives a basic categorisation of non-solution caves according to their origin. The group of non-solution caves originated byendogenous processes consists of magmatic, volcanic and tectogene caves. Fluvial erosion caves, caves formed by movingglacier and deposition of moraine sediments, suffusion caves, constructional travertine caves, mudlow caves, wave cutcaves, caves originated by deformation of rocks caused by their volumetric changes, caves originated by gravitydisintegration of rocks, mechanically weathered caves, eolian caves, caves of biogenic origin, pyrogenic caves, and cavesformed as a result of the technogenic activatisation of natural processes are distinguished within the group of non-solutioncaves originated by exogenous processes.
1. IntroductionDuring last years much knowledge was obtained about thecaves originated by non-solution processes. But their geneticclassification is not completed until now. Only partialclassifications of some genetic groups of non karstic caveswere worked up, mostly without the unified terminology(Halliday 1960, 2004; Wood 1974; Grimes 1975; Vítek 1983;Andrejčuk 1985; Sjöberg 1986; Striebel 1999; Honda 1999;Bella and Gaál 2007, and others). Based on clearly definedgeological and geomorphologic criteria (action ofendogenous or exogenous processes, type of geomorphicprocess and mechanism of cave origin) the basiccategorisation of non-solution caves is presented in the paper(more detailly elaborated by Bella 2012). We do not deal withcaves originated by solution in hardly soluble rocks,conglomerates or other lithified sedimentary rocks and bymelting of ice.
2. Caves originated by endogenous processesThis group of caves originated by natural processes inducedby the inner dynamics of the Earth, i.e. magmatism,volcanism, earthquake or tectonic processes.
2.1. Magmatic caves
They are smaller geode-like magmatic cavities created byintrusive magmatism under the Earth´s surface, often withoutnatural entrance (cavities uncovered in the mines or quarries).They often contain many crystals of various minerals formedby slowly cooled solution in magma bubbles (Dubljanskijand Andrejčuk 1989).
2.2. Volcanic caves
This wide group includes the caves created by volcanicexplosion, lava effusion and various volcanic – rheogenetic,pneumatogenetic and pyrogenic processes.
Roofed lava channels – subcrustal lava caves originated bygradual growing of hardening lava from both sides of roof.The roofing happened also by connecting of flowed blocksof hardened lava and by lateral levees of inunded lava(Greeley and Hyde 1972; Atkinson et al. 1975; Calvari andPinkerton 1999; Grimes 2008; Harris et al. 2009).
Lava tube caves – tubes or tunnels formed by outflowing ofhot lava from the bellow solidified roof crust. If the liquidlava has been locked inside the tunnel, in these places largerooms originated. Straight tunnel has symmetric profile whileasymmetric profile is resulted by the change of a direction offlowing lava (Greeley 1971; Wood 1974; Calvari andPinkerton 1999; Halliday 2004b). Also lateral narrowsubcrustal simple or branched tubes (lava overflow caves)can be formed on the side of main lava flow (Grimes 2008).Kempe (2009) distinguishes single-trunked, double- or multi-trunked, and superimposed-trunked systems of lava flows.
Drainage tubes of active rift zones – underground spaceslooking like lava tube caves can occur within large dykesintruded along fractures, eruptive fissures or rift zones lava.The fissures are remodelled by intruded lava and the spaceshave an oval shape (Harter 1976; Favre 1993; Okubo andMartel 1998; Halliday 2008).
Lava rise caves – some places of horizontal lava surfaceraised by pressure of accumulated hot lava about 0.5–1 mthereupon the low-lying underground spaces are created(Halliday 1998; Gadányi 2008).
Lava ridge caves – smaller triangle-shaped caves occur inthe lateral part of lava flows in consequence of decreasing incentral zone of lava surface, also in the toe part of lava flowby pressure of flowing lava (Chitwood 1989; Gadányi 2008).
Lava tumulus caves – occur under elliptic elevation of lavasurface (tumulus) in consequence of decreasing of solidifiedlava. They can reach about 5 m of height (Ollier 1962;Chitwood 1989; Halliday 1998; Gadányi 2008).
Boulder caves in lava flows – generally occur in the frontalpart of aa lava between larger blocks of solidified lavasurface.
Karst and Caves in Other Rocks, Pseudokarst – oral 2013 ICS Proceedings
237
Volcanic crater shafts – vertical shafts originated bydecreasing lava into the diatremas and necks of craterstructure. They have floater or bell-like shape (Stefánson1992; Favre 1993).
Volcanic exhalation caves – smaller caves created byexhalation or explosion of ascending volcanic gases in scoriacone. In an ideal case the chimney, which flowed into smallhorizontal cave, is preserved (Eszterhás 2004; Gaál andBalciar 2008).
Chimneys of spatter cones and hornitos – open verticalvolcanic conduits formed by blowing of very liquid lava fromprimary fractures which creates spatter cones or hornitos(Ollier 1964; Licitra 1993).
Lava blister caves – lava bubbles of diameter about 1 m,rarely to 5 m originated by accumulation and pneumaticexpansion of gas in lava (Ollier 1962).
Polygenetic spatter cone caves in carbonatite volcanoes –a rare case of cave origin in spatter cones in the summit craterof Ol Doinyo Lengai in Tanzania, cavities under spatter conesoriginated by thermal erosion, and meteoric water andcondensation corrosion of natrocarbonatite lava (McFarlaneet al. 2004).
Volcanic pyrogenetic tree moulds – formed by burning-outof trees in glowing lava (Finch 1931; Balázs 1974; Honda1999; Gaál 2003a; Bella and Gaál 2007). According to theposition of tree trunks they can be vertical, inclined orhorizontal. Tree moulds are known as simple type, compoundtype with several trees and tree-break type. From amorphological point of view the mushroom type, plate type,bottle type, “narusawa” type (cedar-like cave after burningof gase) and “hudoiwa” type (with accumulated lava in afrontal part of tree) are distinguished (Tachihara et al. 2002).
Volcanic eruptive fissure caves – along the fissuresoriginated by movement or quake eventually by pneumaticpressure during volcanic eruptions. Generally they havefissure character sporadically with marks of flowing lava(Ogawa 1986; Leotta and Liuzzo 1998; Halliday 2004b).
2.3. Tectogene caves
The group includes the caves originated in consequence ofendogenous tectonic movement and earthquake. They occurmostly along the fissure, rarely on the fold structure.
Fault caves – along the disjunctive fault and fissures formedby extension tectonic movement. They have linear characterwith narrow and long passages (Kiernan 1982; Dubljanskijand Andrejčuk 1989).
Rift caves – fault caves in the margin part of the rift zoneand trench fault along the mobile zones of the Earth (Davis1998).
Fold caves – rare occurring caves on the flexion of folds(Kiernan 1982).
Collapsed pit crater caves – vertical circular or ellipticshafts along the active rift zone in the crossing place withstructural or stratigraphic discontinuity. They occur mostlyin areas of large shield volcanoes (Halliday 1998; Okubo andMartel 1998).
Seizmotectonic fracture caves – caves along the narrowfissures created in consequence of decompression seismicquake after melting of glacier and isostatic uplift inScandinavia (Sjöberg 1986).
Seismotectonic boulder caves – underground spacesbetween rock blocks originated by disintegration of granitemassive disturbed by seismic quake. The seismotectonicboulder caves can also be originated by earthquake-inducedrockfall (Sjöberg 1986, 1987).
3. Caves originated by exogenous processesThis group involves the caves, which originated by fluvialerosion, glacier moving, suffosion, marine abrasion, gravitydisintegration (sliding and falling of rock blocks), mechanicalweathering (fissure and boulder exfoliation), frostweathering, eolian processes (corrosion and deflation),biogenic way, pyrogenic processes and the caves oftechnogenic activatisation of natural processes.
3.1. Fluvial erosion caves
The genetic group of caves originated by mechanical erosionof water flow that means abrading of rock walls and scouringof river channels.
River bank erosion caves – formed in the rock banks of riverchannel by lateral erosion mainly in meanders along horizontalbedding plane (Trimmel 1968; Striebel 1999; Day 2001).
Waterfall erosion caves – formed by backward erosion offalling water under occasional or constant waterfall (Striebel1999; Day 2001).
Fluvial channel erosion caves – occur at the contact of rocksof different permeability and hardness or along fractures, thewater course become engrosses in the floor (Kempe andWerner 2003).
3.2. Caves formed by moving glacier and deposition ofmoraine sediments
This group includes the caves formed by mechanicaldeformation of glacier and underlying rocks, also subglacialcaves formed as glacier slides over abrupt changes in thebedrock surface, and glacial boulder caves.
Glacier crevasse caves – formed by extension strain on theelevation of bedrock (V shape crevasse) or by compression indepression (A shape crevasse). The other diagonal crevassescan be formed in consequence of unequal moving of glacierin its central and side parts (White 1988). Crevasses formedby rotation of ice masses in the steep upper part of glacialcirques are named “bergschrunds” (Battle and Lewis 1951).
Crevasse caves under glacier in bedrock deformated andfractured by pressure of moving glacier, so-called“glaciotectonic” caves (Schroeder et al. 1986; Sjöberg 1986,1989; Schroeder 2004).
Subglacial cavities formed as glacier slides over abruptchanges in the bedrock surface, the ice separated frombedrock in the lee of a downward step (Pulina et al. 2003;Fountain 2005).
Karst and Caves in Other Rocks, Pseudokarst – oral 2013 ICS Proceedings
238
Glacial boulder caves – irregular, chaotic cavities betweenlarge blocks of moraine or erratic boulders (Kiernan 1982;Sjöberg 1986).
3.3. Suffosion caves
Suffosion or piping caves formed by washing out of soft clasticmaterial by infiltration or flowing underground water. Theyoriginated mainly in less consistent clastic rocks as clay, loess,silt, laterite, weathered sandstone and volcaniclastic rocks.
Suffosion tunnel caves – originated by suffosion and erosiongenerally on the contact of loose rocks and impermeablebackground (Clausen 1970; Cílek 1997; Bella et al. 2005;Grimes and Spate 2008).
Suffosion collapse shafts – formed by decrease andsubsequent collapse of hanging rock upper suffosion tunnels(Clausen 1970; Urban 2004).
3.4. Synsedimentary travertine caves
Constructional caves originated by precipitation of travertinefrom solutions.
Travertine crater caves – spring travertine throats insidetravertine craters (Bella 2005; Halliday 2011).
Travertine fissure ridge caves – rare occurring longitudinalnarrow cavities along an effluence fissure (Pisarowicz 2003;Halliday 2011).
Caves of constructive travertine waterfalls – mostlylongitudinal cavities along the foot of constructive travertinewaterfalls (Trimmel 1968; Bella 2005).
3.5. Mudflow caves
They present sporadic caves formed by outflowing of liquidmud from under and upper dried indurate crust on slopes ofmud volcanoes (Kalenda 2010).
3.6. Wave-cut caves
They are formed by mechanical wave abrasion at the foot ofcostal cliffs of sea or large lake formed by insoluble rocks(Moore 1954; Bunnell 1988).
3.7. Caves originated by deformation of rocks caused bytheir volumetric changes
These are rarely occurring caves formed by enlarging ofvolume of evaporite caused by water absorbing. Inconsequence of hydratation of anhydrite to gypsum the rockcan expand till 50–60 % whereby some hydratation raisedsubcrustal cavities is formed.
Hydratation raised caves – upward raised subcrustalcavities between hydrated gypsum upper anhydrite orsubjacent beds. Some narrow cavities – gypsum tumuli – arealso created by rising caused by precipitation orrecrystallization of gypsum (Gorbunova 1978; Reinboth1997; Callafora and Pulido-Bosch 1999).
Subcrustal cavities of “tepee” structure – upwardcambered margin of expanded megapolygons of agglutinatedcrust of carbonate-evaporite coastal sediments in periodicinundated and shrinkages basins (Kendall and Warren 1987).
Salt diapire fissure caves – occur in the raising salt stumpor diapire of hydrated anhydrite (Vendeville and Jackson1992).
3.8. Caves originated by gravity disintegration of rocks
Such caves occur in areas with vertically dissected relief andsuitable geological conditions (rigid rocks with underlyingsoft or plastic beds).
Crevice caves – formed by gravity movement of marginalrigid blocks upper underlying plastic beds on the slopes(Campbell 1968; Vítek 1983; Self 1990; Turchinov 1990;Filippov 1997; Margielewski and Urban 2003; Halliday 2004and others). Gaál (2003b) distinguishes deflection crevicecaves (formed in initial or opening phase by deflection ofmarginal blocks), inclination crevice caves (formed bybackward inclination of blocks in relation to their rotation),decrease crevice caves (horizontal or subhorizontal cavesformed by decreasing of blocks in the initial phase),displacement crevice caves (caves in “wide crevice” formedby gravity transfer of block in the sliding phase, mostlycombined crevice-boulder caves are formed). The crevicecaves are also formed on the coastal cliffs of a sea or lakeand on the gravity disintegrated steep coast of carbonateplatforms. The bank-margin fracture type of “blue holes” inBahamas probably was formed during glacioeustaticdecrease of sea level (Smart et al. 1988; Mylroie 2004).
Falling-out caves – small caves formed after gravity falling-out of released blocks. Disintegration and releasing can besupported by termomechanical weathering (Striebel 1999).
Rockfall / rockslide boulder caves – chaotic cavities formedby deposition of disintegrated large angular boulders fromfalling or sliding rock blocks at the base of cliffs on slopes,in the bottom of valleys or at the foot of coastal cliffs.Rockfall boulder caves are originated by sudden falling ofrocks, rockslide boulder caves by sliding and subsequentdisintregration of rock blocks (Kiernan 1982; Vítek 1983;Striebel 1999; Bella and Gaál 2010 and others). Outside aridregions, in-valley boulder caves (so-called “purgatory caves”in California and the northeastern United States) arecommonly featured by mechanical erosion of undergroundstreams (Finlayson 1981; Halliday 2004a).
3.9. Caves originated by mechanical weathering
This group involves caves originated by mechanicalweathering and associated slope processes: caves in rockstructures disintegrated by macroexfoliation, frost weatheringcaves, and caves formed by insolation and salt weathering.
Exfoliation caves – formed in consequence of segregation ofrock squama mostly parallel with rock surface. Therefore theexfoliation cracks are often curved like an onion. Exfoliationcaves are formed along the fissures (fissure exfoliation cave),by falling-out of block along the fissure (fissure-falling-outexfoliation cave), among boulders formed by exfoliationdisintegration along the bedding or cubical jointing “in situ”(boulder exfoliation cave), wide and narrow simple exfoliation
Karst and Caves in Other Rocks, Pseudokarst – oral 2013 ICS Proceedings
239
underground spaces (woolsack cave), weathered exfoliationcaves and small deltoid caves of A-tents type (Ollier 1965;Jennings 1978; Striebel 1999; Twidale 2009).
Frost weathering caves – generally shelter type cavesoriginated by break-up of host rock in consequence of frost(Schroeder 1979; Mitter 1983; Cílek 1996; Striebel 1999).Belong them also weathered boulder caves in glacial andperiglacial regions (Striebel 1999).
Tree moulds formed by mechanical disintegration ofsilicified or carbonified trees covered by volcaniclastic bedsor lahars (Gaál 2003a; Bella and Gaál 2007).
Tafoni caves – originated by insolation weathering along thecontact plane of primary cubical jointing of granite andsimilar rocks. The favorable conditions of its origin are inrepeated moistly and dry climatic areas (Martini 1978;Twidale 1982; Vidal Romani 2007).
Salt weathering caves – small caves originated by changeof volume in consequence of crystallization of salt in porusesand cracks. They are as foot-cliffs shelter caves or cavesformed along lithologically or tectonically weakened partsof rocks (Gavrilović 1981; Cílek 1998).
3.10. Eolian caves
This group involves smaller caves originated by windcorrasion and deflation mainly in soft and loose rocks locatedmainly in arid and semiarid regions.
Corrasion caves – simple elliptic cavities originated bymechanical abrasion by wind (White 1988; Dubljanskij andAndrejčuk 1989).
Deflation caves – short cavities generally with two entrancesalong which wind insufflate the soft particles of weatheredrock. They occur most frequently in mountain ridges andelevation in open terrains (Dubljanskij and Andrejčuk 1989).
3.11. Caves of biogenic origin
Reef caves – small irregular constructional cavities in barrierreefs and atolls formed by growing of corals under sea level(Trimmel 1968).
Caves excavated by animals – small cavities excavatedmainly as hiding-place (salt ingestion caves). These cavesoccur in rock with salt because salt is searched by elephants,buffalos, antelopes and other animals (Carey and Middleton1973; Lundquist and Varnedoe 2006).
Biogenic tree moulds – formed by biogenic disintegrationof necrotic tree trunks by funguses and microorganisms. Theyare known mainly in travertine (Bella and Gaál 2007;Gradziński 2008).
3.12. Pyrogenic caves of self-kindled fires
These caves represent cavities after burned out of coal layersor other burnable raw material (Maximovich 1969;Dubljanskij and Andrejčuk 1989). In volcanic rocks treemoulds formed by burning was described as volcanicpyrogenic tree moulds.
3.13. Caves of technogenic activatisation of naturalprocesses
This group involves caves originated by natural processes butin consequence of human activity, mostly mining,exploitation of raw material or violation of slope stability.
Consequent crevice and breakdown caves – formed bygravity block movement anthropogenically induced by rockinstability (Eszterhás 1993).
Technogenic pyrogenic caves – created by undergroundburning of coal in order to obtain of gas for electric energy(Andrejčuk 1985; Dubljanskij and Andrejčuk 1989).
4. ConclusionTotally 56 types of non-solution caves are distinguished andbriefly characterised in this paper (21 types are related toendogenous processes, 35 types to exogenous processes).Various genetic types of non-solution caves point to a highdiversity of their formation in varied environments withdifferent lithological, structural-tectonic, geomorphologic andclimatic conditions. Non-solution caves originated mostly inmagmatic, volcanic and volcaniclastic rocks, crystalline shalesand clastic sedimentary rocks, constructional caves also intravertine and coral limestone. Some specific types of non-solution caves are known in gypsum and salt. A higher varietyof cave formation by exogenous processes is linked with ahigher heterogenity of the Earth-surface dynamics.Comparing with solution caves, an occurrence of non-solutioncaves is lower but their genetic diversity is higher. Severalnon-solution caves are important sites of nature and humanhistory. Therefore they are protected as natural monuments orare included within protected areas.
ReferencesAndrejčuk VN, 1985. Klassifikacija podzemnych polostej. Izvestija
VGO, 117, 4, 341–348 (in Russian).
Atkinson A, Griffin TJ, Stephenson PJ, 1975. A major lava tubesystem from Undara Volcano, North Queensland. Bulletin ofVolcanology, 39(2), 266–293.
Balázs D, 1974. Lávaüregek keletkezése, típusai és formakincse.Földrajzi Közlöny, 2, 135–148.
Battle WRB, Lewis WV, 1951. Temperature observation inbergschrunds and their relationship to cirque erosion. Journal ofGeology, 59(6), 537–545.
Bella P, 2005. Syngenetické travertínové jaskyne na Slovensku.Geomorphologia Slovaca, 5(2), 23–29 (in Slovak).
Bella P, 2012. Genetické typy jaskýň. Verbum, Ružomberok (inSlovak).
Bella P, Gaál Ľ, 2007. Tree mould caves within the framework ofcave genetic classification. Nature Conservation, 63, 7–11.
Bella P, Gaál Ľ, 2010. Medzibalvanové jaskyne – terminológiaa genetické typy. Aragonit, 15(1), 3–10 (in Slovak).
Bella P, Gaál Ľ, Inokura Y, 2005. Sufózne jaskyne vovulkanoklastických horninách v doline Nagatani pri Kagošime.Slovenský kras, 43, 67–80 (in Slovak).
Bunnell D, 1988. Sea caves of Santa Cruz Island, Santa Barbara,California. McNally and Loftin Publishers.
Karst and Caves in Other Rocks, Pseudokarst – oral 2013 ICS Proceedings
240
Calaforra JM, Pulido-Bosch A, 1999. Genesis and evolution ofgypsum tumuli. Earth Surface Processes and Landforns, 24(10),919–930.
Calvari S, Pinkerton H, 1999. Lava tube morphology on Etna andevidence for lava emplacement mechanism. Journal ofVolcanology and Geothermal Research, 90(3–4), 263–280.
Campbell NP, 1968. The Role of Gravity Sliding in theDevelopment of Some Montana Caves. Bulletin of the NationalSpeleological Society, 30(2), 25–29.
Carey SD, Middleton AL, 1973. The Rock House – An UnusualMississippi Shelter Cave. NSS News, 31(11), 198.
Cílek V, 1996. Vznik previsů a jeskynních výklenků v bralné častiVelké Fatry. Speleofórum, 15, 34–36 (in Slovak).
Cílek V, 1997. Sufozní podzemní systém ve sprašové rokliv Zeměchách u Kralup. Speleo, 25, 19–23 (in Czech).
Cílek V, 1998. Fyzikálne-chemické procesy vzniku pískovcovéhopseudokrasu. In: V Cílek, J Kopecký (Eds.) Pískovcovýfenomén: klíma, život a reliéf. Knihovna ČSS, 32, Praha,134–153 (in Czech).
Clausen EN, 1970. Badland caves of Wyoming. Bulletin of theNational Speleological Society, 32 (3), 59–69.
Davis RA, 1998. Tectonic caves of Solai in the Kenyan Rift Valley.International Journal of Speleology 27B(1–4), 69–74.
Day MJ, 2001. Sandstone caves in Wisconsin. Proceedings of the13th International Congress of Speleology, 1, Brasilia, 88–92.
Dubljanskij VN, Andrejčuk V N, 1989. Speleologija (terminologia,svjazi s drugimi naukami, klassifikacija polostej). Uraľskoeotdelenie AN SSSR, Kungur (in Russian).
Eszterhás I, 1993. Konsequenzhöhlen. Jahresbericht derHöhlenforschergruppe Rhein-Main, Frankfurt a. M., 43–44 (inGerman).
Eszterhás I, 2004. Durch exhalation entstandene höhlen imKarpatenbecken. In: L Gaál (Ed.) Proceedings of the 8th
International Symposium on Pseudokarst, Teplý Vrch, 7–13.
Favre G, 1993. Some observations on pits craters and relations withlava tubes. In: WR Halliday (Ed.) Proceeding of the 3rd
International Symposium on Vulcanospeleology (Bend,Oregon), Washington, 37–41.
Filippov AG, 1997. Gravity caves of the Siberian Platform. In: PYJeannin (Ed.) Proceedings of the 12th International Congress ofSpeleology, 1, La Chaux-de-Fonds, 465–468.
Finch RH, 1931. Lava tree casts and tree molds. The Volcano Letter(Hawaiian Volcano Observatory), 316, 1–3.
Finlayson B, 1981. Underground streams on acid igneous rocks inVictoria. Helictite, 19(1), 5–14.
Fountain AG, 2005. Glacier Caves. In: DC Culvier, WB White(Eds.) Encyclopedia of caves. Elsevier Academic Press,271–275.
Gaál Ľ, 2003a. Tree mould caves in Slovakia. International Journalof Speleology, 32, 1–4, 107–111.
Gaál Ľ, 2003b. Genetické typy rozsadlinových jaskýň na Slovensku.Slovenský kras, 41, 29–45 (in Slovak).
Gaál Ľ, Balciar I, 2008. Caves in the youngest volcanic structure inSlovakia. Proceedings of the 10th International Symposium onPseudokarst, Gorizia, 165–167.
Gadányi P, 2008. Caves under uplifted surface crusts of basalt lavaflows. Proceedings of the 10th International Symposium onPseudokarst, Gorizia, 119–126.
Gavrilović D, 1981. Genetic types of caves in Sahara. Evropejskaregionalna konferencia po speleologija, Sbornik ot materiali, 2,Sofia, 137–139.
Gorbunova KA, 1978. Peščery gidratacii. Peščery, 61–63 (inRussian).
Gradziński M, 2008. Origin of a unique tree-mould type cave intravertine based on examples from the village Lúčky (Liptov,Slovakia). Slovenský kras, 46(2), 325–331.
Greeley R, 1971. Observations of actively forming lava tubes andassociated structures, Hawaii. Modern Geology, 2, 207–223.
Greeley R, Hyde JH, 1972. Lava Tubes of the Cave Basalt, MountSt. Helens, Washington. Geological Society of America Bulletin,83(8), 2397–2418.
Grimes KG, 1975. Pseudokarst: Definition and types. Proceedingsof the 10th Biennial Conference of the Australian SpeleologicalFederation (Brisbane, 27–29 December 1974), Sydney, 6–10.
Grimes KG, 2008. Subcrustal Drainage Lava Caves; examples fromVictoria, Australia. In: R Espinasa-Pereña, J Pint (Eds.)Proceedings of the X, XI, and XII International Symposia onVulcanospeleology. AMCS Bulletin, 19, 35–44.
Grimes K, Spate A, 2008. Laterite Karst. Australasian Cave andKarst Management Association Journal, 73, 49–52.
Halliday WR, 1960. Pseudokarst in The United States. Bulletin ofthe National Speleological Society, 22(2), 109–113.
Halliday WR, 1998. Hollow volcanic tumulus caves of KilaueaCaldera, Hawai County, Hawaii. International Journal ofSpeleology, 27B(1–4), 95–105.
Halliday WR, 2004a. Talus caves. In: J Gunn (Ed.) Encyclopediaof Caves and Karst Sciences. Fitzroy Dearbon, New York –London, 723–724.
Halliday WR, 2004b. Volcanic caves. In: J Gunn (Ed.) Encyclopediaof Caves and Karst Sciences. Fitzroy Dearbon, New York –London, 760–764.
Halliday WR, 2008. What Is a Lava Tubes? In: R Espinasa-Pereña,J Pint (Eds.) Proceedings of the X, XI, and XII InternationalSymposia on Vulcanospeleology. AMCS Bulletin, 19, 48–56.
Halliday WR, 2011. Karst and pseudokarst at Mammoth HotSprings, Yellowstone National Park, USA. International Unionof Speleology, Pseudokarst Commission Newsletter, 22, 10–19.
Harris AL, Massimiliano F, Francesco M, Hamilton CW, 2009.Construction dynamics of a lava channel. Bulletin ofVolcanology, 71, 4, 459–474.
Harter JW, 1976. Morphologic Classification of Lava Tubes. In: WRHalliday (Ed.) Proceedings of the International Symposium onVulcanospeleology (White Salmon, Washigton). NSS, Seattle,74–85.
Honda T, 1999. Classification of lava tree molds with/withoutremelted inner surface according to its formation process. In: NBarone, G Licitra (Eds.) Proceedings of the IXth InternationalSymposium on Vulcanospeleology, Catania, Italy, 123–124.
Chitwood LA, 1989. Inflated lava. Desert Ramblings, TheNewsletter of the Oregon Natural Desert Association, 2(1), 1–4.
Jennings JN, 1978. Genetic variety in a-tents and related features.Australian Geographer, 14(1), 34–38.
Kalenda P, 2010. Ázerbajdžán – země bahenních sopek a takébahenních jeskyní. Speleo, 54, 16–19 (in Slovak).
Kempe S, 2009. Principles of pyroduct (lava tunnel) formation. In:WB White (Ed.) Proceedings of the 15th International Congressof Speleology, 2, Kerrville, Texas, USA, 668–674.
Karst and Caves in Other Rocks, Pseudokarst – oral 2013 ICS Proceedings
241
Kempe S, Werner MS, 2003. The Kuka´iau Cave, Mauna Kea,Hawaii, created by water erosion, a new Hawaiian cave type.Journal of Cave and Karst Studies, 65(1), 53–67.
Kendall CGSt, Warren J, 1987. A review of the origin and settingof tepees and their associated fabrics. Sedimentology, 34(6),1007–1027.
Kiernan K, 1982. Mechanically shaped pseudokarst: talus, joint andfault caves and their potential in Tasmania. Journal of SydneySpeleological Society, 26(3), 41–51.
Leotta A, Liuzzoi M, 1998. The 1981 eruptive fissure on Mt. Etna:considerations on its exploration and genesis. InternationalJournal of Speleology 27B(1–4), 147–153.
Licitra GM, 1993. Essay on genetic classification of volcanic caves.In: WR Halliday (Ed.) Proceedings of the 3th InternationalSymposium on Vulcanospeleology (Bend, Oregon), Vancouver,Washington, 118–120.
Lundquist ChA, Varnedoe WW, 2006. Salt ingestion caves.International Journal of Speleology, 35(1), 13–18.
Margielewski W, Urban J, 2003. Crevice-type caves as initial formsof rock landslide development in the Flysch Carpathians.Geomorphology, 54(3–4), 325–338.
Martini IP, 1978. Tafoni weathering, with examples from Tuscany,Italy. Zeitschrift fűr Geomorphologie, 22(1), 44–67.
Maximovich GA, 1969. Peščery podzemnych požarov. Peščery7(8), 87–88 (in Russian).
McFarlane DA, Lundberg J, Belton F, 2004. An Unusual Lava CaveFrom Ol Doinyo Lengai, Tanzania. Journal of Cave and KarstStudies, 66(3), 98–101.
Mitter P, 1983. Frost Features in the Karst Region of the WestCarpathian Mountains. In: TL Pewe, J Brown (Eds.) Permafrost:Proceedings of the Fourth International Conference, FairbanksJuly 17–22, 1983. Washington DC, 861–865.
Moore DG, 1954. Origin and development of sea caves. Bulletin ofthe National Speleological Society, 16, 71–76.
Mylroie JE, 2004. Blue holes of the Bahamas. In: J Gunn (Ed.)Encyclopedia of Caves and Karst Sciences. Fitzroy Dearbon,New York – London, 155–156.
Ogawa T, 1986. The formation of lava caves. Communications, 9th
International Congress of Speleology, 2, Barcelona, 47–51.
Okubo C, Martel S, 1998. Pit cra ter formation on Kilauea volcano,Hawaii. Journal of Volcanology and Geothermal Research, 86(1–4), 1–18.
Ollier CD, 1962. Tumuli and Lava Blisters of Victoria, Australia.Nature, 202, 1284–1286.
Ollier CD, 1964. Caves and related features at Mount Eccles.Victorian Naturalist, 81, 64–71.
Ollier CD, 1965. Some features of granite weathering in Australia.Zeitschrift für Geomorphologie, NF, 9, 285–304.
Pisarowicz J, 2003. Beneath Yellowstone. Rocky Mountain Caving,20(4), 12–18.
Pulina M, Řehák J, Schroeder J. 2003. Les cavités glaciaires sousle regard spéléologique. Karstologia, 42(2), 23–36.
Reinboth F, 1997. Die Zwerglöcher bei Walkenried am Südharz-Bemerkumgen zur Frage der Quellungshöhlen. Die Höhle,48(1), 1–13 (in German).
Self C, 1990. A gravity sliding cave in Western England. In: JWagner (Ed.) IV. symposium o pseudokrasu, sborník referátů.Knihovna ČSS, 23, Praha, 139–145.
Schroeder J, 1979. Dévelopement de cavités d’origine mécaniquedans un karst froid (Nahanni, T. N. O., Canada). Annales de laSociété géologique de Belgique, 108, 59–67.
Schroeder J, Beaupré M, Cloutier M, 1986. Ice-push caves inplatform limestone of the Montreal area. Canadian Journal ofEarth Sciences, 23(11), 1842–1851.
Schroeder J, 2004. Glaciotectonic cavities. In: AS Goudie (Ed.)Encyclopedia of Geomorphology. Routledge, London, 470–471.
Sjöberg R, 1986. A proposal for a classification system for GraniticCaves. Communications, 9th International Congress ofSpeleology, 2, Barcelona, 25–27.
Sjöberg R, 1987. Caves as indicators of neotectonics in Sweden.Zeitschrift für Geomorphologie, NF, Suppl. 63, 141–148.
Smart PL, Palmer RJ, Whitaker F, Wright VP 1988. NeptunianDikes and Fissure Fills: An Overview and Account of SomeModern Examples. In: NP James, PW Choquette (Eds.)Paleokarst. Springer-Verlag, New York – Berlin – Heidelberg –London – Paris – Tokyo, 149–163.
Stefánson ÁB, 1992. Príhnúkargígur. In: GT Rea (Ed.) Proceedingof the 6th International Symposium on Vulcanospelogy, 197–203.
Striebel T, 1999. Typen von Sandsteinhöhlen und Granithöhlen inder Umgebung von Bayreuth. Pseudokrasový zborník, 1,Knihovna ČSS, 35, Praha, 51–57.
Tachihara H, Sawa I, Kuroishikawa Y, Ogawa T, Honda T, Kim B,Makita T, Watanabe N, Ninata H, Nakau K, 2002. The shapeclassification and formation model by observation of lava tree-mold. Review of Osaka University of Economics and Law, 84,46.
Trimmel H, 1968. Höhlenkunde. Friedr. Vieweg und Sohn,Braunschweig.
Turchinov I. 1990. Pseudokrasové jeskyně ve SkolevskýchBeskydech (Ukrajinské Karpaty). In: J Wagner (Ed.) IV.symposium o pseudokrasu, Knihovna ČSS, 23, Praha, 119–124(in Czech).
Twidale CR, 1982. Granite landforms. Elsevier, Amsterdam.
Twidale CR, 2009. On the origin of A-tents (pop-ups), sheetstructures, and associated forms. Progress in PhysicalGeography, 33(2), 147–162.
Urban J, 2004. Morphological evolution of the pseudokarst formsin Quaternary loesses of Southern Poland – a case study of Bugajnear Pinczów, Nida Basin. In: L Gaál (Ed.) Proceedings of the8th International Symposium on Pseudokarst, Teplý Vrch, 75–83.
Vendeville BC, Jackson MPA, 1992. The rise of diapirs during thin-skinned extension: Marine and Petroleum Geology, 9(4),331–353.
Vidal Romaní JR, 2007. Origin of tafoni elastic deformation.International Conference on Granite Caves. Abstracts, LaCoruña, 20–21.
Vítek J, 1983. Classification of Pseudokarst Forms inCzechoslovakia. International Journal of Speleology, 13(1–4),1–18.
White W B, 1988. Geomorphology and Hydrology of KarstTerrains. Oxford Univ. Press, Oxford – New York.
Wood C, 1974. The genesis and classification of lava tube caves.Transactions of the British Cave Research Association, 1(1),15–28.
Karst and Caves in Other Rocks, Pseudokarst – oral 2013 ICS Proceedings
242
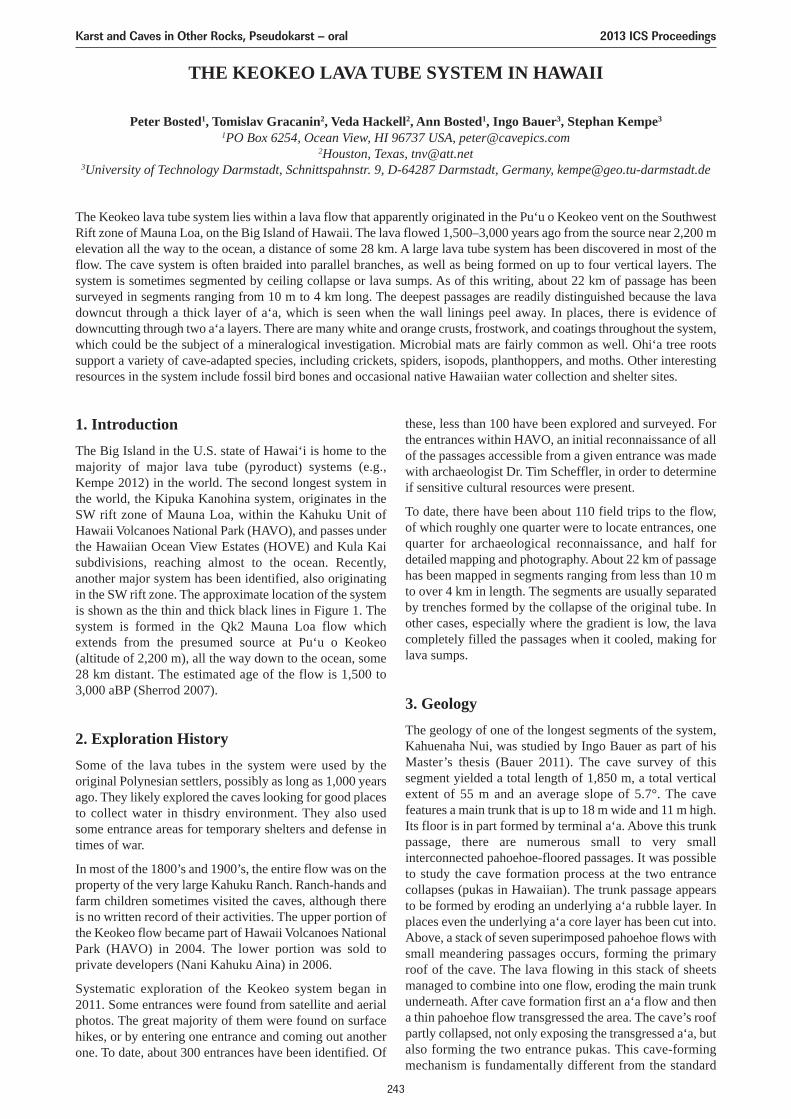
THE KEOKEO LAVA TUBE SYSTEM IN HAWAII
Peter Bosted1, Tomislav Gracanin2, Veda Hackell2, Ann Bosted1, Ingo Bauer3, Stephan Kempe3
1PO Box 6254, Ocean View, HI 96737 USA, [email protected], Texas, [email protected]
3University of Technology Darmstadt, Schnittspahnstr. 9, D-64287 Darmstadt, Germany, [email protected]
The Keokeo lava tube system lies within a lava flow that apparently originated in the Pu‘u o Keokeo vent on the SouthwestRift zone of Mauna Loa, on the Big Island of Hawaii. The lava flowed 1,500–3,000 years ago from the source near 2,200 melevation all the way to the ocean, a distance of some 28 km. A large lava tube system has been discovered in most of theflow. The cave system is often braided into parallel branches, as well as being formed on up to four vertical layers. Thesystem is sometimes segmented by ceiling collapse or lava sumps. As of this writing, about 22 km of passage has beensurveyed in segments ranging from 10 m to 4 km long. The deepest passages are readily distinguished because the lavadowncut through a thick layer of a‘a, which is seen when the wall linings peel away. In places, there is evidence ofdowncutting through two a‘a layers. There are many white and orange crusts, frostwork, and coatings throughout the system,which could be the subject of a mineralogical investigation. Microbial mats are fairly common as well. Ohi‘a tree rootssupport a variety of cave-adapted species, including crickets, spiders, isopods, planthoppers, and moths. Other interestingresources in the system include fossil bird bones and occasional native Hawaiian water collection and shelter sites.
1. IntroductionThe Big Island in the U.S. state of Hawai‘i is home to themajority of major lava tube (pyroduct) systems (e.g.,Kempe 2012) in the world. The second longest system inthe world, the Kipuka Kanohina system, originates in theSW rift zone of Mauna Loa, within the Kahuku Unit ofHawaii Volcanoes National Park (HAVO), and passes underthe Hawaiian Ocean View Estates (HOVE) and Kula Kaisubdivisions, reaching almost to the ocean. Recently,another major system has been identified, also originatingin the SW rift zone. The approximate location of the systemis shown as the thin and thick black lines in Figure 1. Thesystem is formed in the Qk2 Mauna Loa flow whichextends from the presumed source at Pu‘u o Keokeo(altitude of 2,200 m), all the way down to the ocean, some28 km distant. The estimated age of the flow is 1,500 to3,000 aBP (Sherrod 2007).
2. Exploration HistorySome of the lava tubes in the system were used by theoriginal Polynesian settlers, possibly as long as 1,000 yearsago. They likely explored the caves looking for good placesto collect water in thisdry environment. They also usedsome entrance areas for temporary shelters and defense intimes of war.
In most of the 1800’s and 1900’s, the entire flow was on theproperty of the very large Kahuku Ranch. Ranch-hands andfarm children sometimes visited the caves, although thereis no written record of their activities. The upper portion ofthe Keokeo flow became part of Hawaii Volcanoes NationalPark (HAVO) in 2004. The lower portion was sold toprivate developers (Nani Kahuku Aina) in 2006.
Systematic exploration of the Keokeo system began in2011. Some entrances were found from satellite and aerialphotos. The great majority of them were found on surfacehikes, or by entering one entrance and coming out anotherone. To date, about 300 entrances have been identified. Of
these, less than 100 have been explored and surveyed. Forthe entrances within HAVO, an initial reconnaissance of allof the passages accessible from a given entrance was madewith archaeologist Dr. Tim Scheffler, in order to determineif sensitive cultural resources were present.
To date, there have been about 110 field trips to the flow,of which roughly one quarter were to locate entrances, onequarter for archaeological reconnaissance, and half fordetailed mapping and photography. About 22 km of passagehas been mapped in segments ranging from less than 10 mto over 4 km in length. The segments are usually separatedby trenches formed by the collapse of the original tube. Inother cases, especially where the gradient is low, the lavacompletely filled the passages when it cooled, making forlava sumps.
3. GeologyThe geology of one of the longest segments of the system,Kahuenaha Nui, was studied by Ingo Bauer as part of hisMaster’s thesis (Bauer 2011). The cave survey of thissegment yielded a total length of 1,850 m, a total verticalextent of 55 m and an average slope of 5.7°. The cavefeatures a main trunk that is up to 18 m wide and 11 m high.Its floor is in part formed by terminal a‘a. Above this trunkpassage, there are numerous small to very smallinterconnected pahoehoe-floored passages. It was possibleto study the cave formation process at the two entrancecollapses (pukas in Hawaiian). The trunk passage appearsto be formed by eroding an underlying a‘a rubble layer. Inplaces even the underlying a‘a core layer has been cut into.Above, a stack of seven superimposed pahoehoe flows withsmall meandering passages occurs, forming the primaryroof of the cave. The lava flowing in this stack of sheetsmanaged to combine into one flow, eroding the main trunkunderneath. After cave formation first an a‘a flow and thena thin pahoehoe flow transgressed the area. The cave’s roofpartly collapsed, not only exposing the transgressed a‘a, butalso forming the two entrance pukas. This cave-formingmechanism is fundamentally different from the standard
Karst and Caves in Other Rocks, Pseudokarst – oral 2013 ICS Proceedings
243
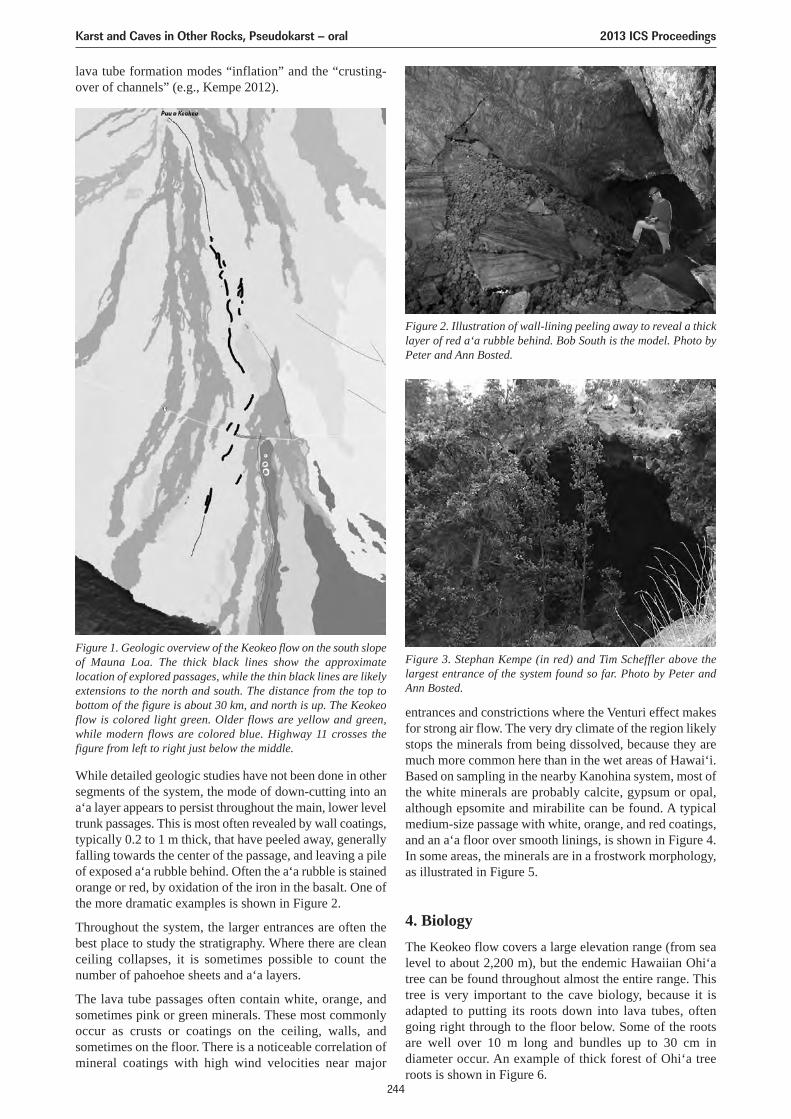
lava tube formation modes “inflation” and the “crusting-over of channels” (e.g., Kempe 2012).
Figure 1. Geologic overview of the Keokeo flow on the south slopeof Mauna Loa. The thick black lines show the approximatelocation of explored passages, while the thin black lines are likelyextensions to the north and south. The distance from the top tobottom of the figure is about 30 km, and north is up. The Keokeoflow is colored light green. Older flows are yellow and green,while modern flows are colored blue. Highway 11 crosses thefigure from left to right just below the middle.
Figure 2. Illustration of wall-lining peeling away to reveal a thicklayer of red a‘a rubble behind. Bob South is the model. Photo byPeter and Ann Bosted.
Figure 3. Stephan Kempe (in red) and Tim Scheffler above thelargest entrance of the system found so far. Photo by Peter andAnn Bosted.
While detailed geologic studies have not been done in othersegments of the system, the mode of down-cutting into ana‘a layer appears to persist throughout the main, lower leveltrunk passages. This is most often revealed by wall coatings,typically 0.2 to 1 m thick, that have peeled away, generallyfalling towards the center of the passage, and leaving a pileof exposed a‘a rubble behind. Often the a‘a rubble is stainedorange or red, by oxidation of the iron in the basalt. One ofthe more dramatic examples is shown in Figure 2.
Throughout the system, the larger entrances are often thebest place to study the stratigraphy. Where there are cleanceiling collapses, it is sometimes possible to count thenumber of pahoehoe sheets and a‘a layers.
The lava tube passages often contain white, orange, andsometimes pink or green minerals. These most commonlyoccur as crusts or coatings on the ceiling, walls, andsometimes on the floor. There is a noticeable correlation ofmineral coatings with high wind velocities near major
entrances and constrictions where the Venturi effect makesfor strong air flow. The very dry climate of the region likelystops the minerals from being dissolved, because they aremuch more common here than in the wet areas of Hawai‘i.Based on sampling in the nearby Kanohina system, most ofthe white minerals are probably calcite, gypsum or opal,although epsomite and mirabilite can be found. A typicalmedium-size passage with white, orange, and red coatings,and an a‘a floor over smooth linings, is shown in Figure 4.In some areas, the minerals are in a frostwork morphology,as illustrated in Figure 5.
4. BiologyThe Keokeo flow covers a large elevation range (from sealevel to about 2,200 m), but the endemic Hawaiian Ohi‘atree can be found throughout almost the entire range. Thistree is very important to the cave biology, because it isadapted to putting its roots down into lava tubes, oftengoing right through to the floor below. Some of the rootsare well over 10 m long and bundles up to 30 cm indiameter occur. An example of thick forest of Ohi‘a treeroots is shown in Figure 6.
Karst and Caves in Other Rocks, Pseudokarst – oral 2013 ICS Proceedings
244
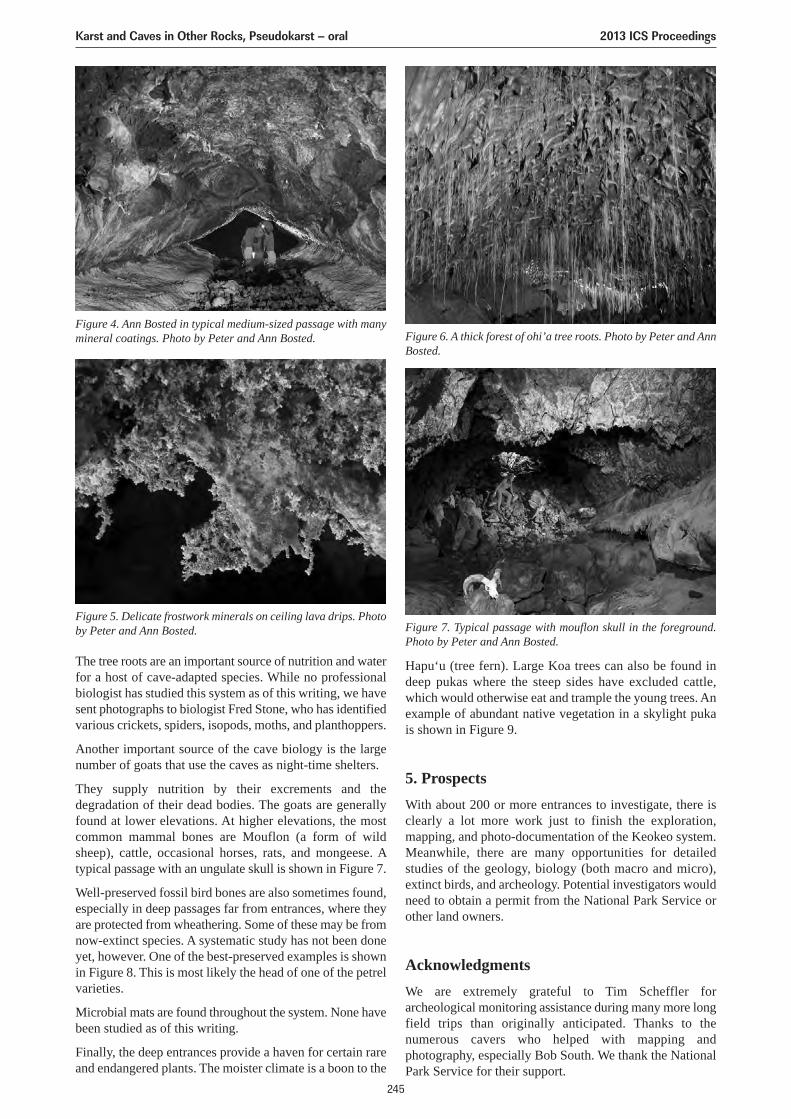
The tree roots are an important source of nutrition and waterfor a host of cave-adapted species. While no professionalbiologist has studied this system as of this writing, we havesent photographs to biologist Fred Stone, who has identifiedvarious crickets, spiders, isopods, moths, and planthoppers.
Another important source of the cave biology is the largenumber of goats that use the caves as night-time shelters.
They supply nutrition by their excrements and thedegradation of their dead bodies. The goats are generallyfound at lower elevations. At higher elevations, the mostcommon mammal bones are Mouflon (a form of wildsheep), cattle, occasional horses, rats, and mongeese. Atypical passage with an ungulate skull is shown in Figure 7.
Well-preserved fossil bird bones are also sometimes found,especially in deep passages far from entrances, where theyare protected from wheathering. Some of these may be fromnow-extinct species. A systematic study has not been doneyet, however. One of the best-preserved examples is shownin Figure 8. This is most likely the head of one of the petrelvarieties.
Microbial mats are found throughout the system. None havebeen studied as of this writing.
Finally, the deep entrances provide a haven for certain rareand endangered plants. The moister climate is a boon to the
Figure 4. Ann Bosted in typical medium-sized passage with manymineral coatings. Photo by Peter and Ann Bosted. Figure 6. A thick forest of ohi’a tree roots. Photo by Peter and Ann
Bosted.
Figure 7. Typical passage with mouflon skull in the foreground.Photo by Peter and Ann Bosted.
Figure 5. Delicate frostwork minerals on ceiling lava drips. Photoby Peter and Ann Bosted.
Hapu‘u (tree fern). Large Koa trees can also be found indeep pukas where the steep sides have excluded cattle,which would otherwise eat and trample the young trees. Anexample of abundant native vegetation in a skylight pukais shown in Figure 9.
5. ProspectsWith about 200 or more entrances to investigate, there isclearly a lot more work just to finish the exploration,mapping, and photo-documentation of the Keokeo system.Meanwhile, there are many opportunities for detailedstudies of the geology, biology (both macro and micro),extinct birds, and archeology. Potential investigators wouldneed to obtain a permit from the National Park Service orother land owners.
AcknowledgmentsWe are extremely grateful to Tim Scheffler forarcheological monitoring assistance during many more longfield trips than originally anticipated. Thanks to thenumerous cavers who helped with mapping andphotography, especially Bob South. We thank the NationalPark Service for their support.
Karst and Caves in Other Rocks, Pseudokarst – oral 2013 ICS Proceedings
245
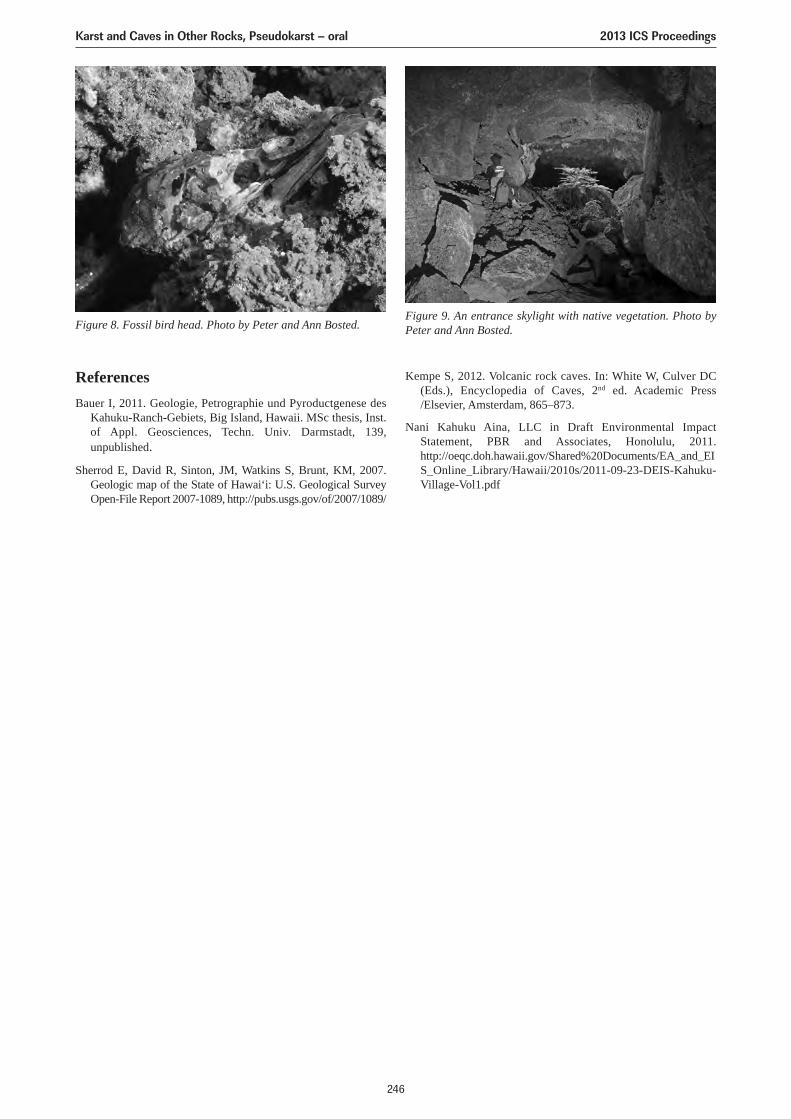
ReferencesBauer I, 2011. Geologie, Petrographie und Pyroductgenese des
Kahuku-Ranch-Gebiets, Big Island, Hawaii. MSc thesis, Inst.of Appl. Geosciences, Techn. Univ. Darmstadt, 139,unpublished.
Sherrod E, David R, Sinton, JM, Watkins S, Brunt, KM, 2007.Geologic map of the State of Hawai‘i: U.S. Geological SurveyOpen-File Report 2007-1089, http://pubs.usgs.gov/of/2007/1089/
Kempe S, 2012. Volcanic rock caves. In: White W, Culver DC(Eds.), Encyclopedia of Caves, 2nd ed. Academic Press/Elsevier, Amsterdam, 865–873.
Nani Kahuku Aina, LLC in Draft Environmental ImpactStatement, PBR and Associates, Honolulu, 2011.http://oeqc.doh.hawaii.gov/Shared%20Documents/EA_and_EIS_Online_Library/Hawaii/2010s/2011-09-23-DEIS-Kahuku-Village-Vol1.pdf
Figure 8. Fossil bird head. Photo by Peter and Ann Bosted.Figure 9. An entrance skylight with native vegetation. Photo byPeter and Ann Bosted.
Karst and Caves in Other Rocks, Pseudokarst – oral 2013 ICS Proceedings
246
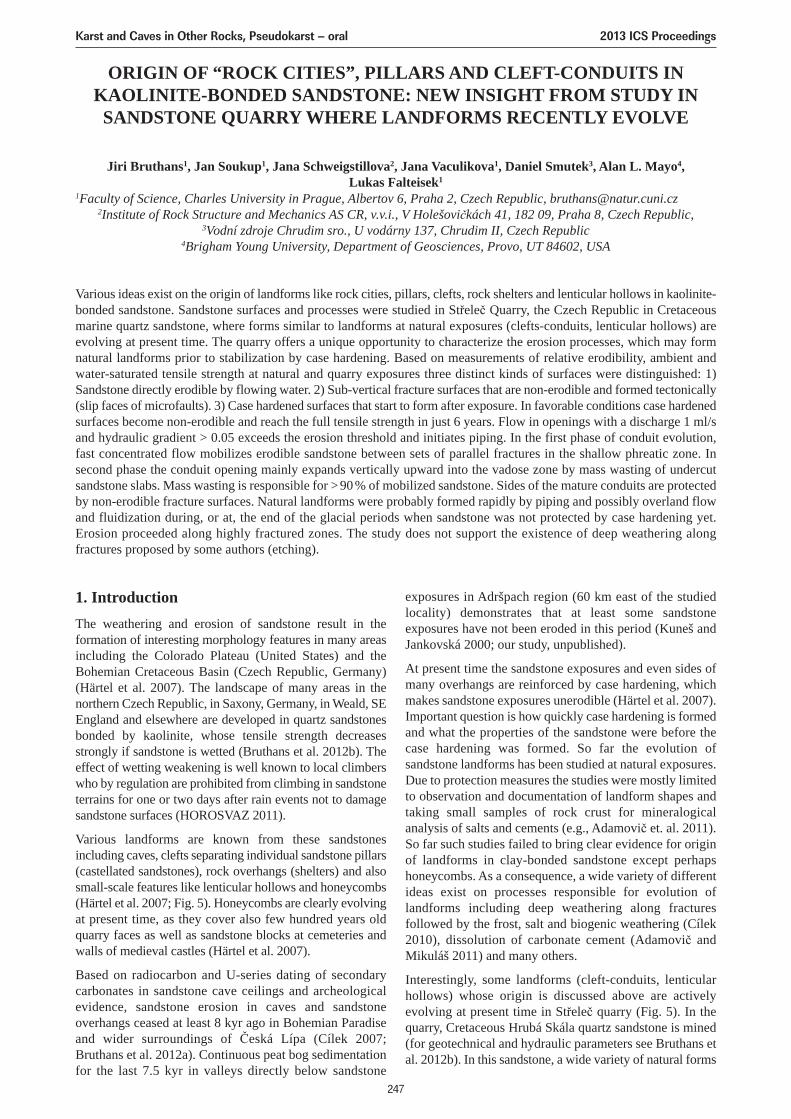
ORIGIN OF “ROCK CITIES”, PILLARS AND CLEFT-CONDUITS INKAOLINITE-BONDED SANDSTONE: NEW INSIGHT FROM STUDY IN
SANDSTONE QUARRY WHERE LANDFORMS RECENTLY EVOLVE
Jiri Bruthans1, Jan Soukup1, Jana Schweigstillova2, Jana Vaculikova1, Daniel Smutek3, Alan L. Mayo4,Lukas Falteisek1
1Faculty of Science, Charles University in Prague, Albertov 6, Praha 2, Czech Republic, [email protected] of Rock Structure and Mechanics AS CR, v.v.i., V Holešovičkách 41, 182 09, Praha 8, Czech Republic,
3Vodní zdroje Chrudim sro., U vodárny 137, Chrudim II, Czech Republic4Brigham Young University, Department of Geosciences, Provo, UT 84602, USA
Various ideas exist on the origin of landforms like rock cities, pillars, clefts, rock shelters and lenticular hollows in kaolinite-bonded sandstone. Sandstone surfaces and processes were studied in Střeleč Quarry, the Czech Republic in Cretaceousmarine quartz sandstone, where forms similar to landforms at natural exposures (clefts-conduits, lenticular hollows) areevolving at present time. The quarry offers a unique opportunity to characterize the erosion processes, which may formnatural landforms prior to stabilization by case hardening. Based on measurements of relative erodibility, ambient andwater-saturated tensile strength at natural and quarry exposures three distinct kinds of surfaces were distinguished: 1)Sandstone directly erodible by flowing water. 2) Sub-vertical fracture surfaces that are non-erodible and formed tectonically(slip faces of microfaults). 3) Case hardened surfaces that start to form after exposure. In favorable conditions case hardenedsurfaces become non-erodible and reach the full tensile strength in just 6 years. Flow in openings with a discharge 1 ml/sand hydraulic gradient > 0.05 exceeds the erosion threshold and initiates piping. In the first phase of conduit evolution,fast concentrated flow mobilizes erodible sandstone between sets of parallel fractures in the shallow phreatic zone. Insecond phase the conduit opening mainly expands vertically upward into the vadose zone by mass wasting of undercutsandstone slabs. Mass wasting is responsible for >90% of mobilized sandstone. Sides of the mature conduits are protectedby non-erodible fracture surfaces. Natural landforms were probably formed rapidly by piping and possibly overland flowand fluidization during, or at, the end of the glacial periods when sandstone was not protected by case hardening yet.Erosion proceeded along highly fractured zones. The study does not support the existence of deep weathering alongfractures proposed by some authors (etching).
1. IntroductionThe weathering and erosion of sandstone result in theformation of interesting morphology features in many areasincluding the Colorado Plateau (United States) and theBohemian Cretaceous Basin (Czech Republic, Germany)(Härtel et al. 2007). The landscape of many areas in thenorthern Czech Republic, in Saxony, Germany, in Weald, SEEngland and elsewhere are developed in quartz sandstonesbonded by kaolinite, whose tensile strength decreasesstrongly if sandstone is wetted (Bruthans et al. 2012b). Theeffect of wetting weakening is well known to local climberswho by regulation are prohibited from climbing in sandstoneterrains for one or two days after rain events not to damagesandstone surfaces (HOROSVAZ 2011).
Various landforms are known from these sandstonesincluding caves, clefts separating individual sandstone pillars(castellated sandstones), rock overhangs (shelters) and alsosmall-scale features like lenticular hollows and honeycombs(Härtel et al. 2007; Fig. 5). Honeycombs are clearly evolvingat present time, as they cover also few hundred years oldquarry faces as well as sandstone blocks at cemeteries andwalls of medieval castles (Härtel et al. 2007).
Based on radiocarbon and U-series dating of secondarycarbonates in sandstone cave ceilings and archeologicalevidence, sandstone erosion in caves and sandstoneoverhangs ceased at least 8 kyr ago in Bohemian Paradiseand wider surroundings of Česká Lípa (Cílek 2007;Bruthans et al. 2012a). Continuous peat bog sedimentationfor the last 7.5 kyr in valleys directly below sandstone
exposures in Adršpach region (60 km east of the studiedlocality) demonstrates that at least some sandstoneexposures have not been eroded in this period (Kuneš andJankovská 2000; our study, unpublished).
At present time the sandstone exposures and even sides ofmany overhangs are reinforced by case hardening, whichmakes sandstone exposures unerodible (Härtel et al. 2007).Important question is how quickly case hardening is formedand what the properties of the sandstone were before thecase hardening was formed. So far the evolution ofsandstone landforms has been studied at natural exposures.Due to protection measures the studies were mostly limitedto observation and documentation of landform shapes andtaking small samples of rock crust for mineralogicalanalysis of salts and cements (e.g., Adamovič et. al. 2011).So far such studies failed to bring clear evidence for originof landforms in clay-bonded sandstone except perhapshoneycombs. As a consequence, a wide variety of differentideas exist on processes responsible for evolution oflandforms including deep weathering along fracturesfollowed by the frost, salt and biogenic weathering (Cílek2010), dissolution of carbonate cement (Adamovič andMikuláš 2011) and many others.
Interestingly, some landforms (cleft-conduits, lenticularhollows) whose origin is discussed above are activelyevolving at present time in Střeleč quarry (Fig. 5). In thequarry, Cretaceous Hrubá Skála quartz sandstone is mined(for geotechnical and hydraulic parameters see Bruthans etal. 2012b). In this sandstone, a wide variety of natural forms
Karst and Caves in Other Rocks, Pseudokarst – oral 2013 ICS Proceedings
247
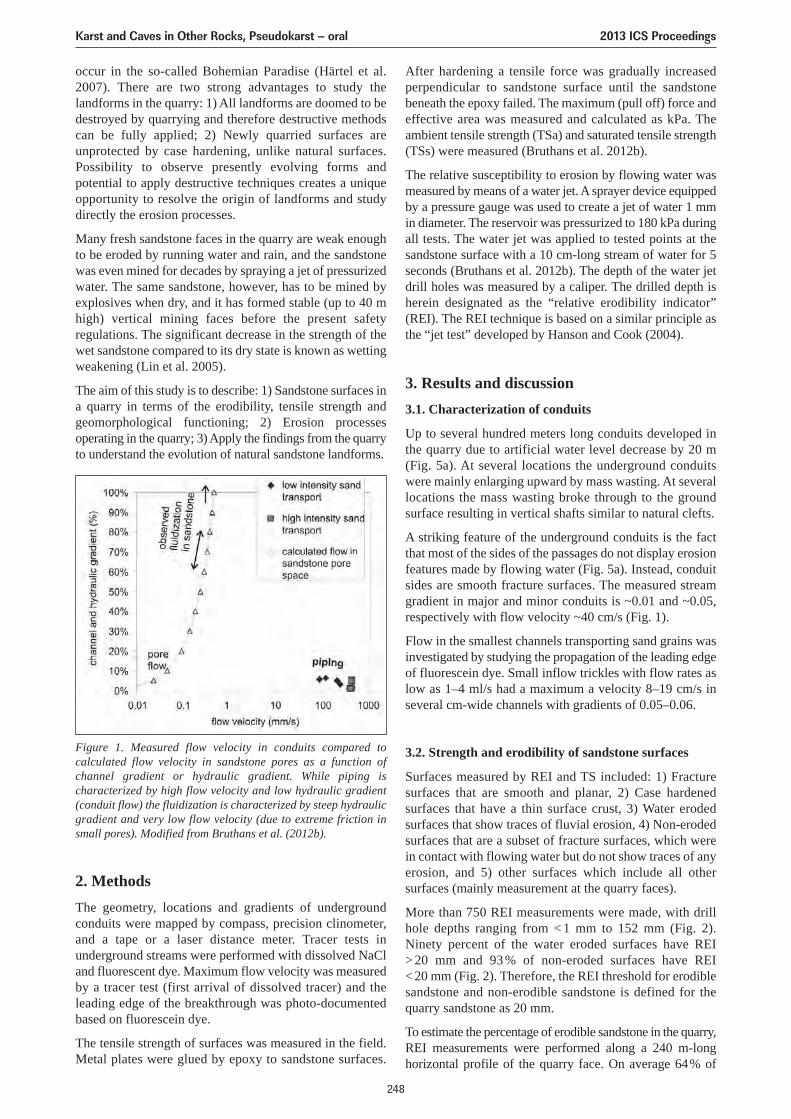
occur in the so-called Bohemian Paradise (Härtel et al.2007). There are two strong advantages to study thelandforms in the quarry: 1) All landforms are doomed to bedestroyed by quarrying and therefore destructive methodscan be fully applied; 2) Newly quarried surfaces areunprotected by case hardening, unlike natural surfaces.Possibility to observe presently evolving forms andpotential to apply destructive techniques creates a uniqueopportunity to resolve the origin of landforms and studydirectly the erosion processes.
Many fresh sandstone faces in the quarry are weak enoughto be eroded by running water and rain, and the sandstonewas even mined for decades by spraying a jet of pressurizedwater. The same sandstone, however, has to be mined byexplosives when dry, and it has formed stable (up to 40 mhigh) vertical mining faces before the present safetyregulations. The significant decrease in the strength of thewet sandstone compared to its dry state is known as wettingweakening (Lin et al. 2005).
The aim of this study is to describe: 1) Sandstone surfaces ina quarry in terms of the erodibility, tensile strength andgeomorphological functioning; 2) Erosion processesoperating in the quarry; 3) Apply the findings from the quarryto understand the evolution of natural sandstone landforms.
After hardening a tensile force was gradually increasedperpendicular to sandstone surface until the sandstonebeneath the epoxy failed. The maximum (pull off) force andeffective area was measured and calculated as kPa. Theambient tensile strength (TSa) and saturated tensile strength(TSs) were measured (Bruthans et al. 2012b).
The relative susceptibility to erosion by flowing water wasmeasured by means of a water jet. A sprayer device equippedby a pressure gauge was used to create a jet of water 1 mmin diameter. The reservoir was pressurized to 180 kPa duringall tests. The water jet was applied to tested points at thesandstone surface with a 10 cm-long stream of water for 5seconds (Bruthans et al. 2012b). The depth of the water jetdrill holes was measured by a caliper. The drilled depth isherein designated as the “relative erodibility indicator”(REI). The REI technique is based on a similar principle asthe “jet test” developed by Hanson and Cook (2004).
3. Results and discussion3.1. Characterization of conduits
Up to several hundred meters long conduits developed inthe quarry due to artificial water level decrease by 20 m(Fig. 5a). At several locations the underground conduitswere mainly enlarging upward by mass wasting. At severallocations the mass wasting broke through to the groundsurface resulting in vertical shafts similar to natural clefts.
A striking feature of the underground conduits is the factthat most of the sides of the passages do not display erosionfeatures made by flowing water (Fig. 5a). Instead, conduitsides are smooth fracture surfaces. The measured streamgradient in major and minor conduits is ~0.01 and ~0.05,respectively with flow velocity ~40 cm/s (Fig. 1).
Flow in the smallest channels transporting sand grains wasinvestigated by studying the propagation of the leading edgeof fluorescein dye. Small inflow trickles with flow rates aslow as 1–4 ml/s had a maximum a velocity 8–19 cm/s inseveral cm-wide channels with gradients of 0.05–0.06.
3.2. Strength and erodibility of sandstone surfaces
Surfaces measured by REI and TS included: 1) Fracturesurfaces that are smooth and planar, 2) Case hardenedsurfaces that have a thin surface crust, 3) Water erodedsurfaces that show traces of fluvial erosion, 4) Non-erodedsurfaces that are a subset of fracture surfaces, which werein contact with flowing water but do not show traces of anyerosion, and 5) other surfaces which include all othersurfaces (mainly measurement at the quarry faces).
More than 750 REI measurements were made, with drillhole depths ranging from < 1 mm to 152 mm (Fig. 2).Ninety percent of the water eroded surfaces have REI> 20 mm and 93 % of non-eroded surfaces have REI<20 mm (Fig. 2). Therefore, the REI threshold for erodiblesandstone and non-erodible sandstone is defined for thequarry sandstone as 20 mm.
To estimate the percentage of erodible sandstone in the quarry,REI measurements were performed along a 240 m-longhorizontal profile of the quarry face. On average 64% of
Figure 1. Measured flow velocity in conduits compared tocalculated flow velocity in sandstone pores as a function ofchannel gradient or hydraulic gradient. While piping ischaracterized by high flow velocity and low hydraulic gradient(conduit flow) the fluidization is characterized by steep hydraulicgradient and very low flow velocity (due to extreme friction insmall pores). Modified from Bruthans et al. (2012b).
2. MethodsThe geometry, locations and gradients of undergroundconduits were mapped by compass, precision clinometer,and a tape or a laser distance meter. Tracer tests inunderground streams were performed with dissolved NaCland fluorescent dye. Maximum flow velocity was measuredby a tracer test (first arrival of dissolved tracer) and theleading edge of the breakthrough was photo-documentedbased on fluorescein dye.
The tensile strength of surfaces was measured in the field.Metal plates were glued by epoxy to sandstone surfaces.
Karst and Caves in Other Rocks, Pseudokarst – oral 2013 ICS Proceedings
248
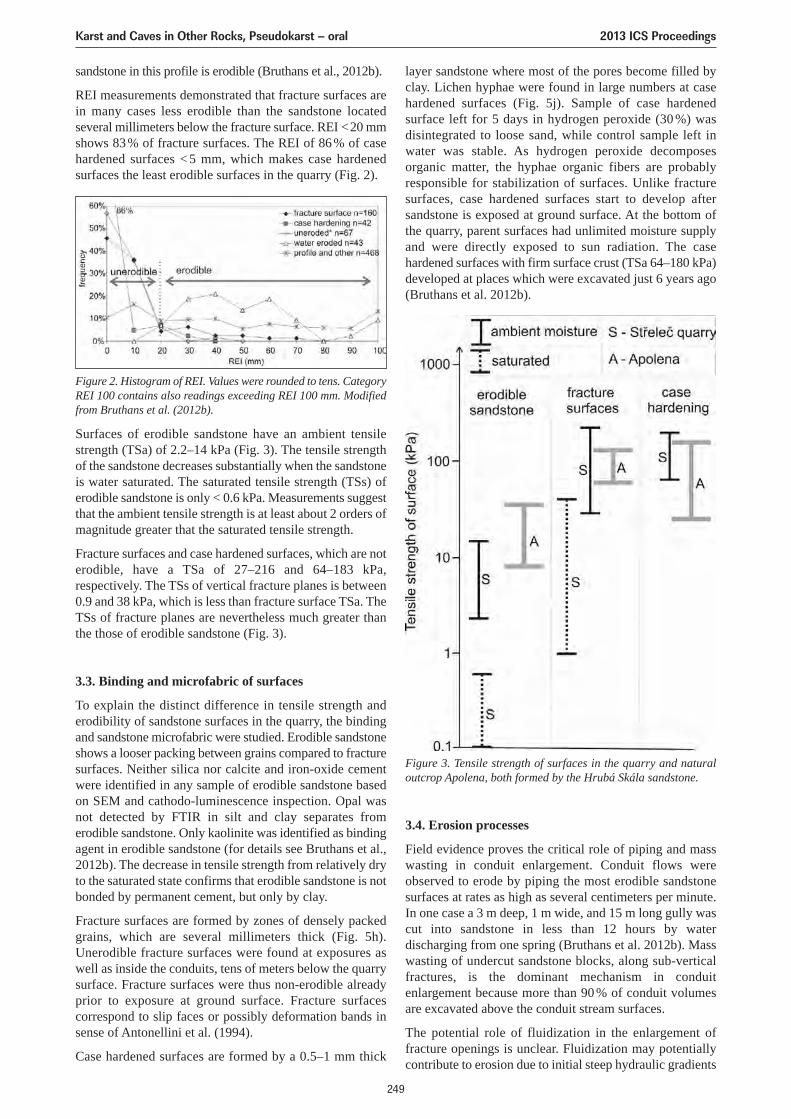
sandstone in this profile is erodible (Bruthans et al., 2012b).
REI measurements demonstrated that fracture surfaces arein many cases less erodible than the sandstone locatedseveral millimeters below the fracture surface. REI <20 mmshows 83% of fracture surfaces. The REI of 86% of casehardened surfaces < 5 mm, which makes case hardenedsurfaces the least erodible surfaces in the quarry (Fig. 2).
layer sandstone where most of the pores become filled byclay. Lichen hyphae were found in large numbers at casehardened surfaces (Fig. 5j). Sample of case hardenedsurface left for 5 days in hydrogen peroxide (30 %) wasdisintegrated to loose sand, while control sample left inwater was stable. As hydrogen peroxide decomposesorganic matter, the hyphae organic fibers are probablyresponsible for stabilization of surfaces. Unlike fracturesurfaces, case hardened surfaces start to develop aftersandstone is exposed at ground surface. At the bottom ofthe quarry, parent surfaces had unlimited moisture supplyand were directly exposed to sun radiation. The casehardened surfaces with firm surface crust (TSa 64–180 kPa)developed at places which were excavated just 6 years ago(Bruthans et al. 2012b).
Figure 2. Histogram of REI. Values were rounded to tens. CategoryREI 100 contains also readings exceeding REI 100 mm. Modifiedfrom Bruthans et al. (2012b).
Figure 3. Tensile strength of surfaces in the quarry and naturaloutcrop Apolena, both formed by the Hrubá Skála sandstone.
Surfaces of erodible sandstone have an ambient tensilestrength (TSa) of 2.2–14 kPa (Fig. 3). The tensile strengthof the sandstone decreases substantially when the sandstoneis water saturated. The saturated tensile strength (TSs) oferodible sandstone is only < 0.6 kPa. Measurements suggestthat the ambient tensile strength is at least about 2 orders ofmagnitude greater that the saturated tensile strength.
Fracture surfaces and case hardened surfaces, which are noterodible, have a TSa of 27–216 and 64–183 kPa,respectively. The TSs of vertical fracture planes is between0.9 and 38 kPa, which is less than fracture surface TSa. TheTSs of fracture planes are nevertheless much greater thanthe those of erodible sandstone (Fig. 3).
3.3. Binding and microfabric of surfaces
To explain the distinct difference in tensile strength anderodibility of sandstone surfaces in the quarry, the bindingand sandstone microfabric were studied. Erodible sandstoneshows a looser packing between grains compared to fracturesurfaces. Neither silica nor calcite and iron-oxide cementwere identified in any sample of erodible sandstone basedon SEM and cathodo-luminescence inspection. Opal wasnot detected by FTIR in silt and clay separates fromerodible sandstone. Only kaolinite was identified as bindingagent in erodible sandstone (for details see Bruthans et al.,2012b). The decrease in tensile strength from relatively dryto the saturated state confirms that erodible sandstone is notbonded by permanent cement, but only by clay.
Fracture surfaces are formed by zones of densely packedgrains, which are several millimeters thick (Fig. 5h).Unerodible fracture surfaces were found at exposures aswell as inside the conduits, tens of meters below the quarrysurface. Fracture surfaces were thus non-erodible alreadyprior to exposure at ground surface. Fracture surfacescorrespond to slip faces or possibly deformation bands insense of Antonellini et al. (1994).
Case hardened surfaces are formed by a 0.5–1 mm thick
3.4. Erosion processes
Field evidence proves the critical role of piping and masswasting in conduit enlargement. Conduit flows wereobserved to erode by piping the most erodible sandstonesurfaces at rates as high as several centimeters per minute.In one case a 3 m deep, 1 m wide, and 15 m long gully wascut into sandstone in less than 12 hours by waterdischarging from one spring (Bruthans et al. 2012b). Masswasting of undercut sandstone blocks, along sub-verticalfractures, is the dominant mechanism in conduitenlargement because more than 90 % of conduit volumesare excavated above the conduit stream surfaces.
The potential role of fluidization in the enlargement offracture openings is unclear. Fluidization may potentiallycontribute to erosion due to initial steep hydraulic gradients
Karst and Caves in Other Rocks, Pseudokarst – oral 2013 ICS Proceedings
249
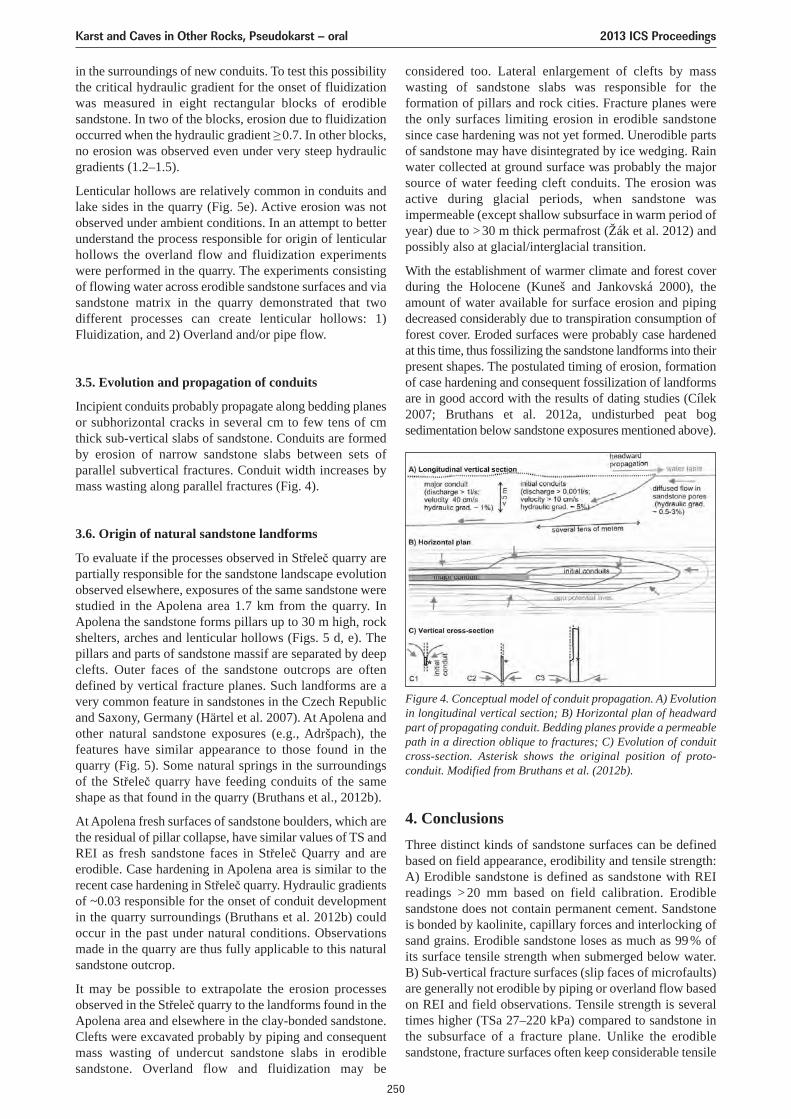
in the surroundings of new conduits. To test this possibilitythe critical hydraulic gradient for the onset of fluidizationwas measured in eight rectangular blocks of erodiblesandstone. In two of the blocks, erosion due to fluidizationoccurred when the hydraulic gradient ≥0.7. In other blocks,no erosion was observed even under very steep hydraulicgradients (1.2–1.5).
Lenticular hollows are relatively common in conduits andlake sides in the quarry (Fig. 5e). Active erosion was notobserved under ambient conditions. In an attempt to betterunderstand the process responsible for origin of lenticularhollows the overland flow and fluidization experimentswere performed in the quarry. The experiments consistingof flowing water across erodible sandstone surfaces and viasandstone matrix in the quarry demonstrated that twodifferent processes can create lenticular hollows: 1)Fluidization, and 2) Overland and/or pipe flow.
3.5. Evolution and propagation of conduits
Incipient conduits probably propagate along bedding planesor subhorizontal cracks in several cm to few tens of cmthick sub-vertical slabs of sandstone. Conduits are formedby erosion of narrow sandstone slabs between sets ofparallel subvertical fractures. Conduit width increases bymass wasting along parallel fractures (Fig. 4).
3.6. Origin of natural sandstone landforms
To evaluate if the processes observed in Střeleč quarry arepartially responsible for the sandstone landscape evolutionobserved elsewhere, exposures of the same sandstone werestudied in the Apolena area 1.7 km from the quarry. InApolena the sandstone forms pillars up to 30 m high, rockshelters, arches and lenticular hollows (Figs. 5 d, e). Thepillars and parts of sandstone massif are separated by deepclefts. Outer faces of the sandstone outcrops are oftendefined by vertical fracture planes. Such landforms are avery common feature in sandstones in the Czech Republicand Saxony, Germany (Härtel et al. 2007). At Apolena andother natural sandstone exposures (e.g., Adršpach), thefeatures have similar appearance to those found in thequarry (Fig. 5). Some natural springs in the surroundingsof the Střeleč quarry have feeding conduits of the sameshape as that found in the quarry (Bruthans et al., 2012b).
At Apolena fresh surfaces of sandstone boulders, which arethe residual of pillar collapse, have similar values of TS andREI as fresh sandstone faces in Střeleč Quarry and areerodible. Case hardening in Apolena area is similar to therecent case hardening in Střeleč quarry. Hydraulic gradientsof ~0.03 responsible for the onset of conduit developmentin the quarry surroundings (Bruthans et al. 2012b) couldoccur in the past under natural conditions. Observationsmade in the quarry are thus fully applicable to this naturalsandstone outcrop.
It may be possible to extrapolate the erosion processesobserved in the Střeleč quarry to the landforms found in theApolena area and elsewhere in the clay-bonded sandstone.Clefts were excavated probably by piping and consequentmass wasting of undercut sandstone slabs in erodiblesandstone. Overland flow and fluidization may be
considered too. Lateral enlargement of clefts by masswasting of sandstone slabs was responsible for theformation of pillars and rock cities. Fracture planes werethe only surfaces limiting erosion in erodible sandstonesince case hardening was not yet formed. Unerodible partsof sandstone may have disintegrated by ice wedging. Rainwater collected at ground surface was probably the majorsource of water feeding cleft conduits. The erosion wasactive during glacial periods, when sandstone wasimpermeable (except shallow subsurface in warm period ofyear) due to >30 m thick permafrost (Žák et al. 2012) andpossibly also at glacial/interglacial transition.
With the establishment of warmer climate and forest coverduring the Holocene (Kuneš and Jankovská 2000), theamount of water available for surface erosion and pipingdecreased considerably due to transpiration consumption offorest cover. Eroded surfaces were probably case hardenedat this time, thus fossilizing the sandstone landforms into theirpresent shapes. The postulated timing of erosion, formationof case hardening and consequent fossilization of landformsare in good accord with the results of dating studies (Cílek2007; Bruthans et al. 2012a, undisturbed peat bogsedimentation below sandstone exposures mentioned above).
4. ConclusionsThree distinct kinds of sandstone surfaces can be definedbased on field appearance, erodibility and tensile strength:A) Erodible sandstone is defined as sandstone with REIreadings > 20 mm based on field calibration. Erodiblesandstone does not contain permanent cement. Sandstoneis bonded by kaolinite, capillary forces and interlocking ofsand grains. Erodible sandstone loses as much as 99% ofits surface tensile strength when submerged below water.B) Sub-vertical fracture surfaces (slip faces of microfaults)are generally not erodible by piping or overland flow basedon REI and field observations. Tensile strength is severaltimes higher (TSa 27–220 kPa) compared to sandstone inthe subsurface of a fracture plane. Unlike the erodiblesandstone, fracture surfaces often keep considerable tensile
Figure 4. Conceptual model of conduit propagation. A) Evolutionin longitudinal vertical section; B) Horizontal plan of headwardpart of propagating conduit. Bedding planes provide a permeablepath in a direction oblique to fractures; C) Evolution of conduitcross-section. Asterisk shows the original position of proto-conduit. Modified from Bruthans et al. (2012b).
Karst and Caves in Other Rocks, Pseudokarst – oral 2013 ICS Proceedings
250
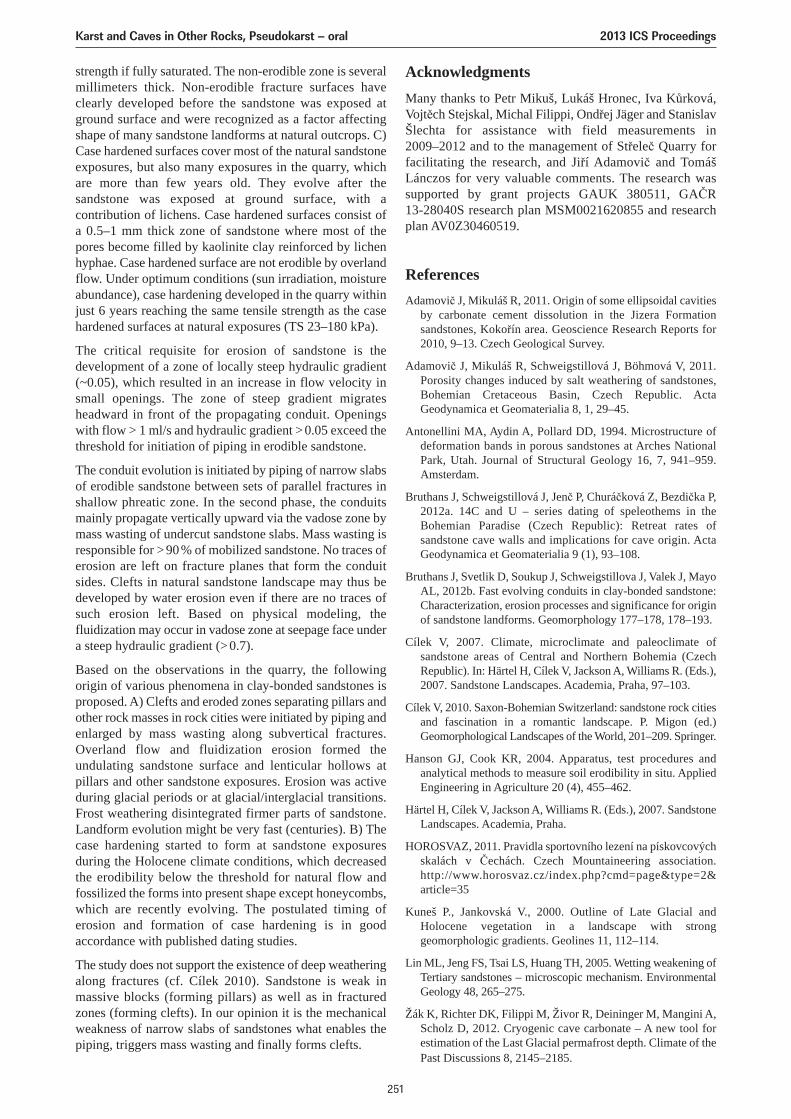
strength if fully saturated. The non-erodible zone is severalmillimeters thick. Non-erodible fracture surfaces haveclearly developed before the sandstone was exposed atground surface and were recognized as a factor affectingshape of many sandstone landforms at natural outcrops. C)Case hardened surfaces cover most of the natural sandstoneexposures, but also many exposures in the quarry, whichare more than few years old. They evolve after thesandstone was exposed at ground surface, with acontribution of lichens. Case hardened surfaces consist ofa 0.5–1 mm thick zone of sandstone where most of thepores become filled by kaolinite clay reinforced by lichenhyphae. Case hardened surface are not erodible by overlandflow. Under optimum conditions (sun irradiation, moistureabundance), case hardening developed in the quarry withinjust 6 years reaching the same tensile strength as the casehardened surfaces at natural exposures (TS 23–180 kPa).
The critical requisite for erosion of sandstone is thedevelopment of a zone of locally steep hydraulic gradient(~0.05), which resulted in an increase in flow velocity insmall openings. The zone of steep gradient migratesheadward in front of the propagating conduit. Openingswith flow > 1 ml/s and hydraulic gradient >0.05 exceed thethreshold for initiation of piping in erodible sandstone.
The conduit evolution is initiated by piping of narrow slabsof erodible sandstone between sets of parallel fractures inshallow phreatic zone. In the second phase, the conduitsmainly propagate vertically upward via the vadose zone bymass wasting of undercut sandstone slabs. Mass wasting isresponsible for >90% of mobilized sandstone. No traces oferosion are left on fracture planes that form the conduitsides. Clefts in natural sandstone landscape may thus bedeveloped by water erosion even if there are no traces ofsuch erosion left. Based on physical modeling, thefluidization may occur in vadose zone at seepage face undera steep hydraulic gradient (>0.7).
Based on the observations in the quarry, the followingorigin of various phenomena in clay-bonded sandstones isproposed. A) Clefts and eroded zones separating pillars andother rock masses in rock cities were initiated by piping andenlarged by mass wasting along subvertical fractures.Overland flow and fluidization erosion formed theundulating sandstone surface and lenticular hollows atpillars and other sandstone exposures. Erosion was activeduring glacial periods or at glacial/interglacial transitions.Frost weathering disintegrated firmer parts of sandstone.Landform evolution might be very fast (centuries). B) Thecase hardening started to form at sandstone exposuresduring the Holocene climate conditions, which decreasedthe erodibility below the threshold for natural flow andfossilized the forms into present shape except honeycombs,which are recently evolving. The postulated timing oferosion and formation of case hardening is in goodaccordance with published dating studies.
The study does not support the existence of deep weatheringalong fractures (cf. Cílek 2010). Sandstone is weak inmassive blocks (forming pillars) as well as in fracturedzones (forming clefts). In our opinion it is the mechanicalweakness of narrow slabs of sandstones what enables thepiping, triggers mass wasting and finally forms clefts.
AcknowledgmentsMany thanks to Petr Mikuš, Lukáš Hronec, Iva Kůrková,Vojtěch Stejskal, Michal Filippi, Ondřej Jäger and StanislavŠlechta for assistance with field measurements in2009–2012 and to the management of Střeleč Quarry forfacilitating the research, and Jiří Adamovič and TomášLánczos for very valuable comments. The research wassupported by grant projects GAUK 380511, GAČR13-28040S research plan MSM0021620855 and researchplan AV0Z30460519.
ReferencesAdamovič J, Mikuláš R, 2011. Origin of some ellipsoidal cavities
by carbonate cement dissolution in the Jizera Formationsandstones, Kokořín area. Geoscience Research Reports for2010, 9–13. Czech Geological Survey.
Adamovič J, Mikuláš R, Schweigstillová J, Böhmová V, 2011.Porosity changes induced by salt weathering of sandstones,Bohemian Cretaceous Basin, Czech Republic. ActaGeodynamica et Geomaterialia 8, 1, 29–45.
Antonellini MA, Aydin A, Pollard DD, 1994. Microstructure ofdeformation bands in porous sandstones at Arches NationalPark, Utah. Journal of Structural Geology 16, 7, 941–959.Amsterdam.
Bruthans J, Schweigstillová J, Jenč P, Churáčková Z, Bezdička P,2012a. 14C and U – series dating of speleothems in theBohemian Paradise (Czech Republic): Retreat rates ofsandstone cave walls and implications for cave origin. ActaGeodynamica et Geomaterialia 9 (1), 93–108.
Bruthans J, Svetlik D, Soukup J, Schweigstillova J, Valek J, MayoAL, 2012b. Fast evolving conduits in clay-bonded sandstone:Characterization, erosion processes and significance for originof sandstone landforms. Geomorphology 177–178, 178–193.
Cílek V, 2007. Climate, microclimate and paleoclimate ofsandstone areas of Central and Northern Bohemia (CzechRepublic). In: Härtel H, Cílek V, Jackson A, Williams R. (Eds.),2007. Sandstone Landscapes. Academia, Praha, 97–103.
Cílek V, 2010. Saxon-Bohemian Switzerland: sandstone rock citiesand fascination in a romantic landscape. P. Migon (ed.)Geomorphological Landscapes of the World, 201–209. Springer.
Hanson GJ, Cook KR, 2004. Apparatus, test procedures andanalytical methods to measure soil erodibility in situ. AppliedEngineering in Agriculture 20 (4), 455–462.
Härtel H, Cílek V, Jackson A, Williams R. (Eds.), 2007. SandstoneLandscapes. Academia, Praha.
HOROSVAZ, 2011. Pravidla sportovního lezení na pískovcovýchskalách v Čechách. Czech Mountaineering association.http://www.horosvaz.cz/index.php?cmd=page&type=2&article=35
Kuneš P., Jankovská V., 2000. Outline of Late Glacial andHolocene vegetation in a landscape with stronggeomorphologic gradients. Geolines 11, 112–114.
Lin ML, Jeng FS, Tsai LS, Huang TH, 2005. Wetting weakening ofTertiary sandstones – microscopic mechanism. EnvironmentalGeology 48, 265–275.
Žák K, Richter DK, Filippi M, Živor R, Deininger M, Mangini A,Scholz D, 2012. Cryogenic cave carbonate – A new tool forestimation of the Last Glacial permafrost depth. Climate of thePast Discussions 8, 2145–2185.
Karst and Caves in Other Rocks, Pseudokarst – oral 2013 ICS Proceedings
251
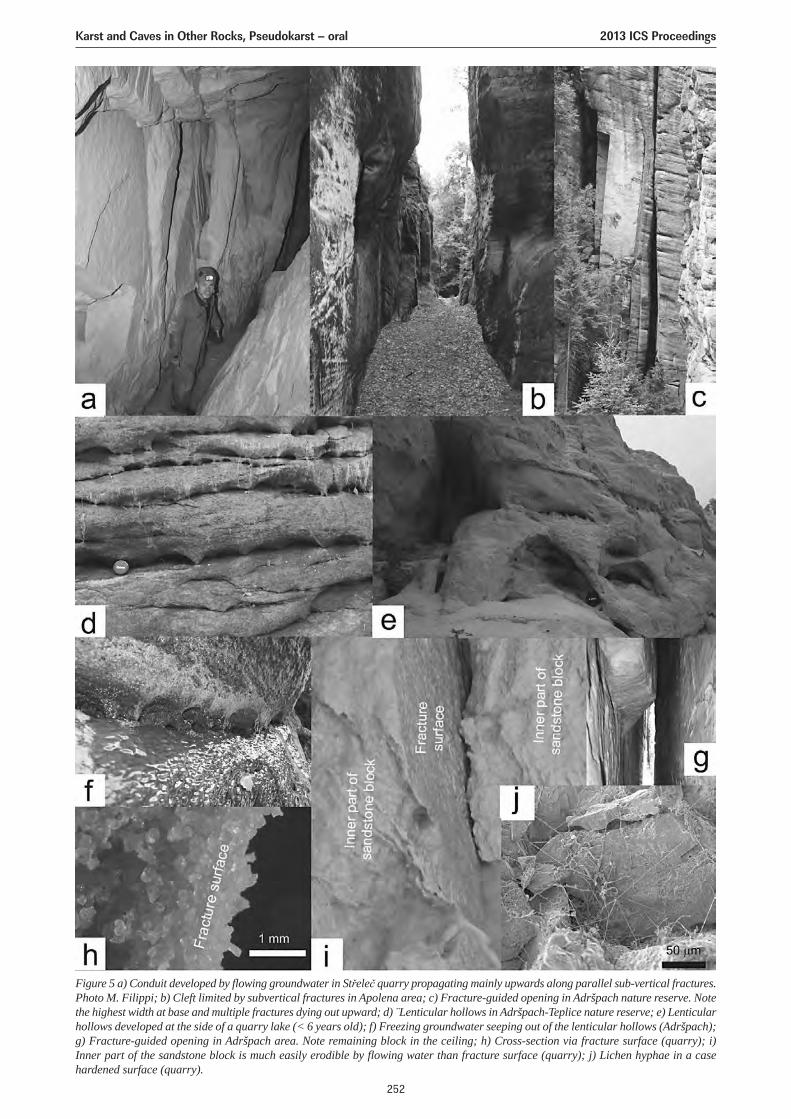
Figure 5 a) Conduit developed by flowing groundwater in Střeleč quarry propagating mainly upwards along parallel sub-vertical fractures.Photo M. Filippi; b) Cleft limited by subvertical fractures in Apolena area; c) Fracture-guided opening in Adršpach nature reserve. Notethe highest width at base and multiple fractures dying out upward; d) ̈ Lenticular hollows in Adršpach-Teplice nature reserve; e) Lenticularhollows developed at the side of a quarry lake (< 6 years old); f) Freezing groundwater seeping out of the lenticular hollows (Adršpach);g) Fracture-guided opening in Adršpach area. Note remaining block in the ceiling; h) Cross-section via fracture surface (quarry); i)Inner part of the sandstone block is much easily erodible by flowing water than fracture surface (quarry); j) Lichen hyphae in a casehardened surface (quarry).
Karst and Caves in Other Rocks, Pseudokarst – oral 2013 ICS Proceedings
252
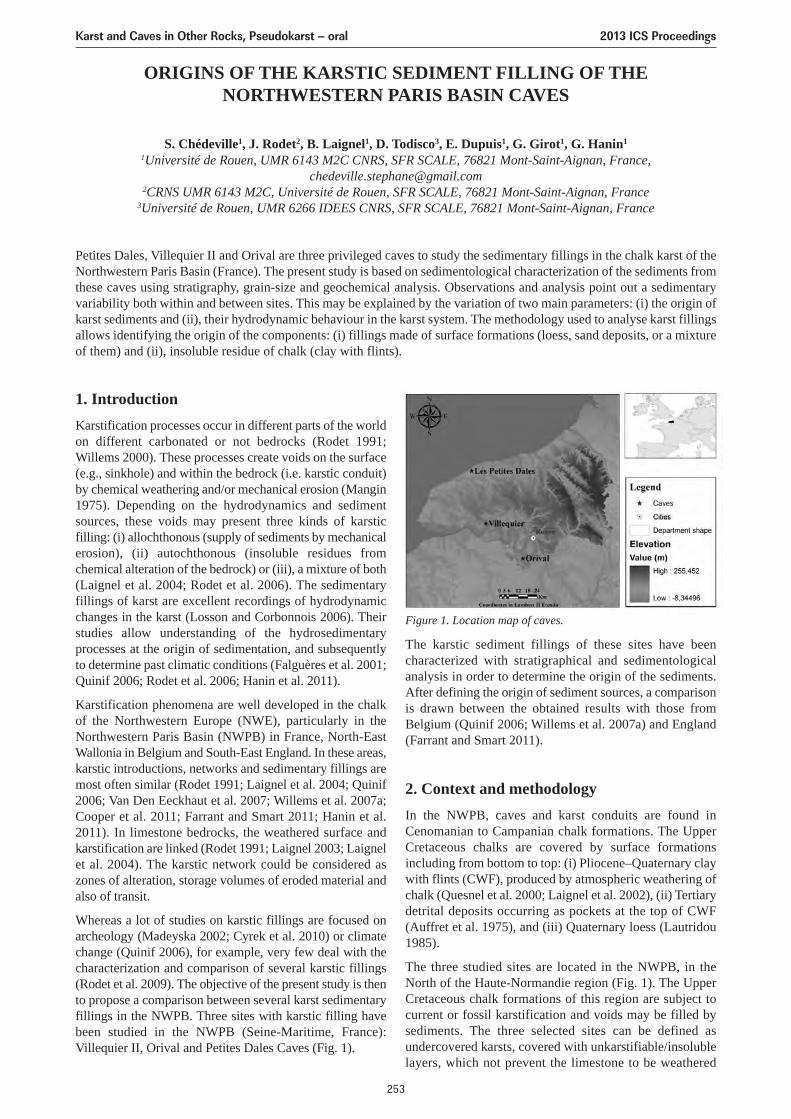
ORIGINS OF THE KARSTIC SEDIMENT FILLING OF THENORTHWESTERN PARIS BASIN CAVES
S. Chédeville1, J. Rodet2, B. Laignel1, D. Todisco3, E. Dupuis1, G. Girot1, G. Hanin1
1Université de Rouen, UMR 6143 M2C CNRS, SFR SCALE, 76821 Mont-Saint-Aignan, France,[email protected]
2CRNS UMR 6143 M2C, Université de Rouen, SFR SCALE, 76821 Mont-Saint-Aignan, France3Université de Rouen, UMR 6266 IDEES CNRS, SFR SCALE, 76821 Mont-Saint-Aignan, France
Petites Dales, Villequier II and Orival are three privileged caves to study the sedimentary fillings in the chalk karst of theNorthwestern Paris Basin (France). The present study is based on sedimentological characterization of the sediments fromthese caves using stratigraphy, grain-size and geochemical analysis. Observations and analysis point out a sedimentaryvariability both within and between sites. This may be explained by the variation of two main parameters: (i) the origin ofkarst sediments and (ii), their hydrodynamic behaviour in the karst system. The methodology used to analyse karst fillingsallows identifying the origin of the components: (i) fillings made of surface formations (loess, sand deposits, or a mixtureof them) and (ii), insoluble residue of chalk (clay with flints).
1. IntroductionKarstification processes occur in different parts of the worldon different carbonated or not bedrocks (Rodet 1991;Willems 2000). These processes create voids on the surface(e.g., sinkhole) and within the bedrock (i.e. karstic conduit)by chemical weathering and/or mechanical erosion (Mangin1975). Depending on the hydrodynamics and sedimentsources, these voids may present three kinds of karsticfilling: (i) allochthonous (supply of sediments by mechanicalerosion), (ii) autochthonous (insoluble residues fromchemical alteration of the bedrock) or (iii), a mixture of both(Laignel et al. 2004; Rodet et al. 2006). The sedimentaryfillings of karst are excellent recordings of hydrodynamicchanges in the karst (Losson and Corbonnois 2006). Theirstudies allow understanding of the hydrosedimentaryprocesses at the origin of sedimentation, and subsequentlyto determine past climatic conditions (Falguères et al. 2001;Quinif 2006; Rodet et al. 2006; Hanin et al. 2011).
Karstification phenomena are well developed in the chalkof the Northwestern Europe (NWE), particularly in theNorthwestern Paris Basin (NWPB) in France, North-EastWallonia in Belgium and South-East England. In these areas,karstic introductions, networks and sedimentary fillings aremost often similar (Rodet 1991; Laignel et al. 2004; Quinif2006; Van Den Eeckhaut et al. 2007; Willems et al. 2007a;Cooper et al. 2011; Farrant and Smart 2011; Hanin et al.2011). In limestone bedrocks, the weathered surface andkarstification are linked (Rodet 1991; Laignel 2003; Laignelet al. 2004). The karstic network could be considered aszones of alteration, storage volumes of eroded material andalso of transit.
Whereas a lot of studies on karstic fillings are focused onarcheology (Madeyska 2002; Cyrek et al. 2010) or climatechange (Quinif 2006), for example, very few deal with thecharacterization and comparison of several karstic fillings(Rodet et al. 2009). The objective of the present study is thento propose a comparison between several karst sedimentaryfillings in the NWPB. Three sites with karstic filling havebeen studied in the NWPB (Seine-Maritime, France):Villequier II, Orival and Petites Dales Caves (Fig. 1).
The karstic sediment fillings of these sites have beencharacterized with stratigraphical and sedimentologicalanalysis in order to determine the origin of the sediments.After defining the origin of sediment sources, a comparisonis drawn between the obtained results with those fromBelgium (Quinif 2006; Willems et al. 2007a) and England(Farrant and Smart 2011).
2. Context and methodologyIn the NWPB, caves and karst conduits are found inCenomanian to Campanian chalk formations. The UpperCretaceous chalks are covered by surface formationsincluding from bottom to top: (i) Pliocene–Quaternary claywith flints (CWF), produced by atmospheric weathering ofchalk (Quesnel et al. 2000; Laignel et al. 2002), (ii) Tertiarydetrital deposits occurring as pockets at the top of CWF(Auffret et al. 1975), and (iii) Quaternary loess (Lautridou1985).
The three studied sites are located in the NWPB, in theNorth of the Haute-Normandie region (Fig. 1). The UpperCretaceous chalk formations of this region are subject tocurrent or fossil karstification and voids may be filled bysediments. The three selected sites can be defined asundercovered karsts, covered with unkarstifiable/insolublelayers, which not prevent the limestone to be weathered
Figure 1. Location map of caves.
Karst and Caves in Other Rocks, Pseudokarst – oral 2013 ICS Proceedings
253
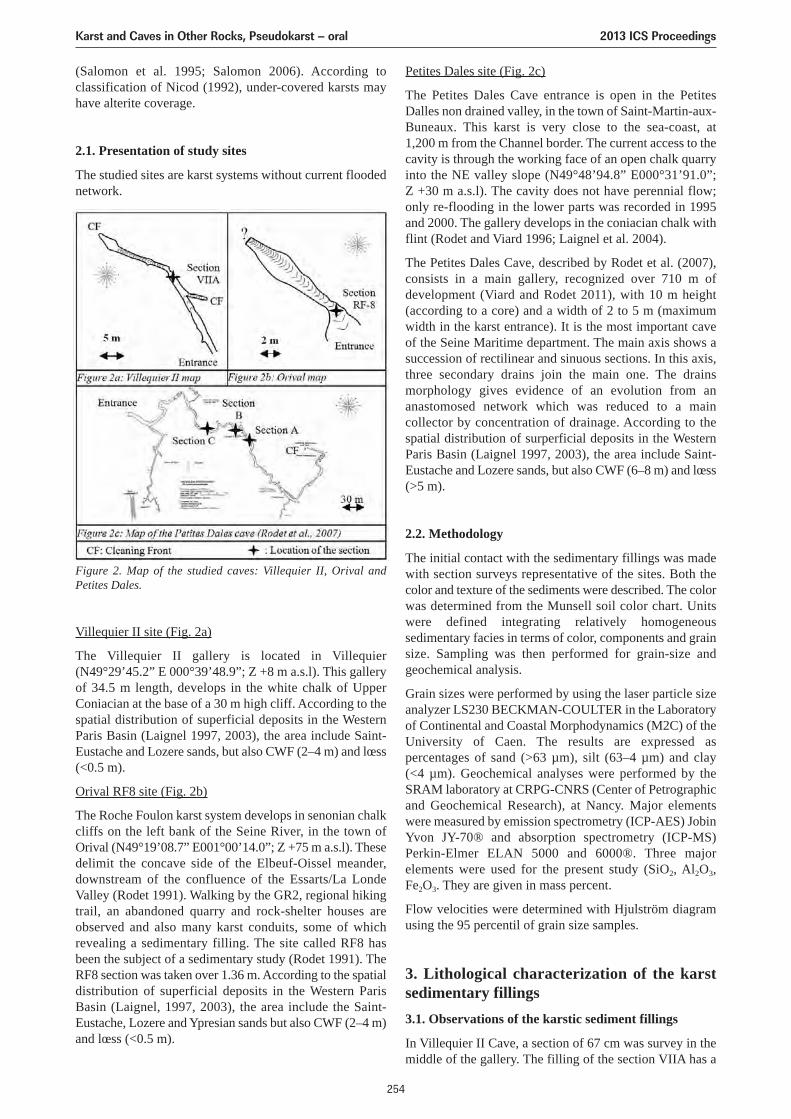
(Salomon et al. 1995; Salomon 2006). According toclassification of Nicod (1992), under-covered karsts mayhave alterite coverage.
2.1. Presentation of study sites
The studied sites are karst systems without current floodednetwork.
Petites Dales site (Fig. 2c)
The Petites Dales Cave entrance is open in the PetitesDalles non drained valley, in the town of Saint-Martin-aux-Buneaux. This karst is very close to the sea-coast, at1,200 m from the Channel border. The current access to thecavity is through the working face of an open chalk quarryinto the NE valley slope (N49°48’94.8” E000°31’91.0”;Z +30 m a.s.l). The cavity does not have perennial flow;only re-flooding in the lower parts was recorded in 1995and 2000. The gallery develops in the coniacian chalk withflint (Rodet and Viard 1996; Laignel et al. 2004).
The Petites Dales Cave, described by Rodet et al. (2007),consists in a main gallery, recognized over 710 m ofdevelopment (Viard and Rodet 2011), with 10 m height(according to a core) and a width of 2 to 5 m (maximumwidth in the karst entrance). It is the most important caveof the Seine Maritime department. The main axis shows asuccession of rectilinear and sinuous sections. In this axis,three secondary drains join the main one. The drainsmorphology gives evidence of an evolution from ananastomosed network which was reduced to a maincollector by concentration of drainage. According to thespatial distribution of surperficial deposits in the WesternParis Basin (Laignel 1997, 2003), the area include Saint-Eustache and Lozere sands, but also CWF (6–8 m) and lœss(>5 m).
2.2. Methodology
The initial contact with the sedimentary fillings was madewith section surveys representative of the sites. Both thecolor and texture of the sediments were described. The colorwas determined from the Munsell soil color chart. Unitswere defined integrating relatively homogeneoussedimentary facies in terms of color, components and grainsize. Sampling was then performed for grain-size andgeochemical analysis.
Grain sizes were performed by using the laser particle sizeanalyzer LS230 BECKMAN-COULTER in the Laboratoryof Continental and Coastal Morphodynamics (M2C) of theUniversity of Caen. The results are expressed aspercentages of sand (>63 µm), silt (63–4 µm) and clay(<4 µm). Geochemical analyses were performed by theSRAM laboratory at CRPG-CNRS (Center of Petrographicand Geochemical Research), at Nancy. Major elementswere measured by emission spectrometry (ICP-AES) JobinYvon JY-70® and absorption spectrometry (ICP-MS)Perkin-Elmer ELAN 5000 and 6000®. Three majorelements were used for the present study (SiO2, Al2O3,Fe2O3. They are given in mass percent.
Flow velocities were determined with Hjulström diagramusing the 95 percentil of grain size samples.
3. Lithological characterization of the karstsedimentary fillings3.1. Observations of the karstic sediment fillings
In Villequier II Cave, a section of 67 cm was survey in themiddle of the gallery. The filling of the section VIIA has a
Figure 2. Map of the studied caves: Villequier II, Orival andPetites Dales.
Villequier II site (Fig. 2a)
The Villequier II gallery is located in Villequier(N49°29’45.2” E 000°39’48.9”; Z +8 m a.s.l). This galleryof 34.5 m length, develops in the white chalk of UpperConiacian at the base of a 30 m high cliff. According to thespatial distribution of superficial deposits in the WesternParis Basin (Laignel 1997, 2003), the area include Saint-Eustache and Lozere sands, but also CWF (2–4 m) and lœss(<0.5 m).
Orival RF8 site (Fig. 2b)
The Roche Foulon karst system develops in senonian chalkcliffs on the left bank of the Seine River, in the town ofOrival (N49°19’08.7” E001°00’14.0”; Z +75 m a.s.l). Thesedelimit the concave side of the Elbeuf-Oissel meander,downstream of the confluence of the Essarts/La LondeValley (Rodet 1991). Walking by the GR2, regional hikingtrail, an abandoned quarry and rock-shelter houses areobserved and also many karst conduits, some of whichrevealing a sedimentary filling. The site called RF8 hasbeen the subject of a sedimentary study (Rodet 1991). TheRF8 section was taken over 1.36 m. According to the spatialdistribution of superficial deposits in the Western ParisBasin (Laignel, 1997, 2003), the area include the Saint-Eustache, Lozere and Ypresian sands but also CWF (2–4 m)and lœss (<0.5 m).
Karst and Caves in Other Rocks, Pseudokarst – oral 2013 ICS Proceedings
254
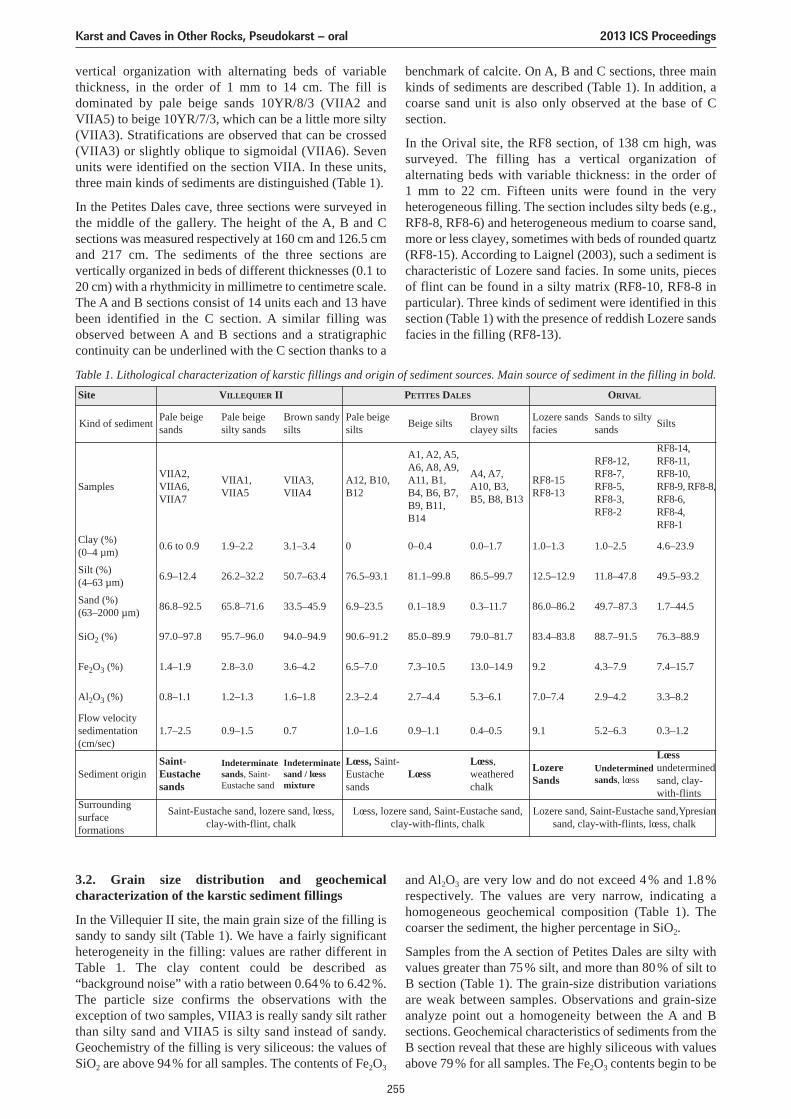
vertical organization with alternating beds of variablethickness, in the order of 1 mm to 14 cm. The fill isdominated by pale beige sands 10YR/8/3 (VIIA2 andVIIA5) to beige 10YR/7/3, which can be a little more silty(VIIA3). Stratifications are observed that can be crossed(VIIA3) or slightly oblique to sigmoidal (VIIA6). Sevenunits were identified on the section VIIA. In these units,three main kinds of sediments are distinguished (Table 1).
In the Petites Dales cave, three sections were surveyed inthe middle of the gallery. The height of the A, B and Csections was measured respectively at 160 cm and 126.5 cmand 217 cm. The sediments of the three sections arevertically organized in beds of different thicknesses (0.1 to20 cm) with a rhythmicity in millimetre to centimetre scale.The A and B sections consist of 14 units each and 13 havebeen identified in the C section. A similar filling wasobserved between A and B sections and a stratigraphiccontinuity can be underlined with the C section thanks to a
benchmark of calcite. On A, B and C sections, three mainkinds of sediments are described (Table 1). In addition, acoarse sand unit is also only observed at the base of Csection.
In the Orival site, the RF8 section, of 138 cm high, wassurveyed. The filling has a vertical organization ofalternating beds with variable thickness: in the order of1 mm to 22 cm. Fifteen units were found in the veryheterogeneous filling. The section includes silty beds (e.g.,RF8-8, RF8-6) and heterogeneous medium to coarse sand,more or less clayey, sometimes with beds of rounded quartz(RF8-15). According to Laignel (2003), such a sediment ischaracteristic of Lozere sand facies. In some units, piecesof flint can be found in a silty matrix (RF8-10, RF8-8 inparticular). Three kinds of sediment were identified in thissection (Table 1) with the presence of reddish Lozere sandsfacies in the filling (RF8-13).
Table 1. Lithological characterization of karstic fillings and origin of sediment sources. Main source of sediment in the filling in bold.
3.2. Grain size distribution and geochemicalcharacterization of the karstic sediment fillings
In the Villequier II site, the main grain size of the filling issandy to sandy silt (Table 1). We have a fairly significantheterogeneity in the filling: values are rather different inTable 1. The clay content could be described as“background noise” with a ratio between 0.64% to 6.42%.The particle size confirms the observations with theexception of two samples, VIIA3 is really sandy silt ratherthan silty sand and VIIA5 is silty sand instead of sandy.Geochemistry of the filling is very siliceous: the values ofSiO2 are above 94% for all samples. The contents of Fe2O3
and Al2O3 are very low and do not exceed 4 % and 1.8 %respectively. The values are very narrow, indicating ahomogeneous geochemical composition (Table 1). Thecoarser the sediment, the higher percentage in SiO2.
Samples from the A section of Petites Dales are silty withvalues greater than 75% silt, and more than 80% of silt toB section (Table 1). The grain-size distribution variationsare weak between samples. Observations and grain-sizeanalyze point out a homogeneity between the A and Bsections. Geochemical characteristics of sediments from theB section reveal that these are highly siliceous with valuesabove 79% for all samples. The Fe2O3 contents begin to be
Site VILLEQUIER II
Pale beigesands
Pale beigesilty sands
Brown sandysilts
Pale beigesilts Beige silts
A1, A2, A5,A6, A8, A9,A11, B1,B4, B6, B7,B9, B11,B14
A4, A7,A10, B3,B5, B8, B13
RF8-15RF8-13
RF8-12, RF8-7, RF8-5, RF8-3, RF8-2
RF8-14,RF8-11,RF8-10,RF8-9, RF8-8,RF8-6,RF8-4,RF8-1
A12, B10,B12
VIIA3,VIIA4
VIIA1,VIIA5
VIIA2,VIIA6,VIIA7
Brown clayey silts
Lozere sandsfacies
Sands to siltysands Silts
PETITES DALES ORIVAL
Kind of sediment
Samples
Clay (%)(0–4 µm) 0.6 to 0.9 1.9–2.2 3.1–3.4 0 0–0.4 0.0–1.7 1.0–1.3 1.0–2.5 4.6–23.9
Silt (%)(4–63 µm) 6.9–12.4 26.2–32.2 50.7–63.4 76.5–93.1 81.1–99.8 86.5–99.7 12.5–12.9 11.8–47.8 49.5–93.2
Sand (%)(63–2000 µm) 86.8–92.5 65.8–71.6 33.5–45.9 6.9–23.5 0.1–18.9 0.3–11.7 86.0–86.2 49.7–87.3 1.7–44.5
SiO2 (%) 97.0–97.8 95.7–96.0 94.0–94.9 90.6–91.2 85.0–89.9 79.0–81.7 83.4–83.8 88.7–91.5 76.3–88.9
Fe2O3 (%) 1.4–1.9 2.8–3.0 3.6–4.2 6.5–7.0 7.3–10.5 13.0–14.9 9.2 4.3–7.9 7.4–15.7
Al2O3 (%) 0.8–1.1 1.2–1.3 1.6–1.8 2.3–2.4 2.7–4.4 5.3–6.1 7.0–7.4 2.9–4.2 3.3–8.2
Flow velocitysedimentation(cm/sec)
Sediment origin
Surroundingsurfaceformations
1.7–2.5 0.9–1.5 0.7 1.0–1.6 0.9–1.1 0.4–0.5 9.1 5.2–6.3 0.3–1.2
Saint-Eustachesands
Indeterminatesands, Saint-Eustache sand
Indeterminatesand / lœssmixture
Lœss, Saint-Eustachesands
LœssLœss,weatheredchalk
LozereSands
Undeterminedsands, lœss
Lœssundeterminedsand, clay-with-flints
Saint-Eustache sand, lozere sand, lœss,clay-with-flint, chalk
Lœss, lozere sand, Saint-Eustache sand,clay-with-flints, chalk
Lozere sand, Saint-Eustache sand,Ypresiansand, clay-with-flints, lœss, chalk
Karst and Caves in Other Rocks, Pseudokarst – oral 2013 ICS Proceedings
255
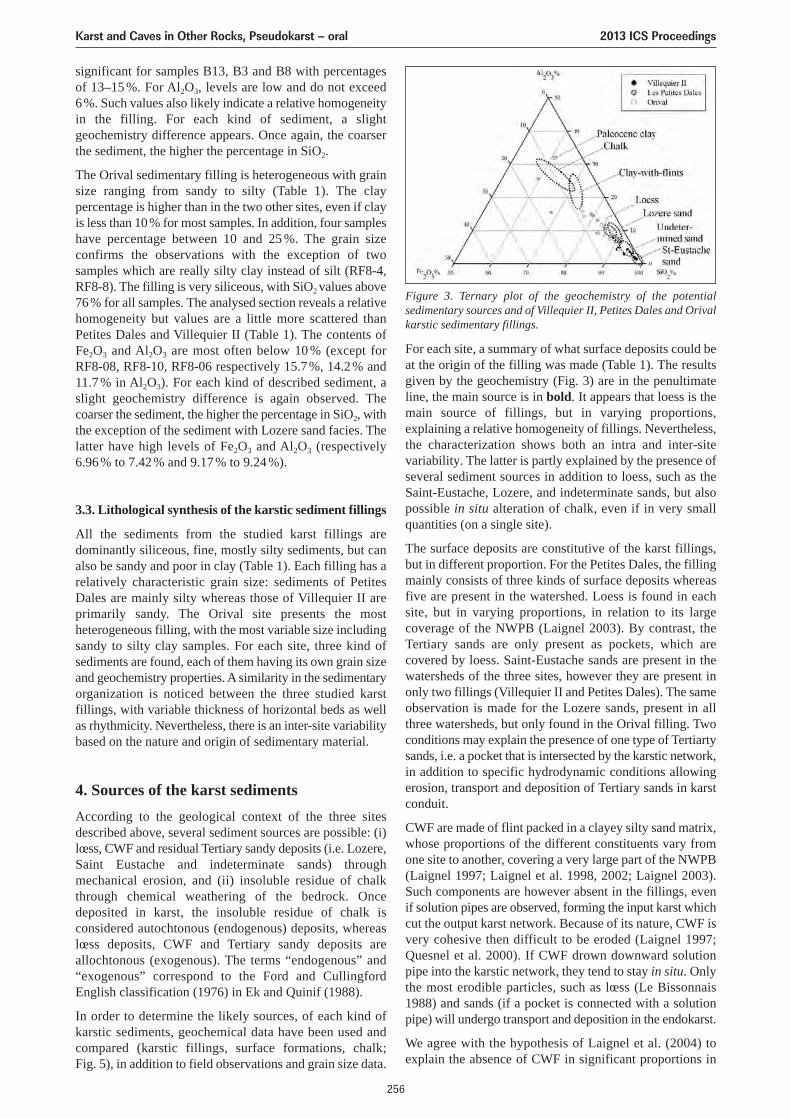
significant for samples B13, B3 and B8 with percentagesof 13–15 %. For Al2O3, levels are low and do not exceed6%. Such values also likely indicate a relative homogeneityin the filling. For each kind of sediment, a slightgeochemistry difference appears. Once again, the coarserthe sediment, the higher the percentage in SiO2.
The Orival sedimentary filling is heterogeneous with grainsize ranging from sandy to silty (Table 1). The claypercentage is higher than in the two other sites, even if clayis less than 10% for most samples. In addition, four sampleshave percentage between 10 and 25 %. The grain sizeconfirms the observations with the exception of twosamples which are really silty clay instead of silt (RF8-4,RF8-8). The filling is very siliceous, with SiO2 values above76% for all samples. The analysed section reveals a relativehomogeneity but values are a little more scattered thanPetites Dales and Villequier II (Table 1). The contents ofFe2O3 and Al2O3 are most often below 10 % (except forRF8-08, RF8-10, RF8-06 respectively 15.7%, 14.2% and11.7 % in Al2O3). For each kind of described sediment, aslight geochemistry difference is again observed. Thecoarser the sediment, the higher the percentage in SiO2, withthe exception of the sediment with Lozere sand facies. Thelatter have high levels of Fe2O3 and Al2O3 (respectively6.96% to 7.42% and 9.17% to 9.24%).
3.3. Lithological synthesis of the karstic sediment fillings
All the sediments from the studied karst fillings aredominantly siliceous, fine, mostly silty sediments, but canalso be sandy and poor in clay (Table 1). Each filling has arelatively characteristic grain size: sediments of PetitesDales are mainly silty whereas those of Villequier II areprimarily sandy. The Orival site presents the mostheterogeneous filling, with the most variable size includingsandy to silty clay samples. For each site, three kind ofsediments are found, each of them having its own grain sizeand geochemistry properties. A similarity in the sedimentaryorganization is noticed between the three studied karstfillings, with variable thickness of horizontal beds as wellas rhythmicity. Nevertheless, there is an inter-site variabilitybased on the nature and origin of sedimentary material.
4. Sources of the karst sedimentsAccording to the geological context of the three sitesdescribed above, several sediment sources are possible: (i)lœss, CWF and residual Tertiary sandy deposits (i.e. Lozere,Saint Eustache and indeterminate sands) throughmechanical erosion, and (ii) insoluble residue of chalkthrough chemical weathering of the bedrock. Oncedeposited in karst, the insoluble residue of chalk isconsidered autochtonous (endogenous) deposits, whereaslœss deposits, CWF and Tertiary sandy deposits areallochtonous (exogenous). The terms “endogenous” and“exogenous” correspond to the Ford and CullingfordEnglish classification (1976) in Ek and Quinif (1988).
In order to determine the likely sources, of each kind ofkarstic sediments, geochemical data have been used andcompared (karstic fillings, surface formations, chalk;Fig. 5), in addition to field observations and grain size data.
For each site, a summary of what surface deposits could beat the origin of the filling was made (Table 1). The resultsgiven by the geochemistry (Fig. 3) are in the penultimateline, the main source is in bold. It appears that loess is themain source of fillings, but in varying proportions,explaining a relative homogeneity of fillings. Nevertheless,the characterization shows both an intra and inter-sitevariability. The latter is partly explained by the presence ofseveral sediment sources in addition to loess, such as theSaint-Eustache, Lozere, and indeterminate sands, but alsopossible in situ alteration of chalk, even if in very smallquantities (on a single site).
The surface deposits are constitutive of the karst fillings,but in different proportion. For the Petites Dales, the fillingmainly consists of three kinds of surface deposits whereasfive are present in the watershed. Loess is found in eachsite, but in varying proportions, in relation to its largecoverage of the NWPB (Laignel 2003). By contrast, theTertiary sands are only present as pockets, which arecovered by loess. Saint-Eustache sands are present in thewatersheds of the three sites, however they are present inonly two fillings (Villequier II and Petites Dales). The sameobservation is made for the Lozere sands, present in allthree watersheds, but only found in the Orival filling. Twoconditions may explain the presence of one type of Tertiartysands, i.e. a pocket that is intersected by the karstic network,in addition to specific hydrodynamic conditions allowingerosion, transport and deposition of Tertiary sands in karstconduit.
CWF are made of flint packed in a clayey silty sand matrix,whose proportions of the different constituents vary fromone site to another, covering a very large part of the NWPB(Laignel 1997; Laignel et al. 1998, 2002; Laignel 2003).Such components are however absent in the fillings, evenif solution pipes are observed, forming the input karst whichcut the output karst network. Because of its nature, CWF isvery cohesive then difficult to be eroded (Laignel 1997;Quesnel et al. 2000). If CWF drown downward solutionpipe into the karstic network, they tend to stay in situ. Onlythe most erodible particles, such as lœss (Le Bissonnais1988) and sands (if a pocket is connected with a solutionpipe) will undergo transport and deposition in the endokarst.
We agree with the hypothesis of Laignel et al. (2004) toexplain the absence of CWF in significant proportions in
Figure 3. Ternary plot of the geochemistry of the potentialsedimentary sources and of Villequier II, Petites Dales and Orivalkarstic sedimentary fillings.
Karst and Caves in Other Rocks, Pseudokarst – oral 2013 ICS Proceedings
256
the fillings. Therefore, our results do not reach those ofSweeting (1973), suggesting that clay particles come fromerosion of CWF. Our studies are consistent with those ofReams (1968) showing that clay have two possible origins:the in situ alteration of the chalk in the endokarst and/orarrivals of surface sediments by mechanical erosion.
To summarize, the most erodible sediments are primarilydeployed in the karst network. Different sediment originspartly explain the variability between each site. Within asingle site, sediment origin is probably not the only causeof the variability of the filling. Another parameterinfluences intrakarstic sedimentation, especiallyhydrodynamic conditions.
5. Discussions and conclusionsKarsts of NWPB present introduction forms as sinkholes(Laignel et al. 1997; Quesnel et al. 2000) and current orancient restitution forms, as springs or caves (Rodet 1991;Laignel et al. 2004; Hanin et al. 2011). Ancient karstsystems could be filled depending on the hydrodynamicconditions and sediment sources. Sedimentary fillingscharacterization is essential to understand sedimentdynamics in endokarst (Coquerel et al. 1993; Laignel et al.2004; Hanin et al. 2011) and also to determine thepaleoenvironmental conditions in a given area.
Karst fillings from NWPB are made of surroundingsuperficial formations, from clayey silt to coarse sandymaterial, according to the sediment sources and thehydrodynamics in karst (Laignel et al. 2004). Studies in theNorth-East Wallonia (Belgium) have shown the same kindof karst introduction (solution pipes) associated with filledcaves (Van Den Eeckhaut et al. 2007; Willems et al. 2007a,2007b; Rodet et al. 2009). Fillings mainly consist in siltyto sandy particles as examplified by the Montagne SaintPierre (Willems et al. 2007a). The latter study has beenshown that the filling is primarily made of sands and loess(surrounding surface formations) with also slight proportionof residual material from chalk alteration.
South-East of England has similar forms of introduction asNWPB and North-East Wallonia like solution pipes andcave fillings with similar size particles (Cooper et al. 2011).Farrant and Smart (2011) have also shown that filling ispartly composed from surrounding surface formations withalso residuals from chalk alteration.
To conclude, a sedimentological characterization of karstfillings allows determinating sediment sources. Bycomparing the sediment fills and the surface formationsseveral sources were identified in studied caves: surfaceformations (Tertiary sand, clay-with-flints, and lœss) andinsoluble of residual alteration of chalk bedrock. Asimilarity is apparent between karst of the NWPB and thatof NWE when considering (i) karst morphology, (ii)sediment fillings, and also (iii) particle sizes of theallochtonous material. One of the future perspectives isnotably to apply GIS to the study of karst, e.g., inintegrating data concerning surrounding surface formationsand to draw comparisons between caves from differentregions of the NWE. Such study should also be associatedwith large sedimentological analyses and when possible,accurate dating of the endokarstic deposits.
AcknowledgementWe wish thank the members of CNEK (Centre Normandd’Étude du Karst – http://www.cnek.org/) for theiroutstanding work at the Petites Dales cave. More thantwenty years of cave excavation until today for the accessto the site. Thank for keeping the history of works inreferenced pictures archives. Thanks to the SCALE and theUpper Normandy Council for the study grant allocation.
ReferencesAuffret JP, Bignot G, Blondeau A, Cavelier C, Pomerol C, 1975.
Geologie du Bassin Tertiaire de la Manche Orientale au Largedu Pays de Caux [and Discussion], Philosophical Transactionsof the Royal Society of London. Series A, Mathematical andPhysical Sciences, 279(1288), 169–176.
Cooper AH, Farrant AR, Price SJ, 2011. The use of karstgeomorphology for planning, hazard avoidance anddevelopment in Great Britain. Geomorphology, 144, 118–131.
Coquerel G, Lefebvre D, Rodet J, Staigre J-C, 1993. La grotte duFuniculaire. Spéléogenèse et étude d’un remplissage ferro-manganique. Karstologia, 22(2), 35–42.
Cyrek K, Socha P, Stefaniak K, Madeyska T, Miroslaw-Grabowska J, Sudol M, Czyzewski L, 2010. Palaeolithic ofBisnik Cave (Southern Poland) within the environmentalbackground, Quaternary International, 220(1–2), 5–30.
Ek C, Quinif Y, 1988. Les sédiments détritiques des grottes: aperçuet synthétique. Annales de la Société Géologique de Belgique,111, 1–7.
Falguères C, Bahain J-J, Yokoyama Y, Bischoff JL, Arsuaga JL,De Castro JMB, Carbonell E, Dolo J-M, 2001. Datation parRPE et U-Th des sites pléistocènes d’Atapuerca: Sima de losHuesos, Trinchera Dolina et Trinchera Galeria. Bilangéochronologique. L’Anthopologie, 105, 71–81.
Farrant AR, Smart PL, 2011. Role of sediment in speleogenesis;sedimentation and paragenesis. Geomorphology, 134, 79–93.
Ford TD, Cullingford CHD. 1976. The science of speleology.London Academic Press.
Hanin G, Laignel B, Massei N, Hauchard E, Ladhui V, ChédevilleS, 2011. Hydrological variations and sediment transfer in akarst system (Radicatel springs, Upper Normandy, France)controlled by climate fluctuations. Proceedings of Hydrology& Hydrogeology of the Karst, 9th Conference on LimestoneHydrogeology, Besançon (France), 221–224.
Laignel B, 1997. Les altérites à silex de l’ouest du bassin de Paris:caractérisation lithologique, genèse et utilisation potentiellecomme granulat., Thèse de Doctorat, Université de Rouen,édition BRGM, Orléans, France.
Laignel B, 2003. Caractérisation et dynamique érosive desystèmes géomorphologiques continentaux sur substratcrayeux. Mémoire de HDR., Université de Rouen.
Laignel B, Dupuis E, Rodet J, Lacroix M, Massei N, 2004. Anexample of sedimentary filing in the chalk karst of the WesternParis Basin: characterization, origins and hydrosedimentarybehaviour. Zeitschrift für Geomorphologie, 48(2), 219–243.
Laignel B, Quesnel F, Meyer R, 2002. Classification and origin ofthe clay with flints of the Western Paris Basin (France).Zeitschrift für Geomorphologie, 46(1), 69–91.
Karst and Caves in Other Rocks, Pseudokarst – oral 2013 ICS Proceedings
257
Laignel B, Quesnel F, Meyer R, Macaire J-J, 1998. Relationsquantitatives entre les craies à silex et les formations résiduellesà silex de l’ouest du Bassin de Paris, Geodinamica Acta, 11(4),171–181.
Laignel B, Quesnel F, Spencer C, 1997. Une nouvelle ressourceen granulats: les formations résiduelles à silex, Géochronique,63, 9–10.
Lautridou J-P, 1985. Le cycle périglaciaire pléistocène en Europedu Nord-Ouest et plus particulièrement en Normandie. Thèsede Doctorat d’Etat, Université de Caen.
Le Bissonnais Y, 1988. Analyse des mécanismes de désagrégationet de la mobilisation des particules de terre sous l’action despluies. Thèse de Doctorat es Sciences, Ecole DoctoraleI.N.R.A., Université d’Orléans.
Losson B, Corbonnois J, 2006. Les modes de sédimentationdétritique: nouvelle méthode de détermination appliquée à desremplissages endokarstiques. Geologica Belgica, 9(3–4),257–265.
Madeyska T, 2002. Evidence of climatic variations in loess andcave palaeolithic sites of Southern Poland and WesternUkraine. Quaternary International, 91(1), 65–73.
Mangin A, 1975. Contribution à l’étude hydrodynamique desaquifères karstiques. Thèse de Docteur en Sciences, Universitéde Dijon 1975; Annales de Speléologie, 1974, 29, 3, 283–332;1974, 29, 4, 495–601; 1975, 30, 1, 21–124.
Nicod J, 1992. Les karsts sous couverture (sableuse, argileuseet/ou détritique) en France, d’après des travaux récents.Cuadernos de Seccion, Historia, Donastia: Eusko Ikaskuntza,20, 165–185.
Quesnel F, Laignel B, Bourdillon C, Meyer R, 2000. Les altéritesà silex de Seine-Maritime (France): typologie, chronologie etgéodynamique. Bulletin d’Information des Géologues duBassin de Paris, 37(1), 17–31.
Quinif Y, 2006. Complex stratigraphic sequences in Belgian cavescorrelation with climatic changes during the middle, the upperPleistocene and the Holocene. Geologica Belgica, 9(3–4),231–244.
Reams MW, 1968. Cave sediments and the geomorphic history ofthe Ozarks. Ph.D. thesis, Washington University, St Louis,Missouri.
Rodet J, 1991. Les karsts de la craie: étude comparative. Thèse deDoctorat d’Etat, Université de Paris IV-Sorbonne.
Rodet J, Viard J-P (eds.), 1996. La grotte des Petites Dales, Spéléo-Drack.
Rodet J, Laignel B, Brocard G, Dupuis E, Massei N, Viard J-P,2006. Contribution of a sedimentary study to the concept ofkarstic evolution of a chalk cave in the werstern Paris Basin(Normandy, France), Geologica Belgica, 9(3–4), 287–296.
Rodet J, Viard JP, Poudras J, 2007. À la découverte de la grottedes Petites Dales (Saint Martin aux Buneaux, Seine Maritime,France), Spéléo-Tract.
Rodet J, Willems L, Brown J, Ogier-Halim S, Bourdin M, ViardJ-P, 2009. Morphodynamic incidences of the trepanning of theendokarst by solution pipes. Examples of chalk caves inWestern Europe (France and Belgium). Proceedings of the 15thInternational Congress of Speleology, Kerrville (Texas, USA),19-26 july 2009, UIS, vol. 3, contributed papers: 1657–1661.
Salomon JN, 2006. Précis de karstologie, 2ème ed., Pressesuniversitaires de Bordeaux, Collection Scienteren.
Salomon J-N, Pomel S, Nicod J, 1995. L’évolution descryptokarsts: comparaison entre le Périgord-Quercy (France)et le Franken Alb (Allemagne). Zeitschrift fürGeomorphologie, 39(4), 381–409.
Sweeting MM, 1973. Karst landforms. Mc Millan, London.
Van Den Eeckhaut M, Poesen J, Dusar M, Martens V, DuchateauP, 2007. Sinkhole formation above underground limestonequarries: A case study in South Limburg (Belgium).Geomorphology, 91(1–2), 19–37.
Viard JP, Rodet J, 2011. Seine-Maritime: Grotte des Petites Dales,Saint-Martin-aux-Buneaux. Spelunca, 122(5), 0242–1771.
Willems L, 2000. Phénomènes karstiques en roches silicatées noncarbonatées. Cas des grès, des micaschistes, des gneiss et desgranites en Afrique sahélienne et équatoriale. Thèse deDoctorat, Université de Liège (Belgique).
Willems L, Rodet J, Ek C, Dusar M, Lagrou D, Fournier M,Laignel B, Pouclet A, 2007a. Karsts des craies et calcarénitesde la Montagne Saint-Pierre (Basse Meuse liégeoise). Bulletindes Chercheurs de la Wallonie, 46.
Willems L, Rodet J, Fournier M, Laignel B, Dusar M, Lagrou D,Pouclet A, Massei N, Dussart-Baptista L, Compère P, 2007b.Polyphase karst system in Cretaceous chalk and calcarenite ofthe Belgian-Dutch border. Zeitschrift für Geomorphologie,51(3), 361–376.
Karst and Caves in Other Rocks, Pseudokarst – oral 2013 ICS Proceedings
258
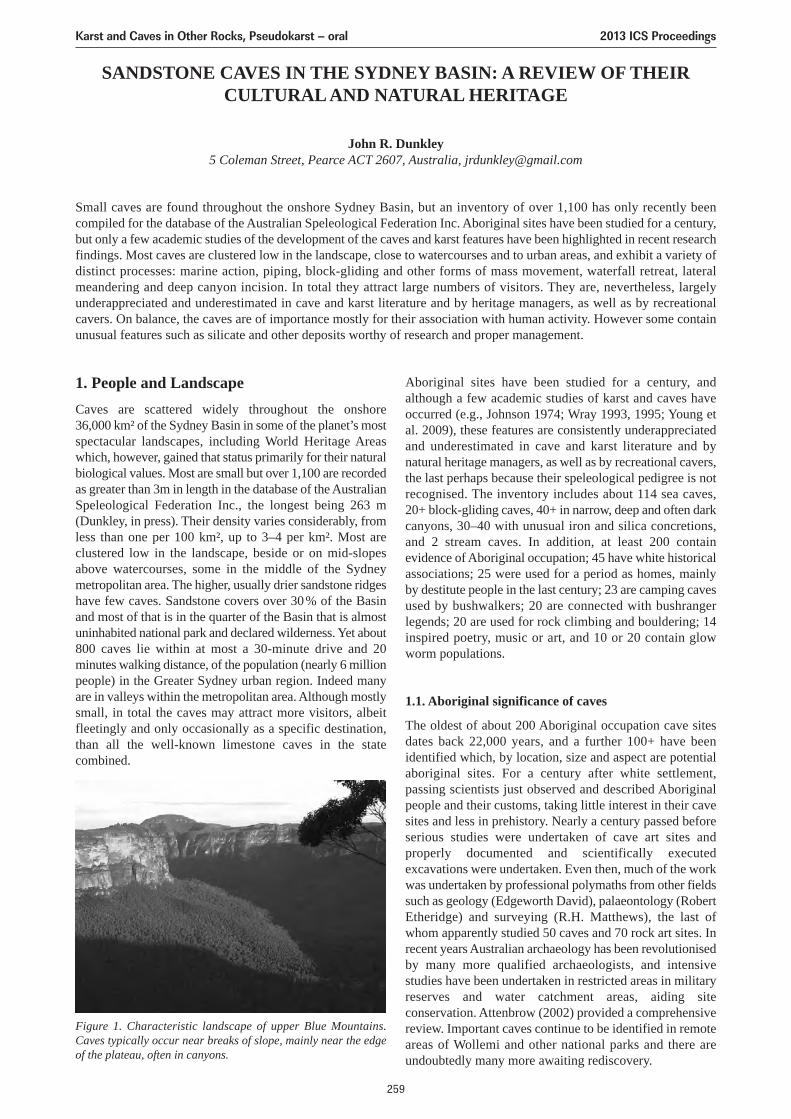
SANDSTONE CAVES IN THE SYDNEY BASIN: A REVIEW OF THEIRCULTURAL AND NATURAL HERITAGE
John R. Dunkley5 Coleman Street, Pearce ACT 2607, Australia, [email protected]
Small caves are found throughout the onshore Sydney Basin, but an inventory of over 1,100 has only recently beencompiled for the database of the Australian Speleological Federation Inc. Aboriginal sites have been studied for a century,but only a few academic studies of the development of the caves and karst features have been highlighted in recent researchfindings. Most caves are clustered low in the landscape, close to watercourses and to urban areas, and exhibit a variety ofdistinct processes: marine action, piping, block-gliding and other forms of mass movement, waterfall retreat, lateralmeandering and deep canyon incision. In total they attract large numbers of visitors. They are, nevertheless, largelyunderappreciated and underestimated in cave and karst literature and by heritage managers, as well as by recreationalcavers. On balance, the caves are of importance mostly for their association with human activity. However some containunusual features such as silicate and other deposits worthy of research and proper management.
1. People and LandscapeCaves are scattered widely throughout the onshore36,000 km² of the Sydney Basin in some of the planet’s mostspectacular landscapes, including World Heritage Areaswhich, however, gained that status primarily for their naturalbiological values. Most are small but over 1,100 are recordedas greater than 3m in length in the database of the AustralianSpeleological Federation Inc., the longest being 263 m(Dunkley, in press). Their density varies considerably, fromless than one per 100 km², up to 3–4 per km². Most areclustered low in the landscape, beside or on mid-slopesabove watercourses, some in the middle of the Sydneymetropolitan area. The higher, usually drier sandstone ridgeshave few caves. Sandstone covers over 30% of the Basinand most of that is in the quarter of the Basin that is almostuninhabited national park and declared wilderness. Yet about800 caves lie within at most a 30-minute drive and 20minutes walking distance, of the population (nearly 6 millionpeople) in the Greater Sydney urban region. Indeed manyare in valleys within the metropolitan area. Although mostlysmall, in total the caves may attract more visitors, albeitfleetingly and only occasionally as a specific destination,than all the well-known limestone caves in the statecombined.
Aboriginal sites have been studied for a century, andalthough a few academic studies of karst and caves haveoccurred (e.g., Johnson 1974; Wray 1993, 1995; Young etal. 2009), these features are consistently underappreciatedand underestimated in cave and karst literature and bynatural heritage managers, as well as by recreational cavers,the last perhaps because their speleological pedigree is notrecognised. The inventory includes about 114 sea caves,20+ block-gliding caves, 40+ in narrow, deep and often darkcanyons, 30–40 with unusual iron and silica concretions,and 2 stream caves. In addition, at least 200 containevidence of Aboriginal occupation; 45 have white historicalassociations; 25 were used for a period as homes, mainlyby destitute people in the last century; 23 are camping cavesused by bushwalkers; 20 are connected with bushrangerlegends; 20 are used for rock climbing and bouldering; 14inspired poetry, music or art, and 10 or 20 contain glowworm populations.
1.1. Aboriginal significance of caves
The oldest of about 200 Aboriginal occupation cave sitesdates back 22,000 years, and a further 100+ have beenidentified which, by location, size and aspect are potentialaboriginal sites. For a century after white settlement,passing scientists just observed and described Aboriginalpeople and their customs, taking little interest in their cavesites and less in prehistory. Nearly a century passed beforeserious studies were undertaken of cave art sites andproperly documented and scientifically executedexcavations were undertaken. Even then, much of the workwas undertaken by professional polymaths from other fieldssuch as geology (Edgeworth David), palaeontology (RobertEtheridge) and surveying (R.H. Matthews), the last ofwhom apparently studied 50 caves and 70 rock art sites. Inrecent years Australian archaeology has been revolutionisedby many more qualified archaeologists, and intensivestudies have been undertaken in restricted areas in militaryreserves and water catchment areas, aiding siteconservation. Attenbrow (2002) provided a comprehensivereview. Important caves continue to be identified in remoteareas of Wollemi and other national parks and there areundoubtedly many more awaiting rediscovery.
Figure 1. Characteristic landscape of upper Blue Mountains.Caves typically occur near breaks of slope, mainly near the edgeof the plateau, often in canyons.
Karst and Caves in Other Rocks, Pseudokarst – oral 2013 ICS Proceedings
259
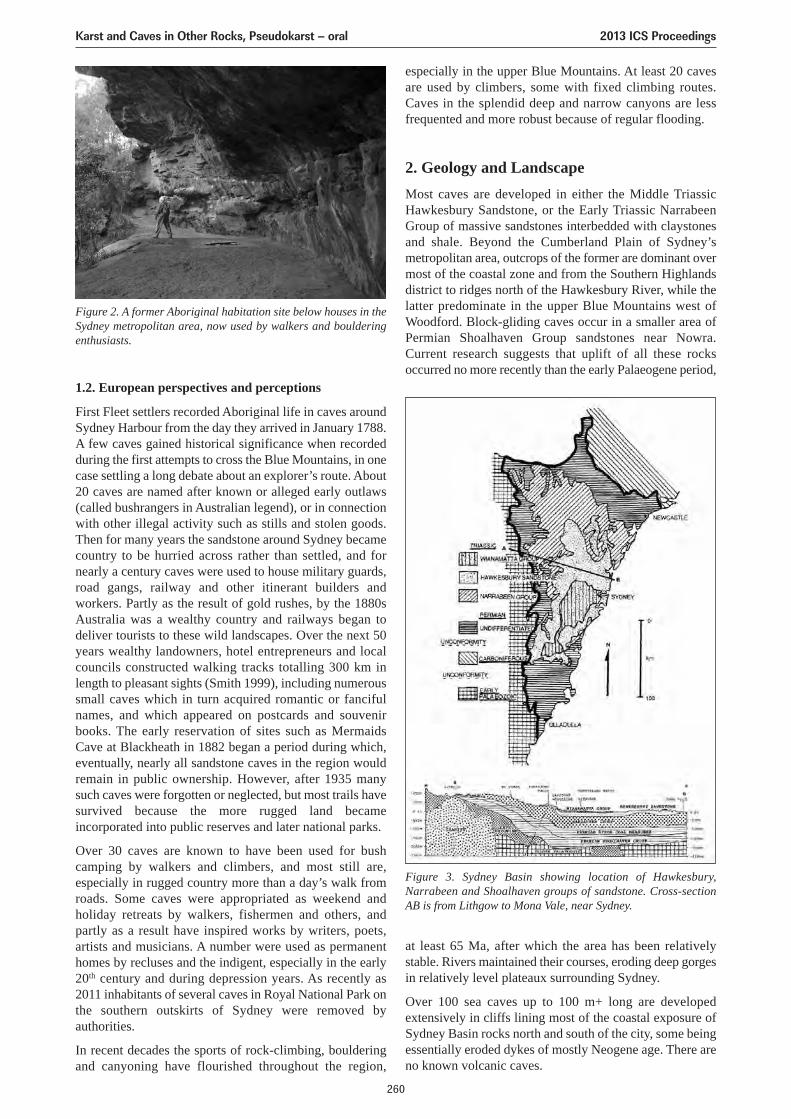
1.2. European perspectives and perceptions
First Fleet settlers recorded Aboriginal life in caves aroundSydney Harbour from the day they arrived in January 1788.A few caves gained historical significance when recordedduring the first attempts to cross the Blue Mountains, in onecase settling a long debate about an explorer’s route. About20 caves are named after known or alleged early outlaws(called bushrangers in Australian legend), or in connectionwith other illegal activity such as stills and stolen goods.Then for many years the sandstone around Sydney becamecountry to be hurried across rather than settled, and fornearly a century caves were used to house military guards,road gangs, railway and other itinerant builders andworkers. Partly as the result of gold rushes, by the 1880sAustralia was a wealthy country and railways began todeliver tourists to these wild landscapes. Over the next 50years wealthy landowners, hotel entrepreneurs and localcouncils constructed walking tracks totalling 300 km inlength to pleasant sights (Smith 1999), including numeroussmall caves which in turn acquired romantic or fancifulnames, and which appeared on postcards and souvenirbooks. The early reservation of sites such as MermaidsCave at Blackheath in 1882 began a period during which,eventually, nearly all sandstone caves in the region wouldremain in public ownership. However, after 1935 manysuch caves were forgotten or neglected, but most trails havesurvived because the more rugged land becameincorporated into public reserves and later national parks.
Over 30 caves are known to have been used for bushcamping by walkers and climbers, and most still are,especially in rugged country more than a day’s walk fromroads. Some caves were appropriated as weekend andholiday retreats by walkers, fishermen and others, andpartly as a result have inspired works by writers, poets,artists and musicians. A number were used as permanenthomes by recluses and the indigent, especially in the early20th century and during depression years. As recently as2011 inhabitants of several caves in Royal National Park onthe southern outskirts of Sydney were removed byauthorities.
In recent decades the sports of rock-climbing, boulderingand canyoning have flourished throughout the region,
especially in the upper Blue Mountains. At least 20 cavesare used by climbers, some with fixed climbing routes.Caves in the splendid deep and narrow canyons are lessfrequented and more robust because of regular flooding.
2. Geology and LandscapeMost caves are developed in either the Middle TriassicHawkesbury Sandstone, or the Early Triassic NarrabeenGroup of massive sandstones interbedded with claystonesand shale. Beyond the Cumberland Plain of Sydney’smetropolitan area, outcrops of the former are dominant overmost of the coastal zone and from the Southern Highlandsdistrict to ridges north of the Hawkesbury River, while thelatter predominate in the upper Blue Mountains west ofWoodford. Block-gliding caves occur in a smaller area ofPermian Shoalhaven Group sandstones near Nowra.Current research suggests that uplift of all these rocksoccurred no more recently than the early Palaeogene period,
Figure 2. A former Aboriginal habitation site below houses in theSydney metropolitan area, now used by walkers and boulderingenthusiasts.
Figure 3. Sydney Basin showing location of Hawkesbury,Narrabeen and Shoalhaven groups of sandstone. Cross-sectionAB is from Lithgow to Mona Vale, near Sydney.
at least 65 Ma, after which the area has been relativelystable. Rivers maintained their courses, eroding deep gorgesin relatively level plateaux surrounding Sydney.
Over 100 sea caves up to 100 m+ long are developedextensively in cliffs lining most of the coastal exposure ofSydney Basin rocks north and south of the city, some beingessentially eroded dykes of mostly Neogene age. There areno known volcanic caves.
Karst and Caves in Other Rocks, Pseudokarst – oral 2013 ICS Proceedings
260
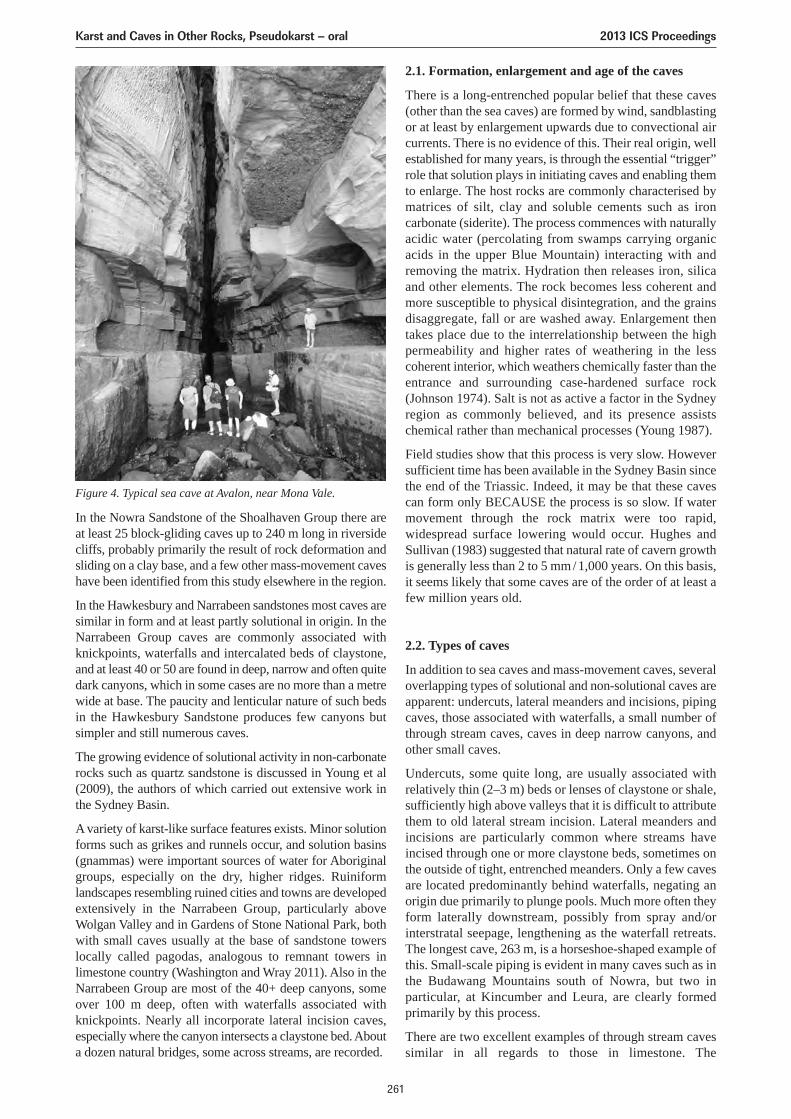
In the Nowra Sandstone of the Shoalhaven Group there areat least 25 block-gliding caves up to 240 m long in riversidecliffs, probably primarily the result of rock deformation andsliding on a clay base, and a few other mass-movement caveshave been identified from this study elsewhere in the region.
In the Hawkesbury and Narrabeen sandstones most caves aresimilar in form and at least partly solutional in origin. In theNarrabeen Group caves are commonly associated withknickpoints, waterfalls and intercalated beds of claystone,and at least 40 or 50 are found in deep, narrow and often quitedark canyons, which in some cases are no more than a metrewide at base. The paucity and lenticular nature of such bedsin the Hawkesbury Sandstone produces few canyons butsimpler and still numerous caves.
The growing evidence of solutional activity in non-carbonaterocks such as quartz sandstone is discussed in Young et al(2009), the authors of which carried out extensive work inthe Sydney Basin.
A variety of karst-like surface features exists. Minor solutionforms such as grikes and runnels occur, and solution basins(gnammas) were important sources of water for Aboriginalgroups, especially on the dry, higher ridges. Ruiniformlandscapes resembling ruined cities and towns are developedextensively in the Narrabeen Group, particularly aboveWolgan Valley and in Gardens of Stone National Park, bothwith small caves usually at the base of sandstone towerslocally called pagodas, analogous to remnant towers inlimestone country (Washington and Wray 2011). Also in theNarrabeen Group are most of the 40+ deep canyons, someover 100 m deep, often with waterfalls associated withknickpoints. Nearly all incorporate lateral incision caves,especially where the canyon intersects a claystone bed. Abouta dozen natural bridges, some across streams, are recorded.
2.1. Formation, enlargement and age of the caves
There is a long-entrenched popular belief that these caves(other than the sea caves) are formed by wind, sandblastingor at least by enlargement upwards due to convectional aircurrents. There is no evidence of this. Their real origin, wellestablished for many years, is through the essential “trigger”role that solution plays in initiating caves and enabling themto enlarge. The host rocks are commonly characterised bymatrices of silt, clay and soluble cements such as ironcarbonate (siderite). The process commences with naturallyacidic water (percolating from swamps carrying organicacids in the upper Blue Mountain) interacting with andremoving the matrix. Hydration then releases iron, silicaand other elements. The rock becomes less coherent andmore susceptible to physical disintegration, and the grainsdisaggregate, fall or are washed away. Enlargement thentakes place due to the interrelationship between the highpermeability and higher rates of weathering in the lesscoherent interior, which weathers chemically faster than theentrance and surrounding case-hardened surface rock(Johnson 1974). Salt is not as active a factor in the Sydneyregion as commonly believed, and its presence assistschemical rather than mechanical processes (Young 1987).
Field studies show that this process is very slow. Howeversufficient time has been available in the Sydney Basin sincethe end of the Triassic. Indeed, it may be that these cavescan form only BECAUSE the process is so slow. If watermovement through the rock matrix were too rapid,widespread surface lowering would occur. Hughes andSullivan (1983) suggested that natural rate of cavern growthis generally less than 2 to 5 mm/1,000 years. On this basis,it seems likely that some caves are of the order of at least afew million years old.
2.2. Types of caves
In addition to sea caves and mass-movement caves, severaloverlapping types of solutional and non-solutional caves areapparent: undercuts, lateral meanders and incisions, pipingcaves, those associated with waterfalls, a small number ofthrough stream caves, caves in deep narrow canyons, andother small caves.
Undercuts, some quite long, are usually associated withrelatively thin (2–3 m) beds or lenses of claystone or shale,sufficiently high above valleys that it is difficult to attributethem to old lateral stream incision. Lateral meanders andincisions are particularly common where streams haveincised through one or more claystone beds, sometimes onthe outside of tight, entrenched meanders. Only a few cavesare located predominantly behind waterfalls, negating anorigin due primarily to plunge pools. Much more often theyform laterally downstream, possibly from spray and/orinterstratal seepage, lengthening as the waterfall retreats.The longest cave, 263 m, is a horseshoe-shaped example ofthis. Small-scale piping is evident in many caves such as inthe Budawang Mountains south of Nowra, but two inparticular, at Kincumber and Leura, are clearly formedprimarily by this process.
There are two excellent examples of through stream cavessimilar in all regards to those in limestone. The
Figure 4. Typical sea cave at Avalon, near Mona Vale.
Karst and Caves in Other Rocks, Pseudokarst – oral 2013 ICS Proceedings
261
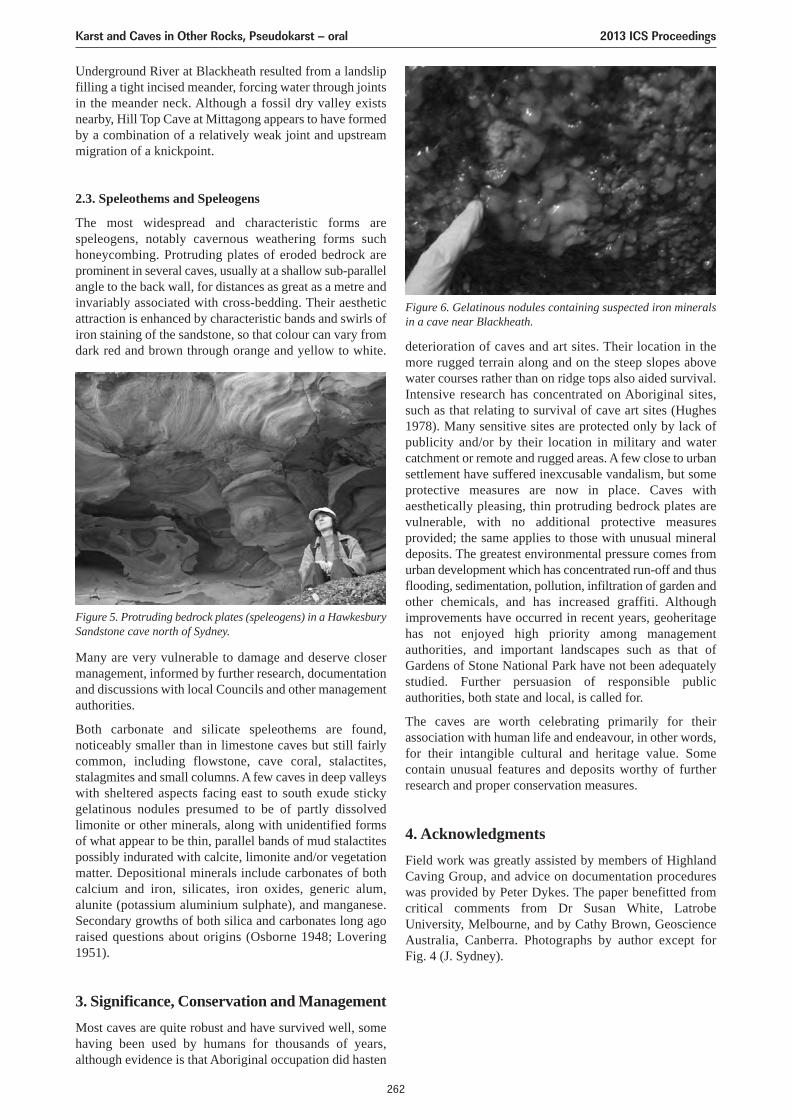
Underground River at Blackheath resulted from a landslipfilling a tight incised meander, forcing water through jointsin the meander neck. Although a fossil dry valley existsnearby, Hill Top Cave at Mittagong appears to have formedby a combination of a relatively weak joint and upstreammigration of a knickpoint.
2.3. Speleothems and Speleogens
The most widespread and characteristic forms arespeleogens, notably cavernous weathering forms suchhoneycombing. Protruding plates of eroded bedrock areprominent in several caves, usually at a shallow sub-parallelangle to the back wall, for distances as great as a metre andinvariably associated with cross-bedding. Their aestheticattraction is enhanced by characteristic bands and swirls ofiron staining of the sandstone, so that colour can vary fromdark red and brown through orange and yellow to white. deterioration of caves and art sites. Their location in the
more rugged terrain along and on the steep slopes abovewater courses rather than on ridge tops also aided survival.Intensive research has concentrated on Aboriginal sites,such as that relating to survival of cave art sites (Hughes1978). Many sensitive sites are protected only by lack ofpublicity and/or by their location in military and watercatchment or remote and rugged areas. A few close to urbansettlement have suffered inexcusable vandalism, but someprotective measures are now in place. Caves withaesthetically pleasing, thin protruding bedrock plates arevulnerable, with no additional protective measuresprovided; the same applies to those with unusual mineraldeposits. The greatest environmental pressure comes fromurban development which has concentrated run-off and thusflooding, sedimentation, pollution, infiltration of garden andother chemicals, and has increased graffiti. Althoughimprovements have occurred in recent years, geoheritagehas not enjoyed high priority among managementauthorities, and important landscapes such as that ofGardens of Stone National Park have not been adequatelystudied. Further persuasion of responsible publicauthorities, both state and local, is called for.
The caves are worth celebrating primarily for theirassociation with human life and endeavour, in other words,for their intangible cultural and heritage value. Somecontain unusual features and deposits worthy of furtherresearch and proper conservation measures.
4. AcknowledgmentsField work was greatly assisted by members of HighlandCaving Group, and advice on documentation procedureswas provided by Peter Dykes. The paper benefitted fromcritical comments from Dr Susan White, LatrobeUniversity, Melbourne, and by Cathy Brown, GeoscienceAustralia, Canberra. Photographs by author except forFig. 4 (J. Sydney).
Figure 5. Protruding bedrock plates (speleogens) in a HawkesburySandstone cave north of Sydney.
Many are very vulnerable to damage and deserve closermanagement, informed by further research, documentationand discussions with local Councils and other managementauthorities.
Both carbonate and silicate speleothems are found,noticeably smaller than in limestone caves but still fairlycommon, including flowstone, cave coral, stalactites,stalagmites and small columns. A few caves in deep valleyswith sheltered aspects facing east to south exude stickygelatinous nodules presumed to be of partly dissolvedlimonite or other minerals, along with unidentified formsof what appear to be thin, parallel bands of mud stalactitespossibly indurated with calcite, limonite and/or vegetationmatter. Depositional minerals include carbonates of bothcalcium and iron, silicates, iron oxides, generic alum,alunite (potassium aluminium sulphate), and manganese.Secondary growths of both silica and carbonates long agoraised questions about origins (Osborne 1948; Lovering1951).
3. Significance, Conservation and ManagementMost caves are quite robust and have survived well, somehaving been used by humans for thousands of years,although evidence is that Aboriginal occupation did hasten
Figure 6. Gelatinous nodules containing suspected iron mineralsin a cave near Blackheath.
Karst and Caves in Other Rocks, Pseudokarst – oral 2013 ICS Proceedings
262
ReferencesAttenbrow V, 2002. Sydney’s Aboriginal Past. Univ. NSW Press,
Sydney, 225.
Dunkley J, 2013 (in press). Caves, people and land: Sandstonecaves of the Blue Mountains and Sydney Region. AustralianSpeleological Federation Inc., Sydney.
Hughes PJ, 1978. Weathering in sandstone shelters in the SydneyBasin and the survival of rock art. Proc. International Workshopon the Conservation of Rock Art, Perth, Sept. 1977, 36–41.
Hughes PJ, Sullivan ME, 1983. The geoarchaeology of the SydneyBasin sandstones. In Young, R.W. & Nanoson, G.C. eds.Aspects of Australian sandstone landscapes. Australian and NewZealand Geomorphological Group, Wollongong, 120–126.
Johnson ARM, 1974. Cavernous Weathering at Berowra, N.S.W.Aust. Geographer XII, 6. 531–535.
Lovering JF, 1951. The Mystery of the “Limestone” Caves inNational Park. Aust. Museum Magazine, March 12, 1951.155–157.
Osborne GD 1948. A Review of Some Aspects of the Stratigraphy,Structure and Physiography of the Sydney Basin.J.Proc.Linn.Soc.NSW 83 pts 1–2, 4–37.
Smith J, 1999. Blue Mountains District walking track heritagestudy: Historical report prepared for NSW National Parks andWildlife Service. Heritage assessment & conservationguidelines prepared for NSW National Parks and WildlifeService by MUSEcape Pty Ltd & David Beaver.
Washington H, Wray RAL, 2011. The Geoheritage andGeomorphology of the Sandstone Pagodas of the North-western Blue Mountains Region NSW. Proc.Linn.Soc. NSW132, 131–143.
Wray, RAL 1993. Solutional Landforms on Silicates: largelyignored or simply unrecognised? In Proc. 19th Biennial Conf.Aust.Speleol.Federation, Launceston, 110.
Wray, RAL, 1995. Solutional Landforms in Quartz Sandstones ofthe Sydney Basin. PhD thesis, Univ. Wollongong, 381.
Young, ARM, 1987. Salt as an agent in the development ofcavernous weathering. Geology 15, 962–966.
Young R, Wray RAL, Young A, 2009. Sandstone Landforms.Cambridge UP, Cambridge, 304.
Karst and Caves in Other Rocks, Pseudokarst – oral 2013 ICS Proceedings
263
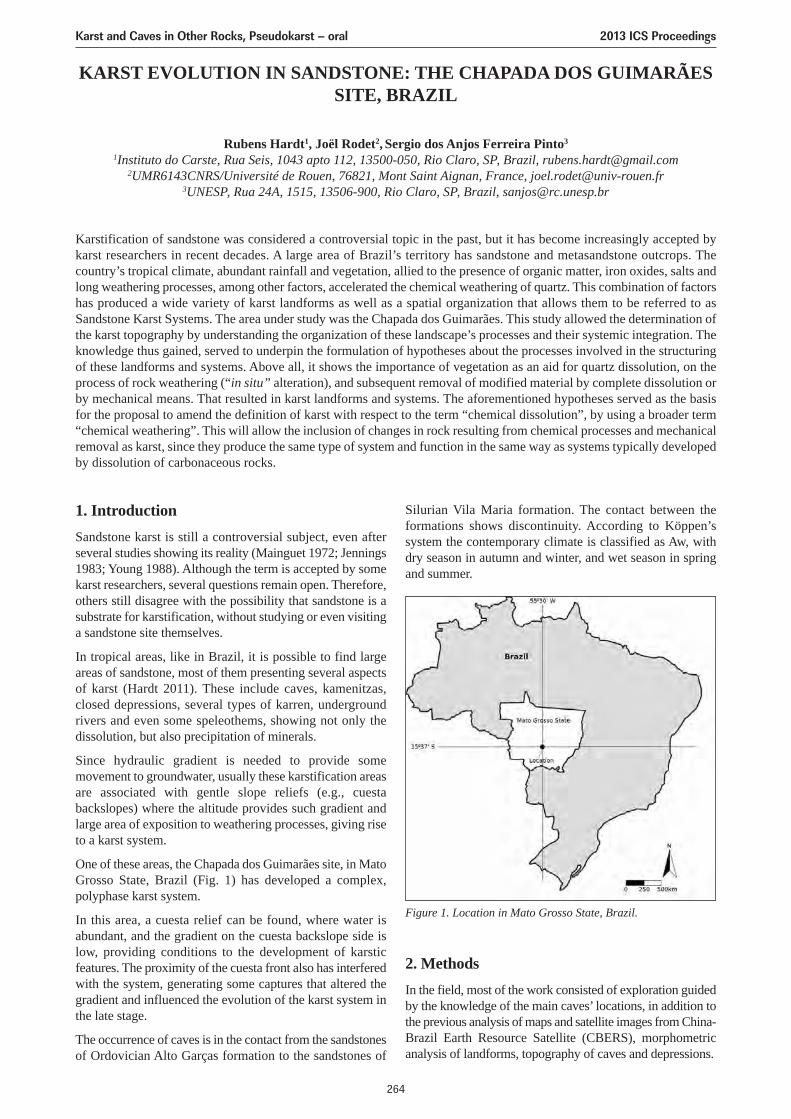
KARST EVOLUTION IN SANDSTONE: THE CHAPADA DOS GUIMARÃESSITE, BRAZIL
Rubens Hardt1, Joël Rodet2, Sergio dos Anjos Ferreira Pinto3
1Instituto do Carste, Rua Seis, 1043 apto 112, 13500-050, Rio Claro, SP, Brazil, [email protected]/Université de Rouen, 76821, Mont Saint Aignan, France, [email protected]
3UNESP, Rua 24A, 1515, 13506-900, Rio Claro, SP, Brazil, [email protected]
Karstification of sandstone was considered a controversial topic in the past, but it has become increasingly accepted bykarst researchers in recent decades. A large area of Brazil’s territory has sandstone and metasandstone outcrops. Thecountry’s tropical climate, abundant rainfall and vegetation, allied to the presence of organic matter, iron oxides, salts andlong weathering processes, among other factors, accelerated the chemical weathering of quartz. This combination of factorshas produced a wide variety of karst landforms as well as a spatial organization that allows them to be referred to asSandstone Karst Systems. The area under study was the Chapada dos Guimarães. This study allowed the determination ofthe karst topography by understanding the organization of these landscape’s processes and their systemic integration. Theknowledge thus gained, served to underpin the formulation of hypotheses about the processes involved in the structuringof these landforms and systems. Above all, it shows the importance of vegetation as an aid for quartz dissolution, on theprocess of rock weathering (“in situ” alteration), and subsequent removal of modified material by complete dissolution orby mechanical means. That resulted in karst landforms and systems. The aforementioned hypotheses served as the basisfor the proposal to amend the definition of karst with respect to the term “chemical dissolution”, by using a broader term“chemical weathering”. This will allow the inclusion of changes in rock resulting from chemical processes and mechanicalremoval as karst, since they produce the same type of system and function in the same way as systems typically developedby dissolution of carbonaceous rocks.
1. IntroductionSandstone karst is still a controversial subject, even afterseveral studies showing its reality (Mainguet 1972; Jennings1983; Young 1988). Although the term is accepted by somekarst researchers, several questions remain open. Therefore,others still disagree with the possibility that sandstone is asubstrate for karstification, without studying or even visitinga sandstone site themselves.
In tropical areas, like in Brazil, it is possible to find largeareas of sandstone, most of them presenting several aspectsof karst (Hardt 2011). These include caves, kamenitzas,closed depressions, several types of karren, undergroundrivers and even some speleothems, showing not only thedissolution, but also precipitation of minerals.
Since hydraulic gradient is needed to provide somemovement to groundwater, usually these karstification areasare associated with gentle slope reliefs (e.g., cuestabackslopes) where the altitude provides such gradient andlarge area of exposition to weathering processes, giving riseto a karst system.
One of these areas, the Chapada dos Guimarães site, in MatoGrosso State, Brazil (Fig. 1) has developed a complex,polyphase karst system.
In this area, a cuesta relief can be found, where water isabundant, and the gradient on the cuesta backslope side islow, providing conditions to the development of karsticfeatures. The proximity of the cuesta front also has interferedwith the system, generating some captures that altered thegradient and influenced the evolution of the karst system inthe late stage.
The occurrence of caves is in the contact from the sandstonesof Ordovician Alto Garças formation to the sandstones of
Silurian Vila Maria formation. The contact between theformations shows discontinuity. According to Köppen’ssystem the contemporary climate is classified as Aw, withdry season in autumn and winter, and wet season in springand summer.
Figure 1. Location in Mato Grosso State, Brazil.
2. MethodsIn the field, most of the work consisted of exploration guidedby the knowledge of the main caves’ locations, in addition tothe previous analysis of maps and satellite images from China-Brazil Earth Resource Satellite (CBERS), morphometricanalysis of landforms, topography of caves and depressions.
Karst and Caves in Other Rocks, Pseudokarst – oral 2013 ICS Proceedings
264
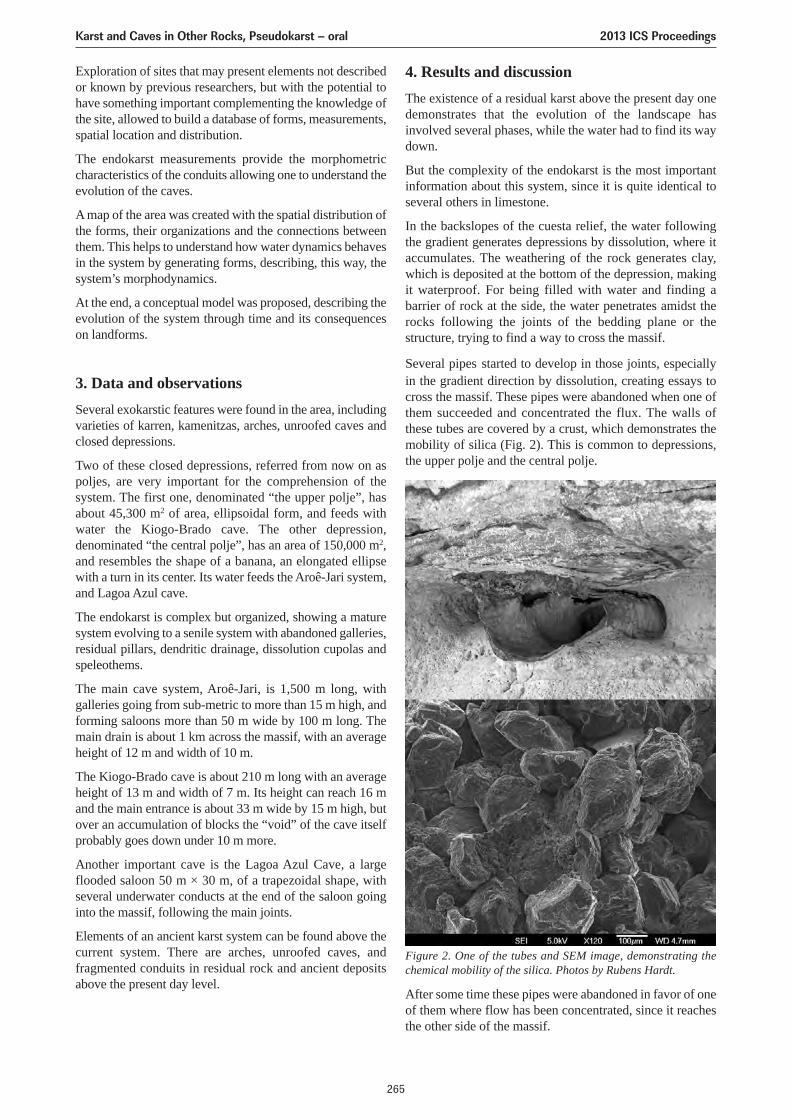
Exploration of sites that may present elements not describedor known by previous researchers, but with the potential tohave something important complementing the knowledge ofthe site, allowed to build a database of forms, measurements,spatial location and distribution.
The endokarst measurements provide the morphometriccharacteristics of the conduits allowing one to understand theevolution of the caves.
A map of the area was created with the spatial distribution ofthe forms, their organizations and the connections betweenthem. This helps to understand how water dynamics behavesin the system by generating forms, describing, this way, thesystem’s morphodynamics.
At the end, a conceptual model was proposed, describing theevolution of the system through time and its consequenceson landforms.
3. Data and observationsSeveral exokarstic features were found in the area, includingvarieties of karren, kamenitzas, arches, unroofed caves andclosed depressions.
Two of these closed depressions, referred from now on aspoljes, are very important for the comprehension of thesystem. The first one, denominated “the upper polje”, hasabout 45,300 m2 of area, ellipsoidal form, and feeds withwater the Kiogo-Brado cave. The other depression,denominated “the central polje”, has an area of 150,000 m2,and resembles the shape of a banana, an elongated ellipsewith a turn in its center. Its water feeds the Aroê-Jari system,and Lagoa Azul cave.
The endokarst is complex but organized, showing a maturesystem evolving to a senile system with abandoned galleries,residual pillars, dendritic drainage, dissolution cupolas andspeleothems.
The main cave system, Aroê-Jari, is 1,500 m long, withgalleries going from sub-metric to more than 15 m high, andforming saloons more than 50 m wide by 100 m long. Themain drain is about 1 km across the massif, with an averageheight of 12 m and width of 10 m.
The Kiogo-Brado cave is about 210 m long with an averageheight of 13 m and width of 7 m. Its height can reach 16 mand the main entrance is about 33 m wide by 15 m high, butover an accumulation of blocks the “void” of the cave itselfprobably goes down under 10 m more.
Another important cave is the Lagoa Azul Cave, a largeflooded saloon 50 m × 30 m, of a trapezoidal shape, withseveral underwater conducts at the end of the saloon goinginto the massif, following the main joints.
Elements of an ancient karst system can be found above thecurrent system. There are arches, unroofed caves, andfragmented conduits in residual rock and ancient depositsabove the present day level.
4. Results and discussionThe existence of a residual karst above the present day onedemonstrates that the evolution of the landscape hasinvolved several phases, while the water had to find its waydown.
But the complexity of the endokarst is the most importantinformation about this system, since it is quite identical toseveral others in limestone.
In the backslopes of the cuesta relief, the water followingthe gradient generates depressions by dissolution, where itaccumulates. The weathering of the rock generates clay,which is deposited at the bottom of the depression, makingit waterproof. For being filled with water and finding abarrier of rock at the side, the water penetrates amidst therocks following the joints of the bedding plane or thestructure, trying to find a way to cross the massif.
Several pipes started to develop in those joints, especiallyin the gradient direction by dissolution, creating essays tocross the massif. These pipes were abandoned when one ofthem succeeded and concentrated the flux. The walls ofthese tubes are covered by a crust, which demonstrates themobility of silica (Fig. 2). This is common to depressions,the upper polje and the central polje.
Figure 2. One of the tubes and SEM image, demonstrating thechemical mobility of the silica. Photos by Rubens Hardt.
After some time these pipes were abandoned in favor of oneof them where flow has been concentrated, since it reachesthe other side of the massif.
Karst and Caves in Other Rocks, Pseudokarst – oral 2013 ICS Proceedings
265
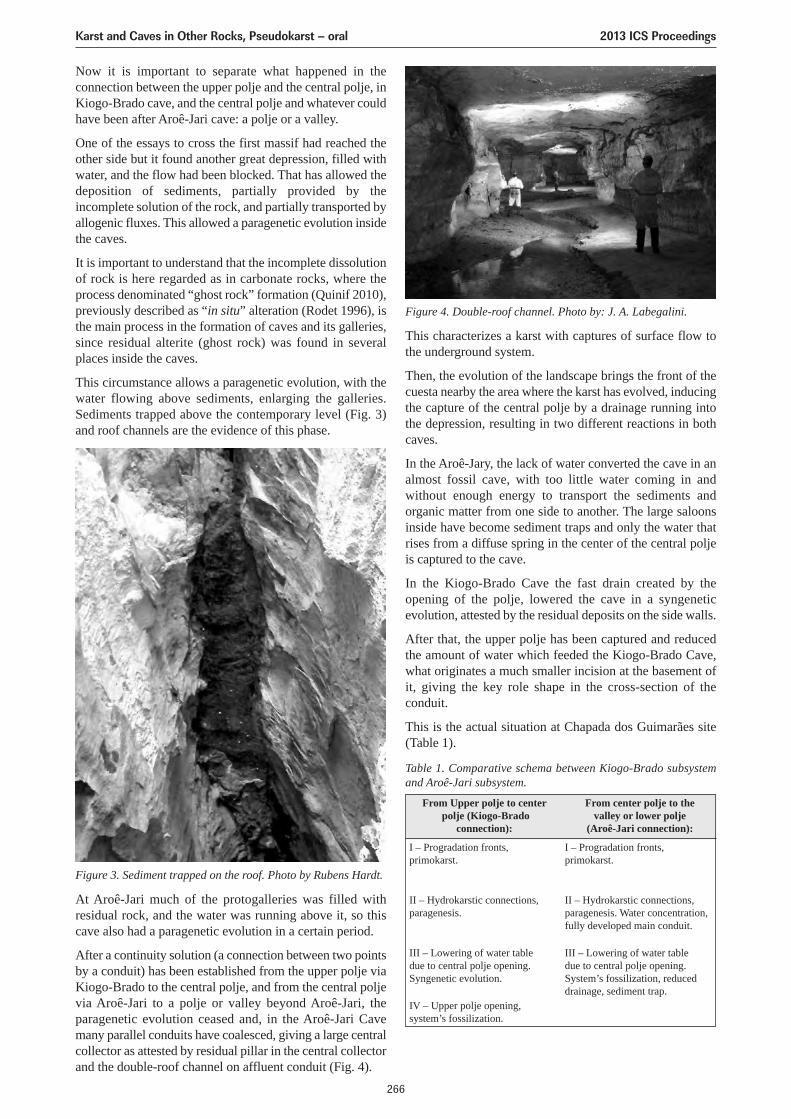
Now it is important to separate what happened in theconnection between the upper polje and the central polje, inKiogo-Brado cave, and the central polje and whatever couldhave been after Aroê-Jari cave: a polje or a valley.
One of the essays to cross the first massif had reached theother side but it found another great depression, filled withwater, and the flow had been blocked. That has allowed thedeposition of sediments, partially provided by theincomplete solution of the rock, and partially transported byallogenic fluxes. This allowed a paragenetic evolution insidethe caves.
It is important to understand that the incomplete dissolutionof rock is here regarded as in carbonate rocks, where theprocess denominated “ghost rock” formation (Quinif 2010),previously described as “in situ” alteration (Rodet 1996), isthe main process in the formation of caves and its galleries,since residual alterite (ghost rock) was found in severalplaces inside the caves.
This circumstance allows a paragenetic evolution, with thewater flowing above sediments, enlarging the galleries.Sediments trapped above the contemporary level (Fig. 3)and roof channels are the evidence of this phase.
Figure 3. Sediment trapped on the roof. Photo by Rubens Hardt.
Figure 4. Double-roof channel. Photo by: J. A. Labegalini.
At Aroê-Jari much of the protogalleries was filled withresidual rock, and the water was running above it, so thiscave also had a paragenetic evolution in a certain period.
After a continuity solution (a connection between two pointsby a conduit) has been established from the upper polje viaKiogo-Brado to the central polje, and from the central poljevia Aroê-Jari to a polje or valley beyond Aroê-Jari, theparagenetic evolution ceased and, in the Aroê-Jari Cavemany parallel conduits have coalesced, giving a large centralcollector as attested by residual pillar in the central collectorand the double-roof channel on affluent conduit (Fig. 4).
This characterizes a karst with captures of surface flow tothe underground system.
Then, the evolution of the landscape brings the front of thecuesta nearby the area where the karst has evolved, inducingthe capture of the central polje by a drainage running intothe depression, resulting in two different reactions in bothcaves.
In the Aroê-Jary, the lack of water converted the cave in analmost fossil cave, with too little water coming in andwithout enough energy to transport the sediments andorganic matter from one side to another. The large saloonsinside have become sediment traps and only the water thatrises from a diffuse spring in the center of the central poljeis captured to the cave.
In the Kiogo-Brado Cave the fast drain created by theopening of the polje, lowered the cave in a syngeneticevolution, attested by the residual deposits on the side walls.
After that, the upper polje has been captured and reducedthe amount of water which feeded the Kiogo-Brado Cave,what originates a much smaller incision at the basement ofit, giving the key role shape in the cross-section of theconduit.
This is the actual situation at Chapada dos Guimarães site(Table 1).
Table 1. Comparative schema between Kiogo-Brado subsystemand Aroê-Jari subsystem.
From Upper polje to centerpolje (Kiogo-Brado
connection):
From center polje to the valley or lower polje
(Aroê-Jari connection):
I – Progradation fronts,primokarst.
I – Progradation fronts,primokarst.
II – Hydrokarstic connections,paragenesis.
II – Hydrokarstic connections,paragenesis. Water concentration,fully developed main conduit.
III – Lowering of water tabledue to central polje opening.Syngenetic evolution.
III – Lowering of water tabledue to central polje opening.System’s fossilization, reduceddrainage, sediment trap.
IV – Upper polje opening, system’s fossilization.
Karst and Caves in Other Rocks, Pseudokarst – oral 2013 ICS Proceedings
266
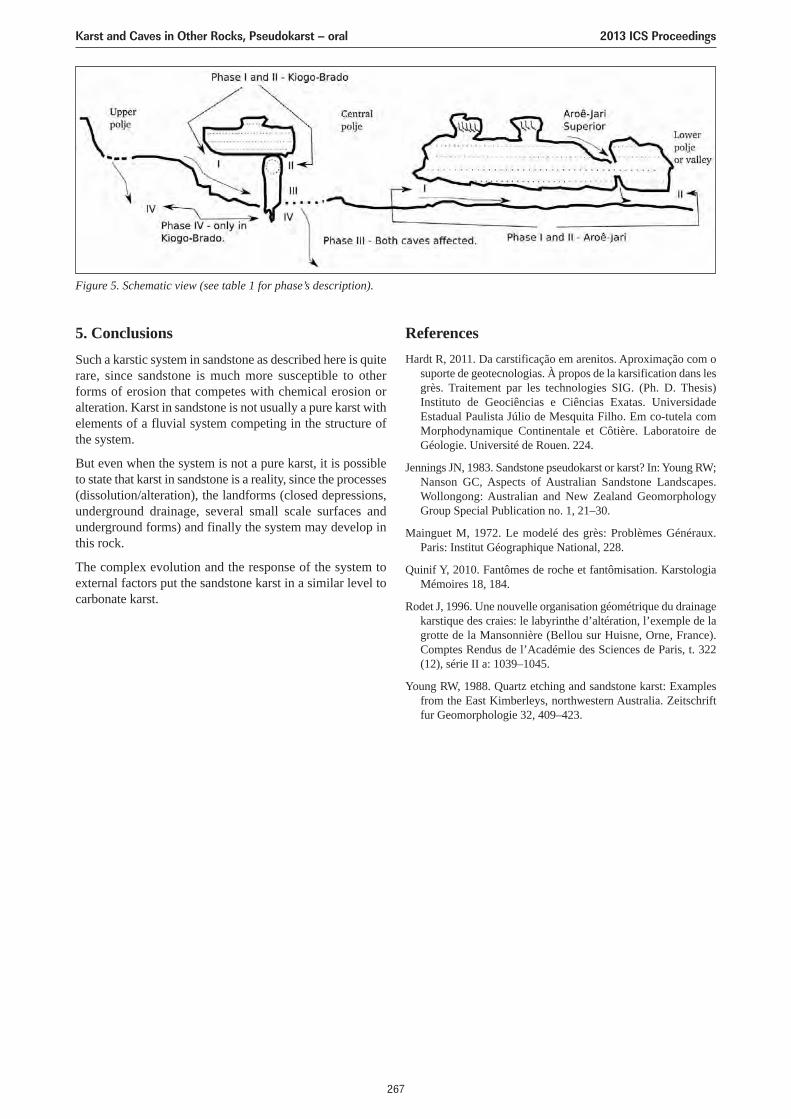
5. ConclusionsSuch a karstic system in sandstone as described here is quiterare, since sandstone is much more susceptible to otherforms of erosion that competes with chemical erosion oralteration. Karst in sandstone is not usually a pure karst withelements of a fluvial system competing in the structure ofthe system.
But even when the system is not a pure karst, it is possibleto state that karst in sandstone is a reality, since the processes(dissolution/alteration), the landforms (closed depressions,underground drainage, several small scale surfaces andunderground forms) and finally the system may develop inthis rock.
The complex evolution and the response of the system toexternal factors put the sandstone karst in a similar level tocarbonate karst.
ReferencesHardt R, 2011. Da carstificação em arenitos. Aproximação com o
suporte de geotecnologias. À propos de la karsification dans lesgrès. Traitement par les technologies SIG. (Ph. D. Thesis)Instituto de Geociências e Ciências Exatas. UniversidadeEstadual Paulista Júlio de Mesquita Filho. Em co-tutela comMorphodynamique Continentale et Côtière. Laboratoire deGéologie. Université de Rouen. 224.
Jennings JN, 1983. Sandstone pseudokarst or karst? In: Young RW;Nanson GC, Aspects of Australian Sandstone Landscapes.Wollongong: Australian and New Zealand GeomorphologyGroup Special Publication no. 1, 21–30.
Mainguet M, 1972. Le modelé des grès: Problèmes Généraux.Paris: Institut Géographique National, 228.
Quinif Y, 2010. Fantômes de roche et fantômisation. KarstologiaMémoires 18, 184.
Rodet J, 1996. Une nouvelle organisation géométrique du drainagekarstique des craies: le labyrinthe d’altération, l’exemple de lagrotte de la Mansonnière (Bellou sur Huisne, Orne, France).Comptes Rendus de l’Académie des Sciences de Paris, t. 322(12), série II a: 1039–1045.
Young RW, 1988. Quartz etching and sandstone karst: Examplesfrom the East Kimberleys, northwestern Australia. Zeitschriftfur Geomorphologie 32, 409–423.
Figure 5. Schematic view (see table 1 for phase’s description).
Karst and Caves in Other Rocks, Pseudokarst – oral 2013 ICS Proceedings
267
THREE TYPES OF CREVICE-TYPE CAVES IN THE AREA OF CZECHFLYSCH CARPATHIANS
Jan Lenart1,2, Tomáš Pánek1
1Department of Physical Geography and Geoecology, Faculty of Science, University of Ostrava, Chittussiho 10, 71000,Ostrava-Slezská Ostrava, Czech republic, [email protected]
2ZO ČSS 7.01 Orcus, Čáslavská 407, 73581, Bohumín, Czech republic, [email protected]
The crevice-type caves of the Czech part of the Outern Western Carpathians are formed by the processes of thegravitationall slope movements: spreading (or incipient translational sliding), toppling and rotational sliding. The OuternWestern Carpathians are built by the flych Mesozoic rocks: sandstones, conglomerates and shales. The aim of the researchwas to detect types of the process and to divide the caves into the cathegories.
1. IntroductionCaves are among the most distinctive forms of pseudokarstphenomena (Halliday 2007). Most extensive and widespreadpseudokarst caves are crevice-type caves formed duringevolution of slope failures (Vítek 1978). Margielewski andUrban (2003) considered the crevices to be free spacesbetween two rock blocks, when at least one of them isaffected by slope movement. Most commonly, theyaccompany evolution of deep-seated gravitational slopedeformations (DSGSDs); i.e. types of large-scale andrelatively short-displacement mass movements affectinglarge volumes of mountain ridges (Němčok 1972; Dramisand Sorriso-Valvo 1994) and reaching the depth at least 30m (Hutchinson 1988). They are mostly slow or extremelyslow mass movements with the average velocity less than 18mm per year (Varnes 1978). However, besides DSGSDs, thecrevice-type caves can be produced also within the shallowand medium-deep (<30 m according to Hutchinson, 1988)structurally-predisposed landslides (Margielewski 2009).
The crevice-type caves of the same genesis may occur indistinct types of rocks. The crevices very often cut incoherentsedimentary flysch rocks: sandstones and conglomerates withintercalations of shales, but can occur in granites, quartzites,gneisses and other lithologies (Vítek 1978). Crevicesoriginate also in the carbonate karst rocks (limestones anddolomites), but these are usually classified as a karst caves(Vítek 1978). Typically, crevices and crevice-type cavesoccur within the areas built by anisotropic rigid rocksunderlain by the plastic shales (Pánek et al. 2009 and 2010).
Crevice-type caves originate by the process of gravitationalwidening and movement of tectonically or lithologicallypredisposed rock massif. This type of caves is mostlyregularly narrow-shaped (“A” and “V” or “H” letter in cross-section) with high walls and flat roofs or floors. The corridorsmay reach appreciable length (Vítek 1978 and 1981). Withinthe crevice-type cave development, other processes mightplay a role, such as water erosion, frost weathering, rockfalls,seasonal temperature change etc. (Vítek 1981; Margielewskiet al. 2007; Klimeš et al. 2012). In such circumstances, thecrevice-type cave is each cave originated in the soluble orinsoluble rocks by the influence of gravitationally ortectonically induced widening of fissures (Panoš 2001).Some authors divide the crevice-type caves into the primaryendogenic diapiric crack caves, rock-slide caves and primaryexogenic frost caves (Panoš 2001). Pokorný and Holec
(2009) classify the pseudokarst caves in respect to genesisinto a crack type, cleft type, talus type, erosional type andcombined type. Crack type is a high, narrow and wideningto the bottom cave. The ceiling is flat, fixed and connectedwith the overlapping rock. If the whole massif is not stable,the cave is indicated as a cleft type (crevice-type) (Pokornýand Holec 2009). This typology seems to be very problematicbecause different types of ceilings usually occur within aparticular crevice. In the flysch rocks of Outern WesternCarpathians (OWC), there are specific cases of crevice-typecorridors with flat and homogenous ceilings.
These caves were mapped in the OWC systematically sincethe middle of 20th century. In the Czech Republic, the largestcrevice-type caves were mapped by Foldyna and Pavlica(Foldyna 1968; Foldyna and Pavlica 1968) and by Wagneret al. (1990).
The research of gravitational slope deformations and crevice-type caves has converged together in the last ten years (e. g.case studies: Baroň et al. 2003a; Margielewski and Urban2003; Pánek et al. 2007 and 2010; Klimeš et al. 2012).Thanks to the opened crevices, we can study the internalstructure of landslide bodies from inside and make theanalysis of slope deformations more properly (Margielewski2006). Some comprehensive studies of gravitational slopedeformations and crevice-type caves use the investigationperformed within the caves for the survey of internal structureof landslides and regime of slope movements (Margielewskiand Urban 2003; Baroň et al. 2004). The evolution of slopedeformations and the origin of crevices in anisotropic rockmassifs are predisposed by tectonic and lithologicaldiscontinuities (e.g., faults, joints, schistosity and beddingplanes; Kirchner and Krejčí 2002; Di Luzio et al. 2004;Margielewski 2006; Brideau et al. 2009; Jaboyedoff et al.2009) and driven by various gravitational mechanisms likelateral spreading, toppling, sagging (sackung), rotational andtranslational sliding, and/or compound (as an intermediatecause between rotational and translational sliding) movement(e. g. Kleczkowski 1955, Němčok et. al. 1972; Varnes 1978;Hutchinson 1988; EPOCH 1993). Crevice-type caves usuallyindicate the initial forms of gravitational slope deformationdevelopment (Margielewski and Urban 2003; Margielewskiet al. 2007; Margielewski 2009), but whilst in karst areas theevolution of a cave is running cyclically (Bosák 2003), in thearea affected by mass movement the evolution is runningonly in one direction – gravitationally downwards.
Karst and Caves in Other Rocks, Pseudokarst – oral 2013 ICS Proceedings
268
2. Regional settingsThe OWC are formed predominantly by flysch Mesozoic andPaleogene sediments which were folded and thrusted morethan 50 km onto the Carpathian foredeep during the lowerand middle Miocene alpine orogeny phases (Menčík et al.1983; Krejčí et al. 2004). The following units (nappes) aredistinguished in the region (from the south): Magura Unit,Silesian Unit and Sub-Silesian Unit. The strata consist ofthick-bedded sandstones or conglomerates with mica,glauconitic and calcific admixture and thin-beddedintercalations of shales with predominant content of illite andkaolinite clay minerals (Menčík et al. 1983; Eliáš 2000;Pánek et al. 2011). Regarding the dip of strata, ridges areoften asymmetrical, with the character of monoclinal ridgesand cuestas. This is typically demonstrated within the SilesianUnit (e.g., Moravskoslezské Beskydy Mts.) characterized bysteep northern slopes and gentle, long southern slopespredisposed by bedding planes (e.g., Rybář et al. 2008). Theflysch massif is strongly disrupted by joints and faultstrending in the E-W, N-S and NE-SW (Menčík et al. 1983;Krejčí et al. 2002; Bubík et al. 2004) and WNW-ESEdirection (Menčík et al. 1983; Pánek and Duras 2002).
Slope deformations are common features in the OWC(Margielewski 2006). Susceptibility of this region to massmovements is given by (i) overall disequilibrium of flyschnappes which are not in balance with underlying basementconsisting of soft Neogene deposits (Krejčí et al. 2004), (ii)strong anisotropy of flysch rocks creating conditions for thedevelopment of slip surfaces (Margielewski 2006) and (iii)high precipitation totals which together with summer heavydownpours and rapid snow melt at the end of winter generatehigh pore pressures within the rock mass. Typical slopemovements are represented by DSGSDs and structurally-induced landslides, very often accompanied by the origin ofcrevice-type caves (Margielewski 2009).
3. Recent movement and formsThe downward movement of a landslide determines the maintrend of movements – their direction and velocity. Themovement proper for crevice-type cave creation is very slow(creep) and the crevices are typically formed upright to themovement direction (Baroň et al. 2003; Margielewski andUrban 2003). Seasonal movements measured between twoopposite walls of crevice are caused by the volumetric changeof rocks which are partly elastic. These cyclic movementsbecome evident as a narrowing and widening of crevices. Therate of movements depends on season and water content inrock (Klimeš et al. 2012). The main gravitationally inducedmovement and seasonal elastic movement is accompaniedby secondary movements of relaxed blocks, boulders andsediments.
There are three main types of corridor shapes formed by thedistinct gravitational movement of flysch massif: (i) “V-letter-shaped” where the upper part of crevice is significantlywider than lower part, (ii) “A-letter-shaped” crevices whenthe ceiling is significantly narrower than the bottom and (iii)“H-letter-shaped” forms with no difference in width betweenlower and upper part of crevice. The first type indicatestoppling, the second one is associated with rotational slidesand the third one signifies lateral spreading or translational
slides. There is a problem with vast subsided and fissuredrock blocks which can falsely indicate the type of movementsusing this approach. This mistake can be eliminated partiallyby observing and correlating bedding planes which in theconditions of flysch rocks are usually very well detectable.The subtle morphology of cave corridors is shaped by watererosion caused by episodic inflows (Urban 2005).
As for the vertical caves, each level) is usually shiftedstaircase. The elevation of bedding planes, sedimentaryreglets or boundaries in sedimentary sequences between twoopposite walls sometimes significantly change along thecrevice. These are the signs of vertical displacement orrotational movements. In the horizontally established caves,a typical feature is an intra-bed creep. During this process,the regularly shaped rooms with flat roofs are created bymovement of blocks along bedding planes. In the case of anadvanced stadium of cave evolution, there could be,,corridor-like” areas created between the fallen, tilted and cracked rockblocks and boulders. Typically, extensive rooms, levels andcorridors are connected with each other only by narrow andsmall scuttles.
4. MethodsThere were 8 crevice-type caves investigated in the area ofCzech part of Outern Western Carpathians: The Cyrilka Cave(length 535 m, depth 16 m), The Kněhyňská Jeskyně Cave(length 280 m, depth 57 m), The Velká Ondrášova JeskyněCave (length 217 m, depth 35 m), The Salajka Cave (length156 m), The Velryba Cave (length 50 m), The Kyklop Cave(length 40 m), The Na Gírové I Cave (length 46 m) and TheČertova Díra Cave (length 74 m, depth 35 m) (Wagner et al.1990). The used methods were: (i) Analysis of corridors(“A”, “V” or “H”) by observing and measuring theirdimensions using tape and laser range-finder Leica Disto A3;(ii) measuring of microstructures (cracks, faults) usinggeological compass; (iii) comparing subsurface cavities withsurface trenches and sinkholes using a DEM combined withmaps of the caves; (iv) construction of typical cross-sectionsof cave corridors, using data from microstructural measuringand proportions of corridors measuring.
5. Exemplary resultsThere are three types of crevice-type caves in the investigatedarea, exemplified by particular caves:
5.1. The Kyklop Cave
The entrance of the Kyklop cave is situated on the SE slopeof the Kněhyně Mt., just 100 m under the summit (Fig. 1).The slope is highly disturbed by the activity of a landslide.Corridors follow the direction of the trench: SW-NE andSSW-NNE. Everywhere within the cave these two directionsoccur as opened cracks and narrow corridors. In the samedirections, also a small secondary cave Žánova Díraoriginated. This cave (20 m long) is geneticaly connectedwith the Kyklop Cave and the direction of the main corridorfollows the south-western ending of the trench.
The walls are formed by the massive sandstones of the
Karst and Caves in Other Rocks, Pseudokarst – oral 2013 ICS Proceedings
269
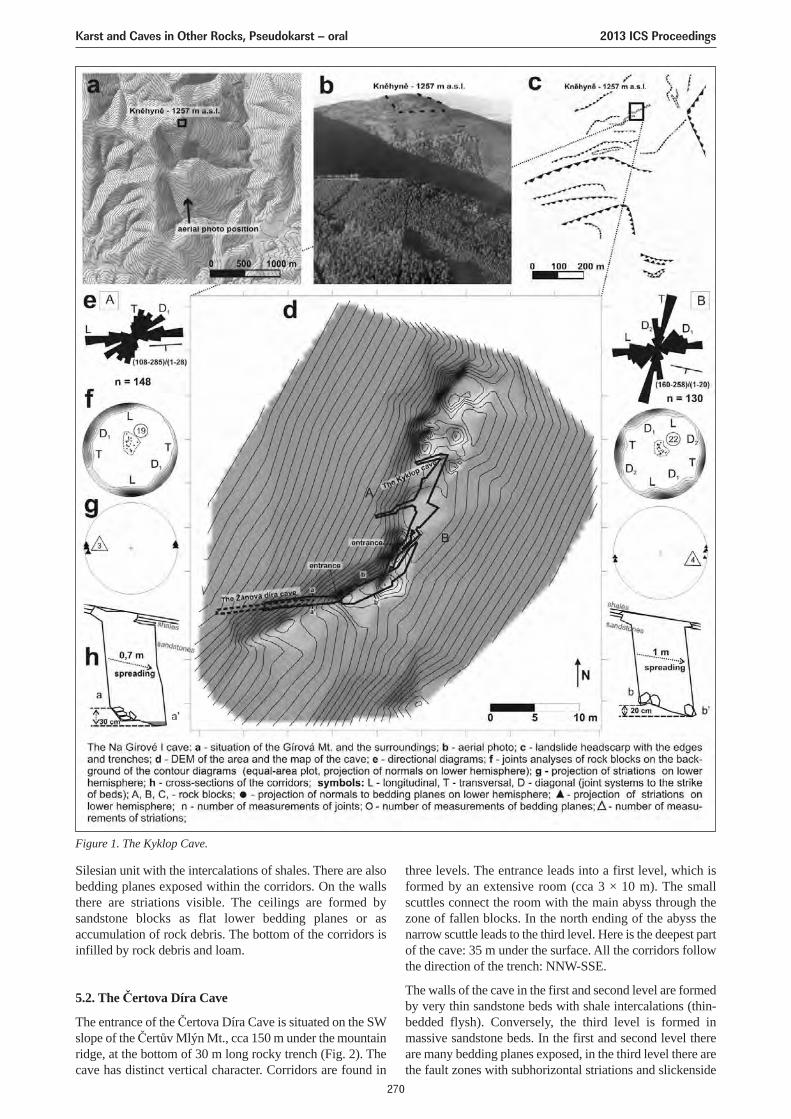
Silesian unit with the intercalations of shales. There are alsobedding planes exposed within the corridors. On the wallsthere are striations visible. The ceilings are formed bysandstone blocks as flat lower bedding planes or asaccumulation of rock debris. The bottom of the corridors isinfilled by rock debris and loam.
5.2. The Čertova Díra Cave
The entrance of the Čertova Díra Cave is situated on the SWslope of the Čertův Mlýn Mt., cca 150 m under the mountainridge, at the bottom of 30 m long rocky trench (Fig. 2). Thecave has distinct vertical character. Corridors are found in
three levels. The entrance leads into a first level, which isformed by an extensive room (cca 3 × 10 m). The smallscuttles connect the room with the main abyss through thezone of fallen blocks. In the north ending of the abyss thenarrow scuttle leads to the third level. Here is the deepest partof the cave: 35 m under the surface. All the corridors followthe direction of the trench: NNW-SSE.
The walls of the cave in the first and second level are formedby very thin sandstone beds with shale intercalations (thin-bedded flysh). Conversely, the third level is formed inmassive sandstone beds. In the first and second level thereare many bedding planes exposed, in the third level there arethe fault zones with subhorizontal striations and slickenside
Figure 1. The Kyklop Cave.
Karst and Caves in Other Rocks, Pseudokarst – oral 2013 ICS Proceedings
270
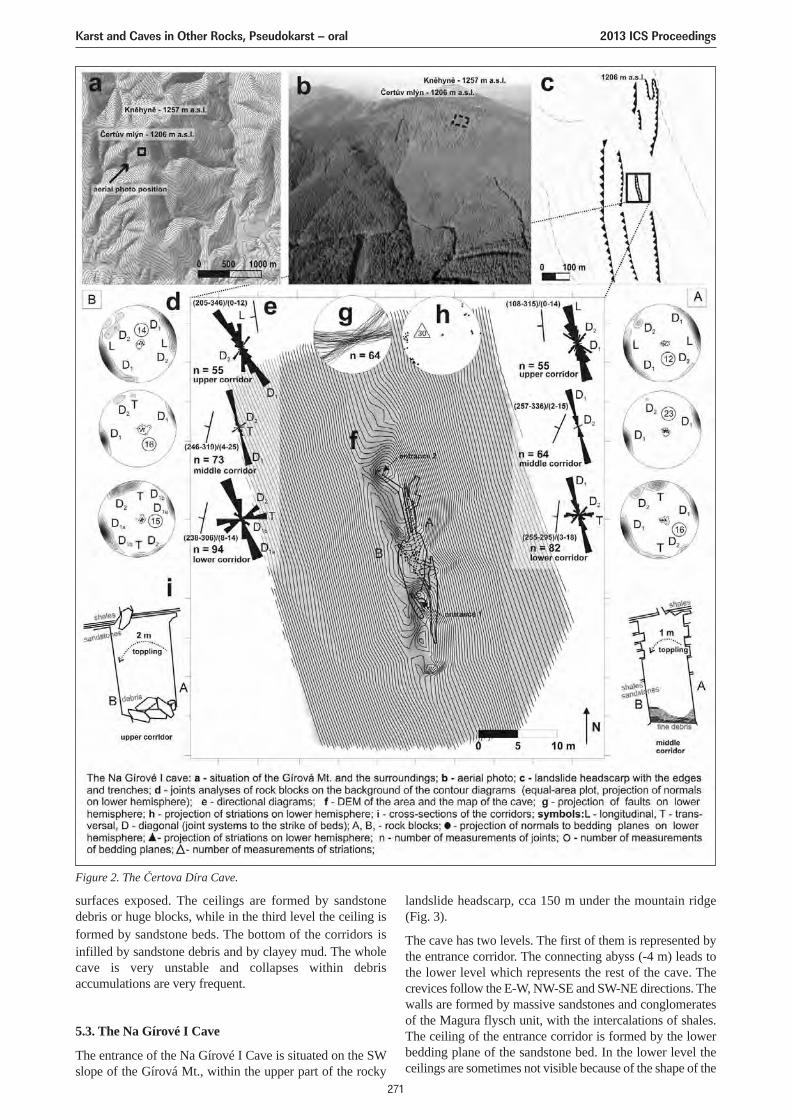
surfaces exposed. The ceilings are formed by sandstonedebris or huge blocks, while in the third level the ceiling isformed by sandstone beds. The bottom of the corridors isinfilled by sandstone debris and by clayey mud. The wholecave is very unstable and collapses within debrisaccumulations are very frequent.
5.3. The Na Gírové I Cave
The entrance of the Na Gírové I Cave is situated on the SWslope of the Gírová Mt., within the upper part of the rocky
landslide headscarp, cca 150 m under the mountain ridge(Fig. 3).
The cave has two levels. The first of them is represented bythe entrance corridor. The connecting abyss (-4 m) leads tothe lower level which represents the rest of the cave. Thecrevices follow the E-W, NW-SE and SW-NE directions. Thewalls are formed by massive sandstones and conglomeratesof the Magura flysch unit, with the intercalations of shales.The ceiling of the entrance corridor is formed by the lowerbedding plane of the sandstone bed. In the lower level theceilings are sometimes not visible because of the shape of the
Figure 2. The Čertova Díra Cave.
Karst and Caves in Other Rocks, Pseudokarst – oral 2013 ICS Proceedings
271
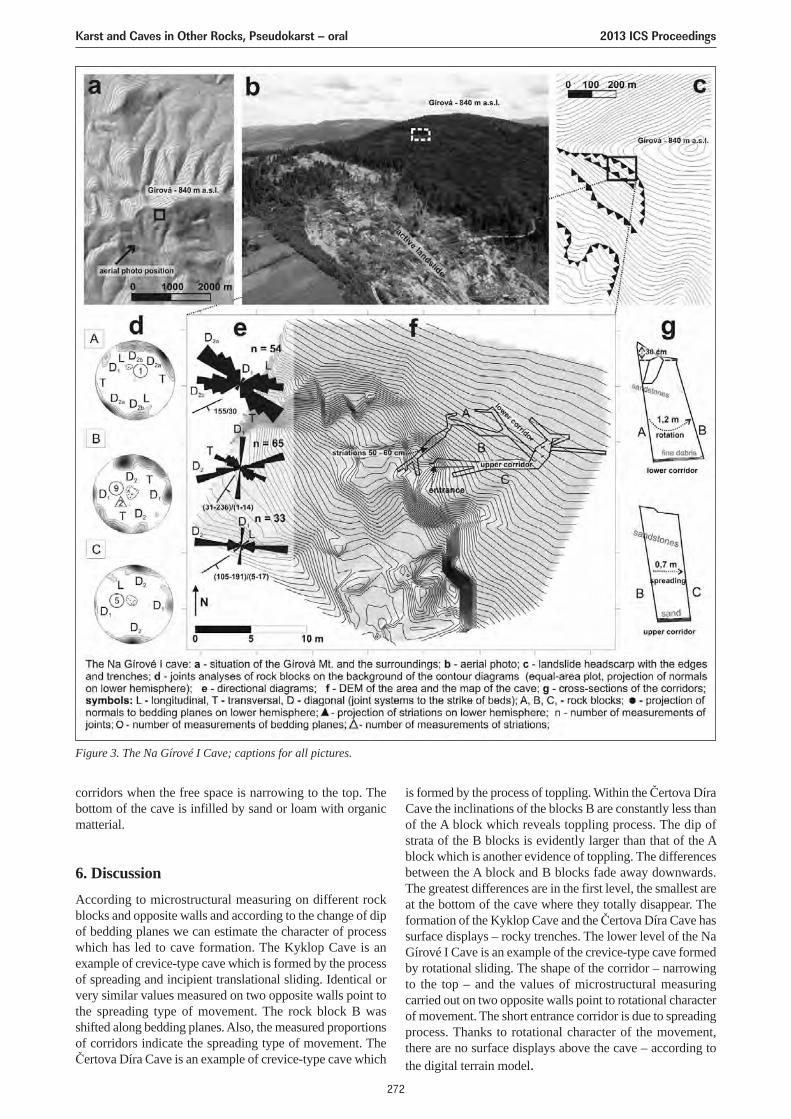
corridors when the free space is narrowing to the top. Thebottom of the cave is infilled by sand or loam with organicmatterial.
6. DiscussionAccording to microstructural measuring on different rockblocks and opposite walls and according to the change of dipof bedding planes we can estimate the character of processwhich has led to cave formation. The Kyklop Cave is anexample of crevice-type cave which is formed by the processof spreading and incipient translational sliding. Identical orvery similar values measured on two opposite walls point tothe spreading type of movement. The rock block B wasshifted along bedding planes. Also, the measured proportionsof corridors indicate the spreading type of movement. TheČertova Díra Cave is an example of crevice-type cave which
is formed by the process of toppling. Within the Čertova DíraCave the inclinations of the blocks B are constantly less thanof the A block which reveals toppling process. The dip ofstrata of the B blocks is evidently larger than that of the Ablock which is another evidence of toppling. The differencesbetween the A block and B blocks fade away downwards.The greatest differences are in the first level, the smallest areat the bottom of the cave where they totally disappear. Theformation of the Kyklop Cave and the Čertova Díra Cave hassurface displays – rocky trenches. The lower level of the NaGírové I Cave is an example of the crevice-type cave formedby rotational sliding. The shape of the corridor – narrowingto the top – and the values of microstructural measuringcarried out on two opposite walls point to rotational characterof movement. The short entrance corridor is due to spreadingprocess. Thanks to rotational character of the movement,there are no surface displays above the cave – according tothe digital terrain model.
Figure 3. The Na Gírové I Cave; captions for all pictures.
Karst and Caves in Other Rocks, Pseudokarst – oral 2013 ICS Proceedings
272
In accordance with the currently used nomenclature of thegravitational movements we can term these three exemplarycrevice-type caves. The Kyklop cave, which is formed by thespreading movement, pertains to the category of thespreading-type caves. The Čertova Díra Cave, which isformed by toppling movement, pertains to the category of thetoppling-type caves. The Na Gírové I Cave, which is formedby the rotation movement, pertains to the category of therotational-type caves. This nomenclature is based on thecriterion of genesis.
7. ConclusionThere were 8 crevice-type caves investigated in the area of theCzech part of the flysch Outern Western Carpathians. Thesecaves have been formed by various processes of gravitationalslope movements: spreading, toppling, rotational sliding. Thesurvey involved description of shapes of corridors,microstructural measuring, comparison of subsurface cavitieswith surface trenches and sinkholes using a DEM combinedwith cave maps and construction of typical cross-sections ofcave corridors, usinga data from the microstructural measuring.In accordance with the currently used nomenclature of thegravitational movements these crevice-type caves was dividedinto a three cathegories: spreading-type caves, toppling-typecaves, rotational-type caves.
AcknowledgmentsSurvey was co-funded by the financial subsidy within theprogram “Support for science and research in Moravian-Silesian Region 2012” provided by the Moravian-SilesianRegion and by the University of Ostrava Foundation projectSGS04/PřF/2012.
ReferencesBaroň I, Cílek V, Melichar R, 2003. Pseudokrasové jeskyně jako
indikátory svahových pohybů. Geol. výzk. Mor. Slez. v r. 2002.Brno, 84–87 (in Czech).
Baroň I, Cílek V, Krejčí O, Melichar R, Hubatka F, 2004. Structureand dynamics of deep-seated slope failures in the Magura FlyshNappe, outer Western Carpathians (Czech republic). Nat. Haz.and Earth Sys. Sc. 4, 549–562.
Bosák P, 2003. Karst processes from the beginning to the end: Howcan they be dated? Speleogenesis and Evolution of KarstAquifers 1(3), 1–24.
Brideau MA, Yan M, Stead D, 2009. The role of tectonic damageand brittle rock fracture in the development of large rock slopefailures. Geomorphology 103, 30–49.
Bubík M, Krejčí O, Kirchner K, 2004. Geologická minulost apřítomnost Frýdeckomístecka. Muzeum Frýdek-Místek. 54 (inCzech).
Di Luzio E, Saroli M, Esposito C, Bianchi-Fasani G, Cavinato GP,Scarascia-Mugnozza G, 2004. Influence of structural frameworkon mountain slope deformation in the Maiella anticline (CentralApennines, Italy). Geomorphology 60, 417–432.
Dramis F, Sorriso-Valvo M, 1994. Deep-seated gravitational slopedeformations, related landslides and tectonics. EngineeringGeology 38, 231–243.
Eliáš M, 2000. Vztahy mezi pústevenskými pískovci a pískovciMalinovské skály (Godulské souvrství s.s.) v Beskydech. Geol.výzk. Mor. Slez. v roce 1999, 64–66, in Czech).
EPOCH (European Community Programme) (1993. Temporaloccurence and forecasting of landslides in the Europeancommunity, (Ed. J-C. Flageollet). 3 volumes, Contract No. 900025.
Foldyna J, 1968. Pseudokras v godulských vrstvách dílčího příkrovugodulského (Moravskoslezské Beskydy). Sborník věd. pracíVŠB, ř. hor.-geol. 14. Ostrava. 83–103 (in Czech).
Foldyna J, Pavlica J, 1968. Pseudokras masívu Lysé hory aKněhyně. Sborník věd. prací VŠB, ř. hor.-geol. 14. Ostrava.69–82 (in Czech).
Halliday WR, 2007. Pseudokarst in the 21st century. Journal of caveand karst studies 69, 103–113.
Hutchinson JN, 1988. Morphological and geotechnical parametersof landslides in relation to geology and hydrogeology.Proceedings, Fifth International Symposium on Landslides,Rotterdam, 3–35.
Jaboyedoff M, Couture R, Locat P, 2009. Structural analysis ofTurtle Mountain (Alberta) using digital elevation model: towarda progressive failure. Geomorphology 103, 5–16.
Kirchner K, Krejčí O, 2002. Slope deformations and theirsignificance for relief development in the middle part of theOuter Western Carpathians in Moravia. Moravian geographicalreports 10, 10–19.
Kleczkowski A, 1955. Osuwiska i zjawiska pokrewne. Warszawa,Wyd. Geol., 93 (in Polish).
Klimeš J, Rowberry MD, Blahůt J, Briestenský M, Hartvich F,Košťák B, Rybář J, Stemberk J, Štěpančíková P, 2012. Themonitoring of slow-moving landslides and assessment ofstabilisation measures using an optical–mechanical crack gauge.Landslides 9, 3, 407–415.
Krejčí O, Baroň I, Bíl M, Hubatka F, Jurová Z, Kirchner K, 2002.Slope movements in the Flysch Carpathians of Eastern CzechRepublic triggered by extreme rainfalls in 1997: a case study.Physics and Chemistry of the Earth 27, 1567–1576.
Krejčí O, Hubatka F, Švancara J, 2004. Gravitational spreading ofthe elevated mountain ridges in the Moravian-Silesian Beskids.Acta Geodyn. Geomater. 135, 97–109.
Margielewski W, 2006. Structural control and types of movementsof rock mass in anisotropic rocks: case studies in the PolishFlysch Carpathians. Geomorphology 77, 47–68.
Margielewski W, 2009. Problematyka osuwisk strukturalnych wKarpatach fliszowych w świetle zunifikowanych kryteriówklasyfikacji ruchów masowych – przegląd krytyczny. Prz. Geol.57, 905–917 (in Polish).
Margielewski W, Urban J, 2003. Crevice-type caves as initial formsof rock landslide development in the Flysch Carpathians.Geomorphology 54, 325–338.
Margielewski W, Urban J, Szura C, 2007. Jaskinia Miecharska cave(Beskid Śląski Mts., Polish Outer Carpathians. case study of acrevice-type cave developed on a sliding surface. NatureConservation 63, 57–68.
Mastella L, Zuchiewicz W, Tokarski AK, Rubinkiewicz J,Leonowicz P, Szczęsny R, 1997. Aplication of joint analysis forpaleostress reconstructions in structuraly complicated settings:case study from Silesian nappe, Outer Carpathians, Poland. Prz.Geol. 45, 1064–1066.
Karst and Caves in Other Rocks, Pseudokarst – oral 2013 ICS Proceedings
273
Menčík E, Adamová M, Dvořák J, Dudek A, Jetel J, Jurková A,Hanzlíková E, Houša V, Peslová H, Rybářová L, Šmíd B,Šebesta J, Tyráček J, Vašíček Z, 1983. GeologieMoravskoslezských Beskyd a Podbeskydské pahorkatiny.Ústřední Ústav Geologický, Praha, 304 (in Czech).
Němčok A, 1972. Gravitational slope deformation in highmountains. Proceedings of the 24th International GeologicalCongress. Montreal, vol. 13, 132–141.
Pánek T, Duras R, 2002. The morphotectonics of the easternmarginal slope of The Ropice-range (The MoravskoslezskéBeskydy Mts.). Moravian geographical reports 10, 20–27.
Pánek T, Tábořík P, Hradecký J, 2007. Gravitační rozpad hřbetuČertova mlýna (Moravskoslezské Beskydy). Geol. výzk. Mor.Slez. v r. 2006. Brno, 124–129 (in Czech).
Pánek T, Hradecký J, Šilhán K, Smolková V, Altová V, 2009. Timeconstraints for the evolution of a large slope collapse in karstifiedmountainous terrain of the southwestern Crimean Mountains,Ukraine. Geomorphology 108: 171–181.
Pánek T, Margielewski W, Tábořík P, Urban J, Hradecký J, SzuraC, 2010. Gravitationally induced caves and other discontinuitiesdetected by 2D electrical resistivity tomography: Case studiesfrom the Polish Flysch Carpathians. Geomorphology 123,165–180.
Pánek T, Tábořík P, Klimeš J, Komárková V, Hradecký J, ŠťastnýM, 2011. Deep-seated gravitational slope deformations in thehighest parts of the Czech Flysch Carpathians: Evolutionarymodel based on kinematic analysis, electrical imaging andtrenching. Geomorphology 129, 92–112.
Panoš V, 2001. Karsologická a speleologická terminologie. Knižnécentrum, Žilina. 352 (in Czech).
Pokorný R, Holec M, 2009. Jeskyně Ústeckého kraje.Nakladatelství XYZ. Praha, 278 (in Czech).
Rybář J, Jánoš V, Klimeš J, Nýdl T, 2008. Strukturně podmíněnésvahové pohyby ve východní části Moravskoslezských Beskyd.Zpr. geol. výzk. v roce 2007. Česká geologická služba, Praha,113–118 (in Czech).
Urban, J, 2005. Pseudokarst caves as an evidence of sandstoneforms evolution – a case study of Niekłań, the ŚwiętokrzyskieMts., central Poland. Ferrantia 44, 181–185.
Varnes, D.J, 1978. Slope movements: type and processes.Landslides: analysis and control. National Academy of Sciences,Washington DC. Special report 176, 12–33.
Vítek J, 1978. Typy pseudokrasových jeskyní v ČSR.Československý kras 30, 17–28 (in Czech).
Vítek J, 1981. Morfogenetická typizace pseudokrasuv Československu. Sborník ČGS 3, 153–165 (in Czech).
Wagner J, Demek J, Stráník J, 1990. Jeskyně MoravskoslezskýchBeskyd a okolí. ČSS, Praha. 132 (in Czech).
Karst and Caves in Other Rocks, Pseudokarst – oral 2013 ICS Proceedings
274
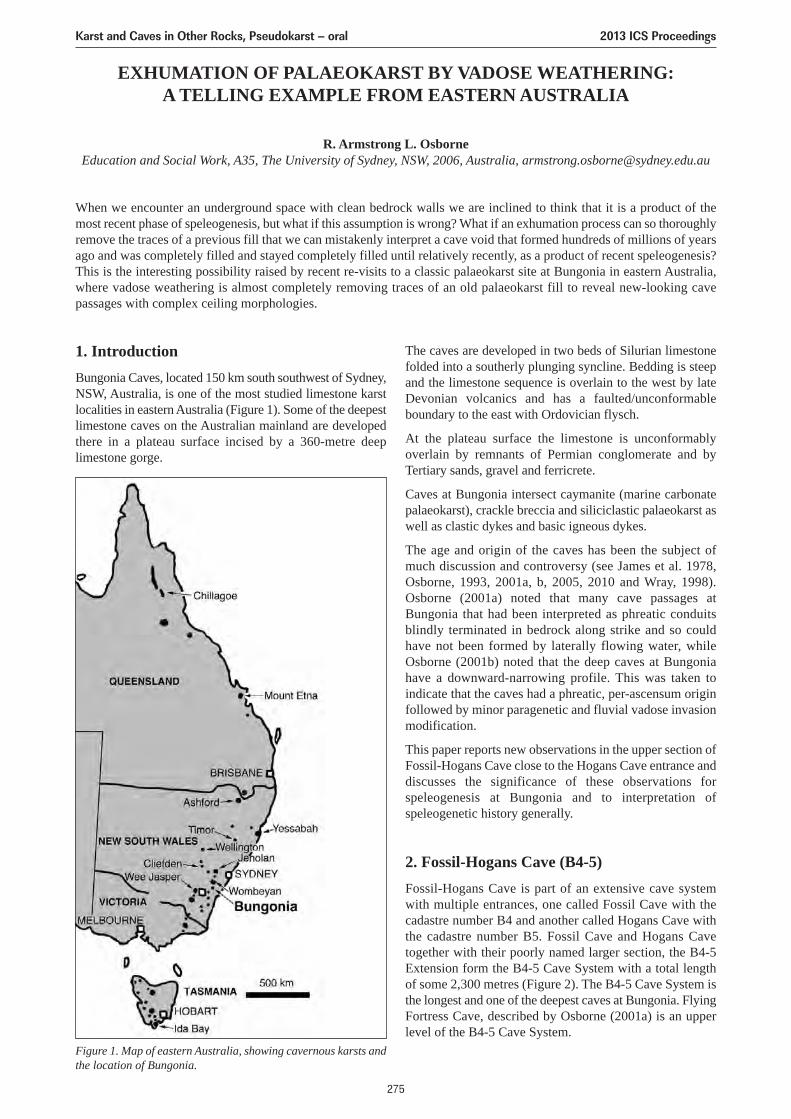
EXHUMATION OF PALAEOKARST BY VADOSE WEATHERING:A TELLING EXAMPLE FROM EASTERN AUSTRALIA
R. Armstrong L. OsborneEducation and Social Work, A35, The University of Sydney, NSW, 2006, Australia, [email protected]
When we encounter an underground space with clean bedrock walls we are inclined to think that it is a product of themost recent phase of speleogenesis, but what if this assumption is wrong? What if an exhumation process can so thoroughlyremove the traces of a previous fill that we can mistakenly interpret a cave void that formed hundreds of millions of yearsago and was completely filled and stayed completely filled until relatively recently, as a product of recent speleogenesis?This is the interesting possibility raised by recent re-visits to a classic palaeokarst site at Bungonia in eastern Australia,where vadose weathering is almost completely removing traces of an old palaeokarst fill to reveal new-looking cavepassages with complex ceiling morphologies.
1. IntroductionBungonia Caves, located 150 km south southwest of Sydney,NSW, Australia, is one of the most studied limestone karstlocalities in eastern Australia (Figure 1). Some of the deepestlimestone caves on the Australian mainland are developedthere in a plateau surface incised by a 360-metre deeplimestone gorge.
The caves are developed in two beds of Silurian limestonefolded into a southerly plunging syncline. Bedding is steepand the limestone sequence is overlain to the west by lateDevonian volcanics and has a faulted/unconformableboundary to the east with Ordovician flysch.
At the plateau surface the limestone is unconformablyoverlain by remnants of Permian conglomerate and byTertiary sands, gravel and ferricrete.
Caves at Bungonia intersect caymanite (marine carbonatepalaeokarst), crackle breccia and siliciclastic palaeokarst aswell as clastic dykes and basic igneous dykes.
The age and origin of the caves has been the subject ofmuch discussion and controversy (see James et al. 1978,Osborne, 1993, 2001a, b, 2005, 2010 and Wray, 1998).Osborne (2001a) noted that many cave passages atBungonia that had been interpreted as phreatic conduitsblindly terminated in bedrock along strike and so couldhave not been formed by laterally flowing water, whileOsborne (2001b) noted that the deep caves at Bungoniahave a downward-narrowing profile. This was taken toindicate that the caves had a phreatic, per-ascensum originfollowed by minor paragenetic and fluvial vadose invasionmodification.
This paper reports new observations in the upper section ofFossil-Hogans Cave close to the Hogans Cave entrance anddiscusses the significance of these observations forspeleogenesis at Bungonia and to interpretation ofspeleogenetic history generally.
2. Fossil-Hogans Cave (B4-5)Fossil-Hogans Cave is part of an extensive cave systemwith multiple entrances, one called Fossil Cave with thecadastre number B4 and another called Hogans Cave withthe cadastre number B5. Fossil Cave and Hogans Cavetogether with their poorly named larger section, the B4-5Extension form the B4-5 Cave System with a total lengthof some 2,300 metres (Figure 2). The B4-5 Cave System isthe longest and one of the deepest caves at Bungonia. FlyingFortress Cave, described by Osborne (2001a) is an upperlevel of the B4-5 Cave System.
Figure 1. Map of eastern Australia, showing cavernous karsts andthe location of Bungonia.
Karst and Caves in Other Rocks, Pseudokarst – oral 2013 ICS Proceedings
275
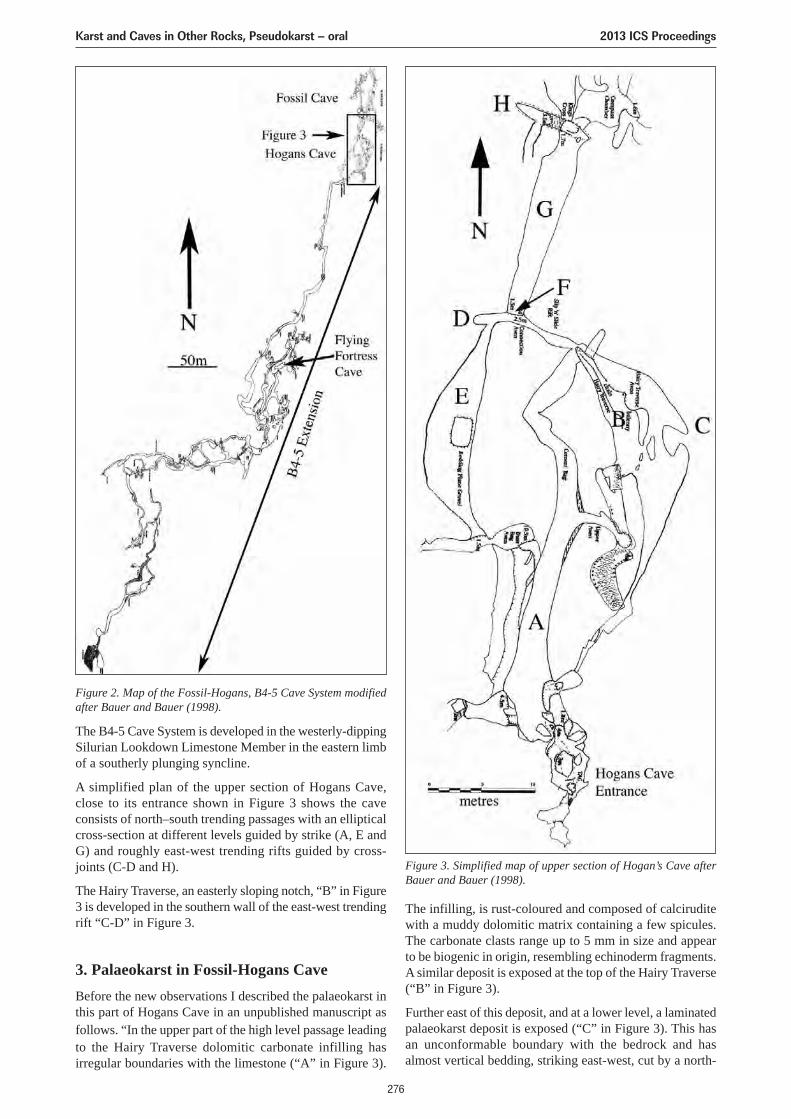
The B4-5 Cave System is developed in the westerly-dippingSilurian Lookdown Limestone Member in the eastern limbof a southerly plunging syncline.
A simplified plan of the upper section of Hogans Cave,close to its entrance shown in Figure 3 shows the caveconsists of north–south trending passages with an ellipticalcross-section at different levels guided by strike (A, E andG) and roughly east-west trending rifts guided by cross-joints (C-D and H).
The Hairy Traverse, an easterly sloping notch, “B” in Figure3 is developed in the southern wall of the east-west trendingrift “C-D” in Figure 3.
3. Palaeokarst in Fossil-Hogans CaveBefore the new observations I described the palaeokarst inthis part of Hogans Cave in an unpublished manuscript asfollows. “In the upper part of the high level passage leadingto the Hairy Traverse dolomitic carbonate infilling hasirregular boundaries with the limestone (“A” in Figure 3).
The infilling, is rust-coloured and composed of calciruditewith a muddy dolomitic matrix containing a few spicules.The carbonate clasts range up to 5 mm in size and appearto be biogenic in origin, resembling echinoderm fragments.A similar deposit is exposed at the top of the Hairy Traverse(“B” in Figure 3).
Further east of this deposit, and at a lower level, a laminatedpalaeokarst deposit is exposed (“C” in Figure 3). This hasan unconformable boundary with the bedrock and hasalmost vertical bedding, striking east-west, cut by a north-
Figure 2. Map of the Fossil-Hogans, B4-5 Cave System modifiedafter Bauer and Bauer (1998).
Figure 3. Simplified map of upper section of Hogan’s Cave afterBauer and Bauer (1998).
Karst and Caves in Other Rocks, Pseudokarst – oral 2013 ICS Proceedings
276
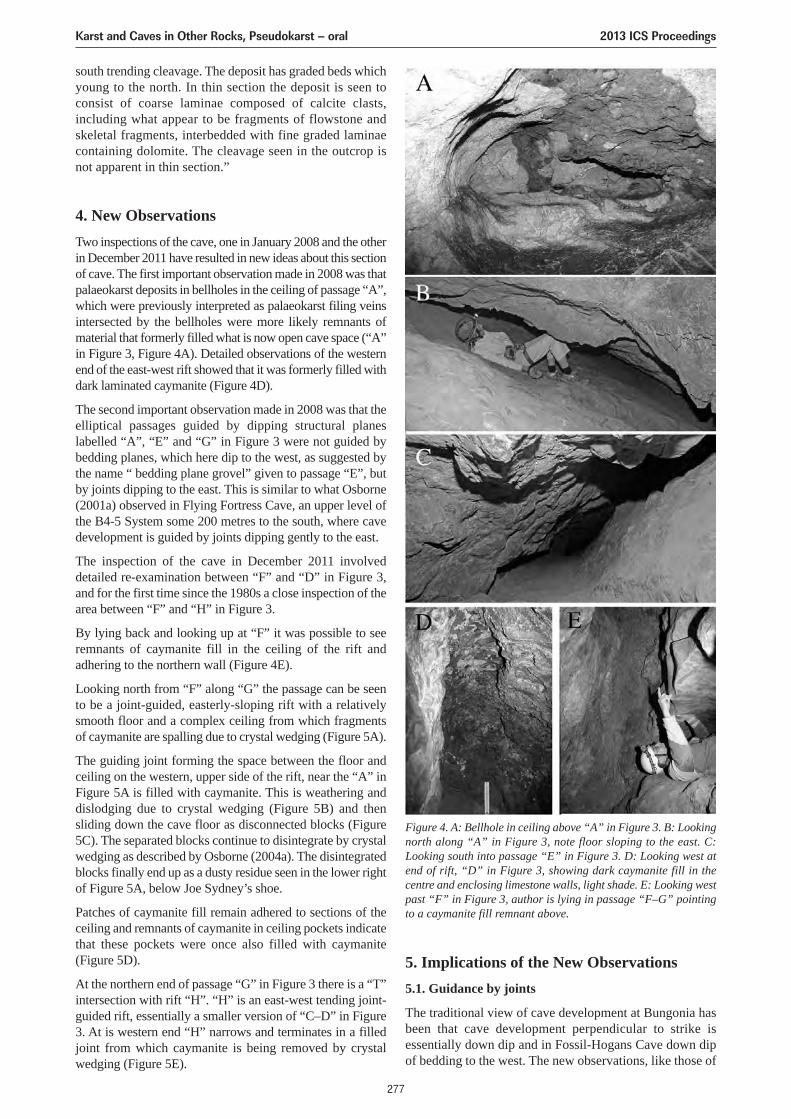
south trending cleavage. The deposit has graded beds whichyoung to the north. In thin section the deposit is seen toconsist of coarse laminae composed of calcite clasts,including what appear to be fragments of flowstone andskeletal fragments, interbedded with fine graded laminaecontaining dolomite. The cleavage seen in the outcrop isnot apparent in thin section.”
4. New ObservationsTwo inspections of the cave, one in January 2008 and the otherin December 2011 have resulted in new ideas about this sectionof cave. The first important observation made in 2008 was thatpalaeokarst deposits in bellholes in the ceiling of passage “A”,which were previously interpreted as palaeokarst filing veinsintersected by the bellholes were more likely remnants ofmaterial that formerly filled what is now open cave space (“A”in Figure 3, Figure 4A). Detailed observations of the westernend of the east-west rift showed that it was formerly filled withdark laminated caymanite (Figure 4D).
The second important observation made in 2008 was that theelliptical passages guided by dipping structural planeslabelled “A”, “E” and “G” in Figure 3 were not guided bybedding planes, which here dip to the west, as suggested bythe name “ bedding plane grovel” given to passage “E”, butby joints dipping to the east. This is similar to what Osborne(2001a) observed in Flying Fortress Cave, an upper level ofthe B4-5 System some 200 metres to the south, where cavedevelopment is guided by joints dipping gently to the east.
The inspection of the cave in December 2011 involveddetailed re-examination between “F” and “D” in Figure 3,and for the first time since the 1980s a close inspection of thearea between “F” and “H” in Figure 3.
By lying back and looking up at “F” it was possible to seeremnants of caymanite fill in the ceiling of the rift andadhering to the northern wall (Figure 4E).
Looking north from “F” along “G” the passage can be seento be a joint-guided, easterly-sloping rift with a relativelysmooth floor and a complex ceiling from which fragmentsof caymanite are spalling due to crystal wedging (Figure 5A).
The guiding joint forming the space between the floor andceiling on the western, upper side of the rift, near the “A” inFigure 5A is filled with caymanite. This is weathering anddislodging due to crystal wedging (Figure 5B) and thensliding down the cave floor as disconnected blocks (Figure5C). The separated blocks continue to disintegrate by crystalwedging as described by Osborne (2004a). The disintegratedblocks finally end up as a dusty residue seen in the lower rightof Figure 5A, below Joe Sydney’s shoe.
Patches of caymanite fill remain adhered to sections of theceiling and remnants of caymanite in ceiling pockets indicatethat these pockets were once also filled with caymanite(Figure 5D).
At the northern end of passage “G” in Figure 3 there is a “T”intersection with rift “H”. “H” is an east-west tending joint-guided rift, essentially a smaller version of “C–D” in Figure3. At is western end “H” narrows and terminates in a filledjoint from which caymanite is being removed by crystalwedging (Figure 5E).
5. Implications of the New Observations5.1. Guidance by joints
The traditional view of cave development at Bungonia hasbeen that cave development perpendicular to strike isessentially down dip and in Fossil-Hogans Cave down dipof bedding to the west. The new observations, like those of
Figure 4. A: Bellhole in ceiling above “A” in Figure 3. B: Lookingnorth along “A” in Figure 3, note floor sloping to the east. C:Looking south into passage “E” in Figure 3. D: Looking west atend of rift, “D” in Figure 3, showing dark caymanite fill in thecentre and enclosing limestone walls, light shade. E: Looking westpast “F” in Figure 3, author is lying in passage “F–G” pointingto a caymanite fill remnant above.
Karst and Caves in Other Rocks, Pseudokarst – oral 2013 ICS Proceedings
277
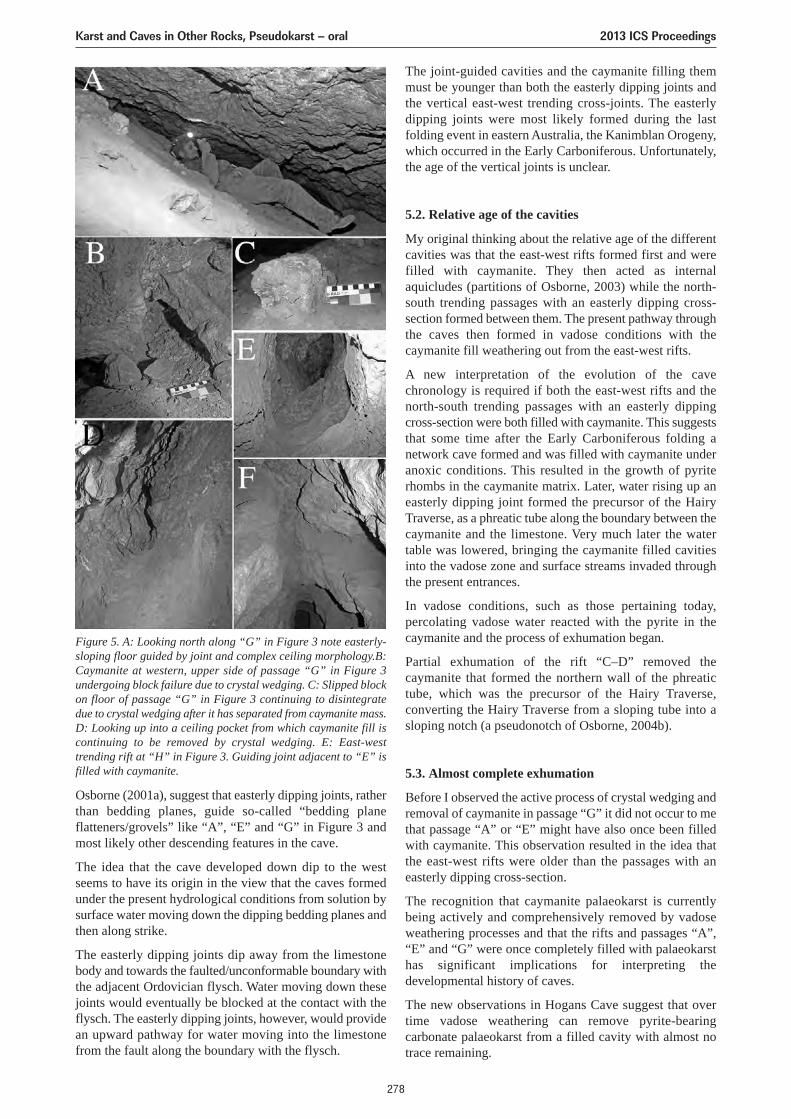
Osborne (2001a), suggest that easterly dipping joints, ratherthan bedding planes, guide so-called “bedding planeflatteners/grovels” like “A”, “E” and “G” in Figure 3 andmost likely other descending features in the cave.
The idea that the cave developed down dip to the westseems to have its origin in the view that the caves formedunder the present hydrological conditions from solution bysurface water moving down the dipping bedding planes andthen along strike.
The easterly dipping joints dip away from the limestonebody and towards the faulted/unconformable boundary withthe adjacent Ordovician flysch. Water moving down thesejoints would eventually be blocked at the contact with theflysch. The easterly dipping joints, however, would providean upward pathway for water moving into the limestonefrom the fault along the boundary with the flysch.
The joint-guided cavities and the caymanite filling themmust be younger than both the easterly dipping joints andthe vertical east-west trending cross-joints. The easterlydipping joints were most likely formed during the lastfolding event in eastern Australia, the Kanimblan Orogeny,which occurred in the Early Carboniferous. Unfortunately,the age of the vertical joints is unclear.
5.2. Relative age of the cavities
My original thinking about the relative age of the differentcavities was that the east-west rifts formed first and werefilled with caymanite. They then acted as internalaquicludes (partitions of Osborne, 2003) while the north-south trending passages with an easterly dipping cross-section formed between them. The present pathway throughthe caves then formed in vadose conditions with thecaymanite fill weathering out from the east-west rifts.
A new interpretation of the evolution of the cavechronology is required if both the east-west rifts and thenorth-south trending passages with an easterly dippingcross-section were both filled with caymanite. This suggeststhat some time after the Early Carboniferous folding anetwork cave formed and was filled with caymanite underanoxic conditions. This resulted in the growth of pyriterhombs in the caymanite matrix. Later, water rising up aneasterly dipping joint formed the precursor of the HairyTraverse, as a phreatic tube along the boundary between thecaymanite and the limestone. Very much later the watertable was lowered, bringing the caymanite filled cavitiesinto the vadose zone and surface streams invaded throughthe present entrances.
In vadose conditions, such as those pertaining today,percolating vadose water reacted with the pyrite in thecaymanite and the process of exhumation began.
Partial exhumation of the rift “C–D” removed thecaymanite that formed the northern wall of the phreatictube, which was the precursor of the Hairy Traverse,converting the Hairy Traverse from a sloping tube into asloping notch (a pseudonotch of Osborne, 2004b).
5.3. Almost complete exhumation
Before I observed the active process of crystal wedging andremoval of caymanite in passage “G” it did not occur to methat passage “A” or “E” might have also once been filledwith caymanite. This observation resulted in the idea thatthe east-west rifts were older than the passages with aneasterly dipping cross-section.
The recognition that caymanite palaeokarst is currentlybeing actively and comprehensively removed by vadoseweathering processes and that the rifts and passages “A”,“E” and “G” were once completely filled with palaeokarsthas significant implications for interpreting thedevelopmental history of caves.
The new observations in Hogans Cave suggest that overtime vadose weathering can remove pyrite-bearingcarbonate palaeokarst from a filled cavity with almost notrace remaining.
Figure 5. A: Looking north along “G” in Figure 3 note easterly-sloping floor guided by joint and complex ceiling morphology.B:Caymanite at western, upper side of passage “G” in Figure 3undergoing block failure due to crystal wedging. C: Slipped blockon floor of passage “G” in Figure 3 continuing to disintegratedue to crystal wedging after it has separated from caymanite mass.D: Looking up into a ceiling pocket from which caymanite fill iscontinuing to be removed by crystal wedging. E: East-westtrending rift at “H” in Figure 3. Guiding joint adjacent to “E” isfilled with caymanite.
Karst and Caves in Other Rocks, Pseudokarst – oral 2013 ICS Proceedings
278
The exhumed ancient cavities are virtually indistinguishablefrom adjacent much younger features. The exhumed ancientcavities may even be partly re-filled with recent sediment,as has occurred in Hogans Cave, completely obscuring theirmore ancient origins.
Workers in regions with a complex and long history ofspeleogenesis need to be alert to the possibility that thebright shiny-walled cavity containing the young sedimentsmay be a very old feature that has benefited from thespeleogenetic equivalent of liposuction and a facelift.
AcknowledgmentsI would like to thank Neville, Tom and Chris Osborne fortheir assistance in the field in 2008. Joe Sydney andmembers of the NSW Cave Rescue Squad and CanberraSpeleological Society assisted with fieldwork in 2011.Research at Bungonia Caves was undertaken under theconditions of a NSW National Parks and Wildlife ServiceScientific Licence. P. J. Osborne assisted with proofreading.
ReferencesBauer J, Bauer P, 1998. Eds. Under Bungonia. J.B. Books, Oak
Flats.James JM, Francis G, Jennings JN, 1978. Bungonia Caves and
Gorge; a new view of their geology and geomorphology,Helictite, 16(2), 53–63.
Osborne RAL, 1993. A new history of cave development atBungonia, N.S.W. Australian Geographer, 24(1), 62–74.
Osborne RAL, 2001a. Halls and narrows: Network caves indipping limestone, examples from eastern Australia. Cave andKarst Science, 28(1), 3–14.
Osborne RAL, 2001b. Non-meteoric speleogenesis: evidence fromeastern Australia. Proceedings of the 13th InternationalCongress of Speleology, Brasilia D.F., Brazil, July 15–22,2001, 1, 97–101.
Osborne RAL, 2003. Partitions, compartments and portals: Cavedevelopment internally impounded karst masses. Speleogenesisand Evolution of Karst Aquifers: The virtual Scientific Journal,1(4), 1–12. www.speleogenesis.info
Osborne RAL, 2004a. Cave breakdown by vadose weathering.International Journal of Speleology, 31(1/4), 37–53.
Osborne RAL, 2004b. The trouble with cupolas. Acta carsologica,33(2), 9–36.
Osborne RAL, 2005. Dating ancient caves and related palaeokarst.Acta Carsologica, 34(1), 51–72.
Osborne RAL, 2010. Rethinking eastern Australian caves. In PBishop and B Pillans (Eds.) Australian Landscapes. GeologicalSociety of London Special Publication 346, 289–308.
Wray RAL, 1998. Changing ideas on the landscape and speleologicevolution of Bungonia Caves. In J Bauer and P Bauer (Eds.)Under Bungonia. J.B. Books, Oak Flats, 29–39.
Karst and Caves in Other Rocks, Pseudokarst – oral 2013 ICS Proceedings
279
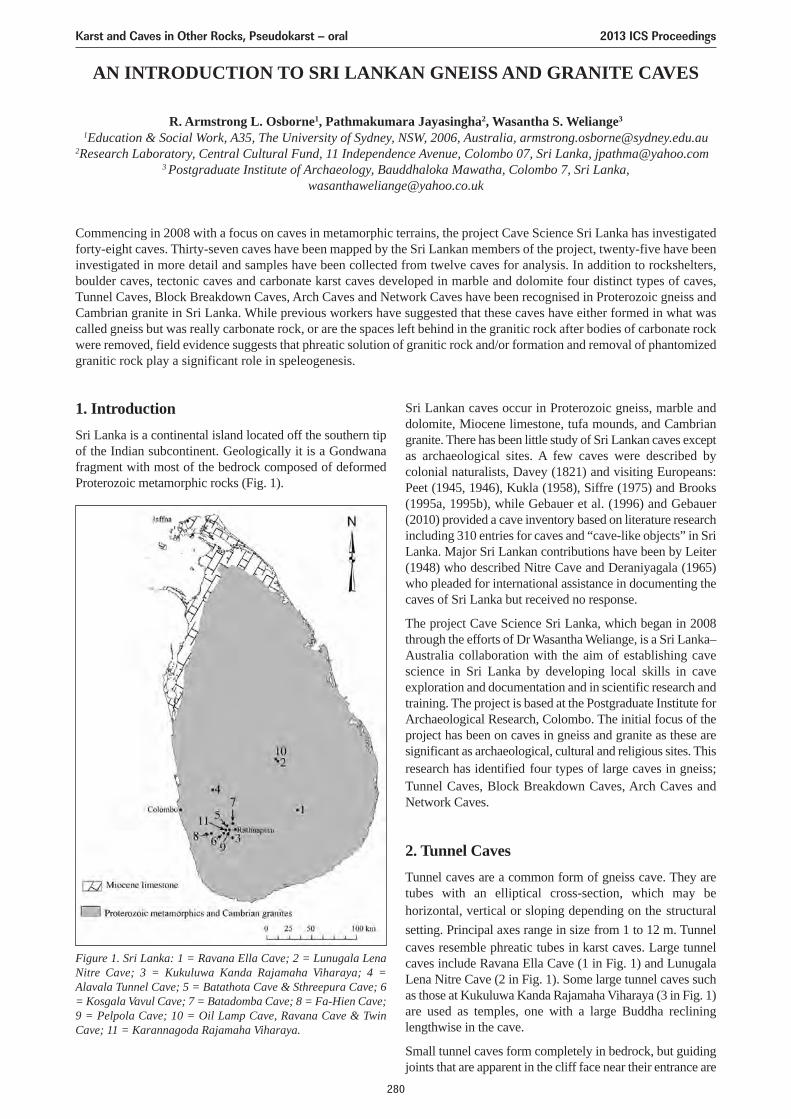
AN INTRODUCTION TO SRI LANKAN GNEISS AND GRANITE CAVES
R. Armstrong L. Osborne1, Pathmakumara Jayasingha2, Wasantha S. Weliange3
1Education & Social Work, A35, The University of Sydney, NSW, 2006, Australia, [email protected] Laboratory, Central Cultural Fund, 11 Independence Avenue, Colombo 07, Sri Lanka, [email protected]
3 Postgraduate Institute of Archaeology, Bauddhaloka Mawatha, Colombo 7, Sri Lanka,[email protected]
Commencing in 2008 with a focus on caves in metamorphic terrains, the project Cave Science Sri Lanka has investigatedforty-eight caves. Thirty-seven caves have been mapped by the Sri Lankan members of the project, twenty-five have beeninvestigated in more detail and samples have been collected from twelve caves for analysis. In addition to rockshelters,boulder caves, tectonic caves and carbonate karst caves developed in marble and dolomite four distinct types of caves,Tunnel Caves, Block Breakdown Caves, Arch Caves and Network Caves have been recognised in Proterozoic gneiss andCambrian granite in Sri Lanka. While previous workers have suggested that these caves have either formed in what wascalled gneiss but was really carbonate rock, or are the spaces left behind in the granitic rock after bodies of carbonate rockwere removed, field evidence suggests that phreatic solution of granitic rock and/or formation and removal of phantomizedgranitic rock play a significant role in speleogenesis.
1. IntroductionSri Lanka is a continental island located off the southern tipof the Indian subcontinent. Geologically it is a Gondwanafragment with most of the bedrock composed of deformedProterozoic metamorphic rocks (Fig. 1).
Sri Lankan caves occur in Proterozoic gneiss, marble anddolomite, Miocene limestone, tufa mounds, and Cambriangranite. There has been little study of Sri Lankan caves exceptas archaeological sites. A few caves were described bycolonial naturalists, Davey (1821) and visiting Europeans:Peet (1945, 1946), Kukla (1958), Siffre (1975) and Brooks(1995a, 1995b), while Gebauer et al. (1996) and Gebauer(2010) provided a cave inventory based on literature researchincluding 310 entries for caves and “cave-like objects” in SriLanka. Major Sri Lankan contributions have been by Leiter(1948) who described Nitre Cave and Deraniyagala (1965)who pleaded for international assistance in documenting thecaves of Sri Lanka but received no response.
The project Cave Science Sri Lanka, which began in 2008through the efforts of Dr Wasantha Weliange, is a Sri Lanka–Australia collaboration with the aim of establishing cavescience in Sri Lanka by developing local skills in caveexploration and documentation and in scientific research andtraining. The project is based at the Postgraduate Institute forArchaeological Research, Colombo. The initial focus of theproject has been on caves in gneiss and granite as these aresignificant as archaeological, cultural and religious sites. Thisresearch has identified four types of large caves in gneiss;Tunnel Caves, Block Breakdown Caves, Arch Caves andNetwork Caves.
2. Tunnel CavesTunnel caves are a common form of gneiss cave. They aretubes with an elliptical cross-section, which may behorizontal, vertical or sloping depending on the structuralsetting. Principal axes range in size from 1 to 12 m. Tunnelcaves resemble phreatic tubes in karst caves. Large tunnelcaves include Ravana Ella Cave (1 in Fig. 1) and LunugalaLena Nitre Cave (2 in Fig. 1). Some large tunnel caves suchas those at Kukuluwa Kanda Rajamaha Viharaya (3 in Fig. 1)are used as temples, one with a large Buddha reclininglengthwise in the cave.
Small tunnel caves form completely in bedrock, but guidingjoints that are apparent in the cliff face near their entrance are
Figure 1. Sri Lanka: 1 = Ravana Ella Cave; 2 = Lunugala LenaNitre Cave; 3 = Kukuluwa Kanda Rajamaha Viharaya; 4 =Alavala Tunnel Cave; 5 = Batathota Cave & Sthreepura Cave; 6= Kosgala Vavul Cave; 7 = Batadomba Cave; 8 = Fa-Hien Cave;9 = Pelpola Cave; 10 = Oil Lamp Cave, Ravana Cave & TwinCave; 11 = Karannagoda Rajamaha Viharaya.
Karst and Caves in Other Rocks, Pseudokarst – oral 2013 ICS Proceedings
280
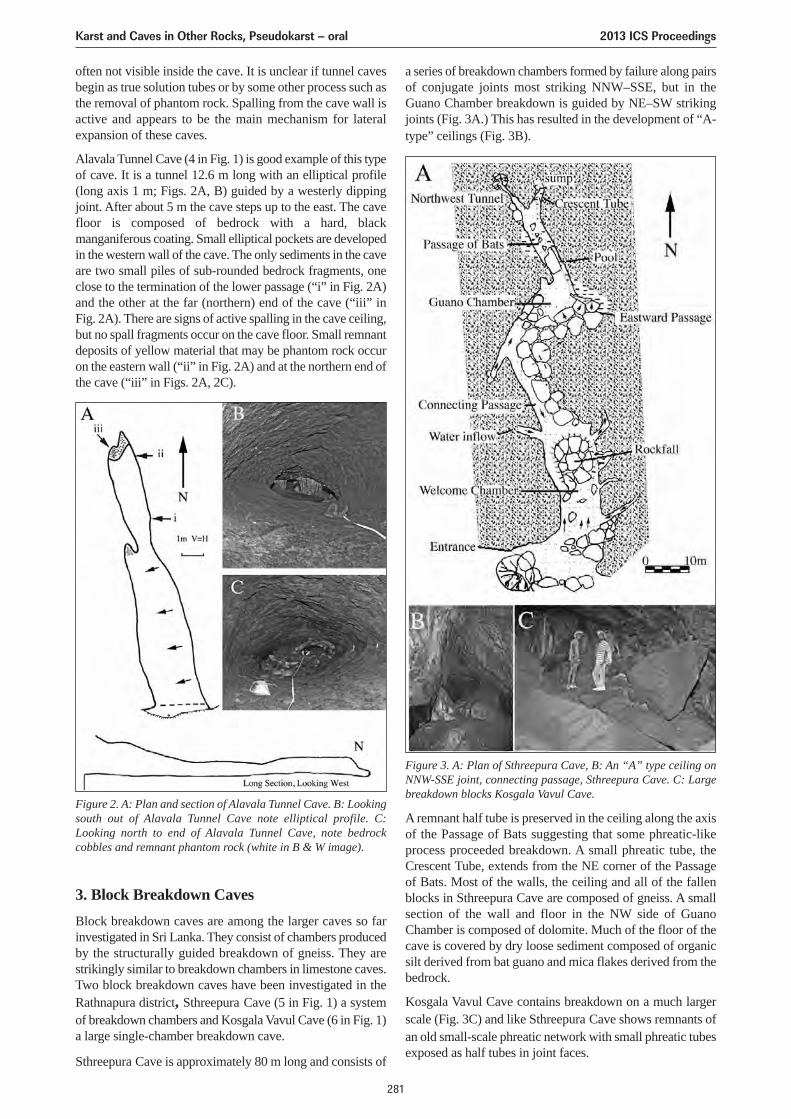
often not visible inside the cave. It is unclear if tunnel cavesbegin as true solution tubes or by some other process such asthe removal of phantom rock. Spalling from the cave wall isactive and appears to be the main mechanism for lateralexpansion of these caves.
Alavala Tunnel Cave (4 in Fig. 1) is good example of this typeof cave. It is a tunnel 12.6 m long with an elliptical profile(long axis 1 m; Figs. 2A, B) guided by a westerly dippingjoint. After about 5 m the cave steps up to the east. The cavefloor is composed of bedrock with a hard, blackmanganiferous coating. Small elliptical pockets are developedin the western wall of the cave. The only sediments in the caveare two small piles of sub-rounded bedrock fragments, oneclose to the termination of the lower passage (“i” in Fig. 2A)and the other at the far (northern) end of the cave (“iii” inFig. 2A). There are signs of active spalling in the cave ceiling,but no spall fragments occur on the cave floor. Small remnantdeposits of yellow material that may be phantom rock occuron the eastern wall (“ii” in Fig. 2A) and at the northern end ofthe cave (“iii” in Figs. 2A, 2C).
a series of breakdown chambers formed by failure along pairsof conjugate joints most striking NNW–SSE, but in theGuano Chamber breakdown is guided by NE–SW strikingjoints (Fig. 3A.) This has resulted in the development of “A-type” ceilings (Fig. 3B).
Figure 2. A: Plan and section of Alavala Tunnel Cave. B: Lookingsouth out of Alavala Tunnel Cave note elliptical profile. C:Looking north to end of Alavala Tunnel Cave, note bedrockcobbles and remnant phantom rock (white in B & W image).
Figure 3. A: Plan of Sthreepura Cave, B: An “A” type ceiling onNNW-SSE joint, connecting passage, Sthreepura Cave. C: Largebreakdown blocks Kosgala Vavul Cave.
3. Block Breakdown CavesBlock breakdown caves are among the larger caves so farinvestigated in Sri Lanka. They consist of chambers producedby the structurally guided breakdown of gneiss. They arestrikingly similar to breakdown chambers in limestone caves.Two block breakdown caves have been investigated in theRathnapura district, Sthreepura Cave (5 in Fig. 1) a systemof breakdown chambers and Kosgala Vavul Cave (6 in Fig. 1)a large single-chamber breakdown cave.
Sthreepura Cave is approximately 80 m long and consists of
A remnant half tube is preserved in the ceiling along the axisof the Passage of Bats suggesting that some phreatic-likeprocess proceeded breakdown. A small phreatic tube, theCrescent Tube, extends from the NE corner of the Passageof Bats. Most of the walls, the ceiling and all of the fallenblocks in Sthreepura Cave are composed of gneiss. A smallsection of the wall and floor in the NW side of GuanoChamber is composed of dolomite. Much of the floor of thecave is covered by dry loose sediment composed of organicsilt derived from bat guano and mica flakes derived from thebedrock.
Kosgala Vavul Cave contains breakdown on a much largerscale (Fig. 3C) and like Sthreepura Cave shows remnants ofan old small-scale phreatic network with small phreatic tubesexposed as half tubes in joint faces.
Karst and Caves in Other Rocks, Pseudokarst – oral 2013 ICS Proceedings
281
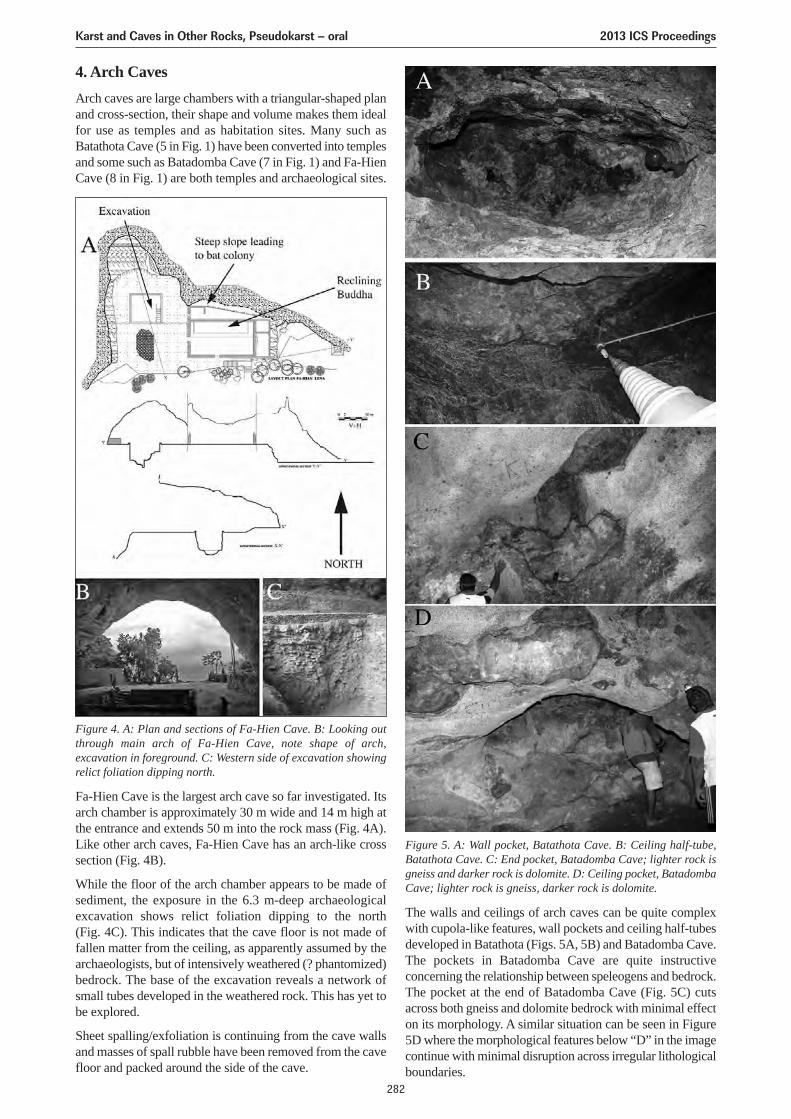
4. Arch CavesArch caves are large chambers with a triangular-shaped planand cross-section, their shape and volume makes them idealfor use as temples and as habitation sites. Many such asBatathota Cave (5 in Fig. 1) have been converted into templesand some such as Batadomba Cave (7 in Fig. 1) and Fa-HienCave (8 in Fig. 1) are both temples and archaeological sites.
Figure 4. A: Plan and sections of Fa-Hien Cave. B: Looking outthrough main arch of Fa-Hien Cave, note shape of arch,excavation in foreground. C: Western side of excavation showingrelict foliation dipping north.
Figure 5. A: Wall pocket, Batathota Cave. B: Ceiling half-tube,Batathota Cave. C: End pocket, Batadomba Cave; lighter rock isgneiss and darker rock is dolomite. D: Ceiling pocket, BatadombaCave; lighter rock is gneiss, darker rock is dolomite.
Fa-Hien Cave is the largest arch cave so far investigated. Itsarch chamber is approximately 30 m wide and 14 m high atthe entrance and extends 50 m into the rock mass (Fig. 4A).Like other arch caves, Fa-Hien Cave has an arch-like crosssection (Fig. 4B).
While the floor of the arch chamber appears to be made ofsediment, the exposure in the 6.3 m-deep archaeologicalexcavation shows relict foliation dipping to the north(Fig. 4C). This indicates that the cave floor is not made offallen matter from the ceiling, as apparently assumed by thearchaeologists, but of intensively weathered (? phantomized)bedrock. The base of the excavation reveals a network ofsmall tubes developed in the weathered rock. This has yet tobe explored.
Sheet spalling/exfoliation is continuing from the cave wallsand masses of spall rubble have been removed from the cavefloor and packed around the side of the cave.
The walls and ceilings of arch caves can be quite complexwith cupola-like features, wall pockets and ceiling half-tubesdeveloped in Batathota (Figs. 5A, 5B) and Batadomba Cave.The pockets in Batadomba Cave are quite instructiveconcerning the relationship between speleogens and bedrock.The pocket at the end of Batadomba Cave (Fig. 5C) cutsacross both gneiss and dolomite bedrock with minimal effecton its morphology. A similar situation can be seen in Figure5D where the morphological features below “D” in the imagecontinue with minimal disruption across irregular lithologicalboundaries.
Karst and Caves in Other Rocks, Pseudokarst – oral 2013 ICS Proceedings
282
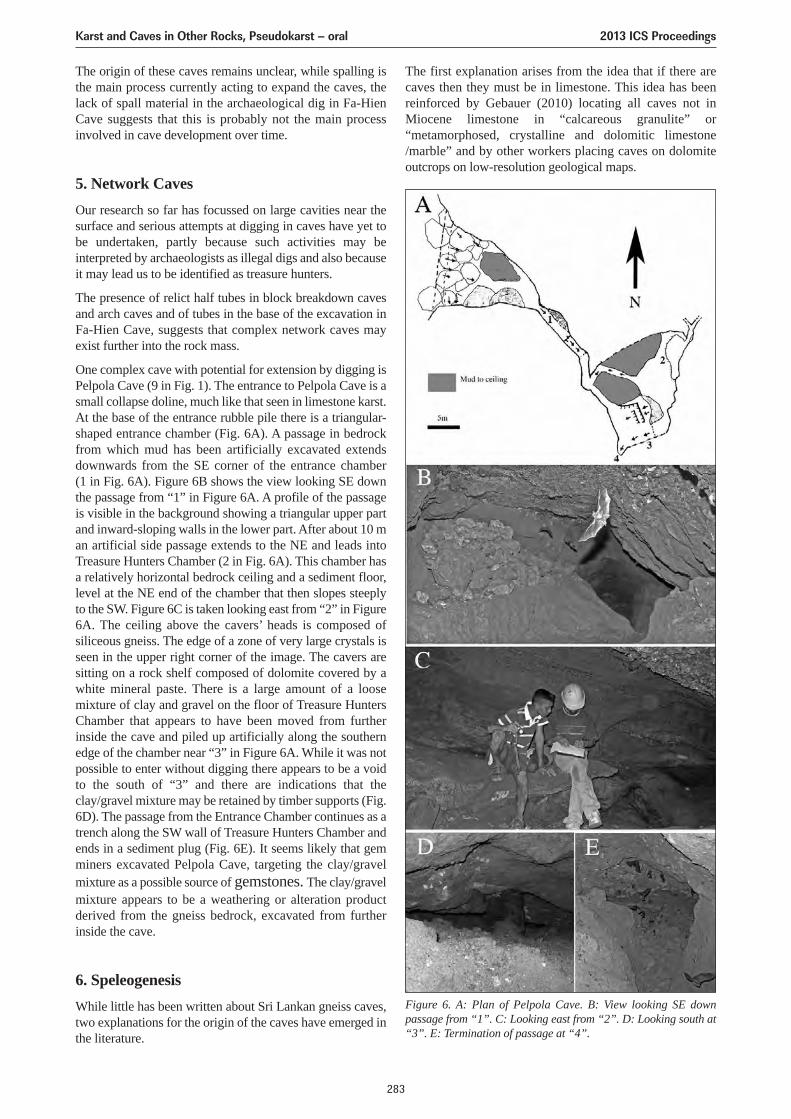
The origin of these caves remains unclear, while spalling isthe main process currently acting to expand the caves, thelack of spall material in the archaeological dig in Fa-HienCave suggests that this is probably not the main processinvolved in cave development over time.
5. Network CavesOur research so far has focussed on large cavities near thesurface and serious attempts at digging in caves have yet tobe undertaken, partly because such activities may beinterpreted by archaeologists as illegal digs and also becauseit may lead us to be identified as treasure hunters.
The presence of relict half tubes in block breakdown cavesand arch caves and of tubes in the base of the excavation inFa-Hien Cave, suggests that complex network caves mayexist further into the rock mass.
One complex cave with potential for extension by digging isPelpola Cave (9 in Fig. 1). The entrance to Pelpola Cave is asmall collapse doline, much like that seen in limestone karst.At the base of the entrance rubble pile there is a triangular-shaped entrance chamber (Fig. 6A). A passage in bedrockfrom which mud has been artificially excavated extendsdownwards from the SE corner of the entrance chamber(1 in Fig. 6A). Figure 6B shows the view looking SE downthe passage from “1” in Figure 6A. A profile of the passageis visible in the background showing a triangular upper partand inward-sloping walls in the lower part. After about 10 man artificial side passage extends to the NE and leads intoTreasure Hunters Chamber (2 in Fig. 6A). This chamber hasa relatively horizontal bedrock ceiling and a sediment floor,level at the NE end of the chamber that then slopes steeplyto the SW. Figure 6C is taken looking east from “2” in Figure6A. The ceiling above the cavers’ heads is composed ofsiliceous gneiss. The edge of a zone of very large crystals isseen in the upper right corner of the image. The cavers aresitting on a rock shelf composed of dolomite covered by awhite mineral paste. There is a large amount of a loosemixture of clay and gravel on the floor of Treasure HuntersChamber that appears to have been moved from furtherinside the cave and piled up artificially along the southernedge of the chamber near “3” in Figure 6A. While it was notpossible to enter without digging there appears to be a voidto the south of “3” and there are indications that theclay/gravel mixture may be retained by timber supports (Fig.6D). The passage from the Entrance Chamber continues as atrench along the SW wall of Treasure Hunters Chamber andends in a sediment plug (Fig. 6E). It seems likely that gemminers excavated Pelpola Cave, targeting the clay/gravelmixture as a possible source of gemstones. The clay/gravelmixture appears to be a weathering or alteration productderived from the gneiss bedrock, excavated from furtherinside the cave.
6. SpeleogenesisWhile little has been written about Sri Lankan gneiss caves,two explanations for the origin of the caves have emerged inthe literature.
The first explanation arises from the idea that if there arecaves then they must be in limestone. This idea has beenreinforced by Gebauer (2010) locating all caves not inMiocene limestone in “calcareous granulite” or“metamorphosed, crystalline and dolomitic limestone/marble” and by other workers placing caves on dolomiteoutcrops on low-resolution geological maps.
Figure 6. A: Plan of Pelpola Cave. B: View looking SE downpassage from “1”. C: Looking east from “2”. D: Looking south at“3”. E: Termination of passage at “4”.
Karst and Caves in Other Rocks, Pseudokarst – oral 2013 ICS Proceedings
283
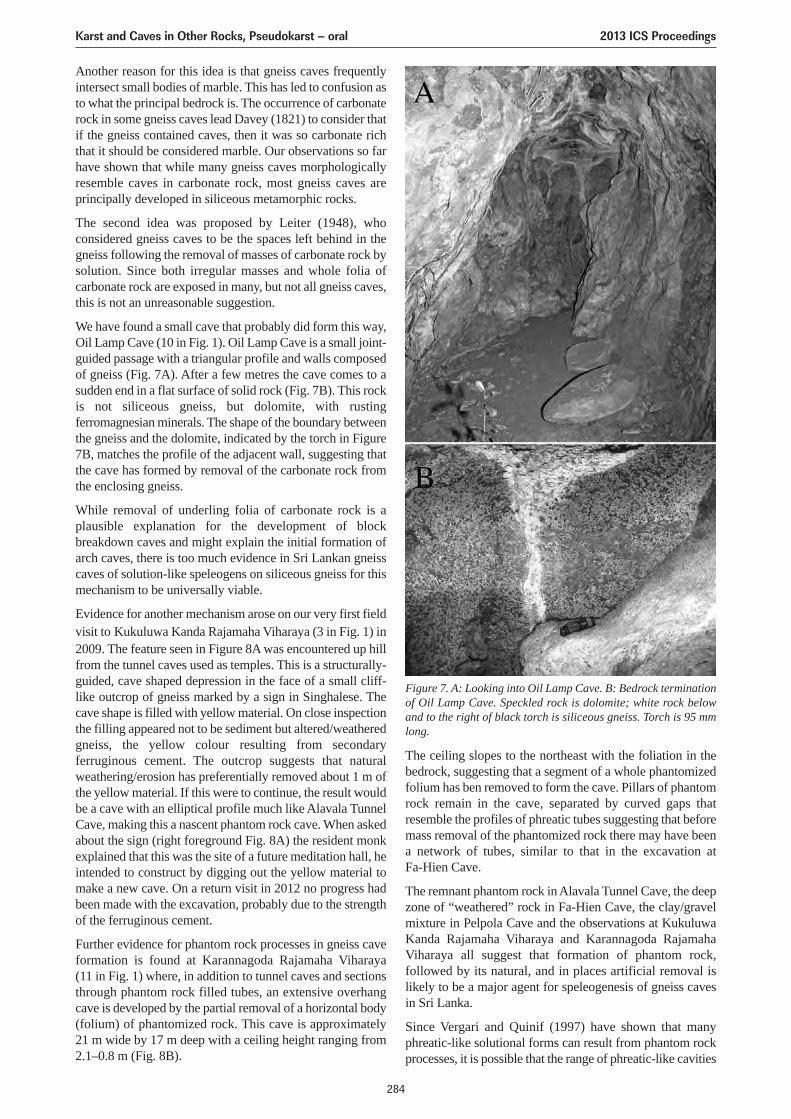
Another reason for this idea is that gneiss caves frequentlyintersect small bodies of marble. This has led to confusion asto what the principal bedrock is. The occurrence of carbonaterock in some gneiss caves lead Davey (1821) to consider thatif the gneiss contained caves, then it was so carbonate richthat it should be considered marble. Our observations so farhave shown that while many gneiss caves morphologicallyresemble caves in carbonate rock, most gneiss caves areprincipally developed in siliceous metamorphic rocks.
The second idea was proposed by Leiter (1948), whoconsidered gneiss caves to be the spaces left behind in thegneiss following the removal of masses of carbonate rock bysolution. Since both irregular masses and whole folia ofcarbonate rock are exposed in many, but not all gneiss caves,this is not an unreasonable suggestion.
We have found a small cave that probably did form this way,Oil Lamp Cave (10 in Fig. 1). Oil Lamp Cave is a small joint-guided passage with a triangular profile and walls composedof gneiss (Fig. 7A). After a few metres the cave comes to asudden end in a flat surface of solid rock (Fig. 7B). This rockis not siliceous gneiss, but dolomite, with rustingferromagnesian minerals. The shape of the boundary betweenthe gneiss and the dolomite, indicated by the torch in Figure7B, matches the profile of the adjacent wall, suggesting thatthe cave has formed by removal of the carbonate rock fromthe enclosing gneiss.
While removal of underling folia of carbonate rock is aplausible explanation for the development of blockbreakdown caves and might explain the initial formation ofarch caves, there is too much evidence in Sri Lankan gneisscaves of solution-like speleogens on siliceous gneiss for thismechanism to be universally viable.
Evidence for another mechanism arose on our very first fieldvisit to Kukuluwa Kanda Rajamaha Viharaya (3 in Fig. 1) in2009. The feature seen in Figure 8A was encountered up hillfrom the tunnel caves used as temples. This is a structurally-guided, cave shaped depression in the face of a small cliff-like outcrop of gneiss marked by a sign in Singhalese. Thecave shape is filled with yellow material. On close inspectionthe filling appeared not to be sediment but altered/weatheredgneiss, the yellow colour resulting from secondaryferruginous cement. The outcrop suggests that naturalweathering/erosion has preferentially removed about 1 m ofthe yellow material. If this were to continue, the result wouldbe a cave with an elliptical profile much like Alavala TunnelCave, making this a nascent phantom rock cave. When askedabout the sign (right foreground Fig. 8A) the resident monkexplained that this was the site of a future meditation hall, heintended to construct by digging out the yellow material tomake a new cave. On a return visit in 2012 no progress hadbeen made with the excavation, probably due to the strengthof the ferruginous cement.
Further evidence for phantom rock processes in gneiss caveformation is found at Karannagoda Rajamaha Viharaya(11 in Fig. 1) where, in addition to tunnel caves and sectionsthrough phantom rock filled tubes, an extensive overhangcave is developed by the partial removal of a horizontal body(folium) of phantomized rock. This cave is approximately21 m wide by 17 m deep with a ceiling height ranging from2.1–0.8 m (Fig. 8B).
The ceiling slopes to the northeast with the foliation in thebedrock, suggesting that a segment of a whole phantomizedfolium has ben removed to form the cave. Pillars of phantomrock remain in the cave, separated by curved gaps thatresemble the profiles of phreatic tubes suggesting that beforemass removal of the phantomized rock there may have beena network of tubes, similar to that in the excavation atFa-Hien Cave.
The remnant phantom rock in Alavala Tunnel Cave, the deepzone of “weathered” rock in Fa-Hien Cave, the clay/gravelmixture in Pelpola Cave and the observations at KukuluwaKanda Rajamaha Viharaya and Karannagoda RajamahaViharaya all suggest that formation of phantom rock,followed by its natural, and in places artificial removal islikely to be a major agent for speleogenesis of gneiss cavesin Sri Lanka.
Since Vergari and Quinif (1997) have shown that manyphreatic-like solutional forms can result from phantom rockprocesses, it is possible that the range of phreatic-like cavities
Figure 7. A: Looking into Oil Lamp Cave. B: Bedrock terminationof Oil Lamp Cave. Speckled rock is dolomite; white rock belowand to the right of black torch is siliceous gneiss. Torch is 95 mmlong.
Karst and Caves in Other Rocks, Pseudokarst – oral 2013 ICS Proceedings
284
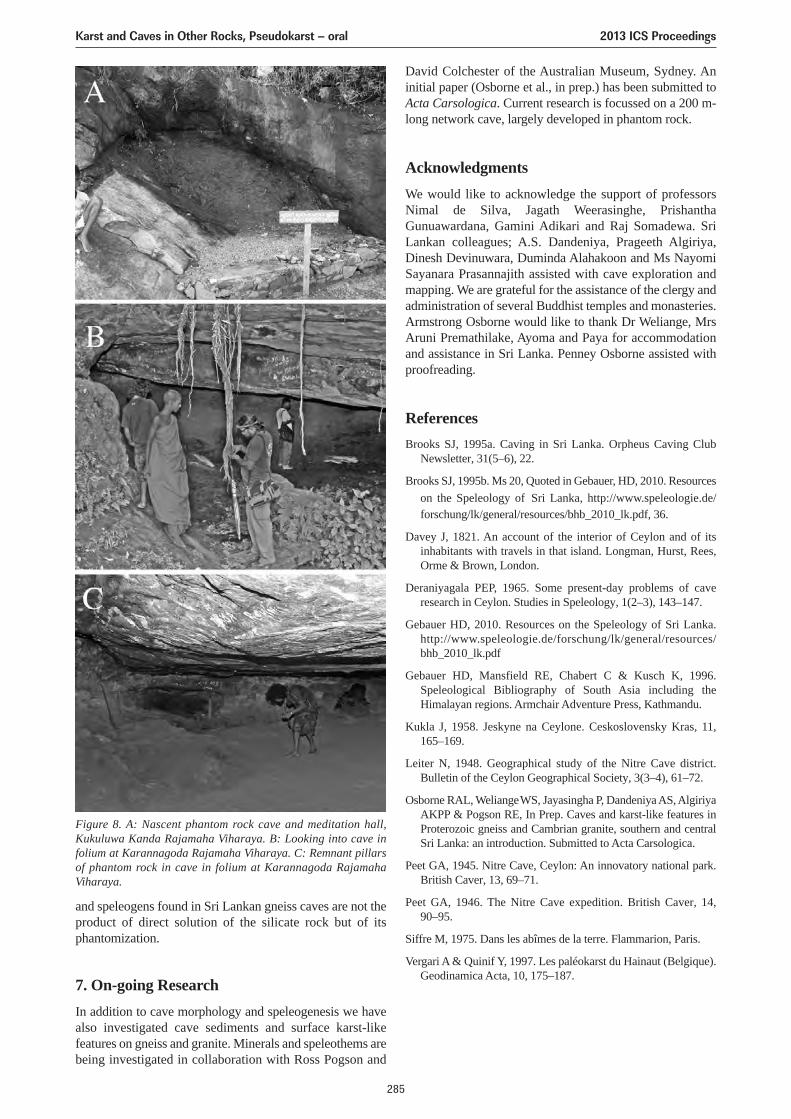
and speleogens found in Sri Lankan gneiss caves are not theproduct of direct solution of the silicate rock but of itsphantomization.
7. On-going ResearchIn addition to cave morphology and speleogenesis we havealso investigated cave sediments and surface karst-likefeatures on gneiss and granite. Minerals and speleothems arebeing investigated in collaboration with Ross Pogson and
David Colchester of the Australian Museum, Sydney. Aninitial paper (Osborne et al., in prep.) has been submitted toActa Carsologica. Current research is focussed on a 200 m-long network cave, largely developed in phantom rock.
AcknowledgmentsWe would like to acknowledge the support of professorsNimal de Silva, Jagath Weerasinghe, PrishanthaGunuawardana, Gamini Adikari and Raj Somadewa. SriLankan colleagues; A.S. Dandeniya, Prageeth Algiriya,Dinesh Devinuwara, Duminda Alahakoon and Ms NayomiSayanara Prasannajith assisted with cave exploration andmapping. We are grateful for the assistance of the clergy andadministration of several Buddhist temples and monasteries.Armstrong Osborne would like to thank Dr Weliange, MrsAruni Premathilake, Ayoma and Paya for accommodationand assistance in Sri Lanka. Penney Osborne assisted withproofreading.
ReferencesBrooks SJ, 1995a. Caving in Sri Lanka. Orpheus Caving Club
Newsletter, 31(5–6), 22.
Brooks SJ, 1995b. Ms 20, Quoted in Gebauer, HD, 2010. Resourceson the Speleology of Sri Lanka, http://www.speleologie.de/forschung/lk/general/resources/bhb_2010_lk.pdf, 36.
Davey J, 1821. An account of the interior of Ceylon and of itsinhabitants with travels in that island. Longman, Hurst, Rees,Orme & Brown, London.
Deraniyagala PEP, 1965. Some present-day problems of caveresearch in Ceylon. Studies in Speleology, 1(2–3), 143–147.
Gebauer HD, 2010. Resources on the Speleology of Sri Lanka.http://www.speleologie.de/forschung/lk/general/resources/bhb_2010_lk.pdf
Gebauer HD, Mansfield RE, Chabert C & Kusch K, 1996.Speleological Bibliography of South Asia including theHimalayan regions. Armchair Adventure Press, Kathmandu.
Kukla J, 1958. Jeskyne na Ceylone. Ceskoslovensky Kras, 11,165–169.
Leiter N, 1948. Geographical study of the Nitre Cave district.Bulletin of the Ceylon Geographical Society, 3(3–4), 61–72.
Osborne RAL, WeliangeWS, Jayasingha P, Dandeniya AS, AlgiriyaAKPP & Pogson RE, In Prep. Caves and karst-like features inProterozoic gneiss and Cambrian granite, southern and centralSri Lanka: an introduction. Submitted to Acta Carsologica.
Peet GA, 1945. Nitre Cave, Ceylon: An innovatory national park.British Caver, 13, 69–71.
Peet GA, 1946. The Nitre Cave expedition. British Caver, 14,90–95.
Siffre M, 1975. Dans les abîmes de la terre. Flammarion, Paris.
Vergari A & Quinif Y, 1997. Les paléokarst du Hainaut (Belgique).Geodinamica Acta, 10, 175–187.
Figure 8. A: Nascent phantom rock cave and meditation hall,Kukuluwa Kanda Rajamaha Viharaya. B: Looking into cave infolium at Karannagoda Rajamaha Viharaya. C: Remnant pillarsof phantom rock in cave in folium at Karannagoda RajamahaViharaya.
Karst and Caves in Other Rocks, Pseudokarst – oral 2013 ICS Proceedings
285
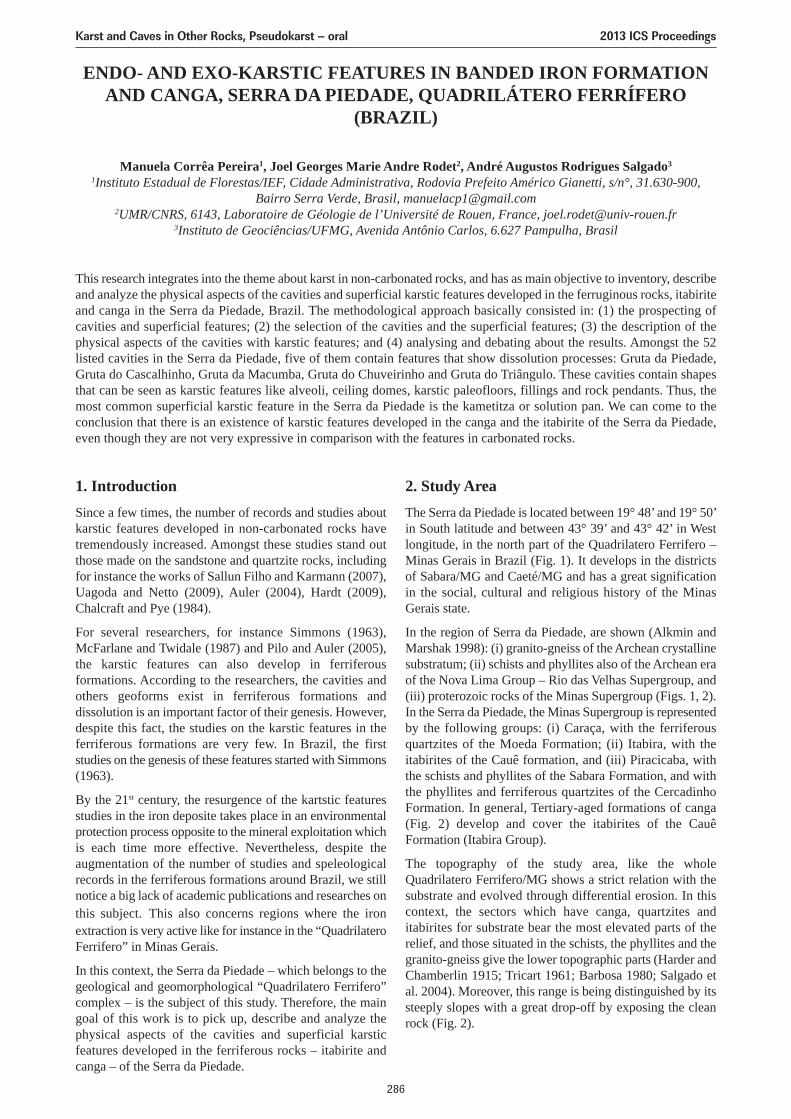
ENDO- AND EXO-KARSTIC FEATURES IN BANDED IRON FORMATIONAND CANGA, SERRA DA PIEDADE, QUADRILÁTERO FERRÍFERO
(BRAZIL)
Manuela Corrêa Pereira1, Joel Georges Marie Andre Rodet2, André Augustos Rodrigues Salgado3
1Instituto Estadual de Florestas/IEF, Cidade Administrativa, Rodovia Prefeito Américo Gianetti, s/n°, 31.630-900,Bairro Serra Verde, Brasil, [email protected]
2UMR/CNRS, 6143, Laboratoire de Géologie de l’Université de Rouen, France, [email protected] de Geociências/UFMG, Avenida Antônio Carlos, 6.627 Pampulha, Brasil
This research integrates into the theme about karst in non-carbonated rocks, and has as main objective to inventory, describeand analyze the physical aspects of the cavities and superficial karstic features developed in the ferruginous rocks, itabiriteand canga in the Serra da Piedade, Brazil. The methodological approach basically consisted in: (1) the prospecting ofcavities and superficial features; (2) the selection of the cavities and the superficial features; (3) the description of thephysical aspects of the cavities with karstic features; and (4) analysing and debating about the results. Amongst the 52listed cavities in the Serra da Piedade, five of them contain features that show dissolution processes: Gruta da Piedade,Gruta do Cascalhinho, Gruta da Macumba, Gruta do Chuveirinho and Gruta do Triângulo. These cavities contain shapesthat can be seen as karstic features like alveoli, ceiling domes, karstic paleofloors, fillings and rock pendants. Thus, themost common superficial karstic feature in the Serra da Piedade is the kametitza or solution pan. We can come to theconclusion that there is an existence of karstic features developed in the canga and the itabirite of the Serra da Piedade,even though they are not very expressive in comparison with the features in carbonated rocks.
1. IntroductionSince a few times, the number of records and studies aboutkarstic features developed in non-carbonated rocks havetremendously increased. Amongst these studies stand outthose made on the sandstone and quartzite rocks, includingfor instance the works of Sallun Filho and Karmann (2007),Uagoda and Netto (2009), Auler (2004), Hardt (2009),Chalcraft and Pye (1984).
For several researchers, for instance Simmons (1963),McFarlane and Twidale (1987) and Pilo and Auler (2005),the karstic features can also develop in ferriferousformations. According to the researchers, the cavities andothers geoforms exist in ferriferous formations anddissolution is an important factor of their genesis. However,despite this fact, the studies on the karstic features in theferriferous formations are very few. In Brazil, the firststudies on the genesis of these features started with Simmons(1963).
By the 21st century, the resurgence of the kartstic featuresstudies in the iron deposite takes place in an environmentalprotection process opposite to the mineral exploitation whichis each time more effective. Nevertheless, despite theaugmentation of the number of studies and speleologicalrecords in the ferriferous formations around Brazil, we stillnotice a big lack of academic publications and researches onthis subject. This also concerns regions where the ironextraction is very active like for instance in the “QuadrilateroFerrifero” in Minas Gerais.
In this context, the Serra da Piedade – which belongs to thegeological and geomorphological “Quadrilatero Ferrifero”complex – is the subject of this study. Therefore, the maingoal of this work is to pick up, describe and analyze thephysical aspects of the cavities and superficial karsticfeatures developed in the ferriferous rocks – itabirite andcanga – of the Serra da Piedade.
2. Study AreaThe Serra da Piedade is located between 19° 48’ and 19° 50’in South latitude and between 43° 39’ and 43° 42’ in Westlongitude, in the north part of the Quadrilatero Ferrifero –Minas Gerais in Brazil (Fig. 1). It develops in the districtsof Sabara/MG and Caeté/MG and has a great significationin the social, cultural and religious history of the MinasGerais state.
In the region of Serra da Piedade, are shown (Alkmin andMarshak 1998): (i) granito-gneiss of the Archean crystallinesubstratum; (ii) schists and phyllites also of the Archean eraof the Nova Lima Group – Rio das Velhas Supergroup, and(iii) proterozoic rocks of the Minas Supergroup (Figs. 1, 2).In the Serra da Piedade, the Minas Supergroup is representedby the following groups: (i) Caraça, with the ferriferousquartzites of the Moeda Formation; (ii) Itabira, with theitabirites of the Cauê formation, and (iii) Piracicaba, withthe schists and phyllites of the Sabara Formation, and withthe phyllites and ferriferous quartzites of the CercadinhoFormation. In general, Tertiary-aged formations of canga(Fig. 2) develop and cover the itabirites of the CauêFormation (Itabira Group).
The topography of the study area, like the wholeQuadrilatero Ferrifero/MG shows a strict relation with thesubstrate and evolved through differential erosion. In thiscontext, the sectors which have canga, quartzites anditabirites for substrate bear the most elevated parts of therelief, and those situated in the schists, the phyllites and thegranito-gneiss give the lower topographic parts (Harder andChamberlin 1915; Tricart 1961; Barbosa 1980; Salgado etal. 2004). Moreover, this range is being distinguished by itssteeply slopes with a great drop-off by exposing the cleanrock (Fig. 2).
Karst and Caves in Other Rocks, Pseudokarst – oral 2013 ICS Proceedings
286
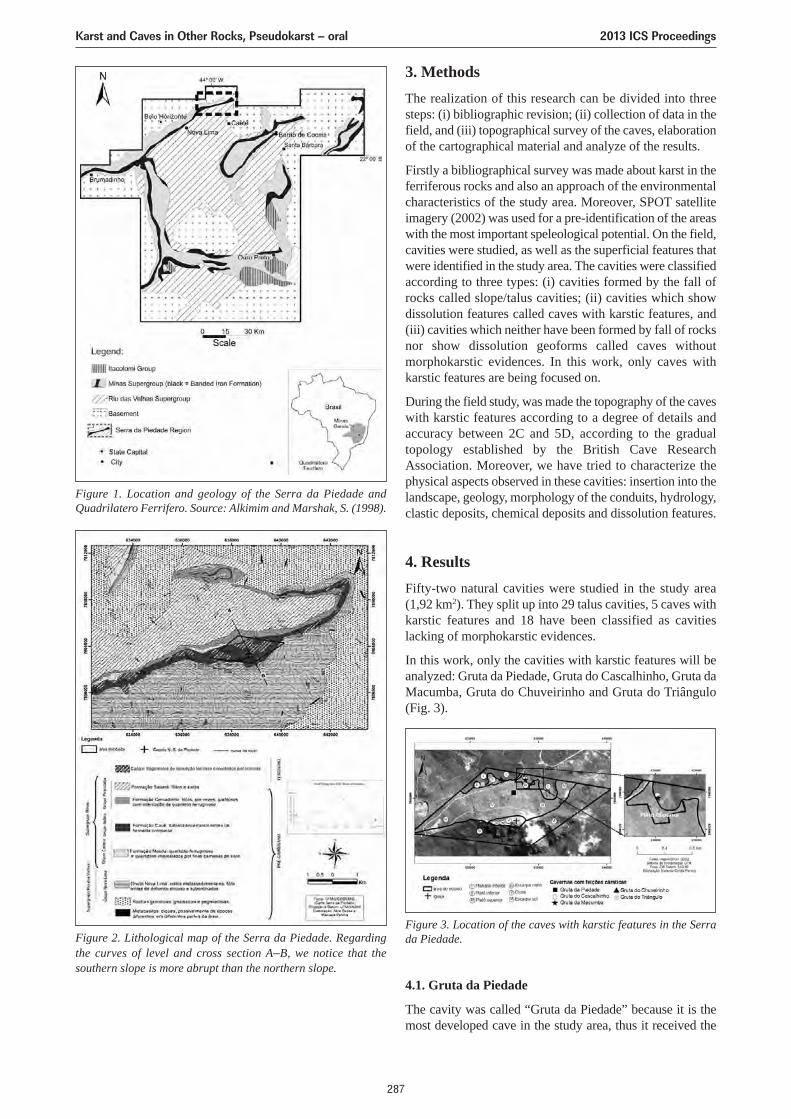
3. MethodsThe realization of this research can be divided into threesteps: (i) bibliographic revision; (ii) collection of data in thefield, and (iii) topographical survey of the caves, elaborationof the cartographical material and analyze of the results.
Firstly a bibliographical survey was made about karst in theferriferous rocks and also an approach of the environmentalcharacteristics of the study area. Moreover, SPOT satelliteimagery (2002) was used for a pre-identification of the areaswith the most important speleological potential. On the field,cavities were studied, as well as the superficial features thatwere identified in the study area. The cavities were classifiedaccording to three types: (i) cavities formed by the fall ofrocks called slope/talus cavities; (ii) cavities which showdissolution features called caves with karstic features, and(iii) cavities which neither have been formed by fall of rocksnor show dissolution geoforms called caves withoutmorphokarstic evidences. In this work, only caves withkarstic features are being focused on.
During the field study, was made the topography of the caveswith karstic features according to a degree of details andaccuracy between 2C and 5D, according to the gradualtopology established by the British Cave ResearchAssociation. Moreover, we have tried to characterize thephysical aspects observed in these cavities: insertion into thelandscape, geology, morphology of the conduits, hydrology,clastic deposits, chemical deposits and dissolution features.
4. ResultsFifty-two natural cavities were studied in the study area(1,92 km2). They split up into 29 talus cavities, 5 caves withkarstic features and 18 have been classified as cavitieslacking of morphokarstic evidences.
In this work, only the cavities with karstic features will beanalyzed: Gruta da Piedade, Gruta do Cascalhinho, Gruta daMacumba, Gruta do Chuveirinho and Gruta do Triângulo(Fig. 3).
Figure 1. Location and geology of the Serra da Piedade andQuadrilatero Ferrifero. Source: Alkimim and Marshak, S. (1998).
Figure 2. Lithological map of the Serra da Piedade. Regardingthe curves of level and cross section A–B, we notice that thesouthern slope is more abrupt than the northern slope.
Figure 3. Location of the caves with karstic features in the Serrada Piedade.
4.1. Gruta da Piedade
The cavity was called “Gruta da Piedade” because it is themost developed cave in the study area, thus it received the
Karst and Caves in Other Rocks, Pseudokarst – oral 2013 ICS Proceedings
287
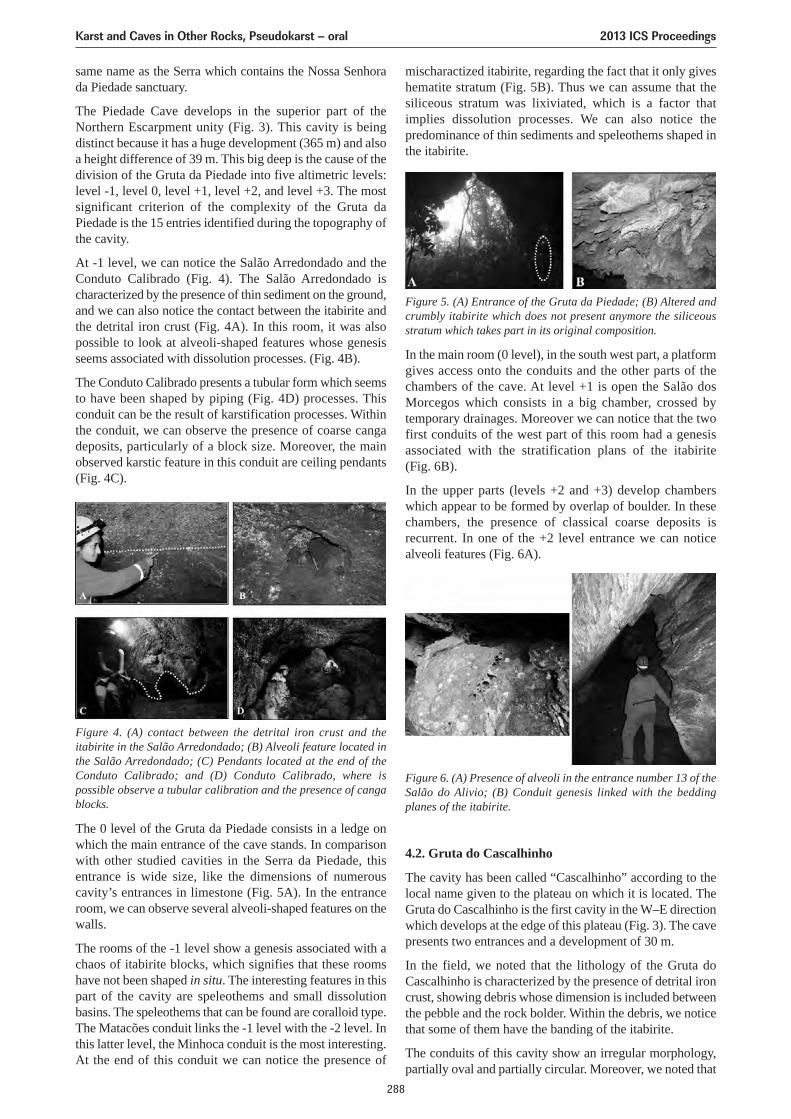
same name as the Serra which contains the Nossa Senhorada Piedade sanctuary.
The Piedade Cave develops in the superior part of theNorthern Escarpment unity (Fig. 3). This cavity is beingdistinct because it has a huge development (365 m) and alsoa height difference of 39 m. This big deep is the cause of thedivision of the Gruta da Piedade into five altimetric levels:level -1, level 0, level +1, level +2, and level +3. The mostsignificant criterion of the complexity of the Gruta daPiedade is the 15 entries identified during the topography ofthe cavity.
At -1 level, we can notice the Salão Arredondado and theConduto Calibrado (Fig. 4). The Salão Arredondado ischaracterized by the presence of thin sediment on the ground,and we can also notice the contact between the itabirite andthe detrital iron crust (Fig. 4A). In this room, it was alsopossible to look at alveoli-shaped features whose genesisseems associated with dissolution processes. (Fig. 4B).
The Conduto Calibrado presents a tubular form which seemsto have been shaped by piping (Fig. 4D) processes. Thisconduit can be the result of karstification processes. Withinthe conduit, we can observe the presence of coarse cangadeposits, particularly of a block size. Moreover, the mainobserved karstic feature in this conduit are ceiling pendants(Fig. 4C).
mischaractized itabirite, regarding the fact that it only giveshematite stratum (Fig. 5B). Thus we can assume that thesiliceous stratum was lixiviated, which is a factor thatimplies dissolution processes. We can also notice thepredominance of thin sediments and speleothems shaped inthe itabirite.
Figure 4. (A) contact between the detrital iron crust and theitabirite in the Salão Arredondado; (B) Alveoli feature located inthe Salão Arredondado; (C) Pendants located at the end of theConduto Calibrado; and (D) Conduto Calibrado, where ispossible observe a tubular calibration and the presence of cangablocks.
Figure 5. (A) Entrance of the Gruta da Piedade; (B) Altered andcrumbly itabirite which does not present anymore the siliceousstratum which takes part in its original composition.
Figure 6. (A) Presence of alveoli in the entrance number 13 of theSalão do Alivio; (B) Conduit genesis linked with the beddingplanes of the itabirite.
The 0 level of the Gruta da Piedade consists in a ledge onwhich the main entrance of the cave stands. In comparisonwith other studied cavities in the Serra da Piedade, thisentrance is wide size, like the dimensions of numerouscavity’s entrances in limestone (Fig. 5A). In the entranceroom, we can observe several alveoli-shaped features on thewalls.
The rooms of the -1 level show a genesis associated with achaos of itabirite blocks, which signifies that these roomshave not been shaped in situ. The interesting features in thispart of the cavity are speleothems and small dissolutionbasins. The speleothems that can be found are coralloid type.The Matacões conduit links the -1 level with the -2 level. Inthis latter level, the Minhoca conduit is the most interesting.At the end of this conduit we can notice the presence of
In the main room (0 level), in the south west part, a platformgives access onto the conduits and the other parts of thechambers of the cave. At level +1 is open the Salão dosMorcegos which consists in a big chamber, crossed bytemporary drainages. Moreover we can notice that the twofirst conduits of the west part of this room had a genesisassociated with the stratification plans of the itabirite(Fig. 6B).
In the upper parts (levels +2 and +3) develop chamberswhich appear to be formed by overlap of boulder. In thesechambers, the presence of classical coarse deposits isrecurrent. In one of the +2 level entrance we can noticealveoli features (Fig. 6A).
4.2. Gruta do Cascalhinho
The cavity has been called “Cascalhinho” according to thelocal name given to the plateau on which it is located. TheGruta do Cascalhinho is the first cavity in the W–E directionwhich develops at the edge of this plateau (Fig. 3). The cavepresents two entrances and a development of 30 m.
In the field, we noted that the lithology of the Gruta doCascalhinho is characterized by the presence of detrital ironcrust, showing debris whose dimension is included betweenthe pebble and the rock bolder. Within the debris, we noticethat some of them have the banding of the itabirite.
The conduits of this cavity show an irregular morphology,partially oval and partially circular. Moreover, we noted that
Karst and Caves in Other Rocks, Pseudokarst – oral 2013 ICS Proceedings
288
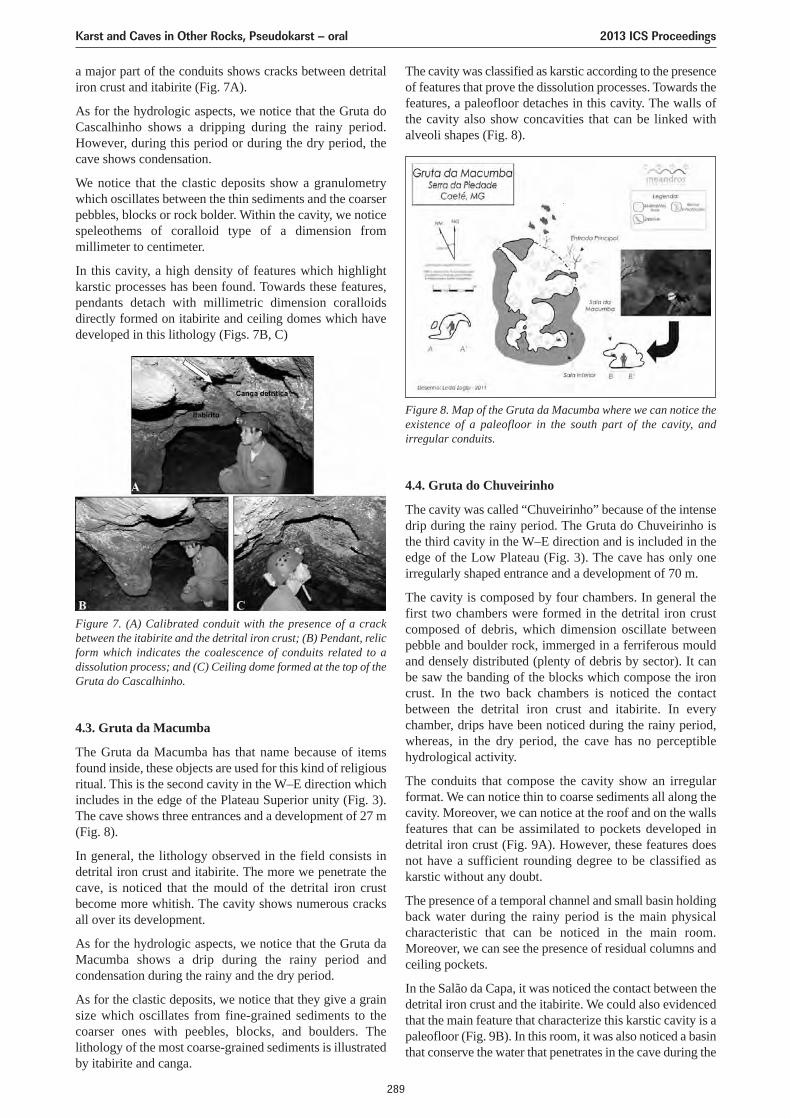
a major part of the conduits shows cracks between detritaliron crust and itabirite (Fig. 7A).
As for the hydrologic aspects, we notice that the Gruta doCascalhinho shows a dripping during the rainy period.However, during this period or during the dry period, thecave shows condensation.
We notice that the clastic deposits show a granulometrywhich oscillates between the thin sediments and the coarserpebbles, blocks or rock bolder. Within the cavity, we noticespeleothems of coralloid type of a dimension frommillimeter to centimeter.
In this cavity, a high density of features which highlightkarstic processes has been found. Towards these features,pendants detach with millimetric dimension coralloidsdirectly formed on itabirite and ceiling domes which havedeveloped in this lithology (Figs. 7B, C)
The cavity was classified as karstic according to the presenceof features that prove the dissolution processes. Towards thefeatures, a paleofloor detaches in this cavity. The walls ofthe cavity also show concavities that can be linked withalveoli shapes (Fig. 8).
Figure 7. (A) Calibrated conduit with the presence of a crackbetween the itabirite and the detrital iron crust; (B) Pendant, relicform which indicates the coalescence of conduits related to adissolution process; and (C) Ceiling dome formed at the top of theGruta do Cascalhinho.
4.3. Gruta da Macumba
The Gruta da Macumba has that name because of itemsfound inside, these objects are used for this kind of religiousritual. This is the second cavity in the W–E direction whichincludes in the edge of the Plateau Superior unity (Fig. 3).The cave shows three entrances and a development of 27 m(Fig. 8).
In general, the lithology observed in the field consists indetrital iron crust and itabirite. The more we penetrate thecave, is noticed that the mould of the detrital iron crustbecome more whitish. The cavity shows numerous cracksall over its development.
As for the hydrologic aspects, we notice that the Gruta daMacumba shows a drip during the rainy period andcondensation during the rainy and the dry period.
As for the clastic deposits, we notice that they give a grainsize which oscillates from fine-grained sediments to thecoarser ones with peebles, blocks, and boulders. Thelithology of the most coarse-grained sediments is illustratedby itabirite and canga.
Figure 8. Map of the Gruta da Macumba where we can notice theexistence of a paleofloor in the south part of the cavity, andirregular conduits.
4.4. Gruta do Chuveirinho
The cavity was called “Chuveirinho” because of the intensedrip during the rainy period. The Gruta do Chuveirinho isthe third cavity in the W–E direction and is included in theedge of the Low Plateau (Fig. 3). The cave has only oneirregularly shaped entrance and a development of 70 m.
The cavity is composed by four chambers. In general thefirst two chambers were formed in the detrital iron crustcomposed of debris, which dimension oscillate betweenpebble and boulder rock, immerged in a ferriferous mouldand densely distributed (plenty of debris by sector). It canbe saw the banding of the blocks which compose the ironcrust. In the two back chambers is noticed the contactbetween the detrital iron crust and itabirite. In everychamber, drips have been noticed during the rainy period,whereas, in the dry period, the cave has no perceptiblehydrological activity.
The conduits that compose the cavity show an irregularformat. We can notice thin to coarse sediments all along thecavity. Moreover, we can notice at the roof and on the wallsfeatures that can be assimilated to pockets developed indetrital iron crust (Fig. 9A). However, these features doesnot have a sufficient rounding degree to be classified askarstic without any doubt.
The presence of a temporal channel and small basin holdingback water during the rainy period is the main physicalcharacteristic that can be noticed in the main room.Moreover, we can see the presence of residual columns andceiling pockets.
In the Salão da Capa, it was noticed the contact between thedetrital iron crust and the itabirite. We could also evidencedthat the main feature that characterize this karstic cavity is apaleofloor (Fig. 9B). In this room, it was also noticed a basinthat conserve the water that penetrates in the cave during the
Karst and Caves in Other Rocks, Pseudokarst – oral 2013 ICS Proceedings
289
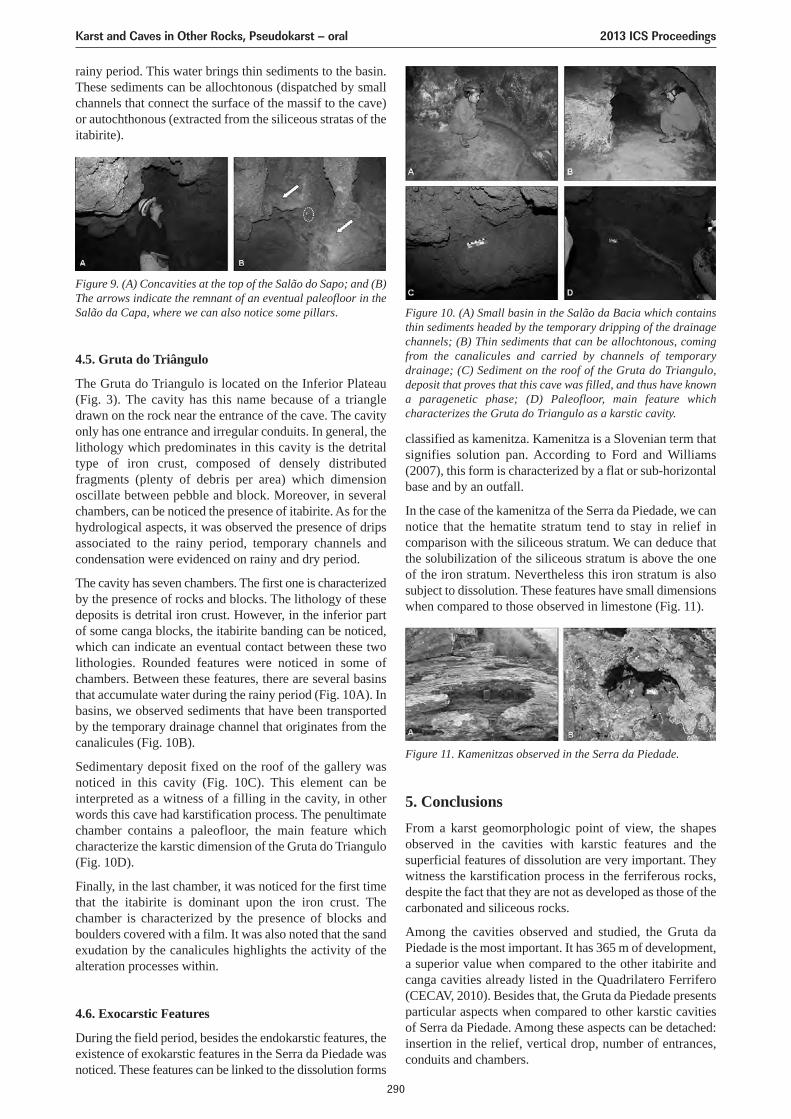
rainy period. This water brings thin sediments to the basin.These sediments can be allochtonous (dispatched by smallchannels that connect the surface of the massif to the cave)or autochthonous (extracted from the siliceous stratas of theitabirite).
classified as kamenitza. Kamenitza is a Slovenian term thatsignifies solution pan. According to Ford and Williams(2007), this form is characterized by a flat or sub-horizontalbase and by an outfall.
In the case of the kamenitza of the Serra da Piedade, we cannotice that the hematite stratum tend to stay in relief incomparison with the siliceous stratum. We can deduce thatthe solubilization of the siliceous stratum is above the oneof the iron stratum. Nevertheless this iron stratum is alsosubject to dissolution. These features have small dimensionswhen compared to those observed in limestone (Fig. 11).
Figure 9. (A) Concavities at the top of the Salão do Sapo; and (B)The arrows indicate the remnant of an eventual paleofloor in theSalão da Capa, where we can also notice some pillars.
4.5. Gruta do Triângulo
The Gruta do Triangulo is located on the Inferior Plateau(Fig. 3). The cavity has this name because of a triangledrawn on the rock near the entrance of the cave. The cavityonly has one entrance and irregular conduits. In general, thelithology which predominates in this cavity is the detritaltype of iron crust, composed of densely distributedfragments (plenty of debris per area) which dimensionoscillate between pebble and block. Moreover, in severalchambers, can be noticed the presence of itabirite. As for thehydrological aspects, it was observed the presence of dripsassociated to the rainy period, temporary channels andcondensation were evidenced on rainy and dry period.
The cavity has seven chambers. The first one is characterizedby the presence of rocks and blocks. The lithology of thesedeposits is detrital iron crust. However, in the inferior partof some canga blocks, the itabirite banding can be noticed,which can indicate an eventual contact between these twolithologies. Rounded features were noticed in some ofchambers. Between these features, there are several basinsthat accumulate water during the rainy period (Fig. 10A). Inbasins, we observed sediments that have been transportedby the temporary drainage channel that originates from thecanalicules (Fig. 10B).
Sedimentary deposit fixed on the roof of the gallery wasnoticed in this cavity (Fig. 10C). This element can beinterpreted as a witness of a filling in the cavity, in otherwords this cave had karstification process. The penultimatechamber contains a paleofloor, the main feature whichcharacterize the karstic dimension of the Gruta do Triangulo(Fig. 10D).
Finally, in the last chamber, it was noticed for the first timethat the itabirite is dominant upon the iron crust. Thechamber is characterized by the presence of blocks andboulders covered with a film. It was also noted that the sandexudation by the canalicules highlights the activity of thealteration processes within.
4.6. Exocarstic Features
During the field period, besides the endokarstic features, theexistence of exokarstic features in the Serra da Piedade wasnoticed. These features can be linked to the dissolution forms
Figure 10. (A) Small basin in the Salão da Bacia which containsthin sediments headed by the temporary dripping of the drainagechannels; (B) Thin sediments that can be allochtonous, comingfrom the canalicules and carried by channels of temporarydrainage; (C) Sediment on the roof of the Gruta do Triangulo,deposit that proves that this cave was filled, and thus have knowna paragenetic phase; (D) Paleofloor, main feature whichcharacterizes the Gruta do Triangulo as a karstic cavity.
Figure 11. Kamenitzas observed in the Serra da Piedade.
5. ConclusionsFrom a karst geomorphologic point of view, the shapesobserved in the cavities with karstic features and thesuperficial features of dissolution are very important. Theywitness the karstification process in the ferriferous rocks,despite the fact that they are not as developed as those of thecarbonated and siliceous rocks.
Among the cavities observed and studied, the Gruta daPiedade is the most important. It has 365 m of development,a superior value when compared to the other itabirite andcanga cavities already listed in the Quadrilatero Ferrifero(CECAV, 2010). Besides that, the Gruta da Piedade presentsparticular aspects when compared to other karstic cavitiesof Serra da Piedade. Among these aspects can be detached:insertion in the relief, vertical drop, number of entrances,conduits and chambers.
Karst and Caves in Other Rocks, Pseudokarst – oral 2013 ICS Proceedings
290
It can be concluded that more researches, focused on thisspecific theme are necessary. More specifically, geologicaland geochemical analysis shall allow affirmate, with a moresystematized approach, the morphogenesis and themorphodynamics of these cavities.
AcknowledgmentsTo the speleologists Luciano Faria and Roberto Cassimirofor their full support on the field. To the members ofMeandros Espeleo Clube and to the students of the KarstGeomorphology class (from the program of the Post-Graduation in Geography – UFMG) for their unrestraintsupport during the topography phase of the cavities anddiscussions on the field. Finally to the CNPq for thefinancing of this research.
ReferencesAlkimim FF, Marshak S, 1998. Transamazonian orogeny in the Sâo
Francisco cráton, Minas Gerais, Brazil: evidence forPaleoproterozoic collision and collapse in the QuadriláteroFerrífero. Precambrian Res. 90, 29–58.
Auler AS, 2004. Quartzite caves of South America. Encyclopediaof Caves and Karst Science (Gunn, J. ed.). Fitzroy Dearborn,New York, 611–613.
Barbosa GV,1980. Superfícies de erosão no Quadrilátero Ferrífero,Minas Gerais. Rev. Bros. Gcoc., 10(l): 89–10l.
CECAV – Centro Nacional de Pesquisa e Conservação deCavernas, 2010. Base de dados das cavernas localizadas emMinas Gerais. Disponível em: www.icmbio.gov.br/cecav.Acesso em: 8 out. 2010.
Chalcraft D, Pye K, 1984. Humid tropical weathering of quartzitein Southeastern Venezuela. Zeitschrift fur Geomorphologie.Berlin: 28(3): 321–332.
Ford D, Williams P, 2007. Karst Geomorphology and Hydrology.London: Chapman and Hall.
Harder EC, Chamberlin RT, 1915. The geology of central MinasGerais, Brazil. Journal of Geology, 13: 341–378, 385–424.
Hardt R, Pinto SAF, 2009. Carste em Litologias não Carbonáticas.Revista Brasileira de Geomorfologia, v. 10, 99–105.
MCfarlane MJ, Twidale CR, 1987. Karstic features associated withtropical weathering profiles. In: Zeitschrift fur GeomorphologieSuppl. Bd, 64, 73–95.
Piló LB, Auler A, 2005. Cavernas em minério de ferro e canga deCapão Xavier, Quadrilátero Ferrífero, MG. O Carste, 17(3),92–105.
Salgado AAR, Varajão CAC, Colin F, Braucher R, Nalini JuniorHA, Varajão AFD, 2004. O papel da denudação geoquímica noprocesso de erosão diferencial no Quadrilatero Ferrifero/MG.Revista Brasileira de Geomorfologia. 5(1): 55–69.
Sallun Filho WS, Karmann I, 2009. Dolinas em arenito da baciado Paraná: evidências de carste subjacente em Jardim (MS) ePonta Grossa (PR). In: Revista Brasileira de Geociências,setembro de 2007, p. 551–564. Arquivo digital disponível em:www.sbgeo.org.br. Acesso em: 25 de setembro de 2009.
Simmons GC, 1963. Canga Caves in the Quadrilátero Ferrífero,Minas Gerais, Brazil. The National Speleological SocietyBulletin 25: 66–72.
Tricart J, 1961. O Modelado do Quadrilátero Ferrífero Sul de BeloHorizonte. Annales de Geographie, 70 (379): 255–272.
Uagoda RSA, Netto ALC, 2006. Depressões Fechadas em RelevoCárstico-Quartzítico, Bacia do Ribeirão Ribeirão Santana,Médio Vale do Rio Paraíba do Sul. Anuário do Instituto deGeociências da UFRJ, 29 – 87–100.
Karst and Caves in Other Rocks, Pseudokarst – oral 2013 ICS Proceedings
291
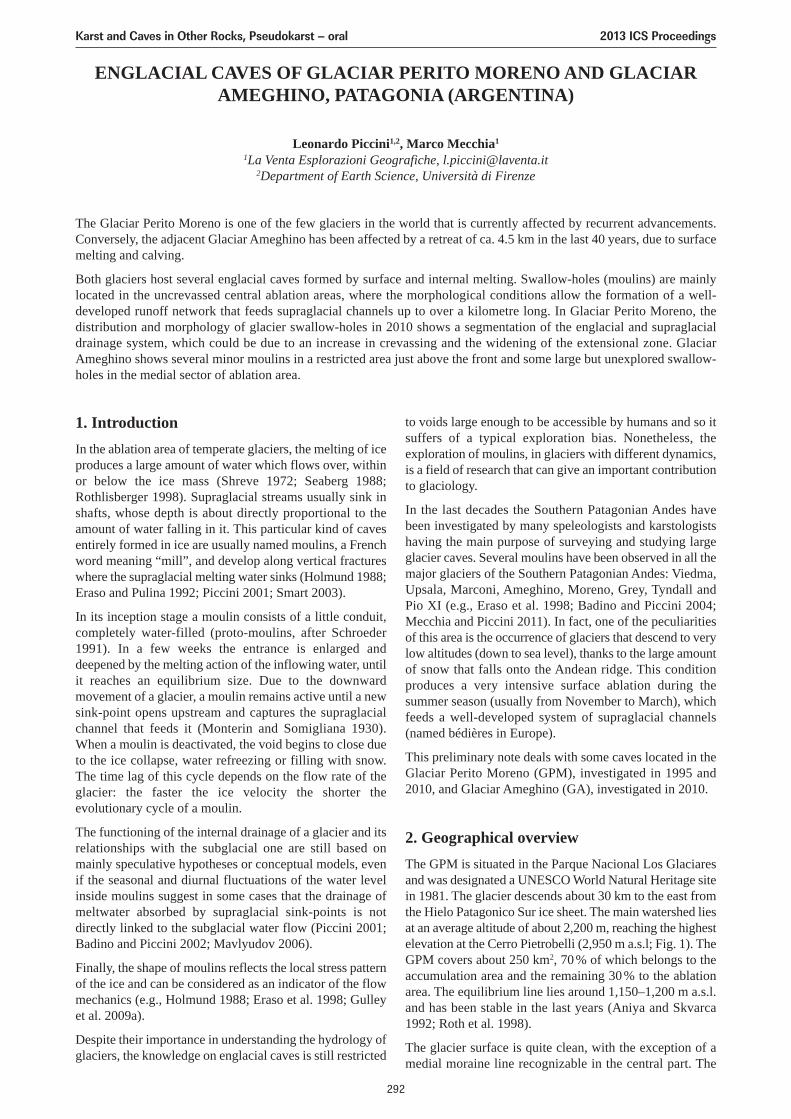
ENGLACIAL CAVES OF GLACIAR PERITO MORENO AND GLACIARAMEGHINO, PATAGONIA (ARGENTINA)
Leonardo Piccini1,2, Marco Mecchia1
1La Venta Esplorazioni Geografiche, [email protected] of Earth Science, Università di Firenze
The Glaciar Perito Moreno is one of the few glaciers in the world that is currently affected by recurrent advancements.Conversely, the adjacent Glaciar Ameghino has been affected by a retreat of ca. 4.5 km in the last 40 years, due to surfacemelting and calving.
Both glaciers host several englacial caves formed by surface and internal melting. Swallow-holes (moulins) are mainlylocated in the uncrevassed central ablation areas, where the morphological conditions allow the formation of a well-developed runoff network that feeds supraglacial channels up to over a kilometre long. In Glaciar Perito Moreno, thedistribution and morphology of glacier swallow-holes in 2010 shows a segmentation of the englacial and supraglacialdrainage system, which could be due to an increase in crevassing and the widening of the extensional zone. GlaciarAmeghino shows several minor moulins in a restricted area just above the front and some large but unexplored swallow-holes in the medial sector of ablation area.
1. IntroductionIn the ablation area of temperate glaciers, the melting of iceproduces a large amount of water which flows over, withinor below the ice mass (Shreve 1972; Seaberg 1988;Rothlisberger 1998). Supraglacial streams usually sink inshafts, whose depth is about directly proportional to theamount of water falling in it. This particular kind of cavesentirely formed in ice are usually named moulins, a Frenchword meaning “mill”, and develop along vertical fractureswhere the supraglacial melting water sinks (Holmund 1988;Eraso and Pulina 1992; Piccini 2001; Smart 2003).
In its inception stage a moulin consists of a little conduit,completely water-filled (proto-moulins, after Schroeder1991). In a few weeks the entrance is enlarged anddeepened by the melting action of the inflowing water, untilit reaches an equilibrium size. Due to the downwardmovement of a glacier, a moulin remains active until a newsink-point opens upstream and captures the supraglacialchannel that feeds it (Monterin and Somigliana 1930).When a moulin is deactivated, the void begins to close dueto the ice collapse, water refreezing or filling with snow.The time lag of this cycle depends on the flow rate of theglacier: the faster the ice velocity the shorter theevolutionary cycle of a moulin.
The functioning of the internal drainage of a glacier and itsrelationships with the subglacial one are still based onmainly speculative hypotheses or conceptual models, evenif the seasonal and diurnal fluctuations of the water levelinside moulins suggest in some cases that the drainage ofmeltwater absorbed by supraglacial sink-points is notdirectly linked to the subglacial water flow (Piccini 2001;Badino and Piccini 2002; Mavlyudov 2006).
Finally, the shape of moulins reflects the local stress patternof the ice and can be considered as an indicator of the flowmechanics (e.g., Holmund 1988; Eraso et al. 1998; Gulleyet al. 2009a).
Despite their importance in understanding the hydrology ofglaciers, the knowledge on englacial caves is still restricted
to voids large enough to be accessible by humans and so itsuffers of a typical exploration bias. Nonetheless, theexploration of moulins, in glaciers with different dynamics,is a field of research that can give an important contributionto glaciology.
In the last decades the Southern Patagonian Andes havebeen investigated by many speleologists and karstologistshaving the main purpose of surveying and studying largeglacier caves. Several moulins have been observed in all themajor glaciers of the Southern Patagonian Andes: Viedma,Upsala, Marconi, Ameghino, Moreno, Grey, Tyndall andPio XI (e.g., Eraso et al. 1998; Badino and Piccini 2004;Mecchia and Piccini 2011). In fact, one of the peculiaritiesof this area is the occurrence of glaciers that descend to verylow altitudes (down to sea level), thanks to the large amountof snow that falls onto the Andean ridge. This conditionproduces a very intensive surface ablation during thesummer season (usually from November to March), whichfeeds a well-developed system of supraglacial channels(named bédières in Europe).
This preliminary note deals with some caves located in theGlaciar Perito Moreno (GPM), investigated in 1995 and2010, and Glaciar Ameghino (GA), investigated in 2010.
2. Geographical overviewThe GPM is situated in the Parque Nacional Los Glaciaresand was designated a UNESCO World Natural Heritage sitein 1981. The glacier descends about 30 km to the east fromthe Hielo Patagonico Sur ice sheet. The main watershed liesat an average altitude of about 2,200 m, reaching the highestelevation at the Cerro Pietrobelli (2,950 m a.s.l; Fig. 1). TheGPM covers about 250 km2, 70% of which belongs to theaccumulation area and the remaining 30% to the ablationarea. The equilibrium line lies around 1,150–1,200 m a.s.l.and has been stable in the last years (Aniya and Skvarca1992; Roth et al. 1998).
The glacier surface is quite clean, with the exception of amedial moraine line recognizable in the central part. The
Karst and Caves in Other Rocks, Pseudokarst – oral 2013 ICS Proceedings
292
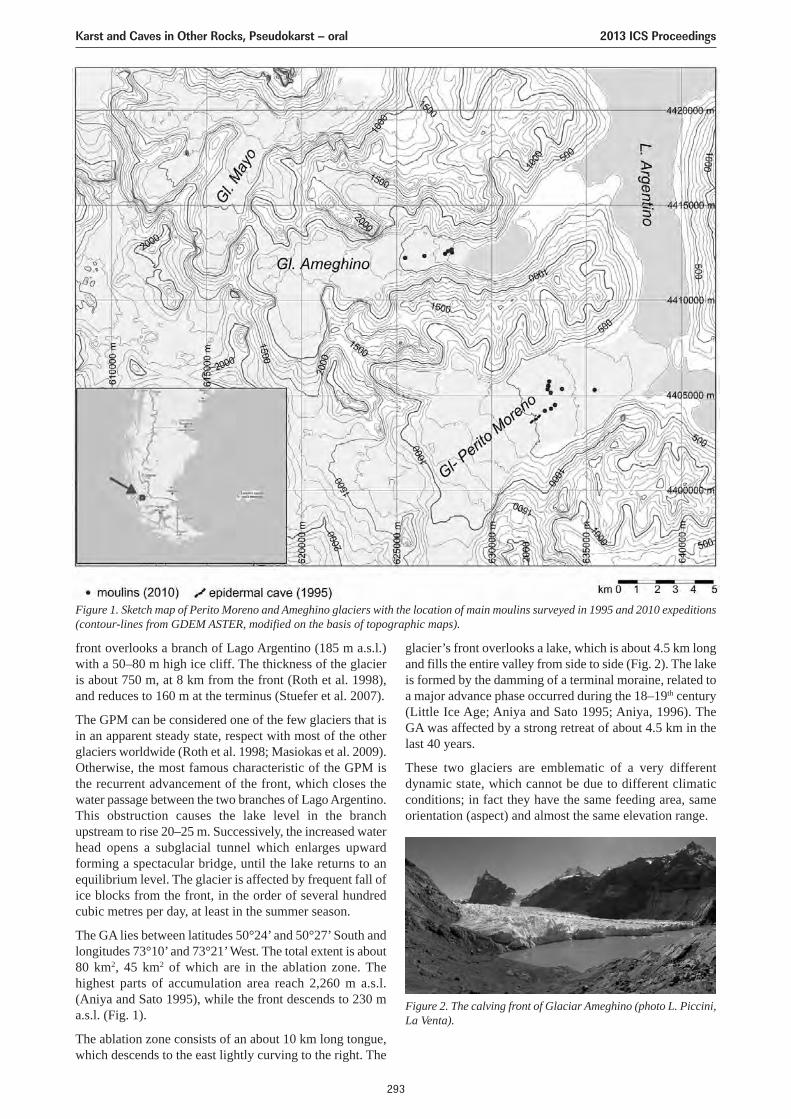
front overlooks a branch of Lago Argentino (185 m a.s.l.)with a 50–80 m high ice cliff. The thickness of the glacieris about 750 m, at 8 km from the front (Roth et al. 1998),and reduces to 160 m at the terminus (Stuefer et al. 2007).
The GPM can be considered one of the few glaciers that isin an apparent steady state, respect with most of the otherglaciers worldwide (Roth et al. 1998; Masiokas et al. 2009).Otherwise, the most famous characteristic of the GPM isthe recurrent advancement of the front, which closes thewater passage between the two branches of Lago Argentino.This obstruction causes the lake level in the branchupstream to rise 20–25 m. Successively, the increased waterhead opens a subglacial tunnel which enlarges upwardforming a spectacular bridge, until the lake returns to anequilibrium level. The glacier is affected by frequent fall ofice blocks from the front, in the order of several hundredcubic metres per day, at least in the summer season.
The GA lies between latitudes 50°24’ and 50°27’ South andlongitudes 73°10’ and 73°21’ West. The total extent is about80 km2, 45 km2 of which are in the ablation zone. Thehighest parts of accumulation area reach 2,260 m a.s.l.(Aniya and Sato 1995), while the front descends to 230 ma.s.l. (Fig. 1).
The ablation zone consists of an about 10 km long tongue,which descends to the east lightly curving to the right. The
glacier’s front overlooks a lake, which is about 4.5 km longand fills the entire valley from side to side (Fig. 2). The lakeis formed by the damming of a terminal moraine, related toa major advance phase occurred during the 18–19th century(Little Ice Age; Aniya and Sato 1995; Aniya, 1996). TheGA was affected by a strong retreat of about 4.5 km in thelast 40 years.
These two glaciers are emblematic of a very differentdynamic state, which cannot be due to different climaticconditions; in fact they have the same feeding area, sameorientation (aspect) and almost the same elevation range.
Figure 2. The calving front of Glaciar Ameghino (photo L. Piccini,La Venta).
Figure 1. Sketch map of Perito Moreno and Ameghino glaciers with the location of main moulins surveyed in 1995 and 2010 expeditions(contour-lines from GDEM ASTER, modified on the basis of topographic maps).
Karst and Caves in Other Rocks, Pseudokarst – oral 2013 ICS Proceedings
293
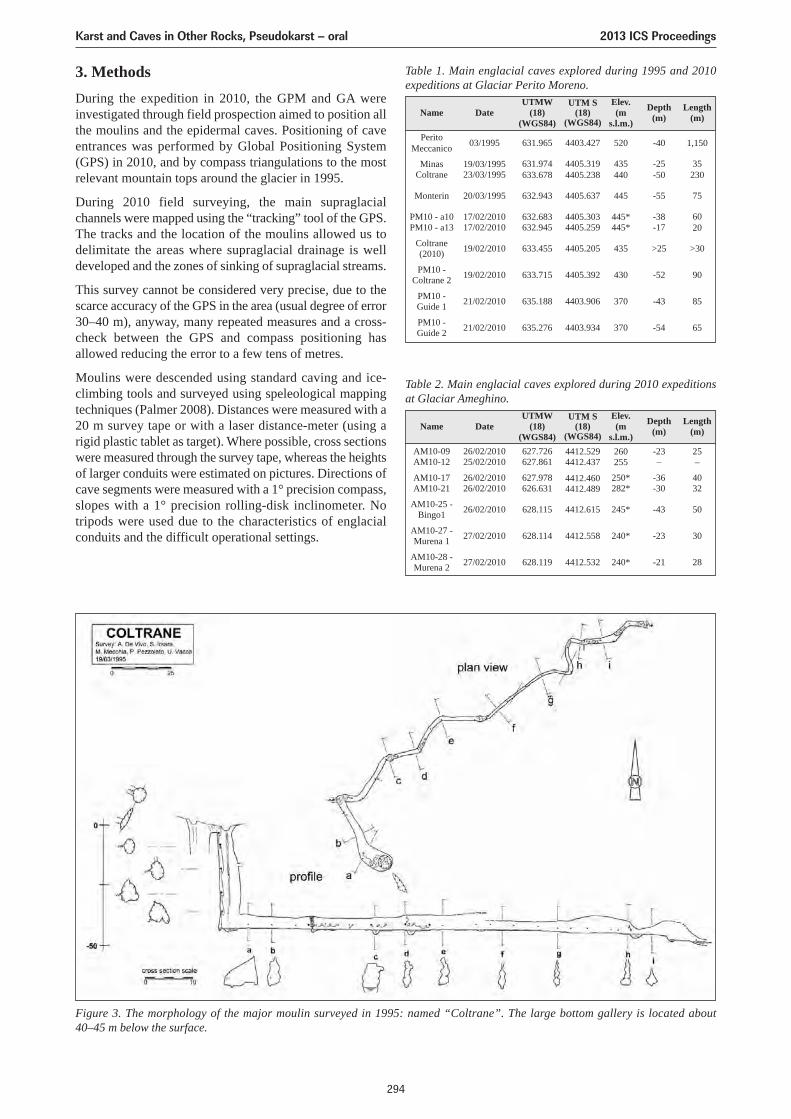
3. MethodsDuring the expedition in 2010, the GPM and GA wereinvestigated through field prospection aimed to position allthe moulins and the epidermal caves. Positioning of caveentrances was performed by Global Positioning System(GPS) in 2010, and by compass triangulations to the mostrelevant mountain tops around the glacier in 1995.
During 2010 field surveying, the main supraglacialchannels were mapped using the “tracking” tool of the GPS.The tracks and the location of the moulins allowed us todelimitate the areas where supraglacial drainage is welldeveloped and the zones of sinking of supraglacial streams.
This survey cannot be considered very precise, due to thescarce accuracy of the GPS in the area (usual degree of error30–40 m), anyway, many repeated measures and a cross-check between the GPS and compass positioning hasallowed reducing the error to a few tens of metres.
Moulins were descended using standard caving and ice-climbing tools and surveyed using speleological mappingtechniques (Palmer 2008). Distances were measured with a20 m survey tape or with a laser distance-meter (using arigid plastic tablet as target). Where possible, cross sectionswere measured through the survey tape, whereas the heightsof larger conduits were estimated on pictures. Directions ofcave segments were measured with a 1° precision compass,slopes with a 1° precision rolling-disk inclinometer. Notripods were used due to the characteristics of englacialconduits and the difficult operational settings.
Figure 3. The morphology of the major moulin surveyed in 1995: named “Coltrane”. The large bottom gallery is located about40–45 m below the surface.
Table 1. Main englacial caves explored during 1995 and 2010expeditions at Glaciar Perito Moreno.
Name
PeritoMeccanico
MinasColtrane
Monterin
PM10 - a10PM10 - a13
Coltrane(2010)
Date
03/1995
19/03/199523/03/1995
20/03/1995
17/02/201017/02/2010
19/02/2010
UTMW(18)
(WGS84)
631.965
631.974633.678
632.943
632.683632.945
633.455
UTM S(18)
(WGS84)
4403.427
4405.3194405.238
4405.637
4405.3034405.259
4405.205
Elev.(m
s.l.m.)
520
435440
445
445*445*
435
Depth (m)
-40
-25-50
-55
-38-17
>25
Length (m)
1,150
35230
75
6020
>30
PM10 -Coltrane 2 19/02/2010 633.715 4405.392 430 -52 90
PM10 -Guide 1 21/02/2010 635.188 4403.906 370 -43 85
PM10 -Guide 2 21/02/2010 635.276 4403.934 370 -54 65
Table 2. Main englacial caves explored during 2010 expeditionsat Glaciar Ameghino.
Name
AM10-09AM10-12
AM10-17AM10-21
AM10-25 -Bingo1
AM10-27 -Murena 1
AM10-28 -Murena 2
Date
26/02/201025/02/2010
26/02/201026/02/2010
26/02/2010
27/02/2010
27/02/2010
UTMW(18)
(WGS84)627.726627.861
627.978626.631
628.115
628.114
628.119
UTM S(18)
(WGS84)4412.5294412.437
4412.4604412.489
4412.615
4412.558
4412.532
Elev.(m
s.l.m.)260255
250*282*
245*
240*
240*
Depth (m)
-23–
-36-30
-43
-23
-21
Length (m)
25–
4032
50
30
28
Karst and Caves in Other Rocks, Pseudokarst – oral 2013 ICS Proceedings
294
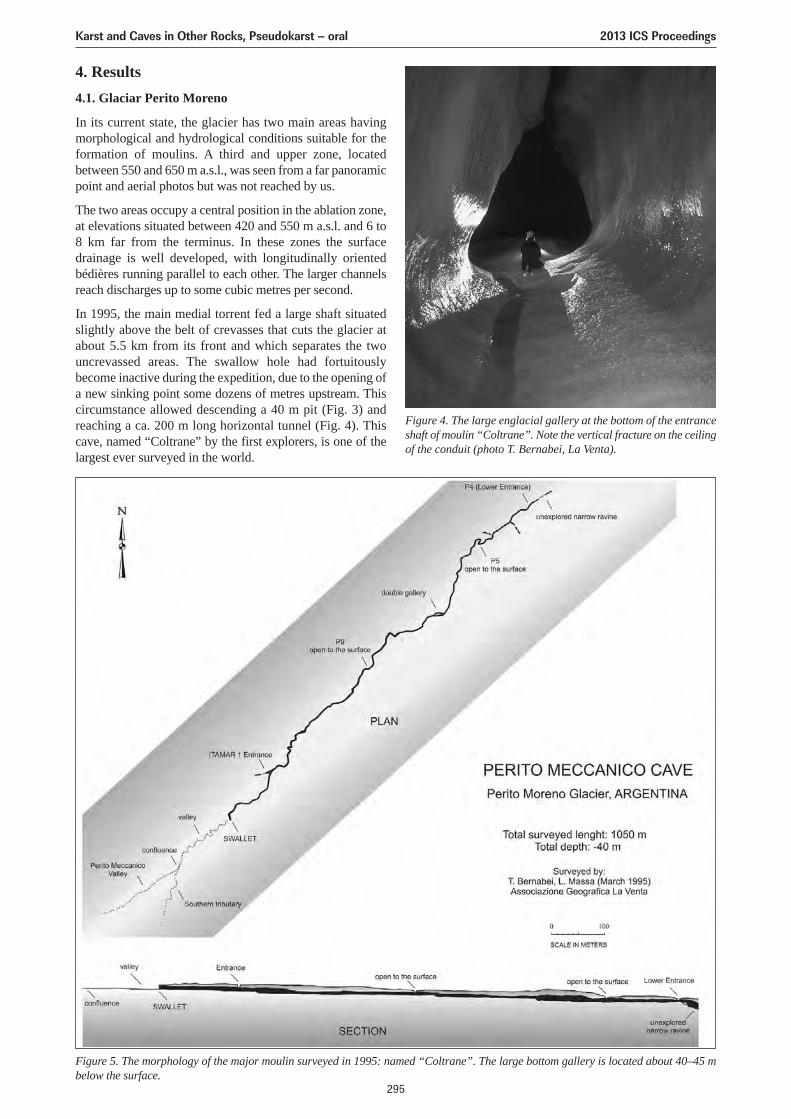
4. Results4.1. Glaciar Perito Moreno
In its current state, the glacier has two main areas havingmorphological and hydrological conditions suitable for theformation of moulins. A third and upper zone, locatedbetween 550 and 650 m a.s.l., was seen from a far panoramicpoint and aerial photos but was not reached by us.
The two areas occupy a central position in the ablation zone,at elevations situated between 420 and 550 m a.s.l. and 6 to8 km far from the terminus. In these zones the surfacedrainage is well developed, with longitudinally orientedbédières running parallel to each other. The larger channelsreach discharges up to some cubic metres per second.
In 1995, the main medial torrent fed a large shaft situatedslightly above the belt of crevasses that cuts the glacier atabout 5.5 km from its front and which separates the twouncrevassed areas. The swallow hole had fortuitouslybecome inactive during the expedition, due to the opening ofa new sinking point some dozens of metres upstream. Thiscircumstance allowed descending a 40 m pit (Fig. 3) andreaching a ca. 200 m long horizontal tunnel (Fig. 4). Thiscave, named “Coltrane” by the first explorers, is one of thelargest ever surveyed in the world.
Figure 5. The morphology of the major moulin surveyed in 1995: named “Coltrane”. The large bottom gallery is located about 40–45 mbelow the surface.
Figure 4. The large englacial gallery at the bottom of the entranceshaft of moulin “Coltrane”. Note the vertical fracture on the ceilingof the conduit (photo T. Bernabei, La Venta).
Karst and Caves in Other Rocks, Pseudokarst – oral 2013 ICS Proceedings
295
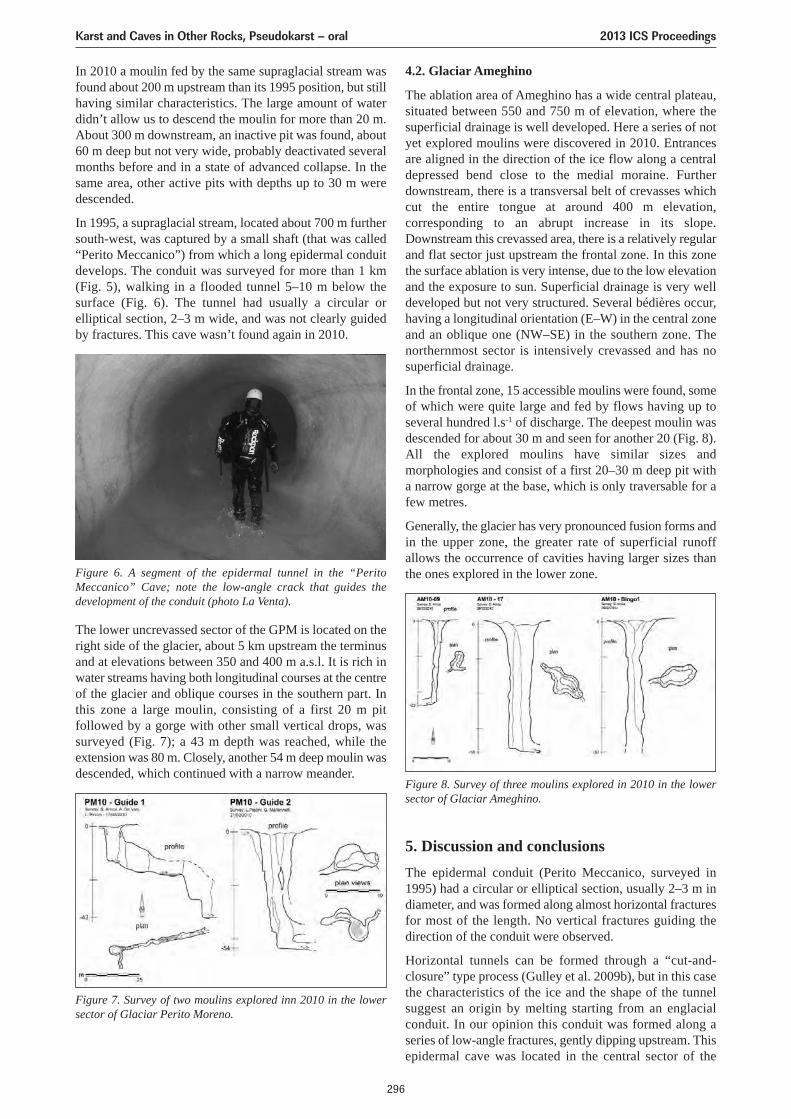
In 2010 a moulin fed by the same supraglacial stream wasfound about 200 m upstream than its 1995 position, but stillhaving similar characteristics. The large amount of waterdidn’t allow us to descend the moulin for more than 20 m.About 300 m downstream, an inactive pit was found, about60 m deep but not very wide, probably deactivated severalmonths before and in a state of advanced collapse. In thesame area, other active pits with depths up to 30 m weredescended.
In 1995, a supraglacial stream, located about 700 m furthersouth-west, was captured by a small shaft (that was called“Perito Meccanico”) from which a long epidermal conduitdevelops. The conduit was surveyed for more than 1 km(Fig. 5), walking in a flooded tunnel 5–10 m below thesurface (Fig. 6). The tunnel had usually a circular orelliptical section, 2–3 m wide, and was not clearly guidedby fractures. This cave wasn’t found again in 2010.
4.2. Glaciar Ameghino
The ablation area of Ameghino has a wide central plateau,situated between 550 and 750 m of elevation, where thesuperficial drainage is well developed. Here a series of notyet explored moulins were discovered in 2010. Entrancesare aligned in the direction of the ice flow along a centraldepressed bend close to the medial moraine. Furtherdownstream, there is a transversal belt of crevasses whichcut the entire tongue at around 400 m elevation,corresponding to an abrupt increase in its slope.Downstream this crevassed area, there is a relatively regularand flat sector just upstream the frontal zone. In this zonethe surface ablation is very intense, due to the low elevationand the exposure to sun. Superficial drainage is very welldeveloped but not very structured. Several bédières occur,having a longitudinal orientation (E–W) in the central zoneand an oblique one (NW–SE) in the southern zone. Thenorthernmost sector is intensively crevassed and has nosuperficial drainage.
In the frontal zone, 15 accessible moulins were found, someof which were quite large and fed by flows having up toseveral hundred l.s-1 of discharge. The deepest moulin wasdescended for about 30 m and seen for another 20 (Fig. 8).All the explored moulins have similar sizes andmorphologies and consist of a first 20–30 m deep pit witha narrow gorge at the base, which is only traversable for afew metres.
Generally, the glacier has very pronounced fusion forms andin the upper zone, the greater rate of superficial runoffallows the occurrence of cavities having larger sizes thanthe ones explored in the lower zone.
Figure 8. Survey of three moulins explored in 2010 in the lowersector of Glaciar Ameghino.
Figure 6. A segment of the epidermal tunnel in the “PeritoMeccanico” Cave; note the low-angle crack that guides thedevelopment of the conduit (photo La Venta).
The lower uncrevassed sector of the GPM is located on theright side of the glacier, about 5 km upstream the terminusand at elevations between 350 and 400 m a.s.l. It is rich inwater streams having both longitudinal courses at the centreof the glacier and oblique courses in the southern part. Inthis zone a large moulin, consisting of a first 20 m pitfollowed by a gorge with other small vertical drops, wassurveyed (Fig. 7); a 43 m depth was reached, while theextension was 80 m. Closely, another 54 m deep moulin wasdescended, which continued with a narrow meander.
5. Discussion and conclusionsThe epidermal conduit (Perito Meccanico, surveyed in1995) had a circular or elliptical section, usually 2–3 m indiameter, and was formed along almost horizontal fracturesfor most of the length. No vertical fractures guiding thedirection of the conduit were observed.
Horizontal tunnels can be formed through a “cut-and-closure” type process (Gulley et al. 2009b), but in this casethe characteristics of the ice and the shape of the tunnelsuggest an origin by melting starting from an englacialconduit. In our opinion this conduit was formed along aseries of low-angle fractures, gently dipping upstream. Thisepidermal cave was located in the central sector of the
Figure 7. Survey of two moulins explored inn 2010 in the lowersector of Glaciar Perito Moreno.
Karst and Caves in Other Rocks, Pseudokarst – oral 2013 ICS Proceedings
296
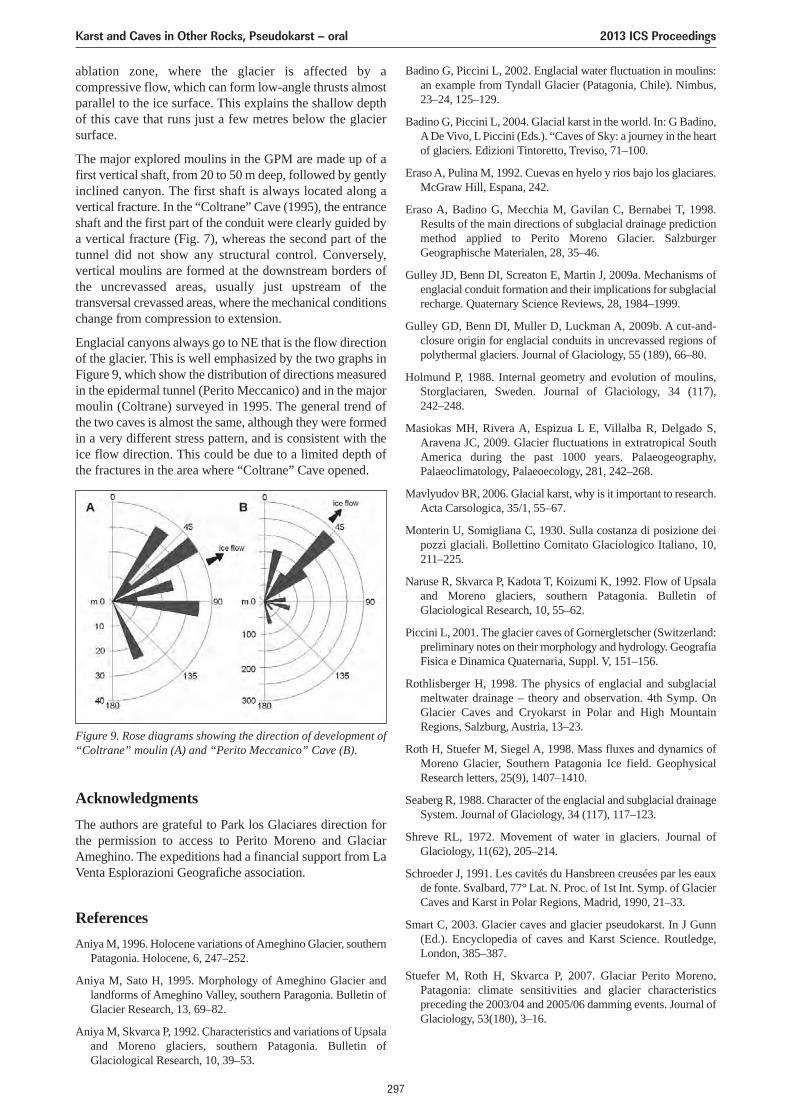
ablation zone, where the glacier is affected by acompressive flow, which can form low-angle thrusts almostparallel to the ice surface. This explains the shallow depthof this cave that runs just a few metres below the glaciersurface.
The major explored moulins in the GPM are made up of afirst vertical shaft, from 20 to 50 m deep, followed by gentlyinclined canyon. The first shaft is always located along avertical fracture. In the “Coltrane” Cave (1995), the entranceshaft and the first part of the conduit were clearly guided bya vertical fracture (Fig. 7), whereas the second part of thetunnel did not show any structural control. Conversely,vertical moulins are formed at the downstream borders ofthe uncrevassed areas, usually just upstream of thetransversal crevassed areas, where the mechanical conditionschange from compression to extension.
Englacial canyons always go to NE that is the flow directionof the glacier. This is well emphasized by the two graphs inFigure 9, which show the distribution of directions measuredin the epidermal tunnel (Perito Meccanico) and in the majormoulin (Coltrane) surveyed in 1995. The general trend ofthe two caves is almost the same, although they were formedin a very different stress pattern, and is consistent with theice flow direction. This could be due to a limited depth ofthe fractures in the area where “Coltrane” Cave opened.
Badino G, Piccini L, 2002. Englacial water fluctuation in moulins:an example from Tyndall Glacier (Patagonia, Chile). Nimbus,23–24, 125–129.
Badino G, Piccini L, 2004. Glacial karst in the world. In: G Badino,A De Vivo, L Piccini (Eds.). “Caves of Sky: a journey in the heartof glaciers. Edizioni Tintoretto, Treviso, 71–100.
Eraso A, Pulina M, 1992. Cuevas en hyelo y rios bajo los glaciares.McGraw Hill, Espana, 242.
Eraso A, Badino G, Mecchia M, Gavilan C, Bernabei T, 1998.Results of the main directions of subglacial drainage predictionmethod applied to Perito Moreno Glacier. SalzburgerGeographische Materialen, 28, 35–46.
Gulley JD, Benn DI, Screaton E, Martin J, 2009a. Mechanisms ofenglacial conduit formation and their implications for subglacialrecharge. Quaternary Science Reviews, 28, 1984–1999.
Gulley GD, Benn DI, Muller D, Luckman A, 2009b. A cut-and-closure origin for englacial conduits in uncrevassed regions ofpolythermal glaciers. Journal of Glaciology, 55 (189), 66–80.
Holmund P, 1988. Internal geometry and evolution of moulins,Storglaciaren, Sweden. Journal of Glaciology, 34 (117),242–248.
Masiokas MH, Rivera A, Espizua L E, Villalba R, Delgado S,Aravena JC, 2009. Glacier fluctuations in extratropical SouthAmerica during the past 1000 years. Palaeogeography,Palaeoclimatology, Palaeoecology, 281, 242–268.
Mavlyudov BR, 2006. Glacial karst, why is it important to research.Acta Carsologica, 35/1, 55–67.
Monterin U, Somigliana C, 1930. Sulla costanza di posizione deipozzi glaciali. Bollettino Comitato Glaciologico Italiano, 10,211–225.
Naruse R, Skvarca P, Kadota T, Koizumi K, 1992. Flow of Upsalaand Moreno glaciers, southern Patagonia. Bulletin ofGlaciological Research, 10, 55–62.
Piccini L, 2001. The glacier caves of Gornergletscher (Switzerland:preliminary notes on their morphology and hydrology. GeografiaFisica e Dinamica Quaternaria, Suppl. V, 151–156.
Rothlisberger H, 1998. The physics of englacial and subglacialmeltwater drainage – theory and observation. 4th Symp. OnGlacier Caves and Cryokarst in Polar and High MountainRegions, Salzburg, Austria, 13–23.
Roth H, Stuefer M, Siegel A, 1998. Mass fluxes and dynamics ofMoreno Glacier, Southern Patagonia Ice field. GeophysicalResearch letters, 25(9), 1407–1410.
Seaberg R, 1988. Character of the englacial and subglacial drainageSystem. Journal of Glaciology, 34 (117), 117–123.
Shreve RL, 1972. Movement of water in glaciers. Journal ofGlaciology, 11(62), 205–214.
Schroeder J, 1991. Les cavités du Hansbreen creusées par les eauxde fonte. Svalbard, 77° Lat. N. Proc. of 1st Int. Symp. of GlacierCaves and Karst in Polar Regions, Madrid, 1990, 21–33.
Smart C, 2003. Glacier caves and glacier pseudokarst. In J Gunn(Ed.). Encyclopedia of caves and Karst Science. Routledge,London, 385–387.
Stuefer M, Roth H, Skvarca P, 2007. Glaciar Perito Moreno,Patagonia: climate sensitivities and glacier characteristicspreceding the 2003/04 and 2005/06 damming events. Journal ofGlaciology, 53(180), 3–16.
Figure 9. Rose diagrams showing the direction of development of“Coltrane” moulin (A) and “Perito Meccanico” Cave (B).
AcknowledgmentsThe authors are grateful to Park los Glaciares direction forthe permission to access to Perito Moreno and GlaciarAmeghino. The expeditions had a financial support from LaVenta Esplorazioni Geografiche association.
ReferencesAniya M, 1996. Holocene variations of Ameghino Glacier, southern
Patagonia. Holocene, 6, 247–252.
Aniya M, Sato H, 1995. Morphology of Ameghino Glacier andlandforms of Ameghino Valley, southern Paragonia. Bulletin ofGlacier Research, 13, 69–82.
Aniya M, Skvarca P, 1992. Characteristics and variations of Upsalaand Moreno glaciers, southern Patagonia. Bulletin ofGlaciological Research, 10, 39–53.
Karst and Caves in Other Rocks, Pseudokarst – oral 2013 ICS Proceedings
297
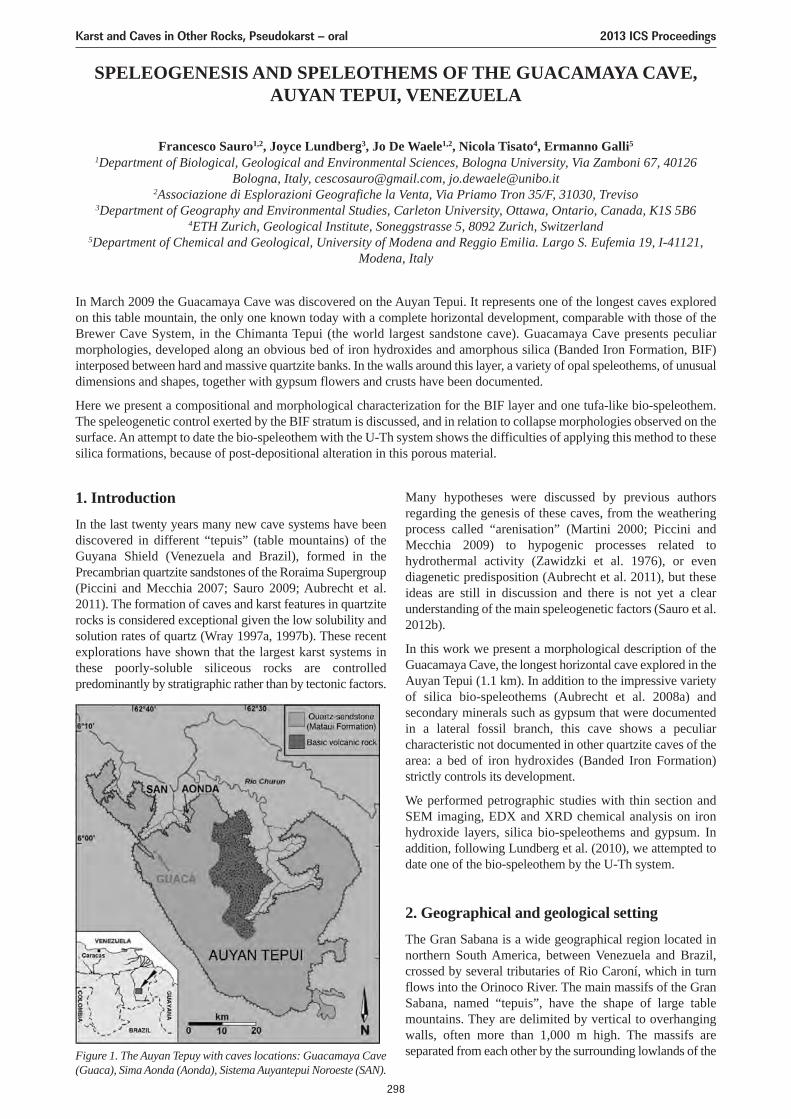
SPELEOGENESIS AND SPELEOTHEMS OF THE GUACAMAYA CAVE,AUYAN TEPUI, VENEZUELA
Francesco Sauro1,2, Joyce Lundberg3, Jo De Waele1,2, Nicola Tisato4, Ermanno Galli5
1Department of Biological, Geological and Environmental Sciences, Bologna University, Via Zamboni 67, 40126Bologna, Italy, [email protected], [email protected]
2Associazione di Esplorazioni Geografiche la Venta, Via Priamo Tron 35/F, 31030, Treviso3Department of Geography and Environmental Studies, Carleton University, Ottawa, Ontario, Canada, K1S 5B6
4ETH Zurich, Geological Institute, Soneggstrasse 5, 8092 Zurich, Switzerland5Department of Chemical and Geological, University of Modena and Reggio Emilia. Largo S. Eufemia 19, I-41121,
Modena, Italy
In March 2009 the Guacamaya Cave was discovered on the Auyan Tepui. It represents one of the longest caves exploredon this table mountain, the only one known today with a complete horizontal development, comparable with those of theBrewer Cave System, in the Chimanta Tepui (the world largest sandstone cave). Guacamaya Cave presents peculiarmorphologies, developed along an obvious bed of iron hydroxides and amorphous silica (Banded Iron Formation, BIF)interposed between hard and massive quartzite banks. In the walls around this layer, a variety of opal speleothems, of unusualdimensions and shapes, together with gypsum flowers and crusts have been documented.
Here we present a compositional and morphological characterization for the BIF layer and one tufa-like bio-speleothem.The speleogenetic control exerted by the BIF stratum is discussed, and in relation to collapse morphologies observed on thesurface. An attempt to date the bio-speleothem with the U-Th system shows the difficulties of applying this method to thesesilica formations, because of post-depositional alteration in this porous material.
1. IntroductionIn the last twenty years many new cave systems have beendiscovered in different “tepuis” (table mountains) of theGuyana Shield (Venezuela and Brazil), formed in thePrecambrian quartzite sandstones of the Roraima Supergroup(Piccini and Mecchia 2007; Sauro 2009; Aubrecht et al.2011). The formation of caves and karst features in quartziterocks is considered exceptional given the low solubility andsolution rates of quartz (Wray 1997a, 1997b). These recentexplorations have shown that the largest karst systems inthese poorly-soluble siliceous rocks are controlledpredominantly by stratigraphic rather than by tectonic factors.
Many hypotheses were discussed by previous authorsregarding the genesis of these caves, from the weatheringprocess called “arenisation” (Martini 2000; Piccini andMecchia 2009) to hypogenic processes related tohydrothermal activity (Zawidzki et al. 1976), or evendiagenetic predisposition (Aubrecht et al. 2011), but theseideas are still in discussion and there is not yet a clearunderstanding of the main speleogenetic factors (Sauro et al.2012b).
In this work we present a morphological description of theGuacamaya Cave, the longest horizontal cave explored in theAuyan Tepui (1.1 km). In addition to the impressive varietyof silica bio-speleothems (Aubrecht et al. 2008a) andsecondary minerals such as gypsum that were documentedin a lateral fossil branch, this cave shows a peculiarcharacteristic not documented in other quartzite caves of thearea: a bed of iron hydroxides (Banded Iron Formation)strictly controls its development.
We performed petrographic studies with thin section andSEM imaging, EDX and XRD chemical analysis on ironhydroxide layers, silica bio-speleothems and gypsum. Inaddition, following Lundberg et al. (2010), we attempted todate one of the bio-speleothem by the U-Th system.
2. Geographical and geological settingThe Gran Sabana is a wide geographical region located innorthern South America, between Venezuela and Brazil,crossed by several tributaries of Rio Caroní, which in turnflows into the Orinoco River. The main massifs of the GranSabana, named “tepuis”, have the shape of large tablemountains. They are delimited by vertical to overhangingwalls, often more than 1,000 m high. The massifs areseparated from each other by the surrounding lowlands of theFigure 1. The Auyan Tepuy with caves locations: Guacamaya Cave
(Guaca), Sima Aonda (Aonda), Sistema Auyantepui Noroeste (SAN).
Karst and Caves in Other Rocks, Pseudokarst – oral 2013 ICS Proceedings
298
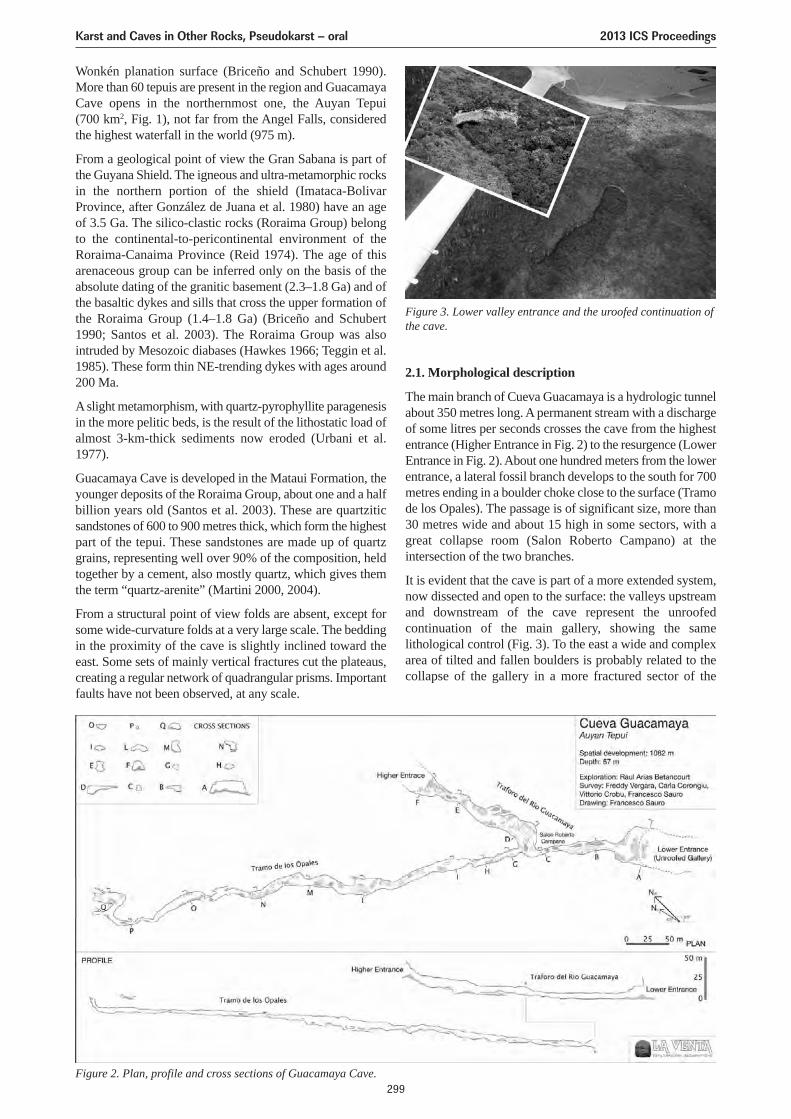
Wonkén planation surface (Briceño and Schubert 1990).More than 60 tepuis are present in the region and GuacamayaCave opens in the northernmost one, the Auyan Tepui(700 km2, Fig. 1), not far from the Angel Falls, consideredthe highest waterfall in the world (975 m).
From a geological point of view the Gran Sabana is part ofthe Guyana Shield. The igneous and ultra-metamorphic rocksin the northern portion of the shield (Imataca-BolivarProvince, after González de Juana et al. 1980) have an ageof 3.5 Ga. The silico-clastic rocks (Roraima Group) belongto the continental-to-pericontinental environment of theRoraima-Canaima Province (Reid 1974). The age of thisarenaceous group can be inferred only on the basis of theabsolute dating of the granitic basement (2.3–1.8 Ga) and ofthe basaltic dykes and sills that cross the upper formation ofthe Roraima Group (1.4–1.8 Ga) (Briceño and Schubert1990; Santos et al. 2003). The Roraima Group was alsointruded by Mesozoic diabases (Hawkes 1966; Teggin et al.1985). These form thin NE-trending dykes with ages around200 Ma.
A slight metamorphism, with quartz-pyrophyllite paragenesisin the more pelitic beds, is the result of the lithostatic load ofalmost 3-km-thick sediments now eroded (Urbani et al.1977).
Guacamaya Cave is developed in the Mataui Formation, theyounger deposits of the Roraima Group, about one and a halfbillion years old (Santos et al. 2003). These are quartziticsandstones of 600 to 900 metres thick, which form the highestpart of the tepui. These sandstones are made up of quartzgrains, representing well over 90% of the composition, heldtogether by a cement, also mostly quartz, which gives themthe term “quartz-arenite” (Martini 2000, 2004).
From a structural point of view folds are absent, except forsome wide-curvature folds at a very large scale. The beddingin the proximity of the cave is slightly inclined toward theeast. Some sets of mainly vertical fractures cut the plateaus,creating a regular network of quadrangular prisms. Importantfaults have not been observed, at any scale.
2.1. Morphological description
The main branch of Cueva Guacamaya is a hydrologic tunnelabout 350 metres long. A permanent stream with a dischargeof some litres per seconds crosses the cave from the highestentrance (Higher Entrance in Fig. 2) to the resurgence (LowerEntrance in Fig. 2). About one hundred meters from the lowerentrance, a lateral fossil branch develops to the south for 700metres ending in a boulder choke close to the surface (Tramode los Opales). The passage is of significant size, more than30 metres wide and about 15 high in some sectors, with agreat collapse room (Salon Roberto Campano) at theintersection of the two branches.
It is evident that the cave is part of a more extended system,now dissected and open to the surface: the valleys upstreamand downstream of the cave represent the unroofedcontinuation of the main gallery, showing the samelithological control (Fig. 3). To the east a wide and complexarea of tilted and fallen boulders is probably related to thecollapse of the gallery in a more fractured sector of the
Figure 3. Lower valley entrance and the uroofed continuation ofthe cave.
Figure 2. Plan, profile and cross sections of Guacamaya Cave.
Karst and Caves in Other Rocks, Pseudokarst – oral 2013 ICS Proceedings
299
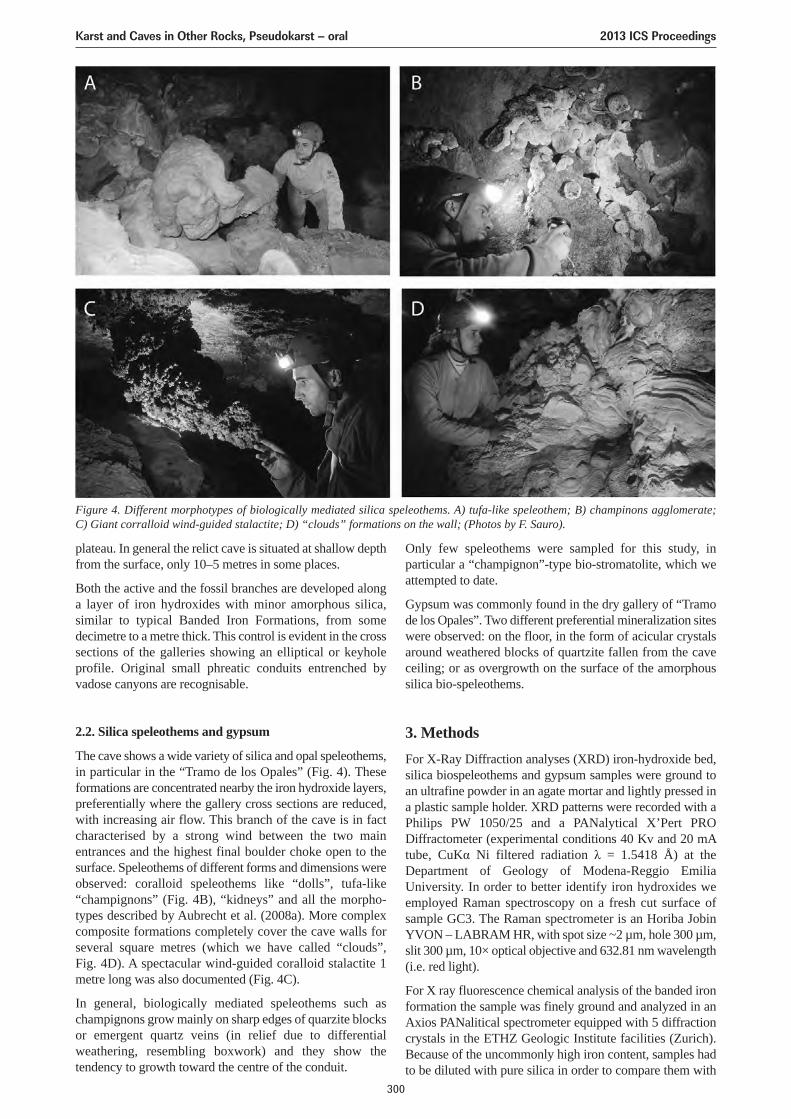
plateau. In general the relict cave is situated at shallow depthfrom the surface, only 10–5 metres in some places.
Both the active and the fossil branches are developed alonga layer of iron hydroxides with minor amorphous silica,similar to typical Banded Iron Formations, from somedecimetre to a metre thick. This control is evident in the crosssections of the galleries showing an elliptical or keyholeprofile. Original small phreatic conduits entrenched byvadose canyons are recognisable.
2.2. Silica speleothems and gypsum
The cave shows a wide variety of silica and opal speleothems,in particular in the “Tramo de los Opales” (Fig. 4). Theseformations are concentrated nearby the iron hydroxide layers,preferentially where the gallery cross sections are reduced,with increasing air flow. This branch of the cave is in factcharacterised by a strong wind between the two mainentrances and the highest final boulder choke open to thesurface. Speleothems of different forms and dimensions wereobserved: coralloid speleothems like “dolls”, tufa-like“champignons” (Fig. 4B), “kidneys” and all the morpho-types described by Aubrecht et al. (2008a). More complexcomposite formations completely cover the cave walls forseveral square metres (which we have called “clouds”,Fig. 4D). A spectacular wind-guided coralloid stalactite 1metre long was also documented (Fig. 4C).
In general, biologically mediated speleothems such aschampignons grow mainly on sharp edges of quarzite blocksor emergent quartz veins (in relief due to differentialweathering, resembling boxwork) and they show thetendency to growth toward the centre of the conduit.
Only few speleothems were sampled for this study, inparticular a “champignon”-type bio-stromatolite, which weattempted to date.
Gypsum was commonly found in the dry gallery of “Tramode los Opales”. Two different preferential mineralization siteswere observed: on the floor, in the form of acicular crystalsaround weathered blocks of quartzite fallen from the caveceiling; or as overgrowth on the surface of the amorphoussilica bio-speleothems.
3. MethodsFor X-Ray Diffraction analyses (XRD) iron-hydroxide bed,silica biospeleothems and gypsum samples were ground toan ultrafine powder in an agate mortar and lightly pressed ina plastic sample holder. XRD patterns were recorded with aPhilips PW 1050/25 and a PANalytical X’Pert PRODiffractometer (experimental conditions 40 Kv and 20 mAtube, CuKα Ni filtered radiation λ = 1.5418 Å) at theDepartment of Geology of Modena-Reggio EmiliaUniversity. In order to better identify iron hydroxides weemployed Raman spectroscopy on a fresh cut surface ofsample GC3. The Raman spectrometer is an Horiba JobinYVON – LABRAM HR, with spot size ~2 µm, hole 300 µm,slit 300 µm, 10× optical objective and 632.81 nm wavelength(i.e. red light).
For X ray fluorescence chemical analysis of the banded ironformation the sample was finely ground and analyzed in anAxios PANalitical spectrometer equipped with 5 diffractioncrystals in the ETHZ Geologic Institute facilities (Zurich).Because of the uncommonly high iron content, samples hadto be diluted with pure silica in order to compare them with
Figure 4. Different morphotypes of biologically mediated silica speleothems. A) tufa-like speleothem; B) champinons agglomerate;C) Giant corralloid wind-guided stalactite; D) “clouds” formations on the wall; (Photos by F. Sauro).
Karst and Caves in Other Rocks, Pseudokarst – oral 2013 ICS Proceedings
300
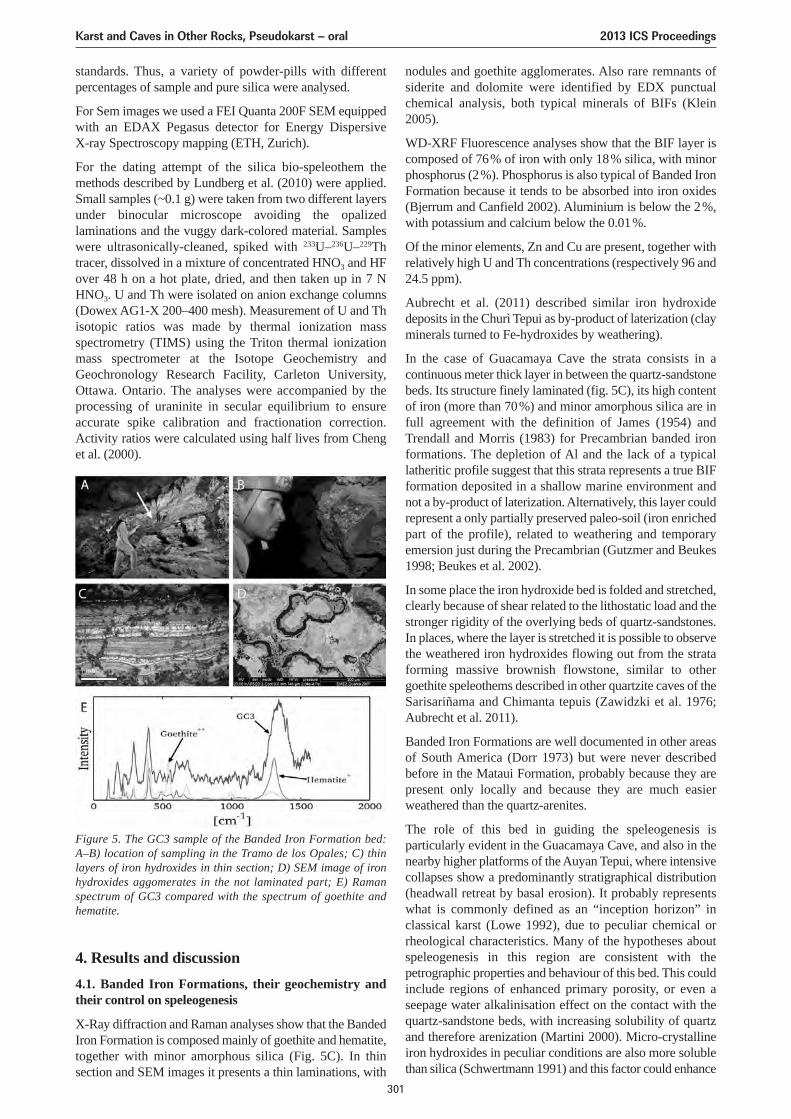
standards. Thus, a variety of powder-pills with differentpercentages of sample and pure silica were analysed.
For Sem images we used a FEI Quanta 200F SEM equippedwith an EDAX Pegasus detector for Energy DispersiveX-ray Spectroscopy mapping (ETH, Zurich).
For the dating attempt of the silica bio-speleothem themethods described by Lundberg et al. (2010) were applied.Small samples (~0.1 g) were taken from two different layersunder binocular microscope avoiding the opalizedlaminations and the vuggy dark-colored material. Sampleswere ultrasonically-cleaned, spiked with 233U–236U–229Thtracer, dissolved in a mixture of concentrated HNO3 and HFover 48 h on a hot plate, dried, and then taken up in 7 NHNO3. U and Th were isolated on anion exchange columns(Dowex AG1-X 200–400 mesh). Measurement of U and Thisotopic ratios was made by thermal ionization massspectrometry (TIMS) using the Triton thermal ionizationmass spectrometer at the Isotope Geochemistry andGeochronology Research Facility, Carleton University,Ottawa. Ontario. The analyses were accompanied by theprocessing of uraninite in secular equilibrium to ensureaccurate spike calibration and fractionation correction.Activity ratios were calculated using half lives from Chenget al. (2000).
4. Results and discussion4.1. Banded Iron Formations, their geochemistry andtheir control on speleogenesis
X-Ray diffraction and Raman analyses show that the BandedIron Formation is composed mainly of goethite and hematite,together with minor amorphous silica (Fig. 5C). In thinsection and SEM images it presents a thin laminations, with
nodules and goethite agglomerates. Also rare remnants ofsiderite and dolomite were identified by EDX punctualchemical analysis, both typical minerals of BIFs (Klein2005).
WD-XRF Fluorescence analyses show that the BIF layer iscomposed of 76% of iron with only 18% silica, with minorphosphorus (2%). Phosphorus is also typical of Banded IronFormation because it tends to be absorbed into iron oxides(Bjerrum and Canfield 2002). Aluminium is below the 2%,with potassium and calcium below the 0.01%.
Of the minor elements, Zn and Cu are present, together withrelatively high U and Th concentrations (respectively 96 and24.5 ppm).
Aubrecht et al. (2011) described similar iron hydroxidedeposits in the Churì Tepui as by-product of laterization (clayminerals turned to Fe-hydroxides by weathering).
In the case of Guacamaya Cave the strata consists in acontinuous meter thick layer in between the quartz-sandstonebeds. Its structure finely laminated (fig. 5C), its high contentof iron (more than 70%) and minor amorphous silica are infull agreement with the definition of James (1954) andTrendall and Morris (1983) for Precambrian banded ironformations. The depletion of Al and the lack of a typicallatheritic profile suggest that this strata represents a true BIFformation deposited in a shallow marine environment andnot a by-product of laterization. Alternatively, this layer couldrepresent a only partially preserved paleo-soil (iron enrichedpart of the profile), related to weathering and temporaryemersion just during the Precambrian (Gutzmer and Beukes1998; Beukes et al. 2002).
In some place the iron hydroxide bed is folded and stretched,clearly because of shear related to the lithostatic load and thestronger rigidity of the overlying beds of quartz-sandstones.In places, where the layer is stretched it is possible to observethe weathered iron hydroxides flowing out from the strataforming massive brownish flowstone, similar to othergoethite speleothems described in other quartzite caves of theSarisariñama and Chimanta tepuis (Zawidzki et al. 1976;Aubrecht et al. 2011).
Banded Iron Formations are well documented in other areasof South America (Dorr 1973) but were never describedbefore in the Mataui Formation, probably because they arepresent only locally and because they are much easierweathered than the quartz-arenites.
The role of this bed in guiding the speleogenesis isparticularly evident in the Guacamaya Cave, and also in thenearby higher platforms of the Auyan Tepui, where intensivecollapses show a predominantly stratigraphical distribution(headwall retreat by basal erosion). It probably representswhat is commonly defined as an “inception horizon” inclassical karst (Lowe 1992), due to peculiar chemical orrheological characteristics. Many of the hypotheses aboutspeleogenesis in this region are consistent with thepetrographic properties and behaviour of this bed. This couldinclude regions of enhanced primary porosity, or even aseepage water alkalinisation effect on the contact with thequartz-sandstone beds, with increasing solubility of quartzand therefore arenization (Martini 2000). Micro-crystallineiron hydroxides in peculiar conditions are also more solublethan silica (Schwertmann 1991) and this factor could enhance
Figure 5. The GC3 sample of the Banded Iron Formation bed:A–B) location of sampling in the Tramo de los Opales; C) thinlayers of iron hydroxides in thin section; D) SEM image of ironhydroxides aggomerates in the not laminated part; E) Ramanspectrum of GC3 compared with the spectrum of goethite andhematite.
Karst and Caves in Other Rocks, Pseudokarst – oral 2013 ICS Proceedings
301
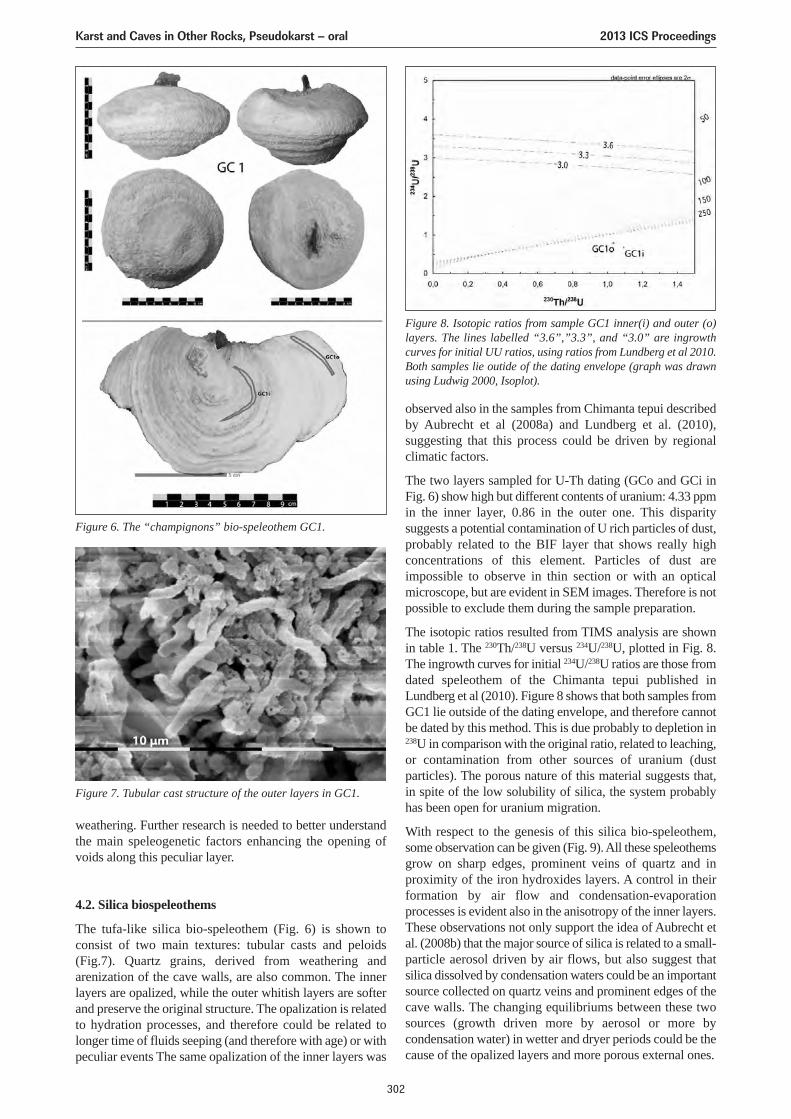
weathering. Further research is needed to better understandthe main speleogenetic factors enhancing the opening ofvoids along this peculiar layer.
4.2. Silica biospeleothems
The tufa-like silica bio-speleothem (Fig. 6) is shown toconsist of two main textures: tubular casts and peloids(Fig.7). Quartz grains, derived from weathering andarenization of the cave walls, are also common. The innerlayers are opalized, while the outer whitish layers are softerand preserve the original structure. The opalization is relatedto hydration processes, and therefore could be related tolonger time of fluids seeping (and therefore with age) or withpeculiar events The same opalization of the inner layers was
observed also in the samples from Chimanta tepui describedby Aubrecht et al (2008a) and Lundberg et al. (2010),suggesting that this process could be driven by regionalclimatic factors.
The two layers sampled for U-Th dating (GCo and GCi inFig. 6) show high but different contents of uranium: 4.33 ppmin the inner layer, 0.86 in the outer one. This disparitysuggests a potential contamination of U rich particles of dust,probably related to the BIF layer that shows really highconcentrations of this element. Particles of dust areimpossible to observe in thin section or with an opticalmicroscope, but are evident in SEM images. Therefore is notpossible to exclude them during the sample preparation.
The isotopic ratios resulted from TIMS analysis are shownin table 1. The 230Th/238U versus 234U/238U, plotted in Fig. 8.The ingrowth curves for initial 234U/238U ratios are those fromdated speleothem of the Chimanta tepui published inLundberg et al (2010). Figure 8 shows that both samples fromGC1 lie outside of the dating envelope, and therefore cannotbe dated by this method. This is due probably to depletion in238U in comparison with the original ratio, related to leaching,or contamination from other sources of uranium (dustparticles). The porous nature of this material suggests that,in spite of the low solubility of silica, the system probablyhas been open for uranium migration.
With respect to the genesis of this silica bio-speleothem,some observation can be given (Fig. 9). All these speleothemsgrow on sharp edges, prominent veins of quartz and inproximity of the iron hydroxides layers. A control in theirformation by air flow and condensation-evaporationprocesses is evident also in the anisotropy of the inner layers.These observations not only support the idea of Aubrecht etal. (2008b) that the major source of silica is related to a small-particle aerosol driven by air flows, but also suggest thatsilica dissolved by condensation waters could be an importantsource collected on quartz veins and prominent edges of thecave walls. The changing equilibriums between these twosources (growth driven more by aerosol or more bycondensation water) in wetter and dryer periods could be thecause of the opalized layers and more porous external ones.
Figure 6. The “champignons” bio-speleothem GC1.
Figure 7. Tubular cast structure of the outer layers in GC1.
Figure 8. Isotopic ratios from sample GC1 inner(i) and outer (o)layers. The lines labelled “3.6”,”3.3”, and “3.0” are ingrowthcurves for initial UU ratios, using ratios from Lundberg et al 2010.Both samples lie outide of the dating envelope (graph was drawnusing Ludwig 2000, Isoplot).
Karst and Caves in Other Rocks, Pseudokarst – oral 2013 ICS Proceedings
302
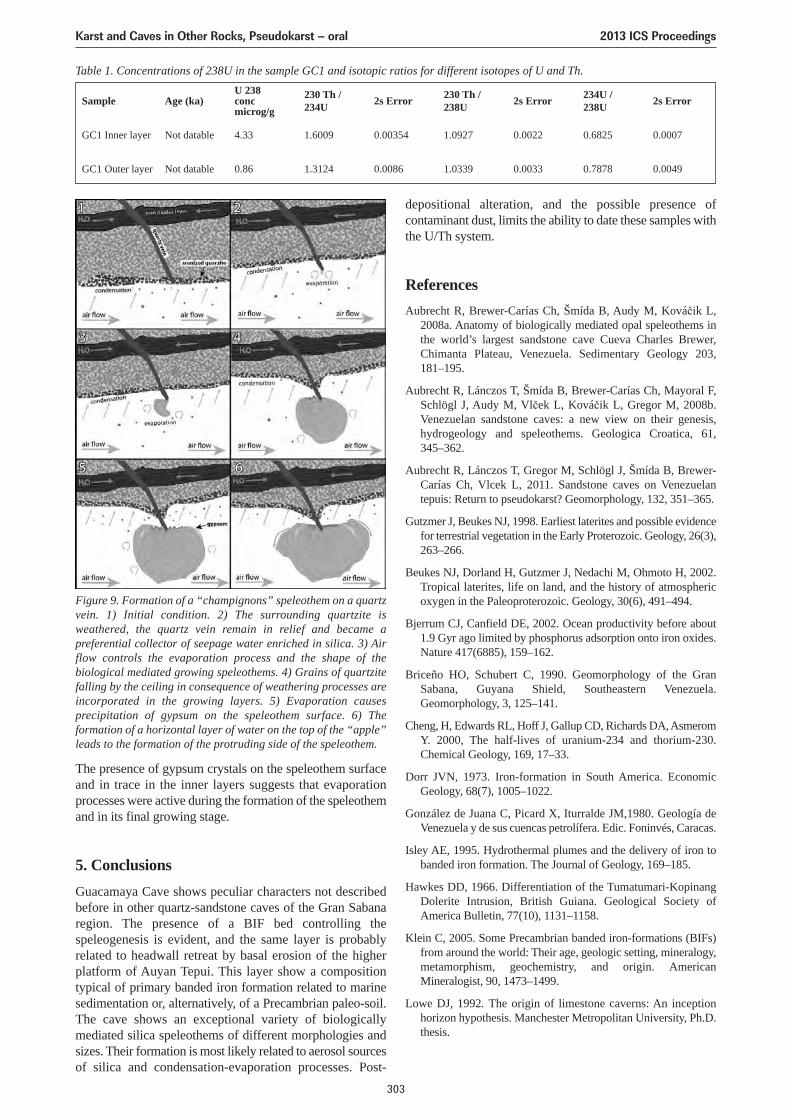
The presence of gypsum crystals on the speleothem surfaceand in trace in the inner layers suggests that evaporationprocesses were active during the formation of the speleothemand in its final growing stage.
5. ConclusionsGuacamaya Cave shows peculiar characters not describedbefore in other quartz-sandstone caves of the Gran Sabanaregion. The presence of a BIF bed controlling thespeleogenesis is evident, and the same layer is probablyrelated to headwall retreat by basal erosion of the higherplatform of Auyan Tepui. This layer show a compositiontypical of primary banded iron formation related to marinesedimentation or, alternatively, of a Precambrian paleo-soil.The cave shows an exceptional variety of biologicallymediated silica speleothems of different morphologies andsizes. Their formation is most likely related to aerosol sourcesof silica and condensation-evaporation processes. Post-
depositional alteration, and the possible presence ofcontaminant dust, limits the ability to date these samples withthe U/Th system.
ReferencesAubrecht R, Brewer-Carías Ch, Šmída B, Audy M, Kováčik L,
2008a. Anatomy of biologically mediated opal speleothems inthe world’s largest sandstone cave Cueva Charles Brewer,Chimanta Plateau, Venezuela. Sedimentary Geology 203,181–195.
Aubrecht R, Lánczos T, Šmída B, Brewer-Carías Ch, Mayoral F,Schlögl J, Audy M, Vlček L, Kováčik L, Gregor M, 2008b.Venezuelan sandstone caves: a new view on their genesis,hydrogeology and speleothems. Geologica Croatica, 61,345–362.
Aubrecht R, Lánczos T, Gregor M, Schlögl J, Šmída B, Brewer-Carías Ch, Vlcek L, 2011. Sandstone caves on Venezuelantepuis: Return to pseudokarst? Geomorphology, 132, 351–365.
Gutzmer J, Beukes NJ, 1998. Earliest laterites and possible evidencefor terrestrial vegetation in the Early Proterozoic. Geology, 26(3),263–266.
Beukes NJ, Dorland H, Gutzmer J, Nedachi M, Ohmoto H, 2002.Tropical laterites, life on land, and the history of atmosphericoxygen in the Paleoproterozoic. Geology, 30(6), 491–494.
Bjerrum CJ, Canfield DE, 2002. Ocean productivity before about1.9 Gyr ago limited by phosphorus adsorption onto iron oxides.Nature 417(6885), 159–162.
Briceño HO, Schubert C, 1990. Geomorphology of the GranSabana, Guyana Shield, Southeastern Venezuela.Geomorphology, 3, 125–141.
Cheng, H, Edwards RL, Hoff J, Gallup CD, Richards DA, AsmeromY. 2000, The half-lives of uranium-234 and thorium-230.Chemical Geology, 169, 17–33.
Dorr JVN, 1973. Iron-formation in South America. EconomicGeology, 68(7), 1005–1022.
González de Juana C, Picard X, Iturralde JM,1980. Geología deVenezuela y de sus cuencas petrolífera. Edic. Foninvés, Caracas.
Isley AE, 1995. Hydrothermal plumes and the delivery of iron tobanded iron formation. The Journal of Geology, 169–185.
Hawkes DD, 1966. Differentiation of the Tumatumari-KopinangDolerite Intrusion, British Guiana. Geological Society ofAmerica Bulletin, 77(10), 1131–1158.
Klein C, 2005. Some Precambrian banded iron-formations (BIFs)from around the world: Their age, geologic setting, mineralogy,metamorphism, geochemistry, and origin. AmericanMineralogist, 90, 1473–1499.
Lowe DJ, 1992. The origin of limestone caverns: An inceptionhorizon hypothesis. Manchester Metropolitan University, Ph.D.thesis.
Sample Age (ka)U 238concmicrog/g
230 Th /234U 2s Error 230 Th /
238U 2s Error 234U /238U 2s Error
GC1 Inner layer Not datable 4.33 1.6009 0.00354 1.0927 0.0022 0.6825 0.0007
GC1 Outer layer Not datable 0.86 1.3124 0.0086 1.0339 0.0033 0.7878 0.0049
Table 1. Concentrations of 238U in the sample GC1 and isotopic ratios for different isotopes of U and Th.
Figure 9. Formation of a “champignons” speleothem on a quartzvein. 1) Initial condition. 2) The surrounding quartzite isweathered, the quartz vein remain in relief and became apreferential collector of seepage water enriched in silica. 3) Airflow controls the evaporation process and the shape of thebiological mediated growing speleothems. 4) Grains of quartzitefalling by the ceiling in consequence of weathering processes areincorporated in the growing layers. 5) Evaporation causesprecipitation of gypsum on the speleothem surface. 6) Theformation of a horizontal layer of water on the top of the “apple”leads to the formation of the protruding side of the speleothem.
Karst and Caves in Other Rocks, Pseudokarst – oral 2013 ICS Proceedings
303
Ludwig KR, 2000. Isoplot: A geochronolgoical Toolkit forMicrosoft Excel.Berkeley Geochronology Center, SpecialPublication No. 1a.
Lundberg J, Brewer-Carias C, McFarlane D.A, 2010 Preliminaryresults from U-Th dating of glacial-interglacial deposition cyclesin a silica speleothem from Venezuela. Quaternary Research, 74,113–120.
James HL, 1954. Sedimentary facies of iron-formation. EconomicGeology, 49(3), 235–293.
Piccini L, Mecchia M, 2009. Solution weathering rate and origin ofkarst landforms and caves in the quartzite of Auyan-tepui (GranSabana, Venezuela). Geomorphology, 106, 15–25.
Martini JEJ, 2000. Dissolution of quartz and silicate minerals. InSpeleogenesis-Evolution of karst aquifers. (Klimchouk et al.eds). National Speleological Society, Huntsville, 452–457.
Martini JEJ, 2004. Silicate Karst. In Encyclopedia of Caves andKarst Science (Gunn ed.). Fitzroy Dearborn, London, 1385–1393.
Reid AR, 1974. Stratigraphy of the type area of the Roraima Group,Venezue la. Bolletin de Geologia, Venezuela, Pub. Especial, 6,343–353.
Santos JOS, Potter PE, Reis NJ, Hartmann LA, Fletcher IR,McNaughton NJ, 2003. Age, source, and regional stratigraphyof the Roraima Supergroup and Roraima-like outliers in northernSouth America based on U-Pb geochronology. GeologicalSociety of America Bulletin, 115, 331–348.
Sauro F, 2009. Mondi Perduti, sugli altopiani quarzitici delVenezuela. Speleologia, 61, 38–47.
Sauro F, De Waele J, Forti P, Galli E, Vergara F, 2012a. Speleogenesie speleotemi di opale della Cueva Guacamaya, Auyan Tepui,Gran Sabana, Venezuela. Atti del XXI Congresso Nazionale diSpeleologia, Trieste, 291–298.
Sauro F, Piccini L, Mecchia M, De Waele J, (2012b, in press).Comment on “Sandstone caves on Venezuelan tepuis: Return topseudokarst?” by R. Aubrecht, T. Lánczos,M., Gregor, J.Schlögl, B. Smída, P. Smída, B., Brewer-Carías, Ch., Vlcek, L.Geomorphology.
Schwertmann U, 1991. Solubility and dissolution of iron oxides.Plant and Soil, 130 (1), 1–25.
Teggin D, Martinez M, Palacios G, 1985. Un estudio preliminar delas diabasas del estado Bolivar, Venezuela. Memorias VICongreso Geologico Venezolano. Caracas, 2159–2206.
Trendall AF, Morris RC (Eds.), 1983. Iron-Formation: Facts andProblems (Vol. 6). Elsevier Science.
Urbani F, Talukdar S, Szczerban E, Colveé P, 1977. Metamorfismode las rocas del Grupo Roraima. Edo. Bolívar y TerritorioFederal Amazonas. Memorias V Congreso GeologicoVenezolano, Caracas, 623–638.
Wray RAL, 1997a. A global review of solutional weathering formson quartz sandstones. Earth Science Reviews, 42, 137–160.
Wray RAL, 1997b. Quartzite dissolution: karst or pseudokarst?Cave and Karst Science, 24, 81–86.
Zawidzki P, Urbani F, Koisar B, 1976. Preliminary notes on thegeology of the Sarisariñama plateau, Venezuela, and the originof its caves. Boletin Sociedad Venezolana de Espeleologia, 7,29–37.
Karst and Caves in Other Rocks, Pseudokarst – oral 2013 ICS Proceedings
304
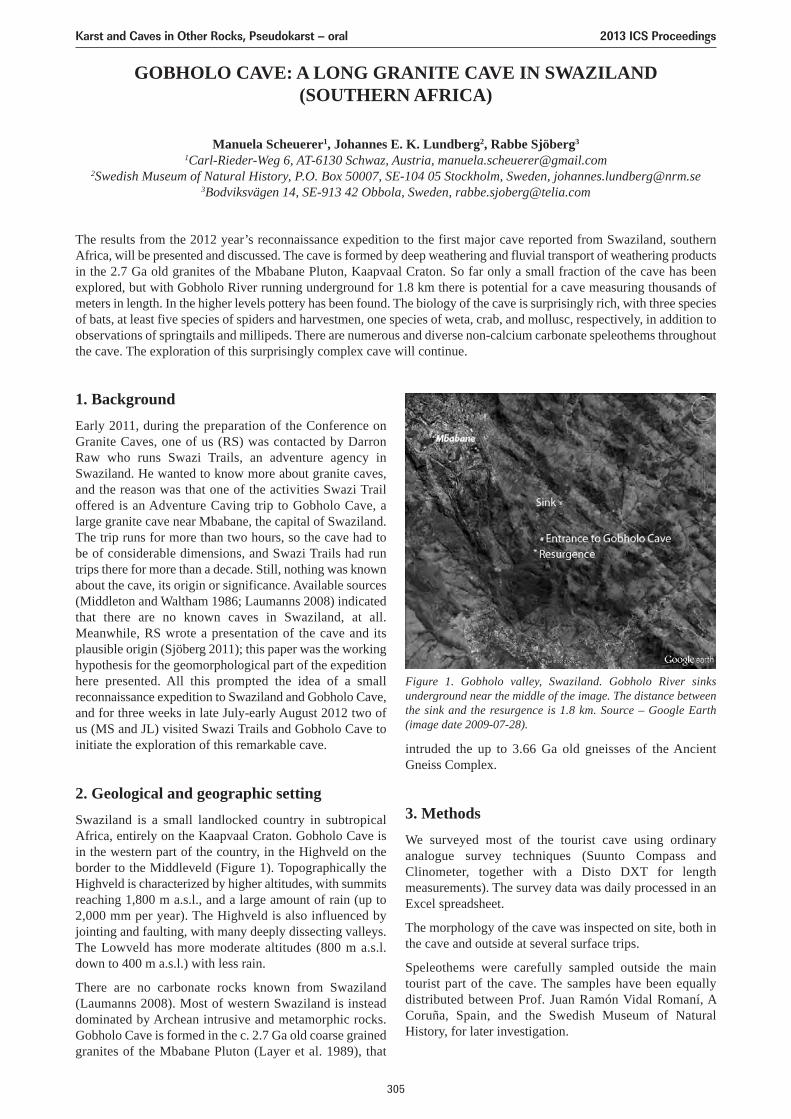
GOBHOLO CAVE: A LONG GRANITE CAVE IN SWAZILAND(SOUTHERN AFRICA)
Manuela Scheuerer1, Johannes E. K. Lundberg2, Rabbe Sjöberg3
1Carl-Rieder-Weg 6, AT-6130 Schwaz, Austria, [email protected] Museum of Natural History, P.O. Box 50007, SE-104 05 Stockholm, Sweden, [email protected]
3Bodviksvägen 14, SE-913 42 Obbola, Sweden, [email protected]
The results from the 2012 year’s reconnaissance expedition to the first major cave reported from Swaziland, southernAfrica, will be presented and discussed. The cave is formed by deep weathering and fluvial transport of weathering productsin the 2.7 Ga old granites of the Mbabane Pluton, Kaapvaal Craton. So far only a small fraction of the cave has beenexplored, but with Gobholo River running underground for 1.8 km there is potential for a cave measuring thousands ofmeters in length. In the higher levels pottery has been found. The biology of the cave is surprisingly rich, with three speciesof bats, at least five species of spiders and harvestmen, one species of weta, crab, and mollusc, respectively, in addition toobservations of springtails and millipeds. There are numerous and diverse non-calcium carbonate speleothems throughoutthe cave. The exploration of this surprisingly complex cave will continue.
1. BackgroundEarly 2011, during the preparation of the Conference onGranite Caves, one of us (RS) was contacted by DarronRaw who runs Swazi Trails, an adventure agency inSwaziland. He wanted to know more about granite caves,and the reason was that one of the activities Swazi Trailoffered is an Adventure Caving trip to Gobholo Cave, alarge granite cave near Mbabane, the capital of Swaziland.The trip runs for more than two hours, so the cave had tobe of considerable dimensions, and Swazi Trails had runtrips there for more than a decade. Still, nothing was knownabout the cave, its origin or significance. Available sources(Middleton and Waltham 1986; Laumanns 2008) indicatedthat there are no known caves in Swaziland, at all.Meanwhile, RS wrote a presentation of the cave and itsplausible origin (Sjöberg 2011); this paper was the workinghypothesis for the geomorphological part of the expeditionhere presented. All this prompted the idea of a smallreconnaissance expedition to Swaziland and Gobholo Cave,and for three weeks in late July-early August 2012 two ofus (MS and JL) visited Swazi Trails and Gobholo Cave toinitiate the exploration of this remarkable cave.
2. Geological and geographic settingSwaziland is a small landlocked country in subtropicalAfrica, entirely on the Kaapvaal Craton. Gobholo Cave isin the western part of the country, in the Highveld on theborder to the Middleveld (Figure 1). Topographically theHighveld is characterized by higher altitudes, with summitsreaching 1,800 m a.s.l., and a large amount of rain (up to2,000 mm per year). The Highveld is also influenced byjointing and faulting, with many deeply dissecting valleys.The Lowveld has more moderate altitudes (800 m a.s.l.down to 400 m a.s.l.) with less rain.
There are no carbonate rocks known from Swaziland(Laumanns 2008). Most of western Swaziland is insteaddominated by Archean intrusive and metamorphic rocks.Gobholo Cave is formed in the c. 2.7 Ga old coarse grainedgranites of the Mbabane Pluton (Layer et al. 1989), that
intruded the up to 3.66 Ga old gneisses of the AncientGneiss Complex.
3. MethodsWe surveyed most of the tourist cave using ordinaryanalogue survey techniques (Suunto Compass andClinometer, together with a Disto DXT for lengthmeasurements). The survey data was daily processed in anExcel spreadsheet.
The morphology of the cave was inspected on site, both inthe cave and outside at several surface trips.
Speleothems were carefully sampled outside the maintourist part of the cave. The samples have been equallydistributed between Prof. Juan Ramón Vidal Romaní, ACoruña, Spain, and the Swedish Museum of NaturalHistory, for later investigation.
Figure 1. Gobholo valley, Swaziland. Gobholo River sinksunderground near the middle of the image. The distance betweenthe sink and the resurgence is 1.8 km. Source – Google Earth(image date 2009-07-28).
Karst and Caves in Other Rocks, Pseudokarst – oral 2013 ICS Proceedings
305
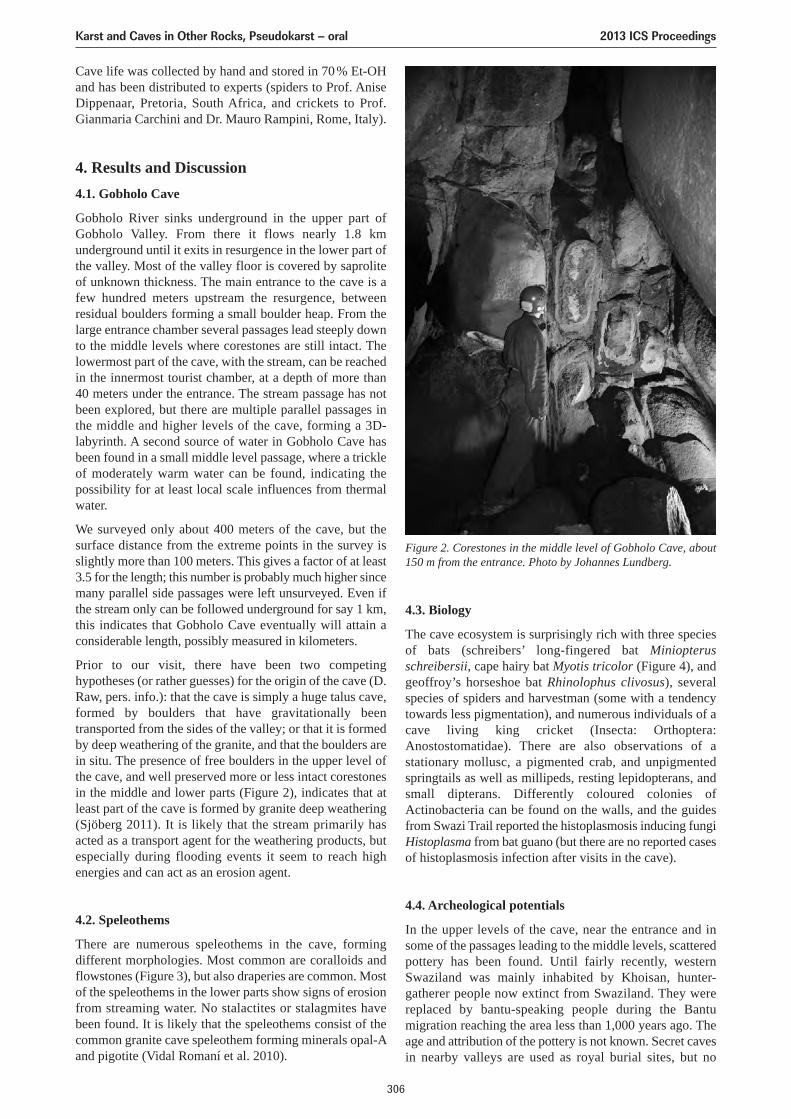
Cave life was collected by hand and stored in 70% Et-OHand has been distributed to experts (spiders to Prof. AniseDippenaar, Pretoria, South Africa, and crickets to Prof.Gianmaria Carchini and Dr. Mauro Rampini, Rome, Italy).
4. Results and Discussion4.1. Gobholo Cave
Gobholo River sinks underground in the upper part ofGobholo Valley. From there it flows nearly 1.8 kmunderground until it exits in resurgence in the lower part ofthe valley. Most of the valley floor is covered by saproliteof unknown thickness. The main entrance to the cave is afew hundred meters upstream the resurgence, betweenresidual boulders forming a small boulder heap. From thelarge entrance chamber several passages lead steeply downto the middle levels where corestones are still intact. Thelowermost part of the cave, with the stream, can be reachedin the innermost tourist chamber, at a depth of more than40 meters under the entrance. The stream passage has notbeen explored, but there are multiple parallel passages inthe middle and higher levels of the cave, forming a 3D-labyrinth. A second source of water in Gobholo Cave hasbeen found in a small middle level passage, where a trickleof moderately warm water can be found, indicating thepossibility for at least local scale influences from thermalwater.
We surveyed only about 400 meters of the cave, but thesurface distance from the extreme points in the survey isslightly more than 100 meters. This gives a factor of at least3.5 for the length; this number is probably much higher sincemany parallel side passages were left unsurveyed. Even ifthe stream only can be followed underground for say 1 km,this indicates that Gobholo Cave eventually will attain aconsiderable length, possibly measured in kilometers.
Prior to our visit, there have been two competinghypotheses (or rather guesses) for the origin of the cave (D.Raw, pers. info.): that the cave is simply a huge talus cave,formed by boulders that have gravitationally beentransported from the sides of the valley; or that it is formedby deep weathering of the granite, and that the boulders arein situ. The presence of free boulders in the upper level ofthe cave, and well preserved more or less intact corestonesin the middle and lower parts (Figure 2), indicates that atleast part of the cave is formed by granite deep weathering(Sjöberg 2011). It is likely that the stream primarily hasacted as a transport agent for the weathering products, butespecially during flooding events it seem to reach highenergies and can act as an erosion agent.
4.2. Speleothems
There are numerous speleothems in the cave, formingdifferent morphologies. Most common are coralloids andflowstones (Figure 3), but also draperies are common. Mostof the speleothems in the lower parts show signs of erosionfrom streaming water. No stalactites or stalagmites havebeen found. It is likely that the speleothems consist of thecommon granite cave speleothem forming minerals opal-Aand pigotite (Vidal Romaní et al. 2010).
4.3. Biology
The cave ecosystem is surprisingly rich with three speciesof bats (schreibers’ long-fingered bat Miniopterusschreibersii, cape hairy bat Myotis tricolor (Figure 4), andgeoffroy’s horseshoe bat Rhinolophus clivosus), severalspecies of spiders and harvestman (some with a tendencytowards less pigmentation), and numerous individuals of acave living king cricket (Insecta: Orthoptera:Anostostomatidae). There are also observations of astationary mollusc, a pigmented crab, and unpigmentedspringtails as well as millipeds, resting lepidopterans, andsmall dipterans. Differently coloured colonies ofActinobacteria can be found on the walls, and the guidesfrom Swazi Trail reported the histoplasmosis inducing fungiHistoplasma from bat guano (but there are no reported casesof histoplasmosis infection after visits in the cave).
4.4. Archeological potentials
In the upper levels of the cave, near the entrance and insome of the passages leading to the middle levels, scatteredpottery has been found. Until fairly recently, westernSwaziland was mainly inhabited by Khoisan, hunter-gatherer people now extinct from Swaziland. They werereplaced by bantu-speaking people during the Bantumigration reaching the area less than 1,000 years ago. Theage and attribution of the pottery is not known. Secret cavesin nearby valleys are used as royal burial sites, but no
Figure 2. Corestones in the middle level of Gobholo Cave, about150 m from the entrance. Photo by Johannes Lundberg.
Karst and Caves in Other Rocks, Pseudokarst – oral 2013 ICS Proceedings
306
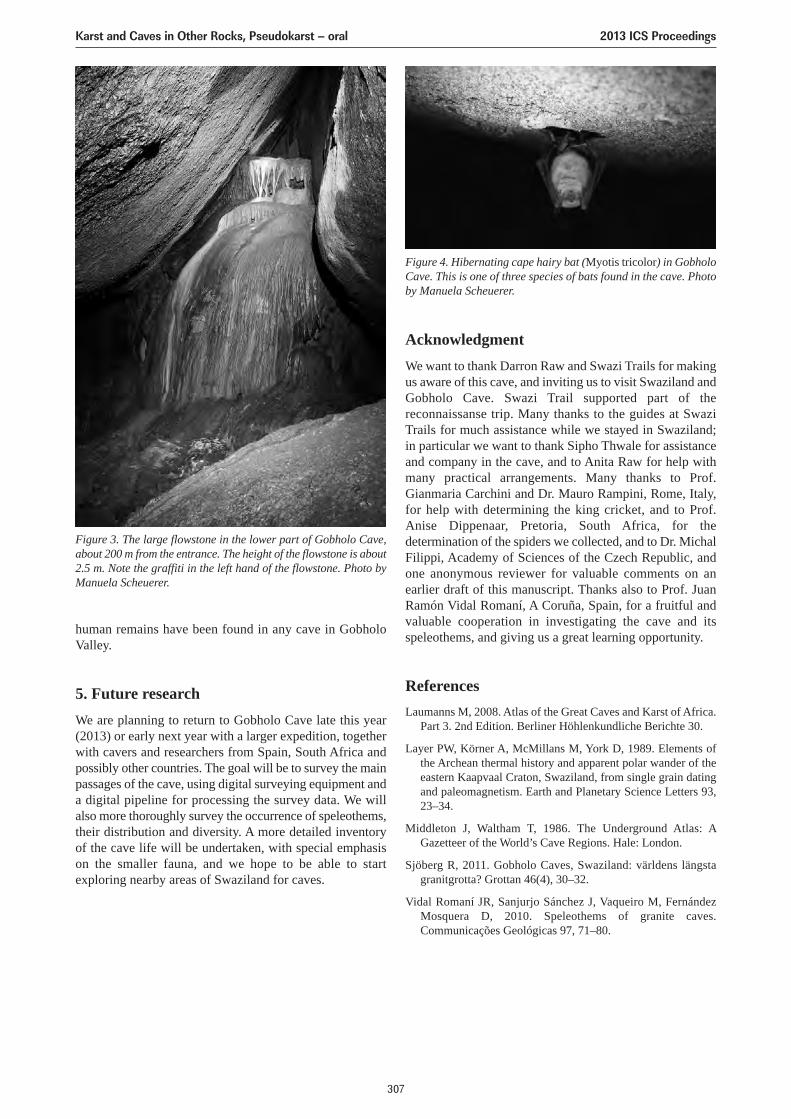
human remains have been found in any cave in GobholoValley.
5. Future researchWe are planning to return to Gobholo Cave late this year(2013) or early next year with a larger expedition, togetherwith cavers and researchers from Spain, South Africa andpossibly other countries. The goal will be to survey the mainpassages of the cave, using digital surveying equipment anda digital pipeline for processing the survey data. We willalso more thoroughly survey the occurrence of speleothems,their distribution and diversity. A more detailed inventoryof the cave life will be undertaken, with special emphasison the smaller fauna, and we hope to be able to startexploring nearby areas of Swaziland for caves.
AcknowledgmentWe want to thank Darron Raw and Swazi Trails for makingus aware of this cave, and inviting us to visit Swaziland andGobholo Cave. Swazi Trail supported part of thereconnaissanse trip. Many thanks to the guides at SwaziTrails for much assistance while we stayed in Swaziland;in particular we want to thank Sipho Thwale for assistanceand company in the cave, and to Anita Raw for help withmany practical arrangements. Many thanks to Prof.Gianmaria Carchini and Dr. Mauro Rampini, Rome, Italy,for help with determining the king cricket, and to Prof.Anise Dippenaar, Pretoria, South Africa, for thedetermination of the spiders we collected, and to Dr. MichalFilippi, Academy of Sciences of the Czech Republic, andone anonymous reviewer for valuable comments on anearlier draft of this manuscript. Thanks also to Prof. JuanRamón Vidal Romaní, A Coruña, Spain, for a fruitful andvaluable cooperation in investigating the cave and itsspeleothems, and giving us a great learning opportunity.
ReferencesLaumanns M, 2008. Atlas of the Great Caves and Karst of Africa.
Part 3. 2nd Edition. Berliner Höhlenkundliche Berichte 30.
Layer PW, Körner A, McMillans M, York D, 1989. Elements ofthe Archean thermal history and apparent polar wander of theeastern Kaapvaal Craton, Swaziland, from single grain datingand paleomagnetism. Earth and Planetary Science Letters 93,23–34.
Middleton J, Waltham T, 1986. The Underground Atlas: AGazetteer of the World’s Cave Regions. Hale: London.
Sjöberg R, 2011. Gobholo Caves, Swaziland: världens längstagranitgrotta? Grottan 46(4), 30–32.
Vidal Romaní JR, Sanjurjo Sánchez J, Vaqueiro M, FernándezMosquera D, 2010. Speleothems of granite caves.Communicações Geológicas 97, 71–80.
Figure 3. The large flowstone in the lower part of Gobholo Cave,about 200 m from the entrance. The height of the flowstone is about2.5 m. Note the graffiti in the left hand of the flowstone. Photo byManuela Scheuerer.
Figure 4. Hibernating cape hairy bat (Myotis tricolor) in GobholoCave. This is one of three species of bats found in the cave. Photoby Manuela Scheuerer.
Karst and Caves in Other Rocks, Pseudokarst – oral 2013 ICS Proceedings
307
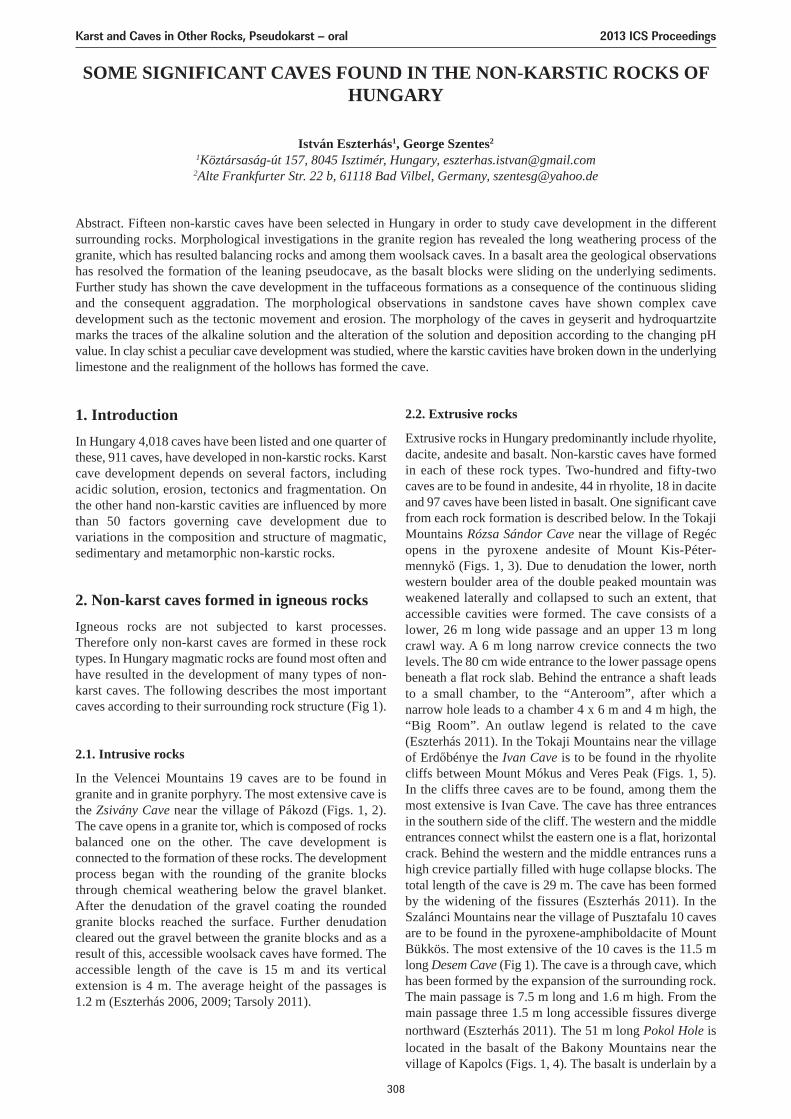
SOME SIGNIFICANT CAVES FOUND IN THE NON-KARSTIC ROCKS OFHUNGARY
István Eszterhás1, George Szentes2
1Köztársaság-út 157, 8045 Isztimér, Hungary, [email protected] Frankfurter Str. 22 b, 61118 Bad Vilbel, Germany, [email protected]
Abstract. Fifteen non-karstic caves have been selected in Hungary in order to study cave development in the differentsurrounding rocks. Morphological investigations in the granite region has revealed the long weathering process of thegranite, which has resulted balancing rocks and among them woolsack caves. In a basalt area the geological observationshas resolved the formation of the leaning pseudocave, as the basalt blocks were sliding on the underlying sediments.Further study has shown the cave development in the tuffaceous formations as a consequence of the continuous slidingand the consequent aggradation. The morphological observations in sandstone caves have shown complex cavedevelopment such as the tectonic movement and erosion. The morphology of the caves in geyserit and hydroquartzitemarks the traces of the alkaline solution and the alteration of the solution and deposition according to the changing pHvalue. In clay schist a peculiar cave development was studied, where the karstic cavities have broken down in the underlyinglimestone and the realignment of the hollows has formed the cave.
1. IntroductionIn Hungary 4,018 caves have been listed and one quarter ofthese, 911 caves, have developed in non-karstic rocks. Karstcave development depends on several factors, includingacidic solution, erosion, tectonics and fragmentation. Onthe other hand non-karstic cavities are influenced by morethan 50 factors governing cave development due tovariations in the composition and structure of magmatic,sedimentary and metamorphic non-karstic rocks.
2. Non-karst caves formed in igneous rocksIgneous rocks are not subjected to karst processes.Therefore only non-karst caves are formed in these rocktypes. In Hungary magmatic rocks are found most often andhave resulted in the development of many types of non-karst caves. The following describes the most importantcaves according to their surrounding rock structure (Fig 1).
2.1. Intrusive rocks
In the Velencei Mountains 19 caves are to be found ingranite and in granite porphyry. The most extensive cave isthe Zsivány Cave near the village of Pákozd (Figs. 1, 2).The cave opens in a granite tor, which is composed of rocksbalanced one on the other. The cave development isconnected to the formation of these rocks. The developmentprocess began with the rounding of the granite blocksthrough chemical weathering below the gravel blanket.After the denudation of the gravel coating the roundedgranite blocks reached the surface. Further denudationcleared out the gravel between the granite blocks and as aresult of this, accessible woolsack caves have formed. Theaccessible length of the cave is 15 m and its verticalextension is 4 m. The average height of the passages is1.2 m (Eszterhás 2006, 2009; Tarsoly 2011).
2.2. Extrusive rocks
Extrusive rocks in Hungary predominantly include rhyolite,dacite, andesite and basalt. Non-karstic caves have formedin each of these rock types. Two-hundred and fifty-twocaves are to be found in andesite, 44 in rhyolite, 18 in daciteand 97 caves have been listed in basalt. One significant cavefrom each rock formation is described below. In the TokajiMountains Rózsa Sándor Cave near the village of Regécopens in the pyroxene andesite of Mount Kis-Péter-mennykő (Figs. 1, 3). Due to denudation the lower, northwestern boulder area of the double peaked mountain wasweakened laterally and collapsed to such an extent, thataccessible cavities were formed. The cave consists of alower, 26 m long wide passage and an upper 13 m longcrawl way. A 6 m long narrow crevice connects the twolevels. The 80 cm wide entrance to the lower passage opensbeneath a flat rock slab. Behind the entrance a shaft leadsto a small chamber, to the “Anteroom”, after which anarrow hole leads to a chamber 4 x 6 m and 4 m high, the“Big Room”. An outlaw legend is related to the cave(Eszterhás 2011). In the Tokaji Mountains near the villageof Erdőbénye the Ivan Cave is to be found in the rhyolitecliffs between Mount Mókus and Veres Peak (Figs. 1, 5).In the cliffs three caves are to be found, among them themost extensive is Ivan Cave. The cave has three entrancesin the southern side of the cliff. The western and the middleentrances connect whilst the eastern one is a flat, horizontalcrack. Behind the western and the middle entrances runs ahigh crevice partially filled with huge collapse blocks. Thetotal length of the cave is 29 m. The cave has been formedby the widening of the fissures (Eszterhás 2011). In theSzalánci Mountains near the village of Pusztafalu 10 cavesare to be found in the pyroxene-amphiboldacite of MountBükkös. The most extensive of the 10 caves is the 11.5 mlong Desem Cave (Fig 1). The cave is a through cave, whichhas been formed by the expansion of the surrounding rock.The main passage is 7.5 m long and 1.6 m high. From themain passage three 1.5 m long accessible fissures divergenorthward (Eszterhás 2011). The 51 m long Pokol Hole islocated in the basalt of the Bakony Mountains near thevillage of Kapolcs (Figs. 1, 4). The basalt is underlain by a
Karst and Caves in Other Rocks, Pseudokarst – oral 2013 ICS Proceedings
308
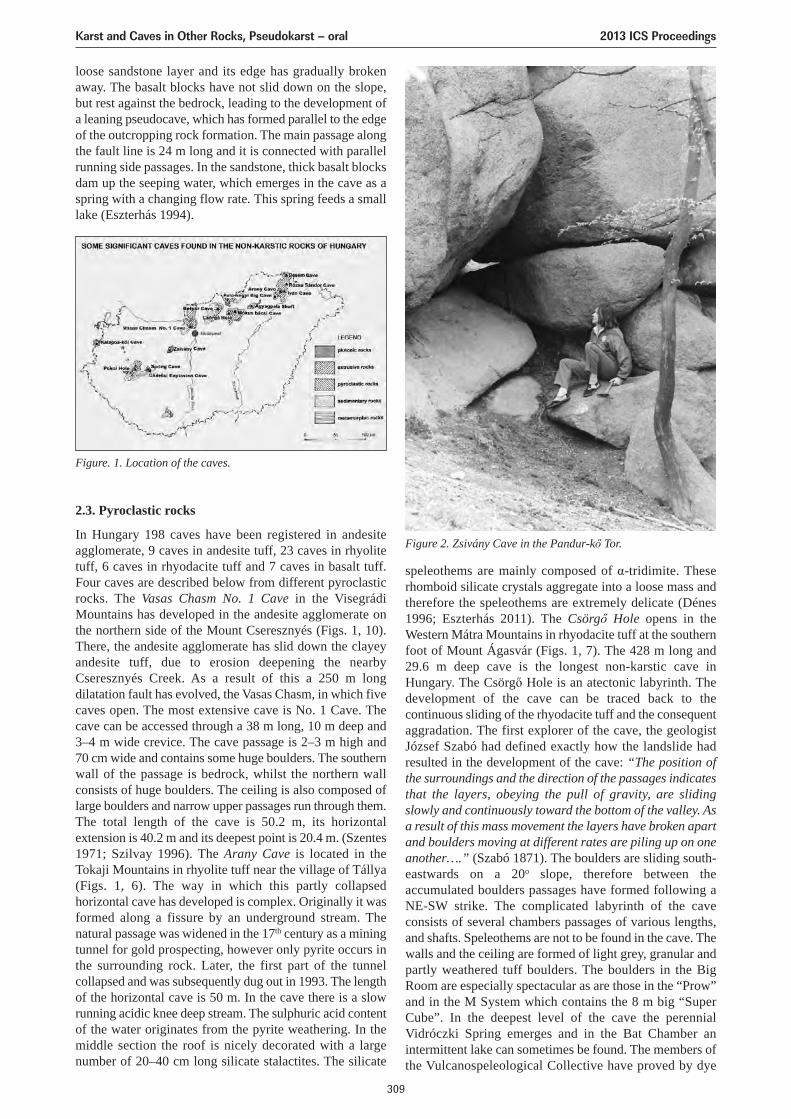
loose sandstone layer and its edge has gradually brokenaway. The basalt blocks have not slid down on the slope,but rest against the bedrock, leading to the development ofa leaning pseudocave, which has formed parallel to the edgeof the outcropping rock formation. The main passage alongthe fault line is 24 m long and it is connected with parallelrunning side passages. In the sandstone, thick basalt blocksdam up the seeping water, which emerges in the cave as aspring with a changing flow rate. This spring feeds a smalllake (Eszterhás 1994).
speleothems are mainly composed of α-tridimite. Theserhomboid silicate crystals aggregate into a loose mass andtherefore the speleothems are extremely delicate (Dénes1996; Eszterhás 2011). The Csörgő Hole opens in theWestern Mátra Mountains in rhyodacite tuff at the southernfoot of Mount Ágasvár (Figs. 1, 7). The 428 m long and29.6 m deep cave is the longest non-karstic cave inHungary. The Csörgő Hole is an atectonic labyrinth. Thedevelopment of the cave can be traced back to thecontinuous sliding of the rhyodacite tuff and the consequentaggradation. The first explorer of the cave, the geologistJózsef Szabó had defined exactly how the landslide hadresulted in the development of the cave: “The position ofthe surroundings and the direction of the passages indicatesthat the layers, obeying the pull of gravity, are slidingslowly and continuously toward the bottom of the valley. Asa result of this mass movement the layers have broken apartand boulders moving at different rates are piling up on oneanother….” (Szabó 1871). The boulders are sliding south-eastwards on a 20o slope, therefore between theaccumulated boulders passages have formed following aNE-SW strike. The complicated labyrinth of the caveconsists of several chambers passages of various lengths,and shafts. Speleothems are not to be found in the cave. Thewalls and the ceiling are formed of light grey, granular andpartly weathered tuff boulders. The boulders in the BigRoom are especially spectacular as are those in the “Prow”and in the M System which contains the 8 m big “SuperCube”. In the deepest level of the cave the perennialVidróczki Spring emerges and in the Bat Chamber anintermittent lake can sometimes be found. The members ofthe Vulcanospeleological Collective have proved by dye
Figure. 1. Location of the caves.
Figure 2. Zsivány Cave in the Pandur-kő Tor.
2.3. Pyroclastic rocks
In Hungary 198 caves have been registered in andesiteagglomerate, 9 caves in andesite tuff, 23 caves in rhyolitetuff, 6 caves in rhyodacite tuff and 7 caves in basalt tuff.Four caves are described below from different pyroclasticrocks. The Vasas Chasm No. 1 Cave in the VisegrádiMountains has developed in the andesite agglomerate onthe northern side of the Mount Cseresznyés (Figs. 1, 10).There, the andesite agglomerate has slid down the clayeyandesite tuff, due to erosion deepening the nearbyCseresznyés Creek. As a result of this a 250 m longdilatation fault has evolved, the Vasas Chasm, in which fivecaves open. The most extensive cave is No. 1 Cave. Thecave can be accessed through a 38 m long, 10 m deep and3–4 m wide crevice. The cave passage is 2–3 m high and70 cm wide and contains some huge boulders. The southernwall of the passage is bedrock, whilst the northern wallconsists of huge boulders. The ceiling is also composed oflarge boulders and narrow upper passages run through them.The total length of the cave is 50.2 m, its horizontalextension is 40.2 m and its deepest point is 20.4 m. (Szentes1971; Szilvay 1996). The Arany Cave is located in theTokaji Mountains in rhyolite tuff near the village of Tállya(Figs. 1, 6). The way in which this partly collapsedhorizontal cave has developed is complex. Originally it wasformed along a fissure by an underground stream. Thenatural passage was widened in the 17th century as a miningtunnel for gold prospecting, however only pyrite occurs inthe surrounding rock. Later, the first part of the tunnelcollapsed and was subsequently dug out in 1993. The lengthof the horizontal cave is 50 m. In the cave there is a slowrunning acidic knee deep stream. The sulphuric acid contentof the water originates from the pyrite weathering. In themiddle section the roof is nicely decorated with a largenumber of 20–40 cm long silicate stalactites. The silicate
Karst and Caves in Other Rocks, Pseudokarst – oral 2013 ICS Proceedings
309
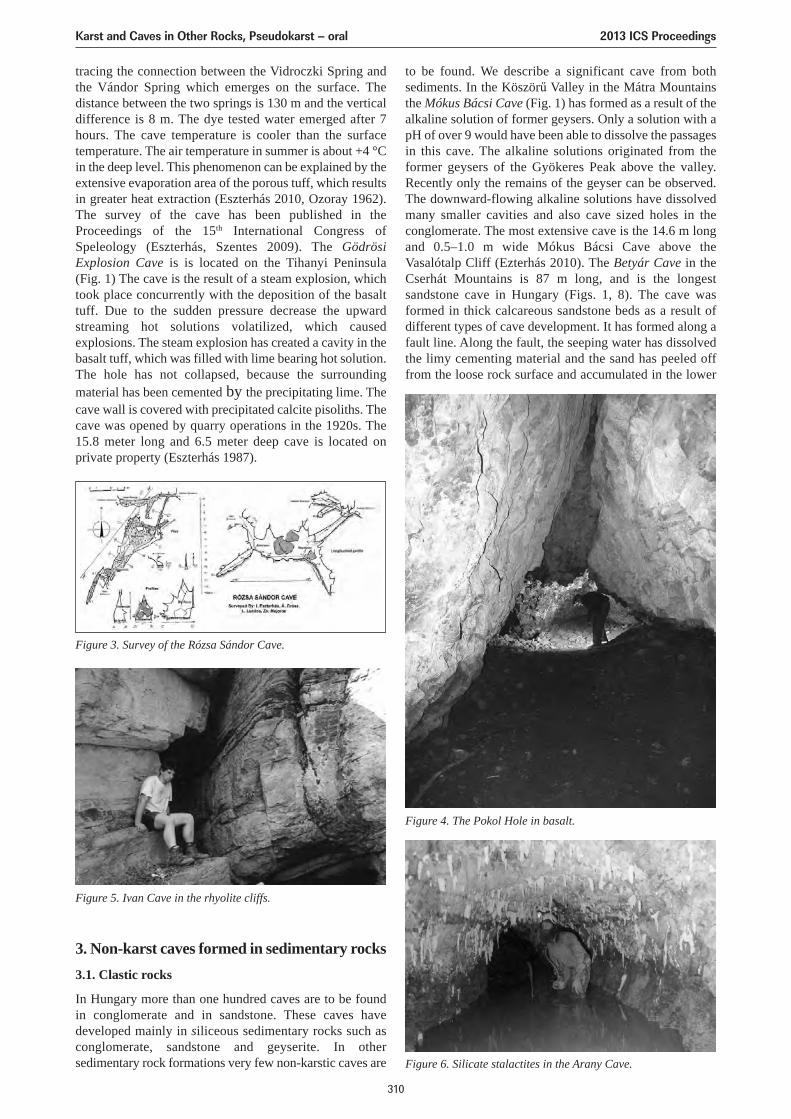
tracing the connection between the Vidroczki Spring andthe Vándor Spring which emerges on the surface. Thedistance between the two springs is 130 m and the verticaldifference is 8 m. The dye tested water emerged after 7hours. The cave temperature is cooler than the surfacetemperature. The air temperature in summer is about +4 °Cin the deep level. This phenomenon can be explained by theextensive evaporation area of the porous tuff, which resultsin greater heat extraction (Eszterhás 2010, Ozoray 1962).The survey of the cave has been published in theProceedings of the 15th International Congress ofSpeleology (Eszterhás, Szentes 2009). The GödrösiExplosion Cave is is located on the Tihanyi Peninsula(Fig. 1) The cave is the result of a steam explosion, whichtook place concurrently with the deposition of the basalttuff. Due to the sudden pressure decrease the upwardstreaming hot solutions volatilized, which causedexplosions. The steam explosion has created a cavity in thebasalt tuff, which was filled with lime bearing hot solution.The hole has not collapsed, because the surroundingmaterial has been cemented by the precipitating lime. Thecave wall is covered with precipitated calcite pisoliths. Thecave was opened by quarry operations in the 1920s. The15.8 meter long and 6.5 meter deep cave is located onprivate property (Eszterhás 1987).
3. Non-karst caves formed in sedimentary rocks3.1. Clastic rocks
In Hungary more than one hundred caves are to be foundin conglomerate and in sandstone. These caves havedeveloped mainly in siliceous sedimentary rocks such asconglomerate, sandstone and geyserite. In othersedimentary rock formations very few non-karstic caves are
to be found. We describe a significant cave from bothsediments. In the Köszörű Valley in the Mátra Mountainsthe Mókus Bácsi Cave (Fig. 1) has formed as a result of thealkaline solution of former geysers. Only a solution with apH of over 9 would have been able to dissolve the passagesin this cave. The alkaline solutions originated from theformer geysers of the Gyökeres Peak above the valley.Recently only the remains of the geyser can be observed.The downward-flowing alkaline solutions have dissolvedmany smaller cavities and also cave sized holes in theconglomerate. The most extensive cave is the 14.6 m longand 0.5–1.0 m wide Mókus Bácsi Cave above theVasalótalp Cliff (Ezterhás 2010). The Betyár Cave in theCserhát Mountains is 87 m long, and is the longestsandstone cave in Hungary (Figs. 1, 8). The cave wasformed in thick calcareous sandstone beds as a result ofdifferent types of cave development. It has formed along afault line. Along the fault, the seeping water has dissolvedthe limy cementing material and the sand has peeled offfrom the loose rock surface and accumulated in the lower
Figure 3. Survey of the Rózsa Sándor Cave.
Figure 5. Ivan Cave in the rhyolite cliffs.
Figure 6. Silicate stalactites in the Arany Cave.
Figure 4. The Pokol Hole in basalt.
Karst and Caves in Other Rocks, Pseudokarst – oral 2013 ICS Proceedings
310
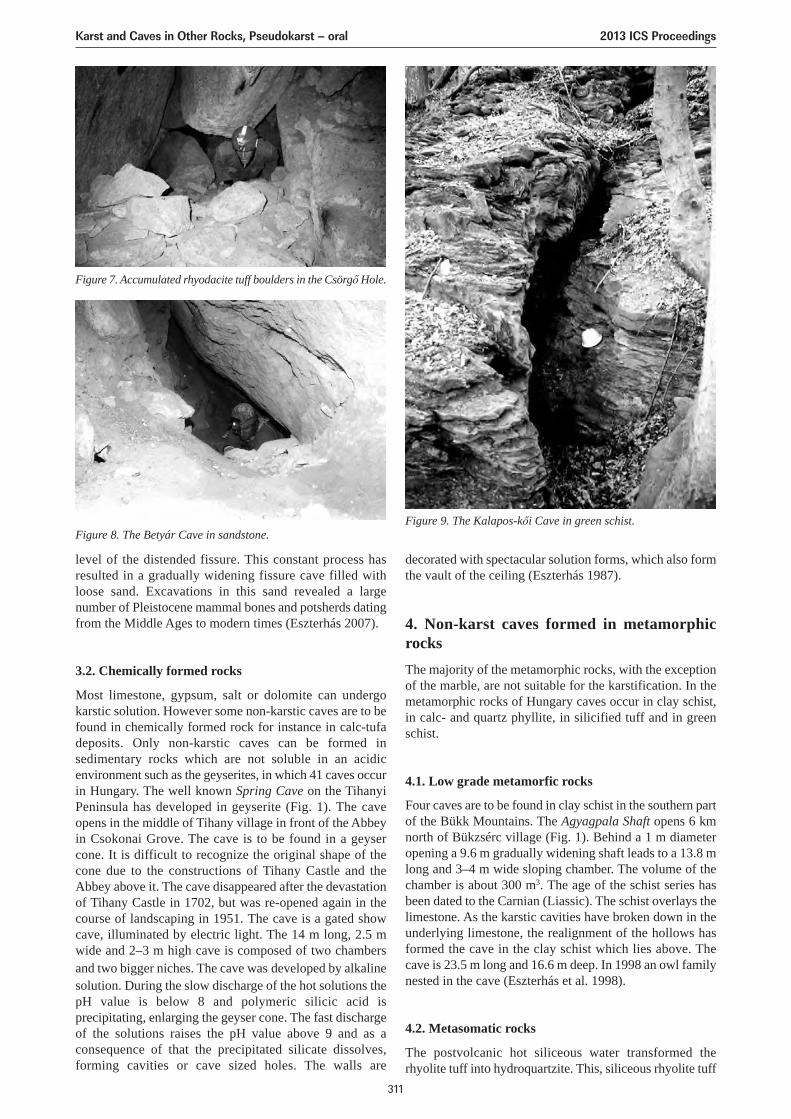
level of the distended fissure. This constant process hasresulted in a gradually widening fissure cave filled withloose sand. Excavations in this sand revealed a largenumber of Pleistocene mammal bones and potsherds datingfrom the Middle Ages to modern times (Eszterhás 2007).
3.2. Chemically formed rocks
Most limestone, gypsum, salt or dolomite can undergokarstic solution. However some non-karstic caves are to befound in chemically formed rock for instance in calc-tufadeposits. Only non-karstic caves can be formed insedimentary rocks which are not soluble in an acidicenvironment such as the geyserites, in which 41 caves occurin Hungary. The well known Spring Cave on the TihanyiPeninsula has developed in geyserite (Fig. 1). The caveopens in the middle of Tihany village in front of the Abbeyin Csokonai Grove. The cave is to be found in a geysercone. It is difficult to recognize the original shape of thecone due to the constructions of Tihany Castle and theAbbey above it. The cave disappeared after the devastationof Tihany Castle in 1702, but was re-opened again in thecourse of landscaping in 1951. The cave is a gated showcave, illuminated by electric light. The 14 m long, 2.5 mwide and 2–3 m high cave is composed of two chambersand two bigger niches. The cave was developed by alkalinesolution. During the slow discharge of the hot solutions thepH value is below 8 and polymeric silicic acid isprecipitating, enlarging the geyser cone. The fast dischargeof the solutions raises the pH value above 9 and as aconsequence of that the precipitated silicate dissolves,forming cavities or cave sized holes. The walls are
decorated with spectacular solution forms, which also formthe vault of the ceiling (Eszterhás 1987).
4. Non-karst caves formed in metamorphicrocksThe majority of the metamorphic rocks, with the exceptionof the marble, are not suitable for the karstification. In themetamorphic rocks of Hungary caves occur in clay schist,in calc- and quartz phyllite, in silicified tuff and in greenschist.
4.1. Low grade metamorfic rocks
Four caves are to be found in clay schist in the southern partof the Bükk Mountains. The Agyagpala Shaft opens 6 kmnorth of Bükzsérc village (Fig. 1). Behind a 1 m diameteropening a 9.6 m gradually widening shaft leads to a 13.8 mlong and 3–4 m wide sloping chamber. The volume of thechamber is about 300 m3. The age of the schist series hasbeen dated to the Carnian (Liassic). The schist overlays thelimestone. As the karstic cavities have broken down in theunderlying limestone, the realignment of the hollows hasformed the cave in the clay schist which lies above. Thecave is 23.5 m long and 16.6 m deep. In 1998 an owl familynested in the cave (Eszterhás et al. 1998).
4.2. Metasomatic rocks
The postvolcanic hot siliceous water transformed therhyolite tuff into hydroquartzite. This, siliceous rhyolite tuff
Figure 7. Accumulated rhyodacite tuff boulders in the Csörgő Hole.
Figure 8. The Betyár Cave in sandstone.Figure 9. The Kalapos-kői Cave in green schist.
Karst and Caves in Other Rocks, Pseudokarst – oral 2013 ICS Proceedings
311
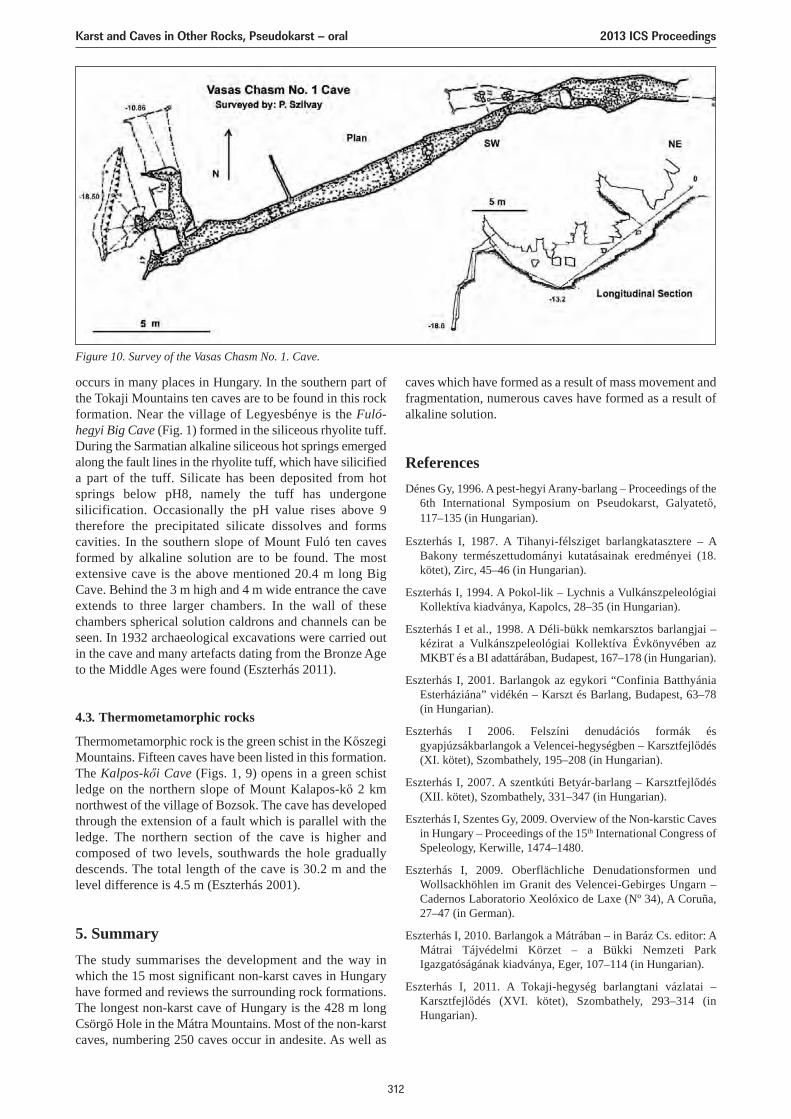
occurs in many places in Hungary. In the southern part ofthe Tokaji Mountains ten caves are to be found in this rockformation. Near the village of Legyesbénye is the Fuló-hegyi Big Cave (Fig. 1) formed in the siliceous rhyolite tuff.During the Sarmatian alkaline siliceous hot springs emergedalong the fault lines in the rhyolite tuff, which have silicifieda part of the tuff. Silicate has been deposited from hotsprings below pH8, namely the tuff has undergonesilicification. Occasionally the pH value rises above 9therefore the precipitated silicate dissolves and formscavities. In the southern slope of Mount Fuló ten cavesformed by alkaline solution are to be found. The mostextensive cave is the above mentioned 20.4 m long BigCave. Behind the 3 m high and 4 m wide entrance the caveextends to three larger chambers. In the wall of thesechambers spherical solution caldrons and channels can beseen. In 1932 archaeological excavations were carried outin the cave and many artefacts dating from the Bronze Ageto the Middle Ages were found (Eszterhás 2011).
4.3. Thermometamorphic rocks
Thermometamorphic rock is the green schist in the KőszegiMountains. Fifteen caves have been listed in this formation.The Kalpos-kői Cave (Figs. 1, 9) opens in a green schistledge on the northern slope of Mount Kalapos-kő 2 kmnorthwest of the village of Bozsok. The cave has developedthrough the extension of a fault which is parallel with theledge. The northern section of the cave is higher andcomposed of two levels, southwards the hole graduallydescends. The total length of the cave is 30.2 m and thelevel difference is 4.5 m (Eszterhás 2001).
5. SummaryThe study summarises the development and the way inwhich the 15 most significant non-karst caves in Hungaryhave formed and reviews the surrounding rock formations.The longest non-karst cave of Hungary is the 428 m longCsörgő Hole in the Mátra Mountains. Most of the non-karstcaves, numbering 250 caves occur in andesite. As well as
caves which have formed as a result of mass movement andfragmentation, numerous caves have formed as a result ofalkaline solution.
ReferencesDénes Gy, 1996. A pest-hegyi Arany-barlang – Proceedings of the
6th International Symposium on Pseudokarst, Galyatető,117–135 (in Hungarian).
Eszterhás I, 1987. A Tihanyi-félsziget barlangkatasztere – ABakony természettudományi kutatásainak eredményei (18.kötet), Zirc, 45–46 (in Hungarian).
Eszterhás I, 1994. A Pokol-lik – Lychnis a VulkánszpeleológiaiKollektíva kiadványa, Kapolcs, 28–35 (in Hungarian).
Eszterhás I et al., 1998. A Déli-bükk nemkarsztos barlangjai –kézirat a Vulkánszpeleológiai Kollektíva Évkönyvében azMKBT és a BI adattárában, Budapest, 167–178 (in Hungarian).
Eszterhás I, 2001. Barlangok az egykori “Confinia BatthyániaEsterháziána” vidékén – Karszt és Barlang, Budapest, 63–78(in Hungarian).
Eszterhás I 2006. Felszíni denudációs formák ésgyapjúzsákbarlangok a Velencei-hegységben – Karsztfejlődés(XI. kötet), Szombathely, 195–208 (in Hungarian).
Eszterhás I, 2007. A szentkúti Betyár-barlang – Karsztfejlődés(XII. kötet), Szombathely, 331–347 (in Hungarian).
Eszterhás I, Szentes Gy, 2009. Overview of the Non-karstic Cavesin Hungary – Proceedings of the 15th International Congress ofSpeleology, Kerwille, 1474–1480.
Eszterhás I, 2009. Oberflächliche Denudationsformen undWollsackhöhlen im Granit des Velencei-Gebirges Ungarn –Cadernos Laboratorio Xeolóxico de Laxe (Nº 34), A Coruña,27–47 (in German).
Eszterhás I, 2010. Barlangok a Mátrában – in Baráz Cs. editor: AMátrai Tájvédelmi Körzet – a Bükki Nemzeti ParkIgazgatóságának kiadványa, Eger, 107–114 (in Hungarian).
Eszterhás I, 2011. A Tokaji-hegység barlangtani vázlatai –Karsztfejlődés (XVI. kötet), Szombathely, 293–314 (inHungarian).
Figure 10. Survey of the Vasas Chasm No. 1. Cave.
Karst and Caves in Other Rocks, Pseudokarst – oral 2013 ICS Proceedings
312

Eszterhás I, Szentes Gy, 2012. A List of non-karstic Caves inHungary – http://geogr.elte.hu/nonkarstic, Ozoray Gy, 1962.The genesis of non-karstic natural cavities as elucidatedbyHungarian examples – Karszt- és Barlangkutatás II. évfolyam),Budapest, 127–136.
Szabó J, 1871. Az Ágasvári barlang a Mátrában – FöldtaniKözlöny (I. évfolyam), Pest 11–12 Szentes Gy, 1971. Cavesformed in the volcanic rocks of Hungary – Karszt- ésBarlangkutatás (VI. évfolyam), Budapest, 117–129 (inHungarian).
Szilvay P, 1996. Vasas-szakadék I. sz. barlangja – in Eszterhás-Szabó-Szilvay-Tinn: A Visegrádi – hegység barlangjai (I. rész)– kézirat a Vulkánszpeleológiai Kollektíva Évkönyvében azMKBT és a BI adattárában, Budapest, 118–128 (in Hungarian).
Tarsoly P, 2011. A Velencei-hegység gyapjúzsákbarlangjai –Nyugat- magyarországi Egyetem GEO honlap, Székesfehérvár(in Hungarian).
Karst and Caves in Other Rocks, Pseudokarst – oral 2013 ICS Proceedings
313
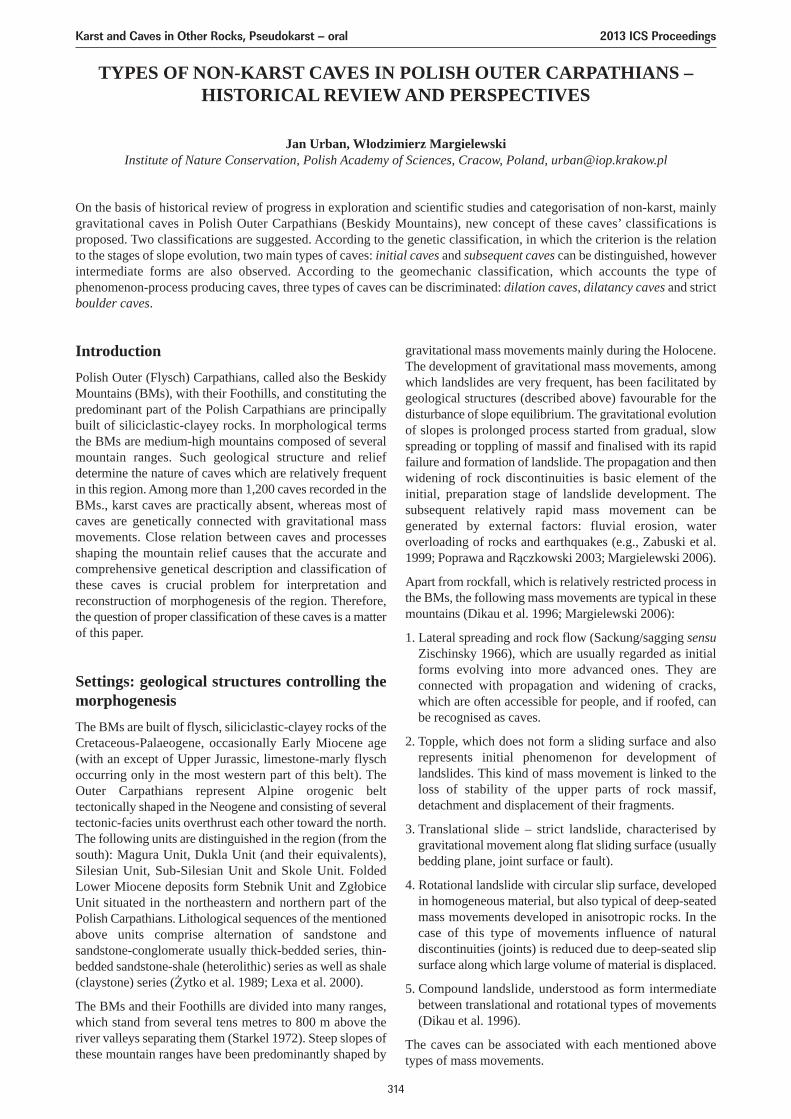
TYPES OF NON-KARST CAVES IN POLISH OUTER CARPATHIANS –HISTORICAL REVIEW AND PERSPECTIVES
Jan Urban, Włodzimierz MargielewskiInstitute of Nature Conservation, Polish Academy of Sciences, Cracow, Poland, [email protected]
On the basis of historical review of progress in exploration and scientific studies and categorisation of non-karst, mainlygravitational caves in Polish Outer Carpathians (Beskidy Mountains), new concept of these caves’ classifications isproposed. Two classifications are suggested. According to the genetic classification, in which the criterion is the relationto the stages of slope evolution, two main types of caves: initial caves and subsequent caves can be distinguished, howeverintermediate forms are also observed. According to the geomechanic classification, which accounts the type ofphenomenon-process producing caves, three types of caves can be discriminated: dilation caves, dilatancy caves and strictboulder caves.
IntroductionPolish Outer (Flysch) Carpathians, called also the BeskidyMountains (BMs), with their Foothills, and constituting thepredominant part of the Polish Carpathians are principallybuilt of siliciclastic-clayey rocks. In morphological termsthe BMs are medium-high mountains composed of severalmountain ranges. Such geological structure and reliefdetermine the nature of caves which are relatively frequentin this region. Among more than 1,200 caves recorded in theBMs., karst caves are practically absent, whereas most ofcaves are genetically connected with gravitational massmovements. Close relation between caves and processesshaping the mountain relief causes that the accurate andcomprehensive genetical description and classification ofthese caves is crucial problem for interpretation andreconstruction of morphogenesis of the region. Therefore,the question of proper classification of these caves is a matterof this paper.
Settings: geological structures controlling themorphogenesisThe BMs are built of flysch, siliciclastic-clayey rocks of theCretaceous-Palaeogene, occasionally Early Miocene age(with an except of Upper Jurassic, limestone-marly flyschoccurring only in the most western part of this belt). TheOuter Carpathians represent Alpine orogenic belttectonically shaped in the Neogene and consisting of severaltectonic-facies units overthrust each other toward the north.The following units are distinguished in the region (from thesouth): Magura Unit, Dukla Unit (and their equivalents),Silesian Unit, Sub-Silesian Unit and Skole Unit. FoldedLower Miocene deposits form Stebnik Unit and ZgłobiceUnit situated in the northeastern and northern part of thePolish Carpathians. Lithological sequences of the mentionedabove units comprise alternation of sandstone andsandstone-conglomerate usually thick-bedded series, thin-bedded sandstone-shale (heterolithic) series as well as shale(claystone) series (Żytko et al. 1989; Lexa et al. 2000).
The BMs and their Foothills are divided into many ranges,which stand from several tens metres to 800 m above theriver valleys separating them (Starkel 1972). Steep slopes ofthese mountain ranges have been predominantly shaped by
gravitational mass movements mainly during the Holocene.The development of gravitational mass movements, amongwhich landslides are very frequent, has been facilitated bygeological structures (described above) favourable for thedisturbance of slope equilibrium. The gravitational evolutionof slopes is prolonged process started from gradual, slowspreading or toppling of massif and finalised with its rapidfailure and formation of landslide. The propagation and thenwidening of rock discontinuities is basic element of theinitial, preparation stage of landslide development. Thesubsequent relatively rapid mass movement can begenerated by external factors: fluvial erosion, wateroverloading of rocks and earthquakes (e.g., Zabuski et al.1999; Poprawa and Rączkowski 2003; Margielewski 2006).
Apart from rockfall, which is relatively restricted process inthe BMs, the following mass movements are typical in thesemountains (Dikau et al. 1996; Margielewski 2006):
1. Lateral spreading and rock flow (Sackung/sagging sensuZischinsky 1966), which are usually regarded as initialforms evolving into more advanced ones. They areconnected with propagation and widening of cracks,which are often accessible for people, and if roofed, canbe recognised as caves.
2. Topple, which does not form a sliding surface and alsorepresents initial phenomenon for development oflandslides. This kind of mass movement is linked to theloss of stability of the upper parts of rock massif,detachment and displacement of their fragments.
3. Translational slide – strict landslide, characterised bygravitational movement along flat sliding surface (usuallybedding plane, joint surface or fault).
4. Rotational landslide with circular slip surface, developedin homogeneous material, but also typical of deep-seatedmass movements developed in anisotropic rocks. In thecase of this type of movements influence of naturaldiscontinuities (joints) is reduced due to deep-seated slipsurface along which large volume of material is displaced.
5. Compound landslide, understood as form intermediatebetween translational and rotational types of movements(Dikau et al. 1996).
The caves can be associated with each mentioned abovetypes of mass movements.
Karst and Caves in Other Rocks, Pseudokarst – oral 2013 ICS Proceedings
314
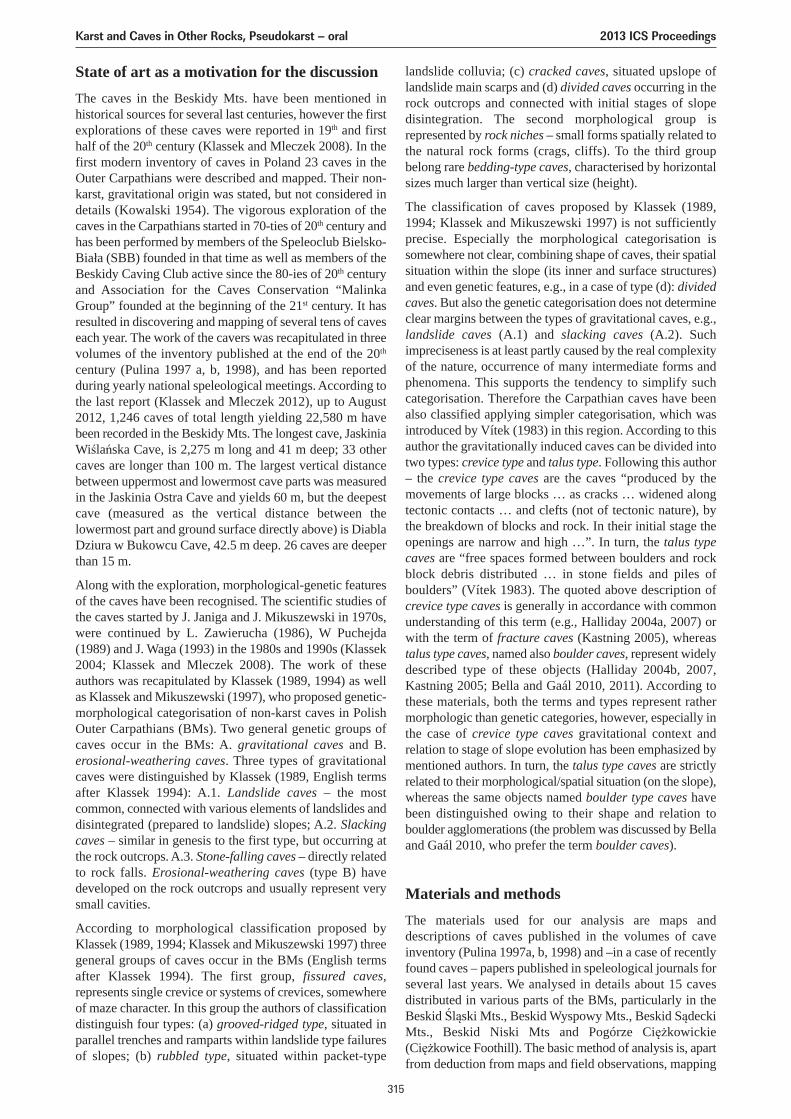
State of art as a motivation for the discussionThe caves in the Beskidy Mts. have been mentioned inhistorical sources for several last centuries, however the firstexplorations of these caves were reported in 19th and firsthalf of the 20th century (Klassek and Mleczek 2008). In thefirst modern inventory of caves in Poland 23 caves in theOuter Carpathians were described and mapped. Their non-karst, gravitational origin was stated, but not considered indetails (Kowalski 1954). The vigorous exploration of thecaves in the Carpathians started in 70-ties of 20th century andhas been performed by members of the Speleoclub Bielsko-Biała (SBB) founded in that time as well as members of theBeskidy Caving Club active since the 80-ies of 20th centuryand Association for the Caves Conservation “MalinkaGroup” founded at the beginning of the 21st century. It hasresulted in discovering and mapping of several tens of caveseach year. The work of the cavers was recapitulated in threevolumes of the inventory published at the end of the 20th
century (Pulina 1997 a, b, 1998), and has been reportedduring yearly national speleological meetings. According tothe last report (Klassek and Mleczek 2012), up to August2012, 1,246 caves of total length yielding 22,580 m havebeen recorded in the Beskidy Mts. The longest cave, JaskiniaWiślańska Cave, is 2,275 m long and 41 m deep; 33 othercaves are longer than 100 m. The largest vertical distancebetween uppermost and lowermost cave parts was measuredin the Jaskinia Ostra Cave and yields 60 m, but the deepestcave (measured as the vertical distance between thelowermost part and ground surface directly above) is DiablaDziura w Bukowcu Cave, 42.5 m deep. 26 caves are deeperthan 15 m.
Along with the exploration, morphological-genetic featuresof the caves have been recognised. The scientific studies ofthe caves started by J. Janiga and J. Mikuszewski in 1970s,were continued by L. Zawierucha (1986), W Puchejda(1989) and J. Waga (1993) in the 1980s and 1990s (Klassek2004; Klassek and Mleczek 2008). The work of theseauthors was recapitulated by Klassek (1989, 1994) as wellas Klassek and Mikuszewski (1997), who proposed genetic-morphological categorisation of non-karst caves in PolishOuter Carpathians (BMs). Two general genetic groups ofcaves occur in the BMs: A. gravitational caves and B.erosional-weathering caves. Three types of gravitationalcaves were distinguished by Klassek (1989, English termsafter Klassek 1994): A.1. Landslide caves – the mostcommon, connected with various elements of landslides anddisintegrated (prepared to landslide) slopes; A.2. Slackingcaves – similar in genesis to the first type, but occurring atthe rock outcrops. A.3. Stone-falling caves – directly relatedto rock falls. Erosional-weathering caves (type B) havedeveloped on the rock outcrops and usually represent verysmall cavities.
According to morphological classification proposed byKlassek (1989, 1994; Klassek and Mikuszewski 1997) threegeneral groups of caves occur in the BMs (English termsafter Klassek 1994). The first group, fissured caves,represents single crevice or systems of crevices, somewhereof maze character. In this group the authors of classificationdistinguish four types: (a) grooved-ridged type, situated inparallel trenches and ramparts within landslide type failuresof slopes; (b) rubbled type, situated within packet-type
landslide colluvia; (c) cracked caves, situated upslope oflandslide main scarps and (d) divided caves occurring in therock outcrops and connected with initial stages of slopedisintegration. The second morphological group isrepresented by rock niches – small forms spatially related tothe natural rock forms (crags, cliffs). To the third groupbelong rare bedding-type caves, characterised by horizontalsizes much larger than vertical size (height).
The classification of caves proposed by Klassek (1989,1994; Klassek and Mikuszewski 1997) is not sufficientlyprecise. Especially the morphological categorisation issomewhere not clear, combining shape of caves, their spatialsituation within the slope (its inner and surface structures)and even genetic features, e.g., in a case of type (d): dividedcaves. But also the genetic categorisation does not determineclear margins between the types of gravitational caves, e.g.,landslide caves (A.1) and slacking caves (A.2). Suchimpreciseness is at least partly caused by the real complexityof the nature, occurrence of many intermediate forms andphenomena. This supports the tendency to simplify suchcategorisation. Therefore the Carpathian caves have beenalso classified applying simpler categorisation, which wasintroduced by Vítek (1983) in this region. According to thisauthor the gravitationally induced caves can be divided intotwo types: crevice type and talus type. Following this author– the crevice type caves are the caves “produced by themovements of large blocks … as cracks … widened alongtectonic contacts … and clefts (not of tectonic nature), bythe breakdown of blocks and rock. In their initial stage theopenings are narrow and high …”. In turn, the talus typecaves are “free spaces formed between boulders and rockblock debris distributed … in stone fields and piles ofboulders” (Vítek 1983). The quoted above description ofcrevice type caves is generally in accordance with commonunderstanding of this term (e.g., Halliday 2004a, 2007) orwith the term of fracture caves (Kastning 2005), whereastalus type caves, named also boulder caves, represent widelydescribed type of these objects (Halliday 2004b, 2007,Kastning 2005; Bella and Gaál 2010, 2011). According tothese materials, both the terms and types represent rathermorphologic than genetic categories, however, especially inthe case of crevice type caves gravitational context andrelation to stage of slope evolution has been emphasized bymentioned authors. In turn, the talus type caves are strictlyrelated to their morphological/spatial situation (on the slope),whereas the same objects named boulder type caves havebeen distinguished owing to their shape and relation toboulder agglomerations (the problem was discussed by Bellaand Gaál 2010, who prefer the term boulder caves).
Materials and methodsThe materials used for our analysis are maps anddescriptions of caves published in the volumes of caveinventory (Pulina 1997a, b, 1998) and –in a case of recentlyfound caves – papers published in speleological journals forseveral last years. We analysed in details about 15 cavesdistributed in various parts of the BMs, particularly in theBeskid Śląski Mts., Beskid Wyspowy Mts., Beskid SądeckiMts., Beskid Niski Mts and Pogórze Ciężkowickie(Ciężkowice Foothill). The basic method of analysis is, apartfrom deduction from maps and field observations, mapping
Karst and Caves in Other Rocks, Pseudokarst – oral 2013 ICS Proceedings
315
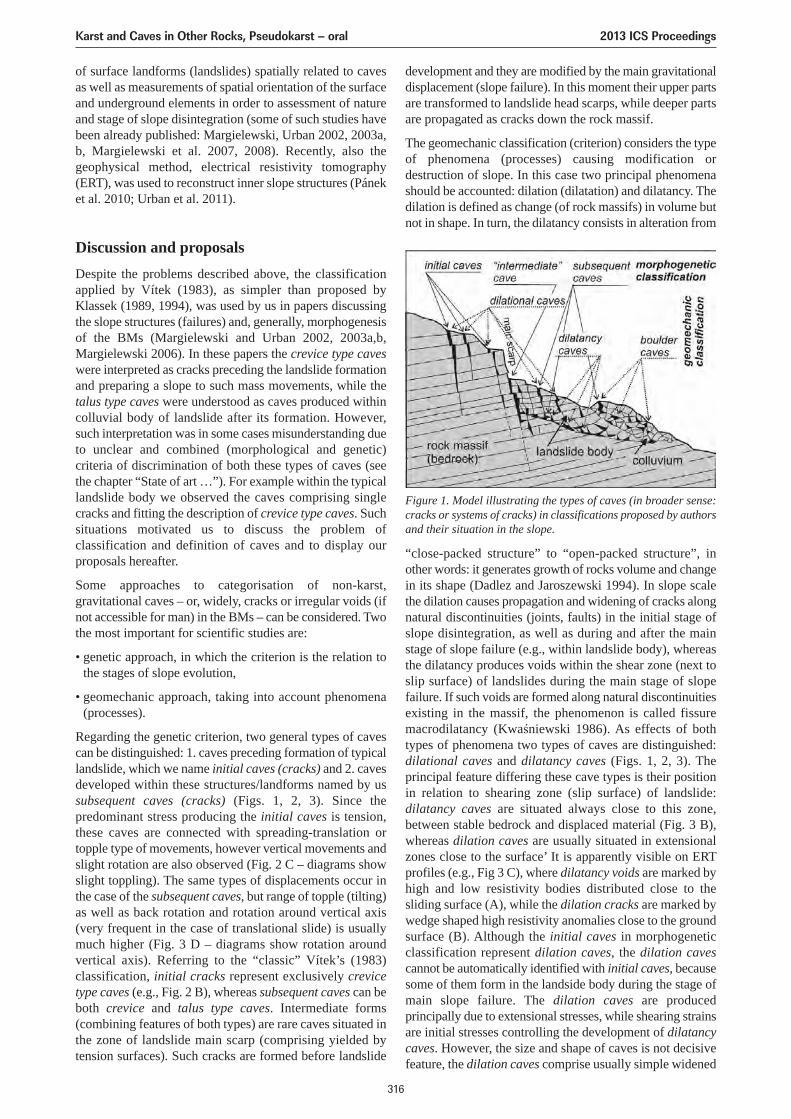
of surface landforms (landslides) spatially related to cavesas well as measurements of spatial orientation of the surfaceand underground elements in order to assessment of natureand stage of slope disintegration (some of such studies havebeen already published: Margielewski, Urban 2002, 2003a,b, Margielewski et al. 2007, 2008). Recently, also thegeophysical method, electrical resistivity tomography(ERT), was used to reconstruct inner slope structures (Páneket al. 2010; Urban et al. 2011).
Discussion and proposalsDespite the problems described above, the classificationapplied by Vítek (1983), as simpler than proposed byKlassek (1989, 1994), was used by us in papers discussingthe slope structures (failures) and, generally, morphogenesisof the BMs (Margielewski and Urban 2002, 2003a,b,Margielewski 2006). In these papers the crevice type caveswere interpreted as cracks preceding the landslide formationand preparing a slope to such mass movements, while thetalus type caves were understood as caves produced withincolluvial body of landslide after its formation. However,such interpretation was in some cases misunderstanding dueto unclear and combined (morphological and genetic)criteria of discrimination of both these types of caves (seethe chapter “State of art …”). For example within the typicallandslide body we observed the caves comprising singlecracks and fitting the description of crevice type caves. Suchsituations motivated us to discuss the problem ofclassification and definition of caves and to display ourproposals hereafter.
Some approaches to categorisation of non-karst,gravitational caves – or, widely, cracks or irregular voids (ifnot accessible for man) in the BMs – can be considered. Twothe most important for scientific studies are:
• genetic approach, in which the criterion is the relation tothe stages of slope evolution,
• geomechanic approach, taking into account phenomena(processes).
Regarding the genetic criterion, two general types of cavescan be distinguished: 1. caves preceding formation of typicallandslide, which we name initial caves (cracks) and 2. cavesdeveloped within these structures/landforms named by ussubsequent caves (cracks) (Figs. 1, 2, 3). Since thepredominant stress producing the initial caves is tension,these caves are connected with spreading-translation ortopple type of movements, however vertical movements andslight rotation are also observed (Fig. 2 C – diagrams showslight toppling). The same types of displacements occur inthe case of the subsequent caves, but range of topple (tilting)as well as back rotation and rotation around vertical axis(very frequent in the case of translational slide) is usuallymuch higher (Fig. 3 D – diagrams show rotation aroundvertical axis). Referring to the “classic” Vítek’s (1983)classification, initial cracks represent exclusively crevicetype caves (e.g., Fig. 2 B), whereas subsequent caves can beboth crevice and talus type caves. Intermediate forms(combining features of both types) are rare caves situated inthe zone of landslide main scarp (comprising yielded bytension surfaces). Such cracks are formed before landslide
development and they are modified by the main gravitationaldisplacement (slope failure). In this moment their upper partsare transformed to landslide head scarps, while deeper partsare propagated as cracks down the rock massif.
The geomechanic classification (criterion) considers the typeof phenomena (processes) causing modification ordestruction of slope. In this case two principal phenomenashould be accounted: dilation (dilatation) and dilatancy. Thedilation is defined as change (of rock massifs) in volume butnot in shape. In turn, the dilatancy consists in alteration from
Figure 1. Model illustrating the types of caves (in broader sense:cracks or systems of cracks) in classifications proposed by authorsand their situation in the slope.
“close-packed structure” to “open-packed structure”, inother words: it generates growth of rocks volume and changein its shape (Dadlez and Jaroszewski 1994). In slope scalethe dilation causes propagation and widening of cracks alongnatural discontinuities (joints, faults) in the initial stage ofslope disintegration, as well as during and after the mainstage of slope failure (e.g., within landslide body), whereasthe dilatancy produces voids within the shear zone (next toslip surface) of landslides during the main stage of slopefailure. If such voids are formed along natural discontinuitiesexisting in the massif, the phenomenon is called fissuremacrodilatancy (Kwaśniewski 1986). As effects of bothtypes of phenomena two types of caves are distinguished:dilational caves and dilatancy caves (Figs. 1, 2, 3). Theprincipal feature differing these cave types is their positionin relation to shearing zone (slip surface) of landslide:dilatancy caves are situated always close to this zone,between stable bedrock and displaced material (Fig. 3 B),whereas dilation caves are usually situated in extensionalzones close to the surface’ It is apparently visible on ERTprofiles (e.g., Fig 3 C), where dilatancy voids are marked byhigh and low resistivity bodies distributed close to thesliding surface (A), while the dilation cracks are marked bywedge shaped high resistivity anomalies close to the groundsurface (B). Although the initial caves in morphogeneticclassification represent dilation caves, the dilation cavescannot be automatically identified with initial caves, becausesome of them form in the landside body during the stage ofmain slope failure. The dilation caves are producedprincipally due to extensional stresses, while shearing strainsare initial stresses controlling the development of dilatancycaves. However, the size and shape of caves is not decisivefeature, the dilation caves comprise usually simple widened
Karst and Caves in Other Rocks, Pseudokarst – oral 2013 ICS Proceedings
316
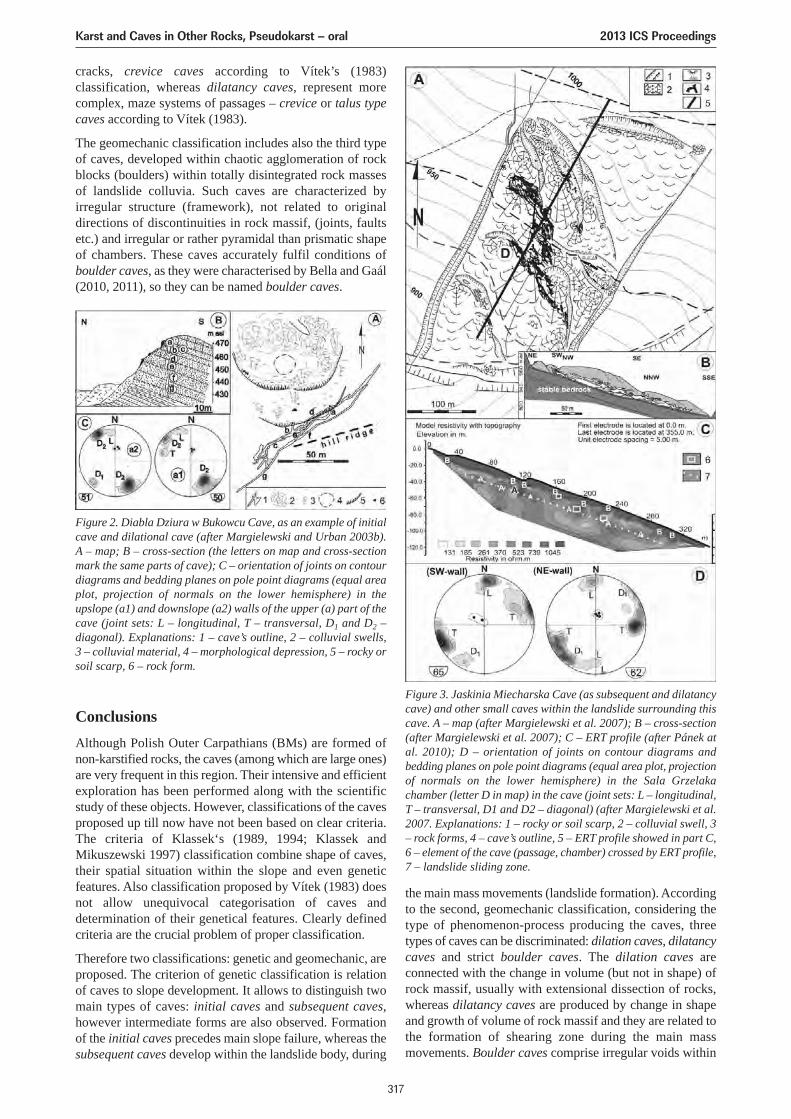
cracks, crevice caves according to Vítek’s (1983)classification, whereas dilatancy caves, represent morecomplex, maze systems of passages – crevice or talus typecaves according to Vítek (1983).
The geomechanic classification includes also the third typeof caves, developed within chaotic agglomeration of rockblocks (boulders) within totally disintegrated rock massesof landslide colluvia. Such caves are characterized byirregular structure (framework), not related to originaldirections of discontinuities in rock massif, (joints, faultsetc.) and irregular or rather pyramidal than prismatic shapeof chambers. These caves accurately fulfil conditions ofboulder caves, as they were characterised by Bella and Gaál(2010, 2011), so they can be named boulder caves.
ConclusionsAlthough Polish Outer Carpathians (BMs) are formed ofnon-karstified rocks, the caves (among which are large ones)are very frequent in this region. Their intensive and efficientexploration has been performed along with the scientificstudy of these objects. However, classifications of the cavesproposed up till now have not been based on clear criteria.The criteria of Klassek‘s (1989, 1994; Klassek andMikuszewski 1997) classification combine shape of caves,their spatial situation within the slope and even geneticfeatures. Also classification proposed by Vítek (1983) doesnot allow unequivocal categorisation of caves anddetermination of their genetical features. Clearly definedcriteria are the crucial problem of proper classification.
Therefore two classifications: genetic and geomechanic, areproposed. The criterion of genetic classification is relationof caves to slope development. It allows to distinguish twomain types of caves: initial caves and subsequent caves,however intermediate forms are also observed. Formationof the initial caves precedes main slope failure, whereas thesubsequent caves develop within the landslide body, during
the main mass movements (landslide formation). Accordingto the second, geomechanic classification, considering thetype of phenomenon-process producing the caves, threetypes of caves can be discriminated: dilation caves, dilatancycaves and strict boulder caves. The dilation caves areconnected with the change in volume (but not in shape) ofrock massif, usually with extensional dissection of rocks,whereas dilatancy caves are produced by change in shapeand growth of volume of rock massif and they are related tothe formation of shearing zone during the main massmovements. Boulder caves comprise irregular voids within
Figure 3. Jaskinia Miecharska Cave (as subsequent and dilatancycave) and other small caves within the landslide surrounding thiscave. A – map (after Margielewski et al. 2007); B – cross-section(after Margielewski et al. 2007); C – ERT profile (after Pánek atal. 2010); D – orientation of joints on contour diagrams andbedding planes on pole point diagrams (equal area plot, projectionof normals on the lower hemisphere) in the Sala Grzelakachamber (letter D in map) in the cave (joint sets: L – longitudinal,T – transversal, D1 and D2 – diagonal) (after Margielewski et al.2007. Explanations: 1 – rocky or soil scarp, 2 – colluvial swell, 3– rock forms, 4 – cave’s outline, 5 – ERT profile showed in part C,6 – element of the cave (passage, chamber) crossed by ERT profile,7 – landslide sliding zone.
Figure 2. Diabla Dziura w Bukowcu Cave, as an example of initialcave and dilational cave (after Margielewski and Urban 2003b).A – map; B – cross-section (the letters on map and cross-sectionmark the same parts of cave); C – orientation of joints on contourdiagrams and bedding planes on pole point diagrams (equal areaplot, projection of normals on the lower hemisphere) in theupslope (a1) and downslope (a2) walls of the upper (a) part of thecave (joint sets: L – longitudinal, T – transversal, D1 and D2 –diagonal). Explanations: 1 – cave’s outline, 2 – colluvial swells,3 – colluvial material, 4 – morphological depression, 5 – rocky orsoil scarp, 6 – rock form.
Karst and Caves in Other Rocks, Pseudokarst – oral 2013 ICS Proceedings
317
the chaotic agglomeration of boulders in landslide colluvia.
These two classifications could help in scientific descriptionof caves connected with gravitational mass movements,because application of them (i.e. identification of caveaccording to their criteria) makes possible cleardetermination of geomorphologic situation of cave and itsgenesis.
This study was conducted within a scientific project No.NN306 522 738 granted by Polish Ministry of Sciences in2010–2013, and statutory works of the Institute of NatureConservation PAS.
ReferencesBella P, Gaál L, 2010. Boulder caves – terminology and genetic
types (English abstract). Aragonit 15(1), 3–10.
Bella P, Gaál L, 2011. Terminology and genetic types of bouldercaves. Pseudokarst Commission Newsletter 22, 1–5 (Englishand German versions). http://wwwpub.zih.tu-dresden.de/~simmert/pkarst/08 _newsletter/newsletter_022.pdf
Dadlez R, Jaroszewski W, 1994. Tektonika. Wyd. PWN, Warszawa(in Polish).
Dikau R, Brunsden D, Schrott L, Ibsen ML, (Eds.) 1996. Landsliderecognition. Identification, Movement and Causes. Willey,Chichester.
Halliday WR, 2004a. Crevice caves. In: J Gunn (Ed.),Encyclopedia of caves and karst science. Fitzroy Dearborn,New York, London, 510–518.
Halliday WR, 2004b. Talus caves. In: J Gunn (Ed.), Encyclopediaof caves and karst science. Fitzroy Dearborn, New York,London, 1544–1550.
Halliday WR, 2007. Pseudokarst in 21st century. Journal of Caveand Karst Studies, 69(1), 103–113.
Kastning EH, 2005. Very small and eclectic caves: conservationand management issues. National Cave and Karst ManagementSymposium. Albany, New York, 92–101.
Klassek G, 1989. Study of caves in Beskidy Mts. and CarpathianFoothills in Poland. In: 2. Sympozium o Pseudokrasu. Sborníkreferatů ze sympozia. Janovičky u Broumova, 1985. CzechSpeleological Society, vol. 10. Praha, 44–48 (in Czech, Germansummary).
Klassek G, 1994. Pseudokarst caves in Polish Karpaty Mts. In: 5thPseudokatrst Sympozium with International Participation,Szczyrk 1994. Proceedings. Bielsko-Biała, 5–9 (in Polish,English summary).
Klassek G, 2004. Caves of the Polish Flysch Carpathians. In: LGaál (Ed.), Proceedings of the 8th Intern. Symp. on Pseudokarst.Teply Vrch, Slovakia, 2004. Slovak Cave Administration,Liptovský Mikuláš, 69–74.
Klassek G, Mikuszewski J, 1997. Przyrodnicza charakterystykajaskiń, warunków ich występowania i rozwoju w obszarzepolskich Karpat fliszowych. In: M Pulina (Ed.), Jaskiniepolskich Karpat fliszowych, v. 1. Pol. Tow. Przyjaciół Nauk oZiemi, Warszawa, 7–18 (in Polish).
Klassek G, Mleczek T, 2008. Exploration of caves in the PolishOuter Carpathians in the past and nowadays. Zacisk – specialissue (9th Intern. Symp. on Pseudokarst). Bull. of the SpeleoclubBielsko-Biała, Bielsko-Biała, 4–6.
Klassek G, Mleczek T, 2012. Eksploracja i inwentaryzacja jaskińpolskich Karpat Fliszowych (sierpień 2011 r. – sierpień 2012r.). In: J Szulc, W Wróblewski W (Eds.), Materiały 46.Sympozjum Speleologicznego, Góra Św. Anny, 19–21.10.2012.Sekcja Speleologiczna PTP im. Kopernika. Kraków, 42–45 (inPolish).
Kowalski K, 1954. Jaskinie Beskidów i Pogórza Karpackiego. In:Kowalski K. Jaskinie Polski, vol. 3. Narodowe Muz.Archeologiczne, Warszawa, 25–67 (in Polish).
Kwaśniewski M, 1986. Dylatancja jako zwiastun zniszczenia skały.Przegląd Górniczy 42(2), 42–49 and 42(6), 184–190 (in Polish).
Lexa J, Bezák V, Elečko M, Mello J, Polák M, Potfaj M, Vozár J,(Eds.) 2000. Geological map of Western Carpathians andadjacent areas 1:500,000. Geol. Survey of Slovak Republic,Bratislava.
Margielewski W, 2006. Structural control and types of movementsof rock mass in anisotropic rocks: case studies in the PolishFlysch Carpathians. Geomorphology 77, 47–68.
Margielewski W, Urban J, 2002. Initiation of mass movement inthe Polish Flysch Carpathians studied in the selected crevicetype caves. In: J Rybář, J Stemberk, P Wagner (Eds.),Landslides. AA Balkema Publ, Lisse-Abingdon-Exton-Tokyo,405–409.
Margielewski W, Urban J, 2003a. Crevice-type caves as initialforms of rock landslide development in the Flysch Carpathians.Geomorphology 54, 325–338.
Margielewski W, Urban J, 2003b. Direction and nature of jointscontrolling development of deep seated mass movements: a casestudy of Diabla Dziura cave (Polish flysch Carpathians).Geomorphologia Slovaca 3, 58–59.
Margielewski W, Urban J, Szura C, 2007. Jaskinia Miecharska cave(Beskid Śląski Mts., Polish Outer Carpathians): case study of acrevice-type cave developed on a sliding surface. NatureConservation 63, 57–68.
Margielewski W, Szura C, Urban J, 2008. Jaskinia Miecharska cave(Beskid Śląski Mts., Polish Outer Carpathians), the largest non-karst cave in the flysch Carpathians. Zacisk – special issue (9th
Intern. Symp. on Pseudokarst). Bull. of the Speleoclub Bielsko-Biała, Bielsko-Biała, 7–13.
Pánek T, Margielewski W, Tábořík P, Urban J, Hradecký J, SzuraC, 2010. Gravitationally induced caves and other discontinuitiesdetected by 2D electrical resistivity tomography: Case studiesfrom the Polish Flysch Carpathians. Geomorphology 123,165–180.
Poprawa D, Rączkowski W, 2003. Carpathian landslide (southernPoland). Przegląd Geologiczny, 51(8), 685–692 (in Polish,English abstract).
Puchejda W, 1989. Genesis of the cave in Trzy Kopce in theSilesian Beskidy Mts. Kras i Speleologia 6(XV): 66–78(in Polish, English abstract).
Pulina M, 1997a. Jaskinie polskich Karpat fliszowych, v. 1. Pol.Tow. Przyjaciół Nauk o Ziemi, Warszawa (in Polish).
Pulina M, 1997b. Jaskinie polskich Karpat fliszowych, v. 2. Pol.Tow. Przyjaciół Nauk o Ziemi, Warszawa (in Polish).
Pulina M, 1998. Jaskinie polskich Karpat fliszowych, v. 3. Pol.Tow. Przyjaciół Nauk o Ziemi, Warszawa (in Polish).
Starkel L. 1972. An outline of the relief of the Polish Carpathiansand its importance for human management. ProblemyZagospodarowania Ziem Górskich 10, 75–150 (in Polish,English abstract).
Karst and Caves in Other Rocks, Pseudokarst – oral 2013 ICS Proceedings
318

Urban J, Panek T, Taborik P, Hradecky J, Margielewski W, SzuraC, 2011. Caves in the Flysch Carpathians detected by ERTmethod. In: J Simmert (Ed.), Proceedings of the 11th Intern.Symp. Pseudokarst. 12–16 May, Saupsdorf – SaxonSwitzerland, Germany. Dresden: 132–143.
Vítek J, 1983. Classification of pseudokarst forms inCzechoslovakia. Intern. Journal of Speleology 13, 1–18.
Waga JM, 1993. Genesis of the Komoniecki Cave in the BeskidMały. Kras i Speleologia 7(XVI): 94–101 (in Polish, Englishabstract).
Zabuski L, Thiel K, Bober L, 1999. Landslides in the PolishCarpathians Flysch. Geology, modelling, stability calculations.Publ.: IBW PAN, Gdańsk (in Polish, English abstract).
Zawierucha L, 1986. Zarys typologii jaskiń pseudokrasowychBeskidów i Pogórza Karpackiego. In: Inwentarz jaskińbeskidzkich p. V. PTTK, Speleoklub Bielsko-Biała, 16–18 (inPolish).
Zischinsky U, 1966. On the deformation on high slopes. Sitzber, 1Kongr. Int. Ges. Felsmechanic, 2. Lissboa, 179–185.
Żytko K, Zając R, Gucik S, Ryłko W, Oszczypko N, Garlicka I,Nemčok J, Eliáš M, Menčík E, Stráník Z, 1989. Map of thetectonic elements of the Western Outer Carpathians and theirforeland. PIG Warszawa; GUDS Bratislava; UUG Praha.
Karst and Caves in Other Rocks, Pseudokarst – oral 2013 ICS Proceedings
319
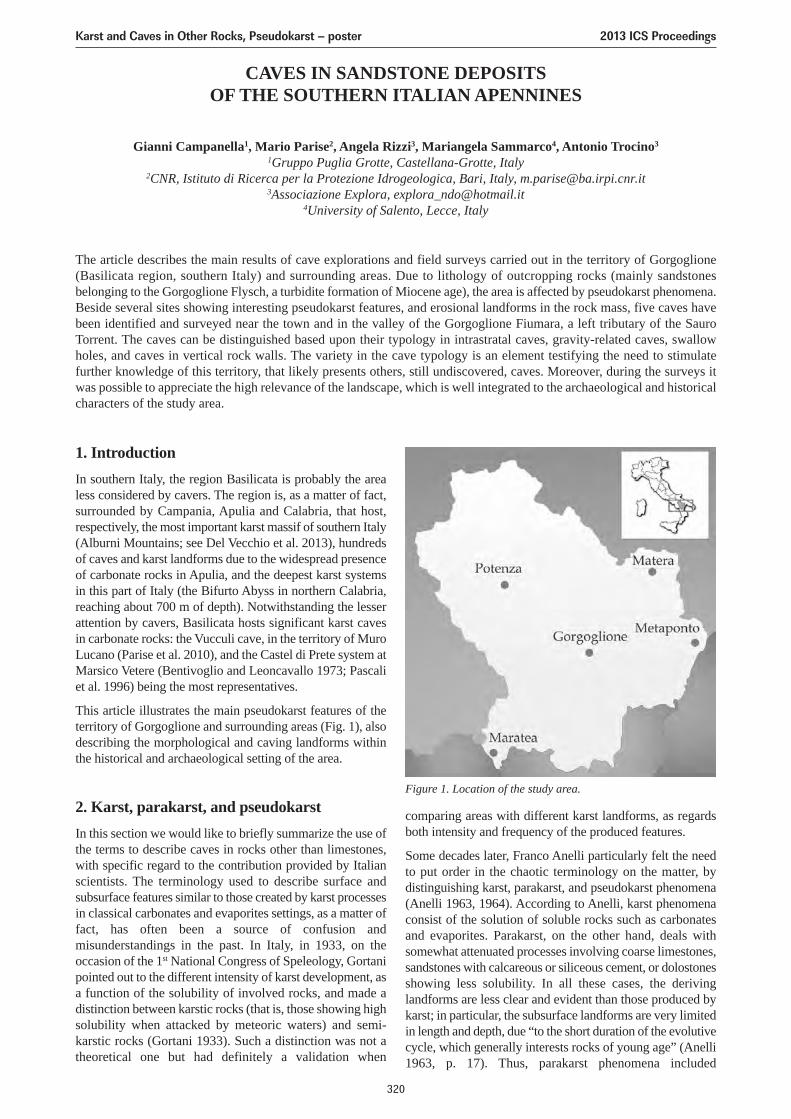
CAVES IN SANDSTONE DEPOSITSOF THE SOUTHERN ITALIAN APENNINES
Gianni Campanella1, Mario Parise2, Angela Rizzi3, Mariangela Sammarco4, Antonio Trocino3
1Gruppo Puglia Grotte, Castellana-Grotte, Italy2CNR, Istituto di Ricerca per la Protezione Idrogeologica, Bari, Italy, [email protected]
3Associazione Explora, [email protected] of Salento, Lecce, Italy
The article describes the main results of cave explorations and field surveys carried out in the territory of Gorgoglione(Basilicata region, southern Italy) and surrounding areas. Due to lithology of outcropping rocks (mainly sandstonesbelonging to the Gorgoglione Flysch, a turbidite formation of Miocene age), the area is affected by pseudokarst phenomena.Beside several sites showing interesting pseudokarst features, and erosional landforms in the rock mass, five caves havebeen identified and surveyed near the town and in the valley of the Gorgoglione Fiumara, a left tributary of the SauroTorrent. The caves can be distinguished based upon their typology in intrastratal caves, gravity-related caves, swallowholes, and caves in vertical rock walls. The variety in the cave typology is an element testifying the need to stimulatefurther knowledge of this territory, that likely presents others, still undiscovered, caves. Moreover, during the surveys itwas possible to appreciate the high relevance of the landscape, which is well integrated to the archaeological and historicalcharacters of the study area.
1. IntroductionIn southern Italy, the region Basilicata is probably the arealess considered by cavers. The region is, as a matter of fact,surrounded by Campania, Apulia and Calabria, that host,respectively, the most important karst massif of southern Italy(Alburni Mountains; see Del Vecchio et al. 2013), hundredsof caves and karst landforms due to the widespread presenceof carbonate rocks in Apulia, and the deepest karst systemsin this part of Italy (the Bifurto Abyss in northern Calabria,reaching about 700 m of depth). Notwithstanding the lesserattention by cavers, Basilicata hosts significant karst cavesin carbonate rocks: the Vucculi cave, in the territory of MuroLucano (Parise et al. 2010), and the Castel di Prete system atMarsico Vetere (Bentivoglio and Leoncavallo 1973; Pascaliet al. 1996) being the most representatives.
This article illustrates the main pseudokarst features of theterritory of Gorgoglione and surrounding areas (Fig. 1), alsodescribing the morphological and caving landforms withinthe historical and archaeological setting of the area.
2. Karst, parakarst, and pseudokarstIn this section we would like to briefly summarize the use ofthe terms to describe caves in rocks other than limestones,with specific regard to the contribution provided by Italianscientists. The terminology used to describe surface andsubsurface features similar to those created by karst processesin classical carbonates and evaporites settings, as a matter offact, has often been a source of confusion andmisunderstandings in the past. In Italy, in 1933, on theoccasion of the 1st National Congress of Speleology, Gortanipointed out to the different intensity of karst development, asa function of the solubility of involved rocks, and made adistinction between karstic rocks (that is, those showing highsolubility when attacked by meteoric waters) and semi-karstic rocks (Gortani 1933). Such a distinction was not atheoretical one but had definitely a validation when
comparing areas with different karst landforms, as regardsboth intensity and frequency of the produced features.
Some decades later, Franco Anelli particularly felt the needto put order in the chaotic terminology on the matter, bydistinguishing karst, parakarst, and pseudokarst phenomena(Anelli 1963, 1964). According to Anelli, karst phenomenaconsist of the solution of soluble rocks such as carbonatesand evaporites. Parakarst, on the other hand, deals withsomewhat attenuated processes involving coarse limestones,sandstones with calcareous or siliceous cement, or dolostonesshowing less solubility. In all these cases, the derivinglandforms are less clear and evident than those produced bykarst; in particular, the subsurface landforms are very limitedin length and depth, due “to the short duration of the evolutivecycle, which generally interests rocks of young age” (Anelli1963, p. 17). Thus, parakarst phenomena included
Figure 1. Location of the study area.
Karst and Caves in Other Rocks, Pseudokarst – poster 2013 ICS Proceedings
320
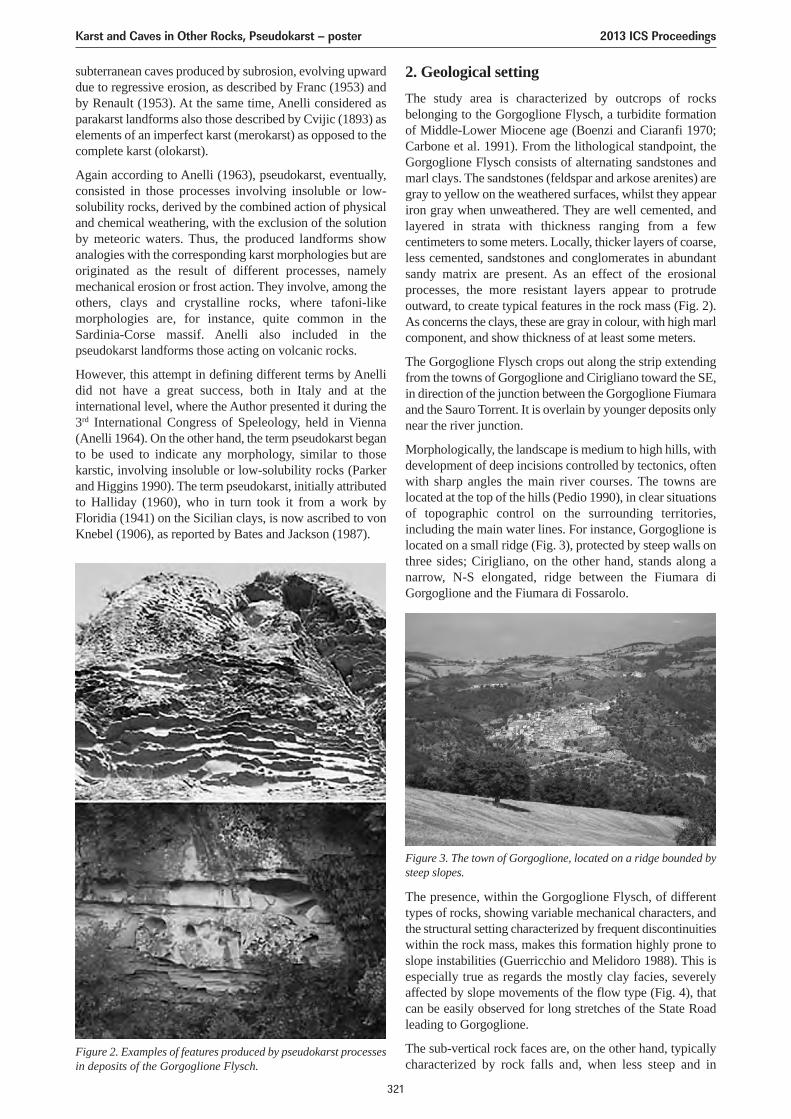
subterranean caves produced by subrosion, evolving upwarddue to regressive erosion, as described by Franc (1953) andby Renault (1953). At the same time, Anelli considered asparakarst landforms also those described by Cvijic (1893) aselements of an imperfect karst (merokarst) as opposed to thecomplete karst (olokarst).
Again according to Anelli (1963), pseudokarst, eventually,consisted in those processes involving insoluble or low-solubility rocks, derived by the combined action of physicaland chemical weathering, with the exclusion of the solutionby meteoric waters. Thus, the produced landforms showanalogies with the corresponding karst morphologies but areoriginated as the result of different processes, namelymechanical erosion or frost action. They involve, among theothers, clays and crystalline rocks, where tafoni-likemorphologies are, for instance, quite common in theSardinia-Corse massif. Anelli also included in thepseudokarst landforms those acting on volcanic rocks.
However, this attempt in defining different terms by Anellidid not have a great success, both in Italy and at theinternational level, where the Author presented it during the3rd International Congress of Speleology, held in Vienna(Anelli 1964). On the other hand, the term pseudokarst beganto be used to indicate any morphology, similar to thosekarstic, involving insoluble or low-solubility rocks (Parkerand Higgins 1990). The term pseudokarst, initially attributedto Halliday (1960), who in turn took it from a work byFloridia (1941) on the Sicilian clays, is now ascribed to vonKnebel (1906), as reported by Bates and Jackson (1987).
2. Geological settingThe study area is characterized by outcrops of rocksbelonging to the Gorgoglione Flysch, a turbidite formationof Middle-Lower Miocene age (Boenzi and Ciaranfi 1970;Carbone et al. 1991). From the lithological standpoint, theGorgoglione Flysch consists of alternating sandstones andmarl clays. The sandstones (feldspar and arkose arenites) aregray to yellow on the weathered surfaces, whilst they appeariron gray when unweathered. They are well cemented, andlayered in strata with thickness ranging from a fewcentimeters to some meters. Locally, thicker layers of coarse,less cemented, sandstones and conglomerates in abundantsandy matrix are present. As an effect of the erosionalprocesses, the more resistant layers appear to protrudeoutward, to create typical features in the rock mass (Fig. 2).As concerns the clays, these are gray in colour, with high marlcomponent, and show thickness of at least some meters.
The Gorgoglione Flysch crops out along the strip extendingfrom the towns of Gorgoglione and Cirigliano toward the SE,in direction of the junction between the Gorgoglione Fiumaraand the Sauro Torrent. It is overlain by younger deposits onlynear the river junction.
Morphologically, the landscape is medium to high hills, withdevelopment of deep incisions controlled by tectonics, oftenwith sharp angles the main river courses. The towns arelocated at the top of the hills (Pedio 1990), in clear situationsof topographic control on the surrounding territories,including the main water lines. For instance, Gorgoglione islocated on a small ridge (Fig. 3), protected by steep walls onthree sides; Cirigliano, on the other hand, stands along anarrow, N-S elongated, ridge between the Fiumara diGorgoglione and the Fiumara di Fossarolo.
Figure 2. Examples of features produced by pseudokarst processesin deposits of the Gorgoglione Flysch.
Figure 3. The town of Gorgoglione, located on a ridge bounded bysteep slopes.
The presence, within the Gorgoglione Flysch, of differenttypes of rocks, showing variable mechanical characters, andthe structural setting characterized by frequent discontinuitieswithin the rock mass, makes this formation highly prone toslope instabilities (Guerricchio and Melidoro 1988). This isespecially true as regards the mostly clay facies, severelyaffected by slope movements of the flow type (Fig. 4), thatcan be easily observed for long stretches of the State Roadleading to Gorgoglione.
The sub-vertical rock faces are, on the other hand, typicallycharacterized by rock falls and, when less steep and in
Karst and Caves in Other Rocks, Pseudokarst – poster 2013 ICS Proceedings
321
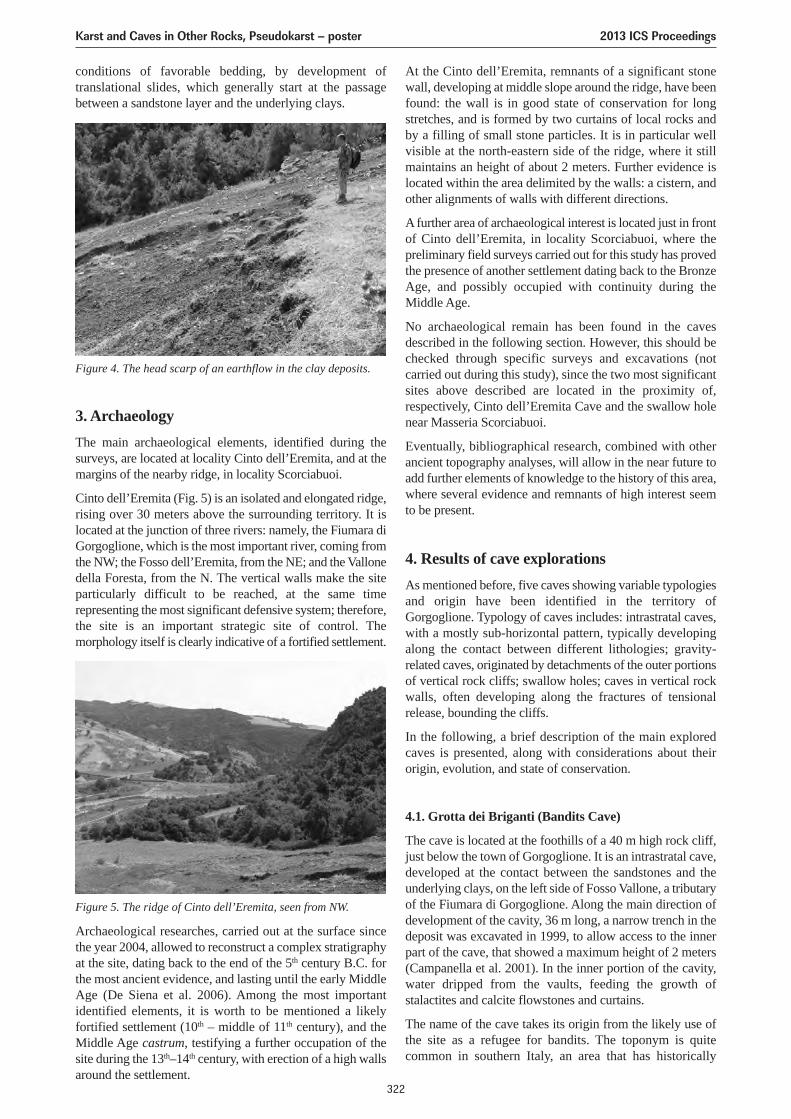
conditions of favorable bedding, by development oftranslational slides, which generally start at the passagebetween a sandstone layer and the underlying clays.
At the Cinto dell’Eremita, remnants of a significant stonewall, developing at middle slope around the ridge, have beenfound: the wall is in good state of conservation for longstretches, and is formed by two curtains of local rocks andby a filling of small stone particles. It is in particular wellvisible at the north-eastern side of the ridge, where it stillmaintains an height of about 2 meters. Further evidence islocated within the area delimited by the walls: a cistern, andother alignments of walls with different directions.
A further area of archaeological interest is located just in frontof Cinto dell’Eremita, in locality Scorciabuoi, where thepreliminary field surveys carried out for this study has provedthe presence of another settlement dating back to the BronzeAge, and possibly occupied with continuity during theMiddle Age.
No archaeological remain has been found in the cavesdescribed in the following section. However, this should bechecked through specific surveys and excavations (notcarried out during this study), since the two most significantsites above described are located in the proximity of,respectively, Cinto dell’Eremita Cave and the swallow holenear Masseria Scorciabuoi.
Eventually, bibliographical research, combined with otherancient topography analyses, will allow in the near future toadd further elements of knowledge to the history of this area,where several evidence and remnants of high interest seemto be present.
4. Results of cave explorationsAs mentioned before, five caves showing variable typologiesand origin have been identified in the territory ofGorgoglione. Typology of caves includes: intrastratal caves,with a mostly sub-horizontal pattern, typically developingalong the contact between different lithologies; gravity-related caves, originated by detachments of the outer portionsof vertical rock cliffs; swallow holes; caves in vertical rockwalls, often developing along the fractures of tensionalrelease, bounding the cliffs.
In the following, a brief description of the main exploredcaves is presented, along with considerations about theirorigin, evolution, and state of conservation.
4.1. Grotta dei Briganti (Bandits Cave)
The cave is located at the foothills of a 40 m high rock cliff,just below the town of Gorgoglione. It is an intrastratal cave,developed at the contact between the sandstones and theunderlying clays, on the left side of Fosso Vallone, a tributaryof the Fiumara di Gorgoglione. Along the main direction ofdevelopment of the cavity, 36 m long, a narrow trench in thedeposit was excavated in 1999, to allow access to the innerpart of the cave, that showed a maximum height of 2 meters(Campanella et al. 2001). In the inner portion of the cavity,water dripped from the vaults, feeding the growth ofstalactites and calcite flowstones and curtains.
The name of the cave takes its origin from the likely use ofthe site as a refugee for bandits. The toponym is quitecommon in southern Italy, an area that has historically
Figure 4. The head scarp of an earthflow in the clay deposits.
3. ArchaeologyThe main archaeological elements, identified during thesurveys, are located at locality Cinto dell’Eremita, and at themargins of the nearby ridge, in locality Scorciabuoi.
Cinto dell’Eremita (Fig. 5) is an isolated and elongated ridge,rising over 30 meters above the surrounding territory. It islocated at the junction of three rivers: namely, the Fiumara diGorgoglione, which is the most important river, coming fromthe NW; the Fosso dell’Eremita, from the NE; and the Vallonedella Foresta, from the N. The vertical walls make the siteparticularly difficult to be reached, at the same timerepresenting the most significant defensive system; therefore,the site is an important strategic site of control. Themorphology itself is clearly indicative of a fortified settlement.
Figure 5. The ridge of Cinto dell’Eremita, seen from NW.
Archaeological researches, carried out at the surface sincethe year 2004, allowed to reconstruct a complex stratigraphyat the site, dating back to the end of the 5th century B.C. forthe most ancient evidence, and lasting until the early MiddleAge (De Siena et al. 2006). Among the most importantidentified elements, it is worth to be mentioned a likelyfortified settlement (10th – middle of 11th century), and theMiddle Age castrum, testifying a further occupation of thesite during the 13th–14th century, with erection of a high wallsaround the settlement.
Karst and Caves in Other Rocks, Pseudokarst – poster 2013 ICS Proceedings
322
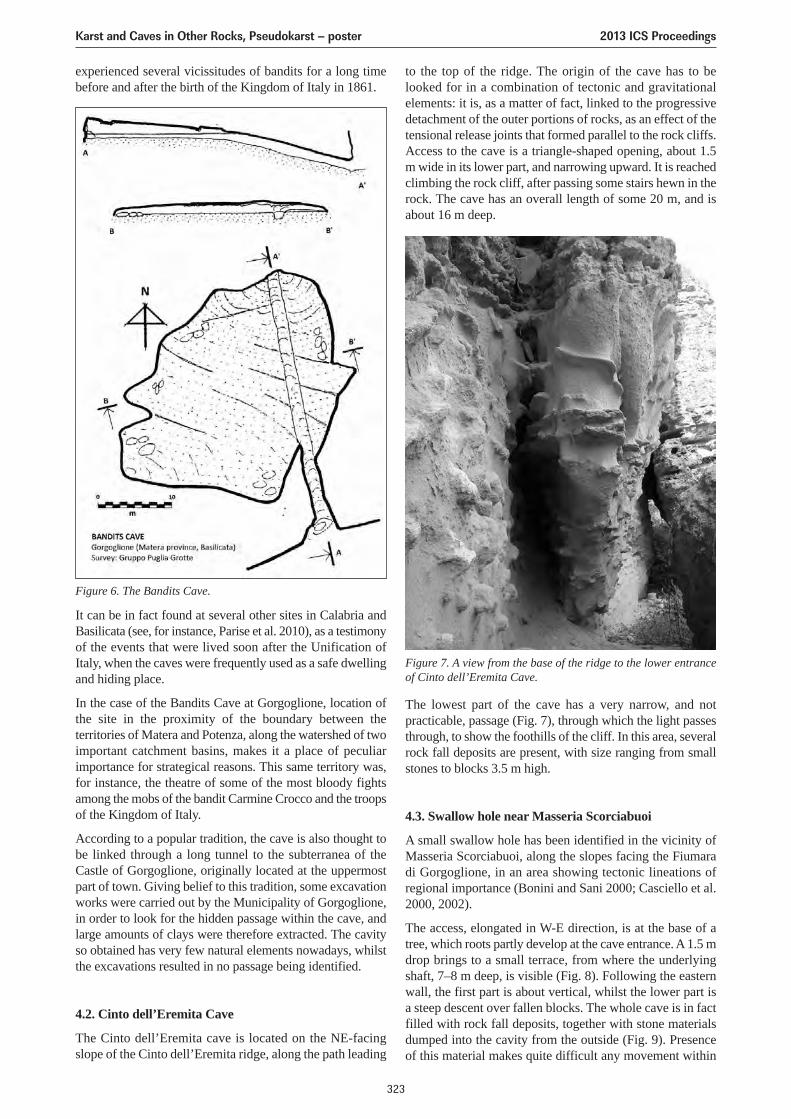
experienced several vicissitudes of bandits for a long timebefore and after the birth of the Kingdom of Italy in 1861.
to the top of the ridge. The origin of the cave has to belooked for in a combination of tectonic and gravitationalelements: it is, as a matter of fact, linked to the progressivedetachment of the outer portions of rocks, as an effect of thetensional release joints that formed parallel to the rock cliffs.Access to the cave is a triangle-shaped opening, about 1.5m wide in its lower part, and narrowing upward. It is reachedclimbing the rock cliff, after passing some stairs hewn in therock. The cave has an overall length of some 20 m, and isabout 16 m deep.
Figure 6. The Bandits Cave.
It can be in fact found at several other sites in Calabria andBasilicata (see, for instance, Parise et al. 2010), as a testimonyof the events that were lived soon after the Unification ofItaly, when the caves were frequently used as a safe dwellingand hiding place.
In the case of the Bandits Cave at Gorgoglione, location ofthe site in the proximity of the boundary between theterritories of Matera and Potenza, along the watershed of twoimportant catchment basins, makes it a place of peculiarimportance for strategical reasons. This same territory was,for instance, the theatre of some of the most bloody fightsamong the mobs of the bandit Carmine Crocco and the troopsof the Kingdom of Italy.
According to a popular tradition, the cave is also thought tobe linked through a long tunnel to the subterranea of theCastle of Gorgoglione, originally located at the uppermostpart of town. Giving belief to this tradition, some excavationworks were carried out by the Municipality of Gorgoglione,in order to look for the hidden passage within the cave, andlarge amounts of clays were therefore extracted. The cavityso obtained has very few natural elements nowadays, whilstthe excavations resulted in no passage being identified.
4.2. Cinto dell’Eremita Cave
The Cinto dell’Eremita cave is located on the NE-facingslope of the Cinto dell’Eremita ridge, along the path leading
Figure 7. A view from the base of the ridge to the lower entranceof Cinto dell’Eremita Cave.
The lowest part of the cave has a very narrow, and notpracticable, passage (Fig. 7), through which the light passesthrough, to show the foothills of the cliff. In this area, severalrock fall deposits are present, with size ranging from smallstones to blocks 3.5 m high.
4.3. Swallow hole near Masseria Scorciabuoi
A small swallow hole has been identified in the vicinity ofMasseria Scorciabuoi, along the slopes facing the Fiumaradi Gorgoglione, in an area showing tectonic lineations ofregional importance (Bonini and Sani 2000; Casciello et al.2000, 2002).
The access, elongated in W-E direction, is at the base of atree, which roots partly develop at the cave entrance. A 1.5 mdrop brings to a small terrace, from where the underlyingshaft, 7–8 m deep, is visible (Fig. 8). Following the easternwall, the first part is about vertical, whilst the lower part isa steep descent over fallen blocks. The whole cave is in factfilled with rock fall deposits, together with stone materialsdumped into the cavity from the outside (Fig. 9). Presenceof this material makes quite difficult any movement within
Karst and Caves in Other Rocks, Pseudokarst – poster 2013 ICS Proceedings
323
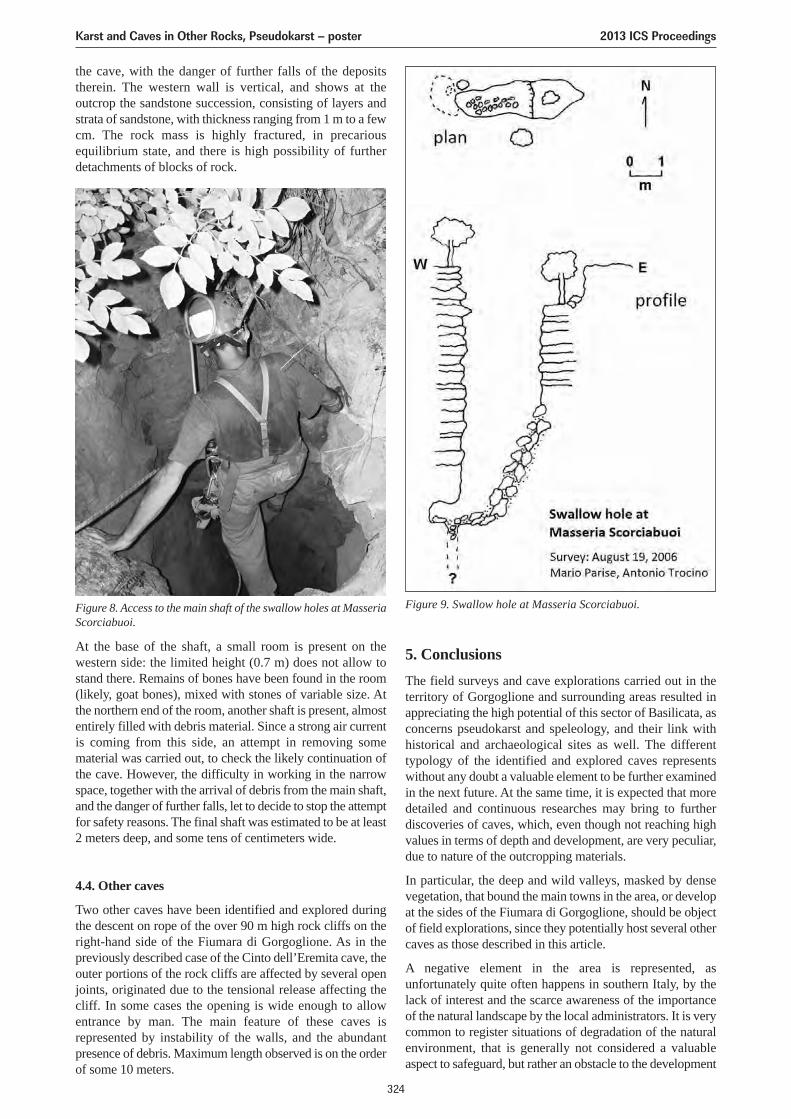
At the base of the shaft, a small room is present on thewestern side: the limited height (0.7 m) does not allow tostand there. Remains of bones have been found in the room(likely, goat bones), mixed with stones of variable size. Atthe northern end of the room, another shaft is present, almostentirely filled with debris material. Since a strong air currentis coming from this side, an attempt in removing somematerial was carried out, to check the likely continuation ofthe cave. However, the difficulty in working in the narrowspace, together with the arrival of debris from the main shaft,and the danger of further falls, let to decide to stop the attemptfor safety reasons. The final shaft was estimated to be at least2 meters deep, and some tens of centimeters wide.
4.4. Other caves
Two other caves have been identified and explored duringthe descent on rope of the over 90 m high rock cliffs on theright-hand side of the Fiumara di Gorgoglione. As in thepreviously described case of the Cinto dell’Eremita cave, theouter portions of the rock cliffs are affected by several openjoints, originated due to the tensional release affecting thecliff. In some cases the opening is wide enough to allowentrance by man. The main feature of these caves isrepresented by instability of the walls, and the abundantpresence of debris. Maximum length observed is on the orderof some 10 meters.
the cave, with the danger of further falls of the depositstherein. The western wall is vertical, and shows at theoutcrop the sandstone succession, consisting of layers andstrata of sandstone, with thickness ranging from 1 m to a fewcm. The rock mass is highly fractured, in precariousequilibrium state, and there is high possibility of furtherdetachments of blocks of rock.
5. ConclusionsThe field surveys and cave explorations carried out in theterritory of Gorgoglione and surrounding areas resulted inappreciating the high potential of this sector of Basilicata, asconcerns pseudokarst and speleology, and their link withhistorical and archaeological sites as well. The differenttypology of the identified and explored caves representswithout any doubt a valuable element to be further examinedin the next future. At the same time, it is expected that moredetailed and continuous researches may bring to furtherdiscoveries of caves, which, even though not reaching highvalues in terms of depth and development, are very peculiar,due to nature of the outcropping materials.
In particular, the deep and wild valleys, masked by densevegetation, that bound the main towns in the area, or developat the sides of the Fiumara di Gorgoglione, should be objectof field explorations, since they potentially host several othercaves as those described in this article.
A negative element in the area is represented, asunfortunately quite often happens in southern Italy, by thelack of interest and the scarce awareness of the importanceof the natural landscape by the local administrators. It is verycommon to register situations of degradation of the naturalenvironment, that is generally not considered a valuableaspect to safeguard, but rather an obstacle to the development
Figure 8. Access to the main shaft of the swallow holes at MasseriaScorciabuoi.
Figure 9. Swallow hole at Masseria Scorciabuoi.
Karst and Caves in Other Rocks, Pseudokarst – poster 2013 ICS Proceedings
324
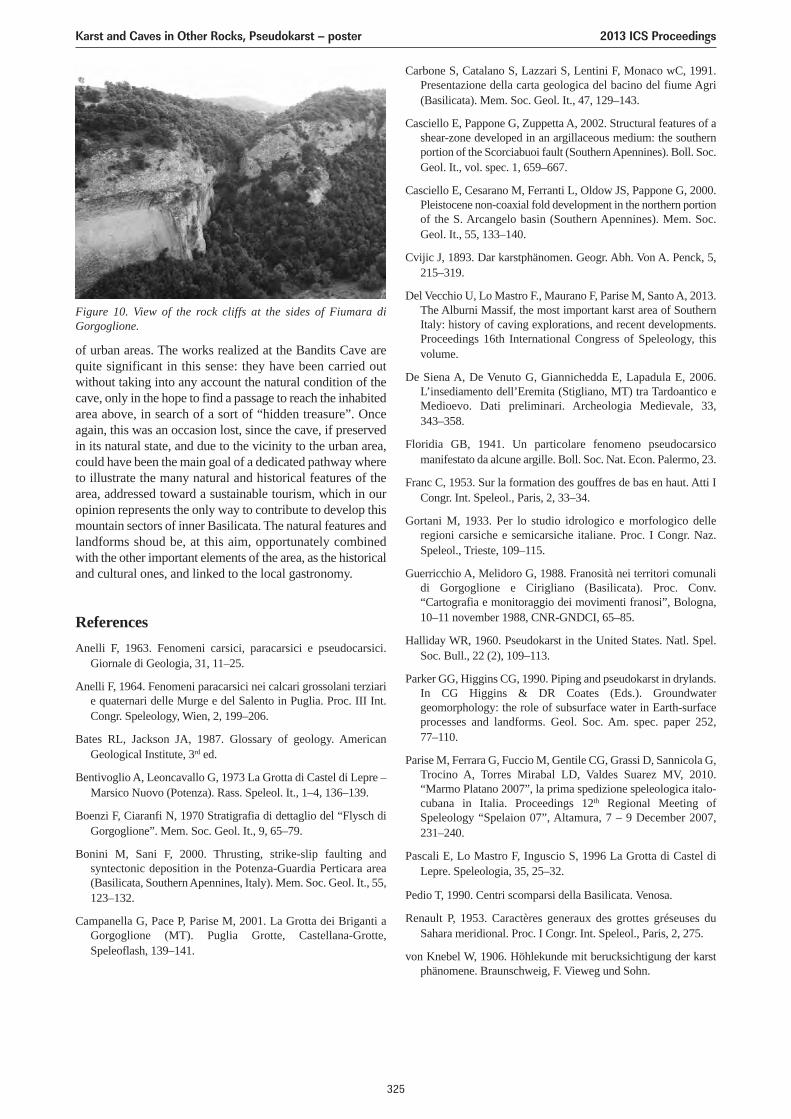
of urban areas. The works realized at the Bandits Cave arequite significant in this sense: they have been carried outwithout taking into any account the natural condition of thecave, only in the hope to find a passage to reach the inhabitedarea above, in search of a sort of “hidden treasure”. Onceagain, this was an occasion lost, since the cave, if preservedin its natural state, and due to the vicinity to the urban area,could have been the main goal of a dedicated pathway whereto illustrate the many natural and historical features of thearea, addressed toward a sustainable tourism, which in ouropinion represents the only way to contribute to develop thismountain sectors of inner Basilicata. The natural features andlandforms shoud be, at this aim, opportunately combinedwith the other important elements of the area, as the historicaland cultural ones, and linked to the local gastronomy.
ReferencesAnelli F, 1963. Fenomeni carsici, paracarsici e pseudocarsici.
Giornale di Geologia, 31, 11–25.
Anelli F, 1964. Fenomeni paracarsici nei calcari grossolani terziarie quaternari delle Murge e del Salento in Puglia. Proc. III Int.Congr. Speleology, Wien, 2, 199–206.
Bates RL, Jackson JA, 1987. Glossary of geology. AmericanGeological Institute, 3rd ed.
Bentivoglio A, Leoncavallo G, 1973 La Grotta di Castel di Lepre –Marsico Nuovo (Potenza). Rass. Speleol. It., 1–4, 136–139.
Boenzi F, Ciaranfi N, 1970 Stratigrafia di dettaglio del “Flysch diGorgoglione”. Mem. Soc. Geol. It., 9, 65–79.
Bonini M, Sani F, 2000. Thrusting, strike-slip faulting andsyntectonic deposition in the Potenza-Guardia Perticara area(Basilicata, Southern Apennines, Italy). Mem. Soc. Geol. It., 55,123–132.
Campanella G, Pace P, Parise M, 2001. La Grotta dei Briganti aGorgoglione (MT). Puglia Grotte, Castellana-Grotte,Speleoflash, 139–141.
Carbone S, Catalano S, Lazzari S, Lentini F, Monaco wC, 1991.Presentazione della carta geologica del bacino del fiume Agri(Basilicata). Mem. Soc. Geol. It., 47, 129–143.
Casciello E, Pappone G, Zuppetta A, 2002. Structural features of ashear-zone developed in an argillaceous medium: the southernportion of the Scorciabuoi fault (Southern Apennines). Boll. Soc.Geol. It., vol. spec. 1, 659–667.
Casciello E, Cesarano M, Ferranti L, Oldow JS, Pappone G, 2000.Pleistocene non-coaxial fold development in the northern portionof the S. Arcangelo basin (Southern Apennines). Mem. Soc.Geol. It., 55, 133–140.
Cvijic J, 1893. Dar karstphänomen. Geogr. Abh. Von A. Penck, 5,215–319.
Del Vecchio U, Lo Mastro F., Maurano F, Parise M, Santo A, 2013.The Alburni Massif, the most important karst area of SouthernItaly: history of caving explorations, and recent developments.Proceedings 16th International Congress of Speleology, thisvolume.
De Siena A, De Venuto G, Giannichedda E, Lapadula E, 2006.L’insediamento dell’Eremita (Stigliano, MT) tra Tardoantico eMedioevo. Dati preliminari. Archeologia Medievale, 33,343–358.
Floridia GB, 1941. Un particolare fenomeno pseudocarsicomanifestato da alcune argille. Boll. Soc. Nat. Econ. Palermo, 23.
Franc C, 1953. Sur la formation des gouffres de bas en haut. Atti ICongr. Int. Speleol., Paris, 2, 33–34.
Gortani M, 1933. Per lo studio idrologico e morfologico delleregioni carsiche e semicarsiche italiane. Proc. I Congr. Naz.Speleol., Trieste, 109–115.
Guerricchio A, Melidoro G, 1988. Franosità nei territori comunalidi Gorgoglione e Cirigliano (Basilicata). Proc. Conv.“Cartografia e monitoraggio dei movimenti franosi”, Bologna,10–11 november 1988, CNR-GNDCI, 65–85.
Halliday WR, 1960. Pseudokarst in the United States. Natl. Spel.Soc. Bull., 22 (2), 109–113.
Parker GG, Higgins CG, 1990. Piping and pseudokarst in drylands.In CG Higgins & DR Coates (Eds.). Groundwatergeomorphology: the role of subsurface water in Earth-surfaceprocesses and landforms. Geol. Soc. Am. spec. paper 252,77–110.
Parise M, Ferrara G, Fuccio M, Gentile CG, Grassi D, Sannicola G,Trocino A, Torres Mirabal LD, Valdes Suarez MV, 2010.“Marmo Platano 2007”, la prima spedizione speleologica italo-cubana in Italia. Proceedings 12th Regional Meeting ofSpeleology “Spelaion 07”, Altamura, 7 – 9 December 2007,231–240.
Pascali E, Lo Mastro F, Inguscio S, 1996 La Grotta di Castel diLepre. Speleologia, 35, 25–32.
Pedio T, 1990. Centri scomparsi della Basilicata. Venosa.
Renault P, 1953. Caractères generaux des grottes gréseuses duSahara meridional. Proc. I Congr. Int. Speleol., Paris, 2, 275.
von Knebel W, 1906. Höhlekunde mit berucksichtigung der karstphänomene. Braunschweig, F. Vieweg und Sohn.
Figure 10. View of the rock cliffs at the sides of Fiumara diGorgoglione.
Karst and Caves in Other Rocks, Pseudokarst – poster 2013 ICS Proceedings
325
KARST DEVELOPED IN SILICICLASTIC ROCKS AT SERRA DOESPINHAÇO MERIDIONAL, MINAS GERAIS (BRAZIL)
Alessandra Mendes Carvalho Vasconcelos1,2, Fernanda Cristina Rodrigues de Souza2, Joel Rodet1, CristianeValéria de Oliveira2, André Augusto Rodrigues Salgado2
1Université de Rouen, Laboratory of Geology, Place Emile Blondel, 76821Mont Saint Aignan, France;work in co-supervision with Universidade Federal de Minas Gerais, CAPES granted, [email protected],
[email protected] Federal de Minas Gerais, Geography Department, Av. Antônio Carlos, 6627, Belo Horizonte,
MG, Brazil, [email protected], [email protected], [email protected]
This study aims to develop a karst synthesis development in siliciclastic rocks and its spatial distribution at Serra doEspinhaço Meridional (SdEM – Southern Espinhaço Ridge), Minas Gerais (MG), from synthetic survey and mapping ofthe main areas with presence of more common caves and karst morphologies. The methodological procedure consists ina literature review, consulting to the database of Centro Nacional de Pesquisa e Conservação de Cavernas – CECAV(National Center for Research and Conservation of Caves), tabulating the data already surveyed and their respectivecoordinates, fieldwork and karst prospection. Later, the data were organized for graphing and location maps of the mainfeatures and discussion of the results. It is highlighted that most of the features studied in SdEM correspond to caves(88%). The location of the features mapped is inserted, primarily, in the eastern and western edges of SdEM and in thecentral area of this geomorphological unit. Therefore, it appears that although the entire ridge studied has a potential fordevelopment of landforms, the carried studies has a horizontal, conceptual, descriptive, and focused on speleology, nature.In the field, were identified features as pits, shelters, sinkholes, kamenitzas, lapiaz, bee nests, among others, whosemorphology is equivalent to those identified in carbonate rocks. It is intended, in this way, to encourage scientific studiesdevelopment on the other karst features and verticalise issues related to geochronology, morphometry and geochemistryfactors of karst formation in this area and siliciclastic rocks.
1. IntroductionThe term karst has been used historically to refer to reliefsdeveloped in soluble rocks, primarily of carbonates such aslimestone and dolomite, with the main parameter is thelithology. The first studies on karst consider it as an areaconstituted solely by carbonate rocks, with characteristicshapes, both surface and groundwater. From scienceevolution, other equally soluble rocks, such as gypsum,came to be regarded in the process of karstification, beingcapable of developing typical morphological features, ascaves, dry valleys, sinks, and others emerged from thedissolution.
As the study progressed, other lithologies have began to beconsidered for karst formation, relating to its formationparticular rocks, soluble, like evaporite, carbonate rocks andquartzite, however this one associated to extremely humidtropical regions. White (1988) relates karst to carbonate,gypsum and other non-specific rocks and describes it as alandscape formed by closed depressions of different sizes,drainage interrupted surface systems, caves andunderground drainage formed by dissolving process.
Studies, like Willems (2002) in Equatorial Africa, considerthat any rock can produce karst, some more likely to sufferdissolution than others. Some research dismiss (Fénelon1965, Jennings 1985) the influence of rock and concentrateon the landscape morphological characteristics,considering karst as considering karst as any other area withtypical morphological features, independent or fromlithology.
Currently, besides lithology and dissolution, otherconstraints are also being considered in the process of karstformation, such as hydrology, given the importance of water
in weathering processes, in the breakdown and in thetransportion through the ducts (Ford and Williams 2007).The structural constraints, as cracks and breaks, also playan important role, since they can guide the ducts formationand are among other elements, the gateway to thesubsurface water and the karst development. The acidulatedwater penetrates these cracks by reacting with minerals,regardless of the type of rock, and may producekarstification. If the constraints, tectonic, lithologic,climatic and vegetation are favorable, the greater the varietyof karst features generated (Hardt 2011).
Authors like Klimchouk et al. (2000) also does not considerthe type of rock as the main element in the karst formation,but other conditions like dissolving and hydrology trait inthe karst system, considering the karst as a mass transfersystem integrated with soluble rocks, and permeabilitystructural dominated by channels established by the rockmaterial dissolution, being arranged to facilitate thecirculation of fluids.
Based on studies performed by the mentioned researchers,then it is understood that the karst can develop from anyrock, even from the least soluble, such as sandstone andquartzite. Even though the dissolution process is notpredominant, an association among other factors such astectonics, climate, hydrology, vegetation may extend theconditions for the performance of chemical weathering andgenerate morphologies typically karstic, forming a karstsystem. Thus, this study aims to produce a synthesis onkarst on Serra do Espinhaço Meridional, Minas Gerais,from the survey and mapping of the main areas with caves,and with the most common morphologies, developed in notcarbonate rocks, especially the quartzite.
Karst and Caves in Other Rocks, Pseudokarst – poster 2013 ICS Proceedings
326
2. Karstification in siliciclastic rocksAccording to Ford and Williams (2007), any type of rock canundergo dissolution depending on environmental conditions,regardless of the type of mineral that composes it.
In the case of silica, the dissolution occurs in the form ofsilicic acid generated from the hydration of quartz. This acidis much weaker than the carbonic acid. The solubility ofsilica is not significantly affected at pH lower than 9,continuously decreasing with the pH reduction. Thisprocess allows the silica dissolution, but is very timeconsuming, because it is a very slow reaction.
To Ford and Williams (2007), siliceous rocks can developkarst ways of dissolution, even slowly, from small tointermediate dimensions, because as carbonates andevaporites, they are practically monomineralicos in itscomposition.
In quartz, under the water action, the silica solubility is toolow, but in the case of amorphous silica, such as those foundin sandstone cements, the solubility grows. In all forms ofsilica, solubility increases with water temperatures above50 °C. However, at higher pH conditions, resulting fromhydrolysis, silicon, as well as aluminum, is solubilized andcauses the silicate structure breakage, generating fragmentsof different sizes which are removed by the the action ofwater, contributing to karstification.
It is common that this reaction occurs in the pH range 5–9.If there are more or less percolation of water solublecomponents are removed completely or partially, resultingrespectively in full or partial hydrolysis.
In quartzites it is common to find karst development alongthe ridges and cliffs, due to hydraulic gradient these steeperareas, which allows a rapid and efficient flow of the water,removing the accumulated residues. But to the developmentof the karst morphology on the lithology from thedissolution, there are three basic requirements (Ford andWilliams 2007):
• High purity mineral so that grains of insolublealuminosilicates do not block the underground channels;
• Thick layer of rock with few cleavage planes withintersection fractures with significant and far between.
• Lack of relevant geomorphological processes such asthose related to the action of ice or sea, allowing the formsof slow dissolution able to develop.
The discontinuity is another factor that plays a fundamentalrole in the dissolution process. The secondary porosity,mainly linked to the plans tectonic origin, like fractures andfaults, has great influence on the karst forms development,since percolation of water through these plans fractureswould cause the gradual dissolution of rock, especially inthe discontinuities and its adjacent areas.
From the elements which contribute to the dissolution ofsiliceous rocks, also stands out the organic material. Karstlandscapes developed on siliceous rocks have strong linkswith plenty of rainfall and vegetation cover over the rock,which makes the water rich in organic acids. These acidsare able to erode the rock through the process of chelationby microorganisms, which cause the dissolution of quartzcreating alveolar forms (Smith 2004).
Another major factor in the silica dissolution is the presenceof ferrous catalysts, which associated with water, favors amore rapid dissolution of quartz (Hardt 2011). Inaccordance with Silva (2004), the presence of chlorides mayalso increase dissolution rates due to the increased surfacereactivity of the silica, as a function of increasing itsionization potential.
Very often, dissolution in siliceous rocks occurs mainly onthe quartzose cement rock, due to amorphous silica and noton quartz grains, yielding a residue of undissolved silicaand occupying the void part newly formed. This processwas identified by Rodet (1996) and further described byQuinif (2010) and Rodet (2012) as fantomisation or Ghost-rock karst, and may be the process that prevails in formingthe siliceous karst (Hardt 2011).
3. The non carbonate karst in BrazilBrazil has great potential for karstic development in noncarbonate rocks, but studies are still recent and the data areincipient. The main studies were developed in quartzite,sandstone and itabirite by Hardt (2009), Auler (2011),Willems et al. (2004), Correa (2012), among others.
As shown in table 1, in Brazil, the largest number of knowncavities is developed in carbonate rocks and iron ore. Aulerand Piló (2011) emphasize the high Brazilian potential inthe development of cavities in quartzite and sandstone,because although the known percentage is small (> 1%), itis already known that the larger of this type of rock cavitiesare located in Brazil.
According to Karmann (1979) and Hardt et al. (2009), themain areas with potential for development of non carbonatickarst in Brazil are: Chapada Diamantina – Bahia (quartzite),northwestern Amazon (quartzite and sandstone), south andnorth-central Minas Gerais (quartzite), Serra das Confusões,and Serra da Capivara, Sete Cidades, in Piaui (sandstone),Tocantins (sandstone), Serra Geral – Minas Gerais and RioGrande do Sul (sandstone) and Chapada dos Guimarães andPareci, in Mato Grosso (sandstone).
Karst in itabirite also has a great potential, as in Pará, andin the Iron Quadrangle region in Minas Gerais Gerais, butonly in a few studies (Corrêa 2012).
4. MethodsFirst literature review on karst was performed, focusingespecially on the main activities of karst geomorphologydeveloped on Serra do Espinhaço Meridional. Later, wesearched the body responsible for caves records in Brazil,Centro Nacional de Pesquisas e Conservação de Cavernas– the National Centre for Research and Conservation ofCaves – (CECAV) in order to raise areas with caves in thestudy region. From then on, field work and karstprospections in certain points previously selected weremade. From these data, was organized a database on karststudies already undertaken in the area, as well as somepotential areas which do not have scientific studies.Afterwards, the maps of distribution of major karst featuresidentified were generated. It should be noted that this studydoes not attempt to identify all caves, but to demonstrate
Karst and Caves in Other Rocks, Pseudokarst – poster 2013 ICS Proceedings
327
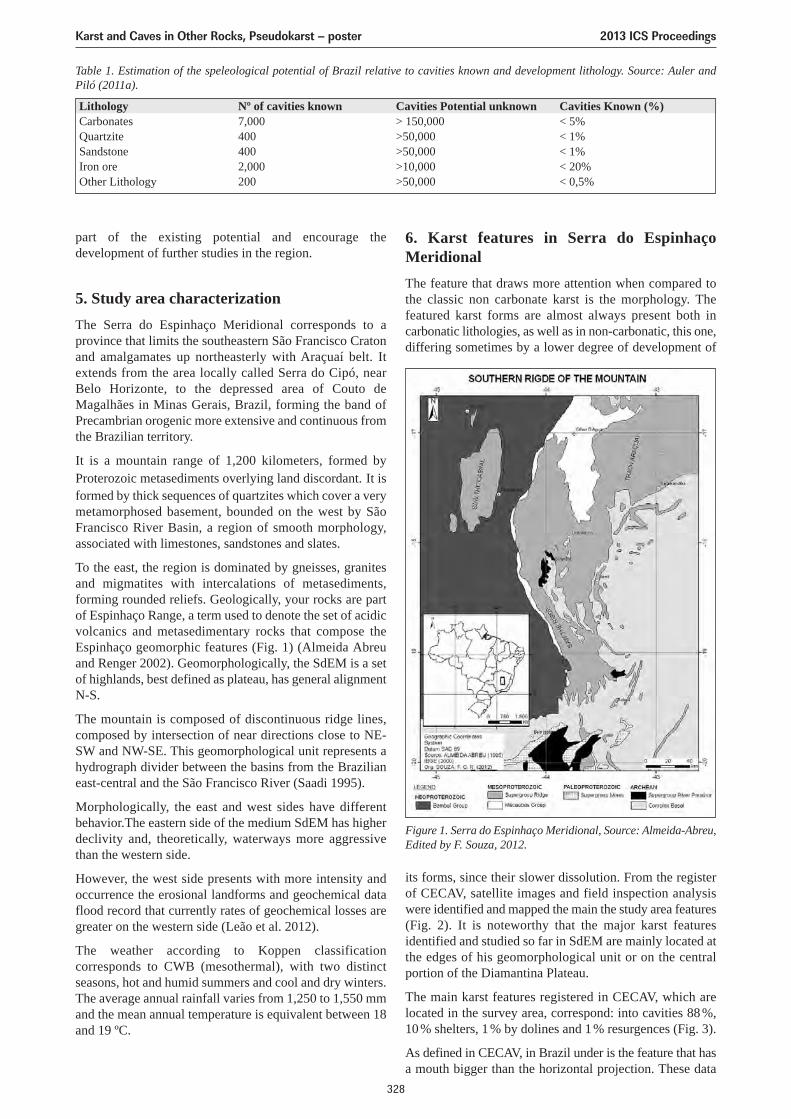
part of the existing potential and encourage thedevelopment of further studies in the region.
5. Study area characterizationThe Serra do Espinhaço Meridional corresponds to aprovince that limits the southeastern São Francisco Cratonand amalgamates up northeasterly with Araçuaí belt. Itextends from the area locally called Serra do Cipó, nearBelo Horizonte, to the depressed area of Couto deMagalhães in Minas Gerais, Brazil, forming the band ofPrecambrian orogenic more extensive and continuous fromthe Brazilian territory.
It is a mountain range of 1,200 kilometers, formed byProterozoic metasediments overlying land discordant. It isformed by thick sequences of quartzites which cover a verymetamorphosed basement, bounded on the west by SãoFrancisco River Basin, a region of smooth morphology,associated with limestones, sandstones and slates.
To the east, the region is dominated by gneisses, granitesand migmatites with intercalations of metasediments,forming rounded reliefs. Geologically, your rocks are partof Espinhaço Range, a term used to denote the set of acidicvolcanics and metasedimentary rocks that compose theEspinhaço geomorphic features (Fig. 1) (Almeida Abreuand Renger 2002). Geomorphologically, the SdEM is a setof highlands, best defined as plateau, has general alignmentN-S.
The mountain is composed of discontinuous ridge lines,composed by intersection of near directions close to NE-SW and NW-SE. This geomorphological unit represents ahydrograph divider between the basins from the Brazilianeast-central and the São Francisco River (Saadi 1995).
Morphologically, the east and west sides have differentbehavior.The eastern side of the medium SdEM has higherdeclivity and, theoretically, waterways more aggressivethan the western side.
However, the west side presents with more intensity andoccurrence the erosional landforms and geochemical dataflood record that currently rates of geochemical losses aregreater on the western side (Leão et al. 2012).
The weather according to Koppen classificationcorresponds to CWB (mesothermal), with two distinctseasons, hot and humid summers and cool and dry winters.The average annual rainfall varies from 1,250 to 1,550 mmand the mean annual temperature is equivalent between 18and 19 ºC.
6. Karst features in Serra do EspinhaçoMeridionalThe feature that draws more attention when compared tothe classic non carbonate karst is the morphology. Thefeatured karst forms are almost always present both incarbonatic lithologies, as well as in non-carbonatic, this one,differing sometimes by a lower degree of development of
Table 1. Estimation of the speleological potential of Brazil relative to cavities known and development lithology. Source: Auler andPiló (2011a).
Figure 1. Serra do Espinhaço Meridional, Source: Almeida-Abreu,Edited by F. Souza, 2012.
its forms, since their slower dissolution. From the registerof CECAV, satellite images and field inspection analysiswere identified and mapped the main the study area features(Fig. 2). It is noteworthy that the major karst featuresidentified and studied so far in SdEM are mainly located atthe edges of his geomorphological unit or on the centralportion of the Diamantina Plateau.
The main karst features registered in CECAV, which arelocated in the survey area, correspond: into cavities 88%,10% shelters, 1% by dolines and 1% resurgences (Fig. 3).
As defined in CECAV, in Brazil under is the feature that hasa mouth bigger than the horizontal projection. These data
LithologyCarbonatesQuartziteSandstoneIron oreOther Lithology
Nº of cavities known7,0004004002,000200
Cavities Potential unknown> 150,000>50,000>50,000>10,000>50,000
Cavities Known (%)< 5%< 1%< 1%< 20%< 0,5%
Karst and Caves in Other Rocks, Pseudokarst – poster 2013 ICS Proceedings
328
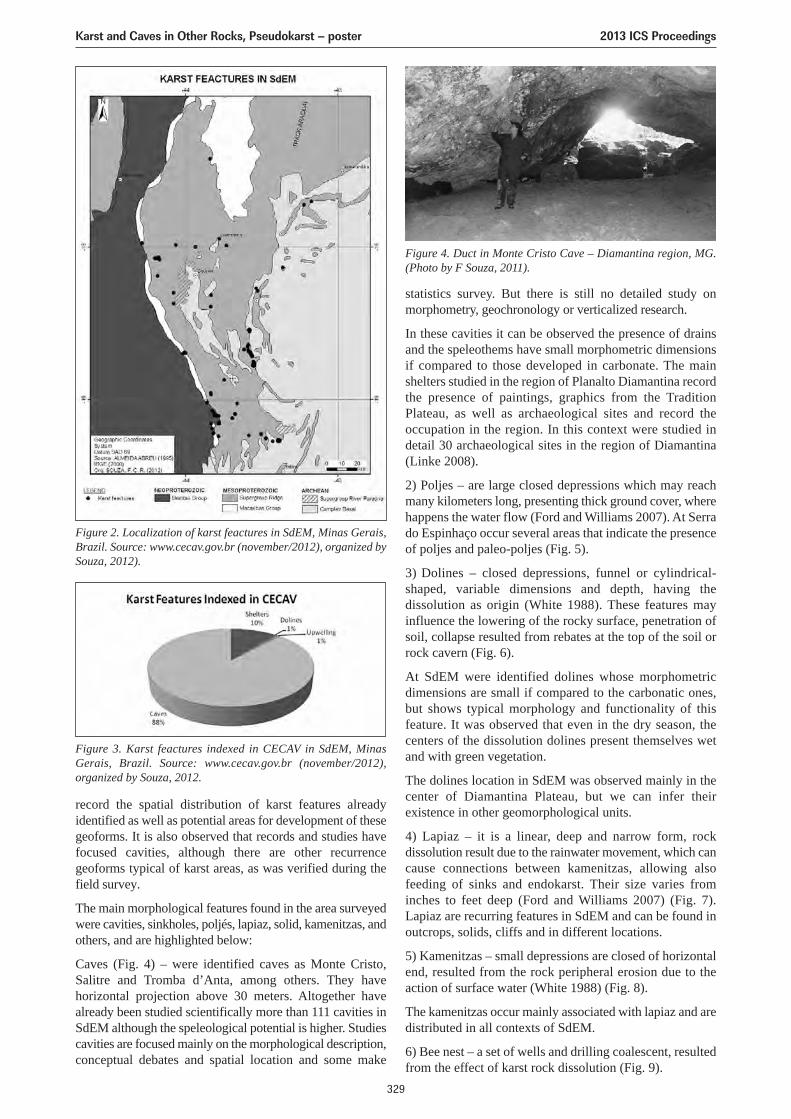
record the spatial distribution of karst features alreadyidentified as well as potential areas for development of thesegeoforms. It is also observed that records and studies havefocused cavities, although there are other recurrencegeoforms typical of karst areas, as was verified during thefield survey.
The main morphological features found in the area surveyedwere cavities, sinkholes, poljés, lapiaz, solid, kamenitzas, andothers, and are highlighted below:
Caves (Fig. 4) – were identified caves as Monte Cristo,Salitre and Tromba d’Anta, among others. They havehorizontal projection above 30 meters. Altogether havealready been studied scientifically more than 111 cavities inSdEM although the speleological potential is higher. Studiescavities are focused mainly on the morphological description,conceptual debates and spatial location and some make
Figure 3. Karst feactures indexed in CECAV in SdEM, MinasGerais, Brazil. Source: www.cecav.gov.br (november/2012),organized by Souza, 2012.
Figure 4. Duct in Monte Cristo Cave – Diamantina region, MG.(Photo by F Souza, 2011).
statistics survey. But there is still no detailed study onmorphometry, geochronology or verticalized research.
In these cavities it can be observed the presence of drainsand the speleothems have small morphometric dimensionsif compared to those developed in carbonate. The mainshelters studied in the region of Planalto Diamantina recordthe presence of paintings, graphics from the TraditionPlateau, as well as archaeological sites and record theoccupation in the region. In this context were studied indetail 30 archaeological sites in the region of Diamantina(Linke 2008).
2) Poljes – are large closed depressions which may reachmany kilometers long, presenting thick ground cover, wherehappens the water flow (Ford and Williams 2007). At Serrado Espinhaço occur several areas that indicate the presenceof poljes and paleo-poljes (Fig. 5).
3) Dolines – closed depressions, funnel or cylindrical-shaped, variable dimensions and depth, having thedissolution as origin (White 1988). These features mayinfluence the lowering of the rocky surface, penetration ofsoil, collapse resulted from rebates at the top of the soil orrock cavern (Fig. 6).
At SdEM were identified dolines whose morphometricdimensions are small if compared to the carbonatic ones,but shows typical morphology and functionality of thisfeature. It was observed that even in the dry season, thecenters of the dissolution dolines present themselves wetand with green vegetation.
The dolines location in SdEM was observed mainly in thecenter of Diamantina Plateau, but we can infer theirexistence in other geomorphological units.
4) Lapiaz – it is a linear, deep and narrow form, rockdissolution result due to the rainwater movement, which cancause connections between kamenitzas, allowing alsofeeding of sinks and endokarst. Their size varies frominches to feet deep (Ford and Williams 2007) (Fig. 7).Lapiaz are recurring features in SdEM and can be found inoutcrops, solids, cliffs and in different locations.
5) Kamenitzas – small depressions are closed of horizontalend, resulted from the rock peripheral erosion due to theaction of surface water (White 1988) (Fig. 8).
The kamenitzas occur mainly associated with lapiaz and aredistributed in all contexts of SdEM.
6) Bee nest – a set of wells and drilling coalescent, resultedfrom the effect of karst rock dissolution (Fig. 9).
Figure 2. Localization of karst feactures in SdEM, Minas Gerais,Brazil. Source: www.cecav.gov.br (november/2012), organized bySouza, 2012).
Karst and Caves in Other Rocks, Pseudokarst – poster 2013 ICS Proceedings
329
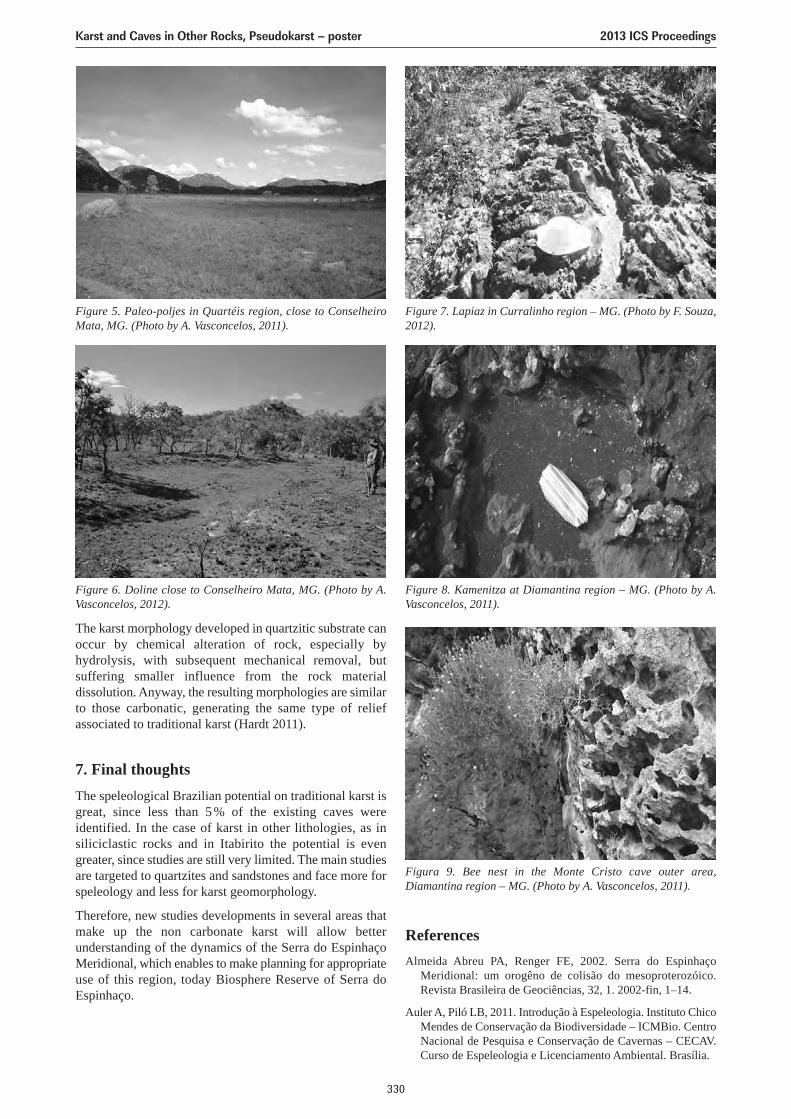
ReferencesAlmeida Abreu PA, Renger FE, 2002. Serra do Espinhaço
Meridional: um orogêno de colisão do mesoproterozóico.Revista Brasileira de Geociências, 32, 1. 2002-fin, 1–14.
Auler A, Piló LB, 2011. Introdução à Espeleologia. Instituto ChicoMendes de Conservação da Biodiversidade – ICMBio. CentroNacional de Pesquisa e Conservação de Cavernas – CECAV.Curso de Espeleologia e Licenciamento Ambiental. Brasília.
The karst morphology developed in quartzitic substrate canoccur by chemical alteration of rock, especially byhydrolysis, with subsequent mechanical removal, butsuffering smaller influence from the rock materialdissolution. Anyway, the resulting morphologies are similarto those carbonatic, generating the same type of reliefassociated to traditional karst (Hardt 2011).
7. Final thoughtsThe speleological Brazilian potential on traditional karst isgreat, since less than 5 % of the existing caves wereidentified. In the case of karst in other lithologies, as insiliciclastic rocks and in Itabirito the potential is evengreater, since studies are still very limited. The main studiesare targeted to quartzites and sandstones and face more forspeleology and less for karst geomorphology.
Therefore, new studies developments in several areas thatmake up the non carbonate karst will allow betterunderstanding of the dynamics of the Serra do EspinhaçoMeridional, which enables to make planning for appropriateuse of this region, today Biosphere Reserve of Serra doEspinhaço.
Figure 5. Paleo-poljes in Quartéis region, close to ConselheiroMata, MG. (Photo by A. Vasconcelos, 2011).
Figure 6. Doline close to Conselheiro Mata, MG. (Photo by A.Vasconcelos, 2012).
Figure 7. Lapiaz in Curralinho region – MG. (Photo by F. Souza,2012).
Figure 8. Kamenitza at Diamantina region – MG. (Photo by A.Vasconcelos, 2011).
Figura 9. Bee nest in the Monte Cristo cave outer area,Diamantina region – MG. (Photo by A. Vasconcelos, 2011).
Karst and Caves in Other Rocks, Pseudokarst – poster 2013 ICS Proceedings
330
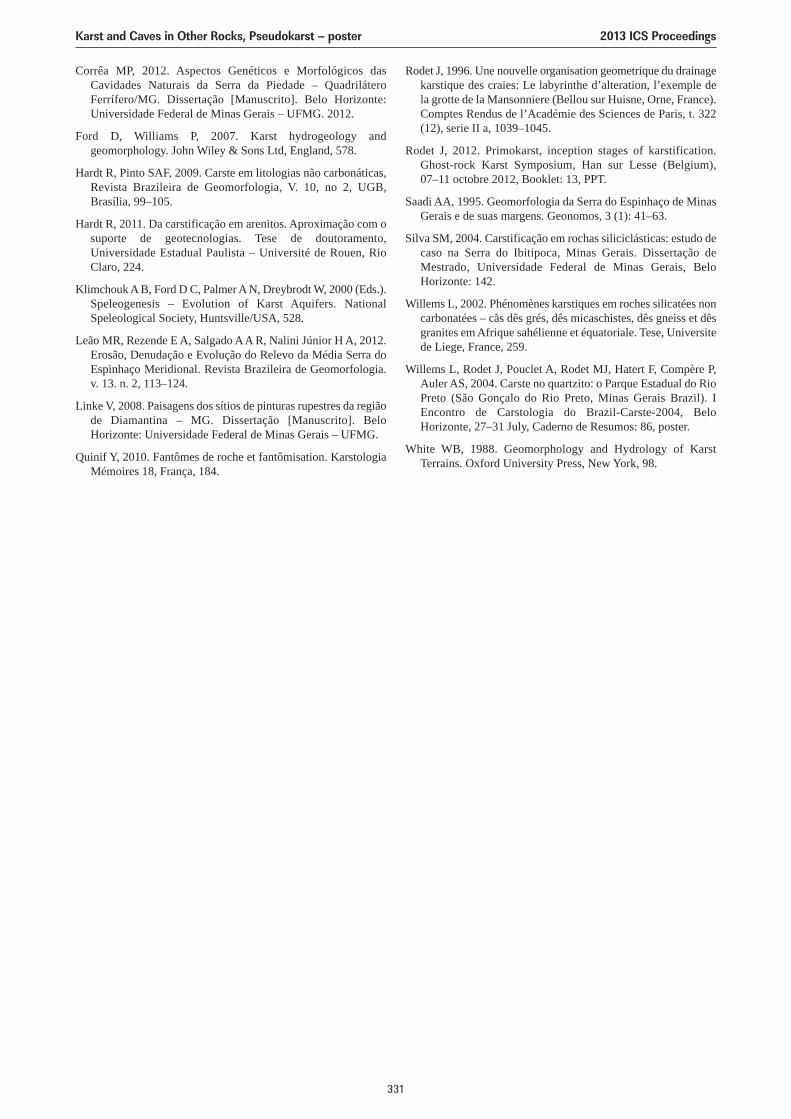
Corrêa MP, 2012. Aspectos Genéticos e Morfológicos dasCavidades Naturais da Serra da Piedade – QuadriláteroFerrífero/MG. Dissertação [Manuscrito]. Belo Horizonte:Universidade Federal de Minas Gerais – UFMG. 2012.
Ford D, Williams P, 2007. Karst hydrogeology andgeomorphology. John Wiley & Sons Ltd, England, 578.
Hardt R, Pinto SAF, 2009. Carste em litologias não carbonáticas,Revista Brazileira de Geomorfologia, V. 10, no 2, UGB,Brasília, 99–105.
Hardt R, 2011. Da carstificação em arenitos. Aproximação com osuporte de geotecnologias. Tese de doutoramento,Universidade Estadual Paulista – Université de Rouen, RioClaro, 224.
Klimchouk A B, Ford D C, Palmer A N, Dreybrodt W, 2000 (Eds.).Speleogenesis – Evolution of Karst Aquifers. NationalSpeleological Society, Huntsville/USA, 528.
Leão MR, Rezende E A, Salgado A A R, Nalini Júnior H A, 2012.Erosão, Denudação e Evolução do Relevo da Média Serra doEspinhaço Meridional. Revista Brazileira de Geomorfologia.v. 13. n. 2, 113–124.
Linke V, 2008. Paisagens dos sítios de pinturas rupestres da regiãode Diamantina – MG. Dissertação [Manuscrito]. BeloHorizonte: Universidade Federal de Minas Gerais – UFMG.
Quinif Y, 2010. Fantômes de roche et fantômisation. KarstologiaMémoires 18, França, 184.
Rodet J, 1996. Une nouvelle organisation geometrique du drainagekarstique des craies: Le labyrinthe d’alteration, l’exemple dela grotte de la Mansonniere (Bellou sur Huisne, Orne, France).Comptes Rendus de l’Académie des Sciences de Paris, t. 322(12), serie II a, 1039–1045.
Rodet J, 2012. Primokarst, inception stages of karstification.Ghost-rock Karst Symposium, Han sur Lesse (Belgium),07–11 octobre 2012, Booklet: 13, PPT.
Saadi AA, 1995. Geomorfologia da Serra do Espinhaço de MinasGerais e de suas margens. Geonomos, 3 (1): 41–63.
Silva SM, 2004. Carstificação em rochas siliciclásticas: estudo decaso na Serra do Ibitipoca, Minas Gerais. Dissertação deMestrado, Universidade Federal de Minas Gerais, BeloHorizonte: 142.
Willems L, 2002. Phénomènes karstiques em roches silicatées noncarbonatées – cãs dês grés, dês micaschistes, dês gneiss et dêsgranites em Afrique sahélienne et équatoriale. Tese, Universitede Liege, France, 259.
Willems L, Rodet J, Pouclet A, Rodet MJ, Hatert F, Compère P,Auler AS, 2004. Carste no quartzito: o Parque Estadual do RioPreto (São Gonçalo do Rio Preto, Minas Gerais Brazil). IEncontro de Carstologia do Brazil-Carste-2004, BeloHorizonte, 27–31 July, Caderno de Resumos: 86, poster.
White WB, 1988. Geomorphology and Hydrology of KarstTerrains. Oxford University Press, New York, 98.
Karst and Caves in Other Rocks, Pseudokarst – poster 2013 ICS Proceedings
331

332

2013 ICS Proceedings
333
Speleogenesis
Session:

334
LAG AND TRANSFER TIME INFERRED FROM MELTINGCYCLES RECORD IN THE COULOMP KARST SPRING
(ALPES DE HAUTE-PROVENCE, FRANCE)
Philippe Audra1, Jean-Claude Nobécourt2
1Polytech Nice, Sophia, University of Nice, Sophia Antipolis, 930 route des Colles, 06903 Sophia-Antipolis,France and Innovative City, IMREDD, Nice, France, [email protected]
2CRESPE, Le Hameau de l’Ara, 259 boulevard Reine Jeanne, 06140 VENCE, France, [email protected]
A 11-days long period of snowmelt cycles was selected from the discharge and temperature data collected at Coulompspring (Alpes de Haute-Provence, France), which is the largest of French Southern Alps with a discharge of 1 m3/s. Itscatchment is 30–50 km2-large and mainly composed of marly limestones and poorly permeable covers, responsible of acombined diffuse and concentrated recharge. From Q data we extracted snowmelt discharge (Snowmelt Q = oscillatingpart of the discharge) and Basal Q. The contribution of Snowmelt Q is 30–50% of Q. Amplitude of spring temperature(Tspring) is about 2 °C due to alternation of cold snowmelt water with low residence time and “warm” phreatic water withlonger residence time. The lag between the peak of air temperature (Tair) corresponding to the maximum of snow meltingand the peaks of Q, corresponding to the transfer time between surface and spring, is less than 10 h. This 10 h transfertime combines about 7 h of vertical transfer through the vadose zone and 3 h of horizontal transfer through the drain.
1. IntroductionSnowmelt recharges karst aquifer through diffuse and slowseepage or through sudden contribution when abruptmelting combines with air warming and huge downpouring. Sudden melting is quickly transferred throughhigh-velocity conduits, with limited storage. On thecontrary, part of seepage uses low-velocity routes mainlythrough tiny fissures and contributes to storage in epikarst,vadose zone, and epiphreatic zone. As a consequence,snowmelt contributes to the deferred runoff during low-water periods at the end of summer, where the amount orscarcity of discharge depends on the thickness of the snowmantle accumulated during winter and on the rhythms ofthe snowmelt during spring. Otherwise, snowmelt dailycycles give rhythm to the input, which is transformed andtransferred at the spring, and which allows making detailedanalysis of the transfer function, namely transit routes,transfer time and lag, and storage time and capacity (Vignaand Suozzi 2009).
In this paper, we study the Coulomp spring in Alpes deHaute-Provence (France), which is the largest karst springof the Southern French Alps. Recharge conditions arecomplex and are determined by diverse type of rockoutcrops in the catchment where diffuse recharge ispredominant. The monitoring of the spring, with a recordof discharge and temperature during 4 yearly cycles, givesthe possibility to focus on different kind of recharge period,namely long recessions, flash floods (Audra and Nobécourt2012), long flooding periods, or snow melting, which is thetopic of this paper. We analyze the recorded data combinedwith observations of the spring activity. The aim of thisstudy is to understand the snowmelt cycles and their role inthe spring activity, and the transfer times in the differentkarst zones (seepage fissures vs. conduits). Moreover, theunderstanding of transfer times is an important challenge toallow cave exploration. Indeed, the underground river is thelargest of France (average Q = 1 m3/s), which explorationrepresents a caving and scientific challenge and the accessof the underground system is controlled by 3 sumps at the
entrance which require pumping and which can close whenflooding occurs.
2. Context and dynamic of the Coulomp springThe Coulomp spring (commune of Castellet-lès-Sausses,Department of Alpes-de-Haute-Provence, France) pours outat 1,300 m a.s.l. with a scenery 65 m-high waterfall. Theunderground river has been explored along 1.7 km upstreamto the spring (Audra et al. 2009). The spring is fed by a 30–50 km2-large catchment, which encompasses theBaussebérard and Grand Coyer (2,693 m) Mountains (Fig. 1).The mean annual discharge is 1 m3/s, making this spring thelargest of the Southern French Alps. Most of the seepageoccurs through Upper Cretaceous marly limestones, whichthickness is several hundreds of meters and which in turnare covered uncomformably by the Nummulitic Trilogy(Nummulitic limestones, Priabonian blue clay, and Annotsandstones). The thickness and extension of these poorlypermeable covers makes a particular recharge, whichcombine both diffuse seepage through marly limestones andconcentrated input in sinkholes originating from surfacerunoff on marls and clays. Extreme discharges (30 m3/s;250 L/s) reveal a typical karst dynamic, influenced by fasttransfer through conduits and long recessions kept on goingby storage in sandstone covers and in the thick marly-limestone infiltration zone.
3. Material and methodsThe spring pool level is recorded each 30 mn, andtransformed in discharge (Q) through a rating curve,constructed with chemical gauging at different discharge.For the concerned discharges (200–2,000 L/s), the ratingcurve quality is fair (R2 = 0.976). We recorded springtemperature (Tspring) and air temperature (Tair) with the samefrequency. Tair is overestimated in the middle of the day,since the data logger was exposed to direct solar insulation.
Speleogenesis – oral 2013 ICS Proceedings
335
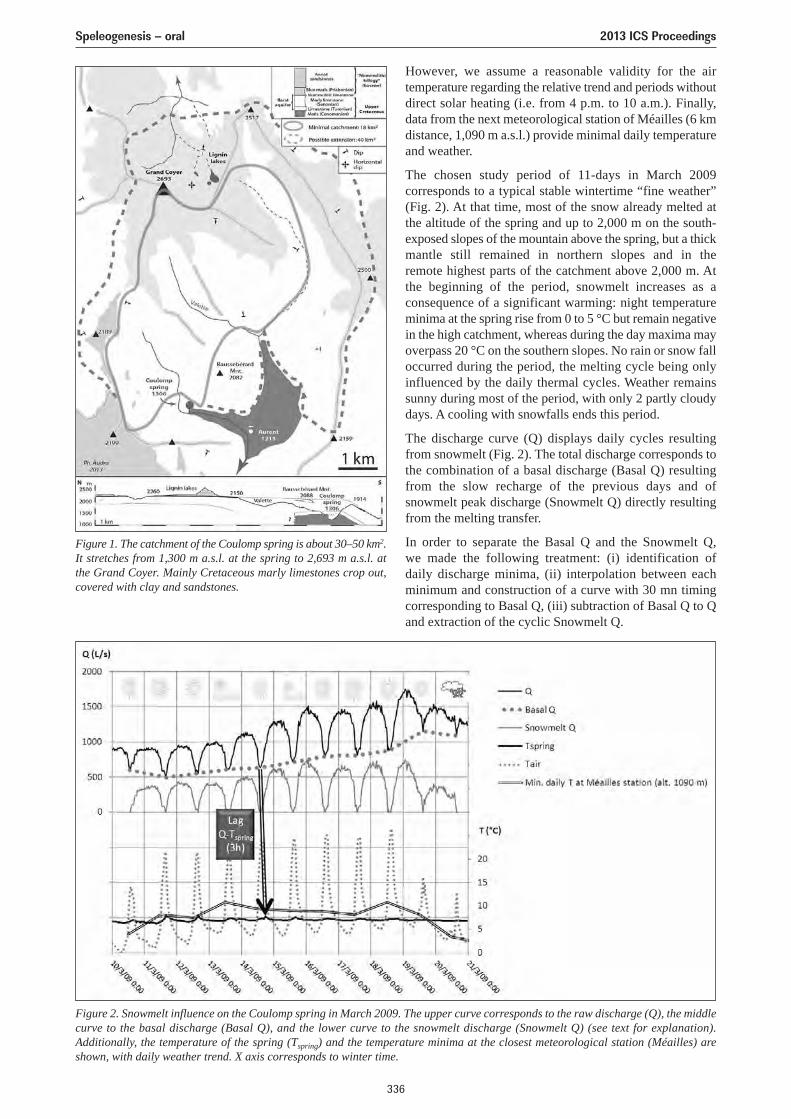
Figure 2. Snowmelt influence on the Coulomp spring in March 2009. The upper curve corresponds to the raw discharge (Q), the middlecurve to the basal discharge (Basal Q), and the lower curve to the snowmelt discharge (Snowmelt Q) (see text for explanation).Additionally, the temperature of the spring (Tspring) and the temperature minima at the closest meteorological station (Méailles) areshown, with daily weather trend. X axis corresponds to winter time.
Figure 1. The catchment of the Coulomp spring is about 30–50 km2.It stretches from 1,300 m a.s.l. at the spring to 2,693 m a.s.l. atthe Grand Coyer. Mainly Cretaceous marly limestones crop out,covered with clay and sandstones.
However, we assume a reasonable validity for the airtemperature regarding the relative trend and periods withoutdirect solar heating (i.e. from 4 p.m. to 10 a.m.). Finally,data from the next meteorological station of Méailles (6 kmdistance, 1,090 m a.s.l.) provide minimal daily temperatureand weather.
The chosen study period of 11-days in March 2009corresponds to a typical stable wintertime “fine weather”(Fig. 2). At that time, most of the snow already melted atthe altitude of the spring and up to 2,000 m on the south-exposed slopes of the mountain above the spring, but a thickmantle still remained in northern slopes and in the remote highest parts of the catchment above 2,000 m. At the beginning of the period, snowmelt increases as aconsequence of a significant warming: night temperatureminima at the spring rise from 0 to 5 °C but remain negativein the high catchment, whereas during the day maxima mayoverpass 20 °C on the southern slopes. No rain or snow falloccurred during the period, the melting cycle being onlyinfluenced by the daily thermal cycles. Weather remainssunny during most of the period, with only 2 partly cloudydays. A cooling with snowfalls ends this period.
The discharge curve (Q) displays daily cycles resultingfrom snowmelt (Fig. 2). The total discharge corresponds tothe combination of a basal discharge (Basal Q) resultingfrom the slow recharge of the previous days and ofsnowmelt peak discharge (Snowmelt Q) directly resultingfrom the melting transfer.
In order to separate the Basal Q and the Snowmelt Q, we made the following treatment: (i) identification of daily discharge minima, (ii) interpolation between each minimum and construction of a curve with 30 mn timingcorresponding to Basal Q, (iii) subtraction of Basal Q to Qand extraction of the cyclic Snowmelt Q.
Speleogenesis – oral 2013 ICS Proceedings
336
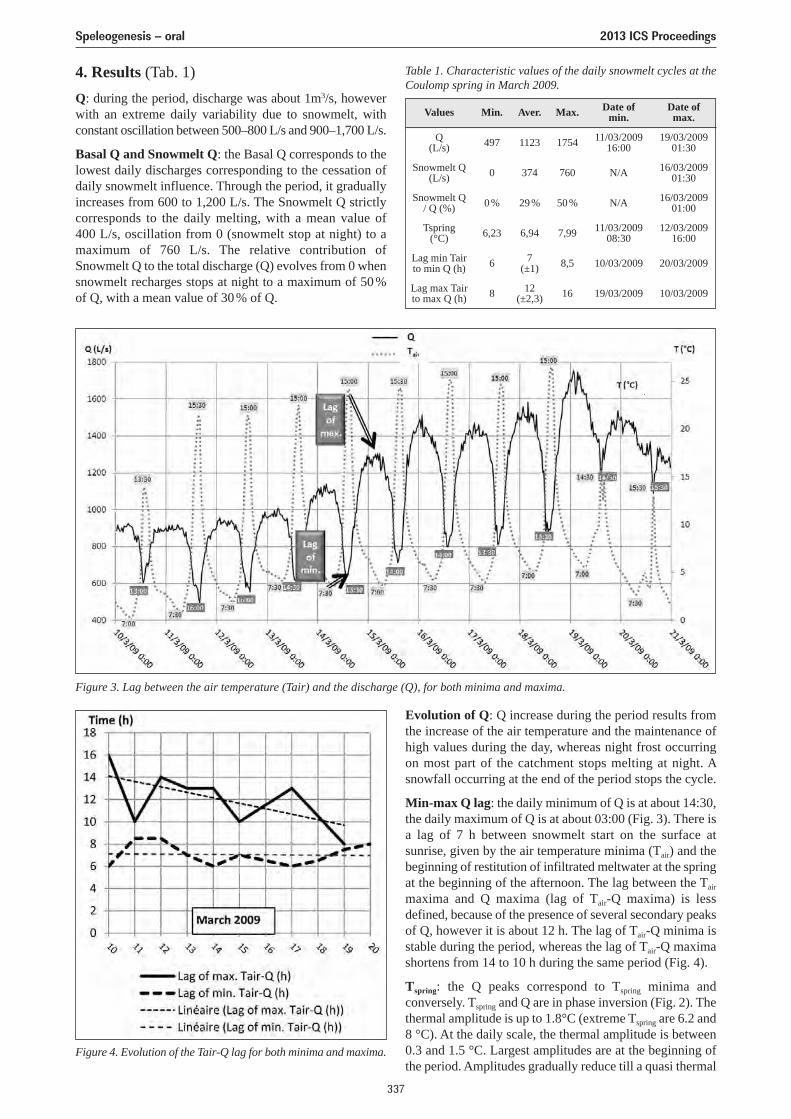
Evolution of Q: Q increase during the period results fromthe increase of the air temperature and the maintenance ofhigh values during the day, whereas night frost occurringon most part of the catchment stops melting at night. Asnowfall occurring at the end of the period stops the cycle.
Min-max Q lag: the daily minimum of Q is at about 14:30,the daily maximum of Q is at about 03:00 (Fig. 3). There isa lag of 7 h between snowmelt start on the surface atsunrise, given by the air temperature minima (Tair) and thebeginning of restitution of infiltrated meltwater at the springat the beginning of the afternoon. The lag between the Tair
maxima and Q maxima (lag of Tair-Q maxima) is lessdefined, because of the presence of several secondary peaksof Q, however it is about 12 h. The lag of Tair-Q minima isstable during the period, whereas the lag of Tair-Q maximashortens from 14 to 10 h during the same period (Fig. 4).
Tspring: the Q peaks correspond to Tspring minima andconversely. Tspring and Q are in phase inversion (Fig. 2). Thethermal amplitude is up to 1.8°C (extreme Tspring are 6.2 and8 °C). At the daily scale, the thermal amplitude is between0.3 and 1.5 °C. Largest amplitudes are at the beginning ofthe period. Amplitudes gradually reduce till a quasi thermal
Table 1. Characteristic values of the daily snowmelt cycles at theCoulomp spring in March 2009.
Values Min. Aver. Max. Date of min.
Date of max.
Q(L/s) 497 1123 1754 11/03/2009
16:0019/03/2009
01:30
Snowmelt Q(L/s) 0 374 760 N/A 16/03/2009
01:30
Snowmelt Q/ Q (%) 0% 29% 50% N/A 16/03/2009
01:00
Tspring(°C) 6,23 6,94 7,99 11/03/2009
08:3012/03/2009
16:00
Lag min Tairto min Q (h) 6 7
(±1) 8,5 10/03/2009 20/03/2009
Lag max Tairto max Q (h) 8 12
(±2,3) 16 19/03/2009 10/03/2009
4. Results (Tab. 1)Q: during the period, discharge was about 1m3/s, howeverwith an extreme daily variability due to snowmelt, withconstant oscillation between 500–800 L/s and 900–1,700 L/s.
Basal Q and Snowmelt Q: the Basal Q corresponds to thelowest daily discharges corresponding to the cessation ofdaily snowmelt influence. Through the period, it graduallyincreases from 600 to 1,200 L/s. The Snowmelt Q strictlycorresponds to the daily melting, with a mean value of400 L/s, oscillation from 0 (snowmelt stop at night) to amaximum of 760 L/s. The relative contribution ofSnowmelt Q to the total discharge (Q) evolves from 0 whensnowmelt recharges stops at night to a maximum of 50%of Q, with a mean value of 30% of Q.
Figure 3. Lag between the air temperature (Tair) and the discharge (Q), for both minima and maxima.
Figure 4. Evolution of the Tair-Q lag for both minima and maxima.
Speleogenesis – oral 2013 ICS Proceedings
337
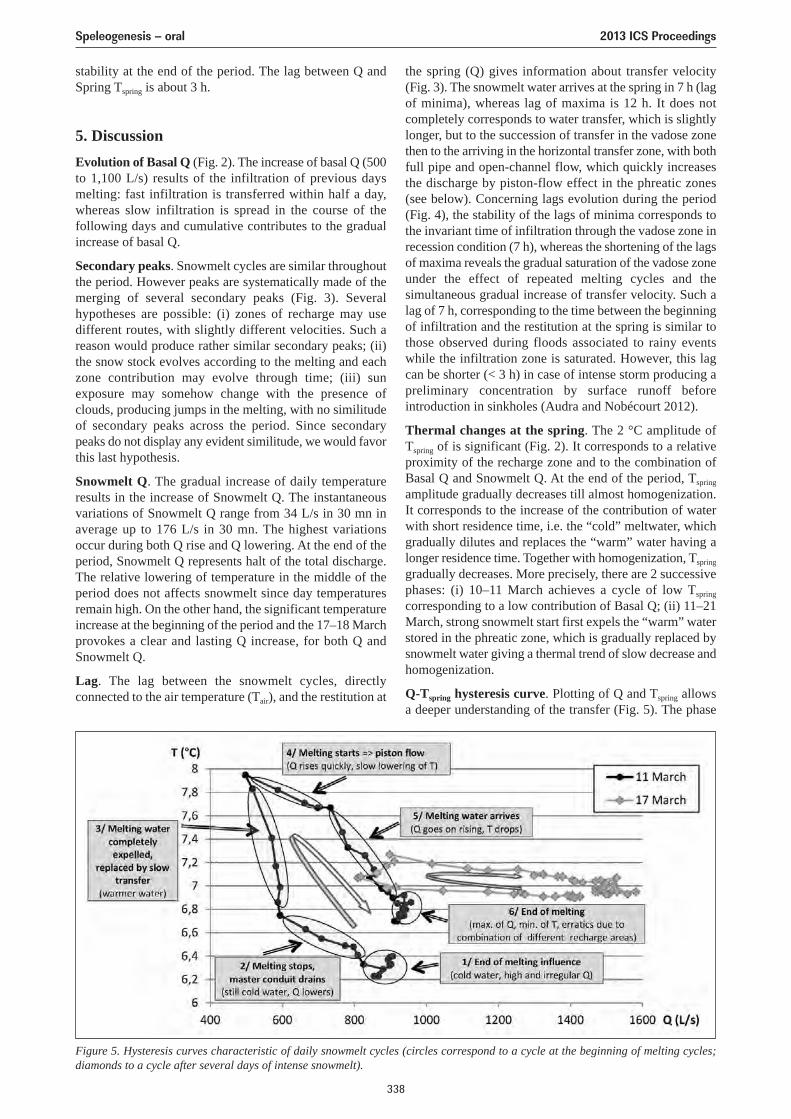
stability at the end of the period. The lag between Q andSpring Tspring is about 3 h.
5. DiscussionEvolution of Basal Q (Fig. 2). The increase of basal Q (500to 1,100 L/s) results of the infiltration of previous daysmelting: fast infiltration is transferred within half a day,whereas slow infiltration is spread in the course of thefollowing days and cumulative contributes to the gradualincrease of basal Q.
Secondary peaks. Snowmelt cycles are similar throughoutthe period. However peaks are systematically made of themerging of several secondary peaks (Fig. 3). Severalhypotheses are possible: (i) zones of recharge may usedifferent routes, with slightly different velocities. Such areason would produce rather similar secondary peaks; (ii)the snow stock evolves according to the melting and eachzone contribution may evolve through time; (iii) sunexposure may somehow change with the presence ofclouds, producing jumps in the melting, with no similitudeof secondary peaks across the period. Since secondarypeaks do not display any evident similitude, we would favorthis last hypothesis.
Snowmelt Q. The gradual increase of daily temperatureresults in the increase of Snowmelt Q. The instantaneousvariations of Snowmelt Q range from 34 L/s in 30 mn inaverage up to 176 L/s in 30 mn. The highest variationsoccur during both Q rise and Q lowering. At the end of theperiod, Snowmelt Q represents halt of the total discharge.The relative lowering of temperature in the middle of theperiod does not affects snowmelt since day temperaturesremain high. On the other hand, the significant temperatureincrease at the beginning of the period and the 17–18 Marchprovokes a clear and lasting Q increase, for both Q andSnowmelt Q.
Lag. The lag between the snowmelt cycles, directlyconnected to the air temperature (Tair), and the restitution at
the spring (Q) gives information about transfer velocity(Fig. 3). The snowmelt water arrives at the spring in 7 h (lagof minima), whereas lag of maxima is 12 h. It does notcompletely corresponds to water transfer, which is slightlylonger, but to the succession of transfer in the vadose zonethen to the arriving in the horizontal transfer zone, with bothfull pipe and open-channel flow, which quickly increasesthe discharge by piston-flow effect in the phreatic zones(see below). Concerning lags evolution during the period(Fig. 4), the stability of the lags of minima corresponds tothe invariant time of infiltration through the vadose zone inrecession condition (7 h), whereas the shortening of the lagsof maxima reveals the gradual saturation of the vadose zoneunder the effect of repeated melting cycles and thesimultaneous gradual increase of transfer velocity. Such alag of 7 h, corresponding to the time between the beginningof infiltration and the restitution at the spring is similar tothose observed during floods associated to rainy eventswhile the infiltration zone is saturated. However, this lagcan be shorter (< 3 h) in case of intense storm producing apreliminary concentration by surface runoff beforeintroduction in sinkholes (Audra and Nobécourt 2012).
Thermal changes at the spring. The 2 °C amplitude ofTspring of is significant (Fig. 2). It corresponds to a relativeproximity of the recharge zone and to the combination ofBasal Q and Snowmelt Q. At the end of the period, Tspring
amplitude gradually decreases till almost homogenization.It corresponds to the increase of the contribution of waterwith short residence time, i.e. the “cold” meltwater, whichgradually dilutes and replaces the “warm” water having alonger residence time. Together with homogenization, Tspring
gradually decreases. More precisely, there are 2 successivephases: (i) 10–11 March achieves a cycle of low Tspring
corresponding to a low contribution of Basal Q; (ii) 11–21March, strong snowmelt start first expels the “warm” waterstored in the phreatic zone, which is gradually replaced bysnowmelt water giving a thermal trend of slow decrease andhomogenization.
Q-Tspring hysteresis curve. Plotting of Q and Tspring allowsa deeper understanding of the transfer (Fig. 5). The phase
Figure 5. Hysteresis curves characteristic of daily snowmelt cycles (circles correspond to a cycle at the beginning of melting cycles;diamonds to a cycle after several days of intense snowmelt).
Speleogenesis – oral 2013 ICS Proceedings
338
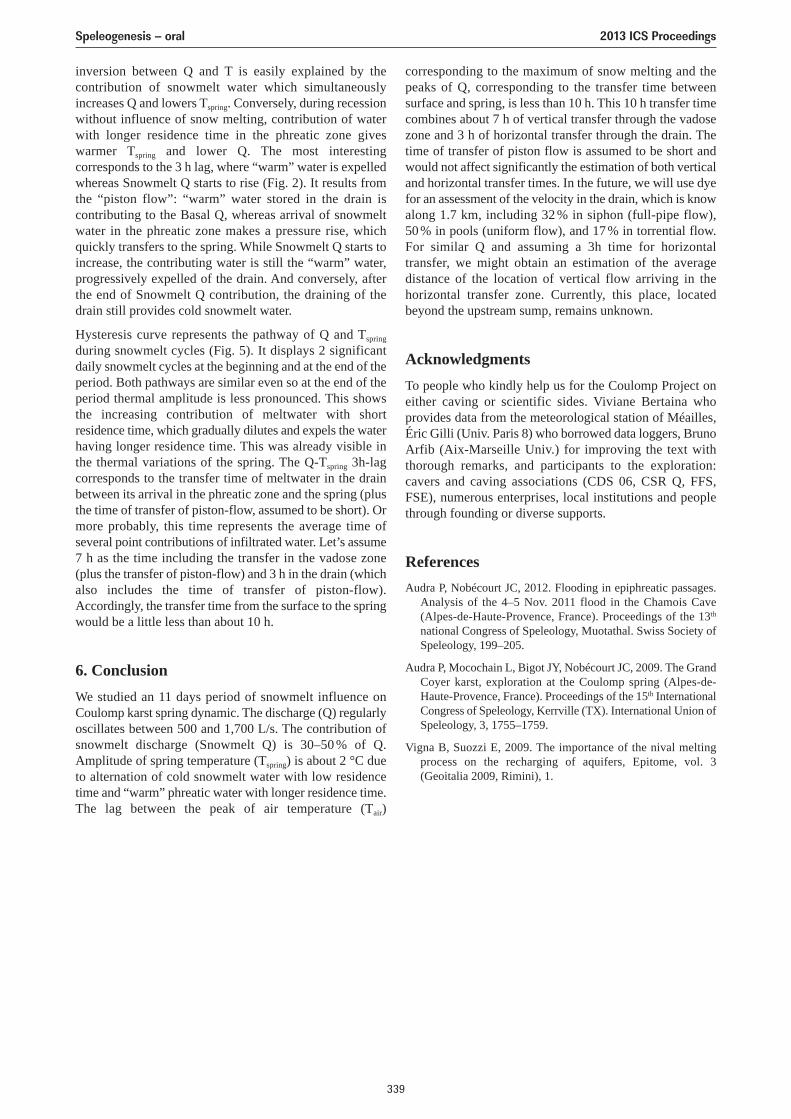
inversion between Q and T is easily explained by thecontribution of snowmelt water which simultaneouslyincreases Q and lowers Tspring. Conversely, during recessionwithout influence of snow melting, contribution of waterwith longer residence time in the phreatic zone giveswarmer Tspring and lower Q. The most interestingcorresponds to the 3 h lag, where “warm” water is expelledwhereas Snowmelt Q starts to rise (Fig. 2). It results fromthe “piston flow”: “warm” water stored in the drain iscontributing to the Basal Q, whereas arrival of snowmeltwater in the phreatic zone makes a pressure rise, whichquickly transfers to the spring. While Snowmelt Q starts toincrease, the contributing water is still the “warm” water,progressively expelled of the drain. And conversely, afterthe end of Snowmelt Q contribution, the draining of thedrain still provides cold snowmelt water.
Hysteresis curve represents the pathway of Q and Tspring
during snowmelt cycles (Fig. 5). It displays 2 significantdaily snowmelt cycles at the beginning and at the end of theperiod. Both pathways are similar even so at the end of theperiod thermal amplitude is less pronounced. This showsthe increasing contribution of meltwater with shortresidence time, which gradually dilutes and expels the waterhaving longer residence time. This was already visible inthe thermal variations of the spring. The Q-Tspring 3h-lagcorresponds to the transfer time of meltwater in the drainbetween its arrival in the phreatic zone and the spring (plusthe time of transfer of piston-flow, assumed to be short). Ormore probably, this time represents the average time ofseveral point contributions of infiltrated water. Let’s assume7 h as the time including the transfer in the vadose zone(plus the transfer of piston-flow) and 3 h in the drain (whichalso includes the time of transfer of piston-flow).Accordingly, the transfer time from the surface to the springwould be a little less than about 10 h.
6. ConclusionWe studied an 11 days period of snowmelt influence onCoulomp karst spring dynamic. The discharge (Q) regularlyoscillates between 500 and 1,700 L/s. The contribution ofsnowmelt discharge (Snowmelt Q) is 30–50 % of Q.Amplitude of spring temperature (Tspring) is about 2 °C dueto alternation of cold snowmelt water with low residencetime and “warm” phreatic water with longer residence time.The lag between the peak of air temperature (Tair)
corresponding to the maximum of snow melting and thepeaks of Q, corresponding to the transfer time betweensurface and spring, is less than 10 h. This 10 h transfer timecombines about 7 h of vertical transfer through the vadosezone and 3 h of horizontal transfer through the drain. Thetime of transfer of piston flow is assumed to be short andwould not affect significantly the estimation of both verticaland horizontal transfer times. In the future, we will use dyefor an assessment of the velocity in the drain, which is knowalong 1.7 km, including 32 % in siphon (full-pipe flow),50% in pools (uniform flow), and 17% in torrential flow.For similar Q and assuming a 3h time for horizontaltransfer, we might obtain an estimation of the averagedistance of the location of vertical flow arriving in thehorizontal transfer zone. Currently, this place, locatedbeyond the upstream sump, remains unknown.
AcknowledgmentsTo people who kindly help us for the Coulomp Project oneither caving or scientific sides. Viviane Bertaina whoprovides data from the meteorological station of Méailles,Éric Gilli (Univ. Paris 8) who borrowed data loggers, BrunoArfib (Aix-Marseille Univ.) for improving the text withthorough remarks, and participants to the exploration:cavers and caving associations (CDS 06, CSR Q, FFS,FSE), numerous enterprises, local institutions and peoplethrough founding or diverse supports.
ReferencesAudra P, Nobécourt JC, 2012. Flooding in epiphreatic passages.
Analysis of the 4–5 Nov. 2011 flood in the Chamois Cave(Alpes-de-Haute-Provence, France). Proceedings of the 13th
national Congress of Speleology, Muotathal. Swiss Society ofSpeleology, 199–205.
Audra P, Mocochain L, Bigot JY, Nobécourt JC, 2009. The GrandCoyer karst, exploration at the Coulomp spring (Alpes-de-Haute-Provence, France). Proceedings of the 15th InternationalCongress of Speleology, Kerrville (TX). International Union ofSpeleology, 3, 1755–1759.
Vigna B, Suozzi E, 2009. The importance of the nival meltingprocess on the recharging of aquifers, Epitome, vol. 3(Geoitalia 2009, Rimini), 1.
Speleogenesis – oral 2013 ICS Proceedings
339
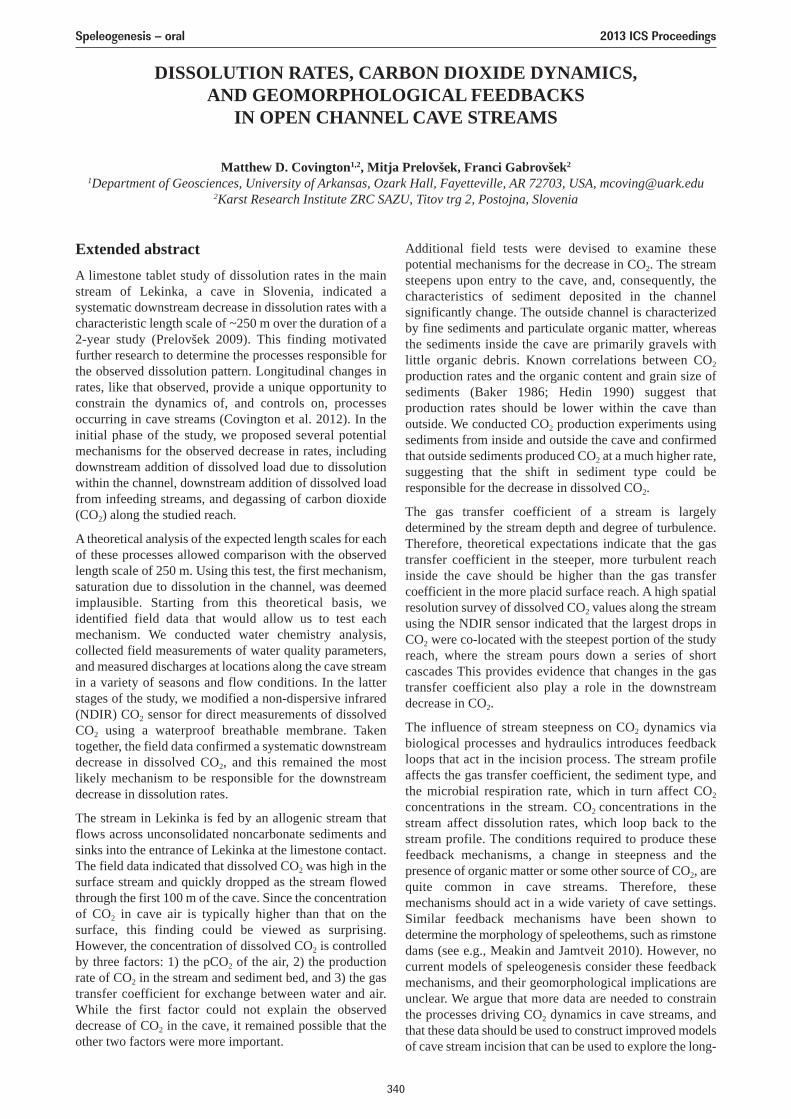
DISSOLUTION RATES, CARBON DIOXIDE DYNAMICS,AND GEOMORPHOLOGICAL FEEDBACKS
IN OPEN CHANNEL CAVE STREAMS
Matthew D. Covington1,2, Mitja Prelovšek, Franci Gabrovšek2
1Department of Geosciences, University of Arkansas, Ozark Hall, Fayetteville, AR 72703, USA, [email protected] Research Institute ZRC SAZU, Titov trg 2, Postojna, Slovenia
Extended abstractA limestone tablet study of dissolution rates in the mainstream of Lekinka, a cave in Slovenia, indicated asystematic downstream decrease in dissolution rates with acharacteristic length scale of ~250 m over the duration of a2-year study (Prelovšek 2009). This finding motivatedfurther research to determine the processes responsible forthe observed dissolution pattern. Longitudinal changes inrates, like that observed, provide a unique opportunity toconstrain the dynamics of, and controls on, processesoccurring in cave streams (Covington et al. 2012). In theinitial phase of the study, we proposed several potentialmechanisms for the observed decrease in rates, includingdownstream addition of dissolved load due to dissolutionwithin the channel, downstream addition of dissolved loadfrom infeeding streams, and degassing of carbon dioxide(CO2) along the studied reach.
A theoretical analysis of the expected length scales for eachof these processes allowed comparison with the observedlength scale of 250 m. Using this test, the first mechanism,saturation due to dissolution in the channel, was deemedimplausible. Starting from this theoretical basis, weidentified field data that would allow us to test eachmechanism. We conducted water chemistry analysis,collected field measurements of water quality parameters,and measured discharges at locations along the cave streamin a variety of seasons and flow conditions. In the latterstages of the study, we modified a non-dispersive infrared(NDIR) CO2 sensor for direct measurements of dissolvedCO2 using a waterproof breathable membrane. Takentogether, the field data confirmed a systematic downstreamdecrease in dissolved CO2, and this remained the mostlikely mechanism to be responsible for the downstreamdecrease in dissolution rates.
The stream in Lekinka is fed by an allogenic stream thatflows across unconsolidated noncarbonate sediments andsinks into the entrance of Lekinka at the limestone contact.The field data indicated that dissolved CO2 was high in thesurface stream and quickly dropped as the stream flowedthrough the first 100 m of the cave. Since the concentrationof CO2 in cave air is typically higher than that on thesurface, this finding could be viewed as surprising.However, the concentration of dissolved CO2 is controlledby three factors: 1) the pCO2 of the air, 2) the productionrate of CO2 in the stream and sediment bed, and 3) the gastransfer coefficient for exchange between water and air.While the first factor could not explain the observeddecrease of CO2 in the cave, it remained possible that theother two factors were more important.
Additional field tests were devised to examine thesepotential mechanisms for the decrease in CO2. The streamsteepens upon entry to the cave, and, consequently, thecharacteristics of sediment deposited in the channelsignificantly change. The outside channel is characterizedby fine sediments and particulate organic matter, whereasthe sediments inside the cave are primarily gravels withlittle organic debris. Known correlations between CO2
production rates and the organic content and grain size ofsediments (Baker 1986; Hedin 1990) suggest thatproduction rates should be lower within the cave thanoutside. We conducted CO2 production experiments usingsediments from inside and outside the cave and confirmedthat outside sediments produced CO2 at a much higher rate,suggesting that the shift in sediment type could beresponsible for the decrease in dissolved CO2.
The gas transfer coefficient of a stream is largelydetermined by the stream depth and degree of turbulence.Therefore, theoretical expectations indicate that the gastransfer coefficient in the steeper, more turbulent reachinside the cave should be higher than the gas transfercoefficient in the more placid surface reach. A high spatialresolution survey of dissolved CO2 values along the streamusing the NDIR sensor indicated that the largest drops inCO2 were co-located with the steepest portion of the studyreach, where the stream pours down a series of shortcascades This provides evidence that changes in the gastransfer coefficient also play a role in the downstreamdecrease in CO2.
The influence of stream steepness on CO2 dynamics viabiological processes and hydraulics introduces feedbackloops that act in the incision process. The stream profileaffects the gas transfer coefficient, the sediment type, andthe microbial respiration rate, which in turn affect CO2
concentrations in the stream. CO2 concentrations in thestream affect dissolution rates, which loop back to thestream profile. The conditions required to produce thesefeedback mechanisms, a change in steepness and thepresence of organic matter or some other source of CO2, arequite common in cave streams. Therefore, thesemechanisms should act in a wide variety of cave settings.Similar feedback mechanisms have been shown todetermine the morphology of speleothems, such as rimstonedams (see e.g., Meakin and Jamtveit 2010). However, nocurrent models of speleogenesis consider these feedbackmechanisms, and their geomorphological implications areunclear. We argue that more data are needed to constrainthe processes driving CO2 dynamics in cave streams, andthat these data should be used to construct improved modelsof cave stream incision that can be used to explore the long-
Speleogenesis – oral 2013 ICS Proceedings
340

term implications of such feedback mechanisms on cavemorphology. The details of this study are presented inCovington et al. (in press).
ReferencesBaker J, 1986. Relationship between microbial activity of stream
sediments, determined by three different methods, and abioticvariables. Microbial Ecology 12(2), 193–203.
Covington MD, Prelovšek M, Gabrovšek F, in press. Influence of CO2 dynamics on the longitudinal variation of incision rates in soluble bedrock channels: feedback mechanisms.Geomorphology.
Covington MD, Luhmann AJ, Wicks CM, Saar MO, 2012. Processlength scales and longitudinal damping in karst. Journal ofGeophysical Research – Earth Surface 117(F1), F01025.
Hedin L, 1990. Factors controlling sediment community resprirationin woodland stream ecosystems. Oikos 57(1), 94–105.
Meakin P, Jamtveit B, 2010. Geological pattern formation bygrowth and dissolution in aqueous systems. Proceedings of theRoyal Society A: Mathematical, Physical and EngineeringSciences 466(2115), 659–694.
Prelovšek M, 2009. Present-day speleogenetic processes, factorsand features in the epiphreatic zone. Ph.D. thesis. Universityof Nova Gorica, Nova Gorica, Slovenia.
Speleogenesis – oral 2013 ICS Proceedings
341
A METHODOLOGY TO ESTIMATE THE AGE OF CAVES IN NORTHERNLATITUDES, USING TOERFJELLHOLA IN NORWAY AS AN EXAMPLE
Trevor FaulknerLimestone Research Group, Geography, Earth and Environmental Sciences, University of Birmingham, Edgbaston,
Birmingham, B15 2TT, UK, [email protected]
The minimum ages of cave passages are commonly reported by dating their chemical or clastic deposits. Few studies haveattempted to provide detailed timescales for the evolution of caves without such deposits. This paper addresses this issuefor complex caves formed in glaciated regions, especially those in northern latitudes that were covered by extensiveicesheets during the Pleistocene. Toerfjellhola in Norway is chosen as an example to illustrate a methodology by whichits cave development history can be deduced by considering probable entrenchment and dissolution rates and localgeomorphological changes, whilst working backwards in time and upwards in elevation. Such a method suggests thatToerfjellhola initially comprised two separate palaeocaves whose present highest level passages were formed during theElsterian deglaciation at the transition from MIS12 to MIS11c. The two caves probably became connected by a commonflow route during the Eemian Interglacial at MIS5e.
1. IntroductionA universal problem in karst geomorphology is to derive aspeleogenetic history for caves in a karst area (Ford andWilliams 2007). Although phases of cave development maybe deduced from studies of cave surveys and caveelevations, these are commonly correlated with externalgeological and geomorphological events only if supportedby the dating of speleothems and / or other internal deposits.Such deposits can provide minimum existence ages for thecontaining cave passages, but it is problematic to derivespeleogenetic timetables without them. However, theinterglacial hydrological flow routes from sinks to risingsfor caves formed in glaciated valleys can changesignificantly after rejuvenation caused by each cycle ofglacial erosion (e.g., Häuselmann et al. 2007). Glacial cycleshad a period of c. 100,000 years during the last one millionyears. If previous surface flows and underground vadoseand phreatic flows can be correlated to glacial events, thisshould provide an estimated timetable for speleogenesis.This paper considers situations in the repeatedly-glaciatedmountainous Caledonides in northern latitudes by usingToerfjellhola in Central Scandinavia as an example ofmulti-cycle speleogenesis. Large glaciations started theexcavation of local U-shaped valleys and fjords from2.8–2.5 Ma, and full-scale continental glaciations startedfrom 0.9 Ma (Fredin 2002). Toerfjellhola is formed inamphibolite grade marble that was created by intensefolding and metamorphism in the Cambrian to SilurianCaledonide orogeny. Hence, any karst structures in itsprevious sedimentary limestone lithology have been lost.Its tectonic inception is assumed to be derived from openfractures created as late as the Pleistocene by deglacialuplift and seismicity at the culminations of Scandinavianglaciations (Faulkner 2006a). The cave development historyfor Toerfjellhola is thus likely to be shorter, simpler andeasier to derive than the histories of caves in sedimentarylimestones that experienced similar glacial environments:inception in those caves may have started soon afterdiagenesis (Lowe and Gunn 1997).
Central Scandinavia has nearly 1,000 recorded cavesbetween 64°30’N and 66°20’N (Engh and Sjöberg 1981;
Faulkner 2005). The caves tend to cluster along marbleoutcrops and remain within 50 m of the overlying surfaceor less than one-eighth of the depth of the local glaciatedvalley (Faulkner 2007a). About a third are “combination”caves (Faulkner 2009a) that contain relict phreatic passagescommonly above a single mainly vadose streamway, as inToerfjellhola. Local cave development probably follows arepeating four-stage process (Faulkner 2005; 2010):tectonic inception; deglacial speleogenesis beneath an ice-dammed lake (IDL) or a subglacial reservoir; interglacialspeleogenesis; and glacial removal. These processes leadto an internal Top-Down, Middle-Outwards (TDMO) modelof cave development (Faulkner 2007b). The combinationcaves are mostly “single-cycle” caves that developed theirphreatic passages during the Weichselian deglaciation.There are only about 25 that appear to be “multi-cycle”caves that have experienced several Pleistocene glaciations.Of these, Toerfjellhola is one of the most complex, withpassages at nine levels. Its sump is c. 50 m below thesurface, which is more than the amount of local bedrockremoved at each glaciation. It is therefore a good candidateto have developed over several glacial–interglacial cycles.This paper deduces its possible history, despite its lack ofdatable stalagmite and it having clastic deposits and a fewstraw stalactites that likely derive from, or were formedafter, the last deglaciation.
Toerfjellhola is the longest cave in the Helgeland NappeComplex (HNC). The marble is well-banded in grey andwhite colours, commonly with a vertical foliation. Thedominant country rock is mica schist, supplemented byoutcrops of granite, gneiss and amphibolites, withcommonly linear stripe karst marble outcrops (Gustavson1988). The cave is one of only five known in vertical stripekarst in the HNC that also contain steeply-sloping relictpassages. It lies 5 km NE of Tosenfjord on the SW flank ofToerfjell (1,000 m) in Brønnøy commune, Norway(Faulkner and Newton 1995: Fig. 15). The Main Entrancesink is at WGS84 UTM coordinates VN06504927 at analtitude of 485 m a.s.l. The cave has a surveyed length of1,896 m and a depth of 101 m. It is situated on a benchwithin an unmapped marble outcrop measuring perhaps1,000 m by 200 m above the upper, dry, part of
Speleogenesis – oral 2013 ICS Proceedings
342
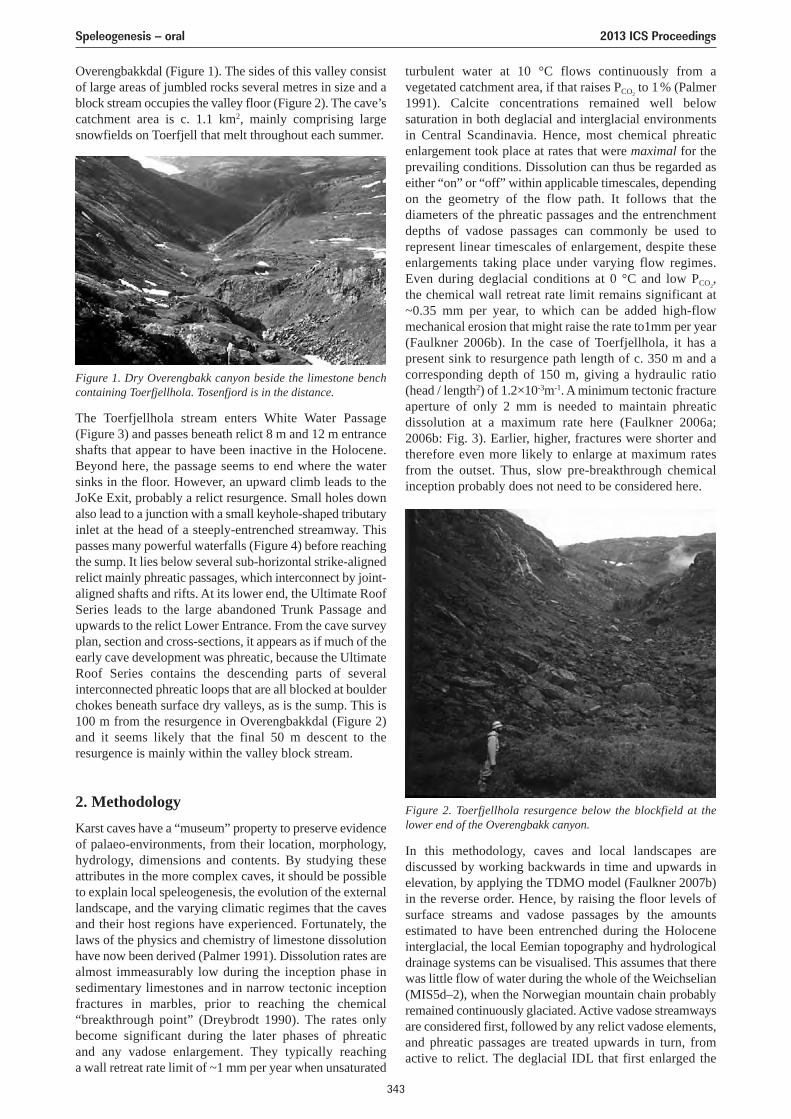
Overengbakkdal (Figure 1). The sides of this valley consistof large areas of jumbled rocks several metres in size and ablock stream occupies the valley floor (Figure 2). The cave’scatchment area is c. 1.1 km2, mainly comprising largesnowfields on Toerfjell that melt throughout each summer.
turbulent water at 10 °C flows continuously from avegetated catchment area, if that raises PCO2
to 1% (Palmer1991). Calcite concentrations remained well belowsaturation in both deglacial and interglacial environmentsin Central Scandinavia. Hence, most chemical phreaticenlargement took place at rates that were maximal for theprevailing conditions. Dissolution can thus be regarded aseither “on” or “off” within applicable timescales, dependingon the geometry of the flow path. It follows that thediameters of the phreatic passages and the entrenchmentdepths of vadose passages can commonly be used torepresent linear timescales of enlargement, despite theseenlargements taking place under varying flow regimes.Even during deglacial conditions at 0 °C and low PCO2
,the chemical wall retreat rate limit remains significant at~0.35 mm per year, to which can be added high-flowmechanical erosion that might raise the rate to1mm per year(Faulkner 2006b). In the case of Toerfjellhola, it has apresent sink to resurgence path length of c. 350 m and acorresponding depth of 150 m, giving a hydraulic ratio(head / length2) of 1.2×10⁻³m-1. A minimum tectonic fractureaperture of only 2 mm is needed to maintain phreaticdissolution at a maximum rate here (Faulkner 2006a;2006b: Fig. 3). Earlier, higher, fractures were shorter andtherefore even more likely to enlarge at maximum ratesfrom the outset. Thus, slow pre-breakthrough chemicalinception probably does not need to be considered here.
Figure 1. Dry Overengbakk canyon beside the limestone benchcontaining Toerfjellhola. Tosenfjord is in the distance.
Figure 2. Toerfjellhola resurgence below the blockfield at thelower end of the Overengbakk canyon.
The Toerfjellhola stream enters White Water Passage(Figure 3) and passes beneath relict 8 m and 12 m entranceshafts that appear to have been inactive in the Holocene.Beyond here, the passage seems to end where the watersinks in the floor. However, an upward climb leads to theJoKe Exit, probably a relict resurgence. Small holes downalso lead to a junction with a small keyhole-shaped tributaryinlet at the head of a steeply-entrenched streamway. Thispasses many powerful waterfalls (Figure 4) before reachingthe sump. It lies below several sub-horizontal strike-alignedrelict mainly phreatic passages, which interconnect by joint-aligned shafts and rifts. At its lower end, the Ultimate RoofSeries leads to the large abandoned Trunk Passage andupwards to the relict Lower Entrance. From the cave surveyplan, section and cross-sections, it appears as if much of theearly cave development was phreatic, because the UltimateRoof Series contains the descending parts of severalinterconnected phreatic loops that are all blocked at boulderchokes beneath surface dry valleys, as is the sump. This is100 m from the resurgence in Overengbakkdal (Figure 2)and it seems likely that the final 50 m descent to theresurgence is mainly within the valley block stream.
2. MethodologyKarst caves have a “museum” property to preserve evidenceof palaeo-environments, from their location, morphology,hydrology, dimensions and contents. By studying theseattributes in the more complex caves, it should be possibleto explain local speleogenesis, the evolution of the externallandscape, and the varying climatic regimes that the cavesand their host regions have experienced. Fortunately, thelaws of the physics and chemistry of limestone dissolutionhave now been derived (Palmer 1991). Dissolution rates arealmost immeasurably low during the inception phase insedimentary limestones and in narrow tectonic inceptionfractures in marbles, prior to reaching the chemical“breakthrough point” (Dreybrodt 1990). The rates onlybecome significant during the later phases of phreatic and any vadose enlargement. They typically reaching a wall retreat rate limit of ~1 mm per year when unsaturated
In this methodology, caves and local landscapes arediscussed by working backwards in time and upwards inelevation, by applying the TDMO model (Faulkner 2007b)in the reverse order. Hence, by raising the floor levels ofsurface streams and vadose passages by the amountsestimated to have been entrenched during the Holoceneinterglacial, the local Eemian topography and hydrologicaldrainage systems can be visualised. This assumes that therewas little flow of water during the whole of the Weichselian(MIS5d–2), when the Norwegian mountain chain probablyremained continuously glaciated. Active vadose streamwaysare considered first, followed by any relict vadose elements,and phreatic passages are treated upwards in turn, fromactive to relict. The deglacial IDL that first enlarged the
Speleogenesis – oral 2013 ICS Proceedings
343
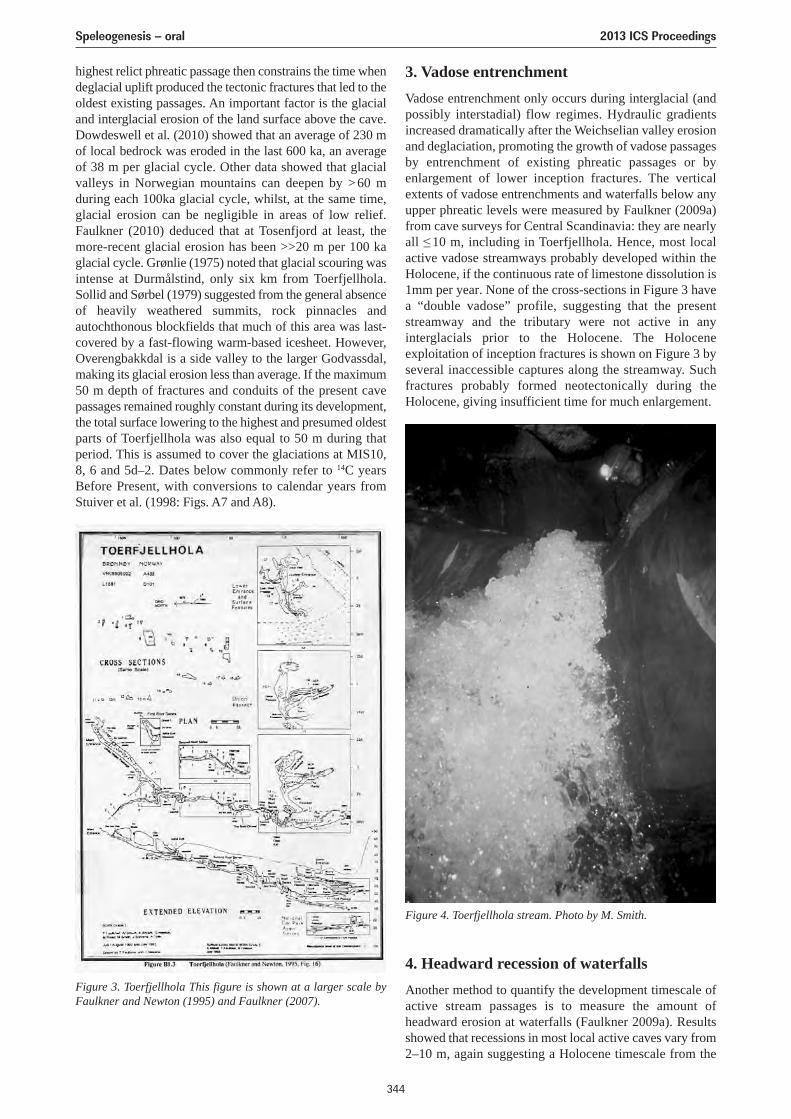
highest relict phreatic passage then constrains the time whendeglacial uplift produced the tectonic fractures that led to theoldest existing passages. An important factor is the glacialand interglacial erosion of the land surface above the cave.Dowdeswell et al. (2010) showed that an average of 230 mof local bedrock was eroded in the last 600 ka, an averageof 38 m per glacial cycle. Other data showed that glacialvalleys in Norwegian mountains can deepen by >60 mduring each 100ka glacial cycle, whilst, at the same time,glacial erosion can be negligible in areas of low relief.Faulkner (2010) deduced that at Tosenfjord at least, themore-recent glacial erosion has been >>20 m per 100 kaglacial cycle. Grønlie (1975) noted that glacial scouring wasintense at Durmålstind, only six km from Toerfjellhola.Sollid and Sørbel (1979) suggested from the general absenceof heavily weathered summits, rock pinnacles andautochthonous blockfields that much of this area was last-covered by a fast-flowing warm-based icesheet. However,Overengbakkdal is a side valley to the larger Godvassdal,making its glacial erosion less than average. If the maximum50 m depth of fractures and conduits of the present cavepassages remained roughly constant during its development,the total surface lowering to the highest and presumed oldestparts of Toerfjellhola was also equal to 50 m during thatperiod. This is assumed to cover the glaciations at MIS10,8, 6 and 5d–2. Dates below commonly refer to 14C yearsBefore Present, with conversions to calendar years fromStuiver et al. (1998: Figs. A7 and A8).
3. Vadose entrenchmentVadose entrenchment only occurs during interglacial (andpossibly interstadial) flow regimes. Hydraulic gradientsincreased dramatically after the Weichselian valley erosionand deglaciation, promoting the growth of vadose passagesby entrenchment of existing phreatic passages or byenlargement of lower inception fractures. The verticalextents of vadose entrenchments and waterfalls below anyupper phreatic levels were measured by Faulkner (2009a)from cave surveys for Central Scandinavia: they are nearlyall ≤10 m, including in Toerfjellhola. Hence, most localactive vadose streamways probably developed within theHolocene, if the continuous rate of limestone dissolution is1mm per year. None of the cross-sections in Figure 3 havea “double vadose” profile, suggesting that the presentstreamway and the tributary were not active in anyinterglacials prior to the Holocene. The Holoceneexploitation of inception fractures is shown on Figure 3 byseveral inaccessible captures along the streamway. Suchfractures probably formed neotectonically during theHolocene, giving insufficient time for much enlargement.
Figure 4. Toerfjellhola stream. Photo by M. Smith.
Figure 3. Toerfjellhola This figure is shown at a larger scale byFaulkner and Newton (1995) and Faulkner (2007).
4. Headward recession of waterfallsAnother method to quantify the development timescale ofactive stream passages is to measure the amount ofheadward erosion at waterfalls (Faulkner 2009a). Resultsshowed that recessions in most local active caves vary from2–10 m, again suggesting a Holocene timescale from the
Speleogenesis – oral 2013 ICS Proceedings
344
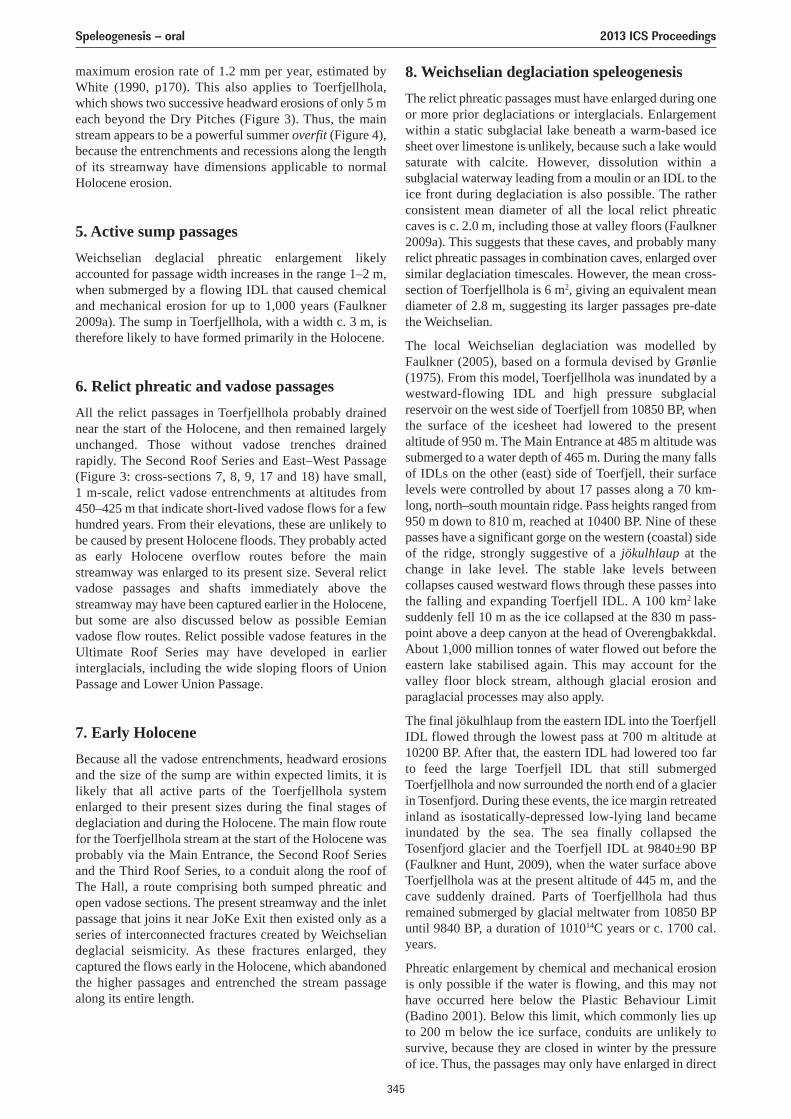
maximum erosion rate of 1.2 mm per year, estimated byWhite (1990, p170). This also applies to Toerfjellhola,which shows two successive headward erosions of only 5 meach beyond the Dry Pitches (Figure 3). Thus, the mainstream appears to be a powerful summer overfit (Figure 4),because the entrenchments and recessions along the lengthof its streamway have dimensions applicable to normalHolocene erosion.
5. Active sump passagesWeichselian deglacial phreatic enlargement likelyaccounted for passage width increases in the range 1–2 m,when submerged by a flowing IDL that caused chemicaland mechanical erosion for up to 1,000 years (Faulkner2009a). The sump in Toerfjellhola, with a width c. 3 m, istherefore likely to have formed primarily in the Holocene.
6. Relict phreatic and vadose passagesAll the relict passages in Toerfjellhola probably drainednear the start of the Holocene, and then remained largelyunchanged. Those without vadose trenches drained rapidly. The Second Roof Series and East–West Passage(Figure 3: cross-sections 7, 8, 9, 17 and 18) have small, 1 m-scale, relict vadose entrenchments at altitudes from450–425 m that indicate short-lived vadose flows for a fewhundred years. From their elevations, these are unlikely tobe caused by present Holocene floods. They probably actedas early Holocene overflow routes before the mainstreamway was enlarged to its present size. Several relictvadose passages and shafts immediately above thestreamway may have been captured earlier in the Holocene,but some are also discussed below as possible Eemianvadose flow routes. Relict possible vadose features in theUltimate Roof Series may have developed in earlierinterglacials, including the wide sloping floors of UnionPassage and Lower Union Passage.
7. Early HoloceneBecause all the vadose entrenchments, headward erosionsand the size of the sump are within expected limits, it islikely that all active parts of the Toerfjellhola systemenlarged to their present sizes during the final stages ofdeglaciation and during the Holocene. The main flow routefor the Toerfjellhola stream at the start of the Holocene wasprobably via the Main Entrance, the Second Roof Seriesand the Third Roof Series, to a conduit along the roof ofThe Hall, a route comprising both sumped phreatic andopen vadose sections. The present streamway and the inletpassage that joins it near JoKe Exit then existed only as aseries of interconnected fractures created by Weichseliandeglacial seismicity. As these fractures enlarged, theycaptured the flows early in the Holocene, which abandonedthe higher passages and entrenched the stream passagealong its entire length.
8. Weichselian deglaciation speleogenesisThe relict phreatic passages must have enlarged during oneor more prior deglaciations or interglacials. Enlargementwithin a static subglacial lake beneath a warm-based icesheet over limestone is unlikely, because such a lake wouldsaturate with calcite. However, dissolution within asubglacial waterway leading from a moulin or an IDL to theice front during deglaciation is also possible. The ratherconsistent mean diameter of all the local relict phreaticcaves is c. 2.0 m, including those at valley floors (Faulkner2009a). This suggests that these caves, and probably manyrelict phreatic passages in combination caves, enlarged oversimilar deglaciation timescales. However, the mean cross-section of Toerfjellhola is 6 m2, giving an equivalent meandiameter of 2.8 m, suggesting its larger passages pre-datethe Weichselian.
The local Weichselian deglaciation was modelled byFaulkner (2005), based on a formula devised by Grønlie(1975). From this model, Toerfjellhola was inundated by awestward-flowing IDL and high pressure subglacialreservoir on the west side of Toerfjell from 10850 BP, whenthe surface of the icesheet had lowered to the presentaltitude of 950 m. The Main Entrance at 485 m altitude wassubmerged to a water depth of 465 m. During the many fallsof IDLs on the other (east) side of Toerfjell, their surfacelevels were controlled by about 17 passes along a 70 km-long, north–south mountain ridge. Pass heights ranged from950 m down to 810 m, reached at 10400 BP. Nine of thesepasses have a significant gorge on the western (coastal) sideof the ridge, strongly suggestive of a jökulhlaup at thechange in lake level. The stable lake levels betweencollapses caused westward flows through these passes intothe falling and expanding Toerfjell IDL. A 100 km2 lakesuddenly fell 10 m as the ice collapsed at the 830 m pass-point above a deep canyon at the head of Overengbakkdal.About 1,000 million tonnes of water flowed out before theeastern lake stabilised again. This may account for thevalley floor block stream, although glacial erosion andparaglacial processes may also apply.
The final jökulhlaup from the eastern IDL into the ToerfjellIDL flowed through the lowest pass at 700 m altitude at10200 BP. After that, the eastern IDL had lowered too farto feed the large Toerfjell IDL that still submergedToerfjellhola and now surrounded the north end of a glacierin Tosenfjord. During these events, the ice margin retreatedinland as isostatically-depressed low-lying land becameinundated by the sea. The sea finally collapsed theTosenfjord glacier and the Toerfjell IDL at 9840±90 BP(Faulkner and Hunt, 2009), when the water surface aboveToerfjellhola was at the present altitude of 445 m, and thecave suddenly drained. Parts of Toerfjellhola had thusremained submerged by glacial meltwater from 10850 BPuntil 9840 BP, a duration of 101014C years or c. 1700 cal.years.
Phreatic enlargement by chemical and mechanical erosionis only possible if the water is flowing, and this may nothave occurred here below the Plastic Behaviour Limit(Badino 2001). Below this limit, which commonly lies upto 200 m below the ice surface, conduits are unlikely tosurvive, because they are closed in winter by the pressureof ice. Thus, the passages may only have enlarged in direct
Speleogenesis – oral 2013 ICS Proceedings
345
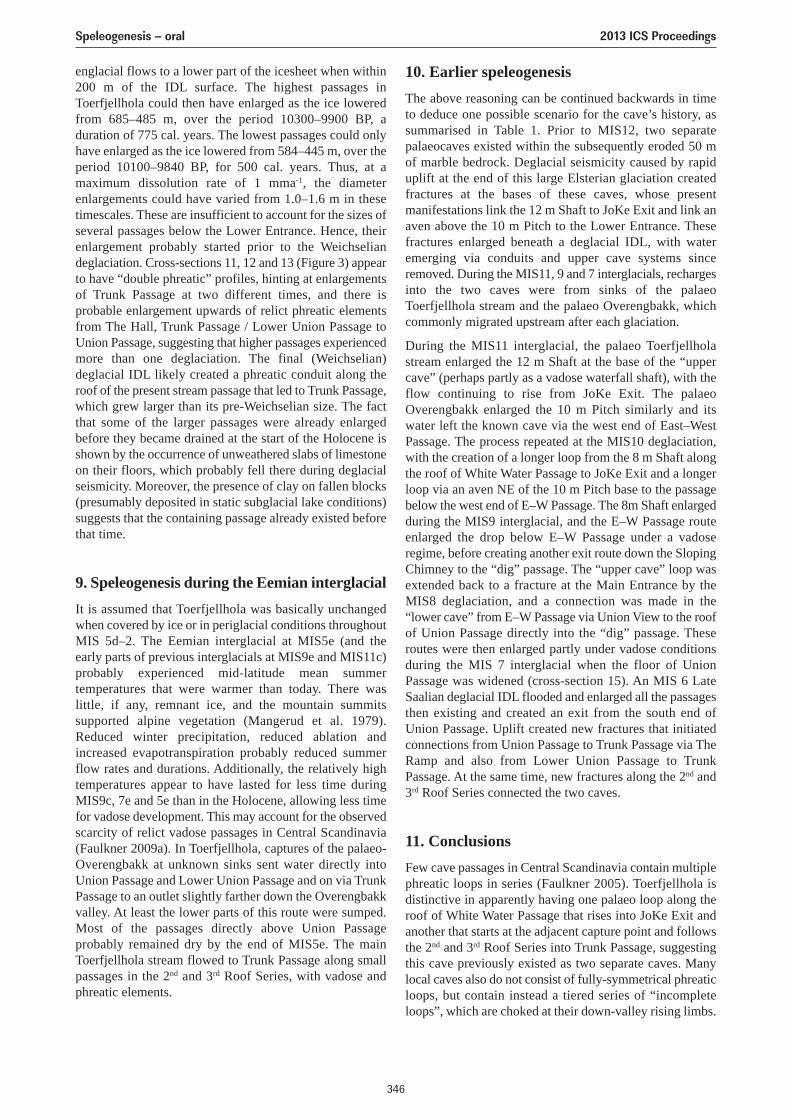
englacial flows to a lower part of the icesheet when within200 m of the IDL surface. The highest passages inToerfjellhola could then have enlarged as the ice loweredfrom 685–485 m, over the period 10300–9900 BP, aduration of 775 cal. years. The lowest passages could onlyhave enlarged as the ice lowered from 584–445 m, over theperiod 10100–9840 BP, for 500 cal. years. Thus, at amaximum dissolution rate of 1 mma-1, the diameterenlargements could have varied from 1.0 –1.6 m in thesetimescales. These are insufficient to account for the sizes ofseveral passages below the Lower Entrance. Hence, theirenlargement probably started prior to the Weichseliandeglaciation. Cross-sections 11, 12 and 13 (Figure 3) appearto have “double phreatic” profiles, hinting at enlargementsof Trunk Passage at two different times, and there isprobable enlargement upwards of relict phreatic elementsfrom The Hall, Trunk Passage / Lower Union Passage toUnion Passage, suggesting that higher passages experiencedmore than one deglaciation. The final (Weichselian)deglacial IDL likely created a phreatic conduit along theroof of the present stream passage that led to Trunk Passage,which grew larger than its pre-Weichselian size. The factthat some of the larger passages were already enlargedbefore they became drained at the start of the Holocene isshown by the occurrence of unweathered slabs of limestoneon their floors, which probably fell there during deglacialseismicity. Moreover, the presence of clay on fallen blocks(presumably deposited in static subglacial lake conditions)suggests that the containing passage already existed beforethat time.
9. Speleogenesis during the Eemian interglacialIt is assumed that Toerfjellhola was basically unchangedwhen covered by ice or in periglacial conditions throughoutMIS 5d–2. The Eemian interglacial at MIS5e (and the early parts of previous interglacials at MIS9e and MIS11c)probably experienced mid-latitude mean summertemperatures that were warmer than today. There was little, if any, remnant ice, and the mountain summitssupported alpine vegetation (Mangerud et al. 1979).Reduced winter precipitation, reduced ablation andincreased evapotranspiration probably reduced summerflow rates and durations. Additionally, the relatively hightemperatures appear to have lasted for less time duringMIS9c, 7e and 5e than in the Holocene, allowing less timefor vadose development. This may account for the observedscarcity of relict vadose passages in Central Scandinavia(Faulkner 2009a). In Toerfjellhola, captures of the palaeo-Overengbakk at unknown sinks sent water directly intoUnion Passage and Lower Union Passage and on via TrunkPassage to an outlet slightly farther down the Overengbakkvalley. At least the lower parts of this route were sumped.Most of the passages directly above Union Passageprobably remained dry by the end of MIS5e. The mainToerfjellhola stream flowed to Trunk Passage along smallpassages in the 2nd and 3rd Roof Series, with vadose andphreatic elements.
10. Earlier speleogenesisThe above reasoning can be continued backwards in timeto deduce one possible scenario for the cave’s history, assummarised in Table 1. Prior to MIS12, two separatepalaeocaves existed within the subsequently eroded 50 mof marble bedrock. Deglacial seismicity caused by rapiduplift at the end of this large Elsterian glaciation createdfractures at the bases of these caves, whose presentmanifestations link the 12 m Shaft to JoKe Exit and link anaven above the 10 m Pitch to the Lower Entrance. Thesefractures enlarged beneath a deglacial IDL, with wateremerging via conduits and upper cave systems sinceremoved. During the MIS11, 9 and 7 interglacials, rechargesinto the two caves were from sinks of the palaeoToerfjellhola stream and the palaeo Overengbakk, whichcommonly migrated upstream after each glaciation.
During the MIS11 interglacial, the palaeo Toerfjellholastream enlarged the 12 m Shaft at the base of the “uppercave” (perhaps partly as a vadose waterfall shaft), with theflow continuing to rise from JoKe Exit. The palaeoOverengbakk enlarged the 10 m Pitch similarly and itswater left the known cave via the west end of East–WestPassage. The process repeated at the MIS10 deglaciation,with the creation of a longer loop from the 8 m Shaft alongthe roof of White Water Passage to JoKe Exit and a longerloop via an aven NE of the 10 m Pitch base to the passagebelow the west end of E–W Passage. The 8m Shaft enlargedduring the MIS9 interglacial, and the E–W Passage routeenlarged the drop below E–W Passage under a vadoseregime, before creating another exit route down the SlopingChimney to the “dig” passage. The “upper cave” loop wasextended back to a fracture at the Main Entrance by theMIS8 deglaciation, and a connection was made in the“lower cave” from E–W Passage via Union View to the roofof Union Passage directly into the “dig” passage. Theseroutes were then enlarged partly under vadose conditionsduring the MIS 7 interglacial when the floor of UnionPassage was widened (cross-section 15). An MIS 6 LateSaalian deglacial IDL flooded and enlarged all the passagesthen existing and created an exit from the south end ofUnion Passage. Uplift created new fractures that initiatedconnections from Union Passage to Trunk Passage via TheRamp and also from Lower Union Passage to TrunkPassage. At the same time, new fractures along the 2nd and3rd Roof Series connected the two caves.
11. ConclusionsFew cave passages in Central Scandinavia contain multiplephreatic loops in series (Faulkner 2005). Toerfjellhola isdistinctive in apparently having one palaeo loop along theroof of White Water Passage that rises into JoKe Exit andanother that starts at the adjacent capture point and followsthe 2nd and 3rd Roof Series into Trunk Passage, suggestingthis cave previously existed as two separate caves. Manylocal caves also do not consist of fully-symmetrical phreaticloops, but contain instead a tiered series of “incompleteloops”, which are choked at their down-valley rising limbs.
Speleogenesis – oral 2013 ICS Proceedings
346
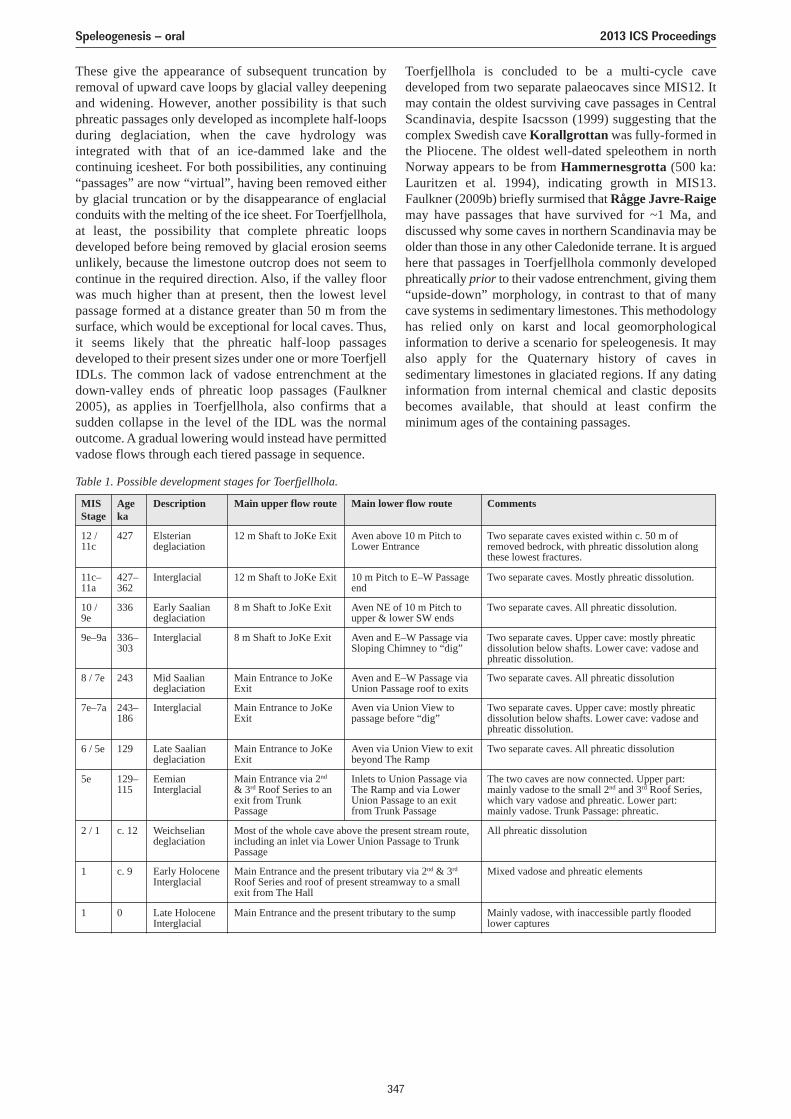
These give the appearance of subsequent truncation byremoval of upward cave loops by glacial valley deepeningand widening. However, another possibility is that suchphreatic passages only developed as incomplete half-loopsduring deglaciation, when the cave hydrology wasintegrated with that of an ice-dammed lake and thecontinuing icesheet. For both possibilities, any continuing“passages” are now “virtual”, having been removed eitherby glacial truncation or by the disappearance of englacialconduits with the melting of the ice sheet. For Toerfjellhola,at least, the possibility that complete phreatic loopsdeveloped before being removed by glacial erosion seemsunlikely, because the limestone outcrop does not seem tocontinue in the required direction. Also, if the valley floorwas much higher than at present, then the lowest levelpassage formed at a distance greater than 50 m from thesurface, which would be exceptional for local caves. Thus,it seems likely that the phreatic half-loop passagesdeveloped to their present sizes under one or more ToerfjellIDLs. The common lack of vadose entrenchment at thedown-valley ends of phreatic loop passages (Faulkner2005), as applies in Toerfjellhola, also confirms that asudden collapse in the level of the IDL was the normaloutcome. A gradual lowering would instead have permittedvadose flows through each tiered passage in sequence.
Toerfjellhola is concluded to be a multi-cycle cavedeveloped from two separate palaeocaves since MIS12. Itmay contain the oldest surviving cave passages in CentralScandinavia, despite Isacsson (1999) suggesting that thecomplex Swedish cave Korallgrottan was fully-formed inthe Pliocene. The oldest well-dated speleothem in northNorway appears to be from Hammernesgrotta (500 ka:Lauritzen et al. 1994), indicating growth in MIS13.Faulkner (2009b) briefly surmised that Rågge Javre-Raigemay have passages that have survived for ~1 Ma, anddiscussed why some caves in northern Scandinavia may beolder than those in any other Caledonide terrane. It is arguedhere that passages in Toerfjellhola commonly developedphreatically prior to their vadose entrenchment, giving them“upside-down” morphology, in contrast to that of manycave systems in sedimentary limestones. This methodologyhas relied only on karst and local geomorphologicalinformation to derive a scenario for speleogenesis. It mayalso apply for the Quaternary history of caves insedimentary limestones in glaciated regions. If any datinginformation from internal chemical and clastic depositsbecomes available, that should at least confirm theminimum ages of the containing passages.
Table 1. Possible development stages for Toerfjellhola.
MISStage
12 / 11c
427 Elsteriandeglaciation
12 m Shaft to JoKe Exit Aven above 10 m Pitch toLower Entrance
Two separate caves existed within c. 50 m ofremoved bedrock, with phreatic dissolution alongthese lowest fractures.
Two separate caves. Mostly phreatic dissolution.
Two separate caves. All phreatic dissolution.
Two separate caves. Upper cave: mostly phreaticdissolution below shafts. Lower cave: vadose andphreatic dissolution.
Two separate caves. All phreatic dissolution
Two separate caves. Upper cave: mostly phreaticdissolution below shafts. Lower cave: vadose andphreatic dissolution.
Two separate caves. All phreatic dissolution
The two caves are now connected. Upper part:mainly vadose to the small 2nd and 3rd Roof Series,which vary vadose and phreatic. Lower part:mainly vadose. Trunk Passage: phreatic.
All phreatic dissolution
Mixed vadose and phreatic elements
Mainly vadose, with inaccessible partly floodedlower captures
10 m Pitch to E–W Passageend
Aven NE of 10 m Pitch toupper & lower SW ends
Aven and E–W Passage viaSloping Chimney to “dig”
Aven and E–W Passage viaUnion Passage roof to exits
Aven via Union View topassage before “dig”
Aven via Union View to exitbeyond The Ramp
Inlets to Union Passage viaThe Ramp and via LowerUnion Passage to an exitfrom Trunk Passage
12 m Shaft to JoKe Exit
8 m Shaft to JoKe Exit
8 m Shaft to JoKe Exit
Main Entrance to JoKeExit
Main Entrance to JoKeExit
Main Entrance to JoKeExit
Main Entrance via 2nd
& 3rd Roof Series to anexit from TrunkPassage
Most of the whole cave above the present stream route,including an inlet via Lower Union Passage to TrunkPassage
Main Entrance and the present tributary via 2nd & 3rd
Roof Series and roof of present streamway to a smallexit from The Hall
Main Entrance and the present tributary to the sump
Early Saaliandeglaciation
Mid Saaliandeglaciation
Interglacial
Late Saaliandeglaciation
EemianInterglacial
Weichseliandeglaciation
Early HoloceneInterglacial
Late HoloceneInterglacial
Interglacial
Interglacial427–362
336
336–303
243
243–186
129
129–115
c. 12
c. 9
0
11c–11a
10 / 9e
9e–9a
8 / 7e
7e–7a
6 / 5e
5e
2 / 1
1
1
Ageka
Description Main upper flow route Main lower flow route Comments
Speleogenesis – oral 2013 ICS Proceedings
347
ReferencesBadino G, 2001. Glacial karst phenomenology. Proceedings of the
13th International Speleological Congress. Paper 179, 5.
Dowdeswell JA, Ottesen D, Rise L, 2010. Rate of sedimentdelivery from the Fennoscandian Ice Sheet through an ice age.Geology, 38 (1), 3–6.
Dreybrodt W, 1990. The role of dissolution kinetics in thedevelopment of karst aquifers in limestone: a model simulationof karst evolution. Journal of Geology, 98 (5), 639–655.
Engh R, Sjöberg R, 1981. Svenska Grottor Nr. 4. Karst och Grottori svenska fjällen, 58.
Faulkner TL, 2005. Cave inception and development inCaledonide metacarbonate rocks. PhD Thesis. University ofHuddersfield.
Faulkner T, 2006a. Tectonic inception in Caledonide marbles. ActaCarsologica, 35 (1), 7–21.
Faulkner T, 2006b. Limestone dissolution in phreatic conditionsat maximum rates and in pure, cold, water. Cave and KarstScience, 33 (1), 11–20.
Faulkner T, 2007a. The one-eighth relationship that constrainsdeglacial seismicity and cave development in Caledonidemarbles. Acta Carsologica, 36 (2), 195–202.
Faulkner T, 2007b. The top-down, middle-outwards model of cavedevelopment in Caledonide marbles. Cave and Karst Science,34 (1), 3–16.
Faulkner T, 2009a. Relationships between cave dimensions andlocal catchment areas in Central Scandinavia: implications forspeleogenesis. Cave and Karst Science, 36 (1), 11–20.
Faulkner T, 2009b. The general model of cave development in themetalimestones of the Caledonide terranes. Proceedings of the15th International Speleological Congress, Kerrville, USA.Vol. 2 863–870.
Faulkner T, 2010. An external model of speleogenesis duringQuaternary glacial cycles in the marbles of central Scandinavia.Cave and Karst Science, 37 (3), 79–92.
Faulkner TL, Hunt CO, 2009. Holocene deposits from Neptune’sCave, Nordland, Norway: environmental interpretation andrelation to the deglacial and emergence history of the Velfjord–Tosenfjord area. Boreas, 38, 691–704.
Faulkner T, Newton G, 1995. Toerfjellhola and Other Caves atVevelstad and Brønnøy, Norway. Cave and Karst Science,22 (1), 3–22.
Ford DC, Williams P, 2007. Karst hydrogeology andgeomorphology. John Wiley and Sons, 562.
Fredin O, 2002. Glacial inception and quaternary mountainglaciations in Fennoscandia. Quaternary International, 95/96,99–112.
Grønlie A, 1975. Geologien I Vefsnbygdene. Vefsn Bygdebok1975, 417–483.
Gustavson M, 1988. Mosjøen. Description of the 1:250,000bedrock geological map. Norges Geologiske Undersøkelse.Skrifter 87, 47.
Häuselmann P, Granger DE, Jeannin P-Y, Lauritzen S-E, 2007.Abrupt glacial valley incision at 0.8Ma dated from cavedeposits in Switzerland. Geology, 35 (2), 143–146.
Isacsson G, 1999. Korallgrottan – ett nyckelhål till historien.Jämtlands Grottförening Årsskrift 1999, 9–11, 18.
Lauritzen, S-E, Haugen, JE, Løvlie, R and Gilje-Nielsen, H. 1994.Geochronological potential of isoleucine epimerization incalcite speleothems. Quaternary Research 41, 52–58.
Lowe DJ, Gunn J, 1997. Carbonate Speleogenesis: An InceptionHorizon Hypothesis. Acta Carsologica, 26/2, 38, 457–488.
Mangerud J, Sønstegaard E, Sejrup H-P, 1979. Correlation of theEemian (interglacial) stage and the deep-sea sea oxygen-isotope stratigraphy. Nature, 277, 189–192.
Palmer AN, 1991. Origin and Morphology of limestone caves.Geological Society of America Bulletin, 103, 1–21.
Sollid JL, Sørbel L, 1979. Deglaciation of western central Norway.Boreas, 8, 233–239.
Stuiver M and 9 authors, 1998. INTCAL 98 radiocarbon agecalibration, 24000–0 cal BP. Radiocarbon, 40 (3), 1041–1083.
White WB, 1990. Chapter 7. Surface and near-surface karstlandforms. in Higgins CG, Coates DR (Eds.). Groundwatergeomorphology: The role of subsurface water in Earth-surfaceprocesses and landforms. Geological Society of AmericaSpecial Paper, 252, 157–175.
Speleogenesis – oral 2013 ICS Proceedings
348
HOW DO APERTURE SIZES IN LIMESTONE VARY FOR THE ONSETS OFTURBULENT FLOW AND FIRST-ORDER DISSOLUTION KINETICS?
Trevor FaulknerLimestone Research Group, Geography, Earth and Environmental Sciences, University of Birmingham, Edgbaston,
Birmingham, B15 2TT, UK, [email protected]
It is commonly stated in the literature that the “breakthrough” point at the transition from slow high-order to fast first-order dissolution kinetics in limestone occurs at an exit aperture of about one centimetre, and that this coincides with thetransition from a wholly laminar flow to a turbulent flow. These relationships are approximately true for a range of conduitgeometries in sub-horizontally bedded strata. However, the exit aperture for the onset of turbulence varies with the hydraulicgradient whereas the exit aperture for the onset of first-order kinetics varies with the hydraulic ratio, which is the hydraulicgradient divided by the path length. These transitions only occur at the same exit aperture for planar fissures and cylindricaltubes of lengths 290 m and 452 m. Breakthrough can occur before or after the onset of turbulence. Aperture sizes forbreakthrough and turbulence can be over a metre for long and shallow conduits but sub millimetre for short and steepconduits. This paper analyses these relationships for many conduits in natural and artificial conditions and discusses theirrelevance to the multitude of possible karst situations, where hydraulic ratios can be considered over 17 orders ofmagnitude.
1. IntroductionThe physics and chemistry of limestone dissolution alongplanar fissures and cylindrical conduits were derived in twokey papers over twenty years ago by Dreybrodt (1990) andPalmer (1991). These built on important earlier works,including those by Weyl (1958), Bögli (1964), White (1977)and Palmer (1981). A later treatise to present detailed (andanimated) models of speleogenesis based on the principlesof the Palmer / Dreybrodt model is that by Dreybrodt et al.(2005). Palmer (1991: Eq. 6) showed that when water flowspast any point in a conduit in natural limestone, the rate ofsolutional wall retreat (S) is:
S = 31.56kn(1/ρ)(1 – C/Cs)n cm per year,
where kn mg-cm L-1 s-1 is the appropriate reactioncoefficient, ρ gm cm-3 is the density of the limestone, C gmcm-3 is the point concentration of calcite in solution, Cs gmcm-3 is the appropriate saturation concentration of calciteand n is the reaction order. kn, C and Cs vary withtemperature and PCO2 levels. kn>1 also varies with C/Cs, andC also varies with the geometrical and hydrologicalparameters of the conduit. Dissolution when the solution iswell below saturation occurs at a fast “first-order kinetics”rate, where n = 1. At the beginning of the conduit, C is at aminimum, and may be close to zero for an allogenic streamrunning from non-carbonate rocks. In this case, dissolutionat the entrance is at the appropriate maximum rate ofSmax = 31.56k1/ρ cm a-1. The calcite concentration increasesdownstream from the entry point. If C approaches Cs, thedissolution rate becomes small and the reaction proceeds with“higher-order kinetics” as the flow continues. The changeoccurs near a point along the conduit that Weyl (1958)called the “penetration length”, where 0.6 < C/CS < 0.9,dependent on temperature and PCO2. Beyond here, n ≥ 4,governed by non-calcitic impurities, and “mixingcorrosion” (Bögli 1964) can be important if sustained overlong geological timescales. The Palmer/Dreybrodt modelquantifies the gradual conduit enlargement under slow high-order kinetics as the penetration length slowly increases.When it reaches to the exit of the aperture, there is a “kinetic
trigger” (White 1977) and dissolution then occurs at theapplicable maximum first-order rate over the whole lengthof the flow path, to create a conduit with a near-uniformcross-section. This important event in karst evolution iscalled the “breakthrough point” (Dreybrodt 1990). Iflimestone comprised pure calcite, the penetration lengthmight not increase and caves would then only form if initialfracture geometries allowed immediate first-orderdissolution kinetics, i.e. “tectonic inception” (Faulkner 2006a;2006b). When C/Cs becomes < c. 60 %, “breakthroughbehaviour” dominates and mixing corrosion is unimportant(Romanov et al. 2003). At 10 °C and with the inflowingwater containing 1 % CO2, Smax ≈ 1 mm per year (Palmer1991), although even faster dissolution rates seem possiblein water that is extremely unsaturated (e.g., Palmer 1991:Fig. 8). Wall retreat rates may also be increased bymechanical erosion, which is lithology dependent andamplified in turbulent flow. White (1977) pointed out thatthe kinetic trigger can occur at an exit aperture of 1–10 mm,a range that has been widely quoted. He also stated that thiscoincides approximately with the size at which whollylaminar flow starts to become turbulent (without there beinga causal relationship), and this “coincidence” has also beenwidely assumed. This paper analyses these relationships anddiscusses their relevance to the multitude of possible karstsituations.
Flow rates, water velocities and the transition to turbulentflow in conduits are controlled by the hydraulic gradient(HG; Head / path length = H/L), among other variables. Themain parameters at the chemical breakthrough point arecontrolled by a geometrical variable called the “hydraulicratio”, which equals the hydraulic gradient divided by thepath length (HR; H/L2; Dreybrodt 1990). The necessity forthe extra divisor can be understood, because dissolutionalways proceeds along the whole path length. Based on thework of Palmer (1991), which itself was based on theHagen-Poiseuille Equations for laminar flow, theserelationships were plotted graphically by Faulkner (2006a:Fig. 3). Those curves illustrated the linear relationshipsamong the logarithms of hydraulic conductivity, water
Speleogenesis – oral 2013 ICS Proceedings
349
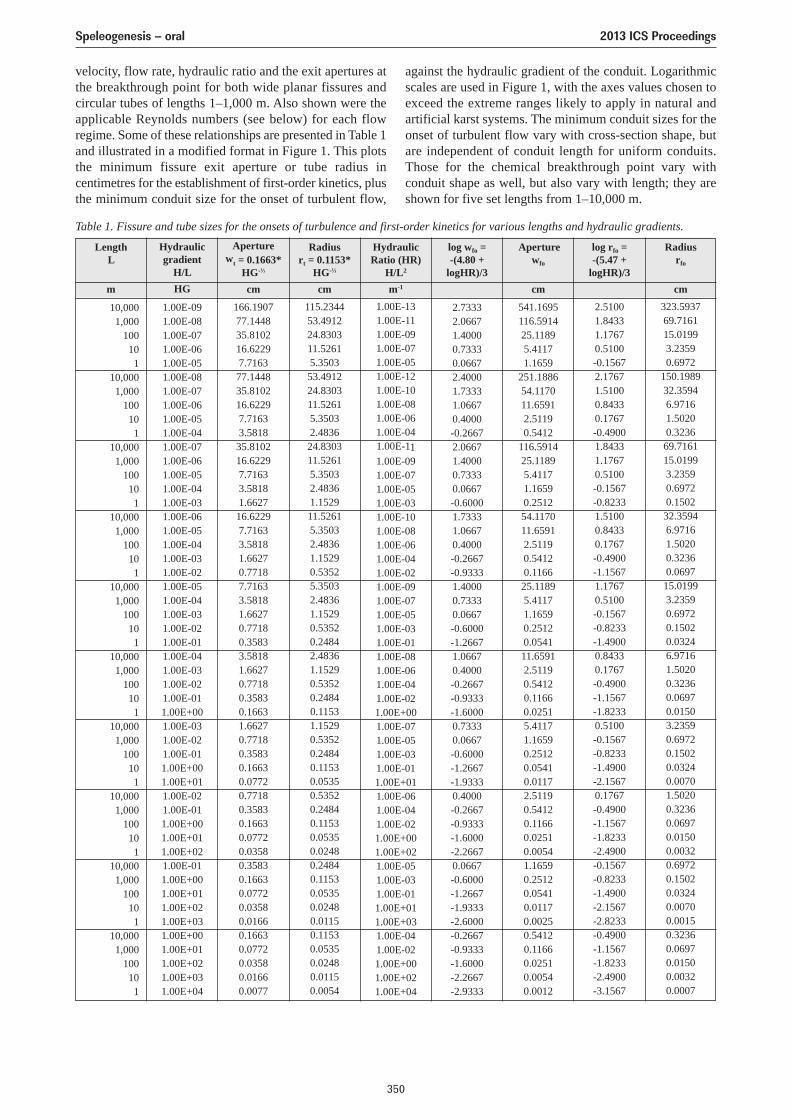
velocity, flow rate, hydraulic ratio and the exit apertures atthe breakthrough point for both wide planar fissures andcircular tubes of lengths 1–1,000 m. Also shown were theapplicable Reynolds numbers (see below) for each flowregime. Some of these relationships are presented in Table 1and illustrated in a modified format in Figure 1. This plotsthe minimum fissure exit aperture or tube radius incentimetres for the establishment of first-order kinetics, plusthe minimum conduit size for the onset of turbulent flow,
against the hydraulic gradient of the conduit. Logarithmicscales are used in Figure 1, with the axes values chosen toexceed the extreme ranges likely to apply in natural andartificial karst systems. The minimum conduit sizes for theonset of turbulent flow vary with cross-section shape, butare independent of conduit length for uniform conduits.Those for the chemical breakthrough point vary withconduit shape as well, but also vary with length; they areshown for five set lengths from 1–10,000 m.
Table 1. Fissure and tube sizes for the onsets of turbulence and first-order kinetics for various lengths and hydraulic gradients.
LengthL
m
10,0001,000
100101
10,0001,000
100101
10,0001,000
100101
10,0001,000
100101
10,0001,000
100101
10,0001,000
100101
10,0001,000
100101
10,0001,000
100101
10,0001,000
100101
10,0001,000
100101
Hydraulicgradient
H/LHG
1.00E-091.00E-081.00E-071.00E-061.00E-051.00E-081.00E-071.00E-061.00E-051.00E-041.00E-071.00E-061.00E-051.00E-041.00E-031.00E-061.00E-051.00E-041.00E-031.00E-021.00E-051.00E-041.00E-031.00E-021.00E-011.00E-041.00E-031.00E-021.00E-011.00E+001.00E-031.00E-021.00E-011.00E+001.00E+011.00E-021.00E-011.00E+001.00E+011.00E+021.00E-011.00E+001.00E+011.00E+021.00E+031.00E+001.00E+011.00E+021.00E+031.00E+04
166.190777.144835.810216.62297.716377.144835.810216.62297.71633.581835.810216.62297.71633.58181.662716.62297.71633.58181.66270.77187.71633.58181.66270.77180.35833.58181.66270.77180.35830.16631.66270.77180.35830.16630.07720.77180.35830.16630.07720.03580.35830.16630.07720.03580.01660.16630.07720.03580.01660.0077
115.234453.491224.830311.52615.350353.491224.830311.52615.35032.483624.830311.52615.35032.48361.152911.52615.35032.48361.15290.53525.35032.48361.15290.53520.24842.48361.15290.53520.24840.11531.15290.53520.24840.11530.05350.53520.24840.11530.05350.02480.24840.11530.05350.02480.01150.11530.05350.02480.01150.0054
1.00E-131.00E-111.00E-091.00E-071.00E-051.00E-121.00E-101.00E-081.00E-061.00E-041.00E-111.00E-091.00E-071.00E-051.00E-031.00E-101.00E-081.00E-061.00E-041.00E-021.00E-091.00E-071.00E-051.00E-031.00E-011.00E-081.00E-061.00E-041.00E-021.00E+001.00E-071.00E-051.00E-031.00E-011.00E+011.00E-061.00E-041.00E-021.00E+001.00E+021.00E-051.00E-031.00E-011.00E+011.00E+031.00E-041.00E-021.00E+001.00E+021.00E+04
2.73332.06671.40000.73330.06672.40001.73331.06670.4000-0.26672.06671.40000.73330.0667-0.60001.73331.06670.4000-0.2667-0.93331.40000.73330.0667-0.6000-1.26671.06670.4000-0.2667-0.9333-1.60000.73330.0667-0.6000-1.2667-1.93330.4000-0.2667-0.9333-1.6000-2.26670.0667-0.6000-1.2667-1.9333-2.6000-0.2667-0.9333-1.6000-2.2667-2.9333
541.1695116.591425.11895.41171.1659
251.188654.117011.65912.51190.5412
116.591425.11895.41171.16590.251254.117011.65912.51190.54120.116625.11895.41171.16590.25120.054111.65912.51190.54120.11660.02515.41171.16590.25120.05410.01172.51190.54120.11660.02510.00541.16590.25120.05410.01170.00250.54120.11660.02510.00540.0012
2.51001.84331.17670.5100-0.15672.17671.51000.84330.1767-0.49001.84331.17670.5100-0.1567-0.82331.51000.84330.1767-0.4900-1.15671.17670.5100-0.1567-0.8233-1.49000.84330.1767-0.4900-1.1567-1.82330.5100-0.1567-0.8233-1.4900-2.15670.1767-0.4900-1.1567-1.8233-2.4900-0.1567-0.8233-1.4900-2.1567-2.8233-0.4900-1.1567-1.8233-2.4900-3.1567
323.593769.716115.01993.23590.6972
150.198932.35946.97161.50200.323669.716115.01993.23590.69720.150232.35946.97161.50200.32360.069715.01993.23590.69720.15020.03246.97161.50200.32360.06970.01503.23590.69720.15020.03240.00701.50200.32360.06970.01500.00320.69720.15020.03240.00700.00150.32360.06970.01500.00320.0007
Aperturewt = 0.1663*
HG-⅓
cm
Radiusrt = 0.1153*
HG-⅓
cm
HydraulicRatio (HR)
H/L2
m-1
log wfo =-(4.80 +
logHR)/3
Aperturewfo
cm
log rfo =-(5.47 +
logHR)/3
Radiusrfo
cm
Speleogenesis – oral 2013 ICS Proceedings
350
2. Onset of turbulent flowBy convention, dimensionless Reynolds Numbers (Re) areused to characterise flow regimes in fissures and pipes.These are commonly defined as: Re = wρV/μ (fissure) andRe = 2rρV/μ (tube), where w cm = aperture width of afissure, r cm = radius of a cylindrical tube, ρ = the densityof the water = 1gm cm-3, V cm sec-1 = its mean velocity andμ = its dynamic viscosity = 0.01307 gm cm-1 sec-1 at 10 °C(Ford and Williams 2007: p112).
Laminar flows in fissures and tubes obey the Hagen-Poiseuille Equations: V = w2ρg*HG/12μ (fissure) andV = r2ρg*HG/8μ (tube), by re-arrangement of Palmer(1991: Eq. 3), where g = 981 cm sec-2 is the gravitationalacceleration, HG = Hydraulic Gradient. Normally, 0 ≤ HG ≤1,which is the normal maximum for vertical flow paths undersubaerial conditions. HG>1 is possible for inlets submergedbeneath a reservoir or lake.
The above equations can be re-arranged to state theapplicable aperture and radius in terms of the ReynoldsNumber:
w = [12μ2Re/(ρ2g*HG)]⅓ cm (fissure) and
r = [4μ2Re/(ρ2g*HG)]⅓ cm (tube).
The value of Re at which flows in karst conduits start tobecome turbulent is assumed to be 2,200 (Kaufmann andBraun 1999). Substituting this value and the other givenconstants into these equations gives: wt = 0.1663(HG)-⅓ cm(fissure) and rt = 0.1153(HG)-⅓ cm (tube), where wt and rt
are the minimum aperture or radius for the onset ofturbulent flow in fissures or tubes in limestone. Two plotsin Figure 1 show how these vary from 166 cm or 115 cm atHG = 10-9 via 0.018 cm or 0.012 cm at HG = 100 to0.008 cm or 0.005 cm at HG = 104.
3. Onset of first-order kineticsThe approximate fissure aperture (wfo) and tube radius (rfo)at the breakthrough point at 10 °C with 1 % PCO2 for anunsaturated input stream (i.e. C0 = 0 gm CaCO3 cm-3) werederived by Faulkner (2006a) from the discussion by Palmer (1991: p8 and Figs. 12a and 12b). These gave:log wfo = log rfo = -(5 + logHR)/3, where HR m-1 = thehydraulic ratio and the path length L is measured in metres. However, more accurate derivations are:log wfo = -(4.80 + logHR)/3 and log rfo = -(5.47 + logHR)/3,which are used to generate five length plots in Figure 1 forboth fissures and tubes. These show how the aperture orradius required vary from 541 cm or 324 cm for a 10 kmflow route with HG = 10-9 and HR = 10-13 m-1 via 0.12 cm or0.08 cm for a 100 m length with HG = 100 and HR = 10-2 m-1
to 0.0012 cm or 0.0007 cm for a 1 m length with HG = 104
and HR = 104 m-1.
4. Coincidence of turbulence and breakthroughThe onsets of turbulent flow and first-order kinetics coincide at the same conduit sizes if:wt = wfo (fissures) or rt = rfo (tubes), i.e. if:log wt = log[0.1663(HG)-⅓] = -(4.80 + logHR)/3 or if:
log rt = log[0.1153(HG)-⅓] = -(5.47 + logHR)/3.
Noting that HR = HG/L, these relationships simplify atcoincidence to L = 290 m (fissures) and L = 452 m (tubes),for any hydraulic gradient and its related conduit size.Because 100 m-long fissures have a similar aperture atbreakthrough as the radius of a 100 m-long tube at the onsetof turbulence for each HG, and 1,000 m-long fissures havea similar aperture at the onset of turbulence as the radius ofa 1,000 m-long tube at breakthrough, these two pairs ofcurves almost coincide on Figure 1.
5. DiscussionKarst hydrologists state that hydraulic gradients commonlyoccur in the range 10-2 to 10-4 for karst aquifers in sub-horizontal sedimentary limestones (e.g., White 1988: p165).From Figure 1, the breakthrough point in a 100 m-longfissure or tube occurs when the aperture or radius reaches0.54–2.51 cm or 0.32–1.50 cm over this HG range. For1,000 m- and 10,000 m-long flow routes, the required sizesincrease to 1.17–5.41 cm or 0.70–3.24 cm and 2.51–11.66 cmor 1.50–6.97 cm. However, for long flow paths withHG ≤ 10-4, they can increase up to several metres. For steepflows with 10-2 ≤ HG ≤ 100, they can reduce to < 1 mm. Forfissures or tubes that are < 290 m or < 452 m long at anyHG, the onset of turbulent flow occurs after their exit widthsor radii reach their breakthrough sizes, but will be gainedunder fast first-order kinetics. For conduits longer thanthose lengths, turbulence starts before breakthrough isachieved. The Palmer/Dreybrodt analysis applies only forlaminar flow. For each conduit size, turbulence reduces themean velocity and discharge rate. Hence, for these longerconduits, the onset of first-order dissolution is delayed andmight only be achieved at larger aperture sizes than shown.Beyond the “central” ranges of HG from 10-2 to 10-4 and Lfrom 100–1,000 m, Figure 1 illustrates the applicablebreakthrough points and onsets of turbulence at the extremelimits of both natural and artificial practical situations, asdiscussed below.
6. Breakthrough timeDreybrodt (1990) and Palmer (1991) presented similarequations to represent TB, the time taken for a planar fissurewith an initial aperture of w0 to achieve breakthrough.A simplified form of Palmer (1991: Eq. 8) is: TB =constant*w0
-3.12*(HR)-1.37 years, where the constant varieswith temperature and the PCO2 of the input stream. Palmer(1991: Fig. 13) plotted TB against HR for various w0 from0.001–0.1 cm for 1,000,000 ≥ TB ≥ 100 years. For TB <100years, the linear relationships on log-log scales breakdown,reaching TB = 0 for conditions at tectonic inception(Faulkner 2006a: Fig. 5). Hence, there is a wide range ofbreakthrough times in natural karst systems that vary withhydraulic gradient, conduit length and initial aperture.
7. DiagenesisLimestone is commonly formed by carbonate deposition inshallow tropical or deep marine environments, followed by
Speleogenesis – oral 2013 ICS Proceedings
351
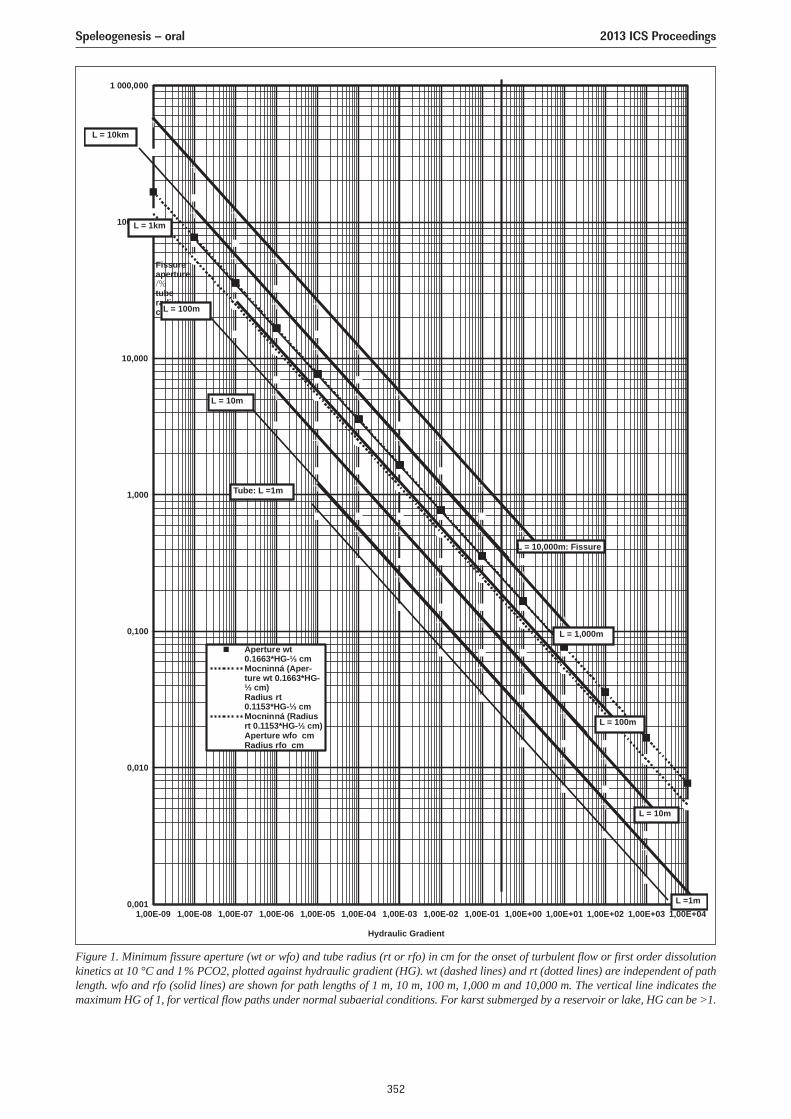
Figure 1. Minimum fissure aperture (wt or wfo) and tube radius (rt or rfo) in cm for the onset of turbulent flow or first order dissolutionkinetics at 10 °C and 1% PCO2, plotted against hydraulic gradient (HG). wt (dashed lines) and rt (dotted lines) are independent of pathlength. wfo and rfo (solid lines) are shown for path lengths of 1 m, 10 m, 100 m, 1,000 m and 10,000 m. The vertical line indicates themaximum HG of 1, for vertical flow paths under normal subaerial conditions. For karst submerged by a reservoir or lake, HG can be >1.
/%
Speleogenesis – oral 2013 ICS Proceedings
352
compaction, lithification, and diagenesis in partly meteoricwaters. During diagenesis, apertures are at the scale of thepores between crystals, orders of magnitude below valuesin Figure 1, so that chemical breakthrough does not apply.
8. Long drainage basinsFollowing exhumation and uplift, initial flows inhomogeneous non-fractured limestone would be alonginception horizons, perhaps in an adjacent more permeablelithology (Lowe and Gunn 1997). Apertures commonlyremain at the pore scale, so that breakthrough is still notpossible, even with short vertical flow paths, until high-order dissolution eventually creates conduits with w >0.001 cm. For example, for long “shallow” karst aquifers,i.e. those ≥ 1 km in length with HG ≤ 10-2, chemicalbreakthrough does not occur until the conduit reaches over1 cm in size. From Palmer (1991: Fig. 13), this would takeover one million years, if the initial aperture was 0.01 cm.
For long fractured limestone aquifers, the flow route mightreach deep below the surface and even pass through non-calcitic lithologies before rising to the resurgence. Becausenatural fractures tend to reduce in size with depth and therock temperature increases, the flow would follow a paththrough apertures of varying initial size at varying temp-eratures, with the possible addition of strong acid dissol-ution. The effect on breakthrough times is much morecomplex. This is the realm of hypogene speleogenesis(Klimchouk 2007), where this new science still requiresconsiderable analysis and quantification (Faulkner 2007a).
9. Shorter drainage routesThe initial apertures of shorter fracture networks probablylie in the range 0.001–0.1 cm. From Figure 1, only thoseshort flow paths with L < 10 m, w > 0.01 cm and HG > 10-2
could exhibit breakthrough behaviour. However, fracturesin the “common” HG range 10-2 – 10-4 with 1.0 cm > w >0.1 cm (which may apply close to the surface) could be atbreakthrough for L < 1,000 m.
10. Tall vertical fracturesIt is conceivable that limestone cliffs, including any ≥ 1 kmhigh, could have vertical fracture systems that reach fromthe cliff top to the cliff base. Water percolating down suchfractures at HG = 1 would reach the breakthrough point atan aperture of 0.25 cm, if there is enough recharge to keepthe fissure filled with water. For shorter cliffs, the requiredapertures are smaller. This explains the numerous marblecave entrances located near valley shoulders in CentralScandinavia (Faulkner 2005).
11. Epikarst joints and limestone pavementsIn the epikarst, water-filled vertical joints ≤ 10 m high thattransmit water into a lower vadose zone would needapertures of only 0.05 cm to achieve first-order kineticdissolution. This is the place where joint openings arenaturally the largest, from surface stress relief and other
processes. Hence, breakthrough is reached quickly here, oreven immediately on the opening of a joint, if it is largeenough for tectonic inception. This explains the epikarstphenomenon, where cave entrance passages can beshowered with water during heavy rain. Similarly, newdolines can form rapidly in abandoned limestone quarries(Gunn and Gagen 1987). Vertical grikes ≤1 m deep arecommon in limestone pavements. They achieve fastdissolution with apertures of 0.025 cm, making tectonicinception even more likely here. Smooth pavements undercontinuous rainfall would lower up to 0.5 mm per year bydissolution, best exemplified by 1.5 m of marble erosion inthe Holocene at Madre de Dios, Chile (Faulkner 2009).
12. Speleothem dripwatersSpeleothem deposition occurs when dissolved calciteprecipitates by CO2 vigorously degassing in cave air, wherethe dripwater flow reaches an open passage roof or wall. Ifautogenic water at 10 °C seeps through a non-carbonaterock with PCO2 of 1% derived from overlying soils, it willcontain little dissolved calcite before entering the limestone,but will then reach calcite saturation in closed conditions at50 mg L-1 (Palmer 1991: Fig. 7). Similar autogenic waterflowing through calcareous soils with 1% PCO2 continuouslymaintained in open conditions could saturate at 212 mg L-1
before entering the lime-stone. The PCO2 of cave air doesnot normally fall below the level of the surface atmospheric,presently 0.04%. Water under such conditions saturates at12 or 68 mg L-1 in closed or open conditions, respectively.Assuming degassing occurs under open conditions, dripsmay thus become aggress-ive, with no deposition, ordeposit a maximum of 144 mg of speleothem from eachlitre of water. Water flowing from a passage via fissures inits floor that drips into a lower passage may experience“prior calcite precipitation” (Fairchild and Baker, 2012,p. 26). It will then become aggressive or deposit speleothemagain, depending on the relative PCO2 of the cave air in thetwo passages.
It seems conceivable that dripwaters could achievechemical breakthrough and then enlarge bedding planes andjoints along their flow path, to create explorable passagesand shafts. However, the presence of large and oldspeleothems in many caves suggests that dripwaters enterthe limestone nearly saturated and/or flow in long tinyfissures, remaining near saturation for >>100,000 years. Inthe competition between the slow enlargement of thedripwater flow path and the lower PCO2 level of cave air,degassing should help retain the chemical regime before thedrip exit in a pre-breakthrough condition and prolongdeposition.
The geometry of dripwater flow paths is never known, andhas rarely, if ever, been modelled. Cave air PCO2 can varyfrom dangerous levels of ~5%, when degassing and depos-ition are unlikely, to atmospheric levels at cave entrances,where speleothems are commonly located. Nevertheless,dripwaters from cave roofs that follow a vertical path downshort joints from a bare limestone surface are more likelyto be aggressive and less likely to deposit speleothem, in contrast to those that flow from calcareous soils along longer flow paths with small hydraulic gradients.
Speleogenesis – oral 2013 ICS Proceedings
353
Under intermediate conditions, dripwater might becomeaggressive during floods that raise hydraulic gradients,thereby causing dissolution of speleothem.
During winter, interesting and complex competitions ariseamong the effects of lower temperature and itsconsequential reduction of biological activity and thereforeof PCO2 in dripwaters. Reduced temperature increases theamount of calcite that can be held in solution, therebyincreasing penetration lengths and significantly reducingbreakthrough times. (However, dissolution rates aresignificantly reduced after breakthrough). Reduced PCO2
levels reduce the calcite saturation level, thereby reducingpenetration lengths and increasing breakthrough times(post-breakthrough dissolution rates are also somewhatreduced for applicable ranges of PCO2). Because thetemperature change is likely to be damped when thedripwater reaches open cave passage, the change in PCO2 islikely to have the major influence. Thus, assuming thedripwater flow always operates with high-order kinetics,i.e. it remains pre-breakthrough, its solute load is reducedand therefore winter precipitation of speleothem should bereduced, at the same flow rate. However, the PCO2 of wintercave air may also reduce, increasing precipitation.
13. Speleogenesis below reservoirs and lakesIf the entry to the karst is itself under a head of water, thishead needs to be added to the head within the karst to givethe applicable hydraulic gradient. Such increased HGs cancause rapid breakthrough by enlargement of karst fracturesbeneath a reservoir, as studied by Dreybrodt (1996). Thus,a reservoir dam can be bypassed by an underlying conduit,causing significant leakage of the reservoir. Close to thewall of the dam, the HG can exceed unity. For example,from Figure 1, if the leakage is 900 m away and down thevalley from a fracture system that leads 100 m below thebase of a dam that holds back water 100 m deep, L =1,000 m and HG = 200/1,000 = 0.2, giving a breakthroughaperture of 0.4 cm. For a 10 m-long sub-horizontal fracturedirectly beneath the same dam, HG = 10, giving a requiredaperture of 0.025 cm, so that immediate tectonic inceptionis likely here. Similar conditions can arise during thedeglaciation of continental ice sheets in mountainous areas,if the fractures become submerged by an ice-dammed lake(Faulkner 2005). In this case, the flow path is from the lakeand via the fractures back into the lake and then intoenglacial conduits within the continuing ice sheet, ordirectly from the fractures into Nye channels at the base ofa warm-based ice sheet. Despite the water being at 0 °C,with a PCO2 then of only 0.02 %, such situations can alsocause tectonic inception and fairly rapid first-orderdissolution (Faulkner 2006b).
14. Rejuvenation in alpine situationsGlacial valleys in mountainous areas, including those athigh latitudes, were significantly rejuvenated followinglarge-scale erosion during each Pleistocene glaciation. Atleast the upper and outer parts of palaeocaves may beremoved during glacial maxima (Faulkner 2007b). Duringeach ensuing interglacial, sinks may be captured farther
upstream and resurgences find lower outlets. Clearly, theseeffects may make significant changes to hydraulic gradientsand hydraulic ratios, depending on the local topography.They provide opportunities for new fractures at lower levelsto carry some of the drainage. These may in turn eventuallyachieve breakthrough and then grow large enough to beexplored by diving.
15. ConclusionsThe onset of turbulence in a uniform conduit is controlledby two main variables: the aperture (i.e. fissure width ortube radius) and the hydraulic gradient, whereas the onsetof first-order kinetics after breakthrough is also controlledby the length of the conduit. Mathematically, hydraulicgradient and length are usefully combined into a singlevariable, the hydraulic ratio. The two onsets only coincideat the same aperture for planar fissures of length 290 m andfor cylindrical tubes of length 452 m, the actual aperturedepending on the hydraulic gradient. Thus, breakthroughmay occur before or after flow becomes turbulent,depending on conduit length. The time to reach it alsodepends on three main variables: initial aperture, hydraulicgradient, and conduit length. For many karst aquifers,breakthrough occurs at an aperture of about 1cm for 10 m-long conduits at a hydraulic gradient of 10-4 and for longerand steeper conduits up to 1,000 m long at 10-2. However,there are many different karstic situations governed by thesame laws. In practice, the breakthrough aperture may varyfrom the sub-millimetre to several metres and hydraulicratios can be considered over 17 orders of magnitude.
AcknowledgementsThe author is grateful to Art Palmer and Philippe Audra fortheir suggestions to clarify several points.
ReferencesBögli A, 1964. Mischungskorrosion – ein Beiträg zur
Verkarstungsproblem. Erdkunde, 18, 83–92.
[English translation by Elder E, 1985. Mixture Corrosion – acontribution to the karstification problem. NationalSpeleological Society, Cave Geology, 1 (10), 393–406].
Dreybrodt W, 1990. The role of dissolution kinetics in thedevelopment of karst aquifers in limestone: a model simulationof karst evolution. Journal of Geology, 98 (5), 639–655.
Dreybrodt W, 1996. Principles of early development of karstconduits under natural and man-made conditions revealed bymathematical analysis of numerical models. Water ResourcesResearch, 32 (9), 2923–2935.
Dreybrodt W, Gabrovsek F, Romanov D, 2005. Processes ofspeleogenesis: a modeling approach. Zalozba, ZRC. Postojna– Ljubljana. 376.
Fairchild, IJ, Baker, A, 2012. Speleothem Science. Wiley-Blackwell, 432.
Faulkner TL, 2005. Cave inception and development inCaledonide metacarbonate rocks. PhD Thesis. University ofHuddersfield.
Speleogenesis – oral 2013 ICS Proceedings
354
Faulkner T, 2006a. Limestone dissolution in phreatic conditionsat maximum rates and in pure, cold, water. Cave and KarstScience, 33 (1), 11–20.
Faulkner T, 2006b. Tectonic inception in Caledonide marbles. ActaCarsologica, 35 (1), 7–21.
Faulkner T, 2007a. Book review: Hypogene Speleogenesis:Hydrogeological and morphogenetic perspective by Dr. ABKlimchouk, National Cave and Karst Research Institute SpecialPaper No. 1, 2007, 106. Cave and Karst Science, 33 (3),138–141.
Faulkner T, 2007b. The top-down, middle-outwards model of cavedevelopment in Caledonide marbles. Cave and Karst Science,34 (1), 3–16.
Faulkner T, 2009. Limestone erosion rates and rainfall. Cave andKarst Science, 36 (3), 94–95.
Ford DC, Williams P, 2007. Karst hydrogeology andgeomorphology, 562. John Wiley and Sons.
Gunn J, Gagen P, 1987. Limestone quarrying and sinkholedevelopment in the English Peak District. in Beck and Wilson(Eds.) Karst hydrogeology, Rotterdam: Balkema, 121–125.
Kaufmann G, Braun J, 1999. Karst aquifer evolution in fracturedrocks. Water Resources Research, 35 (11), 3223–3238.
Klimchouk A, 2007. Hypogene Speleogenesis: Hydrogeologicaland Morphogenetic Perspective. National Cave and KarstResearch Institute Special Paper No. 1, 106.
Lowe DJ, Gunn J, 1997. Carbonate Speleogenesis: An InceptionHorizon Hypothesis. Acta Carsologica, 26/2, 38, 457–488.
Palmer AN, 1981. Hydrochemical factors in the origin oflimestone caves. Proceedings of the eighth InternationalSpeleological Congress, 120–122.
Palmer AN, 1991. Origin and Morphology of limestone caves.Geological Society of America Bulletin, 103, 1–21, 157–175.
Palmer A, 2007. Cave Geology. Cave Books. Dayton, Ohio. 454.
Romanov D, Gabrovsek F, Dreybrodt W, 2003. The impact ofhydrochemical boundary conditions on the evolution oflimestone karst aquifers. Journal of Hydrology 276, 240–53.
Weyl PK, 1958. The solution kinetics of calcite. Journal ofGeology, 66, 163–176.
White WB, 1977. Role of solution kinetics in the development ofkarst aquifers. in Tolsen and Doyle (Eds.) Internationalassociation of Hydrogeologists, Memoirs, 12, 503–517. WhiteWB, 1988. Geomorphology and hydrology of karst terrains.Oxford University Press.
Speleogenesis – oral 2013 ICS Proceedings
355
INVESTIGATIONS INTO THE POTENTIALFOR HYPOGENE SPELEOGENESIS IN THE CUMBERLAND PLATEAU
OF SOUTHEAST KENTUCKY, U.S.A.
Lee J. FloreaDepartment of Geological Sciences, Ball State University, 2000 W. University Ave., Muncie, IN 47306, U.S.A.,
This manuscript offers preliminary geochemical evidence that investigates the potential for hypogene speleogenesis inthe Cumberland Plateau of southeastern Kentucky, U.S.A. The region was traditionally considered a classic example ofepigenic karst, but new insights have uncovered tantalizing observations that suggest alternatives to simple carbonic acidspeleogenesis. Such first-order observations have included natural petroleum seeps at the surface and in caves, occasionalcave morphologies consistent with action of hypogene fluids, and prolific gypsum within cave passages. To this point,geochemical data from caves and springs verify carbonic acid as the primary dissolutional agent; however, these sameanalyses cannot rule out sulfuric acid as a secondary source of dissolution. In this paper, Principal Component Analysisof ionic data reveals two components that coordinate with parameters associated with “karst water” and shallow brine. Incontrast, molar ratios of Ca+ and Mg+ as compared to HCO3
- and SO42- closely follow the reaction pathway stipulated by
the carbonate equilibria reactions. Despite these data, the role, if any, of hypogene speleogenesis in the karst of theCumberland Plateau remains inconclusive. It is very likely that carbonic acid dominates speleogenesis; however,contributions from sulfuric acid may influence our understanding of “inception” and carbon flux within these aquifers.
1. IntroductionThe chemistry of groundwater in karst aquifers reflectscontributions from the dissolution of carbonate bedrockwhere the sources of acid come primarily from the reactionsbetween water and dissolved carbon dioxide, whichproduces carbonic acid, or between dissolved oxygen andsulfide, which produces sulfuric acid. In the case ofcarbonic acid, the net chemical reaction yields equalcontributions of dissolved inorganic carbon (DIC) fromboth soil/atmosphere and bedrock:
assuming equal contributions from the two acids, only 25%of the DIC will originate from the soil/atmosphere. Thistestifies to the relative strength of the two acids.
The first of the above equations represents the “carbonicacid speleogenesis”, or CAS, model of cave development,where carbon-dioxide-enriched waters from percolating,epigenetic recharge react with the carbonate bedrock (Fordand Williams 2007; White 1988). Caves in southeasternKentucky, U.S.A. serve in the literature as classic examplesof epigenic karst (e.g., Simpson and Florea 2009). In thesesystems the chemical products of carbonate dissolution,Ca2+, Mg2+, and HCO3
- (and as a result pH) are generallyinversely correlated to discharge – as discharge goes up, theconcentration of these ions (and therefore specificconductance – SpC) goes down due to, in part, dilution.This notwithstanding pulses of storage water pushedthrough at the beginning of storm events.
The second equation, in contrast, represents the “sulfuricacid speleogenesis” (Jagnow et al. 2000), or SAS, model ofcave development. This model is used to explain, forexample, the caves from the Guadalupe Mountains of NewMexico (Hill 1990) where sources of acidity arise frombelow – a “hypogene” model. Modern examples of SAShave been identified in Cueva de Villa Luz in Mexico (Hoseet al. 2000), Grotte di Frasassi in Italy (Galdenzi andMenchetti 1995), the hydrothermal springs and caves in theCerna River Valley (Wynn et al. 2010; Onac et al. 2011) inRomania, and Lower Kane Cave in Wyoming (Engel et al.2004), among others. Re-appraisal of hypogenic theoriesbased on hydrogeological definition has been done inKlimchouk (2007). Recent investigations in the Edwardsaquifer in central Texas (e.g., Schindel et al. 2008) are anexample of a region specific approach to understandinghypogene speleogenesis.
This brief paper explores the relationship between ions insolution and field chemistry in spring water from southeast
Note that the above reaction yields a 1:2 molar ratio ofcations to bicarbonate in the products. Contrast this withthe case of sulfuric acid, where the net reaction with thecarbonate bedrock limestone reveals DIC derived solelyfrom the bedrock:
In this reaction, note that the molar ratio between the cationsand bicarbonate and between the cations and anions in theproducts is 1:1 and 2:3, respectively.
Finally, if we combine the two reactions above into a netreaction assuming equal contributions from carbonic andsulfuric acids, we arrive at the following:
that reveals a 3:4 molar ratio between the cations in solutionand bicarbonate or a 3:5 ratio between the cations andanions in solution. It is important to mention that, when
Speleogenesis – oral 2013 ICS Proceedings
356
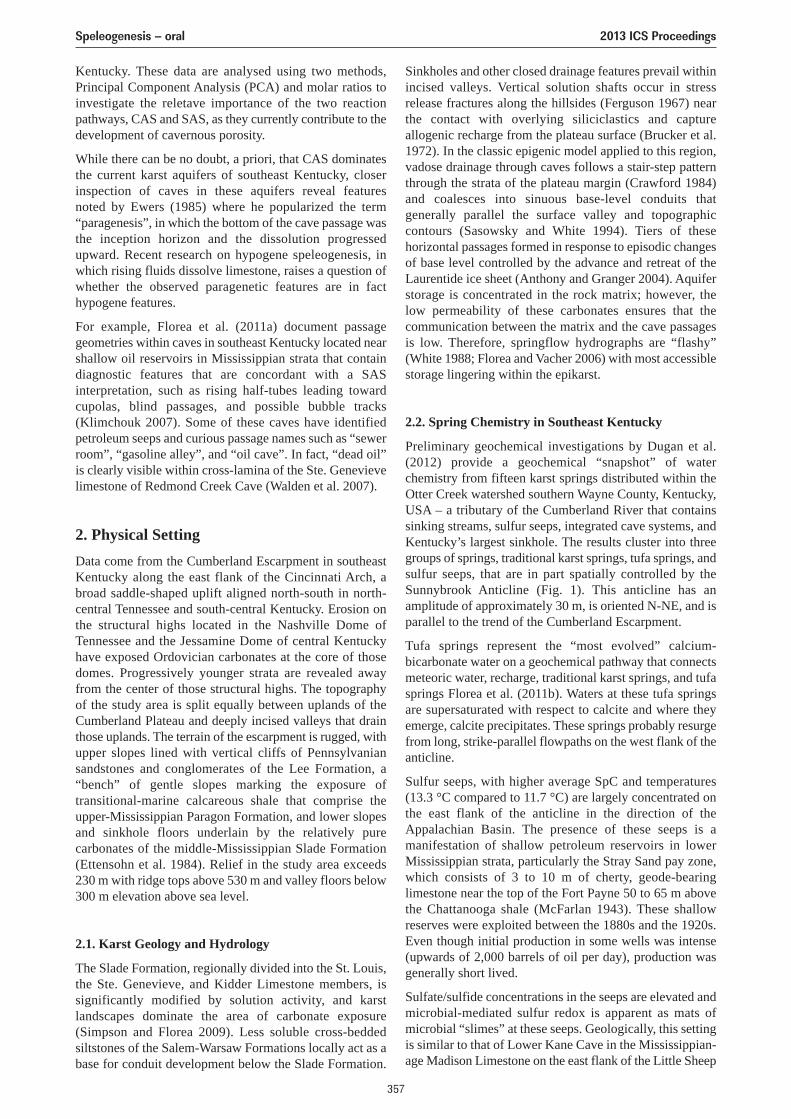
Kentucky. These data are analysed using two methods,Principal Component Analysis (PCA) and molar ratios toinvestigate the reletave importance of the two reactionpathways, CAS and SAS, as they currently contribute to thedevelopment of cavernous porosity.
While there can be no doubt, a priori, that CAS dominatesthe current karst aquifers of southeast Kentucky, closerinspection of caves in these aquifers reveal features noted by Ewers (1985) where he popularized the term“paragenesis”, in which the bottom of the cave passage wasthe inception horizon and the dissolution progressedupward. Recent research on hypogene speleogenesis, inwhich rising fluids dissolve limestone, raises a question ofwhether the observed paragenetic features are in facthypogene features.
For example, Florea et al. (2011a) document passagegeometries within caves in southeast Kentucky located nearshallow oil reservoirs in Mississippian strata that containdiagnostic features that are concordant with a SASinterpretation, such as rising half-tubes leading towardcupolas, blind passages, and possible bubble tracks(Klimchouk 2007). Some of these caves have identifiedpetroleum seeps and curious passage names such as “sewerroom”, “gasoline alley”, and “oil cave”. In fact, “dead oil”is clearly visible within cross-lamina of the Ste. Genevievelimestone of Redmond Creek Cave (Walden et al. 2007).
2. Physical SettingData come from the Cumberland Escarpment in southeastKentucky along the east flank of the Cincinnati Arch, abroad saddle-shaped uplift aligned north-south in north-central Tennessee and south-central Kentucky. Erosion onthe structural highs located in the Nashville Dome ofTennessee and the Jessamine Dome of central Kentuckyhave exposed Ordovician carbonates at the core of thosedomes. Progressively younger strata are revealed awayfrom the center of those structural highs. The topographyof the study area is split equally between uplands of theCumberland Plateau and deeply incised valleys that drainthose uplands. The terrain of the escarpment is rugged, withupper slopes lined with vertical cliffs of Pennsylvaniansandstones and conglomerates of the Lee Formation, a“bench” of gentle slopes marking the exposure oftransitional-marine calcareous shale that comprise theupper-Mississippian Paragon Formation, and lower slopesand sinkhole floors underlain by the relatively purecarbonates of the middle-Mississippian Slade Formation(Ettensohn et al. 1984). Relief in the study area exceeds 230 m with ridge tops above 530 m and valley floors below300 m elevation above sea level.
2.1. Karst Geology and Hydrology
The Slade Formation, regionally divided into the St. Louis,the Ste. Genevieve, and Kidder Limestone members, issignificantly modified by solution activity, and karstlandscapes dominate the area of carbonate exposure(Simpson and Florea 2009). Less soluble cross-beddedsiltstones of the Salem-Warsaw Formations locally act as abase for conduit development below the Slade Formation.
Sinkholes and other closed drainage features prevail withinincised valleys. Vertical solution shafts occur in stressrelease fractures along the hillsides (Ferguson 1967) nearthe contact with overlying siliciclastics and captureallogenic recharge from the plateau surface (Brucker et al.1972). In the classic epigenic model applied to this region,vadose drainage through caves follows a stair-step patternthrough the strata of the plateau margin (Crawford 1984)and coalesces into sinuous base-level conduits thatgenerally parallel the surface valley and topographiccontours (Sasowsky and White 1994). Tiers of thesehorizontal passages formed in response to episodic changesof base level controlled by the advance and retreat of theLaurentide ice sheet (Anthony and Granger 2004). Aquiferstorage is concentrated in the rock matrix; however, the low permeability of these carbonates ensures that thecommunication between the matrix and the cave passagesis low. Therefore, springflow hydrographs are “flashy”(White 1988; Florea and Vacher 2006) with most accessiblestorage lingering within the epikarst.
2.2. Spring Chemistry in Southeast Kentucky
Preliminary geochemical investigations by Dugan et al.(2012) provide a geochemical “snapshot” of waterchemistry from fifteen karst springs distributed within theOtter Creek watershed southern Wayne County, Kentucky,USA – a tributary of the Cumberland River that containssinking streams, sulfur seeps, integrated cave systems, andKentucky’s largest sinkhole. The results cluster into threegroups of springs, traditional karst springs, tufa springs, andsulfur seeps, that are in part spatially controlled by theSunnybrook Anticline (Fig. 1). This anticline has anamplitude of approximately 30 m, is oriented N-NE, and isparallel to the trend of the Cumberland Escarpment.
Tufa springs represent the “most evolved” calcium-bicarbonate water on a geochemical pathway that connectsmeteoric water, recharge, traditional karst springs, and tufasprings Florea et al. (2011b). Waters at these tufa springsare supersaturated with respect to calcite and where theyemerge, calcite precipitates. These springs probably resurgefrom long, strike-parallel flowpaths on the west flank of theanticline.
Sulfur seeps, with higher average SpC and temperatures(13.3 °C compared to 11.7 °C) are largely concentrated onthe east flank of the anticline in the direction of theAppalachian Basin. The presence of these seeps is amanifestation of shallow petroleum reservoirs in lowerMississippian strata, particularly the Stray Sand pay zone,which consists of 3 to 10 m of cherty, geode-bearinglimestone near the top of the Fort Payne 50 to 65 m abovethe Chattanooga shale (McFarlan 1943). These shallowreserves were exploited between the 1880s and the 1920s.Even though initial production in some wells was intense(upwards of 2,000 barrels of oil per day), production wasgenerally short lived.
Sulfate/sulfide concentrations in the seeps are elevated andmicrobial-mediated sulfur redox is apparent as mats ofmicrobial “slimes” at these seeps. Geologically, this settingis similar to that of Lower Kane Cave in the Mississippian-age Madison Limestone on the east flank of the Little Sheep
Speleogenesis – oral 2013 ICS Proceedings
357
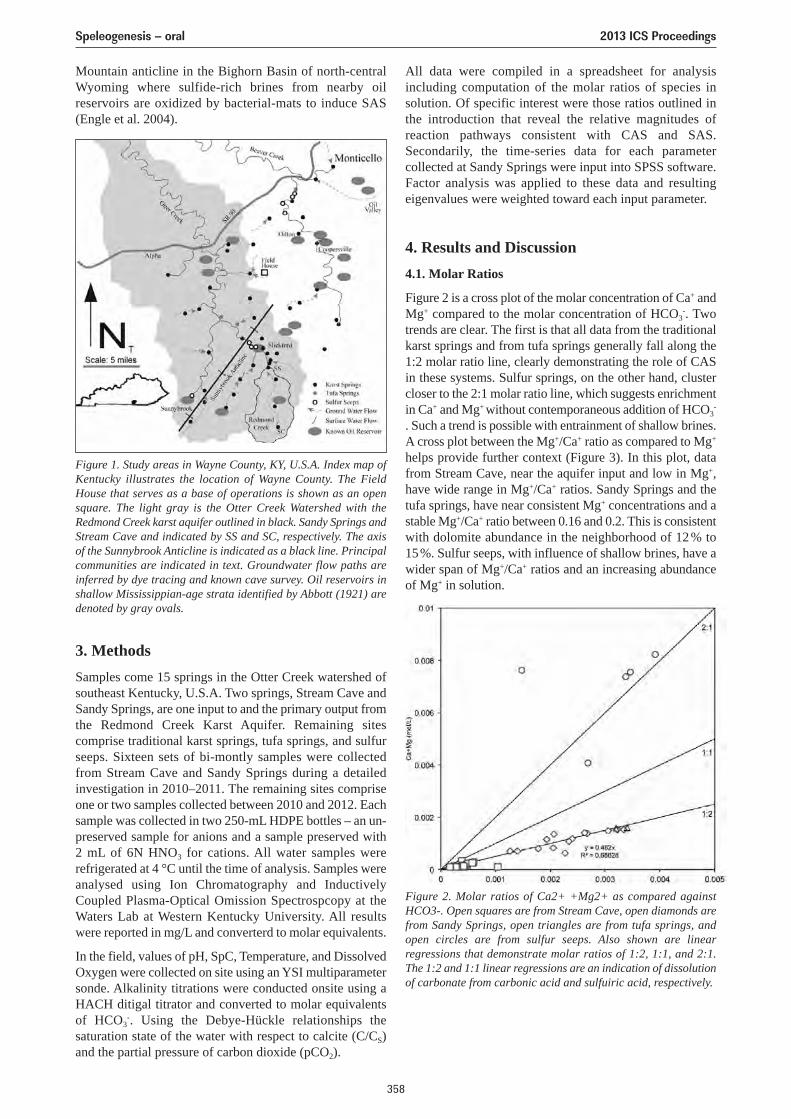
3. MethodsSamples come 15 springs in the Otter Creek watershed ofsoutheast Kentucky, U.S.A. Two springs, Stream Cave andSandy Springs, are one input to and the primary output fromthe Redmond Creek Karst Aquifer. Remaining sitescomprise traditional karst springs, tufa springs, and sulfurseeps. Sixteen sets of bi-montly samples were collectedfrom Stream Cave and Sandy Springs during a detailedinvestigation in 2010–2011. The remaining sites compriseone or two samples collected between 2010 and 2012. Eachsample was collected in two 250-mL HDPE bottles – an un-preserved sample for anions and a sample preserved with 2 mL of 6N HNO3 for cations. All water samples wererefrigerated at 4 °C until the time of analysis. Samples wereanalysed using Ion Chromatography and InductivelyCoupled Plasma-Optical Omission Spectrospcopy at theWaters Lab at Western Kentucky University. All resultswere reported in mg/L and converterd to molar equivalents.
In the field, values of pH, SpC, Temperature, and DissolvedOxygen were collected on site using an YSI multiparametersonde. Alkalinity titrations were conducted onsite using aHACH ditigal titrator and converted to molar equivalentsof HCO3
-. Using the Debye-Hückle relationships thesaturation state of the water with respect to calcite (C/CS)and the partial pressure of carbon dioxide (pCO2).
All data were compiled in a spreadsheet for analysisincluding computation of the molar ratios of species insolution. Of specific interest were those ratios outlined inthe introduction that reveal the relative magnitudes ofreaction pathways consistent with CAS and SAS.Secondarily, the time-series data for each parametercollected at Sandy Springs were input into SPSS software.Factor analysis was applied to these data and resultingeigenvalues were weighted toward each input parameter.
4. Results and Discussion4.1. Molar Ratios
Figure 2 is a cross plot of the molar concentration of Ca+ andMg+ compared to the molar concentration of HCO3
-. Twotrends are clear. The first is that all data from the traditionalkarst springs and from tufa springs generally fall along the1:2 molar ratio line, clearly demonstrating the role of CASin these systems. Sulfur springs, on the other hand, clustercloser to the 2:1 molar ratio line, which suggests enrichmentin Ca+ and Mg+ without contemporaneous addition of HCO3
-
. Such a trend is possible with entrainment of shallow brines.A cross plot between the Mg+/Ca+ ratio as compared to Mg+
helps provide further context (Figure 3). In this plot, datafrom Stream Cave, near the aquifer input and low in Mg+,have wide range in Mg+/Ca+ ratios. Sandy Springs and thetufa springs, have near consistent Mg+ concentrations and astable Mg+/Ca+ ratio between 0.16 and 0.2. This is consistentwith dolomite abundance in the neighborhood of 12% to15%. Sulfur seeps, with influence of shallow brines, have awider span of Mg+/Ca+ ratios and an increasing abundanceof Mg+ in solution.
Figure 1. Study areas in Wayne County, KY, U.S.A. Index map ofKentucky illustrates the location of Wayne County. The FieldHouse that serves as a base of operations is shown as an opensquare. The light gray is the Otter Creek Watershed with theRedmond Creek karst aquifer outlined in black. Sandy Springs andStream Cave and indicated by SS and SC, respectively. The axisof the Sunnybrook Anticline is indicated as a black line. Principalcommunities are indicated in text. Groundwater flow paths areinferred by dye tracing and known cave survey. Oil reservoirs inshallow Mississippian-age strata identified by Abbott (1921) aredenoted by gray ovals.
Figure 2. Molar ratios of Ca2+ +Mg2+ as compared againstHCO3-. Open squares are from Stream Cave, open diamonds arefrom Sandy Springs, open triangles are from tufa springs, andopen circles are from sulfur seeps. Also shown are linearregressions that demonstrate molar ratios of 1:2, 1:1, and 2:1.The 1:2 and 1:1 linear regressions are an indication of dissolutionof carbonate from carbonic acid and sulfuiric acid, respectively.
Mountain anticline in the Bighorn Basin of north-centralWyoming where sulfide-rich brines from nearby oilreservoirs are oxidized by bacterial-mats to induce SAS(Engle et al. 2004).
Speleogenesis – oral 2013 ICS Proceedings
358
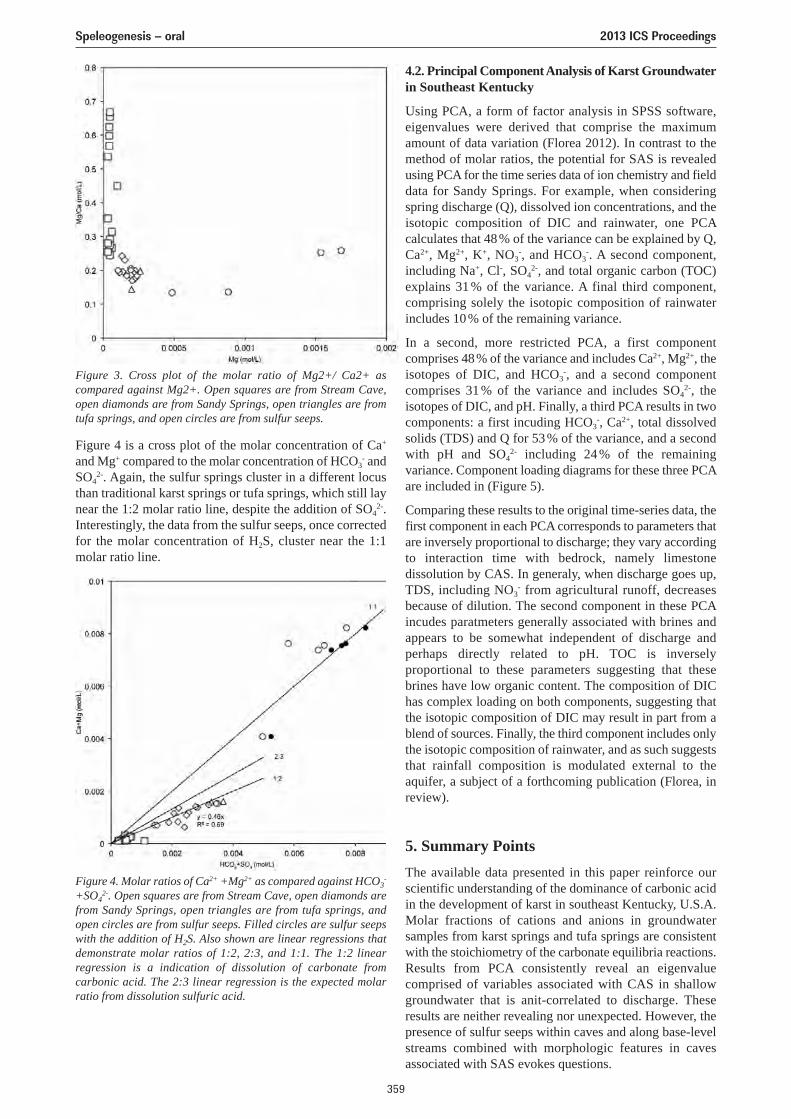
4.2. Principal Component Analysis of Karst Groundwaterin Southeast Kentucky
Using PCA, a form of factor analysis in SPSS software,eigenvalues were derived that comprise the maximumamount of data variation (Florea 2012). In contrast to themethod of molar ratios, the potential for SAS is revealedusing PCA for the time series data of ion chemistry and fielddata for Sandy Springs. For example, when consideringspring discharge (Q), dissolved ion concentrations, and theisotopic composition of DIC and rainwater, one PCAcalculates that 48% of the variance can be explained by Q,Ca2+, Mg2+, K+, NO3
-, and HCO3-. A second component,
including Na+, Cl-, SO42-, and total organic carbon (TOC)
explains 31 % of the variance. A final third component,comprising solely the isotopic composition of rainwaterincludes 10% of the remaining variance.
In a second, more restricted PCA, a first componentcomprises 48% of the variance and includes Ca2+, Mg2+, theisotopes of DIC, and HCO3
-, and a second componentcomprises 31 % of the variance and includes SO4
2-, theisotopes of DIC, and pH. Finally, a third PCA results in twocomponents: a first incuding HCO3
-, Ca2+, total dissolvedsolids (TDS) and Q for 53% of the variance, and a secondwith pH and SO4
2- including 24 % of the remainingvariance. Component loading diagrams for these three PCAare included in (Figure 5).
Comparing these results to the original time-series data, thefirst component in each PCA corresponds to parameters thatare inversely proportional to discharge; they vary accordingto interaction time with bedrock, namely limestonedissolution by CAS. In generaly, when discharge goes up,TDS, including NO3
- from agricultural runoff, decreasesbecause of dilution. The second component in these PCAincudes paratmeters generally associated with brines andappears to be somewhat independent of discharge andperhaps directly related to pH. TOC is inverselyproportional to these parameters suggesting that thesebrines have low organic content. The composition of DIChas complex loading on both components, suggesting thatthe isotopic composition of DIC may result in part from ablend of sources. Finally, the third component includes onlythe isotopic composition of rainwater, and as such suggeststhat rainfall composition is modulated external to theaquifer, a subject of a forthcoming publication (Florea, inreview).
5. Summary PointsThe available data presented in this paper reinforce ourscientific understanding of the dominance of carbonic acidin the development of karst in southeast Kentucky, U.S.A.Molar fractions of cations and anions in groundwatersamples from karst springs and tufa springs are consistentwith the stoichiometry of the carbonate equilibria reactions.Results from PCA consistently reveal an eigenvaluecomprised of variables associated with CAS in shallowgroundwater that is anit-correlated to discharge. Theseresults are neither revealing nor unexpected. However, thepresence of sulfur seeps within caves and along base-levelstreams combined with morphologic features in cavesassociated with SAS evokes questions.
Figure 3. Cross plot of the molar ratio of Mg2+/ Ca2+ ascompared against Mg2+. Open squares are from Stream Cave,open diamonds are from Sandy Springs, open triangles are fromtufa springs, and open circles are from sulfur seeps.
Figure 4. Molar ratios of Ca2+ +Mg2+ as compared against HCO3-
+SO42-. Open squares are from Stream Cave, open diamonds are
from Sandy Springs, open triangles are from tufa springs, andopen circles are from sulfur seeps. Filled circles are sulfur seepswith the addition of H2S. Also shown are linear regressions thatdemonstrate molar ratios of 1:2, 2:3, and 1:1. The 1:2 linearregression is a indication of dissolution of carbonate fromcarbonic acid. The 2:3 linear regression is the expected molarratio from dissolution sulfuric acid.
Figure 4 is a cross plot of the molar concentration of Ca+
and Mg+ compared to the molar concentration of HCO3- and
SO42-. Again, the sulfur springs cluster in a different locus
than traditional karst springs or tufa springs, which still laynear the 1:2 molar ratio line, despite the addition of SO4
2-.Interestingly, the data from the sulfur seeps, once correctedfor the molar concentration of H2S, cluster near the 1:1molar ratio line.
Speleogenesis – oral 2013 ICS Proceedings
359
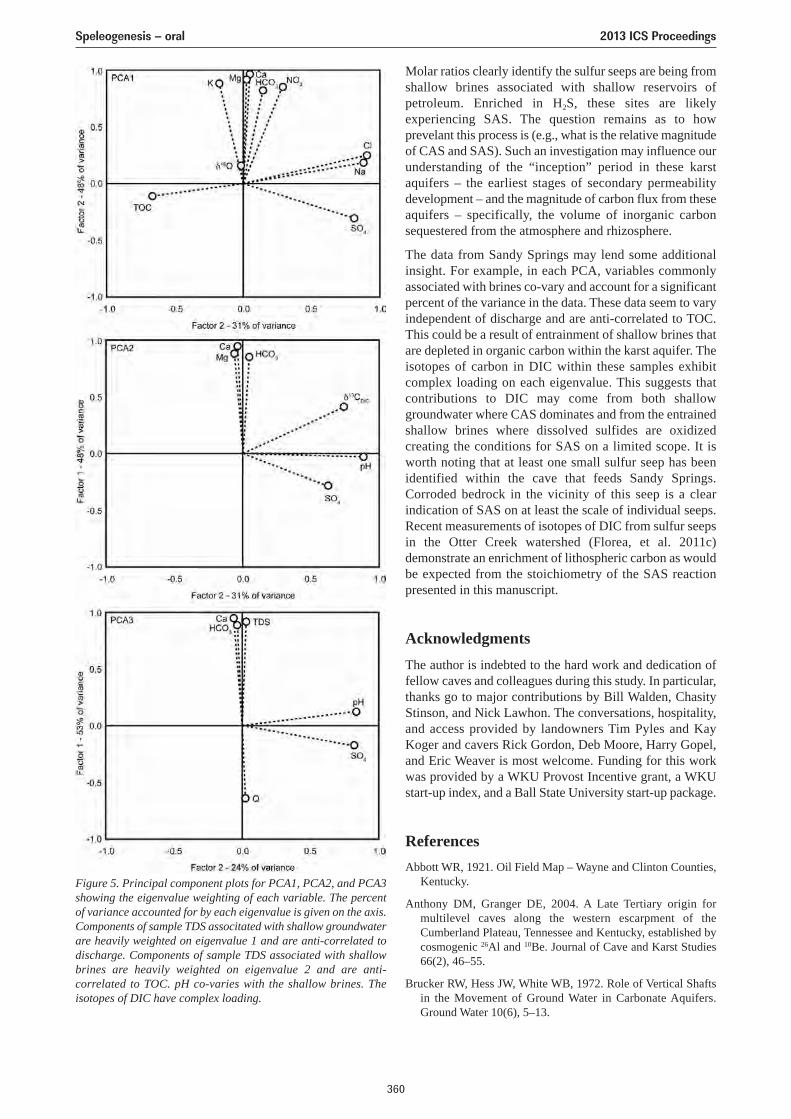
Molar ratios clearly identify the sulfur seeps are being fromshallow brines associated with shallow reservoirs ofpetroleum. Enriched in H2S, these sites are likelyexperiencing SAS. The question remains as to howprevelant this process is (e.g., what is the relative magnitudeof CAS and SAS). Such an investigation may influence ourunderstanding of the “inception” period in these karstaquifers – the earliest stages of secondary permeabilitydevelopment – and the magnitude of carbon flux from theseaquifers – specifically, the volume of inorganic carbonsequestered from the atmosphere and rhizosphere.
The data from Sandy Springs may lend some additionalinsight. For example, in each PCA, variables commonlyassociated with brines co-vary and account for a significantpercent of the variance in the data. These data seem to varyindependent of discharge and are anti-correlated to TOC.This could be a result of entrainment of shallow brines thatare depleted in organic carbon within the karst aquifer. Theisotopes of carbon in DIC within these samples exhibitcomplex loading on each eigenvalue. This suggests thatcontributions to DIC may come from both shallowgroundwater where CAS dominates and from the entrainedshallow brines where dissolved sulfides are oxidizedcreating the conditions for SAS on a limited scope. It isworth noting that at least one small sulfur seep has beenidentified within the cave that feeds Sandy Springs.Corroded bedrock in the vicinity of this seep is a clearindication of SAS on at least the scale of individual seeps.Recent measurements of isotopes of DIC from sulfur seepsin the Otter Creek watershed (Florea, et al. 2011c)demonstrate an enrichment of lithospheric carbon as wouldbe expected from the stoichiometry of the SAS reactionpresented in this manuscript.
AcknowledgmentsThe author is indebted to the hard work and dedication offellow caves and colleagues during this study. In particular,thanks go to major contributions by Bill Walden, ChasityStinson, and Nick Lawhon. The conversations, hospitality,and access provided by landowners Tim Pyles and KayKoger and cavers Rick Gordon, Deb Moore, Harry Gopel,and Eric Weaver is most welcome. Funding for this workwas provided by a WKU Provost Incentive grant, a WKUstart-up index, and a Ball State University start-up package.
ReferencesAbbott WR, 1921. Oil Field Map – Wayne and Clinton Counties,
Kentucky.
Anthony DM, Granger DE, 2004. A Late Tertiary origin formultilevel caves along the western escarpment of theCumberland Plateau, Tennessee and Kentucky, established bycosmogenic 26Al and 10Be. Journal of Cave and Karst Studies66(2), 46–55.
Brucker RW, Hess JW, White WB, 1972. Role of Vertical Shaftsin the Movement of Ground Water in Carbonate Aquifers.Ground Water 10(6), 5–13.
Figure 5. Principal component plots for PCA1, PCA2, and PCA3showing the eigenvalue weighting of each variable. The percentof variance accounted for by each eigenvalue is given on the axis.Components of sample TDS associtated with shallow groundwaterare heavily weighted on eigenvalue 1 and are anti-correlated todischarge. Components of sample TDS associated with shallowbrines are heavily weighted on eigenvalue 2 and are anti-correlated to TOC. pH co-varies with the shallow brines. Theisotopes of DIC have complex loading.
Speleogenesis – oral 2013 ICS Proceedings
360
Christophersen N Hooper RP, 1992. Multivariate analysis ofstream water chemical data: the use of principal componentsanalysis for the end-member mixing problem. Water ResourcesResearch 28, 99–107.
Crawford NC, 1984. Karst landform development along theCumberland Plateau Escarpment of Tennessee. In: RG LeFleur(ed.). Groundwater as a geomorphic agent. Boston, Allen andUnwin, Inc., 294–338.
Dugan CR Florea LJ, Walden WD, 2012. A GeochemicalInvestigation of Springs within the Otter Creek watershed:Wayne County, Southeastern Kentucky. Geological Society ofAmerica Abstracts with Programs 44(4), 26.
Engel AS, Stern LA, Bennett PC, 2004. Microbial contributionsto cave formation: New insights into sulfuric acidspeleogenesis. Geology 32(5), 369–372.
Ettensohn FR, Rice CR, Dever GR Jr, Chesnut DR, 1984. Sladeand Paragon Formations; New stratigraphic nomenclature forMississippian rocks along the Cumberland Escarpment inKentucky. U.S. Geological Survey Bulletin 1605-B, 37.
Ewers RO, 1985. Patterns of cave development along theCumberland Escarpment. In: PH Dougherty (ed.). Caves andkarst of Kentucky. Kentucky Geological Survey SpecialPublication, 63–77.
Ferguson HF, 1967. Valley stress release in the Allegheny Plateau.Bulletin of the Association of Engineering Geologists 4, 63–71.
Florea LJ, In revision. Selective recharge and isotopic compositionof shallow groundwater within temperate, epigenic carbonateaquifers. Journal of Hydrology.
Florea LJ, 2012. Principal Component Analysis of GeochemicalData from a Karst Aquifer in Southeast Kentucky. GeologicalSociety of America Abstracts with Programs 44(4), 26.
Florea, L.J.; Stinson, C.L.; Weaver, E.; Lawhon, N.; Wynn, J. 2011a. Finding holes in a theory or finding a theory in holes– the potential role of hypogene speleogenesis for caves of theCumberland Plateau in southeastern Kentucky. GeologicalSociety of America Abstracts with Programs 43(5), 19.
Florea LJ, Lawhon N, Stinson CL, 2011b. William D. Walden.Geochemical Characterization of the Redmond Creek KarstAquifer, Southeast Kentucky. 2011 National SpeleologicalSociety Convention Program Guide, 32–33.
Florea LJ, Wynn J, Lawhon N, Stinson CL, Walden W, 2011c.Variation of δ13C in the Carbonate Aquifers of the CumberlandPlateau of Southeast Kentucky. Geological Society of AmericaAbstracts with Programs 43(5), 342.
Florea, LJ, Vacher, HL, 2006. Springflow Hydrographs: Eogeneticversus Telogenetic Karst. Ground Water 44(3), 352–361.
Ford DC, Williams P, 2007. Karst Hydrogeology andGeomorphology. John Wiley & Sons, 562.
Galdenzi S, Menichetti M, 1995. Occurrence of hypogenic cavesin a karst region: Examples from central Italy. EnvironmentalGeology 26, 39–47.
Hill CA, 1990. Sulfuric acid speleogenesis of Carlsbad Cavernand its relationship to hydrocarbons, Delaware Basin, NewMexico and Texas. American Association of PetroleumGeologists Bulletin 74(11), 1685–1694.
Hose LD, Palmer AN, Palmer MV, Northup DE, Boston PJ,DuChene HR, 2000. Microbiology and geochemistry in ahydrogen sulphide rich karst environment. Chemical Geology169, 399–423.
Jagnow DH, Hill CA, Davis DG, DuChene HR, Cunningham KI,Northup DE, Queen JM, 2000. History of the sulfuric acidtheory of speleogenesis in the Guadalupe Mountains, NewMexico, Journal of Cave and Karst Studies 62(2), 54–59.
Klimchouk AB, 2007. Hypogene speleogenesis: Hydrogeologicaland Morphogenetic perspective. National Cave and KarstResearch Institute Special Paper 1, 106.
McFarlan AC, 1943. Geology of Kentucky. University of Kentucky,531.
Onac BP, Wynn JG, Sumrall JB, 2011. Tracing the sources of cavesulfates: a unique case from Cerna Valley, Romania. ChemicalGeology 288, 105–114.
Sasowsky ID, White WB, 1994. The role of stress release fracturingin the development of cavernous porosity in carbonate aquifers.Water Resources Research 30(12), 3523–3530.
Schindel, GM, Johnson S, Alexander CE, 2008. HypogeneProcesses in the Edwards Aquifer in South-Central Texas, aNew Conceptual Model to Explain Aquifer Dynamics. AAPGAnnual Convention, San Antonio, TX.
Simpson LC, Florea LJ, 2009. The Cumberland Plateau of EasternKentucky. In: AN Palmer and MV Palmer (eds.). Caves andKarst of America. National Speleological Society, 70–79.
Walden WD, Walden KM, Florea LJ, 2007. The Caves and Karstof Redmond Creek, Wayne County, Kentucky. 2007 NationalSpeleological Society Convention Program Guide, 107.
White WB, 1988. Geomorphology and Hydrology of KarstTerrains. New York, Oxford University Press, 464.
Wynn JG, Sumrall JB, Onac BP, 2010. Sulfur isotopic compositionand the source of dissolved sulfur species in the thermo-mineralsprings of the Cerna Valley, Romania. Chemical Geology 271,31–43.
Speleogenesis – oral 2013 ICS Proceedings
361
THE ROLE OF BASE LEVEL INCISION AND TRANSIENT RECHARGEIN VERTICAL ORGANISATION OF KARST NETWORK
Franci Gabrovšek1, Philipp Häuselmann2, Philippe Audra3
1Karst Research Institute ZRC SAZU, Titov trg 2, Postojna, Slovenia, [email protected] Institute for Speleology and Karstology SISKA, Box 818, 2300 La Chaux-de-Fonds, Switzerland,
[email protected] Nice – Sophia, University of Nice – Sophia Antipolis, 930 route des Colles, 06410 BIOT, France & Innovative
City – IMREDD, Nice, France, [email protected]
Vertical organization of karst network or “speleogenesis inthe dimension of length and depth” has been in researchfocus for more than a century. Different models have beenproposed, each focusing the speleogenesis to: a) the vadosezone, where the solution is most aggressive b) the watertable, where the density of flow is highest and c) to thephreatic zone, referring to the deep Darcyan flow paths.
Different models were unified into a single concept, the fourstate model of Ford and Ewers (1978). The model relatesgeometry of caves to the frequency of penetrable fissures.It has been successfully applied to numerous speleogeneticsettings.
In the last decade these conceptual models have been alsoverified with the numerical ones. Gabrovšek and Dreybrodt(2001) modelled 2D unconfined fracture network inconstant boundary conditions. The model showed theimportance of flow focusing at the water table which isdropping in time due to the increasing permeability. Mostsimulations resulted in the formation of a water table caveat the base level. Deeper phreatic loops were more anexception than a rule, limited to the cases with the absenceof flow paths in the vicinity of the base level. Similar resultswere obtained by Kaufmann (2003) who modelled avertical fracture network embedded in a porous matrix.Base level changes have been also considered (Dreybrodtet al. 2005), demonstrating that valley incision and backfilling can result in deep phreatic loops.
Carbonate massifs of young orogenes are normally heavilyfractured due to the intense tectonic activity. According tothe four state model, one would expect that water tablecaves would be common, but several studies reveal thatthey are more an exception than a rule. The looping caveswith soutirages connecting different cave levels, are morecommon than the water table caves (Jeannin et al. 2000).
Speleogenesis in Alpine environments is influenced by highuplift and valley incision rate and irregular recharge.
Several works have stressed the potential importance ofrecharge variation in vertical development of karst network(e.g., Häuselmann et al. 2003) based on field observations.In this work we adopt some of these conceptual approachesand translate them into a simple mathematical model basedon basic principles of flow, dissolution and transport. Thefull paper described in this extended abstract has beensubmitted to publication (Häuselmann et al. 2012).
The conceptual model is fairly simple: Initially we assumea master conduit discharging part of the karst massif to aspring at the base level. The incision of the base level starts
and triggers the evolution of new pathways along somedeeper levels below the master conduit. While masterconduit also incises into an underground canyon, the deeppathways evolve toward maturity and capture increasingportion of flow. The question arises what will happen first:a) an underground – water table cave connecting both levelsor b) all the flow will be diverted along the lower pathway.
The incision of the master conduit is a result of acombination of chemical and mechanical erosion. We makea rather crude (but reasonable for the purpose) assumptionthat it is constant in time.
The development of deep pathway is treated with theapproach given in detail in several sources (Dreybrodt et al.2005). The model couples flow and dissolution along apathway (single fracture) through mass balance assumingthat within each segment of the fracture, the dissolved masscontributes to the saturation ratio of the solution. Analyticalsolution is based on the approximation that the entirepathway is widened uniformly, defined by minimumdissolution rates at the exit (Gabrovšek and Dreybrodt2000). This way dissolution and widening rates of thefracture is calculated. When the head difference betweenboth ends of the pathway is constant, such coupling resultsin increasing flow rate, which in turn enhances dissolutionrates and vice versa. The feedback mechanism ends with anabrupt increase of both, flow and dissolution rates, calledthe breakthrough. After the breakthrough, the dissolutionrate along the pathway is constant and maximal and theflow rate increases at the maximal rate. Soon the pathwaycan capture all available flow.
In our model the evolution of deep pathway is driven by avariable hydraulic head. It initially increases in time as thevalley incises faster than the master conduit. When valleypasses the elevation of deep pathway, the head is maximal,latter the head drops with incision of the an underground.
The analytical solution for the evolution of a pathway undervarying hydraulic head as given above, divides theparameter space into a region where the breakthrough ofthe lower pathway is possible (formation of a loop) and aregion where the master conduit develops into a anunderground.
We introduce the Loop-to-Canyon-Ratio (LCR), aparameter predicting which of the two outcomes is morelikely to occur in certain settings.
Generally an initial master conduit is not straight, butundulates in both planes. One can also assume several sub-
Speleogenesis – oral 2013 ICS Proceedings
362
vertical fractures (proto soutirages) connecting the level ofthe master conduit and the deep pathway. In case of atransient recharge, composed of floods and dry periods, theevent water is stored in the depression of the (undulating)master conduit after the flood recession. This water seepsalong the proto soutirages towards the deep pathway andenlarges them. Therefore, deep pathways evolve also whenthe master conduit does not. This mechanism considerablyincreases the LCR. Therefore, the loops evolve more likelyin transient recharge conditions.
Although the model includes several approximations, itpresents a step forward by assessing the relative importanceof some basic parameters related to specific speleogeneticsettings.
ReferencesAudra Ph, Palmer AN (in press). The vertical dimension of karst
– Controls of vertical cave pattern. In: J Shroder and A Frumkin(Eds.). Treatise on Geomorphology, vol. 6. Academic Press,San Diego.
Dreybrodt W, Gabrovsek F, 2000. Dynamics of the evolution of asingle karst conduit. In: A. Klimchouk, DC Ford, AN Palmerand W Dreybrodt (Eds.). Speleogenesis: Evolution of KarstAquifers. NSS, Huntsville, 184–193.
Dreybrodt W, Gabrovsek F, Romanov D, 2005. Processes ofspeleogenesis: a modeling approach. Zalozba ZRC, Ljubljana.
Ford DC, Ewers RO, 1978. The development of limestone cavesystems in the dimensions of length and depth. Can J Earth Sci,15, 1783–1798.
Gabrovsek F, Dreybrodt W, 2001. A model of the early evolutionof karst aquifers in limestone in the dimensions of length anddepth. Journal of Hydrology, 240(3–4), 206–224.
Häuselmann Ph, Gabrovšek F, Audra Ph, 2012. “Looping caves”versus “watertable caves”: The role of base level changes andrecharge variations in the dimensions of length and depth.Submitted to GSA.
Häuselmann Ph, Jeannin P-Y, Monbaron M, 2003. Role ofepiphreatic flow and soutirages in conduit morphogenesis: theBärenschacht example (BE, Switzerland). Zeitschrift fürGeomorphologie, 47(2), 171–190.
Jeannin PY, Bitterli T, Häuselmann Ph, 2000. Genesis of a largecave system: the case study of the North of Lake Thun system(Canton Bern, Switzerland). In: A. Klimchouk, DC Ford, ANPalmer and W Dreybrodt (Eds.). Speleogenesis: Evolution ofKarst Aquifers. NSS, Huntsville, 338–347.
Kaufmann G, 2003. Modelling unsaturated flow in an evolvingkarst aquifer. Journal of Hydrology, 276(1–4), 53–70.
Palmer AN, 1991. Origin and morphology of limestone caves.Geological Society of America Bulletin, 103, 1–21.
Speleogenesis – oral 2013 ICS Proceedings
363
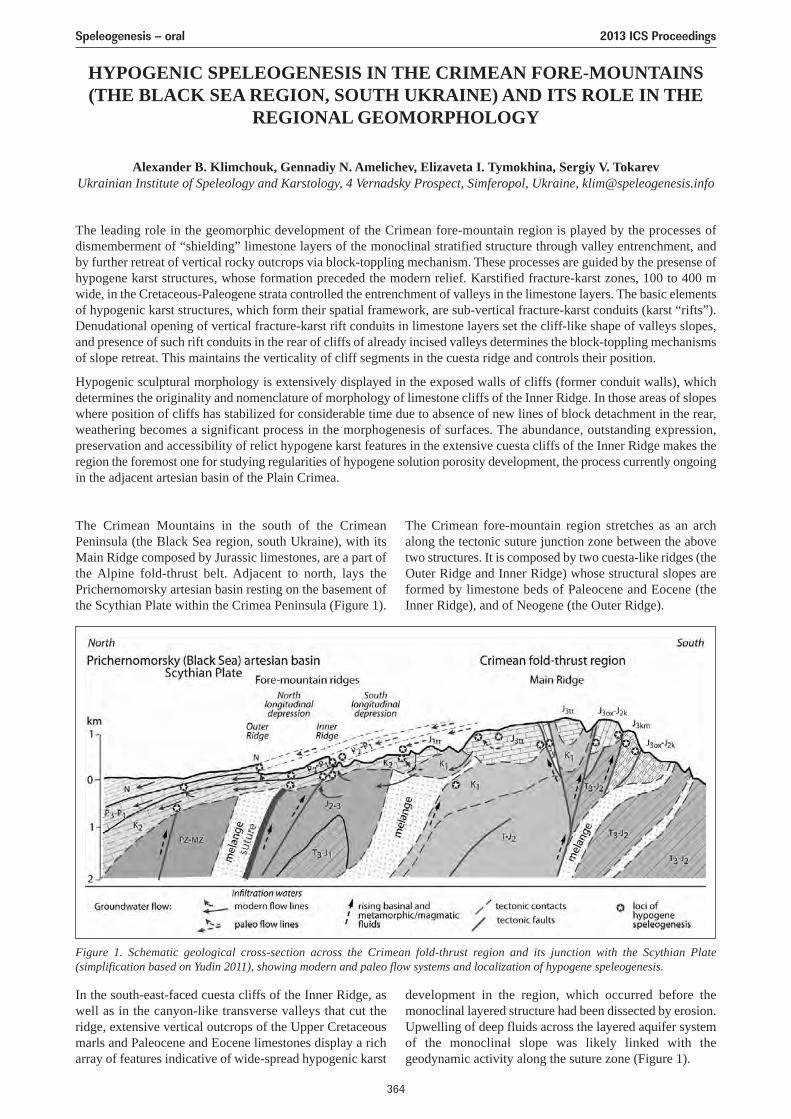
HYPOGENIC SPELEOGENESIS IN THE CRIMEAN FORE-MOUNTAINS(THE BLACK SEA REGION, SOUTH UKRAINE) AND ITS ROLE IN THE
REGIONAL GEOMORPHOLOGY
Alexander B. Klimchouk, Gennadiy N. Amelichev, Elizaveta I. Tymokhina, Sergiy V. TokarevUkrainian Institute of Speleology and Karstology, 4 Vernadsky Prospect, Simferopol, Ukraine, [email protected]
The leading role in the geomorphic development of the Crimean fore-mountain region is played by the processes ofdismemberment of “shielding” limestone layers of the monoclinal stratified structure through valley entrenchment, andby further retreat of vertical rocky outcrops via block-toppling mechanism. These processes are guided by the presense ofhypogene karst structures, whose formation preceded the modern relief. Karstified fracture-karst zones, 100 to 400 mwide, in the Cretaceous-Paleogene strata controlled the entrenchment of valleys in the limestone layers. The basic elementsof hypogenic karst structures, which form their spatial framework, are sub-vertical fracture-karst conduits (karst “rifts”).Denudational opening of vertical fracture-karst rift conduits in limestone layers set the cliff-like shape of valleys slopes,and presence of such rift conduits in the rear of cliffs of already incised valleys determines the block-toppling mechanismsof slope retreat. This maintains the verticality of cliff segments in the cuesta ridge and controls their position.
Hypogenic sculptural morphology is extensively displayed in the exposed walls of cliffs (former conduit walls), whichdetermines the originality and nomenclature of morphology of limestone cliffs of the Inner Ridge. In those areas of slopeswhere position of cliffs has stabilized for considerable time due to absence of new lines of block detachment in the rear,weathering becomes a significant process in the morphogenesis of surfaces. The abundance, outstanding expression,preservation and accessibility of relict hypogene karst features in the extensive cuesta cliffs of the Inner Ridge makes theregion the foremost one for studying regularities of hypogene solution porosity development, the process currently ongoingin the adjacent artesian basin of the Plain Crimea.
The Crimean Mountains in the south of the CrimeanPeninsula (the Black Sea region, south Ukraine), with itsMain Ridge composed by Jurassic limestones, are a part ofthe Alpine fold-thrust belt. Adjacent to north, lays thePrichernomorsky artesian basin resting on the basement ofthe Scythian Plate within the Crimea Peninsula (Figure 1).
In the south-east-faced cuesta cliffs of the Inner Ridge, aswell as in the canyon-like transverse valleys that cut theridge, extensive vertical outcrops of the Upper Cretaceousmarls and Paleocene and Eocene limestones display a richarray of features indicative of wide-spread hypogenic karst
Figure 1. Schematic geological cross-section across the Crimean fold-thrust region and its junction with the Scythian Plate(simplification based on Yudin 2011), showing modern and paleo flow systems and localization of hypogene speleogenesis.
The Crimean fore-mountain region stretches as an archalong the tectonic suture junction zone between the abovetwo structures. It is composed by two cuesta-like ridges (theOuter Ridge and Inner Ridge) whose structural slopes areformed by limestone beds of Paleocene and Eocene (theInner Ridge), and of Neogene (the Outer Ridge).
development in the region, which occurred before themonoclinal layered structure had been dissected by erosion.Upwelling of deep fluids across the layered aquifer systemof the monoclinal slope was likely linked with thegeodynamic activity along the suture zone (Figure 1).
Speleogenesis – oral 2013 ICS Proceedings
364
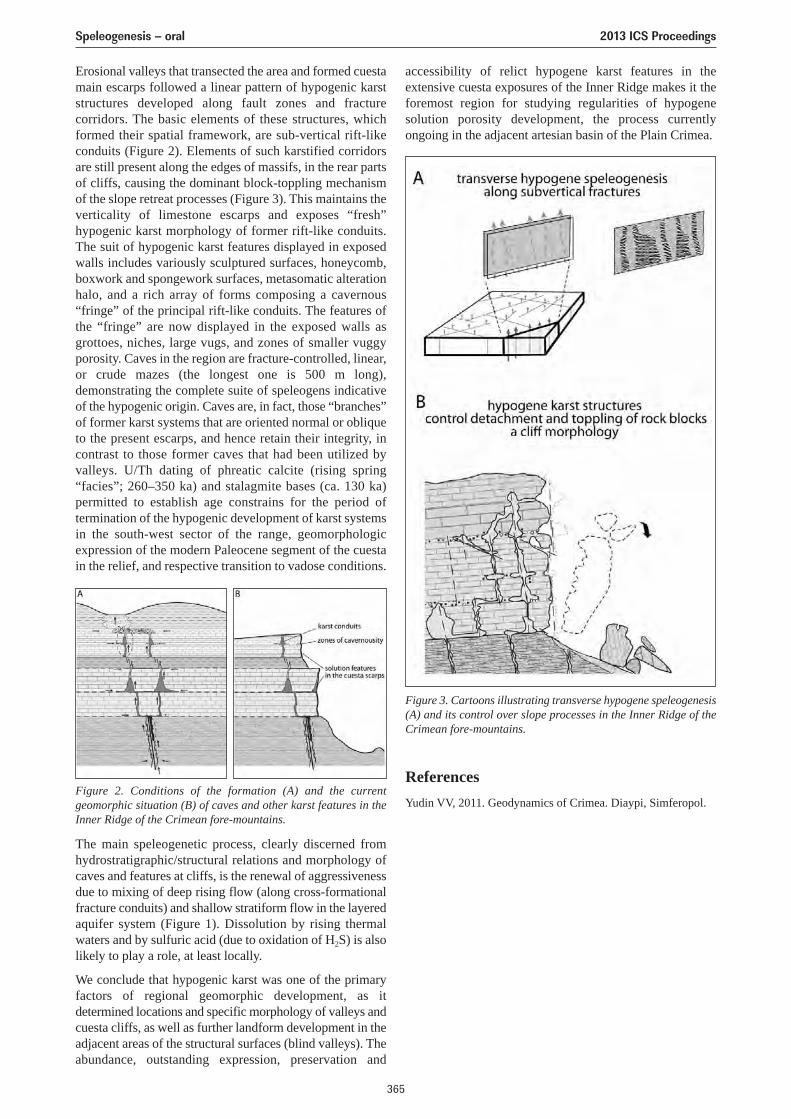
Erosional valleys that transected the area and formed cuestamain escarps followed a linear pattern of hypogenic karststructures developed along fault zones and fracturecorridors. The basic elements of these structures, whichformed their spatial framework, are sub-vertical rift-likeconduits (Figure 2). Elements of such karstified corridorsare still present along the edges of massifs, in the rear partsof cliffs, causing the dominant block-toppling mechanismof the slope retreat processes (Figure 3). This maintains theverticality of limestone escarps and exposes “fresh”hypogenic karst morphology of former rift-like conduits.The suit of hypogenic karst features displayed in exposedwalls includes variously sculptured surfaces, honeycomb,boxwork and spongework surfaces, metasomatic alterationhalo, and a rich array of forms composing a cavernous“fringe” of the principal rift-like conduits. The features ofthe “fringe” are now displayed in the exposed walls asgrottoes, niches, large vugs, and zones of smaller vuggyporosity. Caves in the region are fracture-controlled, linear,or crude mazes (the longest one is 500 m long),demonstrating the complete suite of speleogens indicativeof the hypogenic origin. Caves are, in fact, those “branches”of former karst systems that are oriented normal or obliqueto the present escarps, and hence retain their integrity, incontrast to those former caves that had been utilized byvalleys. U/Th dating of phreatic calcite (rising spring“facies”; 260–350 ka) and stalagmite bases (ca. 130 ka)permitted to establish age constrains for the period oftermination of the hypogenic development of karst systemsin the south-west sector of the range, geomorphologicexpression of the modern Paleocene segment of the cuestain the relief, and respective transition to vadose conditions.
accessibility of relict hypogene karst features in theextensive cuesta exposures of the Inner Ridge makes it theforemost region for studying regularities of hypogenesolution porosity development, the process currentlyongoing in the adjacent artesian basin of the Plain Crimea.
Figure 2. Conditions of the formation (A) and the currentgeomorphic situation (B) of caves and other karst features in theInner Ridge of the Crimean fore-mountains.
Figure 3. Cartoons illustrating transverse hypogene speleogenesis(A) and its control over slope processes in the Inner Ridge of theCrimean fore-mountains.
The main speleogenetic process, clearly discerned fromhydrostratigraphic/structural relations and morphology ofcaves and features at cliffs, is the renewal of aggressivenessdue to mixing of deep rising flow (along cross-formationalfracture conduits) and shallow stratiform flow in the layeredaquifer system (Figure 1). Dissolution by rising thermalwaters and by sulfuric acid (due to oxidation of H2S) is alsolikely to play a role, at least locally.
We conclude that hypogenic karst was one of the primaryfactors of regional geomorphic development, as itdetermined locations and specific morphology of valleys andcuesta cliffs, as well as further landform development in theadjacent areas of the structural surfaces (blind valleys). Theabundance, outstanding expression, preservation and
ReferencesYudin VV, 2011. Geodynamics of Crimea. Diaypi, Simferopol.
Speleogenesis – oral 2013 ICS Proceedings
365
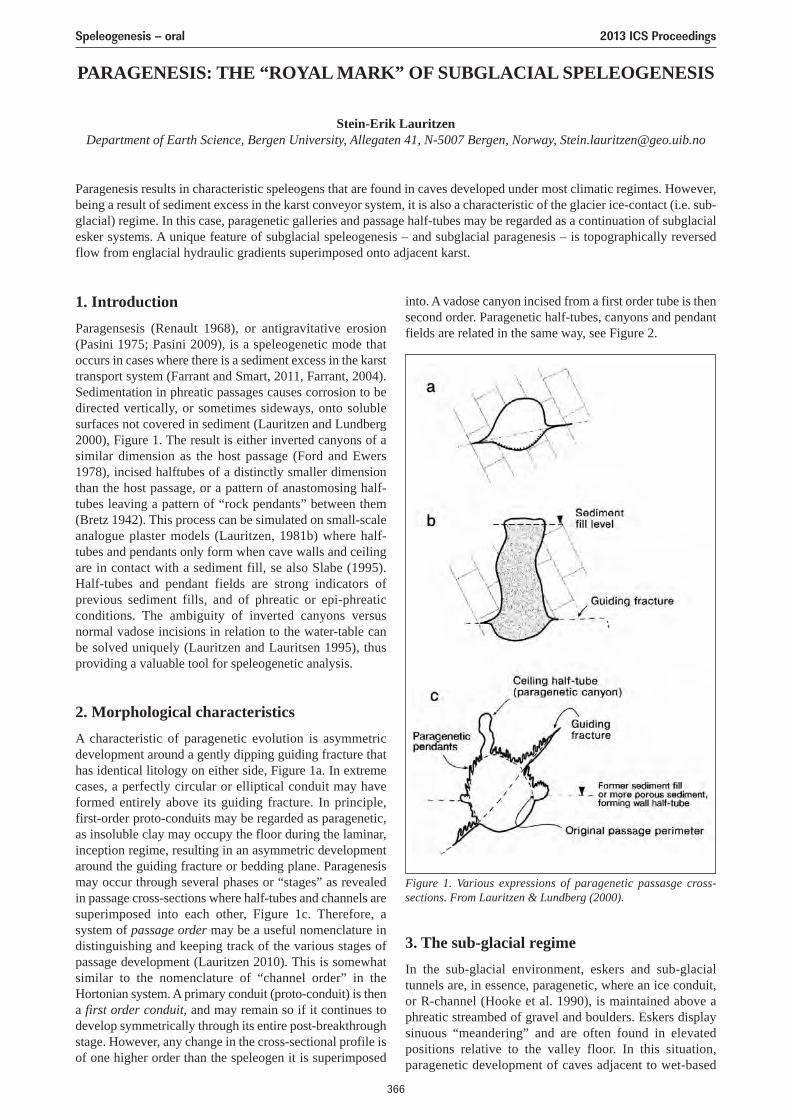
PARAGENESIS: THE “ROYAL MARK” OF SUBGLACIAL SPELEOGENESIS
Stein-Erik LauritzenDepartment of Earth Science, Bergen University, Allegaten 41, N-5007 Bergen, Norway, [email protected]
Paragenesis results in characteristic speleogens that are found in caves developed under most climatic regimes. However,being a result of sediment excess in the karst conveyor system, it is also a characteristic of the glacier ice-contact (i.e. sub-glacial) regime. In this case, paragenetic galleries and passage half-tubes may be regarded as a continuation of subglacialesker systems. A unique feature of subglacial speleogenesis – and subglacial paragenesis – is topographically reversedflow from englacial hydraulic gradients superimposed onto adjacent karst.
1. IntroductionParagensesis (Renault 1968), or antigravitative erosion(Pasini 1975; Pasini 2009), is a speleogenetic mode thatoccurs in cases where there is a sediment excess in the karsttransport system (Farrant and Smart, 2011, Farrant, 2004).Sedimentation in phreatic passages causes corrosion to bedirected vertically, or sometimes sideways, onto solublesurfaces not covered in sediment (Lauritzen and Lundberg2000), Figure 1. The result is either inverted canyons of asimilar dimension as the host passage (Ford and Ewers1978), incised halftubes of a distinctly smaller dimensionthan the host passage, or a pattern of anastomosing half-tubes leaving a pattern of “rock pendants” between them(Bretz 1942). This process can be simulated on small-scaleanalogue plaster models (Lauritzen, 1981b) where half-tubes and pendants only form when cave walls and ceilingare in contact with a sediment fill, se also Slabe (1995).Half-tubes and pendant fields are strong indicators ofprevious sediment fills, and of phreatic or epi-phreaticconditions. The ambiguity of inverted canyons versusnormal vadose incisions in relation to the water-table canbe solved uniquely (Lauritzen and Lauritsen 1995), thusproviding a valuable tool for speleogenetic analysis.
2. Morphological characteristicsA characteristic of paragenetic evolution is asymmetricdevelopment around a gently dipping guiding fracture thathas identical litology on either side, Figure 1a. In extremecases, a perfectly circular or elliptical conduit may haveformed entirely above its guiding fracture. In principle,first-order proto-conduits may be regarded as paragenetic,as insoluble clay may occupy the floor during the laminar,inception regime, resulting in an asymmetric developmentaround the guiding fracture or bedding plane. Paragenesismay occur through several phases or “stages” as revealedin passage cross-sections where half-tubes and channels aresuperimposed into each other, Figure 1c. Therefore, asystem of passage order may be a useful nomenclature indistinguishing and keeping track of the various stages ofpassage development (Lauritzen 2010). This is somewhatsimilar to the nomenclature of “channel order” in theHortonian system. A primary conduit (proto-conduit) is thena first order conduit, and may remain so if it continues todevelop symmetrically through its entire post-breakthroughstage. However, any change in the cross-sectional profile isof one higher order than the speleogen it is superimposed
into. A vadose canyon incised from a first order tube is thensecond order. Paragenetic half-tubes, canyons and pendantfields are related in the same way, see Figure 2.
3. The sub-glacial regimeIn the sub-glacial environment, eskers and sub-glacialtunnels are, in essence, paragenetic, where an ice conduit,or R-channel (Hooke et al. 1990), is maintained above aphreatic streambed of gravel and boulders. Eskers displaysinuous “meandering” and are often found in elevatedpositions relative to the valley floor. In this situation,paragenetic development of caves adjacent to wet-based
Figure 1. Various expressions of paragenetic passasge cross-sections. From Lauritzen & Lundberg (2000).
Speleogenesis – oral 2013 ICS Proceedings
366
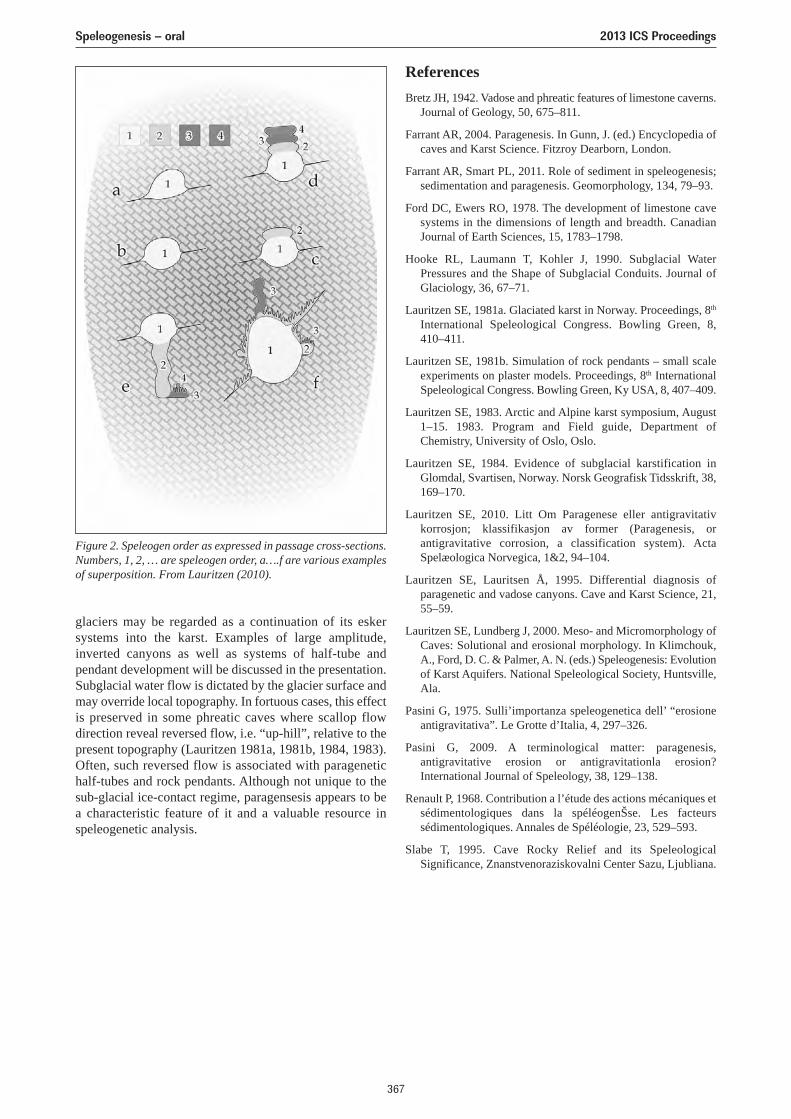
glaciers may be regarded as a continuation of its eskersystems into the karst. Examples of large amplitude,inverted canyons as well as systems of half-tube andpendant development will be discussed in the presentation.Subglacial water flow is dictated by the glacier surface andmay override local topography. In fortuous cases, this effectis preserved in some phreatic caves where scallop flowdirection reveal reversed flow, i.e. “up-hill”, relative to thepresent topography (Lauritzen 1981a, 1981b, 1984, 1983).Often, such reversed flow is associated with paragenetichalf-tubes and rock pendants. Although not unique to thesub-glacial ice-contact regime, paragensesis appears to bea characteristic feature of it and a valuable resource inspeleogenetic analysis.
ReferencesBretz JH, 1942. Vadose and phreatic features of limestone caverns.
Journal of Geology, 50, 675–811.
Farrant AR, 2004. Paragenesis. In Gunn, J. (ed.) Encyclopedia ofcaves and Karst Science. Fitzroy Dearborn, London.
Farrant AR, Smart PL, 2011. Role of sediment in speleogenesis;sedimentation and paragenesis. Geomorphology, 134, 79–93.
Ford DC, Ewers RO, 1978. The development of limestone cavesystems in the dimensions of length and breadth. CanadianJournal of Earth Sciences, 15, 1783–1798.
Hooke RL, Laumann T, Kohler J, 1990. Subglacial WaterPressures and the Shape of Subglacial Conduits. Journal ofGlaciology, 36, 67–71.
Lauritzen SE, 1981a. Glaciated karst in Norway. Proceedings, 8th
International Speleological Congress. Bowling Green, 8,410–411.
Lauritzen SE, 1981b. Simulation of rock pendants – small scaleexperiments on plaster models. Proceedings, 8th InternationalSpeleological Congress. Bowling Green, Ky USA, 8, 407–409.
Lauritzen SE, 1983. Arctic and Alpine karst symposium, August1–15. 1983. Program and Field guide, Department ofChemistry, University of Oslo, Oslo.
Lauritzen SE, 1984. Evidence of subglacial karstification inGlomdal, Svartisen, Norway. Norsk Geografisk Tidsskrift, 38,169–170.
Lauritzen SE, 2010. Litt Om Paragenese eller antigravitativkorrosjon; klassifikasjon av former (Paragenesis, orantigravitative corrosion, a classification system). ActaSpelæologica Norvegica, 1&2, 94–104.
Lauritzen SE, Lauritsen Å, 1995. Differential diagnosis ofparagenetic and vadose canyons. Cave and Karst Science, 21,55–59.
Lauritzen SE, Lundberg J, 2000. Meso- and Micromorphology ofCaves: Solutional and erosional morphology. In Klimchouk,A., Ford, D. C. & Palmer, A. N. (eds.) Speleogenesis: Evolutionof Karst Aquifers. National Speleological Society, Huntsville,Ala.
Pasini G, 1975. Sulli’importanza speleogenetica dell’ “erosioneantigravitativa”. Le Grotte d’Italia, 4, 297–326.
Pasini G, 2009. A terminological matter: paragenesis,antigravitative erosion or antigravitationla erosion?International Journal of Speleology, 38, 129–138.
Renault P, 1968. Contribution a l’étude des actions mécaniques etsédimentologiques dans la spéléogenŠse. Les facteurssédimentologiques. Annales de Spéléologie, 23, 529–593.
Slabe T, 1995. Cave Rocky Relief and its SpeleologicalSignificance, Znanstvenoraziskovalni Center Sazu, Ljubliana.
Figure 2. Speleogen order as expressed in passage cross-sections.Numbers, 1, 2, … are speleogen order, a….f are various examplesof superposition. From Lauritzen (2010).
Speleogenesis – oral 2013 ICS Proceedings
367
GLACIER ICE-CONTACT SPELEOGENESIS
Stein-Erik Lauritzen1, Rannveig Øvrevik Skoglund2
1Department of Earth Science, Bergen University, Allegaten 41, N-5007 Bergen, Norway, [email protected] of Geography, University of Bergen, Fosswinckelsgt. 6, N-5007, Bergen, Norway,
The classic hypothesis of G. Horn’s (1935) subglacial speleogenesis as an explanation of the relatively small diametercave conduits in the Scandinavian marble stripe karst is reviewed. Recent work, including accurate cave mapping andmorphological analysis, radiometric dating of cave deposits, chemical kinetics experiments and computer simulationshave challenged the old theory. Scandinavia has relatively small caves that often have surprisingly high ages, going beyondthe limit of Th/U dating. The high ages are apparently compensated by correspondingly slow wall retreat rates in the ice-contact regime, and longer periods when the caves were inactive. Ice-contact speleogenesis varied in time and space, inpace with waxing and waning of wet-based ice. Maze or labyrinth morphology appears as a characteristic feature of cavesascribed to these processes.
1. Subglacial speleogenesisBetween WW1 and WW2, the Norwegian geologist andspeleologist Gunnar Horn (1894–1946) studied caves in themarble karst of North Norway. Horn published his resultsin German and Norwegian periodicals (Horn 1935, 1937,1945, 1947). These ideas were new and radical for theirtime, resulting from a remarkable train of originalobservations and thoughts. Horn’s main thesis was thatphreatic speleogenesis under subglacial conditions was asimple and feasible explanation for the formation ofnumerous relict and truncated phreatic caves that arelocated in hanging position within the walls of glaciallysculptured valleys. In modern terminology, the ice-contactregime beneath wet-based glaciers and ice-sheets was a sufficient speleogenetic agent. Presently, more than2,000 karst caves have been recorded in the country, withmaximum lengths and depths of 25 km and 580 m,respectively. However, most of them are relatively small(passage diameter) compared to caves in other countries,and – from the viewpoint that size is a measure of (activegrowth) age – one may infer that the caves are relativelyyoung. Horn suggested that the last glacial cycle wouldhave been sufficient to account for the development of theserelatively small cave passages. Horn was also the first toname the characteristic stripe-karst morphology (Horn1937; Lauritzen 2001) in the marble-mica schist setting.
2. ChronologyOur investigations, since the mid-1970’ies, have focussedon morphological analysis, studies of cave sediments andradiometric dating of speleothems which made it possibleto test Horn’s hypothesis. First, we have shown that manycaves, also relatively small ones, consist of labyrinths ormazes, either horizontally or vertically, depending on theattitude of the host rock in the marble stripes. Second, manycaves, even quite small ones, contain speleothems that datebeyond the last glacial cycle, some also exceed the presentlimit of the method (Th/U: 750,000 yr.). These caves may,in principle, even be older than the Quaternary ice-ages,although direct proof of pre-glacial deposits in them has yetto be found.
3. Flow regimes and labyrinth morphologyThrough accurate cave mapping and scallop morphometry,we have been able to demonstrate that the corrosive flowthat caused wall retreat was quite slow, corresponding toaverage groundwater velocities in non-glacial karst(Lauritzen et al. 2011), and that “levels” or tiers in verticalmaze caves did not operate independently, but were part ofa flow network that involved the whole (known) cave(Lauritzen 1982). Many relict labyrinths which slope intothe hillside, like the Grønli system (Lauritzen et al. 2005)and the Nonshaugen system (Skoglund Øvrevik andLauritzen 2011) were effluent (discharge areas) whenactive. Other caves display terrain-reversed phreatic flow(Lauritzen 1984). These features are best explained by ice-contact under hydraulic gradients superimposed from asurrounding glacier or ice-sheet. Modelling experimentssuggest that when in contact with a wet-based glacier, karstaquifers tend to develop maze or labyrinth morphology(Skoglund et al., 2010).
4. Subglacial wall retreat ratesDue to the chemical conditions in subglacial waters and thegeneral high content of alkaline rock flour with a largespecific area, speleogenetic wall retreat rates are up to 50 times less effective under subglacial conditions thanunder non-glacial (interglacial) conditions. All these effects,and field observations, provides a good explanation why wehave relatively small caves of a comparably high age(Lauritzen and Skoglund 2013).
5. The “car-wash” analogySpeleothem (stalagmite) dates represent periods when thecave was inactive (drained). Likewise, the periods offormation for calcareous concretions (Höhlenkrapfen, Kyrle(1923), “doles” in French), reveal periods when the cavewas filled with sediments having pore-water that was super-saturated with respect to carbonate, which byinference mean that speleogenesis was stagnant. ManyHöhlenkrapfen which we to-day find cemented onto clean-
Speleogenesis – oral 2013 ICS Proceedings
368
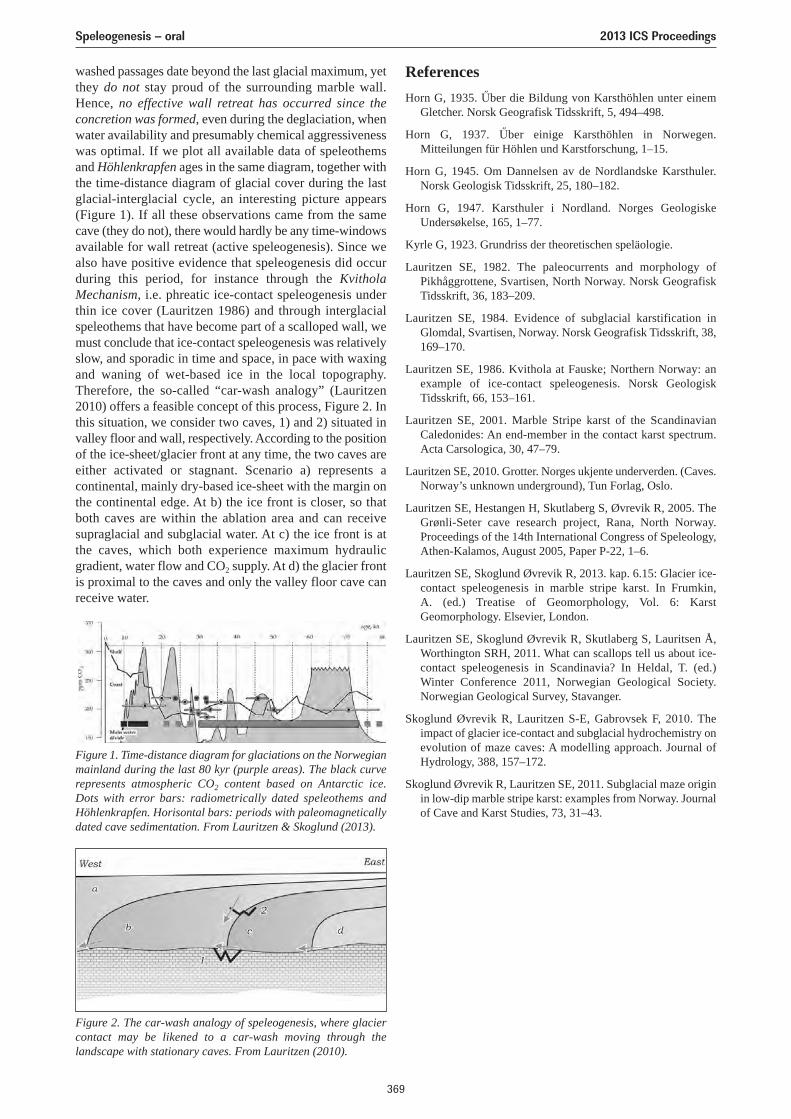
washed passages date beyond the last glacial maximum, yetthey do not stay proud of the surrounding marble wall.Hence, no effective wall retreat has occurred since theconcretion was formed, even during the deglaciation, whenwater availability and presumably chemical aggressivenesswas optimal. If we plot all available data of speleothemsand Höhlenkrapfen ages in the same diagram, together withthe time-distance diagram of glacial cover during the lastglacial-interglacial cycle, an interesting picture appears(Figure 1). If all these observations came from the samecave (they do not), there would hardly be any time-windowsavailable for wall retreat (active speleogenesis). Since wealso have positive evidence that speleogenesis did occurduring this period, for instance through the KvitholaMechanism, i.e. phreatic ice-contact speleogenesis underthin ice cover (Lauritzen 1986) and through interglacialspeleothems that have become part of a scalloped wall, wemust conclude that ice-contact speleogenesis was relativelyslow, and sporadic in time and space, in pace with waxingand waning of wet-based ice in the local topography.Therefore, the so-called “car-wash analogy” (Lauritzen2010) offers a feasible concept of this process, Figure 2. Inthis situation, we consider two caves, 1) and 2) situated invalley floor and wall, respectively. According to the positionof the ice-sheet/glacier front at any time, the two caves areeither activated or stagnant. Scenario a) represents acontinental, mainly dry-based ice-sheet with the margin onthe continental edge. At b) the ice front is closer, so thatboth caves are within the ablation area and can receivesupraglacial and subglacial water. At c) the ice front is atthe caves, which both experience maximum hydraulicgradient, water flow and CO2 supply. At d) the glacier frontis proximal to the caves and only the valley floor cave canreceive water.
ReferencesHorn G, 1935. Űber die Bildung von Karsthöhlen unter einem
Gletcher. Norsk Geografisk Tidsskrift, 5, 494–498.
Horn G, 1937. Űber einige Karsthöhlen in Norwegen.Mitteilungen für Höhlen und Karstforschung, 1–15.
Horn G, 1945. Om Dannelsen av de Nordlandske Karsthuler.Norsk Geologisk Tidsskrift, 25, 180–182.
Horn G, 1947. Karsthuler i Nordland. Norges GeologiskeUndersøkelse, 165, 1–77.
Kyrle G, 1923. Grundriss der theoretischen speläologie.
Lauritzen SE, 1982. The paleocurrents and morphology ofPikhåggrottene, Svartisen, North Norway. Norsk GeografiskTidsskrift, 36, 183–209.
Lauritzen SE, 1984. Evidence of subglacial karstification inGlomdal, Svartisen, Norway. Norsk Geografisk Tidsskrift, 38,169–170.
Lauritzen SE, 1986. Kvithola at Fauske; Northern Norway: anexample of ice-contact speleogenesis. Norsk GeologiskTidsskrift, 66, 153–161.
Lauritzen SE, 2001. Marble Stripe karst of the ScandinavianCaledonides: An end-member in the contact karst spectrum.Acta Carsologica, 30, 47–79.
Lauritzen SE, 2010. Grotter. Norges ukjente underverden. (Caves.Norway’s unknown underground), Tun Forlag, Oslo.
Lauritzen SE, Hestangen H, Skutlaberg S, Øvrevik R, 2005. TheGrønli-Seter cave research project, Rana, North Norway.Proceedings of the 14th International Congress of Speleology,Athen-Kalamos, August 2005, Paper P-22, 1–6.
Lauritzen SE, Skoglund Øvrevik R, 2013. kap. 6.15: Glacier ice-contact speleogenesis in marble stripe karst. In Frumkin, A. (ed.) Treatise of Geomorphology, Vol. 6: KarstGeomorphology. Elsevier, London.
Lauritzen SE, Skoglund Øvrevik R, Skutlaberg S, Lauritsen Å,Worthington SRH, 2011. What can scallops tell us about ice-contact speleogenesis in Scandinavia? In Heldal, T. (ed.)Winter Conference 2011, Norwegian Geological Society.Norwegian Geological Survey, Stavanger.
Skoglund Øvrevik R, Lauritzen S-E, Gabrovsek F, 2010. Theimpact of glacier ice-contact and subglacial hydrochemistry onevolution of maze caves: A modelling approach. Journal ofHydrology, 388, 157–172.
Skoglund Øvrevik R, Lauritzen SE, 2011. Subglacial maze originin low-dip marble stripe karst: examples from Norway. Journalof Cave and Karst Studies, 73, 31–43.
Figure 1. Time-distance diagram for glaciations on the Norwegianmainland during the last 80 kyr (purple areas). The black curverepresents atmospheric CO2 content based on Antarctic ice. Dots with error bars: radiometrically dated speleothems andHöhlenkrapfen. Horisontal bars: periods with paleomagneticallydated cave sedimentation. From Lauritzen & Skoglund (2013).
Figure 2. The car-wash analogy of speleogenesis, where glaciercontact may be likened to a car-wash moving through thelandscape with stationary caves. From Lauritzen (2010).
Speleogenesis – oral 2013 ICS Proceedings
369
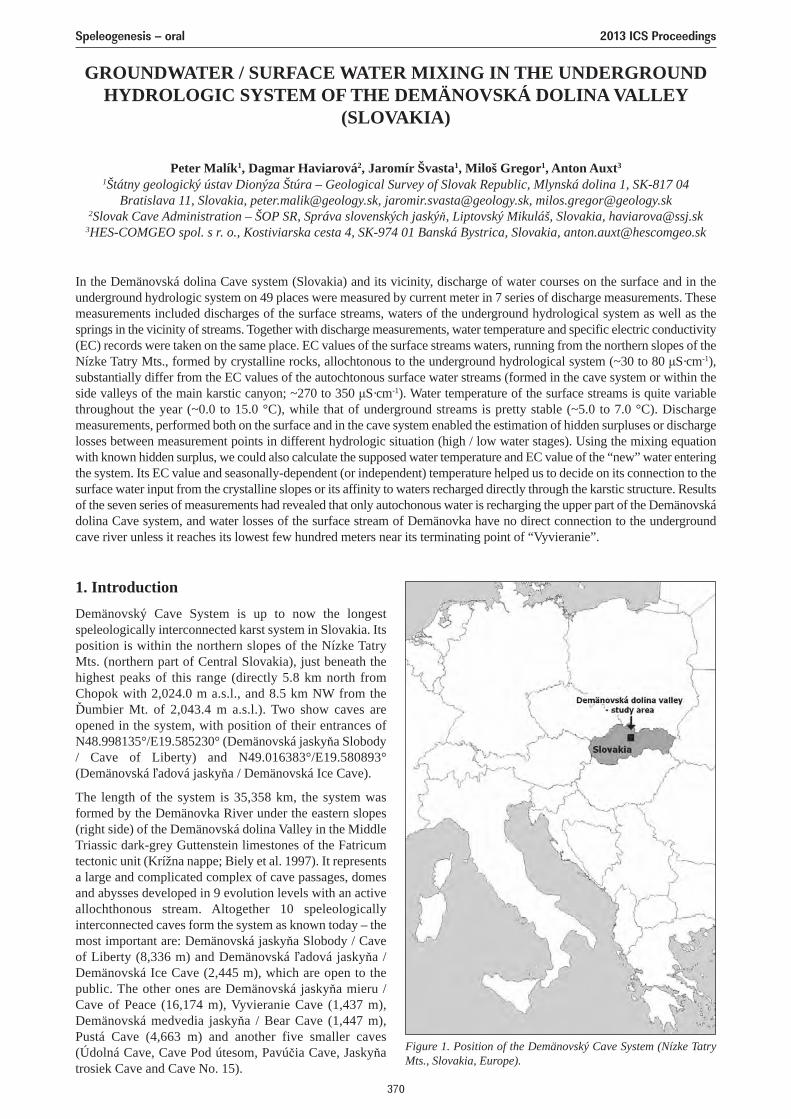
GROUNDWATER / SURFACE WATER MIXING IN THE UNDERGROUNDHYDROLOGIC SYSTEM OF THE DEMÄNOVSKÁ DOLINA VALLEY
(SLOVAKIA)
Peter Malík1, Dagmar Haviarová2, Jaromír Švasta1, Miloš Gregor1, Anton Auxt3
1Štátny geologický ústav Dionýza Štúra – Geological Survey of Slovak Republic, Mlynská dolina 1, SK-817 04Bratislava 11, Slovakia, [email protected], [email protected], [email protected]
2Slovak Cave Administration – ŠOP SR, Správa slovenských jaskýň, Liptovský Mikuláš, Slovakia, [email protected] spol. s r. o., Kostiviarska cesta 4, SK-974 01 Banská Bystrica, Slovakia, [email protected]
In the Demänovská dolina Cave system (Slovakia) and its vicinity, discharge of water courses on the surface and in theunderground hydrologic system on 49 places were measured by current meter in 7 series of discharge measurements. Thesemeasurements included discharges of the surface streams, waters of the underground hydrological system as well as thesprings in the vicinity of streams. Together with discharge measurements, water temperature and specific electric conductivity(EC) records were taken on the same place. EC values of the surface streams waters, running from the northern slopes of theNízke Tatry Mts., formed by crystalline rocks, allochtonous to the underground hydrological system (~30 to 80 μS·cm-1),substantially differ from the EC values of the autochtonous surface water streams (formed in the cave system or within theside valleys of the main karstic canyon; ~270 to 350 μS·cm-1). Water temperature of the surface streams is quite variablethroughout the year (~0.0 to 15.0 ° C), while that of underground streams is pretty stable (~5.0 to 7.0 ° C). Dischargemeasurements, performed both on the surface and in the cave system enabled the estimation of hidden surpluses or dischargelosses between measurement points in different hydrologic situation (high / low water stages). Using the mixing equationwith known hidden surplus, we could also calculate the supposed water temperature and EC value of the “new” water enteringthe system. Its EC value and seasonally-dependent (or independent) temperature helped us to decide on its connection to thesurface water input from the crystalline slopes or its affinity to waters recharged directly through the karstic structure. Resultsof the seven series of measurements had revealed that only autochonous water is recharging the upper part of the Demänovskádolina Cave system, and water losses of the surface stream of Demänovka have no direct connection to the undergroundcave river unless it reaches its lowest few hundred meters near its terminating point of “Vyvieranie”.
1. IntroductionDemänovský Cave System is up to now the longestspeleologically interconnected karst system in Slovakia. Itsposition is within the northern slopes of the Nízke TatryMts. (northern part of Central Slovakia), just beneath thehighest peaks of this range (directly 5.8 km north fromChopok with 2,024.0 m a.s.l., and 8.5 km NW from theĎumbier Mt. of 2,043.4 m a.s.l.). Two show caves areopened in the system, with position of their entrances ofN48.998135°/E19.585230° (Demänovská jaskyňa Slobody/ Cave of Liberty) and N49.016383°/E19.580893°(Demänovská ľadová jaskyňa / Demänovská Ice Cave).
The length of the system is 35,358 km, the system wasformed by the Demänovka River under the eastern slopes(right side) of the Demänovská dolina Valley in the MiddleTriassic dark-grey Guttenstein limestones of the Fatricumtectonic unit (Krížna nappe; Biely et al. 1997). It representsa large and complicated complex of cave passages, domesand abysses developed in 9 evolution levels with an activeallochthonous stream. Altogether 10 speleologicallyinterconnected caves form the system as known today – themost important are: Demänovská jaskyňa Slobody / Caveof Liberty (8,336 m) and Demänovská ľadová jaskyňa /Demänovská Ice Cave (2,445 m), which are open to thepublic. The other ones are Demänovská jaskyňa mieru /Cave of Peace (16,174 m), Vyvieranie Cave (1,437 m),Demänovská medvedia jaskyňa / Bear Cave (1,447 m),Pustá Cave (4,663 m) and another five smaller caves(Údolná Cave, Cave Pod útesom, Pavúčia Cave, Jaskyňatrosiek Cave and Cave No. 15).
Figure 1. Position of the Demänovský Cave System (Nízke TatryMts., Slovakia, Europe).
Speleogenesis – oral 2013 ICS Proceedings
370
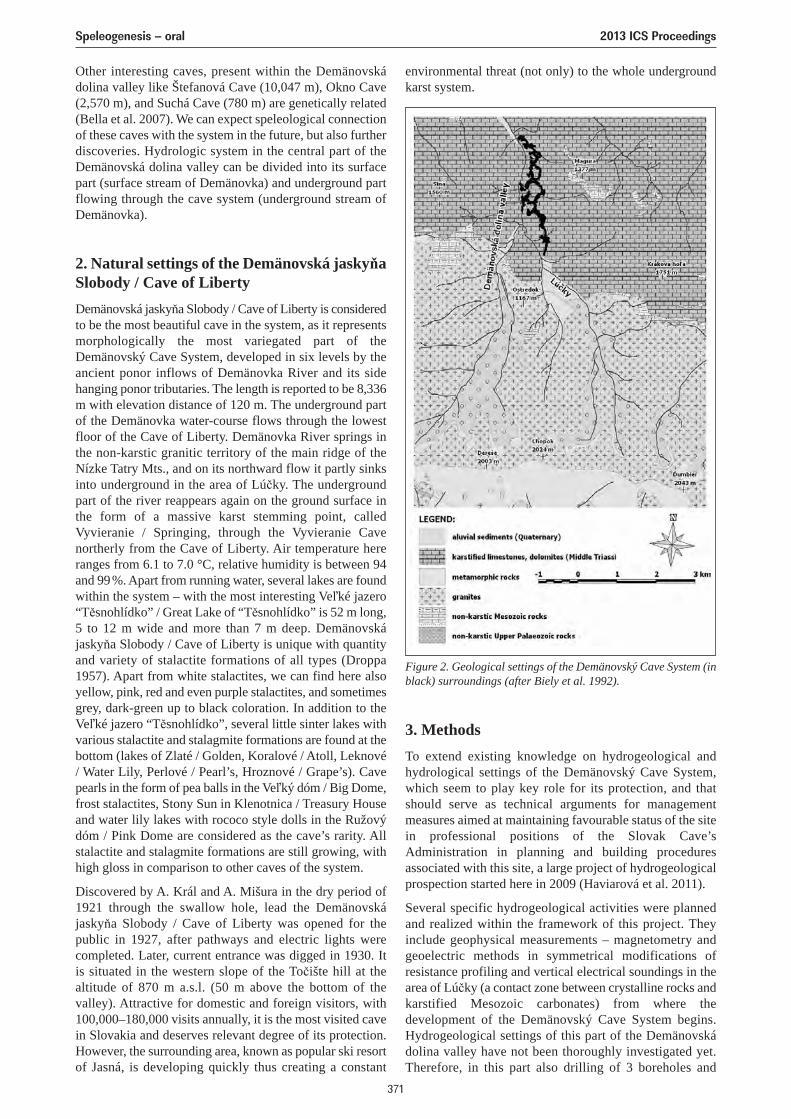
Other interesting caves, present within the Demänovskádolina valley like Štefanová Cave (10,047 m), Okno Cave(2,570 m), and Suchá Cave (780 m) are genetically related(Bella et al. 2007). We can expect speleological connectionof these caves with the system in the future, but also furtherdiscoveries. Hydrologic system in the central part of theDemänovská dolina valley can be divided into its surfacepart (surface stream of Demänovka) and underground partflowing through the cave system (underground stream ofDemänovka).
2. Natural settings of the Demänovská jaskyňaSlobody / Cave of LibertyDemänovská jaskyňa Slobody / Cave of Liberty is consideredto be the most beautiful cave in the system, as it representsmorphologically the most variegated part of theDemänovský Cave System, developed in six levels by theancient ponor inflows of Demänovka River and its sidehanging ponor tributaries. The length is reported to be 8,336m with elevation distance of 120 m. The underground partof the Demänovka water-course flows through the lowestfloor of the Cave of Liberty. Demänovka River springs inthe non-karstic granitic territory of the main ridge of theNízke Tatry Mts., and on its northward flow it partly sinksinto underground in the area of Lúčky. The undergroundpart of the river reappears again on the ground surface inthe form of a massive karst stemming point, calledVyvieranie / Springing, through the Vyvieranie Cavenortherly from the Cave of Liberty. Air temperature hereranges from 6.1 to 7.0 °C, relative humidity is between 94and 99%. Apart from running water, several lakes are foundwithin the system – with the most interesting Veľké jazero“Těsnohlídko” / Great Lake of “Těsnohlídko” is 52 m long,5 to 12 m wide and more than 7 m deep. Demänovskájaskyňa Slobody / Cave of Liberty is unique with quantityand variety of stalactite formations of all types (Droppa1957). Apart from white stalactites, we can find here alsoyellow, pink, red and even purple stalactites, and sometimesgrey, dark-green up to black coloration. In addition to theVeľké jazero “Těsnohlídko”, several little sinter lakes withvarious stalactite and stalagmite formations are found at thebottom (lakes of Zlaté / Golden, Koralové / Atoll, Leknové/ Water Lily, Perlové / Pearl’s, Hroznové / Grape’s). Cavepearls in the form of pea balls in the Veľký dóm / Big Dome,frost stalactites, Stony Sun in Klenotnica / Treasury Houseand water lily lakes with rococo style dolls in the Ružovýdóm / Pink Dome are considered as the cave’s rarity. Allstalactite and stalagmite formations are still growing, withhigh gloss in comparison to other caves of the system.
Discovered by A. Král and A. Mišura in the dry period of1921 through the swallow hole, lead the Demänovskájaskyňa Slobody / Cave of Liberty was opened for thepublic in 1927, after pathways and electric lights werecompleted. Later, current entrance was digged in 1930. Itis situated in the western slope of the Točište hill at thealtitude of 870 m a.s.l. (50 m above the bottom of thevalley). Attractive for domestic and foreign visitors, with100,000–180,000 visits annually, it is the most visited cavein Slovakia and deserves relevant degree of its protection.However, the surrounding area, known as popular ski resortof Jasná, is developing quickly thus creating a constant
environmental threat (not only) to the whole undergroundkarst system.
Figure 2. Geological settings of the Demänovský Cave System (inblack) surroundings (after Biely et al. 1992).
3. MethodsTo extend existing knowledge on hydrogeological andhydrological settings of the Demänovský Cave System,which seem to play key role for its protection, and thatshould serve as technical arguments for managementmeasures aimed at maintaining favourable status of the sitein professional positions of the Slovak Cave’sAdministration in planning and building proceduresassociated with this site, a large project of hydrogeologicalprospection started here in 2009 (Haviarová et al. 2011).
Several specific hydrogeological activities were plannedand realized within the framework of this project. Theyinclude geophysical measurements – magnetometry andgeoelectric methods in symmetrical modifications ofresistance profiling and vertical electrical soundings in thearea of Lúčky (a contact zone between crystalline rocks andkarstified Mesozoic carbonates) from where thedevelopment of the Demänovský Cave System begins.Hydrogeological settings of this part of the Demänovskádolina valley have not been thoroughly investigated yet.Therefore, in this part also drilling of 3 boreholes and
Speleogenesis – oral 2013 ICS Proceedings
371
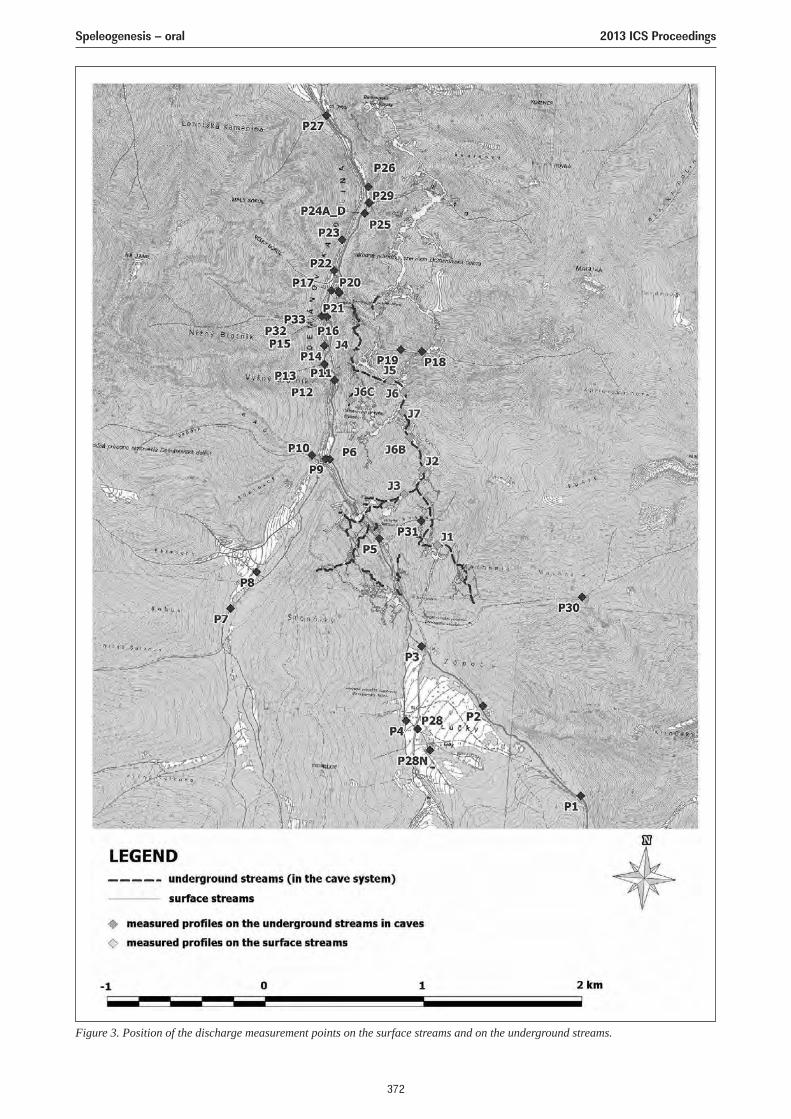
Figure 3. Position of the discharge measurement points on the surface streams and on the underground streams.
Speleogenesis – oral 2013 ICS Proceedings
372
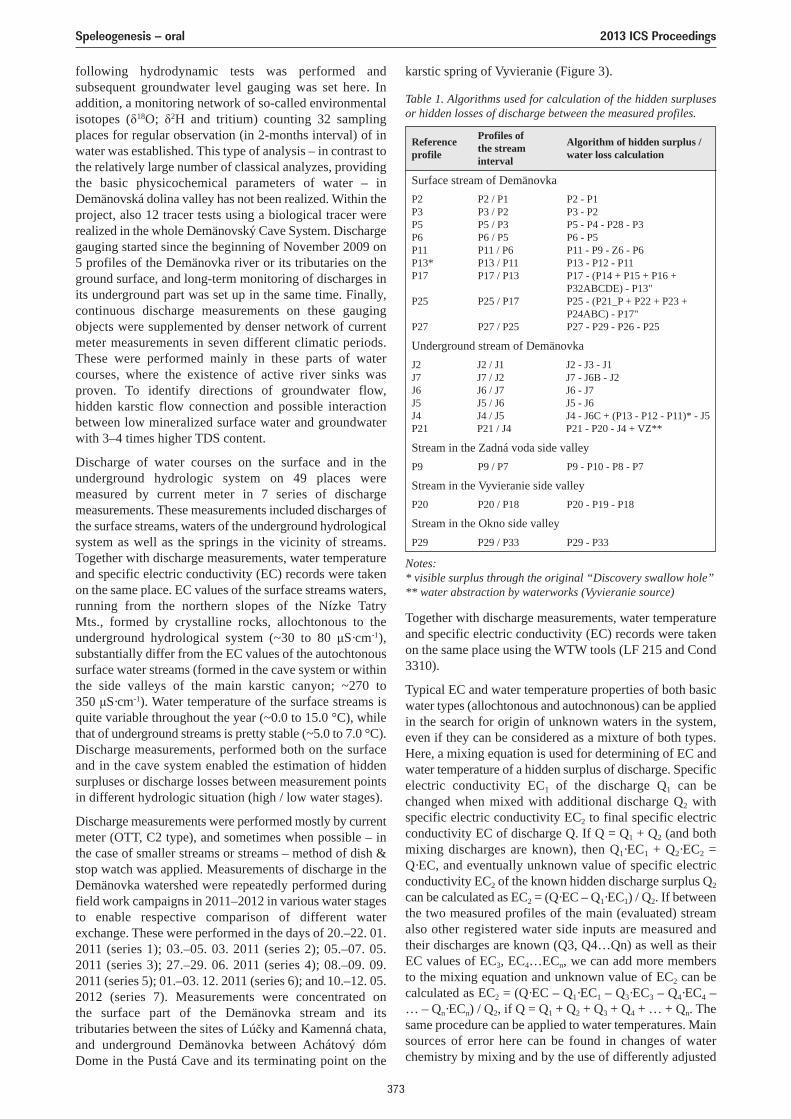
following hydrodynamic tests was performed andsubsequent groundwater level gauging was set here. Inaddition, a monitoring network of so-called environmentalisotopes (δ18O; δ2H and tritium) counting 32 samplingplaces for regular observation (in 2-months interval) of inwater was established. This type of analysis – in contrast tothe relatively large number of classical analyzes, providingthe basic physicochemical parameters of water – inDemänovská dolina valley has not been realized. Within theproject, also 12 tracer tests using a biological tracer wererealized in the whole Demänovský Cave System. Dischargegauging started since the beginning of November 2009 on5 profiles of the Demänovka river or its tributaries on theground surface, and long-term monitoring of discharges inits underground part was set up in the same time. Finally,continuous discharge measurements on these gaugingobjects were supplemented by denser network of currentmeter measurements in seven different climatic periods.These were performed mainly in these parts of watercourses, where the existence of active river sinks wasproven. To identify directions of groundwater flow, hidden karstic flow connection and possible interactionbetween low mineralized surface water and groundwaterwith 3–4 times higher TDS content.
Discharge of water courses on the surface and in theunderground hydrologic system on 49 places weremeasured by current meter in 7 series of dischargemeasurements. These measurements included discharges ofthe surface streams, waters of the underground hydrologicalsystem as well as the springs in the vicinity of streams.Together with discharge measurements, water temperatureand specific electric conductivity (EC) records were takenon the same place. EC values of the surface streams waters,running from the northern slopes of the Nízke Tatry Mts., formed by crystalline rocks, allochtonous to theunderground hydrological system (~30 to 80 μS·cm-1),substantially differ from the EC values of the autochtonoussurface water streams (formed in the cave system or withinthe side valleys of the main karstic canyon; ~270 to350 μS·cm-1). Water temperature of the surface streams isquite variable throughout the year (~0.0 to 15.0 °C), whilethat of underground streams is pretty stable (~5.0 to 7.0 °C).Discharge measurements, performed both on the surfaceand in the cave system enabled the estimation of hiddensurpluses or discharge losses between measurement pointsin different hydrologic situation (high / low water stages).
Discharge measurements were performed mostly by currentmeter (OTT, C2 type), and sometimes when possible – inthe case of smaller streams or streams – method of dish &stop watch was applied. Measurements of discharge in theDemänovka watershed were repeatedly performed duringfield work campaigns in 2011–2012 in various water stagesto enable respective comparison of different waterexchange. These were performed in the days of 20.–22. 01.2011 (series 1); 03.–05. 03. 2011 (series 2); 05.–07. 05.2011 (series 3); 27.–29. 06. 2011 (series 4); 08.–09. 09.2011 (series 5); 01.–03. 12. 2011 (series 6); and 10.–12. 05.2012 (series 7). Measurements were concentrated on the surface part of the Demänovka stream and its tributaries between the sites of Lúčky and Kamenná chata,and underground Demänovka between Achátový dómDome in the Pustá Cave and its terminating point on the
karstic spring of Vyvieranie (Figure 3).
Surface stream of Demänovka
Underground stream of Demänovka
Stream in the Vyvieranie side valley
Stream in the Okno side valley
Stream in the Zadná voda side valley
P2P3P5P6P11P13*P17
P25
P27
J2J7J6J5J4P21
P9 P9 / P7 P9 - P10 - P8 - P7
P20 P20 / P18 P20 - P19 - P18
P29 P29 / P33 P29 - P33
J2 / J1J7 / J2J6 / J7J5 / J6J4 / J5P21 / J4
J2 - J3 - J1J7 - J6B - J2J6 - J7J5 - J6J4 - J6C + (P13 - P12 - P11)* - J5P21 - P20 - J4 + VZ**
P2 / P1P3 / P2P5 / P3P6 / P5P11 / P6P13 / P11P17 / P13
P25 / P17
P27 / P25
P2 - P1P3 - P2P5 - P4 - P28 - P3P6 - P5P11 - P9 - Z6 - P6P13 - P12 - P11P17 - (P14 + P15 + P16 +P32ABCDE) - P13"P25 - (P21_P + P22 + P23 +P24ABC) - P17"P27 - P29 - P26 - P25
Referenceprofile
Profiles ofthe streaminterval
Algorithm of hidden surplus /water loss calculation
Notes:* visible surplus through the original “Discovery swallow hole”** water abstraction by waterworks (Vyvieranie source)
Table 1. Algorithms used for calculation of the hidden surplusesor hidden losses of discharge between the measured profiles.
Together with discharge measurements, water temperatureand specific electric conductivity (EC) records were takenon the same place using the WTW tools (LF 215 and Cond3310).
Typical EC and water temperature properties of both basicwater types (allochtonous and autochnonous) can be appliedin the search for origin of unknown waters in the system,even if they can be considered as a mixture of both types.Here, a mixing equation is used for determining of EC andwater temperature of a hidden surplus of discharge. Specificelectric conductivity EC1 of the discharge Q1 can bechanged when mixed with additional discharge Q2 withspecific electric conductivity EC2 to final specific electricconductivity EC of discharge Q. If Q = Q1 + Q2 (and bothmixing discharges are known), then Q1·EC1 + Q2·EC2 =Q·EC, and eventually unknown value of specific electricconductivity EC2 of the known hidden discharge surplus Q2
can be calculated as EC2 = (Q·EC – Q1·EC1) / Q2. If betweenthe two measured profiles of the main (evaluated) streamalso other registered water side inputs are measured andtheir discharges are known (Q3, Q4…Qn) as well as theirEC values of EC3, EC4…ECn, we can add more membersto the mixing equation and unknown value of EC2 can becalculated as EC2 = (Q·EC – Q1·EC1 – Q3·EC3 – Q4·EC4 –… – Qn·ECn) / Q2, if Q = Q1 + Q2 + Q3 + Q4 + … + Qn. Thesame procedure can be applied to water temperatures. Mainsources of error here can be found in changes of waterchemistry by mixing and by the use of differently adjusted
Speleogenesis – oral 2013 ICS Proceedings
373
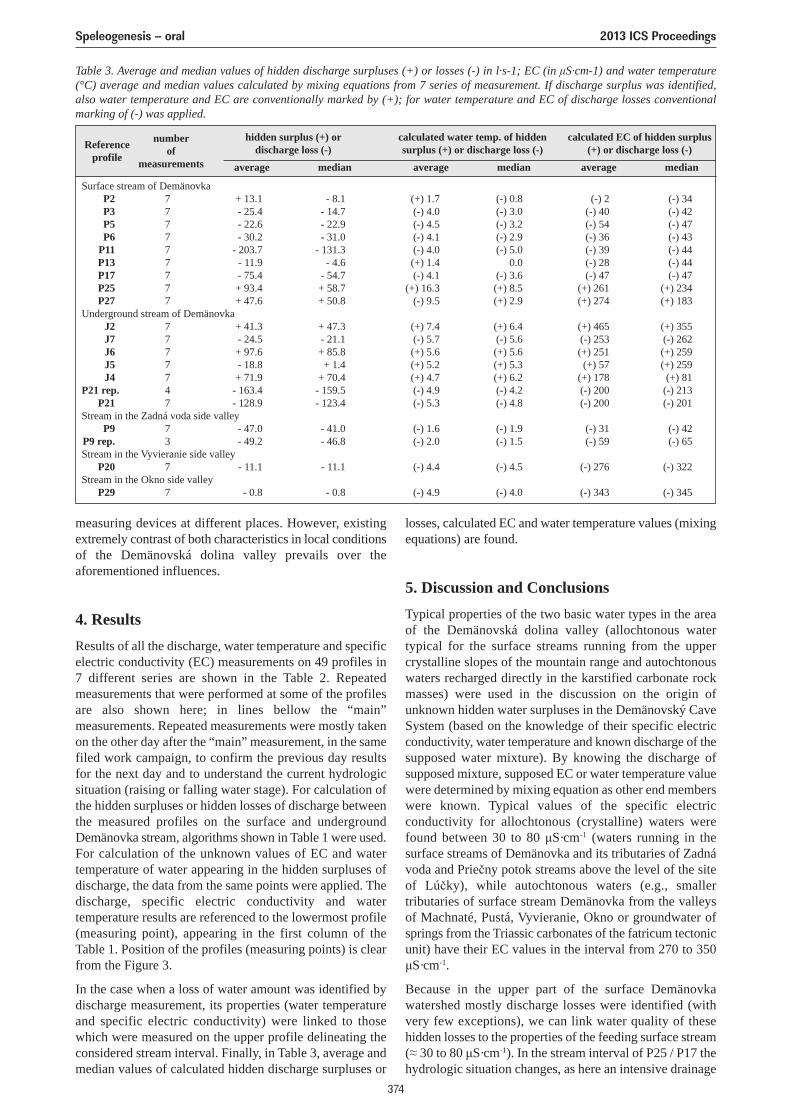
losses, calculated EC and water temperature values (mixingequations) are found.
5. Discussion and ConclusionsTypical properties of the two basic water types in the areaof the Demänovská dolina valley (allochtonous watertypical for the surface streams running from the uppercrystalline slopes of the mountain range and autochtonouswaters recharged directly in the karstified carbonate rockmasses) were used in the discussion on the origin ofunknown hidden water surpluses in the Demänovský CaveSystem (based on the knowledge of their specific electricconductivity, water temperature and known discharge of thesupposed water mixture). By knowing the discharge ofsupposed mixture, supposed EC or water temperature valuewere determined by mixing equation as other end memberswere known. Typical values of the specific electricconductivity for allochtonous (crystalline) waters werefound between 30 to 80 μS·cm-1 (waters running in thesurface streams of Demänovka and its tributaries of Zadnávoda and Priečny potok streams above the level of the siteof Lúčky), while autochtonous waters (e.g., smallertributaries of surface stream Demänovka from the valleysof Machnaté, Pustá, Vyvieranie, Okno or groundwater ofsprings from the Triassic carbonates of the fatricum tectonicunit) have their EC values in the interval from 270 to 350μS·cm-1.
Because in the upper part of the surface Demänovkawatershed mostly discharge losses were identified (withvery few exceptions), we can link water quality of thesehidden losses to the properties of the feeding surface stream(≈ 30 to 80 μS·cm-1). In the stream interval of P25 / P17 thehydrologic situation changes, as here an intensive drainage
measuring devices at different places. However, existingextremely contrast of both characteristics in local conditionsof the Demänovská dolina valley prevails over theaforementioned influences.
4. ResultsResults of all the discharge, water temperature and specificelectric conductivity (EC) measurements on 49 profiles in7 different series are shown in the Table 2. Repeatedmeasurements that were performed at some of the profilesare also shown here; in lines bellow the “main”measurements. Repeated measurements were mostly takenon the other day after the “main” measurement, in the samefiled work campaign, to confirm the previous day resultsfor the next day and to understand the current hydrologicsituation (raising or falling water stage). For calculation ofthe hidden surpluses or hidden losses of discharge betweenthe measured profiles on the surface and undergroundDemänovka stream, algorithms shown in Table 1 were used.For calculation of the unknown values of EC and watertemperature of water appearing in the hidden surpluses ofdischarge, the data from the same points were applied. Thedischarge, specific electric conductivity and watertemperature results are referenced to the lowermost profile(measuring point), appearing in the first column of theTable 1. Position of the profiles (measuring points) is clearfrom the Figure 3.
In the case when a loss of water amount was identified bydischarge measurement, its properties (water temperatureand specific electric conductivity) were linked to thosewhich were measured on the upper profile delineating theconsidered stream interval. Finally, in Table 3, average andmedian values of calculated hidden discharge surpluses or
Table 3. Average and median values of hidden discharge surpluses (+) or losses (-) in l·s-1; EC (in μS·cm-1) and water temperature(°C) average and median values calculated by mixing equations from 7 series of measurement. If discharge surplus was identified,also water temperature and EC are conventionally marked by (+); for water temperature and EC of discharge losses conventionalmarking of (-) was applied.
Surface stream of DemänovkaP2 7 + 13.1 - 8.1 (+) 1.7 (-) 0.8 (-) 2 (-) 34P3 7 - 25.4 - 14.7 (-) 4.0 (-) 3.0 (-) 40 (-) 42P5 7 - 22.6 - 22.9 (-) 4.5 (-) 3.2 (-) 54 (-) 47P6 7 - 30.2 - 31.0 (-) 4.1 (-) 2.9 (-) 36 (-) 43
P11 7 - 203.7 - 131.3 (-) 4.0 (-) 5.0 (-) 39 (-) 44P13 7 - 11.9 - 4.6 (+) 1.4 0.0 (-) 28 (-) 44P17 7 - 75.4 - 54.7 (-) 4.1 (-) 3.6 (-) 47 (-) 47P25 7 + 93.4 + 58.7 (+) 16.3 (+) 8.5 (+) 261 (+) 234P27 7 + 47.6 + 50.8 (-) 9.5 (+) 2.9 (+) 274 (+) 183
Underground stream of DemänovkaJ2 7 + 41.3 + 47.3 (+) 7.4 (+) 6.4 (+) 465 (+) 355J7 7 - 24.5 - 21.1 (-) 5.7 (-) 5.6 (-) 253 (-) 262J6 7 + 97.6 + 85.8 (+) 5.6 (+) 5.6 (+) 251 (+) 259J5 7 - 18.8 + 1.4 (+) 5.2 (+) 5.3 (+) 57 (+) 259J4 7 + 71.9 + 70.4 (+) 4.7 (+) 6.2 (+) 178 (+) 81
P21 rep. 4 - 163.4 - 159.5 (-) 4.9 (-) 4.2 (-) 200 (-) 213P21 7 - 128.9 - 123.4 (-) 5.3 (-) 4.8 (-) 200 (-) 201
Stream in the Zadná voda side valleyP9 7 - 47.0 - 41.0 (-) 1.6 (-) 1.9 (-) 31 (-) 42
P9 rep. 3 - 49.2 - 46.8 (-) 2.0 (-) 1.5 (-) 59 (-) 65Stream in the Vyvieranie side valley
P20 7 - 11.1 - 11.1 (-) 4.4 (-) 4.5 (-) 276 (-) 322Stream in the Okno side valley
P29 7 - 0.8 - 0.8 (-) 4.9 (-) 4.0 (-) 343 (-) 345
Referenceprofile
numberof
measurements
hidden surplus (+) ordischarge loss (-)
calculated water temp. of hiddensurplus (+) or discharge loss (-)
calculated EC of hidden surplus(+) or discharge loss (-)
average median average median average median
Speleogenesis – oral 2013 ICS Proceedings
374
these values calculated by mixing equations was also5.6 °C. Calculated water temperatures were found withinthe range of 4.6–6.8 °C. Also in this case, it is evident thatautochnous waters, recharged and circulating within theTriassic limestones and dolomites of the Demänovskádolina fatricum unit hydrogeological structure areparticipating on feeding of the underground stream here.
AcknowledgmentsDischarge measurements were covered by the project“Improving the care of the Ramsar site – caves in theDemänovská dolina Valley”, proposed by the Slovak CavesAdministration to the call of the Operational ProgramEnvironment (call number OPZP-PO5-09-1) for theprogram period of 2007–2013, co-financed by the EuropeanFund of Regional Development and the Ministry ofEnvironment of Slovak Republic. All these institutions aredeeply acknowledged.
ReferencesBella P, Hlaváčová I, Holúbek P (eds.), 2007. Zoznam jaskýň
Slovenskej republiky. Slovenské múzeum ochrany prírody ajaskyniarstva, Správa slovenských jaskýň, Slovenskáspeleologická spoločnosť, Liptovský Mikuláš (in Slovak).
Biely A (ed.), Beňuška P, Bezák V, Bujnovský A, Halouzka R,Ivanička J, Kohút M, Klinec A, Lukáčik E, Maglay J, Miko O,Pulec M, Putiš M, Vozár J 1992. Geologická mapa NízkychTatier 1: 50,000, GÚDŠ, Bratislava, map (in Slovak).
Biely A, Bezák V (eds.), Bujnovský A, Vozárová A, Klinec A,Miko O, Halouzka R, Vozár J, Beňuška P, Hanzel V, Kubeš P,Liščák P, Lukáčik E, Maglay J, Molák B, Pulec M, Putiš M &Slavkay M 1997. Vysvetlivky ku geologickej mape NízkychTatier 1: 50 000, GÚDŠ, Bratislava (in Slovak).
Droppa, A. 1957: Demänovské jaskyne. Krasové zjavyDemänovskej doliny (in Slovak). SAV, Bratislava (in Slovak).
Haviarová D, Malík P, Grolmusová Z, Veis P, Michalko J, 2011.Predbežné výsledky monitorovania izotopového zloženia vôdv Demänovskej doline a jej podzemnom hydrologickomsystéme (in Slovak). Aragonit 16(1–2), 69–70 (in Slovak).
function is evident (gaining river), and autochtonous waters(waters of the Demänovská dolina underground hydrologicsystem) are feeding the surface stream in this part. AverageEC value of the hidden surpluses that were calculated bythe mixing equation was 261 μS·cm-1 and its median valuewas 234 μS·cm-1 (hidden surpluses average was 93.4 l·s-1,and their median was 58.7 l·s-1). Similar situation was foundon the last stream interval of the surface Demänovka(P27 / P25; hidden surpluses in average of 47.6 l·s-1 andmedian of 50.8 l·s-1). Average value of the calculatedspecific electric conductivity according to the mixingequation should be of 274 μS·cm-1 and EC median from theseven series of measurements was 183 μS·cm-1. Thelowermost tested stream interval – according to wider rangeof calculated values – is probably characterised by mixingof different water types with variable EC value, probablymore connected to the same or other (i.e. tributaries ofDemänovka) surface streams.
In the underground hydrologic system of the Demänovskádolina valley, between the profiles of J1 (Achátový dómDome of the Pustá jaskyňa Cave) and J2 (Pekelný dómDome of the Demänovská jaskyňa slobody Cave) anaverage EC value of hidden water surplus according to themixing equation was found as 465 μS·cm-1 and medianvalue of 7 series of measurements was 355 μS·cm-1.Similarly calculated average value of the supposed watertemperature was 7.4 °C (median of 6.4 °C). This means thatin the area between those two profiles apart from thetributary stream from the Jazerný dóm Dome of theŠtefanová Cave (registered on the J3 profile) also anothersurplus of water of several tens of l·s-1 of autochtonousorigin, i. e. waters circulating vôd within the hydrogeologicstructure of Triassic carbonates of the fatricum tectonic unit(with average of 41.3 l·s-1 and median of 47.3 l·s-1).
More important hidden water surpluses to the undergroundDemänovka stream, confirmed by all seven series ofmeasurements between the profiles of J7 / J6 (reachingvalues from 43.0 l·s-1 to 195.3 l·s-1, with an average of97.6 l·s-1, and median of 85.8 l·s-1), showed average valueof the calculated EC of about 251 μS·cm-1 and their medianwas 259 μS·cm-1. Average of calculated water temperaturesof the hidden discharge surplus was 5.6 °C and median of
Speleogenesis – oral 2013 ICS Proceedings
375
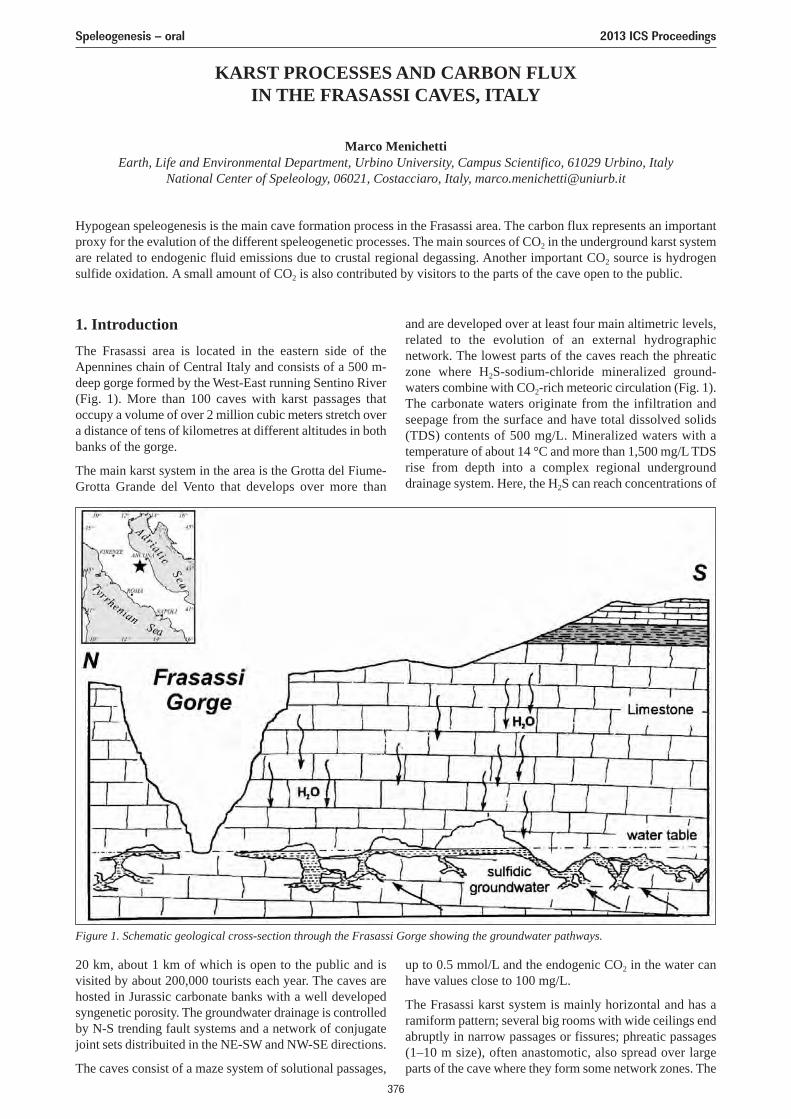
KARST PROCESSES AND CARBON FLUXIN THE FRASASSI CAVES, ITALY
Marco MenichettiEarth, Life and Environmental Department, Urbino University, Campus Scientifico, 61029 Urbino, Italy
National Center of Speleology, 06021, Costacciaro, Italy, [email protected]
Hypogean speleogenesis is the main cave formation process in the Frasassi area. The carbon flux represents an importantproxy for the evalution of the different speleogenetic processes. The main sources of CO2 in the underground karst systemare related to endogenic fluid emissions due to crustal regional degassing. Another important CO2 source is hydrogensulfide oxidation. A small amount of CO2 is also contributed by visitors to the parts of the cave open to the public.
1. IntroductionThe Frasassi area is located in the eastern side of theApennines chain of Central Italy and consists of a 500 m-deep gorge formed by the West-East running Sentino River(Fig. 1). More than 100 caves with karst passages thatoccupy a volume of over 2 million cubic meters stretch overa distance of tens of kilometres at different altitudes in bothbanks of the gorge.
The main karst system in the area is the Grotta del Fiume-Grotta Grande del Vento that develops over more than
and are developed over at least four main altimetric levels,related to the evolution of an external hydrographicnetwork. The lowest parts of the caves reach the phreaticzone where H2S-sodium-chloride mineralized ground-waters combine with CO2-rich meteoric circulation (Fig. 1).The carbonate waters originate from the infiltration andseepage from the surface and have total dissolved solids(TDS) contents of 500 mg/L. Mineralized waters with atemperature of about 14 °C and more than 1,500 mg/L TDSrise from depth into a complex regional undergrounddrainage system. Here, the H2S can reach concentrations of
Figure 1. Schematic geological cross-section through the Frasassi Gorge showing the groundwater pathways.
20 km, about 1 km of which is open to the public and isvisited by about 200,000 tourists each year. The caves arehosted in Jurassic carbonate banks with a well developedsyngenetic porosity. The groundwater drainage is controlledby N-S trending fault systems and a network of conjugatejoint sets distribuited in the NE-SW and NW-SE directions.
The caves consist of a maze system of solutional passages,
up to 0.5 mmol/L and the endogenic CO2 in the water canhave values close to 100 mg/L.
The Frasassi karst system is mainly horizontal and has aramiform pattern; several big rooms with wide ceilings endabruptly in narrow passages or fissures; phreatic passages(1–10 m size), often anastomotic, also spread over largeparts of the cave where they form some network zones. The
Speleogenesis – oral 2013 ICS Proceedings
376
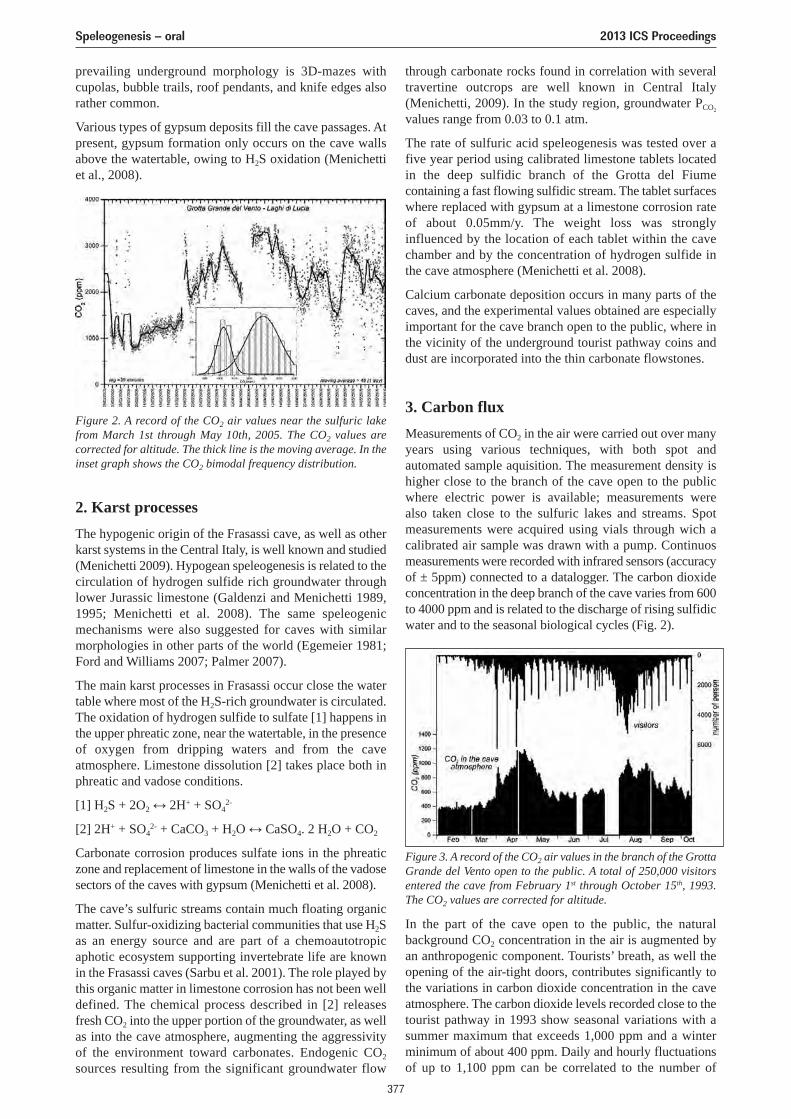
prevailing underground morphology is 3D-mazes withcupolas, bubble trails, roof pendants, and knife edges alsorather common.
Various types of gypsum deposits fill the cave passages. Atpresent, gypsum formation only occurs on the cave wallsabove the watertable, owing to H2S oxidation (Menichettiet al., 2008).
through carbonate rocks found in correlation with severaltravertine outcrops are well known in Central Italy(Menichetti, 2009). In the study region, groundwater PCO2
values range from 0.03 to 0.1 atm.
The rate of sulfuric acid speleogenesis was tested over afive year period using calibrated limestone tablets locatedin the deep sulfidic branch of the Grotta del Fiumecontaining a fast flowing sulfidic stream. The tablet surfaceswhere replaced with gypsum at a limestone corrosion rateof about 0.05mm/y. The weight loss was stronglyinfluenced by the location of each tablet within the cavechamber and by the concentration of hydrogen sulfide inthe cave atmosphere (Menichetti et al. 2008).
Calcium carbonate deposition occurs in many parts of thecaves, and the experimental values obtained are especiallyimportant for the cave branch open to the public, where inthe vicinity of the underground tourist pathway coins anddust are incorporated into the thin carbonate flowstones.
3. Carbon fluxMeasurements of CO2 in the air were carried out over manyyears using various techniques, with both spot andautomated sample aquisition. The measurement density ishigher close to the branch of the cave open to the publicwhere electric power is available; measurements were also taken close to the sulfuric lakes and streams. Spotmeasurements were acquired using vials through wich acalibrated air sample was drawn with a pump. Continuosmeasurements were recorded with infrared sensors (accuracyof ± 5ppm) connected to a datalogger. The carbon dioxideconcentration in the deep branch of the cave varies from 600to 4000 ppm and is related to the discharge of rising sulfidicwater and to the seasonal biological cycles (Fig. 2).
Figure 2. A record of the CO2 air values near the sulfuric lakefrom March 1st through May 10th, 2005. The CO2 values arecorrected for altitude. The thick line is the moving average. In theinset graph shows the CO2 bimodal frequency distribution.
Figure 3. A record of the CO2 air values in the branch of the GrottaGrande del Vento open to the public. A total of 250,000 visitorsentered the cave from February 1st through October 15th, 1993.The CO2 values are corrected for altitude.
2. Karst processesThe hypogenic origin of the Frasassi cave, as well as otherkarst systems in the Central Italy, is well known and studied(Menichetti 2009). Hypogean speleogenesis is related to thecirculation of hydrogen sulfide rich groundwater throughlower Jurassic limestone (Galdenzi and Menichetti 1989,1995; Menichetti et al. 2008). The same speleogenicmechanisms were also suggested for caves with similarmorphologies in other parts of the world (Egemeier 1981;Ford and Williams 2007; Palmer 2007).
The main karst processes in Frasassi occur close the watertable where most of the H2S-rich groundwater is circulated.The oxidation of hydrogen sulfide to sulfate [1] happens inthe upper phreatic zone, near the watertable, in the presenceof oxygen from dripping waters and from the caveatmosphere. Limestone dissolution [2] takes place both inphreatic and vadose conditions.
[1] H2S + 2O2 ↔ 2H+ + SO42-
[2] 2H+ + SO42- + CaCO3 + H2O ↔ CaSO4. 2 H2O + CO2
Carbonate corrosion produces sulfate ions in the phreaticzone and replacement of limestone in the walls of the vadosesectors of the caves with gypsum (Menichetti et al. 2008).
The cave’s sulfuric streams contain much floating organicmatter. Sulfur-oxidizing bacterial communities that use H2Sas an energy source and are part of a chemoautotropicaphotic ecosystem supporting invertebrate life are knownin the Frasassi caves (Sarbu et al. 2001). The role played bythis organic matter in limestone corrosion has not been welldefined. The chemical process described in [2] releasesfresh CO2 into the upper portion of the groundwater, as wellas into the cave atmosphere, augmenting the aggressivityof the environment toward carbonates. Endogenic CO2
sources resulting from the significant groundwater flow
In the part of the cave open to the public, the naturalbackground CO2 concentration in the air is augmented byan anthropogenic component. Tourists’ breath, as well theopening of the air-tight doors, contributes significantly tothe variations in carbon dioxide concentration in the caveatmosphere. The carbon dioxide levels recorded close to thetourist pathway in 1993 show seasonal variations with asummer maximum that exceeds 1,000 ppm and a winterminimum of about 400 ppm. Daily and hourly fluctuationsof up to 1,100 ppm can be correlated to the number of
Speleogenesis – oral 2013 ICS Proceedings
377
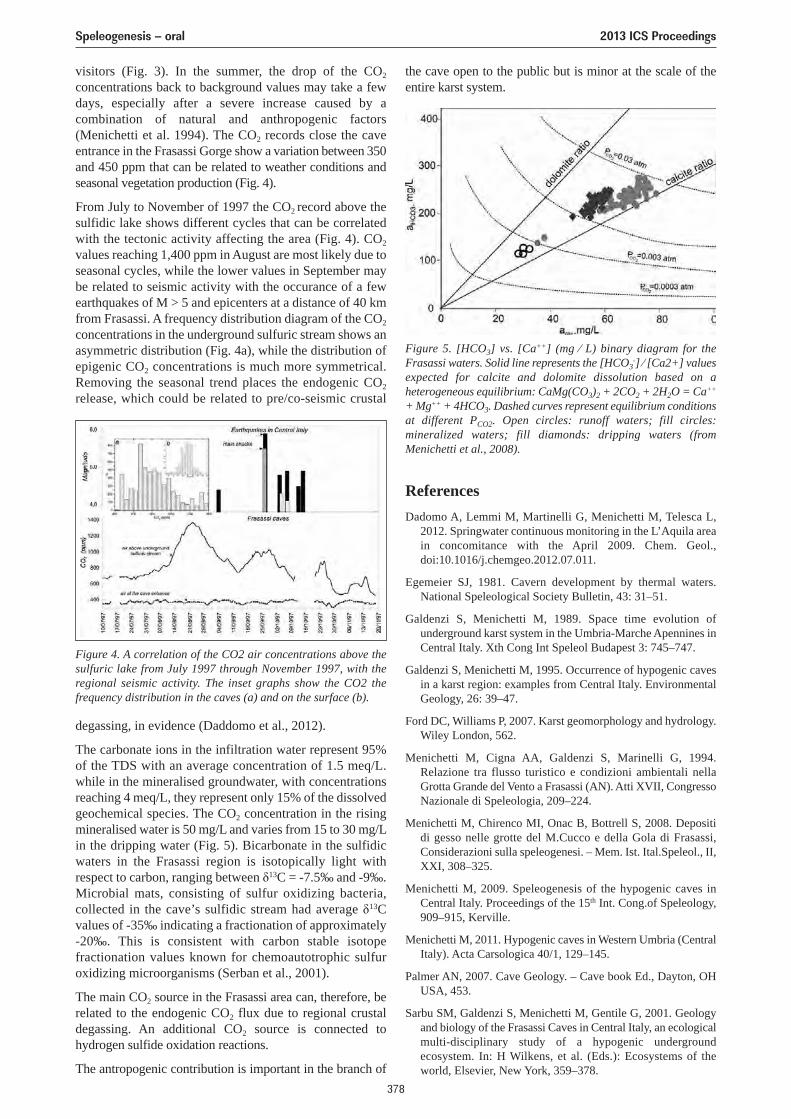
visitors (Fig. 3). In the summer, the drop of the CO2
concentrations back to background values may take a fewdays, especially after a severe increase caused by acombination of natural and anthropogenic factors(Menichetti et al. 1994). The CO2 records close the caveentrance in the Frasassi Gorge show a variation between 350and 450 ppm that can be related to weather conditions andseasonal vegetation production (Fig. 4).
From July to November of 1997 the CO2 record above thesulfidic lake shows different cycles that can be correlatedwith the tectonic activity affecting the area (Fig. 4). CO2
values reaching 1,400 ppm in August are most likely due toseasonal cycles, while the lower values in September maybe related to seismic activity with the occurance of a fewearthquakes of M > 5 and epicenters at a distance of 40 kmfrom Frasassi. A frequency distribution diagram of the CO2
concentrations in the underground sulfuric stream shows anasymmetric distribution (Fig. 4a), while the distribution ofepigenic CO2 concentrations is much more symmetrical.Removing the seasonal trend places the endogenic CO2
release, which could be related to pre/co-seismic crustal
ReferencesDadomo A, Lemmi M, Martinelli G, Menichetti M, Telesca L,
2012. Springwater continuous monitoring in the L’Aquila areain concomitance with the April 2009. Chem. Geol.,doi:10.1016/j.chemgeo.2012.07.011.
Egemeier SJ, 1981. Cavern development by thermal waters.National Speleological Society Bulletin, 43: 31–51.
Galdenzi S, Menichetti M, 1989. Space time evolution ofunderground karst system in the Umbria-Marche Apennines inCentral Italy. Xth Cong Int Speleol Budapest 3: 745–747.
Galdenzi S, Menichetti M, 1995. Occurrence of hypogenic cavesin a karst region: examples from Central Italy. EnvironmentalGeology, 26: 39–47.
Ford DC, Williams P, 2007. Karst geomorphology and hydrology.Wiley London, 562.
Menichetti M, Cigna AA, Galdenzi S, Marinelli G, 1994.Relazione tra flusso turistico e condizioni ambientali nellaGrotta Grande del Vento a Frasassi (AN). Atti XVII, CongressoNazionale di Speleologia, 209–224.
Menichetti M, Chirenco MI, Onac B, Bottrell S, 2008. Depositidi gesso nelle grotte del M.Cucco e della Gola di Frasassi,Considerazioni sulla speleogenesi. – Mem. Ist. Ital.Speleol., II,XXI, 308–325.
Menichetti M, 2009. Speleogenesis of the hypogenic caves inCentral Italy. Proceedings of the 15th Int. Cong.of Speleology,909–915, Kerville.
Menichetti M, 2011. Hypogenic caves in Western Umbria (CentralItaly). Acta Carsologica 40/1, 129–145.
Palmer AN, 2007. Cave Geology. – Cave book Ed., Dayton, OHUSA, 453.
Sarbu SM, Galdenzi S, Menichetti M, Gentile G, 2001. Geologyand biology of the Frasassi Caves in Central Italy, an ecologicalmulti-disciplinary study of a hypogenic undergroundecosystem. In: H Wilkens, et al. (Eds.): Ecosystems of theworld, Elsevier, New York, 359–378.
Figure 4. A correlation of the CO2 air concentrations above thesulfuric lake from July 1997 through November 1997, with theregional seismic activity. The inset graphs show the CO2 thefrequency distribution in the caves (a) and on the surface (b).
degassing, in evidence (Daddomo et al., 2012).
The carbonate ions in the infiltration water represent 95%of the TDS with an average concentration of 1.5 meq/L.while in the mineralised groundwater, with concentrationsreaching 4 meq/L, they represent only 15% of the dissolvedgeochemical species. The CO2 concentration in the risingmineralised water is 50 mg/L and varies from 15 to 30 mg/Lin the dripping water (Fig. 5). Bicarbonate in the sulfidicwaters in the Frasassi region is isotopically light withrespect to carbon, ranging between δ13C = -7.5‰ and -9‰.Microbial mats, consisting of sulfur oxidizing bacteria,collected in the cave’s sulfidic stream had average δ13Cvalues of -35‰ indicating a fractionation of approximately-20‰. This is consistent with carbon stable isotopefractionation values known for chemoautotrophic sulfuroxidizing microorganisms (Serban et al., 2001).
The main CO2 source in the Frasassi area can, therefore, berelated to the endogenic CO2 flux due to regional crustaldegassing. An additional CO2 source is connected tohydrogen sulfide oxidation reactions.
The antropogenic contribution is important in the branch of
Figure 5. [HCO3] vs. [Ca++] (mg ⁄ L) binary diagram for theFrasassi waters. Solid line represents the [HCO3
-] ⁄ [Ca2+] valuesexpected for calcite and dolomite dissolution based on aheterogeneous equilibrium: CaMg(CO3)2 + 2CO2 + 2H2O = Ca++
+ Mg++ + 4HCO3. Dashed curves represent equilibrium conditionsat different PCO2. Open circles: runoff waters; fill circles:mineralized waters; fill diamonds: dripping waters (fromMenichetti et al., 2008).
the cave open to the public but is minor at the scale of theentire karst system.
Speleogenesis – oral 2013 ICS Proceedings
378
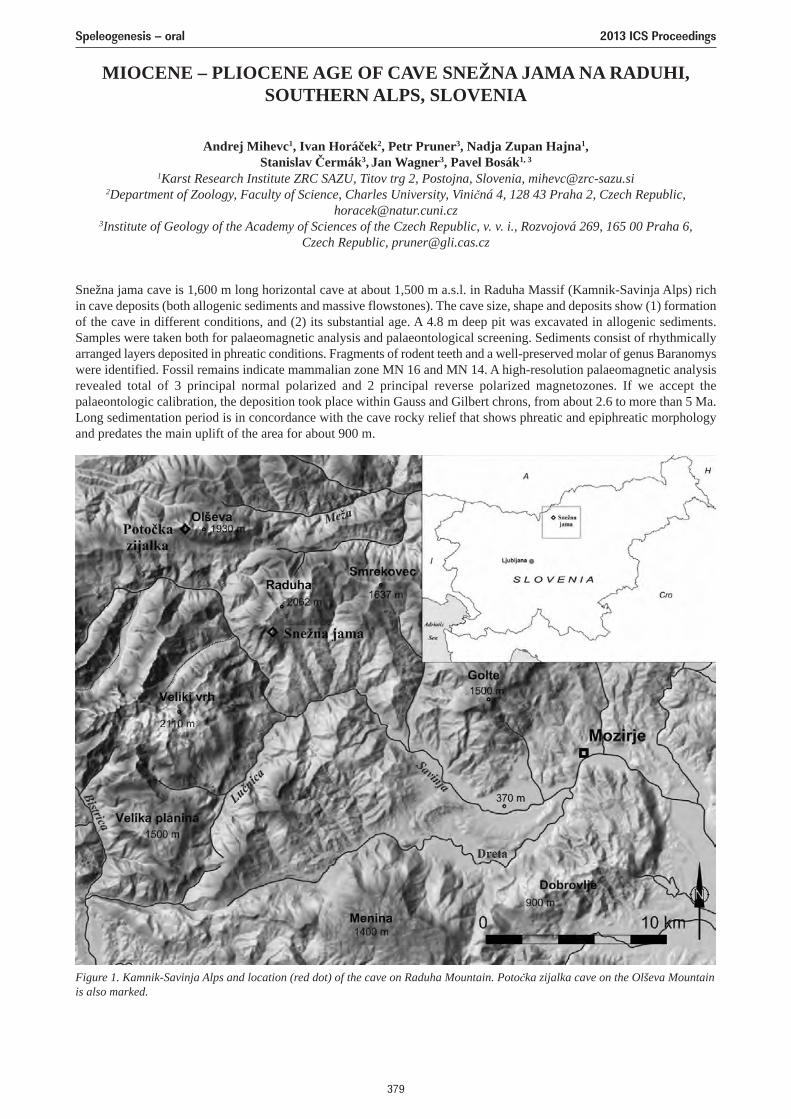
MIOCENE – PLIOCENE AGE OF CAVE SNEŽNA JAMA NA RADUHI,SOUTHERN ALPS, SLOVENIA
Andrej Mihevc1, Ivan Horáček2, Petr Pruner3, Nadja Zupan Hajna1,Stanislav Čermák3, Jan Wagner3, Pavel Bosák1, 3
1Karst Research Institute ZRC SAZU, Titov trg 2, Postojna, Slovenia, [email protected] of Zoology, Faculty of Science, Charles University, Viničná 4, 128 43 Praha 2, Czech Republic,
[email protected] of Geology of the Academy of Sciences of the Czech Republic, v. v. i., Rozvojová 269, 165 00 Praha 6,
Czech Republic, [email protected]
Snežna jama cave is 1,600 m long horizontal cave at about 1,500 m a.s.l. in Raduha Massif (Kamnik-Savinja Alps) richin cave deposits (both allogenic sediments and massive flowstones). The cave size, shape and deposits show (1) formationof the cave in different conditions, and (2) its substantial age. A 4.8 m deep pit was excavated in allogenic sediments.Samples were taken both for palaeomagnetic analysis and palaeontological screening. Sediments consist of rhythmicallyarranged layers deposited in phreatic conditions. Fragments of rodent teeth and a well-preserved molar of genus Baranomyswere identified. Fossil remains indicate mammalian zone MN 16 and MN 14. A high-resolution palaeomagnetic analysisrevealed total of 3 principal normal polarized and 2 principal reverse polarized magnetozones. If we accept thepalaeontologic calibration, the deposition took place within Gauss and Gilbert chrons, from about 2.6 to more than 5 Ma.Long sedimentation period is in concordance with the cave rocky relief that shows phreatic and epiphreatic morphologyand predates the main uplift of the area for about 900 m.
Figure 1. Kamnik-Savinja Alps and location (red dot) of the cave on Raduha Mountain. Potočka zijalka cave on the Olševa Mountainis also marked.
Speleogenesis – oral 2013 ICS Proceedings
379
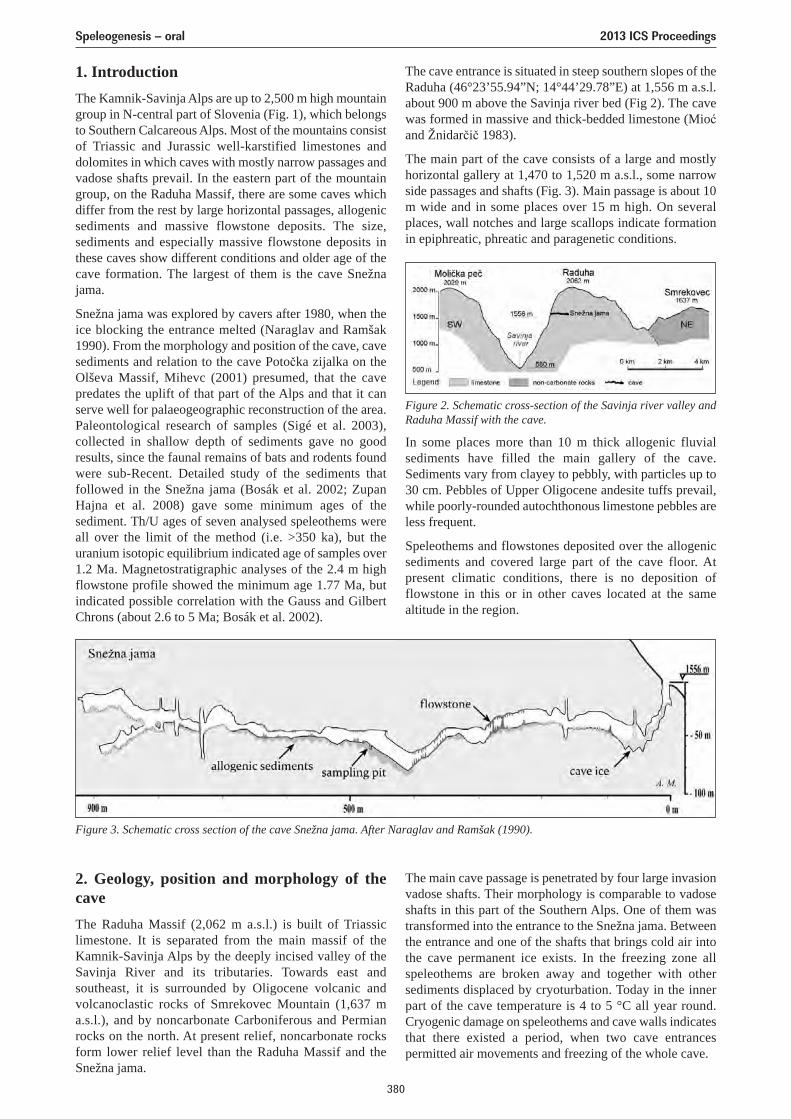
1. IntroductionThe Kamnik-Savinja Alps are up to 2,500 m high mountaingroup in N-central part of Slovenia (Fig. 1), which belongsto Southern Calcareous Alps. Most of the mountains consistof Triassic and Jurassic well-karstified limestones anddolomites in which caves with mostly narrow passages andvadose shafts prevail. In the eastern part of the mountaingroup, on the Raduha Massif, there are some caves whichdiffer from the rest by large horizontal passages, allogenicsediments and massive flowstone deposits. The size,sediments and especially massive flowstone deposits inthese caves show different conditions and older age of thecave formation. The largest of them is the cave Snežnajama.
Snežna jama was explored by cavers after 1980, when theice blocking the entrance melted (Naraglav and Ramšak1990). From the morphology and position of the cave, cavesediments and relation to the cave Potočka zijalka on theOlševa Massif, Mihevc (2001) presumed, that the cavepredates the uplift of that part of the Alps and that it canserve well for palaeogeographic reconstruction of the area.Paleontological research of samples (Sigé et al. 2003),collected in shallow depth of sediments gave no goodresults, since the faunal remains of bats and rodents foundwere sub-Recent. Detailed study of the sediments thatfollowed in the Snežna jama (Bosák et al. 2002; ZupanHajna et al. 2008) gave some minimum ages of thesediment. Th/U ages of seven analysed speleothems wereall over the limit of the method (i.e. >350 ka), but theuranium isotopic equilibrium indicated age of samples over1.2 Ma. Magnetostratigraphic analyses of the 2.4 m highflowstone profile showed the minimum age 1.77 Ma, butindicated possible correlation with the Gauss and GilbertChrons (about 2.6 to 5 Ma; Bosák et al. 2002).
2. Geology, position and morphology of thecaveThe Raduha Massif (2,062 m a.s.l.) is built of Triassiclimestone. It is separated from the main massif of theKamnik-Savinja Alps by the deeply incised valley of theSavinja River and its tributaries. Towards east andsoutheast, it is surrounded by Oligocene volcanic andvolcanoclastic rocks of Smrekovec Mountain (1,637 ma.s.l.), and by noncarbonate Carboniferous and Permianrocks on the north. At present relief, noncarbonate rocksform lower relief level than the Raduha Massif and theSnežna jama.
Figure 2. Schematic cross-section of the Savinja river valley andRaduha Massif with the cave.
The cave entrance is situated in steep southern slopes of theRaduha (46°23’55.94”N; 14°44’29.78”E) at 1,556 m a.s.l.about 900 m above the Savinja river bed (Fig 2). The cavewas formed in massive and thick-bedded limestone (Mioćand Žnidarčič 1983).
The main part of the cave consists of a large and mostlyhorizontal gallery at 1,470 to 1,520 m a.s.l., some narrowside passages and shafts (Fig. 3). Main passage is about 10m wide and in some places over 15 m high. On severalplaces, wall notches and large scallops indicate formationin epiphreatic, phreatic and paragenetic conditions.
In some places more than 10 m thick allogenic fluvialsediments have filled the main gallery of the cave.Sediments vary from clayey to pebbly, with particles up to30 cm. Pebbles of Upper Oligocene andesite tuffs prevail,while poorly-rounded autochthonous limestone pebbles areless frequent.
Speleothems and flowstones deposited over the allogenicsediments and covered large part of the cave floor. Atpresent climatic conditions, there is no deposition offlowstone in this or in other caves located at the samealtitude in the region.
The main cave passage is penetrated by four large invasionvadose shafts. Their morphology is comparable to vadoseshafts in this part of the Southern Alps. One of them wastransformed into the entrance to the Snežna jama. Betweenthe entrance and one of the shafts that brings cold air intothe cave permanent ice exists. In the freezing zone allspeleothems are broken away and together with othersediments displaced by cryoturbation. Today in the innerpart of the cave temperature is 4 to 5 °C all year round.Cryogenic damage on speleothems and cave walls indicatesthat there existed a period, when two cave entrancespermitted air movements and freezing of the whole cave.
Figure 3. Schematic cross section of the cave Snežna jama. After Naraglav and Ramšak (1990).
Speleogenesis – oral 2013 ICS Proceedings
380
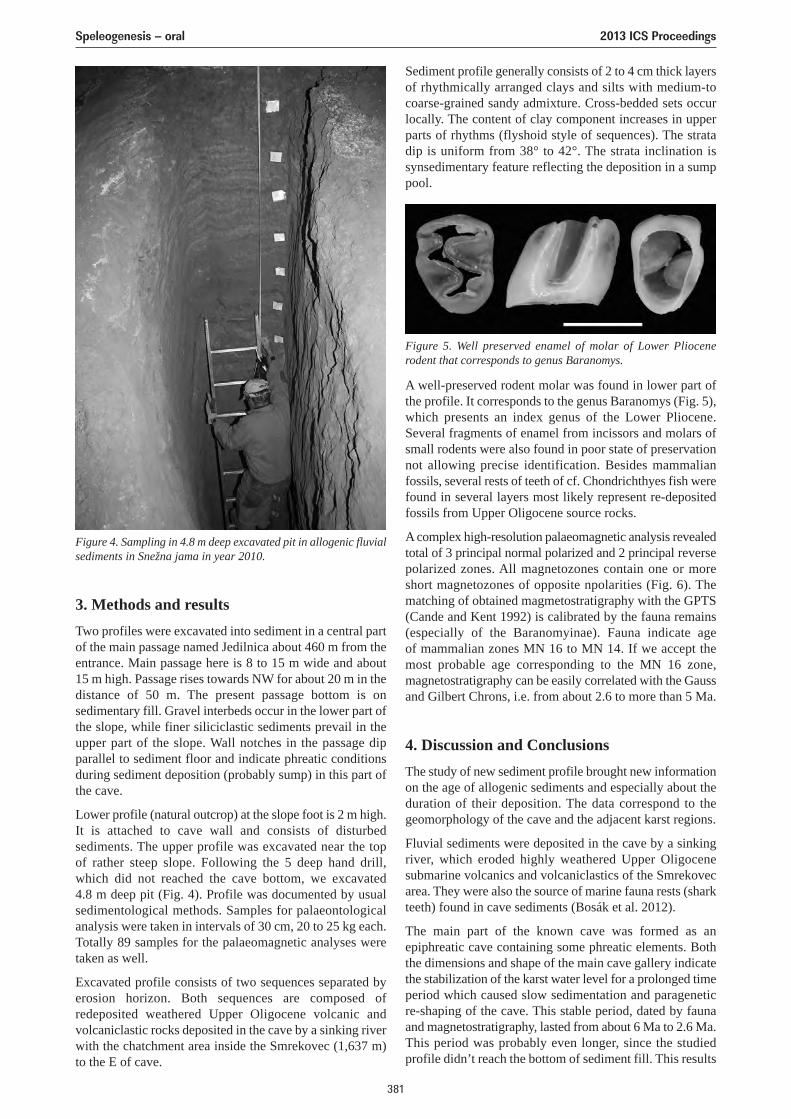
3. Methods and resultsTwo profiles were excavated into sediment in a central partof the main passage named Jedilnica about 460 m from theentrance. Main passage here is 8 to 15 m wide and about15 m high. Passage rises towards NW for about 20 m in thedistance of 50 m. The present passage bottom is onsedimentary fill. Gravel interbeds occur in the lower part ofthe slope, while finer siliciclastic sediments prevail in theupper part of the slope. Wall notches in the passage dipparallel to sediment floor and indicate phreatic conditionsduring sediment deposition (probably sump) in this part ofthe cave.
Lower profile (natural outcrop) at the slope foot is 2 m high.It is attached to cave wall and consists of disturbedsediments. The upper profile was excavated near the top of rather steep slope. Following the 5 deep hand drill, which did not reached the cave bottom, we excavated 4.8 m deep pit (Fig. 4). Profile was documented by usualsedimentological methods. Samples for palaeontologicalanalysis were taken in intervals of 30 cm, 20 to 25 kg each.Totally 89 samples for the palaeomagnetic analyses weretaken as well.
Excavated profile consists of two sequences separated byerosion horizon. Both sequences are composed ofredeposited weathered Upper Oligocene volcanic andvolcaniclastic rocks deposited in the cave by a sinking riverwith the chatchment area inside the Smrekovec (1,637 m)to the E of cave.
Sediment profile generally consists of 2 to 4 cm thick layersof rhythmically arranged clays and silts with medium-tocoarse-grained sandy admixture. Cross-bedded sets occurlocally. The content of clay component increases in upperparts of rhythms (flyshoid style of sequences). The stratadip is uniform from 38° to 42° . The strata inclination issynsedimentary feature reflecting the deposition in a sumppool.
Figure 4. Sampling in 4.8 m deep excavated pit in allogenic fluvialsediments in Snežna jama in year 2010.
Figure 5. Well preserved enamel of molar of Lower Pliocenerodent that corresponds to genus Baranomys.
A well-preserved rodent molar was found in lower part ofthe profile. It corresponds to the genus Baranomys (Fig. 5),which presents an index genus of the Lower Pliocene.Several fragments of enamel from incissors and molars ofsmall rodents were also found in poor state of preservationnot allowing precise identification. Besides mammalianfossils, several rests of teeth of cf. Chondrichthyes fish werefound in several layers most likely represent re-depositedfossils from Upper Oligocene source rocks.
A complex high-resolution palaeomagnetic analysis revealedtotal of 3 principal normal polarized and 2 principal reversepolarized zones. All magnetozones contain one or moreshort magnetozones of opposite npolarities (Fig. 6). Thematching of obtained magmetostratigraphy with the GPTS(Cande and Kent 1992) is calibrated by the fauna remains(especially of the Baranomyinae). Fauna indicate age of mammalian zones MN 16 to MN 14. If we accept themost probable age corresponding to the MN 16 zone,magnetostratigraphy can be easily correlated with the Gaussand Gilbert Chrons, i.e. from about 2.6 to more than 5 Ma.
4. Discussion and ConclusionsThe study of new sediment profile brought new informationon the age of allogenic sediments and especially about theduration of their deposition. The data correspond to thegeomorphology of the cave and the adjacent karst regions.
Fluvial sediments were deposited in the cave by a sinkingriver, which eroded highly weathered Upper Oligocenesubmarine volcanics and volcaniclastics of the Smrekovecarea. They were also the source of marine fauna rests (sharkteeth) found in cave sediments (Bosák et al. 2012).
The main part of the known cave was formed as anepiphreatic cave containing some phreatic elements. Boththe dimensions and shape of the main cave gallery indicatethe stabilization of the karst water level for a prolonged timeperiod which caused slow sedimentation and parageneticre-shaping of the cave. This stable period, dated by faunaand magnetostratigraphy, lasted from about 6 Ma to 2.6 Ma.This period was probably even longer, since the studiedprofile didn’t reach the bottom of sediment fill. This results
Speleogenesis – oral 2013 ICS Proceedings
381
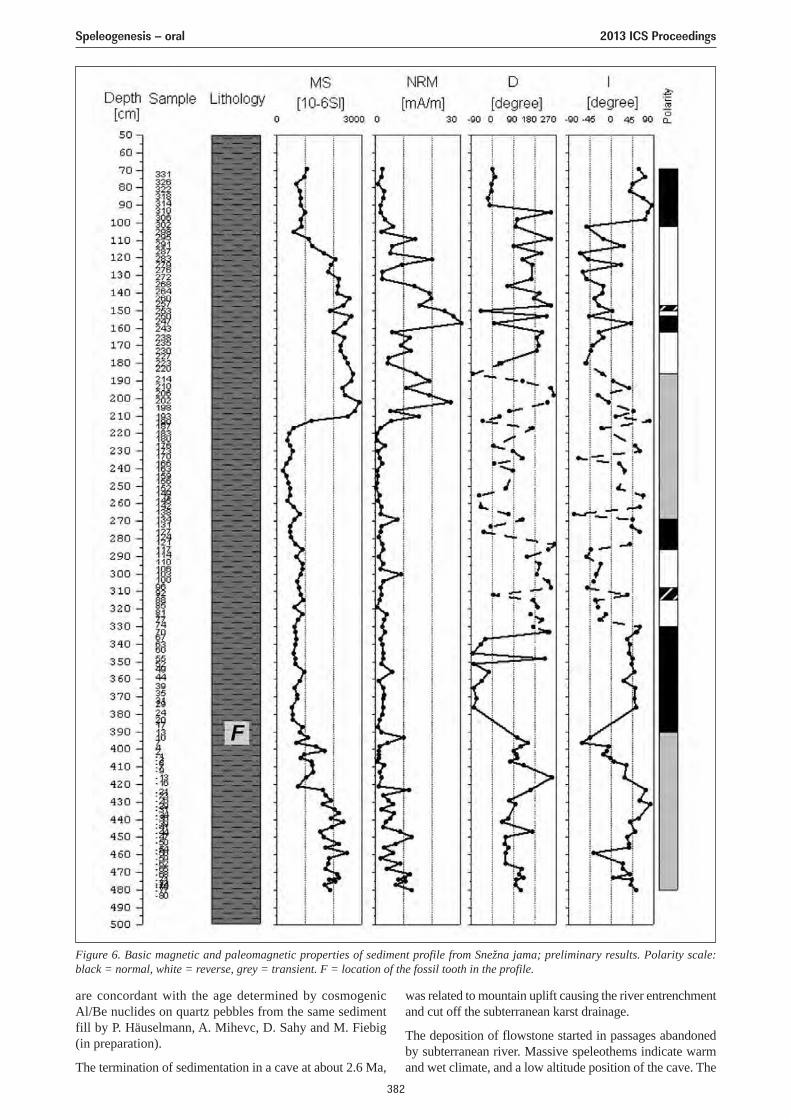
Figure 6. Basic magnetic and paleomagnetic properties of sediment profile from Snežna jama; preliminary results. Polarity scale:black = normal, white = reverse, grey = transient. F = location of the fossil tooth in the profile.
are concordant with the age determined by cosmogenicAl/Be nuclides on quartz pebbles from the same sedimentfill by P. Häuselmann, A. Mihevc, D. Sahy and M. Fiebig(in preparation).
The termination of sedimentation in a cave at about 2.6 Ma,
was related to mountain uplift causing the river entrenchmentand cut off the subterranean karst drainage.
The deposition of flowstone started in passages abandonedby subterranean river. Massive speleothems indicate warmand wet climate, and a low altitude position of the cave. The
Speleogenesis – oral 2013 ICS Proceedings
382
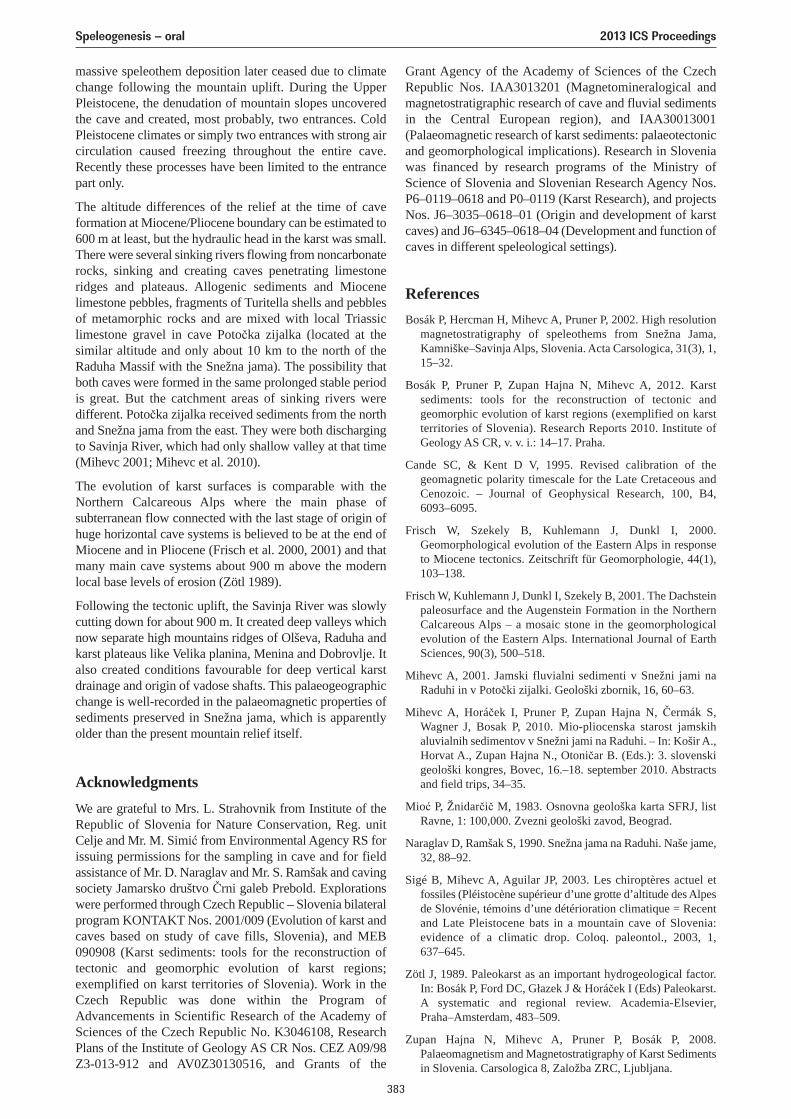
massive speleothem deposition later ceased due to climatechange following the mountain uplift. During the UpperPleistocene, the denudation of mountain slopes uncoveredthe cave and created, most probably, two entrances. ColdPleistocene climates or simply two entrances with strong aircirculation caused freezing throughout the entire cave.Recently these processes have been limited to the entrancepart only.
The altitude differences of the relief at the time of caveformation at Miocene/Pliocene boundary can be estimated to600 m at least, but the hydraulic head in the karst was small.There were several sinking rivers flowing from noncarbonaterocks, sinking and creating caves penetrating limestoneridges and plateaus. Allogenic sediments and Miocenelimestone pebbles, fragments of Turitella shells and pebblesof metamorphic rocks and are mixed with local Triassiclimestone gravel in cave Potočka zijalka (located at thesimilar altitude and only about 10 km to the north of theRaduha Massif with the Snežna jama). The possibility thatboth caves were formed in the same prolonged stable periodis great. But the catchment areas of sinking rivers weredifferent. Potočka zijalka received sediments from the northand Snežna jama from the east. They were both dischargingto Savinja River, which had only shallow valley at that time(Mihevc 2001; Mihevc et al. 2010).
The evolution of karst surfaces is comparable with theNorthern Calcareous Alps where the main phase ofsubterranean flow connected with the last stage of origin ofhuge horizontal cave systems is believed to be at the end ofMiocene and in Pliocene (Frisch et al. 2000, 2001) and thatmany main cave systems about 900 m above the modernlocal base levels of erosion (Zötl 1989).
Following the tectonic uplift, the Savinja River was slowlycutting down for about 900 m. It created deep valleys whichnow separate high mountains ridges of Olševa, Raduha andkarst plateaus like Velika planina, Menina and Dobrovlje. Italso created conditions favourable for deep vertical karstdrainage and origin of vadose shafts. This palaeogeographicchange is well-recorded in the palaeomagnetic properties ofsediments preserved in Snežna jama, which is apparentlyolder than the present mountain relief itself.
AcknowledgmentsWe are grateful to Mrs. L. Strahovnik from Institute of theRepublic of Slovenia for Nature Conservation, Reg. unitCelje and Mr. M. Simić from Environmental Agency RS forissuing permissions for the sampling in cave and for fieldassistance of Mr. D. Naraglav and Mr. S. Ramšak and cavingsociety Jamarsko društvo Črni galeb Prebold. Explorationswere performed through Czech Republic – Slovenia bilateralprogram KONTAKT Nos. 2001/009 (Evolution of karst andcaves based on study of cave fills, Slovenia), and MEB090908 (Karst sediments: tools for the reconstruction oftectonic and geomorphic evolution of karst regions;exemplified on karst territories of Slovenia). Work in theCzech Republic was done within the Program ofAdvancements in Scientific Research of the Academy ofSciences of the Czech Republic No. K3046108, ResearchPlans of the Institute of Geology AS CR Nos. CEZ A09/98Z3-013-912 and AV0Z30130516, and Grants of the
Grant Agency of the Academy of Sciences of the CzechRepublic Nos. IAA3013201 (Magnetomineralogical andmagnetostratigraphic research of cave and fluvial sedimentsin the Central European region), and IAA30013001(Palaeomagnetic research of karst sediments: palaeotectonicand geomorphological implications). Research in Sloveniawas financed by research programs of the Ministry of Science of Slovenia and Slovenian Research Agency Nos.P6–0119–0618 and P0–0119 (Karst Research), and projectsNos. J6–3035–0618–01 (Origin and development of karstcaves) and J6–6345–0618–04 (Development and function ofcaves in different speleological settings).
ReferencesBosák P, Hercman H, Mihevc A, Pruner P, 2002. High resolution
magnetostratigraphy of speleothems from Snežna Jama,Kamniške–Savinja Alps, Slovenia. Acta Carsologica, 31(3), 1,15–32.
Bosák P, Pruner P, Zupan Hajna N, Mihevc A, 2012. Karstsediments: tools for the reconstruction of tectonic andgeomorphic evolution of karst regions (exemplified on karstterritories of Slovenia). Research Reports 2010. Institute ofGeology AS CR, v. v. i.: 14–17. Praha.
Cande SC, & Kent D V, 1995. Revised calibration of thegeomagnetic polarity timescale for the Late Cretaceous andCenozoic. – Journal of Geophysical Research, 100, B4,6093–6095.
Frisch W, Szekely B, Kuhlemann J, Dunkl I, 2000.Geomorphological evolution of the Eastern Alps in responseto Miocene tectonics. Zeitschrift für Geomorphologie, 44(1),103–138.
Frisch W, Kuhlemann J, Dunkl I, Szekely B, 2001. The Dachsteinpaleosurface and the Augenstein Formation in the NorthernCalcareous Alps – a mosaic stone in the geomorphologicalevolution of the Eastern Alps. International Journal of EarthSciences, 90(3), 500–518.
Mihevc A, 2001. Jamski fluvialni sedimenti v Snežni jami naRaduhi in v Potočki zijalki. Geološki zbornik, 16, 60–63.
Mihevc A, Horáček I, Pruner P, Zupan Hajna N, Čermák S,Wagner J, Bosak P, 2010. Mio-pliocenska starost jamskihaluvialnih sedimentov v Snežni jami na Raduhi. – In: Košir A.,Horvat A., Zupan Hajna N., Otoničar B. (Eds.): 3. slovenskigeološki kongres, Bovec, 16.–18. september 2010. Abstractsand field trips, 34–35.
Mioć P, Žnidarčič M, 1983. Osnovna geološka karta SFRJ, listRavne, 1: 100,000. Zvezni geološki zavod, Beograd.
Naraglav D, Ramšak S, 1990. Snežna jama na Raduhi. Naše jame,32, 88–92.
Sigé B, Mihevc A, Aguilar JP, 2003. Les chiroptères actuel etfossiles (Pléistocène supérieur d’une grotte d’altitude des Alpesde Slovénie, témoins d’une détérioration climatique = Recentand Late Pleistocene bats in a mountain cave of Slovenia:evidence of a climatic drop. Coloq. paleontol., 2003, 1,637–645.
Zötl J, 1989. Paleokarst as an important hydrogeological factor.In: Bosák P, Ford DC, Głazek J & Horáček I (Eds) Paleokarst.A systematic and regional review. Academia-Elsevier,Praha–Amsterdam, 483–509.
Zupan Hajna N, Mihevc A, Pruner P, Bosák P, 2008.Palaeomagnetism and Magnetostratigraphy of Karst Sedimentsin Slovenia. Carsologica 8, Založba ZRC, Ljubljana.
Speleogenesis – oral 2013 ICS Proceedings
383
SEDIMENTARY STUDY AND U-TH DATATIONS CONTRIBUTION TO THEMORPHODYNAMIC RECONSTITUTION OF THE JUNCTION CHAMBER
(KASSARAT CAVE, NABAY, LEBANON): A GEOMORPHOLOGICALAPPROACH FOR PALAEOHYDROLOGICAL RECORDS ANALYSIS
Nehme C.1,2,3, Delannoy J.-J.1,3, Jaillet S.1, Adjizian-Gerard J.2,3, John Hellstrom4, Comaty T.3, Arzouni M.3, Matta P.31EDYTEM UMR 5204-CNRS, Université de Savoie, le Bourget du Lac, France, [email protected]
2Département de géographie, Université Saint-Joseph de Beyrouth, Liban3Association Libanaise d’Etudes Spéléologique (ALES), Mansourieh, Liban, [email protected]
4Earth science department, University of Melbourne, Australia
Several studies on karst systems and geomorphology has been initiated in Lebanon recently by EDYTEM laboratory UMR5204-CNRS, France in collaboration with Saint Joseph University of Beirut and the Association Libanaise d’étudesspéléologiques (ALES). One of these researches aims at reconstituting: i) speleogenic evolution based on geomorphologicindicators, ii) karstogenesis reconstitution related with the downcutting of the Mediterranean hydrographic network(Antelias and Kelb river), iii) paleogeographical reconstitution of these tow valleys.Two caves have been chosen in each valley and a morphogenic analysis has been completed in each cave with ageomorphological approach. One of the main caves studied, downstream Antelias valley, is Kessarat cave with itsunderground river and its 4.6 km gallery development. A 6.45 m height section has been studied in the Junction gallery toreconstitute the deposition process of the sector in response to a collapse process. Stratigraphy observations as well asgrain size and morphoscopic analysis on sand layers have helped us to reconstitute the deposit dynamics and the paleoflowsof the underground river such as velocity variations and flows directions. Four reconstitution stages are suggested todescribe the river deviation. U-Th datations on two stalagmites Kt12011 and Kt22011 suggest upper Pleistocene age tothe collapse and the deposition episode in the Junction Chamber. Both collapse and deposition processes are set in therecent stage of Kessarat cave speleogenesis.
1. IntroductionIn the framework of a PhD research study, Antelias valley was chosen as a main study site to reconstitutepaleogeographical phases of the landscape based onspeleogenesis and sedimentary analysis conducted on cavesnetworks and sediments. One of the main caves studied isKessarat cave (Nabay) with its underground river, situatedin the downstream section of the Antelias valley. Amorphogenic analysis has been completed by using aspeleogenetic approach. Six speleogenetic stages have beenidentified in Kassarat cave (Nehme et al. 2012):
• The first speleogenetic stage embraces initial developmentof the cave. Phreatic forms (tubular galleries, semi tubularchannel and anastomosis ceiling, notches and dissolutionpockets) located along the canyon ceiling and in the uppergalleries of Kassarat cave were formed in the phreaticzone of the Antelias karst system during a period of highposition of the base level.
• The second and third stages are the result of a water tablemigration downstream of the valley. The KassaratUnderground River entrenched a canyon below the initialphreatic level.
• The fourth stage is a second erosion level characterizedby formation of a semi-phreatic tube at the base of theKassarat underground canyon. This indicates a probablesecond erosional level with a long-term stabilization ofthe water table level at the base of the canyon.
• The fifth and the sixth stage resume processes occurred inthe vadose zone of the Antelias Karst after the water levelmigration downstream: collapse of the canyon ceiling
initiated local hydrodynamic readjustments of theunderground river regime.
To better understand recent hydrodynamic modifications ofKassarat Underground River in respond to a ceiling collapse,the Junction Chamber was chosen for its morphologyaspects and for its well-preserved sediments. The chambercontains a wide range of fluvial sediments (pebble, sand,clay) up to 10 m height. This sector functioned as a sedimenttrap due to the collapse. A sedimentary study was conductedon these deposits. Stratigraphy analyses as well as grain-sizeand morphoscopic analysis on sand layers helped us toreconstitute the deposition dynamics of this site during andafter the collapse phenomena.
2. Geography and geology settingsLocated in the central part of Mount-Lebanon chain, 10 kmnorth of Beirut city, Antelias area is mostly formed bymiddle Jurassic dolomitic limestone (J4-J5) (Dubertret1951; Walley 1998). This well karstified area is known forits high concentration of caves (Abdul-Nour 2004) andkarstic networks (e.g., Kassarat, Nabaa el-Chataouieh, 22April, Bear, el-Dahr, Kanaan) (Figure 3). The tectonicsetting (Hakim 1988; Walley 1998; Gédéon 1999) ofAntelias region indicates local and regional faults with aNNE-SSW and E-W orientation.
Antelias River has 20.4 km2 of catchment area and drainsdirectly to the Mediterranean Sea (Figure 1). Feeding theAntelias river all over the year, the Fouar Antelias springcatchment area is ten times greater (208 km2) than theAntelias River catchment area (Hakim 1985; Labaky 2005)
Speleogenesis – oral 2013 ICS Proceedings
384
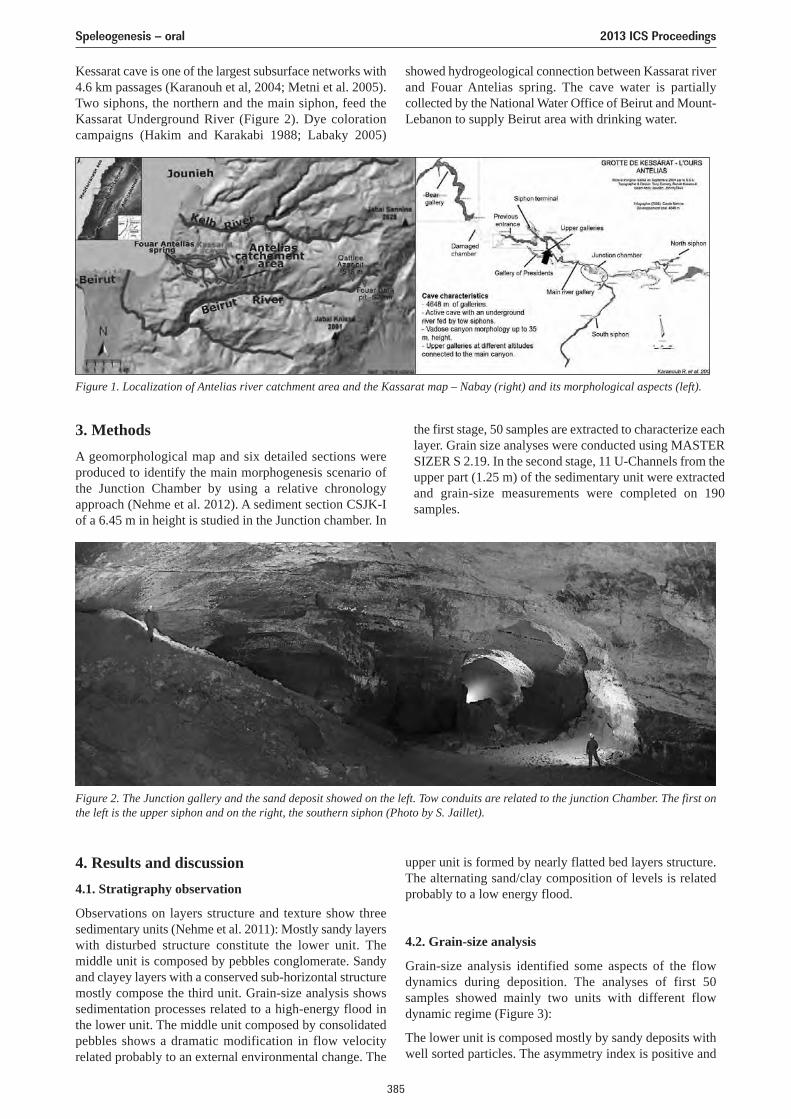
Kessarat cave is one of the largest subsurface networks with4.6 km passages (Karanouh et al, 2004; Metni et al. 2005).Two siphons, the northern and the main siphon, feed theKassarat Underground River (Figure 2). Dye colorationcampaigns (Hakim and Karakabi 1988; Labaky 2005)
3. MethodsA geomorphological map and six detailed sections wereproduced to identify the main morphogenesis scenario ofthe Junction Chamber by using a relative chronologyapproach (Nehme et al. 2012). A sediment section CSJK-Iof a 6.45 m in height is studied in the Junction chamber. In
Figure 1. Localization of Antelias river catchment area and the Kassarat map – Nabay (right) and its morphological aspects (left).
Figure 2. The Junction gallery and the sand deposit showed on the left. Tow conduits are related to the junction Chamber. The first onthe left is the upper siphon and on the right, the southern siphon (Photo by S. Jaillet).
the first stage, 50 samples are extracted to characterize eachlayer. Grain size analyses were conducted using MASTERSIZER S 2.19. In the second stage, 11 U-Channels from theupper part (1.25 m) of the sedimentary unit were extractedand grain-size measurements were completed on 190samples.
showed hydrogeological connection between Kassarat riverand Fouar Antelias spring. The cave water is partiallycollected by the National Water Office of Beirut and Mount-Lebanon to supply Beirut area with drinking water.
4. Results and discussion4.1. Stratigraphy observation
Observations on layers structure and texture show threesedimentary units (Nehme et al. 2011): Mostly sandy layerswith disturbed structure constitute the lower unit. Themiddle unit is composed by pebbles conglomerate. Sandyand clayey layers with a conserved sub-horizontal structuremostly compose the third unit. Grain-size analysis showssedimentation processes related to a high-energy flood inthe lower unit. The middle unit composed by consolidatedpebbles shows a dramatic modification in flow velocityrelated probably to an external environmental change. The
upper unit is formed by nearly flatted bed layers structure.The alternating sand/clay composition of levels is relatedprobably to a low energy flood.
4.2. Grain-size analysis
Grain-size analysis identified some aspects of the flowdynamics during deposition. The analyses of first 50samples showed mainly two units with different flowdynamic regime (Figure 3):
The lower unit is composed mostly by sandy deposits withwell sorted particles. The asymmetry index is positive and
Speleogenesis – oral 2013 ICS Proceedings
385
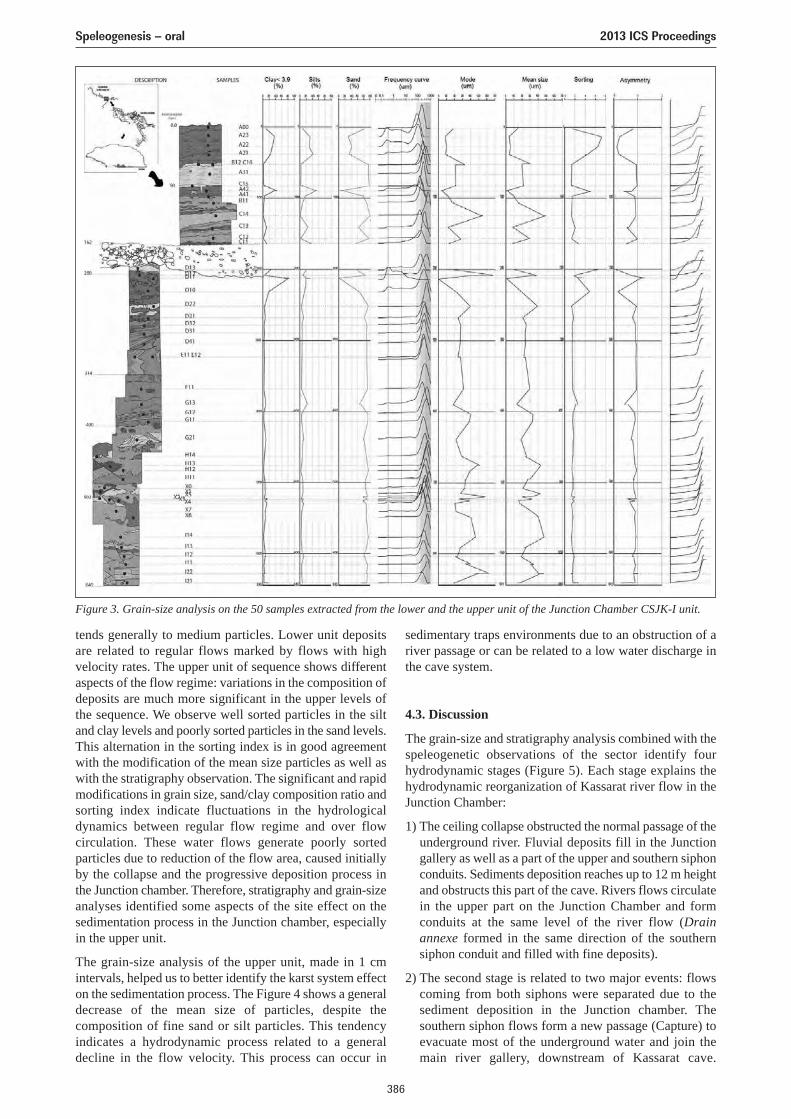
Figure 3. Grain-size analysis on the 50 samples extracted from the lower and the upper unit of the Junction Chamber CSJK-I unit.
tends generally to medium particles. Lower unit depositsare related to regular flows marked by flows with highvelocity rates. The upper unit of sequence shows differentaspects of the flow regime: variations in the composition ofdeposits are much more significant in the upper levels ofthe sequence. We observe well sorted particles in the siltand clay levels and poorly sorted particles in the sand levels.This alternation in the sorting index is in good agreementwith the modification of the mean size particles as well aswith the stratigraphy observation. The significant and rapidmodifications in grain size, sand/clay composition ratio andsorting index indicate fluctuations in the hydrologicaldynamics between regular flow regime and over flowcirculation. These water flows generate poorly sortedparticles due to reduction of the flow area, caused initiallyby the collapse and the progressive deposition process inthe Junction chamber. Therefore, stratigraphy and grain-sizeanalyses identified some aspects of the site effect on thesedimentation process in the Junction chamber, especiallyin the upper unit.
The grain-size analysis of the upper unit, made in 1 cmintervals, helped us to better identify the karst system effecton the sedimentation process. The Figure 4 shows a generaldecrease of the mean size of particles, despite thecomposition of fine sand or silt particles. This tendencyindicates a hydrodynamic process related to a generaldecline in the flow velocity. This process can occur in
sedimentary traps environments due to an obstruction of ariver passage or can be related to a low water discharge inthe cave system.
4.3. Discussion
The grain-size and stratigraphy analysis combined with thespeleogenetic observations of the sector identify fourhydrodynamic stages (Figure 5). Each stage explains thehydrodynamic reorganization of Kassarat river flow in theJunction Chamber:
1) The ceiling collapse obstructed the normal passage of theunderground river. Fluvial deposits fill in the Junctiongallery as well as a part of the upper and southern siphonconduits. Sediments deposition reaches up to 12 m heightand obstructs this part of the cave. Rivers flows circulatein the upper part on the Junction Chamber and formconduits at the same level of the river flow (Drainannexe formed in the same direction of the southernsiphon conduit and filled with fine deposits).
2) The second stage is related to two major events: flowscoming from both siphons were separated due to thesediment deposition in the Junction chamber. Thesouthern siphon flows form a new passage (Capture) toevacuate most of the underground water and join themain river gallery, downstream of Kassarat cave.
Speleogenesis – oral 2013 ICS Proceedings
386
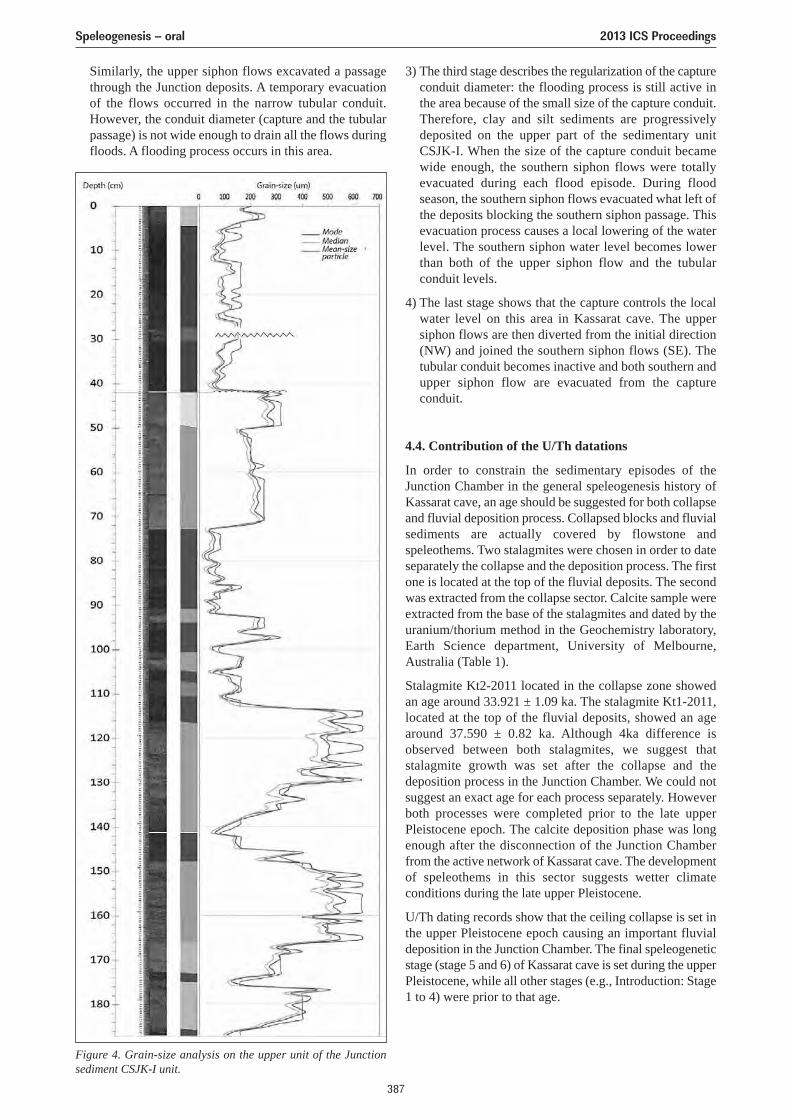
Similarly, the upper siphon flows excavated a passagethrough the Junction deposits. A temporary evacuationof the flows occurred in the narrow tubular conduit.However, the conduit diameter (capture and the tubularpassage) is not wide enough to drain all the flows duringfloods. A flooding process occurs in this area.
3) The third stage describes the regularization of the captureconduit diameter: the flooding process is still active inthe area because of the small size of the capture conduit.Therefore, clay and silt sediments are progressivelydeposited on the upper part of the sedimentary unitCSJK-I. When the size of the capture conduit becamewide enough, the southern siphon flows were totallyevacuated during each flood episode. During floodseason, the southern siphon flows evacuated what left ofthe deposits blocking the southern siphon passage. Thisevacuation process causes a local lowering of the waterlevel. The southern siphon water level becomes lowerthan both of the upper siphon flow and the tubularconduit levels.
4) The last stage shows that the capture controls the localwater level on this area in Kassarat cave. The uppersiphon flows are then diverted from the initial direction(NW) and joined the southern siphon flows (SE). Thetubular conduit becomes inactive and both southern andupper siphon flow are evacuated from the captureconduit.
4.4. Contribution of the U/Th datations
In order to constrain the sedimentary episodes of theJunction Chamber in the general speleogenesis history ofKassarat cave, an age should be suggested for both collapseand fluvial deposition process. Collapsed blocks and fluvialsediments are actually covered by flowstone andspeleothems. Two stalagmites were chosen in order to dateseparately the collapse and the deposition process. The firstone is located at the top of the fluvial deposits. The secondwas extracted from the collapse sector. Calcite sample wereextracted from the base of the stalagmites and dated by theuranium/thorium method in the Geochemistry laboratory,Earth Science department, University of Melbourne,Australia (Table 1).
Stalagmite Kt2-2011 located in the collapse zone showedan age around 33.921 ± 1.09 ka. The stalagmite Kt1-2011,located at the top of the fluvial deposits, showed an agearound 37.590 ± 0.82 ka. Although 4ka difference isobserved between both stalagmites, we suggest thatstalagmite growth was set after the collapse and thedeposition process in the Junction Chamber. We could notsuggest an exact age for each process separately. Howeverboth processes were completed prior to the late upperPleistocene epoch. The calcite deposition phase was longenough after the disconnection of the Junction Chamberfrom the active network of Kassarat cave. The developmentof speleothems in this sector suggests wetter climateconditions during the late upper Pleistocene.
U/Th dating records show that the ceiling collapse is set inthe upper Pleistocene epoch causing an important fluvialdeposition in the Junction Chamber. The final speleogeneticstage (stage 5 and 6) of Kassarat cave is set during the upperPleistocene, while all other stages (e.g., Introduction: Stage1 to 4) were prior to that age.
Figure 4. Grain-size analysis on the upper unit of the Junctionsediment CSJK-I unit.
Speleogenesis – oral 2013 ICS Proceedings
387
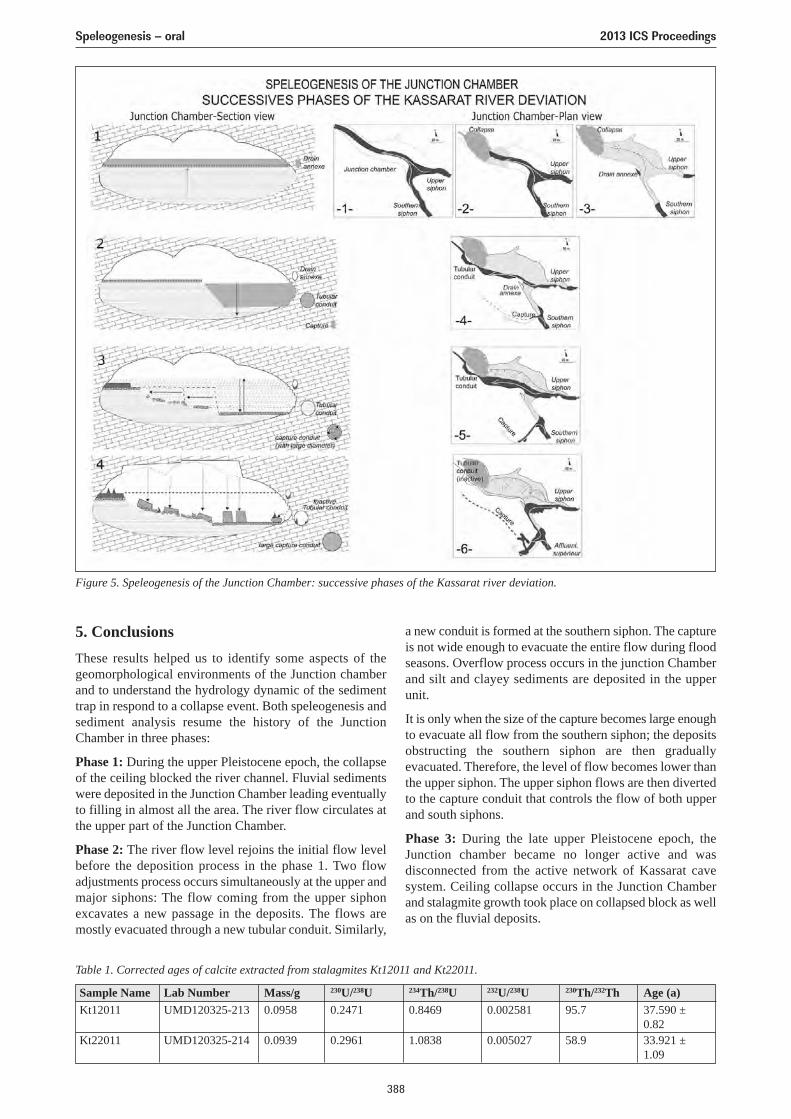
5. ConclusionsThese results helped us to identify some aspects of thegeomorphological environments of the Junction chamberand to understand the hydrology dynamic of the sedimenttrap in respond to a collapse event. Both speleogenesis andsediment analysis resume the history of the JunctionChamber in three phases:
Phase 1: During the upper Pleistocene epoch, the collapseof the ceiling blocked the river channel. Fluvial sedimentswere deposited in the Junction Chamber leading eventuallyto filling in almost all the area. The river flow circulates atthe upper part of the Junction Chamber.
Phase 2: The river flow level rejoins the initial flow levelbefore the deposition process in the phase 1. Two flowadjustments process occurs simultaneously at the upper andmajor siphons: The flow coming from the upper siphonexcavates a new passage in the deposits. The flows aremostly evacuated through a new tubular conduit. Similarly,
a new conduit is formed at the southern siphon. The captureis not wide enough to evacuate the entire flow during floodseasons. Overflow process occurs in the junction Chamberand silt and clayey sediments are deposited in the upperunit.
It is only when the size of the capture becomes large enoughto evacuate all flow from the southern siphon; the depositsobstructing the southern siphon are then graduallyevacuated. Therefore, the level of flow becomes lower thanthe upper siphon. The upper siphon flows are then divertedto the capture conduit that controls the flow of both upperand south siphons.
Phase 3: During the late upper Pleistocene epoch, theJunction chamber became no longer active and wasdisconnected from the active network of Kassarat cavesystem. Ceiling collapse occurs in the Junction Chamberand stalagmite growth took place on collapsed block as wellas on the fluvial deposits.
Figure 5. Speleogenesis of the Junction Chamber: successive phases of the Kassarat river deviation.
Table 1. Corrected ages of calcite extracted from stalagmites Kt12011 and Kt22011.
Sample Name Lab Number Mass/g 230U/238U 234Th/238U 232U/238U 230Th/232Th Age (a)Kt12011 UMD120325-213 0.0958 0.2471 0.8469 0.002581 95.7 37.590 ±
0.82Kt22011 UMD120325-214 0.0939 0.2961 1.0838 0.005027 58.9 33.921 ±
1.09
Speleogenesis – oral 2013 ICS Proceedings
388

AcknowledgmentsWe aknowledge ANR-LIBRIS for providing financialsupport for the U/Th datations. Many thanks to B.T.D.(Bureau Technique et Développement) for providinghydrological data on Antelias spring. Finally, we’re thankfulto Pierre-Charles Gérard and A.L.E.S. cavers-AssociationLibanaise d’Etudes Spéléologiques for providing technicalsupport to complete sampling during field trips.
ReferencesAbdul-Nour H, 2004. Les cavités de l’endokarst du Liban-
Spéléorient, (4), 116–128.
Dubertret L, 1951. Carte géologique du Liban: Feuille de Beyrouth1/50000e. Carte géologique et notice, Ministère des travauxpublics, Beirut, Lebanon.
Gedeon M, 1999. Structural analysis of latitudinal fault in theMount-Lebanon north of Beirut: their kinematics and their rolein the tectonic evolution of Lebanon. Master thesis, AmericanUniversity of Beirut, Lebanon.
Hakim B, Karkabi S, 1988. Coloration du gouffre de Faouar Daraet de la grotte des Kessarat. Al-Ouate-Ouate, (3), 18–31.
Karanouh R, Bou jawdeh I, Comaty A, Tawk J, 2004. Mgharet elKessarat cave system. Al-Ouate-Ouate, (13), map appendix.
Labaky W, 2005. A semi quantitative description of a dye tracingExperiment in the fouar Antelias drainage Basin. Al-Ouat-Ouat,(13), 28–35.
Metni M, Nader FH, Mgharet el-Kessarat, 2005. History,Morphology and Speleogenesis. Al-Ouate-Ouate, (13), 8–13.
Nehme C, Delannoy J-J, Adjizian-Gerard J, 2011. Reconstitutionof the groundwater palaeoflow of Kessarat cave, Anteliasvalley, Lebanon: A geomorphological approach inpalaeohydrological records analysis. Poster abstract ID 1893,XVIII INQUA Congress, Bern, Switzerland, 2011.
Nehme C, Delannoy J-J, Adjizian-Gerard J, Hellstrom J, 2012. LatePleistocene evolution of Antelias valley (Lebanon): speleogenicapproach applied on Kassarat cave system with implication ofU/Th datations records. Fianl Proc. 20th Int. karst school, KarstResearch Institute, Postojna, Slovenia, 66–67.
Speleogenesis – oral 2013 ICS Proceedings
389
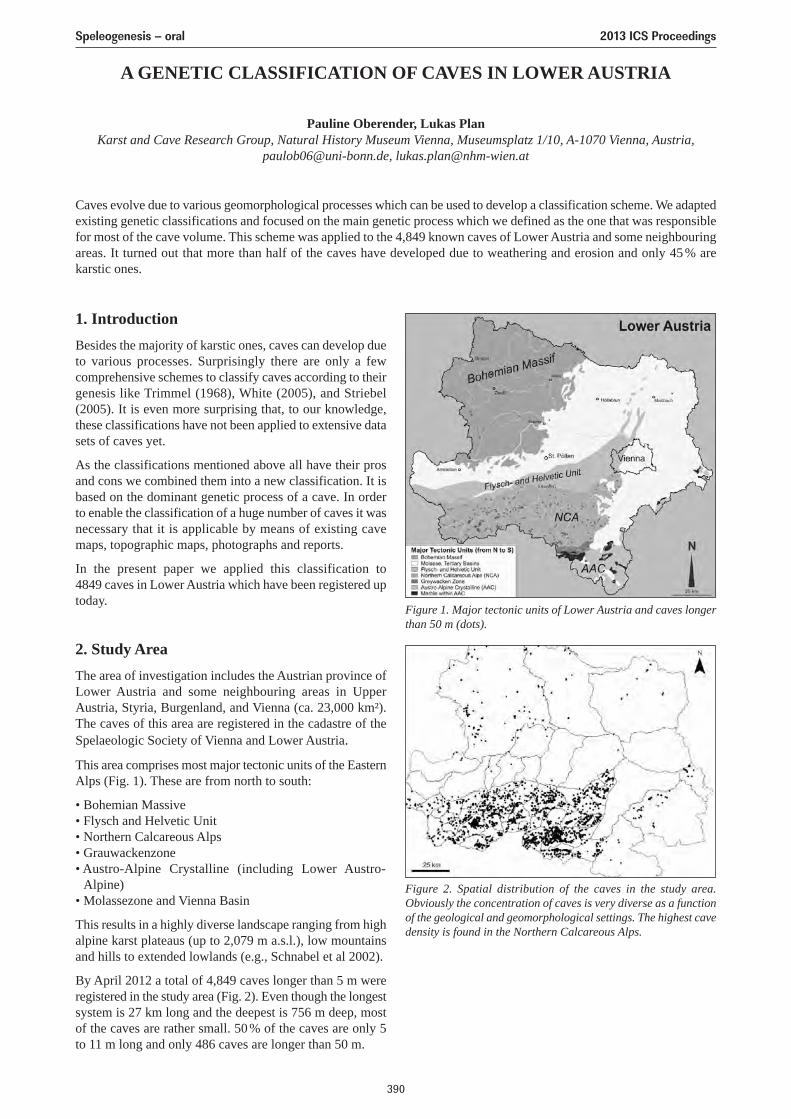
A GENETIC CLASSIFICATION OF CAVES IN LOWER AUSTRIA
Pauline Oberender, Lukas PlanKarst and Cave Research Group, Natural History Museum Vienna, Museumsplatz 1/10, A-1070 Vienna, Austria,
[email protected], [email protected]
Caves evolve due to various geomorphological processes which can be used to develop a classification scheme. We adaptedexisting genetic classifications and focused on the main genetic process which we defined as the one that was responsiblefor most of the cave volume. This scheme was applied to the 4,849 known caves of Lower Austria and some neighbouringareas. It turned out that more than half of the caves have developed due to weathering and erosion and only 45 % arekarstic ones.
1. IntroductionBesides the majority of karstic ones, caves can develop dueto various processes. Surprisingly there are only a fewcomprehensive schemes to classify caves according to theirgenesis like Trimmel (1968), White (2005), and Striebel(2005). It is even more surprising that, to our knowledge,these classifications have not been applied to extensive datasets of caves yet.
As the classifications mentioned above all have their prosand cons we combined them into a new classification. It isbased on the dominant genetic process of a cave. In orderto enable the classification of a huge number of caves it wasnecessary that it is applicable by means of existing cavemaps, topographic maps, photographs and reports.
In the present paper we applied this classification to 4849 caves in Lower Austria which have been registered uptoday.
2. Study AreaThe area of investigation includes the Austrian province ofLower Austria and some neighbouring areas in UpperAustria, Styria, Burgenland, and Vienna (ca. 23,000 km²).The caves of this area are registered in the cadastre of theSpelaeologic Society of Vienna and Lower Austria.
This area comprises most major tectonic units of the EasternAlps (Fig. 1). These are from north to south:
• Bohemian Massive• Flysch and Helvetic Unit• Northern Calcareous Alps• Grauwackenzone• Austro-Alpine Crystalline (including Lower Austro-
Alpine)• Molassezone and Vienna Basin
This results in a highly diverse landscape ranging from highalpine karst plateaus (up to 2,079 m a.s.l.), low mountainsand hills to extended lowlands (e.g., Schnabel et al 2002).
By April 2012 a total of 4,849 caves longer than 5 m wereregistered in the study area (Fig. 2). Even though the longestsystem is 27 km long and the deepest is 756 m deep, mostof the caves are rather small. 50% of the caves are only 5to 11 m long and only 486 caves are longer than 50 m.
Figure 1. Major tectonic units of Lower Austria and caves longerthan 50 m (dots).
Figure 2. Spatial distribution of the caves in the study area.Obviously the concentration of caves is very diverse as a functionof the geological and geomorphological settings. The highest cavedensity is found in the Northern Calcareous Alps.
Speleogenesis – oral 2013 ICS Proceedings
390
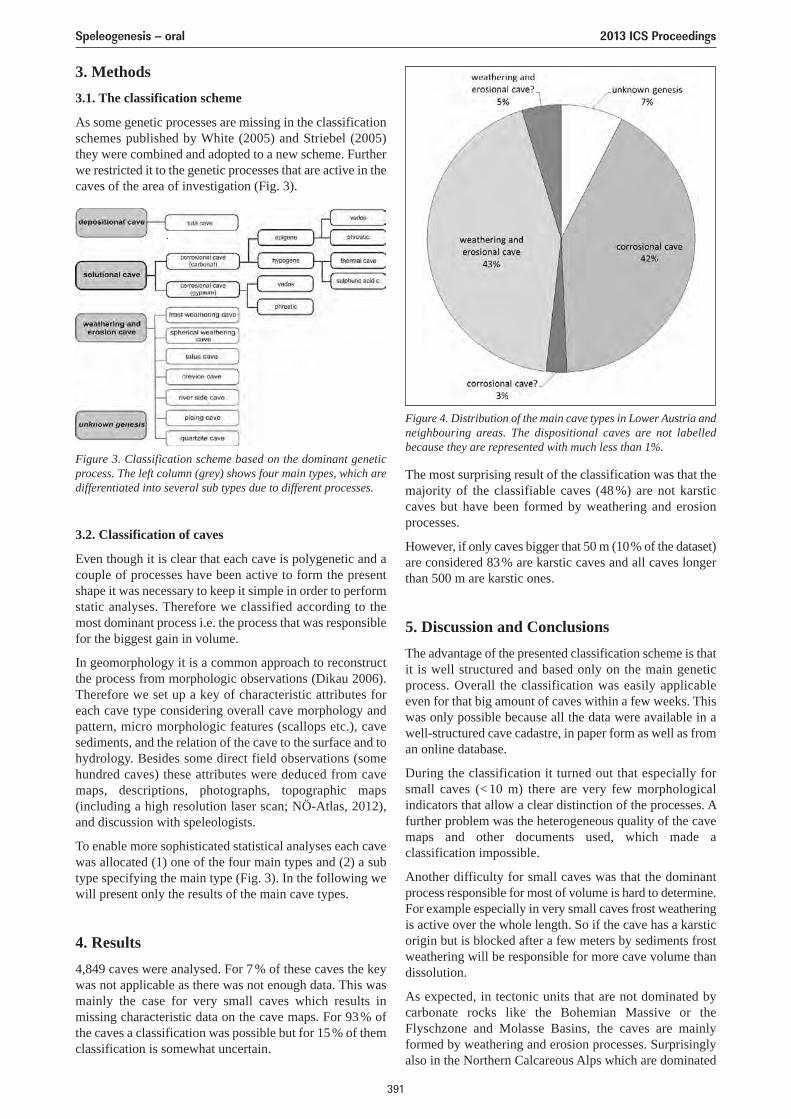
3.2. Classification of caves
Even though it is clear that each cave is polygenetic and acouple of processes have been active to form the presentshape it was necessary to keep it simple in order to performstatic analyses. Therefore we classified according to themost dominant process i.e. the process that was responsiblefor the biggest gain in volume.
In geomorphology it is a common approach to reconstructthe process from morphologic observations (Dikau 2006).Therefore we set up a key of characteristic attributes foreach cave type considering overall cave morphology andpattern, micro morphologic features (scallops etc.), cavesediments, and the relation of the cave to the surface and tohydrology. Besides some direct field observations (somehundred caves) these attributes were deduced from cavemaps, descriptions, photographs, topographic maps(including a high resolution laser scan; NÖ-Atlas, 2012),and discussion with speleologists.
To enable more sophisticated statistical analyses each cavewas allocated (1) one of the four main types and (2) a subtype specifying the main type (Fig. 3). In the following wewill present only the results of the main cave types.
4. Results4,849 caves were analysed. For 7% of these caves the keywas not applicable as there was not enough data. This wasmainly the case for very small caves which results inmissing characteristic data on the cave maps. For 93% ofthe caves a classification was possible but for 15% of themclassification is somewhat uncertain.
The most surprising result of the classification was that themajority of the classifiable caves (48 %) are not karsticcaves but have been formed by weathering and erosionprocesses.
However, if only caves bigger that 50 m (10% of the dataset)are considered 83% are karstic caves and all caves longerthan 500 m are karstic ones.
5. Discussion and ConclusionsThe advantage of the presented classification scheme is thatit is well structured and based only on the main geneticprocess. Overall the classification was easily applicableeven for that big amount of caves within a few weeks. Thiswas only possible because all the data were available in awell-structured cave cadastre, in paper form as well as froman online database.
During the classification it turned out that especially forsmall caves (< 10 m) there are very few morphologicalindicators that allow a clear distinction of the processes. Afurther problem was the heterogeneous quality of the cavemaps and other documents used, which made aclassification impossible.
Another difficulty for small caves was that the dominantprocess responsible for most of volume is hard to determine.For example especially in very small caves frost weatheringis active over the whole length. So if the cave has a karsticorigin but is blocked after a few meters by sediments frostweathering will be responsible for more cave volume thandissolution.
As expected, in tectonic units that are not dominated bycarbonate rocks like the Bohemian Massive or theFlyschzone and Molasse Basins, the caves are mainlyformed by weathering and erosion processes. Surprisinglyalso in the Northern Calcareous Alps which are dominated
Figure 3. Classification scheme based on the dominant geneticprocess. The left column (grey) shows four main types, which aredifferentiated into several sub types due to different processes.
Figure 4. Distribution of the main cave types in Lower Austria andneighbouring areas. The dispositional caves are not labelledbecause they are represented with much less than 1%.
3. Methods3.1. The classification scheme
As some genetic processes are missing in the classificationschemes published by White (2005) and Striebel (2005)they were combined and adopted to a new scheme. Furtherwe restricted it to the genetic processes that are active in thecaves of the area of investigation (Fig. 3).
Speleogenesis – oral 2013 ICS Proceedings
391

by limestone and dolomite half of the caves have beendeveloped by karstification and the other half by weatheringand erosion processes.
AcknowledgmentsThe work was supported in the frame of a project(NÖHÖKAT) with the Federal Government of LowerAustria. The Speleological Society of Vienna and LowerAustria provided all the collected information on caves.
ReferencesDikau R, 2006. Oberflächenprozesse – ein altes oder ein neues
Thema? Geographica Helvetica, 61 (3), 170–180.
Striebel T, 2005. Höhlenbildung in “nicht verkarstungsfähigen”Gesteinen: welche Formen sind Karstformen? LaichingerHöhlenfreund, 40, 31–52.
Trimmel H, 1968. Höhlenkunde. Friedrich Vieweg & Sohn,Braunschweig.
White W B & Culver D C, 2005. Defintion of Cave. In: White WB & Culver D C (Eds). Encyclopedia of Caves. Elsevier,Amsterdam, 81–85.
NÖ-Atlas, 2012. Geländehöhe (Laserscan). http://atlas.noe.gv.at
Speleogenesis – oral 2013 ICS Proceedings
392
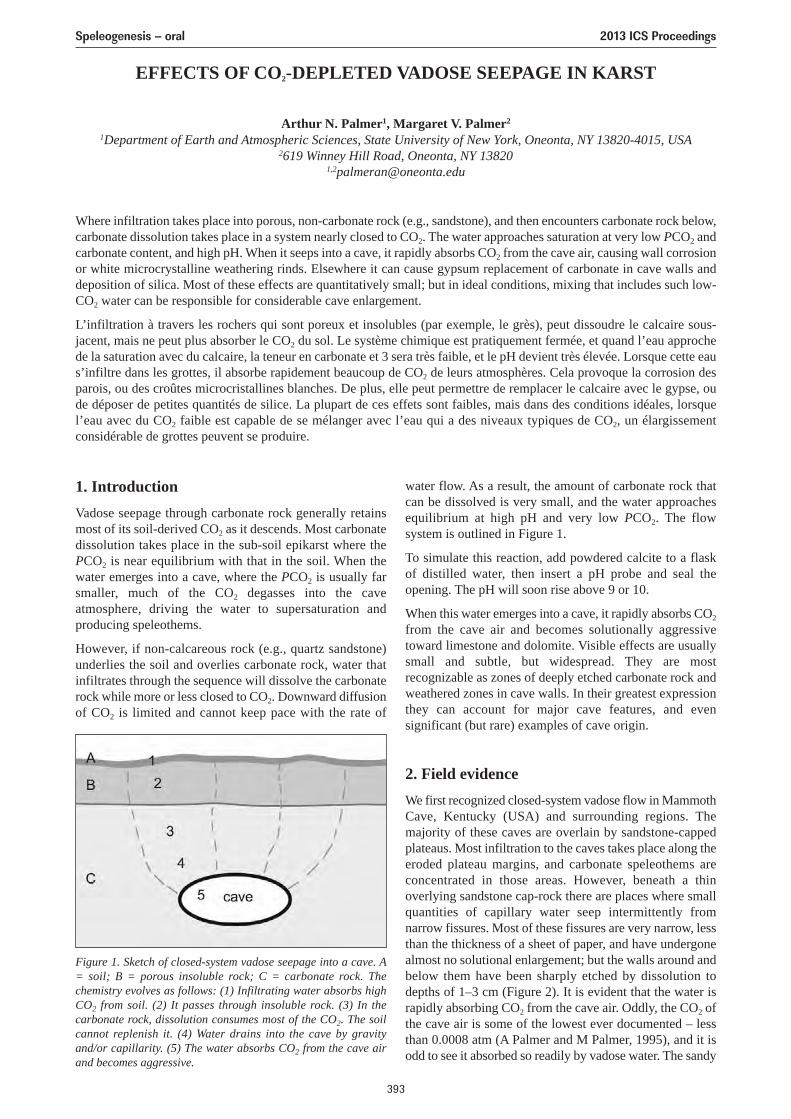
EFFECTS OF CO2-DEPLETED VADOSE SEEPAGE IN KARST
Arthur N. Palmer1, Margaret V. Palmer2
1Department of Earth and Atmospheric Sciences, State University of New York, Oneonta, NY 13820-4015, USA2619 Winney Hill Road, Oneonta, NY 13820
Where infiltration takes place into porous, non-carbonate rock (e.g., sandstone), and then encounters carbonate rock below,carbonate dissolution takes place in a system nearly closed to CO2. The water approaches saturation at very low PCO2 andcarbonate content, and high pH. When it seeps into a cave, it rapidly absorbs CO2 from the cave air, causing wall corrosionor white microcrystalline weathering rinds. Elsewhere it can cause gypsum replacement of carbonate in cave walls anddeposition of silica. Most of these effects are quantitatively small; but in ideal conditions, mixing that includes such low-CO2 water can be responsible for considerable cave enlargement.
L’infiltration à travers les rochers qui sont poreux et insolubles (par exemple, le grès), peut dissoudre le calcaire sous-jacent, mais ne peut plus absorber le CO2 du sol. Le système chimique est pratiquement fermée, et quand l’eau approchede la saturation avec du calcaire, la teneur en carbonate et 3 sera très faible, et le pH devient très élevée. Lorsque cette eaus’infiltre dans les grottes, il absorbe rapidement beaucoup de CO2 de leurs atmosphères. Cela provoque la corrosion desparois, ou des croûtes microcristallines blanches. De plus, elle peut permettre de remplacer le calcaire avec le gypse, oude déposer de petites quantités de silice. La plupart de ces effets sont faibles, mais dans des conditions idéales, lorsquel’eau avec du CO2 faible est capable de se mélanger avec l’eau qui a des niveaux typiques de CO2, un élargissementconsidérable de grottes peuvent se produire.
1. IntroductionVadose seepage through carbonate rock generally retainsmost of its soil-derived CO2 as it descends. Most carbonatedissolution takes place in the sub-soil epikarst where thePCO2 is near equilibrium with that in the soil. When thewater emerges into a cave, where the PCO2 is usually farsmaller, much of the CO2 degasses into the caveatmosphere, driving the water to supersaturation andproducing speleothems.
However, if non-calcareous rock (e.g., quartz sandstone)underlies the soil and overlies carbonate rock, water thatinfiltrates through the sequence will dissolve the carbonaterock while more or less closed to CO2. Downward diffusionof CO2 is limited and cannot keep pace with the rate of
water flow. As a result, the amount of carbonate rock thatcan be dissolved is very small, and the water approachesequilibrium at high pH and very low PCO2. The flowsystem is outlined in Figure 1.
To simulate this reaction, add powdered calcite to a flaskof distilled water, then insert a pH probe and seal theopening. The pH will soon rise above 9 or 10.
When this water emerges into a cave, it rapidly absorbs CO2
from the cave air and becomes solutionally aggressivetoward limestone and dolomite. Visible effects are usuallysmall and subtle, but widespread. They are mostrecognizable as zones of deeply etched carbonate rock andweathered zones in cave walls. In their greatest expressionthey can account for major cave features, and evensignificant (but rare) examples of cave origin.
2. Field evidenceWe first recognized closed-system vadose flow in MammothCave, Kentucky (USA) and surrounding regions. Themajority of these caves are overlain by sandstone-cappedplateaus. Most infiltration to the caves takes place along theeroded plateau margins, and carbonate speleothems areconcentrated in those areas. However, beneath a thinoverlying sandstone cap-rock there are places where smallquantities of capillary water seep intermittently fromnarrow fissures. Most of these fissures are very narrow, lessthan the thickness of a sheet of paper, and have undergonealmost no solutional enlargement; but the walls around andbelow them have been sharply etched by dissolution todepths of 1–3 cm (Figure 2). It is evident that the water israpidly absorbing CO2 from the cave air. Oddly, the CO2 ofthe cave air is some of the lowest ever documented – lessthan 0.0008 atm (A Palmer and M Palmer, 1995), and it isodd to see it absorbed so readily by vadose water. The sandy
Figure 1. Sketch of closed-system vadose seepage into a cave. A= soil; B = porous insoluble rock; C = carbonate rock. Thechemistry evolves as follows: (1) Infiltrating water absorbs highCO2 from soil. (2) It passes through insoluble rock. (3) In thecarbonate rock, dissolution consumes most of the CO2. The soilcannot replenish it. (4) Water drains into the cave by gravityand/or capillarity. (5) The water absorbs CO2 from the cave airand becomes aggressive.
Speleogenesis – oral 2013 ICS Proceedings
393
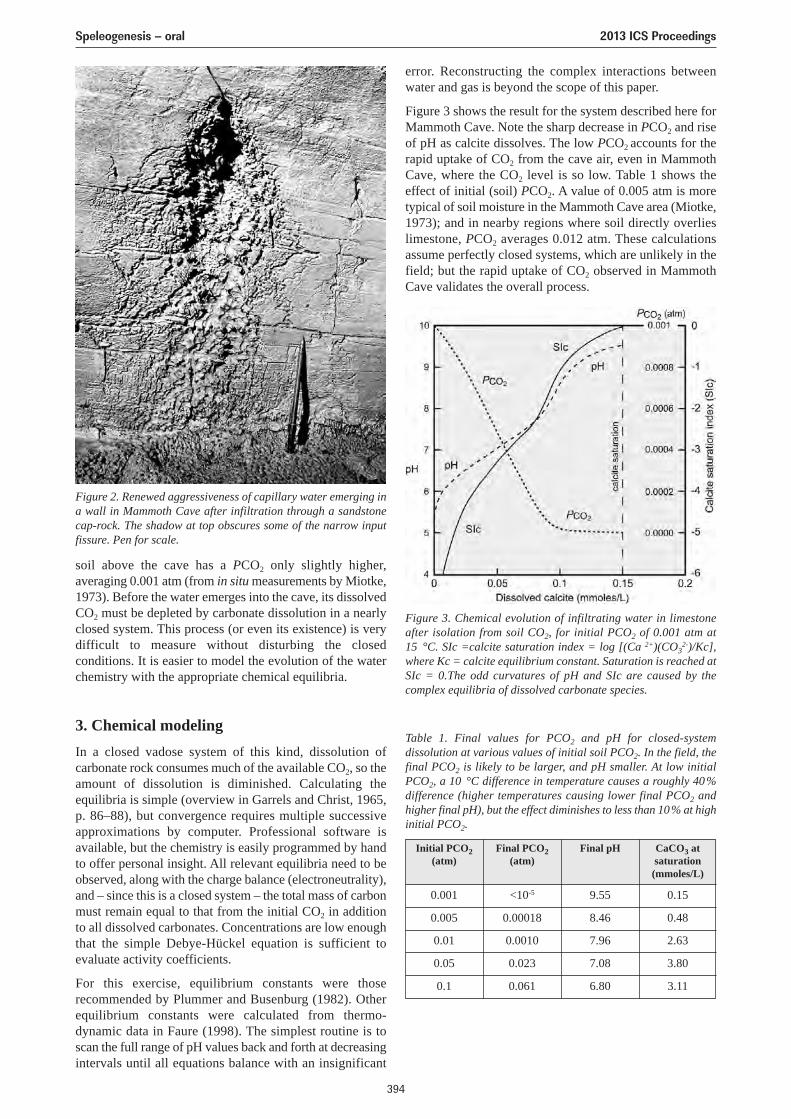
soil above the cave has a PCO2 only slightly higher,averaging 0.001 atm (from in situ measurements by Miotke,1973). Before the water emerges into the cave, its dissolvedCO2 must be depleted by carbonate dissolution in a nearlyclosed system. This process (or even its existence) is verydifficult to measure without disturbing the closedconditions. It is easier to model the evolution of the waterchemistry with the appropriate chemical equilibria.
3. Chemical modelingIn a closed vadose system of this kind, dissolution ofcarbonate rock consumes much of the available CO2, so theamount of dissolution is diminished. Calculating theequilibria is simple (overview in Garrels and Christ, 1965,p. 86–88), but convergence requires multiple successiveapproximations by computer. Professional software isavailable, but the chemistry is easily programmed by handto offer personal insight. All relevant equilibria need to beobserved, along with the charge balance (electroneutrality),and – since this is a closed system – the total mass of carbonmust remain equal to that from the initial CO2 in additionto all dissolved carbonates. Concentrations are low enoughthat the simple Debye-Hückel equation is sufficient toevaluate activity coefficients.
For this exercise, equilibrium constants were thoserecommended by Plummer and Busenburg (1982). Otherequilibrium constants were calculated from thermo-dynamic data in Faure (1998). The simplest routine is toscan the full range of pH values back and forth at decreasingintervals until all equations balance with an insignificant
error. Reconstructing the complex interactions betweenwater and gas is beyond the scope of this paper.
Figure 3 shows the result for the system described here forMammoth Cave. Note the sharp decrease in PCO2 and riseof pH as calcite dissolves. The low PCO2 accounts for therapid uptake of CO2 from the cave air, even in MammothCave, where the CO2 level is so low. Table 1 shows theeffect of initial (soil) PCO2. A value of 0.005 atm is moretypical of soil moisture in the Mammoth Cave area (Miotke,1973); and in nearby regions where soil directly overlieslimestone, PCO2 averages 0.012 atm. These calculationsassume perfectly closed systems, which are unlikely in thefield; but the rapid uptake of CO2 observed in MammothCave validates the overall process.
Figure 2. Renewed aggressiveness of capillary water emerging ina wall in Mammoth Cave after infiltration through a sandstonecap-rock. The shadow at top obscures some of the narrow inputfissure. Pen for scale.
Figure 3. Chemical evolution of infiltrating water in limestoneafter isolation from soil CO2, for initial PCO2 of 0.001 atm at15 °C. SIc =calcite saturation index = log [(Ca 2+)(CO3
2-)/Kc],where Kc = calcite equilibrium constant. Saturation is reached atSIc = 0.The odd curvatures of pH and SIc are caused by thecomplex equilibria of dissolved carbonate species.
Table 1. Final values for PCO2 and pH for closed-systemdissolution at various values of initial soil PCO2. In the field, thefinal PCO2 is likely to be larger, and pH smaller. At low initialPCO2, a 10 °C difference in temperature causes a roughly 40%difference (higher temperatures causing lower final PCO2 andhigher final pH), but the effect diminishes to less than 10% at highinitial PCO2.
Initial PCO2(atm)
Final PCO2(atm)
Final pH CaCO3 atsaturation(mmoles/L)
0.001 <10-5 9.55 0.15
0.005 0.00018 8.46 0.48
0.01 0.0010 7.96 2.63
0.05 0.023 7.08 3.80
0.1 0.061 6.80 3.11
Speleogenesis – oral 2013 ICS Proceedings
394
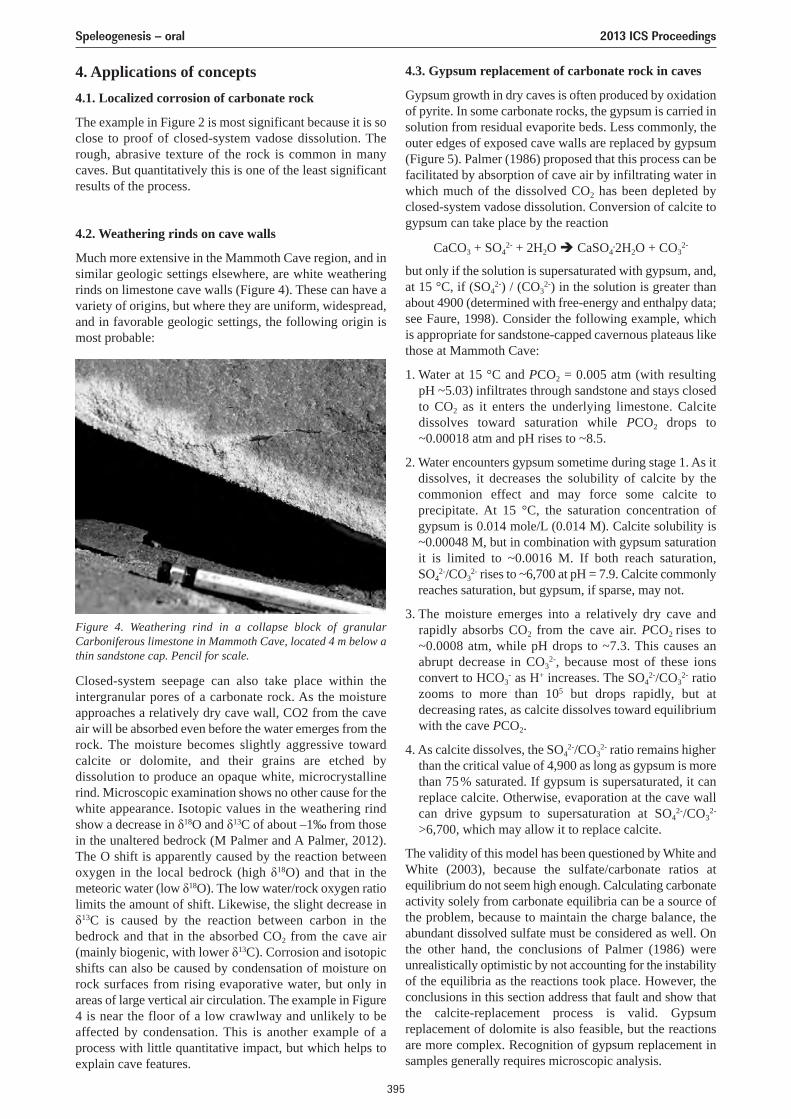
4. Applications of concepts4.1. Localized corrosion of carbonate rock
The example in Figure 2 is most significant because it is soclose to proof of closed-system vadose dissolution. Therough, abrasive texture of the rock is common in manycaves. But quantitatively this is one of the least significantresults of the process.
4.2. Weathering rinds on cave walls
Much more extensive in the Mammoth Cave region, and insimilar geologic settings elsewhere, are white weatheringrinds on limestone cave walls (Figure 4). These can have avariety of origins, but where they are uniform, widespread,and in favorable geologic settings, the following origin ismost probable:
Closed-system seepage can also take place within theintergranular pores of a carbonate rock. As the moistureapproaches a relatively dry cave wall, CO2 from the caveair will be absorbed even before the water emerges from therock. The moisture becomes slightly aggressive towardcalcite or dolomite, and their grains are etched bydissolution to produce an opaque white, microcrystallinerind. Microscopic examination shows no other cause for thewhite appearance. Isotopic values in the weathering rindshow a decrease in δ18O and δ13C of about –1‰ from thosein the unaltered bedrock (M Palmer and A Palmer, 2012).The O shift is apparently caused by the reaction betweenoxygen in the local bedrock (high δ18O) and that in themeteoric water (low δ18O). The low water/rock oxygen ratiolimits the amount of shift. Likewise, the slight decrease inδ13C is caused by the reaction between carbon in thebedrock and that in the absorbed CO2 from the cave air(mainly biogenic, with lower δ13C). Corrosion and isotopicshifts can also be caused by condensation of moisture onrock surfaces from rising evaporative water, but only inareas of large vertical air circulation. The example in Figure4 is near the floor of a low crawlway and unlikely to beaffected by condensation. This is another example of aprocess with little quantitative impact, but which helps toexplain cave features.
4.3. Gypsum replacement of carbonate rock in caves
Gypsum growth in dry caves is often produced by oxidationof pyrite. In some carbonate rocks, the gypsum is carried insolution from residual evaporite beds. Less commonly, theouter edges of exposed cave walls are replaced by gypsum(Figure 5). Palmer (1986) proposed that this process can befacilitated by absorption of cave air by infiltrating water inwhich much of the dissolved CO2 has been depleted byclosed-system vadose dissolution. Conversion of calcite togypsum can take place by the reaction
CaCO3 + SO42- + 2H2O CaSO4
.2H2O + CO32-
but only if the solution is supersaturated with gypsum, and,at 15 °C, if (SO4
2-) / (CO32-) in the solution is greater than
about 4900 (determined with free-energy and enthalpy data;see Faure, 1998). Consider the following example, whichis appropriate for sandstone-capped cavernous plateaus likethose at Mammoth Cave:
1. Water at 15 °C and PCO2 = 0.005 atm (with resulting pH ~5.03) infiltrates through sandstone and stays closedto CO2 as it enters the underlying limestone. Calcitedissolves toward saturation while PCO2 drops to~0.00018 atm and pH rises to ~8.5.
2. Water encounters gypsum sometime during stage 1. As itdissolves, it decreases the solubility of calcite by thecommonion effect and may force some calcite toprecipitate. At 15 °C, the saturation concentration ofgypsum is 0.014 mole/L (0.014 M). Calcite solubility is~0.00048 M, but in combination with gypsum saturationit is limited to ~0.0016 M. If both reach saturation,SO4
2-/CO32- rises to ~6,700 at pH = 7.9. Calcite commonly
reaches saturation, but gypsum, if sparse, may not.
3. The moisture emerges into a relatively dry cave andrapidly absorbs CO2 from the cave air. PCO2 rises to~0.0008 atm, while pH drops to ~7.3. This causes anabrupt decrease in CO3
2-, because most of these ionsconvert to HCO3
- as H+ increases. The SO42-/CO3
2- ratiozooms to more than 105 but drops rapidly, but atdecreasing rates, as calcite dissolves toward equilibriumwith the cave PCO2.
4. As calcite dissolves, the SO42-/CO3
2- ratio remains higherthan the critical value of 4,900 as long as gypsum is morethan 75% saturated. If gypsum is supersaturated, it canreplace calcite. Otherwise, evaporation at the cave wallcan drive gypsum to supersaturation at SO4
2-/CO32-
>6,700, which may allow it to replace calcite.
The validity of this model has been questioned by White andWhite (2003), because the sulfate/carbonate ratios atequilibrium do not seem high enough. Calculating carbonateactivity solely from carbonate equilibria can be a source ofthe problem, because to maintain the charge balance, theabundant dissolved sulfate must be considered as well. Onthe other hand, the conclusions of Palmer (1986) wereunrealistically optimistic by not accounting for the instabilityof the equilibria as the reactions took place. However, theconclusions in this section address that fault and show thatthe calcite-replacement process is valid. Gypsumreplacement of dolomite is also feasible, but the reactionsare more complex. Recognition of gypsum replacement insamples generally requires microscopic analysis.
Figure 4. Weathering rind in a collapse block of granularCarboniferous limestone in Mammoth Cave, located 4 m below athin sandstone cap. Pencil for scale.
Speleogenesis – oral 2013 ICS Proceedings
395
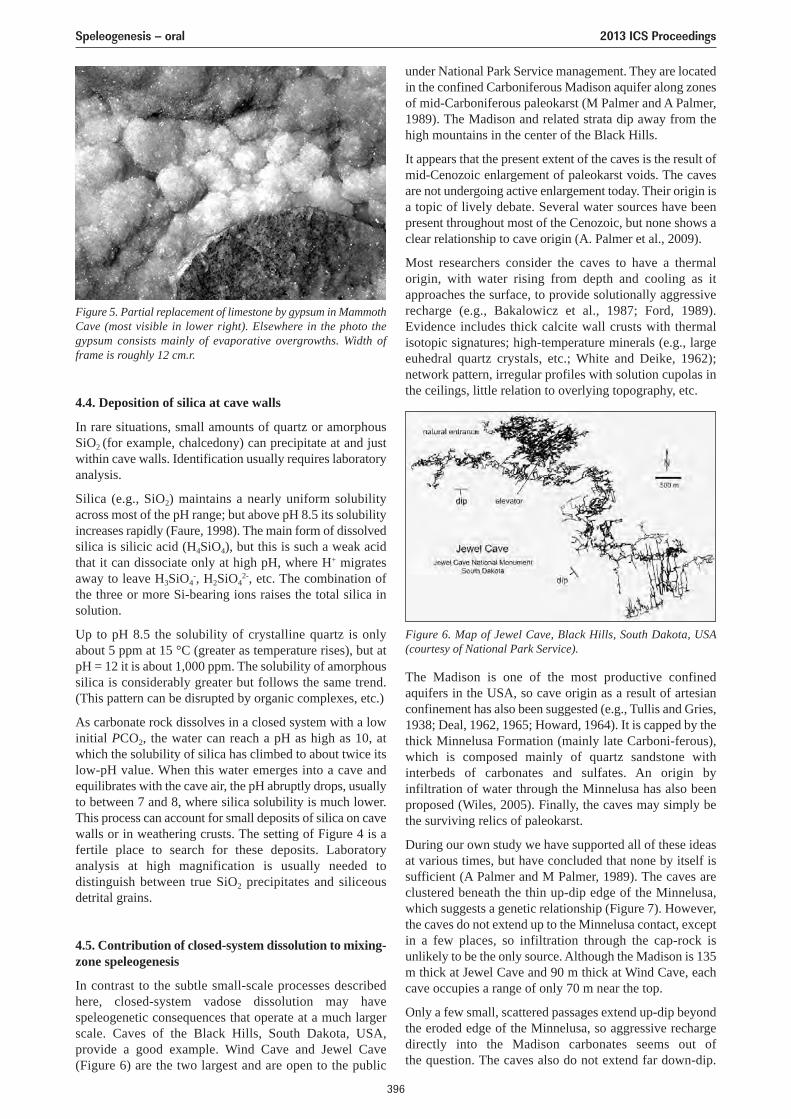
4.4. Deposition of silica at cave walls
In rare situations, small amounts of quartz or amorphousSiO2 (for example, chalcedony) can precipitate at and justwithin cave walls. Identification usually requires laboratoryanalysis.
Silica (e.g., SiO2) maintains a nearly uniform solubilityacross most of the pH range; but above pH 8.5 its solubilityincreases rapidly (Faure, 1998). The main form of dissolvedsilica is silicic acid (H4SiO4), but this is such a weak acidthat it can dissociate only at high pH, where H+ migratesaway to leave H3SiO4
-, H2SiO42-, etc. The combination of
the three or more Si-bearing ions raises the total silica insolution.
Up to pH 8.5 the solubility of crystalline quartz is onlyabout 5 ppm at 15 °C (greater as temperature rises), but atpH = 12 it is about 1,000 ppm. The solubility of amorphoussilica is considerably greater but follows the same trend.(This pattern can be disrupted by organic complexes, etc.)
As carbonate rock dissolves in a closed system with a lowinitial PCO2, the water can reach a pH as high as 10, atwhich the solubility of silica has climbed to about twice itslow-pH value. When this water emerges into a cave andequilibrates with the cave air, the pH abruptly drops, usuallyto between 7 and 8, where silica solubility is much lower.This process can account for small deposits of silica on cavewalls or in weathering crusts. The setting of Figure 4 is afertile place to search for these deposits. Laboratoryanalysis at high magnification is usually needed todistinguish between true SiO2 precipitates and siliceousdetrital grains.
4.5. Contribution of closed-system dissolution to mixing-zone speleogenesis
In contrast to the subtle small-scale processes describedhere, closed-system vadose dissolution may havespeleogenetic consequences that operate at a much largerscale. Caves of the Black Hills, South Dakota, USA,provide a good example. Wind Cave and Jewel Cave(Figure 6) are the two largest and are open to the public
under National Park Service management. They are locatedin the confined Carboniferous Madison aquifer along zonesof mid-Carboniferous paleokarst (M Palmer and A Palmer,1989). The Madison and related strata dip away from thehigh mountains in the center of the Black Hills.
It appears that the present extent of the caves is the result ofmid-Cenozoic enlargement of paleokarst voids. The cavesare not undergoing active enlargement today. Their origin isa topic of lively debate. Several water sources have beenpresent throughout most of the Cenozoic, but none shows aclear relationship to cave origin (A. Palmer et al., 2009).
Most researchers consider the caves to have a thermalorigin, with water rising from depth and cooling as itapproaches the surface, to provide solutionally aggressiverecharge (e.g., Bakalowicz et al., 1987; Ford, 1989).Evidence includes thick calcite wall crusts with thermalisotopic signatures; high-temperature minerals (e.g., largeeuhedral quartz crystals, etc.; White and Deike, 1962);network pattern, irregular profiles with solution cupolas inthe ceilings, little relation to overlying topography, etc.
Figure 6. Map of Jewel Cave, Black Hills, South Dakota, USA(courtesy of National Park Service).
The Madison is one of the most productive confinedaquifers in the USA, so cave origin as a result of artesianconfinement has also been suggested (e.g., Tullis and Gries,1938; Deal, 1962, 1965; Howard, 1964). It is capped by thethick Minnelusa Formation (mainly late Carboni-ferous),which is composed mainly of quartz sandstone withinterbeds of carbonates and sulfates. An origin byinfiltration of water through the Minnelusa has also beenproposed (Wiles, 2005). Finally, the caves may simply bethe surviving relics of paleokarst.
During our own study we have supported all of these ideasat various times, but have concluded that none by itself issufficient (A Palmer and M Palmer, 1989). The caves areclustered beneath the thin up-dip edge of the Minnelusa,which suggests a genetic relationship (Figure 7). However,the caves do not extend up to the Minnelusa contact, exceptin a few places, so infiltration through the cap-rock isunlikely to be the only source. Although the Madison is 135m thick at Jewel Cave and 90 m thick at Wind Cave, eachcave occupies a range of only 70 m near the top.
Only a few small, scattered passages extend up-dip beyondthe eroded edge of the Minnelusa, so aggressive rechargedirectly into the Madison carbonates seems out of the question. The caves also do not extend far down-dip.
Figure 5. Partial replacement of limestone by gypsum in MammothCave (most visible in lower right). Elsewhere in the photo thegypsum consists mainly of evaporative overgrowths. Width offrame is roughly 12 cm.r.
Speleogenesis – oral 2013 ICS Proceedings
396
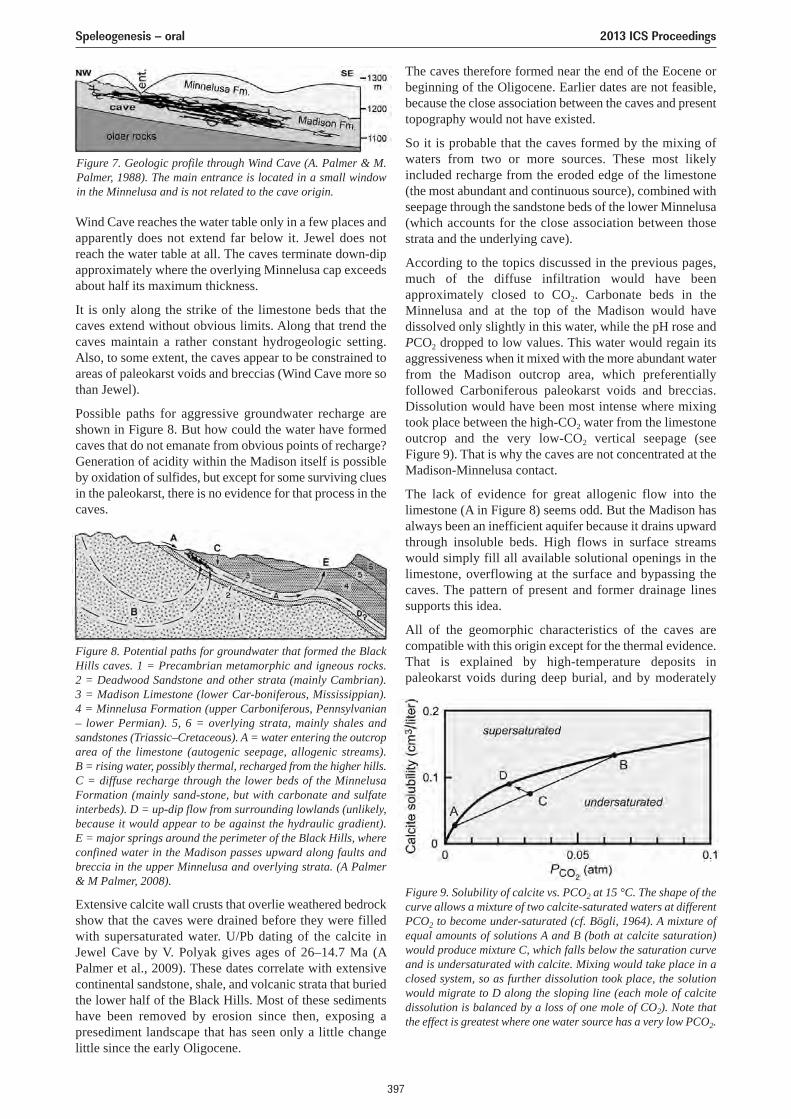
Wind Cave reaches the water table only in a few places andapparently does not extend far below it. Jewel does notreach the water table at all. The caves terminate down-dipapproximately where the overlying Minnelusa cap exceedsabout half its maximum thickness.
It is only along the strike of the limestone beds that thecaves extend without obvious limits. Along that trend thecaves maintain a rather constant hydrogeologic setting.Also, to some extent, the caves appear to be constrained toareas of paleokarst voids and breccias (Wind Cave more sothan Jewel).
Possible paths for aggressive groundwater recharge areshown in Figure 8. But how could the water have formedcaves that do not emanate from obvious points of recharge?Generation of acidity within the Madison itself is possibleby oxidation of sulfides, but except for some surviving cluesin the paleokarst, there is no evidence for that process in thecaves.
The caves therefore formed near the end of the Eocene orbeginning of the Oligocene. Earlier dates are not feasible,because the close association between the caves and presenttopography would not have existed.
So it is probable that the caves formed by the mixing ofwaters from two or more sources. These most likelyincluded recharge from the eroded edge of the limestone(the most abundant and continuous source), combined withseepage through the sandstone beds of the lower Minnelusa(which accounts for the close association between thosestrata and the underlying cave).
According to the topics discussed in the previous pages,much of the diffuse infiltration would have beenapproximately closed to CO2. Carbonate beds in theMinnelusa and at the top of the Madison would havedissolved only slightly in this water, while the pH rose andPCO2 dropped to low values. This water would regain itsaggressiveness when it mixed with the more abundant waterfrom the Madison outcrop area, which preferentiallyfollowed Carboniferous paleokarst voids and breccias.Dissolution would have been most intense where mixingtook place between the high-CO2 water from the limestoneoutcrop and the very low-CO2 vertical seepage (seeFigure 9). That is why the caves are not concentrated at theMadison-Minnelusa contact.
The lack of evidence for great allogenic flow into thelimestone (A in Figure 8) seems odd. But the Madison hasalways been an inefficient aquifer because it drains upwardthrough insoluble beds. High flows in surface streamswould simply fill all available solutional openings in thelimestone, overflowing at the surface and bypassing thecaves. The pattern of present and former drainage linessupports this idea.
All of the geomorphic characteristics of the caves arecompatible with this origin except for the thermal evidence.That is explained by high-temperature deposits inpaleokarst voids during deep burial, and by moderately
Figure 8. Potential paths for groundwater that formed the BlackHills caves. 1 = Precambrian metamorphic and igneous rocks. 2 = Deadwood Sandstone and other strata (mainly Cambrian). 3 = Madison Limestone (lower Car-boniferous, Mississippian). 4 = Minnelusa Formation (upper Carboniferous, Pennsylvanian– lower Permian). 5, 6 = overlying strata, mainly shales andsandstones (Triassic–Cretaceous). A = water entering the outcroparea of the limestone (autogenic seepage, allogenic streams). B = rising water, possibly thermal, recharged from the higher hills.C = diffuse recharge through the lower beds of the MinnelusaFormation (mainly sand-stone, but with carbonate and sulfateinterbeds). D = up-dip flow from surrounding lowlands (unlikely,because it would appear to be against the hydraulic gradient). E = major springs around the perimeter of the Black Hills, whereconfined water in the Madison passes upward along faults andbreccia in the upper Minnelusa and overlying strata. (A Palmer& M Palmer, 2008).
Figure 9. Solubility of calcite vs. PCO2 at 15 °C. The shape of thecurve allows a mixture of two calcite-saturated waters at differentPCO2 to become under-saturated (cf. Bögli, 1964). A mixture ofequal amounts of solutions A and B (both at calcite saturation)would produce mixture C, which falls below the saturation curveand is undersaturated with calcite. Mixing would take place in aclosed system, so as further dissolution took place, the solutionwould migrate to D along the sloping line (each mole of calcitedissolution is balanced by a loss of one mole of CO2). Note thatthe effect is greatest where one water source has a very low PCO2.
Extensive calcite wall crusts that overlie weathered bedrockshow that the caves were drained before they were filledwith supersaturated water. U/Pb dating of the calcite inJewel Cave by V. Polyak gives ages of 26–14.7 Ma (APalmer et al., 2009). These dates correlate with extensivecontinental sandstone, shale, and volcanic strata that buriedthe lower half of the Black Hills. Most of these sedimentshave been removed by erosion since then, exposing apresediment landscape that has seen only a little changelittle since the early Oligocene.
Figure 7. Geologic profile through Wind Cave (A. Palmer & M.Palmer, 1988). The main entrance is located in a small windowin the Minnelusa and is not related to the cave origin.
Speleogenesis – oral 2013 ICS Proceedings
397
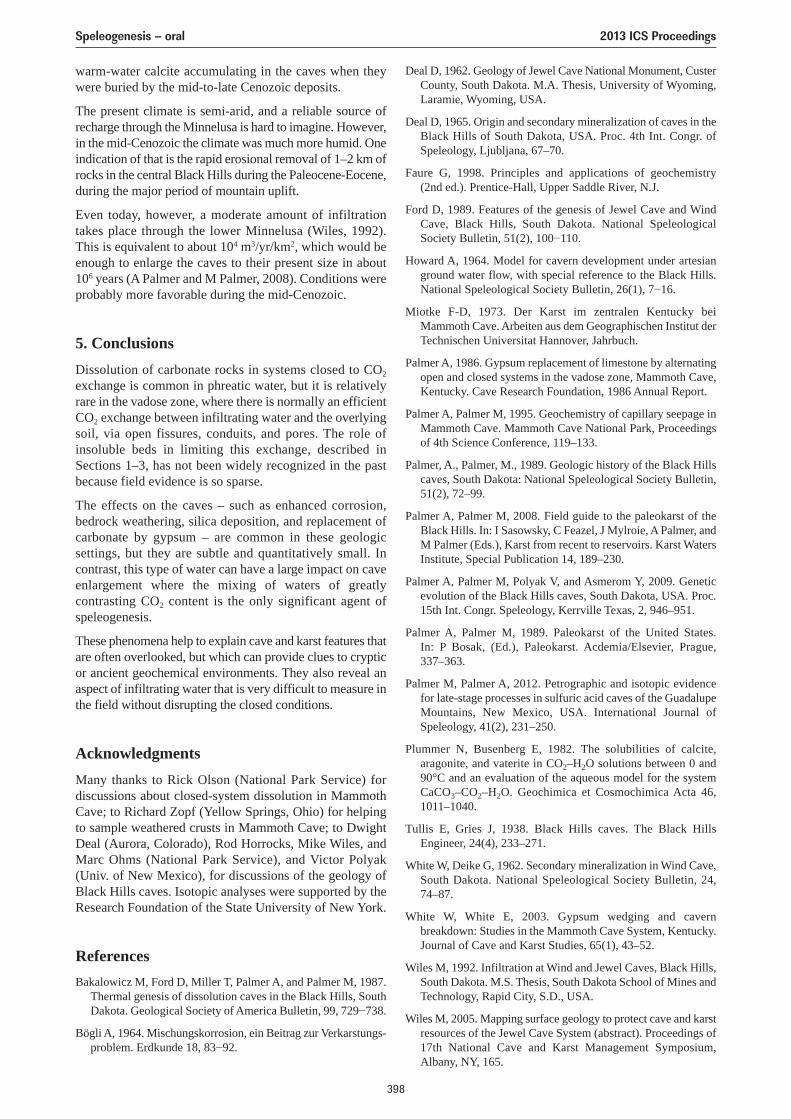
warm-water calcite accumulating in the caves when theywere buried by the mid-to-late Cenozoic deposits.
The present climate is semi-arid, and a reliable source ofrecharge through the Minnelusa is hard to imagine. However,in the mid-Cenozoic the climate was much more humid. Oneindication of that is the rapid erosional removal of 1–2 km ofrocks in the central Black Hills during the Paleocene-Eocene,during the major period of mountain uplift.
Even today, however, a moderate amount of infiltrationtakes place through the lower Minnelusa (Wiles, 1992).This is equivalent to about 104 m3/yr/km2, which would beenough to enlarge the caves to their present size in about106 years (A Palmer and M Palmer, 2008). Conditions wereprobably more favorable during the mid-Cenozoic.
5. ConclusionsDissolution of carbonate rocks in systems closed to CO2
exchange is common in phreatic water, but it is relativelyrare in the vadose zone, where there is normally an efficientCO2 exchange between infiltrating water and the overlyingsoil, via open fissures, conduits, and pores. The role ofinsoluble beds in limiting this exchange, described inSections 1–3, has not been widely recognized in the pastbecause field evidence is so sparse.
The effects on the caves – such as enhanced corrosion,bedrock weathering, silica deposition, and replacement ofcarbonate by gypsum – are common in these geologicsettings, but they are subtle and quantitatively small. Incontrast, this type of water can have a large impact on caveenlargement where the mixing of waters of greatlycontrasting CO2 content is the only significant agent ofspeleogenesis.
These phenomena help to explain cave and karst features thatare often overlooked, but which can provide clues to crypticor ancient geochemical environments. They also reveal anaspect of infiltrating water that is very difficult to measure inthe field without disrupting the closed conditions.
AcknowledgmentsMany thanks to Rick Olson (National Park Service) fordiscussions about closed-system dissolution in MammothCave; to Richard Zopf (Yellow Springs, Ohio) for helpingto sample weathered crusts in Mammoth Cave; to DwightDeal (Aurora, Colorado), Rod Horrocks, Mike Wiles, andMarc Ohms (National Park Service), and Victor Polyak(Univ. of New Mexico), for discussions of the geology ofBlack Hills caves. Isotopic analyses were supported by theResearch Foundation of the State University of New York.
ReferencesBakalowicz M, Ford D, Miller T, Palmer A, and Palmer M, 1987.
Thermal genesis of dissolution caves in the Black Hills, SouthDakota. Geological Society of America Bulletin, 99, 729−738.
Bögli A, 1964. Mischungskorrosion, ein Beitrag zur Verkarstungs-problem. Erdkunde 18, 83−92.
Deal D, 1962. Geology of Jewel Cave National Monument, CusterCounty, South Dakota. M.A. Thesis, University of Wyoming,Laramie, Wyoming, USA.
Deal D, 1965. Origin and secondary mineralization of caves in theBlack Hills of South Dakota, USA. Proc. 4th Int. Congr. ofSpeleology, Ljubljana, 67–70.
Faure G, 1998. Principles and applications of geochemistry (2nd ed.). Prentice-Hall, Upper Saddle River, N.J.
Ford D, 1989. Features of the genesis of Jewel Cave and WindCave, Black Hills, South Dakota. National SpeleologicalSociety Bulletin, 51(2), 100−110.
Howard A, 1964. Model for cavern development under artesianground water flow, with special reference to the Black Hills.National Speleological Society Bulletin, 26(1), 7−16.
Miotke F-D, 1973. Der Karst im zentralen Kentucky beiMammoth Cave. Arbeiten aus dem Geographischen Institut derTechnischen Universitat Hannover, Jahrbuch.
Palmer A, 1986. Gypsum replacement of limestone by alternatingopen and closed systems in the vadose zone, Mammoth Cave,Kentucky. Cave Research Foundation, 1986 Annual Report.
Palmer A, Palmer M, 1995. Geochemistry of capillary seepage inMammoth Cave. Mammoth Cave National Park, Proceedingsof 4th Science Conference, 119–133.
Palmer, A., Palmer, M., 1989. Geologic history of the Black Hillscaves, South Dakota: National Speleological Society Bulletin,51(2), 72–99.
Palmer A, Palmer M, 2008. Field guide to the paleokarst of theBlack Hills. In: I Sasowsky, C Feazel, J Mylroie, A Palmer, andM Palmer (Eds.), Karst from recent to reservoirs. Karst WatersInstitute, Special Publication 14, 189–230.
Palmer A, Palmer M, Polyak V, and Asmerom Y, 2009. Geneticevolution of the Black Hills caves, South Dakota, USA. Proc.15th Int. Congr. Speleology, Kerrville Texas, 2, 946–951.
Palmer A, Palmer M, 1989. Paleokarst of the United States.In: P Bosak, (Ed.), Paleokarst. Acdemia/Elsevier, Prague,337–363.
Palmer M, Palmer A, 2012. Petrographic and isotopic evidencefor late-stage processes in sulfuric acid caves of the GuadalupeMountains, New Mexico, USA. International Journal ofSpeleology, 41(2), 231–250.
Plummer N, Busenberg E, 1982. The solubilities of calcite,aragonite, and vaterite in CO2–H2O solutions between 0 and90°C and an evaluation of the aqueous model for the systemCaCO3–CO2–H2O. Geochimica et Cosmochimica Acta 46,1011–1040.
Tullis E, Gries J, 1938. Black Hills caves. The Black HillsEngineer, 24(4), 233–271.
White W, Deike G, 1962. Secondary mineralization in Wind Cave,South Dakota. National Speleological Society Bulletin, 24,74–87.
White W, White E, 2003. Gypsum wedging and cavernbreakdown: Studies in the Mammoth Cave System, Kentucky.Journal of Cave and Karst Studies, 65(1), 43–52.
Wiles M, 1992. Infiltration at Wind and Jewel Caves, Black Hills,South Dakota. M.S. Thesis, South Dakota School of Mines andTechnology, Rapid City, S.D., USA.
Wiles M, 2005. Mapping surface geology to protect cave and karstresources of the Jewel Cave System (abstract). Proceedings of17th National Cave and Karst Management Symposium,Albany, NY, 165.
Speleogenesis – oral 2013 ICS Proceedings
398
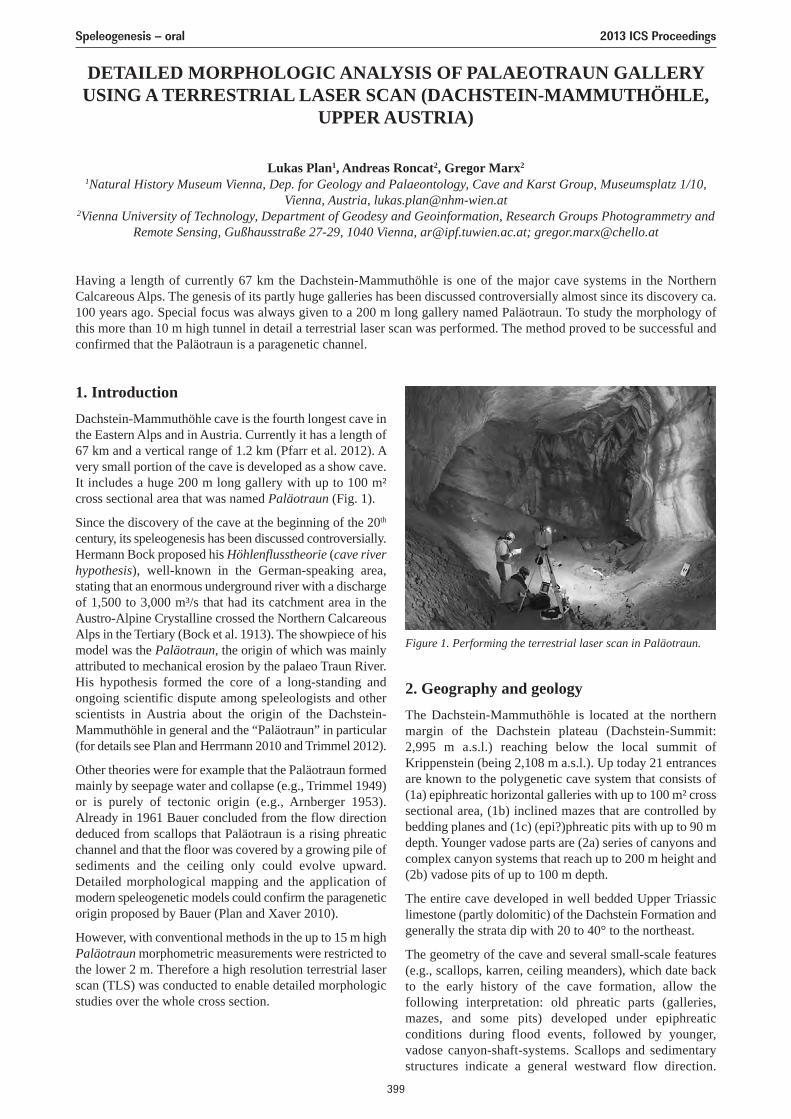
DETAILED MORPHOLOGIC ANALYSIS OF PALAEOTRAUN GALLERYUSING A TERRESTRIAL LASER SCAN (DACHSTEIN-MAMMUTHÖHLE,
UPPER AUSTRIA)
Lukas Plan1, Andreas Roncat2, Gregor Marx2
1Natural History Museum Vienna, Dep. for Geology and Palaeontology, Cave and Karst Group, Museumsplatz 1/10,Vienna, Austria, [email protected]
2Vienna University of Technology, Department of Geodesy and Geoinformation, Research Groups Photogrammetry andRemote Sensing, Gußhausstraße 27-29, 1040 Vienna, [email protected]; [email protected]
Having a length of currently 67 km the Dachstein-Mammuthöhle is one of the major cave systems in the NorthernCalcareous Alps. The genesis of its partly huge galleries has been discussed controversially almost since its discovery ca.100 years ago. Special focus was always given to a 200 m long gallery named Paläotraun. To study the morphology ofthis more than 10 m high tunnel in detail a terrestrial laser scan was performed. The method proved to be successful andconfirmed that the Paläotraun is a paragenetic channel.
1. IntroductionDachstein-Mammuthöhle cave is the fourth longest cave inthe Eastern Alps and in Austria. Currently it has a length of67 km and a vertical range of 1.2 km (Pfarr et al. 2012). Avery small portion of the cave is developed as a show cave.It includes a huge 200 m long gallery with up to 100 m²cross sectional area that was named Paläotraun (Fig. 1).
Since the discovery of the cave at the beginning of the 20th
century, its speleogenesis has been discussed controversially.Hermann Bock proposed his Höhlenflusstheorie (cave riverhypothesis), well-known in the German-speaking area,stating that an enormous underground river with a dischargeof 1,500 to 3,000 m³/s that had its catchment area in theAustro-Alpine Crystalline crossed the Northern CalcareousAlps in the Tertiary (Bock et al. 1913). The showpiece of hismodel was the Paläotraun, the origin of which was mainlyattributed to mechanical erosion by the palaeo Traun River.His hypothesis formed the core of a long-standing andongoing scientific dispute among speleologists and otherscientists in Austria about the origin of the Dachstein-Mammuthöhle in general and the “Paläotraun” in particular(for details see Plan and Herrmann 2010 and Trimmel 2012).
Other theories were for example that the Paläotraun formedmainly by seepage water and collapse (e.g., Trimmel 1949)or is purely of tectonic origin (e.g., Arnberger 1953).Already in 1961 Bauer concluded from the flow directiondeduced from scallops that Paläotraun is a rising phreaticchannel and that the floor was covered by a growing pile ofsediments and the ceiling only could evolve upward.Detailed morphological mapping and the application ofmodern speleogenetic models could confirm the parageneticorigin proposed by Bauer (Plan and Xaver 2010).
However, with conventional methods in the up to 15 m highPaläotraun morphometric measurements were restricted tothe lower 2 m. Therefore a high resolution terrestrial laserscan (TLS) was conducted to enable detailed morphologicstudies over the whole cross section.
2. Geography and geologyThe Dachstein-Mammuthöhle is located at the northernmargin of the Dachstein plateau (Dachstein-Summit:2,995 m a.s.l.) reaching below the local summit ofKrippenstein (being 2,108 m a.s.l.). Up today 21 entrancesare known to the polygenetic cave system that consists of(1a) epiphreatic horizontal galleries with up to 100 m² crosssectional area, (1b) inclined mazes that are controlled bybedding planes and (1c) (epi?)phreatic pits with up to 90 mdepth. Younger vadose parts are (2a) series of canyons andcomplex canyon systems that reach up to 200 m height and(2b) vadose pits of up to 100 m depth.
The entire cave developed in well bedded Upper Triassiclimestone (partly dolomitic) of the Dachstein Formation andgenerally the strata dip with 20 to 40° to the northeast.
The geometry of the cave and several small-scale features(e.g., scallops, karren, ceiling meanders), which date backto the early history of the cave formation, allow thefollowing interpretation: old phreatic parts (galleries,mazes, and some pits) developed under epiphreaticconditions during flood events, followed by younger,vadose canyon-shaft-systems. Scallops and sedimentarystructures indicate a general westward flow direction.
Figure 1. Performing the terrestrial laser scan in Paläotraun.
Speleogenesis – oral 2013 ICS Proceedings
399
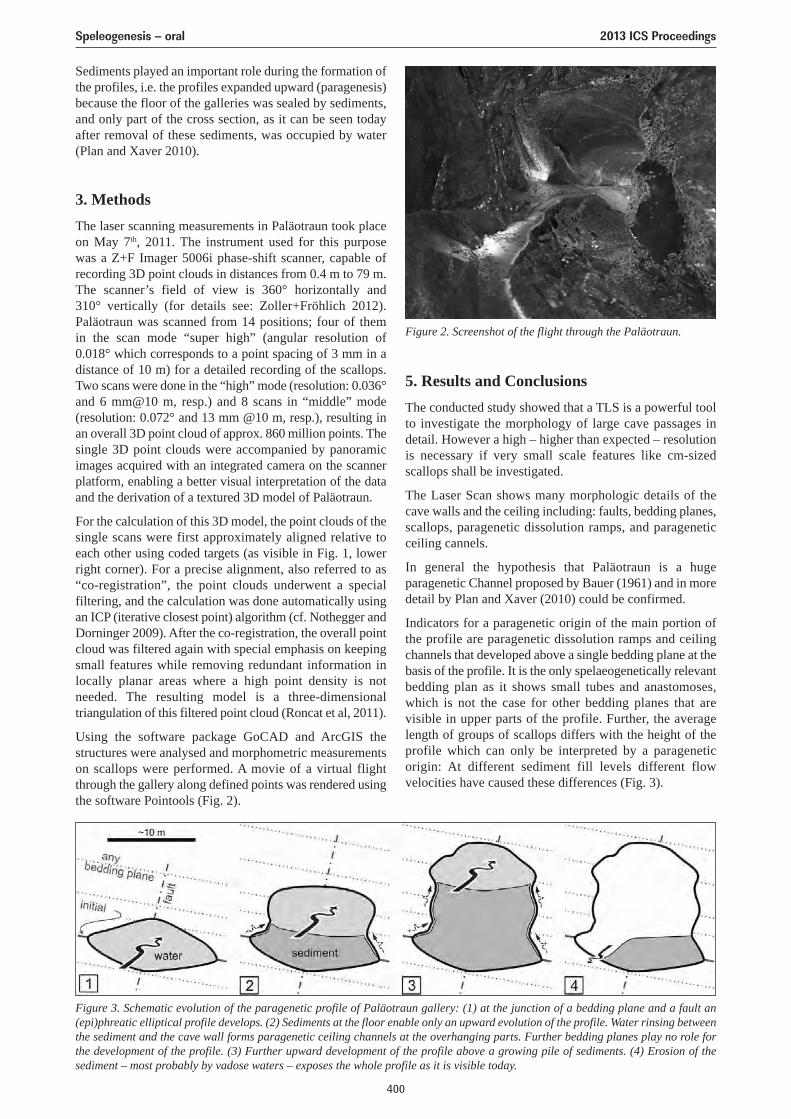
Sediments played an important role during the formation ofthe profiles, i.e. the profiles expanded upward (paragenesis)because the floor of the galleries was sealed by sediments,and only part of the cross section, as it can be seen todayafter removal of these sediments, was occupied by water(Plan and Xaver 2010).
3. MethodsThe laser scanning measurements in Paläotraun took placeon May 7th, 2011. The instrument used for this purpose was a Z+F Imager 5006i phase-shift scanner, capable ofrecording 3D point clouds in distances from 0.4 m to 79 m.The scanner’s field of view is 360° horizontally and 310° vertically (for details see: Zoller+Fröhlich 2012).Paläotraun was scanned from 14 positions; four of them in the scan mode “super high” (angular resolution of 0.018° which corresponds to a point spacing of 3 mm in adistance of 10 m) for a detailed recording of the scallops.Two scans were done in the “high” mode (resolution: 0.036°and 6 mm@10 m, resp.) and 8 scans in “middle” mode(resolution: 0.072° and 13 mm @10 m, resp.), resulting inan overall 3D point cloud of approx. 860 million points. Thesingle 3D point clouds were accompanied by panoramicimages acquired with an integrated camera on the scannerplatform, enabling a better visual interpretation of the dataand the derivation of a textured 3D model of Paläotraun.
For the calculation of this 3D model, the point clouds of thesingle scans were first approximately aligned relative toeach other using coded targets (as visible in Fig. 1, lowerright corner). For a precise alignment, also referred to as“co-registration”, the point clouds underwent a specialfiltering, and the calculation was done automatically usingan ICP (iterative closest point) algorithm (cf. Nothegger andDorninger 2009). After the co-registration, the overall pointcloud was filtered again with special emphasis on keepingsmall features while removing redundant information inlocally planar areas where a high point density is notneeded. The resulting model is a three-dimensionaltriangulation of this filtered point cloud (Roncat et al, 2011).
Using the software package GoCAD and ArcGIS thestructures were analysed and morphometric measurementson scallops were performed. A movie of a virtual flightthrough the gallery along defined points was rendered usingthe software Pointools (Fig. 2).
5. Results and ConclusionsThe conducted study showed that a TLS is a powerful toolto investigate the morphology of large cave passages indetail. However a high – higher than expected – resolutionis necessary if very small scale features like cm-sizedscallops shall be investigated.
The Laser Scan shows many morphologic details of thecave walls and the ceiling including: faults, bedding planes,scallops, paragenetic dissolution ramps, and parageneticceiling cannels.
In general the hypothesis that Paläotraun is a hugeparagenetic Channel proposed by Bauer (1961) and in moredetail by Plan and Xaver (2010) could be confirmed.
Indicators for a paragenetic origin of the main portion ofthe profile are paragenetic dissolution ramps and ceilingchannels that developed above a single bedding plane at thebasis of the profile. It is the only spelaeogenetically relevantbedding plan as it shows small tubes and anastomoses,which is not the case for other bedding planes that arevisible in upper parts of the profile. Further, the averagelength of groups of scallops differs with the height of theprofile which can only be interpreted by a parageneticorigin: At different sediment fill levels different flowvelocities have caused these differences (Fig. 3).
Figure 2. Screenshot of the flight through the Paläotraun.
Figure 3. Schematic evolution of the paragenetic profile of Paläotraun gallery: (1) at the junction of a bedding plane and a fault an(epi)phreatic elliptical profile develops. (2) Sediments at the floor enable only an upward evolution of the profile. Water rinsing betweenthe sediment and the cave wall forms paragenetic ceiling channels at the overhanging parts. Further bedding planes play no role forthe development of the profile. (3) Further upward development of the profile above a growing pile of sediments. (4) Erosion of thesediment – most probably by vadose waters – exposes the whole profile as it is visible today.
Speleogenesis – oral 2013 ICS Proceedings
400
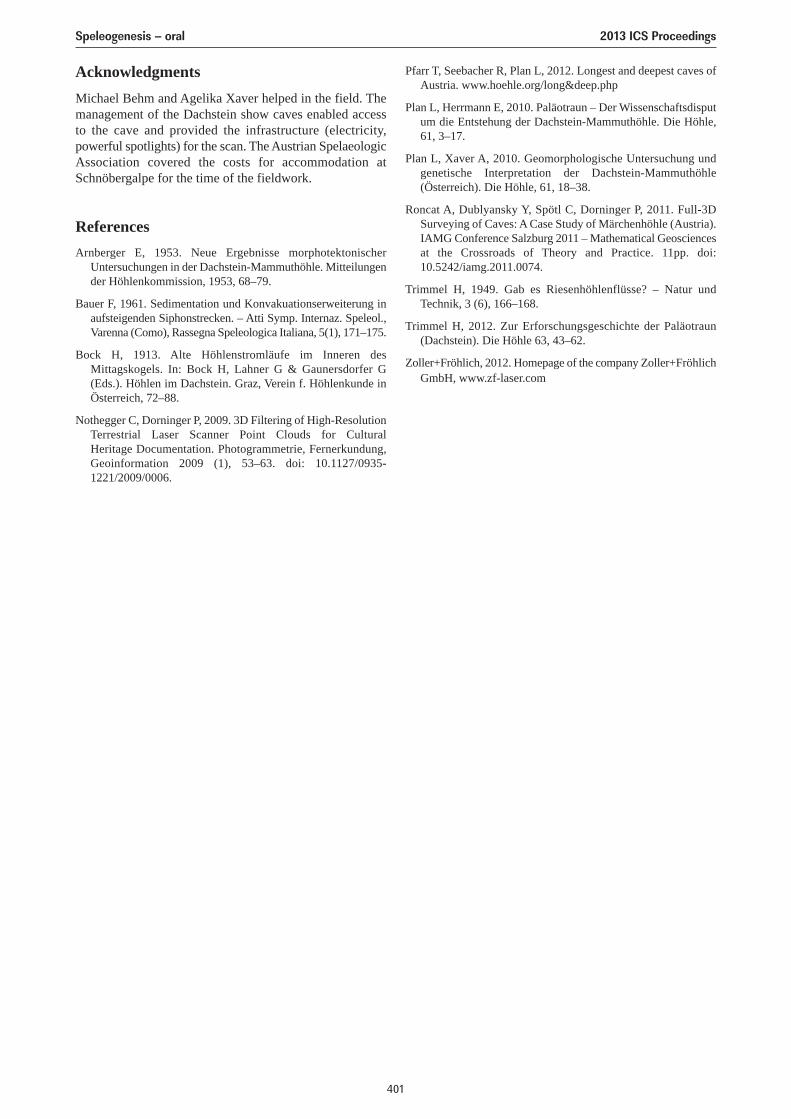
AcknowledgmentsMichael Behm and Agelika Xaver helped in the field. Themanagement of the Dachstein show caves enabled accessto the cave and provided the infrastructure (electricity,powerful spotlights) for the scan. The Austrian SpelaeologicAssociation covered the costs for accommodation atSchnöbergalpe for the time of the fieldwork.
ReferencesArnberger E, 1953. Neue Ergebnisse morphotektonischer
Untersuchungen in der Dachstein-Mammuthöhle. Mitteilungender Höhlenkommission, 1953, 68–79.
Bauer F, 1961. Sedimentation und Konvakuationserweiterung inaufsteigenden Siphonstrecken. – Atti Symp. Internaz. Speleol.,Varenna (Como), Rassegna Speleologica Italiana, 5(1), 171–175.
Bock H, 1913. Alte Höhlenstromläufe im Inneren desMittagskogels. In: Bock H, Lahner G & Gaunersdorfer G(Eds.). Höhlen im Dachstein. Graz, Verein f. Höhlenkunde inÖsterreich, 72–88.
Nothegger C, Dorninger P, 2009. 3D Filtering of High-ResolutionTerrestrial Laser Scanner Point Clouds for Cultural Heritage Documentation. Photogrammetrie, Fernerkundung,Geoinformation 2009 (1), 53–63. doi: 10.1127/0935-1221/2009/0006.
Pfarr T, Seebacher R, Plan L, 2012. Longest and deepest caves ofAustria. www.hoehle.org/long&deep.php
Plan L, Herrmann E, 2010. Paläotraun – Der Wissenschaftsdisputum die Entstehung der Dachstein-Mammuthöhle. Die Höhle,61, 3–17.
Plan L, Xaver A, 2010. Geomorphologische Untersuchung undgenetische Interpretation der Dachstein-Mammuthöhle(Österreich). Die Höhle, 61, 18–38.
Roncat A, Dublyansky Y, Spötl C, Dorninger P, 2011. Full-3DSurveying of Caves: A Case Study of Märchenhöhle (Austria).IAMG Conference Salzburg 2011 – Mathematical Geosciencesat the Crossroads of Theory and Practice. 11pp. doi:10.5242/iamg.2011.0074.
Trimmel H, 1949. Gab es Riesenhöhlenflüsse? – Natur undTechnik, 3 (6), 166–168.
Trimmel H, 2012. Zur Erforschungsgeschichte der Paläotraun(Dachstein). Die Höhle 63, 43–62.
Zoller+Fröhlich, 2012. Homepage of the company Zoller+FröhlichGmbH, www.zf-laser.com
Speleogenesis – oral 2013 ICS Proceedings
401
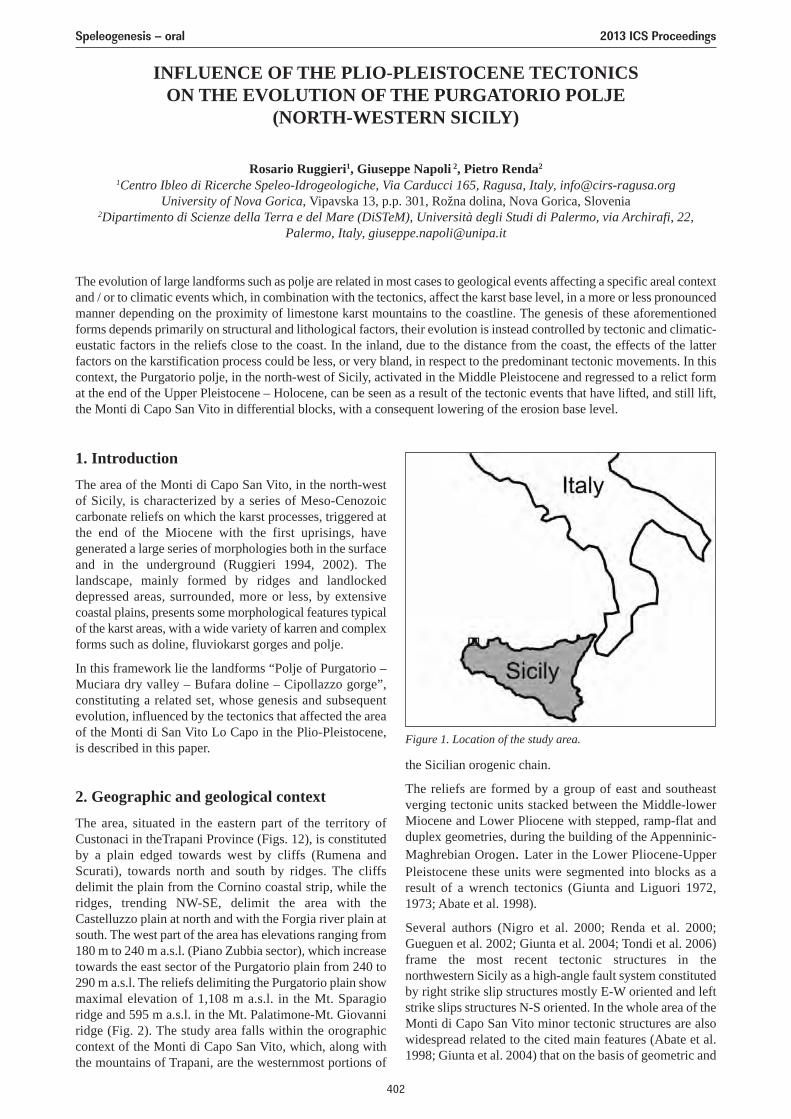
INFLUENCE OF THE PLIO-PLEISTOCENE TECTONICSON THE EVOLUTION OF THE PURGATORIO POLJE
(NORTH-WESTERN SICILY)
Rosario Ruggieri1, Giuseppe Napoli 2, Pietro Renda2
1Centro Ibleo di Ricerche Speleo-Idrogeologiche, Via Carducci 165, Ragusa, Italy, [email protected] of Nova Gorica, Vipavska 13, p.p. 301, Rožna dolina, Nova Gorica, Slovenia
2Dipartimento di Scienze della Terra e del Mare (DiSTeM), Università degli Studi di Palermo, via Archirafi, 22,Palermo, Italy, [email protected]
The evolution of large landforms such as polje are related in most cases to geological events affecting a specific areal contextand / or to climatic events which, in combination with the tectonics, affect the karst base level, in a more or less pronouncedmanner depending on the proximity of limestone karst mountains to the coastline. The genesis of these aforementionedforms depends primarily on structural and lithological factors, their evolution is instead controlled by tectonic and climatic-eustatic factors in the reliefs close to the coast. In the inland, due to the distance from the coast, the effects of the latterfactors on the karstification process could be less, or very bland, in respect to the predominant tectonic movements. In thiscontext, the Purgatorio polje, in the north-west of Sicily, activated in the Middle Pleistocene and regressed to a relict format the end of the Upper Pleistocene – Holocene, can be seen as a result of the tectonic events that have lifted, and still lift,the Monti di Capo San Vito in differential blocks, with a consequent lowering of the erosion base level.
1. IntroductionThe area of the Monti di Capo San Vito, in the north-westof Sicily, is characterized by a series of Meso-Cenozoiccarbonate reliefs on which the karst processes, triggered atthe end of the Miocene with the first uprisings, havegenerated a large series of morphologies both in the surfaceand in the underground (Ruggieri 1994, 2002). Thelandscape, mainly formed by ridges and landlockeddepressed areas, surrounded, more or less, by extensivecoastal plains, presents some morphological features typicalof the karst areas, with a wide variety of karren and complexforms such as doline, fluviokarst gorges and polje.
In this framework lie the landforms “Polje of Purgatorio –Muciara dry valley – Bufara doline – Cipollazzo gorge”,constituting a related set, whose genesis and subsequentevolution, influenced by the tectonics that affected the areaof the Monti di San Vito Lo Capo in the Plio-Pleistocene,is described in this paper.
2. Geographic and geological contextThe area, situated in the eastern part of the territory ofCustonaci in theTrapani Province (Figs. 12), is constitutedby a plain edged towards west by cliffs (Rumena andScurati), towards north and south by ridges. The cliffsdelimit the plain from the Cornino coastal strip, while theridges, trending NW-SE, delimit the area with theCastelluzzo plain at north and with the Forgia river plain atsouth. The west part of the area has elevations ranging from180 m to 240 m a.s.l. (Piano Zubbia sector), which increasetowards the east sector of the Purgatorio plain from 240 to290 m a.s.l. The reliefs delimiting the Purgatorio plain showmaximal elevation of 1,108 m a.s.l. in the Mt. Sparagioridge and 595 m a.s.l. in the Mt. Palatimone-Mt. Giovanniridge (Fig. 2). The study area falls within the orographiccontext of the Monti di Capo San Vito, which, along withthe mountains of Trapani, are the westernmost portions of
the Sicilian orogenic chain.
The reliefs are formed by a group of east and southeastverging tectonic units stacked between the Middle-lowerMiocene and Lower Pliocene with stepped, ramp-flat andduplex geometries, during the building of the Appenninic-Maghrebian Orogen. Later in the Lower Pliocene-UpperPleistocene these units were segmented into blocks as aresult of a wrench tectonics (Giunta and Liguori 1972,1973; Abate et al. 1998).
Several authors (Nigro et al. 2000; Renda et al. 2000;Gueguen et al. 2002; Giunta et al. 2004; Tondi et al. 2006)frame the most recent tectonic structures in thenorthwestern Sicily as a high-angle fault system constitutedby right strike slip structures mostly E-W oriented and leftstrike slips structures N-S oriented. In the whole area of theMonti di Capo San Vito minor tectonic structures are alsowidespread related to the cited main features (Abate et al.1998; Giunta et al. 2004) that on the basis of geometric and
Figure 1. Location of the study area.
Speleogenesis – oral 2013 ICS Proceedings
402
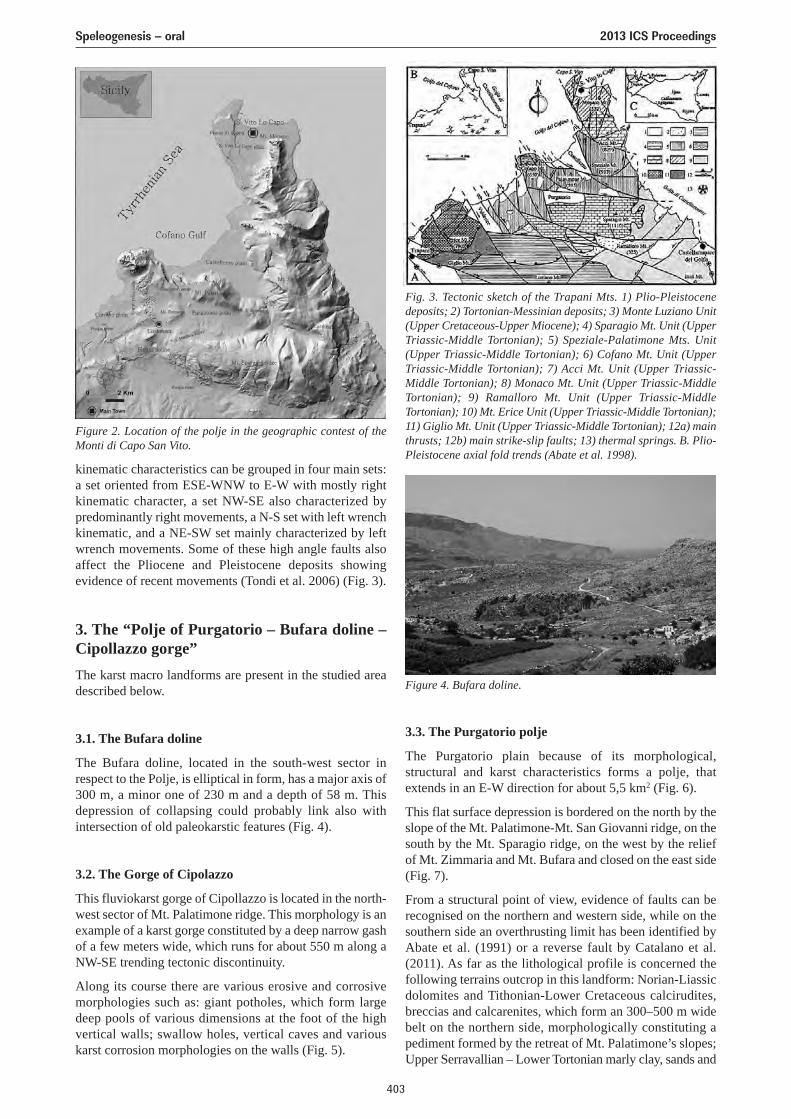
kinematic characteristics can be grouped in four main sets:a set oriented from ESE-WNW to E-W with mostly rightkinematic character, a set NW-SE also characterized bypredominantly right movements, a N-S set with left wrenchkinematic, and a NE-SW set mainly characterized by leftwrench movements. Some of these high angle faults alsoaffect the Pliocene and Pleistocene deposits showingevidence of recent movements (Tondi et al. 2006) (Fig. 3).
3. The “Polje of Purgatorio – Bufara doline –Cipollazzo gorge”The karst macro landforms are present in the studied areadescribed below.
3.1. The Bufara doline
The Bufara doline, located in the south-west sector inrespect to the Polje, is elliptical in form, has a major axis of300 m, a minor one of 230 m and a depth of 58 m. Thisdepression of collapsing could probably link also withintersection of old paleokarstic features (Fig. 4).
3.2. The Gorge of Cipolazzo
This fluviokarst gorge of Cipollazzo is located in the north-west sector of Mt. Palatimone ridge. This morphology is anexample of a karst gorge constituted by a deep narrow gashof a few meters wide, which runs for about 550 m along aNW-SE trending tectonic discontinuity.
Along its course there are various erosive and corrosivemorphologies such as: giant potholes, which form largedeep pools of various dimensions at the foot of the highvertical walls; swallow holes, vertical caves and variouskarst corrosion morphologies on the walls (Fig. 5).
3.3. The Purgatorio polje
The Purgatorio plain because of its morphological,structural and karst characteristics forms a polje, thatextends in an E-W direction for about 5,5 km2 (Fig. 6).
This flat surface depression is bordered on the north by theslope of the Mt. Palatimone-Mt. San Giovanni ridge, on thesouth by the Mt. Sparagio ridge, on the west by the reliefof Mt. Zimmaria and Mt. Bufara and closed on the east side(Fig. 7).
From a structural point of view, evidence of faults can berecognised on the northern and western side, while on thesouthern side an overthrusting limit has been identified byAbate et al. (1991) or a reverse fault by Catalano et al.(2011). As far as the lithological profile is concerned thefollowing terrains outcrop in this landform: Norian-Liassicdolomites and Tithonian-Lower Cretaceous calcirudites,breccias and calcarenites, which form an 300–500 m widebelt on the northern side, morphologically constituting apediment formed by the retreat of Mt. Palatimone’s slopes;Upper Serravallian – Lower Tortonian marly clay, sands and
Figure 4. Bufara doline.
Figure 2. Location of the polje in the geographic contest of theMonti di Capo San Vito.
Fig. 3. Tectonic sketch of the Trapani Mts. 1) Plio-Pleistocenedeposits; 2) Tortonian-Messinian deposits; 3) Monte Luziano Unit(Upper Cretaceous-Upper Miocene); 4) Sparagio Mt. Unit (UpperTriassic-Middle Tortonian); 5) Speziale-Palatimone Mts. Unit(Upper Triassic-Middle Tortonian); 6) Cofano Mt. Unit (UpperTriassic-Middle Tortonian); 7) Acci Mt. Unit (Upper Triassic-Middle Tortonian); 8) Monaco Mt. Unit (Upper Triassic-MiddleTortonian); 9) Ramalloro Mt. Unit (Upper Triassic-MiddleTortonian); 10) Mt. Erice Unit (Upper Triassic-Middle Tortonian);11) Giglio Mt. Unit (Upper Triassic-Middle Tortonian); 12a) mainthrusts; 12b) main strike-slip faults; 13) thermal springs. B. Plio-Pleistocene axial fold trends (Abate et al. 1998).
Speleogenesis – oral 2013 ICS Proceedings
403
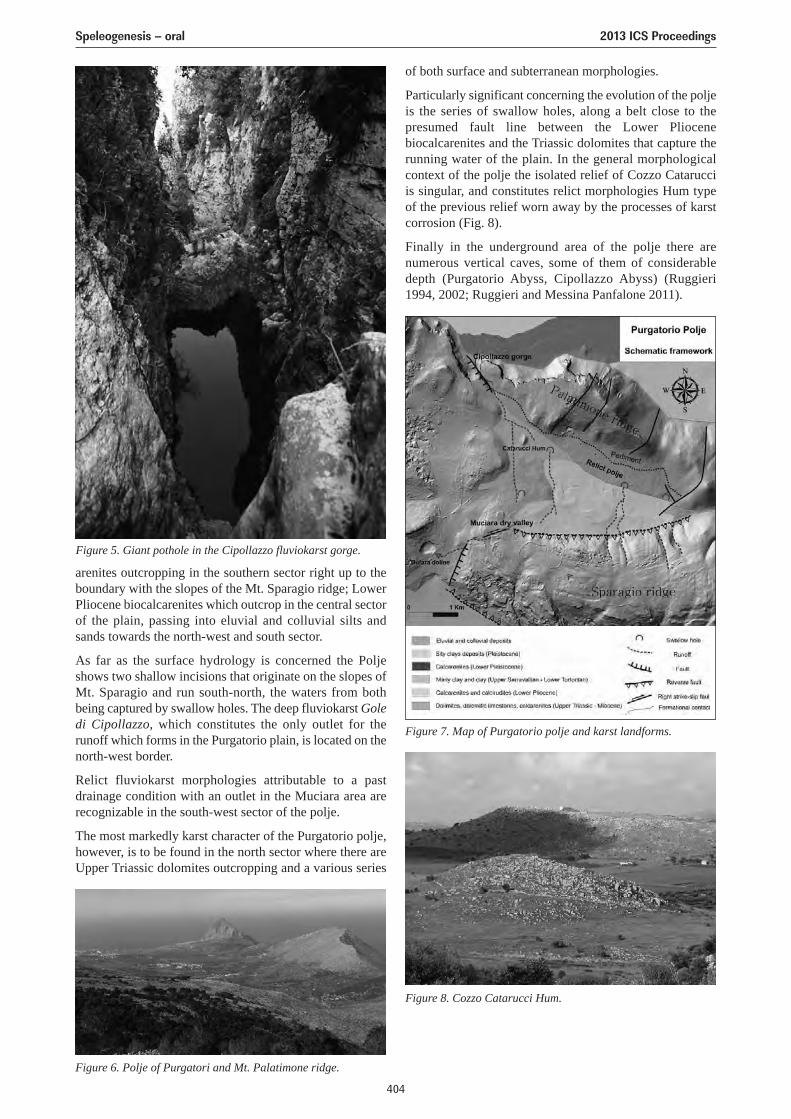
arenites outcropping in the southern sector right up to theboundary with the slopes of the Mt. Sparagio ridge; LowerPliocene biocalcarenites which outcrop in the central sectorof the plain, passing into eluvial and colluvial silts andsands towards the north-west and south sector.
As far as the surface hydrology is concerned the Poljeshows two shallow incisions that originate on the slopes ofMt. Sparagio and run south-north, the waters from bothbeing captured by swallow holes. The deep fluviokarst Goledi Cipollazzo, which constitutes the only outlet for therunoff which forms in the Purgatorio plain, is located on thenorth-west border.
Relict fluviokarst morphologies attributable to a pastdrainage condition with an outlet in the Muciara area arerecognizable in the south-west sector of the polje.
The most markedly karst character of the Purgatorio polje,however, is to be found in the north sector where there areUpper Triassic dolomites outcropping and a various series
of both surface and subterranean morphologies.
Particularly significant concerning the evolution of the poljeis the series of swallow holes, along a belt close to thepresumed fault line between the Lower Pliocenebiocalcarenites and the Triassic dolomites that capture therunning water of the plain. In the general morphologicalcontext of the polje the isolated relief of Cozzo Catarucciis singular, and constitutes relict morphologies Hum typeof the previous relief worn away by the processes of karstcorrosion (Fig. 8).
Finally in the underground area of the polje there arenumerous vertical caves, some of them of considerabledepth (Purgatorio Abyss, Cipollazzo Abyss) (Ruggieri1994, 2002; Ruggieri and Messina Panfalone 2011).
Figure 5. Giant pothole in the Cipollazzo fluviokarst gorge.
Figure 7. Map of Purgatorio polje and karst landforms.
Figure 6. Polje of Purgatori and Mt. Palatimone ridge.
Figure 8. Cozzo Catarucci Hum.
Speleogenesis – oral 2013 ICS Proceedings
404
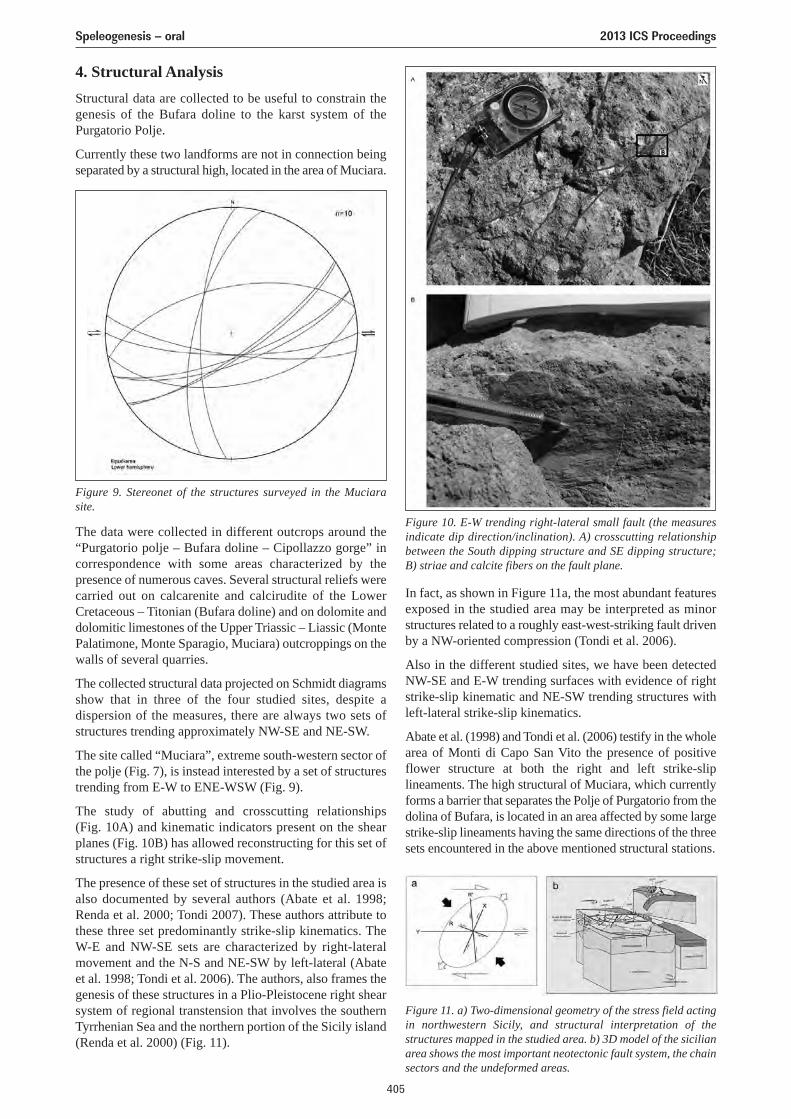
In fact, as shown in Figure 11a, the most abundant featuresexposed in the studied area may be interpreted as minorstructures related to a roughly east-west-striking fault drivenby a NW-oriented compression (Tondi et al. 2006).
Also in the different studied sites, we have been detectedNW-SE and E-W trending surfaces with evidence of rightstrike-slip kinematic and NE-SW trending structures withleft-lateral strike-slip kinematics.
Abate et al. (1998) and Tondi et al. (2006) testify in the wholearea of Monti di Capo San Vito the presence of positiveflower structure at both the right and left strike-sliplineaments. The high structural of Muciara, which currentlyforms a barrier that separates the Polje of Purgatorio from thedolina of Bufara, is located in an area affected by some largestrike-slip lineaments having the same directions of the threesets encountered in the above mentioned structural stations.
Figure 11. a) Two-dimensional geometry of the stress field actingin northwestern Sicily, and structural interpretation of thestructures mapped in the studied area. b) 3D model of the sicilianarea shows the most important neotectonic fault system, the chainsectors and the undeformed areas.
4. Structural AnalysisStructural data are collected to be useful to constrain thegenesis of the Bufara doline to the karst system of thePurgatorio Polje.
Currently these two landforms are not in connection beingseparated by a structural high, located in the area of Muciara.
The data were collected in different outcrops around the“Purgatorio polje – Bufara doline – Cipollazzo gorge” incorrespondence with some areas characterized by thepresence of numerous caves. Several structural reliefs werecarried out on calcarenite and calcirudite of the LowerCretaceous – Titonian (Bufara doline) and on dolomite anddolomitic limestones of the Upper Triassic – Liassic (MontePalatimone, Monte Sparagio, Muciara) outcroppings on thewalls of several quarries.
The collected structural data projected on Schmidt diagramsshow that in three of the four studied sites, despite adispersion of the measures, there are always two sets ofstructures trending approximately NW-SE and NE-SW.
The site called “Muciara”, extreme south-western sector ofthe polje (Fig. 7), is instead interested by a set of structurestrending from E-W to ENE-WSW (Fig. 9).
The study of abutting and crosscutting relationships (Fig. 10A) and kinematic indicators present on the shearplanes (Fig. 10B) has allowed reconstructing for this set ofstructures a right strike-slip movement.
The presence of these set of structures in the studied area isalso documented by several authors (Abate et al. 1998;Renda et al. 2000; Tondi 2007). These authors attribute tothese three set predominantly strike-slip kinematics. TheW-E and NW-SE sets are characterized by right-lateralmovement and the N-S and NE-SW by left-lateral (Abateet al. 1998; Tondi et al. 2006). The authors, also frames thegenesis of these structures in a Plio-Pleistocene right shearsystem of regional transtension that involves the southernTyrrhenian Sea and the northern portion of the Sicily island(Renda et al. 2000) (Fig. 11).
Figure 9. Stereonet of the structures surveyed in the Muciarasite.
Figure 10. E-W trending right-lateral small fault (the measuresindicate dip direction/inclination). A) crosscutting relationshipbetween the South dipping structure and SE dipping structure; B) striae and calcite fibers on the fault plane.
Speleogenesis – oral 2013 ICS Proceedings
405
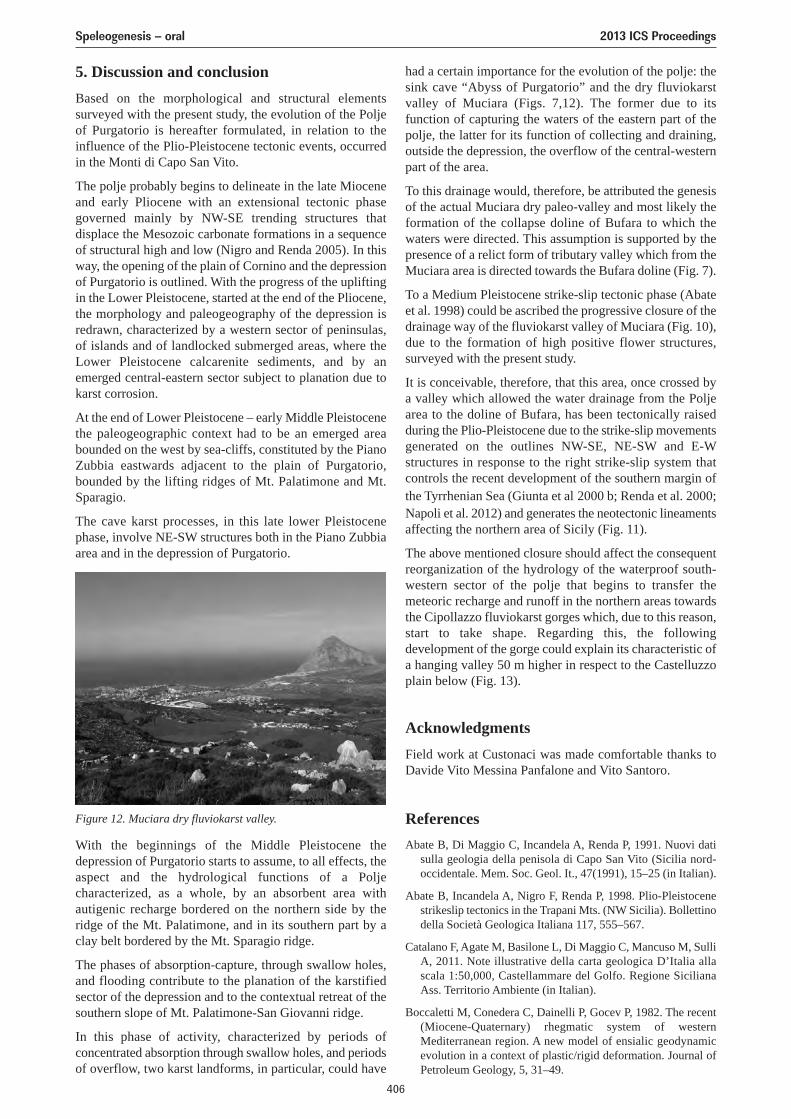
With the beginnings of the Middle Pleistocene thedepression of Purgatorio starts to assume, to all effects, theaspect and the hydrological functions of a Poljecharacterized, as a whole, by an absorbent area withautigenic recharge bordered on the northern side by theridge of the Mt. Palatimone, and in its southern part by aclay belt bordered by the Mt. Sparagio ridge.
The phases of absorption-capture, through swallow holes,and flooding contribute to the planation of the karstifiedsector of the depression and to the contextual retreat of thesouthern slope of Mt. Palatimone-San Giovanni ridge.
In this phase of activity, characterized by periods ofconcentrated absorption through swallow holes, and periodsof overflow, two karst landforms, in particular, could have
Figure 12. Muciara dry fluviokarst valley.
5. Discussion and conclusionBased on the morphological and structural elementssurveyed with the present study, the evolution of the Poljeof Purgatorio is hereafter formulated, in relation to theinfluence of the Plio-Pleistocene tectonic events, occurredin the Monti di Capo San Vito.
The polje probably begins to delineate in the late Mioceneand early Pliocene with an extensional tectonic phasegoverned mainly by NW-SE trending structures thatdisplace the Mesozoic carbonate formations in a sequenceof structural high and low (Nigro and Renda 2005). In thisway, the opening of the plain of Cornino and the depressionof Purgatorio is outlined. With the progress of the upliftingin the Lower Pleistocene, started at the end of the Pliocene,the morphology and paleogeography of the depression isredrawn, characterized by a western sector of peninsulas,of islands and of landlocked submerged areas, where theLower Pleistocene calcarenite sediments, and by anemerged central-eastern sector subject to planation due tokarst corrosion.
At the end of Lower Pleistocene – early Middle Pleistocenethe paleogeographic context had to be an emerged areabounded on the west by sea-cliffs, constituted by the PianoZubbia eastwards adjacent to the plain of Purgatorio,bounded by the lifting ridges of Mt. Palatimone and Mt.Sparagio.
The cave karst processes, in this late lower Pleistocenephase, involve NE-SW structures both in the Piano Zubbiaarea and in the depression of Purgatorio.
had a certain importance for the evolution of the polje: thesink cave “Abyss of Purgatorio” and the dry fluviokarstvalley of Muciara (Figs. 7,12). The former due to itsfunction of capturing the waters of the eastern part of thepolje, the latter for its function of collecting and draining,outside the depression, the overflow of the central-westernpart of the area.
To this drainage would, therefore, be attributed the genesisof the actual Muciara dry paleo-valley and most likely theformation of the collapse doline of Bufara to which thewaters were directed. This assumption is supported by thepresence of a relict form of tributary valley which from theMuciara area is directed towards the Bufara doline (Fig. 7).
To a Medium Pleistocene strike-slip tectonic phase (Abateet al. 1998) could be ascribed the progressive closure of thedrainage way of the fluviokarst valley of Muciara (Fig. 10),due to the formation of high positive flower structures,surveyed with the present study.
It is conceivable, therefore, that this area, once crossed bya valley which allowed the water drainage from the Poljearea to the doline of Bufara, has been tectonically raisedduring the Plio-Pleistocene due to the strike-slip movementsgenerated on the outlines NW-SE, NE-SW and E-Wstructures in response to the right strike-slip system thatcontrols the recent development of the southern margin ofthe Tyrrhenian Sea (Giunta et al 2000 b; Renda et al. 2000;Napoli et al. 2012) and generates the neotectonic lineamentsaffecting the northern area of Sicily (Fig. 11).
The above mentioned closure should affect the consequentreorganization of the hydrology of the waterproof south-western sector of the polje that begins to transfer themeteoric recharge and runoff in the northern areas towardsthe Cipollazzo fluviokarst gorges which, due to this reason,start to take shape. Regarding this, the followingdevelopment of the gorge could explain its characteristic ofa hanging valley 50 m higher in respect to the Castelluzzoplain below (Fig. 13).
AcknowledgmentsField work at Custonaci was made comfortable thanks toDavide Vito Messina Panfalone and Vito Santoro.
ReferencesAbate B, Di Maggio C, Incandela A, Renda P, 1991. Nuovi dati
sulla geologia della penisola di Capo San Vito (Sicilia nord-occidentale. Mem. Soc. Geol. It., 47(1991), 15–25 (in Italian).
Abate B, Incandela A, Nigro F, Renda P, 1998. Plio-Pleistocenestrikeslip tectonics in the Trapani Mts. (NW Sicilia). Bollettinodella Società Geologica Italiana 117, 555–567.
Catalano F, Agate M, Basilone L, Di Maggio C, Mancuso M, SulliA, 2011. Note illustrative della carta geologica D’Italia allascala 1:50,000, Castellammare del Golfo. Regione SicilianaAss. Territorio Ambiente (in Italian).
Boccaletti M, Conedera C, Dainelli P, Gocev P, 1982. The recent(Miocene-Quaternary) rhegmatic system of westernMediterranean region. A new model of ensialic geodynamicevolution in a context of plastic/rigid deformation. Journal ofPetroleum Geology, 5, 31–49.
Speleogenesis – oral 2013 ICS Proceedings
406
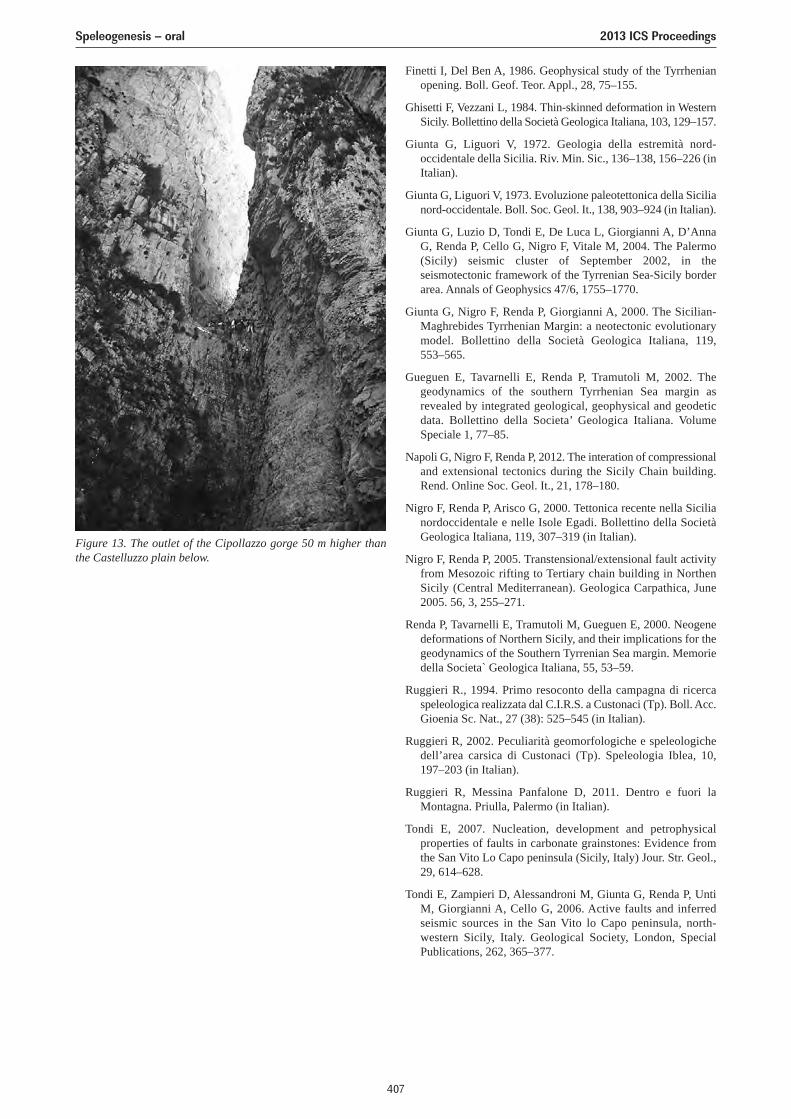
Finetti I, Del Ben A, 1986. Geophysical study of the Tyrrhenianopening. Boll. Geof. Teor. Appl., 28, 75–155.
Ghisetti F, Vezzani L, 1984. Thin-skinned deformation in WesternSicily. Bollettino della Società Geologica Italiana, 103, 129–157.
Giunta G, Liguori V, 1972. Geologia della estremità nord-occidentale della Sicilia. Riv. Min. Sic., 136–138, 156–226 (inItalian).
Giunta G, Liguori V, 1973. Evoluzione paleotettonica della Sicilianord-occidentale. Boll. Soc. Geol. It., 138, 903–924 (in Italian).
Giunta G, Luzio D, Tondi E, De Luca L, Giorgianni A, D’AnnaG, Renda P, Cello G, Nigro F, Vitale M, 2004. The Palermo(Sicily) seismic cluster of September 2002, in theseismotectonic framework of the Tyrrenian Sea-Sicily borderarea. Annals of Geophysics 47/6, 1755–1770.
Giunta G, Nigro F, Renda P, Giorgianni A, 2000. The Sicilian-Maghrebides Tyrrhenian Margin: a neotectonic evolutionarymodel. Bollettino della Società Geologica Italiana, 119,553–565.
Gueguen E, Tavarnelli E, Renda P, Tramutoli M, 2002. Thegeodynamics of the southern Tyrrhenian Sea margin asrevealed by integrated geological, geophysical and geodeticdata. Bollettino della Societa’ Geologica Italiana. VolumeSpeciale 1, 77–85.
Napoli G, Nigro F, Renda P, 2012. The interation of compressionaland extensional tectonics during the Sicily Chain building.Rend. Online Soc. Geol. It., 21, 178–180.
Nigro F, Renda P, Arisco G, 2000. Tettonica recente nella Sicilianordoccidentale e nelle Isole Egadi. Bollettino della SocietàGeologica Italiana, 119, 307–319 (in Italian).
Nigro F, Renda P, 2005. Transtensional/extensional fault activityfrom Mesozoic rifting to Tertiary chain building in NorthenSicily (Central Mediterranean). Geologica Carpathica, June2005. 56, 3, 255–271.
Renda P, Tavarnelli E, Tramutoli M, Gueguen E, 2000. Neogenedeformations of Northern Sicily, and their implications for thegeodynamics of the Southern Tyrrenian Sea margin. Memoriedella Societa` Geologica Italiana, 55, 53–59.
Ruggieri R., 1994. Primo resoconto della campagna di ricercaspeleologica realizzata dal C.I.R.S. a Custonaci (Tp). Boll. Acc.Gioenia Sc. Nat., 27 (38): 525–545 (in Italian).
Ruggieri R, 2002. Peculiarità geomorfologiche e speleologichedell’area carsica di Custonaci (Tp). Speleologia Iblea, 10,197–203 (in Italian).
Ruggieri R, Messina Panfalone D, 2011. Dentro e fuori laMontagna. Priulla, Palermo (in Italian).
Tondi E, 2007. Nucleation, development and petrophysicalproperties of faults in carbonate grainstones: Evidence fromthe San Vito Lo Capo peninsula (Sicily, Italy) Jour. Str. Geol.,29, 614–628.
Tondi E, Zampieri D, Alessandroni M, Giunta G, Renda P, UntiM, Giorgianni A, Cello G, 2006. Active faults and inferredseismic sources in the San Vito lo Capo peninsula, north-western Sicily, Italy. Geological Society, London, SpecialPublications, 262, 365–377.
Figure 13. The outlet of the Cipollazzo gorge 50 m higher thanthe Castelluzzo plain below.
Speleogenesis – oral 2013 ICS Proceedings
407
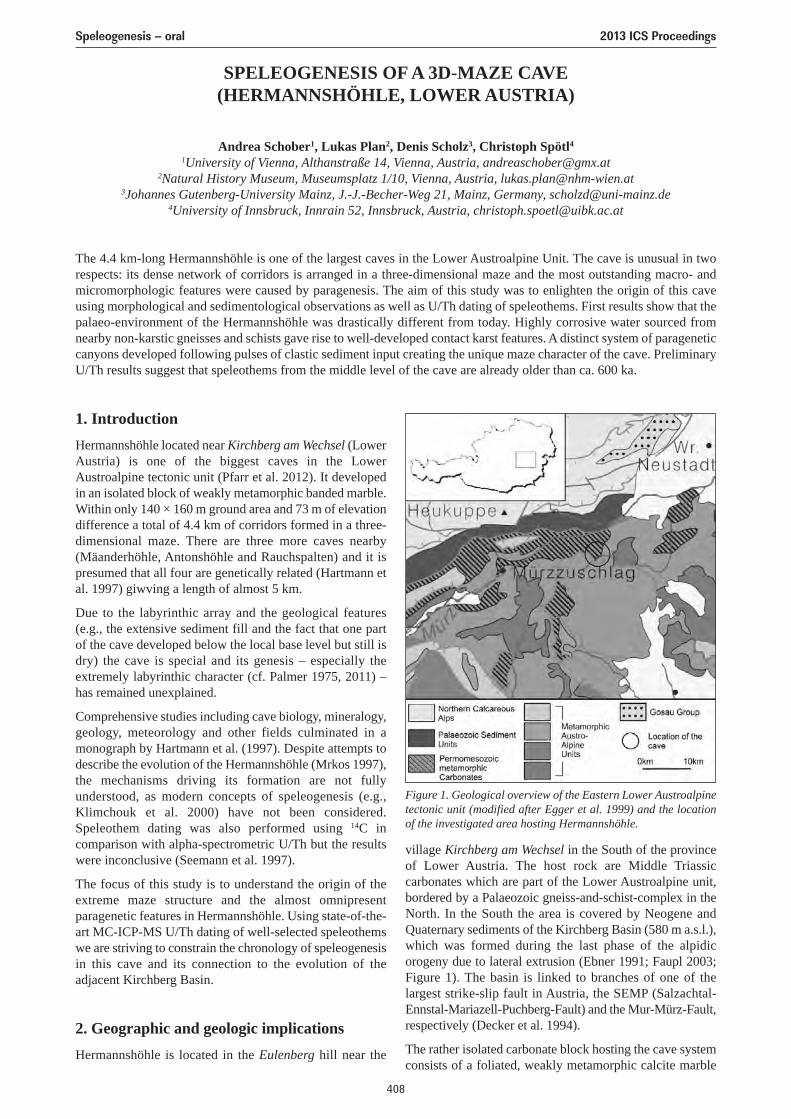
SPELEOGENESIS OF A 3D-MAZE CAVE(HERMANNSHÖHLE, LOWER AUSTRIA)
Andrea Schober1, Lukas Plan2, Denis Scholz3, Christoph Spötl4
1University of Vienna, Althanstraße 14, Vienna, Austria, [email protected] History Museum, Museumsplatz 1/10, Vienna, Austria, [email protected]
3Johannes Gutenberg-University Mainz, J.-J.-Becher-Weg 21, Mainz, Germany, [email protected] of Innsbruck, Innrain 52, Innsbruck, Austria, [email protected]
The 4.4 km-long Hermannshöhle is one of the largest caves in the Lower Austroalpine Unit. The cave is unusual in tworespects: its dense network of corridors is arranged in a three-dimensional maze and the most outstanding macro- andmicromorphologic features were caused by paragenesis. The aim of this study was to enlighten the origin of this caveusing morphological and sedimentological observations as well as U/Th dating of speleothems. First results show that thepalaeo-environment of the Hermannshöhle was drastically different from today. Highly corrosive water sourced fromnearby non-karstic gneisses and schists gave rise to well-developed contact karst features. A distinct system of parageneticcanyons developed following pulses of clastic sediment input creating the unique maze character of the cave. PreliminaryU/Th results suggest that speleothems from the middle level of the cave are already older than ca. 600 ka.
1. IntroductionHermannshöhle located near Kirchberg am Wechsel (LowerAustria) is one of the biggest caves in the LowerAustroalpine tectonic unit (Pfarr et al. 2012). It developedin an isolated block of weakly metamorphic banded marble.Within only 140 × 160 m ground area and 73 m of elevationdifference a total of 4.4 km of corridors formed in a three-dimensional maze. There are three more caves nearby(Mäanderhöhle, Antonshöhle and Rauchspalten) and it ispresumed that all four are genetically related (Hartmann etal. 1997) giwving a length of almost 5 km.
Due to the labyrinthic array and the geological features(e.g., the extensive sediment fill and the fact that one partof the cave developed below the local base level but still isdry) the cave is special and its genesis – especially theextremely labyrinthic character (cf. Palmer 1975, 2011) –has remained unexplained.
Comprehensive studies including cave biology, mineralogy,geology, meteorology and other fields culminated in amonograph by Hartmann et al. (1997). Despite attempts todescribe the evolution of the Hermannshöhle (Mrkos 1997),the mechanisms driving its formation are not fullyunderstood, as modern concepts of speleogenesis (e.g.,Klimchouk et al. 2000) have not been considered.Speleothem dating was also performed using 14C incomparison with alpha-spectrometric U/Th but the resultswere inconclusive (Seemann et al. 1997).
The focus of this study is to understand the origin of theextreme maze structure and the almost omnipresentparagenetic features in Hermannshöhle. Using state-of-the-art MC-ICP-MS U/Th dating of well-selected speleothemswe are striving to constrain the chronology of speleogenesisin this cave and its connection to the evolution of theadjacent Kirchberg Basin.
2. Geographic and geologic implicationsHermannshöhle is located in the Eulenberg hill near the
village Kirchberg am Wechsel in the South of the provinceof Lower Austria. The host rock are Middle Triassiccarbonates which are part of the Lower Austroalpine unit,bordered by a Palaeozoic gneiss-and-schist-complex in theNorth. In the South the area is covered by Neogene andQuaternary sediments of the Kirchberg Basin (580 m a.s.l.),which was formed during the last phase of the alpidicorogeny due to lateral extrusion (Ebner 1991; Faupl 2003;Figure 1). The basin is linked to branches of one of thelargest strike-slip fault in Austria, the SEMP (Salzachtal-Ennstal-Mariazell-Puchberg-Fault) and the Mur-Mürz-Fault,respectively (Decker et al. 1994).
The rather isolated carbonate block hosting the cave systemconsists of a foliated, weakly metamorphic calcite marble
Figure 1. Geological overview of the Eastern Lower Austroalpinetectonic unit (modified after Egger et al. 1999) and the locationof the investigated area hosting Hermannshöhle.
Speleogenesis – oral 2013 ICS Proceedings
408
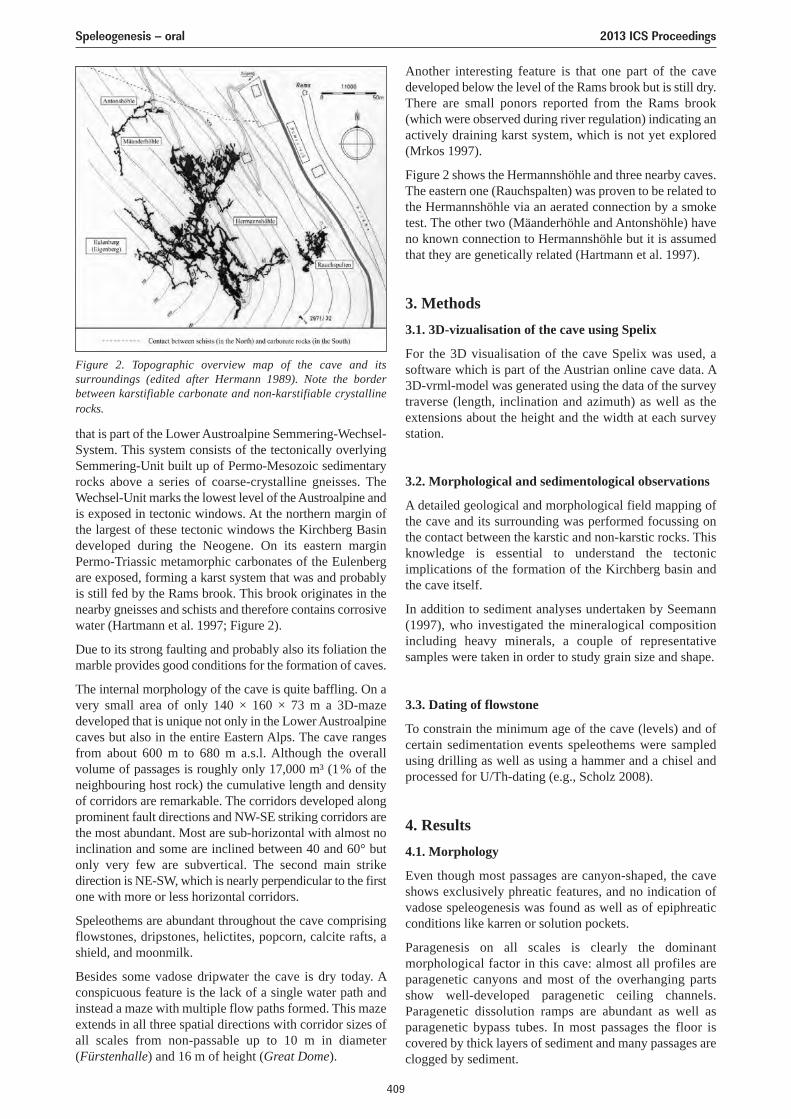
that is part of the Lower Austroalpine Semmering-Wechsel-System. This system consists of the tectonically overlyingSemmering-Unit built up of Permo-Mesozoic sedimentaryrocks above a series of coarse-crystalline gneisses. TheWechsel-Unit marks the lowest level of the Austroalpine andis exposed in tectonic windows. At the northern margin ofthe largest of these tectonic windows the Kirchberg Basindeveloped during the Neogene. On its eastern marginPermo-Triassic metamorphic carbonates of the Eulenbergare exposed, forming a karst system that was and probablyis still fed by the Rams brook. This brook originates in thenearby gneisses and schists and therefore contains corrosivewater (Hartmann et al. 1997; Figure 2).
Due to its strong faulting and probably also its foliation themarble provides good conditions for the formation of caves.
The internal morphology of the cave is quite baffling. On avery small area of only 140 × 160 × 73 m a 3D-mazedeveloped that is unique not only in the Lower Austroalpinecaves but also in the entire Eastern Alps. The cave rangesfrom about 600 m to 680 m a.s.l. Although the overallvolume of passages is roughly only 17,000 m³ (1% of theneighbouring host rock) the cumulative length and densityof corridors are remarkable. The corridors developed alongprominent fault directions and NW-SE striking corridors arethe most abundant. Most are sub-horizontal with almost noinclination and some are inclined between 40 and 60° butonly very few are subvertical. The second main strikedirection is NE-SW, which is nearly perpendicular to the firstone with more or less horizontal corridors.
Speleothems are abundant throughout the cave comprisingflowstones, dripstones, helictites, popcorn, calcite rafts, ashield, and moonmilk.
Besides some vadose dripwater the cave is dry today. Aconspicuous feature is the lack of a single water path andinstead a maze with multiple flow paths formed. This mazeextends in all three spatial directions with corridor sizes ofall scales from non-passable up to 10 m in diameter(Fürstenhalle) and 16 m of height (Great Dome).
Another interesting feature is that one part of the cavedeveloped below the level of the Rams brook but is still dry.There are small ponors reported from the Rams brook(which were observed during river regulation) indicating anactively draining karst system, which is not yet explored(Mrkos 1997).
Figure 2 shows the Hermannshöhle and three nearby caves.The eastern one (Rauchspalten) was proven to be related tothe Hermannshöhle via an aerated connection by a smoketest. The other two (Mäanderhöhle and Antonshöhle) haveno known connection to Hermannshöhle but it is assumedthat they are genetically related (Hartmann et al. 1997).
3. Methods3.1. 3D-vizualisation of the cave using Spelix
For the 3D visualisation of the cave Spelix was used, asoftware which is part of the Austrian online cave data. A3D-vrml-model was generated using the data of the surveytraverse (length, inclination and azimuth) as well as theextensions about the height and the width at each surveystation.
3.2. Morphological and sedimentological observations
A detailed geological and morphological field mapping ofthe cave and its surrounding was performed focussing onthe contact between the karstic and non-karstic rocks. Thisknowledge is essential to understand the tectonicimplications of the formation of the Kirchberg basin andthe cave itself.
In addition to sediment analyses undertaken by Seemann(1997), who investigated the mineralogical compositionincluding heavy minerals, a couple of representativesamples were taken in order to study grain size and shape.
3.3. Dating of flowstone
To constrain the minimum age of the cave (levels) and ofcertain sedimentation events speleothems were sampledusing drilling as well as using a hammer and a chisel andprocessed for U/Th-dating (e.g., Scholz 2008).
4. Results4.1. Morphology
Even though most passages are canyon-shaped, the caveshows exclusively phreatic features, and no indication ofvadose speleogenesis was found as well as of epiphreaticconditions like karren or solution pockets.
Paragenesis on all scales is clearly the dominantmorphological factor in this cave: almost all profiles areparagenetic canyons and most of the overhanging partsshow well-developed paragenetic ceiling channels.Paragenetic dissolution ramps are abundant as well asparagenetic bypass tubes. In most passages the floor iscovered by thick layers of sediment and many passages areclogged by sediment.
Figure 2. Topographic overview map of the cave and itssurroundings (edited after Hermann 1989). Note the borderbetween karstifiable carbonate and non-karstifiable crystallinerocks.
Speleogenesis – oral 2013 ICS Proceedings
409
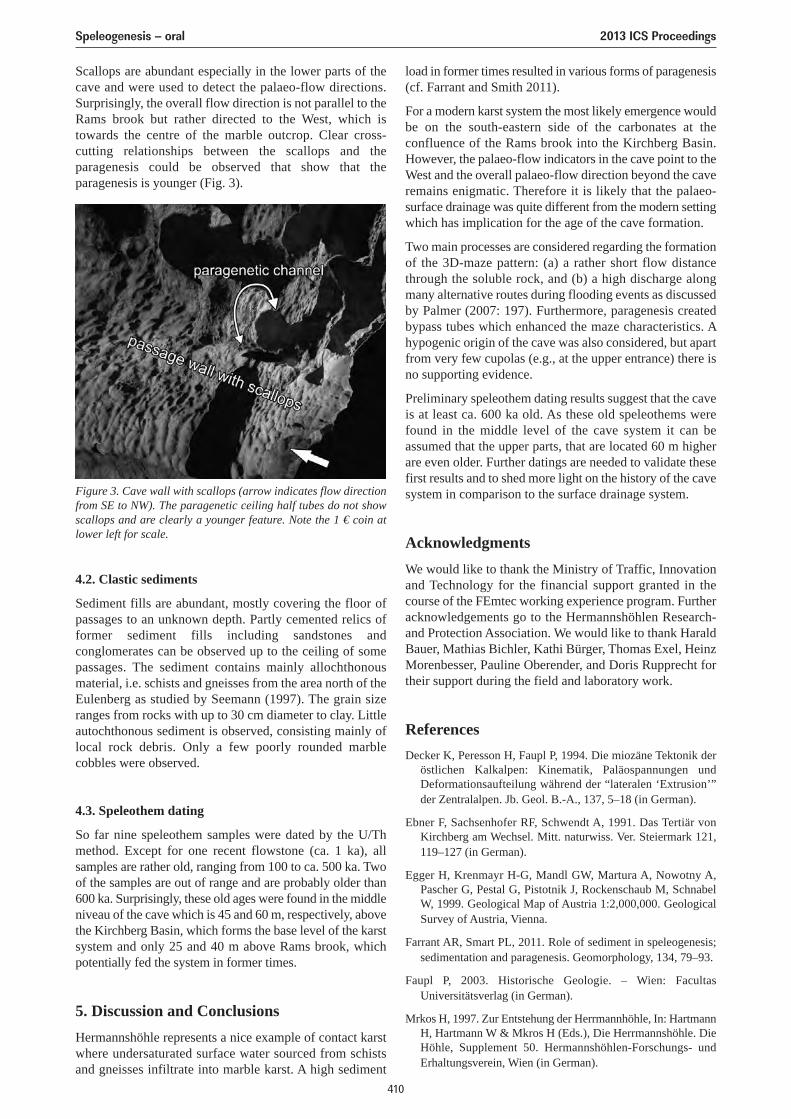
Scallops are abundant especially in the lower parts of thecave and were used to detect the palaeo-flow directions.Surprisingly, the overall flow direction is not parallel to theRams brook but rather directed to the West, which istowards the centre of the marble outcrop. Clear cross-cutting relationships between the scallops and theparagenesis could be observed that show that theparagenesis is younger (Fig. 3).
load in former times resulted in various forms of paragenesis(cf. Farrant and Smith 2011).
For a modern karst system the most likely emergence wouldbe on the south-eastern side of the carbonates at theconfluence of the Rams brook into the Kirchberg Basin.However, the palaeo-flow indicators in the cave point to theWest and the overall palaeo-flow direction beyond the caveremains enigmatic. Therefore it is likely that the palaeo-surface drainage was quite different from the modern settingwhich has implication for the age of the cave formation.
Two main processes are considered regarding the formationof the 3D-maze pattern: (a) a rather short flow distancethrough the soluble rock, and (b) a high discharge alongmany alternative routes during flooding events as discussedby Palmer (2007: 197). Furthermore, paragenesis createdbypass tubes which enhanced the maze characteristics. Ahypogenic origin of the cave was also considered, but apartfrom very few cupolas (e.g., at the upper entrance) there isno supporting evidence.
Preliminary speleothem dating results suggest that the caveis at least ca. 600 ka old. As these old speleothems werefound in the middle level of the cave system it can beassumed that the upper parts, that are located 60 m higherare even older. Further datings are needed to validate thesefirst results and to shed more light on the history of the cavesystem in comparison to the surface drainage system.
AcknowledgmentsWe would like to thank the Ministry of Traffic, Innovationand Technology for the financial support granted in thecourse of the FEmtec working experience program. Furtheracknowledgements go to the Hermannshöhlen Research-and Protection Association. We would like to thank HaraldBauer, Mathias Bichler, Kathi Bürger, Thomas Exel, HeinzMorenbesser, Pauline Oberender, and Doris Rupprecht fortheir support during the field and laboratory work.
ReferencesDecker K, Peresson H, Faupl P, 1994. Die miozäne Tektonik der
östlichen Kalkalpen: Kinematik, Paläospannungen undDeformationsaufteilung während der “lateralen ‘Extrusion’”der Zentralalpen. Jb. Geol. B.-A., 137, 5–18 (in German).
Ebner F, Sachsenhofer RF, Schwendt A, 1991. Das Tertiär vonKirchberg am Wechsel. Mitt. naturwiss. Ver. Steiermark 121,119–127 (in German).
Egger H, Krenmayr H-G, Mandl GW, Martura A, Nowotny A,Pascher G, Pestal G, Pistotnik J, Rockenschaub M, SchnabelW, 1999. Geological Map of Austria 1:2,000,000. GeologicalSurvey of Austria, Vienna.
Farrant AR, Smart PL, 2011. Role of sediment in speleogenesis;sedimentation and paragenesis. Geomorphology, 134, 79–93.
Faupl P, 2003. Historische Geologie. – Wien: FacultasUniversitätsverlag (in German).
Mrkos H, 1997. Zur Entstehung der Herrmannhöhle, In: HartmannH, Hartmann W & Mkros H (Eds.), Die Herrmannshöhle. DieHöhle, Supplement 50. Hermannshöhlen-Forschungs- undErhaltungsverein, Wien (in German).
Figure 3. Cave wall with scallops (arrow indicates flow directionfrom SE to NW). The paragenetic ceiling half tubes do not showscallops and are clearly a younger feature. Note the 1 € coin atlower left for scale.
4.2. Clastic sediments
Sediment fills are abundant, mostly covering the floor ofpassages to an unknown depth. Partly cemented relics offormer sediment fills including sandstones andconglomerates can be observed up to the ceiling of somepassages. The sediment contains mainly allochthonousmaterial, i.e. schists and gneisses from the area north of theEulenberg as studied by Seemann (1997). The grain sizeranges from rocks with up to 30 cm diameter to clay. Littleautochthonous sediment is observed, consisting mainly oflocal rock debris. Only a few poorly rounded marblecobbles were observed.
4.3. Speleothem dating
So far nine speleothem samples were dated by the U/Thmethod. Except for one recent flowstone (ca. 1 ka), allsamples are rather old, ranging from 100 to ca. 500 ka. Twoof the samples are out of range and are probably older than600 ka. Surprisingly, these old ages were found in the middleniveau of the cave which is 45 and 60 m, respectively, abovethe Kirchberg Basin, which forms the base level of the karstsystem and only 25 and 40 m above Rams brook, whichpotentially fed the system in former times.
5. Discussion and ConclusionsHermannshöhle represents a nice example of contact karstwhere undersaturated surface water sourced from schistsand gneisses infiltrate into marble karst. A high sediment
Speleogenesis – oral 2013 ICS Proceedings
410

Hartmann H, Hartmann W, Mrkos H, 1997. Die Herrmannshöhle.Die Höhle, Supplement 50. Hermannshöhlen-Forschungs- undErhaltungsverein, Wien (in German).
Herrmann P, Mandl GW, Matura A, Neubauer F, Riedmüller G &Tollmann A, 1992. Geologische Karte der Republik Österreich1:50,000: Blatt 105 Neunkirchen. – Geologische Bundesanstalt,Wien (in German).
Klimchouk AB, Ford DC, Palmer, AN, Dreybrodt W, 2000.Speleogenesis: Evolution of Karst Aquifers. – NSS, Huntsville,Alabama (USA).
Palmer AN, 1975. The origin of maze caves. Natl. Speleol. Soc.Bull. 37, 56–76.
Palmer AN, 2007. Cave Geology. Cave Books, Dayton.
Palmer AN, 2011. Distinction between epigenic and hypogenicmaze caves. Geomorphology, 134, 9–22.
Pfarr T, Seebacher R, Plan L, 2012. Longest and deepest caves ofAustria. www.hoehle.org/long&deep.php
Scholz D, Hofmann D, 2008. 230Th/U-dating of fossil corals andspeleothems. Quaternary Science Journal, 57 (1–2), 52–76.
Seemann R, 1997. Sediment- und Mineralinhalt derHermannshöhle, In: Hartmann H, Hartmann W & Mkros H(Eds.), Die Herrmannshöhle. Die Höhle, Supplement 50.Hermannshöhlen-Forschungs- und Erhaltungsverein, Wien (inGerman).
Seemann R, Geyh MA, Franke HW, 1997. Altersbestimmung anSinter- und Tropfsteinformationen der Herrmannhöhle, In:Hartmann H, Hartmann W, Mrkos H (Eds.), DieHerrmannshöhle. Die Höhle, Supplement 50. Hermannshöhlen-Forschungs- und Erhaltungsverein, Wien (in German).
Speleogenesis – oral 2013 ICS Proceedings
411
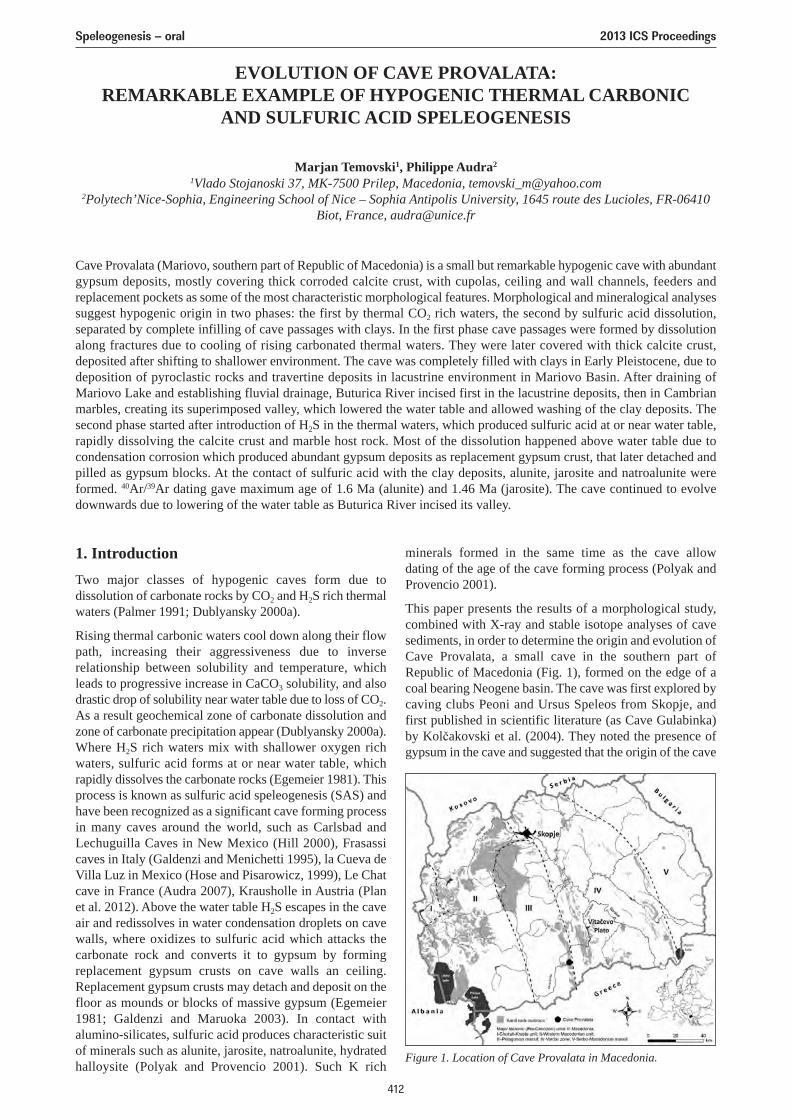
EVOLUTION OF CAVE PROVALATA:REMARKABLE EXAMPLE OF HYPOGENIC THERMAL CARBONIC
AND SULFURIC ACID SPELEOGENESIS
Marjan Temovski1, Philippe Audra2
1Vlado Stojanoski 37, MK-7500 Prilep, Macedonia, [email protected]’Nice-Sophia, Engineering School of Nice – Sophia Antipolis University, 1645 route des Lucioles, FR-06410
Biot, France, [email protected]
Cave Provalata (Mariovo, southern part of Republic of Macedonia) is a small but remarkable hypogenic cave with abundantgypsum deposits, mostly covering thick corroded calcite crust, with cupolas, ceiling and wall channels, feeders andreplacement pockets as some of the most characteristic morphological features. Morphological and mineralogical analysessuggest hypogenic origin in two phases: the first by thermal CO2 rich waters, the second by sulfuric acid dissolution,separated by complete infilling of cave passages with clays. In the first phase cave passages were formed by dissolutionalong fractures due to cooling of rising carbonated thermal waters. They were later covered with thick calcite crust,deposited after shifting to shallower environment. The cave was completely filled with clays in Early Pleistocene, due todeposition of pyroclastic rocks and travertine deposits in lacustrine environment in Mariovo Basin. After draining ofMariovo Lake and establishing fluvial drainage, Buturica River incised first in the lacustrine deposits, then in Cambrianmarbles, creating its superimposed valley, which lowered the water table and allowed washing of the clay deposits. Thesecond phase started after introduction of H2S in the thermal waters, which produced sulfuric acid at or near water table,rapidly dissolving the calcite crust and marble host rock. Most of the dissolution happened above water table due tocondensation corrosion which produced abundant gypsum deposits as replacement gypsum crust, that later detached andpilled as gypsum blocks. At the contact of sulfuric acid with the clay deposits, alunite, jarosite and natroalunite wereformed. 40Ar/39Ar dating gave maximum age of 1.6 Ma (alunite) and 1.46 Ma (jarosite). The cave continued to evolvedownwards due to lowering of the water table as Buturica River incised its valley.
1. IntroductionTwo major classes of hypogenic caves form due todissolution of carbonate rocks by CO2 and H2S rich thermalwaters (Palmer 1991; Dublyansky 2000a).
Rising thermal carbonic waters cool down along their flowpath, increasing their aggressiveness due to inverserelationship between solubility and temperature, whichleads to progressive increase in CaCO3 solubility, and alsodrastic drop of solubility near water table due to loss of CO2.As a result geochemical zone of carbonate dissolution andzone of carbonate precipitation appear (Dublyansky 2000a).Where H2S rich waters mix with shallower oxygen richwaters, sulfuric acid forms at or near water table, whichrapidly dissolves the carbonate rocks (Egemeier 1981). Thisprocess is known as sulfuric acid speleogenesis (SAS) andhave been recognized as a significant cave forming processin many caves around the world, such as Carlsbad andLechuguilla Caves in New Mexico (Hill 2000), Frasassicaves in Italy (Galdenzi and Menichetti 1995), la Cueva deVilla Luz in Mexico (Hose and Pisarowicz, 1999), Le Chatcave in France (Audra 2007), Krausholle in Austria (Planet al. 2012). Above the water table H2S escapes in the caveair and redissolves in water condensation droplets on cavewalls, where oxidizes to sulfuric acid which attacks thecarbonate rock and converts it to gypsum by formingreplacement gypsum crusts on cave walls an ceiling.Replacement gypsum crusts may detach and deposit on thefloor as mounds or blocks of massive gypsum (Egemeier1981; Galdenzi and Maruoka 2003). In contact withalumino-silicates, sulfuric acid produces characteristic suitof minerals such as alunite, jarosite, natroalunite, hydratedhalloysite (Polyak and Provencio 2001). Such K rich
minerals formed in the same time as the cave allow dating of the age of the cave forming process (Polyak andProvencio 2001).
This paper presents the results of a morphological study,combined with X-ray and stable isotope analyses of cavesediments, in order to determine the origin and evolution ofCave Provalata, a small cave in the southern part ofRepublic of Macedonia (Fig. 1), formed on the edge of acoal bearing Neogene basin. The cave was first explored bycaving clubs Peoni and Ursus Speleos from Skopje, andfirst published in scientific literature (as Cave Gulabinka)by Kolčakovski et al. (2004). They noted the presence ofgypsum in the cave and suggested that the origin of the cave
Figure 1. Location of Cave Provalata in Macedonia.
Speleogenesis – oral 2013 ICS Proceedings
412
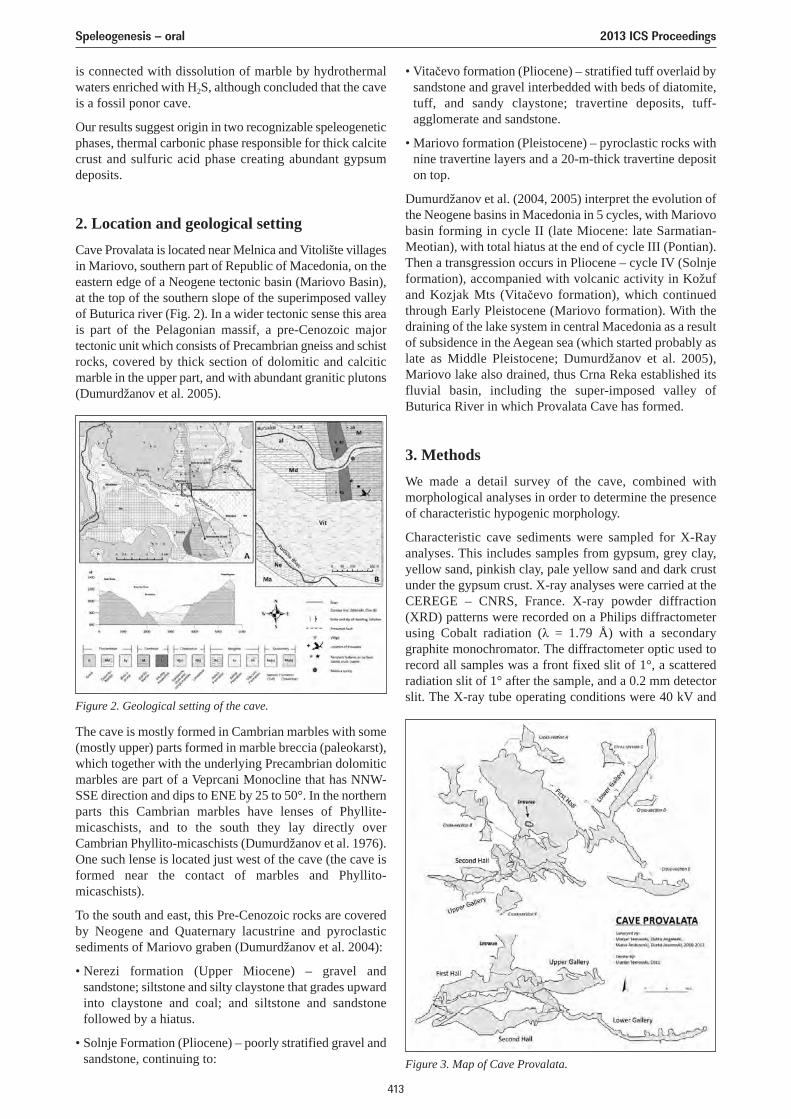
is connected with dissolution of marble by hydrothermalwaters enriched with H2S, although concluded that the caveis a fossil ponor cave.
Our results suggest origin in two recognizable speleogeneticphases, thermal carbonic phase responsible for thick calcitecrust and sulfuric acid phase creating abundant gypsumdeposits.
2. Location and geological settingCave Provalata is located near Melnica and Vitolište villagesin Mariovo, southern part of Republic of Macedonia, on theeastern edge of a Neogene tectonic basin (Mariovo Basin),at the top of the southern slope of the superimposed valleyof Buturica river (Fig. 2). In a wider tectonic sense this areais part of the Pelagonian massif, a pre-Cenozoic majortectonic unit which consists of Precambrian gneiss and schistrocks, covered by thick section of dolomitic and calciticmarble in the upper part, and with abundant granitic plutons(Dumurdžanov et al. 2005).
• Vitačevo formation (Pliocene) – stratified tuff overlaid bysandstone and gravel interbedded with beds of diatomite,tuff, and sandy claystone; travertine deposits, tuff-agglomerate and sandstone.
• Mariovo formation (Pleistocene) – pyroclastic rocks withnine travertine layers and a 20-m-thick travertine depositon top.
Dumurdžanov et al. (2004, 2005) interpret the evolution ofthe Neogene basins in Macedonia in 5 cycles, with Mariovobasin forming in cycle II (late Miocene: late Sarmatian-Meotian), with total hiatus at the end of cycle III (Pontian).Then a transgression occurs in Pliocene – cycle IV (Solnjeformation), accompanied with volcanic activity in Kožufand Kozjak Mts (Vitačevo formation), which continuedthrough Early Pleistocene (Mariovo formation). With thedraining of the lake system in central Macedonia as a resultof subsidence in the Aegean sea (which started probably aslate as Middle Pleistocene; Dumurdžanov et al. 2005),Mariovo lake also drained, thus Crna Reka established itsfluvial basin, including the super-imposed valley ofButurica River in which Provalata Cave has formed.
3. MethodsWe made a detail survey of the cave, combined withmorphological analyses in order to determine the presenceof characteristic hypogenic morphology.
Characteristic cave sediments were sampled for X-Rayanalyses. This includes samples from gypsum, grey clay,yellow sand, pinkish clay, pale yellow sand and dark crustunder the gypsum crust. X-ray analyses were carried at theCEREGE – CNRS, France. X-ray powder diffraction(XRD) patterns were recorded on a Philips diffractometerusing Cobalt radiation (λ = 1.79 Å) with a secondarygraphite monochromator. The diffractometer optic used torecord all samples was a front fixed slit of 1°, a scatteredradiation slit of 1° after the sample, and a 0.2 mm detectorslit. The X-ray tube operating conditions were 40 kV and
Figure 2. Geological setting of the cave.
Figure 3. Map of Cave Provalata.
The cave is mostly formed in Cambrian marbles with some(mostly upper) parts formed in marble breccia (paleokarst),which together with the underlying Precambrian dolomiticmarbles are part of a Veprcani Monocline that has NNW-SSE direction and dips to ENE by 25 to 50°. In the northernparts this Cambrian marbles have lenses of Phyllite-micaschists, and to the south they lay directly overCambrian Phyllito-micaschists (Dumurdžanov et al. 1976).One such lense is located just west of the cave (the cave isformed near the contact of marbles and Phyllito-micaschists).
To the south and east, this Pre-Cenozoic rocks are coveredby Neogene and Quaternary lacustrine and pyroclasticsediments of Mariovo graben (Dumurdžanov et al. 2004):
• Nerezi formation (Upper Miocene) – gravel andsandstone; siltstone and silty claystone that grades upwardinto claystone and coal; and siltstone and sandstonefollowed by a hiatus.
• Solnje Formation (Pliocene) – poorly stratified gravel andsandstone, continuing to:
Speleogenesis – oral 2013 ICS Proceedings
413
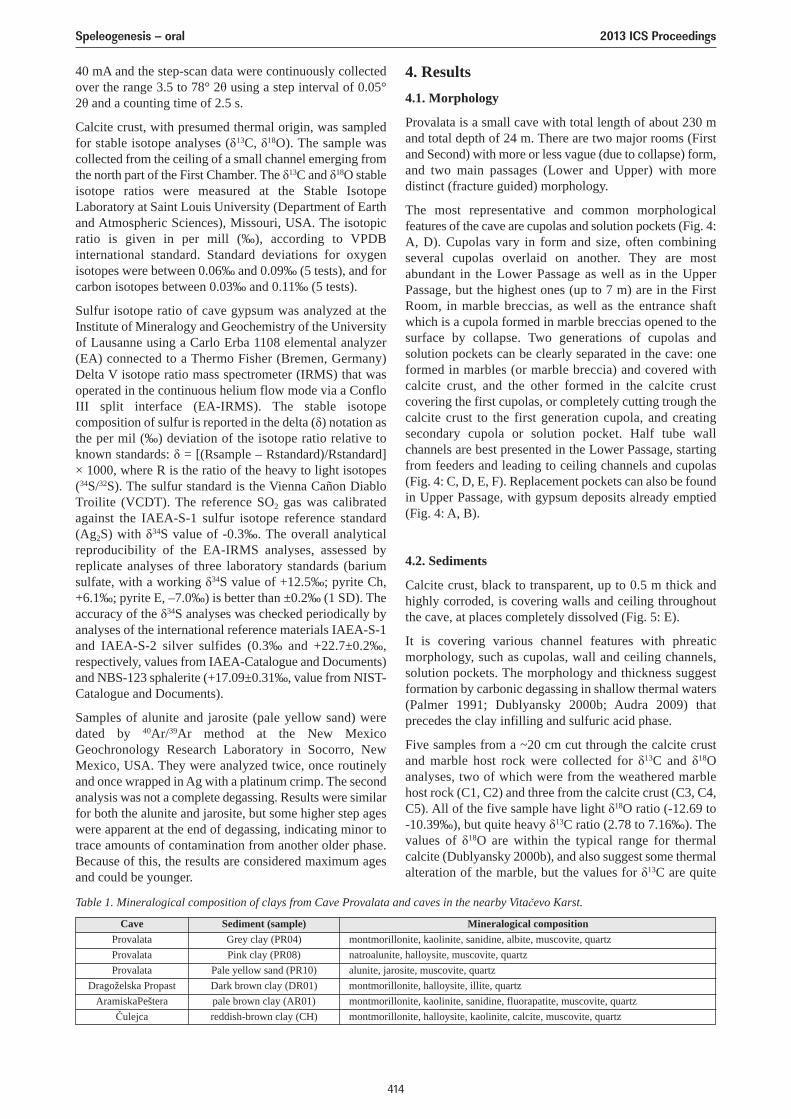
40 mA and the step-scan data were continuously collectedover the range 3.5 to 78° 2θ using a step interval of 0.05°2θ and a counting time of 2.5 s.
Calcite crust, with presumed thermal origin, was sampledfor stable isotope analyses (δ13C, δ18O). The sample wascollected from the ceiling of a small channel emerging fromthe north part of the First Chamber. The δ13C and δ18O stableisotope ratios were measured at the Stable IsotopeLaboratory at Saint Louis University (Department of Earthand Atmospheric Sciences), Missouri, USA. The isotopicratio is given in per mill (‰), according to VPDBinternational standard. Standard deviations for oxygenisotopes were between 0.06‰ and 0.09‰ (5 tests), and forcarbon isotopes between 0.03‰ and 0.11‰ (5 tests).
Sulfur isotope ratio of cave gypsum was analyzed at theInstitute of Mineralogy and Geochemistry of the Universityof Lausanne using a Carlo Erba 1108 elemental analyzer(EA) connected to a Thermo Fisher (Bremen, Germany)Delta V isotope ratio mass spectrometer (IRMS) that wasoperated in the continuous helium flow mode via a ConfloIII split interface (EA-IRMS). The stable isotopecomposition of sulfur is reported in the delta (δ) notation asthe per mil (‰) deviation of the isotope ratio relative toknown standards: δ = [(Rsample – Rstandard)/Rstandard]× 1000, where R is the ratio of the heavy to light isotopes(34S/32S). The sulfur standard is the Vienna Cañon DiabloTroilite (VCDT). The reference SO2 gas was calibratedagainst the IAEA-S-1 sulfur isotope reference standard(Ag2S) with δ34S value of -0.3‰. The overall analyticalreproducibility of the EA-IRMS analyses, assessed byreplicate analyses of three laboratory standards (bariumsulfate, with a working δ34S value of +12.5‰; pyrite Ch,+6.1‰; pyrite E, –7.0‰) is better than ±0.2‰ (1 SD). Theaccuracy of the δ34S analyses was checked periodically byanalyses of the international reference materials IAEA-S-1and IAEA-S-2 silver sulfides (0.3‰ and +22.7±0.2‰,respectively, values from IAEA-Catalogue and Documents)and NBS-123 sphalerite (+17.09±0.31‰, value from NIST-Catalogue and Documents).
Samples of alunite and jarosite (pale yellow sand) weredated by 40Ar/39Ar method at the New MexicoGeochronology Research Laboratory in Socorro, NewMexico, USA. They were analyzed twice, once routinelyand once wrapped in Ag with a platinum crimp. The secondanalysis was not a complete degassing. Results were similarfor both the alunite and jarosite, but some higher step ageswere apparent at the end of degassing, indicating minor totrace amounts of contamination from another older phase.Because of this, the results are considered maximum agesand could be younger.
4. Results4.1. Morphology
Provalata is a small cave with total length of about 230 mand total depth of 24 m. There are two major rooms (Firstand Second) with more or less vague (due to collapse) form,and two main passages (Lower and Upper) with moredistinct (fracture guided) morphology.
The most representative and common morphologicalfeatures of the cave are cupolas and solution pockets (Fig. 4:A, D). Cupolas vary in form and size, often combiningseveral cupolas overlaid on another. They are mostabundant in the Lower Passage as well as in the UpperPassage, but the highest ones (up to 7 m) are in the FirstRoom, in marble breccias, as well as the entrance shaftwhich is a cupola formed in marble breccias opened to thesurface by collapse. Two generations of cupolas andsolution pockets can be clearly separated in the cave: oneformed in marbles (or marble breccia) and covered withcalcite crust, and the other formed in the calcite crustcovering the first cupolas, or completely cutting trough thecalcite crust to the first generation cupola, and creatingsecondary cupola or solution pocket. Half tube wallchannels are best presented in the Lower Passage, startingfrom feeders and leading to ceiling channels and cupolas(Fig. 4: C, D, E, F). Replacement pockets can also be foundin Upper Passage, with gypsum deposits already emptied(Fig. 4: A, B).
4.2. Sediments
Calcite crust, black to transparent, up to 0.5 m thick andhighly corroded, is covering walls and ceiling throughoutthe cave, at places completely dissolved (Fig. 5: E).
It is covering various channel features with phreaticmorphology, such as cupolas, wall and ceiling channels,solution pockets. The morphology and thickness suggestformation by carbonic degassing in shallow thermal waters(Palmer 1991; Dublyansky 2000b; Audra 2009) thatprecedes the clay infilling and sulfuric acid phase.
Five samples from a ~20 cm cut through the calcite crustand marble host rock were collected for δ13C and δ18Oanalyses, two of which were from the weathered marblehost rock (C1, C2) and three from the calcite crust (C3, C4,C5). All of the five sample have light δ18O ratio (-12.69 to-10.39‰), but quite heavy δ13C ratio (2.78 to 7.16‰). Thevalues of δ18O are within the typical range for thermalcalcite (Dublyansky 2000b), and also suggest some thermalalteration of the marble, but the values for δ13C are quite
Table 1. Mineralogical composition of clays from Cave Provalata and caves in the nearby Vitačevo Karst.
Cave Sediment (sample) Mineralogical compositionProvalata Grey clay (PR04) montmorillonite, kaolinite, sanidine, albite, muscovite, quartzProvalata Pink clay (PR08) natroalunite, halloysite, muscovite, quartzProvalata Pale yellow sand (PR10) alunite, jarosite, muscovite, quartz
Dragoželska Propast Dark brown clay (DR01) montmorillonite, halloysite, illite, quartzAramiskaPeštera pale brown clay (AR01) montmorillonite, kaolinite, sanidine, fluorapatite, muscovite, quartz
Čulejca reddish-brown clay (CH) montmorillonite, halloysite, kaolinite, calcite, muscovite, quartz
Speleogenesis – oral 2013 ICS Proceedings
414
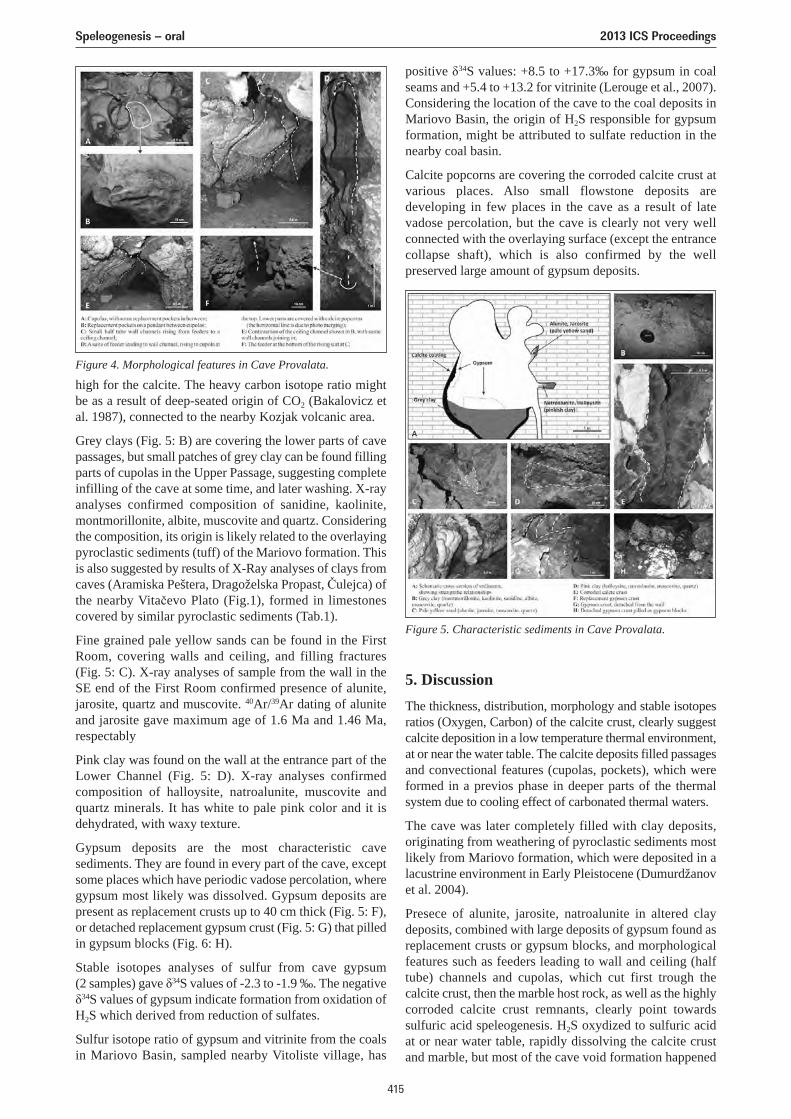
high for the calcite. The heavy carbon isotope ratio mightbe as a result of deep-seated origin of CO2 (Bakalovicz etal. 1987), connected to the nearby Kozjak volcanic area.
Grey clays (Fig. 5: B) are covering the lower parts of cavepassages, but small patches of grey clay can be found fillingparts of cupolas in the Upper Passage, suggesting completeinfilling of the cave at some time, and later washing. X-rayanalyses confirmed composition of sanidine, kaolinite,montmorillonite, albite, muscovite and quartz. Consideringthe composition, its origin is likely related to the overlayingpyroclastic sediments (tuff) of the Mariovo formation. Thisis also suggested by results of X-Ray analyses of clays fromcaves (Aramiska Peštera, Dragoželska Propast, Čulejca) ofthe nearby Vitačevo Plato (Fig.1), formed in limestonescovered by similar pyroclastic sediments (Tab.1).
Fine grained pale yellow sands can be found in the FirstRoom, covering walls and ceiling, and filling fractures(Fig. 5: C). X-ray analyses of sample from the wall in theSE end of the First Room confirmed presence of alunite,jarosite, quartz and muscovite. 40Ar/39Ar dating of aluniteand jarosite gave maximum age of 1.6 Ma and 1.46 Ma,respectably
Pink clay was found on the wall at the entrance part of theLower Channel (Fig. 5: D). X-ray analyses confirmedcomposition of halloysite, natroalunite, muscovite andquartz minerals. It has white to pale pink color and it isdehydrated, with waxy texture.
Gypsum deposits are the most characteristic cavesediments. They are found in every part of the cave, exceptsome places which have periodic vadose percolation, wheregypsum most likely was dissolved. Gypsum deposits arepresent as replacement crusts up to 40 cm thick (Fig. 5: F),or detached replacement gypsum crust (Fig. 5: G) that pilledin gypsum blocks (Fig. 6: H).
Stable isotopes analyses of sulfur from cave gypsum(2 samples) gave δ34S values of -2.3 to -1.9 ‰. The negativeδ34S values of gypsum indicate formation from oxidation ofH2S which derived from reduction of sulfates.
Sulfur isotope ratio of gypsum and vitrinite from the coalsin Mariovo Basin, sampled nearby Vitoliste village, has
positive δ34S values: +8.5 to +17.3‰ for gypsum in coalseams and +5.4 to +13.2 for vitrinite (Lerouge et al., 2007).Considering the location of the cave to the coal deposits inMariovo Basin, the origin of H2S responsible for gypsumformation, might be attributed to sulfate reduction in thenearby coal basin.
Calcite popcorns are covering the corroded calcite crust atvarious places. Also small flowstone deposits aredeveloping in few places in the cave as a result of latevadose percolation, but the cave is clearly not very wellconnected with the overlaying surface (except the entrancecollapse shaft), which is also confirmed by the wellpreserved large amount of gypsum deposits.
Figure 4. Morphological features in Cave Provalata.
Figure 5. Characteristic sediments in Cave Provalata.
5. DiscussionThe thickness, distribution, morphology and stable isotopesratios (Oxygen, Carbon) of the calcite crust, clearly suggestcalcite deposition in a low temperature thermal environment,at or near the water table. The calcite deposits filled passagesand convectional features (cupolas, pockets), which wereformed in a previos phase in deeper parts of the thermalsystem due to cooling effect of carbonated thermal waters.
The cave was later completely filled with clay deposits,originating from weathering of pyroclastic sediments mostlikely from Mariovo formation, which were deposited in alacustrine environment in Early Pleistocene (Dumurdžanovet al. 2004).
Presece of alunite, jarosite, natroalunite in altered claydeposits, combined with large deposits of gypsum found asreplacement crusts or gypsum blocks, and morphologicalfeatures such as feeders leading to wall and ceiling (halftube) channels and cupolas, which cut first trough thecalcite crust, then the marble host rock, as well as the highlycorroded calcite crust remnants, clearly point towardssulfuric acid speleogenesis. H2S oxydized to sulfuric acidat or near water table, rapidly dissolving the calcite crustand marble, but most of the cave void formation happened
Speleogenesis – oral 2013 ICS Proceedings
415
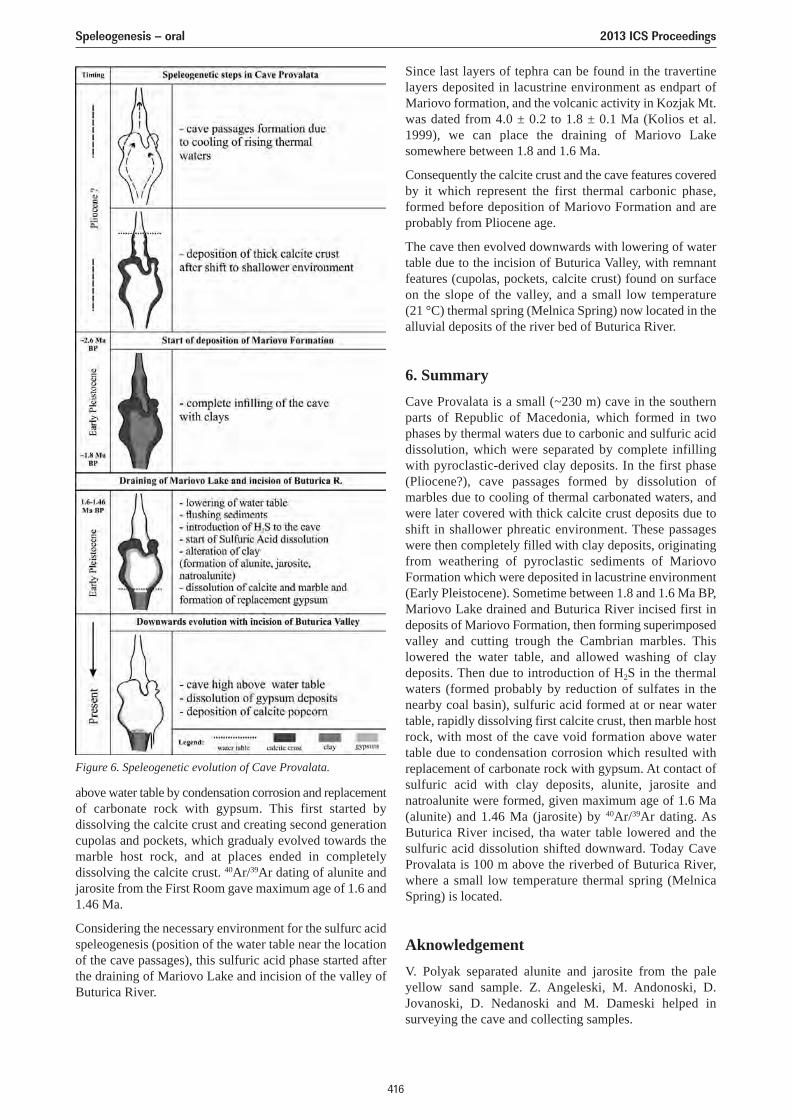
above water table by condensation corrosion and replacementof carbonate rock with gypsum. This first started bydissolving the calcite crust and creating second generationcupolas and pockets, which gradualy evolved towards themarble host rock, and at places ended in completelydissolving the calcite crust. 40Ar/39Ar dating of alunite andjarosite from the First Room gave maximum age of 1.6 and1.46 Ma.
Considering the necessary environment for the sulfurc acidspeleogenesis (position of the water table near the locationof the cave passages), this sulfuric acid phase started afterthe draining of Mariovo Lake and incision of the valley ofButurica River.
Since last layers of tephra can be found in the travertinelayers deposited in lacustrine environment as endpart ofMariovo formation, and the volcanic activity in Kozjak Mt.was dated from 4.0 ± 0.2 to 1.8 ± 0.1 Ma (Kolios et al.1999), we can place the draining of Mariovo Lakesomewhere between 1.8 and 1.6 Ma.
Consequently the calcite crust and the cave features coveredby it which represent the first thermal carbonic phase,formed before deposition of Mariovo Formation and areprobably from Pliocene age.
The cave then evolved downwards with lowering of watertable due to the incision of Buturica Valley, with remnantfeatures (cupolas, pockets, calcite crust) found on surfaceon the slope of the valley, and a small low temperature(21 °C) thermal spring (Melnica Spring) now located in thealluvial deposits of the river bed of Buturica River.
6. SummaryCave Provalata is a small (~230 m) cave in the southernparts of Republic of Macedonia, which formed in twophases by thermal waters due to carbonic and sulfuric aciddissolution, which were separated by complete infillingwith pyroclastic-derived clay deposits. In the first phase(Pliocene?), cave passages formed by dissolution ofmarbles due to cooling of thermal carbonated waters, andwere later covered with thick calcite crust deposits due toshift in shallower phreatic environment. These passageswere then completely filled with clay deposits, originatingfrom weathering of pyroclastic sediments of MariovoFormation which were deposited in lacustrine environment(Early Pleistocene). Sometime between 1.8 and 1.6 Ma BP,Mariovo Lake drained and Buturica River incised first indeposits of Mariovo Formation, then forming superimposedvalley and cutting trough the Cambrian marbles. Thislowered the water table, and allowed washing of claydeposits. Then due to introduction of H2S in the thermalwaters (formed probably by reduction of sulfates in thenearby coal basin), sulfuric acid formed at or near watertable, rapidly dissolving first calcite crust, then marble hostrock, with most of the cave void formation above watertable due to condensation corrosion which resulted withreplacement of carbonate rock with gypsum. At contact ofsulfuric acid with clay deposits, alunite, jarosite andnatroalunite were formed, given maximum age of 1.6 Ma(alunite) and 1.46 Ma (jarosite) by 40Ar/39Ar dating. AsButurica River incised, tha water table lowered and thesulfuric acid dissolution shifted downward. Today CaveProvalata is 100 m above the riverbed of Buturica River,where a small low temperature thermal spring (MelnicaSpring) is located.
AknowledgementV. Polyak separated alunite and jarosite from the paleyellow sand sample. Z. Angeleski, M. Andonoski, D.Jovanoski, D. Nedanoski and M. Dameski helped insurveying the cave and collecting samples.
Figure 6. Speleogenetic evolution of Cave Provalata.
Speleogenesis – oral 2013 ICS Proceedings
416
ReferencesAudra P, 2007. Karst et spéléogenèse épigènes, hypogènes,
recherches appliquées et valorisation (Epigene and hypogenekarst and speleogenesis. Operative research and valorisation).Habilitation Thesis, University of Nice Sophia-Antipolis, 278.
Audta P, 2009. The association between bubble trails and folia: amorphological and sedimentary indicator of hypogenicspeleogenesis by degassing, example from Adaouste Cave(Provence, France). International Journal of Speleology, 38(2),93–102.
Bakalowicz MJ, Ford DC, Miller TE, Palmer AN, Palmer MV,1987. Thermal genesis of dissolution caves in the Black Hills,South Dakota. Geological Society of America Bulletin, 99,729–738.
Dublyansky YV, 2000a. Dissolution of carbonates by geothermalwaters. In: Klimchouk AB, Ford DC, Palmer AN, DreybrodtW, (Eds). Speleogenesis: Evolution of karst aquifers:Huntsville, Ala. National Speleological Society, 158–159.
Dublyansky YV, 2000b. Hydrothermal speleogenesis – its settingsand peculiar features. Klimchouk AB, Ford DC, Palmer AN,Dreybrodt W, (Eds). Speleogenesis: Evolution of karst aquifers:Huntsville, Ala. National Speleological Society, 292–297.
Dumurdžanov N, Hristov S, Pavlovski B, Ivanova V, 1976.Explanatory notes for the General Geological map of Vitolišteand Kajmakčalan. Federal Geological Survey, Beograd, 1–61(in Macedonian).
Dumurdžanov N, Serafimovski T, Burchfiel, BC, 2004. Evolutionof the Neogene-Pleistocene Basins of Macedonia. GeologicalSociety of America, Digital Map and Chart Series 1, 1–20.
Dumurdžanov N, Serafimovski T, Burchfiel BC, 2005. Cenozoictectonics of Macedonia and its relation to the South Balkanextensional regime. Geological Society of America, Geosphere,1(1), 1–22.
Egemeier SJ, 1981. Cavern development by thermal waters. NSSBulletin 43, 31–51.
Galdenzi S, Maruoka T, 2003. Gypsum deposits in the Frasassicaves, Central Italy. Journal of Cave and Karst Studies, 65,111–125.
Galdenzi S, Menichetti M, 1995. Occurrence of hypogenic cavesin a karst region: examples from central Italy. EnvironmentalGeology 26, 39–47.
Hill CA, 2000. Overview of geological history of cavedevelopment in the Guadalupe Mountains, New Mexico,Journal of Cave and Karst Studies, 62(2), 60–71.
Hose LD, Pisarowicz JA, 1999. Cueva de Villa Luz, Tabasco,Mexico: reconnaissance study of an active sulfur spring caveand ecosystem. Journal of Cave and Karst Studies 61, 13–21.
Kolios N, Innocenti F, Maneti P, Poccerilo O, Guiliani O, 1980.The Pliocene Volcanism of the Voras Mts (Central Maceodonia,Greece). Bull. Volcanol., 43(3), 553–568.
Kolčakovski D, Boev B, Hristovski S, Petreska B, 2004. CaveGulabinka – Mariovo, preliminary speleological exploration.Bulletin for Physical Geography, Institute of Geography –PMF, Skopje, 1, 35–43 (in Macedonian).
Lerouge C, Gouin J, Deschamps Y, Widory D, Laggoun-DefargeF, Tasev G, Serafimovski T, Yossifova M, 2007.Characterization of coal from the Mariovo basin, Macedonia –Insights from organic geochemical and sulphur isotopic data.In: Andrew CJ, et al (Eds.). Digging Deeper, 9th Biennial SGAMeeting, August 20–23, 2007, Dublin, Ireland, vol. II,901–904.
Palmer AN, 1991. Origin and morphology of limestone caves.Geological Society of America Bulletin, 103 (1), 1–21.
Plan L, Tschegg C, De Waelle J, Spötl C, 2012. Corrosionmorphology and cave wall alteration in an Alpine sulfuric acidcave (Kraushöhle, Austria), Geomorphology 169–170, 45–54.
Polyak VJ, Provencio P. 2001. By-product materials related toH2S-H2SO4 influenced speleogenesis of Carlsbad, Lechuguilla,and other caves of the Guadalupe Mountains, New Mexico.Journal of Caves and Karst Science, 63(1), 23–32.
Speleogenesis – oral 2013 ICS Proceedings
417
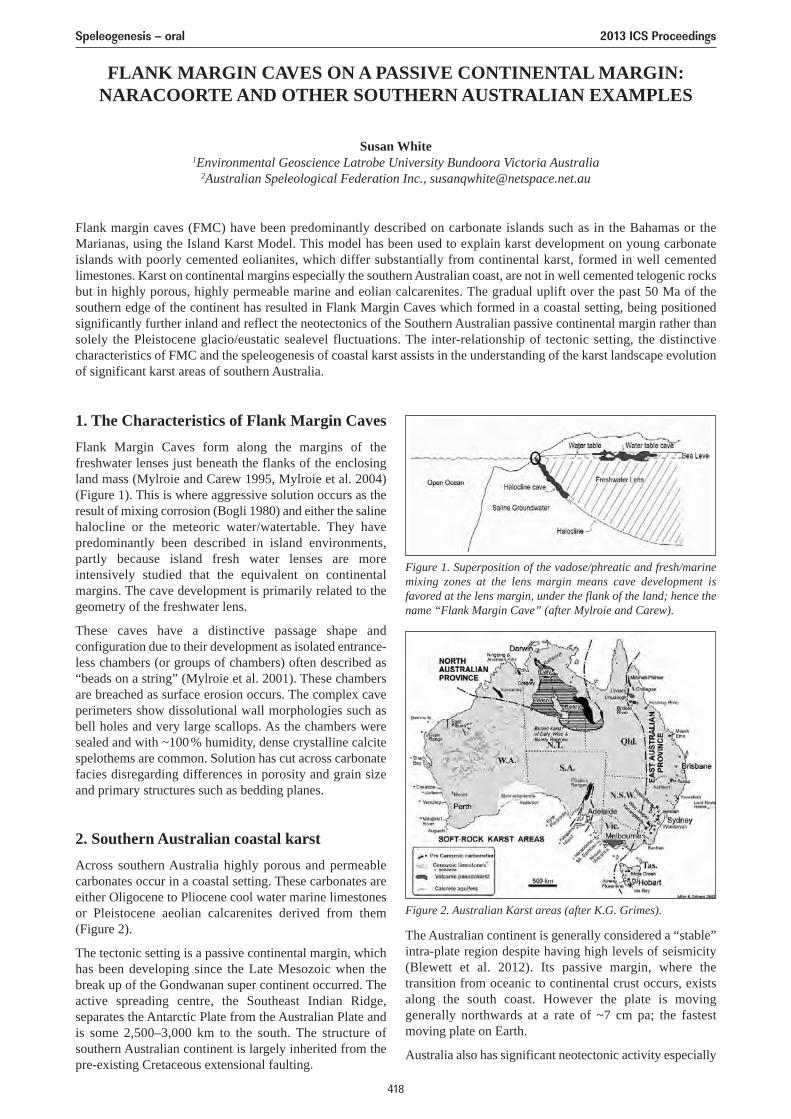
FLANK MARGIN CAVES ON A PASSIVE CONTINENTAL MARGIN:NARACOORTE AND OTHER SOUTHERN AUSTRALIAN EXAMPLES
Susan White1Environmental Geoscience Latrobe University Bundoora Victoria Australia
2Australian Speleological Federation Inc., [email protected]
Flank margin caves (FMC) have been predominantly described on carbonate islands such as in the Bahamas or theMarianas, using the Island Karst Model. This model has been used to explain karst development on young carbonateislands with poorly cemented eolianites, which differ substantially from continental karst, formed in well cementedlimestones. Karst on continental margins especially the southern Australian coast, are not in well cemented telogenic rocksbut in highly porous, highly permeable marine and eolian calcarenites. The gradual uplift over the past 50 Ma of thesouthern edge of the continent has resulted in Flank Margin Caves which formed in a coastal setting, being positionedsignificantly further inland and reflect the neotectonics of the Southern Australian passive continental margin rather thansolely the Pleistocene glacio/eustatic sealevel fluctuations. The inter-relationship of tectonic setting, the distinctivecharacteristics of FMC and the speleogenesis of coastal karst assists in the understanding of the karst landscape evolutionof significant karst areas of southern Australia.
1. The Characteristics of Flank Margin CavesFlank Margin Caves form along the margins of thefreshwater lenses just beneath the flanks of the enclosingland mass (Mylroie and Carew 1995, Mylroie et al. 2004)(Figure 1). This is where aggressive solution occurs as theresult of mixing corrosion (Bogli 1980) and either the salinehalocline or the meteoric water/watertable. They havepredominantly been described in island environments,partly because island fresh water lenses are moreintensively studied that the equivalent on continentalmargins. The cave development is primarily related to thegeometry of the freshwater lens.
These caves have a distinctive passage shape andconfiguration due to their development as isolated entrance-less chambers (or groups of chambers) often described as“beads on a string” (Mylroie et al. 2001). These chambersare breached as surface erosion occurs. The complex caveperimeters show dissolutional wall morphologies such asbell holes and very large scallops. As the chambers weresealed and with ~100% humidity, dense crystalline calcitespelothems are common. Solution has cut across carbonatefacies disregarding differences in porosity and grain sizeand primary structures such as bedding planes.
2. Southern Australian coastal karstAcross southern Australia highly porous and permeablecarbonates occur in a coastal setting. These carbonates areeither Oligocene to Pliocene cool water marine limestonesor Pleistocene aeolian calcarenites derived from them(Figure 2).
The tectonic setting is a passive continental margin, whichhas been developing since the Late Mesozoic when thebreak up of the Gondwanan super continent occurred. Theactive spreading centre, the Southeast Indian Ridge,separates the Antarctic Plate from the Australian Plate andis some 2,500–3,000 km to the south. The structure ofsouthern Australian continent is largely inherited from thepre-existing Cretaceous extensional faulting.
Figure 2. Australian Karst areas (after K.G. Grimes).
Figure 1. Superposition of the vadose/phreatic and fresh/marinemixing zones at the lens margin means cave development isfavored at the lens margin, under the flank of the land; hence thename “Flank Margin Cave” (after Mylroie and Carew).
The Australian continent is generally considered a “stable”intra-plate region despite having high levels of seismicity(Blewett et al. 2012). Its passive margin, where thetransition from oceanic to continental crust occurs, existsalong the south coast. However the plate is movinggenerally northwards at a rate of ~7 cm pa; the fastestmoving plate on Earth.
Australia also has significant neotectonic activity especially
Speleogenesis – oral 2013 ICS Proceedings
418
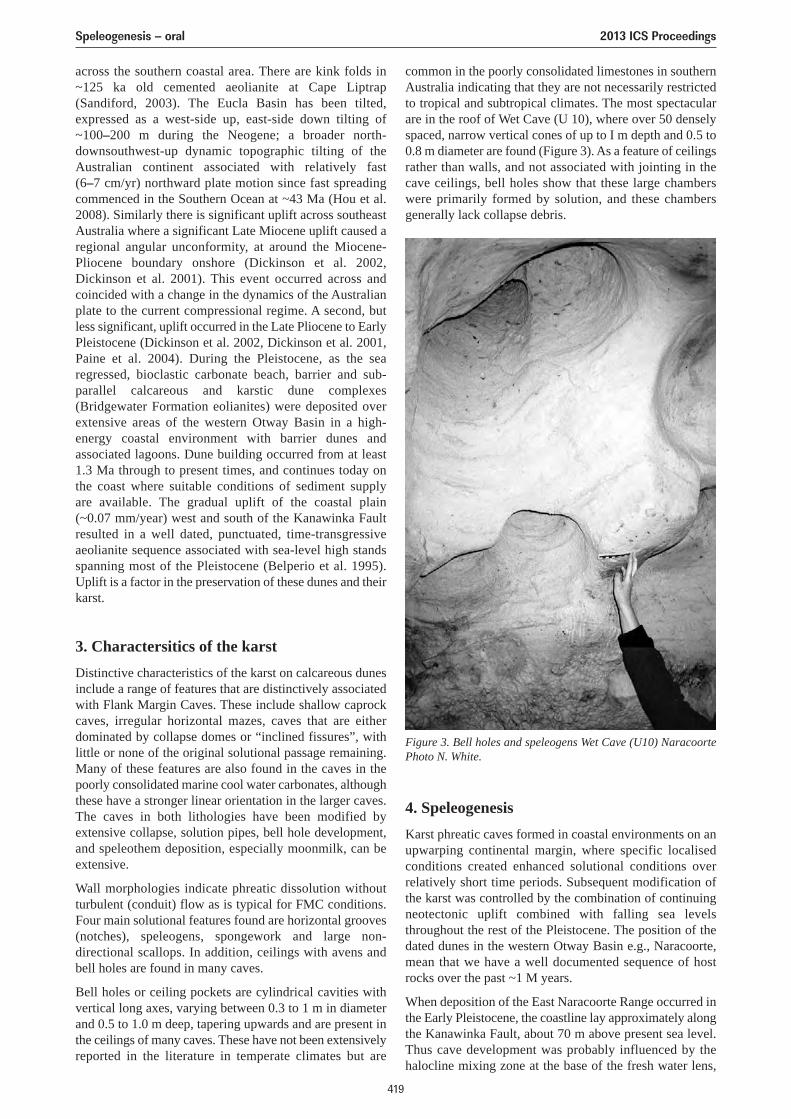
across the southern coastal area. There are kink folds in~125 ka old cemented aeolianite at Cape Liptrap(Sandiford, 2003). The Eucla Basin has been tilted,expressed as a west-side up, east-side down tilting of~100–200 m during the Neogene; a broader north-downsouthwest-up dynamic topographic tilting of theAustralian continent associated with relatively fast(6–7 cm/yr) northward plate motion since fast spreadingcommenced in the Southern Ocean at ~43 Ma (Hou et al.2008). Similarly there is significant uplift across southeastAustralia where a significant Late Miocene uplift caused aregional angular unconformity, at around the Miocene-Pliocene boundary onshore (Dickinson et al. 2002,Dickinson et al. 2001). This event occurred across andcoincided with a change in the dynamics of the Australianplate to the current compressional regime. A second, butless significant, uplift occurred in the Late Pliocene to EarlyPleistocene (Dickinson et al. 2002, Dickinson et al. 2001,Paine et al. 2004). During the Pleistocene, as the searegressed, bioclastic carbonate beach, barrier and sub-parallel calcareous and karstic dune complexes(Bridgewater Formation eolianites) were deposited overextensive areas of the western Otway Basin in a high-energy coastal environment with barrier dunes andassociated lagoons. Dune building occurred from at least1.3 Ma through to present times, and continues today on the coast where suitable conditions of sediment supply are available. The gradual uplift of the coastal plain (~0.07 mm/year) west and south of the Kanawinka Faultresulted in a well dated, punctuated, time-transgressiveaeolianite sequence associated with sea-level high standsspanning most of the Pleistocene (Belperio et al. 1995).Uplift is a factor in the preservation of these dunes and theirkarst.
3. Charactersitics of the karstDistinctive characteristics of the karst on calcareous dunesinclude a range of features that are distinctively associatedwith Flank Margin Caves. These include shallow caprockcaves, irregular horizontal mazes, caves that are eitherdominated by collapse domes or “inclined fissures”, withlittle or none of the original solutional passage remaining.Many of these features are also found in the caves in thepoorly consolidated marine cool water carbonates, althoughthese have a stronger linear orientation in the larger caves.The caves in both lithologies have been modified byextensive collapse, solution pipes, bell hole development,and speleothem deposition, especially moonmilk, can beextensive.
Wall morphologies indicate phreatic dissolution withoutturbulent (conduit) flow as is typical for FMC conditions.Four main solutional features found are horizontal grooves(notches), speleogens, spongework and large non-directional scallops. In addition, ceilings with avens andbell holes are found in many caves.
Bell holes or ceiling pockets are cylindrical cavities withvertical long axes, varying between 0.3 to 1 m in diameterand 0.5 to 1.0 m deep, tapering upwards and are present inthe ceilings of many caves. These have not been extensivelyreported in the literature in temperate climates but are
common in the poorly consolidated limestones in southernAustralia indicating that they are not necessarily restrictedto tropical and subtropical climates. The most spectacularare in the roof of Wet Cave (U 10), where over 50 denselyspaced, narrow vertical cones of up to I m depth and 0.5 to0.8 m diameter are found (Figure 3). As a feature of ceilingsrather than walls, and not associated with jointing in thecave ceilings, bell holes show that these large chamberswere primarily formed by solution, and these chambersgenerally lack collapse debris.
Figure 3. Bell holes and speleogens Wet Cave (U10) NaracoortePhoto N. White.
4. SpeleogenesisKarst phreatic caves formed in coastal environments on anupwarping continental margin, where specific localisedconditions created enhanced solutional conditions overrelatively short time periods. Subsequent modification ofthe karst was controlled by the combination of continuingneotectonic uplift combined with falling sea levelsthroughout the rest of the Pleistocene. The position of thedated dunes in the western Otway Basin e.g., Naracoorte,mean that we have a well documented sequence of hostrocks over the past ~1 M years.
When deposition of the East Naracoorte Range occurred inthe Early Pleistocene, the coastline lay approximately alongthe Kanawinka Fault, about 70 m above present sea level.Thus cave development was probably influenced by thehalocline mixing zone at the base of the fresh water lens,
Speleogenesis – oral 2013 ICS Proceedings
419
enhancing aggressiveness. The groundwater mixing zonegeometry is controlled by sea level and the water table inhigh permeability limestones such as the Miocene coolwater Gambier Limestone. Additionally the watertablewould have been generally very flat at Naracoorte. Thecaves show many characteristic features of FMC. The mainarea of cave development lay probably between 400 m to500 m inland from the high water mark when sea level wasat 70 m above present conditions. If the water table werebetween 1 and 2 m above sea level in this area (assuming asimilar very low gradient of 1:250 to that inland from thepresent coastline), the fresh/seawater zone would have beenat least 40 m below sea level. This appears to be below thedepth at which most caves at Naracoorte have developed(~61 m a.s.l. and 25 to 30 m below present surface.However, if the area was an estuarine or back swampenvironment similar to the present coastal areas, e.g.,Glenelg River estuary, the water table would have beenlower, e.g., at 0.75 m above sea level or less. The haloclinewould then be at ~30 m depth and halocline enhancedformation is possible.
Similar development and features can be seen on theNullarbor (Burnett et al. in review) and on Kangaroo Island(Mylroie and Mylroie 2009). However in all cases thelength of time of the landscape development means thatsignificant landscape lowering has occurred and the cavesmay now be closer to the present land surface than whenthey formed.
In the case of Kangaroo Island, Mylroie and Mylroie (2009)have argued for the presence of FMC but have overemphasised the role of the Pleistocene eustatic sea levelfluctuations and under estimated the role of neotectonicswhich has overprinted the global sea level fluctuations onthe southern Australian continental margin.
5. ConclusionsLimestone dissolution is enhanced at the vadose/phreaticand fresh-water/saltwater interfaces due to mixing effectsand oxidation of organic matter at these density interfaces.The position of the fresh-water lens has fluctuated througha vertical range of over 100 m, due to Quaternary glacio-eustasy, but local tectonics can overprint glacio-eustaticevents, adding to the complexity of the record. The karst iseogenetic, having been formed in eogenetic rocks, whichare rocks that never underwent burial beyond the range ofmeteoric diagenesis.
The karst landscape development on the Cenozoic coolwater marine limestones and eolianites along the southernAustralian margin are related to the coastal conditions whenthe main karstification has occurred. This much moreextensive than previously thought and helps explain thecomplex speleogenesis. The uplift of the land coupled withthe fluctuating Pleistocene sea levels has resulted in a muchmore complex scenario than previously thought andexplains the relatively sparse karst areas interspersed withvery intense karstification.
AcknowledgementsThanks to John Webb and Nicholas White for theirassistance.
ReferencesBelperio AP (Compiler), 1995. Quaternary. In: JF Drexel and WV
Preiss (Eds.), The Geology of South Australia. South AustraliaGeological Survey Bulletin 54. Adelaide, 219–280.
Blewett RS, Kennett BLN, Huston DL, 2012. Australia in Timeand Space. In: Shaping a Nation: A Geology of Australia,Blewett RS (ed.),Geoscience Australia and ANU E Press,Canberra, 332–379.
Bögli A, 1980. Karst hydrology and physical speleology: Springer-Verlag, Berlin, 270.
Burnett S, Webb JA, White S, in review. Shallow Caves andBlowholes on the Nullarbor Plain, Australia – Flank MarginCaves on a Low Gradient Limestone Platform.
Carew JL, Mylroie JE, 1995. Quaternary tectonic stability of theBahamian Archipelago: Evidence from fossil coral reefs and flankmargin caves: Quaternary Science Reviews, 14, 144–153.
Dickinson JA, Wallace MW, Holdgate GR, Daniels J, GallagherSJ, Thomas L, 2001. Neogene Tectonics in SE Australia:implications for petroleum systems. Australian PetroleumExploration Association Journal (2001): 37–52.
Dickinson JA, Wallace MW, Holdgate G, Gallagher SJ, ThomasL, 2002. Origin and timing of the Miocene Plioceneunconformity in southeast Australia. Journal of SedimentaryResearch, 72(2), 288–303.
Hou B, Frakes LA, Sandiford M, Worrall L, Keeling J., Alley NF,2008. Cenozoic Eucla Basin and associated palaeovalleys,southern Australia – climatic and tectonic influences onlandscape evolution, sedimentation and heavy mineralaccumulation. Sedimentary Geology 203, 112–130.
Mylroie JE, Jenson JW, Mylroie JR, Carew JL 2004. Epikarst onEogenetic Rocks In Karst Waters Institute Special Publication9. 132–134.
Mylroie JE, Mylroie JR, 2009. Caves as sea level and upliftindicators, Kangaroo Island, South Australia. Journal of Caveand Karst Studies, 71 (1), 32–47.
Mylroie JE, Jenson JW, Taborosi D, Jocson JMU, Vann DT, WexelC, 2001. Karst features of Guam in terms of a general modelof carbonate island karst: Journal of Cave and Karst Studies,63(1), 9–22.
Paine MD, Bennetts DA, Webb JA, Morand VJ, 2004. Nature andextent of Pliocene strandlines in southwestern Victoria and theirapplication to Late Neogene tectonics. Australian Journal ofEarth Sciences, 51(3), 407–422.
Sandiford M, 2003. Neotectonics of southeastern Australia:linking the Quaternary faulting record with seismicity and insitu stress, In: RR Hillis and D Muller (Eds.). Evolution anddynamics of the Australian Plate. Geological Society ofAustralia, Special Publication, 22, 101–113.
Speleogenesis – oral 2013 ICS Proceedings
420
TRITIUM AND H, O AND C STABLE ISOTOPES AS A TOOL FORTRACKING OF WATER CIRCULATION IN THE NIEDŹWIEDZIA CAVE
SYSTEM (SUDETES, POLAND)
Michał Gąsiorowski, Helena HercmanInstitute of Geological Sciences PAS, Twarda 51/55, PL-00818, Warszawa, Poland, [email protected]
Water circulation in Niedźwiedzia Cave system is complicated. The system is fed by direct infiltration of precipitation,infiltration from the surface stream and, possibly, by rising flow from deep sources. The cave is drained by system of karstsprings in the Kleśnica stream valley, but some part of water flows across border ridge and occurs in Morava stream valley,Czech Republic (Ciężkowski et al. 2009). We tried to use tritium and stable isotopes to describe hydrology of the cavesystem and analyzed 155 water samples for stable isotopes and 38 water samples for tritium content. The NiedźwiedziaCave system is composed of three levels of halls and galleries. In the upper level, stable isotope composition in drip waterplots close to the local meteoritic water line (LMWL) on the δ18O vs δD diagram. It varies during the year similar to stableisotope composition of precipitation (i.e. low δ18O values during winters and higher δ18O during summers). The delaybetween isotopic signal in precipitation and drip water is ~10–14 days and this can be interpreted as a time of infiltrationfrom the surface to the cave upper level. The correlation between isotopic composition of precipitation and drip water isnot observed in the lower level of the cave system. There isotopic composition of drip water is more stable during theyear. We use tritium dating method to estimate the age of this water. It has shown that infiltration time to the lower levelis 1.4±0.3 year. The “oldest” water was found in karst spring draining the cave system. The estimated transit time is 3–4 years and suggest admixture of some “old” water that was not sampled in the cave.
AcknowledgmentsThe authors thank Artur Sawicki from the “NiedźwiedziaCave” authority for his support during the field work. JerzyBieroński gave us many useful hydrological informationand guys from the speleological club “Sekcja GrotołazówWrocław” gave us strong support during collection of watersamples. This study is funded by the National ScienceCenter grant no. N N306 131038 and IGS PAS internalproject “Tryt”.
ReferencesCiężkowski W, Buczyński S, Rzonca B, Marszałek H, Wąsik M,
Staśko S, 2009. Groundwater of karst terrain in the Sudetes.In: K. Stefaniak, A. Tyc and P. Socha (Eds). Karst of theCzęstochowa Upland and of the Eastern Sudetes. Studies of theFaculty of Earth Sciences University of Silesia, Sosnowiec-Wrocław, 371–384.
Speleogenesis – poster 2013 ICS Proceedings
421

422
2013 ICS Proceedings
423
Cave Mineralogy
Session:

424
HYPOGENE SULFURIC ACID SPELEOGENESIS AND RARESULFATE MINERALS (FIBROFERRITE, JAROSITE SUBGROUP)
BAUME GALINIERE CAVE (ALPES-DE-HAUTE-PROVENCE, FRANCE)
Philippe Audra1, Fernando Gázquez2, Fernando Rull3, Jean-Yves Bigot4, Hubert Camus5
1Polytech Nice – Sophia, University of Nice – Sophia Antipolis, 930 route des Colles, 06903 Sophia-Antipolis,France & Innovative City – IMREDD, Nice, France, [email protected]
2Water Resources and Environmental Geology Research Group, Dept. of Hydrogeology and Analytical Chemistry –University of Almería, Crta. Sacramento s/n, 04120 La Cañada de San Urbano, Almería, Spain, [email protected]
3Unidad Asociada UVA-CSIC al Centro de Astrobiología, University of Valladolid. Parque tecnológico Boecillo,47151 Valladolid, Spain, [email protected]
4Association française de karstologie (AFK), 21 rue des Hospices, 34090 Montpellier, France,[email protected]
5CENOTE, 1 chemin de Valdegour, 30900 Nîmes, France, [email protected]
The oxidation of sulfide sources (H2S gas, pyrite, hydrocarbons) produces sulfuric acid that strongly reacts with bedrock,causing limestone dissolution and complex interactions with other minerals. This type of cave development, known assulfuric acid speleogenesis, is a subcategory of hypogenic speleogenesis, where aggressive water rises from depth. It alsoproduces uncommon minerals, mainly sulfates. Baume Galinière is located in Southern France, in the Vaucluse springwatershed. This small maze cave displays characteristic features such as corrosion notches, calcite dikes and iron crusts,and sulfate minerals. Thirteen minerals were identified, including elemental sulfur, calcite, quartz, pyrite, goethite, gypsum,fibroferrite, plus all of the six members of the jarosite subgroup (jarosite, argentojarosite, ammoniojarosite,hydroniumjarosite, natrojarosite, plumbojarosite). The Baume Galinière deposits are the first documented cave occurrenceof argentojarosite and the second known occurrence of plumbojarosite, hydronium jarosite, ammoniojarosite, andfibroferrite. Together with other hypogenic caves in the Vaucluse watershed, Baume Galinière Cave owes its origin inburied conditions to deep water rising along major faults, mixing with meteoric water at the contact of the karst aquiferand overlying impervious cover, and causing pyrite deposition. Sulfuric acid speleogenesis occurred later after base leveldrop, when the cave arrived in shallow phreatic then in vadose zone, with oxidation of pyrites involving sulfidic gases.Attenuated oxidation is still occurring through condensation of incoming air from outside. Baume Galinière Cave recordsthe position of the paleo-cover and documents its retreat in relationship to valley incision caused by uplift and tilting ofthe Vaucluse block during Neogene.
1. IntroductionSulfuric acid speleogenesis involves the dissolution oflimestone by sulfuric acid derived from H2S that degassesfrom hypogenic water fed by deep sources (Egemeir 1983).The source of acidity may be hydrocarbons, sulfides orsulfates, or may be a result of volcanism. Cave developmentis due to strong acid corrosion, which also resulted inproduction of secondary sulfate minerals and developmentof microbial activity evidenced by the presence ofpoolfingers (Melim et al. 2001). These minerals are mainlygypsum and rare sulfate minerals, depending on thecomposition of the hypogenic water and the host carbonaterock. Sulfuric acid caves develop near the water table,where mixing of meteoric water and hypogenic waterallows oxidation processes. Such caves record position ofthe water table contemporaneous with their developmentand are good markers of geomorphological evolution.Baume Galinière is a cave located at the edge of theVaucluse Plateau, close to the margin of impervious bedsthat overlie the karst aquifer. The cave contains masses ofpyrite that are of hypogenic origin. The speleogenetichistory of the cave points toward the oxidation of thesepyrite masses during a vadose phase as a result of meteoricwater seepage. Oxidation is ongoing under the influence of
air convection between the surface atmosphere and thecave, which results in seasonal condensation andevaporation. Beside the classical products of sulfideoxidation, such as gypsum and iron oxihydroxides, someunusual sulfates are present. These minerals occur ascolorful crusts or foam-like silky masses. Mineral analyseshave been performed, using XRD, Raman, SEM imaging,and stable isotopes. In this paper, we present details ofmineralogy of Baume Galinière. Discussion focuses onmineral genesis and on cave genesis in relation to thegeomorphological evolution of the region. In addition to thepresence of rare sulfate cave minerals, Baume Galinièrealso records successive stages of regional geomorphologicalevolution. The area is an important place to study theevolution of the Vaucluse area landscape.
2. A sulfuric cave at the border of the VauclusePlateauBaume Galinière Cave is located in Provence (South-EastFrance), at the foot of Ventoux Plateau, which roughlycorresponds to the Vaucluse spring catchment (Fig. 1).
Cave Mineralogy – oral 2013 ICS Proceedings
425
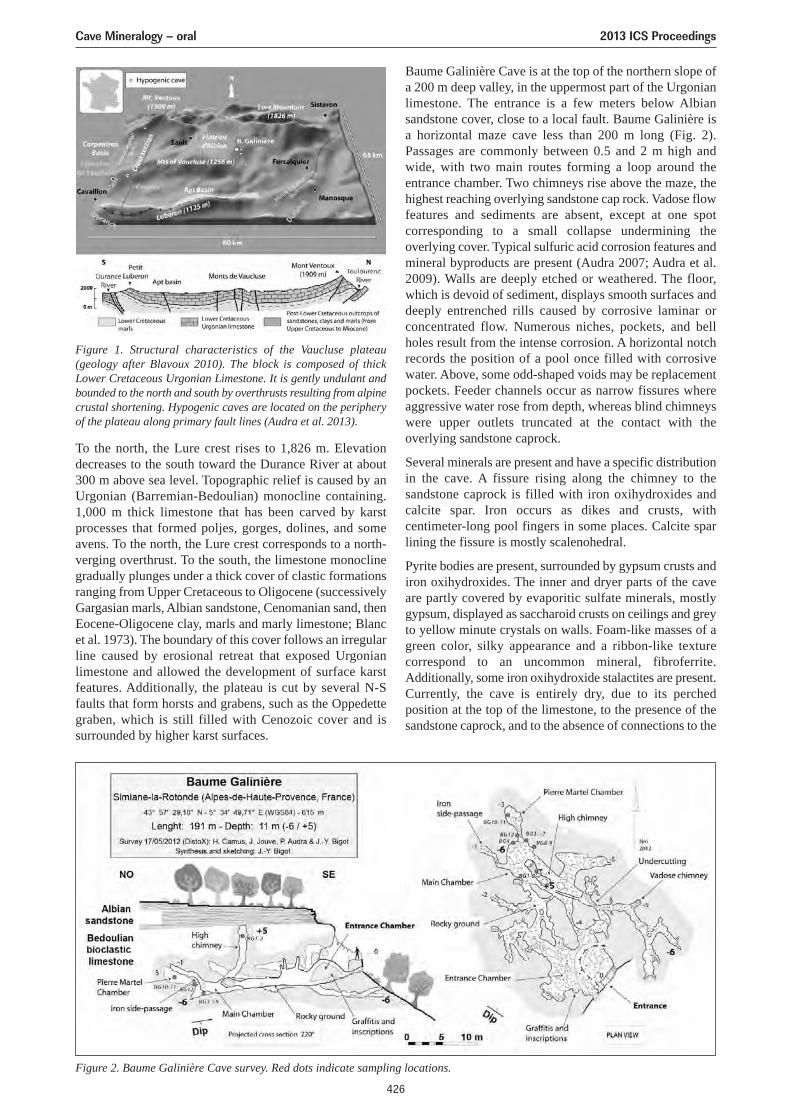
To the north, the Lure crest rises to 1,826 m. Elevationdecreases to the south toward the Durance River at about300 m above sea level. Topographic relief is caused by anUrgonian (Barremian-Bedoulian) monocline containing.1,000 m thick limestone that has been carved by karstprocesses that formed poljes, gorges, dolines, and someavens. To the north, the Lure crest corresponds to a north-verging overthrust. To the south, the limestone monoclinegradually plunges under a thick cover of clastic formationsranging from Upper Cretaceous to Oligocene (successivelyGargasian marls, Albian sandstone, Cenomanian sand, thenEocene-Oligocene clay, marls and marly limestone; Blancet al. 1973). The boundary of this cover follows an irregularline caused by erosional retreat that exposed Urgonianlimestone and allowed the development of surface karstfeatures. Additionally, the plateau is cut by several N-Sfaults that form horsts and grabens, such as the Oppedettegraben, which is still filled with Cenozoic cover and issurrounded by higher karst surfaces.
Baume Galinière Cave is at the top of the northern slope ofa 200 m deep valley, in the uppermost part of the Urgonianlimestone. The entrance is a few meters below Albiansandstone cover, close to a local fault. Baume Galinière isa horizontal maze cave less than 200 m long (Fig. 2).Passages are commonly between 0.5 and 2 m high andwide, with two main routes forming a loop around theentrance chamber. Two chimneys rise above the maze, thehighest reaching overlying sandstone cap rock. Vadose flowfeatures and sediments are absent, except at one spotcorresponding to a small collapse undermining theoverlying cover. Typical sulfuric acid corrosion features andmineral byproducts are present (Audra 2007; Audra et al.2009). Walls are deeply etched or weathered. The floor,which is devoid of sediment, displays smooth surfaces anddeeply entrenched rills caused by corrosive laminar orconcentrated flow. Numerous niches, pockets, and bellholes result from the intense corrosion. A horizontal notchrecords the position of a pool once filled with corrosivewater. Above, some odd-shaped voids may be replacementpockets. Feeder channels occur as narrow fissures whereaggressive water rose from depth, whereas blind chimneyswere upper outlets truncated at the contact with theoverlying sandstone caprock.
Several minerals are present and have a specific distributionin the cave. A fissure rising along the chimney to thesandstone caprock is filled with iron oxihydroxides andcalcite spar. Iron occurs as dikes and crusts, withcentimeter-long pool fingers in some places. Calcite sparlining the fissure is mostly scalenohedral.
Pyrite bodies are present, surrounded by gypsum crusts andiron oxihydroxides. The inner and dryer parts of the caveare partly covered by evaporitic sulfate minerals, mostlygypsum, displayed as saccharoid crusts on ceilings and greyto yellow minute crystals on walls. Foam-like masses of agreen color, silky appearance and a ribbon-like texturecorrespond to an uncommon mineral, fibroferrite.Additionally, some iron oxihydroxide stalactites are present.Currently, the cave is entirely dry, due to its perchedposition at the top of the limestone, to the presence of thesandstone caprock, and to the absence of connections to the
Figure 1. Structural characteristics of the Vaucluse plateau(geology after Blavoux 2010). The block is composed of thickLower Cretaceous Urgonian Limestone. It is gently undulant andbounded to the north and south by overthrusts resulting from alpinecrustal shortening. Hypogenic caves are located on the peripheryof the plateau along primary fault lines (Audra et al. 2013).
Figure 2. Baume Galinière Cave survey. Red dots indicate sampling locations.
Cave Mineralogy – oral 2013 ICS Proceedings
426
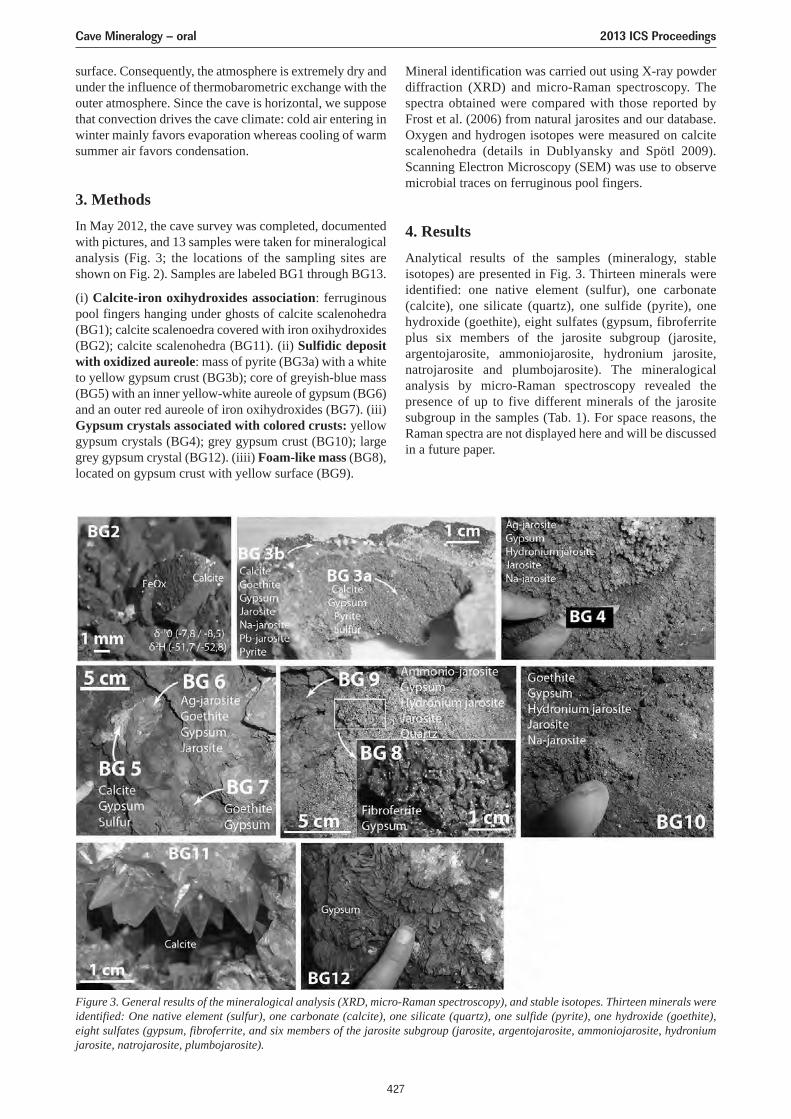
surface. Consequently, the atmosphere is extremely dry andunder the influence of thermobarometric exchange with theouter atmosphere. Since the cave is horizontal, we supposethat convection drives the cave climate: cold air entering inwinter mainly favors evaporation whereas cooling of warmsummer air favors condensation.
3. MethodsIn May 2012, the cave survey was completed, documentedwith pictures, and 13 samples were taken for mineralogicalanalysis (Fig. 3; the locations of the sampling sites areshown on Fig. 2). Samples are labeled BG1 through BG13.
(i) Calcite-iron oxihydroxides association: ferruginouspool fingers hanging under ghosts of calcite scalenohedra(BG1); calcite scalenoedra covered with iron oxihydroxides(BG2); calcite scalenohedra (BG11). (ii) Sulfidic depositwith oxidized aureole: mass of pyrite (BG3a) with a whiteto yellow gypsum crust (BG3b); core of greyish-blue mass(BG5) with an inner yellow-white aureole of gypsum (BG6)and an outer red aureole of iron oxihydroxides (BG7). (iii)Gypsum crystals associated with colored crusts: yellowgypsum crystals (BG4); grey gypsum crust (BG10); largegrey gypsum crystal (BG12). (iiii) Foam-like mass (BG8),located on gypsum crust with yellow surface (BG9).
Mineral identification was carried out using X-ray powderdiffraction (XRD) and micro-Raman spectroscopy. Thespectra obtained were compared with those reported byFrost et al. (2006) from natural jarosites and our database.Oxygen and hydrogen isotopes were measured on calcitescalenohedra (details in Dublyansky and Spötl 2009).Scanning Electron Microscopy (SEM) was use to observemicrobial traces on ferruginous pool fingers.
4. ResultsAnalytical results of the samples (mineralogy, stableisotopes) are presented in Fig. 3. Thirteen minerals wereidentified: one native element (sulfur), one carbonate(calcite), one silicate (quartz), one sulfide (pyrite), onehydroxide (goethite), eight sulfates (gypsum, fibroferriteplus six members of the jarosite subgroup (jarosite,argentojarosite, ammoniojarosite, hydronium jarosite,natrojarosite and plumbojarosite). The mineralogicalanalysis by micro-Raman spectroscopy revealed thepresence of up to five different minerals of the jarositesubgroup in the samples (Tab. 1). For space reasons, theRaman spectra are not displayed here and will be discussedin a future paper.
Figure 3. General results of the mineralogical analysis (XRD, micro-Raman spectroscopy), and stable isotopes. Thirteen minerals wereidentified: One native element (sulfur), one carbonate (calcite), one silicate (quartz), one sulfide (pyrite), one hydroxide (goethite),eight sulfates (gypsum, fibroferrite, and six members of the jarosite subgroup (jarosite, argentojarosite, ammoniojarosite, hydroniumjarosite, natrojarosite, plumbojarosite).
Cave Mineralogy – oral 2013 ICS Proceedings
427
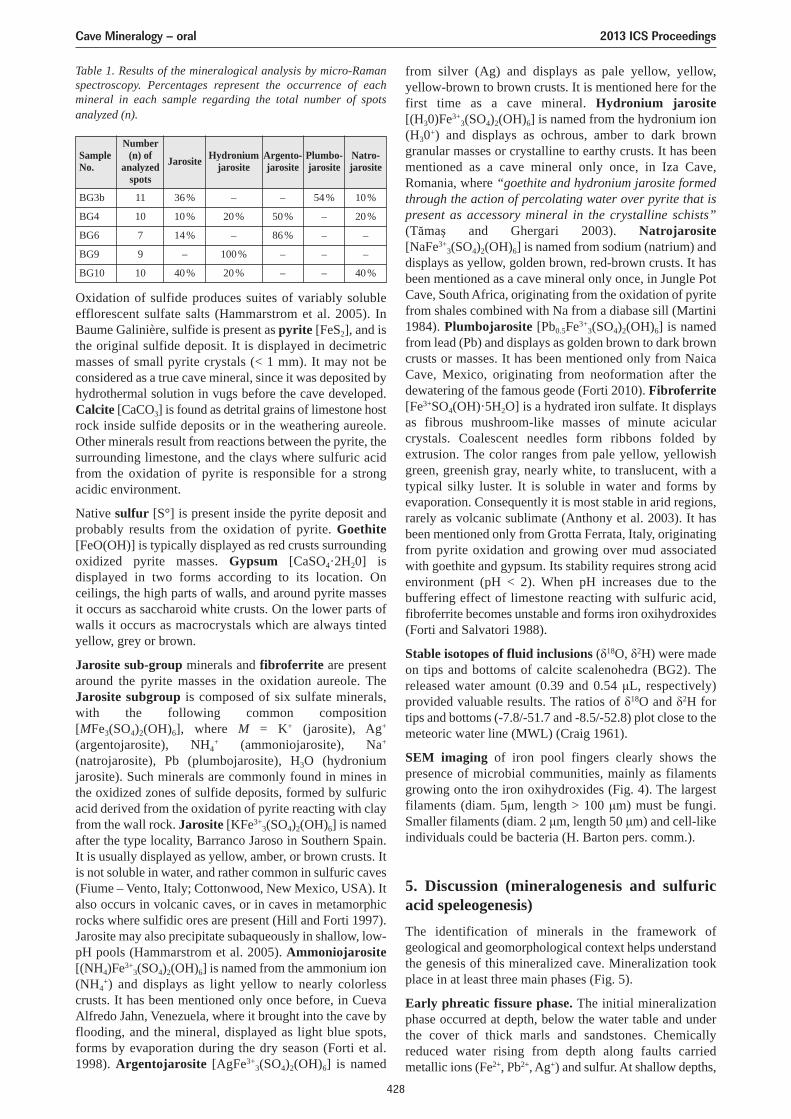
Table 1. Results of the mineralogical analysis by micro-Ramanspectroscopy. Percentages represent the occurrence of eachmineral in each sample regarding the total number of spotsanalyzed (n).
Oxidation of sulfide produces suites of variably solubleefflorescent sulfate salts (Hammarstrom et al. 2005). InBaume Galinière, sulfide is present as pyrite [FeS2], and isthe original sulfide deposit. It is displayed in decimetricmasses of small pyrite crystals (< 1 mm). It may not beconsidered as a true cave mineral, since it was deposited byhydrothermal solution in vugs before the cave developed.Calcite [CaCO3] is found as detrital grains of limestone hostrock inside sulfide deposits or in the weathering aureole.Other minerals result from reactions between the pyrite, thesurrounding limestone, and the clays where sulfuric acidfrom the oxidation of pyrite is responsible for a strongacidic environment.
Native sulfur [S°] is present inside the pyrite deposit andprobably results from the oxidation of pyrite. Goethite[FeO(OH)] is typically displayed as red crusts surroundingoxidized pyrite masses. Gypsum [CaSO4·2H20] isdisplayed in two forms according to its location. Onceilings, the high parts of walls, and around pyrite massesit occurs as saccharoid white crusts. On the lower parts ofwalls it occurs as macrocrystals which are always tintedyellow, grey or brown.
Jarosite sub-group minerals and fibroferrite are presentaround the pyrite masses in the oxidation aureole. TheJarosite subgroup is composed of six sulfate minerals,with the following common composition[MFe3(SO4)2(OH)6], where M = K+ (jarosite), Ag+
(argentojarosite), NH4+ (ammoniojarosite), Na+
(natrojarosite), Pb (plumbojarosite), H3O (hydroniumjarosite). Such minerals are commonly found in mines inthe oxidized zones of sulfide deposits, formed by sulfuricacid derived from the oxidation of pyrite reacting with clayfrom the wall rock. Jarosite [KFe3+
3(SO4)2(OH)6] is namedafter the type locality, Barranco Jaroso in Southern Spain.It is usually displayed as yellow, amber, or brown crusts. Itis not soluble in water, and rather common in sulfuric caves(Fiume – Vento, Italy; Cottonwood, New Mexico, USA). Italso occurs in volcanic caves, or in caves in metamorphicrocks where sulfidic ores are present (Hill and Forti 1997).Jarosite may also precipitate subaqueously in shallow, low-pH pools (Hammarstrom et al. 2005). Ammoniojarosite[(NH4)Fe3+
3(SO4)2(OH)6] is named from the ammonium ion(NH4
+) and displays as light yellow to nearly colorlesscrusts. It has been mentioned only once before, in CuevaAlfredo Jahn, Venezuela, where it brought into the cave byflooding, and the mineral, displayed as light blue spots,forms by evaporation during the dry season (Forti et al.1998). Argentojarosite [AgFe3+
3(SO4)2(OH)6] is named
from silver (Ag) and displays as pale yellow, yellow,yellow-brown to brown crusts. It is mentioned here for thefirst time as a cave mineral. Hydronium jarosite[(H30)Fe3+
3(SO4)2(OH)6] is named from the hydronium ion(H30+) and displays as ochrous, amber to dark browngranular masses or crystalline to earthy crusts. It has beenmentioned as a cave mineral only once, in Iza Cave,Romania, where “goethite and hydronium jarosite formedthrough the action of percolating water over pyrite that ispresent as accessory mineral in the crystalline schists”(Tămaş and Ghergari 2003). Natrojarosite[NaFe3+
3(SO4)2(OH)6] is named from sodium (natrium) anddisplays as yellow, golden brown, red-brown crusts. It hasbeen mentioned as a cave mineral only once, in Jungle PotCave, South Africa, originating from the oxidation of pyritefrom shales combined with Na from a diabase sill (Martini1984). Plumbojarosite [Pb0.5Fe3+
3(SO4)2(OH)6] is namedfrom lead (Pb) and displays as golden brown to dark browncrusts or masses. It has been mentioned only from NaicaCave, Mexico, originating from neoformation after thedewatering of the famous geode (Forti 2010). Fibroferrite[Fe3+SO4(OH)·5H2O] is a hydrated iron sulfate. It displaysas fibrous mushroom-like masses of minute acicularcrystals. Coalescent needles form ribbons folded byextrusion. The color ranges from pale yellow, yellowishgreen, greenish gray, nearly white, to translucent, with atypical silky luster. It is soluble in water and forms byevaporation. Consequently it is most stable in arid regions,rarely as volcanic sublimate (Anthony et al. 2003). It hasbeen mentioned only from Grotta Ferrata, Italy, originatingfrom pyrite oxidation and growing over mud associatedwith goethite and gypsum. Its stability requires strong acidenvironment (pH < 2). When pH increases due to thebuffering effect of limestone reacting with sulfuric acid,fibroferrite becomes unstable and forms iron oxihydroxides(Forti and Salvatori 1988).
Stable isotopes of fluid inclusions (δ18O, δ2H) were madeon tips and bottoms of calcite scalenohedra (BG2). Thereleased water amount (0.39 and 0.54 μL, respectively)provided valuable results. The ratios of δ18O and δ2H fortips and bottoms (-7.8/-51.7 and -8.5/-52.8) plot close to themeteoric water line (MWL) (Craig 1961).
SEM imaging of iron pool fingers clearly shows thepresence of microbial communities, mainly as filamentsgrowing onto the iron oxihydroxides (Fig. 4). The largestfilaments (diam. 5μm, length > 100 μm) must be fungi.Smaller filaments (diam. 2 μm, length 50 μm) and cell-likeindividuals could be bacteria (H. Barton pers. comm.).
5. Discussion (mineralogenesis and sulfuricacid speleogenesis)The identification of minerals in the framework ofgeological and geomorphological context helps understandthe genesis of this mineralized cave. Mineralization tookplace in at least three main phases (Fig. 5).
Early phreatic fissure phase. The initial mineralizationphase occurred at depth, below the water table and underthe cover of thick marls and sandstones. Chemicallyreduced water rising from depth along faults carriedmetallic ions (Fe2+, Pb2+, Ag+) and sulfur. At shallow depths,
SampleNo.
Number(n) of
analyzedspots
Jarosite Hydroniumjarosite
Argento-jarosite
Plumbo-jarosite
Natro-jarosite
BG3b
BG4
BG6
BG9
BG10
11
10
7
9
10
36 %
10 %
14 %
–
40 %
–
20 %
–
100 %
20 %
–
50 %
86 %
–
–
54 %
–
–
–
–
10 %
20 %
–
–
40 %
Cave Mineralogy – oral 2013 ICS Proceedings
428
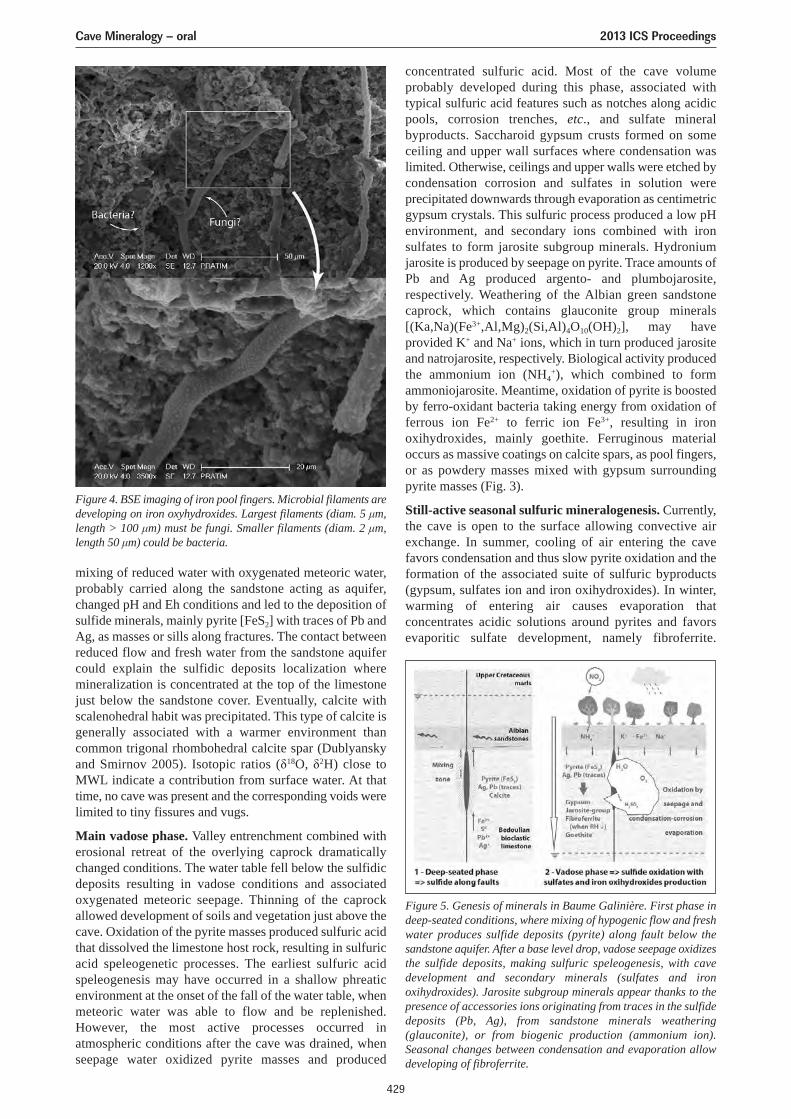
mixing of reduced water with oxygenated meteoric water,probably carried along the sandstone acting as aquifer,changed pH and Eh conditions and led to the deposition ofsulfide minerals, mainly pyrite [FeS2] with traces of Pb andAg, as masses or sills along fractures. The contact betweenreduced flow and fresh water from the sandstone aquifercould explain the sulfidic deposits localization wheremineralization is concentrated at the top of the limestonejust below the sandstone cover. Eventually, calcite withscalenohedral habit was precipitated. This type of calcite isgenerally associated with a warmer environment thancommon trigonal rhombohedral calcite spar (Dublyanskyand Smirnov 2005). Isotopic ratios (δ18O, δ2H) close toMWL indicate a contribution from surface water. At thattime, no cave was present and the corresponding voids werelimited to tiny fissures and vugs.
Main vadose phase. Valley entrenchment combined witherosional retreat of the overlying caprock dramaticallychanged conditions. The water table fell below the sulfidicdeposits resulting in vadose conditions and associatedoxygenated meteoric seepage. Thinning of the caprockallowed development of soils and vegetation just above thecave. Oxidation of the pyrite masses produced sulfuric acidthat dissolved the limestone host rock, resulting in sulfuricacid speleogenetic processes. The earliest sulfuric acidspeleogenesis may have occurred in a shallow phreaticenvironment at the onset of the fall of the water table, whenmeteoric water was able to flow and be replenished.However, the most active processes occurred inatmospheric conditions after the cave was drained, whenseepage water oxidized pyrite masses and produced
concentrated sulfuric acid. Most of the cave volumeprobably developed during this phase, associated withtypical sulfuric acid features such as notches along acidicpools, corrosion trenches, etc., and sulfate mineralbyproducts. Saccharoid gypsum crusts formed on someceiling and upper wall surfaces where condensation waslimited. Otherwise, ceilings and upper walls were etched bycondensation corrosion and sulfates in solution wereprecipitated downwards through evaporation as centimetricgypsum crystals. This sulfuric process produced a low pHenvironment, and secondary ions combined with ironsulfates to form jarosite subgroup minerals. Hydroniumjarosite is produced by seepage on pyrite. Trace amounts ofPb and Ag produced argento- and plumbojarosite,respectively. Weathering of the Albian green sandstonecaprock, which contains glauconite group minerals[(Ka,Na)(Fe3+,Al,Mg)2(Si,Al)4O10(OH)2], may haveprovided K+ and Na+ ions, which in turn produced jarositeand natrojarosite, respectively. Biological activity producedthe ammonium ion (NH4
+), which combined to formammoniojarosite. Meantime, oxidation of pyrite is boostedby ferro-oxidant bacteria taking energy from oxidation offerrous ion Fe2+ to ferric ion Fe3+, resulting in ironoxihydroxides, mainly goethite. Ferruginous materialoccurs as massive coatings on calcite spars, as pool fingers,or as powdery masses mixed with gypsum surroundingpyrite masses (Fig. 3).
Still-active seasonal sulfuric mineralogenesis. Currently,the cave is open to the surface allowing convective airexchange. In summer, cooling of air entering the cavefavors condensation and thus slow pyrite oxidation and theformation of the associated suite of sulfuric byproducts(gypsum, sulfates ion and iron oxihydroxides). In winter,warming of entering air causes evaporation thatconcentrates acidic solutions around pyrites and favorsevaporitic sulfate development, namely fibroferrite.
Figure 4. BSE imaging of iron pool fingers. Microbial filaments aredeveloping on iron oxyhydroxides. Largest filaments (diam. 5 μm,length > 100 μm) must be fungi. Smaller filaments (diam. 2 μm,length 50 μm) could be bacteria.
Figure 5. Genesis of minerals in Baume Galinière. First phase indeep-seated conditions, where mixing of hypogenic flow and freshwater produces sulfide deposits (pyrite) along fault below thesandstone aquifer. After a base level drop, vadose seepage oxidizesthe sulfide deposits, making sulfuric speleogenesis, with cavedevelopment and secondary minerals (sulfates and ironoxihydroxides). Jarosite subgroup minerals appear thanks to thepresence of accessories ions originating from traces in the sulfidedeposits (Pb, Ag), from sandstone minerals weathering(glauconite), or from biogenic production (ammonium ion).Seasonal changes between condensation and evaporation allowdeveloping of fibroferrite.
Cave Mineralogy – oral 2013 ICS Proceedings
429
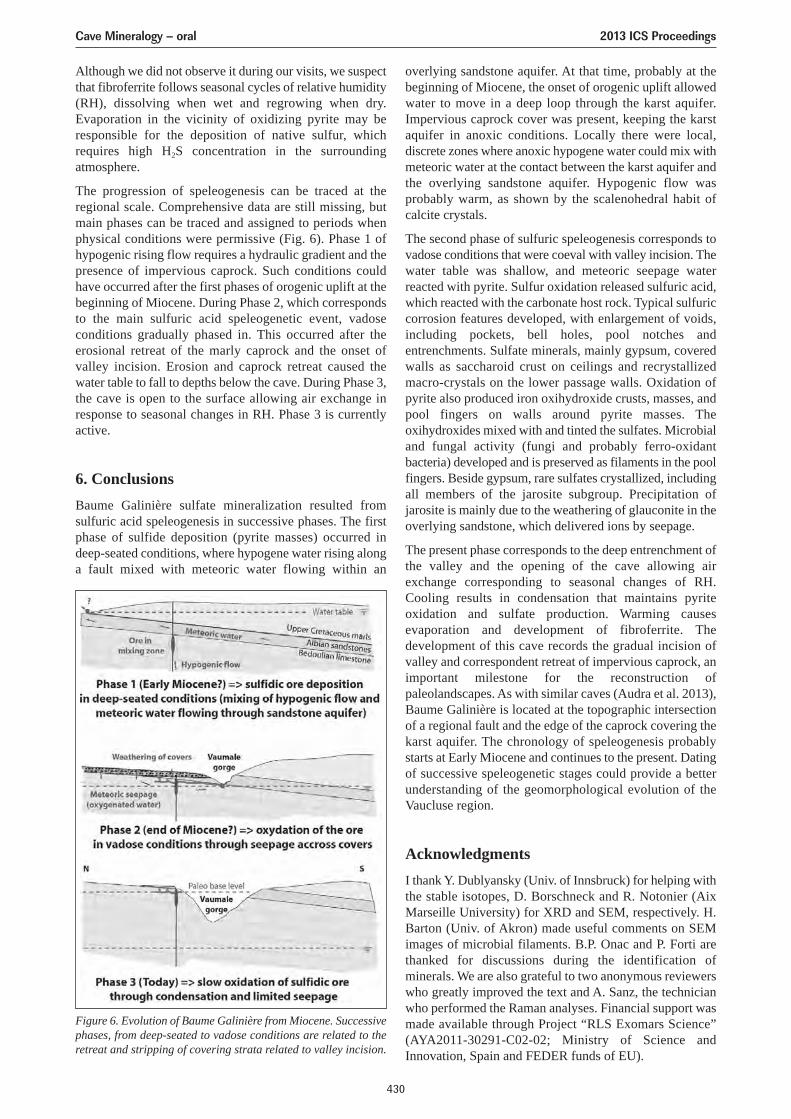
Although we did not observe it during our visits, we suspectthat fibroferrite follows seasonal cycles of relative humidity(RH), dissolving when wet and regrowing when dry.Evaporation in the vicinity of oxidizing pyrite may beresponsible for the deposition of native sulfur, whichrequires high H2S concentration in the surroundingatmosphere.
The progression of speleogenesis can be traced at theregional scale. Comprehensive data are still missing, butmain phases can be traced and assigned to periods whenphysical conditions were permissive (Fig. 6). Phase 1 ofhypogenic rising flow requires a hydraulic gradient and thepresence of impervious caprock. Such conditions couldhave occurred after the first phases of orogenic uplift at thebeginning of Miocene. During Phase 2, which correspondsto the main sulfuric acid speleogenetic event, vadoseconditions gradually phased in. This occurred after theerosional retreat of the marly caprock and the onset ofvalley incision. Erosion and caprock retreat caused thewater table to fall to depths below the cave. During Phase 3,the cave is open to the surface allowing air exchange inresponse to seasonal changes in RH. Phase 3 is currentlyactive.
6. ConclusionsBaume Galinière sulfate mineralization resulted fromsulfuric acid speleogenesis in successive phases. The firstphase of sulfide deposition (pyrite masses) occurred indeep-seated conditions, where hypogene water rising alonga fault mixed with meteoric water flowing within an
overlying sandstone aquifer. At that time, probably at thebeginning of Miocene, the onset of orogenic uplift allowedwater to move in a deep loop through the karst aquifer.Impervious caprock cover was present, keeping the karstaquifer in anoxic conditions. Locally there were local,discrete zones where anoxic hypogene water could mix withmeteoric water at the contact between the karst aquifer andthe overlying sandstone aquifer. Hypogenic flow wasprobably warm, as shown by the scalenohedral habit ofcalcite crystals.
The second phase of sulfuric speleogenesis corresponds tovadose conditions that were coeval with valley incision. Thewater table was shallow, and meteoric seepage waterreacted with pyrite. Sulfur oxidation released sulfuric acid,which reacted with the carbonate host rock. Typical sulfuriccorrosion features developed, with enlargement of voids,including pockets, bell holes, pool notches andentrenchments. Sulfate minerals, mainly gypsum, coveredwalls as saccharoid crust on ceilings and recrystallizedmacro-crystals on the lower passage walls. Oxidation ofpyrite also produced iron oxihydroxide crusts, masses, andpool fingers on walls around pyrite masses. Theoxihydroxides mixed with and tinted the sulfates. Microbialand fungal activity (fungi and probably ferro-oxidantbacteria) developed and is preserved as filaments in the poolfingers. Beside gypsum, rare sulfates crystallized, includingall members of the jarosite subgroup. Precipitation ofjarosite is mainly due to the weathering of glauconite in theoverlying sandstone, which delivered ions by seepage.
The present phase corresponds to the deep entrenchment ofthe valley and the opening of the cave allowing airexchange corresponding to seasonal changes of RH.Cooling results in condensation that maintains pyriteoxidation and sulfate production. Warming causesevaporation and development of fibroferrite. Thedevelopment of this cave records the gradual incision ofvalley and correspondent retreat of impervious caprock, animportant milestone for the reconstruction ofpaleolandscapes. As with similar caves (Audra et al. 2013),Baume Galinière is located at the topographic intersectionof a regional fault and the edge of the caprock covering thekarst aquifer. The chronology of speleogenesis probablystarts at Early Miocene and continues to the present. Datingof successive speleogenetic stages could provide a betterunderstanding of the geomorphological evolution of theVaucluse region.
AcknowledgmentsI thank Y. Dublyansky (Univ. of Innsbruck) for helping withthe stable isotopes, D. Borschneck and R. Notonier (AixMarseille University) for XRD and SEM, respectively. H.Barton (Univ. of Akron) made useful comments on SEMimages of microbial filaments. B.P. Onac and P. Forti arethanked for discussions during the identification ofminerals. We are also grateful to two anonymous reviewerswho greatly improved the text and A. Sanz, the technicianwho performed the Raman analyses. Financial support wasmade available through Project “RLS Exomars Science”(AYA2011-30291-C02-02; Ministry of Science andInnovation, Spain and FEDER funds of EU).
Figure 6. Evolution of Baume Galinière from Miocene. Successivephases, from deep-seated to vadose conditions are related to theretreat and stripping of covering strata related to valley incision.
Cave Mineralogy – oral 2013 ICS Proceedings
430
ReferencesAnthony JW, Bideaux RA, Bladh KW, Nichols MC, (Eds.) 2003.
Handbook of Mineralogy, 1, 588p. Mineralogical Society ofAmerica, Chantilly. http://www.handbookofmineralogy.org/
Audra P, 2007. Karst et spéléogenèse épigènes, hypogènes,recherches appliquées et valorisation. Habilitation Thesis,Univ. of Nice Sophia-Antipolis, France.
Audra P, Mocochain L, Bigot JY, Nobécourt JC, 2009.Morphological indicators of hypogenic speleogenesis. In:Klimchouk A and Ford D (Eds.). Hypogene Speleogenesis andKarst Hydrogeology of Artesian Basins, Special Paper,1. Ukrainian Institute of Speleology and Karstology, Kiev,23–32.
Audra P, Bigot JY, Camus H, Gauchon C, Wienin M, 2013. Lagrotte-mine du Piei (Lagnes, Vaucluse), paléokarst hypogèneà remplissage de minerai de fer oxydé (The Piei mine-cave(Lagnes, Vaucluse, France), a hypogene iron-ore paleokarst).Karstologia (accepted).
Blanc JJ, Weydert P, Masse JP, Roux M, Peyronnet P de, RouireJ. 1973. Carte géologique de la France à 1/50,000 “Sault-de-Vaucluse”. BRGM, Orléans.
Craig H, 1961. Isotopic variations in meteoric waters source.Science, 133(3,465), 1702–1703.
Dublyansky YV, Spötl C, 2009. Hydrogen and oxygen isotopes ofwater from inclusions in minerals: design of a new crushingsystem and on-line continuous-flow isotope ratio massspectrometric analysis. Rapid Commun. Mass Spectrom, 23,2605–2613.
Dublyansky YV, Smirnov S, 2005. Cavity-based secondarymineralization in volcanic tuffs of Yucca Mountain, Nevada: anew type of the polymineral vadose speleothem, or ahydrothermal deposit? International Journal of Speleology,34(1–2), 25–44.
Egemeier SJ, 1981. Cavern development by thermal waters. NSSBulletin, 43(2), 31–51.
Forti P, 2010. Genesis and evolution of the caves in the NaicaMine (Chihuahua, Mexico). Zeitschrift für Geomorphologie,54(2), 115–135.
Forti P, Salvatori S, 1988. Nuovi minerali di grotta: la fibroferritedi Grotta Ferrata. Riv. Mineral. Italiana, 4, 219–226.
Forti P., Urbani F, Rossi A, 1998. Minerales secundarios de lascuevas del Indio y Alfredo Jahn, estado Miranda, Venezuela.Boletín de la Sociedad Venezolana de Espeleología, 32.
Frost RL, Will RA, Weir ML, Martens W, Mills S, 2006. A Ramaspectroscopy study of selected natural jarosites. SpectrochimicaActa, Part A., 63, 1–8.
Hammarstrom JM, Seal II RR, Meier AL, Kornfeld JM, 2005.Secondary sulfate minerals associated with acid drainage in theeastern US: recycling of metals and acidity in surficialenvironments. Chemical Geology, 215, 407–431.
Hill C, Forti P, 1997. Cave mineral of the world. NationalSpeleological Society, Huntsville.
Martini J, 1984. Jungle Pot. South Africa speleol. Assoc. Bull, 22,5.
Melim LA, Shinglman KM, Boston PJ, Northup DE, Spilde MN,Queen JM 2001. Evidence for Microbial Involvement in PoolFinger Precipitation, Hidden Cave, New Mexico.Geomicrobiology Journal, 18(3), 311–329.
Tămaş T, Ghergari L, 2003. Hydronium jarosite from Iza Cave(Rodnei Mts., Romania). Acta Mineralogica-Petrographica,Abstract Series, 1, 102.
Cave Mineralogy – oral 2013 ICS Proceedings
431
RARE SULFATES (MIRABILITE, EUGSTERITE)IN THE DRY MICROCLIMATE OF CHAMOIS CAVE
(ALPES-DE-HAUTE-PROVENCE, FRANCE)
Philippe Audra1, Jean-Claude Nobécourt2
1Polytech Nice – Sophia, University of Nice – Sophia Antipolis, 930 route des Colles, 06903 Sophia-Antipolis,France & Innovative City – IMREDD, Nice, France, [email protected]
2CRESPE, Le Hameau de l’Ara, 259 boulevard Reine Jeanne, 06140 VENCE, France, [email protected]
The Chamois Cave (Alpes-de-Haute-Provence, France) opens at 1,360 m asl. above the Coulomp spring, which is fed bythe Grand Coyer massif (2,693 m). The cave develops 10 km and gives access to the Underground Coulomp, one of thelargest underground rivers in France. As any mountain cave, the air is cold, between 4 °C (highest part receiving airbreathed in at 2,000 m altitude) and 8.5 °C (lowest confined part) where the river temperature is 6 °C. In this low part ofthe cave, a tributary (Thenardier Gallery) displays a fossil level covered with various decorations. On the ceiling, calcitehelictites [CaCO3] are surrounded with hydromagnesite [Mg5(CO3)4(OH)2·4H2O]. The lower part of the walls and the finesediment on the ground are covered with sulfates: gypsum [CaSO4·2H2O], mirabilite [Na2SO4·10H2O], and eugsterite[Na4Ca(SO4)3·2H2O]. The two last minerals are common in salars depressions, lava tube and in cave developing undersemi-arid condition, and not so frequent in temperate caves. Their presence in Chamois Cave is explained by themicroclimate (RH 88 %, T = 8.5 °C). The lowest part of the cave is under dry conditions because of the air subsidence thatcauses warming without moisture renewal since percolation are rare. Moreover, the Thenardier Gallery is confined betweena sump upstream and a temporary sump downstream. Such a low RH allows developing of these minerals under evaporationeffect. S comes from the weathering of pyrites that are present in limestone and Na from the weathering of sandstones insediments. These evaporative conditions makes the Chamois cave an exceptional one, since mirabilite is not frequent intemperate caves and eugsterite is mentioned only for the second time in cave.
1. IntroductionCaves are well known for their decorations, where calciteis the dominant mineral precipitated by CO2 degassing.Some minerals, such as sulfates, are due to evaporationprocess. Gypsum is a common species; however somesulfate minerals are more rarely encountered, especially intemperate and wet caves. Several mineralogical species incaves are partly or entirely due to evaporation processes. Ifcalcite [CaCO3] generally precipitates through CO2
degassing, precipitation can be boosted by evaporationallowing supersaturation. When evaporation continues, theCa/Mg ratio lowers, allowing the successive deposition ofaragonite, huntite [CaMg3(CO3)4], then hydromagnesite[Mg5(CO3)4(OH)2·4H2O]. Such gradation is typical inconfined or ventilated parts of caves where strongevaporation occurs, making calcite stalactites covered witharagonite frostwork generally developing on wind side, andhydromagnesite cotton ball growing at the tip of aragoniteneedles where the solution reaches the highest saturation.Sulfates are frequent and highly soluble minerals, whichconsequently can develop only in dry conditions. Gypsum[CaSO4·2H2O] is the most frequent. In especially dryconditions, magnesium sulfates such as epsomite[MgSO4·7H2O] or sodium sulfates, such as mirabilite[Na2SO4·10H2O] and thenardite [Na2SO4] can develop withdecreasing level of hydration. Eugsterite[Na4Ca(SO4)3·2H2O] was only once identified in a cave, inTurner Avenue, Mammoth Cave (Benington 1959; visiblein White 2005, photo. 2B, p. 290), but the name was latergiven from another locality. It occurs as acicular crystalsinside a water-clear mirabilite stalactite (White oral comm.).
The evaporation gradient pumps out the solutions presentinside the rock toward the cave wall. Sulfates crystals grow
by extrusion (Hill and Forti 1997). In cold caves,percolations can only be saturated with respect to calciteand aragonite. Consequently, other mineral forms dependon processes other than degassing, i.e. concentration of thesolution by evaporation (Harmon et al. 1983).
The stability of extremely soluble sulfates is closelydependent on cave climate conditions. Consequently, theygrow seasonally when cave air is dry and re-dissolve whenmoisture increases. Epsomite melts under the breath or theheat of carbide lamp (Hill and Forti 1997). Below 70 % ofrelative humidity (RH), mirabilite spontaneouslydehydrates to thenardite (Onac 2012), which in turn is stableat 5–40 % RH. Phase diagram (T – RH) of sodium sulfatesare available from Flatt (2002), and discussed byRodriguez-Navarro et al. (2000) for non-equilibriumconditions.
Cave sulfate minerals can have several origins (White2005): interstratal evaporites in limestone rock (gypsum,anhydrite), oxidation of pyrite present in the limestone orin the caprock (e.g., sandstone at Mammoth Cave,Kentucky), oxidation of hypogenic H2S corroding andreplacing the limestone (Lechuguilla Cave, New-Mexico;Polyak and Provencio 2001), or brines such as in the Naicamine geodes (Mexico; Forti 2010). The geochemistry of thesolution shall contain the elements necessary for Na-Ca-sulfate salt precipitation, i.e. Na, sulfate ion, etc. Studies onsoil and salt pans evidenced the need of Na/Ca ratio > 4,pH > 5, and rapidly changing local environments andvariations in redox, pH, and rates of availability of S andother elements (Fitzpatrick et al. 2005). In caves,percolation through limestone containing pyrites and strongevaporation could mimic such conditions.
Gypsum forms bulk crystals (on soil, dentate gypsum, gypsum
Cave Mineralogy – oral 2013 ICS Proceedings
432
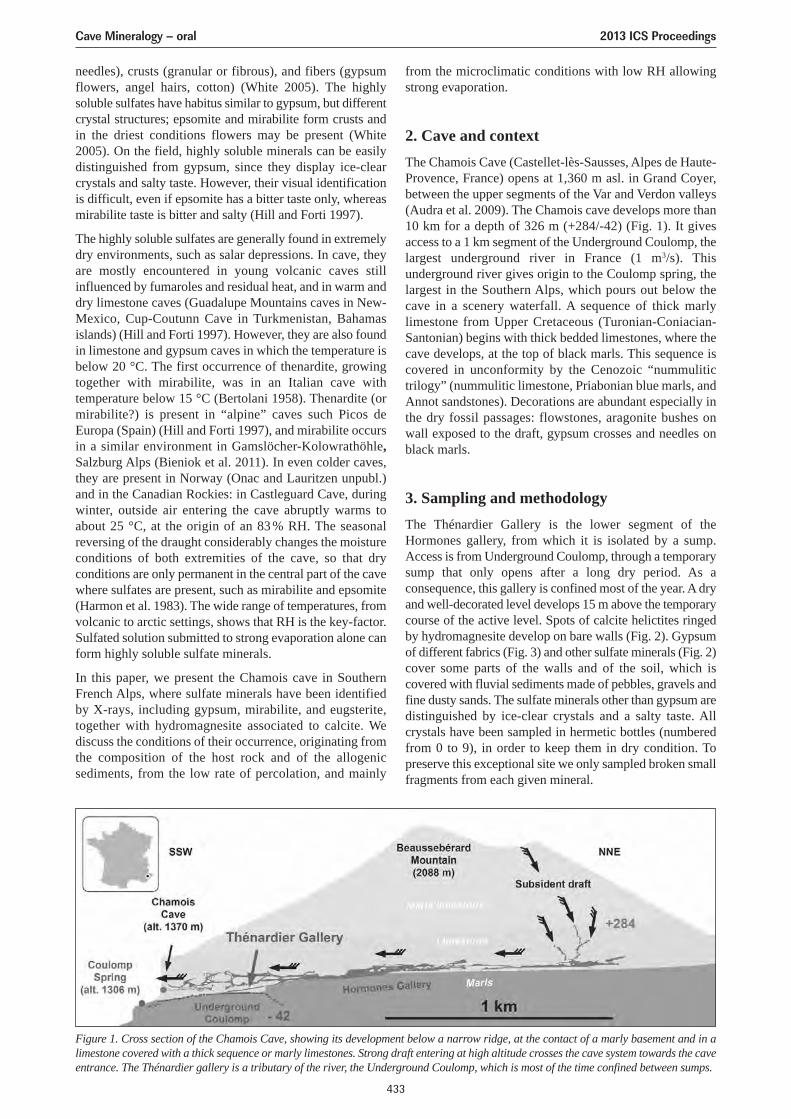
needles), crusts (granular or fibrous), and fibers (gypsumflowers, angel hairs, cotton) (White 2005). The highlysoluble sulfates have habitus similar to gypsum, but differentcrystal structures; epsomite and mirabilite form crusts andin the driest conditions flowers may be present (White2005). On the field, highly soluble minerals can be easilydistinguished from gypsum, since they display ice-clearcrystals and salty taste. However, their visual identificationis difficult, even if epsomite has a bitter taste only, whereasmirabilite taste is bitter and salty (Hill and Forti 1997).
The highly soluble sulfates are generally found in extremelydry environments, such as salar depressions. In cave, theyare mostly encountered in young volcanic caves stillinfluenced by fumaroles and residual heat, and in warm anddry limestone caves (Guadalupe Mountains caves in New-Mexico, Cup-Coutunn Cave in Turkmenistan, Bahamasislands) (Hill and Forti 1997). However, they are also foundin limestone and gypsum caves in which the temperature isbelow 20 °C. The first occurrence of thenardite, growingtogether with mirabilite, was in an Italian cave withtemperature below 15 °C (Bertolani 1958). Thenardite (ormirabilite?) is present in “alpine” caves such Picos deEuropa (Spain) (Hill and Forti 1997), and mirabilite occursin a similar environment in Gamslöcher-Kolowrathöhle,Salzburg Alps (Bieniok et al. 2011). In even colder caves,they are present in Norway (Onac and Lauritzen unpubl.)and in the Canadian Rockies: in Castleguard Cave, duringwinter, outside air entering the cave abruptly warms toabout 25 °C, at the origin of an 83 % RH. The seasonalreversing of the draught considerably changes the moistureconditions of both extremities of the cave, so that dryconditions are only permanent in the central part of the cavewhere sulfates are present, such as mirabilite and epsomite(Harmon et al. 1983). The wide range of temperatures, fromvolcanic to arctic settings, shows that RH is the key-factor.Sulfated solution submitted to strong evaporation alone canform highly soluble sulfate minerals.
In this paper, we present the Chamois cave in SouthernFrench Alps, where sulfate minerals have been identifiedby X-rays, including gypsum, mirabilite, and eugsterite,together with hydromagnesite associated to calcite. Wediscuss the conditions of their occurrence, originating fromthe composition of the host rock and of the allogenicsediments, from the low rate of percolation, and mainly
from the microclimatic conditions with low RH allowingstrong evaporation.
2. Cave and contextThe Chamois Cave (Castellet-lès-Sausses, Alpes de Haute-Provence, France) opens at 1,360 m asl. in Grand Coyer,between the upper segments of the Var and Verdon valleys(Audra et al. 2009). The Chamois cave develops more than10 km for a depth of 326 m (+284/-42) (Fig. 1). It givesaccess to a 1 km segment of the Underground Coulomp, thelargest underground river in France (1 m3/s). Thisunderground river gives origin to the Coulomp spring, thelargest in the Southern Alps, which pours out below thecave in a scenery waterfall. A sequence of thick marlylimestone from Upper Cretaceous (Turonian-Coniacian-Santonian) begins with thick bedded limestones, where thecave develops, at the top of black marls. This sequence iscovered in unconformity by the Cenozoic “nummulitictrilogy” (nummulitic limestone, Priabonian blue marls, andAnnot sandstones). Decorations are abundant especially inthe dry fossil passages: flowstones, aragonite bushes onwall exposed to the draft, gypsum crosses and needles onblack marls.
3. Sampling and methodologyThe Thénardier Gallery is the lower segment of theHormones gallery, from which it is isolated by a sump.Access is from Underground Coulomp, through a temporarysump that only opens after a long dry period. As aconsequence, this gallery is confined most of the year. A dryand well-decorated level develops 15 m above the temporarycourse of the active level. Spots of calcite helictites ringedby hydromagnesite develop on bare walls (Fig. 2). Gypsumof different fabrics (Fig. 3) and other sulfate minerals (Fig. 2)cover some parts of the walls and of the soil, which iscovered with fluvial sediments made of pebbles, gravels andfine dusty sands. The sulfate minerals other than gypsum aredistinguished by ice-clear crystals and a salty taste. Allcrystals have been sampled in hermetic bottles (numberedfrom 0 to 9), in order to keep them in dry condition. Topreserve this exceptional site we only sampled broken smallfragments from each given mineral.
Figure 1. Cross section of the Chamois Cave, showing its development below a narrow ridge, at the contact of a marly basement and in alimestone covered with a thick sequence or marly limestones. Strong draft entering at high altitude crosses the cave system towards the caveentrance. The Thénardier gallery is a tributary of the river, the Underground Coulomp, which is most of the time confined between sumps.
Cave Mineralogy – oral 2013 ICS Proceedings
433
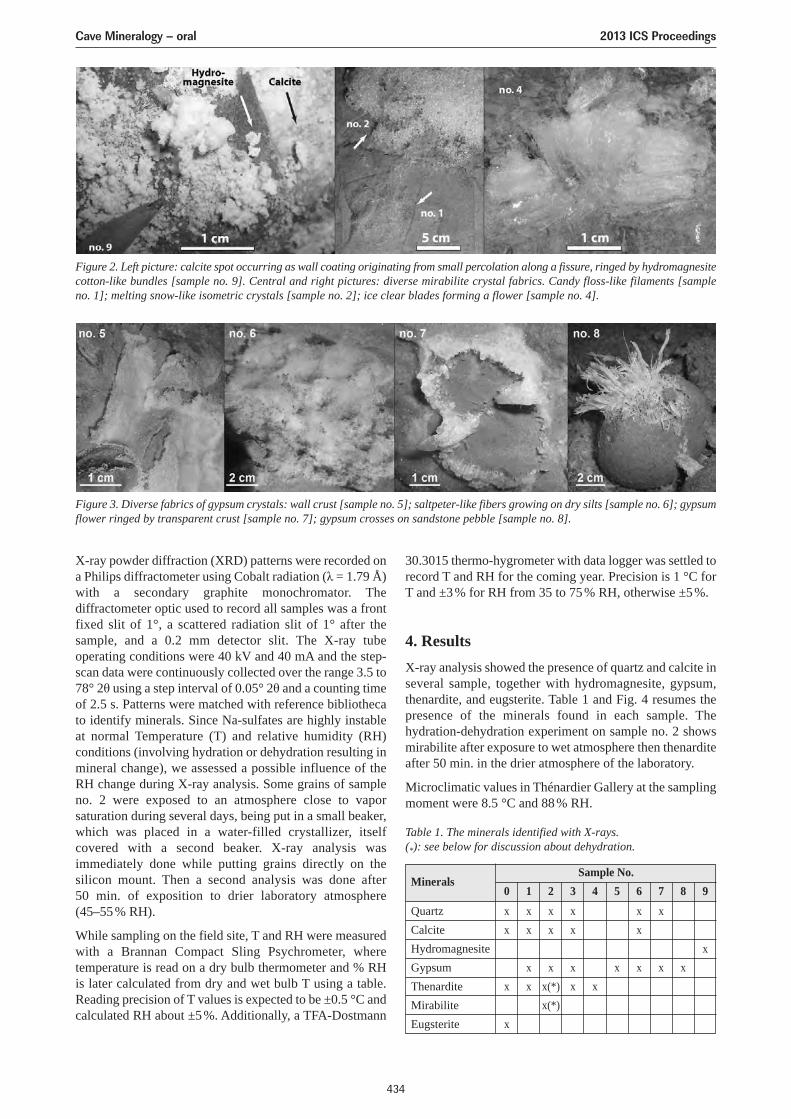
X-ray powder diffraction (XRD) patterns were recorded ona Philips diffractometer using Cobalt radiation (λ = 1.79 Å)with a secondary graphite monochromator. Thediffractometer optic used to record all samples was a frontfixed slit of 1°, a scattered radiation slit of 1° after thesample, and a 0.2 mm detector slit. The X-ray tubeoperating conditions were 40 kV and 40 mA and the step-scan data were continuously collected over the range 3.5 to78° 2θ using a step interval of 0.05° 2θ and a counting timeof 2.5 s. Patterns were matched with reference bibliothecato identify minerals. Since Na-sulfates are highly instableat normal Temperature (T) and relative humidity (RH)conditions (involving hydration or dehydration resulting inmineral change), we assessed a possible influence of theRH change during X-ray analysis. Some grains of sampleno. 2 were exposed to an atmosphere close to vaporsaturation during several days, being put in a small beaker,which was placed in a water-filled crystallizer, itselfcovered with a second beaker. X-ray analysis wasimmediately done while putting grains directly on thesilicon mount. Then a second analysis was done after50 min. of exposition to drier laboratory atmosphere(45–55 % RH).
While sampling on the field site, T and RH were measuredwith a Brannan Compact Sling Psychrometer, wheretemperature is read on a dry bulb thermometer and % RHis later calculated from dry and wet bulb T using a table.Reading precision of T values is expected to be ±0.5 °C andcalculated RH about ±5 %. Additionally, a TFA-Dostmann
30.3015 thermo-hygrometer with data logger was settled torecord T and RH for the coming year. Precision is 1 °C forT and ±3 % for RH from 35 to 75 % RH, otherwise ±5 %.
4. ResultsX-ray analysis showed the presence of quartz and calcite inseveral sample, together with hydromagnesite, gypsum,thenardite, and eugsterite. Table 1 and Fig. 4 resumes thepresence of the minerals found in each sample. Thehydration-dehydration experiment on sample no. 2 showsmirabilite after exposure to wet atmosphere then thenarditeafter 50 min. in the drier atmosphere of the laboratory.
Microclimatic values in Thénardier Gallery at the samplingmoment were 8.5 °C and 88 % RH.
Table 1. The minerals identified with X-rays.(*): see below for discussion about dehydration.
Figure 2. Left picture: calcite spot occurring as wall coating originating from small percolation along a fissure, ringed by hydromagnesitecotton-like bundles [sample no. 9]. Central and right pictures: diverse mirabilite crystal fabrics. Candy floss-like filaments [sampleno. 1]; melting snow-like isometric crystals [sample no. 2]; ice clear blades forming a flower [sample no. 4].
Figure 3. Diverse fabrics of gypsum crystals: wall crust [sample no. 5]; saltpeter-like fibers growing on dry silts [sample no. 6]; gypsumflower ringed by transparent crust [sample no. 7]; gypsum crosses on sandstone pebble [sample no. 8].
Sample No.1
Minerals
QuartzCalciteHydromagnesiteGypsumThenarditeMirabiliteEugsterite
xx
xx
0
xx
x
x
2
xx
xx(*)x(*)
3
xx
xx
4
x
5
x
6
xx
x
7
x
x
8
x
9
x
Cave Mineralogy – oral 2013 ICS Proceedings
434
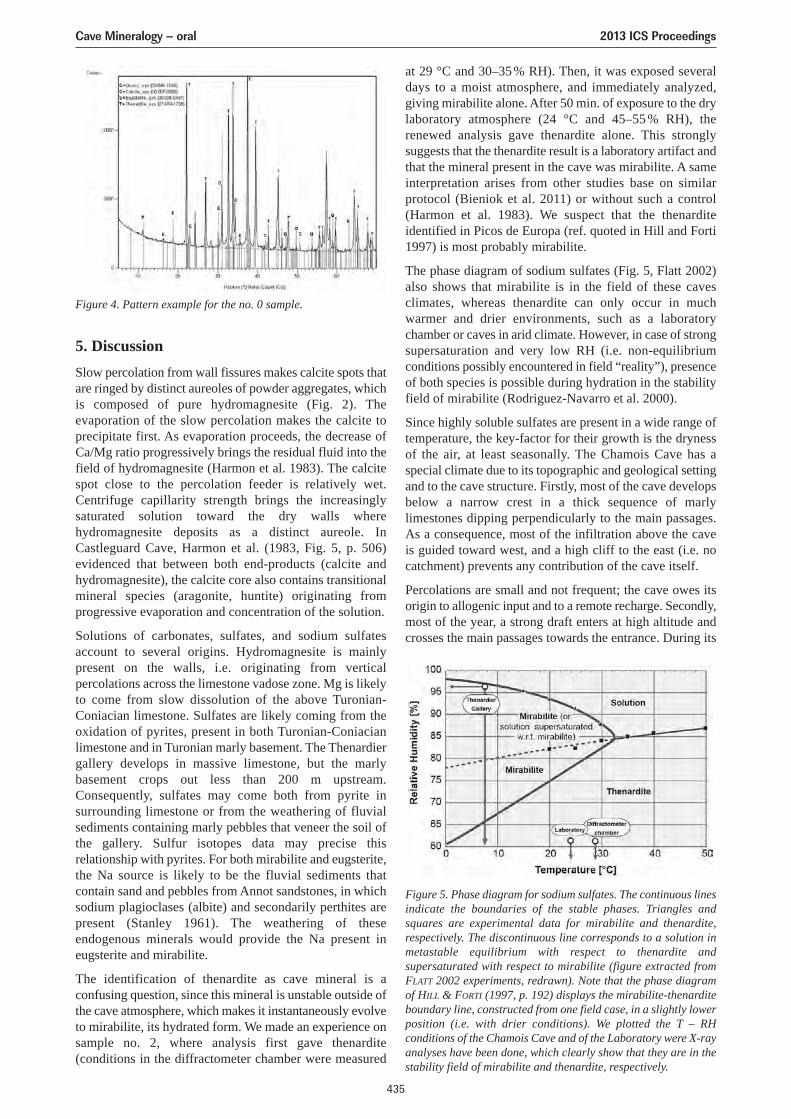
5. DiscussionSlow percolation from wall fissures makes calcite spots thatare ringed by distinct aureoles of powder aggregates, whichis composed of pure hydromagnesite (Fig. 2). Theevaporation of the slow percolation makes the calcite toprecipitate first. As evaporation proceeds, the decrease ofCa/Mg ratio progressively brings the residual fluid into thefield of hydromagnesite (Harmon et al. 1983). The calcitespot close to the percolation feeder is relatively wet.Centrifuge capillarity strength brings the increasinglysaturated solution toward the dry walls wherehydromagnesite deposits as a distinct aureole. InCastleguard Cave, Harmon et al. (1983, Fig. 5, p. 506)evidenced that between both end-products (calcite andhydromagnesite), the calcite core also contains transitionalmineral species (aragonite, huntite) originating fromprogressive evaporation and concentration of the solution.
Solutions of carbonates, sulfates, and sodium sulfatesaccount to several origins. Hydromagnesite is mainlypresent on the walls, i.e. originating from verticalpercolations across the limestone vadose zone. Mg is likelyto come from slow dissolution of the above Turonian-Coniacian limestone. Sulfates are likely coming from theoxidation of pyrites, present in both Turonian-Coniacianlimestone and in Turonian marly basement. The Thenardiergallery develops in massive limestone, but the marlybasement crops out less than 200 m upstream.Consequently, sulfates may come both from pyrite insurrounding limestone or from the weathering of fluvialsediments containing marly pebbles that veneer the soil ofthe gallery. Sulfur isotopes data may precise thisrelationship with pyrites. For both mirabilite and eugsterite,the Na source is likely to be the fluvial sediments thatcontain sand and pebbles from Annot sandstones, in whichsodium plagioclases (albite) and secondarily perthites arepresent (Stanley 1961). The weathering of theseendogenous minerals would provide the Na present ineugsterite and mirabilite.
The identification of thenardite as cave mineral is aconfusing question, since this mineral is unstable outside ofthe cave atmosphere, which makes it instantaneously evolveto mirabilite, its hydrated form. We made an experience onsample no. 2, where analysis first gave thenardite(conditions in the diffractometer chamber were measured
at 29 °C and 30–35 % RH). Then, it was exposed severaldays to a moist atmosphere, and immediately analyzed,giving mirabilite alone. After 50 min. of exposure to the drylaboratory atmosphere (24 °C and 45–55 % RH), therenewed analysis gave thenardite alone. This stronglysuggests that the thenardite result is a laboratory artifact andthat the mineral present in the cave was mirabilite. A sameinterpretation arises from other studies base on similarprotocol (Bieniok et al. 2011) or without such a control(Harmon et al. 1983). We suspect that the thenarditeidentified in Picos de Europa (ref. quoted in Hill and Forti1997) is most probably mirabilite.
The phase diagram of sodium sulfates (Fig. 5, Flatt 2002)also shows that mirabilite is in the field of these cavesclimates, whereas thenardite can only occur in muchwarmer and drier environments, such as a laboratorychamber or caves in arid climate. However, in case of strongsupersaturation and very low RH (i.e. non-equilibriumconditions possibly encountered in field “reality”), presenceof both species is possible during hydration in the stabilityfield of mirabilite (Rodriguez-Navarro et al. 2000).
Since highly soluble sulfates are present in a wide range oftemperature, the key-factor for their growth is the drynessof the air, at least seasonally. The Chamois Cave has aspecial climate due to its topographic and geological settingand to the cave structure. Firstly, most of the cave developsbelow a narrow crest in a thick sequence of marlylimestones dipping perpendicularly to the main passages.As a consequence, most of the infiltration above the caveis guided toward west, and a high cliff to the east (i.e. nocatchment) prevents any contribution of the cave itself.
Percolations are small and not frequent; the cave owes itsorigin to allogenic input and to a remote recharge. Secondly,most of the year, a strong draft enters at high altitude andcrosses the main passages towards the entrance. During its
Figure 4. Pattern example for the no. 0 sample.
Figure 5. Phase diagram for sodium sulfates. The continuous linesindicate the boundaries of the stable phases. Triangles andsquares are experimental data for mirabilite and thenardite,respectively. The discontinuous line corresponds to a solution inmetastable equilibrium with respect to thenardite andsupersaturated with respect to mirabilite (figure extracted fromFLATT 2002 experiments, redrawn). Note that the phase diagramof HILL & FORTI (1997, p. 192) displays the mirabilite-thenarditeboundary line, constructed from one field case, in a slightly lowerposition (i.e. with drier conditions). We plotted the T – RHconditions of the Chamois Cave and of the Laboratory were X-rayanalyses have been done, which clearly show that they are in thestability field of mirabilite and thenardite, respectively.
Cave Mineralogy – oral 2013 ICS Proceedings
435
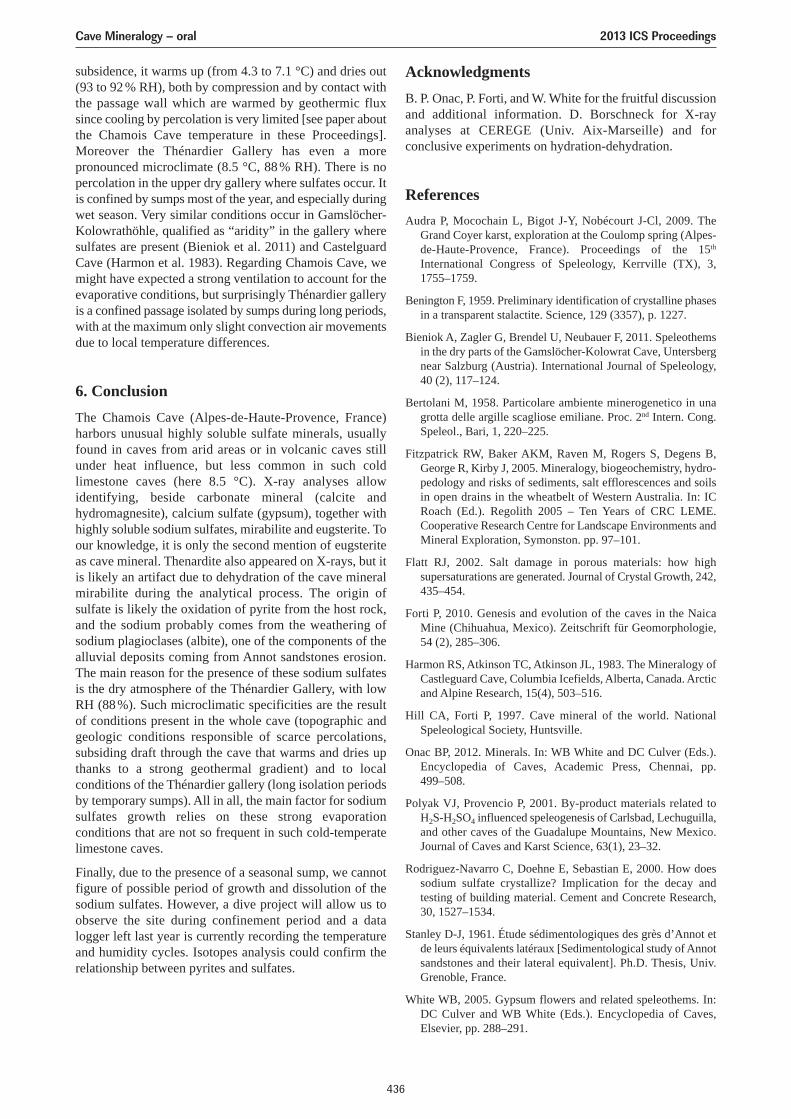
subsidence, it warms up (from 4.3 to 7.1 °C) and dries out(93 to 92 % RH), both by compression and by contact withthe passage wall which are warmed by geothermic fluxsince cooling by percolation is very limited [see paper aboutthe Chamois Cave temperature in these Proceedings].Moreover the Thénardier Gallery has even a morepronounced microclimate (8.5 °C, 88 % RH). There is nopercolation in the upper dry gallery where sulfates occur. Itis confined by sumps most of the year, and especially duringwet season. Very similar conditions occur in Gamslöcher-Kolowrathöhle, qualified as “aridity” in the gallery wheresulfates are present (Bieniok et al. 2011) and CastelguardCave (Harmon et al. 1983). Regarding Chamois Cave, wemight have expected a strong ventilation to account for theevaporative conditions, but surprisingly Thénardier galleryis a confined passage isolated by sumps during long periods,with at the maximum only slight convection air movementsdue to local temperature differences.
6. ConclusionThe Chamois Cave (Alpes-de-Haute-Provence, France)harbors unusual highly soluble sulfate minerals, usuallyfound in caves from arid areas or in volcanic caves stillunder heat influence, but less common in such coldlimestone caves (here 8.5 °C). X-ray analyses allowidentifying, beside carbonate mineral (calcite andhydromagnesite), calcium sulfate (gypsum), together withhighly soluble sodium sulfates, mirabilite and eugsterite. Toour knowledge, it is only the second mention of eugsteriteas cave mineral. Thenardite also appeared on X-rays, but itis likely an artifact due to dehydration of the cave mineralmirabilite during the analytical process. The origin ofsulfate is likely the oxidation of pyrite from the host rock,and the sodium probably comes from the weathering ofsodium plagioclases (albite), one of the components of thealluvial deposits coming from Annot sandstones erosion.The main reason for the presence of these sodium sulfatesis the dry atmosphere of the Thénardier Gallery, with lowRH (88 %). Such microclimatic specificities are the resultof conditions present in the whole cave (topographic andgeologic conditions responsible of scarce percolations,subsiding draft through the cave that warms and dries upthanks to a strong geothermal gradient) and to localconditions of the Thénardier gallery (long isolation periodsby temporary sumps). All in all, the main factor for sodiumsulfates growth relies on these strong evaporationconditions that are not so frequent in such cold-temperatelimestone caves.
Finally, due to the presence of a seasonal sump, we cannotfigure of possible period of growth and dissolution of thesodium sulfates. However, a dive project will allow us toobserve the site during confinement period and a datalogger left last year is currently recording the temperatureand humidity cycles. Isotopes analysis could confirm therelationship between pyrites and sulfates.
AcknowledgmentsB. P. Onac, P. Forti, and W. White for the fruitful discussionand additional information. D. Borschneck for X-rayanalyses at CEREGE (Univ. Aix-Marseille) and forconclusive experiments on hydration-dehydration.
ReferencesAudra P, Mocochain L, Bigot J-Y, Nobécourt J-Cl, 2009. The
Grand Coyer karst, exploration at the Coulomp spring (Alpes-de-Haute-Provence, France). Proceedings of the 15th
International Congress of Speleology, Kerrville (TX), 3,1755–1759.
Benington F, 1959. Preliminary identification of crystalline phasesin a transparent stalactite. Science, 129 (3357), p. 1227.
Bieniok A, Zagler G, Brendel U, Neubauer F, 2011. Speleothemsin the dry parts of the Gamslöcher-Kolowrat Cave, Untersbergnear Salzburg (Austria). International Journal of Speleology,40 (2), 117–124.
Bertolani M, 1958. Particolare ambiente minerogenetico in unagrotta delle argille scagliose emiliane. Proc. 2nd Intern. Cong.Speleol., Bari, 1, 220–225.
Fitzpatrick RW, Baker AKM, Raven M, Rogers S, Degens B,George R, Kirby J, 2005. Mineralogy, biogeochemistry, hydro-pedology and risks of sediments, salt efflorescences and soilsin open drains in the wheatbelt of Western Australia. In: ICRoach (Ed.). Regolith 2005 – Ten Years of CRC LEME.Cooperative Research Centre for Landscape Environments andMineral Exploration, Symonston. pp. 97–101.
Flatt RJ, 2002. Salt damage in porous materials: how highsupersaturations are generated. Journal of Crystal Growth, 242,435–454.
Forti P, 2010. Genesis and evolution of the caves in the NaicaMine (Chihuahua, Mexico). Zeitschrift für Geomorphologie,54 (2), 285–306.
Harmon RS, Atkinson TC, Atkinson JL, 1983. The Mineralogy ofCastleguard Cave, Columbia Icefields, Alberta, Canada. Arcticand Alpine Research, 15(4), 503–516.
Hill CA, Forti P, 1997. Cave mineral of the world. NationalSpeleological Society, Huntsville.
Onac BP, 2012. Minerals. In: WB White and DC Culver (Eds.).Encyclopedia of Caves, Academic Press, Chennai, pp.499–508.
Polyak VJ, Provencio P, 2001. By-product materials related toH2S-H2SO4 influenced speleogenesis of Carlsbad, Lechuguilla,and other caves of the Guadalupe Mountains, New Mexico.Journal of Caves and Karst Science, 63(1), 23–32.
Rodriguez-Navarro C, Doehne E, Sebastian E, 2000. How doessodium sulfate crystallize? Implication for the decay andtesting of building material. Cement and Concrete Research,30, 1527–1534.
Stanley D-J, 1961. Étude sédimentologiques des grès d’Annot etde leurs équivalents latéraux [Sedimentological study of Annotsandstones and their lateral equivalent]. Ph.D. Thesis, Univ.Grenoble, France.
White WB, 2005. Gypsum flowers and related speleothems. In:DC Culver and WB White (Eds.). Encyclopedia of Caves,Elsevier, pp. 288–291.
Cave Mineralogy – oral 2013 ICS Proceedings
436
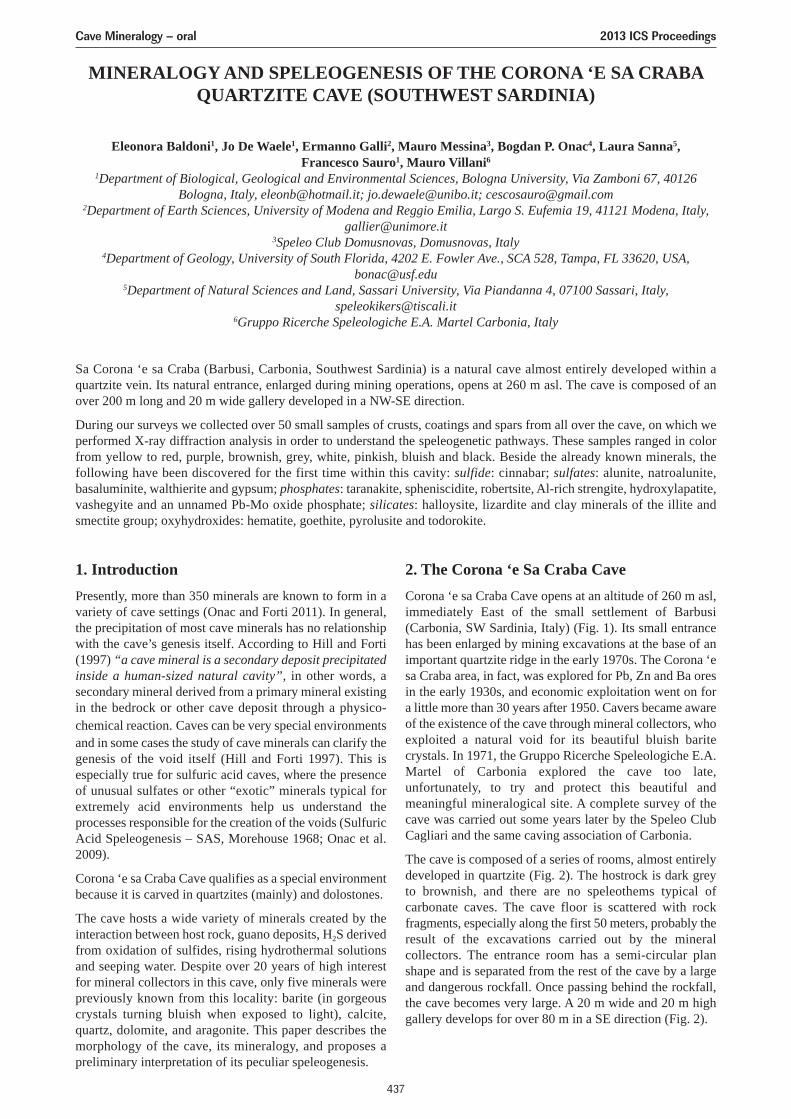
MINERALOGY AND SPELEOGENESIS OF THE CORONA ‘E SA CRABAQUARTZITE CAVE (SOUTHWEST SARDINIA)
Eleonora Baldoni1, Jo De Waele1, Ermanno Galli2, Mauro Messina3, Bogdan P. Onac4, Laura Sanna5,Francesco Sauro1, Mauro Villani6
1Department of Biological, Geological and Environmental Sciences, Bologna University, Via Zamboni 67, 40126Bologna, Italy, [email protected]; [email protected]; [email protected]
2Department of Earth Sciences, University of Modena and Reggio Emilia, Largo S. Eufemia 19, 41121 Modena, Italy,[email protected]
3Speleo Club Domusnovas, Domusnovas, Italy4Department of Geology, University of South Florida, 4202 E. Fowler Ave., SCA 528, Tampa, FL 33620, USA,
[email protected] of Natural Sciences and Land, Sassari University, Via Piandanna 4, 07100 Sassari, Italy,
[email protected] Ricerche Speleologiche E.A. Martel Carbonia, Italy
Sa Corona ‘e sa Craba (Barbusi, Carbonia, Southwest Sardinia) is a natural cave almost entirely developed within aquartzite vein. Its natural entrance, enlarged during mining operations, opens at 260 m asl. The cave is composed of anover 200 m long and 20 m wide gallery developed in a NW-SE direction.
During our surveys we collected over 50 small samples of crusts, coatings and spars from all over the cave, on which weperformed X-ray diffraction analysis in order to understand the speleogenetic pathways. These samples ranged in colorfrom yellow to red, purple, brownish, grey, white, pinkish, bluish and black. Beside the already known minerals, thefollowing have been discovered for the first time within this cavity: sulfide: cinnabar; sulfates: alunite, natroalunite,basaluminite, walthierite and gypsum; phosphates: taranakite, spheniscidite, robertsite, Al-rich strengite, hydroxylapatite,vashegyite and an unnamed Pb-Mo oxide phosphate; silicates: halloysite, lizardite and clay minerals of the illite andsmectite group; oxyhydroxides: hematite, goethite, pyrolusite and todorokite.
1. IntroductionPresently, more than 350 minerals are known to form in avariety of cave settings (Onac and Forti 2011). In general,the precipitation of most cave minerals has no relationshipwith the cave’s genesis itself. According to Hill and Forti(1997) “a cave mineral is a secondary deposit precipitatedinside a human-sized natural cavity”, in other words, asecondary mineral derived from a primary mineral existingin the bedrock or other cave deposit through a physico-chemical reaction. Caves can be very special environmentsand in some cases the study of cave minerals can clarify thegenesis of the void itself (Hill and Forti 1997). This isespecially true for sulfuric acid caves, where the presenceof unusual sulfates or other “exotic” minerals typical forextremely acid environments help us understand theprocesses responsible for the creation of the voids (SulfuricAcid Speleogenesis – SAS, Morehouse 1968; Onac et al.2009).
Corona ‘e sa Craba Cave qualifies as a special environmentbecause it is carved in quartzites (mainly) and dolostones.
The cave hosts a wide variety of minerals created by theinteraction between host rock, guano deposits, H2S derivedfrom oxidation of sulfides, rising hydrothermal solutionsand seeping water. Despite over 20 years of high interestfor mineral collectors in this cave, only five minerals werepreviously known from this locality: barite (in gorgeouscrystals turning bluish when exposed to light), calcite,quartz, dolomite, and aragonite. This paper describes themorphology of the cave, its mineralogy, and proposes apreliminary interpretation of its peculiar speleogenesis.
2. The Corona ‘e Sa Craba CaveCorona ‘e sa Craba Cave opens at an altitude of 260 m asl,immediately East of the small settlement of Barbusi(Carbonia, SW Sardinia, Italy) (Fig. 1). Its small entrancehas been enlarged by mining excavations at the base of animportant quartzite ridge in the early 1970s. The Corona ‘esa Craba area, in fact, was explored for Pb, Zn and Ba oresin the early 1930s, and economic exploitation went on fora little more than 30 years after 1950. Cavers became awareof the existence of the cave through mineral collectors, whoexploited a natural void for its beautiful bluish baritecrystals. In 1971, the Gruppo Ricerche Speleologiche E.A.Martel of Carbonia explored the cave too late,unfortunately, to try and protect this beautiful andmeaningful mineralogical site. A complete survey of thecave was carried out some years later by the Speleo ClubCagliari and the same caving association of Carbonia.
The cave is composed of a series of rooms, almost entirelydeveloped in quartzite (Fig. 2). The hostrock is dark greyto brownish, and there are no speleothems typical ofcarbonate caves. The cave floor is scattered with rockfragments, especially along the first 50 meters, probably theresult of the excavations carried out by the mineralcollectors. The entrance room has a semi-circular planshape and is separated from the rest of the cave by a largeand dangerous rockfall. Once passing behind the rockfall,the cave becomes very large. A 20 m wide and 20 m highgallery develops for over 80 m in a SE direction (Fig. 2).
Cave Mineralogy – oral 2013 ICS Proceedings
437
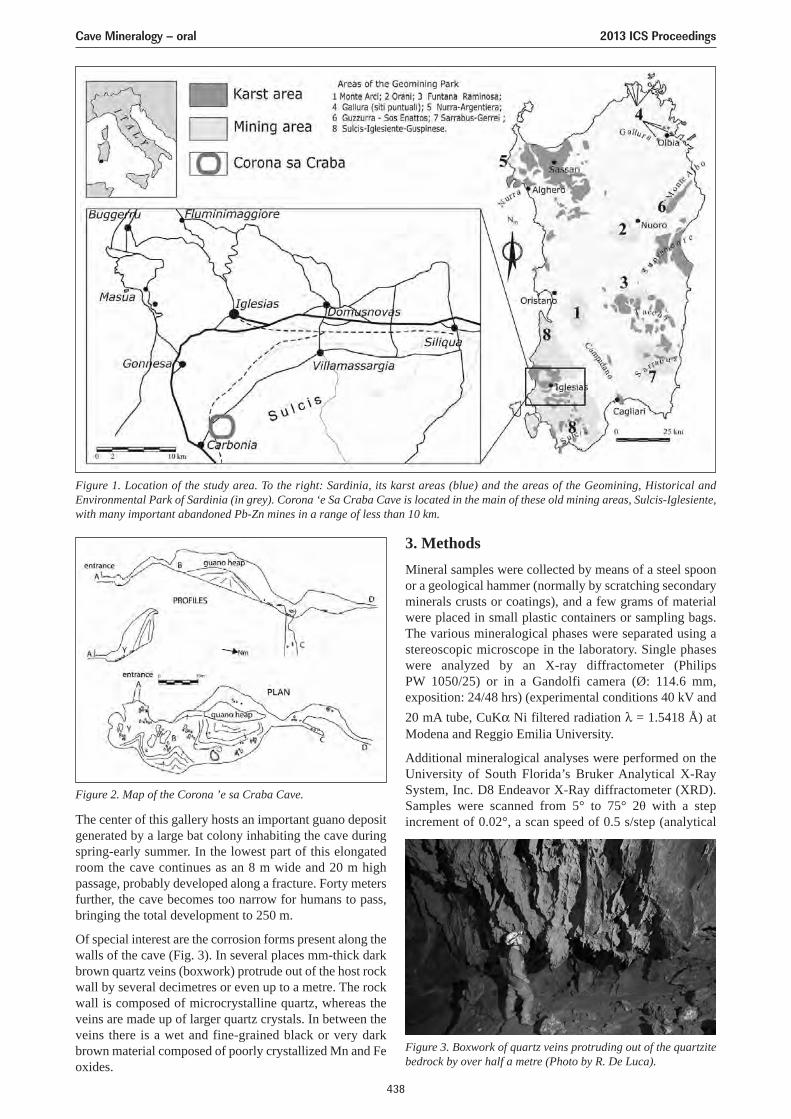
The center of this gallery hosts an important guano depositgenerated by a large bat colony inhabiting the cave duringspring-early summer. In the lowest part of this elongatedroom the cave continues as an 8 m wide and 20 m highpassage, probably developed along a fracture. Forty metersfurther, the cave becomes too narrow for humans to pass,bringing the total development to 250 m.
Of special interest are the corrosion forms present along thewalls of the cave (Fig. 3). In several places mm-thick darkbrown quartz veins (boxwork) protrude out of the host rockwall by several decimetres or even up to a metre. The rockwall is composed of microcrystalline quartz, whereas theveins are made up of larger quartz crystals. In between theveins there is a wet and fine-grained black or very darkbrown material composed of poorly crystallized Mn and Feoxides.
3. MethodsMineral samples were collected by means of a steel spoonor a geological hammer (normally by scratching secondaryminerals crusts or coatings), and a few grams of materialwere placed in small plastic containers or sampling bags.The various mineralogical phases were separated using astereoscopic microscope in the laboratory. Single phaseswere analyzed by an X-ray diffractometer (PhilipsPW 1050/25) or in a Gandolfi camera (Ø: 114.6 mm,exposition: 24/48 hrs) (experimental conditions 40 kV and20 mA tube, CuKα Ni filtered radiation λ = 1.5418 Å) atModena and Reggio Emilia University.
Additional mineralogical analyses were performed on theUniversity of South Florida’s Bruker Analytical X-RaySystem, Inc. D8 Endeavor X-Ray diffractometer (XRD).Samples were scanned from 5° to 75° 2θ with a stepincrement of 0.02°, a scan speed of 0.5 s/step (analytical
Figure 1. Location of the study area. To the right: Sardinia, its karst areas (blue) and the areas of the Geomining, Historical andEnvironmental Park of Sardinia (in grey). Corona ‘e Sa Craba Cave is located in the main of these old mining areas, Sulcis-Iglesiente,with many important abandoned Pb-Zn mines in a range of less than 10 km.
Figure 2. Map of the Corona ’e sa Craba Cave.
Figure 3. Boxwork of quartz veins protruding out of the quartzitebedrock by over half a metre (Photo by R. De Luca).
Cave Mineralogy – oral 2013 ICS Proceedings
438
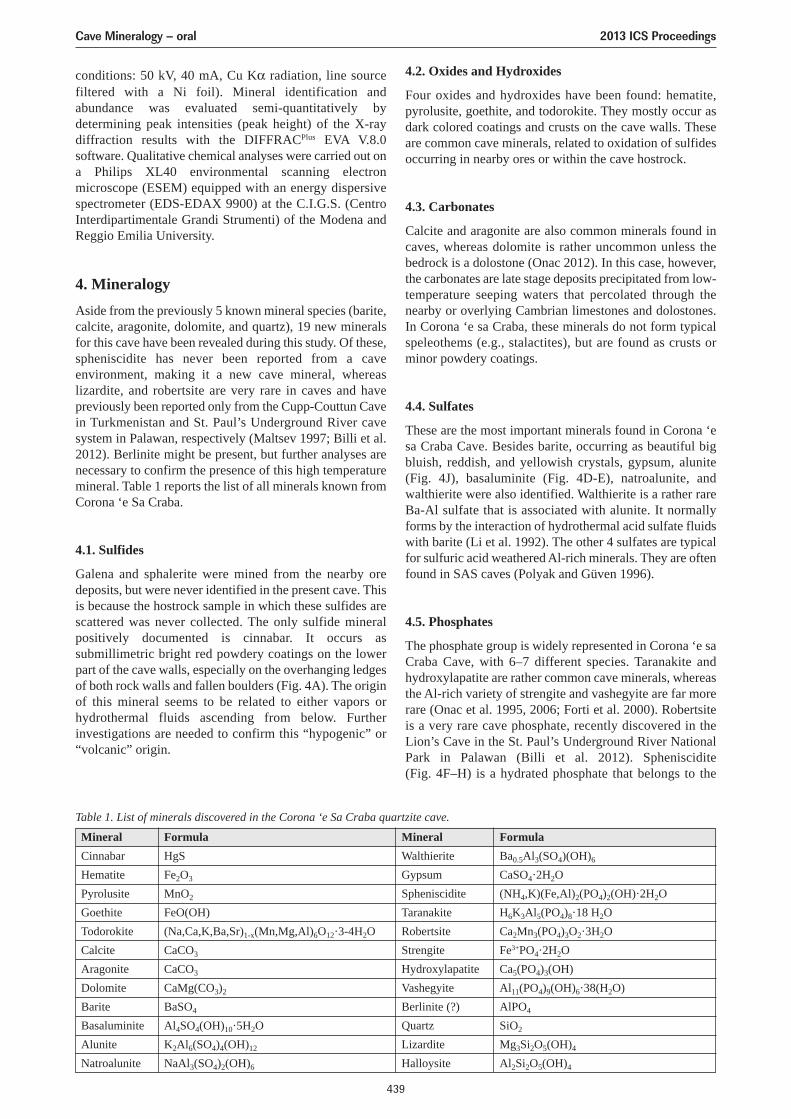
conditions: 50 kV, 40 mA, Cu Kα radiation, line sourcefiltered with a Ni foil). Mineral identification andabundance was evaluated semi-quantitatively bydetermining peak intensities (peak height) of the X-raydiffraction results with the DIFFRACPlus EVA V.8.0software. Qualitative chemical analyses were carried out ona Philips XL40 environmental scanning electronmicroscope (ESEM) equipped with an energy dispersivespectrometer (EDS-EDAX 9900) at the C.I.G.S. (CentroInterdipartimentale Grandi Strumenti) of the Modena andReggio Emilia University.
4. MineralogyAside from the previously 5 known mineral species (barite,calcite, aragonite, dolomite, and quartz), 19 new mineralsfor this cave have been revealed during this study. Of these,spheniscidite has never been reported from a caveenvironment, making it a new cave mineral, whereaslizardite, and robertsite are very rare in caves and havepreviously been reported only from the Cupp-Couttun Cavein Turkmenistan and St. Paul’s Underground River cavesystem in Palawan, respectively (Maltsev 1997; Billi et al.2012). Berlinite might be present, but further analyses arenecessary to confirm the presence of this high temperaturemineral. Table 1 reports the list of all minerals known fromCorona ‘e Sa Craba.
4.1. Sulfides
Galena and sphalerite were mined from the nearby oredeposits, but were never identified in the present cave. Thisis because the hostrock sample in which these sulfides arescattered was never collected. The only sulfide mineralpositively documented is cinnabar. It occurs assubmillimetric bright red powdery coatings on the lowerpart of the cave walls, especially on the overhanging ledgesof both rock walls and fallen boulders (Fig. 4A). The originof this mineral seems to be related to either vapors orhydrothermal fluids ascending from below. Furtherinvestigations are needed to confirm this “hypogenic” or“volcanic” origin.
4.2. Oxides and Hydroxides
Four oxides and hydroxides have been found: hematite,pyrolusite, goethite, and todorokite. They mostly occur asdark colored coatings and crusts on the cave walls. Theseare common cave minerals, related to oxidation of sulfidesoccurring in nearby ores or within the cave hostrock.
4.3. Carbonates
Calcite and aragonite are also common minerals found incaves, whereas dolomite is rather uncommon unless thebedrock is a dolostone (Onac 2012). In this case, however,the carbonates are late stage deposits precipitated from low-temperature seeping waters that percolated through thenearby or overlying Cambrian limestones and dolostones.In Corona ‘e sa Craba, these minerals do not form typicalspeleothems (e.g., stalactites), but are found as crusts orminor powdery coatings.
4.4. Sulfates
These are the most important minerals found in Corona ‘esa Craba Cave. Besides barite, occurring as beautiful bigbluish, reddish, and yellowish crystals, gypsum, alunite(Fig. 4J), basaluminite (Fig. 4D-E), natroalunite, andwalthierite were also identified. Walthierite is a rather rareBa-Al sulfate that is associated with alunite. It normallyforms by the interaction of hydrothermal acid sulfate fluidswith barite (Li et al. 1992). The other 4 sulfates are typicalfor sulfuric acid weathered Al-rich minerals. They are oftenfound in SAS caves (Polyak and Güven 1996).
4.5. Phosphates
The phosphate group is widely represented in Corona ‘e saCraba Cave, with 6–7 different species. Taranakite andhydroxylapatite are rather common cave minerals, whereasthe Al-rich variety of strengite and vashegyite are far morerare (Onac et al. 1995, 2006; Forti et al. 2000). Robertsiteis a very rare cave phosphate, recently discovered in theLion’s Cave in the St. Paul’s Underground River NationalPark in Palawan (Billi et al. 2012). Spheniscidite(Fig. 4F–H) is a hydrated phosphate that belongs to the
Table 1. List of minerals discovered in the Corona ‘e Sa Craba quartzite cave.
Mineral Formula Mineral FormulaCinnabar HgS Walthierite Ba0.5Al3(SO4)(OH)6
Hematite Fe2O3 Gypsum CaSO4·2H2OPyrolusite MnO2 Spheniscidite (NH4,K)(Fe,Al)2(PO4)2(OH)·2H2OGoethite FeO(OH) Taranakite H6K3Al5(PO4)8·18 H2OTodorokite (Na,Ca,K,Ba,Sr)1-x(Mn,Mg,Al)6O 12·3-4H2O Robertsite Ca2Mn3(PO4)3O2·3H2OCalcite CaCO3 Strengite Fe3+PO4·2H2OAragonite CaCO3 Hydroxylapatite Ca5(PO4)3(OH) Dolomite CaMg(CO3)2 Vashegyite Al11(PO4)9(OH)6·38(H2O)Barite BaSO4 Berlinite (?) AlPO4
Basaluminite Al4SO4(OH)10·5H2O Quartz SiO2
Alunite K2Al6(SO4)4(OH)12 Lizardite Mg3Si2O5(OH)4
Natroalunite NaAl3(SO4)2(OH)6 Halloysite Al2Si2O5(OH)4
Cave Mineralogy – oral 2013 ICS Proceedings
439
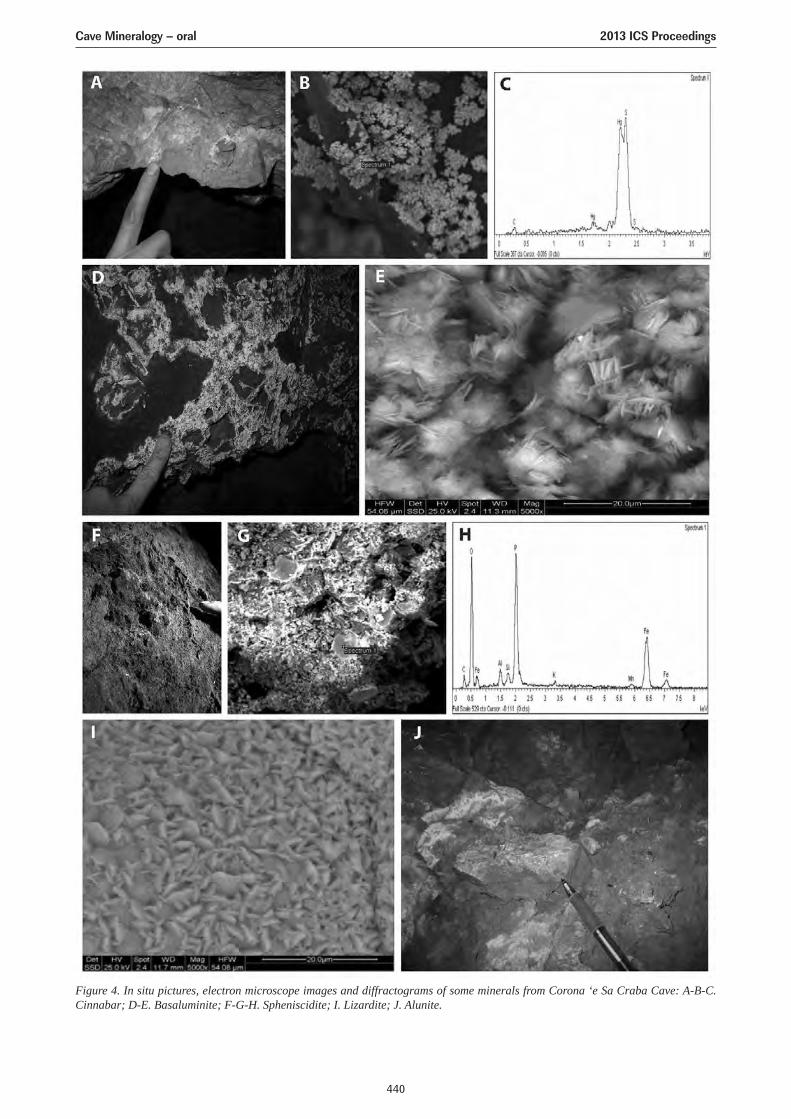
Figure 4. In situ pictures, electron microscope images and diffractograms of some minerals from Corona ‘e Sa Craba Cave: A-B-C.Cinnabar; D-E. Basaluminite; F-G-H. Spheniscidite; I. Lizardite; J. Alunite.
Cave Mineralogy – oral 2013 ICS Proceedings
440
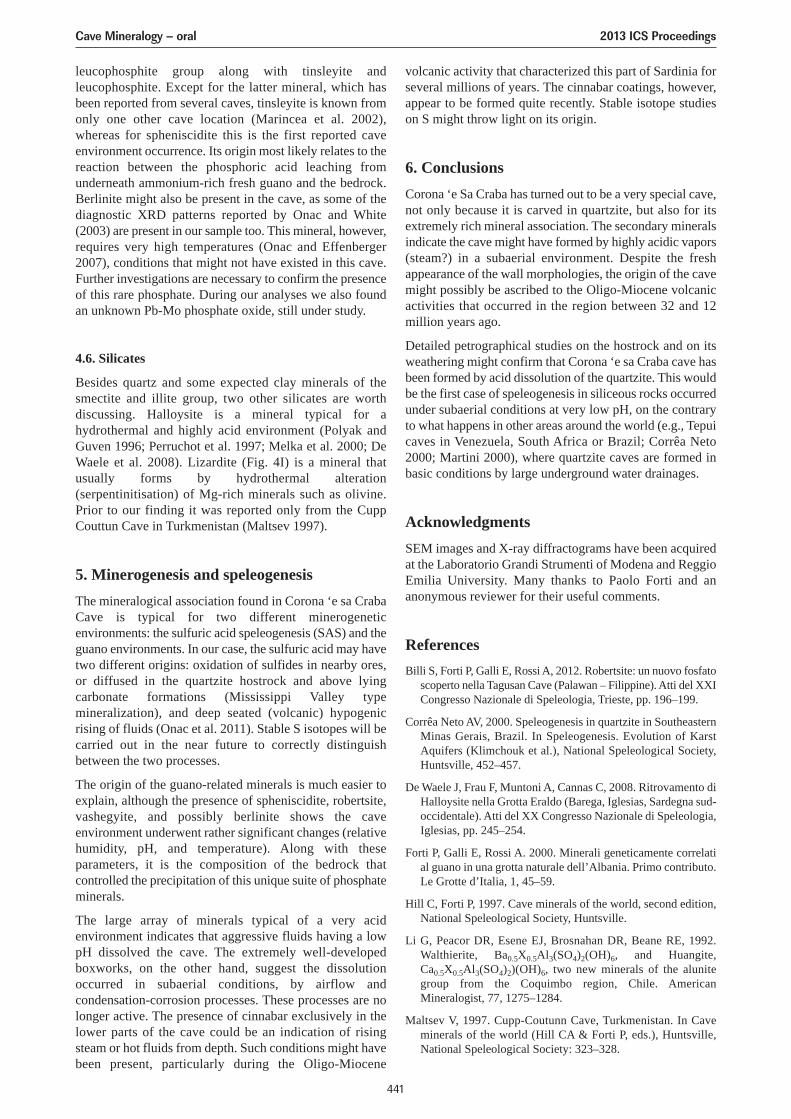
leucophosphite group along with tinsleyite andleucophosphite. Except for the latter mineral, which hasbeen reported from several caves, tinsleyite is known fromonly one other cave location (Marincea et al. 2002),whereas for spheniscidite this is the first reported caveenvironment occurrence. Its origin most likely relates to thereaction between the phosphoric acid leaching fromunderneath ammonium-rich fresh guano and the bedrock.Berlinite might also be present in the cave, as some of thediagnostic XRD patterns reported by Onac and White(2003) are present in our sample too. This mineral, however,requires very high temperatures (Onac and Effenberger2007), conditions that might not have existed in this cave.Further investigations are necessary to confirm the presenceof this rare phosphate. During our analyses we also foundan unknown Pb-Mo phosphate oxide, still under study.
4.6. Silicates
Besides quartz and some expected clay minerals of thesmectite and illite group, two other silicates are worthdiscussing. Halloysite is a mineral typical for ahydrothermal and highly acid environment (Polyak andGuven 1996; Perruchot et al. 1997; Melka et al. 2000; DeWaele et al. 2008). Lizardite (Fig. 4I) is a mineral thatusually forms by hydrothermal alteration(serpentinitisation) of Mg-rich minerals such as olivine.Prior to our finding it was reported only from the CuppCouttun Cave in Turkmenistan (Maltsev 1997).
5. Minerogenesis and speleogenesisThe mineralogical association found in Corona ‘e sa CrabaCave is typical for two different minerogeneticenvironments: the sulfuric acid speleogenesis (SAS) and theguano environments. In our case, the sulfuric acid may havetwo different origins: oxidation of sulfides in nearby ores,or diffused in the quartzite hostrock and above lyingcarbonate formations (Mississippi Valley typemineralization), and deep seated (volcanic) hypogenicrising of fluids (Onac et al. 2011). Stable S isotopes will becarried out in the near future to correctly distinguishbetween the two processes.
The origin of the guano-related minerals is much easier toexplain, although the presence of spheniscidite, robertsite,vashegyite, and possibly berlinite shows the caveenvironment underwent rather significant changes (relativehumidity, pH, and temperature). Along with theseparameters, it is the composition of the bedrock thatcontrolled the precipitation of this unique suite of phosphateminerals.
The large array of minerals typical of a very acidenvironment indicates that aggressive fluids having a lowpH dissolved the cave. The extremely well-developedboxworks, on the other hand, suggest the dissolutionoccurred in subaerial conditions, by airflow andcondensation-corrosion processes. These processes are nolonger active. The presence of cinnabar exclusively in thelower parts of the cave could be an indication of risingsteam or hot fluids from depth. Such conditions might havebeen present, particularly during the Oligo-Miocene
volcanic activity that characterized this part of Sardinia forseveral millions of years. The cinnabar coatings, however,appear to be formed quite recently. Stable isotope studieson S might throw light on its origin.
6. ConclusionsCorona ‘e Sa Craba has turned out to be a very special cave,not only because it is carved in quartzite, but also for itsextremely rich mineral association. The secondary mineralsindicate the cave might have formed by highly acidic vapors(steam?) in a subaerial environment. Despite the freshappearance of the wall morphologies, the origin of the cavemight possibly be ascribed to the Oligo-Miocene volcanicactivities that occurred in the region between 32 and 12million years ago.
Detailed petrographical studies on the hostrock and on itsweathering might confirm that Corona ‘e sa Craba cave hasbeen formed by acid dissolution of the quartzite. This wouldbe the first case of speleogenesis in siliceous rocks occurredunder subaerial conditions at very low pH, on the contraryto what happens in other areas around the world (e.g., Tepuicaves in Venezuela, South Africa or Brazil; Corrêa Neto2000; Martini 2000), where quartzite caves are formed inbasic conditions by large underground water drainages.
AcknowledgmentsSEM images and X-ray diffractograms have been acquiredat the Laboratorio Grandi Strumenti of Modena and ReggioEmilia University. Many thanks to Paolo Forti and ananonymous reviewer for their useful comments.
ReferencesBilli S, Forti P, Galli E, Rossi A, 2012. Robertsite: un nuovo fosfato
scoperto nella Tagusan Cave (Palawan – Filippine). Atti del XXICongresso Nazionale di Speleologia, Trieste, pp. 196–199.
Corrêa Neto AV, 2000. Speleogenesis in quartzite in SoutheasternMinas Gerais, Brazil. In Speleogenesis. Evolution of KarstAquifers (Klimchouk et al.), National Speleological Society,Huntsville, 452–457.
De Waele J, Frau F, Muntoni A, Cannas C, 2008. Ritrovamento diHalloysite nella Grotta Eraldo (Barega, Iglesias, Sardegna sud-occidentale). Atti del XX Congresso Nazionale di Speleologia,Iglesias, pp. 245–254.
Forti P, Galli E, Rossi A. 2000. Minerali geneticamente correlatial guano in una grotta naturale dell’Albania. Primo contributo.Le Grotte d’Italia, 1, 45–59.
Hill C, Forti P, 1997. Cave minerals of the world, second edition,National Speleological Society, Huntsville.
Li G, Peacor DR, Esene EJ, Brosnahan DR, Beane RE, 1992.Walthierite, Ba0.5X0.5Al3(SO4)2(OH)6, and Huangite,Ca0.5X0.5Al3(SO4)2)(OH)6, two new minerals of the alunitegroup from the Coquimbo region, Chile. AmericanMineralogist, 77, 1275–1284.
Maltsev V, 1997. Cupp-Coutunn Cave, Turkmenistan. In Caveminerals of the world (Hill CA & Forti P, eds.), Huntsville,National Speleological Society: 323–328.
Cave Mineralogy – oral 2013 ICS Proceedings
441
Marincea S, Dumitras D, Gibert R, 2002. Tinsleyite in the “dry”Cioclovina Cave (Sureanu Mountains, Romania): the secondoccurence. European Journal of Mineralogy, 14, 157–164.
Martini JEJ, 2000. Quartzite caves in southern Africa. InSpeleogenesis. Evolution of Karst Aquifers (Klimchouk et al.),National Speleological Society, Huntsville, 458–461.
Melka K, Suchy V, Zeman A, Bosak P, Langrovà A, 2000.Halloysite from karst sediments of the Koneprusy area:evidence for acid hydrothermal speleogenesis in the Bohemiankarst, Czech Republic. Acta Universitatis Carolinae, Geologica,44(2–4), 117–124.
Morehouse DF, 1968. Cave development via the sulfuric acidreaction. National Speleological Society Bulletin, 30(1), 1–10.
Onac BP, 2012. Minerals. In Encyclopedia of Caves (WhiteWB & Culver DC, eds.), Chennai: Academic Press, 499–508.
Onac BP, Effenberger HS, 2007. Re-examination of berlinite(AlPO4) from the Cioclovina Cave (Romania). AmericanMineralogist, 92, 1998–2001.
Onac BP, Forti P, 2011. Minerogenetic mechanisms occurring inthe cave environment, an overview. International Journal ofSpeleology, 40 (2), 1–20.
Onac BP, White WB, 2003. First reported sedimentary occurrenceof berlinite (AlPO4) in the phosphate bearing sediments fromCioclovina Cave (Romania). American Mineralogist, 88,1395–1397.
Onac BP, Bengeanu M, Botez M, Zih J, 1995. Preliminary reporton the mineralogy of Pestera din Valea Rea (Bihor Mountains,Romania). Theoretical and Applied Karstology, 8, 75–79.
Onac BP, Zaharia L, Kearns J, Veress D, 2006. Vashegyite fromGaura cu Muscă Cave (Locvei Mountains, Romania): a newand rare phosphate occurrence. International Journal ofSpeleology, 35(2), 67–73
Onac BP, Sumrall J, Tămaş T, Povară I, Kearns J, Dârmiceanu V,Vereș D, Lascu C, 2009. The relationship between caveminerals and H2S-rich thermal waters along the Cerna Valley(SW Romania). Acta Carsologica, 38(1), 27–39.
Onac BP, Wynn JG, Sumrall JB., 2011. Tracing the sources of cavesulfates: a unique case from Cerna Valley, Romania. ChemicalGeology, 288, 105–114.
Perruchot A, Dupuis C, Brouard E, Nicaise D, Ertus ETR, 1997.L’halloysites karstique: comparaison des gisements types deWallonie (Belgique) et du Perigord (France). Clay Minerals,32(2), 271–287.
Polyak VJ, Güven N, 1996. Alunite, natroalunite and hydratedhalloysite in Carlsbad Cavern and Lechuguilla Cave, NewMexico. Clays and Clay Minerals, 44(6), 843–850.
Cave Mineralogy – oral 2013 ICS Proceedings
442
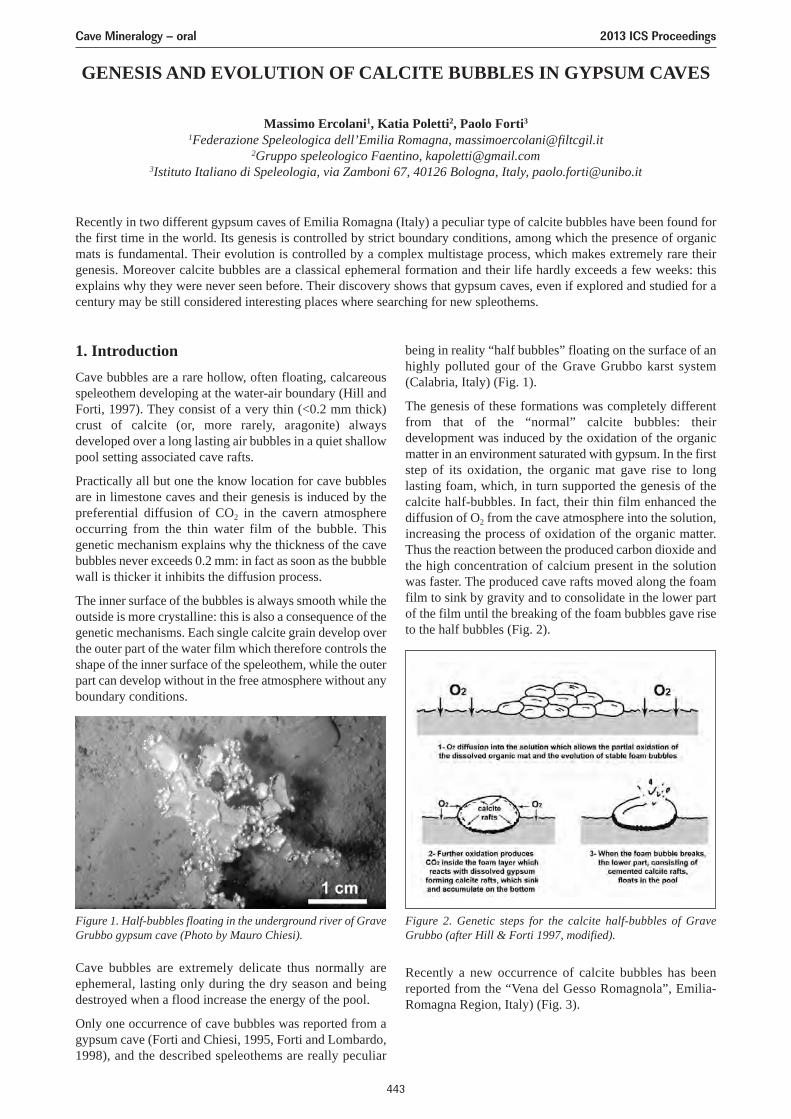
GENESIS AND EVOLUTION OF CALCITE BUBBLES IN GYPSUM CAVES
Massimo Ercolani1, Katia Poletti2, Paolo Forti3
1Federazione Speleologica dell’Emilia Romagna, [email protected] speleologico Faentino, [email protected]
3Istituto Italiano di Speleologia, via Zamboni 67, 40126 Bologna, Italy, [email protected]
Recently in two different gypsum caves of Emilia Romagna (Italy) a peculiar type of calcite bubbles have been found forthe first time in the world. Its genesis is controlled by strict boundary conditions, among which the presence of organicmats is fundamental. Their evolution is controlled by a complex multistage process, which makes extremely rare theirgenesis. Moreover calcite bubbles are a classical ephemeral formation and their life hardly exceeds a few weeks: thisexplains why they were never seen before. Their discovery shows that gypsum caves, even if explored and studied for acentury may be still considered interesting places where searching for new spleothems.
1. IntroductionCave bubbles are a rare hollow, often floating, calcareousspeleothem developing at the water-air boundary (Hill andForti, 1997). They consist of a very thin (<0.2 mm thick)crust of calcite (or, more rarely, aragonite) alwaysdeveloped over a long lasting air bubbles in a quiet shallowpool setting associated cave rafts.
Practically all but one the know location for cave bubblesare in limestone caves and their genesis is induced by thepreferential diffusion of CO2 in the cavern atmosphereoccurring from the thin water film of the bubble. Thisgenetic mechanism explains why the thickness of the cavebubbles never exceeds 0.2 mm: in fact as soon as the bubblewall is thicker it inhibits the diffusion process.
The inner surface of the bubbles is always smooth while theoutside is more crystalline: this is also a consequence of thegenetic mechanisms. Each single calcite grain develop overthe outer part of the water film which therefore controls theshape of the inner surface of the speleothem, while the outerpart can develop without in the free atmosphere without anyboundary conditions.
Cave bubbles are extremely delicate thus normally areephemeral, lasting only during the dry season and beingdestroyed when a flood increase the energy of the pool.
Only one occurrence of cave bubbles was reported from agypsum cave (Forti and Chiesi, 1995, Forti and Lombardo,1998), and the described speleothems are really peculiar
being in reality “half bubbles” floating on the surface of anhighly polluted gour of the Grave Grubbo karst system(Calabria, Italy) (Fig. 1).
The genesis of these formations was completely differentfrom that of the “normal” calcite bubbles: theirdevelopment was induced by the oxidation of the organicmatter in an environment saturated with gypsum. In the firststep of its oxidation, the organic mat gave rise to longlasting foam, which, in turn supported the genesis of thecalcite half-bubbles. In fact, their thin film enhanced thediffusion of O2 from the cave atmosphere into the solution,increasing the process of oxidation of the organic matter.Thus the reaction between the produced carbon dioxide andthe high concentration of calcium present in the solutionwas faster. The produced cave rafts moved along the foamfilm to sink by gravity and to consolidate in the lower partof the film until the breaking of the foam bubbles gave riseto the half bubbles (Fig. 2).
Recently a new occurrence of calcite bubbles has beenreported from the “Vena del Gesso Romagnola”, Emilia-Romagna Region, Italy) (Fig. 3).
Figure 1. Half-bubbles floating in the underground river of GraveGrubbo gypsum cave (Photo by Mauro Chiesi).
Figure 2. Genetic steps for the calcite half-bubbles of GraveGrubbo (after Hill & Forti 1997, modified).
Cave Mineralogy – oral 2013 ICS Proceedings
443
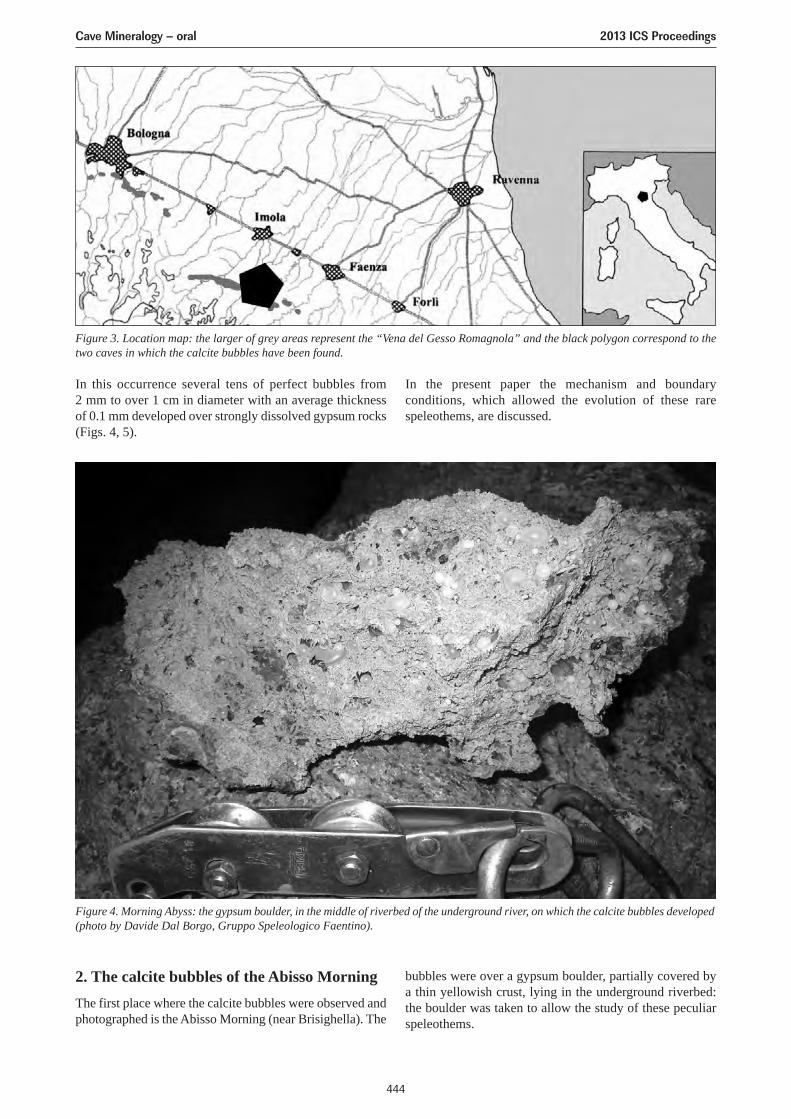
In this occurrence several tens of perfect bubbles from2 mm to over 1 cm in diameter with an average thicknessof 0.1 mm developed over strongly dissolved gypsum rocks(Figs. 4, 5).
In the present paper the mechanism and boundaryconditions, which allowed the evolution of these rarespeleothems, are discussed.
2. The calcite bubbles of the Abisso MorningThe first place where the calcite bubbles were observed andphotographed is the Abisso Morning (near Brisighella). The
bubbles were over a gypsum boulder, partially covered bya thin yellowish crust, lying in the underground riverbed:the boulder was taken to allow the study of these peculiarspeleothems.
Figure 3. Location map: the larger of grey areas represent the “Vena del Gesso Romagnola” and the black polygon correspond to thetwo caves in which the calcite bubbles have been found.
Figure 4. Morning Abyss: the gypsum boulder, in the middle of riverbed of the underground river, on which the calcite bubbles developed(photo by Davide Dal Borgo, Gruppo Speleologico Faentino).
Cave Mineralogy – oral 2013 ICS Proceedings
444
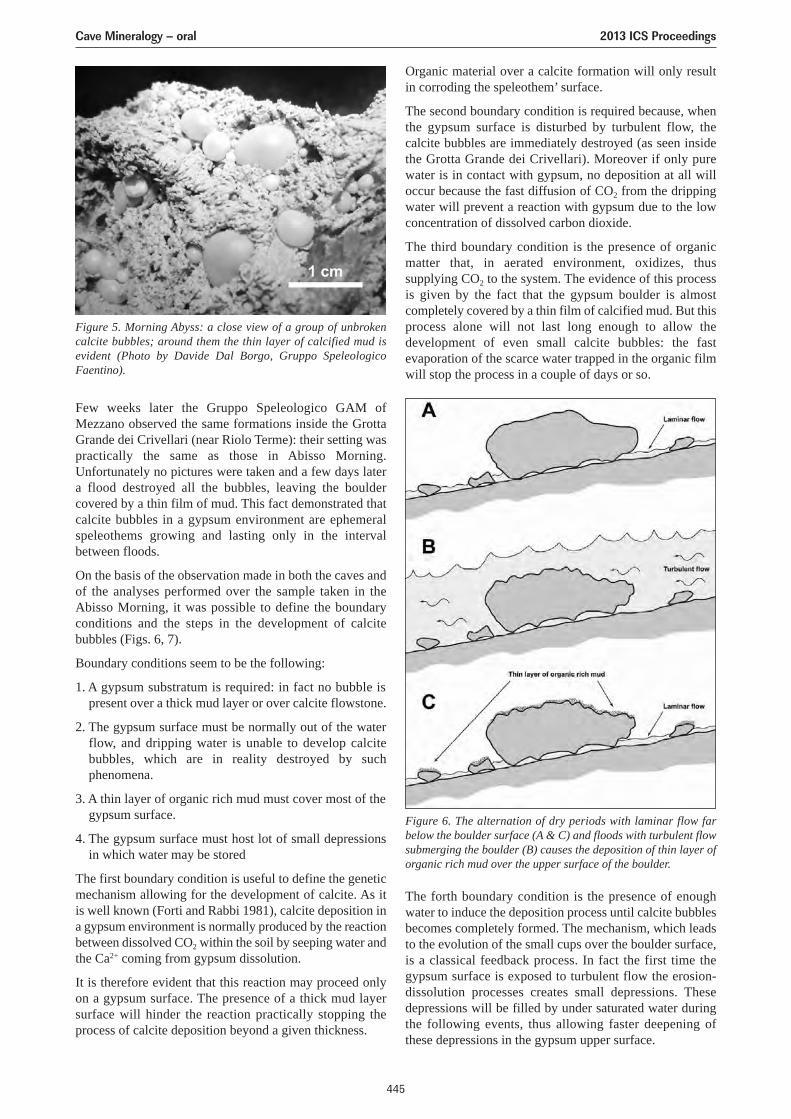
Few weeks later the Gruppo Speleologico GAM ofMezzano observed the same formations inside the GrottaGrande dei Crivellari (near Riolo Terme): their setting waspractically the same as those in Abisso Morning.Unfortunately no pictures were taken and a few days latera flood destroyed all the bubbles, leaving the bouldercovered by a thin film of mud. This fact demonstrated thatcalcite bubbles in a gypsum environment are ephemeralspeleothems growing and lasting only in the intervalbetween floods.
On the basis of the observation made in both the caves andof the analyses performed over the sample taken in theAbisso Morning, it was possible to define the boundaryconditions and the steps in the development of calcitebubbles (Figs. 6, 7).
Boundary conditions seem to be the following:
1. A gypsum substratum is required: in fact no bubble ispresent over a thick mud layer or over calcite flowstone.
2. The gypsum surface must be normally out of the waterflow, and dripping water is unable to develop calcitebubbles, which are in reality destroyed by suchphenomena.
3. A thin layer of organic rich mud must cover most of thegypsum surface.
4. The gypsum surface must host lot of small depressionsin which water may be stored
The first boundary condition is useful to define the geneticmechanism allowing for the development of calcite. As itis well known (Forti and Rabbi 1981), calcite deposition ina gypsum environment is normally produced by the reactionbetween dissolved CO2 within the soil by seeping water andthe Ca2+ coming from gypsum dissolution.
It is therefore evident that this reaction may proceed onlyon a gypsum surface. The presence of a thick mud layersurface will hinder the reaction practically stopping theprocess of calcite deposition beyond a given thickness.
Organic material over a calcite formation will only resultin corroding the speleothem’ surface.
The second boundary condition is required because, whenthe gypsum surface is disturbed by turbulent flow, thecalcite bubbles are immediately destroyed (as seen insidethe Grotta Grande dei Crivellari). Moreover if only purewater is in contact with gypsum, no deposition at all willoccur because the fast diffusion of CO2 from the drippingwater will prevent a reaction with gypsum due to the lowconcentration of dissolved carbon dioxide.
The third boundary condition is the presence of organicmatter that, in aerated environment, oxidizes, thussupplying CO2 to the system. The evidence of this processis given by the fact that the gypsum boulder is almostcompletely covered by a thin film of calcified mud. But thisprocess alone will not last long enough to allow thedevelopment of even small calcite bubbles: the fastevaporation of the scarce water trapped in the organic filmwill stop the process in a couple of days or so.
The forth boundary condition is the presence of enoughwater to induce the deposition process until calcite bubblesbecomes completely formed. The mechanism, which leadsto the evolution of the small cups over the boulder surface,is a classical feedback process. In fact the first time thegypsum surface is exposed to turbulent flow the erosion-dissolution processes creates small depressions. Thesedepressions will be filled by under saturated water duringthe following events, thus allowing faster deepening ofthese depressions in the gypsum upper surface.
Figure 5. Morning Abyss: a close view of a group of unbrokencalcite bubbles; around them the thin layer of calcified mud isevident (Photo by Davide Dal Borgo, Gruppo SpeleologicoFaentino).
Figure 6. The alternation of dry periods with laminar flow farbelow the boulder surface (A & C) and floods with turbulent flowsubmerging the boulder (B) causes the deposition of thin layer oforganic rich mud over the upper surface of the boulder.
Cave Mineralogy – oral 2013 ICS Proceedings
445
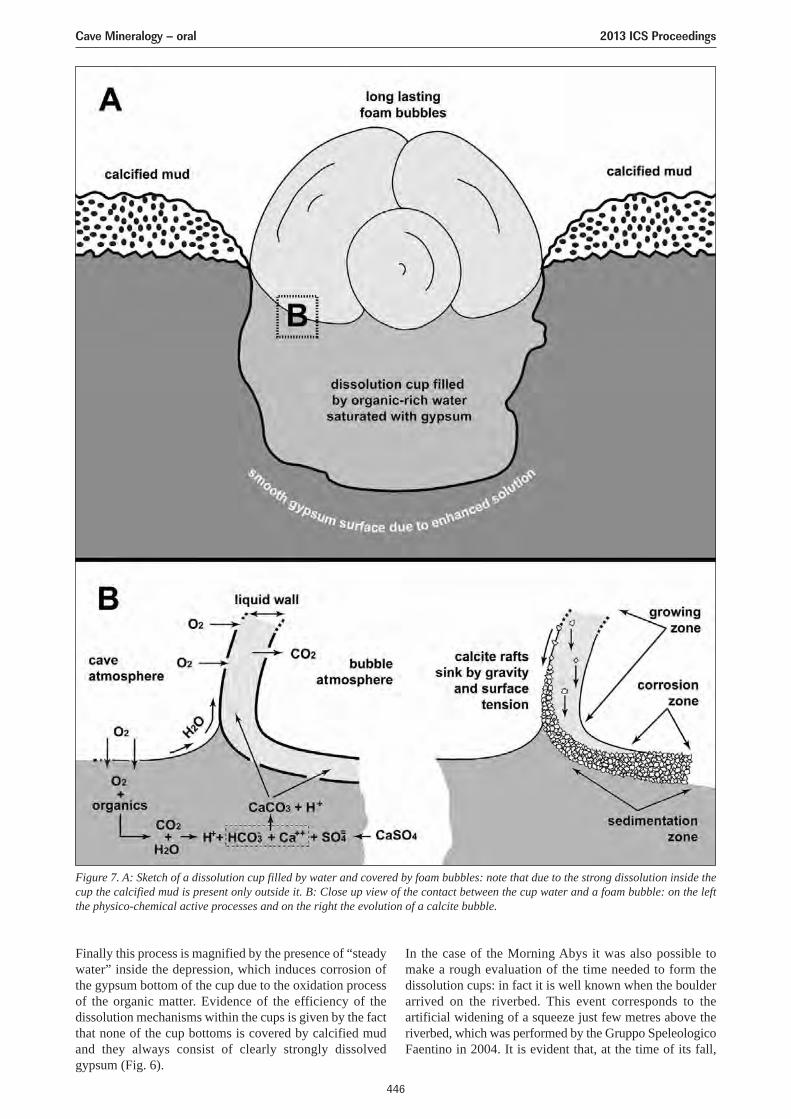
Finally this process is magnified by the presence of “steadywater” inside the depression, which induces corrosion ofthe gypsum bottom of the cup due to the oxidation processof the organic matter. Evidence of the efficiency of thedissolution mechanisms within the cups is given by the factthat none of the cup bottoms is covered by calcified mudand they always consist of clearly strongly dissolvedgypsum (Fig. 6).
In the case of the Morning Abys it was also possible tomake a rough evaluation of the time needed to form thedissolution cups: in fact it is well known when the boulderarrived on the riverbed. This event corresponds to theartificial widening of a squeeze just few metres above theriverbed, which was performed by the Gruppo SpeleologicoFaentino in 2004. It is evident that, at the time of its fall,
Figure 7. A: Sketch of a dissolution cup filled by water and covered by foam bubbles: note that due to the strong dissolution inside thecup the calcified mud is present only outside it. B: Close up view of the contact between the cup water and a foam bubble: on the leftthe physico-chemical active processes and on the right the evolution of a calcite bubble.
Cave Mineralogy – oral 2013 ICS Proceedings
446
the bypsum boulde was abosolutely flat, coming from acompact gypsum layer, and thus all the dissolution cups onits surface must have developed in less than 8 years.
Finally it is necessary to explain why the genesis of suchstrange speleothems is so rare. This is explained by thecomplexity of the subsequent steps by which the processmust develop, which makes the sequence extremelydifficult to be fulfilled.
The 10 steps in the development of the calcite bubbles maybe summarized as follow:
1. The process starts with a gypsum boulder being locatedalong the main flow of a subterranean river, with itsupper part always dry except for short and rare periodsof the highest floods. The fast erosion and dissolution ofgypsum exposed to turbulent water flow makespractically impossible to the gypsum riverbed to be insuch a condition. Moreover this occurrence is shortlasting also for a fallen and/or transported gypsumboulders.
2. During rare foods the gypsum boulder is submerged bywater and its upper surface is partially eroded anddissolved by the under saturated water thus creatingseveral small “dissolution cup” on its surface. Anysubsequent flood will enlarge and deepen these cups. Incase the food occurs when calcite bubbles where alreadydeveloped (step 10), all of them will be broken and/orwashed away.
3. At the end of each flood a thin film of mud and clay isdeposited over the gypsum boulder and a small quantityof water is also stored in each “dissolution cup”. Iforganic content of the mud and of the water is low thedevelopment of the calcite bubbles cannot start: in factno foam can be produced and no CO2 will be availableto react with gypsum and produce calcium carbonate. Inthis case nothing will happen except for evaporation ofall the water from the gypsum surface until a new floodoccurs (step 2).
4. If the concentration of organic mats is high, thedevelopment of the calcite bubbles may start. Oxygendiffuses from the cave atmosphere into the wet mud layerand into the water in the dissolution cups. Thus theorganic mat is oxidized and the produced CO2 corrodesthe underlying gypsum with simultaneous deposition ofcalcite which gives rise to the thin crust composed bycalcified mud over the corroded gypsum surface.
5. In a very short time (a few days) the oxidation stopsbecause all the water trapped within the mud layerevaporates. The only places in which oxidation may lastmuch longer is within the “dissolution cups”, which actas accumulation traps and, in the mean time, avoid fastevaporation due to their scarce surface contact with thecave atmosphere.
6. Oxidation within the cups allow for the development oflong lasting foam bubbles, which in turn act aspreferential places for diffusion of the atmosphericoxygen into the solution saturated by gypsum, thusbecoming places of enhanced calcite deposition.
7. The dimension of the “cups” controls the maximum sizeof the foam bubbles (i.e. of the calcite bubbles) even ifin the same cup different independent bubbles maydevelop.
8. The calcite deposition over the foam causes a progressivehindering of the diffusion of the atmospheric O2 into thesolution, which brings to complete stop the process whenthe calcite films reaches a thickness of about 0.1 mm,which is in fact the same for all the bubbles no mattertheir dimensions.
9. After calcite deposition ceases, over the bubbles theprocess still going on is the slow capillary upwelling ofwater from the cup to the free surface, where evaporationlasts until water is available. During this period, thedrying out of the calcite bubbles may cause cracks intheir surface and also the breakdown of those notperfectly developed.
10. When all the water and mud left by the flood is died upno further evolution of the speleothems (calcified mudand bubbles) is possible. From this moment on the cavebubbles are “frozen” until a new flood destroys themand new bubbles evolve (from step 2).
The complexity of the boundary conditions, and of theprocess leading to the development of the calcite bubblesin a gypsum cave, can explain why these speleothem are sorare. Maybe these formation are fairly more common, buttheir fragility avoid them from being seen even few weeksafter their growth.
In our opinion the condensation-corrosion is the main agentfor the demolition of the cave bubbles. In fact condensationwater, carrying CO2 (due to the diffusion from the cavernatmosphere) and no CaCO3 at all, is always aggressivetoward calcite.
Condensation over the bubbles brings aggressive water incontact with the very thin film of calcite, which is rapidlycorroded causing the collapse of the whole bubble.
3. Final RemarksThe recently discovered calcite bubbles of the GrottaGrande dei Crivellari and Abisso Fantini are a clearexample of the complexity of the physico-chemicalprocesses that can be active within a gypsum cave.
The main reason why they were never observed before isbecause they tend to be destroyed few days or weeks aftertheir development.
Until now it was commonly accepted that the fewspeleothems growing in the gypsum environment were wellknown and there was no chance to find a new one.
The newly discovered cave bubbles show that gypsumcaves, even those explored and studied for a least a century,may still be very interesting places to search for newspeleothems.
Cave Mineralogy – oral 2013 ICS Proceedings
447

ReferencesForti P, Chiesi M, 1995. A proposito di un particolare tipo di calcite
flottante osservato nella Grotta Grave Grubbo – CB 258(Verzino, Calabria). Atti e Mem. Comm. Boegan 32, 43–53.
Forti P, Lombardo N, 1998. I depositi chimici del sistema carsicoGrave Grubbo – Risorgente di Vallone Cufalo (Verzino,Calabria). Memorie dell’Istituto Italiano di Speleologia s. 2,10, 83–92.
Forti P, Rabbi E, 1981. The role of CO2 in gypsum speleogenesis:I° contribution. Int. J. of Speleol. 11, 207–218.
Hill CA, Forti P, 1997. Cave Minerals of the World. NationalSpeleological Society, Huntsville.
Cave Mineralogy – oral 2013 ICS Proceedings
448
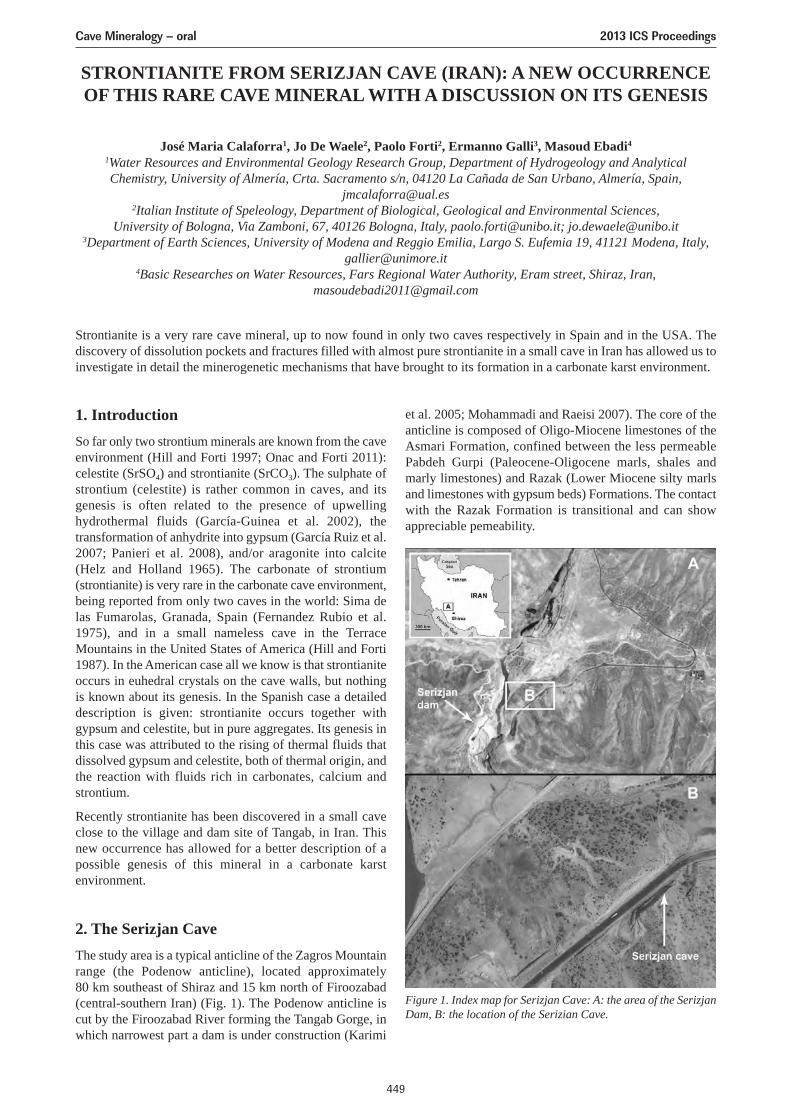
STRONTIANITE FROM SERIZJAN CAVE (IRAN): A NEW OCCURRENCEOF THIS RARE CAVE MINERAL WITH A DISCUSSION ON ITS GENESIS
José Maria Calaforra1, Jo De Waele2, Paolo Forti2, Ermanno Galli3, Masoud Ebadi4
1Water Resources and Environmental Geology Research Group, Department of Hydrogeology and AnalyticalChemistry, University of Almería, Crta. Sacramento s/n, 04120 La Cañada de San Urbano, Almería, Spain,
[email protected] Institute of Speleology, Department of Biological, Geological and Environmental Sciences,
University of Bologna, Via Zamboni, 67, 40126 Bologna, Italy, [email protected]; [email protected] of Earth Sciences, University of Modena and Reggio Emilia, Largo S. Eufemia 19, 41121 Modena, Italy,
[email protected] Researches on Water Resources, Fars Regional Water Authority, Eram street, Shiraz, Iran,
Strontianite is a very rare cave mineral, up to now found in only two caves respectively in Spain and in the USA. Thediscovery of dissolution pockets and fractures filled with almost pure strontianite in a small cave in Iran has allowed us toinvestigate in detail the minerogenetic mechanisms that have brought to its formation in a carbonate karst environment.
1. IntroductionSo far only two strontium minerals are known from the caveenvironment (Hill and Forti 1997; Onac and Forti 2011):celestite (SrSO4) and strontianite (SrCO3). The sulphate ofstrontium (celestite) is rather common in caves, and itsgenesis is often related to the presence of upwellinghydrothermal fluids (García-Guinea et al. 2002), thetransformation of anhydrite into gypsum (García Ruiz et al.2007; Panieri et al. 2008), and/or aragonite into calcite(Helz and Holland 1965). The carbonate of strontium(strontianite) is very rare in the carbonate cave environment,being reported from only two caves in the world: Sima delas Fumarolas, Granada, Spain (Fernandez Rubio et al.1975), and in a small nameless cave in the TerraceMountains in the United States of America (Hill and Forti1987). In the American case all we know is that strontianiteoccurs in euhedral crystals on the cave walls, but nothingis known about its genesis. In the Spanish case a detaileddescription is given: strontianite occurs together withgypsum and celestite, but in pure aggregates. Its genesis inthis case was attributed to the rising of thermal fluids thatdissolved gypsum and celestite, both of thermal origin, andthe reaction with fluids rich in carbonates, calcium andstrontium.
Recently strontianite has been discovered in a small caveclose to the village and dam site of Tangab, in Iran. Thisnew occurrence has allowed for a better description of apossible genesis of this mineral in a carbonate karstenvironment.
2. The Serizjan CaveThe study area is a typical anticline of the Zagros Mountainrange (the Podenow anticline), located approximately80 km southeast of Shiraz and 15 km north of Firoozabad(central-southern Iran) (Fig. 1). The Podenow anticline iscut by the Firoozabad River forming the Tangab Gorge, inwhich narrowest part a dam is under construction (Karimi
et al. 2005; Mohammadi and Raeisi 2007). The core of theanticline is composed of Oligo-Miocene limestones of theAsmari Formation, confined between the less permeablePabdeh Gurpi (Paleocene-Oligocene marls, shales andmarly limestones) and Razak (Lower Miocene silty marlsand limestones with gypsum beds) Formations. The contactwith the Razak Formation is transitional and can showappreciable pemeability.
Figure 1. Index map for Serizjan Cave: A: the area of the SerizjanDam, B: the location of the Serizian Cave.
Cave Mineralogy – oral 2013 ICS Proceedings
449
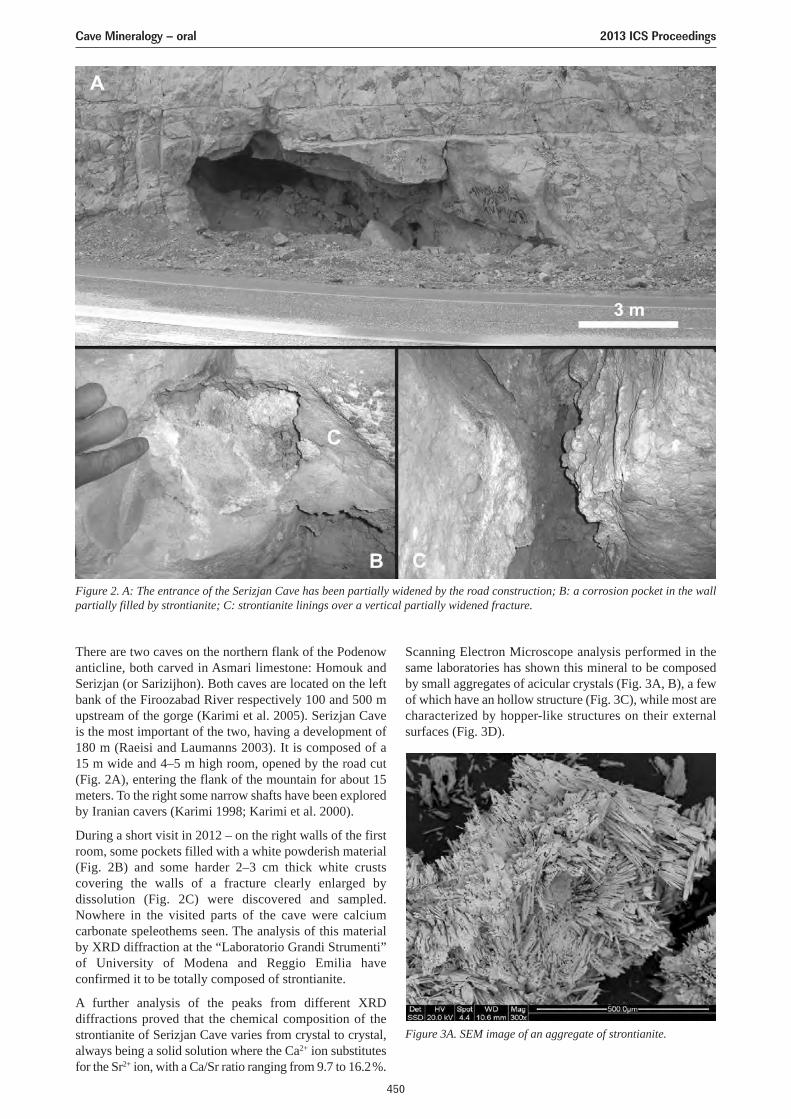
There are two caves on the northern flank of the Podenowanticline, both carved in Asmari limestone: Homouk andSerizjan (or Sarizijhon). Both caves are located on the leftbank of the Firoozabad River respectively 100 and 500 mupstream of the gorge (Karimi et al. 2005). Serizjan Caveis the most important of the two, having a development of180 m (Raeisi and Laumanns 2003). It is composed of a15 m wide and 4–5 m high room, opened by the road cut(Fig. 2A), entering the flank of the mountain for about 15meters. To the right some narrow shafts have been exploredby Iranian cavers (Karimi 1998; Karimi et al. 2000).
During a short visit in 2012 – on the right walls of the firstroom, some pockets filled with a white powderish material(Fig. 2B) and some harder 2–3 cm thick white crustscovering the walls of a fracture clearly enlarged bydissolution (Fig. 2C) were discovered and sampled.Nowhere in the visited parts of the cave were calciumcarbonate speleothems seen. The analysis of this materialby XRD diffraction at the “Laboratorio Grandi Strumenti”of University of Modena and Reggio Emilia haveconfirmed it to be totally composed of strontianite.
A further analysis of the peaks from different XRDdiffractions proved that the chemical composition of thestrontianite of Serizjan Cave varies from crystal to crystal,always being a solid solution where the Ca2+ ion substitutesfor the Sr2+ ion, with a Ca/Sr ratio ranging from 9.7 to 16.2 %.
Scanning Electron Microscope analysis performed in thesame laboratories has shown this mineral to be composedby small aggregates of acicular crystals (Fig. 3A, B), a fewof which have an hollow structure (Fig. 3C), while most arecharacterized by hopper-like structures on their externalsurfaces (Fig. 3D).
Figure 3A. SEM image of an aggregate of strontianite.
Figure 2. A: The entrance of the Serizjan Cave has been partially widened by the road construction; B: a corrosion pocket in the wallpartially filled by strontianite; C: strontianite linings over a vertical partially widened fracture.
Cave Mineralogy – oral 2013 ICS Proceedings
450
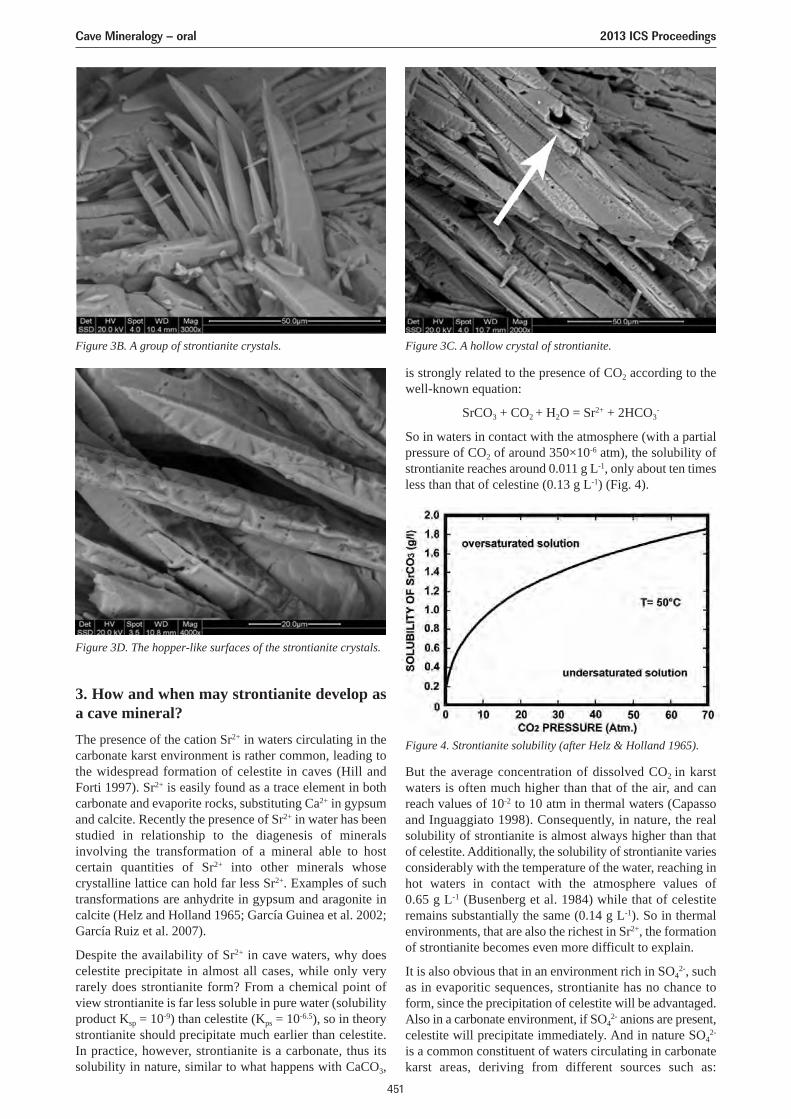
3. How and when may strontianite develop asa cave mineral?The presence of the cation Sr2+ in waters circulating in thecarbonate karst environment is rather common, leading tothe widespread formation of celestite in caves (Hill andForti 1997). Sr2+ is easily found as a trace element in bothcarbonate and evaporite rocks, substituting Ca2+ in gypsumand calcite. Recently the presence of Sr2+ in water has beenstudied in relationship to the diagenesis of mineralsinvolving the transformation of a mineral able to hostcertain quantities of Sr2+ into other minerals whosecrystalline lattice can hold far less Sr2+. Examples of suchtransformations are anhydrite in gypsum and aragonite incalcite (Helz and Holland 1965; García Guinea et al. 2002;García Ruiz et al. 2007).
Despite the availability of Sr2+ in cave waters, why doescelestite precipitate in almost all cases, while only veryrarely does strontianite form? From a chemical point ofview strontianite is far less soluble in pure water (solubilityproduct Ksp = 10-9) than celestite (Kps = 10-6.5), so in theorystrontianite should precipitate much earlier than celestite.In practice, however, strontianite is a carbonate, thus itssolubility in nature, similar to what happens with CaCO3,
is strongly related to the presence of CO2 according to thewell-known equation:
SrCO3 + CO2 + H2O = Sr2+ + 2HCO3-
So in waters in contact with the atmosphere (with a partialpressure of CO2 of around 350×10-6 atm), the solubility ofstrontianite reaches around 0.011 g L-1, only about ten timesless than that of celestine (0.13 g L-1) (Fig. 4).
But the average concentration of dissolved CO2 in karstwaters is often much higher than that of the air, and canreach values of 10-2 to 10 atm in thermal waters (Capassoand Inguaggiato 1998). Consequently, in nature, the realsolubility of strontianite is almost always higher than thatof celestite. Additionally, the solubility of strontianite variesconsiderably with the temperature of the water, reaching inhot waters in contact with the atmosphere values of0.65 g L-1 (Busenberg et al. 1984) while that of celestiteremains substantially the same (0.14 g L-1). So in thermalenvironments, that are also the richest in Sr2+, the formationof strontianite becomes even more difficult to explain.
It is also obvious that in an environment rich in SO42-, such
as in evaporitic sequences, strontianite has no chance toform, since the precipitation of celestite will be advantaged.Also in a carbonate environment, if SO4
2- anions are present,celestite will precipitate immediately. And in nature SO4
2-
is a common constituent of waters circulating in carbonatekarst areas, deriving from different sources such as:
Figure 3B. A group of strontianite crystals. Figure 3C. A hollow crystal of strontianite.
Figure 3D. The hopper-like surfaces of the strontianite crystals.
Figure 4. Strontianite solubility (after Helz & Holland 1965).
Cave Mineralogy – oral 2013 ICS Proceedings
451
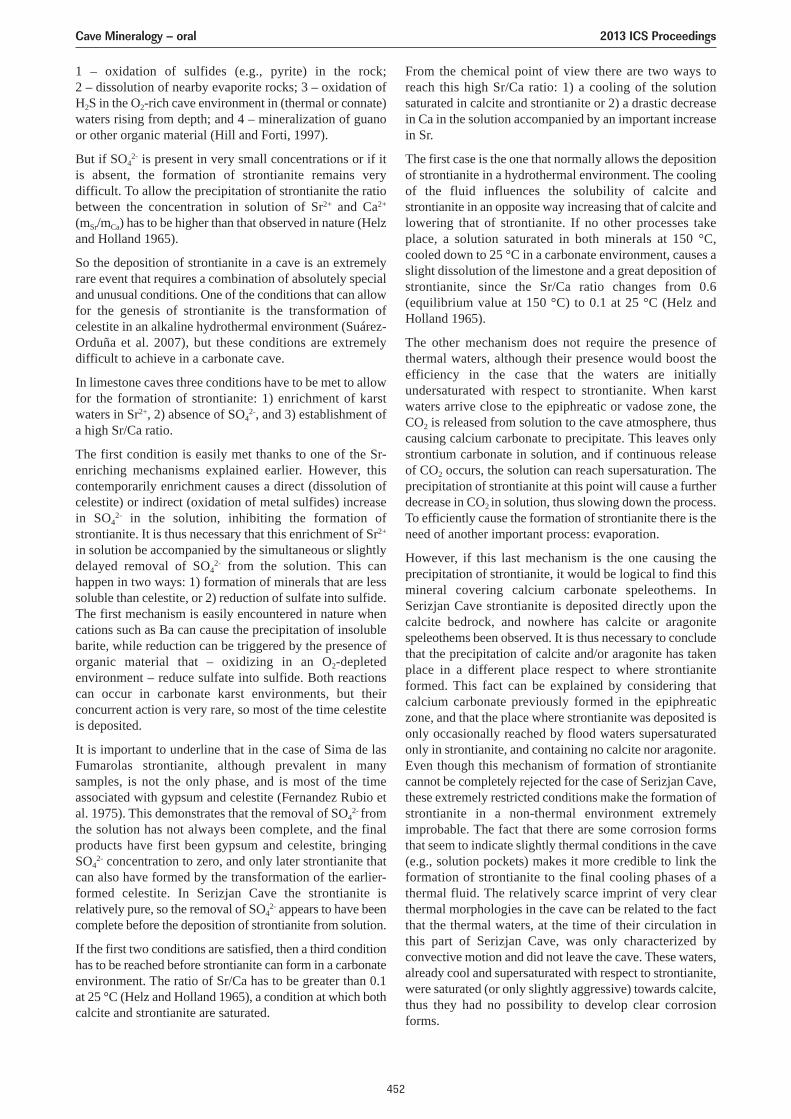
1 – oxidation of sulfides (e.g., pyrite) in the rock;2 – dissolution of nearby evaporite rocks; 3 – oxidation ofH2S in the O2-rich cave environment in (thermal or connate)waters rising from depth; and 4 – mineralization of guanoor other organic material (Hill and Forti, 1997).
But if SO42- is present in very small concentrations or if it
is absent, the formation of strontianite remains verydifficult. To allow the precipitation of strontianite the ratiobetween the concentration in solution of Sr2+ and Ca2+
(mSr/mCa) has to be higher than that observed in nature (Helzand Holland 1965).
So the deposition of strontianite in a cave is an extremelyrare event that requires a combination of absolutely specialand unusual conditions. One of the conditions that can allowfor the genesis of strontianite is the transformation ofcelestite in an alkaline hydrothermal environment (Suárez-Orduña et al. 2007), but these conditions are extremelydifficult to achieve in a carbonate cave.
In limestone caves three conditions have to be met to allowfor the formation of strontianite: 1) enrichment of karstwaters in Sr2+, 2) absence of SO4
2-, and 3) establishment ofa high Sr/Ca ratio.
The first condition is easily met thanks to one of the Sr-enriching mechanisms explained earlier. However, thiscontemporarily enrichment causes a direct (dissolution ofcelestite) or indirect (oxidation of metal sulfides) increasein SO4
2- in the solution, inhibiting the formation ofstrontianite. It is thus necessary that this enrichment of Sr2+
in solution be accompanied by the simultaneous or slightlydelayed removal of SO4
2- from the solution. This canhappen in two ways: 1) formation of minerals that are lesssoluble than celestite, or 2) reduction of sulfate into sulfide.The first mechanism is easily encountered in nature whencations such as Ba can cause the precipitation of insolublebarite, while reduction can be triggered by the presence oforganic material that – oxidizing in an O2-depletedenvironment – reduce sulfate into sulfide. Both reactionscan occur in carbonate karst environments, but theirconcurrent action is very rare, so most of the time celestiteis deposited.
It is important to underline that in the case of Sima de lasFumarolas strontianite, although prevalent in manysamples, is not the only phase, and is most of the timeassociated with gypsum and celestite (Fernandez Rubio etal. 1975). This demonstrates that the removal of SO4
2- fromthe solution has not always been complete, and the finalproducts have first been gypsum and celestite, bringingSO4
2- concentration to zero, and only later strontianite thatcan also have formed by the transformation of the earlier-formed celestite. In Serizjan Cave the strontianite isrelatively pure, so the removal of SO4
2- appears to have beencomplete before the deposition of strontianite from solution.
If the first two conditions are satisfied, then a third conditionhas to be reached before strontianite can form in a carbonateenvironment. The ratio of Sr/Ca has to be greater than 0.1at 25 °C (Helz and Holland 1965), a condition at which bothcalcite and strontianite are saturated.
From the chemical point of view there are two ways toreach this high Sr/Ca ratio: 1) a cooling of the solutionsaturated in calcite and strontianite or 2) a drastic decreasein Ca in the solution accompanied by an important increasein Sr.
The first case is the one that normally allows the depositionof strontianite in a hydrothermal environment. The coolingof the fluid influences the solubility of calcite andstrontianite in an opposite way increasing that of calcite andlowering that of strontianite. If no other processes takeplace, a solution saturated in both minerals at 150 °C,cooled down to 25 °C in a carbonate environment, causes aslight dissolution of the limestone and a great deposition ofstrontianite, since the Sr/Ca ratio changes from 0.6(equilibrium value at 150 °C) to 0.1 at 25 ° C (Helz andHolland 1965).
The other mechanism does not require the presence ofthermal waters, although their presence would boost theefficiency in the case that the waters are initiallyundersaturated with respect to strontianite. When karstwaters arrive close to the epiphreatic or vadose zone, theCO2 is released from solution to the cave atmosphere, thuscausing calcium carbonate to precipitate. This leaves onlystrontium carbonate in solution, and if continuous releaseof CO2 occurs, the solution can reach supersaturation. Theprecipitation of strontianite at this point will cause a furtherdecrease in CO2 in solution, thus slowing down the process.To efficiently cause the formation of strontianite there is theneed of another important process: evaporation.
However, if this last mechanism is the one causing theprecipitation of strontianite, it would be logical to find thismineral covering calcium carbonate speleothems. InSerizjan Cave strontianite is deposited directly upon thecalcite bedrock, and nowhere has calcite or aragonitespeleothems been observed. It is thus necessary to concludethat the precipitation of calcite and/or aragonite has takenplace in a different place respect to where strontianiteformed. This fact can be explained by considering thatcalcium carbonate previously formed in the epiphreaticzone, and that the place where strontianite was deposited isonly occasionally reached by flood waters supersaturatedonly in strontianite, and containing no calcite nor aragonite.Even though this mechanism of formation of strontianitecannot be completely rejected for the case of Serizjan Cave,these extremely restricted conditions make the formation ofstrontianite in a non-thermal environment extremelyimprobable. The fact that there are some corrosion formsthat seem to indicate slightly thermal conditions in the cave(e.g., solution pockets) makes it more credible to link theformation of strontianite to the final cooling phases of athermal fluid. The relatively scarce imprint of very clearthermal morphologies in the cave can be related to the factthat the thermal waters, at the time of their circulation inthis part of Serizjan Cave, was only characterized byconvective motion and did not leave the cave. These waters,already cool and supersaturated with respect to strontianite,were saturated (or only slightly aggressive) towards calcite,thus they had no possibility to develop clear corrosionforms.
Cave Mineralogy – oral 2013 ICS Proceedings
452
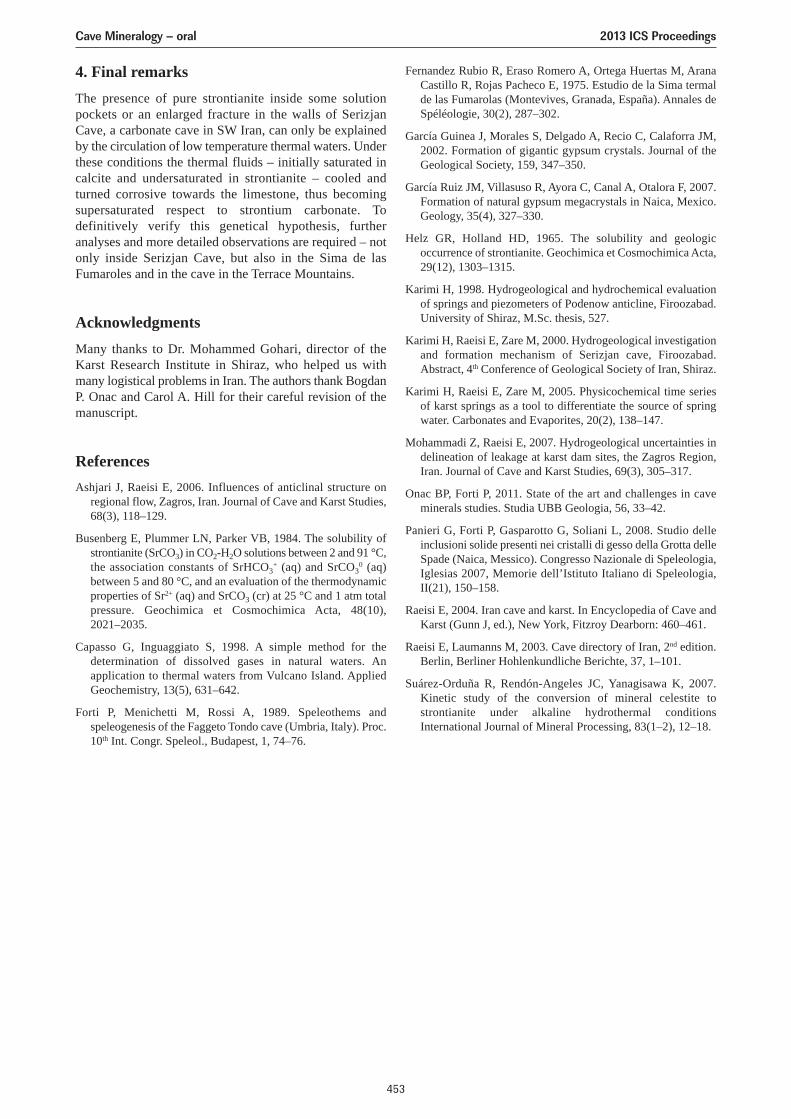
4. Final remarksThe presence of pure strontianite inside some solutionpockets or an enlarged fracture in the walls of SerizjanCave, a carbonate cave in SW Iran, can only be explainedby the circulation of low temperature thermal waters. Underthese conditions the thermal fluids – initially saturated incalcite and undersaturated in strontianite – cooled andturned corrosive towards the limestone, thus becomingsupersaturated respect to strontium carbonate. Todefinitively verify this genetical hypothesis, furtheranalyses and more detailed observations are required – notonly inside Serizjan Cave, but also in the Sima de lasFumaroles and in the cave in the Terrace Mountains.
AcknowledgmentsMany thanks to Dr. Mohammed Gohari, director of theKarst Research Institute in Shiraz, who helped us withmany logistical problems in Iran. The authors thank BogdanP. Onac and Carol A. Hill for their careful revision of themanuscript.
ReferencesAshjari J, Raeisi E, 2006. Influences of anticlinal structure on
regional flow, Zagros, Iran. Journal of Cave and Karst Studies,68(3), 118–129.
Busenberg E, Plummer LN, Parker VB, 1984. The solubility ofstrontianite (SrCO3) in CO2-H2O solutions between 2 and 91 °C,the association constants of SrHCO3
+ (aq) and SrCO30 (aq)
between 5 and 80 °C, and an evaluation of the thermodynamicproperties of Sr2+ (aq) and SrCO3 (cr) at 25 °C and 1 atm totalpressure. Geochimica et Cosmochimica Acta, 48(10),2021–2035.
Capasso G, Inguaggiato S, 1998. A simple method for thedetermination of dissolved gases in natural waters. Anapplication to thermal waters from Vulcano Island. AppliedGeochemistry, 13(5), 631–642.
Forti P, Menichetti M, Rossi A, 1989. Speleothems andspeleogenesis of the Faggeto Tondo cave (Umbria, Italy). Proc.10th Int. Congr. Speleol., Budapest, 1, 74–76.
Fernandez Rubio R, Eraso Romero A, Ortega Huertas M, AranaCastillo R, Rojas Pacheco E, 1975. Estudio de la Sima termalde las Fumarolas (Montevives, Granada, España). Annales deSpéléologie, 30(2), 287–302.
García Guinea J, Morales S, Delgado A, Recio C, Calaforra JM,2002. Formation of gigantic gypsum crystals. Journal of theGeological Society, 159, 347–350.
García Ruiz JM, Villasuso R, Ayora C, Canal A, Otalora F, 2007.Formation of natural gypsum megacrystals in Naica, Mexico.Geology, 35(4), 327–330.
Helz GR, Holland HD, 1965. The solubility and geologicoccurrence of strontianite. Geochimica et Cosmochimica Acta,29(12), 1303–1315.
Karimi H, 1998. Hydrogeological and hydrochemical evaluationof springs and piezometers of Podenow anticline, Firoozabad.University of Shiraz, M.Sc. thesis, 527.
Karimi H, Raeisi E, Zare M, 2000. Hydrogeological investigationand formation mechanism of Serizjan cave, Firoozabad.Abstract, 4th Conference of Geological Society of Iran, Shiraz.
Karimi H, Raeisi E, Zare M, 2005. Physicochemical time seriesof karst springs as a tool to differentiate the source of springwater. Carbonates and Evaporites, 20(2), 138–147.
Mohammadi Z, Raeisi E, 2007. Hydrogeological uncertainties indelineation of leakage at karst dam sites, the Zagros Region,Iran. Journal of Cave and Karst Studies, 69(3), 305–317.
Onac BP, Forti P, 2011. State of the art and challenges in caveminerals studies. Studia UBB Geologia, 56, 33–42.
Panieri G, Forti P, Gasparotto G, Soliani L, 2008. Studio delleinclusioni solide presenti nei cristalli di gesso della Grotta delleSpade (Naica, Messico). Congresso Nazionale di Speleologia,Iglesias 2007, Memorie dell’Istituto Italiano di Speleologia,II(21), 150–158.
Raeisi E, 2004. Iran cave and karst. In Encyclopedia of Cave andKarst (Gunn J, ed.), New York, Fitzroy Dearborn: 460–461.
Raeisi E, Laumanns M, 2003. Cave directory of Iran, 2nd edition.Berlin, Berliner Hohlenkundliche Berichte, 37, 1–101.
Suárez-Orduña R, Rendón-Angeles JC, Yanagisawa K, 2007.Kinetic study of the conversion of mineral celestite tostrontianite under alkaline hydrothermal conditionsInternational Journal of Mineral Processing, 83(1–2), 12–18.
Cave Mineralogy – oral 2013 ICS Proceedings
453
SKELETON CRYSTALS OF CRYOGENIC GYPSUM FROM KUNGURICE CAVE, URAL MOUNTAINS, RUSSIA
Olga Kadebskaya, Ilya TchaikovskyMining Institute of Ural Branch of Russian Academy of Sciences – Sibirskaya78a – 614007 Perm, Russia;
Investigation of new cryogenic formations from the Kungur Ice Cave allowed identifying, for the first time, unusuallylarge individual crystals of gypsum, some reaching 5 mm or more. The main influencing factor in the formation of thenew gypsum crystals is the microclimate of karst cavity. The cave is being the laboratory where the processes of modernformation of minerals (cryogenic among them) can be observed. The variety of forms existence of water (liquid, ice,vapor), the character of air moving and thermal regime are defined by diversity of microclimatic zones and geochemicalbarriers. All these conditions specify such a wide variation of crystallomorphological features of newly formed cryogenicgypsum. The mineral component was filtered from the liquid water and studied (morphology and chemical composition)with a scanning electronic microscope (SEM) VEGA 3 LMH with a system of the x-ray energy-dispersive microanalysisINCA Energy 350/X-max 20. It was found that most of the subindividuals within aggregates are twins with a complexskeleton structure. The skeleton structure of gypsum individuals is determined by presence of internal partitions, orientedaccording to the faces of two or three pinacoids ({010}, {100}, {001}) and two prisms ({120} {111}), that is, parallel tothe faces defining crystal shape. Such formations of mineral objects have not been observed before and this paper discussesthe most possible mechanisms responsible for their formation.
1. IntroductionThe Kungur Ice Cave is located in Eastern Europe on theoutskirts of the old Russian town of Kungur. Inphysiography terms, the region surrounding the cave arealies in the Eastern part of the Russian (East European) plainand is limited to the juncture of two geographical areas –the High Trans-Volga (Zavolzhye) and the Ufa plateau. Theregion is often called Pre-Urals due to its proximity (about100 km) to the Ural Mountains.
The cave is widely known in Russia and abroad as the mostinteresting speleological tourism attraction, as a kind of“visiting card” of the Perm Krai. Over 5 million touristshave visited the cave since the early XXth century. In thelast 5 years, annual attendance is on average 90,000 people,but in the mid-1980s the number of tourists amounted to200,000 people a year.
The cave has attracted keen interest of naturalists for about300 years. It has been reviewed in about 100 popular andover 500 scientific publications. Detailed stationarygeological, speleological, biological and other observationshave been made there for the last 50 years.
2. Geography and geologyThe Kungur Ice Cave has been developed in the interfluvialgypsum-carbonate massif, cut from the south by the majorriver Sylva and from the north by the Shakva River. Thewater regime, both in the past and in the present, is closelyrelated to the Sylva River. The “Ledyanaya Gora” massif isa plateau-like, strongly karstified elevation, rising at90–96 m above the river valley beds. The massif slopes aresteep, with fragments of fractured terraces. The karst reliefof the interfluvial plateau is notable for its morphologicaldiversity. Density of karst forms on the Ledyanaya Goraranges from 150–200 units in the watershed part of the
plateau to 200–300 units in the slope and over 500 units persquare kilometer in the selvedge of the massif (includingthe cave).
The massif and the cave act in all respects as a model ofconjugated evolution of surface and subsurface forms ofcarbonate and sulphate karst. Unlike well-known gypsumcaves of Europe (Germany, Spain, Italy, Poland andUkraine) formed in the Trias and Miocene gypsum, theKungur cave developped in the much older sulphate strata– those of the lower Permian section. Air circulationcharacteristics, cave morphology as well as regional climateare conducive to the formation and accumulation ofdifferent ice forms in the cave, including perennial ice(underground ice mounds). Due to more severe climaticconditions in the region and peculiarities of the cave airexchange with environment, underground ice persists in thecave year-round despite low hypsometric marks of theterrain (120 m above sea level) – in contrast to EastEuropean ice caves, located from 969 m (Dobshinskaya Icecave) to over 1,100 m above sea level (e.g., Eiseriesenwelt,Scărișoara and others).
The cave constitutes a fairly special environment formineral formation, which is characterized by:
• mainly sulphate, less so carbonate, lithologic backgroundof the cave host rocks (gypsum, anhydrite, dolomite,limestone, and clay);
• abundant moisture (infiltration of rain, surface snow meltand groundwater, underground lakes, periodic floodwaterwith suspension, condensation moisture, etc.);
• in general cool (0 to +4 °С) and cold (below 0 °С) airtemperatures;
• microclimatic inhomogeneity manifested in the airtemperature zonality, seasonal migration of microclimaticzones, and vertical stratification of the air column;
Cave Mineralogy – oral 2013 ICS Proceedings
454
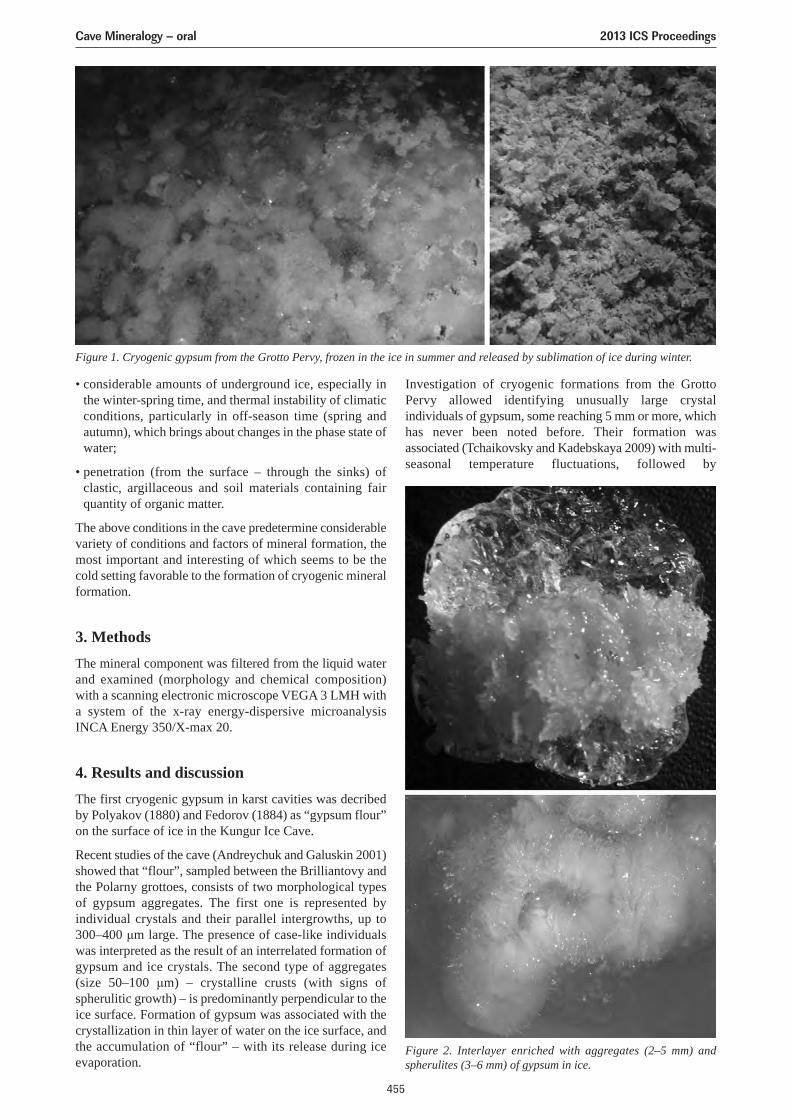
• considerable amounts of underground ice, especially inthe winter-spring time, and thermal instability of climaticconditions, particularly in off-season time (spring andautumn), which brings about changes in the phase state ofwater;
• penetration (from the surface – through the sinks) ofclastic, argillaceous and soil materials containing fairquantity of organic matter.
The above conditions in the cave predetermine considerablevariety of conditions and factors of mineral formation, themost important and interesting of which seems to be thecold setting favorable to the formation of cryogenic mineralformation.
3. MethodsThe mineral component was filtered from the liquid waterand examined (morphology and chemical composition)with a scanning electronic microscope VEGA 3 LMH witha system of the x-ray energy-dispersive microanalysisINCA Energy 350/X-max 20.
4. Results and discussionThe first cryogenic gypsum in karst cavities was decribedby Polyakov (1880) and Fedorov (1884) as “gypsum flour”on the surface of ice in the Kungur Ice Cave.
Recent studies of the cave (Andreychuk and Galuskin 2001)showed that “flour”, sampled between the Brilliantovy andthe Polarny grottoes, consists of two morphological typesof gypsum aggregates. The first one is represented byindividual crystals and their parallel intergrowths, up to300–400 μm large. The presence of case-like individualswas interpreted as the result of an interrelated formation ofgypsum and ice crystals. The second type of aggregates(size 50–100 μm) – crystalline crusts (with signs ofspherulitic growth) – is predominantly perpendicular to theice surface. Formation of gypsum was associated with thecrystallization in thin layer of water on the ice surface, andthe accumulation of “flour” – with its release during iceevaporation.
Investigation of cryogenic formations from the GrottoPervy allowed identifying unusually large crystalindividuals of gypsum, some reaching 5 mm or more, whichhas never been noted before. Their formation wasassociated (Tchaikovsky and Kadebskaya 2009) with multi-seasonal temperature fluctuations, followed by
Figure 2. Interlayer enriched with aggregates (2–5 mm) andspherulites (3–6 mm) of gypsum in ice.
Figure 1. Cryogenic gypsum from the Grotto Pervy, frozen in the ice in summer and released by sublimation of ice during winter.
Cave Mineralogy – oral 2013 ICS Proceedings
455
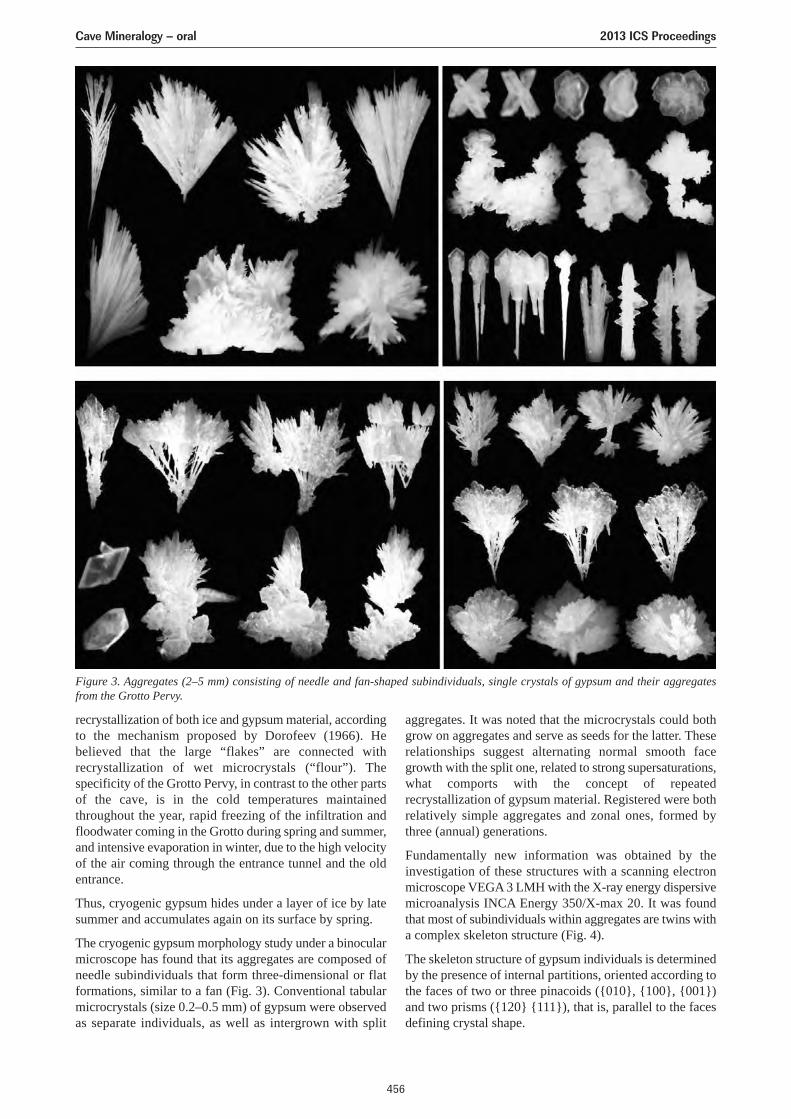
recrystallization of both ice and gypsum material, accordingto the mechanism proposed by Dorofeev (1966). Hebelieved that the large “flakes” are connected withrecrystallization of wet microcrystals (“flour”). Thespecificity of the Grotto Pervy, in contrast to the other partsof the cave, is in the cold temperatures maintainedthroughout the year, rapid freezing of the infiltration andfloodwater coming in the Grotto during spring and summer,and intensive evaporation in winter, due to the high velocityof the air coming through the entrance tunnel and the oldentrance.
Thus, cryogenic gypsum hides under a layer of ice by latesummer and accumulates again on its surface by spring.
The cryogenic gypsum morphology study under a binocularmicroscope has found that its aggregates are composed ofneedle subindividuals that form three-dimensional or flatformations, similar to a fan (Fig. 3). Conventional tabularmicrocrystals (size 0.2–0.5 mm) of gypsum were observedas separate individuals, as well as intergrown with split
aggregates. It was noted that the microcrystals could bothgrow on aggregates and serve as seeds for the latter. Theserelationships suggest alternating normal smooth facegrowth with the split one, related to strong supersaturations,what comports with the concept of repeatedrecrystallization of gypsum material. Registered were bothrelatively simple aggregates and zonal ones, formed bythree (annual) generations.
Fundamentally new information was obtained by theinvestigation of these structures with a scanning electronmicroscope VEGA 3 LMH with the X-ray energy dispersivemicroanalysis INCA Energy 350/X-max 20. It was foundthat most of subindividuals within aggregates are twins witha complex skeleton structure (Fig. 4).
The skeleton structure of gypsum individuals is determinedby the presence of internal partitions, oriented according tothe faces of two or three pinacoids ({010}, {100}, {001})and two prisms ({120} {111}), that is, parallel to the facesdefining crystal shape.
Figure 3. Aggregates (2–5 mm) consisting of needle and fan-shaped subindividuals, single crystals of gypsum and their aggregatesfrom the Grotto Pervy.
Cave Mineralogy – oral 2013 ICS Proceedings
456
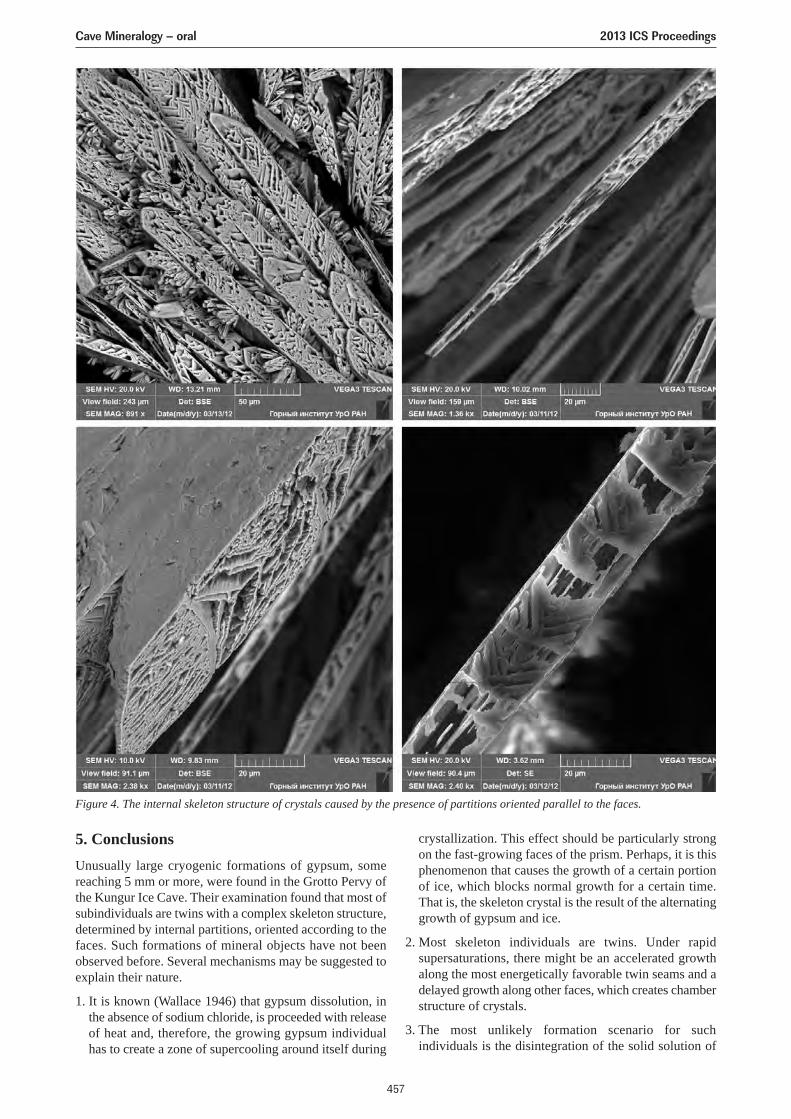
5. ConclusionsUnusually large cryogenic formations of gypsum, somereaching 5 mm or more, were found in the Grotto Pervy ofthe Kungur Ice Cave. Their examination found that most ofsubindividuals are twins with a complex skeleton structure,determined by internal partitions, oriented according to thefaces. Such formations of mineral objects have not beenobserved before. Several mechanisms may be suggested toexplain their nature.
1. It is known (Wallace 1946) that gypsum dissolution, inthe absence of sodium chloride, is proceeded with releaseof heat and, therefore, the growing gypsum individualhas to create a zone of supercooling around itself during
crystallization. This effect should be particularly strongon the fast-growing faces of the prism. Perhaps, it is thisphenomenon that causes the growth of a certain portionof ice, which blocks normal growth for a certain time.That is, the skeleton crystal is the result of the alternatinggrowth of gypsum and ice.
2. Most skeleton individuals are twins. Under rapidsupersaturations, there might be an accelerated growthalong the most energetically favorable twin seams and adelayed growth along other faces, which creates chamberstructure of crystals.
3. The most unlikely formation scenario for suchindividuals is the disintegration of the solid solution of
Figure 4. The internal skeleton structure of crystals caused by the presence of partitions oriented parallel to the faces.
Cave Mineralogy – oral 2013 ICS Proceedings
457

calcium sulphate which contains more than twomolecules of water. However, chemists or mineralogistshave not yet known such a compound.
Identification of the reasons for such individuals formationmay hold the key to create the innovative constructionmaterials through the use of cold.
ReferencesAndreychuk V, Galuskin E, 2001. Cryogenic mineral formations
of the Kungur Ice Cave. Caves: Univ. Perm, 27–28, 108–116.
Dorofeyev E, 1966. Calcite films and crystals of gypsum in theKungur Ice Cave. Caves: Perm. Univ. Perm, 6 (7), 39–47.
Tchaikovsky II, Kadebskaya OI, 2009. Cryogenic gypsum ofKungur Ice Cave. Problems of Mineralogy, Petrology andMetallogeny. Col. of articles. Perm. Univ. Perm, 12, 85–90.
Polyakov IS, 1880. Anthropological trips to Central and EasternRussia. Notes of the Anthropological Society. St-Petersburg,Encl. to vol. 37, 12 p.
Fedorov YeS, 1884. Observations in Kungur Ice cave. Notes ofthe Mineralogical Society. The 2nd series, 19, 191 pp.
Wallace WE, 1946. Heats of Solution and Dilution of CalciumSulfate Dihydrate in Aqueous, Sodium Chloride Solutions.J. Phys. Chem., 50 (2), 152–168.
Cave Mineralogy – oral 2013 ICS Proceedings
458
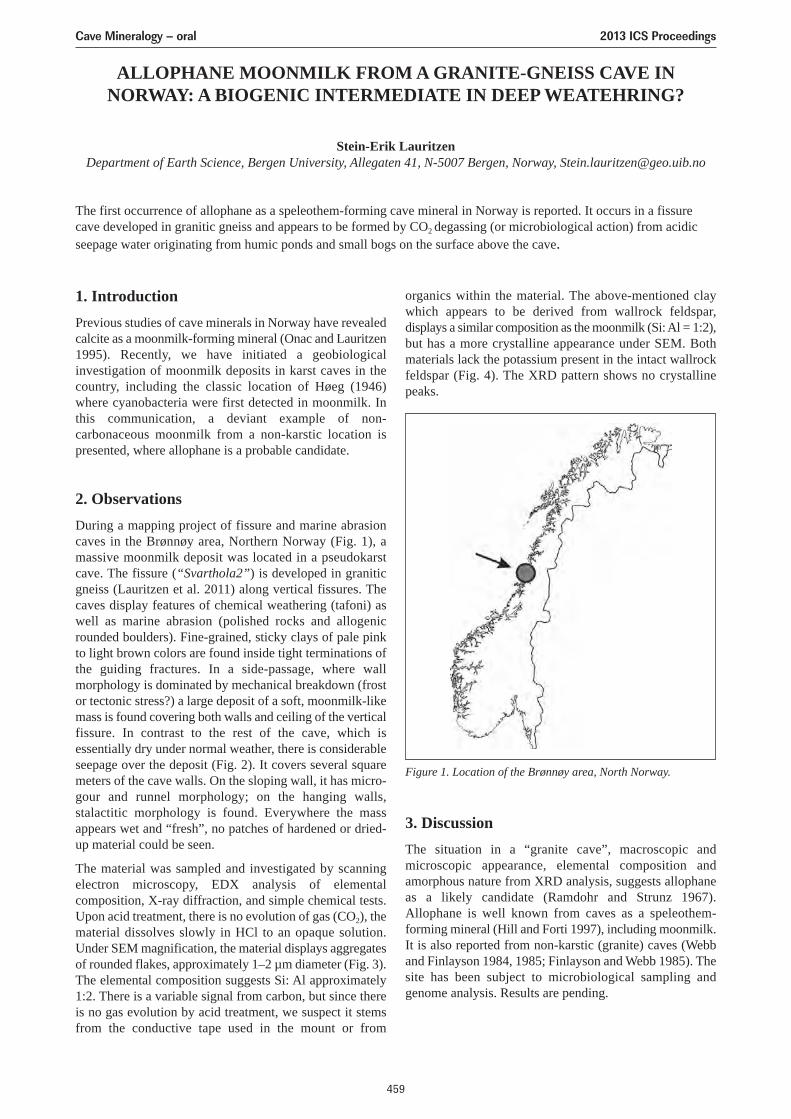
ALLOPHANE MOONMILK FROM A GRANITE-GNEISS CAVE INNORWAY: A BIOGENIC INTERMEDIATE IN DEEP WEATEHRING?
Stein-Erik LauritzenDepartment of Earth Science, Bergen University, Allegaten 41, N-5007 Bergen, Norway, [email protected]
The first occurrence of allophane as a speleothem-forming cave mineral in Norway is reported. It occurs in a fissurecave developed in granitic gneiss and appears to be formed by CO2 degassing (or microbiological action) from acidicseepage water originating from humic ponds and small bogs on the surface above the cave.
1. IntroductionPrevious studies of cave minerals in Norway have revealedcalcite as a moonmilk-forming mineral (Onac and Lauritzen1995). Recently, we have initiated a geobiologicalinvestigation of moonmilk deposits in karst caves in thecountry, including the classic location of Høeg (1946)where cyanobacteria were first detected in moonmilk. Inthis communication, a deviant example of non-carbonaceous moonmilk from a non-karstic location ispresented, where allophane is a probable candidate.
2. ObservationsDuring a mapping project of fissure and marine abrasioncaves in the Brønnøy area, Northern Norway (Fig. 1), amassive moonmilk deposit was located in a pseudokarstcave. The fissure (“Svarthola2”) is developed in graniticgneiss (Lauritzen et al. 2011) along vertical fissures. Thecaves display features of chemical weathering (tafoni) aswell as marine abrasion (polished rocks and allogenicrounded boulders). Fine-grained, sticky clays of pale pinkto light brown colors are found inside tight terminations ofthe guiding fractures. In a side-passage, where wallmorphology is dominated by mechanical breakdown (frostor tectonic stress?) a large deposit of a soft, moonmilk-likemass is found covering both walls and ceiling of the verticalfissure. In contrast to the rest of the cave, which isessentially dry under normal weather, there is considerableseepage over the deposit (Fig. 2). It covers several squaremeters of the cave walls. On the sloping wall, it has micro-gour and runnel morphology; on the hanging walls,stalactitic morphology is found. Everywhere the massappears wet and “fresh”, no patches of hardened or dried-up material could be seen.
The material was sampled and investigated by scanningelectron microscopy, EDX analysis of elementalcomposition, X-ray diffraction, and simple chemical tests.Upon acid treatment, there is no evolution of gas (CO2), thematerial dissolves slowly in HCl to an opaque solution.Under SEM magnification, the material displays aggregatesof rounded flakes, approximately 1–2 µm diameter (Fig. 3).The elemental composition suggests Si: Al approximately1:2. There is a variable signal from carbon, but since thereis no gas evolution by acid treatment, we suspect it stemsfrom the conductive tape used in the mount or from
organics within the material. The above-mentioned claywhich appears to be derived from wallrock feldspar,displays a similar composition as the moonmilk (Si: Al = 1:2),but has a more crystalline appearance under SEM. Bothmaterials lack the potassium present in the intact wallrockfeldspar (Fig. 4). The XRD pattern shows no crystallinepeaks.
3. DiscussionThe situation in a “granite cave”, macroscopic andmicroscopic appearance, elemental composition andamorphous nature from XRD analysis, suggests allophaneas a likely candidate (Ramdohr and Strunz 1967).Allophane is well known from caves as a speleothem-forming mineral (Hill and Forti 1997), including moonmilk.It is also reported from non-karstic (granite) caves (Webband Finlayson 1984, 1985; Finlayson and Webb 1985). Thesite has been subject to microbiological sampling andgenome analysis. Results are pending.
Figure 1. Location of the Brønnøy area, North Norway.
Cave Mineralogy – oral 2013 ICS Proceedings
459
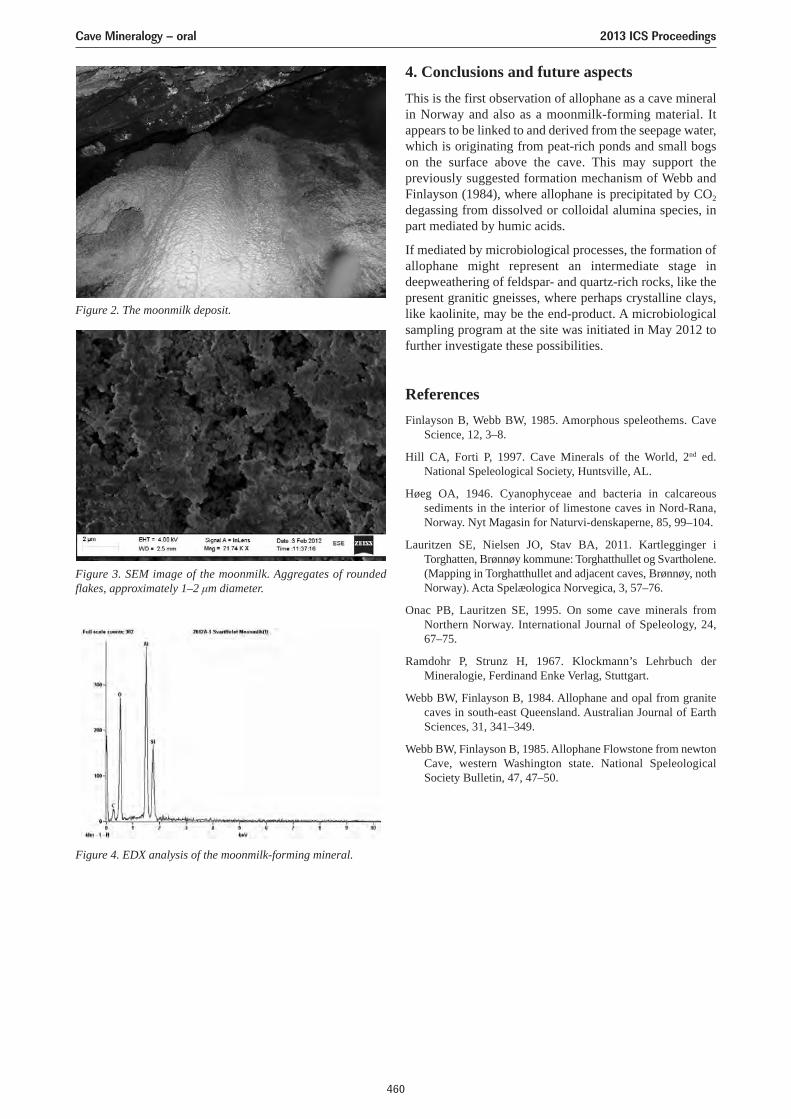
4. Conclusions and future aspectsThis is the first observation of allophane as a cave mineralin Norway and also as a moonmilk-forming material. Itappears to be linked to and derived from the seepage water,which is originating from peat-rich ponds and small bogson the surface above the cave. This may support thepreviously suggested formation mechanism of Webb andFinlayson (1984), where allophane is precipitated by CO2
degassing from dissolved or colloidal alumina species, inpart mediated by humic acids.
If mediated by microbiological processes, the formation ofallophane might represent an intermediate stage indeepweathering of feldspar- and quartz-rich rocks, like thepresent granitic gneisses, where perhaps crystalline clays,like kaolinite, may be the end-product. A microbiologicalsampling program at the site was initiated in May 2012 tofurther investigate these possibilities.
ReferencesFinlayson B, Webb BW, 1985. Amorphous speleothems. Cave
Science, 12, 3–8.
Hill CA, Forti P, 1997. Cave Minerals of the World, 2nd ed.National Speleological Society, Huntsville, AL.
Høeg OA, 1946. Cyanophyceae and bacteria in calcareoussediments in the interior of limestone caves in Nord-Rana,Norway. Nyt Magasin for Naturvi-denskaperne, 85, 99–104.
Lauritzen SE, Nielsen JO, Stav BA, 2011. Kartlegginger iTorghatten, Brønnøy kommune: Torghatthullet og Svartholene.(Mapping in Torghatthullet and adjacent caves, Brønnøy, nothNorway). Acta Spelæologica Norvegica, 3, 57–76.
Onac PB, Lauritzen SE, 1995. On some cave minerals fromNorthern Norway. International Journal of Speleology, 24,67–75.
Ramdohr P, Strunz H, 1967. Klockmann’s Lehrbuch derMineralogie, Ferdinand Enke Verlag, Stuttgart.
Webb BW, Finlayson B, 1984. Allophane and opal from granitecaves in south-east Queensland. Australian Journal of EarthSciences, 31, 341–349.
Webb BW, Finlayson B, 1985. Allophane Flowstone from newtonCave, western Washington state. National SpeleologicalSociety Bulletin, 47, 47–50.
Figure 2. The moonmilk deposit.
Figure 3. SEM image of the moonmilk. Aggregates of roundedflakes, approximately 1–2 μm diameter.
Figure 4. EDX analysis of the moonmilk-forming mineral.
Cave Mineralogy – oral 2013 ICS Proceedings
460
CALCITE SPELEOTHEMS IN PSEUDOKARST TJUV-ANTES GROTTA,NORTHERN SWEDEN
Johannes E. K. Lundberg1, Magnus Ivarsson1, Therese Sallstedt1,2, Rabbe Sjöberg3, Juan Ramón Vidal Romaní4,Love Dalén1, Stina Höglund5
1Swedish Museum of Natural History, P.O. Box 50007, SE-104 05 Stockholm, Sweden, [email protected],[email protected], [email protected], [email protected]
2Biologisk Institut, Syddansk Universitet, Campusvej 55, DK-5230 Odense M, Denmark3Bodviksvägen 14, SE-913 42 Obbola, Sweden, [email protected]
4Instituto Universitario de Xeoloxia Isidro Parga Pondal, ES-15071 A Coruña, Spain, [email protected] University, Wenner-Gren Institute, SE-106 91 Stockholm, [email protected]
Tjuv-Antes grotta (Tjuv-Ante’s Cave) is a 30 m long round-abraded sea cave (“tunnel cave”) formed along a dolerite dykein granite gneiss. The cave was formed during a relatively short period about 7 ka ago. In the inner part, on the doleriteceiling and walls, are several coralloid and crust forming speleothems. The main speleothem forming mineral was identifiedas calcite, and later research has focused on the role of the microorganisms (in particular fungi and bacteria) in theprecipitation and erosion of the speleothem. DNA has successfully been extracted from young and old (ca. 1 ka) speleothemand preliminary results show a dominance of Actinobacteria and Proteobacteria. Actinobacteria (actinomycetes) seems toplay an important role in the formation of speleothem while a fungal community plays both a constructive role, as theystimulate calcite precipitation, and are being incorporated in the speleothem, and a destructive role as they actively boreand dissolve the calcite.
1. IntroductionAlthough often not as spectacular as their karsticcounterparts, speleothems in granitic caves are fairlycommon (Vidal Romaní et al. 2010). The most commonmineral is opal-A (Vidal Romaní and Vaqueir 2007), a non-crystalline, amorphous and hydrated form of silica, whilecalcite so far has not been reported as speleothem formingmineral from granitic caves. Tjuv-Antes grotta (Tjuv-Ante’sCave) in Västerbotten County, northern Sweden, is a round-abraded sea cave (“tunnel cave” sensu Sjöberg 1986). It islocated in Storrisberget’s Nature Reserve (N63°35.6’E19°22.8’, 90 m a.s.l.), and the about 30 m long cave isformed along a dolerite dyke in granite gneiss (Sjöberg1982). Its formation took place during a relatively shorttime about 7 ka ago at a time when the post-glacial reboundexposed the dolerite dyke for the plucking and polishingeffects from the high-energy waves and the pebbles andcobbles it carried (Sjöberg 1982). In the inner part of thecave one of us (RS) observed speleothems already in thelate 1960’s. Samples were recently sent to JVR whoconcluded that the speleothems are mainly composed ofcalcite with an associated microflora. The presence ofcalcite speleothems in a basically granitic cave thusprompted a more detailed investigation.
2. Material and MethodsTjuv-Antes Grotta lies in the cold temperate zone, but nearthe subarctic, with a climate characterized by largetemperature variations. The January mean temperature isabout -10 °C, while the July mean temperature is around+15 °C; the annual mean temperature is close to +5 °C. Themean precipitation is 700 mm/year, with about 35 % of theprecipitation falling as snow (SMHI 2012).
Samples from four locations in the cave were collected in
early May 2011. During the sampling, we made sure not tohandle the specimens with ungloved hands. The specimenswere wrapped in aluminum foil, and stored on ice duringthe transportation to the Swedish Museum of NaturalHistory (NRM), Stockholm, and transferred to freezer(-20 °C) where they were stored until analysis. Samples ofnearby non-mineralized biofilms (colonies) were collectedin glass tubes and also stored on ice until transfer to freezer.A subset of the samples was sent to JVR in A Coruña, Spain,where they were analyzed using Scanning ElectronMicroscopy (SEM) coupled with Energy DispersiveSpectrometry (EDS). At NRM, they were analyzed withEnvironmental Scanning Electron Microscopy (ESEM)coupled with EDS. δ13C analysis were also performed ontwo speleothem samples, using a Carlo Erbas NC2500analyzer connected to a Finnigan MAT Delta V massspectrometer. One sample was radiocarbon dated. Samplesof the biofilms were stained using the dye DyLight488 NHS ester and analyzed under fluorescent microscopy.At the Ancient DNA laboratory at NRM, one speleothemwas sampled for DNA extraction and sequencing.
3. ResultsThe speleothems were exclusively found on dolerite in theinnermost part of Tjuv-Antes Grotta (Fig. 1). We observedthree morpho-types of speleothems in Tjuv-Antes Grotta(Fig. 2). Type 1 is coral-like speleothems consisting ofglobular calcite cemented into 1–4 cm long, elongatedfinger-shaped coralloids (Fig. 2A). They were apparentlyactively growing on the cave wall and ceiling, and oftencovered in a brown-black biofilm. Type 2 includes popcorn-like smooth and rounded speleothems, resembling thecoralloid fabrics to some extent (Fig. 2B). Type 3 aresmooth calcite crusts that often exhibits small evenlypolished protrusions, and resembling a highly eroded
Cave Mineralogy – oral 2013 ICS Proceedings
461
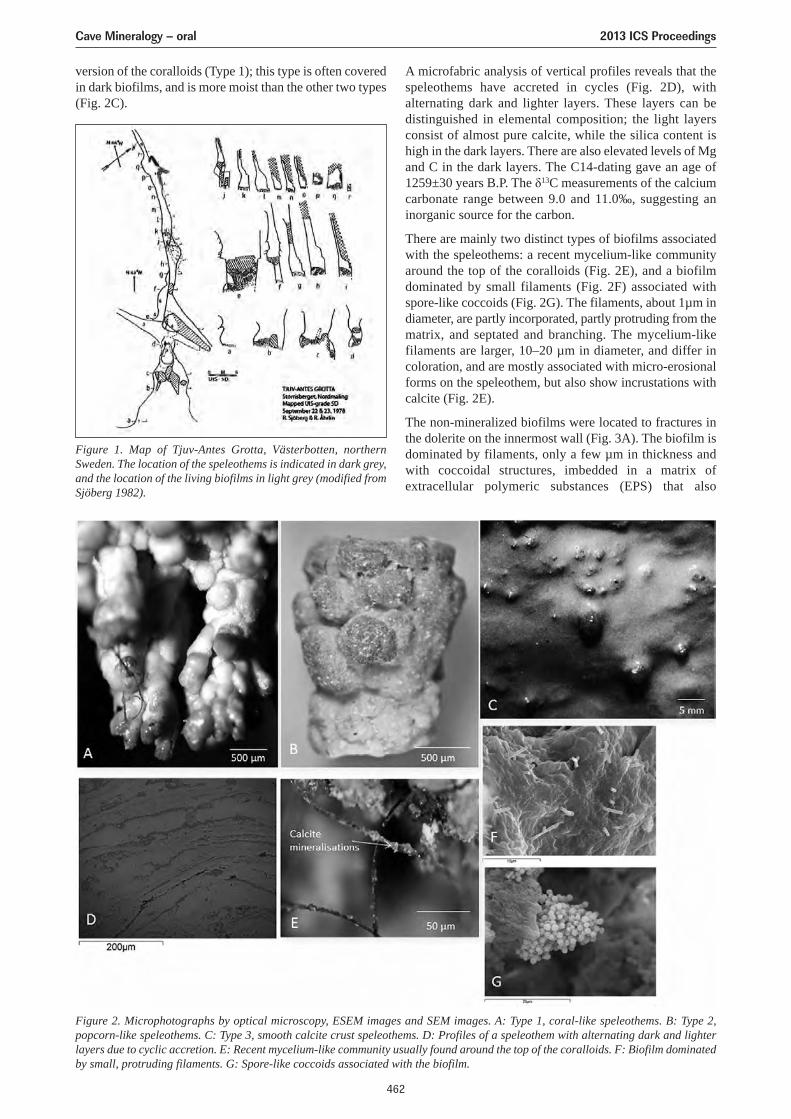
version of the coralloids (Type 1); this type is often coveredin dark biofilms, and is more moist than the other two types(Fig. 2C).
A microfabric analysis of vertical profiles reveals that thespeleothems have accreted in cycles (Fig. 2D), withalternating dark and lighter layers. These layers can bedistinguished in elemental composition; the light layersconsist of almost pure calcite, while the silica content ishigh in the dark layers. There are also elevated levels of Mgand C in the dark layers. The C14-dating gave an age of1259±30 years B.P. The δ13C measurements of the calciumcarbonate range between 9.0 and 11.0‰, suggesting aninorganic source for the carbon.
There are mainly two distinct types of biofilms associatedwith the speleothems: a recent mycelium-like communityaround the top of the coralloids (Fig. 2E), and a biofilmdominated by small filaments (Fig. 2F) associated withspore-like coccoids (Fig. 2G). The filaments, about 1µm indiameter, are partly incorporated, partly protruding from thematrix, and septated and branching. The mycelium-likefilaments are larger, 10–20 µm in diameter, and differ incoloration, and are mostly associated with micro-erosionalforms on the speleothem, but also show incrustations withcalcite (Fig. 2E).
The non-mineralized biofilms were located to fractures inthe dolerite on the innermost wall (Fig. 3A). The biofilm isdominated by filaments, only a few µm in thickness andwith coccoidal structures, imbedded in a matrix ofextracellular polymeric substances (EPS) that also
Figure 1. Map of Tjuv-Antes Grotta, Västerbotten, northernSweden. The location of the speleothems is indicated in dark grey,and the location of the living biofilms in light grey (modified fromSjöberg 1982).
Figure 2. Microphotographs by optical microscopy, ESEM images and SEM images. A: Type 1, coral-like speleothems. B: Type 2,popcorn-like speleothems. C: Type 3, smooth calcite crust speleothems. D: Profiles of a speleothem with alternating dark and lighterlayers due to cyclic accretion. E: Recent mycelium-like community usually found around the top of the coralloids. F: Biofilm dominatedby small, protruding filaments. G: Spore-like coccoids associated with the biofilm.
Cave Mineralogy – oral 2013 ICS Proceedings
462
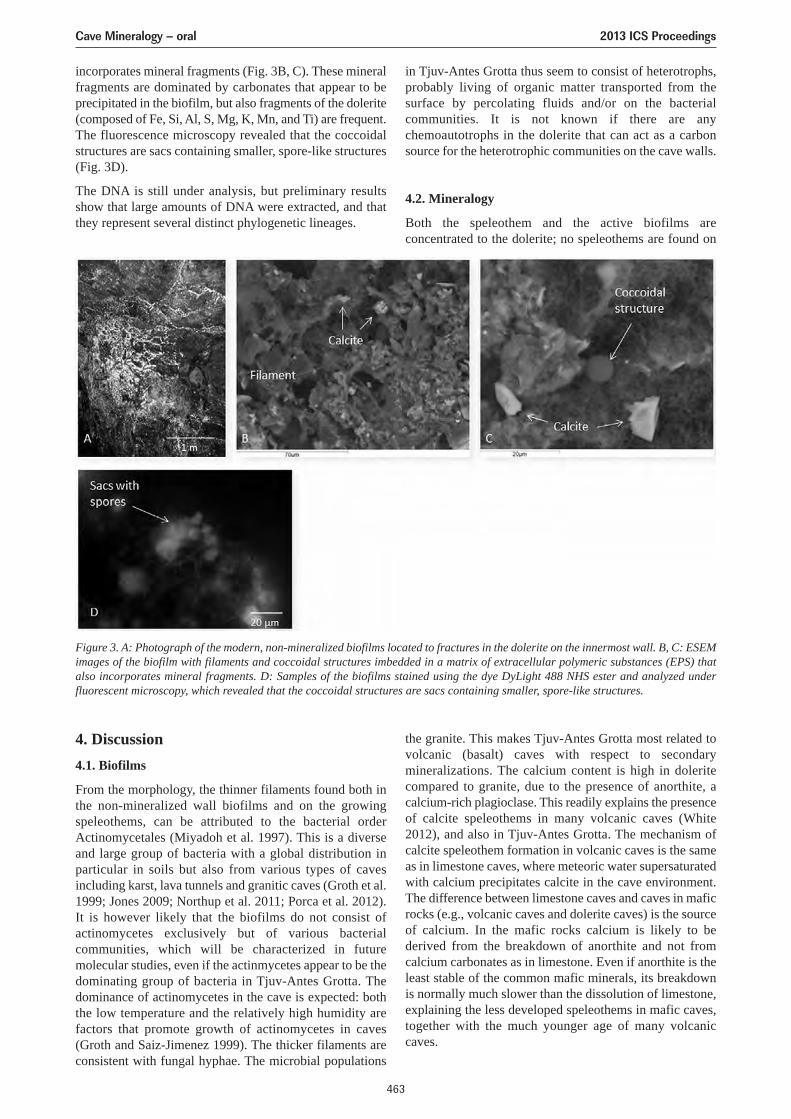
Cave Mineralogy – oral 2013 ICS Proceedings
463
incorporates mineral fragments (Fig. 3B, C). These mineralfragments are dominated by carbonates that appear to beprecipitated in the biofilm, but also fragments of the dolerite(composed of Fe, Si, Al, S, Mg, K, Mn, and Ti) are frequent.The fluorescence microscopy revealed that the coccoidalstructures are sacs containing smaller, spore-like structures(Fig. 3D).
The DNA is still under analysis, but preliminary resultsshow that large amounts of DNA were extracted, and thatthey represent several distinct phylogenetic lineages.
in Tjuv-Antes Grotta thus seem to consist of heterotrophs,probably living of organic matter transported from thesurface by percolating fluids and/or on the bacterialcommunities. It is not known if there are anychemoautotrophs in the dolerite that can act as a carbonsource for the heterotrophic communities on the cave walls.
4.2. Mineralogy
Both the speleothem and the active biofilms areconcentrated to the dolerite; no speleothems are found on
Figure 3. A: Photograph of the modern, non-mineralized biofilms located to fractures in the dolerite on the innermost wall. B, C: ESEMimages of the biofilm with filaments and coccoidal structures imbedded in a matrix of extracellular polymeric substances (EPS) thatalso incorporates mineral fragments. D: Samples of the biofilms stained using the dye DyLight 488 NHS ester and analyzed underfluorescent microscopy, which revealed that the coccoidal structures are sacs containing smaller, spore-like structures.
4. Discussion4.1. Biofilms
From the morphology, the thinner filaments found both inthe non-mineralized wall biofilms and on the growingspeleothems, can be attributed to the bacterial orderActinomycetales (Miyadoh et al. 1997). This is a diverseand large group of bacteria with a global distribution inparticular in soils but also from various types of cavesincluding karst, lava tunnels and granitic caves (Groth et al.1999; Jones 2009; Northup et al. 2011; Porca et al. 2012).It is however likely that the biofilms do not consist ofactinomycetes exclusively but of various bacterialcommunities, which will be characterized in futuremolecular studies, even if the actinmycetes appear to be thedominating group of bacteria in Tjuv-Antes Grotta. Thedominance of actinomycetes in the cave is expected: boththe low temperature and the relatively high humidity arefactors that promote growth of actinomycetes in caves(Groth and Saiz-Jimenez 1999). The thicker filaments areconsistent with fungal hyphae. The microbial populations
the granite. This makes Tjuv-Antes Grotta most related tovolcanic (basalt) caves with respect to secondarymineralizations. The calcium content is high in doleritecompared to granite, due to the presence of anorthite, acalcium-rich plagioclase. This readily explains the presenceof calcite speleothems in many volcanic caves (White2012), and also in Tjuv-Antes Grotta. The mechanism ofcalcite speleothem formation in volcanic caves is the sameas in limestone caves, where meteoric water supersaturatedwith calcium precipitates calcite in the cave environment.The difference between limestone caves and caves in maficrocks (e.g., volcanic caves and dolerite caves) is the sourceof calcium. In the mafic rocks calcium is likely to bederived from the breakdown of anorthite and not fromcalcium carbonates as in limestone. Even if anorthite is theleast stable of the common mafic minerals, its breakdownis normally much slower than the dissolution of limestone,explaining the less developed speleothems in mafic caves,together with the much younger age of many volcaniccaves.
4.3. Life cycle of the speleothems
The speleothems in Tjuv-Antes Grotta seem to be highlyinfluenced by the microbial presence. The actinomycete-dominated biofilms cover most of the surface of thegrowing speleothems, and seem to be incorporated in thedarker layers of the speleothems. There are also apparentlyabiotic growths of the speleothems (as deduced from theδ13C analysis), resulting in the light colored bands. It is stillpossible that microbial activity have indirect influences alsoon this phase of the growth by altering the microenviron-ment to facilitate precipitation of calcite (Castanier et al.1999).
The fungal presence seems to have a dual role in the lifecycle of the speleothems. There are evidence for aconstructional role by precipitation of calcite (encrustedhyphae), but also for an erosion dominated phase, that maybe responsible, at least in part, for the Type 3 speleothems.
We are still awaiting the results from the molecular analysisof the microbial communities in the speleothems. We wouldalso like to characterize the different phases in thespeleothem life cycle, and the different contributions fromthe microbial communities.
AcknowledgmentThe speleothems were collected in a Nature Reserve andNatura 2000 Site, with permission from the CountyGovernment Länsstyrelsen Västerbotten (permission 521-6864-2010), and we want to thank the Länsstyrelsen for thepermission. Some of the analyses (ESEM/EDS, fluorescentmicroscopy and stable isotope analysis) were conducted atStockholm University; in particular we would like to thankMarianne Ahlbom at the Department of GeologicalSciences for assistance during the ESEM. Many thanks alsoto Dr. Bogdan P. Onac (University of South Florida) andone anonymous reviewer for valuable comments on anearlier draft of the manuscript.
ReferencesCastanier S, Le Metayer-Levrel G, Perthuisot J-P, 1999. Ca-
carbonates precipitation and limestone genesis: themicrobiogeologists point of view. Sedimentary Geology, 126,9–23.
Groth I, Siaz-Jimenez C, 1999. Actinomycetes in hypogeanenvironments. Geomicrobiology Journal, 16, 1–8.
Groth I, Vettermann R, Schuetze B, Schumann P, Saiz-Jimenez C,1999. Actinomycetes in karstic caves of northern Spain(Altamira and Tito Bustillo). Journal of MicrobiologicalMethods, 36, 115–122.
Jones B, 2009. Phosphatic precipitates associated withactinomycetes in speleothems from Grand Cayman, BritishWest Indies. Sedimentary Geology, 219, 302–317.
Miyadoh S, Tsuchizaki N, Ishikawa J, Hotta K, 1997. Digital Atlasof Actinomycetes. Society for Actinomycetes Japan andAkasura publishing, Tokyo.
Northup DE, Melim LA, Spilde MN, Hathaway JJM, Garcia MG,Moya M, Stone FD, Boston PJ, Dapkevicius MLNE, RiquelmeC, 2011. Lava cave microbial communities within mats andsecondary mineral deposits: implications for life detection onother plantes. Astrobiology, 11, 601–618.
Porca E, Jurado V, Žgur-Bertok D, Saiz-Jimenez C, Pašic L, 2012.Comparative analysis of yellow microbial communitiesgrowing on the walls of geographically distinct caves indicatesa common core of microorganisms involved in their formation.FEMS Microbiology Ecology, 81, 255–266.
Sjöberg R, 1982. Tunnelgrottor i södra Västerbotten: morfologiskaoch morfogenetiska studier. Gerum Rapport, A31.
Sjöberg R, 1986. Tunnelgrottor i Norden: geomorfologiska studier.Gerum Naturgeografi 3. Umeå University, Umeå.
SMHI 2012. Klimatdata, http://www.smhi.se/klimatdata (visited2012-12-13).
White WB, 2012. Secondary mineral in volcanic caves: data fromHawai’i. Journal of Cave and Karst Studies, 72, 75–85.
Vidal Romaní JR, Vaqueiro M, 2007. Types of granite caves andassociated speleothems: genesis and evolution. NatureConstervation, 63, 41–46.
Vidal Romaní JR, Sanjurjo Sánchez J, Vaqueiro M, FernándezMosquera D, 2010. Speleothems of granite caves.Communicações Geológicas, 97, 71–80.
Cave Mineralogy – oral 2013 ICS Proceedings
464
DATING DIAGENISED ARAGONITE SPELEOTHEMS
Rebeca Martín-García1, Ana M. Alonso-Zarza1, Silvia Frisia2
1Department of Petrology and Geochemistry, Faculty of Geology-Institute of Geosciences, Universidad Complutense deMadrid-CSIC 28040, Madrid, Spain, [email protected]
2Environmental and Climate Change Research Group, School of Environmental and Life Sciences, The University ofNewcastle, Callaghan 2308 NSW, Australia, [email protected]
The U-series method is widely used to date cave carbonates. Generally, in stalagmites, every layer is cover by a youngerone, but locally the U/Th analysis reveals that some speleothem layers display a different age than expected given theirrelative stratigraphic position. These results are omitted very often in palaeoclimate studies and considered just as“anomalies”. Two samples of speleothems with anomalies from Castañar Cave (Spain) have been studied in detail in orderto decipher the causes involved in these processes of age modification. A stalagmite sampled at -20 m from the surfacedisplays an older than expected age and does not follow the stratigraphic order. This anomaly can be explained due toenrichment in the daughter isotope, 230Th, or a leaching of the parent isotope,
238U. A pool rim sampled at -26 m displaysa younger age in the inner part of the speleothem than in the outer part. This anomaly can be explained due to enrichmentin the parent isotope 238U, or due to leaching of the daughter isotope 230Th. The exposure of the samples to continuousnatural dripping and the diagenetic processes observed, caused an alteration of the original age. The presence of thesediagenetic processes is only detectable through detailed petrographic analysis of the speleothems.
1. IntroductionSpeleothem-based chronology studies are fundamental tounderstand past climate events, timing speleogenesisprocesses and the rates at which they occur (St Pierre et al.,2009). The U-series analytical method is well-known fordating (Frank et al. 2000; Hellstrom 2003; van Calsterenand Thomas 2006). This dating method is based on thedisequilibrium between U and Th and among other uses, ithas application to the Quaternary carbonate materials andspeleothems. 230Th/234U radioactive isotopes begin with anactivity ratio equal to 0, that over time approaches 1 by thedecay of 234U to 230Th. Knowing the value of thisrelationship and the decay constants is possible to calculatethe age of the samples (Hellstrom 2003). This method hasbeen widely used in rocks, which, in combination with theanalysis of 13C and 18O isotopes, are used to obtainpalaeoclimate curves (Kaufman 1998; Fairchild et al. 2006;Spötl et al. 2008).
The U and Th isotopes are in secular equilibrium with thehost rock, which usually is at least several million years old.However, percolation waters are well away from thisbalance due to the different geochemical behavior of bothisotopes. Th is insoluble and therefore the ratio 230Th/238Uin drip water is 0; this is one of the bases of this datingtechnique. By contrast, the U concentration in the dripwaters is well above the equilibrium because 234U is verysoluble (Scholz and Hoffmann, 2008). The initial 234U/238Uin drip waters can vary greatly depending on the age of thehost rock and the time of residence of water in the rock. Inany case this does not affect the application of the U/Th-series dating technique because the initial 234U/238U ratio isnot necessary for the calculations (Scholz and Hoffmann2008).
However, sometimes the U/Th analysis reveals speleothemlayers with inverted ages. When this occurs, theseanomalous results are simply omitted without a geneticexplanation. The origin of these anomalies is important to
know because of the obvious consequences for speleothemdating and paleoclimate implications (Muñoz-García et al.2007). The most important criterion for deciding if an age iscorrect or not is that it should follow a logical stratigraphicorder, with the oldest age at the base and youngest towardsthe tip (Kaufmann 2003; Romanov et al. 2008a).
The basic characteristics for an ideal-for-dating speleothemare, according to Borsato et al. (2003), 1. that it containssufficient amounts of U, 2. that it is not contaminated withdetrital Th particles, and 3. that it behaves as a closedsystem in which no remobilization or input of U or its decayproducts, especially 230Th, has occurred (Cherdyntsev 1971;Gascoyne et al. 1978; Ford and Williams 2007). Accordingto Scholz and Hoffmann (2008) the breach of any of thesecriteria along with errors during analysis or samplepreparation can generate anomalous ages.
In this work we try to analyze the reasons for the presenceof anomalous dating in the speleothems of Castañar Cave.In this cave, most of the speleothems were originallyaragonitic in mineralogy. Aragonite, being an unstablemineral, undergoes diagenetic processes that cause problemsin dating which are sometimes difficult to detect. Errorsduring the preparation and analysis of the samples arediscarded as long as the anomalous results were repeated.
2. Castañar CaveCastañar Cave is located in the village of Castañar de Ibor,in Cáceres, Spain. Geologically is located in the easternIberian Massif (west-central sector of the IberianPeninsula), specifically in the Ibor Anticline which formspart of a sector named Domain of Vertical Folds (Díez-Balda et al. 1990). This domain is characterized by thepresence of broad antiforms of NW-SE direction (Fig. 1a).The rocks of the area can be divided into two largestratigraphic units, the Domo Extremeño Group and IborGroup (Álvarez Nava et al. 1988), separated by an
Cave Mineralogy – oral 2013 ICS Proceedings
465
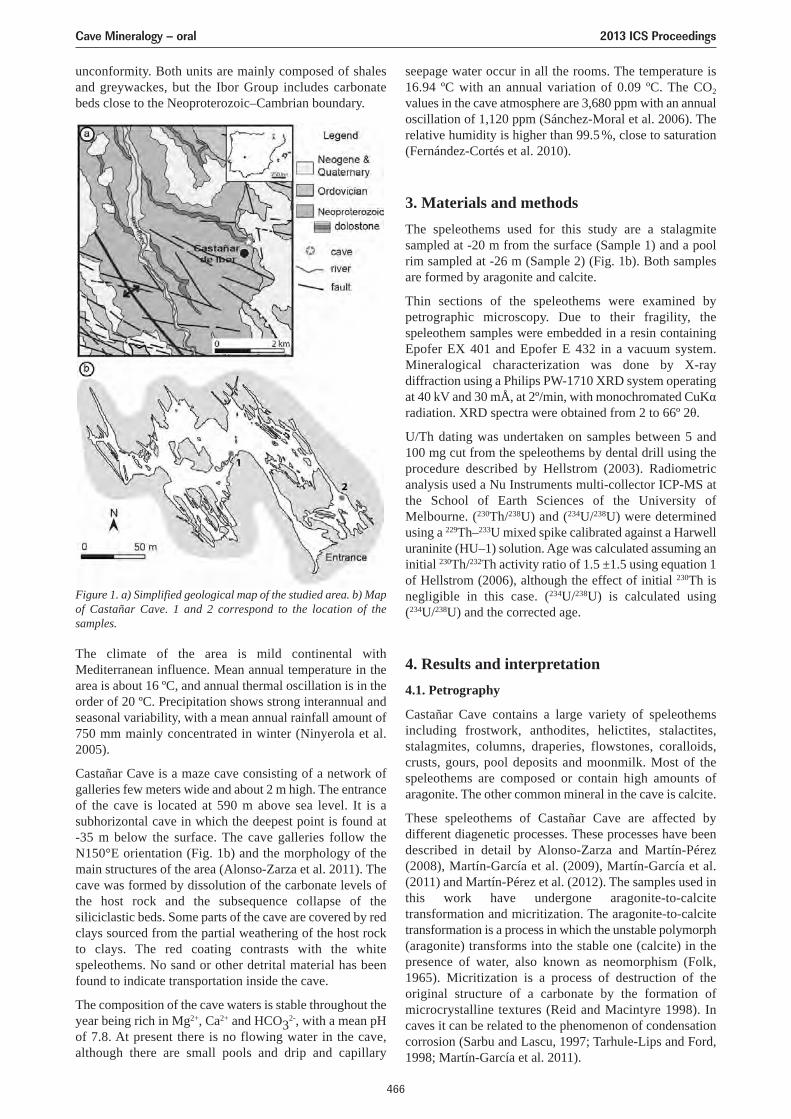
unconformity. Both units are mainly composed of shalesand greywackes, but the Ibor Group includes carbonatebeds close to the Neoproterozoic–Cambrian boundary.
The climate of the area is mild continental withMediterranean influence. Mean annual temperature in thearea is about 16 ºC, and annual thermal oscillation is in theorder of 20 ºC. Precipitation shows strong interannual andseasonal variability, with a mean annual rainfall amount of750 mm mainly concentrated in winter (Ninyerola et al.2005).
Castañar Cave is a maze cave consisting of a network ofgalleries few meters wide and about 2 m high. The entranceof the cave is located at 590 m above sea level. It is asubhorizontal cave in which the deepest point is found at-35 m below the surface. The cave galleries follow theN150°E orientation (Fig. 1b) and the morphology of themain structures of the area (Alonso-Zarza et al. 2011). Thecave was formed by dissolution of the carbonate levels ofthe host rock and the subsequence collapse of thesiliciclastic beds. Some parts of the cave are covered by redclays sourced from the partial weathering of the host rockto clays. The red coating contrasts with the whitespeleothems. No sand or other detrital material has beenfound to indicate transportation inside the cave.
The composition of the cave waters is stable throughout theyear being rich in Mg2+, Ca2+ and HCO3
2-, with a mean pHof 7.8. At present there is no flowing water in the cave,although there are small pools and drip and capillary
seepage water occur in all the rooms. The temperature is16.94 ºC with an annual variation of 0.09 ºC. The CO2
values in the cave atmosphere are 3,680 ppm with an annualoscillation of 1,120 ppm (Sánchez-Moral et al. 2006). Therelative humidity is higher than 99.5%, close to saturation(Fernández-Cortés et al. 2010).
3. Materials and methodsThe speleothems used for this study are a stalagmitesampled at -20 m from the surface (Sample 1) and a poolrim sampled at -26 m (Sample 2) (Fig. 1b). Both samplesare formed by aragonite and calcite.
Thin sections of the speleothems were examined bypetrographic microscopy. Due to their fragility, thespeleothem samples were embedded in a resin containingEpofer EX 401 and Epofer E 432 in a vacuum system.Mineralogical characterization was done by X-raydiffraction using a Philips PW-1710 XRD system operatingat 40 kV and 30 mÅ, at 2º/min, with monochromated CuKαradiation. XRD spectra were obtained from 2 to 66º 2θ.
U/Th dating was undertaken on samples between 5 and100 mg cut from the speleothems by dental drill using theprocedure described by Hellstrom (2003). Radiometricanalysis used a Nu Instruments multi-collector ICP-MS atthe School of Earth Sciences of the University ofMelbourne. (230Th/238U) and (234U/238U) were determinedusing a 229Th–233U mixed spike calibrated against a Harwelluraninite (HU–1) solution. Age was calculated assuming aninitial 230Th/232Th activity ratio of 1.5 ±1.5 using equation 1of Hellstrom (2006), although the effect of initial 230Th isnegligible in this case. (234U/238U) is calculated using(234U/238U) and the corrected age.
4. Results and interpretation4.1. Petrography
Castañar Cave contains a large variety of speleothemsincluding frostwork, anthodites, helictites, stalactites,stalagmites, columns, draperies, flowstones, coralloids,crusts, gours, pool deposits and moonmilk. Most of thespeleothems are composed or contain high amounts ofaragonite. The other common mineral in the cave is calcite.
These speleothems of Castañar Cave are affected bydifferent diagenetic processes. These processes have beendescribed in detail by Alonso-Zarza and Martín-Pérez(2008), Martín-García et al. (2009), Martín-García et al.(2011) and Martín-Pérez et al. (2012). The samples used inthis work have undergone aragonite-to-calcitetransformation and micritization. The aragonite-to-calcitetransformation is a process in which the unstable polymorph(aragonite) transforms into the stable one (calcite) in thepresence of water, also known as neomorphism (Folk,1965). Micritization is a process of destruction of theoriginal structure of a carbonate by the formation ofmicrocrystalline textures (Reid and Macintyre 1998). Incaves it can be related to the phenomenon of condensationcorrosion (Sarbu and Lascu, 1997; Tarhule-Lips and Ford,1998; Martín-García et al. 2011).
Figure 1. a) Simplified geological map of the studied area. b) Mapof Castañar Cave. 1 and 2 correspond to the location of thesamples.
Cave Mineralogy – oral 2013 ICS Proceedings
466
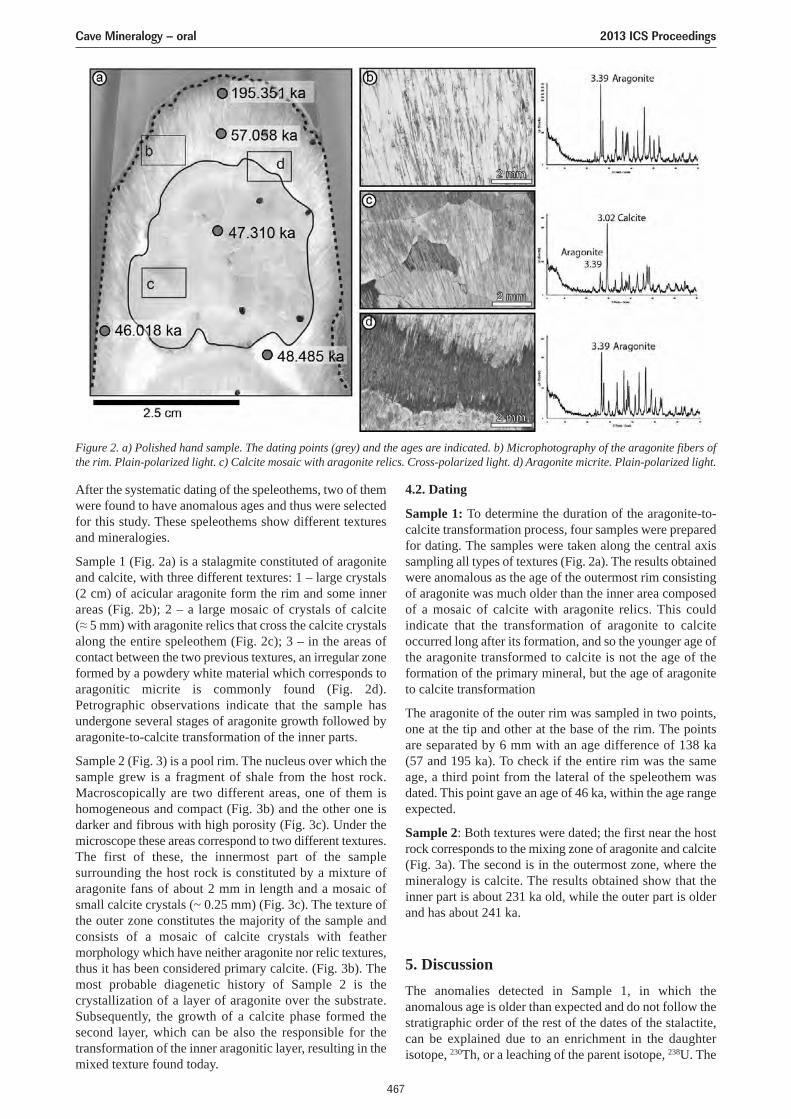
After the systematic dating of the speleothems, two of themwere found to have anomalous ages and thus were selectedfor this study. These speleothems show different texturesand mineralogies.
Sample 1 (Fig. 2a) is a stalagmite constituted of aragoniteand calcite, with three different textures: 1 – large crystals(2 cm) of acicular aragonite form the rim and some innerareas (Fig. 2b); 2 – a large mosaic of crystals of calcite(≈ 5 mm) with aragonite relics that cross the calcite crystalsalong the entire speleothem (Fig. 2c); 3 – in the areas ofcontact between the two previous textures, an irregular zoneformed by a powdery white material which corresponds toaragonitic micrite is commonly found (Fig. 2d).Petrographic observations indicate that the sample hasundergone several stages of aragonite growth followed byaragonite-to-calcite transformation of the inner parts.
Sample 2 (Fig. 3) is a pool rim. The nucleus over which thesample grew is a fragment of shale from the host rock.Macroscopically are two different areas, one of them ishomogeneous and compact (Fig. 3b) and the other one isdarker and fibrous with high porosity (Fig. 3c). Under themicroscope these areas correspond to two different textures.The first of these, the innermost part of the samplesurrounding the host rock is constituted by a mixture ofaragonite fans of about 2 mm in length and a mosaic ofsmall calcite crystals (~ 0.25 mm) (Fig. 3c). The texture ofthe outer zone constitutes the majority of the sample andconsists of a mosaic of calcite crystals with feathermorphology which have neither aragonite nor relic textures,thus it has been considered primary calcite. (Fig. 3b). Themost probable diagenetic history of Sample 2 is thecrystallization of a layer of aragonite over the substrate.Subsequently, the growth of a calcite phase formed thesecond layer, which can be also the responsible for thetransformation of the inner aragonitic layer, resulting in themixed texture found today.
4.2. Dating
Sample 1: To determine the duration of the aragonite-to-calcite transformation process, four samples were preparedfor dating. The samples were taken along the central axissampling all types of textures (Fig. 2a). The results obtainedwere anomalous as the age of the outermost rim consistingof aragonite was much older than the inner area composedof a mosaic of calcite with aragonite relics. This couldindicate that the transformation of aragonite to calciteoccurred long after its formation, and so the younger age ofthe aragonite transformed to calcite is not the age of theformation of the primary mineral, but the age of aragoniteto calcite transformation
The aragonite of the outer rim was sampled in two points,one at the tip and other at the base of the rim. The pointsare separated by 6 mm with an age difference of 138 ka(57 and 195 ka). To check if the entire rim was the sameage, a third point from the lateral of the speleothem wasdated. This point gave an age of 46 ka, within the age rangeexpected.
Sample 2: Both textures were dated; the first near the hostrock corresponds to the mixing zone of aragonite and calcite(Fig. 3a). The second is in the outermost zone, where themineralogy is calcite. The results obtained show that theinner part is about 231 ka old, while the outer part is olderand has about 241 ka.
5. DiscussionThe anomalies detected in Sample 1, in which theanomalous age is older than expected and do not follow thestratigraphic order of the rest of the dates of the stalactite,can be explained due to an enrichment in the daughterisotope, 230Th, or a leaching of the parent isotope, 238U. The
Figure 2. a) Polished hand sample. The dating points (grey) and the ages are indicated. b) Microphotography of the aragonite fibers ofthe rim. Plain-polarized light. c) Calcite mosaic with aragonite relics. Cross-polarized light. d) Aragonite micrite. Plain-polarized light.
Cave Mineralogy – oral 2013 ICS Proceedings
467
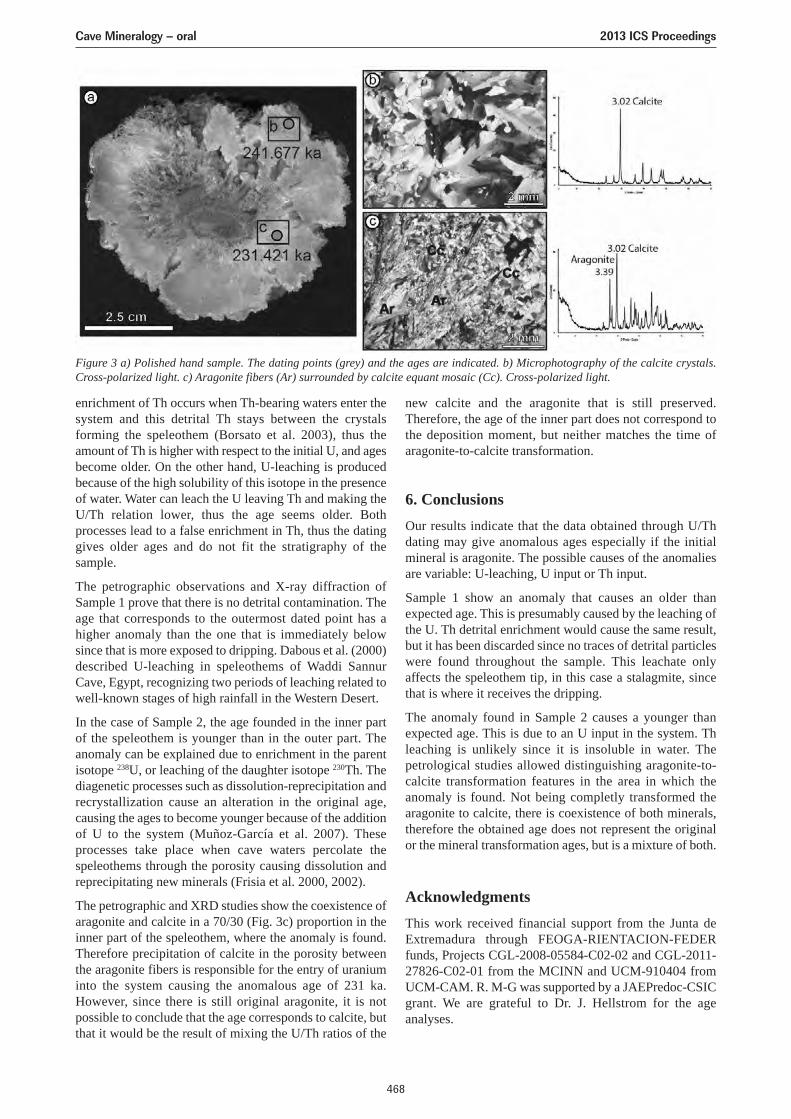
enrichment of Th occurs when Th-bearing waters enter thesystem and this detrital Th stays between the crystalsforming the speleothem (Borsato et al. 2003), thus theamount of Th is higher with respect to the initial U, and agesbecome older. On the other hand, U-leaching is producedbecause of the high solubility of this isotope in the presenceof water. Water can leach the U leaving Th and making theU/Th relation lower, thus the age seems older. Bothprocesses lead to a false enrichment in Th, thus the datinggives older ages and do not fit the stratigraphy of thesample.
The petrographic observations and X-ray diffraction ofSample 1 prove that there is no detrital contamination. Theage that corresponds to the outermost dated point has ahigher anomaly than the one that is immediately belowsince that is more exposed to dripping. Dabous et al. (2000)described U-leaching in speleothems of Waddi SannurCave, Egypt, recognizing two periods of leaching related towell-known stages of high rainfall in the Western Desert.
In the case of Sample 2, the age founded in the inner partof the speleothem is younger than in the outer part. Theanomaly can be explained due to enrichment in the parentisotope 238U, or leaching of the daughter isotope 230Th. Thediagenetic processes such as dissolution-reprecipitation andrecrystallization cause an alteration in the original age,causing the ages to become younger because of the additionof U to the system (Muñoz-García et al. 2007). Theseprocesses take place when cave waters percolate thespeleothems through the porosity causing dissolution andreprecipitating new minerals (Frisia et al. 2000, 2002).
The petrographic and XRD studies show the coexistence ofaragonite and calcite in a 70/30 (Fig. 3c) proportion in theinner part of the speleothem, where the anomaly is found.Therefore precipitation of calcite in the porosity betweenthe aragonite fibers is responsible for the entry of uraniuminto the system causing the anomalous age of 231 ka.However, since there is still original aragonite, it is notpossible to conclude that the age corresponds to calcite, butthat it would be the result of mixing the U/Th ratios of the
new calcite and the aragonite that is still preserved.Therefore, the age of the inner part does not correspond tothe deposition moment, but neither matches the time ofaragonite-to-calcite transformation.
6. ConclusionsOur results indicate that the data obtained through U/Thdating may give anomalous ages especially if the initialmineral is aragonite. The possible causes of the anomaliesare variable: U-leaching, U input or Th input.
Sample 1 show an anomaly that causes an older thanexpected age. This is presumably caused by the leaching ofthe U. Th detrital enrichment would cause the same result,but it has been discarded since no traces of detrital particleswere found throughout the sample. This leachate onlyaffects the speleothem tip, in this case a stalagmite, sincethat is where it receives the dripping.
The anomaly found in Sample 2 causes a younger thanexpected age. This is due to an U input in the system. Thleaching is unlikely since it is insoluble in water. Thepetrological studies allowed distinguishing aragonite-to-calcite transformation features in the area in which theanomaly is found. Not being completly transformed thearagonite to calcite, there is coexistence of both minerals,therefore the obtained age does not represent the originalor the mineral transformation ages, but is a mixture of both.
AcknowledgmentsThis work received financial support from the Junta deExtremadura through FEOGA-RIENTACION-FEDERfunds, Projects CGL-2008-05584-C02-02 and CGL-2011-27826-C02-01 from the MCINN and UCM-910404 fromUCM-CAM. R. M-G was supported by a JAEPredoc-CSICgrant. We are grateful to Dr. J. Hellstrom for the ageanalyses.
Figure 3 a) Polished hand sample. The dating points (grey) and the ages are indicated. b) Microphotography of the calcite crystals.Cross-polarized light. c) Aragonite fibers (Ar) surrounded by calcite equant mosaic (Cc). Cross-polarized light.
Cave Mineralogy – oral 2013 ICS Proceedings
468
ReferencesAlonso-Zarza AM, Martín-Pérez A, 2008. Dolomite in caves:
recent dolomite formation in oxic, non-sulfate environments.Castañar Cave, Spain. Sedimentary Geology, 205, 160–164.
Alonso-Zarza AM, Martín-Pérez A, Martín-García R, Gil-Peña I,Meléndez A, Martínez-Flores E, Hellstrom J, Muñoz-Barco P,2011. Structural and host rock controls on the distribution,morphology and mineralogy of speleothems in the CastañarCave (Spain). Geological Magazine, 148, 211–225.
Álvarez Nava H, García Casquero JL, Gil A, Hernández UrrozJLorenzo S, López Díaz F, Mira M, Monteserín V, Nozal F,Pardo MV, Picart J, Robles R, Santamaría J, Solé J, 1988.Unidades litoestratigráficas de los materiales precámbrico-cámbricos de la mitad suroriental de la Zona Centro-Ibérica.In: II Congreso Geológico de España. 19–22.
Borsato A, Quinif Y, Bini A, Dublyansky Y, 2003. Open-systemalpine speleothems: implications for U-series dating andpaleoclimate reconstructions. Studi Trentini di ScienzeNaturali: Acta Geologica, 80, 71–83.
Dabous A, Osmond J, 2000. U/Th isotopic study of speleothemsfrom the Wadi Sannur Cavern, Eastern Desert of Egypt.Carbonates and Evaporites, 15, 1–6.
Díez-Balda MA, Vegas R, González-Lodeiro F, 1990. Central-Iberian Zone. Autochthonous Sequences: Structure. In: R.D.Dallmeyer and E. Martínez-García (Eds.). Pre-MesozoicGeology of Iberia. Springer-Verlag, Berlin, 172–188.
Fairchild IJ, Smith CL, Baker A, Fuller L, Spötl C, Mattey D,McDermott F, EIMF, 2006. Modification and preservation ofenvironmental signals in speleothems. Earth-Science Reviews,75, 105–153.
Fernández-Cortés A, Sánchez-Moral S, Cañavera JC, Cuevas-González J, Cuezva S, Andreu JM, 2010. Variations in seepagewater geochemistry induced by natural and anthropogenicmicroclimatic changes: Implications for speleothem growthconditions. Geodinamica Acta, 23, 1–13.
Folk RL, 1965. Some aspects of recrystallization in ancientlimestones. In: L.C. Pray and R.C. Murray (Eds.)Dolomitization and Limestone Diagenesis. A Symposium.SEMP Special Paper, Tulsa, Oklahoma, 14–48.
Ford DC, Williams PW, 2007. Karst geomorphology andhydrology. Wiley, Chichester.
Frank N, Braum M, Hambach U, Mangini A, Wagner G, 2000. WarmPeriod Growth of Travertine during the Last Interglaciation inSouthern Germany. Quaternary Research, 38–48.
Frisia S, Borsato A, Fairchild IJ, McDermott F, 2000. Calcitefabrics, growth mechanisms, and environments of formationin speleothems from the Italian Alps and Southwestern Ireland.Journal of Sedimentary Research, 70, 1183–1196.
Frisia S, Borsato A, Fairchild IJ, McDermott F, Selmo EM, 2002.Aragonite-Calcite relationships in speleothems (Grotte deClamouse, France): environment, fabrics, and carbonategeochemistry. Journal of Sedimentary Research, 72, 687–699.
Gascoyne M, Ford DC, Schwarcz HP, 1978. Uranium series datingand stable isotope studies of speleothems. Part 1: Theory andtechinques, In: Transactions. British Cave ResearchAssociation, Buxton, 91–112.
Hellstrom J, 2003. Rapid and accurate U/Th dating using parallelion-counting multi-collector ICP-MS. Journal of AnalyticalAtomic Spectrometry, 18, 1346–1351.
Hellstrom J, 2006. U-Th dating of speleothems with high initial230Th using stratigraphical constraint. QuaternaryGeochronology, 1, 289–295.
Cherdyntsev VV, 1971. Uranium 234. Israel Programme forScientific Translations, Jerusalem.
Kaufman A, Wasserburg GJ, Porcelli D, Bar-Matthews M, AyalonA, Halicz L, 1998. U-Th isotope systematics from the Soreqcave, Israel and climatic correlations. Earth and PlanetaryScience Letters, 156, 141–155.
Kaufmann G, 2003. Stalagmite growth and palaeo-climate: thenumerical perspective. Earth and Planetary Science Letters,214, 251–266.
Martín-García R, Alonso-Zarza AM, Martín-Pérez A, 2009. Lossof primary texture and geochemical signatures in speleothemsdue to diagenesis: Evidences from Castañar Cave, Spain.Sedimentary Geology, 221, 141–149.
Martín-García R, Martín-Pérez A, Alonso-Zarza AM, 2011.Weathering of host rock and corrosion over speleothems inCastañar cave, Spain: an example of a complex meteoricenvironment. Carbonates and Evaporites, 26, 83–94.
Martín-Pérez A, Martín-García R, Alonso-Zarza AM, 2012.Diagenesis of a drapery speleothem from Castañar Cave: fromdissolution to dolomitization. International Journal ofSpeleology, 42, 251–266.
Muñoz-García MB, Martín-Chivelet J, Rossi C, Ford DC,Schwarcz HP, 2007. Chronology of Termination II and the LastInterglacial Period in North Spain based on stable isotoperecords of stalagmites from Cueva del Cobre (Palencia).Journal of Iberian Geology, 33, 17–30.
Ninyerola M, Pons X, Roure JM, 2005. Atlas Climatico Digitalde la Peninsula Iberica. Metodologia y aplicaciones enbioclimatologia y geobotanica. Universidad Autonoma deBarcelona, Bellaterra.
Reid RP, Macintyre IG, 1998. Carbonate recrystallization inshallow marine environments: A widespread diagenetic processforming micritized grains. Journal of Sedimentary Research,68, 928–946 Part A.
Romanov D, Kaufmann G, Dreybrodt W, 2008. Modelingstalagmite growth by first principles of chemistry and physicsof calcite precipitation. Geochimica et Cosmochimica Acta, 72,423–437.
Sarbu SM, Lascu C, 1997. Condensation corrosion in MovileCave, Romania. Journal of Cave and Karst Studies, 59,99–102.
Sánchez-Moral S, Cuezva S, Lario J, Taborda-Duarte M, 2006.Hydrochemistry of karstic waters in a low-energy cave(Castañar de Ibor, Spain). In: J.J. Durán, B. Andreo and F.Carrasco (Eds.). Karst, cambio climático y aguas subterráneas.IGME, Madrid, 339–347.
Scholz D, Hoffmann D, 2008. 230Th/U-dating of fossil corals andspeleothems. Eiszeitalter und Gegenwart. Quaternary ScienceJournal, 57, 52–76.
Spötl C, Scholz D, Mangini A, 2008. A terrestrial U/Th-datedstable isotope record of the Penultimate Interglacial. Earth andPlanetary Science Letters, 276, 283–292.
St Pierre E, Zhao J, Reed E, 2009. Expanding the utility ofUranium-series dating of speleothems for archaeological andpalaeontological applications. Journal of ArchaeologicalScience, 36, 1416–1423.
Tarhule-Lips RFA, Ford DC, 1998. Condensation corrosion incaves of Cayman Brac and Isla de Mona. Journal of Cave andKarst Studies, 60, 84–9.
van Calsteren P, Thomas L, 2006. Uranium-series dating in naturalenviroment science. Earth-Science Reviews, 75, 155–175.
Cave Mineralogy – oral 2013 ICS Proceedings
469
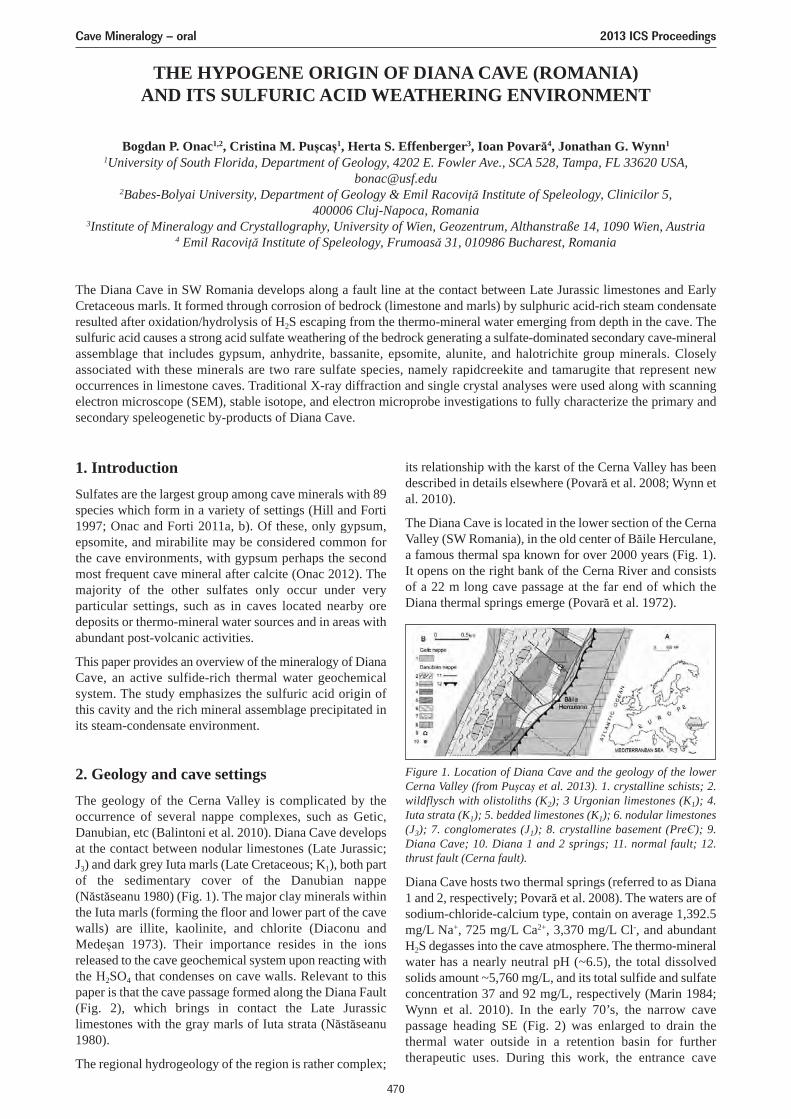
THE HYPOGENE ORIGIN OF DIANA CAVE (ROMANIA)AND ITS SULFURIC ACID WEATHERING ENVIRONMENT
Bogdan P. Onac1,2, Cristina M. Pușcaș1, Herta S. Effenberger3, Ioan Povară4, Jonathan G. Wynn1
1University of South Florida, Department of Geology, 4202 E. Fowler Ave., SCA 528, Tampa, FL 33620 USA,[email protected]
2Babes-Bolyai University, Department of Geology & Emil Racoviță Institute of Speleology, Clinicilor 5,400006 Cluj-Napoca, Romania
3Institute of Mineralogy and Crystallography, University of Wien, Geozentrum, Althanstraße 14, 1090 Wien, Austria4 Emil Racoviță Institute of Speleology, Frumoasă 31, 010986 Bucharest, Romania
The Diana Cave in SW Romania develops along a fault line at the contact between Late Jurassic limestones and EarlyCretaceous marls. It formed through corrosion of bedrock (limestone and marls) by sulphuric acid-rich steam condensateresulted after oxidation/hydrolysis of H2S escaping from the thermo-mineral water emerging from depth in the cave. Thesulfuric acid causes a strong acid sulfate weathering of the bedrock generating a sulfate-dominated secondary cave-mineralassemblage that includes gypsum, anhydrite, bassanite, epsomite, alunite, and halotrichite group minerals. Closelyassociated with these minerals are two rare sulfate species, namely rapidcreekite and tamarugite that represent newoccurrences in limestone caves. Traditional X-ray diffraction and single crystal analyses were used along with scanningelectron microscope (SEM), stable isotope, and electron microprobe investigations to fully characterize the primary andsecondary speleogenetic by-products of Diana Cave.
1. IntroductionSulfates are the largest group among cave minerals with 89species which form in a variety of settings (Hill and Forti1997; Onac and Forti 2011a, b). Of these, only gypsum,epsomite, and mirabilite may be considered common forthe cave environments, with gypsum perhaps the secondmost frequent cave mineral after calcite (Onac 2012). Themajority of the other sulfates only occur under veryparticular settings, such as in caves located nearby oredeposits or thermo-mineral water sources and in areas withabundant post-volcanic activities.
This paper provides an overview of the mineralogy of DianaCave, an active sulfide-rich thermal water geochemicalsystem. The study emphasizes the sulfuric acid origin ofthis cavity and the rich mineral assemblage precipitated inits steam-condensate environment.
2. Geology and cave settingsThe geology of the Cerna Valley is complicated by theoccurrence of several nappe complexes, such as Getic,Danubian, etc (Balintoni et al. 2010). Diana Cave developsat the contact between nodular limestones (Late Jurassic;J3) and dark grey Iuta marls (Late Cretaceous; K1), both partof the sedimentary cover of the Danubian nappe(Năstăseanu 1980) (Fig. 1). The major clay minerals withinthe Iuta marls (forming the floor and lower part of the cavewalls) are illite, kaolinite, and chlorite (Diaconu andMedeșan 1973). Their importance resides in the ionsreleased to the cave geochemical system upon reacting withthe H2SO4 that condenses on cave walls. Relevant to thispaper is that the cave passage formed along the Diana Fault(Fig. 2), which brings in contact the Late Jurassiclimestones with the gray marls of Iuta strata (Năstăseanu1980).
The regional hydrogeology of the region is rather complex;
its relationship with the karst of the Cerna Valley has beendescribed in details elsewhere (Povară et al. 2008; Wynn etal. 2010).
The Diana Cave is located in the lower section of the CernaValley (SW Romania), in the old center of Băile Herculane,a famous thermal spa known for over 2000 years (Fig. 1).It opens on the right bank of the Cerna River and consistsof a 22 m long cave passage at the far end of which theDiana thermal springs emerge (Povară et al. 1972).
Diana Cave hosts two thermal springs (referred to as Diana1 and 2, respectively; Povară et al. 2008). The waters are ofsodium-chloride-calcium type, contain on average 1,392.5mg/L Na+, 725 mg/L Ca2+, 3,370 mg/L Cl-, and abundantH2S degasses into the cave atmosphere. The thermo-mineralwater has a nearly neutral pH (~6.5), the total dissolvedsolids amount ~5,760 mg/L, and its total sulfide and sulfateconcentration 37 and 92 mg/L, respectively (Marin 1984;Wynn et al. 2010). In the early 70’s, the narrow cavepassage heading SE (Fig. 2) was enlarged to drain thethermal water outside in a retention basin for furthertherapeutic uses. During this work, the entrance cave
Figure 1. Location of Diana Cave and the geology of the lowerCerna Valley (from Pușcaș et al. 2013). 1. crystalline schists; 2.wildflysch with olistoliths (K2); 3 Urgonian limestones (K1); 4.Iuta strata (K1); 5. bedded limestones (K1); 6. nodular limestones(J3); 7. conglomerates (J1); 8. crystalline basement (PreЄ); 9.Diana Cave; 10. Diana 1 and 2 springs; 11. normal fault; 12.thrust fault (Cerna fault).
Cave Mineralogy – oral 2013 ICS Proceedings
470
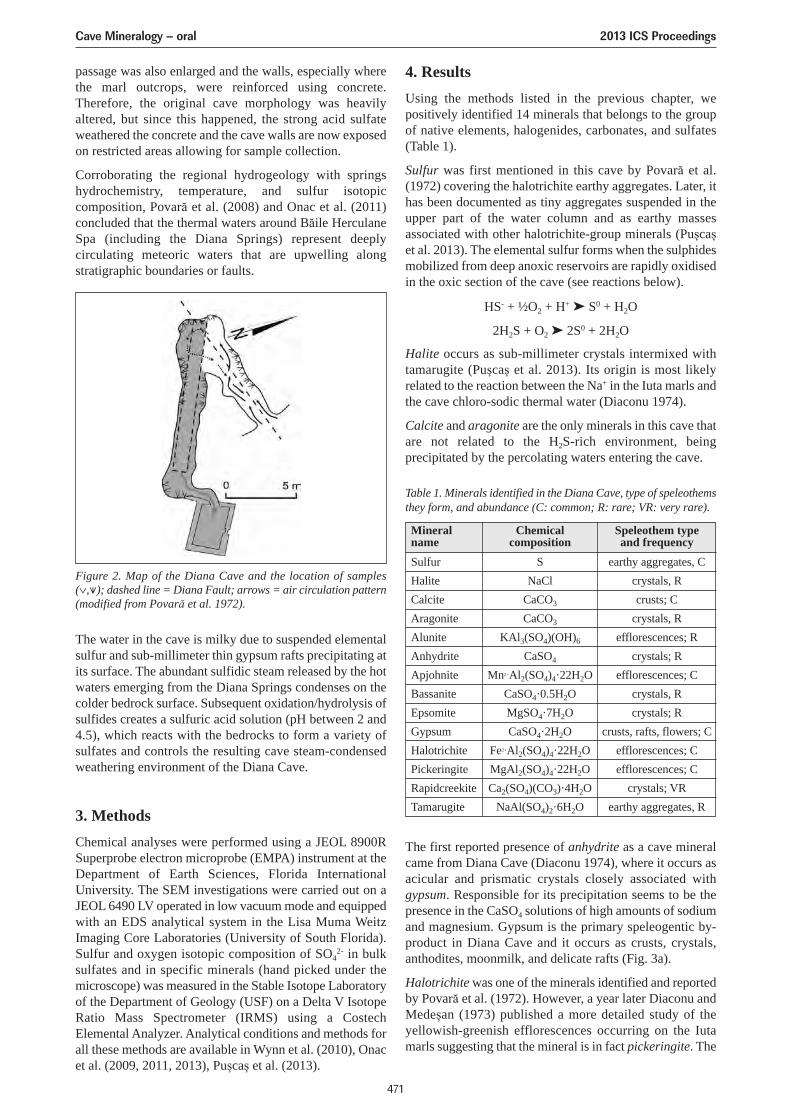
passage was also enlarged and the walls, especially wherethe marl outcrops, were reinforced using concrete.Therefore, the original cave morphology was heavilyaltered, but since this happened, the strong acid sulfateweathered the concrete and the cave walls are now exposedon restricted areas allowing for sample collection.
Corroborating the regional hydrogeology with springshydrochemistry, temperature, and sulfur isotopiccomposition, Povară et al. (2008) and Onac et al. (2011)concluded that the thermal waters around Băile HerculaneSpa (including the Diana Springs) represent deeplycirculating meteoric waters that are upwelling alongstratigraphic boundaries or faults.
The water in the cave is milky due to suspended elementalsulfur and sub-millimeter thin gypsum rafts precipitating atits surface. The abundant sulfidic steam released by the hotwaters emerging from the Diana Springs condenses on thecolder bedrock surface. Subsequent oxidation/hydrolysis ofsulfides creates a sulfuric acid solution (pH between 2 and4.5), which reacts with the bedrocks to form a variety ofsulfates and controls the resulting cave steam-condensedweathering environment of the Diana Cave.
3. MethodsChemical analyses were performed using a JEOL 8900RSuperprobe electron microprobe (EMPA) instrument at theDepartment of Earth Sciences, Florida InternationalUniversity. The SEM investigations were carried out on aJEOL 6490 LV operated in low vacuum mode and equippedwith an EDS analytical system in the Lisa Muma WeitzImaging Core Laboratories (University of South Florida).Sulfur and oxygen isotopic composition of SO4
2- in bulksulfates and in specific minerals (hand picked under themicroscope) was measured in the Stable Isotope Laboratoryof the Department of Geology (USF) on a Delta V IsotopeRatio Mass Spectrometer (IRMS) using a CostechElemental Analyzer. Analytical conditions and methods forall these methods are available in Wynn et al. (2010), Onacet al. (2009, 2011, 2013), Pușcaș et al. (2013).
4. ResultsUsing the methods listed in the previous chapter, wepositively identified 14 minerals that belongs to the groupof native elements, halogenides, carbonates, and sulfates(Table 1).
Sulfur was first mentioned in this cave by Povară et al.(1972) covering the halotrichite earthy aggregates. Later, ithas been documented as tiny aggregates suspended in theupper part of the water column and as earthy massesassociated with other halotrichite-group minerals (Pușcașet al. 2013). The elemental sulfur forms when the sulphidesmobilized from deep anoxic reservoirs are rapidly oxidisedin the oxic section of the cave (see reactions below).
HS- + ½O2 + H+ ➤ S0 + H2O
2H2S + O2 ➤ 2S0 + 2H2O
Halite occurs as sub-millimeter crystals intermixed withtamarugite (Pușcaș et al. 2013). Its origin is most likelyrelated to the reaction between the Na+ in the Iuta marls andthe cave chloro-sodic thermal water (Diaconu 1974).
Calcite and aragonite are the only minerals in this cave thatare not related to the H2S-rich environment, beingprecipitated by the percolating waters entering the cave.
The first reported presence of anhydrite as a cave mineralcame from Diana Cave (Diaconu 1974), where it occurs asacicular and prismatic crystals closely associated withgypsum. Responsible for its precipitation seems to be thepresence in the CaSO4 solutions of high amounts of sodiumand magnesium. Gypsum is the primary speleogentic by-product in Diana Cave and it occurs as crusts, crystals,anthodites, moonmilk, and delicate rafts (Fig. 3a).
Halotrichite was one of the minerals identified and reportedby Povară et al. (1972). However, a year later Diaconu andMedeșan (1973) published a more detailed study of theyellowish-greenish efflorescences occurring on the Iutamarls suggesting that the mineral is in fact pickeringite. The
Figure 2. Map of the Diana Cave and the location of samples(∨,⩛); dashed line = Diana Fault; arrows = air circulation pattern(modified from Povară et al. 1972).
Table 1. Minerals identified in the Diana Cave, type of speleothemsthey form, and abundance (C: common; R: rare; VR: very rare).
Mineralname
Chemicalcomposition
Speleothem typeand frequency
Sulfur S earthy aggregates, CHalite NaCl crystals, RCalcite CaCO3 crusts; CAragonite CaCO3 crystals, RAlunite KAl3(SO4)(OH)6 efflorescences; RAnhydrite CaSO4 crystals; RApjohnite Mn2+Al2(SO4)4·22H2O efflorescences; CBassanite CaSO4·0.5H2O crystals, REpsomite MgSO4·7H2O crystals; RGypsum CaSO4·2H2O crusts, rafts, flowers; CHalotrichite Fe2+Al2(SO4)4·22H2O efflorescences; CPickeringite MgAl2(SO4)4·22H2O efflorescences; CRapidcreekite Ca2(SO4)(CO3)·4H2O crystals; VRTamarugite NaAl(SO4)2·6H2O earthy aggregates, R
Cave Mineralogy – oral 2013 ICS Proceedings
471
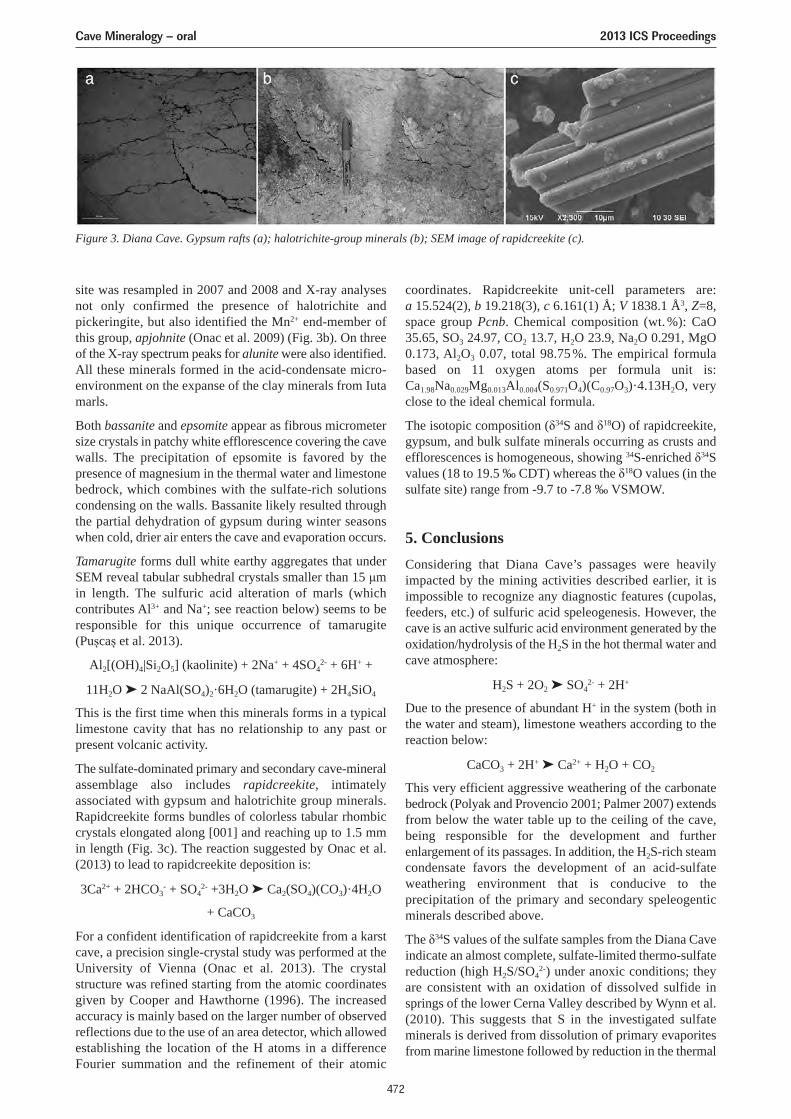
site was resampled in 2007 and 2008 and X-ray analysesnot only confirmed the presence of halotrichite andpickeringite, but also identified the Mn2+ end-member ofthis group, apjohnite (Onac et al. 2009) (Fig. 3b). On threeof the X-ray spectrum peaks for alunite were also identified.All these minerals formed in the acid-condensate micro-environment on the expanse of the clay minerals from Iutamarls.
Both bassanite and epsomite appear as fibrous micrometersize crystals in patchy white efflorescence covering the cavewalls. The precipitation of epsomite is favored by thepresence of magnesium in the thermal water and limestonebedrock, which combines with the sulfate-rich solutionscondensing on the walls. Bassanite likely resulted throughthe partial dehydration of gypsum during winter seasonswhen cold, drier air enters the cave and evaporation occurs.
Tamarugite forms dull white earthy aggregates that underSEM reveal tabular subhedral crystals smaller than 15 μmin length. The sulfuric acid alteration of marls (whichcontributes Al3+ and Na+; see reaction below) seems to beresponsible for this unique occurrence of tamarugite(Pușcaș et al. 2013).
Al2[(OH)4|Si2O5] (kaolinite) + 2Na+ + 4SO42- + 6H+ +
11H2O ➤ 2 NaAl(SO4)2·6H2O (tamarugite) + 2H4SiO4
This is the first time when this minerals forms in a typicallimestone cavity that has no relationship to any past orpresent volcanic activity.
The sulfate-dominated primary and secondary cave-mineralassemblage also includes rapidcreekite, intimatelyassociated with gypsum and halotrichite group minerals.Rapidcreekite forms bundles of colorless tabular rhombiccrystals elongated along [001] and reaching up to 1.5 mmin length (Fig. 3c). The reaction suggested by Onac et al.(2013) to lead to rapidcreekite deposition is:
3Ca2+ + 2HCO3- + SO4
2- +3H2O ➤ Ca2(SO4)(CO3)·4H2O
+ CaCO3
For a confident identification of rapidcreekite from a karstcave, a precision single-crystal study was performed at theUniversity of Vienna (Onac et al. 2013). The crystalstructure was refined starting from the atomic coordinatesgiven by Cooper and Hawthorne (1996). The increasedaccuracy is mainly based on the larger number of observedreflections due to the use of an area detector, which allowedestablishing the location of the H atoms in a differenceFourier summation and the refinement of their atomic
coordinates. Rapidcreekite unit-cell parameters are:a 15.524(2), b 19.218(3), c 6.161(1) Å; V 1838.1 Å3, Z=8,space group Pcnb. Chemical composition (wt. %): CaO35.65, SO3 24.97, CO2 13.7, H2O 23.9, Na2O 0.291, MgO0.173, Al2O3 0.07, total 98.75 %. The empirical formulabased on 11 oxygen atoms per formula unit is:Ca1.98Na0.029Mg0.013Al0.004(S0.971O4)(C0.97O3)·4.13H2O, veryclose to the ideal chemical formula.
The isotopic composition (δ34S and δ18O) of rapidcreekite,gypsum, and bulk sulfate minerals occurring as crusts andefflorescences is homogeneous, showing 34S-enriched δ34Svalues (18 to 19.5 ‰ CDT) whereas the δ18O values (in thesulfate site) range from -9.7 to -7.8 ‰ VSMOW.
5. ConclusionsConsidering that Diana Cave’s passages were heavilyimpacted by the mining activities described earlier, it isimpossible to recognize any diagnostic features (cupolas,feeders, etc.) of sulfuric acid speleogenesis. However, thecave is an active sulfuric acid environment generated by theoxidation/hydrolysis of the H2S in the hot thermal water andcave atmosphere:
H2S + 2O2 ➤ SO42- + 2H+
Due to the presence of abundant H+ in the system (both inthe water and steam), limestone weathers according to thereaction below:
CaCO3 + 2H+ ➤ Ca2+ + H2O + CO2
This very efficient aggressive weathering of the carbonatebedrock (Polyak and Provencio 2001; Palmer 2007) extendsfrom below the water table up to the ceiling of the cave,being responsible for the development and furtherenlargement of its passages. In addition, the H2S-rich steamcondensate favors the development of an acid-sulfateweathering environment that is conducive to theprecipitation of the primary and secondary speleogenticminerals described above.
The δ34S values of the sulfate samples from the Diana Caveindicate an almost complete, sulfate-limited thermo-sulfatereduction (high H2S/SO4
2-) under anoxic conditions; theyare consistent with an oxidation of dissolved sulfide insprings of the lower Cerna Valley described by Wynn et al.(2010). This suggests that S in the investigated sulfateminerals is derived from dissolution of primary evaporitesfrom marine limestone followed by reduction in the thermal
Figure 3. Diana Cave. Gypsum rafts (a); halotrichite-group minerals (b); SEM image of rapidcreekite (c).
Cave Mineralogy – oral 2013 ICS Proceedings
472
aquifer and re-oxidation in the cave atmosphere. The δ18Ovalues of the sulfate minerals indicate an abundant 18Oexchange with H2O(l) during hydration and near completeexclusion of oxygen derived from O2(aq) in sulfate mineralsfrom the Diana Cave (Onac et al. 2011).
The results reported in this note provide further evidencethat apart from expected speleogentic primary by-productminerals such are gypsum and alunite, other rarer phases(i.e. tamarugite and rapidcreekite) precipitate in the sulfide-rich steam condensate environment of Diana Cave ifoptimal pH, geochemical ingredients, and relative humidityconditions are met. These settings, however, are essentiallydifferent from other non-carbonate caves or terrestrialrecords previously documented for the last two minerals.
AcknowledgmentsThe Domogled-Valea Cernei National Park grantedapproval to collect samples for analysis. Dr. C. Marin fromthe “Emil Racoviţă” Institute of Speleology and G. Ponta(PELA) offered many insights into Cerna Valleyhydrochemistry; S.C. Hercules S.A. Vera Dârmiceanu,Lucian Nicoliţă, S. Bucur, E. Primejdie, Z. Puşcaş, C.Stremţan, Daniel Vereş, and C. Cizmaş assisted us duringthe field campaigns. M. Pușcaș acknowledges the financialsupport through POSDRU 6/1.5/S/3–“Doctoral studies:through science towards society”. The Romanian NationalUniversity Research Council (grant ID_544 to Onac)contributed funds for this research.
ReferencesBalintoni I, Balica C, Ducea MN, Hann HP, Șabliovschi V, 2010.
The anatomy of a Gondwanan terrane: The Neoproterozoic-Ordovician basement of the pre-Alpine Sebeş-Lotru compositeterrane (South Carpathians, Romania). Gond. Res., 17,561–572.
Cooper MA, Hawthorne FC, 1996. The crystal structure ofrapidcreekite, Ca2(SO4)(CO3)(H2O)4, and its relation to thestructure of gypsum. Can. Mineral., 34, 99–106.
Diaconu G, 1974. Quelques considérations sur la présence del’anhydrite dans la grotte “Pestera Diana” (Băile Herculane-Roumanie). Trav. Inst. Spéol. “E. Racovitza”, XIII, 191–194.
Diaconu G, Medeşan A, 1973. Sur la présence de pickeringite dansla grotte Diana (Băile Herculane, Roumanie). Trav. Inst. Spéol.“E. Racovitza”, XII, 303–309.
Hill CA, Forti P, 1997. Cave minerals of the world. NationalSpeleological Society, Huntsville, Alabama.
Marin C, 1984. Hydrochemical considerations in the lower Cernariver basin. Theor. Appl. Karstol., 1, 173–182.
Năstăseanu SV, 1980. Géologie des Monts Cerna. AnuarulInstitutului de Geologie şi Geofizică, LIV, 153–280.
Onac BP, 2012. Minerals. In: WB White and DC Culver (Eds.).Encyclopedia of Caves, Academic Press, Chennai, pp. 499–508.
Onac BP, Forti P, 2011a. Minerogenetic mechanisms occurring inthe cave environment: an overview. Int. J. Speleol., 40, 79–98.
Onac BP, Forti P, 2011b. State of the art and challenges in caveminerals studies. Studia UBB Geologia, 56, 33–42.
Onac BP, Puşcaş CM, Effenberger HS, Wynn JG, Povară I, 2013.Rapidcreekite in the sulfuric acid weathering environment ofDiana Cave, Romania. Am. Mineral., accepted.
Onac BP, Sumrall J, Tămaş T, Povară I, Kearns J, Dârmiceanu V,Vereş D, Lascu C, 2009. The relationship between caveminerals and hypogene activity along the Cerna Valley (SWRomania). Acta Carsologica, 38, 67–79.
Onac BP, Wynn JG, Sumrall JB, 2011. Tracing the sources of cavesulfates: a unique case from Cerna Valley, Romania. Chem.Geol., 288, 105–114.
Palmer AN, 2007. Cave Geology. Cave Books, Dayton.
Polyak VJ, Provencio P, 2001. By-product materials related toH2S-H2SO4 influenced speleogenesis of Carlsbad, Lechuguilla,and other caves of the Guadalupe Mountains, New Mexico.Journal of Cave and Karst Studies, 63(1), 23–32.
Povară I, Diaconu G, Goran C, 1972. Observations préliminairessur les grottes influencées par les eaux thermo-minérales de lazone Băile-Herculane. Trav. Inst. Spéol. “Emile Racovitza”,XI, 355–365.
Povară I, Simion G, Marin M, 2008. Thermo-mineral waters fromthe Cerna Valley Basin (Romania). Studia UBB, Geologia, 53,41–54.
Puşcaş CM, Onac BP, Effenberger HS, Povară I, 2013. Acid-sulphate alteration origin of tamarugite in a typical karstsetting: Diana Cave, Romania. Eur. J. Mineral., DOI:10.1127/0935-1221/2013/0025-2294.
Wynn JG, Sumrall JG, Onac BP, 2010. Sulfur isotopiccomposition and the source of dissolved sulfur species inthermo-mineral springs of the Cerna Valley, Romania. Chem.Geol., 271, 31–43.
Cave Mineralogy – oral 2013 ICS Proceedings
473
THE LIFE CYCLE OF SPELEOTHEMS,WITH POSSIBLE IMPLICATIONS FOR RADIOMETRIC DATING
Charles SelfUniversity of Bristol Spelaeological Society, UK, [email protected]
1. IntroductionThe study of the origin and evolution of mineral bodies istermed genetic mineralogy and includes nucleation,initiation on a growth surface, development, alteration anddisintegration (Grigor’ev 1961). Genetic mineralogy hastwo branches: phylogeny is the study of mineral species andtheir paragenesis (i.e. their contemporary growth with othermineral species); ontogeny is the study of individualcrystals (mineral individuals), how these combine asaggregates, and their development as physical bodies.Ontogeny can only be applied to minor mineral bodies, i.e.those that have a “through” structure and/or texture (definedbelow) and are a product of synchronous crystallization orrecrystallization in some geometrically defined space. Mostspeleothems are minor mineral bodies and so can be studiedby mineralogic techniques such as ontogeny; onlyspelothems that have gone through more than one cycle ofgrowth need be studied by petrographic techniques.
It is possible to recognise four levels of organisation ofminor mineral bodies. At the first level are individualswhich grow from a single crystal nucleus during one phaseof crystallization and which have a continuouscrystallographic structure. At the second level areaggregates made from several (often many) of theseindividuals; most single speleothems are aggregates. At thethird level the Russian term kora (meaning “crust”) is usedto link similar aggregates growing at the same time in thesame crystallization space; an example is the stalactite/stalagmite kora, which is such a familiar feature of the cavelandscape. An ensemble is the fourth hierarchy level and isnecessary because each cycle of growth begins wet andbecomes steadily drier (Stepanov 1999); in this way
stalactites of the gravitational water environment becomeovergrown by corallites of the capillary film environment.Some old speleothems have gone through two or morecycles of growth; for these mineral bodies, each cycle mustbe considered separately.
The terms structure and texture have very precise meaningsin ontogeny. Structure describes the physical nature ofcrystal individuals and their bonding, while texturedescribes the geometric aspects of construction ofaggregates made from these individuals. “Through”structure therefore means that an aggregate is made fromindividuals that have a similar structure. “Through” texturemeans that a kora describes aggregates with a similartexture that are growing independently and near to eachother. In this way, the rules governing the growth ofindividuals and aggregates also apply to the higherhierarchy levels. This introduction is intended as a briefoverview of the main terms and concepts of ontogeny. Fora detailed report, see Self and Hill (2003); for a moreconcise version, see Self (2004) or Self and Hill (2005a).For a modern crystallographic assessment of ontogeny, seeWhite (2012).
2. The life cycle of speleothems2.1. Nucleation and initiation
Nucleation (in free space) and initiation (on a growthsurface) are alternative beginnings for a minor mineralbody. For homogeneous nucleation, forming directly fromthe liquid, there is an energy barrier that needs to beovercome to create a solid/liquid interface; this requires a
All speleothems have a natural life cycle, which begins with their initiation as a crystal embryo (crystallite). As a crystallitegrows and becomes a crystal, it now needs to compete with other crystals for growth space and the supply of new material.Some crystals are competitively successful and continue their development, while others are not and their growth ceases.This process is known as selection. The successful crystal individuals have a distinct pattern of boundaries withneighbouring crystals (called texture) and the combined mineral body is now an aggregate. Most speleothems are mineralaggregates.
There are four main factors which control the growth of a speleothem: the chemistry of the supply solution generallydetermines the mineral species; supersaturation determines the size and structure of the mineral individuals from which itis constructed; characteristic (Curie) symmetry controls texture and therefore what type of aggregate is formed; geometryof supply determines the speleothem’s morphology. As a speleothem ages it may undergo alteration, either by replacement(with another mineral species) or by recrystallization. The ultimate fate of any speleothem is disintegration, either bysolution or mechanical erosion.
Diagenesis poses a serious problem for palaeo-environmental studies. Partial dissolution of speleothems causesmicritization within crystals, with selective dissolution based on trace element chemistry. During recrystallization, thecave water may introduce new material, or leach away trace elements such as uranium. The destruction of structure ascrystal boundaries are erased can bring sedimentary impurities such as thorium within the body of the new crystal. In thisway uranium and its daughter fission products become separated and the homogeneity of the sample is lost. Petrographicand geochemical screening may be necessary before attempting radiometric dating of old speleothems.
Cave Mineralogy – oral 2013 ICS Proceedings
474
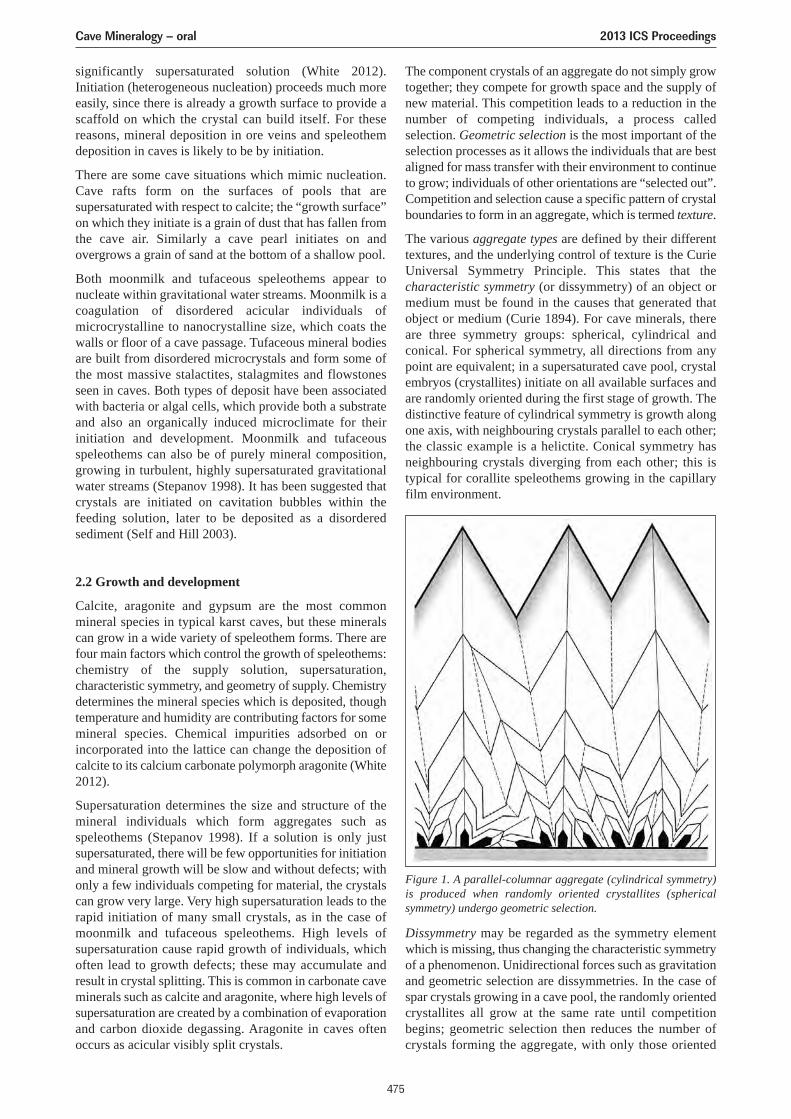
significantly supersaturated solution (White 2012).Initiation (heterogeneous nucleation) proceeds much moreeasily, since there is already a growth surface to provide ascaffold on which the crystal can build itself. For thesereasons, mineral deposition in ore veins and speleothemdeposition in caves is likely to be by initiation.
There are some cave situations which mimic nucleation.Cave rafts form on the surfaces of pools that aresupersaturated with respect to calcite; the “growth surface”on which they initiate is a grain of dust that has fallen fromthe cave air. Similarly a cave pearl initiates on andovergrows a grain of sand at the bottom of a shallow pool.
Both moonmilk and tufaceous speleothems appear tonucleate within gravitational water streams. Moonmilk is acoagulation of disordered acicular individuals ofmicrocrystalline to nanocrystalline size, which coats thewalls or floor of a cave passage. Tufaceous mineral bodiesare built from disordered microcrystals and form some ofthe most massive stalactites, stalagmites and flowstonesseen in caves. Both types of deposit have been associatedwith bacteria or algal cells, which provide both a substrateand also an organically induced microclimate for theirinitiation and development. Moonmilk and tufaceousspeleothems can also be of purely mineral composition,growing in turbulent, highly supersaturated gravitationalwater streams (Stepanov 1998). It has been suggested thatcrystals are initiated on cavitation bubbles within thefeeding solution, later to be deposited as a disorderedsediment (Self and Hill 2003).
2.2 Growth and development
Calcite, aragonite and gypsum are the most commonmineral species in typical karst caves, but these mineralscan grow in a wide variety of speleothem forms. There arefour main factors which control the growth of speleothems:chemistry of the supply solution, supersaturation,characteristic symmetry, and geometry of supply. Chemistrydetermines the mineral species which is deposited, thoughtemperature and humidity are contributing factors for somemineral species. Chemical impurities adsorbed on orincorporated into the lattice can change the deposition ofcalcite to its calcium carbonate polymorph aragonite (White2012).
Supersaturation determines the size and structure of themineral individuals which form aggregates such asspeleothems (Stepanov 1998). If a solution is only justsupersaturated, there will be few opportunities for initiationand mineral growth will be slow and without defects; withonly a few individuals competing for material, the crystalscan grow very large. Very high supersaturation leads to therapid initiation of many small crystals, as in the case ofmoonmilk and tufaceous speleothems. High levels ofsupersaturation cause rapid growth of individuals, whichoften lead to growth defects; these may accumulate andresult in crystal splitting. This is common in carbonate caveminerals such as calcite and aragonite, where high levels ofsupersaturation are created by a combination of evaporationand carbon dioxide degassing. Aragonite in caves oftenoccurs as acicular visibly split crystals.
The component crystals of an aggregate do not simply growtogether; they compete for growth space and the supply ofnew material. This competition leads to a reduction in thenumber of competing individuals, a process calledselection. Geometric selection is the most important of theselection processes as it allows the individuals that are bestaligned for mass transfer with their environment to continueto grow; individuals of other orientations are “selected out”.Competition and selection cause a specific pattern of crystalboundaries to form in an aggregate, which is termed texture.
The various aggregate types are defined by their differenttextures, and the underlying control of texture is the CurieUniversal Symmetry Principle. This states that thecharacteristic symmetry (or dissymmetry) of an object ormedium must be found in the causes that generated thatobject or medium (Curie 1894). For cave minerals, thereare three symmetry groups: spherical, cylindrical andconical. For spherical symmetry, all directions from anypoint are equivalent; in a supersaturated cave pool, crystalembryos (crystallites) initiate on all available surfaces andare randomly oriented during the first stage of growth. Thedistinctive feature of cylindrical symmetry is growth alongone axis, with neighbouring crystals parallel to each other;the classic example is a helictite. Conical symmetry hasneighbouring crystals diverging from each other; this istypical for corallite speleothems growing in the capillaryfilm environment.
Dissymmetry may be regarded as the symmetry elementwhich is missing, thus changing the characteristic symmetryof a phenomenon. Unidirectional forces such as gravitationand geometric selection are dissymmetries. In the case ofspar crystals growing in a cave pool, the randomly orientedcrystallites all grow at the same rate until competitionbegins; geometric selection then reduces the number ofcrystals forming the aggregate, with only those oriented
Figure 1. A parallel-columnar aggregate (cylindrical symmetry)is produced when randomly oriented crystallites (sphericalsymmetry) undergo geometric selection.
Cave Mineralogy – oral 2013 ICS Proceedings
475
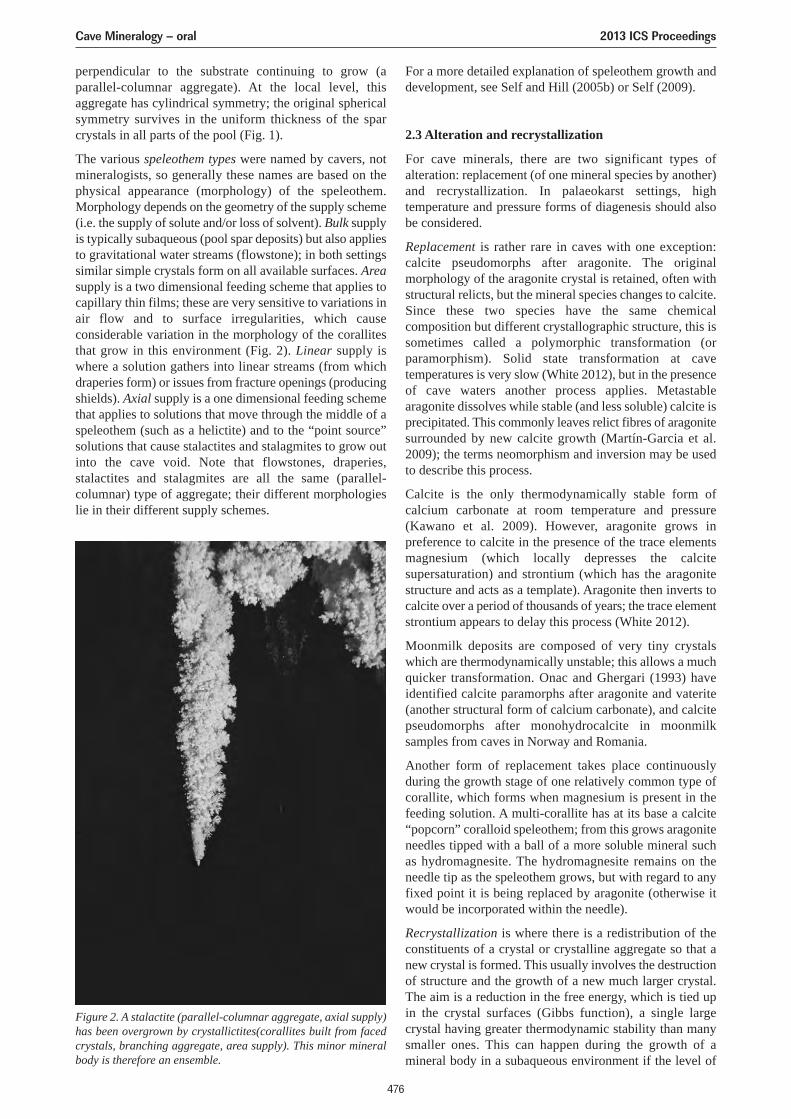
perpendicular to the substrate continuing to grow (aparallel-columnar aggregate). At the local level, thisaggregate has cylindrical symmetry; the original sphericalsymmetry survives in the uniform thickness of the sparcrystals in all parts of the pool (Fig. 1).
The various speleothem types were named by cavers, notmineralogists, so generally these names are based on thephysical appearance (morphology) of the speleothem.Morphology depends on the geometry of the supply scheme(i.e. the supply of solute and/or loss of solvent). Bulk supplyis typically subaqueous (pool spar deposits) but also appliesto gravitational water streams (flowstone); in both settingssimilar simple crystals form on all available surfaces. Areasupply is a two dimensional feeding scheme that applies tocapillary thin films; these are very sensitive to variations inair flow and to surface irregularities, which causeconsiderable variation in the morphology of the corallitesthat grow in this environment (Fig. 2). Linear supply iswhere a solution gathers into linear streams (from whichdraperies form) or issues from fracture openings (producingshields). Axial supply is a one dimensional feeding schemethat applies to solutions that move through the middle of aspeleothem (such as a helictite) and to the “point source”solutions that cause stalactites and stalagmites to grow outinto the cave void. Note that flowstones, draperies,stalactites and stalagmites are all the same (parallel-columnar) type of aggregate; their different morphologieslie in their different supply schemes.
For a more detailed explanation of speleothem growth anddevelopment, see Self and Hill (2005b) or Self (2009).
2.3 Alteration and recrystallization
For cave minerals, there are two significant types ofalteration: replacement (of one mineral species by another)and recrystallization. In palaeokarst settings, hightemperature and pressure forms of diagenesis should alsobe considered.
Replacement is rather rare in caves with one exception:calcite pseudomorphs after aragonite. The originalmorphology of the aragonite crystal is retained, often withstructural relicts, but the mineral species changes to calcite.Since these two species have the same chemicalcomposition but different crystallographic structure, this issometimes called a polymorphic transformation (orparamorphism). Solid state transformation at cavetemperatures is very slow (White 2012), but in the presenceof cave waters another process applies. Metastablearagonite dissolves while stable (and less soluble) calcite isprecipitated. This commonly leaves relict fibres of aragonitesurrounded by new calcite growth (Martín-Garcia et al.2009); the terms neomorphism and inversion may be usedto describe this process.
Calcite is the only thermodynamically stable form ofcalcium carbonate at room temperature and pressure(Kawano et al. 2009). However, aragonite grows inpreference to calcite in the presence of the trace elementsmagnesium (which locally depresses the calcitesupersaturation) and strontium (which has the aragonitestructure and acts as a template). Aragonite then inverts tocalcite over a period of thousands of years; the trace elementstrontium appears to delay this process (White 2012).
Moonmilk deposits are composed of very tiny crystalswhich are thermodynamically unstable; this allows a muchquicker transformation. Onac and Ghergari (1993) haveidentified calcite paramorphs after aragonite and vaterite(another structural form of calcium carbonate), and calcitepseudomorphs after monohydrocalcite in moonmilksamples from caves in Norway and Romania.
Another form of replacement takes place continuouslyduring the growth stage of one relatively common type ofcorallite, which forms when magnesium is present in thefeeding solution. A multi-corallite has at its base a calcite“popcorn” coralloid speleothem; from this grows aragoniteneedles tipped with a ball of a more soluble mineral suchas hydromagnesite. The hydromagnesite remains on theneedle tip as the speleothem grows, but with regard to anyfixed point it is being replaced by aragonite (otherwise itwould be incorporated within the needle).
Recrystallization is where there is a redistribution of theconstituents of a crystal or crystalline aggregate so that anew crystal is formed. This usually involves the destructionof structure and the growth of a new much larger crystal.The aim is a reduction in the free energy, which is tied upin the crystal surfaces (Gibbs function), a single largecrystal having greater thermodynamic stability than manysmaller ones. This can happen during the growth of amineral body in a subaqueous environment if the level of
Figure 2. A stalactite (parallel-columnar aggregate, axial supply)has been overgrown by crystallictites(corallites built from facedcrystals, branching aggregate, area supply). This minor mineralbody is therefore an ensemble.
Cave Mineralogy – oral 2013 ICS Proceedings
476
supersaturation is very low. The solution remainssupersaturated with respect to large crystals, but becomesundersaturated with respect to small ones (because the ratioof mass/surface energy is a function of size). Small crystalsdissolve while large ones continue to grow, thus minimizingthe stored energy (Grigor’ev 1961). This is particularlyrelevant to the growth of readily soluble minerals such asgypsum.
Recrystallization during growth is a feature of conicalstalactites: skeleton crystals are formed at the growth tipduring disconnection of each drip; these later recrystallizeinto the central monocrystalline tube which is alwayspresent in crystalline stalactites.
Recrystallization of older calcite speleothems is verycommon in caves, though most stalactites, stalagmites andflowstones retain their structures for hundreds of thousandsof years. When recrystallization begins, this is sometimesvisible on the surface of the speleothem, which developshighly reflective, plate-like facets. One side effect ofrecrystallization is that the speleothem develops a simplertexture, which greatly reduces its shear and tensilestrengths; as a result, it is weaker and much more prone todestruction.
2.4 Destruction and disintegration
There are occasions where the processes of destruction anddisintegration of a mineral body are incomplete. In acountry prone to earthquakes, broken stalactites andstalagmites may litter the floor of a cave; this is destruction,but not disintegration. New stalagmites may grow on thetilted remains of the old, the cave environmental conditionsnot having changed. Both the old and the new speleothemsare still part of the same stalactite/stalagmite kora, havingthe same structural and textural regularities, but noworganized in a more complex manner.
Crystallization environments in caves evolve, becomingsuccessively drier until a new wet phase marks the start ofa new growth cycle (Stepanov 1999). These cycles are notalways complete, but the sequence remains the same. At theend of one cycle of growth, a new one may begin withfurther deposition of material rather than partial or completedissolution of the earlier mineral body. In this way, morecomplex mineral bodies may form.
Partial dissolution is a very important diagenetic processthat can affect the rock surfaces of a cave (Zupan Hajna2003) and also its speleothems (Martín-Garcia et al. 2009).This process is also known as micritization, from the sizeof the particles left behind. For aragonite speleothems, thereappears to be preferential dissolution of crystals (or zoneswithin crystals) with a high Sr content; for calcitespeleothems, it is zones with a high Mg content. There mayalso be a change in the stable isotope signatures of carbonand oxygen in the remaining micrite, as lighter isotopeshave a greater mobility (Martín-Garcia et al. 2009).
The ultimate fate of any minor mineral body isdisintegration, whether by solution or mechanical erosion.It may take many millions of years, or (in the case of icefrostwork) it can happen overnight.
3. Radiometric dating of speleothemsThe primary assumption for all radiometric dating ofspeleothems is that the material being tested ishomogeneous. The feeding solutions that form carbonatespeleothems have traces of uranium in solution which isincorporated into the crystal lattice. Small sedimentaryinclusions containing the element thorium, which is notwater soluble, are also sometimes incorporated into thegrowing crystal. 234Uranium decays to 230Thorium at a fixedrate, so the proportion of the two elements in a speleothemsample gives its age. Sedimentary thorium contains amixture of isotopes, including 230Thorium but, provided thequantity of impurity is small, it is possible to calculate theproportion that formed within the sample by radioactivedecay. On this basis, the sample can be consideredhomogeneous and the calculated age reliable.
Diagenesis changes everything. During partial dissolution,the trace element and stable isotope chemistry of aspeleothem can change, making the sample unsuitable forpalaeo-environmental studies. During replacement andrecrystallization, the cave water may introduce new materialwith a different chemistry. The destruction of structuremeans that crystal boundaries, where insoluble impuritiesmight be expected, may become incorporated into a newand larger crystal. Some parts of the new crystal will appear“clean”, while other parts will be full of impurities. Overlonger periods of time, the new crystal lattice actively triesto eject material that does not conform: this is known ascollecting recrystallization and is very obvious in mineralveins, where dark metallic and pale gangue minerals areclearly separated (Stepanov 1998).
The problem for radiometric studies is that sedimentary andradiogenic thorium will collect together as recrystallizationprogresses. Uranium is more mobile and may be leachedfrom the calcite lattice structure. This means that theuranium and its daughter fission products becomeseparated, and homogeneity of the sample is lost. Wherethere is a suspicion that recrystallization has taken place,petrographic and geochemical screening should be used todetermine if a sample is of primary origin (Bruce Railsbacket al. 2002). Coarse clear columnar calcite and wide rangesof uranium concentration in the same specimen are usefulwarning signs.
This conclusion applies to other uranium series datingtechniques, such as uranium-lead, since thorium is a link inthe chain of radioactive decay. The great age that the U/Pbtechnique is able to measure means that many of thespeleothems being tested are likely to have recrystallized.The trend towards smaller sample sizes means that localinhomogeneities should be more clearly apparent, but onlyif there are multiple tests of the same sample. This subjectwarrants further investigation.
ReferencesBruce Railsback L, Dabous AA, Osmond JK, Fleisher CJ, 2002.
Petrographic and geochemical screening of speleothems forU-series dating: an example from recrystallized speleothemsfrom Wadi Sannur Cavern, Egypt. Journal of Cave and KarstStudies, 64, 108–116.
Cave Mineralogy – oral 2013 ICS Proceedings
477
Curie P, 1894. Sur la symetrie dans les phenomenes physiques,symetrie d’un champ electrique et d’un champ magnitique.Journal de Physics, 3, 3, 395–415 (In French).
Grigor’ev DP, 1961, Ontogeny of minerals. Lvov, Izdatel’stvoL’vovskogo Univ. (In Russian). English translation 1965, IsraelProgram for Scientific Translations.
Kawano J, Shimobayashi N, Miyake A, Kitamura M, 2009.Precipitation diagram of calcium carbonate polymorphs: itsconstruction and significance. Journal of Physics: CondensedMatter, 21, 1–6.
Martín-Garcia R, Alonso-Zarza A, Martín-Pérez A, 2009. Loss ofprimary texture and geochemical signatures in speleothems dueto diagenesis: Evidences from Castañar Cave, Spain.Sedimentary Geology, 221, 141–149.
Onac BP, Ghergari L, 1993. Moonmilk mineralogy in someRomanian and Norwegian caves. Cave Science, 20, 107–111.
Self CA, 2004. The internal organization of speleothems. ActaCarsologica, 33, 245–255.
Self CA, 2009. Which features of the cave environment controlthe growth of speleothems? Proc. 15th ICS, Kerrville, Texas,USA, pp. 332–337.
Self CA, Hill CA, 2003. How speleothems grow: An introductionto the ontogeny of cave minerals. Journal of Cave and KarstStudies, 65, 130–151.
Self CA, Hill CA, 2005a. An introduction to genetic mineralogyand the concept of “ontogeny of cave minerals”. Proc. 14th ICS,Athens, Greece, pp 125–129.
Self CA, Hill CA, 2005b. How geometric factors determine whichtype of speleothem will grow in a cave environment. Proc. 14th
ICS, Athens, Greece, pp. 318–321.
Stepanov VI, 1998. Notes on mineral growth from the archive ofV. I. Stepanov (1924–1988). Proceedings of the University ofBristol Spelaeological Society, 21, 25–42.
Stepanov VI, 1999. Periodicity of crystallization processes in karstcaves. Cave Geology, 2, 209–220.
White WB, 2012. Speleothem microstructure/speleothemontogeny: a review of Western contributions. InternationalJournal of Speleology, 41, 329–358.
Zupan Hajna N, 2003. Incomplete solution: weathering of cavewalls and the production, transport and deposition of carbonatefines. ZRC SAZU, Postojna-Ljubljana.
Cave Mineralogy – oral 2013 ICS Proceedings
478
SPELEOTHEMS IN CAVITIES DEVELOPED IN MAGMATIC ROCKS
Juan Ramón Vidal-Romaní, Jorge Sanjurjo-Sánchez, Marcos Vaqueiro-Rodríguez, Laura González-López,María José López-Galindo1
1University Institute of Geology, Campus de Elviña s/n 15071, Coruña, Spain, [email protected]
Four types of natural cavities in magmatic rocks are known: (1) developed along fracture planes, (2) associated withresidual block fields, (3) tafone, and (4) lava tube. These openings are the only access for the runoff toward inside therocky massif. The water flows always of low velocity (trickles) weather the rock forming small fissural regoliths that aremoved by the water and then deposited, giving rise to granular detrital accumulations (primary speleothems) of openworktexture. The porous system of these sediments is the temporal refuge for different microorganisms (bacteria, algae, fungi,testate amoebae, spores, diatoms, collembola and mites, etc.), which inhabit the cavity during the humid stage. Theirorganic activity provides the water with metabolic compounds able to solubilise ions, mainly Si, of the rock withoutchanges in pH which in the dry stage will precipitate by oversaturation as opal-A and other authigenic minerals that willnot only contribute to cement the primary speleothems but also to form the secondary speleothems. The shape of thespeleothems, either cylindrical or planar, is mainly defined by the way of the water circulation at low velocity by dripping,capillarity, foam-drops like textures or by laminar flow. The relationship between the microbiological activity and theprocesses of weathering, dissolution and sedimentation justifies their name as biospeleothems.
1. IntroductionThe speleothems studied in this paper are formed during thewater circulation at low velocity (trickles) through thefissural system of massifs of igneous rocks. In the water/rockcontact the physical weathering produces a heterometricdetrital aggregate of mineral grains which are first movedby the water as a hydro-suspension (slurry) and thendeposited on the walls, floor or ceiling of the cave. Thesetypes of speleothems may be considered as residualmaterials because they derive from the rocky substratum ofthe cavity, but other authigenic species are associated withthem, i.e. generated in the same cave at room temperatureas amorphous opal, evansite, bolivarite, struvite, pigotite,taranakite, allophane, hematite, goethite. The most commonmineral species among these is the amorphous opal (calledcoralloid in the old works (Caldcleugh 1829; Swarzlow andKeller 1937), though here the term opal-A is used (VidalRomaní et al. 2010). An additional feature of the silicahydrogel from which the opal-A speleothems are formed isthat it may be the base for the formation of new authigenicmineral species called whiskers (Twidale and Vidal Romaní2005). Whiskers twined crystalline aggregates of mineralspecies such as halite, gypsum, siderite, cerussite, plumbeanaragonite, malachite, etc., though this list is growing everyday more. However, in the caves developed in basic igneousrocks (gabbros, diorites, peridotites, basalts), the amorphousopal speleothems are not very frequent, other minerals, alsoauthigenic, as the carbonates of Ca, Mg, Fe, Pb, etc. beinghabitual. All these minerals were described in caves of verydifferent rock types and varied geographic-climaticenvironments: temperate humid, arid to cold regions (Spain,Portugal, Azof speleothems in cavities in magmaticrocksores Islands, United Kingdom, Germany, Poland,Czech Republic, Sweden, Finland, Corea), tropical (Brazil,Venezuela, Madagascar), arid (South Australia, Argentina,Nigeria, Botswana, Mexico, U.S.A., etc) (Willems et al.1998, 2002; Twidale and Vidal Romaní 2005; Vidal Romaníet al. 2010).
2. Morphological features of the speleothemsSpeleothems are not only differentiated by theirmineralogical composition but also by their morphology.For example, carbonates or whiskers associated with theamorphous opal speleothems are always presented ascrystals of high idiomorphy in spite of their small size. Onthe contrary, the amorphous mineral species are adapted tothe relief of the surface on which they deposit, and theirmorphology is related to the features of the dynamics of thefluid, which originates the speleothem.
The following types of speleothems in cavities in magmaticrocks are distinguished:
2.1. Cylindrical speleothems
They are associated with water movement either by drippingor capillarity. There are different types as follows:
Stalactites s.s.: they are formed on the upper part of rockfissures (the ceiling or eaves of cavities) when the weightof the drop overcomes the superficial stress (then drippingis produced).
Grass-shaped speleothems: multiple associations of verythin (maximum 1 mm) cylindrical forms and associatedwith the ceiling, walls or floor of cavities. Thesespeleothems grow by deposition associated with capillarymovements of the water through the agglomerate mass ofclastic accumulations of angular grains soaked with water.
Anti-stalactites: These individual speleothems (VidalRomaní and Vilaplana 1984) grow by capillary movementsof the water from a clast grain mineral agglomerate soakedin water. They are usually thicker (up to 4 mm of diameter)and reach longitudinal developments between 4 and 10 mm.
Stalagmites s.s.: these speleothems are infrequent in theigneous rock caves. They are formed by the precipitationof the substances dissolved or dragged by the water whichfall from the stalactites s.s.
Cave Mineralogy – oral 2013 ICS Proceedings
479
Club-like stromatolites s.l.: they are formed by the growthof biofilms of blue-green algae while there is humidityinside the cave. When the environment dries, the algaetransform into the substratum of the new generation of algaethat will grow in the following humid stage.
2.2. Planar speleothems
They may normally appear associated on any flat, low reliefsurface (either ceiling or floor) but even in subverticalsurfaces as far as they do not overpass the threshold ofdripping, which is given by the stress adherence of the waterto the cave rocky surfaces. Different types of planarspeleothems are distinguished:
Flowstone, rimstones and microgours: they are continuouscovers of the cave rocky surface with variable thicknessesand may also hide the rock micro rugosity. They aredisordered accumulations of mineral clasts pushed by thewater layer during the humid phases marked by linealaccumulations with sinuous shape behind the ones that mayeven hold water temporarily. Flowstones, rimstones andassociated pool (microgour) are associated with flat (eitherceiling or floor), gentle-sloped and inclined or evensubvertical surfaces when the flow speed does not overpassthe threshold of water-rock superficial adherence in thetrickles.
Water drop structures: they are similar to the foam-likestructures formed on the upper part of the beach when anadvance front of the water layer is individualized into smalldrops. They are associated with the ceiling of the cavitywhere the water is divided into small drops, which, bysuperficial stress, attract a thin coat of clasts of mineralsthat the water evaporation will cement as opal-A allowingthe conservation of the morphology of the drop.
3. MethodsDifferent analytical techniques have been used to studythese speleothems: ICP Mass Spectroscopy, XRD, XRF,and mainly SEM; all of them, but the last, are destructiveanalytical methods. Though SEM gives morphologicalinformation (texture, structure, morphometry of grains), italso gives data of elemental composition with thebackscattered X-R. From the first works (Caldcleugh 1829)these speleothems were considered to be formed by waterdripping ignoring the existence of other types ofspeleothems. In this work, the information obtained byStereoscopic Microscopy is included, allowing toestablishing the complete sequence of formation ofspeleothems.
4. Results and discussionThe following stages are distinguished in the formation ofspeleothems: (1) accumulation of the granular materialcoming from the fissure regolith and transported by water;(2) first colonisation by microorganisms as bacteria, algae,fungi, amoebae, collembola and mites; (3) formation,dissolution and precipitation of amorphous opal; and (4)formation of whiskers from the silica hydrogel. The activity
of these microorganisms promotes the dissolution of Si,mainly, (Ehrlich 1996) providing with low molecularweight organic acids (mainly oxalates) with chelant abilitywithout pH changes (McMahon and Chapelle 1991; Barkeret al. 1997). Later, the dissolved Si precipitates asamorphous opal SiO2·15(H2O), 100 times more soluble inwater converting the generation of speleothems into acontinuous process always depending on the watercirculation through the fissure system. Each time it rainsagain, the re-circulation of water through the fissural systemof the rocky massif produces the re-dissolution of theamorphous opal and its later re-precipitation. This phase inthe evolution of the speleothem is favourable for the growthof authigenic minerals of small size, whiskers, which arelocated on the points where water accumulates; for thecylindrical speleothems on their final edge and for theplanar speleothems or flowstone in the places where thewater accumulates in the microgour or pool. Themineralogy of these whiskers is very varied: gypsum,carbonates, halides, though the most common is gypsum(CaSO4
.2H2O). In some cases, whiskers appear as isolatedindividuals except for gypsum which always gives nicetwinned crystalline associations in physical continuity, withdeposits of opal-A. Some authors attribute the presence ofS necessary for the formation of gypsum to the activity ofmicroorganisms (Franklin et al. 1994; Welch and Ulllman1996) which are able to produce sulphate oxides fromoxidation of organic matter, this latter invariably associatedwith the zones where the speleothems are observed (VidalRomaní et al. 2003). Some authors (García Ruíz andMigues 1982) achieved to reproduce the process inlaboratory using a silica hydrogel base to obtain the growthof crystals of different substances in very lowconcentrations. In the cavities of igneous rocks, gypsumwhiskers are normally found, but also, in accordance withour own observations, whiskers of calcite, aragonite,plumboaragonite and phosphates are also formed. Someauthors (Van Rosmalen and Marcheé 1976) explain thediverse morphology of the gypsum whiskers formed fromsilica hydrogel by the presence of different additives orimpurities. The lowest abundance of opal-A speleothems issymptomatic in cavities (e.g., lava tube) (Woo et al. 2008)developed in basic igneous rocks (syenites, granodiorites,diabases, etc.) and their physical association with calcitecrystals obviously formed (Beinlich and Austrheim 2012)by combination of CO2 dissolved in water with brucite orother carbonates existing in the rock. At pressure and roomtemperature, Si does not form stable crystalline structuresbut minerals of low temperature (opal-A) slowly evolvetoward more stable polymorphs of silica as opal-CT(Bustillo 1995). Notwithstanding, the first essays to dateopal-A speleothems by OSL (Sanjurjo and Vidal Romaní2011) seem to indicate that at least in some climaticenvironments the transition Opal-A to Opal-CT may bedelayed many thousands of years.
These types of microenvironments developed in the poroussystem of the speleothems either cylindrical or flowstoneswith their small gours where water is kept temporarily area very suitable environment for the development ofmicroorganisms which develop their vital cycle while waterremains. Their disappearance by evaporation during the drystages causes the precipitation of amorphous opal dissolved
Cave Mineralogy – oral 2013 ICS Proceedings
480
in it fossilizing the microorganisms or their remains that areimmediately coated by opal-A. Each time the rain providesthe fissural system with water, life regenerates, at leastpartially, in the speleothem producing the germination ofthe latent or resistance forms developed in diatoms, spores,algae, testate amoebae, etc, which live and develop in themicro speleological system. At the same time, otherorganisms (mites and collembola) use the speleothem asphysical support to move and feed on organic matter. Thegrowth processes of the speleothems are superposed to theones of the development of microorganisms in thesecavities causing subtle differences between life andsedimentation, justifying the name of biospeleothems givento these deposits.
5. ConclusionsThe partially open fissure systems of granitic massifsthrough which water circulates at very slow speed (trickles)are natural environments with which different types ofneomineralizations are associated: opal-A, gypsum, themost frequent minerals. These biominerals orbiospeleothems are formed indirectly due tomicrobiological processes (as a consequence of reactionsproduced by the metabolic products derived from theorganic activity). Si and Al are the most abundant elementsin the granitic rocks and thus mainly prevail in theinfiltration water. The oversaturation by water evaporationor/and the pH changes cause the precipitation of theelements and solubilised compounds originating thespeleothems of granite systems. Opal-A (Si) is the mostimportant type of speleothem quantitatively and the mostdiversified morphologically. The organisms (bacteria, algae,fungi) that live and are developed in these speleothems areactive while the speleothem is wet. When water flowdiminishes or evaporates, the organisms react developingresistance spores staying until the next humid period whenthey germinate again. Mites and collembola also haveactivity in the speleothem using the content in organicmatter of the same speleothem for their subsistence. Thelast stage in the speleothem development is where S oforganic origin is combined with the Ca of the plagioclases,and using the substratum of amorphous silica (silica gel)gypsum crystals develop with an excellent idiomorphy andare present widely in the opal-A.
AcknowledgmentsThis paper is a contribution to the Research Project BTE-CGL-2006-08996 of the Ministry of Education and Scienceof Spain. We thanks Ana Martelli for the translation andhelp to eliminate many errors and inconsistencies.
ReferencesBarker WW, Welch SA, Banfield JF, 1997. Biogeochemical
weathering of silicate minerals. In: Geomicrobiology:interactions between microbes and minerals (Banfield, J. F. andNealson KH, eds.). Washington: Mineralogical Society ofAmerica, 391–428.
Beinlich A, Håkon Austrheim H, 2012. In situ sequestration ofatmospheric CO2 at low temperature and surface cracking ofserpentinized peridotite in mine shafts. Chemical Geology,332–333, 32–44.
Bennett PC, 1991. Quartz dissolution in an organic-rich aqueoussystem. Geochimica et Cosmochimica Acta, 55, 1781–1797.
Blyth AJ, Baker A, Collins MJ, Penkman KEH, Gilmour MA,Moss J S, Genty D, Drysdale RN, 2008. Molecular organicmatter in speleothems and its potential as an environmentalproxy. Quaternary Science Reviews, 27, 905–921.
Brady PV, Walther JV, 1990. Kinetics of quartz dissolution at lowtemperatures. Chemical Geology, 82, 253–264.
Bustillo MA, 1995. Una nueva ultraestructura de ópalo CT ensilcretas. Posible indicador de influencia bacteriana. EstudiosGeológicos, 51, 3–8.
Caldcleugh A, 1829. On the geology of Rio de Janeiro.Transactions of the Geological Society, 2, 69–72.
Cañaveras JC, Sánchez-Moral S, Soler V, Saiz-Jiménez C, 2001.Microorganisms and microbially induced fabrics in cave walls.Geomicrobiology Journal, 18, 223–240.
Ehrlich HL, 1996. Geomicrobiology. 3rd ed. Marcel Dekker, Inc.,New York, 719.
Franklin SP, Ajas AJr, Dewers, TA, Tieh T.T, 1994. The role ofcarboxilic acids in albite and quartz dissolution: Anexperimental study under diagenetic conditions. Geochimicaet Cosmochimica Acta, 58(20), 4259–4279.
García-Ruíz JM, Migues F, 1982. Condiciones de formación delprimer precipitado en la técnica del gel de sílice. EstudiosGeológicos, 38, 3–14.
Kröger N, Deutzmann R, Sumper M, 1999. Polycationic peptidesfrom diatom biosilica that direct silica nanosphere formation.Science, 286, 1129–1131.
McMahon PB, Chapelle FH, 1991. Microbial production oforganic acids in aquitard sediments and its role in aquifergeochemistry. Nature, 349, 233–235.
Sanjurjo Sánchez, J, Vidal Romaní JR, 2011. Luminescence datingof pseudokarst speleothems: a first approach. 2nd Conferenceon Micro-raman and luminescence studies in the Earth andPlanetary Sciences (CORALS II). May 18–21, Madrid, Spain.
Swarzlow CI, Keller WD, 1937. Coralloid Opal. Journal ofGeology, 45, 101–108.
Twidale CR, Vidal Romaní JR, 2005. Landforms and geology ofgranite terrains. Balkema, London, 351.
Van Rosmalen GM, Marcheé WGH, 1976. A comparison ofgypsum crystals grown in silica gel and agar in the presence ofadditives. Journal of Crystal Growth, 35, 169–176.
Vidal Romani J.R, Vilaplana JM, 1984. Datos preliminares parael estudios de espeleotemas en cavidades graníticas. Cadernosdo Laboratorio Xeolóxico de Laxe, 7, 35–324.
Vidal Romaní JR, Bourne, J A, Twidale CR, Campbell EM, 2003.Siliceous cylindrical speleothems in granitoids in warmsemiarid and humid climates. Zeitschrift für Geomorphologie,47(4), 417–437.
Vidal Romaní JR, Sanjurjo J, Vaqueiro, M, Fernández MosqueraD, 2010. Speleothem development and biological activity ingranite cavities. Geomorphologie: relief, processus,environment, 4, 337–346.
Cave Mineralogy – oral 2013 ICS Proceedings
481

Welch SA, Ullman WJ, 1996. Feldspar dissolution in acidic andorganic solutions: Compositional and pH dependence ofdissolution rate. Geochimica et Cosmochimica Acta, 60(16),2939–2948.
Willems L, Compere P, Sponholz B, 1998. Study of siliceous karstgenesis in eastern Niger: microscopy and X-ray microanalysisof speleothems. Zeitschrift für Geomorphologie, 42(2), 129–142.
Willems L, Compère P, Hatert F, Pouclet A, Vicat JP, Ek C,Boulvain F, 2002. Karst in granitic rocks, South Camerun: cavegenesis and silica and taranakite speleothems. Terra Nova, 14,355–362.
Woo KS, Choi DW, Lee KC, 2008. Silicification of cave coralsfrom some lava tube caves in the Jeju Island, Korea:Implications for speleogenesis and a proxy forpaleoenvironmental change during the Late Quaternary.Quaternary International, 176–177, 82–95.
Cave Mineralogy – oral 2013 ICS Proceedings
482
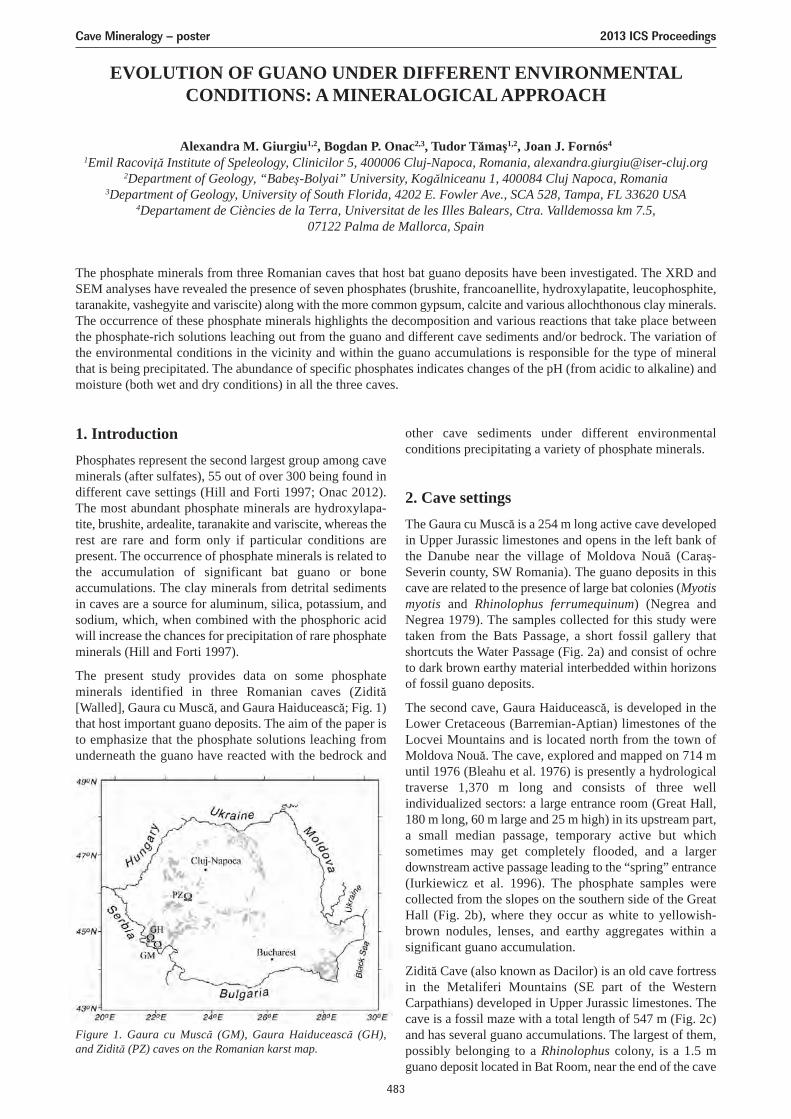
Figure 1. Gaura cu Muscă (GM), Gaura Haiducească (GH),and Zidită (PZ) caves on the Romanian karst map.
EVOLUTION OF GUANO UNDER DIFFERENT ENVIRONMENTALCONDITIONS: A MINERALOGICAL APPROACH
Alexandra M. Giurgiu1,2, Bogdan P. Onac2,3, Tudor Tămaş1,2, Joan J. Fornós4
1Emil Racoviţă Institute of Speleology, Clinicilor 5, 400006 Cluj-Napoca, Romania, [email protected] of Geology, “Babeş-Bolyai” University, Kogălniceanu 1, 400084 Cluj Napoca, Romania
3Department of Geology, University of South Florida, 4202 E. Fowler Ave., SCA 528, Tampa, FL 33620 USA4Departament de Ciències de la Terra, Universitat de les Illes Balears, Ctra. Valldemossa km 7.5,
07122 Palma de Mallorca, Spain
The phosphate minerals from three Romanian caves that host bat guano deposits have been investigated. The XRD andSEM analyses have revealed the presence of seven phosphates (brushite, francoanellite, hydroxylapatite, leucophosphite,taranakite, vashegyite and variscite) along with the more common gypsum, calcite and various allochthonous clay minerals.The occurrence of these phosphate minerals highlights the decomposition and various reactions that take place betweenthe phosphate-rich solutions leaching out from the guano and different cave sediments and/or bedrock. The variation ofthe environmental conditions in the vicinity and within the guano accumulations is responsible for the type of mineralthat is being precipitated. The abundance of specific phosphates indicates changes of the pH (from acidic to alkaline) andmoisture (both wet and dry conditions) in all the three caves.
1. IntroductionPhosphates represent the second largest group among caveminerals (after sulfates), 55 out of over 300 being found indifferent cave settings (Hill and Forti 1997; Onac 2012).The most abundant phosphate minerals are hydroxylapa-tite, brushite, ardealite, taranakite and variscite, whereas therest are rare and form only if particular conditions arepresent. The occurrence of phosphate minerals is related tothe accumulation of significant bat guano or boneaccumulations. The clay minerals from detrital sedimentsin caves are a source for aluminum, silica, potassium, andsodium, which, when combined with the phosphoric acidwill increase the chances for precipitation of rare phosphateminerals (Hill and Forti 1997).
The present study provides data on some phosphateminerals identified in three Romanian caves (Zidită[Walled], Gaura cu Muscă, and Gaura Haiducească; Fig. 1)that host important guano deposits. The aim of the paper isto emphasize that the phosphate solutions leaching fromunderneath the guano have reacted with the bedrock and
other cave sediments under different environmentalconditions precipitating a variety of phosphate minerals.
2. Cave settingsThe Gaura cu Muscă is a 254 m long active cave developedin Upper Jurassic limestones and opens in the left bank ofthe Danube near the village of Moldova Nouă (Caraş-Severin county, SW Romania). The guano deposits in thiscave are related to the presence of large bat colonies (Myotismyotis and Rhinolophus ferrumequinum) (Negrea andNegrea 1979). The samples collected for this study weretaken from the Bats Passage, a short fossil gallery thatshortcuts the Water Passage (Fig. 2a) and consist of ochreto dark brown earthy material interbedded within horizonsof fossil guano deposits.
The second cave, Gaura Haiducească, is developed in theLower Cretaceous (Barremian-Aptian) limestones of theLocvei Mountains and is located north from the town ofMoldova Nouă. The cave, explored and mapped on 714 muntil 1976 (Bleahu et al. 1976) is presently a hydrologicaltraverse 1,370 m long and consists of three wellindividualized sectors: a large entrance room (Great Hall,180 m long, 60 m large and 25 m high) in its upstream part,a small median passage, temporary active but whichsometimes may get completely flooded, and a largerdownstream active passage leading to the “spring” entrance(Iurkiewicz et al. 1996). The phosphate samples werecollected from the slopes on the southern side of the GreatHall (Fig. 2b), where they occur as white to yellowish-brown nodules, lenses, and earthy aggregates within asignificant guano accumulation.
Zidită Cave (also known as Dacilor) is an old cave fortressin the Metaliferi Mountains (SE part of the WesternCarpathians) developed in Upper Jurassic limestones. Thecave is a fossil maze with a total length of 547 m (Fig. 2c)and has several guano accumulations. The largest of them,possibly belonging to a Rhinolophus colony, is a 1.5 mguano deposit located in Bat Room, near the end of the cave
Cave Mineralogy – poster 2013 ICS Proceedings
483
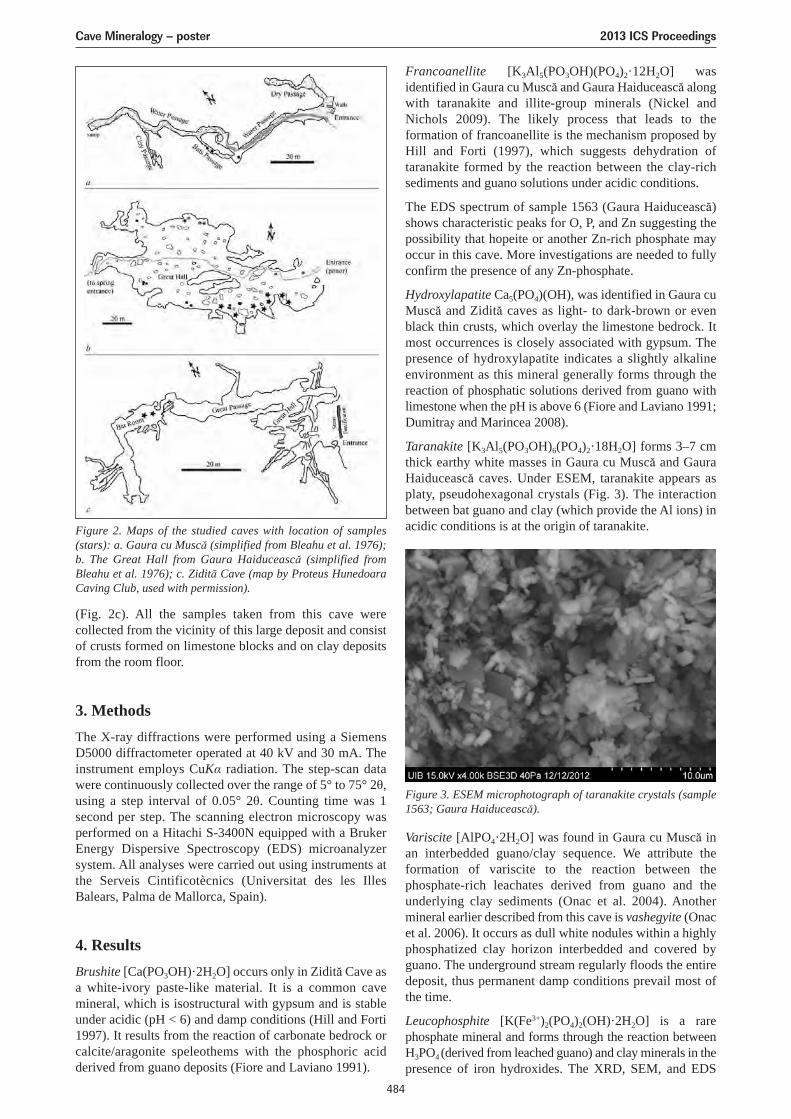
(Fig. 2c). All the samples taken from this cave werecollected from the vicinity of this large deposit and consistof crusts formed on limestone blocks and on clay depositsfrom the room floor.
3. MethodsThe X-ray diffractions were performed using a SiemensD5000 diffractometer operated at 40 kV and 30 mA. Theinstrument employs CuKα radiation. The step-scan datawere continuously collected over the range of 5° to 75° 2θ,using a step interval of 0.05° 2θ. Counting time was 1second per step. The scanning electron microscopy wasperformed on a Hitachi S-3400N equipped with a BrukerEnergy Dispersive Spectroscopy (EDS) microanalyzersystem. All analyses were carried out using instruments atthe Serveis Cintificotècnics (Universitat des les IllesBalears, Palma de Mallorca, Spain).
4. ResultsBrushite [Ca(PO3OH)·2H2O] occurs only in Zidită Cave asa white-ivory paste-like material. It is a common cavemineral, which is isostructural with gypsum and is stableunder acidic (pH < 6) and damp conditions (Hill and Forti1997). It results from the reaction of carbonate bedrock orcalcite/aragonite speleothems with the phosphoric acidderived from guano deposits (Fiore and Laviano 1991).
Francoanellite [K3Al5(PO3OH)(PO4)2·12H2O] wasidentified in Gaura cu Muscă and Gaura Haiducească alongwith taranakite and illite-group minerals (Nickel andNichols 2009). The likely process that leads to theformation of francoanellite is the mechanism proposed byHill and Forti (1997), which suggests dehydration oftaranakite formed by the reaction between the clay-richsediments and guano solutions under acidic conditions.
The EDS spectrum of sample 1563 (Gaura Haiducească)shows characteristic peaks for O, P, and Zn suggesting thepossibility that hopeite or another Zn-rich phosphate mayoccur in this cave. More investigations are needed to fullyconfirm the presence of any Zn-phosphate.
Hydroxylapatite Ca5(PO4)(OH), was identified in Gaura cuMuscă and Zidită caves as light- to dark-brown or evenblack thin crusts, which overlay the limestone bedrock. Itmost occurrences is closely associated with gypsum. Thepresence of hydroxylapatite indicates a slightly alkalineenvironment as this mineral generally forms through thereaction of phosphatic solutions derived from guano withlimestone when the pH is above 6 (Fiore and Laviano 1991;Dumitraş and Marincea 2008).
Taranakite [K3Al5(PO3OH)6(PO4)2·18H2O] forms 3–7 cmthick earthy white masses in Gaura cu Muscă and GauraHaiducească caves. Under ESEM, taranakite appears asplaty, pseudohexagonal crystals (Fig. 3). The interactionbetween bat guano and clay (which provide the Al ions) inacidic conditions is at the origin of taranakite.
Variscite [AlPO4·2H2O] was found in Gaura cu Muscă inan interbedded guano/clay sequence. We attribute theformation of variscite to the reaction between thephosphate-rich leachates derived from guano and theunderlying clay sediments (Onac et al. 2004). Anothermineral earlier described from this cave is vashegyite (Onacet al. 2006). It occurs as dull white nodules within a highlyphosphatized clay horizon interbedded and covered byguano. The underground stream regularly floods the entiredeposit, thus permanent damp conditions prevail most ofthe time.
Leucophosphite [K(Fe3+)2(PO4)2(OH)·2H2O] is a rarephosphate mineral and forms through the reaction betweenH3PO4 (derived from leached guano) and clay minerals in thepresence of iron hydroxides. The XRD, SEM, and EDS
Figure 2. Maps of the studied caves with location of samples(stars): a. Gaura cu Muscă (simplified from Bleahu et al. 1976);b. The Great Hall from Gaura Haiducească (simplified fromBleahu et al. 1976); c. Zidită Cave (map by Proteus HunedoaraCaving Club, used with permission).
Figure 3. ESEM microphotograph of taranakite crystals (sample1563; Gaura Haiducească).
Cave Mineralogy – poster 2013 ICS Proceedings
484
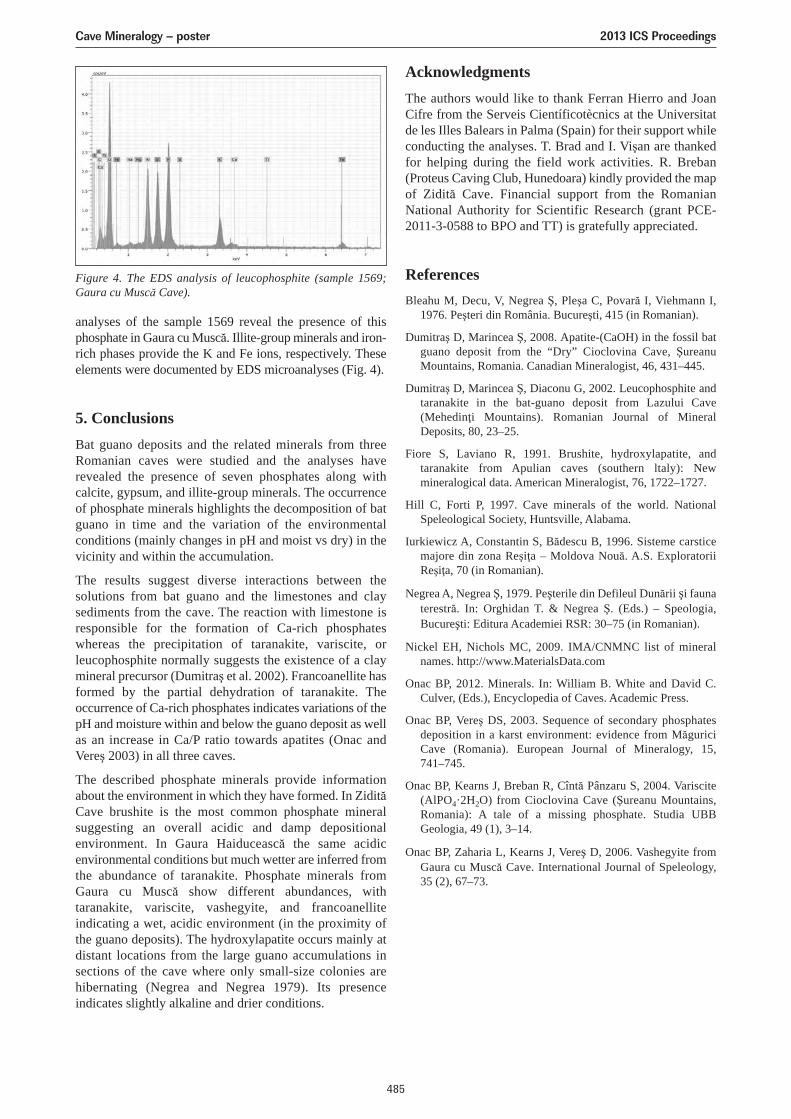
analyses of the sample 1569 reveal the presence of thisphosphate in Gaura cu Muscă. Illite-group minerals and iron-rich phases provide the K and Fe ions, respectively. Theseelements were documented by EDS microanalyses (Fig. 4).
5. ConclusionsBat guano deposits and the related minerals from threeRomanian caves were studied and the analyses haverevealed the presence of seven phosphates along withcalcite, gypsum, and illite-group minerals. The occurrenceof phosphate minerals highlights the decomposition of batguano in time and the variation of the environmentalconditions (mainly changes in pH and moist vs dry) in thevicinity and within the accumulation.
The results suggest diverse interactions between thesolutions from bat guano and the limestones and claysediments from the cave. The reaction with limestone isresponsible for the formation of Ca-rich phosphateswhereas the precipitation of taranakite, variscite, orleucophosphite normally suggests the existence of a claymineral precursor (Dumitraş et al. 2002). Francoanellite hasformed by the partial dehydration of taranakite. Theoccurrence of Ca-rich phosphates indicates variations of thepH and moisture within and below the guano deposit as wellas an increase in Ca/P ratio towards apatites (Onac andVereş 2003) in all three caves.
The described phosphate minerals provide informationabout the environment in which they have formed. In ZidităCave brushite is the most common phosphate mineralsuggesting an overall acidic and damp depositionalenvironment. In Gaura Haiducească the same acidicenvironmental conditions but much wetter are inferred fromthe abundance of taranakite. Phosphate minerals fromGaura cu Muscă show different abundances, withtaranakite, variscite, vashegyite, and francoanelliteindicating a wet, acidic environment (in the proximity ofthe guano deposits). The hydroxylapatite occurs mainly atdistant locations from the large guano accumulations insections of the cave where only small-size colonies arehibernating (Negrea and Negrea 1979). Its presenceindicates slightly alkaline and drier conditions.
AcknowledgmentsThe authors would like to thank Ferran Hierro and JoanCifre from the Serveis Científicotècnics at the Universitatde les Illes Balears in Palma (Spain) for their support whileconducting the analyses. T. Brad and I. Vişan are thankedfor helping during the field work activities. R. Breban(Proteus Caving Club, Hunedoara) kindly provided the mapof Zidită Cave. Financial support from the RomanianNational Authority for Scientific Research (grant PCE-2011-3-0588 to BPO and TT) is gratefully appreciated.
ReferencesBleahu M, Decu, V, Negrea Ş, Pleşa C, Povară I, Viehmann I,
1976. Peşteri din România. Bucureşti, 415 (in Romanian).
Dumitraş D, Marincea Ş, 2008. Apatite-(CaOH) in the fossil batguano deposit from the “Dry” Cioclovina Cave, ŞureanuMountains, Romania. Canadian Mineralogist, 46, 431–445.
Dumitraş D, Marincea Ş, Diaconu G, 2002. Leucophosphite andtaranakite in the bat-guano deposit from Lazului Cave(Mehedinţi Mountains). Romanian Journal of MineralDeposits, 80, 23–25.
Fiore S, Laviano R, 1991. Brushite, hydroxylapatite, andtaranakite from Apulian caves (southern ltaly): Newmineralogical data. American Mineralogist, 76, 1722–1727.
Hill C, Forti P, 1997. Cave minerals of the world. NationalSpeleological Society, Huntsville, Alabama.
Iurkiewicz A, Constantin S, Bădescu B, 1996. Sisteme carsticemajore din zona Reşiţa – Moldova Nouă. A.S. ExploratoriiReşiţa, 70 (in Romanian).
Negrea A, Negrea Ş, 1979. Peşterile din Defileul Dunării şi faunaterestră. In: Orghidan T. & Negrea Ş. (Eds.) – Speologia,Bucureşti: Editura Academiei RSR: 30–75 (in Romanian).
Nickel EH, Nichols MC, 2009. IMA/CNMNC list of mineralnames. http://www.MaterialsData.com
Onac BP, 2012. Minerals. In: William B. White and David C.Culver, (Eds.), Encyclopedia of Caves. Academic Press.
Onac BP, Vereş DS, 2003. Sequence of secondary phosphatesdeposition in a karst environment: evidence from MăguriciCave (Romania). European Journal of Mineralogy, 15,741–745.
Onac BP, Kearns J, Breban R, Cîntă Pânzaru S, 2004. Variscite(AlPO4·2H2O) from Cioclovina Cave (Şureanu Mountains,Romania): A tale of a missing phosphate. Studia UBBGeologia, 49 (1), 3–14.
Onac BP, Zaharia L, Kearns J, Vereş D, 2006. Vashegyite fromGaura cu Muscă Cave. International Journal of Speleology,35 (2), 67–73.
Figure 4. The EDS analysis of leucophosphite (sample 1569;Gaura cu Muscă Cave).
Cave Mineralogy – poster 2013 ICS Proceedings
485
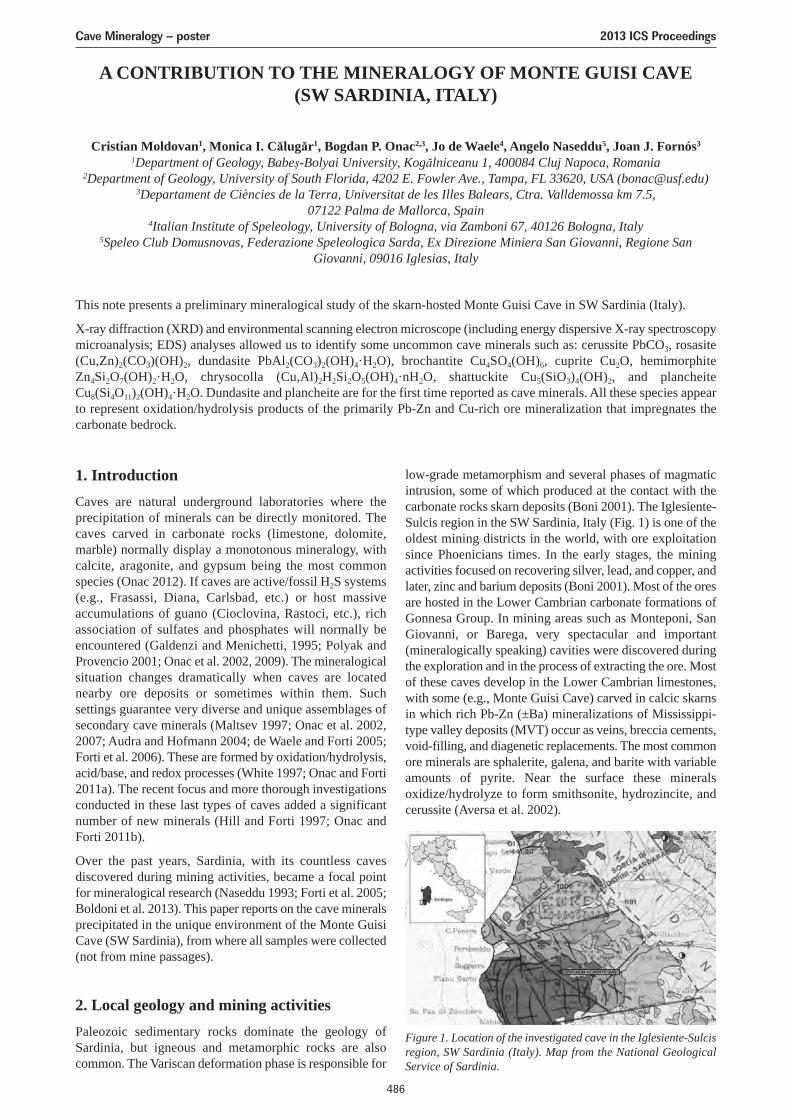
A CONTRIBUTION TO THE MINERALOGY OF MONTE GUISI CAVE(SW SARDINIA, ITALY)
Cristian Moldovan1, Monica I. Călugăr1, Bogdan P. Onac2,3, Jo de Waele4, Angelo Naseddu5, Joan J. Fornós3
1Department of Geology, Babeș-Bolyai University, Kogălniceanu 1, 400084 Cluj Napoca, Romania2Department of Geology, University of South Florida, 4202 E. Fowler Ave., Tampa, FL 33620, USA ([email protected])
3Departament de Ciències de la Terra, Universitat de les Illes Balears, Ctra. Valldemossa km 7.5,07122 Palma de Mallorca, Spain
4Italian Institute of Speleology, University of Bologna, via Zamboni 67, 40126 Bologna, Italy5Speleo Club Domusnovas, Federazione Speleologica Sarda, Ex Direzione Miniera San Giovanni, Regione San
Giovanni, 09016 Iglesias, Italy
This note presents a preliminary mineralogical study of the skarn-hosted Monte Guisi Cave in SW Sardinia (Italy).
X-ray diffraction (XRD) and environmental scanning electron microscope (including energy dispersive X-ray spectroscopymicroanalysis; EDS) analyses allowed us to identify some uncommon cave minerals such as: cerussite PbCO3, rosasite(Cu,Zn)2(CO3)(OH)2, dundasite PbAl2(CO3)2(OH)4·H2O), brochantite Cu4SO4(OH)6, cuprite Cu2O, hemimorphiteZn4Si2O7(OH)2·H2O, chrysocolla (Cu,Al)2H2Si2O5(OH)4·nH2O, shattuckite Cu5(SiO3)4(OH)2, and plancheiteCu8(Si4O11)2(OH)4·H2O. Dundasite and plancheite are for the first time reported as cave minerals. All these species appearto represent oxidation/hydrolysis products of the primarily Pb-Zn and Cu-rich ore mineralization that impregnates thecarbonate bedrock.
1. IntroductionCaves are natural underground laboratories where theprecipitation of minerals can be directly monitored. Thecaves carved in carbonate rocks (limestone, dolomite,marble) normally display a monotonous mineralogy, withcalcite, aragonite, and gypsum being the most commonspecies (Onac 2012). If caves are active/fossil H2S systems(e.g., Frasassi, Diana, Carlsbad, etc.) or host massiveaccumulations of guano (Cioclovina, Rastoci, etc.), richassociation of sulfates and phosphates will normally beencountered (Galdenzi and Menichetti, 1995; Polyak andProvencio 2001; Onac et al. 2002, 2009). The mineralogicalsituation changes dramatically when caves are locatednearby ore deposits or sometimes within them. Suchsettings guarantee very diverse and unique assemblages ofsecondary cave minerals (Maltsev 1997; Onac et al. 2002,2007; Audra and Hofmann 2004; de Waele and Forti 2005;Forti et al. 2006). These are formed by oxidation/hydrolysis,acid/base, and redox processes (White 1997; Onac and Forti2011a). The recent focus and more thorough investigationsconducted in these last types of caves added a significantnumber of new minerals (Hill and Forti 1997; Onac andForti 2011b).
Over the past years, Sardinia, with its countless cavesdiscovered during mining activities, became a focal pointfor mineralogical research (Naseddu 1993; Forti et al. 2005;Boldoni et al. 2013). This paper reports on the cave mineralsprecipitated in the unique environment of the Monte GuisiCave (SW Sardinia), from where all samples were collected(not from mine passages).
2. Local geology and mining activitiesPaleozoic sedimentary rocks dominate the geology ofSardinia, but igneous and metamorphic rocks are alsocommon. The Variscan deformation phase is responsible for
low-grade metamorphism and several phases of magmaticintrusion, some of which produced at the contact with thecarbonate rocks skarn deposits (Boni 2001). The Iglesiente-Sulcis region in the SW Sardinia, Italy (Fig. 1) is one of theoldest mining districts in the world, with ore exploitationsince Phoenicians times. In the early stages, the miningactivities focused on recovering silver, lead, and copper, andlater, zinc and barium deposits (Boni 2001). Most of the oresare hosted in the Lower Cambrian carbonate formations ofGonnesa Group. In mining areas such as Monteponi, SanGiovanni, or Barega, very spectacular and important(mineralogically speaking) cavities were discovered duringthe exploration and in the process of extracting the ore. Mostof these caves develop in the Lower Cambrian limestones,with some (e.g., Monte Guisi Cave) carved in calcic skarnsin which rich Pb-Zn (±Ba) mineralizations of Mississippi-type valley deposits (MVT) occur as veins, breccia cements,void-filling, and diagenetic replacements. The most commonore minerals are sphalerite, galena, and barite with variableamounts of pyrite. Near the surface these mineralsoxidize/hydrolyze to form smithsonite, hydrozincite, andcerussite (Aversa et al. 2002).
Figure 1. Location of the investigated cave in the Iglesiente-Sulcisregion, SW Sardinia (Italy). Map from the National GeologicalService of Sardinia.
Cave Mineralogy – poster 2013 ICS Proceedings
486
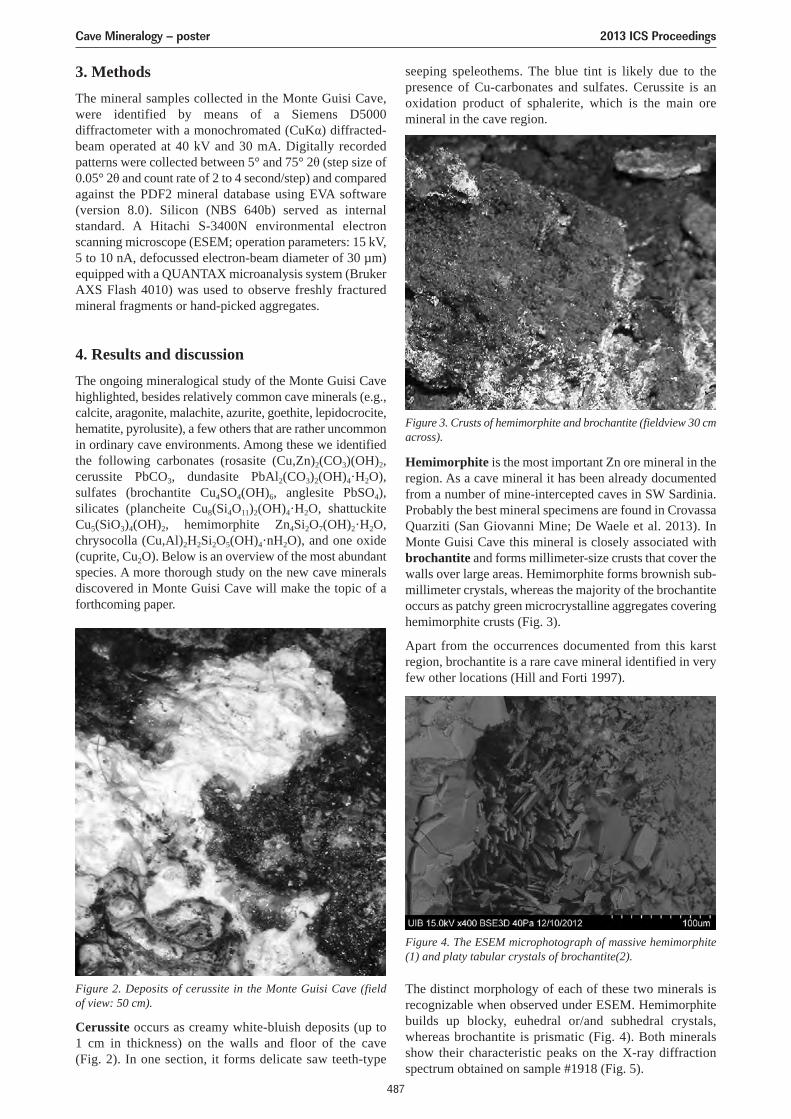
3. MethodsThe mineral samples collected in the Monte Guisi Cave,were identified by means of a Siemens D5000diffractometer with a monochromated (CuKα) diffracted-beam operated at 40 kV and 30 mA. Digitally recordedpatterns were collected between 5° and 75° 2θ (step size of0.05° 2θ and count rate of 2 to 4 second/step) and comparedagainst the PDF2 mineral database using EVA software(version 8.0). Silicon (NBS 640b) served as internalstandard. A Hitachi S-3400N environmental electronscanning microscope (ESEM; operation parameters: 15 kV,5 to 10 nA, defocussed electron-beam diameter of 30 µm)equipped with a QUANTAX microanalysis system (BrukerAXS Flash 4010) was used to observe freshly fracturedmineral fragments or hand-picked aggregates.
4. Results and discussionThe ongoing mineralogical study of the Monte Guisi Cavehighlighted, besides relatively common cave minerals (e.g.,calcite, aragonite, malachite, azurite, goethite, lepidocrocite,hematite, pyrolusite), a few others that are rather uncommonin ordinary cave environments. Among these we identifiedthe following carbonates (rosasite (Cu,Zn)2(CO3)(OH)2,cerussite PbCO3, dundasite PbAl2(CO3)2(OH)4·H2O),sulfates (brochantite Cu4SO4(OH)6, anglesite PbSO4),silicates (plancheite Cu8(Si4O11)2(OH)4·H2O, shattuckiteCu5(SiO3)4(OH)2, hemimorphite Zn4Si2O7(OH)2·H2O,chrysocolla (Cu,Al)2H2Si2O5(OH)4·nH2O), and one oxide(cuprite, Cu2O). Below is an overview of the most abundantspecies. A more thorough study on the new cave mineralsdiscovered in Monte Guisi Cave will make the topic of aforthcoming paper.
Cerussite occurs as creamy white-bluish deposits (up to1 cm in thickness) on the walls and floor of the cave(Fig. 2). In one section, it forms delicate saw teeth-type
seeping speleothems. The blue tint is likely due to thepresence of Cu-carbonates and sulfates. Cerussite is anoxidation product of sphalerite, which is the main oremineral in the cave region.
Hemimorphite is the most important Zn ore mineral in theregion. As a cave mineral it has been already documentedfrom a number of mine-intercepted caves in SW Sardinia.Probably the best mineral specimens are found in CrovassaQuarziti (San Giovanni Mine; De Waele et al. 2013). InMonte Guisi Cave this mineral is closely associated withbrochantite and forms millimeter-size crusts that cover thewalls over large areas. Hemimorphite forms brownish sub-millimeter crystals, whereas the majority of the brochantiteoccurs as patchy green microcrystalline aggregates coveringhemimorphite crusts (Fig. 3).
Apart from the occurrences documented from this karstregion, brochantite is a rare cave mineral identified in veryfew other locations (Hill and Forti 1997).
The distinct morphology of each of these two minerals isrecognizable when observed under ESEM. Hemimorphitebuilds up blocky, euhedral or/and subhedral crystals,whereas brochantite is prismatic (Fig. 4). Both mineralsshow their characteristic peaks on the X-ray diffractionspectrum obtained on sample #1918 (Fig. 5).
Figure 2. Deposits of cerussite in the Monte Guisi Cave (fieldof view: 50 cm).
Figure 3. Crusts of hemimorphite and brochantite (fieldview 30 cmacross).
Figure 4. The ESEM microphotograph of massive hemimorphite(1) and platy tabular crystals of brochantite(2).
Cave Mineralogy – poster 2013 ICS Proceedings
487
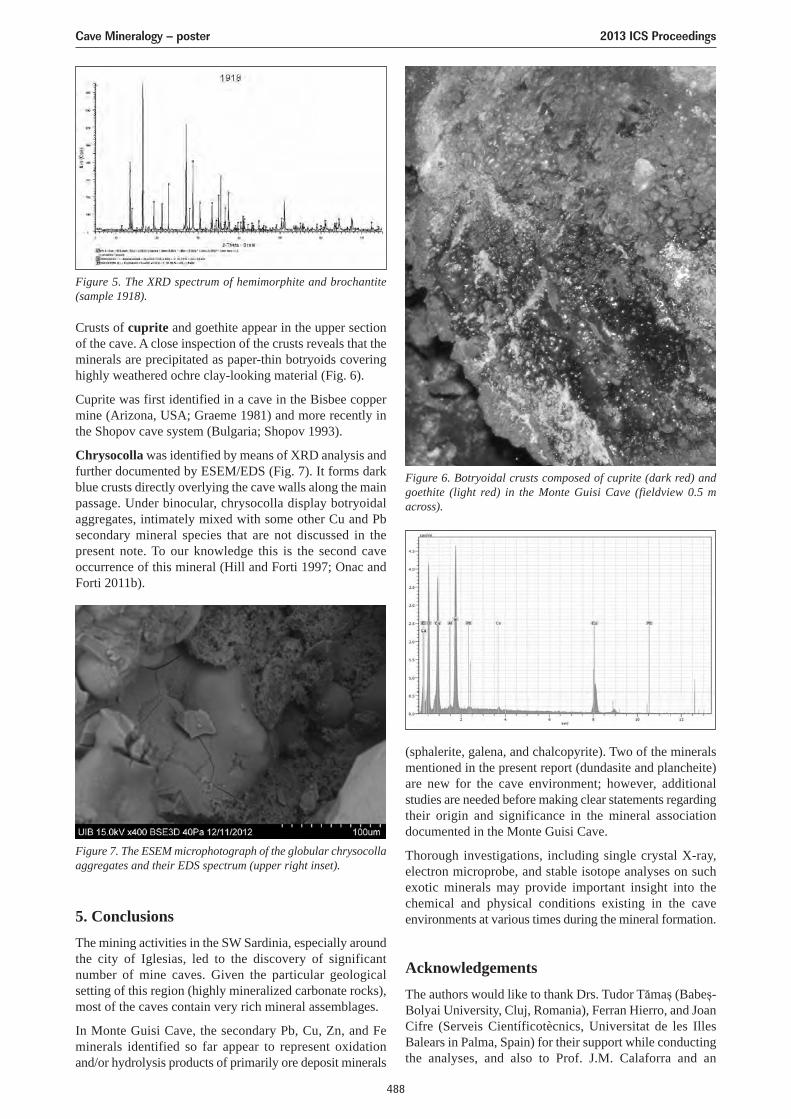
Crusts of cuprite and goethite appear in the upper sectionof the cave. A close inspection of the crusts reveals that theminerals are precipitated as paper-thin botryoids coveringhighly weathered ochre clay-looking material (Fig. 6).
Cuprite was first identified in a cave in the Bisbee coppermine (Arizona, USA; Graeme 1981) and more recently inthe Shopov cave system (Bulgaria; Shopov 1993).
Chrysocolla was identified by means of XRD analysis andfurther documented by ESEM/EDS (Fig. 7). It forms darkblue crusts directly overlying the cave walls along the mainpassage. Under binocular, chrysocolla display botryoidalaggregates, intimately mixed with some other Cu and Pbsecondary mineral species that are not discussed in thepresent note. To our knowledge this is the second caveoccurrence of this mineral (Hill and Forti 1997; Onac andForti 2011b).
Figure 5. The XRD spectrum of hemimorphite and brochantite(sample 1918).
Figure 6. Botryoidal crusts composed of cuprite (dark red) andgoethite (light red) in the Monte Guisi Cave (fieldview 0.5 macross).
Figure 7. The ESEM microphotograph of the globular chrysocollaaggregates and their EDS spectrum (upper right inset).
5. ConclusionsThe mining activities in the SW Sardinia, especially aroundthe city of Iglesias, led to the discovery of significantnumber of mine caves. Given the particular geologicalsetting of this region (highly mineralized carbonate rocks),most of the caves contain very rich mineral assemblages.
In Monte Guisi Cave, the secondary Pb, Cu, Zn, and Feminerals identified so far appear to represent oxidationand/or hydrolysis products of primarily ore deposit minerals
(sphalerite, galena, and chalcopyrite). Two of the mineralsmentioned in the present report (dundasite and plancheite)are new for the cave environment; however, additionalstudies are needed before making clear statements regardingtheir origin and significance in the mineral associationdocumented in the Monte Guisi Cave.
Thorough investigations, including single crystal X-ray,electron microprobe, and stable isotope analyses on suchexotic minerals may provide important insight into thechemical and physical conditions existing in the caveenvironments at various times during the mineral formation.
AcknowledgementsThe authors would like to thank Drs. Tudor Tămaș (Babeș-Bolyai University, Cluj, Romania), Ferran Hierro, and JoanCifre (Serveis Científicotècnics, Universitat de les IllesBalears in Palma, Spain) for their support while conductingthe analyses, and also to Prof. J.M. Calaforra and an
Cave Mineralogy – poster 2013 ICS Proceedings
488
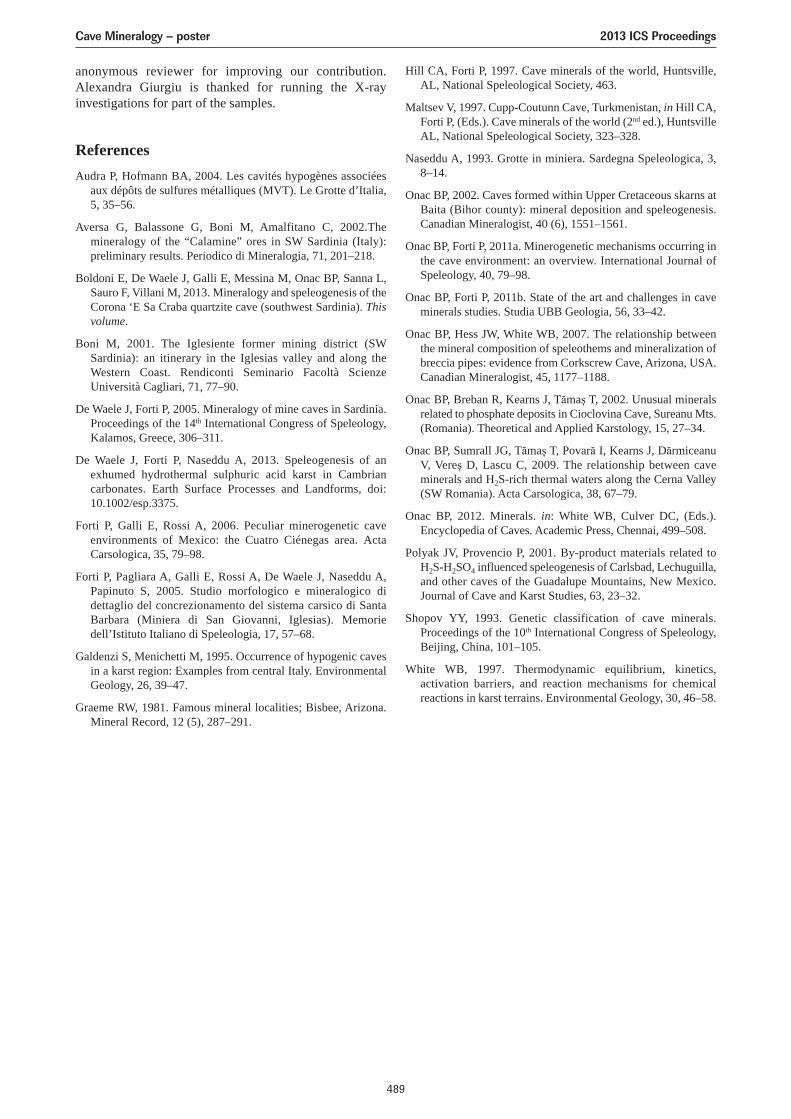
anonymous reviewer for improving our contribution.Alexandra Giurgiu is thanked for running the X-rayinvestigations for part of the samples.
ReferencesAudra P, Hofmann BA, 2004. Les cavités hypogènes associées
aux dépôts de sulfures métalliques (MVT). Le Grotte d’Italia,5, 35–56.
Aversa G, Balassone G, Boni M, Amalfitano C, 2002.Themineralogy of the “Calamine” ores in SW Sardinia (Italy):preliminary results. Periodico di Mineralogia, 71, 201–218.
Boldoni E, De Waele J, Galli E, Messina M, Onac BP, Sanna L,Sauro F, Villani M, 2013. Mineralogy and speleogenesis of theCorona ‘E Sa Craba quartzite cave (southwest Sardinia). Thisvolume.
Boni M, 2001. The Iglesiente former mining district (SWSardinia): an itinerary in the Iglesias valley and along theWestern Coast. Rendiconti Seminario Facoltà ScienzeUniversità Cagliari, 71, 77–90.
De Waele J, Forti P, 2005. Mineralogy of mine caves in Sardinia.Proceedings of the 14th International Congress of Speleology,Kalamos, Greece, 306–311.
De Waele J, Forti P, Naseddu A, 2013. Speleogenesis of anexhumed hydrothermal sulphuric acid karst in Cambriancarbonates. Earth Surface Processes and Landforms, doi:10.1002/esp.3375.
Forti P, Galli E, Rossi A, 2006. Peculiar minerogenetic caveenvironments of Mexico: the Cuatro Ciénegas area. ActaCarsologica, 35, 79–98.
Forti P, Pagliara A, Galli E, Rossi A, De Waele J, Naseddu A,Papinuto S, 2005. Studio morfologico e mineralogico didettaglio del concrezionamento del sistema carsico di SantaBarbara (Miniera di San Giovanni, Iglesias). Memoriedell’Istituto Italiano di Speleologia, 17, 57–68.
Galdenzi S, Menichetti M, 1995. Occurrence of hypogenic cavesin a karst region: Examples from central Italy. EnvironmentalGeology, 26, 39–47.
Graeme RW, 1981. Famous mineral localities; Bisbee, Arizona.Mineral Record, 12 (5), 287–291.
Hill CA, Forti P, 1997. Cave minerals of the world, Huntsville,AL, National Speleological Society, 463.
Maltsev V, 1997. Cupp-Coutunn Cave, Turkmenistan, in Hill CA,Forti P, (Eds.). Cave minerals of the world (2nd ed.), HuntsvilleAL, National Speleological Society, 323–328.
Naseddu A, 1993. Grotte in miniera. Sardegna Speleologica, 3,8–14.
Onac BP, 2002. Caves formed within Upper Cretaceous skarns atBaita (Bihor county): mineral deposition and speleogenesis.Canadian Mineralogist, 40 (6), 1551–1561.
Onac BP, Forti P, 2011a. Minerogenetic mechanisms occurring inthe cave environment: an overview. International Journal ofSpeleology, 40, 79–98.
Onac BP, Forti P, 2011b. State of the art and challenges in caveminerals studies. Studia UBB Geologia, 56, 33–42.
Onac BP, Hess JW, White WB, 2007. The relationship betweenthe mineral composition of speleothems and mineralization ofbreccia pipes: evidence from Corkscrew Cave, Arizona, USA.Canadian Mineralogist, 45, 1177–1188.
Onac BP, Breban R, Kearns J, Tămaș T, 2002. Unusual mineralsrelated to phosphate deposits in Cioclovina Cave, Sureanu Mts.(Romania). Theoretical and Applied Karstology, 15, 27–34.
Onac BP, Sumrall JG, Tămaș T, Povară I, Kearns J, DărmiceanuV, Vereș D, Lascu C, 2009. The relationship between caveminerals and H2S-rich thermal waters along the Cerna Valley(SW Romania). Acta Carsologica, 38, 67–79.
Onac BP, 2012. Minerals. in: White WB, Culver DC, (Eds.).Encyclopedia of Caves. Academic Press, Chennai, 499–508.
Polyak JV, Provencio P, 2001. By-product materials related toH2S-H2SO4 influenced speleogenesis of Carlsbad, Lechuguilla,and other caves of the Guadalupe Mountains, New Mexico.Journal of Cave and Karst Studies, 63, 23–32.
Shopov YY, 1993. Genetic classification of cave minerals.Proceedings of the 10th International Congress of Speleology,Beijing, China, 101–105.
White WB, 1997. Thermodynamic equilibrium, kinetics,activation barriers, and reaction mechanisms for chemicalreactions in karst terrains. Environmental Geology, 30, 46–58.
Cave Mineralogy – poster 2013 ICS Proceedings
489
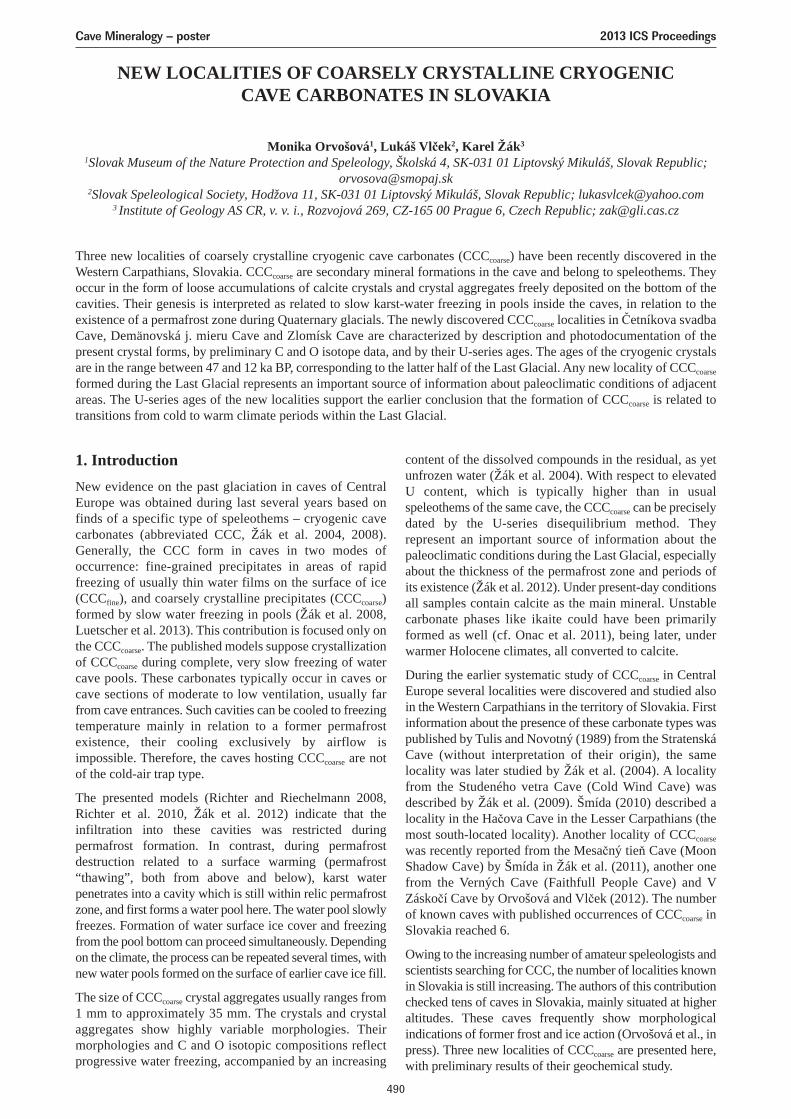
NEW LOCALITIES OF COARSELY CRYSTALLINE CRYOGENICCAVE CARBONATES IN SLOVAKIA
Monika Orvošová1, Lukáš Vlček2, Karel Žák3
1Slovak Museum of the Nature Protection and Speleology, Školská 4, SK-031 01 Liptovský Mikuláš, Slovak Republic;[email protected]
2Slovak Speleological Society, Hodžova 11, SK-031 01 Liptovský Mikuláš, Slovak Republic; [email protected] Institute of Geology AS CR, v. v. i., Rozvojová 269, CZ-165 00 Prague 6, Czech Republic; [email protected]
Three new localities of coarsely crystalline cryogenic cave carbonates (CCCcoarse) have been recently discovered in theWestern Carpathians, Slovakia. CCCcoarse are secondary mineral formations in the cave and belong to speleothems. Theyoccur in the form of loose accumulations of calcite crystals and crystal aggregates freely deposited on the bottom of thecavities. Their genesis is interpreted as related to slow karst-water freezing in pools inside the caves, in relation to theexistence of a permafrost zone during Quaternary glacials. The newly discovered CCCcoarse localities in Četníkova svadbaCave, Demänovská j. mieru Cave and Zlomísk Cave are characterized by description and photodocumentation of thepresent crystal forms, by preliminary C and O isotope data, and by their U-series ages. The ages of the cryogenic crystalsare in the range between 47 and 12 ka BP, corresponding to the latter half of the Last Glacial. Any new locality of CCCcoarse
formed during the Last Glacial represents an important source of information about paleoclimatic conditions of adjacentareas. The U-series ages of the new localities support the earlier conclusion that the formation of CCCcoarse is related totransitions from cold to warm climate periods within the Last Glacial.
1. IntroductionNew evidence on the past glaciation in caves of CentralEurope was obtained during last several years based onfinds of a specific type of speleothems – cryogenic cavecarbonates (abbreviated CCC, Žák et al. 2004, 2008).Generally, the CCC form in caves in two modes ofoccurrence: fine-grained precipitates in areas of rapidfreezing of usually thin water films on the surface of ice(CCCfine), and coarsely crystalline precipitates (CCCcoarse)formed by slow water freezing in pools (Žák et al. 2008,Luetscher et al. 2013). This contribution is focused only onthe CCCcoarse. The published models suppose crystallizationof CCCcoarse during complete, very slow freezing of watercave pools. These carbonates typically occur in caves orcave sections of moderate to low ventilation, usually farfrom cave entrances. Such cavities can be cooled to freezingtemperature mainly in relation to a former permafrostexistence, their cooling exclusively by airflow isimpossible. Therefore, the caves hosting CCCcoarse are notof the cold-air trap type.
The presented models (Richter and Riechelmann 2008,Richter et al. 2010, Žák et al. 2012) indicate that theinfiltration into these cavities was restricted duringpermafrost formation. In contrast, during permafrostdestruction related to a surface warming (permafrost“thawing”, both from above and below), karst waterpenetrates into a cavity which is still within relic permafrostzone, and first forms a water pool here. The water pool slowlyfreezes. Formation of water surface ice cover and freezingfrom the pool bottom can proceed simultaneously. Dependingon the climate, the process can be repeated several times, withnew water pools formed on the surface of earlier cave ice fill.
The size of CCCcoarse crystal aggregates usually ranges from1 mm to approximately 35 mm. The crystals and crystalaggregates show highly variable morphologies. Theirmorphologies and C and O isotopic compositions reflectprogressive water freezing, accompanied by an increasing
content of the dissolved compounds in the residual, as yetunfrozen water (Žák et al. 2004). With respect to elevatedU content, which is typically higher than in usualspeleothems of the same cave, the CCCcoarse can be preciselydated by the U-series disequilibrium method. Theyrepresent an important source of information about thepaleoclimatic conditions during the Last Glacial, especiallyabout the thickness of the permafrost zone and periods ofits existence (Žák et al. 2012). Under present-day conditionsall samples contain calcite as the main mineral. Unstablecarbonate phases like ikaite could have been primarilyformed as well (cf. Onac et al. 2011), being later, underwarmer Holocene climates, all converted to calcite.
During the earlier systematic study of CCCcoarse in CentralEurope several localities were discovered and studied alsoin the Western Carpathians in the territory of Slovakia. Firstinformation about the presence of these carbonate types waspublished by Tulis and Novotný (1989) from the StratenskáCave (without interpretation of their origin), the samelocality was later studied by Žák et al. (2004). A localityfrom the Studeného vetra Cave (Cold Wind Cave) wasdescribed by Žák et al. (2009). Šmída (2010) described alocality in the Hačova Cave in the Lesser Carpathians (themost south-located locality). Another locality of CCCcoarse
was recently reported from the Mesačný tieň Cave (MoonShadow Cave) by Šmída in Žák et al. (2011), another onefrom the Verných Cave (Faithfull People Cave) and VZáskočí Cave by Orvošová and Vlček (2012). The numberof known caves with published occurrences of CCCcoarse inSlovakia reached 6.
Owing to the increasing number of amateur speleologists andscientists searching for CCC, the number of localities knownin Slovakia is still increasing. The authors of this contributionchecked tens of caves in Slovakia, mainly situated at higheraltitudes. These caves frequently show morphologicalindications of former frost and ice action (Orvošová et al., inpress). Three new localities of CCCcoarse are presented here,with preliminary results of their geochemical study.
Cave Mineralogy – poster 2013 ICS Proceedings
490
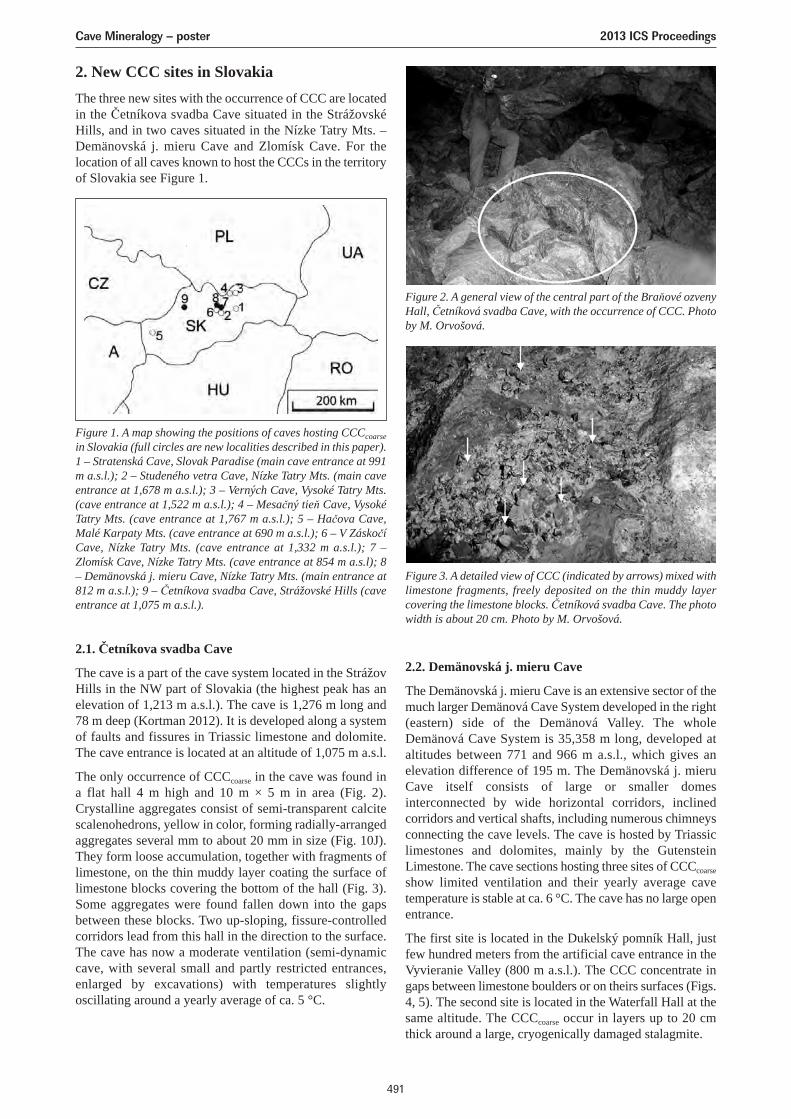
2. New CCC sites in SlovakiaThe three new sites with the occurrence of CCC are locatedin the Četníkova svadba Cave situated in the StrážovskéHills, and in two caves situated in the Nízke Tatry Mts. –Demänovská j. mieru Cave and Zlomísk Cave. For thelocation of all caves known to host the CCCs in the territoryof Slovakia see Figure 1.
2.1. Četníkova svadba Cave
The cave is a part of the cave system located in the StrážovHills in the NW part of Slovakia (the highest peak has anelevation of 1,213 m a.s.l.). The cave is 1,276 m long and78 m deep (Kortman 2012). It is developed along a systemof faults and fissures in Triassic limestone and dolomite.The cave entrance is located at an altitude of 1,075 m a.s.l.
The only occurrence of CCCcoarse in the cave was found ina flat hall 4 m high and 10 m × 5 m in area (Fig. 2).Crystalline aggregates consist of semi-transparent calcitescalenohedrons, yellow in color, forming radially-arrangedaggregates several mm to about 20 mm in size (Fig. 10J).They form loose accumulation, together with fragments oflimestone, on the thin muddy layer coating the surface oflimestone blocks covering the bottom of the hall (Fig. 3).Some aggregates were found fallen down into the gapsbetween these blocks. Two up-sloping, fissure-controlledcorridors lead from this hall in the direction to the surface.The cave has now a moderate ventilation (semi-dynamiccave, with several small and partly restricted entrances,enlarged by excavations) with temperatures slightlyoscillating around a yearly average of ca. 5 °C.
2.2. Demänovská j. mieru Cave
The Demänovská j. mieru Cave is an extensive sector of themuch larger Demänová Cave System developed in the right(eastern) side of the Demänová Valley. The wholeDemänová Cave System is 35,358 m long, developed ataltitudes between 771 and 966 m a.s.l., which gives anelevation difference of 195 m. The Demänovská j. mieruCave itself consists of large or smaller domesinterconnected by wide horizontal corridors, inclinedcorridors and vertical shafts, including numerous chimneysconnecting the cave levels. The cave is hosted by Triassiclimestones and dolomites, mainly by the GutensteinLimestone. The cave sections hosting three sites of CCCcoarse
show limited ventilation and their yearly average cavetemperature is stable at ca. 6 °C. The cave has no large openentrance.
The first site is located in the Dukelský pomník Hall, justfew hundred meters from the artificial cave entrance in theVyvieranie Valley (800 m a.s.l.). The CCC concentrate ingaps between limestone boulders or on theirs surfaces (Figs.4, 5). The second site is located in the Waterfall Hall at thesame altitude. The CCCcoarse occur in layers up to 20 cmthick around a large, cryogenically damaged stalagmite.
Figure 1. A map showing the positions of caves hosting CCCcoarsein Slovakia (full circles are new localities described in this paper).1 – Stratenská Cave, Slovak Paradise (main cave entrance at 991m a.s.l.); 2 – Studeného vetra Cave, Nízke Tatry Mts. (main caveentrance at 1,678 m a.s.l.); 3 – Verných Cave, Vysoké Tatry Mts.(cave entrance at 1,522 m a.s.l.); 4 – Mesačný tieň Cave, VysokéTatry Mts. (cave entrance at 1,767 m a.s.l.); 5 – Hačova Cave,Malé Karpaty Mts. (cave entrance at 690 m a.s.l.); 6 – V ZáskočíCave, Nízke Tatry Mts. (cave entrance at 1,332 m a.s.l.); 7 –Zlomísk Cave, Nízke Tatry Mts. (cave entrance at 854 m a.s.l); 8– Demänovská j. mieru Cave, Nízke Tatry Mts. (main entrance at812 m a.s.l.); 9 – Četníkova svadba Cave, Strážovské Hills (caveentrance at 1,075 m a.s.l.).
Figure 2. A general view of the central part of the Braňové ozvenyHall, Četníková svadba Cave, with the occurrence of CCC. Photoby M. Orvošová.
Figure 3. A detailed view of CCC (indicated by arrows) mixed withlimestone fragments, freely deposited on the thin muddy layercovering the limestone blocks. Četníková svadba Cave. The photowidth is about 20 cm. Photo by M. Orvošová.
Cave Mineralogy – poster 2013 ICS Proceedings
491
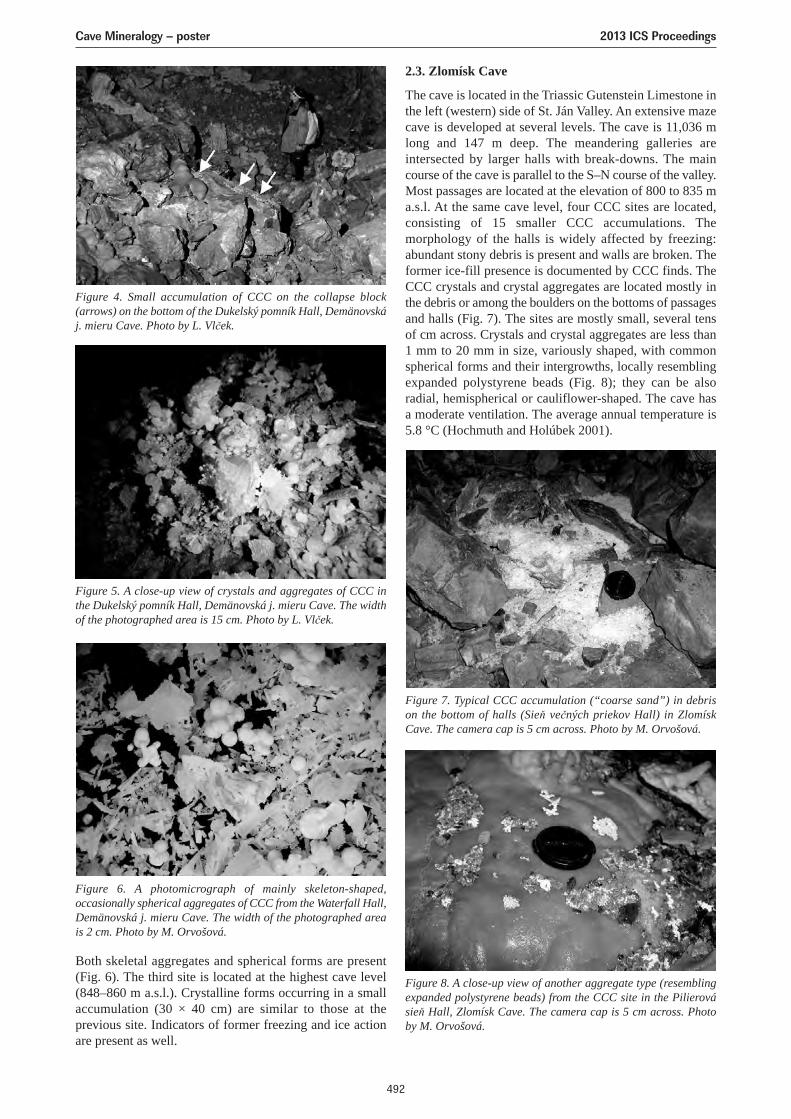
Both skeletal aggregates and spherical forms are present(Fig. 6). The third site is located at the highest cave level(848–860 m a.s.l.). Crystalline forms occurring in a smallaccumulation (30 × 40 cm) are similar to those at theprevious site. Indicators of former freezing and ice actionare present as well.
2.3. Zlomísk Cave
The cave is located in the Triassic Gutenstein Limestone inthe left (western) side of St. Ján Valley. An extensive mazecave is developed at several levels. The cave is 11,036 mlong and 147 m deep. The meandering galleries areintersected by larger halls with break-downs. The maincourse of the cave is parallel to the S–N course of the valley.Most passages are located at the elevation of 800 to 835 ma.s.l. At the same cave level, four CCC sites are located,consisting of 15 smaller CCC accumulations. Themorphology of the halls is widely affected by freezing:abundant stony debris is present and walls are broken. Theformer ice-fill presence is documented by CCC finds. TheCCC crystals and crystal aggregates are located mostly inthe debris or among the boulders on the bottoms of passagesand halls (Fig. 7). The sites are mostly small, several tensof cm across. Crystals and crystal aggregates are less than1 mm to 20 mm in size, variously shaped, with commonspherical forms and their intergrowths, locally resemblingexpanded polystyrene beads (Fig. 8); they can be alsoradial, hemispherical or cauliflower-shaped. The cave hasa moderate ventilation. The average annual temperature is5.8 °C (Hochmuth and Holúbek 2001).
Figure 4. Small accumulation of CCC on the collapse block(arrows) on the bottom of the Dukelský pomník Hall, Demänovskáj. mieru Cave. Photo by L. Vlček.
Figure 5. A close-up view of crystals and aggregates of CCC inthe Dukelský pomník Hall, Demänovská j. mieru Cave. The widthof the photographed area is 15 cm. Photo by L. Vlček.
Figure 7. Typical CCC accumulation (“coarse sand”) in debrison the bottom of halls (Sieň večných priekov Hall) in ZlomískCave. The camera cap is 5 cm across. Photo by M. Orvošová.
Figure 8. A close-up view of another aggregate type (resemblingexpanded polystyrene beads) from the CCC site in the Pilierovásieň Hall, Zlomísk Cave. The camera cap is 5 cm across. Photoby M. Orvošová.
Figure 6. A photomicrograph of mainly skeleton-shaped,occasionally spherical aggregates of CCC from the Waterfall Hall,Demänovská j. mieru Cave. The width of the photographed areais 2 cm. Photo by M. Orvošová.
Cave Mineralogy – poster 2013 ICS Proceedings
492
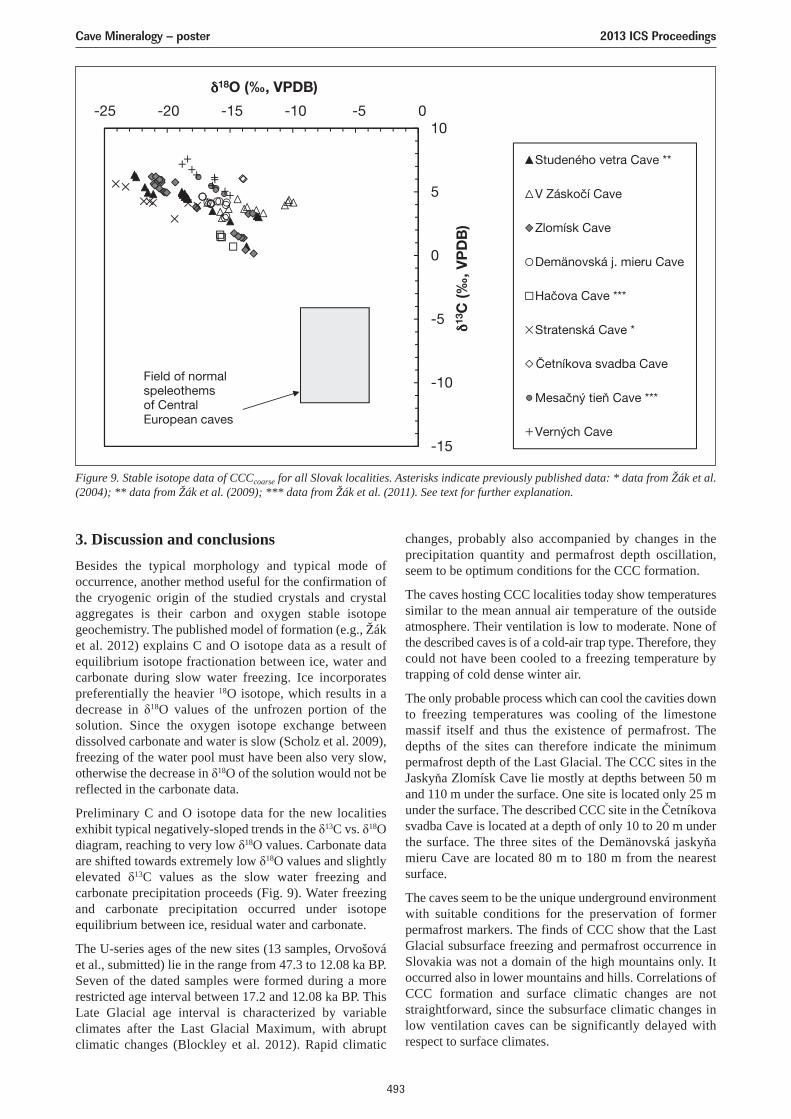
3. Discussion and conclusionsBesides the typical morphology and typical mode ofoccurrence, another method useful for the confirmation ofthe cryogenic origin of the studied crystals and crystalaggregates is their carbon and oxygen stable isotopegeochemistry. The published model of formation (e.g., Žáket al. 2012) explains C and O isotope data as a result ofequilibrium isotope fractionation between ice, water andcarbonate during slow water freezing. Ice incorporatespreferentially the heavier 18O isotope, which results in adecrease in δ18O values of the unfrozen portion of thesolution. Since the oxygen isotope exchange betweendissolved carbonate and water is slow (Scholz et al. 2009),freezing of the water pool must have been also very slow,otherwise the decrease in δ18O of the solution would not bereflected in the carbonate data.
Preliminary C and O isotope data for the new localitiesexhibit typical negatively-sloped trends in the δ13C vs. δ18Odiagram, reaching to very low δ18O values. Carbonate dataare shifted towards extremely low δ18O values and slightlyelevated δ13C values as the slow water freezing andcarbonate precipitation proceeds (Fig. 9). Water freezingand carbonate precipitation occurred under isotopeequilibrium between ice, residual water and carbonate.
The U-series ages of the new sites (13 samples, Orvošováet al., submitted) lie in the range from 47.3 to 12.08 ka BP.Seven of the dated samples were formed during a morerestricted age interval between 17.2 and 12.08 ka BP. ThisLate Glacial age interval is characterized by variableclimates after the Last Glacial Maximum, with abruptclimatic changes (Blockley et al. 2012). Rapid climatic
changes, probably also accompanied by changes in theprecipitation quantity and permafrost depth oscillation,seem to be optimum conditions for the CCC formation.
The caves hosting CCC localities today show temperaturessimilar to the mean annual air temperature of the outsideatmosphere. Their ventilation is low to moderate. None ofthe described caves is of a cold-air trap type. Therefore, theycould not have been cooled to a freezing temperature bytrapping of cold dense winter air.
The only probable process which can cool the cavities downto freezing temperatures was cooling of the limestonemassif itself and thus the existence of permafrost. Thedepths of the sites can therefore indicate the minimumpermafrost depth of the Last Glacial. The CCC sites in theJaskyňa Zlomísk Cave lie mostly at depths between 50 mand 110 m under the surface. One site is located only 25 munder the surface. The described CCC site in the Četníkovasvadba Cave is located at a depth of only 10 to 20 m underthe surface. The three sites of the Demänovská jaskyňamieru Cave are located 80 m to 180 m from the nearestsurface.
The caves seem to be the unique underground environmentwith suitable conditions for the preservation of formerpermafrost markers. The finds of CCC show that the LastGlacial subsurface freezing and permafrost occurrence inSlovakia was not a domain of the high mountains only. Itoccurred also in lower mountains and hills. Correlations ofCCC formation and surface climatic changes are notstraightforward, since the subsurface climatic changes inlow ventilation caves can be significantly delayed withrespect to surface climates.
Figure 9. Stable isotope data of CCCcoarse for all Slovak localities. Asterisks indicate previously published data: * data from Žák et al.(2004); ** data from Žák et al. (2009); *** data from Žák et al. (2011). See text for further explanation.
Cave Mineralogy – poster 2013 ICS Proceedings
493
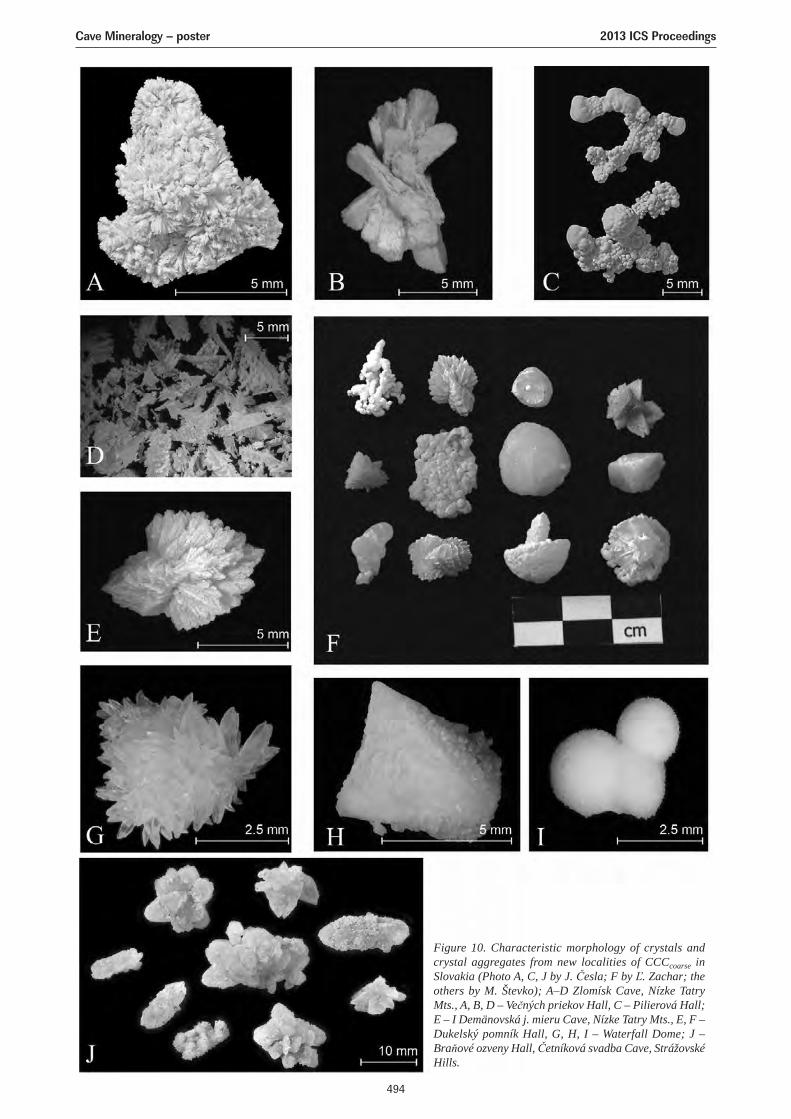
Figure 10. Characteristic morphology of crystals andcrystal aggregates from new localities of CCCcoarse inSlovakia (Photo A, C, J by J. Česla; F by Ľ. Zachar; theothers by M. Števko); A–D Zlomísk Cave, Nízke TatryMts., A, B, D – Večných priekov Hall, C – Pilierová Hall;E – I Demänovská j. mieru Cave, Nízke Tatry Mts., E, F –Dukelský pomník Hall, G, H, I – Waterfall Dome; J –Braňové ozveny Hall, Četníková svadba Cave, StrážovskéHills.
Cave Mineralogy – poster 2013 ICS Proceedings
494
The high morphological variability of CCC crystals andaggregates and their causes are the the subject of currentcontinuous research (Fig. 10). Regional mapping of CCCsites, their morphology, ages, and geographic distributionshould provide important information about the distributionof Glacial temperatures and help in the study of terrestrialpaleoclimates of the Western Carpathians.
Nowadays, there are 9 CCC localities known in the cavesof Western Carpathians, Slovakia. The last three – theČetníkova svadba Cave in the Strážovské Hills, theDemänovská j. mieru Cave and Zlomísk Cave in the NízkeTatry Mts. – are newly introduced in this paper.
AcknowledgmentsThis study was supported by Operational Program Researchand Development through the project “Centre of excellencefor integrated research of Earth’s geosphere” No. ITMS-26220120064 co-financed by ERDF. Participation of K.Žák was supported by RVO67985831 Program. For thepossibility to work in the caves, technical help, andimportant field-data we wish to thank the members of theSlovak Speleological Society, the Strážovské vrchySpeleoclub, the Demänovská dolina Speleoclub and theNicolaus Speleoclub, especially Bohuslav Kortman, JánKasák, Milo Lisý, Pavel Herich, Michal Danko and PeterHolúbek.
ReferencesBlockley SPE, Lane CS, Hardiman M, Rasmussen SO, Seierstad
IK, Steffensen JP, Svensson A, Lotter AF, Turney CSM,Ramsey CB, INTIMATE members, 2012. Synchronisation ofpalaeoenvironmental records over the last 60,000 years, andextended INTIMATE event stratigraphy to 48,000 b2k.Quaternary Science Reviews, 36, 2–10.
Hochmuth Z, Holúbek P, 2001. Geomorfologické pomery atopografia novoobjavených častí Jaskyne zlomísk v Jánskejdoline v Nízkych Tatrách. Slovenský kras, 36, 59–80.
Kortman B, 2012. “Zbojnícky systém” na Strážove realitou?Spravodaj Slovenskej speleologickej spoločnosti, 3, 48–49.
Luetscher M, Borreguero M, Moseley GE, Spötl C, Edwards RL,2013. Alpine permafrost thawing during the Medieval WarmPeriod identified from cryogenic cave carbonates. TheCryosphere Discuss, 7, 419–440.
Onac BP, Wynn JG, Citterio M, 2011. Ikaite in the Scarisoara IceCave (Romania): origin and significance. GeophysicalResearch Abstracts, 13, EGU2011–5188.
Orvošová M, Vlček L, 2012. Nové nálezy kryogénnychjaskynných agregátov – čudesných kryštálikov z doby ľadovej.Spravodaj SSS, 1, 76–82.
Orvošová M, Vlček L, Holúbek P, Orvoš P, in press. Frost andcave ice action as a cause of speleothem destruction during theGlacial: examples from selected caves of Slovakia. ActaCarsologica Slovaca.
Orvošová M, Žák K, Deininger M, Milovský R, under review.Detection of permafrost depth penetration and permafrostduration in caves: Methodology based on cryogenic cavecarbonate and a case study of the Last Permafrost Maximumin Western Carpathians, Slovakia. Boreas, submitted.
Richter DK, Riechelmann DFC, 2008. Late Pleistocene cryogeniccalcite spherolites from the Malachitdom Cave (NE RhenishSlate Mountains, Germany): origin, unusual internal structureand stable C-O isotope composition. International Journal ofSpeleology, 37, 2, 119–129.
Richter DK, Meissner A, Immenhauser U, Schulte U, Dorsten I,2010. Cryogenic and non-cryogenic pool calcites indicatingpermafrost and non-permafrost periods: a case study from theHerbstlabyrinth-Advent Cave system (Germany). TheCryosphere, 4, 501–509.
Scholz D, Mühlinghaus C, Mangini A, 2009. Modelling δ13C andδ18O in the solution layer on stalagmite surfaces, Geochimicaet Cosmochimica Acta, 73, 2592–2602.
Šmída B, 2010. Geomorfológia a genéza Plaveckého krasu akomodelového územia tzv. konktaktného krasu Západných Karpáts nižšou energiou reliéfotvorby, Ph.D. Thesis, Faculty of NaturalSciences, Comenius University in Bratislava, 220.
Tulis J, Novotný L. 1989. System of Stratenská Cave, OsvetaPublishers, Martin, 464.
Žák K, Urban J, Cílek V, Hercman H, 2004. Cryogenic cave calcitefrom several Central European caves: age, carbon and oxygenisotopes and a genetic model. Chemical Geology, 206, 119–136.
Žák K, Onac BP, Perşoiu A, 2008. Cryogenic carbonates in caveenvironments: A review. Quaternary International, 187, 84–96.
Žák K, Hercman H, Orvošová M, Jačková I, 2009. Cryogenic cavecarbonates from the Cold Wind Cave, Nízke Tatry Mountains,Slovakia: Extending the age range of cryogenic cave carbonateformation to the Saalian. International Journal of Speleology,38, 2, 139–152.
Žák K, Šmída B, Filippi M, Živor R, Komaško A, Vybíral S, 2011.Nové lokality kryogénneho karbonátu v České republice a naSlovensku. Speleofórum, 30, 103–110.
Žák K, Richter DK, Fillipi M, Živor R, Deininger M, Mangini A,Scholz D, 2012. Cryogenic cave carbonate – a new tool forestimation of the Last Glacial permafrost depth of the CentralEurope. Climate of the Past, 8, 1–17.
Cave Mineralogy – poster 2013 ICS Proceedings
495
496
We thank all partners for their kind support of the 16th International Congress of Speleology!
Czech Convention Bureau CzechTourism
Village of Rudice
Ministerstvo životního prostředíČeské republiky
Ministry of the Environment of the CzechRepublic
South Moravian Region
City of Brno
Cave Administration of the CzechRepublic
Administration of the MoravianKarst Protected Landscape Area
Institute of Geology, Academy ofSciences of the Czech Republic
Czech Geological Survey Town of Blansko
Moravian Museum
Association for CountryDevelopment – Moravian Karst
Agency for the Nature Conservation and LandscapeProtection of the Czech Republic
Partners of the 16th ICS
2013 ICS Proceedings

We thank all sponsors for their kind support of the 16th International Congress of Speleology!
Wine of Pazderka’s Clan Scurion
Beal Trade Fairs Brno
Mediform spol. s r.o. Czech Lime Association
Planteko
Esri
Society for the Moravian Karst
Sponsors of the 16th ICS
497
Starobrno
2013 ICS Proceedings

498
Jiří Adamovič ................................................................................................217J. Adjizian-Gerard .......................................................................................384Ana M. Alonso-Zarza................................................................................465Sergio dos Anjos Ferreira Pinto ............................................................264Asma Al Farraj Al Ketbi ............................................................................164Alexandra Alexeeva ...................................................................................185Gennadiy N. Amelichev............................................................................364Sarah M. Arpin...............................................................................................15M. Arzouni....................................................................................................384Naser Asadí....................................................................................................48Roman Aubrecht ........................................................................................221Philippe Audra..........................................144, 335, 362, 412, 425, 432Anton Auxt ...................................................................................................370Hughes Badaoui .........................................................................................105Giovanni Badino............................................................................................35Shirin Bahadorinia.........................................................................................16Darko Bakšić ..................................................................................................17Eleonora Baldoni ........................................................................................437Teo Barišić ......................................................................................................17Ivo Baroň.......................................................................................................227Ingo Bauer ..........................................................................................231, 243David Bečkovský ........................................................................................227Pavel Bella ............................................................................................94, 237Pavol Bella ......................................................................................................94Zsolt Bendő .................................................................................................150Fabrizio Benvenuto....................................................................................144Maria Dulcinea M.R. Bessa ....................................................................173Jean-Yves Bigot.................................................................................144, 425Neven Bočić ................................................................................................170Martin Bochud...............................................................................................21Carl Bolster...................................................................................................110Pavel Bosák .................................................................................................379Ann Bosted ..................................................................................................243Peter Bosted ..............................................................................27, 231, 243Ines Krajcar Bronić ....................................................................................196Jiří Bruthans................................................................................48, 206, 247José María Calaforra..........................................................................78, 449Gianni Campanella ....................................................................................320Hubert Camus ............................................................................................425José Adilson Dias Cavalcanti..................................................................173Monica I. Călugăr.......................................................................................486Martin Chadima ....................................................................................94, 96Chadi Chaker...............................................................................................105S. Chédeville................................................................................................253T. Comaty.....................................................................................................384Stanislav Čermák .......................................................................................379Kristýna Čížková............................................................................................94Matthew D. Covington.............................................................................340Ilenia Maria D’Angeli ...................................................................................29Love Dalén ...................................................................................................461Antonio De Vivo............................................................................................35Jo De Waele................................................29, 144, 298, 437, 449, 486J.-J. Delannoy ...............................................................................................384Petr Dobeš ...................................................................................................179Jiří Dragoun...................................................................................................179Marek Duliński ..............................................................................................89John R. Dunkley ..........................................................................................259E. Dupuis ......................................................................................................253Masoud Ebadi.............................................................................................449Herta S. Effenberger.................................................................................470Massimo Ercolani ......................................................................................443István Eszterhás .........................................................................................308Sanja Faivre..................................................................................................170Lukáš Falteisek ...........................................................................................247Andrew R. Farrant ..............................................................................42, 132Trevor Faulkner.................................................................................342, 349Michal Filippi........................................................................................48, 179Lee J. Florea.................................................................................................356Derek C. Ford .................................................................................16, 54, 55
Joan J. Fornós....................................................................................483, 486Paolo Forti..................................................................................35, 443, 449Nikolay Franz ...............................................................................................185Silvia Frisia ...................................................................................................465Amos Frumkin ...............................................................................................60Darryl E. Granger ..........................................................................................94Christopher G. Groves ................................................................................15Ludovít Gaál.................................................................................................237Franci Gabrovšek...................................................................164, 340, 362Ermanno Galli ...............................................................144, 298, 437, 449Mladen Garašić .....................................................................................66, 72Davor Garašić................................................................................................72Michał Gąsiorowski...................................................................................421Fernando Gázquez.............................................................................78, 425Ghassem Ghaderi ......................................................................................190G. Girot..........................................................................................................253Alexandra M. Giurgiu ................................................................................483Laura González-López ..............................................................................479Andrzej Górny................................................................................................89Petra Gostinčar .............................................................................................84Tomislav Gracanin .....................................................................................243Michał Gradziński.........................................................................................89Miloš Gregor ...............................................................................................370Chris Groves.........................................................................................99, 110Veda Hackell................................................................................................243G. Hanin........................................................................................................253Roman Hapka ................................................................................................21Rubens Hardt..............................................................................................264Eko Haryono ..................................................................................................90Philipp Häuselmann ..................................................................................362Dagmar Haviarová .....................................................................................370Sayed Hassen Hejazi...................................................................................16John Hellstrom............................................................................................384Habib Helou.................................................................................................105Helena Hercman.........................................................................89, 94, 421Helena Herman.............................................................................................96Stina Höglund .............................................................................................461Zdenko Hochmuth ....................................................................................201Peter Holúbek................................................................................................94Ivan Horáček ...............................................................................................379Nada Horvatinčić .......................................................................................170Irina Inshina..................................................................................................185Magnus Ivarsson........................................................................................461Ondřej Jäger .........................................................................................48, 206S. Jaillet .........................................................................................................384Pathmakumara Jayasingha ......................................................................280Sándor Józsa................................................................................................150Jean-Marc Jutzet............................................................................................21Olga Kadebskaya .......................................................................................454Jaroslav Kadlec ......................................................................................94, 96Leila Karimi...................................................................................................190Anton Kazak.................................................................................................185Stephan Kempe................................................................................231, 243Ditta Kicińska ..............................................................................................194Alexander B. Klimchouk...........................................................................364Martin Knez .................................................................................................164Marijan Kovačić ..........................................................................................170František Krejča .........................................................................................206B. Laignel ......................................................................................................253Tomáš Lánczos...........................................................................................221Stein-Erik Lauritzen.....................................................107, 366, 368, 459Albrecht Leis ...............................................................................................196Jan Lenart .....................................................................................................268Robert N. Lerch ............................................................................................99Lenka Lisá.......................................................................................................96María José López-Galindo.......................................................................479Johannes E. K. Lundberg ...............................................................305, 461Joyce Lundberg...........................................................................................298John Lyles ........................................................................................................27
Authors Index
2013 ICS Proceedings

499
Alan L. Mayo................................................................................................247Kun Ma..........................................................................................................121Giuliana Madonia .......................................................................................144Laurent Magne............................................................................................126Peter Malík...................................................................................................370Magda Mandić............................................................................................196Włodzimierz Margielewski ......................................................................314Rebeca Martín-García..............................................................................465Gregor Marx ................................................................................................399P. Matta.........................................................................................................384Marco Mecchia..........................................................................................292Marco Menichetti ......................................................................................376Jan Mertlík ....................................................................................................217Mauro Messina ..........................................................................................437Marc Metni ..................................................................................................105Lumír Míča...................................................................................................227Andrej Mihevc...................................................................................196, 379Radek Mikuláš.............................................................................................217Benjamin V. Miller ...............................................................................99, 110Cristian Moldovan .....................................................................................486Janez Mulec .................................................................................................164Fadi H. Nader ..............................................................................................105Alireza Nadimi................................................................................................16Giuseppe Napoli .......................................................................................402Angelo Naseddu ........................................................................................486Tomáš Navrátil.............................................................................................217C. Nehme.....................................................................................................384Tibor Németh..............................................................................................150Jean-Claude Nobécourt.......................................................144, 335, 432Steven R. Noble............................................................................................42Jiří Novotný ...................................................................................................179Olga Novysh ................................................................................................185Pauline Oberender ....................................................................................390Hedi Oberhänsli ............................................................................................96Monika Orvošová...............................................................................94, 490Alexandr Osintsev ........................................................................................96Bogdan P. Onac..................................................116, 437, 470, 483, 486R. Armstrong L. Osborne ..............................................................275, 280Dalibor Paar ....................................................................................................17Arthur N. Palmer ........................................................................................393Margaret V. Palmer ...................................................................................393Tomáš Pánek...............................................................................................268Kyriaki Papadopoulou-Vrynioti...............................................................208Mario Parise ................................................................................................320Christos Pennos .........................................................................................107Manuela Corrêa Pereira...........................................................................286Cristina M. Pușcaș ....................................................................................470Metka Petrič ................................................................................................164Alena Petrvalská.........................................................................................201Leonardo Piccini ...........................................................................................35Lukas Plan ...............................................................................390, 399, 408Katia Poletti .................................................................................................443Jason S. Polk.........................................................................................99, 110Gheorghe M. Ponta....................................................................................116Ioan Povară ..................................................................................................470Mitja Prelovšek...........................................................................................340Petr Pruner ...........................................................................................94, 379Stanisław Przybyszowski ..........................................................................89Leonardo Puccini .......................................................................................292Pietro Renda................................................................................................402Angela Rizzi .................................................................................................320Joël Rodet ........................................121, 126, 154, 253, 264, 286, 326Andreas Roncat..........................................................................................399Rosario Ruggieri .................................................................................29, 402Fernando Rull ..............................................................................................425André Augusto Rodrigues Salgado............................................286, 326Therese Sallstedt.......................................................................................461Mariangela Sammarco.............................................................................320Jorge Sanjurjo-Sánchez............................................................................479
Laura Sanna .........................................................................................29, 437Francesco Sauro..............................................................................298, 437Manuela Scheuerer...................................................................................305Ján Schlögl....................................................................................................221Petr Schnabl...................................................................................................94Andrea Schober .........................................................................................408Denis Scholz ...............................................................................................408Jana Schweigstillová..................................................................................247Charles Self........................................................................................132, 474Michael J. Simms..........................................................................................42Rabbe Sjöberg..................................................................................305, 461Rannveig Øvrevik Skoglund ....................................................................368Tadej Slabe ..................................................................................................164Daniel Smutek.............................................................................................247Sergey Sorokin............................................................................................185Jan Soukup ...................................................................................................247Fernanda Cristina Rodrigues de Souza ..............................................326Christoph Spötl ..........................................................................................408Jacek Szczygieł............................................................................................137George Szentes..........................................................................................308Stanislav Šlechta ..........................................................................................94Branislav Šmída ..........................................................................................221Jaromír Švasta .............................................................................................370Tudor Tămaş ...............................................................................................483Johnny Tawk.................................................................................................105Ilya Tchaikovsky..........................................................................................454Marjan Temovski ........................................................................................412Nicola Tisato ...............................................................................................298D. Todisco....................................................................................................253Sergiy V. Tokarev........................................................................................364Antonio Trocino..........................................................................................320Elizaveta І. Tymokhina ..............................................................................364Cesar Ulisses Vieira Veríssimo..............................................................173Jan Urban ......................................................................................................314István Berényi Üveges ..............................................................................150Judit Berényi Üveges .................................................................................150Jana Vaculíková ...........................................................................................247Cristiane Valéria de Oliveira ...................................................................326Sean Vanderhoff .........................................................................................110Marcos Vaqueiro-Rodríguez...................................................................479Alessandra Mendes Carvalho Vasconcelos .....................................326Emmanuel Vassilakis ................................................................................208Marco Vattano ............................................................................................144Clovis Vaz Parente .....................................................................................173Jiří Vejlupek...................................................................................................179Jean-Pierre Viard ...............................................................................121, 126Gábor Vid .....................................................................................................150Juan Ramón Vidal-Romaní.............................................................461, 479Nicholaus Vieira .........................................................................................158Orsolya Viktorik ..........................................................................................150Mauro Villani ...............................................................................................437Lukáš Vlček........................................................................................221, 490Anna Vojtěchová ........................................................................................206Jan Wagner...................................................................................................379Adam Walker...............................................................................................158Wasantha S. Weliange.............................................................................280Susan White ................................................................................................418Luc Willems.................................................................................................154Jonathan G. Wynn......................................................................................470Nyguen Xuan Nam .....................................................................................116Charles Yonge.............................................................................................158Mohammad Zare..........................................................................................48Nadja Zupan-Hajna .........................................................................164, 379Karel Žák ............................................................................................179, 490
2013 ICS Proceedings


Czech Republic, Brno
July 21 –28, 2013
© Czech Speleological Societywww.speleo.cz
ISBN 978-80-87857-09-0