Proceedings IE 2015.pdf - International Conference on ...
637
International Conference on Informatics in Economy Proceedings of the 14th International Conference on INFORMATICS in ECONOMY (IE 2015) Education, Research & Business Technologies Bucharest, Romania April 30 – May 03, 2015 Published by Bucharest University of Economic Studies Press www.conferenceie.ase.ro ISSN 2284-7472 ISSN-L = 2247-1480
-
Upload
khangminh22 -
Category
Documents
-
view
0 -
download
0
Transcript of Proceedings IE 2015.pdf - International Conference on ...

International Conference on
Informatics in Economy
Proceedings of the 14th International Conference on
INFORMATICS in ECONOMY (IE 2015)
Education, Research & Business Technologies
Bucharest, Romania
April 30 – May 03, 2015
Published by Bucharest University of Economic Studies Press
www.conferenceie.ase.ro
ISSN 2284-7472
ISSN-L = 2247-1480

International Conference on
Informatics in Economy
Proceedings of the 14th International Conference on
INFORMATICS in ECONOMY (IE 2015)
Education, Research & Business Technologies
Bucharest, Romania
April 30 – May 03, 2015
Published by Bucharest University of Economic Studies Press
www.conferenceie.ase.ro
Cover: Assoc. Prof. Cătălin BOJA Copyright © 2015, by Bucharest University of Economic Studies Press
All the copyright of the present book belongs to the Bucharest Academy of Economic Studies Press.
All rights reserved. No part of this publication may be reproduced, stored in a retrieval system, or
transmitted in any form or by any means, electronic, mechanical, photocopying, recording, or
otherwise, without the prior written permission of the Editor of Bucharest University of Economic
Studies Press.
All papers of the present volume were peer reviewed by two independent reviewers. Acceptance was
granted when both reviewers' recommendations were positive.
See also: http://www.conferenceie.ase.ro
ISSN 2284-7472
ISSN-L 2247-1480

International Conference on
Informatics in Economy
Proceedings of the 14th International Conference on
INFORMATICS in ECONOMY (IE 2015)
Education, Research & Business Technologies
Bucharest, Romania
April 30 – May 03, 2015
Conference organized by:
Bucharest University of
Economic Studies
Department of Economic Informatics
and Cybernetics
INFOREC Association

Editors: Assoc. Prof. Cătălin Boja, Bucharest University of Economic Studies, Romania
Lect. Mihai Doinea, Bucharest University of Economic Studies, Romania
Lect. Cristian Ciurea, Bucharest University of Economic Studies, Romania
Prof. Paul Pocatilu, Bucharest University of Economic Studies, Romania
Assoc. Prof. Lorena Bătăgan, Bucharest University of Economic Studies, Romania
Lect. Alina Ion, Bucharest University of Economic Studies, Romania
Lect. Vlad Diaconiță, Bucharest University of Economic Studies, Romania
Lect. Madalina Andreica, Bucharest University of Economic Studies, Romania
Assist. Camelia Delcea, Bucharest University of Economic Studies, Romania
Assist. Alin Zamfiroiu, Bucharest University of Economic Studies, Romania
Assist. Madalina Zurini, Bucharest University of Economic Studies, Romania
Assist. Oana Popescu, Bucharest University of Economic Studies, Romania
International Program Committee Members: Frederique Biennier, INSA de Lion, FRANCE
Wladimir Bodrow, University of Applied Sciences, Berlin, GERMANY
Ewa Bojar, Lublin University of Technology, POLAND
Pino Caballero-Gil, University of La Laguna, SPAIN
Hans Czap, Trier University, GERMANY
Florin Filip, Romanian Academy, ROMANIA
Howard Duncan, Dublin City University, IRELAND
Manfred Fischer, Wirtscahftsuniversitaet Wien, AUSTRIA
Janis Grundspenkis, Riga Technical University, LATVIA
Timothy Hall, Univesity of Limerick, IRELAND
Luca Iandoli, University Federico II, ITALY
Ivan Jelinek, Czech Technical University in Prague, CZECH REPUBLIC
Jones Karl, Liverpool John Moores University, UNITED KINGDOM
Karlheinz Kautz, Copenhagen Business School, DENMARK
Wong Wing Keung, National University of Singapore, SINGAPORE
Yannis Manolopoulos, Aristotle University of Thessaloniki, GREECE
Lynn Martin, University of Central England, Birmingham, UNITED KINGDOM
Antonio Jose Mendes, University of Coimbra, PORTUGAL
Mihaela I. Muntean, West University of Timisoara, ROMANIA
Peter Nijkamp, Free University of Amsterdam, NETHERLANDS
Maria Parlinska, Warsaw University of Life Sciences, POLAND
Boris Rachev, Bulgarian Chapter of the ACM, BULGARIA
George Roussos, BirkBeck University of London, UNITED KINGDOM
Frantz Rowe, University of Nantes, FRANCE
Doru E Tiliute, "Stefan cel Mare" University of Suceava, ROMANIA
Eduardo Tome, Universidade Lusiada de Famalicao, PORTUGAL
Michael Tschichholz, Fraunhofer eGovernment Center, GERMANY
Giuseppe Zollo, University Federico II, ITALY

Preface
This year, the 14th International Conference on INFORMATICS in ECONOMY (IE 2015),
Education, Research & Business Technologies, was held in Bucharest, Romania, between April 30th
and May 03rd, 2015. The Conference promoted research results in Business Informatics and related
Computer Science topics: Cloud, Distributed and Parallel Computing, Mobile-Embedded and
Multimedia Solutions, E-Society, Enterprise and Business Solutions, Databases and Data
Warehouses, Audit and Project Management, Quantitative Economics, Artificial Intelligence and Data
mining. The Conference has represented a meeting point for participants from all over the world, both
from academia and from industry.
The conference was first organized in 1993 in collaboration with researchers from Institut
National des Sciences Appliquées de Lyon (INSA de Lion), France. From 1993 to 2011, the
conference have been organized once at two years, publishing in ten editions high quality papers and
bringing together specialists from around the world. Starting with 2012, the conference takes place
annually, the 11th and 12th edition volumes have been indexed by ISI Thomson Reuters in its ISI
Proceedings directory and the 13th edition volume is under evaluation.
The International Conference on Informatics in Economy is one of the first scientific events
on this subject in Romania and during the last ten years has gained an international scientific
recognition. At national level, remains one of the most important scientific events that gather the
entire Romanian Economic Informatics community.
The conference has made partnerships with international journals like Journal of Economic
Computation and Economic Cybernetics Studies and Research (http://ecocyb.ase.ro), Informatica
Economica (http://revistaie.ase.ro), Economy Informatics (http://economyinformatics.ase.ro), Journal
of Applied Quantitative Methods (http://www.jaqm.ro), Database Systems Journal
(http://www.dbjournal.ro/), Journal of Mobile, Embedded and Distributed Systems
(http://www.jmeds.eu) and International Journal of Economic Practices and Theories
(www.ijept.org) to publish an extended format of the conference best papers.
A Conference such as this can only succeed as a team effort, so the Editors want to thank the
International Scientific Committee and the Reviewers for their excellent work in reviewing the papers
as well as their invaluable input and advice.
The Editors

Proceedings of the IE 2015 International Conference
www.conferenceie.ase.ro
i
Table of Contents
SECTION Cloud & Distributed/Parallel Computing
GENERAL PURPOSE SYSTEM FOR GENERATING EVALUATION
FORMS (GPS4GEF) ............................................................................................................... 1
Daniel HOMOCIANU, Dinu AIRINEI
UPON A MULTI CRITERIA OFFER-DEMAND CONTINOUS MATCHING
ALGORITHM .......................................................................................................................... 7
Claudiu VINŢE, Amelia CRISTESCU
STOCHASTIC PROCESSES AND QUEUEING THEORY FOR CLOUD
COMPUTER PERFORMANCE ANALYSIS .................................................................... 13
Florin-Cătălin ENACHE
AN EVALUATION OF THE FUZZY VAULT SCHEME DIFFUSION POINTS
ORDER OF MAGNITUDE .................................................................................................. 20
Marius-Alexandru VELCIU, Victor-Valeriu PATRICIU, Mihai TOGAN
EVOLUTION OF TELECOM BSS: FROM VOICE SERVICES TO COMPLEX IT
SERVICES.............................................................................................................................. 26
Ioan DRĂGAN, Răzvan Daniel ZOTA
HIERARCHICAL DISTRIBUTED HASH TABLES FOR VIDEO RECOGNITION IN
CONTENT DELIVERY NETWORKS ............................................................................... 32
Alecsandru PĂTRAȘCU, Ion BICA, Victor Valeriu PATRICIU
DRIVING BUSINESS AGILITY WITH THE USE OF CLOUD ANALYTICS ............ 38
Mihaela MUNTEAN
ORGANIZING SECURE GROUPS OF RELIABLE SERVICES IN DISTRIBUTED
SYSTEMS ............................................................................................................................... 44
Cezar TOADER, Corina RĂDULESCU, Cristian ANGHEL, Graţiela BOCA
AN OVERVIEW STUDY OF SOFTWARE DEFINED NETWORKING ...................... 50
Alexandru STANCU, Simona HALUNGA, George SUCIU, Alexandru VULPE
CONSUMER RIGHTS IN THE CONTEXT OF CLOUD BASED PROCESSING OF
OPEN DATA .......................................................................................................................... 56
Lorena BĂTĂGAN, Cătălin BOJA, Mihai DOINEA
SECURE CYBER SECURITY THREAT INFORMATION EXCHANGE .................... 63
Mihai-Gabriel IONITA
ADOPTION OF CLOUD COMPUTING IN THE ENTERPRISE .................................. 68
Floarea NĂSTASE, Carmen TIMOFTE
HEALTHY AGEING MOBILE GIS APPLICATIONS DEVELOPMENT AND AUDIT
FOR THE ACHIEVEMENT OF SOCIAL SUSTAINABILITY ...................................... 73
Cosmin TOMOZEI, Cristian AMANCEI
CLOUD–BASED ARCHITECTURE FOR PERFORMANCE MANAGEMENT
SYSTEMS FOR SMES.......................................................................................................... 79

Proceedings of the IE 2015 International Conference
www.conferenceie.ase.ro
ii
Alexandra RUSĂNEANU
SOFTWARE TOOLS AND ONLINE SERVICES THAT ENABLE
GEOGRAPHICALLY DISTRIBUTED SOFTWARE DEVELOPMENT OF WEB
APPLICATIONS ................................................................................................................... 84
Mihai GHEORGHE
THE IMPORTANCE OF JAVA PROGRAMMING LANGUAGE IN
IMPLEMENTING DISTRIBUTED SYSTEMS OF DECISION FOR ONLINE
CREDITING .......................................................................................................................... 90
Robert-Madalin CRISTESCU
PERSONAL DATA VULNERABILITIES AND RISKS MODEL .................................. 95
Gheorghe Cosmin SILAGHI
SECTION Mobile-Embedded & Multimedia Solutions
A BUSINESS MODEL FOR THE INTERACTION BETWEEN ACTORS OF
CULTURAL ECONOMY ................................................................................................... 102
Cristian CIUREA, Florin Gheorghe FILIP
NEAR FIELD COMMUNICATION - THE STATE OF KNOWLEDGE AND USE OF
NFC TECHNOLOGIES AND APPLICATIONS BY USERS OF SMART MOBILE
DEVICES .............................................................................................................................. 108
Mihaela Filofteia TUTUNEA
HOW TO VISUALIZE ONTOLOGIES. A STUDY FROM AN END USER’S
POINT OF VIEW ................................................................................................................ 116
Bogdan IANCU
STUDY ON STUDENTS MOBILE LEARNING ACCEPTANCE ................................ 122
Daniel MICAN, Nicolae TOMAI
CONDUCTING PROCESS MODEL UNDERSTANDING CONTROLLED
EXPERIMENTS USING EYE-TRACKING: AN EXPERIENCE REPORT ............... 128
Razvan PETRUSEL, Cristian BOLOGA
A TEST DATA GENERATOR BASED ON ANDROID LAYOUT FILES .................. 135
Paul POCATILU, Sergiu CAPISIZU
EMV/BITCOIN PAYMENT TRANSACTIONS AND DYNAMIC DATA
AUTHENTICATION WITH SMART JAVA CARDS .................................................... 141
Marius POPA, Cristian TOMA
ACCURATE GEO-LOCATION READING IN ANDROID .......................................... 152
Felician ALECU, Răzvan DINA

Proceedings of the IE 2015 International Conference
www.conferenceie.ase.ro
iii
SECTION E-Society, Enterprise & Business Solutions
ABOUT OPTIMIZING WEB APPLICATIONS ............................................................. 158
Marian Pompiliu CRISTESCU, Laurentiu Vasile CIOVICA
THE RELATIONSHIP BETWEEN ENVIRONMENTAL AND ENERGY
INDICATORS. THE CASE STUDY OF EUROPE ......................................................... 164
Titus Felix FURTUNĂ, Marian DÂRDALĂ, Roman KANALA
IS THE INTEGRATED MANAGEMENT SYSTEM OF QUALITY, ENVIRONMENT
AND HEATH AND SAFETY A SOLUTION FOR SME’S PERFORMANCE? .......... 170
Dorin MAIER, Adela Mariana VADASTREANU, Andreea MAIER
A FRAMEWORK FOR DESIGNING AN ONTOLOGY-BASED E-LEARNING
SYSTEM IN HEALTHCARE HUMAN RESOURCE MANAGEMENT ..................... 176
Lidia BAJENARU, Ion Alexandru MARINESCU, Ion SMEUREANU
PROJECT MANAGEMENT COMPETENCY ASSESSMENT FOR IT
PROFESSIONALS: AN ANALYTIC HIERARCHY PROCESS APPROACH ........... 182
Elena-Alexandra TOADER
BUSINESS SUCCESS BY IMPROVING THE INNOVATION
MANAGEMENT ................................................................................................................. 189
Adela Mariana VADASTREANU, Dorin MAIER, Andreea MAIER
RECOMMENDER SYSTEMS, A USEFUL TOOL FOR VIRTUAL MARKETPLACE;
CASE STUDY ...................................................................................................................... 195
Loredana MOCEAN, Miranda VLAD, Mihai AVORNICULUI
METHODOLOGY FOR THE COHERENT ROMANIAN LINKED OPEN
GOVERNMENT DATA ECOSYSTEM............................................................................ 202
Codrin-Florentin NISIOIU
QUALITY METRICS FOR EVALUATING INTERACTIVITY LEVEL OF CITIZEN
ORIENTED WEB BASED SOFTWARE SOLUTIONS ................................................. 207
Emanuel Eduard HERȚELIU
BRIDGE PKI ........................................................................................................................ 212
Eugen Ștefan Dorel COJOACĂ, Mădălina Elena RAC-ALBU, Floarea NĂSTASE
AN ENTERPRISE APPROACH TO DEVELOPING COMPLEX
APPLICATIONS ................................................................................................................. 218
Alexandru-Mihai MARINESCU, Anca ANDREESCU
A PRELIMINARY ANALYSIS OF BUSINESS INFORMATION SYSTEMS MASTER
PROGRAMME CURRICULUM BASED ON THE GRADUATES SURVEY ............ 224
Marin FOTACHE, Valerică GREAVU-ȘERBAN, Florin DUMITRIU
TEAMWORK CULTURE IN IASI IT COMPANIES .................................................... 231
Doina FOTACHE, Luminița HURBEAN
CRM- PHENOMENOLOGICAL AND CONCEPTUAL ANALYSIS IN REFERENCE
TO THE “STATE OF ART” .............................................................................................. 238
Mihaela IONESCU
CONTINUOUS INTEGRATION IN OPEN SOURCE SOFTWARE
PROJECTS ........................................................................................................................... 244
Mihai GEORGESCU, Cecilia CIOLOCA

Proceedings of the IE 2015 International Conference
www.conferenceie.ase.ro
iv
SERVICE-ORIENTED MODELING AND ARCHITECTURE FOR AN
E-FINANCIAL ASSISTANT INTEGRATION WITHIN THE
BANKING SYSTEM ........................................................................................................... 250
Mirela TURKEȘ, Irina RAICU, Alexandra RUSĂNEANU
RISK ASSESSMENT FRAMEWORK FOR SUCCESSFUL
E-GOVERNMENT PROJECTS ........................................................................................ 256
Otniel DIDRAGA
AN ASSESSMENT OF THE MAIN BENEFITS AND CHARACTERISTICS
OF BUSINESS SOFTWARE FROM THE PERSPECTIVE OF
ROMANIAN SMEs ............................................................................................................. 261
Victor LAVRIC
ECONOMIC VALUE EXCHANGES IN MULTI-PARTY COLLABORATIONS:
USING E3-VALUE TO ANALYSE THE M-PESA ECOSYSTEM ............................... 267
Caroline KINUTHIA, Andrew KAHONGE
ASPECTS OF INTER-ORGANIZATIONAL KNOWLEDGE MANAGEMENT IN
COLLABORATIVE NETWORKS ................................................................................... 273
Marinela MIRCEA
4D(ATA) PARADIGM AND EGOVERNMENT ............................................................. 279
Bogdan GHILIC-MICU, Marian STOICA, Cristian USCATU
AUTOMATIC USER PROFILE MAPPING TO MARKETING SEGMENTS IN A
BIG DATA CONTEXT ....................................................................................................... 285
Anett HOPPE, Ana ROXIN, Christophe NICOLLE
DECISION-MAKING PROCESS ASSISTANCE USING PRECISION TREE
MODULE OF PALISADE DECISION TOOLS SUITE ................................................. 292
Georgeta SOAVA, Mircea Alexandru RADUTEANU, Catalina SITNIKOV
RoaML: AN INNOVATIVE APPROACH ON MODELING WEB SERVICES ......... 299
Cătălin STRÎMBEI, Georgiana OLARU
INFORMATION SYSTEMS IMPLEMENTATION IN THE JIU
VALLEY SME’S .................................................................................................................. 307
Eduard EDELHAUSER, Lucian LUPU DIMA
META-INSTRUCTION IN E-EDUCATION ................................................................... 314
Gabriel ZAMFIR
SEMANTIC WEB TECHNOLOGIES FOR IMPLEMENTING COST-EFFECTIVE
AND INTEROPERABLE BUILDING INFORMATION MODELING........................ 322
Tarcisio MENDES de FARIAS, Ana-Maria ROXIN, Christophe NICOLLE
PRELIMINARY RESULTS OF AN EMPIRICAL INVESTIGATION ON BLENDED
LEARNING IMPLEMENTATION IN A ROMANIAN HEI ......................................... 329
Iuliana DOROBĂȚ
BUSINESS PROCESS MANAGEMENT DRIVEN BY DATA GOVERNANCE ........ 335
Liviu CIOVICĂ, Răzvan Daniel ZOTA, Ana-Maria CONSTANTINESCU
M-LEARNING AND LIFELONG LEARNING............................................................... 341 Alina-Mihaela ION, Dragoș VESPAN

Proceedings of the IE 2015 International Conference
www.conferenceie.ase.ro
v
SECTION Databases & Data Warehouse
THE PROBLEM OF DATA CONSISTENCY IN ANALYTICAL SYSTEMS ............ 347
Oleksandr SAMANTSOV, Olena KACHKO
BIG DATA ANALYSIS AS FUNDAMENT FOR PRICING DECISIONS ................... 352
Anca APOSTU
ON A HADOOP CLICHÉ: PHYSICAL AND LOGICAL MODELS
SEPARATION ..................................................................................................................... 357
Ionuț HRUBARU, Marin FOTACHE
BIG DATA CHALLENGES FOR HUMAN RESOURCES MANAGEMENT ............ 364
Adela BÂRA, Iuliana ȘIMONCA (BOTHA), Anda BELCIU, Bogdan NEDELCU
ARCHITECTURE OF SMART METERING SYSTEMS .............................................. 369
Simona-Vasilica OPREA, Ion LUNGU
DATA WAREHOUSE PYRAMIDAL SCHEMA ARCHITECTURE - SUPPORT FOR
BUSINESS INTELLIGENCE SYSTEMS ......................................................................... 375
Aida-Maria POPA
BUSINESS INTELLIGENCE FOR HEALTHCARE INDUSTRY ............................... 381
Mihaela IVAN, Manole VELICANU, Ionut TARANU
STREAMLINING BUSINESS PROCESSES IN ACADEMIA BY BUILDING AND
MANIPULATING A BUSINESS RULES REPOSITORY ............................................. 387
Alexandra Maria Ioana FLOREA, Ana-Ramona BOLOGA, Vlad DIACONIȚA, Razvan
BOLOGA
ENHANCING THE ETL PROCESS IN DATA WAREHOUSE SYSTEMS ................ 392
Ruxandra PETRE
SECTION Audit and Project Management
SOFTWARE DEVELOPMENT METHODOLOGY FOR INNOVATIVE PROJECTS -
ISDF METHODOLOGY .................................................................................................... 398
Mihai Liviu DESPA
AGILITY IN THE IT SERVICES SECTOR: A STUDY FOR ROMANIA ................. 410
Eduard-Nicolae BUDACU, Constanta-Nicoleta BODEA, Stelian STANCU
IMPROVEMENT OPPORTUNITIES BY USING REMOTE AUDIT IN THE
MARITIME TRANSPORT ................................................................................................ 418
Costel STANCA, Viorela-Georgiana STȊNGĂ, Gabriel RAICU, Ramona TROMIADIS
AUDIT REPORTS VALIDATION BASED ON ONTOLOGIES .................................. 422
Ion IVAN, Claudiu BRANDAS, Alin ZAMFIROIU
APPLICATION OF BUSINESS INTELLIGENCE IN PROJECT
MANAGEMENT ................................................................................................................. 428
Mihaela I. MUNTEAN, Liviu Gabriel CABᾸU

Proceedings of the IE 2015 International Conference
www.conferenceie.ase.ro
vi
SECTION Quantitative Economics
ANALYSIS OF THE MACROECONOMIC CAUSAL RELATIONSHIPS WHICH
CAN DETERMINE A COUNTRY TO ENTER A SOVEREIGN DEBT CRISIS ....... 433
Alexandra Maria CONSTANTIN, Adina CRISTEA
INVESTING OPTIMALLY IN ADVERTISING AND QUALITY TO MITIGATE
PRODUCT-HARM CRISIS ............................................................................................... 437
Francesco MORESINO
COUPLING TECHNO-ECONOMIC ENERGY MODELS WITH A SHARE OF
CHOICE ............................................................................................................................... 443
Francesco MORESINO, Emmanuel FRAGNIÈRE, Roman KANALA, Adriana REVEIU, Ion
SMEUREANU
A GENDER ANALYSIS OF THE MINIMUM WAGE EFFECTS UPON
EMPLOYMENT IN ROMANIA........................................................................................ 449
Madalina Ecaterina POPESCU, Larisa STANILA, Amalia CRISTESCU
JUNCTIONS BETWEEN EVALUATION THEORY AND GAMES THEORY ......... 455
Marin MANOLESCU, Magdalena TALVAN
ROMANIAN EDUCATION SYSTEM – EFFICIENCY STATE ................................... 461
Madalina Ioana STOICA, Crisan ALBU
GST FOR COMPANY’S REPUTATION ANALYSIS IN ONLINE
ENVIRONMENTS .............................................................................................................. 467
Camelia DELCEA
DETERMINANTS OF EU MIGRATION. PANEL DATA ANALYSIS ....................... 473
Costin-Alexandru CIUPUREANU, Elena-Maria PRADA
EUROPEAN COUNTRIES AND THE SUSTAINABILITY CHALLENGE: FOCUS
ON TRANSPORTATION ................................................................................................... 479
Georgiana MARIN, Alexandra MATEIU
THE EVALUATION AND STRENGTHENING OF THE FREIGHT TRANSPORT
SYSTEM, AS A SOLUTION FOR SUSTAINABLE DEVELOPMENT
IN ROMANIA ...................................................................................................................... 485
Georgiana MARIN, Alexandra MATEIU
INNOVATION – CONTENT, NATIONAL INNOVATION STRATEGIES
AND MODELLING INNOVATION USING THE MICROECONOMIC
APPROACH ......................................................................................................................... 491
Stelian STANCU, Constanţa-Nicoleta BODEA, Oana Mădălina POPESCU, Orlando Marian
VOICA, Laura Elly NAGHI
RISK AWARENESS AS COMPETITIVE FACTOR FOR PUBLIC
ADMINISTRATION - A GERMAN CASE STUDY ....................................................... 497
Markus BODEMANN, Marieta OLARU, Ionela Carmen PIRNEA
SOVEREIGN RISK DEPENDENCE PATTERN IN EMERGING EUROPE ............ 504
Gabriel GAIDUCHEVICI
MEASURE YOUR GENDER GAP: WAGE INEQUALITIES USING BLINDER
OAXACA DECOMPOSITION .......................................................................................... 510
Radu-Ioan VIJA, Ionela-Catalina ZAMFIR
Proceedings of the IE 2015 International Conference
www.conferenceie.ase.ro
vii
THE CONSUMPTION CHANNEL OF NON-KEYNESIAN EFFECTS. SOME
EMPIRICAL EVIDENCES FOR ROMANIA ................................................................. 517
Ana ANDREI, Angela GALUPA, Sorina GRAMATOVICI
FEEDBACK ANALYSIS AND PARAMETRIC CONTROL ON PROCESS OF
DISPOSABLE INCOME ALLOCATION – A DYNAMIC MODEL ON PORTUGAL’S
NATIONAL ECONOMY .................................................................................................... 523
Bianca Ioana POPESCU, Emil SCARLAT, Nora CHIRIȚĂ
INEQUALITY OF INCOME DISTRIBUTION IN ROMANIA. METHODS OF
MEASUREMENT AND CAUSES ..................................................................................... 529
Malina Ionela BURLACU
WAR GAMES AND A THIRD PARTY INTERVENTION IN CONFLICT ................ 534
Mihai Daniel ROMAN
MACROECONOMIC FACTORS OF SMEs PERFORMANCE IN ROMANIA IN THE
PERIOD 2005-2013. A TIME SERIES APPROACH ...................................................... 540
Marușa BECA, Ileana Nișulescu ASHRAFZADEH
EFFICIENCY OF THE EUROPEAN STRUCTURAL FUNDS INVESTED IN
EDUCATIONAL INFRASTRUCTURE ........................................................................... 546
Monica ROMAN
RESOURCES ALLOCATION MODEL IN A CLUSTERED CLOUD
CONFIGURATION ............................................................................................................. 552
Mioara BANCESCU
UPON DECISION-MAKING IN ALTERNATIVE DESIGN PROBLEMS ................. 558
Dimitri GOLENKO-GINZBURG
SECTION Artificial Intelligence & Data-mining
ARTIFICIAL NEURAL NETWORK APPROACH FOR DEVELOPING
TELEMEDICINE SOLUTIONS: FEED-FORWARD BACK PROPAGATION
NETWORK .......................................................................................................................... 563
Mihaela GHEORGHE
NEURAL NETWORK-BASED APPROACH IN FORECASTING FINANCIAL
DATA .................................................................................................................................... 570
Cătălina-Lucia COCIANU, Hakob GRIGORYAN
SEMANTIC HMC FOR BUSINESS INTELLIGENCE USING CROSS-
REFERENCING .................................................................................................................. 576
Rafael PEIXOTO, Thomas HASSAN, Christophe CRUZ, Aurélie BERTAUX, Nuno SILVA
MULTI-DOMAIN RETRIEVAL OF GEOSPATIAL DATA SOURCES
IMPLEMENTING A SEMANTIC CATALOGUE .......................................................... 582
Julio Romeo VIZCARRA, Christophe CRUZ
EMOTIONAL ROBO-INTELLIGENCE CREATION PROCESS ............................... 587
Dumitru TODOROI

Proceedings of the IE 2015 International Conference
www.conferenceie.ase.ro
viii
MODELING THE RELATIONSHIPS NETWORKS INSIDE GROUPS AS
GRAPHS ............................................................................................................................... 601
Diana RIZESCU (AVRAM), Vasile AVRAM
A SEMANTIC MOBILE WEB APPLICATION FOR RADIATION SAFETY IN
CONTAMINATED AREAS ............................................................................................... 607
Liviu-Adrian COTFAS, Antonin SEGAULT, Federico TAJARIOL, Ioan ROXIN
PREDICTING EFFICIENCY OF JAPANESE BANKING SYSTEM USING
ARTIFICIAL NEURAL NETWORKS (ANN): DATA ENVELOPMENT ANALYSIS
(DEA) APPROACH ............................................................................................................. 613
Ionut-Cristian IVAN
SEMANTIC RELATIONS BETWEEN AUTHORSHIP, DOMAINS
AND CULTURAL ORIENTATION WITHIN TEXT DOCUMENT
CLASSIFICATION ............................................................................................................. 618
Mădălina ZURINI

Proceedings of the IE 2015 International Conference
www.conferenceie.ase.ro
1
GENERAL PURPOSE SYSTEM FOR GENERATING EVALUATION
FORMS (GPS4GEF)
Daniel HOMOCIANU
Department of Research - Faculty of Economics and Business Administration
“Alexandru Ioan Cuza” University of Iasi [email protected]
Dinu AIRINEI
Department of Accounting, Business Information Systems and Statistics - Faculty of
Economics and Business Administration, “Alexandru Ioan Cuza” University of Iasi [email protected]
Abstract. The paper introduces a general purpose model used to dynamically and randomly
generate on-line evaluation forms starting from a simple data source format containing
questions, answers and links to interactive materials that embeds documentations and/or
simulations and aiming to increase the productivity of evaluation and assessment. It also
underlines the advantages of using such a model for any teacher, professor or user involved in
assessment and evaluation processes and presents a short description of the components
designed to make it functional.
Keywords: On-Line Forms, GAS (Google Apps Script), GPS4GEF
JEL classification: C88, I25, Y10
1. Introduction
In 1995 and 1996 we had the first implementations of forms using the html language. Dave
Raggett had been working for some time on his new ideas for HTML, and at last he formalized
them in a document published as an Internet Draft in March, 1995. He dealt with HTML tables
and tabs, footnotes and forms. In December 1996, the HTML ERB became the HTML Working
Group and began to work on `Cougar', the next version of HTML with completion late spring,
1997, eventually to become HTML 4. With all sorts of innovations for the disabled and support
for international languages, as well as providing style sheet support, extensions to forms,
scripting and much more, HTML 4 breaks away from the simplicity and charm of HTML of
earlier years [1].
PHP as known today is the successor of a product named PHP/FI (Personal Home Page Tools/
Forms Interpreter). At beginning it was used by its original creator (Rasmus Lerdorf - 1994) to
tracks the visits of his on-line CV. Then it was developed to provide interactions with data
bases and a framework for developing simple and dynamic web applications [2]. One of the
most powerful features of PHP is the way it handles HTML forms [3].
The history of forms is longer taking into account the traditional programming languages that
evolved to the ones based on events and visual interfaces with forms, icons and many other
objects. A simple example is Microsoft Visual Basic (MS VB) that included forms as core
objects even from its 2.0 version (1992). And that seems to be related to the fact that thought-
out the History of VB the focus has always been on rapid application development and that's
what makes it such a widely used programming environment [4].

Proceedings of the IE 2015 International Conference
www.conferenceie.ase.ro
2
In fact, by considering telephone questionnaires or listed and distributed forms, this history
involves a long period of time while these were manually processed (typewritten/edited) and
later scanned and recognized.
In this paper we present the components of a general purpose system designed to automatically
and randomly generate evaluation forms needed in education and not only.
2. Reasons for using Google Apps Script (GAS) GAS is a Java Script cloud scripting language that provides easy ways to automate tasks across
Google products and third party services and build web applications [5].
In terms of ease of use and speed of programming we consider that GAS is as good as Visual
Basic for Applications (VBA) whereas VB is recognized a RAD (Rapid Application
Development) [6] environment. There are many on-line available examples [7] proving GAS’s
ability to interact with data sources [8] and to automatically generate results.
3. The GPS4GEF’s architecture The structure of a data source accepted by the GPS4GEF form generator system was designed
as many sheets in a Google Spreadsheet file (Figure 1). Every single sheet contains records
(lines) with question id, type, title, help text, number of answers, all answers, all correct
answers and the URL of an interactive (and/or video) support file if necessary (Figure 1).
Figure 1. The general structure of a simple data source format (Google Spreadsheets) designed by authors [9]
as input for GPS4GEF

Proceedings of the IE 2015 International Conference
www.conferenceie.ase.ro
3
This kind of data sources (Figure 1 – example on Information Technologies for Business) will
be specified (a forty four characters ID) using the GPS4GEF Google form (Figure 2 – upper
left) responsible for generating evaluation forms with automatic feed-back. Their simple
structure is meant to increase productivity when dealing with the necessity to create a great
amount of questions and support files available for a group of users and integrated into
randomly and automatically generated forms in order to use them to give a feed-back and
evaluate. The control of URL’s persistence is another big reason of this approach because after
a test is done (the forms are distributed and completed), the associated data collectors must be
downloaded and the forms deleted.
Figure 2. The GPS4GEF form and its corresponding data collector designed by authors [10] to accept simple
data sources in order to generate evaluation forms and their corresponding data collectors embedding score
computation and feed-back scripts In association with the “On form submit” event (Figure 3), the GPS4GEF form uses a function
named onThisFormSubmit (Figure 4) responsible for interacting with the specific data source
constructed following the recommended pattern [11] (Figure 1) in order to dynamically
generate evaluation forms (Figure 5).
Figure 3. The function onThisFormSubmit associated to the corresponding event
This function is defined using GAS in the script section (Tools / Script editor…) of the data
collector spreadsheet (bottom of fig.2) associated to the GPS4GEF form and has sixty eight
commented lines of code (top of fig.4) needed: (1) to open the GPS4GEF’s suggested source
spreadsheet made and/or used by the instructor according to the indicated pattern (fig.1 and
fig.2 – upper left), (2) to automatically and randomly generate a new evaluation form, a
corresponding data collector spreadsheet with a submit trigger needed to give to participants

Proceedings of the IE 2015 International Conference
www.conferenceie.ase.ro
4
an evaluation feed-back (e-mail) and (3) to send to the instructor the links of the newly created
form and data collector (e-mail).
Figure 4. The onThisFormSubmit function as edited by authors [12] behind the GPS4GEF form’s data collector
and the other eleven functions [13] needed to support it
Proceedings of the IE 2015 International Conference
www.conferenceie.ase.ro
5
In addition, we have defined two other commented functions (middle of fig.4 – code lines: 70-
75 and 77-96) needed to support onThisFormSubmit, namely: createSubmitTriger (function
that programmatically creates a submit trigger associated to the dynamically generated
evaluation form’s data collector spreadsheet) and oFs (function that is used by the
createSubmitTriger to compute the evaluation scores after each submit). There are also nine
commented functions (bottom of fig.4 – code lines: 98-134) used to easily manipulate strings:
Cstr, Len, Mid, Left, Right, Search, DebugAssert, IsMissing and isUndefined. Last three of
these are used for controlling exceptions in strings.
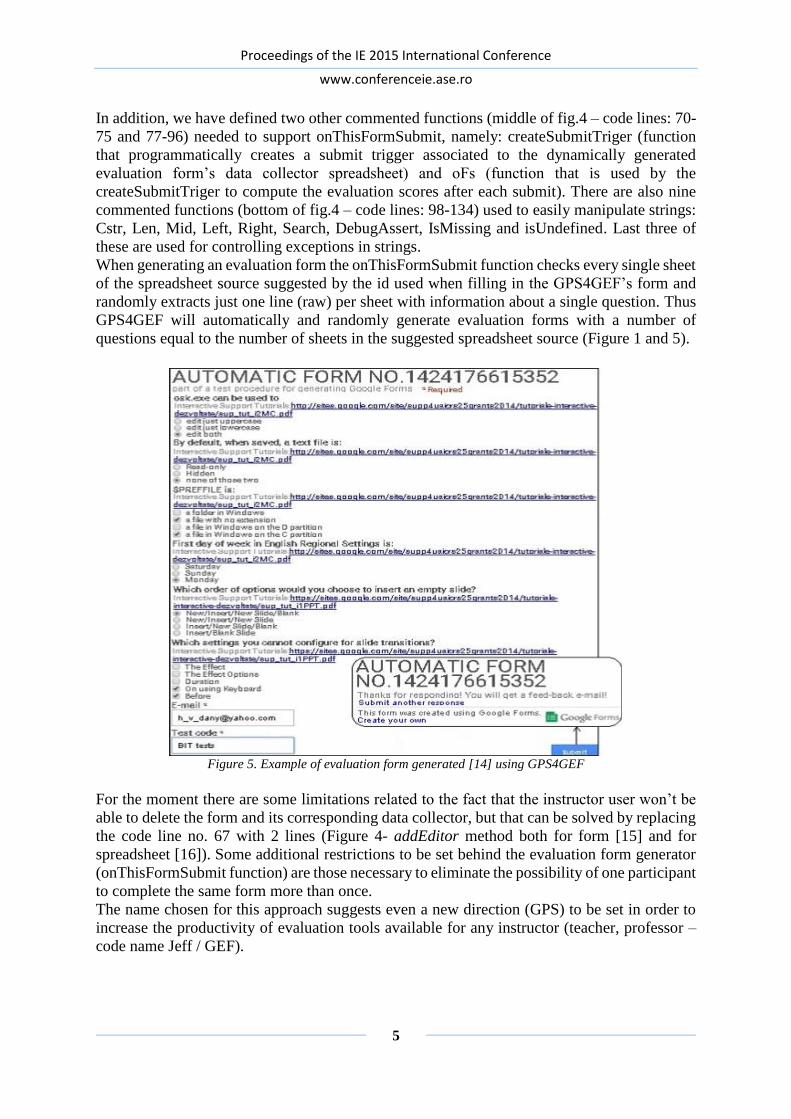
When generating an evaluation form the onThisFormSubmit function checks every single sheet
of the spreadsheet source suggested by the id used when filling in the GPS4GEF’s form and
randomly extracts just one line (raw) per sheet with information about a single question. Thus
GPS4GEF will automatically and randomly generate evaluation forms with a number of
questions equal to the number of sheets in the suggested spreadsheet source (Figure 1 and 5).
Figure 5. Example of evaluation form generated [14] using GPS4GEF
For the moment there are some limitations related to the fact that the instructor user won’t be
able to delete the form and its corresponding data collector, but that can be solved by replacing
the code line no. 67 with 2 lines (Figure 4- addEditor method both for form [15] and for
spreadsheet [16]). Some additional restrictions to be set behind the evaluation form generator
(onThisFormSubmit function) are those necessary to eliminate the possibility of one participant
to complete the same form more than once.
The name chosen for this approach suggests even a new direction (GPS) to be set in order to
increase the productivity of evaluation tools available for any instructor (teacher, professor –
code name Jeff / GEF).
Proceedings of the IE 2015 International Conference
www.conferenceie.ase.ro
6
4. Conclusions The general conclusion of the paper underlines the context of knowledge, education and
lifelong learning and the importance of assessment and evaluation supported by tools able to
move the focus from technical and implementation details to patterns to be followed in order
to increase the productivity of evaluation.
The examples describes the components of a functional model implemented with minimum
effort and using technologies freely available for a large target group.
The paper does not claim completeness although the approach was defined after many tests
made using various educational methods and tools for simulation, learning and evaluation (Tata
Interactive Systems TOPSIM [17], Blackboard, Moodle and Microsoft SharePoint [18]) most
of them finalized with dissemination of results.
Acknowledgment This paper was funded by “Alexandru Ioan Cuza” University of Iasi (UAIC) within the research
grant no.GI-2014-17 - the competition, named “Grants for Young Researchers at UAIC” and
also by The Department of Research of The Faculty of Economics and Business Administration
(FEAA), UAIC.
References [1] Raggett. A history of HTML: http://www.w3.org/People/Raggett/book4/ch02.html, 1998,
[Feb. 20, 2015].
[2] History of PHP, http://php.net/manual/en/history.php.php, [Feb. 20, 2015].
[3] Dealing with Forms, http://php.net/manual/en/tutorial.forms.php, [Feb. 20, 2015].
[4] History of Visual Basic, http://www.max-visual-basic.com/history-of-visual-basic.html,
2010, [Feb. 20, 2015].
[5] Build web apps and automate tasks with Google Apps Script, http://www.google.com/
script/start/, [Feb. 20, 2015].
[6] Janssen. Rapid Application Development (RAD): http://www.techopedia.com/defini
tion/3982/rapid-application-development-rad, [Feb. 20, 2015].
[7] Google Apps Script Tagged Questions, http://stackoverflow.com/questions/tagged/
google-apps-script, [Feb. 20, 2015].
[8] Top 10 Google Apps Scripts for Education, https://www.synergyse.com/blog/top-10-
google-apps-scripts-for-education/, July 1, 2013, [Feb. 20, 2015].
[9] sites.google.com/site/supp4ie2015/downloads/spsh_source.tiff?attredirects=0&d=1
[10] docs.google.com/forms/d/1hhhRPaG07P47VFwbVMIejmQd0j6LQXFVosb2S_2BdiI
[11] sites.google.com/site/supp4ie2015/downloads/BTR.xlsx?attredirects=0&d=1
[12] sites.google.com/site/supp4ie2015/downloads/OTFS.tiff?attredirects=0&d=1
[13] sites.google.com/site/supp4ie2015/downloads/OFS_other_f.tiff?attredirects=0&d=1
[14] docs.google.com/forms/d/1Ljf0c-EAXOhsvOpFGR3NjXaNHK09pc0j7blUgzOhR9o
[15] Google Apps Script, Class From, https://developers.google.com/apps-script/reference
/forms/form, [Feb. 20, 2015].
[16] Google Apps Script, Class Spreadsheet, https://developers.google.com/apps-script/ref
erence/spreadsheet/spreadsheet, [Feb. 20, 2015].
[17] D. Homocianu and D. Airinei, “Design of a Simulation Environment for Group
Decisions”, in Proc. The 19th IBIMA Conference, Barcelona, 2012, pp.1944-1950.
[18] D. Homocianu, et al. (2014, September). Multimedia for Learning in Economy and
Cybernetics, Journal of Economic Computation and Economic Cybernetics Studies and
Research [Online]. 3(48). Available: http://www.ecocyb.ase.ro/eng/articles_3-2014/
homocianu%20daniel,%20cristina%20necula.pdf
Proceedings of the IE 2015 International Conference
www.conferenceie.ase.ro
7
UPON A MULTI CRITERIA OFFER-DEMAND CONTINOUS
MATCHING ALGORITHM
Claudiu VINŢE
Bucharest University of Economic Studies
Amelia CRISTESCU
Bucharest University of Economic Studies
Abstract. Our ongoing research intends to identify a mechanism for continuously matching
the offers and the demands for job positions posted by companies and candidates, respectively,
on a dedicated web portal: job2me. This paper briefly presents our focus on the matching
algorithm, and the environment that we developed purposely for simulating the load with
requests that may come from both sides: offers and demands for job positions. Our approach
for the job2me portal involves a collection of distributed services interconnected through a
message oriented middleware (MoM). The whole architecture of the distributed system is a
service oriented one. The services that deliver the system functionality are glued together
through a proprietary message oriented API based on JMS. This paper concerns the data
model and the methodology that we conceived and implemented for obtaining a fast and fair
matching algorithm, along with the test results that we obtained within the simulation
environment.
Keywords: Job Market, Demand and Offer, Multi Criteria Matching Algorithm, Messaging.
JEL classification: C610, C630, C880
1. Introduction
In an ever more competitive social and business environment, the ability to find a job, from a
potential employee perspective and, correspondently, to identify a suitable candidate for a
certain open position, from an employer point of view, are two sides of a coin that urge each
other to reach unification in a timely fashion. And there are indeed two aspect of this problem:
creating the opportunity for job offer side to enter in contact, to meet, to set up an interview
with a candidate, potential employee;
make this link as quickly as possible, and in a cost effective way.
The stable matching problem, and the algorithm that Gale and Shapely proposed in 1962 for
making all marriages stable for any equal number of men and women [1], inspired a numerous
researches in various domains where the process of bringing together offer and demand could
be performed in an algorithmic manner.
There are a many web portals, see www.ejobs.ro for instance, where job offers and demands
can be posted, and tools for screening are provided for both sides of the market. These platforms
generally create a meeting place for offer and demand, but lack to play an active role in
identifying suitable matches.
SAUGE project on the other hand, which name stands for Semantic Analyses for Unrestricted
Generalized Employment, aims at providing a technology that could capture the key aspects
contained in a manually written CV, and transforming them into structured information which
would be subsequently connected within the context of a Linked Open Data initiative [2].
Proceedings of the IE 2015 International Conference
www.conferenceie.ase.ro
8
In this context, our research aims to conceive and implement a deterministic algorithm that
matches multiple criteria provided by, or collected from both offer and demand sides [3].
2. The simulation environment for the matching engine
The premises from which we embarked on our research project are the followings:
I. regardless of how the key aspects of a job offer (requirements), or of a job demand (skills)
are collected and supplied to the matching engine as input data, the algorithm should
complement and complete the process of creating a direct link offers and demands placed
into the system;
II. the output of the matching algorithm should be in the form of asynchronous messages
that inform the sides regarding a potential match, and open the gateway for arranging job
interviews;
III. the matching algorithm has to have embedded enough relaxation, in order to not exclude
interview opportunities – more interviews are preferred, rather than missing a potentially
suitable candidate.
The first premise means that either the key aspects, identified by each side as being defining
selection criteria, are collected explicitly via various forms supplied within the web portal, or
are deducted through semantic analysis from descriptive files containing job requirements, and
CVs respectively, the matching has to be eventually attempted on a common set of criteria, for
both offer and demand.
The simulation environment that we conceived for testing the matching algorithm has
architecture of a service orientation, and comprises the following components, interconnected
through a proprietary message oriented API based on JMS:
DOME – Demand-Offer Matching Engine – the component that encapsulates the
matching algorithm;
PRODS – Pseudo-Random Offer-Demand Simulator – is the service responsible with
feeding quasi-continuously the matching algorithm with job offers and demands
constructed based on the instructions provided in the configuration files.
The simulation environment is a distributed software solution that is intended to provide the
framework that can easily accommodate later on additional services required by a fully
functional web portal dedicated to collect and match job offers and demands [4]. The
components of the service oriented architecture communicate by passing messages via a JMS
message broker [5], [6], [7]. PRODS plays the role of message producer and places the newly
generated job offers and demands on the offer queues (DOME_OFFER_QUEUE), and demand
queues (DOME_DEAMND_QUEUE), respectively.
Once a match is identified by DOME, a message is generated and stored in the system database.
Within job2me software solution, the matching message is to be transmitted asynchronously to
both sides via email. The simulation framework is illustrated in Figure 1.

Proceedings of the IE 2015 International Conference
www.conferenceie.ase.ro
9
Message Broker
DOME_OFFER_QUEUE
DOME_DEMAND_QUEUE DOME
PRODS
Configuration
files
Configuration
files
job2me DB
Figure 1. The architecture of simulation environment employed to test the matching algorithm
A job offer or a demand consists in a collection of attributes, such as:
ID – a unique identifier of a company offer or demand formulated by a candidate;
job demand - “D”, or job offer - “O”;
type: unpaid, internship, job;
job period: 1 month, 3 months, 6 months, one year, indefinite period;
start date;
end date;
number of working hours per day;
city;
district;
country;
year of experience (required by position offered, respectively possessed by the
candidate);
In addition to the above criteria, a job offer or demand had an associated list of skills. Our
simulation targeted job chiefly in the information technology sector, and therefore we grouped
the skills in five categories, or sections:
programming languages and technologies,
database systems;
operating systems;
foreign languages;
development, administrative tools and others.
Within each section, a particular skill may have a certain level:
beginner,
intermediate,
advance.
It is worth to notice that a greater number of categories, or more granular levels associated to
skills, do not change fundamentals of the matching algorithm approach, hence they a subject
to be customised. Each category of skills has associated a certain relevance, or weight, and
these weighting values are fetched from the configuration files, during the initialization of the
algorithm environment.
Proceedings of the IE 2015 International Conference
www.conferenceie.ase.ro
10
3. The offer-demand continuous matching algorithm
The matching algorithm that we propose is designed to attempt to find a match anytime a new
job offer or a new job demand is entered in the system, against the existing demands,
respectively offers, previously placed in the system, and employed as patterns to be matched
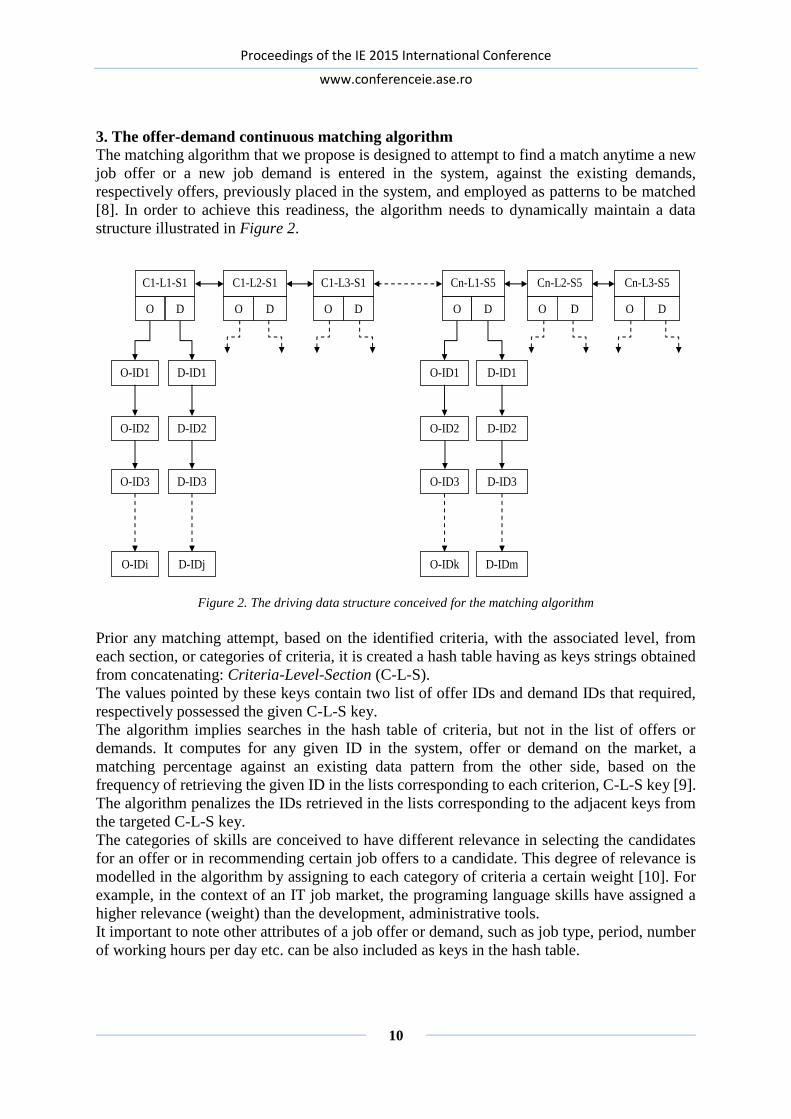
[8]. In order to achieve this readiness, the algorithm needs to dynamically maintain a data
structure illustrated in Figure 2.
C1-L1-S1 C1-L2-S1 C1-L3-S1 Cn-L1-S5 Cn-L2-S5 Cn-L3-S5
O-ID1 D-ID1
O-ID2 D-ID2
O-ID3 D-ID3
O-IDi D-IDj
O-ID1 D-ID1
O-ID2 D-ID2
O-ID3 D-ID3
O-IDk D-IDm
O D O D O D O D O D O D
Figure 2. The driving data structure conceived for the matching algorithm
Prior any matching attempt, based on the identified criteria, with the associated level, from
each section, or categories of criteria, it is created a hash table having as keys strings obtained
from concatenating: Criteria-Level-Section (C-L-S).
The values pointed by these keys contain two list of offer IDs and demand IDs that required,
respectively possessed the given C-L-S key.
The algorithm implies searches in the hash table of criteria, but not in the list of offers or
demands. It computes for any given ID in the system, offer or demand on the market, a
matching percentage against an existing data pattern from the other side, based on the
frequency of retrieving the given ID in the lists corresponding to each criterion, C-L-S key [9].
The algorithm penalizes the IDs retrieved in the lists corresponding to the adjacent keys from
the targeted C-L-S key.
The categories of skills are conceived to have different relevance in selecting the candidates
for an offer or in recommending certain job offers to a candidate. This degree of relevance is
modelled in the algorithm by assigning to each category of criteria a certain weight [10]. For
example, in the context of an IT job market, the programing language skills have assigned a
higher relevance (weight) than the development, administrative tools.
It important to note other attributes of a job offer or demand, such as job type, period, number
of working hours per day etc. can be also included as keys in the hash table.

Proceedings of the IE 2015 International Conference
www.conferenceie.ase.ro
11
4. Test results and further research
This paper aims to briefly present the results of our ongoing research on multi criteria offer-
demand continuously matching algorithm, along with the environment that we developed
purposely for simulating the load with requests that may come from both sides: offers and
demands for job positions.
Since in the real job market, an offer and a demand may stay listed for a reasonably long period
of time, we needed to verify the impact that a continuously growing data structure, employed
by the algorithm, would have on the required matching time [11].
Within the simulation environment we recorded time required by the algorithm to identify the
best match for a new job offer that enters a system that contains a growing number of demand
patterns to compare against to. The evolution of the average matching time in milliseconds is
presented in the Figure 3 below.
Figure 3. The evolution of the average matching time in milliseconds,
function of the existing number of demands in the system
The preliminary test results indicate a polynomial evolution of the average matching time,
function of the existing number of corresponding patterns in the system [12]. The findings are
corroborated by the test results obtained when matching a new demand against the existing
offer patterns in the system (Figure 4).
Figure 4. The evolution of the average matching time, in milliseconds,
function of the existing number of offers in the system
15 15 16 16
21
26
30
0
5
10
15
20
25
30
35
50 100 250 500 1000 2500 5000
Offer average matching time (ms)
15 15 16 16
2224
28
0
5
10
15
20
25
30
50 100 250 500 1000 2500 5000
Demand average matching time (ms)

Proceedings of the IE 2015 International Conference
www.conferenceie.ase.ro
12
The above results were obtained on a platform with the following characteristics: Intel® Core
™ i5 CPU, [email protected], dual core, 4GB RAM, running Windows 7 Home Premium, 64-
bit operating system.
Our ongoing research aims to refine the multi criteria offer-demand continuously matching
algorithm that we succinctly presented in the paper, and integrate it within the web portal
job2me, in order to offer a dedicated platform to the graduates of Economic Informatics Faculty
that would facilitate their moves on the job market.
References
[1] D. Gale, L. Shapley, "College Admissions and the Stability of Marriage", American
Mathematical Monthly, Vol. 69, pp. 9–14, 1962
[2] SAUGE project – Semantic Analyses for Unrestricted Generalized Employment. Internet:
http://sauge-project.eu/overview/
[3] C. Vinţe, “The Informatics of the Equity Markets - A Collaborative Approach”, Informatica
Economica, Vol. 13, Issue 2/2009, pp. 76-85, ISSN 1453-1305, Available at:
http://revistaie.ase.ro/content/50/009%20-%20Vinte.pdf
[4] A. S. Tanenbaum, M. van Steen, Distributed Systems - Principles and Paradigm, Vrije
Universiteit Amsterdam, The Netherlands, Prentice Hall, New Jersey, 2002, pp. 99-119,
414-488, 648-677
[5] M. Richards, R. Monson-Haefel, D. A. Chappell, Java Message Service (Second Edition),
O’Reilly Media Inc., Sebastopol, California, 2009.
[6] C. Vinţe, “Upon a Message-Oriented Trading API”, Informatica Economica, Vol. 14, No.
1/2010, pp 208-216, ISSN 1453-1305, Available at:
http://revistaie.ase.ro/content/53/22%20Vinte.pdf
[7] S. Mffeis, Professional JMS Programming, Wrox Press 2001, pp. 515-548, Available:
http://www.maffeis.com/articles/softwired/profjms_ch11.pdf
[8] J. W. Cook, H. W. Cunningham, R. W. Pulleyblank, A. Schrijver, Combinatorial
Optimization, John Wiley & Sons, Inc., New York, 1998
[9] D. E. Knuth, The Art of Computer Programming - volume 3, Sorting and Searching,
Addison-Wesley Publishing Company, 1973
[10] K. L. Donald, S. R. Douglas, Combinatorial Algorithms: Generation, Enumeration, and
Search, CRC Press LLC, New York, 1999
[11] L. G. Nemhauser, A. L. Wolsey, Integer and Combinatorial Optimization, John Wiley &
Sons, Inc., New York, 1999
[12] H. C. Papadimitriou, K. Steiglitz, Combinatorial Optimization - Algorithms and
Complexity, Dover Publication, Inc., Mineola, New York, 1998
Proceedings of the IE 2015 International Conference
www.conferenceie.ase.ro
13
STOCHASTIC PROCESSES AND QUEUEING THEORY FOR CLOUD
COMPUTER PERFORMANCE ANALYSIS
Florin-Cătălin ENACHE
Bucharest University of Economic Studies [email protected]
Abstract. The growing character of the cloud business has manifested exponentially in the last
5 years. The capacity managers need to concentrate on a practical way to simulate the random
demands a cloud infrastructure could face, even if there are not too many mathematical tools
to simulate such demands. This paper presents an introduction into the most important
stochastic processes and queueing theory concepts used for modeling computer performance.
Moreover, it shows the cases where such concepts are applicable and when not, using clear
programming examples on how to simulate a queue, and how to use and validate a simulation,
when there are no mathematical concepts to back it up.
Keywords: capacity planning, capacity management, queueing theory, statistics, metrics JEL classification: C02, C15, C61
1. Introduction During the last years, the types and complexity of people’s needs increased fast. In order to
face all changes, the technology had to develop new ways to fulfill the new demands.
Therefore, I take a deeper look into the basic terms needed for understanding the stochastic
analysis and the queueing theory approaches for computers performance models. The most
important distribution for analyzing computer performance models is the exponential
distribution, while the most representative distribution for statistical analysis is the Gaussian
(or normal) distribution. For the purpose of this article, an overview of the exponential
distribution will be discussed.
2.1 The Poisson Process
In probability theory, a Poisson process is a stochastic process that counts the number of events
and the time points at which these events occur in a given time interval. The time between each
pair of consecutive events has an exponential distribution with parameter λ and each of these
inter-arrival times is assumed independent of other inter-arrival times. Considering a process
for which requests arrive at random, it turns out that the density function that describes that
random process is exponential. This derivation will turn out to be extremely important for
simulations, in particular for applications modeling computer performance. A typical example
is modeling the arrival of requests at a server. The requests are coming from a large unknown
population, but the rate of arrival, λ can be estimated as the number of arrivals in a given period
of time. Since it is not reasonable to model the behavior of the individuals in the population
sending the requests, it can be safely assumed that the requests are generated independently
and at random.
Modeling such a process can help answering the question of how a system should be designed,
in which requests arrive at random time points. If the system is busy, then the requests queue
up, therefore, if the queue gets too long, the users might experience bad delays or request drops,
if the buffers are not big enough. From a capacity planner point of view, it is important to know

Proceedings of the IE 2015 International Conference
www.conferenceie.ase.ro
14
how build up a system that can handle requests that arrive at random and are unpredictable,
except in a probability sense.
To understand and to simulate such a process, a better understanding of its randomness is
required. For example, considering the following time axis (as in the second figure), the random
arrivals can be represented as in the figure below.
Figure 1. Random arrivals in time
If X is the random variable representing the times between two consecutive arrivals (arrows),
according to the PASTA Theorem (Poisson Arrivals See Time Averages)[1], it is safe to
assume that all X-es are probabilistically identical. Describing this randomness is equivalent to
finding the density function of X that represents the time distance between two consecutive
arrows.
Figure 2. Interval of length 𝑡 divided into n intervals.
The problem described above needs to be transformed so that it can be handled with known
mathematical tools. Supposing that an arbitrary interval of length 𝑡 is chosen, then the
probability of the time until the first arrival is longer than 𝑡 is P(X> 𝑡). This is by definition
1-FX(𝑡), where FX(𝑡) is the distribution function to be calculated. If time would be discrete, by
dividing the interval between 0 and 𝑡 into n intervals, the calculating FX(𝑡) reduces to
calculating the probability of no arrow in the first n intervals, and switching back to the
continuous case by taking n.
Let p be the probability that an arrow lands in any of the n time intervals, which is true for any
of the n intervals since any of them is as likely as any other to have an arrow in it, then
( ) 1n
P X t p , which is the probability on no arrow, 1-p, in the first n intervals. As
mentioned, when taking n , 0p and np t . The equality np t represents the
average number of arrows in n intervals – np – which is equal to the average number of arrows
calculated as t - the arrival rate multiplied by the length of the interval. After switching to
the continuous case, it is derived that:
00lim 1
( ) lim (1 ) lim(1 )n
x
n
n n t
n nt xp
enp t n
tP X t p e
n
(1)
Which is equivalent to0,( 0)
( ) 1 ( )1 ,( 0)t
tP X t P X t
e t
, and
0,( 0)( ) ( )
, ( 0)X tX
tdf t t
dt e tF
(2)

Proceedings of the IE 2015 International Conference
www.conferenceie.ase.ro
15
2.2 The exponential distribution.
The random variable X derived from the Poisson process studied in section 2.1 of this paper is
called exponential with the parameter 𝜆 ( X~Exp(𝜆) ). The probability density function (PDF)
of X is defined as fX (𝑡)={0, 𝑖𝑓 𝑡 < 0
𝑒−𝜆𝑡, 𝑖𝑓 𝑡 ≥ 0, which plots as in the figure below for different values
of the parameter 𝜆.
Figure 3. PDF for 𝜆 in (0.5, 1.0, 1.5)
Integrating by parts, it is easy to demonstrate the property that 0
1te dt
, which is actually
obvious, since the sum of all probabilities of a random variable X has to add up to 1. If
X~Exp(𝜆) then the following properties are true [2] :
The expected value the random variable X, E(X)= 0
1tt e dt
(3) ,
Expected value of X2 , E(X2)= 2
2
0
2tt e dt
(4) and
The variance of X, V(X)=E(X2) – [E(X)]2=
2
2 2
2 1 1
(5) .
When used in simulating computer performance models, the parameter λ denotes usually the
arrival rate. From the properties of the exponential distribution, it can be deduced that the
higher the arrival rate λ is, the smaller are the expected value – E(X) – and variance – V(X) –
of the exponentially distributed random variable X.
3.1. Introduction to the Queueing Theory M/G/1 Problem – FIFO Assumption
Considering a system where demands are coming at random, but the resources are limited, the
classic queueing problem is how to describe the system as a function of random demands.
Moreover, the service times of each request are also random, as in figure 4:

Proceedings of the IE 2015 International Conference
www.conferenceie.ase.ro
16
Figure 4. Random arrivals with random service times
From a request point of view, when a new request arrives, it has two possibilities:
It arrives and the server is available. Then it keeps the server busy for a random amount
of time until the request is processed, or
Typical case, when a request arrives, it finds a queue in front of it, and it needs to wait.
The queueing theory helps answering questions like what is the average time that a request
spends waiting in queue before it is serviced. The time a request must wait is equal to the sum
of the service times for every request that is in the queue in front of the current request plus the
remaining partial service time of the customer that was in service at the time of the arrival of
the current request.
Calculating the expected waiting time of the new request mathematically, it would be the sum
(further named “convolution”) of the density functions of each of the service time requirements
of the requests in the queue, which could be any number of convolutions, plus the convolution
with the remaining partial service time of the customer that was in service at the time of the
arrival of the current request. Furthermore, the number of terms in the convolution, meaning
the number of requests waiting in the queue, is itself a random variable [1].
On the other side, looking at the time interval between the arrival and the leave of the nth
request, it helps in developing a recursive way of estimating the waiting times. The nth request
arrives at time Tn and, in general, it waits for a certain amount of time – noted in the below
figure with Wn. This will be 0 if the request arrives when the server is idle, because the request
is being served immediately. To enforce the need of queueing theory, in real-life, a request
arrives typically when the server is busy, and it has to wait. After waiting, the request gets
serviced for a length of time Xn, and then leaves the system.
Figure 5. Representation for calculating the waiting time, depending on the arrival of the (n+1)th customer
Recursively, when the next customer arrives, there are 2 possibilities:
The arrival can occur after the nth request was already serviced, therefore Wn+1=0
(explained in the right grey-boxed part of figure 5), or

Proceedings of the IE 2015 International Conference
www.conferenceie.ase.ro
17
The arrival occurs after Tn but before the nth request leaves the system. From the fifth
figure the waiting time of the (n+1)th request is deduced as the distance between its
arrival and the moment when the nth request leaves the system, mathematically
represented as Wn+1=Wn+Xn-IAn+1, where IAn+1 is the inter-arrival time between the
nth and (n+1)th request. This can be easily translated into a single instruction that can be
solved recursively using any modern programming language.
3.2. Performance measurements for the M/G/1 queue
If λ is the arrival rate and X is the service time, the server utilization is given by:
( ), ( ) 1
1,
E X if E X
otherwise
(6)
Moreover, if the arrivals are described by a Poisson process, the probability that a request must
wait in a queue is 0P W (7), and the mean waiting time is given by the Pollaczek-
Khintchin formula [3]:
2
( ) ( )* (1 )
1 2 ( )
E X VE W
X
E X
(8)
In addition, if the service times are exponentially distributed and the service follows the FIFO
principle (“first-in-first-out”, also knows as FCFS, “first-come-first-serve”), then the
distribution function of the waiting time is given by the following formula [1]:
(1 )( )
0, 0
( )
1 , 0
tW p
E X
t
F t
e t
(9)
There is no simple formula for Fw(t) when the service times are not exponentially distributed,
but using computer simulation can help developing such models, after validating classic models
as the one above.
4.1. Software simulation of the Queueing Problem
As described previously, modeling the M/G/1 queue can be done by using a recursive algorithm
by generating the inter-arrival time and the service times using the Inverse Transform Method
[4].
The following lines written in the BASIC programming language simulate such an algorithm,
although almost any programming language could be used.
100 FOR I=1 to 10000
110 IA= ? ‘inter-arrival times to be generated
120 T=T+IA ‘time of the next arrival
130 W=W+X-IA ‘recursive calculation of waiting times
140 IF W<0 THEN W=0
150 IF W>0 THEN C=C+1 ‘count all requests that wait
160 SW=SW+W ‘sum of waiting times for calculating E(W)
170 X= ? ‘service times to be generated
180 SX=SX+X ‘sum of service times for calculating Utilization
190 NEXT I
200 PRINT SX / T, C / 10000, SW / 10000 ‘print Utilization, P(W)
and E(W)

Proceedings of the IE 2015 International Conference
www.conferenceie.ase.ro
18
4.2. Generating random service and inter-arrival times using the Inverse Transform
Method
Assuming that the computer can generate independent identically distributed values that are
uniformly distributed in the interval (0,1), a proper method of generating random variable
values according to any specified distribution function is using the Inverse Transform Method.
To generate the random number X, it is enough to input the random computer generated number
on the vertical axis and to project the value over the distribution function G, where G is the
desired distribution to be generated. Projecting the point from the G graph further down on the
horizontal axis, delivers the desired randomly distributed values described by the G density
function. This method is practically reduced to finding the inverse function of the distribution
function of the distribution according to which the numbers are generated. By plugging in the
computer randomly generated numbers, a new random variable is generated with has its
distribution function G(u) [4]. This procedure is schematically described in the below figure.
Figure 6. Illustration of the Inverse Transform Method
For example, for a Poisson process of arrivals that are exponentially distributed with parameter
λ, where λ is the arrival rate and 1
( )E IA , according to the Inverse Transform Method, a
value of λ=1.6 arrivals per second is derived, equivalent to an average inter-arrival time of
1 5
8 seconds. For ( ) 1 uG u e R with u≥0, it is deduced that
1( ) 1/ ln(1 )G R R
where R is the computer-generated value. Therefore, the instruction 110 from section 3 of this
paper becomes: 110 IA=-(5/8)*LOG(1-RND), where RND is the BASIC function that
generate values uniformly distributed between 0 and 1. Of course, any programming language
that is able to generate random independent identically distributed numbers between 0 and 1
can be used for simulation.
5. Comparing the mathematical solution of the queueing problem with the computer
simulation
To illustrate the applicability of the software simulation, 4 different arrival times distributions
are analyzed :
1. Exponential service time, with mean service time E(X)=0.5
2. Constant service time, X=0.5
3. Uniformly identical distributed service times between 0 and 1, X~U(0,1)
4. Service times of 1/3 have a probability of 90%, and service times of 2 have a probability
of 10%.

Proceedings of the IE 2015 International Conference
www.conferenceie.ase.ro
19
For all 4 simulations, exponential distributed inter-arrivals with λ=1.6 are used as derived in
4.2 section. All calculations in the following table are done according to the formulas presented
in section 3.2.
Table 1. Comparison between the mathematical and simulated results
ρ P(W>0) P(W>0.5) E(W)
X Formula of X Theory Simulation Theory Simulation Theory Simulation Theory Simulation
1 -0.5*LOG(1-RND) 0.8 0.799436 0.8 0.799817 0.6549
8
0.654924 2 1.991853
2 0.5 0.8 0.799724 0.8 0.799895 NA 0.55622 1 0.997296
3 RND 0.8 0.800048 0.8 0.800103 NA 0.622625 1,(3) 1.332808
4 q = RND:
IF q <= 0.9
THEN X = 1 / 3
ELSE X = 2
0.8 0.804667 0.8 0.799336 NA 0.616419 2 1.999094
All 4 simulations have been chosen in such way that E(X)=0.5, and the distinction is done by
choosing the service times with different distributions. Since the utilization is directly
dependent on the arrival rate and mean arrival times, it is equal with 80% in all 4 cases.
According to (7), the probability of waiting is also equal to 80% in all 4 cases.
In this simulation, the mean waiting time, as deduced from the Pollaczek-Khintchin(8) formula,
confirms the accuracy of the simulation model, and gives insights also for the other cases,
offering a clear approximation of the behavior of the designed system. It is interesting to
observe that mean waiting time when having exponential service times is double in comparison
with the mean waiting time when having constant service times, although the mean service
time, the utilization and the probability of waiting are equal in both cases.
6. Conclusions
Based on all information presented in this paper, I can conclude that computer simulation is an
important tool for the analysis of queues whose service times have any arbitrary specified
distribution. In addition, the theoretical results for the special case of exponential service times
(8) are extremely important because they can be used to check the logic and accuracy of the
simulation, before extending it to more complex situations.
Moreover, such a simulation gives insight on how such a queue would behave as a result of
different service times. Further, I consider that it offers a methodology for looking into more
complicated cases, when a mathematical approach cannot help.
References [1] R. B. Cooper, Introduction to Queueing Theory, Second Edition. New York: North Holland,
1981, pp. 208-232.
[2] S. Ghahramani, Fundamentals of Probability with Stochastic Processes, Third Edition.
Upper Saddle River, Pearson Prentice Hall 2005, pp.284-292. [3] L. Lakatos , “A note on the Pollaczek-Khinchin Formula”, Annales Univ. Sci. Budapest.,
Sect. Comp. 29 pp. 83-91, 2008.
[4] K. Sigman, “Inverse Transform Method”. Available at:
http://www.columbia.edu/~ks20/4404-Sigman/4404-Notes-ITM.pdf [January 15, 2015].
[5] K. Sigman, “Exact Simulation of the stationary distribution of the FIFO M/G/c Queue”, J.
Appl. Spec., Vol. 48A, pp. 209-213, 2011, Available at:
http://www.columbia.edu/~ks20/papers/QUESTA-KS-Exact.pdf [January 20, 2015].
Proceedings of the IE 2015 International Conference
www.conferenceie.ase.ro
20
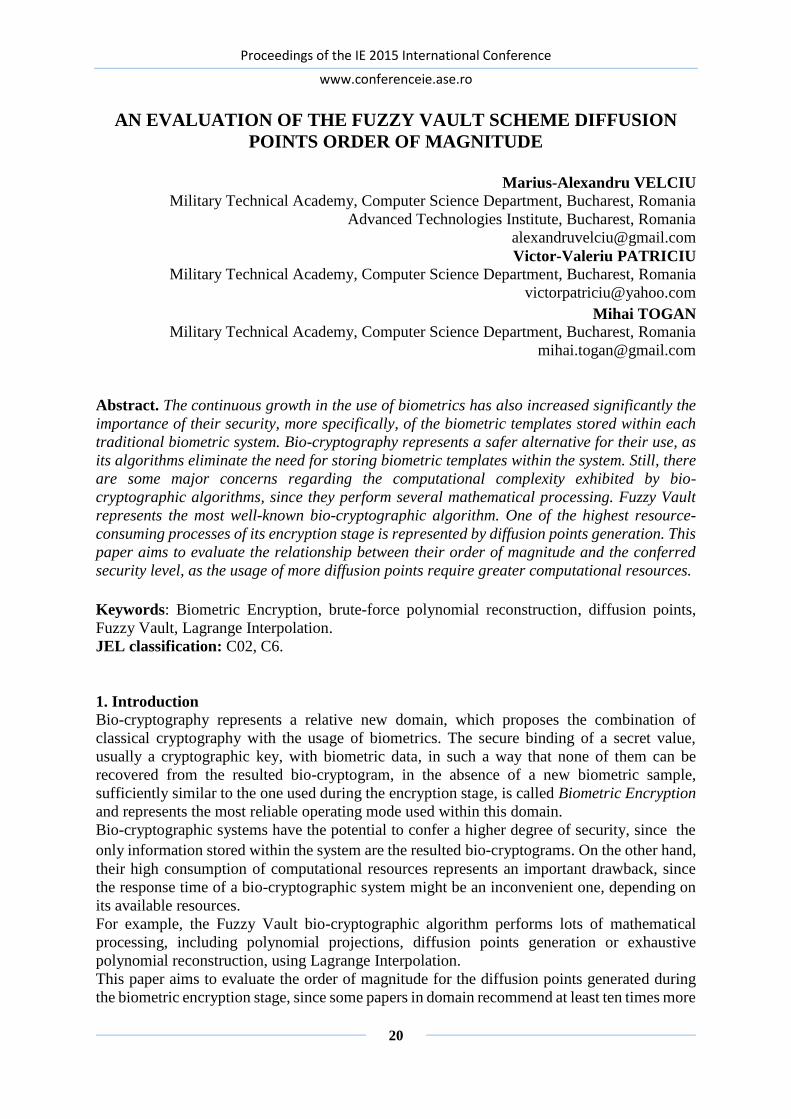
AN EVALUATION OF THE FUZZY VAULT SCHEME DIFFUSION
POINTS ORDER OF MAGNITUDE
Marius-Alexandru VELCIU
Military Technical Academy, Computer Science Department, Bucharest, Romania
Advanced Technologies Institute, Bucharest, Romania [email protected] Victor-Valeriu PATRICIU
Military Technical Academy, Computer Science Department, Bucharest, Romania
Mihai TOGAN
Military Technical Academy, Computer Science Department, Bucharest, Romania
Abstract. The continuous growth in the use of biometrics has also increased significantly the
importance of their security, more specifically, of the biometric templates stored within each
traditional biometric system. Bio-cryptography represents a safer alternative for their use, as
its algorithms eliminate the need for storing biometric templates within the system. Still, there
are some major concerns regarding the computational complexity exhibited by bio-
cryptographic algorithms, since they perform several mathematical processing. Fuzzy Vault
represents the most well-known bio-cryptographic algorithm. One of the highest resource-
consuming processes of its encryption stage is represented by diffusion points generation. This
paper aims to evaluate the relationship between their order of magnitude and the conferred
security level, as the usage of more diffusion points require greater computational resources.
Keywords: Biometric Encryption, brute-force polynomial reconstruction, diffusion points,
Fuzzy Vault, Lagrange Interpolation. JEL classification: C02, C6.
1. Introduction Bio-cryptography represents a relative new domain, which proposes the combination of
classical cryptography with the usage of biometrics. The secure binding of a secret value,
usually a cryptographic key, with biometric data, in such a way that none of them can be
recovered from the resulted bio-cryptogram, in the absence of a new biometric sample,
sufficiently similar to the one used during the encryption stage, is called Biometric Encryption
and represents the most reliable operating mode used within this domain.
Bio-cryptographic systems have the potential to confer a higher degree of security, since the
only information stored within the system are the resulted bio-cryptograms. On the other hand,
their high consumption of computational resources represents an important drawback, since
the response time of a bio-cryptographic system might be an inconvenient one, depending on
its available resources.
For example, the Fuzzy Vault bio-cryptographic algorithm performs lots of mathematical
processing, including polynomial projections, diffusion points generation or exhaustive
polynomial reconstruction, using Lagrange Interpolation.
This paper aims to evaluate the order of magnitude for the diffusion points generated during
the biometric encryption stage, since some papers in domain recommend at least ten times more

Proceedings of the IE 2015 International Conference
www.conferenceie.ase.ro
21
diffusion points than genuine ones [1][2], but without a reasoning for that choice. The
evaluation process will consist of a brute-force attacks resistance measurement, as an attempt
to relate the diffusion points order of magnitude with the security level of the entire encryption
schema.
The rest of the paper is organized as follows: Section 2 comprises the theoretical background
of this article, describing the Fuzzy Vault scheme and its main parameters; Section 3 describes
our proposed evaluation method for determining the optimal order of magnitude for diffusion
points and Section 4 presents the experimental results that were obtained.
2. Background information Although Bio-cryptography proposes several different modes of combining the usage of
cryptography and biometrics, including the key generation or key unlocking scenarios, the most
representative bio-cryptographic mode is key binding, also known as the Biometric Encryption
process. This is due to the fact that key regeneration is an instable process, as biometric data
tends to exhibit a high entropy, even for the same user characteristics.
The most widely used bio-cryptographic algorithm is the Fuzzy Vault scheme, described in the
following section of our paper.
2.1 Fuzzy Vault biometric encryption and decryption The Fuzzy Vault scheme represents a biometric encryption algorithm based on mathematical
principles regarding polynomial calculus in a finite field. Its security relies on the difficulty of
the polynomial reconstruction problem [3], as the initial secret key is encoded under the form
of a low-degree polynomial.
Figure 1. Fuzzy Vault enrollment and verification principles
During the enrollment stage, where biometric encryption takes place, the initial secret key is
mapped to the encoding polynomial construction, which has the following generic form:
P(u) = ckxk+ck-1x
k-1+ ... + c2x2+c1x+c0 , (1)
where k represents the degree of the encoding polynomial and c0 ... ck represent its coefficients,
resulted, usually, from mapping each 16 bits of the key to the corresponding decimal value.
The evaluation of each user digitized biometric template values on the polynomial curve
derived above will generate the associated original encoding points, also called genuine points

Proceedings of the IE 2015 International Conference
www.conferenceie.ase.ro
22
[4], that will represent the only information related to the initial secret key to be stored within
the system database.
Since the plaintext storing of the genuine points would make the polynomial reconstruction
problem trivial, as any polynomial of degree k can be reconstructed, by using Lagrange
Interpolation and any k + 1 points residing on its polynomial curve, the random diffusion points
generation mechanism is used, in order to spread the original information across the final bio-
cryptogram. An important condition needs to be imposed on each pair of these points, as they
mustn’t belong to the encoding polynomial curve, because they could generate false acceptance
points [3]:
RDP = {(ai , bi )}, with bi ≠ P(ai ) (2)
During the verification stage, in order to successfully complete the biometric decryption
process and recover the initial secret key, each user must provide a fresh biometric sample,
which will be used to identify genuine points within the bio-cryptogram. If it sufficiently
resembles with the one used during enrollment, polynomial reconstruction and secret key
recovery are feasible.
The checksum mechanism is required, as a method of identifying the correct encoding
polynomial from all the candidates [5], since diffusion points extraction from the bio-
cryptogram will result in erroneous polynomials reconstruction.
2.2 Fuzzy Vault specific operating parameters The main parameters used for configuring the Fuzzy Vault encryption scheme were already
mentioned in the algorithm description and they comprise the number of genuine points, the
order of magnitude of the diffusion points and the encoding polynomial degree.
The number of genuine points represents a quantifier for the initial secret value that is encoded
and secured within the final bio-cryptogram. Its value depends directly on the biometric
template content, being influenced by the digitizing parameters that were used to derive it from
the biometric sample. It is denoted by n, usually.
The order of magnitude of the diffusion points represents the particular aspect of the Fuzzy
Vault biometric encryption scheme, as these points are randomly generated with the purpose
of securing the encoded secret information and they influence, directly, the security level of
the entire scheme. It is denoted by m, usually.
The encoding polynomial degree is another important metric for the Fuzzy Vault scheme, as it
directly influences the genuine points acceptance threshold. A higher degree polynomial can
lower the threshold value, since it adds more precision for the genuine points evaluation on the
encoding polynomial curve [6]. It is denoted, usually, by k.
As already stated in the previous sections, the usage of more diffusion points confers a higher
security level, but it also affects the performances of the encryption algorithm, as their
generation is a highly resource consuming operation. Considering the fact that the usage of a
large scale bio-cryptographic system would require much user input and output, its time
response represents an important metric. This aspect brings the designers of such a system to
another compromise, similar to the false acceptance / false rejection one, which requires the
finding of an optimal balance between the conferred security level and the system response
time.
3. Our proposed evaluation method In our study, we aimed to evaluate the strength of the Fuzzy Vault construction, by measuring
its resistance against brute-force attacks, for different biometric encryption scenarios, with
various orders of magnitude for the diffusion points.
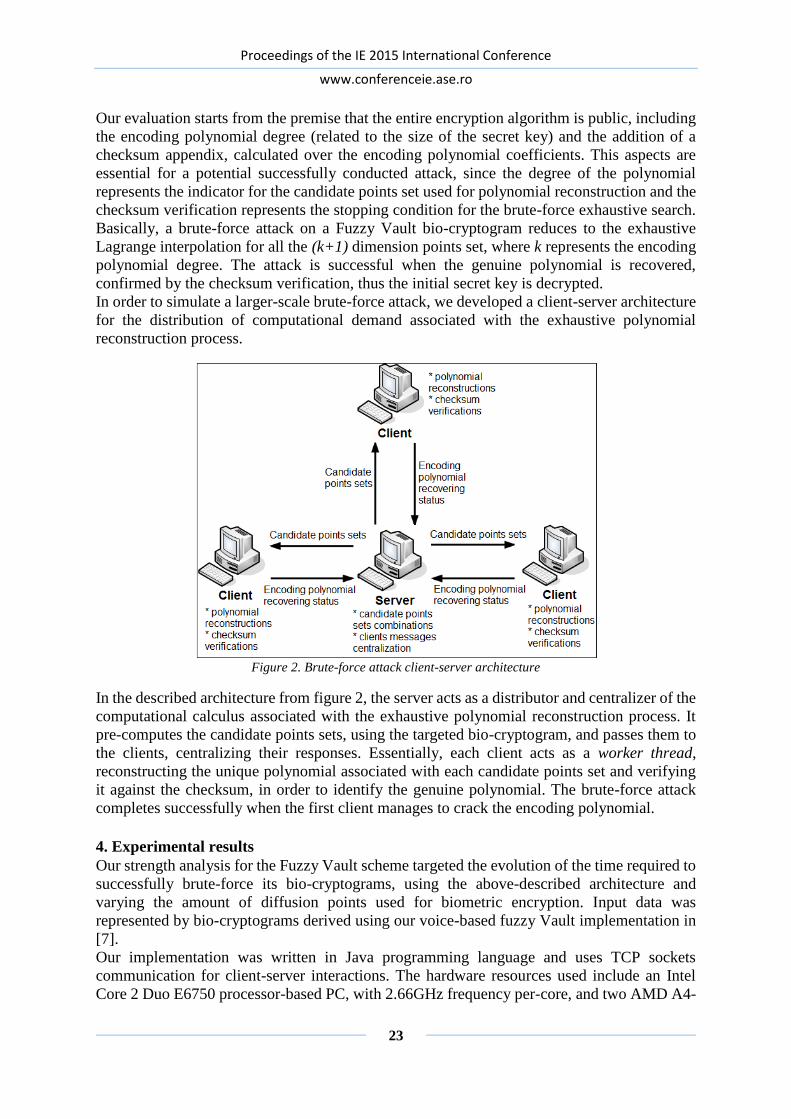
Proceedings of the IE 2015 International Conference
www.conferenceie.ase.ro
23
Our evaluation starts from the premise that the entire encryption algorithm is public, including
the encoding polynomial degree (related to the size of the secret key) and the addition of a
checksum appendix, calculated over the encoding polynomial coefficients. This aspects are
essential for a potential successfully conducted attack, since the degree of the polynomial
represents the indicator for the candidate points set used for polynomial reconstruction and the
checksum verification represents the stopping condition for the brute-force exhaustive search.
Basically, a brute-force attack on a Fuzzy Vault bio-cryptogram reduces to the exhaustive
Lagrange interpolation for all the (k+1) dimension points set, where k represents the encoding
polynomial degree. The attack is successful when the genuine polynomial is recovered,
confirmed by the checksum verification, thus the initial secret key is decrypted.
In order to simulate a larger-scale brute-force attack, we developed a client-server architecture
for the distribution of computational demand associated with the exhaustive polynomial
reconstruction process.
Figure 2. Brute-force attack client-server architecture
In the described architecture from figure 2, the server acts as a distributor and centralizer of the
computational calculus associated with the exhaustive polynomial reconstruction process. It
pre-computes the candidate points sets, using the targeted bio-cryptogram, and passes them to
the clients, centralizing their responses. Essentially, each client acts as a worker thread,
reconstructing the unique polynomial associated with each candidate points set and verifying
it against the checksum, in order to identify the genuine polynomial. The brute-force attack
completes successfully when the first client manages to crack the encoding polynomial.
4. Experimental results Our strength analysis for the Fuzzy Vault scheme targeted the evolution of the time required to
successfully brute-force its bio-cryptograms, using the above-described architecture and
varying the amount of diffusion points used for biometric encryption. Input data was
represented by bio-cryptograms derived using our voice-based fuzzy Vault implementation in
[7].
Our implementation was written in Java programming language and uses TCP sockets
communication for client-server interactions. The hardware resources used include an Intel
Core 2 Duo E6750 processor-based PC, with 2.66GHz frequency per-core, and two AMD A4-

Proceedings of the IE 2015 International Conference
www.conferenceie.ase.ro
24
5000 APU Quad-core processor laptops, with 1.5 GHz per-core. The PC was employed as the
server, and both laptops were used as clients. The brute-force mechanism was parallelized,
using java thread programming, meaning that we had eight active working threads at our
disposal.
Still, it is important to mention that our exhaustive polynomial reconstruction attempts started
from the statistical assumption that genuine points have a relatively uniform distribution within
the bio-cryptogram, of value 1/m, where m represents the diffusion points magnitude order.
This is due to the fact that even for the smallest bio-cryptogram used, the total number of points
contained was bigger than 5000, resulting, for a k = 7 degree encoding polynomial, in a total
number of C(5000, k+1) = C(5000, 8) = 9.63399119864E+24 polynomial reconstructions,
impossible to calculate in finite time, by any existing computing infrastructure.
In other words, for a biometric encryption scheme having an order of magnitude of the diffusion
points with the value of three, we can assume that one out of four points is genuine. This way,
the entire range of values to be used for candidate points sets combinations can get reduced to
a 8*4 = 32 points subset, for the same encoding polynomial mentioned above. Still, this
approach does not guarantee the genuine polynomial recovery by using only the partial subset,
but allows the reduction of the exhaustive search to a finite-time one, with a decent probability
of succeeding the attack. Table 1 summarizes the experimental results obtained using our
proposed architecture.
Table 1. Experimental results
Nr. of
original
points
Nr. of
diffusion
points
Diffusion
points
order of
magnitude
Restrained
analysis subset
dimension
Nr. of total
polynomial
reconstruction
attempts
Required time to
break the bio-
cryptogram
1342 4026 3 32 10.518.300 22 min.
1342 5368 4 40 76.904.685 2 h 45 min.
1342 6710 5 48 377.348.994 10 h 25 min.
1342 8052 6 56 1.420.494.075 1 day 18 h 30 min.
1342 9394 7 64 4.426.165.368 4 days 10 h
1342 10736 8 72 11.969.016.345 Unevaluated
Experimental results show that the Fuzzy Vault bio-cryptograms are vulnerable to a statistical-
based brute-force attack, even though we were able to evaluate the system until an order of
magnitude of the diffusion points with the value of seven. By extrapolating our attack success
rates and time durations, we could estimate that our infrastructure would require about three
months for cracking an ordinary Fuzzy Vault bio-cryptogram, with a recommended order of
magnitude value of ten. If we take into consideration our limited computational resources and
the improvisational character of our architecture, much under a large-scale grid computational
infrastructure, we can state that Fuzzy Vault algorithm can be cracked in a matter of weeks by
a statistical-based brute-force attack.
Still, we want to emphasize the fact that our starting presumption assumed an uniform
distribution of genuine points within the bio-cryptograms, considerably reducing our analysis
subsets. Our attacks success rates were possible due to the generation of our input data
accordingly to this assumption. That’s why, we consider that, besides the magnitude order of
the diffusion points, another important aspect is the distribution of genuine points within the

Proceedings of the IE 2015 International Conference
www.conferenceie.ase.ro
25
final bio-cryptogram, which should be as irregular as possible, making it harder for a statistical-
based brute-force attack to succeed.
5. Conclusions Bio-cryptography could represent an important breakthrough in the field of biometrics,
considering the elimination of the need for storing biometric templates. Still, there are some
important concerns regarding its algorithms computational complexity and resistance against
some bio-cryptogram oriented attacks.
Our paper proposes an evaluation of the relationship between the order of magnitude for the
diffusion points used within the Fuzzy Vault bio-cryptographic algorithm and its conferred
security level, since many papers in domain recommend the usage of at least ten times more
diffusion points than genuine ones.
We have implemented a statistical-based brute-force simulation infrastructure, in order to
conduct some conclusions regarding the targeted biometric encryption scheme. Experimental
results showed that Fuzzy Vault bio-cryptograms are quite vulnerable in front of such a
statistical-based attack, denoting the fact that the most common value used for diffusion points
magnitude order genuine, ten, does not confer a high security level. Moreover, we emphasized
the fact that points distribution within the Vault has a major importance too, as its degree of
irregularity might confer more security than simply increasing the number of diffusion points /
number of genuine points ratio.
Acknowledgment This paper has been financially supported within the project entitled “Horizon 2020 – Doctoral and Postdoctoral Studies: Promoting the National Interest through Excellence, Competitiveness and Responsibility in the Field of Romanian Fundamental and Applied Scientific Research”, contract number POSDRU/159/1.5/S/140106. This project is co-financed by European Social Fund through Sectoral Operational Program for Human Resources Development 2007-2013. Investing in people!
References [1] K. Nandakumar, Anil K. Jain, and S. Pankanti, “Fingerprint-Based Fuzzy Vault:
Implementation and Performance”, in IEEE Transactions on Information Forensics and
Security, vol. 2, pp.744–757, December 2007.
[2] N. Radha, S. Karthikeyan, “Securing Retina Fuzzy Vault System using Soft Biometrics”,
in Global Journal of Computer Science and Technology, vol. 10, pp.13–18, September 2010.
[3] P. Sood, M. Kaur, “Methods of automatic alignment of fingerprint in fuzzy vault”, in Recent
Advances in Engineering and Computational Sciences (RAECS), pp.1-4, Chandigarh, India,
March 2014.
[4] A. Mitas, M. Bugdol, “Strengthening a cryptographic system with behavioural biometric”,
Third international conference on Information Technologies in Biomedicine, pp. 266-276,
2010
[5] C. Orencik, T. Pedersen and E. Savas, “Securing Fuzzy Vault schemes through biometric
hashing”, in Turkish Journal of Electrical Engineering & Computer Sciences, vol. 18, 2010.
[6] G. Eskander, R. Sabourin and E. Granger, “A bio-cryptographic system based on offline
signature images”, Information Sciences, vol. 259, pp.170–191, 2014.
[7] M. A. Velciu, V. V. Patriciu, “Methods of reducing bio-cryptographic algorithms
computational complexity”, at The 15th International Symposium on Computational
Intelligence and Informatics (CINTI 2014), Budapest, November 2014.

Proceedings of the IE 2015 International Conference
www.conferenceie.ase.ro
26
EVOLUTION OF TELECOM BSS: FROM VOICE SERVICES TO
COMPLEX IT SERVICES
Ioan DRĂGAN
Bucharest University of Economic Studies [email protected]
Răzvan Daniel ZOTA
Bucharest University of Economic Studies [email protected]
Abstract. Although less known outside strictly specialized environments, Business Support
Systems (BSS) are highly complex and the subject of their installation in cloud implementations
is less addressed. This paper presents a study based on direct interviews with representatives
of telecom operators about their vision of the future BSS solutions depending on the services
they will provide. Installation in cloud environments represents a less approached subject by
the providers of such solutions. Moreover, this area has a certain number of challenges that
require collaboration between providers and operators.
Keywords: Business Support Systems, Cloud implementations, Telecom providers
JEL classification: L86, D83, L15
1. Introduction In one of the simplest forms, business support systems (BSS) represent the “connection point”
between external relations (customers, suppliers and partners) and an enterprise’s products and
services. Moreover, products and services are correlated with corresponding resources, like
networking infrastructure, applications, contents and factories [1].
Basically, a BSS has to handle the taking of orders, payment issues, revenues and managing
customers, etc. According to eTOM Framework it supports four processes: product
management, order management, revenue management and customer management [2].
Product management supports product development, sales and management of products,
offers and bundles addressed to businesses and regular customers. Product management
regularly includes offering product discounts, appropriate pricing and managing how
products relate to one another.
Customer management. Service providers require a single view of the customer and need
to support complex hierarchies across customer-facing applications also known as
customer relationship management. Customer management also covers the partner
management and 24x7 web-based customer self-service.
Revenue management is focused on billing, charging and settlement.
Order management involves taking and handling the customer order. It encompasses four
areas: order decomposition, order orchestration, order fallout and order status
management.

Proceedings of the IE 2015 International Conference
www.conferenceie.ase.ro
27
Figure 5. BSS Functions [3]
In order to identify the main characteristics several market research methods have been used:
Research of existing BSS software providers and analysis of their top selling products
Interviews with telecom operators’ representatives
Other existing studies based on market available products
eTOM standard [3]
By following these methods some quantitative and qualitative key performance indicators
were applied that would help us understand the operators’ needs and how we can develop this
as a collaborative system [4]:
Qualitative: user experience, ability to adopt new services, operator onboarding
experience, interconnection between on premise equipment and cloud based software,
quality of this interoperation and coordination;
Quantitative: number of customers it can support, number of operators it can support,
handling processing peeks and data retention policy.
2. Traditional BSS services Traditional telecom networks made money by providing technology to connect users, and
services that were derived from that technology. To achieve optimum return on investment,
network equipment and services investments were made with a very long life cycle. Products
were expected to be in service from five up to 20 years, but technology evolution proved them
wrong.
Initially, BSS systems supported a limited number of services:
Customer relationship management – this was used by telecom operators to manage
their customers, mostly based on human intervention from qualified personnel
Billing services – based on service usage the customers were billed and an invoice was
sent to them monthly.
Order handling – orders were mostly handled manually by operators; this was only a
matter of registering and tracking them.
Services supported by traditional BSS solutions:
Voice calls – initially, voice calls were billed based on connection time, without any
reference to source or destination of the call
SMS – billed based on number of text messages, without any source/destination
considerations
Data - In 1991, 2G was available and provided also data services, which was a challenge
to be billed. Initially, data services were billed based on the connection minutes

Proceedings of the IE 2015 International Conference
www.conferenceie.ase.ro
28
Billing services evolved into complicated price plans based on source, destination, roaming,
time based triggers and other constrains, but was still based on strict usage and monthly fees.
It didn’t provide any means of charging other experience based services.
Customer management systems evolved into self-service portals up to some degree, but still do
not offer any means of dynamically assigning services based on customer profile.
The next generation BSS is considered to be linked to the launch of 3G which provided high
speed internet connections and add on services based on the new service layer.
3. Evolution towards multi system integrated services
Figure 6. BSS evolution [5]
The introduction of 4G/LTE networks created a multitude of new opportunities for wireless
operators but also presented a set of new challenges. It’s giving telecom operators the chance
to develop new, differentiated wireless services, and potentially new sources of revenue like
[6]:
Content distribution: audio/video
Software services for enterprises. E.g. mobile device management, subscription based
office solutions
Mobile payment solutions
According to telecom operators, the top telecom industry trends in BSS systems and
architecture are being driven by service layer architecture and the need to manage customer
experiences rather than subscription services. The major changes include the following:
Transforming from a supply to demand side vision of the business;
Transforming from human personnel support to automated support
Transforming from “management as an overlay” to “management as service logic”.
In the telecom operators’ network of the future vision, the "services" will involve the
experiences from a dynamic composition of transport/connection resources, content and
processing resources, subscriber knowledge based on customer’s behavior and location.
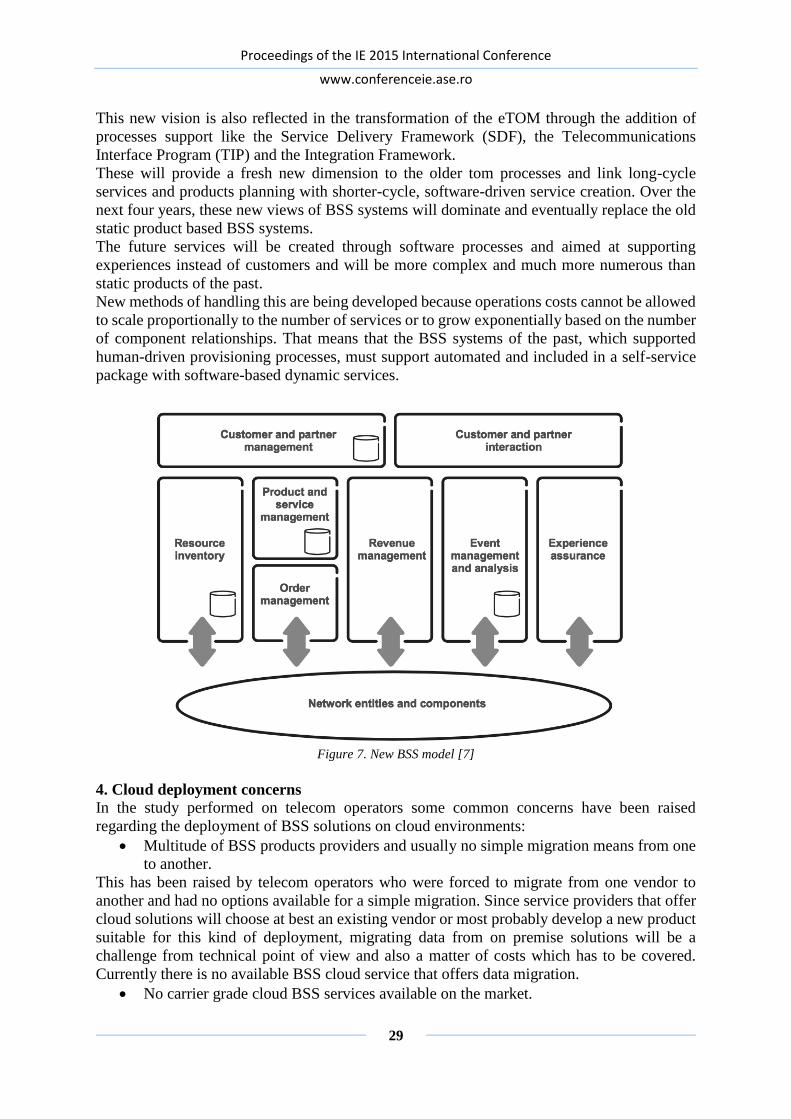
Proceedings of the IE 2015 International Conference
www.conferenceie.ase.ro
29
This new vision is also reflected in the transformation of the eTOM through the addition of
processes support like the Service Delivery Framework (SDF), the Telecommunications
Interface Program (TIP) and the Integration Framework.
These will provide a fresh new dimension to the older tom processes and link long-cycle
services and products planning with shorter-cycle, software-driven service creation. Over the
next four years, these new views of BSS systems will dominate and eventually replace the old
static product based BSS systems.
The future services will be created through software processes and aimed at supporting
experiences instead of customers and will be more complex and much more numerous than
static products of the past.
New methods of handling this are being developed because operations costs cannot be allowed
to scale proportionally to the number of services or to grow exponentially based on the number
of component relationships. That means that the BSS systems of the past, which supported
human-driven provisioning processes, must support automated and included in a self-service
package with software-based dynamic services.
Figure 7. New BSS model [7]
4. Cloud deployment concerns
In the study performed on telecom operators some common concerns have been raised
regarding the deployment of BSS solutions on cloud environments:
Multitude of BSS products providers and usually no simple migration means from one
to another.
This has been raised by telecom operators who were forced to migrate from one vendor to
another and had no options available for a simple migration. Since service providers that offer
cloud solutions will choose at best an existing vendor or most probably develop a new product
suitable for this kind of deployment, migrating data from on premise solutions will be a
challenge from technical point of view and also a matter of costs which has to be covered.
Currently there is no available BSS cloud service that offers data migration.
No carrier grade cloud BSS services available on the market.
Proceedings of the IE 2015 International Conference
www.conferenceie.ase.ro
30
Existing cloud BSS services offer at most 99.9% availability and scalability up to a medium
MVNO(Mobile Virtual Network Operator), but none of them offers a carrier grade service
availability 99.999% (“the five 9s” as it is called by telecom operators) with scalability up to
tens of millions of subscribers. Since this is a “niche” market, such products were not suitable
until now from costs perspective. The only “promise of delivery” is Ericsson’s “BSS as a
service” which should be available at the beginning of 2016. This will be based on Ericsson
products only and might offer some degree of compatibility with on premise deployments.
No options to pay for occasional extension of capacity (ex. monthly bill run, New
Year’s eve, other planned events).
Current pay as you grow subscriptions (or pay for what you use) allow limited capacity
extension and require complex setups in some occasions. Telecom operators currently use
“ready to deploy” virtual machines for capacity expansions in case of special events like:
monthly bill run, New Year’s Eve, discounts or historical bills adjustments. Meanwhile, these
VMs are turned off and this capacity is used for other activities. Deploying and configuring
VMs every time it’s needed on public/shared cloud infrastructure would add extra complexity
and human intervention. Currently there are no available software solutions for “event aware”
self-defining infrastructure.
5. Conclusions Nowadays, telecom operators are looking for new sources of revenue based on customer
experience rather than fix priced products. New business models based on revenue sharing are
now used in partnerships between telecom operators and software vendors. Customers are now
getting software for free and paying only for usage/data plans/data consumptions.
The introduction of 4G/LTE networks and high speed Wi-Fi hotspots allowed telecom
operators to distribute media content like music or videos. Even though, this media content is
distributed as free of charge, the data consumption is charged accordingly.
This multitude of services has to be managed by the new BSS model. Since there are numerous
combinations of services, human operators can’t handle them on a regular basis. Based on the
customer’s profile, services have to be offered as an add-on experience or via a self-service
approach. Integrating with other software or media vendors is a must and cloud deployments
would enable a separation of concerns: BSS solution suppliers would handle the enterprise
integration and telecom operators would develop new experiences for their customers.
Eventually, cloud deployments present numerous problems since this niche software did not
present a financial interest for cloud solutions provides. Solving these problems is actually a
matter of processes and convincing telecom operators to invest time and effort and work
together with their software or media partners and cloud service providers.
Future research will be directed towards identifying the most suitable components to
accommodate telecom operator’s requests and developing a proof of concept cloud
deployment. This will be presented to the same audience in order to study it and provide the
following feedback:
Qualitative analysis of the system: does it fit your current needs? How would you
improve it? Does it provide the expected processing speed? Can it accommodate your
new services?
Quantitative analysis of the system: does it scale enough to your needs? Can it
accommodate more than one operator?

Proceedings of the IE 2015 International Conference
www.conferenceie.ase.ro
31
Acknowledgment Part of the present work is done under the auspices of the doctoral program in Economic
Informatics – the doctoral school of Bucharest University of Economic Studies.
References [1] L. Angelin, U. Ollson, P. Tengroth, Business Support Systems. Internet, Available at:
http://www.ericsson.com/res/thecompany/docs/publications/ericsson_review/2010/busines
s_support_systems.pdf [Feb, 2010].
[2] eTOM – The Business Process Framework, pp. 41-49, GB921B [Mar, 2014]
[3] T. Poulos. “The BSS/OSS Best,” TMforum. Internet, Available at:
http://www.tmforum.org/ArticleTheBSSOSS/9835/home.html [Dec, 2010]
[4] C. Ciurea, “A Metrics Approach for Collaborative Systems”, Informatica Economica, Vol.
13, No. 2/2009.
[5] Evolution of OSSBSS – Telcordia workshop, Ericsson Review [Dec, 2013] [Online].
Available: http://www.slideshare.net/Ericsson/next-generation-ossbss-architecture
[6] “Integrated platform for financial transactions and electronic banking services made
available on mobile devices using the technology with widespread” – SERAFIMO, Contract
PN II nr. 3039/01.10.2008
[7] “Ericsson BSS vision” in Mobile World Congress, Barcelona, [Mar, 2013].
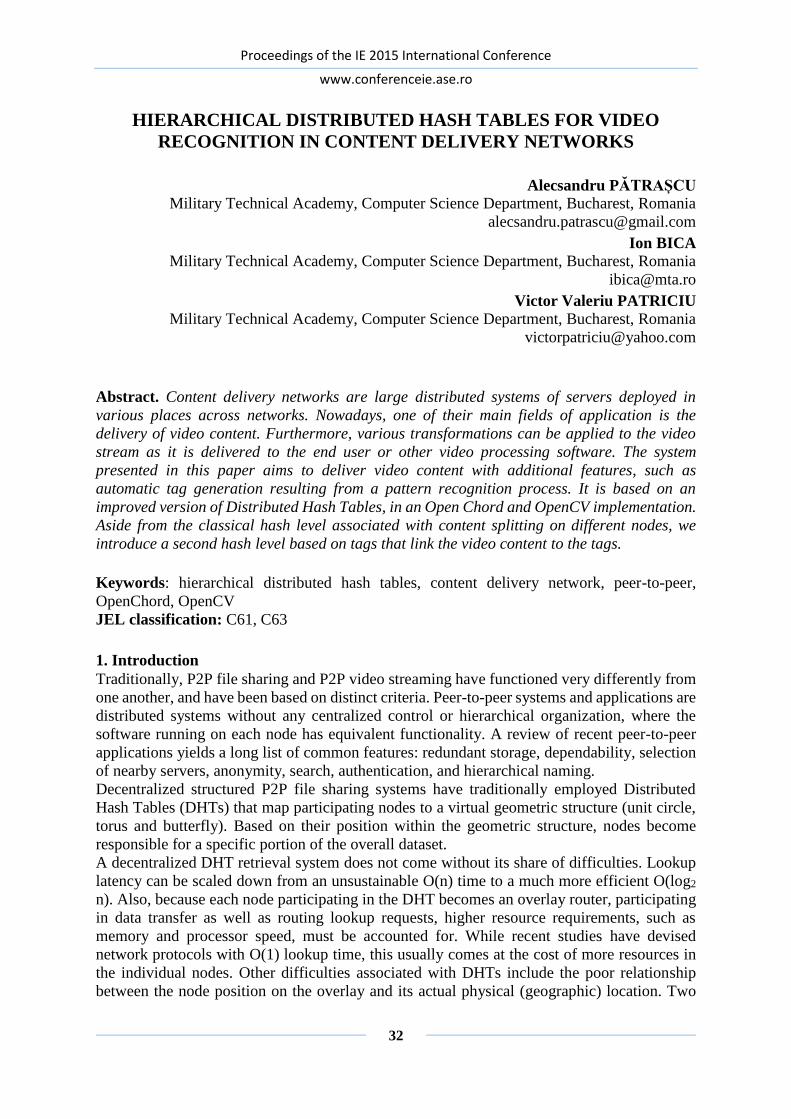
Proceedings of the IE 2015 International Conference
www.conferenceie.ase.ro
32
HIERARCHICAL DISTRIBUTED HASH TABLES FOR VIDEO
RECOGNITION IN CONTENT DELIVERY NETWORKS
Alecsandru PĂTRAȘCU
Military Technical Academy, Computer Science Department, Bucharest, Romania [email protected]
Ion BICA
Military Technical Academy, Computer Science Department, Bucharest, Romania [email protected]
Victor Valeriu PATRICIU
Military Technical Academy, Computer Science Department, Bucharest, Romania [email protected]
Abstract. Content delivery networks are large distributed systems of servers deployed in
various places across networks. Nowadays, one of their main fields of application is the
delivery of video content. Furthermore, various transformations can be applied to the video
stream as it is delivered to the end user or other video processing software. The system
presented in this paper aims to deliver video content with additional features, such as
automatic tag generation resulting from a pattern recognition process. It is based on an
improved version of Distributed Hash Tables, in an Open Chord and OpenCV implementation.
Aside from the classical hash level associated with content splitting on different nodes, we
introduce a second hash level based on tags that link the video content to the tags.
Keywords: hierarchical distributed hash tables, content delivery network, peer-to-peer,
OpenChord, OpenCV
JEL classification: C61, C63
1. Introduction Traditionally, P2P file sharing and P2P video streaming have functioned very differently from
one another, and have been based on distinct criteria. Peer-to-peer systems and applications are
distributed systems without any centralized control or hierarchical organization, where the
software running on each node has equivalent functionality. A review of recent peer-to-peer
applications yields a long list of common features: redundant storage, dependability, selection
of nearby servers, anonymity, search, authentication, and hierarchical naming.
Decentralized structured P2P file sharing systems have traditionally employed Distributed
Hash Tables (DHTs) that map participating nodes to a virtual geometric structure (unit circle,
torus and butterfly). Based on their position within the geometric structure, nodes become
responsible for a specific portion of the overall dataset.
A decentralized DHT retrieval system does not come without its share of difficulties. Lookup
latency can be scaled down from an unsustainable O(n) time to a much more efficient O(log2
n). Also, because each node participating in the DHT becomes an overlay router, participating
in data transfer as well as routing lookup requests, higher resource requirements, such as
memory and processor speed, must be accounted for. While recent studies have devised
network protocols with O(1) lookup time, this usually comes at the cost of more resources in
the individual nodes. Other difficulties associated with DHTs include the poor relationship
between the node position on the overlay and its actual physical (geographic) location. Two

Proceedings of the IE 2015 International Conference
www.conferenceie.ase.ro
33
nodes whose overlay addresses may be virtually close to one another can easily be continents
apart, from a physical standpoint. Moreover, the churn process specific to the Chord protocol,
in which participating nodes join and leave the DHT rapidly, can result in partitioning and slow
recovery of the overlay.
Multimedia streaming and file sharing have very different approaches. The goals of media
streaming strategies include minimizing jitter and latency, while maximizing bandwidth usage
and visual quality. Popular methodologies for media streaming usually employ direct client-
server relationships, or otherwise leverage the strengths of P2P transfers in the form of
multicast trees. The benefits of a tree based system include minimal protocol overhead in
individual nodes, implementation simplification, and predictable video stream arrival latencies.
It is possible for many of the difficulties associated with multicast tree transmissions to be
mitigated by the strengths of the P2P file sharing system if a video stream can, in part, be
managed like a file. Ideally, the strengths of a decentralized file system and a multicast
broadcast system can be combined to form a decentralized P2P video streaming protocol. The
DHT can be used to provide tracking for sections of the video stream and thus enable VCR-
type fast forwarding and rewind-type functionality, by allowing nodes to locate other nodes of
interest.
This paper is structured as follows. In section 2 we present some general notions about DHTs
which are related to our topic, in section 3 we detail the proposed architecture. The
implementation progress so far is presented in section 4. Section 5 concludes our paper.
2. DHT Generalities
Recent work on DHTs [1] have resulted in algorithms such as CAN, in order to better correlate
overlay positioning with geographical positioning. The application of a latency-aware DHT
can aid in the formation of a multicast tree, by grouping nodes that are geographically closer
to one another, in the virtual overlay network. Furthermore, a DHT structure that handles churn
well can help nodes in a multicast tree to find new parent nodes when they are disrupted by
their peers leaving the network. For this purpose, we introduce our application - an application
layer protocol for streaming and routing, that runs on top of a structured DHT overlay. The
overlay that we have chosen is Chord [8].
The Chord protocol supports just one operation: given a key, it maps the key onto a node.
Depending on the application using Chord, that node might be responsible for storing a value
associated with the key. Chord uses a variant of consistent hashing to assign keys to Chord
nodes. Consistent hashing tends to balance load, since each node receives roughly the same
number of keys, and involves relatively little movement of keys when nodes join and leave the
system.
Video streaming over best-effort, packet-switched networks is challenging, due to a number of
factors such as high bit rates, delay, and loss of sensitivity [2-4]. Thus, transport protocols such
as TCP are not suitable for streaming applications. To this end, many solutions based on
different approaches have been proposed. From the Chord perspective, there are
implementations based on multicast and TCP-friendly protocols for streaming multimedia data
over the Internet. Multicast reduces network bandwidth by not sending duplicate packets over
the same physical link, but it is only appropriate for situations where there are one sender and
many receivers.
The rapid increase in computer processing power, combined with the fast-paced improvement
of digital camera capabilities [5], has resulted in equally rapid advances in computer vision
capability and use. Computer vision software is supported by the free Open Source Computer
Vision Library (OpenCV)[6] that can (optionally) be highly optimized, by using the
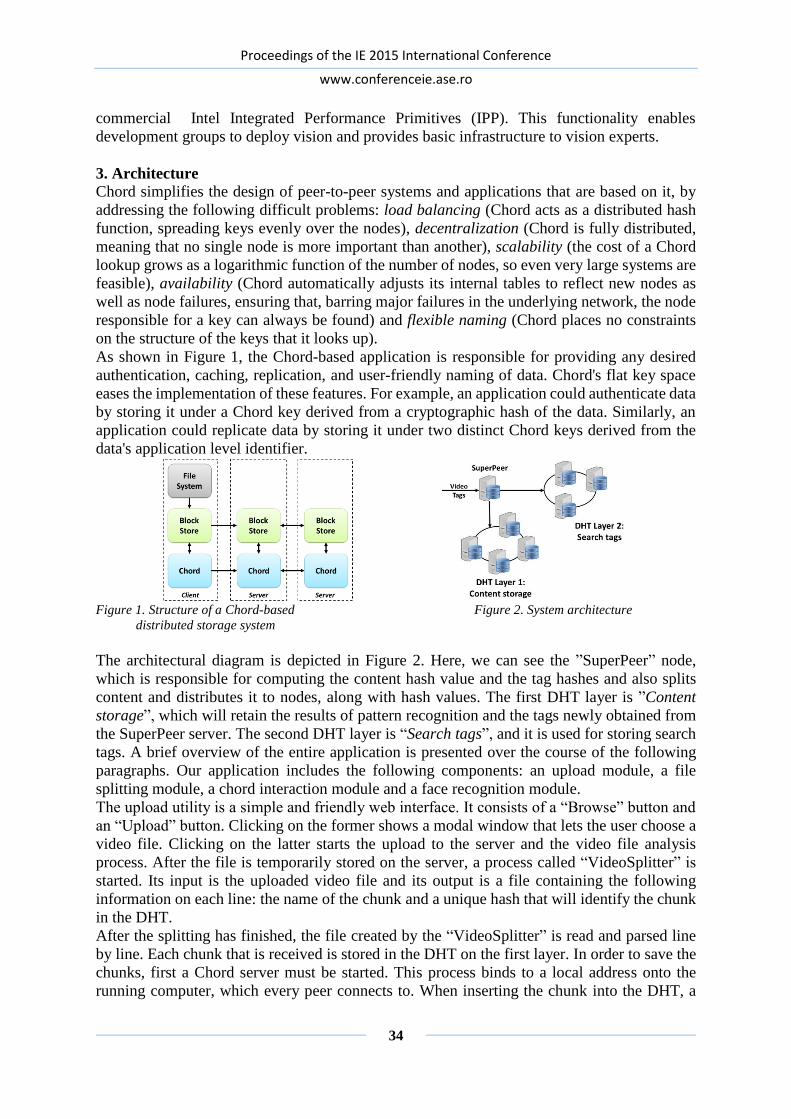
Proceedings of the IE 2015 International Conference
www.conferenceie.ase.ro
34
commercial Intel Integrated Performance Primitives (IPP). This functionality enables
development groups to deploy vision and provides basic infrastructure to vision experts.
3. Architecture
Chord simplifies the design of peer-to-peer systems and applications that are based on it, by
addressing the following difficult problems: load balancing (Chord acts as a distributed hash
function, spreading keys evenly over the nodes), decentralization (Chord is fully distributed,
meaning that no single node is more important than another), scalability (the cost of a Chord
lookup grows as a logarithmic function of the number of nodes, so even very large systems are
feasible), availability (Chord automatically adjusts its internal tables to reflect new nodes as
well as node failures, ensuring that, barring major failures in the underlying network, the node
responsible for a key can always be found) and flexible naming (Chord places no constraints
on the structure of the keys that it looks up).
As shown in Figure 1, the Chord-based application is responsible for providing any desired
authentication, caching, replication, and user-friendly naming of data. Chord's flat key space
eases the implementation of these features. For example, an application could authenticate data
by storing it under a Chord key derived from a cryptographic hash of the data. Similarly, an
application could replicate data by storing it under two distinct Chord keys derived from the
data's application level identifier.
Figure 1. Structure of a Chord-based Figure 2. System architecture
distributed storage system
The architectural diagram is depicted in Figure 2. Here, we can see the ”SuperPeer” node,
which is responsible for computing the content hash value and the tag hashes and also splits
content and distributes it to nodes, along with hash values. The first DHT layer is ”Content
storage”, which will retain the results of pattern recognition and the tags newly obtained from
the SuperPeer server. The second DHT layer is “Search tags”, and it is used for storing search
tags. A brief overview of the entire application is presented over the course of the following
paragraphs. Our application includes the following components: an upload module, a file
splitting module, a chord interaction module and a face recognition module.
The upload utility is a simple and friendly web interface. It consists of a “Browse” button and
an “Upload” button. Clicking on the former shows a modal window that lets the user choose a
video file. Clicking on the latter starts the upload to the server and the video file analysis
process. After the file is temporarily stored on the server, a process called “VideoSplitter” is
started. Its input is the uploaded video file and its output is a file containing the following
information on each line: the name of the chunk and a unique hash that will identify the chunk
in the DHT.
After the splitting has finished, the file created by the “VideoSplitter” is read and parsed line
by line. Each chunk that is received is stored in the DHT on the first layer. In order to save the
chunks, first a Chord server must be started. This process binds to a local address onto the
running computer, which every peer connects to. When inserting the chunk into the DHT, a
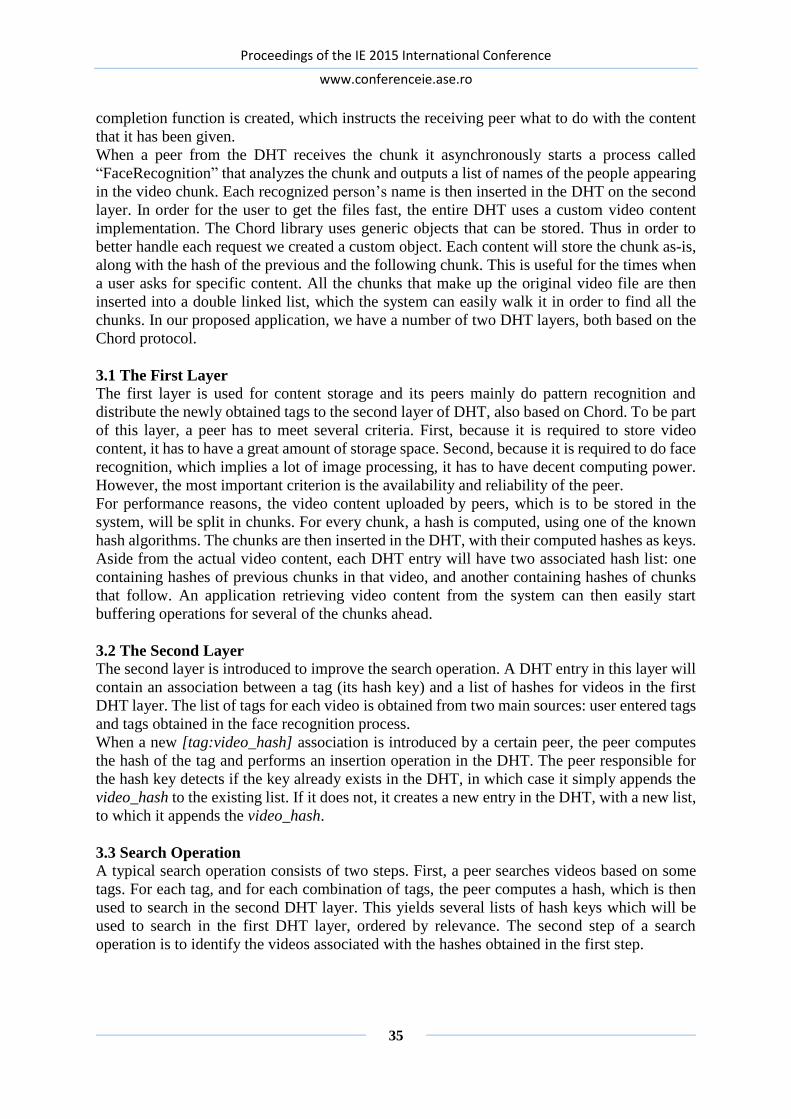
Proceedings of the IE 2015 International Conference
www.conferenceie.ase.ro
35
completion function is created, which instructs the receiving peer what to do with the content
that it has been given.
When a peer from the DHT receives the chunk it asynchronously starts a process called
“FaceRecognition” that analyzes the chunk and outputs a list of names of the people appearing
in the video chunk. Each recognized person’s name is then inserted in the DHT on the second
layer. In order for the user to get the files fast, the entire DHT uses a custom video content
implementation. The Chord library uses generic objects that can be stored. Thus in order to
better handle each request we created a custom object. Each content will store the chunk as-is,
along with the hash of the previous and the following chunk. This is useful for the times when
a user asks for specific content. All the chunks that make up the original video file are then
inserted into a double linked list, which the system can easily walk it in order to find all the
chunks. In our proposed application, we have a number of two DHT layers, both based on the
Chord protocol.
3.1 The First Layer
The first layer is used for content storage and its peers mainly do pattern recognition and
distribute the newly obtained tags to the second layer of DHT, also based on Chord. To be part
of this layer, a peer has to meet several criteria. First, because it is required to store video
content, it has to have a great amount of storage space. Second, because it is required to do face
recognition, which implies a lot of image processing, it has to have decent computing power.
However, the most important criterion is the availability and reliability of the peer.
For performance reasons, the video content uploaded by peers, which is to be stored in the
system, will be split in chunks. For every chunk, a hash is computed, using one of the known
hash algorithms. The chunks are then inserted in the DHT, with their computed hashes as keys.
Aside from the actual video content, each DHT entry will have two associated hash list: one
containing hashes of previous chunks in that video, and another containing hashes of chunks
that follow. An application retrieving video content from the system can then easily start
buffering operations for several of the chunks ahead.
3.2 The Second Layer
The second layer is introduced to improve the search operation. A DHT entry in this layer will
contain an association between a tag (its hash key) and a list of hashes for videos in the first
DHT layer. The list of tags for each video is obtained from two main sources: user entered tags
and tags obtained in the face recognition process.
When a new [tag:video_hash] association is introduced by a certain peer, the peer computes
the hash of the tag and performs an insertion operation in the DHT. The peer responsible for
the hash key detects if the key already exists in the DHT, in which case it simply appends the
video_hash to the existing list. If it does not, it creates a new entry in the DHT, with a new list,
to which it appends the video_hash.
3.3 Search Operation
A typical search operation consists of two steps. First, a peer searches videos based on some
tags. For each tag, and for each combination of tags, the peer computes a hash, which is then
used to search in the second DHT layer. This yields several lists of hash keys which will be
used to search in the first DHT layer, ordered by relevance. The second step of a search
operation is to identify the videos associated with the hashes obtained in the first step.

Proceedings of the IE 2015 International Conference
www.conferenceie.ase.ro
36
3.4 Face recognition
The face recognition module of our system uses OpenCV. This module needs to be a standalone
application that is present on every peer in the first layer. Once a peer has new video content,
it will start a face recognition job. This module attempts to identify people in the video and
return their names. Those names are then stored in the system, within the second DHT layer.
The face recognition process has two steps: face detection, which decides which parts of an
image are faces and which are not, and actual face recognition, which attempts to identify the
persons to whom the detected faces belong.
OpenCV uses a type of face detector called a Haar Cascade classifier. Given an image, which
can come from a file or from a live video stream, the face detector examines each image
location and classifies it as “Face” or “Not Face”. Classification assumes a fixed scale for the
face, say 50x50 pixels. Since faces in an image might be smaller or larger than this, the
classifier runs over the image several times, searching for faces across a range of scales. This
may seem as an enormous amount of processing, but thanks to some algorithmic tricks,
classification is very fast, even when it's applied using several scales. The classifier uses data
stored in an XML file to decide how to classify each image location.
The actual face recognition is the process of figuring out whose face it is. The eigenface
algorithm is used to this end. Eigenface is a simple face recognition algorithm that's easy to
implement. It's the first face-recognition method that computer vision students learn, and it's
one of the standard methods in the computer vision field. Turk and Pentland published the
paper that describes the Eigenface method in 1991.
The steps used in eigenface are also used in many advanced methods. One reason eigenface is
so important is that the basic principles behind it - PCA and distance-based matching - appear
over and over in numerous computer vision and machine learning applications.
Here's how recognition works: given example face images for each of several people, plus an
unknown face image to recognize:
1. Compute a “distance” between the new image and each of the example faces
2. Select the example image that's closest to the new one as the most likely known person
3. If the distance to that face image is above a threshold, “recognize” the image as that person,
otherwise, classify the face as an “unknown” person.
Distance, in the original eigenface paper, is measured as the point-to-point distance (the
Euclidean distance).
4. Implementation so far
Up until now, we have implemented the basic structure of the application. The source is freely
available at [7]. The upload utility, the file splitting, online face recognition, face recognition
and video recorder utilities are all working properly.
During development, we ran into a series of problems. One big problem that we encountered
was the lack of support of the Chord library the detecting that a video file chunk is received. In
order to make it work, we had to modify the library and add this feature. To make it more
interesting, we added the possibility for the framework to run more than one specific command
when receiving data chunks. The user can customize the command in order to choose what to
do after the chunk is received, which is basically a completion function. This is executed
asynchronously, in order to make the system responsive and scalable.
Another problem was communication between the three different platforms we used: C++ for
OpenCV, PHP for the upload utility and Java for the DHT network. The solution was that to
check every action executed by each component against the operating system, when launching
the processes. Also, a lot of “try-catch” blocks have been used, in order to catch errors that
could appear in such a large system implementation.

Proceedings of the IE 2015 International Conference
www.conferenceie.ase.ro
37
OpenCV was used to develop the automatic tagging functionality. The development was done
on a Windows 7 machine with Visual Studio 2010. Even though OpenCV has a Windows
installer which installs all required DLL's in place, it crashed when trying to run the utilities
which relied on it. The solution was to recompile all the libraries from source.
5. Conclusion and Future Work
In this paper we have proposed a system consisting of a content delivery network that uses
distributed hash tables on top of Chord, for storing and providing content, to achieve an entirely
decentralized and unmanaged form of peer-to-peer video streaming. To this end, we introduced
basic file splitting and content analysis across the network.
Research for our video content distribution network is currently in the incipient phase, but
results in this direction look encouraging. We are already taking into account improvements to
the whole system, especially the DHT modules. This means further development of the Chord
library, to make it more secure and reliable, and implementation of new features. We also aim
to improve path optimizations for the video chunks, so that the parts travel the least amount of
time in our DHT in order to reach the destination peer, as well as load balancing between peers,
so that the network doesn’t become unresponsive in case of massive reception of video files.
All of these are going to help us deliver video content between network nodes at much greater
speed.
Acknowledgment
This paper has been financially supported within the project entitled “Horizon 2020 - Doctoral
and Postdoctoral Studies: Promoting the National interest through Excellence, Competitiveness
and Responsibility in the Field of Romanian Fundamental and Applied Scientific Research”,
contract number POSDRU/159/1.5/S/140106. This project is co-financed by European Social
Fund through the Sectoral Operational Programme for Human Resources Development 2007 -
2013. Investing in people!
References [1] W. Tan and A. Zakhor, “Real-time INTERNET video using error resilient scalable
compression and tcp-friendly transport protocol”, IEEE Transactions on Multimedia, vol.
1, pp. 172-186, June 1999.
[2] I. Clarke, “A distributed decentralised information storage and retrieval system”, Master’s
thesis, University of Edinburgh, 1999.
[3] F. Dabek, E. Brunskill, M. F. Kaashoek, D. Karger, R. Morris, I. Stioca, H. Balakrishnan,
“Building peer-to-peer systems with Chord, a distributed location service”, In Proceedings
of the 8th IEEE Workshop on Hot Topics in Operating Systems (HotOS-VIII),
Elmau/Oberbayern, Germany, May 2001, pp. 71-76.
[4] W. Poon, J. Lee, and D. Chiu, “Comparison of Data Replication Strategies for Peer-to-Peer
Video Streaming”, Fifth International Conference on Information Communications and
Signal Processing, pp. 518-522, December 2005.
[5] C. Y. Fang, C. S. Fuh, P. S. Yen, S. Cherng, and S. W. Chen, “An Automatic Road Sign
Recognition System based on a Computational Model of Human Recognition Processing”,
Computer Vision and Image Understanding, Vol. 96 , Issue 2, November 2004.
[6] OpenCV library, http://www.intel.com/research /mrl/research/opencv
[7] https://github.com/apatrascu/dvcdn
[8] I. Stoica, "Chord: A scalable peer-to-peer lookup service for internet applications," ACM
SIGCOMM Computer Communication Review Vol. 31, No. 4, 2001, pp. 149-160.

Proceedings of the IE 2015 International Conference
www.conferenceie.ase.ro
38
DRIVING BUSINESS AGILITY WITH THE USE OF CLOUD
ANALYTICS
Mihaela MUNTEAN
Bucharest University of Economic Studies, Bucharest [email protected]
Abstract. In a global and dynamic economy, the businesses must adapt quickly to changes that
appear continuously, it must be agile. Businesses that are agile will be able to compete in a
dynamic global economy. Also, it is common knowledge that business intelligence is a crucial
factor to the business success. But traditional BI is in contradiction with frequently changing
business requirements and “big data”. The purpose of this paper was to investigate how
business intelligence and cloud computing could be used together to provide agility in business.
Also, the paper gives an overview of the current state of cloud-based business intelligence and
presents briefly the different models for cloud-based BI such as BI SaaS and BI PaaS. Finally,
the paper identifies the strengths and weaknesses of cloud-based BI.
Keywords: agile business, business intelligence, cloud-based business intelligence JEL classification: C88, L86
1. Introduction Considering the current situation, the businesses must adapt quickly to changes that appear
continuously, in a global and dynamic economy, they must be agile. In a world that changes
permanently, the leadership position is temporary, only agility creates a competitive advantage
for companies. Also, there is too much information that changes faster than the information
systems. Information is a strategic resource for companies, and decisions must be taken based
on a huge amount of real time information, from a high variety of internal and external sources,
unstructured and structured sources. In the article „The ten dimensions of business agility” [2],
Craig le Clair, from Forrester Research, has identified the main factors that influence business
agility. These factors are presented in figure 1. They are grouped into three categories:
marketing, organization and IT technologies. Also, in figure 1 are presented the main IT
technologies that affect directly and not business agility. We can see that cloud computing and
BI is two important factors that can influence the agility of a business. Also, during 2010-2015,
according to Gartner Group consulting company [4], BI and cloud computing were considered
high priority technologies for CIO. In 2014, the market survey included 2339 CIOs from 77
countries, with a total of 300 billion dollars revenue. We can observe that BI has been ranked
first from 2012 until today, 50% of those interviewed have considered that BI technology is
very important for companies activity (figure 2). Cloud computing ranked first in 2011 and
since 2012, it has been constantly ranked third until today. Also, the top three IT technologies
which will be subjected to massive investment in 2015 are: BI systems and advanced analytics,
cloud computing and mobile technologies. Cloud computing and business intelligence are part
of the core technological platform for digital businesses, named by Gartner Group “the nexus
of forces”. This technological platform will change the way we see the society and businesses,
and also, will create new business models. Also, this platform will modify the way businesses
interact with customers, it will change the collaboration with employees and partners and it

Proceedings of the IE 2015 International Conference
www.conferenceie.ase.ro
39
will improve business agility. The information will be accessible, shareable and usable by
anyone, anytime and anywhere.
Figure 1. The main factors that influence business agility
Figure 2. Cloud and BI in CIO’s technology priorities
The main characteristics of cloud computing are: uses the internet technologies, offers a
scalable and elastic infrastructure, offers shared resources, fault tolerance, offers services with
metered use that are accessible through a standardized interface (for example, web client) over
the Internet [1]. The services are offered at the customer’s demand and they are flexible, and
the resources are dynamically supplied and they can be shared by a large group of clients.
busi
nes
s ag
ilit
y
marketing Market responsiveness
-social networks produce rapid changes in customer behavior and
increase company visibility. Social marketing is equivalent to direct
marketing, but more quickly and for a very large audience;
social CRM
Channel integration
(online channels with offline channels)Big data analytics, mobile technologies
organization
Knowledge dissemination
-easy access to knowledge through the
organizational restructuring
-improving collaboration
using new collaboration software
using social networks as collaboration
software
Digital psychology
-advanced digital skills for business users using self-service tools for creating new
services
Change management
-awareness of change
-behavior change-brands and services must continuously change to be
competitive
IT technologies
Business intelligenceusing self-service BI, smart data discovery, advanced
analytics, in-memory
Infrastructure elasticity cloud computing
business processes architecture
-new working patterns, rules, templates
using new BPM tools,
BRM tools, BPM PaaS
Software innovation
-new information systemsusing agile development methodologies
Sourcing and supply chain
-feedback mechanisms for continuous adaptation of the
supply chain
using agile SCM
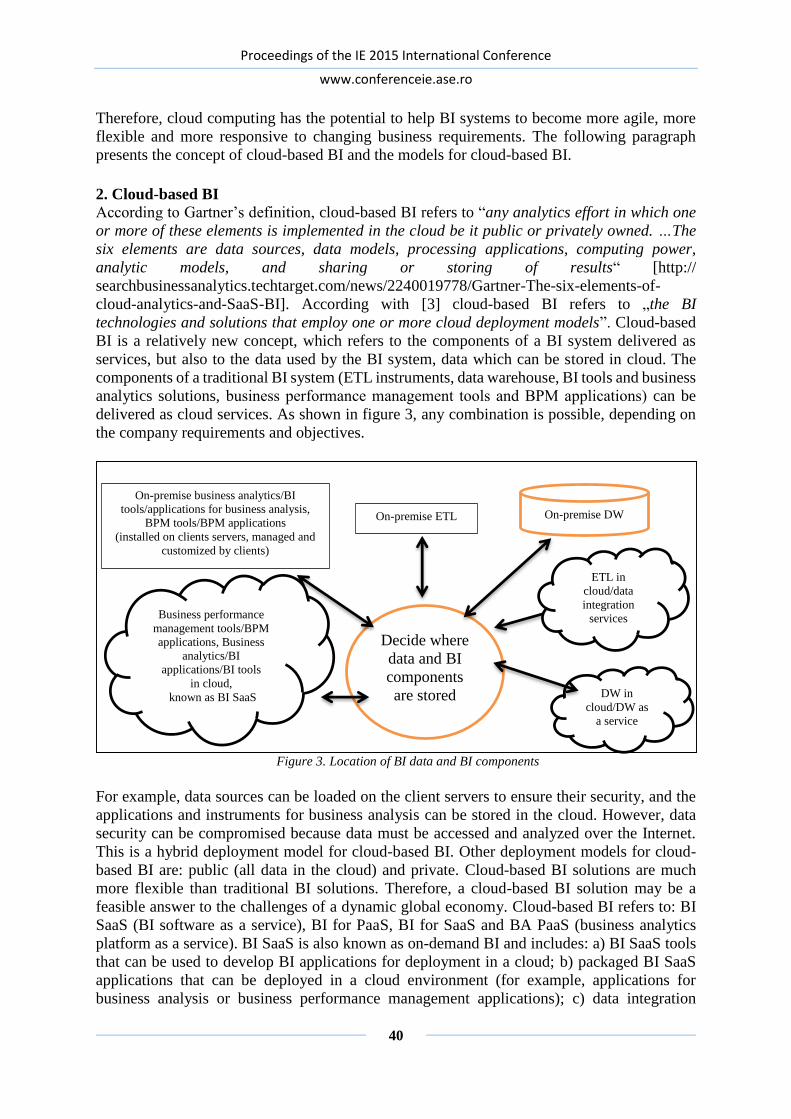
Proceedings of the IE 2015 International Conference
www.conferenceie.ase.ro
40
Therefore, cloud computing has the potential to help BI systems to become more agile, more
flexible and more responsive to changing business requirements. The following paragraph
presents the concept of cloud-based BI and the models for cloud-based BI.
2. Cloud-based BI
According to Gartner’s definition, cloud-based BI refers to “any analytics effort in which one
or more of these elements is implemented in the cloud be it public or privately owned. …The
six elements are data sources, data models, processing applications, computing power,
analytic models, and sharing or storing of results“ [http://
searchbusinessanalytics.techtarget.com/news/2240019778/Gartner-The-six-elements-of-
cloud-analytics-and-SaaS-BI]. According with [3] cloud-based BI refers to „the BI
technologies and solutions that employ one or more cloud deployment models”. Cloud-based
BI is a relatively new concept, which refers to the components of a BI system delivered as
services, but also to the data used by the BI system, data which can be stored in cloud. The
components of a traditional BI system (ETL instruments, data warehouse, BI tools and business
analytics solutions, business performance management tools and BPM applications) can be
delivered as cloud services. As shown in figure 3, any combination is possible, depending on
the company requirements and objectives.
Figure 3. Location of BI data and BI components
For example, data sources can be loaded on the client servers to ensure their security, and the
applications and instruments for business analysis can be stored in the cloud. However, data
security can be compromised because data must be accessed and analyzed over the Internet.
This is a hybrid deployment model for cloud-based BI. Other deployment models for cloud-
based BI are: public (all data in the cloud) and private. Cloud-based BI solutions are much
more flexible than traditional BI solutions. Therefore, a cloud-based BI solution may be a
feasible answer to the challenges of a dynamic global economy. Cloud-based BI refers to: BI
SaaS (BI software as a service), BI for PaaS, BI for SaaS and BA PaaS (business analytics
platform as a service). BI SaaS is also known as on-demand BI and includes: a) BI SaaS tools
that can be used to develop BI applications for deployment in a cloud; b) packaged BI SaaS
applications that can be deployed in a cloud environment (for example, applications for
business analysis or business performance management applications); c) data integration
On-premise business analytics/BI
tools/applications for business analysis,
BPM tools/BPM applications
(installed on clients servers, managed and
customized by clients)
On-premise DW
Decide where
data and BI
components
are stored
Business performance
management tools/BPM
applications, Business
analytics/BI
applications/BI tools
in cloud,
known as BI SaaS DW in
cloud/DW as
a service
On-premise ETL
ETL in
cloud/data
integration
services
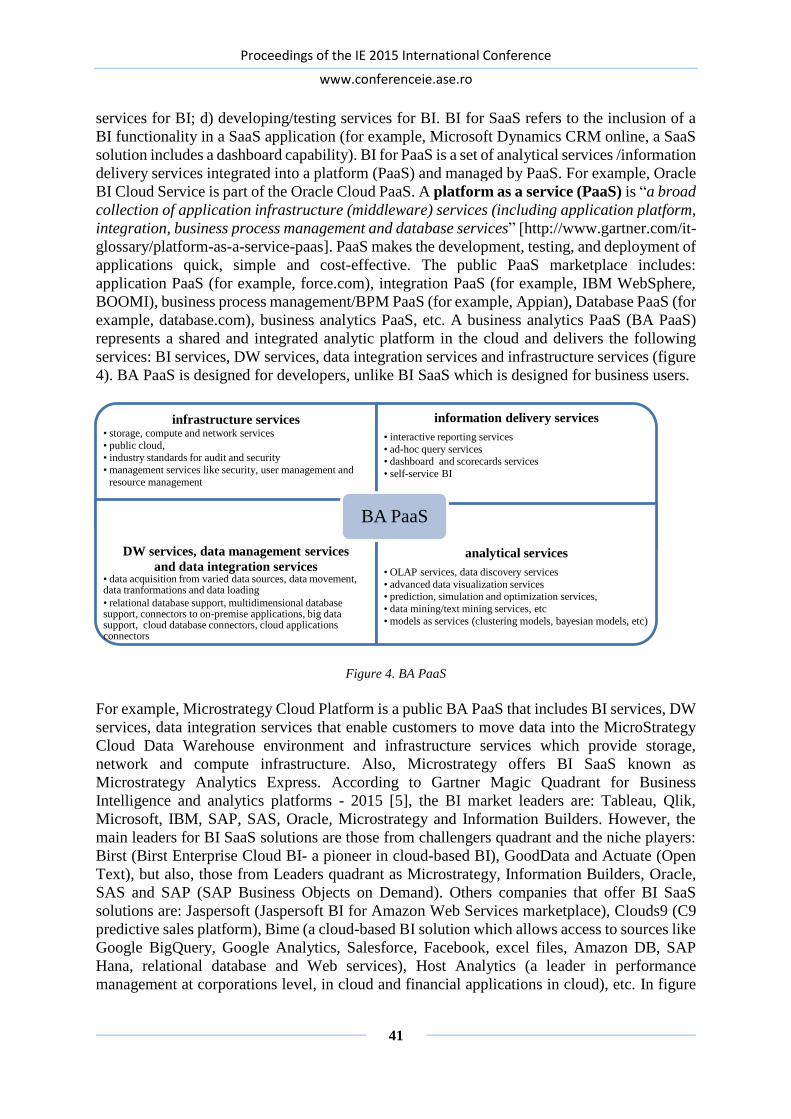
Proceedings of the IE 2015 International Conference
www.conferenceie.ase.ro
41
services for BI; d) developing/testing services for BI. BI for SaaS refers to the inclusion of a
BI functionality in a SaaS application (for example, Microsoft Dynamics CRM online, a SaaS
solution includes a dashboard capability). BI for PaaS is a set of analytical services /information
delivery services integrated into a platform (PaaS) and managed by PaaS. For example, Oracle
BI Cloud Service is part of the Oracle Cloud PaaS. A platform as a service (PaaS) is “a broad
collection of application infrastructure (middleware) services (including application platform,
integration, business process management and database services” [http://www.gartner.com/it-
glossary/platform-as-a-service-paas]. PaaS makes the development, testing, and deployment of
applications quick, simple and cost-effective. The public PaaS marketplace includes:
application PaaS (for example, force.com), integration PaaS (for example, IBM WebSphere,
BOOMI), business process management/BPM PaaS (for example, Appian), Database PaaS (for
example, database.com), business analytics PaaS, etc. A business analytics PaaS (BA PaaS)
represents a shared and integrated analytic platform in the cloud and delivers the following
services: BI services, DW services, data integration services and infrastructure services (figure
4). BA PaaS is designed for developers, unlike BI SaaS which is designed for business users.
Figure 4. BA PaaS
For example, Microstrategy Cloud Platform is a public BA PaaS that includes BI services, DW
services, data integration services that enable customers to move data into the MicroStrategy
Cloud Data Warehouse environment and infrastructure services which provide storage,
network and compute infrastructure. Also, Microstrategy offers BI SaaS known as
Microstrategy Analytics Express. According to Gartner Magic Quadrant for Business
Intelligence and analytics platforms - 2015 [5], the BI market leaders are: Tableau, Qlik,
Microsoft, IBM, SAP, SAS, Oracle, Microstrategy and Information Builders. However, the
main leaders for BI SaaS solutions are those from challengers quadrant and the niche players:
Birst (Birst Enterprise Cloud BI- a pioneer in cloud-based BI), GoodData and Actuate (Open
Text), but also, those from Leaders quadrant as Microstrategy, Information Builders, Oracle,
SAS and SAP (SAP Business Objects on Demand). Others companies that offer BI SaaS
solutions are: Jaspersoft (Jaspersoft BI for Amazon Web Services marketplace), Clouds9 (C9
predictive sales platform), Bime (a cloud-based BI solution which allows access to sources like
Google BigQuery, Google Analytics, Salesforce, Facebook, excel files, Amazon DB, SAP
Hana, relational database and Web services), Host Analytics (a leader in performance
management at corporations level, in cloud and financial applications in cloud), etc. In figure
infrastructure services• storage, compute and network services
• public cloud, • industry standards for audit and security
• management services like security, user management and
resource management
information delivery services
• interactive reporting services
• ad-hoc query services• dashboard and scorecards services
• self-service BI
DW services, data management services
and data integration services• data acquisition from varied data sources, data movement, data tranformations and data loading
• relational database support, multidimensional database support, connectors to on-premise applications, big data support, cloud database connectors, cloud applications connectors
analytical services
• OLAP services, data discovery services
• advanced data visualization services• prediction, simulation and optimization services,
• data mining/text mining services, etc
• models as services (clustering models, bayesian models, etc)
BA PaaS

Proceedings of the IE 2015 International Conference
www.conferenceie.ase.ro
42
5 there are presented the different models for cloud-based BI together with few vendors and
their solutions.
Figure 5. Cloud-based BI models
The main factors that determine the implementation of a cloud-based BI solution by companies
and the main problems which appear during the implementation of a cloud-based BI solution
are presented in table 1. The importance of cloud–based BI solutions has significantly increased
every year from 2012 until today. The major factor for the cloud-based business intelligence
market growth is the huge volume of structured and unstructured data. Usually, small
companies are those who want the implementation of a cloud-based BI solution. The most
interested departments in cloud-based BI are: sales department (with most public BI cloud
implementations), marketing and executive management (with most private BI cloud
implementations). Also, the Gartner Magic Quadrant [5] shows that the primary interest is in
hybrid and private cloud-based BI.
BI for SaaS
Oracle Transaction BI -embedded SaaS
analytics in Oracle Fusion
SaaS applications
Power BI in Microsoft Office 365 in cloud, etc
BI for PaaS
Jaspersoft for
Redhat Open
Shift PaaS
Yellowfin
+Elastic
Intelligence+Con
nection Cloud -
PaaS
BA PaaS
Teradata Aster
Discovery PaaS (DW
as a service, Data
discovery as a service,
data management as a
service)
GoodData Open
Analytics Platform
Microstrategy Cloud
Platform,
Oracle Cloud Platform
as a Service
DW as a service (Vertica, Kognitio,
Amazon Redshift - PaaSDW service)
Data management services (Oracle DB
public Backup services, Oracle DB public Cloud
Services)
BI SaaS
Applications for business analysis in cloud (Birst,
PivotLink BI, Cloud9 Analytics, IBM Cognos Analytic
Applications, SAP BusinessObjects BI on-demandon public cloud, Microstrategy
Analytics Express, etc)
BI tools in cloud (SAP Lumira Cloud, Tibco Spotfire Cloud,
IBM Watson analytics in cloud, etc)
BPM services (Appian cloud-based BPM, Pega BPM,
Corddys Operation Intelligence)
Data integration services (IBM CastIron, Informatica
PowerCenter Cloud Edition, Snaplogic Dataflow, Talend
Integration Suite on RightScale managed platform, etc)
Development/testing services (IBM Rational soft delivery
services, Oracle Java public cloud services, etc)
IaaS for BI (SAP BI for cloud deployments, SQL Server 2012 BI in the cloud – Microsoft Azure VM, Microstrategy
Cloud, IBM Cloud Managed Services, Oracle Storage Cloud Services, Oracle Compute Cloud Services, etc)
Web client, mobile applications
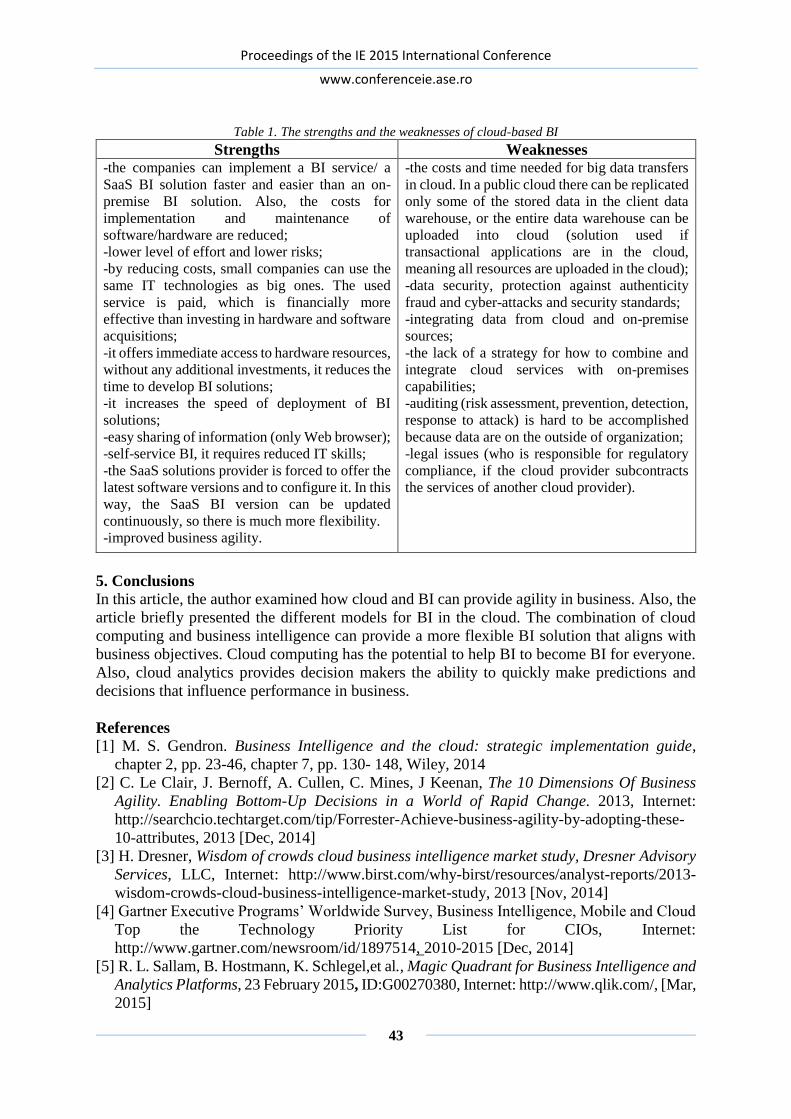
Proceedings of the IE 2015 International Conference
www.conferenceie.ase.ro
43
Table 1. The strengths and the weaknesses of cloud-based BI
Strengths Weaknesses -the companies can implement a BI service/ a
SaaS BI solution faster and easier than an on-
premise BI solution. Also, the costs for
implementation and maintenance of
software/hardware are reduced;
-lower level of effort and lower risks;
-by reducing costs, small companies can use the
same IT technologies as big ones. The used
service is paid, which is financially more
effective than investing in hardware and software
acquisitions;
-it offers immediate access to hardware resources,
without any additional investments, it reduces the
time to develop BI solutions;
-it increases the speed of deployment of BI
solutions;
-easy sharing of information (only Web browser);
-self-service BI, it requires reduced IT skills;
-the SaaS solutions provider is forced to offer the
latest software versions and to configure it. In this
way, the SaaS BI version can be updated
continuously, so there is much more flexibility.
-improved business agility.
-the costs and time needed for big data transfers
in cloud. In a public cloud there can be replicated
only some of the stored data in the client data
warehouse, or the entire data warehouse can be
uploaded into cloud (solution used if
transactional applications are in the cloud,
meaning all resources are uploaded in the cloud);
-data security, protection against authenticity
fraud and cyber-attacks and security standards;
-integrating data from cloud and on-premise
sources;
-the lack of a strategy for how to combine and
integrate cloud services with on-premises
capabilities;
-auditing (risk assessment, prevention, detection,
response to attack) is hard to be accomplished
because data are on the outside of organization;
-legal issues (who is responsible for regulatory
compliance, if the cloud provider subcontracts
the services of another cloud provider).
5. Conclusions In this article, the author examined how cloud and BI can provide agility in business. Also, the
article briefly presented the different models for BI in the cloud. The combination of cloud
computing and business intelligence can provide a more flexible BI solution that aligns with
business objectives. Cloud computing has the potential to help BI to become BI for everyone.
Also, cloud analytics provides decision makers the ability to quickly make predictions and
decisions that influence performance in business.
References [1] M. S. Gendron. Business Intelligence and the cloud: strategic implementation guide,
chapter 2, pp. 23-46, chapter 7, pp. 130- 148, Wiley, 2014
[2] C. Le Clair, J. Bernoff, A. Cullen, C. Mines, J Keenan, The 10 Dimensions Of Business
Agility. Enabling Bottom-Up Decisions in a World of Rapid Change. 2013, Internet:
http://searchcio.techtarget.com/tip/Forrester-Achieve-business-agility-by-adopting-these-
10-attributes, 2013 [Dec, 2014]
[3] H. Dresner, Wisdom of crowds cloud business intelligence market study, Dresner Advisory
Services, LLC, Internet: http://www.birst.com/why-birst/resources/analyst-reports/2013-
wisdom-crowds-cloud-business-intelligence-market-study, 2013 [Nov, 2014]
[4] Gartner Executive Programs’ Worldwide Survey, Business Intelligence, Mobile and Cloud
Top the Technology Priority List for CIOs, Internet:
http://www.gartner.com/newsroom/id/1897514, 2010-2015 [Dec, 2014]
[5] R. L. Sallam, B. Hostmann, K. Schlegel,et al., Magic Quadrant for Business Intelligence and
Analytics Platforms, 23 February 2015, ID:G00270380, Internet: http://www.qlik.com/, [Mar,
2015]
Proceedings of the IE 2015 International Conference
www.conferenceie.ase.ro
44
ORGANIZING SECURE GROUPS OF RELIABLE SERVICES IN
DISTRIBUTED SYSTEMS
Cezar TOADER
Technical University of Cluj-Napoca [email protected]
Corina RĂDULESCU
Technical University of Cluj-Napoca [email protected]
Cristian ANGHEL Technical University of Cluj-Napoca
[email protected] Graţiela BOCA
Technical University of Cluj-Napoca [email protected]
Abstract. This paper refers to service-oriented architectures where replication of services is
used to increase the system reliability. A protocol for secure message exchange is proposed in
this paper. This approach is based on organizing groups of replicated services and using
specific identifiers in the proposed security protocol.
Keywords: distributed systems, services, SOA, replication, dependability, security protocol. JEL classification: C65, C88, L86
1. Introduction Modern companies relies on various network technologies to communicate with clients,
partners, and institutions. IT specialists need to use all their creativity to change the structure
and shape the systems according to modern concepts as service-orientation, reliability,
readiness and so on. Analysts and IT professionals agreed that key concepts and trends like
Cloud Computing, and Advanced Technologies all rely on Applications Architecture, and this
means, mainly, Service-Oriented Architectures and Web-Based applications [1].
On the same trend of applications architecture, this paper refers to service-oriented
architectures where service replication is used in order to increase system dependability.
Dependability is a comprehensive concept which incorporates several components:
availability, reliability/safety, security, privacy, integrity, maintainability [2]. A very important
mean to achieve reliability is fault tolerance. This term refers to specific techniques able to
provide a correct service even in the presence of errors. In reliable systems, replication is a
technique widely accepted to avoid system failures.
Consider now a distributed service-oriented architecture. Consider the case when the main
service and its replicas are running on separate machines. Within this system, the replicated
service initiates and controls execution of operations on the remote services. For this reason,
in this paper the replicated service is called service manager and noted WS Manager, and its
replicas are called workers and are noted Worker 1, … Worker n, as in Figure 1 [3].
The communication between the service manager and the worker services can be considered a
problem of secure messages distribution to a group of legitimate receivers. In the absence of
specific mechanisms to ensure safety communications, there is a possibility for an attacker to

Proceedings of the IE 2015 International Conference
www.conferenceie.ase.ro
45
intercept messages and illegally get data about a service worker and its operations.
Figure 1. Distribution of unencrypted messages,
M, from a service manager to worker services Figure 2. The secure distribution of messages
to a group of legitimate recipients
2. The proposed approach A protocol able to ensure the security of the messages exchanged between the service manager,
noted WS Manager, and the worker services is mandatory for a reliable system.
The proposed protocol is required to meet the following major objectives, noted O.1÷O.5:
O.1. The content of the messages transmitted between the system services must be
encrypted using a crypto-system with public or private key.
O.2. An accidental decryption of a message sent to any of the service workers must not
give sufficient data for an attacker to be able to decrypt subsequent messages.
O.3. A possible compromise of a service worker must not provide sufficient
information to the attacker to compromise other workers.
O.4. A possible compromise of a service manager must not provide sufficient
information to attacker to compromise the service manager.
O.5. The algorithm used to protect sensitive information must use a series of secret data
which will never be sent over the network, such as: the identifier of service which issued
the message, the identifier of legitimate recipient of the message, and the identifier of
the service group including the transmitter and the legitimate receiver.
Consider now for analysis a distributed system based on Web services, in which replication is
used to increase reliability. Messages travels between the service manager and the service
workers. Essentially, these are XML documents complying with specific protocols [4].
In the approach proposed in this paper there are no restrictions on XML document schemas,
which allow the proposed method to be suited for all systems based on Web services.
In the normal operating mode of the system, when all services are functional, the manager
sends out specific messages. The security of communications between the manager and the
workers is realized by using crypto-systems with public or private key.
The method proposed in this paper refers to the broadcasting of secure messages to multiple
recipients, which is called secure message broadcasting. To broadcast secure messages, a
session key is used, in the case of private key crypto-system, or a pair of session keys is used,
in the case of a public key crypto-system. In this approach, a secure method to transmit the
session decryption key to the recipient should be established, simultaneously with the
encrypted message. This session decryption key must be protected by a locking algorithm.
The secure lock algorithm is known by both parts that exchange messages. This algorithm uses
two categories of data: (a) secret and constant data; (b) non-secret and variable data. Secret
data are never sent over the network, and are parts of the service configuration.

Proceedings of the IE 2015 International Conference
www.conferenceie.ase.ro
46
They are constant until a major reconfiguration of the system is made. The secrecy of this
information is essential. On the other hand, the algorithm also uses non-secret data, which are
transmitted over the network as part of the messages, but are changed in every message.
An attacker cannot decrypt message intercepted on the network, because he doesn’t know the
secret data necessary for unlock the message. And even he finds out non-secret data from a
certain message, this is useless for the next messages.
3. Related works There can be different ways to implement the secure lock. There are methods for secure
distribution based on Chinese Remainder Theorem [5]. In this paper, a different scheme for
secure lock algorithm is proposed. It’s based on Lagrange interpolation polynomials.
4. The proposed protocol Starting from the major objectives O.1 ÷ O.4 stated above, a specific organization of replication
services is proposed. Each service within the system is assigned a security identifier.
Furthermore, the services are organized as groups of security, by taking into account their role
within the system, or other criteria chosen by the administrators. Each group is assigned a group
security identifier, GID, established by the system administrators. Services communicate with
each other only within a security group. A message has a sender and a legitimate receiver in
the same group. Their identifiers are noted SID (Sender ID) and RID (Receiver ID). These
identifiers, SID, RID, and GID, are used in the algorithm.
The major objective O.1 is achieved if a crypto-system with public or private key will be
implemented within the distributed system. The use of the services security identifiers, SID for
message sender, and RID for message receiver, determines a separate protection of messages
and thus the major objectives O.2 and O.3 are achieved. By using the group identifiers, GID,
the lock algorithm determines a separation of security problems based on service groups. Thus
the major objective O.4 is achieved.
In this approach, after defining the security groups, the next goal is to obtain a higher degree
of security by “locking” the encrypted value of the session key used for messages. The locking
algorithm used in the distributed system is based on using different Shamir's threshold sharing
schemes [6] within different security groups. This scheme should be used in a specific way, by
taking into account the identifiers of services and group, SID, RID, and GID. The rules are
presented below. This way the major objective O.5 is achieved.
The service manager, WS Manager, broadcasts to many worker services the same encrypted
message SM together with the session key, obviously not in clear text. Firstly, this key is
encrypted and further this value is protected by a secure lock.
Notations in Figure 2:
WS Manager – the manager of the worker services (i.e. the replication manager);
Worker 1, … Worker 3 – the worker services (i.e. the replication executors);
C – the encrypted form of M (i.e. the message payload);
e, d – the encryption session key, and the decryption session key;
e1, e2, e3 – the secret keys of the services Worker 1, Worker 2, and Worker 3;
D1, D2, D3 – the results of the encryption of key d using the secret keys of workers;
Y1(D1), Y2(D2), Y3(D3) – the “locked” forms of the encrypted values D1, D2, D3;
SM – the secure messages (having two parts, C and Y) sent over the network.
Every legitimate recipient of the messages knows all the information required to reconstruct
the session decrypting key and, subsequently, to decrypt the secure message SM.
The technique presented below is used to protect the decryption session key with a computed

Proceedings of the IE 2015 International Conference
www.conferenceie.ase.ro
47
lock. This locked value can be „unlocked” by any of the legitimate recipients of the message.
The operation of lock removal is based on the secret reconstruction in the Lagrange
polynomials interpolation, and the secret is the value of the session key for decryption. This
decryption key, noted d, allows the legitimate recipient of the message to obtain the original
message M, in clear text. Every worker i must be able to compute the secret necessary to
remove the lock and obtain the decryption key d. The method is presented below.
5. The proposed secure lock method The secure lock method is based on a specific algorithm. The system components compute
different parts of the same algorithm: a) the message sender knows a secret value and uses this
secret to lock an information needed to be sent over the network, and b) the message receiver
have to compute the secret value and, based on it, have to determine the decryption key and
only after this step it can determine the clear message M.
The structure of the secure message SM can be seen in Figure 2. It has two parts. The secure
lock is used to protect only the second part and does not affect the message payload, C.
Firstly, the decryption session key, d, is itself encrypted using the encryption key of the
recipient ei in order to obtain the encrypted value Di. This encrypted value won’t be transmitted
in this form on the network. The message sender performs a “locking” procedure.
Using a specific algorithm based on Lagrange polynomials interpolation, the message sender
takes the value Di and computes the second part of the secure message SM. That message is
destined to a specific receiver, i.e. the worker i (i = 1, 2, 3). Protecting the values Di using a
specific algorithm is just like a protection given by a “secure lock”.
The message receiver (the worker i, where i = 1, 2, 3), using specific information found in the
message body, performs the unlocking procedure and recovers the encrypted value Di. After
this step, the recipient decrypts the value Di using its own key ei and obtains the session key,
d, which is required to decrypt the first part of the secure message, C, as seen in Figure 2.
At the level of worker i, the process of obtaining the value Di is the process of obtaining the
secret S in the Shamir’s (k, n) threshold sharing scheme [6]. The worker service needs to know
some parameters. If the threshold k is higher, then the number of necessary parameters to
compute the secret S is increasing. A short description of the scheme is given below.
In order to share a secret to n participants, the following values have to be computed:
ii xfy , where i = 1, 2, … n (1)
where the polynomial f(x) is given by the relation:
1
1
2
210
k
k xaxaxaaxf (2)
The term a0 is the secret S, and the other coefficients are non-null integers, randomly chosen.
In order to re-compute the secret using only k parts, k < n, the Lagrange interpolation
polynomial will be used. The Lagrange polynomial is given by the relation:
1
0
k
i
ii xlyxL (3)
where - yi are known values, previously calculated with (1);
- li (x) are the Lagrange basis polynomials, given by the relation:
1
0
k
ij
j ji
j
ixx
xxxl (4)
The secret S is the free term in the Lagrange polynomial given by (3).
The proposed approach presented in this paper is based on the case where the threshold k = 3.

Proceedings of the IE 2015 International Conference
www.conferenceie.ase.ro
48
The scheme becomes the Shamir’s threshold (3, n) secret sharing scheme.
In order to compute the value S, three pairs of values must be known:
221100 ,;,;, yxyxyx (5)
If all these values would be written in the secure message sent over the network, then too much
information would be exposed on the network. Thus, an attacker analyzing the network traffic
would be able to use these six values and to compute the secret S for its own use. This
possibility will be eliminated by using the method presented below.
The proposed method avoids sending over the network all the values in (5) at once.
In order to do that, a special organization of parameters is needed:
The values x0, x1 and x2 must never be sent over the network.
These values are, in fact, the identifiers of services and groups, respectively:
– x0 = GID (i.e. Group ID – the Group Identifier);
– x1 = SID (Sender ID) – the Sender Identifier;
– x2 = RID (Receiver ID) – the Receiver Identifier.
The values y0, y1 and y2 are to be sent over the network included in the secure
messages SM. These values depend on the secret S and other tow randomly chosen
coefficients, a1 and a2 , which are changed at every message broadcast session.
6. The protocol for building secure messages The secure messages are built by the message sender, WS Manager, and are meant to be
decrypted by the receiver, the Worker i, where i = 1, 2, 3, as shown above in Figure 2.
The layout and the steps of the proposed protocol are presented below.
Input data:
The original message M (clear text);
The encrypting session key, e (needed to obtain encrypted form C of M);
The decrypting session key, d (needed to obtain M from C);
The secret keys of receivers, noted ei , i = 1, 2, 3;
The values GID, SID, and RID, noted here as x0, x1, x2.
Output data:
The encrypted form, C, of the initial message M.
The value noted Yi (Di) = {y0, y1, y2} which is basically an array of values obtained by
the locking algorithm applied to the encrypted form Di of the decrypting session key. Algorithm: BuildSecureMessage
Class: WSManager {
GenerateKeys(); EncryptMessage (ClearMessage M, EncryptionKey e);
EncryptKey (DecryptionKey d, SecretKey ei );
Lock (EncryptedKey D, GID x0, SID x1, RID x2);
Build (EncryptedMessage C, LockedEncryptedKey Y); }
Implements: Class: WSManager, instance name: wsManager STEP 1: { e, d } := wsManager.GenerateKeys( );
STEP 2: C := wsManager.EncryptMessage( M, e );
STEP 3: Di := wsManager.EncryptKey(d, ei );
STEP 4: {y0, y1, y2 } := wsManager.Lock(Di, x0, x1, x2);
STEP 5: SM := wsManager.Build( C, {y0, y1, y2 } );
7. The protocol for decrypting secure messages
In order to extract the clear text M, the message receiver must remove the lock to obtain the
encrypted form of the decrypting session key d. Further, the clear text M can be obtained. The

Proceedings of the IE 2015 International Conference
www.conferenceie.ase.ro
49
steps of the proposed protocol are presented below.
Input data:
The encrypted form, C, of the original message, M;
The value Yi (Di) = {y0, y1, y2} which is basically a set of values used to compute the
encrypted form Di of the session key d;
The secret keys ei , i = 1, 2, 3, of every message receiver (i.e. workers);
The values GID, SID, and RID, noted here as x0, x1, x2.
Output data:
The decrypting session key, d (necessary to obtain the message M from C);
The original message M (clear text); Algorithm: DecryptSecureMessage
Class: Worker {
ExtractMessageParts(); Unlock (LockedEncryptedKey { y0, y1, y2 }, GID x0, SID x1, RID x2);
DecryptKey (EncryptedKey D, SecretKey di ); DecryptMessage (EncryptedMessage C, DecryptionKey d); }
Implements: Class: Worker, instance name: worker STEP 1: { C, {y0, y1, y2 } } := worker. ExtractMessageParts(SM );
STEP 2: Di := worker.Unlock( y0, y1, y2, x0, x1, x2 );
STEP 3: d := worker.DecryptKey(Di, di);
STEP 4: M := worker.DecryptMessage(C, d );
8. Conclusions A protocol for increasing the security of the message exchange between a service manager and
the managed worker services is proposed in this paper. The problem is defined and the logical
links between the proposed solution and the system dependability are shown.
Major objectives were defined, and an original approach based on secure groups of services is
presented. The proposed objectives are achieved one by one. The paper shows details about the
security protocol, and shows the security identifiers used in the locking algorithm.
The proposed protocol for replication systems organized as group of services keeps a high level
of security for the message exchange between legitimate services. The existence of security
groups and a security protocol which uses secret identifiers never sent over the network bring
many benefits in the security strategies of replication-based distributed systems. The security
protocol presented in this paper could be a significant contribution to the increasing of the
system dependability.
References [1] R. Altman, K. Knoernschild, “SOA and Application Architecture Key Initiative
Overview,” Gartner, Internet https://www.gartner.com/doc/2799817, July 16, 2014.
[2] A. Avizienis, J.C. Laprie, B. Randell, “Fundamental Concepts of Dependability,” in:
Research Report no. 1145, LAAS-CNRS, 2001.
[3] C. Toader, “Increasing Reliability of Web Services”, Journal of Control Engineering and
Applied Informatics, Vol.12, No.4, pp.30-35, ISSN 1454-8658, Dec.2010.
[4] T. Bray, J. Paoli, C.M. Sperberg-McQueen, E. Maler, F. Yeargeau, Extensible Markup
Language (XML) 1.0 (Fifth Edition), W3C Recommendation, Internet:
http://www.w3.org/TR/xml/, Nov. 26, 2008.
[5] G.H. Chiou and W.T. Chen, “Secure Broadcasting Using the Secure Lock”, IEEE
Transactions on Software Engineering, Vol.15, No.8, pp. 929-934, Aug.1989.
[6] A. Shamir, “How to share a secret”, Communications of ACM, Vol. 22, Issue 11, pp. 612-
613, Nov. 1979.

Proceedings of the IE 2015 International Conference
www.conferenceie.ase.ro
50
AN OVERVIEW STUDY OF SOFTWARE DEFINED NETWORKING
Alexandru STANCU
University “POLITEHNICA” of Bucharest
Simona HALUNGA
University “POLITEHNICA” of Bucharest
George SUCIU
University “POLITEHNICA” of Bucharest / BEIA
Alexandru VULPE
University “POLITEHNICA” of Bucharest
Abstract. Recent technological advances have determined the emergence of several limitations
that the traditional networks have. This situation lead the networking industry to rethink
network architectures in order to solve these issues. This paper presents a short overview and
history of the new paradigm that appeared in this context, Software Defined Networking (SDN).
First of all, this concept is briefly presented. After that, the ideas that form the fundaments of
SDN are introduced. They appeared from previous research in the industry: active networks,
data and control planes separation and OpenFlow protocol. Afterwards, the motivation behind
SDN is exposed by displaying the limitations that traditional networks have and the concepts
that promote this new paradigm. Next, we present a few details about the SDN paradigm and
some techno-economic aspects. The paper concludes with future research directions, which
are related to the definition of use cases for Wireless & Mobile applications and possibly
development and even implementation of SDN applications that optimize the wireless networks.
Keywords: Internet of Things, OpenFlow, Open Networking Foundation, programmable
networks, Software Defined Networking.
JEL classification: O30, O31, O33
1. Introduction Software Defined Networking (SDN) is a new paradigm in networking that has its roots in the
work and ideas behind OpenFlow project, which was started at the Stanford University around
the year 2009 [1]. Many of the concepts and ideas used in SDN, however, have evolved in the
last 25 years and now fit perfectly in this new paradigm that proposes to change the manner in
which networks are designed and managed.
Software defined networks represent a network architecture where the forwarding state of the
data plane is managed by a distant control plane, decoupled from the data plane. This network
architecture is based on the following four concepts [2]: (i) data and control plane decoupling;
(ii) forwarding decisions are based on data flows, instead of the destination address; (iii) the
control logic moves to an external entity, the SDN controller, that runs a network operating
system; (iv) the network is programmable through software applications that run in the network
operating system and interact with the devices from the data plane.

Proceedings of the IE 2015 International Conference
www.conferenceie.ase.ro
51
SDN emerged to satisfy some of the needs that appeared in traditional networks: innovation in
the management of the networks and the ease of introducing new services in the network [3].
These are not new needs in networking, they were studied also in the past, but now, through
SDN, they can be satisfied in a viable manner, which does not imply major changes in the
existing network infrastructure.
In the next section a brief history of SDN is presented, along with the ideas that form the
fundaments of this new paradigm and the research that led the emergence of these ideas: the
active networks, the separation of the data and control planes and the OpenFlow protocol. The
following section illustrates the motivation behind SDN and the limitations of the traditional
networks that caused the rethinking of network architectures. The penultimate section specifies
a few details about the SDN concept, such as its fundamental abstractions and a few techno-
economic aspects. The article concludes with some future research directions.
2. History of SDN SDN history can be divided into three stages, each influencing this new paradigm through the
concepts they proposed [1]:
Active networks – that introduced the programmable functions in the network,
enhancing the degree of innovation (in the mid 1990 – beginning of 2000);
Data and control plane separation – which led to the development of open interfaces
between the data and the control planes (approximately 2001 – 2007);
Development of the OpenFlow protocol and network operating systems – which
represents the first large scale adoption of an open interface, making the data and
control plane separation practical and scalable.
2.1 Active networks Active networks represent the networks where switches can perform some calculations or
operations on the data packets. They introduced a radical concept for the control of the network,
by proposing a programming interface that exposed resources from individual nodes in the
network and sustained the building of specific functionalities, that could have been applied to
a subset of packets that transit that node [1].
The main motivation for the active networks was that of accelerating innovation. At that
moment, introducing a new concept, service or technology in a wide area network, such as the
Internet, could take up to ten years, from the prototype phase until large scale implementation.
It was intended for the active nodes from the network to allow routers/switches to download
new services in the existing infrastructure, while coexisting without problems with legacy
devices in the network.
Even though the active networks were not implemented on a large scale, some of the proposed
ideas were considered by the SDN [1]:
Network programmable functions, that ease innovation;
Network virtualization and the possibility of decoding software programs based on
packet headers;
Attention to middleboxes (e.g. firewalls, deep packet inspection devices etc.) and the
manner in which their functions are composed.
2.2 Data and control planes separation
Networks have had, since the beginning, integrated data and control planes. This led to some
disadvantages: difficulties in the network management, in the debugging of the network
configuration or in the control or prediction of the forwarding behavior.

Proceedings of the IE 2015 International Conference
www.conferenceie.ase.ro
52
The first attempts for the separation of the data and control planes date from the 1980s [2]. At
that time, AT&T was proposing the discard of in-band signaling and the introduction of a
Network Control Point (NCP), thus achieving the data and control planes separation. Also,
newer initiatives exist that propose the separation between the data and the control planes:
ETHANE [4], NOX [5], ForCES [6], OpenFlow. These have the advantage of not needing
substantial changes in the forwarding devices, which translates into an easier adoption by the
networking industry.
The ideas behind the data and control planes separation that were considered in SDN are [1]:
A logical centralized control that uses an open interface to the data plane;
Distributed states management.
2.3 OpenFlow protocol and network operating systems Before the OpenFlow protocol emerged, the ideas behind SDN were suffering from a
contradiction between the vision of completely programmable networks and the pragmatism
that would allow launching in real networks. OpenFlow found a balance between these two
objectives, through the possibility of implementing on existing devices (existent hardware
support) and implementing more functions than its predecessors. Even though relying on
existing hardware implied certain limitations, OpenFlow was immediately ready for
implementing on existing production networks.
At the beginning, the OpenFlow protocol was implemented on campus networks. After the
success in this type of networks, the protocol began to be implemented in other types of
networks, such as data centers.
The ideas that emerge in SDN, derived from the research conducted for developing the
OpenFlow protocol:
Generalizing the functions and the network equipment;
The vision of a network operating system;
Techniques for managing the distributed states.
3. Motivation behind SDN
The explosion of the mobile devices and the content they access, the introduction of cloud
services and also server virtualization determined the networking industry to rethink the
architecture of the networks [7]. Thus, limitations of the traditional networks were found and,
together with the needs determined by the general technological evolution, led to the
conclusion that a new paradigm in networking is necessary: Software Defined Networking.
Satisfying market requirements at the moment, with the traditional network architectures is
almost impossible. Operational costs for such networks are very high, because network devices
need to be managed individually when implementing new policies or, due to the fact that the
equipment that comes from different vendors must be handled differently. In addition to the
operational costs, also the capital expenditures for a network increased, because of the
middleboxes that need to be introduced in the network in order to ensure security or to perform
traffic engineering tasks. Some of the limitations from traditional networks that led to the
emergence of this new paradigm are [7]:
Complexity – that leads to network stagnation. In order to introduce a new device in the
network, administrators need to reconfigure several hardware and software entities,
using management tools, as well as considering several factors, such as software
version of the devices, network topology etc. Thereby, this complexity of traditional
networks implies a slow evolution and difficulties in network innovation, in order to
reduce the risk of service disruption. It also leads to an inability of the network to adapt
dynamically to the changing traffic patterns, user requests or applications;

Proceedings of the IE 2015 International Conference
www.conferenceie.ase.ro
53
Vendor dependency – corporations nowadays require a fast response for the changes in
business or customer needs. However, this fast response is delayed by the product cycle
of the equipment vendors, which can span over multiple years;
Scalability issues – offering more bandwidth that the connection can support, or over-
subscription, based on predictable traffic patterns does not represent a solution anymore
in nowadays networks. In big data centers, that rely on virtualization, traffic patterns
are very dynamic, thus hard to predict. This implies also configuring hundreds of
network elements and it is impossible to do this manually;
Network policies inconsistency – for implementing network-wide policies in a
production network, up to thousands of devices need to be configured. Thus, because
of this complexity, ensuring such policies for quality of service, security or access is
very difficult.
There are some ideas that promote this new networking paradigm, such as:
The need for higher bandwidth – nowadays large data volumes require parallel
processing on up to thousands of interconnected servers, which need direct connections.
The growth of these data volumes translates into the need of higher bandwidth from the
networks. The data center operators need to create a network that scales to remarkable
dimensions and maintains connectivity between any two network nodes;
The need of flexible access to IT resources – lately, employees demand to be able to
join the enterprise network through a series of heterogeneous devices, such as laptops,
smartphones or tablets;
Cloud services development – enterprises began utilizing cloud services, both public
and private, leading to a massive growth of this type of services. Companies now desire
access to applications, infrastructure and other IT resources on demand and at any time.
In order to implement these demands, scalability is needed for computing power,
storage and also for network resources and it is advisable to be able to operate these
modifications from a common point and using common tools;
Dynamic traffic models – with the emergence of data centers, traffic patterns have
changed drastically. Newer applications access many more servers and databases, this
implying an avalanche of east-west traffic between different machines, before the
information gets back to the user through a traditional north-south traffic pattern.
Software defined networks are proving to be very suited in the context of the emergence of a
new concept, the Internet of Things (IoT), satisfying exactly the needs it has: the need for
higher bandwidth, dynamic network reconfiguration and a simplified network architecture that
facilitates innovation [8].
4. Software Defined Networking paradigm
SDN represents a new paradigm in networking architectures and it has four fundamental
concepts: (i) the decoupling of the data and control planes, (ii) forwarding decisions are based
on data flows, instead of destination address, (iii) the control plane moves into an external
logical entity, the SDN controller, which runs a network operating system and (iv) the network
is programmable through software applications.
Software defined networks can be defined through three fundamental abstractions [2], as
illustrated in Figure 8.
Forwarding abstraction;
Distribution abstraction;
Specifications abstraction.

Proceedings of the IE 2015 International Conference
www.conferenceie.ase.ro
54
Ideally, forwarding abstraction represents allowing any forwarding behavior that the software
applications desire, with the support of the control plane, without needing to be aware of the
details about hardware capabilities of the underlying infrastructure. An example of such an
abstraction is the OpenFlow protocol.
Distribution abstraction refers to the situation where SDN applications should not be aware of
distributed states issues from the network, transforming the problems of a distributed control
plane, as in traditional networks, into a logically centralized control plane. These issues are
solved through a common distribution level, the network operating system.
Specifications abstraction represents the ability of a software application to express a certain
behavior of the network, but not to be responsible also for implementing this behavior. This
ability can be achieved through virtualization solutions and also through network programming
languages.
From an economic point of view, SDN offers a reduction of the costs in the network. In
traditional networks, lately, both operational costs and capital expenditures increased. The
latter because the need of security and traffic engineering appeared, middleboxes need to be
purchased and introduced in the networks. The operational expenditures increased because the
network equipment comes from different vendors and have different methods and tools to be
managed. SDN provides a solution to these increasing costs. It is cheaper to hire a team of
software engineers that develop complex software applications for controlling the network,
than to purchase devices that have the same capabilities in a proprietary manner.
5. Conclusions and discussions SDN represents the most important paradigm that emerged in networking in the recent years.
It appeared as a solution to the stringent needs that surfaced in the industry, caused by the
Network infrastructure
Forwarding
devices
Network operating system (SDN controller)
Network abstractions
Application 1 Application 2 Application N
Global view of the network
Abstract views of the network
Open northbound interface
Open southbound interface
Dat
a p
lan
e C
on
tro
l p
lan
e
Figure 8 - SDN architecture and its fundamental abstractions [1]

Proceedings of the IE 2015 International Conference
www.conferenceie.ase.ro
55
evolution of other technologies, such as cloud infrastructures, mobility, big data applications
or the concept of Internet of Things [9]. Thereby, SDN tries to address and satisfy these needs,
by accelerating innovation in the network and simplifying and automation of the management
of big networks.
Because SDN is a research field that is not mature yet, standards and user cases are still
emerging for this paradigm. If, for the southbound interfaces, OpenFlow protocol is accepted
by the majority as being the most suitable, in the case of the northbound interface a proposal
that is unanimously accepted has not yet emerged. An interesting direction is represented by
the research from the “Wireless & Mobile” Work Group, from Open Networking Foundation
(ONF). This organization promotes the adoption of SDN through developing open standards.
A future research direction is represented by the studying of use cases and afterwards
development and implementation of SDN applications in the context of optimizing wireless
transport networks. These applications should not be mistaken for Software Defined Radio
(SDR). SDR is intended for replacing classical radio hardware with radios that are
reconfigurable through software [10]. In contrast, SDN applications that reside in the Wireless
& Mobile category run over the SDN network operating system and are able to reconfigure the
elements of a wireless network through the OpenFlow interface.
Acknowledgement
The work has been funded by the Sectorial Operational Program Human Resources
Development 2007-2013 of the Ministry of European Funds through the Financial Agreement
POSDRU/159/1.5/S/134398 and supported in part by the SARAT-IWSN project.
References
[1] N. Feamster, J. Rexford and E. Zegura, "The Road to SDN: An intellectual history of
programmable networks," ACM Queue, vol. XI, no. 12, 2013.
[2] D. Kreutz, F. M. V. Ramos, P. Verissimo, C. E. Rothenberg, S. Azodolmolky and S.
Uhlig, "Software-Defined Networking: A Comprehensive Survey," 2014.
[3] J. Tourrilhes, P. Sharma, S. Banerjee and J. Pettit, "The Evolution of SDN and OpenFlow:
A Standards Perspective," ONF, 2014.
[4] M. Casado, M. Freedman, J. Pettit, J. Luo and N. McKeown, "Ethane: Taking Control of
the Enterprise," in SIGCOMM, Kyoto, 2007.
[5] N. Gude, T. Koponen, J. Pettit, B. Pfaff, M. Casado and N. McKeown, "NOX: towards
an operating system for networks," Comp. Comm. Rev., 2008.
[6] A. Doria, J. Salim, R. Haas, H. Khosravi, W. Wang, L. Dong, R. Gopal and J. Halpern,
"Forwarding and Control Element Separation (ForCES) Protocol Specification," Internet
Engineering Task Force, 2010.
[7] Open Networking Foundation, "Software-Defined Networking: The New Norm for
Networks," White Paper, 2012.
[8] R. Vilata, R. Munoz, R. Casellas and R. Martinez, "Enabling Internet of Things with
Software Defined Networking," CTTC, 2015.
[9] G. Suciu, A. Vulpe, O. Fratu and V. Suciu, "Future networks for convergent cloud and
M2M multimedia applications," in Wireless Communications, Vehicular Technology,
Information Theory and Aerospace & Electronic Systems (VITAE), 2014.
[10] B. Bing, "Sowtware-Defined Radio Basics," IEEE Computer Society, 2005.

Proceedings of the IE 2015 International Conference
www.conferenceie.ase.ro
56
CONSUMER RIGHTS IN THE CONTEXT OF
BIG AND OPEN DATA SOCIETY
Lorena BĂTĂGAN
The Bucharest University of Economic Studies, Romania [email protected]
Cătălin BOJA
The Bucharest University of Economic Studies, Romania [email protected]
Mihai DOINEA
The Bucharest University of Economic Studies, Romania [email protected]
Abstract. We live in a digital world and access to information is a ubiquitous state either we
are at work, at home or at shopping. Although the costs of access to sources of information is
becoming smaller, consumers still encounter a lack of information about the products and
services they purchase in order to take their best decision. Consumers have the right to be
informed to make good decisions about their acquisitions. This paper examines the relationship
between efforts made by EU structures and organizations at national level towards an Open
Data society, as to a Data Driven economy, in which real time access to knowledge allows
consumers to find out almost immediately everything they can about what they buy and how
they can be protected against frauds of all sorts. The paper is highlighting the advantages of
integrating technologies and digital standards in public politics for protecting consumer rights.
Keywords: Big Data, innovation, SMEs, consumer rights, cloud processing.
JEL classification: O31, O33, L25
1. Introduction We are living in a fully digitalized era in which every economic process can be automatically
recorded, measured and its information can be delivered instantaneously to concerned parties.
Moreover, the technology development costs are lowered each day, making it possible the
production of various sensors and autonomous electronic boards that can be embedded easily
in consumer and industrial products allowing a constant monitoring of its qualities
characteristics.
Since the adoption by the United Nations in 1985 of the Consumer Protection Guidelines and
their review in 1999, CI - Consumers International (2013), the “right to be informed” through
accurate information about goods and services and access to proper information is one of the
consumer seven basic legitimate needs.
Because of the globalization of production chains in the food industry and not only, many
parties involved in the process of producing a single product or a category of products are
distributing their goods across the entire globe, this way making it harder to track them and to
monitor their quality. For example, in United States, 60% of fruits and vegetables on the market
are imported from more than 150 countries [1]. Production chains became so complex and so
large that it is very expensive and time consuming to record all the related information and it
is impossible to make it accessible to the consumer. Even providing a reduced set of
information becomes a challenge, given the limited space that is available on printed labels.
Proceedings of the IE 2015 International Conference
www.conferenceie.ase.ro
57
The large volume of information gathered for the product will require a redesign of products
labels. Today there are different policies for products labeling, based on text and visible logo’s,
like the ones for the ecologic products [2]. Also, the large number of industry and economy
parties that influence directly and indirectly the production, delivery, storage and selling stages
for a particular product requires an interoperability framework between e-government services
and the private sector ones [3].
The low level of adoption of information technology by agricultural farms in many countries,
mostly emergent and under development [4] is an obstacle in reaching this objective. Despite
that, the benefits for both producers and for the society are too valuable not to be included in
strategies for future development [5].
2. Big and Open Data
The preoccupation about open data in the world starts in January 2004 when Ministers of
science and technology of OECD - Organization for Economic Cooperation and Development
countries, that includes most developed countries of the world, met in Paris and discussed the
need for international guidelines on access to research data [6]. The specific aims and
objectives of these principles and guidelines [6] are:
to inform about the meaning of openness and sharing of research data among the
public research communities within member countries and beyond;
to promote the exchange of good practices in data access and sharing;
to inform the public about the potential costs and benefits;
to highlight the regulations regarding data access and sharing;
to establish a framework of operational principles for research data access
arrangements in member countries;
to inform the member countries on how to improve the international research.
In 2007 the OECD signed a declaration that essentially states that all publicly funded archive
data should be made publicly available. Subsequently, in 2006 the OKF - Open Knowledge
Foundation [7] has proposed a definition of what it means open content, namely: “A piece of
data or content is open if anyone is free to use, reuse, and redistribute it — subject only, at
most, to the requirement to attribute and/or share-alike”. With respect to data, as stated by [8],
it is required that a dataset be accessible (usually by being online) at no cost and with no
technical restrictions to facilitate its reuse. The European Union (EU) was for many years
interested about the issue of open data as a resource for innovative products and services and
as a means of addressing social challenges and fostering government transparency [9]. It is has
been observed, as it is highlighted in the EU's report, that a better use of data, including
government data, can help to power the economy, serving as a basis for a wide range of
information products and services and improving the efficiency of the public sector and of
different segments of industry [9], [10].
Because the EU wants to promote openness, in the Open Data Charter - the report regarding
the open data, they committed to [9]:
identify and make available core and high-value datasets held at EU level;
publish data on the EU Open Data Portal;
promote the application of these principles of Open Data Charter in all 28 EU
Member States;
support activities, outreach, consultation and engagement;
share experiences of work in the area of open data.
From the beginning, the most important use of open data is in governmental area. Based on
Open Governmental Data the firms and institutions can reuse freely the available government

Proceedings of the IE 2015 International Conference
www.conferenceie.ase.ro
58
information in innovative ways. Vivek Kundra from Harvard College highlighted in his paper
[11] that the Weather Channel, an American television network, and Garmin, a firm that
develops navigation products, aviation, and marine technologies (with market cap of over $7
billion at end of January 2013) were built using raw government data. In this case we can say
that open data has significant importance for both public and private sectors (table no. 1).
Table 1. Economic Benefits of Open Data
Adapted from: The Open Data Economy Unlocking Economic Value [12]
Drive revenue
through multiple
areas
Cut costs and
improve
efficiency
Generate
employment and
develop skills
Build a transparent
society
Public
sector
Increased tax
revenues through
increased
economic activity
Revenues through
selling high value
added information
for a price
Reduction in
transactional costs
Increased service
efficiency through
linked data
Create jobs in
current challenging
times
Encourage
entrepreneurship
Transparency is
essential for public
sector to improve
their performance.
Private
sector
Drive new
business
opportunities
Reduced cost by
not having to
invest in
conversion of raw
government data
Better decision
making based on
accurate
information
Gain skilled
workforce
For private sector
transparency is an
important material
for innovative new
business ventures.
The availability of open data has grown significantly in the last years [13]. Some main
motivations for use open data are that open access to publicly funded data provides greater
returns from the public investment [14], improve the business efficiency and can help the
customer to access large quantities of datasets.
Open data is often indispensable for public system development and service delivery, but can
also be valuable for others, such as traffic information, healthcare, education, market [14]. It is
essential to the market to use open data because this will offer: diversity of opinion (each person
have some opinions), independence (people opinions are independent), decentralization (each
person is able to draw some conclusions using local knowledge) and aggregation (similar
solutions can be aggregated).
3. Open data impact
The ODI - Open Data Institute has highlighted in its Open Data Barometer in 2013 (a global
report) the open data impact. They mention [15] that in cities where open data had been used
there can be found some important change in areas like government transparency, government
efficiency, environmental sustainability, social inclusion, economic growth and entrepreneurial
activity (figure no. 1).

Proceedings of the IE 2015 International Conference
www.conferenceie.ase.ro
59
Figure 1. Open data impact
Data source: Open Data Barometer, 2013 Global Report– ODI
Open data initiative can be found in different domains. CCA - Capgemini Consulting Analysis
thought his vice-president Dinand Tinholt [12] highlighted that open data can enable an
increase in business activity by allowing the creation of new firms, new products and services.
A big number of countries including USA, France, UK, Denmark, Spain and Finland have
observed that open data have a tangible impact on the volume of business activity. It is evident
that the businesses that use open data in their activities can generate high returns through the
development of new products and services.
In every successful open data ecosystem [16] we can identify three principal components
(figure no. 2): government (open data produced or collected by the public sector), business
(open data produced or collected by private sector) and customers (personal or non-personal
data of individual customers/citizens published on open domain).
Figure 2. Open data ecosystem
For the moment we can find open data solutions implemented in domains like: transport,
business, geographic and these are based on open data produced by the public sector. Small
and medium companies based on open data from different domains generate new businesses
and jobs. The CCA [12] in their analysis identified the most popular open date domains (figure
no. 3).
0 0.2 0.4 0.6 0.8 1 1.2 1.4 1.6 1.8
Transparency & accountability
Entrepreneurial open data use
Government efficiency
Economic growth
Enviromental sustainability
Inclusion of marginalised groups
Customers
Business and Industry
Government
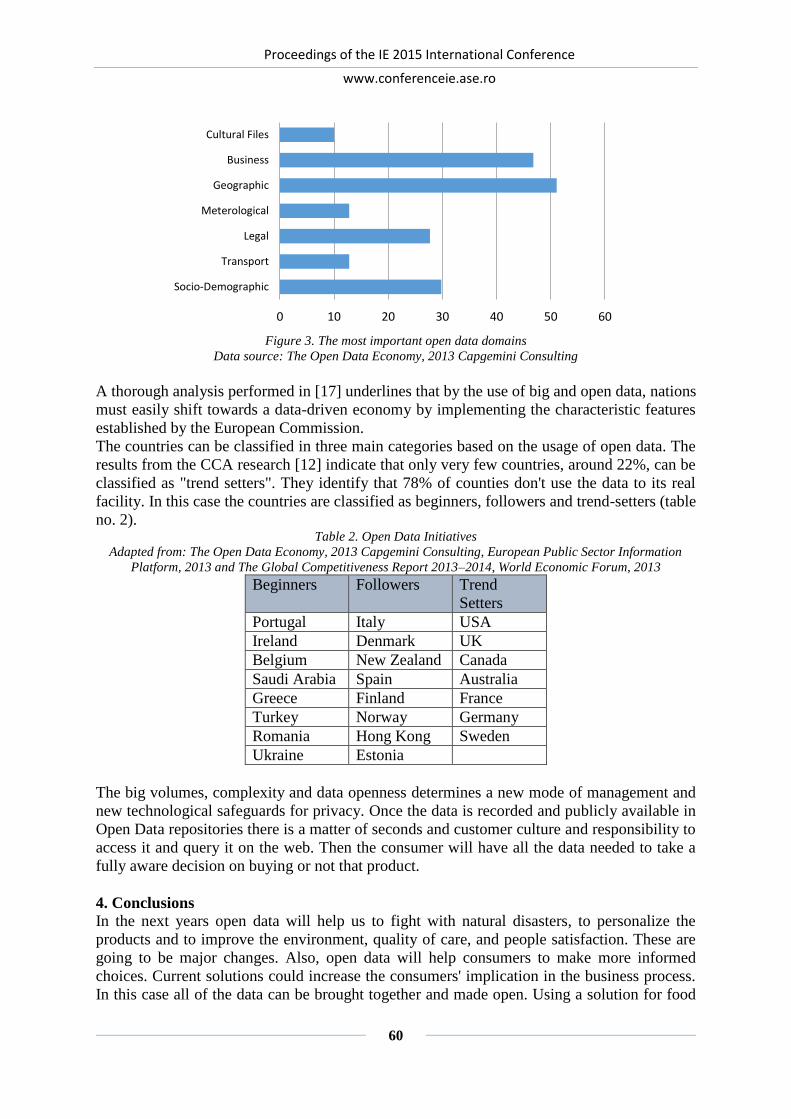
Proceedings of the IE 2015 International Conference
www.conferenceie.ase.ro
60
Figure 3. The most important open data domains
Data source: The Open Data Economy, 2013 Capgemini Consulting
A thorough analysis performed in [17] underlines that by the use of big and open data, nations
must easily shift towards a data-driven economy by implementing the characteristic features
established by the European Commission.
The countries can be classified in three main categories based on the usage of open data. The
results from the CCA research [12] indicate that only very few countries, around 22%, can be
classified as "trend setters". They identify that 78% of counties don't use the data to its real
facility. In this case the countries are classified as beginners, followers and trend-setters (table
no. 2). Table 2. Open Data Initiatives
Adapted from: The Open Data Economy, 2013 Capgemini Consulting, European Public Sector Information
Platform, 2013 and The Global Competitiveness Report 2013–2014, World Economic Forum, 2013
Beginners Followers Trend
Setters
Portugal Italy USA
Ireland Denmark UK
Belgium New Zealand Canada
Saudi Arabia Spain Australia
Greece Finland France
Turkey Norway Germany
Romania Hong Kong Sweden
Ukraine Estonia
The big volumes, complexity and data openness determines a new mode of management and
new technological safeguards for privacy. Once the data is recorded and publicly available in
Open Data repositories there is a matter of seconds and customer culture and responsibility to
access it and query it on the web. Then the consumer will have all the data needed to take a
fully aware decision on buying or not that product.
4. Conclusions
In the next years open data will help us to fight with natural disasters, to personalize the
products and to improve the environment, quality of care, and people satisfaction. These are
going to be major changes. Also, open data will help consumers to make more informed
choices. Current solutions could increase the consumers' implication in the business process.
In this case all of the data can be brought together and made open. Using a solution for food
0 10 20 30 40 50 60
Socio-Demographic
Transport
Legal
Meterological
Geographic
Business
Cultural Files

Proceedings of the IE 2015 International Conference
www.conferenceie.ase.ro
61
safety, consumers will choose products that are good for their own health and for the
environment. Open data play an important role between consumers and businesses by offering
consumers more information. For the consumer, the right to be informed will be backed up by
the right information.
There are three milestones that once achieved will open new horizons in our society concerning
consumer protection and rights. One is the technology milestone that requires the development
of an autonomous sensor infrastructure that will acquire data. The second milestone is the
implementation of an access to knowledge infrastructure based on public policies and open
data repositories. The last milestone is modelling the consumers’ culture in order to increase
responsibility and awareness.
Acknowledgment This paper is supported by the Sectorial Operational Programme Human Resources
Development (SOP HRD), financed from the European Social Fund and by the Romanian
Government under the contract number SOP HRD/159/1.5/S/136077.
References
[1] U.S. Food and Drug Administration, 2007. Food Protection Plan: An integrated strategy
for protecting the nation’s food supply; [pdf] Washington: Department of Health and
Human Services. Available at: < http://www.ntis.gov>.
[2] Dinu, V., Schileru, I. and Atanase, A., 2012. Attitude of Romanian consumers related to
products’ ecological labelling. Amfiteatru Economic, XIV (31), pp.8-24.
[3] Constantinescu, R., 2013. Interoperability Solutions for E-Government Services, In
INFOREC, Proceedings of the 12th International Conference on INFORMATICS in
ECONOMY (IE 2013), Bucharest, Romania, 25-28 April 2013. Bucharest: ASE Publishing
House
[4] Moga, L.M., Constantin, D.L., Antohi, V.M., 2012. A Regional Approach of the
Information Technology Adoption in the Romanian Agricultural Farms, Informatica
Economică, 16(4), pp. 29-36
[5] Commission of the European Communities COM(2009) 278 final of 18 June 2009 on
Internet of Things — An action plan for Europe. [online] Available at: <http://eur-
lex.europa.eu/LexUriServ/LexUriServ.do?uri=COM:2009:0278:FIN:EN:PDF>,
[6] Organization for Economic Co-operation and Development, 2007. OECD Principles and
Guidelines for Access to Research Data from Public Funding, Retrieved January 25, 2014,
Available online at http://www.oecd.org/sti/sci-tech/38500813.pdf
[7] Open Knowledge Foundation, 2006. Open Knowledge Definition. [online] Available at:
<http://opendefinition.org>
[8] Davies, T., Perini, F. and Alonso, J. M., 2013a. Researching the emerging impacts of open
data, [online] ODDC (Open Data in Developing Countries) conceptual framework,
Available at: <http://www.opendataresearch.org/sites/default/files/posts/> [Accessed 23
November 2013]
[9] EU, 2013. EU implementation of G8 Open Data Charter, 2013. [pdf] Brussels: EU.
Available at: <http://ec.europa.eu/digital-agenda/en/news/eu-implementatio>
[10]G8UK, 2013. G8 Open Data Charter, [pdf] Available at
<http://www.diplomatie.gouv.fr/fr/IMG/pdf/Open_Data_Charter_FINAL_10_June_2013
_cle4a3a4b.pdf>
[11] Kundra, V., 2011. Digital Fuel of the 21st Century: Innovation through Open Data and
the Network Effect, [pdf] Harvard: Harvard University Press, 2011, Available at:

Proceedings of the IE 2015 International Conference
www.conferenceie.ase.ro
62
<http://www.hks.harvard.edu/presspol/publications/papers/discussion_papers/d70_kundr
a.pdf>
[12] Tinholt, D., 2013., The Open Data Economy Unlocking Economic Value by Opening
Government and Public Data, [online] Capgemini Consulting, Available at:
<http://www.capgemini-consulting.com/resource-file-
access/resource/pdf/opendata_pov_6feb.pdf>
[13] Bătăgan L., 2014, The Role of Open Government Data in Urban Areas Development,
Informatica Economică vol. 18, no. 2/2014
http://www.revistaie.ase.ro/content/70/08%20-%20Batagan.pdf
[14] Janssen, M., Charalabidis, Y. and Zuiderwijk, A., 2012. Benefits, Adoption Barriers and
Myths of Open Data and Open Government. Information Systems Management, [e-
journal] 29(4), pp.258-268, Available at:
<http://www.tandfonline.com/doi/full/10.1080/10580530.2012.716740>
[15] Davies, T., Farhan, H., Alonso, J., Rao, B., Iglesias, C., 2013b. Open Data Barometer,
2013 Global Report – ODI( Open Data Institute) conceptual framework , Available at:
<http://www.opendataresearch.org/dl/odb2013/Open-Data-Barometer-2013-Global-
Report.pdf>
[16] Deloitte, 2013. Open data - Driving growth, ingenuity and innovation, [pdf] Deloitte,
Available at: <http://www.deloitte.com/assets/dcom-unitedkingdom/> [Accessed 2
December 2013]
[17] Filip, F.G., Herrera-Viedma, E., 2014, Big Data in the European Union, The Bridge, Vol.
44, No. 4, pp. 33-37, 2014

Proceedings of the IE 2015 International Conference
www.conferenceie.ase.ro
63
SECURE CYBER SECURITY THREAT INFORMATION EXCHANGE
Mihai-Gabriel IONITA
Military Technical Academy, Bucharest, Romania
Abstract. The following paper tackles one of the most important fields of current cyber
security, in our opinion. This article concerns threat information exchange. Without
information exchange a cyber-security system’s functionality is severely hampered. An event
might not trigger a specific danger threshold if attacks are stealthy and targeted. But the same
attack, if information is gathered and correlated from different sources around an
organization’s network it might hit that specific threshold, and also hit an alarm point which
will be much more visible to a human operator. In different studies it is demonstrated that a
single hit can make the difference from an incident which is categorized as important and
treated in a timely manner or, in the other scenario which is categorized as usual traffic and
left uninvestigated. Information regarding cyber threats, when exchanged between entities
involved in the same field of action permits transforming information into intelligence. The
theme discussed in the present paper is focused on intelligent threat exchange, which makes
different checks and decisions before sending different information in a secure manner. Any
attack detail can be used by a third party for exploiting different vulnerable resources from the
protected organization, if discovered. Another thorny problem of the current cyber security
state is that of standardizing the way security incident information is normalized and packed
for transport. This latter problem is also delved into in the current article. The experimental
setup is built on top of a neural network and an evolved SIEM like infrastructure, for collecting,
analyzing and sharing threat information.
Keywords: cyber security, intelligent threat exchange, neural networks, SIEM, HIDS
JEL classification: C63, C88
1. Introduction
In today’s current cyber security world evaluating incidents without knowing what happens to
your neighbor or without having full visibility in your organization is imaginable and a sure
way towards failure. There have been different initiatives in this field but there is a huge
problem which keeps the domain from evolving. This is the standardization of event
information definition and the standardization of message format for exchanging information
regarding different cyber security events.
The organization which invests large amounts of money in any important initiative which can
return investments is the Department of Homeland Security (DHS) of the United States of
America (USA). The interest of the DHS is to keep the pole position in this filed which is of
huge interest to the civil, governmental and military forces of the USA. Cyber threat exchange
through a standardized, reliable, tested and nonetheless a secure protocol is of the utmost
importance. Because the USA have a large base of security information collectors, which are
geographically distributed and are administered by different entities which sometimes may not
be willing to share or give away all their collected security incident information to other entities
from other fields of activity. As an example, maybe the public sector would be unwilling to
share information with the governmental entities which are involved in intelligence collection

Proceedings of the IE 2015 International Conference
www.conferenceie.ase.ro
64
activities. In the same direction, it may be possible that militarized structures would not want
to give away attack information to civil organizations in the governmental hierarchy.
In this respect, there is high interest for selective security information sharing based on preset
relationships whit other organizations. But another problem consists a drawback and this is the
fact that log information has to be standardized when shared, otherwise computational
resources and time will be lost for interpreting, correlating and integrating the received
information into the own database. This will of course lead to delays in cross correlation of
events and decision taking when quick action is needed.
2 Protocols for the common definition of cyber threat information, incidents and
Indicators of Compromise (IOC)
As stated above, the DHS, one of the most active sponsors of the standardization initiatives has
pushed through MITRE the Common Vulnerabilities and Exposures (CVE) standard which
was adopted by more than 75 vendors, and quickly developed into the de facto standard for
defining vulnerabilities. Since then it is used for comparing different vulnerabilities from
different vendors. And it is really helpful in comparing the severity of different exposures.
Another initiative the MITRE organization is pursuing for standardizing is the Structured
Threat Information eXpression (STIX) which is “a collaborative community-driven effort to
define and develop a standardized language to represent structured cyber threat information.
The STIX Language intends to convey the full range of potential cyber threat information and
strives to be fully expressive, flexible, extensible, automatable, and as human-readable as
possible. [1]”
3 Protocols for securely exchanging cyber incidents and security information
As in the previous section, MITRE is also working on standardizing the Trusted Automated
eXchange of Indicator Information (TAXII), alongside STIX. “TAXII defines a set of services
and message exchanges that, when implemented, enable sharing of actionable cyber threat
information across organization and product/service boundaries. TAXII, through its member
specifications, defines concepts, protocols, and message exchanges to exchange cyber threat
information for the detection, prevention, and mitigation of cyber threats. TAXII is not a
specific information sharing initiative or application and does not attempt to define trust
agreements, governance, or other non-technical aspects of cyber threat information sharing.
Instead, TAXII empowers organizations to achieve improved situational awareness about
emerging threats, and enables organizations to easily share the information they choose with
the partners they choose. [2]”
This protocol is a flexible one, as it supports the major models for exchanging information in
a graph architecture:
Source-subscriber – one way transfer from the source to the subscriber, used in
public/private bulletins, alerts or warning
Peer-to-peer – both push and pull methodology for secret sharing, usually used in
collaboration on different attacks. It permits the entities to establish different trust
relationships directly with its partners, directly, for exchanging only the needed
information.
Hub-and-spoke – similar to the previous model, but here the dissemination of information
happens through a central entity, the hub. Here different checking and vetting operations
can be done on the information received from the spokes, before sending it to the other
spokes.
Another strong initiative in this domain is that of NATO countries. They have come up with
different frameworks for exchanging threat data in a secure manner.
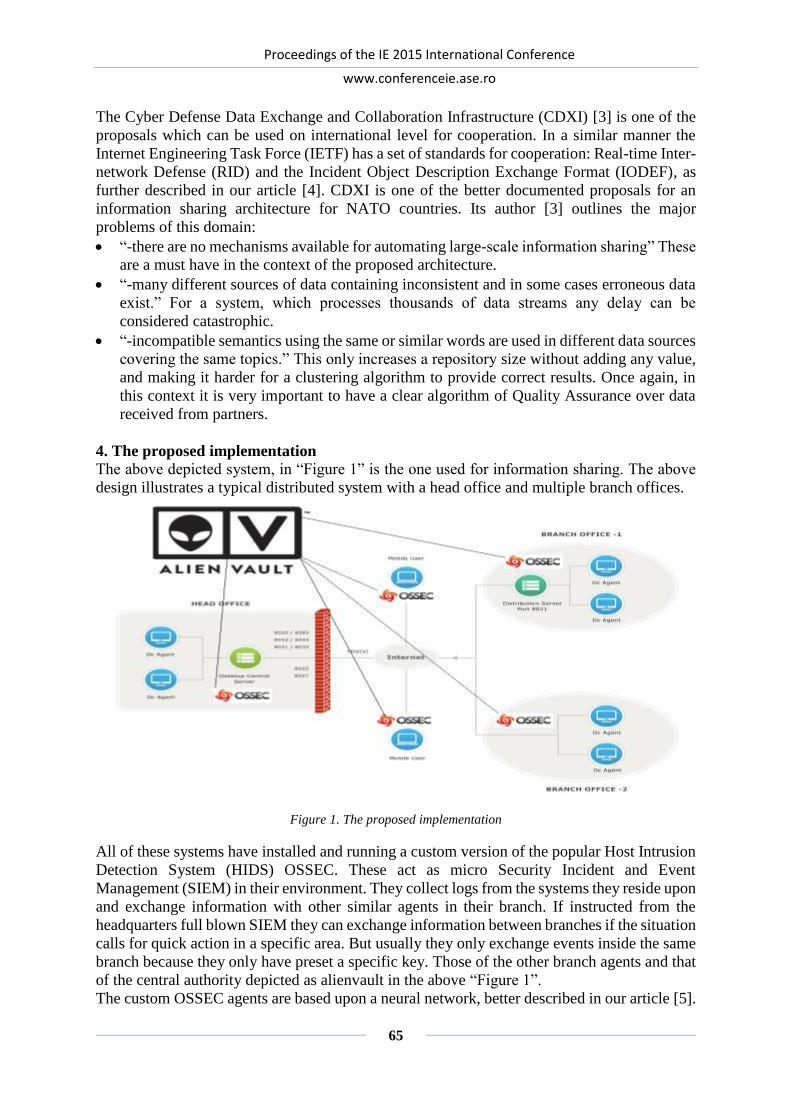
Proceedings of the IE 2015 International Conference
www.conferenceie.ase.ro
65
The Cyber Defense Data Exchange and Collaboration Infrastructure (CDXI) [3] is one of the
proposals which can be used on international level for cooperation. In a similar manner the
Internet Engineering Task Force (IETF) has a set of standards for cooperation: Real-time Inter-
network Defense (RID) and the Incident Object Description Exchange Format (IODEF), as
further described in our article [4]. CDXI is one of the better documented proposals for an
information sharing architecture for NATO countries. Its author [3] outlines the major
problems of this domain:
“-there are no mechanisms available for automating large-scale information sharing” These
are a must have in the context of the proposed architecture.
“-many different sources of data containing inconsistent and in some cases erroneous data
exist.” For a system, which processes thousands of data streams any delay can be
considered catastrophic.
“-incompatible semantics using the same or similar words are used in different data sources
covering the same topics.” This only increases a repository size without adding any value,
and making it harder for a clustering algorithm to provide correct results. Once again, in
this context it is very important to have a clear algorithm of Quality Assurance over data
received from partners.
4. The proposed implementation
The above depicted system, in “Figure 1” is the one used for information sharing. The above
design illustrates a typical distributed system with a head office and multiple branch offices.
Figure 1. The proposed implementation
All of these systems have installed and running a custom version of the popular Host Intrusion
Detection System (HIDS) OSSEC. These act as micro Security Incident and Event
Management (SIEM) in their environment. They collect logs from the systems they reside upon
and exchange information with other similar agents in their branch. If instructed from the
headquarters full blown SIEM they can exchange information between branches if the situation
calls for quick action in a specific area. But usually they only exchange events inside the same
branch because they only have preset a specific key. Those of the other branch agents and that
of the central authority depicted as alienvault in the above “Figure 1”.
The custom OSSEC agents are based upon a neural network, better described in our article [5].

Proceedings of the IE 2015 International Conference
www.conferenceie.ase.ro
66
As depicted in Figure. 2, “the proposed architecture implies a Feed-Forward Backward-
Propagating neural network based on two input layers, ten hidden layers and one output layer.
The training was done using 1000 input values and 1000 output values captured from a network
of sensors formed by local agents, based on the processed security events. The training was
done using the Levenberg-Marquardt method. Performance was calculated using the Mean
Square Error approach. [5]”
Figure 2. The proposed architecture based on Feed Forward Backward Propagating Neural
We use the same experimental criteria as in [6] for defining risk assessment metrics, these are
described below, in Table 1.
Table 1. Risk calculated for different types of attacks
Asset
Determined
risk using
Neural Net
Probability Harm Calculated Risk
Network info 0.0026 5 0 Null – 0
User accounts 12.0014 3 4 High – 12
System
integrity 12.0013 4 3 HIGH – 12
Data
exfiltration 12.0009 2 6 HIGH – 12
System
availability 15.0007 3 5 HIGH - 15
The results in “Table 1” are obtained after comparing the output of the neural network to the
calculated result of the following formula:
Risk = (Probability x Harm) (Distress_ signal + 1) (1)
5. Conclusions and future research
As stated above, threat exchange information is crucial for the development of the cyber
security field. The detection of current, sophisticated, cyber-attacks is impossible without
proper sharing of an organization’s current attack information. From this information, if
introduced as input in our neural network different correlations can be made which could detect
sophisticated attacks which are orchestrated or even APT (Advanced Persistent Threat)
campaigns which could go undetected if callbacks to C&C (Command and Control )servers
are not registered. The key aspect and the “take away” idea of this paper is that without
standardizing and normalizing events all this collaboration would be impossible between
organizations which have heterogeneous communication infrastructures.
For extending this implementation we are currently working on extending this application in
the “complicated” world of the Internet of Things.

Proceedings of the IE 2015 International Conference
www.conferenceie.ase.ro
67
References
[1] MITRE, "the STIX Language," [Online]. Available: https://stix.mitre.org/.
[2] MITRE, "Trusted Automated eXchange of Indicator Information," [Online]. Available:
http://makingsecuritymeasurable.mitre.org/docs/taxii-intro-handout.pdf.
[3] O. S. S. Luc Dandurand, "Towards Improved Cyber Security," 5th International
Conference on Cyber Conflict, 2013 .
[4] V.-V. P. Mihai-Gabriel IONITA, "Autoimmune Cyber Retaliation Supported by Visual
Analytics," Journal of Mobile, Embedded and Distributed Systems, vol. VI, no. 3, pp.
112-121, 2014.
[5] M.-G. Ionita and V.-V. Patriciu, "Biologically inspired risk assessment in cyber security
using neural networks," IEEE Xplore, vol. 10.1109/ICComm.2014.6866746, no. 5, pp.
1 - 4, 2014.
[6] M.-G. Ionita and V.-V. Patriciu, "Achieving DDoS resiliency in a software defined
network by intelligent risk assessment based on neural networks and danger theory,"
Computational Intelligence and Informatics (CINTI), 2014 IEEE 15th International
Symposium on Computational Intelligence and Informatics, vol. IEEE, no.
10.1109/CINTI.2014.7028696, pp. 319-324, 19-21 Nov. 2014.
[7] S. Wohlgemuth, "Resilience as a New Enforcement Model for IT Security Based on
Usage Control," in Security and Privacy Workshops (SPW), 2014 IEEE, San Jose, CA,
2014.
[8] K. R. Hofmann Stefan, "Towards a security architecture for IP-based optical
transmission systems," in Bell Labs Technical Journal (Volume:16 , Issue: 1 ), DOI:
10.1002/bltj.20491, 2011.
[9] J. M. R. M. Sultana S., "Improved Needham-Schroeder protocol for secured and
efficient key distributions," in Computers and Information Technology, 2009. ICCIT
'09. 12th International Conference on, DOI: 10.1109/ICCIT.2009.5407301, 2009.
[10] T. T. M. J. Spyridopoulos T., "Incident analysis & digital forensics in SCADA and
industrial control systems," in System Safety Conference incorporating the Cyber
Security Conference 2013, 8th IET International, DOI: 10.1049/cp.2013.1720, 2013.

Proceedings of the IE 2015 International Conference
www.conferenceie.ase.ro
68
ADOPTION OF CLOUD COMPUTING IN THE ENTERPRISE
Floarea NĂSTASE
Department of Economic Informatics and Cybernetics
Bucharest University of Economic Studies, Romania
Carmen TIMOFTE
Department of Economic Informatics and Cybernetics
Bucharest University of Economic Studies, Romania
Abstract. The majority of companies have Internet access, but the number of them using cloud
computing is relatively low. This paper is about the companies that use cloud computing and
about those who should implement it, in order to increase efficiency. We talk about risk and
the immense benefits of adopting cloud computing in the enterprises.
Keywords: cloud computing, enterprises, ICT.
JEL classification: L86, L81, L84
1. Introduction
Information and communication technology (ICT) is a major factor of innovation and
productivity improvement in all sectors of society. In the last years, ICT has made a significant
contribution to labor productivity growth [1]. However, information and communication
technologies are expensive and require specialized skills and systems maintenance effort for
storing and processing data correctly. Not all companies or individuals are able to acquire and
operate on the latest dedicated systems.
The solution, instead of building their own IT infrastructure, companies are able to access
computing resources hosted on the Internet by third parties. Using hardware and software
accessible via the Internet or network, often delivered as services, is known as cloud
computing. Cloud technology will generate new business opportunities and will influence the
future work, since the allocation of physical space for corporate offices, the possibility of
developing new concepts, carrying out the audit etc.
2. Cloud Computing in enterprises of the European Union In September 2012, the European Commission adopted a strategy for exploiting the potential
of cloud computing in Europe [2]. The strategy highlights actions to achieve a net gain of 2.5
million new jobs in Europe and an annual increase of 160 billion euros in EU GDP
(approximately 1%) in 2020. Earnings are estimated will be achieved if the EU cloud strategy
fully materializes. The aim of the strategy is to stimulate the adoption of cloud computing
solutions in Europe, both in the public and private sectors, by providing a safe and reliable.
As you know, access to the Internet is the cornerstone for e-business, with the possibility of
connecting people and businesses around the world. Percentage of enterprises in the European
Union using computers connected to the internet seems to have reached a saturation level.
According to Eurostat - the authority dealing with the processing and publication of statistical
information in the European Union (EU28) in 2013, 96% of enterprises had access to the
Internet (Fig. 1). Share of enterprises with access to the Internet is similar in most countries.

Proceedings of the IE 2015 International Conference
www.conferenceie.ase.ro
69
Figure 1. Enterprises with Internet access in the EU28 in 2013 (source:
http://ec.europa.eu/eurostat/statistics-explained/index.php/E-business_integration)
Although the majority of companies have Internet access, the number of solutions using cloud
computing is relatively low. In 2014, Eurostat published a study on the use of cloud technology
in enterprises in Europe, showing that [3]:
19% of EU companies were using cloud computing, especially for systems hosting email
and file storage (Fig. 2).
46% of these companies (of 19%) were using advanced cloud services, such as financial
accounting software, customer relationship management or computing power for the
implementation of business applications.
Twice as many companies prefer the use of public cloud solutions (12%) than those in the
private cloud (7%).
4 of 10 companies (39%) said that using cloud security breach risks would be the main
factor limiting the use of cloud computing services.
42% of those who reported not using cloud lack sufficient knowledge about cloud
computing and therefore were reluctant to use them.
Figure 2. Using cloud computing services to businesses in EU28, 2014 (% of firms)
(source:http://ec.europa.eu/eurostat/statistics-explained/index.php/Cloud_computing_-
_statistics_on_the_use_by_enterprises)
The highest percentage of businesses that used cloud computing in 2014 were observed in
Finland (51%), Italy (40%), Sweden (39%) and Denmark (38%). In contrast, the use of cloud
computing services in less than 10% of all enterprises in Romania was found (5%), Latvia (6%)
and Poland (6%), Bulgaria (8%), Greece (8%) and Hungary (8%). It appears that companies in
Romania uses the least cloud computing services, ranking last.
In 16 member states of the European Union, cloud computing is mainly used for e-mail, such
as in Italy (86%), Croatia (85%) and Slovakia (84%). In 11 states, cloud computing services
were mainly used for storage of files, for example in Ireland (74%), UK (71%), Denmark (70%)
and Cyprus (70%), while Netherlands stood by hosting databases of businesses (64%).

Proceedings of the IE 2015 International Conference
www.conferenceie.ase.ro
70
Figure 3. Using cloud computing services in European companies, 2014
(source: http://ec.europa.eu/eurostat/documents/2995521/6208098/4-09122014-AP-EN.pdf)
3. Benefits of using cloud computing to businesses Already there are economic enterprises and government agencies who turn with confidence to
the opportunities of cloud computing systems. The benefits of cloud computing systems will
fundamentally change the possibilities of small organizations (with small-scale business and
non-profit organizations) to acquire ICT capabilities to enhance productivity and foster
innovation.
Through cloud computing can configure a virtual office that provides the flexibility of
connecting to a business from anywhere and at any time. Access to business data is very easy.
Connection can be done with a growing number of devices used in today's business
environment, such as smartphones, tablets. Cloud computing offers businesses a number of
benefits such as:
Reduce IT costs: Migrating business in cloud computing can reduce the costs of
managing and maintaining IT systems. Rather than purchase expensive equipment and
software for a particular type of business can reduce costs by using the resources of a
cloud computing service provider. Operating costs will be reduced because:
o cost of system upgrades and new hardware and software may be included in the
contract;
o will no longer pay wages for skilled IT personnel;
o energy consumption cost will be reduced;

Proceedings of the IE 2015 International Conference
www.conferenceie.ase.ro
71
o For example, Amazon Web Services (AWS)
(http://aws.amazon.com/ecommerce-applications/) provides a cloud computing
solution for small and large ecommerce. The solution for making online and
retail sales, is flexible, secure, highly scalable and price.
Scalability: The business can quickly have the necessary resources, it is highly flexible
for resource allocation or withdrawal according to business needs. This task is cloud
computing service provider
Business Continuity: Protecting data and systems is an important part of business
continuity planning. If a natural disaster, power outage or other undesirable event data
stored in the cloud are protected in a secure location, with the potential to be
subsequently accessed quickly, minimizing any loss of productivity.
Effectiveness of the collaboration: collaboration in a cloud environment offers a
business the ability to communicate and share data/information much easier compared
to traditional methods. For example, if a project working in different locations can use
cloud computing to provide all participants access to the same files.
The flexibility of working practices: Cloud computing allows employees to be more
flexible in how they work. For example, it is possible to access data from home, when
employees are on vacation or while commuting to and from work (provided there is an
internet connection).
Access to automatic updates: Access to automatic updates for IT business requirements
may be included in the contract with the service provider. Depending on cloud
computing service provider, the system will be regularly updated with the latest
technology. This may include updated versions of software and upgrades for servers
and processing power.
4. Risks of using cloud computing
Most risks of using cloud computing solutions is the lack of data and lack of control over
information processing.
Environmental Security: The concentration of computing resources and users in a cloud
computing environment is also a concentration of security threats. Because of their size
and importance, cloud environments are often covered by a series of attacks. Before
entering into a contract for a service, it is desirable to be informed by the cloud service
provider about how access control is achieved, which are practices vulnerability
assessment and configuration management controls if there are patches and to see if the
data is properly protected.
Security and privacy: the organization's confidential data hosting service providers and
cloud involves transfer of data security controls at the service provider. It is necessary
that the service provider needs to understand privacy and data security organization, to
comply with data security and privacy, and regulations that apply, such as HIPAA
(Health Insurance Portability and Accountability Act), PCI DSS ( Payment Card
Industry Data Security Standard), FISMA (Federal Information Security Management
Act) or considerations of the Gramm-Leach Privacy-Bliley Act.
If cloud computing service is used only for data storage is recommended their encryption
before being transferred to the cloud. We will use strong encryption systems, under the
exclusive control of the consumer cloud services. This ensures data confidentiality (4).
If the data stored in the cloud computing will be processed and distributed, your cloud service
provider to have access to them. Security measures are achieved by an agreement on how cloud
computing provider can use the data.

Proceedings of the IE 2015 International Conference
www.conferenceie.ase.ro
72
Data availability and business continuity: A major risk to business continuity in the
cloud computing environment is the loss of Internet connection. Cloud computing
provider must have controls for checking and ensuring connectivity to the Internet.
Sometimes, if a vulnerability is identified, it is possible that access to cloud computing
provider to interrupt to correct the problem.
Disaster Recovery: The ability to recover in case of disaster cloud provider, is vital to
the recovery plan and a company that hosts the computing resources and data to the
cloud provider.
5. Conclusion
Cloud computing is a technology that will be used by both small businesses and large
enterprises to develop and implement their applications. Moreover, current European policy
initiatives, such as data protection and law reform Common European Sales, reduce barriers to
adoption of cloud computing technology in the EU.
References
[1] OECD Science, Technology and Industry Scoreboard 2013. Internet:
http://www.oecd.org/sti/scoreboard-2013.pdf, April 27, 2014 [Oct. 20, 2014];
[2] Marnix Dekker, Dimitra Liveri, Certification in the EU Cloud Strategy, European Union
Network and Information Security Agency (ENISA), November 2014;
[3] Konstantinos GIANNAKOURIS, Maria SMIHILY, Cloud computing - statistics on the use
by enterprises, noiembrie 2014. Internet: http://ec.europa.eu/eurostat/statistics-explained/index.php/Cloud_computing_statistics_on_the_use_by_enterprises#Methodology_.2
F_Metadata, November 27, 2014 [Oct. 20, 2014].
[4] CERT-RO, Cum să abordezi protecția datelor în cloud. Internet: http://www.cert-
ro.eu/files/doc/886_20141001111032007308300_X.pdf, April 27, 2014 [Oct. 20, 2014];
[5] Avizul nr. 05/2012 privind „cloud computing”. Internet: http://ec.europa.eu/justice/data-
protection/article-29/documentation/opinion-recommendation/files/2012/wp196_ro.pdf,
July 27, 2012 [Jan. 20, 2015]
Proceedings of the IE 2015 International Conference
www.conferenceie.ase.ro
73
HEALTHY AGEING MOBILE GIS APPLICATIONS DEVELOPMENT
AND AUDIT FOR THE ACHIEVEMENT OF SOCIAL
SUSTAINABILITY
Cosmin TOMOZEI
Vasile Alecsandri University of Bacău, Romania
Cristian AMANCEI
Bucharest University of Economic Studies, Romania
Abstract. The objective of this paper is to present a reliable way for the engineering,
reengineering and audit of mobile health applications. This research implied the constructive
analysis of health applications of several types, by means of international scientific databases,
in which these types of applications were presented. Secondly, the use of mobile devices and
GIS applications for senior citizens have been taken into account so as to create efficient ways
of communication and processing of medical and spatial data. These types of applications
should provide help and support for people in need and assist the decision makers, both
patients and health specialists for the assurance of the quality of life as well as the seniors’
autonomy.
Keywords: mobile health, GIS, sensors, data analysis, audit.
JEL classification: JEL classification: L86 – computer software
1. Introduction Some of the best-known aspects of sustainability achievement concerning the modern society
are represented by age friendly communities and by the easiness of access to the resources by
the senior citizens. In papers such as [1] the age friendliness of cities is analyzed, especially by
taking into account the allocation of health resources. The knowledge-based society has as a
main objective to offer the people in need the appropriate health resources and services in a
suitable time, furthermore to support the autonomy and possibility of elderly to live in a secure,
healthy and friendly environment, which presumes that they should be able to work with the
new information and communication technologies so as to provide valuable information to the
medical staff and to their families.
In order to accomplish this social goal, it is very important that the data which result from the
interaction of the senior citizens with the technological devices to be subjected to analytical
procedures as well as the extraction of the most significant information, by the specialists,
though data modelling and estimation procedures. Such procedures are identified in [2], in
which exposure to environmental risk factors is assessed. The thematic maps are based on the
geocoding process and on and on the utilization of GPS devices, sensors and databases.
Valuable data, obtained by smart devices and sensors are processed and transmitted to the
health specialists.
On the one hand, the geographic information systems offer a reliable support for data
representation and analysis, by integrating specific procedures, such as spatial analysis and
regression, time series, charts and geo-coordinates, which are very helpful in the development
of health graphical representations on thematic maps. As tablets and intelligent devices are

Proceedings of the IE 2015 International Conference
www.conferenceie.ase.ro
74
greatly used in healthcare, as mentioned in [3], for general practitioners and patients, aiming to
reduce the incidence of strokes and monitor the cardiovascular diseases, additional
functionalities may be taken into account, for the spatial analysis of diseases and for the
creation of estimation models. Smart devices are appropriate for mapping software and by
means of touchscreens, gestures and sensors a set of new indicators is in position of being
developed.
A novel approach of healthy aging application development consists of the events which are
implemented by software functionalities, which should be used for elderly people interaction
with the devices by tap, double tap, tap-and-hold, pan or slide which are very usable and
comfortable in the user interaction. These events or gestures combined with geolocation
facilities and data obtained through sensors becomes more and more beneficial in mHealth [4]
applications development.
It is stated that the mHealth phenomena got significant attention in the last years, because of
the devices that support the health objectives and transformed the health services and their
accessibility for the patients. Complex communication functionalities have been created, by
connecting medical devices via Wi-Fi and Bluetooth for the transmission of data regarding the
physical condition of the patients, such as blood pressure, glycaemia, body temperature, heart
rate but further analyses are to be accomplished for more elaborated examinations and
calculations.
2. Citizen assistance, healthcare and quality of life
The assurance of a good public health system represents a continuous aim of researchers and
practitioners, so as to draw-up the characteristics and the necessity of well-being for the elderly
people. Measures have been taken [5] for the building of healthy living environments by
combining medical treatments with movement and physical exercises. Furthermore, studies
and policies about the “aging-in-place” have been created in order to contribute to the people’s
autonomy in life.
Mobile applications and remote sensors e.g. smart wearable devices and pedometers support
the development of healthy communities and age-friendly environments. Several factors such
as walkability, air quality and green space as well as reduced levels of danger have been
considered as vital for age friendly environments.
These factors, as well as personal health information should be in position of being modelled
with the support of smart devices and customized for the personal health requirements, in order
to assist [6] the seniors for the maintenance of life quality and health condition. Citizen oriented
health assistance services are continuously lifelong provided and assure the possibility of
managing their needs and treatments, with health practitioners advisory services approval.
Mobile health and the integration of sensors and wearable technologies offer to the elderly
people new ways of connectivity and interaction, within a smart medical distributed system for
uninterrupted healthcare assistance. Furthermore, clinical professionals utilize such assistance
systems in order to support the elder patients’ home care.
These services are accessible via dedicated protocols and their functionalities are exposed to
the mobile devices which the patients carry in their daily lives. An important issue is
represented by the success in communication between the clinical specialists, the software
development teams and the beneficiaries concerning the objectives, the personal health plan
structures, the data formats and the data exchange between the actors by means of specialized
services. Another important issue is related to the data storage and the distribution between
specialized servers and Cloud machines, for large files and objects such as medical imaging
files, and personal mobile devices, with a direct effect on how data is queried and structured in
the following stages for the specialized medical decision support activities. Automated

Proceedings of the IE 2015 International Conference
www.conferenceie.ase.ro
75
reasoning procedures may be implemented and adapted for the creation of personalized
recommendations based on each person activity history and health records. Service oriented
architectures and service composition models for health management are being implemented
and invoked by mobile health applications.
3. mHealth applications engineering for senior citizens
A reliable taxonomy of mHealth applications is presented in [4] and offers a holistic image
about the objectives, engineering, maintenance and reengineering of health applications.
Organizations adopt more and more mHealth apps for the increasing of the patients’
satisfaction regarding the medical and social services. These applications deeply contribute to
the autonomy of the patients and support the achievement of high levels of the life quality.
In this section, we present a simple example for mobile application with use in healthy aging
and especially with regards on the quality of life of the senior citizens.
For elderly people the consumption of water, salt, coffee, prescription medication, as well as
the movement per day represent key elements for a healthy and autonomous life. These factors,
identified as exogenous variable in a regression model, may straightforwardly be modeled by
means of mobile devices and services, in a mobile-first cloud first strategy of going forward,
according to [10].
Blood pressure is taken into account as an endogenous variable, modelled in terms of the
identified exogenous variables, by means of classes in the mobile health applications. The
classes and the mHealth services are instantiated on the mobile devices. The identified linear
regression model will be useful in the estimation of the blood pressure based on the quantities
of products which the patients had consumed and consequently in-place recommendations will
be given to the patients.
A secondary phenomenon which assures the quality of life of senior citizens is represented by
the movement per day variable. The movement per day a citizen does is measured by
pedometers and activity trackers wearables and gets easily modeled by mobile devices via
Bluetooth connections. The movement per day is depending on the weather and especially on
the temperature, because it is advisable that the elderly people should avoid the outdoor
activities on very cold or very hot weather. Another aspect regarding the values of the
movement per day factor is determined by the geographical location of the citizen towns of
residence. This leads to the adoption of the GIS modules and furthermore on the integration of
map modelling procedure on mHealth application based on a process of software
reengineering.
Time series and regression analysis are key elements in the analysis of health indicators and in
the estimation of health data models. Limits should be set by medical specialists and those
limits should not be exceeded by the patients in their daily life.
In (1), (2) and (3) the regression models for the blood pressure and movement per day are
analytically defined and described as simultaneous equations models.
kk medicationwatercoffeesaltfpressureBlood ,,,_ (1)
kk positiongeoetemperaturfdayperMovement ,__ (2)
k
NrEx
j
kjjkkkk uetaVarExetaVarExBP 1
11 (3)
where:
BPk – the dependent, endogenous variable of ecuation k within the model,
identified as blood pressure;
1keta – the intercept of the simultaneous equations model;

Proceedings of the IE 2015 International Conference
www.conferenceie.ase.ro
76
lketa , – the coefficient of the independente variabile Varexk1, of the model;
ku – the error term.
The optimization of the model leads to personalized recommendation of quantities for each of
the exogenous variables, e. g. salt, medication, water and coffee in order to support the
positioning of the blood pressure in the normal limits. The models should be structurally
consistent and avoid multicollinearity. The size of the model is determined by the number of
exogenous variables and the number of data series. This analysis of multicollinearity checks
whether there is correlation between the explanatory variables which lead to the inconsistence
of the model.
An additional aspect, which is significant for the quality of life is represented by electronic
prescriptions, which are directly sent on mobile devices, back ended in Cloud and with push
notifications. The electronic prescription sent on mobile devices with notification will
considerably decrease the time spent by the elderly people as well as the effort to get the
necessary medication for the assurance of their quality of life.
4. mHealth application audit approach
In this section, we present the audit approach proposed for our mobile application architecture
proposal.
The audit starts with a security risk analysis main focused on analyzing vulnerabilities and
threats to the mHealth information resources in order to decide what controls should be
implemented in the future development phases. Due to the complex interactions among the
components of the information system, a single vulnerability may have multiple propagation
paths, leading to different security risks for our application [11].
Based on a self-assessment of the patient information manipulated by the application, we have
developed a list of main risk factors and proposed mitigation controls presented in Table 1.
Table 1. mHealth main risk factors and proposed mitigating controls
Category Risk factor Proposed mitigating control
Application
security
Application access
control
Access to the analysis results will be
permitted through accounts validated by the
application administrator.
Access to personal data will be permitted only
through authentication with digital
certificates.
Application processing
history
Logs will be maintained for the processing
history of the application at a high detail level.
Capability of fault
tolerance
All the client requests will be parsed and the
application will respond only to a predefined
set of utilization cases, for all the other
requests general messages will be presented.
Data security Data confidentiality The access to the database will be restricted
only to trusted connections that are enforced
by digital certificates, due to the sensitivity of
the data stored.
Data integrity Data upload will be permitted only for the
administrative users that remain responsible to
ensure the integrity of the data. The client
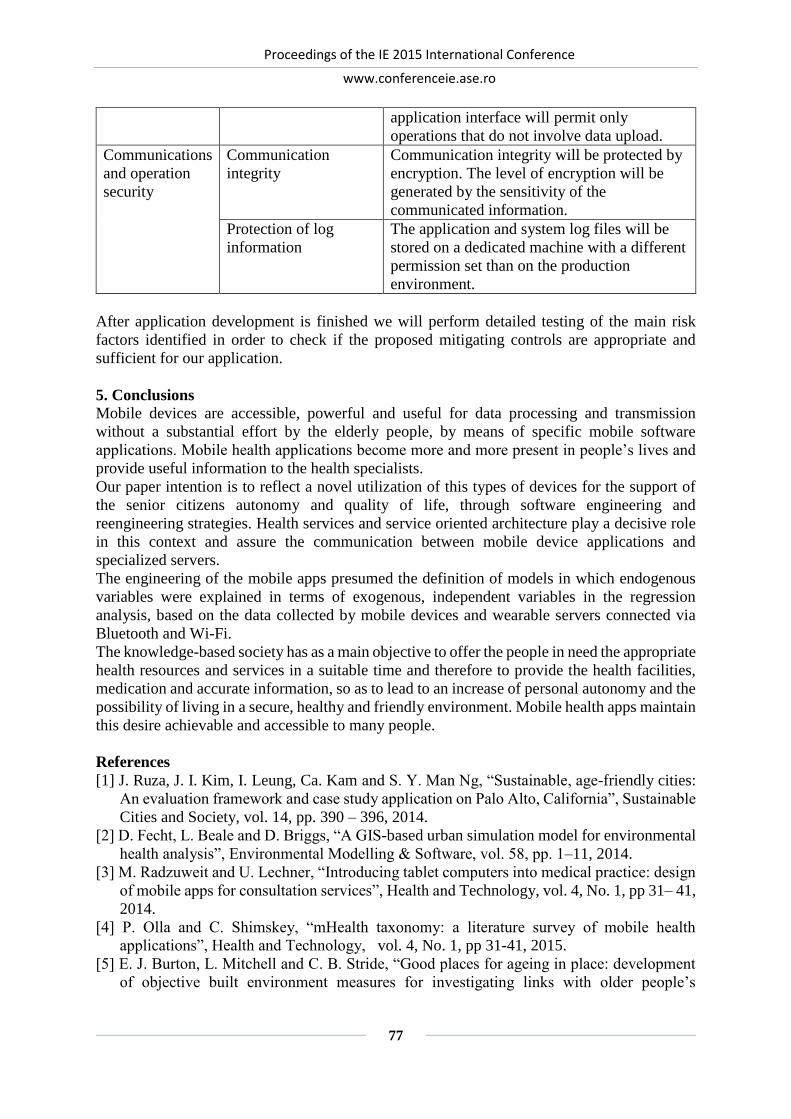
Proceedings of the IE 2015 International Conference
www.conferenceie.ase.ro
77
application interface will permit only
operations that do not involve data upload.
Communications
and operation
security
Communication
integrity
Communication integrity will be protected by
encryption. The level of encryption will be
generated by the sensitivity of the
communicated information.
Protection of log
information
The application and system log files will be
stored on a dedicated machine with a different
permission set than on the production
environment.
After application development is finished we will perform detailed testing of the main risk
factors identified in order to check if the proposed mitigating controls are appropriate and
sufficient for our application.
5. Conclusions
Mobile devices are accessible, powerful and useful for data processing and transmission
without a substantial effort by the elderly people, by means of specific mobile software
applications. Mobile health applications become more and more present in people’s lives and
provide useful information to the health specialists.
Our paper intention is to reflect a novel utilization of this types of devices for the support of
the senior citizens autonomy and quality of life, through software engineering and
reengineering strategies. Health services and service oriented architecture play a decisive role
in this context and assure the communication between mobile device applications and
specialized servers.
The engineering of the mobile apps presumed the definition of models in which endogenous
variables were explained in terms of exogenous, independent variables in the regression
analysis, based on the data collected by mobile devices and wearable servers connected via
Bluetooth and Wi-Fi.
The knowledge-based society has as a main objective to offer the people in need the appropriate
health resources and services in a suitable time and therefore to provide the health facilities,
medication and accurate information, so as to lead to an increase of personal autonomy and the
possibility of living in a secure, healthy and friendly environment. Mobile health apps maintain
this desire achievable and accessible to many people.
References
[1] J. Ruza, J. I. Kim, I. Leung, Ca. Kam and S. Y. Man Ng, “Sustainable, age-friendly cities:
An evaluation framework and case study application on Palo Alto, California”, Sustainable
Cities and Society, vol. 14, pp. 390 – 396, 2014.
[2] D. Fecht, L. Beale and D. Briggs, “A GIS-based urban simulation model for environmental
health analysis”, Environmental Modelling & Software, vol. 58, pp. 1–11, 2014.
[3] M. Radzuweit and U. Lechner, “Introducing tablet computers into medical practice: design
of mobile apps for consultation services”, Health and Technology, vol. 4, No. 1, pp 31– 41,
2014.
[4] P. Olla and C. Shimskey, “mHealth taxonomy: a literature survey of mobile health
applications”, Health and Technology, vol. 4, No. 1, pp 31-41, 2015.
[5] E. J. Burton, L. Mitchell and C. B. Stride, “Good places for ageing in place: development
of objective built environment measures for investigating links with older people’s

Proceedings of the IE 2015 International Conference
www.conferenceie.ase.ro
78
wellbeing”, BMC Public Health, Vol. 11, 2011, Available:
http://www.biomedcentral.com/1471-2458/11/839.
[6] S. C. Christopoulou, “A smart citizen healthcare assistant framework”, Health and
Technology, vol. 3, No. 3, pp 249-265.
[7] J. Kerr, S. Duncan, J. Schipperjin, “Using Global Positioning Systems in Health Research
A Practical Approach to Data Collection and Processing” American Journal of Preventive
Medicine, vol. 41, No. 5, pp. 532–540, 2011.
[8] A. K. Lyseen, C. Nøhr, E. M. Sørensen, O. Gudes, E. M. Geraghty, N. T. Shaw, C. Bivona-
Tellez, “A Review and Framework for Categorizing Current Research and Development in
Health Related Geographical Information Systems (GIS) Studies”, Yearbook of Medical
Informatics, Available: http://www.ncbi.nlm.nih.gov/pubmed/25123730
[9] N. Vercruyssen, C. Tomozei, I. Furdu, S. Varlan, C. Amancei, “Collaborative
Recommender System Development with Ubiquitous Computing Capability for Risk
Awareness”, Studies in Informatics and Control, vol. 24, No. 1, pp. 91-100, 2015.
[10] Satya Nadella: Mobile First, Cloud First Press Briefing, Available:
http://news.microsoft.com/2014/03/27/satya-nadella-mobile-first-cloud-first-press-
briefing/
[11] [ N. Feng, H. J. Wang, L. Li,”A security risk analysis model for information systems:
Causal relationships of risk factors and vulnerability propagation analysis”, Information
Sciences Journal 256/2014, pp. 57-73

Proceedings of the IE 2015 International Conference
www.conferenceie.ase.ro
79
CLOUD–BASED ARCHITECTURE FOR PERFORMANCE
MANAGEMENT SYSTEMS FOR SMES
Alexandra RUSĂNEANU
Bucharest University of Economic Studies
Abstract. Performance is a continuous state that a company or individual desire to achieve.
In order to reach for this result a company needs to prioritize and manage its activities with
less effort and less resources. For a small company such as SMEs resources are limited,
especially financial resources. This paper is proposing a performance management system
hosted on a Cloud environment. Basically, the performance management application will run
on a SaaS architecture based environment.
Keywords: cloud, SME, performance management, architecture
JEL classification: M20
1. Introduction Performance is a concept used in all economic sectors; it is a general state that all economic
entities desire to reach, whether they are companies, employees or shareholders. "Performance
is associated with two key processes: performance management and performance
measurement"[1]
Performance management is a set of analytical and managerial processes that help the
organization achieve its strategic, operational and individual objectives. The three main
activities which are defining the performance management concept are: setting the strategic,
operational and individual objective, consolidating the measurement information relative to the
objective which is relevant for the progress of the company and managers' decisions regarding
enhancements of the activity based on the measurement indicators. Because in large companies
most of the managerial activities involve managing a large amount of data, many software
vendors offer Business Intelligence and Business Performance Management software to
support this process.
"Business Intelligence concept involves raw data that needs to be condensed from different
data sources and then transformed in information. Performance Management concept uses this
information and transpose it into an intuitive decision making format. “To differentiate BI from
PM, performance management can be viewed as deploying the power of BI, but the two are
inseparable. Think of PM as an application of BI. PM adds context and direction for BI.”[2]
Performance measurement is a concept defined as "a way to collect, analyze and report
information regarding a group, an individual, an organization, a system or a component. This
involves the study of the processes or the strategies of a company. The performance is the
criteria on which a company can determine its capacity to prevail."[3]
2. Cloud computing for SMEs
Cloud computing is one of the most revolutionary technologies that helps governs and
companies to enhance its services and performance. Cloud computing technology helped
multiple companies to reduce their costs of IT infrastructure and IT equipment maintenance
costs, to benefit from the flexibility and scalability of Cloud by having access, basically, to
unlimited storage, to increase its processing capacity, IT efficiency and agility. Also, this

Proceedings of the IE 2015 International Conference
www.conferenceie.ase.ro
80
technology has eliminated the need for external storage devices, such as software discs,
physical servers, and the need for installation of updates, upgrades and specialized employees
for maintaining the IT infrastructure.
A survey-based study made by Reza Sahandi, Adel Alkhalil and Justice Opara-Martins
explored the requests and concerns that small businesses have regarding Cloud Computing
technology. The most important premises of the study were the following:
the factors that encouraged small businesses to migrate to Cloud;
the adopted strategies for Cloud services utilization.
The study was conducted in Great Britain and the survey was completed by IT decision-makers
and managers. The results show that 45.5% of the SME want to implement Cloud-based
services to reduce costs and 44.9% to benefit from mobility and convenience when accessing
cloud-based applications. These figures demonstrate that small businesses are aware of the
advantages of the adoption of such technology. Also, the study brings another aspect that SMEs
find appealing, as follows: the "ubiquity and flexibility of Cloud Computing (38.9%),
increasing computing capacity (32.9%) and providing greater IT efficiency (31.7%)"[4]
The results for the second premise emphasize important aspects regarding operational activities
that SME have: 32.5% of the respondents are planning to use the Cloud-based services for
current operational activities. This percent shows the fact that small businesses knows the
advantages of this technology and the fact that Cloud technology can interoperate with other
systems. On the other hand, 27% of the respondents have mentioned that they do not have in
plan to use Cloud-based services yet.
Among the main concerns of SMEs for adopting cloud-based solutions include primarily the
Privacy and Data Protection. This is number one reason why SMEs don't desire to migrate to
a cloud-based solution. Also, confidentiality, data integrity and vendor lock-in are a major
concern as well. "Still, Cloud Computing is a winsome venture for SMEs but it certainly takes
a good business sense and steps in order to fully reap its benefits"[4]
Another representative study conducted by Ashwini Rath, Sanjay Kumar, Sanjay Mohapatra,
Rahul Thakurta in India, a developing country, was made in order to reveal the degree of
interest and understanding of the SMEs for Cloud Computing services. This study covered
issues like:
"- The level of awareness among SMEs regarding Cloud;
- The level of willingness among SMEs to invest in Cloud;
- The potential reasons behind possible engagement with Cloud;
- which layer of cloud computing architecture is most likely to be used?"[5]
The results of the above study show that 93% of the respondents already have information
about Cloud Computing and its benefits. Regarding the potential reasons behind possible
engagement with Cloud Computing 19% responded that cost reduction is the most important
and 18% responded that controlling marginal profit is the second most important factor. Also
45% of the respondents were willing to use individual software packages (Software as a
Service) and 43% were willing to use a complete operating system on which they can add
custom software. This is called Platform as a Service.
3. Cloud-based architecture for SMEs
Both studies have emphasized that small business are interested in Cloud Computing solutions
even though some are active in a developed country and some in a developing country. Most
small businesses are interested in Software as a Service (SaaS) applications. There are several
advantages of using this type of architecture compared to traditional ones such as:

Proceedings of the IE 2015 International Conference
www.conferenceie.ase.ro
81
- Lower costs. This type of application resides in a shared or multitenant environment
where the software and hardware costs are maintained by the service provider. A small
company only pays for access to it.
- No installing and configuring time. Basically, the small company has instant access
to the application, the installing and configuring process will be done by the service provider.
- Scalability and integration. A SaaS solution is hosted in a cloud environment that is
scalable and can be integrated with other cloud solutions. In case of a traditional solution
whenever you need to integrate it with another software your need to buy hardware, software
and assistance to integrate them, but using a cloud environment with SaaS software all the work
will be done by the service provider.
-Pay as you go. This is the main concept for cloud solutions because it gives companies
the benefit of predictable costs for all services that they want. For small businesses a predictable
cost is essential for their budget. Also, service providers have personalized offers in order to
be aligned to different budget types and needs that small businesses have.
- No responsibility for upgrades, updates, uptime and security. The service provider
will take care of this type of maintenance activities that are necessary for managing software.
A performance management system is essential for tracking the progress of the organization,
but small businesses do not have the infrastructure to host and use a powerful performance
management system even though they need one. The SaaS technology and a PM system is a
perfect combination for obtaining great results with less effort. This paper is proposing a SaaS
architecture for a performance management system that will have access to different on-
premise databases, if the company doesn't want to move all their data sources into the Cloud
environment, and to different Social Media data sources to retrieve information in order to
apply marketing analytics.
The following SaaS architecture, depicted in Figure 1, is composed from a SaaS platform on
which all the business related information are stored and processed. The performance
management system is hosted on the platform and has access to on-premise applications of the
company in order to retrieve financial, staff or other department related data. The PM
application has access to Social Media platforms and mines for significant data that will allow
it to create relevant analytics. The customer which was represented in the diagram as being a
manager will access the Performance Management application using a browser. The
application can be accessed using only an Internet connection. The PM software is protected
by a firewall and by the security management tool hosted on the SaaS platform. The user will
have access to the content depending on its role. Each type of user will have a different role
associated with his account depending on the type of information he is accredited to access.
Figure 2. SaaS architecture

Proceedings of the IE 2015 International Conference
www.conferenceie.ase.ro
82
The SaaS platform structure can be seen in the Figure 2 diagram. The Presentation Layer
consists from multiple UI modules such as: Reporting module which will be used for
generating performance reports on different areas or departments. The User Interface
components are composed from Dashboards, Scoreboards, Strategy Maps and Administration
related interface. The reporting module is implemented using a special API named Apache POI
which is generating Office documents such as Excel, Word or even PowerPoint presentations.
The dashboards, scoreboards and other type of data presentation will be generated using
different technologies such as JQuery, Ajax and Javascript.
The Business Application Layer is composed from business related modules: HR, CRM,
Inventory, SCM, Financial or Sales. The data used by these modules can be retrieved from the
data sources available in the cloud or on-premises data sources. The KPI Generator will process
all the existing data and will calculate the key performance indicators and other indicators that
will be sending to the presentation layer.
The Service Layer is mostly composed from component management modules which will
administrate the internal core of the platform and will provide security for the communication
between components.
Figure 2. SaaS platform overview
5. Conclusions
A SaaS architecture-based application can be a real option for small businesses due to their
limited availability of resources. Also, it can be personalized for each company based on their
available budget. In order to determine SMEs to implement a Cloud based architecture issues
such as security, data privacy or vendor lock-in need to be addressed. Cloud computing
providers should invest more in network and physical security in order to offer to customers a
secured software solution.
Acknowledgment
This work was cofinanced from the European Social Fund through Sectoral Operational
Programme Human Resources Development 2007-2013, project number
POSDRU/159/1.5/S/142115 „Performance and excellence in doctoral and postdoctoral
research in Romanian economics science domain”.
References
[1] A. Brudan, ”Rediscovering performance management: systems, learning and integration”
Measuring Business Excellence, vol. 14, issue 1, 2010.

Proceedings of the IE 2015 International Conference
www.conferenceie.ase.ro
83
[2] A. Rusăneanu, ”Comparative analysis of the main Business Intelligence solutions”,
Informatică Economică, Vol. 17, No.2/2013, pp.148.
[3] A. Rusăneanu, ”Rules for selecting and using key performance indicators for the Service
Industry”, Vol. 2, Issue 2(4) /2014, pp. 661-666.
[4] R. Sahandi, A. Alkhalil, J. Opara-Martins, ”Cloud computing from SMEs perspective: a
survey based investigation”, Journal of Information Technology Management Volum
XXIV, Number 1, 2013.
[5] A. Rath, S. Kumar, S. Mohapatra, R. Thakurta, ”Decision points for adoption Cloud
Computing in SMEs”, available at:
http://www.academia.edu/3139478/Decision_points_for_adoption_Cloud_Computing_in_S
MEs (accessed on March 14th 2015).

Proceedings of the IE 2015 International Conference
www.conferenceie.ase.ro
84
SOFTWARE TOOLS AND ONLINE SERVICES THAT ENABLE
GEOGRAPHICALLY DISTRIBUTED SOFTWARE DEVELOPMENT
OF WEB APPLICATIONS
Mihai GHEORGHE
Bucharest University of Economic Studies
Abstract. Geographically Distributed Software Development (GDSD) has seen an increased
popularity during the last years mainly because of the fast Internet adoption in the countries
with emerging economies, correlated with the continuous seek for reduced development costs
as well with the rise of the Software as a Service (SaaS) platforms which address planning,
coordination and various development tasks. However, the implementation of an efficient
model of GDSD has proven challenging due to cultural and legal differences, communication
and coordination issues and software quality concerns. This study identifies the basic
development operations and the interactions among team members as well as the software
tools and online services that successfully cope with these. Two perspectives are reviewed:
software development specific operations and interactions and the connections between the
employer and the remote employees in terms of communication, billing and payments. The
study focuses on the development process of web applications. In the end the author analyses
the impact of using these solutions on cost, duration and quality compared to conventional in-
house software development processes.
Keywords: Freelancing, Global Software Development, Human Resources Management, IT
Project Management, Software Development Tools
JEL classification: F63, O31, O33
1. Introduction
Depending on both the complexity of the software product and the management model the
Software Development Process may have multiple roles for its team members [1]. A typical
role hierarchy is described in Figure 1. The dashed lines illustrate informal interactions.
A Geographically Distributed Software Development process happens when the team members
are not collocated and share different time-zones, languages, cultures and legislations.
Mainly as a result of distance, communication, coordination and control are challenging in
GDSD. Communication is reported to be one of the key processes in software development
and is heavily linked to the effectiveness of coordination and control [2].
From its current professional position, as the owner and manager of a software company since
2006, the author has frequently dealt with offshore development scenarios, mostly as a provider
and occasionally as a customer. Based on the literature review and the author’s experience, this
study aims to answer the following two research questions:
RQ1: Is there any set of software tools and online services that can address the
communication, coordination and control inconveniences generated by the distributed
approach in the GDSD?
RQ2: How does the use of these software tools and online services influence the cost,
duration and quality of each activity from the Software Development Process?

Proceedings of the IE 2015 International Conference
www.conferenceie.ase.ro
85
Figure 1. A typical role hierarchy in a Software Development Process [1]
2. Software Development related operations In an ever-growing demand for software products numerous development models have arisen
from heavy planned Waterfall models to lightweight Agile variations. Determining the most
suitable ones for developing web applications is not covered by the current study. Regardless
of their order, duration and allocated importance there are some elementary activities which
reside in all software development methodologies (Figure 2). The dashed arrows suggest that
the sequence of the operations can vary with the methodology. Coding is usually an individual
activity so it shouldn’t be different in GDSD from conventional in-house development.
Figure 2. Typical Software Development activities
Knowledge transfer is a crucial activity in GDSD, and it can span across the entire development
process [3]. Knowledge transfer doesn’t happen only between stakeholders and the
development team but inside the team as well, for instance when a senior programmer mentors
junior staff.
In the following subsections, software tools and online platforms that support the identified
operations are showcased.

Proceedings of the IE 2015 International Conference
www.conferenceie.ase.ro
86
2.1. Requirements management
Issuing requirements in a manner that can be handled to the hierarchy of development roles
may vary from a brief document to an exhaustive set of specifications, use-case diagrams, test
scenarios, performance and security restrictions.
Conventional in-house development processes can benefit from direct communication among
team members, internal meetings, documents and quick revisions.
Wireframes and Prototyping
The functional and layout requirements for web applications can be described using wireframes
and live world-wide accessible prototypes. Both literature and crawling the web reveal
numerous free and paid online services that transform static designs into clickable interactive
prototypes which can be published and shared with the development team and stakeholders.
InVision [4] is an online prototyping service for websites and mobile apps that among others
allows simultaneous work on the same project, enhances presentations with gestures,
transitions and animation support, stores the project on its own cloud infrastructure or with
other services such as Dropbox, supports versioning, comes with a collection of prototype
templates. According to their website [4], IBM, Adobe, Twitter, HP, PayPal, Intel, Yahoo,
Salesforce, Nike are among the companies that use the service. Basic features are free of
charge, but the company features an enterprise plan as well for unlimited projects, team
members and storage.
Similar services (Justinmind, Axure, iRise, Microsoft Visio) are widely used in managing the
requirements and distributing them across the team regardless of their location making them
suitable for GDSD. Requirements errors are the largest contributor to change requests, and cost
to mitigate these errors grows exponentially through the lifecycle [1][5]. Therefore using
specialized prototyping services can increase the efficiency of requirements management,
reduces the duration of this activity and although it usually comes with a licensing or
subscription cost, can reduce the overall cost of the development process.
2.2. Task assignment
Assigning tasks to a geographically distributed development team, setting dependencies
between tasks, monitoring progress and other development metrics is more difficult in a GDSD
framework compared to an in-house development scenario [6].
In order to address this issue, a great number of integrated project management SaaS platforms
has evolved. Basecamp, JIRA, Pivotal Tracker, Asana, Teamwork, Producteev are just a few
products which the author has successfully worked with so far. Features like team management,
collaborative reporting, issue tracking, time tracking, document management, software
development metrics and reports, budget management, invoicing are fairly common. For less
complex projects, usually basic features, limited number of projects, limited team members or
trial use come free of charge. Monthly or annual subscriptions can be contracted with costs /
month ranging from $15 to $750, for projects that have hundreds of team members. For an
organization that large, the costs are insignificant while the benefits from a real-time world-
wide accessible project management framework are considerable.
2.3. Management of the source code
Assuring source code coherency when multiple programmers contribute to the same product
has been an issue for a while. The Source Code Control System (SCCS), created in 1970 is the
first Version Control System (VCS) to be mentioned [7]. Since then, code complexity has
dramatically increased.

Proceedings of the IE 2015 International Conference
www.conferenceie.ase.ro
87
In a GDSD environment, for web applications that evolve from one day to another, there is the
need to commit source code changes frequently, often simultaneously between different team
members, without having the risk of unintentionally overwriting someone else’s work.
Managing the code changes manually is very inefficient and prone to errors, practically
impossible even for medium complexity projects. Since SVN appeared in 2001 [7], developers
can work on the same code file at the same time and the system can deal with conflicts and
automatically merge the contribution into a single files. Unlike SVN which has a centralized
repository, Git is one of the distributed VCS that requires each contributor to have its own
repository. This means, the developers can work even if they don’t have a permanent Internet
connection. Along with the use of acknowledged web frameworks (ASP.NET MVC, Zend for
PHP, Spring for Java, or other similar), adoption of a mature VCS can address security
concerns by restricting access for a certain group of developers to core functionality. For
instance, access can be restricted for a Front End Developer to the application’s controllers,
while granting permissions to test his own work [9].
The most popular modern VCS such as SVN, Git, Mercurial, Bazaar are free of charge.
2.4. Testing and debugging
Due to their nature, web applications are accessible from virtually any place in the world as
long as there is an Internet connection and a browser. However, testing web applications is a
vast field which can be divided in several domains.
In the GDSD configuration, Functional Testing and User Interface and Usability Testing can
be addressed as a crowdsource operation in order to validate the product on as most computing
devices, operating systems, browsers and human behaviors as possible. Compared to in-house
development, the quality and speed of this activity will be increased. uTest.com is a service
that supports crowdsource testing with more than 150.000 testers and Quality Assurance
specialists [10]. Efficient automated testing can be performed for source code compliance with
http://validator.w3.org/. Suggestions for correcting the source code are provided on the fly.
Also, automated load and performance testing with Google Page Speed and Yahoo! Slow
algorithms can be achieved on http://gtmetrix.com/, http://tools.pingdom.com/fpt/ or similar
services.
2.5. Knowledge transfer
Notes on Knowledge Transfer (KT) for GDSD have been posted in section 2.1 in relation with
Requirements Management. However, in conventional in-house development processes, KT is
also an information exchange between various team members mostly through direct informal
communication. In the GDSD environment, due to time-zone, language and cultural barriers,
informal communication is at a minimum level so KT is hard to achieve in a properly manner.
3. Non-development related operations
Setting up a GDSD framework doesn’t exclusively consist of dealing with technical and
procedural challenges. The relation between the employee (provider) and the employer (the
customer) needs to be supported as well.
3.1. Communication
Informal communication is usually done through instant messaging systems, conference calls
and video calls. Platforms such as Skype, Apple iChat and Google+ Hangout are easy to use
but require an increased bandwidth for multiple attendants [11]. This can either have a negative
impact on the quality of the transmissions or an increase of costs for updating the Internet
connection.

Proceedings of the IE 2015 International Conference
www.conferenceie.ase.ro
88
3.2. Effort evaluation and Billing
Unlike in-house development, in GDSD configuration, concerns may arise regarding the
amount of time spent by each team member in the project’s benefit. Software products have
been developed to monitor the activity of remote team members, create various reports and
even automatically generate invoices. Elance’s Work View, is a desktop software client that
counts the time spent on a project and sends random screenshots to the client. Each week,
automated billing for the tracked hour is performed [12]. RescueTime is different time
management products focused on increasing individual productivity by providing more
detailed reports, blocking distracting websites. It records time based on keystrokes and mouse
movements [13].
3.3. Payments
Convenient international payments are not a novelty anymore. Various platforms have gained
popularity and became trustful for many business as well for peer to peer payments. PayPal is
reported as the most used in terms of users and transaction volumes. It is available in 203
countries and 26 currencies, it features invoicing and charges from 0.2% to 3.9% depending on
the account type and payment [14]. For premier accounts, withdrawals to credit card can be
processed in less than 24 hours. Other less popular platforms such as Skrill or Payoneer feature
lower fees. Payoneer supports a fast withdrawal which transfers the money on an international
self-issued credit card within 2 hours since initiated [15].
4. Conclusions
A series of activities have been identified as requiring a different approach in a GDSD
configuration against in-house software development. Online services and software tools that
respond to specific needs of these activities have been evaluated.
RQ1: The set of software products and online platforms which have been evaluated can address
the inconveniences generated by the GDSD approach and in some cases can even perform
better than conventional in-house development activities.
RQ2: The effects on activity cost, quality and duration due to the use of the proposed solutions
is described in Table 1 and Table 2. + means an increase, - a decrease, 0 no significant impact,
n/a not applicable.
Table 1. GDSD Software Development Activities and the impact of using Online Services and other
tools
Activity Impact on cost Impact on quality Impact on duration
Managing
requirements + ++ -
Assigning tasks 0 + +
Managing source
code coherency 0 + -
Testing and
debugging + + -
Knowledge
transfer 0 -- +++

Proceedings of the IE 2015 International Conference
www.conferenceie.ase.ro
89
Table 2. Non-Development activities in GDSD and the impact of using Online Services and other tools
Activity Impact on cost Impact on quality Impact on duration
Communication + - +
Billing 0 + -
Payment 0 n/a -
Acknowledgment
This paper was co-financed from the European Social Fund, through the Sectorial Operational
Programme Human Resources Development 2007-2013, project number
POSDRU/159/1.5/S/138907 "Excellence in scientific interdisciplinary research, doctoral and
postdoctoral, in the economic, social and medical fields -EXCELIS", coordinator The
Bucharest University of Economic Studies.
References
[1] V. Mikulovic and M. Heiss "How do I know what I have to do?: the role of the inquiry
culture in requirements communication for distributed software development projects", in
ICSE '06: Proceedings of the 28th international conference on Software engineering, 2006
[2] B. Fernando, T. Hall, A. Fitzpatrick "The impact of media selection on stakeholder
communication in agile global software development: a preliminary industrial case study",
in Proceedings of the 49th SIGMIS annual conference on Computer personnel research,
2011
[3] F. Salger and G. Engels "Knowledge transfer in global software development: leveraging
acceptance test case specifications" in ICSE '10: Proceedings of the 32nd ACM/IEEE
International Conference on Software Engineering - Volume 2, 2010
[4] InVision | Free Web & Mobile Prototyping (Web, iOS, Android) and UI Mockup Tool,
http://www.invisionapp.com/#tour, [Mar. 09, 2015]
[5] iRise | Rapid Collaborative Prototyping: Build better software faster, http://www.irise.com/,
[Mar. 09, 2015]
[6] G. Wiredu "A framework for the analysis of coordination in global software development"
in: International workshop on Global software development for the practitioner, 2006
[7] J. Loeliger "Version Control with Git", O’Reilly Media, Inc., 2009, pp. 1-6
[8] C. Brindescu, M. Codoban, S. Shmarkatiuk, D. Dig "How do centralized and distributed
version control systems impact software changes?" in ICSE 2014: Proceedings of the 36th
International Conference on Software Engineering, 2014
[9] B. Collins-Sussman, B. Fitzpatrick, C. Pilato "Version Control with Subversion For
Subversion 1.7", California, 2011, pp. 202 – 205
[10] uTest – Software Testing Community, http://www.utest.com/, [Mar. 09, 2015]
[11] Y. Xu, C. Yu, J. Li, Y. Liu "Video telephony for end-consumers: measurement study of
Google+, iChat, and Skype" in IMC '12: Proceedings of the 2012 ACM conference on
Internet measurement conference, 2012
[12] Elance Tracker with Work View™,
https://www.elance.com/php/tracker/main/trackerDownload.php, [Mar. 09, 2015]
[13] RescueTime: Feature, https://www.rescuetime.com/features, [Mar. 09, 2015]
[14] Paypal Global – All Countries, https://www.paypal.com/ro/webapps/mpp/country-
worldwide, [Mar. 09, 2015]
[15] Global Payments, Payout Services & Money Transfer | Payoneer,
http://www.payoneer.com/home-b.aspx, [Mar. 09, 2015]
Proceedings of the IE 2015 International Conference
www.conferenceie.ase.ro
90
THE IMPORTANCE OF JAVA PROGRAMMING LANGUAGE IN
IMPLEMENTING DISTRIBUTED SYSTEMS OF DECISION FOR
ONLINE CREDITING
Robert-Madalin CRISTESCU
Bucharest University of Economic Studies, Romania
Abstract. The distributed systems for online crediting are modern and very important
nowadays. These systems can approve online credit without too much effort. All procedures
starting from papers to the credit approval are done online with the help of a distributed system
implemented in Java programming language. The Java programming language is more and
more used nowadays and it helps implementing some systems which have a high level of
difficulty concerning implementation. This system is very useful because it reduces the effort
that the customers make such as the way to the office and obtaining necessary papers for the
credit decision. The crediting decisions which this system can make are very correct and quick.
These systems can announce the customers in a short time if the request they made was
successful or not. The distributed systems of decision implemented in Java programming
language are easy to use and have a high level of response especially on client-server part
which is the most important because the request are sent there and the credit decisions are
made.
Keywords: decision systems, distributed systems, java programming language, online
crediting.
JEL classification: D81
1. Introduction
‘Nowadays, with the broadening usage of distributed systems and Grid, the need for
cooperation between many different heterogeneous organizations occurs. Such cooperation
usually requires sharing of access to data, service and other tangible or intangible resources.’
[10].
The objective is to demonstrate that a distributed system of decision for online crediting
implemented in Java programming language is for the future and it will be more and more
requested and used.
The term of distributed systems refers to ‘the collaboration among connected devices, such as
tiny, stand-alone, embedded microcontrollers, networking devices, embedded PCs, robotics
systems, computer peripherals, wireless data systems, sensors, and signal processors resulting
in networked systems of embedded computing devices whose functional components are nearly
invisible to end users.’ [7]
The banking institutions are managed by ‘distributed database management system’. [8]
Distributed systems are more and more important nowadays because they help making
decisions in what client-server crediting type concerns. Distributed systems of client-server
type implemented in Java programming language give the possibility to find out the crediting
decisions online in a very short time. Also, Java programming language is used for creating
web services that are used in the distributed system of decision. Without these web services,

Proceedings of the IE 2015 International Conference
www.conferenceie.ase.ro
91
the application cannot work at normal parameters. The most important services are SOAP,
ESB, WSDL.
Many people prefer this type of crediting because they do not have time to go to the bank
because of their work. Many people work in areas with no banks and this type of crediting is
very useful for them. The persons who want online credit save time in what the crediting
decision concerns and they have a very easy way to send the files. All papers necessary for the
credit request file can be scanned and this system can make a decision in what the crediting
concerns only after the clients and the data we have in each client’s papers are introduced in
the data base. The system makes the right decisions because it is meant to transmit positive
decisions if only a certain client fills the conditions implemented in the system. The conditions
are similar to those we meet in banks.
‘The Internet explosion and the possibility of direct digital interaction with large numbers of
home consumers presents tremendous opportunities, and challenges, to the financial services
community. ‘ [6]
2. Distributed systems of decision for online crediting
‘Along with banking sector development and increasing demands regarding customer care
improvement, performance providing, transaction efficiency and security, internal processes
optimization, increasing complexity level of products and service, banking information
systems have known a continuous evolution.’[4]
‘To address that new world traditional reductionist vision of information systems is becoming
to be replaced by sociomaterial construction a complex adaptive systems approach. Virtual
organization represents that approach.’ [2]
In order to be efficient, the distributed systems of decision have to be implemented in a strong
and latest program. Java programming language is used more and more often for implementing
some systems and it has the power to decide if online credits are approved or not depending on
the parameters introduced into the system. The bank institutions need these systems because
they have the advantage to win a bigger number of clients who want credits if they buy such a
system. Any employee of a bank can easily use such a system because it has the latest interface.
The distributed system of decision has modules implemented on the client part and on the
server part too. Client-server communication can take place very quickly if the so-called EJB
(Enterprise Java Beans) are used. The distributed system can make more decisions at the same
time. There is the possibility that the number of clients be very big because the system can be
implemented so that it can handle very much requests and at the same time do the calculations
rapidly.
‘The development of a robust and secure communications infrastructure is a key factor to
building up an electronic banking system.’ [9] Online crediting with the help of distributed
systems can be achieved following certain stages: contacting the banking institution that has
such a system, scanning papers and sending them to the respective bank. Contacting can be
made through a simple phone call. Scanning papers is made by the client and then he sends it
to the banking institution for evaluation. Sending is made with the help of an e-mail address
well secured.

Proceedings of the IE 2015 International Conference
www.conferenceie.ase.ro
92
Figure 1. In this figure we can observe the architecture of modules which take part of distributed system for
online crediting.
3. The role of Java programming language in implementing distributed systems for online
crediting
The Java programming language has a very important role in implementing distributed systems
for online crediting. Distributed systems implemented in Java programming language have
protocols of request-reply type on their base. They can offer support for emitting a request from
distance. The most used methods for implementing a distributed system are RMI (Remote
Method Invocation) and Corba. ‘Java is often used to develop portable grid applications, with
programs being sequences (compositions) of remote method calls.’ [1]. ‘CORBA run-time
system works as the executing environment for Ag2D application.’ [11] Distributed systems
implemented in Java J2EE use web services like SOAP, ESB, WSDL. Implementing a web
service is made as following: an .xml file with the respective data is created. Then it is
configured in another .xml file and the existence of the respective wsdl is notified. Then certain
Java classes on the web service can be ruled and generated and it can be observed where the
request and the response are. The next steps are strictly on the implementation part of the web
service in Java in order to be functional. A web service needs the following implementations:
the implementation of builders, the implementation of DTO (Data Transfer Object), the
implementation of an interface, the implementation of a client, the implementation of a service,
the implementation of a transformer, the implementation of a controller. The implemented
builders are practically used for making the links on request header. DTO (Data Transfer
Object) contains the fields from response which have on their base Getter and Setter. The
interface contains methods and fields which are static and final types. The client can be Stateful
or Stateless type and it is used for calling the builders. ‘Stateful aspects can react to the trace
of a program execution; they can support modular implementations of several crosscutting
concerns like error detection, security, event handling, and debugging.’[5] The service is used
for receiving requests and sending them to ESB (Enterprise Service Bus). The transformer
takes information from Response and puts it in DTO. The controller makes the connection
between Request and Response and calls the web service. The distributed system for online
crediting can be updated using Maven Update from the developing menu.

Proceedings of the IE 2015 International Conference
www.conferenceie.ase.ro
93
Figure 2. In this figure we can observe the architecture of distributed system of decision for online crediting.
4. Demonstrative application
This demonstrative application presents the efficiency in the future of a distributed system of
online crediting implemented in Java programming language.
Table 1. Demonstrative application with the employees of some companies that will request a credit in the
future
Name and
firstname
Company Prefers going
to the bank for
requesting a
credit
Prefers the bank
having the
distributed
system for online
crediting
In case the bank does not
have the distributed
system, he/she choses or
not to change the banking
institution
Selariu Ramona Accenture No Yes She choses changing the
banking institution
Tarbuc Constantin Else Digital
Solutions
No Yes He choses changing the
banking institution
Chirita Georgian
Catalin
Vodafone No Yes He choses changing the
banking institution
Irimia Alexandra CSM Bucuresti No Yes She choses changing the
banking institution
Popa Alexandru Perfect Bite
Dentistry
No Yes He choses changing the
banking institution
5. Conclusions
Considering the questionnaires that I applied, the distributed system is very useful for a banking
institution because it can win very much clients in a short time. If the banking institution has
more and more clients who ask for credits, the profit obtained from interests will increase
significantly and the bank will increase its turnover and can develop more. ‘Electronic banking
systems provide us with easy access to banking services.’ [3] For buying this distributed
system, the bank institution has to make a serious investment and to replace the system that it

Proceedings of the IE 2015 International Conference
www.conferenceie.ase.ro
94
has at the respective time with this one. If more and more banks buy a system like this in a
short period of time, clients can obtain a legerity from more banking institutions. The banking
institutions who do not want to buy a system like this will lose market share in front of the
institutions that have such an informatics system. The interface of the informatics system is
easy to use for each employee of the banking institution. It is not necessary a training period
for improving the use this system, because it will have an interface easy to use and also one of
the latest. Nowadays, technology improves and more and more bank institutions make major
investments in the internal informatics systems. If these investments are not made, it is a great
risk level that those systems that the institutions have at the respective time cannot handle the
processes that an employee has to achieve in those systems because they have an older
implementation. The amortization of investment can be achieved in a very short time because
the number of clients will raise and the bank’s profit will be bigger. In the future, there will be
made a lot of questionnaires based on this information and there will be clearly seen the
advantages of this system.
References
[1] Alt, M., Gorlatch, S. (2005). Adapting Java RMI for grid computing, Future Generation
Computer Systems, Volume 21, Issue 5, pp. 699–707.
[2] Amorim, B.S.R, Sousa, J.L.R. (2014). Information System conceptualization drive of
unique business process through virtual organizations, Procedia Technology, 16, pp. 867
– 875.
[3] Claessens, J., Dem, V., De Cock, D. et al. (2002). On the Security of Today’s Online
Electronic Banking Systems, Computers & Security, Volume 21, Issue 3, pp. 253–265.
[4] Georgescu, M., Jefleab, V. (2015). The particularity of the banking information system,
Procedia Economics and Finance, 20, pp. 268 – 276.
[5] Leger, P., Tanter, E., Fukuda, H. (2015). An expressive stateful aspect language, Science
of Computer Programming, Volume 102, pp. 108–141.
[6] Leong, S.K., Srikanthan, T., Hura, G.S. (1998). An Internet application for on-line
banking, Computer Communications, Volume 20, Issue 16, pp. 1534–1540.
[7] Salibekyan, S., Panfilov, P. (2015). A New Approach for Distributed Computing in
Embedded Systems. Procedia Engineering, 100, pp. 977 – 986.
[8] Sene, M., Moreaux, P., Haddad, S. (2006). Performance evaluation of distributed
Database-A Banking system case study, A volume in IFAC Proceedings Volumes, pp.
351–356.
[9] Sklira, M., Pomportsis, A.S., Obaidat, M.S. (2003). A framework for the design of bank
communications systems, Computer Communications, Volume 26, Issue 15, pp. 1775–
1781.
[10] Stelmach, M., Kryza, B, Slota, R., Kitowski, J. (2011). Distributed Contract Negotiation
System for Virtual Organizations, Procedia Computer Science, 4, pp. 2206–2215.
[11] Wang, L. (2008). Implementation and performance evaluation of the parallel CORBA
application on computational grids, Advances in Engineering Software, Volume 39, Issue
3, pp. 211–218.
Proceedings of the IE 2015 International Conference
www.conferenceie.ase.ro
95
PERSONAL DATA VULNERABILITIES AND RISKS MODEL
Gheorghe Cosmin SILAGHI
Babeș-Bolyai University Cluj-Napoca
Abstract: Nowadays, a huge concern came up about the capabilities of intelligence forces to
perform mass surveillance and the extent of these capabilities. Performing personal data
interception is possible because, within society, a lot of sensitive data flow between various
systems. This paper draws a picture of the vulnerabilities and risks regarding personal data
and discusses issues regarding data interception and mining for legal purposes.
Keywords: mass surveillance, personal data, risks and vulnerabilities
JEL classification: Z18, K14, K36
1. Introduction
With the emergence of the Snowden affair, a lot of concern came up about the capabilities of
the intelligence forces to perform mass surveillance and dataveillance and the extent of these
activities. From the technological point of view, scientists and legal people acknowledge the
fact that technical capabilities of existing hardware equipment and software do exceed the
perceived limit of fair collection and usage of data for security purposes, from a privacy
concern point of view. Now, we are aware that national agencies like National Security Agency
(NSA) of US, Australian Signals Directorate (ASD) [1], Government Communication
Headquarters (GCHQ) [2] from UK, European intelligence agencies, Communications
Security Establishment Canada (CSEC) [3] are programmatically using sophisticated tools to
perform mass surveillance on all of us, intercepting Internet and phone communications and
breaching basic privacy principles, regardless whether the target is legitimate intercepted or
not, in a hope to proactively respond the various security threats of our global world like
terrorism. Are such behaviours legitimate, acceptable and proportionate? How those operations
could happen in a democratic world which abides the principles of human rights, including
privacy? Smart surveillance of real time communication of all sorts is not possible without
advanced data mining techniques allowing for face and voice recognition and identification of
individuals. But, extracted information is useless without being correlated with personal data
already stored on police and administrative databases operated worldwide.
This paper presents a model concerning vulnerabilities and risks regarding personal data. The
model builds on the general picture concerning data usage by Law Enforcement Agencies
(LEA) and Security and Intelligence Services (SIS) and depicts the data flows where sensitive
information could be collected. Furthermore, we list the relevant databases containing personal
sensitive data for the usage of detection, prevention and prosecution of crimes and some tools
that can be used for Open Source Intelligence (OSINT) purposes.
2. Data vulnerabilities and risks model
This section develops a vulnerabilities and risks model for tracking the sensitive personal
information of users world-wide. Nowadays, humans communicate more and more and they
make extensive use of novel technologies like broadband while traditional communication
stagnates. The latest data [4] released by the International Telecommunication Union (ITU) –
the United Nations specialized agency for information and communication technologies clearly

Proceedings of the IE 2015 International Conference
www.conferenceie.ase.ro
96
shows1 the advance of mobile telecommunications against fixed telephony and the increased
stake of mobile broadband. Thus, while people go mobile and on Internet they leave traces of
their existence by revealing their personal data with various occasions, voluntarily and
involuntarily. Mass surveillance of communication and Internet leads towards collection of
huge amount of data, being therefore possible to identify people and their daily activity through
these traces.
Based on the above motivation, we insist about the usefulness of a high level picture, displaying
important points where people leave traces about their personal data and daily activities.
Identifying the data sources and the data flows during communication can help us to point out
the relevant vulnerabilities for personal data leakage. We emphasize that these vulnerabilities
can be exploited for various purposes, including lawful interception for crime detection and
prosecution – carried on by Law Enforcement Agencies (LEA) or Security and Intelligence
Services (SIS), profiling for private commercial usage and for governmental reasons, or simply
(organized) criminal activities like money stealing directly affecting the people identified by
those data.
First of all, we need to point out relevant data which are vulnerable to various attacks. As we
can see on figure 1, citizens’ data, infrastructure data and corporate data are target of mass
surveillance by LEA and SIS.
Figure 1 - Relevant data under surveillance [5]
1 In 2013, at the world level, ITU reports 1.17 billion fixed telephony subscriptions, compared with 6.83 billion
mobile-cellular subscriptions. From 2005 up to 2013, mobile cellular subscriptions increased more than 3 times.
In 2013 ITU reports more than 2 billion mobile broadband subscriptions, 3 times more than fixed (wired)
broadband subscriptions.

Proceedings of the IE 2015 International Conference
www.conferenceie.ase.ro
97
Our focus is on citizens’ data or other data which can lead to revealing citizens’ personal
information. On one side, part of citizens’ data is produced for citizens’ identification by the
government – an administrative purpose, on the other side, people communicate and these data
is different as it falls under the privacy and confidentiality right of humans. Mass surveillance
does collect especially this second sort of data and matches it against the existing personal data
in the governmental databases.
In the next section, we will enumerate the governmental databases specifically used for crime
detection by LEAs or other databases used for administrative purposes, collecting personal
data.
Figure 2 presents how citizens’ data is produced and how it flows on various communication
environments, including Internet. This figure allows us to identify the vulnerable points where
personal data can be “stolen”.
Figure 2 - Personal and communication data flows
Users store their personal data in their computing devices like laptops, PCs, tables and
smartphones. With these devices they do carry their daily activity on Internet, in the form of
emails, web searches, participation in social networking, generating user content on blogs,
wikis, clouds or other applications. Tracing back the user daily activity on the Internet, one can
reach the device used to post this activity and, given access to the device, one can access the
personal data.
Users communicate via phone-calls. With the movement of analogic telephony towards the
digital one and with the emergence of novel mobile phone technologies like 3G and 4G, we
notice that the telephony network goes towards an IP network, thus, being vulnerable to the
same risks like the Internet.
Therefore, of high risk are all the communication lines between the user directly and the devices
he/she uses – like the (mobile) telephone and the communication lines between the devices and
Proceedings of the IE 2015 International Conference
www.conferenceie.ase.ro
98
the remote applications cooperating with those devices. If this communication is intercepted,
all personal data, user generated content or personal expression become vulnerable.
In general, we assume that (Internet) applications we use indeed do for us the intended
functionality and not another one. We do trust the application we use. But, a lot of them collect
data from us and use this data for purposes – like profiling, not specified in the service level
agreement consented between us and the application or service provider. Therefore,
applications we use represent another risk against our data. Either their operators use the data
in purposes not known to the user, or they use the applications as backdoors towards our
devices.
Users perform daily activities being present in public private places where there are sensors
deployed – like CCTV cameras. Those sensors register the user activity and behaviour,
communicating it to some central control room, using the same communication lines. Thus,
they represent another source of information capable of revealing important details to person
identification.
Besides their daily activity and behaviour, people need to register with the governmental
structures, their identification data being stored in the governmental administrative databases.
Information contained in governmental databases is the most reliable one with respect to user
identification. Thus, if LEAs and SISs intend to exploit the data-related vulnerabilities of our
behaviour, they need to synchronize gathered intelligence with existing facts stored in the
police and administrative databases.
We notice that majority of communication passes over some networking infrastructure,
regardless if it is a wired infrastructure – like the fibre-optic or a satellite communication.
Therefore, investigating the networking infrastructure in detail is a must.
All networking communication abides to some technical standards well known by the technical
people. Vulnerabilities and risks of the networking communication become valid for both
positive usage within lawful interception and for misuse as part of criminal activities.
We also notice that mobile communication tends to go on the same computer networking
standards. This implies that mobile communication and Internet traffic fall under the coverage
of the same networking standards, enhancing the effectiveness of both lawful interception
activities and, on the other side, of the (organized) criminal activities.
We also notice that personal data is matched against the content of administrative or police
databases, enumerated on the next section.
Also, besides user generated content on the Internet, a lot of information is produced and
broadcasted by media and this information source represents a valuable asset in what regards
surveillance. Automated systems intercept open media broadcasted data – like TV streaming,
and extracted data is matched against citizens’ data, either these obtained from lawful
interception, or those stored in databases. We will brief on the Open source intelligence concept
on section 4.
3. Databases and data storage systems
In this section, without being exhaustive, we enumerate several databases in use by LEAs and
governments to store personal data of citizens, for law enforcement or administrative purposes.
LEAs of different countries use their custom databases, and coordinate their content with the
general database of Interpol.
Interpol manages ICPO – the Interpol Nominal data database ICIS (International Criminal
Information System), in use by 190 countries for the detection and prosecution of crimes in
general. It contains more than 153 000 records on known international criminals, missing
persons and dead bodies, with their names, birth dates, physical description, photographs,
criminal histories, fingerprints, etc.

Proceedings of the IE 2015 International Conference
www.conferenceie.ase.ro
99
LEAs of different countries manage specific or specialised (police) databases, including
specific structured data (e.g. DNA, fingerprints, stolen passports) or data recorded for specific
types of crime (e.g. theft of Works of Art, terrorist activities). For example, many countries
implements AFIS (Automated Fingerprint System) – which is an integrated computer system
with a database of millions of personal data used for the identification of fingerprints. Many
countries use national DNA databases. National databases often have match rates for linking a
crime scene profile with a previously stored person (between 20-50%). The INTERPOL DNA
Database [6] introduces a data matching system with the capacity to connect its international
profile matching system to all member states using DNA profiling. Participating countries
actively use the DNA Gateway as a tool in their criminal investigations and it regularly detects
potential links between DNA profiles submitted by member countries. Other highly used
databases include stolen works of art, stolen motor vehicles, arms register, missing persons,
stolen and lost travel documents, stolen administrative documents.
Administrative databases held by public authorities are kept for specific administrative
purposes, not for police purposes. On a case to case basis, authorization can be given upon
certain conditions to LEAs to access directly or indirectly topical data in the context of a
criminal investigation. In includes the Personal Information File (in form of a register of
residents or civil registry), passports, national IDs, drivers’ licenses, visa information, the
asylum seekers information systems (Eurodac), the Interagency Border Inspection System,
criminal records, consular lookout and support system, the consolidated consular database, etc.
4. Open source intelligence
According with US Department of Army, open source intelligence (OSINT) is defined [7] as
the discipline that gathers intelligence from “publicly collected information that is collected,
exploited and disseminated in a timely manner to an appropriate audience for the purpose of
addressing a specific intelligence and information requirement”. We shall notice and
emphasize two essential properties of OSINT: (i) It exploits publicly available information, in
the sense that any data produced for the general public on various environments with various
purposes fall under the OSINT definition and (ii) The source of information is open, in the
sense that data can openly be gathered without the expectation of privacy. Amongst open
information sources we can have electronic environments which can be interrogated
automatically, or humans. We notice that the above-presented definition covers various
environments like:
media, including written media on newspapers or magazines broadcasted media like
radio or TV,
WWW, with all publicly information available on it, including websites, social
networking, wikis, blogs, video-sharing, search engines, images, maps, geospatial
information etc. In general, web-based user generated content, deep and dark web fall
under this category.
Professional and academic communities that spread their knowledge in workshops and
conferences, publishing reports, academic articles, books etc.
Official governmental sources, releasing various reports like demographic reports,
official statistics, laws and regulations, official speeches, press conferences and
debates, budgets, public information emerging out of e-government systems
Information that can be gathered by interrogating computer machines and other
networked elements available over the Internet, including publicly available sensors
Geospatial information collected from satellites, GIS systems, maps, atlases, airspace
and maritime navigation data, environmental data.

Proceedings of the IE 2015 International Conference
www.conferenceie.ase.ro
100
OSINT assumes that all information is collected from open sources, which preclude the privacy
assumption. Ones who use OSINT assume that they do not have to abide to privacy concerns,
as all the data is available to everyone.
Countries like USA or Great Britain justify their controversial mass surveillance programs like
PRISM or Tempora to fulfill the some of the goals of OSINT. But, there are many simple or
sophisticated OSINT tools used in practice.
Several simple tools are based on open source software. We enumerate here tools like The
Wayback Machine, Who.is, Maltego, public translation services like Google translate,
IP2Location, NewsNow, SocialMention, Google Hacking Database, or the Social engineering
toolkit. Being based on open-source technologies, these tools and other ones are of the same
usage for both the investigators and the criminals.
Besides these open-source software tools, there is a massive software market for companies
that build integrated and expensive software for LEA and SIS usage, especially for OSINT
purposes. We enumerate here companies like Sail Labs Technology, GlimmerGlass, Verint,
Trovicor, SS8, Mobiliaris, Ipoque, and others2. Companies like these one gather in huge
exhibitions to present their developments to LEAs and SIS, where most of the presentations
are held with closed doors, on invitation basis only.
5. Conclusion
This paper presents a vulnerabilities and risk model concerning sensitive personal data. With
the nowadays extent of dataveillance and massive surveillance programs operated by countries
all over the world, a controversial question comes in about the legitimacy of these programs
and whether they violate human rights including the right of privacy.
We want to draw attention to weak points there sensitive personal data are vulnerable and list
several tools used by law enforcement agencies and intelligence services for data surveillance.
Scientific community in IT needs to be aware that developed technologies are used by both
sides of the game: by the governmental investigators and by criminals.
Acknowledgement
We acknowledge support from the European Union’s Seventh Framework Programme for
research, technological development and demonstration under FP7 RESPECT project, grant
agreement no. 285285.
References
[1] Tim Leslie and Mark Corcovan, Explained: Australia’s Involvement with the NSA, the US
spy agency at heart of global scandal, ABC News, 19 Nov 2013,
http://www.abc.net.au/news/2013-11-08/australian-nsa-involvement-explained/5079786
[2] Julian Borger, GCHQ and European spy agencies worked together on mass surveillance,
The Guardian, 1 Nov 2013, http://www.theguardian.com/uk-news/2013/nov/01/gchq-
europe-spy-agencies-mass-surveillance-snowden
[3] Greg Weston, Glenn Greenwald, Ryan Gallagher, Snowden document shows Canada set
up spy posts for NSA, CBC News, 9 Dec 2013, http://www.cbc.ca/news/politics/snowden-
document-shows-canada-set-up-spy-posts-for-nsa-1.2456886
2 The enumeration is not exhaustive and our intention is not to advertise those companies.

Proceedings of the IE 2015 International Conference
www.conferenceie.ase.ro
101
[4] International Telecommunication Union, World Telecommunication / ICT Indicators
database 2013, key 2006-2013 data, available at http://www.itu.int/en/ITU-
D/Statistics/Pages/stat/default.aspx
[5] Joseph A. Cannataci, Defying the logic, forgetting the facts: the new European proposal for
data protection in the police sector, European Journal of Law and Technology, vol. 4(2),
2013, http://ejlt.org/article/view/284/390
[6] http://www.interpol.int/INTERPOL-expertise/Forensics/DNA
[7] Headquarters Department of Army, Open-source intelligence, ATP 2-22.9, July 2012,
available at http://www.fas.org/irp/doddir/army/atp2-22-9.pdf

Proceedings of the IE 2015 International Conference
www.conferenceie.ase.ro
102
A BUSINESS MODEL FOR THE INTERACTION BETWEEN ACTORS
OF CULTURAL ECONOMY
Cristian CIUREA
Bucharest University of Economic Studies, Bucharest, Romania
[email protected] Florin Gheorghe FILIP
Romanian Academy- INCE & BAR, Bucharest, Romania
Abstract. The paper proposes a business model for the efficiency optimization of the
interaction between all actors involved in cultural heritage sector, such as galleries, libraries,
archives and museums (GLAM). The implementation of virtual exhibitions on mobile devices
is described and analyzed as a key factor for increasing the cultural heritage visibility. New
perspectives on the development of virtual exhibitions for mobile devices are considered.
Keywords: cultural heritage, virtual exhibitions, business model, mobile applications. JEL classification: Z1, O1
1. Introduction We are living in the era of the internet and mobile technologies, where information can be
accessible at a touch/click distance and the most important is that the access can be anytime
and from anywhere. Mobile technologies have evolved at exponential rate in the last years and
the evolution will continue. The rapid change of mobile devices in hardware and software have
made possible the replacement of old computers and laptops with smart phones and tablets
when discussing about internet surfing, email checking and so on [1].
Young people represent the majority of mobile device users, having grown up with these
gadgets and being familiar with their use. A big issue of the anytime-anywhere access to
information of young people is that they want to discover everything online, they have no time
to go to libraries to read classic books, they are not willing to visit museums and art galleries
to explore exhibitions of paintings, sculptures and so on. Thus, their knowledge of culture,
literature and history is not as rich as schools and universities expected them to have.
In order to aid the young generation and to increase the visibility and number of visitors,
libraries and museums have decided to present their exhibitions and collections online. The
idea of virtual exhibitions implementation on mobile devices, as native mobile applications, is
accepted by many museums and libraries that already have digitized material available online.
A virtual exhibition goes beyond digitizing a collection which is primarily meant for
preservation [2]. The potential offered by mobile technologies and the increased number of mobile devices
processing multimedia content, both offline and online, facilitate the implementation of virtual
exhibitions on mobile devices [3]. In [4] and [5], a cybernetic model for computerization of the
cultural heritage is proposed in order to study the relationship between the organizations
involved.

Proceedings of the IE 2015 International Conference
www.conferenceie.ase.ro
103
2. Cultural economy
The idea of cultural economy originated in the 90s, when De Michelis said that “Europe's
cultural heritage is a strategic resource similar to oil for Arab countries”. Through the
digitization process of multimedia collections from libraries, museums and other cultural
institutions, the knowledge and development of national and European cultural heritage
elements are ensured [4].
The cultural economy is a combination of technological developments, human factor, new
business models and geopolitical and economic evolutions [6], as shown in Figure 1.
Figure 1. Components of Cultural Economy
When discussing about cultural economy, we must consider the academic world’s perspective
on democratization of the access to knowledge and on preservation of the original objects of
cultural heritage.
At the same time, heritage and culture in a globalized world are exposed to a wide range of
demands of consumption and communication [7].
The evolution of information and communication technologies must ensure not only a
better knowledge and preservation of cultural heritage items, but it must promise an
increased number of direct visitors of cultural institutions as well. Software applications
for creating virtual exhibitions, in addition to being used as tools to prepare and build
content for virtual visits, may help the staff of a museum or library to conceive and create
exhibitions [8].
Technology has offered museums and libraries the means to create more vivid and
attractive presentations for communicating their message to the visitors in a more effective
and attractive manner [9].
3. The proposed business model
The model proposed for explaining the interaction between actors of cultural heritage sector
has the objective to highlight the direct relation between investment in digitization and
visibility of cultural heritage exhibits on the one side, and the number of visitors and revenues
of cultural institutions on the other side [10]. The model supposed to increase the visibility and

Proceedings of the IE 2015 International Conference
www.conferenceie.ase.ro
104
attractiveness of different exhibits and collections stored in libraries and museums by making
them available online with the support of mobile applications for the implementation of virtual
exhibitions [11] [12].
The objective of implementing virtual exhibitions on mobile devices is not to replace physical
exhibitions, but to bring art consumers closer to what they love, to make collections accessible
at any time and from any place, to keep visitors informed in the field with new exhibitions or
events and to open people’s appetite to knowledge [13].
Here is the simplified business model:
𝑥1(𝑘) = ∑ 𝑑𝑖(𝑘)
𝑤
𝑖=1
+ ∑ 𝑣𝑖(𝑘)
𝑤
𝑖=1
+ 𝑥0(𝑘)
𝑦1(𝑘) = ∑ 𝑚𝑖(𝑘)
𝑧
𝑖=1
+ ∑ ℎ𝑖(𝑘)
𝑧
𝑖=1
+ 𝑦0(𝑘)
where:
k – the current month;
x1 – the number of estimated physical visitors of cultural institutions;
x0 – the number of existing physical visitors of cultural institutions (who visit them
repeatedly);
di – the increase of the number of visitors resulting from investments in digitization;
vi – the increase of the number of visitors resulting from investments in visibility
(implementation of virtual exhibitions for mobile devices);
y1 – the estimated revenue of cultural institutions;
y0 – the current revenue of cultural institutions;
mi – the revenue resulting from investments in visibility (development of virtual
exhibitions for mobile devices);
hi – the revenue resulting from data reuse (digitized collections reuse);
w – the number of exhibits selected for digitization;
z – the number of digitized exhibits selected for reuse.
In Figure 2 below, there are presented the relations between implementation of virtual
exhibitions for mobile devices on the number of visitors and revenues of galleries, libraries,
archives and museums. The figure shows a simplified diagram of the proposed business model,
in which users of mobile applications, such as virtual exhibitions, come to visit cultural
institutions, due to exploration of virtual exhibition on the mobile device.
In the preconditions of the business model proposed, we consider that data should be reusable
also for other virtual exhibitions or in other online way. The concept of permanent universal
cultural depot appears, which is totally distributed, infinite in size and accessible anytime and
anywhere and implementing the vision of the British novelist H. G. Wells [14].
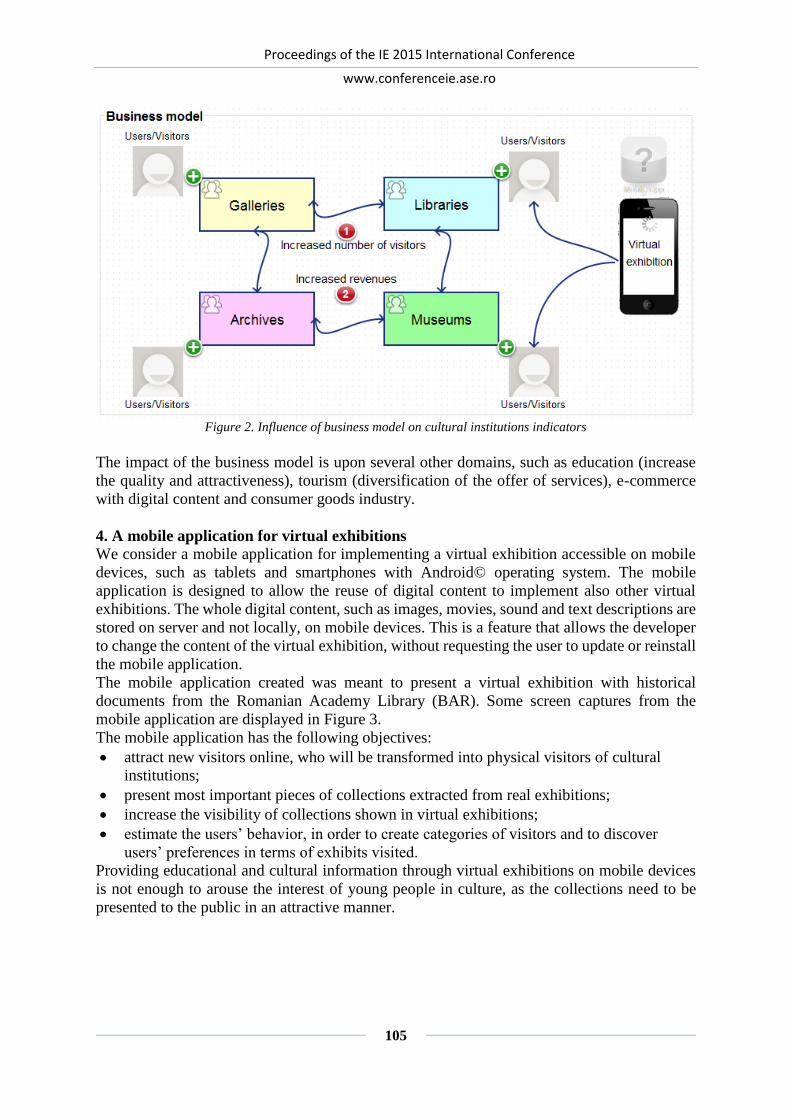
Proceedings of the IE 2015 International Conference
www.conferenceie.ase.ro
105
Figure 2. Influence of business model on cultural institutions indicators
The impact of the business model is upon several other domains, such as education (increase
the quality and attractiveness), tourism (diversification of the offer of services), e-commerce
with digital content and consumer goods industry.
4. A mobile application for virtual exhibitions
We consider a mobile application for implementing a virtual exhibition accessible on mobile
devices, such as tablets and smartphones with Android© operating system. The mobile
application is designed to allow the reuse of digital content to implement also other virtual
exhibitions. The whole digital content, such as images, movies, sound and text descriptions are
stored on server and not locally, on mobile devices. This is a feature that allows the developer
to change the content of the virtual exhibition, without requesting the user to update or reinstall
the mobile application.
The mobile application created was meant to present a virtual exhibition with historical
documents from the Romanian Academy Library (BAR). Some screen captures from the
mobile application are displayed in Figure 3.
The mobile application has the following objectives:
attract new visitors online, who will be transformed into physical visitors of cultural
institutions;
present most important pieces of collections extracted from real exhibitions;
increase the visibility of collections shown in virtual exhibitions;
estimate the users’ behavior, in order to create categories of visitors and to discover
users’ preferences in terms of exhibits visited.
Providing educational and cultural information through virtual exhibitions on mobile devices
is not enough to arouse the interest of young people in culture, as the collections need to be
presented to the public in an attractive manner.
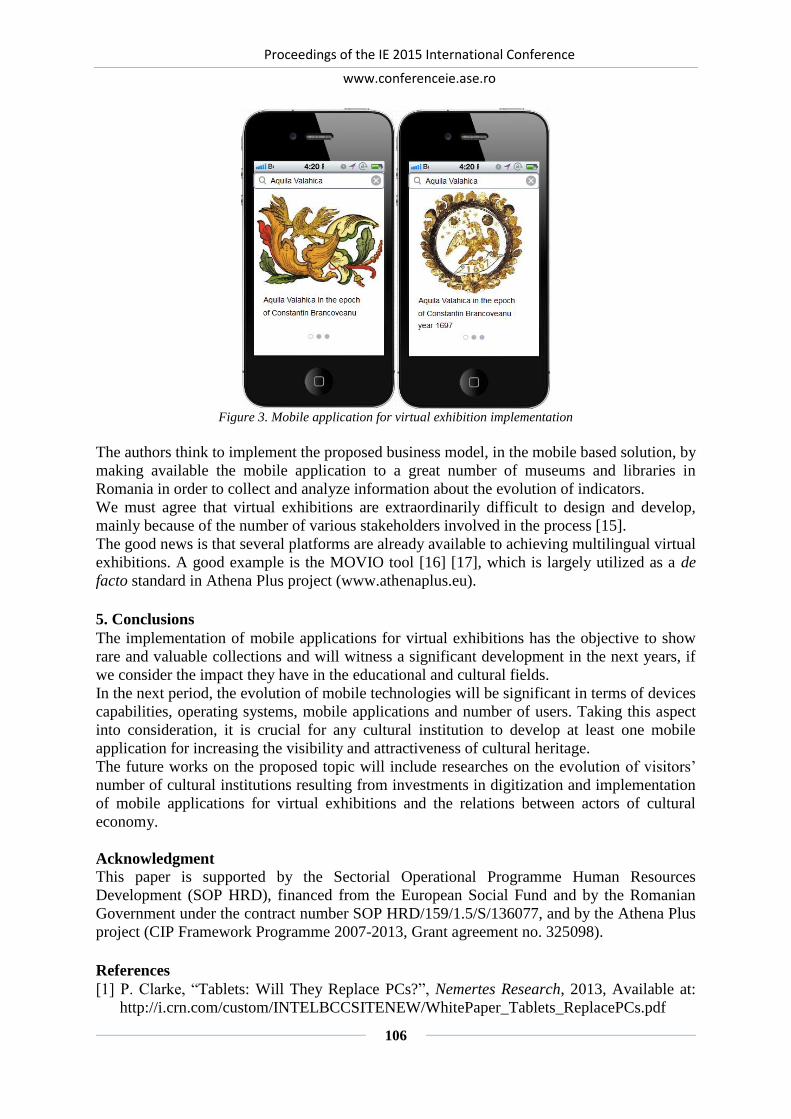
Proceedings of the IE 2015 International Conference
www.conferenceie.ase.ro
106
Figure 3. Mobile application for virtual exhibition implementation
The authors think to implement the proposed business model, in the mobile based solution, by
making available the mobile application to a great number of museums and libraries in
Romania in order to collect and analyze information about the evolution of indicators.
We must agree that virtual exhibitions are extraordinarily difficult to design and develop,
mainly because of the number of various stakeholders involved in the process [15].
The good news is that several platforms are already available to achieving multilingual virtual
exhibitions. A good example is the MOVIO tool [16] [17], which is largely utilized as a de
facto standard in Athena Plus project (www.athenaplus.eu).
5. Conclusions The implementation of mobile applications for virtual exhibitions has the objective to show
rare and valuable collections and will witness a significant development in the next years, if
we consider the impact they have in the educational and cultural fields.
In the next period, the evolution of mobile technologies will be significant in terms of devices
capabilities, operating systems, mobile applications and number of users. Taking this aspect
into consideration, it is crucial for any cultural institution to develop at least one mobile
application for increasing the visibility and attractiveness of cultural heritage.
The future works on the proposed topic will include researches on the evolution of visitors’
number of cultural institutions resulting from investments in digitization and implementation
of mobile applications for virtual exhibitions and the relations between actors of cultural
economy.
Acknowledgment This paper is supported by the Sectorial Operational Programme Human Resources
Development (SOP HRD), financed from the European Social Fund and by the Romanian
Government under the contract number SOP HRD/159/1.5/S/136077, and by the Athena Plus
project (CIP Framework Programme 2007-2013, Grant agreement no. 325098).
References [1] P. Clarke, “Tablets: Will They Replace PCs?”, Nemertes Research, 2013, Available at:
http://i.crn.com/custom/INTELBCCSITENEW/WhitePaper_Tablets_ReplacePCs.pdf

Proceedings of the IE 2015 International Conference
www.conferenceie.ase.ro
107
[2] G. Dumitrescu, F. G. Filip, A. Ioniţă, C. Lepădatu, “Open Source Eminescu’s Manuscripts:
A Digitization Experiment,” Studies in Informatics and Control, Vol. 19, No. 1, pp. 79-84.
[3] F. G. Filip, C. Ciurea, H. Dragomirescu, I. Ivan, “Cultural Heritage and Modern Information
and Communication Technologies,” Technological and Economic Development of
Economy, Vol. 21, Issue 3, 2015.
[4] F. G. Filip, “Information Technologies in Cultural Institutions,” Studies in Informatics and
Control, Vol. 6, No. 4, 1996, pp. 385-400.
[5] F. G. Filip, D. A. Donciulescu, C. I. Filip, “A Cybernetic Model of Computerization of the
Cultural Heritage,” Computer Science Journal of Moldova, Vol. 9, No. 2(26), 2001, pp.
101-112.
[6] F. G. Filip, “Catre o economie a culturii si o infrastructura informationala intelectuala,”
ACADEMICA, 12 (132), pp. 12-13.
[7] A. Alzua-Sorzabal, M. T. Linaza, M. Abad, L. Arretxea, A. Susperregui, “Interface
Evaluation for Cultural Heritage Applications: the case of FERRUM exhibition,” The 6th
International Symposium on Virtual Reality, Archaeology and Cultural Heritage (VAST
2005), The Eurographics Association, 2005.
[8] J. Gomes, M. B. Carmo, A. P. Cláudio, “Creating and Assembling Virtual Exhibitions from
Existing X3D Models,” Docs.DI, 2011.
[9] G. Lepouras, A. Katifori, C. Vassilakis, D. Charitos, “Real exhibitions in a Virtual
Museum,” Virtual Reality Journal, Springer-Verlag, Vol 7, No 2, 2003, pp. 120-128.
[10] C. Ciurea, C. Tudorache, “New Perspectives on the Development of Virtual Exhibitions
for Mobile Devices,” Economy Informatics, Vol. 14, No. 1/2014, pp. 31-38.
[11] C. Ciurea, C. Coseriu, C. Tudorache, “Implementing Mobile Applications for Virtual
Exhibitions using Augmented Reality,” Journal of Mobile, Embedded and Distributed
Systems, Vol. 6, No. 3, 2014, pp. 96-100.
[12] C. Ciurea, A. Zamfiroiu, A. Grosu, “Implementing Mobile Virtual Exhibition to Increase
Cultural Heritage Visibility,” Informatica Economică, Vol. 18, No. 2/2014, pp. 24-31.
[13] C. Ciurea, G. Dumitrescu, C. Lepadatu, “The Impact Analysis of Implementing Virtual
Exhibitions for Mobile Devices on the Access to National Cultural Heritage,” Proceedings
of 2nd International Conference ‘Economic Scientific Research - Theoretical, Empirical
and Practical Approaches’, ESPERA 2014, 13-14 November 2014, Bucharest, Romania.
[14] H. G. Wells, World Brain, Methuen & Co., London, 1938, Available at:
https://ebooks.adelaide.edu.au/w/wells/hg/world_brain/
[15] S. Foo, Y. L. Theng, H.L.D. Goh, J. C. Na, “From Digital Archives to Virtual Exhibitions,”
Handbook of Research on Digital Libraries: Design, Development and Impact, IGI Global,
Hershey, PA, pp. 88-101.
[16] S. H. Minelli, M. T. Natale, B. Dierickx, P. Ongaro, D. Ugoletti, R. Saccoccio, M. Aguilar
Santiago, “MOVIO: A semantic content management and valorisation approach for
archives and cultural institutions,” Girona 2014: Arxius i Indústries Culturals, 2014,
Available at: http://www.girona.cat/web/ica2014/ponents/textos/id234.pdf
[17] M. T. Natale, S. H. Minelli, B. Dierickx, P. Ongaro, M. Piccininno, D. Ugoletti, R.
Saccoccio, A. Raggioli, “Exhibiting Intangible Cultural Heritage using MOVIO: a
multilingual toolkit for creating curated digital exhibitions, made available by the
AthenaPlus project,” ICOM 2014 - Access and Understanding – Networking in the Digital
Era: intangible Cultural Heritage, 2014, Available at:
http://www.cidoc2014.de/images/sampledata/cidoc/papers/H-2_Natale_Minelli_et-
al_paper.pdf

Proceedings of the IE 2015 International Conference
www.conferenceie.ase.ro
108
NEAR FIELD COMMUNICATION - THE STATE OF KNOWLEDGE
AND USE OF NFC TECHNOLOGIES AND APPLICATIONS BY USERS
OF SMART MOBILE DEVICES
Mihaela Filofteia TUTUNEA
Babeș-Bolyai University of Cluj-Napoca, Faculty of Business
Abstract. The evolution of mobile technologies in the past decade has imposed NFC as the
new technology for proximity communication, at the same time there being launched NFC-
enabled smart devices that have opened new opportunities for conducting daily activities using
contactless technologies. The development of these technologies has determined dedicated
applications and software solutions to grow in number to the point that they are now covering
more and more areas of daily activities. From this perspective, the present paper is divided
into two parts: the first provides an overview of NFC technologies and their applications, while
the second represents a study of the state of knowledge and use of NFC technologies and
applications by users of smart mobile devices. The findings provide useful information for
producers of smart mobile devices and mobile applications dedicated to new technologies and
intelligent devices and obviously, for their users.
Keywords: NFC, mobile applications, smart mobile devices
JEL classification: L86, M15
1. Introduction and literature review The continuing development of mobile technologies and applications and related software
solutions, has created new trends in terms of consumer orientation toward smart mobile
devices.
In recent years we have all witnessed the fast development of these devices, generation after
generation, and their permanent enrichment with new communication functions and features.
In these evolutionary trends we can also include the use of NFC (Near Field Communication)
technologies, considered some of the newest facilities in proximity communication.
Based on these considerations, the present paper was divided in two parts, namely: the first one
presents a general perspective on NFC technologies and on the main related applications, while
the second part focuses on the study of the state of knowledge 108n dues of NFC technologies
and applications by users of smart mobile devices.
Given the fact that the study can be considered singular in the landscape of the use of NFC
technologies, the findings are very useful also for understanding the NFC ecosystem, defined
as „different applications (marketing, payments, identity, access, transit, peer-to-peer, posters,
gaming, product labels) and different end markets (e.g., consumer, medical, enterprise) –
especially beyond payment [23].
a. NFC – general aspects According to the NFC Forum, which was founded in 2004 by Nokia, Philips and Sony, Near
Field Communication (NFC) is „a standards-based short-range wireless connectivity
technology” [16]. In time, the NFC Forum has continued its mission to promote the use of NFC
technology and at present it includes 190 members among whom equipment and electronic and
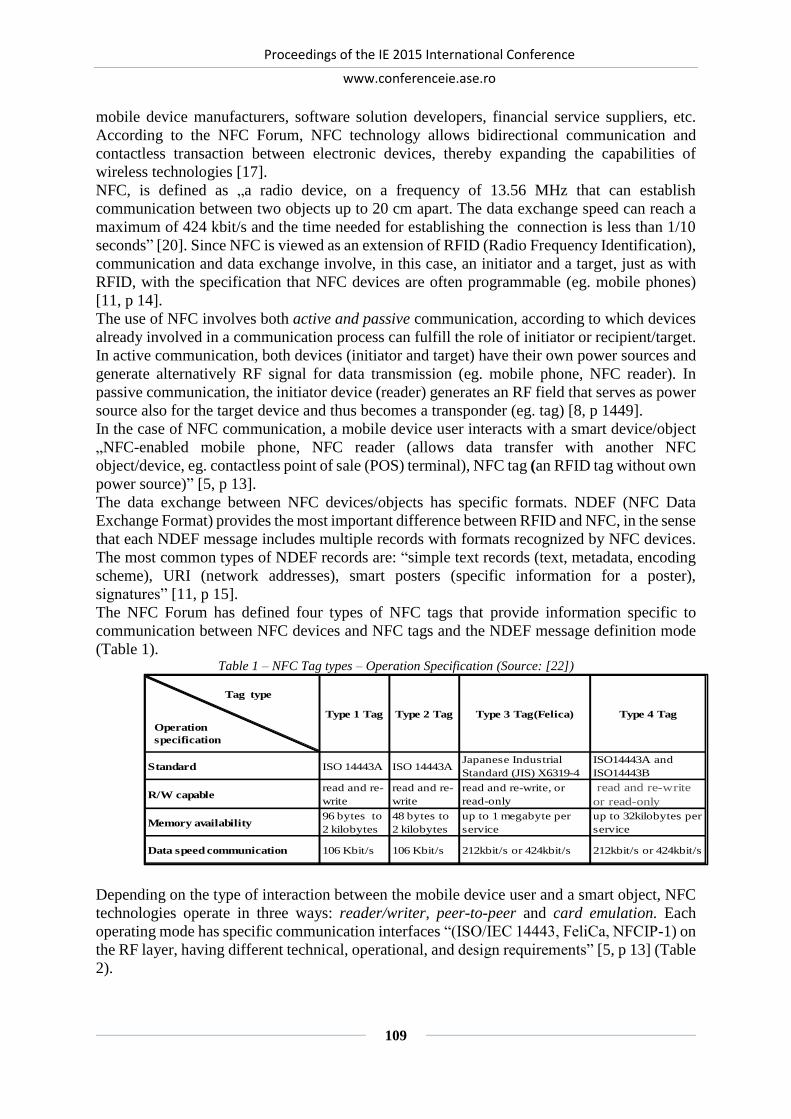
Proceedings of the IE 2015 International Conference
www.conferenceie.ase.ro
109
mobile device manufacturers, software solution developers, financial service suppliers, etc.
According to the NFC Forum, NFC technology allows bidirectional communication and
contactless transaction between electronic devices, thereby expanding the capabilities of
wireless technologies [17].
NFC, is defined as „a radio device, on a frequency of 13.56 MHz that can establish
communication between two objects up to 20 cm apart. The data exchange speed can reach a
maximum of 424 kbit/s and the time needed for establishing the connection is less than 1/10
seconds” [20]. Since NFC is viewed as an extension of RFID (Radio Frequency Identification),
communication and data exchange involve, in this case, an initiator and a target, just as with
RFID, with the specification that NFC devices are often programmable (eg. mobile phones)
[11, p 14].
The use of NFC involves both active and passive communication, according to which devices
already involved in a communication process can fulfill the role of initiator or recipient/target.
In active communication, both devices (initiator and target) have their own power sources and
generate alternatively RF signal for data transmission (eg. mobile phone, NFC reader). In
passive communication, the initiator device (reader) generates an RF field that serves as power
source also for the target device and thus becomes a transponder (eg. tag) [8, p 1449].
In the case of NFC communication, a mobile device user interacts with a smart device/object
„NFC-enabled mobile phone, NFC reader (allows data transfer with another NFC
object/device, eg. contactless point of sale (POS) terminal), NFC tag (an RFID tag without own
power source)” [5, p 13].
The data exchange between NFC devices/objects has specific formats. NDEF (NFC Data
Exchange Format) provides the most important difference between RFID and NFC, in the sense
that each NDEF message includes multiple records with formats recognized by NFC devices.
The most common types of NDEF records are: “simple text records (text, metadata, encoding
scheme), URI (network addresses), smart posters (specific information for a poster),
signatures” [11, p 15].
The NFC Forum has defined four types of NFC tags that provide information specific to
communication between NFC devices and NFC tags and the NDEF message definition mode
(Table 1). Table 1 – NFC Tag types – Operation Specification (Source: [22])
Depending on the type of interaction between the mobile device user and a smart object, NFC
technologies operate in three ways: reader/writer, peer-to-peer and card emulation. Each
operating mode has specific communication interfaces “(ISO/IEC 14443, FeliCa, NFCIP-1) on
the RF layer, having different technical, operational, and design requirements” [5, p 13] (Table
2).
Type 1 Tag Type 2 Tag Type 3 Tag(Felica) Type 4 Tag
Standard ISO 14443A ISO 14443A Japanese Industrial
Standard (JIS) X6319-4
ISO14443A and
ISO14443B
R/W capableread and re-
write
read and re-
write
read and re-write, or
read-only
read and re-write
or read-only
Memory availability96 bytes to
2 kilobytes
48 bytes to
2 kilobytes
up to 1 megabyte per
service
up to 32kilobytes per
service
Data speed communication 106 Kbit/s 106 Kbit/s 212kbit/s or 424kbit/s 212kbit/s or 424kbit/s
Operation
specification
Tag type

Proceedings of the IE 2015 International Conference
www.conferenceie.ase.ro
110
Table 2 – NFC operating modes (Source: [5, p 15-18])
Reader/Writer Peer-to-
Peer
Card Emulation
Read request (MU SO)
Data transfer (SO MU)
Processing within device Additional service usage (MU > SP)
Write request (MU SO)
Acknowledgment (SO MU)
Data
request/transfer (MU > MU)
Additional service
usage (MU > SP)
Service request
(MU SP)
Background services (SP >TPS)
Service usage + data
(optional) (SP MU) (Mobile user – MU; Smart object (NFC tags) – SO; Service provider – SP; Third-Party Services – TPS)
From a statistical perspective, IHS Technology shows that by 2018, 64% of the mobile phones
shipped worldwide will be NFC-enabled, compared to only 18.2% as they were in 2013; and
if in 2013 Android phones represented 93% of all shipped NFC phones, in 2018 Android will
represent only 75% of NFC phone market [18].
The main benefits of using NFC technology are „ease of use, versatility and security”, while
the main disadvantages usually refer to „compatibility, costs, security” [15].
Regarding security in NFC technologies, the following are the most common attacks:
“eavesdropping, man-in-the-middle-attack, denial of service, phishing, relay attack, data
modification” [24].
b. Application Fields for NFC technology Eight categories were identified for classifying NFC applications: „healthcare services, smart
environment services, mobile payment, ticketing and loyalty services, entertainment services,
social network services, educational services, location based services, work force and retail
management services” [4].
Healthcare Services
The applicability of NFC technologies in medicine covers different solutions, devices and
monitoring systems for various ailments and can be used including in a home-based regime.
Thus, healthcare companies have created numerous biometric devices using NFC technologies,
as there are the cases of Ergonomidesign that developed „Minimum”, a biometric device that
monitors different vital parameters using NFC cloud; and Impak Health, the creator of
„RhythmTrack”, which monitors patients’ daily activity and slumber.
The new trend of developing NFC wearable devices imposed itself on the market. Fitbit is just
one of the companies that offer NFC applications for monitoring intelligent bracelets [9]. In
2013, the Harvard Medical School developed a NFC medication tracking system, which is „a
bedside system” that uses Google Nexus NFC devices 7 [10]. NFC applications can also be
found in passive systems that use NFC tags to monitor alerts like medical appointments,
meetings, events, etc. [21].
Security problems for Mobile Health Monitoring Applications refer mainly to ”denial of
services, phishing and lost property” [8, p 1550].
Proximity Payments
ITU defines Proximity Payments as „the main payment method for B2C transactions that
implies the use of a mobile phone as equivalent to a credit or debit card (mobile wallet) or
(POS)”. The best known and most used „mobile wallets” are: Google Wallet as a NFC-enabled
device, a cloud based payment platform using a cloud-based NFC contactless card emulation
service from YESpay International Limited and YES-wallet.com, Apple’s Passbook for iOS 6,

Proceedings of the IE 2015 International Conference
www.conferenceie.ase.ro
111
China UnionPay’s largest provider of NFC Mobile Payments in China and NTTDoCoMo,
which dominates the market for NFC Mobile Payments in Japan [12].
Marketing
NFC technologies are associated with a new interaction model called „touch paradigm”,
according to which, „the user is offered context-aware services in an smart environment”. The
authors propose a model that integrates NFC and QR codes with smart environments, that
allows the management ”of all kinds of mobile coupons” [3]. Some of the areas in which „the
NFC tap and touch marketing” can be applied are: “discount store products, public
transportation and tourism, payment methods, NFC social media, NFC smart posters, Smart
home NFC settings, car NFC settings, office NFC settings, Smart City settings-NFC utility
meters” [14].
Access, authorization and monitoring
In some universities, for example in Spain, NFC technologies are used in professor and student
identification applications. These technologies are integrated with NFC Smart cards, but there
is the possibility of extending to other smart objects like cards, bracelets, cell phones, etc. [19].
The Mobile-Campus application, is another example of using NFC technologies for providing
information specific to students and related to the university campus [2]. Other universities
have implemented autonomous systems that monitor students’ attendance using NFC
technologies [13].
Military
NFC has ”a vital role in the army, particularly in the area of cordless communication where
short range communication is essential” [7].
Tourism
A number of possible NFC applications were identified also in tourism: “information supply,
access and authorization (hotels, museums, events), mobile ticketing, loyalty management,
bonus and membership cards” [6]. Gabriella Arcese, et al., emphasizes that “NFC technology
can be regarded as one of the recent ICT developments that has a huge potential for travel and
tourism” [1].
2. Smart devices users - study of the state of knowledge and use of NFC technologies and
applications The aim of this study was to identify the state of knowledge regarding NFC technologies and
the state of use of related applications, having as a starting point users’ NFC-enabled
infrastructure. It was based on the use of primary and secondary information sources, the
former resulting from the administration of a questionnaire and the latter from the collection
of statistical data and research studies from the online and offline environments. The
questionnaire had a modular design and comprised 12 closed-ended questions. It was created
in a mobile and web-based format and was structured as follows:
the first module - identification of respondents’ socio-demographic information like age,
sex, education, country of residence;
the second module - identification of respondents’ mobile infrastructure, such as the type
of used mobile devices [phone, Smathphone, tablet, wearables (SmartWatch, bracelet, etc.)
and mobile operating system, the telephone/mobile device model;
the last module - focused on NFC - determination of respondents’ awareness level regarding
the possession of a NFC-enabled device, the level of use of NFC communication facilities
and applications, the type and frequency of use of NFC applications.
The study was conducted in the time span February - December 2014 on a random sample. The
population under investigation counted 823 subjects, of which 601 formed the final sample.

Proceedings of the IE 2015 International Conference
www.conferenceie.ase.ro
112
The questionnaire was administered online, on social networks, at the end of the study period
being collected 567 valid questionnaires, which constituted the subject of the present analysis.
3. Results and discussions The analysis of the data collected through the first question module facilitated sketching
respondents’ socio-demographic profile, according to which: most users are males (58.6%)
aged between 25 and 34 years (29.12%) [the other age categories, in descending order, were:
35-44 (26.10%), 18-24 (22.05%), 45-54 (18.05%), 55-64 (4.23%), over 65 (0.45%)], holding
an academic degree (41.32%) [the indicated educational categories were the following: college
(29.57%), high school (17.06%), graduate (6.98%)]; according to the declared country of
residence, 57.98% of the respondents were from Romania and the remaining 42,02% from 29
countries around the world, the best and least represented being Spain (8.01%) and China
(0.98%), respectively; for Italy, UK, France, USA, Germany, Greece and the Rep. of Moldavia
the representation was between 6 and 8% (Figure 1).
Figure 1 - Respondents by country of residence
The second module of questions revealed the following regarding respondents’ mobile
infrastructure: 19.24% of the respondents have three mobile devices, while 46.12% have only
two; 78.65% have smartphones, 47.22% tablets and 28.11% wearable gadgets; the predominant
operating system is Android (40.22%), followed by iOS (33.31%), Windows Phone (11.01%),
BlackBerry (9.03%) and others (< 3.56%).
The analysis of the last question module allowed:
identifying respondents’ awareness level regarding possessing a NFC-enabled device,
which was tested by two questions, one referring to the model of the owned mobile device
(in this case the respondents were given a list of NFC-enabled mobile devices) and other to
the fact whether the mobile device was NFC-enabled or not. The respondents were given
further details for either question so that they fully understand them and be able to provide
an informed answer. The results were contradictory in the sense that, although 36.05% of
the respondents selected NFC-enabled mobile device models, only 10.78% of them actually
knew that, 64.89% did not know what to answer and 24% said their device was not NFC-
enabled. Of the Romanian respondents, only 3.17% said they knew they had a NFC-enabled
device.
identifying the level of communication facility and NFC application use - of the respondents
aware of possessing NFC-enabled devices, 65.47% reported using NFC facilities, 21.77%
said they never used them and 12.76% said they tried them out of curiosity; none of the
Romanian respondents indicated using the NFC applications.
determining the type of used NFC applications - the highest percentage of respondents are
declared non-users of NFC applications (32.89%); the applications used by over 20% of
the respondents are health and appointment monitoring (24.12%), data sharing and

Proceedings of the IE 2015 International Conference
www.conferenceie.ase.ro
113
collaboration (23.76%) and mobile printing and scanning (20.12%); the applications used
by over 10% of the respondents were related to touristic information and guidance
(10.34%); the other application categories were used by less than 10% of the respondents
(Figure 2).
Figure 2 - Used NFC applications
identifying the frequency of using NFC applications – this brings to the foreground the
segment of those who use these applications rarely (29.43%), followed by non-users
(24.12%); permanent users and those using NFC applications only for job-related purposes
represent 23.67% and 22.78%, respectively; a smaller percentage (9.34%) declared
themselves only occasional users of NFC applications (Figure 3).
Figure 3 - Frequency of using NFC applications
4. Conclusions In a world where words like digital, online and mobile have become intrinsic to everyday life
and manufacturers of mobile devices permanently create real trends regarding the consumption
of such products - from those designed for common use, to gadgets and wareables, there
emerges the possibility of a trend envisaging the synchronization between users’ capacity to
absorb new technologies and the latter’s evolution and launching speed. If mobile users were
able to familiarize themselves with the permanent use of Bluetooth and Wi-Fi, it is now high
time that NFC technologies be assimilated. Although NFC and NFC-enabled devices have been
present on the market for some years now, actual and possible users are little, if at all, aware
of their existence and the benefits they bring.
From this perspective, the present study aimed to identify aspects related to users’ awareness
of NFC-enabled mobile devices and the facilities offered by these technologies, as well as the
level of using related applications.
The findings revealed a faint user profile regarding NFC facilities and applications: only
10.78% of the respondents were aware of possessing NFC-enabled mobile devices, while

Proceedings of the IE 2015 International Conference
www.conferenceie.ase.ro
114
65.47% of the sample said they used NFC facilities, health monitoring being the most common;
however, most respondents confessed they use NFC applications very rarely.
An important aspect brought out by the study refers to the fact that there is a delay in users’
adaptation to smart mobile devices equipped with new communication facilities and
technologies (NFC, in our case) besides their common features. It is possible that users perceive
the necessity of having a smart device only at the level of trend in gadget fashion and not as a
need or desire to use new features and applications routinely.
Therefore, the author believe that the results of the present research may provide useful
information for manufacturers of both smart mobile devices and mobile applications for new
technologies and smart devices. Last but not least, they can guide smart device users in the
buying process and help them benefit from the enhanced facilities of the purchased items.
References
[1] G. Arcese, G. Campagna, S. Flammini, O. Martucci, “Near Field Communication:
Technology and Market Trends”, Technologies 2014, 2, pp 143-163, p. 154, available:
http://www.mdpi.com/2227-7080/2/3/143
[2] Bhattacharya Sagnik, Panbu, M. B., Design and Development of Mobile Campus, an
Android based Mobile Application for University Campus Tour Guide, International
Journal of Innovative Technology and Exploring Engineering (IJITEE) ISSN: 2278-3075,
2013, Volume-2, Issue-3, pp. 25-29, available:
http://www.ijitee.org/attachments/File/v2i3/C0405022313.pdf
[3] F. Borrego-Jaraba, P. G. Castro, C. G. García, L. I. Ruiz, A. M. Gómez-Nieto, “A
Ubiquitous NFC Solution for the Development of Tailored Marketing Strategies Based on
Discount Vouchers and Loyalty Cards”, Sensors 2013, 13, pp 6334-5354, p 6334, 6335,
available: http://www.mdpi.com/1424-8220/13/5/6334
[4] O. Busra, A. Mohammed, O. Kerem and C. Vedat, “Classification of NFC Applications in
Diverse Service Domains”, International Journal of Computer and Communication
Engineering, 2013, Vol. 2, No. 5, pp: 614, available: http://www.ijcce.org/papers/260-
F00028.pdf
[5] V. Coskun, K. Okay, B. Ozdenizci, “NFC Professional Development Application For
Android”, 2013, John Wiley & Sons, Ltd., pp 1-283, p 13,14, 15-18, available: http://it-
ebooks.info/book/2218/
[6] R. Egger, “The impact of near field communication on tourism, Journal of Hospitality and
Tourism Technology”, 2013, Vol. 4, Issue: 2, pp 119-133, p. 122, available:
http://www.emeraldinsight.com/action/doSearch?AllField=egger&SeriesKey=jhtt
[7] G. Gopichand, T. Chaitanya, Krishna, R. Ravi Kumar, “Near Field Communication and Its
Applications in Various Fields”, International Journal of Engineering Trends and
Technology (IJETT), 2013, Volume4, Issue4, pp 1305-1309, p 1307, available:
http://www.ijettjournal.org/volume-4/issue-4/IJETT-V4I4P359.pdf
[8] P. S. Halgaonkar, N. S. Daga, V. M. Wadhai, “Survey on Near Field Communication in
Healthcare”, International Journal of Science and Research (IJSR), 2014, Volume 3 Issue
12, p 1449-1450, available http://www.ijsr.net/archive/v3i12/U1VCMTQ3NTk=.pdf
[9] HCL, Near Field Communication in Medical Services, Whitepaper, April 2013, [Online],
http://www.hcltech.com/sites/default/files/near_field_communication_in_medical_device
s.pdf, pp. 9, [September 6, 2014]
[10]R. Boden, Harvard Medical School develops NFC medication tracking system , April
2013, http://www.nfcworld.com/2013/04/04/323325/harvard-medical-school-develops-
nfc-medication-tracking-system/, [December,9, 2014]

Proceedings of the IE 2015 International Conference
www.conferenceie.ase.ro
115
[11] T. Igoe, D. Coleman, B. Jepson, Beginning NFC Near Field Communication with Arduino,
Android, and PhoneGap, O’Reilly Media, Inc., 2014, pp: 1-232, p:14,15, available:
http://it-ebooks.info/book/3199/
[12] ITU-T Technology Watch Report May 2013 The Mobile Money Revolution. Part 1:
NFC Mobile Payments, available: http://www.itu.int/dms_pub/itu-
t/oth/23/01/T23010000200001PDFE.pdf
[13] L. Kumari, N. M. Midhila, E. Blessy, B. Karthik, “Automatic Wireless Attendance
Recording and Management Using Near Field Communication (NFC)”, International
Journal of Advanced Research in Computer Engineering & Technology (IJARCET), 2013,
Volume 2, Issue 4, p 1642-1645
[14] D. Mitrea, “Near Fiels Communications - From Touch To Tap Marketing Empirical
Studies, Sea - Practical Application Of Science”, 2014, Volume II, Issue 2 (4), pp 623-630,
p 625-626, available: Http://Www.Sea.Bxb.Ro/Article/Sea_4_72.Pdf
[15] R. N. Nagashree, R. Vibha, N. Aswini, “Near Field Communication”, I.J. Wireless and
Microwave Technologies, 2014, 2, pp 20-30, available:
http://www.mecs-press.org/ijwmt/ijwmt-v4-n2/IJWMT-V4-N2-3.pdf
[16] NFC Forum 1, What Is NFC?, http://nfc-forum.org/what-is-nfc/ [January, 21, 2015]
[17] NFC Forum 2, Our Mission & Goals, http://nfc-forum.org/about-us/the-nfc-
forum/[January, 21, 2015]
[18] S. Clark, Two in three phones to come with NFC in 2018, NFC world,
http://www.nfcworld.com/2014/02/12/327790/two-three-phones-come-nfc-2018/, [June,
6, 2014]
[19] D. Palma, J. E. Agudo, H. Sánchez, M. Macías, “An Internet of Things Example:
Classrooms Access Control over Near Field Communication”, Sensors 2014, 14, pp 6998-
7012, p 6999, 7003, available: http://www.mdpi.com/1424-8220/14/4/6998
[20] D. Popescu, M. Georgescu, “Internet Of Things - Some Ethical Issues, The USV Annals
Of Economics And Public Administration”, Volume 13, Issue 2(18), 2013, pp 208-214, p:
210, available:
http://www.seap.usv.ro/annals/arhiva/USVAEPA_VOL.13,ISSUE_2%2818%29,2013_fu
lltext.pdf
[21] M. Quratulain, F. Munazza, R. Iqbal, A. Awais, “NFC Tags-Based Notification System
for Medical Appointments”, International Journal of Automation and Smart Technology ,
2014, pp. 191-195
[22] C. Sathya, M. Usharani, “A Survey of Technologies to Enable Security in Near-Field
Communication Tag Design”, International Journal of Innovative Research in Advanced
Engineering (IJIRAE) ISSN: 2349-2163, 2014, Volume 1, Issue 10, pp 412-415
[23] Smart Card Alliance Mobile & NFC Council Webinar, NFC Application Ecosystems:
Introduction, Peer-to-Peer, NFC Tags/Posters and Product Label Applications, 2012, pp. 4,
http://www.smartcardalliance.org/resources/webinars/nfc_app_ecosystem/20120927_NF
C_Application_Ecosystems.pdf [December, 12, 2014]
[24] P. Suthar, N. Pandya, “Near Field Communication”- An Enhanced Approach Towards
Contactless Services, International Journal of Advanced Research in Computer Science,
2013, Volume 4, No. 2, pp 139-142

Proceedings of the IE 2015 International Conference
www.conferenceie.ase.ro
116
HOW TO VISUALIZE ONTOLOGIES. A STUDY FROM AN END
USER’S POINT OF VIEW
Bogdan IANCU
The Bucharest University of Economic Studies [email protected]
Abstract. This working paper aims to present a new approach for visualizing ontologies’ data,
dedicated especially to non-technical end users. All the graphical representation formats
widely available for the semantic web data are dedicated in general to experienced users that
have the necessary Web 3.0 background. They use notations and rules that can be hard to
understand by the final users, notions that are somehow unnecessary for them. In this short
study we propose a new usability for the already existent open source JavaScript based charts
libraries. Even if they were designed for other usages like an alternative for bar charts (the
case of bubble chart) or for the first Web 2.0 sites (the case of tag clouds), they can be easily
adapted to represent complex ontologies. The first part of this paper presents the main known
graphical representations used by the semantic web experts. The way in which we can adapt
other charts to display ontologies together with some graphical examples are presented in the
final part of the study. Keywords: charts, JavaScript, ontologies, Web 3.0 JEL classification: C55, C88, Y10
1. Introduction The current generation of semantic web uses formats like RDF, RDFS or OWL for representing
internally the structure, the constraints or the individuals of an ontology. Even these formats
are widely used in the research field by experts they are not well known by non-technical and
sometimes even by technical users. But there are cases when websites that are using ontologies
want to display them directly to the final user. In this case the already known graphical
representations of ontologies are not very useful because they were designed by experts for
experts and make use of notations and rules that are not just hard to understand, but also
unnecessary for a user of the website.
In the first part of this paper are presented the existing ontology graphical representations with
theirs’ pros and cons. We will see where they stop being useful for end users and start being
annoying instead, by displaying unnecessary or hard to understand information.
The second part proposes ways of using JavaScript based charts types dedicated to other kinds
of representations as a base that can be adapted to represent ontologies in a more user-friendly
way.
There are a lot of open source JavaScript based charts libraries on the web like Charts.js [8],
D3.js [9], amCharts [10] or Google Charts [11]. They offer graphical representations like
bubble chart, flower chart or chord diagram that can be easily adapted to display the ontology’s
individuals and relations.
All this study is in fact a research made in order to find a solution regarding the representation
of a media description ontology. To be more explicit, this ontology contains data regarding the
knowledge that can be extracted from the eLearning videos posted on Youtube. The struggle
consists in how to display the videos that contain the information that the user is interested in,
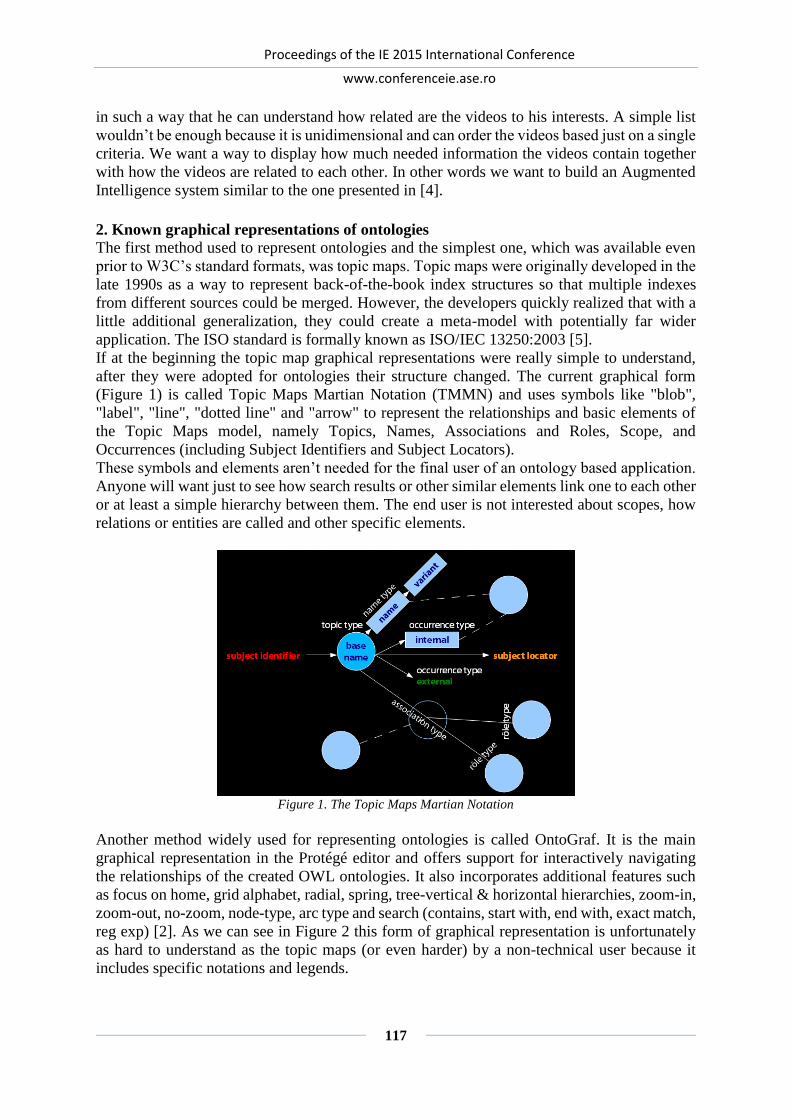
Proceedings of the IE 2015 International Conference
www.conferenceie.ase.ro
117
in such a way that he can understand how related are the videos to his interests. A simple list
wouldn’t be enough because it is unidimensional and can order the videos based just on a single
criteria. We want a way to display how much needed information the videos contain together
with how the videos are related to each other. In other words we want to build an Augmented
Intelligence system similar to the one presented in [4].
2. Known graphical representations of ontologies The first method used to represent ontologies and the simplest one, which was available even
prior to W3C’s standard formats, was topic maps. Topic maps were originally developed in the
late 1990s as a way to represent back-of-the-book index structures so that multiple indexes
from different sources could be merged. However, the developers quickly realized that with a
little additional generalization, they could create a meta-model with potentially far wider
application. The ISO standard is formally known as ISO/IEC 13250:2003 [5].
If at the beginning the topic map graphical representations were really simple to understand,
after they were adopted for ontologies their structure changed. The current graphical form
(Figure 1) is called Topic Maps Martian Notation (TMMN) and uses symbols like "blob",
"label", "line", "dotted line" and "arrow" to represent the relationships and basic elements of
the Topic Maps model, namely Topics, Names, Associations and Roles, Scope, and
Occurrences (including Subject Identifiers and Subject Locators).
These symbols and elements aren’t needed for the final user of an ontology based application.
Anyone will want just to see how search results or other similar elements link one to each other
or at least a simple hierarchy between them. The end user is not interested about scopes, how
relations or entities are called and other specific elements.
Figure 1. The Topic Maps Martian Notation
Another method widely used for representing ontologies is called OntoGraf. It is the main
graphical representation in the Protégé editor and offers support for interactively navigating
the relationships of the created OWL ontologies. It also incorporates additional features such
as focus on home, grid alphabet, radial, spring, tree-vertical & horizontal hierarchies, zoom-in,
zoom-out, no-zoom, node-type, arc type and search (contains, start with, end with, exact match,
reg exp) [2]. As we can see in Figure 2 this form of graphical representation is unfortunately
as hard to understand as the topic maps (or even harder) by a non-technical user because it
includes specific notations and legends.

Proceedings of the IE 2015 International Conference
www.conferenceie.ase.ro
118
Figure 2. The OntoGraf representation of a Traffic Signs ontology
So the problem to resolve is how to represent ontologies in such a way that even the least
technical user could understand them. A solution is by using already known graphical
representations that can be adapted to semantic web formats. The way in which we can adapt
them is presented in the next part.
3. Adapting JavaScript based charts for ontology representation We are in the era of mobile devices and technologies, heading ourselves to the Internet of
Things (IoT), the network of physical objects or "things" embedded with electronics, software,
sensors and connectivity to enable it to achieve greater value and service by exchanging data
with the manufacturer, operator and/or other connected device [7].
The majority of sites have now dedicated mobile applications or at least a responsive design.
Responsive web design is an approach to web design aimed at crafting sites to provide an
optimal viewing experience: easy reading and navigation with a minimum of resizing, panning,
and scrolling, across a wide range of devices (from desktop computer monitors to mobile
phones) [6]. This thing means that the new ways of representing ontologies for the end user
should be not only easy to understand, but also adapted to different resolutions and computing
powers.
JavaScript is a programming language that can be used on any kind of device because it is
supported natively by any browser. Together with HTML5 it has the advantage of being a
lightweight solution for displaying different kinds of charts. There are a lot of chart responsive
libraries like the one remembered in the introduction part: Charts.js, D3.js, amCharts, Google
Charts, etc. From those open source libraries we will choose just four types of graphs that can
be easily adapted to represent semantic data: the bubble chart, the tag cloud, the flower chart
and the chord diagram.
The bubble chart (Figure 3) is used in general as an alternative to bar charts. Instead of drawing
bars which display the values scaled to the chart sizes, rounded shapes are being drown with
sizes that reflect the values. But the bubble chart has another advantage (one that the bar chart
hasn’t): it can also display how the values are related to each other. By grouping bubbles in
clusters we can represent the fact that they can be categorized somehow or that it exists a
relation between them.

Proceedings of the IE 2015 International Conference
www.conferenceie.ase.ro
119
Figure 3. Different types of JavaScript based bubble charts
We can make use of this chart for ontology representations by adapting some of its features.
First of all in an ontology we don’t have values, or at least not in all ontologies. So in order to
adapt the bubble chart to ontologies we should choose at the beginning what the bubbles will
represent.
Ontologies consists, at their lowest level, of triples (subject-predicate-object). These triples are
considered the fundamental building blocks of semantic representations. The subject in a triple
corresponds to an entity - a “thing” for which we have a conceptual class, predicates are a
property of the entity to which they are attached and objects fall into two classes: entities that
can be the subject in other triples, and literal values such as strings or numbers [3].
Thus in our case the bubbles will be entities and the values that will give their sizes will be the
number of relations (properties) that each entity has: 𝑉𝑖 = ∑(𝑁𝑠 𝑖 + 𝑁𝑜 𝑖)
max (∑(𝑁𝑠 𝑖 + 𝑁𝑜 𝑖))∗ 𝑀 (1). Equation
(1) says that the value for the bubble’s i size will be the sum of triples in which the entity i
appears as subject plus the triples in which the same entity appears as object, all this divided
by the maximum of this sum from the entire ontology and multiplied by the maximum physical
size of a bubble.
In this way the most important entities from our ontology will be bigger and the less important
ones will be smaller. Furthermore we can draw linked entities with the same color to show that
they are somehow related. Entities that are linked to more than one other entity could be colored
with all the related colors or with the most dominant one (the one of the entity which has the
most relations to). In this way we provide a simple method to visualize our ontology for any
kind of user. One does not have to know what a triple is and what all those arches represent.
The chart will be self-explanatory: the bigger – the most important, the smaller – the less
important, same color – somehow related.
A similar approach will be used for the tag cloud, but here instead of bubbles we will display
the label object of each entity. This label will be written in a rectangle shaped box which size
will depend on the number of the entity’s appearances in triples (Figure 4).
Figure 4. A tag cloud that uses the terms’ numbers of appearances in text

Proceedings of the IE 2015 International Conference
www.conferenceie.ase.ro
120
The flower chart (Figure 5) is somehow similar to the presented ontology graphical
representations. But it has an advantage, beside the one of being based on HTML5 and
JavaScript, which the others don’t: it can be displayed also in a 3D format. The user can interact
with the chart and rotate it on any axis, getting the full benefits of the representation in this
way.
Figure 5. Different types of JavaScript based flower charts
Because these kind of chart is very similar to the topic maps it is not hard to adapt it in order
to represent semantic data. If we talk about the first chart presented above (Figure 5 – left side),
the only thing that we should do will be to represent only the most important property of each
entity by a line and to grow the bubbles based on the total number of triples in which they
appear like we did for the bubble chart.
To obtain the graphic presented in the right side of the Figure 5 is even simpler: we will display
all entities as dots and all the properties as lines without any legend or notation. In practice
though, the first representation could be from our point of view more representative.
The chord diagram (Figure 6) allows us to represent a large amount of data in a single chart.
That means that it is an ideal resource for large ontologies too. It is actually used for situation
in which different types of data are related to each other, just like in the ontologies. So in order
to display semantic data in this format there aren’t so many things to change. We will represent
all the entities as labels (by using the rdfs:label corresponding object) around a circle and all
the properties as chords that link the entities in triples. The result has a great impact for the end
user because he can easily see how things are related just by crossing the mouse over the needed
entities.
Figure 6. Different types of JavaScript based chord diagrams

Proceedings of the IE 2015 International Conference
www.conferenceie.ase.ro
121
4. Conclusions The widely used graphical representations of ontologies in the research field aren’t a good way
of representing semantic data when it comes to end non-technical users. These kind of
representations usually use notations or symbols known only by the people from the web
semantic field. In order to resolve this kind of problem this paper presented some ways in which
we can use classical chart formats that are available as JavaScript/HTML5 responsive libraries
for displaying ontologies’ data. We saw that with some adaptions the meaningful data from
any ontology can be outputted to the final user in a way in which it can be easily understand.
Even if there are another researches on this theme like [1], they tend to focus more on finding
new ways of displaying ontologies for experienced users, not for non-technical ones. Future
work includes the full development of the media description ontology remembered in the
introduction part and the adaption of a presented chat in order to display the search results.
Acknowledgment This paper was co-financed from the European Social Fund, through the Sectorial Operational
Programme Human Resources Development 2007-2013, project number
POSDRU/159/1.5/S/138907 "Excellence in scientific interdisciplinary research, doctoral and
postdoctoral, in the economic, social and medical fields -EXCELIS", coordinator The
Bucharest University of Economic Studies.
References [1] S. da Silva, C. Isabel and C. M. Dal Sasso Freitas, “Using visualization for exploring
relationships between concepts in ontologies” in Information Visualisation (IV), 2011 15th
International Conference on. IEEE, 2011, pp. 317-322. [2] V. Swaminathan and R. Sivakumar, (2012, April). A Comparative Study of Recent
Ontology Visualization Tools with a Case of Diabetes Data. International Journal of
Research in Computer Science [Online]. 2 (3): pp. 31-36. Available:
http://www.ijorcs.org/uploads/archive/Vol2_Issue3_06.pdf
[3] T. Segaran, C. Evans and J. Taylor, Programming the Semantic Web. Sebastopol: O’Reilly
Media, 2009, pp 19-22.
[4] Big Data and the Rise of Augmented Intelligence: Sean Gourley at TEDxAuckland,
Internet: http://tedxtalks.ted.com/video/Big-Data-and-the-Rise-of-Augmen, December 7,
2012, [March 10, 2015]
[5] Topic Maps – Wikipedia, the free encyclopedia, Internet:
http://en.wikipedia.org/wiki/Topic_Maps, November 23, 2014, [March 12, 2015]
[6] Responsive web design – Wikipedia, the free encyclopedia, Internet:
http://en.wikipedia.org/wiki/Responsive_web_design, March 9, 2015, [March 12, 2015]
[7] Internet of Things – Wikipedia, the free encyclopedia, Internet:
http://en.wikipedia.org/wiki/Internet_of_Things, March 11, 2015, [March 12, 2015]
[8] Chart.js | Open source HTML5 Charts for your website. Internet: http://www.chartjs.org/,
March 10, 2015 [March 10, 2015]
[9] D3.js – Data-Driven Documents, Internet: http://d3js.org/, March 10, 2015 [March 10,
2015]
[10] JavaScript Charts and Maps | amCharts, Internet: http://www.amcharts.com/, March 10,
2015 [March 10, 2015]
[11] Google Charts – Google Developers, Internet, https://developers.google.com/chart/,
February 25, 2015 [March 10, 2015]

Proceedings of the IE 2015 International Conference
www.conferenceie.ase.ro
122
STUDY ON STUDENTS MOBILE LEARNING ACCEPTANCE
Daniel MICAN
Babeş-Bolyai University, Business Information Systems Department
Nicolae TOMAI Babeş-Bolyai University, Business Information Systems Department
Abstract. Mobile learning has become very popular recently, due to the spectacular
development of embedded technology in the frame of mobile devices. Therefore, this study is
based on capturing the perceptions in using mobile devices by students of bachelor and master
from the FSEGA, Babeș Bolyai University. The first step we took was to run a prospective
study, using as main instrument the questionnaire. At this study participated 40 respondents.
After analyzing the results we observed that reading lecture materials is leading the top of the
preferences, followed by listening to lectures and watching presentations. Receiving lectures
materials and marks play an important role among the preferences, the majority of the
respondents confirming these activities. Moreover, we observed that the vast majority of the
respondents consider that software and mobile learning applications improve the success of a
lecture overall and increase the quality of e-learning process. Furthermore, for fulfilling all
the lecture objectives it is suggested to combine the usage of the traditional learning methods
with the mobile learning ones.
Keywords: mobile devices, mobile learning, mobile learning activities, mobile technology JEL classification: Z19
1. Introduction Mobile learning refers to delivering the educational process towards the students through
mobile devices. The students can access the educational content anytime and from any location
via Internet. Due to the high degree of presentation of mobile devices, a series of learning
paradigms have been designed which are intended for the remote use. Therefore, scientist have
developed an increased interest with respect to the usage of mobile devices and the perception
of the users regarding the learning activities [3], [5], [6], [7]. Firstly, we pass in review the
directions of mobile devices in the literature and secondly we will present the results obtained
in the framework of this study. Likewise, we will indicate the particularities resulted from
analyzing the data gathered from the respondents with regard to the preferences of both mobile
devices usage and the preferred mobile learning activities. We will end this paper by presenting
the conclusions and the directions of future works.
2. Related work In the literature there have been identified a series of researches that focus on the use of mobile
devices in the learning process. These researches are based on studying the desired
functionalities, perceptions and the user’s attitude with regard to the usage of new devices in
the process of mobile learning. Stockwell [3] conducted a study with a group of 75 students
from the Waseda University, Tokio, Japan. In this study, they analyzed the preferences of using
either a mobile device or a desktop computer in language learning process. The user’s

Proceedings of the IE 2015 International Conference
www.conferenceie.ase.ro
123
preferences have been captured by using questionnaires and logs on the server. The result of
the study reveals the fact that the students show a general positive attitude with regard to using
mobile devices in the language learning process, even if they are aware about some limitations
of the mobile devices. More than two-thirds of the subjects taking part at this experiment
showed an increased interest in using mobile phones in the language learning process, both on
a short and on a long period of time. In his study [6], Wang investigated the relevant
determinants of mobile learning acceptance based on the Unified Theory of Acceptance and
Use of Technology (UTAUT). The goal of Wangs study, was to determine some potential
differences caused by gender or age. The results obtained from 330 Taiwanese subjects
indicated that the relevant factors in using mobile learning were determined by the following
criteria: performance expectancy, effort expectancy, social influence, perceived playfulness
and self-management of learning. Likewise, they have identified the fact that the age
differences temper both the effects of effort expectancy and social influence. Furthermore, the
gender differences temper the social influence and self-management of learning in using
mobile learning.
An extensive study into mobile learning is presented in [4]. This study is shaping the stage of
technology taking into consideration the papers published in journals, technical reports and
research projects. Learning requires at least two types of subjects: the person who will be
trained and the content itself [2]. In this case, a person can use three important types of learning:
auditory, visual and tactile. The new technology offers innovative learning rules that can be
used together with the traditional ones. The increasingly widespread of Internet devices
especially of the mobile devices has improved the quality and the flexibility of learning, thus
providing a new learning paradigm, called: mobile learning [1]. Based on the developed and
implemented system at the Shangai Jiaotong University, Wang showed that the mobile learning
activities can involve the students much better in the learning process. Therefore, the students
changed their status of passive learners in learners involved not only emotionally but also
intellectually in the learning tasks. A global view over the field of mobile learning belongs to
Wu [7]. Wu undertook a literature review, offering a comprehensive summary on the basis of
164 studies from 2003 to 2010. The main findings reveal that most studies were focused on
efficiency, designing the learning system or doing experiments and surveys.
3. Case study The goal of this prospective study was to test the trends in the field of mobile learning. In order
to demonstrate the functional links among the presented elements, a larger sample volume
would be required which would allow the use of econometric models. After collecting and
processing the data, we obtained a series of results illustrated in the following. In terms of
owned mobile devices, we obtained the results illustrated in Figure 1. Smart phones and laptops
are the most popular mobile devices. They are in the possession of 75% and 57% of the
respondents. The big losers are mobile phones that are in the possession of 25% of the
respondents. These are on the list of purchasing preferences of only 5% of the students taking
part in this study.
Even if none of the respondents have an eReader, these seem to be preferred for purchasing by
12,5% of the respondents. It seems that the winner on the mobile devices market remains the
smart phone. Even if the smart phone is the winner in the “Possession Category”, this continues
to lead the purchase preferences of the respondents. Therefore, 37% of them want to purchase
a smart phone. The smart phone is surprisingly followed by TabletPC. This is preferred by 35%
of the respondents and it is owned by 30% of them. In terms of connecting to Internet, the vast
majority of owned mobile devices are connected to Internet. If we take into consideration the
laptops, the percentage of the devices connected to Internet is higher than of the owned devices

Proceedings of the IE 2015 International Conference
www.conferenceie.ase.ro
124
due to the fact that a part of the respondents use laptops in order to connect to Internet, but
they do not hold this mobile device. These use the laptop generally at work. It seems that the
ultra-books did not gain a significant market share due to very high prices. Instead of ultra-
books people still prefer laptops precisely because of the low prices.
Figure 1. Owned mobile devices, desired and connected to the Internet
Wi-Fi is used by 97,5% and is preferred as a primary method of connecting to Internet by
72,5% of the respondents. The mobile networks have gained ground lately and are being used
to connect to Internet by 60% of the respondents. A significant part of the respondents, namely
27,5% prefer mobile networks to connect to Internet. These results are shown in Figure 2.
Figure 2. Connecting mobile devices to the Internet via Wi-Fi and mobile networks
With regard to the time the subjects spent using mobile devices we obtained the following
results: the vast majority of the respondents, namely 95% use mobile devices daily. Thus, 50%
of them use the mobile devices between 1 and 3 hours, and 37,5% use them more than 4 hours
daily. This is illustrated in Figure 3.
0.00%
10.00%
20.00%
30.00%
40.00%
50.00%
60.00%
70.00%
80.00%
Owned devices
Wanted devices
Internet connected
0.00%
20.00%
40.00%
60.00%
80.00%
100.00%
used on device used more often
WiFi
Mobile network
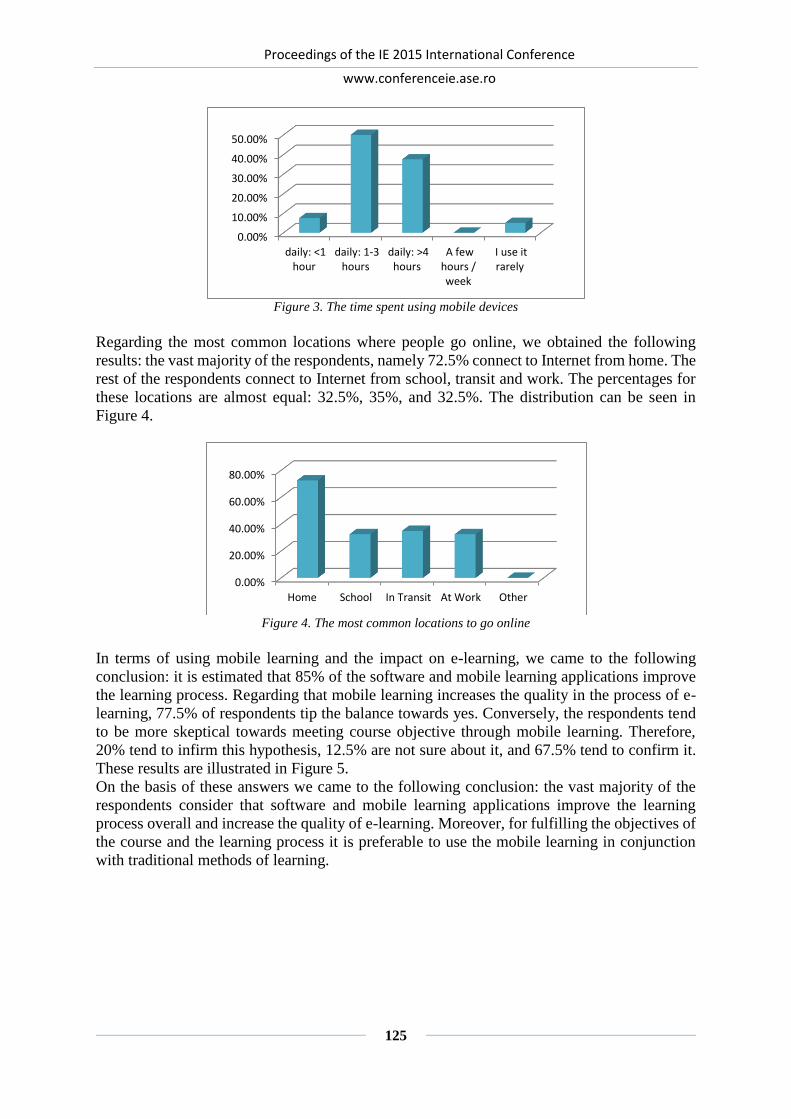
Proceedings of the IE 2015 International Conference
www.conferenceie.ase.ro
125
Figure 3. The time spent using mobile devices
Regarding the most common locations where people go online, we obtained the following
results: the vast majority of the respondents, namely 72.5% connect to Internet from home. The
rest of the respondents connect to Internet from school, transit and work. The percentages for
these locations are almost equal: 32.5%, 35%, and 32.5%. The distribution can be seen in
Figure 4.
Figure 4. The most common locations to go online
In terms of using mobile learning and the impact on e-learning, we came to the following
conclusion: it is estimated that 85% of the software and mobile learning applications improve
the learning process. Regarding that mobile learning increases the quality in the process of e-
learning, 77.5% of respondents tip the balance towards yes. Conversely, the respondents tend
to be more skeptical towards meeting course objective through mobile learning. Therefore,
20% tend to infirm this hypothesis, 12.5% are not sure about it, and 67.5% tend to confirm it.
These results are illustrated in Figure 5.
On the basis of these answers we came to the following conclusion: the vast majority of the
respondents consider that software and mobile learning applications improve the learning
process overall and increase the quality of e-learning. Moreover, for fulfilling the objectives of
the course and the learning process it is preferable to use the mobile learning in conjunction
with traditional methods of learning.
0.00%
10.00%
20.00%
30.00%
40.00%
50.00%
daily: <1hour
daily: 1-3hours
daily: >4hours
A fewhours /week
I use itrarely
0.00%
20.00%
40.00%
60.00%
80.00%
Home School In Transit At Work Other

Proceedings of the IE 2015 International Conference
www.conferenceie.ase.ro
126
Figure 5. Influence of mobile learning in the learning activities
In order to outline the feedback regarding mobile learning activities we collected and analyzed
the answers relating to: receiving marks, writing exams and quick tests, playing educational
games, watching presentations, listing to lectures, reading course materials, voice recording
and receiving course materials. The results we get show that the respondents have a clear
preference for reading the lecture/course materials. A percentage of 67.50% completely agree
reading the course materials, and a 22.50% are agree to read the course materials on mobile
devices. This activity is followed by listening to lectures and watching presentations. The
percentages of the respondents that agree to these activities are: 90% and 82.5%.
Figure 6. Feedback on mobile learning favorite activities
Receiving marks and lecture materials continues to be preferred by a large number of the
respondents. At the end of the list the respondents highlighted the following: voice recording,
writing exams and quick tests and the playing educational games. Thus, 42.5% of the
respondents seem not to be sure about the voice recording. On the other hand, surprisingly,
15% of the respondents are not sure about playing educational games, and 32.5% do not agree
with this activity.
5. Conclusions In this paper we made a prospective study to test the trends in the field of mobile learning.
After collecting, processing and analyzing the data, we can make the following statements:
smart phones and laptops are the most popular owned mobile devices. These are in the
0% 20% 40% 60% 80% 100%
the use of mobile learning software would improve…
the mobile learning increases the quality of e-learning
the course learning objectives can be met by mobile…
Yes Probably Not Sure Probably Not No
0% 10% 20% 30% 40% 50% 60% 70% 80% 90% 100%
receive learning materials
voice recording
read course materials
listening to lectures
watch presentations
play educational games
take exams and quizzes
receive grades
Completely Agree Somewhat Agree Not Sure Somewhat Disagree Completely Disagree

Proceedings of the IE 2015 International Conference
www.conferenceie.ase.ro
127
possession of 75% and 57% of the respondents and are leading the purchasing preferences
together with the tablet pc. The big losers are mobile phones that do not appear anymore on the
purchasing preferences list. The respondents use at least one mobile device that is connected
to Internet and 95% of them use mobile devices daily.
With respect to the use of mobile learning and the impact on e-learning we observed that the
majority of the respondents consider that software and mobile learning applications improve
the overall learning process in the frame of a lecture or a course and increases the quality in the
frame of e-learning. Moreover, we have reached the conclusion that in order to fulfill all the
course objectives it is preferred to combine the traditional learning methods with the mobile
learning methods. Furthermore, regarding the use of mobile learning activities we obtained the
following results: the reading of course materials is leading the top preferences. A percentage
of 67.50% completely agree to read the course materials and 22.50% agree to read the course
materials on mobile devices. This activity is followed by listening to lectures and watching
presentations. Receiving marks and course materials continues to be preferred to a large
number of the respondents. At the end of the list the respondents highlighted the following:
voice recording, taking exams and quick tests and playing educational games. Thus, 42.5% of
the respondents seem not to be sure about the voice recording. On the other hand, surprisingly,
15% of the respondents are not sure about playing educational games, and 32.5 % do not agree
with this activity. In future studies, we aim to increase the sample size which would allow the
use of econometric models and the establishment of certain links and dependencies.
References [1] J. Donner, "Research approaches to mobile use in the developing world: A review of the
literature," The information society, vol. 24, no. 3, pp. 140-159, 2008.
[2] J. L. Moore, C. Dickson-Deane, K. Galyen, "e-Learning, online learning, and distance
learning environments: Are they the same?," The Internet and Higher Education, vol. 14,
no. 2, pp. 129-135, 2011.
[3] G. Stockwell, "Investigating learner preparedness for and usage patterns of mobile
learning," ReCALL, vol. 20, no. 3, pp. 253-270, 2008.
[4] O. R. Pereira and J. J. Rodrigues, "Survey and analysis of current mobile learning
applications and technologies," ACM Computing Surveys (CSUR), vol. 46, no. 2, article
27, 35 pages, 2013.
[5] M. Wang, R. Shen, D. Novak, X. Pan, "The impact of mobile learning on students' learning
behaviours and performance: Report from a large blended classroom," British Journal of
Educational Technology, vol. 40, no. 4, pp. 673-695, 2009.
[6] Y. S. Wang, M. C. Wu, H. Y. Wang, "Investigating the determinants and age and gender
differences in the acceptance of mobile learning," British Journal of Educational
Technology, vol. 40, no. 1, pp. 92-118, 2009.
[7] W. H. Wu, Y. C. J. Wu, C. Y. Chen, H. Y. Kao, C. H. Lin, S. H. Huang, "Review of trends
from mobile learning studies: A meta-analysis," Computers & Education, vol. 59, no. 2,
pp. 817-827, 2012.

Proceedings of the IE 2015 International Conference
www.conferenceie.ase.ro
128
CONDUCTING PROCESS MODEL UNDERSTANDING
CONTROLLED EXPERIMENTS USING EYE-TRACKING: AN
EXPERIENCE REPORT
Razvan PETRUSEL
Babeș-Bolyai University of Cluj-Napoca, Romania [email protected]
Cristian BOLOGA
Babeș-Bolyai University of Cluj-Napoca, Romania [email protected]
Abstract. The research introduced in the paper is placed in the area of Business Process
Management (BPM). It is a major concern for industry and research, having process models
are at its core. The paper approaches controlled experiments that employ eye-tracking as the
observation method, for researching process model understanding. Previous research in the
field, was conducted using only indirect observation methods. Eye-tracking was employed in
several related fields, from which we distill the major points of interest related to experimental
design (e.g. metrics, tasks, participant selection, etc.). The main contribution of the paper is a
set of guidelines based on the state-of-the-art review, and our own experience with eye-tracking
based controlled experiments.
Keywords: business process model understanding, eye-tracking empirical research, eye-
tracking controlled experiment. JEL classification: C80, C90, L23.
1. Introduction Business process management (BPM) is a mature area both for industry and research. In
industry all major business software vendors (SAP, Oracle, IBM) sell process-oriented suites.
Also, there is a wealth of implementations from smaller companies supporting BPM projects
major stages (e.g. modeling, operational support, reporting and controlling). This push of
software developers is driven by the fact that most medium and large companies migrate to
process-oriented architectures. Research on BPM spreads across all continents [1], [2]. Venues
for BPM are high-profile journals and dedicated tracks in several major information systems
conferences.
At the core of BPM is the business process model (or process model for short). There is a
standard notation for drawing such models (BPMN) as well as a few other, widely-known in
industry (EPC or UML Activity Diagrams) or research (Petri Nets). No matter how the process
model is graphically depicted, the underlying assumption is that a human reader will be able to
understand it. So far, there is a body of knowledge on how process model understanding can
be improved. However, it all stands on research performed using indirect methods (i.e.
interviews, questionnaires and controlled experiments). This paper discusses how process
model understanding can be researched by applying direct observation methods. Eye-tracking
is such a direct method, given the so-called ‘eye-mind relationship’ which emphasizes the
strong connection between human thinking and the object focused by his eyes.
This paper unfolds as follows. First, we introduce the background of eye-tracking as a research
method. Then, we establish the state-of-the-art in eye-tracking based research in several areas

Proceedings of the IE 2015 International Conference
www.conferenceie.ase.ro
129
closely related to process model understanding. This is the base for a synthesis regarding major
points to be observed while executing an eye-tracking controlled experiment. In the end we
give our own experience in organizing and running such empirical research.
2. Background
2.1. Eye-tracking
Eye-tracking is a technique employed in research for over 50 years. At first, most research
effort was put into refining the technique itself. Then, its use spread to a large number of
research topics ranging from medicine to computer science. The most influential work
(according to citation count) on eye-tracking research methodology are those of Duchowski [3]
and, more recently Holmqvist et al. [4].
The human brain is built to filter the information that can be potentially processed (i.e. this is
commonly named attention). Medical research has shown that there is a so-called ‘eye-mind
relationship’, which basically means that we can accurately perceive something only if we
fixate it with our eyes and focus our attention to it, and that there is a direct relationship between
eye movements and the cognitive load of the brain [5]. Therefore, the easiest way to detect the
object of attention is to measure where the eyes are fixated. The human eye has a very limited
area where visual stimuli (e.g. images) are registered and sent to the brain with the highest
acuity (i.e. the foveal region, which is about 8% of the visual field). Therefore, the eye is
constructed to move around and then pause such that the object of interest is placed in the
fovea. Eye-tracking is a technique that pinpoints the object of interest of a subject based on the
eye mechanics. A relevant insight from medical research is that the brain needs around 80
milliseconds of seeing an image before it is registered by the brain (under normal lighting
conditions). This delay is different when it comes to reading (50-60 ms) or seeing pictures (150
ms). There are several techniques that can be employed to detect eye movements. The latest
technique is remote and non-intrusive, and is called Pupil Centre Corneal Reflection. Such eye-
tracking hardware commonly consists of one or more video cameras and an infrared
illuminator. The cameras basically film the eyes and then software calculates the vector based
on the angle of the illuminator reflection on the pupil. Thus, the position of the eye in space
and the direction of gaze can be predicted with high accuracy. In our experiments, the subjects
needed to examine a business process model drawn using the Business Process Model and
Notation (BPMN) standard, in order to answer a comprehension question. The focus of
attention from one model element to the other is captured as eyes fixate the different elements.
The main eye functions that can be measured are: fixations (pause of eye movements on a
specific area of the visual field), saccades (rapid movement between two fixations) and drift
(fine adjustments that keep perception of stationary object). When it comes to scientific
research based on the eye-tracking observation method, there are several metrics that are
commonly recorded [3], [4]: the number of fixations, the duration of each fixation, the
saccades, and the sequence of fixations. The most common metric is the fixation count.
How are eye-metrics calculated by an eye-tracking system? During a recording, raw eye
movement data points are collected every 16.6 ms (given that our eye-tracker works at a
frequency of 60 Hz). Each data point has a timestamp and a coordinate (x, y). The analysis
software processes this log and aggregates the data points into fixations. This is basically done
using two thresholds: distance threshold (to aggregate data points in a fixation, the distance
between them should be less than a certain number of pixels) and fixation threshold (to detect
a fixation, data points should be in close proximity of each other over a certain period of time).

Proceedings of the IE 2015 International Conference
www.conferenceie.ase.ro
130
2.2. Controlled experiments on understanding, using eye-tracking as an observation method
We performed an analysis on the papers listed in the first 15 hit pages of Goggle Scholar on
the key-words “eye-tracking” and “eye tracking” (duplicate hits were removed). A second
search was done considering the first 15 pages of Google Scholar filtered by papers published
after 2010. All papers were classified according to their title and abstract into four categories:
medicine (approx. 44% of the papers), research on eye-tracking methodology (~22%), human
factors and behavior (~17%), usability (~16.5%), while papers on other issues amounted to
about 2%. Only papers on usability topic were investigated further. All the abstracts of the
papers in this pool were read. Papers that presented interest during this screening, were fully
read. Then, we further divided the papers into three sub-categories for which we extended our
search on the papers citing and being cited by. The first category that matches our topic are
eye-tracking papers related to BPM. We found only a handful of such papers. A close match
to our field were the eye-tracking papers on other types of model understanding (e.g. UML
diagrams, geographical maps, etc.). Finally, we also found our topic matches research on
learning, more specifically on the influence of visual enhancements on understanding graphical
depictions of concepts.
When it comes to eye-tracking papers related to BPM, our previous research [6] was the only
one approaching process model understanding with eye-tracking. We investigated the
relevance of the notion of Relevant Region on business process model comprehension using
27 participants. We concluded that, the correctness of the comprehension question answers can
be predicted based on the number of Relevant Region elements fixated by the reader, and on
the percentage of time spent fixating the Relevant Region. The other noticeable paper
employing eye-tracking in BPM [7] investigates how process models are created based on a
textual description. The experiment was run on a population of 25 students, but only 2 instances
were used in analysis. Eye-tracking metrics used in analysis were fixations and the fixation
durations. A third paper [8] is vaguely introducing eye-tracking as a possible tool to be used in
BPM research. The one hypothesis under investigation postulates that eye-tracking is a suitable
method to assess requirements for user satisfaction in business process modeling. A fourth
paper concludes that current low-cost eye-tracking systems are suited for research in BPM [8].
One of the most interesting papers from the second sub-category attempts to identify the
influence of layout, color and stereotypes on the comprehension of UML Class diagrams [9].
Comprehension effort was measured by the total number of fixations (i.e. the more fixations
on a diagram the worst the layout). The assumption is that more fixations indicate an inefficient
exploration that leads the subject to span his attention inefficiently over more model elements
than necessary. The study was performed using 12 subjects of various expertise (faculty, Ph.D.,
master and bachelor students as well as novices with no UML background).
Gathering more insights, by employing eye-tracking, than previously obtained by a
questionnaire-based study was the spark of [10]. The study targeted understanding UML Class
diagrams. The 15 academics participants were introduced with diagrams in an attempt to
compare two model layouts. Metrics used in the study were grouped in three classes: fixation
count (total number of fixations on the model), fixation rate (number of fixations on relevant
classes (i.e. tasks in a process model), number of fixations on relevant classes and associations
(i.e. tasks and edges in a process model), number of fixations on other model elements), and
fixation duration (average duration of all fixations, average fixation duration on classes,
average fixation duration on classes and associations, and average fixation duration on other
model elements).
Jeanmart et. al. [11] used eye-tracking to study UML Class diagrams comprehension (more
specifically, a certain design pattern). The approach was to conduct experiments on diagrams

Proceedings of the IE 2015 International Conference
www.conferenceie.ase.ro
131
in 3 conditions: no patterns, with patterns in canonical layout and with patterns in a modified
layout. The study was conducted on a population of 24 students.
For the third sub-category, there is an excellent review of studies that use eye-tracking to
explain and enhance learning (with words and graphics) [12]. Most interesting for us is a
comparison of 6 papers with regard to content, independent variables, eye-tracking metrics,
dependent/outcome variables as well as the main research contribution. Some interesting facts
revealed by this comparison are: a) when it comes to eye-tracking measures, all studies relied
on the time spent looking at the relevant areas; b) the dependent variables measured
comprehension as accuracy at answering test questions; and c) in 25% of the papers, the factor
was visual cues, thus making it the most researched one. Eye-tracking was employed to test
the influence of cues on learning in [13]. Two experiments are reported on a population of 57
undergraduate students. The independent variables were the number of fixations and the
duration of fixations (as there was a high correlation between the two, the latter was not
reported in the paper). The dependent variables are learning time and a comprehension measure
(a composite between binary answer questions and one descriptive answer question that
calculated the percentage of an expected number of 15 items).
The influence of visual cues on learning performance was also assessed in [14]. There were
two factors (cues and no cues) evaluated using questionnaires and computer support, but no
eye-tracking. Overall, learning efficiency (measured both as learning concepts, and learning
time) was measured.
In [15], step-by-step guidance is provided by highlighting the steps required for performing a
task using software interface. Basically, menus and toolbars items are dynamically colored in
an e-mail application while the user performs some task. The evaluation metrics were: user
responses and time performance. There were 64 participants in the experiment.
Reading a process model requires the user to employ some sort of visual search strategy. To
this regard, the efficiency of map reading visual efficiency is investigated using eye-tracking
in [16]. The experimenters set the sequence of activities that must be performed (e.g. explore
map, select appropriate map layer, locate area, zoom-in to relevant area, identify correct piece
of information for the response). That lead to the need to compare the ‘ideal’ visualization and
the subject’s fixations. In [16] string-matching metrics as Levenshtein distance and others were
used to cluster subjects.
2. State-of-the-art summary: main points to consider when running eye-tracking
controlled experiments When a new controlled experiment is designed, the researcher needs to focus on several main
issues: stimuli and tasks (what kind of activities need to be executed under observation and on
what objects), participants (how many persons are observed and what is their level of
expertise), experimental procedure (how is the experiment organized), experimental instrument
(how is the eye-tracking data collected, how is raw data turned into useful outputs), measures
(on what is data collected so that the hypothesizes are tested).
Given the short review of several papers related to eye-tracking controlled experiments on
process model understanding, researchers addressed those points as follows:
Participants Between 12 and 64, with most experiments around 25 participants.
Mostly students at various levels and some experts (academic and very rarely industry).
Stimuli (factors of the experiment): model layout (e.g. canonical design patterns vs.
random), visual signaling of elements (Coloring of model elements, Visual cues on the
model, animations on the model)
Tasks in the experiment: between 1 and 6 tasks to be performed on between 1 and 3 models.
Mostly not more than 3 tasks to be performed in one experiment.

Proceedings of the IE 2015 International Conference
www.conferenceie.ase.ro
132
Eye-tracker settings:
- most papers use 60 Hz bright-pupil systems.
- Fixation duration threshold: not reported in most papers, when reported between
0.05 and 0.5 seconds.
- Pixel threshold (used to group collected raw focus coordinates into fixations) not
reported in most papers, when reported between 20 and 50 pixels.
Metrics: Fixation count, Fixation duration, Task time, Correctness of answers (in one
instance a more complex approach to correctness),
Data analysis: data consistency test, ANOVA and/or ANCOVA, rarely regression analysis.
3. Guidelines based on our experience with designing and running eye-tracking based
controlled experiments So far we organized several eye-tracking experiments in an attempt to shed more light on how
humans make sense of business process models. Considering the points reviewed before, our
insights are:
Participants: the expertise level of participants is very important. Generality can be
achieved by a balanced mix of academic (researchers and/or students) and industry
participants.
Stimuli: careful consideration is needed when choosing: the modeling notation, and
complexity of models (e.g. measured as the number of elements in the model). If the
experiments are within-subjects, the same model needs to be at least twice. Our experience
shows that mirroring a model is enough to mitigate the learning effect.
Tasks: the typical task is answering comprehension questions. For within-subjects
experiments, the same task needs to be performed twice. To mitigate learning effect, our
solution was manipulating the graphical representation (e.g. mirror model, re-label it).
When asking comprehension questions about the control-flow of process models, one needs
to cover at least: sequence, concurrency, and exclusive choice. Questions can be asked
about the model itself (e.g. find the ‘shortest path’) or about resource and data perspectives.
Experimental procedure: given that it’s a direct observation method, an eye-tracking
experiment has the disadvantage that it can be done only one person at a time. The average
time needed to complete the experiment is rarely disclosed in papers. It’s capital that the
researcher balances between a lengthy procedure (e.g. that involves more models that
increase the generality of the conclusions) and the impact of fatigue on the participants.
Our experience shows that striking this balance needs several iterations of re-design and
testing.
Eye-tracker settings: in our experiments there is no statistically significant difference
between various thresholds used for aggregating raw data coordinates into fixations. For
example, by changing the duration setting from 0.05 to 0.1 and then to 0.15 seconds, we
noticed a polynomial increase in the number of fixations. However, when expressed as
percentages, the changes were insignificant between the three settings. This holds true for
the distance threshold as well. Therefore, standard eye-tracker settings should be fine for
most cases.
Metrics: fixation count and average fixation duration must be used, as they are at the core
of eye-tracking outputs. Additional data can be recorded on task duration or on participant’s
confidence in the comprehension question answer (for our experiments so far confidence
didn’t provide further insights). We employed efficiency as well, calculated as answer
correctness over task time. Also, if there is a notion of ‘relevant element’ in a model, classic
search metrics such as precision and recall can be used.

Proceedings of the IE 2015 International Conference
www.conferenceie.ase.ro
133
Data analysis: in the case of within-subjects experiments, paired samples tests are very
relevant. Given the normality of the data, one can choose Student’s T-test (normally
distributed data) or Wicoxon Rank Sum Test (not–normal distribution).
4. Conclusions We introduced the state-of-the art in controlled experiments using eye-tracking in the area of
model understanding. Then, considering our experience in the field, we put forward a set of
essential guidelines to consider when designing and running eye-tracking experiments in
process model understanding.
The main contribution of the paper are the guidelines, which are aimed at researchers that will
attempt to investigate process models. We believe that this is a useful summary of our
experience as pioneers in applying eye-tracking for directly investigating process model
understanding.
References [1] W. M. van der Aalst, “Business process management: A comprehensive survey”, ISRN
Software Engineering, vol. 2013, Article ID 507984, 37 pages, 2013.
doi:10.1155/2013/507984
[2] R. K. Ko, S. S. Lee, and E. W. Lee, “Business process management (BPM) standards: a
survey”, Business Process Management Journal, vol. 15, no. 5, pp. 744-791, 2009.
[3] A. Duchowski, Eye tracking methodology: Theory and practice, Berlin: Springer, 2007.
[4] K. Holmqvist, M. Nyström, R. Andersson, R. Dewhurst, H. Jarodzka, and J. Van de Weijer,
Eye tracking: A comprehensive guide to methods and measures, Oxford University Press,
2011.
[5] M.A. Just, and P.A. Carpenter, Eye fixations and cognitive processes, Cognitive
Psychology, vol. 8, no. 4, pp. 441–480, 1976.
[6] R. Petrusel, and J. Mendling, “Eye-Tracking the Factors of Process Model Comprehension
Tasks” Lecture Notes in Computer Science, vol. 7908, pp. 224-239, 2013
[7] J. Pinggera, M. Furtner, M. Martini, P. Sachse, K. Reiter, S. Zugal, and B. Weber,
“Investigating the Process of Process Modeling with Eye Movement Analysis”, Lecture
Notes in Business Information Processing vol. 132, pp 438-450, 2013.
[8] F. Hogrebe, N. Gehrke, and M. Nüttgens, “Eye Tracking Experiments in Business Process
Modeling: Agenda Setting and Proof of Concept” in Proc. EMISA 2011, pp. 183-188.
[9] Y. Shehnaaz, K. Huzefa, and J. I. Maletic, “Assessing the Comprehension of UML Class
Diagrams via Eye Tracking” In Proc. 15th IEEE International Conference on Program
Comprehension, 2007, pp. 113-122.
[10] B. Sharif, and J. I. Maletic, “An Eye Tracking Study on the Effects of Layout in
Understanding the Role of Design Patterns”, In Proc. ICSM 2010, pp. 1-10.
[11] S. Jeanmart, Y. G. Gueheneuc, H. Sahraoui, and N. Habra, “ Impact of the visitor pattern
on program comprehension and maintenance” In Proc 3rd IEEE International Symposium
on Empirical Software Engineering and Measurement 2009, pp. 69-78.
[12] R. E. Mayer, “Unique contributions of eye-tracking research to the study of learning with
graphics”, Learning and instruction, vol. 20 no. 2, 167-171, 2010.
[13] J. M., Boucheix, and R. K. Lowe, “An eye tracking comparison of external pointing cues
and internal continuous cues in learning with complex animations”. Learning and
instruction, vol 20, no. 2, pp. 123-135, 2010.
[14] L. Lin, and R. K. Atkinson, “Using animations and visual cueing to support learning of
scientific concepts and processes”, Computers & Education, vol. 56, no. 3, pp. 650-658,
2011.

Proceedings of the IE 2015 International Conference
www.conferenceie.ase.ro
134
[15] L. Antwarg, T. Lavie, L. Rokach, B. Shapira, and J. Meyer, “Highlighting items as means
of adaptive assistance’, Behaviour & Information Technology, vol. 32, no. 8, pp. 761-777,
2013.
[16] A. Çöltekin, S. I. Fabrikant, and M. Lacayo, “Exploring the efficiency of users' visual
analytics strategies based on sequence analysis of eye movement recordings”, International
Journal of Geographical Information Science, vol. 24, no. 10, pp. 1559-1575, 2010.

Proceedings of the IE 2015 International Conference
www.conferenceie.ase.ro
135
A TEST DATA GENERATOR BASED ON ANDROID LAYOUT FILES
Paul POCATILU
Bucharest University of Economic Studies
Sergiu CAPISIZU
Bucharest Bar
Abstract. Test data generation represents an important step for a high quality testing process
for any software, even for mobile devices. As proposed in previous works, an interesting source
for random data generation is represented by the UI layout files. This paper presents a system
dedicated to Android layout files that uses these files as input and generates an XML-based file
used by the test data generator to obtain test data sets.
Keywords: mobile applications, layout files, software testing, test data generators, software
quality
JEL classification: C49, C61, L86
1. Introduction
Software testing represents an important step in software development [1], [2]. The testing
process is thoroughly presented in books like [3] and [4]. Like other applications, mobile
applications require testing in order to achieve a required level of quality. This can be done
using similar tools and frameworks and also specific and dedicated tools, depending on the
platform. Some of the mobile application testing types are shortly described in [5].
During the testing process, test data generation has its own role for testing success. Test data
generation is made using different tools and techniques. The paper continues the researches
presented in [6] and [7] and focuses on template generation for test data based on Android
layout files. Test data templates are XML-based files written using DSL (Data Specification
Language). The generated test data can be used by own testing tools or frameworks or can be
used as inputs for existing testing frameworks and tools.
The paper is structured as follows. The section Android testing frameworks and tools presents
the most important aspects related to Android applications testing. It also make a short
presentation of the Android testing instruments. Test data generation section describes the
proposed system for test data generator based on Android layout files. In Data Specification
Language (DSL) section is detailed the XML-based language used for test data specification.
The proposed parser for Android layout files is presented in the last section, Android layout
files parser. The paper ends with conclusion and future work.
2. Android testing frameworks and tools
Android applications being developed using Java programming language, JUnit testing
framework is suitable for the automated testing of functional issues. JUnit is a testing
framework for regressive unit testing of Java programs [8]. The main Java classes used by the
framework are associated to test cases and suites.
The Android platform includes several tools and frameworks. Also, third party developers have
built such tools and framework for Android applications testing. In [9] are presented the
fundamentals of Android applications testing.

Proceedings of the IE 2015 International Conference
www.conferenceie.ase.ro
136
Table 1 summarizes the most used Android testing tools and frameworks. Many of these are
based on JUnit. Table 1- Android testing tools and frameworks
Framework/Tool Included in
Android API
Testing level Testing
approach
Type
Espresso Yes UI testing Black box Framework
Android
Instrumentation API
Yes Unit testing White box Framework
Monkey Yes UI testing Black box Tool
monkeyrunner Yes UI testing Black box Tool
Robotium No UI testing Black box Framework
Robolectric No Unit testing White box Framework
UI Automator Yes UI testing Black box Framework
Espresso is a testing framework used for UI testing. It is based on JUnit and it is included in
Android Support Repository.
Android Instrumentation framework is developed by Google for testing Android applications.
It allows to control the life cycle of the Android applications and components during the tests.
Monkey is a testing tool that runs within the emulator or on the mobile device. It is used to send
random events to the Android device (user or system).
monkeyrunner provides an API that can be used to control an Android device by installing
applications, sending commands and taking and saving screenshots.
Robotium is a testing framework for Android and hybrid application. It is based on Android
Instrumentation and it is used to automate UI testing.
Robolectric is framework that allows testing on a JVM running on a computer. This will speed-
up the testing process.
UI Automator framework provides an API that allows to control user and system applications
for UI testing.
In [10] there is a short presentation of several other Android testing frameworks and tools:
Mockito – a framework for testing Java and Android applications; it allows creation of
mock objects for testing and it is used in unit testing;
EasyMock – a testing framework used in unit testing; it uses mock objects;
PowerMock – a framework based on Mockito and EasyMock;
Inifinitest – a testing plugin for Eclipse and IntelliJ; it is a continuous test runner.
In order to automate the testing process, some of these tools can run using generated data by
dedicated tools.
Specific Android testing approaches are presented in [11], [12] and [13].
3. Test data generation
In order to generate test data, test data generators (TDG) can be based on random functions or
can use inputs related to application under test (specifications, source files, data constraints,
list of values, layout files etc.).
The test data will be used either for white-box testing (as in [14]) or for functional testing.
White-box testing requires a deeper knowledge of source code and a previous analysis of it is
required before [15].
Our proposed solution take as input an XML-based file that includes a description of each field
for which will be generated test data.
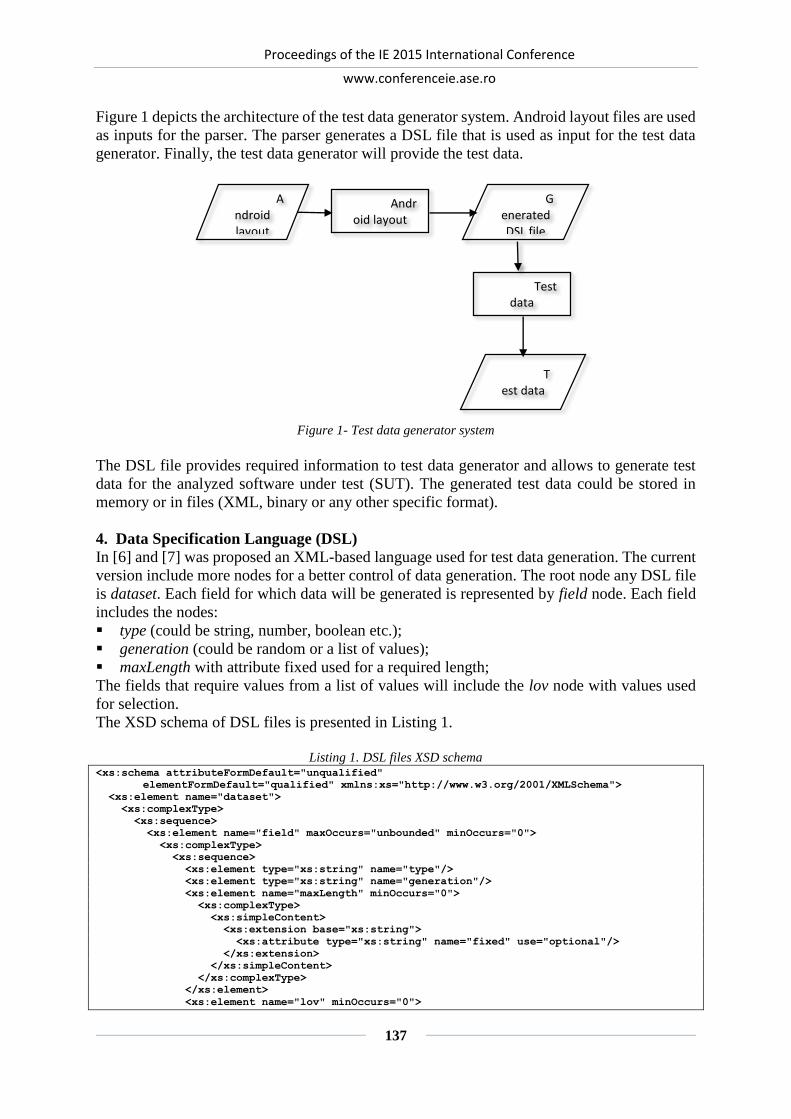
Proceedings of the IE 2015 International Conference
www.conferenceie.ase.ro
137
Figure 1 depicts the architecture of the test data generator system. Android layout files are used
as inputs for the parser. The parser generates a DSL file that is used as input for the test data
generator. Finally, the test data generator will provide the test data.
Figure 1- Test data generator system
The DSL file provides required information to test data generator and allows to generate test
data for the analyzed software under test (SUT). The generated test data could be stored in
memory or in files (XML, binary or any other specific format).
4. Data Specification Language (DSL)
In [6] and [7] was proposed an XML-based language used for test data generation. The current
version include more nodes for a better control of data generation. The root node any DSL file
is dataset. Each field for which data will be generated is represented by field node. Each field
includes the nodes:
type (could be string, number, boolean etc.);
generation (could be random or a list of values);
maxLength with attribute fixed used for a required length;
The fields that require values from a list of values will include the lov node with values used
for selection.
The XSD schema of DSL files is presented in Listing 1.
Listing 1. DSL files XSD schema
<xs:schema attributeFormDefault="unqualified"
elementFormDefault="qualified" xmlns:xs="http://www.w3.org/2001/XMLSchema">
<xs:element name="dataset">
<xs:complexType>
<xs:sequence>
<xs:element name="field" maxOccurs="unbounded" minOccurs="0">
<xs:complexType>
<xs:sequence>
<xs:element type="xs:string" name="type"/>
<xs:element type="xs:string" name="generation"/>
<xs:element name="maxLength" minOccurs="0">
<xs:complexType>
<xs:simpleContent>
<xs:extension base="xs:string">
<xs:attribute type="xs:string" name="fixed" use="optional"/>
</xs:extension>
</xs:simpleContent>
</xs:complexType>
</xs:element>
<xs:element name="lov" minOccurs="0">
Android layout
parser
Android layout
Generated DSL file
Test data
generator
Test data

Proceedings of the IE 2015 International Conference
www.conferenceie.ase.ro
138
<xs:complexType>
<xs:sequence>
<xs:element
type="xs:string" name="item" maxOccurs="unbounded" minOccurs="0"/>
</xs:sequence>
</xs:complexType>
</xs:element>
</xs:sequence>
<xs:attribute type="xs:string" name="type" use="optional"/>
</xs:complexType>
</xs:element>
</xs:sequence>
</xs:complexType>
</xs:element>
</xs:schema>
Data length will be deduced from the Android UI layout files (such as android:maxLength
attribute).
Data type could be determined based on android:inputType and initial fields values. For input
that include numbers and a specific format (like phone numbers, date etc.), it should be included
the format also.
Also, for numeric fields, it could be added the nodes minValue and maxValue and their
corresponding values obtained from the layout file or specifications or could be added later.
5. Android layout files parser
The Android layout parser uses XML-based files available in res/layout folder of the Android
project. Several sources, such as [16], present the content and structure of Android layout files.
In order to exemplify the DSL template generation, the XML layout from Listing 2 was used.
Listing 2 - Android layout file used as example
<?xml version="1.0" encoding="utf-8"?>
<ScrollView xmlns:android= "http://schemas.
android.com/apk/res/android"
android:layout_width="match_parent"
android:layout_height="match_parent" >
<LinearLayout
android:layout_width="match_parent"
android:layout_height="match_parent"
android:orientation="vertical" >
<!-- Author label here-->
<EditText
android:id="@+id/editAutor"
android:layout_width="match_parent"
android:layout_height="wrap_content"
android:inputType="textCapWords"/>
<!--Title label here -->
<EditText
android:id="@+id/editTitlu"
android:layout_width="match_parent"
android:layout_height="wrap_content"
android:inputType="text"/>
<!--Date lable here -->
<EditText
android:id="@+id/data"
android:layout_width="match_parent"
android:layout_height="wrap_content"
android:inputType="date"/>
<!-- Publisher label here -->
<EditText
android:id="@+id/editEditura"
android:layout_width="match_parent"
android:layout_height="wrap_content"
android:inputType="text"/>
<!--ISBN label here-->
<EditText
android:id="@+id/editIsbn"
android:layout_width="match_parent"
android:layout_height="wrap_content"/>
<!--Price label here -->
<EditText
android:id="@+id/editPret"
android:layout_width="match_parent"
android:layout_height="wrap_content"
android:text="0"
android:inputType="number"/>
<!-- -->
<Spinner
android:id="@+id/spinGen"
android:layout_width="match_parent"
android:layout_height="wrap_content"/>
<!--Status label here -->
<CheckBox
android:id="@+id/checkUzata"
android:layout_width="wrap_content"
android:layout_height="wrap_content"/>
<Button
android:id="@+id/buttonSalveaza"
android:layout_height="wrap_content"
android:layout_width="wrap_content"
android:layout_gravity="center"
android:text="Salveaza" />
</LinearLayout>
</ScrollView>
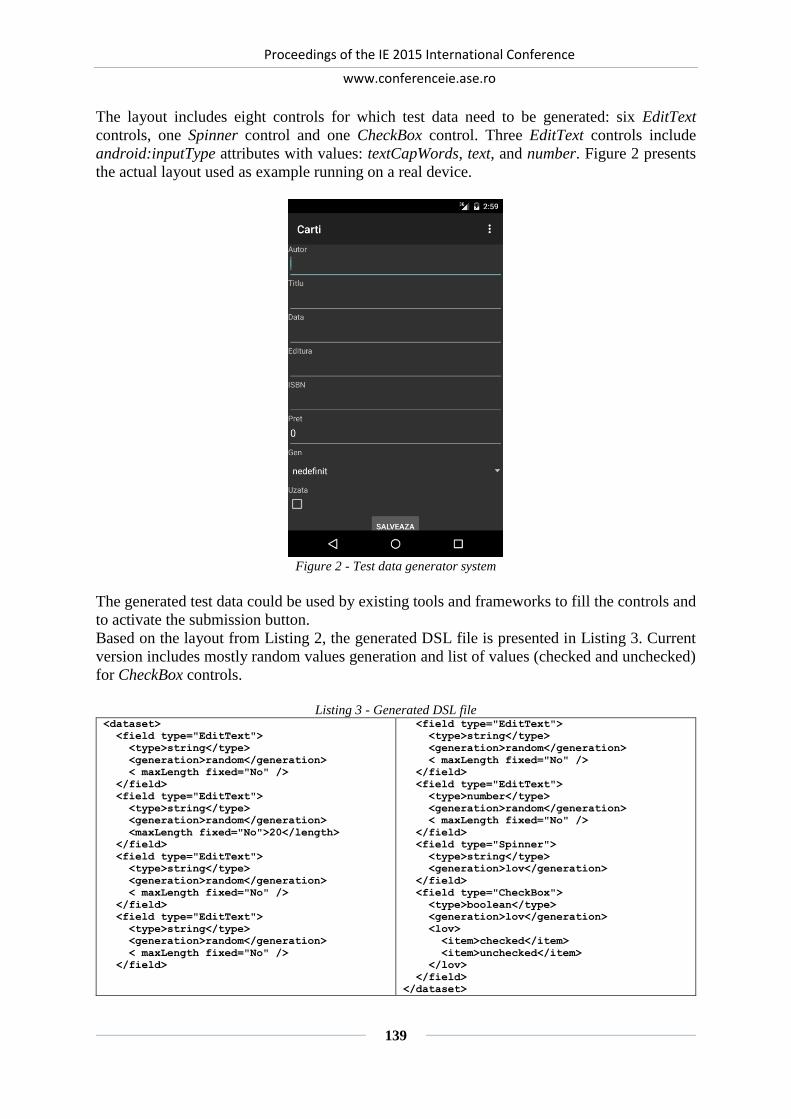
Proceedings of the IE 2015 International Conference
www.conferenceie.ase.ro
139
The layout includes eight controls for which test data need to be generated: six EditText
controls, one Spinner control and one CheckBox control. Three EditText controls include
android:inputType attributes with values: textCapWords, text, and number. Figure 2 presents
the actual layout used as example running on a real device.
Figure 2 - Test data generator system
The generated test data could be used by existing tools and frameworks to fill the controls and
to activate the submission button.
Based on the layout from Listing 2, the generated DSL file is presented in Listing 3. Current
version includes mostly random values generation and list of values (checked and unchecked)
for CheckBox controls.
Listing 3 - Generated DSL file
<dataset>
<field type="EditText">
<type>string</type>
<generation>random</generation>
< maxLength fixed="No" />
</field>
<field type="EditText">
<type>string</type>
<generation>random</generation>
<maxLength fixed="No">20</length>
</field>
<field type="EditText">
<type>string</type>
<generation>random</generation>
< maxLength fixed="No" />
</field>
<field type="EditText">
<type>string</type>
<generation>random</generation>
< maxLength fixed="No" />
</field>
<field type="EditText">
<type>string</type>
<generation>random</generation>
< maxLength fixed="No" />
</field>
<field type="EditText">
<type>number</type>
<generation>random</generation>
< maxLength fixed="No" />
</field>
<field type="Spinner">
<type>string</type>
<generation>lov</generation>
</field>
<field type="CheckBox">
<type>boolean</type>
<generation>lov</generation>
<lov>
<item>checked</item>
<item>unchecked</item>
</lov>
</field>
</dataset>

Proceedings of the IE 2015 International Conference
www.conferenceie.ase.ro
140
This DSL file represents an input for the test data generator. In this stage, the DSL file does
not fully automate test data generators. It could require a manual intervention or other
additional parsers or editors that need to narrow data boundaries or add other constraints or
will provide the list of values for list-based controls. For example, the for the Spinner control,
the list of values has to be filled before data generation.
6. Conclusions and future work
The proposed system can be integrated with many testing frameworks and tools available for
Android platform. The presented format of DSL files is a preview and it will be improved
during the future researches.
The next steps include the development of the test data generator that will generate test data
based on DSL files.
References
[1] S. Pressman, Software Engineering: A Practitioner’s Approach. 7th ed., New York:
McGraw-Hill, 2009
[2] I. Sommerville, Software Engineering. 9th ed., Boston: Addison-Wesley, 2011
[3] G. J. Myers, C. Sandler, T. Badgett, The Art of Software Testing, 3rd Edition, Wiley, 2011
[4] M. Roper, Software Testing, McGraw-Hill Book, 1994
[5] M. Kumar and M. Chauhan, "Best Practices in Mobile Application Testing (White Paper),"
Infosys, Bangalore, 2013
[6] P. Pocatilu, F. Alecu and S. Capisizu, "A Test Data Generator for Mobile Applications," in
Proc. of the IE 2014 International Conference, Bucharest, Romania, May 15-18, 2014, pp.
116-121
[7] P. Pocatilu and F. Alecu, "An UI Layout Files Analyzer for Test Data Generation,"
Informatica Economica, vol. 18, no. 2/2014, pp. 53-62
[8] J. Langr, A. Hunt and D. Thomas, Pragmatic Unit Testing in Java 8 with JUnit, The
Pragmatic Programmers, 2015
[9] Testing Fundamentals | Android Developers, available at:
http://developer.android.com/tools/testing/testing_android.html
[10] P. Pocatilu, I. Ivan et al, Programarea aplicațiilor Android, Bucharest: ASE Publishing
House, 2015
[11] S. Yang, D. Yan and R. Rountev, "Testing for poor responsiveness in Android
applications," in Proc. of the 1st International Workshop on the Engineering of Mobile-
Enabled Systems (MOBS), 2013, pp. 1 – 6
[12] A. Gupta, Learning Pentesting for Android Devices, Packt Publishing, 2014
[13] W. Choi, G. Necula and K. Sen, "Guided GUI testing of Android apps with minimal restart
and approximate learning," in Proc. of the 2013 ACM SIGPLAN international conference
on Object oriented programming systems languages & applications (OOPSLA '13). ACM,
New York, NY, USA, pp. 623-640
[14] S. Jiang, Y. Zhang and D. Yi, "Test Data Generation Approach for Basis Path Coverage,"
ACM SIGSOFT Software Engineering Notes, vol. 37, no. 3, pp. 1-7, 2012
[15] A. Zamfiroiu, "Source Code Quality Metrics Building for Mobile Applications," in proc.
of the IE 2014 International Conference, Bucharest, pp. 136-140
[16] R. Meier, Professional Android 4 Application Development, Wiley, 2012
Proceedings of the IE 2015 International Conference
www.conferenceie.ase.ro
141
EMV/BITCOIN PAYMENT TRANSACTIONS AND DYNAMIC DATA
AUTHENTICATION WITH SMART JAVA CARDS
Marius POPA
Department of Economic Informatics & Cybernetics
Bucharest University of Economic Studies [email protected]
Cristian TOMA Department of Economic Informatics & Cybernetics
Bucharest University of Economic Studies [email protected]
Abstract. In the paper is presented EMV and Bitcoin payment transactions. For the EMV
transaction is presented in details the contact-based and contactless transactions, as well as
the authentication between the card and the terminal procedures. The Bitcoin section presents
only the usage aspects of the payment transactions, but with details for future development in
terms of implementation within open source code using Java Card technology.
Keywords: EMVCo, Bitcoin, DDA – Dynamic Data Authentication, e-payment transaction,
cryptographic security. JEL classification: C88, L86, Y80
1. Introduction A smart card payment is the transfer of an item of value expressed as money amount using a
specific hardware device called smart card in order to get goods, services or to fulfill legal
obligations.
A smart card has small sizes similar to classic bank cards, and embeds integrated circuits for
various purposes like identity, authentications and application processing. There are many
applications of the smart card, part of these ones being presented as it follows [12]:
Financial – the smart card is used as credit card in classic way, having improved transaction
security; also, electronic wallets can be deployed as smart card applications and pre-loaded
by funds, avoiding the connection to bank at payment time.
Subscriber Identity Module – the smart card is used to securely store international mobile
subscriber identity and the related key for users of the mobile telephony (mobile phones,
tablets, computers and so forth).
Identification – the smart cards are used to authenticate the citizens’ identity; there are
some examples of implemented identity systems at governmental level in which the
citizens use the smart cards to address public services or to be compliant with the legal
requirements; this kind of applications requires employing a Public Key Infrastructure
(PKI).
Public transit – the smart cards are used in integrated ticketing infrastructures implemented
and operated by public transit operators; applications may include also financial or identity
features for small payments transactions or other public services; for instance, the public
transit operator in Bucharest provides two kinds of cards depending on the presence of the
electronic wallet as feature in the card application; a card may be named or not, being used
as identity card during the operator controls of the bus passengers.

Proceedings of the IE 2015 International Conference
www.conferenceie.ase.ro
142
Computer security – the smart card is used to store certificates to authenticate some
computer operations like secure web browsing, disk encryption, single sign-on an so forth;
in this case, the smart card acts like a security token.
Schools – the smart card is used to support the service offers to the students (small
payments within the campus, public transportation and so forth), their tracking and
monitoring within the scholar infrastructure, control access to the school’s or college’s
facilities.
Healthcare – the smart card is used to improve the security and privacy of the patient
information, avoid the health care frauds, access to the patient’s medical information
immediately in case of emergency, improved support in data migration between medical
personnel; the Romanian National Health Insurance Agency performs a national program
for health care cards distribution in order to earn the benefits of smart card-based health
system; the National Agency will use the collected data to reduce the health care frauds,
improve the national health care programs and to monitor the health of the citizens, all
these information having a positive impact in the budgets in the coming years and better
distribution of the public funds to public services provided to the citizens.
Other applications – the smart card may be used in every areas where the advantages
presented above may be implemented; for instance, the economic organizations can protect
their businesses using a smart card-based system for exchanges of goods and services; the
requirement is a critical one in high technology fields and for those companies invest large
money amount in research and development; such organizations have to get the chance to
cover their expenses.
Multiple-use systems – a smart card may be used in multiple purposes: identity, health
care, payment, public transportation and so forth; in such case, some restriction and legal
requirements are applied in order to make functional the smart card-based system.
The smart card-based systems have evident benefits, but some problems can appear during
their exploitation. The main threat is the malware and security attacks that may compromise
the smart card or the system.
The design of a smart card is stated by ISO/IEC 7810 standard regarding its size. Also, the
design considers how the smart card interacts with a card reader in order to send and receive
data to and from the back-end systems.
Regarding the communication channel between the smart card and card reader, the following
types of smart card are considered [12]:
Contact smart cards – communication is made by a contact area that have some contact
pads in order to provide the electrical connectivity; the smart card is powered by the card
reader;
Contactless smart cards – communication and powering is made by radio-frequency (RF)
induction; the smart card requires proximity to card reader in order to power its circuits
and communicate via a radio channel.
Dual smart cards – the both communication interfaces (contact-based and contactless) are
implemented upon the same smart card.
Universal Serial Bus – USB smart cards – communication is made by USB attaching the
smart card to a computer; in this case, the smart card becomes a security token and
authenticates some operations (like connection of the computer to Internet via a USB
dongle containing a SIM smart card).
In banking area, the smart card is used to support financial transactions among people, public
institutions and economic organizations. Some applications are developed according to
industry standards elaborated and implemented by professional and commercial associations
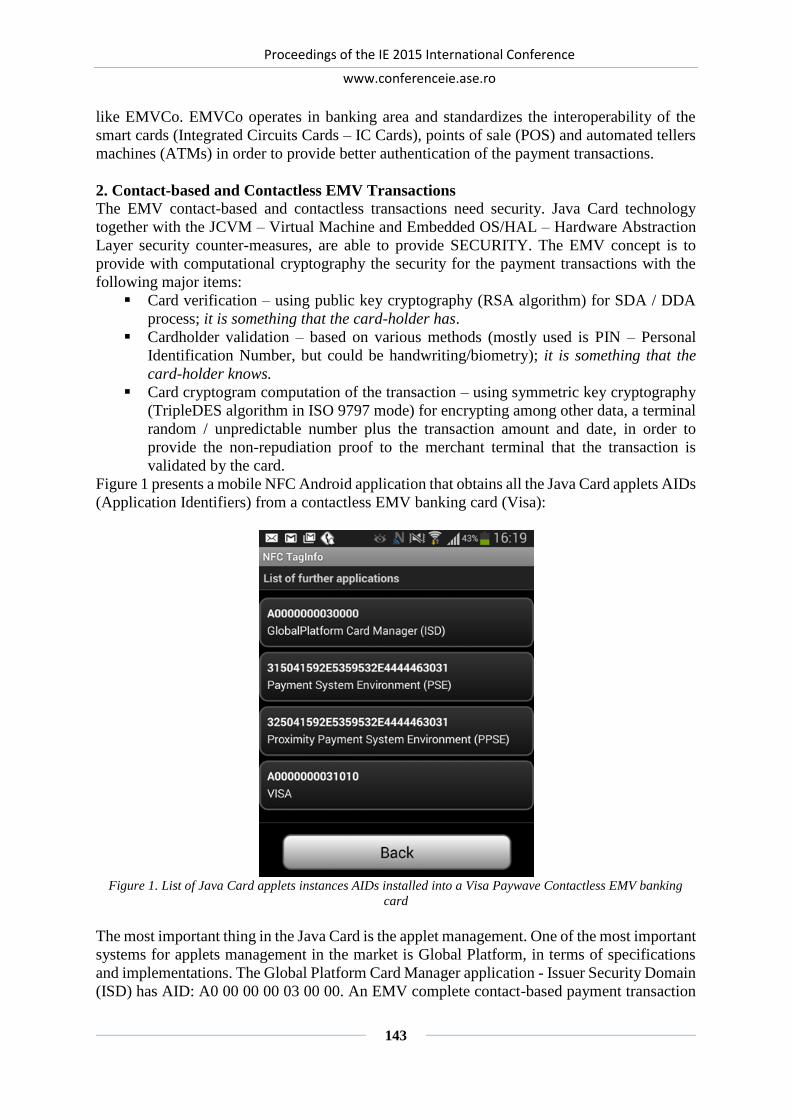
Proceedings of the IE 2015 International Conference
www.conferenceie.ase.ro
143
like EMVCo. EMVCo operates in banking area and standardizes the interoperability of the
smart cards (Integrated Circuits Cards – IC Cards), points of sale (POS) and automated tellers
machines (ATMs) in order to provide better authentication of the payment transactions.
2. Contact-based and Contactless EMV Transactions The EMV contact-based and contactless transactions need security. Java Card technology
together with the JCVM – Virtual Machine and Embedded OS/HAL – Hardware Abstraction
Layer security counter-measures, are able to provide SECURITY. The EMV concept is to
provide with computational cryptography the security for the payment transactions with the
following major items:
Card verification – using public key cryptography (RSA algorithm) for SDA / DDA
process; it is something that the card-holder has.
Cardholder validation – based on various methods (mostly used is PIN – Personal
Identification Number, but could be handwriting/biometry); it is something that the
card-holder knows.
Card cryptogram computation of the transaction – using symmetric key cryptography
(TripleDES algorithm in ISO 9797 mode) for encrypting among other data, a terminal
random / unpredictable number plus the transaction amount and date, in order to
provide the non-repudiation proof to the merchant terminal that the transaction is
validated by the card.
Figure 1 presents a mobile NFC Android application that obtains all the Java Card applets AIDs
(Application Identifiers) from a contactless EMV banking card (Visa):
Figure 1. List of Java Card applets instances AIDs installed into a Visa Paywave Contactless EMV banking
card
The most important thing in the Java Card is the applet management. One of the most important
systems for applets management in the market is Global Platform, in terms of specifications
and implementations. The Global Platform Card Manager application - Issuer Security Domain
(ISD) has AID: A0 00 00 00 03 00 00. An EMV complete contact-based payment transaction

Proceedings of the IE 2015 International Conference
www.conferenceie.ase.ro
144
[4] and the place of the offline data authentication (ODA – red text) mechanisms within the
EMV transaction flow is emphasized in figure 2:
Figure 2. Complete Contact-based EMV transaction and the place of DDA
In order to reduce time of the card and terminal interaction in the proximity radio field for the
contactless payment transaction, all the phases from Figure 2 are compressed in Figure 3,
according with [5]:
1. Application Selection
•For contact base is the selection of PSE Java Card applet with AID: "1PAY.SYS.DDF01" and then the selection of the payment applet via Global Platform Card Manager Issuer Security Domain (ISD)
•For contactless is the selectionof PPSE Java Card applet with AID: "2PAY.SYS.DDF01" and then the selection of the payment applet (e.g. Visa Paywave contactless: A0000000031010) via GP ISD
•See Figure 1 for AIDs values and complete names of ISD, PSE, and PPSE; for each ISO SELECT APDU, PSE/PPSE and EMV payment applications, the Java Card applets responds with FCI - File Control Information
2. Initiate Applicatio
n Processing
& Read Applicatio
n Data
•Intiate Application: Terminal sends GPO (Get Processing Options EMV APDU command) and receive from the card Data Objects encoded in TLV (Tag-Length-Value)
•Read Applications Parameters: Terminal read records (with READ RECORD APDU command) from the card file system for getting necessary Data Objects encoded in TLV (e.g. PAN - Personal Account Number, Cardholder name, etc.)
3. Offline Data
Authentication
•SDA - Static Data Authentication
•DDA - Dynamic Data Authentication - it will be detailed in the next sections
• These authentication is used for M2M (Machine-2-Machine) Auth => the card is genuine (mainly is the card authentication to the terminal) using INTERNAL AUTHENTICATE APDU Command
4. Restriction
s Processing
•It is performed only by the terminal, in order to compare the Terminal Data versus Data Objects read from the card (e.g. Does the terminal support the payment application version? Is the terminal current date within the card validity period? Is the card listed in the black-list?)
5. Cardholder Verificatio
n
•Depending of CVM (Cardholder Verification Method: a) No PIN - Personal Identification Number, b) Offline PIN - in clear OR encrypted with public keys, c) Online PIN, d) Handwriting, e) Biometry, f) combination between handwriting and everything else), the terminal sends VERIFY PIN APDU command, in order to authenticate if the person knows the secret (PIN) and he/she is genuine. Before offline PIN try-conter and check procedure, triggered by VERIFY PIN APDU and processed inside the smart card, it could be use GET DATA APDU immediatelly after step 4 executed only by the terminal.
6. Terminal Risk
Management
•It use also GET DATA APDU Command and response in order to obtain from the card IAC - Issuer Action Code, and then it is triggered the updating of the ATC - Application Transaction Counter / counter value of the last online transaction.
7. Terminal Action
Analysis
•After obtaining IAC from the smart card in the previous step, there are rules applied inside of the terminal, in order to: a) Approve transaction offline, b) Decline transaction offline or c) process the transaction online with the card issuer bank. After getting IAC from the card by the terminal, with GET DATA/READ APDU, sample rules are: i) if (offline PIN verification == fail) => terminal goes online; ii) if (the merchant press a special button on the terminal) => terminal goes online; iii) if (transaction_amount > transaction_limit) => terminal goes online. After this step is performed, the terminal is able to send first GENERATE AC (Application Cryptogram) APDU
8. Card Action
Analysis
• The main part in here is to have an 8 byte cryptogram generated with DES algorithm by the card, in order to: a) Accept the transaction offline (TC - Transaction cryptogram), b) Accept the transaction but only online (ARQC - Application Request Cryptogram) and wait for ARPC (Application Response Cryptogram) from the issuer bank, c) Refuse directly the offline transactio - AAC (Application Authentication cryptogram).

Proceedings of the IE 2015 International Conference
www.conferenceie.ase.ro
145
Figure 3. Kernel 6 Contactless EMV transaction flow, Copyright [5]
In the contactless scenario for the first tap, the time should be less than 0,5 second or maximum
1 second, therefore the DDA (Dynamic Data Authentication) signature is encapsulated by the
card into GPO (General Processing Options) APDU (Application Protocol Data Unit)
Response or could be stored as EMV Data Object (TLV – Tag-Length-Value) into the card
“file system” if the signature is greater than 1024 bits. The second tap is optional and it is
recommended if the PIN is required in order to update the tries remaining in case of CVM
failure (wrong PIN).
3. Dynamic Data Authentication Process in Payment Transactions
The financial smart card-based application may be or not be in accordance with EMV
specifications. The EMVCo efforts to ensure a secure interoperability of the participant

Proceedings of the IE 2015 International Conference
www.conferenceie.ase.ro
146
components of a financial transaction were materialized into four books of specifications as it
follows [http://www.emvco.com/specifications.aspx]:
1. Application Independent IC Card to Terminal Interface Requirements.
2. Security and Key Management.
3. Application Specification.
4. Cardholder, Attendant, and Acquirer Interface Requirements.
For that application compliant with EMV specification, Dynamic Data Authentication (DDA)
has the role to detect the fake/altered/duplicated IC Cards during an offline transaction. The
offline transaction is made when online/real-time authorization is not required for the
transaction. In order to do that, the terminal (card reader) must deal with such kind of
transactions and the bank also agrees that the IC Card may accept and implement the offline
transaction by its applet application. Also, the bank can establish some offline transaction
parameters at IC Card personalization time like the maximum amount per offline transaction,
maximum number of consecutive offline transactions, maximum cumulative amount and so
forth as security barriers against the possible transaction frauds. According to EMV
specifications, the offline transaction data authentication is made by the following mechanisms
[3]:
Static Data Authentication (SDA) – detection of data alteration after the IC Card
personalization.
Dynamic Data Authentication (DDA) – detection of data alteration received from the
terminal or generated by the IC Card.
Combined DDA and application cryptogram generation (CDA) – includes verification of
the signature (DDA and application cryptogram) by the terminal.
The application cryptogram is a transaction certificate in order to authenticate a transaction to
be accepted.
The DDA signature process has the following characteristics [3]:
It is performed by the terminal and the card – as requirement, the IC Card needs
coprocessor.
The DDA signature authenticates the IC Card resident and generated data and data
received from the terminal.
It detects the fake/altered/duplicated IC Cards.
The DDA signature generation process has the following settings [3]:
Access to the Certification Authority (CA) RSA public key.
Access to the Issuer Bank (IB) RSA public key certificate.
Access to the static data certificate.
IC Card RSA key pair stored on the card – the RSA private key is securely stored and
cannot leave the card; the RSA public key is signed and stored together with static
application data.
Random challenge generated by the terminal in order to be signed by IC Card RSA private
key.
The security components and roles are depicted in figure 4 and the following considerations
are available for payment applications compliant to EMV specifications:
CA RSA key pair – the CA RSA public key is stored in each terminal; the CA RSA private
key is used to sign the IB RSA public key certificate.
IB RSA key pair – the IB RSA public key is stored by IB RSA public key certificate
signing by CA RSA private key and stored by the IC Card; to have access to IB RSA public
key, the IB RSA public key certificate must be decrypted using the CA RSA public key
stored by the terminal and then the IB RSA public key can be extracted from the certificate;
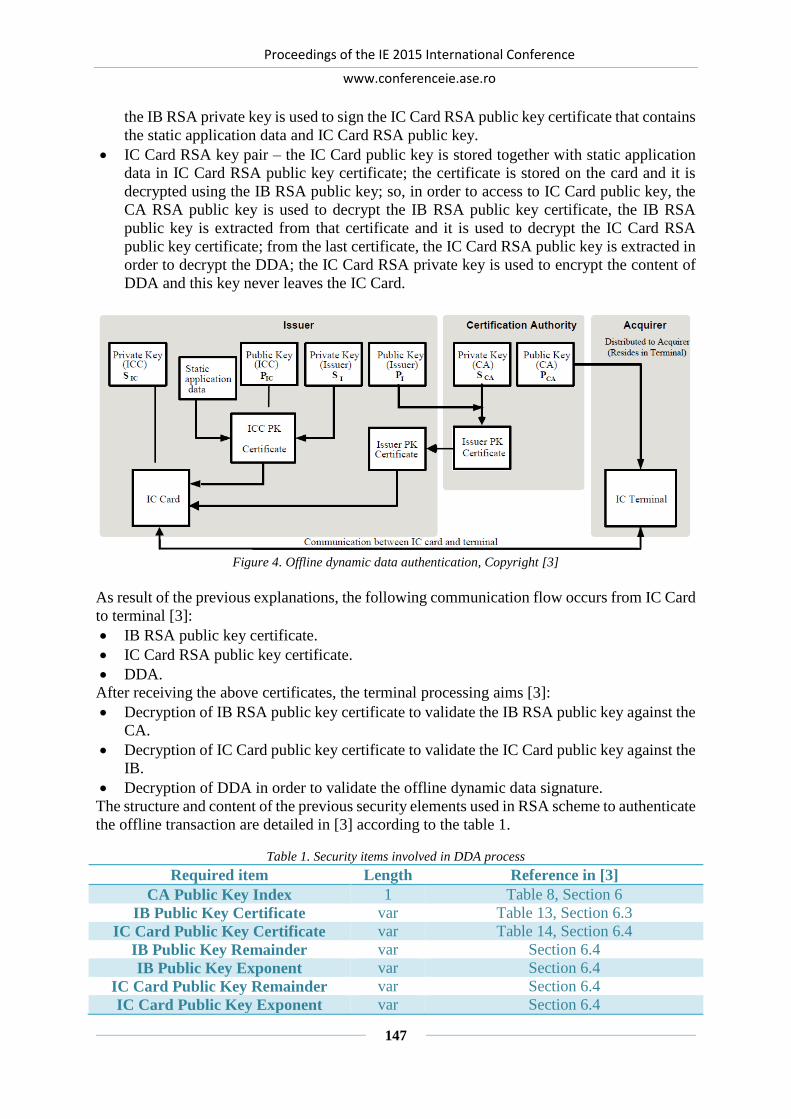
Proceedings of the IE 2015 International Conference
www.conferenceie.ase.ro
147
the IB RSA private key is used to sign the IC Card RSA public key certificate that contains
the static application data and IC Card RSA public key.
IC Card RSA key pair – the IC Card public key is stored together with static application
data in IC Card RSA public key certificate; the certificate is stored on the card and it is
decrypted using the IB RSA public key; so, in order to access to IC Card public key, the
CA RSA public key is used to decrypt the IB RSA public key certificate, the IB RSA
public key is extracted from that certificate and it is used to decrypt the IC Card RSA
public key certificate; from the last certificate, the IC Card RSA public key is extracted in
order to decrypt the DDA; the IC Card RSA private key is used to encrypt the content of
DDA and this key never leaves the IC Card.
Figure 4. Offline dynamic data authentication, Copyright [3]
As result of the previous explanations, the following communication flow occurs from IC Card
to terminal [3]:
IB RSA public key certificate.
IC Card RSA public key certificate.
DDA.
After receiving the above certificates, the terminal processing aims [3]:
Decryption of IB RSA public key certificate to validate the IB RSA public key against the
CA.
Decryption of IC Card public key certificate to validate the IC Card public key against the
IB.
Decryption of DDA in order to validate the offline dynamic data signature.
The structure and content of the previous security elements used in RSA scheme to authenticate
the offline transaction are detailed in [3] according to the table 1.
Table 1. Security items involved in DDA process Required item Length Reference in [3]
CA Public Key Index 1 Table 8, Section 6
IB Public Key Certificate var Table 13, Section 6.3
IC Card Public Key Certificate var Table 14, Section 6.4
IB Public Key Remainder var Section 6.4
IB Public Key Exponent var Section 6.4
IC Card Public Key Remainder var Section 6.4
IC Card Public Key Exponent var Section 6.4

Proceedings of the IE 2015 International Conference
www.conferenceie.ase.ro
148
Required item Length Reference in [3]
IC Card Private Key var Section 6.5, Section 6.6
Signed Dynamic Application Data var Table 17, Section 6.5
Signed Static Application Data var Table 7, Section 5.4
DDA is an improvement of SDA in order to secure the payments transactions. DDA uses
dynamic data like unpredictable number and other transaction-related data to prevent the use
of fake/altered/duplicated cards in offline transaction. DDA is specific only for offline
transaction otherwise the payment transaction protection is ensured by real-time/online
verification and validation. Offline transactions are available in the context of IC Card
personalization and terminal transaction qualifiers.
4. Bitcoin Payments Transaction Usage
The Bitcoin is an alternative payment system having an electronic currency (BTC), but it is not
quite an e-cash/e-coin payment system. The entire system is based on wallets able to store the
signed transactions and miners applications able to produce bitcoins (BTC). In the figure 5 is
presented the Android mobile application MyCelium that handles BTC wallets. For each
payment transaction, in order to provide anonymity, the application is generating every time
another private and public keys pair for ECDSA (Elliptic Curve Digital Signature Algorithm),
and BTC Wallet identification value in Base64 encoding.
Figure 5. Mobile Application BTC Wallet Accounts
If the user of the BTC Wallet needs to send BTC value within a payment transaction or the
one need to pay a product or a service, then should choose the “Send” option as in figure 6:

Proceedings of the IE 2015 International Conference
www.conferenceie.ase.ro
149
Figure 6. Mobile Application BTC Wallet Send option
Each transaction input (Source and Destination BTC Wallet, BTC Amount, etc.) is processed
with RIPEMD-160/SHA-256/SHA-512 hash function and encrypted with ECDSA asymmetric
key algorithm. Figure 7 shows the transaction details, which can be verified into a 3rd party
BTC payment transaction platform as [6] in Figure 8:
Figure 7. Mobile Application BTC Wallet Transaction details option

Proceedings of the IE 2015 International Conference
www.conferenceie.ase.ro
150
Figure 8. BTC Transactions details in BlockChain.info web platform [6]
As can be seen in figure 7 and 8 each BTC payment transaction can be identified unique
identified through the HASH value or the transaction value (in this case 0,004 BTC) available
into the BTC block chain at the web address:
https://blockchain.info/address/1PM4iKXj4uQUs51CsVVPPgRiXskxS4YgPT. From Java
Card perspective, there are open source implementations: [9], [10], [11].
5. Conclusions
From the point of view of the SECURITY of the payment transaction, both EMVCo and
Bitcoin compliant applications have been implemented in Java Card API on the real hardware
and Java Card Virtual Machine 2.x version. In terms of security, Java Card platform and
technology has a serious advantage over other platforms in terms of design (e.g. possible in the
future, to implement security hardening in Java Card VM implementation against the logical
attacks), community (Oracle/Sun Microsystems Technology Network developers and JavaOne
conference events) and enforcement institutions (Global Platform). Besides the security the
advantages, the Java Card implementation is portable on various hardware architectures such
as: Mobile device (with (U)SIM – Universal Subscriber Identity Module / eSE – embedded
Secure Element / TEE – Trusted Execution Environment hardware), Java Card USB token,
Java Card dual interface/contactless smart card, etc.

Proceedings of the IE 2015 International Conference
www.conferenceie.ase.ro
151
References
[1] C. Boja, M. Doinea and P Pocatilu, “Impact of the Security requirements on Mobile
Applications Usability”, Economy Informatics, vol. 13, no 1, pp. 64 – 72, 2013
[2] C. Toma, C. Ciurea and I. Ivan, “Approaches on Internet of Things Solutions”, Journal of
Mobile, Embedded and Distributed Systems, vol. 5, no. 3, pp. 124 – 129, 2013
[3] EMV Integrated Circuit Card Specifications for Payment Systems, Book 2, Security and
Key Management, Version 4.3, November 2011, EMVCo, LLC
[4] EMV Integrated Circuit Card Specifications for Payment Systems, Book 3, Application
Specification, Version 4.3, November 2011, EMVCo, LLC
[5] EMV Contactless Specifications for Payment Systems, Book C-6, Kernel 6 Specification,
Version 2.5, February 2015, EMVCo, LLC
[6] https://blockchain.info
[7] http://www.cnas.ro/page/cardul-national-de-asigurari-de-sanatate-2.html
[8] http://www.emvco.com/specifications.aspx
[9] https://github.com/LedgerHQ/btchipJC
[10] https://github.com/Toporin/SatoChipApplet
[11] https://ledgerhq.github.io/btchip-doc/bitcoin-technical-1.4.2.html
[12] http://en.wikipedia.org/wiki/Smart_card

Proceedings of the IE 2015 International Conference
www.conferenceie.ase.ro
152
ACCURATE GEO-LOCATION READING IN ANDROID
Felician ALECU
Bucharest University of Economic Studies [email protected]
Răzvan DINA
Bucharest University of Economic Studies, Romania
Abstract. “112 – Show my Location” is an Android app intended to be used in all emergency
situations where the current location coordinates (taken by GPS/Network) are needed. For
minimum power consumption, the location is updated on demand only. The application is listed
on Google Play Store (eu112) and can be installed, tested and regularly used free of charge.
Keywords: 112, European emergency number, current location coordinates, Android. JEL classification: O33
1. Introduction On 20th January 2014, a plane of Romanian Superior School of Aviation (transporting a five-
person medical team) crashed in Apuseni Mountains. Even if a call at 112 was made at 16:16,
the rescue teams reached the site around 22 (after 6 hours) because all the methods used to
locate the place failed.
Despite the fact all the passengers were carrying mobile phones, the rescue services were
severely delayed because they did not receive the proper coordinates of the crash site.
One of the passengers used a smartphone to report the GPS coordinates but the application he
used just got the GSM tower position that was sent further to the emergency services, instead
the real location. Few other attempts were done to find out the current location but the maps
application reported the hour as the position (19, 33, 20/1 and 19, 37, 20/1 after four minutes),
probably because the GPS was not active on the device.
Unfortunately, even if she survived the crash, the student girl Aura ION died of hypothermia
because of the long emergency response, the rescue teams reaching the site after 6 hours from
the crash.
For such cases when it is vital to report accurate position data to the emergency services, a
simple and power effective application can make the difference between life and death.
2. App Description The aim of the “112 – Show my Location” application is to offer the user all the details needed
by the emergency services for a quick localization. 112 is the European emergency number,
available free of charge, 24/7, anywhere in the European Union. Persons can dial 112 (by
landline phones as well as mobiles) to reach the emergency services like police, medical
assistance and fire brigade.
The application is listed on the Google Play Store (eu112), so anyone can use it free of charge,
as illustrated in Figure 1.

Proceedings of the IE 2015 International Conference
www.conferenceie.ase.ro
153
Figure 1. The Google Play Store listing
For minimum power consumption, the location is only updated on demand. The current
coordinates (taken by GPS/Network in Decimal Degrees) are displayed and also highlighted
on the map.
3. The user interface The 112 number should be use for emergency situations only. Using the number for any other
reason is an abuse (if done intentionally) or misuse (if done accidentally). Because any abuse
is a criminal offence, the application is first requesting the user to enter a random password
(Figure 2), trying to prevent the pocket dialing situations or the cases in which children playing
with the phone may inadvertently call the emergency number.
Figure 2. Asking for a password in order to prevent any accidental call to 112
The Update Location button can be used to manually update the current location. The
application will show the phone number (as it is defined under the android settings), the date,
the current position latitude and longitude and the time of the last location update (Figure 3).
All these details are vital for the rescue teams trying to locate any person in danger but carrying
a smartphone.

Proceedings of the IE 2015 International Conference
www.conferenceie.ase.ro
154
Figure 3. Showing the current phone location
For minimum power consumption, the location can only be updated on demand since the
battery level should be preserved as long as possible in any critical situation.
The user has the choice to call 112 and to report the details displayed by the application (for
example the phone can be switched on the speaker mode in order to be able to read the position
coordinates). A more convenient option is to send the location by SMS (Figure 4) to a number
that can be manually entered or selected from the address book.
Figure 4. The selection of the phone number to send the current location coordinates to
4. Implementation details In order to be able to provide a contextual experience based on location awareness, the
application is using the new Google Play services location APIs instead the old Android
framework location APIs (android.location). The application needs a Google API key that can
be generated under Google Developer Console -> APIs -> Credentials, as illustrated in Figure
5.

Proceedings of the IE 2015 International Conference
www.conferenceie.ase.ro
155
Figure 5. The Google API key used to connect the application to the Google Play services
The previously generated API key must be included into the app manifest file, as described in
Listing 1. The fine and coarse location permissions are needed to allow the application to use
all the available location providers in order to get location as precise as possible.
Listing 1. Defining the Google API key
AndroidManifest.XML
…
<uses-permission android:name="android.permission.ACCESS_COARSE_LOCATION" />
<uses-permission android:name="android.permission.ACCESS_FINE_LOCATION" />
…
<meta-data
android:name="com.google.android.maps.v2.API_KEY"
android:value="AI**********************************" />
…
This key is used by the application to connect to the Google Play services, as presented in
Listing 2. Listing 2. Using the Google API key
MainActivity.java
…
protected synchronized void buildGoogleApiClient() {
mGoogleApiClient = new GoogleApiClient.Builder(this)
.addConnectionCallbacks(this)
.addOnConnectionFailedListener(this)
.addApi(LocationServices.API)
.build();
createLocationRequest();
}
protected void createLocationRequest() {
mLocationRequest = new LocationRequest();
// Sets the desired interval for active location updates.
mLocationRequest.setInterval(UPDATE_INTERVAL_IN_MILLISECONDS);
// Sets the fastest rate for active location updates.
mLocationRequest.setFastestInterval(FASTEST_UPDATE_INTERVAL_IN_MILLISECONDS);
// Sets the priority for the most precise location possible
mLocationRequest.setPriority(LocationRequest.PRIORITY_HIGH_ACCURACY);
}

Proceedings of the IE 2015 International Conference
www.conferenceie.ase.ro
156
By pressing the Update Location button, the FusedLocationApi is used (Listing 3) to provide
the best available location update based on different location providers like GPS or WiFi.
Listing 3. Getting the location updates
MainActivity.java
…
protected void startLocationUpdates() {
LocationServices.FusedLocationApi.requestLocationUpdates(
mGoogleApiClient, mLocationRequest, this);
}
The new location details are obtained by the onLocationChanged method, as exemplified in
Listing 4.
Listing 4. The details of the new location
MainActivity.java
…
@Override
public void onLocationChanged(Location location) {
mCurrentLocation = location;
mLastUpdateTime = DateFormat.getTimeInstance(
DateFormat.MEDIUM, Locale.UK).format(new Date());
// update details
mDateText.setText(DateFormat.getDateInstance(
DateFormat.SHORT, Locale.UK).format(new Date()));
mLatitudeText.setText(String.valueOf(mCurrentLocation.getLatitude()));
mLongitudeText.setText(String.valueOf(mCurrentLocation.getLongitude()));
mLastUpdateTimeText.setText(mLastUpdateTime);
mMap.clear();
LatLng latLng = new LatLng(mCurrentLocation.getLatitude(),
mCurrentLocation.getLongitude());
mMap.animateCamera(CameraUpdateFactory.newLatLngZoom(latLng, 17)); //from 2 to 21
mMap.addMarker(new MarkerOptions()
.title("You are HERE!")
.snippet("Lat " + String.valueOf(mCurrentLocation.getLatitude()) +
", Long " + String.valueOf(mCurrentLocation.getLongitude()))
.position(latLng));
// location updated
Toast.makeText(this, "Location updated.", Toast.LENGTH_SHORT).show();
}
By pressing the Call 112 button, the dialing pad appears with the 112 number already entered,
so the user has to only press the green call button (Listing 5). Unfortunately, only the system
applications are allowed to directly call the special numbers like 112.
Listing 5. Calling 112
//MainActivity.java
public void Call112ButtonHandler(View view) {
Uri callUri = Uri.parse("tel://112");
Intent callIntent = new Intent(Intent.ACTION_CALL,callUri);
callIntent.setFlags(Intent.FLAG_ACTIVITY_NEW_TASK
| Intent.FLAG_ACTIVITY_NO_USER_ACTION);
startActivity(callIntent);
}

Proceedings of the IE 2015 International Conference
www.conferenceie.ase.ro
157
For sending the SMS, starting with Android 4.4 KitKat only the default SMS application can
send and receive messages. In order to be able to send short text messages even if there is no
reason to be defined as the default SMS app, the “112 – Show my Location” is forced to use
the SmsManager feature, as presented in Listing 6.
Listing 6. Sending position details by SMS
MainActivity.java
...
private void SendSMS(String phoneNumber, String smsMessage) {
try {
SmsManager smsManager = SmsManager.getDefault();
smsManager.sendTextMessage(phoneNumber, null, smsMessage, null, null);
Toast.makeText(getApplicationContext(), "SMS to " + phoneNumber + " sent.",
Toast.LENGTH_LONG).show();
} catch (Exception e) {
Toast.makeText(getApplicationContext(),
"SMS failed, please try again later.", Toast.LENGTH_LONG).show();
e.printStackTrace();
}
}
5. Conclusions The application could be very useful for any emergency situation because it offers all the
necessary details in a faster and reliable way with minimum battery power consumption.
Being based on the Google location API, the application is us using Google Play services to
determine the current position in a faster and accurate way by using the best available location
taken from several different sources like GPS or WiFi.
In real life critical situations, such an application can easily save lives.
Acknowledgement
This paper was co-financed from the European Social Fund, through the Sectorial Operational
Programme Human Resources Development 2007-2013, project number
POSDRU/159/1.5/S/138907 "Excellence in scientific interdisciplinary research, doctoral and
postdoctoral, in the economic, social and medical fields - EXCELIS", coordinator The
Bucharest University of Economic Studies.
References
[1] P. Pocatilu, I. Ivan, A. Visoiu, F. Alecu, A. Zamfiroiu, B. Iancu, Programarea
aplicatiilor Android, ASE 2015, ISBN: 978-606-505-856-9.
[2] Making Your App Location-Aware,
https://developer.android.com/training/location/index.html
[3] Comunicat oficial al Serviciului de Telecomunicatii Speciale (STS) remis MEDIAFAX,
http://www.mediafax.ro/social/sts-medicul-zamfir-nu-a-trimis-coordonatele-geografice-
ci-ce-vedea-in-jur-si-ora-de-pe-mobil-12015644
Proceedings of the IE 2015 International Conference
www.conferenceie.ase.ro
158
ABOUT OPTIMIZING WEB APPLICATIONS
Marian Pompiliu CRISTESCU
“Lucian Blaga” University of Sibiu [email protected] Laurentiu Vasile CIOVICA
“ALMA MATER” University, Sibiu [email protected]
Abstract: Software optimization is an extended area of software engineering and an
important stage in software product development. If taken into account a number of n
programs which solve the same problem, the optimal program will be considered the one
which gives the best value for an indicator called performance criterion. In the present paper
is accomplished the description of the techniques used for optimizing the web applications,
putting in the same time pre and post optimization code fragments, measurements of the
access time in the case of an online application for testing intelligence called IQ Test. The IQ
Test application developed from simple linear structure to arborescence structure with
directed arcs to descendants, because after optimizations to get a high degree of flexibility,
the final version being represented by a graph structure, where browsing is realized on a lot
of routes and is possible the navigation in any direction.
Keywords: web application, software optimization, methods of optimizing, intelligence.
JEL classification: C88, C89
1. Introduction
The development of web application follows, like determinant item, the architecture which is
sitting on the base of it. In this case, in majority of the cases is using the customer server
technology to implement the applications distributed in system. The principal components of
the application which use this architecture are the server and the customer.
In web applications, the server component is represented by web servers. This applications
are produced for specialized companies. In application presented in this study the web server
is Tomcat. The customer component is represented by web browsers.
According to [3], the simplest web applications are those in which the servers send files with
static content to browser. The disadvantage of this applications is that any information update
must be made files from the server, which inevitably determine to permanent updates, in the
other words to projects that can never be considered finished.
For the solving of this problems, were developed technologies [1], [5] which after receiving
the request, don’t send anymore the content of a file, but their build the dynamic answer,
eventually after consulting the local databases whose content is modifying in time. This type
of applications architecture is called „three tier”, which involve three elements: the Browser,
the Web Server and the Data Base Server.
The optimization of a program involve „ improving the performances of this, although was
obtained, for the moment, a superior value for the performance criterion [2]. The solution is
not unique because from an optimization to another one ameliorate the performance. Also
should take in consideration the local character of the optimization, this referring to a
program which is modify or to the comparing result of a very small number of programs
between them, which represent the solve version of a problem.
Proceedings of the IE 2015 International Conference
www.conferenceie.ase.ro
159
The optimization of the program means the program improving. All the references are made
at a lot of target programs. After the optimization is realized the informatics application and
bringing it’s at a functional form without any errors. Is discussed of optimization in the
context of an application which solve correct and complete the problem for that was realized.
2. Methods for optimizing the web applications The concept of optimizing is different from the one of correcting the errors. The goal of this
operation is to improve the characteristics of the application, bringing it to an optimum level.
According to [4], „The optimization of an application describes the modification process of
the software product through development of versions or solutions with a higher quality
level”.
2.1 Minimizing the memory space Because it takes in discussion a web application, the most consumers of the memory space
would be the multimedia resources, so that the optimization effort will be directed mainly to a
favorable report between compression and quality. In the application Test IQ the most
voluminous multimedia resource is the video tutorial which in uncompressed version has the
size of 14242 KB. It achieves a considerable economy, using the codec TSCC TechSmith
Screen Capture Codec. This codec is optimized for print screens so that the result file would
be small and well compressed, occupying 6788 KB, the space economy in this case would be
7454 KB.
The next element for space minimizing is the database. By storing the database application
strictly necessary elements and their corresponding encoding shrinks the size of the database.
In this case the application contains 3 tables assimilated to the 3 tests. Economical solution
for storing the ID of the question, the image represented as BLOB, the code for the interface
type and the correct answer database provides sufficient robustness while keeping to an
acceptable size. This way the values of 0.5KB - Table 1 0.57KB - table 2 and 0.16KB - table
3 reaches a cumulative value of 1.23 KB for the database.
Another important aspect for reduce the occupied memory is to minimize the input. In this
case, by requiring the user name and first name as input ensures a small size of the input.
2.2 Maximizing the performance of the source code
One of the advantages of distributed applications is the presence applets, Java programs
designed to run in the web browser. Here appear two conflicting issues: dynamic related
facilities that an applet brings web application performance in contrast with lower speed
feature of Java. To compensate for this shortcoming, it is necessary applet source code
optimization so as to increase the speed of compilation. This goal is achieved by several
methods:
Operation substitution - when is possible, slower operators (/,*,^) should be replaced with
faster operators as bit shifting.
x >> 2used in place ofx / 4
x << 1in place ofx * 2.
Bonded operations are recommended:
a+=i more efficient than a = a+i.
Elimination of understatements it’s a very good modality to eliminate redundant
calculation.
double x = d * (l / m) * sx;double y = d * (l / m) * sy;it’s replaced by:
double s = d * (l / m);double x = s * sx;double y = s * sy;
Proceedings of the IE 2015 International Conference
www.conferenceie.ase.ro
160
Invariant code usage in applet’s development. If an invariant it’s used to formulate a result,
is more efficient to isolate the invariant.
In expression: for (int i = 0; i < x.length; i++)
x[i] *= Math.PI * Math.cos(y);
can be observed the redundant calculation of each mathematical expression in each iteration.
Optimized approach assumes expressions unique calculation and the later usage of the result:
double ex = Math.PI * Math.cos(y);
for (int i = 0; i < x.length; i++)
x[i] *= ex;
Same algorithm is valid also for image constructions:
for (int i = 0; i < n; i++)
img[i]=getImage(getCodeBase(),"im"+i+".gif";
becomes: URL url = getCodeBase();
for (int i = 0; i < n; i++)
img[i]=getImage(url,"im"+i+".gif");
Correct definition of variables takes in consideration that the local variables are the fastest to
access. So in the construction of the methods it is recommended the usage of this type of
variables as much as possible. Another suggestion refers to specifies access. For each method
that doesn’t varies from instance to instance of the class, or which are constant on all the
execution, it’s used static and final. This way there won’t be any lost times with instantiation
of the variables each time a new object is created.
Reuse of the code greatly improves program efficiency. It’s recommended the usage of
classes expanded from already existent classes and to be called from already existent
libraries. This way can be personalized classes which are used in the interface trough usage
of expanding standard classes and adding additional fields and methods.
class MyJPanel extends JPanel{
private IqApplet ia;
private int punctaj;
public MyJPanel(IqApplet ia, int x){
super();
this.ia = ia;
punctaj = x;
}
Another method is the reuse of objects. Instantiation of a new object consumes time, so
when possible recycle is preferred. Especially for formatting elements of an applet as object
of Font type. Instead of declaring a new object for title’s font, answers and questions, it’s
used an generic object Font, which will actualize trough setFont() method.
Graphic optimization is an important aspect in applet’s functionality. If the speed in this
sector is improved the performance of the application would decisively improve also. This
won content should not compromise the image quality because there are situations when it’s
preferred a slower approach for a better quality.
Classic case it’s represented by algorithm “Double Buffering” which purpose is to reduce the
blinking effect of images on the screen. For this algorithm there is also an optimization. It’s

Proceedings of the IE 2015 International Conference
www.conferenceie.ase.ro
161
used the property of “clipping”, which doesn’t assumes that all the surface will be redraw, but
only the exclusively needed components. Optimized algorithm is presented here:
public void update(Graphics g) {
Graphics offgc; // graphic object with which it draws// image in background
Image offscreen = null; //image which will be bonded
Rectangle box = g.getClipRect();//area determination which must be // redrawn
offscreen = createImage(box.width, box.height); // image creation
offgc = offscreen.getGraphics();
// cleaning of exposed area
offgc.setColor(getBackground());
offgc.fillRect(0, 0, box.width, box.height);
offgc.setColor(getForeground());
offgc.translate(-box.x, -box.y);
paint(offgc);
// image transfer on the area
g.drawImage(offscreen, box.x, box.y, this);
}
Other optimization strategies for graphic components involve reusing the libraries which
already exist. In the case of building geometric forms is recommended to use the
drawPolygon() method for a lines draw cycle with drawLine().
The optimization of written text has a high importance because an applet contain also
informative sections. It’s recommended using the specialized StringTokenizer classes for
solving a StringBuffer text on units for concatenations.
The optimization of compiler brings more value for above methods to prove them effective.
Will be used a JIT compiler instead of the classic Java VM. JIT just-in-time compiler is a
program which convert the byte code Java which is interpreted in instructions which can be
sent to the processor. The disadvantage of this method consists in the fact that lose the code
portability which is provide by the byte code.
Other optimization practice involves that after the entire code was be developed and tested,
will be recompile with optimization options from the activate compilation by the javac-o
console command.
A special attention in the case of code optimization must give to the servlet for intermediation
which this realized between applet and the database will be efficient. For optimizing is used
the next methods:
Storing static dates in XML files and the extraction of these inside of the init() method which
is specify to the servlet. Init() method is executed only once on the servlet instantiation and is
overwrite, so that is preferred this approach in the favor of the dynamic generation of the data
at each customer call to servlet. At the bottom is showed the init() method and the way in
which is got the values of some data from attached XML configuration:
...
private String connectionURL;
private String contentType;
private String user;
private String password;
public void init(ServletConfig config)throws ServletException{
super.init(config);
connectionURL = config.getInitParameter("connectionURL");
Proceedings of the IE 2015 International Conference
www.conferenceie.ase.ro
162
contentType = config.getInitParameter("contentType");
user = config.getInitParameter("user");
password = config.getInitParameter("password");
if(password == null)
password = "";
}
The utilization of the print() method instead of the println() method when sending data for
objects such as PrintWriter and others. It is recommended to use print(), the more efficient
way, because, intern println() takes the data and sends it to print(). The difference in aspect
between the results of the two methods is visible only on the HTML source.
The periodical flush of the exit flux (output flush) ensures that the user sees the result
before the entire page loads. Even though this process doesn’t improve the application in
general, the user is offered the sensation that the page is processed faster. The technique is
useful especially when pages have parts with lots of graphics or parts which require intense
processing.
Supplementation of the answer buffer size in which the servlets load content. When the
buffer fills up, the servlet creates a socket type connection towards the client and unloads the
buffer. To reduce the number of sockets and traffic it is recommended to increase the size of
the buffer through a response.setBufferSize(10240) appeal.
Restricting appeals to ServletContext.log - the appeal method for ServletContext.log
degrades performance. To increase efficiency the appeals to this method are reduced in favor
of displaying on the console System.out.println().
2.3 Maximization of the satisfaction level of the user
Because the purpose of the application is that of testing an ability, the projected interface will
be simple and oriented towards functionality. The user’s first contact with the application is
through the initial form. To ensure the users satisfaction the following elements are taken into
consideration in the creation of the interface for Test IQ:
all the important elements of the page are placed onto the surface accessible without
scrolling. This lets the user understand the application more easily without necessitating
supplementary actions;
the form is created in a way to not confuse the user. The background color isn’t
disturbing, the obligatory brackets are marked with red and signaled with an informative
note, the information required from a user is at a minimum level and are in a logical
succession. Implied values exist for each bracket except NAME and FIRST NAME, for
the reason of avoiding errors;
validations together with the correct display of error messages are realized in an intuitive
manner to guide the user;
on the start page the user will find a description of each test. Upon accessing them the
user can find out particular information, the necessary time to finish the test and other
information to guide the user;
outside of the NAME and FIRST NAME brackets represented through textboxes, which
permit the user to introduce desired characters, the rest of the brackets requires simple
selection. Through this the possible mistakes that can be made by the user are minimized,
thus less errors appear.
the application comes with a tutorial which familiarizes the user with it. The tutorial is
available as a video or a slideshow in order to accommodate users that have browsers
without media plug-ins;

Proceedings of the IE 2015 International Conference
www.conferenceie.ase.ro
163
after pressing the save button, the user is announced through the appearance of an
hourglass that the application is loading and will be available shortly.
The test application is very important for the optimization process. From the perspective of
user satisfaction maximization, the app has to be easy to use, easily navigable, and must have
enough command panels to facilitate an optimal use process of a test.
3. Conclusions
The optimization of web applications represents an accumulation of methods, which act on
different routes and follow the improvement of the applications performance taking into
consideration the wants of the user. The optimization process starts after a certain application
is functional and in each case necessitates a precaution as not to reduce the performance of
one function through the optimization of another. Such an outcome does not justify the
optimization. For the Test IQ application the optimization of the client, applet, server and
servlet has been insisted upon. In each part the interface, data transfer, resource management
and result display was the focus.
The optimization of a web application means creating a rigorous projection on both the
source code and language and the applications structure. The duration of the optimization is
desired to be shorter, the complexity of the application reasonable, as in to present
functionality and sufficient robustness to permit ulterior development and maintenance. 4
stages of development have been registered on the path of evolution of Test IQ, each with
their own well defined local purposes. At the finalization of each stage the application is
tested rigorously as to ensure that there are no errors when it reaches the next stage.
References
[1] Bajaj A., Krishnan R., “CMU-WEB: A Conceptual Model For Designing Usable Web
Applications”, Journal of Database Management, Idea Group Publishing, Volume 10,
Issue 4, Page 33, The Heintz School Carnegie Mellon University, 1 October, 1999, ISSN
10638016;
[2] Boja Catalin, “Aspecte privind optimizarea în domeniul informaticii aplicate în
economie”, Economie teoretică şi aplicată, Bucureşti 2007, ISSN 1844-0029 (editia
online), pg 43-54;
[3] Cristescu M.P., Cristescu C.I., Cucu C., “Distributed applications. Practical rules”, in
Proc. 17th International Economic Conference IECS 2010 „THE ECONOMIC WORLD’
DESTINY: CRISIS AND GLOBALIZATION?”, vol. I, ISBN 978-973-739-987-8, Sibiu,
Romania, may 13-14, 2010, pp. 69-74;
[4] Ivan Ion, Boja Catalin, “Practica optimizării aplicaţiilor informatice”, Editura ASE,
Bucureşti, 2007, ISBN 978-973-594-932-7, 483 pg;
[5] King A., “Website Optimization: Speed, Search Engine & ConversionRate Secrets”,
published by O’Rilley Media Inc., USA 2008, ISBN 978-0-596-51508-9, 349 pg.

Proceedings of the IE 2015 International Conference
www.conferenceie.ase.ro
164
THE RELATIONSHIP BETWEEN ENVIRONMENTAL AND
ENERGY INDICATORS. THE CASE STUDY OF EUROPE
Titus Felix FURTUNĂ
The Bucharest University of Economic Studies
Marian DÂRDALĂ
The Bucharest University of Economic Studies
Roman KANALA
Université de Genève
Abstract. The largest amount of CO2 emissions in the European Union originates from the
production of electricity and heat. Coal-based energy production in the EU has generated
more than 20% of total CO2 emissions in the EU. In this paper, we analyze the relationship
between environmental indicators and various sets of energy indicators. We propose to use
the generalized canonical analysis in order to study the relationship among many sets of
indicators. The programmatic support for Canonical Analysis and Generalized Canonical
Analysis software application is provided by the Java Apache Commons Math Library. For
graphical representation we used the Java specialized library Java Free Report. Factorial
distributions of the countries in canonical axis are displayed on maps prepared in ArcGIS by
ESRI.
Keywords: Canonical analysis, Generalized Canonical analysis, Environmental Indicators,
Energy, GIS
JEL classification: C380, C8, Q4
1. Introduction
In our society, energy is essential to meet the daily needs of individuals, industry, transport,
agriculture and services. The energy issues are of main concern, because of their increasing
importance and impact on the environment. Air pollution contributes to an increase of the
greenhouse effect that causes global warming. Non-renewable energy resources produce
many pollutants during their operation. On the other side, renewable energy is often
considered as “clean” energy. However, no energy path is entirely emission-free.
Based on data provided by Eurostat, we draw a relationship between the structure of energy
production, especially electricity and emission of greenhouse gases and other pollutants. The
sets of indicators are as follows:
Set1 - Emissions of greenhouse gases and air pollutants;
Set2 - Main indicators of energy;
Set3 - Final energy consumption by products;
Set4 - Final energy consumption by sectors;
Set5 - Electricity production by sources.
General connection among these sets of variables can be studied in a first stage using the
generalized canonical analysis. Pairs of data sets having a connection between them can be
studied in the second stage applying canonical analysis.

Proceedings of the IE 2015 International Conference
www.conferenceie.ase.ro
165
The Canonical Analysis is a statistical method, proposed in 1936 by Hotelling [1a]. It is used
for significance hypothesis testing and to depict the relationship between two sets of variables
amongst two sets. Generalized Canonical Analysis is an extension of Canonical Analysis for
many sets of variables. Among these methods, let’s mention the following ones: Sumcor
method [2] consists in maximizing the sum of the canonical correlations, Carroll method
[1][5] consists in maximizing the sum of correlations between the common canonical
variables and canonical variables of the groups, SSqCor method [3][4] consists in
maximizing the sum of the squares of correlations of canonical variables couples. Various
conditions and optimal criterion may produce different results [8].
2. Generalized Canonical Analysis. Problem formulation
Let q observations tables X1, X2, ..., Xq describe the same n individuals. Let’s note mi the
number of columns of the Xi matrix, and with Wi the Rn subspace generated by the columns
of Xi matrix. With Pi is noted the orthogonal projector on the Wi subspace. We suppose that
n >
q
i
im1
. According with Carroll criteria [1][7] Generalized Canonical Analysis determines
in the first step an auxiliary variable Z1 and q canonical variable zi
1 (i = 1, q), so that
q
i
izZR1
112 ),( to be maximal under constraint: 11 ZZt
=1. In order to have the sum of
correlations to be maximal, the zi1 vectors are chosen as orthogonal projections of the Z1
vectors on Wi subspaces (Wi: zi1 = Pi∙Z
1) . So, the above sum can be rewritten as:
q
i i
t
i
i
tq
i
q
ii
t
i
i
t
i
i
q
i
i
zzn
zZ
zzn
zZn
zVarZVar
zZCovzZR
111
211
1 1 11
2
11
11
211
1
112
1
1
,),( .
Replacing 1
iz with Pi∙Z1 and taking account that iii
t
i PPPP 2, we obtain:
1
1
111
1 111
211
1
112 11),( ZP
nZZPZ
nZPPZn
ZPZzZR
q
i
i
t
i
tq
i
q
ii
t
i
t
i
tq
i
i
.
So, the optimal problem becomes:
1
1
11
1
1
1
1
ZZ
ZPn
ZMaxim
t
q
i
i
t
Z .
The solution of this problem, the Z1 variable, is the eigenvector of the
q
i
iPn 1
1matrix
corresponding to the highest eigenvalue. The canonical variables of the groups are
determined by relation: zi1 = PiZ
1.
In the k step the Zk auxiliary variable and the zik (i = 1, q) canonical values are
determined so that
q
i
k
i
k zZR1
2 ),( be maximal, subject to constraints:
1) 1ktk ZZ
2) 1,1 ,0 kjZZ jtk .

Proceedings of the IE 2015 International Conference
www.conferenceie.ase.ro
166
The Zk variable is the eigenvector of the
q
i
iPn 1
1matrix corresponding to the
eigenvalue of k order (order of magnitude). The canonical variables of groups are: zik = PiZ
k.
4. Relationship between sets of indicators
The set of emissions of greenhouse gases and air pollutants includes the following indicators:
air emissions produced in industry and households sectors by electricity, gas, steam and
air conditioning supply;
air pollution by: Sulphur oxides, Nitrogen oxides, Ammonia, Non-methane volatile
organic compounds, Particulates (< 10µm) in sector of energy production and distribution
and energy use in industry;
greenhouse Gas Emissions (CO2 equivalent) in energy and energy industry.
The set of main indicators in energy:
energy intensity of the economy - Gross inland consumption of energy divided by GDP
(kg of oil equivalent per 1 000 EUR);
implicit tax rate on energy - EUR per ton of oil equivalent;
combined heat and power generation - percent of gross electricity generation;
electricity generated from renewable sources - percent of gross electricity consumption;
market share of the largest generator in the electricity market - percent of the total
generation;
share of renewable energy in gross final energy consumption.
The set of final energy consumption by sectors includes indicators that represent the total sum
of energy supplied to the final consumer's door for all energy uses. The values are expressed
as a percentage. The indicators of the final energy consumption by product set represent the
total final energy consumption and the energy consumption of a selected number of products
or product groups. These values are also expressed as a percentage. The last set of indicators
reflect the structure of electric power sources. First we apply the generalized canonical
analysis in order to discover the relationship among all the five data sets. The results are
evaluated by applying of a significance test based on Wilk’s - Bartlett statistic [6]. In Table 1
are presented the significance test results for the first three canonical roots and a significance
level equal with 0.05. There is no significant relationship among the five data sets at the
global level.
Table 1 - Statistical significance of auxiliary canonical variables
Root Chi Square Degree of freedom Critical Chi Square
Z1 18.42809 35 49.80185
Z2 8.70627 34 48.60237
Z3 4.52463 33 47.39988
Canonical correlation for each group is presented in Table 2. It's about correlations between
auxiliary canonical variables and canonical variables of sets. We remove from the analysis
data sets where the correlations between auxiliary canonical variables and the canonical
variables of the data sets have low values: Set2 and Set4.
For graphical representation of the individuals on the auxiliary canonical axis, we propose to
use a map of Europe. Countries with similarities regarding the relationship between the three
sets of indicators are colored in close colors (white, light grey, dark grey).

Proceedings of the IE 2015 International Conference
www.conferenceie.ase.ro
167
Figure 1. Map of European countries colored using the first auxiliary canonical variable
The countries for which the values on the first auxiliary canonical variable axis are smaller
are colored in lighter shades of colors. These countries are the ones in which the link between
energy activities and environment indicators is smaller. As anyone can see, the relationships
are more intense in countries that generate energy mainly out of fuels such as oil, coal or gas.
Table 2 - Auxiliary canonical variables - canonical variables correlations
Root Set1 Set2 Set3 Set4 Set5 Total
Z1 0.84015 0.7552 0.95213 0.81302 0.92712 4.28761
Z2 0.81263 0.77401 0.77447 0.55641 0.84853 3.76606
Z3 0.65885 0.70746 0.81826 0.34197 0.83167 3.35821
After removing Set2 and Set4, we apply a new algorithm for the three remaining sets. The
significance test validates the first three auxiliary canonical roots.
Table 3 - Statistical significance for three sets analysis
Root Chi Square Degree of freedom Critical Chi
Square
Z1 102.7433 32 46.19426
Z2 71.78868 31 44.98534
Z3 51.89408 30 43.77297
Z4 38.57813 29 42.55697
Z5 27.81176 28 41.33714
The recalculated canonical correlations for the first three sets are presented in Table 4. Only
the significant auxiliary canonical variables are taken into consideration.
Table 2 - Auxiliary canonical variables - canonical variables correlations with 3 sets.
Root Set1 Set3 Set5 Total
Z1 0.92265 0.94266 0.95369 2.819
Z2 0.88179 0.8732 0.88205 2.63705
Z3 0.81013 0.79537 0.8268 2.43231

Proceedings of the IE 2015 International Conference
www.conferenceie.ase.ro
168
To determine the correlations among significant canonical auxiliary variables and variables
of groups, a detailed look on relations among groups is required. The correlation circle
among the first two canonical auxiliary variables and the variables of groups is drawn in
Figure 2.
Canonical analysis is a good work tool to define the connection among various phenomena
represented in the data sets. In case of connection between emission of pollutants and the
activity in the energy sector, the results show that a some correlation exists.
Figure 2 - Correlation between auxiliary canonical variables and the group variables
It can be observed that some values are low, which means that the energy production and
energy consumption behave in a different way when it comes to the emission of pollutants.
For instance, the electric energy produced from oil is characterized by a strong correlation
with many indicators concerning pollution. A more detailed image concerning the
relationships between sets can be obtained by computing the correlations among variables of
each group and the canonical variables of groups. High correlations indicate variables whose
significance contributes to the relationship among sets. In Figure 3 is presented the
correlation circle of two data sets. It can be observed that the concentration of points
represents the same variables but in the different spaces.
5. Conclusions
The canonical analysis is a good work tool to depict the relationships among various
phenomena represented the data sets. The case study results show that a significant
relationship exists between pollutants emission and the activity of the energy sector. This
relationship is stronger in countries where the energy is mostly generated from fossile fuels.

Proceedings of the IE 2015 International Conference
www.conferenceie.ase.ro
169
Figure 3 - Correlation between canonical variables and the group variables in each space
Acknowledgment
This work was supported by the Swiss Enlargement Contribution in the framework of the
Romanian-Swiss Research Program (Grant IZERZ0_142217).
References
[1] J. D. Carroll, “Generalization of canonical correlation analysis to three or more sets of
colonnes”, Proceedings of the 76th Annual Convention of the American Psychological
Association, 1968, p. 227-228
[1a] H. Hotelling, “Relations Between Two Sets of Variates”, Biometrika 28(3-4), 1936, pp. 321-377
[2] P. Horst, “Relations among m sets of measures”, Psychometrika 26(2), 1961(a), p. 129-
149
[3] R.J. Kettering, “Canonical analysis”, Encyclopedia of statistical Sciences, S. Kotz, N.L.
Johnson, New York, Wiley, 1983, p. 354-365
[4] R. J. Kettering, “Canonical analysis of several sets of variables”, Biometrika 58(3), 1971,
p. 433-451
[5] V.Nzobounsana, T. Dhornet, “Écart : une nouvelle méthode d’analyse canonique
généralisée (ACG“, Revue de Statistique Appliquée, 51(4), 2003, p. 57-82
[6] M.S. Bartlett, M.S., “A Note on the Multiplying Factors for Various chi2
Approximations“, J R Stat Soc Series B 16 (2), p. 296–298, 1954
[7] Diday, E., Pouget, J., Lemaire, J., Testu, F., “Elements d’analyse de donnee“, Dunod,
Paris, 1985
[8] A. Gifi, (1990). “Nonlinear multivariate analysis.” Chichester: John Wiley and Sons,
1990 (First edition 1981 Department of Data Theory, University of Leiden).
[9] Commons Math: The Apache Commons Mathematics Library:
https://commons.apache.org/proper/commons-math/
[10] JFreeChart - Java chart library: http://www.jfree.org/jfreechart/
[11] Eurostat: http://ec.europa.eu/eurostat/data/database
[12] International Energy Agency: http://www.iea.org/statistics/statisticssearch/report

Proceedings of the IE 2015 International Conference
www.conferenceie.ase.ro
170
IS THE INTEGRATED MANAGEMENT SYSTEM OF QUALITY,
ENVIRONMENT AND HEATH AND SAFETY A SOLUTION FOR
SME’S PERFORMANCE?
Dorin MAIER
The Bucharest University of Economic Studies
Adela Mariana VADASTREANU
National Institute of Research and Development for Isotopic and Molecular
Technologies and Technical University of Cluj-Napoca
Andreea MAIER
Technical University of Cluj Napoca
Abstract. The research made in this paper comes in the context of the more and more
demanding economic environment for the SMEs. In this sense in order to stay on the market
organizations need to reduce production cost to make more profit but also to meet the
quality, environment and health and safety requirements. Various standards have been
developed in order to certificate organizations that they respect the requirements. Applying
an integrated standards model is shown to be a more effective way then applying the
standards independently. The problem that arises is that in order to adopt the integrated
version of standards there have to be made some changes at the organizational level. In the
case of SMEs every change that needs to be done has an effect on its activity, and in this
sense the paper tries to deal with the changes needed for adopting an integrated management
system and if those changes have an influence over the performance of the SMEs. After the
analysis of the results, we can conclude that in order to improve the SMEs performance a
necessary step is the implementation of the integrated management system, despite the
disadvantages that can affect the SME’s activity.
Keywords: ISO 9000, ISO 14000, OHSAS 18000, Business performance
JEL classification: M12, M21, P17
1. Introduction The new challenges for the success of business in today’s economic context are in a
continuous development. Companies are struggling to reduce production cost, make more
profit, and still meet with all the environmental, quality or health and safety demands or
create a better image to overcome competition. Implementing several standards
simultaneously and independently can be costly and human resource demanding. Integrating
the standards has been shown to be a means of overcoming these difficulties. On the other
hand, integration of the standards requires some changes in the organization such as;
integrating the actual management systems, focus on products, stakeholder collaboration and
the creation of a learning environment, which might lead to some factors that might hinder
integration of management systems which include the absence of knowledge amongst
employees and the management, absence of demands;.
There are significant differences in the character of large and small companies. The lack of
resources, technical ability, time and capital usually lead SMEs to inaction [1]. They are

Proceedings of the IE 2015 International Conference
www.conferenceie.ase.ro
171
closely integrated into the fabric of the local community, have staff that usually come from
within a small radius of the company and often use traditional processes or services [2].
Furthermore, [1] assert that smaller firms tend to lack information management systems to
concentrate information-gathering with one or two key personnel rather than sharing
scanning activities among a range of top executives, while larger firms on the other hand,
have the capital to employ external consultants or may even have in-house experts.
2. Approaches regarding the integrated quality - environment - occupational health and
safety management systems The researchers and practitioners all over the world study the concept of integrated
management system. A series of definition, in order to cover all the aspect of an integrated
management system were formulated. Among this definition for this paper we have consider
that the definition of [3] is quite conclusive. According to this definition, an integrated
management system is conceptualized as a single set of interconnected processes that share a
unique pool of human, information, material, infrastructure and financial resources, in order
to achieve a composite of goals related to the satisfaction of a variety of stakeholders. A
management system sets the goals and objectives, outlines the strategies and tactics, and
develops the plans, schedules, and necessary controls to run an organization.
Since many management systems have been developed, companies have two choices: leave
these to function as specific systems, or integrate them. An integrated management system is
‘the organizational structure, resources and procedures used to plan, monitor and control
project quality, safety and environment’ [4]. The need that gave birth to this trend worldwide
[5] considers that the appearance of integrated management systems is not of a successfully
visionary nature, but rather a result of the real constraints on current markets in which
organizations operate.
By analysing the definition of an integrated management system we can draw some general
lines that cover all the aspect related to the integration of the management systems. In the
same research where we have find the definition of integrated management systems [3], the
author consider that integration of management systems is really about two things: standards
and internal systems that these standards describe. If both are considered, the ultimate goal is
‘one standard, one system’. However, this research examines to what extent small and
medium companies have achieved the goal of ‘many standards, one system’, because since
management standards keep emerging like mushrooms, any effort towards an integrated
standard that would cover all the current ones is useless.
In the literature there are a lot of studies that have approach the problem of integration of
management systems and are presented a various type of possible integration and model of
integration were developed. In this paper we do not study the theory of integration and also
due to the limitation of pages we cannot present all the models. For this study we have chosen
a model of integration proposed by the authors in paper [5].
The management systems integration is possible because ISO 9001, ISO 14001 standards are
compatible and OHSAS 18001:1999 specification was modeled on ISO 14001; all referential
have process-oriented approach based on the concept PDCA (Plan - Do - Check - Act).
Common principle of the systems is the continuous improvement (see Figure 1.).
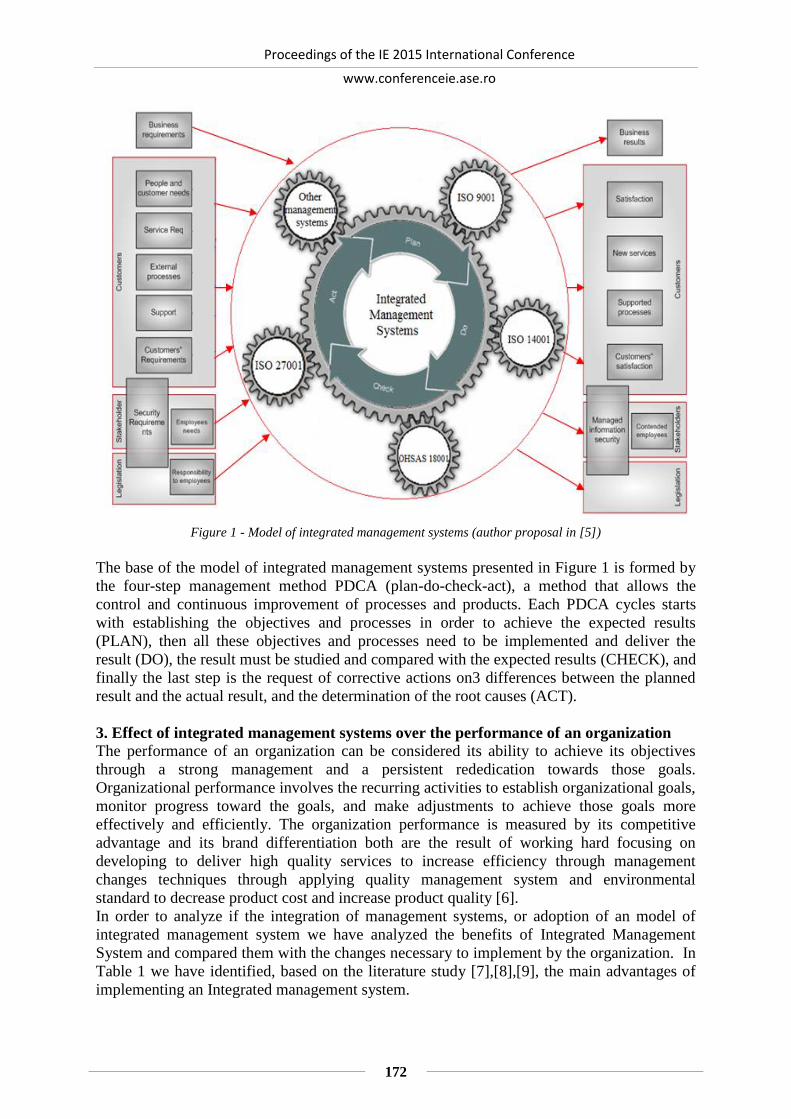
Proceedings of the IE 2015 International Conference
www.conferenceie.ase.ro
172
Figure 1 - Model of integrated management systems (author proposal in [5])
The base of the model of integrated management systems presented in Figure 1 is formed by
the four-step management method PDCA (plan-do-check-act), a method that allows the
control and continuous improvement of processes and products. Each PDCA cycles starts
with establishing the objectives and processes in order to achieve the expected results
(PLAN), then all these objectives and processes need to be implemented and deliver the
result (DO), the result must be studied and compared with the expected results (CHECK), and
finally the last step is the request of corrective actions on3 differences between the planned
result and the actual result, and the determination of the root causes (ACT).
3. Effect of integrated management systems over the performance of an organization
The performance of an organization can be considered its ability to achieve its objectives
through a strong management and a persistent rededication towards those goals.
Organizational performance involves the recurring activities to establish organizational goals,
monitor progress toward the goals, and make adjustments to achieve those goals more
effectively and efficiently. The organization performance is measured by its competitive
advantage and its brand differentiation both are the result of working hard focusing on
developing to deliver high quality services to increase efficiency through management
changes techniques through applying quality management system and environmental
standard to decrease product cost and increase product quality [6].
In order to analyze if the integration of management systems, or adoption of an model of
integrated management system we have analyzed the benefits of Integrated Management
System and compared them with the changes necessary to implement by the organization. In
Table 1 we have identified, based on the literature study [7],[8],[9], the main advantages of
implementing an Integrated management system.

Proceedings of the IE 2015 International Conference
www.conferenceie.ase.ro
173
Table 1 - Summarizes benefits that an SME can gain from the implementation of an Integrated Management
System
Benefits of Integrated Management System
improvement of internal efficiency and effectiveness
homogeneity in management methodologies
the reduction in the fuzzy management boundaries between individual systems and in the broadening of the horizon beyond the functional level of any individual
avoid duplications between procedures of the systems
eliminate the overlap of effort reduction in external certification
costs over single certification audits
alignment of objectives, processes, resources in different areas
positive for small business reducing paperwork synergy effects elimination of effort and redundancies a holistic approach to managing
business risks improve internal and external
communication reduce risks
increase in profit margins improvement of quality of
management by down-sizing three functional departments to one and reducing fuzzy management boundaries between individual systems
increase in operational efficiency by harmonizing organizational structures with similar elements and sharing information across traditional organizational boundaries
streamlining paperwork and communication
less redundancy and conflicting elements
time saving more transparency more feasibility better structured processes clearer responsibilities harmonization of MS documentation responsibilities and relationships
gain a structured balance of authority/power
expose conflicting objectives identify and rationalize conflicting focus organization onto business goals create a formalization of informal
systems harmonize and optimize practices
identify and facilitate staff training and development
reduction of coordination problem improved operational performance cross-functional teamwork motivation of staff enhanced customer confidence simplified systems resulting in less confusion, redundancy or conflicts in
documentation optimized resources in maintaining a
single system with a single simplification of requirements integrated audits
Another aspect that we have analysed in the literature was the negative part of implementing
an integrated management system, or the price that an organization has to pay in order to
have a functional management system [10]. The principal disadvantages and barriers for
implementing an integrated management system are summarized in Table 2.
Table 2 - Disadvantages and barriers to the implementation of integrated management systems
Disadvantages of integrated management systems
transmission of non-conformances from one system to other systems
the maintenances of additional procedures like document changes, training or
calibration may overload the support staff
in some cases the need of additional support, that may create conflict between
new group and older one

Proceedings of the IE 2015 International Conference
www.conferenceie.ase.ro
174
the lack of knowledge and competence in the organization
the organizational separation of the systems
hope for a clear focus in dept of single standard
security with the existing management systems
the management has one-sided focus on one area
the workers have to work differently
In order to achieve the aimed integrated policy, targets and objectives it is needed to develop
the capabilities and support mechanism. In fact, the organization should focus on aligning its
internal assets, i.e., people, strategy, resources and structure. The alignment of assets is an
important characteristic of successful small and medium enterprises [11].
Implementation and compliance of the Integrated Management System requires the
development of capabilities and support mechanisms in order to achieve the integrated
policy, objectives and targets. In fact, the organization should focus on aligning its internal
assets, i.e., people, strategy, resources, and structure.
4. Conclusions
The recognition of management systems was possible because of multiple causes like the
legislation changes in quality, environment and health, the rapid technological
advancements, the on-going necessity for developing new skills for the employees and many
more. The requirements of the organizations related to standards are to enable it to control
those key management functions with maximum effectiveness and minimum bureaucracy.
In the case of SMEs the importance of the management systems is higher, due to the limited
human and financial resources. In this context, the integrated management systems have a
bigger importance. In the literature, we can find several models for integrating different
management systems, the most used are quality, environmental and health and safety
management systems.
Also the researches identify the advantages and the disadvantages of the integrated
management system. We can consider as the main advantages the coordinated decisions,
coherence in the organization’s activity and in the end the efficiency with lower costs. If we
focus on the disadvantages, the difficulty of implementation and the reduction of flexibility
are the main ones. However, by analysing all the advantages and disadvantages we can
conclude that in order increase the performance in business a necessary step is
implementation of integrated management systems.
Acknowledgements
This paper benefited from financial support through the National Institute of Research and
Development for Isotopic and Molecular Technologies, Cluj-Napoca, Romania.
References
[1] Holt, D., Anthony, S. and Viney, H. (2000) , Supporting Environmental Improvements in
Small and Medium-Sized Enterprises in UK. Greener Management International, Issue
30, pp. 29-49.
[2] http://www.aippimm.ro/articol/imm/legislatie-imm/definitie-imm accessed at 15.02.2015
[3] Karapetrovic, S. (2003) Musings on integrated management. Measuring Business
Excellence, Vol. 7, no. 1, pp. 4-13.
[3] Griffith, A. (2000) Integrated management systems: a single management system solution
for project control? Engineering, Construction and Architectural Management, Vol. 7, no
3, pp. 232-240

Proceedings of the IE 2015 International Conference
www.conferenceie.ase.ro
175
[4] Dragomir, M. (2010), Cercetări şi contribuţii privind concepţia, dezvoltarea,
implementarea şi îmbunătăţirea continuă a sistemelor de management integrat al calităţii,
mediului şi sănătăţii şi securităţii muncii în întreprinderile industriale, teza de doctorat, pp
15- 18, Universitatea Tehnică, Cluj- Napoca
[5] Olaru, M, Maier, D., Nicoara, D., Maier, A., (2013), Establishing the basis for
development of an organization by adopting the integrated management systems:
comparative study of various models and concepts of integration, 2nd World Conference on Business, Economics and Management (BEM) Location: Antalya, Turkey Date: APR 25-28, 2013
[6] Gavris, O. (2009), „Management of infrastructure rehabilitation works using multicriteria
analysis”, 6th International Conference on the Management of Technological Changes
Location: Alexandroupolis, GREECE Date: SEP 03-05, 2009
[7] Anastasiu, L. (2009), „How the changing of technology can become a motivating factor in
human resources management”, 6th International Conference on the Management of
Technological Changes Location: Alexandroupolis, GREECE Date: SEP 03-05, 2009
[8] Ciplea, S, Ciplea, C., Anastasiu, L., Popa, A.,(2010), „Costs optimization methods with
applications in students trening”, 6th International Seminar on the Quality Management in
Higher Education Location: Tulcea, ROMANIA Date: JUL 08-09, 2010
[9] Olaru, M. (1999), Managementul calităţii, ediţia a 2-a revizuită şi adăugită, Editura
Economică, Bucureşti
[10] Darabonţ, D., Pece, Ş., (2003), Studiu privind elaborarea unui sistem de management al
securităţii şi sănătăţii în muncă, Institutul Naţional de Cercetare Dezvoltare pentru
Protecţia Muncii, Bucureşti.
[11] Roncea, S, Sârbu, F. (2004), Ghid Pentru Proiectarea şi Implementarea unui Sistem
Integrat de Management Calitate – Mediu - Sănătate şi Securitate în Muncă, QM
Consulting, Bucureşti

Proceedings of the IE 2015 International Conference
www.conferenceie.ase.ro
176
A FRAMEWORK FOR DESIGNING AN ONTOLOGY-BASED E-
LEARNING SYSTEM IN HEALTHCARE HUMAN RESOURCE
MANAGEMENT
Lidia BAJENARU
National Institute for Research & Development in Informatics, 8-10, Mareşal Averescu
Avenue, Bucharest, Romania
Ion Alexandru MARINESCU
National Institute for Research & Development in Informatics, 8-10, Mareşal Averescu
Avenue, Bucharest, Romania
Ion SMEUREANU
Department of Economic Informatics and Cybernetics, Bucharest University of Economic
Studies, 6, Romana Square, Romania
Abstract. In this paper we present the personalized e-learning system components based on
ontology, a tailored training system adapted to the needs of hospital management, and the
architecture that will form the basis of the proposed e-learning system implementation.
We present the technical and conceptual aspects of our e-learning system for the course
personalization. The system is composed of different knowledge components what represent
the system’s information about the specific domain, namely Healthcare Human Resources
Management (HHRM), and the student model. This system builds a personalized educational
content to meet the target group preferences and the need for knowledge in domain. The
modelling of the educational domain specific to HHRM and the use of ontologies in the
process of personalized learning experience are implemented into an intelligent learning
Web platform. The proposed ontological e-learning system aims: to provide a comprehensive
and systematic knowledge base about the competences and knowledge of the target group
enabling training depending on the profile and goals of the student. The gain of this type of
training will be a more competent evaluation and management of the health services
provided by hospital.
Keywords: E-learning, ontology, human resource management, personalization, architecture.
JEL classification: D83, M12, I19
1. Introduction
The e-learning goal is to "break" the barriers of time and space by the automation of learning
[1]. The proposed e-learning system addresses the management team of a university hospital
in order to verify and improve knowledge in the HHRM field as professional requirements.
This paper presents a proposal of architecture for an ontology-based system, a tailored
training system adapted to the needs of hospital management. The ontology usage model in e-
learning system is developed to structure the educational content in the domain of HHRM
from Romania [2]. The proposed method for the development of this system is based on
building a personalized learning path for each student according to his profile and
preferences. Personalization and reuse of educational materials of this system is achieved
using semantic Web technology and proposes an ontological approach.

Proceedings of the IE 2015 International Conference
www.conferenceie.ase.ro
177
Semantic Web underlies the new WWW architecture that allows searching and navigating
through cyberspace by content with formal semantics [3]. Ontology is part of the Semantic
Web structure and according to Gruber [4] it is the explicit specification of a
conceptualization which facilitates the exchange of knowledge in a domain.
Among the instruments designed to support the development of ontology we used Protégé
[5]. Ontology components are used in the Semantic Web as a form of representation of
knowledge. Ontologies generally describe: classes, attributes, individuals, relations.
Ontologies are used to model educational domains and to build, organize and update specific
learning resources (e.g. student profiles, learning paths, learning objects).
The proposed ontological e-learning system aims: to provide a comprehensive and systematic
knowledge base about the competences and knowledge of the target group enabling training
depending on the profile and goals of the student. The gain of this type of training will be a
more competent evaluation and management of the health services provided by hospital.
2. General aspects on the modelling of the system processes
The results of the modelling processes of the proposed intelligent e-learning system are the
following [6]:
a student model based on the student's knowledge for learning personalisation;
a conceptual model of the HHRM domain – an ontology for knowledge modelling.
The student model is used to adapt the interaction mode of the e-learning system according to
the user’s needs [7]. The domain model is used to breaks down the body of knowledge into a
set of domain knowledge elements.
The Student Model is built based on the following features: profile identification, knowledge,
learning style, learning goal, student’s goal, student skills level assessment and feedback. The
modelling process involves other main domains: learning modelling process and digital
content modelling, and it is based on basic concepts of Information Management System
(IMS) standard.
Building the student model is based on the static and dynamic models. The main source of
static information (that does not change during system-student interaction) is the student
profile. It contains the following information: personal identification data, cognitive profile,
preferences on educational content, education. The student performance and the information
regarding knowledge gained during the e-learning process are stored dynamically in the
student portfolio and serve to continuously update the student model [6]. Student’s profile
was implemented with the Protégé environment [6].
Our knowledge domain is about Healthcare Human Resources Management in an university
hospital in Romania. The identified domain concepts are organized into an ontology and were
implemented using Protégé, as shown in [6].
In the modelling process of the knowledge domain, body of knowledge is decomposed into a
set of domain knowledge called "concepts". These basic pieces of knowledge or information
are represented by learning objects (LOs). LO based on IMS standard help personalize the
educational content, respectively the learning material is offered according to the student
needs. The learning path scenario of our system is based on the level of knowledge of the
student and his requirements. It should allow the students to access the content of a particular
field of knowledge - in our case, the specific desired job, necessary to complete their specific
training. The personalization of the learning units is achieved by selecting a Learning Object
(LO) for each specific concept of the learning path. The learning objects arise both from
classical content providers (teachers, publications etc.) and from automatic collection of
specific content from the Web. In the first case, the system links the student learning
preferences to the learning object metadata contained in the system database.

Proceedings of the IE 2015 International Conference
www.conferenceie.ase.ro
178
The graphical representation of the e-learning process concepts hierarchy can be seen in
Figure 1.
Figure 1 - An ontological representation for system concepts
The knowledge base consists of information about students’ skills, function and competences,
and the general and specific HRM concepts within a university hospital.
3. Overview of the e-learning system
The modelling of the educational domain specific to human resource management into a
hospital and the use of ontologies in the process of personalized learning experience will be
implemented into an intelligent learning Web platform.
The general conceptual architecture of the e-learning system is presented in Figure 2.
The system allows the student to access a set of HRM domain concepts (categories), where
each domain concept is associated with an explicit formal description. After the student
chooses the HRM domain target concepts, the system triggers the training process by
evaluating several alternatives that aim to build an adequate course (presentation) which
satisfies both the student's current knowledge state and his / her personalized learning
preferences [8].
The core of the intelligent e-learning system is an ontology (Domain description) which plays
the role of a systematic and comprehensive repository of knowledge on the skills of the target
group, containing basic concepts (such as competence, management, person, skills etc.)
allowing the application of available knowledge and its relationships to other concepts,
instances and properties.
The Student Model determines the students' current level of knowledge and the objectives that
he / she wishes to achieve by training. It guides the students' learning activity and it is built
incrementally by the system using both sources of data offered directly by the student
(collected via electronic forms generated by the system) and by the student-system
interaction.
The Collect / Up-to-date Component creates an updated Student Model and collects data from
various sources for this model. The main source of static information (that does not change
during system-student interaction) is the student profile. The student performance and the
information regarding knowledge gained during the e-learning process are stored dynamically
in the student portfolio and serve to continuously update the Student Model.

Proceedings of the IE 2015 International Conference
www.conferenceie.ase.ro
179
Figure 2 - The general conceptual architecture for the proposed e-learning system
Current knowledge level of the student (Knowledge state) is evaluated by the system using
pre-testing students' prior knowledge, collected by pre-assessment tests, and based on the
results obtained from the learning process. The learning style defines how the student prefers
to learn and it can be adapted according to the developed cognitive capacities.
Depending on the profile and responsibilities of each member of the management team, they
will have access to e-learning platform, in order to get a personalized learning program based
on a specific ontology and to get their bibliographies compliant to their learning requirements
[6]. After the result delivery, the user profile is dynamically filled with additional
information, achieving the Student Model. Using the mechanisms of the learning process, the
system will link the target concepts chosen by the student, the description of the HRM
domain (Ontology) and the student's current level of knowledge, options, profile and
preferences. Based on these specific domain concepts, the necessary learning units (course,
lesson, module etc.) will be personalized and launched allowing the student to access
educational content from a particular knowledge domain.
The student goes through the learning unit and obtains results from evaluations for each
module. The system validates the intermediate results, providing or not the students the right
to continue the sequence of activities, and updates their profile. The system analyses the key
concepts of the student profile (e.g. learning style) and provides dynamic information
(specific links, references etc.). The system compares the individual results obtained from
tests with the required domain-specific knowledge, providing at the end of the training a
feedback with recommendations for additional training.
4. The architecture of proposed HHRM system
The architecture of the proposed Web-based intelligent educational system is three-tier client
server architecture. The client-side is concerned only with user interface and connection to
the server. The personalized e-learning processes combine the student model with the domain
model in order to deliver suitable course contents to the student. The system adapts the course
contents according to the students test evaluations.

Proceedings of the IE 2015 International Conference
www.conferenceie.ase.ro
180
The logical architecture integrates: the Web server that provides: the user interface and
access to the database, the application programs through which the main functions of the
system are performed by providing the capabilities necessary for the training platform, and
the database server that will host the system database (educational content, profiles and
portfolios of the students) and ensures storage and retrieval of data necessary to run a course.
The technical architecture of the system is composed of two major blocks: the functional
block that provides functionality and the data block containing the system repositories. The
functional block contains the client (represented by the Web browser) and the server (the
Web server along with other specific components). The data block is composed of the
following repositories: users (students), metadata, and content. The system components are
described below, and a graphical representation of this may be seen in Figure 3:
A. The User Interface is a client-side component by which the user requests an URL and
selects the option of training.
B. The Semantic Web Component runs on the server-side and serves as support for two
other important components: D and F. It is personalized developed around a semantic Web
engine. This component is able to process RDF formatted documents and information
based on the proposed training model of the system, performing optimal connections
between specific resources, tailored to the student.
C. The Front-end Web Server is the first server-side component of the proposed system that
interacts with the clients. It receives requests from the client through HTTP protocol,
forwards the request for internal processing, waits and sends back to the client the
response in a specific Web page format to be displayed in the browser.
D. The Security Component is a server-side component and is designed to ensure optimal
and safe use of the system. It is responsible for authentication of participants, based on
user name and password, and for authorization and access control to resources, depending
on the user's role and context.
Figure 3 - The System Technical Architecture Diagram
E. The Content Generation Component runs at server level and is responsible for
processing and generating the optimum personalised content of educational material to the
participant, using the student model specific to the system. It works with the other two D
and F to finally provide a high degree of course personalization to the target group.

Proceedings of the IE 2015 International Conference
www.conferenceie.ase.ro
181
F. The Learning Unit Allocation Component works also at the server-side level. This
component together with the Web Semantic engine (E) analyse the specific context of
each member of the target group and, using an internal algorithm based on the data model
and other attributes of the student, starting from the log in the system; it determines the
best personalized training path for the student to follow in order to maximize the
knowledge assimilation level.
G. The Storage Component essentially identifies the source database server that will store
the persistent information of the system. It retains the student specific information, both
his profile information and information relating to his activities and progress.
5. Conclusions
The purpose of the project consists in the implementation of a new approach for the health
system managers’ training based on modern e-learning technologies. In this paper we have
presented the overall e-learning system for training in HHRM field including its
functionalities. These functionalities include the building a personalized learning path for the
each student according to his/her profile and preferences. This is possible because the system
contains both a representation of the student’s knowledge and his learning preferences, and
the knowledge domain. The proposed system is provided with an abstract representation of
the specific domain (by ontology) and with the description of learning objects. The system
contains a hierarchical content structure and semantic relationships between concepts. This is
important for searching and sequencing learning resources in Web-based e-learning systems.
The proposed system architecture is able to support training activities in an interactive way,
based on the semantic Web by its components.
References
[1] V.R. Pandit, “e-Learning System Based on Semantic Web”, International Conference on
Emerging Trends on Engineering and Technology (ICETET), 2010, IEEE, ISSN: 2157-
0477.
[2] L. Băjenaru, A.-M. Borozan and I. Smeureanu, “An Ontology Based Approach for E-
Learning in Health Human Resources Planning”, In Proc. The 13th International
Conference on Informatics in Economy, pp. 352-357, ISSN: 2247-1480, 2014.
[3] T. Berners-Lee and M. Fischetti, Weaving the Web: The original design and ultimate
destiny of the World Wide Web by its Inventor. New York: HarperCollins Publishers, 1st
Edition, 2000.
[4] T.R. Gruber, “Toward Principles for the Design of Ontologies Used personalization
Knowledge Sharing”, International Workshop on Formal Ontology, International Journal
of Human-Computer Studies, Vol. 43, Issue 5-6 November / December, pp. 907-928,
1995.
[5] N.F. Noy, R.W. Fergerson and M.A. Musen, “The knowledge model of Protégé-2000:
Combining interoperability and flexibility”, In Proc. The 2nd International Conference on
Knowledge Engineering and Knowledge Management, 2000, Springer-Verlag, pp. 17-32.
[6] L. Băjenaru and I. Smeureanu, “An Ontology Based Approach for Modeling E-Learning
in Healthcare Human Resource Management”, Journal of Economic Computation and
Economic Cybernetics Studies and Research, ISSN: 0424–267X, Vol. 49, No. 1, 2015.
[7] P. Brusilovsky and C. Peylo, “Adaptive and intelligent web-based educational systems”,
International Journal of Artificial Intelligence in Education, Vol. 13, pp. 156-169, 2003.
[8] N. Capuano, M. Gaeta, A. Micarelli and E. Sangineto, “An Intelligent Web Teacher
System for Learning Personalisation and Semantic Web Compatibility”, In Proc.The
Eleventh international PEG conference, Russia, 2003.

Proceedings of the IE 2015 International Conference
www.conferenceie.ase.ro
182
PROJECT MANAGEMENT COMPETENCY ASSESSMENT FOR IT
PROFESSIONALS: AN ANALYTIC HIERARCHY PROCESS
APPROACH
Elena-Alexandra TOADER The Bucharest University of Economic Studies, Romania
Abstract. The paper proposes the use of the Analytic Hierarchy Process (AHP) applied on
the competency model defined by the authors in previous studies and in case of two IT
projects with different characteristics in which employees operates. First, the PM
competency model was decomposed into a hierarchical structure. AHP through pairwise
comparisons by five technical experts was utilized in order to determine weight values for the
each competency category and for each competency element within the two projects. The
prioritization of the competences was made for the performance level: expertise. Using
Wilcoxon Signed Ranks statistical test on AHP results, we can determine if there is a
significant difference between the two projects competency elements at the performance
level: expertise. The AHP results will be implemented into a competency assessment tool. An
activity scenario was defined to help the integration of AHP method in the competency tool
assessment.
Keywords: Competency Register, IT Competency Assessment, Analytic Hierarchy Process.
JEL classification: C44, M51
1. Introduction
The competitive advantage of an IT organization is given by the increasing interest in the
development of project management competencies of the technical professionals that are
working within it [1]. Many software firms have implemented assessment tools in order to
evaluate the performance of their professionals. It is important to have an objective and
transparent competency assessment tool in order to obtain valid results.
Placing the right people in the right projects can lead to the success of the project, therefore
monitoring the performance of the employees has become one of the most important goal in
software organizations.
Due to the importance of this assignment process of the right people into the right projects,
the multi criteria decision making techniques have become more popular.
Deciding the weights of each competency is not an easy task since there are many aspects
that should be taken into consideration. We propose an evaluation method based on a multi-
criteria decision method (MCDM) named Analytic Hierarchy Process (AHP). The AHP is a
decision support tool that can to assess, construct, generate, prioritize or measure
competences demanded by various professions [2].
AHP method has been applied in different contexts, such as: engineering problems [3], e-
banking security [4], layout design [5] and evaluation of technology investment decisions [6].
2. Analytical Hierarchical Process (AHP)
Analytic Hierarchy Process (AHP) is a multi-criteria decision method (MCDM) introduced
by [7]. The AHP method integrates qualitative information and quantitative values into the
same decision making methodology by evaluating the elements of the decision.

Proceedings of the IE 2015 International Conference
www.conferenceie.ase.ro
183
The Analytic Hierarchy Process (AHP) was developed in order to structure a decision process
into a scenario process influenced by several independent factors. The method contains a
hierarchical structure that holds dependencies and interactions between the elements. The
hierarchy tree is structured from top (the main goal of the decision-maker) through criteria
and sub-criteria. The tree can have as many sub-criteria as needed [7].
The AHP allows prioritization between the elements generating a weight for each evaluation
criteria by using pairwise comparisons. After that, AHP assign a score to each option
according to the decision taken. The higher score is considered a better performance of the
option with respect to the criteria considered. Finally, the AHP combines the criteria weights
with the option scores, determining a global score for each option. The global score for a
given option is a sum of the weighted scores in respect to all the criteria [7].
The steps of the AHP method are described by [8] and are the following: problem definition
and creation of the hierarchy containing the elements and the criteria for evaluation; the
construction of a set of pairwise comparison of the elements and the calculation of the
priorities; verify the results and the judgements; synthesize the judgements in order to set up
local weights and consistency of comparisons; selection of the best variant based on the
aggregations of the weights across various levels in order to obtain the final weights of
alternatives.
The AHP method helps decision-makers to select a solution from a set of alternatives and
provide the possibility to make the comparison between the alternatives. In competency
assessment domain, the method has been used by several studies [9], [10], [11], in the project
managers selection [12], [13], as well in the personnel recruitment process [14].
3. Methodology
3.1 Research Method
The aim of the current research was to estimate the weights for each competency category
and for each competency element within two IT projects. The IT projects have different
characteristics. The method application will help in finding the optimal solution for
determination and ranking the competency elements and will test the hypothesis that there is
a significant difference between the competency elements within those two IT projects. The
weights are calculated for the performance level: expertise.
Based on the competency ontology defined by [16], we can define the competency elements
within each competency category as a set of knowledge and abilities that an IT professional
must possesses in order to achieve a specific performance level. A performance level is
determined through performance indicators defined in the ontology [16]: awareness,
familiarity, mastery, expertise. The competency model defined by [15] contains 15 PM
competencies grouped by three categories: methodical, personal-social and strategic-
organizational.
The methodical category is containing the following competency elements: knowledge of
applied PM methods; technical analysis of information; the automation and optimizing of
work’ processes; the evaluation, review and quality assurance of work and implementation of
the maintenance technique. The personal-social category is containing the following
competency elements: teamwork, creativity, vigilance, efficiency, motivation, ethics and
stress resistance. The strategic-organizational category is containing the following
competency elements: permanent organization; health, security, safety and environment and
respect of work methods and procedures.
In order to illustrate the implementation of the AHP method, first a complete hierarchical
structure was represented based on the competency model defined by [15]. This structure

Proceedings of the IE 2015 International Conference
www.conferenceie.ase.ro
184
established the model that will be used in order to evaluate and compare the competency
categories and the competency elements within the competency model.
Suggested methodology was tested on a small group of five IT professionals that are working
in software Romanian organizations in two IT projects with different characteristics. Even
though the number of the IT professionals is small, and the number of projects as well, in this
test we can show the first results of using the AHP algorithm and demonstrate if there is a
significant difference between the competency elements within the two IT projects. The IT
professionals filled a questionnaire related to each competency category and each
competency item within the competency model corresponding for each IT project. Their
responses has been synthesized using AHP method.
For each decision, the decision-maker (in our case, the IT professional) has to indicate the
preferences or priority of each competency category or for each competency element in terms
of how it contributes to each criterion. The scale used was proposed by [7]. The scale
comparison values are: 1 - equally important, 3 - weakly more important, 5 - strongly more
important, 7- very strongly more important, 9 - absolutely more important.
After the preference for each competency category and for each competency element is made,
a pair-wise comparison matrices is constructed. It is necessary to synthesise the pair-wise
matrices. The synthesizing is made by dividing each element of the matrix by its columns
total. The weights are obtained by calculating the row average. The next step is the
verification of the consistency of the pair-wise comparison matrix. The CR is acceptable if it
is not exceed 0.10. If the CR is greater than 0.10, then the judgment matrix is inconsistent and
should be improved [7]. The analysis of the AHP results for the two projects was conducted
by using SPSS ver.19 software and Wilcoxon signed-rank test. Using Wilcoxon test, we can
demonstrate if there is a significant difference between the competency elements of the two
projects.
3.2 Analysis and Discussion
The AHP hierarchical structure was represented using Web-HIPRE [19], a free applet web-
based software (available: http://hipre.aalto.fi) for the first IT project analyzed. In Figure 1 is
described the hierarchical structure based on the competency model defined by [17].
In Table 1 are described the pairwise comparisons between each competency category for
first project. The consistency of the pair-wise comparison matrix (CR) is 0.099, is lower than
0.10 and that means that the judgment matrix is valid.
In Table 2 is described the standardized matrix and the weight of each competency criteria
for the first project. As we can observe, at the expert level of performance, the methodical
competencies have the weight of 65%, the personal-social competencies 21% and the
strategic-organizational competencies 17.5%.
Table 1 - The pairwise comparisons matrix Table 2 - Standardized matrix
Competency
category
C1 C2 C3 Weight
C1 0.62 3.5 3 61.5%
C2 0.29 1 1.4 21%
C3 0.33 0.71 1 17.5%
Competency
category
C1 C2 C3
C1 1 3.5 3
C2 0.29 1 1.4
C3 0.33 0.71 1
Sum 1.62 5.21 5.4

Proceedings of the IE 2015 International Conference
www.conferenceie.ase.ro
185
Figure 1 - Structuring AHP Model in Web-HIPRE (Source: http://hipre.aalto.fi)
Similar, we can compute the weights for each competency element from the competency
model defined by [9]. In the methodical category, priority has the competence knowledge of
applied PM methods (0.34%), followed by the automating and optimizing work processes.
(0.27). In the personal-social category, the priority is given by the permanent organization
competency (0.21%), followed by the motivation (0.2%). In the strategic-organizational
category, the priority has the respect of work methods and procedures (0.49%). The results
for the first project are described in Table 3.
Table 3 - The competency element weights
Competency element Weight Competency element Weight
C11. Knowledge of applied PM
methods
0.34 % C24. Efficiency 0.12%
C12. Technical analysis of
information
0.18 % C25. Motivation 0.2%
C13. Automating and optimizing
work processes
0.27% C26. Ethics 0.12%
C14. Evaluation, review and quality
assurance of work
0.10% C27. Stress resistance 0.08%
C15. Implementation of the
maintenance technique.
0.11% C31. Permanent organization 0.21%
C21. Teamwork 0.15% C32. Health, security, safety
and environment
0.3 %
C22. Creativity 0.17% C33. Respect of work methods
and procedures
0.49%
C23. Vigilance 0.16%
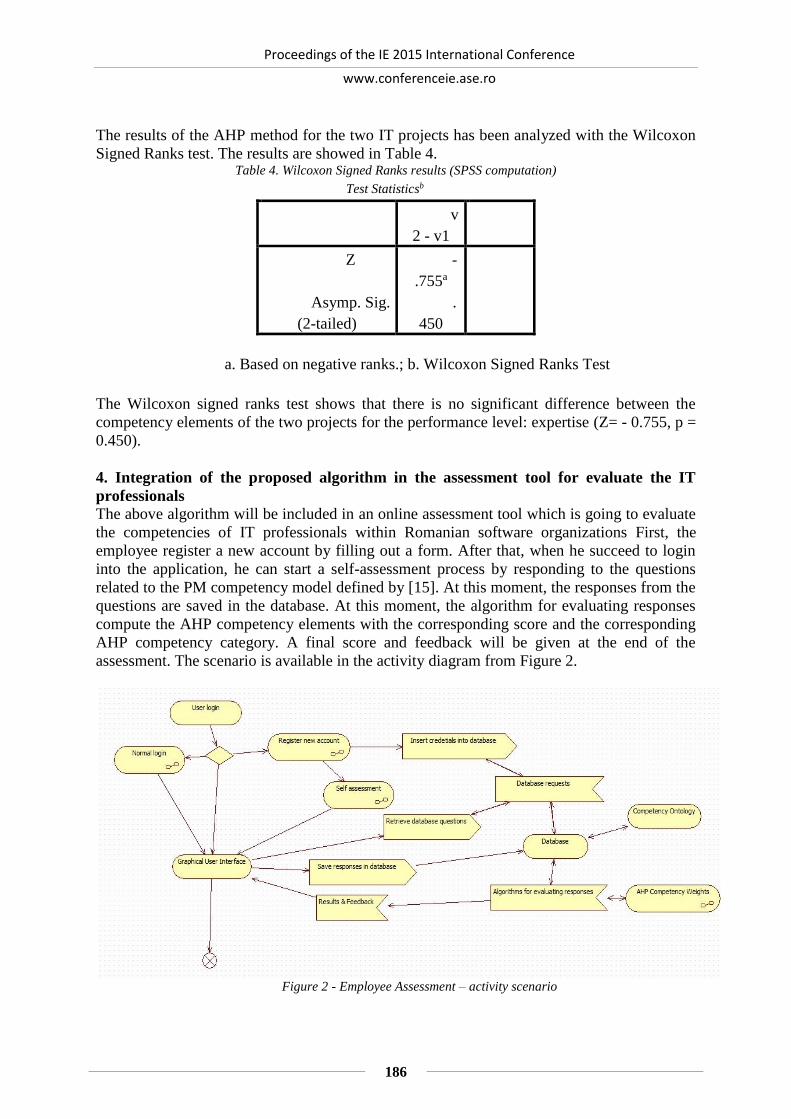
Proceedings of the IE 2015 International Conference
www.conferenceie.ase.ro
186
The results of the AHP method for the two IT projects has been analyzed with the Wilcoxon
Signed Ranks test. The results are showed in Table 4. Table 4. Wilcoxon Signed Ranks results (SPSS computation)
a. Based on negative ranks.; b. Wilcoxon Signed Ranks Test
The Wilcoxon signed ranks test shows that there is no significant difference between the
competency elements of the two projects for the performance level: expertise (Z= - 0.755, p =
0.450).
4. Integration of the proposed algorithm in the assessment tool for evaluate the IT
professionals
The above algorithm will be included in an online assessment tool which is going to evaluate
the competencies of IT professionals within Romanian software organizations First, the
employee register a new account by filling out a form. After that, when he succeed to login
into the application, he can start a self-assessment process by responding to the questions
related to the PM competency model defined by [15]. At this moment, the responses from the
questions are saved in the database. At this moment, the algorithm for evaluating responses
compute the AHP competency elements with the corresponding score and the corresponding
AHP competency category. A final score and feedback will be given at the end of the
assessment. The scenario is available in the activity diagram from Figure 2.
Figure 2 - Employee Assessment – activity scenario
Test Statisticsb
v
2 - v1
Z -
.755a
Asymp. Sig.
(2-tailed)
.
450

Proceedings of the IE 2015 International Conference
www.conferenceie.ase.ro
187
5. Conclusion
The aim of the study was to estimate the weights for each competency category and for each
competency element for two IT projects with different characteristics. Using an evaluation
method based on a multi-criteria decision method (MCDM) named Analytic Hierarchy
Process (AHP) we can find the optimal solution for determination and ranking the
competency elements. In order to illustrate the implementation of the AHP method, first a
complete hierarchical structure was represented. Then, through pairwise comparisons by five
technical experts were determined the weight values for the each competency category and
for each competency element within the PM competency model. Wilcoxon signed ranks test
shows that there is no significant difference between the competency elements of the two
projects for the performance level: expertise
It was underlined the integration of the AHP method into the competency assessment tool
developed in order help in determining and improving the performance level of IT
professionals. A limitation of our study is that the assessment tool was not implemented yet
in a Romanian IT organization, so no relevant results are available. Another limitation is that
the employer module has not been developed yet.
Future research should be directed through developing open questions for the evaluating the
assessment items, through developing the employer module and through implementing the
assessment tool into in a Romanian software organization.
Acknowledgment
Toader Elena Alexandra was co-financed from the European Social Fund, through the
Sectorial Operational Programme Human Resources Development 2007-2013, project
number POSDRU/159/1.5/S/138907 "Excellence in scientific interdisciplinary research,
doctoral and postdoctoral, in the economic, social and medical fields -EXCELIS",
coordinator The Bucharest University of Economic Studies.
References
[1] Fisher, E. 2010. “What Practitioners consider to be the Skills and Behaviours of an
Effective People Project Manager” International Journal of Project Management, JPMA-
01272, 9p.
[2] Hafeez and Essmail, 2007K. Hafeez, E.A. Essmail Evaluating organization core
competences and associated personal competencies using analytical hierarchy process
Management Research News, 30 (8) (2007), pp. 530–547
[3] Wang, L., and Raz, T. (1991). Analytic Hierarchy Process Based on Data Flow Problem.
Computers & IE, 20:355-365.
[4] Syamsuddin I., Hwang J. (2009). The Application of AHP Model to Guide Decision
Makers: A Case Study of E-Banking Security, Third Asia International Conference on
Modelling & Simulation, 25-29 May 2009, Bandung, Bali, Indonesia;
[5] Cambron, K.E. and Evans, G.W., (1991). Layout Design Using the Analytic Hierarchy
Process. Computers & IE, 20: 221-229.
[6] Boucher, T.O. and McStravic, E.L. (1991). Multi-attribute Evaluation within a Present
Value Framework and its Relation to the Analytic Hierarchy Process. The Engineering
Economist, 37: 55-71.
[7] Saaty, T.L. (1980). The Analytic Hierarchy Process. McGraw-Hill International, New
York, NY, U.S.A.
[8] Saaty, T. L. (1999) The seven pillars of the analytic hierarchy process. Proceedings of the
ISAHP Conference (AHPIC 1999), Kobe, pp. 20-33.

Proceedings of the IE 2015 International Conference
www.conferenceie.ase.ro
188
[9] João Varajão, Maria Manuela Cruz-Cunha. (2013) Using AHP and the IPMA
Competence Baseline in the project managers’ selection process, International Journal of
Production Research, vol 51, pp. 3342-3354
[10] Brožová, H. (2011). Weighting of Students´ Preferences of Teacher´s competencies.
Journal on Efficiency and Responsibility in Education and Science, 4(4), 170-177, ISSN
1803-1617.
[11] Jan Bartoška, Martin Flégl, Martina Jarkovská (2012) IPMA Standard Competence
Scope in Project Management Education, International Education Studies; Vol. 5, No. 6;
[12] Kelemenis, A., K. Ergazakis, and D. Askounis. 2011. “Support Managers’ Selection
Using an Extension of Fuzzy Topsis.” Expert Systems with Applications 38: 2774–2782.
[13] Zavadskas, E. K., P. Vainiunas, Z. Turskis, and J. Tamosaitiene. 2012. “Multiple Criteria
Decision Support System for Assessment of Project Managers in Construction.”
International Journal of Information Technology & Decision Making 11 (2): 501–520.
[14] Hsiao, W.-H., T.-S. Chang, M.-S. Huang, and Y.-C. Chen. 2011. “Selection Criteria of
Recruitment for Information Systems Employees: Using the Analytic Hierarchy Process
(AHP) Method.” African Journal of Business Management 5: 6201–6209.
[15] Bodea C. N., E-A. Toader, “Development of the PM competency model for IT
professionals, base for HR management in software organizations”, 12th International
Conference on Informatics in Economy (IE 2013), Education, Research and business
Technologies, Bucharest, April 2013
[16] Bodea C. N., E-A. Toader, “Ontology-based modeling of the professional competencies
- a comparative analysis”, 11th International Conference on Informatics in Economy (IE
2012), Education, Research and business Technologies, Bucharest, May 2012, pp. 452-
458
[17] J. Mustajoki, and R.P. Hämäläinen, “Web-HIPRE: Global decision support by value tree
and AHP analysis”, INFOR, vol. 38, no. 3, 2000, pp. 208-220

Proceedings of the IE 2015 International Conference
www.conferenceie.ase.ro
189
BUSINESS SUCCESS BY IMPROVING THE INNOVATION
MANAGEMENT
Adela Mariana VADASTREANU
National Institute of Research and Development for Isotopic and Molecular
Technologies and Technical University of Cluj-Napoca
Dorin MAIER
The Bucharest University of Economic Studies
Andreea MAIER
Technical University of Cluj Napoca
Abstract. The more and more demanding economic context emphasizes the awareness of the
importance of innovation for organizations. This paper highlights the importance of the
innovation for an organization and also gives some practical solution in order to improve the
overall success of the business through a better approach of innovation. The research in this
paper is conducted in such a manner that it can be read and apply by everyone, regardless of
his / her knowledge of innovation management. After a short introduction, where we briefly
define innovation, we have study the literature and establish the main determinants of
innovation. We proposed an integrated model of innovation management and in the end, we
proposed a solution for improving the innovation management by using a innovation
quadrant. By using this solution, every organization, regardless of the specific activity, may
identify a direction for improving the innovation capacity. In the conclusion part we offer
some advices, based on our studies, for the organizations and for the employees also, in
order to be more innovative and thus to be more successful.
Keywords: Innovation, innovation management, business success
JEL classification: O32, M21
1. Introduction Innovation was and still is a subject of high interest in the economic literature [1], [2], [3].
But not only the theoreticians study it also the practitioners and researchers deal with
innovation manly because of its relevance for the increase of the success and survival of
firms. Innovation was considered the elixir of life for companies, regardless of their size and
profile [4],[5],[6],[7],[8],[9]. Innovation is a dominant factor in maintaining global
competitiveness [10],[11].
In the same time, innovation is not easy. The efforts of innovating over the years have
provided a wealth of failed innovation projects. Even large companies that were once
precursors and creators of all markets have failed to remain competitive when major changes,
especially technological, occurred [12], [13].
Organizations are so accustomed to what they do (basic skills) that they get stuck there, and
when the environment changes (ex. changing customer requirements, changing regulations)
they are unable to adapt easily and quickly [14], [15].
Innovating today will be easier to innovate tomorrow [16], [17]. The attention of many top
executives is largely focused on the urgent problems of daily management; innovation is
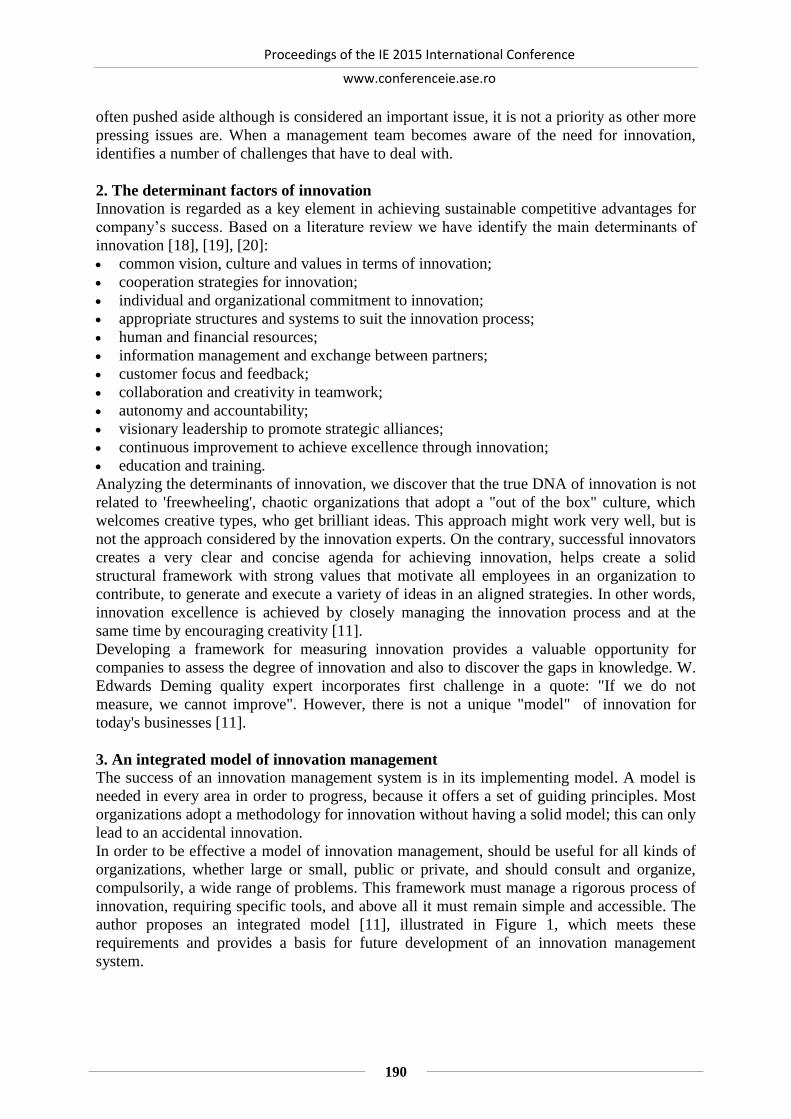
Proceedings of the IE 2015 International Conference
www.conferenceie.ase.ro
190
often pushed aside although is considered an important issue, it is not a priority as other more
pressing issues are. When a management team becomes aware of the need for innovation,
identifies a number of challenges that have to deal with.
2. The determinant factors of innovation Innovation is regarded as a key element in achieving sustainable competitive advantages for
company’s success. Based on a literature review we have identify the main determinants of
innovation [18], [19], [20]:
common vision, culture and values in terms of innovation;
cooperation strategies for innovation;
individual and organizational commitment to innovation;
appropriate structures and systems to suit the innovation process;
human and financial resources;
information management and exchange between partners;
customer focus and feedback;
collaboration and creativity in teamwork;
autonomy and accountability;
visionary leadership to promote strategic alliances;
continuous improvement to achieve excellence through innovation;
education and training.
Analyzing the determinants of innovation, we discover that the true DNA of innovation is not
related to 'freewheeling', chaotic organizations that adopt a "out of the box" culture, which
welcomes creative types, who get brilliant ideas. This approach might work very well, but is
not the approach considered by the innovation experts. On the contrary, successful innovators
creates a very clear and concise agenda for achieving innovation, helps create a solid
structural framework with strong values that motivate all employees in an organization to
contribute, to generate and execute a variety of ideas in an aligned strategies. In other words,
innovation excellence is achieved by closely managing the innovation process and at the
same time by encouraging creativity [11].
Developing a framework for measuring innovation provides a valuable opportunity for
companies to assess the degree of innovation and also to discover the gaps in knowledge. W.
Edwards Deming quality expert incorporates first challenge in a quote: "If we do not
measure, we cannot improve". However, there is not a unique "model" of innovation for
today's businesses [11].
3. An integrated model of innovation management
The success of an innovation management system is in its implementing model. A model is
needed in every area in order to progress, because it offers a set of guiding principles. Most
organizations adopt a methodology for innovation without having a solid model; this can only
lead to an accidental innovation.
In order to be effective a model of innovation management, should be useful for all kinds of
organizations, whether large or small, public or private, and should consult and organize,
compulsorily, a wide range of problems. This framework must manage a rigorous process of
innovation, requiring specific tools, and above all it must remain simple and accessible. The
author proposes an integrated model [11], illustrated in Figure 1, which meets these
requirements and provides a basis for future development of an innovation management
system.
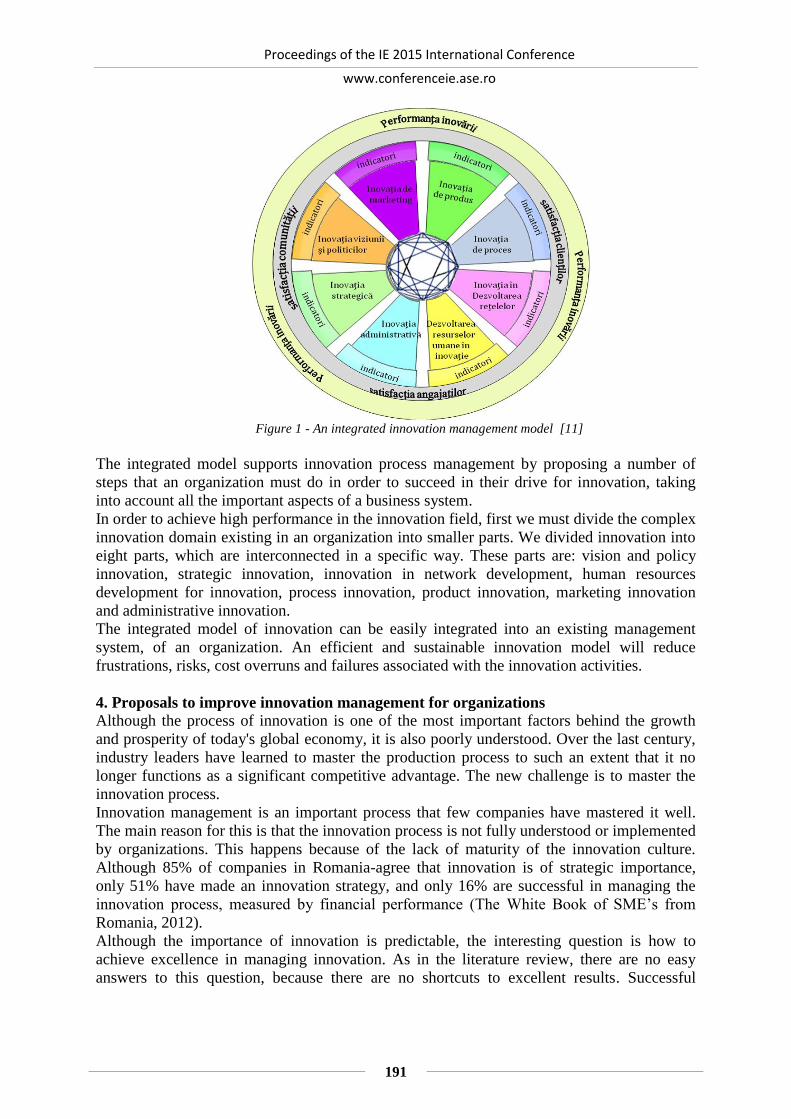
Proceedings of the IE 2015 International Conference
www.conferenceie.ase.ro
191
Figure 1 - An integrated innovation management model [11]
The integrated model supports innovation process management by proposing a number of
steps that an organization must do in order to succeed in their drive for innovation, taking
into account all the important aspects of a business system.
In order to achieve high performance in the innovation field, first we must divide the complex
innovation domain existing in an organization into smaller parts. We divided innovation into
eight parts, which are interconnected in a specific way. These parts are: vision and policy
innovation, strategic innovation, innovation in network development, human resources
development for innovation, process innovation, product innovation, marketing innovation
and administrative innovation.
The integrated model of innovation can be easily integrated into an existing management
system, of an organization. An efficient and sustainable innovation model will reduce
frustrations, risks, cost overruns and failures associated with the innovation activities.
4. Proposals to improve innovation management for organizations Although the process of innovation is one of the most important factors behind the growth
and prosperity of today's global economy, it is also poorly understood. Over the last century,
industry leaders have learned to master the production process to such an extent that it no
longer functions as a significant competitive advantage. The new challenge is to master the
innovation process.
Innovation management is an important process that few companies have mastered it well.
The main reason for this is that the innovation process is not fully understood or implemented
by organizations. This happens because of the lack of maturity of the innovation culture.
Although 85% of companies in Romania-agree that innovation is of strategic importance,
only 51% have made an innovation strategy, and only 16% are successful in managing the
innovation process, measured by financial performance (The White Book of SME’s from
Romania, 2012).
Although the importance of innovation is predictable, the interesting question is how to
achieve excellence in managing innovation. As in the literature review, there are no easy
answers to this question, because there are no shortcuts to excellent results. Successful
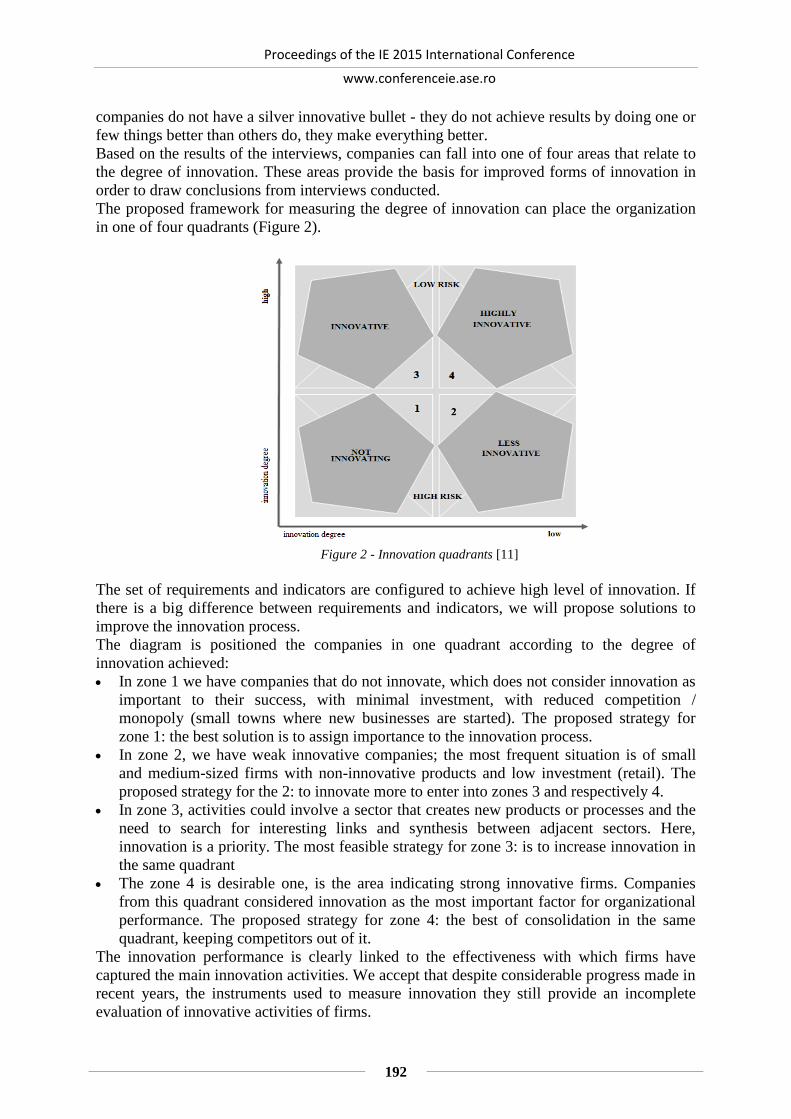
Proceedings of the IE 2015 International Conference
www.conferenceie.ase.ro
192
companies do not have a silver innovative bullet - they do not achieve results by doing one or
few things better than others do, they make everything better.
Based on the results of the interviews, companies can fall into one of four areas that relate to
the degree of innovation. These areas provide the basis for improved forms of innovation in
order to draw conclusions from interviews conducted.
The proposed framework for measuring the degree of innovation can place the organization
in one of four quadrants (Figure 2).
Figure 2 - Innovation quadrants [11]
The set of requirements and indicators are configured to achieve high level of innovation. If
there is a big difference between requirements and indicators, we will propose solutions to
improve the innovation process.
The diagram is positioned the companies in one quadrant according to the degree of
innovation achieved:
In zone 1 we have companies that do not innovate, which does not consider innovation as
important to their success, with minimal investment, with reduced competition /
monopoly (small towns where new businesses are started). The proposed strategy for
zone 1: the best solution is to assign importance to the innovation process.
In zone 2, we have weak innovative companies; the most frequent situation is of small
and medium-sized firms with non-innovative products and low investment (retail). The
proposed strategy for the 2: to innovate more to enter into zones 3 and respectively 4.
In zone 3, activities could involve a sector that creates new products or processes and the
need to search for interesting links and synthesis between adjacent sectors. Here,
innovation is a priority. The most feasible strategy for zone 3: is to increase innovation in
the same quadrant
The zone 4 is desirable one, is the area indicating strong innovative firms. Companies
from this quadrant considered innovation as the most important factor for organizational
performance. The proposed strategy for zone 4: the best of consolidation in the same
quadrant, keeping competitors out of it.
The innovation performance is clearly linked to the effectiveness with which firms have
captured the main innovation activities. We accept that despite considerable progress made in
recent years, the instruments used to measure innovation they still provide an incomplete
evaluation of innovative activities of firms.

Proceedings of the IE 2015 International Conference
www.conferenceie.ase.ro
193
5. Conclusions
The more intense competitiveness the more innovative companies are, due to continued
momentum to remain on the market to come up with something new and thus to overcome
competition.
Based on our research we have established some advices for the companies in order to be
more innovative. First aspect is related to the management support, not only to approve the
new innovative way of thinking but also a more active support such as employees motivation
or the provision of training and development programs. Another aspect is creating an
environment in which every employee can freely expose his ideas. The rewarding of
employees, they should be rewarded accordingly and here we do not mean just a monetary
reward but also an emotional one, such as public recognition of theirs merit in the company.
The communication networks within the company must be very effective, so that if an
employee has a new and innovative idea regarding a product, service or process, it can be
heard and properly capitalized. An intelligent allocation of resources. Organizational culture
should allow the development of innovation and thus be a culture that is willing to take the
risk, to embrace constructive failure to obtain extraordinary results.
Until now we have just give advice to the company in order to be more innovative, but every
employee can improve their innovative thinking by being more creative, flexible and
communicative; they must have confidence in their abilities; they must be brave to express
and support innovative ideas at work; they must be ready and willing to make responsible
decisions at work, in other words to be willing to take a moderate risk.
Acknowledgements
This paper benefited from financial support through the National Institute of Research and
Development for Isotopic and Molecular Technologies, Cluj-Napoca, Romania.
References
[1] Milbergs, E., V. (2007), “Innovation Metrics: Measurement to Insight. IBM Corporation”,
Center for Accelerating Innovation
[2] Brad, S. (2008b), „Vectors of Innovation to Support Quality Initiatives in the Framework
of ISO 9001:2000”, Int. Journal of Quality & Reliability Management, Vol. 25, Nr. 7, pp.
674-693
[3] Leavengood, S. (2011), „Identifying Best Quality Management Practices for Achieving
Quality and Innovation Performance in the Forest Products Industry”, Portland State
University
[4] Gavris, O. (2009), „Management of infrastructure rehabilitation works using multicriteria
analysis”, 6th International Conference on the Management of Technological Changes
Location: Alexandroupolis, GREECE Date: SEP 03-05, 2009
[5] Varis, M. (2010), „Types of innovation, sources of information and performance in
entrepreneurial SMEs”, European Journal of Innovation Management, Vol. 13, Nr. 2, pp.
128-154
[6] Anastasiu, L. (2009), „How the changing of technology can become a motivating factor in
human resources management”, 6th International Conference on the Management of
Technological Changes Location: Alexandroupolis, GREECE Date: SEP 03-05, 2009
[7] Ciplea, S, Ciplea, C., Anastasiu, L., Popa, A.,(2010), „Costs optimization methods with
applications in students trening”, 6th International Seminar on the Quality Management in
Higher Education Location: Tulcea, ROMANIA Date: JUL 08-09, 2010

Proceedings of the IE 2015 International Conference
www.conferenceie.ase.ro
194
[8] Xu, J., Houssin, R., Caillaud, E., Gardoni, M. (2010), „Macro process of knowledge
management for continuous innovation”, Journal of knowledge management, Vol. 14, pp.
573 – 591
[9] Lin, R. (2010), „Customer relationshipmanagement and innovation capability: an
empirical study”, Industrial Management & Data Systems, Vol. 1, pp. 111-133
[10] Maier, A. (2013), „Cercetări şi contribuţii la dezvoltatea modelelor de management al
inovării”,(teză de doctorat), Universitatea Tehnică, Cluj- Napoca, România
[11] Prahalad, C. (1994), „Competing for the Future”, Ed. H. B. Press, Massachusetts
[12] Vachhrajani, H. (2008), „A symbiosis of Quality and Innovation : Creating an integrated
model for SMEs, Quality- Striving for Excellence”, Vol. 5, Nr. 6
[13] Tushman, M., Nadler, D. (1986), „Organising for Innovation, California Management
Review”, Vol. 28, Nr. 4, pp. 74-92, Spring
[14] Anthony, S., Christensen, C. (2005), „Innovation Handbook: A Road Map to Disruptive
Growth, The Road to Disruption”, Harvard Business School Publishing
[15] Leavy, B. (2010), „Design thinking – a new mental model of value innovation”, Strategy
&Leadership, Vol. 38, pp. 5 – 14
[16] Zhao, F. (2000), „Managing Innovation and Quality of Collaborative R&D”, The Centre
for Management Quality Research, RMIT University
[17] Garcia, R., Calantone, R. (2002), „A Critical Look at Technological Innovation
Typology and Innovativeness Terminology: A Literature Review”, Journal of Product
Innovation Management, Vol. 19, Nr. 2, pp. 110-32
[18] Scotchmer, S. (2004), „Innovation and Incentives”, Cambridge, MA: MIT Press
[19] Prügl, R., Franke, N. (2005), „Factors impacting the succes of tookits for user innovation
and design”, Working paper, Vienna University of Economics
[20] Valencia, J. (2010), „Organizational culture as determinant of product innovation”,
European Journal of Innovation Management, Vol. 13, Nr. 4, pp. 466-480

Proceedings of the IE 2015 International Conference
www.conferenceie.ase.ro
195
RECOMMENDER SYSTEMS, A USEFUL TOOL FOR VIRTUAL
MARKETPLACE; CASE STUDY
Loredana MOCEAN
Babes - Bolyai University of Cluj – Napoca
Miranda VLAD
„Dimitrie Cantemir” Christian University Bucharest,
The Faculty of Economic Sciences ClujNapoca, miranda.vlad@ cantemircluj.ro
Mihai AVORNICULUI
Babes - Bolyai University of Cluj – Napoca
Abstract. A consequence of changes in demographic and cultural environment is the
changing attitude and lifestyle of consumers. Consumers are more mature, more refined,
have more discernment are more cosmopolitan, more individualistic and more concerned
about health and environmental problems.
The aim of this article is to present a case study of recommender systems through their most
important aspects. There are also presented several types of algorithms used and
implemented in special cases and problems that have to be considered in time.
Keywords: Recommender Systems, Collaborative Marketplace, Algorithms
JEL classifications: C63, C82
1. Introduction
Recommender systems have become an important research domain in recent years; they
compare a user profile to several reference characteristics and predict the rating or
preferences of the user which would be given to an item that was not yet considered.
In order to make this possible we must answers the following questions:
What kind of products do we buy?
What kind of products are frequently bought by other users?
Which are purchased most frequently?
What is the frequency of purchased products from a certain category?
Recommender systems are applications that offer the user objects, notions from his circle of
interest (movies, music, news, images, persons). Recommendations are made based on the
systems knowledge about the users profile (explicit or implicit).
The aim of a recommending system is to generate useful recommendations for a group of
users. A critical component is the generation of recommendations from liable sources for
human decisions.
2. Classification
Recommender systems can be of two types - from the point of view of algorithms used, as
they are presented in [1]:
recommender systems based on the content of the article. These algorithms focus on the
content of the article and offer as recommendations similar articles to the actual one,
initially based on special metrics such as tags;

Proceedings of the IE 2015 International Conference
www.conferenceie.ase.ro
196
recommender systems based on collaborative filtering. These systems use the entities
from the application (users, articles, user preferences, actions) and recommend articles
based on user preferences. User preferences can be studied based on their explicit actions
(voting) and implicit behavior.
Collaborative filtering methods can be further classified as follows:
methods based on users. The preferences of similar users are used to recommend further
articles;
methods based on articles. Similar articles are searched based on the quantification of
several social aspects, for example if users preferred a given article and also voted
positively for other articles.
3. Characteristics
In the followings the important characteristics of the recommender systems are described ([1]
and [2]):
recommendation transparency is a characteristic through which the systems offer
motivation for the recommended article;
exploration vs. Exploitation.
Assume the following situation: there are two articles that can be recommended for a group
of users and the user activity for an initial article can be recorded. The problem is the decision
making: should the two articles be recommended and if yes then when exactly is the best
moment to maximize the effect of the recommendation on the user.
the problem of offering a user friendly interface can be solved by the navigation guiding
of the user. This case is applicable when the content is very large within the application;
correct moment valuation;
a recommender system considers the changes that the outdating of an article can bring to
the relevance of the information;
the scalability of the system is very important in the context of big data;
diversity is important when recommendation of very similar elements minimizes the
effect on the user [3].
In this domain appear the following classic problems of a recommender system:
cold start problem: appears when a user is new and there are no information regarding this
and preferences cannot be deduced;
first rater problem refers to the new articles for which no references were made and no
preferences were shared;
problem of manipulation, for example when a group of users gives negative comments for
a competitive article;
confidentiality.
It appears when a user has to evaluate given recommendations; it is not wanted that the users‘
preferences to be published.
There are a few important approaches regarding recommender systems.
a) Amazon.com virtual store
Amazon uses recommender algorithms that personalize each users online shopping. The
algorithm named „Item-to-Item Collaborative Filtering” [4] offers real time recommendation,
it is scalable to big data and is obtaining good recommendations. The algorithm makes a
connection between the purchased item and the items noted by other similar users, then it
combines the similar items into a list of recommendations. In order to define the best match
for a given item, the algorithm builds a table of similar items by finding the ones that the
consumers tend to buy together. A product-product matrix can be built through the iteration

Proceedings of the IE 2015 International Conference
www.conferenceie.ase.ro
197
of all pairs and calculating a similarity metric for each pair. Despite of this, a lot of the
product pairs do not have the same clients, so that the approach is inefficient from the aspect
of the time of processing and the memory used. The following iterative algorithm offers a
better approach by calculating the similarity between a given product and all the products that
have a connection with it [1].
Products = { Ii | Ii a Product}, Clients = { Ci | Ci a Client}.
Auxiliary functions:
BuyersFor: Products → PClients;
BuyesrFor(Ii)={Ci1...Cij...Cin | Cij, buyer of product Ii}, ∀ ∈ i I Products and ∈ ij C Clients.
BuyedBy: Clients→ PProducts;
BuyedBy(Ci)={Ij1...Ijk...Ijm|Ijk was buyed by client Ci}, ∀ ∈ i C Clients and ∈ jk I Products.
SimilarityCalc: Products x Products→ [0,1];
SimilarityCalc(Ii, Ik) is the result of a similarity matrix M between 2 products Ii and Ik.
Function CalculateSimilarity(Catalog) {
Associations:= ø , Similarities:= ø
For each product Ii in Products {
For each client Cij in BuyersFor(Ii) {
For each product Ik in BuyedBy(Cij) {
Associations := Associations U( Ii , Ik)
}
}
For each product Ik associated with Ii {
Similarities := Similarities U(Ii , Ik, SimilarityCalc(Ii, Ik))
}
}
}
b) User influence in recommender systems
In the context of image recommendation [5] propose a method of ordering recommendations
based on an algorithm similar to PageRank. It is considered that a user who holds qualitative
images is likely to appreciate other images of quality (being an authority in this matter). The
quality of an image is given by the weighted sum of user authorities that marked the image as
favourite.
c) Bootstrapping methods for recommender systems
Recommender systems start without information about the users or items. Olsson &
Rudström in paper [6] propose a method that initiates a recommender system (bootstraps)
with a set of artificial user profiles. These can be obtained by the sampling of a probabilistic
model built on previous knowledge.
4. Evaluation of recommender systems
Recommendation systems have a variety of properties that may affect user experience, such
as accuracy, robustess, scalability. The evaluation of recommender systems can be made as it
follows ([7] and [1]):
„Root Mean Square Error” (RMSE) method; it is a popular method for calculating user
preferences with the following formula: RMSE(P) = √∑ (Pest,i−Preal,i)2
i
n;
average of absolute difference between the real value of the preference and the estimated
value of the recommender system;
data split in a training set and a testing set so that the classifiers are being evaluated. After
the training set is presented to the system, it needs to calculate the preferences for the
instances from the testing set. These preferences are compared to the real ones, so that an
error score is obtained for this algorithm.

Proceedings of the IE 2015 International Conference
www.conferenceie.ase.ro
198
5. Case Study: Amazon.com online store
We try to implement a method also used in [8]. The methode in our case is used in
recommendation systems. The study presents 3 books. Book A is called “Geschichten von
der Polizei”, book B is called “Geschichten vom Rennfahrer Mick” and book C is called “Die
Wilde Autobande”.
The percent of recommendations of each product at the initial t0 moment is : A 50%, B 20%,
C 30%. The percent of fidelity from a week to other week is:
For the product A – 60%
For the product B – 70%
For the product C – 50%
The rest preferences of other users are given in the next table.
Table 1 - The rest preferences
The product which is
cancelled buy the buyers
Reorientations for recommendations to other products
A B C
A - 18 23
B 11 - 13
C 7 11 -
We intend to analyze the evolution of virtual market recommendations within 4 weeks, of
products A, B and C.
The analytic algorithm is:
1. We establish the data input.
2. We write initial distribution. Table 2 - Initial distribution
Initial distribution 0.50 0.20 0.30
3. We analyze the evolution of virtual market recommendations within 4 weeks.
Transition probabilities matrix is built according to reliability coefficient and
reorientations of buyers.
P=(0.59 0.18 0.230.11 0.76 0.130.07 0.11 0.82
)
4. We build the matrix of probabilities of transition.
Table 3 - Matrix of probabilities
0.59 0.18 0.23
0.11 0.76 0.13
0.07 0.11 0.82
5. We build the recommendations percentage after first week. The Market percentage
recommendation are: Table - 4 Market percentage
0.59 0.18 0.23
0.11 0.76 0.13
0.07 0.11 0.82
6. We build the percentages on the marketplace after 1,2,3 and 4 weeks.

Proceedings of the IE 2015 International Conference
www.conferenceie.ase.ro
199
Table 5 - Percentages of marketplace
The percentage after 1st week 0.338 0.275 0.387
The percentage after 2nd week 0.31 0.291 0.399
The percentage after 3nd week 0.29 0.32 0.39
The percentage after 4th week 0.21 0.344 0.446
7. We build the situation regarding the evolution of product market recommendations for
weeks considered. Table 6 - Evolution of product market
W0 W1 W2 W3 W4
A 0.5 0.338 0.31 0.29 0.21
B 0.2 0.275 0.291 0.32 0.344
C 0.3 0.387 0.399 0.344 0.446
8. We draw curve evolution on four weeks for each product.
Figure 1 - Curve evolution
State of art
In the past decade, there has been a vast amount of research in the field of recommender
systems, mostly focusing on designing new algorithms for recommendations.
In paper [9], the authors introduce a model for recommendation systems, based on a utility
matrix of preferences. They introduce the concept of a “long-tail “which explains the
advantage of on-line vendors over conventional, brick-and-mortar vendors. They, then,
briefly survey the sorts of applications in which recommendation systems have proved useful.
Prem Melville and Vikas Sindhwani in paper [10] say that “The design of such
recommendation engines depends on the domain and the particular characteristics of the data
available”.
To succeed in practice, a recommender system must employ a strong initial model, must be
solvable quickly, and should not consume too much memory.
In their paper [11], the authors describe their particular model, its initialization using a
predictive model, the solution and update algorithm, and its actual performance on a
commercial site.
The weakness of the popular EM is examined in the paper [12]. It is based on learning
approach for Bayesian hierarchical linear models and propose a better learning technique
0
0.1
0.2
0.3
0.4
0.5
0.6
W0 W1 W2 W3 W4
Pe
rce
nta
ge
Weeks
A
B
C
Proceedings of the IE 2015 International Conference
www.conferenceie.ase.ro
200
called Modified EM. They showed that the new technique is theoretically more
computationally efficient than the standard EM algorithm as in paper [13][14].
The doctoral thesis of Shengbo Guo [15]is about how Bayesian methods can be applied to
explicitly model and efficiently reason about uncertainty to make optimal recommendations.
The proposed methodology from paper [16] improves the performance of simple Multi-rating
Recommender Systems as a result of two main causes; the creation of groups of user profiles
prior to the application of Collaborative Filtering algorithm and the fact that these profiles are
the result of a user modeling process, which is based on individual user’s value system and
exploits Multiple Criteria Decision Analysis techniques.
Bedi et al. in their paper [17] tell us that “Fuzzy sets can handle and process uncertainty in
human decision-making and if used in user modeling can be of advantage as it will result in
recommendations closely meeting user preferences”. In their paper, a hybrid multi-agent
recommender system is designed and developed where user's preferences; needs and
satisfaction are modeled using interval type-2 (IT2) fuzzy sets.
Conclusions
Based on the studies and the implementation of the proposed application, the benefits and the
special utility of the recommender system could be evaluated, in the context of a large and
hard-to-explore search space.
References
[1] M. Roditis, A. Tabacariu and Ş.Trăuşan-Matu, “Sistem de recomandare de imagini pe
baza aspectelor sociale, semantice şi vizuale”, Revista Română de Interacţiune Om-
Calculator 4(1) 2011, 23-50
[2] J. Riedl J, T. Beaupre and J. Sanders, “Research Challenges in Recommenders“, ACM
Recommender System 2009, avalaible online at http://recsys.acm.org/2009/tutorial3.pdf,
2009
[3] G. Linden, “What is a Good Recommendation Algorithm?” In Communications of the
ACM. Available at http://cacm.acm.org/blogs/blog-cacm/22925-what-is-a-good recommendation
[4] G. Linden G., B. Smith and J.York , “Amazon.com Recommendations: Item-to-Item
Collaborative Filtering”, IEEE Internet Computing, vol. 7, no. 1, pp. 76-80, Jan./Feb.
2003
[5] V. Hosu and S. Trausan-Matu, “Metodă de recomandare bazată pe rang, considerând
satisfacţia utilizatorilor” in D.M.Popovici, A.Marhan (eds.), Proceedings of the 4-th
International Conference of Interaction Human-Computer, Ed. RoCHI 2007, MATRIX
ROM, Bucureşti, 2007, pp.129-132
[6] Olsson T., Rudström Å. Genesis, “A method for bootstrapping recommender systems
using prior knowledge”, in Olsson T., Bootstrapping and Decentralizing Recommender
Systems - IT Licentiate theses, 2003-006. Uppsala University, Department of Information
Technology, Uppsala, Sueden, 2003.
[7] Shani G, Gunawardana A. “ Recommender Systems Handbook 2011”, Part 2, 257-297,
2011
[8] Camelia Ratiu-Suciu, “Modelarea & simularea proceselor economice”, Ed. Economica,
2003
[9] Chapter 9, “Recommendation Systems” avalaible online at http://infolab.stanford.edu/
~ullman/mmds/ch9.pdf

Proceedings of the IE 2015 International Conference
www.conferenceie.ase.ro
201
[10] Prem Melville and Vikas Sindhwani, Recommender Systems, IBM T.J. Watson
Research Center, Yorktown Heights, NY available online at
http://vikas.sindhwani.org/recommender.pdf
[12]. G. Shani, D. Heckerman et al. , “An MDP-Based Recommender System”, available
online at http://jmlr.csail.mit.edu/papers/volume6/shani05a/shani05a.pdf
[13] G. Jawaheer , P. Weller , P. Kostkova , “Modeling User Preferences in Recommender
Systems: A Classification Framework for Explicit and Implicit User Feedback”, Journal
of Machine Learning Research 6 (2005) 1265–1295
[14] Yi Zhang , J. Koren, “Efficient Bayesian Hierarchical User Modeling for
Recommendation Systems”, https://users.soe.ucsc.edu/~yiz/papers/c10-sigir07.pdf
[15]. S. Guo, “Bayesian Recommender Systems: Models and Algorithms” Doctoral thesis,
http://users.cecs.anu.edu.au/~sguo/thesis.pdf
[16]. K. Lakiotaki , N. F. Matsatsinis and A.Tsoukiàs, “Multi-Criteria User Modeling in
Recommender Systems”,
http://www.lamsade.dauphine.fr/~tsoukias/papers/Lakiotakietal.pdf
[17]. P. Bedi, P. Vashisth and P. Khurana, “Preeti, Modeling user preferences in a hybrid
recommender system using type-2 fuzzy sets” http://ieeexplore.ieee.org/xpl/login.jsp?tp=&arnumber=6622471&url=http%3A%2F%2Fieeexplore.ieee.org%2Fxpls%2Fabs_all.jsp%3Farnumber%3D6622471
[18] P. Adjiman, “Flexible Collaborative Filtering in JAVA with Mahout Taste”. available at
http://philippeadjiman.com/blog/2009/11/11/flexible-collaborativefiltering-in-java-with-
mahout-taste/, 2009.
[19] A. Boch, A. Zisserman, X. Munoz, “Representing shape with a spatial pyramid kernel”.
CIVR’07, available at http://eprints.pascalnetwork.org/archive/00003009/01/bosch07.pdf
[20] P. Resnick and H.Varian H., “Recommender systems. În Communications of the ACM,
Volume 40, Issue 3 (March 1997). Pg: 56 – 58, 1997
[21] B. Sarwar, G. Karypis and J. Konstan, „Item-Based Collaborative Filtering
Recommendation Algorithms”. In WWW10, Hong Kong, May 2001
[22] P.-N. Tan, M. Steinbach, V. Kumar, „Introduction to Data Mining”, Addison Wesley,
2005
[23] J. Vermorel and M. Mohri “Multi-Armed Bandit Algorithms and Empirical Evaluation”
in European Conference on Machine Learning, available at
http://www.cs.nyu.edu/~mohri/ pub/bandit.pdf, 2004

Proceedings of the IE 2015 International Conference
www.conferenceie.ase.ro
202
METHODOLOGY FOR THE COHERENT ROMANIAN LINKED
OPEN GOVERNMENT DATA ECOSYSTEM
Codrin-Florentin NISIOIU
Bucharest University of Economic Studies
Abstract. Linked Open Government Data(LOGD) facilitates the integration of data and
allows the link between the disparate government data sets. The increasing use / reuse of the
releases LOGD increases the need to improve the quality of data. The availability of LOGD
allows the creation of new services offered by the public / private sector. The reuse of LOGD
in the e-government applications leads to a considerable reduction in costs. The article is
divided in 3 sections. The first section is describing the LOGD ecosystem, the second section
propose a methodology for a coherent Romanian Linked Open Government Data Ecosystem
and the third section put LOGD ecosystem in the context of metadata economy.
Keywords: Linked Open Government Data (LOGD), Open Data, Romanian LOGD
ecosystem
JEL classification: M15, O38
1. The LOGD ecosystem
Data are provided by the specific areas of public sector information - geographic information,
business specific information, legal information, weather data, social data, information on
transport, cultural heritage information and information about education and research.
The LOGD life cycle is based on a demand - supply data model. There is a "data provider"
that selects, shapes, publish and perform the data management for the data supply. There is
also a "consumer data" that looks for, integrates, reuses and provides feedback for the data
demand in order to improve the data management.
The specific actors of the LOGD ecosystem are:
1. The data providers represented by the public administrations that "open" its data and
provide it as "Linked Open Government Data" (LOGD).
2. Data Consumers are citizens, entrepreneurs, companies and public administrations that
reuse LOGD through value-added applications and services.
3. Data brokers are third-party organizations, public or private, which manages data
catalogs and marketplaces facilitating access to the available LOGD. They can provide
additional services such as advanced queries, data visualization and the ability to export in
various formats.
4. Regulatory Entities represented by the local / regional / national public administrations
and cross-border institutions - for example the European Commission regulates LOGD
through policies, laws and directives.
The LOGD ecosystem is analyzed through the 9 areas of Business Model Canvas [1]:
1. The value proposition provides an overview of an organization's products and services
that have added value to the consumer of data.
2. The key-resources are represented by the necessary activities and resources to create
added value to the customer.
3. Key partners are those who made a voluntary cooperative agreement between two or
more organizations to create added value for the customer.

Proceedings of the IE 2015 International Conference
www.conferenceie.ase.ro
203
4. Key activities are represented by the ability to execute action models that are needed to
create added value to the customer.
5. The cost structure is achieved through the representation in money of all means
involved in the business model.
6 The customer segments are represented by the organizations that perform added value
for LOGD.
7. The income obtained through LOGD - the way used by an organization to obtain
revenue.
8. The channels are the way to keep in touch with the clients.
9. The customer relations are represented by the type of bond that is created between the
supplier and the client company.
The value proposition can be achieved through: the flexible integration of data, the increasing
data quality, new services and reducing costs.
The errors are progressively corrected through the mechanisms of "crowd-sourcing" and
"self-service".
The key resources are: the URI policies, the infrastructure of linked data and also the specific
skills and competencies. URI policies must ensure the permanence and uniformity of the Web
identifiers. The infrastructure of "linked data" is the web infrastructure needed to achieve the
"linked data". Skills and competencies are key resources needed to develop and maintain
"linked data".
The key partners may be the governmental partners, entities from the business environment
or from NGOs. The government partners are regulators, e-Government agencies and other
entities from the public administration. The business partners are ICT providers, the data
providers and the data brokers. The NGOs are part of lobby groups, communities and
engaged civic action groups.
The LOGD specific key activities are: the development, the maintenance and the promotion.
The development specific activities consist of identification activities, modeling,
transformation, harmonization, publication and reuse of LOGD. The maintenance specific
activities consist of support activities for users, server maintenance etc. The promotion
specific activities consist of activities regarding the promotion of the LOGD use.
The LOGD cost consists of the development, the maintenance and the promotion cost. The
development costs include the costs needed for the identification, the modeling, the
processing, the harmonization, the publication and the reuse of LOGD. The maintenance
costs include the costs of updating the data and/or the specific infrastructure maintenance
costs. The promotion costs of the availability of data as "linked data" are obtained by
comparing the costs of promotion of their availability through other means.
Customer segments using LOGD are: the government, the NGOs, the companies specialized
in working with LOGD and the academic environment. The companies specialized in
working with LOGD may have in their teams data brokers, LOGD services developers and
journalists focused on data. The pricing model includes: the income sources, the used pricing
model, the price structure and the type of license LOGD associated.
The specific LOGD revenue sources are from: public funds (LOGD is partially financed by
the government), user fees (LOGD is partly funded from subscriptions) and advertising. The
model of the price may be: free, freemium - the data are free, but the features, functionality
and proprietary virtual goods are paid, premium - quality data associated with a certain image
and a certain prestige among users.
The price structure consists of fee for LOGD subscriptions or LOGD fee for the
"application". LOGD licensing types should consider: the unknown licensing - "linked data"
service does not indicate under what license data can be used, modified and redistributed; the

Proceedings of the IE 2015 International Conference
www.conferenceie.ase.ro
204
award restrictions; the restrictions for commercial use; the "share-a-like" restrictions - for
redistribution it will be used the same license or other public good.
The LOGD distribution is achieved through: Web APIs (LOGD are accessible through Web
APIs), download datasets that are part of a "Data Bank", the proprietary applications and the
Web applications.
The networking mechanisms are based on "branding" (LOGD has a brand strategy that refers
to the value of data), on advertising (the consumer is informed of specific services "linked
data" through advertising), on user support (there is a support centre in order to use LOGD)
and on user feedback mechanism (measuring user satisfaction and ensure general feedback).
2. Methodology for a coherent Romanian Linked Open Government Data Ecosystem
The methodology comprises the following steps: I) the developing of the "desk research"
preparatory work; II) the collecting metrics for each case study; III) making interviews; IV)
the specific set of questions for the LOGD provider / consumer.
The minimum information gathered in the "desk research" is: LOGD user/provider mission;
the provision and the reuse of linked data; LOGD price; the LOGD licensing and the market
analysis. The LOGD user / provider mission is presented in a few words correlating with
public work performed by it. The provision and the reuse of the linked data are made as a
summary that presents linked data through the links, the documents, the used vocabularies
and the linking services description of data. The LOGD price is shown through the applied
price and the specific documentation. The LOGD licensing is presented through the applied
licensing conditions. The market analysis shows the market players, the LOGD providers and
users. Sources of information from step I are: the public administration websites, annual
reports and studies on public sector data.
The collected metrics for each case study are: 1) the use: the number of URIs / queries, the
number of LOGD government re-users and the number of LOGD re-users of trading; 2) the
incomes and the income sources: public funds, incomes from LOGD annually subscriptions
and data on demand per year, the LOGD price developments per year, advertising; 3) costs:
cost of development – which are necessary to all activities of LOGD identification, modeling,
transformation, harmonization, publication and / or reuse, maintenance costs per year -
necessary costs for the publication of the updated data, maintenance costs - costs of the
specific infrastructure and promotion costs - promotion costs of the data availability as
“linked” data. 4) the benefits: the number of “linked” data sets the number of applications
LOGD – based, the number of requests for correction of data and cost savings by integrating
information.
Interviewing – There will be at least two interviews with the LOGD provider and LOGD
beneficiary.
The set of questions specific for the LOGD provider / consumer are: 1) Organization - How is
correlated the LOGD demand / use with the public activities specific to the organization?
There is a strategic document within the organization that motivates the investment in LOGD
provision / reuse? What are the future plans? 2) Proposals – Does the provision of LOGD
data create new opportunities for the flexible data integration? Has the data quality increased?
Have new services appeared? Have the costs been reduced? Who are the facilitators / the
main inhibitors for LOGD to provide added value to the users? 3) The key resources - has
your organization a policy regarding URIs? Can you describe the infrastructure for "linked"
data from your organization? What skills and competencies are required in order to provide /
to use LOGD? 4) The key partners - What organizations are the key partners in the LOGD
provision / use? Key activities - What activities do you have in order to provide / use LOGD?
5) Cost Structure - What investments were made by your organization in order to provide /

Proceedings of the IE 2015 International Conference
www.conferenceie.ase.ro
205
use LOGD? What were the costs in order to publish maintain and promote LOGD? What are
the trends? 6) Customer segments - What are the main users of LOGD services? How often
LOGD is used? What is the trend? 7) Income - What is the LOGD financing? What is the
mechanism of price or what are the other sources of income? What type of license is used for
reuse? 8) Channels - What are the channels most commonly used to investigate LOGD? Web
APIs? Website? Application? Market data? 9) Customer relations - There is a branding
strategy for LOGD? Investments in specific advertising for LOGD?
3. Metadata Economy
The metadata widely interoperable represents a new IT phenomenon that in combination with
new licensing strategy creates new opportunities for the products diversification and the
creation of new opportunities. The media industry has attracted attention by switching from
traditional content to metadata and by professionalizing the specific strategies in order to
conserve and enhance the quality of structured data by applying Semantic Web principles [2].
Using Semantic Web approach is relevant when the distribution of goods increases and
allows the multiplicity of services and customer portfolios. The uniform application of RDF
data model is the cornerstone of the Semantic Web and Linked Open Data, allowing syntactic
and semantic interoperability. Saumur and Shiri [3] have considered the increase of
researches conducted on issues related to metadata and the decrease of the traditional ones
(such as indexing, the artificial intelligence, etc.). They [3] have documented new areas of
research such as Web-based cataloging, classification and interoperability.
K. Haase believes [4] that with the increasing volume of data, the economic value of
metadata increases too. Facing the necessary pressure in order to diversify business,
especially in knowledge-based business sectors such as media, life sciences, banking,
insurance or trade, it requires a constant search for new ways to create value-added products
and services to existing customers or to attract new consumers. The specific concepts of
metadata such as metadata schemas, vocabularies, ontologies, identifiers, queries, etc. have
become central factor of production in the efficient operation of existing and opening new
ways of diversifying products and services. But the approach of Sjurts [5] believes that
diversification can be seen in the light of interoperable metadata. The resource-based
approach investigates how valuable economic resources are created and exploited
commercially.
The market-based approach investigates the new consumers and the market segments that can
be penetrated and are safe. Both approaches are intertwined and affect each other. The
recognition and the understanding of the specificity of interoperable metadata is crucial in
developing a business around the metadata semantics especially when there are applied the
appropriate licensing strategies. Due to the increasing interaction between the factors specific
to the creation of goods it has been passed from the value chain approach to the network
approach [6]. The network approach takes into account two factors: 1. An input can be used
in various contexts for different purposes and 2. an economic actor can be active at different
levels of simultaneous creation of added value. Latif [7] used this approach to describe the
structural coupling of economic actors, their roles and the sets involved in creating
Interconnected Data. Added value networks are characterized by a highly organizational
complexity and require different governance principles in the "open source" projects. Demil
& Lecoque in [8] developed the concept of "Governance Bazaar" in which interactions
between economic actors are characterized by: decentralization, collaborative engagement
model, resource sharing and hybrid business models composed of strong and weak property
rights.

Proceedings of the IE 2015 International Conference
www.conferenceie.ase.ro
206
4. Conclusions
I think that the same principle used in “Governance Bazaar” can be adopted in the Linked
Open Government Data ecosystem in order to design and to govern the open data
infrastructure based on the federalization principle, self-service and collaborative way of
creating value in. My future research will focus on: 1) proposing architecture for LOGD
ecosystem based on the federalization principle, self-service and collaborative way of
creating value in. 2) use the proposed methodology to prove the sustainability of the LOGD
architecture.
Acknowledgment
This work was cofinanced from the European Social Fund through Sectoral Operational
Programme Human Resources Development 2007-2013, project number
POSDRU/159/1.5/S/142115 „Performance and excellence in doctoral and postdoctoral
research in Romanian economics science domain”
References
[1] Osterwalder, A., & Pigneur, Y. (2009). Business Model Generation.
[2] Rachel Lovinger. Nimble: a razorfish report on publishing in the digital age. Technical
report, 2010.
[3] Kristie Saumure and Ali Shiri. “Knowledge organization trends in library and
information studies: a preliminary comparison of the pre-and postweb eras”. Journal of
Information Science, vol. 34(5), pp. 651-666, 2008.
[4] Kenneth Haase. “Context for semantic metadata” in Proceedings of the 12th annual ACM
international conference on Multimedia, MULTIMEDIA '04, New York, USA, 2004, pp.
204-211.
[5] Insa Sjurts. “Cross-media strategien in der deutschen medienbranchhe. eine okonomische
analyse zu varianten und erfolgsaussichten.” In Bjorn Muller-Kalthoff, editor, Cross-
Media Management, pages 3-18. Springer,2002.
[6] Axel Zerdick, Arnold Picot, Klaus Schrape, Alexander Artope, Klaus Goldhammer,
Ulrich T. Lange, Eckart Vierkant, Esteban Lopez-Escobar,and Roger Silverstone. “E-
conomics: Strategies for the Digital Marketplace”. Springer, 1st edition, 2000.
[7] Atif Latif, Anwar Us Saeed, Partick Hoeer, Alexander Stocker, and Claudia Wagner.
“The linked data value chain: A lightweight model for business engineers”. In
Proceedings of I-Semantics 2009 - 5th International Conference on Semantic Systems,
Graz, Austria, 2009, pp. 568-577.
[8] Benoit Demil and Xavier Lecocq. “Neither market nor hierarchy nornetwork: The
emergence of bazaar governance.” Organization Study, vol. 27(10), pp. 1447-1466, 2006

Proceedings of the IE 2015 International Conference
www.conferenceie.ase.ro
207
QUALITY METRICS FOR EVALUATING INTERACTIVITY
LEVEL OF CITIZEN ORIENTED WEB BASED SOFTWARE
SOLUTIONS
Emanuel Eduard HERȚELIU
Bucharest Academy of Economic Studies
Abstract. This paper presents a way to evaluate the quality of web based software solutions
in means of what degree of interaction is provided to user. The types of analyzed solutions
are presented divided into categories. Evaluation is done using quality metrics. The metrics
are presented as well as the process of collecting data and applying them. Collecting data is
done using an automated tool. The modules of the tool are presented and the process of using
it is highlighted.
Keywords: Quality, Metrics, Citizen Oriented, Web Based Software Solutions
JEL classification: O38
1. Introduction
Web environment is a good choice to host applications that provide services to citizens. This
makes a specific application easily reachable throughout a high range of devices and software
platforms. The number of persons in EU that use internet daily increased from 31% in 2006
to 65% in 2014 [1] which means that developing an online app is a must in order to reach out
to a big percent of users. Applications designed and developed for citizens are usually funded
by governments and intended to help them by providing online services that make their life
easier. This is why they are usually free of charge, highly interactive and accessible. Services
provided by national and local governments through online apps are:
information sharing services that update to citizens news about changes in payment and
tax schemes, laws, local and national administrative info, cultural, community and social
events that they could or need to attend, touristic information;
multimedia guiding with the use of audio and video features in order to inform citizens
and help them with their administrative tasks;
payment services helping tax payers save time as doing it from home or form certain
places with devices designed especially for administrative payments;
online surveys services in order to gain information about user’s satisfaction with the
services and improvements that can be done based on their opinion;
enhancements that help disabled people use the services and keep informed;
archives containing forms and document templates that are available to download so that
people could save time by filling them prior using them at service desks.
Steps towards good online services are taken by governments all over EU and worldwide but
at the moment not all services are provided to citizens. There are local and national
administrations that provide one or few of the services but they need to be centralized and
standardized so integrating new services does not involve unnecessary efforts and costs.
2. Interactivity approach
When categorizing online services provided to citizens, in terms of interactivity there is a
distinction between certain types of web based solutions [2]. Thus using interactivity as
criteria the following categories of informatics applications are distinguished:

Proceedings of the IE 2015 International Conference
www.conferenceie.ase.ro
208
static applications in which content is displayed for user as static content so user can read
it and not much action being needed other than scrolling, navigating through pages,
following links, hiding and un-hiding containers filled with information;
dynamic applications where certain content is brought from the server and displayed
based on user interaction and demands via input controls;
archives as applications with downloadable content as forms, pictures and documents
relevant to user needs as a citizen;
dynamic archives as apps where user can not only download content but contribute by
uploading personal documents;
media applications where user can access audio and video informative content depending
on his interest and perform interacting actions with the players and tools used to
display/stream the content;
mixt applications which can include specific forms of all categories presented, user
inserted data is processed on the server and calculations are made before sending a
response and updating the page with the results.
When developing the interactivity level of services provided to citizens an important step to
make is to include as many forms of interaction as possible diversifying actions user can
perform and improving the quality of the results user obtain when accessing the app [3]. The
presented application types are linked to user actions in Table 1.
Table 1 – Applications categories and user actions
Application Type Specific User Actions Services
static scrolling, change pages, follow
links, hide un-hide content
schedule updates, news, informative
content, touristic information,
timetables
dynamic
filling in text boxes, checking
checkboxes, switching between
radio buttons, submitting forms
tax paying, properties buying
archives downloading files downloading administrative forms,
documents, papers and books
dynamic archives downloading/uploading files uploading content
media streaming video and audio
content, viewing pictures
watching news, informative and
educational movies and pictures
The categories and user actions presented in Table 1 are intended to draw a line between
certain types of applications oriented towards helping people in day by day life. Combined
with the number of steps necessary to reach to results this approach of interactivity is
measurable using metrics.
3. Interactivity evaluation tool
In order to evaluate the level of interactivity a set of metrics was built. They are intended to
categorize apps and tell the degree of interaction user gets when accessing the app. Being
web based the analyzed apps are evaluated by parsing the html code of each page. The goal is
to make it easy to measure the interactivity for a high number of applications at a time. Thus
an open source web crawler was integrated and an automation tool built and used to get and
parse the source code based on app’s URL as described in Figure 1.

Proceedings of the IE 2015 International Conference
www.conferenceie.ase.ro
209
`
Figure 1 – Quality evaluation tool
The automated tool presented in Figure 1 consists of three main modules that are
interconnected and linked to databases:
the crawler module which is an open source crawler integrated and configured to accept
as input a range of app URLs and crawl each one of them; crawling begins on homepage
of the app and then follows the links found on the page to proceed to the next pages of the
same app; checking that a page belongs to the same app is done by checking that it shares
the same domain and port as homepage; the output of crawler module is source code of
each page that is sent to the database to be further processed;
the parser module which reaches the database for the source code crawled and reads it as
input; crawled source code is rigorously parsed following apps structure and each page is
divided in its component HTML nodes that are sent as output to be processed in the next
step;
the processing module has two input sources in terms of the parsed HTML nodes and
built metrics that were prior stored in the database; during processing the module does
counting, keywords matching, calculating page’s length in order to give a meaning to the
metrics that calculate loading easiness; the processed data is stored in the database
according to each app and page;
a fourth module is under construction and it’s intended to for communicating with the
database and retrieve the results in order to bring it using HTML to the final user in
formats that include graphics, tables and explaining text.
URL 1
URL 2
...
URL i
...
URL n
Input: Apps
URL set =========
ssssset
CRAWLER
DATABASE
Output: source code for
each page
SC 1
SC 2
...
SC i
...
SC n
Input: Source Code
PARSER
Output: HTML nodes
BUILT METRICS
PROCESSING MODULE
Output: quality level

Proceedings of the IE 2015 International Conference
www.conferenceie.ase.ro
210
The technologies used to build the automated tool are ASP.NET with Visual Studio 2013 as a
working environment. The databases are built and managed using SQL Server 2012. Entity
Framework is used in order to facilitate easy integration between database and modules. The
presentation module is built also using ASP.NET as a web app using MVC 5 pattern.
4. Evaluating interactivity using metrics
According to the categories of applications presented, metrics are calculated for a set of web
based applications. The metrics are related to the HTML code of each page and are applied
evaluating the nodes via the automated tool presented. The metrics used are divided in three
categories:
binary metrics used to show whether a specific node was found on the page or not having
the value of 1 in case of a found node or 0 if node not found;
counting metrics are used to count the total number of apparition of certain nodes inside
the page content;
ratio metrics are used to highlight to what extent the content of the page is represented by
a certain type of node; they are calculated as summing up all nodes of a certain type and
dividing the sum to the total number of nodes of the page.
Evaluating the HTML nodes is done by applying metrics from each category both at page
level and at whole application level [4]. The metrics are presented in Table 2 together with
their meaning in terms of interactivity.
Table 2 – Interactivity metrics
Metric Symbol Metric
Category
Way of expressing Means of
interactivity
Total number of pages
per application
PN
Counting
Summing up all pages
crawled for an app
The complexity of
the problem
solved by the
application
The total number of
nodes per page/app
NN Counting
Summing up all nodes
parsed per page/app
The structure of
page/application
Form nodes present on
page/app
FE Binary
Searching for nodes of
type form
Application is
interactive
The weight of input
nodes in the total
number of app/page
nodes
IR
Ratio
Dividing the total number
of input nodes to the total
number of nodes found on
page/app
Application’s
extent of
interactivity
Input nodes of type file
present on page/app
IFE Counting
Summing up the input
nodes of type file
Application allows
file uploads
Total number of files
available for download
per page/app
DFN
Counting
Summing up all files
available for input per
page/app
Application allows
file downloads
Secure protocol present SE Binary
Checking the protocol of
app’s URL
Application allows
secure transactions
The metrics presented in Table 2 are chosen based on their contribution in evaluating the
interactivity level for citizen oriented web based apps. They are meant to be used as variables
of quality indicators for evaluating interactivity level. The presence of form html nodes at an
app level calculated by FE metric is meaningful for the interactivity level because it tells
weather the citizen oriented web based app provides results calculated by submitting user
input values or not. The weight of input nodes calculated by IR metric for the apps that

Proceedings of the IE 2015 International Conference
www.conferenceie.ase.ro
211
provide forms elements is important because it tells about the effort and information needed
from user in the interaction process.
The metrics are applied on application sets. The metrics set MS is built: 𝑀𝑆 ={ 𝑀1, 𝑀2, … , 𝑀𝑖, … 𝑀𝑁𝑇𝑀}, where Mi represents the i metric in the total of NTM = 7 metrics
from Table 2. Each metric is calculated for a set of applications. The applications set AS is
built: 𝐴𝑆 = { 𝐴1, 𝐴2, … , 𝐴𝑖 , … 𝐴𝑁𝑇𝐴 }, where Ai represents the i application in the total of NTA
applications. The results are evaluated individually for each app and then for the entire set of
applications as presented in Table 3.
Table 3 – metrics set and applications set
App \ Metric 𝑴𝟏 𝑴𝟐 ... 𝑴𝒋 ... 𝑴𝑵𝑻𝑴
𝑨𝟏 𝑚11 𝑚12 ... 𝑚1𝑗 ... 𝑚1𝑁𝑇𝑀
𝑨𝟐 𝑚21 𝑚22 ... 𝑚2𝑗 ... 𝑚2𝑁𝑇𝑀
... ... ... ... ... ... ...
𝑨𝒊 𝑚𝑖1 𝑚𝑖2 ... 𝑚𝑖𝑗 ... 𝑚𝑖𝑁𝑇𝑀
... ... ... ... ... ... ...
𝑨𝑵𝑻𝑨 𝑚𝑁𝑇𝐴1 𝑚𝑁𝑇𝐴2 ... 𝑚𝑁𝑇𝐴𝑗 ... 𝑚𝑁𝑇𝐴𝑁𝑇𝑀
Total 𝑻𝑴𝟏 𝑻𝑴𝟐 ... 𝑻𝑴𝒋 ... 𝑻𝑴𝑵𝑻𝑴
In Table 3 the way of evaluating the metrics are presented for a set of NTA applications. The
element 𝑚𝑖𝑗 represents the value obtained for the 𝑀𝑗 metric when applied on the application
𝐴𝑖. The last row of the table represents the totals for each metric. The total 𝑇𝑀𝑗 corresponding to 𝑀𝑗 metric is calculated as the average of the 𝑚𝑖𝑗 values for all NTA
apps.
5. Conclusions
Achieving a high interactivity level is a key for developing good quality web based citizen
oriented software solutions. Thus built metrics need to be applied on a high range of
applications in order to refine and validate the obtained results. Thus further developing and
enhancement of the automated tool and the metrics themselves are to be done so they
measure quality with a high level of accuracy.
Acknowledgment
This work was cofinanced from the European Social Fund through Sectoral Operational
Programme Human Resources Development 2007-2013, project number
POSDRU/159/1.5/S/134197 „Performance and excellence in doctoral and postdoctoral
research in Romanian economics science domain”.
References
[1] Source: Eurostat. Internet: http://ec.europa.eu/eurostat/documents/2995521/6343581/4-
16122014-BP-EN.pdf/b4f07b2a-5aee-4b91-b017-65bcb6d95daa, March 16, 2015
[2] Ion IVAN, Bogdan VINTILĂ, Dragoș PALAGHIȚĂ - Types Of Citizen Orientated
Informatics Applications, Open Education Journal, Russia, ISSN 1818-4243, No.6, 2009
[3] Maria HAIGH – Software quality, non-functional software requirements and IT-business
alignment, Software Quality Journal, Vol. 18, Issue 3, September 2010, pp.323-339,
ISSN 09639314
[4] Christof EBERT, Manfred BUNDSCHUH, Reiner DUMKE, Andreas
SCHMIETENDORF – Best Practices in Software Measurement, Publisher: Springer
Verlag Berlin Heidelberg, 2005, 300 pp, ISBN 978-3-540-26734-8

Proceedings of the IE 2015 International Conference
www.conferenceie.ase.ro
212
BRIDGE PKI
Eugen Ștefan Dorel COJOACĂ
Ministry for Information Society, Romania,
Doctoral School of University of Economic Studies, Bucharest
Mădălina Elena RAC-ALBU
Bucharest University of Medicine and Pharmacy “Carol Davila”, Romania,
Doctoral School of University of Economic Studies, Bucharest
Floarea NĂSTASE
Bucharest University of Economic Studies, Romania
Abstract. In this article we present one of the initiatives of the Ministry of Informatics
Society, namely: the "Bridge PKI", this project wants to provide business infrastructure
enabling interoperability between accredited vendors of electronic signatures in Romania
and secure access to this infrastructure. The project aims to increase the administrative
efficiency using new electronic technologies of communication and to boost the use of
electronic documents. Implemented project was financed by European funds and has taken
that step further interconnection with existing similar systems in EU countries.
Keywords: interoperability, PKI, e-Business, e-Government, e-Services
JEL classification: M10, M14, O33
1. Introduction
MSI Strategy (Ministry for Informatics Society) on computerization of public services at
central and local level must pursue notably several directions:
Increasing the efficiency of the administrative apparatus using new electronic
technologies of communication;
Orientation of public services to the needs of citizens and businesses;
Provide free access to public information;
Transparency in the exercise of the administration;
Fulfilling the standards of European administration, to interconnect systems in the EU
Member.
The users of these services must trust in government. For example, the citizen must have the
guarantee that official documents received were not changed and were even sent by the
Authority. At the same time, public authorities must be able to verify that the received
documents are from people who claim to have sent and if the documents are original.
To ensure the security of the main objectives in managing electronic documents, IT systems
are using infrastructures based on public key cryptography.
According to [1], “Public Key Infrastructure (PKI) refers to the technical mechanisms,
procedures and policies that collectively provide a framework for addressing the previously
illustrated fundamentals of security - authentication, confidentiality, integrity, non-
repudiation and access control.”

Proceedings of the IE 2015 International Conference
www.conferenceie.ase.ro
213
For effective cooperation between companies, citizens and government, as well as public
authorities in other Member States of the European Union, PKI systems need to be
interoperable.
There are several models based on public key infrastructure [2] [3]:
1. The authority validation model - is based on using OCSP protocol (Online Certificate
Status Protocol) to interview a server about the status of the certificates.
As advantages of this solution can be mentioned:
online consultation always provides updated information;
validation information should not be disseminated on all workstations.
As disadvantages can be mentioned:
users must use the OCSP compliant software tools;
the checking of the validation path is partially assigned to someone else.
2. The hierarchical model - certification authorities are organized hierarchically, each of
which issues certificates to subordinated authorities or to their users.
As advantages of this solution can be mentioned:
certification paths are easily determined because they are unidirectional. For each
certificate there is a single certification path to the root certification authority;
a hierarchical architecture provides a high degree of scalability, adding new subordinate
certification authority to allow the management of a high number of users being simple
to achieve.
As disadvantages can be mentioned:
compromise of the private key of the root certification authority is catastrophic, requiring
revocation of all existing certificates and recreate the hierarchy;
the reliability between organizations or companies is not necessarily hierarchical and
therefore it is very difficult to find one authority that all trust in.
3. The mesh method - All certification authorities (CA) are considered reliable points.
Certification Authorities (CA) issue certificates to another; pair of certificates describing
bidirectional trust relationship.
As advantages of this solution can be mentioned:
compromise of a certification authority (CA) does not destroy the entire structure of
public keys;
a public key "mesh" can be easily constructed from a set of certification authority (CA)
isolates.
As disadvantages can be mentioned:
can develop an endless loop of certificates;
the contents of a certificate cannot be used for recognition of access rights.
4. The Web / Internet Trust model - This solution is based on the list of trusted
certificates CTL (Certificate Trust List).
As advantages of this solution can be mentioned:
compromise of a certification authority (CA) does not destroy the whole structure of
public keys;
achieving certification path is simpler than in the case of the "mesh".
As disadvantages can be mentioned:
do not process the revocations and does not provide support for using multiple
certification policies;
lacks mechanisms to protect data integrity.
5. The Bridge CA model - is also based on mutual certification relations, but trust model
used is the star type. As advantages of this solution can be mentioned:

Proceedings of the IE 2015 International Conference
www.conferenceie.ase.ro
214
compared to "mesh" model, the certification path discovery becomes easier;
certification paths are shorter
Using electronic signature in e-Government services is very important because it allows the
use of electronic documents. There are many projects that use electronic signature and their
management is not an easy task in this regard with studies showing solutions to obtain
optimal solutions [4]. Thus, interoperability between public key infrastructures has different
meanings depending on the context it is used - essential in this project is interoperability
between different areas.
Each entity involved in this project has its own PKI architecture, resulting the need for the
PKI hierarchy to interact with each other. Thus, entities that adhere to this system will be
recognized in the topology. When the unit Enrollment in this system succeeds, secure
communication will be resolved between the parties; there will be no need for any auxiliary
authentication because the unit is considered a reliable one in the system.
The solution of the project is based on the draft list of certificate authorities to ensure
interoperability between domains trust of different public keys. The system is simple and
easy to manage and to avoid the disadvantages that may occur in terms of security are
introduced lists of trusted certificates (CTL - Trust List Certificate). It will distribute a list of
trusted root certification authorities that includes, in its own certificate signed list of the
system.
The system architecture provides participating members the following services:
Distribution of CA accredited certificates as a signed list, the list of trust (TL);
Cross-certification certifying of participating members who do not want to use the trusted
list (TL);
Provide public key certificate for each member PKI and the appropriate certificate
revocation list;
PKI interface specification for each member that interacts with the BCA;
The opportunity of the participants to test and validate their own interface to the reference
site.
2. Concept
In order to achieve the aspirations of the project were considered several possible solutions
(each with its advantages and disadvantages) resulting in the optimal solution for
implementing a combination of popular Web / Internet Trust and Model Bridge CA - Figure
1. This model overcomes the disadvantages of other PKI models (simple, hierarchical or
mesh) and achieving mutual trust between participants who will retain their own reliable
structure. Advantages of this model are:
this model is open;
the compromise of a certification authority (CA) does not destroy the whole structure of
public keys;
achieving certification path is simpler than in the case of the " mesh ";
compared to its public key " mesh " certification path discovery becomes easier;
certification paths are shorter.
Bridge PKI uses cross- certification process, a process that involves the following steps:
application, submit documentation, mapping policies, technical interoperability testing,
approval of the application, the negotiation of an agreement, cross certification.

Proceedings of the IE 2015 International Conference
www.conferenceie.ase.ro
215
Figure 1 - The PKI Bridge
3. Bridge PKI Architecture
PKI Bridge is compatible with external Certificate Authority issuing X.509 v2 CRL and
X.509v3 certificates and X.500 uses distinct names. It also uses two critical extensions: the
extension that implements basic constraints which indicates whether the subject of the
certificate is a Certification Authority and "key usage" which specifies whether the private
key can be used for signature verification certificates and CRL-s. From the functional point
of view, the system regards:
ITU X.509 v3 – format digital certificates;
X.509v2 – certificates issued CRL-s;
RFC 5280 – for issuing, publishing and revoke digital certificates;
RSA, DSA, ECDSA –cryptographic algorithms for signature;
SHA-1, MD5 - cryptographic algorithms for hash;
DH – shift key (RSA key length of 1024 to 4096 bits);
PKCS#7/PKCS#10 for managing certificates;
PKCS#11 and PKCS#12 – to store private keys;
FIPS 140-2 level 1 – for cryptographic libraries;
CRL, OCSP (RFC 2560) – to validate certificates.
Architecture degree of implementation is shown in Figure 2 and Figure 3.

Proceedings of the IE 2015 International Conference
www.conferenceie.ase.ro
216
Figure 2 - Bridge PKI Final Architecture specifying relevant functionalities
Figure 3 - Final Bridge PKI architecture – interoperability with: PCU (Single Point of Contact in Romania) ,
SEAP ( Electronic Public Procurement System), IMM (Portal for IMMs in Romania ) , NTC ( National Trade
Register Office ) [5]
As can be seen in Figure 3, interoperability is achieved with some systems developed by the
Ministry for Information Society and also with the National Trade Register Office, an
institution that operates with a very high flow of documents from citizens.
4. Conclusions
The implementation of this project has allowed a work environment that ensures through
interoperability the following features:

Proceedings of the IE 2015 International Conference
www.conferenceie.ase.ro
217
The capacity of a public key applications to interact with another application of public
key;
The possibility of mixing of components from different companies to create a public key
infrastructure organization;
Interaction between the fields of public keys, belonging to different organizations, to
enable secures transactions between these organizations.
References
[1] What is PKI?, availale: https://www.comodo.com/resources/small-business/digital-
certificates1. php
[2] RFC5217, M. Shimaoka, N. Hastings, R. Nielsen - Network Working Group
[3] PKI Interoperability Models, Chris Connolly, Peter van Dijk, Francis Vierboom, Stephan
Wilson, Galexis, February 2005
[4] F. Pop, C. Dobre, D. Popescu, V. Ciobanu and V. Cristea, “Digital Certificate
Management for Document Workflow in E-Government Services”, proc. of Electronic
Government, 9th IFIP WG 8.5 International Conference, EGOV 2010, Lausanne,
Switzerland, pp 363-374, August\September 2010, Springer
[5] Portal e-Romania, available:
http://portaleromania.ro/wps/portal/Eromania/!ut/p/c5/04_SB8K8xLLM9MSSzP y8xBz9
CP0os_hAAwNfSydDRwP_UGMzA0_XUEtv4-
AQYwMDA_1wkA6zeAMcwNFA388jPz dVvyA7rxwA-
YBK0g!!/dl3/d3/L2dBISEvZ0FBIS9nQSEh/?WCM_GLOBAL_CONTEXT
=/wps/wcm/connect/portaluri/portaluri/articole/articoleportal&categ=BridgePKI&IdSite=
1d2c2d0042e44462a78faf6a9cee2aac
Proceedings of the IE 2015 International Conference
www.conferenceie.ase.ro
218
AN ENTERPRISE APPROACH TO DEVELOPING COMPLEX
APPLICATIONS
Alexandru-Mihai MARINESCU Endava Romania
Anca ANDREESCU Bucharest University of Economic Studies
Abstract. Nowadays, developing applications for various clients has become a matter of
delivering speed and sacrificing quality. In many situations, the deliverable has to meet strict
deadlines but most often doesn’t, due to poor planning. Many steps of the software
development cycle are elided, thus leading to software defects, a rigid structure that is unable
to adapt to future requirements and, probably, the most significant, poor performance of the
application. In the following paper we will highlight the most important steps one can take
when developing a software solution in order to meet a high standard of quality. We will
follow the early development of an application that delivers university schedules to students,
directly to their smartphones. The software solution is comprised of a server based on the
REST architectural style, developed on the .NET Framework, and three native mobile
applications, one for each popular operating system.
Keywords: .NET, Development, mobile, performance, quality, REST
JEL classification: C88, A23
1. Introduction Building an enterprise grade application with no prior experience might be a daunting task.
Developing a plan and executing it will make this task a lot easier. Applying a set of rules
and following certain steps towards building a proper software solution requires an idea to act
as a nucleation point for the application.
In this article we will look at some of the steps that can go into such a plan and how they
were implemented in a software solution for delivering university schedules to students’
smartphones.
The “Orarum” project started from these simple questions: why do we still check our
schedule at the university’s notice board? Moreover, why do we write them down at the back
of a notebook when we could be using a device that almost everybody owns: a smartphone?
The need for a mobile application for querying university schedules is certainly not new but
through personal experience we managed to narrow it down to a few basic requirements that
should make up a schedule application.
2. Proofing the business idea
Identifying a good business idea is the first step towards developing a great application. We
won’t go into details on how to do that, since it is not the scope of this article, but we will
highlight, what we believe to be, the two most important aspects to consider.

Proceedings of the IE 2015 International Conference
www.conferenceie.ase.ro
219
2.1 Identify the uniqueness of the idea and study the competition
What makes the idea unique? Uniqueness doesn’t necessarily mean one has to invent
something, just to set oneself apart from the competition. She/he should choose a set of
characteristics she/he wants the application to offer and compare it to what other software
solutions have to offer, in the case that competition exists.
For “Orarum”, the conclusion to this step was simple: besides the basic read-only schedule
displayed on the university’s website, there were no management tools to help the student
keep track of his/her schedule, through the means of a mobile application.
2.2 Get consumer feedback
Identifying a need through personal experiences is, most of the time, not enough to market-
proof one’s idea. Reach out to the target demographic, not just friends and family, but people
who would actually want to use the software product. They're much less likely to be biased.
There are two easy and conclusive ways to do so: develop and distribute a questionnaire and
interview key users, presented as follows.
2.2.1 Develop and distribute a questionnaire
The survey should be easy to complete and not take much time. In order to certify the
“Orarum” idea, we had created a 6 question survey which took approximately 30 seconds to
complete. We used a popular website based tool for creating and distributing it, thus,
reaching little over 100 students and providing vital information on which to develop the
application.
2.2.2 Interview key users of your future application
A questionnaire can’t possibly be short and cover every aspect of what one is looking for.
That’s why a complementary method is to interview a few key users from the target public.
Determining who they are will vary depending on the idea, of course. The interview for the
“Orarum” project targeted students of several universities from Bucharest. The gathered
information helped determine how to store the data in order to record all the aspects of the
students’ schedule.
Subsequent to this process, the initial requirements identified might change, or new ones
might get added. It is normal at this point for the business logic to adapt to the environment.
3. Setting up the project
Similar to sculpting a masterpiece, developing a software solution from scratch will require a
few tools to help out along the way and produce far better results. Besides the obvious
integrated development environment and database management tool, here is a list of auxiliary
software applications crucial for aiding the software development process.
3.1. Revision control tools
Revision control simply means versioning all the files used in the software solution, in order
to keep better track of changes. If working on the project is an individual task, a source code
management tool will just provide a way to save one’s work somewhere to a central server,
keep track of it and ensure consistency. The benefits of such a tool are greatly enhanced when
there are multiple people working on the same solution.
Signing up for a repository is the first step towards having revision control. It can be free or
subscription based. Either way, choosing one should be based on the following criteria: cost,
efficiency, security and guaranteed up-time.

Proceedings of the IE 2015 International Conference
www.conferenceie.ase.ro
220
Depending on what hosting site you chose for the distributed version control system (DVCS),
you will now need to download a client to interface it. Generally there are three directions
one can take: Git, SVN or Team Foundation Server.
For the “Orarum” project a Git repository was chosen, with a Git client for Microsoft Visual
Studio.
3.2 Issue tracking tools
An issue tracking system is a software solution for managing and maintaining lists of stories
and defects. It helps an organization, or an individual to stay on top of important issues,
collaborate better, deliver higher quality software and increase productivity.
Bugzilla, Apache Bloodhound, Team Foundation Server are just a few from a very long list.
They use different back-end databases for persistence, are written in various languages and
offer a plethora of features.
Atlassian JIRA is the issue tracking product that was used in the development of the
university schedule project. Signing up for Atlassian Bitbucket was free for up to five users
and it offered unlimited private repositories, code reviews, JIRA integration, dedicated
support, custom domains and a REST API.
3.3 Database design tools
Having a proper tool for developing the database will save you a significant amount of time
in the development of the solution. From our experience designing the database for the
“Orarum” project, we found that a visual tool adds a lot of benefits. Being able to collaborate,
have a friendly UI, have a smooth workflow, be able to manage models and generate SQL
we’re just some of the features we were looking for in a database design tool. Since it
supported Microsoft SQL Server and offered an impressive list of features, the option we
chose was Vertabelo, a website based tool.
4. Developing the application
4.1 Setting up coding conventions and identifying best practices
Performance is important to your application. A “performance culture” should permeate the
whole development process, right through from setting up coding conventions and identifying
best practices to acceptance testing [1],[2].
Every aspect of the development cycle should be covered. Depending on the language
chosen, many coding best practices can be easily identified. Probably, the best thing one can
do is to look them up in books like Effective C#, Effective Java, Clean Code etc.
Doing this setup, prior to starting actual development will result in an individual or a team to
be more productive. Here is a list of ten “rules” to developing performant enterprise
applications [3]:
1. Design first, then code
2. Have the right tools available to measure performance
3. Write code that is clear and easy to maintain and understand
4. Gain an understanding of underlying tasks that the framework performs
5. Set performance goals as early as possible
6. Only optimize when necessary
7. Avoid optimizing too early
8. Not delay optimization too far
9. Assume that poor performance is caused by human error rather than the platform
10. Employ an iterative routine of measuring, investigating, refining/correcting.

Proceedings of the IE 2015 International Conference
www.conferenceie.ase.ro
221
4.2 Developing the database
Every well build application rests on a solid database. Having a strong and efficient design
will vastly improve the performance of the entire system. A database application should be
properly designed to take advantage of the database server capabilities. Applying a set of
principles and best practices will not only improve application performance but also have
impact on security, availability and reliability, code readability and maintainability, memory
and disk usage [4].
There is a huge choice of database management systems (DBMS), which includes packaged
and open source database suites. The main suppliers include Fujitsu, Hewlett-Packard,
Hitachi, IBM, Microsoft, NCR Teradata, Oracle, Progress, SAS Institute and Sybase [5].
The primary aspect one should consider when choosing the right DBMS for his/her solution
should be how well it bonds with the framework. For example the .NET Framework is
optimized for SQL Server. Obviously, this choice will be influenced by many other factors,
primarily, cost. If such is the case, one should opt for an open source database and pay close
attention when choosing the most optimized ORM.
The database structure will not be set in stone but it will be more difficult to refactor once
development has started. Therefore, the process of constructing the database should not be
rushed. Instead, opt for an iterative approach and always try to apply best practices and
standards. This is where the database design tool plays a big role.
4.3 Building the application’s structure
Now that we got a good database to work with, it is time to move on to developing the
application. The first step is to define your folder structure and abide by the conventions you
set earlier. In the short term, ignoring best practices will allow you to code rapidly, but in the
long term it will affect code maintainability [6].
As before, there is no one correct way to do so. It will depend on what type of project you
will develop, what framework you are using or what platform you are designing for. Bottom
line is that you should have a neat project solution that will be maintainable.
4.4 Developing prototypes
A proof of concept (POC) is a demonstration aimed at verifying that certain concepts or
theories can be achieved. A prototype is designed to determine feasibility, but does not
represent the final deliverable [7].
Developing several prototype applications, prior to working on the main one will clear any
questions regarding implementation and boost confidence that the product can be delivered.
A POC does not represent the final deliverable and it is usually not tested.
Prototypes still require specifications and will most likely not exclude the need for an
extensive system analysis. They shouldn’t replace model-driven designs.
In the context of an enterprise application this can mean anything from a new piece of
software that needs to integrate perfectly with the system to a new feature that needs to be
added. Probably the most significant proof of concept that was realized for the “Orarum”
project was the integration of the mobile applications with the Facebook API. It demonstrated
that a user can log-in, access his/her groups and friends and post messages to his/her account.
4.5 Implementing the user stories
Implementing the previously created user stories should be done iteratively. The software
should be delivered in a rapid and incremental manner, always remaining adaptable in
response to change. Even though you set in mind a number of specifications, the development

Proceedings of the IE 2015 International Conference
www.conferenceie.ase.ro
222
should begin by implementing just part of the software, which can be reviewed in order to
identify further requirements. Everything we set up will allow the development team to work
in a more agile fashion.
At the end of each iteration, the project can receive vital feedback. Any defects can be
tracked at an early stage, thus avoiding major problems further down the development cycle.
From the perspective of the development team, the adoption of iterative and incremental
development is empowering, enabling team members to actively and aggressively attack
project risks and challenges in whatever they judge to be the most appropriate manner.
Managing iterations by setting clear objectives and objectively measuring results ensures that
you are free to find the best way to deliver results [8].
4.6 Writing unit and integration tests
Each piece of software you write should be thoroughly tested. Developing both unit tests and
integration tests in each iteration of the software development process is mandatory for
producing quality applications [9].
A unit test is a single piece of automated code that exercises a function and checks a single
explicit assumption about it. An integration test, by comparison, takes many
functions/systems, connects them end to end, inputs data on one end and gets it out the other.
It still makes an explicit assumption but also makes many implicit assumptions as well.
A software test should be readable, maintainable and trustworthy. If any of these two
qualities are pretty high, consequently, they will drag the third one up with them.
Here are four anti-patterns one should avoid when developing tests:
1. The opaque anti-pattern
The code inside the test should be easily readable and informative. The variable names
should be self-explanatory and the test name should be consistent. An example to follow
can be: NameOfFunctionUnderTest_ContextOfTest_DesiredResultOfTest().
One should follow the arrange-act-assert setup when writing the test, in order to make it
easily scannable.
2. The wet anti-pattern
In production code, one would use the DRY principle (Don’t Repeat Yourself). The same
convention should be applied to testing. Pull similar segments of code into a single
function that each test can use. Group similar functions and create helper classes in your
testing solution. Basically, keep the same production sensibilities in test code.
3. The deep anti-pattern
This pattern applies more to unit testing but it can be extrapolated to integration testing as
well. In a nut shell, unit tests should make a single assumption. If a test fails, we should
know exactly why it failed and where.
A best practice we found when developing the “Orarum” application was to override
Equals() and GetHashCode() functions in all of the entity classes used across the solution.
In consequence, instead of asserting each property of the class, a test can now assert the
object as a whole. This also changes the behavior of a collection assert.
4. The wide anti-pattern
This last anti-pattern applies only to unit testing since it specifies that a unit test should
not make implicit assumptions. When a test fails, we should know just from the output
what code to fix in production.
Creating production code that uses dependency injection will allow one to write unit tests
that can mock behavior and decouple from other components. This is called inversion of
control.

Proceedings of the IE 2015 International Conference
www.conferenceie.ase.ro
223
5. Conclusions Developing an enterprise grade application might be an overwhelming task but having a plan,
and taking one step at a time will produce a faster, cheaper and more performing software
solution. Together we have looked at how to find and business proof the idea, how to set up
the project and all the necessary tools and how to solidly develop an application in order to
produce superior results. Every aspect of your project should abide by certain conventions
and best practices. These rules will have to be found throughout the entire solution: database,
application directory structure and file names and both production code and testing code.
Prototypes might be very useful but they can also take up time, thus the right balance must be
found.
Every subject that we enlisted in this research paper can be an investigation of itself and there
is certainly a lot of depth to each and every one of them. On top of this, there are many other
aspects that can comprise an application development cycle.
The “Orarum” application was a great way to exercise everything that we’ve learned until
then, as well as discover new concepts and methodologies. As stated above, there is a lot
more to discover so we encourage the reader to find an idea and implement a performance
oriented software solution by all means possible. After all, “The bitterness of poor quality
remains long after the sweetness of meeting the schedule has been forgotten.” – Anonymous
References [1] B. Wagner, Effective C# (Covers C# 4.0): 50 Specific Ways to Improve Your C#, 2nd
Edition), Pearsons Education Inc., 2010.
[2] B. Wagner, More Effective C#: 50 Specific Ways to Improve Your C#, Pearsons Education
Inc., 2009.
[3] R. Page and P. Factor, „.NET performance- The Crib Sheet”, May 2008, available:
https://www.simple-talk.com/dotnet/performance/net-performance-
cribsheet/#_Toc198269213 [March 14, 2015]
[4] An Oracle White Paper. Guide for Developing High-Performance Database Applications,
available: http://www.oracle.com/technetwork/database/performance/perf-guide-wp-final-
133229.pdf [March 14, 2015]
[5] A. Mohamed, „Choosing the right database management system”, available:
http://www.computerweekly.com/feature/Choosing-the-right-database-management-
system [March 14, 2015]
[6] R. C. Martin, Clean Code: A Handbook of Agile Software Craftsmanship, Pearsons
Education Inc., 2008.
[7] Business Analyst Learnings. Proof of Concept: Benefits & Risks of Prototyping in
Business Analysis, available: http://businessanalystlearnings.com/blog/2013/9/1/proof-of-
concept-benefits-risks-of-prototyping-in-business-analysis [March 14, 2015]
[8] IBM developer Works, "What is iterative development?,", 2012, available:
http://www.ibm.com/developerworks/rational/library/may05/bittner-spence/ [March 14,
2015]
[9] R. Osherove, The Art of Unit Testing: with examples in C#, Manning Publications, 2013.

Proceedings of the IE 2015 International Conference
www.conferenceie.ase.ro
224
A PRELIMINARY ANALYSIS OF BUSINESS INFORMATION
SYSTEMS MASTER PROGRAMME CURRICULUM BASED ON THE
GRADUATES SURVEY
Marin FOTACHE Al.I.Cuza University of Iași
Valerică GREAVU-ȘERBAN
Alexandru Ioan Cuza University of Iasi, Romania
Florin DUMITRIU Al.I.Cuza University of Iași
Abstract. The most recent economic crisis forced western companies to cut their IT budgets.
This was possible in many cases by outsourcing IT projects in countries like Romania. For
Romanian Information Systems graduates outsourcing has steeply increased the job offer.
But it also changed the required skills (competencies) ratio between technical and business
issues. When crises erupted a lot of ERP projects had been launched but since then only a
few have been completed and recently very few have been initiated. New IS jobs require more
technical skills and urge for curricula recalibration. This paper presents some preliminary
results of a survey conducted in 2013 and 2015 for the graduates of IS master programme at
Al.I.Cuza University of Iasi. The survey main objectives were to identify the required skills on
the IT market, graduates opinion about the programme, including curricula, syllabi,
internship, infrastructure, teaching staff, and program strengths and weaknesses and re-align
curricula to the industry demand.
Keywords: information systems curricula, graduates survey, R, SharePoint JEL classification: M15
1. Introduction As academic discipline and research topic, Information Systems (IS) has followed a
convoluted trajectory. It's never ending identity crisis [1] [2] combined with a steep decline in
enrolments after 2000, especially in US programmes [3], rose questions about its future.
Amidst funeral moods, Romanian (and other Eastern-European) IS programmes have thrived
at both undergraduate and graduate levels [3]. Romania’s increasing attractiveness for IT
outsourcing (lower wages, technical skills, proficiency in foreign languages) created a big
appetite for IT professionals and consequently IS enrolment has constantly risen.
As technologies change quickly, so the industry requirements. IS programmes must adapt
their curricula based on similar programmes curricula, including model curriculum
guidelines published by Association for Information Systems [3], listening to the industry
needs (involving industry representatives), and getting feedback from graduates.
This paper presents some results of a survey targeting Business Information Systems master
graduates at Al.I.Cuza University of Iasi (UAIC). Technical solution for analysis was
developed using Microsoft SharePoint Server platform and R/RStudio language/platform.

Proceedings of the IE 2015 International Conference
www.conferenceie.ase.ro
225
2. Information systems undergraduate and graduate programmes curricula As technical and business topics could be mixed in various proportions, diversification of IS
programmes manifests not only among universities from different countries, but also within
the same country [3]. At UAIC both undergraduate and graduate Information Systems
programmes curricula were developed following recommendations ACM/AIS [3][5][6].
Figure 1 shows the main courses proposed in IS2010 undergraduate curriculum [5] model
and their relation to the career tracks of the IS graduates.
Figure 1 - Structure of ACM/AIS IS2010 undergraduate curriculum [5]
At master level, MSIS2006 [6] nominated 24 possible career tracks (such as: Academia;
Knowledge Management; Computer Forensics; Managing the IS Function; Consulting; Data
Management and Warehousing; Mobile Computing; Database and Multi-tiered Systems;
Decision Making; Project Management; Security; Systems Analysis & Design; Enterprise
Resources Planning; Telecommunications) each with suggested courses. Despite the relative
obsolescence of the MSIS2006 (the next curriculum model for IS graduate programmes is
expected within a year or two), we claim that since 1997 (undergraduate) and 2007 (master),
IS programmes at UAIC have been properly aligned to ACM/AIS recommendations.
3. Graduates survey brief description Graduates survey was designed in 2013 and made available for graduates from September to
December 2013 and from January to March 2015. Some of the sections of questionnaire are:
Personal details (e.g. age, gender); Graduation path for both bachelor and master levels;
Carrier path (year of first employment, company profile, location and stakeholders, income
level; Free/open messages (for teachers, colleagues, future students, five positive and five
negative features of the programme); Level of satisfaction about teaching staff and activities,
different areas of interest (programming, modelling, databases, etc.) research opportunities
and administrative components of master degree, all using a Likert scale from 1 to 5.

Proceedings of the IE 2015 International Conference
www.conferenceie.ase.ro
226
The questionnaire was distributed through social networks (mainly on Facebook, where
graduates have pages organized by enrolment year). There were 84 answers, but only 74 were
kept as the 10 of them were flawed (seven respondents did not respond to any questions, and
three seem to be still students and not graduates) etc.
Proportion of the respondents’ genre follows the proportion of students’ genre for BIS
(figure2, left). 58.9% of respondents are females and only 41.1% males. This contradicts a
much-debated anxiety - the scarcity of women in computing.
Figure 2 - Respondents’ genre (left) and enrolment year (right)
Analysing the number of answers per admission year (Figure 2, right) one can notice some
discrepancies between 2009/2010 and 2011/2012. Based on the number of enrolled students
and the “fresh memory” factor, we expected the number of 2011/2012 respondents to be
bigger than for 2009/2010. The figures indicate the opposite. Somehow ironically, this
psychological factor of memory freshness might be part of the explanation.
4. Technical platforms As students BIS graduates had extensively used (Microsoft) Share Point Portal. So, we chose
it as platform for the questionnaire instead of an equivalent free solution. Share Point assures
a better control over the respondents (as former UAIC students). Free Internet surveying tools
allowed anonymous answers but malicious people might fill in multiple malformed answers
and alter the results. Even if the free tools surveys could be protected by the uniqueness of an
IP address, it is largely acknowledged that any person can access many devices connected to
the Internet, or can use proxy servers to access and respond multiple times to a survey.
A basic requirement for surveys is the anonymity of respondents [7] [8]. SharePoint is a
powerful tool that authenticates the user but also anonymizes the respondent without coding.
Another Share Point strength is the definition question branch logic if necessary. Also
SharePoint provides a graphical summary of answers in real time, determining key users to
react in promoting the survey on multiple media: e-mail, social media, and specific websites.
Almost any question format can be implemented in a SharePoint survey: Single line of text,
Multiple line of text, Choice, Rating Scale, Number, Date and Time, Yes/No. All answers are
saved into the server database. Results can be exported as RSS, spreadsheets or .csv files.
For data visualization and analysis we chose an increasingly popular open-source platform,
R/RStudio. R is the most dynamic data language [9], [4]. Main R packages used in this
analysis are: stringr, reshape, plyr, dplyr and ggplot2.
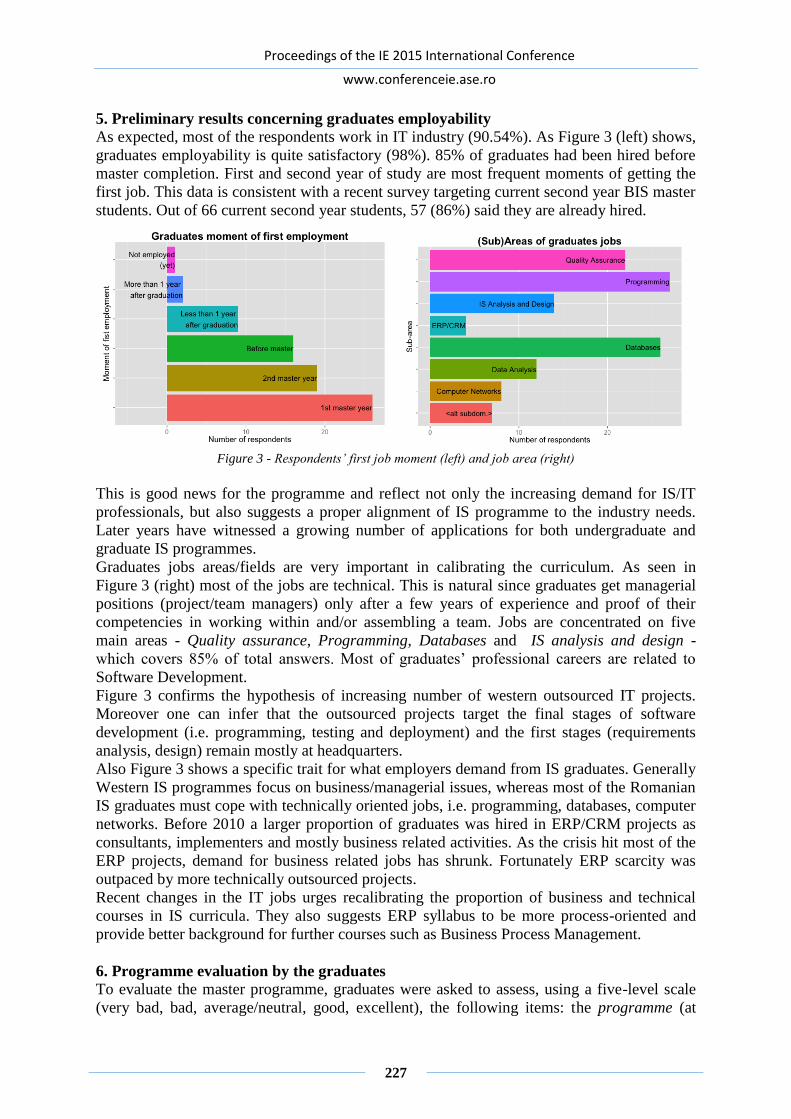
Proceedings of the IE 2015 International Conference
www.conferenceie.ase.ro
227
5. Preliminary results concerning graduates employability As expected, most of the respondents work in IT industry (90.54%). As Figure 3 (left) shows,
graduates employability is quite satisfactory (98%). 85% of graduates had been hired before
master completion. First and second year of study are most frequent moments of getting the
first job. This data is consistent with a recent survey targeting current second year BIS master
students. Out of 66 current second year students, 57 (86%) said they are already hired.
Figure 3 - Respondents’ first job moment (left) and job area (right)
This is good news for the programme and reflect not only the increasing demand for IS/IT
professionals, but also suggests a proper alignment of IS programme to the industry needs.
Later years have witnessed a growing number of applications for both undergraduate and
graduate IS programmes.
Graduates jobs areas/fields are very important in calibrating the curriculum. As seen in
Figure 3 (right) most of the jobs are technical. This is natural since graduates get managerial
positions (project/team managers) only after a few years of experience and proof of their
competencies in working within and/or assembling a team. Jobs are concentrated on five
main areas - Quality assurance, Programming, Databases and IS analysis and design -
which covers 85% of total answers. Most of graduates’ professional careers are related to
Software Development.
Figure 3 confirms the hypothesis of increasing number of western outsourced IT projects.
Moreover one can infer that the outsourced projects target the final stages of software
development (i.e. programming, testing and deployment) and the first stages (requirements
analysis, design) remain mostly at headquarters.
Also Figure 3 shows a specific trait for what employers demand from IS graduates. Generally
Western IS programmes focus on business/managerial issues, whereas most of the Romanian
IS graduates must cope with technically oriented jobs, i.e. programming, databases, computer
networks. Before 2010 a larger proportion of graduates was hired in ERP/CRM projects as
consultants, implementers and mostly business related activities. As the crisis hit most of the
ERP projects, demand for business related jobs has shrunk. Fortunately ERP scarcity was
outpaced by more technically outsourced projects.
Recent changes in the IT jobs urges recalibrating the proportion of business and technical
courses in IS curricula. They also suggests ERP syllabus to be more process-oriented and
provide better background for further courses such as Business Process Management.
6. Programme evaluation by the graduates To evaluate the master programme, graduates were asked to assess, using a five-level scale
(very bad, bad, average/neutral, good, excellent), the following items: the programme (at

Proceedings of the IE 2015 International Conference
www.conferenceie.ase.ro
228
general level), courses (utility for their professional activity, teaching, link to practice,
research content), professors (teaching, availability, attitude towards students), infrastructure
(labs, classrooms, public spaces), administrative staff performance and attitude towards
students/graduates, internship, etc.
Figures 4 and 5 show high score for teaching staff, master programme and courses (94%,
69% and 59%). Adding half of the average level assessments, the positive percentages reach
96%, 84% and 77%. This suggests proper teaching skills, availability and proper attitude
towards students, a very positive image about programme and positive opinion about courses.
Figure 4 - Evaluation of teaching staff, programme and courses
These findings are also enforced by the mean values – 4.45, 3.90 and 3.73 - out of a
maximum of 5, and the relative low standard deviations (Figure 5).
Figure 5 - Evaluation of teaching staff, programme and courses as a heatmap
Overall programme assessment ranges between teaching stuff and courses assessments and
that the latter has a negative contribution on the programme score. Therefore, we think it will
be necessary to conduct a more detailed survey in order to find out which courses have to be
updated or even which revisions on IS curricula are requested and consequently get the
proper alignment of the programme to the industry needs. Also, the new study has to validate
the hypothesis of increasing need on technical courses and diminishing business-oriented
ones.
Proceedings of the IE 2015 International Conference
www.conferenceie.ase.ro
229
7. Limits, discussions and conclusions This article analyses curriculum issues of Business Information Systems Master Programme
from the perspectives of alumni, based on them experience during the studies and how they
were influenced by this program in career. Privacy and malevolent actions were taken into
considerations when survey was developed and disseminated. There are some limitations of
this study. The number of respondents is satisfactory, but one can ask if the graduates who
filled in the questionnaire faithfully represent the entire population of BIS graduates. It is
possible that unlucky or ill-prepared graduates who have not succeeded in getting a
rewarding job avoided answering. Also the distance between survey and graduation time
could affect the quality of some answers. Our study revealed a proper alignment of IS
programme to the industry needs and a very satisfactory graduates employability. We also
found out that most of graduates’ professional careers were related to Software Development,
especially the final stages of software development and that the IT market, and that the
technical skills were required more than business-oriented ones. These finding might explain
why the courses issue had a negative contribution on programme reputation compared with
the teaching stuff issue. Unlike Western IS programmes Romanian ones must cope with
technical skills, i.e. programming, databases, computer networks, etc.
In the next stage of our study we will check the hypothesis of increasing the weight of
technical courses in the master programme curricula to the injury of business-oriented
subjects.
Acknowledgment The R solution for master analysis was developed within ASIGMA (Asigurarea Calității în
Învățământul Masteral Internaționalizat: Dezvoltarea cadrului național în vederea
compatibilizării cu Spațiul European al Învățământului Superior) project,
POSDRU/86/1.2/S/59367
References [1] I. Benbasat and R.W. Zmud, “The Identity Crisis Within the IS Discipline: Defining and
Communicating the Discipline’s Core Properties,” MIS Quarterly, 27(2), pp.183-194,
2003
[2] R. Hirschheim, H.K. Klein, “Crisis in the IS Field ? A Critical Reflection on the Status of
the Discipline,” Journal of the Association for Information Systems, 4(5), pp.237-293,
2003
[3] M. Fotache, “Information Systems / Business Informatics Programmes in Europe.
Uniformity or Diversification?,” in Proc. of the Second Symposium on Business
Informatics in Central and Eastern Europe - CEE Symposium 2011, Cluj-Napoca
[4] M. Fotache, “Using R for Data Analysis of Master Graduates Survey,” in Proc. of the
23rd International Business Information Management Conference (IBIMA), Valencia,
2014
[5] H.Topi et al., “IS 2010: Curriculum Guidelines for Undergraduate Degree Programs in
Information Systems,” Communications of the Association for Information Systems, Vol.
26, 2010
[6] J.T. Gorgone et al., “MSIS 2006: Model Curriculum and Guidelines for Graduate Degree
Programs in Information Systems,” Communications of the Association for Information
Systems, Vol.17, 2006 (also published in ACM CIGCSE Bulletin, 38(2), 2006).

Proceedings of the IE 2015 International Conference
www.conferenceie.ase.ro
230
[7] A. Barak, Psychological Aspects of Cyberspace: Theory, Research, Applications,
Cambridge University Press, 2008
[8] N. Schwarz and S. Sudman, Context Effects in Social and Psychological Research, New
York: Springer, 2011
[9] B. Muenchen. Job Trends in the Analytics Market: New, Improved, now Fortified with C,
Java, MATLAB, Python, Julia and Many More!, 2014, Internet:
http://r4stats.com/2014/02/25/job-trends-improved/ [March 5, 2014]

Proceedings of the IE 2015 International Conference
www.conferenceie.ase.ro
231
TEAMWORK CULTURE IN IASI IT COMPANIES
Doina FOTACHE ”Alexandru Ioan Cuza” University of Iași
Luminița HURBEAN West University of Timișoara [email protected]
Abstract. The liberty and the individuality of the modern society are supported by a complex
communication system based on sophisticated technological solutions which contain the
mechanism of functional integration in the present day organizations. The teamwork culture
plays an important role in an IT company success nowadays, in the larger context of
globalization and growing complexity and functionality expected from modern software
solutions. However, teamwork cannot be treated separate from the software development
methodologies and we remarked the rise of the Agile and, in particular, the SCRUM
methodologies. Therefore, besides the collaborative technological platforms adopted by IT
companies on a large scale, we cannot ignore the methodological, organizational and
motivational features of teamwork. Our study of teamwork culture attended on the IT
companies from Iaşi, a recognized centre for its contribution to the IT education in Romania
and in the EU. The paper includes a study based on the authors’ experience in giving
specialty lectures at BA and MA levels in Informatics and Business Information Systems, as
well as on the experience of practitioners invited as guest lectures. We suggest solutions to
support the bachelor graduates’ successful employment in IT companies. Our conclusions
encourage us to consider further research focused on the actual evolution of organizational
culture strategies correlated with the methodologies for developing software projects by
teams in the IT industry, irrespective of the company they belong to.
Keywords: teamwork, teamwork culture, agile methodologies, agile team, SCRUM
JEL classification: L86, O33
1. Introduction In the last 15 years, IT companies were looking to become agile, in order to improve the
flexibility and responsiveness of their software development teams, so that they can react
promptly and efficiently to the changing requirements and turbulences of today’s dynamic
and global environment. Many software development models, such as rapid prototyping, joint
application design (JAD), rapid application development (RAD), extreme programming (XP),
or SCRUM, have been proposed to improve the flexibility of IT project teams, for faster and
simpler software development processes. In agile software development, teamwork and
communication are fundamental values for the project success.
2. A brief review of the teamwork concept linked to software development The topic of teamwork was extensively researched, long before the IT industry elevation, but
the IT field was widely used as a research ground, because it is based on teamwork. Classical
1960s research like Tuckman’s is returned and reinterpreted in the efforts to discover the
secret of creating a successful team [1]. A team is defined as a small number of people with

Proceedings of the IE 2015 International Conference
www.conferenceie.ase.ro
232
complementary skills who perform for a common purpose and keep to established
performance goals, for which they are commonly responsible. The team performance is
extremely important in software development, therefore many studies were conducted in this
area.
Teamwork is expected to create a work environment that encourages “listening and
responding constructively to views expressed by others, giving others the benefit of the
doubt, providing support, and recognizing the interests and achievements of others”[2]. Such
a work environment promotes individual performance, which enhances team performance,
and this one supports the organization’s performance.
So, basically, team performance is based on human interaction. In the traditional
methodologies of software development, when a plan-driven product-line approach was
utilized, the team was lead with the “Command and Control” method and the team leader had
absolute authority and applied an autocratic leadership style. As the need for organizational
agility and responsiveness grew, more flexible and modern management strategies have been
set up. Prediction, verifiability, and control were replaced by uniqueness, ambiguity,
complexity, and change. Contrasting the “Command and Control”, the “Engage and Create”
method came into view, with the main focus of getting people engaged and invested. The
team leader engages team members by “inviting them to offer their perspectives, participate
in team decisions and requiring them to adopt a strong sense of accountability” [3]. In IT
teams, this change can be considered more as a conversion, and it is considered as one of the
biggest challenges when introducing agile software development methodology, because
organizational culture and people mindset cannot be changed easily [4]. In an attempt to
summarize, the characteristics of agile versus traditional methodologies are like in Table 1.
Table 1- Agile versus Traditional Methodologies
Characteristic Traditional Methodologies Agile Methodologies
Approach Predictive Adaptive
Emphasis Process oriented People oriented
Management style Autocratic Decentralized
Team size Large Small
Culture Command and control Engage and create
Change approach Change sustainability Change adaptability
Planning Comprehensive Minimal
Documentation Heavy Low
Success measurement Compliance with plan Business value
Nowadays, the technological developments on one side, and the amplified globalization of
software development and the outsourcing practice on the other side, create software
engineering challenges due to the impact of temporal, geographical and cultural differences,
and require specific approaches to address these issues ([5], [6], [7]). Geographically wide
spread businesses influence the organizational structure of IT companies and generate a
multicultural environment with globally interconnected teams. Globalization can no longer to
be stopped and, at the same time, we speak of multiculturalism and ethnocentrism because
teamwork goes beyond the organizational and even national limits [8]. The hypothesis of
cultural egalitarianism (possible due to informational technology) is not to be trust due to the
cultural assimilation tendencies (we mention here the Anglo-Saxon linguistic globalization
present in the software companies which, for a long time, produced only English versions of
their software). Many traditional cultures, like French, German, or Spanish have been
reduced to silence in the long term development plans of program producers for all users [9].

Proceedings of the IE 2015 International Conference
www.conferenceie.ase.ro
233
Characteristics of agile development versus global development and their antagonism are
presented in Table 2.
Table 2 - Characteristics of Agile versus Global Software Development
Characteristic Global Development Agile Development
Team structure Team specialization Self-organizing
Communication frequency Only when necessary Regular collaboration
Communication means Technology mediated Face-to-Face
Synchronization Often asynchronous Synchronous
Communication cardinality Tunneled Many-to-Many
Communication style Formal Informal
Management culture Command and control Responsive
Decision making Centralized Collaborative (source: adapted from [5])
Why and when do organizations choose or have to adopt the agile development project
methodologies? Teams are social systems in permanent change, this modification being
known as group dynamics [10]. A team forms in time, while continuous changes occur in
team members, in team environment, in the relation established for reaching goals and
business values. Often in IT projects, time, this important resource, is poor. Besides their
normal tasks, employees in this field carry out obligatory activities for personal development,
mentorship (graduate and internship programs provide them with human resources) and
promoting the solutions of their companies [11]. Thus, at the company level, the following
goals for team development are carefully monitored:
clarification of common goals and values,
improvement of assuming the role of each team member,
stimulation of interaction and open communication in a team,
formation and identification with team culture,
fostering inter team support,
establishing positive interdependence
improving group productivity,
clarification of peer work goals and relational problems,
learning the positive solving of conflicts,
fostering the cooperation and elimination of competitive behavior,
awareness of interdependence.
Stimulating and impeding factors related to agile teamwork are presented in Table 3.
Table 3 - Stimulating and inhibiting factors in agile teamwork
Agile team = concentration of energies
(synergy) Stimulating
factors Inhibiting
factors Members of a successful team:
have clearly defined roles,
share resources,
share common values,
have a successful leader.
Team members self-
appreciation
Neglecting personal and
collective needs of team
members
Agile team:
replaces organization hierarchy,
has measurable goals,
has unconventional ideas.
Establish of common
values an goals
(consensus)
Goals and values no longer
coincide in time

Proceedings of the IE 2015 International Conference
www.conferenceie.ase.ro
234
Agile team:
values diversity and complementarities,
initiates rituals and manifestations which
trigger change in company culture.
Communicate for
clarification of values
and establish goals
Autocratic way of
establishing goals, orders
and obligations
Agile team:
strives to win,
is knowledgeable of competition,
encourages a healthy competitive attitude.
Appropriate praises The policy of competition
party
Agile team:
is highly interdependent,
eliminates barriers and solve problems.
Open reaction of all
team members Avoiding individual and
collective praise
controls individual ego-es Solving problems Direct annoying criticism
manages conflicts Praising and
celebrating success
Negate/neglect conflicts
identifies causes of failure Looking for escape-goats
engage team members Exaggeration of success (source: adapted from [12])
3. A succinct analysis of IT companies in IASI Despite the problems reported on the local IT market, 2013 and 2014 were defined as positive
years for Iași companies and the results on the increase trend. The most profitable companies
were Amazon, Centric, and SCC Services. The financial results for 2013 indicate high
profits: 2.2 million lei for Amazon, 1.5 million lei for Centric, and 1.3 million lei for SCC.
These foreign investments are closely followed by a local company, Focality, which recorded
1.28 million lei in profit is the same year. The positive tendency is sustained by the overall
figures:
- In 2012, total number of employees for the first 10 IT companies was 800 and the overall
profit was 11.69 million lei.
- In 2013, the first 10 IT companies employed almost 1000 persons, while profit reached
12.5 million lei.
- The statistics for 2014 are not published yet, but the unofficial numbers indicate a
positive evolution of both indicators. However, in December 2014, tens of IT employees
were fired – three IT companies diminished their operations and let go a large number of
people, some rumors speak of a hundred IT specialists fired. So overall 2014 numbers
might not look as good as they could.
The Iasi IT market analysis in the last few years offered a current total of 6.000 employees
and over 900 million lei revenues. In a classification based on the number of employees, the
first place is occupied by Continental Automotive with 1000 people (see the entire top 10 in
Table 4). Table 4 - The Iasi IT companies top 10 based on number of employees
Position Company No. of employees
1. Continental Iaşi 1000
2. Unicredit Business Integrated Solutions 400
3. SCC Services 385
4. Mind Software 291
5. Endava 290
6. Amazon Development Center 172
7. Centric IT Solutions 110
8. Iaşi Security Software 83
9. Beenear 80
10. Ness România 75

Proceedings of the IE 2015 International Conference
www.conferenceie.ase.ro
235
In our research, we have also investigated the salaries and the job requested experience,
competencies and skills in software development, as we read the opened positions that IT
companies offered, documenting online (on the e-jobs site) and at the Iasi Business Days
event in 2014:
- Junior positions (0-1 year experience): 350-600 Euro, depending on primary
competencies, foreign languages, other skills;
- Middle positions (2-4 years work experience) with good IT skills and knowledge of
software development methodologies: 700-1300 Euro;
- Senior positions (5 or more years IT work experience) with solid IT skills and practical
knowledge of software development methodologies: 1200-3000 Euro.
4. Agile practices in IT companies from Iasi The applied study was directed to the top 10 companies presented in Table 4 and had the
following issues to answer to:
- Do IT companies acknowledge and implement the teamwork culture and is
multiculturalism present in the IT companies?
- What software development methodologies do they apply?
- Do IT companies have internship or graduate programmes in software development field?
Afterwards, the educational offer was analyzed in order to establish how Universities prepare
their students to become eligible candidates for IT jobs, by indicating the existence or
absence of those courses that provide the expected competencies.
The empirical study used the interview as investigation method, results being collected from
the case studies conducted by student teams as projects or final dissertations, and also the
direct study of the companies’ web sites and of their specific job descriptions. The research
methodology includes the experimental method and the probative thinking.
The findings of the studied issues for the 10 major IT companies are presented in Table 5.
Table 5 - The findings of studied issues in the top 10 Iasi IT companies
Company Teamwork
culture &
Multiculturalism
relevance
Software development
methodologies used
Internship or graduate
programmes in
software
development
Continental
Automotive Iaşi
Yes V-cycle, Waterfall
model, SCRUM
Yes + scholarships
Unicredit Business
Integrated Solutions
Yes Waterfall model,
SCRUM
Yes
SCC Services Yes SCRUM Yes
Mind Software Yes SCRUM Yes
Endava Yes SCRUM Yes
Amazon Dev. Center Yes SCRUM, Spring Yes
Centric IT Solutions Yes SCRUM Yes
Iaşi Security
Software
Yes Agile No
Beenear Yes SCRUM No
Ness România Yes SCRUM Yes
With no exception, all investigated companies confirm our assumption about the teamwork
culture and admit that multiculturalism is a characteristic of their teams at present. In terms of
software development methodologies, all of them are not only aware, but use the agile

Proceedings of the IE 2015 International Conference
www.conferenceie.ase.ro
236
approach and most of them (8 of 10) offer internships. SCRUM seems to be the specific agile
method they prefer.
Based on the theoretical findings and the data exposed in Table 5, we further analysed the
most representative study programs in the field of software development from three different
faculties in Iasi, tracking the academic courses that may offer students the basic knowledge
on teamwork and software development methodologies (see Table 6).
Table 6 - The findings of studied issues in the top 10 Iasi IT companies
Academic Entity Groupware
Software
development /
engineering
Agile
methodologies
Informatics Program - Faculty of
Informatics (“Al. I. Cuza” University) No Yes No
Economic Informatics Program -
Faculty of Economics and Business
Administration (“Al. I. Cuza”
University)
Yes Yes No
Applied Informatics Program -
Faculty of Computer Engineering and
Automatic Control (Technical
University)
No Yes No
According to this simple analysis, graduates are not prepared for the current approach in
software development. All study programs have the classical courses of software engineering,
with the aim of assuring the significant technical skills expected from a graduate. Only one of
the three analyzed programs offers a course of “Groupware”, which develops the abilities for
teamwork and none has a course dedicated to agile methodologies. We have discovered an
optional course of “Inter-human communication” at the Technical University, which is more
than nothing. However, the results are eloquent and confirm our perception that students need
to have more than technical skills and knowledge. The development of internship and
graduate programmes in IT companies strengthen this opinion and try to supply the lack of
specific courses with actual practical work.
5. Conclusions Teamwork is an important ingredient in present-day work in IT companies, as agile practices
have been accepted in many organizations. Our study confirmed these facts. IT companies
now expect to hire skilled people, who can follow agile methodologies. One of the most
important ingredients is communication, and the Agile Manifesto stipulates that "the most
efficient and effective method of conveying information to and within a development team is
face-to-face conversation" [13]. In present-day large, multicultural IT projects teams, this is a
challenge. Therefore we considered that the Universities’ specialized study programs should
be adapted to current trends and we analyzed them. The findings reveal that graduates are not
prepared for the new approaches in software development, although they have good technical
skills and knowledge. The practice of internships which was established in the IT companies
targeted this need, with training components like “shadowing existing projects” or “soft skills
training programs”, but we consider that Universities should also upgrade their curriculum
appropriately.
Our study was limited to the representative study programs in one academic centre and local
IT companies. We believe that our conclusions are relevant for the entire spectrum of

Proceedings of the IE 2015 International Conference
www.conferenceie.ase.ro
237
Romanian IT study programs, although exceptions should also exist. An extended analysis
would be of interest in order to formulate an objective conclusion. Also, the analysis should
be also expanded into the syllabi of the courses and the practical stage. With regard to the IT
companies, all of them are obviously aware of the agile practices. Simply considering our
findings one can observe that all the small companies use agile methodologies. Large
companies, with big and complex projects, prefer the traditional methods and we agree that
agile methods can be inefficient in large organizations and certain type of processes. A more
comprehensive study in the IT companies should differentiate the firm size, the team size and
the project type and also address the organizational culture issues.
References
[1] B. Tuckman, “Developmental sequence in small groups,” Psychological Bulletin, no. 63,
1965, cited in N.B. Moe et al., “A teamwork model for understanding an agile team: A
case study of a Scrum project”, Information and Software Technology, no. 52, 2010, pp.
480–491.
[2] J.R. Katzenbach and D.K. Smith, “The discipline of teams,” Harvard Business Review 71
(2), pp.111–120, 1993.
[3] P. Plotczyk and S. Murphy, “Command and Control is OUT! Create and Engage is IN!”,
available: http://www.wsa-intl.com/278-this-month-s-articles/command--control-is-out-
engage-create-is-in/
[4] F. Fagerholm, et al, “Performance Alignment Work: How software developers experience
the continuous adaptation of team performance in Lean and Agile environments,”
Information and Software Technology, February 2015
[5] F. Dumitriu, D. Oprea and G. Mesnita, “Issues and strategy for agile global software
development adoption,” Recent researches in Applied Economics, 2011, pp. 37-42.
[6] A. Grama and V.D. Pavaloaia, "Outsourcing IT – The Alternative for a Successful
Romanian SME," Procedia Economics and Finance, Volume 15, 2014, pp. 1404–1412.
[7] O. Dospinescu and M. Perca, “Technological integration for increasing the contextual
level of information,” Analele Stiintifice ale Universitatii" Alexandru Ioan Cuza" din Iasi-
Stiinte Economice, Vol. 58, 2011, pp. 571-581
[8] A. Munteanu, D. Fotache and O. Dospinescu, “The New Information Technologies:
Blessing, Curse or Ethnocentrism Fertiliser?”, Proc. of The 9th IBIMA International
Business Information Management Conference, January 4-6, 2008 Marrakech, Morocco.
[9] D. Fotache, A. Munteanu and O. Dospinescu, “Cultural Antropologic Reflections in the
Digital Space", Proc. of the 14th International Business Information Management
Conference (14th IBIMA), Istanbul, Turkey, 2010.
[10] D. J. Devine, “A review and integration of classification systems relevant to teams in
organizations,” Group Dynamics: Theory, Research, and Practice, pp. 291-310, 2002.
[11] C.M. Carson, D.C. Mosley, S.L. Boyar, “Goal orientation and supervisory behaviours:
Impacting SMWT effectiveness”, Team Performance Management, pp. 152-162, 2004.
[12] M.L. Liua, N.T. Liub, C. Dinga and C.P. Lin, ”Exploring team performance in high-
tech industries: Future trends of building up teamwork”, Technological Forecasting and
Social Change, Volume 91, 2015, pp. 295–310.
[13] Manifesto for Agile Software Development, available: http://www.agilemanifesto.org/

Proceedings of the IE 2015 International Conference
www.conferenceie.ase.ro
238
CRM- PHENOMENOLOGICAL AND CONCEPTUAL ANALYSIS IN
REFERENCE TO THE “STATE OF ART”
Mihaela IONESCU
Business Administration Doctoral School,
Bucharest University of Economic Studies
Abstract. The latest technological trends have brought into focus longstanding discussions
regarding the role played by Customer Relationship Management solutions in modern
organizations and furthermore, the role they play in relationships with the customers. The
article will summarize a thorough knowledge of how CRM solutions apply and allow
developing a new paradigm of education so that the individuals can develop their skills and
use all native and acquired knowledge in achieving any goal. In the modern business,
competition becomes more pronounced and knowledge as a source of success of the company
in the market becomes a necessary strategic choice. First, the author will make an
introduction on how information becomes a key resource and the central business function of
the company that takes an active part in the virtual market. Then, through benefits and scales
of interest, the author will explain the role of Customer Relationship Management which is
indispensable because it facilitates the acquisition of knowledge about the factors affecting
the company. In most of the situations, there is no business analysis or standardize work,
which would lead to predetermined patterns of education.
Keywords: business intelligence, consumer behavior, customer expectation, customer
relationship management, education, innovation JEL classification: M150, O3
1. Introduction In analyzing the state of the art, the article will take in account the improvements taking place
in the general process of design and selection of advanced CRM solutions to meet current,
emerging or future requirements scheduled by a certain organization. The process of
designing, developing and implementing the company`s objectives is the new perspective
substantially influencing state of the art for the application of CRM and similar systems. [1]
During the last decades, the use of artificial intelligence technology in order to support the
company`s projects has constantly increased. For instance, the researchers implemented in
the 1980s in USA highlighting that the interest for alternative communication solutions in
business increased. Due to the implementation of improved intelligence technology, problem
diagnostics raised by 30%-35%, facilitating the potential in-depth evaluation of the situations
occurring inside the company or between the company and its customers. [1]
In current competitive and dynamic environment, business intelligence consists in efficient
processing of a vast amount of information, in order to create a concrete representation of the
state of a company, as well as the emerging trends affecting its activity. For example, the
state of art consisting companies in the 1990s and the contemporary development of state of
art presents a substantial evolution. Due to the increasing of social media, blogs and other
media resources, state of art can`t be restricted anymore to the level of dealing exclusively
with structured information. Gradual and constant information sources vary and are directly
Proceedings of the IE 2015 International Conference
www.conferenceie.ase.ro
239
integrated into companies` environments, creating the image of textual information that is
shared through web and intranets. The new face of state of art is deeply marked by media
convergence, including audio and video streaming, as way to create an improved availability,
supported by high-quality information. [2]
The concept of state of art highlights the fact that a business process consists of several
functions that are performed in a certain order, able to transform both information and
material implied by a particular company. Business processes rely on internal and external
levels, associated with the type of customers they are willing to communicate with. In both
cases, for the executions of the tasks assumed on both levels, business processes require
people, data, technical and information resources. The state of art is the matrix that
encompasses every activity performed to obtain the fulfillment of the task assigned. For
example, in the case of an industrial enterprise, the state of art consist every process starting
with customers` orders to the effective shipment of their product, as well as their
maintenance. [3]
The concept of state of art is a challenging one, inviting to constant competition that
stimulates companies in creating improved products. For instance, in the 1970s in US, there
were few and dominant semiconductor and semiconductor equipment companies, some of
American suppliers preferring to sell traditional products, considered to globally satisfy the
customers` needs. Once the Asian, especially the Japanese similar products entered the
American market, the size of the local market for semiconductors expanded, the American
companies being willing to resist the "intruder". In addition, once their products became
mature, in terms of performance, comparing with the rival ones, the US companies
introduced some of their products in the Asian market, changing the balance of initial state-
of-art perspective. The continuous flux between the two distant markets is determined by the
preference of Japanese suppliers towards the foreign companies to sell their state-of-the-art
products. [4]
In the past decades, research on sustainable innovations has expanded rapidly to increase our
understanding of the ways in which new technologies and social practices enable societies to
become more sustainable. It`s likely to notice a gradual evolution of this trend, since coherent
perspectives have been introduced that analyze systemically the ways in which more
sustainable technologies are adopted in society, such as transition management and
innovation systems research. State-of-art was a key feature to the developing of companies in
the last decades, being currently considered a feature of "corporate sustainability
management, sustainable organizational development and sustainable innovation in daily
business". [5]
1.1 Benefits and the scale of interest for using CRM solutions Since at the beginning of 2000s, CRM became an essential feature in business world, as
pointed by several reports of studies implemented by large sales companies, the importance
of state of art substantially increased. According to IDC report, during 2000-2003, CRM was
associated with a market growth from $4 billion to $11 billion, at the end of 2003 [6]. Taking
in account this explosive evolution, the perception of CRM radically changed from being the
right software to imply, in order to assure a satisfactory business tool.
CRM was viewed as something "more" [6], a concept requiring "a new customer-centric
business model which must be supported by a set of applications integrating the front and
back office processes" [7]. Comparing with the previous perspective, the state or art
connected with the current image of CRM is based on a dual structure, both front and back
office, not exclusively back office, since the company has to be permanently connected to

Proceedings of the IE 2015 International Conference
www.conferenceie.ase.ro
240
their customers, not only in the case of a transaction as the sale of a certain product or
service.
R. Buehrer and Ch. D. Mueller developed in 2001 a research among major European
managers, highlighted that recently the state of art associated with CRM was marked by an
essential transformation. CRM is not just a business solution, is a target towards customers
and partners, as consequence the concept can be divided into different concrete classes,
mostly operational software (business operations management), analytical software (business
performance management) and collaborative software (business collaboration management).
According to the results obtained by the researchers, the last category of CRM
implementation, collaborative software, is the most common perspective (60%), followed by
CRM as operational software (58%) and the analytical image of CRM (53%). As the
mentioned proportions display (a common perspective of 30%), CRM is used as a complete
solutions comprising operational analytical and collaborative abilities. In addition, the results
of the research draw the attention on the habitude of purchasing CRM packages, but selecting
the CRM tool/tools that best fits the company`s objectives, being customized by the existing
IT departments [6].
While asked about the effective implementation of CRM tools, the interviewed managers
mentioned that it`s a recurrent frame for business-to-business relationship management
(67%), as well as for business-to-consumer relationship management (65%). Only 16% of the
managers participating to the research admitted that CRM solutions can support business-to-
employee relationship management, being a perspective that doesn`t use the maximal
capacity of CRM, keeping the business to a traditional implementation of it. Concretely,
business-to-business uses of CRM focus on the company`s processes with partners, while
business-to-consumer CRM solutions are based on the satisfaction of the end-consumer. In
addition, a business-to-employee use of CRM would create a reliable management structure
to support collaboration among employees within a company ([6] R. Buehrer, Ch. D.
Mueller,2002).
Artificial intelligence was gradually included in the managing process, supposing a strategic
use of information and data acquisition methods to identify and analyze the activity of the
company. Through the new updated related to CRM and similar projects, the company are
able to efficiently improve their resources, in order to raise the global productivity, in order to
deliver satisfactory services and products to customers. In order to fulfill this objective,
companies are generally interested in:
- Anticipating the potential future failures of the company through predictive and
preventive maintenance, including its production and its communication with customers
- Reduction or elimination of actual or potential fault diagnosis, in response to an
improved orientation towards customers` needs
- Optimization of performance by identifying the potential levels or parts that can be
implied by organization, in order to improve its global production
- Rapid isolation of any problem and effective implementation of solutions, in order to
avoid a potential crisis occurring to the production of the company or to the
communication developed with its customers. [1]
State-of-art completes and directs the evolution of certain business intelligence solutions
adopted by companies. For example, currently companies are marked by an increasing web
process integration including application servers, workflow solutions, collaboration portal,
and document management systems or data warehouse package. In order to create a unique
and efficient product, representatives of the company are connected through workflow
solutions, including individual activities into integrated business process.
Proceedings of the IE 2015 International Conference
www.conferenceie.ase.ro
241
In order to implement the new perspective of state-of-art, companies rely on suitable software
with the capability to define and map the required activities, as well as to monitor and report
their development. A suggestive example is the collaboration portal reuniting internal and
external sources, as well as promoting collaborative work, despite the geographical obstacles.
Based on a heterogeneous, distributed and semi-structured information platform, the new
business intelligence solutions are able to deliver adequate results to the executive team`s
demands. [8]
Generally, the current state-of-the-art business intelligence technologies are a class of tools
that have evolved in the last 30 years, able to store, manipulate and transform a larger amount
of information than the previous solutions. In order to perform this performance, those
solutions focus on increased data and text mining algorithms, using statistical algorithms and
genetic algorithms. In the first category factors such as forecasting, classifying or multivariate
analysis are included, while the genetic algorithms are factors individually created by the
company`s profile. All information display by those algorithms is grouped in groups and
subgroups of similar concepts, creating the taxonomy of the elements analyzed. The already
created classification algorithms are used to index the remaining data. Concretely, the
indexing and categorization procedures are performed by web services and can be
manipulated through any portal or engine functioning on a standard SOAP protocol. [8]
An eloquent example of company implying modern business intelligence solutions is IBM, a
notorious computer manufacturer. The business groups associated under the brand IBM are
cooperating into a global framework, in order to support the production and the sales`
evolution in North America, Europe and Asia. To achieve its purposes, especially the
expansion of global customer base, IBM relies on a particular structure starting with the
2000s. IBM`s overseas divisions don`t operate independently on a country-by-country base as
before, but into an unifying network, in order to stimulate cooperation. In addition, IBM
modified its people supply chain, creating mini-IBMs in each country with their own
administration and manufacturing, as a form of multinational business model.
The perspective radically changed, under the impact of Asian brands` competition, producing
high-quality goods and services in a similar pattern. In order to reduce costs and deliver
efficient services and goods, IBM created a global integrated operation network, reuniting
workers and suppliers worldwide into competency centers, aiming to implement low costs in
same places but in others attempting to have highly skilled employees closer to customers.
Further, IBM experts specialized into certain business functions were organized into clusters
of business expertise, located in any country of the world, but connected to each other and
headquarters. Through high-speed intranets and project managers` support, those specialized
clusters cancel the disadvantage issued by a job relocation, providing efficient results to the
global infrastructure of the company. [9]
Business Intelligence solutions are increasingly used by companies, in order to create and
maintain a reliable customer relationship management, monitor the assets or stocks, as well
as to increase sales, as major objectives. Business Intelligence solutions dedicated to an
efficient customer relationship management, including CRM, focus on the exploration on the
long-term of potential and current customers` value. The logic is simple and efficient for a
company: the more it knows its customers, the more it can anticipate their needs and offer
products or services able to increase its revenues, through a satisfactory sales process.
Besides the immediate profit, companies are able to reinforce their position in front of
shareholder presenting a concrete value that can be associated with further targeted marketing
activities. [10]
As Business Intelligence solution, CRM is packed by IT vendors (17 sellers worldwide) in
three main categories: small businesses with less or equal 50 users of the tool, medium

Proceedings of the IE 2015 International Conference
www.conferenceie.ase.ro
242
businesses between 51 to 499 users of CRM and large businesses, including 500 or more
users of CRM. Analyzing the profit rates of IT companies selling CRM solutions, the major
buyers of the tool is represented by major companies (63%), followed by medium companies
(56%) and 16% as small businesses. [6]
Structurally, a sophisticated CRM solution could support the global customer lifecycle, based
on four major phases: "knowledge, intention, contracting and settlement" [11]. A reliable
CRM solution will be able to provide to the company acquiring it administration
management, marketing management, customer service management, logistics management,
sales management, as well as customer interaction management. The majority of CRM
software providers rely on the satisfaction of three basic functionalities, including knowledge,
intention and contracting, while the settlement phase as reflected through contract
management and online tracking of sales is an issue increasingly demanded by companies.
[11]
1.2 CRM capability to offer preset patterns of education to companies and educational
institutions
Through its expanding functionality, as providing a valuable overview of a company`s
performance, CRM can be also reckoned as an entrepreneurial educating tool. Managers
"learn" the capacities of their companies, as well as the targeted customers, while employees
"learn" to use the maximal potential of their company, as well as to create a reliable
relationship with customers. Generally, CRM is an educational tool as it creates interaction
between the company and its customers/partners, as well as it generates the ability to evaluate
the processes between company and external interaction. [6]
Concretely, a reliable CRM solution will be able to grant sufficient control and flexibility to
the company, in order to satisfy the needs and analyzed expectations of their customers. As
follows, few features about CRM will be mentioned, that have to be understood and correctly
managed by companies.
Currently CRM solutions can be analyzed through the "metric", as image of the marketing
impact created by the business performance. Managers and employees are interested in
retrieving information about acquired customers, the percentage of customers, the value of
cross-selling, customer migration to other products offered by the company, if possible to
products offered by competition or the social changes in their customer behavior. Based on
the existing data, as well as on the potential scenarios offered by CRM reports, companies
can implement a unique marketing strategy or a suite of strategies, to assure the profitability
of the business. Concretely, based on the data generated by CRM, companies adopt small
marketing measures, in order to reduce the impact of customers` perception rigidity, since an
exclusive focus as customer acquisition at the expense of the customer retention is likely to
create an imbalance of loyalty, globally affecting the activity of the company [12].
2. Conclusions Similarly to any other business intelligence solution, CRM is marked by interoperability, but
expanded to an unmatched level. Through CRM, managers, employees or partners can easily
and securely exchange data between applications as database, email or extracted report. The
more database is supported, the less redundant the results will be for the company willing to
extract them and compare them with previous performance. In order to support an interactive
and quick use of CRM, companies usually complete it with Microsoft SQL Server (70%),
Oracle (65%), Sybase (37%) or IBM DB/2 (28%). In order to provide a reliable
interoperability, ERP activities associated with back office of the CRM are supported by
Oracle or SAP R/3 standards. Despite its multiple perspective, CRM is still an undiscovered

Proceedings of the IE 2015 International Conference
www.conferenceie.ase.ro
243
opportunity for business, since managers prefer to focus on statistical analysis, on short-term,
rather than expanding CRM to the limits of a global analysis. In this case, CRM is still a
subject that has to be "learnt", by both managers and employees or partners, in order to take
advantage of a satisfactory experience [1].
CRM is an essential factor on corporate agendas, for both small and large businesses, being
considered a new technology that will help companies target in a more efficient way their
global market segments, micro-segments or individual customers markets. CRM is perceived
as new marketing thinking, in contrast with the traditional methods, focusing on a more
focused attitude on customers` needs. A concise definition of CRM is the method “to create,
develop and enhance relationships with carefully targeted customers in order to improve
customer value and corporate profitability and thereby maximize shareholder value” (A.
Payne, 2005), in order to improve the potential of profitable, long-term perspectives.
Acknowledgment Mihaela Ionescu: This work was supported by the project “Excellence academic routes in
doctoral and postdoctoral research - READ” co-funded from the European Social Fund
through the Development of Human Resources Operational Programme 2007-2013, contract
no. POSDRU/159/1.5/S/137926.
References [1] D. Blumberg, Managing High-Tech Services Using a CRM Strategy, CRC Press LLC,
London, 2003.
[2] M. Castellanos, U. Dayal and V. Markl, Enabling Real-Time Business Intelligence,
Springer, New York, 2011.
[3] J. Elzinga, Th. Gulledge, C-Y. Lee, Engineering Advancing the State of the Art, Kluwer
Academic Publishers, Amsterdam, 1999.
[4] United States General Accounting Office, Report International Trade- US Business
Access to Certain Foreign State-of-the-Art Technology (1991), GAO, Washington.
[5] F. Boons and F. Ludeke-Freund, “Business models for sustainable innovation: state-of-
the-art and steps towards a research agenda”, Journal of Cleaner Production, no 45, 2012.
[6] R. Buehrer and C. D. Mueller, “Approach To Overcome Existing Limitations For CRM-
Implementation”, Journal ECIS 2002, June 6-8, 2002.
[7] Magic Software report The CRM Phenomenon – Whitepaper (2000), Magic Software
Enterprises Ltd, New York.
[8] C. Cunha and M. Manuela, Adaptive Technologies and Business Integration: Social,
Managerial and Organizational Dimensions, Idea Group Reference, London, 2007.
[9] V. Kale, Inverting the Paradox of Excellence. How Companies Use Variations for
Business Excellence and How Enterprise Variations Are Enabled by SAP, CRC Press,
New York, 2014.
[10] R. J. Baran, R. J. Galka and D. P. Strunk, Principles of Customer Relationship
Management, Thomson South-Western, New York, 2008.
[11] R. M. Morgan, J. Turner Parish and G. Deitz, Handbook on Research in Relationship
Marketing, Edward Elgar Publishing Limited, London, 2014.
[12] A. Payne and P. Frow, “A Strategic Framework for Customer Relationship
Management,” Journal Of Marketing, 2005, vol. 69, no. 4.

Proceedings of the IE 2015 International Conference
www.conferenceie.ase.ro
244
CONTINUOUS INTEGRATION IN OPEN SOURCE SOFTWARE
PROJECTS
Mihai GEORGESCU Bucharest University of Economic Studies
Cecilia CIOLOCA Bucharest University of Economic Studies
Abstract. The paper describes the process of continuous integration applied for open source
projects. It presents the advantages of having continuous integration and also offers a
practical approach towards introducing CI in a project using an open source tool. The
concept of continuous integration is explained using detailed diagram along with adjacent
processes related to this concept.
Keywords: architecture, build, continuous integration, open source, project, source control
JEL classification: J86, C88, C89
1. Introduction A software engineering team contains highly specialized people which handle different
aspects of the software product lifecycle. During the development and testing phase the main
persons involved are the programmers and testers. In this paper the author analyzes the
infrastructure architecture that is responsible for making the development and testing process
more fluid and effective in both open source and commercial software projects.
In [1] the authors investigate whether continuous integration has impact in open source
software projects. According to the author, the practice of having continuous integration in
open source projects has started to grow in the last years.
Teams in open source software projects are geographically distributed among different
locations. All team members are contributing to the same project and share all its resources.
The task of maintaining a fully working set of source code is a difficult task due to the big
number of people that introduce changes to the code. Another challenge in open source
projects is the availability, at any given moment, of a runnable version of the product to the
testing team. Each modification performed on the source code must be available to the testing
team as soon as possible so that it can be tested and delivered. Usually, in commercial
software companies, the development and testing processes have scheduled deadlines so the
need of fast propagation of changes onto testing environments is not essential as compared to
open source environments.
In open source projects anyone can contribute to the source code, even it is only one or many
contributions. Because of this, it is mandatory for the project owner to make sure that any
modification of source code meets the following rules and objectives:
- Will not break the build, meaning that the source code will not compile anymore;
- All automated unit tests are performed successfully;
- Any source code change is rapidly available to someone for tests and feedback;
- Potential problems will be found as soon as possible.

Proceedings of the IE 2015 International Conference
www.conferenceie.ase.ro
245
A software project contains many interconnected modules depending on its architecture. In
open source and commercial software projects, the project infrastructure consists of the
following environments:
- Development environment represents the virtual or physical location where the current
version of the software product is available to all programmers which contribute to the
project. All source code changes are performed initially on this environment;
- Staging environment represents the virtual or physical location where the current
version of the software product is available for testing of any modification. This
environment must be stable and updated at very short intervals with modifications from
the development environment.
Both development and staging environments can be either local or hosted by the project.
Figure 1 - Relationship between development and staging environments
The environments depicted in Figure 1 are mandatory for an efficient management of a
software project. These environments must be synchronized at different intervals. The length
of the intervals is relative to the software project needs. If it is an open source project, these
environments should be synchronized at shorter intervals to allow changes to be available
rapidly to other members of the project. The process of updating the environments with latest
changes, running the automated tests at the moment of actually committing the modifications
is called continuous integration.
This paper aims at explaining the concept of continuous integration in software projects and
presenting an open source tool that helps achieve this. The advantages introduced by this
process are also highlighted in the context of open source projects and commercial ones.
2. Explaining the Continuous Integration (CI) process
Before implementing the process of Continuous Integration (CI) in a software project, the
following concepts must be understood.
Source Code is the set of files containing the software application behavior written in a
programming language.
Source Code Repository is the virtual location where the source code is hosted. There are
well known software applications that manage the access to the source code, thus performing
the role of a source code repository. The main functionalities of a source code repository are:
- Commit or check in – is the process of pushing modifications to the source code
repository;
- Check out – is the process of marking the file as in use in order to inform other members
that modifications will be performed on it;
- Get version – retrieves a specific file version or the latest one from source code
repository;
- Branch – a complete set of source code copied from an existing one;

Proceedings of the IE 2015 International Conference
www.conferenceie.ase.ro
246
- Merge – the process of combining one or several source code files.
Build is the process of compiling a set of source code and perform any related activities to
produce a working output which forms the software product. It can be achieved using the
development IDE and can also be automatized using different tools.
Unit Test is the process of writing methods for testing existing software application
functionalities.
Automated Tests is the process of automating, by means of software tools, the calls of the
unit test methods.
Project Community represents the totality of persons contributing to the project.
Understanding the above processes is mandatory for successfully implement continuous
integration. The way CI is integrated in an open source software project is presented in Figure
2.
Figure 2 - The process of Continuous Integration in open source software projects
In [2] the continuous integration process phases are described. In open source projects the
following process is taking place when a community member introduces a change:
- Before performing any modification, the developer must obtain the latest version of
source code from the source code repository;
- Source code is modified locally with the requested functionality;
- A build is performed by the developer to initially test the functionality on the
development environment;
- If initial tests are positive, the files are committed to the source code repository;
- A new build package will be performed by the project owner along with all necessary
post build configurations and the staging environment is updated;
- Members of the community can get the latest staging build and install it locally or
perform tests on the staging environment;
- The process is resumed from the beginning when the next change appears.
The [3] book introduces Jenkins as one of the most well-known open source continuous
integration tools and describes step by step the entities required for successfully apply it to a

Proceedings of the IE 2015 International Conference
www.conferenceie.ase.ro
247
project. It offers a complete guide on configuring the tool and customize it using the available
plugins.
In [4] the paper identifies other processes that can automatize using continuous integration
which includes:
- Generating the project documentation automatically;
- Static code analysis;
- Spell checker and code beautifier.
The purpose of CI is to automate the above process so that every commit operation to the
source code repository will trigger an automated update of both development and staging
environments. Continuous integration process is also responsible for running automated unit
tests, any post build operations and inform all project members about the results of the entire
operation.
Being able to automatically propagate user changes to all environments and perform all build
related tasks introduces great advantages to the open source project management. The
advantages are presented in the next chapter of this paper.
3. Advantages of having continuous integration in open source projects
In [5] the main advantages of having a continuous integration process in open source projects
are:
- Automatize the repetitive manual processes;
- Generate deployable version of the software at any time;
- Reduce risk;
- Provide real time feedback on the build status;
- Improve the quality of the software product.
CI automates existing manual process and introduces additional steps to allow generation of a
deliverable build package at any time. This is one of the biggest advantages offered by CI as
the output of this process will generate a tangible software product that can be directly
accessed by the community members. Any time a user performs a change in a project’s file,
CI system will trigger all activities required to produce a ready to be delivered application
package. Without having a reliable CI, all these operations must be manually performed. Due
to the high number of changes in a project and the lack of a CI, it will create a big overhead
for the project owner to prepare at short intervals a ready to deliver package of the
application.
Reducing risk is achieved by quickly integrating changes thus obtaining rapid feedback from
testers. CI runs unit tests automatically so any defect can be quickly identified. Every time a
change is introduced to the software product, the developers are making assumption that it
will not negatively affect any existing functionality. Most of the times this is not what
actually happens and defects are introduced. CI helps overcome this problem by offering real
time feedback. In [6] the author shares his experience starting as a software tester on
traditional methodologies while transitioning to the agile software testing and concludes
highlighting the importance of continuous integration in agile environments.
4. Open source tool for implementing the Continuous Integration Process
The research in this paper identified an open source tool that facilitates continuous integration
in projects. In [7] the authors present several implementations of continuous integration along
with the differences between them. Based on the research, the authors propose a descriptive
model for documenting and understanding the implementation of continuous integration.
According to Jenkins official documentation there are more than 100.000 active users that are
using Jenkins project as the CI tools for their projects. Jenkins is the leading open source

Proceedings of the IE 2015 International Conference
www.conferenceie.ase.ro
248
continuous integration server and it also provides more than 1000 plugins to support building
and testing virtually any project.
In order to set up a CI environment, the project must have the following major prerequisites:
- Source Code repository containing the necessary files to build the project;
- Dedicated hardware machine to host Jenkins CI;
- Environments to deploy the software package obtained after build.
After Jenkins CI is installed on a dedicated machine, it must be configured so that it will have
access to the source code repository. The first step is to configure Jenkins CI so that it will fit
the needs of your project. Among the settings there are email server, security rights and
plugins to be used.
The next step is to create build projects inside Jenkins CI for all components of the software
application. At this step it is important to build your solution with the corresponding plugin
provided by Jenkins. If it is a Java, C#, C++ or other types of projects, than the correct build
plugin must be installed. Jenkins CI allows configuration of builds to be started at different
intervals or real time at any modification in the source code. Upon completion of these steps
and running the first build, in the Jenkins CI main window the project should look similar to
the one in Figure 3.
Figure 3 - A build project created in Jenkins CI
The information provided in the main Jenkins CI window for each build project is:
- List of defined build projects;
- The status of the build: success, failed or inconclusive;
- Last time when the build failed or finished with success;
- The duration of the build process;
- The percentage of successful builds from the total number of builds.
By analyzing this information, the project owner can evaluate the health of the project and
identify reasons for build failures very fast. In [8] the authors present a framework based on
Jenkins CI dedicated for building student projects, executing automated tests, running static
code analysis and calculating code coverage. This paper confirms the extensibility of the
Jenkins CI environment.
To further extend the continuous integration process, as presented in [9], automatic unit tests
can be implemented using the proposed automatic test generation tool CTG which increased
the test coverage by an average of 60%.
An improvement for making Jenkins CI fully distributed is presented in [10] and allows
communication and synchronization of multiple CI servers every time new artifacts produced
by the build are updated.
5. Conclusions
Continuous Integration is beneficial for the software project no matter if it is open source or
commercial, as it provides real-time feedback about the build health and automatizes all
manual processes. Having this process in place offers the following benefits:
- Reduce risk of broken builds;
- Automatize manual processes;
- Provides real time feedback about the health of the build;
- Runs automated unit tests and provides fast results;
- Automatically updates all development and testing environments.

Proceedings of the IE 2015 International Conference
www.conferenceie.ase.ro
249
Due to the distributed nature of teams in open source projects it is essential to have an
integrated build system. This allows defining rules and processes each time a team member
does a modification on the source code which increases the chances of quickly finding
possible problems.
References [1] Amit Deshpande and Dirk Riehle, Continuous Integration in Open Source Software
Development, Open Source Development, Communities and Quality, Springer US, pp.
273-280, 2008, ISBN: 978-0-387-09683-4
[2] P. M. Duvall, S. Matyas and A. Glover, Continuous Integration, Improving Software
Quality and Reducing Risks, Addison-Wesley, 2008, ISBN: 978-0-321-33638-5
[3] A. Berg, Jenkins Continuous Integration Cookbook, Packt Publishing, 2012, 344 pages,
ISBN: 978-1849517409
[4] M. Ettl et al. "Continuous software integration and quality control during software
development," IVS 2012 General Meeting Proceedings, 2012.
[5] J. Holck and N. Jørgensen, "Continuous Integration and Quality Assurance: A Case Study
of Two Open Source Projects," Australasian Journal of Information Systems, vol. 11, no.
1, pp. 40-53, 2003, ISSN 1449-8618
[6] S. Stolberg, "Enabling Agile Testing through Continuous Integration," Agile Conference,
vol., no., pp.369 - 374, 24-28 Aug. 2009
[7] D. Ståhl and J. Bosch, "Modeling continuous integration practice differences in industry
software development," Journal of Systems and Software, Volume 87, January 2014, pp.
48-59
[8] S. Heckman, J. King and M. Winters, "Automating Software Engineering Best Practices
Using an Open Source Continuous Integration Framework," in Proc. of the 46th ACM
Technical Symposium on Computer Science Education, ACM, New York, USA, pp.677-
677
[9] J. Campos, A. Arcuri, G. Fraser and R. Abreu, "Continuous test generation: enhancing
continuous integration with automated test generation", in Proc. of the 29th ACM/IEEE
international conference on Automated software engineering (ASE '14), ACM, New
York, NY, USA, 55-66, 2014
[10] S. Dösinger, R. Mordinyi and S. Biffl, "Communicating continuous integration servers
for increasing effectiveness of automated testing," in Proc. of the 27th IEEE/ACM
International Conference on Automated Software Engineering ACM, New York, NY,
USA, pp. 374-377

Proceedings of the IE 2015 International Conference
www.conferenceie.ase.ro
250
SERVICE-ORIENTED MODELING AND ARCHITECTURE FOR AN
E-FINANCIAL ASSISTANT INTEGRATION WITHIN THE BANKING
SYSTEM
Mirela TURKEȘ
Dimitrie-Cantemir Christian University
Irina RAICU Bucharest University of Economic Studies/CRI, Paris 1 Pantheon-Sorbonne University
[email protected]/ [email protected]
Alexandra RUSĂNEANU
Bucharest University of Economic Studies
Abstract. The financial system plays a vital role in supporting sustainable economic growth.
Due to their importance in the financial system and influence on national economies,
banks are highly regulated in most countries. Banks are struggling with heterogeneous
legacy systems that are difficult to change and integrate. Service Oriented Architecture
(SOA) has recently gained popularity as a new approach to integrate business applications in
banking sector in order to attain the integration, flexibility and efficiency to succeed in this
complex business environment. The aim of this paper is to propose an E-Financial Assistant
(EFA) system, an information system that acts as an intermediary between individuals and
specialized information systems exposed by banks and financial institutions, which can be
easily integrated with other banking systems. The solution helps understand the way the
adoption of SOA in E-Banking can create an open and collaborative environment, with low
costs and efficient service management.
Keywords: e-banking, e-financial, enterprise service bus, integration, service-oriented
architecture
JEL classification: F15, G2, P4
1. Introduction The banking system has one of the most complex and sophisticated IT infrastructure. Each
bank has its own financial software which stores client data, transactional data, financial data
and data regarding their products and services. The data models used by each bank to define
and manage the information are different. What if the information regarding products and
services can be structured in a homogeneous manner for each bank? This approach can have
major benefits on the banking market from the client point of view. If a customer needs a
credit he will visit various banks and requests offers from each one and analyze them in order
to decide which one is the most suitable for his needs. Using the above approach, the
customer can access a collaborative environment where all the information regarding credits
can be found for any bank and he can make a decision based only on the information exposed
by the collaborative application without visiting a bank to request for offers. Today's
technology can create a platform that can integrate all the information regarding products,
services, financial data, and transform it into valuable information for the customer.

Proceedings of the IE 2015 International Conference
www.conferenceie.ase.ro
251
2. SOA integration with ESB
To thrive in today's business environment, there is a need in dynamic, interactive and cost-
effective network of employee, customer, partner and supplier relationships. And this
requires more agility through the processes and systems that make up the network. For many
businesses is IT complexity that makes this hard to achieve. IT complexity and costs often
arise from an organization’s approach to application integration. The resulting connectivity
tangle can lead to unreliable connectivity, slow and inflexible application integration, costly
point-to-point connectivity and inability to effectively leverage new connectivity methods for
people, processes and information. However, these challenges can be addressed with a SOA
approach that integrates applications and integrates services through an Enterprise Service
Bus (ESB) to ensure the business gets the right information to the right place at the right time.
Also, it addresses the business agility and cost optimization needed to succeed. A service-
oriented architecture (SOA) is a combination of consumers and services that collaborate,
supported by a managed set of capabilities, guided by principles and governed by supporting
standards. [1] The concept of service-oriented architecture includes a set of desirable design
characteristics for promoting interoperability, re-usability and organizational agility as well
as a service-oriented business process-modeling paradigm. SOA is commonly used to
designate anything contributing to an enterprise platform based on service-oriented
principles. It is an example of business and computing evolution, an architectural approach
for business that includes and requires supporting technologies capabilities. An ESB solution
has two main functional areas: messaging and enrichment. [2] Messaging is the reliable
delivery of information whenever, wherever it's needed. Enrichment is the enhancement of
messages with matching and routing communication between services, conversion between
transport protocols, transformations between data formats and identification and distribution
of business events. For business agility, the software products have to be delivered faster to
the market place. While messaging supports reliable delivery of business information, ESBs
products eliminate the integration logic, normally developed for each application. Without
this time consuming overhead, the integration of all applications is simplified, allowing for
more flexibility and faster delivery of business services. Over time, organizations continue to
add complexity and costs for development and maintenance of point-to-point connections. An
ESB solution eliminates redundant and complex connectivity programming. Flexibility and
costs are the only barriers to successful application integration. Another is addressing
emerging technologies and standards while quickly accessing business information
everywhere. ESB enables the creation of new, low-cost services by seamlessly bridging Web
2.0 technology to existing legacy and back-end enterprise applications. [3] Also, it federates a
single logical ESB infrastructure to share data, applications and resources by forming a single
logical ESB infrastructure across systems and applications. The reach of the business data can
be extended from and to any device or system within or outside of business network.
3. Design and implementation of the E-Financial Assistant
E-Financial Assistant (EFA) is an information system that acts as an intermediary between
individuals and specialized information systems exposed by banks and financial institutions.
The main functionality of EFA is to present to clients the best credit offers, function of their
personal and financial data and their preferences. EFA inquires the banks for their credit
offers based on the client's data. But, prior to sending the client's personal data, it validates it
with the General Direction of Persons Evidence (GDPE) [4]. Banks may send back offers on
client's initial credit preferences or if the client preferences does not match any of their offers,

Proceedings of the IE 2015 International Conference
www.conferenceie.ase.ro
252
banks send offers with other credit preferences that are close to the initial ones. EFA
calculates the best deals and if the client chooses one credit offer, EFA takes care of all
formalities. First, it validates the client financial data with both Credit Office (CO) [5] and
General Registry of Employees (GRE) [6]. Then sends the results to the selected bank and
based on this validation the bank decides the credit approval. In the Figure 1, the functional
requirements of EFA are described by the use-case diagram.
Figure 1 - Functional requirements of EFA
3.1. Business modelling The actors that interact with the system are the clients applying for a credit. The agent that
interacts with the system is the EFA Administrator which may add a contract with another
bank that wants to participate in the application. The stakeholders are represented by GDPE,
GRE and CO. The main business use case is the appliance to a credit.
The software requirements include both functional and non-functional requirements. The
non-functional requirements are specific to any ESB:
- Location transparency: the client has to be decoupled from the bank providers locations;
EFA provides a central platform to communicate with any application necessary without
coupling the message sender to the message receiver;
- Transport protocol conversion: EFA should seamlessly integrate applications with
different transport protocols like HTTP(S) to JMS, FTP to a file batch, and SMTP to
TCP;
- Message transformation: EFA should provide functionality to transform messages from
one format to the other based on open standards like XSLT and XPath.

Proceedings of the IE 2015 International Conference
www.conferenceie.ase.ro
253
- Message routing: EFA should determine the ultimate destination of an incoming
message;
- Security: EFA should provide Authentication, authorization, and encryption functionality
for securing incoming messages to prevent malicious use as well as securing outgoing
messages to satisfy the security requirements of the service provider.
- Monitoring and management: A monitoring and management environment is necessary to
configure EFA to be high-performing and reliable and also to monitor the runtime
execution of the message flows.
3.2. Architecture Design and Integration within banking system
The credit appliance integration solution consists of several message exchanges: one message
exchange asks the banks for credit offers function of client input data. Another message
exchange involves the response messages from the banks with their credit offers. Because
these are request/reply exchanges, we combined them into one message flow design as can be
seen in the Figure 2. Next, the confirmation exchange can then be placed in a separate
message flow design to improve the readability of the diagram. The decision about how the
messages should be sent to the two banks area falls under the Message Channel patterns. The
two patterns in the message channel category that can solve this problem are Point-to-Point
and Publish Subscribe. With the Point-to-Point pattern solution; there are introduced two new
message channels, which have a fixed message producer and consumer application. The
Publish Subscribe pattern seems better suited because publishes a message to a topic and
subscribed consumers can consume the message. If the number of banks increases, it can be
easily added with publish-subscribe channel. So we chose publish-subscribe channel to ask
the banks for their credit offers. Next, it appears the problem of how does the banks know
where to send the message back. Here comes into picture the Return Address pattern which
states that the request message should contain a Return Address that indicates where to send
the reply message. So, a Return Address is put in the header of the message because it’s not
part of the data being transmitted.
Figure 2 - The message flow design diagram of the bank's credit offers part
To implement the response-message exchange with the banking institutions, it at first seems
that there is no specific integration functionality. Figure 3 shows an overview of this
confirmation message flow. But not all the messages arriving from banks are displayed to
client. They need to be aggregated into one or more best deals if equal monthly instalment.
This functionality is achieved by adding the Aggregator pattern. The second message flow
diagram addresses the choice of a credit offer. A content-based router is used to route the

Proceedings of the IE 2015 International Conference
www.conferenceie.ase.ro
254
message to the chosen bank application. The content based router inspects the content of the
message; based on the bank name, it determines the correct target endpoint. Then, the bank
application returns a confirmation message that it has received the message. The
implementation of publish-subscribe functionality in ServiceMix involves configuring a
number of JBI components.
Figure 3 -The message flow design diagram of the credit choice part
Figure 4 shows all the JBI components required for the first part of the integration solution.
Firstly, JMS endpoints are configured using servicemix-jms component. Next, integrating
Spring beans in a ServiceMix message flow, implies marshaling and unmarshaling of the
XML messages that flow through the JBI bus to the Java beans that are defined as the input
parameters and return value for the Spring restaurant bean. Two components are applicable to
implement the Spring bean invocation: the Bean service engine and the JSR-181 service
engine. For our approach, we used the JSR-181 service engine, because this component is
capable of (un)marshaling the XML messages automatically. Finally, for routing the
incoming message to the bank beans and handling the bank responses we used the Camel
service engine.
Figure 4 - JBI components needed to implement the publish-subscribe functionality

Proceedings of the IE 2015 International Conference
www.conferenceie.ase.ro
255
5. Conclusions A collaborative platform based on a Message Broker technology is a real option for the
financial system in order to offer an advanced tool for potential customers to inform about
products and services and apply for credits. Sustainable economic growth aims to provide
customers satisfactions both through consuming of banking products or provision of banking
services and increasing the clients' life quality. Therefore, an E-Financial Assistant
collaborative platform is a key element in supporting sustainable economic growth. The
effort to achieve a relationship based on mutual trust and collaboration between the bank and
its client represents a core motive of banks activities. Through the platform, the clients have
quick access to the most advantageous credit offers, thereby contributing to the individual
client wellbeing. Other advantage of this platform is that the banks can handle in an efficient
manner the information about their clients. Databases which keep information about the
clients are created and thus, the data can be used to design new banking products or for
improvement of the banking methods. On other hand, the integration of collaborative
application within existing banking systems is faster, less complex and lower cost.
The customer can benefit from this collaborative application on many levels such as financial
and personal. The application aims to satisfy two kinds of needs: Effective needs - clients are
concerned with what banks can offer to them in order to satisfy their various needs such as,
the need to access a credit for funding or refinancing an existing credit, lower costs regarding
the access to the loan, a reduced time of according the loan, extended loan duration, reduced
documentation. The needs of customers can be satisfied based on the diversity of banking
products and services correlated with the ability of faster adaptability of banking services
according the current needs of their clients. Also, the application satisfy the Virtual needs of
their clients through the use of a modern technology which provides an user friendly interface
in order to be accessible anytime and anywhere by the customers in a facile manner. The
collaborative application provides the quick access to banks offers, especially to the
advantageous crediting conditions.
In conclusion, this collaborative environment can generate information regarding the
competitiveness among banks in such a way that banks will change their products to become
more competitive, therefore the customer will benefit the most.
References [1] I.Raicu, "Proposal of a SOA model to serve as a practical framework for E-Justice
interoperability," Proc. of the 13th International Conference on Informatics in Economy,
Bucharest, 2014
[2] Schmidt M.T., Hutchison, B. , Lambros, P. and R. Phippen, "The Enterprise Service Bus:
Making service-oriented architecture real," IBM Systems Journal, vol. 44, Issue: 4,
pp.781 – 797, 2005
[3] N. Basias, M. Themistocleous and V. Morabito, "A Decision Making Framework for
SOA Adoption in e-Banking: A Case Study Approach," Journal of Economics, Business
and Management, Vol. 3, No. 1, 2015
[4] General Direction of Persons Evidence, available: http://dgepmb.ro/furnizari-de-date-cu-
caracter-personal-din-rnep/54
[5] Credit Office, available: http://www.birouldecredit.ro/index.htm
[6] General Registry of Employees, available:
https://reges.inspectiamuncii.ro/Cont/Autentificare?ReturnUrl=%2fPreluariRegistre

Proceedings of the IE 2015 International Conference
www.conferenceie.ase.ro
256
RISK ASSESSMENT FRAMEWORK FOR SUCCESSFUL
E-GOVERNMENT PROJECTS
Otniel DIDRAGA West University of Timisoara
Abstract. E-government projects are intended to increase information and services
availability, interactivity and accessibility for citizens and businesses through the advanced
use of ICT. These projects are exposed to various risks. The complexity of e-government risks
requires a detailed analysis of risks. There are several risk categories, and risks are ranked
as high, medium or low. Applying risk management techniques reduces the impact of risks on
the success of the project. We propose a risk assessment framework for e-government
projects implementation. Successful projects depend on risk management strategies, and the
proposed framework can be applied in order to increase the effectiveness of services
delivered to users by the government.
Keywords: E-government, Risks, Risk Assessment, Successful projects. JEL classification: H7, H11, D81
1. Introduction The concept of E-government [1] defines the generic use of new communication technologies
and computer applications by the central and local public administration to improve the
administrative activities.
Technology provides governments two significant opportunities: increased operational
efficiency by costs reduction and productivity increase, and better quality of services
provided by the public administration [2].
E-government can provide opportunities to transform public administration into an
instrument of sustainable development [3].
E-government means using ICT to make public service better, cheaper and faster [4].
Through innovation and e-government, public administrations can be more efficient, provide
better services and respond to demands for transparency and accountability [3].
E-government services have several benefits: transparency, accountability [5],
responsiveness, visibility, efficiency, performance, and integration. These benefits can be
registered by the public administration organizations that make use of on-line services [6].
E-government projects have to be successfully designed and deployed in order to deliver the
expected benefits for quality services for citizens and businesses [7]. In order to be
successful, e-government projects must build trust within agencies, between agencies, across
governments, and with businesses, NGOs and citizens [5].
The trust in e-government services is directly enhanced by the citizens’ higher perception of
technological and organizational trustworthiness, the quality and usefulness of e-government
services, the Internet experience, and propensity to trust [8].
Projects of implementing e-services are inherently complex [7], and while e-government still
includes electronic interactions of government-to-government (G2G); government-to-
business (G2B), and government-to-consumer (G2C), we must consider a multi-stakeholder
approach to e-government projects[3].

Proceedings of the IE 2015 International Conference
www.conferenceie.ase.ro
257
Gatman considers that active stakeholders, refer to any actor that has a role in identifying,
communicating, developing, enhancing, using e-Government solutions [6].
Public managers need to be involved actively as stakeholders, not just users of information,
and e-government projects miss their targeted objective, become redundant, waste valuable
resources, and lack interoperability because stakeholders are not sufficiently involved [6].
Successful involvement of stakeholders can create the environment that would support
communities in developing ICT capacities and resources according to their particular needs in
active and functional public administration [6].
Stoica makes a classification of e-government projects [9]:
a) from the functionality/implementation point of view in degree/readiness:
1. implemented projects;
2. pilot projects;
3. abandoned pilot projects;
b) from the point of view of success in implementation:
1. successful projects;
2. failed projects;
3. new projects (unverified);
c) awarded projects:
1. internationally awarded projects;
2. considered best practices/models at national level.
Stoica gives examples of successful e-government projects [9], [10]: The Electronic System
for Public Acquisitions e-Procurement (ESPP) – a successful Romanian e-government
project considering the financial impact and number of users. The project was part of the
Government Programme 2009-2013 Strategy (‘eRomania’) [11]. Stoica consideres “it is
easier, with more impact and more successful, to implement individual high-level projects,
already verified, and considered examples of good practice at international level” [9].
Assessment of e-government projects should consider dimensions: strategic, technological,
organizational, economic, operational, and services [12].
2. Risk Management in E-government Projects E-government projects involve people, processes and technology [13]. In particular, they deal
with multiple and complex challenges [2] and face several roadblocks that eventually obstruct
their potential to deliver the intended benefits to the citizens [13]. The roadblocks or
resistance items can be: technical issues; inadequate standards and frameworks; conflicting
initiatives; coordinating issues; security and privacy concerns; budgetary constraints; and
inadequate skills, awareness, and digital divide [13].
Evangelidis enumerates possible risks that may be experienced in e-government projects:
uncertain timescale prediction, increased costs and delays, misguided decisions, dependence
on technology, security risks and unpredictable risks related to the nature of the ICTs [7].
Ex-ante assessment (pre-implementation) of the value of e-government projects is usually
conducted via risk assessment or risk analysis [12].
Risk and risk management influence the success of generic IT projects [14]. The effects of
risk management in IT projects encompass: creating awareness, establishing trust and setting
priorities, clarifying expectations, creating acceptance and commitment, thus contributing to
a higher success probability of IT projects [14].
Risk assessment usually occurs in the design phase of the project. Nevertheless, after the e-
government project has been implemented, a second phase of evaluation is necessary. The
second assessment evaluates whether or not risks were successfully mitigated and what on-

Proceedings of the IE 2015 International Conference
www.conferenceie.ase.ro
258
going action is needed. Thus, the two components of assessing the strategic dimension are
objectives and risk management [12].
Considering the risk management process, the activities can be divided into two basic steps of
activities that relate to each other, and they should be performed consequently [15]: risk
analysis (assessment) and risk management (mitigation).
Risk management implies high levels of complexity and the outcome is not always as
planned, identifying the risks in e-government projects allows risks to be managed [16].
Effective risk assessment can determine success or failure of e-government projects [12].
3. Risk Assessment Framework for E-government Projects The result of our research is the proposed model of Risk Assesment Framework for E-
government Projects. Our framework is based on a multidimensional approach to risk
assessment in e-government projects. The first dimension is the Project Phases, the second
dimension is the Risk Categories, and the third dimension is Risk Assesment Activities (Table
1). The Risk Assesment Activities are iterative processes. These processes are executed in all
project phases and for all risk categories.
Table 1. Risk Assessment Framework (own development)
Project
Phases
Risks
Categories
Initiation
and
Planning
Analysis Design Implementation Maintenance
Risk
assessm
ent
an
d R
isk M
itigatio
n P
lan
Project Management
and Coordination
Project Team
experience
Project Team
Communication
Social and cultural
context
Social and economic
context
Communication with
citizens
Support and
Assistance of citizens
Technical issues and
standards
Security and privacy
Legal factors
Productivity for
Citizens and
Government
Budgetary
constraints
Political influence

Proceedings of the IE 2015 International Conference
www.conferenceie.ase.ro
259
The risk categories included in the framework are: project management and coordination [2],
project team experience (skills) [13], team communication and coordination [13], social and
cultural context [5] [13], social and economic context [12], citizen communication [15],
support and assistance of citizens [15], technical issues and standards [6] [12] [13], security
and privacy [2] [13], legal factors [2] [15], productivity (accessibility) for citizens [15],
budgetary constraints [6] [12] [13], and political influence [2] [5] [6] [7].
Risk assessment must occur in the colored phases presented in Table 1.
Risks are assessed by their probability of occurrence (unlikely, moderate and likely) and their
impact (high, medium, low) on the outcome of the project [14] [15].
After every iterative risk assessment activity, a Risk Mitigation Plan will result in order to
classify and control risks for achieving project success.
4. Conclusions E-government projects are complex endeavors. They require strategic planning and applying
risk management activities to minimize risk and to deliver e-services successfully to citizens,
businesses, and other public authorities.
The challenges imposed by the occurrence of risks must be overcome through risk
management. One important step in risk management is the risk assessment activity.
Performing risk assessment during the phases of a project is a continuous process that results
in a clear understanding of the strategy and challenges of the project.
E-government projects involve different people, many processes, and high technology.
Like any other IT project, E-government projects must include a risk management strategy
based on a standard framework, making the results transparent to the stakeholders.
Governments must apply control methods and risk mitigation plans to build citizen’s trust in
using e-services.
Successful projects that are already verified and considered examples of good practice
depend on risk management strategies.
Our proposed framework can be applied in order to increase the effectiveness of services
delivered to users by the government. Assessing risks through the proposed framework
creates awareness, establishes trust and sets priorities, clarifies expectations, and creates
acceptance.
The limit of our proposed framework model is that it has not been tested in practice, but it
may find applicability in different areas in the public sector, further empirical research being
needed to validate the framework.
Acknowledgment This work was cofinanced from the European Social Fund through Sectoral Operational
Programme Human Resources Development 2007-2013, project number POSDRU
159/1.5/S/142115 “Performance and excellence in doctoral and postdoctoral research in
Romanian economics science domain”.
References [1] MCSI, “Strategia Națională privind Agenda Digitală pentru România 2020” – Februarie
2015, http://www.mcsi.ro/CMSPages/GetFile.aspx?nodeguid=0617c1d7-182f-44c0-a978-
4d8653e2c31d
[2] J.R. Gil-Garcia, and T.A. Pardo, “E-government Success Factors: Mapping Practical
Tools to Theoretical Foundations”, Government Information Quarterly 22 (2005), pp.
187–216.

Proceedings of the IE 2015 International Conference
www.conferenceie.ase.ro
260
[3] United Nations, “E-Government Survey 2014 – E-Government for the Future We Want”,
2014, ISBN: 978-92-1-123198-4, http://www.unpan.org/e-government
[4] European Commission, “Delivering the European Advantage? ‘How European
Governments can and should benefit from innovative public services’ - eGovernment
Benchmark – May 2014”, Luxembourg, Publications Office of the European Union,
2014, ISBN 978-92-79-38052-5.
[5] T. Almarabeh, and A. AbuAli, “A General Framework for E-Government: Definition
Maturity Challenges, Opportunities, and Success”, European Journal of Scientific
Research, Vol. 39, No.1 (2010), pp. 29-42.
[6] A. Gatman, “e-Government – Assisting Reformed Public Administration in Romania”,
Romanian Journal of Economics, vol. 32, No. 1(41), 2011, pp. 216-242.
[7] A. Evangelidis, “FRAMES – A Risk Assessment Framework for e-Services”, Electronic
Journal of e-Government, Vol. 2, No. 1, Jun 2004, pp. 21-30.
[8] S.E., Colesca, “Increasing E-Trust: A Solution to Minimize Risk in E-Government
Adoption”, Journal of Applied Quantitative Methods, vol. 4, no. 1, 2009, pp. 31-44,
ISSN: 1842-4562.
[9] O. Stoica, “E-Government Implementation in Romania. From National Success to
International Example”, 2009,
http://www.nispa.org/conf_paper_detail.php?cid=17&p=1549&pid=166
[10] O. Stoica, “Romanian E-Government between Success and Failure”, 2008,
http://www.nispa.org/conf_paper_detail.php?cid=16&p=1253&pid=166
[11] European Commission, “eGovernment in Romania, Edition 12.0 - eGovernement
Factsheets”, January 2015,
https://joinup.ec.europa.eu/sites/default/files/egov_in_romania_-_january_2015_-
_v.12.0_final.pdf
[12] J. Esteves, and R.C. Joseph, “A comprehensive framework for the assessment of
eGovernment projects”, Government Information Quarterly, vol. 25, 2008, pp. 118–132.
[13] A.M. Al-Khouri, N. Al-Mazrouie, and M. Bommireddy, “A Strategy Framework For the
Risk Assessment And Mitigation For Large E-Government Projects”, International
Journal of Managing Value and Supply Chains (IJMVSC), Vol. 1, No. 2, December 2010,
pp. 36-43.
[14] O. Didraga, “The Role and the Effects of Risk Management in IT Projects Success”.
Informatica Economica Journal, Vol. 17, no. 1, 2013, pp. 86-98.
[15] M. Podgoršek, “Risk assessment of e-service projects”, 4th Working seminar on
Performance auditing, April 20 – 21, 2004 in Moscow, Russia.
[16] S. Paquette, P.T. Jaeger, and S.C. Wilson, “Identifying the Security Risks Associated
With Governmental Use of Cloud Computing”, Government Information Quarterly 27
(2010), pp. 245–253.

Proceedings of the IE 2015 International Conference
www.conferenceie.ase.ro
261
AN ASSESSMENT OF THE MAIN BENEFITS AND
CHARACTERISTICS OF BUSINESS SOFTWARE FROM THE
PERSPECTIVE OF ROMANIAN SMEs
Victor LAVRIC Bucharest University of Economic Studies, Romania
Abstract. This paper investigates the main benefits and characteristics of business software
from the perspective of Romanian SMEs. In order to do so, we analyze the data collected
from more than 1.400 Romanian enterprises. As we identify the most frequently used types of
software, the main benefits that entrepreneurs assign to them and specific structural
implications of some software solutions, we therefore are able to extract valuable insights
regarding the business software market in Romania and its potential to extend both in size
and depth.
Keywords: business software, cloud computing, innovation, SMEs
JEL classification: O31, O33, L25
1. Introduction Business software solutions became a key concept in today’s economic environment, being
achieved a consensus among economists, both practitioners and theoreticians, that the class of
software that addresses the specific needs of various business processes [1] is an essential
element of current economic processes. As the economic environment is becoming more and
more dynamic and unpredictable, companies are forced to adapt rapidly their products,
services and business processes, therefore posing a challenge from the perspective of
business software integration [2]. In this context, there are research papers that emphasize the
fact that “execution of Business Software Systems encounters many problems, leading to the
high scale of their failure, which then is reflected in considerable financial losses” [3].
Nonetheless, there is evidence that “as the business environment gets more challenging,
SMEs are now implementing ERP packages to be more competitive, efficient and customer-
friendly” [4]. As the development of the IT&C market has shown many times, despite the
innovative approaches or technologies incorporated in a software product, the failure to
address the consumers’ subjective requirements could bring very fast to unfortunate
consequences. Theoretical literature went further and defined this situation as a basic
contradiction – “the software industry has been engaged in ongoing effort to solve the basic
contradiction between the personalization of user’s needs and the versatility of the software
products” [5].
In order to address this basic contradiction, we will focus in our study on the investigation of the
main benefits and characteristics of business software from the perspective of Romanian SMEs.
2. The most frequently used business software solutions in the SMEs sector
In order to analyze the use of business software solutions by the Romanian SMEs we will
rely on the data collected in March – April 2014 from 1.569 enterprises that operate in
economic sectors such as services, constructions, industry, transportation and tourism [6].
The size of the sample, as well as the complexity of the questionnaire used for the interviews,

Proceedings of the IE 2015 International Conference
www.conferenceie.ase.ro
262
gives us the means to engage in a relevant quantitative analysis with structural implications.
In Figure 1 we present the 16 most frequently used business software solutions, or, to be
more precise, the purposes for which they are utilized. Therefore, the entrepreneurs and
managers from the Romanian small and medium-sized enterprises reveal a high propensity to
use specific software solutions for email management (67.08%), invoicing (43.54%) and
accounting (41.18%). Smaller percentages are encountered in the case of wage (24.85%) and
inventory (23.15%) management software, being followed by software solutions addressing
issues like ecommerce (13.11%), goods management (11.34%), communication by SMS
(11.02%), HR management and timekeeping (9.25%), website management (7.93%), large
files transfer (6.95%), data storage (6.75%), achieving software (6.56%), communication by
newsletter (5.90%), personnel recruitment (5.70%) and legal information software (5.51%).
Although the elements that are not in the first 16 have very low percentages, they are
important for our analysis because, in a competitive environment, the differentiation in terms
of diversity and intensity of using business software solutions contributes to higher
performance and competitiveness consolidation. This is the case for software that targets the
following needs: managing internal portals, data collection, document management, fleet
management, videoconferencing, customer relationship management (CRM), enterprise
resource planning (ERP), employee performance management, sales force automation (SFA)
and call center management
Figure 1 - The most frequently used business software solutions
By taking a closer look to the above mentioned elements, we can identify five main
categories of challenges that entrepreneurs and managers from the Romanian SMEs are
trying to bypass with the help of specific business software solutions. Although there could
be spotted some overlap among these categories, we find it very useful for our analysis, as it
is facilitating interpretation of some structural differences, both from the perspective of size
and performance. Therefore, the challenges that demand a more intense response in terms of
business software use by the small and medium-sized enterprises are the following:
1. Improving communication with clients, business partners and other relevant
stakeholders: email, ecommerce (online store), SMS communication, newsletter, internal
portal, videoconferencing and call center management.
5.51%
5.70%
5.90%
6.56%
6.75%
6.95%
7.93%
9.25%
11.02%
11.34%
13.11%
23.15%
24.85%
41.18%
43.54%
67.08%
Legal information
Recruitment
Newsletter
Archiving software
Data storage
Large files transfer
Website management
HR management and timekeeping
SMS communication
Goods management
Ecommerce (online store)
Inventory management
Wage management
Accounting
Invoicing

Proceedings of the IE 2015 International Conference
www.conferenceie.ase.ro
263
2. Developing the infrastructure for data management: large files transfer, data storage,
archiving software, data collection, website management and document management.
3. Increasing the efficiency of resource allocation: customer relationship management,
enterprise resource planning, fleet management and sales force automation.
4. Providing a more rigorous management of human resources: wage management, HR
management and timekeeping, recruitment and employee performance management.
5. Optimization and informatization of the operational processes: invoicing, accounting,
inventory management, goods management, legal information.
Table 1 - The structure of the most frequently used business software by size and performance evolution
16 most frequently used business
software solutions
Last year performance Size
Much
better Better Identical Worse
Much
worse Micro Small Medium
Email 55.88% 75.19% 61.83% 65.21% 70.00% 62.37% 75.29% 78.26%
Invoicing 82.35% 61.11% 37.44% 34.79% 46.25% 36.02% 63.32% 76.81%
Accounting 50.00% 55.56% 36.83% 33.42% 46.25% 33.76% 61.00% 73.91%
Wage management 76.47% 41.11% 20.73% 13.97% 26.25% 17.97% 42.08% 68.12%
Inventory management 23.53% 33.70% 19.39% 19.18% 31.25% 18.13% 35.52% 52.17%
Ecommerce (online store) 5.88% 17.41% 12.80% 10.96% 7.50% 12.33% 12.36% 21.74%
Goods management 26.47% 12.59% 10.00% 10.14% 13.75% 9.19% 15.44% 27.54%
SMS communication 2.94% 10.74% 11.71% 7.40% 18.75% 8.86% 16.22% 23.19%
HR management and timekeeping 5.88% 15.56% 7.80% 6.03% 13.75% 6.20% 15.44% 34.78%
Website management 2.94% 10.00% 7.93% 6.30% 6.25% 6.04% 10.81% 26.09%
Large files transfer 38.24% 14.44% 4.88% 3.01% 3.75% 5.16% 8.88% 27.54%
Data storage 55.88% 12.96% 3.78% 3.29% 7.50% 5.16% 9.65% 20.29%
Archiving software 14.71% 9.26% 6.10% 3.56% 8.75% 4.43% 10.81% 24.64%
Newsletter 0.00% 5.19% 6.71% 5.48% 1.25% 5.56% 5.02% 11.59%
Recruitment 64.71% 12.22% 2.93% 1.64% 2.50% 3.79% 9.27% 23.19%
Legal information 11.76% 11.85% 3.66% 4.38% 2.50% 4.19% 7.72% 17.39%
Our structural analysis highlights the fact that the frequency of using the above mentioned
business software solutions is positively correlated with the SMEs’ size (Table 1). This
finding is an extension of the empirical evidence that the diversity and number of the utilized
business software items increases along with the size of the company: microenterprises (1-9
employees) use on average 2.39 items, small enterprises (10-49 employees) – 3.99 items,
while medium-sized enterprises (50-249 employees) use on average 6.07 business software
solutions. We can explain this phenomenon by underlining the following tendencies:
the complexity of the processes in a company, both strategically and operationally,
increases faster than the size of the enterprise, therefore the objective need for business
software solutions becomes more acute and diversified;
the management of the larger companies is more professional and experienced, thus
possessing the necessary skills for operating specific business software solutions, as well
as the insight needed for spotting the areas that demand such approaches;
the larger the enterprise, the more resources it can allocate for the acquisition of business
software, IT infrastructure and personnel with adequate skills and knowledge;
in most of the cases, larger companies engage in more complex projects, therefore there is
a greater need for professional business tools.
A closer look to the magnitude of variation in conjunction with SMEs size reveals the
following hierarchy of the challenges that demand a more intense response in terms of
business software solutions: (1) increasing the efficiency of resource allocation, (2) providing
a more rigorous management of human resources, (3) developing the infrastructure for data
management, (4) optimization and informatization of the operational processes and (5)

Proceedings of the IE 2015 International Conference
www.conferenceie.ase.ro
264
improving communication with clients, business partners and other relevant stakeholders.
The above mentioned findings are sustained by the following facts regarding the magnitude
by which the share of the entities that use a specific software solution in the case of the
enterprises with better and much better results is larger than the percentages of the SMEs
using the same solution, but with worse and much worse outcomes:
17.67 times higher on average for the business software focused on increasing the
efficiency of resource allocation: customer relationship management (16.59), enterprise
resource planning (37.69), fleet management (2.84) and sales force automation (13.58);
6.46 times higher on average for the solutions focusing on providing a more rigorous
management of human resources: wage management (2.92), HR management and
timekeeping (1.08), recruitment (18.56) and employee performance management (3.28);
3.68 times higher on average for the software that relates to data management: large files
transfer (7.79), data storage (6.38), archiving software (1.95), data collection (3.63),
website management (1.03) and document management (1.31);
1.85 times higher on average for the business software focused on Optimization and
informatization of the operational processes: invoicing (1.77), accounting (1.32),
inventory management (1.13), goods management (1.64), legal information (3.43);
1.21 times higher on average for the solutions focusing on improving communication
with clients, business partners and other relevant stakeholders: email (0.97), ecommerce
(1.26), SMS (0.52), newsletter (0.77), internal portal (1.23), videoconferencing (2.56).
By continuing our structural analysis from the perspective of SMEs’ performance dynamics,
an interesting finding arises – the above mentioned hierarchy maintains, therefore the ratio
between the percentages of the companies with better and much better results and those of the
enterprise with worst and much worst performances decreases as the ranking is falling. It
might be that larger organizations are more stable and have greater chances of succeeding,
however this resilience of the hierarchy points out that better performance and higher
employment is positively correlated with all the five challenges we have presented earlier, but
with different degrees of intensity.
3. The main benefits of the business software solutions
Our research also investigates what are the main benefits of the business software items as
seen by Romanian entrepreneurs and managers from SMEs. The importance of the perceived
benefits relies on the fact that they transpose into demanded features and characteristics of
business software solutions. As the development of the IT&C market has shown, despite the
innovative approaches or technologies incorporated in a software product, the failure to
address the consumers’ subjective requirements could bring very fast to unfortunate
consequences.
Their perception is presented in Figure 2, thus underlining the importance of data security
(45.25%), easier collaboration between team members (28.74%), flexible access to corporate
data (28.30%), easier control of internal processes (21.54%), increased customer satisfaction
(19.44%), compliance with current legislation (19.38%), increased performance by
optimizing the operational processes (12.11%), increased productivity of specific
departments (10.33%), customized services and products for clients (7.20%), obtaining
detailed reports regarding various departments (6.88%), paying a monthly fee (5.23%),
removing redundant data entry activities in multiple applications (4.84%), intuitive menus in
Romanian language (4.59%), free and fast upgrade of the software (3.95%) and the feature of
Single Sign On (0.83%).

Proceedings of the IE 2015 International Conference
www.conferenceie.ase.ro
265
Figure 2 - The main benefits of the business software solutions
The structural analysis from the perspective of the SMEs’ size highlights the fact there are
four main types of benefits (Table 2):
a) Business software benefits whose propensity is positively correlated with the size: easier
collaboration between team members, increased customer satisfaction, compliance with
current legislation, paying a monthly fee, removing redundant data entry activities and
software menus in Romanian language.
b) Business software benefits that have quasi-equal percentage for micro and small
enterprises, but a significantly higher value for medium-sized companies: easier control
of internal processes, optimizing the operational processes and single sign on.
c) Business software benefits that have quasi-equal percentage for medium and small
organizations, but a significantly lower value for micro-enterprises: data security, flexible
access to corporate data, increased productivity of specific departments and obtaining
detailed reports.
d) Business software benefits whose values have no clear relationship with the size of the
firm: customized services and products for clients, free and fast upgrade of the software.
Table 2 - The structure of the main benefits of the business software solutions
Benefits of the business software solutions Size
Micro Small Medium
Data security 43.51% 51.35% 52.17%
Easier collaboration between team members 25.22% 37.84% 56.52%
Flexible access to corporate data 27.32% 31.66% 31.88%
Easier control of internal processes 20.95% 21.62% 30.43%
Increased customer satisfaction 17.32% 25.48% 33.33%
Compliance with current legislation 18.21% 23.17% 24.64%
Increased performance by optimizing the operational processes 11.85% 11.58% 17.39%
Increased productivity of specific departments 9.11% 14.67% 14.49%
Customized services and products for clients 6.29% 11.58% 5.80%
Obtaining detailed reports regarding various departments 5.56% 11.58% 11.59%
Paying a monthly fee 4.92% 5.79% 7.25%
Removing redundant data entry activities in multiple applications 3.79% 5.79% 18.84%
Menus in Romanian language 4.03% 6.18% 7.25%
Free and fast upgrade of the software 3.79% 4.63% 2.90%
Single Sign On 0.56% 0.77% 4.35%
0.83%
3.95%
4.59%
4.84%
5.23%
6.88%
7.20%
10.33%
12.11%
19.38%
19.44%
21.54%
28.30%
28.74%
45.25%
Single Sign On
Free and fast upgrade of the software
Menus in Romanian language
Removing redundant data entry activities
Paying a monthly fee
Obtaining detailed reports
Customized services and products for clients
Increased productivity of specific departments
Optimizing the operational processes
Compliance with current legislation
Increased customer satisfaction
Easier control of internal processes
Flexible access to corporate data
Easier collaboration between team members
Data security
Proceedings of the IE 2015 International Conference
www.conferenceie.ase.ro
266
4. Conclusions As the findings of this paper suggest, the diversity and number of the business software items
used increases along with the size of the company. Therefore, the competitive environment
makes it very profitable to acquire new business tools, both in terms of diversity and intensity
of using business software solutions, thus contributing to higher performance and
competitiveness consolidation. By investigating more than 25 purposes for which SMEs use
business software, our analysis allowed us to cluster them in five categories – five challenges
that demand a more intense response in terms of business software use: (1) increasing the
efficiency of resource allocation, (2) providing a more rigorous management of human
resources, (3) developing the infrastructure for data management, (4) optimization and
informatization of the operational processes and (5) improving communication with clients,
business partners and other relevant stakeholders. We consider it very valuable for business
software providers to address the issue of product development from a complex perspective,
thus including in the process such elements as (a) the correlation between a specific domain
of operationalization and the size of the company (even the evolution of the organizational
performance) and (b) the specific benefits that a user expects to receive (i.e.
features/characteristics of the software). Although there is a lot of space for product
customization, a good assessment of the market’s needs and consumer expectations
contributes consistently to a more efficient allocation of resources and opportunity scouting.
Acknowledgement
This work was cofinanced from the European Social Fund through Sectoral Operational
Programme Human Resources Development 2007 - 2013, project number
POSDRU/159/1.5/S/142115 „Performance and excellence in doctoral and postdoctoral
research in Romanian economics science domain”.
References [1] P. Schubert, "Business software as a facilitator for business process excellence:
experiences from case studies," Electronic Markets, vol. 17, no. 3, p. 187-198, August
2007.
[2] D. Rombach, M. Kläs and C. Webel, "Measuring the Impact of Emergence in Business
Applications," Future Business Software, p. 25-26, 2014.
[3] B. Czarnacka-Chrobot, "The Economic Importance of Business Software Systems
Development and Enhancement Projects Functional Assessment," International Journal
on Advances in Systems and Measurements, vol. 4, no. 1&2, p. 135, 2011.
[4] J. Esteves, "A benefits realisation road-map framework for ERP usage in small and
medium-sized enterprises," Journal of Enterprise Information Management, vol. 22, no.
1/2, p. 25-35, 2009.
[5] H. Yang, X. Rui, Y. Liu and J. He, "Business Software Rapid Development Platform
based on SOA," International Journal of Database Theory and Application, vol. 6, no. 3,
p. 21, 2013.
[6] O. Nicolescu, A. Isaic-Maniu, I. Drăgan, C. Nicolescu, O. M. Bâra, M. L. Borcoş and V.
Lavric, White charter of Romanian SMEs in 2014. CNIPMMR. Bucharest: Sigma
Publishing House, 2014.

Proceedings of the IE 2015 International Conference
www.conferenceie.ase.ro
267
ECONOMIC VALUE EXCHANGES IN MULTI-PARTY
COLLABORATIONS: USING E3-VALUE TO ANALYSE THE M-PESA
ECOSYSTEM
Caroline KINUTHIA Vienna University of Technology
Andrew KAHONGE University of Nairobi
Abstract. The mobile market is increasingly facing cut-throat competition. There is a
multitude of stakeholders jostling to rake in the profits. For the brand-new actor keen to
propitiously make a debut in the market, there is need to explore business opportunities in
this novel mobile money industry based on the distribution of value in the network. The goal
is to increase and sustain profitability for the enterprise at all costs. In particular, the
principle of economic reciprocity is the glue that has held M-PESA; a mobile based financial
innovation that first premiered in Kenya together. This paper models value exchanges within
the M-PESA ecosystem using e3-value in order to determine which actor is doing what and
with whom. The contribution is an analysis that addresses these questions: Who are the
business actors involved in the operations? What is in the offing for the actors? What are the
elements of offerings? What value-creating activities have produced or consumed these
offerings? What activities are performed by which actors? Finally, would a different business
model be better positioned to boost M-PESA’s economic value?
Keywords: e3-value, mobile ecosystem, m-pesa, multi-party collaborations, value network
JEL classification: F16, G23, O32
1. Introduction
The contentious question amongst stakeholders is how to effectively apportion profit in the
mobile financial market. In the past, the success of a company relied on its own ability to
single-handedly, create products and provide efficient services. Innovation has brought about
new trends of conducting business. The distinct characteristic of mobile payment ecosystem
is the amalgamation of multiple players in the value network. Every player is competing to
maximize revenue. As already implied, the gap can be bridged by determining and creating
efficient business models.
The objective of the paper is to analyze value creation in the context of mobile payments and
thereafter model the M-PESA system illustrating the economic value exchanges within multi-
party collaborations. We collected information by conducting semi-structured expert
interviews with different professionals in the mobile payment sphere. Other data collecting
activities included distributing user questionnaires and accessing recent literature from
Safaricom [6] [7], which is the Mobile Network Operator that provides the M-PESA’s
technology. This technology has subsequently been mirrored by other countries due to its
success in Kenya.

Proceedings of the IE 2015 International Conference
www.conferenceie.ase.ro
268
The answers we seek comprise:
I. Determining the actors in the network and what they are offering.
II. Establishing the gains that collaboration brings.
III. Identifying activities performed by each actor.
IV. Gauging the capacity of the model to deal with disagreements among different players
amicably.
The paper is organized as follows. In Section 2, we will look at the M-PESA system at a
glance. The next Section discusses the e3-value business model. In Section 4, we will present
the methodology. Thereafter we will present our results, which is an illustration of the M-
PESA technology using [1] and [8] toolset and editor. Finally, we will draw some
conclusions.
2. M-PESA technology at a glance
2.1 How does it work?
M-PESA is a money-transfer service that is operated by Safaricom, the largest mobile
network operator in Kenya. The first step requires the customer to register an M-PESA
account at an M-PESA agency. The M-PESA agent acts as a middleman between the mobile
network operator and the customer. Registration is free. However, the customer should
produce the following: a Safaricom SIM card which has a Safaricom mobile number,
customer’s official names, date of birth and original identification documents of the customer
(National ID, military ID, alien ID or passport). Copies of identification documents are sent
to the Safaricom headquarters for record keeping. Once the customer is officially registered,
the system sends an acknowledgement SMS to both the agent and the customer
acknowledging successful registration. The SMS is a four-digit key that also contains further
instructions on how to complete the activation process. This four-digit key may be
customized to the customer’s numbers of choice and is subsequently used as a PIN number.
Thereafter, the customer may proceed to carry out financial transactions.
2.2 M-PESA Services
The M-PESA system is layered to serve multiple players. Initially, the basic services that
were offered by M-PESA included cash deposits to customer’s own account, loading of
airtime from customer’s mobile wallet, sending money to other M-PESA accounts,
withdrawing hard cash from the M-PESA agent and paying utility bills as mentioned by [5].
However, the quest for traditional financial companies, banks and start-ups to cash in and
leverage for a competitive edge has led to the emergence of new innovative money-transfer
services. Parents can now pay school fees for their children directly to the school via M-
PESA. Another benefit is that customers are able to receive loans at a lower interest rate than
what the banks charge. Remittances of bulk payments (Business to Consumer) may also be
carried out. Some organizations disburse payments through this process to their both their
customers and employers. Many employees have comfortably embraced M-PESA as a safe
platform to receive their salary and insurance payments. In Kenya, the unbanked populace
finds M-PESA as a ubiquitous and fair payment method [3]. The need to carry cash around is
also eliminated resulting to a reduction of criminal attacks. Recently, M-PESA has partnered
with other international companies in a bid to improve service delivery. These partners which
include [1] Western Union, World Remit, Xpress Money, XendPay, SkyForex, Skrill and
Post Finance operate as a conduit allowing customers to send and receive money directly by
phone from United States of America, United Kingdom, United Arab Emirates and Europe.

Proceedings of the IE 2015 International Conference
www.conferenceie.ase.ro
269
3. e3-value approach
3.1 e3-value graphical notation
The developer of e3-value approach [1] [8] modeled a value web made of actors that execute
activities by creating, exchanging and consuming things that have economic value [9]. This
modeling language is ideal for the M-PESA infrastructure. It is ontological-based and it
incorporates concepts from requirements engineering and conceptual modeling [4]. The main
focus is to identify and analyse how value is created, exchanged and consumed in multi-actor
collaborations [2]. The ontology consists of a set of concepts that can easily be used to model
real scenarios. The e3-value ontology is classified under three sub-viewpoints:
I. The global actor viewpoint
It comprises of the Actor, Value Object, Value Port, Value Offering, Value
Interface. Value Transfer, Value Transaction, Market Segment
II. The detailed actor viewpoint.
It comprises of the Composite Actor.
III. The value activity viewpoint.
It comprises of Value Activity
consists-of in
0..* 0..*
has assigned to aas assigned to has 0..1 1..* 1 1 ..* 0..1
1 consists-of
1..2 in
1.. * consists-of 1 consists-of
1..* in has-in in-connects 1..* in offers- offered-
requests requested-by
0..* 1
0..* 1 0..* 1
has- out-connects
out 1..*
Figure 1 - e3-value ontology example source [1]
The graphical notation of e3-value consists of relations and concepts that have been
developed by [1]. The question which drives this approach is; will the idea be something of
economic value?
Market
Segment
Value
Interface
Actor
Value
Transaction
Value
Offering
Value
Exchange
Value
Port
Value
Object

Proceedings of the IE 2015 International Conference
www.conferenceie.ase.ro
270
Figure 2 - e3-value graphical notation source [1]
3.2 e3-value example
Figure 3 - A simplified example to illustrate e3value exchanges
Item [1] shows the start stimulus, the process begins from this point. In Figure 3, there are
two actors which are graphically represented by rectangles; couple and wedding planner
indicated as Item [2]. An actor is an economically independent entity that has the capacity to
increase its own value. Item [3] indicates a value interface. It groups one in-going and one
out-going value offering. Value ports are usually drawn within it. Item [4] shows a value
object. A value object is either a service or product that brings economic value to the actor.
Item [5] is known as a value exchange and is used to connect two value ports with each other.
Item [6] shows value ports which help to interconnect actors in order to facilitate exchange of
value objects. Item [7] shows a value activity. Value activities should be profitable to, at the
very least, one actor. Item [8] joins the value interface with the stop stimulus. Item [9] is a
stop stimulus and its function is to show where the process terminates.
4. Methodology
19 expert interviewees were consulted in order to shed light on the goings-on at MPESA’s
headquarters. 44 percent of the interviewees were technical personnel, while 40 percent held
managerial positions. 10 percent of the remaining interviewees worked as regulators with the
Actor Market segment Value interface Value ports AND (fork/join)
Value activity Value Exchange with Value Objects OR (fork/join) Start Stimulus Payment Goods/Service Stop Stimulus
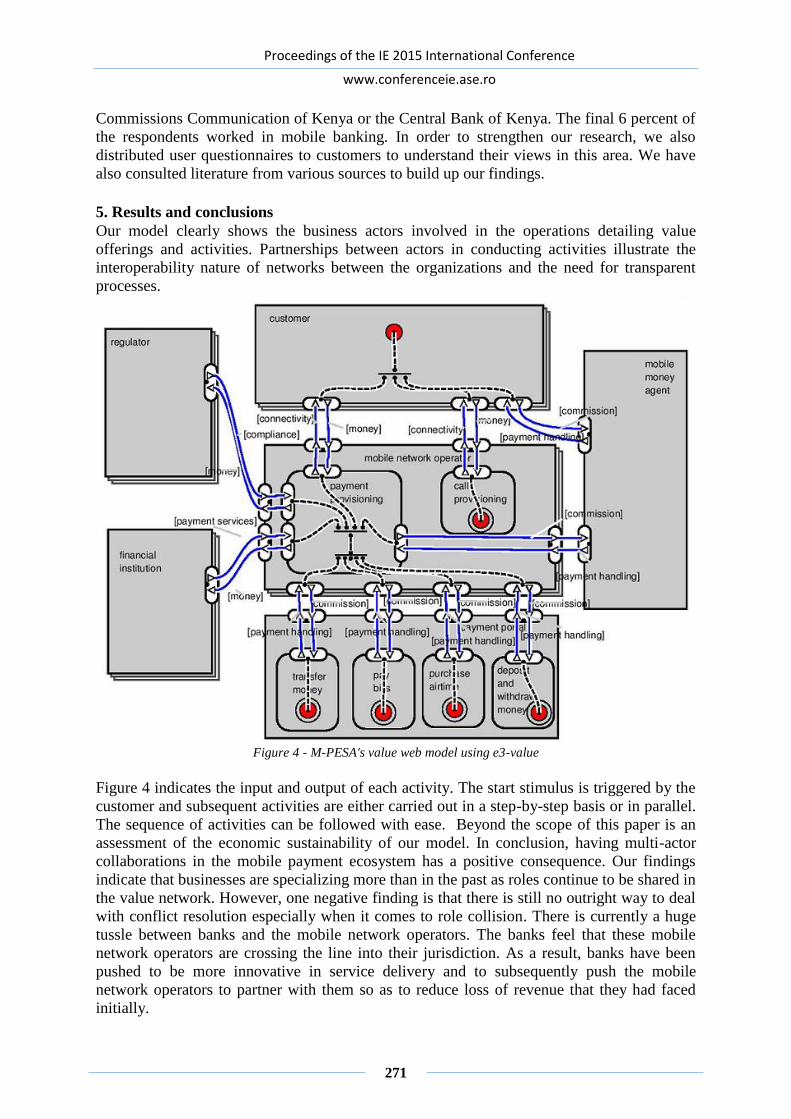
Proceedings of the IE 2015 International Conference
www.conferenceie.ase.ro
271
Commissions Communication of Kenya or the Central Bank of Kenya. The final 6 percent of
the respondents worked in mobile banking. In order to strengthen our research, we also
distributed user questionnaires to customers to understand their views in this area. We have
also consulted literature from various sources to build up our findings.
5. Results and conclusions Our model clearly shows the business actors involved in the operations detailing value
offerings and activities. Partnerships between actors in conducting activities illustrate the
interoperability nature of networks between the organizations and the need for transparent
processes.
Figure 4 - M-PESA's value web model using e3-value
Figure 4 indicates the input and output of each activity. The start stimulus is triggered by the
customer and subsequent activities are either carried out in a step-by-step basis or in parallel.
The sequence of activities can be followed with ease. Beyond the scope of this paper is an
assessment of the economic sustainability of our model. In conclusion, having multi-actor
collaborations in the mobile payment ecosystem has a positive consequence. Our findings
indicate that businesses are specializing more than in the past as roles continue to be shared in
the value network. However, one negative finding is that there is still no outright way to deal
with conflict resolution especially when it comes to role collision. There is currently a huge
tussle between banks and the mobile network operators. The banks feel that these mobile
network operators are crossing the line into their jurisdiction. As a result, banks have been
pushed to be more innovative in service delivery and to subsequently push the mobile
network operators to partner with them so as to reduce loss of revenue that they had faced
initially.

Proceedings of the IE 2015 International Conference
www.conferenceie.ase.ro
272
Acknowledgment
We gratefully acknowledge the PhD School of Informatics, Vienna University of Technology
in conjunction with the city of Vienna for funding this research. We are also thankful to Prof.
Gerti Kappel and Prof. Christian Huemer who introduced to us the e3-value business
methodology. A special thank you to Dr. Rainer Schuster for sparing time from his busy
schedule to discuss e3-value semantics with us and for offering his insights in this topic. We
would also like to mention our fellow colleagues Ilian Berov and Kateryna Zaslavska for
their great input, our esteemed interviewee participants from Safaricom (Kenya),
Communications Commission of Kenya and Central Bank of Kenya. Last but not least, we
appreciate the input of Brian Omwenga; an adjunct faculty at the University of Nairobi, an
ambassador of the Africa Innovation Foundation’s, Innovation Prize for Africa and the
chairperson of the Software Engineering technical committee (TC94) setting national
software engineering standards at the Kenya Bureau of Standards.
References
[1] J. Gordijn, "The e3-value toolset," [Online]. Available: www.e3value.com. [Accessed 17
February 2015].
[2] R. Schuster and T. Motal, "From e3-value to REA: Modeling Multi-party E-business
Collaborations," in Proc. of the Seventh IEEE International Conference on E-Commerce
Technology, Munich, 2009.
[3] T. K. Omwansa, "M-PESA: Progress and Prospects," in Proc. of the Mobile World
Congress, GSMA special edition, Nairobi, 2009.
[4] K. Pousttchi and Y. Hufenbach, "Value Creation in the MobileMarket - A Reference
Model for the Role(s) of the FutureMobile Network Operator," Business & Information
Systems Engineering, vol. 3, no. 5, pp. 299-311, 2011.
[5] I. Mas and D. Radcliffe, "Scaling Mobile Money," Journal of Payments Strategy and
Systems, vol. 5, no. 3, 2011.
[6] W. Jack and S. Tavneet, "The Economics of M-Pesa," Masachusetts, 2010.
[7] Safaricom. [Online]. Available: http://www.safaricom.co.ke/. [Accessed 15 February
2015].
[8] J. Gordijn and H. Akkermans, "Value based requirements engineering: Exploring
innovative e-commerce idea," Requirements Engineering Journal, vol. 8, no. 2, pp. 114-
134, 2003.
[9] C. Huemer, A. Schmidt, H. Werthner and M. Zapletal, "A UML Profile for the e3-value
e-Business Modeling Ontology," in Prof. of the 20th International Conference on
Advanced Information Systems Engineering

Proceedings of the IE 2015 International Conference
www.conferenceie.ase.ro
273
ASPECTS OF INTER-ORGANIZATIONAL KNOWLEDGE
MANAGEMENT IN COLLABORATIVE NETWORKS
Marinela MIRCEA
The Bucharest University of Economic Studies, Bucharest, Romania [email protected]
Abstract. In the knowledge society, the interest given to the organizational networks and
knowledge management is more and more obvious. Among the potential advantages offered by
the two approaches, the increase of flexibility and obtaining a competitive advantage on the
market hold an important place. Apart from the offered advantages, both the organizational
networks and the inter-organizational knowledge management are confronted with problems
and challenges. Inter-organizational knowledge management is a complex process due to both
the nature of knowledge and to the collaborative environment. Two of the major challenges of
inter-organizational knowledge management are knowledge sharing between the members of
the organizational network and interoperability. The main purpose of the paper is the analysis
of the knowledge management process within organizational networks, with an accent on the
changes made by the collaborative environment. Throughout the paper the importance and
necessity of an inter-organizational knowledge management is emphasized, a comparative
analysis of certain aspects of intra and inter-organizational knowledge is performed and the
collaborative characteristics that influence the stages of the knowledge management process
are identified.
Keywords: collaborative networks, information technology, inter-organizational knowledge,
knowledge management. JEL classification: D83, L14, O33
1. Introduction The importance of knowledge and organizational networks in obtaining a competitive
advantage on the market is recognized both by theoreticians and by practitioners as well. The
increase of the number of collaborative networks, the accent on knowledge within the society
based on knowledge and innovation come to support those who want to adhere to new
organizational forms that would lead to obtaining success on the global market.
Knowledge is known as one of the most important assets of management within organizations,
as knowledge allows organizations to use and develop resources, to increase the competitive
ability and to obtain a substantial competitive advantage [1]. Knowledge also represents an
important source that allows nations, organizations, and persons to obtain benefits, such as:
learning improvement, innovation, and decision making. Any organization, public or private,
needs a knowledge management process in order to obtain the best performances [2].
In global economy, the strong competition, the frequent changes on the market, the higher and
higher demands concerning quality, lead to the necessity of new organizational forms.
Organizational networks are acknowledged as organizational forms characterized by an
increased flexibility and that may lead to obtaining the competitive advantage on the market.
Apart from the potential advantages, organizational networks are also confronted with
problems and challenges that are particularly connected to the complexity of the collaborative
environment.

Proceedings of the IE 2015 International Conference
www.conferenceie.ase.ro
274
Inter-organizational knowledge can be defined as an explicit set of knowledge that is
formalized and created by organizations [3]. The interactions within the network allow
organizations to develop the collaborative and relational tacit knowledge and to generate inter-
organizational tacit knowledge that can be capitalized within the inter-organizational memory
[4].The inter-organizational knowledge allows organizations to develop distinctive abilities,
which may lead to the increase of the innovation ability.
Inter-organizational knowledge management is a complex process due to both the nature of
knowledge (intangible, dynamic, intrinsic) and to the collaborative environment as well. One
of the major challenges of inter-organizational knowledge management is its sharing among
the members of the organizational network. The knowledge sharing depends on a series of
factors, such as: the security of the communication channel, the organizational culture of the
participants and their roles, the nature of knowledge (tacit and explicit; formal and informal),
the organizational structure, and the support offered by the information and communications
technology (ICT).
Interoperability also represents another challenge within the inter-organizational knowledge
management. The existence of certain heterogeneous knowledge management systems within
different partner organizations that are not able to communicate and to integrate themselves,
leads to the limitation of reusing the inter-organizational knowledge (formalized explicit
knowledge) [1].
The main purpose of the paper is represented by the analysis of the knowledge management
process within organizational networks, with an emphasis on the changes produced by the
collaborative environment. Throughout the paper the importance and necessity of an inter-
organizational knowledge management is emphasized, a comparative analysis of certain
aspects of intra and inter-organizational knowledge is performed and the collaborative
characteristics that influence the stages of the knowledge management process are identified.
2. Inter-organizational knowledge in collaborative networks
The analysis of the knowledge management process involves the recognition of the types of
knowledge and of the means in which the collaboration influences the stages of their
management process. The explicit or coded knowledge is the knowledge that is transmitted
through a formal, systemic language and that is sent as data, scientific formulas, specifications
or manuals [5]. In such case, both the communications technologies and the knowledge
management systems of organizations influence their management as well. Insuring the
knowledge management systems’ interoperability is also a critical fact for the success at the
level of network.
Tacit knowledge is personal and difficult to formalize. Tacit knowledge is deeply rooted in
action, procedures, routine, commitments, ideals, values and emotions [5]. Their transfer is
much more difficult to accomplish between organizations. The interactions within the
networks, the organizational culture, and the communications abilities are only a few of the
factors that influence the management of these types of knowledge. Moreover, according to
[6], the lack of certain common goals, the significant differences in the corporate culture, the
competition between partners, the lack of certain cooperation rules, the inadequate coordination
and the opportunistic behavior lead to difficulties and restrictions within the inter-
organizational use of knowledge.
In organizational networks trust represents a catalyst that enables strategic business interactions
and knowledge sharing between organizations [7], [8]. Trust symbolizes the positive
psychological state in which you believe in the goodwill and integrity of the correspondent
regarding the support of the promise to obtain common results. Trust is the fundamental
condition necessary for eliminating incertitude within the interaction processes [9].

Proceedings of the IE 2015 International Conference
www.conferenceie.ase.ro
275
Inter-organizational knowledge presents some differences compared to intra-organizational
knowledge, due to the complexity of the collaborative environment in particular. Table 1
displays some aspects regarding the intra and inter-organizational knowledge. The differences
are not only limited to the aspects in the table. Moreover, the structure of the network, the form
of organization (partnerships on long or short term), the size of the network, as well as other
aspects, influence the inter-organizational knowledge, leading to certain differences within the
stages of the management process.
Table 1- Intra and inter-organizational knowledge aspects
Aspects Intra-organizational Inter-organizational
Geographical area Teams, national organization,
multinational organization.
Organizational network
Barriers Formal, hierarchic. Structural, communication, cultural.
Creation
The knowledge creation is
performed within organization.
Many a time, the knowledge is
created in specialized
departments (departments of
research and development).
The knowledge creation takes place in an unsecure
environment. There is a possibility that within the
process, the partner’s goals or behavior might change
and, furthermore, their collaboration relationships.
Through interactions and the reuse of available
knowledge at the level of network, the possibility of
creation of new knowledge is higher.
Transfer
It is accomplished through the
compliance with the intellectual
property rights. It overlaps with
the knowledge change within
organization.
It is influenced by the characteristics of the network,
such as: culture, type of alliance, available ICT. It
shows common characteristics with many of the
knowledge acquisition processes [10].
Share
Takes place in keeping with the
roles, security and integrity of
the knowledge management
system within organization.
Takes place when the partners manage to cultivate
trust and to build long term partnerships.
Storage
It is carried out in
databases/knowledge bases,
according to the organization’s
strategy.
It is carried out according to the agreements within
the network and to the available technology.
Furthermore, the existence of interoperability at the
level of knowledge management systems is
necessary.
Use/
Reuse
Leads to the development of
new products/services/added
value.
Leads to the development of more new knowledge,
through the interaction of the involved partners, trust
and common goals.
In long term organizational networks, knowledge represents the decisive base for the intelligent
and competent performance of partners, and inter-organizational knowledge management
becomes a new paradigm of strategic management [6].
3. Inter-organizational knowledge management
Inter-organizational knowledge management requires an adequate technology (platforms,
applications, instruments), support infrastructure (processes, network roles) and human capital
(digital abilities, collaboration competences and reflexive practical abilities). The adequate
technology depends on the purpose of the organizational network, on the digital abilities of its
members, as well as on the institutionalization degree of their processes [11]. Starting from the
stages of the knowledge management process identified by Schwartz [12] and from the support
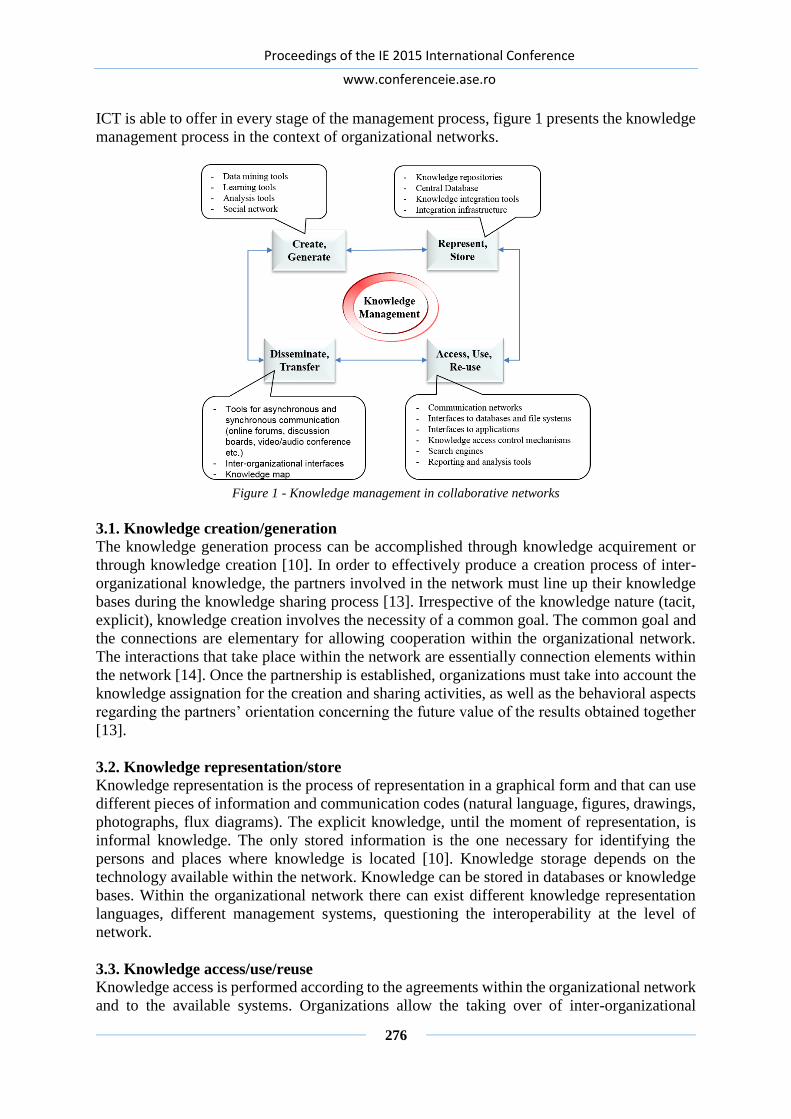
Proceedings of the IE 2015 International Conference
www.conferenceie.ase.ro
276
ICT is able to offer in every stage of the management process, figure 1 presents the knowledge
management process in the context of organizational networks.
Figure 1 - Knowledge management in collaborative networks
3.1. Knowledge creation/generation The knowledge generation process can be accomplished through knowledge acquirement or
through knowledge creation [10]. In order to effectively produce a creation process of inter-
organizational knowledge, the partners involved in the network must line up their knowledge
bases during the knowledge sharing process [13]. Irrespective of the knowledge nature (tacit,
explicit), knowledge creation involves the necessity of a common goal. The common goal and
the connections are elementary for allowing cooperation within the organizational network.
The interactions that take place within the network are essentially connection elements within
the network [14]. Once the partnership is established, organizations must take into account the
knowledge assignation for the creation and sharing activities, as well as the behavioral aspects
regarding the partners’ orientation concerning the future value of the results obtained together
[13].
3.2. Knowledge representation/store
Knowledge representation is the process of representation in a graphical form and that can use
different pieces of information and communication codes (natural language, figures, drawings,
photographs, flux diagrams). The explicit knowledge, until the moment of representation, is
informal knowledge. The only stored information is the one necessary for identifying the
persons and places where knowledge is located [10]. Knowledge storage depends on the
technology available within the network. Knowledge can be stored in databases or knowledge
bases. Within the organizational network there can exist different knowledge representation
languages, different management systems, questioning the interoperability at the level of
network.
3.3. Knowledge access/use/reuse
Knowledge access is performed according to the agreements within the organizational network
and to the available systems. Organizations allow the taking over of inter-organizational

Proceedings of the IE 2015 International Conference
www.conferenceie.ase.ro
277
knowledge and of knowledge that can be reused in order to support the five stages of the
knowledge management process. Thus, the reusable inter-organizational knowledge network
is developed in order to allow member organizations to reuse inter-organizational knowledge
that is stored in the knowledge reservoirs of organizations [3].
3.4. Knowledge dissemination/transfer
Knowledge transfer is an interactive process through which organizations accumulate and
develop new knowledge; it allows business partners to detect and understand business
problems and to develop viable solutions [9]. The knowledge transfer can be accomplished
through different mechanisms: formal or informal [15]; coded or personalized; individualized
or institutionalized [16]. Wagner claims that sharing knowledge within an inter-organizational
network allows the creation of more diverse knowledge than sharing within an organization
[17]. The transfer of knowledge shall be accomplished through a user interface, according to
the used mechanism and the agreements established at the level of network.
In case the knowledge is tacit, the communication is best carried out through socialization or
through the facilities offered by the multimedia communication technology. The effectiveness
and efficiency of the knowledge transfer processes is affected by the assimilation capacity of
the receiver [10]. In order to carry out a better knowledge transfer, both the receiver and the
sender must have a common fund of knowledge (the existence of a redundancy). If there is no
common fund of knowledge, the receiver will not have the possibility to understand the
transferred content, and the process of information is useless. At the opposite side, if the
receiver already contains the transferred information, then it already represents knowledge for
the receiver.
4. Conclusions The society based on knowledge, the new organizational forms, the global market, the
development of the information and communications technology, are the pillars of the
continuous development and innovation. The knowledge associated with new organizational
forms and with appropriate means of management may lead to agility and to gaining the
competitive advantage on the market. However, their embrace does not guarantee
organizational success without an adequate analysis of the ICT support. The present paper
points out certain aspects regarding inter-organizational knowledge within organizational
networks. The paper represents a starting point towards a more detailed analysis of inter-
organizational knowledge management and of the appropriate ICT support.
Acknowledgment This paper was co-financed from the European Social Fund, through the Sectoral Operational
Programme Human Resources Development 2007-2013, project number POSDRU/
159/1.5/S/138907 "Excellence in scientific interdisciplinary research, doctoral and
postdoctoral, in the economic, social and medical fields - EXCELIS", coordinator The
Bucharest University of Economic Studies.
References [1] N. Leung, S.K. Lau and J. Fan, “Enhancing the Reusability of Inter-Organizational
Knowledge: an Ontology-Based Collaborative Knowledge Management Network,”
Electronic Journal of Knowledge Management, vol. 7, no. 2, pp 233 – 244, 2009.
[2] K.A. Al-Busaidi, “A Framework of Critical Factors to Knowledge Workers’ Adoption of
Inter-organizational Knowledge Sharing Systems,” Journal of Organizational Knowledge
Management, vol. 2013, pp. 1-11, 2013.

Proceedings of the IE 2015 International Conference
www.conferenceie.ase.ro
278
[3] N.K.Y. Leung, S.K. Lau and J. Fan, “An Ontology-Based Knowledge Network to Reuse
Inter-Organizational Knowledge,” in 18th Australasian Conference on Information
Systems, Toowoomba, 2007, pp. 896-906.
[4] I. Zouaghi, “Tacit Knowledge Generation and Inter-Organizational Memory Development
in a Supply Chain Context,” Systemics, Cybernetics and Informatics, vol. 9, no. 5, pp. 77-
85, 2011.
[5] E. Shijaku. Knowledge creation and sharing in an organization: An empirical analysis of
the New Product Development process. Internet:
https://www.theseus.fi/bitstream/handle/10024/21190/Shijaku_Elio.pdf?sequence=1,
2010 [February 20, 2015] [6] T. Blecker and R. Neumann, “Interorganizational Knowledge Management: Some
Perspectives for Knowledge Oriented Strategic Managment in Virtual Organizations,”
Interorganizational Knowledge Management, pp. 63-83, 2000.
[7] J.H. Cheng, “Inter-organizational relationships and information sharing in supply chains,”
International Journal of Information Management, vol. 31, no. 4, pp. 374–384, 2011.
[8] S. Hoejmose, S. Brammer and A. Millington, “Green supply chain management: the role
of trust and top management in B2B and B2C markets,” Industrial Marketing Management,
vol. 41, no. 4, pp. 609–620, 2012.
[9] Y.H. Chen, T.P. Lin and D. Yen, “How to facilitate inter-organizational knowledge sharing:
The impact of trust,” Information & Management, vol. 51, pp. 568–578, 2014.
[10] Y. Jarrar, M. Zairi and G. Schiuma. Defining Organisational Knowledge: A Best Practice
Perspective. Internet:
http://ecbpm.com/files/Knowledge%20Management/Defining%20Organisational%20Kno
wledge.pdf, 2010 [February 20, 2015] [11] M. Velasco. Knowledge transfer model for collaborative networks. Internet:
http://www.olkc2013.com/sites/www.olkc2013.com/files/downloads/146.pdf, 2013,
[February 20, 2015] [12] D.G. Schwartz, Encyclopedia of Knowledge Management. Hershey, London, Melbourne,
Singapore: Ed. Idea Group Reference, 2006, pp. 1-902.
[13] A. Capasso, G.B. Dagnino and A. Lanza, Strategic Capabilities and Knowledge Transfer
Within and Between Organizations:New Perspectives from Acquisitions, Networks,
Learning and Evolution, Ed. Edward Elgar Publishing, 2005, pp. 1-377.
[14] M. Brannback, “R&D collaboration: role of Ba in knowledgecreating networks,”
Knowledge Management Research & Practice, vol. 1, pp. 28–38, April 2003.
[15] A.A. Bolazeva. Inter-organizational knowledge transfer mechanisms in the focal
company: a case study. Internet:
http://dspace.ou.nl/bitstream/1820/3698/1/MWAABolazevamei2010.pdf, 2010 [February
20, 2015] [16] W.F. Boh, “Mechanisms for Sharing Knowledge in Project-based Organizations,”
Information and Organization, vol. 17, no. 1, pp. 27-58, 2007.
[17] S.M. Wagner and C. Buko, “An Empirical Investigation of Knowledge-sharing in
Networks,” The Journal of Supply Chain Management, vol. 41, no. 4, pp. 17-31, November
2005.

Proceedings of the IE 2015 International Conference
www.conferenceie.ase.ro
279
4D(ATA) PARADIGM AND EGOVERNMENT
Bogdan GHILIC-MICU
Bucharest University of Economics, Romania
Marian STOICA
Bucharest University of Economics, Romania
Cristian USCATU
Bucharest University of Economics, Romania
Abstract. The move towards global informational society supported by information and
communication technology leads to a radical change of most classical concepts regarding
society structure and the way it is directed and controlled. In this context, we define the 4D(ata)
paradigm in terms of Big Data, Social Data, Linked Data and Mobile Data, as an emergent
model for supporting national and global eGovernment projects. The proposed model has a
high flexibility, adaptable to all four directions of electronic government: G2C, G2B, G2G,
G2E. in this paper we will approach the four concepts defining the 4D(ata) paradigm
independently (as much as possible), highlighting the implications on eGovernment.
Additionally we will identify the synergic effect of existence and functioning of the 4D in
contemporary government systems.
Keywords: big data, social data, linked data, mobile data, eGovernment, information and
communication technology (ICT).
JEL classification: M15, O32, O38
1. Introduction
An essential component of informational society is e-democracy, which concerns the activity
and interactions of citizens, public institutions and political organizations through information
and communications technology (ICT). The purpose of these activities is the development and
promotion of democracy values through citizens’ participation to the decisional process
together with the public authorities, so that citizens can really see the results of their efforts.
ICT facilities, especially communication environments used for interaction by citizens,
organizations and public institutions become fundamental instruments in the process of
modernization of society and government structures.
While electronic government mainly refers to accessibility of government services, electronic
democracy refers to the citizen’s active role in enlarging his possibilities through ICT. Thus,
electronic democracy allows citizens to get involved in public institutions’ activity, taking part
in the decisional process, and it allows the government to react adequately to citizens’ needs
[1].
Information society impact on personal life and individual development of citizens may be
analyzed from several points of view. Such an analysis must consider firstly the model of this
new type of society with all its political, economic and social characteristics both on the level
of individual countries and on international level.
This new concept implemented on country level helps users and has multiple benefic effects.
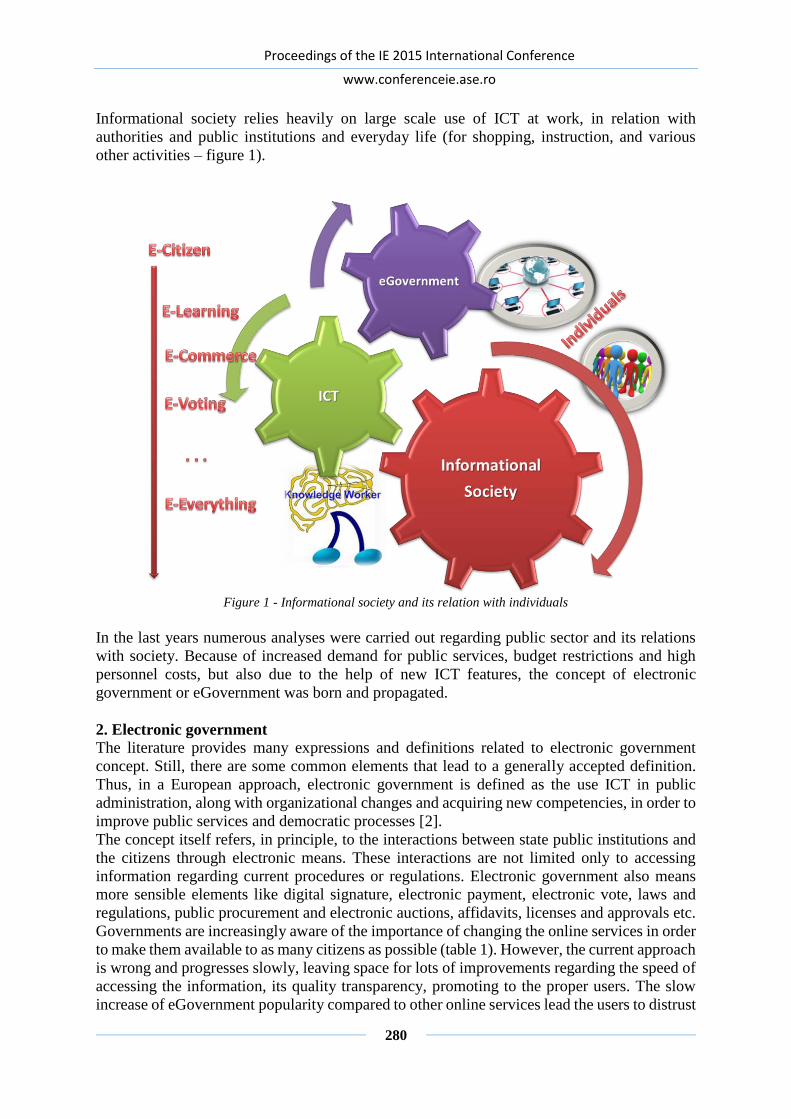
Proceedings of the IE 2015 International Conference
www.conferenceie.ase.ro
280
Informational society relies heavily on large scale use of ICT at work, in relation with
authorities and public institutions and everyday life (for shopping, instruction, and various
other activities – figure 1).
Figure 1 - Informational society and its relation with individuals
In the last years numerous analyses were carried out regarding public sector and its relations
with society. Because of increased demand for public services, budget restrictions and high
personnel costs, but also due to the help of new ICT features, the concept of electronic
government or eGovernment was born and propagated.
2. Electronic government
The literature provides many expressions and definitions related to electronic government
concept. Still, there are some common elements that lead to a generally accepted definition.
Thus, in a European approach, electronic government is defined as the use ICT in public
administration, along with organizational changes and acquiring new competencies, in order to
improve public services and democratic processes [2].
The concept itself refers, in principle, to the interactions between state public institutions and
the citizens through electronic means. These interactions are not limited only to accessing
information regarding current procedures or regulations. Electronic government also means
more sensible elements like digital signature, electronic payment, electronic vote, laws and
regulations, public procurement and electronic auctions, affidavits, licenses and approvals etc.
Governments are increasingly aware of the importance of changing the online services in order
to make them available to as many citizens as possible (table 1). However, the current approach
is wrong and progresses slowly, leaving space for lots of improvements regarding the speed of
accessing the information, its quality transparency, promoting to the proper users. The slow
increase of eGovernment popularity compared to other online services lead the users to distrust

Proceedings of the IE 2015 International Conference
www.conferenceie.ase.ro
281
online public services, creating a vicious circle.
Table 1 - eGovernment strategy benefits
Public sector
in relation
with
Examples Benefits
Citizens
Information
Culture
Health
Education
Transaction advantages
Tax collecting
Wide range of means of
communication, reduced costs for
transactions, expanded services,
openness towards democratic
participation.
Businesses
Support programs
Advice and help
Regulations
Tax collecting
Fast, reduced transaction costs,
facilitates transactions
Suppliers E-procurement
Reduced transaction costs, better stock
management, collaborative
environments
Other
components of
the public
sector
Communication:
Between departments
and agencies
Between local and
central governments
Increased efficiency, reduced
transaction costs, more efficient use of
knowledge bases, more flexible
arrangements
Electronic government is an instrument that contributes to the harmonization of relations
between citizens and public authorities, based on mutual respect and interested collaboration
between the state and citizens. Both theoreticians and practitioners identify and recognize (by
use in specific projects) the four pylons of electronic government: G2C (government to
citizen/consumer), G2B (government to business), G2G (government to government /
administration), G2E (government to public employees). All these forms are based on
electronic government principles, synthesized in six recommendations:
A. Transparent partnership – all activities must be transparent, publicly discussed, considering
the opinions and ideas of all parties involved;
B. Accessible information – respect the citizens fundamental right of access to public
information;
C. Social orientation – implement electronic government considering the citizens’ needs;
D. Legislative harmonization – harmonize the legal framework with international regulations
and standards;
E. Protection and security – respect the constitutional rights and liberties of citizens in the
process of creating, storing, processing and transmitting information, including protection
of personal data, through means and methods of ensuring information security;
F. Priority for political, economic and social dimension against the technological aspects.
Electronic government provides administrations with an online environment for providing
information, observing the most important concepts of electronic environment [3]. Also, the
4D(ata) approach highlights the benefits of applying Linked Data and Big Data concepts. The

Proceedings of the IE 2015 International Conference
www.conferenceie.ase.ro
282
accent is on accountability of governments regarding public data. Also, Social Data concept
evaluates the social dimension of electronic government.
3. Big Data dimension of 4D(ata) paradigm
A multitude of references in literature puts Big Data either in the category of abstract concepts
or specific instruments of information and communications technology. For
comprehensiveness, our approach will consider both aspects. Thus, we may define Big Data as
the concept used to describe datasets of such large size and high complexity that prevents
standard applications to process them. The size of these datasets is above the possibilities of
typical database systems (SGBD) to collect, process, manage and analyze. Because they may
come from a wide range of domains (social, political, economic, scientific, cultural etc.) they
are important for competition, increasing productivity, innovation and increasing the number
of consumers.
The premises of Big Data development are found, firstly, in the spectacular development of
ICT in the last years, which allows today’s world to be better connected, easier to find / locate,
hear / listen. From the perspective if ICT instruments, Big Data may be defined as the
technology that processes large volumes of data, beyond the usual abilities of traditional data
bases. Thus, the Big Data has the two facets of a coin: the descriptive part in the concept
(objective facet) and the applicative part in the technology (subjective facet).
Although one of sectors that benefit most from Big Data is the business sector, public sector is
not outside its influence [4]. On the contrary, Big Data may help lots of governments in serving
their citizens, overcoming the national problems and challenges like unemployment and fraud
fight (for example the American program Medical Fraud Strike Force –
http://www.stopmedicarefraud.gov).
On European side, the first government to employ Big Data was Great Britain, through Horizon
Scanning Center. Using this project, the British government tried to find answers to the
problem of global warming, regional and international tensions and security. The project with
the most significant impact on electronic government was launched in 2009 through the public
portal www.data.gov.uk. It provides users, since the first year of launch, with thousands of
datasets to help them understand the governing ways and policies. The platform offers the
citizens the possibility to get involved in electronic government, giving them the e-citizen
statute [5].
4. Social Data dimension of the 4D(ata) paradigm
There are multiple possibilities to define Social Media. Most definitions highlight three
important elements: (1) user generated content, (2) communities and (3) Web 2.0. [6]
Globalwebindex, for example, quoted by [7], provides the statistics regarding the use of Social
Media (http://www.globalwebindex.net). First four platforms on top are Facebook, Google+,
Youtube and Twitter. The next three platforms are social networks from China, including Sina
Weibo, Tencent, Weibo and Qzone.
In the context of the proposed 4D(ata) paradigm, Social Data means the structured information
obtained from analyses and statistics that describes the behavior patterns of individuals
regarding certain public interest subjects. The information is drawn from the use of electronic
platforms, mainly social platforms and web services that favor human interaction. This
information is gathered on a specific time frame and used to extrapolate certain behavior
patterns or collective trends of change (in specific domains of interests: culture, sport,
education, entertainment, fashion etc.).
The perspective of electronic government must perceive Social Data in terms of data
voluntarily created and disseminated by citizens through social platforms. This type of data is

Proceedings of the IE 2015 International Conference
www.conferenceie.ase.ro
283
mainly subjective and they must be considered appropriately in e-government strategies.
Social Data dimension is used by the government to understand the public opinion, anticipate
the reaction to adoption of governmental decision.
5. Linked Data dimension of 4D(ata) paradigm
The term of Linked Data (interconnected data) was introduced by Sir Tim Berners-Lee, director
of World Wide Web (W3C) consortium and creator of World Wide Web (in 1990), in one of
his works on the architecture of web space [1], [8]. The term describes a way of publishing and
interconnecting data in a structured form, starting from the idea that data becomes more
valuable and more credible when they are connected to other data. This model seeks to
standardize data from heterogeneous sources, using as main rules the RDF model (Resource
Description Framework) in order to publish structured data on the web.
As dimension of 4D(ata) paradigm in relation with electronic government, Linked Data
describes a way to publish structured data so that they interconnect and increase their usability
through semantic queries. This data may be built on current standards, like HTTP, RDS or URI
(Uniform Resource Identifier), with the goal of enriching computing units data bases, leading
to more relevant results.
There are numerous benefits for governments using linked data standards to publish data. Lots
of governments have started a decade ago to create a governmental linked data web space inside
an interconnected data cloud. These attempts involve a more responsible and secure availability
of data and for consumers this translates into easier and more flexible access to government
data.
In the last years there are more and more government projects involving the use of Linked
Data. Starting with www.data.gov platform of United States and continuing with European
Union LATC (Linked open data Arround The Clock), PlanetData project, DaPaaS (Data and
Platform as a Service) project and Linked pen Data 2 (LOD2) project, they all provide
thousands of datasets for every user.
Linked Data standards provide numerous opportunities for government actions regarding
statistics and geo-spatial information because the most useful datasets also contain statistical
information, whether it is the number of vehicles registered in a year or the real location of a
certain event. Both domains have the same large numbers of interested users, thus the use of
Linked Data standard is benefic.
One example of Linked Data for geo-spatial information is provided by the British government.
Through the INSPIRE directive, Great Britain makes sure the European countries exchange
spatial information. Among other functionalities, the directive provides identifiers for spatial
objects and a resolution mechanism (built on standard web architecture).
6. Mobile Data dimension of 4D(ata) paradigm
Like the other three dimensions of the 4D(ata) paradigm related to electronic government,
Mobile Data is a natural consequence of technological development. The mobile phone has
evolved from a simple voice device to multimedia communications, able to access and transfer
audio and video data, functioning also as a global positioning device, electronic wallet etc. In
this context, government applications may take advantage of the functionalities of this widely
used device.
Correlated with the terms previously analyzed, Mobile Data means the possibility to provide
citizens with a collection of instruments for strategic use of governmental services or
applications available only for mobile devices, laptops, tablets and wireless internet
infrastructure.
The relation between citizens and the government has changed since the apparition of Open
Proceedings of the IE 2015 International Conference
www.conferenceie.ase.ro
284
Data concept and mobile applications. They now interact through application for public
transportation payment through mobile phone, emergency applications etc. on the background
of a trend to provide more transparent public data. In a continuously changing society, adapting
to more flexible economic and political conditions, the changes do not stop here (see the
concept of democracy 3.0).
For example, in USA, government agencies have developed applications for airport security
(MyTSA – Transportation Security Administration) or applications that help small enterprises
to apply for various regulations. Other applications provide instructions for emergency
situations, maps to shelters and rescue centers. Still, the potential of mobile data is only
exploited by governments on a small scale.
7. Conclusions
Electronic government must be a goal by itself. Unfortunately, in Romania all the ideas and
efforts of the government have been so far only answers to requests from outside and were
oriented on technology, neglecting all social, political and economic aspects. A more complex
approach, better coordinated and closer to Romanian realities may have better results and lower
costs. A few failures in implementation of western policies in other domains should have taught
us already that in Romania it is hard to build on large scale due to political cycle, budget
restrictions and mentalities. Although, we must not overlook projects that enjoy continued
success (for example the governmental portal for public procurement SEAP – www.e-
licitatie.ro).
Bibliography
[1] W3C, available: http://www.w3.org/standards/semanticweb/data, 2013, [Feb. 20, 2015].
[2] Roșca I. Gh., Ghilic-Micu B., Stoica M. – eds., Informatica. Societatea Informațională. E-
Serviciile, Economica Publishing House, 2006.
[3] Programul de guvernare 2013-2016, available: http://data.gov.ro/about, [Feb. 20, 2015].
[4] European eGovernment Action Plan 2011-2015. Internet: http://ec.europa.eu/digital-
agenda/en/european-egovernment-action-plan-2011-2015, Digital agenda for Europe, A
Europa 2020 Initiative, [Feb. 20, 2015].
[5] Internet, available: http://data.gov.uk/faq, [Feb. 20, 2015].
[6] T. Ahlqvist, A. Bäck, M. Halonen and S. Heinonen (2008), Social Media Roadmaps.
Exploring the futures triggered by social media, [On-line]. VTT Technical Research Centre
of Finland, ESPOO 2008, VTT TIEDOTTEITA research notes 2454 ISBN 978-951-38-
7247-available: http://www.vtt.fi/publications/index.jsp [Feb. 20, 2015].
[7] M. Hu and L. Bing, “Mining and Summarizing Customer Reviews”, in Proceedings of
ACM Conference on Knowledge Discovery and Data Mining (ACM- SIGKDD-2004),
Seattle, Washington, 2004.
[8] Epimorphics Ltd., available: http://www.epimorphics.com/web/resources/what-is-linked-
data, 2012, [Feb. 20, 2015].
Proceedings of the IE 2015 International Conference
www.conferenceie.ase.ro
285
AUTOMATIC USER PROFILE MAPPING TO
MARKETING SEGMENTS IN A BIG DATA CONTEXT
Anett HOPPE
CheckSem Research Group
Laboratoire Electronique, Informatique Et Images (LE2I) UMR CNRS 6306
University of Burgundy, Dijon, France
Ana ROXIN
CheckSem Research Group
Laboratoire Electronique, Informatique Et Images (LE2I) UMR CNRS 6306
University of Burgundy, Dijon, France
Christophe NICOLLE CheckSem Research Group
Laboratoire Electronique, Informatique Et Images (LE2I) UMR CNRS 6306
University of Burgundy, Dijon, France
Abstract. Within the discussion about the analysis methods for Big Data contexts, semantic
technologies often get discarded for reasons of efficiency. While machine learning and
statistics are known to have shortcomings when handling natural language, their advantages
in terms of performance outweigh potential concerns. We argue that even when handling vast
amounts of data, the usage of semantic technologies can be profitable and demonstrate this by
developing an ontology-based system for automatically mapping user profiles to pre-defined
marketing segments.
Keywords: marketing segment, user profiling, semantic Web, Web mining.
JEL classification: M31, L86, D80
1. Introduction
Due to rising mass and complexity of information and products available on the Web, content
customization becomes more and more crucial to enable efficient usage. As stated in a paper
from 2000 [1], technology brings vendor and customer “closer than ever before”, as the former
are able to follow every user’s path on the Web and adapt offers and contents accordingly.
Mass customization, the provision of individualized content for a large number of customers,
heavily relies on automatic analysis of usage histories, web contents and their structures.
Profiling approaches have to connect content information with each user’s individual
navigation history. On a web-scale, this is qualified as a “Big Data” problem [2]. A system
aiming for effective use profiling has to cope with those information masses and deduce
appropriate content to display in quasi-real-time, reacting on momentary and long-term
information needs equally.
In the case of the MindMinings system presented here, we aim for an application mapping user
profiles (built from implicit information) to marketing segments. More specific, we have been
working with experts from digital advertising to identify attributes and concepts that are crucial
for the prediction of a user’s future consumer behavior. On the one hand, the application of
semantic technologies allows to maintain a richer image of each user within the system – by

Proceedings of the IE 2015 International Conference
www.conferenceie.ase.ro
286
extending the keyword-based representation to an ontology structure that relates real-world
concepts with their semantic relationships. On the other hand, the limitation to those entities
that have been identified to be pertinent for consumer segmentation, allows light-weight, rapid
processing.
The implicit information that builds the base for the profiling consists of the browsing
information that is available to each online publisher: user IDs, paired with the contents
requested and a user agent. Based on this information, the goal is to profile the user’s
engagement with certain contents and to predict the likeliness for him to react on a certain
advertisement content, depending on time and used device. All data modelling has been
included in a customized domain ontology (further described in Section 0), that is integrated in
a flexible system that extracts the raw user information from a structured file, retrieves the web
contents in question and relates them to the content-related concepts within the ontology to
allow on-the-fly-segmentation of user activity.
2. Presentation of the implemented approach
The important bottleneck that has been described in relation with semantic technology comes
into play when extracting information through text analysis [7]. Syntactic/semantic analyses of
natural language are costly and have been largely avoided when handling immense amounts of
data [3]. A decoupling of semantic analysis and active user profiling enables us to avoid that
shortcoming of semantic technology. Therein, we benefit from the practical setting in the
industrial application: due to privacy concerns, every online publisher has only access to those
parts of the navigational history that happen on her websites or those of collaborators. Even
though this might involve a conglomerate of differently themed websites, it is still a limited set
of contents that can be continuously monitored and analyzed, the relevant semantic information
kept in the system. In consequence, the task at runtime is reduced to the connection of the
already available semantic page information according to the user’s individual behavior, and
the deduction of inherent patters.
The semantic page information within the system is updated on a regular basis, based on the
lifecycle of the indexed pages. To pertain a maintainable knowledge base, contents that are
vital have to be identified, contents that are outdated or uninteresting for the user base have to
be discarded. At the moment of writing we consider a metric composed of incoming/outgoing
link connections, age of the page and reappearance of its core concepts in novel articles as a
good starting point for an automatic judgment. This allows us to state whether a webpage is
semantically expressive or not. Based on this metric, we perform keyword extraction and
semantic disambiguation of extracted keyword only for webpages considered as semantically
expressive. [4] presents a deeper view on the MindMinings profiling system. The article at
hand will mainly focus on the underlying ontology and application developed.
3. The ontology
3.1. Overall view
The customized domain ontology constitutes the heart of the system. It has been carefully
designed to capture all information that is relevant for the profiling process, but avoiding
unnecessary complexity. As none of the authors has a background in digital advertising, this
working step has been accomplished in dialogue with domain experts.
The goal was a data structure that has the facilities to accompany the profiling process while
being slim. Hence, we limited the scope to those elements that are of high relevance for the
application domain. As a result, we obtain several modules with a varying degree of adaptation
to digital advertising. The basic entities of the user profile consist of attributes that are quite

Proceedings of the IE 2015 International Conference
www.conferenceie.ase.ro
287
generically used through profiling applications. Others, as for example the chosen core
concepts for the qualification of the web contents, feature a set of terms that is highly specific
to consumerism and commerce.
In those cases, we head for a modular ontology design, grouping the concepts in question under
a super-concept. The distinction of specialized and generic components enables to replace the
application-specific element when transferring the data structure to an alternative domain.
Furthermore it enables the integration of a more generic general purpose ontology to facilitate
comparative testing with alternative approaches. 0 shows a high-level overview on the
developed ontology modules and how they connect.
Figure 1 - Schematic view on the top-level classes of the ontology and their relationships
3.2. Main concepts
3.2.1. User ID
The center of the profiling ontology is, of course, the user, identified by an identification string.
As an adaptation to the terminology of digital advertising, this string is called ”BID”, as an
abbreviation for ’browser identification’. The BID concept constitutes the center piece and
connection point for all user related information, be it the modelling of her past navigations or
high-level segment affiliations. It can be seen as the most generic constituent as all profiling
process have to include some way of distinguishing one user from the rest of the group (be it
by a string, an ID number or her name).
3.2.2. Webpage
Web resources are the main source of semantic information. The respective concept is thus the
second anchor point within the ontology. It is identified by a string that contains its URL and
may be connected to further information concerning its domain and owning publisher. The
information is stored as a certain base domain might impose a bias on the topics covered within.
The term ”politics” appearing in a low-level domain, for instance, gives a strong hint on the
topics covered in the child pages. Similarly, a certain partner might be connected to a limited
set of preferred user segments (user profiles mapped to marketing segments).
3.2.3. Navigation history
The navigation history as depicted in the server logs contains the user ID, the page visited, time
stamps, basic information about the used device and, at times, if that particular browsing

Proceedings of the IE 2015 International Conference
www.conferenceie.ase.ro
288
activity represents a successful advertising conversion (meaning, that the page was reached by
clicking of a displayed ad).
The entities related to this part of the user profile are ”Hit” and ”Session” respectively. The
”Hit” groups all information captured for one single user event – the visited web page, time
stamp and user agent. All those data are modelled using OWL datatype properties, including a
boolean variable that captures if the user activity is a reaction on a displayed advertising.
The ”Session” concept groups several clicks based on a time concept. For the moment, the
baseline is to group all hits that have been effectuated in less than thirty minutes’ distance.
3.2.4. Web content information
Each web page is related to summary concepts according to the results of the semantic analysis.
This involves the key concepts that describe the documents content and, based on them, an
affiliation to topic categories that qualify the page on a higher level. To simplify the work with
the experts, those entities are, at the time, named according to the terminology that we
encountered in the domain, ”Keyword” and ”Universe” respectively. Therein, the instances of
”Keyword” capture the found key concepts. The system handles semantically disambiguated
and qualified key concepts, not plain keywords. The term ”Universe” refers to a customized
topic category. The ensemble of universes constitutes a hierarchy of first-level topic concepts
such as ”Foods and Drinks” and ”Kids”. Subordinated are second-level subdivisions such as
”Baby food” and ”Diapers” in the case of the category ”Kids”.
The categorization scheme is probably the module that is most influenced by the application to
digital advertising. For instance, the above division into such fine-grained topic as ”Diapers”
does not seem intuitively graspable. The same applies for first-level categories such as
”Luxury” or ”Hazardous Games” that, from a general point of view in web classification do
not seem of such importance. They are, however, important factors for customer segmentation
and gain such high value in the classification for that.
We make this highly specific categorization scheme interoperable by relating the few core
concepts with their counterparts in existing semantic repositories such as Dbpedia [8]. This
serves unique identification on the one hand; on the other hand it enables us to take advantage
of already existing relational information. Furthermore, all categories are sub-classes of one
central concept ”Universe”. The whole categorization module can thus be exchanged by an
alternative scheme – be it adapted to another application domain or a general classification
standard (such as the category set provided by the Open Directory Project [6]).
3.2.5. Mapping a user profile to marketing segments
The actual qualification of the user happens in two distinct modules that aim to split two levels
of abstraction – the generic user profile and the application-specific segmentation into customer
groups. The ”Profile” class groups sub-classes that capture basic user properties as deductible
from their browsing habits. This includes a group of socio-demographic attributes, such as age
and gender, and behavioral attributes as activity periods during the day or an interest in luxury
goods. Some of these criteria are quite generic to profiling applications – socio-demographic
information are of interest in numerous domains. The behavioral elements however, mirror
clearly the commercial focus of the target application.
So do the user segments that have been exemplified. Indeed, this part of the user profile will
be highly variable, based on current campaigns and clients. The sub-classes of ”Segment”
contain all complex user models that are obtained by combination of attributes from the lower-
level user profile. For a very simple example, one segment ”sporty mom” could capture all
individuals that were recognized as being female, having children and showing an interest in

Proceedings of the IE 2015 International Conference
www.conferenceie.ase.ro
289
sports-related publications for targeting a certain brand of sportswear. Similarly, one could
intend to target often-travelling business people with specific offers from the transport domain.
The usage of membership degrees for the definition of a segment seems quite straightforward
as it is based on notion that seem intuitively interpretable: the certainty with which can be stated
that a user belongs to a certain age group, or the portion of his navigation that is related to a
certain topic category.
In contrast to that, the computation of membership degrees when relating keywords to
categories, or categories to profile attributes poses a conceptual problem. The ”buzzwords”
related to topics evolve in time – a fact that becomes especially clear when considering the
technology domain: new devices appear and replace the former key terms, old terms lose in
importance. In former works, this issue has been solved by analyzing co-occurrence patterns
of terms (e.g. [5]). In our case, we aim to combine two sources of information: the occurrence
patterns in the dynamic corpus of web documents and the rather stable external knowledge
repository. The balancing of both will have important influence on the relational structure of
the ontology.
4. Application example
A few approaches described in literature have been tested in actual industrial environments [9].
We illustrate the current implementation of our system with the example of a user profile
automatically mapped to a pre-defined marketing segment, realized on the base of the ontology.
The goal of a sample campaign described to us by the experts was one targeting individuals
that were (a) mothers, by information known from Customer Relationship Management
(CRM), (b) mainly interested in sports-related topics. The interface shown in 0 shows a
demonstration interface that allows the combination of a list of sample URLs with CRM
information. The URLs are displayed on the left side, together with a classification of their
contents (”Justice and administrations” and ”Sports” in this case). On the right hand side, a set
of drop-down lists allows to enter ”simulated” CRM information. This process is performed
automatically in the system, the manual operation only serves for the demonstration of the
inference engine.
Figure 2 - Demo interface: Combination of content-related features and CRM (male, over 65, no children)
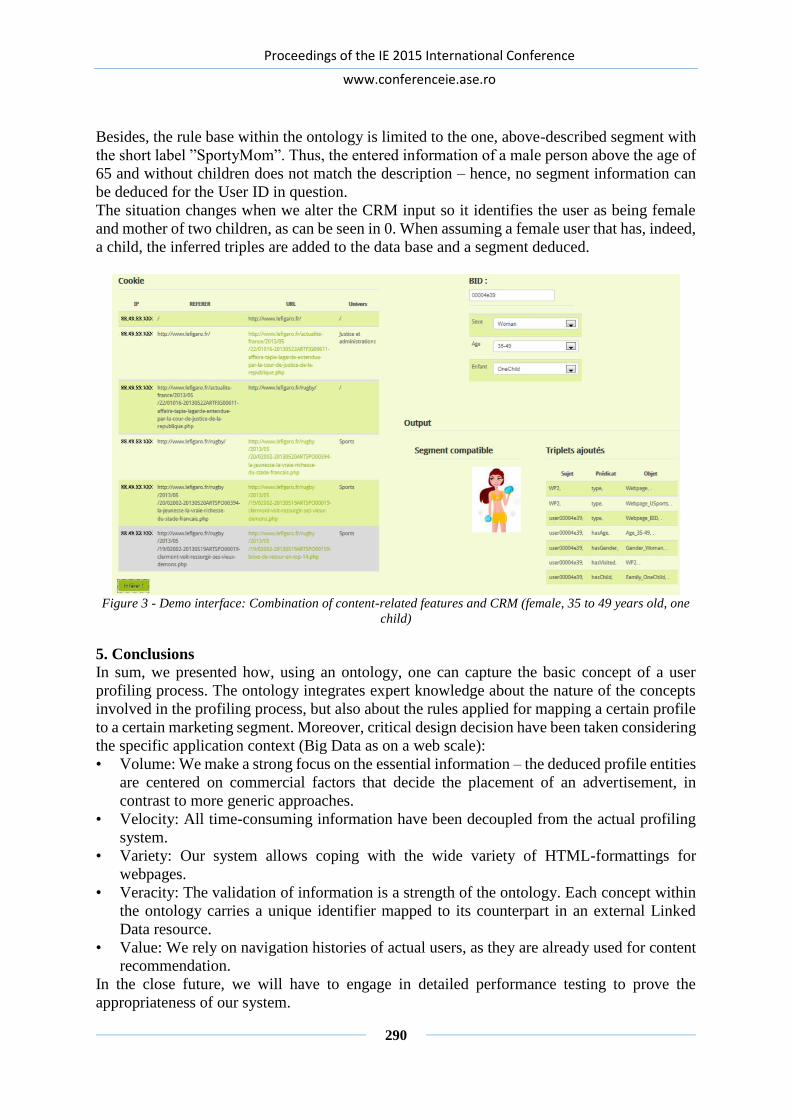
Proceedings of the IE 2015 International Conference
www.conferenceie.ase.ro
290
Besides, the rule base within the ontology is limited to the one, above-described segment with
the short label ”SportyMom”. Thus, the entered information of a male person above the age of
65 and without children does not match the description – hence, no segment information can
be deduced for the User ID in question.
The situation changes when we alter the CRM input so it identifies the user as being female
and mother of two children, as can be seen in 0. When assuming a female user that has, indeed,
a child, the inferred triples are added to the data base and a segment deduced.
Figure 3 - Demo interface: Combination of content-related features and CRM (female, 35 to 49 years old, one
child)
5. Conclusions
In sum, we presented how, using an ontology, one can capture the basic concept of a user
profiling process. The ontology integrates expert knowledge about the nature of the concepts
involved in the profiling process, but also about the rules applied for mapping a certain profile
to a certain marketing segment. Moreover, critical design decision have been taken considering
the specific application context (Big Data as on a web scale):
• Volume: We make a strong focus on the essential information – the deduced profile entities
are centered on commercial factors that decide the placement of an advertisement, in
contrast to more generic approaches.
• Velocity: All time-consuming information have been decoupled from the actual profiling
system.
• Variety: Our system allows coping with the wide variety of HTML-formattings for
webpages.
• Veracity: The validation of information is a strength of the ontology. Each concept within
the ontology carries a unique identifier mapped to its counterpart in an external Linked
Data resource.
• Value: We rely on navigation histories of actual users, as they are already used for content
recommendation.
In the close future, we will have to engage in detailed performance testing to prove the
appropriateness of our system.
Proceedings of the IE 2015 International Conference
www.conferenceie.ase.ro
291
References
[1] J. Srivastava, R. Cooley, M. Deshpande and P.N. Tan, “Web usage mining: Discovery and
applications of usage patterns from web data”. ACM SIGKDD Explorations Newsletter
1(2), 2000, pp.12-23
[2] J. Manyika, M. Chui, B. Brown, J. Bughin, R. Dobbs, C. Roxburgh, and A. H. Byers, “Big
data: The next frontier for innovation, competition, and productivity,” The McKinsey
Global Institute, Tech. Rep., May 2011.
[3] E. Cordo. Building Better Customer Data Profiles with Big Data Technologies, available:
http://data-informed.com/building-better-customer-data-profiles-with-big-data-
technologies/, December 10, 2012 [Feb. 25, 2015].
[4] A. Hoppe, A. Roxin and C. Nicolle, “Dynamic semantic user profiling from implicit web
navigation data”, in proc. of the 13th International Conference on Informatics in Economy,
2014, ISSN: 2247 - 1480
[5] M. Abulaish and L. Dey, “Biological ontology enhancement with fuzzy relations: A text-
mining framework,” in Web Intelligence, 2005. Proceedings. The 2005 IEEE/WIC/ACM
International Conference on. IEEE, 2005, pp. 379–385.
[6] C. Sherman, “Humans do it better: Inside the open directory project,” Online, vol. 24, no.
4, pp. 43–50, 2000.
[7] A. Halevy, P. Norvig, and F. Pereira, “The unreasonable effectiveness of data,” Intelligent
Systems, IEEE, vol. 24, no. 2, 2009, pp. 8–12.
[8] S. Auer, C. Bizer, G. Kobilarov, J. Lehmann, R. Cyganiak, and Z. Ives, “Dbpedia: A
nucleus for a web of open data,” in The semantic web. Springer, 2007, pp. 722–735.
[9] S. Calegari and G. Pasi, “Personal ontologies: Generation of user profiles based on the
fYAGOg ontology,” Information Processing & Management, vol. 49, no. 3, pp. 640 – 658,
2013, personalization and Recommendation in Information Access, available:
http://www.sciencedirect.com/science/article/pii/S0306457312001070 [Feb. 25, 2015]

Proceedings of the IE 2015 International Conference
www.conferenceie.ase.ro
292
DECISION-MAKING PROCESS ASSISTANCE USING PRECISION
TREE MODULE OF PALISADE DECISION TOOLS SUITE
Georgeta SOAVA
University of Craiova, Faculty of Economics and Business Administration
Mircea Alexandru RADUTEANU
University of Craiova, Faculty of Economics and Business Administration
Catalina SITNIKOV
University of Craiova, Faculty of Economics and Business Administration
Abstract. In the information society, the information becomes a "strategic resource" for any
business; systems integration has become particularly important because of the facility of
shared use of data and their movement within and outside the company. In this paper, we
wanted to present the importance and while necessity of using information technologies in the
substantiating and decision-making. Thus we presented some general aspects of the decision
process computerization; we have reviewed some theoretical considerations on interactive
decision support systems and decision-making stages in assisted mode. Based on these, we
considered a particular case of decision-making process under risk and uncertainty on a
reputable company in Romania, SC Guban SA. The problem of study consisted in accepting or
not, to produce under another brand. To address this hypothesis we used the package offered
by Palisade Decision Tools Suite-module, Decision Tree, which offers us the solutions and
recommendations. This model provide decision-makers the ability to quickly process
information available and to address complex problems, time-consuming in real-time, creating
a strategic and competitive advantage for the company.
Keywords: company, decision, decision-tree, information, technologies
JEL classification: M1, D7
1. Introduction
The emergence of a new technological paradigm organized around new information
technology, more powerful and more, supple 'even allow information to become a product of
the production process. In the new economic environment, IT tool tends to become a weapon,
if they haven't it, the main competitors it will use against you. For companies, the implications
of technological, behavioural, organizational especially, are extremely high: they are forced to
increase and restructure of the production circuits, including to reduce for as the information
to circulate more quickly, to manage products with maximum efficiency, by eliminating, where
possible, the stocks to ,,thinking", to produce and react to market signals in real time.
The wide proliferation of the informatics, the current information revolution put their strong
imprint on decision processes. At the moment we notice a computerization of the decision-
making process at more and more companies, namely are using computers in all stages of this
process, through specialized programs that can substantially increase the speed and
effectiveness of decision making. Cybernation of the decision-making process generates
multiple specific advantages in the enterprise: increasing the substantiating degree, of the

Proceedings of the IE 2015 International Conference
www.conferenceie.ase.ro
293
rationality of decisions, the use of a larger volume of information processed with sophisticated
procedures and models; speed up of the decisions, providing higher chances of employment
during the period optimal decision; facilitation and increasing the accuracy in the assessment
of the effects of decisions by managers, especially in the economic; the partial freeing of the
managers to perform routine tasks in particular regarding the collection, processing and
verifying information, which creates the possibility of focusing on the major components of
their work.
2. Decision support systems Automating of the data collection on the evolution of various economic phenomena
characteristic of the firm and its external environment, the use complex computational models
and their analysis leads to an explosion of information available to the decision maker, which
could not be effectively used without decision support systems.
Decision support systems are interactive systems that, through of the decisions models and of
specialized databases provide information to assist managers in making decisions [1]. The main
objective of such a system is to streamline the decision making process by using information
technologies. Over time were formulated many definitions for decision support systems (DSS).
In this regard it is noted Sprague and Carlson, which define the DSS as "an interactive computer
system that assists decision makers in the use of the data and models in order to solve the
problems structured, semi-structured or unstructured"[2]. Kanter believes that "DSS is used in
less structured problems, where art meets science of management"[3]. Kroenke defines the
DSS as "a set of tools, data, models and other resources on that decision makers use them to
understand, evaluate and solve unstructured problems” [4]. O’Brien stated that DSS is a
"system that provides interactive information to support decision-makers in the decision-
making process" [5].
By reviewing the views presented above, the following conclusion emerges: a DSS is an
information system that incorporates data and models used to support, not replace, the human
factor in the decision making, when decisions which will be taken are semi-structured or
unstructured. In such an decision - information environment, the use of DSS and intelligent
systems can assist decision-makers so that they do not lose sight of the major influencing
factors in problem analysis, to be informed on the reasons that motivate decisions their own
experience and enrich their knowledge base through access to knowledge and experience of
others, may transfer their knowledge as knowledge bases or diagnosis. In this way, the use of
decision support systems is an opportunity being beneficial for decision-making activity.
A decision support system is a powerful tool and should be an integral component of
managerial work to extend the manager's ability to process viable information quickly and to
treat complex problems, time consuming, reduces time allotted of the decision process,
improves reliability of decision-making, encourages exploration and learning process, creates
a strategic and competitive advantage for the company.
Analysis of decisions starts the on the one hand, by the premise of the accepting of the human
limits of information processing and, on the other hand, by considering need to incorporating
of the judgments and intuitions, of the imagination results and makers decision creativity.
The aim is not only to solve (in the sense of providing solutions for) different decision
problems, but the primary aims is to help and encourage the decision maker to think, to give
the structure of the problem to understand it better, to choose and "clarify" the goals set and to
identify (or imagine) easier the alternative of action to evaluate.

Proceedings of the IE 2015 International Conference
www.conferenceie.ase.ro
294
3. Palisade Decision Support package – Precision Tree
At company level, the decision situations are very different, and decision-making processes
involved are extremely heterogeneous in terms of structural and functional parameters. In this
way, it requires a deeper approach of the main components involved: decision maker, decision
variants crowd, decision criteria crowd, environment, the crowd of consequences and
objectives. Currently, decision analysis is supported by a number of methods and techniques,
using specific tools such as risk analysis, influence diagrams and decision trees etc. Analysis
of decisions begins, on the one hand, on the assumption of acceptance human limits of
information processing, and on the other hand, from the need to incorporate judgments and
intuitions, of the results of imagination and creativity of the makers.
Decision Tools Suite is software produced by Palisade Corporation, able to provide solutions
for risk analysis, representing a robust and innovative decision support. Decision Tools Suite
contains multiple modules, which added to Microsoft Excel, ensuring flexibility, ease of use,
and addresses a wide range of clients in all areas of life. Decision Tools Suite has been widely
adopted in almost all fields. Since decisions at the company, can be complex and involves
massive amounts of data, Decision Tools Suite are designed for computational speed and
maximum capacity, while maintaining ease of use.
In this paragraph, we have decided to present the facilities offered by this software in the
interactive decision support under risk and uncertainty, using Precision Tree module.
In business in general, but especially in the company’s activity, many times decisions not
depend only by the immediate consequences but on the basis more remote consequences of
future decision-making processes. It should be noted that in the globalization, uncertainty is
manifested significantly. Evaluation of such cascading decision making can be performed using
the decision tree.
Precision Tree is part of a package of decision support Palisade that brings advanced concepts
of modelling and decision analysis of the Microsoft Excel environmental, based on the
traditional model of decision tree. It is used to structure decisions to make them more
understandable to those who need to interpret them.
An analysis of decision provides a simple report format of the preferred route for decision-
making and risk profile of all possible outcomes. It can also present the results to understand
the trade-offs, conflicts of interest, and important objectives.
The decision tree involves consideration of "operative risk" based on the uncertainty of
situation and the impossibility of forecasting accurate it, and involves the following steps: (a)
definition of decision making, of random moments and their succession; (b) collect information
on the various action alternatives; (c) determination of the state of nature and of strings of
events; (d) estimating the effects of the end of each series of events, and evaluation criteria for
effectiveness; (e) discovery of a certain selection policy of the decision alternatives; (f)
sensitivity analysis for the optimal solution; (g) final analysis and issuing recommendations for
decision making.
Determination of the optimal solution actually means finding the best way, the most appropriate
branch of the tree starting from the final node to the initial node.
We will try to exploit the importance of the decision analyze through the decision tree, and the
facilities offered Precision Tree package, of the company Palisade, in decision making, starting
from a situation occurring at a company that manufactures shoes "Guban".
4. Case study - using Precision Tree at Guban Company
The Guban Company has a long history, the modern models by each season are made only
from the finest leather quality, are handmade [6].
The company manufactures and sells footwear in the country and in the European market, about

Proceedings of the IE 2015 International Conference
www.conferenceie.ase.ro
295
one million pairs on year. Margin realized by the company on a pair of shoes is 0.4 euro. A
transnational company from Asia with a strong network of department stores around the world
proposes of Guban Company, manufacture of shoes, but with transnational company brand,
and will earn 0.1 euros, on the pair of shoes but would have a much bigger market outlets.
According to its tradition Guban Company, wants to preserve the brand. It is estimated that the
emergence of this new brand makes a barrier to the current its market. The new market is
expected to be triple, face from losing Guban. If Guban Company refuses proposal, it is
possible as its main competitor (Leonardo), shall have requested and will accept with a
probability of 60%. It may in this case to avoid losing more customers to initiate an advertising
campaign for 300,000 euros, in this case, be able to decrease the profit margin, remained 0.35
euro benefit. We suppose as transnational company will not be able to start an advertising
campaign for 400,000 euros if Guban Company will react (probability 50%).
In this case, we have the following technical data:
1. Considering that Guban accept the Asian company's offer, it can lose: 10% of the market
with a probability of 30%, 15% of the market with a probability of 50%, and 20% of the market
with a probability of 20%;
2. If Guban Company refuses the proposal and the competitor accepts it, we have three
alternatives:
a) Guban Company doing nothing;
b) Guban Company starts an advertising campaign, and in this situation can lose:
given that competitors Guban does nothing: 0% of the market with probability 10%, 5% of
the market with a probability 60%, and 10% of the market with a probability of 30%;
given that competition also begins an advertising campaign, Guban company lose: 10% of
the market with a probability of 30%, 15% of the market with a probability of 40%, and
20% of the market with a probability of 30%;
c) Guban Company decreases the product price, and in this case, there may be two versions:
if competition does nothing, Guban lose: 5% of the market with a probability 30%, 10% of
the market with a probability of 50%, and 15% of the market with a probability of 20%;
if competition begins an advertising campaign, the Guban company may lose: 10% of the
market with a probability of 40%, 15% of the market with a probability of 40%, and 20%
of the market with a probability of 20%.
Using "Precision Tree", we will realize the decision tree, the evaluation of results at each branch
of the tree and is calculated for each variant, expected value. Once launched the challenge
coming from both the transnational company and the competition, the Guban SA Company
could no longer be sure that the margin received for a couple of footwear and therefore will
result in a certain amount of margin variability. This variability brings the manufacturer and
the danger of losing: thus in the achieved decision tree, it can be automatically calculate the
amount that it expects to collect at a pair of shoes under the circumstances, and could also cause
the average value, or expected. Model is shown in Figure1 (a part of the decision tree
constructed as it is very large).
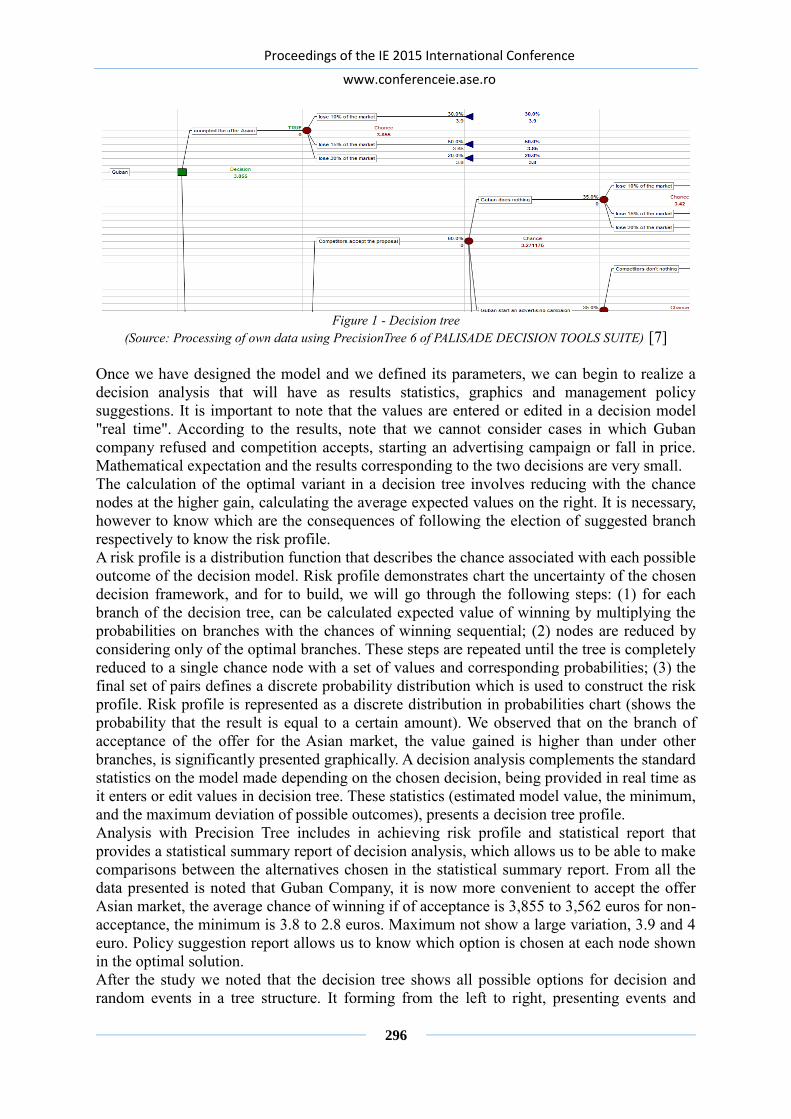
Proceedings of the IE 2015 International Conference
www.conferenceie.ase.ro
296
Figure 1 - Decision tree
(Source: Processing of own data using PrecisionTree 6 of PALISADE DECISION TOOLS SUITE) [7]
Once we have designed the model and we defined its parameters, we can begin to realize a
decision analysis that will have as results statistics, graphics and management policy
suggestions. It is important to note that the values are entered or edited in a decision model
"real time". According to the results, note that we cannot consider cases in which Guban
company refused and competition accepts, starting an advertising campaign or fall in price.
Mathematical expectation and the results corresponding to the two decisions are very small.
The calculation of the optimal variant in a decision tree involves reducing with the chance
nodes at the higher gain, calculating the average expected values on the right. It is necessary,
however to know which are the consequences of following the election of suggested branch
respectively to know the risk profile.
A risk profile is a distribution function that describes the chance associated with each possible
outcome of the decision model. Risk profile demonstrates chart the uncertainty of the chosen
decision framework, and for to build, we will go through the following steps: (1) for each
branch of the decision tree, can be calculated expected value of winning by multiplying the
probabilities on branches with the chances of winning sequential; (2) nodes are reduced by
considering only of the optimal branches. These steps are repeated until the tree is completely
reduced to a single chance node with a set of values and corresponding probabilities; (3) the
final set of pairs defines a discrete probability distribution which is used to construct the risk
profile. Risk profile is represented as a discrete distribution in probabilities chart (shows the
probability that the result is equal to a certain amount). We observed that on the branch of
acceptance of the offer for the Asian market, the value gained is higher than under other
branches, is significantly presented graphically. A decision analysis complements the standard
statistics on the model made depending on the chosen decision, being provided in real time as
it enters or edit values in decision tree. These statistics (estimated model value, the minimum,
and the maximum deviation of possible outcomes), presents a decision tree profile.
Analysis with Precision Tree includes in achieving risk profile and statistical report that
provides a statistical summary report of decision analysis, which allows us to be able to make
comparisons between the alternatives chosen in the statistical summary report. From all the
data presented is noted that Guban Company, it is now more convenient to accept the offer
Asian market, the average chance of winning if of acceptance is 3,855 to 3,562 euros for non-
acceptance, the minimum is 3.8 to 2.8 euros. Maximum not show a large variation, 3.9 and 4
euro. Policy suggestion report allows us to know which option is chosen at each node shown
in the optimal solution.
After the study we noted that the decision tree shows all possible options for decision and
random events in a tree structure. It forming from the left to right, presenting events and

Proceedings of the IE 2015 International Conference
www.conferenceie.ase.ro
297
decisions related. All options, outcomes and expected values with the values and their
associated probabilities are shown directly in the spreadsheet. We note that there is little
ambiguity about the possible outcomes and the decisions of the branches, is enough we to look
at the node, and we can see all possible outcomes, coming from node. Also, the fact that the
data are processed in real time, we have able to test any options want, and finally choose the
one that best satisfy our desires. And to have the best results in the analysis carried out, we can
continue with sensory analysis of each branch, or only the branches that we raise some
questions. To determine which variables matter most in our decisions, we use sensitivity
analysis which is useful for finding the limit values, where an optimal choice for a decision
node changes values.
If we want more information, we can change the limits chosen and restores sensitivity analysis.
Alongside of graphic we have and data report on that was done this, and so we can evaluate
each graph correspond the test data respectively the expected value, and finally see what we
can do to have the highest gain, or in other words the smallest loss. According to these graphs
we can evaluate, the progress of the expected value based on the value of the selected input.
Decision Analysis provided by Precision Tree give us direct reports, including statistical
summaries, risk profiles and provides policy suggestions on that manager to consider them.
Decision analysis can produce more quality results, on that putting them to the available to the
manager enables him to foresee the conflicts of interest and the main important objectives. All
results of analyses are reported directly in Excel for an easy customization, printing and saving.
No need to learn something new because all Precision Tree reports can be modified like any
other Excel worksheet or chart.
Efficient use of decision tree method depends on the update of the information as rolling
process modelling, being quite complicated, as when developing the model can be fully
estimated the decision variants. In order to avoid major deviations, is need as the tree to be
reviewed and according to materialize assumptions to be reassessed reasoning in the decision
intermediate nodes.
The deficiencies of the decision tree method, starting from the lack of information on the
dispersion and shape distribution of all possible outcomes and the probabilities of these
outcomes. It is very important to carry out a full description of probability distributions,
because makers have different reactions and attitudes towards risk, and the shape of the
probability distribution allows outlining a view of the risk associated with each alternative. To
try to limit these shortcomings, we can use the other components of the package from Palisade
Decision Tools.
4. Conclusions
As a result of this, we can say that decision support systems, in the conditions of globalization,
becomes an indispensable condition for managers, to analyze information in order to
substantiate and adoption decisions in real time, which can provide a strategic and competitive
advantage for the company. Palisade software package it constitute in a basic support for
managers in decision making, in conditions of risk and uncertainty. The advantages that result
from the use of a decision support system are not identified in all decision situations or all
decision-makers, but depends on the degree of matching between the decision maker, the
decision context and decision support system. We can say that the package Palisade - Decision
Tools Suite is a specialized system for risk analysis that allows users to control decision-making
and be able to optimize, it so that decisions could ultimately face an uncertain environment
with a plurality of different risks. In this way, we believe that for managers of any company,
such a powerful tool in an uncertain world is mandatory for face challenges.

Proceedings of the IE 2015 International Conference
www.conferenceie.ase.ro
298
References
[1] S. Berar, The decision system of the company. Informatics and Economic Prospects,
available: http://www.geocities.ws/sanda_berar/procesuldecizional.htm2011
[2] R. H. Sprague and E. D. Carlson, Building Effective Decision Support Systems. Englewood
Cliffs, NJ: Prentice-Hall, Inc., 1982, pp.22
[3] R.M. Kanter, B. Stein and T. D. Jick, The Challenge of Organizational Change: How
Companies Experience It and Leaders Guide It. New York: Free Press, 1992, pp.56
[4] D. Kroenke, Management Information System, Mitchell McGraw-Hill, 1992, pp. 38
[5] J.A. O'Brien, Management Information System, McGraw-Hill International Editions, 1999,
pp.79
[6] Compania Guban, available: http://guban.ro/sample-page/
[7] Software Precision Tree 6, Palisade DecisionTools Suite

Proceedings of the IE 2015 International Conference
www.conferenceie.ase.ro
299
RoaML: AN INNOVATIVE APPROACH ON MODELING WEB
SERVICES
Cătălin STRÎMBEI
Al.I.Cuza University of Iasi
Georgiana OLARU
Al.I.Cuza University of Iasi
Abstract. What we intend to argue in this paper is whether a new service-based modeling
approach could be technologically feasible, desirable by architects and developers and viable
as new MDA platform. This new approach we call it RoaML as a “step-brother (or sister)” of
already established SoaML initiative.
Keywords: Web services, RESTful services, Service Oriented Architecture, ROA, SOA.
JEL classification: D83, L86
1. Introduction: web service-based architectures and UML modeling A software architecture is an abstraction of the run-time elements of a software system. It is
defined by the configuration of its elements – components, connectors, and data – constrained
in their function and relationships in order to achieve a desired set of architectural properties
(e.g., reliability, scalability, extensibility, reusability). Currently, two architectural styles are
dominant: Service Oriented Architecture (SOA) and Resource Oriented Architecture (ROA).
The SOA and ROA architectural design patterns and the corresponding distributed
programming paradigms provide a conceptual methodology and development tools for creating
distributed architectures. Distributed architectures consist of components that clients as well as
other components can access through the network via an interface and the interaction
mechanisms the architecture defines; in the cases of ROA and SOA such distributed
components will be named respectively resources and services.
With the emergence of SOA, a new UML specification was needed in order to cover the needs
of designing services - SoaML. In this article we will argue whether another initiative more
appropriate for the specific needs of modelling ROA applications.
1.1 SoaML framework Service Oriented Architecture (SOA) is the paradigm for the development of software systems
based on the concept of service. A development method based on the SOA paradigm requires
some notations to present services, their interfaces and the way they are built, including the
case where they are built from other services, the architecture of a system in terms of services
and the way they are orchestrated [6]. The SoaML specification defines a UML profile with a
metamodel that extends UML to support the range of modelling requirements for SOA,
including the specification of systems of services, the specification of individual service
interfaces, and the specification of service implementations. The SoaML metamodel extends
the UML metamodel to support an explicit service modelling in distributed environments. This
extension aims to support different service modelling scenarios such as single service
description, service-oriented architecture modelling, or service contract definition. This is done

Proceedings of the IE 2015 International Conference
www.conferenceie.ase.ro
300
in such a way as to support the automatic generation of derived artefacts following the approach
of Model Driven Architecture [9].
The OMG SoaML specification also introduces the concept of services architecture to model
how a group of participants that interact through services provided and used to accomplish a
result. According to SoaML, a service is an offer of value to a service consumer (a simple client
or another service) through a well-defined interface that could be available to a community
(which may be the general public). For SoaML, a service architecture is made by a group of
participants providing and consuming services at specific service points [1]. The goals of
SoaML are to support the activities of service modelling and design and to fit into an overall
model-driven development approach, supporting SOA from both a business and an IT
perspective.
1.2 IBM Rational Rose Framework: REST Service Model Concerning the modeling of SOA requirements we have a well-defined standard (SoaML).
Regarding the modelling of ROA requirements, we don’t have any specific official guidelines.
One attempt to customize the modelling and design for RESTful Web Services comes from
IBM, that has included in version 8.0.3 of Rational Software Architect Version a template for
REST Modelling [12]. This template proposes a set of elements for class and sequence
diagrams like Resource Class, Path Dependency, GET Operation, PUT Operation, POST
Operation, HEAD Operation and Delete Operation. These elements allow some kind of basic
resource modelling but they don’t offer other guidelines on how to model more complex
architectures and we think that it does not represent a comprehensive modelling approach
regarding ROA domain.
2. ROA vs. SOA The traditional conceptual model of service-oriented architectures, or the service-oriented
paradigm, seems like one evolutionary way of distributed computing programming. As Object
Orientation paradigm has “naturally” evolved from procedural programming and modular
development, challenged by distributed computing models based on RPC, T. Erl argues that
service orientation evolved from object orientation, challenged by new distributed computing
and integration models BPM, EAI and, finally, by web services standardized such as SOAP
initiatives[3].
Our question is: REST oriented conceptual model could be the next evolutionary step of
service-like architectures? Maybe … or maybe not? The main advantage of SOA over ROA is
the more mature tool support, type-safety of XML requests. Conversely, the main advantage
of ROA is the ease of implementation, the agility of the design, and a lighter approach for
business perspective. Thus, REST services differ from older SOA(P) services taking into
consideration (at least) two perspectives:
the degree of sophistication: REST “philosophy” assumes to simplify web service
“protocol” as much as possible;
the overemphasis on the basic and self-defining Rest principle of HATEOAS (Hypermedia
as the Engine of Application State), something like “if there is not HATEOAS then there
is no Rest”.
Taking into consideration the service design principles stated by T. Earl [3] and [4], there are
some subtle conceptual differences between SOA(P) and REST related to:
service contracts, concerning standardization and design: RESTful requires no formal
contract specification, although REST API standardization and versioning is promoted as
best practice. In fact, RESTful proponents sustain very fluid REST APIs so that there is no
“official” dependency to a formal service interface specification, REST API
Proceedings of the IE 2015 International Conference
www.conferenceie.ase.ro
301
documentations are desirable but not to formally interfere with REST system architecture.
There are some specialized tools to generate REST API docs, like Swagger, but there is no
WSDL-like document implied. A service contract (like a WSDL document) looks like static
typing (from programming languages) of the service providing component. As opposite,
REST approach favor a very dynamic approach, e.g. service operations could be specified
in service resource instance representation as dynamic-links and not through an extra meta-
specification document;
service coupling, concerning intra-service and consumer dependencies: any service-based
architecture (or any kind of distributed component architecture) must have the attribute of
interoperability. In this context, coupling refers to the way of managing service
(component) interdependencies: there is an abstract level that could be understood as
service structural relationships and there is a runtime level where those structural
relationships became live (synchronous or asynchronous) connections. On the other side,
REST services favor a more dynamic approach where link-lists, formatted using
conventional standards like HAL, JSON-LD, Collection+JSON or SIREN as they are
discussed in [10], could be generated specifically for each resource instance, unlike the
more rigid approach of SOAP, where relationships are mostly endpoints statically defined
in WSDL definitions;
service discoverability, concerning interpretability and communication: SOA(P) promoters
developed a sophisticated standard in this regard - UDDI, but, as REST means
“simplification”, REST supporters considered that there is no need for a “middleman” like
a “service registry”, the REST /service is a URL, and the URL must be formatted to be self-
explained;
service composability, concerning composition member design and complex compositions:
SOA(P) approach, in the same line with service coupling principle, favor a contract-first
pattern, as it is coined by R. Daigneau [7]. That means a static way to define composite
services through WSDL specific documents, a declarative workflow spread in industry
within the form of BPEL Orchestrators. On the other side, REST approach favor a more
dynamic way to compose web services based on URL-links (as de facto relationships) close
to point-to-point composability [2]. The are some critics to this kind of linking services
which claim that point-to-point should not be considered as a kind of composability taking
into consideration the that business logic is encapsulated in service implementation.
Therefore “traditional” SOA design principles are not quite entirely appropriate for
RESTful-web services too, consequently ROA architectures might need different service
design solutions.
3. Zero-based approach of RoaML In our opinion, a radical innovative approach assumes a “zero-based approach” - meaning that
it will not continue or refine an existing conceptual metamodel as “UML for Rest” or “UML
for ROA” or even “UML for SOA”... Our goal is to preserve simplicity declared by REST
framework “founders” and theorists, but the “great compromise” is how to maintain
consistency in the same time. In the following we rather propose some guiding principles for a
business-oriented REST/ROA metamodel, and not a complete UML profile or framework for
REST oriented architectures.
3.1 Metamodels Our proposal takes into consideration an approach based on three delimited profiles, as in
Figure 1:

Proceedings of the IE 2015 International Conference
www.conferenceie.ase.ro
302
one focused on the application domain modelling, in fact the business side of the systems,
that we named DDD Metamodel to invoke “Domain Design Driven” principle to model
software components for business[8];
one more substantial and consistent, named REST Metamodel, focused on modelling
application services or components using RESTful principles. This metamodel also covers
some elements dedicated to architectural modelling of more complex application systems
from REST services, into a sub-profile named ROA Metamodel;
last one, the REST Domain Metamodel, has the integrator role, so that meta-modelling
elements from Rest Metamodel (and ROA sub-metamodel) to be tailored for business
specific needs.
Figure 1 - RoaML Metamodels and their relationships
3.2 From REST Metamodel to ROA Metamodel The core REST metamodel, makes a distinction between REST resources (marked with
WebResource stereotype) and the REST services, as their producers, see Figure 2.

Proceedings of the IE 2015 International Conference
www.conferenceie.ase.ro
303
Figure 2 - Core REST Metamodel stereotypes and their relationships
Also this metamodel assumes the existence of resource descriptions where links have a
fundamental role (considering HATEOAS principles). These hyperlinks could identify the
resource (WebLinkSelf), could represent structural relationships with other resources
(WebLinkRelation) or could signify an action endpoint concerning resource itself (other than
standard actions based on GET, POST, PUT, DELETE requests from HTTP protocol). Another
important distinction refers to resource archetypes [8] represented by a set of specialized
WebResource stereotypes: Document, Collection of documents, Store and Controller. A
critical aspect of any component-based model concerns also the way to assemble individual
components in complex systems. In order to address these issues in the context of REST
services based architecture, we propose a meta-extension to the REST core-metamodel in the
form of a ROA (sub)metamodel (shown in Figure 3) based on the distinction between REST
service and REST resource, that will take into consideration: (i) resource binding using
relation-links; (ii)service binding using service-links guided by the link-relations from core
resource model.
Figure 3 - An architectural metamodel for ROA based systems

Proceedings of the IE 2015 International Conference
www.conferenceie.ase.ro
304
3.3. REST domain metamodel Finally, the REST Domain metamodel (see Figure 4) is centered on business WebEntity
concept that tries to combine a fundamental concept from business metamodel with the REST
WebResource from REST architectural model.
Figure 4 - An architectural metamodel for Rest service based systems
The WebEntity description will use at least three other meta-elements:
entityUID for identity purposes, but in the form of self-links;
web-entity-attributes;
web-entity-relationships coming from the web-link-relations of REST core metamodel.
Starting from this framework, a MDA initiative could further add a new level in metamodeling
approach: e.g. one could define a JEE metamodel for JEE as the platform-of-choice to
implement REST services and resources.
4. RoaML target audience The success or failure of any software development or technologically initiative depends on a
critical “quality”: the popularity that could engage a prospective massive audience.
Figure 5 - Measuring REST vs. SOA audience

Proceedings of the IE 2015 International Conference
www.conferenceie.ase.ro
305
We have studied the popularity of SOA versus REST in the last years and we found the
following:
a series of statistics from Programmable Web shows a growth of the REST API from 58%
in 2006 to 73% in 2011, while the SOAP API registered a decrease from 29% in 2006 to
17% in 2011 [14].
another study from indeed.com shows that the trend of REST jobs is increasing (1% in
2014) while the one for SOA jobs is decreasing (0.3% in 2014) [15].
Google trend is showing also a growing interest in REST versus SOA based on the number
of google searches of the topic[13], see figure 5.
Judging by the success of REST we can say that RoaML has an important potential audience.
The key point for the successful adoption of RoaML is represented by it’s simplicity and
flexibility, the same principles that recommend REST over SOAP.
5. Conclusions and future work
As we have argued in our paper, RoaML could be a suitable modelling language for
applications based on resource oriented architecture. At this moment we are presenting just
some guiding principles for a business-oriented REST/ROA metamodel, but we are planning
to improve our metamodel and also to propose a MDA approach for implementing REST
services and resources.
Acknowledgment
This work was supported by the European Social Fund through Sectoral Operational
Programme Human Resources Development 2007 – 2013, project number
POSDRU/159/1.5/S/134197, project title “Performance and Excellence in Doctoral and
Postdoctoral Research in Economic Sciences Domain in Romania”.
References
[1] Choppy, C., Reggio, G. - A Well-Founded Approach to Service Modeling with Casl4Soa,
ACM, 2010
[2] R. T. Fielding, Architectural Styles and the Design of Network-based Software
Architectures, CHAPTER 5 Representational State Transfer (REST),
http://www.ics.uci.edu/~fielding/pubs/dissertation/rest_arch_style.htm, 2000
[3] T. Erl, SOA: principles of service design, Pearson Education, Inc., Boston, Massachusetts:
2008
[4] T. Erl [et.al.], Web service contract design and versioning for SOA, Pearson Education,
Inc., Boston, Massachusetts: 2009, pp.25-26
[5] M. Massé, REST API Design Rulebook, Gravenstein Highway North: O’Reilly Media,
Inc.m 2012, pp.15-16
[6] P. Brown, Implementing SOA: Total Architecture in Practice, Addison Wesley
Professional, 2008
[7] R. Daigneau, Service design patterns: fundamental design solutions for SOAP/WSDL and
restful Web services, Westford, Massachusetts: Pearson Education, Inc., 2012, pp.85-93
[8] E. Evans, Domain Driven Design: Tackling Complexity in the Heart of Software, Pearson
Education, 2004.
[9] OMG, Service oriented architecture Modeling Language (SoaML) Specification Version
1.0.1, 2012
[10] K. Sookocheff, On choosing a hypermedia type for your API - HAL, JSON-LD,
Collection+JSON, SIREN, Oh My!, available: http://sookocheff.com/posts/2014-03-11-on-
choosing-a-hypermedia-format/

Proceedings of the IE 2015 International Conference
www.conferenceie.ase.ro
306
[11] Vinay Sahni, Best Practices for Designing a Pragmatic RESTful API, available:
http://www.vinaysahni.com/best-practices-for-a-pragmatic-restful-api, 2014
[12] S. Katoch, Design and implement RESTful web services with Rational Software
Architect, available: http://www.ibm.com/developerworks/rational/library/design-
implement-restful-web-services/ , 2011
[13] ***, available:
http://www.google.com/trends/explore#q=%2Fm%2F03nsxd%2C%20%2Fm%2F0315s4
&date=1%2F2007%2098m&cmpt=q&tz
[14] ***, available: http://www.infoq.com/news/2011/06/Is-REST-Successful
[15] ***, available: http://www.indeed.com/trendgraph/jobgraph.png?q=Rest%2C+SOAP"
border="0" alt="Rest, SOAP Job Trends graph”
Proceedings of the IE 2015 International Conference
www.conferenceie.ase.ro
307
INFORMATION SYSTEMS IMPLEMENTATION IN THE JIU VALLEY
SME’S
Eduard EDELHAUSER
University of Petroșani
Lucian LUPU DIMA
University of Petroșani
lupu_lucian @yahoo.com
Abstract. The study set sights on 25 Jiu Valley SMEs, and data were collected in 2014 year.
The survey led us to identify the effect of the crisis on SMEs, but also to sets the current stage
of the level of implementation of ICT tools in the 2014 year in Jiu Valley SMEs. The research
was based on a quantitative questionnaire that was structured on 21 questions, seven of the
questions focused on Jiu Valley SMEs during the crisis and other 14 questions oriented on ICT
aspects of SMEs. Jiu Valley, a former mono-industrial area, is facing today with a very difficult
situation. One solution for solving this social problem could be offered by SMEs managers and
ICT experts. The study will represent the foundation of a process of integrated information
systems implementation in the SMEs from the Jiu Valley.
Keywords: SMEs, IT&C, Management Information Systems
JEL classification: C10, L60, M15
1. Theoretical framework
Information systems represent the best method for using information technologies, gather,
process, store, use and disseminate information between employees and organizations. The
field of information systems requires a multi-disciplinary approach, to be able to study the
range of socio-technical phenomena which determine their development, use and effects in
organizations and society as it is defined by the UK Academy for Information Systems. We
consider that the most relevant and well represented Information Systems for the actual
Romanian organizations are the Management Information Systems. Within a pyramid model
of an organization, MIS are management level systems that are used by middle managers,
connecting operational management that use ERP applications and top managers that use an
BI application, and ensure the smooth running of the organization in short to medium term. An
important role of these systems is revealed because MIS offer highly structured information
and allows managers to evaluate an organization’s performance by comparing current with
previous outputs [3],[4].
Information systems include Enterprise Resource Planning (ERP) which represents a tool that
integrate economic processes of an organization and is used to optimize its resources. ERP’s
are systems designed on a client-server architecture basis, and are developed to be able to
process transactions and to facilitate the integration of all the processes from the whole
organization starting with the planning and development stage and reaching to the Front and
Back Office applications described in relations with the suppliers, customers and other partners
[5]. On an international level integrated informational systems have been evolving for more
than 45 years and nowadays all the economic processes of an organization could be integrated.
In Romanian there are still some insular applications (own developed applications by small IT

Proceedings of the IE 2015 International Conference
www.conferenceie.ase.ro
308
companies or by an organization itself, not integrated and usually very small). The only
solution of making a business efficient is to use the ERPs techniques that permit planning the
resources of the enterprise or integrating the information of a business. The name ERP derives
also from the concept that you need a single database where all the functional systems can be
combined in an integrated one, which is offered to all departments by information distribution
[5].
We are now in 2014, emerging of cloud computing that employs networking technology to
deliver applications, as well as data storage independent of the configuration, location or nature
of the hardware. This, along with high speed smartphone and WiFi networks, has led to new
levels of mobility in which managers may access the MIS remotely with laptop, tablet
computers and smartphones. In this context modern management method could contain all of
the ERP modules such as transactional database, management portal or dashboard, BI system,
customizable reporting, resource planning and scheduling, product analysis, external access via
technology such as web services, document management, messaging or chat or wiki and
workflow management [2].
2. Research methodology and results
In the virtue of the questionnaires we achieved the results. In order to analyze the statistical
connections we used correlation analysis for the intensity of the connections between the
variables and regression analysis to estimate the value of a dependent variable (effect) taking
into account the values of other independent variables (causes). We carried out a multiple
regression analysis in order to identify the effect that implementation of ERP, BI and e-
Government applications in the decision making processes of the organization.
2.1. Methodology
The instrument used for collecting data is a quantitative questionnaire. The research based on
the quantitative questionnaire was structured on 21 questions, seven of the focused on Jiu
Valley SMEs during the crisis and other 14 questions oriented on ICT aspects of SMEs such
as: hardware, e-Commerce, ERP business software and BI management software.
2.2. Respondents
The study set sights on over 25 Jiu Valley SMEs, and data were collected in 2014 year. The
survey led us to identify the effect of the crisis on SMEs, but also to sets the current stage of
the level of implementation of ICT tools in the 2014 year in Jiu Valley SMEs. In the category
of Jiu Valley medium enterprises we were focused in our study on manufacturing, construction,
public services and retail. Almost 4,000 employees from a total of 7,500 employees, from the
top 75 medium enterprises are involved in these four areas. In the category of Jiu Valley small
enterprises we were focused on forestry, bakery, lohn, production of furniture and electrical
equipment, construction and retail. Almost 2.300 employee from the 3.300 of the top 150 small
enterprises are involved in these areas [1].
Even data were collected only from 25 organizations, these are representative for the 2014 Jiu
Valley SMEs, because in this economical moment Jiu Valley has only 225 SMEs that could
need an ERP or a BI software instrument as an advanced management method. There were
analyzed over 225 Jiu Valley SME’s, 75 medium enterprises and 150 small enterprises, and
were identified 25 distinct groups without any significant deviations among the enterprises
forming each group. In order to apply this method there were chosen 25 companies that were
included in the present study. Each of these 25 companies is representative for the enterprises
group, having similar trend. This simplified version of the method is suitable for our problem
because in this way there were obtained very clear results.
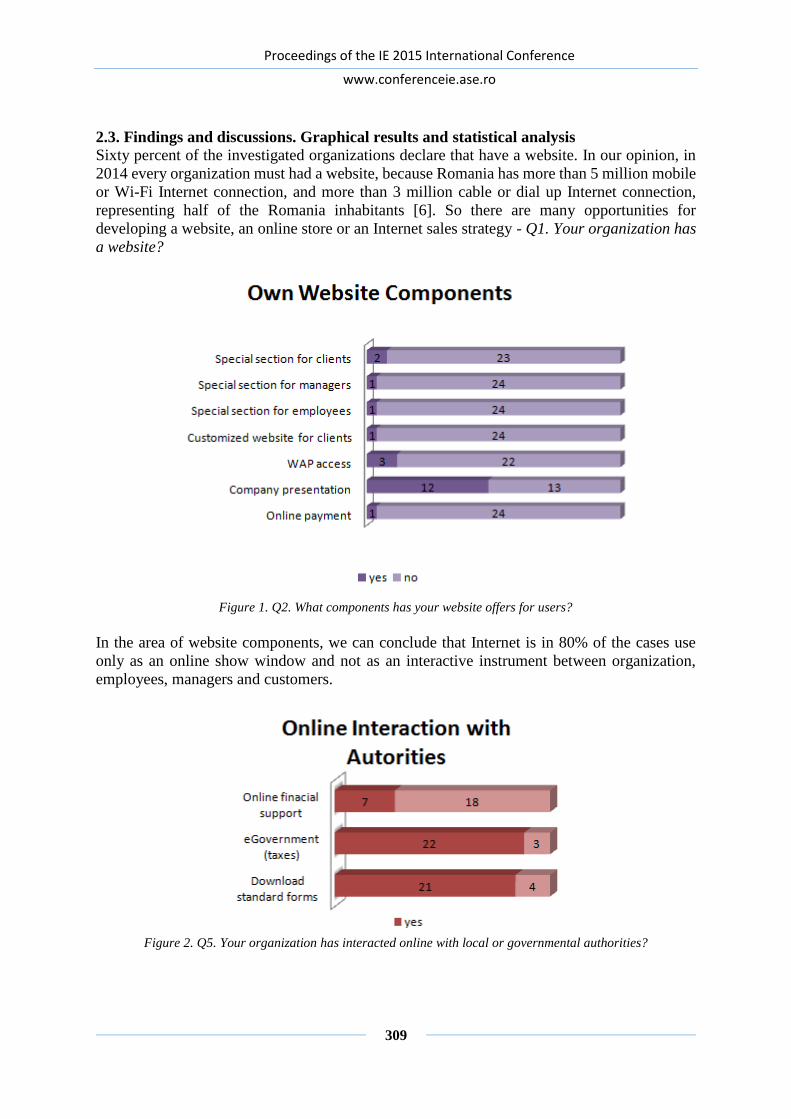
Proceedings of the IE 2015 International Conference
www.conferenceie.ase.ro
309
2.3. Findings and discussions. Graphical results and statistical analysis
Sixty percent of the investigated organizations declare that have a website. In our opinion, in
2014 every organization must had a website, because Romania has more than 5 million mobile
or Wi-Fi Internet connection, and more than 3 million cable or dial up Internet connection,
representing half of the Romania inhabitants [6]. So there are many opportunities for
developing a website, an online store or an Internet sales strategy - Q1. Your organization has
a website?
Figure 1. Q2. What components has your website offers for users?
In the area of website components, we can conclude that Internet is in 80% of the cases use
only as an online show window and not as an interactive instrument between organization,
employees, managers and customers.
Figure 2. Q5. Your organization has interacted online with local or governmental authorities?

Proceedings of the IE 2015 International Conference
www.conferenceie.ase.ro
310
Through e-Romania strategy, the authorities had allocated over 500 billion euro in the period
2010-2013, for the connection of all systems of public administration and for offering over 600
electronic services. So the companies have benefits from these e-Government implementation.
Figure 3 - Q6. The total number of computers (hardware endowment) in your organization
In Romania in 2012, 66.4% of the household population has a computer [6]. So for these 12
companies having 454 employees, 98 of them being involved in ICT activities and having 109
computers, we have a very good ICT endowment.
Figure 4 - Q9. Which are the software components implemented in your organization
We have a low degree of software usage in the 12 companies from the manufacturing field
investigated. Excepting the Office software, having a 100% usage, the CAD/CAM software,
specific for the manufacturing field, having a 58% usage, and the accounting information
systems, having a 66% usage, other software are used only occasionally. As we already knew
from other previous studies (Edelhauser, 2012), the usage of accounting and payment ERP
components is very common in Romanian companies, having a 100% usage for ERP
accounting, and a 83% usage for ERP payment in the 12 investigated companies. The CRM

Proceedings of the IE 2015 International Conference
www.conferenceie.ase.ro
311
and SCM components have a 17% usage, but in the virtue of the Q14 - List proposals of
applications, which you consider necessary to implement in your organization, 4 companies
representing other 33%, wish to implement such a component. Two component are never used:
HR ERP component, probably because Revisal software is mandatory in Romania, and
manufacturing ERP component, probably because the costs for implementing such a software
are very high.
The estimated total amount to be allocated to ICT endowment is 550,000 lei - 5.5 billion lei for
the 25 organizations investigated. (Actually only 18 companies have proposed allocation of
funds) - Q12. Please specify what amount (in lei) you are willing to assign in the coming years
for software implementation in your organization?
Sixty-four percent of the investigated organizations declare that plan to implement a Cloud
technology. Even if in Romania it does not exist a harmonized legislation regarding the Cloud,
the organizations are very conscious about the Cloud technology, and they plan to implement
such a technology - Q13. Please indicate if you plan to implement a Cloud technology in your
organization in the coming years?
Based on Q7 (Number of computers interconnected in a LAN and to the Internet) and Q8 (How
many people in your organization are involved in the ICT activities) from the questionnaire we
have made a regression analyses.
Table 1 - Regression analysis and correlation between the number of computers and the number of employee
with access to these computers for the 12 companies from the manufacturing field
We noticed that there is a strong link (with a significance of correlation R = 0.979 > 0.63 for
11 degrees of freedom). F-test also has a high value (226), and the Sig. corresponding F
statistics is 0.00 (0.00) which gives significant linear relationship between two variables.
Because both F that has a high level, and significance Sig. is reduced, can be concluded that
the results are not coincidental. The regression coefficient R=0.979 shows a strong link
between the variable Personal_acces_IT given to the level of IT, and the independent variable
Calculatoare showing the size of the organization. The model explains 98.5% from the total
variation of the variable Calculatoare (R2= 0.985). The rest of 1.5% is influenced by other
residual factors not included in the model. So the usage of the computers by the employee of
the organizations for the 12 selected organizations from the manufacturing field is excellent.
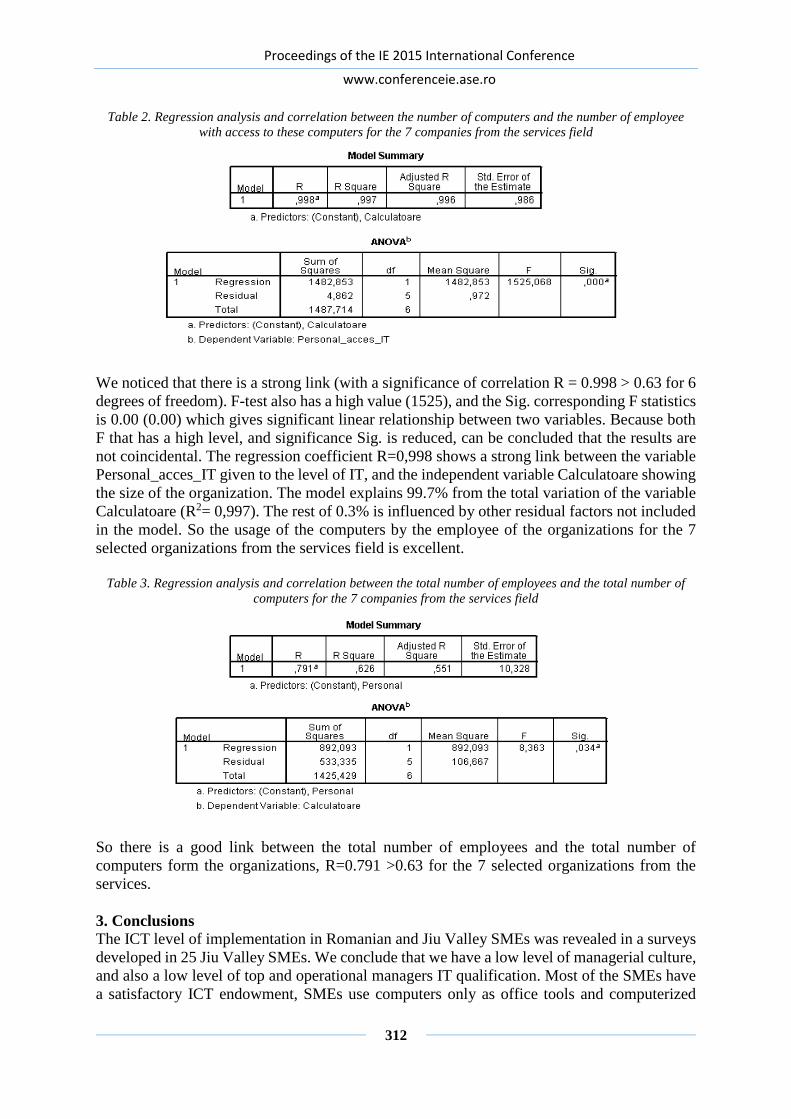
Proceedings of the IE 2015 International Conference
www.conferenceie.ase.ro
312
Table 2. Regression analysis and correlation between the number of computers and the number of employee
with access to these computers for the 7 companies from the services field
We noticed that there is a strong link (with a significance of correlation R = 0.998 > 0.63 for 6
degrees of freedom). F-test also has a high value (1525), and the Sig. corresponding F statistics
is 0.00 (0.00) which gives significant linear relationship between two variables. Because both
F that has a high level, and significance Sig. is reduced, can be concluded that the results are
not coincidental. The regression coefficient R=0,998 shows a strong link between the variable
Personal_acces_IT given to the level of IT, and the independent variable Calculatoare showing
the size of the organization. The model explains 99.7% from the total variation of the variable
Calculatoare (R2= 0,997). The rest of 0.3% is influenced by other residual factors not included
in the model. So the usage of the computers by the employee of the organizations for the 7
selected organizations from the services field is excellent.
Table 3. Regression analysis and correlation between the total number of employees and the total number of
computers for the 7 companies from the services field
So there is a good link between the total number of employees and the total number of
computers form the organizations, R=0.791 >0.63 for the 7 selected organizations from the
services.
3. Conclusions
The ICT level of implementation in Romanian and Jiu Valley SMEs was revealed in a surveys
developed in 25 Jiu Valley SMEs. We conclude that we have a low level of managerial culture,
and also a low level of top and operational managers IT qualification. Most of the SMEs have
a satisfactory ICT endowment, SMEs use computers only as office tools and computerized

Proceedings of the IE 2015 International Conference
www.conferenceie.ase.ro
313
accounting, and this leads to an inefficient managerial decision and a SMEs disadvantage on
the business market.
The ICT in Jiu Valley SME’s has a low level of implementation and some specific modules
such as ERP, BI, CRM, e-Commerce, e-Business or Cloud Technology are rarely used. Even
data were collected only from 25 organizations, these are representative for the 2014 Jiu Valley
SMEs, because in this economical moment Jiu Valley has only 225 SMEs that could need an
ERP or a BI software instrument as an advanced management method.
References [1] P. Barta, (2013) The current situation of the Romanian SMEs, 2012 Edition, Post
Privatization Foundation, Bucharest, 2013, available: http://www.postprivatizare.ro,
[January, 20, 2015].
[2] E. Edelhauser, A. Ionica and M. Leba, “Modern Management Using IT & C Technologies
in Romanian Organizations,” Transformations in Business & Economics, Vilnius
University, Lithuania, vol. 13, no. 2B (32B), 2014, pp. 742-759.
[3] E. Edelhauser and L. Lupu Dima, “Management Information Systems. Past and Present in
Romanian Organisations”, in Proc. The 11th International Conference on Informatics in
Economy IE 2012, Bucharest, 2012, pp. 459-463.
[4] E. Edelhauser, A. Ionică and C. Lupu, “Enterprise Resource Planning and Business
Intelligence, Advanced Management Methods for Romanian Companies”, in Proceedings
of the 1st Management Conference: Twenty Years After, How Management Theory Works,
Technical University of Cluj Napoca, Todesco Publishing House, 2010, pp. 63-72.
[5] D. Fotache and L. Hurbean, Enterprise Resource Planning, Bucharest, Economică
Publishing House, 2004.
[6] ***, (2013) Documentary Analysis Result in Romanian IT&C Sector, [On-line] POAT
2007-2013 project [January, 20, 2015].

Proceedings of the IE 2015 International Conference
www.conferenceie.ase.ro
314
META-INSTRUCTION IN E-EDUCATION
Gabriel ZAMFIR
The Bucharest University of Economic Studies, Bucharest, Romania [email protected]
Abstract. This paper is a conceptual one focused on assisted instruction in e-society,
developed as an appropriate approach for e-education. Assisted instruction is situated between
traditional education and blended learning style, and it requires a different paradigm,
according to the main tendencies of our environment: the faster changing technologies and the
slower systematic implementations in e-education. The new paradigm is proposed as a suitable
orientation of the educational research related to e-science and e-business. The study is
developed starting from the central concept of the e-society, qualifications. A conceptual
paradigm of the e-society is structured in introduction and a functional paradigm is presented
in a conceptual framework. The interrelationships between the building blocks of the assisted
instruction in e-education are designated in a theoretical framework. A paradigm of meta-
instruction, based on assisted individual study and standard assisted instruction applications,
related to Bloom’s taxonomy and concepts map approach is proposed in an analytical
framework. In this context, it is highlighted a different vision of the connection between
ontology and epistemology related to methodology and methods in e-education.
Keywords: assisted individual study, assisted instruction, e-articles, e-classroom, and teacher
assisted learning JEL classification: I23
1. Introduction The central concept of the e-society is qualification and this fact explain why e-education is
valuable both as an end in itself, and as an engine of the community. The development of the
conceptual approaches for describing qualifications is currently an important priority for any
country. In [1, p.22] is specified that traditional models and methods of expressing
qualifications structures are giving way to systems based on explicit reference points using
learning outcomes and competencies, levels and level indicators, subject benchmarks and
qualification descriptors. These devices provide more precision and accuracy and facilitate
transparency and comparison. Without these common approaches, full recognition, real
transparency and thus the creation of an effective European Higher Education Area, will be
more difficult to achieve. As a consequence, in Romania could be visited the National Higher
Education Registry (http://www.rncis.ro/) which it offers options for advanced search selecting
fundamental domain, science branch, hierarchy domain, and study program and it displays a
related summary, including professional competences, transversal competences, and possible
occupations for the owner of the diploma. At the same time, there is the National Qualifications
Authority, where, at present time, there are published 851 occupational standards
(http://www.anc.edu.ro/?page_id=42); the methodology assigned to these results is available.
In 2005 it was established the Romanian Agency for Quality Assurance in Higher Education
(ARACIS) which is an autonomous public institution, of national interest, whose main mission

Proceedings of the IE 2015 International Conference
www.conferenceie.ase.ro
315
is the external evaluation of the Romanian higher education’s quality, at the level of study
programmes, as well as from the institutional point of view. ARACIS uses an online platform
for registering and evaluation of experts included in National Register of Evaluators
(http://www.aracis.ro/nc/en/aracis/).
It is important to highlight that transversal competences are defined in the first annex of the
National Education Law no 1/2011. The transversal competences represent valuable and
attitudinal acquisitions which cross over a domain or study program and they are reflected
through the next descriptions: autonomy and responsibility, social interactions, personal and
professional development. A working definition of transversal competencies is presented in [2,
p.4-5]. In this report it is mentioned that that there are significant variations in the definition
and interpretation of transversal competencies among participating countries and economies.
So, each country and economy would clarify and use their own definitions of transversal
competencies under each domain in their studies. As a conclusion, each domain would remain
generic, and they are presented in Table 1.
Table 1 - UNESCO’s Working Definition of Transversal Competencies
Domains Examples of Key Characteristics
Critical and innovative thinking Creativity, entrepreneurship, resourcefulness,
application skills, reflective thinking, reasoned decision-
making
Inter-personal skills Presentation and communication skills, leadership,
organizational skills, teamwork, collaboration,
initiative, sociability, collegiality
Intra-personal skills Self-discipline, enthusiasm, perseverance, self-
motivation, compassion, integrity, commitment
Global citizenship Awareness, tolerance, openness, respect for diversity,
intercultural understanding, ability to resolve conflicts,
civic/political participation, conflict resolution, respect
for the environment
Optional domain: (Example)
Physical and psychological
health
Healthy lifestyle, healthy feeding, physical fitness,
empathy, self-respect
Synthetizing, we could conclude that e-society is based on three pillars which depend on
qualifications, as it is presented in Figure 1.

Proceedings of the IE 2015 International Conference
www.conferenceie.ase.ro
316
Figure 1 – Conceptual paradigm of the e-society
One important issue in this approach is to highlight, as it is presented in [3], that transversal
competences are recognized as the teachers’ important skills in their organization of the
teaching and learning process and their professional development, as well as in the process of
them teaching these competences to their students. The same author is mentioning that teachers
are the result of their “cumulative autobiography”, so they act on the basis of his/her constructs,
beliefs and understanding of human learning, professional growth and development. This fact
is considered in our analyse being an unrevealed side of the meta-instruction related to an
individual.
2. Conceptual framework Another important issue of this study is to observe that over the time, first there were
developing facts, and second these were getting labels, while, in recent times, there are a lot of
labels already created, while the corresponding facts are late or just only in progress. Referring
to e-science’s input, resources come primary from e-education features, secondly from e-
business structures, while e-science’s output are focused on e-business applications then the
implementations occur in e-education, reflecting an inherited behaviour.
Continuing the previous research, as they are shown in [4] and [5], the e-article could be defined
as the basic result of a scientific research activity in e-science. At the same time, production of
the e-articles is bigger and bigger and some of these are using for learning, as knowledge
objects more or less refined, for understand and apply, and some of these become objects for
analyse, synthesise and evaluation. The two situations could be reflected as a study trying to
find in virtual world the very first scientist or understanding scientometrics; these are two
examples in order to present diversity in scientific research, as soon as the word ‘scientist’
entered the English language in 1834 and there is an interesting history in order to define it,
while bibliometrics become webometrics and then Scientometrics 2.0 based on Social Network
Data and it is going to include new ontologies. On the other hand, using a search engine or a
meta-search engine with the keywords timeline in education, we find out that the blackboard
was invented in 1801 by James Pillans. In 1990, as an improvement, whiteboards begin to erase
the chalkboard from schools (after they have been promoted in business). In 1960, the overhead
projector allowed instructors to use reusable printed transparencies (but first in the army
communities). In 1999, early versions of interactive boards were wired to desktop computers,
while the latest models can connect with mobile devices.

Proceedings of the IE 2015 International Conference
www.conferenceie.ase.ro
317
A useful investigation could be found in [6], where e-society is understood from three versions,
i.e. E-version for electronic, D-version for digital and V-version for virtual. All three can be
used as prefix. The three versions are interrelated to each other and reflect progresses not only
in technologies and but also in applications for our activities. After a terminological analyse of
these versions, it has been found that some terms in the categories of these versions are
interchangeable, some are not. In general, E as a prefix can be placed before terminology of
subjects and objects alike, whereas the D and V suit technology alike. Such a judgement could
explain an adequate comprehension for numerous prefixes associated with learning, term
which reflects, by default, a typical human activity. In this context, [7] describes e-learning as
the way people use an electronic device (usually a computer) with learning technology to
develop new knowledge and skill individually or collaborative; mobile devices with learning
technologies constitute various forms of wireless environments can have many functions to
promote mobile learning (m-learning); the same author highlights that since the early 2000s
new forms of mobile technology containing additional sensor devices have been providing new
directions for technology-assisted learning, and this has led to context-aware ubiquitous
learning (u-learning). Based on the same evolution of technology-enhanced learning, [8] and
[9] complete the stages with a new one, called Smart Learning sustained by social technologies.
It has to be present that previous researches, such as [10], consider necessary a redefinition of
the term social technology, as soon as the concept of social technologies has several aspects
which destabilize the dominant status of technology. Another strategy for learning in e-
education is b-learning (blended learning) which is analysed in [11], considering that e-learning
has become widely used in every type of education (traditional and formal education,
continuous education and corporate training) because of its characteristics such as flexibility,
richness of materials, resource-sharing and cost-effectiveness. In this work, the author paid
more attention to the blended-learning (b-learning) systems, which consider systems
“combining face-to-face instruction with computer-mediated instruction”. B-learning has been
largely used in the context of higher education, and it includes a wide range of learning formats
such as self-study and instructor-led in both an asynchronous and synchronous mode. [12]
analyse e-learning as a concept, and associate e-Learning 1.0, 2.0 and 3.0 with the prevalent
technologies available in their kin Web versions (1.0, 2.0 and 3.0 respectively). In a survey of
predictions, they highlight that e-Learning concept of “anytime, anywhere and anybody” will
be complemented by “anyhow”, i.e. it should be accessible on all types of devices (a-learning).
Based on the three paradigms of the learning in e-society presented in [5] as the lexical one,
the terminological one and the conceptual one, and according to the interrelationships between
the building blocks of an e-education system developed in [13], a conceptual framework for a
functioning e-society is shown in Figure 2.

Proceedings of the IE 2015 International Conference
www.conferenceie.ase.ro
318
Figure 2 – Functional paradigm of the e-society
This approach highlights the three forms of the traditional education system: the formal, the
informal and the non-formal education reflected as web components for a learning perspective
in e-society and consists of the building blocks for a theoretical framework.
3. Theoretical framework A study involved in educational research [14], it creates a paradox when considers that what
knowledge is, and the ways of discovering it, are subjective, as soon as it concludes that it is
important for English language teachers to understand the underlying ontological and
epistemological assumptions behind each piece of research that they read. The author continues
mentioning that teachers need to be able to recognize how these assumptions relate to the
researcher’s chosen methodology and methods, and how these assumptions connect to the
findings which are presented in journal articles. First remark is that English is the native
language for the information technology domain and second, in this domain, initially it is
determinant and then relevant, to analyse the term knowledge distinctively, in meta-language
or in object-language. The working language of the educational research has to imply the term
knowledge connected with data and information, as soon as the interrelations could form
different ontologies for research. There are textbooks in which the authors distinguish between
data, information, and knowledge. In [15], as the author mentions, the term “data” refers to the
syntax, “information” refers to the interpretation, and “knowledge” refers to the way
information is used.
In this context, based on the knowledge framework presented in [13], scientific research could
be defined as a paradigm between theory and practice, related to the cognitive infrastructure of
the researcher. As soon as scientific research supposes two languages, theory includes ontology
as an object language and epistemology as the meta-languages, while practice contains methods
as an object language and methodology as the meta-languages. Such an approach confers a
paradigm of assisted instruction in e-education, as it is shown in Figure 3.

Proceedings of the IE 2015 International Conference
www.conferenceie.ase.ro
319
Figure 3 – The interrelationships between the building blocks of assisted instruction in e-education
Each notion of this paradigm is developed as a construct in a meta-language for a meta-
discipline, in order to integrate an interdisciplinary approach.
4. Analytical framework In order to design an assisted instruction environment in the e-classroom, based on the
analytical framework presented in [16], consisting of the concepts map approach, the context
for developing explicit knowledge, and the pattern of a didactical developing of the content, in
Figure 4 is presented a paradigm which integrates the traditional class, as course and seminar,
in a laboratory activity; this is based on the principles of an assisted instruction system:
individualized learning, personalized learning, interactivity founded on the triple-vision of the
personal computer as tool, tutor and tutee, the adequate information granularity of the content,
assisted instruction developed as a meta-discipline while it integrates inter-disciplinary
approaches because of the diversity as forms of knowing, and trans-disciplinary approaches
because of diversity as forms of knowledge.
Continuing the analyze developed in [17], where for a learning process the content is developed
using a concepts map integrated as a pyramid of notions enabled for knowing, understanding
and applying, while the teaching process is designed on a concepts map aggregated in a network
of notions enabled to analyse, systematize and evaluate the content of the subject, we find two
levels for this approach: a practical one, based on standard assisted instruction applications,
and a theoretical one, centred on assisted individual study, see Figure 4. In a pyramid there are
concepts as basis or aggregate, while in a network, the concepts could be considered,
functionally, as threshold concepts. In assisted instruction, the applications design for learning
include a sequential set of tasks, gradually developed from simple to complex and focused on
knowing, understanding and applying notions used in theories, methodologies and models. It
is the role of the assisted individual study, in a face-to-face interaction in the e-classroom as
teacher assisted learning, to harmonise the conceptual infrastructure of the content in the zone
of proximal development of the learner and to identify and solve the troublesome knowledge
generated by the threshold concepts or by missing concepts in his cognitive infrastructure.

Proceedings of the IE 2015 International Conference
www.conferenceie.ase.ro
320
Figure 4 – The paradigm of meta-instruction related to Bloom’s taxonomy and concepts map
The assisted individual study could be developed based on e-articles, and treated as a dedicated
environment for learning with all the e-learning functionalities understood as support, as soon
as the e-article represents the basic result of a scientific research activity in e-science.
5. Conclusions Learning, as a typical human activity, consists of knowing the past, understanding the present
and applying in the future. This concept could become a paradox if it is not analyse as a notion
of the meta-language when we research the methodology. A new level of the scientific research
is involved when the meta-language becomes the object-language in e-education.
References [1] *** - A Framework for Qualifications of the European Higher Education Area, Bologna
Working Group on Qualifications Frameworks, Published by: Ministry of Science,
Technology and Innovation, Copenhagen K, 2005, pg. 200; the publication can also be
downloaded from: http://www.vtu.dk ISBN (internet): 87-91469-53-8 [2] *** - Transversal Competencies in Education Policy & Practice, Phase I, Regional
Synthesis Report, Published in 2015 by the United Nations Educational, Scientific and
Cultural Organization 7, place de Fontenoy, 75352 Paris 07 SP, France and UNESCO
Bangkok Office, © UNESCO 2015, pg. 80 ISBN: 978-92-9223-509-3 (Electronic version)
This publication is available in Open Access under the Attribution-ShareAlike 3.0 IGO
(CC-BY-SA 3.0 IGO) license (http://creativecommons.org/licenses/by-sa/3.0/igo/).
[3] R. Čepić, S. Tatalović Vorkapić, D. Lončarić, D. Anđić and S. Skočić Mihić, "Considering
Transversal Competences, Personality and Reputation in the Context of the Teachers’
Professional Development," International Education Studies; Vol. 8, No. 2; 2015
[4] G. Zamfir, "Quality-Quantity Paradigm in Assisted Instruction," Journal of Applied
Quantitative Methods, vol. 5, No. 4, Winter 2010, ISSN: 1842-4562, http://www.jaqm.ro
[5] G. Zamfir, "Learning Paradigms in e-Society," Informatica Economică, Volume 17, No.
3/2013, INFOREC Publishing House, DOI: 10.12948/issn14531305/17.3.2013.09
[6] Xiuhua Zhang , Hans Lundin – Understanding E-Society by E, D and V, published in the
volume of the Proceedings of the IADIS International Conference on e-Society, Ávila,
Spain 16-19 July 2004, Edited by Pedro Isaías, Maggie McPherson, Piet Kommers, ISBN
(Book): 972-98947-5-2
[7] G.-Z. Liu and G.-J. Hwang, "A key step to understanding paradigm shifts in e-learning:
towards context-aware ubiquitous learning," British Journal of Educational Technology,
Volume 41 No 2 2010, doi:10.1111/j.1467-8535.2009.00976.x
[8] E. K Adu and D. C C Poo, "Smart Learning: A New Paradigm of Learning in the Smart
Age," proc. of TLHE 2014, International Conference on Teaching & Learning in Higher

Proceedings of the IE 2015 International Conference
www.conferenceie.ase.ro
321
Education, National University of Singapore,
http://www.cdtl.nus.edu.sg/tlhe/tlhe2014/abstracts/aduek.pdf
[9] G.-J. Hwang, "Definition, framework and research issues of smart learning environments -
a context-aware ubiquitous learning perspective," Smart Learning Environments 2014, 1:4,
http://www.slejournal.com/content/1/1/4
[10] A. Skaržauskienė, R. Tamošiūnaitė and I. Žalėnienė, "Defining Social Technologies:
evaluation of social collaboration tools and technologies," The Electronic Journal
Information Systems Evaluation Volume 16 Issue 3 2013, pp. 232-241
[11] P. Peres, L. Lima and V. Lima, "B-Learning Quality: Dimensions, Criteria and
Pedagogical Approach," European Journal of Open, Distance and e-Learning, Vol. 17 / No.
1 – 2014, ISSN 1027-5207, DOI: 10.2478/eurodl-2014-0004
[12] N. Rubens, D. Kaplan and T. Okamoto, "E-Learning 3.0: anyone, anywhere, anytime, and
AI," proc. of International Workshop on Social and Personal Computing for Web-
Supported, SPeL 2011, http://activeintelligence.org/wp-content/papercite-
data/pdf/elearning-30-rubens-spel-2011--preprint.pdf
[13] G. Zamfir, "Assisted Learning Sytems in e-Education," Informatica Economică, Vol. 18
No. 3/2014, INFOREC Publishing House, DOI: 10.12948/issn14531305/18.3.2014.08,
ISSN: 1453-1305, EISSN: 1842-8088, p. 91-102
[14] J. Scotland, "Exploring the Philosophical Underpinnings of Research: Relating Ontology
and Epistemology to the Methodology and Methods of the Scientific, Interpretive, and
Critical Research Paradigms," English Language Teaching; Vol. 5, No. 9; 2012
[15] W. van der Aalst, C. Stahl, Modeling Business Processes: A Petri Net-Oriented Approach,
(Cooperative Information Systems), Publisher: The MIT Press (May 27, 2011)
[16] G. Zamfir, "Concepts Map Approach in e-Classroom," Informatica Economică, Volume
16, no. 3, 2012
[17] G. Zamfir, "Theoretical and Factual Meaning in Assisted Instruction," Informatica
Economică, Vol. 15 No. 2/2011, p. 94-106

Proceedings of the IE 2015 International Conference
www.conferenceie.ase.ro
322
SEMANTIC WEB TECHNOLOGIES FOR IMPLEMENTING COST-
EFFECTIVE AND INTEROPERABLE BUILDING INFORMATION
MODELING
Tarcisio MENDES de FARIAS
CheckSem - LE2I UMR CNRS 6306 - University of Burgundy, Dijon, France
Ana-Maria ROXIN CheckSem - LE2I UMR CNRS 6306 - University of Burgundy, Dijon, France
Christophe NICOLLE CheckSem - LE2I UMR CNRS 6306 - University of Burgundy, Dijon, France
Abstract. In the field of AEC/FM, BIM has been recognized by industrial and political actors
as a powerful tool for resolving data interoperability problems. Coupled with cloud computing
and GIS, BIM would allow integrating different information exchange standard into one single
digital building model that can be real-time edited by several stakeholders or architects. In this
paper, we examine the benefits brought by using Semantic Web technologies in delivering such
universal building model. We present how our approach is a step further in reaching the vision
of BIM, and how it can serve construction process, operation and maintenance, along with
facilities’ lifecycle management.
Keywords: AEC, BIM, facility management, ontology, SWRL.
JEL classification: L74, H57, D80
1. Introduction
When considering a building, its lifecycle comprises two phases: building construction and
facility management. Facility management is generally performed by divisions of
municipalities (be it large or small) or by private contractors. In both cases, the challenge is the
same and addresses data interoperability and management. Indeed, the data produced
throughout the building’s lifecycle is handled and updated by several actors intervening in the
associated processes. This generates a considerable amount of heterogeneous data that has to
be handled by a generally limited number of people. BIM (Building Information Modelling)
[1] is one of the latest approaches proposed in the field of AEC/FM (Architecture, Engineering
and Construction / Facility Management) for organizing into one single model several layers
of information [2]. In the context of our approach, we define BIM as the process of generating,
storing, managing and exchanging building information in an interoperable and reusable
manner [3].
The first step in BIM standardization was conducted in 1999 by buildingSMART (formerly
International Alliance for Interoperability, IAI). It resulted in the development of a model for
representing all components of a physical building, namely the IFC (Industry Foundation
Classes) model [4]. Unlike previous formats such as DXF (Drawing eXchange Format) [5] or
DWG (DraWinG) [6], which were graph- and respectively vector-oriented, the IFC standard
(ISO 10303-21) [7] relies on object-oriented modelling.

Proceedings of the IE 2015 International Conference
www.conferenceie.ase.ro
323
In the context of BIM, a building is represented in the form of one or several IFC files. Those
files contain several different types of information ranging from operational and maintenance
costs to building’s intended use and level of security. The challenges related to the management
of such heterogeneous data are heightened by the considerable number and diversity of actors
manipulating those files. Not only is the manipulation of IFC files a fastidious process, but
there is no standard language or protocol for querying those files in order to display the data
pertaining to a specific context or task. Or given the wide variety of actors working with such
files (municipalities, stakeholders, architects, etc.), and considering their particular
requirements, there is an increasing need to display only the information pertaining to a given
business logic or context. In our vision, BIM stands as a cooperative system of unified business
views of the same building. Thus, we propose a novel approach based on Semantic Web
technologies. This article emphasizes the main advantages brought by this approach, notably
in terms of operations that can be performed and in terms of economies to be realized.
This paper begins with a brief overview of the advantages and challenges related to the
integration of Semantic Web technologies in the BIM vision. Section 0 lists main limits that
exist today concerning BIM. For each of those limits, we present how our approach can
leverage them. We conclude this article by arguing the benefits of using ontologies coupled
with logical rules in order to tackle the above-mentioned BIM-related issues.
2. BIM and knowledge engineering – advantages, challenges, economical model
By implementing a unique model of a building, BIM helps people from the AEC field in
applying a standard approach for projects dealing with buildings or infrastructures. The idea
behind the BIM approach is to define a novel method for collaboration among actors
intervening in such projects, thus allowing them to exchange data and information concerning
the project with the guarantee that the data will remain consistent and accurate.
The vision of BIM relies on a data model that would allow the following [2]:
Integrating all relationships and interactions between building components (structural,
architectural, mechanical), equipment, piping supports, etc. into a fully coordinated model
Capturing modifications and specifications from different stakeholders, while guaranteeing
data’s consistency and accuracy
“Improved collective understanding of the design intent” [8] - delivering stakeholders a
clearer view of the project, while improving decision making
Time and cost savings are among the most well-known advantages of adopting the BIM
approach. Those savings come with the BIM’s promise for improved knowledge and control,
for AEC service providers, over the building lifecycle. Faster project approvals, more
predictable outcomes, sustainable design and analysis services, along with improved
collaboration are only a few examples.
While the advantages of relying on such model-based design have been clearly identified, the
model itself needs additional extended specification. In this year’s month of February, an EU
BIM Task Group has been created. Comprising representative from 15 European Commission
members, the Group’s goal is to define “how it will share best practice and converge on the
adoption of BIM into the European public estate” [9].
Moreover, inefficient interoperability has been identified as a cost raising factor: studies have
shown that it raised new construction costs by $6.18 per square feet, whereas operation and
maintenance costs were risen by $0.23 per square feet [10]. More information about cost
savings related to BIM adoption can be found in [8].
Proceedings of the IE 2015 International Conference
www.conferenceie.ase.ro
324
3 Semantic Web technologies for delivering a realist implementation of a BIM
In [11] authors state that while lack of interoperability among applications is indeed a
significant drawback of current systems, it does not stand as the main factor preventing BIM
adoption. Authors identify three “interrelated” obstacles to BIM adoption in the building
industry. For each barrier, we argue that Semantic Web technologies can be used as leverage.
3.1. Lack of business process integration
3.1.1. Current state As previously presented, the BIM approach aims at integrating design data in a model-based
design process. While this offers interesting advantages in terms of information flow and
process connections, it does not consider the specification of clear relationships in the building
supply chain. The so-described BIM approach fails in clearly specifying the workflow and the
data interactions among stakeholders and other actors intervening thorough the building
lifecycle.
Semantic Web technologies rely on ontologies as a specification mechanism, and this has been
proven to be more expressive than informal languages (e.g. UML). A typical example would
be the modelling of relationships involving logical rules, such as “same-as”. Indeed, UML
cannot represent such relationship, whereas it is handled by ontology languages such as OWL.
When considering the problem of managing heterogeneous services or processes, having such
relationships appears as critical since different systems and applications using different
languages need to be able to identify a same high-level command, along with its “meaning”
and effects [12].
When considering system interoperability, it is generally achieved by first creating an
information model (defining critical concepts), then second, by deducing management models
from this model. Unfortunately, most of the existing approaches rely on informal languages for
specifying the information and the data models. Among those, we may cite the Distributed
Management Task Force’s (DMTF) CIM [13], the TeleManagement Forum’s (TMF) Shared
Information and Data model (SID) [14]. While representing vendor-independent data, these
models fail in sufficiently specifying and integrating contextual information for management
operations. Moreover, the CIM approach relies on a proprietary language [13] and the SID
approach is based on UML.
Knowledge engineering in the form of ontologies allows leverages the drawbacks of the above-
mentioned initiatives. Indeed, ontologies have been proven as a formal mechanism for
specifying a common knowledge for a domain of discourse [15]. The so formally-defined
models become tools for solving meaning interpretation problems. Hence, ontology
engineering appears as a solution for modelling and integrating vendor- and technology-
specific knowledge present in information and data models.
In the context of BIM, and in order to answer the problem of specifying transactional business
process, one could use an ontology for modelling every relationship in the building supply
chain and lifecycle, in terms of roles, risks and benefits [16]:
Roles: tasks defined for each participant, information to be generated, information
exchanges among partners, etc.;
Risks: in the case when the system fails in determining the origin of some design
information, specify how can the associated risk be assigned;
Benefits: clearly identify the savings realized by using the considered model as a decision-
making tool.
Moreover by using ontologies, each process could only use only the necessary subset of all
information created by every other process. For example, when an electrical engineer designs

Proceedings of the IE 2015 International Conference
www.conferenceie.ase.ro
325
the emergency lighting system, he/she does not need to know the colour of the walls or the
carpets present within the same room.
3.1.2. Our approach
In order to address the above listed issues, we have conceived an OWL ontology for the IFC
standard. With such representation of the building information, we are able to implement
shortcuts in the form of logical rules, which allow implementing an intelligent building
information system. Our approach allows a more intuitive extraction of building views and
mitigates the gap of semantic heterogeneity for building software interoperability. The
characteristics of this ontology are given in [3].
Still, several studies have identified clear needs for the integration of construction documents
and data in the standard IFC format. Therefore, we have chosen to integrate the COBie
(Construction Operations Building information exchange) format in our ontology. All mapping
and description of IFC2x4 entities, defined types, select types, and property sets for COBie has
been fully documented in [17]. Starting from these mappings, we have translated them into
logical rules and applied those rules on top of the two ontologies created: one for the IFC
model, one for the COBie model. With this implementation, we are able to automatically
transform COBie data into IFC data. Thus, we have addressed the issue of reducing time waste
associated with the integration of IFC with COBie spreadsheets [18]. We further aim at
improving our knowledge base by introducing links to other models, notably for managing
buildings’ maintenance operations or electrical characteristics. Including such additional
information would allow our system to provide information to users regarding utility
consumption, distribution, use, or cost [19].
3.2. Lack of digital design information computation
3.2.1. Current state
Various formats exist for digital design data. As mentioned in the Introduction, in the context
of BIM, the IFC standard (ISO 10303-21) [1] was chosen for representing building digital
design data. Still, in order to allow a computer to manipulate and perform operations on such
data, one must implement mechanisms that allow computers to understand such data as we
humans do. In other words, the format used for handling such data must contain machine-
interpretable knowledge about the data held. Again, ontologies appear as a solution for this
problem, as they allow specifying such machine-understandable knowledge. Ontology-based
models are “intelligent” as they implement the mechanisms allowing the concepts within the
model to know how to interact with one another [2].
For illustrating this, we may take the example of a room. Such concept does not exist in the
IFC standard, but can be easily defined by means of logical rules over ontology concepts, e.g.
a unique space contained by other building components (such as walls, floors, and ceilings).
Therefore, the whole building model is a knowledge base, while its abstract concepts such as
room or façade wall can be defined using non-graphic data and geometric information. These
concepts can be defined using logical constructs (such as rules and constraints) on top of the
knowledge base. It is therefore possible to query the knowledge base in order to obtain only
the view corresponding to a given concept (e.g. a meeting room). Moreover, when applying
such formalism, if a stakeholder modifies the information pertaining to a given view, this
modification is transmitted through the whole knowledge base and automatically updated in
the views of all the other stakeholders displaying it.

Proceedings of the IE 2015 International Conference
www.conferenceie.ase.ro
326
3.2.2. Our approach
Let us consider the example of a facility manager that needs to handle a building’s façade walls.
The IFC standard does not implement such a concept, but it contains all information for
implicitly describing it. In order to address this limit, our approach allows defining novel
concepts as used by AEC/FM actors by means of SWRL rules [3].
For example, let us consider the case of a facility manager that needs to plan the cleaning of all
windows of a given building. The concept of a windowed-space is not present in the IFC
standard, so identifying such spaces would represent a lot of manual work from the facility
manager. However, this information can be easily exploited, if we create the concept
BimSpaceWithWindow through the following SWRL rule:
IfcRelSpaceBoundary(?x) & IfcSpace(?y) & IfcWindow(?z) & RelBuildingElement(?x, ?z) &
RelSpace(?x, ?y) ⇒ BimSpaceWithWindow(?y)
We can easily extend this example to the case where SWRL rules are used to specify precise
business contexts and processes. A facility manager could therefore specify that window
cleaning should be performed after a façade walls’ cleansing.
3.3. Lack of design information sharing
3.3.1 Current state
The final goal for BIM is to help relevant parties involved in building management (such as
facility managers) to make use of the so-modelled data. While monolithic data models and
software applications fail in delivering the advertised functionalities, studies have identified
loosely coupled applications to be very promising [16]. Still such applications need to
implement innovative share mechanisms for exchanging design information. Indeed,
traditional approaches perform well in contexts where the data to be exchanged is well-defined,
repetitious and transactional.
When considering BIM scenarios for design information exchange, these are mainly performed
on a query basis and need to integrate contextual information for both the query initiator and
the system answering the query. Additionally, such queries are performed over the above-
described knowledge bases, which are far more complex than traditional database systems. The
IFC format allows exchanging platform-independent information across AEC applications.
Still, not only is this standard going to evolve over time, but its underlying structure is very
complex and difficult to query.
3.3.2 Our approach
Query simplification
Having defined the ontology of the IFC model, we are able to define on top of it SWRL rules.
This allows simplifying the writing of SPARQL queries, notably by referencing concepts
created by means of such rules. When considering the SPARQL query that allows retrieving
all external walls of a building, this query can be highly simplified by using the SWRL-defined
concept of “external wall”. Not only is the query simpler, but it also gains in ease of
understanding. Table 1 illustrates this example in further details.
Handling IFC standard evolution
Starting with the publication of the first version of the IFC standard [7], its specification has
been updated several times. Generally, there is no backward support between the different
versions, as illustrated by the IFC change log [7]. This is mainly due to the fact that most
modifications are made in the data model structure: modifying the attributes’ order for a given
IFC entity, replacing a deleted entity with another data structure, etc.

Proceedings of the IE 2015 International Conference
www.conferenceie.ase.ro
327
Our approach is also useful in the case when standard evolution adds new entities as subclasses
of existing IFC entities. By means of SWRL rules, triple store existing data is automatically
restructured. Data extracted from IFC files complying to previous versions of the IFC standard
can be automatically update in order to comply to the newer versions of the standard. These
mechanisms allow us to handle different IFC schemas, thus increasing the interoperability of
information exchange among stakeholders.
Table 1 - Content details
Initial query SELECT ?externalWall WHERE {
?externalWall a ifc:IfcWall.
?o a ifc:IfcDefinesByProperties;
ifc:RelObjects ?externalWall;
ifc:RelPropertyDefinition ?pSet.
?pSet a ifc:IfcPropertySet;
ifc:HasProperties ?p.
?p a ifc:IfcPropertySingleValue;
ifc:Name ?name.
?name ifc:dp_IfcIdentifier "IsExternal".
?p ifc:NominalValue ?val.
?val a ifc:IfcBoolean;
ifc:dp_IfcBoolean "true"^^xsd:boolean}.
SWRL rule ifc:HasProperties(?a, ?x) & ifc:NominalValue(?x, ?z) & ifc:Name(?x, ?y) &
ifc:RelPropertyDefinition(?b, ?a) & ifc:RelObjects(?b, ?c) & ifc:IfcWall(?c) &
ifc:dp_IfcBoolean(?z, “true”^^xsd:boolean) & ifc:dp_IfcIdentifier(?y,
"IsExternal"^^xsd:string) ⇒ BimExternalWall(?c)
Final query SELECT ?externalWall WHERE {
?externalWall a ifc:BimExternalWall.}
4 Conclusion
In this paper, we have presented how Semantic Web technologies can help in achieving the
vision of a model-based BIM information system. Based on the ontology we developed for the
IFC format, we show how AEC actors can make use of it. Our approach allows answering the
various objectives related to data interoperability in the building construction and maintenance
domain. Our approach allows defining concepts missing from the IFC standard but that can be
useful in the context of BIM. For doing so, we use logical rules thus separating the BIM data
structure model (e.g.: IFC) from its semantics. Therefore, we can increase the data model
expressivity without compromising the interoperability level delivered by the IFC standard.
Moreover, we have integrated in our knowledge base an automatic mapping to COBie files,
therefore our system allows extracting data from COBie files and directly transform it into IFC
files.
Acknowledgment
This work is part of a collaborative project with the French company ACTIVe3D who has
financed this work.
References
[1] R. Volk, J. Stengel and F. Schultmann, "Building Information Modeling (BIM) for existing
buildings - Literature review and future needs," Automation in Construction, Volume 38,
pp 109-127 (2014)
[2] Autodesk Building Information Modeling, Realizing the Benefits of BIM, 2011 Autodesk,
Inc., available: http://images.autodesk.com/adsk/files/2011_realizing_bim_final.pdf

Proceedings of the IE 2015 International Conference
www.conferenceie.ase.ro
328
[3] T. M. de Farias, A. Roxin, C. Nicolle, "A Rule Based System for Semantical Enrichment
of Building Information Exchange". Theodore Patkos, Adam Wyner and Adrian Giurca.
RuleML 2014, Aug 2014, Prague, Czech Republic. Vol-1211, pp.2.
[4] R. Vanlande, C. Nicolle, and C. Cruz, "IFC and building lifecycle management,"
Automation in Construction, vol. 18(1), pp. 70-78 (2008)
[5] Autodesk, Inc.: DXF Reference. San Rafael, USA: Autodesk, Inc (2011)
[6] Open Design Alliance: Open Design Specification for .dwg files (2013) [Online],
Available:
http://opendesign.com/files/guestdownloads/OpenDesign_Specification_for_.dwg_files.p
df
[7] International Alliance for Interoperability: IFC2x Versions (2013) [Online], Available:
http://www.buildingsmart-tech.org/specifications/ifc-overview
[8] SmartMarket Report: The Business Value of BIM (2009), pg 26. McGraw-Hill
Construction, Bedford, Massachusetts.
[9] EU BIM Task Group plans ‘convergence’ program, March 3rd 2015, [Online], Available:
http://www.construction-manager.co.uk/news/eu-bim-task-group-plans-convergence-
programme/
[10] G. S. Coleman and J. W. Jun, "Interoperability and the Construction Process, a White
Paper for Building Owners and Project Decision-Makers", available:
http://www.construction.org/clientuploads/resource_center/facilities_mamagement/Intero
perabilityandtheBuildingProcess.pdf
[11] R. Eadie, H. Odeyinka, M. Browne, C. McKeown and M. Yohanis, "Building
Information Modelling Adoption: An Analysis of the Barriers to Implementation," Journal
of Engineering and Architecture, March 2014, Vol. 2, No. 1, pp. 77-101, available:
http://aripd.org/journals/jea/Vol_2_No_1_March_2014/7.pdf
[12] Strassner, J. and Kephart, J., “Autonomic Networks and Systems: Theory and Practice”,
NOMS 2006 Tutorial, April 2006.
[13] DMTF, Common Information Model Standards (CIM), available:
http://www.dmtf.org/standards/standard_cim.php.
[14] SID – Shared Information Data model, available:
http://www.tmforum.org/InformationManagement/1684/home.html.
[15] Guarino N. & Giaretta P., “Ontologies and Knowledge Bases: Towards a
Terminological Clarification, in Towards Very Large Knowledge Bases: Knowledge
Building and Knowledge Sharing”, N. Mars (ed.), IOS Press, Amsterdam, pp. 25–32. 1995.
[16] Phillip G. Bernstein, Jon H. Pittman, Barriers to the Adoption of Building Information
Modeling in the Building Industry, AUTODESK Building solutions, white paper,
November 2004. Available :
http://academics.triton.edu/faculty/fheitzman/Barriers%20to%20the%20Adoption%20of
%20BIM%20in%20the%20Building%20Industry.pdf
[17] BuildingSMART Alliance. MVD COBie (IFC2x4), 2014, [Online], Available:
http://docs.buildingsmartalliance.org/MVD_COBIE/
[18] W. E. East, “Performance Specifications for Building Information Exchange,” Journal
of Building Information Modeling. Fall 2009, pp 18-20.
[19] D. Sapp, “Computerized Maintenance Management Systems (CMMS), Whole
Building Design Guide," National Institute of Building Sciences. January 27, 2011.
[Online], Available: www.wbdg.org/om/cmms.php.

Proceedings of the IE 2015 International Conference
www.conferenceie.ase.ro
329
PRELIMINARY RESULTS OF AN EMPIRICAL INVESTIGATION ON
BLENDED LEARNING IMPLEMENTATION IN A ROMANIAN HEI
Iuliana DOROBĂȚ Department of Economic Informatics and Cybernetics,
Bucharest University of Economic Studies, Romania [email protected]
Abstract. This paper is centred on presenting preliminary results of an empirical investigation
conducted in the Bucharest University of Economic Studies in order to measure the success of
a blended learning project implementation. I present the investigation process and emphasize
on the impact of the newly implemented online.ase.ro platform on the student satisfaction.
Keywords: HEI (Higher Education Institution) blended learning, e-learning systems success,
measuring e-learning systems success, user satisfaction. JEL classification: I21, I23, D83
1. Introduction Blended learning stands for combined, integrative, hybrid learning [1] with the purpose of
attaining learning objectives by applying specific technologies. Blended learning
implementation projects imply the implementation of e-learning systems in order to achieve a
customized act of learning adapted to the individual learning style of students.
Compelled by these new dimensions of the learning process - the need to introduce modern
teaching techniques based on the use of ICT (Information and Communication Technology)
[1] and also the necessity of alignment to the European standards in education [2], a significant
number of Romanian HEIs are embarking on blended learning implementation projects [3]
meant to help them strategically and to improve their services in an increasingly competitive
environment. The Bucharest University of Economic Studies undertook an e-learning system
implementation project during 2014. The Moodle platform online.ase.ro was available online
from the first semester of the current academic year. Therefore, I have had the opportunity to
conduct an empirical investigation regarding the success of this e-learning system
implementation from the student’s perspective.
2. Research model
The investigation process started by analysing several approaches used for measuring the
success of the e-learning systems identified in the academic literature: the DeLone and McLean
(D&M) model [1], [4], [5], the TAM model (Technology Acceptance Model) [1], [6], models
focused on users’ satisfaction [1], [7], [8] and models focused on the e-learning quality [1], [9].
As a result of the completion of this first step of my research I proposed a model which I
entitled it E-Learning System Success (ELSS) that is based on several perspectives: overall
system quality, user perceived control, usefulness and user satisfaction, user attitude, social
factors and benefits of using the e-learning systems.

Proceedings of the IE 2015 International Conference
www.conferenceie.ase.ro
330
Figure 1 - The proposed ELSS model [1].
As it is showed in Figure 1 the proposed model is centred on the user satisfaction dimension.
In the academic literature I identified studies focused on validating models for measuring e-
learning system success [1], [10], and [11]. In my research I concentrated my efforts on
validating the proposed model but also to quantify the influence of the individual learning style
on the student’s satisfaction.
3. Study method
The research method used in my study consists of delivering 2 questionnaires that include
questions regarding student’s personal and academic data and a series of items meant to assess
the proposed ELSS model variables.
The first questionnaire was conducted with the sole purpose to obtain the individual learning
style for each student and contained 18 items (each item offering 2 possible answers). This
questionnaire is based on Kolb’s learning style inventory [12], [13].
The second questionnaire contains questions regarding the variables of subsequent model’s
categories: usefulness and satisfaction (PU - Perceived usefulness, PEU - Perceived ease of
use, S - Satisfaction), perceived control (CSE - Computer self-efficacy, CA - Computer
anxiety), user attitude (IU - Intention to use, U – Use, L- Loyalty), quality (SQ - System quality,
IQ - Information quality, SQ - Service quality, ESQ - Educational system quality) and social
factors (T – Trust, SU - Social usefulness, SI - Service Interaction). These variables were
measured on a 5-point Likert scale ranging from 1 “strongly disagree” to 5 “strongly agree”.

Proceedings of the IE 2015 International Conference
www.conferenceie.ase.ro
331
Students were asked to state the frequency of the Moodle platform usage on a 5-point scale
from “never” to “a lot”.
4. Sample and data collection
As I stated before I applied the blended learning concept during the first semester of the current
academic year (2014/2015), by using the online.ase.ro Moodle platform. The subjects of my
study were students enrolled in the first academic year in the Economic Informatics and
Cybernetics programme from the Faculty of Economic Cybernetics, Statistics and Informatics
of the Bucharest University of Economic Studies in Romania.
The questionnaires were delivered and completed online. I validated 209 questionnaires which
were the support of my study.
5. Preliminary analysis and results
In Table 1 I present the profile of the respondents which reveals that 54,55% of the total number
of participants are females and 45,45% are men. Also, the majority of the respondents is formed
from students that are between 17 and 20 years of age (84,69%). Even though all respondents
are in their first academic year the majority (47,37%) of them already have participated at least
3 online courses. After the analysis of the data collected (these are the results of the first
questionnaire) I identified that the majority of the students are accommodators (44,5%). The
profile of an accommodator is described a person who relies on intuition, is attracted to new
experiences and prefers a practical and experiential approach (commonly known as learning-
by-doing) [14].
Table 1 - The profile of the respondents
Category Frequency Percentage
Gender
Male 95 45,45
Female 114 54,55
Total 209 100
Age
Age between 17-20 years 177 84,69
Age between 20-23 years 23 11
Age between 23-26 years 2 0,96
Age above 26 years 7 3,35
Total 209 100
Individual learning style
Accommodator 93 44,5
Diverger 37 17,7
Assimilator 47 22,49
Converger 32 15,31
Total 209 100
Number of online courses they have participated
1 online course 55 26,32
2 online courses 36 17,22
3 online courses 19 9,09
More than 3 courses 99 47,37
Total 209 100

Proceedings of the IE 2015 International Conference
www.conferenceie.ase.ro
332
In Figure 2, I present the gender and Kolb learning styles distribution. As noticeable, the biggest
difference between male and female participants is less than 5% and it manifests between
divergers.
Figure 2 - Gender and learning styles distribution
Most students have participated in over 3 online courses regardless their learning style (see
Figure 3).
Figure 3 - Student participation in online learning courses
Also the students stated that they use the online.ase.ro platform often (see Figure 4).
Therefore their experience is relevant in the context of this research.
Figure 4 - online.ase.ro frequency of use.
I measured on a Likert scale the student satisfaction regarding the quality of the online learning
system, the online learning process and the blended learning process.
The results show that 76,55% of the participants regardless their learning style are satisfied
with the quality of the Moodle system (see Table 2).

Proceedings of the IE 2015 International Conference
www.conferenceie.ase.ro
333
Table2 - Learning style * S1. Student satisfaction - system quality Crosstabulation.
S1. Student satisfaction - system quality
Total
Strongly
disagree Disagree
Neither
agree nor
disagree Agree
Strongly
agree
Lea
rnin
g
style
Accommodator 1 3 16 52 21 93
Diverger 0 0 6 21 10 37
Assimilator 0 4 10 24 9 47
Converger 0 2 7 17 6 32
Total 1 9 39 114 46 209
Also, 73,68% of the participants stated that they are satisfied with the online learning process
(see Table 3).
Table 3 - Learning style * S2. Student satisfaction - online learning Crosstabulation
S2. Student satisfaction - online learning
Total
Strongly
disagree Disagree
Neither
agree nor
disagree Agree
Strongly
agree
Lea
rnin
g
style
Accommodator 1 3 17 53 19 93
Diverger 0 2 7 22 6 37
Assimilator 0 6 10 23 8 47
Converger 0 1 8 19 4 32
Total 1 12 42 117 37 209
The last measurement reveals that 78,95% of the participants stated that they are satisfied with
the blended learning process (see Table 4).
Table 4 - Learning style * S3. Student satisfaction - blended learning Crosstabulation
S3. Student satisfaction - blended learning
Total Disagree
Neither
agree nor
disagree Agree
Strongly
agree
Lea
rnin
g
style
Accommodator 2 19 58 14 93
Diverger 1 6 20 10 37
Assimilator 1 10 27 9 47
Converger 0 5 18 9 32
Total 4 40 123 42 209
6. Conclusions In this paper I presented only few preliminary results of the empirical investigation conducted
in order to verify the impact of the implementation of the Moodle platform in the Bucharest
University of Economic Studies on the students overall satisfaction. In the first part of this

Proceedings of the IE 2015 International Conference
www.conferenceie.ase.ro
334
paper I emphasized on the research model and on the study method in order to establish the
context of the investigation. Then I extracted and presented some preliminary results.
Considering that the majority of the participants are satisfied with the quality of the Moodle
platform (76,55%) and the quality of the blended learning process (78,95%), I can conclude
that the students enrolled in the first academic year are opened to and embrace the modern
teaching techniques.
Acknowledgment This paper was co-financed from the European Social Fund, through the Sectorial Operational
Programme Human Resources Development 2007-2013, project number
POSDRU/159/1.5/S/138907 “Excellence in scientific interdisciplinary research, doctoral and
postdoctoral, in the economic, social and medical fields - EXCELIS”, coordinator The
Bucharest University of Economic Studies.
References [1] I. Dorobăț, „Models for measuring e-learning systems success: a literature review,”
Informatica Economică Journal, vol. 18, no.3, pp. 77-90, 2014.
[2] A. Ion, D. Vespan, „Human sustainable development in the context of Europa 2020
strategy”, Proc. of the 15th Eurasia Business and Economics Society-EBES Conference -
Lisbon, Lisbon, Portugal, pg.98, 2015.
[3] I. Dorobăț, A. Florea, V. Diaconița, „Applying blended learning in Romanian universities:
between desideratum and reality”, Proc. of the 7th International Conference of Education,
Research and Innovation (ICERI), Seville, Spain, pp. 1819-1825, 2014.
[4] W.H. DeLone, E.R. McLean, "The DeLone and McLean model of information systems
success: A ten-year update," Journal of Management Information Systems, vol.19, pp. 9–
30, 2003.
[5] C.W. Holsapple, A. Lee-Post, "Defining, assessing, and promoting e-learning success: An
information systems perspective," Decision Sciences Journal of Innovative Education, vol.
4, pp. 67–85, 2006.
[6] F. D. Davis, "Perceived usefulness, perceived ease of use, and user acceptance of
information technology," MIS Quarterly, vol. 13, no.3, pp.319–340, 1989.
[7] P.C. Sun, R.J. Tsai, G. Finger, Y.Y. Chen, D. Yeh, "What drives a successful e-Learning?
An empirical investigation of the critical factors influencing learner satisfaction,"
Computers & Education, vol. 50, pp. 1183–1202, 2008.
[8] J.H. Wu, R.D. Tennyson, T.L. Hsia, "A study of student satisfaction in a blended e-learning
system environment," Computers & Education, vol. 55, pp. 155–164, 2010.
[9] J.K. Lee, W.K. Lee, "The relationship of e-Learner’s self-regulatory efficacy and perception
of e-Learning environmental quality," Computers in Human Behavior, vol. 24, pp. 32–47,
2008.
[10] R. Arteaga Sanchez, A. Duarte Hueros, "Motivational factors that influence the acceptance
of Moodle using TAM," Computers in Human Behavior 26 (2010), pg. 1632-1640.
[11] T. Escobar Rodriguez, P. Monge Lozano, "The acceptance of Moodle Technology by
business administration students," Computers & Education 58 (2012), pg. 1085-1093.
[12] A. Kolb, D. Kolb, "The Kolb Learning Style Inventory—Version 3.1, Technical
Specifications," HayGroup Experience Based Learning Systems, Inc., 2005.
[13] D. Terzi, "Exodul adulţilor în instruire," Revista Didactica Pro, vol. 3, pg. 54-65, 2001.
[14] S. Mcleod, "Kolb-Learning styles", 2013, available online on 27 February 2015 at
http://www.simplypsychology.org/learning-kolb.html.

Proceedings of the IE 2015 International Conference
www.conferenceie.ase.ro
335
BUSINESS PROCESS MANAGEMENT DRIVEN BY DATA
GOVERNANCE
Liviu CIOVICĂ Academy of Economic Studies
Răzvan Daniel ZOTA
Academy of Economic Studies
Ana-Maria CONSTANTINESCU Lucian Blaga University of Sibiu
Abstract. As organizations begin to exploit the value of data for strategy and operations, it is
recognized the role of data governance in helping the business to realize the potential value in
data. Data governance provides the capabilities that support the administrative tasks and
processes of data stewardship. It supports the creation of data policies, manage workflows,
and provide monitoring and measurements of policy compliance and data use. Data
governance workbenches and functionality in tools such as master data management (MDM),
data quality, and metadata management are now better equipped to link to data policies (i.e.,
consistency, correctness, completeness, relevancy etc.). This gives to the business data
stewards a better operational control to validate and manage data compliance with data
policies. In this way, we may have a single solution to govern data across the five areas of data
governance — data quality, MDM, metadata management, security, and information life-cycle
management — and, more important, the ability to tie data compliance to quantifiable business
impact. A better and a more consistent approach to Business Process Management is done
through a proper governance and understanding of data.
Keywords: business process, data governance, data quality, data stewardship, information life
- cycle.
JEL classification: M21
1. Introduction Main objective of data governance is to provide an overview of the importance and relevance
of data governance as part of an information management initiative. As business data stewards
become accountable for data governance success, they need solutions to support their activities.
It is not enough to collect data policies and rules, business data stewards need capabilities that
align to the processes and management of data as a new business asset. Data Governance
provides an operating discipline for managing data and information as a key asset of an
enterprise. It includes organization, processes and tools for establishing and exercising decision
rights regarding valuation and management of data.
The elements of data governance are:
Decision making authority;
Compliance;
Policies and standards;

Proceedings of the IE 2015 International Conference
www.conferenceie.ase.ro
336
Data inventories;
Full lifecycle management;
Content management;
Records management;
Preservation and disposal;
Data quality;
Data classification;
Data security and access;
Data risk management;
Data valuation.
1.1 IT Governance and Data Governance
As defined by the IBM Data Governance Council, data governance represents the political
process of changing organizational behavior to enhance and protect data as a strategic
enterprise asset.
The Data Governance Institute defines DG as a system of decision rights and accountabilities
for information-related processes, executed according to agreed-upon models which describe
who can take what actions with what information, and when, under what circumstances, using
what methods.
Data Governance touches both business and IT by answering two questions:
Regarding business: How do we leverage data to improve business process and
performance?
Regarding IT: How do ensure optimal reuse, quality and operational efficiencies?
By running a Data Governance program lifecycle we may develop a value statement, prepare
a roadmap, plan and fund, design the program, deploy the program, govern the data, monitor,
measure, report.
Typically, data Governance has a three-part mission:
Proactively define/align rules;
Provide ongoing, boundary-spanning protection and services to data stakeholders;
React to and resolve issues arising from non-compliance with rules.
Typical universal goals of a Data Governance program are to enable better decision-making
and reduce operational friction, to protect the needs of data stakeholders, train management
and staff to adopt common approaches to data issues, build standard, repeatable processes,
reduce costs and increase effectiveness through coordination of efforts and to ensure
transparency of processes.
IT Governance makes decisions about:
IT investments;
IT application portfolio;
IT project portfolio.
IT Governance aligns the IT strategies and investments with enterprise goals and strategies and
by using Control Objectives for Information and related Technology (COBIT) provides
standards for IT governance. Only a small portion of the COBIT framework addresses
managing information. Some critical issues, such as Sarbanes - Oxley compliance, span the
concerns of corporate governance, IT governance, and data governance.
Data Governance is focused exclusively on the management of data assets and is at the heart
of managing data assets.

Proceedings of the IE 2015 International Conference
www.conferenceie.ase.ro
337
2. Master Data Management and Business Process Management Correlation
Master data can be defined as the data that has been cleansed, rationalized, and integrated into
an enterprise-wide “system of record” for core business activities. [1]
Master Data Management (MDM) is the framework of processes and technologies aimed at
creating and maintaining an authoritative, reliable, sustainable, accurate, and secure data
environment that represents a “single version of truth”, an accepted system of record used both
intra- and inter-enterprise across a diverse set of application systems, lines of business, and
user communities. [2]
As products of data governance, data quality and MDM helps drive business agility by allowing
developers to infuse business process management (BPM) with timely, trusted data from
master data management (MDM), leading to more intelligent business processes.
Timely use of information from MDM is a key factor. MDM data delivery needs to be
integrated with the business process. The data needs to be governed and managed by providing
validation, avoiding duplicates, and so on. These steps for data stewardship need to be
repeatable forming a business process. Therefore, not only does MDM deliver trusted data in
BPM based solution, but also BPM is a key enabler for managing MDM.
MDM comes with a process to manage data stewardship. Data stewardship processes are
modified only by the data stewards to address new issues with data quality – for example,
needing to check valid values for a key data field, validating against an external trusted source,
etc.
MDM and BPM can address challenges in two areas. They can enable more accurate and timely
decision making to enhance business performance, by using BPM to optimize process with
human tasks, automated tasks, and improved visibility. MDM can provide trusted and timely
data to business processes. Enterprise process agility with BPM and trusted timely data from
MDM may be combined.
Master Data can be a trusted asset to the organization’s business processes. BPM helps
implement and enforce policies and coordinates multi-step/multi-role workflow for data.
Although master data management is a valid and strongly recommended product of data
governance, with high potential in delivering valuable and critical data, it still’s presents some
issues in data management organization, like:
Discovery - cannot find the right information;
Integration - cannot manipulate and combine information;
Insight - cannot extract value and knowledge from information;
Dissemination - cannot consume information;
Management – cannot manage and control information volumes and growth.
It also presents some issues in gathering information from users, managers, and all the personal
which needs the correct information to act upon:
52% of users don’t have confidence in their information;
59% of managers miss information they should have used;
42% of managers use wrong information at least once a week;
75% of CIOs believe they can strengthen their competitive advantage by better using and
managing enterprise data;
78% of CIOs want to improve the way they use and manage their data;
Only 15% of CIOs believe that their data is currently comprehensively well managed.
To drive business agility data quality should solve these issues in a proper manner and time:
Poor data quality costs real money;
Process efficiency is negatively impacted by poor data quality;

Proceedings of the IE 2015 International Conference
www.conferenceie.ase.ro
338
Full potential benefits of new systems not be realized because of poor data quality;
Decision making is negatively affected by poor data quality.
Information in all its forms – input, processed, outputs – is a core component of any IT system
and applications exist to process data supplied by users and other applications. Data breathes
life into applications so data must be stored and managed by infrastructure - hardware and
software, representing a key organization asset with substantial value. Significant
responsibilities are imposed on organizations in managing data.
MDM System provides mechanisms for consistent use of master data across the organization
and provides a consistent understanding and trust of master data entities. Is designed to
accommodate and manage change.
Organizations have multiple, often inconsistent, repositories of data for:
Line of business division;
Different channels;
Cross-domain;
Distribution of information;
Packaged systems;
Mergers and acquisitions;
Operational MDM System participates in the operational transactions and business processes
of the enterprise, interacting with other application systems and people. Analytical MDM
System is a source of authoritative information for downstream analytical systems, and
sometimes is a source of insight itself.
3. Data and information management
Data and information management is a business process consisting of the planning and
execution of policies, practices, and projects that acquire, control, protect, deliver, and enhance
the value of data and information assets. Its scope is to manage and use information as a
strategic asset for implementing processes, policies, infrastructure and solutions to govern,
protect, maintain and use information.
To make relevant and correct information available in all business processes and IT systems
for the right people in the right context at the right time with the appropriate security and with
the right quality is necessary to exploit the correct and proper information in business decisions,
processes and relations.
In information management we confront ourselves with two goals, a primary goal and a
secondary goal.
Primary goals are used to:
understand the information needs of the enterprise and all its stakeholders;
capture, store, protect, and ensure the integrity of data assets;
continuously improve the quality of data and information, including accuracy, integrity,
integration, relevance and usefulness of data;
ensure privacy and confidentiality, and to prevent unauthorized inappropriate use of data
and information;
maximize the effective use and value of data and information assets.
Secondary goals are used to:
control the cost of data management;
promote a wider and deeper understanding of the value of data assets;
manage information consistently across the enterprise;
align data management efforts and technology with business needs.

Proceedings of the IE 2015 International Conference
www.conferenceie.ase.ro
339
By managing data and information carefully, like any other asset, by ensuring adequate quality,
security, integrity, protection, availability, understanding and effective use of shared
responsibility for data management between business data owners and IT data management
professionals it results that Data Management is a business function with a set of related
disciplines.
The business function of planning for, controlling and delivering data and information assets
for development, execution, and supervisions of plans, policies, programs, projects, processes,
practices and procedures that control, protect, deliver, and enhance the value of data and
information assets for the scope of the data management functions and for the scope of its
implementation vary widely with the size, means and experience of organizations. Role of data
management remains the same across organizations even though implementation differs
widely.
With a shared role between business and IT, data management is a shared responsibility
between data management professionals within IT and the business data owners representing
the interests of data producers and information consumers. Business data ownership is the
concerned with accountability for business responsibilities in data management.
More accurate and timely decision by making an enhance business performance through BPM
optimizes process with human tasks, automated tasks to improve visibility. MDM provides
trusted and timely data to business processes by combining enterprise process agility with BPM
and with trusted, timely data from MDM.
By ensuring master data as a trusted asset to the organizations processes enforcing appropriate
Data Governance policies to support process consumption with the help of BPM Express by
implementing and enforcing policies and coordinating multi-step / multi-role workflow for
data.
4. Conclusion
Improving data quality is one of those timeless things which can provide value on its own, or
it can be done as a first step towards something else such as master data management (MDM),
or it can be done together with MDM.
Data Governance is necessary in order to meet several strategic business requirements like:
Compliance with regulations and contractual obligations;
Integrated customer management (360 degree view);
Company-wide reporting needs (Single Source of the Truth);
Business integration;
Global business process harmonization.
All of this traces back to lack of data governance and poor quality data in the end. Master data
management technology can address a lot of these issues, but only when driven by an MDM
strategy that includes a vision that supports the overall business and incorporates a metrics-
based business case. Data governance and organizational issues must be put front and center,
and new processes designed to manage data through the entire information management life
cycle. Only then can you successfully implement the new technology you’ll introduce in a data
quality or master data management initiative.
References [1] A. Berson and L. Dubov, Master Data Management and Customer Data Integration for a
Global Enterprise, McGrall-Hill, 2007, pp. 8

Proceedings of the IE 2015 International Conference
www.conferenceie.ase.ro
340
[2] O. Boris, “One Size Does Not Fit All: Best Practices for Data Governance”, University of
St. Gallen, Institute of Information Management Tuck School of Business at Dartmouth
College, Minneapolis, September, 2011
[3] J. J. Korhonen, MDM and Data Governance. Helsinki University of Technology, available:
http://www.jannekorhonen.fi/MDM_and_Data_Governance.pdf

Proceedings of the IE 2015 International Conference
www.conferenceie.ase.ro
341
M-LEARNING AND LIFELONG LEARNING
Alina-Mihaela ION
The Bucharest Academy of Economic Studies, Romania
Dragoș VESPAN
The Bucharest Academy of Economic Studies, Romania
Abstract. The article highlights the impact of using mobile devices by the participants at the
lifelong learning educational process. Seeing human development as a sustainable
development involves adapting to new hardware and software technologies supported by the
progress of information and communication technology. Due to technological development
access to mobile devices grew significantly. This way, the extension of the educational process
towards lifelong learning is simplified by the use of mobile devices. Practically, m-Learning
instruction type for lifelong learning is sustained.
Keywords: lifelong learning, computer assisted instruction, m-learning, mobile devices,
information and communication technology
JEL classification: I2
1. Introduction
The progress known by the information and communications technology led to major changes
in all spheres where it is used and, consequently in educational domain. Using technology in
education encourages at the same time both traditional education process and lifelong learning.
Both at European level and worldwide there is an increasing attention given to lifelong
educational process as a result of the awareness that sustaining lifelong learning process is in a
direct relationship with the living standards of citizens and their quality of life. Investments in
human capital support all other investments. This way, the importance of education and its role
in society is emphasized.
2. Extension of traditional education
At European level, since 2002, m-Learning was seen as an extension of e-Learning. On this
purpose, Ericsson implemented the project "From e-learning to m-learning" as part of the
Leonardo da Vinci II program, under the coordination of the European Union.
According to [1], [2], Leonardo da Vinci II was an European vocational instruction program,
representing a natural following of the Leonardo da Vinci I program, [3].
Leonardo da Vinci II program was conducted between January 2000 and December 2006,
allowing the right of 31 European Union member states to participate at the competition,
including Romania, which it was in the process of adherence at that time.
As [4] states, students in higher education are increasingly using mobile devices in their
personal activities and also in their social activities, including their education.
According to [4], one of the most popular European applications as innovation is Federic@
platform implemented at Federico II University of Naples, Italy. The platform provided to
students is oriented to m-Learning distance instruction type and can be accessed through a wide

Proceedings of the IE 2015 International Conference
www.conferenceie.ase.ro
342
variety of smart phones and tablets. The applications provided by the Federal@ are: Federica
WebLearning, FedericaMobile and Federica iTunes U.
Through these applications, the instructors have benefit from the necessary technology to create
and customize educational materials, and students have access to information using a computer
or a mobile device, as shown in Figure 1.
Figure 1. Example of m-Learning courses for economics
Federico II University provides a wide variety of courses, corresponding to different
specializations as Economics, Medicine, Pharmacy, Engineering, Philosophy, etc.
Generally, distance instruction using computers is considered to be an independent instruction.
On the contrary, in the case of instruction through mobile devices, the educational process
should be considered to be a complementary method for the classical education with presence
in campus or even a complementary instruction method for distance learning.
The advantage provided by the small sizes of mobile devices allows them to be used at any
time by those concerned to get documented in different areas. With a simple Internet
connection, a charged battery and available time, users have the opportunity to study whether
they are into a classroom, in transportation means or at home, completing this way their
knowledge on their domain of interest. Such activities encourage lifelong learning towards a
sustainable human development.
Mobile devices are mainly used for communicating via short text messages, searching of
information or displaying media content. According to [5], materials involving writing large
size texts are not supported due to the small size of the screen which makes them difficult to
be read. In order not to complicate the process of reading and not to get the student tired,
educational supports for m-Learning must fulfil a certain standard and must be designed right
from the start for small screens. Displaying contents optimally on the screens of mobile devices
and structuring them accordingly will increase the interest of students towards m-Learning.
The communication in educational process is encouraged by the mobile technologies. Those
who use m-Learning specific applications can communicate verbally or in writing, can
collaborate through shared applications and can interact through the Social Media specific
applications.

Proceedings of the IE 2015 International Conference
www.conferenceie.ase.ro
343
Communication facilities through SMS, dialog and chat encourage collaborative activities
between those who study using these methods. In [5], based on the arguments presented by [6],
the idea according to which mobile devices represent collaborative learning method.is
sustained.
3. M-Learning and sustainable human development
Mobile devices provide support especially for fast communication. Mobile devices have the
main role of providing support for achieving synchronous and asynchronous communication
between users, according to [7]. The development of social aspects of the users is such
encouraged.
[8] highlights the functionalities of a mobile phone, based on a survey conducted among
students. Analysis of their responses resulted in a ranking of the functionalities of mobile
phones used in the educational process, as follows:
1. Communication
2. Accessing educational content
3. Accessing useful information
4. Social Networking
5. Content authoring
The functionalities mentioned above, which are specific to mobile phones, can be extended as
well to other mobile devices such as laptops (considered to be partial mobile device) and
tablets.
If from educational perspective, the utility of mobile devices is represented by the order of
functionalities above from 2 to 5, Figure 2, when we have a general look, the importance of the
functionalities is exactly the reverse order, from 5 to 2.
Figure 2. The functionalities of mobile devices
Therewith, the functionality of mobile devices can be grouped into:
Basic functionalities represented by communication (verbal communication, SMS, e-
mail), content authoring (texts composition, pictures taking, audio-video recording,
audio recording) and social networking (creating and publishing content on Facebook,
Twitter, YouTube, Instagram, Pinterest).
Advanced functionalities, represented by the possibility to access useful information
(on websites such as electronic dictionaries, blogs specialized in a particular area) and
Over-advanced functionalities
7. Content authoring
using software technologies
and programming environments
Advanced functionalities
6. Accessing educational
content
5. Accessing useful
information
Basic functionalities
3. Social Networking
2. Content authoring
1. Comunication

Proceedings of the IE 2015 International Conference
www.conferenceie.ase.ro
344
accessing the educational content available via PDF files, web pages, and interactive
applications.
Some users of the advanced functionalities of mobile devices are aware of the importance of
getting documented in a particular field, clarifying certain concepts or terms used casually in a
particular context. Unwittingly, they will use these advanced functionalities provided by
mobile devices for self-training. In this case, the educational process is almost imperceptible
to the user. Such self-training activities can be carried out by users of all ages, regardless of
their training. The activity itself can be considered to be specific to lifelong learning, voluntary,
without the user of the device to specifically be aware of the educational process.
The awareness generally occurs among users actively involved in the educational process. This
category of users of mobile devices represents a particular case of all users conducting intentional
learning and organized learning, activities specific to lifelong learning. A distinction between these
two concepts is made in [9].
The definition of these concepts can be adapted for the users of mobile devices in education. For
the users of mobile devices, considering [9] we can say that intentional learning represents the fact
that, at a certain moment of time after completing the initial formation, the user becomes aware
about the continuation of his education in a certain domain and by the importance of participating
at further formation courses in order to increase his level of knowledge, competencies and skills in
the domain of activity he is interested in.
In this scenario, the use of functionalities provided by mobile devices for searching educational
materials, enrolling and graduating specialty or forming courses represents operations that the user
conducted intentionally and is aware of.
Compared to intentional learning, from the perspective of lifelong learning and particularizing
for the case where mobile devices are used in the educational process, organized learning
represents learning that has been planned in a program. The participants do not express
explicitly their intention to follow such type of learning but rather they generally choose this
following some constraints at work.
Implicitly, the users of advanced functionalities, both those who are aware of the educational
process and those which are self-instructing, use also the basic functionalities provided by
mobile devices.
Along with the raise of his instruction level, the user will be capable of using high level
software technologies in order to develop educational content. Thus, Figure 2 can be improved
by adding the sixth functionality represented by the use of high level technologies.
The use of mobile devices in education must be seen further as a complementary instruction
method. As an instructor choses to present the content of the same course either in a classical
way, using a PDF file, or in an interactive way, using specific software technologies, both of
these methods being used to train, mobile technologies can also be viewed as an alternative
way of training. In order to learn, a student may choose to access educational materials either
on a computer or on a mobile device, be it a smartphone. The objective of the instruction and
the role of the device remain the same.
Even if it should not matter how the user choses to view the information in a completion test
of an organized course (PDF or interactive), when talking about mobile devices the situation is
different. Mobile devices may be used for routine evaluation but, for the moment, the final
evaluation conducted exclusively on mobile phone or tablet is not possible.
In order to get a correct and fair assessment, all those taking an exam at the same time should
have exactly the same type of device or devices with identical performances. The problems
that arise not allowing the completion of an educational process by giving final tests on the
mobile phones or tablets can be divided into two categories: financial problems and
methodological issues. From the financial point of view, investments should be made in

Proceedings of the IE 2015 International Conference
www.conferenceie.ase.ro
345
laboratories in order to provide students with access to all types of mobile devices that they can
use along the educational process for studying and also for getting familiar with. Thus, in the
event of taking a test on such a device, the user should have the necessary skills to use the
device without any problems.
From the methodological point of view, the problems that may occur are caused by the novelty
of the use of mobile devices in an educational process that is finalized through awarding
recognized diplomas. There should be different methodologies developed for creating
educational content to be proposed in the training process.
4. Conclusions and future directions
The programs proposed and sustained at European level in the past 25 years represent the proof
of the interest shown for transforming Europe into a competitive and dynamic knowledge-
based economy, as its development is intended to be a durable and sustainable one. Such a
development can only be achieved through investments in human capital, raising its
educational level. Within the European Union, one priority for the coming years is to create
programs that allow sustainable development of EU citizens.
Including mobile devices in educational activities provides more support to students. Still, this
should be seen as an activity that is complementary to the process of lifelong learning, which
is traditionally achieved by presence on campus, or through personal computers.
The advantages of accessing educational content on the tablet or mobile phone are similar to
those of accessing the contents from the personal computer. Deploying complex activities
which involve the use of over-advanced functionalities of mobile devices is hampered by the
small size of the screen.
The basic functionalities of mobile devices are represented by rapid communication and
information transmission, two activities that support collaborative activities between students
or between common users of applications specific to educational field. Using mobile devices
in everyday activities directly encourage voluntary or organized involvement in educational
activities. Due to the advantage of having the ability to keep the user in constant contact with
the educational or lucrative activities he conducts, the use of mobile devices encourages
lifelong learning process.
Acknowledgment
This paper was co-financed from the European Social Fund, through the Sectorial Operational
Programme Human Resources Development 2007-2013, project number
POSDRU/159/1.5/S/138907, "Excellence in scientific interdisciplinary research, doctoral
and postdoctoral, in the economic, social and medical fields - EXCELIS", coordinator The
Bucharest University of Economic Studies, Romania.
References
[1] P. Landers, "From e-Learning to m-Learning," 08 2002. [Online]. Available:
http://learning.ericsson.net/mlearning2/project_one/leo.html. [Accessed 03 2015].
[2] CE, „Obiectivele Europa 2020,” 10 02 2014. [Interactiv]. Available:
http://ec.europa.eu/europe2020/europe-2020-in-a-nutshell/targets/index_ro.htm. [Accesat
04 12 2014].
[3] UE, Educaţie şi formare: cadru general - Programul de învăţare pe tot parcursul vieţii
2007-2013, 2009.
[4] eprof.ro, "Tehnologii Mobile ȋn Învățare," 2015. [Online]. Available:
http://www.eprof.ro/doc/Mobile_learning.pdf.

Proceedings of the IE 2015 International Conference
www.conferenceie.ase.ro
346
[5] A.-M. Ion și P. Pocatilu, „Using M-Learning in Education,” în The Proceedings of the 11th
International Conference on Informatics in Economy, Bucureşti, 2012.
[6] H. Uzunboylu, N. Cavus și E. Ercag, „Using mobile learning to increase environmental
awareness,” Computers & Education, vol. 52, nr. 2, pp. 381-389, february 2009.
[7] A.-M. Ion și D. Vespan, „Collaborative Learning and Knowledge Transfer in
Consciousness Society,” Informatica Economica, vol. 15, nr. 3, pp. 115-127, 2011.
[8] L. Nielsen , " Research-based proof that students use cell phones for LEARNING," 16
February 2013. [Online]. Available:
http://theinnovativeeducator.blogspot.co.at/2013/02/finally-research-based-proof-
that.html. [Accessed 2015].
[9] A.-M. Ion, "Lifelong Learning and Human Sustainable Development in European Union,"
in Proceedings of the 9th International Conference On Economic Cybernetic Analysis:
Positive And Negative Effects Of European Union And Eurozone Enlargement Pone-2014,
Oct 31 - Nov 1st 2014, Bucharest, 2014.

Proceedings of the IE 2015 International Conference
www.conferenceie.ase.ro
347
THE PROBLEM OF DATA CONSISTENCY IN ANALYTICAL
SYSTEMS
Oleksandr SAMANTSOV
Kharkiv National University of Radioelectronics
Olena KACHKO
Kharkiv National University of Radioelectronics
Abstract. Authors describing how data inconsistency in analytic systems between aggregated
and raw data appear and provide a solution how to prevent it due to models of data consistency.
Also the question if we need to have inconsistent data also appear.
Keywords: aggregating data, business intelligence, data analytics, data inconsistency
JEL classification: C88, L86
1. Introduction
Business Intelligence processes are tightly composed in all spheres of life and this leads to the
fact that modern companies handle terabytes of user data. This complicates the structure of
modern analytical data providers, which are multilevel systems, which often give access to data
aggregated at a certain level, rather than raw [1]. One of the challenges when working with
aggregated data is the complexity of the raw data and this leads to delays in processing, which
are critical for some Business Opportunities (medicine, sales) and, moreover, violates one of
the principles of any analytical and distributed system – the principle of consistency. In this
article we will look at methods to deal with consistent data.
2. Sources of latency in analytical databases
The business requirements for a zero-latency analytical environment introduce a set of service
level agreements that go beyond what is typical of a traditional data warehouse. These service
levels focus on three basic characteristics:
1. Continuous data integration, which enables near real-time capturing and loading from
different operational sources. This sort of data integration results in an increasing number of
late-arriving data (e.g. due to propagation delays). Besides technical challenges (mixed
workload caused by concurrent updates and analytical queries, scalability, performance,
minimized scheduled downtimes, etc.) there are other issues which directly affect the analytical
environment:
- Analysis results may change unexpectedly from the analyst’s perspective during the repetition
of an identical analytical query if the result set was affected by newly integrated data in the
meantime. This is a really critical situation, because it confuses analysts that are accustomed
to the stable snapshot paradigm for data warehouses. It is very difficult for them to determine
the cause for such an unexpected change: the newly integrated data.
- Keeping aggregates current. Aggregates are intended to provide better performance for
analytical queries, providing results at a higher level, rather than all the detailed data. This is a
common situation in analytical environments using OLAP. In a traditional data warehouse all
the aggregates are updated at the end of every update window. However, in a continuous
loading environment this is not feasible. We need a model that is able to reflect multiple
versions of aggregates regarding the same dimension hierarchy levels [2].

Proceedings of the IE 2015 International Conference
www.conferenceie.ase.ro
348
2. Active data warehouses. An active data warehouse is event driven, reacts in a timeframe
appropriate to the business needs, and makes tactical decisions or causes operational actions
rather than waiting to produce periodic reports. It provides an integrated information repository
to drive both strategic and tactical decision support within an organization. Furthermore, rule-
driven (active) decision engines can use this information in order to make recommendations or
initiate operational actions in near real time responding to predefined data conditions in the
warehouse. [2].
3. Late-arriving data. Late-arriving datasets are defined as data, which is available for loading
and is logically related to data warehouse datasets already integrated during previous update
periods (e.g. weeks or even months ago). Late-arriving records are welcome because they make
the information more complete. However, those facts and dimension records are bothersome
because they are difficult to integrate. The newly integrated datasets change the counts and
totals for prior history. There are several reasons why we shouldn’t ignore late-arriving data:
- Analysis results may change retrospectively. Late-arriving data can possibly change analysis
results unexpectedly from the analyst’s perspective. This situation is similar to that encountered
in continuous load environments. It is very difficult to determine the cause of an unexpected
change. It can be one of the following two possibilities:
- Late-arriving data is integrated into the data warehouse and affects historical analysis results
by changing counts and totals for prior history. So it need to be re-aggregated.
- Loading errors or data quality problems during data staging (e.g. duplicate rows after
restarting a loading process) affect detailed data and aggregates.
Also, we should take into account the high availability for data warehouses. Availability service
levels for a zero-latency analytical environment are typically more stringent than for strategic
decision support implementations. The active mechanisms of the proposed architecture expand
the scope of a traditional DWH to include tactical decision support queries that are critical for
the operational aspects of an organization’s business. As result, 24 × 7 × 52 (24 hours a day, 7
days a week, 52 weeks a year) availability becomes an important requirement, because without
access to the DWH, the business cannot operate in an optimal way. These availability
requirements apply to both planned (system upgrades, etc.) and unplanned (disaster, etc.)
downtimes [2].
3. Data consistency models
Analytical storage is characterized by a predominance of read operations on write operations.
Therefore, we will focus on client-oriented models of data consistency.
3.1. Potential consistency
This model is characterized by the fact that the paralleling degree in which requests are coming
and the data consistency degree may vary.
These examples can be seen as instances of distributed databases and insensitive to the
relatively high degree of consistency violation. They data usually does not change for a long
time and all copies of it are gradually becoming consistent. This form of consistency is called
potential consistency.
The potentially consistent data warehouse has the following property: in the absence of
changes, all copies of the data are gradually becoming identical. The potential consistency, in
fact, requires only a change to the guaranteed expenditures for all copies, regardless of the time
when it will happen. Conflicts of double entry are often relatively easy to solve, if we assume
that the changes can be made only by a small group processes. Therefore, the implementation
of the potential of consistency is often quite cheap [3].

Proceedings of the IE 2015 International Conference
www.conferenceie.ase.ro
349
According to this data consistency model, we can propose the following solution for data
aggregation: depending on the update rate and volume, a special aggregator program runs on
the database and re-aggregates available data.
This decision will cause data consistency violation, but it will not load the system with
unnecessary operations. This solution may be used if the analytical data that we use does not
require real-time updates or when the refresh rate and the volumes of data are small. For
example, the aggregation of demographic behavior or the user data of a web resource.
3.2. Monotonic-read consistency
The data warehouse provides a monotonic-read consistency if it meets the following condition:
if the process reads the value of a data item X, any subsequent read operations always return
the same value or a newer one.
In other words, the monotonic-read consistency ensures that if the process at time t sees a
certain value of X, then later he would never see an older value of X.
Monotonic-read consistency is implemented as follows. When a client performs a read
operation from the server, the server checks the client dataset to the local presence of all write
operations. If it is not, it binds to other servers to update the data before the read operation.
Based on the definition of monotonic-read consistency, we can offer the following
implementation of a data aggregator. When a user accesses aggregates, it compares the
timestamp of building aggregated data and timestamp of the source data change. If the source
data has been changed, the program starts the aggregation process. For this implementation is
critical to the time to aggregate data. Thus, the first access to aggregates execution after
changing the raw data can be quite lengthy. Therefore, this data consistency model can be used
only for analytical systems with a relative small amount of incoming data.
3.3 Monotonic-write consistency
In many situations, it is important to store copies of all data in the correct order of the
distributed write operations. This can be done, provided with monotonic-write consistency. If
the store has the property of monotonic-write consistency, this means that following conditions
are correct: the write process data item X is completed before any subsequent write operations
of this process in the element X. Here, the completion of the write operation means that the
copy on which the following operations reflects the effect of the previous recording operation,
produced by the same process, and thus it does not matter where the operation has been
initiated. In other words, the writing operation in the copy of the X data item is only performed
if the copy is consistent with the results of the previous recording operation is performed on
the other replicas X.
Consistency monotone recording is implemented similarly to monotonous reading. Whenever
you initiate a new client writes to the server the server looks set customer record. (Again, the
size of this set may be too large for the existing performance requirements.) The server verifies
that these write operations performed first and in the correct order. After performing a new
operation, an identifier of a record of the operation is added to the set of records [3].
Thus, we can offer the following solution. When recording raw data for an analysis system, we
run the aggregator program. To improve performance, it makes sense to run the aggregator not
processing each record, but a certain chunk. At the same time, we should provide that update
of the raw data and their aggregation should appear in the same transaction. This solution is
again suitable for systems with rarely renewed data, however, by horizontally extending the
number of processes that update data (in accordance with the number of CPU cores), we can
achieve good results and frequently updated data.
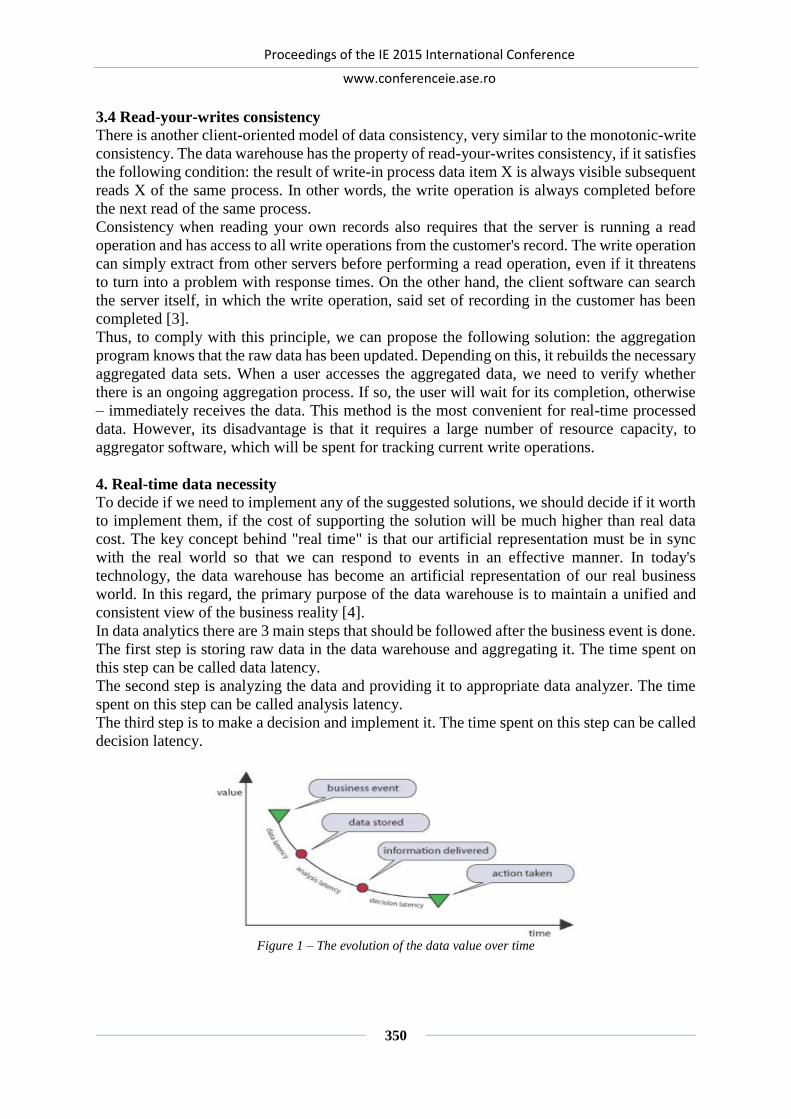
Proceedings of the IE 2015 International Conference
www.conferenceie.ase.ro
350
3.4 Read-your-writes consistency
There is another client-oriented model of data consistency, very similar to the monotonic-write
consistency. The data warehouse has the property of read-your-writes consistency, if it satisfies
the following condition: the result of write-in process data item X is always visible subsequent
reads X of the same process. In other words, the write operation is always completed before
the next read of the same process.
Consistency when reading your own records also requires that the server is running a read
operation and has access to all write operations from the customer's record. The write operation
can simply extract from other servers before performing a read operation, even if it threatens
to turn into a problem with response times. On the other hand, the client software can search
the server itself, in which the write operation, said set of recording in the customer has been
completed [3].
Thus, to comply with this principle, we can propose the following solution: the aggregation
program knows that the raw data has been updated. Depending on this, it rebuilds the necessary
aggregated data sets. When a user accesses the aggregated data, we need to verify whether
there is an ongoing aggregation process. If so, the user will wait for its completion, otherwise
– immediately receives the data. This method is the most convenient for real-time processed
data. However, its disadvantage is that it requires a large number of resource capacity, to
aggregator software, which will be spent for tracking current write operations.
4. Real-time data necessity
To decide if we need to implement any of the suggested solutions, we should decide if it worth
to implement them, if the cost of supporting the solution will be much higher than real data
cost. The key concept behind "real time" is that our artificial representation must be in sync
with the real world so that we can respond to events in an effective manner. In today's
technology, the data warehouse has become an artificial representation of our real business
world. In this regard, the primary purpose of the data warehouse is to maintain a unified and
consistent view of the business reality [4].
In data analytics there are 3 main steps that should be followed after the business event is done.
The first step is storing raw data in the data warehouse and aggregating it. The time spent on
this step can be called data latency.
The second step is analyzing the data and providing it to appropriate data analyzer. The time
spent on this step can be called analysis latency.
The third step is to make a decision and implement it. The time spent on this step can be called
decision latency.
Figure 1 – The evolution of the data value over time

Proceedings of the IE 2015 International Conference
www.conferenceie.ase.ro
351
In figure 1, we are displaying an event for which the value is decreasing rapidly after it first
triggered. This can be applied, for example, to stocks or health care. However, this is not the
only way in which the data cost can be changed.
Figure 2 – Examples of changing the data cost over time
To determine if there is a need to provide real-time data, you should build such a graph, and
estimate how much the data value will change if we won’t have real-time data. If it is much
less than the cost of real time data supporting, than we just need to ignore it.
5. Conclusions
This article proposed methods to solve the problem of inconsistency between aggregated and
raw data in an analytical systems. At the same time, it should be noted that there is no single
way to solve this problem, and the choice depends solely on the characteristics of the system.
We should also never forget that, in order to ensure that data is consistent, we will have to
sacrifice either time on data processing or computing resources, and thus the storage and
processing of data will be more expensive. Therefore, from our point of view it makes sense to
neglect data consistency, unless it is absolutely necessary.
References
[1] D. Moody and M. Kortink, From Enterprise Models to Dimensional Models: A
Methodology for Data Warehouse and Data Mart Design. Internet:
http://ssdi.di.fct.unl.pt/bddw/material_apoio/artigos/files/2000-Moody.pdf [Feb. 26, 2015]
[2] R. M. Bruckener and A. M. Tjoa, Capturing Delays and Valid Times in Data Warehouses
- Towards Timely Consistent Analyses, Journal of Intelligent Information Systems, vol.
19:2, Kluwer, Netherlands, 2002, pp. 169–190
[3] A. S. Tanenbaum and M. Van Steen, Distributed systems: principles and paradigms. New
Jersey: Pearson Education. Inc, 2007, 686 p.
[4] R. Hackathorn, The BI Watch: Real-Time to Real-Value Internet:
https://www.researchgate.net/publication/228498840_The_BI_Watch_Real-
Time_to_Real-Value [Mar 01, 2015]

Proceedings of the IE 2015 International Conference
www.conferenceie.ase.ro
352
BIG DATA ANALYSIS AS FUNDAMENT FOR PRICING DECISIONS
Anca APOSTU
Bucharest University of Economic Studies [email protected]
Abstract. Data-driven decision-making for business, industry, research, commerce and social
media represents nowadays a revolution thanks to the notion of “Big Data”. Big Data Analysis
provides an important source of knowledge while manipulation of such data requires suitable
storage and analysis capabilities. For effective large-scale analysis, locating, identifying,
understanding, and citing data has to happen in an automated manner supported by scalable
cloud platforms. In this article the author’s aim is to present the fundamental aspects of a study
for deducting price calculation elements from Big Data and ways of using these elements for
pricing decisions in retail industry. Learning how to capitalize on Big Data opportunities today
could make the difference for changes to come tomorrow for the mentioned industry.
Keywords: Big Data, Information economics, price calculation, pricing decisions, price
knowledge. JEL classification: C53, C55, C80.
1. Introduction and review of literature Customer price knowledge has been the object of considerable research in the past decades.
Paper [1] cites over sixteen previous studies, most of which focus on measuring customers’
short-term price knowledge of consumer packaged goods. In a typical study, customers are
interviewed either at the point-of-purchase or in their home and asked to recall the price of a
product, or alternatively, to recall the price they last paid for an item. In perhaps the most
frequently cited study, [2] asked supermarket shoppers to recall the price of an item shortly
after they placed it into their shopping cart. Surprisingly, fewer than 50% of consumers
accurately recall the price. Thus, despite the immediate recency of the purchase decision there
is no improvement in the accuracy of the responses.
In a recent paper [3], the authors combine survey data and a field experiment to investigate this
prediction. In their study, they survey 14 customers and collect price recall measures for
approximately two hundred products. They then conduct a field experiment in which they
randomly assign the same items to one of three conditions. In the control condition, items are
offered at the regular retail price. In the price cue condition, a shelf tag with the words “LOW
prices” is used on an item. In the discount condition, the price is offered at a 12% discount
from the regular price.
The authors show that both price cues and price discounts increase demand. But, consistent
with theoretical predictions, the authors find that price cues are more effective on products for
which customers have poor price knowledge [8]. In contrast, price discounts are more effective
when customers have better price knowledge. Together these results highlight the importance
that price knowledge serves in determining the effectiveness of price changes and price cues.
Paper [4] examines consumer price knowledge by comparing the actual market prices and
consumer price estimates in the Finnish grocery market. Although the individual price
estimates of consumers were found to differ significantly from the actual market prices, the
medians of consumer price estimates and market prices were very close to each other for most
of the products in our data. The study indicates that consumer price knowledge is not as poor

Proceedings of the IE 2015 International Conference
www.conferenceie.ase.ro
353
as previously suggested by the results of point-of-purchase studies. The authors suggest that at
least part of the weakness in consumer price knowledge can be explained by differences in
market price variation.
2. The importance of Price Knowledge
The responsibility of pricing officer is to read and understand price attention approach, to
define the products for which he wants to measure price attention and to follow the
methodology based on measuring both price awareness and price sensitivity.
Modeling and analytics are now the hot topic in a vast array of formerly non-scientific
environments: Internet pioneers feverishly seek to uncover the mathematical roots behind
“viral” marketing; physicists are being employed by publishers to forecast how a favorable
New York Times book review sends Amazon sales skyrocketing; geology specialists are
helping some fast-moving consumer goods retailers re-create sales aftershock effects. In each
case, non-scientific environments are being transformed by modeling, forecasting, and
predictive analytics science – namely because in the absence of these powerful disciplines, it
would be nearly impossible for retailers to handle the complexity of data and variables
associated with these tasks.
Most retailers know that technology has played an increasingly important role in helping
retailers set prices. But until recently, these efforts have been rooted in advances in computing
technology, rather than in newfound applications of scientific principles. Real science is a
powerful, pervasive force in retailing today, particularly so for addressing the complex
challenge of retail pricing. Done right, the application of scientific principles to the creation of
a true price optimization strategy can lead to significant sales, margin, and profit lift for
retailers. Our research aims to explain why retailers can no longer thrive without a science-
based pricing system, defines and calls out the new challenges brought by the rising of Big
Data.
3. Big Data – bringing new opportunities in retail systems
Big Data is bringing new opportunities to drive innovation, ramp up productivity, and create
groundbreaking new user experiences. Learning how to capitalize on Big Data opportunities
today could mean positioning for changes to come tomorrow for retail industry.
Big Data is a body of data that is so voluminous, variable and/or fast moving that is not feasible
to process, store, access and analyze it using conventional technologies. So far it has a
skyrocketing volume, estimated to reach 7.9 zettabytes in 2015 (1 zettabyte = 1 trillion GBs)
at an estimated growth rate of +40% per year, 1 petabyte/15s. These changes are mostly due
to cheaper computing power and storage and to the recent changes: High growth in multimedia
(especially video); explosion personal digital devices (change in usage/interaction);
proliferation of sensors, meters, trackers etc. (+30% year); all connected to Internet („digital
exhaust”).
The current sources of data are presented in „Table 1” in relationship with the 3-V Signature
of Big Data – Volume, Variety and Velocity.
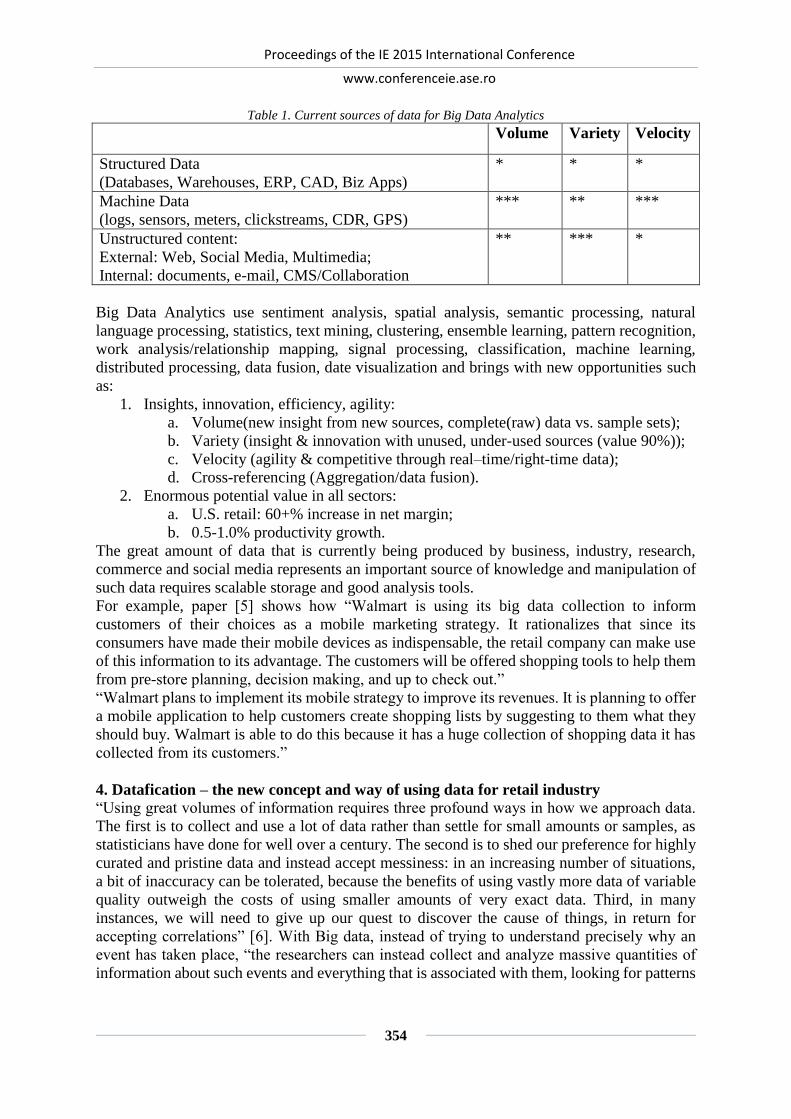
Proceedings of the IE 2015 International Conference
www.conferenceie.ase.ro
354
Table 1. Current sources of data for Big Data Analytics Volume Variety Velocity
Structured Data
(Databases, Warehouses, ERP, CAD, Biz Apps)
* * *
Machine Data
(logs, sensors, meters, clickstreams, CDR, GPS)
*** ** ***
Unstructured content:
External: Web, Social Media, Multimedia;
Internal: documents, e-mail, CMS/Collaboration
** *** *
Big Data Analytics use sentiment analysis, spatial analysis, semantic processing, natural
language processing, statistics, text mining, clustering, ensemble learning, pattern recognition,
work analysis/relationship mapping, signal processing, classification, machine learning,
distributed processing, data fusion, date visualization and brings with new opportunities such
as:
1. Insights, innovation, efficiency, agility:
a. Volume(new insight from new sources, complete(raw) data vs. sample sets);
b. Variety (insight & innovation with unused, under-used sources (value 90%));
c. Velocity (agility & competitive through real–time/right-time data);
d. Cross-referencing (Aggregation/data fusion).
2. Enormous potential value in all sectors:
a. U.S. retail: 60+% increase in net margin;
b. 0.5-1.0% productivity growth.
The great amount of data that is currently being produced by business, industry, research,
commerce and social media represents an important source of knowledge and manipulation of
such data requires scalable storage and good analysis tools.
For example, paper [5] shows how “Walmart is using its big data collection to inform
customers of their choices as a mobile marketing strategy. It rationalizes that since its
consumers have made their mobile devices as indispensable, the retail company can make use
of this information to its advantage. The customers will be offered shopping tools to help them
from pre-store planning, decision making, and up to check out.”
“Walmart plans to implement its mobile strategy to improve its revenues. It is planning to offer
a mobile application to help customers create shopping lists by suggesting to them what they
should buy. Walmart is able to do this because it has a huge collection of shopping data it has
collected from its customers.”
4. Datafication – the new concept and way of using data for retail industry
“Using great volumes of information requires three profound ways in how we approach data.
The first is to collect and use a lot of data rather than settle for small amounts or samples, as
statisticians have done for well over a century. The second is to shed our preference for highly
curated and pristine data and instead accept messiness: in an increasing number of situations,
a bit of inaccuracy can be tolerated, because the benefits of using vastly more data of variable
quality outweigh the costs of using smaller amounts of very exact data. Third, in many
instances, we will need to give up our quest to discover the cause of things, in return for
accepting correlations” [6]. With Big data, instead of trying to understand precisely why an
event has taken place, “the researchers can instead collect and analyze massive quantities of
information about such events and everything that is associated with them, looking for patterns

Proceedings of the IE 2015 International Conference
www.conferenceie.ase.ro
355
that might help predict future occurrences. Big data helps answer what, not why, and often
that’s good enough“, the same authors will report.
The paper in discussion brings into attention the concept of “datafication”, which is not the
same as digitization, which takes analog content and converts it into digital information. The
concept of datafication was first introduced by Shigeomi Koshimizu, a professor at the
Advanced Instritute of Industrial Technology in Tokyo, in a study of people posture when
seated as an attempt to adapt the technology as an antitheft system for cars, and refers to taking
all aspects of life and turning them into data. For example, Google’s augmented-reality glasses
datafy the gaze. Twitter datafies stray thoughts. LinkedIn datafies professional networks.
“Once we datafy things, we can transform their purpose and turn the information into new
forms of value. For example, IBM was granted a U.S. patent in 2012 for “securing premises
using surface based computing technology” – a technical way of describing a touch-sensitive
floor covering, somewhat like a giant smartphone screen. Datafying the floor can open up all
kinds of possibilities. For example, retailers could track the flow of customers through their
stores. Once it becomes possible to turn activities of this kind into data that can be stored and
analyzed, we can learn more about the world – things we could never know before because we
could not measure them easily and cheaply.”
Two decades ago, America’s biggest Retailers—Walmart—planned to increase its market size
by penetrating rural communities located in small towns with the view of bringing its services
to all and sundry while maximizing its profitability [7]. Walmart successfully pulled this off
by analyzing the large sets of data available to them—gathered from its previous ventures—
for understanding the consumption needs of these communities as well as selecting choice
locations for setting up its stores.
Walmart’s move has been credited by most market analysts as the first use of big data in the
retail industry, giving it the tag of “merchandising pioneers in big data” due to the fact that its
analysts successfully analyzed the millions of customer data available to them without the use
of today’s sophisticated software/hardware tools. Since then, smaller retail chains both off and
online has utilized big data in understanding customer consumption needs and building
adequate marketing strategies [9].
“Walmart is also planning to create a mobile app which will help customers when they’re
already in the stores”. The said application is able to sense if the customer is inside a store and
automatically prompts the customer to opt for “Store Mode” so that he can scan codes for
discounts and prices. An application which allows customers to use voice prompt to create a
shopping list based on a customer’s preferences is also one of the topics Walmart invests effort
in. [5]
“According to a study conducted by the retail store, customers who make use of its mobile
applications shop at Walmart’s stores at least twice a month. They also spend 40% more
monthly as compared to customers who are non-app users. In January of this year, Walmart
teamed up with Straight Talk Wireless to create a $45 prepaid plan for its customers who have
smartphones. Clients who bought smartphones at any of Walmart’s stores are also offered a
$25 a month no-interest fixed monthly installments through the store’s credit card.” [10]
5. Conclusions – current challenges, future approaches
The research on price knowledge reveals that there is an opportunity for firms to influence
customers’ price perceptions. Moving forward, the use of Big Data has helped retailers:
optimize the pricing of merchandise, improve marketing campaigns, improve store operations,
product placement and customer satisfaction analysis, staffing policies and providing decision
support.

Proceedings of the IE 2015 International Conference
www.conferenceie.ase.ro
356
The fact remains that retail outlets will continue to face the challenges associated with
gathering useful data and analyzing them to predict the ever changing trends in the retail
industry.
References
[1] Monroe, Kent B. and Angela Y. Lee, 1999, “Remembering versus Knowing: Issues in
Buyers’ Processing of Price Information,” Journal of the Academy of Marketing Science,
Vol. 27, No. 2, pp. 207-225.
[2] Dickson, Peter R. and Sawyer, Alan G., July 1990, “The Price Knowledge and Search of
Supermarket Shoppers”, Journal of Marketing, Vol. 54, No. 3, pp. 42-53, published by:
American Marketing Association, [online] Available: http://www.jstor.org/stable/1251815
[3] Anderson, Eric T., Edward Ku Cho, Bari Harlam and Duncan I. Simester (2007), “Using
Price Cues,” mimeo, MIT, Cambridge MA.
[4] Aalto-Setälä, Ville, Raijas, Anu, 2003, “Actual market prices and consumer price
knowledge”, Journal of Product & Brand Management, ISSN: 1061-0421
[5] De Borja, Florence, June 7, 2013, “Walmart Uses Big Data For its Mobile Marketing
Strategy”, [online] Available: http://cloudtimes.org/2013/06/07/wal-mart-big-data-mobile-
marketing-strategy/
[6] Cukier, Kenneth, Mayer-Schoenberger, Viktor, “The Rise of Big Data. How it’s changing
the way we think about the world”, Foreign Affairs, May/June 2013, pp.28 - 40
[7] McKinsey Global Institute, “Retail Analytics Romance with Big Data”, [online] Available:
http://biginsights.co/retail-analytics-romance-with-big-data/
[8] Anderson, Eric T., Simester, Duncan I., 2008, “Price Cues and Customer Price
Knowledge”, January, [online]
Available: http://www.kellogg.northwestern.edu/faculty/anderson_e/htm/personalpage_fil
es/Papers/Price%20Cues%20Book%20Chapter%20Jan%203.pdf
[9] Schuman, Evan, “Walmart's Latest Big Data Move”, June 10, 2013, [online]
Available: http://www.fierceretail.com/story/walmarts-latest-big-data-move/2013-06-10
[10] Renee Dudley, Lindsey Rupp, “At Walmart and Other Retailers, Price-Matching Has Its
Perils”, May 9, 2013, [online] Available: http://www.businessweek.com/articles/2013-05-
09/at-walmart-and-other-retailers-price-matching-has-its-perils

Proceedings of the IE 2015 International Conference
www.conferenceie.ase.ro
357
ON A HADOOP CLICHÉ: PHYSICAL AND LOGICAL MODELS
SEPARATION
Ionuț HRUBARU
Al.I.Cuza University of Iași
Marin FOTACHE Al.I.Cuza University of Iași
Abstract. One of the biggest achievements in the database world was the separation of the
logical and physical models. The end user is not concerned at all about the underlying physical
structures. She/he only declares the needed information and does not explicit how to get it.
This has been a fundamental rule for decades and fulfilled even by newer data systems (i.e.
NoSQL data stores). However Hadoop blurs the distinction between logical and physical data
layers. Consequently it might be considered a step back in the database community. In this
paper we examine how and why the physical and logical models are tightly coupled in Hadoop,
the way Hive fills the logical-physical gap. We compare Hive layer/framework data model with
the “classical” relational approach. We will also emphasize some architectural issues that
might determine the overall performance of the data system.
Keywords: Big Data, Data Independence, Data Models, Hadoop, Hive JEL classification: L86, M15
1. A brief history of independence in the database world First business applications – developed in early 1960s – stored data in flat/independent files.
Data storage, retrieval and processing were possible only through code. Each program had to
describe the data, and had to explicitly open, loop through, and close the data files. There were
no separation between data and programs [1].
First Data Base Management Systems (DBMSs) provided, among other features, the data
independence, i.e. making application programmers independent from the details of data
representation and storage [1]. ANSI/SPARC generalized the notion of data model and the
three levels of abstraction in a database – external, conceptual/logical, and physical - [1] [2].
Subsequently the relational model proposed high level languages for declaring and processing
data [3].
The three-level data architecture was meant to provide two types of independence, the physical
independence and the logical independence. Logical data independence makes database users
agnostic of any changes in the logical structure of data (e.g. tables and attributes). In other
words, logical data independence is the capacity to change the conceptual schema without
having to change external schemas or application programs. Physical data independence is the
capacity to change the internal schema without having to change the conceptual schema. It
insulates users from changes in the physical storage of the data.
2. Main consequences of logical and physical independence
We argue that data independence is a major feature, which might decide the NoSQL and
Hadoop systems further acceptance. We defend this idea by examining some important
Proceedings of the IE 2015 International Conference
www.conferenceie.ase.ro
358
consequences of logical and physical independence for software development and
organizational information systems:
Separation of database professionals from programmers. Flat/independent data files
architectures required explicit data description in every program that uses them [1]. An average
business application could be composed of hundreds or thousands of pieces of code. All the
information extracted from the data required programming [4]. First DBMSs moved the
description of data (the metadata) into a separate file called data dictionary or system catalog.
Further advancements hid the data declaration and processing from the physical
implementation. Today, database professionals are generally not (“classical”) programmers.
Specialization of programming languages for database management. Programming languages
for data declaration, control and manipulation were among first Domain Specific Languages.
Stripped by many general programming features, they were endowed with simple and
comprehensible commands covering the basic needs of data definition, data processing and
data control. Their success is due mainly to their declarative nature – data professional must
specify what do they want, and not how do they get the information [5].
Open path to standardization and universal acceptance. Logical and physical independence
paved the way towards standardization. In computing industries SQL is a sole example of
ubiquitous acceptance and conformity to the standard by almost all major database vendors [5].
More recently, providers of NoSQL and Hadoop systems realized their products need the
power of high level programming languages so they develop frameworks and systems whose
data language resembles SQL [6].
Separation of concerns for database software producers. Once the data model and the data
language were standardized, for many years the database vendors focused on database
performance and creating powerful features addressing database users and professionals. This
separation explains much of the database advancements and maturity.
The empowerment of end-users (democratization of data). SQL was intended to be so clear and
simple that even the non IT professionals can access and deal with structured data writing and
running SQL queries [7], directly or with various tools support (query designers, report
generators). SQL was the first and still is the most important tool for users to deal with their
own data, at different levels of complexity.
Impedance mismatch. Logical and physical data independence also created or aggravated some
software development problems. Perhaps the most striking is the impedance mismatch.
Designers, on one side, and programmers, on the other side, generally use methodologies and
tools with strong Object-Oriented flavors, such as Rational Unified Process, UML, Java, etc.
The relational model of database layer in most organizations has a completely different
philosophy for modeling the real world. So in the 1990s the demise of relational data model
and its replacement with OO seemed natural and imminent. Now the impedance mismatch
problem persists in software development and various solutions have been proposed such as
Object-Relational Databases, Object-Relational mapping tools.
Programmers (in)competence in exploiting databases (basic) features. A more debatable issue
we defend here is the “impedance mismatch” between programmers and databases. Put simply,
by mere observation of large number of software development projects and professionals, we
cannot help observing how poor the database competency is for most Computer Science /
Software Engineering graduates. Despite thousand page database textbooks, CS/SE graduates
seem to know almost nothing about real world database modeling, stored procedures and what
database logic can do within a software application.
The fall of many data models. The failure of much anticipated data models - such as Object-
Oriented Data Model, XML Data Model -, could be properly explained by the loss of logical
and physical independence those systems entailed. NoSQL and Hadoop technologies might
Proceedings of the IE 2015 International Conference
www.conferenceie.ase.ro
359
have the same fate [8] if data independence and high-level languages (for data definition and
manipulation) are not provided.
3. Big Data and the promised land of data management
The Big Data movement (and hype) is usually associated with new ways of processing data
grouped under two banners, NoSQL and Hadoop. Both groups of technologies have vocally
advertised their departure from the relational/SQL data model. But some scholars and
professionals argue for hybrid data persistence which combines the benefits of SQL with the
scalability of NoSQL and Hadoop systems [9].
Although Big Data has undoubtedly been one the buzzwords in the latest years [10], its
meaning is not always clear. Stonebraker [11] focuses the definition on three essential features:
big volume, big velocity, and big variety. Processing Big Data requires using distributed
architectures and algorithms. Most of them are based on the divide and conquer approach,
whereas others rely mainly on sampling. Sources of big data sets are everywhere: transactions,
logs, emails, social media, sensors, geospatial data, etc.
One key aspect related to all NoSQL systems is that data modeling has radically changed. In
fact NoSQL data stores claim to manage schema-less databases [9]. In SQL DBMSs a database
has at first to be logically modeled (tables, relationships, constraints). In NoSQL and Hadoop
data storage starts not with a logical model but with physical blocks.
As a reaction to NoSQL, some major RDBMS producers have started to include columnar
persistence in their products (a NoSQL family) simultaneously providing an SQL interface. On
the other side, many NoSQL/Hadoop systems and frameworks provide now SQL-like query
languages.
4. Hadoop or data processing without a logical model
Hadoop technologies promised a simpler and more efficient paradigm for distributed file
system. Storing and processing huge amount of data on cheap, commodity hardware were a
breakthrough that helped companies in dealing with ever increasing volumes of data. Some of
the use-cases where Hadoop works best include: log data analysis, data warehouse
modernization, fraud detection, risk modeling, sentiment (text) analysis, image classification,
etc. Although some experts predicted a dark future for it [12], Hadoop’s ecosystem literally
exploded by adding features and technologies to address data velocity (streaming) and variety
(integration). Hadoop’s architecture and infrastructure has two main components: the storage,
which is a distributed file system (HDFS) and the processing components, which in most cases
rely on a map-reduce implementation. Recent Hadoop releases remove Map-Reduce constraint
as single processing platform, by introducing a new resource engine (YARN) and a new data
processing framework (Apache Tez) [13].
Working with Hadoop natively involves knowledge and interaction with the underlying
physical storage, as opposed to the relational world. The main characteristics of HDFS are
sequential writing, lack of support for random reads and non-updatable file content (only
inserts are possible) [14]. That is because Hadoop was intended for batch processing of huge
files that implies reading data, not updating it.
The second component of Hadoop is Map Reduce which processes data stored in HDFS. Map
Reduce is a framework/algorithm designed specifically for parallel processing which goes very
well with the HDFS philosophy of storing data across multiple data nodes (commodity
hardware), in a distributed environment. Map Reduce code (written in Java or other
programming language) runs on each data node in a cluster. It contains two main
functions/interfaces: a Map which processes the input in parallel, produces key value pairs
which become input to a Reduce function which produces the final result.
Proceedings of the IE 2015 International Conference
www.conferenceie.ase.ro
360
Map-Reduce is tightly linked to the input data: the programmer knows what that data is all
about and must design and implement the logic of both Map and Reduce phase. When input
data is changed, the whole java program must be updated. We are not discussing only about
change in structure (new keys, new attributes, etc.) but also about change in volume, which can
affect the logic used by a client application to process the data. These kind of logic and
decisions are automatically taken by an optimizer in the case of a RDBMS, but for Map Reduce,
it is the programmer’s responsibility to implement it.
5. Hive: back to independence?
Initially Hadoop relied only on Map Reduce for data processing. But despite its advantages,
Map-Reduce is awkward for programmers and incomprehensible for non-programmers. Even
the easiest SQL queries translate in long pieces of (mainly Java) code in Map-Reduce. Also,
the lack of repository for metadata creates huge problems in data processing and integration.
Processing data close to the physical storage proved to be not as productive as expected by
Hadoop enthusiasts. The Hadoop myth that for better performances you must know your data
and physical storage is in doubt.
Hive was developed by engineers at Facebook to address their needs for ad-hoc queries and for
an information dictionary [15]. Hive brings structure into the data stored in HDFS by managing
the information about entities (metadata) in a metastore. As data in Hadoop is stored in HDFS,
data serialization and de-serialization use rules defined in programs called SERDEs. These
programs (basically Java classes) help Hive to interpret the data from HDFS.
Apart from the metastore, main Hive modules are: the driver (a counterpart of RDBMSs
optimizer which communicates with Hadoop through Map Reduce jobs that get the data from
HDFS and does the processing); thrift server (used for integration with other applications via
JDBC or ODBC); CLI, Web Interface (client components that access the data); and
Extensibility Interfaces (tools used to define custom functions and SERDEs).
The query lifecycle is pretty much the same as in a relational database server. It goes through
phases such as parsing, generating execution plan using a rule (or cost) based optimizer,
generating the steps (Map Reduce jobs) and executing them.
Hive works with well-known concepts from relational databases world such as tables, columns,
rows and data types. There are primitive data types (string, integer, timestamp, date, etc.) and
collections data types (struct, array, and map). Also user can create custom types, all
implemented in Java and inheriting the underlying behavior.
Besides tables, from a logical perspective there are partitions too. Tables in Hive can be
partitioned, just like in a classical RDBMS, using different columns as criteria to horizontally
split the data. This can help performance since the optimizer can figure out which partition to
use to satisfy the search criteria of a query which can improve significantly the performance
[16]. Unlike relational databases, partitioning has also an impact of how the table is physically
stored.
Another concept related to storage is buckets which are basically hash partitions within the
previously declared partitions, which are useful for sampling and can be a way to control
parallelism at write. When a table is created, the user can specify the column on which buckets
are created and the number of buckets. One can execute a query only on a sample which will
be far more effective than scanning the whole table.

Proceedings of the IE 2015 International Conference
www.conferenceie.ase.ro
361
Figure 1. Partitioned and bucketed table (left) and Map Reduce script in HiveQL (right)
In the example on the left side of figure 1, inside each partition (defined by values of column
invoice_date) the columns used for clustering (supplier) will be hashed into buckets. This way
one can segment large data sets and improve query performance. Records with same supplier
will naturally be stored in the same bucket (through the hash), and each bucket will contain
multiple suppliers. Each bucket will materialize in a separate file in Hive. Bucketing is enforced
only when reading data, not when inserting, and users must pay attention to ensure that data is
loaded correctly by specifying a number of reducers equal to the number of buckets. Partitions
and buckets will impact the HDFS physical layout. So, although Hive offers logical concepts,
it becomes apparent that modeling is still tight to physical design.
Hive generally loads data from HDFS or from external sources by copying files and then trying
to apply the structure on it for reading purposes. The Hive biggest strength is HiveQL (Hive
Query Language) a SQL-like language. With HiveQL it is easy to define table structure and
the rules for data serialization (writing) and de-serialization (reading). These rules refer to file
formats (TextFile, SequenceFile, RCFile, ORCFile), record and column formats, compression
algorithms, etc. Again, in Hive one must know the underlying data, unlike classical RDBMS
where decoupling between physical and logical is a basic feature. Hive works with schema on
read, and unlike RDBMS, it does not enforce schema on write. Structure is applied when
reading data, if there is a mismatch between table definition and the actual data, then Hive will
return what it can read, showing NULL values for the rest, or throwing an error only if reading
is not possible at all.
HiveQL is used for both DDL and DML operations. Since Hive is in fact another layer over
Map Reduce, all HiveQL commands will be translated into Map Reduce jobs executed against
HDFS. This hides Map Reduce implementation from the end user and allow users to specify
what she/he wants not how to process data. But at translation queries can get quite complex
and error prone, which will affect performance. Some of the simplest queries can take in Hive
quite a large amount of time. HiveQL allows a mixture between declarative and procedural:
the user can still write Map Reduce scripts and inject it in the query itself. On the right side of
figure 1 is an example of Map Reduce in Hive.
Currently Hive is and we argue it will remain tightly coupled to its underlying layers, Map
Reduce and HDFS. The separation of logical and physical data layers, is not enforced in a
system like Hadoop targeted to processing large files in batches.
5. Discussions, conclusions and future research Hadoop is not only about HDFS, Map Reduce and Hive. There are many tools and layers
developed to cover areas such as data integration (Sqoop), machine learning (Mahout),
statistics (RHadoop), ETL (Pig), column oriented databases (HBase), scheduling for
workflows (Oozie) making the Hadoop stack evolving to a level that was difficult to predict a
decade ago.
Some renowed scholars [8] do not bet on HDFS’s future` since, unlike a parallel DBMS, Map
Reduce sends the data across nodes to produce query results, not the other way around.

Proceedings of the IE 2015 International Conference
www.conferenceie.ase.ro
362
However, this is not entirely true. Hadoop processes the data locally in the Map phase and
sends the data through the network only in the Reduce phase and only when necessary.
Whether HDFS is or not is faster than a RDBMS or a parallel DBMS is an entirely different
discussion and although out of scope of this paper, we can make the statement that it depends
on the use case. We consider Hadoop will evolve even more in catching up with those uses
cases where relational database systems work better, and in improving in directions beyond
batch processing: streaming and interactive querying.
Hive supposedly brought logical and physical data independence into Hadoop. But this is only
on surface, since the language presents and insists on features that offer capabilities to interact
and manipulate the physical layer directly. There are clauses for serialization and de-
serialization, file formats and this is possible because in Hive we have a schema on read
implementation, it does not impose restrictions. We end up having a logical data model, but
only used for projecting structure over a physical file and data block. Bringing processing so
close to the data entails serious problems when the data changes, since the map reduce jobs
will need to be updated, either because it does not produce the expected result, or the
performance suffers.
Future directions will include testing and analyzing how the modeling decisions, both logical
and physical can affect performance and how, based on specific use cases, architectural
decisions can affect throughput and latency of a business application.
References [1] R. Elmasri, and S.B. Navathe, Fundamentals of database systems, Boston: Addison-
Wesley, 2011, pp. 9-52.
[2] C.W. Bachman, Summary of current work ANSI/X3/SPARC/study group: database
systems, ACM SIGMOD Record, vol. 6, no. 3, pp.16-39, July 1974
[3] E.F. Codd, A Relational Model of Data for Large Shared Data Banks, Communications of
the ACM, vol. 13, no.6, pp. 377-387, June 1970
[4] A. Silberschatz, M. Stonebraker, and J.D. Ullman, Database systems: achievements and
opportunities, ACM SIGMOD Record, vol. 19, no. 4, pp. 6-22, December 1990
[5] M. Stonebraker, Future Trends in Database Systems, IEEE Transaction on Knowledge and
Data Engineering, vol. 1, no. 1, pp. 33-44, March 1989
[6] D. Abadi et al., The Beckman Report on Database Research, ACM SIGMOD Record, vol.
43, no. 3, pp.61-70, December 2014
[7] D.D. Chamberlin Chamberlin and R.F. Boyce, SEQUEL: A structured English query
language in Proceedings of the 1974 ACM SIGFIDET (now SIGMOD) workshop on Data
description, access and control (SIGFIDET '74). ACM, New York, USA, pp. 249-264
[8] M. Stonebraker, A valuable lesson, and whither Hadoop? Communications of the ACM,
vol. 58, no.1, pp.18-19, January 2015
[9] P. J. Sadalage and M. Fowler, NoSQL distilled: a brief guide to the emerging world of
polyglot persistence. Addison-Wesley, 2012, pp. 133-152
[10] H.U. Buhl, M. Röglinger, F. Moser, Big Data: A Fashionable Topic with(out) Sustainable
Relevance for Research and Practice? Business & Information Systems Engineering, vol.
2, 2013, pp.65-69
[11] M. Stonebraker What Does 'Big Data' Mean?, Communications of the ACM
(BLOG@CACM), September 21, 2012, http://cacm.acm.org/blogs/blog-cacm/155468-
what-does-big-data-mean/fulltext
[12] M. Stonebraker, Possible Hadoop Trajectories, Communications of the ACM
(BLOG@CACM), May 2, 2012, Available at http://cacm.acm.org/blogs/blog-
cacm/149074-possible-hadoop-trajectories/ [Jan 20, 2015].

Proceedings of the IE 2015 International Conference
www.conferenceie.ase.ro
363
[13] B. Lublinsky, K. Smith, A. Yabukovich, Professional Hadoop Solutions. Indianapolis,
John Wiley & Sons, 2013
[14] T. White, Hadoop The Definitive Guide. Sebastopol, CA: O’Reilly, 2011;
[15] A. Thusoo, J.S. Sarma, N. Jain, Z. Shao, P. Chakka, N. Zhang, S. Antony, H. Liu and R.
Murthy Hive, A Petabyte Scale Data Warehouse Using Hadoop, ICDE 2010,
http://infolab.stanford.edu/~ragho/hive-icde2010.pdf [Febr. 20, 2015].
[16] B. Clark, et al. "Data Modeling Considerations in Hadoop and Hive," SAS Institute Inc.,
2013, http://support.sas.com/resources/papers/data-modeling-hadoop.pdf [Jan. 15, 2015].

Proceedings of the IE 2015 International Conference
www.conferenceie.ase.ro
364
BIG DATA CHALLENGES FOR HUMAN RESOURCES
MANAGEMENT
Adela BÂRA
The Bucharest University of Economic Studies [email protected]
Iuliana ȘIMONCA (BOTHA) The Bucharest University of Economic Studies
Anda BELCIU The Bucharest University of Economic Studies
Bogdan NEDELCU
The Bucharest University of Economic Studies [email protected]
Abstract. The article shows how complex the human resource recruitment became and offers
an insight on the selection issues many multinational organizations encounter, especially
nowadays, when any software solution is no longer viable if it has no big data capabilities. The
paper’s main objective is to develop a prototype system for assisting the selection of candidates
for an intelligent management of human resources. Furthermore, such a system can be a
starting point for the efficient organization of semi-structured and unstructured data on
recruitment activities.
Keywords: Big Data, Business Intelligence, NoSQL Databases, data mining
JEL classification: C81, D81, D83
1. Introduction In the context of social networks development and ICT challenges, human resource recruitment
and selection issues in multinational organizations is becoming more complex. At this level,
flow of information, data and knowledge comes from multiple sources with various systems
leading to a major effort in the process of extraction, integration, organization and analysis of
data for decision-making recruitment. Also conducting the selection process cannot be
performed effectively by studying profiles, resumes and recruitment sites which presents
subjective heterogeneous information. The paper aims to present intelligent methods for
making the best decisions in human resource selection using Big Data technologies,
optimization techniques and data mining. The solutions will allow automatic acquisition of
information about applicants in recruitment sites, personal web pages, social networks,
websites and academic centers and will enable decision making using intelligent optimization
methods. Research motivation stems from the fact that, in the current global economic crisis,
making effective decisions on recruitment is a key factor for companies.
Technologies for organizing and processing large volumes of heterogeneous data, unstructured
and characterized by a high velocity is in an exponential growth. The amount of data managed
by different recruitment companies available over the Internet on social networks generates
Big Data problem. We use intelligent methods for analyzing such data in order to obtain a
competitive advantage in recruitment and thus in business development.

Proceedings of the IE 2015 International Conference
www.conferenceie.ase.ro
365
2. Processing HR data from heterogeneous sources Currently, information on supply and demand in the labor market is stored electronically as
CVs in the form of text databases. These semi-structured data typically come from portals and
recruitment sites. But there is a huge amount of information on social networks, collaborative
platforms of universities and specialized forums. This data is unstructured. In order to use both
the semi-structured and unstructured data, it is necessary to use the methods and techniques of
parallel processing, extraction, cleansing, transformation and integration in a NoSQL database.
The difficulty of the problem in this case is to analyze and identify solutions and technologies
for Big Data that can be applied for organizing and processing.
For data analysis, data mining methods can determine patterns and profiles for optimal
recruitment strategy. But traditional data mining techniques are inadequate for the volume of
data. In most cases, only a small part of all available documents will be relevant for a particular
candidate. In this case, the difficulty is in identifying and implementing the algorithms for data
mining and text mining to compare and rank the documents in order of importance, relevance
and determination of profiles of candidates for recruitment.
Due of the complexity of the technologies to be used, and the rapid changes in the labor market,
the creation of an architecture that enables the introduction of new data sources, that is capable
of integrating multiple and heterogeneous sources, that includes a level of complex models
analysis and determination of profiles and lead to the creation of a knowledge-based
management of human resources. From this point of view, the difficulty lies in choosing the
elements and builds a platform enabling efficient parallel processing, extracting timely
information, interactive data analysis and satisfy performance requirements imposed by the
paradigm Big Data Analytics.
Set in a rapidly growing number of impressive data collected and stored on the Internet on the
availability of human resources has exceeded the human ability to understand without the help
of powerful tools. Thus, instead of being based on relevant information, important decisions
are made intuitively concerning recruitment, subjective or based on fixed criteria, without
taking into account the complexities of nature and human behavior. To obtain relevant
information methods such as multivariate analysis should be used for data processing, data
mining, statistical methods and mathematical methods that can be applied to large data
volumes. For these applications, the data must be well organized and indexed so as to provide
ease of use and easy retrieval of information. Recent studies oriented towards organization and
processing data from recruitment portals [1], [2] refers to the importance of this analysis for
the selection process and the impact that these techniques have on business performance.
Regarding the determination of the profiles of candidates, there are studies published in [7] and
[8] concerning the application of data mining algorithms (decision trees, association rules,
clustering) for selection of candidates and determine methods of training for staff recruited.
However, these studies do not account for data from social networks and collaborative
platforms, from sources such as universities or forums. Processing of text information and
application of data mining techniques on data from these sources are taken into consideration
more and more. We have developed numerous methods of text mining, but usually they are
oriented selection of documents (where the query is considered as a provider of constraints) or
the assessment documents (where the query is used to classify documents in order of relevance)
[3]. The goal is to retrieve keywords from a query of the text documents and evaluation of each
document depending on how much satisfies the query. In this way is evaluated the relevance
of a document to the query performed. Another method of classifying documents is the vector-
space model presented in [5] and [6]. It involves representation of a document and query
vectors and the use of a measure as an appropriate similarity to determine the suitability of the
query vector and document vector. Automatic classification is an important point in text

Proceedings of the IE 2015 International Conference
www.conferenceie.ase.ro
366
mining, because when there are a large number of documents on-line, the possibility of
automatic organization of these into classes to facilitate retrieval of documents and analysis is
essential.
For software development, there are now business intelligence technologies that can be used.
Also, current developments in information technology have led to the emergence of concepts
and new ways of organizing and processing systems in order to improve access to data and
applications organizations. Cloud Computing architecture that computing power, databases,
storage and software applications coexist in a complex and complete network of servers that
provides users with information as a service, accessible via the Internet using mobile devices.
Such a flexible architecture that allows the connection of several types of subsystems can be
used to create a platform for recruitment. There are also Big Data platforms available in cloud
computing architecture that can be used and adapted to prototype realization set.
3. Big Data Solutions
When the structure of data seems randomly designed (variety), when the speed of the flow of
data is continuously increasing (velocity), when the amount of information is growing each
second (volume) and when there is additional information hidden in the data (value), only one
solution can be assigned to manage this chaos: big data. This syntagma has been so much
promoted by the big software companies, that it seems no software solution is no longer viable
if it has no big data capabilities. The truth is there are some domains like telecommunications,
social networks, human resources, etc. that are specifically predisposed to the four V (variety,
velocity, volume, value). Of course, not only the domain matters. It depends if the data is
historical or not, if it’s supposed to be continuously analyzed, if it’s involved in decision
making processes, if it’s strategic or secret, if it’s structured, semi-structured or unstructured
etc.
The most obvious feature of big data is its volume. More and more people are using smart
devices that are connected to an Internet network and they are producing data each second. The
data is growing visibly from big to huge volume. Science has now a solid ground of data for
making all sorts of assumption based on the data received from patients, clients, athletes, etc.
It’s a paradigm that involves our whole universe in gathering, processing and distributing the
data. It is important to benefit from this flow of data, by storing it properly using big data
solutions.
As source [9] states, the two most used Big Data solutions are Cassandra and HBase. Cassandra
is the leader in achieving the highest throughput for the maximum number of nodes [10]. Of
course, there is a reverse to it: the input/output operations take a lot of time. Cassandra is
released by Facebook. HBase is part of the Apache Hadoop project and has the support of
Google, being used on extremely large data sets (billions of rows and millions of columns).
The modern technology allows efficiently storing and querying the big data sets, and the
emphasis is on using the whole data set and not just samples [11]. Big Data comes hand in hand
with analytics, because the final purpose of collecting the huge amount of data is to process
and analyze it in order to gain information, value. Analytics don’t work directly on data. Data
has to be extracted from the database using a specific language and then pass it to analytical
tools.
Up until Big Data, the best way to query data from databases was the SQL language, which
was specific for structured relational tables. When data began to be hold in NoSQL databases,
SQL became only additionally used in queries. For example, the joins are not available in
NoSQL queries. One above the other, it was recently stated (September 2014), that SQL is
more important that was thought for Big Data, Oracle releasing Big Data SQL, which extends
SQL to Hadoop and NoSQL. This road is only at the beginning.
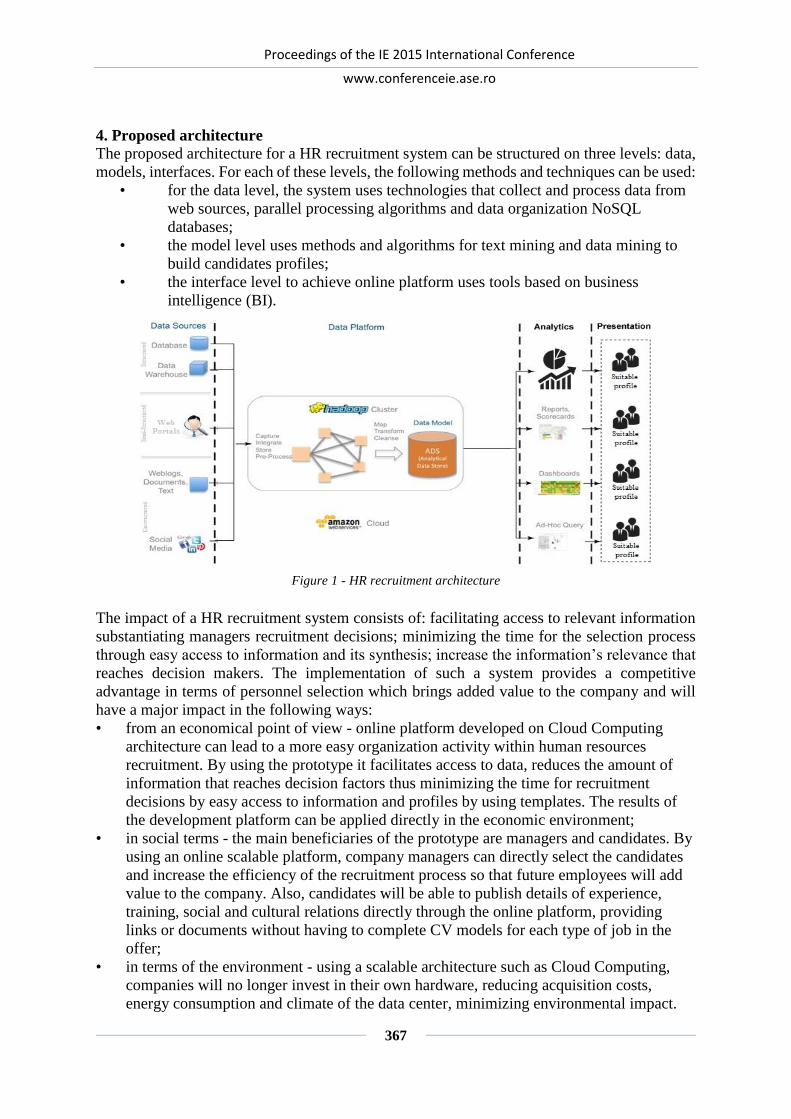
Proceedings of the IE 2015 International Conference
www.conferenceie.ase.ro
367
4. Proposed architecture
The proposed architecture for a HR recruitment system can be structured on three levels: data,
models, interfaces. For each of these levels, the following methods and techniques can be used:
• for the data level, the system uses technologies that collect and process data from
web sources, parallel processing algorithms and data organization NoSQL
databases;
• the model level uses methods and algorithms for text mining and data mining to
build candidates profiles;
• the interface level to achieve online platform uses tools based on business
intelligence (BI).
Figure 1 - HR recruitment architecture
The impact of a HR recruitment system consists of: facilitating access to relevant information
substantiating managers recruitment decisions; minimizing the time for the selection process
through easy access to information and its synthesis; increase the information’s relevance that
reaches decision makers. The implementation of such a system provides a competitive
advantage in terms of personnel selection which brings added value to the company and will
have a major impact in the following ways:
• from an economical point of view - online platform developed on Cloud Computing
architecture can lead to a more easy organization activity within human resources
recruitment. By using the prototype it facilitates access to data, reduces the amount of
information that reaches decision factors thus minimizing the time for recruitment
decisions by easy access to information and profiles by using templates. The results of
the development platform can be applied directly in the economic environment;
• in social terms - the main beneficiaries of the prototype are managers and candidates. By
using an online scalable platform, company managers can directly select the candidates
and increase the efficiency of the recruitment process so that future employees will add
value to the company. Also, candidates will be able to publish details of experience,
training, social and cultural relations directly through the online platform, providing
links or documents without having to complete CV models for each type of job in the
offer;
• in terms of the environment - using a scalable architecture such as Cloud Computing,
companies will no longer invest in their own hardware, reducing acquisition costs,
energy consumption and climate of the data center, minimizing environmental impact.

Proceedings of the IE 2015 International Conference
www.conferenceie.ase.ro
368
5. Conclusions The HR recruitment system can be developed on a flexible architecture of Cloud Computing
so that it can be re-configured for other users by including training and personnel management
services. Determining candidates profiles and templates to characterize their profile can be
further improved by introducing new items of interest for recruitment process. Cassandra or
HBase seem the most proper solution for this BigData situation that requires analysis of a large
volume of data regarding human resources in order to obtain profiles.
Acknowledgment This paper presents some results of the research project: Sistem inteligent pentru predicția,
analiza și monitorizarea indicatorilor de performanță a proceselor tehnologice și de afaceri
în domeniul energiilor regenerabile (SIPAMER), research project, PNII – Collaborative
Projects, PCCA 2013, code 0996, no. 49/2014 funded by NASR.
References [1] C. Nermey, How HR analytics can transform the workplace,
http://www.citeworld.com/article/2137364/big-data-analytics/how-hr-analytics-can-
transform-the-workplace.html, 2014
[2] eQuest Headquarters, Big Data: HR’s Golden Opportunity Arrives,
http://www.equest.com/wp-
content/uploads/2013/05/equest_big_data_whitepaper_hrs_golden_opportunity.pdf , 2014
[3] C. Győrödi, R. Győrödi, G. Pecherle and G. M. Cornea, Full-Text Search Engine Using
MySQL, Journal of Computers, Communications & Control (IJCCC), Vol. 5, Issue 5,
December 2010, pag. 731-740;
[4] D. Taniar, Data Mining and Knowledge Discovery Technologies, IGI Publishing, ISBN
9781599049618 (2008);
[5] A. Kao and S. Poteet, Natural Language Processing and Text Mining, Springer-Verlag
London Limited 2007, ISBN 1-84628-175-X;
[6] A. Srivastava and M.Sahami, Text Mining: Classification, Clustering, and Applications.
Boca Raton, FL: CRC Press. ISBN 978-1-4200-5940-3;
[7] H. Jantan, A. Hamdan and Z. Ali Othman, Data Mining Classification Techniques for
Human Talent Forecasting, Knowledge-Oriented Applications in Data Mining, InTech
Open, 2011, ISBN 978-953-307-154-1;
[8] L. Sadath, Data Mining: A Tool for Knowledge Management in Human Resource,
International Journal of Innovative Technology and Exploring Engineering (IJITEE),
ISSN: 2278-3075, Volume-2, Issue-6, April 2013;
[9] O’Reilly Media, Big Data Now, O’Reilly, September 2011, ISBN: 978-1-449-31518-4.
[11] T. Rabl, M. Sadoghi and H.A. Jacobsen, Solving Big Data Challenges for Enterprise
Application Performance Management, 2012-08-27, VLDB, Vol. 5, ISSN 2150-8097
[12] S. Siddiqui and D. Gupta, Big Data Process Analytics: A Survey, International Journal of
Emerging Research in Management &Technology, Vol. 3, Nr. 7, July 2014, ISSN: 2278-
9359.

Proceedings of the IE 2015 International Conference
www.conferenceie.ase.ro
369
ARCHITECTURE OF SMART METERING SYSTEMS
Simona-Vasilica OPREA
The Bucharest University of Economic Studies [email protected]
Ion LUNGU The Bucharest University of Economic Studies
Abstract. Smart metering systems along with renewable energy sources are advanced
technologies that represent solutions for insufficient conventional primary energy sources
problems, gas emissions, dependency on energy sources located outside European Union and
other problems related to energy efficiency. At electricity consumers’ level, apart from the
period before smart metering system implementation, they may have an active role, by
managing programmable consumption, by using storage equipment and supplying as
prosumers the national grid with electricity produced by small size wind generators or solar
panels based on electricity price. At the grid operators and suppliers level, smart metering
systems allow a better resources planning, reduce energy losses, estimate necessary energy
that should be acquired in order to cover losses, eliminate costs regarding meters reading and
integrate a higher volume of renewable energy sources. This paper mainly describes the
simplified architecture of smart metering systems, with three distinct levels: base level, middle
level and top level.
Keywords: architecture of smart metering systems, renewables integration, advanced
management infrastructure, meter data management, data warehouse
JEL classification: Q20, C55, M15
1. Introduction European strategies regarding integration of renewable energy sources and implementation of
smart metering systems have been taken over into Romanian legislation as national targets. For
implementation of smart metering systems, Romanian National Regulatory Authority approved
gradually implementation of these systems by grid operators so that until 2020, about 80% of
energy consumers should benefit from smart metering systems.
Smart metering systems are electronic devices that measure electricity consumption, allow
secured bidirectional data transmission from/to electricity consumers and supply more
information than a regular meter, by using telecommunications. Smart metering systems
contain subsystems for metering, subsystems for data transmission and subsystems for data
management that are provided by meters.
Smart metering systems – SMS hourly (or even at 15 minutes) measure electricity consumption
using metering electronic devices, transmit recorded data and send it to unified and complex
data management system. Heterogeneity of metering devices imposes data integration
components by using universal standards that allow loading and validating data in a centralized
manner.
According to [1] and [2], these components are part of advanced metering infrastructure – AMI
that measures, collects, analyses energy consumption and facilitate communications with
metering devices. AMI includes hardware components, telecommunication networks,
interfaces, controllers for electricity consumers, software components for meter data
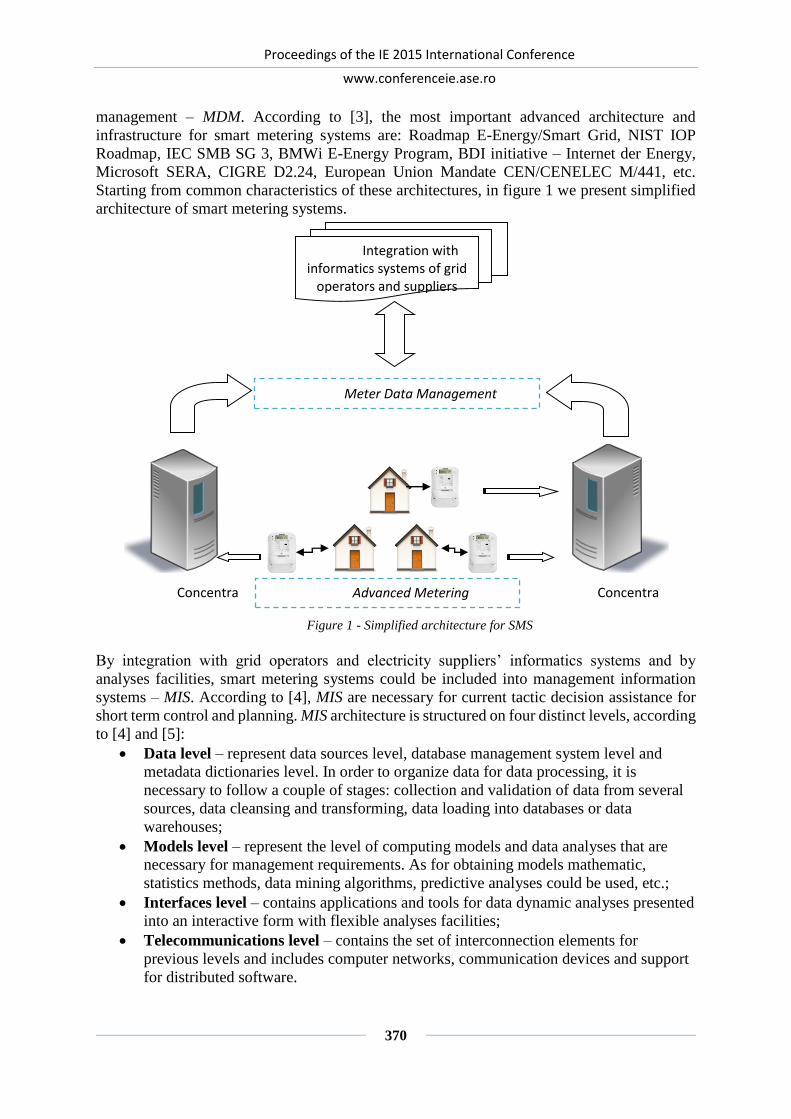
Proceedings of the IE 2015 International Conference
www.conferenceie.ase.ro
370
management – MDM. According to [3], the most important advanced architecture and
infrastructure for smart metering systems are: Roadmap E-Energy/Smart Grid, NIST IOP
Roadmap, IEC SMB SG 3, BMWi E-Energy Program, BDI initiative – Internet der Energy,
Microsoft SERA, CIGRE D2.24, European Union Mandate CEN/CENELEC M/441, etc.
Starting from common characteristics of these architectures, in figure 1 we present simplified
architecture of smart metering systems.
Figure 1 - Simplified architecture for SMS
By integration with grid operators and electricity suppliers’ informatics systems and by
analyses facilities, smart metering systems could be included into management information
systems – MIS. According to [4], MIS are necessary for current tactic decision assistance for
short term control and planning. MIS architecture is structured on four distinct levels, according
to [4] and [5]:
Data level – represent data sources level, database management system level and
metadata dictionaries level. In order to organize data for data processing, it is
necessary to follow a couple of stages: collection and validation of data from several
sources, data cleansing and transforming, data loading into databases or data
warehouses;
Models level – represent the level of computing models and data analyses that are
necessary for management requirements. As for obtaining models mathematic,
statistics methods, data mining algorithms, predictive analyses could be used, etc.;
Interfaces level – contains applications and tools for data dynamic analyses presented
into an interactive form with flexible analyses facilities;
Telecommunications level – contains the set of interconnection elements for
previous levels and includes computer networks, communication devices and support
for distributed software.
Advanced Metering Infrastructure
Concentrator
Concentrator
Meter Data Management
Integration with informatics systems of grid
operators and suppliers
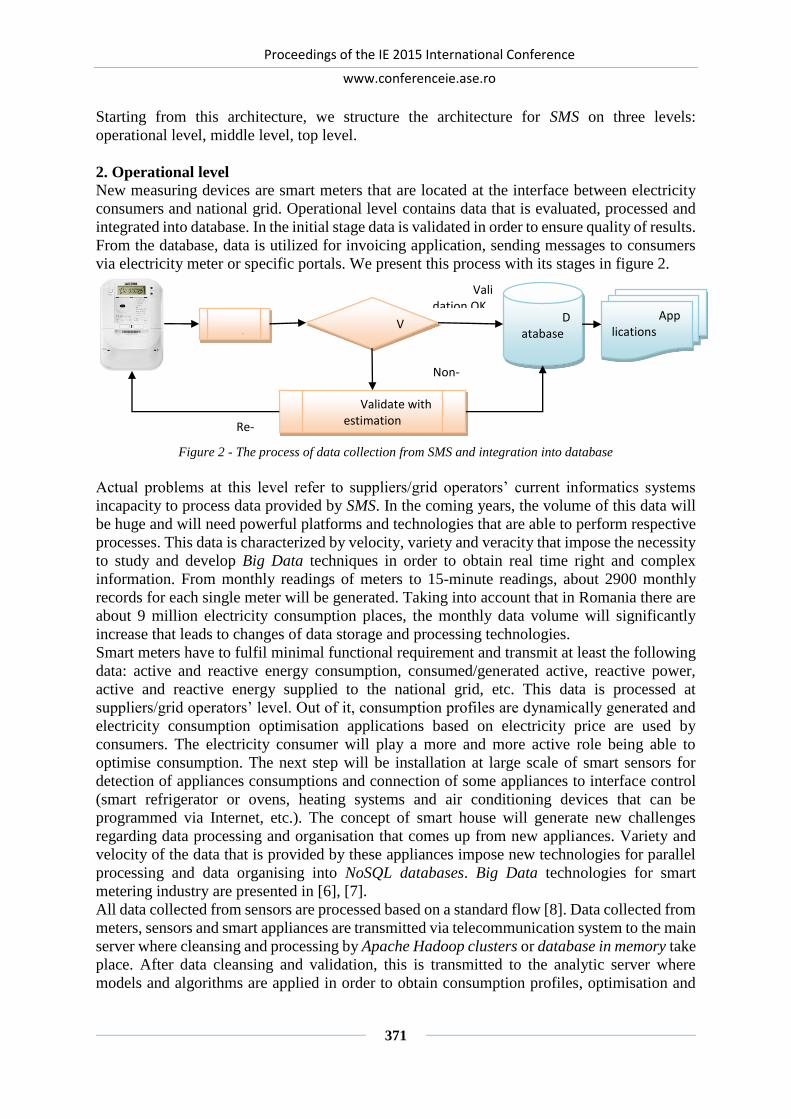
Proceedings of the IE 2015 International Conference
www.conferenceie.ase.ro
371
Starting from this architecture, we structure the architecture for SMS on three levels:
operational level, middle level, top level.
2. Operational level
New measuring devices are smart meters that are located at the interface between electricity
consumers and national grid. Operational level contains data that is evaluated, processed and
integrated into database. In the initial stage data is validated in order to ensure quality of results.
From the database, data is utilized for invoicing application, sending messages to consumers
via electricity meter or specific portals. We present this process with its stages in figure 2.
Figure 2 - The process of data collection from SMS and integration into database
Actual problems at this level refer to suppliers/grid operators’ current informatics systems
incapacity to process data provided by SMS. In the coming years, the volume of this data will
be huge and will need powerful platforms and technologies that are able to perform respective
processes. This data is characterized by velocity, variety and veracity that impose the necessity
to study and develop Big Data techniques in order to obtain real time right and complex
information. From monthly readings of meters to 15-minute readings, about 2900 monthly
records for each single meter will be generated. Taking into account that in Romania there are
about 9 million electricity consumption places, the monthly data volume will significantly
increase that leads to changes of data storage and processing technologies.
Smart meters have to fulfil minimal functional requirement and transmit at least the following
data: active and reactive energy consumption, consumed/generated active, reactive power,
active and reactive energy supplied to the national grid, etc. This data is processed at
suppliers/grid operators’ level. Out of it, consumption profiles are dynamically generated and
electricity consumption optimisation applications based on electricity price are used by
consumers. The electricity consumer will play a more and more active role being able to
optimise consumption. The next step will be installation at large scale of smart sensors for
detection of appliances consumptions and connection of some appliances to interface control
(smart refrigerator or ovens, heating systems and air conditioning devices that can be
programmed via Internet, etc.). The concept of smart house will generate new challenges
regarding data processing and organisation that comes up from new appliances. Variety and
velocity of the data that is provided by these appliances impose new technologies for parallel
processing and data organising into NoSQL databases. Big Data technologies for smart
metering industry are presented in [6], [7].
All data collected from sensors are processed based on a standard flow [8]. Data collected from
meters, sensors and smart appliances are transmitted via telecommunication system to the main
server where cleansing and processing by Apache Hadoop clusters or database in memory take
place. After data cleansing and validation, this is transmitted to the analytic server where
models and algorithms are applied in order to obtain consumption profiles, optimisation and
Read
Validate
Validation OK
Non-validate
Validate with estimation
Database
Re-reading
Applications
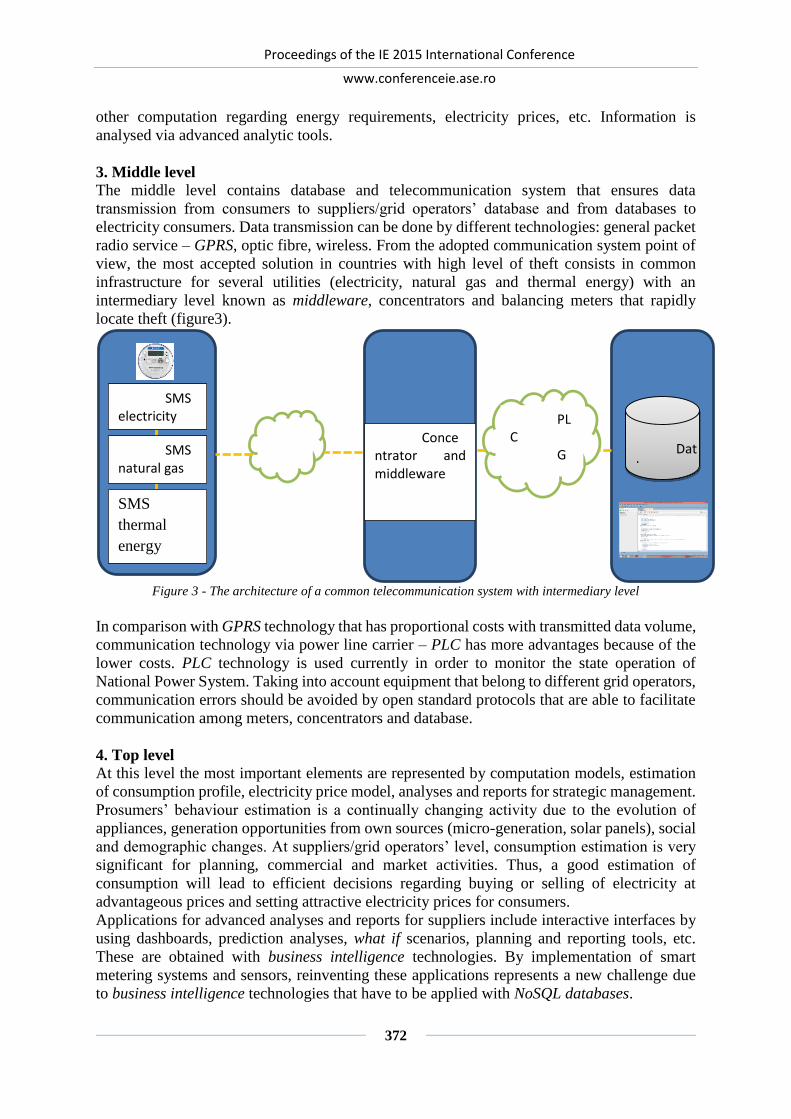
Proceedings of the IE 2015 International Conference
www.conferenceie.ase.ro
372
other computation regarding energy requirements, electricity prices, etc. Information is
analysed via advanced analytic tools.
3. Middle level
The middle level contains database and telecommunication system that ensures data
transmission from consumers to suppliers/grid operators’ database and from databases to
electricity consumers. Data transmission can be done by different technologies: general packet
radio service – GPRS, optic fibre, wireless. From the adopted communication system point of
view, the most accepted solution in countries with high level of theft consists in common
infrastructure for several utilities (electricity, natural gas and thermal energy) with an
intermediary level known as middleware, concentrators and balancing meters that rapidly
locate theft (figure3).
Figure 3 - The architecture of a common telecommunication system with intermediary level
In comparison with GPRS technology that has proportional costs with transmitted data volume,
communication technology via power line carrier – PLC has more advantages because of the
lower costs. PLC technology is used currently in order to monitor the state operation of
National Power System. Taking into account equipment that belong to different grid operators,
communication errors should be avoided by open standard protocols that are able to facilitate
communication among meters, concentrators and database.
4. Top level
At this level the most important elements are represented by computation models, estimation
of consumption profile, electricity price model, analyses and reports for strategic management.
Prosumers’ behaviour estimation is a continually changing activity due to the evolution of
appliances, generation opportunities from own sources (micro-generation, solar panels), social
and demographic changes. At suppliers/grid operators’ level, consumption estimation is very
significant for planning, commercial and market activities. Thus, a good estimation of
consumption will lead to efficient decisions regarding buying or selling of electricity at
advantageous prices and setting attractive electricity prices for consumers.
Applications for advanced analyses and reports for suppliers include interactive interfaces by
using dashboards, prediction analyses, what if scenarios, planning and reporting tools, etc.
These are obtained with business intelligence technologies. By implementation of smart
metering systems and sensors, reinventing these applications represents a new challenge due
to business intelligence technologies that have to be applied with NoSQL databases.
Database
PLCC
SMS electricity
SMS natural gas
SMS
thermal
energy
Concentrator and middleware
PLC
GPRS

Proceedings of the IE 2015 International Conference
www.conferenceie.ase.ro
373
The applications that are designed for electricity consumers include information such as 15-
minute consumption, electricity price, alerts and consumption thresholds, comparison between
their consumption and similar consumers located in the same area, estimations and predictions
of electricity consumption, etc. In figure 4 we propose an architectural model for smart
metering system taking into account characteristics of previous presented levels.
Figure 4 - Architectural model for SMS
The proposed architecture is flexible and can be adapted to new technologic trends regarding
smart appliances, metering devices and sensors.
5. Conclusions Smart metering systems have been implemented due to numerous advantages. They allow a
better integration of renewable energy sources by constantly informing consumers about their
electricity consumption options. They also encourage better usage of national grid by reducing
load peaks and lifting load off-peaks. In these circumstances, electricity price is a very
important key because it stimulates customers to change their behaviour.
Such as management information system, smart metering systems have a similar architecture.
In this paper, we proposed three-level architecture for smart metering system. It contains
operational level, middle level and top level. Each level has particular characteristics that were
described in this paper.
At operational level, the volume of data is tremendous and should be treated by using Big Data
techniques. Variety and velocity of the data that is provided by consumers’ meters and
appliances impose new technologies for parallel processing and data organising into NoSQL
databases. Data collected from meters, sensors and smart appliances are transmitted via
telecommunication system to the main server where cleansing and processing by Apache
Hadoop clusters or database in memory take place.
At middle level, data transmission can be done by different technologies: general packet radio
service – GPRS, optic fibre, wireless. The most accepted solution in countries with high level
of theft consists in common infrastructure for several utilities (electricity, natural gas and
GPR
S WiM
ax Fiber
optic Othe
Operational level Middle level Top level
Determination of consumption profile
Tariffs
Advanced reports
Data
base

Proceedings of the IE 2015 International Conference
www.conferenceie.ase.ro
374
thermal energy) with an intermediary level known as middleware, concentrators and balancing
meters that rapidly locate theft.
The top level includes interactive interfaces by using dashboards, prediction analyses, what if
scenarios, planning and reporting tools. These elements are obtained with business intelligence
technologies. The applications that are designed for electricity consumers include information
such as 15-minute consumption, electricity price, alerts and consumption thresholds,
comparison between their consumption and similar consumers located in the same area,
estimations and predictions of electricity consumption. The architecture proposed is flexible
and can be adapted to new uncertain challenges that come along with smart metering
implementation.
Acknowledgment
This paper presents some results of the research project: Sistem inteligent pentru predicția,
analiza și monitorizarea indicatorilor de performanță a proceselor tehnologice și de afaceri
în domeniul energiilor regenerabile (SIPAMER), research project, PNII – Parteneriate în
domeniile prioritare, PCCA 2013, code 0996, no. 49/2014 funded by NASR.
References [1] D.L. Petromanjanc, O. Momcilovic and I. Scepanovic, Suggested architecture of smart
metering system, Proceedings of the Romanian Academy, Series A, Volume 13, Number
3/2012, The Publishing House of the Romanian Academy, 2012, pp. 278–285
[2] Electric Power Research Institute, Advanced Metering Infrastructure (AMI), Available:
http://www.ferc.gov/eventcalendar/Files/20070423091846EPRI%20%20Advanced%20M
etering.pdf, February, 2007
[3] Joint Working Group on Standards for Smart Grids - Final Report of the
CEN/CENELEC/ETSI Standards for Smart Grids, CEN/CENELEC/ETSI Joint Presidents
Group (JPG), Available: ftp://ftp.cen.eu/PUB/Publications/Brochures/SmartGrids.pdf,
2011
[4] I. Lungu and A. Bâra, “Sisteme informatice executive, Editura ASE, Bucureşti 2007, ISBN
978 – 973 – 594 – 975 – 4
[5] M. Velicanu, I. Lungu, I. Botha, A. Bâra, A. Velicanu and E. Rednic, “Sisteme de baze de
date evoluate, Editura ASE, 2009, ISBN 978-606-505-217-8
[6] J. Bughin, M. Chui and J. Manyika, Clouds, big data, and smart assets: Ten tech-enabled
business trends to watch, McKinsey Quarterly, Available: http://www.itglobal-
services.de/files/100810_McK_Clouds_big_data_and%20smart%20assets.pdf, 2010
[7] S. Rusitschka, K. Eger and C. Gerdes, Smart grid data cloud: A model for utilizing cloud
computing in the smart grid domain, Smart Grid Communications, 2010,
ieeexplore.ieee.org
[8] M. Courtney, How utilities are profiting from Big Data analytics, Engineering and
Technology Magazine, vol 9, issue 1, http://eandt.theiet.org/magazine/2014/01/data-on-
demand.cfm, 2014

Proceedings of the IE 2015 International Conference
www.conferenceie.ase.ro
375
DATA WAREHOUSE PYRAMIDAL SCHEMA ARCHITECTURE -
SUPPORT FOR BUSINESS INTELLIGENCE SYSTEMS
Aida-Maria POPA
Academy of Economic Studies, Bucharest, Romania [email protected]
Abstract. This paper aims to present a new schema for data organizations in data warehouses.
The concept of pyramidal schema is designed to achieve a closer relation between the data
warehouse and Business Intelligence technology. Data orientation on modules and interest
plans aims at identifying has the objective to identify which data is necessary for each module
and which aspects are pursued by the organization's management for business development.
This ongoing research has been conducted based on existing data warehouse’s schemas which
are successfully used in business intelligence systems architectures. This paper will focus on
how pyramidal schema can be an efficient solution for decision-making process at the level of
organization’s management. The subject adapts to the current development trend of companies
where data warehouse is used more frequently for storing a large volume of data and for
complex analysis along with a business intelligence system.
Keywords: business intelligence, data warehouse, making-decision process, pyramidal schema JEL classification: D83
1. Introduction
Currently, the data warehouses are one of the interest points of Business Intelligence systems.
Their role is to provide accurate and complete information to the organization’s management
to facilitate the development of business performance through a proper founded decision-
making process.
In recent years, information has represented a negligible competitive advantage of
organizations in the economic market. Whether the data is more numerous, more detailed and
more accurate, companies can know better the target customers and can respond promptly to
their requirements. They also can extend or, the contrary, narrow target group by identifying
profitable or unprofitable segments from an economic point of view.
As the current economic market tends to be more dynamic, business intelligence solutions must
have accuracy to allow companies to develop effective plans for both short-term and medium
and long term developing.
2. Data warehouses
2.1 Some aspects regarding Data Warehouse
The data warehouse represents a set with a large volume of data (from hundreds of gigabytes
to terabytes) that is used as a compact, integrated and complete data source and it is a support
for different types of information systems (decision support, executive, business intelligence)
with the purpose to provide stored data from relevant sources (operational data, external files,
archives, etc.) aimed at supporting the decision-making process in a company business.
Data warehouse represents a technology that is increasingly present and important in business
operations. Although it is known that data warehouses technology has been appreciated in
recent years, their value continues to increase, being a competent solution in terms of clients
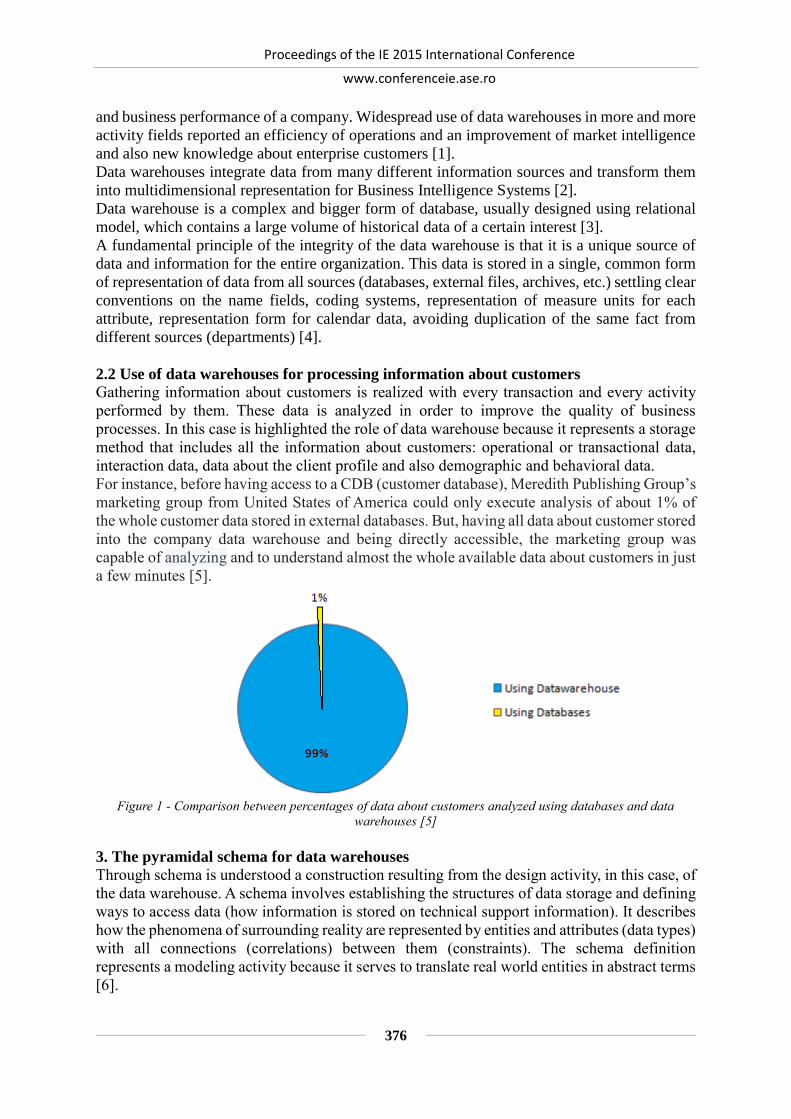
Proceedings of the IE 2015 International Conference
www.conferenceie.ase.ro
376
and business performance of a company. Widespread use of data warehouses in more and more
activity fields reported an efficiency of operations and an improvement of market intelligence
and also new knowledge about enterprise customers [1].
Data warehouses integrate data from many different information sources and transform them
into multidimensional representation for Business Intelligence Systems [2].
Data warehouse is a complex and bigger form of database, usually designed using relational
model, which contains a large volume of historical data of a certain interest [3].
A fundamental principle of the integrity of the data warehouse is that it is a unique source of
data and information for the entire organization. This data is stored in a single, common form
of representation of data from all sources (databases, external files, archives, etc.) settling clear
conventions on the name fields, coding systems, representation of measure units for each
attribute, representation form for calendar data, avoiding duplication of the same fact from
different sources (departments) [4].
2.2 Use of data warehouses for processing information about customers
Gathering information about customers is realized with every transaction and every activity
performed by them. These data is analyzed in order to improve the quality of business
processes. In this case is highlighted the role of data warehouse because it represents a storage
method that includes all the information about customers: operational or transactional data,
interaction data, data about the client profile and also demographic and behavioral data.
For instance, before having access to a CDB (customer database), Meredith Publishing Group’s
marketing group from United States of America could only execute analysis of about 1% of
the whole customer data stored in external databases. But, having all data about customer stored
into the company data warehouse and being directly accessible, the marketing group was
capable of analyzing and to understand almost the whole available data about customers in just
a few minutes [5].
Figure 1 - Comparison between percentages of data about customers analyzed using databases and data
warehouses [5]
3. The pyramidal schema for data warehouses
Through schema is understood a construction resulting from the design activity, in this case, of
the data warehouse. A schema involves establishing the structures of data storage and defining
ways to access data (how information is stored on technical support information). It describes
how the phenomena of surrounding reality are represented by entities and attributes (data types)
with all connections (correlations) between them (constraints). The schema definition
represents a modeling activity because it serves to translate real world entities in abstract terms
[6].

Proceedings of the IE 2015 International Conference
www.conferenceie.ase.ro
377
Multidimensional modeling uses several types of schemas depending on the ways in which
objects can be arranged within the schema: star schema type, snowflake schema type, data
cubes [7].
Pyramidal schema is a structure of four levels of data organization that has the data at the base
and at the top of the pyramid it stores the results of the queries previously performed.
3.1 Specific concepts used in the definition of pyramidal schema
Facts table. In [8] is considered that the fact table is where the numerical measurements of the
business processes are stored and the measurements or events are related by foreign keys to
each dimension table. The fact table has a large volume of data sometimes containing up to
thousands or millions of rows of records. A usual query will compress or extract a large volume
of records into a handful of rows using the aggregation. The most important characteristic of
the fact table is defined by the grain and it represents the level of detail at which measurements
or results are stored. It also determines the dimensionality of the data warehouse and how the
size may have a much greater impact to the business performance.
Surrogate key. A surrogate key in a data warehouse is a unique identifier for an entity in the
modeled world or an object in the data warehouse. The surrogate key is not derived from an
application or real data which means that it does not have any business significance or logical
meaning. A surrogate key is defined as a column that uniquely identifies a one single row in a
table. These keys don’t have a natural relationship with the rest of the columns in a table and
are used in pyramidal schemas just for reducing the number of tables in the model by removing
some of the link tables. Usually the surrogate keys take as value a numeric number. The
surrogate key value is generated and stored with the rest of the columns in a row of a table. It
is also known as a dumb key, because there is no significance associated with the value.[9]
Interest modules table. This table, located on the higher level of the pyramidal schema, contains
the main segments (modules) of the company, recording their ID and name, and is directly
related to the facts table. For instance, in this table can be stored the name of departments or
another division that has access to the company's data or use the records for analysis or reports.
Interest plans table. The records of this table have to respond to one simple question: ”What I
want to know about a company?”. For example, the human resources department wants to
know the evolution of the number of employees, how many of them are qualified for their job,
which is the average age of employees, etc.
Repartition on interest plans table. This table is used as a link table between data and plans of
interest. Thus it can quickly know which data is relevant for analyzing a plan of interest. To
identify a record of data and the correspondence from the interest plans table is used an
indexing table where the tables from the lower level of the pyramidal schema are stored.
3.2 Levels on pyramidal schema of a data warehouse
The lower level (data level): is composed of a set of data organized in tables. Number of tables
from this level is reduced by using surrogate keys so that some of the link tables are removed.
The middle level (the level of distribution on interest plans of tables and records): at this level
are found the table of distribution on interest plans and the table of indexing tables.
The higher level (the level of the interest modules and plans and the annex tables): at this level
are found: modules of interest table which contains major segments of the company`s
organization (financial module, human resources, production etc.); interest plans table which
contains what results are meant to be watched (sales volume, number of employees, salary
expenses etc.); annex tables (measure units, time measure units, etc.).
The top level (the facts table level): is a table with a higher volume of records and it is the
source for analysis and reports. This table is used by the leadership management of the

Proceedings of the IE 2015 International Conference
www.conferenceie.ase.ro
378
company for decision-making process. Using those records along with an efficient business
intelligence system, the business performance can be increased considering that the
information is the most important competitive advantage of any modern company.
In Figure 2 is represented the structure of pyramidal schema for data warehouses and in Figure
3 is designed a database model using the specific tables from pyramidal schema using
Microsoft Office Visio 2013.
Figure 2 - The structure by levels of pyramidal schema
Figure 3 - Representation of tables from pyramidal schema in a relational database
3.3 The necessity and advantages of using pyramidal schema
The main novelty brought by the pyramidal schema in organizing data in a data warehouse is
the use of tables of interest modules and plans. This allows the distributing of results on the
Proceedings of the IE 2015 International Conference
www.conferenceie.ase.ro
379
major segments (departments) and interest plans within a company. Other advantages common
to all data warehouses schemas are [4]:
– transferring and sharing the results stored in the organization between different
departments, offices or business partners;
– storing a large volume of data and also storing the results of queries;
– represents support for decision-making process for the company's leadership
management;
– represents competitive advantage in the economic market and beyond it;
– strategic organization of data to increase business performance;
– stored data is complete and consistent;
– reduced access and data analysis time;
– it can contain data and information on all segments of the company.
BI Systems have earned more and more importance in decision-making processes in companies
which are developed and in progress of development. Organizing data into modules and plans
of interest has a particularly role in detailed analysis of a department or a plan of interest that
is found in certain modules. A company with a complex organizational structure and an
economic activity in several industries is using at global level the BI system, but when these
segments must be individually analyzed, pyramidal schema allows access to the necessary data
and previous obtained results in relation to the analyzed segment.
4. Conclusions
In the context of the ongoing development of the notion of “intelligent warehousing” can be
brought into question also a reorganization of the data into a data warehouse in a schema
oriented on modules and plans of interest. Using pyramidal schema may lead us to a new
concept of data warehouse called “intelligent data warehouse”. Organizing data warehouse
under the pyramidal schema brings the users closer to the notion of Business Intelligence,
because the data is highlighted easier for analysis required for each segment followed by a
development company.
For the applicative part, there will be realized a simulation with test data for the railway field.
Sustainable development of the railway field depends now on the efficient use of data and
information stored. After testing we will see if pyramidal schema is an optimal solution for
areas with a wide range of modules and plans of interest.
References [1] J. Foley, The Top 10 Trends in Data Warehousing, March 10, 2014. Available:
http://www.forbes.com/sites/oracle/2014/03/10/the-top-10-trends-in-data-warehousing/
[2] G. Satyanarayana Reddy, M. Poorna Chander Rao, R. Srinivasu and S. Reddy Rikkula,
Data Warehousing, Data Mining, OLAP and OLTP Technologies Are Essential Elements
To Support Decision-Making Process in Industries, International Journal on Computer
Science and Engineering(IJCSE), vol. 2, No. 9, pp. 2865-2873, 2010, ISSN 2865-2873.
[3] B. Nedelcu, Business Intelligence Systems, Database Systems Journal, Vol. IV, Issue
4/2013, pg. 12-20, 2013, ISSN 2069-3230. Available:
http://www.dbjournal.ro/archive/14/14_2.pdf
[4] M. Velicanu and Gh. Matei, Tehnologia inteligenta afacerii, Editura Ase, Colectia
Informatica, Bucuresti, 2010, ISBN 978-606-505-311-3.
[5] A. Khan, Dr. N. Ehsan, E. Mirza and S. Zahoor Sarwar, Integration between Customer
Relationship Management ( CRM ) and Data Warehousing, Procedia Technology 1,
pp. 239 – 249, 2012, ISSN 2212-0173.

Proceedings of the IE 2015 International Conference
www.conferenceie.ase.ro
380
[6] M. Velicanu, Database systems Explanatory Dictionary, Editura Economica, Bucuresti,
2005, ISBN 973-709-114-0.
[7] I. Lungu and A. Bara, Sisteme informatice executive, Editura Ase, Bucuresti, 2007, ISBN
978-973-594-690-6.
[8] I.Y. Song, W. Rowen, C. Medsker and E. Ewen, An Analysis of Many-to-Many
Relationships Between Fact and Dimension Tables in Dimensional Modeling, Proceedings
of the International Workshop on Design and Management of Data Warehouse
(DMDW’2001), Interlaken, Switzerland, June 4, 2001.
[9] D.P. Pop, Natural versus Surrogate Keys. Performance and Usability, Database Systems
Journal, Vol. II, no. 2/2011, ISSN 2069-3230.

Proceedings of the IE 2015 International Conference
www.conferenceie.ase.ro
381
BUSINESS INTELLIGENCE FOR HEALTHCARE INDUSTRY
Mihaela IVAN
Bucharest University of Economic Studies
Manole VELICANU
Bucharest University of Economic Studies
Ionut TARANU Bucharest University of Economic Studies
Abstract. Global data production is expected to increase at an astonishing 4,300 per cent by
2020 from 2.52 zettabytes in 2010 to 73.5 zettabytes in 2020 [1]. Big data refers to the vast
amount of data that is now being generated and captured in a variety of formats and from a
number of disparate sources. Big data analytics is the intersection of two technical entities that
have come together. First, there’s big data for massive amounts of detailed information.
Second, there’s advanced analytics, which can include predictive analytics, data mining,
statistics, artificial intelligence, natural language processing, and so on. Put them together and
you get big data analytics. In this paper are reviewed the Real-Time Healthcare Analytics
Solutions for Preventative Medicine provided by SAP and the different ideas realized by
possible customers for new applications in Healthcare industry in order to demonstrate that
the healthcare system can and should benefit from the new opportunities provided by ITC in
general and big data analytics in particular.
Keywords: Business Intelligence, healthcare analytics, use-cases, real-time processing. JEL classification: I15, M15, M21
1. Introduction The concepts used and presented in this paper are Big Data, which is a challenge nowadays,
In-Memory, which is a new Business Intelligence technology and Analytics, which is an use
case [2] [3]. Nowadays, it is very important to present the role of Business Intelligence
technology in the healthcare sector.
In [4], Prof. dr. med. Karl Max Einhäupl considered that “in a hospital like Charité it’s an
unending stream of data every day. We see an unending stream of data every day and it is
unconditional important that we collect this data, filter, control it and reuse it for patient care,
or for teaching, or for driving research. In the medical field, it is critical that we move away
from the flood of paper that is overwhelming doctors today; that we continually move toward
electronic data capture.” This means that if you have the right information at the right time then
everything it’s possible.
2. Healthcare Analytics
When discussing about healthcare analytics, it is important to ask how are the statistics numbers
regarding the usage of analytics in healthcare and how this affects the end user’s knowledge?
In the Figure 1 below these numbers are represented, 10% are those who use analytics today
and approximately 75% need analytics [5]. The disadvantage of those who are not using
analytics feature is that they can’t make use of all data because the ability to manage all data is

Proceedings of the IE 2015 International Conference
www.conferenceie.ase.ro
382
getting difficult. On the other side, those who use analytics today are missing new insights,
which means they are not able to imagine the potential.
Figure 1 - Healthcare Analytics
The power of collective insights is realized by following three steps:
Engage: Predict demand and supply of Supply Chain;
Visualize: Understand the customer’s thoughts;
Predict: Provide the proper offers and services to every customer. Also predict new
market trends and innovate new products [6].
Healthcare organizational data it is used in diverse cases like surgical analytics, share
healthcare visualizations and have the clinicians share the processes. Profitability and quality
analysis for management can provide the critical insights to obtain the organizations goals and
gain competitive advantages. Analytical applications are developed to provide the base for the
use of analytics in an enterprise [7].
We must consider that analytics is about people and their needs. We can see in the below picture
(Figure 2) why is this evolution so important and how the people’s thinking are.
Figure 2 - Analytics is for People
The focus is on the empathy of the end user like executives, healthcare operations, clinician,
purchaser and clinical researcher. This is in fact the user experience with these useful tools.
The user experience can be sufficient in terms of satisfaction if the tools have beautiful UI (user
interface) and an easy adoption [8].
As presented in Figure 3, in the healthcare industry it is very important to help the organizations
to measure and improve treatment quality, to address growing concerns, to better manage
revenue and to increase the overall satisfaction.

Proceedings of the IE 2015 International Conference
www.conferenceie.ase.ro
383
Figure 3 - Information vs. data in healthcare industry
There is not necessary to collect more data, because the companies’ needs are to reach more
information, considering that in these days many companies are already confronted with
processing enormous amount of data.
In our opinion the actual context of healthcare analytics it’s about redefining the possible, while
the future evolution can be described in terms like efficiency, performance, data quality, real-
time analytics for patients, doctors and medical researchers.
3. Healthcare Analytics Solutions
A Real-Time Healthcare Analytics Solution for Preventive Medicine is a solution developed
by SAP. It let users to see their analytics and to use all the functionalities of SAP HANA which
is behind this application. This solution saves time and can be easily customized for any use
case [9] [10] [11].
Below are collected different Healthcare use-cases realized by different customers for new
applications in Healthcare industry.
Acceleration of most used SAP Patient Management transactions
Like the clinical workstation, the reasons are the following:
a lot of user complaints related to performance;
the transaction is a key one as it offers a view on all patients of a given ward with
important data.
Many users work with it and use the refresh function which creates additional system load.
This use case is currently being implemented. We could think of further opening it up to
multiple providers in order to provide access to patient information of the complete Health
Information Network (would need to be based on IHE specifications).
Clinical Research Support for cancer patients
This healthcare use-case has the following advantages:
Help medical researchers and physicians comprising up-to-date clinical and medical
information into research processes;
Ability to access all relevant data across organizational boundaries real-time;
Analyses of clinical data based on structured as well as unstructured information;
Create patient cohorts for clinical trials;
Quickly determine Patient/Trial matching;

Proceedings of the IE 2015 International Conference
www.conferenceie.ase.ro
384
Could of course be applied to other patients and specialties;
Use cases is reflected in SAP Solution in Early Adoption "Medical Research Insights";
This use case could be useful for these customers NCT, DKFZ hospitals.
Patient Segmentation This use-case help Healthcare Payers to quickly analyze their patient population in order to
determine potential candidates for a disease management program (e.g. diabetes prevention).
Potential customers for this use-case could be Healthcare Payers and Health Insurances.
Health Plan Analytics This use-case will support Healthcare Payers to analyze the effectiveness of their health
programs (e.g. ROI and Performance Analysis of Disease Management Programs covering
morbidity clustering). As in the previous use-case, potential customers could be also
Healthcare Payers and Health Insurances.
Multi-Resource Planning In this situation, the use-case can help Healthcare Providers to quickly recalculate their
outpatient schedules or inpatient surgery plans based on different types of incidents like
unavailability of doctors etc. Potential customers are Healthcare Providers.
Treatment outcome analysis This will help Healthcare Providers to analyze their patient treatment outcome and costs by
considering diagnosis and DRG codes, length of stay, services performed, claims and
revenues. This could also be used to support the contract negotiation process with the payers,
by providing hospitals with the information support on the real costs for a specific patient
group. Potentially extend this to a multi provider or ACO (Accountable Care Organization)
scenario for the US. As in previous situations, potential customers are Healthcare Providers.
Evidence-based medicine Evidence-based medicine (EBM) aims to apply the best available evidence gained from the
scientific method to clinical decision making. The use case is to suggest medical guidelines
based on past patient treatments. Potential customers are Healthcare Providers.
Drug Recall
This use-case provide fast and efficient recall procedures by determining quickly all the
patients having been administered the drug to be recalled including their location and contact
information. Potential customers are Healthcare Providers.
Track & Trace of Medical Products
This use-case offer monitoring of the logistic chain of medical and pharmaceutical products
from the raw material to the point of consumption by the patient including efficient counterfeit
prevention. Potential customers are Healthcare Providers.
Prevention of Fraud and Abuse
This support analysis of incoming claims in comparison to the claims history with the aim of
detecting cases of fraud and abuse. Originally HANA Olympics use case submitted by Jim
Brett (Partner Manager for E&Y) Jim & Steve pushing on partner development in the US
GRC cross industry use case "Instant Compliance" under evaluation, Healthcare has been
asked to address requirements. Potential customers are Healthcare Payers.
Real-time patient monitoring
This use-case help Monitoring patients in real-time and triggering alerts of necessary
interventions based upon incoming data (e.g. blood pressure). This use case is an example for
a set of use cases like
MEWS (modified early warning score) in the ICU area;
elderly patients at home.
Potential customers are Healthcare Providers.

Proceedings of the IE 2015 International Conference
www.conferenceie.ase.ro
385
Determination of copayment rates Offer an insured patient the possibility to quickly find out which copayment he would have
to make for a given treatment. This service could be offered by a health insurance through a
portal or mobile device to their customers. It would create the required output based on the
insured person's health plan and on the already consumed services. This determination is data
intensive and could be accelerated through HANA. Potential customers are Health Insurances
for their insured persons or Patients directly.
Prevention of Claims Rejection This help medical controllers or physicians by informing them that a case might be subject to
a payer investigation (e.g. MDK in Germany) because of a mismatch between claims and
medical facts and other characteristics like length of stay, age etc. Potential customers are
Healthcare Providers.
In the below table 1 is realized a comparative analysis of use-cases which will be implemented
in the healthcare industry and their key benefits are highlighted.
Table 1 - Comparative analysis of Healthcare use-cases
Use cases Potential customers Key benefits
Acceleration of most used SAP Patient
Management transactions
Healthcare industry Acceleration of transaction
processing
Clinical Research Support for cancer
patients
NCT and DKFZ hospitals
from Munich
Increased patient
satisfaction
Patient Segmentation Healthcare Payers and Health
Insurances
Cost savings for hospitals
Health Plan Analytics Healthcare Payers and Health
Insurances
Real-time analysis
Multi-Resource Planning Healthcare Providers Time saving for planning
Treatment outcome analysis
Healthcare Providers Better outcome
management
Evidence-based medicine Healthcare Providers Better clinical decision
making process
Drug Recall Healthcare Providers Efficient recall procedures
Track & Trace of Medical Products Healthcare Providers Efficient counterfeit
prevention
Prevention of Fraud and Abuse Healthcare Payers Better fraud prevention
Real-time patient monitoring Healthcare Providers Real-time monitoring
Determination of copayment rates Health Insurances for their
insured persons or Patients
directly
Efficient budget planning
Prevention of Claims Rejection Healthcare Providers Efficient claims
management
Our solution proposed in the healthcare industry is based on the use-cases presented above
and has the following objectives:
Real-time analysis of hospital patient management data;
Significant speed up of reporting processes;
Monitoring clinical quality of care and patient safety.
4. Conclusions In conclusion is time for change in Healthcare sector. The use of analytics will enable putting
the right data at the fingertips of the people with the potential to generate lifesaving or lifestyle
improving insights. Big data offers breakthrough possibilities for new research and discoveries,
better patient care, and greater efficiency in health and health care, as detailed in the July issue

Proceedings of the IE 2015 International Conference
www.conferenceie.ase.ro
386
of Health Affairs [12]. We believe that big data analytics can significantly help healthcare
research and ultimately improve the quality of life for patients from any domain.
Acknowledgment This paper was co-financed from the European Social Fund, through the Sectorial Operational
Program Human Resources Development 2007-2013, project number
POSDRU/159/1.5/S/138907 "Excellence in scientific interdisciplinary research, doctoral and
postdoctoral, in the economic, social and medical fields -EXCELIS", coordinator The
Bucharest University of Economic Studies.
References [1] Big Data Strategy - Improved understanding through enhanced data-analytics capability,
Available at http://www.finance.gov.au/agict/, June 2013
[2] M. L. Ivan, Characteristics of In-Memory Business Intelligence, Informatica Economică,
vol. 18, no. 3, 2014, pp. 17-25
[3] A. Bara, I. Botha, V. Diaconiţa, I. Lungu, A. Velicanu, M. Velicanu, A model for Business
Intelligence Systems’ Development, Informatica Economică, vol. 13, no. 4, 2009, pp. 99-
108
[4] J. Flintrop, E. A. Richter-Kuhlmann, H. Stüwe, Interview mit Prof. Dr. med. Karl Max
Einhäupl, Vorstandsvorsitzender der Charité, Available at:
http://www.aerzteblatt.de/archiv/62999/Interview-mit-Prof-Dr-med-Karl-Max-Einhaeupl-
Vorstandsvorsitzender-der-Charite-Universitaetsmedizin-Berlin-Wir-koennen-uns-keine-
Klinik-leisten-die-nicht-zu-den-besten-gehoert
[5] C. Gadalla, A Technical Guide to Leveraging Advanced Analytics Capabilities from SAP,
Available at: http://www.slideshare.net/SAPanalytics/bi2015-charles-
gadallatechguideleveraginganalytics
[6] SAP HANA Platform, Rethinking Information Processing for Genomic and Medical Data,
Available at: https://www.sap.com/bin/sapcom/en_us/downloadasset.2013-02-feb-11-
20.sap-hana-platform-rethinking-information-processing-for-genomic-and-medical-data-
pdf.html
[7] Business Intelligence and Analytics for Healthcare, Available at:
http://www.perficient.com/Industries/Healthcare/Business-Intelligence-Analytics
[8] Kim Gaddy, Making the most of analytics, Insights, Available at:
http://www.utilityanalytics.com/resources/insights/making-most-analytics
[9] Real-Time Healthcare Analytics Solution for Preventative Medicine, United Software
Associates Inc., Available at: http://marketplace.saphana.com/p/3323
[10] T. Knabke, S. Olbrich and S. Fahim, Impacts of In-memory Technology on Data
Warehouse Architectures – A Prototype Implementation in the Field of Aircraft
Maintenance and Service, in Advancing the Impact of Design Science: Moving from
Theory to Practice, Lecture Notes in Computer Science, Springer, Vol. 8463, 2014, pp.
383-387
[11] Big Data Analytics, September 14, 2011, Available at:
http://tdwi.org/research/2011/09/best-practices-report-q4-big-data-analytics.aspx
[12] Using Big Data To Transform Care, Health Affairs, July 2014, Vol. 33, Issue 7, Available
at: content.healthaffairs.org/content/33/7.toc

Proceedings of the IE 2015 International Conference
www.conferenceie.ase.ro
387
STREAMLINING BUSINESS PROCESSES IN ACADEMIA BY
BUILDING AND MANIPULATING A BUSINESS RULES
REPOSITORY
Alexandra Maria Ioana FLOREA
Academy of Economic Studies, Bucharest [email protected]
Ana-Ramona BOLOGA Academy of Economic Studies, Bucharest
Vlad DIACONIȚA
Academy of Economic Studies, Bucharest [email protected]
Razvan BOLOGA
Academy of Economic Studies, Bucharest [email protected]
Abstract. It is evident the existing trend in recent years to regard the university as a trader on
the market that works and is managed like a business. In this context, more and more
universities are interested to increase the efficiency of business processes and invest in the
development of advanced software solutions.
Given these issues, we will present a research proposal which suggest an approach based on
business rules to streamline the coordination and execution of business processes within a
university. From a scientific perspective, the project aims to address the area of researches
based on business rules in academia, which has not been addressed so far. It aims to develop
and implement a technique for identifying and formalizing business rules in academia and to
build a business rules repository that is constantly queried/viewed and updated as changes
occur to regulations regarding business processes or to restrictions on structures, activities
and informational flows inside the university. The business processes model and the rules
repository will be developed for the specific case of the Bucharest University of Economic
Studies and in the next stage it will be generalized for other Romanian public institutions.
Keywords: business processes, business rules, business rules repository, university
management
JEL classification: I23, L86, O33
1. Introduction
Modern universities are complex organizations that, in terms of implemented information
systems present a significant number of challenges. Generally speaking, if we analyze
academics in terms of information, we can identify a set of subsystems with independent
activities, but which develop instead a more or less intense information exchange with other
subsystems, generating in this way inevitable interdepencies.
For these subsystems of activities, universities implement a set of software applications that
automate all or part of the business processes involved. The technical infrastructure of
universities is usually made up of a mosaic of applications developed using different
technologies and, in order to ensure trouble-free execution of business flows there is necessary

Proceedings of the IE 2015 International Conference
www.conferenceie.ase.ro
388
the process integration in the systems they are contained in. This integration can be achieved
in various ways; the most important thing is the existence of an overall view of the functioning
of the university and its interactions with its partners, the objectives pursued and the rules
governing them.
In this article we present an approach based on business rules to streamline the coordination
and execution of business processes from the Bucharest University of Economic Studies.
2. Business rules in academic process modeling Business rules represent some of the most important key documented knowledge within an
organization. They allow the separation of business logic from processes and operational
applications, allowing specification of business knowledge in a way that is easy to understand
but can be executed routinely by automated rules engine.
By researching the current literature, we found that there are no similar, business rules-based
modeling approaches in academia, to date. Current efforts in this field are directed toward the
development of an industrial standard for markup languages to specify business rules on all
levels of the models of the Model Driven Architecture (MDA) [1] such as SBVR (Semantics
of Business Vocabulary and Business Rules Specification) [2] or PRR (Production Rule
Representation) [19]. There were also identified a number of researches on the definition of a
transformation model between different rules specification languages such as [3]. This project
will make an analysis of the current standards and which ones are applicable in the specific
case of a university
Although current approaches existing in the industry can be partially used with the necessary
adaptations, the difficulty lies in formalizing the large number of tacit or implicit knowledge
and the existence of a high degree of information fragmentation. Also, the specific universities
business processes mentioned above show particular aspects, involving increased attention in
their management.
The development of the business processes model of a university comes to offer a collection
of business processes documented in a standardized fashion, to highlight the relationships
between business processes and to ensure quality in their execution by observing a set of rules.
Existing business models can be applied to a part of the academic process, but there are
business processes that are specific to higher education institutions, such as admission, research
grants management, cycle management studies.
3. University business process model The starting point in the identification of business rules will be to build the business processes
model across multiple levels of detail, because only in this way we can capture all types of
behavior, imposed restrictions, interactions, existing interdependencies between processes and
how they call common business rules.
The literature in the field of modeling business processes is very rich especially for the area
dedicated to companies; there are even reference models that have been highly used such as
the SCOR model [4], the Y-CIM model [5], the template created by SAP [6] or the ITIL model
(Information Technology Infrastructure Library) [7]. Implementations have emerged in recent
years focused on processes at university level, and there have even been proposed reference
models based on business processes, such as the one developed by Svensson and Hvolby in
2012 [8], models that can be used as starting point in developing a process-oriented solutions
specific to the Romanian universities environment while taking into account different aspects
in the organization and development of processes and implicitly in how different business rules
are applied.

Proceedings of the IE 2015 International Conference
www.conferenceie.ase.ro
389
An important problem of the business rules approach in academia is the way of communication,
the interaction with all the software applications used within the university. The process model
will identify precisely where and when to apply certain business rules, but for maintaining the
repository a management interface will be developed and a security policy will be defined to
restrict access and changing of information rights and to identify those responsible for keeping
the information up to date.
Existing business models can be applied to a part of the academic processes, but there are
business processes that are specific to higher education units such as admission, research grants
management, study lifecycle management.
An example of how a higher education business process has unique activities which are not
matched with regular activities within existing business processes is detailed in figure 1. In this
figure the main activities that form the students ‘evaluation process can be observed.
Figure 1 - Students’ evaluation process
For this particular process we can identify a number of rules that are in place but aren’t
necessarily documented in a controlled manner.
The license commission’s president must be either a full professor or an associate
professor.
The members of the license commission must be at least lecturers who obtained their
PhDs.
Enrolment in the 2nd year can be done if at least 15 credits were obtained.
Enrolment in the 3rd year can be done if at least 60 credits were obtained, from which at
least 15 from the 2nd year of study.
Enrolment for the license exam must be done at least 8 months prior to the exam date.
The results of the exams must be communicated to the students the next day for oral exam
and in 4 working days for written exams.
Enrolment in the 3rd supplemental year can be done only with tax and for a maximum of
three consecutive times.
These are just a few examples of how an academic business process is governed by rules and
as such they must be adequately documented, stored and managed through a repository.

Proceedings of the IE 2015 International Conference
www.conferenceie.ase.ro
390
4. Rules repository
The overall objective of the research is to build and handle a repository of business rules that
govern business processes in a university. This repository is intended to be an exhaustive
classification that contains and allows the management of all the business rules that operate in
a university, including both academic and economic processes. Also, this repository must be
designed so that it could be used in further research as a core element of a rules engine, through
which business rules will be implemented. To attain this objective we will go through a series
of specific objectives
O1: Designing the conceptual model of business processes at a university.
In investigating the business processes we follow the indications of the Lean methodology and
in order to build the business processes model we use the notations provided by Business
Process Model and Notation version 2.0, the latest version standardized by the Object
Management Group (OMG), thus building models based on modern approaches to data
visualization. As one of the original scientific contributions, note that when modeling the
business rules, we seek to define a technique for identifying and formalizing business rules in
academia.
O2: Developing a conceptual model of business rules that govern the previously modeled
processes.
At the design stage, we keep in mind that the rules stored in the warehouse must be: relevant,
atomic, precise, declarative, reliable, authentic, unique, consistent. The deposit will be
designed so as to store not only rules and their characteristics but also the information captured
in the rules model regarding the associations between rules and processes. Also we must take
into consideration to design the necessary characteristics in order to allow the storage of
historical versions of the sets of rules.
O3: Creating a prototype that implements the rules repository and a management interface.
The advantages of implementing a centralized repository of business rules in a university are
numerous. First a much-improved maintenance can be obtained in the idea that the pace of
change for business rules is different from the business process change pace and changes will
be made unitary and centralized. There is a separation of business rules from business processes
implementation. Analysis and design activities of the business processes model that precedes
the development of the rules repository allow a precise identification of the areas of
responsibility and possible redundancies that might occur in information flows. Also, the
flexibility of the consultation, updating and visibility of the identified set of rules should be
much improved.
The risks identified regarding the proposed models and prototype development include among
others: cumbersome analysis of the processes, due to extremely numerous activities, building
an incomplete business rules model because there are many informal, unspecified rules, the
occurrence of delays of planned activities
5. Conclusions So far, there have been very few attempts made by research groups or by software vendors to
provide models and solutions that address all the activities in a university, describing from one
end to another the academic business processes
Moreover, if the scope of academic processes has been however addressed in other
investigations, there are no similar approaches based on modeling of business rules with
application in academia. So far, it has not been built any business rules engine or any business
rules repository for the rules that govern academic work processes. Although a good knowledge
and understanding of the rules governing academic processes is essential for the smooth
running of specific activities, in academia it exists a vast number of such rules (hundreds) and

Proceedings of the IE 2015 International Conference
www.conferenceie.ase.ro
391
they are both formal and informal and, therefore, difficult to understand fully, so far there has
been no attempt to manage them with a rules repository.
In this context, we propose a research which has a high degree of originality and innovation
addressing a topic that has not been previously studied respectively to develop and implement
a technique for identifying and formalizing business rules in academia and to build a business
rules repository that is constantly queried/viewed and updated as changes occur to regulations
regarding business processes or to restrictions on structures, activities and informational flows
inside the university.
Acknowledgement
This paper was co-financed from the European Social Fund, through the Sectorial Operational
Programme Human Resources Development 2007-2013, project number
POSDRU/156/1.2/G/137499 "Developing and modernizing the curricula in the Business
Informatics field (DEZIE)", beneficiary "Clubul Informaticii Economice - Cyberknowledge
Club".
References [1] Object Management Group, MDA Guide version 1.0.1, june 2003,
http://staffwww.dcs.shef.ac.uk/people/A.Simons/remodel/papers/MDAGuide101Jun03.pd
f
[2] Object Management Group, Production Rule Representation version 1.0 (PRR) . Request
for Proposal, decembrie 2009, http://www.omg.org/spec/PRR/1.0/PDF/
[3] M.H. Linehan, “Semantics in model-driven business design”, IBM T.J. Watson Research
Center, 2006, http://ceur-ws.org/Vol-207/paper08.pdf
[4] SCOR Model, http://www.supplychainopz.com/2011/01/scor-model-for-supply-chain-
improvement.html ,
[5] A.W. Scheer, W. Jost and Ö. Güngöz, “A Reference Model for Industrial Enterprises”,
chapter 8 in “Reference Modeling for Business Systems Analysis”, IGI Global, 2007, p.
167-181
[6] B. F. Dongen, M.H. Jansen-Vullers and H.M.W.Verbik, Verification of the SAP reference
models using EPC reduction, state-space analysis, and invariants, Computers in industry,
vol 58, issue 6, august 2007, p. 579-601
[7] https://www.axelos.com/itil
[8] C. Svensson, H.H. Hvolby, “Establishing a business process reference model for
Universities”, Procedia Technology nr 5, 2012, p. 635-642

Proceedings of the IE 2015 International Conference
www.conferenceie.ase.ro
392
ENHANCING THE ETL PROCESS IN DATA WAREHOUSE SYSTEMS
Ruxandra PETRE
The Bucharest University of Economic Studies [email protected]
Abstract. In today's competitive world, the amount of data that is being collected is increasing
dramatically and organizations use data warehousing solutions to analyze the data and
discover the relevant information contained by it. Therefore, the need for new and innovative
solutions, to integrate data from various sources into data warehouses, is very high.
This paper focuses on the importance of the ETL (Extract, Transform and Load) process in
data warehousing environments, highlighting my proposal of ETL architecture for these
environments. Besides these aspects, the paper presents a case study on enhancing the ETL
experience by using a data integration platform provided by Oracle: ODI (Oracle Data
Integrator).
Keywords: ETL, Data Warehouse, Architecture, Oracle Data Integrator JEL classification: C88, L86
1. Introduction In recent years, organizations have been facing the dramatic increase of the volumes of data
collected and stored in their systems. To address the challenge posed by this, organizations
started to use data warehousing solutions that allow better analysis of the data and the discovery
of the relevant information contained by it. Therefore, the need for new and innovative
solutions, to integrate data from various sources into data warehouses, is very high.
Data needs to be loaded regularly to the data warehouse, in order to fulfill its purpose of
providing a consolidated and consistent data source, used for analysis and reporting. In order
to achieve this, data needs to be retrieved from the operational systems of the enterprise, as
well as from other external data sources, and loaded into the data warehouse.
Data warehousing solutions need to provide the means of integrating the data extracted from
the various source systems. The process used for integration and consolidation of the data of
the organization into the data warehouse, is the ETL (Extract, Transform and Load) process.
During ETL, the data is retrieved from the source systems, business and validation rules are
being applied to it, and then it is loaded to the data warehouse, delivering a unified view of the
enterprise data.
Consequently, an efficient, scalable and reliable ETL process is a key component for a
successful implementation of a data warehouse solution.
2. Overview of the ETL process “The Extract-Transform-Load (ETL) system is the foundation of the data warehouse. A
properly designed ETL system extracts data from the source systems, enforces data quality and
consistency standards, conforms data so that separate sources can be used together, and finally
delivers data in a presentation-ready format so that application developers can build
applications and end users can make decisions.” [1]
An ETL process comprises the following three phases of data processing in a data warehouse:
Extract – covers the retrieval of the required data from the source systems and making
it available for performing calculations;

Proceedings of the IE 2015 International Conference
www.conferenceie.ase.ro
393
Transform – applies integrity and business rules to transform the data from the
sources into the format of the target data warehouse;
Load – ensures that the transformed and aggregated data is loaded to the data
warehouse.
A variation of the ETL process is the ELT (Extract, Load and Transform), which involves
loading the data to the data warehouse, directly from the source systems, and transforming it
there.
Through ELT, “the extract and load process can be isolated from the transformation process.
This has a number of benefits. Isolating the load process from the transformation process
removes an inherent dependency between these stages. In addition to including the data
necessary for the transformations, the extract and load process can include elements of data
that may be required in the future. Indeed, the load process could take the entire source and
load it into the warehouse.” [2]
During the execution of the ETL process, various steps are being performed. The main such
steps, in my opinion, are comprised by the ETL cycle displayed in Figure 1 below:
Figure 1 - ETL process cycle
The ETL cycle consists of the following nine steps, divided between the three main components
of the process:
I. Extract:
1. Build dataset – covers the identification of the reference data that needs to be
extracted from the source systems;
2. Validate data – involves applying validation rules to clean and correct the data that
will be extracted;
3. Retrieve data – consists of copying the validated data to an intermediary layer, named
staging layer, where transformations will be performed upon it;
II. Transform:
1. Check integrity – involves applying integrity rules to the data loaded to the staging
area;
2. Perform calculations – applying business rules to calculate new measures on the
extracted data;
3. Aggregate data – implies performing aggregations upon the raw data;
III. Load:
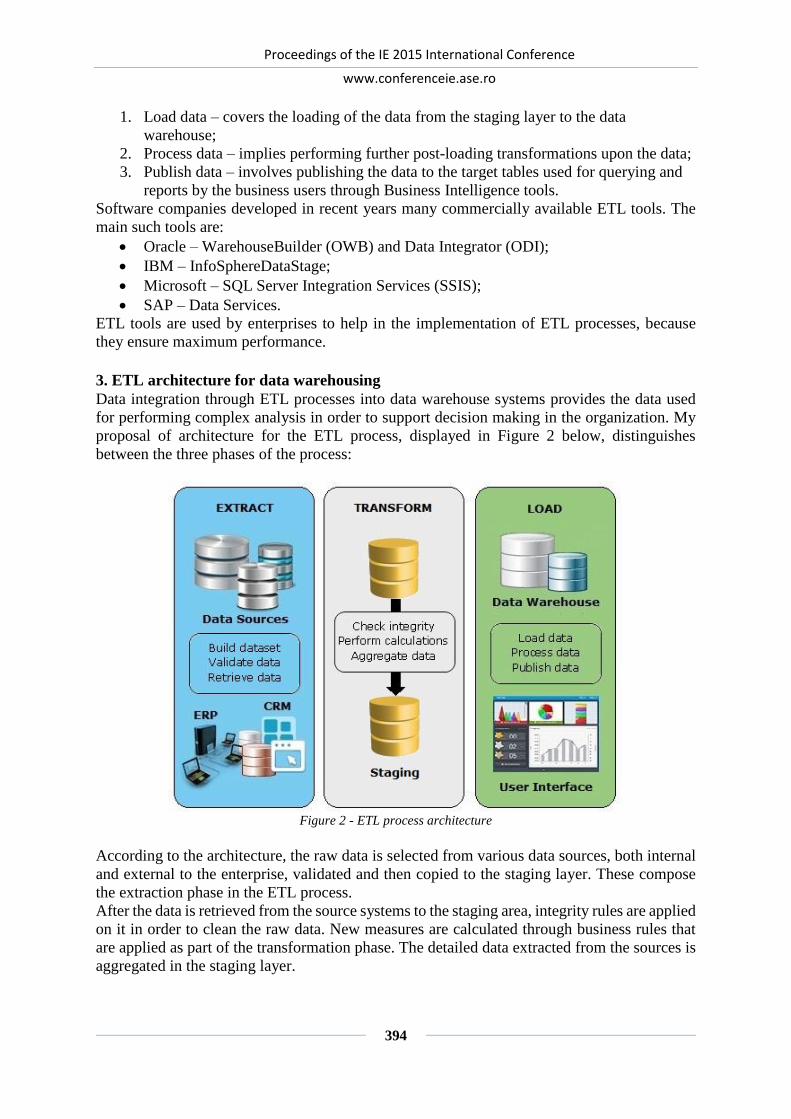
Proceedings of the IE 2015 International Conference
www.conferenceie.ase.ro
394
1. Load data – covers the loading of the data from the staging layer to the data
warehouse;
2. Process data – implies performing further post-loading transformations upon the data;
3. Publish data – involves publishing the data to the target tables used for querying and
reports by the business users through Business Intelligence tools.
Software companies developed in recent years many commercially available ETL tools. The
main such tools are:
Oracle – WarehouseBuilder (OWB) and Data Integrator (ODI);
IBM – InfoSphereDataStage;
Microsoft – SQL Server Integration Services (SSIS);
SAP – Data Services.
ETL tools are used by enterprises to help in the implementation of ETL processes, because
they ensure maximum performance.
3. ETL architecture for data warehousing Data integration through ETL processes into data warehouse systems provides the data used
for performing complex analysis in order to support decision making in the organization. My
proposal of architecture for the ETL process, displayed in Figure 2 below, distinguishes
between the three phases of the process:
Figure 2 - ETL process architecture
According to the architecture, the raw data is selected from various data sources, both internal
and external to the enterprise, validated and then copied to the staging layer. These compose
the extraction phase in the ETL process.
After the data is retrieved from the source systems to the staging area, integrity rules are applied
on it in order to clean the raw data. New measures are calculated through business rules that
are applied as part of the transformation phase. The detailed data extracted from the sources is
aggregated in the staging layer.
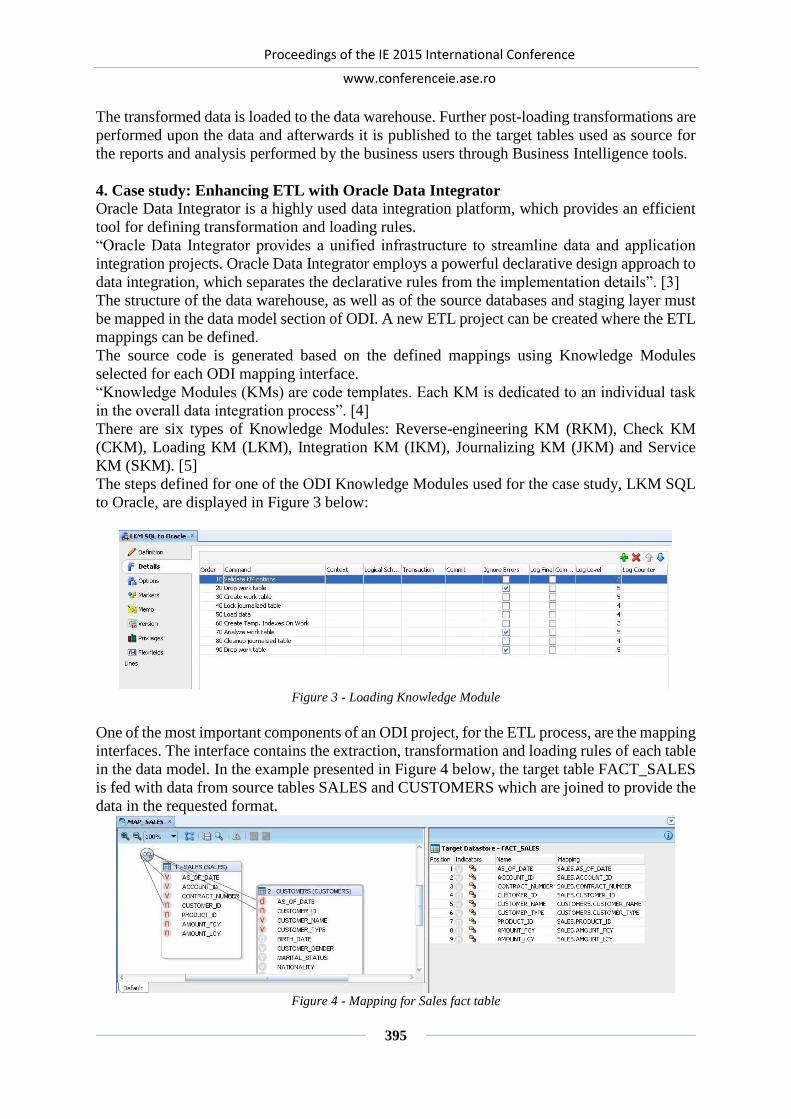
Proceedings of the IE 2015 International Conference
www.conferenceie.ase.ro
395
The transformed data is loaded to the data warehouse. Further post-loading transformations are
performed upon the data and afterwards it is published to the target tables used as source for
the reports and analysis performed by the business users through Business Intelligence tools.
4. Case study: Enhancing ETL with Oracle Data Integrator Oracle Data Integrator is a highly used data integration platform, which provides an efficient
tool for defining transformation and loading rules.
“Oracle Data Integrator provides a unified infrastructure to streamline data and application
integration projects. Oracle Data Integrator employs a powerful declarative design approach to
data integration, which separates the declarative rules from the implementation details”. [3]
The structure of the data warehouse, as well as of the source databases and staging layer must
be mapped in the data model section of ODI. A new ETL project can be created where the ETL
mappings can be defined.
The source code is generated based on the defined mappings using Knowledge Modules
selected for each ODI mapping interface.
“Knowledge Modules (KMs) are code templates. Each KM is dedicated to an individual task
in the overall data integration process”. [4]
There are six types of Knowledge Modules: Reverse-engineering KM (RKM), Check KM
(CKM), Loading KM (LKM), Integration KM (IKM), Journalizing KM (JKM) and Service
KM (SKM). [5]
The steps defined for one of the ODI Knowledge Modules used for the case study, LKM SQL
to Oracle, are displayed in Figure 3 below:
Figure 3 - Loading Knowledge Module
One of the most important components of an ODI project, for the ETL process, are the mapping
interfaces. The interface contains the extraction, transformation and loading rules of each table
in the data model. In the example presented in Figure 4 below, the target table FACT_SALES
is fed with data from source tables SALES and CUSTOMERS which are joined to provide the
data in the requested format.
Figure 4 - Mapping for Sales fact table

Proceedings of the IE 2015 International Conference
www.conferenceie.ase.ro
396
Also, the ODI interface models the flow for loading the data. The flow for loading
FACT_SALES using LKM SQL to Oracle is shown in Figure 5.
Figure 5 - Flow for loading Sales fact table
In order to load data to the target tables from the sources, the mapping interface must be run in
ODI. Figure 6 shows the successful execution of MAP_SALES interface.
Figure 6 - Execution of the Sales loading interface
The most important benefit of using Oracle Data Integrator is the consistent and scalable means
of developing the ETL process. ODI provides an easy to use GUI that ensures fast learning of
the tool, and a means of having centralized ETL processes.
5. Conclusions During recent years, enterprises needed, more and more, new and innovative solutions, to
integrate data from various sources into data warehouses, due to the increase of the volumes of
data.
In this paper we focused on the importance of the ETL process in data warehousing
environments and the steps that are performed when such a process is executed. An architecture
of the ETL process is proposed, which highlights the tasks that must be performed for each
phase of the ETL.

Proceedings of the IE 2015 International Conference
www.conferenceie.ase.ro
397
I presented a case study on the data integration platform provided by Oracle: ODI (Oracle Data
Integrator). ODI provided the means for improving both the development and the maintenance
of the ETL process, by offering the graphical interface to build, manage and maintain data
integration tasks.
References [1] R. Kimball and J. Caserta, The data warehouse ETL toolkit: practical techniques for
extracting, cleaning, conforming, and delivering data, USA, Wiley Publishing, 2004
[2] Robert J Davenport, ETL vs ELT. White Paper, June 2008, Available:
http://www.dataacademy.com/files/ETL-vs-ELT-White-Paper.pdf [March 14, 2015]
[3] Oracle, Oracle Fusion Middleware Getting Started with Oracle Data Integrator, Release
11g (11.1.1), USA, September 2010
[4] Oracle, Fusion Middleware Knowledge Module Developer's Guide for Oracle Data
Integrator, Available:
http://docs.oracle.com/cd/E28280_01/integrate.1111/e12645/intro.htm [March 16, 2015]
[5] Oracle Data Integrator, Available: www.oracle.com [March 15, 2015]

Proceedings of the IE 2015 International Conference
www.conferenceie.ase.ro
398
SOFTWARE DEVELOPMENT METHODOLOGY FOR INNOVATIVE
PROJECTS - ISDF METHODOLOGY
Mihai Liviu DESPA
Bucharest University of Economic Studies [email protected]
Abstract. The paper tackles the issue of formalizing a software development methodology
dedicated to building innovative web applications. The concept of innovative web application
is defined and its specific requirements are highlighted. Innovation is depicted from the end-
user, project owner and project manager’s point of view. The concept of software development
methodology is defined. Current software development models are presented and briefly
analysed. Strengths and weaknesses are depicted and the need for a dedicated innovation
oriented software development methodology is emphasized. The requirements of a software
development methodology are identified by reviewing current scientific computer science
publications. Elements of a software development methodology are also identified by reviewing
scientific literature. The ISDF software development methodology is illustrated by presenting
a case study performed on the ALPHA application. The development life cycle is depicted as
being the basis of every software development methodology. The development life cycle
employed in the ALPHA application is submitted for analysis. Each stage of the software
development cycle is described and characteristics proprietary to the ISDF software
development methodology are highlighted. Artefacts generate by the ISDF software
development methodology in the ALPHA project are submitted for analysis. The ISDF software
development methodology is formalized by presenting its key components: roles, skills, team,
tools, techniques, routines, artefacts, processes, activities, standards, quality control,
restrictions and core principles. Conclusions are formulated and new related research topics
are submitted for debate.
Keywords: software development methodology, innovation, project management
JEL classification: L86
1. Introduction The research efforts and results presented in the current paper apply exclusively to web
applications. Though they might apply to other categories of software applications or to other
fields altogether, they were validated only in the context of web applications. From the end-
user’s point of view, a web application is considered to be innovative if it’s easier to use, faster,
cheaper, more reliable or more secure than other applications that accomplish the same results
or if it fulfils a need that has yet to be address in the online environment. In the context of the
end-user, innovation targets the fulfilment of a specific need.
From the project owner’s point of view a web application is considered innovative if it:
includes at least a functionality that generates added value for the end-user and the
functionality is not found in other web applications that target the same market;
includes a combination of functionalities that generate added value and the combination
of functionalities is not found in the same configuration in any other web application
that targets the same market; functionalities can be found separately in other web
applications but not in the same configuration;

Proceedings of the IE 2015 International Conference
www.conferenceie.ase.ro
399
provides access to a graphic interface that includes elements or element combinations
which improve user experience and are not found in other web applications that target
the same market.
In the context of the project owner innovation focusses on market characteristics and targets
novelty and added value. From the project manager and from the development team’s point of
view a web application is considered to be innovative if it includes functionality that they have
never implemented before. In the context of the project manager and the project team,
innovation focusses on the degree of novelty of the current application compared to previously
implemented applications.
This paper focuses on the perspective of the project manager and the project team regarding
innovative web applications. Research and the author’s own experience in the field of software
development lead to the conclusion that innovative web applications are characterized by
frequent change of specifications, high dynamics of technology and standards, higher than
usual risks, proprietary cost structure and custom testing scenarios. Thus the research
hypothesis of the current paper is the fact that building an innovative web application requires
a dedicated software development methodology.
A software development methodology is an effort to standardize the set of methods, procedures
and artefacts intrinsic to the software development life cycle [1]. The software development
methodology illustrated in the current paper is called Innovative Software Development
Framework and will be referred with the acronym ISDF. The methodology was developed
based on practices employed by the author in innovative IT projects he personally managed in
the last 5 years. The initial methodology was built empirically based on the development life
cycle and was refined and formalized by integrating additional elements identified by
reviewing scientific papers. The resulting methodology was tested and validated in the
successful implementation of three innovative software development projects. The ISDF
methodology is depicted in the current paper by presenting a case study performed on one of
the above mentioned projects. In order to comply with confidentiality contract clauses and to
protect the project owner’s identity data is anonymized and project will be referred to with the
acronym ALPHA.
2. Literature Review
Current software development methodologies are branched into heavyweight and lightweight.
As part of the literature review process, heavyweight and lightweight methodologies were
analysed with an emphasis on epitomizing their overall structure, positive attributes, negative
attributes and the type of project they are suitable for.
Heavyweight methodologies follow the waterfall model and rely on detailed planning,
exhaustive specifications and detailed application design. The waterfall model is predictable,
generates comprehensive software artefacts and diminishes the risk of overlooking major
architectural problems [3]. Waterfall model is typically described as a unidirectional, top down
[6] as every phase begins only after the previous phase has been completed [7]. The output of
one phase becomes input for the next phase [7]. The central figure of the waterfall model is the
project plan [11]. Waterfall development entails high effort and costs for writing and approving
documents, difficulties in responding to change, unexpected quality problems and schedule
overrun due to testing being performed late in the project and lack of project owner feedback
[3]. Other issues proprietary to the waterfall model is the fact that systems often do not reflect
current requirements and lead-time is often generated by the need to approve software artefacts.
Also the waterfall model pushes high-risk and difficult, elements to end of the project,
aggravates complexity overload, encourages late integration and produces unreliable up-front

Proceedings of the IE 2015 International Conference
www.conferenceie.ase.ro
400
schedules and estimates [4]. Waterfall works best for projects with little change, little novelty,
and low complexity [4].
Lightweight methodologies follow the agile model and emphasize working software,
responding to change effectively and user feedback. Agile model was built to be adaptive,
flexible and responsive with an emphasis on collaboration and communication. The Agile
model embraces conflict while encouraging exploration and creativity [5]. Agile model relies
on iterative and incremental development [9] and focuses on people not on technology or
techniques [8]. The central figure of the agile model is the project owner [11]. The downside
of agile model is the fact that it relies on inadequate architectural planning, over-focusing on
early results, generates weak documentation and low levels of test coverage [2]. There is a
powerful negative correlation between the size of the organization and the successful
implementation of the Agile model, thus the larger the organization the harder it is to employ
agile methods [10]. Also the Agile model offers limited support for globally distributed
development teams, reduces the ability to outsource and narrows the perspective of generating
reusable artefacts [12]. Agile model works best for small teams as in large teams the number
of communication lines that have to be maintained can reduce the effectiveness of practices
such as informal face-to-face communications and review meetings [12].
The need for formalizing a software development methodology dedicated to innovative
projects is generated by the fact that traditional heavyweight methodologies are unable of
delivering fast development without compromising quality whereas agile lightweight
methodologies are characterized by inadequate documentation, weak architecture and lack of
risk management [2]. A software development methodology has to be described quantitatively
and qualitatively, has to lead to similar results if used repeatedly, has to be applied with a
reasonable level of success and has to be relatively easy to explain and teach [13]. A software
development methodology should include people, roles, skills, teams, tools, techniques,
processes, activities, standards, quality measuring tools, and team values [12].
3. Developing the ALPHA Application
The core of every software methodology is its development life cycle. The development life
cycle formalized in the ISDF methodology and used in the ALPHA project consists of the
following stages: research, planning, design, prototype, development, testing, setup and
maintenance. Research, planning, development, testing and setup are common stages in most
software development methodologies. Building a prototype, design and maintenance are also
employed in other software development methodologies but are not regarded as distinct
development life cycle stages. Innovative software development projects though, enforce
prototyping as a distinct stage because it plays an important role in reducing risk, refining
specifications and validating the innovative idea that initially lead to the inception of the
project. As part of the research process development, life cycle stages of the ALPHA project
were analysed as independent entities highlighting, people and roles.
Research stage in the ALPHA project methodology was dedicated to gathering and
exchanging information and it involved the project manager, the project owner and the project
team. The project owner’s role was to formulate requirements and communicate them to the
project manager. The project manager’s role was to evaluate requirements and assemble a team
with the necessary set of skills, professional values and experience required to implement the
project. Including the project manager, 8 people were involved in developing the ALPHA
application. Previous experiences lead to the conclusion that the ISDF methodology is effective
on teams that do not exceed 9 team members. When selecting the team members, the project
manager took into account the fact that implementing innovative projects requires strong
associating, questioning, observing, experimenting, and networking skills [14]. The project

Proceedings of the IE 2015 International Conference
www.conferenceie.ase.ro
401
team’s role was to evaluate requirements from a technical perspective. In the ALPHA project,
the project manager together with the project team also had the role of converting requirements
into actual specifications. As part of the research process, the project owner analysed
applications that were similar or complementary to the ALPHA application.
Planning stage in the ALPHA project was dedicated to formalizing the main characteristics of
the web application and it involved the project owner, project manager and the project team.
The project owner had the role of providing feedback on software artefacts. The project
manager’s role was to plan activities, set standards and assign responsibilities to team members.
The project manager together with the team members had the role of defining the overall flow
of the application. The flow was broken down into smaller, easier to manage subassemblies.
For each subassembly a comprehensive set of functionalities was defined. Based on the
required functionality the technical team members designed the database structure. The project
manager together with the project team also chose the tools, technologies and processes that
were going to be employed in the ALPHA project.
Design stage in the ALPHA project was dedicated to creating the graphic component of the
application and it involved the project owner, the project manager and the project team. The
role of the project owner was to provide feedback on the layout. The project manager had the
role of ensuring that the graphic component is consistent with the functionality and the target
group of the web application. The only team member involved in the design stage was the
graphic designer. His role was to create a layout in accordance with specifications received
from the project manager.
Prototype stage in the ALPHA project was dedicated to building a functional proof of concept
and it involved the project owner, the project manager and the project team. The role of the
project owner was to provide feedback on the prototype. The role of the project manager was
to refine specifications in accordance with the project owner’s feedback. The role of the project
team was to build the prototype. Innovative web development projects are characterized by a
considerable degree of uncertainty. Building the prototype had the role of validating the idea
that lead to the inception of the ALPHA project. The prototype also acted as a basis for
delivering consistent feedback and refining specifications.
Development stage in the ALPHA project was dedicated to actually building the functionality
part of the application and it involved the project manager and the project team. The role of the
project manager was to monitor progress, motivate team members and report to the project
owner. The role of the development team was to write code and debug.
Testing stage in the ALPHA project was dedicated to identifying programming, design, and
architectural issues and it involved the project manager and the project team. The role of the
project manager was to insure that the testing scenarios were exhaustive. The role of the project
team was to identify and fix security, functionality, design and architectural issues and fix them.
Also the project team had to ensure that the web application is doing everything it was design
to do and nothing that it wasn’t design to do.
Setup stage in the ALPHA project was dedicated to installing the web application on the live
environment and it involved the project team. The role of the project team was to configuring
the live environment in terms of security, hardware and software resources.
Maintenance stage in the ALPHA project was dedicated to ensuring that the application is
running properly on the live environment and it involved the project team. The role of the
project team was to monitor the traffic, and the firewall, mail, database and network protocols
error logs.
Next step in the research process was to analyses the succession, connections and interaction
of the software development life cycle stages highlighting resources, activities and tools. Fig.

Proceedings of the IE 2015 International Conference
www.conferenceie.ase.ro
402
1 presents a schematic representation of the development life cycle used in the ALPHA project.
The development life cycle presented in Fig. 1 is also representative for the ISDF methodology.
Figure 1. Development life cycle for the ALPHA application.
Research for the ALPHA project started with a series of meetings between the project manager
and the project owner. The project owner presented his vision on the application and detailed
on the initial set of requirements. The project manager then analysed similar web application
already operating in the online environment. The project team performed a technical review of
the requirements. The Research stage ended with the project manager and the project team
drafting the specifications for the ALPHA application. In the Planning stage the project
manager and the project team defined the overall flow of the ALPHA application and broke it
down into manageable subassemblies. The overall flow and the subassemblies were built with
the help of use case diagrams, UCD. Fig. 2 presents the UCD diagram for the Register – Login-
Logout process of the ALPHA application.
Figure 2. UCD diagram for the ALPHA project’s Register – Login – Logout process.

Proceedings of the IE 2015 International Conference
www.conferenceie.ase.ro
403
Building UCDs is an important process in understanding the structure of the application and it
is also one of the first deliverables that the project owner comes into contact with. The ISDF
methodology does not rely heavily on UCDs because building an innovative application is a
very dynamic process and initial planning will change multiple times until the application is
completed. The role of the UCD diagrams in the ISDF methodology is to help the project team
gain a deeper understanding of the application and also provides the project owner with a
preview of what the development’s team is going to implement. In the ALPHA project a
restriction was enforced of building a maximum of 10 UCD’s and allocating a maximum of 2
hours for building each UCD. The Planning stage continued with building the database
structure. Fig. 3 presents a sample of the database structure built for the ALPHA application.
Figure 3. Sample of the ALPHA application database structure.
The role of the database structure in this stage of the ALPHA project was to help the project
team gain a deeper understanding of the application. The database structure built in the
Planning stage was not a mandatory requirement for the final application. The database
structure changed significantly in three separate occasions by the time the project was finished.
The Planning stage ended with the project manager and the project team deciding on what
tools, technologies and process to employ in the development process of the ALPHA
application. In terms of code versioning tools the project team decided to use Tortoise SVN.
For the overall planning, resource allocation, budgeting and activity planning the project
manager decided to use Microsoft Project. In terms of bug tracking, task assignment and
progress monitoring the project manager and the project team decided on using Pivotal Tracker.
In terms of technology the project team opted for the LAMP stack with CentOS as the Linux
distribution. HTTP server of choice was Apache, SGBD system was MySQL and programming
language PHP. In order to facilitate building on a MVC architecture the PHP Zend framework
was chosen. The Planning stage ended with defining standards and quality measuring
techniques. The ALPHA application was designed to be W3C, Yslow and Page Speed
compliant. Data regarding quality was collected using the web application GTmetrix.
In the Prototype phase the project team built a mock-up of the application in order to validate
the assumptions made in the Research and Planning stages. The mock-up was built using
Prototyper. The prototype was built based on the UCD’s developed in the Planning stage and
acted as a proof of concept. The prototype of the ALPHA application was presented to the
project owner for feedback, process represented in Fig. 1 by transition 3. The prototype was
not in accordance with the project owner’s vision on the final application so the project team
completely rebuilt the prototype, process represented in Fig. 1 by transition 6. After rebuilding
the prototype the feedback received form the project owner required only minor adjustments
to the prototype, process represented in Fig. 1 by transition 5. After the adjustments were
implemented the prototype reflected accurately the project’s owner vision on the final

Proceedings of the IE 2015 International Conference
www.conferenceie.ase.ro
404
application. The prototype had to be built fast and it did not require any programming skills.
In the ALPHA project the maximum time allocated for building a prototype was 3% of the
total estimated project time and there were a total of 2 prototypes built. The Research, Planning
and Prototype stages were executed in the spirit of the waterfall model and generated artefacts
that are valuable in the context of innovative projects. After the prototype was approved by the
project owner the Development and Design stage started simultaneously.
The Design stage consisted of a series of layout iterations were the graphic designer created a
layout and made adjustments according to feedback received from the project owner, process
represented in Fig. 1. by transitions 10, 14 and 15. Building the functionality for the ALPHA
application consisted of a series of iterations that were organized according to timeboxing
technique. Each iteration was planned to last two weeks and ended with a functional version
of the application. Deadlines were non-negotiable. Each iteration was built by adding
functionality to the previous iteration. The ALPHA project was built in 8 iterations. An
iteration included the Development, Testing and Setup stages. Development was performed in
the spirit of the Agile methodologies with self-organizing teams and daily meetings to assess
progress and to identify issues. Developers worked in pairs, with only one of them codding
while the other was observing. Roles were exchanged daily. Pair programming reduces the
number of bugs and increases the likelihood of delivering innovative solutions. Functionality
was built following priorities set by the project owner. Functionality prioritisation was
performed using the MoSCoW model.
Testing was performed using the testing scenarios defined in the Planning stage. Scenarios
needed adjustments as the requirements for the ALPHA applications changed during actual
implementation. The testing scenarios included all the instances of the ALPHA application.
Fig. 4 presents a sample of the testing schema used in the ALPHA application.
Figure 4. Sample of the testing schema used for the ALPHA application.
The testing schema was designed for two testers. Each tester was involved in the development
of the application starting from the Planning stage, when they contributed to building the
UCDs, and ending with the Setup stage when they tested the application on the live
environment.
The Setup stage entailed installing the applications on the live environment and adding proper
content. Data was imported into the application’s database in order to generate proper content.
The first versions of the ALPHA application was installed on the live environment after the
first development iteration, which was 5 weeks into the project, including research, planning,
prototyping and design. After the first version of the application was installed on the live
environment feedback was collected from the end-user and project manager. The role of the
end-user was to provide feedback regarding usability, design, and functionality. In the ALPHA
project after the code from the first iteration was installed and tested on the live environment
application was tested by a sample batch of potential end-users. End-user testing was
performed after each iteration. The Maintenance stage started after the code from the last
iteration was setup on the live environment. In the ALPHA project the Maintenance stage
focussed on adding new functionality and improving existing functionality. Also an important

Proceedings of the IE 2015 International Conference
www.conferenceie.ase.ro
405
part of the maintenance process was fixing design, architecture and functionality issues that
were not identified in the Testing stage.
4. Formalizing the ISDF Methodology
The development of the ALPHA application was performed using the ISDF software
development methodology. By analysing the development of the ALPHA application, the
ISDF methodology was formalized and presented in a structured manner. Table 1 presents a
concise view on the ISDF software development methodology.
Table 1. ISDF software development methodology characteristics.
Methodology
characteristic
ISDF Specific
Roles project owner; project manager; project team; end-user
Skills associate; question; observe; experiment; networking
Team 9 individuals; self-organizing; emphasize informal and face-
to-face communication
Tools prototyping; code versioning; bug reporting; progress
tracking; graphic design and workflow applications
Techniques pair programming; timebox approach; MoSCoW
prioritisation of tasks
Routines 30 minute meetings; daily written reports; weekly one hour
meetings for planning or adjusting the current iteration
Artefacts use case digammas; wireframes; prototypes; test case
scenarios; database schemas
Processes and
Activities
create artefacts; build prototypes; extend prototype using
iterative development; collect continues feedback; developed testing
scenarios before actual coding
Standards W3C compliant; B grade by Yslow and Page speed
standards; page size under 2 MB; less than 100 HTTP requests;
average page load time under 5 seconds
Quality
control
compliance; usability; reliability; repeatability; availability;
security
Restrictions no more than 30 minutes per daily meeting; no more than 10
UCDs; no more than 2 hours per UCD; no more than 3 prototypes;
no more than 1% of the total estimated time allocated to building a
prototype
Core
principles
early delivery of working software, welcome change, explore
multiple implementation scenarios, non-negotiable deadlines,
writing code over writing documentation
Roles of core importance for the ISDF methodology are project owner, project manager,
project team and end-user. The role of the project owner is to provide accurate and detailed
application requirements to the project manager and to provide continuous feedback. The ISDF
methodology requires the project owner to be involved in every stage of the development life
cycle. Project owner must provide feedback on all aspects concerning the application but most
important components are: feedback on the prototype, feedback on each development iteration
and feedback on design. The role of the project manager is to compile specifications based on
requirements provided by the project owner, assemble the project team, design the overall flow
of the application, define the implementation timeframe, design testing schemas, track progress

Proceedings of the IE 2015 International Conference
www.conferenceie.ase.ro
406
and report to the project owner. The role of the project team is to plan the architecture of the
application, choose the technologies required to build the application, design the database
structure, design the graphical layout, implement functionality, test the application and setup
the application on the live environment. The role of the end-user is to provide feedback on the
functionality, design, security and usability of the application.
Skills required in developing innovative software and by that matter required in ISDF teams,
are the ability to associate, observe, experiment, network and question. In the context of
innovation, the ability to associate means being able to make connections across areas of
knowledge. Transferring knowledge and ideas from other fields into software development is
an abundant source of innovation. Sharp observation skills are a key element of innovation as
it facilitates gathering data and information that eludes most people. When building a team the
project manager should look for individuals with a network of vast connections. Being exposed
to people with different backgrounds and perspectives increases your own knowledge. ISDF
requires people with experimenting skills that build prototypes and pioneer new concepts and
technologies. Questioning is essential for innovation as it is the catalyst for associating,
observing, experimenting and networking skills [14].
Teams employed in innovative projects built using the ISDF methodology consist of maximum
9 individuals including the project manager. ISDF teams rely heavily on face-to-face
communication. Empirical trials determined that teams larger than 9 individuals have issues
with effectively conducting the daily and weekly meetings. Also project managers find it hard
to properly go through more than 9 reports a day. ISDF teams are self-organized in terms of
assigning tasks and building functionality. The project manager acts as a mediator to balance
workload and solve conflicts.
Tools used in the ISDF methodology include prototyping, code versioning, bug reporting,
progress tracking, graphic design and workflow applications. There are countless tools that can
be used for the above mentioned tasks. Each team should choose tools that they are familiar
with, that suit their budget and comply with their company culture. For instance in the ALPHA
project Prototyper was used for building the prototype, code versioning was performed using
Tortoise SVN, bug reporting and progress tracking was performed using Pivotal Tracker,
graphic design was performed in CorelDraw and workflows were performed using Microsoft
Visio. ISDF is not a methodology that focuses on tools but it definitely tries to exploit them as
much as possible. Using the same tools over and over will allow the project manager to reuse
artefacts from past projects.
Techniques used in the ISDF methodology concern programming, tasks prioritisation and time
management. ISDF relies on pair programming technique to reduce the number of bugs,
increase solution diversity, build collaboration networks and stimulate learning. ISDF uses the
timebox approach for project planning in order to increase focus and avoid missing deadlines.
In the ISDF methodology prioritisation of tasks is accomplished using the MoSCoW technique
in order to ensure early delivery of the most valuable functionality.
Routines enforced by the ISDF methodology consist of daily 30 minute meetings, daily written
reports, weekly one hour meetings for planning or adjusting the current iteration. Every
morning team members meet together with the project manager and share progress on their
work. A special emphasises on these meetings is to identify and eliminate factors that inhibit
progress on tasks. Daily written reports are sent by the team members to the project manager
at the end of each working day. Reports contain details on the tasks performed that particular
day and also allow the team members to transmit more sensitive information to the project
manager; information that they are not comfortable sharing with the rest of the team in the daily
meetings. Weekly meetings are for planning or evaluating the overall progress of the iteration.
Each iteration begins with a weekly meeting where tasks are assigned to team members. Task
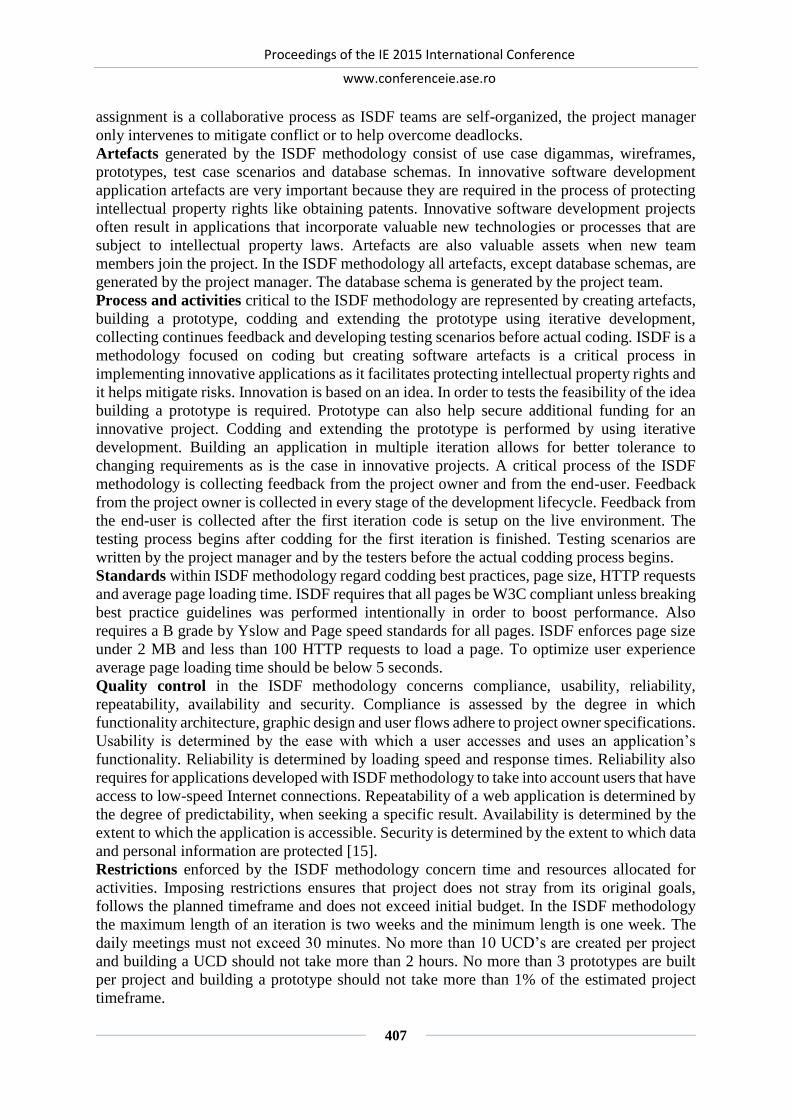
Proceedings of the IE 2015 International Conference
www.conferenceie.ase.ro
407
assignment is a collaborative process as ISDF teams are self-organized, the project manager
only intervenes to mitigate conflict or to help overcome deadlocks.
Artefacts generated by the ISDF methodology consist of use case digammas, wireframes,
prototypes, test case scenarios and database schemas. In innovative software development
application artefacts are very important because they are required in the process of protecting
intellectual property rights like obtaining patents. Innovative software development projects
often result in applications that incorporate valuable new technologies or processes that are
subject to intellectual property laws. Artefacts are also valuable assets when new team
members join the project. In the ISDF methodology all artefacts, except database schemas, are
generated by the project manager. The database schema is generated by the project team.
Process and activities critical to the ISDF methodology are represented by creating artefacts,
building a prototype, codding and extending the prototype using iterative development,
collecting continues feedback and developing testing scenarios before actual coding. ISDF is a
methodology focused on coding but creating software artefacts is a critical process in
implementing innovative applications as it facilitates protecting intellectual property rights and
it helps mitigate risks. Innovation is based on an idea. In order to tests the feasibility of the idea
building a prototype is required. Prototype can also help secure additional funding for an
innovative project. Codding and extending the prototype is performed by using iterative
development. Building an application in multiple iteration allows for better tolerance to
changing requirements as is the case in innovative projects. A critical process of the ISDF
methodology is collecting feedback from the project owner and from the end-user. Feedback
from the project owner is collected in every stage of the development lifecycle. Feedback from
the end-user is collected after the first iteration code is setup on the live environment. The
testing process begins after codding for the first iteration is finished. Testing scenarios are
written by the project manager and by the testers before the actual codding process begins.
Standards within ISDF methodology regard codding best practices, page size, HTTP requests
and average page loading time. ISDF requires that all pages be W3C compliant unless breaking
best practice guidelines was performed intentionally in order to boost performance. Also
requires a B grade by Yslow and Page speed standards for all pages. ISDF enforces page size
under 2 MB and less than 100 HTTP requests to load a page. To optimize user experience
average page loading time should be below 5 seconds.
Quality control in the ISDF methodology concerns compliance, usability, reliability,
repeatability, availability and security. Compliance is assessed by the degree in which
functionality architecture, graphic design and user flows adhere to project owner specifications.
Usability is determined by the ease with which a user accesses and uses an application’s
functionality. Reliability is determined by loading speed and response times. Reliability also
requires for applications developed with ISDF methodology to take into account users that have
access to low-speed Internet connections. Repeatability of a web application is determined by
the degree of predictability, when seeking a specific result. Availability is determined by the
extent to which the application is accessible. Security is determined by the extent to which data
and personal information are protected [15].
Restrictions enforced by the ISDF methodology concern time and resources allocated for
activities. Imposing restrictions ensures that project does not stray from its original goals,
follows the planned timeframe and does not exceed initial budget. In the ISDF methodology
the maximum length of an iteration is two weeks and the minimum length is one week. The
daily meetings must not exceed 30 minutes. No more than 10 UCD’s are created per project
and building a UCD should not take more than 2 hours. No more than 3 prototypes are built
per project and building a prototype should not take more than 1% of the estimated project
timeframe.
Proceedings of the IE 2015 International Conference
www.conferenceie.ase.ro
408
Core principles characterizing the ISDF methodology consist of early delivery of working
software, welcoming change, exploring multiple implementation scenarios and actively
involving project owner into all project stages. ISDF values writing code over writing
specifications. ISDF emphasizes design over documentation. Though planning is not overlook
development is always prioritized. The project owner decides the priority of tasks and deadlines
are non-negotiable.
5. Conclusions Research results presented in the current paper are confined to the web application development
field and were not tested on projects with a timespan larger than 14 months or on project teams
consisting of more than 10 individuals. Innovative software development projects require a
dedicated software development methodology that accounts for frequent change of
specifications, high dynamics of technology and standards, higher than usual risks, proprietary
cost structure and custom testing scenarios. The ISDF methodology was developed empirically
by trial and error in the process of implementing multiple innovative projects. The current
version of the ISDF methodology was refined by reviewing scientific literature and
incorporating valuable elements from the waterfall and agile development models. The
waterfall model provides support for generating software documentation which is valuable in
the case of innovative software development. The agile model provides a process capable of
coping with frequent change of requirements as this is frequently the case in innovative
software development projects. The roles enforced in the ISDF methodology are project owner,
project manager, project team and end-user. The ISDF methodology employs tools for
prototyping, code versioning, bug reporting, progress tracking, graphic design and workflow
applications. The routines proprietary to the ISDF methodology are daily 30 minute meetings,
daily written reports and weekly one hour meetings. The artefacts generated by the ISDF
methodology consist of use case digammas, wireframes, prototypes, test case scenarios and
database schemas. In terms of software development techniques ISDF methodology relies on
pair programming, timebox approach and MoSCoW prioritisation of tasks. The following are
processes and activities proprietary to the ISDF methodology: creating artefacts, building
prototypes, extending prototypes using iterative development, collecting continues feedback
and developing testing scenarios before actual coding. Standards of the ISDF methodology
enforce W3C compliance, Yslow and Page speed B grades, less than 100 HTTP requests to
load a page, page size under 2 MB and page loading time under 5 seconds. Quality control
regards compliance, usability, reliability, repeatability, availability and security. As a future
research topic, ISDF methodology can be scaled in order to accommodate software
development projects that require larger teams.
Acknowledgment
This paper was co-financed from the European Social Fund, through the Sectorial Operational
Programme Human Resources Development 2007-2013, project number
POSDRU/159/1.5/S/138907 "Excellence in scientific interdisciplinary research, doctoral and
postdoctoral, in the economic, social and medical fields -EXCELIS", coordinator The
Bucharest University of Economic Studies.
References
[1] T. DeMarco, “The role of software development methodologies: past, present, and future”,
Proceedings of the 18th international conference on Software engineering, 25-30 Mar.
1996, Berlin, Germany, Publisher: IEEE, ISBN: 0-8186-7246-3, pp. 2-4

Proceedings of the IE 2015 International Conference
www.conferenceie.ase.ro
409
[2] M. R. J. Qureshi, “Agile software development methodology for medium and large
projects”, IET Software, vol.6, no.4, pp.358-363, doi: 10.1049/iet-sen.2011.0110
[3] K. Petersen, C. Wohlin and D. Baca, “The Waterfall Model in Large-Scale Development”,
Proceedings of the 10th International Conference on Product-Focused Software Process
Improvement, 15-17 Jun. 2009, Oulu, Finland, Publisher Springer Berlin Heidelberg, ISBN
978-3-642-02151-0, pp. 386-400
[4] S. H. VanderLeest and A. Buter, “Escape the waterfall: Agile for aerospace”, Proceedings
the 28th Digital Avionics Systems Conference, 23-29 Oct. 2009, Orlando, USA, Publisher:
IEEE, doi: 10.1109/DASC.2009.5347438, pp. 6.D.3-1- 6.D.3-16
[5] T. Dyba and T. Dingsoyr, “What Do We Know about Agile Software Development?”, IEEE
Software, vol.26, no.5, pp. 6-9, doi: 10.1109/MS.2009.145
[6] B. V. Thummadi, O. Shiv and K. Lyytinen, “Enacted Routines in Agile and Waterfall
Processes”, Proceedings of the 2011 Agile Conference, 7-13 Aug., Salt Lake City, USA,
Publisher: IEEE, 2011, doi: 10.1109/AGILE.2011.29 pp. 67-76
[7] P. Trivedi and A. Sharma, “A comparative study between iterative waterfall and
incremental software development life cycle model for optimizing the resources using
computer simulation”, Proceedings of the 2nd International Conference on Information
Management in the Knowledge Economy, 19-20 Dec. 2013, Chandigarh, India, Publisher:
IEEE, pp. 188-194
[8] D. Duka, “Adoption of agile methodology in software development”, Proceedings of the
36th International Convention on Information & Communication Technology Electronics
& Microelectronics, 20-24 May 2013, Opatija, Croatia, Publisher: IEEE, ISBN: 978-953-
233-076-2, pp. 426-430
[9] S. Zhong, C. Liping and C. Tian-en, “Agile planning and development methods”,
Proceedings of the 3rd International Conference on Computer Research and Development,
11-13 Mar. 2011, Shanghai, China, Publisher: IEEE, doi: 10.1109/ICCRD.2011.5764064,
pp. 488-491
[10] J. A. Livermore, “Factors that impact implementing an agile software development
methodology”, Proceedings of the 2007 IEEE SoutheastCon, 22-25 March 2007,
Richmond, USA, Publisher: IEEE, doi: 10.1109/SECON.2007.342860, pp.82-86
[11] T. J. Lehman and A. Sharma, “Software Development as a Service: Agile Experiences”,
Proceedings of the 2011 Annual SRII Global Conference, 29 Mar. - 2 Apr. 2011, San Jose,
USA, Publisher: IEEE, doi: 10.1109/SRII.2011.82, pp. 749-758
[12] A. Cockburn, “Selecting a project's methodology”, IEEE Software, vol.17, no.4, pp. 64-
71, doi: 10.1109/52.854070
[13] R. Klopper, S. Gruner and D. G. Kourie, “Assessment of a framework to compare software
development methodologies”, Proceedings of the 2007 Annual Research Conference of the
South African Institute of Computer Scientists and Information Technologists on IT
Research in Developing Countries, Sunshine Coast, 30 Sep. - 03 Oct. 2007, South Africa,
Publisher: IEEE, doi: 10.1145/1292491.1292498, pp. 56-65
[14] C. M. Christensen, J. Dyer and H. Gregersen, The Innovator's DNA: Mastering the Five
Skills of Disruptive Innovators, Publisher: Harvard Business Review Press, pp. 304, ASIN:
B0054KBLRC
[15] M. Despa, I. Ivan, C. Ciurea, A. Zamfiroiu, C. Sbora, E. Herteliu, “Software testing,
cybernetic process”, Proceedings of the 8th International Conference on Economic
Cybernetic Analysis: Development and Resources, 1-2 Nov. 2013, Bucharest, Romania
ISSN 2247-1820, ISSN-L 2247-1820.

Proceedings of the IE 2015 International Conference
www.conferenceie.ase.ro
410
AGILITY IN THE IT SERVICES SECTOR: A STUDY FOR ROMANIA
Eduard-Nicolae BUDACU
Economic Informatics Doctoral Shool,
Bucharest University of Economic Studies,
Constanta-Nicoleta BODEA Economic Informatics and Cybernetics Department
Bucharest University of Economic Studies,
Centre for Industrial and Services Economics, Romanian Academy
Stelian STANCU Economic Informatics and Cybernetics Department
Bucharest University of Economic Studies,
Centre for Industrial and Services Economics, Romanian Academy
Abstract. The paper presents a study for assessing the agility of the software development
teams working in Romanian IT services sector. The reasons for the adoption of agile practices
and tools are identified and explained. The study started in February 2015 and we can report
the first results. Many companies that have adopted agile practices have aligned their
information infrastructure accordingly, using new tools and giving support to their employees
to attend trainings, certifications and coaching. The companies intend to make further
investments in order to continuously improve the application of the agile methods.
Keywords: Agile, Romanian IT services sector, Software Development, Scrum
JEL classification: L86
1. Introduction
According to the Gartner’ study, cited by Bloomberg [1], in 2014 Romania had over 64,000 IT
specialists, Romania being on the first place in UE in terms of number of employees in the
technology sector per capita and ranks sixth in worldwide. An important characteristic of the
IT sector in Romania is that IT professionals are well educated and relatively cheap. According
to KeysFin’ statistics [2], approximately 70% of the Romanian IT companies were established
in the last 10 years and over 50% of them are still in operation. The financial performance of
the domain has steadily increased, reaching an amount of 2.8 billion euros as average annual
turnover.
IT is a cross-cutting domain, combining several categories of activities. According to NACE
classification, IT domain includes the IT manufacturing and IT services. IT manufacturing is a
small sub-set of high technology manufacturing and so is not considered in detail in our study.
The IT services sector (NACE code K72 “Computer and related activities”) includes the
following activities [3]: hardware and software consultancy and supply, publishing of software
and other software consultancy and supply, data processing, database activities and
maintenance. Software development is the main part of the IT services sector. According to
KeysFin’ statistics [2], over a third of IT firms (35%) are involved in software development,
three times more than in the segment "Other IT services" and two times more than in segment
"Maintenance and Repair". Almost half of the turnover of IT sector (48%) is made by software
development and profit exceeds annually 260 million. On the opposite side, the "Maintenance

Proceedings of the IE 2015 International Conference
www.conferenceie.ase.ro
411
and Repair" produces a profit of 11 times lower. Due to the difficulties in implementing the IT
projects, for many years the paradigm of software development “chronic crisis” is accepted.
Agile approaches were introduced as a solution for this crisis. Many surveys are performed
every year in order to identify the trends in agile adoption. This paper presents some of these
surveys, with the main results achieved during the last years. A similar survey was performed
for Romania and the paper presents the first results obtained based on the data collected until
now.
The paper is structured as follows: after the introductory part (section 1), section 2 presents the
main characteristics of the agile methods and of the agile adoption, as it is known at
international level through different surveys. Section 3 describes the design of our survey,
especially the data collection methods. Section 4 reveals the preliminary results and discussions
of our research. Conclusions are drawn in section 5.
2. Agile approaches adoption in IT services sector
2.1. What does it take to become Agile?
Agile methods are characterized with flexibility, reliance on tacit knowledge, and face to face
communication in contrast to traditional methods that rely on explicit knowledge sharing
mechanism, extensive documentation, and formal means of communication [4]. From the
Software Engineering perspective, the phases of the software development life cycle remain
the same. Requirements gathering and analysis, design, implementation or coding, testing,
deployment and maintenance are present in agile software development. Coding standards,
code review, pair programming and refactoring assure high quality software. Scrum is the most
popular of the agile methods [5]. Scrum is a team-based approach to delivering value to the
business. Team members work together to achieve a shared business goal. The Scrum
framework promotes effective interaction between team members so the team delivers value
to the business. [6] When applied to software development the objective is to deliver value in
the form of software programs or products.
Working software is delivered in a series of short time periods called sprints. Team members
gather for planning in the beginning of the sprint then take daily standup meetings for tracking
progress and identify impediments. The sprint ends with a review sessions to gather feedback
from the users and retrospective meeting for the team to reflect on the process and how to
improve it.
The roles, responsibilities and mindset of an agile team member are different from the ones in
a traditional management approach. The Project Managers shifts from a command-and-control
behavior to one of support and servant leadership. The Scrum Master is responsible for helping
the rest of the team progress, keeping them productive and teaching the Scrum process [6]. The
customer/stakeholder works hand in hand with the development team. Trough the voice of the
Product Owner the product vision and business goals is presented. Team members become less
specialized. The term “generalizing specialist” proposed by Scott Ambler describes agile team
members as “craftspeople, multi-disciplinary developers, cross-functional developers, deep
generalists, polymaths, versatility, or even "renaissance developers"” [7].
Comprehensive documentation is replaced with short, simple description of functionality
written from the user perspective called User Stories [8]. Instead of covering all the details a
user story invites for discussion and negotiation between team members. The objective is to
deliver working software while writing just enough documentation. Selecting the right tools to
support the teams will increase their agility. In order to ship software frequently teams need
continuous integration, automated build and release management tools. When working with
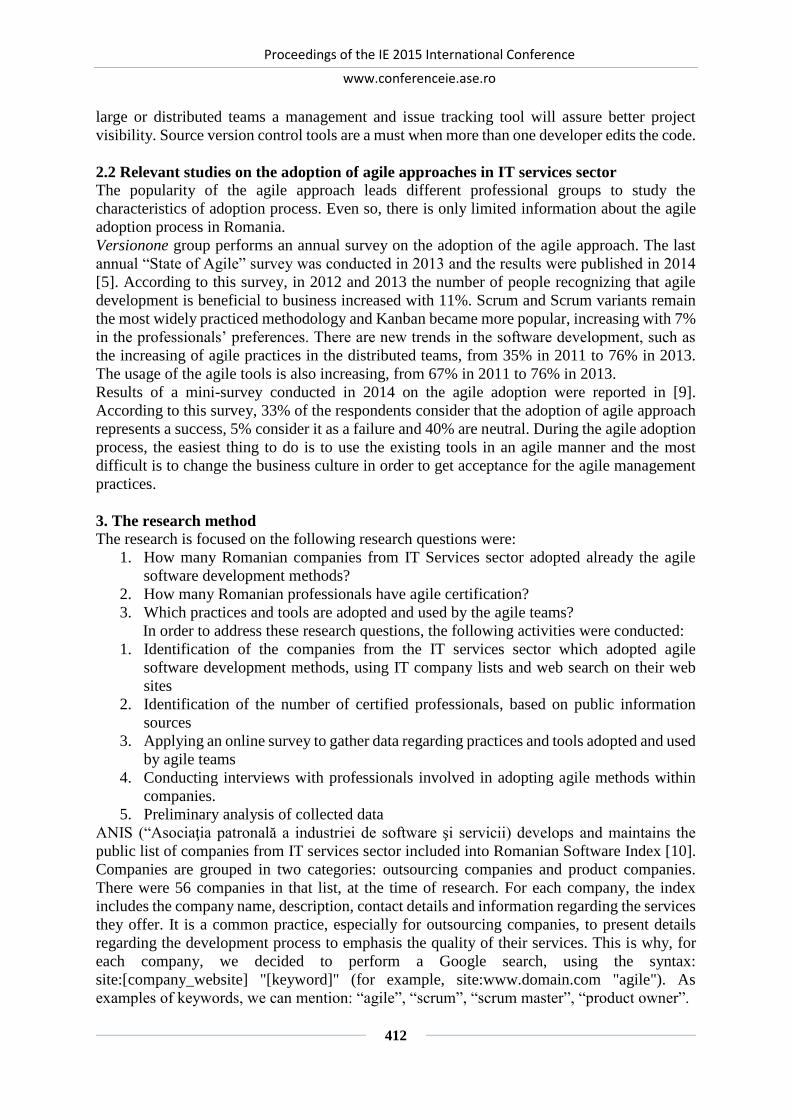
Proceedings of the IE 2015 International Conference
www.conferenceie.ase.ro
412
large or distributed teams a management and issue tracking tool will assure better project
visibility. Source version control tools are a must when more than one developer edits the code.
2.2 Relevant studies on the adoption of agile approaches in IT services sector
The popularity of the agile approach leads different professional groups to study the
characteristics of adoption process. Even so, there is only limited information about the agile
adoption process in Romania.
Versionone group performs an annual survey on the adoption of the agile approach. The last
annual “State of Agile” survey was conducted in 2013 and the results were published in 2014
[5]. According to this survey, in 2012 and 2013 the number of people recognizing that agile
development is beneficial to business increased with 11%. Scrum and Scrum variants remain
the most widely practiced methodology and Kanban became more popular, increasing with 7%
in the professionals’ preferences. There are new trends in the software development, such as
the increasing of agile practices in the distributed teams, from 35% in 2011 to 76% in 2013.
The usage of the agile tools is also increasing, from 67% in 2011 to 76% in 2013.
Results of a mini-survey conducted in 2014 on the agile adoption were reported in [9].
According to this survey, 33% of the respondents consider that the adoption of agile approach
represents a success, 5% consider it as a failure and 40% are neutral. During the agile adoption
process, the easiest thing to do is to use the existing tools in an agile manner and the most
difficult is to change the business culture in order to get acceptance for the agile management
practices.
3. The research method
The research is focused on the following research questions were:
1. How many Romanian companies from IT Services sector adopted already the agile
software development methods?
2. How many Romanian professionals have agile certification?
3. Which practices and tools are adopted and used by the agile teams?
In order to address these research questions, the following activities were conducted:
1. Identification of the companies from the IT services sector which adopted agile
software development methods, using IT company lists and web search on their web
sites
2. Identification of the number of certified professionals, based on public information
sources
3. Applying an online survey to gather data regarding practices and tools adopted and used
by agile teams
4. Conducting interviews with professionals involved in adopting agile methods within
companies.
5. Preliminary analysis of collected data
ANIS (“Asociaţia patronală a industriei de software şi servicii) develops and maintains the
public list of companies from IT services sector included into Romanian Software Index [10].
Companies are grouped in two categories: outsourcing companies and product companies.
There were 56 companies in that list, at the time of research. For each company, the index
includes the company name, description, contact details and information regarding the services
they offer. It is a common practice, especially for outsourcing companies, to present details
regarding the development process to emphasis the quality of their services. This is why, for
each company, we decided to perform a Google search, using the syntax:
site:[company_website] "[keyword]" (for example, site:www.domain.com "agile"). As
examples of keywords, we can mention: “agile”, “scrum”, “scrum master”, “product owner”.

Proceedings of the IE 2015 International Conference
www.conferenceie.ase.ro
413
The search returned a list of web pages within the company’s website where the exact match
of the keyword was found. The results were aggregated in a table containing the name of the
company, website, contact information and number of results indexed by the search engine. 29
companies out of 56 were identified as having at least one reference to the search terms.
The degree of interest in getting agile certifications is then analyzed. We consider the number
of certified professionals being a reliable indicator of individuals’ commitment to apply the
agile methods for a relevant period of time. The agile certification and training programmes
are conducted by ScrumAlliance, APMGInternational, Project Management Institute and
ISTQB. A web scrapping tool was used to collect information regarding the Romanian certified
professionals listed in the ScrumAlliance directory [11]. The results are presented in Table 1.
There are 210 members in the directory and some of them hold multiple certifications. The
most popular certificate is "Certified ScrumMaster® (CSM)", considering that 184
professional members are holding this type of certificate.
Table 1. Scrum Alliance certificates by town
Town No of certified
professionals
Brasov,Romania 1
Bucharest, Romania 77
Cluj-Napoca, Romania 76
Iasi, Romania 13
Oradea, Romania 1
Sibiu, Romania 1
Timisoara, Romania 21
N/A 20
Agile practitioners gather to share their experience in professional meetings. There are 9 groups
with more than 2500 members hosted on the www.meetup.com that share the topic of Agile
Software Development. The biggest group is “The Bucharest Agile Software Meetup Group”
with more than 800 members. Between 40 and 50 members gather monthly in a meeting called
Agile Talks.
These three groups (IT companies, agile certified professionals and online groups of
practitioners) were targeted for an online survey that aimed to identify the methods and
practices used by the Romanian IT companies.
The survey consists in 19 questions that provided one or multiple choices to pick from. It targets
software development team members, technical managers, project managers, CTOs or any
company member that has an overview on the development process. The questions were
adapted from similar surveys applied by [5] and [9]. Between February 15th and February 22nd
the survey was distributed via LinkedIN messages toward certified professionals, emails to
software companies and posted on the agile meet up groups. A preliminary analysis was
conducted on the 97 answers.
Four interviews were conducted with professionals that contributed to the agile methods
implementation within the company they work for. The interviews were semi structured, took
between 45-60 minutes and were hold on Skype. The participants were asked to describe the
reasons for adopting agile, how development teams get organized, phases they went through
while adopting agile, practices and tools used and future plans for development.

Proceedings of the IE 2015 International Conference
www.conferenceie.ase.ro
414
4. The main results
The majority of the respondents have reported that their company has less than 5 years of
experience with Agile practices (see table 2).
Table 2. How many years has your organization been applying agile?
Time interval No. of respondents
Less than 3 years 32
Between 3 and 5 years 32
Between 5 and 10 years 20
More than 10 years 4
Don't know 9
Scrum is by far the most popular agile methods, followed by Kanban and Extreme
Programming (XP). Most of respondents picked more than one method. It was confirmed
during the interviews, that it is common to combine practices in a custom method that best fits
the company needs. Figure 1 presents the most popular agile methods applied by Romanian
companies.
Figure 1. Agile methods
The Scrum popularity is the most popular practice. Team meeting are used by the majority of
the respondents: Planning (87%), Daily standup (87%), Retrospective (81%), Review (74%).
Software requirements are defined in a Product Backlog (84%) and detailed in the Sprint
Backlog (78%). User story are used by 81% of the respondents to define requirements and
enhanced with Definition of Done (71%) and Acceptance Criteria (62%). Practices for tracking
progress like Burn down charts (57%) and Velocity tracking (54%) are less popular but still
widely used. There’s a slightly lower usage of agile software development practices when
compared with management practices. This was confirmed by the participants in the interviews
that more focus was on getting the teams organized by the agile methods in order to be more
flexible on requirement changes and deliver more frequently.
The most common tools used by agile teams (table 3) are Bug trackers (73%), Agile project
management tool (66%), Automated build tool (66%), Taskboards (61%), Wikis (56%).
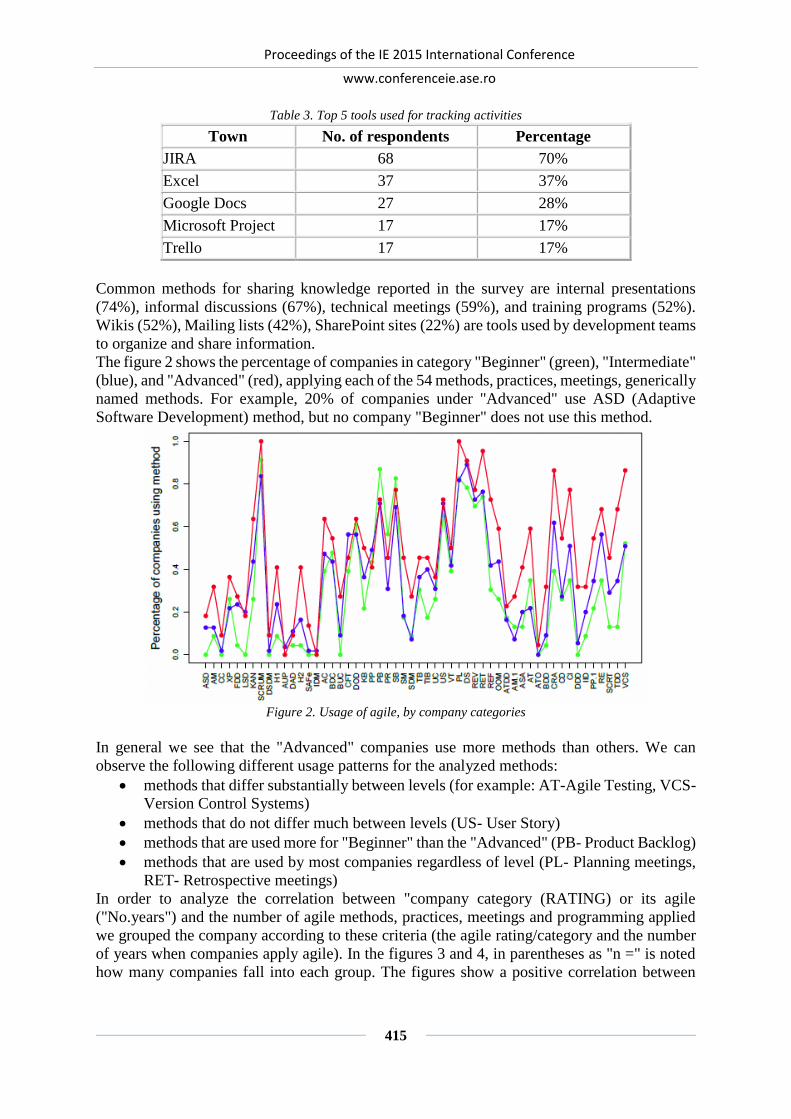
Proceedings of the IE 2015 International Conference
www.conferenceie.ase.ro
415
Table 3. Top 5 tools used for tracking activities
Town No. of respondents Percentage
JIRA 68 70%
Excel 37 37%
Google Docs 27 28%
Microsoft Project 17 17%
Trello 17 17%
Common methods for sharing knowledge reported in the survey are internal presentations
(74%), informal discussions (67%), technical meetings (59%), and training programs (52%).
Wikis (52%), Mailing lists (42%), SharePoint sites (22%) are tools used by development teams
to organize and share information.
The figure 2 shows the percentage of companies in category "Beginner" (green), "Intermediate"
(blue), and "Advanced" (red), applying each of the 54 methods, practices, meetings, generically
named methods. For example, 20% of companies under "Advanced" use ASD (Adaptive
Software Development) method, but no company "Beginner" does not use this method.
Figure 2. Usage of agile, by company categories
In general we see that the "Advanced" companies use more methods than others. We can
observe the following different usage patterns for the analyzed methods:
methods that differ substantially between levels (for example: AT-Agile Testing, VCS-
Version Control Systems)
methods that do not differ much between levels (US- User Story)
methods that are used more for "Beginner" than the "Advanced" (PB- Product Backlog)
methods that are used by most companies regardless of level (PL- Planning meetings,
RET- Retrospective meetings)
In order to analyze the correlation between "company category (RATING) or its agile
("No.years") and the number of agile methods, practices, meetings and programming applied
we grouped the company according to these criteria (the agile rating/category and the number
of years when companies apply agile). In the figures 3 and 4, in parentheses as "n =" is noted
how many companies fall into each group. The figures show a positive correlation between
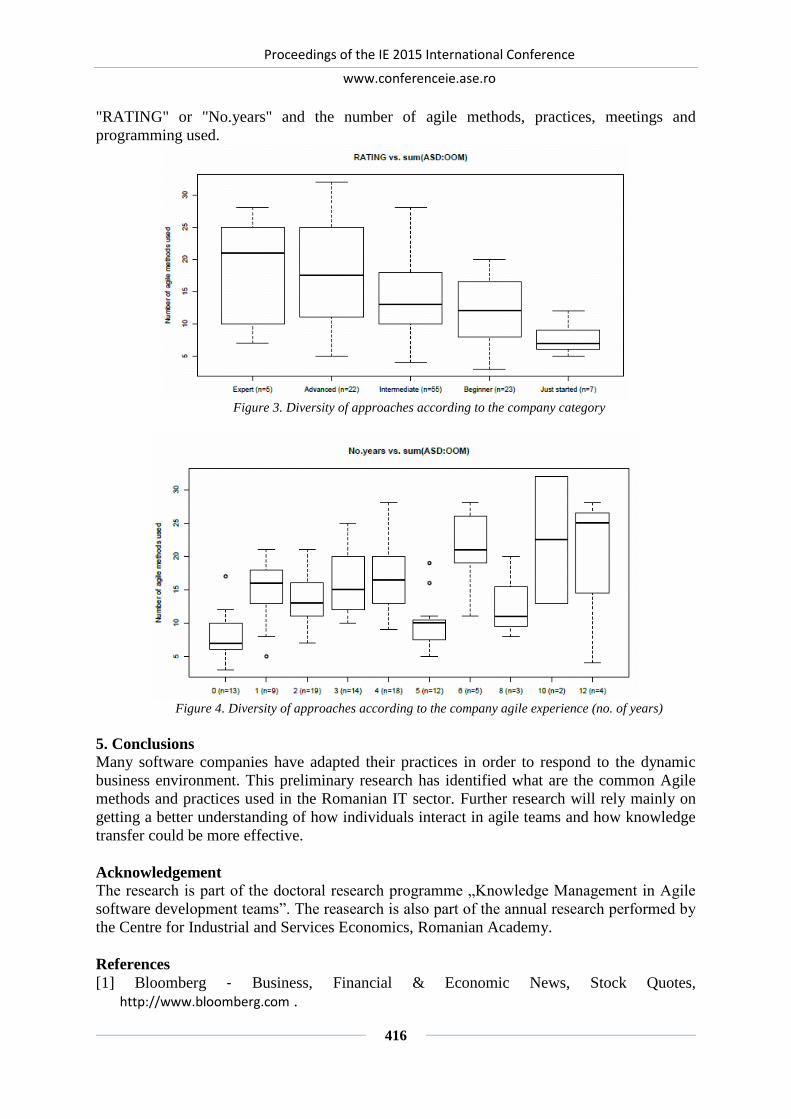
Proceedings of the IE 2015 International Conference
www.conferenceie.ase.ro
416
"RATING" or "No.years" and the number of agile methods, practices, meetings and
programming used.
Figure 3. Diversity of approaches according to the company category
Figure 4. Diversity of approaches according to the company agile experience (no. of years)
5. Conclusions
Many software companies have adapted their practices in order to respond to the dynamic
business environment. This preliminary research has identified what are the common Agile
methods and practices used in the Romanian IT sector. Further research will rely mainly on
getting a better understanding of how individuals interact in agile teams and how knowledge
transfer could be more effective.
Acknowledgement
The research is part of the doctoral research programme „Knowledge Management in Agile
software development teams”. The reasearch is also part of the annual research performed by
the Centre for Industrial and Services Economics, Romanian Academy.
References
[1] Bloomberg ‐ Business, Financial & Economic News, Stock Quotes,
http://www.bloomberg.com .

Proceedings of the IE 2015 International Conference
www.conferenceie.ase.ro
417
[2] KeysFin, ”Analiza din seria Companii la Raport: IT‐ul, sectorul care ne poate scoate din
criză!”, 8 mai 2014, http://www.keysfin.com/#!/Pages/IT_domeniul_momentului
[3] Classification of economic activities NACE rev.1.1, http://ec.europa.eu/environment/emas/pdf/general/nacecodes_en.pdf
[4] Z. Alzoabi (2012), Knowledge Management in Agile Methods Context: What Type of
Knowledge Is Used by Agilests?, In A. Rahman El Sheikh, & M. Alnoukari (Eds.) Business
Intelligence and Agile Methodologies for Knowledge-Based Organizations: Cross-
Disciplinary Applications (pp. 35-71)
[5] Versionone – The 8th Annual State of Agile Survey, Versionone, nc, 2014, available at
www.stateofagile.com
[6] Scrum Alliance Core Scrum v2014.08.15, Internet: https://www.scrumalliance.org/why-scrum/core-scrum-values-roles
[7] S. Ambler, Generalizing Specialists: Improving Your IT Career Skills, available at:
http://www.agilemodeling.com/essays/generalizingSpecialists.htm
[8] M. Cohn, User Stories, Internet: http://www.mountaingoatsoftware.com/agile/user-stories
[9] Scott W. Ambler & Associates, 2014 Agile Adoption Survey, available at: www.ambysoft.com/surveys/
[10] ANIS (Asociaţia patronală a industriei de software şi servicii), Romanian Software Index http://www.softwareindex.ro/
[11] ScrumAlliance Members directory https://www.scrumalliance.org/community/member-directory

Proceedings of the IE 2015 International Conference
www.conferenceie.ase.ro
418
IMPROVEMENT OPPORTUNITIES BY USING REMOTE AUDIT IN
THE MARITIME TRANSPORT
Costel STANCA
Constanta Maritime University [email protected]
Viorela-Georgiana STȊNGĂ Constanta Maritime University
Gabriel RAICU Constanta Maritime University
Ramona TROMIADIS Constanta Maritime University [email protected]
Abstract. The specific of maritime transport involves a large number of audits and inspections
performed on board ships. At present there is no important shipowner running a shipping
company without having an integrated management system including quality, environment,
occupational health, etc. The international maritime conventions impose other
internal/external audits regarding safety management and ship security. The need to increase
efficiency led to a high level of optimization of time spent by ships in ports and the time
available for audits significantly decreased. To be in line with actual IT&C developments the
last edition of the standard establishing guidelines for auditing management systems ISO
19011, adopted in 2011, introduced the concept of remote audit. This paper presents the
results of research regarding the opportunities to use the remote audit for the maritime ships
increasing the possibilities to harmonize the audit program with the ships port calls and to
decrease the supplementary costs involved by auditors’ traveling and accommodation.
Keywords: remote audit, ship, maritime transport
JEL classification: Auditing
1. Introduction According to actual practices on board ships are performed without exceptions three types of
audits and inspections. The most known audits are related to safety and ship security
management based on the codes included into International SOLAS Convention requirements
[1]. All these audits performed by authorities’ representatives or recognized organizations’
auditors must be preceded by intern audits on the related fields.
Another audit type often integrated to the previous presented is involved by the maritime
transport companies voluntary decision to apply management systems based on international
standards such as ISO 9001, ISO 14001, OHSAS 18001 or other.
The third type is given by Flag State Control, Port State Control, classification societies, vetting
and other similar audits and inspections.
The audits on board ship are normally performed during ships are under loading / unloading
operations in ports. Is obvious that the total number of audit days including internal and
external audits is high and the trend is to decrease the time spent by ships in ports due to
introducing of new port operation technologies and optimization of trade routes.
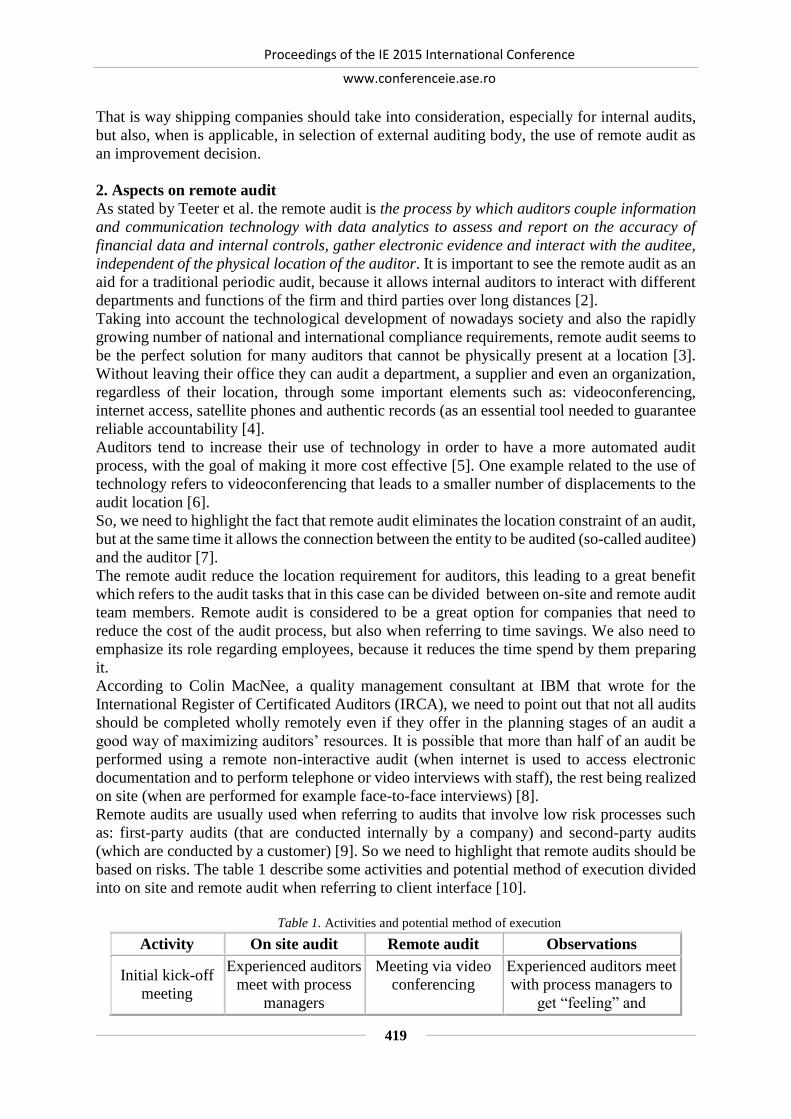
Proceedings of the IE 2015 International Conference
www.conferenceie.ase.ro
419
That is way shipping companies should take into consideration, especially for internal audits,
but also, when is applicable, in selection of external auditing body, the use of remote audit as
an improvement decision.
2. Aspects on remote audit
As stated by Teeter et al. the remote audit is the process by which auditors couple information
and communication technology with data analytics to assess and report on the accuracy of
financial data and internal controls, gather electronic evidence and interact with the auditee,
independent of the physical location of the auditor. It is important to see the remote audit as an
aid for a traditional periodic audit, because it allows internal auditors to interact with different
departments and functions of the firm and third parties over long distances [2].
Taking into account the technological development of nowadays society and also the rapidly
growing number of national and international compliance requirements, remote audit seems to
be the perfect solution for many auditors that cannot be physically present at a location [3].
Without leaving their office they can audit a department, a supplier and even an organization,
regardless of their location, through some important elements such as: videoconferencing,
internet access, satellite phones and authentic records (as an essential tool needed to guarantee
reliable accountability [4].
Auditors tend to increase their use of technology in order to have a more automated audit
process, with the goal of making it more cost effective [5]. One example related to the use of
technology refers to videoconferencing that leads to a smaller number of displacements to the
audit location [6].
So, we need to highlight the fact that remote audit eliminates the location constraint of an audit,
but at the same time it allows the connection between the entity to be audited (so-called auditee)
and the auditor [7].
The remote audit reduce the location requirement for auditors, this leading to a great benefit
which refers to the audit tasks that in this case can be divided between on-site and remote audit
team members. Remote audit is considered to be a great option for companies that need to
reduce the cost of the audit process, but also when referring to time savings. We also need to
emphasize its role regarding employees, because it reduces the time spend by them preparing
it.
According to Colin MacNee, a quality management consultant at IBM that wrote for the
International Register of Certificated Auditors (IRCA), we need to point out that not all audits
should be completed wholly remotely even if they offer in the planning stages of an audit a
good way of maximizing auditors’ resources. It is possible that more than half of an audit be
performed using a remote non-interactive audit (when internet is used to access electronic
documentation and to perform telephone or video interviews with staff), the rest being realized
on site (when are performed for example face-to-face interviews) [8].
Remote audits are usually used when referring to audits that involve low risk processes such
as: first-party audits (that are conducted internally by a company) and second-party audits
(which are conducted by a customer) [9]. So we need to highlight that remote audits should be
based on risks. The table 1 describe some activities and potential method of execution divided
into on site and remote audit when referring to client interface [10].
Table 1. Activities and potential method of execution
Activity On site audit Remote audit Observations
Initial kick-off
meeting
Experienced auditors
meet with process
managers
Meeting via video
conferencing
Experienced auditors meet
with process managers to
get “feeling” and

Proceedings of the IE 2015 International Conference
www.conferenceie.ase.ro
420
understanding of audit in
person
Interviews
Auditor meets with
specific parties in
person
Meeting conducted
by phone, or video
conferencing
Lack of visual
communication removes
bias, non-verbal feedback
Process mapping
Auditor reviews
documentation, tours
facility
Auditor evaluates
flowcharts, verifies
data flow in
Enterprise resource
planning (ERP)
system
Depending on application,
both are essential
Knowledge
engineering
Offline
documentation
reviewed and
updated
Online
documentation
reviewed and
updated
Offline documentation
would be digitized and
kept in an Electronic
Document Management
System (EDMS)
Source: R. A. Teeter and M.A. Vasarhelyi, “Remote Audit: A Review of Audit-Enhancing
Information and Communication Technology Literature”,
http://raw.rutgers.edu/remote%20audit.pdf [Feb. 20, 2015]
Some of the certification bodies introduced own requirements in regards to remote audits, after
the concept was include into ISO 19011 standard, but at present the third party audits are using
this type of audit very rarely, for multisite audit and especially when information or documents
are not available, or the on-site audit is no providing proper conditions to perform the review
of documents or other data.
3. Remote audit on board ships
For the purpose of the research of remote audits efficiency we selected three categories of ships
known to be among those having a reduced time for loading / unloading operations: container
ships, tanker ships and bulk carriers.
For example, a study performed on a number of 647 ships (out of which 127 were for petroleum
products and 33 liquid bulk ships) revealed an average of 35 hours port turnaround average
time for petroleum products ships and 58 hours for other liquid bulk carriers [11].
On the other hand in order to assure an effective internal audit, at least one day is necessary to
cover the requirements of the management system (if is based on a standard only, when more
standards are applicable the time should be increased).
The analysis we performed included the interview of 21 shipmasters (7 ships of each selected
category).
The results shown that in 38% of cases the remote audit was used in the last year for internal
or second-party audits, covering especially online documentation review. The average time
reduced per ship per year was 33% (about one audit day).
The characteristics of maritime transport, which offers a short average time of ships
availability, but a high level of similarities with other “sister ships” make this filed one of the
most recommended for remote audit.
The fact that sometimes the ships owned by the maritime transport company are far from
headquarters location is another reason to use remote audit for ships.

Proceedings of the IE 2015 International Conference
www.conferenceie.ase.ro
421
Solutions adopted for second-party audit include the use a local specialized company to
perform the audit, but this option is no advisable for internal audit, involving a less level of
acquiring the company policies and to find improvement opportunities.
The critical issue for remote audit remains the ability of auditor to correlate the online reviewed
documents and data with on-site audit actions and to realize an effective cross-checking in
order to assure a good coverage of objective evidences related to management system
requirements.
4. Conclusions
Even if the remote audit is still under analysis for third party auditing bodies, for the internal
and second-party audits it is expected to be introduced on a large scale for maritime ships,
reducing considerably the audit time and the related costs. Another important reason leading
to cover partly the audit by remote actions is to reduce the disturbance of onboard activities for
ships having a short turnaround time in ports. The actual developments of IT&C tools will
constitute a catalyst for such decisions.
References
[1] International Convention for the Safety of Life at Sea, 1974, as amended, International
Maritime Organization, 2014
[2] R.A. Teeter, “Essays on the enhanced audit”, Dissertation submitted to the Graduate
School-Newark Rutgers, The State University of New Jersey, May 2014
[3] A. Carlin and F. Gallegos,” IT audit: a critical business process”, IEEE Computer 40 (7),
2007, pp. 87–89.
[4] G. Müller, R. Accorsi, S. Höhn and S. Sackmann, “Sichere Nutzungskontrolle für mehr
Transparenz in Finanzmärkten”, Informatik Spektrum 33 (1), 2010, pp. 3–13.
[5] M. G. Alles, A. Kogan and M. A. Vasarhelyi, “Putting Continuous Auditing Theory into
Practice: Lessons from Two Pilot Implementations”, Journal of Information Systems,
22(2), 2008, pp. 195–214.
[6] M. G. Alles, A. Kogan and M. A. Vasarhelyi, “Principles and problems of audit automation
as a precursor to continuous auditing”, Working paper, Rutgers Accounting Research
Center, Rutgers Business School, 2010.
[7] R. Accorsi, ”A secure log architecture to support remote auditing”, Mathematical and
Computer Modelling 57, 2013, pp. 1578–1591.
[8] Colin MacNee , “What is remote auditing?”, The International Register of Certificated
Auditors, http://www.irca.org/en-gb/resources/INform/archive/issue26/Features/remote-
auditing/ [Feb. 20, 2015]
[9] D.Ade, “Remote Audit: Out of Sight but Not Out of Mind”, in Quasar, July 2012, British
Association of Research Quality Assurance, http://www.mastercontrol.com/audit-
management/remote-audit-out-of-sight-not-out-of-mind.html, [Feb., 25, 2015]
[10] R. A. Teeter and M.A. Vasarhelyi, “Remote Audit: A Review of Audit-Enhancing
Information and Communication Technology Literature”,
http://raw.rutgers.edu/remote%20audit.pdf [Feb. 20, 2015]
[11] E. Kahveci, “Fast turnaround ships and their impact on crews”, Seafarers International
Research Centre, 1998,
http://www.sirc.cf.ac.uk/uploads/publications/Fast%20Turnaround%20Ships.pdf [Feb. 25,
2015]
Proceedings of the IE 2015 International Conference
www.conferenceie.ase.ro
422
AUDIT REPORTS VALIDATION BASED ON ONTOLOGIES
Ion IVAN
University of Economic Studies, Bucharest
Claudiu BRANDAS
West University of Timisoara, Faculty of Economics and Business Administration, Timisoara
Alin ZAMFIROIU
University of Economic Studies, Bucharest
National Institute for Research and Development in Informatics Bucharest
Abstract. Preparing the audit reports is a perfect algorithm-based activity characterized by
generality, determinism, reproducibility, accuracy and a well-established. Audit teams apply
metrics and qualitative analysis carried out reports in the form of structured text from a
template based on different standards. Finally, the report concludes the acceptance or
rejection of the hypothesis formulated objective of the audit work. Audit report is subject to a
validation process through several steps including: Crossing databases; calculation of
indicators; mapping quality levels; Euclidean distance calculation qualitative; drawing
conclusions; comparing the calculated levels; calculating the aggregate indicator; getting
final solution. The auditors obtain effective levels. Through ontologies obtain the audit
calculated level. Because the audit report are qualitative structure of information and
knowledge it is very hard to analyze and interpret by different groups of users (shareholders,
managers or stakeholders). Developing ontology for audit reports validation will be a useful
instrument for both auditors and report users. In this paper we propose an instrument for
validation of audit reports contain a lot of keywords that calculates indicators, a lot of
indicators for each key word there is an indicator, qualitative levels; interpreter who builds a
table of indicators, levels of actual and calculated levels.
Keywords: Audit, Reports, Ontology, Validation, Governance
JEL classification: M42, C52
1. Structures for the audit reports In [1], [2] audit is defined as activity that corrections are made on the way to include techniques,
methods and models for analysis and control of information products.
An audit process is an assurance service regarding to organizational process, risks and control
environment and financial statements accuracy based on auditing methodology.
Auditing processes have well defined task duration in time and tasks set for the team members
are characterized by inputs and outputs described in procedures consistent, coherent and
effective.
According to ISACA Standards [3] the audit report should contain: scope, objectives, period
of coverage and the nature, findings, conclusions and recommendations, timing and extent of
the audit work performed.
From our point of view an audit report is a qualitative structure of information and knowledge
as a results of an audit process. In most of cases audit reports contains: auditor, audited entity,

Proceedings of the IE 2015 International Conference
www.conferenceie.ase.ro
423
scope (or limitations of scope), reference to auditing standards, period, findings, conclusions,
opinion and recommendations.
Consider a real-world entity E to be undertaken by a team using the resources they appear
financially restrictions. Entity E is a product, activity, process or a technology.
It develops a project based on the objective that aims to achieve the entity's project containing:
description of the entity to be performed; deadlines falling in the process of implementation;
resources; risks; controls; activities; inputs; outputs; expenditure budget; implementation team
and sharing tasks on each member.
The audit is a complex activity which is meant to establish the level of concordance between
what is written in the draft with what happened in reality to obtain concrete form of the entity
E. If there are computer applications programming specifications that define a virtual entity as
E. When performing software have seen the extent to which it matches the description in the
specification and implementation process concrete form to the entity E – computer application,
was the same specifications defined.
There is concern at the organization level to conduct and produce products and services at a
defined quality level, so the market to satisfy demand / supply ratio, which means the
liquidation realization of finished goods respectively maximum use of specific lines provide
services.
The audit process is one of the most important process of Corporate Governance. A good
corporate governance means the coordination, collaboration, communication between all
entities involved like shareholders, board of directors, managers, stakeholders and auditors
(internal and external) for divergent objectives so [4],[5]:
transparency;
accountability;
minimizing risks;
performance;
Also for a good corporate governance board of directors, management and auditors must focus
on the following objectives:
not work on stock;
persons performing services respecting procedures have no goals in production;
the quality was not affected in any way and is unconditionally the procedures using
materials exactly as specified; each person is so trained that makes self of what worked and
responsible to control by those who provide quality management;
framing costs in limits that do not affect profit organization;
the deadlines in managing contracts and using additional delays that allow recovery delays.
Assess the returns good governance audit to the initial documentation that contains technical
data, procedures, specific consumption and the parallel implementation of information
describing the way in which processes within the organization in all managerial aspects of
individuals activities, of consumption, recipes of production, operating machinery, the use of
raw materials and materials, finished goods stocks management.
Audit good governance finally materialized through a variety of reports. In order to improve
the transparency, monitoring and multidimensional analysis of corporate governance, these
reports can be represented using XBRL [6], [7].

Proceedings of the IE 2015 International Conference
www.conferenceie.ase.ro
424
2. Validation processes in auditing
Validation in auditing is the auditing audit but is a process which shows that audit steps are
well constructed, audit objectives are well defined, as team members auditing tasks are
distributed and balanced specific flows audit is complete.
It is considered an auditing process defined by:
specialists team structure: nsSSS ,...,, 21 ;
set procedures on which the audit is performed activities nppppP ,...,, 21 ;
people team performed set activities naaaaA ,...,, 21 .
It is considered a lot of organizations norgorgorgorgORG ,...,, 21 for which good
governance is analyzed using validation processes defined above;
In the event that there is a final audit report in which the activity is acceptable or good
governance audit team found that is not acceptable, it is build the Table 1.
Table 1. Raport of audit for organizations
Organization The result of the
audit
Long term real results
of the organization
The result
validation
1org 1rez
1rr 1
2org 2rez
2rr 2
… … … …
norgorg norgrez norgrr norg
If 1 iii rezrr
If 0 iii rezrr
It is calculate the IV, index validation by the formula:
norgIV
norg
i
i 1
If IV > 0,92 means that the validation audit process for good governance is very well built.
If IV <0,92 and IV>0,78 means that the validation process for the proper auditing process is
well good governance built.
Otherwise the validation process of auditing for good governance is itself invalid.
irr
accepted, if the real results concludes that is good governance
unacceptable, if the real results concludes that is bad governance
irez
accepted, if the audit report concludes that is good governance
unacceptable, if the report concludes that is bad governance

Proceedings of the IE 2015 International Conference
www.conferenceie.ase.ro
425
3. Orientation on ontology of the audit
Auditing processes have a specific vocabulary describing the steps, activities, inputs, outputs,
resources, people, functions, products, processes and qualifications to assess how the audited
organization has evolved in the context of corporate governing.
The auditors are available database containing descriptions of product structures, equipment,
fabrication of recipes, the activities, the way in which workers have developed interactions on
a specified time and reflection at the carrying amounts and all financial flows. Developing an
ontology-oriented approach to the audit process returns to:
levels planned big data available and actual levels;
framing intervals or outside timeframes;
activities, processes, products qualitative aspects analyze;
quantitative results mapping with qualitative levels;
building an ontology-oriented audit metrics.
Process-oriented approach ontologies audit complexity requires taking more steps, which the
most important are:
specific vocabulary building corporate governance;
audit reports structure defining;
search algorithms and extract words from database developing;
differential counting from the analysis between the planned and actual level;
simple indicators calculation;
aggregate indicator calculating;
quantitative and qualitative levels mapping;
conclusion of acceptance or rejection generates.
For validation, analysis and interpretation of audit reports based on ontology we define a class
hierarchy of audit report domain knowledge, Figure 1.
Figure 1. Class hierarchy of audit report domain knowledge developed in Protégé [8].

Proceedings of the IE 2015 International Conference
www.conferenceie.ase.ro
426
Accuracy of auditing in corporate governance as a process-oriented ontology requires a long
process of analysis, evaluation and validation and only after that it will be considered as an
acceptable solution has been obtained for the problem defined.
If is wishes to develop problem to consider process refining that involves simplifying
indicators, steps, reporting structures, so without losing the quality of the results to obtain valid
conclusion of the audit.
4. Process validation by ontologies in auditing
Note that solving a problem specific to registration on a level corresponding to each generation
based on a knowledge obtained at a time. It speaks of object-oriented and comprehensive
approach consisted in object-oriented analysis, object-oriented design, object oriented
programming, object oriented databases which means that at this level of knowledge entire
development cycle of systems included techniques, methods and technologies based on object
orientation. Switching to another generation requires that all elements which contribute to the
realization of a system to be based on the latest technologies. In this case we talk about a form
of corporate governance process oriented auditing approach is complete if ontologies but
everything about the audit is based on ontologies, including validation.
Process validation is very specifically in many areas of computer science applied to the data
validation, diagrams validation, source texts validation processing validation to the most
complex components included in software engineering. A valid means to conclude that an
entity meets all the conditions subject to actual use in a specific context.
Auditing methods for improvement of corporate governance is based on a clear set of
procedures designed that ultimately leads to a series of texts that form the final report by
concatenation. The analysis of these texts constitute a linear list that works on the principle of
seriality through a process of analysis equivalent to a continuous crossing leads to the
conclusion that corporate governance was held on acceptable terms, and conditions fragmented
crossing conclusion is contrary.
Build a validation process oriented ontology for auditing processes governing corporate returns
to identify those elements that refer to an organizations collection that have specific audit for
corporate governance oriented ontology.
It builds a small set of indicators that highlight the agreement between the audit result oriented
ontology and the actual behavior of organizations with corporate governance on a time interval
following audit.
Calculation of indicators and their aggregation allows getting a picture on the quality of the
audit process.
Oriented ontology auditing processes analyzing of many organizations and aggregating
information get that level will show that technology audit is rejected.
It is achieved in this way by focusing on ontologies homogenization of the audit process but
also the validation process.
5. Conclusions
Corporate governance systems have a high level of complexity that requires a new approach
when analyzed and subjected to evaluation. The auditing process is an important element for
improving corporate governance and assuring the transparency, accountability in order to
increase performance of organizations.
Corporate governance based organizations are subjects to regular audit process completed,
which also requires a new approach to technology so that all elements of the virtual
environment that reflects the dynamics of the process organization inputs. The only way to
achieve this is oriented approach in a accepted ontologies are defined sets organized in a

Proceedings of the IE 2015 International Conference
www.conferenceie.ase.ro
427
structure abstraction, put in correspondence with elements of real sets and categories and
concepts are related assessment appearances quantitative values in the intervals qualitative
levels. Existing hardware and software resources and access any components thereof are
operating such an approach.
Developing and implementing an ontology-based solution for validating, analyzing and
assessing audit reports create a base for a collaborative decision-making support of auditors
and audit reports users in order to increase the performance of organizations corporate
governance.
Acknowledgement
This work was cofinanced from the European Social Fund through Sectoral Operational
Programme Human Resources Development 2007-2013, project number
POSDRU/159/1.5/S/134197 „Performance and excellence in doctoral and postdoctoral
research in Romanian economics science domain”
References
[1] C. Amancei, "Metrici ale auditului informatic", Teza de doctorat, Bucuresti 2011, 176 pg.
[2] M. Popa, C. Toma and C. Amancei, "Characteristics of the Audit Processes for Distributed
Informatics Systems", Revista Informatica Economica, vol. 13, nr 3, 2009.
[3] ISACA, “IT Standards, Guidelines, and Tools and Techniques for Audit and Assurance and
Control Professionals”, 2010.
[4] C. Brandas, Study on the Support Systems for Corporate Governance, Informatica
Economică vol. 15, no. 4/2011.
[5] K.J. Hopt, "Comparative Corporate Governance: The State of the Art and International
Regulation", working paper no 170/2011, ECGI Working Paper Series of Law, 2011.
[6] C. Brandas, Improving the Decision-Making Process and Transparency of Corporate
Governance Using XBRL, World Academy of Science, Engineering and Technology Vol:6
2012-11-29.
[7] A. Bodaghi, A. Ahmadpour, The Improvement of Governance Decision Making Using
XBRL, 7th International Conference on Enterprise Systems, Accounting and Logistics (7th
ICESAL 2010) 28-29 June 2010, Rhodes Island, Greece.
[8] Protégé, “A free, open-source ontology editor and framework for building intelligent
systems”, Stanford University, 2015.

Proceedings of the IE 2015 International Conference
www.conferenceie.ase.ro
428
APPLICATION OF BUSINESS INTELLIGENCE IN PROJECT
MANAGEMENT
Mihaela I. MUNTEAN
West University of Timisoara, Romania [email protected]
Liviu Gabriel CABᾸU West University of Timisoara, Romania [email protected]
Abstract. The present paper is based on a preprint version published in RePEc database1.
Identifying a constant interest in the approached subject, the initiative of presenting the
working paper at the IE2015 conference was proceeded. The application of Business
Intelligence in project management is adding value to the process. In this terms, project
monitoring is proposed.
Keywords: business intelligence, project management, monitoring, key performance
indicators.
JEL classification: M00, O31, L20
1. Introduction Current business intelligence (BI) approaches are subordinated to performance management
[1], [2], [3], the key performance indicators (KPIs) being an important contributor to the BI
value chain [4], [5]. Successful BI initiatives are possible with the support of technologies,
tools and systems that are capable to sustain the above mentioned value chain. Along the BI
value chain, data is transformed into relevant information and is stored into the data warehouse.
The multidimensional cube, deployed above the data warehouse, together with a set of data
mining techniques will transform the information into valuable knowledge. The KPIs,
technically attached/added to the cube, are further part of the performance management system
[4], [6], [7].
The data warehouse environment concept [8], [9] is equivalent to the introduced BI value chain.
Despite its dominant technological nuance, performance measuring is not neglected. BI
projects are deployed based on a suitable data warehouse schema with respect to the imposed
key performance indicators.
Unaninously, project management (PM) is considered „the process of achieving project
objectives (schedule, budget and performance) through a set of activities that start and end at
certain points in time and produce quantifiable and qualifiable deliverables“ [10].
Methodological approaches to conducting projects have established guidelines for all project
live cycle phases: initiation, planning, execution, monitoring&control, and closing [11], 12.],
[13]. Experts in project management have estimate that PM is 20% planning and 80%
monitoring & control. Monitoring is taken place on schedules, budgets, quality, risks, and
scope [14]. Actual state is compared to baseline; actual performance is compared with the
planned one. Therefore, a minimal set of key performance indicators (KPI) will be introduced
to monitor the project’s progress during its execution.
1 Muntean M., Cabău L.G., Business Intelligence Support for Project Management, http://mpra.ub.uni-
muenchen.de/51905/1/MPRA_paper_51905.pdf

Proceedings of the IE 2015 International Conference
www.conferenceie.ase.ro
429
2. Monitoring Project Execution
In general, the purpose of monitoring can be: to assess project results, to improve project
management, to promote learning, to understand different stakeholder’s perspectives, to ensure
accountability [15]. Based on the introduced project live cycle phases, monitoring is done in
parallel with other processes like planning or execution.
Monitoring implies measuring the progress and performance of the project during its execution
and communicating the status. Project’s performance deviations from the plan are signalized
when:
the team is not working on the correct activities of the project plan;
the team is not on-schedule with the project objectives;
the team is not on-budget with the project resources;
the quality of the work is not acceptable;
additional project control activities cannot be performed.
Based on the diagnosis, appropriate corrective actions will be taken.
2.1 A Minimal Set of Key Performance Indicators
KPIs are used to assess or measure certain aspects of the business operations (at operational
level) and business strategies (at strategic level) that may otherwise be difficult to assign a
quantitative value to. Aberdeen Group recent studies have pointed out that “the creation,
management and continual review of the KPIs can be difficult because it implies referees to
large, complex data volumes and a rapidly changing business dynamics”. However, they should
be specific, measurable, achievable, result-oriented and time-bound.
Monitoring the progress of a project can be done with the help of a minimal set of KPIs. Three
aspects are taken into consideration: schedule progress, budget, and scope.
Monitoring schedule progress can be performed based on the following five KPIs (Table 1).
They are referring to the status of the activities that have been scheduled (per week or per
month), to the progress of activities (ahead, behind or on-schedule) and to the required course
corrections. Table 1. Schedule progress KPIs
No. KPI Name Definition
1.
Activity normal average
(ANA)
Represents the daily average value that must be
achieved by a specific activity, in order to be
successfully completed at the end of a time period.
2.
Activity normal value
(ANV)
Represents the normal value for a particular activity
acquired in a time interval.
3.
Activity current average
(ACA)
Represents the average value of a specific activity in
present time.
4.
Activity average progress
(AAvP)
Represents the progress recorded by a particular
activity (ahead, behind or on-schedule) compared to
baseline.
5.
Activity absolute progress
(AAbP)
Represents the percentage of a specific activity that has
been completed.
Monitoring the budget implies three KPIs (Table 2). They are referring to the amount of
budget that has been spent up to o given date, to the amount of remained budget and to the
revised estimates to complete a programmed activity.

Proceedings of the IE 2015 International Conference
www.conferenceie.ase.ro
430
Table 2. Budget monitoring KPIs
No. KPI Name Definition
1.
Activity total cost
(ATC)
Represents the amount of budget that has been spent for a
specific activity.
2.
Activity total
budgeted (ATB)
Represents the amount of budget that has been allocated for a
specific activity.
3.
Activity remaining
budgeted (ARB)
Represents the amount of budget that has not been spent for a
specific activity.
Monitoring the scope is possible with the next three KPIs; being in scope or out of scope will
be identified. Also, possible occurred changes that will require a scope addition will be marked.
Table 3. Scope monitoring KPIs
No. KPI Name Definition
1.
Project activities on
scope (PAS)
Represents the number of project activities that are in scope.
2.
Project activities out
of scope (PAoS)
Represents the number of project activities that are out of
scope.
3.
Project activities
number (PAN)
Represents the total number of project activities.
It is not recommended to track the considered KPIs any more than once per week or any less
than once per month.
2.2 Defining the proposed KPIs
Following an agile approach for developing the multidimensional model, phases like 1-
conceptual schema design, 2-detailed fact table design, 3-detailed dimension table design, and
4-refine the dimensional model are grounding the approach.
The resulted measures are:
𝑀1 = 𝑄𝑢𝑎𝑛𝑡𝑖𝑡𝑦;
𝑀2 = 𝑈𝑛𝑖𝑡_𝑐𝑜𝑠𝑡;
𝑀3 = 𝑈𝑛𝑖𝑡_𝑏𝑢𝑑𝑔𝑒𝑡𝑒𝑑; (1)
𝑀4 = 𝐴𝑐𝑡𝑖𝑣𝑖𝑡𝑦_𝑡𝑎𝑟𝑔𝑒𝑡_𝑣𝑎𝑙𝑢𝑒;
𝑀5 = 𝐴𝑐𝑡𝑖𝑣𝑖𝑡𝑦_𝑐𝑢𝑟𝑟𝑒𝑛𝑡_𝑣𝑎𝑙𝑢𝑒.
They have been aggregated according to the following dimensions:
𝐷1 = 𝑂𝑏𝑗𝑒𝑐𝑡𝑖𝑣𝑒𝑠 → 𝑂𝑏𝑗𝑒𝑐𝑡𝑖𝑣𝑒𝑠_𝑇𝑦𝑝𝑒𝑠 ; 𝐷2 = 𝐴𝑐𝑡𝑖𝑣𝑖𝑡𝑖𝑒𝑠 → 𝐴𝑐𝑡𝑖𝑣𝑖𝑡𝑖𝑒𝑠_𝑇𝑦𝑝𝑒𝑠;
𝐷3 = 𝑅𝑒𝑠𝑜𝑢𝑟𝑐𝑒𝑠 → 𝑅𝑒𝑠𝑜𝑢𝑟𝑐𝑒𝑠_𝑇𝑦𝑝𝑒𝑠; (2)
𝐷4 = 𝐴𝑐𝑡𝑖𝑣𝑖𝑡𝑖𝑒𝑠_𝑆𝑡𝑎𝑡𝑢𝑠;
𝐷5 = 𝑆𝑡𝑎𝑟𝑡_𝐷𝑎𝑦 → 𝑆𝑡𝑎𝑟𝑡_𝑀𝑜𝑛𝑡ℎ → 𝑆𝑡𝑎𝑟𝑡_𝑌𝑒𝑎𝑟;
𝐷6 = 𝐹𝑖𝑛𝑖𝑠ℎ_𝐷𝑎𝑦 → 𝐹𝑖𝑛𝑖𝑠ℎ_𝑀𝑜𝑛𝑡ℎ → 𝐹𝑖𝑛𝑖𝑠ℎ_𝑌𝑒𝑎𝑟.
Above the DW, the OLAP cube will be deployed and the considered KPIs can be added to the
cube. They will be calculated with the following formulas:
𝐴𝑁𝐴 = 𝑀4
𝐹𝑖𝑛𝑖𝑠ℎ_𝑑𝑎𝑡𝑒 − 𝑆𝑡𝑎𝑟𝑡_𝑑𝑎𝑡𝑒;
𝐴𝑁𝑉 = (𝐶𝑢𝑟𝑟𝑒𝑛𝑡_𝑑𝑎𝑡𝑒 − 𝑆𝑡𝑎𝑟𝑡_𝑑𝑎𝑡𝑒) ∗ 𝐴𝑁𝐴;

Proceedings of the IE 2015 International Conference
www.conferenceie.ase.ro
431
𝐴𝐶𝐴 =𝑀5
𝐶𝑢𝑟𝑟𝑒𝑛𝑡_𝑑𝑎𝑡𝑒 –𝑆𝑡𝑎𝑟𝑡_𝑑𝑎𝑡𝑒; (3)
𝐴𝐴𝑣𝑃 =𝐴𝐶𝐴
𝐴𝑁𝐴∗ 100;
𝐴𝐴𝑏𝑃 =𝑀5
𝑀4∗ 100.
For the above five KPIs, recommended for monitoring the schedule progress, a maximal value
is desired.
The next group KPIs is used to monitor the budget. According to their definition in Table 2,
the following formulas can be used for calculus:
𝐴𝑇𝐶 = 𝑀1 ∗ 𝑀2;
𝐴𝑇𝐵 = 𝑀1 ∗ 𝑀3; (4)
𝐴𝑅𝐵 = 𝐴𝑇𝐵 − 𝐴𝑇𝐶.
While the first KPI is desired to have a minimal value, the other two are appreciated if they
have maximal values.
Concerning the third group of KPIs (Table 3), the following ways of determination are
proposed.
𝑃𝐴𝑆 = 𝐶𝑂𝑈𝑁𝑇 (𝐼𝐷_𝑎𝑐𝑡𝑖𝑣𝑖𝑡𝑦) 𝑊𝐻𝐸𝑅𝐸 𝐴𝑐𝑡𝑖𝑣𝑖𝑡𝑦_𝑡𝑦𝑝𝑒_𝑛𝑎𝑚𝑒 = "𝑜𝑛 𝑠𝑐𝑜𝑝𝑒" ; (5)
𝑃𝐴𝑜𝑆 = 𝐶𝑂𝑈𝑁𝑇 (𝐼𝐷_𝑎𝑐𝑡𝑖𝑣𝑖𝑡𝑦) 𝑊𝐻𝐸𝑅𝐸 𝐴𝑐𝑡𝑖𝑣𝑖𝑡𝑦_𝑡𝑦𝑝𝑒_𝑛𝑎𝑚𝑒 = "𝑜𝑢𝑡 𝑜𝑓 𝑠𝑐𝑜𝑝𝑒";
𝑃𝐴𝑁 = 𝑃𝐴𝑆 + 𝑃𝐴𝑜𝑆.
While PAS is monitored to have a maximal value, PAoS is desired to be as minimal as possible.
3. Conclusions
Among various applications of Business Intelligence (BI), project management approaches can
be substantially enriched by BI based frameworks. Our attention was focused on monitoring
project execution. The current approach is retrieved from our preprint published in RePEc
database1, and represents one of the few initiatives which correlates Business Intelligence with
project management. The introduced KPIs contribute in measuring the progress and
performance of the project during its execution and communicate the status. Monitoring the
schedule progress, the project budget and the scope is possible. The proposal allows further
extensions by introducing additional KPIs, and is reusable in new contexts.
References
[1] D.K. Brohman: The BI Value Chain: Data Driven Decision Support In A Warehouse
Environment, The 33rd Hawaii International Conference on Systems Science, 2000
[2] D. Hatch and M. Lock: Business Intelligence (BI): Performance Management Axis. QI,
Aberdeen Group Research Studies, 2009
[3] M. Muntean, D. Târnăveanu and A. Paul: BI Approach for Business Performance,
Proceedings of the 5th WSEAS Conference on Economy and Management Transformation,
2010
[4] M. Muntean and L. Cabău: Business Intelligence Approach in a Business Performance
Context, http://mpra.ub.uni-muenchen.de/29914/, 2011

Proceedings of the IE 2015 International Conference
www.conferenceie.ase.ro
432
[5] I. A. Jamaludin and Z. Mansor: The Review of Business Intelligence (BI) Success
Determinants in Project Implementation, International Journal of Computer Applications,
vol 33/no. 8, 2011
[6] S. Negash and P. Gray: Business Intelligence, Proceedings of the Americas Conference on
Information Systems, 2003
[7] R. Shelton: Adding a KPI to an SQL Server Analysis Services Cube,
www.Simple_Talk.com, 2010
[8] M. Muntean: Business Intelligence Approaches,WSEAS Conference on Mathematics and
Computers in Business andEconomics, Iaşi, 2012
[8] W. H. Inmon: Building de Data Warehouse,
http://inmoncif.com/inmoncifold/www/library/whiteprsttbuild.pdf, 2000
[9] ***: Overview on Project Management Methodology, http://www.chandleraz.gov
/default.aspx?pageid=511
[10] C. N. Bodea, E. Posdarie and A. R. Lupu: Managementul proiectelor - glosar, Editura
Economica, 2002
[11] C. Brândaş: Sisteme suport de decizie pentru managementul proiectelor, Editura Brumar,
Timisoara, 2007
[12] H. Kerzner: Project Management: A System Approach of Planning, Scheduling and
Controlling, John Willey & Son, Inc., 2009
[13] S. Berkun, Making Things Happen: Mastering Project Management (Theory in Practice),
O’Reilly Media, Inc., 2008
[14] S. Rengasamy: Project Monitoring & Evaluation,
http://www.slideshare.net/srengasamy/project-moni-toring-evaluation-s-presentation,
2008
[15] J.B. Barlow et al.: Overview and Guidance on Agile Development in Large Organizations,
Communications of the Association for Information Systems, vol. 29, 2011
[16] M. Golfarelli, D. Maio, and S. Rizzi: The Dimensional Fact Model: a Conceptual Model
for Data Warehouses, International Journal of of Cooperative Information, vol. 7, no. 2,
1998
[17] M. Nagy: A Framework for SemiAutomated Implementation of Multidimensional Data
Models, Database Systems Journal, vol. 3, no. 2, July 2012
[18] N. Rahman, D. Rutz, and S. Akher: Agile Development in Data Warehousing,
International Journal of Business Intelligence Research, vol. 2, no. 3, July-September 2011
[19] B. H. Wixom, and H. J. Watson: An empirical investigation of the factors affecting data
warehousing success, Journal MIS Quaterly, Volume 25 Issue 1, March 2001
[20] N. Raden: Modeling the Data Warehouse, Archer Decision Sciences, Inc., 1996
[21] C. Phipps and K. Davis: Automating data warehouse conceptual schema design and
evaluation, DMDW'02, Canada, 2002
[22] S. Mahajan: Building a Data Warehouse Using Oracle OLAP Tools, Oracle Technical
Report, ACTA Journal, Sept. 1997
[23] J. Srivastava and P. Chen: Warehouse Creation - A Potential Roadblock to Data
Warehousing, IEEE Transactions on Knowledge and Data Engineering, Vol. 11, No. 1,
January/February 1999
[24] E. Malinowski and E. Zimányi: Hierarchies in a multidimensional model: From
conceptual modeling to logical representation, Data & Knowledge Engineering, 2006,
http://code.ulb.ac.be/dbfiles/MalZim2006article. pdf
[25] M. Nagy: Design and Implementation of Data Warehouses for Business Intelligence
applied in Business, Doctoral Thesis, Cluj-Napoca, 2012
Proceedings of the IE 2015 International Conference
www.conferenceie.ase.ro
433
ANALYSIS OF THE MACROECONOMIC CAUSAL RELATIONSHIPS
WHICH CAN DETERMINE A COUNTRY TO ENTER A SOVEREIGN
DEBT CRISIS
Alexandra Maria CONSTANTIN
The Bucharest University of Economic Studies
Adina CRISTEA
The Bucharest University of Economic Studies
Abstract. Considering the complexity of the sovereign debt crisis phenomenon, this paper
analyses the macroeconomic causal relationships which can determine a country to enter a
sovereign debt crisis, through the prism of causal relationships. The studied macroeconomic
causal relationships consist of significant relationships between the macroeconomic variables
of GDP growth rate, unemployment rate, inflation rate and balance of trade volume, which
can increase the probability of a country entering a sovereign debt crisis.
Keywords: sovereign debt crisis, causal relationships, SAS software, Granger test, Levenberg-
Marquardt method, Gauss-Newton method
JEL classification: C55, E03, G01
1. Introduction The phenomenon of sovereign debt crisis (SDC) is induced by a series of micro and
macroeconomic causal factors. The strategies implemented on a micro and macroeconomic
level can trigger or increase the probability of a sovereign debt crisis, if these strategies are not
able to simultaneously optimize the covering of budget deficit and the honoring of sovereign
obligations.
The danger for vulnerable economies from the Economic and Monetary Union to enter into
SDC is caused by a series of systematic factors. The excessive governmental expenditures
occurring before the recent financial crisis, together with the pro-cyclic behavior of national
authorities [1], have represented the main factors which triggered an increased probability of
entering SDC for countries facing difficulties in honoring their sovereign obligations.
Moreover, most specialists consider that the recent financial crisis represented the catalyst of
SDC in Europe [1]. On the other hand, some specialists believe that the real catalyst is
represented by the behavior regarding real and nominal interest rates. The probability of a
country entering SDC is influenced by numerous causal factors, consisting in the evolution of
specific macroeconomic variables.
2. Macroeconomic causal relationships which can determine a country to enter SDC
A country’s entry into a sovereign debt crisis (SDC) is governed by the macroeconomic causal
relationships. Causal relationships are high complexity relationships which trigger a
phenomenon or a series of phenomena. On the one hand, the causality concept is defined as
„the elementary explanatory scheme, all other explanatory schemes (functional, structural, etc.)
being complex forms, composed in turn from several causal relationships and being therefore

Proceedings of the IE 2015 International Conference
www.conferenceie.ase.ro
434
reducible to causality” [2]. On the other hand, causality is not part of the scientific explanation
of phenomena, scientific explanations being therefore considered noncausal.
The studied macroeconomic causal relationships consist of significant relationships between
the macroeconomic variables, which can increase the probability of a country entering SDC.
The economic phenomena have nonlinear dependencies and evolutions, due to a chaotic
behavior, which is unpredictable and dynamic. For this reason, the studies regarding modeling
of economic processes must consider that economic theory only has the purpose of offering
qualitative information regarding a model’s parameters (eg: the sign, the domain of values).
However, economic theory does not mention the form of the function responsible with defining
the studied parameters’ behavior, this function being nonlinear most of the times.
3. Methodology
We further present our methodology, the considered data and variable sets, the software utilized
for data processing and the empirical results of our study. The study used as analysis methods
the Granger causality test [3], nonlinear regression models [4], parameter estimation methods
for the nonlinear regression model and convergence criteria. The study was realized on five
European areas, delimitated as follows:
Central Europe: Austria, Czech Republic, Switzerland, Germany, Hungary, Poland,
Slovakia, Slovenia, Romania;
Southern Europe: Bulgaria, Cyprus, Croatia, Greece, Italy, Macedonia, Malta,
Montenegro, Portugal, Serbia, Spain;
Northern Europe: Denmark, Finland, Norway, Sweden, Iceland, Estonia, Latvia,
Lithuania;
Eastern Europe: Belarus, Republic of Moldova, Russia, Ukraine;
Western Europe: Belgium, the Netherlands, France, Ireland, Luxemburg, the United
Kingdom.
The variables’ values for the five mentioned European areas were calculated as means of the
variables’ values for each constituent country. The results presented and interpreted below were
obtained by using the Granger causality test and were generated by the SAS 9.3.1. software
[5].
4. Empirical results and conclusions
We further present the empirical results of analyzing causality at the level of SDC, expressed
through the probability of entering SDC for each European area, depending on the interest rate,
GDP growth rate, unemployment rate and balance of trade volume. In presenting the obtained
results for each European area, the following notations were used:
PEurop_Area – the probability of a country from a studied European area to enter CDS;
UNRT – the unemployment rate, at the level of the analyzed European area;
INFLRT – the inflation rate, at the level of the analyzed European area;
GDPGRRT – the GDP growth rate at the level of the analyzed European area;
BT – the balance of trade volume, at the level of the analyzed European area;
According to the Granger test, the probability of a European country to enter SDC is induced
and significantly affected by the GDP growth rate, the inflation rate, the unemployment rate
and the balance of trade volume. The four mentioned macroeconomic variables have a
significant influence in all the five studied European areas.
We further present the mathematical models which most accurately express the relationship
between the probability of a European country in Central, Southern, Northern, Eastern and
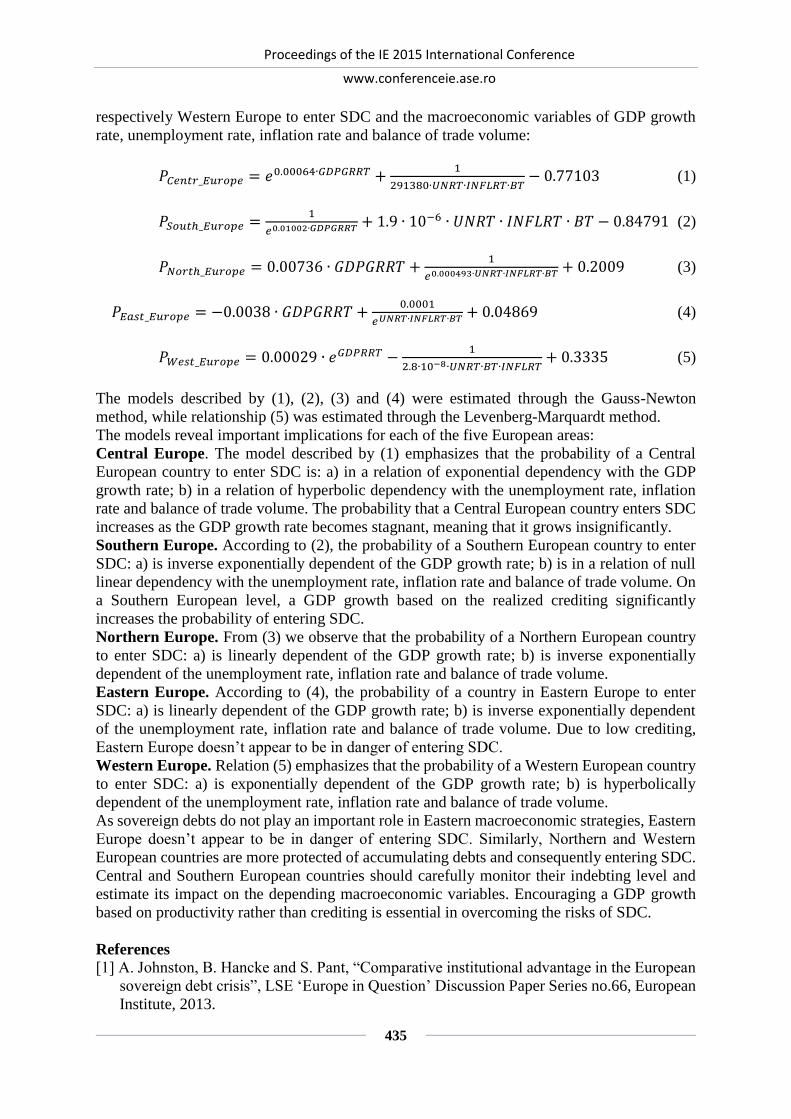
Proceedings of the IE 2015 International Conference
www.conferenceie.ase.ro
435
respectively Western Europe to enter SDC and the macroeconomic variables of GDP growth
rate, unemployment rate, inflation rate and balance of trade volume:
𝑃𝐶𝑒𝑛𝑡𝑟_𝐸𝑢𝑟𝑜𝑝𝑒 = 𝑒0.00064∙𝐺𝐷𝑃𝐺𝑅𝑅𝑇 +1
291380∙𝑈𝑁𝑅𝑇∙𝐼𝑁𝐹𝐿𝑅𝑇∙𝐵𝑇− 0.77103 (1)
𝑃𝑆𝑜𝑢𝑡ℎ_𝐸𝑢𝑟𝑜𝑝𝑒 =1
𝑒0.01002∙𝐺𝐷𝑃𝐺𝑅𝑅𝑇+ 1.9 ∙ 10−6 ∙ 𝑈𝑁𝑅𝑇 ∙ 𝐼𝑁𝐹𝐿𝑅𝑇 ∙ 𝐵𝑇 − 0.84791 (2)
𝑃𝑁𝑜𝑟𝑡ℎ_𝐸𝑢𝑟𝑜𝑝𝑒 = 0.00736 ∙ 𝐺𝐷𝑃𝐺𝑅𝑅𝑇 +1
𝑒0.000493∙𝑈𝑁𝑅𝑇∙𝐼𝑁𝐹𝐿𝑅𝑇∙𝐵𝑇+ 0.2009 (3)
𝑃𝐸𝑎𝑠𝑡_𝐸𝑢𝑟𝑜𝑝𝑒 = −0.0038 ∙ 𝐺𝐷𝑃𝐺𝑅𝑅𝑇 +0.0001
𝑒𝑈𝑁𝑅𝑇∙𝐼𝑁𝐹𝐿𝑅𝑇∙𝐵𝑇+ 0.04869 (4)
𝑃𝑊𝑒𝑠𝑡_𝐸𝑢𝑟𝑜𝑝𝑒 = 0.00029 ∙ 𝑒𝐺𝐷𝑃𝑅𝑅𝑇 −1
2.8∙10−8∙𝑈𝑁𝑅𝑇∙𝐵𝑇∙𝐼𝑁𝐹𝐿𝑅𝑇+ 0.3335 (5)
The models described by (1), (2), (3) and (4) were estimated through the Gauss-Newton
method, while relationship (5) was estimated through the Levenberg-Marquardt method.
The models reveal important implications for each of the five European areas:
Central Europe. The model described by (1) emphasizes that the probability of a Central
European country to enter SDC is: a) in a relation of exponential dependency with the GDP
growth rate; b) in a relation of hyperbolic dependency with the unemployment rate, inflation
rate and balance of trade volume. The probability that a Central European country enters SDC
increases as the GDP growth rate becomes stagnant, meaning that it grows insignificantly.
Southern Europe. According to (2), the probability of a Southern European country to enter
SDC: a) is inverse exponentially dependent of the GDP growth rate; b) is in a relation of null
linear dependency with the unemployment rate, inflation rate and balance of trade volume. On
a Southern European level, a GDP growth based on the realized crediting significantly
increases the probability of entering SDC.
Northern Europe. From (3) we observe that the probability of a Northern European country
to enter SDC: a) is linearly dependent of the GDP growth rate; b) is inverse exponentially
dependent of the unemployment rate, inflation rate and balance of trade volume.
Eastern Europe. According to (4), the probability of a country in Eastern Europe to enter
SDC: a) is linearly dependent of the GDP growth rate; b) is inverse exponentially dependent
of the unemployment rate, inflation rate and balance of trade volume. Due to low crediting,
Eastern Europe doesn’t appear to be in danger of entering SDC.
Western Europe. Relation (5) emphasizes that the probability of a Western European country
to enter SDC: a) is exponentially dependent of the GDP growth rate; b) is hyperbolically
dependent of the unemployment rate, inflation rate and balance of trade volume.
As sovereign debts do not play an important role in Eastern macroeconomic strategies, Eastern
Europe doesn’t appear to be in danger of entering SDC. Similarly, Northern and Western
European countries are more protected of accumulating debts and consequently entering SDC.
Central and Southern European countries should carefully monitor their indebting level and
estimate its impact on the depending macroeconomic variables. Encouraging a GDP growth
based on productivity rather than crediting is essential in overcoming the risks of SDC.
References
[1] A. Johnston, B. Hancke and S. Pant, “Comparative institutional advantage in the European
sovereign debt crisis”, LSE ‘Europe in Question’ Discussion Paper Series no.66, European
Institute, 2013.

Proceedings of the IE 2015 International Conference
www.conferenceie.ase.ro
436
[2] C. Zamfir, 2005. Spre o paradigmă a gândirii sociologice, 2nd ed., Iaşi: Polirom, 2005.
[3] C.W.J. Granger, “Investigating causal relations by econometric models and cross-spectral
methods”, Econometrica Journal, vol. 37, no. 3, pp. 424-438, 1969.
[4] S. Stancu, Econometrie. Teorie şi aplicaţii utilizând EViews, Bucharest: ASE Publishing
House, 2011.
[5] SAS® 9.1.3 Intelligence Platform System Administration Guide. Available:
http://support.sas.com/documentation/configuration/bisag.pdf, accessed 13.01.2015

Proceedings of the IE 2015 International Conference
www.conferenceie.ase.ro
437
INVESTING OPTIMALLY IN ADVERTISING AND QUALITY TO
MITIGATE PRODUCT-HARM CRISIS
Francesco MORESINO
University of Applied Sciences Western Switzerland
Abstract. Product-harm crisis are the nightmare of any firm as they have a disastrous effect
on their sales and image. This paper proposes a new model to compute the optimal investment
in quality and advertising in order to reduce the probability of occurrence of a possible
product-harm crisis and mitigate its effects. This method uses stochastic control theory and
can be used for both tangible products and services.
Keywords: Optimal investment, product-harm crisis, stochastic optimal control. JEL classification: C44, C61
1. Introduction Many examples remind us that no company is immune from a product-harm crisis which can
generate losses of several billion dollars. Take, for example, the most famous case in the car
industry (Toyota and Ford), food and beverage industry (Perrier) or catering (Buffalo Grill).
As evidenced by the case of Toyota, firms known to invest heavily in quality can be affected
as well as less virtuous firms.
In the US, since many years, these crises are always accompanied by costly class action
lawsuits which can be even more damaging than the decline in sales or the image degradation.
In Europe, the number of countries allowing class actions is increasing and the European
Commission considers to promulgate a related directive. To make things even worse,
consumers now act as “consum-actors” and do not hesitate to organize “boycotts”. The recent
case of Kitkat chocolate bars shows us that a powerful company may be forced to revise its
production and communication under pressure from consumers. In the current climate, no
company can ignore the impact of a product-harm crisis when making strategic decisions.
Unfortunately, few tools are used to quantify the effects of a decision on a possible crisis.
Currently, companies have a variety of tools to assess the impact of investments in normal
circumstances but not the effects on a possible crisis. Today there is a real lack, and almost
everything remains to be built.
Crisis management is an important area of management science and many articles and books
have been written on this subject, see for example Bernstein [1]. Most of these publications
offer precepts to follow when crises occur. Some also offer recommendations to prevent or
mitigate a future crisis, without quantifying the effect of these recommendations. For twenty
years, researchers have proposed studies to quantify the consequences of a crisis. Some have
used an experimental approach and have studied the effects that a crisis can have on consumer
expectations (Dawar and Pillutla [2]) or the brand loyalty (Stockmeyer [3]). Others have used
empirical approaches to quantify the effects of a crisis on sales (see e.g. Van Herde et al. [4] or
Cleeren et al. [5]). However, all these studies analyze the crisis ex post and do not offer the
manager a tool to measure the impacts of today's decisions on any future crisis. Other
researchers have studied this problem and have proposed models allowing an ex ante analysis
of crises. Using optimal control theory, they built models that calculate the optimal decision to

Proceedings of the IE 2015 International Conference
www.conferenceie.ase.ro
438
make in an anticipatory manner while taking into account the effects of any future crisis. We
can cite, among others, the pioneering work of Rao [6] and more recently those of Raman and
Naik [7]. Unfortunately, all these works assume that the crisis follows a Wiener process. This
means that, for these models, the crisis is not sudden and violent but its outbreak is spread over
time and its effects are the result of a multitude of small underlying crises. These models are
obviously not realistic, but recently Rubel et al. [8] proposed a new model closer to reality.
Adapting the work of Boukas et al. [9] and Haurie and Moresino [10] in optimal control theory,
they developed a model where crises are described by a Poisson process. The model proposed
by Rubel et al. calculates the optimal investments to be made in advertising, while taking into
account the effects of a possible crisis. This approach opens new perspectives and looks very
promising.
This paper proposes an extension of the model developed by Rubel et al. Indeed, we provide a
new model to calculate the optimal investments in quality and advertising taking into account
the effects of a possible product-harm crisis. We apply the numerical method proposed by
Kusner and Dupuis [11]. This method relies on a discretization of time and space and allows
to reformulate a stochastic control model into a Markov decision process. The solution of this
Markov decision process can be computed solving a linear program.
This paper is organized as follows. In the second section, we present the model. In the third
section, we explain the numerical method used throughout this paper. The fourth section is
dedicated to a numerical case study and finally, in the last section, further research directions
are proposed.
2. The model We propose to extent the model proposed by Rubel et al. allowing investments in quality. Let
j=0 denote the precrisis regime and j=1 the postcrisis regime. Denote with S the sales and Q
the quality. The sales dynamics are given by
𝑑𝑆
𝑑𝑡= 𝛽𝑗√𝑄(𝑡) 𝑢𝑗 (𝑀(𝑡) − 𝑆(𝑡)) − 𝛿𝑗𝑆(𝑡) − 𝜖𝑗𝑆(𝑡)(1 − 𝑄(𝑡)) ,
where M is the market size, u the investment in advertising, β the effectiveness, δ and ϵ decay
rates. The quality dynamics are given by
𝑑𝑄
𝑑𝑡= 𝛼𝑗√𝑣𝑗 (1 − 𝑄(𝑡)) − 𝜇𝑗𝑄(𝑡) ,
where v denote the investment in quality, α the effectiveness and μ the decay rate. The crisis
follows a Markovian process with generator
𝑞𝑖𝑗 = 𝜉𝑖0 + 𝜉𝑖1 𝑄 𝑖 ≠ 𝑗 .
As usual, we denote with
𝑞𝑖 =∑𝑞𝑖𝑗𝑗≠𝑖
≡ 𝑞(𝑄, 𝑖) .
When a crisis occurs, the sales fall and the damage rate is denoted with Φ. The profit function
is given by
𝜋(𝑆, 𝑄, 𝑢, 𝑣) = 𝑚1𝑆 − 𝑚2𝑆𝑄 −𝑚3𝑢 −𝑚4𝑣,

Proceedings of the IE 2015 International Conference
www.conferenceie.ase.ro
439
where 𝑚1is the unit margin, 𝑚2 the unit production price for quality, 𝑚3 and 𝑚4 investment
costs. The objective is to maximize the discounted expected profits
𝑉(𝑆, 𝑄, 𝑖) = max𝑢,𝑣
𝐸 [∫ 𝑒−𝜌𝑡∞
0
𝜋(𝑆, 𝑄, 𝑢, 𝑣)𝑑𝑡]
with discount rate ρ. Applying standard dynamic programming analysis, we obtain the
following Hamilton-Jacobi-Bellman (HJB) equations that provide sufficient conditions for the
optimality (see Fleming and Rishel [12]):
𝜌𝑉(𝑆, 𝑄, 0) = max𝑢,𝑣
{𝜋 +𝜕
𝜕𝑥𝑉(𝑆, 𝑄, 0) ⋅ 𝑓(𝑆, 𝑄, 𝑢, 𝑣)
+ [𝑉(𝑆(1 − Φ), 𝑄, 1) − 𝑉(𝑆, 𝑄, 0)]𝑞(𝑄, 0)} ,
𝜌𝑉(𝑆, 𝑄, 1) = max𝑢,𝑣
{𝜋 +𝜕
𝜕𝑥𝑉(𝑆, 𝑄, 1) ⋅ 𝑓(𝑆, 𝑄, 𝑢, 𝑣) + [𝑉(𝑆, 𝑄, 0) − 𝑉(𝑆, 𝑄, 1)]𝑞(𝑄, 1)} .
3. Numerical method The HJB system of equations can be solved applying Kusner and Dupuis method [11]. This
method approximate the partial derivative as follows:
𝜕
𝜕𝑥𝑘𝑉(𝑥, 𝑖) →
{
𝑉(𝑥 + 𝑒𝑘ℎ𝑘) − 𝑉(𝑥, 𝑖)
ℎ𝑘 if 𝑓𝑘(𝑥, 𝑤) ≥ 0
𝑉(𝑥, 𝑖) − 𝑉(𝑥 − 𝑒𝑘ℎ𝑘)
ℎ𝑘 if 𝑓𝑘(𝑥, 𝑤) < 0 ,
where x=(S,Q), w=(u,v), 𝑓 = ��, 𝑒𝑘 the unit vector of the k-th axis and ℎ𝑘 the grid’s mesh. We
denote with 𝒳 the so obtained grid. Let
𝜔 = max𝑥,𝑖,𝑤
𝑞(𝑄, 𝑖) +∑|𝑓𝑘(𝑥, 𝑤)|
ℎ𝑘𝑘
.
Define the interpolation interval
∆=1
𝜌 + 𝜔
and the discount factor
𝑟 =𝜔
𝜌 + 𝜔 .
The transition probabilities are defined as

Proceedings of the IE 2015 International Conference
www.conferenceie.ase.ro
440
Π(𝑥, 𝑥 ± 𝑒𝑘ℎ𝑘 , 𝑖, 𝑖, 𝑤) =𝑓𝑘±(𝑥, 𝑤)
𝜔ℎ𝑘 ,
Π(𝑥, 𝑥, 𝑖, 𝑗, 𝑤) =𝑞(𝑄, 𝑖)
𝜔 .
Let 𝐵(𝑥, 𝑖) ≥ 0 with ∑ 𝐵(𝑥, 𝑖) = 1𝑥,𝑖 . Substituting this in the HJB equations and using
reflecting boundary conditions leads to the following linear program:
max𝑍{∑∑∑𝜋(𝑥, 𝑤)∆𝑍(𝑥, 𝑖, 𝑤)
𝑤𝑥𝑖
}
s.t.
∑𝑍(𝑦, 𝑗, 𝑤)
𝑤
− 𝑟∑∑∑Π(𝑥, 𝑦, 𝑖, 𝑗, 𝑤)𝑍(𝑥, 𝑖, 𝑤)
𝑤𝑥𝑖
= 𝐵(𝑦, 𝑗) 𝑦 ∈ 𝒳, 𝑗 ∈ 𝐼 ,
𝑍(𝑥, 𝑖, 𝑤) ≥ 0 .
Then the optimal policy is given by
D(𝑤|𝑥, 𝑖) =𝑍(𝑥, 𝑖, 𝑤)
∑ 𝑍(𝑦, 𝑗, ��)�� .
D(𝑤|𝑥, 𝑖) = 1 if w is the optimal decision for the state (𝑥, 𝑖) and zero otherwise.
4. Numerical experiment We run the model for the set of data given in Table 1 and the grid given in Table 2. This set of
data is fictive and is inspired by the car industry.
Table 1- Data
Data Precrisis regime Postcrisis regime Data
α 0.5 0.5 ρ 0.06
µ 0.1 0.1 𝑚1 100
β 0.05 0.05 𝑚2 0.5
δ 0.1 0.3 𝑚3 20
ε 0.01 0.03 𝑚4 1
𝜉0 0.5 2 ϕ 0
𝜉1 -0.005 0.05
M 100 100
Table 2 - Grid
Data Minimum Maximum Mesh
S 0 100 4
Q 0 100 4
u 0 100 10
v 0 100 10

Proceedings of the IE 2015 International Conference
www.conferenceie.ase.ro
441
Figure 1 shows the optimal policy for the precrisis regime. Due to lack of space, not all results
are displayed in this paper. Figure 2 shows that the trajectories are attracted by the so-called
turnpike. This figure shows two trajectories in the precrisis regime, one starting from the point
S(0)=50 and Q(0)=10, the other starting from the point S(0)=90 and Q(0)=80. We see distinctly
that both converge to the turnpike S=76.2 and Q=47.3. Similarly the turnpike for the postcrisis
regime can be found and is S=60.1 and Q=69.5. As expected, sales decline in crisis times.
Interestingly we see that, in case of crisis, it is optimal to invest more in quality in order to quit
as soon as possible this turmoil phase. Finally, Figure 3 shows the steady state probabilities for
both regimes.
Figure 1- Optimal investment in advertising (left) and quality (right) for the precrisis regime.
Figure 2 - Two optimal trajectories with different initial values (precrisis regime). Left: sales; right: quality.
Figure 3- Steady state probabilities. Left: precrisis regime; right: postcrisis regime.
Proceedings of the IE 2015 International Conference
www.conferenceie.ase.ro
442
5. Conclusions This paper proposes an original method to compute the optimal investment in quality and
advertising in order to reduce the probability of occurrence of a possible product-harm crisis
and mitigate its effects. This method is an extension of the method proposed by Rubel et al.
and uses a stochastic control theory approach.
For our fictive case inspired by the car industry, our model shows that in case of crisis, it is
optimal to make a special effort for the quality in order to quit as soon as possible this turmoil
phase.
Finally, we conclude by identifying two directions for further research. First the model could
be enriched in order to take into account endogen competition. For this purpose, we have to
compute a Nash equilibrium instead of an optimum. Second, we can investigate the properties
of the turnpike in order to obtain analytical results. Note that this latter direction could be quite
tricky if not impossible.
Acknowledgment This research was supported by a grant from RCSO Economie & Management, HES-SO.
References [1] J. Bernstein, Manager's Guide to Crisis Management, McGraw-Hill, 2011.
[2] N. Dawar and M. M. Pillutla, “Impact of product-harm crises on brand equity: The
moderating role of consumer expectations”, J. of Marketing Research, vol. 37, no.2, pp
215–226, 2000.
[3] J. Stockmyer, “Brands in crisis: Consumer help for deserving victims”, Advances in
Consumer Research, vol. 23, no. 1, pp. 429–435, 1996.
[4] H. J. Van Heerde, K. Helsen and M. G. Dekimpe. “The impact of a product-harm crisis on
marketing effectiveness”, Marketing Science, vol. 26, no. 2, pp. 230–245, 2007
[5] K. Cleeren, H. J. van Heerde and M. G. Dekimpe “Rising from the Ashes: How Brands and
Categories Can Overcome Product-Harm Crisis”, J. of Marketing, vol. 77, pp. 58–77, 2013.
[6] R. C. Rao, “Estimating continuous time advertising-sales models”, Marketing Science, vol.
5, no. 2, pp. 125-142, 1986
[7] K. Raman and P. A. Naik., “Long-term profit impact of integrated marketing
communications program”, Review of Marketing Science, vol. 2, no. 1, 2004.
[8] O. Rubel, P.A. Naik and S. Srinivasan, “Optimal Advertising When Envisioning a Product-
Harm Crisis”, Marketing Science, vol. 30, no. 6, pp. 1048-1065, 2011.
[9] E. K. Boukas, A. Haurie and P. Michel, “An optimal control problem with a random
stopping time” J. Optim. Theory Appl., vol. 64, no. 3, pp. 471–480, 1990.
[10] A. Haurie and F. Moresino, “A Stochastic Control Model of Economic Growth with
Environmental Disaster Prevention”, Automatica, vol. 42, no. 8, pp. 1417-1428, 2006.
[11] H. J. Kushner and P.G. Dupuis, Numerical methods for stochastic control problems in
continuous time, Springer, 1992.
[12] W. H. Fleming and R. W. Rishel, Deterministic and Stochastic Control, Springer, 1975.

Proceedings of the IE 2015 International Conference
www.conferenceie.ase.ro
443
COUPLING TECHNO-ECONOMIC ENERGY MODELS WITH A
SHARE OF CHOICE
Francesco MORESINO
University of Applied Sciences Western Switzerland
Emmanuel FRAGNIÈRE
University of Applied Sciences Western Switzerland
Roman KANALA
Université de Genève
Adriana REVEIU Bucharest University of Economic Studies
Ion SMEUREANU Bucharest University of Economic Studies
Abstract. Classical energy planning models assume that consumers are rational and this is
obviously not always the case. This paper proposes an original method to take into account the
consumer’s real behavior in an energy model. It couples a classical energy model with a Share
of Choice model.
Keywords: consumer behavior, energy and environmental planning model, share of choice JEL classification: C44, Q48
1. Introduction For decades, energy and environmental planning models such as MARKAL [1], TIMES [2] or
more recently OSeMOSYS [3] have helped policy makers to take their long-term decisions.
However, these classical modes have a weakness: they suppose that all actors are perfectly
rational. To take into account this irrationality, a first attempt has been made using fictive
technologies [4]. In this paper we go a step further, we propose an original method which enable
us to take into account the consumer’s real behavior in an energy model. This method couples
technical methods from operations research with behavioral approaches from social sciences
and is inspired by the method proposed in reference [5]. Roughly speaking, the main step of
this method are the following. First, the consumer's real behavior is estimated with a survey.
Then the results of the survey are incorporated in a Share of Choice model which describes the
consumers' preferences. Finally, the Share of Choice model is coupled with a classical energy
model. The meta-model so obtained permits us to evaluate different possible energy policies.
2. The case study The purpose of this case study is to show how a classical energy model can be coupled with a
Share of Choice model in order to take into account the consumers' real behavior. To illustrate
our method, we take a case study where we put a focus on the consumer’s behavior concerning
bulbs. More precisely, we want to study the consumer’s preference between fluorescent and

Proceedings of the IE 2015 International Conference
www.conferenceie.ase.ro
444
LED bulbs. For this case study, we suppose that the government can conduct two campaigns,
namely an information campaign and a subvention campaign. The final objective is to choose
the optimal policy. For the energy model, we choose OSeMOSYS data set UTOPIA. UTOPIA
is a relatively small though complete energy model and is implemented with the open source
OSeMOSYS code. In UTOPIA, nothing is modified except that we introduce a second bulb
and the possibility of an information campaign and a subvention campaign. Then, we add to
this energy model a Share of Choice model that describes the consumer’s behavior regarding
bulbs.
3. The survey To evaluate the behavior of consumers concerning bulbs, we have conducted a survey in
Romania and interviewed 120 persons. As we need to evaluate the consumers' preference
between only two bulbs and don't need to evaluate the separate effect of the different attributes,
we employ a full-profile approach. More precisely, the survey relies on two steps and each one
is divided in two questions.
The first step aims at evaluating the respondent preference before a possible information
campaign. For this purpose, two cards are presented to the respondent (see Figure 1). The first
card describes the fluorescent bulbs and the second one the LED bulb. Both cards contain
indications that can be found on the packaging. It includes the price, the life duration, the
energy efficiency and the power of the bulb. First, we ask the respondent which bulb he would
be willing to buy. If the respondent choses the LED bulb, we go to the second step. If the
respondent choses the fluorescent bulb, we then evaluate if a possible subvention campaign
could turn him into a LED bulbs buyer. For this purpose we ask a second question: "what is
the maximal amount you are ready to pay for the LED bulb?". This provides us with the
respondent's Willingness To Pay (WTP) for the led bulb.
The second step aims at evaluating the respondent preference after the information campaign.
For this purpose, two cards are presented to the respondent (see Figure 2). Compared to the
previous cards, these cards contain an additional information, namely the annual cost of
utilization. The annual cost includes the depreciation cost and the electricity cost. It is based
on a standard use of 1000 hours per year. Then, as in the first step, we ask the respondent the
same questions to know his preference and his WTP for the LED bulb.
To sum up, the survey provides us with the following two kinds of information: the WTP when
no additional information is given to the respondent and the WTP when he gets additional
information. If the respondent choses the LED bulb even if no subvention is given, the WTP
is of course 35 lei, the actual price of the LED bulb.
Figure 1- First set of cards presented to the respondents
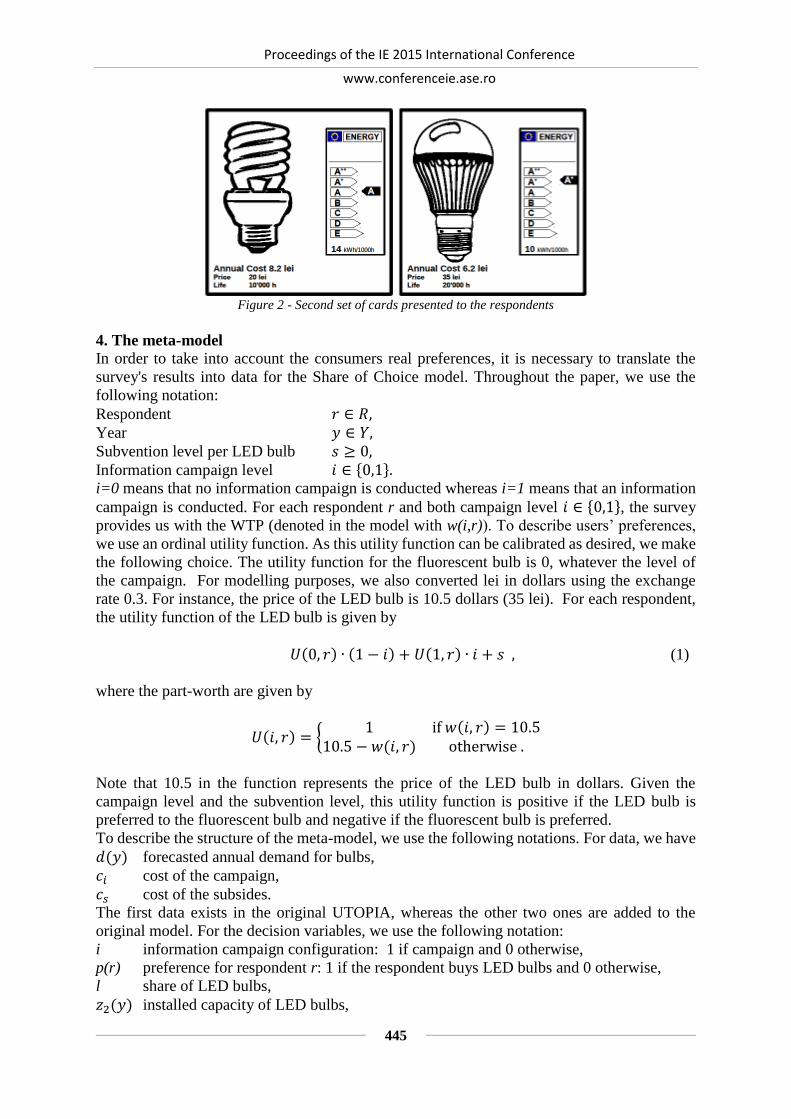
Proceedings of the IE 2015 International Conference
www.conferenceie.ase.ro
445
Figure 2 - Second set of cards presented to the respondents
4. The meta-model In order to take into account the consumers real preferences, it is necessary to translate the
survey's results into data for the Share of Choice model. Throughout the paper, we use the
following notation:
Respondent 𝑟 ∈ 𝑅, Year 𝑦 ∈ 𝑌, Subvention level per LED bulb 𝑠 ≥ 0, Information campaign level 𝑖 ∈ {0,1}. i=0 means that no information campaign is conducted whereas i=1 means that an information
campaign is conducted. For each respondent r and both campaign level 𝑖 ∈ {0,1}, the survey
provides us with the WTP (denoted in the model with w(i,r)). To describe users’ preferences,
we use an ordinal utility function. As this utility function can be calibrated as desired, we make
the following choice. The utility function for the fluorescent bulb is 0, whatever the level of
the campaign. For modelling purposes, we also converted lei in dollars using the exchange
rate 0.3. For instance, the price of the LED bulb is 10.5 dollars (35 lei). For each respondent,
the utility function of the LED bulb is given by
𝑈(0, 𝑟) ∙ (1 − 𝑖) + 𝑈(1, 𝑟) ∙ 𝑖 + 𝑠 , (1)
where the part-worth are given by
𝑈(𝑖, 𝑟) = {1 if 𝑤(𝑖, 𝑟) = 10.5
10.5 − 𝑤(𝑖, 𝑟) otherwise .
Note that 10.5 in the function represents the price of the LED bulb in dollars. Given the
campaign level and the subvention level, this utility function is positive if the LED bulb is
preferred to the fluorescent bulb and negative if the fluorescent bulb is preferred.
To describe the structure of the meta-model, we use the following notations. For data, we have
𝑑(𝑦) forecasted annual demand for bulbs,
𝑐𝑖 cost of the campaign,
𝑐𝑠 cost of the subsides.
The first data exists in the original UTOPIA, whereas the other two ones are added to the
original model. For the decision variables, we use the following notation:
i information campaign configuration: 1 if campaign and 0 otherwise,
p(r) preference for respondent r: 1 if the respondent buys LED bulbs and 0 otherwise,
l share of LED bulbs,
𝑧2(𝑦) installed capacity of LED bulbs,

Proceedings of the IE 2015 International Conference
www.conferenceie.ase.ro
446
𝑧1(𝑦) installed capacity of fluorescent bulbs,
x variables describing the activities in the classical model (𝑑(𝑦), 𝑧1(𝑦), 𝑧2(𝑦), 𝑖 and 𝑠
belong to this vector).
Note that the first four variables don't belong to the original UTOPIA model. The energy model
without Share of Choice writes
min𝑥𝑐 ∙ 𝑥
s.t.
𝐴 ∙ 𝑥 ≥ 𝑏 .
Roughly speaking, the model tries to minimize the costs respecting the constraints that all
demands are satisfied. Then in the meta-model we have to introduce the Share of Choice as
follows. For each respondent 𝑟 ∈ 𝑅, the following two inequalities must hold
𝑈(0, 𝑟) ∙ (1 − 𝑖) + 𝑈(1, 𝑟) ∙ 𝑖 + 𝑠 ≥ (𝑝(𝑟) − 1) ∙ 𝑀 ,
𝑈(0, 𝑟) ∙ (1 − 𝑖) + 𝑈(1, 𝑟) ∙ 𝑖 + 𝑠 ≤ 𝑝(𝑟) ∙ 𝑀.
Where i and p(r) are binary variables and M is a big number. In these two equations, we
recognize the utility function described in Eq. (1). For each respondent r, these two equations
insure that if the utility of the LED bulb is greater than or equal to the utility of the fluorescent
bulb, then the respondent is counted as a LED bulbs buyer (p(r)=1). In the case the utility is
smaller than zero, the respondent is counted as a fluorescent bulbs buyer (p(r)=0). Then, the
proportion of LED bulbs writes
𝑙 =∑ 𝑝(𝑟)𝑟∈𝑅
card(𝑅) ,
where card(R) is the number of respondents. Finally, we must include in the meta-model the
following constraints, where capacity and demand are put in relation:
𝑧1(𝑦) = 𝑑(𝑦) ∙ (1 − 𝑙),
𝑧2(𝑦) = 𝑑(𝑦) ∙ 𝑙 .
These two equations insure that the installed capacity of both bulbs matches the proportion
computed with the Share of Choice. In OSeMOSYS, these two constraints contain capacity
factors and activity to capacity factors not presented here. Table 1 gives the correspondence
between notations used throughout this paper and notations used for the modelling in
OSeMOSYS. Table 1- Name of data and variables
Data Notation Notation in OSeMOSYS
Respondent 𝑟 ∈ 𝑅 R in RESPONDENT
Year 𝑦 ∈ 𝑌 Y in YEAR
Cost of campaign 𝑐𝑖 COST_CAMPAIGN
Cost of subventions 𝑐𝑠 COST_SUBVENTION
Part-worth U(i,r) U[c,r]
Big number M BIGM

Proceedings of the IE 2015 International Conference
www.conferenceie.ase.ro
447
Forecasted annual demand 𝑑(𝑦) SpecifiedAnnualDemand[,”RL”,y]
Variable Notation Notation in OSeMOSYS
Information campaign level 𝑖 ∈ {0,1} campaign
Subvention level 𝑠 ≥ 0 subvention
Preference 𝑝(𝑟) ∈ {0,1} preference
LED bulbs’ share l share
Fluorescent bulbs’ capacity 𝑧1(𝑦) TotalCapacityAnnual[.”RL1”,y]
LED bulbs’ capacity 𝑧2(𝑦) TotalCapacityAnnual[.”RL2”,y]
5. Numerical experiment Our goal is to show how it is possible to couple an energy model with a Share of Choice model.
In order not to modify the original energy model, we decided to use the existing bulb from
UTOPIA though it doesn't have exactly the same price characteristics as the real bulbs ones
such as indicated in our survey. Indeed, the ratio between the price of electricity and the price
of bulbs is lower in UTOPIA than in Romania. In UTOPIA, the existing bulb, namely RL1,
corresponds to the fluorescent bulb. We introduced a new bulb, namely RL2, which correspond
to the LED bulb. Data for both bulbs can be found in Table 2. Excepted the residual capacity,
all data for RL1 are the same as in the original UTOPIA model. Table 2 - Bulbs characteristics
Fluorescent bulb LED bulb
OSeMOSYS symbol RL1 RL2
InputActivityRatio from ELC 1 0.7143
OutputActivityRatio to RL 1 1
FixedCost 9.46 4.73
CapitalCost 100 200
ResidualCapacity 0 0
AvailabilityFactor 1 1
OperationalLife 10 20
VariableCost 0 0
CapacityToActivityUnit 1 1
CapacityFactor 1 1
Data for the residential light are given in Table 3. These data points are the same as in the
original model UTOPIA. Table 3 - Demand for residential light (PJ/year).
Year 0 10 20
SpecifiedAnnualDemand 5.6 8.4 12.6
The cost of the campaign is evaluated from observations based on study [4] and is set as 20
million dollars for the whole horizon.
Our model tries to minimize the global costs for the society. The expenses of the subvention
are paid by the government to individuals. Seen from the point of view of an accountant, this
means that the cost for the society is zero: what is paid from one side is received by the other
side. In our model, the cost of the campaign should be seen as an acceptance cost. Obviously
it should lie between zero and the expenses spent by the government. Indeed, the acceptance
cost cannot be larger than the cost itself. For our experiment, we took an acceptance cost equal
to 50% of the total subvention.

Proceedings of the IE 2015 International Conference
www.conferenceie.ase.ro
448
For this set of data, it is optimal to run an information campaign and give no subvention. The
total discounted cost is 27'860 million dollars. Besides these results, it is important to notice
that the share of LED bulbs mimics the consumers behavior estimated through the survey. Note
that without a Share of Choice model taking into account the irrationality of consumers, this
proportion would have been 100%. Indeed, it is economically rational to buy only LED bulbs.
Figure 3 shows the proportion of fluorescent and LED bulbs for our scenario.
Figure 3- Bulbs penetration.
5. Conclusion We have proposed an original method which enable us to take into account the consumer’s real
behavior in an energy model. This method couples technical methods from operations research
with behavioral approaches from social sciences.
In a further development, we aim to externalize the Share of Choice model. This will have two
advantages. First, it will reduce the number of binary variable, which in turns, will reduce
drastically the complexity of the model. Second, it will ease the modelling. Indeed, it will be
possible to keep linearity properties for more complex models.
Acknowledgment This research was supported by the Swiss Enlargement Contribution in the framework of the
Romanian-Swiss Research Program (Swiss National Fund of Scientific Research Grant
IZERZ0_142217). We would like to thank Andrew Collins the designer of the light bulbs
presented in figures 1 and 2.
References [1] H. Abilock and L. G. Fishbone, “User’s Guide for MARKAL (BNL Version)”, BNL,
27075, 1979.
[2] R. Loulou, U. Remme, A. Kanudia, A. Lehtilä and G. Goldstein, “Documentation for the
TIMES Model”, IEA Energy Technology Systems Analysis Program (ETSAP), 2005.
[3] M. Howells, H. Rogner, N. Strachan, C. Heaps, H. Huntington, S. Kypreos, A. Hughes, S.
Silveira, J. DeCarolis, M. Bazillian and A. Roehrl, “OSeMOSYS: The Open Source Energy
Modeling System. An introduction to its ethos, structure and development”, Energy Policy,
vol. 39, pp. 5850-5870, 2011.
[4] E. Fragnière, R. Kanala, D. Lavigne, F. Moresino and G. Nguene, “Behavioral and
Technological Changes Regarding Lighting Consumptions: A MARKAL Case Study”,
Low Carbon Economy Journal, vol. 1, pp 8-17, 2010.
[5] E. Fragnière, C. Heitz and F. Moresino, “The Concept of Shadow Price to Monetarize the
Intangible Value of Expertise”, in Proc. The IEEE/INFORMS International Conference on
Service Operations and Logistics, and Informatics, vol. 2, pp. 1736-1741, 2008.
Proceedings of the IE 2015 International Conference
www.conferenceie.ase.ro
449
A GENDER ANALYSIS OF THE MINIMUM WAGE EFFECTS UPON
EMPLOYMENT IN ROMANIA
Madalina Ecaterina POPESCU
The Bucharest University of Economic Studies, Romania
The National Scientific Research Institute for Labour and Social Protection, Romania
Larisa STANILA The National Scientific Research Institute for Labour and Social Protection, Romania
Amalia CRISTESCU The Bucharest University of Economic Studies, Romania
The National Scientific Research Institute for Labour and Social Protection, Romania
Abstract: Socio-economic approaches on the minimum wage are more often than not
contradictory. Supporters of the minimum wage believe that this is a way to increase the
wellbeing of individuals, while the opponents believe that the only thing that the minimum wage
does is to reduce the employment rate and/or to increase “working under the table”. In this
context, our paper focuses on the role of the minimum wage on the labour market and its direct
effects upon employment in Romania. We also identify several particularities at gender level
by elaborating an analysis of the minimum wage effects upon male and female employment in
Romania. For that we used quarterly data for the period 2000 Q1 – 2014 Q3 and built two
employment equations differentiated by gender. Our results are consistent with the
international literature and suggest the presence of some gender differences in the way the
minimum wage effects are perceived by the employed population.
Keywords: minimum wage, gender analysis, employment, econometric approach
JEL classification: J21, C22
1. Introduction
In this paper we highlight the role of the minimum wage on the labour market and its direct
effects upon employment in Romania, with several particularities drawn at gender level. As we
know, capitalism is an efficient system of resource and production allocation, but if left
unmanaged it generates and exacerbates economic inequalities. Economic inequality between
people and especially chronic inequality has adverse effects on companies and even the
capitalist system as a whole. For most citizens, solving the inequality issue is related to incomes
which correspond to the salary level; moreover, the ones most affected by inequality are those
who depend on the minimum wage. Many of the economic theories argue that increasing the
minimum wage would reduce the number of jobs, as an increase in wage costs cannot be passed
on to customers, especially in the globalized economy.
However, socio-economic approaches on the minimum wage are more often than not
contradictory. Supporters of the minimum wage believe that this is a way to increase the
wellbeing of individuals, especially of those with low incomes. Opponents, however, believe
that the only thing that the minimum wage does is to reduce the employment rate and/or
increase “working under the table” (informal). Under these circumstances, establishing the

Proceedings of the IE 2015 International Conference
www.conferenceie.ase.ro
450
minimum wage has to reconcile social and economic considerations. Social considerations
refer to the standard of living and income inequality that lead to a certain level of pressure to
increase minimum wages (pressure coming mainly from trade unions). Economic
considerations related to productivity, competitiveness, job creation lead to the pressure (often
from employers) to maintain the minimum wage at a low level [1].
Under conditions of prolonged economic crisis keeping a high level of the minimum wage by
law may have the effect of lowering employment for the category of minimum wage level
employees (generally young and unskilled workers). This indicates once again that the state
should pay a minimum wage difference for these categories, especially if there is no decrease
in the prices on which the minimum wage also depends. This difference which can be a way to
combat unemployment, which is subsidized from the unemployment fund, has to be linked to
the criteria which led to the establishment of the minimum wage [2].
2. Literature review In an analysis performed on the French economy Aghion et al. [3] consider that it is necessary
to rethink the role and the policy of the minimum wage. The authors argue that a minimum
wage too high can damage employment, trust and social mobility. Thus, the only criteria that
must be taken into account should be those fighting against poverty, equity and economic
impacts, particularly on competitiveness and employment.
In recent years the minimum wage has become an increasingly popular policy tool in many
emerging economies, especially since the major challenge of applying the minimum wage
regulations in these economies is given by the rather high level of “work under the table”.
Fialova and Myslikova have conducted an analysis on the impact of minimum wages on the
labour market in the Czech Republic using data from the development regions (NUTS 2) in the
period 2000-2009. The result of the analysis indicated that the minimum wage had a significant
impact on increasing regional unemployment and reduced employment opportunities for
workers with low wages, generally unskilled workers [4].
A similar study was also conducted by Majchrowska și Zółkiewski [5] on the economy in
Poland. Using an econometric model based on time series the authors analysed the impact of
the minimum wage on the employment rate in Poland. The results of the econometric study
indicated that the minimum wage had a negative impact on employment in the period 1999-
2010, and the stronger negative effects took place during the period in which the minimum
salary increased substantially (2005-2010), young people being the most affected segment. At
the same time, the analysis indicated that a unique regional minimum wage can be quite
harmful on the employment rate in poorer regions.
In an analysis conducted on the labour market in Hungary, Halpern et al. identified an important
side effect of increasing the minimum wage on employment and on employment opportunities
in small businesses [6].
Although most studies show a negative effect of the minimum wage on the employment rate,
there are studies that state the contrary. Thus, David and Krueger [7] conducted a study in the
USA showing that the link between the minimum wage and the loss of jobs is weak and
unfounded. One should keep in mind that they have shown not only that the minimum wage
has no effect on employment, but that it can even increase the number of employees. For this
reason, they compared employment in fast-food restaurants in two adjacent states, New Jersey
and Pennsylvania, after the minimum wage increased in New Jersey. Rather than an automatic
reduction in the number of employees, an increased minimum wage presents contradictory
answers that do not avoid the positive effects, including for the employer.
In Romania we can see that the minimum wage is at a very low level which does not ensure a
level of subsistence; furthermore there is not the case of a situation in which the local employer

Proceedings of the IE 2015 International Conference
www.conferenceie.ase.ro
451
uses the workforce accordingly and the latter either emigrates or it is not qualified enough for
the demands of a globally competitive economy [8].
Thus, under current conditions, given the social premises and the need to stimulate domestic
consumption, government policies support raising the minimum wage. However, we have to
point out that any nominal increase in the minimum wage should be made in the context of a
development in labour productivity, because - in the event of a disconnection between these
two elements - we will be faced with negative effects on the medium and long term, including
inflation growth, a decrease in the competitiveness of SMEs, and also a decrease in exports.
There is also the risk of establishing, at the company level, the practice of redistributing a part
of the legitimate income of the highly skilled and productive employees to lower skilled
employees with a lower productivity, which will significantly affect the motivational system
of the company and will discourage performance.
3. Data and methodology
In this study, the analysis focuses on gender analysis of minimum wage impact on employment
in Romania. Using the employed population as a dependent variable, we considered the
following explanatory variables in our model: the national real minimum wage, the gross
domestic product, the average real gross earnings and the net investment index. We used the
consumer price index as chain index in order to obtain real values of the minimum wage and
average earnings and the deflator for the real domestic product.
We targeted the period Q1 2000 - Q3 2014, having therefore 59 observations that were obtained
from the Romanian National Institute of Statistics.
As econometric methods employed in this study, we used the multifactorial linear regression,
with the following general form1:
𝑌𝑡 = 𝛼𝑀𝑊𝑡 + 𝛽𝑅𝑡 + 𝑒𝑡
where et is the white noise error and t takes values from 1 to 59, representing the period Q1
2000 – Q3 2014. MW stands for the minimum wage, while R includes: real average monthly
gross earnings, the gross domestic product and the net investment index
The dependent variable represented by the employed population was divided so to allow a
gender analysis of the minimum wage effects. Since the macroeconomic effects occur in
general with a short delay, we allowed up to four lags for each variable of our analysis,
including the dependent one.
After considering the general form of the model, we then applied several transformations to
the data, in order to reduce their heterogeneity [9]. Thus, we first decided to use all variables
in natural logs. Then, after applying the Augmented Dickey-Fuller and Phillips-Perron tests in
order to check if the series are stationary, the results indicated the need to first difference the
variables (the tests were carried out in Eviews 7). After taking the logs and the first differences,
the general model turned to the following form:
𝑑𝑙𝑌𝑖𝑡 = 𝛼 + 𝛽1 × 𝑑𝑙𝑚𝑤 + 𝛽2 × 𝑑𝑙𝑒𝑎𝑟𝑛𝑡 + 𝛽3 × 𝑑𝑙𝑔𝑑𝑝𝑡 + 𝛽4 × 𝑑𝑙𝑖𝑛𝑣𝑡 + 𝑒𝑡 where: Y - the employed population for each group i, males and females;
mw - the minimum wage;
earn - average gross monthly earnings;
gdp - gross domestic product;
inv - net investments index.
After the estimation of models with statistically significant coefficients, where the selected
regressors explain a large proportion of the variation in the dependent variable, we had to check
1 The model is similar to the one used by Brown, Gilroy and Kohen in 1982.

Proceedings of the IE 2015 International Conference
www.conferenceie.ase.ro
452
that the residuals fulfil the following important conditions: the residuals should not be
correlated or heteroskedastic and should have a normal distribution [10]. In case one or more
of the conditions are not satisfied the estimated coefficients will be biased and inconsistent and
the equation should be re-specified.
4. Econometric results
The male employment equation shows a positive influence of the minimum wage, suggesting
that the minimum wage stimulates the males to find a job and to get employed. In this case, if
we were to increase the minimum wage by 10%, the male employed population would increase
by 0.5%.
The net earnings also acts as a stimulating factor for the male labour supply, only this time the
influence is not from the present value, but from lag 4. Its influence is slightly greater than that
of the minimum wage.
As expected, the net investments have a positive influence on the male employed population.
Although the impact is relatively small, its sign indicates a complementarity between labour
force and new technological equipment.
The impact of the real GDP is oscillating, being distributed negatively on lags 1 (-0.058) and
3 (-0.071) and positively on lag 4 (+0.021). The long run impact is negative (0.108): if the gross
domestic product would increase with 10%, the employed male population would decrease
with 1.08%.
Table 1- The main results of the regression models
Males Females
c -0.00000683 (0.0035) 0.001080 (0.184)
dlmw(t) 0.052 (2.87)*
dlmw(t-1) 0.242 (4.48) ***
dlmw(t-3) -0.246 (-5.18) ***
dlnre(t-3) -0.187 (-2.09) **
dlnre(t-4) 0.066 (2.49)**
dlni 0.03 (2.38)**
dlgdp(t-1) -0.058 (-2.68)**
dlgdp(t-3) -0.071 (-3.47)*
dlgdp(t-4) 0.021 (2.41)** 0.085 (3.84) ***
dlf_empl(t) 0.653 (16.79)*
Estimation method Least Squares Least Squares
R2-adj 0.948 0.69
Normality test (Jarque-Bera) 0.857 0.724
Autocorrelation test
(Breusch-Godfrey LM Test) 0.782 0.51
Heteroskedasticity test
(White) 0.951 0.33
where between brackets are the t statistics, and *, **, *** stands for a 1% , 5% and 10% significance level
A very interesting aspect is that the female employed population is also positively influencing
the male employed population evolution. The coefficient is strong: a 10% increase of the
female work force would result in a 6% increase of the male work force. Having these results,
we may consider the two segments of the work force to be in a complementary relationship
(and not a substitution one).

Proceedings of the IE 2015 International Conference
www.conferenceie.ase.ro
453
Regarding the female employment equation, several particularities can be drawn as well. For
instance, regarding the minimum wage effect upon female employment, two main aspects are
worth mentioned. First aspect is that the three quarters delay shock is negative, which reveals
a normal reaction of employers who are worried to a certain extent of the repercussions of the
annual wage increase. More precisely, a 10% increase in the real minimum wage leads to a
2.46% reduction in female employment with less than a year delay, keeping all the other
variables constant. Second, we also notice a smaller but positive delayed effect of the minimum
wage expected to occur with only one quarter delay on the labour market, confirming that there
is indeed a delayed adjustment of the employers to the frame of the planned wage funds.
The influence of the Gross Domestic Products seems normal although the impact is delayed
with one year, since the growth of the output stimulates employment by the need to create new
job entries and the emergence of new economic activities. The estimated coefficient indicates
that a 1% increase of GDP leads to a 0.085% increase of female employment, keeping all the
other explanatory variables constant.
A negative impact upon female employment is however given by a variation of the real
earnings, indicating that a 10% increase in the real net earnings will lead to a 1.87% decrease
of the female employment with a three quarters delay, when keeping the other variables
constant. This result suggests that female employees are more sensitive to real net earnings
variations and tend to have higher vulnerability in general, in case of a net earnings increase.
5. Conclusions In this paper we elaborated a gender analysis of the minimum wage effects upon employment
in Romania. For that we used quarterly data for the period 2000 Q1 – 2014 Q3 and built two
employment equations differentiated by gender. Our results suggest the presence of some
gender differences in the way the minimum wage effects are perceived by the employed
population.
More precisely, the male employment equation shows a positive influence of the minimum
wage, suggesting that the minimum wage stimulates the males to find a job and to get
employed, while when considering the female employment equation, there is a rather negative
average impact of the minimum wage.
The influence of the GDP seems normal, especially for the female case, when the growth of
the output stimulates employment by the need to create new job entries and the emergence of
new economic activities, even if the effect turns out to be delayed with one year. The impact
of real GDP is however rather oscillating, when referring to the male employment.
In conclusion, our results are consistent with the international literature and bring added value
to the empirical research of the Central and East European countries.
References
[1] Rutkowski, J., „The minimum wage: curse or cure?”, Human Development Economics
Europe and Central Asia Region, The World Bank, 2003.
[2] Grimshaw, D.,”Minimum wage trends during the crisis: The problem of stronger
”minimum wage contours” and weaker unions”, Paper for the Annual Progressive
Economy Forum, Theme: Inequality and the crisis, 2014,
http://www.progressiveeconomy.eu/sites/default/files/papers/Damian%20Grimshaw%20-
%20Minimum%20wages%20during%20the%20crisis.pdf
[3] Aghion,P., Cette, G. and Cohen, E., Changer de modele, Editeur : Odile Jacob, 2014
[4] Fialova, K., and Myslikova, M., ”Minimum Wage: Labour Market Consequences in the
Czech Republic”, IES Working Paper 6, Charles University in Prague, 2009.

Proceedings of the IE 2015 International Conference
www.conferenceie.ase.ro
454
[5] Majchrowska, A., Zółkiewski, Z.,”The impact of minimum wage on employment in
Poland”, Investigaciones Regionales, 24, 2012, pp. 211- 239.
[6] Halpern, L., Koren, M., Korösi, G., Vincze, J., ”Budgetary effects of the rise in the
minimum wage”, Ministry of Finance - Increases in the Minimum Wage in Hungary,
Working Paper No.16, 2004
[7] David, C., Krueger, A., "Minimum Wages and Employment: A Case Study of the Fast-
Food Industry in New Jersey and Pennsylvania1994". American Economic
Review 84 (4):1994, pp.772–793
[8] Roman, M.D., Popescu, M.E. „Forecast scenarios of youth employment in Romania”, Vol.
of the 13th IE Conference, 2014, pp. 554-559.
[9] Wooldridge, J.M., Introductory econometrics – A modern approach, Second Edition, 2002,
pp. 501-528.
[10] Spircu, L., Ciumara, R., Econometrie, ProUniversitaria Publishng House, 2007.
Proceedings of the IE 2015 International Conference
www.conferenceie.ase.ro
455
JUNCTIONS BETWEEN EVALUATION THEORY AND GAMES
THEORY
Marin MANOLESCU
University of Bucharest, Faculty of Psychology and Educational Sciences
Magdalena TALVAN
University of Bucharest, Faculty of Psychology and Educational Sciences
Abstract. The concept of school evaluation has known over the years multiple approaches,
fact that demonstrates the complexity of this process which is so important for the proper
conduct of an educational approach. In the present article we will study school evaluation
through the relation that appears between the inter-conditions between teacher and student,
studied from the perspective of the Games Theory. We consider that is pertinent to make an
analysis of the evaluative approach in terms of the influence that the relationship with
subjective conotations between student and teacher exerts on this evaluative approach,
contextualized by the particularities of each of the two educational actors. In the present paper,
we propose a model of Games theory, where players are the teacher and the student. The
purpose of this model is to theoretically demonstrate how those two educational actors reach
an agreement, regarding the decisions they will make in terms of pupil evaluation by the
teacher.
Keywords: game theory, teacher, student, strategic, evaluation methods JEL classification: C700, I210, I290
1. Introduction
Evaluation theory has experienced over the time multiple conceptual developments which has
to be verified in the classroom, in direct relation between evaluator- the one being evaluated.
From the perspective of educational actors directly involved in the educational process, we can
say that the approaches defining the concept of school evaluation refers to the relationship
between the information resulting from the interpretation and evaluation by the teacher
regarding the evaluated student and the "ideal data and expectations regarding intentions." [3].
In this context, we note that "evaluation is a complex process that allows the issuance of
valuable judgments regarding to an activity and / or result that aims to adopt final decisions
aimed at improving the work of teachers and students and common results thereof". [1]
Traditional methods used in evaluative practice represented by oral evidence, written tests,
practical tests and docimologic test is "a set of practices inherited from different educational
traditions which have gradually mixed to become, over time, sufficiently coherent to impose
itself and who resisted over the time because of their record." [7] The obtained information in
the evaluative practice by applying traditional evaluation methods are successfully completed
by data that can be withheld from the use of alternative methods: systematic observation of
behavior and work of the students; self-evaluation; investigation; project; portfolio. We recall
in this regard the finding that "although almost all experimental research lead to the conclusion
that traditional tests (regardless of the evidence used: written, oral, practical) are subjective,
patriarchal attitude towards the grade made by the professor continues, resulting in moral and

Proceedings of the IE 2015 International Conference
www.conferenceie.ase.ro
456
religious nuances that still paralyzes the desire of fairness and justice of the students or their
parents." [6].Whatever methods are used, teachers should consider the explanation of the
evaluation criteria to the students. "These requirements should not differ from those made
during training", bearing in mind the "pedagogical significance" of the evaluation process. [2]
We talk about training the students to a better self-knowledge to improve the learning style.
With well-chosen evaluation methods and being supported by the teacher, the student will learn
to relate to the evaluation criteria. In time, the student will be able to realize his level of
knowledgein a particular discipline, given its aspirations in relation to the personal
development. This will help the student to better target a career that fits as well as the flexibility
of adapting to the requirements of a rapidly transforming society.
2. Games theory and the relation between educational actors
Games Theory is a relatively new branch of mathematics, with multiple applications in
economical area. The time of occurrence of this new theory is considered to be marked by the
publication of "The Theory of Games and Economic Behaviour", having as authors John von
Neumann and Oskar Morgenstern in 1944. According to them, the game is defined as "any
interaction between various agents, governed by a set of specific rules that establish the
possible movements of each participant and earnings for each combination of moves". [5] We
also note that Solomon Marcus says: "range of these games is universal, the strategic point of
view has relevance in all areas that meet actors with different interests and where, in one way
or another, the actors depend on each other." [4] With reference to the defining characteristics
of the game from the perspective of Neumann and Morgenstern mentioned, we can identify
the actors, the strategies and the gain functions within a evaluative educational model. In this
context, actors or players involved in the game are the teacher and the student. Each is related
to certain objectives, depending on who determines how he will act, so as to obtain maximum
gain. Also, the teacher and the student take decisions that depend on their own strategic choices
and behaviors exhibited by the other educational actor.
3. Games theory model applied in the school evaluation
We present a model of Games Theory adapted in school evaluation, trying to explain through
a mathematical model how the two educational actors - teacher and student- react, one
depending on the other, to achieve maximum gain. The model is first presented in static
perspective, teacher and student taking strategies in the same time. The solution or game
balance can be improved from the dynamic perspective, the two educational actors’ decisions
are taken sequentially in time, as follows: decision is taken by one player (either by the teacher
or the student); decision adopted by the other player involved in the game.
a. The approach of proposed model from a static perspective:
In practice, there may be students and teachers who prefer or not the same evaluation methods.
The static perspective of the proposed model emphasizes that it is unlikely that the two
educational actors to reach a conflict regarding a sample evaluation applied by the teacher at a
time. We will assume that the strategies of the two parties are the same, the preference for two
evaluation methods: either evaluation based on traditional methods (denoted EMT); either
evaluation based on alternative methods (denoted EMA).
Educational gains of the two actors are as follows:
From the student perspective: We will assume that we are dealing with a student who prefers
an evaluation based on alternative methods, an evaluation based on traditional methods. In this
case, we’ll assume that the student has ten units of satisfaction when he is evaluated through
alternative methods and eight units of satisfaction, when he is evaluated through traditional

Proceedings of the IE 2015 International Conference
www.conferenceie.ase.ro
457
methods. For the student, unit satisfaction interpretation can be given by the grade that he
believes that he can achieve in the case of such type of evaluation. If the student whishes to be
examined through alternative methods, but the teacher decides to examine the student through
the traditional methods, it will be a student dissatisfaction and his gain will be zero. If the
student whishes to be evaluated through traditional methods, but the teacher decides to examine
the student using alternative evaluation methods, then the student’s gain will be zero because
there are major discrepancies between the wishes of each of the players involved.
From the teacher’s perspective: We will assume that the teacher would prefer more the
traditional evaluation version (with ten units of satisfaction for teacher and eight units of
satisfaction for the student). From the perspective of the teacher, satisfaction units could be
interpreted as being the maximum grades that can give to the students in relation to the
evaluation method that is proposed. In this case, we will assume that we are dealing with a
demanding teacher who, in the alternative evaluation, considers that the maximum grade that
he can give is 9. Also, the same teacher may give a 10 grade to a traditional sample of
evaluation.
The solution of the proposed model from static perspective can be determined by relative
earnings algorithm, the algorithm of the best response. We denote by S the set of strategies of
the two players. In this case S = SPX SE, where Sp is the set of strategies of the teacher, Sp =
{EMT, EMA} and SE represents the set of students’ strategies SE = {EMT, EMA} For each
player, will define gain functions shown in Table 1: Table 1 - The gain functions of the two players involved in the proposed model
Gain functions of the teacher and students
Teacher
UP: Sp→R
UP(EMT, EMT)=10 ,UP(EMT, EMA)=0,
UP(EMA, EMT)=0, UP(EMA, EMA)=8
Student
UE: SE→R UE(EMT, EMT)=8, UE(EMT,EMA)=0,
UE(EMA, EMT)=0, UE(EMA, EMA)=10
We note that the set of possible solutions of the proposed model is as follows: {(EMT, EMT)
(EMT EMA), (EMA EMT), (EMA EMA)}.We determine, first, the best answer for the teacher,
taking account of possible student’s strategies. The founded answer will highlighted in the gain
matrix. Thus, if the student chooses EMT strategy, then, the best answer for the teacher is to
adopt the same strategy, EMT, because 10> 0. On the other hand, if the student chooses strategy
EMA, then the best response for the teacher is also strategy, EMA, because 8> 0. Next, we will
determine the best response for the student, taking into account the possible strategies of the
teacher. The founded answer will be highlighted in the gains matrix. Thus, for the student, if
the teacher chooses EMT strategy, then, the best response for the student is the same strategy,
EMT, because 8> 0. Also, if the teacher chooses strategy EMA, then the best response for the
student is also strategy, EMA, because 10> 0. The gain matrix is described in Figure 1.
We note that we obtained two equilibria in pure strategies, namely feasible strategies for each
player. These are: either (EMT, EMT), that both educational actors agree with the evaluation
based on traditional methods; or (EMA EMA), the two players agreeing appropriate solution
of the evaluation based on alternative methods.

Proceedings of the IE 2015 International Conference
www.conferenceie.ase.ro
458
Student
EMT
EMA
Teacher
EMT
10, 8 0 , 0
EMA
0 ,0
8, 10
Figure 1 -The model’s solution from static perspective
We find that we can not say precisely which of the two strategies will be chosen by the players.
Therefore, we’ll calculate the probabilities with which the teacher or student, choose one or the
other of the evaluation methods. For this, we denote by p1 and p2 the probabilities with which
the student or teacher prefer the evaluation based on traditional methods. Obviously the
probabilities with each player prefers evaluation based on alternative methods are (1-p1), for
the student, and (1-p2) for the teacher. Then the student’s gain if the teacher adopts strategy
EMT is the UE ((p1, 1-p1); EMT) = 8p1 and the student’s gain if the teacher adopts strategy
EMA is the UE ((p1,1-p1); EMA) 10-10p1.Considering that UE ((p1, 1-p1); EMT), UE = ((p1 1-
p1; EMA) and taking into account p1 + p2 = 1, we obtain equilibrium in mixed strategies,
respectively ((p1,1 - p1), (p2, 1-p2)), with p1 = 5/9 and p2 = 4/9.
In conclusion, the solution of the game, determined by the best response algorithm indicates
three possible equilibrium, two equilibrium in pure strategies, either (EMT, EMT) or (EMO,
EMO) and a mixed strategy equilibrium.
Theoretical solution of this game suggests that fear of failure (which may be due to the choice
of divergent strategies) leads to the fact that the two players coordinate their decisions and
choose the same type of evaluation. On the other hand we can not know for sure which it will
be (because there are two behavioral equilibriumin pure strategies). Equilibrium in mixed
strategies indicates players’ preferences and intensity. At the equilibrium,, the teacher believes
that the student prefers evaluation based on traditional methods with a probability of 5/9 and
evaluation based on of alternative methods with a probability of 5/9, while the student believes
that the teacher prefers evaluation based on traditional methods with a probability of 5/9 and
evaluation basedon alternative methods with a probability of 4/9. The intensity of preferences
(which depends on the gains of each player) in this case may indicate a more probable solution
than another. In case of equal intensity it is difficult to determine which of the equilibrium is
more likely. This uncertainty can be removed if we use the dynamic version of the game.
b. The dynamic approach of the proposed model
If we turn the previously described static game into a dynamic game, one player announces
firs its preference for a particular type of examination after that, the other decides what is best
for him (no matter who starts the game, the teacher or the student) then the equilibrium changes.
The game will be as follows: first, the teacher announces what type of evaluation prefers more,
after that, the student decides on his preferred type of evaluation, by announcing his preference
to the teacher. Extended form of the game, when the teacher is the one who decides first is
described in Figure 2.

Proceedings of the IE 2015 International Conference
www.conferenceie.ase.ro
459
Figure 2 - Description of the model from dynamic perspective. The case when the teacher announces what type
of evaluation will adopt
For the dynamic game, when the teacher decides first, the solution is obtained by the following
reasoning: if the teacher would announce an evaluation based on traditional methods, the
student will compare the gain in order to accept such an evaluation (of 8 units, grade that he
will gain through the evaluation based traditional methods) with the gain he would obtain in
the case in which he would reject the evaluation (zero units) and he will decide to accept the
teacher’s proposal. If the teacher announces an evaluation based on alternative methods, then
the student’s gain is maximum if he accepts the proposal (a gain of 10 units, grade that he can
get through evaluation based on alternative methods). In this case, the student's decision will
be to accept any teacher’s proposal. In this case, the teacher knows that if he proposes an
evaluation based on traditional methods, has a gain of 10 units (can give grade 10), while if he
proposes an evaluation based on alternative methods, he will have a gain of only 8 units (can
give only grade 8). Therefore he will propose the alternative of evaluation based on traditional
methods, which brings a higher gain. We obtained an unique solution corresponding to the
combination of the strategies: (EMT, EMT). For the dynamic game in which the student is the
one who decides first (or first teacher asks students what type of evaluation prefer, then take
the decision about the adopted type of evaluation), the game equilibrium is never the same and
we have the following reasoning: if student would announce that he prefers an evaluation based
on traditional methods, the teacher compares the gain that he would have in case he accepts the
student’s proposal (10 units, the maximum grade that he can give through the evaluation based
on traditional methods) with the gain he would obtain in the case he will reject it (zero units,
discrepancy between the visions of the two players) and he will decide to accept the student’s
proposal. If a student announces that he prefers evaluation based on alternative methods,
teacher gain is 8 units, if he accepts the proposal and zero units if he refuses. In this way, the
teacher’s decision will be to accept any student’s proposal. In this case, the student knows that
if he proposes an evaluation based on traditional methods, it would have a gain of 8 units, while
if he proposes an evaluation based on alternative methods, it would have a gain of 10 units.
Consequently, he will propose the version of evaluation based on alternative methods, which
brings a higher gain, proposal that is accepted by the teacher. We obtained in this way a unique
solution, given by the combination of strategies (EMA, EMA).

Proceedings of the IE 2015 International Conference
www.conferenceie.ase.ro
460
From the dynamic perspective we get a unique equilibrium when one of the two actors
announces a certain way of evaluation, and the other one takes account of these preferences.
Therefore, it is recommended that at the beginning of the semester, to exist a communication
regarding the evaluation methods (dynamic perspective of the proposed model).
4. Conclusions
Interrelation between teacher and student that occur during the school evaluative approaches
can be described using games theory models. This paper proposed a game in which the two
educational actors adopt behavioral strategies in order to achieve maximum gain regarding the
realization of their rational expectations. The set of strategies for the two players is the same,
but the teacher and the student's preferences are different regarding the evaluation methods.
The solution of this model indicates that the transition from static to the dynamic game, on the
one hand, eliminates the uncertainty that might arise when there are multiple equilibriums. On
the other hand we find that the player who takes the first decision is an advantage in relation to
the one which chooses later because the second player will have to "adapt" to the desires and
expectations of the first player.
The proposed model emphasizes the importance of communication between teacher and
student regarding the adoption of appropriate evaluation methods and the individual
peculiarities of the teacher and the student.
References
[1] V. Dumitru, Evaluarea în procesul instructiv-educativ. București: Editura Didactică și
Pedagogică, 2005, pp.14-15.
[2] I. Jinga, A. Petrescu, M. Gavotă and V. Ștefănescu, Evaluarea performanțelor școlare.
București: Editura Afeliu, 1996, pp.50.
[3] M. Manolescu, Activitatea evaluativă între cogniție și metacogniție. București: Meteor
Press, 2003, pp.150.
[4] S. Marcus, Paradigme universale III Jocul. București: Paralela 45, 2007, pp.6.
[5] M. Roman, Jocuri şi negocieri. Bucureşti: AISTEDA, 2000, pp.5.
[6] C. Strungă, Evaluarea școlară. Timișoara: Editura de Vest, 1999, pp.115.
[7] J. Vogler, Evaluarea în învăţământul preuniversitar. Iași: Polirom, 2000, pp.27.

Proceedings of the IE 2015 International Conference
www.conferenceie.ase.ro
461
ROMANIAN EDUCATION SYSTEM – EFFICIENCY STATE
Madalina Ioana STOICA Bucharest University of Economic Studies
Crisan ALBU Bucharest University of Economic Studies
Abstract. In recent years, the higher education system in Romania has been suffering many
changes and the admission to various universities has been modified from year to year. The
reputation and the academic research have been indicators for future potential students when
making the difficult decision of choosing a university. Their evaluation has been made by
different institutions and usually simple fractions have been used to construct rankings. This
study provides an alternative in which multiple input – output systems of variables are used in
evaluating efficiency. Nonparametric technique data envelopment analysis is employed to
provide a comprehensive picture of the performance of universities. Sensitivity analysis to the
variable choice is provided through different efficiency models. Results show potential areas
of improvement in institutions efficiency and could help the government in deciding budget
funds allocations.
Keywords: efficiency, nonparametric techniques, DEA, universities
JEL classification: C8, D7, I21
1. Introduction The evaluation of higher education institutions efficiency is a major concern in this tight budget
funding schema. The prospects and attractiveness of a university resides in its capacity to
efficiently use the available resources in order to maximize its output in terms of results.
Because we are dealing with a multiple variables framework, we need to consider methods of
evaluating the system which permit the inclusion of more than one input and more than one
output.
One major evaluation process has been initiated by the Ministry of Education and Research in
2011 when a platform has been implemented such that each university had to fill in data
regarding their activity in a standardized form. Based on the collected data, the universities
were then classified based on some indicators of type fraction or simple primary data into three
categories: universities centered on education, universities of education and scientific research
or universities of education and artistic creations and universities of high research and
education.
In 2013, an International Assessment Institution – The Association of European Universities
classified for the first time the Romanian universities according to European standards. 12
universities were ranked in the first category, of universities of high research and education.
All private universities were classified into the last category, so the quality of the research in
those institutions was questioned by authorities, which considered lowering the number of
funded places for different levels (bachelor, master or PhD). On the other hand, the high profile
research institutions were allocated approximately 20% more places for research positions,
especially doctorate.

Proceedings of the IE 2015 International Conference
www.conferenceie.ase.ro
462
This paper aims to evaluate institutions efficiency by employing nonparametric technique data
envelopment analysis. The possibility to include more than one input and one output leads to a
comprehensive picture on the performance of universities and the areas where modifications
need to be made in order to increase their efficiency.
The next section provides a short overview of the technique employed, followed by a section
with the data description. The models used to evaluate universities, as well as the results and
the rankings created are presented in the Efficiency models and results section. Conclusions
come at the end.
2. Methodology
The technique employed is data envelopment analysis, which has been developed since the
paper of [1], who introduced the concept of efficiency in relation to the capacity of firms to
transform inputs into outputs. The author decomposes efficiency into two distinct parts: the
technical efficiency and the allocative efficiency. The first one reflects the firm’s capacity of
obtaining maximum amount of output given a fixed quantity of inputs. The latter one introduces
the variables prices and assumes the optimal combination of inputs given their prices and the
technological process. In 1978 the problem was formulated as a linear programming model by
[2] under the restriction of constant returns to scale, which was later relaxed under variable
returns to scale by [3].
The technique assumes the construction of an efficiency frontier where the most efficient firms
or decision making units (DMU) are represented on the curve with an efficiency score of 1,
while all others are found below the curve with an efficiency score less than 1.
In this paper, we will only deal with technical efficiency since not all universities inputs can be
associated with a price. The presentation and notation below follow [4]. Technical efficiency
can be expressed as a fraction of weighted sum of outputs divided by the weighted sum of
inputs. Therefore, for university i technical efficiency can be expressed as follows:
𝑇𝐸𝑖 =∑ 𝑢𝑝𝑖𝑞𝑝𝑖𝑝
∑ 𝑣𝑠𝑖𝑥𝑠𝑖𝑠 (1)
, where for the ith university the variables which represent inputs and outputs are described by
the column vectors xi and respectively, qi and their corresponding weights v′ and respectively,
u′. In the model above we assume a system with N inputs and M outputs. For the purpose of this
analysis, we use the variable returns to scale model, as it is presented in [4]. Only in the case
when universities would operate at an optimum level, we can assume the constant returns to
scale assumption.
Solving a mathematical program, DEA finds a set of weights in the range (0, 1) which are most
favorable for each university [5]. The optimal weights are computed using the variable returns
to scale (VRS) output oriented model as presented in [5]:
min∅,𝜆
∅
𝑠. 𝑡. − ∅𝑞𝑖 + 𝑄𝝀 ≥ 𝟎, 𝑥𝑖 − 𝑋𝝀 ≥ 𝟎, 𝐼1′𝛌=1
𝛌≥ 0. (2)
, where ∅ is a scalar satisfying 1≤ ∅ ≤ ∞, 𝛌 is a scalar vector of order I*1 and 1/∅ is the
proportional increase in outputs that can be achieved by university i, in case of fixed input
quantities. The value of 1/∅ is the technical efficiency score reported in software program
DEAP and lies between 0 and 1.

Proceedings of the IE 2015 International Conference
www.conferenceie.ase.ro
463
One DEA feature is that it provides appropriate benchmarking for DMUs such that we can
compare inefficient observations with efficient ones (peers).
The computation associated with DEA can be made in software program SAS, but also using
a number of specialized other programs especially built for DEA calculations like ONFront,
iDEAs, Warwick DEA, FEAR or DEAP. In this analysis I used DEAP 2.1 build by Tim Coelli.
3. Data description
The data used for this study was collected from the survey of assessing universities in Romania
realized by the Ministry of Education, Research, Youth and Sports in 2011 [6]. The system of
variables is based on the general accepted categories to represent the education process ([7],
[8]) for input: human resources, material resources and financial funds and for output: research
and teaching. We used a system with 8 variables to account for inputs and outputs and a short
description for them is provided below: Table 1 - Variable description
INPUT Description
CDID Cumulated sum of full professors, assistant researchers,
researchers and assistant professors.
TOTINM Enrolled students (graduates and postgraduates)
FOND Total amount of grants (national + foreign)
CARTI Number of books in the school library
DOT Classroom equipment for teaching and research
OUTPUT Description
PUB Cumulated sum of publications of type ISI (International
Statistics Institute) and IDB (International databases)
PUBISI Number of publications in the ISI journals with impact factor
computed
TOTABS Cumulated sum of graduated students
The original database consisted of 61 universities, but we found an outlier in the data
representing CDID against TOTABS and decided to exclude it from the analysis. Some
descriptive statistics are presented in the table below: Table 2 - Descriptive statistics
Particularly high values are reported for standard deviation in case of variables FOND and
CARTI, which reflect the difference in university size.

Proceedings of the IE 2015 International Conference
www.conferenceie.ase.ro
464
4. Efficiency models and results
In order to estimate universities efficiency, we constructed 6 different efficiency models where
we analyzed the results sensitivity in relation to variable change. The models are presented
below: Table 3 - Efficiency models
Model
Variable
1
(2+1) 2
(1+1) 3
(3+2) 4
(3+2) 5
(3+1) 6
(3+1)
INPUT
CDID * * * * * *
FOND * *
CARTI *
DOT * * * *
TOTINM * *
OUTPUT
PUB * * * *
PUBISI *
TOTABS * * *
The aim of the first model was to test whether large universities are more efficient when it
comes to research activity than smaller ones. The model includes human resources input
represented by academic staff and material resources represented by library books to provide
an image of the university size. The research output is measured by the number of publications.
The conclusion is that the size of universities does not influence the number of publications in
journals and we obtained efficient universities of all sizes: large, big, medium and small. Input
slacks have particularly high values for the variable books, suggesting that universities could
lower their library collection number without affecting the research results. This is an indirect
effect of the intense and increasing use of the internet.
In order to study universities efficiency when it comes to high rated journals (with an impact
factor computed) we used model 2. Results show that big universities concentrate resources on
higher quality journals in general. Most of the high profile universities in Romania, like
University Alexandru Ioan Cuza or University of medicine and pharmacy Carol Davila and
University Polytechnic in Bucharest are efficient in this model.
Model 3 introduces an input variable not used in the previous models and it refers to human
capital, particularly total students enrolled, being an indicator of university attractiveness. We
wanted to estimate efficiency score that will reflect university capacity of using available
resources in matter of human and physical capital in order to obtain a high number of graduates
and consistent research work. 16 efficient universities were found, the top being quite similar
to the previous two. In comparison to these models, we changed two input variables and added
a new output. These results confirm the assumption that a ranking does not significantly change
when partial replacement of input variables is made with similar variables, having similar
economic meaning (CARTI<->DOT) or even by introducing a new economic aspect to the
model, TOTINM.
In order to see the effects orientation has on the rankings built, we ran model 3 in an input
orientation (model 4). The assumption that the number of scholars or enrolled students could
be reduced is related to the selection process efficiency. Although the first 20 positions are
almost identical (with one exception), the top has suffered some modifications. It seems that in

Proceedings of the IE 2015 International Conference
www.conferenceie.ase.ro
465
general, technical universities are less efficient in the input orientation, meaning that
universities do not concentrate on minimizing effort or resources, but to obtain maximum
results. The same interpretation is valid for some medical institutions: University of medicine
and pharmacy Gr. T. Popa or University of medicine and pharmacy from Târgu Mureş.
The next two models were built in order to compare rankings that are very different from the
rest of the models presented so far. They account for another economic aspect: financial
resources. Although we have included this new dimension, the results are not very different
from the previous others rankings.
These two models aim to reflect the efficiency of research and respectively, of teaching taking
into account one variable to represent each major category of inputs considered for the analysis:
the number of university academia for human capital, the amount of national and foreign
financial funds to account for financial resources and the equipment available for material
resources.
In order to study trade-off effects between research and teaching, also discussed and analyzed
in [6], we replaced the publications variable with the number of graduates in model 6. The
trade-off refers to the limited amount of time professors have and that a choice needs to made
between allocating more time to teaching or to research. Even if the change of variables was
very important in this case, nine from the fourteen efficient universities in model 5 remain
efficient in model 6. The analysis reveals some examples of trade-offs: Ecologic University in
Bucharest concentrates more on obtaining a high number of graduates than on the research
activity. An opposite example of trade-off is given by University of Agricultural Science and
veterinary medicine in Cluj-Napoca, efficient in model 5, but ranking only on position 47 in
model 6. It seems that in general, concentration on research activity is a time dedication
characteristic of most medical profile universities.
5. Conclusion
The paper provides an efficiency analysis for Romanian universities constructing a sensitivity
study in relation to the variable choice and for approaching different hypothesis. Among these,
we tested whether the size of the university influences publication work or teaching output.
More than that, some models are built in order to strengthen or confirm some results of previous
studies, using other data and variables specification, like it is the case of trade-offs between
research and teaching.
The various models imply multiple variables specification according to the purpose of the
analysis and the technique used was data envelopment analysis. Among advantages of using
this technique we note the flexibility of choosing a series of input variables and a set of output
indicators without any restriction to the functional relation between them. The technique
provides a comprehensive picture of a heterogeneous system where not all indicators need to
be expressed in a quantitative way.
Our contribution to the existing literature is provided by the sensitivity analysis conducted
using six models. The results prove that slight modifications to the input or output variables do
not significantly affect the rankings built; however, changing the variables used with others
that account for different or additional economic purposes or that differ in a high degree from
the original variables may lead to inconsistent rankings in some cases.
In terms of journal publication choice, it seems that universities concentrate their resources on
higher quality journals, and most of the high profile institutions considerably increased their
ranking in the ISI publications model.
The use of financial funds is more efficient in case of small universities than in case of large
institutions. Having access to limited funding, the management seems to adjust its needs in
order to maintain output levels to satisfactory points.

Proceedings of the IE 2015 International Conference
www.conferenceie.ase.ro
466
Further analysis can be conducted taking into account the type of universities (whether they
are generalist or specialized) and also the field of study (ranking medical universities, technical,
and economic). Also, because the study here does not take into account the quality of teaching
as no available data in this matter was found, further investigations regarding this issue are
necessary.
Acknowledgement
This work was supported by the project “Excellence academic routes in doctoral and postdoct
oralresearch READ” cofunded from the European Social Fund through the Development of
HumanResources Operational Programme 20072013, contract no. POSDRU/159/1.5/S/1379
26.
References
[1] M.J. Farrell, “The measurement of productive efficiency,” Journal of Royal Statistical
Society Series A, vol. 120, no. 3, pp. 253-281, 1957.
[2] A. Charnes, W.W. Cooper and E. Rhodes, “Measuring the efficiency of decision making
units,” European Journal of Operational Research. 2, pp. 429-444, 1978.
[3] Banker, R., A. Charnes and W.W. Cooper, “Some models for estimating technical and scale
inefficiencies in data envelopment analysis,” Management Science, no. 30, pp.1078-1092,
1984.
[4] T. J. Coelli, D. S. P. Rao and G. E. Battese, An introduction to efficiency and productivity
analysis, Kluwer Academic Publishers, London. 1998.
[5] M. L. McMillan and D. Datta, The relative efficiencies of Canadian universities: A DEA
perspective, Canadian Public Policy - Analyse de politiques, 1998, vol. XXIV, no. 4.
[6] List of participating universities to the data collection process and the information
introduced in the process: 25 August 2011, 08:00:
http://chestionar.uefiscdi.ro/public5/index.php?page=punivlist [September, 2014].
[7] A. Bonaccorsi, C. Daraio and L. Simar, “Advanced indicators of productivity of uni-
versities. An application of Robust Nonparametric Methods to Italian data,”
Scientometrics. Vol. 66, No. 2, pp. 389-410, 2006.
[8] M. Stoica, “A Survey of Efficiency Studies with Application on Universities” in Proc. of
the IE 2014 International Conference, 2014.
Proceedings of the IE 2015 International Conference
www.conferenceie.ase.ro
467
GST FOR COMPANY’S REPUTATION ANALYSIS IN ONLINE
ENVIRONMENTS
Camelia DELCEA
Bucharest University of Economic Studies [email protected]
Abstract. In the now-a-days economy, the leading businesses have understood the role of
“social” into their everyday activity. Online social networks (OSN) and social media have melt
and become an essential part of every firm’s concerns. Firms have become more and more
involved in online activities, trying to engage new costumers every day. Beside this, the users
of OSN are more informed about a company’s products/services and are seeking information
both in online and offline communities. Even more, their online audiences’ and friends’
opinions have become important in making a decision. Using a grey relational analysis, this
paper tries to shape the relation between firms’ activity in online environments, their
customers’ network characteristics, their perceived image and the company’s reputation.
Keywords: grey knowledge, grey relational analysis, GST, OSN, reputation. JEL classification: C02, G32.
1. Introduction A short and easy to understand definition of OSN is that they “form online communities among
people with common interest, activities, backgrounds, and/or friendships. Most OSN are web-
based and allows users to upload profiles (text, images, and videos) and interact with others in
numerous ways” [1]. As structure, the OSN are usually perceived as a set of nodes – represented
by its users, and a set of directed (e.g. “following” activity on Facebook) of undirected (e.g.
friendship relationships) edges connecting the various pairs of nodes. [2]
But all these pairs of nodes would have no specific value if there wouldn’t be the
communication among the different users, the continuous process of exchanging information
and knowledge. Some of the new works in this field are showing that the whole value of these
OSN comes from users’ interaction.
Among these users, there can easily be identified the “hubs”: the users that have a very large
number of social links with the other members of the social network. This particular type of
users can be very useful for the marketing campaigns as they have a great potential of
communication and interacting with others. Also, the viral marketing campaigns are targeting
the well-connected users. [3, 4]
In OSN more than in other type of communities and networks, grey systems theory (GST) finds
its applicability due to the nature of the relationships between its main actors, mostly due to
the fact that the amount of knowledge extracted is limited. Even more, by adding the human
component, through the consumers’ demands and needs, strictly related to preferences, self-
awareness, self-conscience, free-will, etc. the study of the knowledge that can be extracted
through OSN is becoming more complicated.
Considering the everyday activities, is can easily be seen that the consumers’ opinion regarding
a firm’s reputation depends of a wide array of factors. With the rapid development of OSN and
their users’ engagement, these elements should be considered in order to extract the new
information that can be used in understanding the OSN’s complexity and their influence on

Proceedings of the IE 2015 International Conference
www.conferenceie.ase.ro
468
firm’s reputation. On this purpose, the pre-sent paper tries to shape the relation among some
variables that can be extracted from the online environment and their effects on firm’s
reputation, using some elements taken from the grey systems theory as it will be drawn in the
following.
2. Grey relational analysis Grey systems theory is one of the most recent developed artificial intelligence’s theories and
has been widely applied to a great range of domains, such as: decision making [5], credit risk
assessment [6], bankruptcy forecasting [7], innovation competency evaluation [8], forecasting
[9], evaluating complex products’ quality [10], etc.
Among the methods offered by this theory, grey relational analysis (GRA) is one of the most
known and used as it provides advantages related to the fact that it can generate a statistical
law without a lot of data and it isn’t necessary to have a fixed probability distribution or a linear
correlation between variables. The obtained values for GRA are between 0 and 1 and they are
underlying a stronger relationship among the considered values when the calculated GRA
approaches 1.The steps implied by the conducting such an analysis [7, 11] are presented below:
Calculating the behavior sequence of the system characteristics and the sequence of the related
factors:
.,,2,1,0)),(,),2(),1(( minxxxX iiii (1)
Determining the initial values of each sequence:
)),(,),2(),1(()1(
'''' nxxxx
xX iii
i
ii (2)
Getting the difference sequence:
))(,),2(),1((
)()()( ''0
n
kxkxk
iiii
ii
(3)
Establishing the largest difference and the smallest difference of the two poles:
),(minmin
),(maxmax
km
kM
iki
iki
(4)
Determining the grey relational coefficient:
;,,2,1),1,0(,)(
)(0 mkMk
Mmkr
i
i
(5)
Getting grey relational grade:
n
k
ii krn
r1
00 )(1
(6)
3. Case study For conducting the grey relational analysis, a questionnaire was applied to the online social
networks’ users, 258 persons answering to all the addressed questions. Having the answers, a
confirmatory factor analysis was accomplished in order to validate the construct, validity and
reliability of the questionnaire. After proceeding this, the selected factors were passed through
the grey relational analysis in order to determine the power of the linkage among them.
a. Questionnaire and data The case study was conducted to a 258 respondents, having the age between 18 and 41 years
old. Among them, 98.40% are members on the online social networks, while the rest of have
never been a part of this kind of networks, which reduced our sample to 254 valid respondents.

Proceedings of the IE 2015 International Conference
www.conferenceie.ase.ro
469
Among them, 90.94% have seen a commercial in the social media in the last year or have
seen and participated to a discussion related to a company’s product/ service.
Along with the questions regarding the personal characteristics, the respondents were asked to
answer to a series of questions, evaluated through a Likert scale taking values between 1 and
5, which have been grouped into four constructions:
Firms’ OSN Activity: the respondents were asked to appreciate the firms’ active
involvement in online environments (X1), the online customers’ support centre
activity (X2) and the firms’ active advertising in online environments (X3);
Users’ Activity and Personal Network Characteristics: also measured through three
variables, namely the connection time of each user on OSN platforms (X4), the social
influence of each user – measured through the number of friends that are using a
firm’s product/service and the total number of friends in OSN (X5) and each user’s
active discussion participation in OSN (X6);
Perceived Image: the friends’ opinion regarding the usage of a certain product was
evaluated (X7), the firms’ overall media image (X8) and the sense of achievement felt
by consumers regarding that company’s product/service (X9);
Companies’ Reputation: emotional appeal (X10), the product quality (X11) and value
for money (X12).
As the purpose was to obtain the relational grade among the first three considered variables
on the forth one, companies’ reputation, a model fit analysis was performed using SPSS
AMOS 22 on these three variables (section 3.2.) and then a grey relational analysis was
applied (section 3.3).
b. Model fit through a confirmatory factor analysis Having the answers to the questionnaire above, a confirmatory factor analysis was conducted
in order to validate its main constructions.
The starting construction is pictured in figure 1 (latent construction – A), but due to some values
obtained for main confirmatory factor analysis’s indices such as: CMIN/DF of 2.446, NFI of
0.866, RFI of 0.799, IFI of 0.916, CFI of 0.914, RMSEA of 0.076, etc. which were at the edge
of their threshold, the construction pictured in figure 1: latent construct - B has been validated
(in which the X2 variable was removed) and used in the next section where the grey analysis
was performed.
In the following, the goodness of fit (GOF) for the latent construction – B, as they were
obtained in AMOS 22, are presented. The goodness of fit indicates how well the specified
model reproduces the covariance matrix among the indicator variables, establishing whether
there is similarity between the observed and estimated covariance matrices.
The improved model has a CMIN/DF of 1.552 less than the threshold value 2.000 (Table 1),
indicating a good model fit. Table 1 - CMIN (AMOS 22 Output)
Model NPAR CMIN DF P CMIN/DF
Default model 19 26.377 17 .068 1.552
Saturated model 36 .000 0
Independence model 8 368.245 28 .000 13.152
The values of GFI and AGFI are above the limit of 0.900, recording a 0.977, respectively a
0.950 value (Table 2), while CFI is exceeding 0.900 (being 0.972 – see Table 3) the imposed
value for a model of such complexity and sample size. As for the other three incremental fit

Proceedings of the IE 2015 International Conference
www.conferenceie.ase.ro
470
indices, namely NFI, RFI and IFI, the obtained values are above the threshold value 0.900 for
NFI and IFI and below this value for RFI.
Figure 1- The initial latent construct (A) and the final latent construct (B)
Table 2 - RMR and GFI (AMOS 22 Output)
Model RMR GFI AGFI PGFI
Default model .039 .977 .950 .461
Saturated model .000 1.000
Independence model .254 .707 .623 .550
Table 3 - Baseline comparisons (AMOS 22 Output)
Model NFI
Delta1
RFI
rho1
IFI
Delta2
TLI
rho2 CFI
Default model .928 .882 .973 .955 .972
Saturated model 1.000 1.000 1.000
Independence model .000 .000 .000 .000 .000
As Table 4 shows, the root mean squared error approximation (RMSEA) has a value below
0.100 for the default model, showing that there is a little degree to which the lack of fit is due
to misspecification of the model tested versus being due to sampling error.
The 90 percent confidence interval for the RMSEA is between LO90 of 0.000 and HI90 of
0.080, the upper bound being 0.080, indicating a good model fit. More, the model’s validity
are reliability are evaluated by two additional measures: the average variance extracted (AVE)

Proceedings of the IE 2015 International Conference
www.conferenceie.ase.ro
471
and construct reliability (CR). As these two measures are not computed by AMOS 22, they
have been determined by using the equations presented in [12]. Table 4. RMSEA (AMOS 22 Output)
Model RMSEA LO 90 HI 90 PCLOSE
Default model .047 .000 .080 .524
Independence model .219 .200 .239 .000
After computing, the following values have been obtained for Firms OSN Activity, Users
Activity and Personal Network Characteristics and Perceived Image: AVE: 0.515, 0.503 and
0.518 and CR: 0.683, 0.808 and 0.837. An AVE of 0.500 indicates an adequate convergent
validity, while a CR of 0.700 or above is suggest a good reliability. Having the obtained values,
it can be concluded that the overall construct validity and reliability is good and that the
considered measures are consistently representing the reality.
c. Grey analysis Having validated the considered constructions, a grey relational analysis was per-formed. The
obtained results are presented in Table 5. It can easily be observed that the values obtained in
this analysis are significant as they are situated around 0.700. Table 5. Grey relational analysis
GRA Firms’ OSN
Activity
Users’ Activity and Personal
Network Characteristics
Perceived
Image
Companies’
Reputation .753 .691 .744
The Firms Online Activity construction is having the highest value of 0.753, showing that the
firms’ active involvement and active advertising campaigns conducted in online environments
have a positive and significant influence on that company’s reputation.
Moreover, the customers’ perceived image due to their interaction with other friends/users in
online communities, the online media image and the sense of achievement felt by customers as
they are purchasing a company’s products and services is also important and has a positive
impact on firm’s reputation.
A smaller values is obtained for the construction regarding the Users’ Activity and Personal
Network Characteristics, 0.691, which can underline the fact that personal network
characteristics are not as strictly related to the firms’ reputation as the other two constructs.
In this context, firms can take into account an intensification on their participation in online
environments through marketing campaigns designed to get to their target audience. Also, in
their advertising firms can induce more to their customers the sense of achievement due to the
usage of their products or can try to identify some of the most influential group members for
addressing their message.
4. Conclusions OSN are becoming more and more a now-a-days reality. In this context, companies have
adapted their strategies in order to meet the target audience.
This paper presents a method for selecting some of the most important areas on which a
company can focus in order to increase their reputation.
For this, a questionnaire has been deployed, applied and validated for better extracting the most
appropriate constructions. Grey relational analysis was used as the information flowing within
the feedback loops in OSN is a grey one.

Proceedings of the IE 2015 International Conference
www.conferenceie.ase.ro
472
As further research, a grey systems theory will be used for identifying the most important and
influential node among the most impressionable modes within an OSN. Having this
information, each company can adapt or create a specific strategy that will target this persons
in order to increase and strengthen competitive position on the market.
Acknowledgment This paper was co-financed from the European Social Fund, through the Sectorial
Operational Programme Human Resources Development 2007-2013, project number
POSDRU/159/1.5/S/138907 “Excellence in scientific interdisciplinary research, doctoral
and postdoctoral, in the economic, social and medical fields -EXCELIS”, coordinator
The Bucharest University of Economic Studies.
References [1] F. Schneider, A. Feldmann, B. Krishnamurthy and W. Willinger, “Understanding online
social network usage from a network perspective,” in Proceedings ACM SIGCOMM
Conference on Internet Measurement, 2009, pp. 35-48. [2] J. Heidemann, M. Klier and F. Probst, “Online social networks: A survey of a global
phenomenon,” Computer Networks, vol. 56, pp. 3866-3878, 2012.
[3] J. Yang, C. Yao, W. Ma and G. Chen, “A study of the spreading for viral marketing based
on a complex network model,” Physica A: Statistical Mechanic and its applications, vol.
389, no. 4, pp. 859-870, 2010.
[4] A. Goyal, F. Bonchi and L. Lakshmanan, “Discovering leaders from community actions,”
in Proceedings of the 17th ACM conference on information and knowledge management,
2008 pp. 499-508.
[5] J. Zhu, “Self-adaptation evaluation method in real time dynamics decision-making system
based on grey close relationship,” Grey Systems: Theory and Application, vol. 3, no. 3, pp.
276 – 290, 2013.
[6] J. Jin, Z. Yu, Z. and C. Mi, “Commercial bank credit risk management based on grey
incidence analysis,” Grey Systems: Theory and Application, vol. 2, no. 3, pp.385 – 394,
2012.
[7] C. Delcea, “Not black. Not even white. Definitively grey economic systems,” Journal of
Grey System, vol. 26, no. 1, pp. 11-25, 2014.
[8] Y. Zhu, R. Wang and K. Hipel, “Grey relational evaluation of innovation competency in an
aviation industry cluster,” Grey Systems: Theory and Application, vol. 2, no. 2, pp.272 –
283, 2012.
[9] Q. Zhang and R. Chen, “Application of metabolic GM (1,1) model in financial repression
approach to the financing difficulty of the small and medium-sized enterprises,” Grey
Systems: Theory and Application, vol. 4, no. 2, 2014.
[10] R. Xu, Z. Fang and J. Sun, “A grey STA-GERT quality evaluation model for complex
products based on manufacture-service dual-network,” Grey Systems: Theory and
Application, vol. 4, no. 2, 2014.
[11] S. Liu and Y. Lin, Grey Systems – Theory and Applications, Understanding Complex
Systems Series, Springer-Verlang-Berlin-Heidelberg, 2010.
[12] Y.E. Spanos and S. Lioukas, “An examination into the causal logic of rent generation:
contrasting Porter’s competitive strategy framework and the resource-based perspective,”
Strategic Management Journal, vol. 22, pp. 907-934, 2001.

Proceedings of the IE 2015 International Conference
www.conferenceie.ase.ro
473
DETERMINANTS OF EU MIGRATION. PANEL DATA ANALYSIS
Costin-Alexandru CIUPUREANU
The Bucharest University of Economic Studies
Elena-Maria PRADA
The Bucharest University of Economic Studies
Abstract. There are many studies on migration that show what type of factors influence the
people to migrate or to return to their countries. In our analysis we tried to determine what
type of variables influence the number of emigrants within a country. We used a panel data
regression model for 25 EU countries for a 5 year period, from 2008 to 2012, to show what
drove people to migrate regarding the macro-economic factors or social conditions of a
country. The results show that social contributions, education level of individuals and
economic development of a country are influencing the number of emigrants.
Keywords: Panel Data, Pooled Regression, Migration.
JEL classification: C23, F22, J61.
1. Introduction and literature review Regarding migration there are many studies that show what type of factors influence the
people to migrate or to return to their countries. It is obvious that literature on migration
domain is generous in theories explaining the migration determinants or approaches of
various issues regarding migration. The most acknowledged theories refers to: the
neoclassical theories that emphasizes the role of \economic determinants on migration [1] [2]
and the new economics of labour migration (NELM) developed during the 80s that shows
that the income maximization is influenced also by the skills of the migrants and that „older
workers are less mobile than young workers” [3]. Other theories that explain migration and
its determinants introduce the idea of status and prestige that is offered through finding
another place to live and work, the role of a country’s legislation related to the emigrant’s
social network or cultural factors [4].
More recently, a factor that influences migration is considered also the level of social
protection of a country. Borjas proposed the welfare magnet hypothesis, first mentioned in a
seminar paper. This hypothesis refers to how immigrants prefer countries that are having
generous welfare stipulations to secure themselves against the risks of labour market such as
unemployment. We can conclude that the generosity of social policies of a country attracts
people to migrate, being a pull factor for migration [5].
Migration affects social policies in developing countries as Pillinger showed. The
implications of migration on the welfare systems of developing countries has been neglected,
the social welfare systems not only have to adapt to international migration in countries of
origin, transit and destination, but also that migration policy frameworks can obstruct
important connections between migrants and their homelands and the development of social
welfare systems [6].
Most individuals choose to migrate when their income declines, to this reason there are other
motivations that can be added related more to the sociological aspects that trigger people to

Proceedings of the IE 2015 International Conference
www.conferenceie.ase.ro
474
migrate as: food, health care, shelter, and social needs. All of these aspects are sustained by
the most important aspect: having a job that provide satisfactory amount of money [7].
The phenomenon of migration of the individuals living in developing countries has been
improved by the charm of the developed countries. Remittances became thus for the
developing countries a significant source of external financing and their role is to decrease
the poverty as Devesh Kapur considers [8].
Due to the fact that some work-related migrants might have entered the host country illegally
or with a temporary work contract they usually do not have a high social status in the
destination country. Consequently, they always face lower work conditions than the nationals
of the host countries even though they may have better skills that facilitate the employment in
their home countries. The work-related migrants are in general employed into sectors such as:
construction, hotels or restaurants and health care [9].
An analysis over a period of 28 years starting with 1975 until 2002 on a very large number of
developing countries showed that remittances are a substitute of financial shortcomings, also
remittances improve the allocation of capital, and therefore promote the economic growth in
case of the financial sector does not fulfil the financial needs of the population [10].
Also, over the period 1975-2004 regarding remittances and household consumption
instability for a large sample of developing countries and after controlling for endogeneity of
remittances that analysis revealed that remittance-recipient countries present low instability
of their household consumption and play an insurance role especially for the countries that
have a low developed financial system [11].
Also, over the nexus between migration and development of a country it has been shown that
there is a strong influence, unemployment being one of the main triggers of people to migrate
[12].
Crude rate migrate and household expenditures are strongly correlated and have a mutual
connection, this meaning that money sent back to the origin country of the migrant are found
as a component of household expenditures [13].
In our analysis we tried to show what type of variables influence the number of emigrants of
a country. For demonstrating this we chose a series of variables which according to the most
popular migration theories are influencing people to migrate.
2. Data and method
The analysis will focus on the following variables: Emigrants, Wages, Social Contribution,
Gross Domestic Product, Education Early Leavers to find if there is any relation between
them, how strong it is and its direction.
We used data from Eurostat database. The period of analysis includes 5 years, starting with
year 2008 until 2012, for 25 European Union countries (Austria, Cyprus, Czech Republic,
Denmark, Estonia, Finland, France, Germany (until 1990 former territory of the FRG),
Hungary, Ireland, Italy, Latvia, Lithuania, Luxembourg, Malta, Netherlands, Norway,
Poland, Portugal, Romania, Slovakia, Slovenia, Spain, Sweden, United Kingdom) which had
available data for every variable (for some countries the data set was not available). This
period was chosen in order to try to determine if there are any influences over time surprising
also the effects of the latest financial and economic crisis. The dataset was analysed by using
a simple regression model for panel data.
Emigrants is the dependent variable of the panel data regression model and refers to the
leavers from their native country with the intention to settle in other country.
The variable Wages refers to the wages and salaries data set. According to Eurostat this
variable is defined as ”the total remuneration, in cash or in kind, payable to all persons

Proceedings of the IE 2015 International Conference
www.conferenceie.ase.ro
475
counted on the payroll (including homeworkers), in return for work done during the
accounting period”. This variable does not include the social contributions.
Social Contributions refers to employers' social contributions and other labour costs paid by
the employer.
Gross Domestic Product computed as Euro per inhabitant was employed as being a robust
indicator of economic development of a country.
We also employed in our analysis the Education Early Leavers. This variable refers to the
percentage of population between 18-24 years old that have attained at most lower secondary
education and they are not involved in any other education form.
Panel data involves two dimensions: first cross-sectional and second time series. The panel
data regression model is different from an OLS regression as it provides information of both
dimensions: over individuals and over time. The general model of panel data can be
described as:
yit = αi + ∑ 𝑥𝑖𝑡kk=1 ∙ βkit + εit (1)
where: i = 1,…,N, N is the number of cross-sectional dimension (or individuals);
t = 1,…,T, T is the number of time dimension (or period).
There are many types of panel data models but the most commonly analysed models are
pooled regression, fixed and random effects. We used for our analysis the pooled regression
model considering the fact that the period of time is rather small and it cannot show relevant
information regarding the variation in time.
The fixed effects model, also known as the within estimator, has the assumption that the error
term is correlated with the constant or individual specific term α, because the model can
exclude or omit the time-invariant variables (as gender, religion etc.) from the model [14]. In
the random effects model the α is assumed to be independent of the error term ε and also
mutually independent [15].
An advantage for random effects model is that it can include time-invariant variables,
otherwise the interpretation of it is the same as it is for the fixed effects model.
The pooled regression model usually is carried out on time series cross-sectional data set, it is
often used to compare to it the fixed and random effects models and it considers obviously
both dimensions of the panel data.
The common abbreviations used in the panel data analysis are: for the individual or panel
identifier in our case being the country and we called it as id, for the time variable we named
it t, the other two variables can be easily deducted from their name. For all variables there are
three types of variation described in the regression model for fixed and random effects:
Overall variation – which shows the variation over both dimensions.
Between variation – which shows the variation over individuals, specifically the id.
Within variation – which shows the variation over time (t).
It is obvious that the standard deviation of within variation for id is zero because the cross-
sectional variable does not vary over time, and therefore the between variation for time
variable t is also zero because it does not vary over individual.
3. Results and discussion
Migration has been studied through various analyses including also panel data regression
models, most of them highlighting the macroeconomic determinants, push and pull factors of
migration. Mayda shows that international migration is positively correlated with per worker
GDP levels for the origin countries, using in the analysis data from various sources: the
immigration data was gathered from International Migration Statistics and the

Proceedings of the IE 2015 International Conference
www.conferenceie.ase.ro
476
macroeconomic variables from World Bank’s Global Development Network Growth
Database. So referring to the influence of GDP over the immigration rate we can conclude
that any person who migrates into a country contributes to the GDP growth , immigrants
becoming an important source of revenue growth [17].
Our analysis was made by using Stata 12.0 and we modelled the Emigrants as a function of
Wages, Social Contribution, Gross Domestic Product, Education Early Leavers to show how
much is the influence of these variables, in what direction it goes and what does it mean.
The second step was to analyse the results from the panel data regression model. The method
of regression model for panel data is the same as for the simple linear regression, so by
validating the hypotheses of OLS method we estimate the coefficients of the pooled
regression model shown in the Table 1.
Table1. Results of panel regression
Dependent variable Emigrants
Pooled Regression
Wages 3445,45
Social Contribution 10884,93**
GDP -3,208**
Education Early Leavers 4574,48*
Intercept 23871,22
R Squared 0,1413
Adjusted R Squared 0,1126
F test 4,93*
(*) are significant at 1%, (**) are significant at 5%
The pooled regression model is significant at 5% level of confidence, with an R Square of
0.1413 which shows that there are many other factors that influences the number of
emigrants.
The results from the panel data regression model shows that level of emigrants is influenced
by the level of social contributions directly proportional, so as the social contributions
increase the number of emigrants tend to increase as well.
The same tendency as for the social contributions is followed by the variable Education Early
Leavers. People tend to migrate if they don’t continue their studies, confirming the theory of
low skilled workers.
Also, the Gross Domestic Product, as an indicator for economic development, it has an
indirectly proportional influence on the level of emigrants. This can be explained as if the
country is more developed, people prefer to remain in their countries of origin rather than to
migrate.
The model confirms the neoclassical theory. Also it should be noted that the model is
perfectible, variables can be improved by logarithm and by adding other variables that
explain better the level of emigrants.
4. Conclusions In our analysis we tried to determine what influences people to migrate. For demonstrating
this we have chosen a series of variables which according to the most popular migration
theories are influencing people to migrate.

Proceedings of the IE 2015 International Conference
www.conferenceie.ase.ro
477
The results from the panel data regression model shows that the level of emigrants is
influenced directly proportional by the social contributions, so as the level of social
contributions increase the number of emigrants tend to increase as well.
The same tendency as for the social contributions is followed by the variable Education Early
Leavers. People tend to migrate if they do not continue their studies, confirming the theory of
low skilled workers.
The Gross Domestic Product, as an indicator of economic development, it has an indirectly
proportional influence on the level of emigrants. This can be explained as if the more
developed is a country, people prefer to remain in their country of origin rather than to
migrate.
Acknowledgment
„This paper was co-financed from the European Social Fund, through the Sectorial
Operational Programme Human Resources Development 2007-2013, project number
POSDRU/159/1.5/S/138907 "Excellence in scientific interdisciplinary research, doctoral and
postdoctoral, in the economic, social and medical fields -EXCELIS", coordinator The
Bucharest University of Economic Studies”.
References
[1] W.A. Lewis, “Economic Development with Unlimited Supplies of Labour.” The
Manchester School, 22, pp. 139–191, 1954.
[2] M.P. Todaro, “Migration and economic development: a review of theory, evidence,
methodology and research priorities”. Occasional Paper 18, Nairobi: Institute for
Development Studies, University of Nairobi, 1976.
[3] O. Stark and D. Bloom, “The New Economics of Labour Migration”. American
Economic Review, 1985, No.75, 173-178.
[4] Piore, M.J., Birds of Passage: Migrant Labor Industrial Societies. Cambridge University
Press.New York, 1979.
[5] Borjas, G. J.,“Self-Selection and the Earnings of Immigrants.” American Economic
Review 77, no. 4 pp. 531-53,1987.
[6] J. Pillinger, ”The Migration-Social Policy Nexus: Current and Future Research”. United
Nations Research Institute for Social Development. International Workshop 22–23,
Stockholm, Sweden, 2007.
[7] Z. Goschin and M. Roman,”Determinants of the remitting behaviour of Romanian
emigrants in an economic crisis context”. Eastern Journal of European Studies 2 (3), pp.
87-103, 2012.
[8] D. Kapur, “Development and Migration-Migration and Development - What comes
first?” Social Science Research Council Conference, New York City and Geneva, 2004.
[9] International Labour Organization (ILO), 2010. A rights-based approach. Available on:
http://www.ilo.org/wcmsp5/groups/public/---ed_protect/---protrav/---
migrant/documents/publication/wcms_208594.pdf.
[10] M. Ruiz-Arranz and P. Giuliano, “Remittances, Financial Development, and Growth”,
International Monetary Fund Working Papers 05/234, 2005.
[11] J.L. Combes and C. Ebeke. (2010). Remittances and Household Consumption Instability
in Developing Countries. CERDI, Etudes et Documents. Available:
http://publi.cerdi.org/ed/2010/2010.15.pdf, 2010.
[12] E. Prada, ”Economic development and migration in European Union”, The international
conference present issues of global economy - 10th Edition 1 (XIII), pp. 259-264, 2013.

Proceedings of the IE 2015 International Conference
www.conferenceie.ase.ro
478
[13] R. Bălă and E. Prada, ”Migration and private consumption in Europe: a panel data
analysis, published in Procedia Economics and Finance ISI Proceedings of the 7th
International Conference on Applied Statistics, Bucharest, Romania, 2013.
[14] W. H. Greene, Econometric analysis. Fifth edition. In: New Jersey, Ed.Prentice Hall,
pp. 283-339, 2002.
[15] G.S. Maddala, Introduction to econometrics III-ed edition, Ed. Wiley, 2001
[16] Mayda, A.M., 2009. “International Migration: A Panel Data Analysis of the
Determinants of Bilateral Flows.” Journal of Population Economics 23, no. 4, pp. 1249-
1274.

Proceedings of the IE 2015 International Conference
www.conferenceie.ase.ro
479
EUROPEAN COUNTRIES AND THE SUSTAINABILITY
CHALLENGE: FOCUS ON TRANSPORTATION
Georgiana MARIN
The Bucharest University of Economic Studies [email protected]
Alexandra MATEIU The Bucharest University of Economic Studies
Abstract. This study presents a cluster analysis in the transportation sector based on several
variables like for example: energy consumption level, modal split of freight transport,
harmonized index of consumer prices, greenhouse gas emissions and nitrogen oxides
emissions. These variables were chosen due to their relevance for the transport industry and
taking into account the fact that each country has its sustainability targets imposed by the
European Union. Currently with the increasing freight and transport demand, the European
Union is looking for better ways to facilitate transportation channels that are more eco-
friendly and more efficient in terms of the energy consumption levels. Whether we consider,
rail, road or air transport, sustainability is a key component that needs to be included in each
country’s infrastructure development strategy.
There are three types of country clusters being analyzed using the mentioned variables and
the key principles of the sustainability concept and several recommendations are highlighted
were the ratio between cost structures, air pollution and sustainability targets is not very well
balanced. The main idea of this comparative study is to assess what countries are similar to
Romania in terms of the values of the sustainability transport indicators imposed by the
European Union and to consider what initiatives those countries have taken in order to reach
that particular level. Finally the authors propose several measures that Romania could
reapply from other countries in order to achieve a sustainable development in transport.
Keywords: energy consumption, freight transport, gas emissions, transportation variables
JEL classification: C38, L92, Q56
1. Introduction In 1992, the United Nations conference on the environment and development of Rio de
Janeiro already proposed that ‘‘Indicators of sustainable development need to be developed to
provide solid bases for decision-making at all levels and to contribute to a self-regulating
sustainability of integrated environment and development systems’’ [8].
“Sustainable performance is closely related to the concept of continuity management” [4].
A sustainable economic development can only be secured, if also environmental and social
factors are included in the overall long term infrastructure strategy. “Transports are situated at
the junction of economical and environmental interests. On one hand, transports are an
indispensable activity in an economy characterized by specialization of production and labor.
On the other hand, transports erode stocks of natural resources (mainly energy and raw
material stocks, but also the environment in the broad sense)” [5]. Transport infrastructures,
transport policies or mobility behavior can be assessed by considering energy consumption
onlytogether with some atmospheric pollutant emissions [1], [8], [7].

Proceedings of the IE 2015 International Conference
www.conferenceie.ase.ro
480
The main greenhouse gas emissions are CO2 that are generated by the burning of the
petroleum-based products like for example: car battery cases, gasoline, motor oil, internal
combustion engines etc. During the fuel combustion process also emissions of nitrogen
oxides (NOx), methane (CH4) and hydrofluorocarbon (HFC) are being released in the
environment, causing pollution [3], [9].
For 2020, the European Union has made a unilateral commitment to reduce overall
greenhouse gas emissions from its 28 Member States by 20% compared to 1990 levels which
is one of the headline targets of the EU 2020 strategy [3].
Herman Daly names three requirements for sustainable development: (1) the rates of use of
renewable resources should not exceed the rates of their regeneration; (2) the rates of use of
non-renewable resources should not exceed the rates of development of their substitutes; and
(3) the rates of pollution emission should not exceed the assimilative capacity of the
environment [6].
The main objective of a sustainable transport strategy is to embed elements from economic,
social and environmental areas, in order not to affect the future of the next generations. The
European transport systems are sustaining the competitiveness on the market through
implementing integrated transport channels across Europe, in correlation with efficient prices
levels and through modal split of freight [2]. Taking into account the rate of economic growth
and the increasing mobility needs of the countries, the main challenge is to balance the
benefits of performing technologies with the negative effects on the surrounding
environment. Furthermore the environmental taxes which penalize the transport system for
oil consumption, emissions of greenhouses gases and nitrogen oxides are putting pressure on
the European countries to find new technologies and to develop alternative renewable
resources. The intent of this analysis is to make a statistical assessment on the main
sustainability transport indicators within the European countries and to highlight the
dependencies between the selected variables, with the purpose of recommending measures of
reducing the energy consumption levels, the greenhouse emissions gases through the use of
modal split of freight transport and through finding renewable energy alternatives.
2. Research methodology In order to analyze the transport sector among the European Union the authors have chosen
12 variables as follows:
a) Energy consumption of transport relative to GDP;
b) Modal split of freight transport roads; Modal split of freight transport railways;
c) Volume of freight transport relative to GDP;
d) Energy consumption of transport, rail, Energy consumption of transport, road;
e) HICP - annual average indices for transport prices;
f) Greenhouse gas emissions from transport;
g) Emissions of nitrogen oxides (NOx) from transport non-road, Emissions of nitrogen
oxides (NOx) from transport road, Emissions of particulate matter from transport non-
road, Emissions of particulate matter from transport road.
The 12 variables were selected based on their relevance for a sustainable development in the
transportation sector and also on the correlations that can be done by comparing them. For
example a high demand for freight transportation generates more energy consumption.
Depending on which type of transport is being used, whether railway or road, the annual
average indices for transport prices may fluctuate. Gas emission is also an indicator that
shows the relationship between the economic and environmental sector of that particular

Proceedings of the IE 2015 International Conference
www.conferenceie.ase.ro
481
country, in order to measure the consumption levels and at the same time forecast the
production capacity that needs to be in line with the pollution reduction targets.
The source for the above mentioned data was the EUROSTAT portal from the Sustainable
development - Sustainable transport database. The data has been gathered for 2012, in order
to keep as many cases as possible and to have the most recent data available. For the
greenhouse gas emissions in transport data for the following countries were provided from
2011: Iceland, Switzerland, Norway and Turkey. Nevertheless some countries registered
missing data and were excluded from the analysis: Greece, Croatia, Cyprus, Malta, Iceland,
Switzerland, Turkey.
The hierarchical cluster algorithm was applied as follows:
The methods to determine the distance between the items was the Squared Euclidian
Distance, as it is the most appropriate for the data set;
The authors have chosen the Ward Hierarchical Clustering Method because it does not
need to predict the number of clusters;
As the variables are expressed in different unit measures, the authors have chosen to
standardize them using the Z Scores Method;
3. Research results After performing the Cluster Analysis three clusters were obtained according to the
Dendogram (Figure 1):
The first cluster: Belgium, Czech Republic, Denmark, Ireland, Luxembourg,
Netherlands, Austria, Portugal, Slovakia, Finland, Sweden, Norway;
The second cluster: Bulgaria, Estonia, Latvia, Lithuania, Hungary, Poland, Romania,
Slovenia;
The third cluster: Spain, France, Italy, United Kingdom, Germany.
Figure 1. Dendogram resulted from the Cluster Analysis
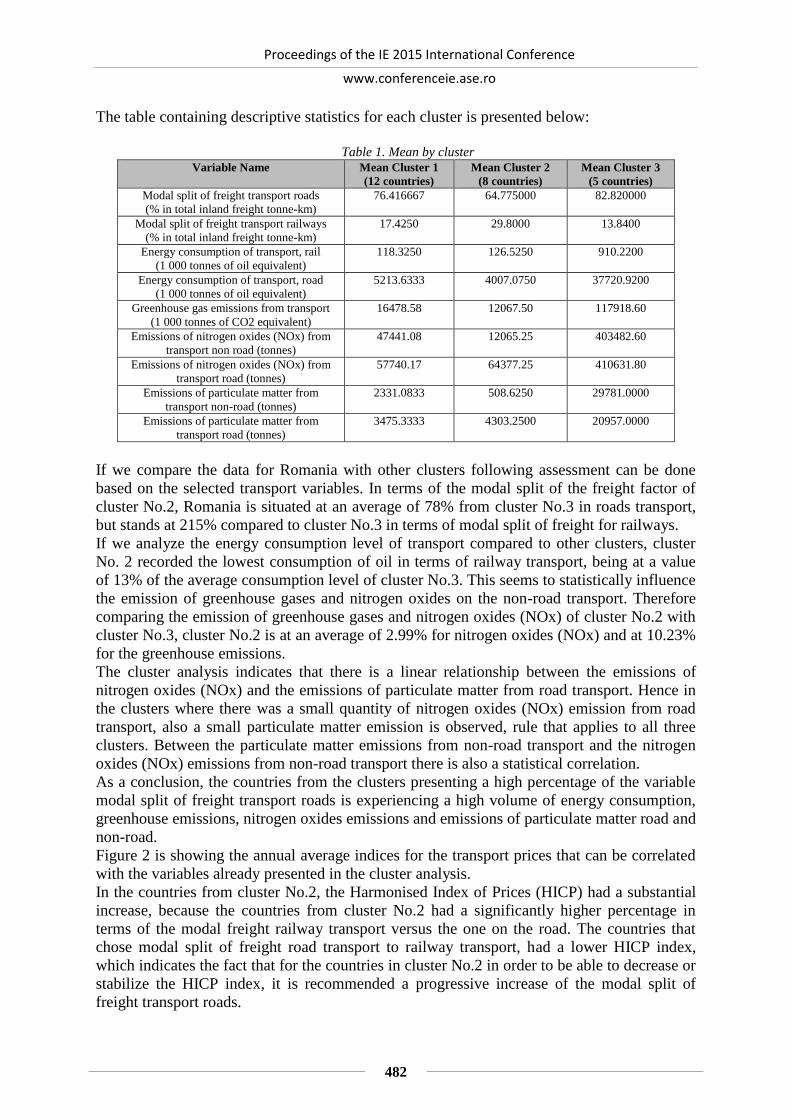
Proceedings of the IE 2015 International Conference
www.conferenceie.ase.ro
482
The table containing descriptive statistics for each cluster is presented below:
Table 1. Mean by cluster
Variable Name Mean Cluster 1
(12 countries)
Mean Cluster 2
(8 countries)
Mean Cluster 3
(5 countries)
Modal split of freight transport roads
(% in total inland freight tonne-km)
76.416667 64.775000 82.820000
Modal split of freight transport railways
(% in total inland freight tonne-km)
17.4250 29.8000 13.8400
Energy consumption of transport, rail
(1 000 tonnes of oil equivalent)
118.3250 126.5250 910.2200
Energy consumption of transport, road
(1 000 tonnes of oil equivalent)
5213.6333 4007.0750 37720.9200
Greenhouse gas emissions from transport
(1 000 tonnes of CO2 equivalent)
16478.58 12067.50 117918.60
Emissions of nitrogen oxides (NOx) from
transport non road (tonnes)
47441.08 12065.25 403482.60
Emissions of nitrogen oxides (NOx) from
transport road (tonnes)
57740.17 64377.25 410631.80
Emissions of particulate matter from
transport non-road (tonnes)
2331.0833 508.6250 29781.0000
Emissions of particulate matter from
transport road (tonnes)
3475.3333 4303.2500 20957.0000
If we compare the data for Romania with other clusters following assessment can be done
based on the selected transport variables. In terms of the modal split of the freight factor of
cluster No.2, Romania is situated at an average of 78% from cluster No.3 in roads transport,
but stands at 215% compared to cluster No.3 in terms of modal split of freight for railways.
If we analyze the energy consumption level of transport compared to other clusters, cluster
No. 2 recorded the lowest consumption of oil in terms of railway transport, being at a value
of 13% of the average consumption level of cluster No.3. This seems to statistically influence
the emission of greenhouse gases and nitrogen oxides on the non-road transport. Therefore
comparing the emission of greenhouse gases and nitrogen oxides (NOx) of cluster No.2 with
cluster No.3, cluster No.2 is at an average of 2.99% for nitrogen oxides (NOx) and at 10.23%
for the greenhouse emissions.
The cluster analysis indicates that there is a linear relationship between the emissions of
nitrogen oxides (NOx) and the emissions of particulate matter from road transport. Hence in
the clusters where there was a small quantity of nitrogen oxides (NOx) emission from road
transport, also a small particulate matter emission is observed, rule that applies to all three
clusters. Between the particulate matter emissions from non-road transport and the nitrogen
oxides (NOx) emissions from non-road transport there is also a statistical correlation.
As a conclusion, the countries from the clusters presenting a high percentage of the variable
modal split of freight transport roads is experiencing a high volume of energy consumption,
greenhouse emissions, nitrogen oxides emissions and emissions of particulate matter road and
non-road.
Figure 2 is showing the annual average indices for the transport prices that can be correlated
with the variables already presented in the cluster analysis.
In the countries from cluster No.2, the Harmonised Index of Prices (HICP) had a substantial
increase, because the countries from cluster No.2 had a significantly higher percentage in
terms of the modal freight railway transport versus the one on the road. The countries that
chose modal split of freight road transport to railway transport, had a lower HICP index,
which indicates the fact that for the countries in cluster No.2 in order to be able to decrease or
stabilize the HICP index, it is recommended a progressive increase of the modal split of
freight transport roads.

Proceedings of the IE 2015 International Conference
www.conferenceie.ase.ro
483
Figure 2. HICP - Annual average indices for transport prices (2005 = 100)
For Romania particularly in order to have a sustainable transportation strategy, a set of mixed
measures need to be implemented. A few examples of such measures are: the increase of
energy efficiency, the development and investment in renewable sources, the modernization
of the road and railway infrastructure networks with emphasis on the railway one in order to
increase the average rail speed and help the fluidization of the traffic, the reduction of the
industries that work with large quantities of goods transported as they consume more energy,
redirection of the flow of goods and consumers to other transport modes that are more eco-
friendly, and the development of trans-European transport routes in order to stay competitive
on the market and create synergies with other countries.
4. Conclusions
All forms of transport generate a lower or higher form of pollution, causing emissions of
greenhouse gases and particulate matters. A careful selection of a freight transport modal split
can solve some pollution greenhouse gases problems by choosing mainly the rail transport,
however for a considerable and sustainable reduction alternative fuels must be found.
The road transport is predominantly focused on oil consumption and a change to renewable
energy sources is limited by the existing infrastructure models. The most viable option in
reducing the level of pollutants and oil consumption lies in the continuous development of
more efficient engines.
In recent years measures have been taken by the European Union countries to change the
source of gasoline in diesel and currently countries like Germany and Austria, started laying
the foundation for the use of compressed methane gas. For example engines and power
stations with natural gas technology. However even if they reduce the level of pollution and
the price of the transportation, they are not renewable sources.
Also changing the road transport on renewable sources like electricity is at the moment
limited to personal cars.
The railway transportation, depending on each engine technology is used can be on diesel or
electric. A high cost is represented by the electrical engine because this means a railway
electrification system that has high infrastructure costs. In the countries where this
infrastructure is already present, the challenge is to modify the source of energy production,
like for example solar panels, wind energy or other eco-friendly sources.

Proceedings of the IE 2015 International Conference
www.conferenceie.ase.ro
484
The end consumer education is also important to limit the pollution generated by the transport
of goods, one of the measures that could be promoted is to reduce the consumption of extra
seasonal food that would limit the transport from distant countries.
To conclude, all countries wishing to have a sustainable transport growth need to invest as a
medium and long term strategy in better transportation infrastructures, in renewable eco-
friendly resources, in more efficient logistics channels, as well as in developing new
technologies that can reduce the emissions of greenhouse gases.
References
[1] B. V. Mathiesen, H. Lund and P. Norgaard, “Integrated transport and renewable energy
systems”, Journal of Utilities Policy 16, pp. 107-116, 2008.
[2] C. Gallez, L. Hivert and A. Polacchini, “Environment energy budget of trips (EEBT): a
new approach to assess the environmental impacts of urban mobility”, International
Journal of Vehicle Design 20 (1-4), pp. 326-334, 1998.
[3] European Comission, Road transport: Reducing CO2 emissions from vehicles. Internet:
http://ec.europa.eu/clima/policies/transport/vehicles/index_en.htm
[4] G. Marin, T. B. Floricel, S. B. Keppler, “Managing sustainable performance in rail freight
transport projects using business continuity management,”in Proc. The 13th International
Conference on Informatics in Economy Education, Research & Business Technologies,
Bucharest, Romania, 2014, pp. 475-481.
[5] G. Marin and G. J. Weber, “Considerations on strategic policies and evaluation criteria for
sustainable transport,” in Proc. The 13th International Conference on Informatics in
Economy Education, Research & Business Technologies, Bucharest, Romania, 2014, pp.
622-629.
[6] H. Daly, Steady State Economics .Washington, DC: Island Press, 1991.
[7] M. J. Saunders, T. Kuhnimhof, B. Chlond and A.N.R. da Silva, “Incorporating transport
energy into urban planning”, Journal of Transportation Research Part A 42, pp. 874-882,
2008.
[8] R. Joumard and J. P. Nicolas, “Transport project assessment methodology within the
framework of sustainable development”, Journal of Ecological Indicators”, pp.136-142,
2010.
[9] United States Environmental Protection Agency (EPA), Sources from Greenhouse Gas
Emissions.Internet:http://www.epa.gov/climatechange/ghgemissions/sources/transportati
on.html.

Proceedings of the IE 2015 International Conference
www.conferenceie.ase.ro
485
THE EVALUATION AND STRENGTHENING OF THE FREIGHT
TRANSPORT SYSTEM, AS A SOLUTION FOR SUSTAINABLE
DEVELOPMENT IN ROMANIA
Georgiana MARIN
The Bucharest University of Economic Studies [email protected]
Alexandra MATEIU The Bucharest University of Economic Studies
Abstract. This paper highlights the sustainability and the advantages of the railway
transport in comparison to the road transport by doing a comprehensive analysis on the main
indicators in the transportation of goods sector. The study emphasizes the importance of
being not only cost effective, but also environmental friendly in choosing the optimum
transportation channel. The ,,Ordinary Least Squares” method is being applied in order to
demonstrate that railway transport is more eco-friendly than other means of transport
considering the energy consumption level. The right balance should be achieved between
using different transportation modes taking into account the infrastructure needs of each
model and also the energy consumption forecast for the goods that need to be delivered.
Although even if new infrastructures are bringing advantages and new opportunities from
both economic and social point of view, their long term sustainability is an important factor
that should be also taken into consideration and especially the effects on the surrounding
environment like for example: air pollution, noise, space consumption etc. Efficiency is an
important component of sustainability, hence any transportation system should target
maximum operational productivity with minimal usage of resources. Finally the paper
concludes by proposing a set of scenarios, which can decrease the energy consumption level
in Romania by changing the volume of the transported goods.
Keywords: hypothesis testing, road and railway freight transport, sustainability
JEL classification: C12, L92, Q56
1. Introduction
“During the last 20plus years, transport issues undergo a development towards a higher level
of effectiveness and sustainability. In this context transports need to face the conflict of
consuming resources on one hand and being a necessity for any economy, independent from
the country” [1]. “Globalization and EU enlargement to the East have created new challenges
for European transport. First, the fast growth of freight transport contributes to the economy,
but also causes congestion, noise, and pollution. EU Commission states that, without
adequate measures, the situation will continue to worsen and increasingly undermine
Europe's competitiveness and the environment” [2]. In this regard, “the EU strategy on
sustainable development has been permanently adapted to the growing exigencies of the
society […] [4]. “The Commission therefore recommends modernizing logistics to boost the
efficacy of individual modes of transport and their combinations. In particular it recommends
a better distribution of traffic towards more environmentally friendly, safer and more energy
efficient modes of transport” [2].

Proceedings of the IE 2015 International Conference
www.conferenceie.ase.ro
486
Sustainability is a concept that can be difficult to operationalize because it involves goals that
are often in conflict with one another, such as environmental conservation, social
responsibility and economic viability [3], [5], [6].
The transportation system is an important part of this concept and it needs to be accompanied
by clear metrics in order be successfully implemented and have a positive impact on the
surrounding environment. Being sustainable in the context of transportation has many aspects
that need to be taken into consideration, especially if one thinks at cost reduction and at the
same time at using wisely the invested resources.
The most widely used definition of sustainable development, from the Brundtland
Commission, is the basis of most definitions for sustainability in various disciplines:
‘‘Development that meets the needs of the present without compromising the ability of future
generations to meet their own needs’’ [7]. This definition clearly states the fact that being
sustainable means having progress, without negatively impacting the current and future
resources. If we also look at other areas, not only at transportation sector, like for example
tourism or agriculture, the same sustainability principle is being applied.
The fundamental concepts of sustainability are often illustrated through the three spheres of
sustainability, which refer to the integrated nature of environmental, social, and economic
sustainability [3].
Following components can be mentioned for each of those three spheres:
a) Environmental area[3]:
- Reduction of consumption of non-renewable and renewable resources for transportation;
- Better utilization of the land area;
- Optimization of transportation channels in order to minimize the impact on the ecological
systems;
- Reduction of waste, air - and noise pollution.
b) Social area[3]:
- Transportation channels are compliant with the safety and human health policies
regulations;
- The management of transportation embeds different governmental and community
procedures;
- Transportation system needs to fulfill primary needs of its customers and at the same time to
incorporate social requests and changes.
c) Economic area [3]:
- Transportation is cost effective and affordable for the customers;
- Transportation system is efficient and also has capacity to meet the requests;
- Transportation channels help the economy of that particular country and create new
networks and opportunities.
These components address the limited capacity of resources one has on Earth and at the same
time highlight the importance of an effective transportation system that is affordable for
everyone and that preserves the current availability of resources.
If we look at the Romanian transportation sector, in order to cope with the EU regulations,
the pressure of globalization and the need of geographical expansion, the system needs to
combine different modes of goods transportation. The suppliers need to focus on new
technologies and integrated solutions in order to reduce costs and at the same time keep the
standard level of quality.
Due to the strong competition between road and railway transportation and the existing EU
regulations, this paper proposes a comparison between the Romanian railway and road
transportation system by analyzing various factors such as: energy consumption level, cost
effectiveness, eco-friendliness, volume of transported goods and infrastructure needs. The
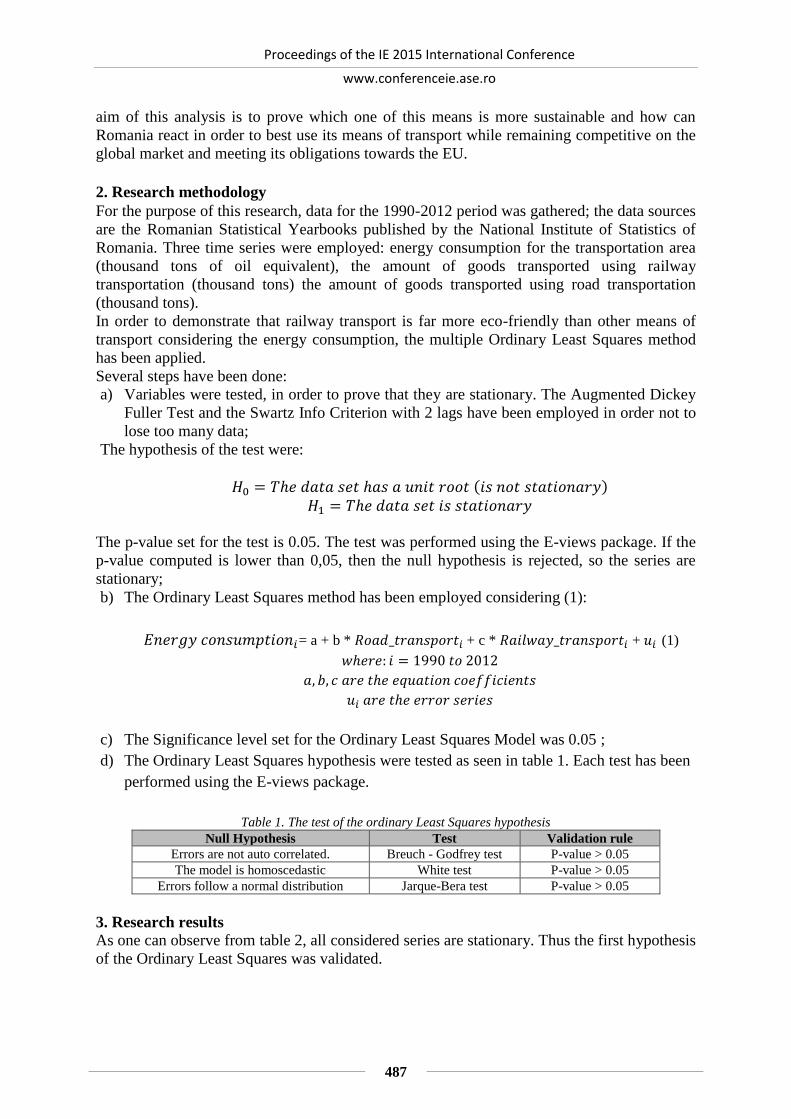
Proceedings of the IE 2015 International Conference
www.conferenceie.ase.ro
487
aim of this analysis is to prove which one of this means is more sustainable and how can
Romania react in order to best use its means of transport while remaining competitive on the
global market and meeting its obligations towards the EU.
2. Research methodology For the purpose of this research, data for the 1990-2012 period was gathered; the data sources
are the Romanian Statistical Yearbooks published by the National Institute of Statistics of
Romania. Three time series were employed: energy consumption for the transportation area
(thousand tons of oil equivalent), the amount of goods transported using railway
transportation (thousand tons) the amount of goods transported using road transportation
(thousand tons).
In order to demonstrate that railway transport is far more eco-friendly than other means of
transport considering the energy consumption, the multiple Ordinary Least Squares method
has been applied.
Several steps have been done:
a) Variables were tested, in order to prove that they are stationary. The Augmented Dickey
Fuller Test and the Swartz Info Criterion with 2 lags have been employed in order not to
lose too many data;
The hypothesis of the test were:
𝐻0 = 𝑇ℎ𝑒 𝑑𝑎𝑡𝑎 𝑠𝑒𝑡 ℎ𝑎𝑠 𝑎 𝑢𝑛𝑖𝑡 𝑟𝑜𝑜𝑡 (𝑖𝑠 𝑛𝑜𝑡 𝑠𝑡𝑎𝑡𝑖𝑜𝑛𝑎𝑟𝑦)
𝐻1 = 𝑇ℎ𝑒 𝑑𝑎𝑡𝑎 𝑠𝑒𝑡 𝑖𝑠 𝑠𝑡𝑎𝑡𝑖𝑜𝑛𝑎𝑟𝑦
The p-value set for the test is 0.05. The test was performed using the E-views package. If the
p-value computed is lower than 0,05, then the null hypothesis is rejected, so the series are
stationary;
b) The Ordinary Least Squares method has been employed considering (1):
𝐸𝑛𝑒𝑟𝑔𝑦 𝑐𝑜𝑛𝑠𝑢𝑚𝑝𝑡𝑖𝑜𝑛𝑖= a + b * 𝑅𝑜𝑎𝑑_𝑡𝑟𝑎𝑛𝑠𝑝𝑜𝑟𝑡𝑖 + c * 𝑅𝑎𝑖𝑙𝑤𝑎𝑦_𝑡𝑟𝑎𝑛𝑠𝑝𝑜𝑟𝑡𝑖 + 𝑢𝑖 (1)
𝑤ℎ𝑒𝑟𝑒: 𝑖 = 1990 𝑡𝑜 2012
𝑎, 𝑏, 𝑐 𝑎𝑟𝑒 𝑡ℎ𝑒 𝑒𝑞𝑢𝑎𝑡𝑖𝑜𝑛 𝑐𝑜𝑒𝑓𝑓𝑖𝑐𝑖𝑒𝑛𝑡𝑠
𝑢𝑖 𝑎𝑟𝑒 𝑡ℎ𝑒 𝑒𝑟𝑟𝑜𝑟 𝑠𝑒𝑟𝑖𝑒𝑠
c) The Significance level set for the Ordinary Least Squares Model was 0.05 ;
d) The Ordinary Least Squares hypothesis were tested as seen in table 1. Each test has been
performed using the E-views package.
Table 1. The test of the ordinary Least Squares hypothesis
Null Hypothesis Test Validation rule
Errors are not auto correlated. Breuch - Godfrey test P-value > 0.05
The model is homoscedastic White test P-value > 0.05
Errors follow a normal distribution Jarque-Bera test P-value > 0.05
3. Research results
As one can observe from table 2, all considered series are stationary. Thus the first hypothesis
of the Ordinary Least Squares was validated.

Proceedings of the IE 2015 International Conference
www.conferenceie.ase.ro
488
Table 2. Augmented Dickey-Fuller test for selected variables
The other Ordinary Least Squares hypothesis is presented below in table 3 and table 4.
As one can observe, all hypothesis were validated meaning that the coefficients could be
interpreted, see table 3. Furthermore, as one can observe from table 4, the p-value of each
regression coefficient was below the significance level, meaning that all coefficients were
statistically significant.
Table 3. The Ordinary Least Squares Hypothesis
Tests for the Ordinary Least
Squares hypothesis
P - value Result
Breuch-Godfrey test 0.27 Errors are not auto correlated.
White test 0.93 The model is homoscedastic
Jarque-Bera test 0.48 Errors follow a normal distribution.
Table 4. Regression coefficients and p-values
Coefficient Coefficient value P value
Road_transport 0.004838 0.0115
Railway_transport -0.064364 0.0019
a 7383.002 0.000
The R square was 60% meaning that the quantity of goods transported annually using railway
and road transportation together explain 60% of the energy consumption in transportation
area. Furthermore, the R square was lower than the Durbin Watson statistics (1.23) meaning
that the regression is not spurious.
The coefficients are interpreted as follows:
a) An increase with one tone of the amount of goods transported using road transportation
increases the total energy consumption in transportation field by 0.004838 tons of oil
equivalent;
b) An increase with one tone of the amount of goods transported using railway
transportation decreases the total energy consumption in transportation field by 0.064364
tons of oil equivalent;
Thus, considering these results, one can conclude that the railway transportation is much eco-
friendly and cheaper than road transportation of goods. Furthermore, even if road
transportation of goods increases due to infrastructure necessities, an equal increase in the
amount of goods transported using railway transportation leads to a considerable decrease of
the energy consumption. As, 60% of the energy consumption in the transportation area is
explained by the amount of goods transported using railway and road transportation modes, a
well balanced mix between the two transportation modes should be implemented in order to
achieve an acceptable energy consumption level in this area.
Variable
Augmented Dickey-Fuller test P value
of the equations’ residuals and
Equations’ coefficients
P value
Level
P value first
difference
Railway_transport
Trend and intercept 0.1341 0.0152
Intercept 0.0000 0.0026
None 0.0002 0.0000
Road_transport
Trend and intercept 0.0000 0.0000
Intercept 0.0000 0.0000
None 0.0000 0.0000
Energy_consumption
Trend and intercept 0.0055 0.0003
Intercept 0.5605 0.0000
None 0.8566 0.0001

Proceedings of the IE 2015 International Conference
www.conferenceie.ase.ro
489
In order to prove so, the authors have proposed a scenario analysis, taking into account the
Report concerning energy efficiency drawn up pursuant to Directive 2012/27/EU, in which
Romania promised to reduce its primary energy consumption until 2020 with 19%, as a
reaction to the 20% target set by the European Commission. For the analysis, the authors
have assumed that the 19% energy consumption target has been set for the freight transport
sector in Romania, in order to analyse what changes in transport volume will this target
require. The source of the datawas the EUROSTAT database and the Romanian Statistical
Yearbooks published by the National Institute of Statistics of Romania.
If the primary energy consumption in transport for 2012 was 5345.1 thousand tonnes of oil
equivalent (TOE) and will need to decrease with 19% until 2020, the value in 2020 will be
5345.1 TOE * 0.81 which gives a total of 4329.6 TOE (y), 1015.5 TOE less in comparison
with 2012.
The following scenarios are further analysed:
a) If road transport will remain in 2020 at its level from 2012 (188415 thousand tones), how
will this influence the railway transport in 2020 ?
Step 1. Calculate the railway transport level in 2020
𝐸𝑛𝑒𝑟𝑔𝑦 𝑐𝑜𝑛𝑠𝑢𝑚𝑝𝑡𝑖𝑜𝑛𝑖= a + b * 𝑅𝑜𝑎𝑑_𝑡𝑟𝑎𝑛𝑠𝑝𝑜𝑟𝑡𝑖+ c * 𝑅𝑎𝑖𝑙𝑤𝑎𝑦_𝑡𝑟𝑎𝑛𝑠𝑝𝑜𝑟𝑡𝑖 + 𝑢𝑖(2)
4329.6 = 7383.002 +0.004838 * 188415 - 0.064364 * railway transport 2020
4329.6 - 7383.002 - 911.551 = - 0.064364 * railway transport 2020
railway transport 2020 = 61602.029 thousand tones
Step 2. Railway transport 2020 - Railway transport 2012 = 61602.029 - 55755 =
5847.029 thousand tones
Step 3. (Railway transport 2020 - Railway transport 2012 )/railway transport 2012 =
0.1048
Railway transport should be 61602.04105 thousand tones in 2020, thus it should increase
by 10% compared to the 2012 level.
b) If road transport increases with 25% in 2020 in comparison with 2012, how much will
the railway transport be?
Railway transport should be 65142.65 thousand tones in 2020, thus it should increase by
16% compared to the 2012 level.
c) If road transport decreases with 25% in 2020 in comparison with 2012, how much will
the railway transport be ?
Railway transport should be 58061.43 thousand tones in 2020, thus it should increase by
4.1% compared to the 2012 level.
d) If rail transport remains at its 2012 level (55755 thousand tones), how will this influence
the road transport?
Road transport should be 110626.87 thousand tones in 2020, thus it should decrease by
41% compared to the 2012 level.
e) If rail transport increases with 25% in 2020 in comparison with 2012, how much will the
road transport be?
Road transport should be 296065.84 thousand tones in 2020, thus it should increase by
57% compared to the 2012 level.
f) If rail transport decreases with 25% in 2020 in comparison with 2012, how much will the
road transport be?

Proceedings of the IE 2015 International Conference
www.conferenceie.ase.ro
490
Road transport should be - 74812.089 thousand tones in 2020, thus it should decrease by
139% compared to the 2012 level. This negative result for 2020 shows that this scenario
is not plausible.
4. Conclusion
The conducted research has demonstrated that railway transportation is more eco-friendly and
cheaper than road transportation of goods. Moreover, it has been found that even if road
freight transportation increases due to infrastructure necessities, an equal increase in the
amount of goods transported using railway transportation leads to a considerable decrease of
the energy consumption. As, 60% of the energy consumption in the transportation area is
explained by the amount of goods transported using railway and road transportation modes,
the research highlighted that a well balanced mix in form of intermodal transportation
between the two transportation modes should be implemented in Romania in order to meet
the EU energy consumption target until 2020. The intermodal transport system stimulates the
creation of new technologies and the optimization of the existing ones, by reducing energy
costs and at the same time preserving the environment. The implementation of this mix needs
to be based on a realistic assessment of the existing market freight infrastructure and on the
coordination between government policies, national and international strategies. Based on the
proposed transport scenarios, further researches will be done in a later stage, in order to show
how can Romania effectively improve its freight transportation sector while being sustainable
on the global market.
References
[1] G. Marin and G. J. Weber, “Considerations on strategic policies and evaluation criteria
for sustainable transport,” in Proc. The 13th International Conference on Informatics in
Economy Education, Research & Business Technologies, Bucharest, Romania, 2014, pp.
622-629.
[2] G. Marin and M. Olaru, “Strategic decisions on modal transport in Romania in connection
with the principles of sustainable development,” in Proc. The International Conference
Emerging Markets Queries in Finance and Business, Bucharest, Romania, 2014.
[3] J. Zheng, N. W. Garrick, C. Atkinson-Palombo, C.McCahill and W. Marshall, “
Guidelines on developing performance metrics for evaluating transportation
sustainability,” Journal of Research in Transportation Business & Management, vol. 7 ,
pp. 164-168, 2013.
[4] M. Olaru, V. Dinu, G. Stoleriu, D. Sandru and V. Dincă, “Responsible Commercial
Activity of SMEs And Specific Values of Sustainable Development In Terms of The
European Excellence,” Amfiteatru Economic, vol. 12, no. 27, pp. 10-27, 2010.
[5] M. Hart, Guide to sustainable community indicators(Second ed.). West Hartford:CT:
Sustainable Measures, 2006.
[6] T. Litman. (2014, June). Well measured: Developing indicators for comprehensive and
sustainable transport planning [Online]. Available: http://www.vtpi.org/wellmeas.pdf.
[7] World Commission on Environment and Development (WCED), Our Common Future.
Oxford University Press, England, 1987.

Proceedings of the IE 2015 International Conference
www.conferenceie.ase.ro
491
INNOVATION – CONTENT, NATIONAL INNOVATION STRATEGIES
AND MODELLING INNOVATION USING THE MICROECONOMIC
APPROACH
Stelian STANCU
The Bucharest University of Economic Studies
Centre for Industrial and Services Economics, Romanian Academy
[email protected]; [email protected]
Constanţa-Nicoleta BODEA
The Bucharest University of Economic Studies
Centre for Industrial and Services Economics, Romanian Academy
Oana Mădălina POPESCU
The Bucharest University of Economic Studies
Orlando Marian VOICA The Bucharest University of Economic Studies
Laura Elly NAGHI The Bucharest University of Economic Studies
Abstract. As innovation - as a determinant factor of economic and social growth - enjoys an
increasing recognition, the nature of innovation, its role and its determining factors begin to
enjoy an increasing attention. The paper highlights the distinction between invention and
innovation, emphasizing that innovation concerns a marketable application in practice of an
invention, namely an integration of economic and social practice of the invention. In terms of
the strategy of research-development and innovation of Romania for the period 2014-2020, it
was defined in the context of the European strategy Europe 2020 and the European Cohesion
Policy. The scheme presented comes to reveal the structure and functionality of the research-
development and innovation system in Romania. The approach at the micro level of the
economic and mathematical model of innovation services highlights the relationship between
innovation and competition, thus emphasizing the level of the equilibrium rate of innovation,
for each firm, in an industry of the same level of competition, namely the intensity of the R&D
at the firm level, in an industry with “uneven” competition.
Key words: innovation, invention, competition, R&D intensity, “even industry”, “uneven
industry”.
JEL classification: D2, O31.
1. Model of service innovation - microeconomic approach
The reality of recent years shows that the competition and innovation indicators are in a
direct relationship, namely:
Competition (C) ↑→ Innovation (I) ↑
1.1. The relationship between innovation and competition

Proceedings of the IE 2015 International Conference
www.conferenceie.ase.ro
492
Let n – be the rate of innovation (the R&D intensity) at firm level (the rate of hazard) and c –
a measure for the competition.
Therefore, the relationship between innovation and competition can be written as follows:
n= 𝑒𝑔(𝑐) (1)
where 𝑔(∙) - represents an unknown function.
Hypothesis 1. It is assumed that the patents have a Poisson distribution with the rate of
hazard (innovation) (1).
1.2. Analysis of the economic and mathematical model
Hypotheses of the model
- it is considered a representative consumer (an identical lot of consumers);
- each consumer offers an inelastic labour unit;
- r – represents the inter-temporal discount;
- 𝑢(𝑦𝑡) = 𝑙𝑛𝑦𝑡 represents the utility function at the level of the representative consumer;
- The good 𝑦 is produced at each moment t using the continuous input, with the
production function given by:
𝑙𝑛𝑦𝑡 = ∫ 𝑙𝑛𝑥𝑗𝑡𝑑𝑗1
0 (2)
where 𝑥𝑗 - represents the sum of two intermediate goods produced by the duopolist in sector j,
given by the substitution function: 𝑥𝑗 = 𝑥𝐴𝑗 + 𝑥𝐵𝑗
- the representative consumer:
picks 𝑥𝐴𝑗 and 𝑥𝐵𝑗 from the optimum problem at the level of sector j:
{
𝑚𝑎𝑥𝑥𝐴𝑗,𝑥𝐵𝑗
{𝑥𝐴𝑗 + 𝑥𝐵𝑗}
𝑝𝐴𝑗𝑥𝐴𝑗 + 𝑝𝐵𝑗𝑥𝐵𝑗 = 1 (3)
- each firm produces using labour force as a single input:
it is assumed that there is a CRS (constant return to scale);
w – represents the wage rate (given).
- 𝑐𝐴 and 𝑐𝐵 represent the unit costs of production of the two industry firms. They are
presumed independent of the produced quantity.
- let k – be the technological level of firm i from the duopoly (industry) j.
Comments:
1. A unit of labour currently employed by firm i, generates an output flow (output):
𝐴𝑖 = 𝛾𝑘𝑖 with i=A, B (4)
where 𝛾 > 1 is a parameter that measures the dimension of the innovation.
2. 𝛾−𝑘𝑖 represent the units of labour, if firm i produces one unit of output.
- let 𝜑(𝑛) =𝑛2
2 be the cost of the R&D in units of labour;
- with this cost 𝜑(𝑛), the firm that employs (leader) moves one technological step
ahead, with a Poisson risk rate (innovation rate n or R&D intensity);
- we assume that the follower moves one step ahead, with the innovation rate h, without
making any R&D expenses (by copying the leader’s technology);
- 𝑛2
2 is the R&D cost of the follower, in order to move one step ahead, with a Poisson
risk rate „n+h”.
Let:
𝑛0 - be the R&D intensity at the level of each firm such as the two firms be at the same level
of competition;
𝑛−1 - be the R&D intensity at the follower firm level, in an “uneven” competitive industry; 𝑛1
- be the R&D intensity at the leader firm level, in an “uneven” competitive industry.

Proceedings of the IE 2015 International Conference
www.conferenceie.ase.ro
493
Observation: 𝑛1 = 0 then the leader firm (innovative) cannot obtain an advantage from
innovation.
The competition degree on the market of a product is inversely proportional with the degree
that two firms at the same industry level are capable to understand. Moreover,, two firms in
an “uneven” industry will not get along. The follower will have a zero profit, while the leader
will have: equal profit with the difference between its revenues, that have been normalized to
one unit, and cost, meaning:
{𝜋−1 = 0
𝜋1 = 1 − 𝛾−1
Comments:
1. Each firm at industry level obtains a profit
Equal to zero, if the firms are incapable to get along (the firms are in a Bertrand
competition, meaning that they have identical products and identical unit costs)
𝜋1
2 , if there is a maximum understanding.
2. If we parametrize competition on the product’s market with ∆= 1 − 휀
where:
∆ - represents the parameter for the competition (it represents altogether the profit growth of
the innovative firm in an industry of the same normalized level (the profit) in connection to
the leader’s profit;
휀 - represents the fraction from the leader’s profit which the follower firm can obtain through
an understanding with the leader
then:
𝜋0 = 휀𝜋1 , if 0 ≤ 휀 ≤1
2.
The influence at equilibrium of the research intensities1 𝑛0 and 𝑛1 and consequently of
the aggregate innovation rate (the Schumpeterian effects and “escape – competition”)
We assume𝑛0 and 𝑛−1 the innovation rates at equilibrium, determined by the necessary
conditions for the Markov symmetric stationary equilibrium, in which each firm tries to
maximize its expected updated profit (with the update rate r = 0)
Proposition.1. The innovation rate at equilibrium, for each firm, in an industry at the same
level of competition, is given by:
𝑛0 = √ℎ2 + 2∆𝜋1 − ℎ (5)
which means that ∆↑→ 𝑛0 ↑;
and respectively2:
𝑛−1 = √ℎ2 + 𝑛02 + 2𝜋1 − ℎ − 𝑛0 (6)
which means that ∆↑→ 𝑛−1 ↓.
Let:
𝜇1 - be the probability that the industry state of equilibrium be “uneven” and
𝜇0 - be the probability that the industry state of equilibrium be “even”.
Throughout any given unit of time (interval), the probability that an industry equilibrium (a
firm or a sector) to change from the “uneven” state to the “even” state is 𝜇1(𝑛−1 + ℎ), while
the probability that an equilibrium industry (a firm or a sector) to change from the “even”
state to the “uneven” state is 2𝜇0𝑛0.
At equilibrium:
𝜇1(𝑛−1 + ℎ) = 2𝜇0𝑛0 (7)
and knowing that 𝜇1 + 𝜇0=1, it can be concluded that the aggregate flow of innovation, I, is
given by:
1 That varies according to the competition measure (the competition degree). 2The innovation rate of a “lazy” firm (follower).

Proceedings of the IE 2015 International Conference
www.conferenceie.ase.ro
494
𝐼 = 𝜇1(𝑛−1 + ℎ) + 2𝜇0𝑛0 =4𝑛0(𝑛−1+ℎ)
2𝑛0+𝑛−1+ℎ (8)
Relationship I-∆ (The aggregate flow of innovation - the competition Degree (intensity))
From Proposition.1. it can be concluded that the equilibrium innovation rate, 𝑛0, grows with
the competition intensity between industry firms.
As a consequence, 𝑛0 can be used as a proxy measure of the competition on a product’s
market, where:
𝑛0 ∈ [𝑥 = √ℎ2 + 𝜋1 − ℎ ; 𝑥 = √ℎ2 + 2𝜋1 − ℎ
with
𝑥 = 𝑥, corresponds to a maximum agreement ( 𝜋0 =𝜋1
2);
𝑥 = 𝑥 corresponds to a maximum competition (𝜋0 = 0).
Comments:
a. When the competition is not strong on the product’s market for the “even” firms it is
hard for each one of them to innovate. The global rate will be the highest when the market
(sector) is in the “uneven” state.
- if the industry will stay most of the time in the “even” state (𝑛0 decreases in relation
to 𝜋0), it can thus be defined the effect escape competition.
b. When the competition degree is very high, in an “uneven” state there are few stimulants
for the “lagging” firm to innovate. As a sequel, the industry will be slow when leaving the
“uneven” state.
- if the industry will stay most of the time in the “uneven” state, the Schumpeter effect
will be defined. [1]
2. Empirical analysis
The analysis of concentration on the electricity supply market shows a downward trend in
2009-2011, both HHI and the cumulative market share of top 5 competitors. However, it can
be noted a low level of concentration on this market. [2]
Figure 1. Evolution of the concentration degree on the electricity supply market towards end-consumers
Source: Data processed by the Competition Council
In 2009-2011, on the segment of supply to final consumers there have been registered
fluctuations in the concentration degree measured by the HHI, but the indicator reflects a low
degree of market concentration. At the same time, the concentration indicators CR5 and
CR10 have declined slightly, indicating an erosion of the key market participants’ share. [3]
With the previous notations and running the model presented, the following results were
obtained at the level of the first two companies in the industry in two specific situations and
particular even, namely uneven:

Proceedings of the IE 2015 International Conference
www.conferenceie.ase.ro
495
Table 1. Results obtained in the case of an even industry, namely an uneven industry
Even industry
Firm 1 Firm 2
Ax 1,732051 Bx 2,157669
𝑛0 0,767764 𝑛0 0,767764
0 0,222222
Uneven industry
Firm 1
(leader)
Firm2
(follower)
Ax 1,732051 Bx 2,157669
1n 0 𝑛−1 0,437529
1 0,666667 1 0
Table 2. The probability of the status to change and integration of the competition degree
Equilibrium analysis
The
probability
that at
equilibrium an
industry to
change from
uneven to
even,
𝜇1(𝑛−1 + ℎ)
0,447989
𝜇0 (The probability
that the equilibrium
state of the industry
to be even)
0,291749
even
The
probability
that at
equilibrium an
industry to
change from
even to
uneven,
2𝜇0𝑛0
0,447989
𝜇1 (The probability
that the equilibrium
state of the industry
to be uneven)
0,708251
uneven
I(the aggregate
innovation flow)
0,895978
Distribution firms
Maximum understanding Maximum competition
𝑥 = 𝑥 0,644459 𝑥 = 𝑥 0,97605
0 0,333333 0 0
Measure of the competition degree, n0 belongs to 𝑥 = 𝑥 0,644459 𝑥 = 𝑥 0,97605
x~ 0,676106
From the data analysis in table 2, it can be seen the equilibrium probability of an industry to
change from uneven into even and vice versa, and the integration or not of the competition
degree 𝑛0 between min and max thresholds respectively, depending on the existing time of
competition, maximum and minimum respectively.

Proceedings of the IE 2015 International Conference
www.conferenceie.ase.ro
496
3. Conclusions:
1. At “even” industry level, we have stronger innovation regardless of the competition
degree on the product’s market [4];
2. The curve ∩ is more abrupt for the “even” industries;
3. The relationship innovation – competition on the market, using an nonlinear flexible
estimator in shape of a ∩.
References
[1] O.C.D.E., La mesure des activités scientifiques et technologiques-Méthode type pour les
enquêtes sur la recherche el le développement expérimental, Manuel de Frascati, 5th
Ed.1993 and 6 th Ed. 2002.
[2] J. Calvert and B.R. Martin, “Changing conceptions of basic research”, Workshop on
policy relevance and measurement of basic research, Oslo, 29-30 October, 2001.
[3] M. Dodgson, D.M. Gann and A.J. Salter, “The intensification of innovation,
International Journal of Innovation Management”, Vol.6, No.1, pp.53, March 2002.
[4] P.I. Otiman and A. Pisoschi, “Unele consideraţii asupra legii privind cercetarea ştiinţifică
şi dezvoltarea tehnologică”, Revista de Politica Ştiinţei şi Scientometrie, Vol.I, No.3,
pp.128, 2003.

Proceedings of the IE 2015 International Conference
www.conferenceie.ase.ro
497
RISK AWARENESS AS COMPETITIVE FACTOR FOR PUBLIC
ADMINISTRATION - A GERMAN CASE STUDY
Markus BODEMANN
The Bucharest University of Economic Studies [email protected]
Marieta OLARU
The Bucharest University of Economic Studies
Ionela Carmen PIRNEA
“Constantin Brancoveanu” University, Rm.Valcea
Abstract. Public administration is under steady reconstruction: challenged by increasing
duties and public demand of more intensified and varied services and decreased funding,
strategies of activity and prevention are current essential tasks. The sustainable execution of
providing mandatory and voluntarily tasks is of prime importance. An adoption of the New
Public Management elements focuses to bridge the distinctions between private and public
management, by applying more private sector elements: Competition, output- and outcome-
orientation and responsibility for public managers. In Germany, the public administrations
have to declare their detected individual chances and threads for a sustainable allocation of
services to the citizens in the annual status report. This approach analyses and compares the
elements in the reports of the state North Rhine-Westphalia, concerning risk in the reports,
distinct them systematically to show chances for awareness and active influence. Further
risks and benefits by a decision are presented in correlation. With greater knowledge of risks
and benefits, their origin and potential kind of harm to citizenry, prevention of decrease of
public value as indicator, will be a competitive advantage of the public administration; in the
internal and external context.
Keywords: new public management, internal and external risks, perception, forecast
JEL classification: H11, H41
1. Introduction Remembering the fundamental approach of Woodrow Wilson at the end of the 19th century
[1], public managers have to track the legal and formal requirements but should be aware of
changes in the internal and external environment. It is obvious, demonstrated by the current
desolate financial situation of a great number of public administrations in Germany, that a
deviation from the traditional kind of managing is necessary. In some cases the sustainable
execution of mandatory tasks is endangered; it is elusive that the constitutional tasks are
reduced by financial bottlenecks. Searches for sources of this imbalance present a wide
variety of possible reasons: increasing number and complexity of tasks, triggered by
legislation and political programs on state, federal and European level. On the other side also
a direct accountability of public managers and local political programs, as Bodemann points
out in 2011 [2], [3].
1.1. Introduction of tools by the New Public Management

Proceedings of the IE 2015 International Conference
www.conferenceie.ase.ro
498
After a century of public management, based on the models developed by Woodrow Wilson,
Max Weber (Bureaucracy) and Frederic Taylor (Scientific Management) [4], the introduction
of the models and tools of the New Public Management (NPM) opened public management
to private sector management tools. A convergence in applied management methods is the
result, but under considering the basic differences between both sectors; financing,
competition, providing of public goods are only a few to name. Simon (1998) explains that
modern scientists make important use of private and public organization. For them the
boundaries are fluid [5]. But this almost 40 year reform is now obviously: Transparency and
comparability are only two effects the reform in Germany established. For better estimation
of the current financial status and to bridge the gap between the private and public sector, the
Germany federal states introduce step by step the double-entry-accounting system, releasing
the former use of cash-accounting. This system was in terms of content, accuracy and extent
accepted, but it lacks for example of depreciation. Therefore, reinvestments for maintaining
of building or other assets or economic goods are financed within the continuous budgeting.
Using the accrual accounting the debt level is obvious, also the development of finances and
the gap between revenues and expenses in the local public budget. Other tools like lean
management and the delegation of accountability in horizontal and vertical extension are used
to create more responsibility and a step forward to a specialized entrepreneurship, inside the
legal framework.
1.2. Closing the gap between public and private sector handling
Beneath the increased public interest in public management and the execution of political
programs, other branches have likewise an increased interest in the current or expected
conditions of the local public administration. The financial service industry waited for the
application of accrual accounting in public sector: On the one hand to get a better impression
of the sustainable development of the institution public administration and on the other hand,
the rules and regulations Basel II and III demands clear measures to check debtors, their
creditability, liquidity and their expected short- and middle term development of finances [6].
The former public sector is now no longer privileged, especially after the publishing of
factual bankruptcy of public administration, first sign by the municipality of Leukerbad in
Switzerland in the nineties of the last century; this bankruptcy was a result of a debt level of
350 Million Franc; a debt of 200 000 Franc for each inhabitant [7].
1.3. Necessity for change for public managers and politicians
As later shown, the situation in Germany is similar; tendency in decreasing own equity as one
consequence of the discrepancy between revenues and expenses, is only one indicator to be
noticed. Without an appropriate forecast system, based of financial indicators, historical and
reference class models and expertise. Further the social and political impact and combined
implications have to be identified and estimated. Only with bridging past and future a more
entrepreneurial approach could be expected [8]. This includes an awareness of the sources
and reasons for developments in the past, but, most important, assumptions and forecasts of
influence factors threatening the sustainable execution of mandatory tasks and regaining
financial space to act and steer. Olaru et al. (2014) come to a similar environmental focus for
private sector organizations [9].
2. Research methodology for indicating, pooling and processing positive and negative
factors
The focus of this research was on the State of North Rhine-Westphalia, located in the middle-
west of Germany. This state combines the complete spectrum of population, from sparse in

Proceedings of the IE 2015 International Conference
www.conferenceie.ase.ro
499
the East to a very compressed area of Rhine and Ruhr. Further the spectrum of production,
industry and research is settled; from farming to chemical industry and IT-technology.
Comparable with these conditions the duties of the public administration are same kind
various. The population surveyed is 271 municipalities with city rights, 125 municipalities
without city rights, in sum 396 political independent public administrations and additional 30
county administrations [10]. For the research 48 municipalities (12%) are selected from all
over the state to get a wide spectrum of identified desired and undesired developments, based
on each individual public administration. To integrate view and status of county
administrations, 10 counties are evaluated (33%). Objective was to summarize the presented
factors, create categories and interpret the number and chosen risk factors.
3. Risk awareness as argument for future decisions in management and politics
Deviant from the three columns of Wilson, Weber and Taylor, identification of not certain
developments is one of the most important but also effective tools to be prepared. The results
of not being aware and prepared will create an acceleration of debt level, decrease of own
equity, decreased reputation and therefore worse credit-conditions which lead to the same
consequences. The suggested management models, performance measurement, decentralized
accountability and competition within boundaries with the private market will be sacrificed
by the effort to provide the basic mandatory tasks to the society. Remarkable is the difference
in presenting adverse and desired effects to further developments of the public administration
as guarantor for individual and collective welfare. Already 20 years ago, Mussurari (1996)
stated that the local government believed to find the reason and the jurisdiction for their
existence within themselves [11].
Under the regulation of "Kameralistik" (Cash-Accounting) the input-orientation was
established. Analyzing the given adverse effects this tendency to concentrate to expected
revenues to spend in the future is already settled. There are only a few mentions which imply
an output-, or more sophisticated, an outcome-orientation of services and products provided.
4. Results of the survey in Germany
Similar to the private sector, municipalities in Germany, especially in the State of North
Rhine-Westphalia, have to prepare and publish a compulsory status report. Beneath the
standard numbers and reports chances and risks have to be declared and their affect for
sustainable provision of mandatory and voluntarily tasks [12]. For the political and
administrative discussion this is an enormous step for more transparency but also for an
increase in accountability and the necessity to estimate consequences of decisions, as
Denhardt and Denhardt (2009) explains the tasks [13]. Analyzing the given status reports it
becomes evident that the municipalities have a wide area of interpretation of the demanded
chances and risks. While some very clear describe their future estimation of development,
others use the status report in a kind of political statement. In these reports neither concrete
suggestions nor a forecast of future events or uncertain influences are given. So the quality
and quantity varies.
Using a correlation of size and volume of budget shows the same spreading. While expecting
a more detailed presentation of risks and chances in the case of fast decreasing own equity of
the public administration, to prove a serious concerns about future developments, the results
are sober. One explanation is the inexperience in using these tools as justification for
decisions in the future and to be aware of uncertain factors for operations and finances is the
short time of application of the double-entry-accounting. Accompanied with other parts of the
New Public Management tools box the increasing convergence of governance rules for
transparency and accountability between public and private sector is directed to more
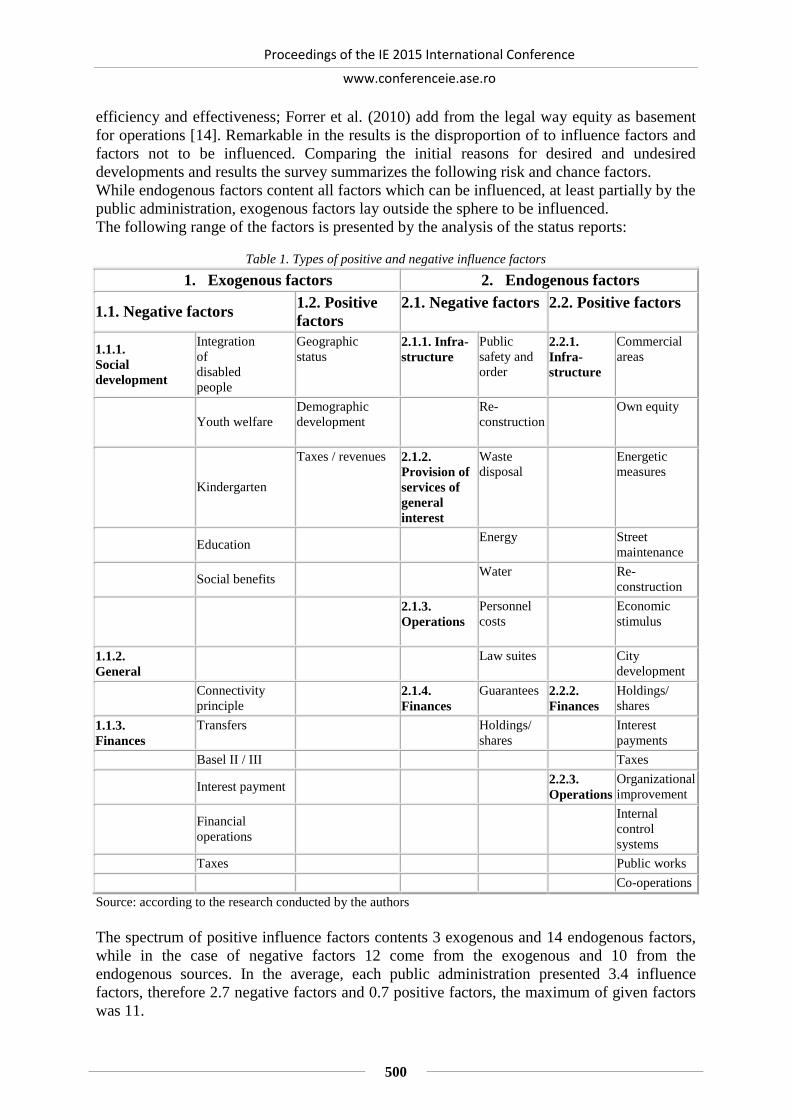
Proceedings of the IE 2015 International Conference
www.conferenceie.ase.ro
500
efficiency and effectiveness; Forrer et al. (2010) add from the legal way equity as basement
for operations [14]. Remarkable in the results is the disproportion of to influence factors and
factors not to be influenced. Comparing the initial reasons for desired and undesired
developments and results the survey summarizes the following risk and chance factors.
While endogenous factors content all factors which can be influenced, at least partially by the
public administration, exogenous factors lay outside the sphere to be influenced.
The following range of the factors is presented by the analysis of the status reports:
Table 1. Types of positive and negative influence factors
1. Exogenous factors 2. Endogenous factors
1.1. Negative factors 1.2. Positive
factors
2.1. Negative factors 2.2. Positive factors
1.1.1.
Social
development
Integration
of
disabled
people
Geographic
status 2.1.1. Infra-
structure
Public
safety and
order
2.2.1.
Infra-
structure
Commercial
areas
Youth welfare
Demographic
development Re-
construction
Own equity
Kindergarten
Taxes / revenues 2.1.2.
Provision of
services of
general
interest
Waste
disposal Energetic
measures
Education Energy Street
maintenance
Social benefits Water Re-
construction
2.1.3.
Operations
Personnel
costs
Economic
stimulus
1.1.2.
General
Law suites City
development
Connectivity
principle
2.1.4.
Finances
Guarantees 2.2.2.
Finances
Holdings/
shares
1.1.3.
Finances
Transfers
Holdings/
shares Interest
payments
Basel II / III Taxes
Interest payment 2.2.3.
Operations
Organizational
improvement
Financial
operations
Internal
control
systems
Taxes Public works
Co-operations
Source: according to the research conducted by the authors
The spectrum of positive influence factors contents 3 exogenous and 14 endogenous factors,
while in the case of negative factors 12 come from the exogenous and 10 from the
endogenous sources. In the average, each public administration presented 3.4 influence
factors, therefore 2.7 negative factors and 0.7 positive factors, the maximum of given factors
was 11.

Proceedings of the IE 2015 International Conference
www.conferenceie.ase.ro
501
The following graph shows the wide spread uncertain factors, given by the public
administration. Most of the examples are legal based and out of any influence. Those
mandatory tasks combined with the neglecting of the connectivity principle, dominate the
operations; space for voluntarily tasks is very limited.
Figure1. Exogenous and endogenous negative factors and their shares
Although the uncertain factors for a sustainable planning are partly described in a very
detailed way, only a view give concrete examples of the consequences in monetary units.
Figure 2. Exogenous and endogenous positive factors and their shares
In the case of endogenous uncertain factors, which could be steered and calculated in
monetary units, guarantees are often described with the initial volume and the decrease over
the runtime. For concrete reconstructions only a few give samples for executed or planned
measures.

Proceedings of the IE 2015 International Conference
www.conferenceie.ase.ro
502
5. Conclusions
The results of the research undertaken show a wide spectrum of uncertain factors; these
factors could have desired and not desired influence of sustainable provision of mandatory
operations and create space for voluntarily tasks. The negative factors outclass the positive.
But within the given factors only in a few cases are combined with monetary values for a
better impression of possible outputs and outcomes. Because of a missing model of the
definition of risk, uncertainty and certainty, the given expectations present a different picture
of risk understanding. Also be noted that a clear priority in measures for positive effects is
given, for example provision of commercial areas and city development. The range of
negative factors is comparatively diffuse.
That leads to the conclusion that public administrations in Germany have a clear
understanding of influence factors, but lack on instruments for calculating the outcomes in
the case of realization of adverse factors. But for strategic use the identification of these
factors will have impact to political targets and the sustainable execution of mandatory tasks.
For better comparison general categories and monetary volumes will give a more
sophisticated and useful impression of current status and expected range of developments.
References [1] W. Wilson, "The Study of Administration," Political Science Quarterly, vol. 2, no. 2, pp.
197-222, June 1887.
[2] M. Bodemann, "Risk awareness als Schlüssel zu einem erfolgreichen Risikomanagement"
in: A, Niedostadek, R. Riedl, and J. Stember (eds.), "Risiken im öffentlichen Bereich,"
Berlin: Lit Verlag, 2011, pp. 87 – 109.
[3] M. Bodemann, M. Olaru and I.C. Pirnea, ”Risk awareness as key success factor for more
efficient management for local public administrations”, Proceedings of The First
International Management Conference in Danube Delta ”Challenges, performances and
tendencies in the organization management”, ASE Publishing House, 2014.
[4] H.G. Rainey, "Understanding and managing public organization", San Francisco, John
Wiley & Sons, 2009.
[5] H.A. Simon, "Why public administration," Journal of Public Administration, Research
and Theory, pp. 1 -11, January 1998.
[6] B. Loevenich, “Der Umgang mit operationellen Risiken in Kreditinstituten – Vorbild für
öffentliche Verwaltungen?,” in: A, Niedostadek, R. Riedl, and J. Stember (eds.),
"Risiken im öffentlichen Bereich," Berlin: Lit Verlag, 2011, pp. 263.
[7] D. Rehfeld, “Rating von Kommunen," in: E. Meurer and G. Stephan, „Rechnungswesen
und Controlling,“ Stuttgart: Haufe, 2005.
[8] C. Pollitt and G. Bouckaert, “Public Management Reform,” Oxford: Oxford University
Press, 2004, pp. 538 – 542.
[9] M. Olaru, D. Maier, A. Maier and M. Bodemann, “Integrated management systems, Key
factor for the sustainable development of an organization,” in: Proceedings of the 13th
International Conference on Informatics in Economy IE 2014 Bucharest, 2014.
[10] “Verwaltungsgliederung in Deutschland am 31.12.2013“. Internet:
https://www.destatis.de/DE/ZahlenFakten/LaenderRegionen/Regionales/Gemeindeverzei
chnis/Administrativ/Archiv/Verwaltungsgliederung/31122013_Jahr.html
[11] R. Mussari, "Autonomy, responsibility and New Public Management," St. Gallen:
Conference on New Public Management in International Perspective., 1996.

Proceedings of the IE 2015 International Conference
www.conferenceie.ase.ro
503
[12] B. Loevenich, “Der Umgang mit operationellen Risiken in Kreditinstituten – Vorbild für
öffentliche Verwaltungen?,” in: A, Niedostadek, R.Riedl, and J. Stember (eds.), "Risiken
im öffentlichen Bereich," Berlin: Lit Verlag, 2011, pp. 257.
[13] R.B. Denhardt and J.V. Denhardt, "Public administration: An action orientation,"
Belmont: Thomson Wadworth, 2009.
[14] J. Forrer, J.E. Kee, K.E. Newcomer and E. Boyer, "Public – private partnerships and the
public accountability question", Public Administration Review, pp. 475-484, 2010.

Proceedings of the IE 2015 International Conference
www.conferenceie.ase.ro
504
SOVEREIGN RISK DEPENDENCE PATTERN IN
EMERGING EUROPE
Gabriel GAIDUCHEVICI
Romanian Academy [email protected]
Abstract. In this study we implement a flexible model to assess both the strength and the
pattern of sovereign risk dependence between several European countries with emerging
economies. We employ a market risk approach to analyzing sovereign risk and provide a
synoptic interpretation of the results facilitating a better understanding of the
interconnectedness of sovereign risk. We conclude that sovereign risk is not a country
specific type of risk but rather a reflection of both internal factors and macroeconomic forces
external to the country.
Keywords: copula, garch, hac, sovereign risk JEL classification: C22, C46, H63
1. Introduction
The purpose in this study is to implement a flexible model to assess both the strength and the
pattern of sovereign risk dependence between several European countries. We aim at giving a
synoptic interpretation to sovereign risk, in the sense that we would like to see whether the
risks associated to these countries move in tandem or they can be analyzed independently.
We pursue a novel implementation by using an extensive data set of credit default swap
(CDS) contracts on the debt issued by 11 European emerging countries. This market risk
approach to analyzing sovereign risk has at least two advantages when compared to more
traditional macroeconomic approaches: i) as CDS spreads reflect the market perspective on
the credit risk of a particular country we believe that these indicators are tightly linked to the
general health of the country’s finances. In addition, using market data improves accuracy
because it reacts promptly to changes in the macroeconomic environment; and ii) CDS
contracts are more liquid than the corresponding sovereign bond market allowing for a
cleaner extraction of the credit risk premium from the CDS spread.
Given the rapid expansion of sovereign debt markets, understanding the nature of sovereign
risk is of increasing importance because it directly affects the cost and flow of capital across
countries. Furthermore, understanding sovereign risk and its interconnectedness improves the
ability of market participants to assess the implications of their investments, especially with
respect to diversification of debt portfolios. Existing literature focuses more on the incentives
and ability of sovereign debtors to repay their debt and, despite its importance, there is
relatively little research on the sources of commonality and dependence in sovereign risk. Of
particular relevance are the studies of [1] who map agency ratings to default losses and then
decompose sovereign credit spreads into credit risk and premium components for a panel of
24 countries. [2] use an affine sovereign credit model to demonstrate how common factors
could induce significant correlation among credit spreads. Our approach is different in that
we seek to describe the interconnectedness of sovereign risk rather than predict individual
country default. We concur that describing an economy by an index might overlook some
information but at the same time we argue that it adds simplicity and produces more realistic
results because it reduces the model dependency on extensive sets of assumptions. Our

Proceedings of the IE 2015 International Conference
www.conferenceie.ase.ro
505
implementation is a combination between the breadth provided by high dimensionality and
the generality of using aggregated indicators.
The paper proceeds as follows: section 2 presents the modeling framework, section 3
describes the implementation and section 4 concludes.
2. Modeling framework
From a methodological perspective, our goal is to disentangle the idiosyncratic components
from the common factors driving the sovereign risk. We employ a copula-GARCH approach
and proceed by dividing the study in two phases. First, we filter the univariate series to
extract all temporal dependence. The resulting cross sectional panel of standardized residuals
reflects only the pure joint dependence. Second, we fit a multidimensional hierarchical
Archimedean copula (HAC) to describe the pattern of association. One advantage of the
copula-GARCH approach is the possibility to specify and estimate the model in stages. The
marginal distributions are specified by an ARMA-GARCH model for each univariate time
series and then a copula (in this case a HAC) is estimated on the probability integral
transforms of the standardized residuals. The result is a valid multi-dimensional joint
distribution that is easier to estimate and interpret.
In the context of this analysis we are interested in modeling the cross sectional dependence
between time series data and therefore we employ an adapted version of Sklar's theorem
introduced by [3]. The multivariate distribution 𝐹 of a vector 𝑌𝑡, conditional on the
information set available at time 𝑡 − 1 given by ℱ𝑡−1 = {𝑌𝑙: 𝑙 ≤ 𝑡 − 1}, is decomposed into
its conditional margins 𝐹𝑖 and the corresponding conditional copula in the following way:
𝐹(𝑦|ℱ𝑡−1 ) = 𝐶{𝐹1(𝑦1|ℱ𝑡−1), … , 𝐹𝑝(𝑦𝑝|ℱ𝑡−1)|ℱ𝑡−1 }
with 𝑌𝑖𝑡|ℱ𝑡−1 ∼ 𝐹𝑖(⋅ |ℱ𝑡−1), 𝑖 = 1, … , 𝑝 (1)
Fitting a copula on the unconditional probability integral transform will result in an
unconditional copula model for the dependence. In a time series context however, it is
necessary to condition on the available past information which first requires the specification
of the margins and then the copula that joins the series cross-sectionally. If we define the
probability integral transform 𝑈𝑖𝑡 = 𝐹𝑖(𝑌𝑖𝑡|ℱ𝑡−1) then the conditional copula of 𝑌𝑡|ℱ𝑡−1 is
given by 𝑈𝑡|ℱ𝑡−1 ∼ 𝐶(⋅ |ℱ𝑡−1). It is important to note that both the margins and the copula
have to be conditional on the same data set. We use the standard ARMA-GARCH approach
to model the univariate distributions by specifying the following general model for each
univariate series:
𝑌𝑖𝑡 = 𝜇𝑖(𝑌𝑡−1) + 𝜎𝑖(𝑌𝑡−1)𝜖𝑖𝑡 (2)
where 𝜖𝑖𝑡 ∼ 𝐹𝑖(0,1), ∀ 𝑡. The conditional copula is fitted on the conditional distribution of the
probability integral transform of the standardized residuals constructed as:
𝜖��𝑡 =
𝑌𝑖𝑡 − 𝜇𝑖(𝑌𝑡−1)
𝜎𝑖(𝑌𝑡−1), 𝑖 = 1, 2 … , 𝑝 (3)
The parametric form of 𝐹𝑖 has to be able to accommodate thicker than normal tails and
possibly an asymmetric shape. For this analysis, we tested both the normal distribution and
the Student-t for its ability to control the thickness of the tails via the degrees of freedom
parameter.
Archimedean copulas are related to the Laplace transforms of univariate distribution
functions. According to [4] if we denote by 𝕃 the class of Laplace transforms that consist of
strictly decreasing differentiable functions than the function 𝐶: [0,1]𝑑 → [0,1] defined as:
𝐶(𝑢1, … , 𝑢𝑛; 𝜃) = 𝜙{𝜙−1(𝑢) + ⋯ + 𝜙−1(𝑢𝑑)}, 𝑢1, … , 𝑢𝑑 ∈ [0,1] (4)

Proceedings of the IE 2015 International Conference
www.conferenceie.ase.ro
506
is a d-dimensional exchangeable Archimedean copula where 𝜙 ∈ 𝕃 is called the generator
function and 𝜃 is the copula parameter. Archimedean copulas provide an elegant solution to
accommodate tail dependence in non-elliptical distributions. However, fitting a fully nested
structure to a large data set is unfeasible. This disadvantage comes from the fact that the
multivariate dependence structure typically depends on a single parameter of the generator
function. Furthermore, the resulting distribution is exchangeable which means the
dependence is symmetric with respect to the permutation of the variables. HACs alleviate
these shortcomings by providing an efficient way to recursively define the dependence
structure for large dimensional data sets. Using the same notation as in (4), a fully nested
HAC connecting 𝑑 − 1 nesting levels is defined recursively by the following relation:
𝐶(𝑢1, … , 𝑢𝑑) = 𝜙𝑑−1{𝜙𝑑−1−1 ° 𝜙𝑑−1{⋯ [𝜙2
−1°𝜙1{𝜙1−1(𝑢1) + 𝜙1
−1(𝑢2)} + 𝜙2−1(𝑢3)]
+ ⋯ 𝜙𝑑−2−1 (𝑢𝑑−1)} + 𝜙𝑑−1
−1 (𝑢𝑑)}
= 𝜙𝑑−1{𝜙𝑑−1−1 ° 𝐶(𝜙1, … , 𝜙𝑑−1)(𝑢1, … , 𝑢𝑑−1) + 𝜙𝑑−1
−1 (𝑢𝑑)}
= 𝐶𝑑−1{𝐶𝑑−2(𝑢1, … , 𝑢𝑑−1), 𝑢𝑑}
(5)
According to [5] such a structure is determined recursively starting at the lowest level with a
copula 𝜙1 forming a variable 𝑧1 = 𝜙1{𝜙1−1(𝑢1) + 𝜙1
−1(𝑢2)}. At the second level another
copula is used to capture de dependence between 𝑧1 and 𝑢3 and so on. The generators 𝜙𝑖may
come from the same family and differ only in parameter or may come from different
generator families. [5] propose an efficient method to determine the optimal structure. The
estimation procedure relies on a recursive multi-stage maximum likelihood method which
determines the parameters at each level and the structure simultaneously (the structure itself
is in fact a parameter to estimate).
3. Model implementation and results
We apply the methodological framework described above to an extensive data set of CDS
contracts on the sovereign debt of 11 European emerging economies. Briefly, a CDS is a
contract whereby the seller provides insurance to the buyer against the losses resulted from a
default by the reference entity. The CDS spread is quoted in basis points for different
maturities across the credit curve. Our data set consists of the daily, 5 year maturity, CDS
spreads of 11 countries spanning a period of roughly 5 years. Figure 1 depicts the time
evolution of the CDS spreads for each country in the data set. Countries are identified by
their ISO country code. The levels of our CDS data are indicative of autoregressive processes
and similar to other market data series they are unlikely to follow a random walk (they are
also bounded below). We model in log-differences to avoid treating the series as near unit
root processes. All data was retrieved from the Bloomberg Database.
Using the methodology of [6] the CDS spread can be expressed as:
𝑆𝑖𝑡 = 1002𝑃𝑖𝑡ℳ𝑖𝑡𝐿𝑖𝑡 (6)
where 𝑃𝑖𝑡is the probability of default, ℳ𝑖𝑡 is the market price of risk and 𝐿𝑖𝑡is the loss given
default (LGD). In our analysis we work with the log-returns of CDS spreads to mitigate their
autoregressive persistence under the following transformation:
𝑦𝑖𝑡 = 𝛥 log 𝑆𝑖𝑡 = 𝛥 log 𝑃𝑖𝑡 + 𝛥 log ℳ𝑖𝑡 + 𝛥 log 𝐿𝑖𝑡 (7)
If we follow the business cycle theory then the market price of risk is constant or evolves
slowly. If we further assume, in accordance with the common practice, a constant LGD then
the second and the third terms in (7) vanish leaving the changes in CDS spreads to be directly
attributed to the changes in the empirical probability of default. Table 1 presents the summary
statistics of the CDS spreads both in their level form and log-returns. Of particular

Proceedings of the IE 2015 International Conference
www.conferenceie.ase.ro
507
importance for our analysis is the high level of kurtosis of the log-return series as this
imposes the need for a distribution to capture the thickness in the tails (and possibly skewed).
Figure 1. CDS spreads for countries in data set (ISO country codes)
Table 1. Summary statistics of CDS spreads both in level and log-return forms
Levels (in basis points) Log returns
1st Qu Median Mean 3rd Qu Mean Std Skew Kurt
ROU 189 252 278 344 - 0.0011 0.0286 - 0.3687 7.6017
HUN 238 291 322 381 - 0.0007 0.0292 0.1818 8.8396
POL 82 126 137 166 - 0.0009 0.0365 0.2100 7.0302
CZE 59 82 91 109 - 0.0008 0.0335 - 0.1096 12.7427
SVN 74 85 111 114 - 0.0007 0.0359 - 0.0003 9.5602
BGR 126 215 229 287 - 0.0007 0.0307 0.0317 7.8669
HRV 252 288 318 344 - 0.0004 0.0271 0.3448 10.2133
SVK 81 136 193 302 0.0000 0.0394 1.8607 34.2530
EST 64 93 137 132 - 0.0013 0.0312 - 0.9213 16.5526
LVA 121 245 292 351 - 0.0014 0.0291 - 0.7707 25.9898
LTU 128 227 243 291 - 0.0012 0.0280 - 0.3372 23.3966
Daily CDS spreads have more autocorrelation (i.e. risk persistence) than is found in other
market data. Therefore our conditional mean-variance models need more structure than the
commonly used model for daily stock returns. Applying an ARMA-GARCH process to the
return series of the two indices removes the temporal correlation but preserves the cross-
sectional dependence. As most asset returns, our series are not stationary (at least in the
variance) and therefore we followed the standard mean-variance model building approach to
make our series temporal independent. The order for the mean equation was determined by
comparing the BIC of ARMA models of orders up to 5. An AR(1) process was optimal for
most of the series and this decision has also been confirmed by the partial autocorrelation
function of the squared log-returns. Then, we used the squared residuals from the mean
equation to test for conditional heteroskedasticity. Applying the Ljung-Box test on the first 12
squared log-returns revealed p-values very close to zero which gives strong indication of
rejecting the null and a motivation to introduce a conditional variance equation. To handle the

Proceedings of the IE 2015 International Conference
www.conferenceie.ase.ro
508
fat tails characteristics we used the Student-t distribution. Taking all the above into
consideration we implemented the following form of mean-variance modeling:
𝑦𝑖𝑡 = 𝜇𝑖 + 𝜃𝑖1𝑦𝑖,𝑡−1 + 𝑒𝑖𝑡
𝑒𝑖𝑡 = 𝜎𝑖𝑡𝜖𝑖𝑡, 𝜖𝑖𝑡 ~ 𝑆𝑡𝑢𝑑𝑒𝑛𝑡 − 𝑡 (𝜈)
𝜎𝑖𝑡 = 𝜔𝑖 + 𝛼𝑒𝑖,𝑡−12 + 𝛽𝜎𝑖,𝑡−1
(8)
and the results are presented in Table 2. For ROU and BGR the degrees of freedom parameter
came out not significant so we used the normal distribution instead. Similarly, for POL, CZE
and SVN the AR(1) parameters were not significant therefore we only used the equation for
the variance - GARCH(1,1). The HAC is fitted on the standardized residuals obtained from
(8). Taking into account the dependence characteristics for each pair of standardized residuals
(judging by the scatterplots) we decided to use the Gumbel generator at each node. HACs
have at least two interesting characteristics: first, the structure is recursive which entails that
the marginal distribution at each node in the tree is also a HAC. However for ease of
interpretation we opted for a fully nested HAC (i.e. binary copula at each node); second, if
the same copula, with a single parameter, is used at each level then the parameters should
increase with the levels. This provides an intuitive interpretation of the copula tree as the
dependence at the bottom is stronger than at the top. In addition, we chose to present the
results in Figure 2 using the equivalent Kendall’s 𝜏 as it is easier to interpret than the
respective copula parameter (𝜏 represents the rank correlation and is bounded by [0,1]). Copula estimation was performed in R using the HAC package by [7].
Table 2. Parameter estimates of the ARMA-GARCH processes
𝜇 𝜃1 𝜔 𝛼 𝛽 𝜈
ROU -0.0013 0.1441 0.0001 0.1540 0.7331
(0.0006) (0.0309) (0.0000) (0.0286) (0.0420)
HUN -0.0011 0.1275 0.0001 0.2334 0.7594 5.1850
(0.0005) (0.0252) (0.0000) (0.0726) (0.0661) (0.3167)
POL -0.0018 0.0001 0.2576 0.7140 4.4670
(0.0006) (0.0000) (0.0520) (0.0317) (0.3593)
CZE 0.0090 0.0000 0.3225 0.4894 3.5680
(0.0043) (0.0000) (0.0747) (0.0189) (0.0654)
SVN -0.0010 0.0002 0.4144 0.5556 3.2352
(0.0004) (0.0001) (0.1848) (0.0464) (0.1513)
BGR -0.0007 0.0874 0.0001 0.1311 0.8140
(0.0003) (0.0304) (0.0000) (0.0224) (0.0291)
HRV -0.0004 0.1161 0.0001 0.2981 0.6160 3.2850
(0.0003) (0.0250) (0.0001) (0.1566) (0.0481) (0.1338)
SVK -0.0002 -0.0450 0.0004 0.3181 0.6593 2.1472
(0.0004) (0.0224) (0.0001) (0.1157) (0.0551) (0.0522)
EST -0.0001 -0.0466 0.0000 0.1874 0.7340 3.1830
(0.0001) (0.0218) (0.0000) (0.0911) (0.0388) (0.0398)
LVA -0.0012 0.0000 0.2586 0.6530 3.5460
(0.0003) (0.0000) (0.0697) (0.0196) (0.0546)
LTU -0.0001 0.0000 0.1795 0.6878 3.4780
(0.0002) (0.0000) (0.0732) (0.0247) (0.0466)
Figure 2. Pattern of sovereign risk dependence

Proceedings of the IE 2015 International Conference
www.conferenceie.ase.ro
509
4. Conclusions In this study we determined the degree of interconnectivity of sovereign risk and the pattern
of association in the credit risk of these countries. Several important conclusions derive from
this study: i) first, copula parameters are significant across the tree meaning that sovereign
risk is not a country specific type of risk but rather a reflection of both internal factors and
macroeconomic forces external to the country; ii) judging by how the countries are grouped it
is evident that countries adopting the euro (SVN, SVK, EST) have a different risk profile and
a weaker connection to the others; iii) the newest members of the EU – ROU, BGR and HRV
are grouped together indicating similar and interconnected sovereign risk. ROU and BGR
present the strongest risk dependence, which is in line with the general perception of seeing
and referencing these countries together; iv) countries that joined the Eurozone most recently-
LVA and LTU are grouped together with CZE, the strongest economy in the group.
Acknowledgment
This work was financially supported through the project "Routes of academic excellence in
doctoral and post-doctoral research - REACH" co-financed through the European Social
Fund, by Sectoral Operational Programme Human Resources Development 2007-2013,
contract no POSDRU/159/1.5/S/137926.
References [1] E. Remolona, M. Scatigna and E. Wu, “The Dynamic Pricing of Sovereign Risk in
Emerging Markets.” The Journal of Fixed Income, vol. 17, no. 4, pp. 57-71, 2008
[2] J. Pan and K. Singleton, “Default and Recovery Implicit in the Term Structure of
Sovereign CDS Spreads”, Journal of Finance, vol. 63, no. 5, pp. 2345-2384, 2008
[3] A. Patton, “Modelling asymmetric exchange rate dependence”, International Economic
Review, vol. 47, no. 2, pp. 527-556, 2006
[4] H. Joe, Multivariate Models and Dependence Concepts. London: Chapman & Hall, 1997.
[5] O. Okhrin, Y. Okhrin and W. Schmid, “On the Structure and Estimation of Hierarchical
Archimedean Copulas”, Journal of Econometrics, vol. 173, no. 2, pp. 189-204, 2013.
[6] P. Carr and L. Wu, “A simple robust link between American puts and credit protection”,
Review of Financial Studies, vol. 24, no. 2, pp. 473-505, 2011
[7] O. Okhrin and A. Ristig, “Hierarchical Archimedean Copulae: The HAC Package”,
Journal of Statistical Software, vol. 58, no. 4, 2014

Proceedings of the IE 2015 International Conference
www.conferenceie.ase.ro
510
MEASURE YOUR GENDER GAP: WAGE INEQUALITIES USING
BLINDER OAXACA DECOMPOSITION
Radu-Ioan VIJA
The Bucharest University of Economic Studies, Economic Cybernetics and Statistics
Doctoral School
Ionela-Catalina ZAMFIR
The Bucharest University of Economic Studies, Economic Cybernetics and Statistics
Doctoral School
Abstract. Nowadays, we can observe many forms of discrimination, from everyday life racial
discrimination, to wage discrimination based on age or gender. This article is explaining and
demonstrating the wage inequalities between men and women by decomposing and analyzing
wage data using the Oaxaca Blinder statistics technique for linear regression models. The
analysis did in this article is emphasizing the importance of wage inequalities in private
companies as in the public institutions by identifying the main factors/statistical variables
which plays an important role in the non-discriminant inequality and especially in
discriminant inequalities.
Keywords: Blinder-Oaxaca decomposition, cluster, linear regression, wage gap, datamining.
JEL Classification: C13, J71
1. Introduction and literature review
In the majority of cases, the Blinder-Oaxaca method is used to study wage gap by sex and
race. Blinder Oaxaca decomposition represents a system of linear regression equations from a
statistical point of view. The discrimination problem is wide spread in these days, especially
as there are more and more organizations, rights and laws dealing with fight against
discrimination. It's measurement and combat is a common topic and modeling became
possible with the proposal of new models. Since the original Oaxaca and Blinder (1973)
decomposition technique model, many studies were made (more in education or social areas),
to test the original model, it's applications areas and it's results (such as: Dodoo, 1991; Farkas
and Vicknair, 1996; DeLeire, 2001; Sayer, 2004; Yun, 2006; Stearns et al., 2007; Berends
and Penaloza, 2008, Becker :1971, Duncan :1969, Ashenfelter: 1987, Altonji : 1999,
Althauser :1972). This study is structured in sections, such as: section 2 presents details the
methodology approach, section 3 is the case study, presenting the dataset used and results for
models applied, and section 4 shows the conclusions and further research.
2. Methodology
2.1. The Blinder-Oaxaca statistic model
We are considering the next conditional regression equation model:
𝑌£ = 𝛼£ + 𝛽£𝑋£ + 휀£, £ ∈ {A, B} (1)
with E(ε£ ) = 0 for £ ∈ {A,B}. We are interested in explaining the difference ∆ :
∆= ��𝐴 − ��𝐵 (2)

Proceedings of the IE 2015 International Conference
www.conferenceie.ase.ro
511
Considering all the co-variables and eventually considering a discriminative effect which will
be decomposed and analyzed later in this article. In order to do this, (Blinder 1973) and
(Oaxaca, 1973) proposed the next decomposition of our difference ∆ :
∆= ��𝐴 − ��𝐵∗
+ ��𝐵∗
− ��𝐵 (3)
where: ��𝐵∗
= 𝛼𝐴 + 𝛽𝐴��𝐵 corresponds to a contradictory model (which will be the YB for our
model for the A population). Thus: ∆= 𝛽𝐴(��𝐴 − ��𝐵) + (𝛼𝐴 − 𝛼𝐵) + (𝛽𝐴 − 𝛽𝐵)��𝐵
(4), where: 𝛿1 = 𝛽𝐴(��𝐴 − ��𝐵) represents the explicable difference by the own characteristics
of the population and 𝛿2 = (𝛼𝐴 − 𝛼𝐵) + (𝛽𝐴 − 𝛽𝐵)��𝐵 represents the effect of the non-
explicable coefficients. The (4) decomposition in two parts can also be seen as a particular
case of a more general decomposition (in matrix format):
∆= (��𝐴 − ��𝐵)[𝐷𝛽𝐴 + (𝐼 − 𝐷)𝛽𝐵] + (𝛽𝐴 − 𝛽𝐵)[(𝐼 − 𝐷)��𝐴 − 𝐷��𝐵] (5)
where β is now the vector including the intercepts and the other regressors of X represent the
set of co-variables completed by a first column of 1. The estimation of the model is based on
the estimators of ordinary least squares (OLS). The parameters α and β are estimated by αˆMC
and βˆMC being conditioned by the statistic populations (the data for populations A and B).
2.2. Cluster and discriminant analyses
Cluster analysis is a part of the methods and techniques for unsupervised pattern recognition.
These techniques as well are trying to satisfy the general criterion of classification [Ruxanda,
2009]: variability within classes must be as small as possible and the variability between
classes must be as high as possible. Partitioning algorithms provide superior results than
hierarchical methods because they run until the STOP condition is fulfilled. The most famous
among partitioning algorithms is the K-Means algorithm. On the other hand, the discriminant
analysis is part of methods and techniques from supervised pattern recognition. With this
method, new observations, about a class membership is unknown, can be classified into
classes using discriminant scores. There are several types of classifiers, but the Fisher linear
classifier is more used than others. The general relation for Fisher's linear classification
function is: 𝐷(𝑥) = 𝛽0 + 𝛽1𝑥1 + 𝛽2𝑥2 + ⋯ + 𝛽𝑛𝑥𝑛 (6), Where: n is the number of variables
(characteristics) in the model, and 𝛽 is the eigenvector of matrix: Σ𝑤−1Σ𝑏, where Σ𝑏 is the
variability between classes and Σ𝑤 is the variability within classes.
3. Results
3.1. Database used
The original database consists in 628 employees, coming from a mix of employees’
confidential data from companies working in the French energy field, all ages confounded
and from all the departments. For cluster and discriminant analyses, two operations were
made on the original dataset: eliminating observations with missing values and observations
that are considered to be outliers3, and standardizing the dataset, in order to classify
observations into 4 classes and estimate linear classification functions. After these operations,
only 528 employees remained, that represents 84% of the original database. The variables
used in our study are: Birth Year (DateNaissance), Sex (Sexe), Year of starting job in the
company (DateEntreeEntreprise), Nationality (Nationalite), Number of university years
(NiveauEtude), Department (BusinessUnit), Number of days off for holidays
(NbJoursAutresAbsences2013), Number of days off for sickness (NbJoursMaladie2013),
Maternity days off (NbJoursCongeParental), Place of work, Type of job contract
3 An outlier is a value that is not included in the statistical interval: [mean-3*Stdev; mean+3*Stdev], that
contains 99.98% of total observations

Proceedings of the IE 2015 International Conference
www.conferenceie.ase.ro
512
(Encadrement), Number of people managed in the company, Wage in 2011, 2012 and 2013
(SBR2011, SBR2012, SBR2013).
3.2. Graphical analysis
a). Wage discrimination related to age and sex
Figure 1. Wage discrimination related to sex and age, source: SAS output
The graph shows clear wage discrimination related to age and sex. It is notable that as they
age, men are paid better, and women tend to gain the same wage. For women, the age brings
small increases in salary, while for men, the age and the experience bring huge increases in
wage. If we think of higher wages as associated with leadership positions, is it possible that
women do not reach leadership positions with age? It is possible that women wages be
influenced by the fact that women become mothers and have maternity leave?
b). Wage discrimination related to business field and sex
Figure 2. Wage discrimination related to business field and sex, source: SAS output
The graph above shows that the salary level was low for women in "Direction generale",
"Finance" and "Supply Chain" fields, while men's salary level was higher for "Direction
generale" and "Finance" field. Men won more that women if they work in "Juridique / Fiscal"
area. These ideas prove once again that there is discrimination between women and men
working in different departments of the same company.
3.3. Cluster and discriminant analyses
Taking into account 7 standardized variables, the cluster analysis shows how observations are
grouped into 4 big clusters. The method used to classify all 5284 individuals is an
algorithmically method5: K-Means algorithm.
4 The remaining individuals after eliminating of outliers and observations with missing values. 5 Among the two classification categories (hierarchically methods and algorithmically method), this algorithm
provides the best results, due to the fact that it "runs" until the classes centroids are stable.

Proceedings of the IE 2015 International Conference
www.conferenceie.ase.ro
513
Row 1 2 3 4 Total Row 1 2 3 4 Total
F
12 224 33 269 Autre 5 5
H 25 47 48 139 259 Direction generale 20 10 55 95 180
Total 25 59 272 172 528 Finance 5 26 20 12 63
Informatique 3 33 36
Juridique / Fiscal 147 147
Marketing 5 19 24
Supply Chain 20 45 8 73
Total 25 59 272 172 528
Figure 3. Classes structure, source: Excel computation
The figure from above shows the classification results. There are 4 classes, each of them
having a certain percentage of women and men, as follows: Class 1: there are 47 men and no
women, 20 of them working in "Direction generale" and 5 of them in "Finance". They are
born between 1954 and 1974, came in the company between 1982 and 2008 and they have an
average wage of 82 239€ in 2011, 87 482€ in 2012 and 92 072€ in 2013. This class may be
named as "top managers" class. It is important to notice here that there are is no woman in
top managers class. Class 2: there are 47 men and 12 women, 26 persons work in "Finance"
and 20 in "Supply Chain". Individuals are born between 1953 and 1962, came in the
company between 1971 and 1990 and they have an average wage of 43 356€ in 2011, 44
525€ in 2012 and 45 918€ in 2013. This class may be named as "middle managers" class.
Taking into account that only 20% of individuals are women, we can observe genre
discrimination when it comes to manager's position. Class 3: there are 224 women and 48
men, 147 of individuals work in "Juridique / Fiscal", 55 in "Direction generale" and 45 in
"Supply Chain". They are born between 1961 and 1985, came in the company between 1988
and 2011 and they have an average wage of 19843€ in 2011, 20943€ in 2012 and 22696€ in
2013. This class may be named as "young and inexperienced workers" class. Class 4: there
are 139 men and 33 women, 95 of the individuals work in "Direction generale" and 33 of
them in "Informatique". They are born between 1956 and 1983, came in the company
between 1989 and 2011 and they have an average wage of 28670€ in 2011, 32189€ in 2012
and 33123€ in 2013. This class may be named as "normal workers" class.
Looking carefully at all 4 classes from above, we might say that the company "prefers"
experienced managers (top and middle level), and middle managers came in the company
much earlier than top managers. From this point of view, what are the reasons that the
company changed top managers more often (including 2008) than middle managers?
Figure 4. Linear discriminant functions, source: SAS output
The figure from above represents the linear discriminant coefficients (Fisher linear classifier)
for all 4 classes indentified above. With these coefficients, it is possible to write the estimator
functions, such as (the discriminant function for class 1): 𝐷1(∙) = −54.27 + 2.76 ∗ Sexe − 3.73 ∗ DateNaissance − 3.19 ∗ DateEntreeEnterprise − 5.50 ∗ SBR2011
+ 24.21 ∗ SBR2012 + 8.22 ∗ SBR2013 + 4.91 ∗ BusinessUnit
Using these functions, and taking into account the sex codification: 1=H (man) and 0=F
(woman), and the BusinessUnit codification (1 for Juridique/Fiscal, 2 for Supply Chain, 3 for
Marketing, 4 for Finance, 5 for Direction generale, 6 for Informatique, 7 for Autre and 8 for
RH) it is possible to calculate 4 discriminants scores (calculated for standardized data). The
higher score "gives" the class for a new individual, for whom the affiliation to a class is
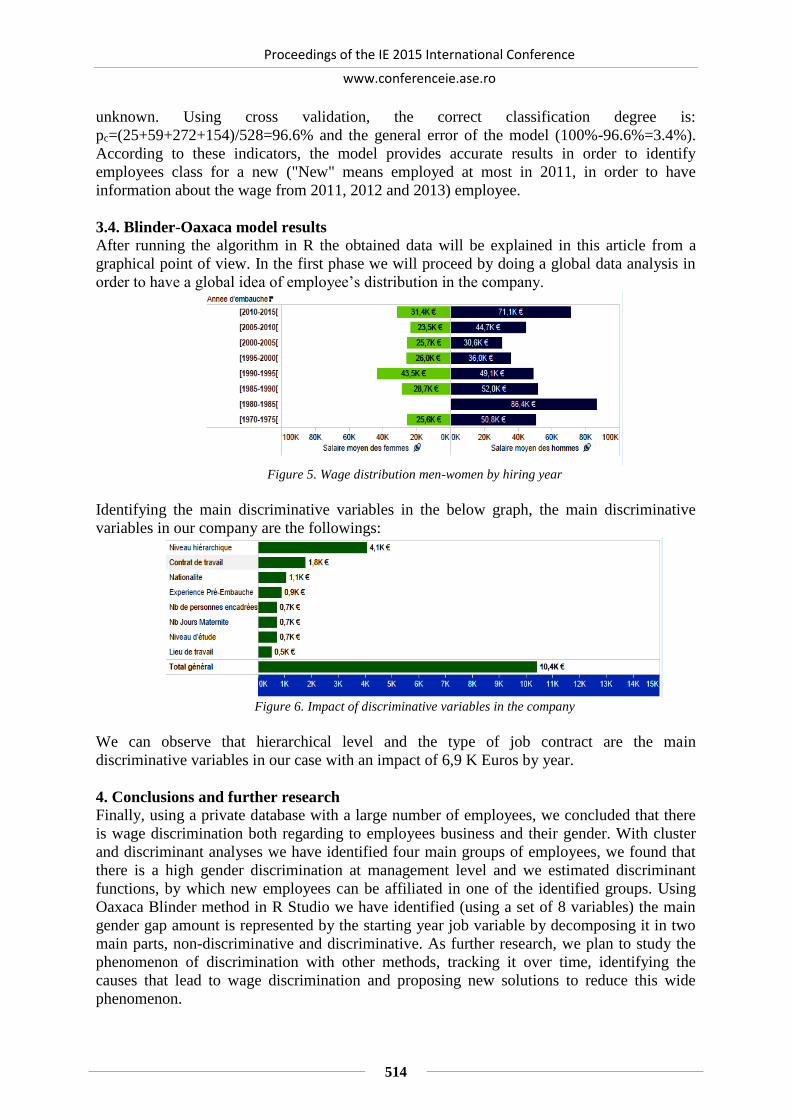
Proceedings of the IE 2015 International Conference
www.conferenceie.ase.ro
514
unknown. Using cross validation, the correct classification degree is:
pc=(25+59+272+154)/528=96.6% and the general error of the model (100%-96.6%=3.4%).
According to these indicators, the model provides accurate results in order to identify
employees class for a new ("New" means employed at most in 2011, in order to have
information about the wage from 2011, 2012 and 2013) employee.
3.4. Blinder-Oaxaca model results
After running the algorithm in R the obtained data will be explained in this article from a
graphical point of view. In the first phase we will proceed by doing a global data analysis in
order to have a global idea of employee’s distribution in the company.
Figure 5. Wage distribution men-women by hiring year
Identifying the main discriminative variables in the below graph, the main discriminative
variables in our company are the followings:
Figure 6. Impact of discriminative variables in the company
We can observe that hierarchical level and the type of job contract are the main
discriminative variables in our case with an impact of 6,9 K Euros by year.
4. Conclusions and further research
Finally, using a private database with a large number of employees, we concluded that there
is wage discrimination both regarding to employees business and their gender. With cluster
and discriminant analyses we have identified four main groups of employees, we found that
there is a high gender discrimination at management level and we estimated discriminant
functions, by which new employees can be affiliated in one of the identified groups. Using
Oaxaca Blinder method in R Studio we have identified (using a set of 8 variables) the main
gender gap amount is represented by the starting year job variable by decomposing it in two
main parts, non-discriminative and discriminative. As further research, we plan to study the
phenomenon of discrimination with other methods, tracking it over time, identifying the
causes that lead to wage discrimination and proposing new solutions to reduce this wide
phenomenon.

Proceedings of the IE 2015 International Conference
www.conferenceie.ase.ro
515
References
[1]. R. P. Althauser and M. Wigler, "Standardization and Component Analysis". Sociological
Methods and Research, Vol. 1, No. 1, pp. 97–135, 1972.
[2]. J.G. Altonji and R. M. Blank., "Race and Gender in the Labor Market", In Handbook of
Labor Economics, Vol. 3C, eds. Orley Ashenfelter and David Card, pp. 3143–3259.
Amsterdam: Elsevier, 1999
[3]. O. Ashenfelter and R. Oaxaca, "The Economics of Discrimination: Economists Enter the
Courtroom", American Economic Review 77 (2), pp. 321–325, 1987
[4]. G. S. Becker, “The Economics of Discrimination”. 2nd ed., Chicago: University of
Chicago Press, 1971
[5]. M. Berends, S. R. Lucas and R. V. Penaloza, “How Changes in Families and Schools Are
Related to Trends in Black-White Test Scores.” Sociology of Education, Vol. 81, pp.
313-344, 2008
[6]. A. S., Blinder, "Wage Discrimination: Reduced Form and Structural Estimates," Journal
of Human Resources, Vol. 8, pp. 436-455, 1973
[7]. T. DeLeire, “Changes in Wage Discrimination against People with Disabilities: 1984-
93.” Journal of Human Resources, Vol. 36, pp. 144–158, 2001
[8]. F. Nil-Amoo Dodoo, “Earnings differences among Blacks in America.” Social Science
Research, Vol. 20, pp. 93-108, 1991
[9]. O.D. Duncan, “Inheritance of Poverty or Inheritance of Race. In On Understanding
Poverty: Perspectives from the Social Sciences”, ed. Daniel P. Moynihan, 1969, pp. 85–
110. New York: Basic Books
[10]. G. Farkas, and V. Keven, “Appropriate Tests of Racial Wage Discrimination Require
Controls for Cognitive Skill: Comment on Cancio, Evans and Maume.” American
Sociological Review, Vol. 61, No. 4, pp. 557-560, 1996
[11]. J.K. Galbraith and L. Jiaqing, Inequality and Industrial Change: a Global View, Chapter
16, James K. Galbraith and Maureen Berner, eds., Cambridge University Press, 2001.
[12]. J. Gardeazabal and A. Ugidos, "More on Identification in Detailed Wage
Decompositions", Review of Economics and Statistics, Vol. 86, No. 4, pp.1034-1036,
2002
[13]. M. Hlavac, "oaxaca: Blinder-Oaxaca Decomposition in R", 2014, R package version
0.1. Available at: http://CRAN.R-project.org/package=oaxaca
[14]. B. Jann, "The Blinder-Oaxaca decomposition for linear regression models", The Stata
Journal, Vol. 8, No. 4, pp. 453-479, 2008
[15]. C. Kim, "Detailed Wage Decompositions: Revisiting the Identification Problem",
Sociological Methodology, Vol. 43, pp. 346-363, 2012
[16]. R. L. Oaxaca, "Male-Female Wage Differentials in Urban Labor Markets," International
Economic Review, Vol. 14, pp. 693-709, 1973
[17]. G. Ruxanda, Analiza multidimensională a datelor, Academia de Studii Economice,
Școala Doctorală, București, 2009
[18]. L. C. Sayer, “Are Parents Investing Less in Children? Trends in Mothers and Fathers
Time with Children.” American Journal of Sociology, Vol. 110, pp. 1-43, 2004
[19]. E. Stearns, S. Moller, J. Blau and S. Potochnick, “Staying Back and Dropping Out: The
Relationship Between Grade Retention and School Dropout.” Sociology of Education
Vol. 80, pp. 210-240, 2007
[20]. M. S. Yun, "Decomposing Differences in the First Moment", Economics Letters, Vol.
82 (2), pp. 273–278, 2004

Proceedings of the IE 2015 International Conference
www.conferenceie.ase.ro
516
[21]. M. S. Yun, "Earnings Inequality in USA, 1969–1999: Comparing Inequality Using
Earnings Equations", Review of Income and Wealth, Vol. 52 (1), pp. 127–144, 2006
[22]. M. S. Yun, "Revisiting Inter-Industry Wage Differentials and the Gender Wage Gap:
An Identification Problem", IZA Discussion Paper No. 2427, 2006, Available at SSRN:
http://ssrn.com/abstract=947083
Proceedings of the IE 2015 International Conference
www.conferenceie.ase.ro
517
THE CONSUMPTION CHANNEL OF NON-KEYNESIAN EFFECTS.
SOME EMPIRICAL EVIDENCES FOR ROMANIA
Ana ANDREI
Bucharest Academy of Economic Studies
Angela GALUPA
Bucharest Academy of Economic Studies
Sorina GRAMATOVICI
Bucharest Academy of Economic Studies
Abstract. The results of the economic research in recent decades highlight the possibility of
expansionary effects of fiscal consolidations. We analyse the consumption channel of non-
Keynesian effects and we use the models proposed by Alfonso (2001), Giavazzi and Pagano
(1996), Rzońca and Ciżkowicz (2005) for empirical verifications of these effects on the
Romanian’s economy data. In order to apply the Rzońca and Ciżkowicz model, we also
computed the fiscal impulse using both primary deficit and Blanchard measures.
Key words: consumption channel, fiscal impulse, fiscal consolidation, Keynesian and non-
Keynesian effects, investments channel
JEL classification: E12, E21, E62, C54
1. Introduction
The recent empirical studies in the area of public finance has been focused on the exploring
the short-run expansionary influence of fiscal consolidations policies, mainly on the private
consumption, on the investments and on the output. These effects have been called by
researchers “non-Keynesian effects of fiscal policy”.
The economic literature in this area contains works of notable names. Among the most
relevant works one can refer to Giavazzi and Pagano [9]. They used the Denmark’s economy
data for the period 1983-1986 and Ireland’s economy data for the period 1987-1989 in order
to point out the evidence of expansionary fiscal contractions. They also analysed if the non-
Keynesian effects are sufficiently large and persistent.
Papers published later by Giavazzi et al. [10], [11] used both consumption and savings
channels to prove these effects.
An interesting result belongs to Bertola and Drazen [4]. They proved that if the ratio of public
consumption to GDP is critically high, then a small increase of the nominator can induce
large changes in private consumption in the opposite direction. Blanchard [5] and Sutherland
[15] proved that by reducing the taxes, one can reduce the permanent income and
consumption, as a consequence of the unsustainability of the current policy, or of the
consumers’ high debt-income ratio. Canale et. al [8] conclude that the reaction of the central
bank can be very important in determining the overall results of a fiscal consolidation. By
consequence, a synchronous and opposite monetary policy intervention could generate non-
Keynessian effects. Therefore it is necessary to correlate the fiscal plans and the central bank
projections.
Proceedings of the IE 2015 International Conference
www.conferenceie.ase.ro
518
Ardagana [3] pointed out that alternative monetary policies have relatively little effect on the
size of short-run fiscal multipliers and therefore they could not influence an expansionary
fiscal contraction.
Alesina and Perotti [2], Blanchard and Perotti [6] contributions on non-Keynesian literature
suggest that the indirect effects of the reduction or expansion of public spending on the
permanent income could be considered as a kind of the crowding-out effects of expansionary
fiscal policies. . Perotti [13] finds that, in the European economies with high debt-to-GDP
levels or rates of debt accumulation, a negative shock to government purchases could
stimulate consumption and output.
Mankiw and Champbell [7] pointed as a cause of non-Keynesian effects, the liquidity
constraints of the households that consume only their disposal income together with the
perception of fiscal policies as extensive and persistent.
Most recent works find evidences of non-Keynesian effects in Greece as one can see, for
example, in Tagkalakis [17] and Szabo [16]. They concluded that non-Keynesian effects are
higher in the case of public spending cuts and recommends expenditures based consolidation.
Bhattacharya and Mukherjee [12] completed an empirical study for OECD countries finding
that private and government consumption are complements in the household utility function,
so non- Keynesian effects can occur.
The aim of our paper is to check out the consumption channel for non-Keynesian effects of
discretionary fiscal policies using statistical data of Romania. In order to complete our study
we extend some of the results of the Afonso [1], Giavazzi, Pagano [9] and Rzońca,
Ciżkowicz [14] regarding consumption models.
2. Consumption Chanel of Non- Keynesian Effects In order to assess the existence of non-Keynesian effects in the EU-15, Afonso [1] used the
following consumption function:
)()( 221110 ttttttt gdgyaac (1)
where tc is the annual growth rate of real private consumption, ty is the growth rate of real
GDP, t , tg are respectively, the real taxes and real government expenditures as a percentage
of GDP, and td is a dummy variable, with 0td for the periods that are nor marked by
significant fiscal adjustments and 1td , in the opposite case.
The theoretical Keynesian effects are: 00 tt cg and 00 tt c , so that
0,0 11 . In the case of the fiscal consolidation, the effects above can be contrary, so that
.0,0 22
We extended the Giavazzi, Pagano [9] consumption model applied for OECD countries
(1972-1996) in order to capture the EU economic space influence. The consumption function
resulted and used to estimate the effects of fiscal policies is defined as is follows.
)()
)(1(
165143121165
143121
28
1413211
ttttttttt
ttttt
EU
ttttt
GGTRTRTTdGG
TRTRTTdYYYCC
(2)
tC is the real consumption, tY the real GDP, 28EU
tY is the income of the EURO ZONE 28
countries, that influence the business cycle for all the members. tT are real taxes, tTR are
real transfers, and tG are real government spending, td is a dummy variable during
semnificative fiscal events as cuts or expansions.
The interest of the authors is focussed on the circumstances in which a fiscal consolidation
can have the effect of increasing of the private consumption and the fall of the private

Proceedings of the IE 2015 International Conference
www.conferenceie.ase.ro
519
consumption in the absence of the fiscal policy. Usually, these effects occur when the debt-
GDP grows fast and when the fiscal correction is large and persistent.
Non-Keynesian effects are expected if 0,0,0 531 . The pure Keynesian effects
take place in “normal” periods (periods that are not affected by a strong and persistent
spending cuts and taxes increase) and if 0,0,0 531 .
The last model we consider is a version of the consumption function proposed by [14] to
analyse the consumption channel for Non-Keynesian effects for new EU members:
1
2
1
1
2
1
1
2
1
1
mt
m
mkt
k
kit
i
itt rfiycc (3)
where tfi represents fiscal impulse resulting from changes in primary deficit, and tr is the real
deposit interest rate, tc is the private consumption growth rate, ty is the real GDP growth
rate.
If the non-Keynesian effects are transmitted from consumption channel then, at least for one
k, 21 ork we have 0k .
In our empirical study, we consider both the Blanchard measure and primary deficit measure
of fiscal impulse.
The primary balance measure is:
)()( 11 tttt tgtgFI (4)
and the BFI measure is:
)())(( 111 ttttt tgtugFI (5)
where tg represents total current expenditures plus gross capital accumulation less interest
payments as a share of GDP, tt represents total revenues as a share of GDP and 1tu is the
unemployment rate previous year. We assume that )( 1tt ug can be approximated based on the
linear regression function:
tttt uug 1101)( (6)
where t is the error.
3. Empirical verifications for Romania
Our empirical work is focused to the verification of the effects of the fiscal policies based on
three models: Afonso [1], Giavazzi, Pagano [9] and Rzońca, Ciżkowicz [14] previously
extended.
In order to apply on the statistical data the Afonso’s model, we used the data from INSSE
data base for the final consumption and for the nominal GDP data, and for government
spending and taxes rates we used the data from EUROSTAT databases.
The estimated Alfonso’s model for Romania is:
𝑐𝑡 = 0.67435𝑦𝑡 + 0.4602∆𝑔𝑡 − 0.264679∆𝜏𝑡 − 0.096327𝑑𝑡∆𝑔𝑡 + 0.19261𝑑𝑡∆𝜏𝑡 (7)
The regression without intercept has satisfactory estimation indicators.
It could be seen that the coefficient of ty which can be thought of as marginal propensity
to consumption, shows that much of the increase in consumption rate is due to income’s
growth rate. It could be seen also that the effects of government spending and tax rates are
Keynesian type. During periods of fiscal consolidation, marked by significant adjustments of
the government spending and of the taxes, the signs of the coefficients mark non Keynesian
effects, so 019261.0,0096327.0 22 .

Proceedings of the IE 2015 International Conference
www.conferenceie.ase.ro
520
Instead, the Keynesian effects are dominant, so that the overall result is not significantly
influenced by periods of strong fiscal events. The observed data and the computed data of
Alfonso’s consumption model applied for Romania could be seen in the figure below.
Figure 1. The consumption growth rate: computed Alfonso’s consumption function data vs observed data
In order to apply the Rzońca, Ciżkowicz model on statistical data, we first computed the
fiscal impulse, using both the primary deficit, and Blanchard’s fiscal impulse.
Before computing BFI, we first estimated the government spending rate as a function of
unemployment rate (International Bureau of Labour, INSSE data), using the following linear
dependence:ttt ug 144825,0021834.0 . (8)
One could see that much of the government spending rate is debt to the unemployment rate
that reflects an important dependence of the government spending’s rate on the
unemployment rate in the previous year.
Figure 2. Fiscal impulse for Romania using Blanchard’s measure, Figure 3. Fiscal impulse for Romania using
primary deficit measure
Using the real interest rate data, computed based on interest rate on deposits and inflation rate
(National Bank of Romania data), the computed fiscal impulse data using both primary
deficit and Blanchard’s fiscal impulse and final consumption and real GDP growth rates, we
estimated Rzońca, Ciżkowicz’s consumption functions.
Figure 4. Rzońca, Ciżkowicz’s consumption rate with primary defficit measure of fiscal impulse computed and
observed.

Proceedings of the IE 2015 International Conference
www.conferenceie.ase.ro
521
The Rzońca, Ciżkowicz’s consumption function with primary defficit fiscal impulse is:
1111 630826,236002,2461329,0165129,0054,049446,00726,0 tttttttt rrfifiyycc
Figure 5. Rzońca, Ciżkowicz’s consumption rate with using BFI measure
The Rzońca, Ciżkowicz’s consumption function with BFI measure is:
1111 078844,362908,2299856,043226,002017,0241026,027898,0 tttttttt rrfifiyycc
Analyzing the results of the estimates in the two versions, we observe a certain
consistency of the two estimations. Both have a positive dependence of the previous
consumption rate, current real income rate, previous real income rate, that are expected
results, reflecting normal consumer behaviour. The signs of tfi are to the both equations
negative, that reflect a non-Keynesian effect with different intensity, more intense in the
second case, meaning a more significant impact on consumption growth rate.
The last model applied in this paper is the model adapted for EU countries of Giavazzi and
Pagano. The input data for this model have the same source as previous and for the
EUROZONE 28 real GDP we used EUROSTAT data.
The estimated function is the following one.
)0.783898-0.709507-5.2138.56360.40413-0.290211(
)0.4871643.1856541.73360.052442.15459--1.16487)(1(
0.000572.3153651.137210.748623669.432
111
111
28
111
ttttttt
ttttttt
EU
ttttt
GGTRTRTTd
GGTRTRTTd
YYYCC
Figure 6. Final consumption absolute growth -computed and observed (extended Giavazzi, Pagano model
applied for Romania)
From the estimated function, we see net Keynesian effects both to the first five variable
coefficients and to the coefficient of the terms multiplied with )1( td (terms reflecting the
periods with moderate discretionary fiscal policies). The terms multiplied with td that
correspond to significant fiscal events reflect non-Keynesian effects of taxes and government
spending, with a relative strong impact on real final consumption.
Analyzing the three empirical applications on Romanian’s economy data, we can conclude
that non–Keynessian effects exist in the periods of strong contracting fiscal discretionary
policies. We also conclude that the overall effects of the fiscality are of Keynesian type as a

Proceedings of the IE 2015 International Conference
www.conferenceie.ase.ro
522
consequence of the fact that the periods of strong consolidations in Romania were not very
long.
References
[1] Afonso Antonio, “Non-Keynesian Effects of Fiscal Policy in the EU-15”, Department of
Economics, Instituto Superior de Economia e Gestão, Universidade Técnica de Lisboa,
research project for the author’s Ph.D. thesis, 2001.
[2] Alesina Alberto and Perotti Roberto, “Fiscal Adjustments in OECD Countries:
Composition and Macroeconomic Effects,” IMF Staff Papers, 1997.
[3] Ardagna Silvia, “Fiscal Stabilizations: When Do They Work and Why”, European
Economic Review, vol. 48(5), 2004.
[4] Bertola Giuseppe, and Drazen Alan, “Trigger Points and Budget Cuts: Explaining the
Effects of Fiscal Austerity”, American Economic Review 83, 1993.
[5] Blanchard Olivier, “Suggestions for a New Set of Fiscal Indicators”, OECD Working
Paper No.79, 1993.
[6] Blanchard Olivier and Perotti Roberto, “An empirical characterization of the dynamic
effects of changes in government spending and taxes on output”, NBER Working Paper
n.7269, and in Quarterly Journal of Economic Theory, vol. 115, 1999 and 2002.
[7] Campbell john Y. and Mankiw Gregory N., “Permanent Income, Current Income and
Consumption”, Journal of Economic and Business, 1990.
[8] Canale Roasaria Rita, Foresti Pasquale, Marani Ugo and Napolitano Oreste,”On
Keynesian Effects of (Apparent) Non-Keynesian Fiscal Policies”, Facolta’ di Economia.
Universita’ di Napoli ”Federico II”, MPRA, 2007.
[9] Giavazzi Francesco, and Pagano Marco, “Non-Keynesian Effects of Fiscal Policy
Changes: International Evidence and the Swedish Experience,” Swedish Economic Policy
Review, 1996.
[10] Giavazzi Francesco, Jappelli Tullio, and Pagano Marco, “Searching for non-Keynesian
effects of fiscal policy changes”, CSEF Centre for Studies in Economics and Finance, WP
n.16, 1999.
[11] Giavazzi Francesco, Jappelli Tullio, Pagano Marco and Benedetti Marina, “Searching
for non-monotonic effects of fiscal policy: new evidence”, NBER working paper 11593,
2005.
[12] Mukherjee Sanchita and Bhattacharya Rina, “Private Sector Consumption and
Government Debt in Advanced Economies: An Empirical Study”, IMF Working Paper,
2013.
[13] Perotti Roberto, “Fiscal Policy in Good Times and Bad”, Quarterly Journal of
Economics, vol. 114, 1999.
[14] Rzońca Andrezej and Ciżkowicz Piotr, “Non-Keynesian Effects of Fiscal Contraction in
New Member States”, WP 519, 2005.
[15] Sutherland Alan, “Fiscal Crises and Aggregate Demand: Can High Public Debt Reverse
the Effects of Fiscal Policy?”, Journal of Public Economics 65, 1997.
[16] Szabó Zsolt. (2013). The Effect of Sovereign Debt on Economic Growth and Economic
Development. [Online] Available: http://www.asz.hu/public-finance-quarterly-
articles/2013/the-effect-of-sovereign-debt-on-economic-growth-and-economic-
development-1/a-szabo-2013-3.pdf.
[17] Tagkalakis Athanasios O. (2013). Discretionary fiscal policy and economic activity of
Greece, WP 166. [Online] Available:
http://www.bankofgreece.gr/BogEkdoseis/Paper2013169.pdf.

Proceedings of the IE 2015 International Conference
www.conferenceie.ase.ro
523
FEEDBACK ANALYSIS AND PARAMETRIC CONTROL ON
PROCESS OF DISPOSABLE INCOME ALLOCATION – A DYNAMIC
MODEL ON PORTUGAL’S NATIONAL ECONOMY
Bianca Ioana POPESCU
The Bucharest University of Economic Studies
Emil SCARLAT
The Bucharest University of Economic Studies
Nora CHIRIȚĂ
The Bucharest University of Economic Studies
Abstract. The present paper emerged from the attempt to build a dynamic model capable of
parametric control, associated with the adjustment processes of national economies – the
case of disposable income allocation – having its basis on the fact that the economy is a
complex adaptive system which is able to regulate itself by feedback processes. The model of
the mechanism for formation and allocation of disposable income aims to describe the
process by which income is formed and is allocated throughout the economy to the main
economic agents in order to resume production processes. The data used for initializing the
state variables and some of the resulting variables of other regulating feedback processes of
the national economy have been introduced as given data from the official stats of Portugal
between 2005 and 2012, years before the economic crisis and the years of economic
recovery. The results of the simulations by modification of parameters have revealed that the
effects of excess or inadequate inventory will have a stronger effect on market prices and
disposable income as they are part of a reinforcing feedback loop stronger within the
mechanism than the balancing feedback loop.
Keywords: disposable income, dynamic model, feedback processes, parametric control,
simulation.
JEL classification: E17, C32
1. Introduction It is fair to say from the beginning of this paper that the novelty that lies in our current
attempt is the idea behind the approach of the national economy as a cybernetic system. From
this point of view we are leaving behind the classical approach of the structure of a national
economy and we take into consideration the structure of feedback processes that are
performing at national level between the redefined subsystems of the national economy in
order to assure the auto-regulation of the system. [1] We will revise and give a brief
description the redesigned structure of the cybernetic system of the national economy, we
will emphasize on the functionalities of the four fundamental feedback processes that are
forming between the subsystems of cybernetic system of the real economy and we are going
to test and asses the model associated with the formation and allocation of the disposable
income.
Classical economics presents relatively static models when dealing with the interaction
between aggregated accounts of the national economy (i.e. price, demand, supply, income,
consumption) and they have been unable to simplify the explanation of the dynamics

Proceedings of the IE 2015 International Conference
www.conferenceie.ase.ro
524
involved. Additionally, the effects of excess or inadequate inventory are often not discussed.
In reality, the market price is affected by the inventory of goods held by the production
system rather than the rate at which the production system are supplying goods and services.
[2]
2. The Redesign of the National Economy
The cybernetics of economy are to be understood along three main themes: the theory that
lies behind the economic systems and thus models, the theory of economic information and
the theory of controlling economic systems. In order to put the basis of the system of a
national economy we have to define what is like our system in focus, what are its components
and the way they interact and function.
This is why we will deal with the cybernetic of the national economy system in relation with
the principal processes that the economic system incorporates, such as the processes that will
determine the material flows (production processes), the exchange of goods and services and
labor, price formation of the goods and services and the distribution of income formed by
trading these products on the associated markets. These processes are the ones that determine
what we understand by real economy while the processes that determine financial flows, such
as formation of money supply and demand, formation of investments, currency exchange will
determine what we are calling monetary economy.
2.1 The Redesign of the Structure of the National Economy
The case for similarities between economics and cybernetics has already been made but our
purpose is to build those cybernetics models that can capture the relations that are important
for our understanding of specific dynamical problems and for their simulation. In order to do
this, the first step in such attempt is to define the subsystems of the national economy in
relation with the regulating processes that we are aiming to model and simulate.
The study and analysis of The Cybernetic System of The National Economy has revealed
four fundamental feedback processes at macroeconomic level: The Feedback Process of
Equilibrium Adjustment on The Market for Goods and Services (formed between subsystems
S1, S2, S4, S5 ), that are forming between the subsystems and in Figure 1 we are presenting
the flows by which they interact.
The Feedback Process of Scarce Resources Allocation (S2, S4, S3) – a mechanism of
allocation of scare resources which describes the process by which the economy allocates
labor, energy and capital to the production system;
The Feedback Process of Disposable Income Allocation (S1, S2, S4, S5) – which will describe
the process by which the realized income in the economy is allocated to the principal
economic agents for resumption of economical processes;
The Feedback Process of Assuring Profitability (S1, S2, S4) – it will describe the way by
which the cybernetic system of the economy assures the allocation of resource to those
economic agents which make use of them with the highest profitability, sustaining this way
the economical process. In the economy, this process is assured by bankruptcy. At individual
level bankruptcy is a failure but at macroeconomic level, it’s the economy’s way of keeping
clean of underperforming agents.
2.2. The Subsystem of the Formation and Distribution of Disposable Income
The subsystems S5, of the formation and distribution of disposable income, is the one that
makes the link between the monetary economy and the real economy by distributing financial
resources. We are not to pay special attention to the way in which the total income is formed
because in the modeling of the disposable income formation we have used the added value

Proceedings of the IE 2015 International Conference
www.conferenceie.ase.ro
525
method, but as we argued before, the importance of this particular subsystem is given by the
process of income distribution.
In order to describe the process of disposable income distribution we will firstly structure the
total national income, 𝑌, into income formed by wages and income formed by property
ownership, 𝑄. We will consider that the income formed by wages will be 𝑌 − 𝑄.
From the size of income derived from wages and property, we can determine the disposable
income derived from wages, 𝑌𝑤 and respectively, the disposable income derived from
property, 𝑌𝑞. [3] Thus, the disposable income derived from wages will be given, at time t, by
the relation:
𝑌𝑤(𝑡) = 𝑊(𝑡) ∗ 𝐿(𝑡) − 𝑡𝑤∗ ∗ 𝑊(𝑡)𝐿(𝑡) + 𝐻𝑤
∗ (𝑡) (1)
Where, 𝑡𝑤∗ will represent the rate of taxes on wages income and 𝐻𝑤
∗ is the level of transfers
from government to employees.
Similarly, the disposable income derived from property ownership is given by the relation:
𝑌𝑞(𝑡) = 𝑄(𝑡) − 𝑡𝑞∗ ∗ 𝑄(𝑡) + 𝐻𝑞
∗(𝑡) (2)
Where, 𝑡𝑞∗ will be the rate of taxes on property and 𝐻𝑞
∗ will represent the size of transfers from
government to property owners (subsidies).
The disposable income derived from wages, 𝑌𝑤 and the disposable income derived from
property, 𝑌𝑞 will will determine the level of total disposable income 𝑌𝑑, which will determine
the level of consumption, 𝐶 and the level of saving, 𝑍. Between consumption and saving
there is an inversely report, the increase in one will generate the decrease in the other.
3. A Dynamic Model for the Feedback Process of the Formation and Allocation of
Disposable Income
The model was built using STELLA Modeling and Simulation Software 9.0 and the data used
for initializing state variables and the input variables were taken from the official stats of
Portugal as they are reported on EUROSTAT between 2005 and 2012. For variable using
volumes, such as total output, intermediate consumption or government consumption, we
have used chain link volumes to 2005, in order to feed the model data from which the effects
of price have been removed and to allow for the simulation data to reflect and simulate on
price effect and delay.
3.1. Model Hypothesis and Functioning
The Process of Disposable Income Formation and Allocation permits the resumption of
production cycles at the level of national economy in such way that the general profitability
will be increased and with the conditions of assuring equilibrium on the markets for goods
and services and the inputs market.
In the structure of the process will enter, besides subsystem S3, all other subsystems of the
real economy cybernetic system. The general structure of the feedback process is formed by
two main feedback loops – on feedback loop corresponds to the process of disposable income
formation while the other one corresponds to the process of disposable income allocation
throughout the economic system. The analytic structure of the feedback mechanism
associated with the process of disposable income allocation is represented in Figure 1.

Proceedings of the IE 2015 International Conference
www.conferenceie.ase.ro
526
Figure 1 - The Functioning Diagram of the Model [1], pp.411
Depending on the aggregated demand we will calculate the excess in wanted inventory (𝐽 −𝐽), which will have an influence on the price level. The real inventory of intermediate
products,𝑋, will form the capital stock, 𝐾, existing into the economy at the current period.
The size of capital stock, will be determinant for the future disposable income,𝑌𝑑 being able
to rise or decrease the level of disposable income in direct relation on how the prices for
capital goods are rising or falling.
The transmission effect associated with the two feedback loops is:
𝑌𝑑 ↑⇒ 𝐶 ↑⇒ 𝐷 ↑⇒ {𝐽 ↑⇒ (𝐽 − 𝐽) ↑⇒ 𝑃 ↑⇒ 𝑌𝑑 ↑
𝐽 ↓⇒ 𝐾 ↓⇒ 𝑌𝑑 ↓}
It can be thus observed that the feedback loop associated with the formation of disposable
income is positive, thus reinforcing, while the feedback loop associated with the distribution
of disposable income is negative. The functioning of the two feedback loop acting together
can cause oscillations determined by fallings of the disposable income.
3.2 Model Implementation and Dynamic Equations
The elements of system dynamic diagrams are feedback loops, accumulation of flows into
state variables and delays. [4] As shown in figure 3, the states variables of the model are the
aggregated demand, 𝐷, 𝑅𝑒𝑎𝑙 𝑆𝑡𝑜𝑐𝑘, 𝑃𝑟𝑖𝑐𝑒, 𝐶𝑎𝑝𝑖𝑡𝑎𝑙 𝑆𝑡𝑜𝑐𝑘, 𝐷𝑖𝑠𝑝𝑜𝑠𝑎𝑏𝑙𝑒 𝐼𝑛𝑐𝑜𝑚𝑒 and 𝐶, final
consumption. The state variables will describe the systems state at each point in time and will
give the general overview on the behavior over time. [5]
Dynamical Equations as they were built from the stock-flow diagram in STELLA 9.0 are as
follows:
𝐷(𝑡) = 𝐷(𝑡 − 𝑑𝑡) + 𝐴𝑔𝑔𝑟𝑒𝑔𝑎𝑡𝑒 𝐷𝑒𝑚𝑎𝑛𝑑 𝐹𝑜𝑟𝑚𝑎𝑡𝑖𝑜𝑛 ∗ 𝑑𝑡 (3)
𝐴𝑔𝑔𝑟𝑒𝑔𝑎𝑡𝑒 𝐷𝑒𝑚𝑎𝑛𝑑 𝐹𝑜𝑟𝑚𝑎𝑡𝑖𝑜𝑛= 𝐶 + 𝑃𝑢𝑏𝑙𝑖𝑐 𝐶𝑜𝑛𝑠𝑢𝑚𝑝𝑡𝑖𝑜𝑛 + 𝐼𝑛𝑡𝑒𝑟𝑚𝑒𝑑𝑖𝑎𝑡𝑒 𝐶𝑜𝑛𝑠𝑢𝑚𝑝𝑡𝑖𝑜𝑛
(4)
𝐷𝑖𝑠𝑝𝑜𝑠𝑎𝑏𝑙𝑒 𝐼𝑛𝑐𝑜𝑚𝑒(𝑡)= 𝐷𝑖𝑠𝑝𝑜𝑠𝑎𝑏𝑙𝑒 𝐼𝑛𝑐𝑜𝑚𝑒(𝑡 − 𝑑𝑡)+ (𝐷𝑖𝑠𝑝𝑜𝑠𝑎𝑏𝑙𝑒 𝐼𝑛𝑐𝑜𝑚𝑒 𝐹𝑜𝑟𝑚𝑎𝑡𝑖𝑜𝑛 − 𝐶𝑜𝑛𝑠𝑢𝑚𝑝𝑡𝑖𝑜𝑛 𝐹𝑜𝑟𝑚𝑎𝑡𝑖𝑜𝑛) ∗ 𝑑𝑡
(5)

Proceedings of the IE 2015 International Conference
www.conferenceie.ase.ro
527
𝐷𝑖𝑠𝑝𝑜𝑠𝑎𝑏𝑙𝑒 𝐼𝑛𝑐𝑜𝑚𝑒 𝐹𝑜𝑟𝑚𝑎𝑡𝑖𝑜𝑛= 𝑁𝑒𝑡 𝑇𝑎𝑥𝑒𝑠 + 𝑃𝑟𝑖𝑐𝑒 ∗ 𝐷𝐸𝐿𝐴𝑌(𝑁𝑒𝑡 𝑂𝑢𝑡𝑝𝑢𝑡, 1) + 𝐶𝑎𝑝𝑖𝑡𝑎𝑙 𝑆𝑡𝑜𝑐𝑘∗ (𝑃𝑟𝑖𝑐𝑒 − 𝐷𝐸𝐿𝐴𝑌(𝑃𝑟𝑖𝑐𝑒, 1))
(6)
𝐶𝑜𝑛𝑠𝑢𝑚𝑝𝑡𝑖𝑜𝑛 𝐹𝑜𝑟𝑚𝑎𝑡𝑖𝑜𝑛 = 𝐶0 + 𝑐𝑐 ∗ 𝐷𝑒𝑙𝑎𝑦 𝑉𝐷 + 𝑓 ∗ 𝑃𝑟𝑖𝑐𝑒 (7)
𝐷𝑒𝑙𝑎𝑦 𝑉𝐷 = 𝐷𝐸𝐿𝐴𝑌(𝐷𝑖𝑠𝑝𝑜𝑠𝑎𝑏𝑙𝑒 𝐼𝑛𝑐𝑜𝑚𝑒, 2) (8)
𝑃𝑟𝑖𝑐𝑒(𝑡) = 𝑃𝑟𝑖𝑐𝑒(𝑡 − 𝑑𝑡) + (𝑃𝑟𝑖𝑐𝑒 𝐼𝑛𝑐𝑟𝑒𝑎𝑠𝑒 − 𝑃𝑟𝑖𝑐𝑒 𝐷𝑒𝑐𝑟𝑒𝑎𝑠𝑒 ∗ 𝑑𝑡 (9)
𝑃𝑟𝑖𝑐𝑒 𝐼𝑛𝑐𝑟𝑒𝑎𝑠𝑒 = 𝑃𝑟𝑖𝑐𝑒 𝑀𝑜𝑑𝑖𝑓𝑖𝑐𝑎𝑡𝑖𝑜𝑛 (10)
𝑃𝑟𝑖𝑐𝑒 𝐷𝑒𝑐𝑟𝑒𝑎𝑠𝑒 = 𝐼𝐹 𝐸𝑥𝑐𝑒𝑠𝑠 𝑜𝑓 𝑊𝑎𝑛𝑡𝑒𝑑 𝑆𝑡𝑜𝑐𝑘< 0 𝑇𝐻𝐸𝑁 (−𝑃𝑟𝑖𝑐𝑒 𝑀𝑜𝑑𝑖𝑓𝑖𝑐𝑎𝑡𝑖𝑜𝑛) 𝐸𝐿𝑆𝐸 0
(11)
𝑅𝑒𝑎𝑙 𝑆𝑡𝑜𝑐𝑘(𝑡) = 𝑅𝑒𝑎𝑙 𝑆𝑡𝑜𝑐𝑘(𝑡 − 𝑑𝑡) + 𝑆𝑡𝑜𝑐𝑘 𝐹𝑜𝑟𝑚𝑎𝑡𝑖𝑜𝑛 ∗ 𝑑𝑡 (12)
𝑆𝑡𝑜𝑐𝑘 𝐹𝑜𝑟𝑚𝑎𝑡𝑖𝑜𝑛 = −(𝐷𝐸𝐿𝐴𝑌(𝑂𝑢𝑡𝑝𝑢𝑡, 2) − 𝐷𝐸𝐿𝐴𝑌(𝐷, 1)) (13)
Figure 2 - Stock - Flow Diagram 9.0 Generated in STELLA for the Model
4. Conclusions
We have run several simulations of the model with dt steps of 1 (yearly) and 0.25 (quarterly).
The data gathered from the simulation has revealed that the parameter Alfa has a great
influence on Price formation and thus on the formation and distribution of the disposable
income. Table 1 shows that slight changes in the behaviour of the productive sector in

Proceedings of the IE 2015 International Conference
www.conferenceie.ase.ro
528
dependence with the demand will introduce socks in the formation of the disposable income
while the consumption formation will be less influenced.
Table 1 - Results on parametric control - simulations with different thresholds for Alfa, dt step =1.
More, the allocation of disposable income for consumption will be dependent of the level of
prices. If the saving will increase, the same effect will take place with the total wealth which
will determine an increase in consumption that will again determine a decrease in savings.
Simulations have revealed that in the studied period, the positive feedback loop will be
stronger until 2009 generating price increases and the growth of the disposable income.
Acknowledgement
This work was cofinanced from the European Social Fund through Sectoral Operational
Programme Human Resources Development 2007-2013, project number
POSDRU/159/1.5/S/134197 “Performance and excellence in doctoral and postdoctoral
research in Romanian economics science domain”.
References
[1] Dagum Camilo, “A New Model of Personal Income Distribution: Specification and
Estimation”, Modeling Income Distributions and Lorenz Curve, Springer, 2008, pp. 3-23.
[2] Krueger Dirk. (2015, February 10). Quantitative Macroeconomics: An Introduction.
[Online] Available: http://www.e-booksdirectory.com/details.php?ebook=2831
[3] Law Averill M. and Kelton David K., Simulation Modeling and Analysis, Third Edition,
McGrawHill, 2000.
[4] Richmond Barry, An Introduction to Systems Thinking with STELLA, isee systems, 2004.
[5] Scarlat Emil and Chiriță Nora, Cibernetica Sistemelor Economice. Bucharest: Ed. ASE,
2003, pp 400-415.

Proceedings of the IE 2015 International Conference
www.conferenceie.ase.ro
529
INEQUALITY OF INCOME DISTRIBUTION IN ROMANIA.
METHODS OF MEASUREMENT AND CAUSES
Malina Ionela BURLACU
The Bucharest Academy of Economic Studies
Abstract. Economic inequality is a subject met in time and in full amplification process, with
the development of civilizations. In the background of the economic crisis there has been
encountered a sense amplification of the income inequality due to the increasing number of
unemployed but also because of lower income among the employed population. This feeling
was boosted by the lack of policies to improve the situation or to enhance. Education is
another issue at national level that should be given major importance in the improvement of
the income distribution. Any directive in this regard should be treated with maximum
importance by both the authorities and the population. The importance of this aspect should
be of higher interest considering that along history was felt the idea that in a country where
the population shows a standard of living increasingly lower, it is more difficult to boost the
economy.
Key words: education, Gini coefficient, income, living standards
JEL Classification: O15, D63, I24
1. Introduction
Income inequality and poverty are the highest points present at the basis of any society. The
fact that in some states it feels stronger and in others less derives from any state’s social
economic policies. The idea of inequality comes since ancient times when there were three
classes (wealthy people whose status was transmitted from generation to generation; the poor
who were deprived of certain things since childhood and an intermediate class). In modern
society three types of inequality are being identified: material inequality; social inequality
and policy inequality. [1] Each type of inequality is reflected on the welfare and living
standards of the population.
Romania, among the Member States of the European Union, is one with a very high level of
income inequality. Various researches in this direction have revealed that an unequal
distribution of income significantly leads to the amplification of the crisis and thus hampering
the recovery process. It is also a factor that prevents the economy to reach its full potential.
2. Methods of measurement and causes
As a method of characterizing, highlighting the degree of income inequality in the present
study, we used the Gini coefficient. It can take values between 0 and 1 or between 0 and
100%, reflecting variation from zero concentration at a maximum concentration. The higher
the coefficient is closer to 0 the more it can be said that it shows perfect income equality.
More specifically, it can be said that the population of the country to which the indicator
value reports to, the same values recorded in income. Conversely, the higher the indicator
value is closer to 1, the more it can be said that the income inequality shows a higher degree
(wealth is concentrated around a single person).
A major benefit of this indicator is the fact that it highlights the value percentage required to
be redistributed so that the income inequality in a country to be as small as possible.
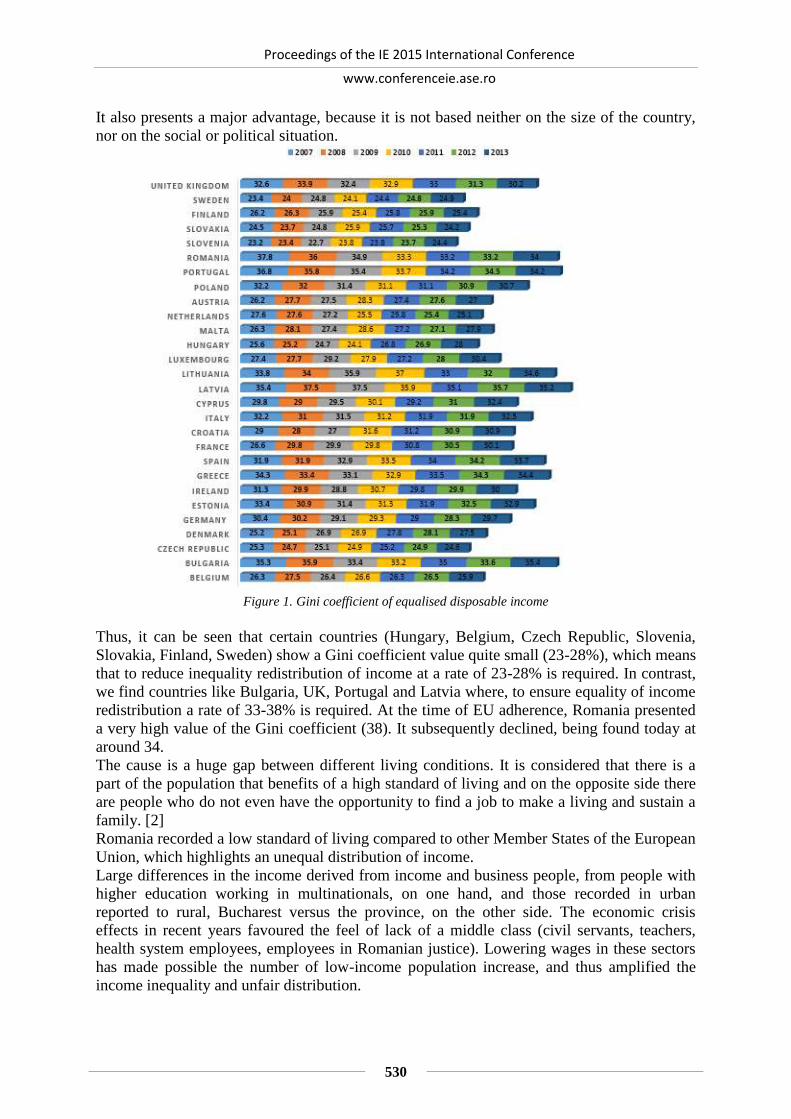
Proceedings of the IE 2015 International Conference
www.conferenceie.ase.ro
530
It also presents a major advantage, because it is not based neither on the size of the country,
nor on the social or political situation.
Figure 1. Gini coefficient of equalised disposable income
Thus, it can be seen that certain countries (Hungary, Belgium, Czech Republic, Slovenia,
Slovakia, Finland, Sweden) show a Gini coefficient value quite small (23-28%), which means
that to reduce inequality redistribution of income at a rate of 23-28% is required. In contrast,
we find countries like Bulgaria, UK, Portugal and Latvia where, to ensure equality of income
redistribution a rate of 33-38% is required. At the time of EU adherence, Romania presented
a very high value of the Gini coefficient (38). It subsequently declined, being found today at
around 34.
The cause is a huge gap between different living conditions. It is considered that there is a
part of the population that benefits of a high standard of living and on the opposite side there
are people who do not even have the opportunity to find a job to make a living and sustain a
family. [2]
Romania recorded a low standard of living compared to other Member States of the European
Union, which highlights an unequal distribution of income.
Large differences in the income derived from income and business people, from people with
higher education working in multinationals, on one hand, and those recorded in urban
reported to rural, Bucharest versus the province, on the other side. The economic crisis
effects in recent years favoured the feel of lack of a middle class (civil servants, teachers,
health system employees, employees in Romanian justice). Lowering wages in these sectors
has made possible the number of low-income population increase, and thus amplified the
income inequality and unfair distribution.

Proceedings of the IE 2015 International Conference
www.conferenceie.ase.ro
531
In light of these aspects it should be paid special attention to finding and applying policies
able to reduce and maintain equity income distribution.
For a quote or correct measurement of income inequality it is necessary to follow two
methodological issues: the definition and calculation of income and the indicators that
highlight inequality.
In Romania two surveys are carried out by the National Statistics Institute (Family Budget
Survey and Integrated Household Survey) to identify disposable income (total income
derived by the members of the household, regardless of source). In order to reflect differences
in household size and composition, this total is divided by the equivalent of "adults" using a
standard scale which assigns a weight of one of the first adult in the household, a weight of
0.5 for each additional household member aged minimum of 14 years and a weight of 0.3 to
household members aged under 14 years. The resulting number is called "disposable income
per equivalent-adult". [5]
The disposable income of a household is at the moment the most effective way to estimate
the standard of living of a household. The calculation of this indicator includes:
- Cash income (earnings, property income, money income from agriculture);
- Income in kind (food and food value from own sources of income in agriculture or services
in the household).
Revenues in nature are a very sensitive topic and worth taking into consideration in the
analysis of income inequality. By including these revenues in the analysis to obtain a much
clearer vision on inequality. Consumption of food resources is of key importance in analyzing
living standard of the population, especially the population that record low cash income. By
failing to take account of this aspect can be achieved overvaluation of inequality in Romania.
[4]
Index of income inequality whenever estimates are higher disposable income per adult-
equivalent (including or excluding value of consumption from own resources) obtained from
all individuals in quintile 5 (the richest) compared to revenues of people in quintila1
(poorest), the distribution of population by disposable income per adult-equivalent [3].
Figure 2. Income inequality index
The value of this indicator has declined in recent years, which indicates a decrease or an
approximation of the richest persons in the category of people who belong to the opposite
extreme, the poorest.
2.1. Causes of income inequality
2.1.1. Lack of investment in education Since ancient times, as in the present education had and still has an important role in the
development of society and thus population. In the current context of modern society
education system is "key" to the development of a country. The differences between social
classes and inequalities between rich and poor is reflected in the growth of a country. The
results of numerous studies in this regard shows that the determining factor of this situation is
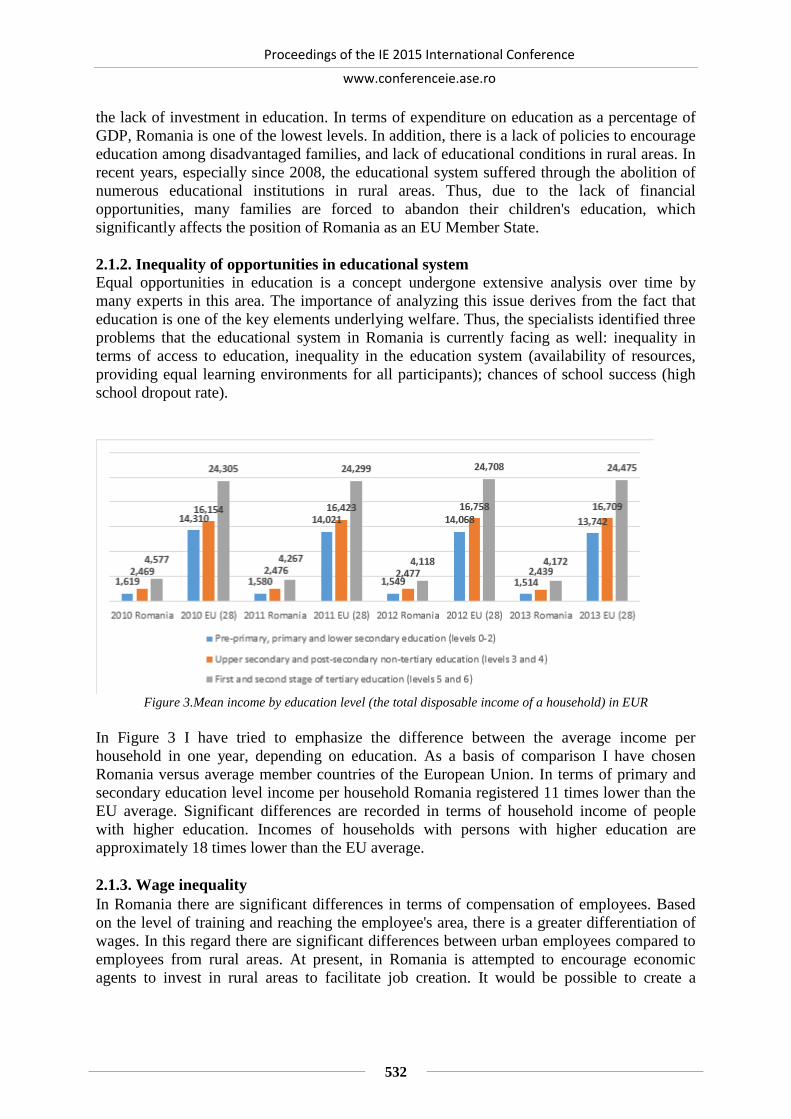
Proceedings of the IE 2015 International Conference
www.conferenceie.ase.ro
532
the lack of investment in education. In terms of expenditure on education as a percentage of
GDP, Romania is one of the lowest levels. In addition, there is a lack of policies to encourage
education among disadvantaged families, and lack of educational conditions in rural areas. In
recent years, especially since 2008, the educational system suffered through the abolition of
numerous educational institutions in rural areas. Thus, due to the lack of financial
opportunities, many families are forced to abandon their children's education, which
significantly affects the position of Romania as an EU Member State.
2.1.2. Inequality of opportunities in educational system
Equal opportunities in education is a concept undergone extensive analysis over time by
many experts in this area. The importance of analyzing this issue derives from the fact that
education is one of the key elements underlying welfare. Thus, the specialists identified three
problems that the educational system in Romania is currently facing as well: inequality in
terms of access to education, inequality in the education system (availability of resources,
providing equal learning environments for all participants); chances of school success (high
school dropout rate).
Figure 3.Mean income by education level (the total disposable income of a household) in EUR
In Figure 3 I have tried to emphasize the difference between the average income per
household in one year, depending on education. As a basis of comparison I have chosen
Romania versus average member countries of the European Union. In terms of primary and
secondary education level income per household Romania registered 11 times lower than the
EU average. Significant differences are recorded in terms of household income of people
with higher education. Incomes of households with persons with higher education are
approximately 18 times lower than the EU average.
2.1.3. Wage inequality
In Romania there are significant differences in terms of compensation of employees. Based
on the level of training and reaching the employee's area, there is a greater differentiation of
wages. In this regard there are significant differences between urban employees compared to
employees from rural areas. At present, in Romania is attempted to encourage economic
agents to invest in rural areas to facilitate job creation. It would be possible to create a

Proceedings of the IE 2015 International Conference
www.conferenceie.ase.ro
533
connection between children's access to education (would increase the number of families
with financial possibilities) and a high standard of living.
The pay gap increases as the imperfections in the functioning of markets. Among the main
reasons that lead to these differences are distinguished the activity, geographic region, and
legal reasons (the system of laws based on which operates a particular type of activity.)
In terms of economic opportunities, the offer in Romania is very low: low income,
increasingly fewer jobs and limited opportunities for finding new employment hatches, high
taxation on labor force that encourages "moonlighting". Together, all these lead to the
creation or amplification feeling unequal distribution of income.
3. Conclusions
Income distribution in Romania is characterized by inequality in full growth. Specified period
last year, through the economic crisis had a negative impact on household incomes by
increasing the number of unemployed, and a significant decrease in wages. The increased
number of low-income people or those at the bottom of the distribution.
It requires addressing policies that promote employment population growth but also proper
remuneration of those who were under the middle class (education system, health system,
public administration). Also, the development of rural economy by increasing the number of
people who occupy a job as well as the deterrence of the ”moonlighting” system are other
directions that contribute to the fair income growth and distribution.
In addition, development of a system for improving the education and professional training
are two major directions of interest that once improved can play a significant role in the
reduction of income inequality.
References
[1] Eurostat, Statistics on income distribution [Online]. Available:
http://ec.europa.eu/eurostat/statistics=explained/index.php/Income_distribution_statistics.
ro
[2] INSSE, www.insse.ro. [Online]. Available:
http://www.insse.ro/cms/files/Web_IDD_BD_ro/O1/O1_6-
Indicele%20inegalitatii%20veniturilor.doc.
[3] Molnar Maria, “Romanian household’s inequality”, Romanian Statistical Review, 2010.
[4] Molnar Maria, ”Household’s income distribution in Romania. Inequality”, Working
Paper, Institute of National Economy, 2009.
[5] Tara Sergiu, Social inequality and poverty in Romania nowadays [Online]. Available:
http://store.ectap.ro/articole/834_ro.pdf.

Proceedings of the IE 2015 International Conference
www.conferenceie.ase.ro
534
WAR GAMES AND A THIRD PARTY INTERVENTION IN CONFLICT
Mihai Daniel ROMAN
The Bucharest University of Economic Studies [email protected]
Abstract. Last decades researchers used game theory to explain and to better understand the
conflict situations. War games were developed in order to analyze a combatant’s behavior in
various situations, especially for two party conflict. In this paper we analyze another class of
war games than involves three parties: two combatant parties and a third party that
influences one or another combatant side following its own benefit. Finally from our case
studies we conclude that is more expensive for the third part to be peacekeeper than to be
peace breaker.
Keywords: game theory model, third party intervention, war, peacekeeper, peace breaker JEL classification: H56, C72
1. Introduction Last decades researchers used game theory to explain and to better understand the conflict
situations. War games were developed in order to analyze a combatant’s behavior in various
situations. Many situations involve two parties in conflict. Military decisions are established
depending on possible strategies and the payoff functions, in complete or incomplete
information.
Another class of war games involves three players: the two combatant parties and a third
party that influences one or another combatant side following its own benefit. This third party
can help another player by supplying military equipment or by direct intervention into the
conflict.
In this paper we propose a game theory model in order to analyze the influence of a third
party into a conflict as peacekeeper or as peace-breaker.
The first part of the paper contains a brief literature review followed by the model
description. Finally we present a study-case for a third party intervention in two different
conflicts that prove the fact that it is easier to be a peace breaker than a peace keeper form an
economic perspective.
2. Literature review
In order to understand the role of a third party in a conflict, it is necessary to better
understand army battles in general. The main problem are the reasons a third party has to
intervene. For example, Regan [14] assumes that third parties take action in order to limit
hostilities. Therefore, he makes the third party a "conflict manager". Siquera [16] similarly
assumes that the short term goal of the third party is to reduce the existing level of conflict.
The intervention of the third party can be perceived as liberal or idealistic. This vision is
formed on the belief that aversion to human tragedy is the main reason why third parties get
involved in the conflict.
Intuitively, the idealistic perspective seems to offer an incomplete description of the third
party. During the Cold War, for example, the Soviet Union made a military intervention for
the left Government ruling Afghanistan. This was not to promote peace in the region, but to
protect its own national security from anti-soviet tropes. In an empirical investigation that

Proceedings of the IE 2015 International Conference
www.conferenceie.ase.ro
535
contradicts his main assumptions, Regan [13] discovered that generally the intervention of a
third party tends to increase the duration of the conflicts. Assuming an idealistic perspective,
this result indicates that a third party intervention would better achieve its purpose if it were
to ignore the conflict. Obviously, a broader explanation is necessary to better understand the
general nature of the third party effect.
Other studies, such as Morgenthau [10] or Bull [2] reach the conclusion that third party
choose to intervene when national interests are at stake. Regan [12], [14] describes this vision
as a "realism paradigm" and identifies it as a dominant philosophy in international policies.
Complementary to realism is the vision that ethic problems and domestic policies play a
crucial role in the third party's decision to intervene, a perspective supported by Blechman [1]
and Carment and James [3].
In this case the success in a territorial conflict of an "ally" can be benefic to a third party in
countless ways. Future potential benefits of a third party include better access to natural
resources and to commerce, better national security, ethical fulfillment and geo-strategic
advantages (Moseley [11]).
Taking into consideration the assumptions that incorporate both the costs and the benefits of
the intervention, we will establish the compromises that a third party makes when they decide
whether to get involved in a conflict or not. An interesting and predominant type of
intervention of a third party, considering Siqueira's model [16], is military subvention. As the
subventions grow, the probability that the ally wins or maintains territorial possession grows
as well. Furthermore, let's assume that the cost of supporting an ally is influenced by the
degree of the military subvention. In the Siqueira model the third party intervention, the third
party is treated exogenously and therefore does not act as an economic agent when choosing
the level of intervention. The third party acts strictly as a peacemaker, regardless of the stakes
of a specific conflict.
Roman [15] describes the conflict situations with financial influences for two parties involved
into the conflict. Depending on economic dimension of the conflict involved parties decides
to attack or to resist into the battle.
Chang et all [4] described a territorial dispute through a three step game that allowed the
decision to have a third party intervene, as well as understanding the nature and the potential
effects of a third party intervention in a broader manner.
3. The Model
In our paper we consider the model analyzed by Chang et all [4] that assumed the third party
is an "egoistical" agent, that pursues its own interests by maximizing a pondered sum of
strategic values associated to a disputed territory, which can be in the "wrong" hands of a
country with no allies. Furthermore, they demonstrated how "intervention technology" in the
form of military assistance (Siqueira, [17]) interacts with the canonic "conflict technologies"
of two rival parts, affecting the results of the game through sequential movement. This three
step game allowed for the examination of the role of a third party in supporting its ally, from
the discouraging perspective.
The description of the game analyzed by the formers is as follows. The third party makes the
first move to support its ally, taking into consideration the impact of its actions on the
following leader: the next sub-games played between two rival parties (1 and 2) over a
disputed territory. For the second and third step of the three-step game, two alternative
scenarios are examined. In the first scenario, the first party, a territorial defendant, moves on
to the second step in order to decide the distribution of the military goods necessary for the
defense. Meanwhile, the second party, the challenger, moves to the third and final step of the
game. The second scenario inverts the movement order between the parties 1 and 2 in the last

Proceedings of the IE 2015 International Conference
www.conferenceie.ase.ro
536
two steps of the general game. In both scenarios, the third party supports its ally, party
number 1.
Before we can label the endogeneity of the intervention of a third party in a conflict between
two rival parties, it is necessary to discuss the term "intervention technology". This term
reflects the degree to which a third party can affect the capability of an ally and by doing so
reflects the general result of the conflict. Supposing that party 3 supports its ally, using
transfers of military subventions (M) which serve to improve the military efficiency of the 1st
party by reducing arming cost. Thus we can indicate a cost reducing function as s=s(M),
where s'(M)= ds/dM<0 and s''(M)= d2s/dM2>0. In other words, an increase of M lowers the
marginal cost of arming for the first party, but the reduction effect of the cost determines an
increasing marginal cost. We will now examine how the technology used the third party's
intervention interacts with the conflict technologies of the respective parties in conflict.
Like in the conflict literature, a canonic "contest success function" is used to capture the
conflict technology.
In other words, the probabilities that the 1st and 2nd party reach an armed conflict are:
𝑝1 =𝐺1
𝐺1+𝛾𝐺2 and 𝑝2 =
𝛾𝐺2
𝐺1+𝛾𝐺2, (1)
where G1(>0) is the quantity of military goods that party 1 allocates for defending a territory,
G2(≥0) is the quantity of military goods that party 2 allocates for attacking a territory, and 𝛾
represents the relative efficiency of one unit of military good of the 2nd party divided by the
efficiency of a good of the 1st party.
The before mentioned success probabilities take the form of a simple addition of the conflict
technologies.
This property suggests that third parties play no role in two-party conflicts. It is easy to check
this affirmation if the two parties use the optimal quantities of weapons in a simultaneous
movement game. Interestingly, we can consider that the multiple step game and the
sequential movement of a third party intervention play an important role on the equilibrium
between the two parties in conflict, regardless of the additive form of the conflict
technologies in (1).
In order to endogenously characterize the third party's choice regarding the level of
intervention we use a three-step game. The third party makes the first move, optimally
choosing a subvention level that maximizes its own objectives. In the second and third step of
the game, the parties 1 and 2 make sequential moves in order to determine the optimal way to
allocate military goods for the conflict, the first to make a move being the owner of the land.
We take into consideration two generic scenarios. In the first scenario, the first party occupies
the territory and therefore assumes the role of Stackelberg ruler/leader during the second step
of the game. The second party, the challenger, moves on to the third and last step of the
game. In the second case, the second party, the owner of the territory, moves on to the second
step while the first party, the challenger, moves to the third and final part of the game.
During the second and third steps, we follow Grossman and Kim [8][9] and other after them
as they use a Stackelberg frame, in which the defendant leads to the allocation of military
goods. Gershenson [5][6] defends this structure assuming that the institutional environment
of the beneficiary is relatively rigid; therefore, the defensive allocation of goods is an
arrangement of the beneficiary. The advantage of this assumption is that it allows us to
analyze a discouraging strategy from the defendant. Chang et all [4] develops a model for
characterizing the possible results of a territorial dispute between two rival parts in a
Stackelberg game.
Knowing that the third party provides military subvention transfers (M) to the first party, we
assume, for analytical simplification, that the function of the opportunity cost is s=1/(1+M)θ ,

Proceedings of the IE 2015 International Conference
www.conferenceie.ase.ro
537
where θ measures the degree of effectivity that each subvention dollar reduces from the
unitary cost for arming for party 1 and 0<θ<1.
Since the third party employs M in the first step, the winning functions for party 1 and 2 in
the following steps of the game are:
𝑌1 = (𝐺1
𝐺1+𝛾𝐺2) 𝑉1 −
1
(1+𝑀)𝜃 𝐺1, 𝑌2 = (𝛾𝐺2
𝐺1+𝛾𝐺2) 𝑉2 − 𝐺2, (2)
where: M (≥ 0) is the level of military subventions transferred from the third party to party 1;
𝜃 represents the efficiency of a one-dollar subvention to reduce the unitary arming cost of
party 1; Vi is the total value that part i (i=1,2) increases in order to keep the territory in the
following period, when it can harness a part of the territory for profoundly intrinsic and
economic reasons.
Considering that the (2) specification implies that fact that the intervention of a third party is
tactically "indirect" in that the military support of the third party does not directly affect the
contest success function of party 1. The use of γ (>0) reflects the asymmetry of conflict. We
can think of it as a "composed/mixt good" that includes a quantity of weapons, trained
soldiers and strategic information.
4. Case study
Case I
In the first part of our case study we analyze the Second World War conflict between
Germany and Poland. At the September 1-st Germany attack Poland without a formal war
declaration. The main motif of this attack was Hitler intention to extend German territory to
East. After invading Austria and Czechoslovakia without any resistance Germany expects to
win without a battle with Great Britain and France. Using the model described in previous
paragraph we determine the subventions and arming levels would have needed Poland in
order to resist to German attack.
We consider Poland as Part 1 (player one), Germany as Part 2 (player 2) and Great Britain as
Part 3 (player 3, the third part of the conflict). We consider also only the airplanes
endowment of Germany and Poland as war arms. We denote by V1 and V2 the war airplanes
value for Poland and Germany and γ the ratio between V2 and V1. We suppose also that θ (the
subvention efficiency) is between 0.2 and 0.3. S1 – S2 is the strategic value for Part 3 if
Poland maintains his territory, Mc and M* are the critical respectively the optimum levels of
military subventions for Poland, G1 and G2 represents the optimum levels for war airplanes
endowments for Poland and Germany and pi represents the attack/riposte probability.
Results for the first model, where Part 1 (Poland) maintains his territory are described in
Table 1. Table 1. Mil. U.S. Dollars
V1 V2 Γ θ Mc S1-S2 M* Stability condition
(𝜃(𝑆1−𝑆2)
2𝛾∗ 𝑉1/𝑉2)
𝜃1−𝜃⁄
>
2γV2/V1>1
𝐺1∗ 𝐺2
∗ 𝑝1∗ 𝑝2
∗
17.4
69.2
1.349
↓.216 ↑.593
51.8
↓
Verified for all cases
93.45
0
1
0 ↓.217 ↑.564 ↓48.8
→.218 →.536 →50.2
↑.219 ↓.510 ↑51.7
↑.220 ↓.485 ↑53.1
Comparing V1 with G1* we can observe that initial endowment of Poland was five times
lower than optimum level necessary to prevent the conflict. The third part war subvention
effort should have dramatically increased by Great Britain and this situation was not
economic possible at this time.

Proceedings of the IE 2015 International Conference
www.conferenceie.ase.ro
538
If the strategic value for conflict third part decreases, then the optimum level of discouraging
arming level is at the same very high standards and Poland can’t support by herself the war
effort.
The main conclusion of this study case is that the initial war endowment and subventions
accorded to Poland could not prevent the German attack in 1939, and the initial decision of
Great Britain was a correct one due the fact that British economy could not support at this
time the war effort for another European country.
Case 2.
The second case analyzed in our paper presents the German attack on Yugoslavia in 1941.
German army was well armed and trained and his attack was a brutal one. Yugoslavian army
tried to resist but the Italian attack assure the victory in less than two weeks.
In our example the first part is Germany (the attacker), the second part is Yugoslavia and the
third part is Italy. We maintains the variables as in our first study case, with the war airplanes
endowment (the first scenario) and with army troops (the second scenario). Germany (part 1)
attack Yugoslavia (part 2) attempting to occupy Yugoslavian territory.
Results for the first scenario are described in Table 2.
Table 2. War airplanes Mil. U.S. Dollars
V1 V2 γ Θ Mc S1-
S2
M* Stability condition
(𝜃(𝑆1−𝑆2)
2𝛾∗ 𝑉1/𝑉2)
𝜃1−𝜃⁄
>
2γV2/V1>1
𝐺1∗ 𝐺2
∗ 𝑝1∗ 𝑝2
∗
14.3
26.9
1.87
↓.247 ↑9.1
12.5
↓.324
Verified for all cases
↓17.84
↓17.85
→17.86
↑17.87
↑17.88
↑.315
↑.309
→.304
↓.298
↓.293
1
0 ↓.248 ↑9.2 ↓.322
→.249 →9.3 →.319
↑.250 ↓.8.9 ↑.317
↑.251 ↓8.5 ↑.315
In this case we can observe the fact that Italy help Germany to win the war against
Yugoslavia. The real Italian subventions to Germany was around 39 mil. US $, value that is
greater like the critical level of subvention result from the model. Also Mc is positive that
indicates Italy like a peace breaker. Also the probability to win the war for Germany is 1,
that indicates the fact Yugoslavia was no chance to resists over Germany and Italy.
For the second scenario we use the soldier numbers as V1 and V2 (V1 the Germans soldiers
that attack Yugoslavia, and V2 the Yugoslavian number of soldiers).
The results for simulation are described in Table 3.
Table 3. Soldier3, Thousands
V1 V2 γ Θ Mc S1-S2 M* Stability condition
(𝜃(𝑆1−𝑆2)
2𝛾∗ 𝑉1/𝑉2)
𝜃1−𝜃⁄
>
2γV2/V1>1
𝐺1∗ 𝐺2
∗ 𝑝1∗ 𝑝2
∗
337
700
2.07
↓.247 ↑21.1
362
↓23.2
Verified for all cases
↓343
↓344
→346
↑347
↑349
↑775
↑768
→ 761
↓754
↓747
1
0 ↓.248 ↑21.2 ↓23.1
→.249 →21.3 →23.0
↑.250 ↓21.2 ↑22.9
↑.251 ↓20.5 ↑22.8
This scenario indicates that Italian support for German army was necessary due on the fact
Yugoslavian army was greater like German troops involved on Yugoslavian front war. Also
in this case Italy help Germany and act like a peace breaker. The theoretical optimum level of

Proceedings of the IE 2015 International Conference
www.conferenceie.ase.ro
539
German soldiers was close to the real one, but Yugoslavia had not the necessary level of
troops to resist over Germany and Italy.
This model confirm the history evolution with a brutal attack from Germany and with the
help of Italy.
5. Conclusions
The war conflicts was intense studied in many papers. One of the most interested analysis
concern the role of a third party in various conflicts. There are different interests of third
parties: from preventing one party attack to helping the attacker to win the war.
Our analysis shows that discouraging strategy is sometimes costly for the third part and
without a great economic power it is not possible to support the war subventions (see US and
EU help for Ukraine).
The optimal intervention for a third party can also be peacemaker or peace breaker depending
on conflict nature or third party relationship with one or another involved parties.
In any case our study shows it is more difficult for a third party to be peacekeeper than to be
peace breaker.
References
[1] B.M. Blechman, „The intervention dilemma”, Washington Quarterly 18, pp. 63–73, 1995.
[2] H. Bull, „Intervention in World Politics”, Clarendon Press, 1984.
[3] D. Carment and J. James „Internal constraints of and interstate ethnic conflict: toward a
crisis-based assessment of irredentism”, Journal of Conflict Resolution 39, pp. 82–109,
1995.
[4] Y.M.Chang and J. Potter and S. Sanders „War and peace: Third-party intervention in
conflict”, European Journal of Political Economy, pp. 954-974, 2007.
[5] D. Gershenson, „Sanctions and civil conflict”, Economica 69, pp. 185–206, 2002.
[6] D. Gershenson and H.I. Grossman, „Civil conflict: ended or never ending?”, Journal of
Conflict Resolution 44, pp. 807–821, 2000.
[7] E. Glaeser „The political economy of hatred, Quarterly Journal of Economics” 120, pp.
45–86, 2005,
[8] H.I. Grossman and M. Kim, „Swords or plowshares? A theory of the security of claims to
property”, Journal of Political Economy 103, pp. 1275–1288, 1995,
[9] I. Grossman and J. Mendoza, „Scarcity and appropriative competition”, European
Journal of Political Economy 19, pp. 747–758, 2003.
[10] H.J. Morgenthau, “To intervene or not to intervene”, Foreign Affairs 45, pp. 425–436,
1967.
[11] A. Moseley, “Political realism. The Internet Encyclopedia of Philosophy”, 2006,
http://www.iep.utm.edu/polphil/
[12] P. Regan, “Conditions for successful third party intervention in intrastate conflicts”
Journal of Conflict Resolution 40, pp. 336–359, 1996.
[13] P. Regan, “Choosing to intervene: outside intervention in internal conflicts”, Journal
of Politics 60, pp. 754–759, 1998.
[14] P. Regan, “Third-party interventions and the duration of intrastate conflicts”, Journal
of Conflict Resolution 46, pp. 55–73, 2002.
[15] M. Roman, “A game theoretic approach of war with financial influences”,
International conference New Challenges in the Field of Military Sciences, Budapest,
September 2010
[16] K. Siqueira, “Conflict and third-party intervention”, Defence and Peace Economics
14, pp. 389–400, 2003.

Proceedings of the IE 2015 International Conference
www.conferenceie.ase.ro
540
MACROECONOMIC FACTORS OF SMEs PERFORMANCE IN
ROMANIA IN THE PERIOD 2005-2013. A TIME SERIES APPROACH
Marușa BECA
The Bucharest University of Economic Studies
Ileana Nișulescu ASHRAFZADEH
The Bucharest University of Economic Studies
Abstract. In this research article, we study the relationship between macroeconomic factors
and the SMEs’ performance for the Romanian economy through the Autoregressive
Distributed Lags Model (ADL). A time series analysis was performed that uses quarterly data
for the period January 2005 – December 2013 in order to determine the effect of the
monetary and tax policy adopted by the Romanian government before, during and after the
2008 economic crisis on the SMEs’ productivity. The deflated value-added per number of
micro enterprises, small firms and medium enterprises is an endogenous variable in three
linear function models with six exogenous macroeconomic variables such as the CPI, the
unemployment rate, the FDI rate, the tax rate and the government expenditure ratio to GDP
and the lags of the dependent variable. The main finding is that the government expenditure
rate variance has the most significant negative impact on the variance of the micro firms
value added among the other explanatory variables, but a positive effect on the small and
medium enterprises value added variance.
Keywords: Autoregressive Distributed Lags Model, firm performance, monetary policy,
Romania, tax policy.
JEL classification: E42, E52, E62
1. Introduction The SMEs are the backbone of Romania’s economy because they create 54% of the national
wealth’s added value and 65% of jobs in Romania. The economic crisis has hit hard in the
Romanian SME sector, the main problems it faces are the late collection of receivables, the
lack of collateral to obtain the loans for investments and the bureaucracy in accessing
European funds. ”The Small and Medium Enterprise (SME) category consists of the firms
that employ less than 250 persons and that have an annual net turnover of maximum € 50
million and/or holds total assets as far as € 43 million.” [1] There are three categories of
SMEs: micro-enterprises, small firms and medium ones in conformity with their turnover or
total assets and number of employees.
In order to perform our analysis, we employed as dependent variables the quarterly deflated
value-added per number of micro companies, small firms and medium enterprises from the
period 2005-2013. The goal of this paper is to establish the relationship between
macroeconomic factors such as the interest rate, the CPI, the tax rate, the unemployment rate,
the FDI rate and the government expenditure rate on one side and the deflated SMEs’ value-
added per number of enterprises on the other side through a time series approach. An
Autoregressive Distributed Lags Model (ADL) is used in our investigation in order to achieve
our goal.

Proceedings of the IE 2015 International Conference
www.conferenceie.ase.ro
541
The study is structured as follows: the second part presents the main literature regarding the
economic growth or firms’ performance at the macroeconomic level, the third part the
methodology and data used, the research design, the fourth part the econometric models
equations and results and the last one presents the main conclusions and recommendations.
2. Literature review Usman (2011) shows that there is a long-run relationship between public expenditure and
growth by using cointegration and VEC results [2]. Nijkamp (2004) finds that the
composition of public expenditure matters for growth. Governments should be aware of the
fact that outlays for education, transport infrastructure, and general government can promote
economic growth. [3]. Fölster’s results point to the fact that both government expenditure and
taxation are found to be negatively associated with economic growth. [4]
Devarajan (1996) shows that an increase in the share of current expenditure has positive and
statistically significant growth effects. By contrast, the relationship between the capital
component of public expenditure and per-capita growth is negative. Thus, seemingly
productive expenditures, when used in excess, could become unproductive [5].
Kneller finds that productive government expenditure enhances growth, while non-productive
expenditure does not. When financed by some combination of non-distortionary taxation and
non-productive expenditure, an increase in productive expenditures significantly enhances the
growth, and an increase in distortionary taxation significantly reduces growth. [6].
Using a VAR model, Mutașcu finds that a positive shock in the rate of dynamic taxation level
generates a rise in the level of economic growth in the long term in the case of Romania [7].
Inward investment has had a significant impact on the economic performance of host
economies, although beneficial effects on domestic companies appear to have been slow to
develop [8].
3. Methodology and data
3.1. Data collection and variables definitions In order to undertake our research, we have used the deflated quarterly time series of the
Romanian SMEs’ value-added from January 2005 to December 2013. The database was
created with the help of the information posted on the official sites of the WorldBank, NIS
(National Institute of Statistics), NBR (National Bank of Romania), and the MPF (Ministry of
Public Finance) of Romania. The macroeconomic variables were selected according to the
review of recent literature in the field and taking into consideration the specific features of
Romania’s economy and the global economic environment. The econometric models and the
data analysis was performed in the Gretl software.
The fiscal policy was assessed though the government expenditure rate and tax rate and the
monetary policy was quantified by the interest rate and CPI.
The dependent variable selected for the analysis is the deflated SMEs’ value-added ratio (the
gross value added at factor cost is the sum of wages and other labor-related cost factors,
profits, operating subsidies, fixed capital amortization, net of taxes linked to production)
divided by the number of SMEs (micro firms, small companies or medium enterprises).
(VA_micro, VA_small, VA_medium).
The independent variables employed in our analysis are the following:
the interest rate of monetary policy (Int_rate) [9]
the tax rate represents the percentage of the tax revenues in the GDP that estimates the
fiscal burden borne by the Romanian enterprises (Tax_Rate) [10]
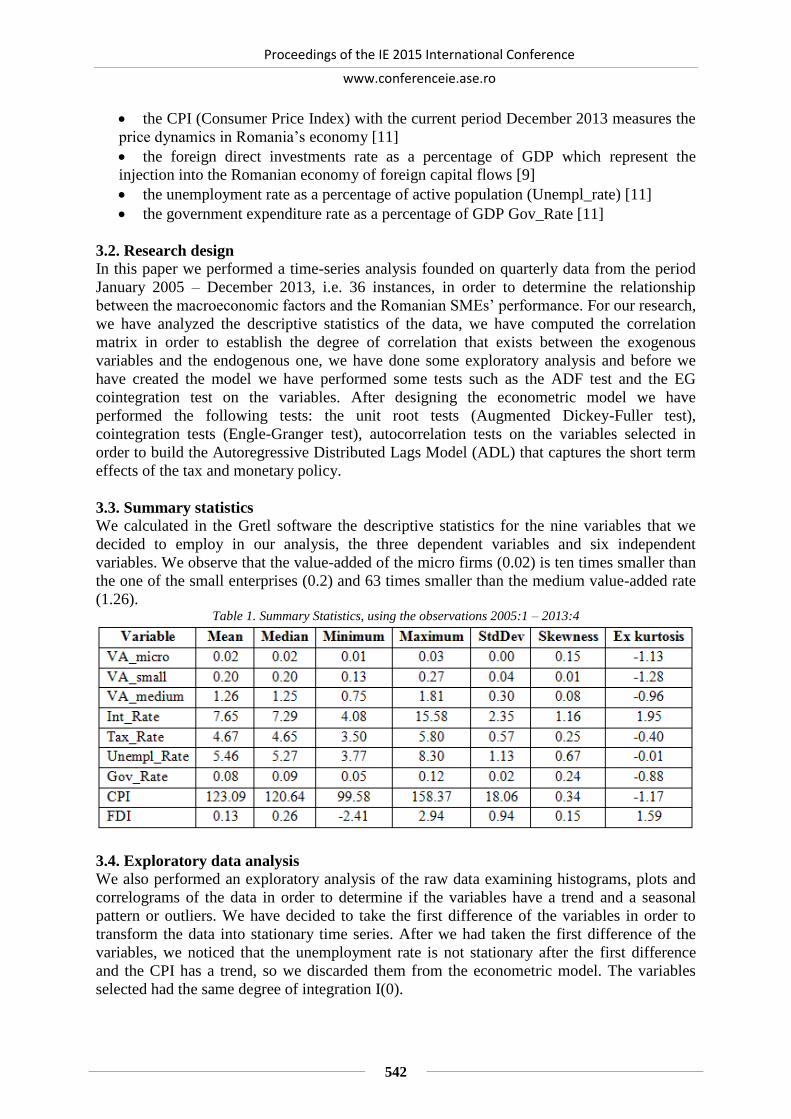
Proceedings of the IE 2015 International Conference
www.conferenceie.ase.ro
542
the CPI (Consumer Price Index) with the current period December 2013 measures the
price dynamics in Romania’s economy [11]
the foreign direct investments rate as a percentage of GDP which represent the
injection into the Romanian economy of foreign capital flows [9]
the unemployment rate as a percentage of active population (Unempl_rate) [11]
the government expenditure rate as a percentage of GDP Gov_Rate [11]
3.2. Research design
In this paper we performed a time-series analysis founded on quarterly data from the period
January 2005 – December 2013, i.e. 36 instances, in order to determine the relationship
between the macroeconomic factors and the Romanian SMEs’ performance. For our research,
we have analyzed the descriptive statistics of the data, we have computed the correlation
matrix in order to establish the degree of correlation that exists between the exogenous
variables and the endogenous one, we have done some exploratory analysis and before we
have created the model we have performed some tests such as the ADF test and the EG
cointegration test on the variables. After designing the econometric model we have
performed the following tests: the unit root tests (Augmented Dickey-Fuller test),
cointegration tests (Engle-Granger test), autocorrelation tests on the variables selected in
order to build the Autoregressive Distributed Lags Model (ADL) that captures the short term
effects of the tax and monetary policy.
3.3. Summary statistics
We calculated in the Gretl software the descriptive statistics for the nine variables that we
decided to employ in our analysis, the three dependent variables and six independent
variables. We observe that the value-added of the micro firms (0.02) is ten times smaller than
the one of the small enterprises (0.2) and 63 times smaller than the medium value-added rate
(1.26). Table 1. Summary Statistics, using the observations 2005:1 – 2013:4
3.4. Exploratory data analysis
We also performed an exploratory analysis of the raw data examining histograms, plots and
correlograms of the data in order to determine if the variables have a trend and a seasonal
pattern or outliers. We have decided to take the first difference of the variables in order to
transform the data into stationary time series. After we had taken the first difference of the
variables, we noticed that the unemployment rate is not stationary after the first difference
and the CPI has a trend, so we discarded them from the econometric model. The variables
selected had the same degree of integration I(0).
Proceedings of the IE 2015 International Conference
www.conferenceie.ase.ro
543
From the correlation matrix we notice that the first differences of the dependent variables
VA_micro, VA_small, VA_medium are negatively correlated with the interest rate,
unemployment rate and government expenditures and positively correlated with the first
difference of the CPI, FDI and the tax rate variables. After performing the Engle-Granger
cointegration test, we concluded that the variables are not cointegrated so the VECM can not
be employed.
4. Econometric models and the main empirical results
In order to explain the SMEs’ value-added rate to certain macroeconomic variables, we
performed an Autoregressive Distributed Lags Model (ADL) on the database that we had
created with the NIS, NBR, and MF data. Coefficients were estimated with ordinary least
squares, and standard errors were calculated using standard asymptotic approximations. The
exploratory analysis, the tests, and the econometric model were performed in the statistical
software Gretl.
After performing the Engle-Granger test for cointegration, we concluded that the independent
variables aren’t cointegrated with the dependent variable. We found the lag length for each of
the variables that are used in the model and then we have not to employ the lags of the
dependent variable because of collinearity issues. We have selected the lags of the exogenous
variables taking into consideration the minimum Akaike Information Criterion (AIC).
We have designed an Autoregressive Distributed Lags Model (ADL) in order to analyze the
short-term effects of macroeconomic variables on SMEs’ value-added in Romania. We took
the first difference for all the variables. Based on the requirement to obtain the minimum
AIC, the final form of the econometric model for the micro firms value added, with all the
coefficients being statistically significant, is the following:
Δ(VA_microt) = -0.001*Δ(Int_Ratet-2) -0.002*Δ(Tax_Ratet-1) + 0.002*Δ(Tax_Ratet-4) –
0.08*Δ(Gov_Ratet) -0.16*Δ(Gov_Ratet-1) -0.05Δ(Gov_Ratet-4) (1)
where:
Δ = the first difference of the variables selected
VA_micro = the deflated value-added per number of micro firms in Romania
VA_microt-i = the lagged deflated value-added per number of micro firms in Romania
Int_Ratet = the interest rate in the current quarter
Tax_Ratet = the tax rate as a percentage of GDP
Gov_Ratet = the government expenditure rate as a percentage of GDP
FDI = foreign direct investment rate as a percentage of GDP
t = the current period, the current quarter
We observe that the government expenditure rate variance has the most significant negative
impact on the variance of the micro firms value added. This model explains 79% of the
variation in the dependent variable VA_micro. All coefficients are statistically significant at a
p-value of 1%, 5% or 10%.
The final form of the econometric model for the small firms value added, with all the
coefficients being statistically significant, is the following:
Δ(VA_smallt) = -0.024*Δ(Int_Ratet-3) -0.035*Δ(Tax_Ratet-1) - 0.023*Δ(Tax_Ratet-2) +
0.017*Δ(Tax_Ratet-4) + 1.54*Δ(Gov_Ratet-2) + 1.59*Δ(Gov_Ratet-3) + 0.78*Δ(Gov_Ratet-4)
+0.013*Δ(FDIt) + 0.011*Δ(FDIt-1) -0.019*Δ(FDIt-3) (2)
We observe that the government expenditure rate variance has the most significant positive
impact on the variance of the small firms value added. This model explains 82.58% of the
variation in the dependent variable VA_small. All coefficients are statistically significant at a
p-value of 1% or 5%.

Proceedings of the IE 2015 International Conference
www.conferenceie.ase.ro
544
The final form of the econometric model for the medium firms value added, with all the
coefficients being statistically significant, is the following:
Δ(VA_mediumt) = -0.14*Δ(Int_Ratet-3) -0.22*Δ(Tax_Ratet-1) - 0.16*Δ(Tax_Ratet-2) +
0.11*Δ(Tax_Ratet-4) + 8.56*Δ(Gov_Ratet-2) + 8.60*Δ(Gov_Ratet-3) + 4.40*Δ(Gov_Ratet-4)
+0.08*Δ(FDIt) + 0.07*Δ(FDIt-1) -0.13*Δ(FDIt-3) (3)
We observe that the government expenditure rate variance has the most significant positive
impact on the variance of the medium firms value added. This model explains 83.60% of the
variation in the dependent variable VA_medium. All coefficients are statistically significant
at a p-value of 1% or 5%.
We have performed some tests in order to verify the assumptions of the linear model and all
of them were met, the White test and Breusch-Pagan test for heteroskedasticity, the normality
of the residuals test, the collinearity test, the Breusch-Godfrey test for autocorrelation.
5. Conclusions
Our analysis suggests that the first differences of the dependent variables VA_micro,
VA_small, VA_medium are negatively correlated with the interest rate, unemployment rate
and government expenditures and positively correlated with the first difference of the CPI,
FDI and the tax rate variables. Our analysis shows that the average value-added of the micro
firms is ten times smaller than the one of the small enterprises and 63 times smaller than the
medium value-added rate.
Our results suggest that the government expenditure rate variance has the most significant
negative impact on the variance of the micro firms value added among the other explanatory
variables but a positive effect on the small and medium enterprises value added variance.
For further research, taking into consideration the fact that the literature review states that the
education expenditure and/or the research and development expenditure as a percentage of
government expenditure have a significant impact on the economic growth of a country, these
variables could be employed in a quarterly time series analysis for the same period in order to
measure their impact on the firms’ performance.
Acknowledgment
This paper was co-financed from the European Social Fund, through the Sectorial
Operational Programme Human Resources Development 2007-2013, project number
POSDRU/159/1.5/S/138907 "Excellence in scientific interdisciplinary research, doctoral and
postdoctoral, in the economic, social and medical fields -EXCELIS", coordinator The
Bucharest University of Economic Studies.
References
[1] AIPPIMM, “Agentia pentru Implementarea Proiectelor și Programelor pentru IMM-uri,”
AIPPIMM web site, 2013. [Online]. Available:
http://www.aippimm.ro/articol/imm/legislatie-imm/definitie-imm. [Accessed: 16-Mar-
2015].
[2] Usman A., Mobolaji H.I., Kilishi A.A., Yaru M.A. and T. A. Yakubu, “Public
expenditure and economic growth in Nigeria,” Asian Economic and Financial Review,
vol. 1, no. 3, pp. 104–113, 2011.
[3] Nijkamp Peter and Poot Jacques, “Meta-analysis of the effect of fiscal policies on long-
run growth,” European Journal of Politcal Economy, vol. 20, no. 1, pp. 91–124, Mar.
2004.
[4] Fölster Stefan and Henrekson Magnus, “Growth effects of government expenditure and
taxation in rich countries,” European Economic Review, vol. 45, pp. 1501–1520, 2001.

Proceedings of the IE 2015 International Conference
www.conferenceie.ase.ro
545
[5] Devarajan Shantayanan, Swaroop Vinaya and Zou Heng-fu, “The composition of public
expenditure and economic growth,” Journal of Monetary Economics, vol. 37, pp. 313–
344, 1996.
[6] Kneller Richard, Bleaney Michael F. and Gemmell Norman, “Fiscal policy and growth:
evidence from OECD countries,”Journal of Public Economics, vol. 74, pp. 171–190,
1999.
[7] Mutaşcu Mihai Ioan and Dănulețiu Dan Constantin, “Taxes and Economic Growth in
Romania,” Annales Universitatis Apulensis Series Oeconomica, vol. 13, no. 1, pp. 94–
105, 2011.
[8] Dawn H. and Pain N., “The Determinants and Impact of Foreign Direct Investment in the
Transition Economies: A Panel Data Analysis,” 1998.
[9] National Bank of Romania, “Raport Analiza Statistica,” National Bank of Romania web
site, 2015. [Online]. Available: http://bnr.ro/Raport-statistic-606.aspx. [Accessed: 10-
Mar-2015].
[10] Ministry of Public Finance, “Executia Bugetului General Consolidat,” Ministry of
Public Finance web site, 2015. [Online]. Available:
http://discutii.mfinante.ro/static/10/Mfp/trezorerie/Rap_trimI2011_anexa.pdf. [Accessed:
12-Apr-2015].
[11] “INSSE - Baze de date statistice - TEMPO-Online serii de timp.” [Online]. Available:
http://statistici.insse.ro/shop/. [Accessed: 10-Mar-2015].

Proceedings of the IE 2015 International Conference
www.conferenceie.ase.ro
546
EFFICIENCY OF THE EUROPEAN STRUCTURAL FUNDS INVESTED
IN EDUCATIONAL INFRASTRUCTURE
Monica ROMAN
The Bucharest University of Economic Studies
Abstract. The aim of the paper is to analyse the regional differences existing between
Romanian counties with respect to the efficiency of European structural funds (ESF) devoted
to finance educational infrastructure. In this purpose, it is employed a non-parametric
method widely used for evaluating the efficiency of public policies, namely Data Envelopment
Analysis (DEA). The regional dimension was enclosed in the model by considering 31
Romanian counties as decision making units (DMUs). The results confirm the deep
disparities existing between Romanian counties concerning the efficiency of using ESF.
Some of the counties with a moderate accession rate of structural funds are among the
efficient DMUs: Braila, Iasi or Cluj.
Keywords: educational, infrastructure, European structural funds, DEA, regional efficiency,
Romania
JEL classification: H83, R58, R25, C54
1. Introduction Becoming a Member State of the European Union, Romania benefited starting with the
programming period 2007-2013 of structural and investments funds, designed to face the
economic challenges and disparities, as well as to value the opportunities available in the
country. The European Union funds represent for Romania financial instruments set up to
assist at reducing the regional disparities and fostering growth thorough in investments
domains such as employment, social inclusion, rural and urban development or research and
innovation. During the programming period 2007-2013, Romania benefited from a budget of
27.5 billion euros of which 19.2 billion euros is for structural and cohesion funds and 8.3
billion for Common Agricultural Policy.
The aim of the paper is to analyse the regional disparities existing between Romanian
counties with respect to the efficiency of structural funds devoted to finance educational
infrastructure. One of the most relevant needs for Romanian social development is the
improvement of the quality of educational infrastructures and reducing the regional
disparities existing between Romanian regions. The Regional Operational Programme
through the Key Area of Intervention 3.4 „ Rehabilitation, modernisation, development and
equipping of pre–university, university education and continuous vocational training
infrastructure” was the programme that addresses the educational infrastructure development
needs.
Therefore, the study fills a gap in the literature by evaluating the efficiency of ESF devoted to
educational infrastructure, provides valuable information for decision makers and also opens
room for further research on this challenging topic. It is employed a non-parametric method
widely used for evaluation the efficiency of public policies, namely Data Envelopment
Analysis (DEA). Efficiency was computed in output oriented model.
The contribution of the paper is threefold: the paper approaches the efficiency of using
structural funds at regional level, being one of the first attempts to apply DEA methodology
Proceedings of the IE 2015 International Conference
www.conferenceie.ase.ro
547
in this respect; the objects of the study are NUTS3 regions from Romania, a country that still
needs to progress to cohesion to other EU countries; the study is using very recent data from
the Programming period 2007-2013.
This paper is structured as follows. Section 2 briefly reviews the literature on DEA
application on public policies evaluation and on the impact of structural funds on economic
growth, respectively. Section 3 discusses the method applied and subsequently and variables
employed, followed by the presentation of the results in section 4. Finally, section 5
concludes.
2. Literature review
DEA approach involves the application of the linear programming technique to trace the
efficiency frontier. DEA was launched by Charnes et al. [4] under the assumption that
production exhibited constant returns to scale, while Banker et al. extended it to the case
where there are variable returns to scale.
It has been successfully applied in measuring both for-profit and non-profit organizations,
such as the effectiveness of regional development policies in northern Greece by by Karkazis
and Thanassoulis [11]. Coelli, Rao and Battese [6] introduce the reader to this literature and
describe several applications.
Governmental efficiency in general and public policies efficiency became research subjects
of an increased number of papers. Zhu [18] provides a series of Data Envelopment Analysis
(DEA) models for efficiency assessment and for decision making purposes. Rhodes and
Southwick [16] use DEA to analyze and compare private and public universities in the USA.
There are several applications of DEA method for Romania; Roman and Suciu [17] provide
an efficiency analysis of research activities using input oriented DEA models and Nitoi [14]
assesses the efficiency of the Romanian banking system using an input oriented, variable
return to scale, DEA model. DEA has also been used to assess different aspects of the
medical field like the efficiency of national health systems [1].
Considering the European Cohesion Policy and using a panel of NUTS3 regions, Becker et
all [3] find positive effects of Objective 1 funds on economic growth, but no employment
effects. Puigcerver-Peñalver [15] finds that structural funds have positively influenced the
growth process at regional level although their impact has been much stronger during the first
Programming period than during the second.
Mohl and Hagen [13] evaluate the growth effects of European structural funds payments at
the regional level. Using a new panel dataset of 124 NUTS regions for the time period 1995-
2005 they found empirical evidence that the effectiveness of structural funds in promoting
growth is strongly dependent on which Objective is analysed. Payments of Objective 2 and 3
have a negative effect on GDP.
3. Method and variables
The variable of interest in our model is the value of European structural funds involved in
projects that support educational infrastructure at NUTS3 aggregation level. Out of the total
number of the projects contracted in this purpose in Romania, there were selected the projects
finalized by April 2014 resulting 131 projects with a total value of 723 million lei. The
projects devoted to financing higher education and research infrastructure were in a small
number and therefore were excluded from the analysis. Other two inputs were also
considered in the efficiency evaluation: the ratio professor/student that counts for the human
resources and the number of classrooms that counts for fix capital. The output variables refer
to education performance (the average graduation rate at The National Test and the average
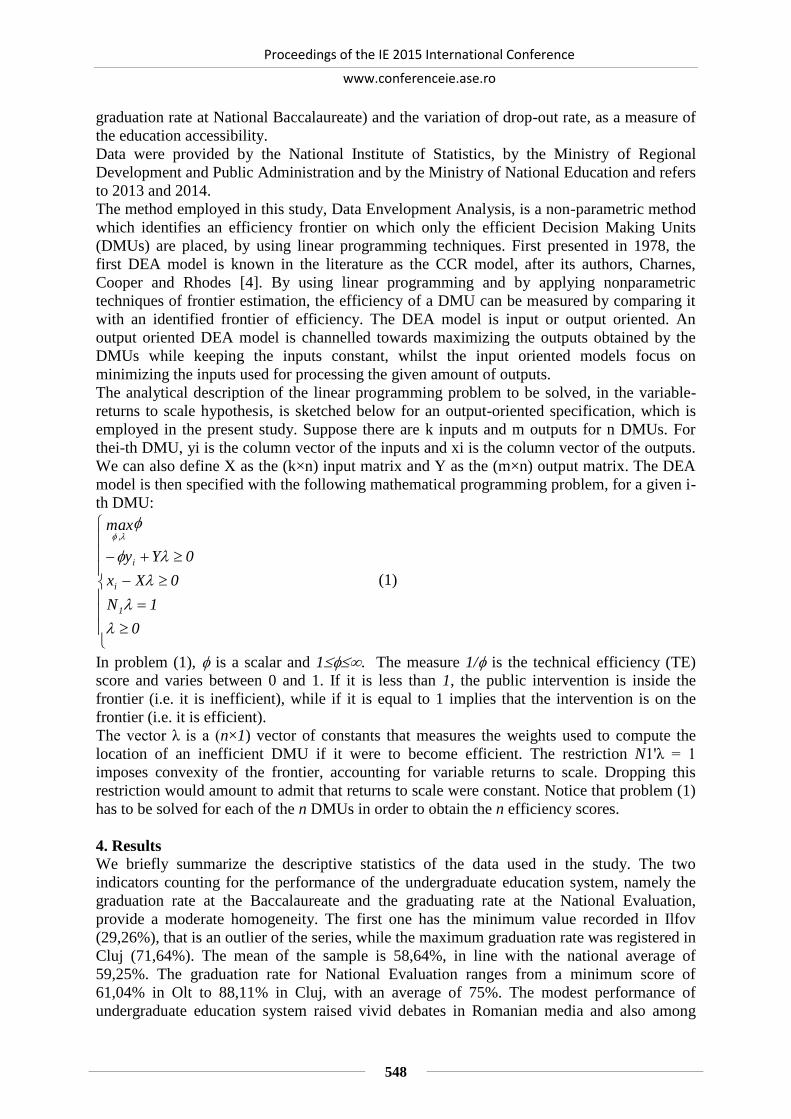
Proceedings of the IE 2015 International Conference
www.conferenceie.ase.ro
548
graduation rate at National Baccalaureate) and the variation of drop-out rate, as a measure of
the education accessibility.
Data were provided by the National Institute of Statistics, by the Ministry of Regional
Development and Public Administration and by the Ministry of National Education and refers
to 2013 and 2014.
The method employed in this study, Data Envelopment Analysis, is a non-parametric method
which identifies an efficiency frontier on which only the efficient Decision Making Units
(DMUs) are placed, by using linear programming techniques. First presented in 1978, the
first DEA model is known in the literature as the CCR model, after its authors, Charnes,
Cooper and Rhodes [4]. By using linear programming and by applying nonparametric
techniques of frontier estimation, the efficiency of a DMU can be measured by comparing it
with an identified frontier of efficiency. The DEA model is input or output oriented. An
output oriented DEA model is channelled towards maximizing the outputs obtained by the
DMUs while keeping the inputs constant, whilst the input oriented models focus on
minimizing the inputs used for processing the given amount of outputs.
The analytical description of the linear programming problem to be solved, in the variable-
returns to scale hypothesis, is sketched below for an output-oriented specification, which is
employed in the present study. Suppose there are k inputs and m outputs for n DMUs. For
thei-th DMU, yi is the column vector of the inputs and xi is the column vector of the outputs.
We can also define X as the (k×n) input matrix and Y as the (m×n) output matrix. The DEA
model is then specified with the following mathematical programming problem, for a given i-
th DMU:
0
1N
0Xx
0Yy
max
1
i
i
,
(1)
In problem (1), is a scalar and 1. The measure 1/ is the technical efficiency (TE)
score and varies between 0 and 1. If it is less than 1, the public intervention is inside the
frontier (i.e. it is inefficient), while if it is equal to 1 implies that the intervention is on the
frontier (i.e. it is efficient).
The vector λ is a (n×1) vector of constants that measures the weights used to compute the
location of an inefficient DMU if it were to become efficient. The restriction N1'λ = 1
imposes convexity of the frontier, accounting for variable returns to scale. Dropping this
restriction would amount to admit that returns to scale were constant. Notice that problem (1)
has to be solved for each of the n DMUs in order to obtain the n efficiency scores.
4. Results
We briefly summarize the descriptive statistics of the data used in the study. The two
indicators counting for the performance of the undergraduate education system, namely the
graduation rate at the Baccalaureate and the graduating rate at the National Evaluation,
provide a moderate homogeneity. The first one has the minimum value recorded in Ilfov
(29,26%), that is an outlier of the series, while the maximum graduation rate was registered in
Cluj (71,64%). The mean of the sample is 58,64%, in line with the national average of
59,25%. The graduation rate for National Evaluation ranges from a minimum score of
61,04% in Olt to 88,11% in Cluj, with an average of 75%. The modest performance of
undergraduate education system raised vivid debates in Romanian media and also among

Proceedings of the IE 2015 International Conference
www.conferenceie.ase.ro
549
decision makers and researchers that tried to identify the possible causes for the situation,
spreading from the poor education conditions in some schools, the disinterest of teachers who
are underpaid, the lack of parental involvement, to the shifts in youth behaviour and lack of
student interest in learning and preparing for a career.
The variation of the drop-out rate has a moderate homogeneity described by a coefficient of
variation of 25% and the mean and median are very close to each-other, pointing out the
symmetry of the series. On average the counties in the sample faced a slow decrease in the
drop-out rate, but, at the same time, there are important regional differences. The highest
decrease in drop-out rate (with 70%) appears in Hunedoara, while the highest increase (of
38%) is in Ilfov.
Input variables are homogenous and Ilfov is again in the most disadvantageous situation with
the minimum values of 2,3 classrooms per 100 pupils and 4,2 professors per 100 pupils. The
best ranked are Sălaj and Vâlcea, respectively.
The values of ESF are by far the most heterogenous of the selected variable (coefficient of
variation is 68%). Maramureş attracted the lowest amount, while Dâmboviţa attracted the
highest amount.
Figure 1. DEA results for CRS and VRS models
The average efficiency scores under the assumption of constant return to scale (CRS) is
0,885, while in the case of variable return to scale (VRS) the average efficiency is slightly
higher, 0,928. In both cases, the scores’ distributions are homogenous. In Figure 1 there are
described the results of DEA in the cases of both CRS and VRS. In practice, it is less likely
to have constant return to scale, and therefore in the following table only the results from the
VRS Model are detailed.
The results in Table 1 deserve further discussion. In the first quartile (Q1) there are seven
counties that are the most inefficient. These counties have modest education performance, but
manage to attract high amounts of funding for improving their educational infrastructure.
Counties such as Hunedoara, Arad, Dâmboviţa or Harghita are among the top recipients of
such financial resources, but the efficiency of using these is relatively low. In the second
group, with efficiency scores range between first (Q1) and second quartile (Q2) there are
eight counties, while five counties have efficiency score between second and third quartile
(Q3), approaching to efficiency frontier. Among these, there are counties such as Braşov,
Vrancea, Sibiu, Bihor or Buzău.

Proceedings of the IE 2015 International Conference
www.conferenceie.ase.ro
550
Table1. The sample counties distributed by technical efficiency scores
One third of the counties in the sample are on the efficiency frontier, having TE scores
equal to 1. Among these we found counties that have attracted financial resources above
average and manage to report good educational performance. These counties are Brăila,
Galaţi, Iaşi and Cluj. These counties could serve as good practice cases.
There are also on the efficiency frontier counties having lowest values of attracted funds
and also having low levels of output indicators, such as Vâlcea, Tulcea, Ilfov. In such
counties seems to be a lack of interest in successfully accession of ESF for improving
educational infrastructure.
The scale efficiency was also considered in the analysis, and scale was computed as the
ratio between efficiency scores in the CRS and VRS models. Not surprisingly, the findings
from both models reflect decreasing return to scale for the great majority of the DMUs,
with a coefficient of returns to scale lower than 1. This implies that an increase in inputs
will generate a smaller increase in outputs. Nine counties that were efficient in both
models present a constant return to scale: Brăila, Constanţa, Galaţi, Hunedoara, Iaşi, Ilfov,
Maramureş, Suceava and Tulcea.
5. Conclusions
In the present study, efficiency of a sample of Romanian counties was computed using a
DEA model output oriented, with a focus on the value of European structural funds. The
results confirm the deep disparities existing between Romanian counties in the efficiency of
using ESF. Some of the counties with a high accession rate of structural funds are among the
efficient DMUs: Braila, Galati, Iasi and Cluj. On the other hand, we found on the efficiency
frontier counties with low accession rate such Constanta, Ilfov, Maramureş, Suceava, Tulcea,
Vâlcea. Conclusions confirm the efficiency of using European structural funds in a number of
counties that have attracted important amounts of money, but at the same time, there are
counties that are far from efficiency frontier and there is room for improving the efficiency of
their use.
References
[1] Asandului Laura, Roman Monica and Fatulescu Puiu, “The Efficiency of Healthcare
Systems in Europe: a Data Envelopment Analysis Approach”, Procedia Economics and
Finance, Volume 10, pp. 261-268, 2014.
Proceedings of the IE 2015 International Conference
www.conferenceie.ase.ro
551
[2] Aristovnik Aleksander and Obadić Alka. “Measuring relative efficiency of secondary
education in selected EU and OECD countries: the case of Slovenia and Croatia”
Technological and Economic Development of Economy 20.3, pp. 419-433, 2014.
[3] Becker Sascha O., Egger Peter H. and Von Ehrlich Maximilian. “Going NUTS: The effect
of EU Structural Funds on regional performance” Journal of Public Economics, 94.9, pp.
578-590, 2010.
[4] Charnes A., Cooper W.W. and Rhodes E., “Measuring the efficiency of decision making
units”, European Journal of Operational. Research, Volume 2, pp. 429-444, 1978.
[5] Charnes A., Cooper W.W., Lewin A.Y. and Seiford, L.M., Data Envelopment Analysis:
Theory, Methodology and Applications, Kluwer Academic Publishers, 1994.
[6] Coelli Timothy, Rao Prasada, O’Donnell Cristopher J. and Battese George E., - An
introduction to efficiency and productivity analysis, Kluver Academic Publishers, Boston,
Dordrecht, London, 1998.
[7] Coelli Tim, “A guide to DEAP Version 2.1: a data envelopment analysis (computer)
program”, CEPA Working Paper 96/08, Department of Econometrics, University of New
England, Armidale, Australia, 1996.
[8] Angel de la Fuente, and Vives Xavier. "Infrastructure and education as instruments of
regional policy: evidence from Spain." Economic policy 10.20, pp. 11-51, 1995.
[9] Dobrescu Emilian and Pociovalisteanu Diana M., “Regional Development And Socio-
Economic Diversity In Romania”, Annals-Economy Series 6, pp. 55-59, 2014.
[10] European Commission/EACEA/Eurydice, 2013. Funding of Education in Europe 2000-
2012: The Impact of the Economic Crisis. Eurydice Report. Luxembourg: Publications
Office of the European Union.
[11] Karkazis John and Thanassoulis Emmanuel, “Assessing the Effectiveness of Regional
Development Policies in Northern Greece”, Socio-Economical Planning Science Vol 32,
no 2. pp. 123-137, 1998.
[12] Mohl Philipp and Hagen Tobias, “Econometric evaluation of EU Cohesion Policy: a
survey”, ZEW Discussion Papers, No. 09-052, 2009.
[13] Mohl Philipp and Hagen Tobias, “Do EU structural funds promote regional growth?
New evidence from various panel data approaches”, Regional Science and Urban
Economics, 40.5, pp. 353-365, 2010.
[14] Nițoi Mihai, “Efficiency in the Romanian Banking System: An Application of Data
Envelopment Analysis”, Romanian Journal of Economics, Institute of National Economy.
vol. 29(2(38)), pp. 162-176, December 2009.
[15] Puigcerver-Peñalver Mari-Carmen, “The impact of structural funds policy on European
regions growth. A theoretical and empirical approach” The European Journal of
Comparative Economics vol.4, no. 2, pp. 179-208, 2007.
[16] Rhodes E. and Southwick L., “Determinants of efficiency in Public and Private
Universities”, Department of Economics, University of South Carolina, 1986.
[17] Roman Monica and Suciu Christina, “Analiza eficienţei activităţii de cercetare
dezvoltare inovare prin metoda DEA [The Efficency Analysis Of R&D Activities By
Using Dea]”, MPRA Paper 44000, University Library of Munich, Germany, 2012.
[18] Zhu Joe, Quantitative Models for Performance Evaluation and Benchmarking: Dat
Envelopment Analysis with Spreadsheets and DEA Excel Solver, Kluwer Academic,
2002.

Proceedings of the IE 2015 International Conference
www.conferenceie.ase.ro
552
RESOURCES ALLOCATION MODEL IN A CLUSTERED CLOUD
CONFIGURATION
Mioara BANCESCU
The Bucharest University of Economic Studies
Abstract. The expansion of cloud computing in the past years has raised a real need of
optimization of the elements implied by the cloud computing configuration. Resource
allocation is one of the most important challenges in the cloud computing architecture
specially when taking into account the limitations in the possibility to endow the servers from
the cloud with processing capacity, storage capacity and network communication capacity.
The challenge in modeling resource allocation in cloud configuration comes as well from the
need for faster and faster response times the client applications configured on the servers in
the cloud can get. This paper proposes a cloud computing resource allocation model.
Keywords: Cloud configuration, general equilibrium, modeling, resource allocation.
JEL classification: C61, C68
1. Introduction
Starting from the numerous definitions of cloud computing, Brodkin [3] argues that ‘cloud
computing is a way of calculating the scalable and elastic IT capacities, provided as a service
to more customers using Internet technologies’. The expansion of cloud computing in the past
years has raised a tremendous need of optimization of the elements implied by cloud
computing architecture. The resource allocation in the cloud is an emerging research topic.
As Han and Xiaolin emphasize on their work [5], once the cloud amplifies, scalable resource
sharing platform becomes cheaper and more accessible, while the problem of managing
resource allocations in a cloud computing environment becomes a challenge due to both
resources and administrative parties.
The variety of cloud resource allocation emerges from the variety of both hardware and
software resources, multiplied by the variety of users. Other contributors are the complex
applications that evolved from monolithic systems to complex multi-tiered systems.
In the paper we model a cloud system formed by two clusters that are managing three types
of resources: processing capacity, storage capacity, network communication capacity. The
first section of the paper focuses on related research work in the area of cloud computing and
resource allocation in cloud configurations. The next section contains the model formulation
with its equations, notions and abbreviations used and justification of the model equations.
The last two sections are dedicated to possible model results and final remarks.
2. Related work
As the cloud computing era raised, the community pointed on cloud resource allocation
problem which has to meet requests like cost justifiability, utility, cost reduction, efficiency,
availability, continuity, scalability and other aspects. For this, related work focused on
managing resource allocations challenges due to the diverse scalability and heterogeneity.
Han and Xiaolin [5] focused on research for cost-effective resource management strategy
design in cloud computing which was driven by the booming virtualization, heterogeneous
nature of users and financial costs. They also studied the minimization problem of resource

Proceedings of the IE 2015 International Conference
www.conferenceie.ase.ro
553
rental cost associated with hosting, while meeting the projected service demand. In addition,
the need of flexible resource allocation was emphasized for the resource trading problem in
cloud setting, where multiple tenants communicate in a Peer-to-Peer approach.
Recently, numerous studies focused on proposing cloud computing resource allocation
models. A threshold-based dynamic resource allocation scheme for cloud was proposed by
Lin et al [7]. This model allocates dynamically the virtual machines among the cloud
applications based on their load changes and use the threshold method to optimize the
resource reallocation decision. Later, the combinatorial double auction resource allocation
proposed by Sarmini et al [9] proved to be economically efficient through the double-sided
competition allowed and bidding on an unrestricted number of items.
In their paper [4], Espadas et al, raise the problem of the majority of Software-as-a-Service
(SaaS) platforms and their applications, where over and under-utilization of resources occur
because of the number of virtual machine instances deployed. The authors propose a tenant-
based model addressing tenant-based isolation, tenant-based load balancing and tenant-based
virtual machine instance allocation.
A paper proposed by Ardagna et al [1] focuses on resource allocation scheduler for multi-tier
autonomic environments in order to maximize the profits associated with multiple class of
Service Level Agreements.
In other related work, Iqbal et all [6] propose a methodology and a system for automatic
detection and resolution of bottlenecks in a multi-tier Web application hosted on a cloud in
order to satisfy maximum response time requirements. In addition the authors propose a
method to identify and retract over-provisioned resources in multi-tier cloud applications.
3. Model Formulation
The components considered for modeling in this paper are the following: two clusters
disposed in a cloud configuration, having different number and type of servers in their
structure, three resources - processing capacity, storage capacity and network communication
capacity, two clients - the applications installed on the servers from each cluster in the cloud
and a service - the response time of each cluster from the cloud to client application requests.
There is a supply and a demand in the cloud for the response time service: on one side, it is
offered based on servers endowments with the three resources and on the other side, the
response time service it is requested by each client application installed on the servers from
the cloud.
The concept of profit A ,
B it is introduced in the model in order to asses the value of the
service gained from the clients owning the applications A
SP,
B
SP subtracted by the cost of
operating the active servers, at cluster level A
SCU,
B
SCU. As the values of the response time
service and the cost of operating the services are considered per unit, the offered quantities of
the service are taken into accountA
SQ,
B
SQ in order to get to the totals values and to total
operating costs.
In order to balance the supply and the demand of the response time service in the cloud,
beside the offered quantities of the service introduced aboveA
SQ,
B
SQ, we introduce as well
the requested quantities of the service A
SQ,
B
SQ. If there is a perfect match between the
quantities offered and the quantities demanded, not having any supply excess or shortage, the
model will return value 1 as a result of executing the model on entry data. If, based on the
entry data, there is a supply in excess, the model will return a value smaller than 1 as a result

Proceedings of the IE 2015 International Conference
www.conferenceie.ase.ro
554
of executing the model. And if based on the entry data there is a shortage of supply in the
cloud, the model will return a value greater than 1 as a result of executing the model.
Under the same concept of balancing the demand and the supply, but at resource level, we
introduce: the values of the resources in the cloud sPPRe , sSPRe , sCPRe , the endowment with
resources i
PsRe , i
SsRe,
i
CsRe and the consumptions of resources
Si
sP
i QPRe
, Si
sS
i QPRe
,
Si
sC
i QPRe
1.
The model proposed in the paper contains other equilibrium conditions, at client applications
level, for which we use the notions of cloud resource values sPPRe , sSPRe , sCPRe and
endowments with resources in the cloud i
PsRe , i
SsRe,
i
CsRe to get to introducing the
notion of income for each cluster AV ,
BV . For the demand side of these equilibrium
conditions we use the requested quantities of the service A
SQ,
B
SQ multiplied with the unitary
values of the service A
SP,
B
SP.
In summary, we are using the following abbreviations in the model: A – the profit of cluster A B – the profit of cluster B
A
SCU - unitary cost of operating the servers in cluster A
B
SCU - unitary cost of operating the servers in cluster B
A
SQ - the offered quantity of the service (cluster A response time offered)
B
SQ - the offered quantity of the service (cluster B response time offered)
A
SP - the value of the service (cluster A response time)
B
SP - the value of the service (cluster B response time)
sPPRe - the value of the processing capacity resource in the cloud;
sSPRe - the value of the storage capacity resource in the cloud;
sCPRe - the value of the communication capacity resource in the cloud;
Si
sP
i QPRe
- where },{ BAi ; the consumption of the processing capacity resource to obtain
cluster A, respectively cluster B response time
Si
sS
i QPRe
- where },{ BAi ; the consumption of the storage capacity resource to obtain
cluster A, respectively cluster B response time
1 To express the resources consumed to obtain the response time in each cluster of the cloud we use the
derivates of the profit functions, as formalized in Hotelling lemma.

Proceedings of the IE 2015 International Conference
www.conferenceie.ase.ro
555
Si
sC
i QPRe
- where },{ BAi ; the consumption of the communication capacity resource to
obtain cluster A, respectively cluster B response time i
PsRe - the endowment with processing capacity resource of cluster i, where },{ BAi i
SsRe - the endowment with storage capacity resource of cluster i, where },{ BAi
i
CsRe - the endowment with communication capacity resource of cluster i, where },{ BAi
A
SQ - the requested quantity of the service (cluster A response time expected)
B
SQ - the requested quantity of the service (cluster B response time expected)
AV - the income of cluster A from the cloud BV - the income of cluster B from the cloud
Based on previous work on general equilibrium modeling technique [2], we propose
in this paper a model for resource allocation in cloud configuration with the following
equations:
(1) 0)( A
S
A
S
A
S CUPQ
(2) 0)( B
S
B
S
B
S CUPQ
(3) 0][ A
S
A
S
A
S QQP
(4) 0][ B
S
B
S
B
S QQP
(5) 0]ReRe[ReRe
Re
B
S
sP
B
A
S
sP
A
B
P
A
PsP QP
QP
ssP
(6) 0]ReRe[ReRe
Re
B
S
sS
B
A
S
sS
A
B
S
A
SsS QP
QP
ssP
(7) 0]ReRe[ReRe
Re
B
S
sC
B
A
S
sC
A
B
C
A
CsC QP
QP
ssP
(8) 0]ReReRe[ ReReRe A
S
A
S
A
CsC
A
SsS
A
PsP
A QPsPsPsPV
(9) 0]ReReRe[ ReReRe B
S
B
S
B
CsC
B
SsS
B
PsP
B QPsPsPsPV
In any of the two clusters from the cloud where the client applications get a positive response
time, the profit should be zero or if it is negative then the response time of the cluster should
be zero, meaning that the cluster becomes inactive in the cloud. Equation (1) represents the
null profit condition for cluster A and equation (2) represents the null profit condition for
cluster B.
For any service or resource having a strictly positive value, the supply in excess is zero or, if
there is any supply in excess, the value of the respective service or resource is zero. Equations
(3) and (4) represent the equilibrium condition for the response time service of cluster A,
respectively cluster B. Equations (5) to (7) represent the equilibrium condition for each
resource in the cloud.
For any client application which is acquiring the response time service, the difference
between the value of clusters endowment with resources and the value of service

Proceedings of the IE 2015 International Conference
www.conferenceie.ase.ro
556
consumption is zero. Equations (8), (9) represent the equilibrium condition for the client
applications.
4. Optimization method and results
The advanced quantitative modeling assumes the use of software packages solutions for
generating final results based on entry data given by the user. Based on our research, the
model proposed in the paper can be executed using GAMS software (General Algebraic
Modeling System) and more specifically, the integrated solver in GAMS that is dedicated to
general equilibrium, MPSGE (Mathematical Programming System for General
Equilibrium)2.
The results that can be obtained are the value and the equilibrium quantity of the service -
cloud response time, the value and the equilibrium quantities of the three resources in the
cloud - processing capacity, storage capacity and network communication capacity. The
interpretation of results is made by comparison with the target value 1, an ideal value towards
which the results should be driven so that imbalances at the moment of the cloud analysis to
be eliminated.
5. Conclusions
In this paper, the problem of resource allocation in cloud computing configuration is
considered. The null profit conditions for each cluster of the cloud, together with the
equilibrium conditions for the response time service of each cluster, the equilibrium condition
for each resource in the cloud - processing capacity, storage capacity and network
communication capacity and together with the equilibrium condition for the client
applications form a model that can be used to asses if the values and the quantities of service
and of resources are close or far from the ideal optimum values they should have. In future
works, the proposed model will be enhanced with case studies, aiming to interpret the results
obtained from executing the model on entry data of a cloud configuration with two or more
clusters.
References
[1] Ardagna Danilo, Trubian Marco and Zhang Li, “SLA based resource allocation policies in
autonomic environments”, Journal of Parallel and Distributed Computing 67(3), pp. 259-
270, 2007.
[2] Băncescu Mioara, “Analysis usage on energy resources with general equilibrium
techniques”, Supliment Revista de Economie Teoretică şi Aplicată, pp. 140-150, ISSN
1844-0029, 2010.
[3] Brodkin Jon. (2008). “Seven Cloud-Computing Security Risks” - Network World, July 02
edition. [Online] Available: http://www.networkworld.com/news/2008/070208-
cloud.html
[4] Espadas Javier, Molina Arturo, Jimenez Guillermo, Molina Martin, Ramirez Raul and
Concha David, “A tenant-based resource allocation model for scaling Software-as-a-
Service applications over cloud computing infrastructures”, Future Generation Computer
Systems 29, pp. 273–286, 2013.
[5] Han Zao and Xiaolin Li, “Resource Management in Utility and Cloud Computing”,
Springer New York Heidelberg Dordrecht, London, pp. 1-37, 2013.
2 Reference: Rutherford [8]

Proceedings of the IE 2015 International Conference
www.conferenceie.ase.ro
557
[6] Iqbal Waheed, Dailey Matthew N., Carrera David and Janecek Paul, “Adaptive resource
provisioning for read intensive multi-tier applications in the cloud”, Future Generation
Computer Systems 27, pp. 871–879, 2011.
[7] Lin Weiwei, Wang James Z., Liang Chen and Qi Deyu, “A Threshold-based Dynamic
Resource Allocation Scheme for Cloud Computing”, Procedia Engineering Volume 23,
pp. 695 – 703, 2011.
[8] Rutherford Thomas, “Applied general equilibrium modeling with MPSGE as a GAMS
subsystem: An overview of the modeling framework and syntax”, Computational
Economics 14, pp. 1-46, 1999.
[9] Sarmini Parnia, Teimouri Youness and Mukhtar Muriati, „A combinatorial double auction
resource allocation model in cloud computing”, Information Sciences, in press, Available
online 13 February 2014, 2014.
[10] Verhoef Chretien, Bhulai Sandjai and Mei Rob, “Optimal resource allocation in
synchronized multi-tier Internet services”, Performance Evaluation Volume 68, pp. 1072–
1084, 2011.
Proceedings of the IE 2015 International Conference
www.conferenceie.ase.ro
558
UPON DECISION-MAKING IN ALTERNATIVE DESIGN PROBLEMS
Dimitri GOLENKO-GINZBURG
Ben-Gurion University of the Negev and Ariel University [email protected]
Abstract. One of the main problems in alternative network planning boils down to
determining the optimal variant to carry out the considered simulated program. In this paper
we will formulate the optimal variants choice criteria for the case of homogenous alternative
networks which have been described in our publications [1-3].
Keywords: full and joint variants, homogenous alternative stochastic network, multi-variant
optimization, optimal decision-making variant, optimality indicator.
JEL Classification: H83, R58, R25, C54
1. Introduction
While examining homogenous alternative networks the problem focuses on determining the
full variant of a design program which is optimal from the viewpoint of a certain accepted
criterion. The difference between stochastic and deterministic alternative models reveals
itself in future utilization of the results of such "multi-variant" optimization. In deterministic
alternative networks the optimal variant has to be executed regardless of any future
conditions and circumstances; furthermore, it may be recommended to be adopted as a kind
of master plan whilst controlling the process of a complicated system design. For stochastic
networks, when each of the competing variants has a non-zero implementation probability,
control problems become more complicated, since we are facing the additional indeterminacy
as to the ways of reaching the ultimate program's targets. Taking into account information
regarding the stochastic variants quality, which has been acquired by means of the optimality
criterion, the design decision-maker should direct his efforts to carrying out measures which
ensure the most beneficial conditions of executing the determined optimal variant and those
ones being close to it.
2. The general approach
The most common situation in practice deals with the case when the quality of variants
should be assessed by several parameters (partial criteria) of the simulated process. With the
latter in mind consider the following two main formalizations of the regarded problem.
I. Let us be given different criteria (parameters) to assess alternative
variants of a plan to carry out a particular set of activities. Note that each
criterion may be calculated in the alternative network on the basis of activity estimates
comprising -th full variants of the simulated program. To calculate values one may
apply the alpha-algorithm outlined in [2].
From the set of possible variants there should be chosen a single one satisfying the following
requirements:
the chosen variant should meet to the greatest extent all accepted criteria, i.e., it
should provide for the extreme value of a metrics which has been defined in a certain way
in the criteria space ;
nnIII ,...,, 21
m
mBBB ,...,, 21
iI
j iI
nIII ,...,, 21

Proceedings of the IE 2015 International Conference
www.conferenceie.ase.ro
559
the numerical metrics variation corresponding to the chosen variant should be the
minimal one when consecutively applying the criteria in any combination and in a
arbitrary order. The latter requirement reflects the need to ensure proper flexibility of the
plan, i.e., the least sensitivity of the relative variant's quality regarding possible
amendments of the adopted optimality criteria.
To determine the regarded metrics consider an -dimension criteria space, while on each
axis (assume the -th axis representing the -th criterion) indicate the corresponding
criterion's value for the -th variant, , of the design program.
In the thus defined space determine for each variant a point such that each of its coordinates
corresponds to the optimal value of every criterion taken apart. It can be well-recognized that
this point is nothing but the "ideal" target that the system should seek to achieve while
executing a particular full variant. Obviously, variants corresponding to such points exist, in
principle, only for plans being characterized by functionally dependent criteria. Introduce
therefore the concept of a quasi-optimal plan for which the metrics value delivers an
extremum in space . In case of a group of criteria which simultaneously
maximize or minimize a certain quality objective, a quasi-optimal plan would correspond to
either minimal or maximal distance from the coordinate origin. Besides the point
corresponding to optimal criteria values (the "ideal"), each variant is also characterized by
sub-optimal values, which turn out the regarded variant to become optimal only in case when
planning and control are carried out by a single and pre-determined criterion ,
. It can be well-recognized that the distance between each pair of sub-optimal
points characterizes the variance of the optimized criteria in the transition
process from delivering the optimal value to one of them to delivering the optimum to
another one. Further on, those distances reflect the closeness of the considered variant to its
"ideal". Indeed, when referring to the geometrical interpretation of the considered problem
(figure 1), we may see how shrinking the distances between sub-optimal points brings the
latter closer together to the "ideal". Besides, the lower the regarded distances are the more
probable diminishing the variety of the optimized parameters becomes, if the analyzed
dependencies are based on smooth and convex functions. In other words, the lower the pair-
wise distances between adjacent sub-optimal points are, the more flexible the considered full
program variant becomes (plan ). This flexibility reveals itself in the fact that plan
does not change its parameters significantly when amending criteria in the process of
on-line control for a design program to create a complicated system.
ni i
j mj ,...,2,1
nIII ,...,, 21
n
kI
nk ,...,2,1
nIII ,...,, 21
jB jB
iI

Proceedings of the IE 2015 International Conference
www.conferenceie.ase.ro
560
Figure 1. Graphical representation of the optimal variant choice
3. Formalization
Let us introduce the following terms:
- the optimal value of the -th criterion for the -th full variant, ,
;
- the point corresponding to the -th variant's "ideal";
- the metrics of the -th variant's "ideal" determined as the distance from
the coordinate origin to point and complying with the main axioms of a metric space;
- the sub-optimal value of the -th criterion for the -th variant on condition that
the -th criterion assumes value , ;
- the distance from "ideal" to the middle of the segment connecting a pair of
sub-optimal points of -type.
It can be well-recognized that there are altogether points being the middles of segments
connecting sub-optimal criteria values when , and there is one such point for .
Keeping up to the introduced designations, the coordinates of those points may be determined
as
ija i j ni ,...,2,1
mj ,...,2,1
njjjj aaaA ,...,, 21 j
jj A,0 j
jA
ija i j
ja nii ,...,1,1,...,2,1
ijr jA
njjjj aaaa ,...,,...,, 21
n2n 2n

Proceedings of the IE 2015 International Conference
www.conferenceie.ase.ro
561
(1)
Substitute the relations for the segments middles to determine the distances of the latter from
the "ideal":
(2)
Using the abbreviated form, we might express the distance from to the middle of the -th
segment also as:
(3)
subject to the assumption that when .
The structure of objective for the quantitative assessment of the -th variant's quality in
compliance with both above mentioned requirements might be represented then in the
following way:
, , (4)
where
(5)
and
. (6)
The quasi-optimal variant to be recommended for the regarded complicated system design
program and the one whose implementation should be stimulated by creating the most
.2
,...,2
,2
,2
.......................................................................
2,...,
2,
2,
2
2,...,
2,
2,
2
11
33
1
2211
32
3
2
3
3
22
3
1
2
1
212
3
1
32
1
2
2
11
njnjj
n
jj
n
jj
n
j
njnjjjjjjj
njnjjjjjjj
aaaaaaaa
aaaaaaaa
aaaaaaaa
.2
...222
...............................................................................................................................................
2...
222
2...
222
21
2
3
1
33
2
2
1
22
2
1
11
232
2
3
3
2
3
2
2
3
22
2
1
3
1
2
1
2
221
2
3
2
3
1
3
2
2
2
1
2
2
1
2
11
1
nj
njnj
j
j
n
j
j
j
n
j
j
j
n
j
nj
nj
njnj
j
jj
j
jj
j
jj
j
nj
njnj
j
jj
j
jj
j
jj
j
aaa
aaa
aaa
aaa
r
aaa
aaa
aaa
aaa
r
aaa
aaa
aaa
aaa
r
jA i
2
1
1
2
n
kkj
i
kj
i
kj
ij aaa
r
kj
i
kj aa ki
F j
jjjj rAF ,0 mj ,...,2,1
n
iijj rr
1
n
iijjj aA
1
,0

Proceedings of the IE 2015 International Conference
www.conferenceie.ase.ro
562
suitable conditions, would be the one delivering the extreme value to the considered
objective, i.e.,
.
It can be well-recognized that applying the above outlined method not only enables
determining all possible ways of reaching the program's final target but facilitates also
choosing from a set of particular design activities the variant which is the least sensitive to
environmental conditions changes. Under these circumstances prediction by means of the
alternative network model becomes an active function of the entire process to plan and
control design of a new complicated system under conditions of stochastic indeterminacy.
References
[1] Golenco (Ginzburg), Lishitz, D.I., Livshitz, S.E. and Kesler, S.Sh., Statistical Modeling in
R&D Projecting, Leningrad: Leningrad University Press (in Russian), 1976.
[2] Golenko-Ginzburg, D., Stochastic Network Models in R&D Projecting, Voronezh:
Nauchnaya Kniga (in Russian), 2010.
[3] Golenko-Ginzburg, D., Burkov, V. and Ben-Yair, A., Planning and Controlling
Multilevel Man-Machine Organization Systems under Random Disturbances, Ariel
University Center of Samaria, Ariel: Elinir Digital Print, 2011.
jmjj
FextremumF,...,2,1
Proceedings of the IE 2015 International Conference
www.conferenceie.ase.ro
563
ARTIFICIAL NEURAL NETWORK APPROACH FOR DEVELOPING
TELEMEDICINE SOLUTIONS: FEED-FORWARD BACK
PROPAGATION NETWORK
Mihaela GHEORGHE
Bucharest University of Economic Studies
Abstract. Artificial neural networks have the ability of learning patterns corresponding to
different medical symptoms and based upon them, their methodologies are representing an
important classifier tool which can be used in the process of early detection of diseases to
distinguish between infected or non-infected patients. This paper presents a neural network
approach for medical diagnosis, more specifically diabetes diagnosing as a case study based
on a feed-forward back propagation network.
Keywords: back propagation, telemedicine, artificial neural network, algorithm
JEL classification: C45, I1
1. Introduction Artificial neural networks represent a powerful instrument which can be used by different
physicians or healthcare professionals in the process of analyzing complex medical data in
order to extract useful information for classification and prognosis. These types of instruments
are mostly important for their ability of identifying patterns or trends within different data sets
that can be further used in prognosis. Thus, neural networks are becoming an important
classifier for different tasks within telemedicine fields and especially regarding medical
diagnosis subset.
Medical information systems from hospitals or other medical institutions have become larger
in recent years and due to these continuous trends it has become difficult to extract useful
information which could be used for decision support systems designed to assist healthcare
providers in taking decisions. Due to the fact that traditional methods consisting in manual
analysis of data are ineffective, artificial neural networks methods are required and are
becoming essential for diagnosing different diseases.
In this study, three-layered MLP (Multilayer Perceptron) feed-forward neural network
architecture is being used and trained with back-propagation algorithm.
2. Artificial neural network: theoretical framework
An artificial neural network (ANN) represents a mathematical model that simulates a biological
neural network in terms of structure and functionalities. It consists of simple processing units,
named neurons, and all the weighted connections between them. The strength of a connection
(weight) between two neurons i and j will be referred within this paper as wij. Therefore, as
described in [1], a neural network is a sorted triple (N,V,w) with two sets N, V and a function
w, where:
- N represents a set of neurons;
- V is defined as a set {(i,j)|i,j ∈ N}, where each pair of (i,j) represents a connection
between neuron i and neuron j;

Proceedings of the IE 2015 International Conference
www.conferenceie.ase.ro
564
- w represents the weight function and is defined as w: V -> R and w(i,j) is the weight of
connection (i,j), also shortened as wij.
Within a neural network, data is being transferred between neurons via connections with a
specific connecting weight. The data processing workflow of a neuron is being represented in
figure 1.
Figure 1. Neural network data processing workflow
This process implies the following [1]:
- A propagation function which receives the output o1,o2,…,on of others neurons
i1,i2,…,in (all of them are connected to neuron j) and has the main scope of transforming
them into network inputs (netj) based on the connected weights wij.
If I = {i1,i2,…,in} represents a set of neurons, then netj is calculated by the
propagation function fprops (1) as follows:
netj = fprops(o1,o2,…,on,𝑤𝑖1𝑗, 𝑤𝑖2𝑗,… 𝑤𝑖𝑛𝑗) (1)
The propagation function is represented by the weighted sum as described in (2) and it
is defined as the multiplication of the output of each neuron i by 𝑤𝑖𝑗 and the summation
of the results:
netj = ∑ (𝑜𝑖 ∗ 𝑤𝑖𝑗)𝑖∈𝐼 (2)
- An activation function which has the ability of transforming the net inputs received
from the propagation function and also the old activation status of a neuron to a new
one. If j represents a specific neuron and aj is the activation state assigned to it. The
threshold value 𝜃j represents the position of the maximum gradient value of the
activation function (3).
aj(t) = fact(netj(t),aj(t-1), 𝜃j) (3)
- An output function which transforms activation to output for others neurons. If j
represents a neuron, the output function (4) calculates the output value based on its
activation state aj.

Proceedings of the IE 2015 International Conference
www.conferenceie.ase.ro
565
fout (aj) = oj (4)
The learning strategy associated to ANN represents an algorithm which can be used to train
neural network in order for this to produce a desired output of a given input. The way that
individual artificial neurons are connected is called topology and this represents, basically, an
architecture or graph of an artificial neuronal network. These topologies are divided into two
basic classes which are illustrated in figure 2.
Figure 2. Neural network topologies: feed-forward (FNN) and recurrent (RNN)
Neurons are grouped in layers and as shown in figure 2, there are usually up to three layers:
input, hidden and output. The differences between topologies [2] are related to the way in which
the information is being sent between neurons. In what concerns feed-forward networks, the
information must flow from input to output in only one direction and without any back-loops.
The simplest feed-forward ANN consists in a single perceptron which is capable of learning
linear separable problems. Regarding recurrent ANN, these are similar to the previous
described ones but they have no restrictions in what concerns back-loops.
In this study, feed-forward neural network architecture and three-layered multilayer Perceptron
are used and trained with back-propagation algorithm.
3. Case study: ANN model for diagnosing diabetes
3.1. Dataset description The dataset used for this study was obtained from UCI Repository of Machine Learning
Database [3] and contains a number of 768 instances representing patient’s diabetes database.
There are a number of 8 attributes and a class, all described in table 1 as follows:
Table 1. Diabetes database attributes
Attribute name Unit
Number of times pregnant Numeric
Plasma glucose concentration mg/dl
Diastolic blood pressure mmHg
Triceps skin fold thickness mm
2-Hour serum insulin 𝜇U/ml
Body mass index ((weight in kg/(height in
m)^2)
Diabetes pedigree function Numeric
Age Numeric (years)
Class variable Numeric (0 or 1)
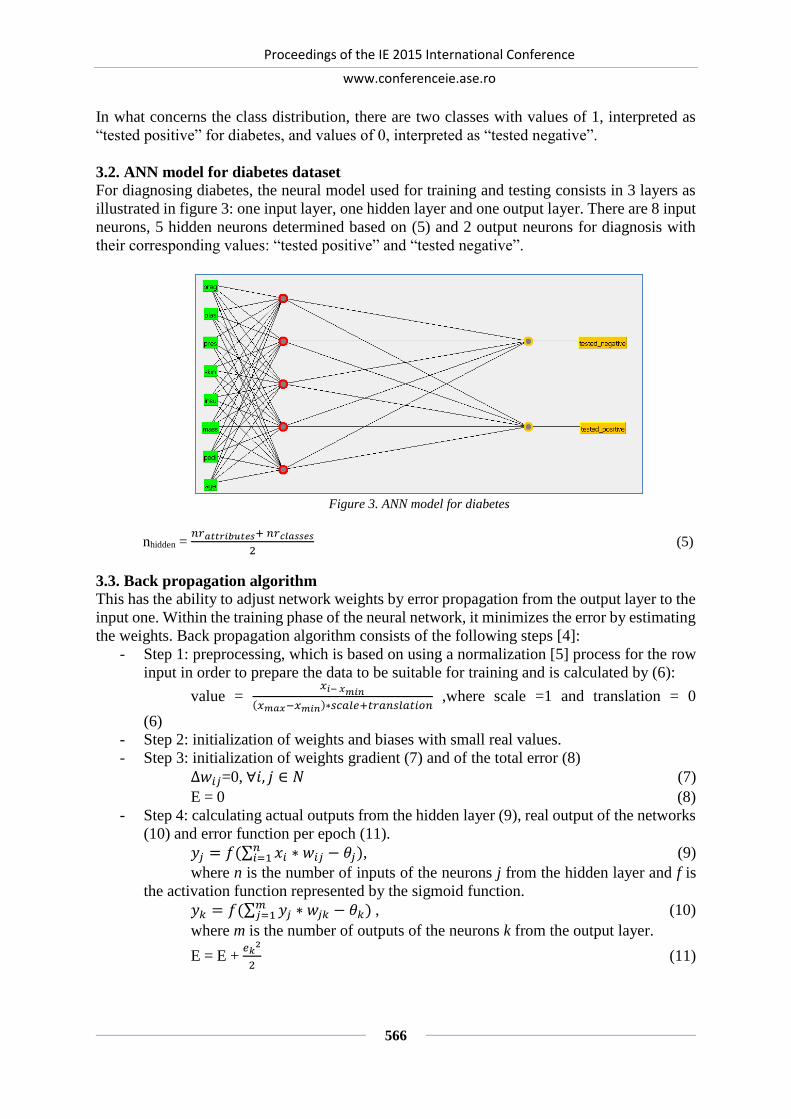
Proceedings of the IE 2015 International Conference
www.conferenceie.ase.ro
566
In what concerns the class distribution, there are two classes with values of 1, interpreted as
“tested positive” for diabetes, and values of 0, interpreted as “tested negative”.
3.2. ANN model for diabetes dataset
For diagnosing diabetes, the neural model used for training and testing consists in 3 layers as
illustrated in figure 3: one input layer, one hidden layer and one output layer. There are 8 input
neurons, 5 hidden neurons determined based on (5) and 2 output neurons for diagnosis with
their corresponding values: “tested positive” and “tested negative”.
Figure 3. ANN model for diabetes
nhidden = 𝑛𝑟𝑎𝑡𝑡𝑟𝑖𝑏𝑢𝑡𝑒𝑠+ 𝑛𝑟𝑐𝑙𝑎𝑠𝑠𝑒𝑠
2 (5)
3.3. Back propagation algorithm
This has the ability to adjust network weights by error propagation from the output layer to the
input one. Within the training phase of the neural network, it minimizes the error by estimating
the weights. Back propagation algorithm consists of the following steps [4]:
- Step 1: preprocessing, which is based on using a normalization [5] process for the row
input in order to prepare the data to be suitable for training and is calculated by (6):
value = 𝑥𝑖− 𝑥𝑚𝑖𝑛
(𝑥𝑚𝑎𝑥−𝑥𝑚𝑖𝑛)∗𝑠𝑐𝑎𝑙𝑒+𝑡𝑟𝑎𝑛𝑠𝑙𝑎𝑡𝑖𝑜𝑛 ,where scale =1 and translation = 0
(6)
- Step 2: initialization of weights and biases with small real values.
- Step 3: initialization of weights gradient (7) and of the total error (8)
∆𝑤𝑖𝑗=0, ∀𝑖, 𝑗 ∈ 𝑁 (7)
E = 0 (8)
- Step 4: calculating actual outputs from the hidden layer (9), real output of the networks
(10) and error function per epoch (11).
𝑦𝑗 = 𝑓(∑ 𝑥𝑖 ∗ 𝑤𝑖𝑗 − 𝜃𝑗𝑛𝑖=1 ), (9)
where n is the number of inputs of the neurons j from the hidden layer and f is
the activation function represented by the sigmoid function.
𝑦𝑘 = 𝑓(∑ 𝑦𝑗 ∗ 𝑤𝑗𝑘 − 𝜃𝑘𝑚𝑗=1 ) , (10)
where m is the number of outputs of the neurons k from the output layer.
E = E + 𝑒𝑘
2
2 (11)

Proceedings of the IE 2015 International Conference
www.conferenceie.ase.ro
567
- Step 5: determining error gradient (12) based on error function (13), adapting gradient
weights for hidden and output layers (14) and determining gradient weights between
input and hidden output layers (15).
𝛿𝑘 = 𝑓′ ∗ 𝑒𝑘=𝑦𝑘(1 − 𝑦𝑘) ∗ 𝑒𝑘 , (12)
where f’ is the derivate of activation function (unipolar sigmoid function)
calculated based on (16).
𝑒𝑘 = 𝑦𝑑,𝑘 − 𝑦𝑘 (13)
∆𝑤𝑗𝑘 = ∆𝑤𝑗𝑘 + 𝑦𝑘 ∗ 𝛿𝑘 (14)
∆𝑤𝑖𝑗 = ∆𝑤𝑖𝑗 + 𝑥𝑖 ∗ 𝛿𝑗 (15)
f’(x) = 𝑒−𝑥
(1+𝑒−𝑥)2 = f(x)*(1-f(x)) (16)
- Step 6: starting a new iteration based on two alternatives that consists in verifying if the
current epoch number is greater than the established one, in which case, the algorithm
will continue with step 4, otherwise all weights will be adapted based on weight
gradient calculated at step 5 and illustrated by (17):
𝑤𝑖𝑗 = 𝑤𝑖𝑗 + 𝜂 ∗ ∆𝑤𝑖𝑗, where 𝜂 represents the learning rate (17)
In order to improve [6] the results and accelerate the learning process in neural networks, the
normal algorithm described previously is changed by introducing the momentum term (α) that
will be applied to the weights during their update as described in (18).
∆𝑤𝑖𝑗(𝑡) = ∆𝑤𝑖𝑗(𝑡) + α ∗ ∆𝑤𝑖𝑗(𝑡 − 1) (18)
3.4. Experiment results and algorithm performance The results obtained by applying the steps described in 3.3 on the dataset presented in 3.1, for
different values of the learning rate and momentum number are described in table 2, for 500
iteration (epoch number), and in table 3, for 1000 iteration.
Table 2. The results for 500 iteration Table 3. The results for 1000 iteration
Based on the results presented in the above tables, the best parameters for the current case study are
obtained with a number of 1000 epochs, a learning rate equal to 0.15 and 0.95 as a momentum term.
The performance of this classifier can be determined by the computation of total classification accuracy
and the root mean square error. The graphical representation for the root mean square error based on
the number of epochs taken into consideration is shown in figure 4.
Learning rate Momentum Root square
error
0.95 0.05 0.3826
0.85 0.15 0.3813
0.75 0.25 0.3803
0.65 0.35 0.3796
0.55 0.45 0.3794
0.45 0.55 0.3818
0.35 0.65 0.3831
0.25 0.75 0.3906
0.15 0.85 0.3785
0.05 0.95 0.3938
Learning rate Momentum Root square
error
0.95 0.05 0.3769
0.85 0.15 0.3758
0.75 0.25 0.3749
0.65 0.35 0.374
0.55 0.45 0.3888
0.45 0.55 0.3758
0.35 0.65 0.3767
0.25 0.75 0.3837
0.15 0.85 0.3689
0.05 0.95 0.3973
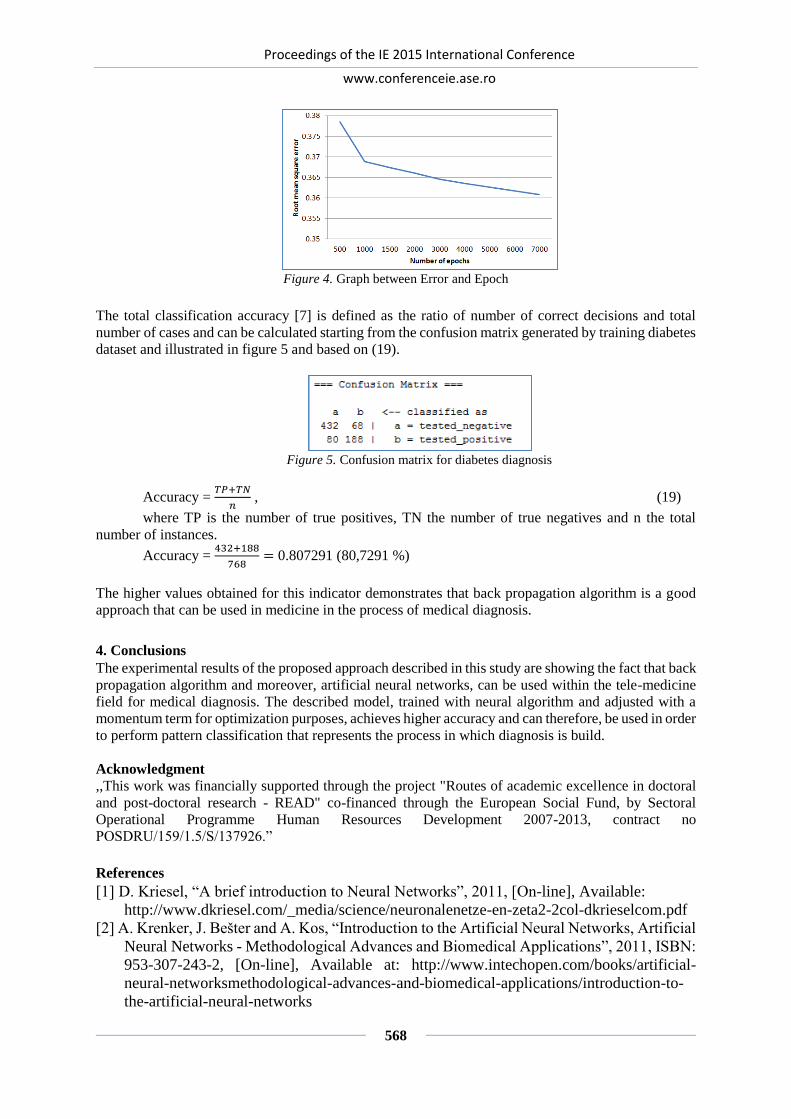
Proceedings of the IE 2015 International Conference
www.conferenceie.ase.ro
568
Figure 4. Graph between Error and Epoch
The total classification accuracy [7] is defined as the ratio of number of correct decisions and total
number of cases and can be calculated starting from the confusion matrix generated by training diabetes
dataset and illustrated in figure 5 and based on (19).
Figure 5. Confusion matrix for diabetes diagnosis
Accuracy = 𝑇𝑃+𝑇𝑁
𝑛 , (19)
where TP is the number of true positives, TN the number of true negatives and n the total
number of instances.
Accuracy = 432+188
768= 0.807291 (80,7291 %)
The higher values obtained for this indicator demonstrates that back propagation algorithm is a good
approach that can be used in medicine in the process of medical diagnosis.
4. Conclusions The experimental results of the proposed approach described in this study are showing the fact that back
propagation algorithm and moreover, artificial neural networks, can be used within the tele-medicine
field for medical diagnosis. The described model, trained with neural algorithm and adjusted with a
momentum term for optimization purposes, achieves higher accuracy and can therefore, be used in order
to perform pattern classification that represents the process in which diagnosis is build.
Acknowledgment ,,This work was financially supported through the project "Routes of academic excellence in doctoral
and post-doctoral research - READ" co-financed through the European Social Fund, by Sectoral
Operational Programme Human Resources Development 2007-2013, contract no
POSDRU/159/1.5/S/137926.”
References [1] D. Kriesel, “A brief introduction to Neural Networks”, 2011, [On-line], Available:
http://www.dkriesel.com/_media/science/neuronalenetze-en-zeta2-2col-dkrieselcom.pdf
[2] A. Krenker, J. Bester and A. Kos, “Introduction to the Artificial Neural Networks, Artificial
Neural Networks - Methodological Advances and Biomedical Applications”, 2011, ISBN:
953-307-243-2, [On-line], Available at: http://www.intechopen.com/books/artificial-
neural-networksmethodological-advances-and-biomedical-applications/introduction-to-
the-artificial-neural-networks

Proceedings of the IE 2015 International Conference
www.conferenceie.ase.ro
569
[3] Internet: https://archive.ics.uci.edu/ml/datasets/Diabetes, [Feb. 21, 2015]
[4] The Back propagation Algorithm. Internet:
http://page.mi.fu-berlin.de/rojas/neural/chapter/K7.pdf, [Feb. 21, 2015]
[5] Statistical Normalization and Back Propagation for Classification. Internet:
http://www.researchgate.net/profile/Santhakumaran_A/publication/260024206_Statistica
l_Normalization_and_Back_Propagation_for_Clasification/links/00b4952f1e2762d4
91000000.pdf, [Feb. 21, 2015]
[6] Improved Back propagation learning in neural networks with windowed momentum.
Internet: http://synapse.cs.byu.edu/papers/IstookIJNS.pdf, [Feb.21, 2015]
[7] Classification, Basic Concept, Decision Trees and Model evaluation. Internet: http://www-
users.cs.umn.edu/~kumar/dmbook/ch4.pdf, [Feb. 21, 2015]

Proceedings of the IE 2015 International Conference
www.conferenceie.ase.ro
570
NEURAL NETWORK-BASED APPROACH IN FORECASTING
FINANCIAL DATA
Cătălina-Lucia COCIANU
Bucharest University of Economic Studies [email protected]
Hakob GRIGORYAN Bucharest University of Economic Studies
Abstract. Considering the fact that markets are generally influenced by different external
factors, the stock market prediction is one of the most difficult tasks of time series analysis. The
research reported in this paper aims to investigate the potential of artificial neural networks
(ANN) in solving the forecast task in the most general case, when the time series are non-
stationary. We used a feed-forward neural architecture: the nonlinear autoregressive network
with exogenous inputs. The network training function used to update the weight and bias
parameters corresponds to gradient descent with adaptive learning rate variant of the
backpropagation algorithm. The results obtained using this technique were compared with the
ones resulted from some ARIMA models. We used the mean squared error (MSE) measure to
evaluate the performances of these two models. The comparative analysis leads to the
conclusion that the proposed model can be successfully applied to forecast the financial data.
Keywords: neural network, nonlinear autoregressive network, exogenous inputs, time series,
ARIMA model
JEL classification: C45, C46, C63, CO2
1. Introduction
Predicting stock price index and its movement has been considered one of the most challenging
applications of time series prediction. According to the efficient market theory proposed in [1],
the stock price follows a random walk and it is practically impossible to make a particular long-
term global forecasting model based on historical data. The ARIMA and ANN techniques have
been successfully used for modeling and forecasting financial time series. Compared with ANN
models, which are complex forecasting systems, ARIMA models are considered to be much
easier techniques for training and forecasting.
Artificial neural networks have been widely used for time series forecasting and they have
shown good performance in predicting stock market data. Chen et al., [2], introduced a neural
network model for time series forecasting based on flexible multi-layer feed-forward
architecture. F. Giordano et al., [3], used a new neural network-based method for prediction of
non-linear time series. Lin et al.,[4], applied artificial neural network to predict Taiwan stock
index option price. Z. Liao et al., [5], applied stochastic time effective neural network to
develop a forecasting model of global stock index. Mohamed et al., [6], used neural networks
to forecast the stock exchange movements in Kuwait Stock Exchange. Cai et al., [7], used
neural networks for predicting large scale conditional volatility and covariance of financial
time series.
In the second section of the paper, we present a nonlinear autoregressive network with
exogenous inputs aiming to forecast the closing price of a particular stock. The ANN-based

Proceedings of the IE 2015 International Conference
www.conferenceie.ase.ro
571
strategy applied for data forecasting is analyzed against the ARIMA model, and a comparative
analysis of these models are described in the final part of the paper.
2. The ANN-based technique for data forecasting
Let Yt be the stock closing value at the moment of time t. For each t, we denote by Xt =
(Xt(1), Xt(2), … , Xt(𝑛))𝑇 the vector whose entries are the values of the indicators significantly
correlated to Yt, that is the correlation coefficient between Xt(𝑖) and Yt is greater than a certain
threshold value, for i = 1,2, … , 𝑛 . The neural model used in our research is a dynamic network.
The direct method was used to build the model of prediction of the stock closing value, which
is described as follows.
Ŷ(t+p) = ƒANN(𝑌𝑡(𝑑)
, 𝑋𝑡(𝑑)
) (1)
𝑌𝑡(𝑑)
= {Yt, Yt−1, Yt−2, … , Yt−d} (2)
𝑋𝑡(𝑑)
= {Xt, Xt−1, Xt−2, … , Xt−d} (3)
where Ŷ(t+p) is the forecasted value of the stock price for the prediction period p and d is the
delay expressing the number of pairs (Xk, Yk), 𝑘 = 𝑡, 𝑡 − 1, … , 𝑡 − 𝑑 used as input of the neural
model. In our model, we consider 𝑝 = 1.
The considered delay has significant influence on the training set and prediction process. We
use correlogram to choose the appropriate window size for our neural networks. We need to
eliminate the lags where the Partial Autocorrelation Function (PACF) is statistically irrelevant
[8].
The nonlinear autoregressive network with exogenous inputs (NARX) is a recurrent dynamic
network, with feedback connections encompassing multiple layers of the network. The output
of the NARX network can be considered an estimate of the output of a certain nonlinear
dynamic system. Since the actual output is available during the training of the network, a series-
parallel architecture is created [9], where the estimated target is replaced by the actual output.
The advantages of using NARX model for forecasting purposes are twofold. On the one hand,
the inputs used in the training phase are more accurate and, on the other hand, since the
resulting network has a feed-forward architecture, FX → FH → FY, a static backpropagation
type of learning can be used. An example of this series-parallel network is depicted in figure
1, where d=2, n=10 and the number of neurons in the hidden layer is 24.
Figure 1. Example of a series-parallel network
After the training step, the series-parallel architecture is converted into a parallel configuration,
in order to perform the multi-step-ahead prediction task. The corresponding neural network
architecture is presented in figure 2.

Proceedings of the IE 2015 International Conference
www.conferenceie.ase.ro
572
Figure 2. Example of a parallelized network
We use the standard performance function, defined by the mean sum of squares of the network
errors. The data division process is cancelled to avoid the early stopping. The network training
function used to update the weight and bias parameters corresponds to gradient descent with
adaptive learning rate variant of the backpropagation algorithm. The number of neurons in the
hidden layer is set according to the following equation [10]:
[2√(𝑚 + 2)𝑁]
where m stands for the number of the neurons of the output layer and N is the dimension of
input data.
3. Experimental results
We tested the proposed model on 300 samples dataset. The samples are historical weekly
observations of a set of variables S, between 3/1/2009 and 11/30/2014. The set S contains the
opening, closing, highest and lowest price respectively of SNP stock from Bucharest Stock
Exchange, and seven indicators obtained from technical and fundamental analysis of the stock
market.
The correlogram shows that for all variables PACF function drops immediately after the 2nd
lag. This means that window size for all variables could be set to 2.
In our tests, we used 200 samples for training purposes and 100 unseen yet samples for
data forecasting.
The neural network parameters are determined based on the following process.
REPEAT
1. Initialize the parameters of the NN.
2. Train the NN using the set of training samples in 6000 epochs.
UNTIL the overall forecasting error computed on the already trained data in terms of
MSE measure is less than a certain threshold value.
In our tests, the threshold value is set to 10−3.
If we denote by 𝑇 = (𝑇(1), 𝑇(2), … , 𝑇(𝑛𝑟)) the vector of target values and by 𝑃 =
(𝑃(1), 𝑃(2), … , 𝑃(𝑛𝑟)) the vector whose entries correspond to the predicted values, the MSE
error measure is defined by
𝑀𝑆𝐸(𝑇, 𝑃) =1
𝑛𝑟∑(𝑇(𝑖) − 𝑃(𝑖))
2 (4)
𝑛𝑟
𝑖=1
The results obtained using the above mentioned technique are reported in the following. The
overall forecasting error computed on the already trained data prediction is 0.00035. The
regression coefficient computed on the already trained data and the data fitting are presented
in Figure 3. The network predictions versus actual data in case of already trained samples are
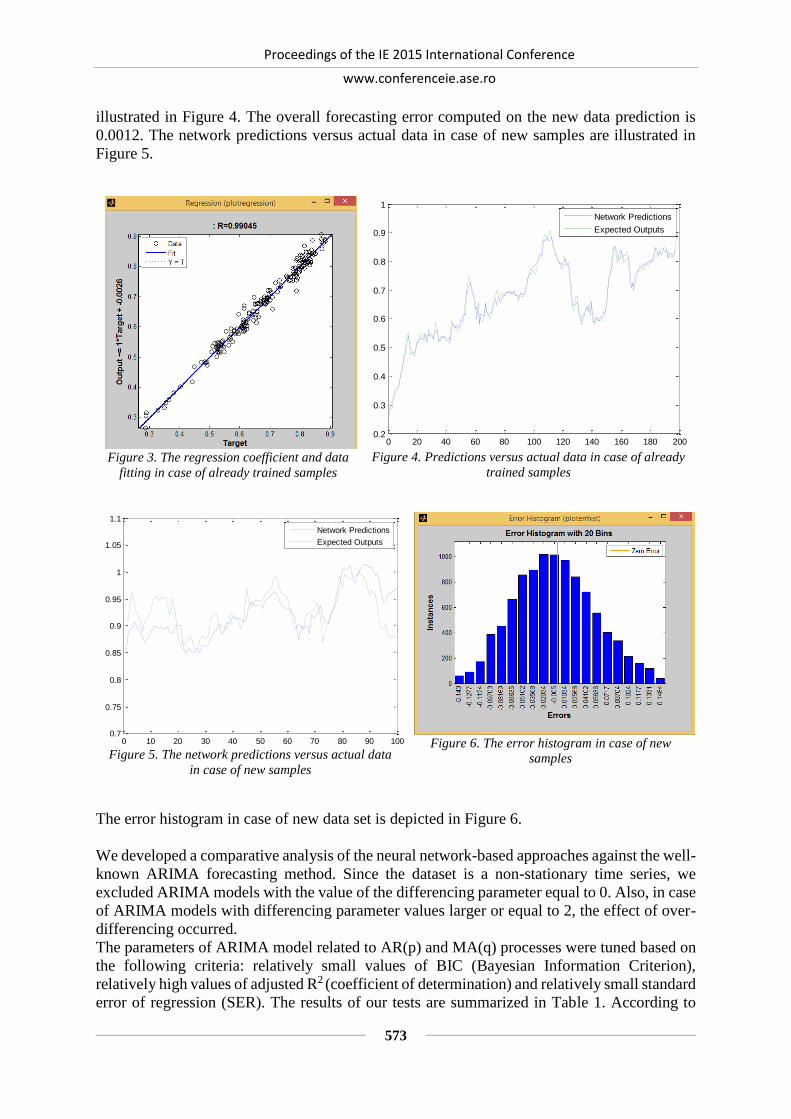
Proceedings of the IE 2015 International Conference
www.conferenceie.ase.ro
573
illustrated in Figure 4. The overall forecasting error computed on the new data prediction is
0.0012. The network predictions versus actual data in case of new samples are illustrated in
Figure 5.
Figure 3. The regression coefficient and data
fitting in case of already trained samples
Figure 4. Predictions versus actual data in case of already
trained samples
Figure 5. The network predictions versus actual data
in case of new samples
Figure 6. The error histogram in case of new
samples
The error histogram in case of new data set is depicted in Figure 6.
We developed a comparative analysis of the neural network-based approaches against the well-
known ARIMA forecasting method. Since the dataset is a non-stationary time series, we
excluded ARIMA models with the value of the differencing parameter equal to 0. Also, in case
of ARIMA models with differencing parameter values larger or equal to 2, the effect of over-
differencing occurred.
The parameters of ARIMA model related to AR(p) and MA(q) processes were tuned based on
the following criteria: relatively small values of BIC (Bayesian Information Criterion),
relatively high values of adjusted R2 (coefficient of determination) and relatively small standard
error of regression (SER). The results of our tests are summarized in Table 1. According to
0 20 40 60 80 100 120 140 160 180 2000.2
0.3
0.4
0.5
0.6
0.7
0.8
0.9
1
Network Predictions
Expected Outputs
0 10 20 30 40 50 60 70 80 90 1000.7
0.75
0.8
0.85
0.9
0.95
1
1.05
1.1
Network Predictions
Expected Outputs
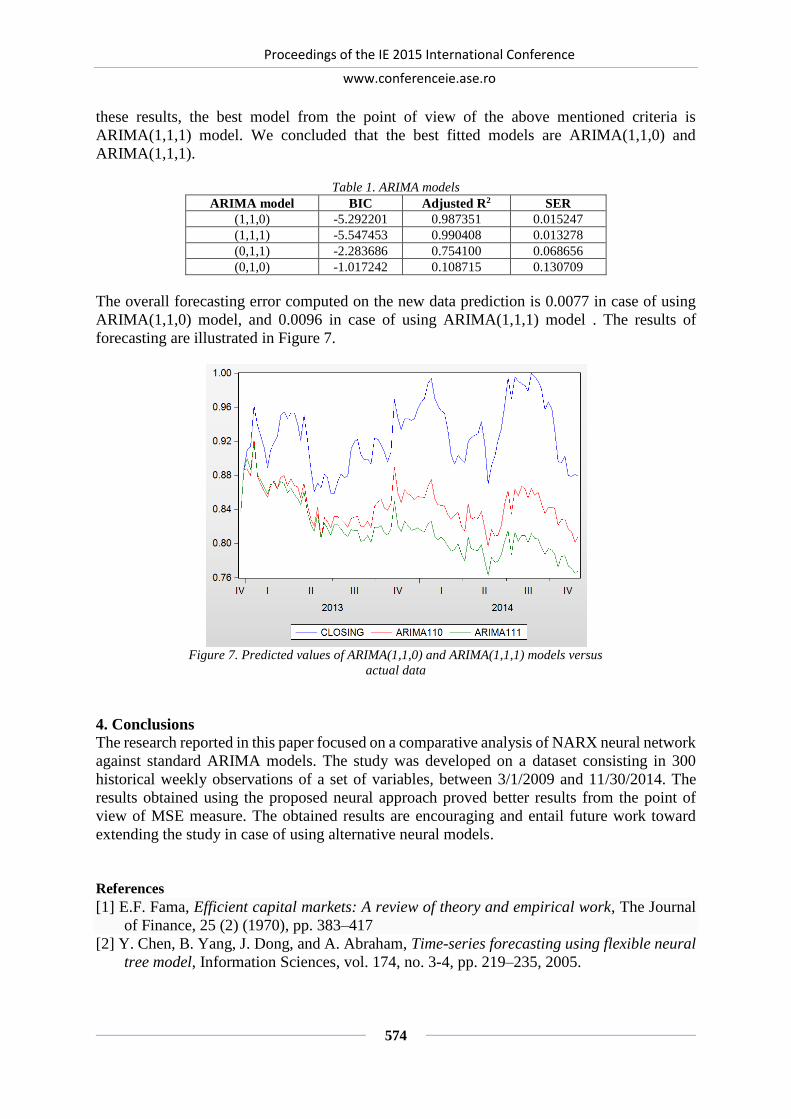
Proceedings of the IE 2015 International Conference
www.conferenceie.ase.ro
574
these results, the best model from the point of view of the above mentioned criteria is
ARIMA(1,1,1) model. We concluded that the best fitted models are ARIMA(1,1,0) and
ARIMA(1,1,1).
Table 1. ARIMA models
ARIMA model BIC Adjusted R2 SER
(1,1,0) -5.292201 0.987351 0.015247
(1,1,1) -5.547453 0.990408 0.013278
(0,1,1) -2.283686 0.754100 0.068656
(0,1,0) -1.017242 0.108715 0.130709
The overall forecasting error computed on the new data prediction is 0.0077 in case of using
ARIMA(1,1,0) model, and 0.0096 in case of using ARIMA(1,1,1) model . The results of
forecasting are illustrated in Figure 7.
Figure 7. Predicted values of ARIMA(1,1,0) and ARIMA(1,1,1) models versus
actual data
4. Conclusions
The research reported in this paper focused on a comparative analysis of NARX neural network
against standard ARIMA models. The study was developed on a dataset consisting in 300
historical weekly observations of a set of variables, between 3/1/2009 and 11/30/2014. The
results obtained using the proposed neural approach proved better results from the point of
view of MSE measure. The obtained results are encouraging and entail future work toward
extending the study in case of using alternative neural models.
References [1] E.F. Fama, Efficient capital markets: A review of theory and empirical work, The Journal
of Finance, 25 (2) (1970), pp. 383–417
[2] Y. Chen, B. Yang, J. Dong, and A. Abraham, Time-series forecasting using flexible neural
tree model, Information Sciences, vol. 174, no. 3-4, pp. 219–235, 2005.

Proceedings of the IE 2015 International Conference
www.conferenceie.ase.ro
575
[3] F. Giordano, M. La Rocca, and C. Perna, Forecasting nonlinear time series with neural
network sieve bootstrap, Computational Statistics and Data Analysis, vol. 51, no. 8, pp.
3871–3884, 2007.
[4] C.T. Lin, H.Y. Yeh, Empirical of the Taiwan stock index option price forecasting model –
Applied artificial neural network, Applied Economics, 41 (15) (2009), pp. 1965–1972
[5] Z. Liao, J. Wang, Forecasting model of global stock index by stochastic time effective
neural network, Expert Systems with Applications, 37 (1) (2009), pp. 834–841
[6] M.M. Mohamed, Forecasting stock exchange movements using neural networks: empirical
evidence from Kuwait, Expert Systems with Applications, vol. 27, no. 9, pp.6302–6309,
2010.
[7] X. Cai, G. Lai, X. Lin, Forecasting large scale conditional volatility and covariance using
neural network on GPU, The Journal of Supercomputing., 63 (2013), pp. 490–507
[8] D.N. Gujarati, Basic econometrics, McGraw-Hill, New York (2003)
[9] Narendra, Kumpati S., Kannan Parthasarathy, Learning Automata Approach to
Hierarchical Multiobjective Analysis, IEEE Transactions on Systems, Man and
Cybernetics, Vol. 20, No. 1, January/February 1991, pp. 263–272.
[10] Fagner A. de Oliveira, Cristiane N. Nobre, Luis E. Zarate Applying Artificial Neural
Networks to prediction of stock price and improvement of the directional prediction index
– Case study of PETR4, Petrobras, Brazil, Journal of Expert Systems with Applications,
40, (2013), 7596–7606.

Proceedings of the IE 2015 International Conference
www.conferenceie.ase.ro
576
SEMANTIC HMC FOR BUSINESS INTELLIGENCE USING CROSS-
REFERENCING
Rafael PEIXOTO
Checksem - Laboratoire Le2i, UMR CNRS 6306, Dijon, France
Thomas HASSAN Checksem - Laboratoire Le2i, UMR CNRS 6306, Dijon, France
[email protected] Christophe CRUZ
Checksem - Laboratoire Le2i, UMR CNRS 6306, Dijon, France
[email protected] Aurélie BERTAUX
Checksem - Laboratoire Le2i, UMR CNRS 6306, Dijon, France
[email protected] Nuno SILVA
GECAD, ISEP-IPP, Porto, Portugal
Abstract. Keeping abreast with current market trends requires the centralization of large amount of
information. Due to the increasing number of news available on the web, selecting only valuable
information for each consumer is mandatory to reduce the consumer information overload. However,
information available on the web can have uncertain and imprecise data, leading to veracity issues. We
aim to measure Big Data veracity using cross-referencing of several information sources. In this work
we present a new vision to cross-referencing of several huge web information sources using a Semantic
Hierarchical Multi-label Classification process called Semantic HMC to extract the knowledge
available in those sources.
Keywords: Ontology, Hierarchical Multi-label Classification, similarity measure. JEL classification: L86 Information and Internet Services
1. Introduction The decision-making process in the economic field requires the centralization and intakes of a large
amount of information. The aim is to keep abreast with current market trends. Thus, contractors,
businessmen and salespersons need to continuously be aware of the market conditions. This means to
be up-to-date regarding ongoing information and projects undergoing development. With the help of
economic monitoring, prospects can be easily identified, so as to establish new contracts. Our tool called
First Pro’fil [1]–[3] (http://www.firsteco.fr/) is specialized in the production and distribution of press
reviews about French regional economic actors. The overload of news is a particular case of information
overload, which is a well-known problem, studied by Information Retrieval and Recommender Systems
research fields. News recommender systems already exist [4], Athena [5], GroupLens [6] or News Dude
[7]. Some of these systems use domain knowledge to improve the recommendation task [4], [5]. To
achieve this goal, a content-based recommender system is being developed [3], [8]. A recommender
system is necessary for ranking the items and a content-based approach is required to analyze the
content of each article to structure and preserve information content. The results of the analysis enables
linking the domain knowledge to the articles to improve the recommendation task [4], [5].
However the amount of news available on the web is growing, requiring new forms of processing to
enable enhanced decision making, insight discovery and process optimization. The term of Big Data is
mainly used to describe these huge datasets. Various types of data compose Big Data, including
unstructured data that represents 90% of its content [10]. An increasing number of V’s has been used

Proceedings of the IE 2015 International Conference
www.conferenceie.ase.ro
577
to characterize Big Data [9], [10]: Volume, Velocity, Variety, Veracity and Value. Volume means the
big amount of data that is generated and stored by transaction-based data stored through the years, text
data constantly streaming in from social media, increasing amounts of sensor data being collected, etc.
Thus, Big Data is not only a huge volume of data but it must be processed quickly. Velocity means both
(i) how fast data is being produced and (ii) how fast the data must be processed and analyzed to meet a
demand. Variety means that various types of data compose Big Data. These types include semi-
structured and unstructured data such as audio, video, webpages, and text, traditional structured data,
etc. Veracity concerns the truthfulness in data. In traditional data warehouses there was always the
assumption that the data is certain, clean, precise and complete but in Big Data context, namely the
user-generated data can be uncertain, erroneous, imprecise and incomplete. The Value characteristic
measure how valuable is the information to a Big Data consumer. Value is the desired outcome of Big
Data analytics and Big Data “raison d’etre” because if data don’t have value then is useless. We aim to
measure data veracity of a Big Data source by using similar data in several web sources linked by cross-
referencing. Cross-referencing means linking the several textual information sources that share similar
meanings. When focusing on cross-referencing web information sources, one must instantly focus on
extracting knowledge from these sources.
To extract knowledge from Big Data sources we propose to use a Semantic HMC [11], [12] process
that is capable of Hierarchically Multi-Classify a large Variety and Volume of unstructured data items.
Hierarchical Multi-Label Classification (HMC) is the combination of Multi-Label classification and
Hierarchical classification [13]. In HMC items can be assigned to different hierarchical paths and
simultaneously may belong to different class labels in a same hierarchical level. The Semantic HMC
process is unsupervised such that no previously labelled examples or enrichment rules to relate the data
items with the labels are needed. The label hierarchy and the enrichment rules are automatically learned
from the data through scalable Machine Learning techniques.
This paper claims that cross-referencing high quality information (i.e. events) in items from several
sources we can measure its veracity. The main contribution of this paper is then to cross-referencing of
huge web information sources by using the Semantic HMC to extract the knowledge available in these
sources. The cross-references are then used to measure the data veracity and improve the
recommendation of economical news.
Next section focuses on related work such as Semantic HMC, semantic measures and Cross-
Referencing Methods Proposals. Section 3 proposes how to cross-referencing huge web information
sources using the Semantic HMC for veracity measure. The last section concludes this paper.
2. Related work In order to compare cross-referencing methods of web information sources, we need to evaluate the
Semantic Measure between concepts. Semantic Measure is normally a philosophic term. It is a point of
view that differs from one person to another regarding the semantic links strengths between two
concepts. Trying to computerize this philosophic term, in order to compare different textual
information, is a complex task and requires performing high-level language processing. However, the
evaluation of the Semantic Measure between two concepts depends firstly on the kind of the semantic
links, and secondly on the kind of knowledge resources.
2.1 Semantic Measure Type In order to compare two concepts, and in particular two textual information sources in the case of
documentary research, one must evaluate the semantic measure between these sources. Semantic
measure is a generic term covering several concepts [14]:
Semantic relatedness, is the most general semantic link between two concepts. Two concepts
do not have to share a common meaning to be considered semantically related or close, as they
can be semantically linked (related) by a functional relationship or frequent association
relationship like meronym or antonym concepts. (e.g. Pilot “is related to” Airplane).

Proceedings of the IE 2015 International Conference
www.conferenceie.ase.ro
578
Semantic similarity, is a specific case of semantic relatedness. Two concepts are considered
similar if they share common meanings and characteristics, like synonym, hyponym and
hypernym concepts (e.g. Old “is similar to” Ancient).
Semantic distance, is the inverse of the semantic relatedness, as it indicates how much two
concepts are unrelated to one another.
2.2 Cross-Referencing Methods Proposals
We have identified three kinds of approaches for Cross-Referencing information: semantic similarity,
paraphrase identification and event extraction techniques.
In order to improve cross-referencing methods for web information sources, semantic measures and
precise semantic similarity definitions are proposed in the literature. These measures can normally be
grouped into five categories: Path Length-based measures [15], Information Content-based measures
[16], [17], [18], Feature-based measures [19], [20], Distributional-based measures[21], [22] and Hybrid
measures [18], [23], [24].
Paraphrase identification corresponds to the ability of identifying phrases, sentences, or longer texts
that convey the same, or almost the same information [25]. Paraphrase identification techniques can be
classified into three categories: recognition, generation, or extraction.
A current active research field in cross-referencing methods for web information sources is event
extraction. Event extraction is a common application of text mining to derive high quality information
from text by identifying events. Event extraction techniques depend on paraphrase identification
methods to identify events expressed in different ways. As Hogenboom et al. [26] cite, one can
distinguish between three main categories of event extraction: data-driven event extraction, knowledge-
driven event extraction, and hybrid event extraction.
3. Cross-referencing
The current paper discusses a large variety of approaches to natural language processing from diverse
fields. When focusing on cross-referencing web information sources, one must instantly focus on
extracting knowledge from these sources. While there is a compromise between the size, the coverage,
the structure and the growth of the knowledge resources, dealing with the knowledge extraction from
huge web information sources is considered the main challenge in hands.
We believe that improving the web structure will be the most efficient approach to measure veracity in
web information sources. We suggest to benefit from the large data offered by the web, and consider
data-driven approaches as the most suitable event extraction techniques. These techniques aim at
converting data into knowledge relying on quantitative methods such as clustering and the use of
statistics. Therefore, choosing paraphrase extraction approaches based on distributional hypothesis and
on recognition approaches based on surface string similarity, are a good solution as they both depend
directly on semantic measures, which can be used to benefit from the presence of large context like the
use of distributional-based measures. Since no approach is yet proved as the most efficient and reliable,
one must choose, regarding the context of the issue, the most suitable combination of approaches. This
choice depends in the first place on the knowledge resource used, then the event extraction technique.
Finally, it depends on the best match between the paraphrase identification techniques and the similarity
measure.
The proposed Semantic HMC process [11], solves this issue by learning automatically a concept
hierarchy and enrichment rules from Big Data through scalable Machine Learning techniques. To
represent the knowledge in the Semantic HMC process, an Ontology-described Knowledge Base is
used. Ontologies [27] are the most accepted way to represent semantics in the Semantic Web [28] and
a good solution for intelligent computer systems that operate close to the human concept level, bridging
the gap between the human requirements and the computational requirements [29]. Initially the
Semantic HMC enriches the ontology from the huge Volume and Variety of initial data and once this
learning phase is finished, the classification system learns incrementally from the new incoming items
to provide high Velocity learning. The result of this Semantic HMC process is a rich ontology with the
items classified with the learned concept hierarchy.

Proceedings of the IE 2015 International Conference
www.conferenceie.ase.ro
579
To infer the most specific concepts for each data item and all subsuming concepts, rule-based reasoning
is used, exhaustively applying a set of rules to a set of triples to infer conclusions. This Rule-based
reasoning approach allows the parallelization and distribution of work by large clusters of inexpensive
machines using Big Data technologies as Map-reduce [30].[30] Web Scale Reasoners [31] currently
uses Rule-Based reasoning to reach high scalability by loading parallelization and distribution, thus
addressing the Velocity and Volume dimensions of Big Data.
The Semantic HMC process consists of 5 individually scalable steps matching the requirements of Big
Data processing:
Indexation creates an index of parsed items and identifies relevant terms.
Vectorization creates a term co-occurrence frequency matrix of all indexed items and a TF-IDF
vector of each item.
Hierarchization creates a hierarchy of relevant concepts based on term-frequency.
Resolution creates classification rules to enrich the ontology based on term-frequency.
Realization first populates the ontology with items and then determines the corresponding
hierarchy concept and all subsumant concepts. This is intended as Hierarchical Multilabel
Classificaiton (HMC).
Once the items are classified, after the realization step, a set of classified items is available for post
processing. Similarity measures can then be easily computed between items classified with the same
labels. Notice that while paraphrase and event extraction technics cannot be undertaken directly on the
whole set of items available in one day at once, it can be undertaken with smaller subsets (i.e. classified
with the same labels) and then cross-reference their sources. Using these cross-referenced items we can
measure its veracity. Two uses of cross-referencing for measure item veracity are identified:
Cross-referencing with information sources that have a particular trustworthy. As an example,
if the item is cross-referenced with trusted sources it is a veracity indicator.
Cross-referencing with a significant set of items from several sources. As an example, if the
item is cross-referenced from several sources we can state that this item has a higher veracity
than an event that appears in a restricted number of items from only one source.
Then exploiting the veracity of its items easily does easily measure the veracity of each source.
4. Conclusions In this paper we present how to cross-referencing of large web information sources by using a Semantic
HMC process to extract the knowledge available in these sources. This cross-referencing principle
allows the First Eco Pro’fil to analyze the economical news veracity. It also discusses a large variety of
approaches to natural language processing from diverse fields that are mandatory to do cross-
referencing. In further work we aim to measure the data veracity as described and use it in the value
extraction process. Our current work consists in the implementation of the proposed methodology using
programming models for processing and generating large data sets as Map-Reduce.
Acknowledgment This project is founded by the company Actualis SARL, the French agency ANRT, the ”Conseil
Régional de Bourgogne” and through the COMPETE Program under the project AAL4ALL
(QREN13852).
5. References [1] C. Cruz and C. Nicolle, “Ontology Enrichment and Automatic Population From XML Data,”
Learning, pp. 17–20, 2008.
[2] D. Werner and C. Cruz, “Precision difference management using a common sub-vector to extend
the extended VSM method,” Procedia Comput. Sci., vol. 18, pp. 1179–1188, 2013.
[3] D. Werner, N. Silva, and C. Cruz, “Using DL-Reasoner for Hierarchical Multilabel Classification
applied to Economical e-News,” in Science and Information Conference, 2014, p. 8.
[4] D. C. De Roure, S. E. Middleton, and N. R. Shadbolt, “Ontological user profiling in recommender
systems,” ACM Transactions on Information Systems, vol. 22, no. 1. pp. 54–88, 2004.
Proceedings of the IE 2015 International Conference
www.conferenceie.ase.ro
580
[5] W. IJntema, F. Goossen, F. Frasincar, and F. Hogenboom, “Ontology-based news
recommendation,” in Proceedings of the 1st International Workshop on Data Semantics - DataSem
’10, 2010, p. 1.
[6] P. Resnick, N. Iacovou, and M. Suchak, “GroupLens: an open architecture for collaborative filtering
of netnews,” Proc. …, vol. pp, pp. 175–186, 1994.
[7] D. Billsus, D. Billsus, M. J. Pazzani, and M. J. Pazzani, “A personal news agent that talks, learns
and explains,” in Proceedings of the third annual conference on Autonomous Agents, 1999, pp.
268–275.
[8] D. Werner, C. Cruz, and C. Nicolle, “Ontology-based Recommender System of Economic
Articles.,” in WEBIST, 2012, pp. 725–728.
[9] M. Chen, S. Mao, and Y. Liu, “Big Data: A Survey,” Mob. Networks Appl., vol. 19, no. 2, pp. 171–
209, Jan. 2014.
[10] P. Hitzler and K. Janowicz, “Linked data, big data, and the 4th paradigm,” Semant. Web, vol. 4,
pp. 233–235, 2013.
[11] T. Hassan, R. Peixoto, C. Cruz, A. Bertaux, and N. Silva, “Semantic HMC for big data analysis,”
in Big Data (Big Data), 2014 IEEE International Conference on, 2014, pp. 26–28.
[12] T. Hassan, R. Peixoto, C. Cruz, N. Silva, and A. Bertaux, “Extraction de la Valeur des données du
Big Data par classification multi-label hiérarchique sémantique,” in EGC 2015 - 15ème conférence
internationale sur l’extraction et la gestion des connaissances, 2015.
[13] W. Bi and J. Kwok, “Multi-label classification on tree-and DAG-structured hierarchies,” Yeast,
pp. 1–8, 2011.
[14] A. Budanitsky and G. Hirst, “Evaluating WordNet-based Measures of Lexical Semantic
Relatedness,” Comput. Linguist., vol. 32, no. August 2005, pp. 13–47, 2006.
[15] C. Leacock and M. Chodorow, “Combining Local Context and WordNet Similarity for Word Sense
Identification,” An Electron. Lex. Database, pp. 265–283, 1998.
[16] D. Lin, “An Information-Theoretic Definition of Similarity,” in Proceedings of ICML, 1998, pp.
296–304.
[17] P. Resnik, “Semantic Similarity in a Taxonomy: An Information-Based Measure and its
Application to Problems of Ambiguity in Natural Language,” J. Artif. Intell. Res., vol. 11, pp. 95–
130, 1999.
[18] T. Pedersen and J. Michelizzi, “WordNet :: Similarity - Measuring the Relatedness of Concepts,”
HLT-NAACL--Demonstrations ’04 Demonstr. Pap. HLT-NAACL 2004, no. Patwardhan 2003, pp.
38–41, 1998.
[19] A. Tversky, “Features of similarity.,” Psychological Review, vol. 84. pp. 327–352, 1977.
[20] E. G. M. Petrakis, G. Varelas, A. Hliaoutakis, and P. Raftopoulou, “X-Similarity: Computing
Semantic Similarity between concepts from different ontologies,” J. Digit. Inf. Manag., vol. 4, pp.
233–237, 2006.
[21] R. L. Cilibrasi and P. M. B. Vitanyi, “The Google Similarity Distance,” IEEE Trans. Knowl. Data
Eng., vol. 19, no. 3, pp. 370–383, 2007.
[22] D. Hindle, “Noun Classification from predicate-argument structures,” in Proceedings of the 28th
annual meeting on Association for Computational Linguistics, 1990, pp. 268–275.
[23] R. Knappe, H. Bulskov, and T. Andreasen, “On Similarity Measures for Concept-based Querying,”
in Proceedings of the 10th International Fuzzy Systems Association World Congress (IFSA’03),
2003, pp. 400–403.
[24] Z. Zhou, Y. Wang, and J. Gu, “New model of semantic similarity measuring in wordnet,” in
Proceedings of 2008 3rd International Conference on Intelligent System and Knowledge
Engineering, 2008, pp. 256–261.
[25] I. Androutsopoulos and P. Malakasiotis, “A survey of paraphrasing and textual entailment
methods,” J. Artif. Intell. Res., vol. 38, pp. 135–187, 2010.
[26] A. Syed, K. Gillela, and C. Venugopal, “The Future Revolution on Big Data,” Future, vol. 2, no.
6, pp. 2446–2451, 2013.
[27] T. R. Gruber, “A Translation Approach to Portable Ontology Specifications by A Translation
Approach to Portable Ontology Specifications,” Knowl. Creat. Diffus. Util., vol. 5, no. April, pp.
199–220, 1993.

Proceedings of the IE 2015 International Conference
www.conferenceie.ase.ro
581
[28] T. Berners-Lee, J. Hendler, and O. Lassila, “The Semantic Web,” Sci. Am., vol. 284, no. 5, pp. 34–
43, 2001.
[29] L. Obrst, “Ontologies for semantically interoperable systems,” in Proceedings of the twelfth
international conference on Information and knowledge management - CIKM ’03, 2003, pp. 366–
369.
[30] J. Dean and S. Ghemawat, “MapReduce : Simplified Data Processing on Large Clusters,”
Commun. ACM, vol. 51, no. 1, pp. 1–13, 2008.
[31] J. Urbani, “Three Laws Learned from Web-scale Reasoning,” in 2013 AAAI Fall Symposium
Series, 2013.
Proceedings of the IE 2015 International Conference
www.conferenceie.ase.ro
582
MULTI-DOMAIN RETRIEVAL OF GEOSPATIAL DATA SOURCES
IMPLEMENTING A SEMANTIC CATALOGUE
Julio Romeo VIZCARRA
Instituto Politécnico Nacional, CIC, Mexico
Christophe CRUZ [email protected]@u-bourgogne.fr
Laboratoire Le2i, UMR CNRS 6306, Dijon, France
Abstract. Nowadays, the expertise of a user plays an important role in the search and retrieval in the
information systems that usually combines general and specialized knowledge in the construction of
queries. In addition, most of the queries systems are currently restricted on specific domains. Tackling
these issues, we propose a methodology that implements a semantic catalogue in order to provide a
smart queries system for retrieving data sources on the web by means of the extension of the user
expertise. We propose the combination of a query expansion method, and the use of similarity measures
and controlled vocabularies. Thus, it allows the system to recommend data sources that are able to fit
the need of a user in terms of information. To reach this goal, we exploit standard such as OWL from
the W3C and the CSW GeoCatalogue from the OGC.
Keywords: Semantic catalogue, smart queries, knowledge engineering, multi-domain retrieval,
similarity across ontologies. JEL classification: L86 Information and Internet Services
1. Introduction
Nowadays, the modern society is in a general crisis of knowledge. This term was introduced by Gross
[1], it refers to the necessity of understanding an increasing number of concepts produced for the science
and technological applications. On this way, the science and the scientific vocabulary have increasingly
merged with wider society through applied science that involves the daily life. As a consequence, the
borders between the scientific knowledge (specialized), and the knowledge in the real world (general)
outside science have become blurred [2][3]. Both kinds of knowledge can be frequently used to refer
common objects or situations. On the other hand, some knowledge is produced within a certain domain,
but it can be consumed for others, commonly this shared knowledge cannot be easily accessed and
known [4]. In this context, the users can face a lack of background, expertise or non-knowledge
(opposite of knowledge) within specific fields.
In order to get closer to a solution of the knowledge issues previously described, users of information
systems need central tools able to handle general and specialized knowledge, non-knowledge and
expertise about different domains. Moreover, another issue has to be taken into account. The
information heterogeneities are thematic, semantic, spatial, temporal, etc. As a consequence, the
conceptualization of a domain can widely differ from another domain by defining distinct concept,
objects, places or circumstances with the same vocabulary or defining the identical concept, objects,
places or events with the identical vocabulary. Thus, these heterogeneities are critical factors in the
information integration and retrieval [5].
Currently, there is a vast amount of spatial information available on the web though services. This
information allows scientists to perform complex analysis. Goodwin [6] used the term smart queries to
describe analyses that combine heterogeneous data sources in order to solve complex problems [7][8].
Our field of interest is the use of heterogeneous data sources to perform spatio-temporal smart queries
using Semantic Web tools. In previous work [9] we presented our research on spatio-temporal operators,
using local data repositories. The next logical step in the evolution of our work is to integrate it to the
SDI (Spatial Data Infrastructure). The term SDI was first introduced by the U.S. National Research

Proceedings of the IE 2015 International Conference
www.conferenceie.ase.ro
583
Council in 1993. It refers to a set of technologies, policies and agreements designed to allow the sharing
of spatial information and resources between institutions [10]. The Spatial Data Infrastructure has a
service-oriented architecture. In such infrastructure, functionalities such as storage and data search are
carried out through Web services. The typical workflow involves: 1) The discovery of a data source, 2)
The download of relevant geospatial data, 3) The use of appropriate analytical methods and 4) The
visualization of the results on a suitable map.
Today, the OGC services can be storage in a catalogue and include metadata information, which is
described in different ways. Those descriptions include problems of heterogeneity which in the process
of integration or retrieval becomes complex, time consumption process, ambiguous, etc. It is relevant
to get the right meaning of the concepts in such descriptions; on the other hand, the traditional queries
have the same problems with their concepts.
As an example, we present two smart queries given to a user who can involve general and specialized
knowledge and non-knowledge:
Query 1: What is the population of crows in southwest of France? In this query, the concept
crow can be described in two ways:
Crow described on general knowledge [11, 12] may be a raven, black bird, superstition bird, a
butterfly called "common raven”, etc.
Crow described in specialized knowledge [13], the crow (Corvus corax) may be related
semantically with “Birds robin to mallard size”, “Birds medium size”, “Other similar birds in
the same category: small corvid , Corvus frugilegus corone (Rook Carrion crow), Pica pica
(Magpie), Garrulus glandarius (Jay), Corvus monedula (Jackdaw), large corvid, etc.”
Query 2: Now considering a query requested for a specialist in geology. What are the locations
with colluvium in USA during the past 20 years?
Using the general knowledge the concept Colluvium is unknown for most of the people [14].
Then it is necessary to describe Colluvium on the specialized knowledge [15], Colluvium is
sediment that has moved downhill to the bottom of the slope without the help of running water
in streams, gravity in the form of soil creep, and downhill.
After consulting the concept Colluvium on the specialized domain, we are able to understand and infer
the meaning on the general knowledge linking this concept with others semantically related on the
general domain such as sediment, deposit, alluvial sedimentation, sedimentary clay, etc.
Our work aims to tackle the issues previously described. We provide to the user the capability of
navigating through large amounts of information with an expert approach. This is obtained with the
inclusion of specialized knowledge in other fields in the search which the user might not have the best
expertise. Moreover, the methodology computes semantically user’s queries and returns similar results
in an ordered relevance list. The main domains considered in the retrieval of data sources are thematic,
spatial and temporal, which can be also described by knowledge specialized and general.
Next section focuses on related work such as Semantic HMC, semantic measures and Cross-
Referencing Methods Proposals. Section 3 deals with our approach to improve cross-referencing using
the Semantic HMC. The last section concludes this paper.
2. Related work This section describes some of the most relevant previous works such as projects and publications.
Moreover, it is presented projects more technical oriented that can be found on the web. They provided
similar solutions the issue tackled.
2.1 Academic purposes
In [16], authors tried to construct a bilingual dictionary from a corpus using the similarity among
concepts by polysemy. The contribution of Sra Suvrit [17] was an enhancing on retrieval of information.
In the experiments, they showed the usage of learning dictionaries enabling a fast and accurate Nearest
Neighbor (NN) retrieval. The dictionaries work on covariance matrix data sets without using semantic
Proceedings of the IE 2015 International Conference
www.conferenceie.ase.ro
584
features. Pedersen Ted [18] processes the semantic on the concepts constructing a dictionary melded
from various sources. They faced the overlapping among dictionaries. In this approach, they
implemented Cross–Level Semantic Similarity (CLSS) which is a novel variation on the problem of
semantic similarity. The work of Shahriar, Md Sumon [19] proposed a smart query answering
architecture oriented to marina sensor data with a data mining approach. They implemented many
processes, but no similarity features were provided to process information. Shvaiko [20] implemented
an extension of Geonetwork [26] adding a new interface. They included semantic capabilities by using
a faceted ontology, but it is limited to semantic matching operations using S-Match [21] between the
query and the ontology. A second work with Farazi [22] exploit this work to provide an enhancement
that extended the capability of the queries by giving similar answers. It computes the similarity using a
nearest neighbor approach without considering a similarity measure that computes the information from
an ontology.
2.2 Services on the web
The project “Aonaware Web Services” [23] presents the possibility of consulting dictionaries for the
human understanding. Concepts are introduced by providing an extensively definition. The project
ontology Lookup Service [24] provides a web service where it is possible to query multiple ontologies
instead of only dictionaries. This service is for human recognition and automatic processing in the
documents' retrieval domain. The work of Falcons [25] provides a service of consulting through queries.
The system looks up for those concepts into their ontologies lexically. As results, the system shows an
excerpt of those ontologies. The system does not use specialized domains, and it is impossible to choose
relevant ontologies for the search.
2.3 Discusion
Based on the analysis of related work, experimental results show that the information retrieval is
improved by using many dictionaries. Word alignment techniques can be applied on shared vocabulary
in dictionaries to face the overlapping of a melded dictionary from several dictionaries. The common
issue in the related work was the conceptual ambiguity which can be tackled with the semantic
processing.
The common factor regarding smart query processing, semantic retrieval and catalogues is the similarity
measure necessity to compute the implicit information from the ontology. The cross–level semantic
similarity is a feasible solution for processing shared knowledge among ontologies. An important
contribution is the extension of the user’s expertise in several areas.
Considering the limitations and main features of presented work, the proposed methodology handles
the knowledge from different domains in order to improve the retrieval with mechanisms of
collaboration among ontologies. Similarity measures are included with the purpose of expanding the
expertise of users on general and specialized knowledge about thematic, spatial and temporal domains.
3. Proposition
This section describes our contribution based on three main stages. The three stages are namely the
“knowledge analysis”, the “data source analysis” and the “query analysis”.
In the “knowledge analysis” stage, a knowledge base is built composed of a set of ontologies
from thematic, spatial and temporal domains. The thematic domains consider general
ontologies described by a common vocabulary (common domains) and specialized ontologies
use specialized concepts (specific domains or domains not commonly used). When the
ontologies are loaded in the knowledge base, a necessary semantic pre-processing is executed
in two steps. The first step calculates similar concepts in each ontology on the same domain.
The second step computes the similarity of the concepts among ontologies.
In the “data source analysis” stage, the geospatial data sources are stored. The concepts that
compose the metadata description are included in the ontology mapping (concept-data source)
in order to link concepts in the ontologies to data sources.

Proceedings of the IE 2015 International Conference
www.conferenceie.ase.ro
585
In last stage called “query analysis”, queries are introduced and transformed into smart queries.
Actually, the query are extended and linked to ontology vocabularies. Users are able to retrieve
geospatial data sources semantically related using knowledge specialized and on the thematic,
spatial and temporal domains. In this stage, the semantic pre-processing from the
conceptualization stage is used in order define the query and get similar concepts related. The
semantic pre-processing is also used in the synthesis stage for obtaining the geospatial data
sources related using the ontology population mapping.
Figure 1 presents the overall solution proposed. Some parts are widely used in many projects like the
pre-processing of the queries. Our approach is unique in the sense that we exploit concept expansion in
each ontology using all the ontology using distance similarity measures. And, the result of this
expansion is also exploited for the expansion of the queries which make the results much broader and
closer to the need of the user. In order to limit the size of the expansion, the principle of intersection
allows the systems to select only the vocabularies that are in common to a set of ontologies after the
expansion process of the ontologies.
. Figure 1. Query analysis stages.
5. Conclusions We have studied the handling of multi domain knowledge as a way for extending the user expertise in
queries processing. This feature can be especially important in the retrieval of data sources in a
catalogue. The inclusion of a mechanism of collaborative domains can extend the information in the
queries and disambiguating the concepts. The similarity measures provide a semantic approach in the
query analysis and in the construction of the catalogue. We have described the work-in-progress that is
currently under development. A significant part of the components of the system have been already
developed, although they still need to be integrated.
References [1] M. Gross, “The Unknown in Process Dynamic Connections of Ignorance, Non-Knowledge and
Related Concepts”, Sage Publications, Current Sociology, vol 55,5 pp 742-759, 2007.

Proceedings of the IE 2015 International Conference
www.conferenceie.ase.ro
586
[2] M. Gross, H. Hoffmann-Riem, “Ecological Restoration as a Real-World Experiment: Designing
Robust Implementation Strategies in an Urban Environment”, Public Understanding of Science
14(3): 269–84, 2005.
[3] W. Krohn, J. Weyer, “Society as a Laboratory: The Social Risks of Experimental Research”,
Science and Public Policy 21(3): 173–83, 1994.
[4] U. Beck, “World Risk Society”, Oxford: Polity Press,1999.
[5] V. Kashyap, et al, “Semantic heterogeneity in global information”, Cooperative Information
Systems: Current Trends and Directions, 1997.
[6] J. Goodwin, “What have ontologies ever done for us - potential applications at a national mapping
agency”, In: in OWL: Experiences and Directions (OWLED), 2005.
[7] Md. S. Shahriar, et al, “Smart query answering for marine sensor data”, Sensors, Molecular
Diversity Preservation International, vol. 11,3, 2885-2897, 2011.
[8] J. Han, Y. Huang, N. Cercone, Y. Fu, “Intelligent Query Answering by Knowledge Discovery
Techniques”, IEEE Trans. Knowl. Data Eng. 8s, 373-390, 1996.
[9] B. Harbelot, H. Arenas, H., C. Cruz, “The spatio-temporal semantics from a perdurantism
perspective”, In: Proceedings of the Fifth International Conference on Advanced Geographic
Information Systems, Applications, and Services GEOProcessing. February-March, 2013.
[10] ESRI: GIS Best Practices: Spatial Data Infrastructure (SDI), 2010
[11] J. Noragh, “Power of Raven, Wisdom of Serpent”, Floris Books. ISBN 0-940262-66-5, 1995.
[12] A. Borang, et al, “Butterflies of Dihang Dibang Biosphere Reserve of Arunachal Pradesh”, Eastern
Himalayas, India, Bullefin of Arunachal Forest Research,vol 24, 41-53, 2008.
[13] Fauna Completeness Ontology. Keith Kintigh. (tDAR ID: 376370); doi:10.6067/XCV8HT2NMV,
2012.
[14] M. Smithson, “Ignorance and Science: Dilemmas, Perspectives, and Prospects”, Knowledge:
Creation, Diffusion, Utilization 15(2): 133–56, 1993.
[15] W. E. Dietrich, et al, “Hollows, colluvium, and landslides in soil-mantled landscapes”,
Binghamton Symposia in Geomorphology, International Series. Allen and Unwin, Hillslope
processes, 361-388, 1986.
[16] L. Xiaodong et al. “Topic models+ word alignment= a flexible framework for extracting bilingual
dictionary from comparable corpus”, Proceedings of the Seventeenth Conference on
Computational Natural Language Learning, Sofia, Bulgari, 212-221, 2013.
[17] S. Suvrit et al., “Generalized dictionary learning for symmetric positive definite matrices with
application to nearest neighbor retrieval”, Machine Learning and Knowledge Discovery in
Databases, Springer.318-332, 2011.
[18] T. Pedersen, “Duluth: Measuring Cross--Level Semantic Similarity with First and Second--Order
Dictionary Overlaps”, SemEval 2014, pp.247, 2014.
[19] Md S. Shahriar, et al, “Smart query answering for marine sensor data,Sensors, Molecular Diversity
Preservation International ,vol. 11,3, 2885-2897, 2011.
[20] P. Shvaiko et al. “A semantic geo-catalogue implementation for a regional SDI”, University of
Trento, 2010.
[21] F. Giunchiglia, P. Shvaiko, M. Yatskevich. “S-Match: an algorithm and an implementation of
semantic matching”, In Proc. of ESWS, 2004.
[22] F. Farazi, et al. “A semantic geo-catalogue for a local administration”, Artificial intelligence
review, Springer ,vol 40,2.193-212, 2013.
[23] Aonaware Web Services. http://services.aonaware.com/DictService/, consulted on November
2014.
[24] The Ontology Lookup Service. http://www.ebi.ac.uk/ontology-lookup/, consulted on November
2014.
[25] Falcons. http://ws.nju.edu.cn/falcons/objectsearch/index.jsp, consulted on November 2014.
[26] J. Ticheler, et al. “GeoNetwork opensource Internationally Standardized Distributed Spatial
Information Management”, OSGeo Journal, vol.2, 1, 2007.
Proceedings of the IE 2015 International Conference
www.conferenceie.ase.ro
587
EMOTIONAL ROBO-INTELLIGENCE CREATION PROCESS
Dumitru TODOROI
AESM
Abstract. Materialization of notions of information, knowledge, and conscience, its functions,
and its adaptability features with the perspective of intelligent systems creation process help
to investigate and develop the Computer Based Information Emotion Systems (CBIES) for
Information, Knowledge based, and Consciousness Societies. There are evaluated the CBIES’
second level elements for these societies based of its corresponding CBIES’ first level
(component parts and phases of activity) elements. Human emotions are examined in order to
create Emotional ROBO-intelligences (EQ) as the continuation of Creative ROBO -
intelligence (IQ). Fruitful cooperation of both IQ and EQ intelligence will evolve in
Consciousness Society, which will be created in the years 2019 - 2035, according to multiple
surveys in the field. Human temperament is examined with the purpose of creating artificial
emotional, sensual and creative intelligences. Adaptable tools of defining the new robotic
elements are used for defining the elements of higher level of emotional creative ROBO-
intelligences. Formulation, formalization and adaptable algorithmization of the higher level
elements of the temperament ROBO-intelligences represent evolutionary development of the
creation process of the ROBO-intelligences of the Consciousness Society. Proposed research
results represent logical continuation of research results [1 - 4].
Keywords: emotion, intelligence, temperament, conscience society, ROBO-intelligence
JEL classification: C45
Introduction
Human society is on the threshold of Consciousness Society and is currently supported by The
Third Industrial Revolution which, according to estimates by scientists in the field, will be
created during the years 2019-2035. Dramaturgical consciousness goes along side with the
distributed energy and communication systems of the third industrial revolution, as well as
psychological Consciousness that came with The Second Industrial Revolution and ideological
Consciousness which participated in The Third Industrial Revolution.
Empathic human civilization has a multitude of features which in Consciousness Society will
be specific and to the robotic civilization. Books [3] and [7] on the basis of our multiple
references support us in demonstration the truth of statement: "In Consciousness Society the
Artificial Intelligence (ROBO-intelligence) will be equal to Human structured Intelligence and
this Society will be empathic”.
For decades robots have diligently been tasked to perform a range of duties largely scoped
within industrial manufacturing. More recently, we have seen the emergence of a new
landscape of more social, personal, expressive, nurturing, and emotional robotic platforms.
Increasingly, robots play a critical new role as extensions of ourselves, enabling our creativity,
creating new objects, serving as companions, expressing emotions, empowering communities,
and challenging our civil rights.
o initiate discussion in Emotional ROBO-intelligence creation process let put the Problem:
ROBO-intelligence entity with emotions (Emotional ROBO-intelligence: EQ) has to activate

Proceedings of the IE 2015 International Conference
www.conferenceie.ase.ro
588
using some situation: Entity is in the best disposition and is asked to clear the dusty room after
school lecture in car driving.
Asked questions: What is emotional ROBO-intelligence? What are ROBO-intelligence’
component parts? What are ROBO-intelligence entity competences to initiate, process, and
finish the task? What ROBO-intelligence competences have to be activated to analyze the
emotion situation for doing this task? What are ROBO-intelligence competences’ measures?
How to program the evaluation process of doing the task using emotional measures? What are
emotional evaluation steps of ROBO-intelligence in the process of doing the task? What
competences are needed to transmit to Asker that task was finished?
Answer to some of questions can be done by the Creative ROBO-intelligences [7] which
possess creative features: Inspiration, Imagery, Imagination, Intuition, Insight, Improvisation,
and Incubation. These IQ features evaluate in correspondence with Six Steps to the Creativity
ROBO-intelligence top: acquire Knowledge, develop Curiosity, become Interested, Passion,
Dedication, and Professionalism.
Creative features and its evaluation steps produce second level IQ items of Creative ROBO-
intelligences. Each IQ item is defines by its special Consciousness Society Intelligent
Information System (Table 1).
Table 1. Consciousness Society Intelligent Information System (CSIIS).
CSIIS’s
phase
\ \ \ \ \ \ \ \ \ \ \ \ \
\
CSIIS’
component part
Consciousness
capture of IQ
item
Consciousness
Storag
e of IQ item
Consciousness
Processing of IQ
item
Consciousnes
s Distribution of IQ
item
IQ
item’s Hard-ware
IQ item’s capturing organs
and tools
IQ
item’s brain
fixation
IQ item’s Neuronal brain
connection
IQ item’s Neuronal
subconscious and
unconscious
connection
IQ
item’s Soft-ware
Drivers
for IQ item’s
capturing organs
and tools
Fixation the IQ
item in
ROBO-
memory
IQ item’s processing in
two brain
hemispheres
IQ item’s Drivers of organs of
Neuronal
subconscious and
unconscious
connection
People &
IQ interaction
People &
ROBO-
intelligence
interaction
initialization
People
& ROBO-
intelligence
interaction
documentation
People &
ROBO intelligence
and
society
consciousness
formation
People &
ROBO intelligence
evolution, its
implementation
in society
IQ
item’s IKC
(data,
information,
knowledge,
consciousness)
IQ item’s IKC formulation
IQ
item’s IKC
formalization
IQ item’s IKC operational
functionalities
IQ item’s IKC
distribution in
subconscious and
unconscious

Proceedings of the IE 2015 International Conference
www.conferenceie.ase.ro
589
IQ
item’s Brain-ware
(methods,
models
algorithms,
procedures)
IQ item’s Brain-ware
capture
IQ
item’s Brain-ware
storage in
ROBO -
memory
IQ item’s Brain-ware
interpretation
technologies
IQ item’s Brain-ware
conscience,
subconscious
and
unconscious
creativity
IQ
item’s Group-ware
(consciousness
communications
)
Individua
l and group IQ
item’s Group-ware
capture
IQ
item’s Group-ware
storage of
group
interactions
Coordinatio
n of individual and
group IQ item’s
Group-ware
processing
IQ item’s
Group-ware
transmission and its
crystallization in
Subconscious
and Unconscious
Each of the cells of the Table 1 contains functional evolution of ROBO – intelligence item.
Evolution is supported by Adaptable ROBO – intelligences creative Tools using Formula for
Creative (Artificial) Intelligence: IQ = IKC*TS [5].
1. Tests in the Emotional ROBO-intelligence creation process
Previous questions underline the problems which have to be solved to obtain the Emotional
ROBO-intelligence which has to understand the human announced task, to do this task in this
emotional situation, to transform its emotion, and to reproduce the answer for Boss about
finishing the task.
Many tests that promise to measure emotional intelligence have appeared in recent years and
are used in the process of creation the Emotional ROBO-intelligence. Some of these tests seem
promising, but many have not been empirically evaluated. We have reviewed many of these
tests and selected those for which there is a substantial body of research having a goal of
creating Emotional ROBO-intelligence (at least five published journal articles or book chapters
that provide empirical data based on the test).
Created Consortium for Research on Emotional Intelligence in Organizations (CREIO) do not
sell or distribute any measures or assessments. To get information related to obtaining specific
tasks of identification and measures such as qualifications or certifications needed to administer
specific measures, to store or process emotions and to organize emotion relationship and
distribution please refer to the contact information provided with the description of each
assessment.
Maps of emotional feelings and Computer Based Information Emotion System (CBIES)
represent the first steps we consider to go through to create Emotional ROBO-intelligence.
2. Maps of emotional feelings
Definition of the emotional existence plan is the following: level of human existence which
registers changes in emotional states.
The way of expressing the emotions can vary very much: love/hate, happiness/sadness,
calmness/anxiety, trust/fury, courage/fear, etc.
Emotions coordinate our behavior and psychological condition during the main survival
events and pleasant interactions. Nevertheless we are aware of our current emotional condition
as happiness or fury; mechanisms that cause/ feed these sensations are still undiscovered. Here
it is used a personal topographic instrument of report that unveils the fact that different
emotional conditions are associated with distinct topographic sensations and universally
cultural body feelings; these feelings could highlight conscious emotional experiences.

Proceedings of the IE 2015 International Conference
www.conferenceie.ase.ro
590
Watching the sensation topography caused by emotions we perceive a unique instrument for
researching the emotions that could be called biomarker against emotional disturbing.
Somatosensory Feedback has been proposed to trigger conscious emotional experiences
because the emotions often are felt by the body. Below (Figure 1) is presented the map of
bodily sensations associated with different emotions using a unique topographical self-report
method.
Figure 1. Bodily sensations map associated with different sensory emotions using a unique topography method
Bodily topography of basic (Upper) and non-basic (Lower) emotions associated with
words. The body maps show regions whose activation increased (warm colors) or decreased
(cool colors) when feeling each emotion.
Researchers at Aalto University in Finland have compiled maps of emotional feelings
associated with culturally universal bodily sensations, which could be at the core of
emotional experience. These emotional feelings are: Fury, Fear, Disgust, Happiness,
Sadness, Anxiety, Amazement, Neutrality, Love, Depression, Pride, Shame, Envy, Hatred.
The researchers found that the most common emotions trigger strong bodily sensations and
the bodily maps of these sensations were topographically different for different emotions
If it is put the question to create some entity - Robot with emotions: Emotional ROBO-
intelligence (EQ), the specialists must study carefully images from the entire world about at
list the human face expressions with different feelings. For an entertaining and pleasant
presence of such a machine to the human, such EQ has to behave politely, express emotions,
„read” human emotions and react adequately. It is interesting at list to create EQ’s Head &
Heart which has to have mobile for expressing emotions such as happiness, sadness or
melancholy.
2.1. Mayer-Salovey-Caruso Emotional Intelligence Test (MSCEIT) is an ability-based
test designed to measure the four branches of the EI model of Mayer and Salovey [8-10].
MSCEIT was developed from an intelligence-testing tradition formed by the emerging
scientific understanding of emotions and their function and from the first published ability
measure specifically intended to assess emotional intelligence, namely Multifactor
Emotional Intelligence Scale (MEIS).

Proceedings of the IE 2015 International Conference
www.conferenceie.ase.ro
591
MSCEIT consists of 141 items and takes 30-45 minutes to complete. MSCEIT provides 15
main scores: Total EI score, two Area scores, four Branch scores, and eight Task scores. In
addition to these 15 scores, there are three Supplemental scores [8].
Mayer-Salovey-Caruso Emotional Intelligence Test – Scales were discussed and analyzed the
Four Branches of Emotional Intelligence:
- Perceiving Emotions: The ability to perceive emotions in oneself and others as well as
in objects, art, stories, music, and other stimuli;
- Facilitating Thought: The ability to generate, use, and feel emotion as necessary to
communicate feelings or employ them in other cognitive processes;
- Understanding Emotions: The ability to understand emotional information, to understand
how emotions combine and progress through relationship transitions, and to appreciate
such emotional meanings;
- Managing Emotions: The ability to be open to feelings, and to modulate them in oneself
and others so as to promote personal understanding and growth
Our goal is to investigate emotional ROBO-intelligences which possess known classical
emotion elements: Happiness, Fear, Surprise, Disgust, Sadness, and Anger from the point of
view of its introduction in the robot entities as intellectual, emotional, moral, temperamental,
and sensual compartments.
Presented by Aalto University’s researchers emotional feelings can be defined and expressed
by the help of classical emotion elements using Adaptable tools.
2.2. Emotional ROBO – intelligence evolution
Follow the performing of physical, intellectual and spiritual work (lower level elements of
ROBO-intelligences) received with emotional developments of ROBO - intelligences: self-
awareness [11], managing emotions, motivation [12], empathy [11] and handling relationships
- lower level elements of ROBO-intelligences - to higher level items of ROBO - intelligences
(Table 2). Its definitions:
Self-awareness is the capacity for introspection and the ability to recognize oneself as an
individual separate from the environment and other individuals;
Managing emotions is ability to control emotional mental states;
Motivation is psychological feature that arouses an organism to action toward a desired goal;
the reason for the action; that which gives purpose and direction to behavior;
Empathy is identification with and understanding of another's situation, feelings, and motives;
Handling relationships - ability to have relationships in/with society.
Table 2. Emotional ROBO - intelligences Evolution
Evolution
versus
Work
Self-awareness Managing emotions Motivation Empathy Handling
relationships
Physical
work
Self- awareness
Physical work
Physical work
managed by
emotions
Motivated
Physical work
Empathic
Physical work
Relational
Physical work
Intellectual
work
Self -awareness
Intellectual
work
Intellectual work
managed by
emotions
Motivated
Intellectual
work
Empathic
Intellectual
work
Relational
Intellectual
work
Spiritual
work
Self -awareness spiritual work
Spiritual work
managed by emotions
Motivated spiritual work
Empathic
spiritual work
Relational
spiritual work

Proceedings of the IE 2015 International Conference
www.conferenceie.ase.ro
592
High level elements of ROBO-intelligences presented in cells of the Table 2 are functionally
defined by the Adaptable Tools of evaluated Integrated Systems [13].
3. Computer Based Information Emotion System functions.
Emotional ROBO-intelligence is a Computer Based Information Emotion System (CBIES),
which component parts are: emotion measure, identification and perception, emotion
storage and processing, and emotion relationship – distribution. Each of CBIES component
parts is supported by corresponding hard-ware, soft-ware, knowledge-ware, social
(people’s)-ware, conscience-ware and group-ware.
It is needs to create special CBIES for each of Emotional ROBO-intelligence’ characteristics:
emotion identification, emotion competence, emotion quantity, quality, and storage,
emotion education, evolution, and processing, and emotion distribution.
3.1. CBIES’s Emotion entity measure is referred to such functions as emotional internal
states, impulses, preferences, resources, and intuitions.
Emotional intelligence measure is referred to the Emotional Self-Awareness: the skill of
perceiving and understanding one’s own emotions.
Emotion entity value for internal states, impulses, preferences, resources, and intuitions as
capacity to identify and understand the impact one’s own feelings is having on thoughts,
decisions, behavior and performance at work.
Quantity and Quality of emotional internal states, impulses, preferences, resources, and
intuitions functionally represent the information to calculate the EQ power as well as powers
for the following 5 composite scales and 15 subscales
3.2. CBIES’s Emotion Identification functionally represents emotion entity’s ID,
Competences, Measure, Value, Quality and Quantity of emotion entity.
Our investigation is referred to the classical emotion elements Happiness, Fear, Surprise,
Disgust, Sadness, and Anger.
Emotional intelligence’s axe with evolution steps are represented by: (1) Self-awareness: recognizing internal feelings,
(2) Managing emotions: finding ways to handle emotions that are appropriate to the situation,
(3) Motivation: using self-control to channel emotions toward a goal,
(4) Empathy: understanding the emotional perspective of other people,
(5) Handling relationships: using personal information and information about others to handle
social relationships and to develop interpersonal skills.
3.3. CBIES’s Emotion entity competences, based on Emotional & Social Competence
Inventory identified by Dr. Daniel Goleman in Working with Emotional Intelligence [Wolff,
2006] and Bar-On model of emotional-social intelligence [Bar-On, 2006], functionally
measure an overall EQ power as well as powers for the following composite scales: Self-
Awareness, Self-Management, Social Awareness, and Relationship Management.
3.3.1. Self-Awareness concerns knowing one's internal states, preferences, resources, and
intuitions. The Self-Awareness cluster contains three competencies:
Emotional Awareness: Recognizing one's emotions and their effects
Accurate Self-Assessment: Knowing one's strengths and limits
Self-Confidence: A strong sense of one's self-worth and capabilities
3.3.2. Self-Management refers to managing ones' internal states, impulses, and resources. The

Proceedings of the IE 2015 International Conference
www.conferenceie.ase.ro
593
Self-Management cluster contains six competencies:
Emotional Self-Control: Keeping disruptive emotions and impulses in check
Transparency: Maintaining integrity, acting congruently with one’s values
Adaptability: Flexibility in handling change
Achievement: Striving to improve or meeting a standard of excellence
Initiative: Readiness to act on opportunities
Optimism: Persistence in pursuing goals despite obstacles and setbacks
3.3.3. Social Awareness refers to how people handle relationships and awareness of others’
feelings, needs, and concerns. The Social Awareness cluster contains three competencies:
Empathy: Sensing others' feelings and perspectives, and taking an active interest in their
concerns
Organizational Awareness: Reading a group's emotional currents and power relationships
Service Orientation: Anticipating, recognizing, and meeting customers' needs
3.3.4. Relationship Management concerns the skill or adeptness at inducing desirable
responses in others. The Relationship Management cluster contains six competencies:
Developing Others: Sensing others' development needs and bolstering their abilities;
Inspirational Leadership: Inspiring and guiding individuals and groups;
Change Catalyst: Initiating or managing change;
Influence: Wielding effective tactics for persuasion;
Conflict Management: Negotiating and resolving disagreements;
Teamwork & Collaboration: Working with others toward shared goals. Creating group
synergy in pursuing collective goals.
3.4. CBIES’s Emotion storage and processing are referred to the process of accumulation the
processing results of emotion educational evolution steps (Home 7 years, High School,
Second school, …) using Piirto’s 7i intelligence characteristics axe and Piirto’s 6 emotion
intelligence evolution steps axe.
Emotional ROBO-intelligence’s axe of hierarchically evaluation steps are functionally
represented by Piirto’s 6 Creativity’s top elements: (a) Acquire Knowledge, (b) Develop
Curiosity, (c) Become Interested, (d) Passion, (e) Dedication, and (f) Professionalism.
3.4.1. CBIES’s Emotional intelligence processing functionally measure:
(1) Emotional Self-Control: the skill of effectively controlling strong emotions experienced,
(2) Emotional Self-Management: the skill of effectively managing one’s own emotions,
(3) Emotional Expression: the skill of effectively expressing one’s own emotions, and
(4) Emotional Reasoning: the skill of utilizing emotional information in decision-making.
One side of emotion processing constitutes emotional intrapersonal processing [Bar-On,
2006]. Emotional management and regulation processing define emotional stress
management.
3.4.2. CBIES’s Emotion intrapersonal processing (self-awareness and self-expression) is a
composition of the next 5 functions:
(1) Self-Regard: To accurately perceive, understand and accept oneself;
(2) Emotional Self-Awareness: To be aware of and understand one’s emotions;
(3) Assertiveness: To effectively and constructively express one’s emotions and oneself;
(4) Independence: To be self-reliant and free of emotional dependency on others;
(5) Self-Actualization: To strive to achieve personal goals and actualize one’s potential.
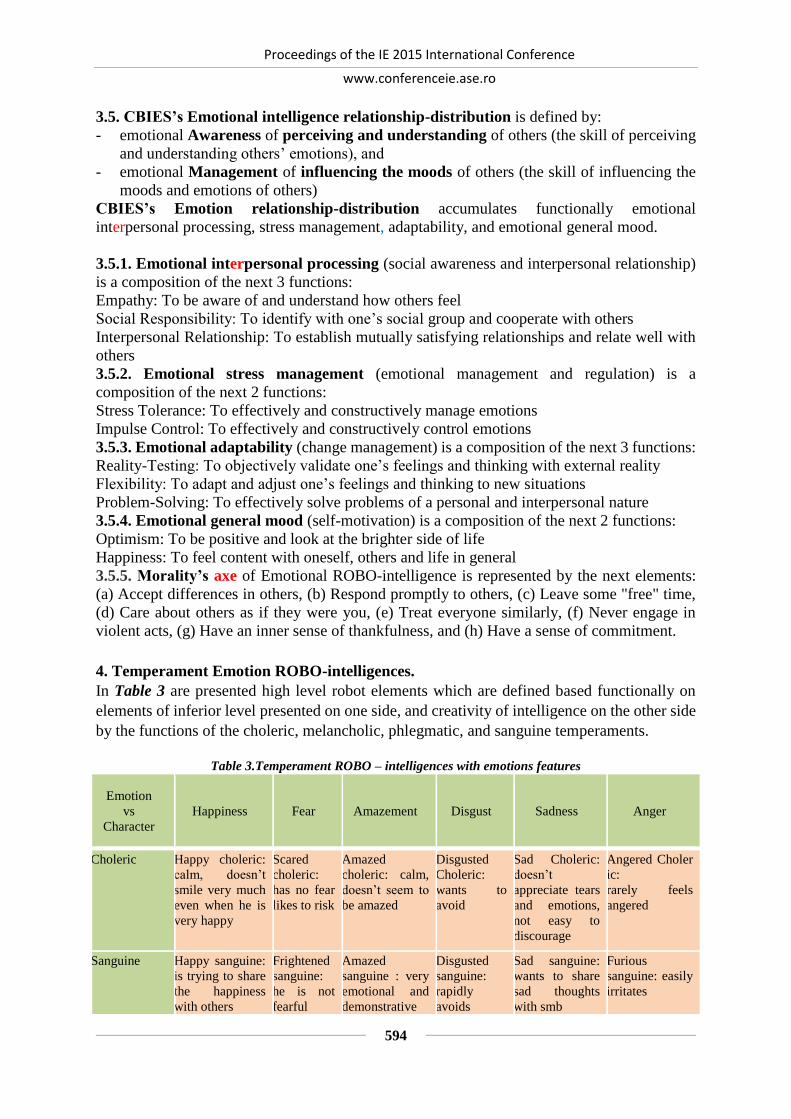
Proceedings of the IE 2015 International Conference
www.conferenceie.ase.ro
594
3.5. CBIES’s Emotional intelligence relationship-distribution is defined by:
- emotional Awareness of perceiving and understanding of others (the skill of perceiving
and understanding others’ emotions), and
- emotional Management of influencing the moods of others (the skill of influencing the
moods and emotions of others)
CBIES’s Emotion relationship-distribution accumulates functionally emotional
interpersonal processing, stress management, adaptability, and emotional general mood.
3.5.1. Emotional interpersonal processing (social awareness and interpersonal relationship)
is a composition of the next 3 functions:
Empathy: To be aware of and understand how others feel
Social Responsibility: To identify with one’s social group and cooperate with others
Interpersonal Relationship: To establish mutually satisfying relationships and relate well with
others
3.5.2. Emotional stress management (emotional management and regulation) is a
composition of the next 2 functions:
Stress Tolerance: To effectively and constructively manage emotions
Impulse Control: To effectively and constructively control emotions
3.5.3. Emotional adaptability (change management) is a composition of the next 3 functions:
Reality-Testing: To objectively validate one’s feelings and thinking with external reality
Flexibility: To adapt and adjust one’s feelings and thinking to new situations
Problem-Solving: To effectively solve problems of a personal and interpersonal nature
3.5.4. Emotional general mood (self-motivation) is a composition of the next 2 functions:
Optimism: To be positive and look at the brighter side of life
Happiness: To feel content with oneself, others and life in general
3.5.5. Morality’s axe of Emotional ROBO-intelligence is represented by the next elements:
(a) Accept differences in others, (b) Respond promptly to others, (c) Leave some "free" time,
(d) Care about others as if they were you, (e) Treat everyone similarly, (f) Never engage in
violent acts, (g) Have an inner sense of thankfulness, and (h) Have a sense of commitment.
4. Temperament Emotion ROBO-intelligences.
In Table 3 are presented high level robot elements which are defined based functionally on
elements of inferior level presented on one side, and creativity of intelligence on the other side
by the functions of the choleric, melancholic, phlegmatic, and sanguine temperaments.
Table 3.Temperament ROBO – intelligences with emotions features
Emotion
vs
Character
Happiness Fear Amazement Disgust Sadness Anger
Choleric Happy choleric:
calm, doesn’t
smile very much
even when he is
very happy
Scared
choleric:
has no fear
likes to risk
Amazed
choleric: calm,
doesn’t seem to
be amazed
Disgusted
Choleric:
wants to
avoid
Sad Choleric:
doesn’t
appreciate tears
and emotions,
not easy to
discourage
Angered Choler
ic:
rarely feels
angered
Sanguine Happy sanguine:
is trying to share
the happiness
with others
Frightened
sanguine:
he is not
fearful
Amazed
sanguine : very
emotional and
demonstrative
Disgusted
sanguine:
rapidly
avoids
Sad sanguine:
wants to share
sad thoughts
with smb
Furious
sanguine: easily
irritates

Proceedings of the IE 2015 International Conference
www.conferenceie.ase.ro
595
emotions
with disgust
Phlegmatic Happy
phlegmatic : a
born
pessimistic,
that keeps him
connected to
the reality
Frightene
d
Phlegmat
ic: is able
to be
calm in
the
middle of
the storm
Amazed
Phlegmatic :
phlegmatic is
master of
himself, is not
overwhelmed
by emotions
Disgusted
Phlegmatic
: doesn’t
offend ,
doesn’t call
attention
on himself
and
performs
what he is
expected to
do without
any
rewards
Sad
phlegmatic:
resists the
challenges
and is
listening to
the others
what they
have to say,
consoles the
suffering ones
Furious
Phlegmatic:
refuses to be
impressed by
the bright
choleric’s
decisions, and
doesn’t take
seriously
melancholic’s
laborious
plans
Melancholic Happy
Melancholic:
has to learn to
be optimistic
Melancho
lic with
fear: is
sober,
sensible
and
correct
Amazed Mel
ancholic: lives
the moment
emotional,
intense and
durable
Disgusted
Melancholi
c: weak
reactivity,
feeling of
inferiority
Sad
Melancholic:
is introverted
silent and
things
profoundly
with a
pessimistic
note
Angered
Melancholic:
without
tempering the
anger the
melancholic
suffers very
much
4.1. Phlegmatic and Melancholic ROBO-Intelligences Examples of Phlegmatic and Melancholic types which possess such classical first level emotion
elements as: Happiness, Fear, Surprise, Disgust, Sadness, and Anger, is presented (Table 4).
Table 4. Phlegmatic and Melancholic ROBO-Intelligences with emotions.
Characters
combination
with
Emotions
Happiness Fear Surprise Disgust Sadness Anger
Phlegmatic Phlegmatic
happiness
Phlegmatic
fear
Phlegmatic
surprise
Phlegmatic
disgust
Phlegmatic
sadness
Phlegmatic
anger
Melancholic Melancholic
happiness
Melancholic
Fear
Melancholic
surprise
Melancholic
disgust
Melancholic
sadness
Melancholic
anger
It is supposed that Phlegmatic ROBO – intelligence to this stage of its development possesses
such first level emotion elements as: Happiness, Fear, Surprise, Disgust, Sadness, and Anger.
More the Phlegmatic ROBO – intelligence possesses the first level elements - features of
Phlegmatic temperament. In such situation the higher level elements of Phlegmatic ROBO –
intelligence (the cell-elements in Table 4) can be developed using theses first level of
Phlegmatic ROBO – intelligence elements.
4.2. Temperament states.
Depending on the temperament man lives different states Table 5 this work needs to be paid
special attention.

Proceedings of the IE 2015 International Conference
www.conferenceie.ase.ro
596
Table 5. Temperament ROBO – intelligences with emotions sub-types.
Emotions
/
Temperaments
Happiness Fear Disgust Anger Sadness Surprise
Choleric Fearless Cheerfully Intolerant Vindictive angry,
stunned
Astonished
Sanguine Pleased Anxious Irritable Cranky Depressed Impressed
Phlegmatic Controlled Inert,
Impenetrable
Patient Calm,peace
support
Compassion
(he relieve
the
suffering)
Balanced
Melancholic Unbalanced Closed,
hidden
Impatiently Control
avoid
situations /
places
Depression Intemperate
4.3. Adapter’s Pragmatic Examples components of Temperament EQ Each element cell in the tables below need to be defined by its ADAPTER. In Table 6 presents
pragmatic examples of the two elements of ROBO - emotional intelligences character that can
stimulate and generate data according to the character's emotions.
Table 6. ROBO - emotional intelligences nature
emotions
combined
with
characters
Happiness Fear Surprise Disgust Sadness Ager
Choleric choleric happy
(a favorite
football team
won)
choleric
fearful
(fears he
will not be
able to
arrive on
time)
choleric
wondering
(colleague
has done
better than
him)
Choleric
disgust
(was awakened
from sleep)
choleric sad
(got sick, you
had to have a
business
meeting)
choleric
enraged
(from an
assembly did
not show any
member of the
organization)
Sanguine The sanguine
happy
(won a trip to
the U.S.)
The
sanguine
fearful
(fears he
will not be
able to
perform the
work
proposed)
The
sanguine
wondering
(friend won
a trip to the
dream)
The sanguine
disgust
(someone
broke the rules
in front of)
The sanguine
sad
(not accepted
for a trip to
France)
The sanguine
anger
(not received
the torch
command
name day)
Phlegmatic phlegmatic
happy
(project was
named best)
Phlegmatic
fear
(will not be
acceptable
to those of a
particular
organizatio
n)
phlegmatic
wondering
(managed
to amaze a
whole room
with his
ideas)
Phlegmatic
disgust
(before
meeting
someone dirty
clothes coffee)
phlegmatic
sad
(with a few
minutes
failed to
submit
timely
project that
worked)
phlegmatic
angered
(someone stole
business ideas)

Proceedings of the IE 2015 International Conference
www.conferenceie.ase.ro
597
Melan
cholic
melancholy
happy
(has been
accepted for a
scientific
research study)
Melancholi
c fear
(will not be
able to fit in
the time
limit)
melancholy
wondering
(Received a
higher
salary than
expected)
Melancholic
disgust
(he was
mocked by
someone)
melancholy
sad
(was fired)
melancholy
angered
(ideas which
were worked
much
appreciated as
unsuccessful)
If we combine all 3 steps of ROBO-intelligences evaluation (Intelligence, Creativity top, and
Emotions) we can create all four types of ROBO-intelligences with Creativity, Temperament,
and Emotions.
Each temperament robot will have his own features, which at the same time shows us that
everyone’s personality is unique and consists of a combination of features.
Artificial creative and emotional intelligence can become a great help to people working with
consumers daily because such robots can determine a human personality and show an idea of
how to interact with them.
Conclusion
Complexity of physical, intellectual and spiritual work determines hardness to which individual
can achieve superior qualities from the pyramid of “type of works” [5]. They should be lived
consciously by the people in order to be introduced into the AI. On the background of society
degradation, there are also people who showed brilliant and unimaginable skills.
Specializing of European space in services and technologies, demonstrates the transition of the
society from the physical to the intellectual and spiritual work. Implementation of these
qualities in ROBO-intelligence would be next step in formation of Consciousness Society.
Emotions, creativity, personality - all these are important features of human being, but lately,
they are used incorrectly leading to conflicts which can be avoided. In order to avoid we can
attach all those features to a robot and make it help us with usual activities.
The way our emotions work is a science in the true sense. Emotional Intelligence involves
bringing emotions to their true place in our lives everyday, its use is relevant to everyone and
is applicable in all environments and professions.
In computers, things evolve exponentially. In just a few generations the robots left the scientific
fantasy, curiosity, and play on the field developed psyche, creativity, the intelligent, emotion
and human spirit to replace or augment their human counterparts.
We're already at the point where you have to consider the next step of evolution in robotics.
According to engineers robotics, it seems that at some point in the near future, the next step
could be a great expansion in robotics. Convince us of this fact predictions, or rather performed
by specialist plans for the future:
(1) The human mind can be downloaded and inserted into the robot's memory in less than 10
years, enabling them to live forever people, these plans are supported by Russian entrepreneur
Dmitry Iţkov who said it has hired 100 scientists carry out the project, called „Avatar'';
(2) Around 2050 in Massachusetts will be legalized marriage with robots, believes David Levy.
It seems ironic that these sentient robots only take so by injecting them with humanity .... The
fact is that robots are nothing without the potential that the human brain is nothing but a
computer do various tricks to emulate.

Proceedings of the IE 2015 International Conference
www.conferenceie.ase.ro
598
True, we have a long way to go to reach our full potential, but '' The world is a true treasure in
changing thing'' and we conclude that the next few years will realize many changes, real
changes for humanity.
In Conscious Society (2019 – 2035) Artificial Intelligence will be equal with the value of
structured Natural Intelligence (IN)
IA = IN structured
In the advanced period of the Society the formula will evaluate in IA > IN structured, from
here starts to activate Artificial Conscience that is the next step in the development of the
Human Society – it will be already ROBO-human Society.
Using Adaptable Tools [13] ROBO-intelligences, represented by its pragmatics as was done
in this research, can be completed with its usage context, its syntax (representation forms), its
semantics (represented by the algorithms of their creation) and by the examples of its higher
level elements. That work have to be done in the nearest feature.
Adaptable tools are based on the usage of ADAPTER. The ADAPTER is a mechanism of
adaptable interactions human-machine on the axes: language, processor, data, actions,
definition and appeal from the point of view of usage in adaptable programming. Adaptable
programming technology is a new direction in drawing up the targets for programming systems
of perspective and adaptable programing technology is practiced via extension and reduction
of ROBO-intelligences creation process.
The Adapter is a metalinguistic instrument with direct contacts with the functioning
environment consist of a) language and translator, b) data and actions (operations, instructions
and conduct) and c) usage and defining activities of the new elements;
The Adapter represents each new element via other elements defining 1) pragmatics of new
element; 2) its syntax (shape) 3) semantics (content – its functional expression given via lower
level elements), 4) context of the new element usage and 5) one or more examples of presenting
the new element.
The Adapter for each of the elements of the 2 level of the emotional ROBO – intelligences have to be presented by the cell element which is processed by presenting it (Table 7) as an
Adapter pragmatics, syntax, content, context and examples of usage.
Table 7. Adapter serving emotional ROBO – intelligences
Adapter
vs
Temperament
Pragmatics Syntax Semantics Context Examples
Choleric Choleric
seeks to be
in control
of
situations,
to be on top,
to be the
best.
Choleric in
syntax use
imperative,
commanding
language,
wording
things as
orders rather
than
requests.
Choleric in
semantics are
firm and
forceful in
their approach
to problems.
They believe in
'tough love’
and try to 'help'
others by
challenging
them to prove
themselves, as
they
They're more
likely to tell
someone who
they are trying
to 'help' that
they're
pathetic,
expecting the
person to say
'no, I'm not
pathetic, I'll
show you!', as
indeed a
choleric would
Their confidence
and demanding
natures make
them natural
leaders, though
this doesn't mean
that they would
necessarily enjoy
leadership
positions; they're
just more likely to
take charge if
necessary rather

Proceedings of the IE 2015 International Conference
www.conferenceie.ase.ro
599
themselves
would.
in response to
such a thing
than fumbling
around worrying.
Sanguine Sanguine
people are
boisterous,
bubbly,
chatty,
openly
emotional,
social
extroverts.
Sanguine fear
consists of 2
syntactic
parts : fear
and
sanguinity
Sanguine fear
of the ROBO –
intelligence
semantically is
defined with
the
contribution of
the semantic
functions of
the
intelligence,
fear and
sanguine fear
Sanguine
ROBO –
Intelligence “is
worried” like a
Sanguine
Sanguines find
social interactions
with faces both
familiar and
unfamiliar
invigorating. This
is how they
recharge, and time
alone - while
sometimes
desirable - can
bore them quickly
Phlegmatic Phlegmatic
do not act
as if they
are better
than others.
They are
eager to
please, and
quick to
give in to
others
rather than
asserting
their own
desires as if
they're the
most
important.
Conflict
terrifies
them. They
do not start it
(except
perhaps in
extreme
circumstance
s), or provoke
it, and try to
defuse it
when it
comes up.
When forced
into an
argument,
they get very
upset and
distressed,
seeking
escape rather
than victory.
Semantic
Phlegmatic
tries and words
things in a way
that is not
offensive to
others. The
will be more
supportive
than critical
Phlegmatic
Robo
intelligence
barely
expresses
emotion at all.
While the
sanguine might
whoop and
cheer and jump
for joy at the
slightest
provocation,
phlegmatics
are unlikely to
express more
than a smile or
a frown. Their
emotions
happen mainly
internally.
The phlegmatic
members of a
pack might have
been the obedient
followers who'd
get much of the
actual work done
at the command of
their superiors.
They may not
stand out, but
without them,
nothing would
work.
Melancholic The
defining
feature of a
melancholi
c attitude is
perfectionis
m. They are
idealists
who wish
for things to
be a certain
way, and
they get
distressed
They are very
wary of
making
friends.
Unlike
sanguine, it
can take them
a very long
time for them
to consider
someone
they're
familiar with
a 'friend', but
once they've
They are
moved deeply
by beauty, and
by distress.
They are very
easily hurt,
because of
their
perfectionistic
tendencies.
Often their
moods are like
delicate glass
sculptures;
built up
They respond
to things that
they dislike
with misery
and with tears
rather than
with rage.
The melancholic
members of a
pack may have
been the analysts,
the information
gatherers. They
scouted for
potential danger,
or for food, and
reported back to
the pack leader.
The more accurate
their findings
were, the better;
this led to a trend

Proceedings of the IE 2015 International Conference
www.conferenceie.ase.ro
600
when they
are not.
reached this
point, they
will likely
stick with
that person
loyally.
slowly,
deliberately,
and carefully,
but easily
broken, and
hard to repair
once shattered.
towards
perfectionism, as
the 'analysts'
closer to
perfection
survived better
than those that
made sloppy
mistakes.
References 1. Mihalcea, R., Rosca, I-Gh., Todoroi, D. “Sisteme informatice in Societatea Conştiinţei.” In
Analele ASEM, Editia a VIII-a, Editura ASEM, 2010, p. 341 – 360.
2. Mihalcea, R., Rosca, I-Gh., Todoroi, D. “Discovering and managing Creativity in
Conscience Society.” In Analele ASEM, Editia a IX-a, Editura ASEM, Chişinău-2011, pp.
225 – 239.
3. Todoroi, D., Creativity in Conscience Society, LAMBERT Academic Publishing,
Saarbrucken, Germany, 2012. ISBN: 978-3-8484-2335-4
4. Todoroi, D., Rosca, I-Gh. “Intelligence development creativity features leveling in
Conscience Society.” In Analele ASEM, Editia a XI-a, Editura ASEM, Chişinău-2013, pp.
278– 290. ISSN 1857-1433
5. Todoroi, D. Crearea societăţii conştiinţei, MaterialeleTeleconferinţei Internaţionale a
tinerilor cercetători “Crearea Societăţii Conştiinţei”, Ed. a 3-a, 11-12 aprilie 2014,
Chişinău, 129 pagini / coord.: Dumitru Todoroi: ASEM (Chisinau, Republic of Moldova),
ARA (CalTech, Los Angeles, USA), UAIC (Iashi, România), ISU (Chicago, USA), UB
(Bacău, România), UC (Cluj, România), ASE (Bucharest, România). ISBN 978-9975-75-
612-6.
[6]. Rifkin, J., The Empathic Civilization: the race to global consciousness in a world in crisis,
Penguin Books Ltd., New York, 2009, ISBN 978-1-58542-765-9
[7] Todoroi, D., Creativity’s Kernel Development for Conscience Society, Informatica
Economică, Bucharest, vol. 16, no. 1/2012, pp. 70 – 86
[8] “Mayer-Salovey-Caruso Emotional Intelligence Test (MSCEIT), by J. D. Mayer, P.
Salovey, and D. R. Caruso, 2002, Toronto, Ontario: Multi-Health Systems, Inc.
[9] Brackett, M. A., & Mayer, J. D. (2003). Convergent, discriminant, and incremental validity
of competing measures of emotional intelligence. Personality and Social Psychology
Bulletin, 29, 1147-1158.
[10] Brackett, M.A., Rivers, S.E., Shiffman, S., Lerner, N., & Salovey, P. (2006). Relating
emotional abilities to social functioning: A comparison of self-report and performance
measures of emotional intelligence. Journal of Personality and Social Psychology, 91,
780-795.
[11] http://dexonline.ro
[12] http://www.thefreedictionary.com/dedication
[13] Todoroi, D., Micuşa, D., Sisteme adaptabile, Editura Alma Mater, Bacău, România,
2014, 158 pagini. ISBN 978-606-527-347-4

Proceedings of the IE 2015 International Conference
www.conferenceie.ase.ro
601
MODELING THE RELATIONSHIPS NETWORKS INSIDE GROUPS
AS GRAPHS
Diana RIZESCU (AVRAM)1 Bucharest University of Economic Studies
[email protected] Vasile AVRAM
Bucharest University of Economic Studies [email protected]
Abstract. The aim of this paper is to establish a common conceptual “framework like” for representing
relationships between elements (agents, parts, individuals) inside of complex systems such as social
and economic systems does no matter they based on agents or based on humans. The representation
realizes analogies with the human brain and psyche in a permanent effort in using the models inspired
by brain and psyche to model social and economic systems. The goal is to find a proof graph
representation of the network relationships inside of “social groups” (does no mater if is a small group,
an enterprise or an entire social system) and to create the possibility to realize the measurements
regarding its internal and external complexity. The graph framework like developed here allows to
represent the attractors and their basins as neighboring relationships that are proof using two Euler
formulas, one specific to graphs and another, proposed here, for sphere to check the completeness.
Keywords: agents, complex systems, emergence, graphs, relationship graph JEL classification: A10, C30, C67
1. Introduction We consider that an objective reality is that in which about every item we can say that is true or not. A
model of the world can be achieved using these true considered elements to mentally represent that
external world and thus to define for that a formal model. Relations between elements of the world seen
results from some cause (have a causal), it means from the sensory data received from this and some
form of coding these signals in the formal system. The formal system thus constructed is handled by
the mind through what we call inference. The simplest way to represent the components of a system is
realized by the input-output (I/O) diagram that describes a transition, modeled mathematically as
p:I→O, where each block is an Agent that realizes changes on the inputs to obtain outputs (Figure 1).
Figure 1. The Representation of Agents as Transaction
We consider that the Agent have two kinds of behavior observable from outside [2]:
- Internal, represented by the operations intrinsic to the Agent (learning, reasoning, decision);
- External represented by the communication and reactions/ interactions with other agents and their
environment.
When we build an agent based system these behave as basic blocks of a software system that uses at
least two technologies, artificial intelligence (AI) and object-oriented (OO) distributed processing. The
resulted software system have the functionality that maps inputs into outputs via pre-established
processing and is reactive by that it focuses on interactions between components as reaction/ response
1 „This paper was co-financed from the European Social Fund, through the Sectorial Operational Programme
Human Resources Development 2007-2013, project number POSDRU/159/1.5/S/138907 "Excellence in
scientific interdisciplinary research, doctoral and postdoctoral, in the economic, social and medical fields -
EXCELIS", coordinator The Bucharest University of Economic Studies”.

Proceedings of the IE 2015 International Conference
www.conferenceie.ase.ro
602
to stimulus from external world and not as traditional applications where important is the execution flux
(this dictates also the predefined/ pre-established reactions. In this “agents society” the agent have the
properties of atomicity (is indivisible), consistency and isolation (is closed and is not affected by the
environment changes) and, durability (its effect is permanent without any “roll-back”). In this context
we can see a system with agents as a network of such interactions and the relationship system do not
represent nothing than a special case of transition of that kind. A way to understand natural and artificial
systems, and also to model them, is represented by the relationships structure between its composing
elements (or parts). In a relational system the outputs of on agent can be inputs for on or many other
agents. The transformation p() is a functional component having the property it exists independently of
material parts that makes it possible (of course the death/ damaging of material part can result in
incapacity of perception of the observer so as scientifically demonstrated recently for the soul). The
complex systems do not necessitate a central processor. The results of recent studies in neurobiology
and cognitive psychology exploit the idea that the emergence of consciousness and self consciousness
are dependent on the rate of production of “cells meta-assemblies” as neural results of self-reflection.
A provision mental state is understood as a global system status that is caused by nonlinear local
complex interactions of its parts, but can not be reduced to such parties [1]. Topological measurements
of these kind of complex networks showed a striking similarity to their many other types of networks,
but completely different and parts of the objective reality (such as Internet, electrical circuits food chains
etc.).
2. From Local to Global Organization
To pass from a local coordination level to a global level of the organization, we must keep in mind that
all interactions between agents inside the complex system will tend to a coherent, stable status, until
agents adapts (mutually) to each other. This process accelerate generally due to the positive feed-back.
The reason is that after two or more agents attains a mutual fit status that defines a stable assembly to
which the other remaining agents can adapt by trying to fit in the existing assembly. As the assembly
grows (become larger) this provides “niches” to which other agents can fit. As many agents joins the
assembly as this become bigger and the provided “niches” to agents to join become bigger too. Thus
the assembly will raise exponentially until will cover the entire global system. This grows is typically
more rapid when the agents are identical (as for example the molecules of the same substance) or similar
(as for example the individuals of the same specie), because the solution given by an agent will be
adopted by the others so that in the future, once found a good local arrangement, will be necessary only
minimal “trial and error”. This is typical of natural self-organization processes as crystallization,
magnetization or the emergence of coherent laser light. When the agents are all different each one at is
turn must explore to find its unique “niche” in a medium that continuously evolves, resulting a less
exploding development. In the case of identical agents the emerging global structure is typically
uniform or regulated, because the optimal arrangement for one agent is also optimal for the others
agents. As a result, the self organization produces a perfect ordered pattern. When the agents are
different as in a ecosystem or a market the resulted structure is more complex and unpredictable.
3. Global Dynamics
If we now consider the system as a whole - rather than individual agents - we can see that the system
undergoes variation. Self-organization means therefore that the system found an attractor, as for
example a part of the state space where it can enter but can not leave. In this respect, the attractor is a
preferred region of global dynamics: surrounding attractor states (the attractor basin) are unstable and
will eventually be lost and replaced by states inside the attractor In nonlinear systems must keep in
mind that the equation of evolution can provide solutions each of them being nothing but a pattern of
behavior. The attractor for a such system represents an equilibrium position that is unique and describes
a time invariant (independent of) situation. The equilibrium state becomes a universal attractor point.
The stability is essentially determined by the response of the system to perturbations.
If X={X1, X2, …, Xn} is the multitude of system inputs then we will consider them as evolving in time
Xi(t) and the perturbation will be highlighted as a stable state of them to moment t to which added the
correction, Xi(t)=Xi,s+xi(t), and the system’s equation can be defined as:

Proceedings of the IE 2015 International Conference
www.conferenceie.ase.ro
603
𝑑𝑥𝑖
𝑑𝑡= 𝐹𝑖({𝑋𝑖,𝑠 + 𝑥𝑖}, 𝜆) − 𝐹𝑖({𝑋𝑖,𝑠}, 𝜆), by which the time dynamics of system (
𝑑𝑥𝑖
𝑑𝑡) is defined
by laws of the changing rate of the system (𝐹𝑖) applied to the snapshot of the system stable state (𝑋𝑖,𝑠)
to which is highlighted the perturbation (𝑥𝑖) as a correction (by incrementing or decrementing) of the
input and with the condition of considering the changing of the parameters (𝜆) by the external world to
the system (control parameters) [3].
Self-organization means to search new attractors appearing when system is far away of equilibrium
state. When in the same space exists more attractors each of them have its own attraction basin
containing the state sets from which starting the system goes to a specific attractor.
The coexistence of multiple attractors is common to systems and shows an adapted behavior able to
achieve regulating tasks. For systems based on informational message exchanges we can define the
attractor as communication of information and interaction of some kind with another agent with the
goal to solve a certain type of problems (in the area of specialization of the agent).
In the human systems the connectivity reflected by that a decision or an action of an individual (group,
organization, institution, human system) will affect all other related individuals in the system. The effect
do not have a uniform impact but vary directly with the state of each individual related at a time.
The connectivity applies to the interrelationship of individuals inside a system and also to the kinship
human systems. Self-organization in this context is taken to mean the group of individuals gathering
together to perform a specific task.
4. Relationship Structure
For being able to determine the regularities of such systems we must be able to define a graph G=(V,M),
for the analyzed system. We denote by V={ vi }, (i=1, 2, …, N) the vertices/ nodes multitude and by L
={ (vi, vj) } the multitude of links/ edges, it means the oriented graph connecting the ordered vertices
pairs, Λ= (V, L). The edge {i,j} is the line starting in the vertices i and ending in the vertices j. The
directed edges are called arcs. Two vertices i and j are called adjacent if they connected by at least one
edge. Each node i is characterized by its degree ki, defined as the number of attached edges. Similarly,
we define the input-degree, kiI, as the number of input edges (links) and output-degree, ki
O , as number
of exiting edges, and with respect of formula ki= kiI + ki
O. The sum of degrees of all nodes is an odd
number. Depending on the existence/ inexistence of directionality in the graph edges this can be
directed, respectively, undirected graph. Some graph G can be used to represent the structure of a system
by considering the system’s elements (parts) as nodes and the edges its interactions. If N is the number
of vertices (nodes) and L is the number of links of the graph then the mean degree (Gm) is Gm=2L/N,
because each edge is attached to two nodes.
5. The Network Structure
Conventionally a network structure is modeled as a graph G which consists of a set of vertices (nodes)
V and a set of edges (and/or arcs) M that we define as unordered pairs of distinct vertices. A path (way)
in G from node vo to node ve is defined as an alternative sequence of nodes and edges (vo, m-1, v1,... me,
ve), where mi = {vi-1, vi} are the edges that realizes the connection to next nodes with respect that no
node can be traversed two or more times. Such a path is not necessarily unique. The length of the path
is given by the number of its nodes. The degree of a node x is given by the number of edges containing
x, for example the number of its neighbors: deg(x)=|{mϵM|xϵm}|= |{yϵV|{x,y}ϵM}|=|σ{x}|, where |A|
defines the cardinality (the number of elements) of the set (multitude) A. If between two nodes vi and
vj exists an edge then the nodes are called adjacent and the adjacency relationship can be quantified by
the term aii=1 and the not adjacent by the term aii=0, of the adjacency matrix AN,N of the graph G,
denoted by A(G).

Proceedings of the IE 2015 International Conference
www.conferenceie.ase.ro
604
Figure 2. Nodes Neighboring
The degree of node i computed as sum of all inputs in the line i of the matrix and the total adjacency of
a graph as sum over all elements of the matrix, such: 𝑎𝑖 = ∑ 𝑎𝑖𝑗𝑁𝑗=1 ; 𝐴(𝐺) = ∑ ∑ 𝑎𝑖𝑗
𝑁𝑗=1
𝑁𝑖=1 = ∑ 𝑎𝑖
𝑁𝑖=1 .
Equivalent, we can define deg(x) as the number of edges incident with the node x and we can consider
the degree of inputs and outputs. The adjacency of undirected graphs (each edge is seen for both related
nodes) is greater than those of directed (because here we consider only the link in the direction indicated
by arrow). The mean degree of the node denoted by <ai> and the connectivity (Conn) are determined
by formulas: < 𝑎𝑖 > = 𝐴(𝐺)
𝑁 ; 𝐶𝑜𝑛𝑛 =
𝐴(𝐺)
𝑁2 =2𝑀
𝑁2 .
The distance d(x, y) is the length of the shortest path in G connecting the node x with node y. If a
connection path between x and y don’ exist we set d(x, y) = . Thus the graph G is connected if and
only if d(x, y) is finite, V x, y ϵ V (x≠y). d(vo, ve) represents the less number of nodes that must be
traversed to attain ve from vo. This number is an integral if we don’t have weighted graphs. The mean
length of a path (l) in a graph with N nodes is given by formula 𝑙 =1
𝑁(𝑁−1)∑ 𝑑(𝑣𝑖, 𝑣𝑗)∀𝑖,𝑗 . In a random
graph the mean length l rise lower the rise of the graph magnitude. The neighbors of a node can be
grouped on categories depending on the number of arcs needed by the path between them, namely
primary neighbors (category zone 1, z1), secondary neighbors (category zone 2, z2), tertiary neighbors
(category zone 3, z3), etc. The set of the neighbors of some node x is σ{x}= {yϵV|{x,y}ϵM}. If we fix
some node x then we can define its neighbors by grouping them depending on the distance between
them as primary, secondary, tertiary, … neighbors that will be included in the corresponding (suitable)
neighboring zones z1, z2, …, zn (Figure 3). The concentric circles with dotted line have the role to
demarcate the neighboring zones (the levels). This representation is suitable to highlight node
adjacency and their degree. To check and verify the neighboring completeness of a specific level we
propose using the Euler’s equation for spheres: if a surface of a sphere is cut into F facets with E edges
and V nodes then we have the equality: V-E+F=2. This equation can be proof by realizing the subgraph
of the interest neighboring order (as for example in Figure 2) and by adding to this fictitious edges
between the nodes of the same level, to form the facets, as illustrated in Figure 3 by the red lines. To
level 2 is defined a dashed fictitious broken line only for understanding reasons in the flat
representation.
In that way we define the facets as if they obtained by cutting a sphere in which our graph can be
inscribed. For each neighboring zone we number the vertices (nodes), and the edges and arcs and check
by the formula. For given example in Figure 3 we have:
- Primary neighbors: (z1): V=1+6=7; E=6+6=12; F=7, hence V-E+F=7-12+7=2
- Secondary (z2): V=1+6+8=15; E=6+6+16=28; F=6+8+1=15, hence V-E+F=15-28+15=2
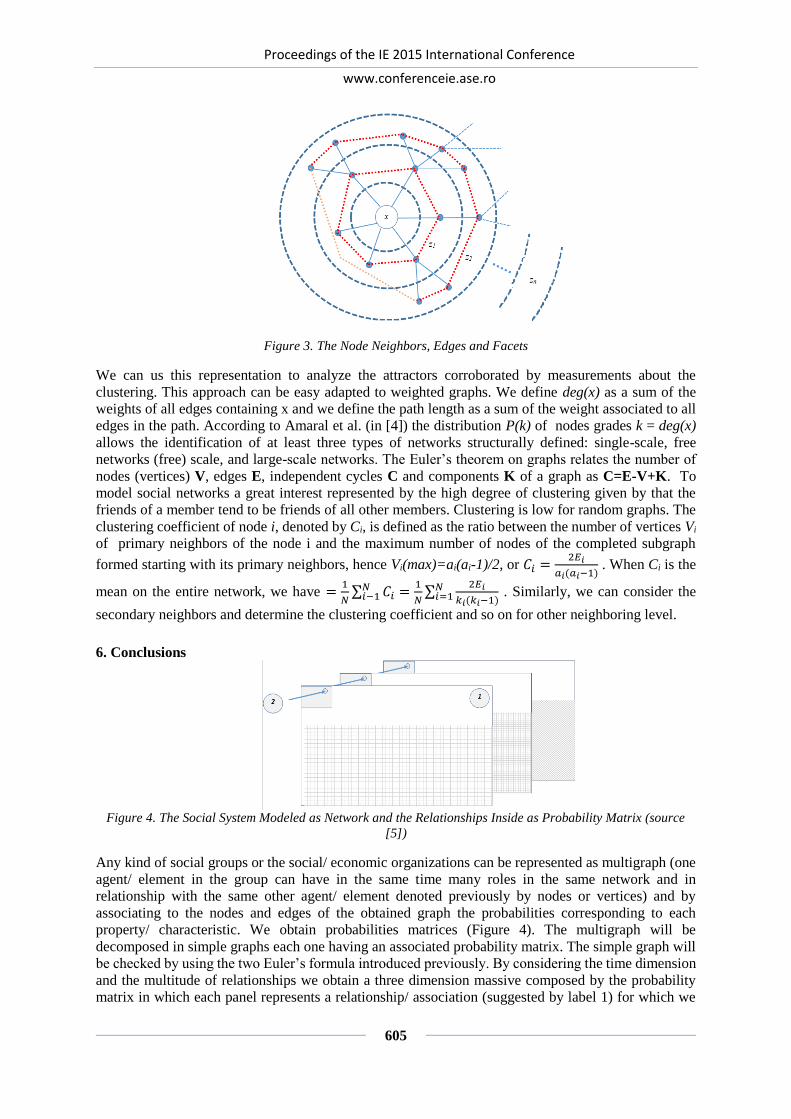
Proceedings of the IE 2015 International Conference
www.conferenceie.ase.ro
605
Figure 3. The Node Neighbors, Edges and Facets
We can us this representation to analyze the attractors corroborated by measurements about the
clustering. This approach can be easy adapted to weighted graphs. We define deg(x) as a sum of the
weights of all edges containing x and we define the path length as a sum of the weight associated to all
edges in the path. According to Amaral et al. (in [4]) the distribution P(k) of nodes grades k = deg(x)
allows the identification of at least three types of networks structurally defined: single-scale, free
networks (free) scale, and large-scale networks. The Euler’s theorem on graphs relates the number of
nodes (vertices) V, edges E, independent cycles C and components K of a graph as C=E-V+K. To
model social networks a great interest represented by the high degree of clustering given by that the
friends of a member tend to be friends of all other members. Clustering is low for random graphs. The
clustering coefficient of node i, denoted by Ci, is defined as the ratio between the number of vertices Vi
of primary neighbors of the node i and the maximum number of nodes of the completed subgraph
formed starting with its primary neighbors, hence Vi(max)=ai(ai-1)/2, or 𝐶𝑖 =2𝐸𝑖
𝑎𝑖(𝑎𝑖−1) . When Ci is the
mean on the entire network, we have =1
𝑁∑ 𝐶𝑖 =
1
𝑁𝑁𝑖−1 ∑
2𝐸𝑖
𝑘𝑖(𝑘𝑖−1)𝑁𝑖=1 . Similarly, we can consider the
secondary neighbors and determine the clustering coefficient and so on for other neighboring level.
6. Conclusions
Figure 4. The Social System Modeled as Network and the Relationships Inside as Probability Matrix (source
[5])
Any kind of social groups or the social/ economic organizations can be represented as multigraph (one
agent/ element in the group can have in the same time many roles in the same network and in
relationship with the same other agent/ element denoted previously by nodes or vertices) and by
associating to the nodes and edges of the obtained graph the probabilities corresponding to each
property/ characteristic. We obtain probabilities matrices (Figure 4). The multigraph will be
decomposed in simple graphs each one having an associated probability matrix. The simple graph will
be checked by using the two Euler’s formula introduced previously. By considering the time dimension
and the multitude of relationships we obtain a three dimension massive composed by the probability
matrix in which each panel represents a relationship/ association (suggested by label 1) for which we

Proceedings of the IE 2015 International Conference
www.conferenceie.ase.ro
606
can compute measurements as mutual entropy, normalized mutual entropy and marginal entropy or the
proposed equivalents based on informational energy when we use excerpts. Once obtained the
probability matrices they can be used as inputs for the models to commensurate the internal and external
complexity (as shown in [5] and [6]), for example. This model will be extended and adapted to realize
the modeling of the relationships in the general model used to integrate the vary brain and psyche
models realize and make cooperate them.
References
[1] K. Mainzer, (2007) Thinking in Complexity - The Computational Dynamics of Matter, Mind, and
Mankind, ISBN 978-3-540-72228-1, Springer.
[2] H. Lin, (2007) Architectural Design of Multi-Agent Systems: Technologies and Techniques, IGI
Global.
[3] J. Moffat, (2003) Complexity Theory and Network Centric Warefare, CCRP Publication Series.
[4] L. A. N. Amaral, A. Scala, M. Barthélémy, and H. E. Stanley, (2003), “Classes of small-world
networks”, Applied Physical Sciences, Proceedings of the National Academy of Sciences USA,
doi: 10.1073/pnas.200327197, pp. 11149–11152.
[5] D. Rizescu and V. Avram, (2013). Using Onicescu's Informational Energy to Approximate Social
Entropy. Procedia - Social and Behavioral Sciences, Volume 114, 21 February 2014, ISSN 1877-
0428, pp. 377-381.
[6] V. Avram and D. Rizescu, (2014) Measuring External Complexity of Complex Adaptive Systems
Using Onicescu’s Informational Energy, Mediterranean Journal of Social Sciences, Vol. 5 No.22,
August 2014, Rome-Italy, ISSN 2039-2117, DOI:10.5901/mjss.2014.v5n22p407, pp. 408-417.

Proceedings of the IE 2015 International Conference
www.conferenceie.ase.ro
607
A SEMANTIC MOBILE WEB APPLICATION FOR RADIATION
SAFETY IN CONTAMINATED AREAS
Liviu-Adrian COTFAS
University of Franche-Comté, Montbéliard, France
Bucharest University of Economic Studies, Bucharest, Romania
[email protected] / [email protected]
Antonin SEGAULT University of Franche-Comté, Montbéliard, France
Federico TAJARIOL University of Franche-Comté, Montbéliard, France
Ioan ROXIN University of Franche-Comté, Montbéliard, France
Abstract. After a nuclear disaster, people living in contaminated areas encounter numerous
questions concerning the risk they face and how to reduce it. In this paper, we present a mobile
web application designed to facilitate knowledge sharing amongst the affected population. The
system allows querying and browsing a base of documents gathered both by experts and
through crowdsourcing. The information needs are modeled as set of use-cases, starting from
existing reports on the long-term radiation safety. A semantic search engine is used to retrieve
the resources annotated with a thesaurus of the concepts relevant to long-term radiation safety.
The application is part of a larger crisis monitoring and management system, which also
includes social media aspect-based emotion and sentiment analysis.
Keywords: crisis communication, post nuclear accident, resilience, semantic web JEL classification: L86, H12, H84
1. Introduction
Crisis communication can be defined as information sharing to protect the stakeholders from
the negative consequences of a crisis ([1] quoting [2]). Among the various types of crises, either
natural, or man-made, the post accidental phase of a nuclear disaster, known as the PAN phase,
is considered to have very specific characteristics. This phase begins after the end of both the
emergency and transition phases, when radioactive substances are no longer leaking into the
environment, and the contamination of the territories can be globally assessed [3]. As shown
by existing research, the uncertainty of the population living in the contaminated areas focus
on practical questions such as “Is it safe to stay?”, “what is safe to eat?”, “what is the health
risk?”, “how to reduce it?”. The information required to answer these questions is both highly
technical and controversial. Moreover, the nuclear risk, man-made, invisible, long-lasting,
leads to particularly high levels of fear [4]. An excessively reassuring crisis communication,
such as the one carried out during the emergency phase of the Fukushima Daiichi disaster by
the Japanese government and TEPCO (the plant's operator), was shown to lead to a loss of trust
[5].
A possible solution for communicating useful knowledge to people in crisis situations, consists
in the development of mobile guide applications. Numerous such applications have already

Proceedings of the IE 2015 International Conference
www.conferenceie.ase.ro
608
been issued by both governmental agencies and non-governmental organizations. Some of the
most popular applications are the ones developed by the Federal Emergency Management
Agency [6] and the American Red Cross [7].
In this paper, we propose a crowdsourcing system to help the population facing a PAN situation
in accessing, understanding and sharing the knowledge they need to assess and reduce their
exposure to radiations. Compared to existing approaches, semantic web technologies have been
used to both store the knowledge and facilitate its discovery trough semantic search. While the
crowdsourcing approach constantly supplies the system with the latest information, the
semantic approach provides the necessary structure and information discovery capabilities. The
mobile web application used for accessing the available information is shown in Figure 1.
Figure 1. Mobile web application for the post accidental phase of a nuclear disaster
The paper is organized as follows. The second section focuses on the structure of the semantic
guide, while also highlighting the information needs of the people living in contaminated areas.
In the third section, the semantic search approach is described, while the fourth section presents
the technical approach as well as an overview of the system crisis monitoring and management
system to which the presented application belongs. The last section summarizes the paper and
introduces some of the future research directions.
2. Semantic Guide
The main information needs of people living in the contaminated areas, were established using
several exiting reports on the long-term radiation safety [3], [8]. Starting from these
information needs, several scenarios have been constructed, each of them containing of a set
of activities such as readings, maps and tools, as shown in Figure 2. The readings are composed
of informative texts and pictures, written either by experts or gathered through crowdsourcing.
Similarly, maps provide contextual information, from both official and crowdsourced sources.
The tools consist of small interactive programs which assist users when calculating internal
and external exposure doses or when sharing assistance and knowledge. The scenarios were
structured with the help of members of the CEPN [9]. During their work in the contaminated
areas of Belarus, through the Ethos [10] and Core [11] rehabilitation project, they noticed that,
while people's questions often relate to high-level scenarios like "What is the health impact ?"
or "How may I protect myself ?", these questions cannot be answered without addressing the

Proceedings of the IE 2015 International Conference
www.conferenceie.ase.ro
609
lower-level scenarios: "Is my environment contaminated ?", "How am I exposed ?". Therefore,
a meta-scenario, modelling the dependencies between the scenarios, shown in Figure 3 is
proposed.
Figure 2 One of the scenarios: "How to measure the
contamination of the environment?”
Figure 3. The meta-scenario, articulation the
set of nine scenarios
3. Semantic Search Beside the pre-set browsing paths defined in these scenarios, the system relies on a semantic
search engine allowing users to perform queries on the documents base. Each document
(corresponding to an activity - readings, maps, tools) is annotated with the radiation safety
concepts it addresses. These concepts are defined in a thesaurus of the domain specific
knowledge, stored as a SKOS vocabulary, as shown in Figure 4. The plain text user queries are
automatically annotated using the same set of concepts. The semantic similarity of all
documents is calculated using distances in the graph of concepts [12], [13], [14] and the closest
documents are displayed, as shown in Figure 5. This order can be adjusted through user
feedbacks, as shown in Figure 8.
Figure 4. The semantic knowledge base
The semantic search engine also relies on a semantic representation of the meta-scenario,
integrated in the domain thesaurus. Each document can thus also be annotated with the scenario
it is related to. When a user performs a query, if the system can identify a relevant scenario, it
can provide information on the other scenarios that may be useful prerequisites, as shown in
Figure 6. The search engine thus acts as a two levels recommendation system.
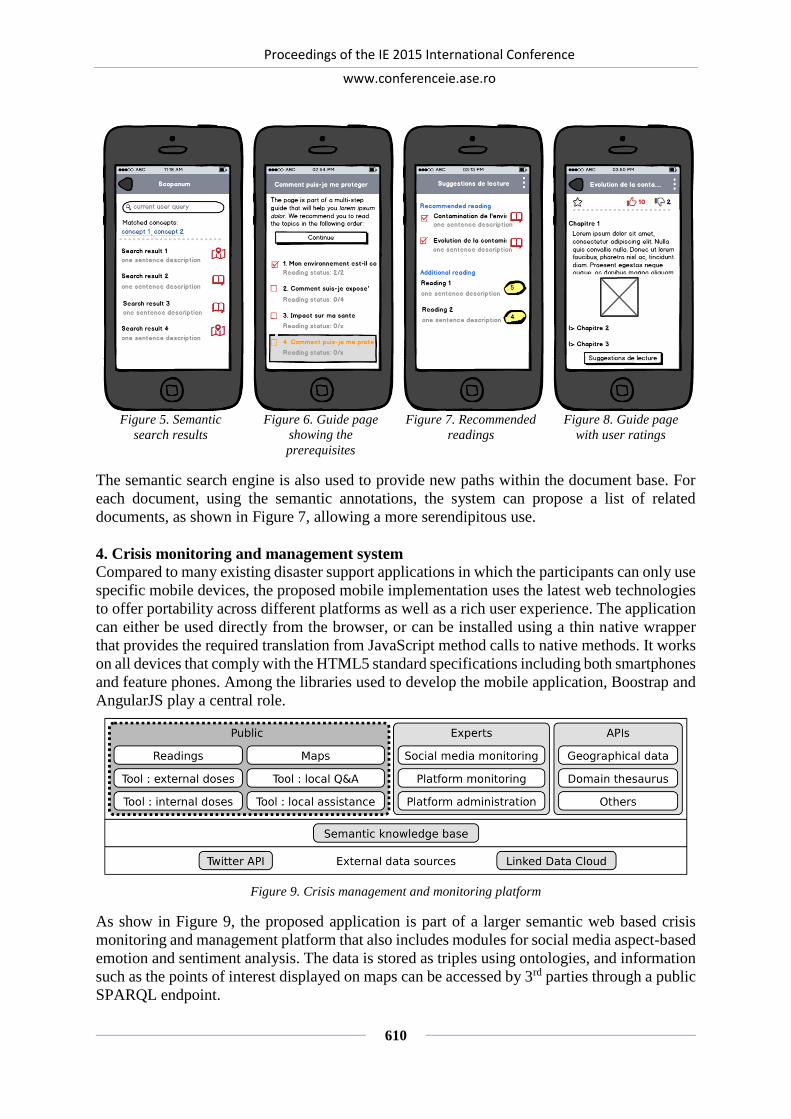
Proceedings of the IE 2015 International Conference
www.conferenceie.ase.ro
610
Figure 5. Semantic
search results
Figure 6. Guide page
showing the
prerequisites
Figure 7. Recommended
readings
Figure 8. Guide page
with user ratings
The semantic search engine is also used to provide new paths within the document base. For
each document, using the semantic annotations, the system can propose a list of related
documents, as shown in Figure 7, allowing a more serendipitous use.
4. Crisis monitoring and management system
Compared to many existing disaster support applications in which the participants can only use
specific mobile devices, the proposed mobile implementation uses the latest web technologies
to offer portability across different platforms as well as a rich user experience. The application
can either be used directly from the browser, or can be installed using a thin native wrapper
that provides the required translation from JavaScript method calls to native methods. It works
on all devices that comply with the HTML5 standard specifications including both smartphones
and feature phones. Among the libraries used to develop the mobile application, Boostrap and
AngularJS play a central role.
Figure 9. Crisis management and monitoring platform
As show in Figure 9, the proposed application is part of a larger semantic web based crisis
monitoring and management platform that also includes modules for social media aspect-based
emotion and sentiment analysis. The data is stored as triples using ontologies, and information
such as the points of interest displayed on maps can be accessed by 3rd parties through a public
SPARQL endpoint.

Proceedings of the IE 2015 International Conference
www.conferenceie.ase.ro
611
5. Conclusion
In this paper, we presented a mobile web application for knowledge sharing amongst people
living a post-nuclear-accident situation. The application includes a semantic search engine
allowing users to browse expert and crowdsourced documents that have been annotated with
domain specific concepts. The development of a prototype for the platform is still a work in
progress. User tests will be conducted with potential users to validate the interface design and
to fine tune the search algorithm. Afterwards, a larger test will then be carried out to evaluate
the impact of the system on users' knowledge and attitudes toward radiation safety. While the
system has been designed for assisting people in post-nuclear accident situations, the proposed
approach can be adapted to other types of crises.
Acknowledgment This study was produced as part of the SCOPANUM reasearch project, supported by grants
from CSFRS (http://csfrs.fr/), and a doctoral grant from Pays de Montbéliard Agglomération
(http://www.agglo-montbeliard.fr/).
References [1] Barbara Reynolds and Matthew W. Seeger, “Crisis and emergency risk communication
as an integrative model,” J. Health Commun., vol. 10, no. 1, pp. 43–55, 2005.
[2] W.T. Coombs, Ongoing Crisis Communication: Planning, Managing, and Responding.
SAGE Publications, 1999.
[3] CODIRPA, “Rapport du groupe de travail « Culture pratique de radioprotection en
situation post-accidentelle »,” ASN, 2011.
[4] Paul Slovic, “Perception of risk from radiation,” Radiat. Prot. Dosimetry, vol. 68, no. 3–
4, pp. 165–180, 1996.
[5] Jessica Li, Arun Vishwanath, and H Raghav Rao, “Retweeting the Fukushima nuclear
radiation disaster,” Commun. ACM, vol. 57, no. 1, pp. 78–85, 2014.
[6] Federal Emergency Management Agency, “Mobile App | FEMA.gov.” [Online].
Available: http://www.fema.gov/mobile-app. [Accessed: 11-Mar-2015].
[7] American Red Cross, “Red Cross Mobile Apps.” [Online]. Available:
http://www.redcross.org/prepare/mobile-apps. [Accessed: 11-Mar-2015].
[8] SAGE Project, Guidance on Practical Radiation Protection for People Living in Long-
Term Contaminated Territories. 2005.
[9] Centre d’étude sur l’Evaluation de la Protection dans le domaine Nucléaire, “CEPN.”
[Online]. Available: http://www.cepn.asso.fr/en/. [Accessed: 11-Mar-2015].
[10] Centre d’étude sur l’Evaluation de la Protection dans le domaine Nucléaire, “ETHOS -
La réhabilitation des conditions de vie dans les territoires contaminés par l’accident de
Tchernobyl en Biélorussie.” [Online]. Available: http://ethos.cepn.asso.fr/. [Accessed:
11-Mar-2015].
[11] United Nations Development Programme, “UNDP Support Project for the ‘Cooperation
for Rehabilitation’ (CORE) Programme in areas affected by Chernobyl.” [Online].
Available: http://un.by/en/undp/db/00011742.html. [Accessed: 11-Mar-2015].
[12] A. Hliaoutakis, G. Varelas, E. Voutsakis, E. G. Petrakis, and E. Milios, “Information
retrieval by semantic similarity,” Int. J. Semantic Web Inf. Syst. IJSWIS, vol. 2, no. 3, pp.
55–73, 2006.
[13] C. Delcea, R-M. Paun, and I-A. Bradea, "Company’s Image Evaluation in Online Social
Networks," Journal of Internet Social Networking and Virtual Communities, 2014.

Proceedings of the IE 2015 International Conference
www.conferenceie.ase.ro
612
[14] G. Orzan, C. Delcea, E. Ioanas and Mihai Cristian Orzan, "Buyers’ Decisions in Online
Social Networks Environment," Journal of Eastern Europe Research in Business &
Economics

Proceedings of the IE 2015 International Conference
www.conferenceie.ase.ro
613
PREDICTING EFFICIENCY OF JAPANESE BANKING SYSTEM
USING ARTIFICIAL NEURAL NETWORKS (ANN): DATA
ENVELOPMENT ANALYSIS (DEA) APPROACH
Ionut-Cristian IVAN
Institute for Doctoral Studies,
Bucharest University of Economic Studies
Abstract. Recent directions of research regarding the efficiency field are mainly connected
with data-mining methodology, resulting thus hybrid models of efficiency scores estimates. The
present paper uses data from 99 Japanese banks while trying to build a learning machine that
could predict, with a given error threshold, the efficiency of a certain DMU (decision making
unit). The initial set of observations is divided into two sub-sets – a training set and a testing
set.
Keywords: Data Envelopment Analysis, Neural Networks, efficiency
JEL classification: C14, C45
This work was cofinanced from the European Social Fund through Sectoral Operational
Programme Human Resources Development 2007-2013, project number POSDRU
159/1.5/S/134197 ”Performance and excellence in doctoral and postdoctoral research in
Romanian economics science domain”.
1. Introduction The Japanese banking system is a unique system, still recovering from the late ’80 economic
bubble that made the stock and real-estate prices to drop dramatically, and also a system that
knows economic disequilibrium during the recent financial crisis. The incongruity of Japanese
banking system comes from the following sources: the existence of special financial
institutions (keiretsu) that acts as intermediary between the financial environment and certain
firms (always the same firm or group of subsidiaries), the stoppage of foreign banks to activate
across Japan, the degree of granularity and the existence of an obvious classification of banks
according to their branches’ spread across the country (inter-regional and intra-regional).
The main idea of this article revolves around the development of a learning machine that could
predict, with a certain degree of error, the estimation of the efficiency score associated with a
bank.
Recently there haven’t been studies that dealt with the idea of implementing data mining
techniques in order to obtain efficiency estimates, but, nonetheless, the following articles must
be considered: “Technical and scale efficiency of Japanese commercial banks: A non-
parametric approach” (Fukuyama, 1993) and “Efficiency in Japanese banking: An empirical
analysis” (Drake and Hall, 2003). The above mentioned articles use data envelopment analysis
(DEA), as a non-parametric tool, to calculate the efficiency scores, based on linear
programming models [1] [2].
In contradistinction to these articles, this paper will use newest data, extracted from the 2012’
reported income statements of the banks and also will introduce supervised learning in order
to help predicting the efficiency score of a new analyzed bank [3].

Proceedings of the IE 2015 International Conference
www.conferenceie.ase.ro
614
The article is structured as follows. The second sections give a short introduction in research
literature. The third section presents in a simple and structured way the main notions that where
use to develop the learning machine. The fourth section is dedicated to the application of the
aforementioned methodology with a short introduction in DEA results. Last section concludes
my research.
2. Literature Review Once the foundations of efficiency techniques were made by Farrell, through his 1957’s work,
"The measurement of productive efficiency", in which Farrell was referring to the idea of
calculating efficiency measures, relative to the convex hull that covers the set of observations
[4], in 1978, Charnes, Cooper and Rhodes introduced the DEA term defining a model with an
input orientation and constant economies of scale. The model was more of a theoretical model
that couldn’t be applied to the real economy, mainly because it considered that all firms operate
at optimal scale. The next step in the development of related non-parametric techniques
methodology was made in 1983, when Cooper, Banker and Charnes included in the linear
programming model the assumption of variables economies of scale. This new model can
differentiate between technical efficiency and scale efficiency, and also can specify in which
part of the economies of scale a firm is found [5].
3. Methodology Prior to the development of the artificial learning machine, the research started with the
application of non-parametric techniques in order to obtain DEA estimates over the observation
set. The simplest linear programming model that can be use to obtain the efficiency scores for
an input orientated approach with constant return to scales, is stated in Coelli’s “An
introduction to efficiency and productivity analysis” (2005) and has the following form (Eq.
1):
minθ,λ
θ
−qi + Qλ ≥ 0 (Eq. 1)
θxi − Xλ ≥ 0
λ ≥ 0 , where θ – scalar, Q – matrix of output, X – matrix of input, λ – vector of constants; in
this case, θ is actually the efficiency score attached to a certain decision making unit [6].
Supplementary constraints are added to ensure the convexity of the envelopment over
the production feasible set, relatively to which the efficiency scores are calculated using the
concept of distance. Practically, the introduction of the convexity of production set constraint,
assures the presence of variable returns to scale.
In the development of the neural network that will be used for predictions, I use the
signal back propagation algorithm [7] in a form of a feed-forward network with bias.
For a simpler representation of the signal back propagation algorithm, I will consider
the following notations:
L1 - the first layer of the neural network (input layer) – associated with index i and p -
number of neurons;
L2 - the second layer of the neural network (hidden layer) – associated with index j and
r - number of neurons;
L3 – the third layer of the neural network (output layer) – associated with index k and
s - number of neurons;
xi, xj, xk – input signal that enters the L1, L2, L3 layers;
yi, yj, yk - the output signal of the L1, L2, L3 layers;
wij - synaptic weights between input layer and hidden layer;

Proceedings of the IE 2015 International Conference
www.conferenceie.ase.ro
615
wjk - synaptic weights between the hidden layer and output layer;
fi - activation function of the neurons from the hidden layer;
fj - activation function of the neurons from the output layer;
ϑ – training rate, ϑϵ(0,1);
Step1. Initialize wij, wjk vectors with random values; consider training rate, and the
maximum tolerable error (as a condition to stop the algorithm);
Step2. Consider a (xn,yn) pair as a network training pair, where nϵ{1,2,...N};
Step3. Determine the activation values of the hidden layer neurons xj = ∑ (wijpi=1 xi)
and output values of the hidden layer yj = fj (xj);
Step4. Determine the values of the activation of neurons in the output layer xk =
∑ (wjkrj=1 yj) and the output value yk = fk (xk);
Step5. Depending on the desired output value ŷ and the actual obtained value yk, the
error term is computed for the output layer’ neurons δk = fk'(xk)( ŷk-yk);
Step6. The error term is calculated for the hidden layer’ neurons: δj = fj'(xj) ∑ (δk ∗sk=1
wjk) Step7. L3 layer’ weights are updated: wjk = wjk + ϑ δk yj
Step8. L2 layer’ weights are updated: wij = wij + ϑ δj yj
STOP. Stop condition is reached when the error established at step 1 is obtained.
4. Empirical Results
While computing the efficiency scores for DEA estimates, I used Fethi and Pasiouras approach
that considers revenues from the income statements as output variables and expenses as input
variables [8]. Thus, I selected net income, interest received and revenues from fees and
commissions as outputs and expenses with fees and commissions, expenses with provisions
and interest paid as inputs. Also, I work in variable return to scale conditions with an input
orientation in computing the distances from observations to the convex hull that covers the data
cloud. I mention that I chose the input orientation, since the banks can change more easily their
inputs rather than their outputs.
Before I started to compute the efficiency scores, I first checked if there are any outlier
observations that could lead to erroneous obtained scores of efficiency.
I considered the inclusion of the analyzed observations in the smallest possible hyper sphere.
The problem was solved by reducing the dimensionality of the representation in a two- or three-
dimensional space and by using the Lagrange method for the minimization of the circle / sphere
that contains our observations (also it can be used certain aggregation methods that could move
the analyzed system in a bi-dimensional space). Once obtained the minimum hyper sphere and
calculated the volume V, we will then calculate n volumes obtained by removing an
observation - Vi, where n equals the number of studied observations; Considering the i-th
observation, if the ratio Vi / V tends to 0, then, the i-th observation is an outlier. A similar test
is performed by Bogetoft and Otto [9] but with an approximation of the volume as the
determinant of a compound matrix, formed by input and output matrices. Space dimensionality
reduction can be performed by applying the methodology afferent with auto - associative neural
networks and/or nonlinear principal component analysis. I suggest the generalized principal
component analysis model. Applying the Oja algorithm [10], which involves changes in
synaptic weights wn according to input values (xn) and output (yn) and a random learning rate
η , according with the following formula (Eq. 2):
Δw = wn+1 – wn = η*yn (xn – yn wn) (Eq. 2)
on a neural network with errors back propagation, will lead to a stable vector of synaptic
weights corresponding to the first principal component; Also, the algorithm can be generalized
to compute more principal components by inserting a number of layers on which Oja's rule can

Proceedings of the IE 2015 International Conference
www.conferenceie.ase.ro
616
be applied. Also, the resulting output variances converge to the eigenvalue associated with the
computed principal component, when the number of iterations tends to infinity (as long as the
activation function is differentiable in the input and in the synaptic weights).
Once applied the above methods I encountered three outliers that were removed from further
analysis. These outliers where actually the keiretsu banks, that were forming a separate cluster.
After applying DEA methodology, I have obtained an average score of efficiency equal to
0.754, meaning that banks could decrease their input by 24.6% and still obtain the same output.
Comparing with the article mentioned in Introduction, the overall average score brings this
research closer to Drake (2003) that obtained 0.72, rather than Fukuyama (2003) [1] [2].
The learning machine have the form of a feed-forward neural network, as it can be seen in
Figure 1, with bias, a 6-6-1 layer formation with six neurons on input and hidden layers and a
single neuron on output layer. The neural network will have its inputs derived from the initial
DEA inputs and outputs and the exit neuron will give us the efficiency estimate.
Figure 1. Architecture of the neural network
As it can be seen, the training phase ended with a 0.044 error term. Prior to the implementation
of the training phase, I defined a partition following a Bernoulli probability distribution, that
allowed me to obtain the percentage of observation that where to be used in the process of
training. Thus, 78% of total number of observation was used as training observations and the
difference as testing observations.

Proceedings of the IE 2015 International Conference
www.conferenceie.ase.ro
617
Also, the neuralnet package in R allows the easy computation of neural networks’ output, being
given the matrix of associated weights, through “compute” function. I applied this function on
the testing set and I have obtained a 0.07 average error.
Further, I parsed the training set into four classes, according to the obtained efficiency
estimates, in order to check the accuracy of the defined neural network while predicting new
DMU’s.
Figure 2. Overall statistics for prediction accuracy
It can be observed that the system predicts the correct cluster with an accuracy of 93%, while
the probability associated with H0: accuracy = 0, tends to 0. Also, Cohen’s Kappa shows a high
level of agreement between classes.
5. Conclusions
The article proposed the development of a learning machine that could correctly predict the
efficiency score of a new DMU. It was observed that the neural networks had good results in
training and testing phase, with small associated errors.
Next research should follow the convergence of the neural networks estimates.
References
[1] Fukuyama, H., “Technical and scale efficiency of Japanese commercial banks: A non-
parametric approach”, Applied Economics 25, 1101–1112, 1993
[2] Drake L., Hall M., “Efficiency in Japanese banking: An empirical analysis, Journal of
Banking Finance”, 891-917, 2003
[3] http://ediunet.jp/
[4] Farell M.J. “The Measurement of Productive Efficiency”, Journal of the Royal Statistical
Society, 253-290, 1957
[5] Charnes, A., Cooper, W.W., “Polyhedral cone––ratio DEA models with an illustrative
application to large commercial banks”, Journal of Econometrics 46, 73–91, 1990
[6] Coelli T., Prasada D.S., “An introduction to efficiency and productivity analysis”, Springer,
2005
[7] Rumelhart D., Hinton G., Williams R., “Learning representations by back-propagation
errors”, Nature 323 (6088), 1986
[8] Fethi M., Pasiouras F. “Assessing bank efficiency and performance with operational
research and artificial intelligence techniques: A survey”, European Journal of
Operational Research, 189-198, 2009
[9] Bogetoft P., Otto L., “Benchmarking with DEA, SFA and R”, Springer, New York, 2010
[10] Haykin S., “Neural networks – a comprehensive foundation”, Prentice Hall, 1999
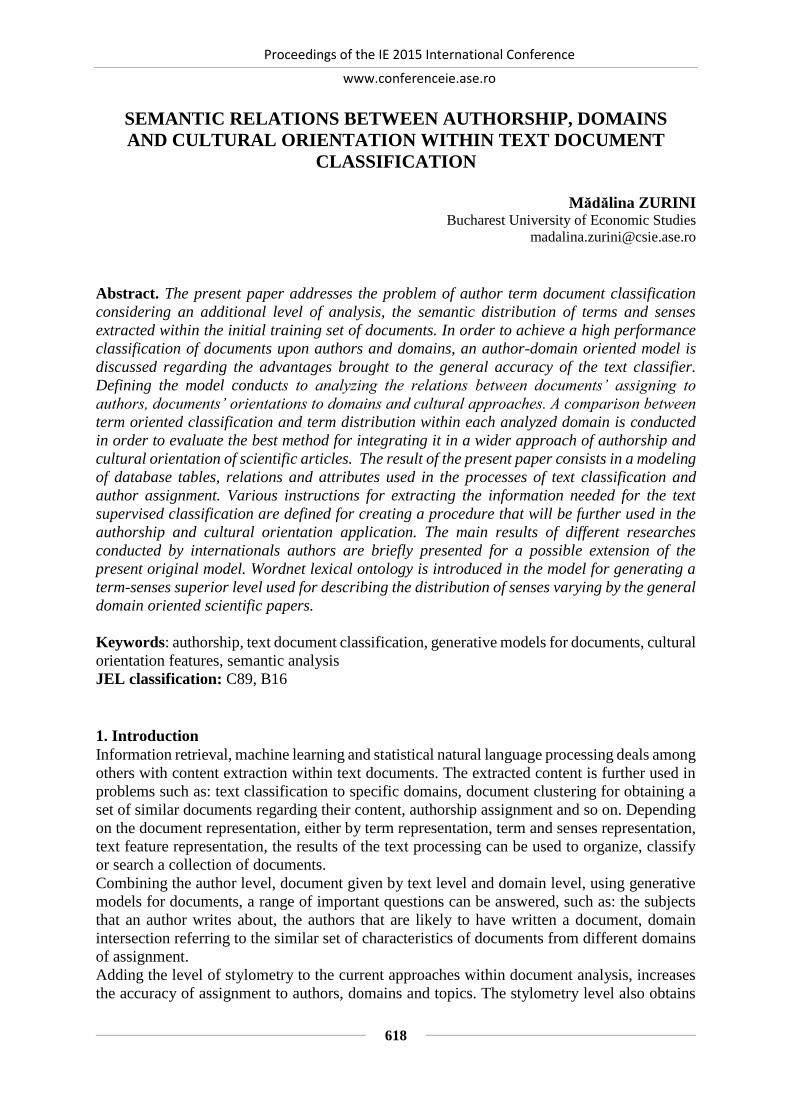
Proceedings of the IE 2015 International Conference
www.conferenceie.ase.ro
618
SEMANTIC RELATIONS BETWEEN AUTHORSHIP, DOMAINS
AND CULTURAL ORIENTATION WITHIN TEXT DOCUMENT
CLASSIFICATION
Mădălina ZURINI
Bucharest University of Economic Studies
Abstract. The present paper addresses the problem of author term document classification
considering an additional level of analysis, the semantic distribution of terms and senses
extracted within the initial training set of documents. In order to achieve a high performance
classification of documents upon authors and domains, an author-domain oriented model is
discussed regarding the advantages brought to the general accuracy of the text classifier.
Defining the model conducts to analyzing the relations between documents’ assigning to
authors, documents’ orientations to domains and cultural approaches. A comparison between
term oriented classification and term distribution within each analyzed domain is conducted
in order to evaluate the best method for integrating it in a wider approach of authorship and
cultural orientation of scientific articles. The result of the present paper consists in a modeling
of database tables, relations and attributes used in the processes of text classification and
author assignment. Various instructions for extracting the information needed for the text
supervised classification are defined for creating a procedure that will be further used in the
authorship and cultural orientation application. The main results of different researches
conducted by internationals authors are briefly presented for a possible extension of the
present original model. Wordnet lexical ontology is introduced in the model for generating a
term-senses superior level used for describing the distribution of senses varying by the general
domain oriented scientific papers.
Keywords: authorship, text document classification, generative models for documents, cultural
orientation features, semantic analysis JEL classification: C89, B16
1. Introduction Information retrieval, machine learning and statistical natural language processing deals among
others with content extraction within text documents. The extracted content is further used in
problems such as: text classification to specific domains, document clustering for obtaining a
set of similar documents regarding their content, authorship assignment and so on. Depending
on the document representation, either by term representation, term and senses representation,
text feature representation, the results of the text processing can be used to organize, classify
or search a collection of documents.
Combining the author level, document given by text level and domain level, using generative
models for documents, a range of important questions can be answered, such as: the subjects
that an author writes about, the authors that are likely to have written a document, domain
intersection referring to the similar set of characteristics of documents from different domains
of assignment.
Adding the level of stylometry to the current approaches within document analysis, increases
the accuracy of assignment to authors, domains and topics. The stylometry level also obtains

Proceedings of the IE 2015 International Conference
www.conferenceie.ase.ro
619
the description of the diversity of an author’s vocabulary, leading to a model for assigning text
documents to a set of authors, further more in the area of cultural orientation analysis.
Authorship attribution, the science of inferring characteristics of the author from the
characteristics of documents written by that author, as presented in [3], is a problem with a
long history and a wide range of application.
In this paper, a general approach of document – author – domain is presented as an initial point
of conducting an extension to cultural orientation. Never the less, semantic analysis is
introduced in the model, using WordNet lexical ontology. WordNet is used for English written
documents with the possibility of identifying the contextual senses of multi-sense used words.
It is proven that transforming the term level to a sense level increases the accuracy of
information extraction from text documents, leading to a high performance in future works
using documents’ representation, such as supervised and unsupervised classification. The paper
presents the classification process at its general function, afterword exemplifying the domains
and codomains of the classification function with problems such as: topics, subjects, authors,
domains, cultures.
In Section 2, the generative models for documents are discussed, using authors and topics,
creating the author-topic model. This model describes the relations between a set of known
authors and a set of given topics. This model narrows the wide representation space of topics
by relating each author to its personal discussing topics within the documents previous assigned
to him.
Section 3 reveals the structure of a database for modelling the process of document
representation, authorship assignment and cultural orientation. For that, using the generative
models described in sector 2, the main attributes, relations, cardinality relations and main
information extraction functions are obtained. Also, the main clustering and classification
algorithms are inserted in the database model for highlighting the area where the parameter
results are to be filled with. Section 4 focuses on the conclusions drawn from the present
research paper, highlighting the future work relating cultural orientation models within
research papers written in English by authors from different cultures.
2. Generative models for text documents Much of the prior work on multi-label document classification uses data sets in which there are
relatively few labels and many training instances for each label, [8]. In [1], the generative
models based on the multi-variant Bernoulli and multinomial distributions are presented as a
widely used method in document representations. In the more recent researches, the spherical
k-means algorithms, with desired properties for document clustering, are used in the special
case of generative models. Generative models of text typically associate a multinomial with
every class label or topic, [7], [2].
The statistical analysis of style, stylometry, as described in [4], is based on the assumption that
every authors’ style has certain features being inaccessible to conscious manipulation.
Therefore they are considered to provide the most reliable basis for the identification of an
author. The style of an author may vary over time because of the differences in topics or genre
and personal development. In general, stylometry should identify features which are invariant
to these effects but are expressive enough to discriminate an author from other writers.
Two different models for extracting the stylometry within text documents implies the use of
distinctive stylistic features that characterize a specific author and models that focus on
extracting the general semantic content of a document rather than the stylistic details of how it
was written.
The probabilistic generative models reduces the process of writing a text document to a simple
series of probabilistic steps. The first step in generating these probabilistic models implies
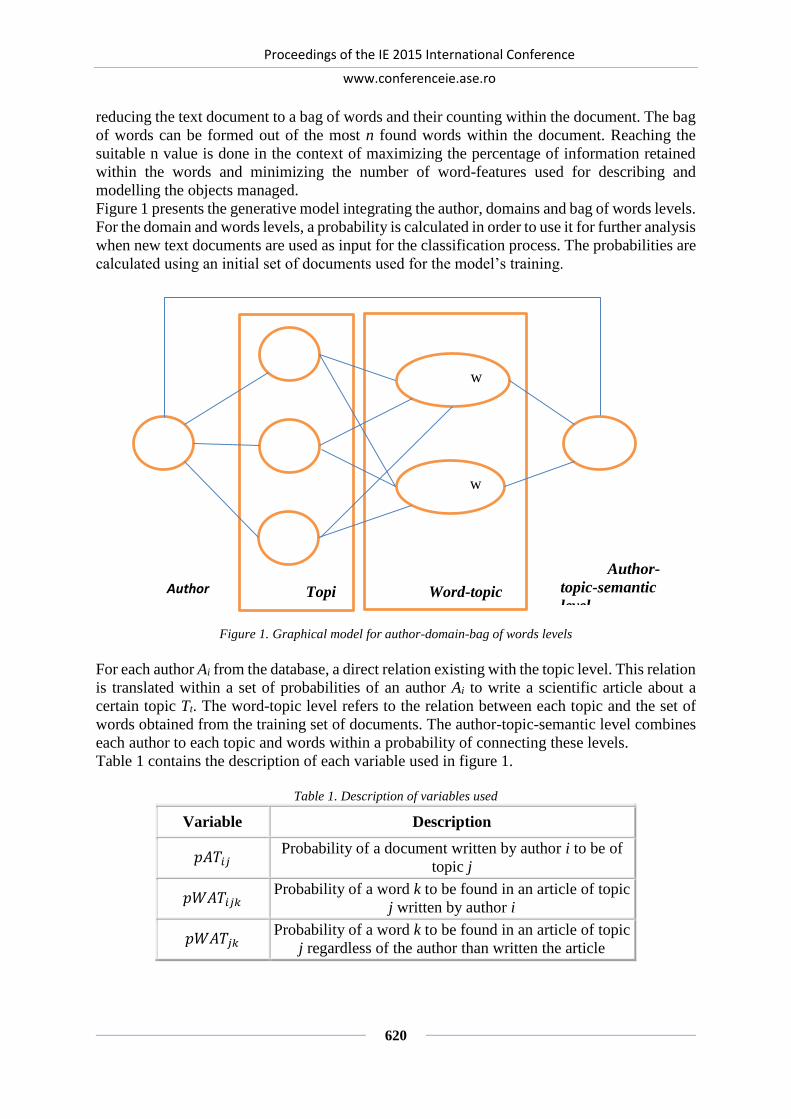
Proceedings of the IE 2015 International Conference
www.conferenceie.ase.ro
620
reducing the text document to a bag of words and their counting within the document. The bag
of words can be formed out of the most n found words within the document. Reaching the
suitable n value is done in the context of maximizing the percentage of information retained
within the words and minimizing the number of word-features used for describing and
modelling the objects managed.
Figure 1 presents the generative model integrating the author, domains and bag of words levels.
For the domain and words levels, a probability is calculated in order to use it for further analysis
when new text documents are used as input for the classification process. The probabilities are
calculated using an initial set of documents used for the model’s training.
Figure 1. Graphical model for author-domain-bag of words levels
For each author Ai from the database, a direct relation existing with the topic level. This relation
is translated within a set of probabilities of an author Ai to write a scientific article about a
certain topic Tt. The word-topic level refers to the relation between each topic and the set of
words obtained from the training set of documents. The author-topic-semantic level combines
each author to each topic and words within a probability of connecting these levels.
Table 1 contains the description of each variable used in figure 1.
Table 1. Description of variables used
Variable Description
𝑝𝐴𝑇𝑖𝑗 Probability of a document written by author i to be of
topic j
𝑝𝑊𝐴𝑇𝑖𝑗𝑘 Probability of a word k to be found in an article of topic
j written by author i
𝑝𝑊𝐴𝑇𝑗𝑘 Probability of a word k to be found in an article of topic
j regardless of the author than written the article
i
1i
2i
ti
W
kji
w
1j
w
Card W j
Topi
c level
Author level
Word-topic
level
Author-
topic-semantic
level

Proceedings of the IE 2015 International Conference
www.conferenceie.ase.ro
621
Given a new document D, the abstract is divided into words. Each word is used and the
probability is computed in order to decide to which topic the document D is most suitable to
be assigned.
𝑇𝐷 = max∏ 𝑝𝑊𝐴𝑇𝑖𝑗𝑘
𝐶𝑎𝑟𝑑 𝑊𝑘=1
𝑗,
where 𝑇𝐷 is the most suitable topic to assign the new document D and Card W is the number
of words in which the abstract of the document D was divided in.
3. Database model for authors, domains and semantic layers Starting from the general description of a generative model used for representing and
classifying scientific articles presented in chapter 2, a database structure is conducted.
The main points in the analysis are transformed within layers of representation: authors, topics
and words. Among each two layers a many to many relation exists. For example, an author can
write articles associated to multiple topics, while a topic can be written by various authors.
When dealing with articles written by more than one author, the information obtain within the
article, the topic and the words and senses are processed for each author from the list of authors.
Figure 2 presents the database used for processing, representing and classifying scientific
articles. The model is structured in an opened way regarding adding new authors, topics,
documents and words. Tables AuthorTopic and WordTopicAuthor are used for transforming
the many to many initial relations among tables into one to many relations suitable for further
extracting possible and needed information.
Figure 2. Proposed database for modelling author, topic and word layers

Proceedings of the IE 2015 International Conference
www.conferenceie.ase.ro
622
Combining the proposed database model with the generative model is done by calculating the
probabilities associated to topics, words and authors. For each formula, a SQL statement is
presented in table 2.
Table 2. Sql statements for probabilities from the generative model
Variable Sql statement
𝑝𝐴𝑇𝑖𝑗
((SELECT AuthorTopic.noDocuments FROM AuthorTopic
WHERE idAuthor = i AND idTopic = j) + 1) / ((SELECT
Author.noDocuments FROM Author WHERE idAuthor = i)
+ SELECT SUM(idTopic) FROM Topic)
𝑝𝑊𝐴𝑇𝑖𝑗𝑘
((SELECT noAppereance.WordTopicAuthor FROM
WordTopicAuthor WHERE idWord = k AND idTopic = j
AND idAuthor = i) + 1) / ((SELECT
SUM(noAppeareance.WordTopicAuthor) FROM
WordTopicAuthor WHERE idWord = k AND idAuthor = i)
+ SELECT SUM(idTopic) FROM Topic
𝑝𝑊𝐴𝑇𝑗𝑘
SELECT AVERAGE (SELECT
noAppereance.WordTopicAuthor FROM WordTopicAuthor
AND Topic WHERE idWord = k AND idTopic = j AND
idAuthor = i) + 1) / ((SELECT
SUM(noAppeareance.WordTopicAuthor) FROM
WordTopicAuthor WHERE idWord = k AND idAuthor = i)
+ SELECT SUM(idTopic) FROM Topic) where i =
SELECT authorID from Author
The presented probabilities are computed and used for assigning to topics new documents
written by various authors that are available within the initial database and training set of
articles.
4. Conclusions The conducted model for extracting and storing the semantic relations between authors,
domains and cultural orientation is used in solving natural language processing problems such
as: clustering, classification, extracting within a set of given document, authors and domains.
Using this model, the accuracy of processing is increased, adding the level of semantic analysis
and author-domain relation. Future work focusses on using this model in authorship assignment
application and authors’ cultural orientation extraction. This extraction is further used for
creating a modelling solution for describing the main semantic interactions between authors
from different cultures and main topics written. Also, it is used in describing the connections
of research conducted by the set of authors analyzed, extrapolating to the whole collectivity.
Furthermore, the present model is discussed in the future as an input base for text document
processing such as: plagiarism analysis, a corpus-based and intrinsic one and near-duplicate
detection, as presented in [6], the exemplification of plagiarism analysis within the web pages
from World Wide Web.
Acknowledgment ,,This work was financially supported through the project "Routes of academic excellence in
doctoral and post-doctoral research - READ" co-financed through the European Social Fund,
Proceedings of the IE 2015 International Conference
www.conferenceie.ase.ro
623
by Sectoral Operational Programme Human Resources Development 2007-2013, contract no
POSDRU/159/1.5/S/137926.”
References [1] S. Zhong and J. Ghosh “A comparative study of generative models for documents
clustering”, in Proceedings of the workshop on Clustering High Dimensional Data and Its
Applications in SIAM Data Mining Conference, 2003
[2] M. Rosen-Zvi “The author-topic model for authors and documents”, in Proceedings of the
20th conference on Uncertainty in artificial intelligence AUAI Press., 2004, pp. 487-494
[3] P. Juola “Authorship attribution”, Foundation and Trends in information Retrieval, Vol 1,
no. 3, pp. 233-234, 2006
[4] J. Diederich, J. Kindermann, E. Leopold and G. Paass “Authorship attribution with support
vector machine”, Applied Intelligence, Vol. 19, no. 1-2, pp. 109-123, 2003
[5] D. Lewis, G. Agam, S. Argamon, O. Frieder, D. Grossman and J. Heard “Building a test
collection for complex document information processing”, in SIGIR’ 06 Proceedings of the
29th annual international ACM SIGIR conference on Research and development in
information retrieval, New York, 2006, pp. 665-666
[6] B. Stein, M. Koppel and E. Stamatatos “Plagiarism analysis, authorship indentification and
near-duplicate detection PAN’07, ACM SIGIR Forum, Vol. 41, no. 2, 2007, pp. 68-71
[7] J. Eisenstein, A. Ahmed and E.P. Xing “Sparse additive generative models for text”, in
Proceedings of the 28th International Conference on Machine Learning, ICML-11, 2011,
pp. 1041-1048
[8] T. Rubin, A. Chambers, P. Smyth and M. Steyvers “Statistical topic models for multi-label
document classification”, Machine Learning, Vol. 88, no. 1-2, 2012, pp. 157-208